UNITED STATES
SECURITIES AND EXCHANGE COMMISSION
Washington, D.C. 20549
FORM N-CSR
CERTIFIED SHAREHOLDER REPORT
OF
REGISTERED MANAGEMENT INVESTMENT COMPANIES
| | |
| Investment Company Act file number: | 811-22114 |
Name of Registrant: | Vanguard Montgomery Funds |
Address of Registrant: | P.O. Box 2600 |
| | Valley Forge, PA 19482 |
Name and address of agent for service: | Heidi Stam, Esquire |
| | P.O. Box 876 |
| | Valley Forge, PA 19482 |
Registrant’s telephone number, including area code: (610) 669-1000 |
Date of fiscal year end: December 31 | |
Date of reporting period: January 1, 2014 – December 31, 2014 |
Item 1: Reports to Shareholders | |
Annual Report | December 31, 2014
Vanguard Market Neutral Fund
The mission continues
On May 1, 1975, Vanguard began operations, a fledgling company based on the simple but revolutionary idea that a mutual fund company should be managed solely in the interest of its investors.
Four decades later, that revolutionary spirit continues to animate the enterprise. Vanguard remains on a mission to give investors the best chance of investment success.
As we mark our 40th anniversary, we thank you for entrusting your assets to Vanguard and giving us the opportunity to help you reach your financial goals in the decades to come.
| |
| Contents | |
| Your Fund’s Total Returns. | 1 |
| Chairman’s Letter. | 2 |
| Advisor’s Report. | 8 |
| Fund Profile. | 10 |
| Performance Summary. | 12 |
| Financial Statements. | 14 |
| Your Fund’s After-Tax Returns. | 29 |
| About Your Fund’s Expenses. | 30 |
| Glossary. | 32 |
Please note: The opinions expressed in this report are just that—informed opinions. They should not be considered promises or advice.
Also, please keep in mind that the information and opinions cover the period through the date on the front of this report. Of course, the
risks of investing in your fund are spelled out in the prospectus.
See the Glossary for definitions of investment terms used in this report.
About the cover: Since our founding, Vanguard has drawn inspiration from the enterprise and valor demonstrated by British
naval hero Horatio Nelson and his command at the Battle of the Nile in 1798. The photograph displays a replica of a merchant
ship from the same era as Nelson’s flagship, the HMS Vanguard.
Your Fund’s Total Returns
| |
| Fiscal Year Ended December 31, 2014 | |
| |
| | Total |
| | Returns |
| Vanguard Market Neutral Fund | |
| Investor Shares | 4.26% |
| Institutional Shares | 4.38 |
| Citigroup Three-Month U.S. Treasury Bill Index | 0.03 |
| Alternative Equity Market Neutral Funds Average | 0.43 |
| Alternative Equity Market Neutral Funds Average: Derived from data provided by Lipper, a Thomson Reuters Company. |
| Institutional Shares are available to certain institutional investors who meet specific administrative, service, and account-size criteria. |
Your Fund’s Performance at a Glance
December 31, 2013, Through December 31, 2014
| | | | | |
| | | | Distributions Per Share | |
| | Starting | Ending | | | |
| | Share | Share | Income | Capital | Return of |
| | Price | Price | Dividends | Gains | Capital |
| Vanguard Market Neutral Fund | | | | | |
| Investor Shares | $11.03 | $11.50 | $0.000 | $0.000 | $0.000 |
| Institutional Shares | 10.97 | 11.45 | 0.000 | 0.000 | 0.000 |
1

Chairman’s Letter
Dear Shareholder,
Vanguard Market Neutral Fund easily outpaced its peers and its benchmark index in 2014 as the broad stock market delivered another year of strong returns.
The fund returned 4.26% for Investor Shares and 4.38% for the lower-cost Institutional Shares. That compares with 0.03% for the benchmark Citigroup Three-Month U.S. Treasury Bill Index and 0.43% for peer funds, on average.
Of course, the fund’s advance pales next to the U.S. equity market’s double-digit return, but that disparity is to be expected. The fund is designed not to follow the returns of the broad stock market but to deliver performance that’s neutral to market conditions.
Not surprisingly, the stock market experienced volatility in 2014. At the beginning of the year and again in the summer, U.S. stocks suffered a steep monthly drop followed by a sharp rebound in the next month. Through these ups and downs, however, the Market Neutral Fund’s returns stayed relatively stable.
Please note that effective December 3, Vanguard eliminated the investment minimum for institutional and financial advisor clients in the fund’s Investor share class.
2
U.S. stocks finished higher for the sixth straight year
U.S. stocks returned nearly 13% for the 12 months ended December 31, 2014, posting gains for the sixth consecutive calendar year. Rising corporate earnings, the growing U.S. economy, and generally accommodative global monetary policies lifted domestic markets. Elsewhere, Europe and China faced economic challenges, tensions flared in the Middle East and Ukraine, and concerns arose over high stock valuations.
Although the Federal Reserve ended its bond-buying program in October, investors seemed to be reassured by its stance that it would be “patient” in deciding when to increase short-term interest rates. Other central banks—including the Bank of Japan, the European Central Bank, and the People’s Bank of China—announced significant stimulus measures.
International stocks didn’t fare as well as their U.S. counterparts, returning about –3% in dollar terms. Their performance was hurt as many foreign currencies weakened against the U.S. dollar. Emerging-market stocks rose slightly, but stocks from the developed markets of Europe and the Pacific region retreated.
Defying analysts’ expectations, bond prices rose during the period
Bond prices received a boost from many of the world’s central banks along with global economic, market, and geopolitical challenges that drew investors to perceived safe havens. In an unexpected rebound
| | | |
| Market Barometer | | | |
| |
| | Average Annual Total Returns |
| | Periods Ended December 31, 2014 |
| | One | Three | Five |
| | Year | Years | Years |
| Stocks | | | |
| Russell 1000 Index (Large-caps) | 13.24% | 20.62% | 15.64% |
| Russell 2000 Index (Small-caps) | 4.89 | 19.21 | 15.55 |
| Russell 3000 Index (Broad U.S. market) | 12.56 | 20.51 | 15.63 |
| FTSE All-World ex US Index (International) | -3.31 | 9.41 | 4.75 |
| |
| Bonds | | | |
| Barclays U.S. Aggregate Bond Index (Broad taxable market) | 5.97% | 2.66% | 4.45% |
| Barclays Municipal Bond Index (Broad tax-exempt market) | 9.05 | 4.30 | 5.16 |
| Citigroup Three-Month U.S. Treasury Bill Index | 0.03 | 0.04 | 0.06 |
| |
| CPI | | | |
| Consumer Price Index | 0.76% | 1.33% | 1.69% |
3
from the previous year, the broad U.S. bond market returned 5.97% for the period.
Even as the Fed pared back its bond purchases, prices climbed and yields fell. (Bond prices and yields move in opposite directions.) The yield of the 10-year Treasury note ended December at 2.19%, down from 2.97% at the close of December 2013.
Municipal bonds returned 9.05%, benefiting from increased demand and generally limited supply.
International bond markets (as measured by the Barclays Global Aggregate Index ex USD) returned –3.08%.
The fund’s long-short approach led to successful 12-month performance
In a sense, Vanguard Market Neutral Fund is actually two portfolios. From its “short” portfolio, it sells borrowed shares in the hope that the stocks’ price will fall. It can then profit by replacing the shares at the lower price. In its “long” portfolio, the fund invests with a traditional approach, in which stocks are selected based on the advisor’s belief that they’ll outperform.
The two portfolios are mirror images. They typically have about the same number of stocks and the same weightings—or allocation levels—to industry sectors. Success hinges on the selection of stocks by the fund’s advisor, Vanguard Equity
| |
| Total Returns | |
| Ten Years Ended December 31, 2014 | |
| | Average |
| | Annual Return |
| Market Neutral Fund Investor Shares | 2.46% |
| Citigroup Three-Month U.S. Treasury Bill Index | 1.46 |
| Alternative Equity Market Neutral Funds Average | 1.36 |
| Alternative Equity Market Neutral Funds Average: Derived from data provided by Lipper, a Thomson Reuters Company. |
The figures shown represent past performance, which is not a guarantee of future results. (Current performance may be lower or higher than the performance data cited. For performance data current to the most recent month-end, visit our website at vanguard.com/performance.) Note, too, that both investment returns and principal value can fluctuate widely, so an investor’s shares, when sold, could be worth more or less than their original cost.
4
Investment Group, through its Quantitative Equity Group. The advisor has developed—and continually refines—computer models to identify the most and least attractive stocks in each sector.
These models, on the whole, worked well for the fiscal year. On the long side, the fund scored big returns with its investments in airlines. These companies benefited from the steep slide in fuel prices as well as industry consolidation that has allowed carriers to raise fares. The fund also had success with short investments in a range of businesses from cosmetics to shipping.
Energy was a weak spot: Shares of oil and gas companies plunged in the second half of the year along with the price of oil. Although the fund had some success with short investments in the sector, it wasn’t enough to offset the big drop in its long positions.
The fund’s combination of short and long investments is intended to enhance diversification by providing returns that aren’t closely correlated with moves of the broad stock market. However, the technique doesn’t work in every sector in every period, as we saw with energy
|
| Vanguard’s outlook for investors: Expect less and stay balanced |
| |
| In Vanguard’s recently published market outlook, global chief economist Joe Davis and his |
| team discuss expected returns for various asset classes over the coming years. Although not |
| bearish, our outlook on global stocks and bonds is the most guarded since 2006. The report |
| cautions that, over the next decade, returns for a balanced portfolio are likely to be moderately |
| below long-run historical averages. |
| |
| Our simulations indicate that the average annualized returns of a 60% equity/40% bond |
| portfolio for the decade ending 2024 are most likely to be centered in the 3%–5% range |
| after inflation, below the actual average after-inflation return of 5.6% for the same portfolio |
| since 1926. |
| |
| Even so, Vanguard firmly believes that the principles for investing success—focusing on clear |
| goals, a suitable asset allocation, low costs, and long-term discipline—remain unchanged. |
| |
| For more information about our expectations and the probability of various outcomes, |
| see Vanguard’s Economic and Investment Outlook, available at vanguard.com/research. |
| |
| |
| |
| IMPORTANT: The projections and other information generated by the Vanguard Capital Markets Model (VCMM) |
| regarding the likelihood of various investment outcomes are hypothetical in nature, do not reflect actual invest- |
| ment results, and are not guarantees of future results. Distribution of return outcomes from VCMM, derived |
| from 10,000 simulations for U.S. equity returns and fixed income returns. Simulations as of September 30, 2014. |
| Results from the model may vary with each use and over time. For more information, please see page 6. |
5
stocks in 2014. The hope is that, in aggregate, the short and long positions will lead to a net positive result. Because of the Market Neutral Fund’s distinctive characteristics, investors should carefully evaluate its appropriateness for their specific situations. The fund can play a role as a portion of an already well-diversified portfolio.
For more about the advisor’s strategy and the fund’s positioning during the year, please see the Advisor’s Report that follows this letter.
The fund’s relative performance was solid over the past decade
For the ten years ended December 31, 2014, the Market Neutral Fund recorded an annualized return of 2.46% for Investor Shares. That exceeded the annual result of the benchmark index by one percentage point and the average annual return of peers by slightly more than that. As you may recall, the fund has been through significant changes in the last decade.
It became a Vanguard fund in 2007, and Vanguard Equity Investment Group became its sole advisor in 2010. We’re confident that the group will continue to successfully implement the fund’s long-short strategy.
To build for the long term, start with a solid foundation
As the leader of a major investment firm, I get asked a lot of questions on all kinds of topics, from the outlook for global markets to the best fund choices for an IRA. But a topic that almost never comes up—and one that I consider perhaps the most important—is setting investment goals.
IMPORTANT: The projections and other information generated by the Vanguard Capital Markets Model regarding the likelihood of various investment outcomes are hypothetical in nature, do not reflect actual investment results, and are not guarantees of future results. VCMM results will vary with each use and over time.
The VCMM projections are based on a statistical analysis of historical data. Future returns may behave differently from the historical patterns captured in the VCMM. More important, the VCMM may be underestimating extreme negative scenarios unobserved in the historical period on which the model estimation is based.
The Vanguard Capital Markets Model® is a proprietary financial simulation tool developed and maintained by Vanguard’s primary investment research and advice teams. The model forecasts distributions of future returns for a wide array of broad asset classes. Those asset classes include U.S. and international equity markets, several maturities of the U.S. Treasury and corporate fixed income markets, international fixed income markets, U.S. money markets, commodities, and certain alternative investment strategies. The theoretical and empirical foundation for the Vanguard Capital Markets Model is that the returns of various asset classes reflect the compensation investors require for bearing different types of systematic risk (beta). At the core of the model are estimates of the dynamic statistical relationship between risk factors and asset returns, obtained from statistical analysis based on available monthly financial and economic data from as early as 1960. Using a system of estimated equations, the model then applies a Monte Carlo simulation method to project the estimated interrelationships among risk factors and asset classes as well as uncertainty and randomness over time. The model generates a large set of simulated outcomes for each asset class over several time horizons. Forecasts are obtained by computing measures of central tendency in these simulations. Results produced by the tool will vary with each use and over time.
6
At Vanguard, we believe that following four timeless, straightforward principles can help put you on the right track toward investment success:
• Goals. Create clear, appropriate
investment goals.
• Balance. Develop a suitable asset
allocation using broadly diversified funds.
• Cost. Minimize cost.
• Discipline. Maintain perspective and
long-term discipline.
All four principles are essential, and the order in which they’re listed is intentional. Every good investment plan begins with a clearly defined goal, which sets the foundation for building your portfolio. (You can read more about our principles in Vanguard’s Principles for Investing Success, available at vanguard.com/ research.)
Setting an investment goal doesn’t have to be complicated. It can be as simple as saving for retirement or for a child’s college education. Being realistic about your goals—and how to meet them—can help you stick with your investment plan even when times get tough.
We’ve recently welcomed a new year, which for many means a new beginning. Now is a perfect time to revisit your investment plan and make any necessary adjustments to help you reach your long-term financial goals.
As always, thank you for investing with Vanguard.
Sincerely,

F. William McNabb III
Chairman and Chief Executive Officer
January 20, 2015
7
Advisor’s Report
U.S. equities delivered their sixth consecutive year of positive returns in 2014. The broad U.S. equity market rose nearly 13%, large-capitalization stocks bested smaller-caps by about 8 percentage points, and value-oriented companies modestly outpaced their growth counterparts. The U.S. equity market far surpassed international markets, both developed and emerging.
Performance in the U.S. market was broad-based: Nine of ten sectors generated positive returns. Results were best in utilities, health care, and information technology. Energy was the only sector to deliver negative returns as oil prices plummeted about 50%.
Vanguard Market Neutral Fund returned 4.26% for Investor Shares and 4.38% for Institutional Shares. The fund’s strategy is not to outperform the equity market but rather to be neutral to market conditions and produce results that exceed the returns of 3-month U.S. Treasury bills.
Conditions continued to improve for the U.S. economy in 2014. Third-quarter GDP growth came in at an annual rate of 5% and unemployment kept declining as the nation approached full employment. Hopefully, wage growth will soon begin to strengthen. As oil and gas prices decline, many consumers will have additional income to spend.
U.S. companies are raising their competitiveness, and that should bode well for profit growth in the near term. However, the economy is not without challenges. The housing market stalled for the year, and uncertainty remains about when and to what extent the Federal Reserve will begin to raise interest rates. Foreign economies are still struggling—some are near recession—and China’s growth rate is decelerating. These uncertainties could lead to volatility in our home markets.
Although it’s important to understand how overall portfolio performance is affected by the macro factors described above, our investment philosophy and process focus on specific stock fundamentals. We compare stocks in the same industry group against one another to identify those with characteristics that we believe will outperform and underperform over the long run. To do this, we use a strict quantitative process that concentrates on a combination of valuation and other factors focused on fundamental growth. We then construct our portfolio with the goal of maximizing expected return and minimizing exposure to risks that our research indicates do not improve returns.
Our analysis for the calendar year reveals that our stock selection model was effective in identifying the leaders
8
and laggards within sectors; all five of our stock selection signals produced positive performance. The growth and valuation models were the strongest contributors, followed by sentiment and quality.
Our stock selection was successful in six of the ten sectors in the benchmark, with the strongest results in industrials, consumer staples, and information technology. Choices in energy detracted most.
Long positions in Southwest Airlines and JetBlue Airways and short positions in Scorpio Bulkers and Chart Industries led our results in industrials. In consumer staples, long positions in Pilgrim’s Pride and Keurig Green Mountain and a short position in Elizabeth Arden drove returns. In information technology, long positions in Freescale Semiconductor and Booz Allen Hamilton contributed most to relative performance.
However, our results in energy were disappointing. Long positions in Basic Energy Services and Comstock Resources, as well as a short position in Cheniere Energy, did not perform as expected and were the largest detractors in this group.
We thank you for your investment and look forward to the new year.
James D. Troyer, CFA,
Principal, Portfolio Manager
James P. Stetler,
Principal, Portfolio Manager
Michael R. Roach, CFA,
Portfolio Manager
Vanguard Equity Investment Group
January 21, 2015
9
Market Neutral Fund
Fund Profile
As of December 31, 2014
| | |
| Share-Class Characteristics | | |
| | Investor | Institutional |
| | Shares | Shares |
| Ticker Symbol | VMNFX | VMNIX |
| Total Expense Ratio1 | 1.60% | 1.50% |
| Management Expenses | 0.19% | 0.09% |
| Dividend Expenses on | | |
| Securities Sold Short2 | 1.18% | 1.18% |
| Borrowing Expenses on | | |
| Securities Sold Short2 | 0.14% | 0.14% |
| Other Expenses | 0.09% | 0.09% |
| | |
| Portfolio Characteristics | | |
| | Long | Short |
| | Portfolio | Portfolio |
| Number of Stocks | 252 | 248 |
| Median Market Cap | $4.3B | $3.7B |
| Price/Earnings Ratio | 16.7x | 42.6x |
| Price/Book Ratio | 2.6x | 2.3x |
| Return on Equity | 13.5% | 12.2% |
| Earnings Growth | | |
| Rate | 18.6% | 13.2% |
| Foreign Holdings | 1.5% | 2.0% |
| |
| Fund Characteristics | |
| Turnover Rate | 73% |
| Short-Term Reserves | 2.3% |
| | |
| Volatility Measures | | |
| | Citigroup | DJ |
| | Three-Month | U.S. Total |
| | U.S. Treasury | Market |
| | Bill Index | FA Index |
| R-Squared | 0.02 | 0.13 |
| Beta | -28.00 | 0.13 |
| These measures show the degree and timing of the fund’s fluctuations compared with the index over 36 months. |
| | |
| Sector Diversification (% of equity exposure) |
| | Long | Short |
| | Portfolio | Portfolio |
| Consumer Discretionary | 17.8% | 18.2% |
| Consumer Staples | 4.8 | 4.0 |
| Energy | 3.7 | 3.9 |
| Financials | 17.3 | 17.4 |
| Health Care | 10.6 | 10.4 |
| Industrials | 14.9 | 15.0 |
| Information Technology | 18.2 | 18.8 |
| Materials | 6.2 | 6.2 |
| Telecommunication Services | 1.0 | 1.0 |
| Utilities | 5.5 | 5.1 |
1 The total expense ratios shown are from the prospectus dated April 25, 2014, and represent estimated costs for the current fiscal year. For the
fiscal year ended December 31, 2014, the annualized total expense ratios were 1.64% for Investor Shares and 1.54% for Institutional Shares.
2 In connection with a short sale, the fund may receive income or be charged a fee based on the market value of the borrowed stock. When a
cash dividend is declared on a stock the fund has sold short, the fund is required to pay an amount equal to that dividend to the party from which
the fund borrowed the stock and to record the payment of the dividend as an expense.
10
Market Neutral Fund
| | |
| Ten Largest Holdings1 (% of total net assets) |
| Long Portfolio | | |
| Greenbrier Cos. Inc. | Construction | |
| | Machinery & Heavy | |
| | Trucks | 0.6% |
| Merrimack | | |
| Pharmaceuticals Inc. | Biotechnology | 0.5 |
| Murphy USA Inc. | Automotive Retail | 0.5 |
| ARRIS Group Inc. | Communications | |
| | Equipment | 0.5 |
| American States Water | | |
| Co. | Water Utilities | 0.5 |
| Nabors Industries Ltd. | Oil & Gas Drilling | 0.5 |
| Southwest Airlines Co. | Airlines | 0.5 |
| Century Aluminum Co. | Aluminum | 0.5 |
| JetBlue Airways Corp. | Airlines | 0.5 |
| Meritor Inc. | Auto Parts | 0.5 |
| Top Ten | | 5.1% |
| | |
| Ten Largest Holdings1 (% of total net assets) |
| Short Portfolio | | |
| |
| Knowles Corp. | Electronic | |
| | Components | 0.6% |
| DigitalGlobe Inc. | Aerospace & | |
| | Defense | 0.5 |
| WageWorks Inc. | Human Resource & | |
| | Employment | |
| | Services | 0.5 |
| Groupon Inc. | Internet Retail | 0.5 |
| Office Depot Inc. | Specialty Stores | 0.5 |
| Gulfport Energy Corp. | Oil & Gas | |
| | Exploration & | |
| | Production | 0.5 |
| Lumber Liquidators | Home | |
| Holdings Inc. | Improvement Retail | 0.5 |
| WellCare Health Plans | Managed Health | |
| Inc. | Care | 0.5 |
| FNF Group | Property & Casualty | |
| | Insurance | 0.5 |
| Aaron's Inc. | Homefurnishing | |
| | Retail | 0.5 |
| Top Ten | | 5.1% |
1 The holdings listed exclude any temporary cash investments and equity index products.
11
Market Neutral Fund
Performance Summary
All of the returns in this report represent past performance, which is not a guarantee of future results that may be achieved by the fund. (Current performance may be lower or higher than the performance data cited. For performance data current to the most recent month-end, visit our website at vanguard.com/performance.) Note, too, that both investment returns and principal value can fluctuate widely, so an investor’s shares, when sold, could be worth more or less than their original cost. The returns shown do not reflect taxes that a shareholder would pay on fund distributions or on the sale of fund shares.
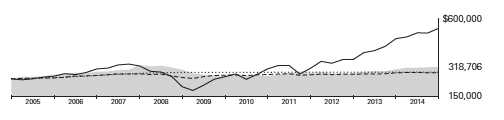
Cumulative Performance: December 31, 2004, Through December 31, 2014
Initial Investment of $250,000
| | | | | |
| | | Average Annual Total Returns | |
| | | Periods Ended December 31, 2014 | |
| |
| | | | | | Final Value |
| | | One | Five | Ten | of a $250,000 |
| | | Year | Years | Years | Investment |
| |
| | Market Neutral Fund*Investor Shares | 4.26% | 3.54% | 2.46% | $318,706 |
| | Citigroup Three-Month U.S. Treasury | | | | |
| •••••••• | Bill Index | 0.03 | 0.06 | 1.46 | 289,154 |
| |
| – – –– | Alternative Equity Market Neutral | | | | |
| | Funds Average | 0.43 | 1.08 | 1.36 | 286,232 |
| | Dow Jones U.S. Total Stock Market | | | | |
| | Float Adjusted Index | 12.47 | 15.72 | 8.09 | 544,466 |
| |
| Alternative Equity Market Neutral Funds Average: Derived from data provided by Lipper, a Thomson Reuters Company. |
| | | | |
| | | | | Final Value |
| | One | Five | Ten | of a $5,000,000 |
| | Year | Years | Years | Investment |
| |
| Market Neutral Fund Institutional Shares | 4.38% | 3.64% | 2.61% | $6,467,781 |
| Citigroup Three-Month U.S. Treasury Bill | | | | |
| Index | 0.03 | 0.06 | 1.46 | 5,783,080 |
| Dow Jones U.S. Total Stock Market Float | | | | |
| Adjusted Index | 12.47 | 15.72 | 8.09 | 10,889,319 |
See Financial Highlights for dividend and capital gains information.
12
Market Neutral Fund
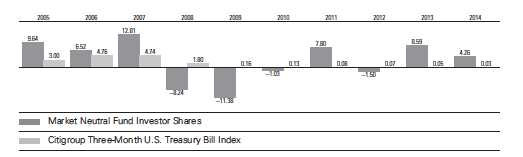
Fiscal-Year Total Returns (%): December 31, 2004, Through December 31, 2014
13
Market Neutral Fund
Financial Statements
Statement of Net Assets
As of December 31, 2014
The fund reports a complete list of its holdings in regulatory filings four times in each fiscal year, at the quarter-ends. For the second and fourth fiscal quarters, the lists appear in the fund’s semiannual and annual reports to shareholders. For the first and third fiscal quarters, the fund files the lists with the Securities and Exchange Commission on Form N-Q. Shareholders can look up the fund’s Forms N-Q on the SEC’s website at sec.gov. Forms N-Q may also be reviewed and copied at the SEC’s Public Reference Room (see the back cover of this report for further information).
| | | |
| | | | Market |
| | | | Value |
| | | Shares | ($000) |
| Common Stocks—Long Positions (95.5%) | |
| Consumer Discretionary (17.0%) | | |
| * † | Murphy USA Inc. | 24,800 | 1,708 |
| † | Royal Caribbean Cruises Ltd. | 19,400 | 1,599 |
| † | Dana Holding Corp. | 73,380 | 1,595 |
| † | Best Buy Co. Inc. | 40,900 | 1,594 |
| * | Lands’ End Inc. | 29,300 | 1,581 |
| * | Madison Square Garden Co. | | |
| | Class A | 20,900 | 1,573 |
| * | American Axle | | |
| | & Manufacturing Holdings | | |
| | Inc. | 69,100 | 1,561 |
| * | Zumiez Inc. | 40,300 | 1,557 |
| * † | Barnes & Noble Inc. | 66,200 | 1,537 |
| * † | Outerwall Inc. | 20,350 | 1,531 |
| * † | NVR Inc. | 1,200 | 1,530 |
| † | Brown Shoe Co. Inc. | 47,600 | 1,530 |
| † | Marriott Vacations | | |
| | Worldwide Corp. | 20,500 | 1,528 |
| | Cato Corp. Class A | 36,200 | 1,527 |
| † | Cablevision Systems Corp. | | |
| | Class A | 73,600 | 1,519 |
| † | Jack in the Box Inc. | 18,900 | 1,511 |
| * † | O’Reilly Automotive Inc. | 7,800 | 1,502 |
| * † | Skechers U.S.A. Inc. Class A | 27,000 | 1,492 |
| † | Marriott International Inc. | | |
| | Class A | 19,000 | 1,483 |
| † | DeVry Education Group Inc. | 31,200 | 1,481 |
| | Big Lots Inc. | 37,000 | 1,481 |
| † | Expedia Inc. | 17,200 | 1,468 |
| † | Home Depot Inc. | 13,900 | 1,459 |
| * † | Vince Holding Corp. | 54,500 | 1,425 |
| † | Domino’s Pizza Inc. | 15,050 | 1,417 |
| † | Hanesbrands Inc. | 12,100 | 1,351 |
| | Whirlpool Corp. | 6,800 | 1,317 |
| * † | Visteon Corp. | 12,200 | 1,304 |
| † | Macy’s Inc. | 19,500 | 1,282 |
| † | Columbia Sportswear Co. | 28,200 | 1,256 |
| * | News Corp. Class A | 72,000 | 1,130 |
| * † | Starz | 34,700 | 1,031 |
| | | |
| * | BJ’s Restaurants Inc. | 18,600 | 934 |
| † | GameStop Corp. Class A | 27,200 | 919 |
| † | Buckle Inc. | 16,800 | 882 |
| † | Dillard’s Inc. Class A | 6,670 | 835 |
| † | Gap Inc. | 18,900 | 796 |
| † | TJX Cos. Inc. | 11,100 | 761 |
| * | Live Nation Entertainment | | |
| | Inc. | 20,800 | 543 |
| | Foot Locker Inc. | 5,200 | 292 |
| | AMC Entertainment | | |
| | Holdings Inc. | 9,800 | 257 |
| | | | 53,079 |
| Consumer Staples (4.6%) | | |
| | Archer-Daniels-Midland Co. | 29,600 | 1,539 |
| † | Bunge Ltd. | 16,200 | 1,473 |
| * † | Pilgrim’s Pride Corp. | 44,000 | 1,443 |
| † | Cal-Maine Foods Inc. | 36,700 | 1,432 |
| † | Sanderson Farms Inc. | 17,000 | 1,428 |
| † | Dr Pepper Snapple Group | | |
| | Inc. | 18,900 | 1,355 |
| † | Keurig Green Mountain Inc. | 9,500 | 1,258 |
| * † | Rite Aid Corp. | 145,900 | 1,097 |
| † | Andersons Inc. | 19,550 | 1,039 |
| | Kimberly-Clark Corp. | 7,800 | 901 |
| * | SUPERVALU Inc. | 64,200 | 623 |
| | Avon Products Inc. | 62,900 | 591 |
| | | | 14,179 |
| Energy (3.4%) | | |
| | Nabors Industries Ltd. | 125,200 | 1,625 |
| | Tesoro Corp. | 19,900 | 1,479 |
| * † | Kosmos Energy Ltd. | 151,200 | 1,269 |
| † | Valero Energy Corp. | 24,700 | 1,223 |
| † | Green Plains Inc. | 43,800 | 1,085 |
| * | Unit Corp. | 18,500 | 631 |
| † | Hess Corp. | 8,500 | 627 |
| * | Helix Energy Solutions Group | | |
| | Inc. | 28,700 | 623 |
| * † | Clayton Williams Energy Inc. | 9,600 | 612 |
| † | SM Energy Co. | 15,800 | 610 |
14
Market Neutral Fund
| | | |
| | | | Market |
| | | | Value |
| | | Shares | ($000) |
| * † | Basic Energy Services Inc. | 65,900 | 462 |
| * | Seventy Seven Energy Inc. | 37,357 | 202 |
| | | | 10,448 |
| Financials (16.5%) | | |
| † | Montpelier Re Holdings Ltd. | 44,500 | 1,594 |
| † | CIT Group Inc. | 33,000 | 1,578 |
| † | International Bancshares | | |
| | Corp. | 59,400 | 1,576 |
| † | Nelnet Inc. Class A | 34,000 | 1,575 |
| † | Reinsurance Group of | | |
| | America Inc. Class A | 17,700 | 1,551 |
| † | Navient Corp. | 71,500 | 1,545 |
| * | Springleaf Holdings Inc. | 42,700 | 1,544 |
| † | Voya Financial Inc. | 36,400 | 1,543 |
| | JPMorgan Chase & Co. | 24,600 | 1,539 |
| † | PrivateBancorp Inc. | 45,900 | 1,533 |
| | Associated Banc-Corp | 81,900 | 1,526 |
| † | Everest Re Group Ltd. | 8,900 | 1,516 |
| † | AmTrust Financial Services | | |
| | Inc. | 26,800 | 1,508 |
| | Assured Guaranty Ltd. | 57,500 | 1,494 |
| † | Santander Consumer USA | | |
| | Holdings Inc. | 75,400 | 1,479 |
| † | Radian Group Inc. | 88,100 | 1,473 |
| † | PartnerRe Ltd. | 12,700 | 1,449 |
| † | Aspen Insurance Holdings | | |
| | Ltd. | 33,100 | 1,449 |
| † | Capital One Financial Corp. | 17,500 | 1,445 |
| * † | Credit Acceptance Corp. | 10,260 | 1,400 |
| | Travelers Cos. Inc. | 12,500 | 1,323 |
| † | Goldman Sachs Group Inc. | 6,800 | 1,318 |
| | RenaissanceRe Holdings Ltd. | 13,400 | 1,303 |
| | Wells Fargo & Co. | 23,200 | 1,272 |
| | Axis Capital Holdings Ltd. | 24,700 | 1,262 |
| † | Talmer Bancorp Inc. Class A | 88,300 | 1,240 |
| † | Ameriprise Financial Inc. | 9,300 | 1,230 |
| * † | Western Alliance Bancorp | 43,800 | 1,218 |
| † | Allied World Assurance Co. | | |
| | Holdings AG | 32,000 | 1,213 |
| † | KeyCorp | 76,500 | 1,063 |
| | Lazard Ltd. Class A | 18,700 | 936 |
| † | Huntington Bancshares Inc. | 87,400 | 919 |
| † | Washington Federal Inc. | 40,600 | 899 |
| | Assurant Inc. | 13,000 | 890 |
| † | Regions Financial Corp. | 81,700 | 863 |
| * | World Acceptance Corp. | 10,650 | 846 |
| | Comerica Inc. | 17,500 | 820 |
| * | Beneficial Mutual Bancorp | | |
| | Inc. | 46,100 | 566 |
| * | MGIC Investment Corp. | 53,200 | 496 |
| | Cathay General Bancorp | 17,000 | 435 |
| | Symetra Financial Corp. | 16,200 | 373 |
| | FBL Financial Group Inc. | | |
| | Class A | 5,700 | 331 |
| | | |
| | Banco Latinoamericano de | | |
| | Comercio Exterior SA | 10,800 | 325 |
| | | | 51,458 |
| Health Care (10.1%) | | |
| * | Merrimack Pharmaceuticals | | |
| | Inc. | 151,600 | 1,713 |
| * † | Health Net Inc. | 29,900 | 1,601 |
| * † | Centene Corp. | 15,200 | 1,578 |
| * † | Quintiles Transnational | | |
| | Holdings Inc. | 26,000 | 1,531 |
| † | Omnicare Inc. | 20,900 | 1,524 |
| * † | Charles River Laboratories | | |
| | International Inc. | 23,400 | 1,489 |
| * † | Premier Inc. Class A | 43,600 | 1,462 |
| * † | Natus Medical Inc. | 40,500 | 1,460 |
| * † | Edwards Lifesciences Corp. | 11,400 | 1,452 |
| * † | Anthem Inc. | 11,000 | 1,382 |
| * † | Lannett Co. Inc. | 32,000 | 1,372 |
| * | Surgical Care Affiliates Inc. | 38,900 | 1,309 |
| † | AbbVie Inc. | 20,000 | 1,309 |
| * | Gilead Sciences Inc. | 13,600 | 1,282 |
| * † | PAREXEL International Corp. | 22,700 | 1,261 |
| * † | HCA Holdings Inc. | 15,355 | 1,127 |
| † | Eli Lilly & Co. | 15,400 | 1,062 |
| † | Select Medical Holdings | | |
| | Corp. | 71,200 | 1,025 |
| * | Globus Medical Inc. | 40,100 | 953 |
| * | Boston Scientific Corp. | 64,800 | 859 |
| * | Medivation Inc. | 8,600 | 857 |
| | Cardinal Health Inc. | 9,600 | 775 |
| * | VCA Inc. | 14,800 | 722 |
| * † | Bruker Corp. | 34,900 | 685 |
| * | MedAssets Inc. | 31,100 | 614 |
| † | Chemed Corp. | 4,600 | 486 |
| * | INC Research Holdings Inc. | | |
| | Class A | 18,200 | 468 |
| | CR Bard Inc. | 1,600 | 267 |
| | | | 31,625 |
| Industrials (14.2%) | | |
| | Greenbrier Cos. Inc. | 32,800 | 1,762 |
| † | Southwest Airlines Co. | 38,400 | 1,625 |
| * † | JetBlue Airways Corp. | 101,800 | 1,615 |
| * † | Meritor Inc. | 106,300 | 1,611 |
| * | Korn/Ferry International | 55,600 | 1,599 |
| * † | Spirit AeroSystems Holdings | | |
| | Inc. Class A | 36,900 | 1,588 |
| | Aircastle Ltd. | 73,900 | 1,579 |
| † | Pitney Bowes Inc. | 63,600 | 1,550 |
| * † | United Rentals Inc. | 14,800 | 1,510 |
| † | Textron Inc. | 35,800 | 1,508 |
| † | Illinois Tool Works Inc. | 15,800 | 1,496 |
| † | Huntington Ingalls Industries | | |
| | Inc. | 13,283 | 1,494 |
| | General Dynamics Corp. | 10,800 | 1,486 |
15
Market Neutral Fund
| | | |
| | | | Market |
| | | | Value |
| | | Shares | ($000) |
| † | Alaska Air Group Inc. | 24,820 | 1,483 |
| † | West Corp. | 44,900 | 1,482 |
| * † | TriNet Group Inc. | 46,800 | 1,464 |
| * | AECOM Technology Corp. | 47,000 | 1,427 |
| † | Cintas Corp. | 17,900 | 1,404 |
| † | Lockheed Martin Corp. | 6,700 | 1,290 |
| † | Deluxe Corp. | 20,200 | 1,258 |
| † | Masco Corp. | 49,000 | 1,235 |
| * | United Continental Holdings | | |
| | Inc. | 16,000 | 1,070 |
| | ArcBest Corp. | 22,800 | 1,057 |
| † | Trinity Industries Inc. | 37,740 | 1,057 |
| | SPX Corp. | 12,200 | 1,048 |
| † | ManpowerGroup Inc. | 14,300 | 975 |
| | Harsco Corp. | 51,500 | 973 |
| * | Spirit Airlines Inc. | 12,800 | 967 |
| † | H&E Equipment Services | | |
| | Inc. | 31,700 | 891 |
| † | UniFirst Corp. | 6,800 | 826 |
| * † | Avis Budget Group Inc. | 11,200 | 743 |
| | Boeing Co. | 5,000 | 650 |
| † | Union Pacific Corp. | 4,300 | 512 |
| | Robert Half International Inc. | 8,300 | 485 |
| † | CIRCOR International Inc. | 8,000 | 482 |
| † | Steelcase Inc. Class A | 26,600 | 477 |
| † | Northrop Grumman Corp. | 2,730 | 402 |
| † | AMERCO | 1,000 | 284 |
| | | | 44,365 |
| Information Technology (17.4%) | | |
| * † | ARRIS Group Inc. | 54,800 | 1,654 |
| * † | RF Micro Devices Inc. | 96,100 | 1,594 |
| * † | Electronic Arts Inc. | 33,500 | 1,575 |
| * † | Freescale Semiconductor | | |
| | Ltd. | 62,410 | 1,575 |
| * † | Aspen Technology Inc. | 44,800 | 1,569 |
| * † | Take-Two Interactive | | |
| | Software Inc. | 55,900 | 1,567 |
| * | Super Micro Computer Inc. | 44,600 | 1,556 |
| * † | Blackhawk Network | | |
| | Holdings Inc. | 40,000 | 1,552 |
| † | CDW Corp. | 43,900 | 1,544 |
| * | VASCO Data Security | | |
| | International Inc. | 54,100 | 1,526 |
| * † | AVG Technologies NV | 77,300 | 1,526 |
| * † | Manhattan Associates Inc. | 36,600 | 1,490 |
| † | Booz Allen Hamilton Holding | | |
| | Corp. | 55,900 | 1,483 |
| † | Computer Sciences Corp. | 23,400 | 1,475 |
| † | Heartland Payment Systems | | |
| | Inc. | 27,000 | 1,457 |
| † | Western Digital Corp. | 13,150 | 1,456 |
| † | Science Applications | | |
| | International Corp. | 29,200 | 1,446 |
| * † | OmniVision Technologies | | |
| | Inc. | 55,200 | 1,435 |
| | | |
| * | Sanmina Corp. | 60,400 | 1,421 |
| * † | Sykes Enterprises Inc. | 60,300 | 1,415 |
| * | CommScope Holding Co. | | |
| | Inc. | 60,100 | 1,372 |
| * † | Gartner Inc. | 15,900 | 1,339 |
| † | SYNNEX Corp. | 16,006 | 1,251 |
| * | iGATE Corp. | 31,500 | 1,244 |
| † | Broadridge Financial | | |
| | Solutions Inc. | 26,800 | 1,238 |
| † | MAXIMUS Inc. | 22,500 | 1,234 |
| | Cypress Semiconductor | | |
| | Corp. | 85,300 | 1,218 |
| | DST Systems Inc. | 12,800 | 1,205 |
| * | TeleTech Holdings Inc. | 50,400 | 1,194 |
| * † | Tech Data Corp. | 16,600 | 1,050 |
| * † | Ciena Corp. | 53,700 | 1,042 |
| | Blackbaud Inc. | 23,800 | 1,030 |
| * | Benchmark Electronics Inc. | 40,400 | 1,028 |
| † | Brocade Communications | | |
| | Systems Inc. | 86,100 | 1,020 |
| | Lexmark International Inc. | | |
| | Class A | 24,500 | 1,011 |
| * † | Anixter International Inc. | 11,400 | 1,008 |
| * † | Advanced Micro Devices | | |
| | Inc. | 352,030 | 940 |
| * | Callidus Software Inc. | 54,800 | 895 |
| † | Avnet Inc. | 17,600 | 757 |
| * † | Rambus Inc. | 67,600 | 750 |
| † | Symantec Corp. | 21,100 | 541 |
| * † | PTC Inc. | 11,800 | 432 |
| * | Ingram Micro Inc. | 14,700 | 406 |
| | Skyworks Solutions Inc. | 5,000 | 364 |
| † | Accenture plc Class A | 2,500 | 223 |
| | Marvell Technology Group | | |
| | Ltd. | 15,200 | 220 |
| | | | 54,328 |
| Materials (6.0%) | | |
| * † | Century Aluminum Co. | 66,600 | 1,625 |
| † | LyondellBasell Industries NV | | |
| | Class A | 19,800 | 1,572 |
| | Alcoa Inc. | 99,400 | 1,569 |
| * † | Stillwater Mining Co. | 105,300 | 1,552 |
| † | Ball Corp. | 21,000 | 1,432 |
| † | United States Steel Corp. | 53,100 | 1,420 |
| * † | Berry Plastics Group Inc. | 43,800 | 1,382 |
| † | PPG Industries Inc. | 5,951 | 1,376 |
| † | CF Industries Holdings Inc. | 4,700 | 1,281 |
| * † | Graphic Packaging Holding | | |
| | Co. | 81,200 | 1,106 |
| | Scotts Miracle-Gro Co. | | |
| | Class A | 16,800 | 1,047 |
| | Avery Dennison Corp. | 17,600 | 913 |
| † | Westlake Chemical Corp. | 14,560 | 889 |
| | Sherwin-Williams Co. | 2,300 | 605 |
| | US Silica Holdings Inc. | 19,100 | 491 |
16
Market Neutral Fund
| | | |
| | | | Market |
| | | | Value |
| | | Shares | ($000) |
| | Cytec Industries Inc. | 6,700 | 309 |
| * | Ferro Corp. | 20,400 | 264 |
| | | | 18,833 |
| Telecommunication Services (1.0%) | | |
| * | Globalstar Inc. | 521,700 | 1,434 |
| * † | Level 3 Communications | | |
| | Inc. | 27,800 | 1,373 |
| | CenturyLink Inc. | 7,800 | 309 |
| | | | 3,116 |
| Utilities (5.3%) | | |
| | American States Water Co. | 43,800 | 1,650 |
| † | Vectren Corp. | 33,400 | 1,544 |
| | WGL Holdings Inc. | 28,100 | 1,535 |
| | Exelon Corp. | 41,200 | 1,528 |
| † | Portland General Electric Co. | 39,300 | 1,487 |
| * | Calpine Corp. | 66,200 | 1,465 |
| † | Entergy Corp. | 16,500 | 1,443 |
| † | Edison International | 21,400 | 1,401 |
| | New Jersey Resources | | |
| | Corp. | 21,400 | 1,310 |
| † | Pinnacle West Capital Corp. | 15,900 | 1,086 |
| † | UGI Corp. | 27,600 | 1,048 |
| | Empire District Electric Co. | 30,700 | 913 |
| | | | 16,410 |
| Total Common Stocks—Long Positions | |
| (Cost $248,775) | | 297,841 |
| Common Stocks Sold Short (-95.3%) | |
| Consumer Discretionary (-17.4%) | |
| * | Groupon Inc. Class A | (204,800) | (1,692) |
| * | Office Depot Inc. | (195,600) | (1,677) |
| * | Lumber Liquidators | | |
| | Holdings Inc. | (25,100) | (1,664) |
| | Aaron’s Inc. | (53,800) | (1,645) |
| * | Meritage Homes Corp. | (45,600) | (1,641) |
| | General Motors Co. | (46,800) | (1,634) |
| * | CarMax Inc. | (24,171) | (1,609) |
| * | DreamWorks Animation | | |
| | SKG Inc. Class A | (71,900) | (1,606) |
| | Men’s Wearhouse Inc. | (35,900) | (1,585) |
| | Brunswick Corp. | (30,900) | (1,584) |
| * | Tesla Motors Inc. | (7,100) | (1,579) |
| | Sotheby’s | (36,100) | (1,559) |
| | Signet Jewelers Ltd. | (11,800) | (1,553) |
| | DR Horton Inc. | (61,300) | (1,550) |
| | Rent-A-Center Inc. | (41,500) | (1,507) |
| * | AMC Networks Inc. | | |
| | Class A | (23,600) | (1,505) |
| * | Houghton Mifflin Harcourt | | |
| | Co. | (72,100) | (1,493) |
| | Ryland Group Inc. | (38,700) | (1,492) |
| * | Vitamin Shoppe Inc. | (30,700) | (1,492) |
| * | Amazon.com Inc. | (4,800) | (1,490) |
| * | Shutterfly Inc. | (35,500) | (1,480) |
| | | |
| * | Loral Space | | |
| | & Communications Inc. | (18,600) | (1,464) |
| * | Priceline Group Inc. | (1,250) | (1,425) |
| | Pier 1 Imports Inc. | (92,400) | (1,423) |
| | American Eagle Outfitters | | |
| | Inc. | (101,300) | (1,406) |
| | Coach Inc. | (37,300) | (1,401) |
| | Starbucks Corp. | (16,800) | (1,378) |
| * | LKQ Corp. | (40,400) | (1,136) |
| * | Toll Brothers Inc. | (29,100) | (997) |
| * | Drew Industries Inc. | (18,600) | (950) |
| * | Ascent Capital Group Inc. | | |
| | Class A | (17,600) | (932) |
| | Harley-Davidson Inc. | (13,600) | (896) |
| | Yum! Brands Inc. | (11,400) | (831) |
| | Churchill Downs Inc. | (8,200) | (781) |
| * | Liberty Broadband Corp. | | |
| | Class A | (15,100) | (756) |
| * | La Quinta Holdings Inc. | (33,500) | (739) |
| * | Liberty Broadband Corp. | (14,800) | (737) |
| | Lions Gate Entertainment | | |
| | Corp. | (22,900) | (733) |
| * | Cabela’s Inc. | (11,100) | (585) |
| * | Belmond Ltd. Class A | (44,400) | (549) |
| * | TRI Pointe Homes Inc. | (33,500) | (511) |
| * | Biglari Holdings Inc. | (1,000) | (400) |
| | Gannett Co. Inc. | (11,500) | (367) |
| * | Under Armour Inc. Class A | (4,400) | (299) |
| * | Pep Boys-Manny Moe | | |
| | & Jack | (30,000) | (295) |
| * | Liberty Media Corp. | (4,600) | (161) |
| | | | (54,189) |
| Consumer Staples (-3.8%) | | |
| * | Post Holdings Inc. | (37,200) | (1,558) |
| * | Darling Ingredients Inc. | (85,100) | (1,546) |
| * | TreeHouse Foods Inc. | (17,900) | (1,531) |
| * | United Natural Foods Inc. | (19,600) | (1,516) |
| | Flowers Foods Inc. | (77,955) | (1,496) |
| | B&G Foods Inc. | (47,200) | (1,411) |
| | Philip Morris International | | |
| | Inc. | (11,100) | (904) |
| | Universal Corp. | (18,400) | (809) |
| | Coca-Cola Co. | (9,500) | (401) |
| | Procter & Gamble Co. | (4,400) | (401) |
| | Whole Foods Market Inc. | (5,100) | (257) |
| | | | (11,830) |
| Energy (-3.7%) | | |
| * | Gulfport Energy Corp. | (39,900) | (1,665) |
| * | Cobalt International Energy | | |
| | Inc. | (178,800) | (1,590) |
| * | Antero Resources Corp. | (37,100) | (1,505) |
| * | Rice Energy Inc. | (61,800) | (1,296) |
| * | PDC Energy Inc. | (28,700) | (1,184) |
| | Williams Cos. Inc. | (22,500) | (1,011) |
17
Market Neutral Fund
| | | |
| | | | Market |
| | | | Value |
| | | Shares | ($000) |
| | CONSOL Energy Inc. | (26,400) | (893) |
| | Spectra Energy Corp. | (24,400) | (886) |
| * | Eclipse Resources Corp. | (101,800) | (716) |
| | Scorpio Tankers Inc. | (62,700) | (545) |
| * | Rosetta Resources Inc. | (14,300) | (319) |
| | | | (11,610) |
| Financials (-16.6%) | | |
| | FNF Group | (47,800) | (1,647) |
| | NorthStar Asset | | |
| | Management Group Inc. | (71,600) | (1,616) |
| * | Genworth Financial Inc. | | |
| | Class A | (186,700) | (1,587) |
| | Loews Corp. | (37,500) | (1,576) |
| | American Equity Investment | | |
| | Life Holding Co. | (53,700) | (1,568) |
| | MB Financial Inc. | (47,600) | (1,564) |
| | Zions Bancorporation | (54,800) | (1,562) |
| | Home BancShares Inc. | (48,100) | (1,547) |
| | First Niagara Financial | | |
| | Group Inc. | (183,400) | (1,546) |
| | CNA Financial Corp. | (39,500) | (1,529) |
| * | PHH Corp. | (63,700) | (1,526) |
| * | Texas Capital Bancshares | | |
| | Inc. | (28,000) | (1,521) |
| | Leucadia National Corp. | (67,800) | (1,520) |
| | Old National Bancorp | (100,700) | (1,498) |
| | Cincinnati Financial Corp. | (28,800) | (1,493) |
| * | KCG Holdings Inc. Class A | (128,100) | (1,492) |
| | Investors Bancorp Inc. | (132,400) | (1,486) |
| | Arthur J Gallagher & Co. | (31,400) | (1,478) |
| * | Markel Corp. | (2,150) | (1,468) |
| | Umpqua Holdings Corp. | (85,100) | (1,448) |
| | Intercontinental Exchange | | |
| | Inc. | (6,600) | (1,447) |
| | PacWest Bancorp | (31,600) | (1,437) |
| | Union Bankshares Corp. | (56,700) | (1,365) |
| * | Hilltop Holdings Inc. | (67,100) | (1,339) |
| | White Mountains Insurance | | |
| | Group Ltd. | (2,100) | (1,323) |
| | Interactive Brokers Group | | |
| | Inc. | (45,200) | (1,318) |
| | CME Group Inc. | (14,500) | (1,286) |
| | Hartford Financial Services | | |
| | Group Inc. | (30,500) | (1,272) |
| | Old Republic International | | |
| | Corp. | (84,500) | (1,236) |
| | M&T Bank Corp. | (9,800) | (1,231) |
| | UMB Financial Corp. | (20,900) | (1,189) |
| | Charles Schwab Corp. | (34,800) | (1,051) |
| | Financial Engines Inc. | (27,800) | (1,016) |
| * | Ocwen Financial Corp. | (66,700) | (1,007) |
| | T. Rowe Price Group Inc. | (11,300) | (970) |
| | New York Community | | |
| | Bancorp Inc. | (44,600) | (714) |
| | | |
| * | Popular Inc. | (17,600) | (599) |
| | Synovus Financial Corp. | (20,442) | (554) |
| | Erie Indemnity Co. Class A | (3,500) | (318) |
| | City National Corp. | (3,900) | (315) |
| * | FNFV Group | (11,498) | (181) |
| | | | (51,840) |
| Health Care (-9.9%) | | |
| * | WellCare Health Plans Inc. | (20,100) | (1,649) |
| * | Alkermes plc | (27,000) | (1,581) |
| * | Medidata Solutions Inc. | (32,900) | (1,571) |
| | Perrigo Co. plc | (9,300) | (1,555) |
| * | Bluebird Bio Inc. | (16,900) | (1,550) |
| * | Neurocrine Biosciences Inc. | (68,900) | (1,539) |
| * | Thoratec Corp. | (46,800) | (1,519) |
| * | Spectranetics Corp. | (43,900) | (1,518) |
| | Owens & Minor Inc. | (43,100) | (1,513) |
| | Cooper Cos. Inc. | (9,300) | (1,507) |
| * | BioMarin Pharmaceutical | | |
| | Inc. | (16,400) | (1,483) |
| * | Masimo Corp. | (55,000) | (1,449) |
| * | Alnylam Pharmaceuticals | | |
| | Inc. | (14,700) | (1,426) |
| | Bio-Techne Corp. | (14,000) | (1,294) |
| * | Allscripts Healthcare | | |
| | Solutions Inc. | (90,200) | (1,152) |
| * | HMS Holdings Corp. | (53,600) | (1,133) |
| * | Puma Biotechnology Inc. | (5,900) | (1,117) |
| * | Tenet Healthcare Corp. | (21,600) | (1,094) |
| * | TESARO Inc. | (26,600) | (989) |
| * | Varian Medical Systems Inc. | (10,300) | (891) |
| * | Endologix Inc. | (56,700) | (867) |
| | Baxter International Inc. | (11,300) | (828) |
| * | Cepheid | (14,200) | (769) |
| * | Insulet Corp. | (8,700) | (401) |
| * | NxStage Medical Inc. | (20,100) | (360) |
| * | Auspex Pharmaceuticals | | |
| | Inc. | (3,825) | (201) |
| | | | (30,956) |
| Industrials (-14.3%) | | |
| * | DigitalGlobe Inc. | (55,300) | (1,713) |
| * | WageWorks Inc. | (26,400) | (1,705) |
| * | UTi Worldwide Inc. | (133,500) | (1,611) |
| * | Colfax Corp. | (31,200) | (1,609) |
| | Crane Co. | (27,300) | (1,602) |
| | Interface Inc. Class A | (97,000) | (1,598) |
| * | USG Corp. | (55,700) | (1,559) |
| * | Wesco Aircraft Holdings | | |
| | Inc. | (110,000) | (1,538) |
| | Babcock & Wilcox Co. | (50,300) | (1,524) |
| * | Armstrong World Industries | | |
| | Inc. | (29,800) | (1,523) |
| * | Nortek Inc. | (18,300) | (1,488) |
| | Heartland Express Inc. | (54,900) | (1,483) |
| * | Beacon Roofing Supply Inc. | (53,200) | (1,479) |
18
Market Neutral Fund
| | | |
| | | | Market |
| | | | Value |
| | | Shares | ($000) |
| | Healthcare Services Group | | |
| | Inc. | (47,600) | (1,472) |
| * | Clean Harbors Inc. | (30,500) | (1,466) |
| * | Advisory Board Co. | (28,000) | (1,371) |
| | Matthews International | | |
| | Corp. Class A | (27,200) | (1,324) |
| * | Jacobs Engineering Group | | |
| | Inc. | (28,500) | (1,274) |
| | JB Hunt Transport Services | | |
| | Inc. | (14,700) | (1,238) |
| * | Stericycle Inc. | (9,400) | (1,232) |
| | Kennametal Inc. | (34,300) | (1,228) |
| * | Copart Inc. | (33,600) | (1,226) |
| | Raven Industries Inc. | (48,600) | (1,215) |
| * | Roadrunner Transportation | | |
| | Systems Inc. | (50,800) | (1,186) |
| | Nielsen NV | (26,500) | (1,185) |
| | Forward Air Corp. | (22,800) | (1,148) |
| * | EnPro Industries Inc. | (17,800) | (1,117) |
| * | DXP Enterprises Inc. | (21,700) | (1,097) |
| * | MasTec Inc. | (47,000) | (1,063) |
| | Fastenal Co. | (21,700) | (1,032) |
| * | Chart Industries Inc. | (29,200) | (999) |
| | Precision Castparts Corp. | (3,900) | (939) |
| * | MRC Global Inc. | (39,000) | (591) |
| | MSA Safety Inc. | (7,642) | (406) |
| * | Scorpio Bulkers Inc. | (181,200) | (357) |
| | | | (44,598) |
| Information Technology (-17.9%) | |
| * | Knowles Corp. | (73,400) | (1,729) |
| * | CoStar Group Inc. | (8,800) | (1,616) |
| * | CommVault Systems Inc. | (30,900) | (1,597) |
| * | Splunk Inc. | (26,500) | (1,562) |
| * | Finisar Corp. | (80,300) | (1,559) |
| * | SunEdison Inc. | (79,700) | (1,555) |
| * | Cornerstone OnDemand Inc. | (43,900) | (1,545) |
| | FEI Co. | (17,100) | (1,545) |
| * | Palo Alto Networks Inc. | (12,600) | (1,544) |
| | Analog Devices Inc. | (27,400) | (1,521) |
| * | Pandora Media Inc. | (85,200) | (1,519) |
| | Altera Corp. | (40,500) | (1,496) |
| * | ServiceNow Inc. | (21,900) | (1,486) |
| * | Entegris Inc. | (111,500) | (1,473) |
| * | HomeAway Inc. | (49,000) | (1,459) |
| * | Trimble Navigation Ltd. | (54,400) | (1,444) |
| * | ViaSat Inc. | (22,600) | (1,424) |
| * | LinkedIn Corp. Class A | (6,200) | (1,424) |
| * | Fortinet Inc. | (46,400) | (1,423) |
| * | Zynga Inc. Class A | (534,100) | (1,421) |
| * | Twitter Inc. | (38,500) | (1,381) |
| | Equinix Inc. | (6,039) | (1,369) |
| * | Dealertrack Technologies | | |
| | Inc. | (29,300) | (1,298) |
| | EMC Corp. | (43,500) | (1,294) |
| | | |
| * | salesforce.com inc | (21,780) | (1,292) |
| | Corning Inc. | (56,100) | (1,286) |
| | Microchip Technology Inc. | (23,700) | (1,069) |
| | FLIR Systems Inc. | (31,400) | (1,015) |
| * | II-VI Inc. | (73,400) | (1,002) |
| * | Informatica Corp. | (25,500) | (972) |
| | Avago Technologies Ltd. | | |
| | Class A | (9,400) | (946) |
| | AVX Corp. | (66,700) | (934) |
| * | SolarWinds Inc. | (18,100) | (902) |
| * | Workday Inc. Class A | (10,700) | (873) |
| | Motorola Solutions Inc. | (13,000) | (872) |
| | KLA-Tencor Corp. | (12,300) | (865) |
| * | Nuance Communications | | |
| | Inc. | (58,900) | (841) |
| | Solera Holdings Inc. | (16,300) | (834) |
| * | Bottomline Technologies | | |
| | de Inc. | (32,100) | (811) |
| | Visa Inc. Class A | (2,900) | (760) |
| * | RealPage Inc. | (33,700) | (740) |
| * | FleetCor Technologies Inc. | (4,950) | (736) |
| * | Cognex Corp. | (17,600) | (727) |
| * | Rackspace Hosting Inc. | (15,300) | (716) |
| | Apple Inc. | (5,450) | (602) |
| * | Bankrate Inc. | (46,160) | (574) |
| | Maxim Integrated Products | | |
| | Inc. | (15,300) | (488) |
| | j2 Global Inc. | (5,400) | (335) |
| | | | (55,876) |
| Materials (-5.9%) | | |
| | HB Fuller Co. | (35,200) | (1,568) |
| | Balchem Corp. | (23,500) | (1,566) |
| | Carpenter Technology Corp. | (31,500) | (1,551) |
| | FMC Corp. | (26,900) | (1,534) |
| * | WR Grace & Co. | (16,000) | (1,526) |
| | Martin Marietta Materials | | |
| | Inc. | (13,800) | (1,523) |
| * | Louisiana-Pacific Corp. | (91,000) | (1,507) |
| | SunCoke Energy Inc. | (63,800) | (1,234) |
| | Air Products & Chemicals | | |
| | Inc. | (7,950) | (1,147) |
| | Southern Copper Corp. | (37,950) | (1,070) |
| | Royal Gold Inc. | (16,350) | (1,025) |
| | Allegheny Technologies Inc. | (28,800) | (1,001) |
| | Mosaic Co. | (19,100) | (872) |
| | Freeport-McMoRan Inc. | (31,200) | (729) |
| | Praxair Inc. | (4,300) | (557) |
| | | | (18,410) |
| Telecommunication Services (-0.9%) | |
| * | United States Cellular Corp. | (39,000) | (1,553) |
| * | SBA Communications Corp. | | |
| | Class A | (12,310) | (1,364) |
| | | | (2,917) |
19
Market Neutral Fund
| | | |
| | | | Market |
| | | | Value |
| | | Shares | ($000) |
| Utilities (-4.9%) | | | |
| NiSource Inc. | | (37,000) | (1,570) |
| Laclede Group Inc. | | (29,100) | (1,548) |
| South Jersey Industries Inc. | (26,100) | (1,538) |
| Dominion Resources Inc. | (20,000) | (1,538) |
| Pattern Energy Group Inc. | | |
| Class A | | (62,300) | (1,536) |
| CMS Energy Corp. | | (42,600) | (1,480) |
| NRG Energy Inc. | | (47,800) | (1,288) |
| ALLETE Inc. | | (23,300) | (1,285) |
| OGE Energy Corp. | | (31,800) | (1,128) |
| ITC Holdings Corp. | | (22,200) | (898) |
| NorthWestern Corp. | | (10,900) | (617) |
| TECO Energy Inc. | | (19,900) | (408) |
| American Water Works Co. | | |
| Inc. | | (6,500) | (346) |
| | | | (15,180) |
| Total Common Stocks Sold Short | |
| (Proceeds $277,034) | | | (297,406) |
| Temporary Cash Investment (2.3%) | |
| Money Market Fund (2.3%) | | |
| 1 Vanguard Market | | | |
| Liquidity Fund, 0.126% | | |
| (Cost $7,114) | 7,114,439 | 7,114 |
| †Other Assets and Liabilities— | | |
| Net (97.5%) | | | 304,394 |
| Net Assets (100%) | | | 311,943 |
| |
| | Amount |
| | ($000) |
| Statement of Assets and Liabilities | |
| Assets | |
| Investment in Securities, | |
| Long Positions, at Value | |
| Unaffiliated Issuers | 297,841 |
| Affiliated Vanguard Funds | 7,114 |
| Total Long Positions | 304,955 |
| Cash Segregated for Short Positions | 302,403 |
| Other Assets | 2,448 |
| Total Assets | 609,806 |
| Liabilities | |
| Securities Sold Short, at Value | 297,406 |
| Other Liabilities | 457 |
| Total Liabilities | 297,863 |
| Net Assets (100%) | 311,943 |
| |
| |
| At December 31, 2014, net assets consisted of: |
| | Amount |
| | ($000) |
| Paid-in Capital | 300,791 |
| Accumulated Net Investment Losses | (166) |
| Accumulated Net Realized Losses | (17,376) |
| Unrealized Appreciation (Depreciation) | |
| Investment Securities—Long Positions | 49,066 |
| Investment Securities Sold Short | (20,372) |
| Net Assets | 311,943 |
| |
| |
| Investor Shares—Net Assets | |
| Applicable to 22,336,082 outstanding | |
| $.001 par value shares of beneficial | |
| interest (unlimited authorization) | 256,908 |
| Net Asset Value Per Share— | |
| Investor Shares | $11.50 |
| |
| |
| Institutional Shares—Net Assets | |
| Applicable to 4,805,766 outstanding | |
| $.001 par value shares of beneficial | |
| interest (unlimited authorization) | 55,035 |
| Net Asset Value Per Share— | |
| Institutional Shares | $11.45 |
See Note A in Notes to Financial Statements.
* Non-income-producing security.
† Long security positions with a value of $180,745,000 and cash of $302,403,000 are held in a segregated account at the fund’s custodian
bank and pledged to a broker-dealer as collateral for the fund’s obligation to return borrowed securities. For so long as such obligations
continue, the fund’s access to these assets is subject to authorization from the broker-dealer.
1 Affiliated money market fund available only to Vanguard funds and certain trusts and accounts managed by Vanguard. Rate shown is the
7-day yield.
See accompanying Notes, which are an integral part of the Financial Statements.
20
Market Neutral Fund
Statement of Operations
| |
| | Year Ended |
| | December 31, 2014 |
| | ($000) |
| Investment Income | |
| Income | |
| Dividends | 3,085 |
| Interest1 | 5 |
| Total Income | 3,090 |
| Expenses | |
| The Vanguard Group—Note B | |
| Investment Advisory Services | 233 |
| Management and Administrative—Investor Shares | 199 |
| Management and Administrative—Institutional Shares | 1 |
| Marketing and Distribution—Investor Shares | 46 |
| Marketing and Distribution—Institutional Shares | 9 |
| Custodian Fees | 32 |
| Audit Fees | 50 |
| Shareholders’ Reports—Investor Shares | 3 |
| Shareholders’ Reports—Institutional Shares | — |
| Dividend Expense on Securities Sold Short | 2,967 |
| Borrowing Expense on Securities Sold Short | 439 |
| Total Expenses | 3,979 |
| Net Investment Income (Loss) | (889) |
| Realized Net Gain (Loss) | |
| Investment Securities—Long Positions | 34,786 |
| Investment Securities Sold Short | (24,651) |
| Realized Net Gain (Loss) | 10,135 |
| Change in Unrealized Appreciation (Depreciation) | |
| Investment Securities—Long Positions | (7,209) |
| Investment Securities Sold Short | 7,463 |
| Change in Unrealized Appreciation (Depreciation) | 254 |
| Net Increase (Decrease) in Net Assets Resulting from Operations | 9,500 |
| 1 Interest income from an affiliated company of the fund was $5,000. |
See accompanying Notes, which are an integral part of the Financial Statements.
21
Market Neutral Fund
Statement of Changes in Net Assets
| | |
| | Year Ended December 31, |
| | 2014 | 2013 |
| | ($000) | ($000) |
| Increase (Decrease) In Net Assets | | |
| Operations | | |
| Net Investment Income (Loss) | (889) | (88) |
| Realized Net Gain (Loss) | 10,135 | 8,423 |
| Change in Unrealized Appreciation (Depreciation) | 254 | 9,099 |
| Net Increase (Decrease) in Net Assets Resulting from Operations | 9,500 | 17,434 |
| Distributions | | |
| Net Investment Income | | |
| Investor Shares | — | (33) |
| Institutional Shares | — | (8) |
| Realized Capital Gain | | |
| Investor Shares | — | — |
| Institutional Shares | — | — |
| Return of Capital | | |
| Investor Shares | — | (16) |
| Institutional Shares | — | (4) |
| Total Distributions | — | (61) |
| Capital Share Transactions | | |
| Investor Shares | 75,328 | 7,869 |
| Institutional Shares | 18,313 | 1,333 |
| Net Increase (Decrease) from Capital Share Transactions | 93,641 | 9,202 |
| Total Increase (Decrease) | 103,141 | 26,575 |
| Net Assets | | |
| Beginning of Period | 208,802 | 182,227 |
| End of Period1 | 311,943 | 208,802 |
| 1 Net Assets—End of Period includes accumulated net investment losses and overdistributed net investment income of ($166,000) and ($105,000), respectively. |
See accompanying Notes, which are an integral part of the Financial Statements.
22
Market Neutral Fund
Financial Highlights
| | | | | |
| Investor Shares | | | | | |
| |
| For a Share Outstanding | Year Ended December 31, |
| Throughout Each Period | 2014 | 2013 | 2012 | 2011 | 2010 |
| Net Asset Value, Beginning of Period | $11.03 | $10.16 | $10.36 | $9.61 | $9.71 |
| Investment Operations | | | | | |
| Net Investment Income (Loss) | (.032) | (.007) | .045 | (.024) | (.038)1 |
| Net Realized and Unrealized Gain (Loss) | | | | | |
| on Investments | .502 | .880 | (.200) | .774 | (.062) |
| Total from Investment Operations | .470 | .873 | (.155) | .750 | (.100) |
| Distributions | | | | | |
| Dividends from Net Investment Income | — | (.002) | (.045) | — | — |
| Distributions from Realized Capital Gains | — | — | — | — | — |
| Return of Capital | — | (.001) | — | — | — |
| Total Distributions | — | (.003) | (.045) | — | — |
| Net Asset Value, End of Period | $11.50 | $11.03 | $10.16 | $10.36 | $9.61 |
| |
| Total Return2 | 4.26% | 8.59% | -1.50% | 7.80% | -1.03% |
| |
| Ratios/Supplemental Data | | | | | |
| Net Assets, End of Period (Millions) | $257 | $174 | $151 | $158 | $116 |
| Ratio of Expenses to Average Net Assets | | | | | |
| Based on Total Expenses3 | 1.64% | 1.57% | 1.88% | 1.69% | 1.84%4 |
| Net of Dividend and Borrowing Expense | | | | | |
| on Securities Sold Short | 0.25% | 0.25% | 0.25% | 0.25% | 0.30%4 |
| Ratio of Net Investment Income (Loss) | | | | | |
| to Average Net Assets | (0.38%) | (0.06%) | 0.44% | (0.22%) | (0.38%) |
| Portfolio Turnover Rate | 73% | 68% | 89% | 91% | 153% |
1 Calculated based on average shares outstanding.
2 Total returns do not include transaction or account service fees that may have applied in the periods shown. Fund prospectuses provide
information about any applicable transaction and account service fees.
3 Includes 2014 dividend and borrowing expense on securities sold short of 1.21% and 0.18%, respectively. Includes 2013 dividend and
borrowing expense on securities sold short of 1.18% and 0.14%, respectively. Includes 2012 dividend and borrowing expense on securities
sold short of 1.52% and 0.11%, respectively. Includes 2011 dividend and borrowing expense on securities sold short of 1.30% and 0.14%,
respectively. Includes 2010 dividend and borrowing expense on securities sold short of 1.49% and 0.05%, respectively.
4 Includes performance-based advisory fee increases (decreases) of (0.07%). Performance-based investment advisory fees did not apply after
fiscal 2010.
See accompanying Notes, which are an integral part of the Financial Statements.
23
Market Neutral Fund
Financial Highlights
| | | | | |
| Institutional Shares | | | | | |
| |
| For a Share Outstanding | Year Ended December 31, |
| Throughout Each Period | 2014 | 2013 | 2012 | 2011 | 2010 |
| Net Asset Value, Beginning of Period | $10.97 | $10.10 | $10.33 | $9.57 | $9.66 |
| Investment Operations | | | | | |
| Net Investment Income (Loss) | (.023) | .006 | .071 | (.010) | (.015)1 |
| Net Realized and Unrealized Gain (Loss) | | | | | |
| on Investments | .503 | .868 | (.215) | .770 | (.075) |
| Total from Investment Operations | .480 | .874 | (.144) | .760 | (.090) |
| Distributions | | | | | |
| Dividends from Net Investment Income | — | (.003) | (.086) | — | — |
| Distributions from Realized Capital Gains | — | — | — | — | — |
| Return of Capital | — | (.001) | — | — | — |
| Total Distributions | — | (.004) | (.086) | — | — |
| Net Asset Value, End of Period | $11.45 | $10.97 | $10.10 | $10.33 | $9.57 |
| |
| Total Return2 | 4.38% | 8.66% | -1.39% | 7.94% | -0.93% |
| |
| Ratios/Supplemental Data | | | | | |
| Net Assets, End of Period (Millions) | $55 | $35 | $31 | $16 | $3 |
| Ratio of Expenses to Average Net Assets | | | | | |
| Based on Total Expenses3 | 1.54% | 1.47% | 1.78% | 1.59% | 1.74%4 |
| Net of Dividend and Borrowing Expense | | | | | |
| on Securities Sold Short | 0.15% | 0.15% | 0.15% | 0.15% | 0.20%4 |
| Ratio of Net Investment Income (Loss) | | | | | |
| to Average Net Assets | (0.28%) | 0.04% | 0.54% | (0.12%) | (0.28%) |
| Portfolio Turnover Rate | 73% | 68% | 89% | 91% | 153% |
1 Calculated based on average shares outstanding.
2 Total returns do not include transaction fees that may have applied in the periods shown. Fund prospectuses provide information about any applicable transaction fees.
3 Includes 2014 dividend and borrowing expense on securities sold short of 1.21% and 0.18%, respectively. Includes 2013 dividend and
borrowing expense on securities sold short of 1.18% and 0.14%, respectively. Includes 2012 dividend and borrowing expense on securities
sold short of 1.52% and 0.11%, respectively. Includes 2011 dividend and borrowing expense on securities sold short of 1.30% and 0.14%,
respectively. Includes 2010 dividend and borrowing expense on securities sold short of 1.49% and 0.05%, respectively.
4 Includes performance-based advisory fee increases (decreases) of (0.07%). Performance-based investment advisory fees did not apply after fiscal 2010.
See accompanying Notes, which are an integral part of the Financial Statements.
24
Market Neutral Fund
Notes to Financial Statements
Vanguard Market Neutral Fund is registered under the Investment Company Act of 1940 as an open-end investment company, or mutual fund. The fund offers two classes of shares, Investor Shares and Institutional Shares. Investor Shares are available to any investor who meets the fund’s minimum purchase requirements. Institutional Shares are designed for investors who meet certain administrative, service, and account-size criteria.
A. The following significant accounting policies conform to generally accepted accounting principles for U.S. investment companies. The fund consistently follows such policies in preparing its financial statements.
1. Security Valuation: Securities are valued as of the close of trading on the New York Stock Exchange (generally 4 p.m., Eastern time) on the valuation date. Equity securities are valued at the latest quoted sales prices or official closing prices taken from the primary market in which each security trades; such securities not traded on the valuation date are valued at the mean of the latest quoted bid and asked prices. Securities for which market quotations are not readily available, or whose values have been materially affected by events occurring before the fund’s pricing time but after the close of the securities’ primary markets, are valued by methods deemed by the board of trustees to represent fair value. Investments in Vanguard Market Liquidity Fund are valued at that fund’s net asset value.
2. Short Sales: Short sales are the sales of securities that the fund does not own. The fund sells a security it does not own in anticipation of a decline in the value of that security. In order to deliver the security to the purchaser, the fund borrows the security from a broker-dealer. The fund must segregate, as collateral for its obligation to return the borrowed security, an amount of cash and long security positions at least equal to the market value of the security sold short. This results in the fund holding a significant portion of its assets in cash. The fund later closes out the position by returning the security to the lender, typically by purchasing the security in the open market. A gain, limited to the price at which the fund sold the security short, or a loss, theoretically unlimited in size, is recognized upon the termination of the short sale. The fund may receive a portion of the income from the investment of collateral, or be charged a fee on borrowed securities, based on the market value of each borrowed security and a variable rate that is dependent upon the availability of such security. The net amounts of income or fees are recorded as interest income (for net income received) or borrowing expense on securities sold short (for net fees charged) on the Statement of Operations. Dividends on securities sold short are reported as an expense in the Statement of Operations.
Cash collateral segregated for securities sold short is recorded as an asset in the Statement of Assets and Liabilities. Long security positions segregated as collateral are shown in the Statement of Net Assets.
3. Federal Income Taxes: The fund intends to continue to qualify as a regulated investment company and distribute all of its taxable income. Management has analyzed the fund’s tax positions taken for all open federal income tax years (December 31, 2011–2014), and has concluded that no provision for federal income tax is required in the fund’s financial statements.
4. Distributions: Distributions to shareholders are recorded on the ex-dividend date.
5. Credit Facility: The fund and certain other funds managed by The Vanguard Group participate in a $2.89 billion committed credit facility provided by a syndicate of lenders pursuant to a credit agreement that may be renewed annually; each fund is individually liable for its borrowings, if any, under the credit facility. Borrowings may be utilized for temporary and emergency purposes, and are subject to the fund’s regulatory and contractual borrowing restrictions. The participating funds are charged administrative fees and an annual commitment fee of 0.06% of the undrawn amount
25
Market Neutral Fund
of the facility; these fees are allocated to the funds based on a method approved by the fund’s board of trustees and included in Management and Administrative expenses on the fund’s Statement of Operations. Any borrowings under this facility bear interest at a rate equal to the higher of the federal funds rate or LIBOR reference rate plus an agreed-upon spread.
The fund had no borrowings outstanding at December 31, 2014, or at any time during the period then ended.
6. Other: Dividend income (or dividend expense on short positions) is recorded on the ex-dividend date. Interest income includes income distributions received from Vanguard Market Liquidity Fund and is accrued daily. Security transactions are accounted for on the date securities are bought or sold. Costs used to determine realized gains (losses) on the sale of investment securities are those of the specific securities sold.
Each class of shares has equal rights as to assets and earnings, except that each class separately bears certain class-specific expenses related to maintenance of shareholder accounts (included in Management and Administrative expenses) and shareholder reporting. Marketing and distribution expenses are allocated to each class of shares based on a method approved by the board of trustees. Income, other non-class-specific expenses, and gains and losses on investments are allocated to each class of shares based on its relative net assets.
B. The Vanguard Group furnishes at cost investment advisory, corporate management, administrative, marketing, and distribution services. The costs of such services are allocated to the fund on methods approved by the board of trustees. The fund has committed to invest up to 0.40% of its net assets in Vanguard. At December 31, 2014, the fund had contributed capital of $27,000 to Vanguard (included in Other Assets), representing 0.01% of the fund’s net assets and 0.01% of Vanguard’s capitalization. The fund’s trustees and officers are also directors and officers of Vanguard.
C. Various inputs may be used to determine the value of the fund’s investments. These inputs are summarized in three broad levels for financial statement purposes. The inputs or methodologies used to value securities are not necessarily an indication of the risk associated with investing in those securities.
Level 1—Quoted prices in active markets for identical securities.
Level 2—Other significant observable inputs (including quoted prices for similar securities, interest rates, prepayment speeds, credit risk, etc.).
Level 3—Significant unobservable inputs (including the fund’s own assumptions used to determine the fair value of investments).
At December 31, 2014, 100% of the market value of the fund’s investments was based on Level 1 inputs.
D. Distributions are determined on a tax basis and may differ from net investment income and realized capital gains for financial reporting purposes. Differences may be permanent or temporary. Permanent differences are reclassified among capital accounts in the financial statements to reflect their tax character. Temporary differences arise when certain items of income, expense, gain, or loss are recognized in different periods for financial statement and tax purposes. These differences will reverse at some time in the future. Differences in classification may also result from the treatment of short-term gains as ordinary income for tax purposes.
26
Market Neutral Fund
For tax purposes, the fund had a net operating loss of $823,000 for the year ended December 31, 2014. This amount has been reclassified from accumulated net investment losses to paid-in capital. At December 31, 2014, the fund had no ordinary income for distribution. The fund used capital loss carryforwards of $10,238,000 to offset taxable capital gains realized during the year ended December 31, 2014. At December 31, 2014, the fund had available capital losses totaling $17,082,000 to offset future net capital gains. Of this amount, $13,688,000 is subject to expiration dates; $8,817,000 may be used to offset future net capital gains through December 31, 2017, and $4,871,000 through December 31, 2018. Capital losses of $3,394,000 realized beginning in fiscal 2011 may be carried forward indefinitely under the Regulated Investment Company Modernization Act of 2010, but must be used before any expiring loss carryforwards.
At December 31, 2014, the cost of long security positions for tax purposes was $256,236,000. Net unrealized appreciation of long security positions for tax purposes was $48,719,000, consisting of unrealized gains of $58,009,000 on securities that had risen in value since their purchase and $9,290,000 in unrealized losses on securities that had fallen in value since their purchase. Tax-basis net unrealized depreciation on securities sold short was $20,372,000, consisting of unrealized gains of $13,583,000 on securities that had fallen in value since their sale and $33,955,000 in unrealized losses on securities that had risen in value since their sale.
E. During the year ended December 31, 2014, the fund purchased $244,971,000 of investment securities and sold $175,506,000 of investment securities, other than temporary cash investments. The proceeds of short sales and the cost of purchases to cover short sales were $309,337,000 and $229,169,000 respectively.
F. Capital share transactions for each class of shares were:
| | | | |
| | Year Ended December 31, |
| | | 2014 | | 2013 |
| | Amount | Shares | Amount | Shares |
| | ($000) | (000) | ($000) | (000) |
| Investor Shares | | | | |
| Issued | 108,782 | 9,542 | 79,310 | 7,510 |
| Issued in Lieu of Cash Distributions | — | — | 49 | 5 |
| Redeemed | (33,454) | (2,954) | (71,490) | (6,637) |
| Net Increase (Decrease)—Investor Shares | 75,328 | 6,588 | 7,869 | 878 |
| Institutional Shares | | | | |
| Issued | 24,195 | 2,121 | 3,557 | 335 |
| Issued in Lieu of Cash Distributions | — | — | 12 | 1 |
| Redeemed | (5,882) | (521) | (2,236) | (212) |
| Net Increase (Decrease) —Institutional Shares | 18,313 | 1,600 | 1,333 | 124 |
At December 31, 2014, Vanguard Managed Payout Fund was the record or beneficial owner of 50% of the fund’s net assets. If the shareholder were to redeem its investment in the fund, the redemption might result in an increase in the fund’s expense ratio, cause the fund to incur higher transaction costs, or lead to the realization of taxable capital gains.
G. Management has determined that no material events or transactions occurred subsequent to December 31, 2014, that would require recognition or disclosure in these financial statements.
27
Report of Independent Registered
Public Accounting Firm
To the Board of Trustees of Vanguard Montgomery Funds and the Shareholders of Vanguard Market Neutral Fund:
In our opinion, the accompanying statement of net assets, statement of assets and liabilities and the related statements of operations and of changes in net assets and the financial highlights present fairly, in all material respects, the financial position of Vanguard Market Neutral Fund (constituting Vanguard Montgomery Funds, hereafter referred to as the “Fund”) at December 31, 2014, the results of its operations for the year then ended, the changes in its net assets for each of the two years in the period then ended, and the financial highlights for each of the five years in the period then ended, in conformity with accounting principles generally accepted in the United States of America. These financial statements and financial highlights (hereafter referred to as “financial statements”) are the responsibility of the Fund’s management. Our responsibility is to express an opinion on these financial statements based on our audits. We conducted our audits of these financial statements in accordance with the standards of the Public Company Accounting Oversight Board (United States). Those standards require that we plan and perform the audit to obtain reasonable assurance about whether the financial statements are free of material misstatement. An audit includes examining, on a test basis, evidence supporting the amounts and disclosures in the financial statements, assessing the accounting principles used and significant estimates made by management, and evaluating the overall financial statement presentation. We believe that our audits, which included confirmation of securities at December 31, 2014 by correspondence with the custodian and broker, by agreement to the underlying ownership records of the transfer agent and the application of alternative auditing procedures where securities purchased had not been received, provide a reasonable basis for our opinion.
/s/PricewaterhouseCoopers LLP
Philadelphia, Pennsylvania
February 18, 2015
28
Your Fund’s After-Tax Returns
This table presents returns for your fund both before and after taxes. The after-tax returns are shown in two ways: (1) assuming that an investor owned the fund during the entire period and paid taxes on the fund’s distributions, and (2) assuming that an investor paid taxes on the fund’s distributions and sold all shares at the end of each period.
Calculations are based on the highest individual federal income tax and capital gains tax rates in effect at the times of the distributions and the hypothetical sales. State and local taxes were not considered. After-tax returns reflect any qualified dividend income. (In the example, returns after the sale of fund shares may be higher than those assuming no sale. This occurs when the sale would have produced a capital loss. The calculation assumes that the investor received a tax deduction for the loss.)
The table shows returns for Investor Shares only; returns for other share classes will differ. Please note that your actual after-tax returns will depend on your tax situation and may differ from those shown. Also note that if you own the fund in a tax-deferred account, such as an individual retirement account or a 401(k) plan, this information does not apply to you. Such accounts are not subject to current taxes.
Finally, keep in mind that a fund’s performance—whether before or after taxes—does not guarantee future results.
Average Annual Total Returns: Market Neutral Fund Investor Shares
Periods Ended December 31, 2014
| | | |
| | One | Five | Ten |
| | Year | Years | Years |
| Returns Before Taxes | 4.26% | 3.54% | 2.46% |
| Returns After Taxes on Distributions | 4.26 | 3.52 | 1.91 |
| Returns After Taxes on Distributions and Sale of Fund Shares | 2.41 | 2.75 | 1.83 |
29
About Your Fund’s Expenses
As a shareholder of the fund, you incur ongoing costs, which include costs for portfolio management, administrative services, and shareholder reports (like this one), among others. Operating expenses, which are deducted from a fund’s gross income, directly reduce the investment return of the fund.
A fund’s expenses are expressed as a percentage of its average net assets. This figure is known as the expense ratio. The following examples are intended to help you understand the ongoing costs (in dollars) of investing in your fund and to compare these costs with those of other mutual funds. The examples are based on an investment of $1,000 made at the beginning of the period shown and held for the entire period.
The accompanying table illustrates your fund’s costs in two ways:
• Based on actual fund return. This section helps you to estimate the actual expenses that you paid over the period. The ”Ending Account Value“ shown is derived from the fund‘s actual return, and the third column shows the dollar amount that would have been paid by an investor who started with $1,000 in the fund. You may use the information here, together with the amount you invested, to estimate the expenses that you paid over the period.
To do so, simply divide your account value by $1,000 (for example, an $8,600 account value divided by $1,000 = 8.6), then multiply the result by the number given for your fund under the heading ”Expenses Paid During Period.“
• Based on hypothetical 5% yearly return. This section is intended to help you compare your fund‘s costs with those of other mutual funds. It assumes that the fund had a yearly return of 5% before expenses, but that the expense ratio is unchanged. In this case—because the return used is not the fund’s actual return—the results do not apply to your investment. The example is useful in making comparisons because the Securities and Exchange Commission requires all mutual funds to calculate expenses based on a 5% return. You can assess your fund’s costs by comparing this hypothetical example with the hypothetical examples that appear in shareholder reports of other funds.
Note that the expenses shown in the table are meant to highlight and help you compare ongoing costs only and do not reflect transaction costs incurred by the fund for buying and selling securities. Further, the expenses do not include any purchase, redemption, or account service fees described in the fund prospectus. If such fees were applied to your account, your costs would be higher. Your fund does not carry a “sales load.”
The calculations assume no shares were bought or sold during the period. Your actual costs may have been higher or lower, depending on the amount of your investment and the timing of any purchases or redemptions.
You can find more information about the fund’s expenses, including annual expense ratios, in the Financial Statements section of this report. For additional information on operating expenses and other shareholder costs, please refer to your fund’s current prospectus.
30
| | | |
| Six Months Ended December 31, 2014 | | | |
| | Beginning | Ending | Expenses |
| | Account Value | Account Value | Paid During |
| Market Neutral Fund | 6/30/2014 | 12/31/2014 | Period |
| Based on Actual Fund Return | | | |
| Investor Shares | $1,000.00 | $1,014.11 | $8.63 |
| Institutional Shares | 1,000.00 | 1,014.17 | 8.07 |
| Based on Hypothetical 5% Yearly Return | | | |
| Investor Shares | $1,000.00 | $1,016.64 | $8.64 |
| Institutional Shares | 1,000.00 | 1,017.19 | 8.08 |
The calculations are based on expenses incurred in the most recent six-month period. The fund’s annualized six-month expense ratios for that period are 1.70% for Investor Shares and 1.59% for Institutional Shares. The dollar amounts shown as “Expenses Paid” are equal to the annualized expense ratio multiplied by the average account value over the period, multiplied by the number of days in the most recent six-month period, then divided by the number of days in the most recent 12-month period.
31
Glossary
Beta. A measure of the magnitude of a fund’s past share-price fluctuations in relation to the ups and downs of a given market index. The index is assigned a beta of 1.00. Compared with a given index, a fund with a beta of 1.20 typically would have seen its share price rise or fall by 12% when the index rose or fell by 10%. For this report, beta is based on returns over the past 36 months for both the fund and the index. Note that a fund’s beta should be reviewed in conjunction with its R-squared (see definition). The lower the R-squared, the less correlation there is between the fund and the index, and the less reliable beta is as an indicator of volatility.
Earnings Growth Rate. The average annual rate of growth in earnings over the past five years for the stocks now in a fund.
Equity Exposure. A measure that reflects a fund’s investments in stocks and stock futures. Any holdings in short-term reserves are excluded.
Expense Ratio. The percentage of a fund’s average net assets used to pay its annual administrative and advisory expenses. These expenses directly reduce returns to investors.
Foreign Holdings. The percentage of a fund represented by securities or depositary receipts of companies based outside the United States.
Inception Date. The date on which the assets of a fund (or one of its share classes) are first invested in accordance with the fund’s investment objective. For funds with a subscription period, the inception date is the day after that period ends. Investment performance is measured from the inception date.
Median Market Cap. An indicator of the size of companies in which a fund invests; the midpoint of market capitalization (market price x shares outstanding) of a fund’s stocks, weighted by the proportion of the fund’s assets invested in each stock. Stocks representing half of the fund’s assets have market capitalizations above the median, and the rest are below it.
Price/Book Ratio. The share price of a stock divided by its net worth, or book value, per share. For a fund, the weighted average price/book ratio of the stocks it holds.
Price/Earnings Ratio. The ratio of a stock’s current price to its per-share earnings over the past year. For a fund, the weighted average P/E of the stocks it holds. P/E is an indicator of market expectations about corporate prospects; the higher the P/E, the greater the expectations for a company’s future growth.
R-Squared. A measure of how much of a fund’s past returns can be explained by the returns from the market in general, as measured by a given index. If a fund’s total returns were precisely synchronized with an index’s returns, its R-squared would be 1.00. If the fund’s returns bore no relationship to the index’s returns, its R-squared would be 0. For this report, R-squared is based on returns over the past 36 months for both the fund and the index.
Return on Equity. The annual average rate of return generated by a company during the past five years for each dollar of shareholder’s equity (net income divided by shareholder’s equity). For a fund, the weighted average return on equity for the companies whose stocks it holds.
Short-Term Reserves. The percentage of a fund invested in highly liquid, short-term securities that can be readily converted to cash.
32
Turnover Rate. An indication of the fund’s trading activity. Funds with high turnover rates incur higher transaction costs and may be more likely to distribute capital gains (which may be taxable to investors). The turnover rate excludes in-kind transactions, which have minimal impact on costs.
33
This page intentionally left blank.
This page intentionally left blank.
The People Who Govern Your Fund
The trustees of your mutual fund are there to see that the fund is operated and managed in your best interests since, as a shareholder, you are a part owner of the fund. Your fund’s trustees also serve on the board of directors of The Vanguard Group, Inc., which is owned by the Vanguard funds and provides services to them on an at-cost basis.
A majority of Vanguard’s board members are independent, meaning that they have no affiliation with Vanguard or the funds they oversee, apart from the sizable personal investments they have made as private individuals. The independent board members have distinguished backgrounds in business, academia, and public service. Each of the trustees and executive officers oversees 177 Vanguard funds.
The following table provides information for each trustee and executive officer of the fund. More information about the trustees is in the Statement of Additional Information, which can be obtained, without charge, by contacting Vanguard at 800-662-7447, or online at vanguard.com.
| |
| InterestedTrustee1 | and Delphi Automotive LLP (automotive components); |
| | Senior Advisor at New Mountain Capital. |
| F. William McNabb III | |
| Born 1957. Trustee Since July 2009. Chairman of the | Amy Gutmann |
| Board. Principal Occupation(s) During the Past Five | Born 1949. Trustee Since June 2006. Principal |
| Years: Chairman of the Board of The Vanguard Group, | Occupation(s) During the Past Five Years: President of |
| Inc., and of each of the investment companies served | the University of Pennsylvania; Christopher H. Browne |
| by The Vanguard Group, since January 2010; Director | Distinguished Professor of Political Science, School of |
| of The Vanguard Group since 2008; Chief Executive | Arts and Sciences, and Professor of Communication, |
| Officer and President of The Vanguard Group, and of | Annenberg School for Communication, with secondary |
| each of the investment companies served by The | faculty appointments in the Department of Philosophy, |
| Vanguard Group, since 2008; Director of Vanguard | School of Arts and Sciences, and at the Graduate |
| Marketing Corporation; Managing Director of The | School of Education, University of Pennsylvania; |
| Vanguard Group (1995–2008). | Trustee of the National Constitution Center; Chair |
| | of the Presidential Commission for the Study of |
| | Bioethical Issues. |
| IndependentTrustees | |
| | JoAnn Heffernan Heisen |
| Emerson U. Fullwood | |
| Born 1948. Trustee Since January 2008. Principal | Born 1950. Trustee Since July 1998. Principal |
| Occupation(s) During the Past Five Years: Executive | Occupation(s) During the Past Five Years: Corporate |
| Chief Staff and Marketing Officer for North America | Vice President and Chief Global Diversity Officer |
| and Corporate Vice President (retired 2008) of Xerox | (retired 2008) and Member of the Executive |
| Corporation (document management products and | Committee (1997–2008) of Johnson & Johnson |
| services); Executive in Residence and 2009–2010 | (pharmaceuticals/medical devices/consumer |
| Distinguished Minett Professor at the Rochester | products); Director of Skytop Lodge Corporation |
| Institute of Technology; Director of SPX Corporation | (hotels), the University Medical Center at Princeton, |
| (multi-industry manufacturing), the United Way of | the Robert Wood Johnson Foundation, and the Center |
| Rochester, Amerigroup Corporation (managed health | for Talent Innovation; Member of the Advisory Board |
| care), the University of Rochester Medical Center, | of the Maxwell School of Citizenship and Public Affairs |
| Monroe Community College Foundation, and North | at Syracuse University. |
| Carolina A&T University. | |
| F. Joseph Loughrey |
| Born 1949. Trustee Since October 2009. Principal |
| Rajiv L. Gupta | Occupation(s) During the Past Five Years: President |
| Born 1945. Trustee Since December 2001.2 | and Chief Operating Officer (retired 2009) of Cummins |
| Principal Occupation(s) During the Past Five Years: | Inc. (industrial machinery); Chairman of the Board |
| Chairman and Chief Executive Officer (retired 2009) | of Hillenbrand, Inc. (specialized consumer services), |
| and President (2006–2008) of Rohm and Haas Co. | and of Oxfam America; Director of SKF AB (industrial |
| (chemicals); Director of Tyco International, Ltd. | machinery), Hyster-Yale Materials Handling, Inc. |
| (diversified manufacturing and services), Hewlett- | (forklift trucks), the Lumina Foundation for Education, |
| Packard Co. (electronic computer manufacturing), | |
| | |
| and the V Foundation for Cancer Research; Member | Executive Officers | |
| of the Advisory Council for the College of Arts and | | |
| Letters and of the Advisory Board to the Kellogg | Glenn Booraem | |
| Institute for International Studies, both at the | Born 1967. Controller Since July 2010. Principal |
| University of Notre Dame. | Occupation(s) During the Past Five Years: Principal |
| | of The Vanguard Group, Inc.; Controller of each of |
| Mark Loughridge | the investment companies served by The Vanguard |
| Born 1953. Trustee Since March 2012. Principal | Group; Assistant Controller of each of the investment |
| Occupation(s) During the Past Five Years: Senior Vice | companies served by The Vanguard Group (2001–2010). |
| President and Chief Financial Officer (retired 2013) | | |
| at IBM (information technology services); Fiduciary | Thomas J. Higgins | |
| Member of IBM’s Retirement Plan Committee (2004– | Born 1957. Chief Financial Officer Since September |
| 2013); Member of the Council on Chicago Booth. | 2008. Principal Occupation(s) During the Past Five |
| | Years: Principal of The Vanguard Group, Inc.; Chief |
| Scott C. Malpass | Financial Officer of each of the investment companies |
| Born 1962. Trustee Since March 2012. Principal | served by The Vanguard Group; Treasurer of each of |
| Occupation(s) During the Past Five Years: Chief | the investment companies served by The Vanguard |
| Investment Officer and Vice President at the University | Group (1998–2008). | |
| of Notre Dame; Assistant Professor of Finance at the | | |
| Mendoza College of Business at Notre Dame; Member | Kathryn J. Hyatt | |
| of the Notre Dame 403(b) Investment Committee; | Born 1955. Treasurer Since November 2008. Principal |
| Board Member of TIFF Advisory Services, Inc. | Occupation(s) During the Past Five Years: Principal of |
| (investment advisor); Member of the Investment | The Vanguard Group, Inc.; Treasurer of each of the |
| Advisory Committees of the Financial Industry | investment companies served by The Vanguard |
| Regulatory Authority (FINRA) and of Major League | Group; Assistant Treasurer of each of the investment |
| Baseball. | companies served by The Vanguard Group (1988–2008). |
| |
| André F. Perold | Heidi Stam | |
| Born 1952. Trustee Since December 2004. Principal | Born 1956. Secretary Since July 2005. Principal |
| Occupation(s) During the Past Five Years: George | Occupation(s) During the Past Five Years: Managing |
| Gund Professor of Finance and Banking, Emeritus | Director of The Vanguard Group, Inc.; General Counsel |
| at the Harvard Business School (retired 2011); | of The Vanguard Group; Secretary of The Vanguard |
| Chief Investment Officer and Managing Partner of | Group and of each of the investment companies |
| HighVista Strategies LLC (private investment firm); | served by The Vanguard Group; Director and Senior |
| Director of Rand Merchant Bank; Overseer of the | Vice President of Vanguard Marketing Corporation. |
| Museum of Fine Arts Boston. | | |
| | Vanguard Senior ManagementTeam |
| Alfred M. Rankin, Jr. | | |
| Born 1941. Trustee Since January 1993. Principal | Mortimer J. Buckley | Chris D. McIsaac |
| Occupation(s) During the Past Five Years: Chairman, | Kathleen C. Gubanich | Michael S. Miller |
| President, and Chief Executive Officer of NACCO | Paul A. Heller | James M. Norris |
| Industries, Inc. (housewares/lignite), and of Hyster- | Martha G. King | Glenn W. Reed |
| Yale Materials Handling, Inc. (forklift trucks); Chairman | John T. Marcante | |
| of the Board of University Hospitals of Cleveland. | | |
| |
| Peter F. Volanakis | Chairman Emeritus and Senior Advisor |
| Born 1955. Trustee Since July 2009. Principal | | |
| Occupation(s) During the Past Five Years: President | John J. Brennan | |
| and Chief Operating Officer (retired 2010) of Corning | Chairman, 1996–2009 | |
| Incorporated (communications equipment); Trustee of | Chief Executive Officer and President, 1996–2008 |
| Colby-Sawyer College; Member of the Advisory Board | | |
| of the Norris Cotton Cancer Center and of the Advisory | Founder | |
| Board of the Parthenon Group (strategy consulting). | | |
| | John C. Bogle | |
| | Chairman and Chief Executive Officer, 1974–1996 |
1 Mr. McNabb is considered an “interested person,” as defined in the Investment Company Act of 1940, because he is an officer of the Vanguard funds.
2 December 2002 for Vanguard Equity Income Fund, the Vanguard Municipal Bond Funds, and the Vanguard State Tax-Exempt Funds.
|  |
| | P.O. Box 2600 |
| | Valley Forge, PA 19482-2600 |
| |
| |
| |
| Connect with Vanguard® > vanguard.com | |
| |
| |
| |
| Fund Information > 800-662-7447 | CFA® is a registered trademark owned by CFA Institute. |
| Direct Investor Account Services > 800-662-2739 | |
| Institutional Investor Services > 800-523-1036 | |
| Text Telephone for People | |
| Who Are Deaf or Hard of Hearing> 800-749-7273 | |
| |
| This material may be used in conjunction | |
| with the offering of shares of any Vanguard | |
| fund only if preceded or accompanied by | |
| the fund’s current prospectus. | |
| |
| All comparative mutual fund data are from Lipper, a | |
| Thomson Reuters Company, or Morningstar, Inc., unless | |
| otherwise noted. | |
| |
| You can obtain a free copy of Vanguard’s proxy voting | |
| guidelines by visiting vanguard.com/proxyreporting or by | |
| calling Vanguard at 800-662-2739. The guidelines are | |
| also available from the SEC’s website, sec.gov. In | |
| addition, you may obtain a free report on how your fund | |
| voted the proxies for securities it owned during the 12 | |
| months ended June 30. To get the report, visit either | |
| vanguard.com/proxyreporting or sec.gov. | |
| |
| You can review and copy information about your fund at | |
| the SEC’s Public Reference Room in Washington, D.C. To | |
| find out more about this public service, call the SEC at | |
| 202-551-8090. Information about your fund is also | |
| available on the SEC’s website, and you can receive | |
| copies of this information, for a fee, by sending a | |
| request in either of two ways: via e-mail addressed to | |
| publicinfo@sec.gov or via regular mail addressed to the | |
| Public Reference Section, Securities and Exchange | |
| Commission, Washington, DC 20549-1520. | |
| |
| | © 2015 The Vanguard Group, Inc. |
| | All rights reserved. |
| | Vanguard Marketing Corporation, Distributor. |
| |
| | Q6340 022015 |
Item 2: Code of Ethics. The Registrant has adopted a code of ethics that applies to the Registrant’s principal executive officer, principal financial officer, principal accounting officer or controller or persons performing similar functions. The Code of Ethics was amended during the reporting period covered by this report to make certain technical, non-material changes.
Item 3: Audit Committee Financial Expert. The following members of the Audit Committee have been determined by the Registrant’s Board of Trustees to be Audit Committee Financial Experts serving on its Audit Committee, and to be independent: Rajiv L. Gupta, Amy Gutmann, JoAnn Heffernan Heisen, F. Joseph Loughrey, Mark Loughridge, Scott C. Malpass, and André F. Perold.
Item 4: Principal Accountant Fees and Services.
(a) Audit Fees.
Audit Fees of the Registrant
Fiscal Year Ended December 31, 2014: $50,000
Fiscal Year Ended December 31, 2013: $46,000
Aggregate Audit Fees of Registered Investment Companies in the Vanguard Group.
Fiscal Year Ended December 31, 2014: $6,605,127
Fiscal Year Ended December 31, 2013: $5,714,113
Includes fees billed in connection with audits of the Registrant, other registered investment companies in the Vanguard complex, The Vanguard Group, Inc. and Vanguard Marketing Corporation.
(b) Audit-Related Fees.
Fiscal Year Ended December 31, 2014: $2,176,479
Fiscal Year Ended December 31, 2013: $1,552,950
Includes fees billed in connection with assurance and related services provided to the Registrant, other registered investment companies in the Vanguard complex, The Vanguard Group, Inc., and Vanguard Marketing Corporation.
(c) Tax Fees.
Fiscal Year Ended December 31, 2014: $316,869
Fiscal Year Ended December 31, 2013: $110,000
Includes fees billed in connection with tax compliance, planning, and advice services provided to the Registrant, other registered investment companies in the Vanguard complex, The Vanguard Group, Inc., and Vanguard Marketing Corporation.
(d) All Other Fees.
Fiscal Year Ended December 31, 2014: $198,163
Fiscal Year Ended December 31, 2013: $132,000
Includes fees billed for services related to tax reported information provided to the Registrant, other registered investment companies in the Vanguard complex, The Vanguard Group, Inc., and Vanguard Marketing Corporation.
(e) (1) Pre-Approval Policies. The policy of the Registrant’s Audit Committee is to consider and, if appropriate, approve before the principal accountant is engaged for such services, all specific audit and non-audit services provided to: the Registrant, other registered investment companies in the Vanguard complex, The Vanguard Group, Inc., and entities controlled by The Vanguard Group, Inc. that provide ongoing services to the Registrant. In making a determination, the Audit Committee considers whether the services are consistent with maintaining the principal accountant’s independence.
In the event of a contingency situation in which the principal accountant is needed to provide services in between scheduled Audit Committee meetings, the Chairman of the Audit Committee would be called on to consider and, if appropriate, pre-approve audit or permitted non-audit services in an amount sufficient to complete services through the next Audit Committee meeting, and to determine if such services would be consistent with maintaining the accountant’s independence. At the next scheduled Audit Committee meeting, services and fees would be presented to the Audit Committee for formal consideration, and, if appropriate, approval by the entire Audit Committee. The Audit Committee would again consider whether such services and fees are consistent with maintaining the principal accountant’s independence.
The Registrant’s Audit Committee is informed at least annually of all audit and non-audit services provided by the principal accountant to the Vanguard complex, whether such services are provided to: the Registrant, other registered investment companies in the Vanguard complex, The Vanguard Group, Inc., or other entities controlled by The Vanguard Group, Inc. that provide ongoing services to the Registrant.
(2) No percentage of the principal accountant’s fees or services were approved pursuant to the waiver provision of paragraph (c)(7)(i)(C) of Rule 2-01 of Regulation S-X.
(f) For the most recent fiscal year, over 50% of the hours worked under the principal accountant’s engagement were not performed by persons other than full-time, permanent employees of the principal accountant.
(g) Aggregate Non-Audit Fees.
Fiscal Year Ended December 31, 2014: $515,032
Fiscal Year Ended December 31, 2013: $242,000
Includes fees billed for non-audit services provided to the Registrant, other registered investment companies in the Vanguard complex, The Vanguard Group, Inc., and Vanguard Marketing Corporation.
(h) For the most recent fiscal year, the Audit Committee has determined that the provision of all non-audit services was consistent with maintaining the principal accountant’s independence.
Item 5: Audit Committee of Listed Registrants.
Not Applicable.
Item 6: Investments.
Not Applicable.
Item 7: Disclosure of Proxy Voting Policies and Procedures for Closed-End Management
Investment Companies.
Not Applicable.
Item 8: Portfolio Managers of Closed-End Management Investment Companies.
Not Applicable.
Item 9: Purchase of Equity Securities by Closed-End Management Investment Company and
Affiliated Purchasers.
Not Applicable.
Item 10: Submission of Matters to a Vote of Security Holders.
Not Applicable.
Item 11: Controls and Procedures.
(a) Disclosure Controls and Procedures. The Principal Executive and Financial Officers concluded that the Registrant’s Disclosure Controls and Procedures are effective based on their evaluation of the Disclosure Controls and Procedures as of a date within 90 days of the filing date of this report.
(b) Internal Control Over Financial Reporting. There were no significant changes in Registrant’s Internal Control Over Financial Reporting or in other factors that could significantly affect this control subsequent to the date of the evaluation, including any corrective actions with regard to significant deficiencies and material weaknesses.
Item 12: Exhibits.
(a) Code of Ethics.
(b) Certifications.
Pursuant to the requirements of the Securities Exchange Act of 1934 and the Investment Company Act of 1940, the registrant has duly caused this report to be signed on its behalf by the undersigned, thereunto duly authorized.
| |
| | VANGUARD MONTGOMERY FUNDS |
| |
| |
| BY: | /s/ F. WILLIAM MCNABB III* |
| F. WILLIAM MCNABB III |
| CHIEF EXECUTIVE OFFICER |
| |
| Date: February 18, 2015 |
Pursuant to the requirements of the Securities Exchange Act of 1934 and the Investment Company Act of 1940, this report has been signed below by the following persons on behalf of the registrant and in the capacities and on the dates indicated.
| |
| | VANGUARD MONTGOMERY FUNDS |
| |
| BY: | /s/ F. WILLIAM MCNABB III* |
| F. WILLIAM MCNABB III |
| CHIEF EXECUTIVE OFFICER |
Date: February 18, 2015 |
| VANGUARD MONTGOMERY FUNDS |
| |
BY: | /s/ THOMAS J. HIGGINS* |
| | THOMAS J. HIGGINS |
| CHIEF FINANCIAL OFFICER |
Date: February 18, 2015 |
* By: /s/ Heidi Stam
Heidi Stam, pursuant to a Power of Attorney filed on April 22, 2014 see file Number 2-17620, Incorporated by Reference.