UNITED STATES
SECURITIES AND EXCHANGE COMMISSION
Washington, D.C. 20549
FORM N-CSR
CERTIFIED SHAREHOLDER REPORT
OF
REGISTERED MANAGEMENT INVESTMENT COMPANIES
| | |
| Investment Company Act file number: | 811-22114 | |
Name of Registrant: | Vanguard Montgomery Funds |
Address of Registrant: | P.O. Box 2600 |
| | Valley Forge, PA 19482 |
Name and address of agent for service: | Heidi Stam, Esquire |
| | P.O. Box 876 |
| | Valley Forge, PA 19482 |
Registrant’s telephone number, including area code: (610) 669-1000 |
Date of fiscal year end: December 31 |
Date of reporting period: January 1, 2015 – December 31, 2015 |
Item 1: Reports to Shareholders |

Annual Report | December 31, 2015
Vanguard Market Neutral Fund
Vanguard’s Principles for Investing Success
We want to give you the best chance of investment success. These principles, grounded in Vanguard’s research and experience, can put you on the right path.
Goals. Create clear, appropriate investment goals.
Balance. Develop a suitable asset allocation using broadly diversified funds. Cost. Minimize cost.
Discipline. Maintain perspective and long-term discipline.
A single theme unites these principles: Focus on the things you can control.
We believe there is no wiser course for any investor.
| |
| Contents | |
| Your Fund’s Total Returns. | 1 |
| Chairman’s Letter. | 2 |
| Advisor’s Report. | 8 |
| Fund Profile. | 10 |
| Performance Summary. | 12 |
| Financial Statements. | 14 |
| Your Fund’s After-Tax Returns. | 31 |
| About Your Fund’s Expenses. | 32 |
| Glossary. | 34 |
Please note: The opinions expressed in this report are just that—informed opinions. They should not be considered promises or advice.
Also, please keep in mind that the information and opinions cover the period through the date on the front of this report. Of course, the
risks of investing in your fund are spelled out in the prospectus.
See the Glossary for definitions of investment terms used in this report.
About the cover: Pictured is a sailing block on the Brilliant, a 1932 schooner docked in Mystic, Connecticut. A type of pulley, the
sailing block helps coordinate the setting of the sails. At Vanguard, the intricate coordination of technology and people allows
us to help millions of clients around the world reach their financial goals.
Your Fund’s Total Returns
| |
| Fiscal Year Ended December 31, 2015 | |
| | Total |
| | Returns |
| Vanguard Market Neutral Fund | |
| Investor Shares | 5.41% |
| Institutional Shares | 5.52 |
| Citigroup Three-Month U.S. Treasury Bill Index | 0.03 |
| Alternative Equity Market Neutral Funds Average | -0.30 |
Alternative Equity Market Neutral Funds Average: Derived from data provided by Lipper, a Thomson Reuters Company.
Institutional Shares are available to certain institutional investors who meet specific administrative, service, and account-size criteria.
| | | | |
| Your Fund’s Performance at a Glance | | | |
| December 31, 2014, Through December 31, 2015 | | | |
| | | | Distributions Per Share |
| | Starting | Ending | | |
| | Share | Share | Income | Capital |
| | Price | Price | Dividends | Gains |
| Vanguard Market Neutral Fund | | | | |
| Investor Shares | $11.50 | $12.12 | $0.002 | $0.000 |
| Institutional Shares | 11.45 | 12.07 | 0.012 | 0.000 |
1

Chairman’s Letter
Dear Shareholder,
After all was said and done, 2015 turned out to be disappointing for investors in stocks as well as bonds and commodities. But it was a good year for Vanguard Market Neutral Fund, which seeks to provide long-term capital appreciation while limiting exposure to general stock market risk.
For the 12 months ended December 31, 2015, the fund returned 5.41% for Investor Shares and 5.52% for the lower-cost Institutional Shares. Although it lagged the results of its comparative standards in the first six months of the year, your fund more than caught up in the second half and outpaced the average return of peer funds by more than 5 percentage points for the year. The benchmark Citigroup Three-Month U.S. Treasury Bill Index returned 0.03% as short-term interest rates remained anchored near zero for most of the year.
Your fund’s advisor, Vanguard Quantitative Equity Group, especially added value with its strategy and selections within the energy and industrials sectors. Financials and consumer-oriented stocks held back the fund’s total return.
Despite troubles, U.S. stocks eked out a seventh year of gains
U.S. stocks returned 0.48% for the 12 months. Although the broad market recorded its worst performance since 2008, it still posted gains for the seventh straight calendar year, thanks to dividends.
2
U.S. stocks rose modestly over the first half of the year but slid in August and September as concerns mounted that China’s economic slowdown would spread globally. Falling oil and commodity prices also affected economies and markets across the world, for better or worse. Central banks in Europe and Asia bolstered their stimulus efforts against weak growth and low inflation. And in December, the Federal Reserve ended months of uncertainty when it raised the target for short-term interest rates to 0.25%–0.5%.
International stocks returned about –5%, restrained by the U.S. dollar’s strength against many foreign currencies. In many countries, returns were positive in local currencies, but emerging markets declined in both dollars and local currencies.
U.S. bonds ended the year with a slender advance
The broad U.S. taxable bond market gained 0.55%; interest income accounted for the modestly positive 12-month result. The yield of the 10-year Treasury note ended December at 2.30%, up only slightly from 2.19% a year earlier. (Bond prices and yields move in opposite directions.) But the yields of shorter-term bonds rose more, especially in the second half of the year as investors anticipated a
| | | |
| Market Barometer | | | |
| |
| | Average Annual Total Returns |
| | Periods Ended December 31, 2015 |
| | One | Three | Five |
| | Year | Years | Years |
| Stocks | | | |
| Russell 1000 Index (Large-caps) | 0.92% | 15.01% | 12.44% |
| Russell 2000 Index (Small-caps) | -4.41 | 11.65 | 9.19 |
| Russell 3000 Index (Broad U.S. market) | 0.48 | 14.74 | 12.18 |
| FTSE All-World ex US Index (International) | -4.72 | 2.04 | 1.48 |
| |
| Bonds | | | |
| Barclays U.S. Aggregate Bond Index (Broad taxable market) | 0.55% | 1.44% | 3.25% |
| Barclays Municipal Bond Index (Broad tax-exempt market) | 3.30 | 3.16 | 5.35 |
| Citigroup Three-Month U.S. Treasury Bill Index | 0.03 | 0.02 | 0.04 |
| |
| CPI | | | |
| Consumer Price Index | 0.73% | 1.00% | 1.53% |
3
rate increase. For example, the 1-year Treasury yield climbed from 0.22% a year ago to 0.60%.
Investors focused on the Fed’s stance on short-term interest rates and alternately embraced or avoided safe-haven assets, depending on the stock market’s strength. At times, bonds benefited from demand for a safe haven amid concerns including Greece’s fiscal crisis.
International bond markets (as measured by the Barclays Global Aggregate Index ex USD) returned –6.02%, reduced by the dollar’s strength. Without this currency effect, returns were modestly positive.
Despite the Fed’s December move, returns for money market funds and savings accounts remained limited by the 0%–0.25% level that had been in place for much of the past seven years.
| Vanguard’s outlook for investors: Not bearish, but cautious |
| |
| In Vanguard’s recently published global economic and investment outlook, Global Chief |
| Economist Joseph Davis and his team discuss various market and economic events 2016 |
| may bring, along with challenges and opportunities for investors. |
| |
| Our forecast includes “frustratingly fragile” economic growth and more modest long-term |
| returns from the global stock and bond markets. The report cautions that for the decade ending |
| 2025, returns for a balanced portfolio are likely to be moderately below historical averages. |
| |
| Our simulations indicate that the average annualized returns of a 60% equity/40% bond |
| portfolio for the decade are most likely to be centered in the 3%–5% range after inflation, |
| below the actual average after-inflation return of 5.5% for the same portfolio since 1926. |
| |
| Even so, Vanguard’s steadfast belief in its principles for investing success—focusing on clear |
| goals, a suitable asset allocation, low costs, and long-term discipline—remains unchanged. |
| |
| For more information about our expectations and the probability of various outcomes, see |
| Vanguard’s Economic and Investment Outlook, available at vanguard.com/research. |
| |
| |
| IMPORTANT: The projections or other information generated by the Vanguard Capital Markets Model® (VCMM) |
| regarding the likelihood of various investment outcomes are hypothetical in nature, do not reflect actual investment |
| results, and are not guarantees of future results. Distribution of return outcomes from VCMM, derived from |
| 10,000 simulations for U.S. equity returns and fixed income returns. Simulations as of September 30, 2015. |
| Results from the model may vary with each use and over time. For more information, please see page 6. |
4
Long and short positions combined to produce another successful year
Traditional actively managed equity mutual funds follow a “long-only” investment strategy, which means their advisor buys and holds stocks because their prices are expected to rise. In contrast, Vanguard Market Neutral Fund follows a “long-short” strategy: In addition to buying stocks that are expected to appreciate, the advisor, Vanguard Quantitative Equity Group, sells stocks that are expected to decline—or to underperform those held long. When selling short, the advisor doesn’t actually hold the stocks; instead, stocks are borrowed and then sold in the hopes of returning them at a lower price. (Short-selling is one of the strategies used in Vanguard Alternative Strategies Fund, which launched in August 2015). The goal of the long-short combination is to achieve market neutrality and a return better than that of a risk-free investment.
The advisor uses sophisticated computer models, developed and continually refined over many years, to help identify the most and least attractive stocks. Typically, the dollar value of the stocks in the advisor’s short portfolio is about the same as the dollar value of the stocks held long. And the allocations to industry sectors are about the same in both the short and long portfolios, with roughly similar numbers of stocks in each sector.
The energy sector, one of the fund’s smaller industry groups, is a good example of how the advisor uses the long-short strategy. During 2015—especially later in
| |
| Total Returns | |
| Ten Years Ended December 31, 2015 | |
| | Average |
| | Annual Return |
| Market Neutral Fund Investor Shares | 2.06% |
| Citigroup Three-Month U.S. Treasury Bill Index | 1.16 |
| Alternative Equity Market Neutral Funds Average | 1.11 |
| Alternative Equity Market Neutral Funds Average: Derived from data provided by Lipper, a Thomson Reuters Company. |
The figures shown represent past performance, which is not a guarantee of future results. (Current performance may be
lower or higher than the performance data cited. For performance data current to the most recent month-end, visit our
website at vanguard.com/performance.) Note, too, that both investment returns and principal value can fluctuate widely, so
an investor’s shares, when sold, could be worth more or less than their original cost.
5
the year—falling oil and gas prices hurt a wide range of energy businesses, not just exploration and production companies and drillers. Not surprisingly, the overall return on the energy stocks in the fund’s long portfolio was negative. The energy stocks sold short, however, declined significantly more, producing a positive total return for the sector. The long-short strategy also worked notably well in industrials, one of the fund’s larger sectors. And, as in 2014, the fund reaped gains from airlines in its long portfolio. Overall, the advisor’s selections in six of the ten industry sectors boosted the fund’s return. Financials were the notable detractor.
It’s important to remember that the nature of the fund’s investment strategy means that there will be times when it can significantly lag the broad stock market. “Getting it right” in a long-short strategy means not only buying the stocks that will do well but also selling short those that won’t. Such a strategy can offer diversification benefits by providing returns that aren’t closely correlated with moves of the broad stock market. And it can offer returns higher than those of money market and other short-term investments. Investors should keep their specific situation in mind as they consider the role the fund can play within a portfolio that is already well-diversified across and within asset classes.
For more about the advisor’s strategy and the fund’s positioning during the year, please see the Advisor’s Report that follows this letter.
Lean and strong years combined to produce solid ten-year results
For the ten years ended December 31, the Market Neutral Fund had an average annual return of a bit more than 2%, about 1 percentage point ahead of its comparative standards. As you may recall, the fund
IMPORTANT: The projections or other information generated by the Vanguard Capital Markets Model (VCMM)
regarding the likelihood of various investment outcomes are hypothetical in nature, do not reflect actual
investment results, and are not guarantees of future results. VCMM results will vary with each use and over time.
The VCMM projections are based on a statistical analysis of historical data. Future returns may behave differently from the
historical patterns captured in the VCMM. More important, the VCMM may be underestimating extreme negative scenarios
unobserved in the historical period on which the model estimation is based.
The VCMM is a proprietary financial simulation tool developed and maintained by Vanguard’s primary investment research
and advice teams. The model forecasts distributions of future returns for a wide array of broad asset classes. Those asset
classes include U.S. and international equity markets, several maturities of the U.S. Treasury and corporate fixed income
markets, international fixed income markets, U.S. money markets, commodities, and certain alternative investment
strategies. The theoretical and empirical foundation for the VCMM is that the returns of various asset classes reflect the
compensation investors require for bearing different types of systematic risk (beta). At the core of the model are estimates
of the dynamic statistical relationship between risk factors and asset returns, obtained from statistical analysis based on
available monthly financial and economic data from as early as 1960. Using a system of estimated equations, the model
then applies a Monte Carlo simulation method to project the estimated interrelationships among risk factors and asset
classes as well as uncertainty and randomness over time. The model generates a large set of simulated outcomes for
each asset class over several time horizons. Forecasts are obtained by computing measures of central tendency in these
simulations. Results produced by the tool will vary with each use and over time.
6
became a Vanguard fund in 2007, and Vanguard Quantitative Equity Group became its sole advisor in 2010. We’re confident that the group will continue to successfully implement the fund’s long-short strategy.
To reach your long-term goals, be realistic and try to save more
Although there have been times when it felt as if stocks and bonds were riding a roller coaster, the markets have generally risen in recent years. The broad global stock market in particular has posted some impressive gains since its turnaround began in 2009.
But 2015 served as a reminder that markets aren’t always favorable. The U.S. stock and bond markets were barely positive, and international stocks and unhedged bonds finished in the red.
In Vanguard’s recently updated long-term look at the economy and markets, our global economists explain why they expect economic growth to remain “frustratingly fragile,” and why their outlook for stock and bond markets is the most guarded since 2006. (For more details, see the box on page 4 and Vanguard’s Economic and Investment Outlook, available at vanguard.com/research.)
Given these muted expectations, what’s the best course of action? I’ve often encouraged shareholders to focus on the things they can control. That advice holds true today.
Consider saving more than you think you may need. That’s one way you can prepare for the volatility that may lie ahead, particularly as markets adjust to changes in policies from the Fed and other central banks.
And, as always, investors would be well-served to follow Vanguard’s principles for investing success:
• Goals. Create clear, appropriate investment goals.
• Balance. Develop a suitable asset allocation using broadly diversified funds.
• Cost. Minimize cost.
• Discipline. Maintain perspective and long-term discipline.
As with saving, each of these principles is within your control, and focusing on them can keep you on the right path.
As always, thank you for investing with Vanguard.
Sincerely,

F. William McNabb III
Chairman and Chief Executive Officer
January 21, 2016
7
Advisor’s Report
The broad U.S. equity market returned 0.48% in 2015. Large-capitalization stocks bettered smaller-caps and growth-oriented companies significantly outpaced their value counterparts. The broad U.S. market fared better than international markets, especially those in developing countries.
In this environment, Vanguard Market Neutral Fund returned 5.41% for Investor Shares, outperforming its benchmark, the 3-month U.S. Treasury bill, by 5.38%. We like to remind investors that the fund’s strategy is not to outperform the equity market, but rather to be neutral to market conditions and produce investment results that exceed the returns of 3-month Treasury bills.
The U.S. economy continued to grow in 2015. Real GDP in the third quarter grew 2.0%, compared with 3.9% in the previous quarter, decelerating mainly because of slowdowns in private inventory investment, exports, and capital spending. Corporate profits decreased 1.6% in the third quarter after rising 3.5% in the second—attractive compared with the rest of the world. A 30% decline in oil prices lifted consumer spending. The job market continued to improve: Nonfarm payroll employment rose by 292,000 in December, and the unemployment rate of 5% was unchanged from the month before. In December, the Federal Reserve raised interest rates for the first time in nearly a decade. Further gradual rate hikes are expected but will depend on economic data.
Foreign currencies continued to lose ground against the dollar, which has weighed on emerging markets, especially those with abundant dollar-denominated debt. Last summer, volatility in Chinese markets spread to global stocks as well as commodities, and it recently returned amid poor economic data from the region. Meanwhile, the European Central Bank is expected to continue its stance of accommodative monetary policy as it aims to spur inflation.
Although it’s important to understand how overall portfolio performance is affected by the macro factors described above, our investment philosophy and process focus on specific stock fundamentals. We evaluate companies within industry groups to determine relative attractiveness. To do this, we use a strict quantitative process that concentrates on a combination of five factors that analyze valuation and growth. We then construct our portfolio using the results of our stock selection model. The goal is to have little exposure to market movements, thus capturing only our stock selection. We maintain dollar neutrality, keeping the market value of long positions equivalent to our short positions’ market value. In addition, since our stock selection model is done within industry groups, we maintain industry neutrality: Our long exposure in an industry group or sector is the same as our short exposure in it.
8
We also try to be beta neutral (beta is a statistical measure of a portfolio’s sensitivity to stock market performance). A long-only equity portfolio with characteristics similar to the broad market can typically be expected to produce a beta of 1.0, meaning that the portfolio market values changes in line with the stock market. Our process balances our long and short positions in amounts to target a beta around 0.0. We achieved this goal: Through December 2015, the five-year beta for the fund relative to a broad equity benchmark Russell 3000 Index has been 0.02, and the three-year beta has been –0.02.
Our stock selection models were effective in identifying the leaders and laggards. The growth and sentiment models were the strongest positive contributors, followed by the quality and management decision signals. Performance was positive on both the long and short side of the portfolio, with the short side contributing more to our results.
Stock selection was strongest in industrials, energy, and health care. Long positions in Hawaiian Holdings and JetBlue Airways and short positions in Colfax and Joy
Global contributed to our success in industrials. In energy, long positions in Tesoro and Valero Energy and a short position in Bonanza Creek Energy helped. Within health care, long positions in PRA Health Sciences and INC Research Holdings and short positions in Fluidigm and HeartWare International contributed the most to relative performance. Financials, however, were disappointing: Long positions in Investment Technology Group and Santander Consumer USA Holdings as well as a short position in Interactive Brokers Group did not perform as expected and were the largest detractors within this group.
We thank you for your investment and look forward to the new year.
James D. Troyer, CFA, Principal,
Portfolio Manager
James P. Stetler, Principal,
Portfolio Manager
Michael R. Roach, CFA, Portfolio Manager
Vanguard Quantitative Equity Group
January 21, 2016
9
Market Neutral Fund
Fund Profile
As of December 31, 2015
| | |
| Share-Class Characteristics | | |
| | Investor Institutional |
| | Shares | Shares |
| Ticker Symbol | VMNFX | VMNIX |
| Total Expense Ratio1 | 1.64% | 1.54% |
| Management Expenses | 0.19% | 0.09% |
| Dividend Expenses on | | |
| Securities Sold Short2 | 1.21% | 1.21% |
| Borrowing Expenses on | | |
| Securities Sold Short2 | 0.18% | 0.18% |
| Other Expenses | 0.06% | 0.06% |
| | |
| Portfolio Characteristics | | |
| | Long | Short |
| | Portfolio | Portfolio |
| Number of Stocks | 297 | 282 |
| Median Market Cap | $2.9B | $3.6B |
| Price/Earnings Ratio | 18.6x | 46.0x |
| Price/Book Ratio | 2.3x | 2.0x |
| Return on Equity | 13.5% | 11.4% |
| Earnings Growth | | |
| Rate | 11.5% | 4.0% |
| Foreign Holdings | 3.8% | 4.3% |
| |
| Fund Characteristics | |
| |
| Turnover Rate | 68% |
| Short-Term Reserves | 5.9% |
| | |
| Volatility Measures | | |
| | Citigroup | DJ |
| | Three-Month | U.S. Total |
| | U.S. Treasury | Market |
| | Bill Index | FA Index |
| R-Squared | 0.01 | 0.00 |
| Beta | 45.70 | -0.02 |
These measures show the degree and timing of the fund’s fluctuations compared with the index over 36 months.
| | |
| Sector Diversification (% of equity exposure) |
| | Long | Short |
| | Portfolio | Portfolio |
| Consumer Discretionary | 14.1% | 13.7% |
| Consumer Staples | 6.2 | 6.0 |
| Energy | 7.2 | 6.7 |
| Financials | 15.9 | 15.9 |
| Health Care | 15.2 | 14.8 |
| Industrials | 14.7 | 14.2 |
| Information Technology | 17.2 | 18.1 |
| Materials | 5.7 | 6.0 |
| Telecommunication Services | 0.9 | 1.3 |
| Utilities | 2.9 | 3.3 |
1 The total expense ratios shown are from the prospectus dated April 28, 2015, and represent estimated costs for the current fiscal year. For the
fiscal year ended December 31, 2015, the total expense ratios were 1.46% for Investor Shares and 1.36% for Institutional Shares.
2 In connection with a short sale, the fund may receive income or be charged a fee based on the market value of the borrowed stock. When a
cash dividend is declared on a stock the fund has sold short, the fund is required to pay an amount equal to that dividend to the party from which
the fund borrowed the stock and to record the payment of the dividend as an expense.
10
Market Neutral Fund
| | |
| Ten Largest Holdings1 (% of total net assets) |
| Long Portfolio | | |
| Ship Finance | Oil & Gas Storage & | |
| International Ltd. | Transportation | 0.5% |
| GEO Group Inc. | Specialized REITs | 0.5 |
| Nordic American | Oil & Gas Storage & | |
| Tankers Ltd. | Transportation | 0.5 |
| PharMerica Corp. | Health Care | |
| | Distributors | 0.5 |
| Advanced Micro Devices | | |
| Inc. | Semiconductors | 0.5 |
| Abercrombie & Fitch Co. Apparel Retail | 0.5 |
| Trinseo SA | Commodity | |
| | Chemicals | 0.5 |
| Scorpio Tankers Inc. | Oil & Gas Storage & | |
| | Transportation | 0.5 |
| Boyd Gaming Corp. | Casinos & Gaming | 0.5 |
| SUPERVALU Inc. | Food Retail | 0.5 |
| Top Ten | | 5.0% |
| | |
| Ten Largest Holdings1 (% of total net assets) |
| Short Portfolio | | |
| |
| Neurocrine Biosciences | | |
| Inc. | Biotechnology | 0.5% |
| Yelp Inc. | Internet Software & | |
| | Services | 0.5 |
| Albemarle Corp. | Specialty Chemicals | 0.5 |
| Dynegy Inc. | Independent Power | |
| | Producers & Energy | |
| | Traders | 0.5 |
| Memorial Resource | Oil & Gas | |
| Development Corp. | Exploration & | |
| | Production | 0.5 |
| Alnylam Pharmaceuticals | | |
| Inc. | Biotechnology | 0.5 |
| Macquarie Infrastructure | | |
| Corp. | Airport Services | 0.5 |
| Kinder Morgan Inc. | Oil & Gas Storage & | |
| | Transportation | 0.5 |
| Cobalt International | Oil & Gas | |
| Energy Inc. | Exploration & | |
| | Production | 0.5 |
| Puma Biotechnology Inc. | Biotechnology | 0.5 |
| Top Ten | | 5.0% |
1 The holdings listed exclude any temporary cash investments and equity index products.
11
Market Neutral Fund
Performance Summary
All of the returns in this report represent past performance, which is not a guarantee of future results that may be achieved by the fund. (Current performance may be lower or higher than the performance data cited. For performance data current to the most recent month-end, visit our website at vanguard.com/performance.) Note, too, that both investment returns and principal value can fluctuate widely, so an investor’s shares, when sold, could be worth more or less than their original cost. The returns shown do not reflect taxes that a shareholder would pay on fund distributions or on the sale of fund shares.
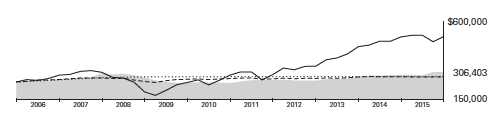
Cumulative Performance: December 31, 2005, Through December 31, 2015
Initial Investment of $250,000
| | | | | |
| | | Average Annual Total Returns | |
| | | Periods Ended December 31, 2015 | |
| |
| | | | | | Final Value |
| | | One | Five | Ten | of a $250,000 |
| | | Year | Years | Years | Investment |
| |
| | Market Neutral Fund*Investor Shares | 5.41% | 4.85% | 2.06% | $306,403 |
| | Citigroup Three-Month U.S. Treasury | | | | |
| •••••••• | Bill Index | 0.03 | 0.04 | 1.16 | 280,836 |
| |
| – – – – | Alternative Equity Market Neutral | | | | |
| | Funds Average | -0.30 | 0.71 | 1.11 | 279,128 |
| | Dow Jones U.S. Total Stock Market | | | | |
| | Float Adjusted Index | 0.44 | 12.14 | 7.48 | 514,086 |
| Alternative Equity Market Neutral Funds Average: Derived from data provided by Lipper, a Thomson Reuters Company. |
| | | | |
| | | | | Final Value |
| | One | Five | Ten | of a $5,000,000 |
| | Year | Years | Years | Investment |
| |
| Market Neutral Fund Institutional Shares | 5.52% | 4.96% | 2.18% | $6,201,404 |
| Citigroup Three-Month U.S. Treasury Bill | | | | |
| Index | 0.03 | 0.04 | 1.16 | 5,616,723 |
| Dow Jones U.S. Total Stock Market Float | | | | |
| Adjusted Index | 0.44 | 12.14 | 7.48 | 10,281,716 |
See Financial Highlights for dividend and capital gains information.
12
Market Neutral Fund
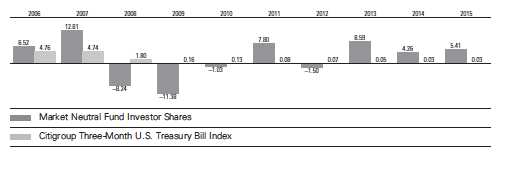
Fiscal-Year Total Returns (%): December 31, 2005, Through December 31, 2015
13
Market Neutral Fund
Financial Statements
Statement of Net Assets
As of December 31, 2015
The fund reports a complete list of its holdings in regulatory filings four times in each fiscal year, at the quarter-ends. For the second and fourth fiscal quarters, the lists appear in the fund’s semiannual and annual reports to shareholders. For the first and third fiscal quarters, the fund files the lists with the Securities and Exchange Commission on Form N-Q. Shareholders can look up the fund’s Forms N-Q on the SEC’s website at sec.gov. Forms N-Q may also be reviewed and copied at the SEC’s Public Reference Room (see the back cover of this report for further information).
| | | |
| | | | Market |
| | | | Value• |
| | | Shares | ($000) |
| Common Stocks—Long Positions (95.8%) | |
| Consumer Discretionary (13.6%) | |
| † | Abercrombie & Fitch Co. | 141,500 | 3,820 |
| †,* | Boyd Gaming Corp. | 190,500 | 3,785 |
| †,* | Pinnacle Entertainment Inc. | 120,800 | 3,759 |
| † | Gannett Co. Inc. | 229,400 | 3,737 |
| †,* | Express Inc. | 215,300 | 3,720 |
| † | American Eagle Outfitters | | |
| | Inc. | 239,200 | 3,708 |
| † | Cooper Tire & Rubber Co. | 97,000 | 3,671 |
| †,* | Penn National Gaming Inc. | 229,000 | 3,669 |
| †,* | American Axle & | | |
| | Manufacturing Holdings | | |
| | Inc. | 193,500 | 3,665 |
| † | Target Corp. | 50,400 | 3,660 |
| †,* | Amazon.com Inc. | 5,400 | 3,650 |
| | Darden Restaurants Inc. | 57,000 | 3,627 |
| †,* | Smith & Wesson Holding | | |
| | Corp. | 163,000 | 3,583 |
| † | GameStop Corp. Class A | 125,700 | 3,525 |
| † | News Corp. Class B | 243,700 | 3,402 |
| †,* | Dave & Buster’s | | |
| | Entertainment Inc. | 65,800 | 2,746 |
| †,* | MSG Networks Inc. | 119,100 | 2,477 |
| † | Expedia Inc. | 19,400 | 2,411 |
| †,* | DISH Network Corp. | | |
| | Class A | 39,800 | 2,276 |
| † | Cracker Barrel Old Country | | |
| | Store Inc. | 17,400 | 2,207 |
| †,* | Michaels Cos. Inc. | 98,300 | 2,173 |
| † | Sturm Ruger & Co. Inc. | 36,200 | 2,158 |
| | Leggett & Platt Inc. | 47,200 | 1,983 |
| * | Diamond Resorts | | |
| | International Inc. | 77,600 | 1,980 |
| †,* | O’Reilly Automotive Inc. | 7,800 | 1,977 |
| †,* | NVR Inc. | 1,200 | 1,972 |
| † | Foot Locker Inc. | 29,700 | 1,933 |
| † | Outerwall Inc. | 52,850 | 1,931 |
| † | Jack in the Box Inc. | 24,800 | 1,902 |
| | | |
| † | Home Depot Inc. | 13,900 | 1,838 |
| † | Caleres Inc. | 62,800 | 1,684 |
| †,* | Denny’s Corp. | 166,900 | 1,641 |
| †,* | Skechers U.S.A. Inc. | | |
| | Class A | 51,600 | 1,559 |
| † | Big Lots Inc. | 37,200 | 1,434 |
| †,* | Madison Square Garden | | |
| | Co. Class A | 7,599 | 1,230 |
| † | Marriott International Inc. | | |
| | Class A | 17,400 | 1,166 |
| * | TRI Pointe Group Inc. | 88,800 | 1,125 |
| * | BJ’s Restaurants Inc. | 22,900 | 995 |
| * | Cooper-Standard Holding | | |
| | Inc. | 11,700 | 908 |
| | AMC Entertainment | | |
| | Holdings Inc. | 26,000 | 624 |
| | New York Times Co. | | |
| | Class A | 44,300 | 595 |
| | Best Buy Co. Inc. | 16,800 | 512 |
| | Bloomin’ Brands Inc. | 29,800 | 503 |
| * | Nautilus Inc. | 29,000 | 485 |
| * | Burlington Stores Inc. | 9,500 | 408 |
| | | | 101,814 |
| Consumer Staples (5.9%) | | |
| †,* | SUPERVALU Inc. | 557,800 | 3,782 |
| † | Universal Corp. | 66,700 | 3,741 |
| †,* | Herbalife Ltd. | 69,600 | 3,732 |
| † | Kroger Co. | 88,700 | 3,710 |
| † | Cal-Maine Foods Inc. | 78,900 | 3,656 |
| † | Dean Foods Co. | 210,000 | 3,601 |
| † | Fresh Del Monte Produce | | |
| | Inc. | 90,900 | 3,534 |
| † | Coty Inc. Class A | 134,000 | 3,434 |
| † | Pilgrim’s Pride Corp. | 121,800 | 2,691 |
| †,* | USANA Health Sciences Inc. | 20,775 | 2,654 |
| †,* | Post Holdings Inc. | 38,900 | 2,400 |
| † | SpartanNash Co. | 85,700 | 1,855 |
| † | Dr Pepper Snapple Group | | |
| | Inc. | 13,900 | 1,295 |
| | Casey’s General Stores Inc. | 9,400 | 1,132 |
14
Market Neutral Fund
| | | |
| | | | Market |
| | | | Value• |
| | | Shares | ($000) |
| | Coca-Cola Bottling Co. | | |
| | Consolidated | 5,000 | 913 |
| | B&G Foods Inc. | 25,400 | 890 |
| | Bunge Ltd. | 11,900 | 813 |
| | Tyson Foods Inc. Class A | 7,800 | 416 |
| | | | 44,249 |
| Energy (6.9%) | | |
| † | Ship Finance International | | |
| | Ltd. | 238,000 | 3,944 |
| † | Nordic American Tankers | | |
| | Ltd. | 251,900 | 3,915 |
| † | Scorpio Tankers Inc. | 472,500 | 3,789 |
| † | Alon USA Energy Inc. | 250,900 | 3,723 |
| † | Noble Corp. plc | 352,900 | 3,723 |
| † | Valero Energy Corp. | 52,400 | 3,705 |
| † | CVR Energy Inc. | 93,700 | 3,687 |
| † | Tesoro Corp. | 34,400 | 3,625 |
| † | Marathon Petroleum Corp. | 67,800 | 3,515 |
| | Western Refining Inc. | 93,600 | 3,334 |
| † | Ensco plc Class A | 191,100 | 2,941 |
| † | PBF Energy Inc. Class A | 79,500 | 2,926 |
| †,* | McDermott International | | |
| | Inc. | 710,000 | 2,378 |
| | Atwood Oceanics Inc. | 151,700 | 1,552 |
| * | EP Energy Corp. Class A | 276,400 | 1,211 |
| | Teekay Tankers Ltd. | | |
| | Class A | 165,600 | 1,139 |
| | Frontline Ltd. | 337,200 | 1,008 |
| | Teekay Corp. | 80,100 | 791 |
| | HollyFrontier Corp. | 10,600 | 423 |
| | Phillips 66 | 4,500 | 368 |
| | | | 51,697 |
| Financials (15.2%) | | |
| | GEO Group Inc. | 136,300 | 3,940 |
| † | Communications Sales & | | |
| | Leasing Inc. | 201,100 | 3,759 |
| † | Lazard Ltd. Class A | 82,700 | 3,722 |
| † | JPMorgan Chase & Co. | 56,300 | 3,717 |
| †,* | MGIC Investment Corp. | 421,000 | 3,717 |
| † | Citigroup Inc. | 71,700 | 3,710 |
| † | SunTrust Banks Inc. | 86,600 | 3,710 |
| † | Assured Guaranty Ltd. | 140,100 | 3,703 |
| † | Bank of America Corp. | 220,000 | 3,703 |
| †,* | Flagstar Bancorp Inc. | 160,200 | 3,702 |
| † | Great Western Bancorp Inc. | 127,200 | 3,691 |
| † | Xenia Hotels & Resorts Inc. | 240,300 | 3,684 |
| † | Hospitality Properties Trust | 139,600 | 3,651 |
| † | Lamar Advertising Co. | | |
| | Class A | 58,800 | 3,527 |
| † | Maiden Holdings Ltd. | 233,300 | 3,478 |
| † | Equinix Inc. | 10,900 | 3,296 |
| † | Apple Hospitality REIT Inc. | 162,300 | 3,241 |
| | Mack-Cali Realty Corp. | 132,000 | 3,082 |
| | Navient Corp. | 238,500 | 2,731 |
| | | |
| † | Universal Insurance | | |
| | Holdings Inc. | 115,900 | 2,687 |
| † | Travelers Cos. Inc. | 23,400 | 2,641 |
| †,* | Santander Consumer USA | | |
| | Holdings Inc. | 162,900 | 2,582 |
| † | Cathay General Bancorp | 73,900 | 2,315 |
| † | Voya Financial Inc. | 60,000 | 2,215 |
| †,* | Credit Acceptance Corp. | 10,160 | 2,174 |
| | Government Properties | | |
| | Income Trust | 133,000 | 2,111 |
| † | Popular Inc. | 74,300 | 2,106 |
| † | First American Financial | | |
| | Corp. | 57,700 | 2,071 |
| † | Hartford Financial Services | | |
| | Group Inc. | 44,900 | 1,951 |
| † | Everest Re Group Ltd. | 10,300 | 1,886 |
| † | PrivateBancorp Inc. | 45,900 | 1,883 |
| † | HFF Inc. Class A | 59,000 | 1,833 |
| | PNC Financial Services | | |
| | Group Inc. | 18,900 | 1,801 |
| * | LendingTree Inc. | 19,800 | 1,768 |
| † | AmTrust Financial Services | | |
| | Inc. | 25,100 | 1,546 |
| † | KeyCorp | 116,300 | 1,534 |
| † | Reinsurance Group of | | |
| | America Inc. Class A | 17,700 | 1,514 |
| * | KCG Holdings Inc. Class A | 122,400 | 1,507 |
| † | International Bancshares | | |
| | Corp. | 51,400 | 1,321 |
| | Wells Fargo & Co. | 23,200 | 1,261 |
| | OM Asset Management plc | 75,000 | 1,150 |
| | Banco Latinoamericano de | | |
| | Comercio Exterior SA | 43,500 | 1,128 |
| * | Arch Capital Group Ltd. | 16,000 | 1,116 |
| † | Huntington Bancshares Inc. | 87,400 | 967 |
| | Nelnet Inc. Class A | 12,200 | 410 |
| * | BofI Holding Inc. | 18,800 | 396 |
| * | World Acceptance Corp. | 10,650 | 395 |
| | Ryman Hospitality | | |
| | Properties Inc. | 7,600 | 392 |
| | | | 114,425 |
| Health Care (14.5%) | | |
| †,* | PharMerica Corp. | 111,000 | 3,885 |
| †,* | Emergent BioSolutions Inc. | 94,200 | 3,769 |
| †,* | AMN Healthcare Services | | |
| | Inc. | 121,100 | 3,760 |
| †,* | Charles River Laboratories | | |
| | International Inc. | 46,600 | 3,746 |
| †,* | NewLink Genetics Corp. | 102,500 | 3,730 |
| †,* | ImmunoGen Inc. | 274,600 | 3,726 |
| †,* | Prestige Brands Holdings | | |
| | Inc. | 72,300 | 3,722 |
| †,* | Cambrex Corp. | 78,900 | 3,715 |
| †,* | United Therapeutics Corp. | 23,700 | 3,712 |
| †,* | Molina Healthcare Inc. | 61,700 | 3,710 |
15
Market Neutral Fund
| | | |
| | | | Market |
| | | | Value• |
| | | Shares | ($000) |
| † | AmerisourceBergen Corp. | | |
| | Class A | 35,700 | 3,702 |
| †,* | Amsurg Corp. | 48,500 | 3,686 |
| †,* | INC Research Holdings Inc. | | |
| | Class A | 75,900 | 3,682 |
| †,* | Insys Therapeutics Inc. | 128,100 | 3,668 |
| †,* | Amedisys Inc. | 92,700 | 3,645 |
| †,* | PRA Health Sciences Inc. | 79,400 | 3,594 |
| † | Eli Lilly & Co. | 42,000 | 3,539 |
| †,* | Bruker Corp. | 135,600 | 3,291 |
| †,* | FibroGen Inc. | 103,500 | 3,154 |
| †,* | ICU Medical Inc. | 25,600 | 2,887 |
| †,* | Centene Corp. | 42,400 | 2,790 |
| †,* | Halozyme Therapeutics Inc. | 155,000 | 2,686 |
| † | Cardinal Health Inc. | 28,900 | 2,580 |
| †,* | Merrimack Pharmaceuticals | | |
| | Inc. | 311,609 | 2,462 |
| †,* | Masimo Corp. | 58,900 | 2,445 |
| †,* | Natus Medical Inc. | 45,800 | 2,201 |
| † | Chemed Corp. | 12,500 | 1,873 |
| †,* | ABIOMED Inc. | 19,900 | 1,797 |
| †,* | Quintiles Transnational | | |
| | Holdings Inc. | 26,000 | 1,785 |
| | Gilead Sciences Inc. | 17,000 | 1,720 |
| †,* | Eagle Pharmaceuticals Inc. | 18,500 | 1,640 |
| | Aetna Inc. | 14,500 | 1,568 |
| * | Community Health Systems | | |
| | Inc. | 58,900 | 1,563 |
| † | Anthem Inc. | 11,000 | 1,534 |
| †,* | Sucampo Pharmaceuticals | | |
| | Inc. Class A | 87,667 | 1,516 |
| †,* | HCA Holdings Inc. | 22,155 | 1,498 |
| * | Adeptus Health Inc. Class A | 21,200 | 1,156 |
| | Quality Systems Inc. | 71,600 | 1,154 |
| †,* | Lannett Co. Inc. | 28,700 | 1,151 |
| * | VCA Inc. | 18,800 | 1,034 |
| * | Array BioPharma Inc. | 156,900 | 662 |
| | | | 109,138 |
| Industrials (14.1%) | | |
| †,* | Spirit AeroSystems | | |
| | Holdings Inc. Class A | 74,700 | 3,740 |
| † | Trinity Industries Inc. | 155,440 | 3,734 |
| † | Owens Corning | 79,200 | 3,725 |
| † | Boeing Co. | 25,700 | 3,716 |
| † | BWX Technologies Inc. | 116,800 | 3,711 |
| †,* | American Woodmark Corp. | 46,300 | 3,703 |
| † | Comfort Systems USA Inc. | 130,200 | 3,700 |
| †,* | JetBlue Airways Corp. | 163,000 | 3,692 |
| † | Interface Inc. Class A | 191,800 | 3,671 |
| † | West Corp. | 169,800 | 3,663 |
| †,* | Hawaiian Holdings Inc. | 102,800 | 3,632 |
| † | Huntington Ingalls Industries | | |
| | Inc. | 28,383 | 3,600 |
| † | Southwest Airlines Co. | 80,600 | 3,471 |
| † | SkyWest Inc. | 181,800 | 3,458 |
| | | | |
| † | Insperity Inc. | | 54,700 | 2,634 |
| †,* | Virgin America Inc. | | 72,900 | 2,625 |
| † | CEB Inc. | | 40,400 | 2,480 |
| † | Greenbrier Cos. Inc. | | 75,200 | 2,453 |
| | Herman Miller Inc. | | 85,300 | 2,448 |
| † | John Bean Technologies | | |
| | Corp. | | 48,300 | 2,407 |
| † | Aircastle Ltd. | | 113,200 | 2,365 |
| †,* | Atlas Air Worldwide | | | |
| | Holdings Inc. | | 55,800 | 2,307 |
| †,* | United Continental Holdings | | |
| | Inc. | | 40,100 | 2,298 |
| † | General Dynamics Corp. | 16,500 | 2,266 |
| † | Alaska Air Group Inc. | | 27,820 | 2,240 |
| †,* | Aerojet Rocketdyne | | | |
| | Holdings Inc. | | 139,000 | 2,177 |
| † | Northrop Grumman Corp. | 11,230 | 2,120 |
| †,* | Dycom Industries Inc. | | 29,300 | 2,050 |
| †,* | Meritor Inc. | | 240,300 | 2,006 |
| † | Cintas Corp. | | 21,200 | 1,930 |
| † | Korn/Ferry International | 57,100 | 1,895 |
| † | Allegiant Travel Co. Class A | 10,500 | 1,762 |
| † | Apogee Enterprises Inc. | 40,100 | 1,745 |
| | Knoll Inc. | | 84,400 | 1,587 |
| † | Pitney Bowes Inc. | | 74,700 | 1,542 |
| † | Deluxe Corp. | | 27,600 | 1,505 |
| † | Textron Inc. | | 35,800 | 1,504 |
| † | Masco Corp. | | 49,000 | 1,387 |
| † | PACCAR Inc. | | 28,600 | 1,356 |
| | General Cable Corp. | | 85,800 | 1,152 |
| * | United Rentals Inc. | | 14,200 | 1,030 |
| | Graco Inc. | | 8,400 | 605 |
| † | ManpowerGroup Inc. | | 5,800 | 489 |
| †,* | Avis Budget Group Inc. | 11,200 | 406 |
| | | | | 105,987 |
| Information Technology (16.5%) | |
| †,* | Advanced Micro Devices | | |
| | Inc. | 1,344,330 | 3,858 |
| † | Booz Allen Hamilton | | | |
| | Holding Corp. Class A | 121,700 | 3,754 |
| †,* | Fitbit Inc. Class A | | 126,600 | 3,746 |
| † | CSG Systems International | | |
| | Inc. | | 104,100 | 3,746 |
| * | Anixter International Inc. | 61,800 | 3,732 |
| †,* | Aspen Technology Inc. | 98,500 | 3,719 |
| * | First Data Corp. Class A | 231,700 | 3,712 |
| †,* | Sykes Enterprises Inc. | 120,500 | 3,709 |
| † | Computer Sciences Corp. | 113,300 | 3,703 |
| † | Leidos Holdings Inc. | | 65,500 | 3,685 |
| †,* | CACI International Inc. | | |
| | Class A | | 39,700 | 3,683 |
| † | Avnet Inc. | | 85,700 | 3,671 |
| † | Ingram Micro Inc. | | 120,700 | 3,667 |
| †,* | GoDaddy Inc. Class A | | 113,900 | 3,652 |
| † | CDW Corp. | | 86,800 | 3,649 |
16
Market Neutral Fund
| | | |
| | | | Market |
| | | | Value• |
| | | Shares | ($000) |
| †,* | Manhattan Associates Inc. | 55,100 | 3,646 |
| †,* | Tech Data Corp. | 54,800 | 3,638 |
| † | SYNNEX Corp. | 40,306 | 3,625 |
| †,* | Cirrus Logic Inc. | 122,200 | 3,609 |
| † | TeleTech Holdings Inc. | 122,300 | 3,413 |
| † | CSRA Inc. | 111,300 | 3,339 |
| †,* | RingCentral Inc. Class A | 131,600 | 3,103 |
| †,* | Gigamon Inc. | 116,600 | 3,098 |
| †,* | Ciena Corp. | 116,000 | 2,400 |
| * | Cardtronics Inc. | 70,800 | 2,382 |
| †,* | Globant SA | 63,500 | 2,382 |
| †,* | Electronic Arts Inc. | 30,700 | 2,110 |
| †,* | MicroStrategy Inc. Class A | 10,600 | 1,900 |
| †,* | ARRIS Group Inc. | 58,971 | 1,803 |
| † | Travelport Worldwide Ltd. | 138,800 | 1,791 |
| †,* | Blackhawk Network | | |
| | Holdings Inc. | 40,000 | 1,768 |
| †,* | Infinera Corp. | 96,700 | 1,752 |
| † | Blackbaud Inc. | 26,000 | 1,712 |
| | Jabil Circuit Inc. | 71,300 | 1,661 |
| † | MAXIMUS Inc. | 29,400 | 1,654 |
| * | Synaptics Inc. | 19,900 | 1,599 |
| †,* | Ambarella Inc. | 28,200 | 1,572 |
| | Ebix Inc. | 46,900 | 1,538 |
| | DST Systems Inc. | 12,800 | 1,460 |
| * | Sanmina Corp. | 65,900 | 1,356 |
| †,* | Super Micro Computer Inc. | 55,000 | 1,348 |
| †,* | AVG Technologies NV | 60,400 | 1,211 |
| | Skyworks Solutions Inc. | 14,300 | 1,099 |
| * | Paycom Software Inc. | 29,000 | 1,091 |
| †,* | VASCO Data Security | | |
| | International Inc. | 62,900 | 1,052 |
| * | Unisys Corp. | 79,100 | 874 |
| * | Benchmark Electronics Inc. | 40,400 | 835 |
| | Lexmark International Inc. | | |
| | Class A | 24,500 | 795 |
| | Western Union Co. | 28,800 | 516 |
| † | Accenture plc Class A | 4,900 | 512 |
| * | Luxoft Holding Inc. Class A | 4,700 | 363 |
| | | | 123,693 |
| Materials (5.5%) | | |
| †,* | Trinseo SA | 135,318 | 3,816 |
| †,* | Chemtura Corp. | 138,000 | 3,763 |
| † | Dow Chemical Co. | 72,600 | 3,737 |
| † | Stepan Co. | 75,000 | 3,727 |
| † | LyondellBasell Industries | | |
| | NV Class A | 42,700 | 3,711 |
| † | Cabot Corp. | 89,900 | 3,675 |
| † | Sealed Air Corp. | 64,500 | 2,877 |
| † | Avery Dennison Corp. | 40,100 | 2,513 |
| † | Domtar Corp. | 62,200 | 2,298 |
| †,* | Ferro Corp. | 178,800 | 1,988 |
| * | Berry Plastics Group Inc. | 49,900 | 1,805 |
| | International Paper Co. | 36,900 | 1,391 |
| | Bemis Co. Inc. | 28,900 | 1,292 |
| | | |
| | Innospec Inc. | 20,300 | 1,103 |
| † | Graphic Packaging Holding | | |
| | Co. | 81,200 | 1,042 |
| | Worthington Industries Inc. | 31,200 | 940 |
| | Commercial Metals Co. | 65,100 | 891 |
| † | Westlake Chemical Corp. | 14,560 | 791 |
| | | | 41,360 |
| Telecommunication Services (0.8%) | |
| † | CenturyLink Inc. | 143,700 | 3,615 |
| † | Telephone & Data Systems | | |
| | Inc. | 70,000 | 1,812 |
| | Verizon Communications | | |
| | Inc. | 14,900 | 689 |
| | | | 6,116 |
| Utilities (2.8%) | | |
| † | UGI Corp. | 111,100 | 3,751 |
| † | FirstEnergy Corp. | 116,300 | 3,690 |
| † | WGL Holdings Inc. | 51,000 | 3,212 |
| † | Exelon Corp. | 96,300 | 2,674 |
| † | Public Service Enterprise | | |
| | Group Inc. | 59,000 | 2,283 |
| † | Edison International | 36,300 | 2,149 |
| † | Ormat Technologies Inc. | 55,900 | 2,039 |
| | American Electric Power | | |
| | Co. Inc. | 17,600 | 1,026 |
| | American States Water Co. | 8,500 | 357 |
| | | | 21,181 |
| Total Common Stocks—Long Positions | |
| (Cost $708,996) | | 719,660 |
| Common Stocks Sold Short (-96.5%) | |
| Consumer Discretionary (-13.2%) | |
| * | Liberty Ventures Class A | (84,800) | (3,825) |
| | EW Scripps Co. Class A | (197,500) | (3,752) |
| | Lions Gate Entertainment | | |
| | Corp. | (115,800) | (3,751) |
| | Dunkin’ Brands Group Inc. | (87,900) | (3,744) |
| * | Under Armour Inc. Class A | (46,300) | (3,732) |
| * | Dollar Tree Inc. | (48,300) | (3,730) |
| * | Buffalo Wild Wings Inc. | (23,300) | (3,720) |
| | PulteGroup Inc. | (208,600) | (3,717) |
| * | Chipotle Mexican Grill Inc. | | |
| | Class A | (7,700) | (3,695) |
| | BorgWarner Inc. | (84,600) | (3,657) |
| * | Shutterfly Inc. | (81,800) | (3,645) |
| * | Netflix Inc. | (31,000) | (3,546) |
| * | Houghton Mifflin Harcourt | | |
| | Co. | (158,300) | (3,448) |
| * | Federal-Mogul Holdings | | |
| | Corp. | (480,200) | (3,289) |
| | CalAtlantic Group Inc. | (80,820) | (3,065) |
| * | TripAdvisor Inc. | (34,600) | (2,950) |
| * | Murphy USA Inc. | (42,700) | (2,593) |
| * | CarMax Inc. | (47,271) | (2,551) |
17
Market Neutral Fund
| | | |
| | | | Market |
| | | | Value• |
| | | Shares | ($000) |
| | Graham Holdings Co. | | |
| | Class B | (4,900) | (2,376) |
| * | Hyatt Hotels Corp. Class A | (48,700) | (2,290) |
| | Ralph Lauren Corp. Class A | (19,700) | (2,196) |
| | CST Brands Inc. | (54,800) | (2,145) |
| * | Meritage Homes Corp. | (61,200) | (2,080) |
| | Standard Motor Products | | |
| | Inc. | (53,000) | (2,017) |
| * | Priceline Group Inc. | (1,580) | (2,014) |
| | Signet Jewelers Ltd. | (16,200) | (2,004) |
| * | LKQ Corp. | (65,000) | (1,926) |
| * | Vitamin Shoppe Inc. | (55,200) | (1,805) |
| * | Liberty Broadband Corp. | (34,300) | (1,779) |
| | Harley-Davidson Inc. | (38,900) | (1,766) |
| * | Liberty TripAdvisor Holdings | | |
| | Inc. Class A | (56,400) | (1,711) |
| | Hanesbrands Inc. | (49,100) | (1,445) |
| * | Ascent Capital Group Inc. | | |
| | Class A | (76,491) | (1,279) |
| | Tiffany & Co. | (15,400) | (1,175) |
| | Interval Leisure Group Inc. | (70,000) | (1,093) |
| * | Apollo Education Group Inc. | (141,300) | (1,084) |
| * | Fiesta Restaurant Group | | |
| | Inc. | (31,100) | (1,045) |
| * | Dorman Products Inc. | (20,800) | (987) |
| | Twenty-First Century Fox | | |
| | Inc. Class A | (33,600) | (912) |
| * | Liberty Broadband Corp. | | |
| | Class A | (15,600) | (806) |
| | Sotheby’s | (28,800) | (742) |
| | | | (99,087) |
| Consumer Staples (-5.8%) | | |
| | Archer-Daniels-Midland Co. | (102,400) | (3,756) |
| * | Monster Beverage Corp. | (25,000) | (3,724) |
| * | Edgewell Personal Care Co. | (47,482) | (3,721) |
| | Whole Foods Market Inc. | (110,800) | (3,712) |
| | Kraft Heinz Co. | (50,600) | (3,682) |
| | Walgreens Boots Alliance | | |
| | Inc. | (38,700) | (3,296) |
| * | HRG Group Inc. | (213,400) | (2,894) |
| * | Sprouts Farmers Market | | |
| | Inc. | (101,100) | (2,688) |
| * | TreeHouse Foods Inc. | (32,600) | (2,558) |
| | Andersons Inc. | (78,000) | (2,467) |
| | JM Smucker Co. | (18,600) | (2,294) |
| | Hershey Co. | (24,300) | (2,169) |
| | Spectrum Brands Holdings | | |
| | Inc. | (20,000) | (2,036) |
| * | Darling Ingredients Inc. | (189,100) | (1,989) |
| * | United Natural Foods Inc. | (43,400) | (1,708) |
| | Mead Johnson Nutrition | | |
| | Co. | (7,400) | (584) |
| | Procter & Gamble Co. | (5,600) | (445) |
| | | | (43,723) |
| | | |
| Energy (-6.5%) | | |
| * | Memorial Resource | | |
| | Development Corp. | (242,800) | (3,921) |
| | Kinder Morgan Inc. | (258,000) | (3,849) |
| * | Cobalt International | | |
| | Energy Inc. | (711,800) | (3,844) |
| * | Cheniere Energy Inc. | (103,000) | (3,837) |
| | Noble Energy Inc. | (116,400) | (3,833) |
| | SM Energy Co. | (192,400) | (3,783) |
| | Anadarko Petroleum Corp. | (77,500) | (3,765) |
| * | Synergy Resources Corp. | (320,400) | (2,730) |
| | Patterson-UTI Energy Inc. | (173,100) | (2,610) |
| | Pioneer Natural Resources | | |
| | Co. | (18,600) | (2,332) |
| * | Diamondback Energy Inc. | (33,500) | (2,241) |
| | ConocoPhillips | (43,300) | (2,022) |
| * | Kosmos Energy Ltd. | (370,700) | (1,928) |
| * | Concho Resources Inc. | (20,200) | (1,876) |
| * | Rice Energy Inc. | (165,400) | (1,803) |
| * | Bonanza Creek Energy Inc. | (288,200) | (1,519) |
| * | Southwestern Energy Co. | (192,600) | (1,369) |
| | Cabot Oil & Gas Corp. | (55,800) | (987) |
| * | Whiting Petroleum Corp. | (46,000) | (434) |
| | | | (48,683) |
| Financials (-15.4%) | | |
| | Leucadia National Corp. | (217,600) | (3,784) |
| | Ventas Inc. | (66,900) | (3,775) |
| | American Homes 4 Rent | | |
| | Class A | (225,400) | (3,755) |
| | Boston Properties Inc. | (29,200) | (3,724) |
| | Kearny Financial Corp. | (293,900) | (3,724) |
| | Kilroy Realty Corp. | (58,700) | (3,715) |
| | Arthur J Gallagher & Co. | (90,600) | (3,709) |
| | White Mountains Insurance | | |
| | Group Ltd. | (5,100) | (3,707) |
| | PacWest Bancorp | (85,800) | (3,698) |
| | Mercury General Corp. | (79,290) | (3,693) |
| | Sterling Bancorp | (227,300) | (3,687) |
| | Northwest Bancshares Inc. | (275,000) | (3,682) |
| | UMB Financial Corp. | (78,800) | (3,668) |
| | Pebblebrook Hotel Trust | (130,600) | (3,659) |
| | Renasant Corp. | (106,000) | (3,647) |
| * | Enstar Group Ltd. | (24,300) | (3,646) |
| | Alexander & Baldwin Inc. | (102,300) | (3,612) |
| * | Stifel Financial Corp. | (82,600) | (3,499) |
| | Potlatch Corp. | (112,700) | (3,408) |
| * | CBRE Group Inc. Class A | (91,800) | (3,174) |
| * | PHH Corp. | (175,000) | (2,835) |
| | Allied World Assurance | | |
| | Co. Holdings AG | (69,600) | (2,588) |
| | Loews Corp. | (63,000) | (2,419) |
| | Zions Bancorporation | (86,800) | (2,370) |
| | Valley National Bancorp | (240,000) | (2,364) |
| * | Texas Capital Bancshares | | |
| | Inc. | (47,800) | (2,362) |
18
Market Neutral Fund
| | | |
| | | | Market |
| | | | Value• |
| | | Shares | ($000) |
| | CNA Financial Corp. | (65,000) | (2,285) |
| | Assurant Inc. | (27,000) | (2,175) |
| | Ameris Bancorp | (61,900) | (2,104) |
| | Virtus Investment Partners | | |
| | Inc. | (17,800) | (2,091) |
| | Wintrust Financial Corp. | (42,500) | (2,062) |
| | Evercore Partners Inc. | | |
| | Class A | (35,100) | (1,898) |
| | Union Bankshares Corp. | (72,600) | (1,832) |
| | M&T Bank Corp. | (14,800) | (1,793) |
| | Unum Group | (50,300) | (1,675) |
| | Umpqua Holdings Corp. | (105,000) | (1,670) |
| | McGraw Hill Financial Inc. | (16,700) | (1,646) |
| | WesBanco Inc. | (53,935) | (1,619) |
| | Outfront Media Inc. | (70,100) | (1,530) |
| | Charles Schwab Corp. | (34,800) | (1,146) |
| | T. Rowe Price Group Inc. | (11,300) | (808) |
| | Boston Private Financial | | |
| | Holdings Inc. | (48,200) | (547) |
| * | Green Dot Corp. Class A | (27,200) | (447) |
| | Monogram Residential | | |
| | Trust Inc. | (37,800) | (369) |
| | | | (115,601) |
| Health Care (-14.3%) | | |
| * | Neurocrine Biosciences Inc. | (70,300) | (3,977) |
| * | Alnylam Pharmaceuticals | | |
| | Inc. | (41,100) | (3,869) |
| * | Puma Biotechnology Inc. | (49,000) | (3,842) |
| * | ACADIA Pharmaceuticals | | |
| | Inc. | (107,300) | (3,825) |
| * | Amicus Therapeutics Inc. | (390,500) | (3,788) |
| * | Wright Medical Group NV | (156,500) | (3,784) |
| * | Acceleron Pharma Inc. | (77,500) | (3,779) |
| | Zimmer Biomet Holdings | | |
| | Inc. | (36,600) | (3,755) |
| * | DexCom Inc. | (45,500) | (3,726) |
| * | Cerner Corp. | (61,900) | (3,725) |
| * | Ultragenyx Pharmaceutical | | |
| | Inc. | (33,200) | (3,724) |
| * | Alexion Pharmaceuticals | | |
| | Inc. | (19,500) | (3,720) |
| * | Bluebird Bio Inc. | (57,900) | (3,718) |
| * | Ophthotech Corp. | (46,500) | (3,652) |
| * | BioMarin Pharmaceutical | | |
| | Inc. | (34,700) | (3,635) |
| * | Sage Therapeutics Inc. | (61,300) | (3,574) |
| * | Intercept Pharmaceuticals | | |
| | Inc. | (23,900) | (3,570) |
| * | Alkermes plc | (38,100) | (3,024) |
| * | Insulet Corp. | (77,900) | (2,945) |
| | Cooper Cos. Inc. | (20,300) | (2,724) |
| | Patterson Cos. Inc. | (58,500) | (2,645) |
| * | STERIS plc | (34,700) | (2,614) |
| | Becton Dickinson and Co. | (16,900) | (2,604) |
| * | Nevro Corp. | (37,700) | (2,545) |
| | | |
| * | ExamWorks Group Inc. | (91,000) | (2,421) |
| * | Achillion Pharmaceuticals | | |
| | Inc. | (222,000) | (2,395) |
| | Medtronic plc | (29,700) | (2,285) |
| * | HeartWare International Inc. | (43,900) | (2,213) |
| * | Allergan plc | (6,500) | (2,031) |
| | Baxter International Inc. | (52,200) | (1,991) |
| * | Brookdale Senior Living Inc. (106,900) | (1,973) |
| | Bio-Techne Corp. | (19,500) | (1,755) |
| * | Medidata Solutions Inc. | (34,900) | (1,720) |
| * | Alder Biopharmaceuticals | | |
| | Inc. | (45,300) | (1,496) |
| * | LDR Holding Corp. | (56,100) | (1,409) |
| * | HMS Holdings Corp. | (76,300) | (942) |
| * | Chimerix Inc. | (99,200) | (888) |
| * | Impax Laboratories Inc. | (20,500) | (877) |
| | | | (107,160) |
| Industrials (-13.7%) | | |
| | Macquarie Infrastructure | | |
| | Corp. | (53,100) | (3,855) |
| * | Colfax Corp. | (162,800) | (3,801) |
| | Oshkosh Corp. | (95,900) | (3,744) |
| * | Verisk Analytics Inc. | | |
| | Class A | (48,400) | (3,721) |
| | Mobile Mini Inc. | (119,100) | (3,708) |
| * | Trex Co. Inc. | (97,300) | (3,701) |
| | Watts Water Technologies | | |
| | Inc. Class A | (74,500) | (3,700) |
| * | Stericycle Inc. | (30,600) | (3,690) |
| | Allegion plc | (55,800) | (3,678) |
| | Primoris Services Corp. | (165,600) | (3,648) |
| * | RBC Bearings Inc. | (56,400) | (3,643) |
| | Heartland Express Inc. | (212,900) | (3,624) |
| | Forward Air Corp. | (82,800) | (3,561) |
| * | KLX Inc. | (91,900) | (2,830) |
| | Tyco International plc | (84,400) | (2,692) |
| | Donaldson Co. Inc. | (92,600) | (2,654) |
| | Norfolk Southern Corp. | (30,500) | (2,580) |
| * | Advisory Board Co. | (51,000) | (2,530) |
| | Raven Industries Inc. | (162,141) | (2,529) |
| * | Kirby Corp. | (45,400) | (2,389) |
| | Parker-Hannifin Corp. | (24,300) | (2,357) |
| * | Echo Global Logistics Inc. | (112,000) | (2,284) |
| | Covanta Holding Corp. | (147,300) | (2,282) |
| | Franklin Electric Co. Inc. | (82,000) | (2,217) |
| | EnPro Industries Inc. | (49,800) | (2,183) |
| * | WageWorks Inc. | (44,500) | (2,019) |
| * | MasTec Inc. | (112,500) | (1,955) |
| | Matthews International | | |
| | Corp. Class A | (36,000) | (1,924) |
| | Joy Global Inc. | (144,200) | (1,818) |
| * | Chart Industries Inc. | (100,100) | (1,798) |
| * | Wesco Aircraft Holdings | | |
| | Inc. | (144,300) | (1,727) |
| | Flowserve Corp. | (39,500) | (1,662) |
19
Market Neutral Fund
| | | |
| | | | Market |
| | | | Value• |
| | | Shares | ($000) |
| * | Huron Consulting Group Inc. | (26,900) | (1,598) |
| * | Genesee & Wyoming Inc. | | |
| | Class A | (29,400) | (1,579) |
| | US Ecology Inc. | (40,100) | (1,461) |
| * | Nortek Inc. | (28,500) | (1,243) |
| | Nielsen Holdings plc | (26,500) | (1,235) |
| * | DXP Enterprises Inc. | (54,000) | (1,231) |
| | Applied Industrial | | |
| | Technologies Inc. | (22,900) | (927) |
| * | Roadrunner Transportation | | |
| | Systems Inc. | (71,080) | (670) |
| * | Spirit Airlines Inc. | (16,200) | (646) |
| * | Babcock & Wilcox | | |
| | Enterprises Inc. | (29,900) | (624) |
| * | NCI Building Systems Inc. | (49,950) | (620) |
| * | Proto Labs Inc. | (9,200) | (586) |
| | | | (102,924) |
| Information Technology (-17.4%) | |
| * | Yelp Inc. Class A | (137,700) | (3,966) |
| * | Twitter Inc. | (163,300) | (3,779) |
| | SS&C Technologies | | |
| | Holdings Inc. | (55,000) | (3,755) |
| * | FleetCor Technologies Inc. | (26,250) | (3,752) |
| * | Envestnet Inc. | (125,500) | (3,746) |
| * | CoStar Group Inc. | (18,100) | (3,741) |
| * | Yahoo! Inc. | (112,400) | (3,738) |
| * | NetSuite Inc. | (44,000) | (3,723) |
| * | NetScout Systems Inc. | (121,200) | (3,721) |
| | FEI Co. | (46,600) | (3,718) |
| | Corning Inc. | (202,900) | (3,709) |
| | QUALCOMM Inc. | (74,100) | (3,704) |
| * | Qorvo Inc. | (72,600) | (3,695) |
| | Cypress Semiconductor | | |
| | Corp. | (376,100) | (3,690) |
| * | Workday Inc. Class A | (46,000) | (3,665) |
| * | CommVault Systems Inc. | (92,800) | (3,652) |
| * | Akamai Technologies Inc. | (68,600) | (3,610) |
| * | LinkedIn Corp. Class A | (15,900) | (3,579) |
| * | ViaSat Inc. | (58,400) | (3,563) |
| * | Demandware Inc. | (65,900) | (3,557) |
| * | WEX Inc. | (40,000) | (3,536) |
| * | Diodes Inc. | (135,900) | (3,123) |
| | AVX Corp. | (232,900) | (2,827) |
| * | Rogers Corp. | (53,800) | (2,774) |
| | Harris Corp. | (31,800) | (2,763) |
| | Vishay Intertechnology Inc. | (224,400) | (2,704) |
| * | Autodesk Inc. | (44,300) | (2,699) |
| * | Trimble Navigation Ltd. | (123,800) | (2,656) |
| | CA Inc. | (90,000) | (2,570) |
| * | Cornerstone OnDemand | | |
| | Inc. | (74,400) | (2,569) |
| * | Micron Technology Inc. | (176,500) | (2,499) |
| | Oracle Corp. | (65,700) | (2,400) |
| * | ANSYS Inc. | (24,200) | (2,239) |
| * | ServiceNow Inc. | (24,400) | (2,112) |
| | | |
| | Microsoft Corp. | (34,500) | (1,914) |
| | Visa Inc. Class A | (23,100) | (1,791) |
| * | CommScope Holding Co. | | |
| | Inc. | (68,300) | (1,768) |
| * | Palo Alto Networks Inc. | (9,700) | (1,709) |
| * | salesforce.com inc | (21,780) | (1,708) |
| | Analog Devices Inc. | (29,500) | (1,632) |
| * | Splunk Inc. | (27,200) | (1,600) |
| * | Alliance Data Systems | | |
| | Corp. | (5,500) | (1,521) |
| * | Pandora Media Inc. | (108,400) | (1,454) |
| * | Bottomline Technologies | | |
| | de Inc. | (32,100) | (954) |
| | FLIR Systems Inc. | (31,400) | (881) |
| | Cognex Corp. | (26,000) | (878) |
| * | Bankrate Inc. | (46,160) | (614) |
| | j2 Global Inc. | (5,400) | (445) |
| * | Finisar Corp. | (27,500) | (400) |
| | | | (130,803) |
| Materials (-5.8%) | | |
| | Albemarle Corp. | (70,200) | (3,932) |
| | Royal Gold Inc. | (104,400) | (3,807) |
| * | Platform Specialty Products | | |
| | Corp. | (294,000) | (3,772) |
| * | Louisiana-Pacific Corp. | (206,900) | (3,726) |
| | WestRock Co. | (81,300) | (3,709) |
| | Eagle Materials Inc. | (61,300) | (3,704) |
| | Allegheny Technologies | | |
| | Inc. | (329,100) | (3,702) |
| | FMC Corp. | (94,500) | (3,698) |
| | Tahoe Resources Inc. | (416,212) | (3,609) |
| * | WR Grace & Co. | (24,400) | (2,430) |
| | Alcoa Inc. | (202,400) | (1,998) |
| | Martin Marietta Materials | | |
| | Inc. | (11,700) | (1,598) |
| | Monsanto Co. | (15,200) | (1,498) |
| | TimkenSteel Corp. | (153,400) | (1,285) |
| | Carpenter Technology Corp. | (37,700) | (1,141) |
| | | | (43,609) |
| Telecommunication Services (-1.3%) | |
| * | SBA Communications | | |
| | Corp. Class A | (35,700) | (3,751) |
| * | Level 3 Communications | | |
| | Inc. | (67,700) | (3,680) |
| | Frontier Communications | | |
| | Corp. | (208,300) | (973) |
| * | Zayo Group Holdings Inc. | (29,400) | (782) |
| | Consolidated | | |
| | Communications Holdings | | |
| | Inc. | (24,500) | (513) |
| | | | (9,699) |
| Utilities (-3.1%) | | |
| * | Dynegy Inc. | (293,300) | (3,930) |
| | WEC Energy Group Inc. | (71,700) | (3,679) |
20
Market Neutral Fund
| | | |
| | | | Market |
| | | | Value• |
| | | Shares | ($000) |
| South Jersey Industries | | |
| Inc. | | (156,100) | (3,672) |
| ITC Holdings Corp. | | (93,500) | (3,670) |
| MDU Resources Group Inc. (121,800) | (2,231) |
| California Water Service | | |
| Group | | (72,200) | (1,680) |
| National Fuel Gas Co. | (34,300) | (1,466) |
| Empire District Electric Co. | (44,800) | (1,258) |
| Pattern Energy Group Inc. | | |
| Class A | | (52,100) | (1,090) |
| OGE Energy Corp. | | (34,700) | (912) |
| | | | (23,588) |
| Total Common Stocks Sold Short | |
| (Proceeds $759,377) | | | (724,877) |
| Temporary Cash Investment (4.4%) | |
| Money Market Fund (4.4%) | | |
| 1 Vanguard Market | | | |
| Liquidity Fund, 0.363% | | |
| (Cost $33,042) | 33,041,504 | 33,042 |
| †Other Assets and Liabilities— | | |
| Net (96.3%) | | | 723,657 |
| Net Assets (100%) | | | 751,482 |
| |
| | | | Amount |
| | | | ($000) |
| Statement of Assets and Liabilities | |
| Assets | | | |
| Investments in Securities, | | |
| Long Positions, at Value | | |
| Unaffiliated Issuers | | | 719,660 |
| Affiliated Vanguard Funds | | 33,042 |
| Total Long Positions | | | 752,702 |
| †Cash Segregated for Short Positions | 712,394 |
| Receivables for Investment | | |
| Securities Sold | | | 30,114 |
| Receivables for Capital Shares Issued | 6,088 |
| Investment in Vanguard | | | 51 |
| Other Assets | | | 582 |
| Total Assets | | | 1,501,931 |
| |
| | Amount |
| | ($000) |
| Liabilities | |
| Securities Sold Short, at Value | 724,877 |
| Payables for Investment Securities | |
| Purchased | 22,083 |
| Payables to Vanguard | 686 |
| Payables for Capital Shares Redeemed | 90 |
| Other Liabilities | 2,713 |
| Total Liabilities | 750,449 |
| Net Assets (100%) | 751,482 |
| |
| At December 31, 2015, net assets consisted of: |
| | Amount |
| | ($000) |
| Paid-in Capital | 718,745 |
| Overdistributed Net Investment Income | (209) |
| Accumulated Net Realized Losses | (12,218) |
| Unrealized Appreciation (Depreciation) | |
| Investment Securities—Long Positions | 10,664 |
| Investment Securities Sold Short | 34,500 |
| Net Assets | 751,482 |
| |
| |
| Investor Shares—Net Assets | |
| Applicable to 53,583,278 outstanding | |
| $.001 par value shares of beneficial | |
| interest (unlimited authorization) | 649,579 |
| Net Asset Value Per Share— | |
| Investor Shares | $12.12 |
| |
| |
| Institutional Shares—Net Assets | |
| Applicable to 8,441,541 outstanding | |
| $.001 par value shares of beneficial | |
| interest (unlimited authorization) | 101,903 |
| Net Asset Value Per Share— | |
| Institutional Shares | $12.07 |
• See Note A in Notes to Financial Statements.
† Long security positions with a value of $467,391,000 and cash of $712,394,000 are held in a segregated account at the fund’s custodian
bank and pledged to a broker-dealer as collateral for the fund’s obligation to return borrowed securities. For so long as such obligations
continue, the fund’s access to these assets is subject to authorization from the broker-dealer.
* Non-income-producing security.
1 Affiliated money market fund available only to Vanguard funds and certain trusts and accounts managed by Vanguard. Rate shown is the
7-day yield.
REIT—Real Estate Investment Trust.
See accompanying Notes, which are an integral part of the Financial Statements.
21
Market Neutral Fund
Statement of Operations
| |
| | Year Ended |
| | December 31, 2015 |
| | ($000) |
| Investment Income | |
| Income | |
| Dividends | 6,197 |
| Interest1 | 23 |
| Total Income | 6,220 |
| Expenses | |
| The Vanguard Group—Note B | |
| Investment Advisory Services | 333 |
| Management and Administrative—Investor Shares | 432 |
| Management and Administrative—Institutional Shares | 26 |
| Marketing and Distribution—Investor Shares | 84 |
| Marketing and Distribution—Institutional Shares | 4 |
| Custodian Fees | 48 |
| Auditing Fees | 53 |
| Shareholders’ Reports—Investor Shares | 5 |
| Shareholders’ Reports—Institutional Shares | 1 |
| Dividend Expense on Securities Sold Short | 4,477 |
| Borrowing Expense on Securities Sold Short | 633 |
| Total Expenses | 6,096 |
| Net Investment Income (Loss) | 124 |
| Realized Net Gain (Loss) | |
| Investment Securities—Long Positions | 19,960 |
| Investment Securities Sold Short | (14,766) |
| Realized Net Gain (Loss) | 5,194 |
| Change in Unrealized Appreciation (Depreciation) | |
| Investment Securities—Long Positions | (38,402) |
| Investment Securities Sold Short | 54,872 |
| Change in Unrealized Appreciation (Depreciation) of Investment Securities | 16,470 |
| Net Increase (Decrease) in Net Assets Resulting from Operations | 21,788 |
| 1 Interest income from an affiliated company of the fund was $23,000. |
See accompanying Notes, which are an integral part of the Financial Statements.
22
Market Neutral Fund
Statement of Changes in Net Assets
| | |
| | Year Ended December 31, |
| | 2015 | 2014 |
| | ($000) | ($000) |
| Increase (Decrease) in Net Assets | | |
| Operations | | |
| Net Investment Income (Loss) | 124 | (889) |
| Realized Net Gain (Loss) | 5,194 | 10,135 |
| Change in Unrealized Appreciation (Depreciation) | 16,470 | 254 |
| Net Increase (Decrease) in Net Assets Resulting from Operations | 21,788 | 9,500 |
| Distributions | | |
| Net Investment Income | | |
| Investor Shares | (103) | — |
| Institutional Shares | (100) | — |
| Realized Capital Gain | | |
| Investor Shares | — | — |
| Institutional Shares | — | — |
| Total Distributions | (203) | — |
| Capital Share Transactions | | |
| Investor Shares | 374,308 | 75,328 |
| Institutional Shares | 43,646 | 18,313 |
| Net Increase (Decrease) from Capital Share Transactions | 417,954 | 93,641 |
| Total Increase (Decrease) | 439,539 | 103,141 |
| Net Assets | | |
| Beginning of Period | 311,943 | 208,802 |
| End of Period1 | 751,482 | 311,943 |
| 1 Net Assets—End of Period includes undistributed (overdistributed) net investment income and accumulated net investment losses of ($209,000) and ($166,000), respectively. |
See accompanying Notes, which are an integral part of the Financial Statements.
23
Market Neutral Fund
Financial Highlights
| | | | | |
| Investor Shares | | | | | |
| |
| For a Share Outstanding | Year Ended December 31, |
| Throughout Each Period | 2015 | 2014 | 2013 | 2012 | 2011 |
| Net Asset Value, Beginning of Period | $11.50 | $11.03 | $10.16 | $10.36 | $9.61 |
| Investment Operations | | | | | |
| Net Investment Income (Loss) | . 0021 | (. 032) | (. 007) | .045 | (.024) |
| Net Realized and Unrealized Gain (Loss) | | | | | |
| on Investments | .620 | .502 | .880 | (.200) | .774 |
| Total from Investment Operations | .622 | .470 | .873 | (.155) | .750 |
| Distributions | | | | | |
| Dividends from Net Investment Income | (.002) | — | (.002) | (.045) | — |
| Distributions from Realized Capital Gains | — | — | — | — | — |
| Return of Capital | — | — | (.001) | — | — |
| Total Distributions | (.002) | — | (.003) | (.045) | — |
| Net Asset Value, End of Period | $12.12 | $11.50 | $11.03 | $10.16 | $10.36 |
| |
| Total Return2 | 5.41% | 4.26% | 8.59% | -1.50% | 7.80% |
| |
| Ratios/Supplemental Data | | | | | |
| Net Assets, End of Period (Millions) | $650 | $257 | $174 | $151 | $158 |
| Ratio of Expenses to Average Net Assets | | | | | |
| Based on Total Expenses3 | 1.46% | 1.64% | 1.57% | 1.88% | 1.69% |
| Net of Dividend and Borrowing Expense on | | | | | |
| Securities Sold Short | 0.25% | 0.25% | 0.25% | 0.25% | 0.25% |
| Ratio of Net Investment Income (Loss) to | | | | | |
| Average Net Assets | 0.01% | (0.38%) | (0.06%) | 0.44% | (0.22%) |
| Portfolio Turnover Rate | 68% | 73% | 68% | 89% | 91% |
1 Calculated based on average shares outstanding.
2 Total returns do not include transaction fees that may have applied in the periods shown. Fund prospectuses provide information about any
applicable transaction fees.
3 Includes 2015 dividend and borrowing expense on securities sold short of 1.06% and 0.15%, respectively. Includes 2014 dividend and
borrowing expense on securities sold short of 1.21% and 0.18%, respectively. Includes 2013 dividend and borrowing expense on securities
sold short of 1.18% and 0.14%, respectively. Includes 2012 dividend and borrowing expense on securities sold short of 1.52% and 0.11%,
respectively. Includes 2011 dividend and borrowing expense on securities sold short of 1.30% and 0.14%, respectively.
See accompanying Notes, which are an integral part of the Financial Statements.
24
Market Neutral Fund
Financial Highlights
| | | | | |
| Institutional Shares | | | | | |
| |
| For a Share Outstanding | Year Ended December 31, |
| Throughout Each Period | 2015 | 2014 | 2013 | 2012 | 2011 |
| Net Asset Value, Beginning of Period | $11.45 | $10.97 | $10.10 | $10.33 | $9.57 |
| Investment Operations | | | | | |
| Net Investment Income (Loss) | . 0111 | (.023) | .006 | .071 | (.010) |
| Net Realized and Unrealized Gain (Loss) | | | | | |
| on Investments | .621 | .503 | .868 | (. 215) | .770 |
| Total from Investment Operations | .632 | .480 | .874 | (.144) | .760 |
| Distributions | | | | | |
| Dividends from Net Investment Income | (.012) | — | (.003) | (.086) | — |
| Distributions from Realized Capital Gains | — | — | — | — | — |
| Return of Capital | — | — | (.001) | — | — |
| Total Distributions | (.012) | — | (.004) | (.086) | — |
| Net Asset Value, End of Period | $12.07 | $11.45 | $10.97 | $10.10 | $10.33 |
| |
| Total Return2 | 5.52% | 4.38% | 8.66% | -1.39% | 7.94% |
| |
| Ratios/Supplemental Data | | | | | |
| Net Assets, End of Period (Millions) | $102 | $55 | $35 | $31 | $16 |
| Ratio of Expenses to Average Net Assets | | | | | |
| Based on Total Expenses3 | 1.36% | 1.54% | 1.47% | 1.78% | 1.59% |
| Net of Dividend and Borrowing Expense on | | | | | |
| Securities Sold Short | 0.15% | 0.15% | 0.15% | 0.15% | 0.15% |
| Ratio of Net Investment Income (Loss) to | | | | | |
| Average Net Assets | 0.11% | (0.28%) | 0.04% | 0.54% | (0.12%) |
| Portfolio Turnover Rate | 68% | 73% | 68% | 89% | 91% |
1 Calculated based on average shares outstanding.
2 Total returns do not include transaction fees that may have applied in the periods shown. Fund prospectuses provide information about any
applicable transaction fees.
3 Includes 2015 dividend and borrowing expense on securities sold short of 1.06% and 0.15%, respectively. Includes 2014 dividend and
borrowing expense on securities sold short of 1.21% and 0.18%, respectively. Includes 2013 dividend and borrowing expense on securities
sold short of 1.18% and 0.14%, respectively. Includes 2012 dividend and borrowing expense on securities sold short of 1.52% and 0.11%,
respectively. Includes 2011 dividend and borrowing expense on securities sold short of 1.30% and 0.14%, respectively.
See accompanying Notes, which are an integral part of the Financial Statements.
25
Market Neutral Fund
Notes to Financial Statements
Vanguard Market Neutral Fund is registered under the Investment Company Act of 1940 as an open-end investment company, or mutual fund. The fund offers two classes of shares: Investor Shares and Institutional Shares. Investor Shares are available to any investor who meets the fund’s minimum purchase requirements. Institutional Shares are designed for investors who meet certain administrative, service, and account-size criteria.
A. The following significant accounting policies conform to generally accepted accounting principles for U.S. investment companies. The fund consistently follows such policies in preparing its financial statements.
1. Security Valuation: Securities are valued as of the close of trading on the New York Stock Exchange (generally 4 p.m., Eastern time) on the valuation date. Equity securities are valued at the latest quoted sales prices or official closing prices taken from the primary market in which each security trades; such securities not traded on the valuation date are valued at the mean of the latest quoted bid and asked prices. Securities for which market quotations are not readily available, or whose values have been materially affected by events occurring before the fund’s pricing time but after the close of the securities’ primary markets, are valued by methods deemed by the board of trustees to represent fair value. Investments in Vanguard Market Liquidity Fund are valued at that fund’s net asset value.
2. Short Sales: Short sales are the sales of securities that the fund does not own. The fund sells a security it does not own in anticipation of a decline in the value of that security. In order to deliver the security to the purchaser, the fund borrows the security from a broker-dealer. The fund must segregate, as collateral for its obligation to return the borrowed security, an amount of cash and long security positions at least equal to the market value of the security sold short. This results in the fund holding a significant portion of its assets in cash. The fund later closes out the position by returning the security to the lender, typically by purchasing the security in the open market. A gain, limited to the price at which the fund sold the security short, or a loss, theoretically unlimited in size, is recognized upon the termination of the short sale. The fund may receive a portion of the income from the investment of collateral, or be charged a fee on borrowed securities, based on the market value of each borrowed security and a variable rate that is dependent upon the availability of such security. The net amounts of income or fees are recorded as interest income (for net income received) or borrowing expense on securities sold short (for net fees charged) on the Statement of Operations. Dividends on securities sold short are reported as an expense in the Statement of Operations.
Cash collateral segregated for securities sold short is recorded as an asset in the Statement of Assets and Liabilities. Long security positions segregated as collateral are shown in the Statement of Net Assets.
3. Federal Income Taxes: The fund intends to continue to qualify as a regulated investment company and distribute all of its taxable income. Management has analyzed the fund’s tax positions taken for all open federal income tax years (December 31, 2012–2015), and has concluded that no provision for federal income tax is required in the fund’s financial statements.
4. Distributions: Distributions to shareholders are recorded on the ex-dividend date.
5. Credit Facility: The fund and certain other funds managed by The Vanguard Group (“Vanguard”) participate in a $3 billion committed credit facility provided by a syndicate of lenders pursuant to a credit agreement that may be renewed annually; each fund is individually liable for its borrowings, if any, under the credit facility. Borrowings may be utilized for temporary and emergency purposes, and are subject to the fund’s regulatory and contractual borrowing restrictions. The participating funds are charged administrative fees and an annual commitment fee of 0.06% of the undrawn amount of the
26
Market Neutral Fund
facility; these fees are allocated to the funds based on a method approved by the fund’s board of trustees and included in Management and Administrative expenses on the fund’s Statement of Operations. Any borrowings under this facility bear interest at a rate equal to the higher of the federal funds rate or LIBOR reference rate plus an agreed-upon spread.
The fund had no borrowings outstanding at December 31, 2015, or at any time during the period then ended.
6. Other: Dividend income (or dividend expense on short positions) is recorded on the ex-dividend date. Interest income includes income distributions received from Vanguard Market Liquidity Fund and is accrued daily. Security transactions are accounted for on the date securities are bought or sold. Costs used to determine realized gains (losses) on the sale of investment securities are those of the specific securities sold.
Each class of shares has equal rights as to assets and earnings, except that each class separately bears certain class-specific expenses related to maintenance of shareholder accounts (included in Management and Administrative expenses) and shareholder reporting. Marketing and distribution expenses are allocated to each class of shares based on a method approved by the board of trustees. Income, other non-class-specific expenses, and gains and losses on investments are allocated to each class of shares based on its relative net assets.
B. In accordance with the terms of a Funds’ Service Agreement (the “FSA”) between Vanguard and the fund, Vanguard furnishes to the fund investment advisory, corporate management, administrative, marketing, and distribution services at Vanguard’s cost of operations (as defined by the FSA). These costs of operations are allocated to the fund based on methods and guidelines approved by the board of trustees. Vanguard does not require reimbursement in the current period for certain costs of operations (such as deferred compensation/benefits and risk/insurance costs); the fund’s liability for these costs of operations is included in Payables to Vanguard on the Statement of Assets and Liabilities.
Upon the request of Vanguard, the fund may invest up to 0.40% of its net assets as capital in Vanguard. At December 31, 2015, the fund had contributed to Vanguard capital in the amount of $51,000, representing 0.01% of the fund’s net assets and 0.02% of Vanguard’s capitalization. The fund’s trustees and officers are also directors and employees, respectively, of Vanguard.
C. Various inputs may be used to determine the value of the fund’s investments. These inputs are summarized in three broad levels for financial statement purposes. The inputs or methodologies used to value securities are not necessarily an indication of the risk associated with investing in those securities.
Level 1—Quoted prices in active markets for identical securities.
Level 2—Other significant observable inputs (including quoted prices for similar securities, interest rates, prepayment speeds, credit risk, etc.).
Level 3—Significant unobservable inputs (including the fund’s own assumptions used to determine the fair value of investments).
At December 31, 2015, 100% of the market value of the fund’s investments was determined based on Level 1 inputs.
D. Distributions are determined on a tax basis and may differ from net investment income and realized capital gains for financial reporting purposes. Differences may be permanent or temporary. Permanent differences are reclassified among capital accounts in the financial statements to reflect their tax character. Temporary differences arise when certain items of income, expense, gain, or loss
27
Market Neutral Fund
are recognized in different periods for financial statement and tax purposes. These differences will reverse at some time in the future. Differences in classification may also result from the treatment of short-term gains as ordinary income for tax purposes.
Certain of the fund’s investments are in securities considered to be passive foreign investment companies, for which any unrealized appreciation and/or realized gains are required to be included in distributable net income for tax purposes. During the year ended December 31, 2015, the fund realized gains on the sale of passive foreign investment companies of $31,000, which have been included in current and prior periods’ taxable income; accordingly, such gains have been reclassified from accumulated net realized losses to overdistributed net investment income. Passive foreign investment companies held at December 31, 2015, had unrealized appreciation of $43,000, of which all has been distributed and is reflected in the balance of overdistributed net investment income.
For tax purposes, at December 31, 2015, the fund had no ordinary income for distribution. The fund used capital loss carryforwards of $4,865,000 to offset taxable capital gains realized during the year ended December 31, 2015. At December 31, 2015, the fund had available capital losses totaling $12,217,000 to offset future net capital gains of $7,346,000 through December 31, 2017, and $4,871,000 through December 31, 2018.
At December 31, 2015, the cost of long security positions for tax purposes was $742,081,000. Net unrealized appreciation of long security positions for tax purposes was $10,621,000, consisting of unrealized gains of $51,689,000 on securities that had risen in value since their purchase and $41,068,000 in unrealized losses on securities that had fallen in value since their purchase. Tax-basis net unrealized appreciation on securities sold short was $34,500,000, consisting of unrealized gains of $64,999,000 on securities that had fallen in value since their purchase and $30,499,000 in unrealized losses on securities that had risen in value since their sale.
E. During the year ended December 31, 2015, the fund purchased $723,064,000 of investment securities and sold $282,985,000 of investment securities, other than temporary cash investments. The proceeds of short sales and the cost of purchases to cover short sales were $914,768,000 and $447,191,000, respectively.
F. Capital share transactions for each class of shares were:
| | | | |
| | Year Ended December 31, |
| | 2015 | 2014 |
| | Amount | Shares | Amount | Shares |
| | ($000) | (000) | ($000) | (000) |
| Investor Shares | | | | |
| Issued | 483,066 | 40,492 | 108,782 | 9,542 |
| Issued in Lieu of Cash Distributions | 92 | 8 | — | — |
| Redeemed | (108,850) | (9,253) | (33,454) | (2,954) |
| Net Increase (Decrease)—Investor Shares | 374,308 | 31,247 | 75,328 | 6,588 |
| Institutional Shares | | | | |
| Issued | 60,931 | 5,124 | 24,195 | 2,121 |
| Issued in Lieu of Cash Distributions | 90 | 7 | — | — |
| Redeemed | (17,375) | (1,495) | (5,882) | (521) |
| Net Increase (Decrease) —Institutional Shares | 43,646 | 3,636 | 18,313 | 1,600 |
28
Market Neutral Fund
At December 31, 2015, one shareholder was the record or beneficial owner of 34% of the fund’s net assets. If the shareholder were to redeem its investment in the fund, the redemption might result in an increase in the fund’s expense ratio, cause the fund to incur higher transaction costs, or lead to the realization of taxable capital gains.
G. Management has determined that no material events or transactions occurred subsequent to December 31, 2015, that would require recognition or disclosure in these financial statements.
29
Report of Independent Registered
Public Accounting Firm
To the Board of Trustees of Vanguard Montgomery Funds and the Shareholders of Vanguard Market Neutral Fund:
In our opinion, the accompanying statement of net assets, statement of assets and liabilities and the related statements of operations and of changes in net assets and the financial highlights present fairly, in all material respects, the financial position of Vanguard Market Neutral Fund (constituting Vanguard Montgomery Funds, hereafter referred to as the “Fund”) at December 31, 2015, the results of its operations for the year then ended, the changes in its net assets for each of the two years in the period then ended, and the financial highlights for each of the five years in the period then ended, in conformity with accounting principles generally accepted in the United States of America. These financial statements and financial highlights (hereafter referred to as “financial statements”) are the responsibility of the Fund’s management. Our responsibility is to express an opinion on these financial statements based on our audits. We conducted our audits of these financial statements in accordance with the standards of the Public Company Accounting Oversight Board (United States). Those standards require that we plan and perform the audit to obtain reasonable assurance about whether the financial statements are free of material misstatement. An audit includes examining, on a test basis, evidence supporting the amounts and disclosures in the financial statements, assessing the accounting principles used and significant estimates made by management, and evaluating the overall financial statement presentation. We believe that our audits, which included confirmation of securities at December 31, 2015 by correspondence with the custodian and brokers, by agreement to the underlying ownership records of the transfer agent and the application of alternative auditing procedures where securities purchased had not been received, provide a reasonable basis for our opinion.
/s/PricewaterhouseCoopers LLP
Philadelphia, Pennsylvania
February 18, 2016
Special 2015 tax information (unaudited) for Vanguard Market Neutral Fund
This information for the fiscal year ended December 31, 2015, is included pursuant to provisions
of the Internal Revenue Code.
The fund distributed $203,000 of qualified dividend income to shareholders during the fiscal year.
For corporate shareholders, 100% of investment income (dividend income plus short-term gains,
if any) qualifies for the dividends-received deduction.
30
Your Fund’s After-Tax Returns
This table presents returns for your fund both before and after taxes. The after-tax returns are shown in two ways: (1) assuming that an investor owned the fund during the entire period and paid taxes on the fund’s distributions, and (2) assuming that an investor paid taxes on the fund’s distributions and sold all shares at the end of each period.
Calculations are based on the highest individual federal income tax and capital gains tax rates in effect at the times of the distributions and the hypothetical sales. State and local taxes were not considered. After-tax returns reflect any qualified dividend income. (In the example, returns after the sale of fund shares may be higher than those assuming no sale. This occurs when the sale would have produced a capital loss. The calculation assumes that the investor received a tax deduction for the loss.)
The table shows returns for Investor Shares only; returns for other share classes will differ. Please note that your actual after-tax returns will depend on your tax situation and may differ from those shown. Also note that if you own the fund in a tax-deferred account, such as an individual retirement account or a 401(k) plan, this information does not apply to you. Such accounts are not subject to current taxes.
Finally, keep in mind that a fund’s performance—whether before or after taxes—does not guarantee future results.
| | | |
| Average Annual Total Returns: Market Neutral Fund Investor Shares | | |
| Periods Ended December 31, 2015 | | | |
| |
| | One | Five | Ten |
| | Year | Years | Years |
| Returns Before Taxes | 5.41% | 4.85% | 2.06% |
| Returns After Taxes on Distributions | 5.40 | 4.84 | 1.56 |
| Returns After Taxes on Distributions and Sale of Fund Shares | 3.06 | 3.78 | 1.51 |
31
About Your Fund’s Expenses
As a shareholder of the fund, you incur ongoing costs, which include costs for portfolio management, administrative services, and shareholder reports (like this one), among others. Operating expenses, which are deducted from a fund’s gross income, directly reduce the investment return of the fund.
A fund’s expenses are expressed as a percentage of its average net assets. This figure is known as the expense ratio. The following examples are intended to help you understand the ongoing costs (in dollars) of investing in your fund and to compare these costs with those of other mutual funds. The examples are based on an investment of $1,000 made at the beginning of the period shown and held for the entire period.
The accompanying table illustrates your fund’s costs in two ways:
• Based on actual fund return. This section helps you to estimate the actual expenses that you paid over the period. The ”Ending Account Value“ shown is derived from the fund‘s actual return, and the third column shows the dollar amount that would have been paid by an investor who started with $1,000 in the fund. You may use the information here, together with the amount you invested, to estimate the expenses that you paid over the period.
To do so, simply divide your account value by $1,000 (for example, an $8,600 account value divided by $1,000 = 8.6), then multiply the result by the number given for your fund under the heading ”Expenses Paid During Period.“
• Based on hypothetical 5% yearly return. This section is intended to help you compare your fund‘s costs with those of other mutual funds. It assumes that the fund had a yearly return of 5% before expenses, but that the expense ratio is unchanged. In this case—because the return used is not the fund’s actual return—the results do not apply to your investment. The example is useful in making comparisons because the Securities and Exchange Commission requires all mutual funds to calculate expenses based on a 5% return. You can assess your fund’s costs by comparing this hypothetical example with the hypothetical examples that appear in shareholder reports of other funds.
Note that the expenses shown in the table are meant to highlight and help you compare ongoing costs only and do not reflect transaction costs incurred by the fund for buying and selling securities. Further, the expenses do not include any purchase, redemption, or account service fees described in the fund prospectus. If such fees were applied to your account, your costs would be higher. Your fund does not carry a “sales load.”
The calculations assume no shares were bought or sold during the period. Your actual costs may have been higher or lower, depending on the amount of your investment and the timing of any purchases or redemptions.
You can find more information about the fund’s expenses, including annual expense ratios, in the Financial Statements section of this report. For additional information on operating expenses and other shareholder costs, please refer to your fund’s current prospectus.
32
| | | |
| Six Months Ended December 31, 2015 | | | |
| | Beginning | Ending | Expenses |
| | Account Value | Account Value | Paid During |
| Market Neutral Fund | 6/30/2015 | 12/31/2015 | Period |
| Based on Actual Fund Return | | | |
| Investor Shares | $1,000.00 | $1,066.14 | $7.60 |
| Institutional Shares | 1,000.00 | 1,067.32 | 7.03 |
| Based on Hypothetical 5% Yearly Return | | | |
| Investor Shares | $1,000.00 | $1,017.85 | $7.43 |
| Institutional Shares | 1,000.00 | 1,018.40 | 6.87 |
The calculations are based on expenses incurred in the most recent six-month period. The fund’s annualized six-month expense ratios for that
period are 1.46% for Investor Shares and 1.35% for Institutional Shares. The dollar amounts shown as “Expenses Paid” are equal to the
annualized expense ratio multiplied by the average account value over the period, multiplied by the number of days in the most recent
six-month period, then divided by the number of days in the most recent 12-month period (184/365).
33
Glossary
Beta. A measure of the magnitude of a fund’s past share-price fluctuations in relation to the ups and downs of a given market index. The index is assigned a beta of 1.00. Compared with a given index, a fund with a beta of 1.20 typically would have seen its share price rise or fall by 12% when the index rose or fell by 10%. For this report, beta is based on returns over the past 36 months for both the fund and the index. Note that a fund’s beta should be reviewed in conjunction with its R-squared (see definition). The lower the R-squared, the less correlation there is between the fund and the index, and the less reliable beta is as an indicator of volatility.
Earnings Growth Rate. The average annual rate of growth in earnings over the past five years for the stocks now in a fund.
Equity Exposure. A measure that reflects a fund’s investments in stocks and stock futures. Any holdings in short-term reserves are excluded.
Expense Ratio. The percentage of a fund’s average net assets used to pay its annual administrative and advisory expenses. These expenses directly reduce returns to investors.
Foreign Holdings. The percentage of a fund represented by securities or depositary receipts of companies based outside the United States.
Inception Date. The date on which the assets of a fund (or one of its share classes) are first invested in accordance with the fund’s investment objective. For funds with a subscription period, the inception date is the day after that period ends. Investment performance is measured from the inception date.
Median Market Cap. An indicator of the size of companies in which a fund invests; the midpoint of market capitalization (market price x shares outstanding) of a fund’s stocks, weighted by the proportion of the fund’s assets invested in each stock. Stocks representing half of the fund’s assets have market capitalizations above the median, and the rest are below it.
Price/Book Ratio. The share price of a stock divided by its net worth, or book value, per share. For a fund, the weighted average price/book ratio of the stocks it holds.
Price/Earnings Ratio. The ratio of a stock’s current price to its per-share earnings over the past year. For a fund, the weighted average P/E of the stocks it holds. P/E is an indicator of market expectations about corporate prospects; the higher the P/E, the greater the expectations for a company’s future growth.
R-Squared. A measure of how much of a fund’s past returns can be explained by the returns from the market in general, as measured by a given index. If a fund’s total returns were precisely synchronized with an index’s returns, its R-squared would be 1.00. If the fund’s returns bore no relationship to the index’s returns, its R-squared would be 0. For this report, R-squared is based on returns over the past 36 months for both the fund and the index.
Return on Equity. The annual average rate of return generated by a company during the past five years for each dollar of shareholder’s equity (net income divided by shareholder’s equity). For a fund, the weighted average return on equity for the companies whose stocks it holds.
Short-Term Reserves. The percentage of a fund invested in highly liquid, short-term securities that can be readily converted to cash.
34
Turnover Rate. An indication of the fund’s trading activity. Funds with high turnover rates incur higher transaction costs and may be more likely to distribute capital gains (which may be taxable to investors). The turnover rate excludes in-kind transactions, which have minimal impact on costs.
35
The People Who Govern Your Fund
The trustees of your mutual fund are there to see that the fund is operated and managed in your best interests since, as a shareholder, you are a part owner of the fund. Your fund’s trustees also serve on the board of directors of The Vanguard Group, Inc., which is owned by the Vanguard funds and provides services to them on an at-cost basis.
A majority of Vanguard’s board members are independent, meaning that they have no affiliation with Vanguard or the funds they oversee, apart from the sizable personal investments they have made as private individuals. The independent board members have distinguished backgrounds in business, academia, and public service. Each of the trustees and executive officers oversees 194 Vanguard funds.
The following table provides information for each trustee and executive officer of the fund. More information about the trustees is in the Statement of Additional Information, which can be obtained, without charge, by contacting Vanguard at 800-662-7447, or online at vanguard.com.
| |
| InterestedTrustee1 | Rajiv L. Gupta |
| | Born 1945. Trustee Since December 2001.2 Principal |
| F. William McNabb III | Occupation(s) During the Past Five Years and Other |
| Born 1957. Trustee Since July 2009. Chairman of | Experience: Chairman and Chief Executive Officer |
| the Board. Principal Occupation(s) During the Past | (retired 2009) and President (2006–2008) of |
| Five Years and Other Experience: Chairman of the | Rohm and Haas Co. (chemicals); Director of Tyco |
| Board of The Vanguard Group, Inc., and of each of | International PLC (diversified manufacturing and |
| the investment companies served by The Vanguard | services), Hewlett-Packard Co. (electronic computer |
| Group, since January 2010; Director of The Vanguard | manufacturing), and Delphi Automotive PLC |
| Group since 2008; Chief Executive Officer and | (automotive components); Senior Advisor at New |
| President of The Vanguard Group, and of each of | Mountain Capital. |
| the investment companies served by The Vanguard | |
| Group, since 2008; Director of Vanguard Marketing | Amy Gutmann |
| Corporation; Managing Director of The Vanguard | Born 1949. Trustee Since June 2006. Principal |
| Group (1995–2008). | Occupation(s) During the Past Five Years and |
| | Other Experience: President of the University of |
| IndependentTrustees | Pennsylvania; Christopher H. Browne Distinguished |
| | Professor of Political Science, School of Arts and |
| Emerson U. Fullwood | Sciences, and Professor of Communication, Annenberg |
| Born 1948. Trustee Since January 2008. Principal | School for Communication, with secondary faculty |
| Occupation(s) During the Past Five Years and | appointments in the Department of Philosophy, School |
| Other Experience: Executive Chief Staff and | of Arts and Sciences, and at the Graduate School of |
| Marketing Officer for North America and Corporate | Education, University of Pennsylvania; Trustee of the |
| Vice President (retired 2008) of Xerox Corporation | National Constitution Center; Chair of the Presidential |
| (document management products and services); | Commission for the Study of Bioethical Issues. |
| Executive in Residence and 2009–2010 Distinguished | |
| Minett Professor at the Rochester Institute of | JoAnn Heffernan Heisen |
| Technology; Director of SPX Corporation (multi-industry | Born 1950. Trustee Since July 1998. Principal |
| manufacturing), the United Way of Rochester, the | Occupation(s) During the Past Five Years and |
| University of Rochester Medical Center, Monroe | Other Experience: Corporate Vice President and |
| Community College Foundation, and North Carolina | Chief Global Diversity Officer (retired 2008) and |
| A&T University. | Member of the Executive Committee (1997–2008) |
| | of Johnson & Johnson (pharmaceuticals/medical |
| | devices/consumer products); Director of Skytop |
| | Lodge Corporation (hotels) and the Robert Wood |
| | Johnson Foundation; Member of the Advisory |
| | Board of the Institute for Women’s Leadership |
| | at Rutgers University. |
| | |
| F. Joseph Loughrey | Executive Officers | |
| Born 1949. Trustee Since October 2009. Principal | | |
| Occupation(s) During the Past Five Years and Other | Glenn Booraem | |
| Experience: President and Chief Operating Officer | Born 1967. Treasurer Since May 2015. Principal |
| (retired 2009) of Cummins Inc. (industrial machinery); | Occupation(s) During the Past Five Years and |
| Chairman of the Board of Hillenbrand, Inc. (specialized | Other Experience: Principal of The Vanguard Group, |
| consumer services), and of Oxfam America; Director | Inc.; Treasurer of each of the investment companies |
| of SKF AB (industrial machinery), Hyster-Yale Materials | served by The Vanguard Group; Controller of each of |
| Handling, Inc. (forklift trucks), the Lumina Foundation | the investment companies served by The Vanguard |
| for Education, and the V Foundation for Cancer | Group (2010–2015); Assistant Controller of each of |
| Research; Member of the Advisory Council for the | the investment companies served by The Vanguard |
| College of Arts and Letters and of the Advisory Board | Group (2001–2010). | |
| to the Kellogg Institute for International Studies, both | | |
| at the University of Notre Dame. | Thomas J. Higgins | |
| Born 1957. Chief Financial Officer Since September |
| Mark Loughridge | 2008. Principal Occupation(s) During the Past Five |
| Born 1953. Trustee Since March 2012. Principal | Years and Other Experience: Principal of The Vanguard |
| Occupation(s) During the Past Five Years and Other | Group, Inc.; Chief Financial Officer of each of the |
| Experience: Senior Vice President and Chief Financial | investment companies served by The Vanguard Group; |
| Officer (retired 2013) at IBM (information technology | Treasurer of each of the investment companies served |
| services); Fiduciary Member of IBM’s Retirement Plan | by The Vanguard Group (1998–2008). |
| Committee (2004–2013); Director of the Dow Chemical | | |
| Company; Member of the Council on Chicago Booth. | Peter Mahoney | |
| Born 1974. Controller Since May 2015. Principal |
| Scott C. Malpass | Occupation(s) During the Past Five Years and |
| Born 1962. Trustee Since March 2012. Principal | Other Experience: Head of Global Fund Accounting |
| Occupation(s) During the Past Five Years and Other | at The Vanguard Group, Inc.; Controller of each of the |
| Experience: Chief Investment Officer and Vice | investment companies served by The Vanguard Group; |
| President at the University of Notre Dame; Assistant | Head of International Fund Services at The Vanguard |
| Professor of Finance at the Mendoza College of | Group (2008–2014). | |
| Business at Notre Dame; Member of the Notre Dame | | |
| 403(b) Investment Committee; Board Member of | Heidi Stam | |
| TIFF Advisory Services, Inc., and Catholic Investment | Born 1956. Secretary Since July 2005. Principal |
| Services, Inc. (investment advisors); Member of | Occupation(s) During the Past Five Years and Other |
| the Investment Advisory Committee of Major | Experience: Managing Director of The Vanguard |
| League Baseball. | Group, Inc.; General Counsel of The Vanguard Group; |
| Secretary of The Vanguard Group and of each of the |
| André F. Perold | investment companies served by The Vanguard Group; |
| Born 1952. Trustee Since December 2004. Principal | Director and Senior Vice President of Vanguard |
| Occupation(s) During the Past Five Years and Other | Marketing Corporation. | |
| Experience: George Gund Professor of Finance and | | |
| Banking, Emeritus at the Harvard Business School | Vanguard Senior ManagementTeam |
| (retired 2011); Chief Investment Officer and Managing | Mortimer J. Buckley | Chris D. McIsaac |
| Partner of HighVista Strategies LLC (private investment | Kathleen C. Gubanich | James M. Norris |
| firm); Director of Rand Merchant Bank; Overseer of | Paul A. Heller | Thomas M. Rampulla |
| the Museum of Fine Arts Boston. | Martha G. King | Glenn W. Reed |
| John T. Marcante | Karin A. Risi |
| Peter F. Volanakis | | |
| Born 1955. Trustee Since July 2009. Principal | | |
| Occupation(s) During the Past Five Years and Other | Chairman Emeritus and Senior Advisor |
| Experience: President and Chief Operating Officer | John J. Brennan | |
| (retired 2010) of Corning Incorporated (communications | Chairman, 1996–2009 | |
| equipment); Trustee of Colby-Sawyer College; | Chief Executive Officer and President, 1996–2008 |
| Member of the Advisory Board of the Norris Cotton | | |
| Cancer Center and of the Advisory Board of the | | |
| Parthenon Group (strategy consulting). | Founder | |
| | John C. Bogle | |
| | Chairman and Chief Executive Officer, 1974–1996 |
1 Mr. McNabb is considered an “interested person,” as defined in the Investment Company Act of 1940, because he is an officer of the Vanguard funds.
2 December 2002 for Vanguard Equity Income Fund, the Vanguard Municipal Bond Funds, and the Vanguard State Tax-Exempt Funds.
|  |
| | P.O. Box 2600 |
| | Valley Forge, PA 19482-2600 |
| |
| |
| |
| Connect with Vanguard® > vanguard.com |
| |
| |
| |
| Fund Information > 800-662-7447 | CFA® is a registered trademark owned by CFA Institute. |
| Direct Investor Account Services > 800-662-2739 | |
| Institutional Investor Services > 800-523-1036 | |
| Text Telephone for People | |
| Who Are Deaf or Hard of Hearing> 800-749-7273 | |
| |
| This material may be used in conjunction | |
| with the offering of shares of any Vanguard | |
| fund only if preceded or accompanied by | |
| the fund’s current prospectus. | |
| |
| All comparative mutual fund data are from Lipper, a | |
| Thomson Reuters Company, or Morningstar, Inc., unless | |
| otherwise noted. | |
| |
| You can obtain a free copy of Vanguard’s proxy voting | |
| guidelines by visiting vanguard.com/proxyreporting or by | |
| calling Vanguard at 800-662-2739. The guidelines are | |
| also available from the SEC’s website, sec.gov. In | |
| addition, you may obtain a free report on how your fund | |
| voted the proxies for securities it owned during the 12 | |
| months ended June 30. To get the report, visit either | |
| vanguard.com/proxyreporting or sec.gov. | |
| |
| You can review and copy information about your fund at | |
| the SEC’s Public Reference Room in Washington, D.C. To | |
| find out more about this public service, call the SEC at | |
| 202-551-8090. Information about your fund is also | |
| available on the SEC’s website, and you can receive | |
| copies of this information, for a fee, by sending a | |
| request in either of two ways: via email addressed to | |
| publicinfo@sec.gov or via regular mail addressed to the | |
| Public Reference Section, Securities and Exchange | |
| Commission, Washington, DC 20549-1520. | |
| |
| | © 2016 The Vanguard Group, Inc. |
| | All rights reserved. |
| | Vanguard Marketing Corporation, Distributor. |
| |
| | Q6340 022016 |
Item 2: Code of Ethics. The Registrant has adopted a code of ethics that applies to the Registrant’s principal executive officer, principal financial officer, principal accounting officer or controller or persons performing similar functions. The Code of Ethics was amended during the reporting period covered by this report to make certain technical, non-material changes.
Item 3: Audit Committee Financial Expert. The following members of the Audit Committee have been determined by the Registrant’s Board of Trustees to be Audit Committee Financial Experts serving on its Audit Committee, and to be independent: Rajiv L. Gupta, Amy Gutmann, JoAnn Heffernan Heisen, F. Joseph Loughrey, Mark Loughridge, Scott C. Malpass, and André F. Perold.
Item 4: Principal Accountant Fees and Services.
(a) Audit Fees.
Audit Fees of the Registrant
Fiscal Year Ended December 31, 2015: $53,000
Fiscal Year Ended December 31, 2014: $50,000
Aggregate Audit Fees of Registered Investment Companies in the Vanguard Group.
Fiscal Year Ended December 31, 2015: $7,000,200
Fiscal Year Ended December 31, 2014: $6,605,127
Includes fees billed in connection with audits of the Registrant, other registered investment companies in the Vanguard complex, The Vanguard Group, Inc. and Vanguard Marketing Corporation.
(b) Audit-Related Fees.
Fiscal Year Ended December 31, 2015: $2,899,096
Fiscal Year Ended December 31, 2014: $2,176,479
Includes fees billed in connection with assurance and related services provided to the Registrant, other registered investment companies in the Vanguard complex, The Vanguard Group, Inc., and Vanguard Marketing Corporation.
(c) Tax Fees.
Fiscal Year Ended December 31, 2015: $353,389
Fiscal Year Ended December 31, 2014: $316,869
Includes fees billed in connection with tax compliance, planning, and advice services provided to the Registrant, other registered investment companies in the Vanguard complex, The Vanguard Group, Inc., and Vanguard Marketing Corporation.
(d) All Other Fees.
Fiscal Year Ended December 31, 2015: $202,313
Fiscal Year Ended December 31, 2014: $198,163
Includes fees billed for services related to tax reported information provided to the Registrant, other registered investment companies in the Vanguard complex, The Vanguard Group, Inc., and Vanguard Marketing Corporation.
(e) (1) Pre-Approval Policies. The policy of the Registrant’s Audit Committee is to consider and, if appropriate, approve before the principal accountant is engaged for such services, all specific audit and non-audit services provided to: the Registrant, other registered investment companies in the Vanguard complex, The Vanguard Group, Inc., and entities controlled by The Vanguard Group, Inc. that provide ongoing services to the Registrant. In making a determination, the Audit Committee considers whether the services are consistent with maintaining the principal accountant’s independence.
In the event of a contingency situation in which the principal accountant is needed to provide services in between scheduled Audit Committee meetings, the Chairman of the Audit Committee would be called on to consider and, if appropriate, pre-approve audit or permitted non-audit services in an amount sufficient to complete services through the next Audit Committee meeting, and to determine if such services would be consistent with maintaining the accountant’s independence. At the next scheduled Audit Committee meeting, services and fees would be presented to the Audit Committee for formal consideration, and, if appropriate, approval by the entire Audit Committee. The Audit Committee would again consider whether such services and fees are consistent with maintaining the principal accountant’s independence.
The Registrant’s Audit Committee is informed at least annually of all audit and non-audit services provided by the principal accountant to the Vanguard complex, whether such services are provided to: the Registrant, other registered investment companies in the Vanguard complex, The Vanguard Group, Inc., or other entities controlled by The Vanguard Group, Inc. that provide ongoing services to the Registrant.
(2) No percentage of the principal accountant’s fees or services were approved pursuant to the waiver provision of paragraph (c)(7)(i)(C) of Rule 2-01 of Regulation S-X.
(f) For the most recent fiscal year, over 50% of the hours worked under the principal accountant’s engagement were not performed by persons other than full-time, permanent employees of the principal accountant.
(g) Aggregate Non-Audit Fees.
Fiscal Year Ended December 31, 2015: $555,702
Fiscal Year Ended December 31, 2014: $515,032
Includes fees billed for non-audit services provided to the Registrant, other registered investment companies in the Vanguard complex, The Vanguard Group, Inc., and Vanguard Marketing Corporation.
(h) For the most recent fiscal year, the Audit Committee has determined that the provision of all non-audit services was consistent with maintaining the principal accountant’s independence.
Item 5: Audit Committee of Listed Registrants.
Not Applicable.
Item 6: Investments.
Not Applicable.
Item 7: Disclosure of Proxy Voting Policies and Procedures for Closed-End Management
Investment Companies.
Not Applicable.
Item 8: Portfolio Managers of Closed-End Management Investment Companies.
Not Applicable.
Item 9: Purchase of Equity Securities by Closed-End Management Investment Company and
Affiliated Purchasers.
Not Applicable.
Item 10: Submission of Matters to a Vote of Security Holders.
Not Applicable.
Item 11: Controls and Procedures.
(a) Disclosure Controls and Procedures. The Principal Executive and Financial Officers concluded that the Registrant’s Disclosure Controls and Procedures are effective based on their evaluation of the Disclosure Controls and Procedures as of a date within 90 days of the filing date of this report.
(b) Internal Control Over Financial Reporting. There were no significant changes in Registrant’s Internal Control Over Financial Reporting or in other factors that could significantly affect this control subsequent to the date of the evaluation, including any corrective actions with regard to significant deficiencies and material weaknesses.
Item 12: Exhibits.
(a) Code of Ethics.
(b) Certifications.
Pursuant to the requirements of the Securities Exchange Act of 1934 and the Investment Company Act of 1940, the registrant has duly caused this report to be signed on its behalf by the undersigned, thereunto duly authorized.
| | VANGUARD MONTGOMERY FUNDS |
| |
| |
| BY: | /s/ F. WILLIAM MCNABB III* |
| F. WILLIAM MCNABB III |
| CHIEF EXECUTIVE OFFICER |
| |
| Date: February 18, 2016 |
Pursuant to the requirements of the Securities Exchange Act of 1934 and the Investment Company Act of 1940, this report has been signed below by the following persons on behalf of the registrant and in the capacities and on the dates indicated.
| | VANGUARD MONTGOMERY FUNDS |
| |
| BY: | /s/ F. WILLIAM MCNABB III* |
| F. WILLIAM MCNABB III |
| CHIEF EXECUTIVE OFFICER |
| Date: February 18, 2016 |
| | VANGUARD MONTGOMERY FUNDS |
BY: | /s/ THOMAS J. HIGGINS* |
| | THOMAS J. HIGGINS |
| CHIEF FINANCIAL OFFICER |
| Date: February 18, 2016 |
* By: /s/ Heidi Stam
Heidi Stam, pursuant to a Power of Attorney filed on April 22, 2014 see file Number 2-17620, Incorporated by Reference.