UNITED STATES
SECURITIES AND EXCHANGE COMMISSION
Washington, D.C. 20549
FORM N-CSR
CERTIFIED SHAREHOLDER REPORT OF
REGISTERED MANAGEMENT INVESTMENT COMPANIES
Investment Company Act file number: 811-22114
| | |
| Name of Registrant: | Vanguard Montgomery Funds |
| Address of Registrant: | P.O. Box 2600 |
| | Valley Forge, PA 19482 |
| |
| Name and address of agent for service: | Anne E. Robinson, Esquire | |
| | P.O. Box 876 | |
| | Valley Forge, PA 19482 | |
Registrant’s telephone number, including area code: (610) 669-1000
Date of fiscal year end: December 31
Date of reporting period: January 1, 2017 – December 31, 2017
Item 1: Reports to Shareholders

Annual Report | December 31, 2017
Vanguard Market Neutral Fund
Vanguard’s Principles for Investing Success
We want to give you the best chance of investment success. These
principles, grounded in Vanguard’s research and experience, can put you on
the right path.
Goals. Create clear, appropriate investment goals.
Balance. Develop a suitable asset allocation using broadly diversified funds.
Cost. Minimize cost.
Discipline. Maintain perspective and long-term discipline.
A single theme unites these principles: Focus on the things you can control.
We believe there is no wiser course for any investor.
| |
| Contents | |
| Your Fund’s Performance at a Glance. | 1 |
| Chairman’s Perspective. | 3 |
| Advisor’s Report. | 7 |
| Results of Proxy Voting. | 9 |
| Fund Profile. | 10 |
| Performance Summary. | 12 |
| Financial Statements. | 14 |
| Your Fund’s After-Tax Returns. | 32 |
| About Your Fund’s Expenses. | 33 |
| Glossary. | 35 |
Please note: The opinions expressed in this report are just that—informed opinions. They should not be considered promises or advice. Also, please keep in mind that the information and opinions cover the period through the date on the front of this report. Of course, the risks of investing in your fund are spelled out in the prospectus.
See the Glossary for definitions of investment terms used in this report.
About the cover: Nautical images have been part of Vanguard’s rich heritage since its start in 1975. For an incoming ship, a lighthouse offers a beacon and safe path to shore. You can similarly depend on Vanguard to put you first––and light the way––as you strive to meet your financial goals. Our client focus and low costs, stemming from our unique ownership structure, assure that your interests are paramount.
Your Fund’s Performance at a Glance
• For the 12 months ended December 31, 2017, Vanguard Market Neutral Fund
returned –4.89% for Investor Shares, underperforming its mandate of beating the
returns of 3-month Treasury bills, which gained 0.84%. The fund also lagged its
market neutral peers, which averaged a –0.53% return.
• The fund’s stock selection model focuses on five signals that rank a universe of
stocks. Two of those signals—growth and sentiment—contributed to performance.
The valuation and quality models detracted.
• Stock selection results in 3 out of 11 sectors were positive on a relative basis, led
by materials, financials, and industrials. Holdings in information technology, consumer
discretionary, energy, and real estate detracted.
• Over the decade ended December 31, the Market Neutral Fund produced an
average annual return of –0.05% for Investor Shares, trailing its peers by a third
of a percentage point.
| |
| Total Returns: Fiscal Year Ended December 31, 2017 | |
| | Total |
| | Returns |
| Vanguard Market Neutral Fund | |
| Investor Shares | -4.89% |
| Institutional Shares | -4.83 |
| Citigroup Three-Month U.S. Treasury Bill Index (Daily) | 0.84 |
Alternative Equity Market Neutral Funds Average -0.53
Alternative Equity Market Neutral Funds Average: Derived from data provided by Lipper, a Thomson Reuters Company.
Institutional Shares are available to certain institutional investors who meet specific administrative, service, and account-size criteria.
1
| |
| Total Returns: Ten Years Ended December 31, 2017 | |
| | Average |
| | Annual Return |
| Market Neutral Fund Investor Shares | -0.05% |
| Spliced Market Neutral Index | 0.34 |
| Alternative Equity Market Neutral Funds Average | 0.28 |
For a benchmark description, see the Glossary.
Alternative Equity Market Neutral Funds Average: Derived from data provided by Lipper, a Thomson Reuters Company.
The figures shown represent past performance, which is not a guarantee of future results. (Current performance may be lower or higher than the performance data cited. For performance data current to the most recent month-end, visit our website at vanguard.com/performance.) Note, too, that both investment returns and principal value can fluctuate widely, so an investor’s shares, when sold, could be worth more or less than their original cost.
2
Chairman’s Perspective

Bill McNabb
Chairman
Dear Shareholder,
Lately I’ve been asked a lot about my legacy. And candidly, that phrase bugs me—it isn’t my legacy. Vanguard’s success is a result of thousands of my colleagues committing to a clear mission: helping investors achieve their financial goals.
The reason the topic has come up is that on December 31, 2017, I officially stepped down as Vanguard’s CEO after almost a decade in that role. I’ll remain chairman for a period to be determined by the board of directors. Tim Buckley, who was previously Vanguard’s president and chief investment officer, was elected CEO. I can’t think of a better successor.
I’ve spent 32 years at Vanguard—almost my entire professional life—and during that time I’ve had the good fortune of working with smart, principled colleagues from across the world. I’ve learned from each of them.
In particular, I would like to thank Jack Bogle, our founder, who took a chance on me when I was a young business school graduate, and Jack Brennan, my predecessor as CEO, who constantly challenged me with new roles and responsibilities.
3
When you’re just starting out, there is nothing quite like getting votes of confidence from people you respect.
The short list
A milestone like this naturally brings about some reflection. With that in mind, here’s a tally—by no means exhaustive—of the accomplishments that we at Vanguard are proud of:
Low costs. Over the last decade, we cut our average asset-weighted expense ratio by about 50%.1 This isn’t a result of some contrived price war. Since its founding, Vanguard has emphasized the benefits
of low-cost investing. As Jack Bogle once said: “The honest steward who charges least, wins most. But not for himself; for those investors who entrust their assets to his care. It is not all that complicated.”
Global diversification. Through our thought leadership and investment options, such as our target-date funds, Vanguard has encouraged clients to obtain exposure to international markets.
Global diversification isn’t just about helping to control risk—it can also be a way of expanding your set of opportunities and harnessing the potential of all markets.
| | | |
| Market Barometer | | | |
| | | Average Annual Total Returns |
| | Periods Ended December 31, 2017 |
| | One Year | Three Years | Five Years |
| Stocks | | | |
| Russell 1000 Index (Large-caps) | 21.69% | 11.23% | 15.71% |
| Russell 2000 Index (Small-caps) | 14.65 | 9.96 | 14.12 |
| Russell 3000 Index (Broad U.S. market) | 21.13 | 11.12 | 15.58 |
| FTSE All-World ex US Index (International) | 27.11 | 8.27 | 7.19 |
| |
| Bonds | | | |
| Bloomberg Barclays U.S. Aggregate Bond Index | | | |
| (Broad taxable market) | 3.54% | 2.24% | 2.10% |
| Bloomberg Barclays Municipal Bond Index | | | |
| (Broad tax-exempt market) | 5.45 | 2.98 | 3.02 |
| Citigroup Three-Month U.S. Treasury Bill Index | 0.84 | 0.37 | 0.23 |
| |
| CPI | | | |
| Consumer Price Index | 2.11% | 1.64% | 1.43% |
1 Source: Vanguard calculation, based on data from Morningstar, Inc., as of December 31, 2016.
4
I’ve been glad to see more and more clients embracing global diversification. I believe this trend will continue as Vanguard’s way of investing takes hold in international markets.
Affordable advice. In the wake of the 2008–2009 Global Financial Crisis, we began working on a new advice model. In 2015, we launched Vanguard Personal Advisor Services®, a hybrid advice offering that delivers value through a combination of a professional advisor and powerful digital technology at a competitive price.
Across the industry, we’ve seen the cost of providing advice coming down. Traditional advisors are embracing low-cost investments, and that, in turn, helps them reduce costs for their own clients. This is a trend that all of us at Vanguard would like to see continue.
Great people. I’ve interacted with hundreds of companies of all sizes and in all industries, and the one quality that sets Vanguard apart from most of them is our emphasis on people. It’s a testament to our culture that colleagues spend 15, 20, or, as in my case, more than 30 years of their professional lives here. Investors benefit because we have consistent, experienced fund management teams and a deep bench of talent that ensures that things go smoothly when it’s time for a transition.
We’ve done a great job attracting new talent, too. We made some notable additions to senior management in the last two years, and we’re continuously grooming our next generation of leaders.
Ready for what comes next
When I was contemplating coming to work at Vanguard, I sat down with my rowing coach at his home in Philadelphia. Over cheesesteaks, he told me that the most important thing was to work for a company that had the same values I held deeply. He was like a second father to me, so I trusted his judgment at a time when I wasn’t so sure about my own. Back then, I never could have anticipated the success Vanguard would have in the coming decades.
I’m no better at predicting the future now. Vanguard has enjoyed significant growth in the last few years, and that presents its own unique set of challenges and opportunities, such as the role we’re playing in advocating for better corporate governance among companies our funds invest in. And the asset management industry is confronting significant changes brought on by technology, shifting demographics, and new regulations.
Although the future is uncertain, I’m confident that Vanguard is well-prepared to tackle whatever comes its way. And one thing I’m sure of: There are big parts of the world that would be well-served by our way of investing.
5
It’s humbling to think about the impact the work we do at Vanguard has on clients who are trying to raise a family, buy a first home, save for college, or prepare for retirement. I’ve always tried to make decisions with investors’ best interests in mind. It has been a privilege working with people who hold to that same ideal.
Thank you for entrusting us with your assets.

F. William McNabb III
Chairman
January 1, 2018
6
Advisor’s Report
During the twelve months ended December 31, 2017, several bellwether U.S. stock indexes hit all-time highs, continuing the trend that began in the wake of last year’s election.
But stocks that drove market gains late last year—value stocks, for example—lagged more mature, multinational growth companies this year, as world economies showed surprising resilience. At the same time, heightened expectations about the new administration’s legislative agenda gave way to a more tempered outlook on how quickly those policies would be implemented.
U.S. stocks returned about 21% for the fiscal year. Large-capitalization stocks outperformed small-caps, and value stocks significantly trailed growth. International stocks outperformed their U.S. counterparts, with emerging markets gaining more than developed markets. The broad U.S. bond market rose 3.54%.
Against that backdrop, Vanguard Market Neutral Fund returned –4.89% for Investor Shares, falling short of its mandate of exceeding the return of 3-month U.S. Treasury bills, which posted a 0.84% gain. Please note that the fund’s long-term record still achieves that mandate and that the fund does not try to outperform the equity market.
During the period, the Federal Reserve raised interest rates three times, signaling a normalization of monetary policy. In raising rates, the Fed cited a stable U.S.
economy, rising inflation that ticked closer to its 2% target, and a tightening labor market. Unemployment dropped to 4.1% in December from 4.8% in January 2017. The housing and manufacturing sectors reported decent activity, wages ticked up, and some commodities posted price increases.
U.S. stock market performance was broad-based; 9 of 11 market sectors advanced, led by information technology, health care, materials, and consumer discretionary. Energy and telecommunication services lagged.
International stocks also climbed as the global economy converged on a steady path slightly above trend growth. Political risk in Europe faded as pro-European Union parties in France and the Netherlands were swept into office and economic growth surprised to the upside.
In Asia, Japan’s economy regained momentum, largely because of a recovery in exports and manufacturing. China’s growth slowed somewhat, mostly because of cooling investment in real estate and infrastructure.
This international environment also benefited U.S. multinational companies with exposure to these markets.
Although it’s important to understand how our overall performance is affected by the macroeconomic factors we’ve described, our approach to investing focuses on
7
specific stock fundamentals and how companies rank relative to their industry peers.
Our model uses five themes to evaluate companies—growth, quality, management decisions, sentiment, and valuation—to generate a composite expected return for all the stocks in our investment universe. We seek to capitalize on investor biases by taking long positions in the stocks that our model ranks high and by shorting those that score the lowest. We aim to keep your fund’s sector exposures neutral because our research has shown that sector bets do not add value over the long term.
In the current investment environment, our stock selection model struggled to generate positive results. Our positions in the information technology, energy, and consumer discretionary sectors hurt most.
Two of our signals—growth and sentiment—contributed positively to relative results. However, the quality and valuation signals detracted to a greater extent. Valuation, which drove the fund’s performance last year, disappointed most, particularly in consumer discretionary, health care, and energy. Quality had particularly poor results in information technology. We still believe exposures to these signals offer a compelling investment opportunity.
Our holdings in information technology companies Square and RingCentral, materials company Chemours, health care firm FibroGen, and Brink Industrial, Owens Corning, and Team, Inc., added most to performance. On the other hand, our positions in health care companies Alnylam Pharmaceuticals, Amicus Therapeutics, and Neurocrine Biosciences were among the biggest detractors, as were Sanchez Energy, SiteOne Landscape Supply in industrials, and Universal Display in IT.
Although the past year has been disappointing, we remain committed to our investment philosophy and process to identify companies with strong, consistent fundamental growth at attractive valuations. We believe these remain the tenets of long-term investment success.
Portfolio Managers:
James P. Stetler
Binbin Guo, Principal,
Head of Alpha Strategies
Vanguard Quantitative Equity Group
January 22, 2018
8
Results of Proxy Voting
At a special meeting of shareholders on November 15, 2017, fund shareholders approved the following proposals:
Proposal 1—Elect trustees for the fund.*
The individuals listed in the table below were elected as trustees for the fund. All trustees with the exception of Ms. Mulligan, Ms. Raskin, and Mr. Buckley (each of whom already serves as a director of The Vanguard Group, Inc.) served as trustees to the funds prior to the shareholder meeting.
| | | |
| | | | Percentage |
| Trustee | For | Withheld | For |
| Mortimer J. Buckley | 136,049,083 | 1,322,745 | 99.0% |
| Emerson U. Fullwood | 135,997,390 | 1,374,437 | 99.0% |
| Amy Gutmann | 135,996,174 | 1,375,653 | 99.0% |
| JoAnn Heffernan Heisen | 136,019,933 | 1,351,894 | 99.0% |
| F. Joseph Loughrey | 135,971,737 | 1,400,090 | 99.0% |
| Mark Loughridge | 136,064,037 | 1,307,790 | 99.0% |
| Scott C. Malpass | 136,076,246 | 1,295,581 | 99.1% |
| F. William McNabb III | 136,025,789 | 1,346,038 | 99.0% |
| Deanna Mulligan | 136,116,441 | 1,255,386 | 99.1% |
| André F. Perold | 136,068,967 | 1,302,860 | 99.1% |
| Sarah Bloom Raskin | 136,027,372 | 1,344,455 | 99.0% |
| Peter F. Volanakis | 136,040,747 | 1,331,081 | 99.0% |
| * Results are for all funds within the same trust. | | | |
Proposal 3—Approve a manager-of-managers arrangement with wholly owned subsidiaries of Vanguard.
This arrangement enables Vanguard or the fund to enter into and materially amend investment advisory arrangements with wholly owned subsidiaries of Vanguard, subject to the approval of the fund’s board of trustees and any conditions imposed by the Securities and Exchange Commission (SEC), while avoiding the costs and delays associated with obtaining future shareholder approval. The ability of the fund to operate in this manner is contingent upon the SEC’s approval of a pending application for an order of exemption.
| | | | | |
| | | | | Broker | Percentage |
| Vanguard Fund | For | Abstain | Against | Non-Votes | For |
| Market Neutral Fund | 108,446,626 | 1,201,840 | 987,379 | 26,735,982 | 78.9% |
9
Market Neutral Fund
Fund Profile
As of December 31, 2017
| | |
| Share-Class Characteristics | | |
| | Investor | Institutional |
| | Shares | Shares |
| Ticker Symbol | VMNFX | VMNIX |
| Total Expense Ratio1 | 1.60% | 1.52% |
| Management Expenses | 0.18% | 0.13% |
| Dividend Expenses on | | |
| Securities Sold Short2 | 1.38% | 1.38% |
| Borrowing Expenses on | | |
| Securities Sold Short2 | 0.00% | 0.00% |
| Other Expenses | 0.04% | 0.01% |
| | |
| Portfolio Characteristics | | |
| | Long | Short |
| | Portfolio | Portfolio |
| Number of Stocks | 242 | 265 |
| Median Market Cap | $4.4B | $4.4B |
| Price/Earnings Ratio | 18.8x | 26.9x |
| Price/Book Ratio | 2.5x | 2.0x |
| Return on Equity | 9.5% | 9.9% |
| Earnings Growth | | |
| Rate | 13.5% | 9.7% |
| Foreign Holdings | 0.0% | 0.7% |
| | |
| Volatility Measures | | |
| | Spliced | DJ |
| | Market | U.S. Total |
| | Neutral | Market |
| | Index | FA Index |
| R-Squared | 0.03 | 0.03 |
| Beta | -8.13 | -0.10 |
These measures show the degree and timing of the fund’s fluctuations compared with the index over 36 months.
| | |
| Sector Diversification (% of equity exposure) |
| | Long | Short |
| | Portfolio | Portfolio |
| Consumer Discretionary | 14.2% | 13.8% |
| Consumer Staples | 4.1 | 3.6 |
| Energy | 5.7 | 6.2 |
| Financials | 17.5 | 17.2 |
| Health Care | 10.9 | 10.0 |
| Industrials | 14.2 | 14.8 |
| Information Technology | 16.2 | 16.7 |
| Materials | 7.4 | 7.8 |
| Real Estate | 6.7 | 7.1 |
| Telecommunication Services | 0.4 | 0.4 |
| Utilities | 2.7 | 2.4 |
| |
| Fund Characteristics | |
| Turnover Rate | 79% |
| Short-Term Reserves | 2.4% |
1 The total expense ratios shown are from the prospectus dated April 28, 2017, and represent estimated costs for the current fiscal year. For the fiscal year ended December 31, 2017, the total expense ratios were 1.54% for Investor Shares and 1.46% for Institutional Shares.
2 In connection with a short sale, the fund may receive income or be charged a fee based on the market value of the borrowed stock. When a cash dividend is declared on a stock the fund has sold short, the fund is required to pay an amount equal to that dividend to the party from which the fund borrowed the stock and to record the payment of the dividend as an expense.
10
Market Neutral Fund
| | |
| Ten Largest Holdings1 (% of total net assets) |
| Long Portfolio | | |
| Freeport-McMoRan Inc. | Copper | 0.6% |
| Alcoa Corp. | Aluminum | 0.6 |
| Universal Insurance | Property & Casualty | |
| Holdings Inc. | Insurance | 0.6 |
| Exelixis Inc. | Biotechnology | 0.6 |
| Delek US Holdings Inc. | Oil & Gas Refining & | |
| | Marketing | 0.6 |
| Burlington Stores Inc. | Apparel Retail | 0.6 |
| Children's Place Inc. | Apparel Retail | 0.6 |
| Rush Enterprises Inc. | Trading Companies & | |
| | Distributors | 0.6 |
| Best Buy Co. Inc. | Computer & | |
| | Electronics Retail | 0.6 |
| XPO Logistics Inc. | Air Freight & | |
| | Logistics | 0.6 |
| Top Ten | | 6.0% |
| | |
| Ten Largest Holdings1 (% of total net assets) |
| Short Portfolio | | |
| |
| Nabors Industries Ltd. | Oil & Gas Drilling | 0.6% |
| Bank of the Ozarks | Regional Banks | 0.6 |
| Compass Minerals | Diversified Metals | |
| International Inc. | & Mining | 0.6 |
| Vulcan Materials Co. | Construction | |
| | Materials | 0.6 |
| SiteOne Landscape | Trading Companies | |
| Supply Inc. | & Distributors | 0.6 |
| ViaSat Inc. | Communications | |
| | Equipment | 0.6 |
| Acuity Brands Inc. | Electrical | |
| | Components & | |
| | Equipment | 0.6 |
| Wabtec Corp. | Construction | |
| | Machinery & Heavy | |
| | Trucks | 0.6 |
| CF Industries Holdings | Fertilizers & | |
| Inc. | Agricultural | |
| | Chemicals | 0.6 |
| Core-Mark Holding Co. | | |
| Inc. | Distributors | 0.6 |
| Top Ten | | 6.0% |
1 The holdings listed exclude any temporary cash investments and equity index products.
11
Market Neutral Fund
Performance Summary
All of the returns in this report represent past performance, which is not a guarantee of future results that may be achieved by the fund. (Current performance may be lower or higher than the performance data cited. For performance data current to the most recent month-end, visit our website at vanguard.com/performance.) Note, too, that both investment returns and principal value can fluctuate widely, so an investor’s shares, when sold, could be worth more or less than their original cost. The returns shown do not reflect taxes that a shareholder would pay on fund distributions or on the sale of fund shares.
Cumulative Performance: December 31, 2007, Through December 31, 2017
Initial Investment of $250,000
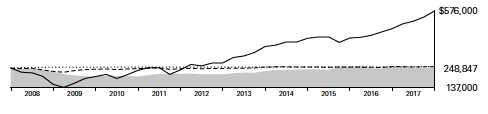
| | | | | |
| | | Average Annual Total Returns | |
| | | Periods Ended December 31, 2017 | |
| |
| | | | | | Final Value |
| | | One | Five | Ten | of a $250,000 |
| | | Year | Years | Years | Investment |
| |
| | Market Neutral Fund Investor Shares | -4.89% | 3.10% | -0.05% | $248,847 |
| |
| • • • • • • • • | Spliced Market Neutral Index | 0.84 | 0.23 | 0.34 | 258,524 |
| |
| – – – – | Alternative Equity Market Neutral | | | | |
| | Funds Average | -0.53 | 0.75 | 0.28 | 257,000 |
| | Dow Jones U.S. Total Stock Market | | | | |
| | Float Adjusted Index | 21.16 | 15.52 | 8.66 | 573,695 |
For a benchmark description, see the Glossary.
Alternative Equity Market Neutral Funds Average: Derived from data provided by Lipper, a Thomson Reuters Company.
| | | | |
| | | | | Final Value |
| | One | Five | Ten | of a $5,000,000 |
| | Year | Years | Years | Investment |
| |
| Market Neutral Fund Institutional Shares | -4.83% | 3.18% | 0.03% | $5,017,287 |
| |
| Spliced Market Neutral Index | 0.84 | 0.23 | 0.34 | 5,170,478 |
| Dow Jones U.S. Total Stock Market Float | | | | |
| Adjusted Index | 21.16 | 15.52 | 8.66 | 11,473,897 |
See Financial Highlights for dividend and capital gains information.
12
Market Neutral Fund
Fiscal-Year Total Returns (%): December 31, 2007, Through December 31, 2017
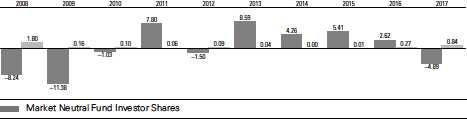
Spliced Market Neutral Index
For a benchmark description, see the Glossary.
13
Market Neutral Fund
Financial Statements
Statement of Net Assets
As of December 31, 2017
The fund reports a complete list of its holdings in regulatory filings four times in each fiscal year, at the quarter-ends. For the second and fourth fiscal quarters, the lists appear in the fund’s semiannual and annual reports to shareholders. For the first and third fiscal quarters, the fund files the lists with the Securities and Exchange Commission on Form N-Q. Shareholders can look up the fund’s Forms N-Q on the SEC’s website at sec.gov. Forms N-Q may also be reviewed and copied at the SEC’s Public Reference Room (see the back cover of this report for further information).
| | | |
| | | | Market |
| | | | Value• |
| | | Shares | ($000) |
| Common Stocks-Long Positions (97.8%) | |
| Consumer Discretionary (13.8%) | |
| *,† | Burlington Stores Inc. | 78,290 | 9,632 |
| † | Children’s Place Inc. | 66,245 | 9,629 |
| † | Best Buy Co. Inc. | 140,120 | 9,594 |
| * | Deckers Outdoor Corp. | 118,640 | 9,521 |
| *,† | Taylor Morrison Home | | |
| | Corp. Class A | 387,291 | 9,477 |
| *,† | Live Nation | | |
| | Entertainment Inc. | 221,093 | 9,412 |
| *,† | Sleep Number Corp. | 249,958 | 9,396 |
| *,† | Liberty Media Corp- | | |
| | Liberty SiriusXM | 235,083 | 9,323 |
| † | Lear Corp. | 52,673 | 9,305 |
| * | Penn National Gaming | | |
| | Inc. | 296,956 | 9,304 |
| | PetMed Express Inc. | 204,220 | 9,292 |
| † | Tailored Brands Inc. | 418,302 | 9,131 |
| † | Royal Caribbean Cruises | | |
| | Ltd. | 76,377 | 9,110 |
| † | Nutrisystem Inc. | 173,016 | 9,101 |
| | MDC Holdings Inc. | 272,861 | 8,699 |
| †,^ | Big Lots Inc. | 154,659 | 8,684 |
| | New York Times Co. | | |
| | Class A | 461,981 | 8,547 |
| *,† | Weight Watchers | | |
| | International Inc. | 186,133 | 8,242 |
| *,† | RH | 92,932 | 8,012 |
| | KB Home | 230,903 | 7,377 |
| *,† | iRobot Corp. | 83,470 | 6,402 |
| * | Gray Television Inc. | 347,731 | 5,824 |
| † | Bloomin’ Brands Inc. | 268,219 | 5,724 |
| *,^ | Conn’s Inc. | 149,962 | 5,331 |
| *,† | Cooper-Standard | | |
| | Holdings Inc. | 42,369 | 5,190 |
| * | Scientific Games Corp. | | |
| | Class A | 94,674 | 4,857 |
| * | Chegg Inc. | 277,214 | 4,524 |
| | | |
| † | News Corp. Class B | 227,386 | 3,774 |
| *,† | MSG Networks Inc. | 173,178 | 3,507 |
| * | Sotheby’s | 61,220 | 3,159 |
| | Gannett Co. Inc. | 146,662 | 1,700 |
| † | Carnival Corp. | 22,043 | 1,463 |
| * | Lumber Liquidators | | |
| | Holdings Inc. | 42,359 | 1,330 |
| * | Fox Factory Holding | | |
| | Corp. | 26,171 | 1,017 |
| | Sinclair Broadcast Group | | |
| | Inc. Class A | 22,379 | 847 |
| | | | 235,437 |
| Consumer Staples (4.0%) | | |
| † | Wal-Mart Stores Inc. | 95,748 | 9,455 |
| † | Costco Wholesale Corp. | 50,272 | 9,357 |
| * | HRG Group Inc. | 533,305 | 9,039 |
| † | National Beverage Corp. | 90,213 | 8,790 |
| † | Conagra Brands Inc. | 224,676 | 8,464 |
| *,† | Pilgrim’s Pride Corp. | 268,033 | 8,325 |
| † | Sanderson Farms Inc. | 59,882 | 8,310 |
| † | Nu Skin Enterprises Inc. | | |
| | Class A | 65,804 | 4,490 |
| | Medifast Inc. | 13,589 | 949 |
| | MGP Ingredients Inc. | 11,919 | 916 |
| | | | 68,095 |
| Energy (5.6%) | | |
| † | Delek US Holdings Inc. | 276,409 | 9,658 |
| † | Marathon Petroleum Corp. | 141,703 | 9,350 |
| | PBF Energy Inc. Class A | 263,376 | 9,337 |
| | ConocoPhillips | 167,919 | 9,217 |
| ^ | RPC Inc. | 359,047 | 9,166 |
| *,† | Unit Corp. | 388,151 | 8,539 |
| *,† | McDermott International | | |
| | Inc. | 1,273,749 | 8,381 |
| * | Laredo Petroleum Inc. | 767,132 | 8,139 |
| * | ProPetro Holding Corp. | 330,035 | 6,653 |
| ^ | CVR Energy Inc. | 171,680 | 6,393 |
| * | CONSOL Energy Inc. | 96,371 | 3,808 |
14
| | | |
| Market Neutral Fund | | |
| |
| |
| |
| | | | Market |
| | | | Value• |
| | | Shares | ($000) |
| | HollyFrontier Corp. | 63,626 | 3,259 |
| *,† | Newfield Exploration Co. | 83,842 | 2,644 |
| | | | 94,544 |
| Financials (17.2%) | | |
| † | Universal Insurance | | |
| | Holdings Inc. | 357,545 | 9,779 |
| † | Unum Group | 171,627 | 9,421 |
| † | JPMorgan Chase & Co. | 87,515 | 9,359 |
| † | CNO Financial Group Inc. | 378,104 | 9,335 |
| † | Zions Bancorporation | 183,196 | 9,312 |
| † | Comerica Inc. | 107,174 | 9,304 |
| † | Regions Financial Corp. | 538,262 | 9,301 |
| † | Lincoln National Corp. | 120,945 | 9,297 |
| † | Ameriprise Financial Inc. | 54,827 | 9,292 |
| † | Bank of America Corp. | 314,707 | 9,290 |
| † | PNC Financial Services | | |
| | Group Inc. | 64,354 | 9,286 |
| † | Citigroup Inc. | 124,565 | 9,269 |
| † | Citizens Financial Group | | |
| | Inc. | 220,583 | 9,260 |
| † | Fifth Third Bancorp | 304,910 | 9,251 |
| † | SunTrust Banks Inc. | 142,996 | 9,236 |
| † | Primerica Inc. | 90,942 | 9,235 |
| † | Synovus Financial Corp. | 192,103 | 9,209 |
| *,† | Walker & Dunlop Inc. | 193,085 | 9,172 |
| *,† | Essent Group Ltd. | 206,764 | 8,978 |
| † | Aflac Inc. | 102,067 | 8,959 |
| | Principal Financial Group | | |
| | Inc. | 124,471 | 8,783 |
| | American Equity | | |
| | Investment Life Holding | | |
| | Co. | 279,189 | 8,579 |
| † | Morgan Stanley | 161,588 | 8,479 |
| † | Assured Guaranty Ltd. | 249,261 | 8,442 |
| | East West Bancorp Inc. | 134,837 | 8,202 |
| † | Nelnet Inc. Class A | 142,636 | 7,814 |
| *,† | Flagstar Bancorp Inc. | 195,567 | 7,318 |
| | Allstate Corp. | 58,257 | 6,100 |
| * | Green Dot Corp. Class A | 93,324 | 5,624 |
| * | Athene Holding Ltd. Class | | |
| | A | 104,717 | 5,415 |
| | Washington Federal Inc. | 141,477 | 4,846 |
| † | MSCI Inc. Class A | 36,775 | 4,653 |
| | Evercore Inc. Class A | 38,748 | 3,487 |
| * | Third Point Reinsurance | | |
| | Ltd. | 206,471 | 3,025 |
| * | MGIC Investment Corp. | 204,904 | 2,891 |
| | First Citizens BancShares | | |
| | Inc. Class A | 7,114 | 2,867 |
| | Bank of NT Butterfield & | | |
| | Son Ltd. | 63,653 | 2,310 |
| * | Encore Capital Group Inc. | 52,553 | 2,212 |
| * | Cadence BanCorp Class A | 54,939 | 1,490 |
��
| | | |
| | Houlihan Lokey Inc. | | |
| | Class A | 31,611 | 1,436 |
| | Moelis & Co. Class A | 24,392 | 1,183 |
| * | NMI Holdings Inc. | | |
| | Class A | 55,768 | 948 |
| | | | 291,649 |
| Health Care (10.6%) | | |
| *,† | Exelixis Inc. | 319,085 | 9,700 |
| *,† | Corcept Therapeutics Inc. | 525,625 | 9,493 |
| *,† | Charles River Laboratories | | |
| | International Inc. | 86,573 | 9,475 |
| † | Bruker Corp. | 275,922 | 9,470 |
| *,† | WellCare Health Plans Inc. | 46,850 | 9,422 |
| † | Baxter International Inc. | 145,114 | 9,380 |
| *,† | PRA Health Sciences Inc. | 102,736 | 9,356 |
| † | Cigna Corp. | 45,985 | 9,339 |
| *,† | Centene Corp. | 92,031 | 9,284 |
| *,† | Masimo Corp. | 108,564 | 9,206 |
| * | Halozyme Therapeutics | | |
| | Inc. | 453,279 | 9,184 |
| *,† | Veeva Systems Inc. | | |
| | Class A | 165,499 | 9,149 |
| * | Medpace Holdings Inc. | 229,532 | 8,323 |
| * | Align Technology Inc. | 37,325 | 8,293 |
| * | Intuitive Surgical Inc. | 22,272 | 8,128 |
| * | IDEXX Laboratories Inc. | 44,633 | 6,980 |
| † | Chemed Corp. | 27,263 | 6,626 |
| * | OraSure Technologies | | |
| | Inc. | 277,091 | 5,226 |
| † | Anthem Inc. | 22,940 | 5,162 |
| * | Myriad Genetics Inc. | 110,522 | 3,796 |
| * | Cotiviti Holdings Inc. | 116,372 | 3,748 |
| * | Tivity Health Inc. | 100,381 | 3,669 |
| | UnitedHealth Group Inc. | 10,211 | 2,251 |
| * | Sangamo Therapeutics | | |
| | Inc. | 105,266 | 1,726 |
| | Agilent Technologies Inc. | 21,622 | 1,448 |
| *,† | FibroGen Inc. | 27,318 | 1,295 |
| * | Omeros Corp. | 65,576 | 1,274 |
| | | | 180,403 |
| Industrials (13.9%) | | |
| * | Rush Enterprises Inc. | | |
| | Class A | 189,115 | 9,609 |
| *,† | XPO Logistics Inc. | 104,471 | 9,569 |
| *,† | TriNet Group Inc. | 215,280 | 9,546 |
| *,† | United Rentals Inc. | 55,481 | 9,538 |
| † | Caterpillar Inc. | 60,375 | 9,514 |
| † | Owens Corning | 103,108 | 9,480 |
| † | Greenbrier Cos. Inc. | 177,759 | 9,475 |
| * | Harsco Corp. | 507,897 | 9,472 |
| † | Allison Transmission | | |
| | Holdings Inc. | 217,924 | 9,386 |
| † | Boeing Co. | 31,804 | 9,379 |
| † | Oshkosh Corp. | 102,882 | 9,351 |
15
| | | |
| Market Neutral Fund | | |
| |
| |
| |
| | | | Market |
| | | | Value• |
| | | Shares | ($000) |
| † | Deere & Co. | 59,693 | 9,343 |
| † | SkyWest Inc. | 174,785 | 9,281 |
| † | Copa Holdings SA Class A | 69,186 | 9,275 |
| *,† | Meritor Inc. | 392,475 | 9,207 |
| *,† | Continental Building | | |
| | Products Inc. | 325,479 | 9,162 |
| † | Brink’s Co. | 116,164 | 9,142 |
| † | Quad/Graphics Inc. | 403,235 | 9,113 |
| | Terex Corp. | 186,047 | 8,971 |
| | Old Dominion Freight | | |
| | Line Inc. | 67,967 | 8,941 |
| *,† | AECOM | 226,548 | 8,416 |
| † | GATX Corp. | 116,916 | 7,267 |
| | ManpowerGroup Inc. | 47,747 | 6,021 |
| * | TrueBlue Inc. | 201,081 | 5,530 |
| † | Wabash National Corp. | 250,129 | 5,428 |
| * | Atlas Air Worldwide | | |
| | Holdings Inc. | 85,063 | 4,989 |
| | Triton International Ltd. | 114,618 | 4,292 |
| * | KLX Inc. | 30,196 | 2,061 |
| * | Aerojet Rocketdyne | | |
| | Holdings Inc. | 61,911 | 1,932 |
| | Kennametal Inc. | 37,229 | 1,802 |
| † | Hawaiian Holdings Inc. | 21,542 | 858 |
| † | Spirit AeroSystems | | |
| | Holdings Inc. Class A | 6,310 | 551 |
| | | | 235,901 |
| Information Technology (15.9%) | |
| *,† | RingCentral Inc. Class A | 195,902 | 9,482 |
| *,† | ON Semiconductor Corp. | 450,788 | 9,439 |
| † | SYNNEX Corp. | 68,834 | 9,358 |
| *,† | Sykes Enterprises Inc. | 296,732 | 9,332 |
| *,† | Extreme Networks Inc. | 740,862 | 9,276 |
| † | Booz Allen Hamilton | | |
| | Holding Corp. Class A | 242,857 | 9,260 |
| *,† | CACI International Inc. | | |
| | Class A | 69,948 | 9,258 |
| † | HP Inc. | 439,348 | 9,231 |
| *,† | VMware Inc. Class A | 73,643 | 9,229 |
| † | TeleTech Holdings Inc. | 229,244 | 9,227 |
| *,† | Match Group Inc. | 294,686 | 9,227 |
| *,† | TTM Technologies Inc. | 578,739 | 9,069 |
| *,† | Ultra Clean Holdings Inc. | 392,145 | 9,055 |
| *,†,^ | Advanced Micro Devices | | |
| | Inc. | 873,953 | 8,984 |
| * | Hortonworks Inc. | 438,814 | 8,824 |
| *,† | Amkor Technology Inc. | 844,530 | 8,487 |
| † | CDW Corp. | 121,806 | 8,464 |
| * | Electro Scientific | | |
| | Industries Inc. | 391,386 | 8,387 |
| *,† | Square Inc. | 241,150 | 8,361 |
| * | Five9 Inc. | 307,425 | 7,649 |
| * | Dell Technologies Inc. | | |
| | Class V | 88,309 | 7,178 |
| | | |
| * | Micron Technology Inc. | 167,153 | 6,873 |
| * | Take-Two Interactive | | |
| | Software Inc. | 61,508 | 6,752 |
| *,† | KEMET Corp. | 437,305 | 6,586 |
| † | CSRA Inc. | 210,723 | 6,305 |
| * | Box Inc. | 289,351 | 6,111 |
| *,† | Anixter International Inc. | 79,798 | 6,065 |
| * | Zebra Technologies Corp. | 57,657 | 5,985 |
| † | Travelport Worldwide Ltd. | 372,239 | 4,865 |
| * | Arista Networks Inc. | 19,000 | 4,476 |
| † | CSG Systems | | |
| | International Inc. | 100,265 | 4,394 |
| * | Appfolio Inc. | 99,665 | 4,136 |
| * | Ichor Holdings Ltd. | 152,351 | 3,748 |
| * | Blucora Inc. | 157,753 | 3,486 |
| * | Control4 Corp. | 99,663 | 2,966 |
| * | Pure Storage Inc. Class A | 185,846 | 2,947 |
| *,† | Cirrus Logic Inc. | 38,013 | 1,971 |
| * | SMART Global Holdings | | |
| | Inc. | 48,227 | 1,625 |
| * | Axcelis Technologies Inc. | 52,393 | 1,504 |
| * | TrueCar Inc. | 132,944 | 1,489 |
| * | Virtusa Corp. | 19,978 | 881 |
| | | | 269,942 |
| Materials (7.2%) | | |
| *,† | Freeport-McMoRan Inc. | 519,527 | 9,850 |
| * | Alcoa Corp. | 181,826 | 9,795 |
| † | Huntsman Corp. | 284,092 | 9,457 |
| *,† | Louisiana-Pacific Corp. | 355,488 | 9,335 |
| † | Greif Inc. Class A | 154,003 | 9,330 |
| † | Chemours Co. | 183,700 | 9,196 |
| *,† | Owens-Illinois Inc. | 413,074 | 9,158 |
| | Warrior Met Coal Inc. | 362,927 | 9,128 |
| | Westlake Chemical Corp. | 85,065 | 9,062 |
| | Tronox Ltd. Class A | 431,885 | 8,858 |
| | Kronos Worldwide Inc. | 338,685 | 8,728 |
| † | United States Steel Corp. | 213,777 | 7,523 |
| * | Century Aluminum Co. | 261,667 | 5,139 |
| | Boise Cascade Co. | 110,161 | 4,395 |
| * | AdvanSix Inc. | 76,591 | 3,222 |
| | | | 122,176 |
| Real Estate (6.6%) | | |
| | Gaming and Leisure | | |
| | Properties Inc. | 256,343 | 9,485 |
| † | Select Income REIT | 373,994 | 9,398 |
| † | Lexington Realty Trust | 953,461 | 9,201 |
| † | Xenia Hotels & Resorts | | |
| | Inc. | 424,479 | 9,165 |
| † | Sabra Health Care REIT | | |
| | Inc. | 459,419 | 8,623 |
| | Pebblebrook Hotel Trust | 225,993 | 8,400 |
| † | Hospitality Properties | | |
| | Trust | 265,093 | 7,913 |
16
| | | |
| Market Neutral Fund | | |
| |
| |
| |
| | | | Market |
| | | | Value• |
| | | Shares | ($000) |
| † | Ryman Hospitality | | |
| | Properties Inc. | 108,996 | 7,523 |
| † | Senior Housing | | |
| | Properties Trust | 384,620 | 7,365 |
| | Forest City Realty Trust | | |
| | Inc. Class A | 304,594 | 7,341 |
| | Sunstone Hotel Investors | | |
| | Inc. | 383,659 | 6,342 |
| † | CoreCivic Inc. | 221,007 | 4,973 |
| | CoreSite Realty Corp. | 36,806 | 4,192 |
| | Getty Realty Corp. | 142,832 | 3,879 |
| † | Government Properties | | |
| | Income Trust | 139,870 | 2,593 |
| | Alexander & Baldwin Inc. | 53,997 | 1,498 |
| | Chatham Lodging Trust | 64,264 | 1,463 |
| | Preferred Apartment | | |
| | Communities Inc. | | |
| | Class A | 63,733 | 1,291 |
| † | Washington Prime Group | | |
| | Inc. | 125,341 | 892 |
| | | | 111,537 |
| Telecommunication Services (0.4%) | |
| *,† | Sprint Corp. | 1,253,642 | 7,384 |
| |
| Utilities (2.6%) | | |
| † | NRG Energy Inc. | 333,929 | 9,510 |
| † | CenterPoint Energy Inc. | 335,000 | 9,501 |
| † | FirstEnergy Corp. | 295,980 | 9,063 |
| † | Entergy Corp. | 110,167 | 8,966 |
| † | National Fuel Gas Co. | 144,813 | 7,952 |
| | | | 44,992 |
| Total Common Stocks-Long | |
| Positions (Cost $1,323,053) | | 1,662,060 |
| Common Stocks Sold Short (-98.0%) | |
| Consumer Discretionary (-13.5%) | |
| | Core-Mark Holding | | |
| | Co. Inc. | (303,350) | (9,580) |
| | ILG Inc. | (331,925) | (9,453) |
| * | Amazon.com Inc. | (8,047) | (9,411) |
| * | G-III Apparel Group Ltd. | (253,667) | (9,358) |
| | Foot Locker Inc. | (198,972) | (9,328) |
| | Advance Auto Parts Inc. | (93,277) | (9,299) |
| | Nexstar Media Group Inc. | | |
| | Class A | (118,723) | (9,284) |
| * | TripAdvisor Inc. | (268,745) | (9,261) |
| | Red Rock Resorts Inc. | | |
| | Class A | (274,153) | (9,250) |
| | NIKE Inc. Class B | (147,820) | (9,246) |
| | Harley-Davidson Inc. | (181,393) | (9,229) |
| * | DISH Network Corp. | | |
| | Class A | (192,175) | (9,176) |
| | Monro Inc. | (160,605) | (9,147) |
| * | IMAX Corp. | (388,672) | (8,998) |
| | | |
| | Tapestry Inc. | (202,089) | (8,938) |
| * | Gentherm Inc. | (278,576) | (8,845) |
| | Mattel Inc. | (557,457) | (8,574) |
| * | Liberty Broadband Corp. | (96,488) | (8,217) |
| * | Fiesta Restaurant | | |
| | Group Inc. | (416,527) | (7,914) |
| | Dick’s Sporting Goods | | |
| | Inc. | (258,981) | (7,443) |
| | Bed Bath & Beyond Inc. | (316,373) | (6,957) |
| * | Houghton Mifflin | | |
| | Harcourt Co. | (702,064) | (6,529) |
| * | Vista Outdoor Inc. | (440,060) | (6,412) |
| * | Liberty Media Corp- | | |
| | Liberty Formula One | (176,527) | (6,030) |
| * | Liberty Ventures | | |
| | Class A | (108,165) | (5,867) |
| | Guess? Inc. | (228,423) | (3,856) |
| * | Laureate Education Inc. | | |
| | Class A | (259,019) | (3,512) |
| * | American Outdoor | | |
| | Brands Corp. | (198,624) | (2,550) |
| | DineEquity Inc. | (33,673) | (1,708) |
| | Tractor Supply Co. | (22,359) | (1,671) |
| * | Liberty Broadband Corp. | | |
| | Class A | (12,477) | (1,061) |
| | Vail Resorts Inc. | (4,068) | (864) |
| * | TRI Pointe Group Inc. | (47,972) | (860) |
| * | Meritage Homes Corp. | (14,376) | (736) |
| * | Lions Gate Entertainment | |
| | Corp. Class B | (18,578) | (590) |
| | | | (229,154) |
| Consumer Staples (-3.5%) | | |
| | Molson Coors Brewing | | |
| | Co. Class B | (115,949) | (9,516) |
| | Dr Pepper Snapple | | |
| | Group Inc. | (97,830) | (9,495) |
| | Coty Inc. Class A | (471,823) | (9,385) |
| * | Rite Aid Corp. | (4,662,398) | (9,185) |
| | Casey’s General Stores | | |
| | Inc. | (74,502) | (8,340) |
| * | Post Holdings Inc. | (91,541) | (7,253) |
| | PriceSmart Inc. | (42,755) | (3,681) |
| | Universal Corp. | (42,882) | (2,251) |
| | Dean Foods Co. | (90,302) | (1,044) |
| | | | (60,150) |
| Energy (-6.1%) | | |
| | Nabors Industries Ltd. | (1,457,897) | (9,957) |
| * | Cheniere Energy Inc. | (177,423) | (9,553) |
| | SM Energy Co. | (430,166) | (9,498) |
| | Baker Hughes a GE Co. | (289,369) | (9,156) |
| | Hess Corp. | (189,195) | (8,981) |
| | Targa Resources Corp. | (183,375) | (8,879) |
| | Range Resources Corp. | (513,215) | (8,755) |
17
| | | |
| Market Neutral Fund | | |
| |
| |
| |
| | | | Market |
| | | | Value• |
| | | Shares | ($000) |
| * | Superior Energy | | |
| | Services Inc. | (858,578) | (8,268) |
| * | PDC Energy Inc. | (130,366) | (6,719) |
| | SemGroup Corp. Class A | (218,197) | (6,590) |
| | Ensco plc Class A | (896,394) | (5,298) |
| | World Fuel Services Corp. | (124,838) | (3,513) |
| * | Kosmos Energy Ltd. | (402,671) | (2,758) |
| | Green Plains Inc. | (145,180) | (2,446) |
| * | Dril-Quip Inc. | (45,891) | (2,189) |
| * | Forum Energy | | |
| | Technologies Inc. | (72,867) | (1,133) |
| | | | (103,693) |
| Financials (-16.9%) | | |
| | Bank of the Ozarks | (204,068) | (9,887) |
| * | Markel Corp. | (8,346) | (9,507) |
| * | Berkshire Hathaway Inc. | | |
| | Class B | (47,511) | (9,418) |
| | Cboe Global Markets Inc. | (75,548) | (9,413) |
| | American International | | |
| | Group Inc. | (157,905) | (9,408) |
| * | Signature Bank | (67,597) | (9,278) |
| * | Brighthouse Financial Inc. | (157,935) | (9,261) |
| | First Midwest Bancorp | | |
| | Inc. | (385,229) | (9,249) |
| | Chemical Financial Corp. | (172,667) | (9,233) |
| | New York Community | | |
| | Bancorp Inc. | (708,090) | (9,219) |
| | United Bankshares Inc. | (263,771) | (9,166) |
| | FNB Corp. | (660,818) | (9,133) |
| | Pinnacle Financial | | |
| | Partners Inc. | (137,176) | (9,095) |
| | First Republic Bank | (104,858) | (9,085) |
| | People’s United Financial | | |
| | Inc. | (482,329) | (9,020) |
| | Validus Holdings Ltd. | (187,556) | (8,800) |
| | Axis Capital Holdings Ltd. | (174,946) | (8,793) |
| | Hope Bancorp Inc. | (481,499) | (8,787) |
| * | LendingClub Corp. | (2,122,916) | (8,768) |
| | Renasant Corp. | (210,563) | (8,610) |
| | IBERIABANK Corp. | (110,901) | (8,595) |
| | Home BancShares Inc. | (362,241) | (8,422) |
| | White Mountains | | |
| | Insurance Group Ltd. | (9,441) | (8,037) |
| * | Enstar Group Ltd. | (39,274) | (7,884) |
| | AmTrust Financial | | |
| | Services Inc. | (736,435) | (7,416) |
| | Community Bank System | | |
| | Inc. | (137,341) | (7,382) |
| | Investors Bancorp Inc. | (505,997) | (7,023) |
| | Mercury General Corp. | (125,893) | (6,728) |
| | Banner Corp. | (117,988) | (6,503) |
| | Aspen Insurance | | |
| | Holdings Ltd. | (138,750) | (5,633) |
| | XL Group Ltd. | (157,838) | (5,550) |
| | | |
| * | PRA Group Inc. | (162,385) | (5,391) |
| * | Alleghany Corp. | (7,620) | (4,542) |
| | South State Corp. | (43,976) | (3,833) |
| | MarketAxess Holdings | | |
| | Inc. | (15,000) | (3,026) |
| * | PHH Corp. | (170,909) | (1,760) |
| * | First BanCorp | (284,983) | (1,453) |
| * | Opus Bank | (42,743) | (1,167) |
| | RLI Corp. | (17,639) | (1,070) |
| | Popular Inc. | (25,231) | (895) |
| | Northwest Bancshares | | |
| | Inc. | (52,098) | (872) |
| | MB Financial Inc. | (19,359) | (862) |
| | | | (287,174) |
| Health Care (-9.8%) | | |
| * | DexCom Inc. | (165,686) | (9,509) |
| * | Acceleron Pharma Inc. | (222,768) | (9,454) |
| * | Envision Healthcare Corp. | (273,515) | (9,453) |
| * | DaVita Inc. | (130,640) | (9,439) |
| | Dentsply Sirona Inc. | (142,866) | (9,405) |
| * | MEDNAX Inc. | (175,699) | (9,389) |
| * | Sage Therapeutics Inc. | (56,504) | (9,307) |
| * | Natus Medical Inc. | (239,597) | (9,153) |
| * | Ultragenyx | | |
| | Pharmaceutical Inc. | (193,274) | (8,964) |
| * | Penumbra Inc. | (94,356) | (8,879) |
| * | Nevro Corp. | (120,855) | (8,344) |
| * | Avexis Inc. | (74,061) | (8,196) |
| * | ICU Medical Inc. | (37,544) | (8,110) |
| * | Sarepta Therapeutics Inc. | (130,517) | (7,262) |
| * | TESARO Inc. | (83,341) | (6,906) |
| * | Ligand Pharmaceuticals | | |
| | Inc. | (44,875) | (6,145) |
| * | Omnicell Inc. | (123,316) | (5,981) |
| | Owens & Minor Inc. | (242,914) | (4,586) |
| * | Aerie Pharmaceuticals Inc. | (65,113) | (3,891) |
| * | Brookdale Senior Living | | |
| | Inc. | (307,856) | (2,986) |
| * | Insmed Inc. | (88,981) | (2,774) |
| * | Five Prime Therapeutics | | |
| | Inc. | (97,352) | (2,134) |
| * | iRhythm Technologies Inc. | (37,511) | (2,102) |
| * | HMS Holdings Corp. | (120,724) | (2,046) |
| * | Varex Imaging Corp. | (24,508) | (984) |
| * | Amicus Therapeutics Inc. | (60,372) | (869) |
| * | Achillion Pharmaceuticals | | |
| | Inc. | (193,048) | (556) |
| | Abaxis Inc. | (6,500) | (322) |
| | | | (167,146) |
| Industrials (-14.5%) | | |
| * | SiteOne Landscape | | |
| | Supply Inc. | (126,492) | (9,702) |
| | Acuity Brands Inc. | (54,614) | (9,612) |
| | Wabtec Corp. | (117,856) | (9,597) |
18
| | | |
| Market Neutral Fund | | |
| |
| |
| |
| | | | Market |
| | | | Value• |
| | | Shares | ($000) |
| | Flowserve Corp. | (227,191) | (9,572) |
| | TransDigm Group Inc. | (34,744) | (9,541) |
| * | Genesee & Wyoming | | |
| | Inc. Class A | (120,325) | (9,473) |
| | Xylem Inc. | (138,799) | (9,466) |
| | Fluor Corp. | (182,567) | (9,430) |
| | Roper Technologies Inc. | (36,233) | (9,384) |
| * | Spirit Airlines Inc. | (207,949) | (9,327) |
| | Covanta Holding Corp. | (548,305) | (9,266) |
| | Cubic Corp. | (156,780) | (9,242) |
| | General Electric Co. | (506,688) | (8,842) |
| | Knight-Swift | | |
| | Transportation Holdings | | |
| | Inc. | (200,889) | (8,783) |
| | Cintas Corp. | (49,996) | (7,791) |
| | Allegiant Travel Co. | | |
| | Class A | (47,682) | (7,379) |
| | Healthcare Services | | |
| | Group Inc. | (130,896) | (6,901) |
| * | Clean Harbors Inc. | (124,422) | (6,744) |
| * | Team Inc. | (417,223) | (6,217) |
| | Matson Inc. | (204,762) | (6,110) |
| | Carlisle Cos. Inc. | (52,311) | (5,945) |
| | Granite Construction Inc. | (93,024) | (5,900) |
| * | Kirby Corp. | (85,769) | (5,729) |
| * | Middleby Corp. | (41,760) | (5,635) |
| * | RBC Bearings Inc. | (41,994) | (5,308) |
| * | NOW Inc. | (442,168) | (4,877) |
| | Tennant Co. | (58,722) | (4,266) |
| * | Welbilt Inc. | (172,804) | (4,063) |
| | Fastenal Co. | (64,369) | (3,520) |
| * | MRC Global Inc. | (187,312) | (3,169) |
| | Astec Industries Inc. | (53,485) | (3,129) |
| | John Bean Technologies | | |
| | Corp. | (27,944) | (3,096) |
| | Hubbell Inc. Class B | (20,850) | (2,822) |
| * | Stericycle Inc. | (40,672) | (2,765) |
| * | Esterline Technologies | | |
| | Corp. | (33,645) | (2,513) |
| | CH Robinson Worldwide | | |
| | Inc. | (24,669) | (2,198) |
| | ABM Industries Inc. | (57,680) | (2,176) |
| * | Hub Group Inc. Class A | (28,823) | (1,381) |
| | Universal Forest | | |
| | Products Inc. | (36,633) | (1,378) |
| * | Chart Industries Inc. | (28,867) | (1,353) |
| | Actuant Corp. Class A | (52,160) | (1,320) |
| * | WageWorks Inc. | (17,390) | (1,078) |
| | | | (246,000) |
| Information Technology (-16.4%) | |
| * | ViaSat Inc. | (128,532) | (9,621) |
| * | FleetCor Technologies | | |
| | Inc. | (49,372) | (9,501) |
| | j2 Global Inc. | (125,826) | (9,441) |
| | | |
| * | WEX Inc. | (66,748) | (9,427) |
| * | Ultimate Software | | |
| | Group Inc. | (43,190) | (9,425) |
| | Analog Devices Inc. | (105,835) | (9,422) |
| * | Guidewire Software Inc. | (125,886) | (9,348) |
| | Cisco Systems Inc. | (243,928) | (9,342) |
| | CA Inc. | (280,532) | (9,336) |
| * | Akamai Technologies Inc. | (143,490) | (9,333) |
| * | Tyler Technologies Inc. | (52,678) | (9,327) |
| * | Palo Alto Networks Inc. | (64,269) | (9,315) |
| | QUALCOMM Inc. | (145,272) | (9,300) |
| | Corning Inc. | (290,409) | (9,290) |
| * | Integrated Device | | |
| | Technology Inc. | (308,810) | (9,181) |
| * | MACOM Technology | | |
| | Solutions Holdings Inc. | (280,532) | (9,129) |
| * | Ellie Mae Inc. | (100,523) | (8,987) |
| * | Inphi Corp. | (242,472) | (8,874) |
| * | Finisar Corp. | (432,810) | (8,808) |
| | Xperi Corp. | (356,081) | (8,688) |
| | Symantec Corp. | (306,767) | (8,608) |
| * | NetScout Systems Inc. | (279,735) | (8,518) |
| | SS&C Technologies | | |
| | Holdings Inc. | (170,685) | (6,909) |
| | FLIR Systems Inc. | (136,679) | (6,372) |
| * | 8x8 Inc. | (442,888) | (6,245) |
| * | Zendesk Inc. | (182,607) | (6,179) |
| | AVX Corp. | (342,113) | (5,919) |
| * | comScore Inc. | (200,000) | (5,700) |
| * | salesforce.com Inc. | (51,442) | (5,259) |
| * | Gartner Inc. | (40,627) | (5,003) |
| * | Envestnet Inc. | (96,030) | (4,787) |
| * | Nuance Communications | | |
| | Inc. | (270,978) | (4,430) |
| * | Keysight Technologies | | |
| | Inc. | (102,934) | (4,282) |
| | TiVo Corp. | (178,987) | (2,792) |
| * | Electronics For Imaging | | |
| | Inc. | (89,935) | (2,656) |
| * | Qorvo Inc. | (35,346) | (2,354) |
| * | eBay Inc. | (46,443) | (1,753) |
| * | Veeco Instruments Inc. | (109,384) | (1,624) |
| * | Infinera Corp. | (224,742) | (1,423) |
| * | MicroStrategy Inc. | | |
| | Class A | (10,627) | (1,395) |
| * | Shutterstock Inc. | (27,811) | (1,197) |
| | | | (278,500) |
| Materials (-7.6%) | | |
| | Compass Minerals | | |
| | International Inc. | (136,282) | (9,846) |
| | Vulcan Materials Co. | (75,694) | (9,717) |
| | CF Industries Holdings | | |
| | Inc. | (225,448) | (9,590) |
| | Ecolab Inc. | (70,191) | (9,418) |
19
| | | |
| Market Neutral Fund | | |
| |
| |
| |
| | | | Market |
| | | | Value• |
| | | Shares | ($000) |
| | Martin Marietta | | |
| | Materials Inc. | (42,330) | (9,357) |
| | Ball Corp. | (245,523) | (9,293) |
| | DowDuPont Inc. | (130,404) | (9,287) |
| * | GCP Applied | | |
| | Technologies Inc. | (291,128) | (9,287) |
| | Nucor Corp. | (145,654) | (9,261) |
| | Mosaic Co. | (355,805) | (9,130) |
| * | Axalta Coating Systems | | |
| | Ltd. | (244,423) | (7,909) |
| | International Flavors & | | |
| | Fragrances Inc. | (40,786) | (6,224) |
| | Hecla Mining Co. | (1,271,707) | (5,049) |
| | RPM International Inc. | (95,348) | (4,998) |
| * | Coeur Mining Inc. | (418,256) | (3,137) |
| | Tahoe Resources Inc. | (640,621) | (3,069) |
| | NewMarket Corp. | (6,650) | (2,643) |
| | Worthington Industries | | |
| | Inc. | (46,544) | (2,051) |
| | | | (129,266) |
| Real Estate (-6.9%) | | |
| | Rayonier Inc. | (301,682) | (9,542) |
| | Vornado Realty Trust | (121,699) | (9,515) |
| | Federal Realty | | |
| | Investment Trust | (71,556) | (9,503) |
| | Boston Properties Inc. | (72,874) | (9,476) |
| | Macerich Co. | (144,224) | (9,473) |
| | Taubman Centers Inc. | (136,579) | (8,936) |
| | SL Green Realty Corp. | (76,234) | (7,694) |
| | Simon Property Group Inc. | (42,144) | (7,238) |
| | American Campus | | |
| | Communities Inc. | (163,793) | (6,720) |
| | Acadia Realty Trust | (236,100) | (6,460) |
| | Paramount Group Inc. | (353,005) | (5,595) |
| | Equity Commonwealth | (170,711) | (5,208) |
| | Education Realty Trust | | |
| | Inc. | (146,785) | (5,126) |
| | Mid-America Apartment | | |
| | Communities Inc. | (46,161) | (4,642) |
| | HFF Inc. Class A | (85,148) | (4,142) |
| | |
| Tanger Factory Outlet | | |
| Centers Inc. | (94,618) | (2,508) |
| Physicians Realty Trust | (109,703) | (1,974) |
| Empire State Realty | | |
| Trust Inc. | (93,428) | (1,918) |
| Marcus & Millichap Inc. | (29,140) | (950) |
| STORE Capital Corp. | (36,100) | (940) |
| | | (117,560) |
| Telecommunication Services (-0.4%) | |
| Shenandoah | | |
| Telecommunications Co. | (140,515) | (4,750) |
| Consolidated | | |
| Communications | | |
| Holdings Inc. | (197,490) | (2,407) |
| | | (7,157) |
| Utilities (-2.4%) | | |
| Aqua America Inc. | (244,118) | (9,577) |
| Dominion Energy Inc. | (116,831) | (9,470) |
| Southern Co. | (191,251) | (9,197) |
| Pattern Energy Group | | |
| Inc. Class A | (173,839) | (3,736) |
| SCANA Corp. | (88,140) | (3,506) |
| New Jersey Resources | | |
| Corp. | (56,715) | (2,280) |
| Ormat Technologies Inc. | (16,141) | (1,033) |
| South Jersey Industries | | |
| Inc. | (31,895) | (996) |
| | | (39,795) |
| Total Common Stocks Sold | | |
| Short (Proceeds $1,555,711) | | (1,665,595) |
| Temporary Cash Investment (3.7%) | |
| Money Market Fund (3.7%) | | |
| 1,2 Vanguard Market | | |
| Liquidity Fund, 1.458% | | |
| (Cost $63,724) | 637,226 | 63,729 |
| †,2 Other Assets and Liabilities— | |
| Net (96.5%) | | 1,639,937 |
| Net Assets (100%) | | 1,700,131 |
20
| |
| Market Neutral Fund | |
| |
| |
| |
| |
| | Amount |
| | ($000) |
| Statement of Assets and Liabilities | |
| Assets | |
| Investments in Securities, | |
| Long Positions, at Value | |
| Unaffiliated Issuers | 1,662,060 |
| Affiliated Vanguard Funds | 63,729 |
| Total Long Positions | 1,725,789 |
| Investment in Vanguard | 103 |
| † Cash Segregated for Short Positions | 1,665,911 |
| Receivables for Investment | |
| Securities Sold | 6,690 |
| Receivables for Accrued Income | 1,505 |
| Receivables for Capital Shares Issued | 2,650 |
| Other Assets | 168 |
| Total Assets | 3,402,816 |
| Liabilities | |
| Securities Sold Short, at Value | 1,665,595 |
| Payables for Investment | |
| Securities Purchased | 7,396 |
| Collateral for Securities on Loan | 12,460 |
| Payables for Capital Shares Redeemed | 14,356 |
| Payables to Vanguard | 531 |
| Accrued Dividend Expense on | |
| Securities Sold Short | 2,347 |
| Total Liabilities | 1,702,685 |
| Net Assets | 1,700,131 |
| |
| |
| At December 31, 2017, net assets consisted of: |
| | Amount |
| | ($000) |
| Paid-in Capital | 1,753,221 |
| Undistributed Net Investment Income | 726 |
| Accumulated Net Realized Losses | (282,944) |
| Unrealized Appreciation (Depreciation) | |
| Investment Securities-Long Positions | 339,012 |
| Investment Securities Sold Short | (109,884) |
| Net Assets | 1,700,131 |
| |
| Investor Shares—Net Assets | |
| Applicable to 117,315,932 outstanding | |
| $.001 par value shares of beneficial | |
| interest (unlimited authorization) | 1,367,870 |
| Net Asset Value Per Share— | |
| Investor Shares | $11.66 |
| |
| |
| Institutional Shares—Net Assets | |
| Applicable to 28,617,923 outstanding | |
| $.001 par value shares of beneficial | |
| interest (unlimited authorization) | 332,261 |
| Net Asset Value Per Share— | |
| Institutional Shares | $11.61 |
• See Note A in Notes to Financial Statements.
* Non-income-producing security.
† Long security positions with a value of $1,016,436,000 and
cash of $1,665,911,000 are held in a segregated account at
the fund’s custodian bank and pledged to a broker-dealer
as collateral for the fund’s obligation to return borrowed
securities. For so long as such obligations continue, the
fund’s access to these assets is subject to authorization
from the broker-dealer.
^ Includes partial security positions on loan to broker-dealers.
The total value of securities on loan is $11,980,000.
1 Affiliated money market fund available only to Vanguard funds
and certain trusts and accounts managed by Vanguard. Rate
shown is the 7-day yield.
2 Includes $12,460,000 of collateral received for securities
on loan.
REIT—Real Estate Investment Trust.
See accompanying Notes, which are an integral part of the Financial Statements.
21
| |
| Market Neutral Fund | |
| |
| |
| Statement of Operations | |
| |
| | Year Ended |
| | December31,2017 |
| | ($000) |
| Investment Income | |
| Income | |
| Dividends | 36,677 |
| Interest1 | 12,145 |
| Securities Lending—Net | 1,231 |
| Total Income | 50,053 |
| Expenses | |
| The Vanguard Group—Note B | |
| Investment Advisory Services | 1,111 |
| Management and Administrative—Investor Shares | 2,195 |
| Management and Administrative—Institutional Shares | 254 |
| Marketing and Distribution—Investor Shares | 355 |
| Marketing and Distribution—Institutional Shares | 11 |
| Custodian Fees | 99 |
| Auditing Fees | 29 |
| Shareholders’ Reports and Proxy—Investor Shares | 109 |
| Shareholders’ Reports and Proxy—Institutional Shares | 8 |
| Trustees’ Fees and Expenses | 2 |
| Dividend Expense on Securities Sold Short | 26,730 |
| Total Expenses | 30,903 |
| Net Investment Income (Loss) | 19,150 |
| Realized Net Gain (Loss) | |
| Investment Securities - Long Positions1 | 199,808 |
| Investment Securities Sold Short | (406,993) |
| Realized Net Gain (Loss) | (207,185) |
| Change in Unrealized Appreciation (Depreciation) | |
| Investment Securities - Long Positions1 | 19,489 |
| Investment Securities Sold Short | 63,242 |
| Change in Unrealized Appreciation (Depreciation) of Investment Securities | 82,731 |
| Net Increase (Decrease) in Net Assets Resulting from Operations | (105,304) |
1 Interest income, realized net gain (loss), and change in unrealized appreciation (depreciation) from an affiliated company of the fund were $215,000, $6,000, and $5,000 respectively.
See accompanying Notes, which are an integral part of the Financial Statements.
22
| | |
| Market Neutral Fund | | |
| |
| |
| Statement of Changes in Net Assets | | |
| |
| | Year Ended December 31, |
| | 2017 | 2016 |
| | ($000) | ($000) |
| Increase (Decrease) in Net Assets | | |
| Operations | | |
| Net Investment Income | 19,150 | 8,134 |
| Realized Net Gain (Loss) | (207,185) | (70,748) |
| Change in Unrealized Appreciation (Depreciation) | 82,731 | 101,233 |
| Net Increase (Decrease) in Net Assets Resulting from Operations | (105,304) | 38,619 |
| Distributions | | |
| Net Investment Income | | |
| Investor Shares | (14,751) | (6,469) |
| Institutional Shares | (3,657) | (1,526) |
| Realized Capital Gain | | |
| Institutional Shares | — | — |
| Investor Shares | — | — |
| Total Distributions | (18,408) | (7,995) |
| Capital Share Transactions | | |
| Investor Shares | (289,113) | 1,085,149 |
| Institutional Shares | 14,828 | 230,873 |
| Net Increase (Decrease) from Capital Share Transactions | (274,285) | 1,316,022 |
| Total Increase (Decrease) | (397,997) | 1,346,646 |
| Net Assets | | |
| Beginning of Period | 2,098,128 | 751,482 |
| End of Period1 | 1,700,131 | 2,098,128 |
1 Net Assets—End of Period includes undistributed (overdistributed) net investment income of $726,000 and ($28,000).
See accompanying Notes, which are an integral part of the Financial Statements.
23
| | | | | |
| Market Neutral Fund | | | | | |
| |
| |
| Financial Highlights | | | | | |
| |
| |
| Investor Shares | | | | | |
| |
| For a Share Outstanding | | | Year Ended December 31, |
| Throughout Each Period | 2017 | 2016 | 2015 | 2014 | 2013 |
| Net Asset Value, Beginning of Period | $12.39 | $12.12 | $11.50 | $11.03 | $10.16 |
| Investment Operations | | | | | |
| Net Investment Income (Loss) | .1111 | .050 | .0021 | (.032) | (.007) |
| Net Realized and Unrealized Gain (Loss) | | | | | |
| on Investments | (.717) | .267 | .620 | .502 | .880 |
| Total from Investment Operations | (.606) | .317 | .622 | .470 | .873 |
| Distributions | | | | | |
| Dividends from Net Investment Income | (.124) | (.047) | (.002) | — | (.002) |
| Distributions from Realized Capital Gains | — | — | — | — | — |
| Return of Capital | — | — | — | — | (.001) |
| Total Distributions | (.124) | (.047) | (.002) | — | (.003) |
| Net Asset Value, End of Period | $11.66 | $12.39 | $12.12 | $11.50 | $11.03 |
| |
| Total Return2 | -4.89% | 2.62% | 5.41% | 4.26% | 8.59% |
| |
| Ratios/Supplemental Data | | | | | |
| Net Assets, End of Period (Millions) | $1,368 | $1,760 | $650 | $257 | $174 |
| Ratio of Total Expenses to Average Net Assets | | | | | |
| Based on Total Expenses3,4 | 1.54% | 1.60% | 1.46% | 1.64% | 1.57% |
| Net of Dividend and Borrowing Expense on | | | | | |
| Securities Sold Short | 0.22% | 0.22% | 0.25% | 0.25% | 0.25% |
| Ratio of Net Investment Income (Loss) to | | | | | |
| Average Net Assets | 0.94% | 0.48% | 0.01% | (0.38%) | (0.06%) |
| Portfolio Turnover Rate | 79% | 64% | 68% | 73% | 68% |
1 Calculated based on average shares outstanding.
2 Total returns do not include transaction fees that may have applied in the periods shown. Fund prospectuses provide information about
any applicable transaction fees.
3 Includes dividend expense on securities sold short of 1.32%, 1.38%, 1.06%, 1.21%, and 1.18%, respectively.
4 Includes borrowing expense on securities sold short of 0.00%, 0.00%, 0.15%, 0.18%, and 0.14%, respectively.
See accompanying Notes, which are an integral part of the Financial Statements.
24
| | | | | |
| Market Neutral Fund | | | | | |
| |
| |
| Financial Highlights | | | | | |
| |
| |
| Institutional Shares | | | | | |
| |
| For a Share Outstanding | | | Year Ended December 31, |
| Throughout Each Period | 2017 | 2016 | 2015 | 2014 | 2013 |
| Net Asset Value, Beginning of Period | $12.34 | $12.07 | $11.45 | $10.97 | $10.10 |
| Investment Operations | | | | | |
| Net Investment Income (Loss) | .1231 | .061 | .0111 | (.023) | .006 |
| Net Realized and Unrealized Gain (Loss) | | | | | |
| on Investments | (.719) | .265 | .621 | .503 | .868 |
| Total from Investment Operations | (.596) | .326 | .632 | .480 | .874 |
| Distributions | | | | | |
| Dividends from Net Investment Income | (.134) | (.056) | (.012) | — | (.003) |
| Distributions from Realized Capital Gains | — | — | — | — | — |
| Return of Capital | — | — | — | — | (.001) |
| Total Distributions | (.134) | (.056) | (.012) | — | (.004) |
| Net Asset Value, End of Period | $11.61 | $12.34 | $12.07 | $11.45 | $10.97 |
| |
| Total Return2 | -4.83% | 2.70% | 5.52% | 4.38% | 8.66% |
| |
| Ratios/Supplemental Data | | | | | |
| Net Assets, End of Period (Millions) | $332 | $338 | $102 | $55 | $35 |
| Ratio of Total Expenses to Average Net Assets | | | | | |
| Based on Total Expenses3,4 | 1.46% | 1.52% | 1.36% | 1.54% | 1.47% |
| Net of Dividend and Borrowing Expense on | | | | | |
| Securities Sold Short | 0.14% | 0.14% | 0.15% | 0.15% | 0.15% |
| Ratio of Net Investment Income (Loss) to | | | | | |
| Average Net Assets | 1.02% | 0.56% | 0.11% | (0.28%) | 0.04% |
| Portfolio Turnover Rate | 79% | 64% | 68% | 73% | 68% |
1 Calculated based on average shares outstanding.
2 Total returns do not include transaction fees that may have applied in the periods shown. Fund prospectuses provide information about
any applicable transaction fees.
3 Includes dividend expense on securities sold short of 1.32%, 1.38%, 1.06%, 1.21%, and 1.18%, respectively.
4 Includes borrowing expense on securities sold short of 0.00%, 0.00%, 0.15%, 0.18%, and 0.14%, respectively.
See accompanying Notes, which are an integral part of the Financial Statements.
25
Market Neutral Fund
Notes to Financial Statements
Vanguard Market Neutral Fund is registered under the Investment Company Act of 1940 as an open-end investment company, or mutual fund. The fund offers two classes of shares: Investor Shares and Institutional Shares. Investor Shares are available to any investor who meets the fund’s minimum purchase requirements. Institutional Shares are designed for investors who meet certain administrative, service, and account-size criteria.
A. The following significant accounting policies conform to generally accepted accounting principles for U.S. investment companies. The fund consistently follows such policies in preparing its financial statements.
1. Security Valuation: Securities are valued as of the close of trading on the New York Stock Exchange (generally 4 p.m., Eastern time) on the valuation date. Equity securities are valued at the latest quoted sales prices or official closing prices taken from the primary market in which each security trades; such securities not traded on the valuation date are valued at the mean of the latest quoted bid and asked prices. Securities for which market quotations are not readily available, or whose values have been materially affected by events occurring before the fund’s pricing time but after the close of the securities’ primary markets, are valued by methods deemed by the board of trustees to represent fair value. Investments in Vanguard Market Liquidity Fund are valued at that fund’s net asset value.
2. Short Sales: Short sales are the sales of securities that the fund does not own. The fund sells a security it does not own in anticipation of a decline in the value of that security. In order to deliver the security to the purchaser, the fund borrows the security from a broker-dealer. The fund must segregate, as collateral for its obligation to return the borrowed security, an amount of cash and long security positions at least equal to the market value of the security sold short. In the absence of a default, the collateral segregated by the fund cannot be repledged, resold or rehypothecated. This results in the fund holding a significant portion of its assets in cash. The fund later closes out the position by returning the security to the lender, typically by purchasing the security in the open market. A gain, limited to the price at which the fund sold the security short, or a loss, theoretically unlimited in size, is recognized upon the termination of the short sale. The fund may receive a portion of the income from the investment of collateral, or be charged a fee on borrowed securities, based on the market value of each borrowed security and a variable rate that is dependent upon the availability of such security. The net amounts of income or fees are recorded as interest income (for net income received) or borrowing expense on securities sold short (for net fees charged) on the Statement of Operations. Dividends on securities sold short are reported as an expense in the Statement of Operations.
Cash collateral segregated for securities sold short is recorded as an asset in the Statement of Assets and Liabilities. Long security positions segregated as collateral are shown in the Statement of Net Assets.
3. Federal Income Taxes: The fund intends to continue to qualify as a regulated investment company and distribute all of its taxable income. Management has analyzed the fund’s tax positions taken for all open federal income tax years (December 31, 2014–2017), and has concluded that no provision for federal income tax is required in the fund’s financial statements.
4. Distributions: Distributions to shareholders are recorded on the ex-dividend date.
5. Securities Lending: To earn additional income, the fund lends its securities to qualified institutional borrowers. Security loans are subject to termination by the fund at any time, and are required to be secured at all times by collateral in an amount at least equal to the market value of
26
Market Neutral Fund
securities loaned. Daily market fluctuations could cause the value of loaned securities to be more or less than the value of the collateral received. When this occurs, the collateral is adjusted and settled on the next business day. The fund further mitigates its counterparty risk by entering into securities lending transactions only with a diverse group of prequalified counterparties, monitoring their financial strength, and entering into master securities lending agreements with its counterparties. The master securities lending agreements provide that, in the event of a counterparty’s default (including bankruptcy), the fund may terminate any loans with that borrower, determine the net amount owed, and sell or retain the collateral up to the net amount owed to the fund; however, such actions may be subject to legal proceedings. While collateral mitigates counterparty risk, in the event of a default, the fund may experience delays and costs in recovering the securities loaned. The fund invests cash collateral received in Vanguard Market Liquidity Fund, and records a liability in the Statement of Assets and Liabilities for the return of the collateral, during the period the securities are on loan. Securities lending income represents fees charged to borrowers plus income earned on invested cash collateral, less expenses associated with the loan. During the term of the loan, the fund is entitled to all distributions made on or in respect of the loaned securities.
6. Credit Facility: The fund and certain other funds managed by The Vanguard Group (“Vanguard”) participate in a $3.1 billion committed credit facility provided by a syndicate of lenders pursuant to a credit agreement that may be renewed annually; each fund is individually liable for its borrowings, if any, under the credit facility. Borrowings may be utilized for temporary and emergency purposes, and are subject to the fund’s regulatory and contractual borrowing restrictions. The participating funds are charged administrative fees and an annual commitment fee of 0.10% of the undrawn amount of the facility; these fees are allocated to the funds based on a method approved by the fund’s board of trustees and included in Management and Administrative expenses on the fund’s Statement of Operations. Any borrowings under this facility bear interest at a rate based upon the higher of the one-month London Interbank Offered Rate, federal funds effective rate, or overnight bank funding rate plus an agreed-upon spread.
The fund had no borrowings outstanding at December 31, 2017, or at any time during the period then ended.
7. Other: Dividend income is recorded on the ex-dividend date. Interest income includes income distributions received from Vanguard Market Liquidity Fund and is accrued daily. Premiums and discounts on debt securities purchased are amortized and accreted, respectively, to interest income over the lives of the respective securities. Security transactions are accounted for on the date securities are bought or sold. Costs used to determine realized gains (losses) on the sale of investment securities are those of the specific securities sold.
Each class of shares has equal rights as to assets and earnings, except that each class separately bears certain class-specific expenses related to maintenance of shareholder accounts (included in Management and Administrative expenses), shareholder reporting, and the proxy. Marketing and distribution expenses are allocated to each class of shares based on a method approved by the board of trustees. Income, other non-class-specific expenses, and gains and losses on investments are allocated to each class of shares based on its relative net assets.
B. In accordance with the terms of a Funds’ Service Agreement (the “FSA”) between Vanguard and the fund, Vanguard furnishes to the fund investment advisory, corporate management, administrative, marketing, and distribution services at Vanguard’s cost of operations (as defined by the FSA). These costs of operations are allocated to the fund based on methods and guidelines approved by the board of trustees. Vanguard does not require reimbursement in the current period
27
Market Neutral Fund
for certain costs of operations (such as deferred compensation/benefits and risk/insurance costs); the fund’s liability for these costs of operations is included in Payables to Vanguard on the Statement of Assets and Liabilities.
Upon the request of Vanguard, the fund may invest up to 0.40% of its net assets as capital in Vanguard. At December 31, 2017, the fund had contributed to Vanguard capital in the amount of $103,000, representing 0.01% of the fund’s net assets and 0.04% of Vanguard’s capitalization. The fund’s trustees and officers are also directors and employees, respectively, of Vanguard.
C. Various inputs may be used to determine the value of the fund’s investments. These inputs are summarized in three broad levels for financial statement purposes. The inputs or methodologies used to value securities are not necessarily an indication of the risk associated with investing in those securities.
Level 1—Quoted prices in active markets for identical securities.
Level 2—Other significant observable inputs (including quoted prices for similar securities, interest rates, prepayment speeds, credit risk, etc.).
Level 3—Significant unobservable inputs (including the fund’s own assumptions used to determine the fair value of investments). Any investments valued with significant unobservable inputs are noted on the Statement of Net Assets.
At December 31, 2017, 100% of the market value of the fund’s investments was determined based on Level 1 inputs.
D. Distributions are determined on a tax basis and may differ from net investment income and realized capital gains for financial reporting purposes. Differences may be permanent or temporary. Permanent differences are reclassified among capital accounts in the financial statements to reflect their tax character. Temporary differences arise when certain items of income, expense, gain, or loss are recognized in different periods for financial statement and tax purposes. These differences will reverse at some time in the future. Differences in classification may also result from the treatment of short-term gains as ordinary income for tax purposes.
For tax purposes, at December 31, 2017, the fund had $1,082,000 of ordinary income available for distribution. At December 31, 2017, the fund had available capital losses totaling $282,442,000 to offset future net capital gains. Of this amount, $4,871,000 is subject to expiration on December 31, 2018. Capital losses of $277,571,000 realized beginning in fiscal 2011 may be carried forward indefinitely under the Regulated Investment Company Modernization Act of 2010, but must be used before any expiring loss carryforwards. Capital loss carryforwards of $7,346,000 expired on December 31, 2017; accordingly, such losses have been reclassified from accumulated net realized losses to paid-in capital.
At December 31, 2017, the cost of long security positions for tax purposes was $1,387,279,000. Net unrealized appreciation of long security positions for tax purposes was $338,510,000, consisting of unrealized gains of $360,605,000 on securities that had risen in value since their purchase and $22,095,000 in unrealized losses on securities that had fallen in value since their purchase. Tax-basis net unrealized depreciation on securities sold short was $109,884,000, consisting of unrealized gains of $88,659,000 on securities that had fallen in value since their purchase and $198,543,000 in unrealized losses on securities that had risen in value since their sale.
28
Market Neutral Fund
E. During the year ended December 31, 2017, the fund purchased $1,582,453,000 of investment securities and sold $2,167,683,000 of investment securities, other than temporary cash investments. The proceeds of short sales and the cost of purchases to cover short sales were $1,948,816,000 and $2,650,364,000, respectively.
| | | | |
| F. Capital share transactions for each class of shares were: | | | |
| | | | Year Ended December 31, |
| | | 2017 | | 2016 |
| | Amount | Shares | Amount | Shares |
| | ($000) | (000) | ($000) | (000) |
| Investor Shares | | | | |
| Issued | 591,027 | 49,285 | 1,698,621 | 139,652 |
| Issued in Lieu of Cash Distributions | 12,597 | 1,078 | 5,571 | 449 |
| Redeemed | (892,737) | (75,101) | (619,043) | (51,631) |
| Net Increase (Decrease)—Investor Shares | (289,113) | (24,738) | 1,085,149 | 88,470 |
| Institutional Shares | | | | |
| Issued | 103,508 | 8,699 | 294,960 | 24,355 |
| Issued in Lieu of Cash Distributions | 2,924 | 251 | 1,239 | 100 |
| Redeemed | (91,604) | (7,730) | (65,326) | (5,499) |
| Net Increase (Decrease)—Institutional Shares | 14,828 | 1,220 | 230,873 | 18,956 |
At December 31, 2017, one shareholder was the record or beneficial owner of 28% of the fund’s net assets. If the shareholder were to redeem its investment in the fund, the redemption might result in an increase in the fund’s expense ratio, cause the fund to incur higher transaction costs, or lead to the realization of taxable capital gains.
G. Management has determined that no material events or transactions occurred subsequent to December 31, 2017, that would require recognition or disclosure in these financial statements.
29
Report of Independent Registered Public Accounting Firm
To the Board of Trustees of Vanguard Montgomery Funds and Shareholders of Vanguard Market Neutral Fund
Opinion on the Financial Statements
We have audited the accompanying statement of net assets and statement of assets and liabilities of Vanguard Market Neutral Fund (“the Fund”) as of December 31, 2017, the related statement of operations for the year ended December 31, 2017, the statement of changes in net assets for each of the two years in the period ended December 31, 2017, including the related notes, and the financial highlights for each of the five years in the period ended December 31, 2017 (collectively referred to as the “financial statements”). In our opinion, the financial statements present fairly, in all material respects, the financial position of the Fund as of December 31, 2017, the results of its operations for the year then ended, the changes in its net assets for each of the two years in the period ended December 31, 2017 and the financial highlights for each of the five years in the period ended December 31, 2017 in conformity with accounting principles generally accepted in the United States of America.
Basis for Opinion
These financial statements are the responsibility of the Fund’s management. Our responsibility is to express an opinion on the Fund’s financial statements based on our audits. We are a public accounting firm registered with the Public Company Accounting Oversight Board (United States) (“PCAOB”) and are required to be independent with respect to the Fund in accordance with the U.S. federal securities laws and the applicable rules and regulations of the Securities and Exchange Commission and the PCAOB.
We conducted our audits of these financial statements in accordance with the standards of the PCAOB. Those standards require that we plan and perform the audit to obtain reasonable assurance about whether the financial statements are free of material misstatement, whether due to error or fraud.
Our audits included performing procedures to assess the risks of material misstatement of the financial statements, whether due to error or fraud, and performing procedures that respond to those risks. Such procedures included examining, on a test basis, evidence regarding the amounts and disclosures in the financial statements. Our audits also included evaluating the accounting principles used and significant estimates made by management, as well as evaluating the overall presentation of the financial statements. Our procedures included confirmation of securities owned as of December 31, 2017 by correspondence with the custodian and brokers and by agreement to the underlying ownership records of the transfer agent; when replies were not received from brokers, we performed other auditing procedures. We believe that our audits provide a reasonable basis for our opinion.
/s/PricewaterhouseCoopers LLP
Philadelphia, Pennsylvania
February 15, 2018
We have served as the auditor of one or more investment companies in The Vanguard Group of Funds since 1975.
30
Special 2017 tax information (unaudited) for Vanguard Market Neutral Fund
This information for the fiscal year ended December 31, 2017, is included pursuant to provisions
of the Internal Revenue Code.
The fund distributed $18,408,000 of qualified dividend income to shareholders during the
fiscal year.
For corporate shareholders, 100% of investment income (dividend income plus short-term gains,
if any) qualifies for the dividends-received deduction.
31
Your Fund’s After-Tax Returns
This table presents returns for your fund both before and after taxes. The after-tax returns are shown in two ways: (1) assuming that an investor owned the fund during the entire period and paid taxes on the fund’s distributions, and (2) assuming that an investor paid taxes on the fund’s distributions and sold all shares at the end of each period.
Calculations are based on the highest individual federal income tax and capital gains tax rates in effect at the times of the distributions and the hypothetical sales. State and local taxes were not considered. After-tax returns reflect any qualified dividend income. (In the example, returns after the sale of fund shares may be higher than those assuming no sale. This occurs when the sale would have produced a capital loss. The calculation assumes that the investor received a tax deduction for the loss.)
The table shows returns for Investor Shares only; returns for other share classes will differ. Please note that your actual after-tax returns will depend on your tax situation and may differ from those shown. Also note that if you own the fund in a tax-deferred account, such as an individual retirement account or a 401(k) plan, this information does not apply to you. Such accounts are not subject to current taxes.
Finally, keep in mind that a fund’s performance—whether before or after taxes—does not guarantee future results.
| | | |
| Average Annual Total Returns: Market Neutral Fund Investor Shares | | |
| Periods Ended December 31, 2017 | | | |
| | One | Five | Ten |
| | Year | Years | Years |
| Returns Before Taxes | -4.89% | 3.10% | -0.05% |
| Returns After Taxes on Distributions | -5.13 | 3.03 | -0.27 |
| Returns After Taxes on Distributions and Sale of Fund Shares | -2.57 | 2.39 | -0.07 |
32
About Your Fund’s Expenses
As a shareholder of the fund, you incur ongoing costs, which include costs for portfolio management, administrative services, and shareholder reports (like this one), among others. Operating expenses, which are deducted from a fund’s gross income, directly reduce the investment return of the fund.
A fund’s expenses are expressed as a percentage of its average net assets. This figure is known as the expense ratio. The following examples are intended to help you understand the ongoing costs (in dollars) of investing in your fund and to compare these costs with those of other mutual funds. The examples are based on an investment of $1,000 made at the beginning of the period shown and held for the entire period.
The accompanying table illustrates your fund’s costs in two ways:
• Based on actual fund return. This section helps you to estimate the actual expenses that you paid over the period. The ”Ending Account Value“ shown is derived from the fund‘s actual return, and the third column shows the dollar amount that would have been paid by an investor who started with $1,000 in the fund. You may use the information here, together with the amount you invested, to estimate the expenses that you paid over the period.
To do so, simply divide your account value by $1,000 (for example, an $8,600 account value divided by $1,000 = 8.6), then multiply the result by the number given for your fund under the heading ”Expenses Paid During Period.“
• Based on hypothetical 5% yearly return. This section is intended to help you compare your fund‘s costs with those of other mutual funds. It assumes that the fund had a yearly return of 5% before expenses, but that the expense ratio is unchanged. In this case—because the return used is not the fund’s actual return—the results do not apply to your investment. The example is useful in making comparisons because the Securities and Exchange Commission requires all mutual funds to calculate expenses based on a 5% return. You can assess your fund’s costs by comparing this hypothetical example with the hypothetical examples that appear in shareholder reports of other funds.
Note that the expenses shown in the table are meant to highlight and help you compare ongoing costs only and do not reflect transaction costs incurred by the fund for buying and selling securities. Further, the expenses do not include any purchase, redemption, or account service fees described in the fund prospectus. If such fees were applied to your account, your costs would be higher. Your fund does not carry a “sales load.”
The calculations assume no shares were bought or sold during the period. Your actual costs may have been higher or lower, depending on the amount of your investment and the timing of any purchases or redemptions.
You can find more information about the fund’s expenses, including annual expense ratios, in the Financial Statements section of this report. For additional information on operating expenses and other shareholder costs, please refer to your fund’s current prospectus.
33
| | | |
| Six Months Ended December 31, 2017 | | | |
| | Beginning | Ending | Expenses |
| | Account Value | Account Value | Paid During |
| Market Neutral Fund | 6/30/2017 | 12/31/2017 | Period |
| Based on Actual Fund Return | | | |
| Investor Shares | $1,000.00 | $995.24 | $7.90 |
| Institutional Shares | 1,000.00 | 995.88 | 7.50 |
| Based on Hypothetical 5% Yearly Return | | | |
| Investor Shares | $1,000.00 | $1,016.95 | $7.98 |
| Institutional Shares | 1,000.00 | 1,017.35 | 7.58 |
The calculations are based on expenses incurred in the most recent six-month period. The fund’s annualized six-month expense ratios for that period are 1.57% for Investor Shares and 1.49% for Institutional Shares. The dollar amounts shown as “Expenses Paid” are equal to the annualized expense ratio multiplied by the average account value over the period, multiplied by the number of days in the most recent six-month period, then divided by the number of days in the most recent 12-month period (184/365).
34
Glossary
Beta. A measure of the magnitude of a fund’s past share-price fluctuations in relation to the ups and downs of a given market index. The index is assigned a beta of 1.00. Compared with a given index, a fund with a beta of 1.20 typically would have seen its share price rise or fall by 12% when the index rose or fell by 10%. For this report, beta is based on returns over the past 36 months for both the fund and the index. Note that a fund’s beta should be reviewed in conjunction with its R-squared (see definition). The lower the R-squared, the less correlation there is between the fund and the index, and the less reliable beta is as an indicator of volatility.
Earnings Growth Rate. The average annual rate of growth in earnings over the past five years for the stocks now in a fund.
Equity Exposure. A measure that reflects a fund’s investments in stocks and stock futures. Any holdings in short-term reserves are excluded.
Expense Ratio. The percentage of a fund’s average net assets used to pay its annual administrative and advisory expenses. These expenses directly reduce returns to investors.
Foreign Holdings. The percentage of a fund represented by securities or depositary receipts of companies based outside the United States.
Inception Date. The date on which the assets of a fund (or one of its share classes) are first invested in accordance with the fund’s investment objective. For funds with a subscription period, the inception date is the day after that period ends. Investment performance is measured from the inception date.
Median Market Cap. An indicator of the size of companies in which a fund invests; the midpoint of market capitalization (market price x shares outstanding) of a fund’s stocks, weighted by the proportion of the fund’s assets invested in each stock. Stocks representing half of the fund’s assets have market capitalizations above the median, and the rest are below it.
Price/Book Ratio. The share price of a stock divided by its net worth, or book value, per share. For a fund, the weighted average price/book ratio of the stocks it holds.
Price/Earnings Ratio. The ratio of a stock’s current price to its per-share earnings over the past year. For a fund, the weighted average P/E of the stocks it holds. P/E is an indicator of market expectations about corporate prospects; the higher the P/E, the greater the expectations for a company’s future growth.
R-Squared. A measure of how much of a fund’s past returns can be explained by the returns from the market in general, as measured by a given index. If a fund’s total returns were precisely synchronized with an index’s returns, its R-squared would be 1.00. If the fund’s returns bore no relationship to the index’s returns, its R-squared would be 0. For this report, R-squared is based on returns over the past 36 months for both the fund and the index.
Return on Equity. The annual average rate of return generated by a company during the past five years for each dollar of shareholder’s equity (net income divided by shareholder’s equity). For a fund, the weighted average return on equity for the companies whose stocks it holds.
Short-Term Reserves. The percentage of a fund invested in highly liquid, short-term securities that can be readily converted to cash.
35
Turnover Rate. An indication of the fund’s trading activity. Funds with high turnover rates incur higher transaction costs and may be more likely to distribute capital gains (which may be taxable to investors). The turnover rate excludes in-kind transactions, which have minimal impact on costs.
Benchmark Information
Spliced Market Neutral Index: Citigroup 3-Month U.S. Treasury Bill Index through March 31, 2016; Citigroup 3-Month U.S. Treasury Bill Index (Daily) thereafter.
36
This page intentionally left blank.
This page intentionally left blank.
The People Who Govern Your Fund
The trustees of your mutual fund are there to see that the fund is operated and managed in your best interests since, as a shareholder, you are a part owner of the fund. Your fund’s trustees also serve on the board of directors of The Vanguard Group, Inc., which is owned by the Vanguard funds and provides services to them on an at-cost basis.
A majority of Vanguard’s board members are independent, meaning that they have no affiliation with Vanguard or the funds they oversee, apart from the sizable personal investments they have made as private individuals. The independent board members have distinguished backgrounds in business, academia, and public service. Each of the trustees and executive officers oversees 201 Vanguard funds.
Information for each trustee and executive officer of the fund appears below. The mailing address of the trustees and officers is P.O. Box 876, Valley Forge, PA 19482. More information about the trustees is in the Statement of Additional Information, which can be obtained, without charge, by contacting Vanguard at 800-662-7447, or online at vanguard.com.
Interested Trustee1
F. William McNabb III
Born 1957. Trustee Since July 2009. Chairman of the Board. Principal Occupation(s) During the Past Five Years and Other Experience: Chairman of the Board of The Vanguard Group, Inc., and of each of the investment companies served by The Vanguard Group, since January 2010; Chief Executive Officer and Director of The Vanguard Group and President and Chief Executive Officer of each of the investment companies served by The Vanguard Group, since 2008; Director of Vanguard Marketing Corporation; President of The Vanguard Group (2008–2017); Managing Director of The Vanguard Group (1995–2008).
Independent Trustees
Emerson U. Fullwood
Born 1948. Trustee Since January 2008. Principal Occupation(s) During the Past Five Years and Other Experience: Executive Chief Staff and Marketing Officer for North America and Corporate Vice President (retired 2008) of Xerox Corporation (document management products and services);
Executive in Residence and 2009–2010 Distinguished Minett Professor at the Rochester Institute of Technology; Lead Director of SPX FLOW, Inc. (multi-industry manufacturing); Director of the United Way of Rochester, the University of Rochester Medical Center, Monroe Community College Foundation, North Carolina A&T University, and Roberts Wesleyan College; Trustee of the University of Rochester.
Rajiv L. Gupta
Born 1945. Trustee Since December 2001.2 Principal Occupation(s) During the Past Five Years and Other Experience: Chairman and Chief Executive Officer (retired 2009) and President (2006–2008) of Rohm and Haas Co. (chemicals); Director of Arconic Inc. (diversified manufacturer), HP Inc. (printer and personal computer manufacturing), and Delphi Automotive plc (automotive components); Senior Advisor at New Mountain Capital.
Amy Gutmann
Born 1949. Trustee Since June 2006. Principal Occupation(s) During the Past Five Years and Other Experience: President of the University of Pennsylvania; Christopher H. Browne
1 Mr. McNabb is considered an “interested person,” as defined in the Investment Company Act of 1940, because he is an officer of the
Vanguard funds.
2 December 2002 for Vanguard Equity Income Fund, the Vanguard Municipal Bond Funds, and the Vanguard State Tax-Exempt Funds.
Distinguished Professor of Political Science, School of Arts and Sciences, and Professor of Communication, Annenberg School for Communication, with secondary faculty appointments in the Department of Philosophy, School of Arts and Sciences, and at the Graduate School of Education, University of Pennsylvania; Trustee of the National Constitution Center.
JoAnn Heffernan Heisen
Born 1950. Trustee Since July 1998. Principal Occupation(s) During the Past Five Years and Other Experience: Corporate Vice President and Member of the Executive Committee (1997–2008), Chief Global Diversity Officer (retired 2008), Vice President and Chief Information Officer (1997–2006), Controller (1995–1997), Treasurer (1991–1995), and Assistant Treasurer (1989–1991) of Johnson & Johnson (pharmaceuticals/medical devices/ consumer products); Director of Skytop Lodge Corporation (hotels) and the Robert Wood Johnson Foundation; Member of the Advisory Board of the Institute for Women’s Leadership at Rutgers University.
F. Joseph Loughrey
Born 1949. Trustee Since October 2009. Principal Occupation(s) During the Past Five Years and Other Experience: President and Chief Operating Officer (retired 2009) of Cummins Inc. (industrial machinery); Chairman of the Board of Hillenbrand, Inc. (specialized consumer services), Oxfam America, and the Lumina Foundation for Education; Director of the V Foundation for Cancer Research; Member of the Advisory Council for the College of Arts and Letters and Chair of the Advisory Board to the Kellogg Institute for International Studies, both at the University of Notre Dame.
Mark Loughridge
Born 1953. Trustee Since March 2012. Principal Occupation(s) During the Past Five Years and Other Experience: Senior Vice President and Chief Financial Officer (retired 2013) at IBM (information technology services); Fiduciary Member of IBM’s Retirement Plan Committee (2004–2013); Member of the Council on Chicago Booth.
Scott C. Malpass
Born 1962. Trustee Since March 2012. Principal Occupation(s) During the Past Five Years and Other Experience: Chief Investment Officer and Vice President at the University of Notre Dame; Assistant Professor of Finance at the Mendoza College of Business at Notre Dame; Member of the Notre Dame 403(b) Investment Committee, the Board of Advisors for Spruceview Capital Partners, the Board of Catholic Investment Services, Inc. (investment advisor), and the Board of Superintendence of the Institute for the Works of Religion; Chairman of the Board of TIFF Advisory Services, Inc. (investment advisor).
André F. Perold
Born 1952. Trustee Since December 2004. Principal Occupation(s) During the Past Five Years and Other Experience: George Gund Professor of Finance and Banking, Emeritus at the Harvard Business School (retired 2011); Chief Investment Officer and Co-Managing Partner of HighVista Strategies LLC (private investment firm); Overseer of the Museum of Fine Arts Boston.
Peter F. Volanakis
Born 1955. Trustee Since July 2009. Principal Occupation(s) During the Past Five Years and Other Experience: President and Chief Operating Officer (retired 2010) of Corning Incorporated (communications equipment); Chairman of the Board of Trustees of Colby-Sawyer College; Member of the Board of Hypertherm, Inc. (industrial cutting systems, software, and consumables).
Executive Officers
Glenn Booraem
Born 1967. Investment Stewardship Officer Since February 2017. Principal Occupation(s) During the Past Five Years and Other Experience: Principal of The Vanguard Group, Inc.; Treasurer (2015–2017), Controller (2010–2015), and Assistant Controller (2001–2010) of each of the investment companies served by The Vanguard Group.
Christine M. Buchanan
Born 1970. Treasurer Since November 2017. Principal Occupation(s) During the Past Five Years and Other Experience: Principal of The Vanguard Group, Inc.; Treasurer of each of the investment companies served by The Vanguard Group; Global Head of Vanguard Fund Administration at The Vanguard Group; Partner at KPMG LLP (2005–2017).
Thomas J. Higgins
Born 1957. Chief Financial Officer Since September 2008. Principal Occupation(s) During the Past Five Years and Other Experience: Principal of The Vanguard Group, Inc.; Chief Financial Officer of each of the investment companies served by The Vanguard Group; Treasurer of each of the investment companies served by The Vanguard Group (1998–2008).
Peter Mahoney
Born 1974. Controller Since May 2015. Principal Occupation(s) During the Past Five Years and Other Experience: Principal of The Vanguard Group, Inc.; Controller of each of the investment companies served by The Vanguard Group; Head of International Fund Services at The Vanguard Group (2008–2014).
Anne E. Robinson
Born 1970. Secretary Since September 2016. Principal Occupation(s) During the Past Five Years and Other Experience: Managing Director of The Vanguard Group, Inc.; General Counsel of The Vanguard Group; Secretary of The Vanguard Group
and of each of the investment companies served by The Vanguard Group; Director and Senior Vice President of Vanguard Marketing Corporation; Managing Director and General Counsel of Global Cards and Consumer Services at Citigroup (2014–2016); Counsel at American Express (2003–2014).
Michael Rollings
Born 1963. Finance Director Since November 2017. Principal Occupation(s) During the Past Five Years and Other Experience: Managing Director of The Vanguard Group, Inc.; Director of Vanguard Marketing Corporation; Treasurer of each of the investment companies served by The Vanguard Group (February 2017–November 2017); Executive Vice President and Chief Financial Officer of MassMutual Financial Group (2006–2016).
| |
| Vanguard Senior Management Team |
| |
| Mortimer J. Buckley | Chris D. McIsaac |
| Gregory Davis | James M. Norris |
| John James | Thomas M. Rampulla |
| Martha G. King | Karin A. Risi |
| John T. Marcante | |
Chairman Emeritus and Senior Advisor
John J. Brennan
Chairman, 1996–2009
Chief Executive Officer and President, 1996–2008
Founder
John C. Bogle
Chairman and Chief Executive Officer, 1974–1996
|  |
| | P.O. Box 2600 |
| | Valley Forge, PA 19482-2600 |
| |
| |
| |
| Connect with Vanguard® > vanguard.com |
| |
| |
| |
| Fund Information > 800-662-7447 | Source for Bloomberg Barclays indexes: Bloomberg |
| Direct Investor Account Services > 800-662-2739 | Index Services Limited. Copyright 2017, Bloomberg. All |
| | rights reserved. |
| Institutional Investor Services > 800-523-1036 | |
| Text Telephone for People | |
| Who Are Deaf or Hard of Hearing> 800-749-7273 | |
| |
| This material may be used in conjunction | |
| with the offering of shares of any Vanguard | |
| fund only if preceded or accompanied by | |
| the fund’s current prospectus. | |
| |
| All comparative mutual fund data are from Lipper, a | |
| Thomson Reuters Company, or Morningstar, Inc., unless | |
| otherwise noted. | |
| |
| You can obtain a free copy of Vanguard’s proxy voting | |
| guidelines by visiting vanguard.com/proxyreporting or by | |
| calling Vanguard at 800-662-2739. The guidelines are | |
| also available from the SEC’s website, sec.gov. In | |
| addition, you may obtain a free report on how your fund | |
| voted the proxies for securities it owned during the 12 | |
| months ended June 30. To get the report, visit either | |
| vanguard.com/proxyreporting or sec.gov. | |
| |
| You can review and copy information about your fund at | |
| the SEC’s Public Reference Room in Washington, D.C. To | |
| find out more about this public service, call the SEC at | |
| 202-551-8090. Information about your fund is also | |
| available on the SEC’s website, and you can receive | |
| copies of this information, for a fee, by sending a | |
| request in either of two ways: via email addressed to | |
| publicinfo@sec.gov or via regular mail addressed to the | |
| Public Reference Section, Securities and Exchange | |
| Commission, Washington, DC 20549-1520. | |
| | © 2018 The Vanguard Group, Inc. |
| | All rights reserved. |
| | Vanguard Marketing Corporation, Distributor. |
| |
| | Q6340 022018 |
Item 2: Code of Ethics. The Registrant has adopted a code of ethics that applies to the Registrant’s principal executive officer, principal financial officer, principal accounting officer or controller or persons performing similar functions. The Code of Ethics was amended during the reporting period covered by this report to make certain technical, non-material changes.
Item 3: Audit Committee Financial Expert. All members of the Audit Committee have been determined by the Registrant’s Board of Trustees to be Audit Committee Financial Experts and to be independent: Rajiv L. Gupta, JoAnn Heffernan Heisen, F. Joseph Loughrey, Mark Loughridge, and Peter F. Volanakis.
Item 4: Principal Accountant Fees and Services.
(a) Audit Fees.
Audit Fees of the Registrant
Fiscal Year Ended December 31, 2017: $29,000
Fiscal Year Ended December 31, 2016: $28,000
Aggregate Audit Fees of Registered Investment Companies in the Vanguard Group.
Fiscal Year Ended December 31, 2017: $8,424,459
Fiscal Year Ended December 31, 2016: $9,629,849
Includes fees billed in connection with audits of the Registrant, other registered investment companies in the Vanguard complex, The Vanguard Group, Inc. and Vanguard Marketing Corporation.
(b) Audit-Related Fees.
Fiscal Year Ended December 31, 2017: $3,194,093
Fiscal Year Ended December 31, 2016: $2,717,627
Includes fees billed in connection with assurance and related services provided to the Registrant, other registered investment companies in the Vanguard complex, The Vanguard Group, Inc., and Vanguard Marketing Corporation.
(c) Tax Fees.
Fiscal Year Ended December 31, 2017: $274,313
Fiscal Year Ended December 31, 2016: $254,050
Includes fees billed in connection with tax compliance, planning, and advice services provided to the Registrant, other registered investment companies in the Vanguard complex, The Vanguard Group, Inc., and Vanguard Marketing Corporation.
(d) All Other Fees.
Fiscal Year Ended December 31, 2017: $0
Fiscal Year Ended December 31, 2016: $214,225
Includes fees billed for services related to tax reported information provided to the Registrant, other registered investment companies in the Vanguard complex, The Vanguard Group, Inc., and Vanguard Marketing Corporation.
(e) (1) Pre-Approval Policies. The policy of the Registrant’s Audit Committee is to consider and, if appropriate, approve before the principal accountant is engaged for such services, all specific audit and non-audit services provided to: the Registrant, other registered investment companies in the Vanguard complex, The Vanguard Group, Inc., and entities controlled by The Vanguard Group, Inc. that provide ongoing services to the Registrant. In making a determination, the Audit Committee considers whether the services are consistent with maintaining the principal accountant’s independence.
In the event of a contingency situation in which the principal accountant is needed to provide services in between scheduled Audit Committee meetings, the Chairman of the Audit Committee would be called on to consider and, if appropriate, pre-approve audit or permitted non-audit services in an amount sufficient to complete services through the next Audit Committee meeting, and to determine if such services would be consistent with maintaining the accountant’s independence. At the next scheduled Audit Committee meeting, services and fees would be presented to the Audit Committee for formal consideration, and, if appropriate, approval by the entire Audit Committee. The Audit Committee would again consider whether such services and fees are consistent with maintaining the principal accountant’s independence.
The Registrant’s Audit Committee is informed at least annually of all audit and non-audit services provided by the principal accountant to the Vanguard complex, whether such services are provided to: the Registrant, other registered investment companies in the Vanguard complex, The Vanguard Group, Inc., or other entities controlled by The Vanguard Group, Inc. that provide ongoing services to the Registrant.
(2) No percentage of the principal accountant’s fees or services were approved pursuant to the waiver provision of paragraph (c)(7)(i)(C) of Rule 2-01 of Regulation S-X.
(f) For the most recent fiscal year, over 50% of the hours worked under the principal accountant’s engagement were not performed by persons other than full-time, permanent employees of the principal accountant.
(g) Aggregate Non-Audit Fees.
Fiscal Year Ended December 31, 2017: $274,313
Fiscal Year Ended December 31, 2016: $468,275
Includes fees billed for non-audit services provided to the Registrant, other registered investment companies in the Vanguard complex, The Vanguard Group, Inc., and Vanguard Marketing Corporation.
(h) For the most recent fiscal year, the Audit Committee has determined that the provision of all non-audit services was consistent with maintaining the principal accountant’s independence.
Item 5: Audit Committee of Listed Registrants.
Not Applicable.
Item 6: Investments.
Not Applicable.
Item 7: Disclosure of Proxy Voting Policies and Procedures for Closed-End Management Investment Companies.
Not Applicable.
Item 8: Portfolio Managers of Closed-End Management Investment Companies.
Not Applicable.
Item 9: Purchase of Equity Securities by Closed-End Management Investment Company and Affiliated Purchasers.
Not Applicable.
Item 10: Submission of Matters to a Vote of Security Holders.
Not Applicable.
Item 11: Controls and Procedures.
(a) Disclosure Controls and Procedures. The Principal Executive and Financial Officers concluded that the Registrant’s Disclosure Controls and Procedures are effective based on their evaluation of the Disclosure Controls and Procedures as of a date within 90 days of the filing date of this report.
(b) Internal Control Over Financial Reporting. There were no significant changes in Registrant’s Internal Control Over Financial Reporting or in other factors that could significantly affect this control subsequent to the date of the evaluation, including any corrective actions with regard to significant deficiencies and material weaknesses.
Item 12: Disclosure of Securities Lending Activities for Closed-End Management Investment Companies.
Not Applicable.
Item 13: Exhibits.
| (a) | Code of Ethics. |
| (b) | Certifications. |
Pursuant to the requirements of the Securities Exchange Act of 1934 and the Investment Company Act of 1940, the registrant has duly caused this report to be signed on its behalf by the undersigned, thereunto duly authorized.
| |
| | VANGUARD MONTGOMERY FUNDS |
BY: | /s/ MORTIMER J. BUCKLEY* MORTIMER J. BUCKLEY CHIEF EXECUTIVE OFFICER |
Date: February 20, 2018
Pursuant to the requirements of the Securities Exchange Act of 1934 and the Investment Company Act of 1940, this report has been signed below by the following persons on behalf of the registrant and in the capacities and on the dates indicated.
| VANGUARD MONTGOMERY FUNDS |
BY: | /s/ MORTIMER J. BUCKLEY * MORTIMER J. BUCKLEY CHIEF EXECUTIVE OFFICER |
| VANGUARD MONTGOMERY FUNDS |
BY: | /s/ THOMAS J. HIGGINS* THOMAS J. HIGGINS CHIEF FINANCIAL OFFICER |
Date: February 20, 2018
* By: /s/ Anne E. Robinson
Anne E. Robinson, pursuant to a Power of Attorney filed on January 18, 2018 see file Number 33-32216, Incorporated by Reference.