UNITED STATES
SECURITIES AND EXCHANGE COMMISSION
Washington, D.C. 20549
FORM N-CSR
CERTIFIED SHAREHOLDER REPORT
OF
REGISTERED MANAGEMENT INVESTMENT COMPANIES
| | |
| Investment Company Act file number: | 811-22114 | |
| |
| Name of Registrant: | Vanguard Montgomery Funds |
| Address of Registrant: | P.O. Box 2600 |
| | Valley Forge, PA 19482 |
| |
| Name and address of agent for service: | Anne E. Robinson, Esquire | |
| | P.O. Box 876 | |
| | Valley Forge, PA 19482 | |
Registrant s telephone number, including area code: (610) 669-1000
Date of fiscal year end: December 31
Date of reporting period: January 1, 2016 - December 31, 2016
Item 1: Reports to Shareholders

Annual Report | December 31, 2016
Vanguard Market Neutral Fund
A new format, unwavering commitment
As you begin reading this report, you ll notice that we ve made some improvements to the opening sections based on feedback from you, our clients.
Page 1 starts with a new Your Fund s Performance at a Glance, a concise, handy summary of how your fund performed during the period.
In the renamed Chairman s Perspective, Bill McNabb will focus on enduring principles and investment insights.
We ve modified some tables, and eliminated some redundancy, but we haven t removed any information.
At Vanguard, we re always looking for better ways to communicate and to help you make sound investment decisions. Thank you for entrusting your assets to us.
| |
| Contents | |
| Your Fund s Performance at a Glance. | 1 |
| Chairman s Perspective. | 3 |
| Advisor s Report. | 7 |
| Fund Profile. | 9 |
| Performance Summary. | 11 |
| Financial Statements. | 13 |
| Your Fund s After-Tax Returns. | 30 |
| About Your Fund s Expenses. | 31 |
| Glossary. | 33 |
Please note: The opinions expressed in this report are just that informed opinions. They should not be considered promises or advice. Also, please keep in mind that the information and opinions cover the period through the date on the front of this report. Of course, the risks of investing in your fund are spelled out in the prospectus.
See the Glossary for definitions of investment terms used in this report.
About the cover: No matter what language you speak, Vanguard has one consistent message and set of principles. Our primary focus is on you, our clients. We conduct our business with integrity as a faithful steward of your assets. This message is shown translated into seven languages, reflecting our expanding global presence.
Your Funds Performance at a Glance
* For the 12 months ended December 31, 2016, Vanguard Market Neutral Fund returned well over 2%, achieving its mandate of beating the returns of 3-month U.S. Treasury bills, which gained 0.27%. Your fund also bested its market neutral peers, which averaged a 1.08% return over the period.
* Your fund s stock selection model generated broad-based performance. As a reminder, the model focuses on five signals that rank a universe of stocks. Four of those signals valuation, management, quality, and growth contributed to performance. The momentum signal was the lone detractor.
* Stock selection results in seven out of 11 sectors were positive, led by information technology, consumer discretionary, and health care. Several holdings in the materials sector were among the stocks that most detracted from performance.
* Over the decade ended December 31, the Market Neutral Fund produced an average annual return of 1.67% for Investor Shares, outpacing its peers by a percentage point.
| |
| Total Returns: Fiscal Year Ended December 31, 2016 | |
| | Total |
| | Returns |
| Vanguard Market Neutral Fund | |
| Investor Shares | 2.62% |
| Institutional Shares | 2.70 |
| Spliced Market Neutral Index | 0.27 |
| Alternative Equity Market Neutral Funds Average | 1.08 |
| For a benchmark description, see the Glossary. | |
| Alternative Equity Market Neutral Funds Average: Derived from data provided by Lipper, a Thomson Reuters Company. | |
Institutional Shares are available to certain institutional investors who meet specific administrative, service, and account-size criteria.
1
| |
| Total Returns: Ten Years Ended December 31, 2016 | |
| | Average |
| | Annual Return |
| Market Neutral Fund Investor Shares | 1.67% |
| Spliced Market Neutral Index | 0.72 |
| Alternative Equity Market Neutral Funds Average | 0.68 |
For a benchmark description, see the Glossary.
Alternative Equity Market Neutral Funds Average: Derived from data provided by Lipper, a Thomson Reuters Company.
The figures shown represent past performance, which is not a guarantee of future results. (Current performance may be lower or higher than the performance data cited. For performance data current to the most recent month-end, visit our website at vanguard.com/performance.) Note, too, that both investment returns and principal value can fluctuate widely, so an investor s shares, when sold, could be worth more or less than their original cost.
2
Chairman s Perspective

Bill McNabb
Chairman and Chief Executive Officer
Dear Shareholder,
If you re like most investors, a big question on your mind is: What s in store for the markets and the economy in 2017?
At Vanguard, we re just as curious about the immediate future. But our curiosity is tempered by our belief that forecasts should give a range of possible outcomes, not pinpoint predictions. After all, there are bound to be occurrences the experts won t see coming.
What really matters for investors
In 2016, we saw two cases in point: The United Kingdom s June vote to exit the European Union and the November election of Donald Trump as U.S. president. Both unexpected outcomes triggered swift market reactions. But despite some short-term volatility, the markets 12-month performance as of December 31, 2016, proved to be less dramatic. U.S. stocks posted healthy returns, and U.S. bonds provided returns close to their long-term averages. International stocks and bonds also advanced, although returns for U.S. investors were reduced by the strength of the U.S. dollar.
The surprises of 2016 remind us to be skeptical of overly precise short-term predictions about 2017. At the cusp of a new year, market prognosticators forecast where the Standard & Poor s 500 Index or the yield on the 10-year Treasury note will end up in 12 months. Such predictions can be attention-getting. They can also be dead wrong.

Investors are better off taking note of long-term trends that stand to influence our economies and markets. We re watching these trends closely, and we discuss our latest assessment in our 2017 economic and market outlook, which you can read at vanguard.com/research.
Our global economic outlook: Expect stabilization, not stagnation
One phenomenon in particular that we re watching is the low-growth, low-interest-rate environment that has marked the global economy since the 2008 09 financial crisis. We don t think this economic backdrop is simply the result of cyclically weak demand or long-term stagnation. Instead, certain structural forces are contributing: Falling technology costs are restraining the amounts businesses are spending on
capital investment, an aging population is weighing on growth in the developed world, and the free movement of capital and products across the globe has restrained prices and wages.
In the near term, these forces will continue to dampen growth, inflation, and interest rates. They also make it unlikely that further monetary stimulus from central banks will do much to spur growth.
I realize this all may sound gloomy, but that s not how we see it. We expect global growth to stabilize at more modest levels, not stagnate. The world isn t headed for Japanese-style deflation, in which a widespread sustained drop in prices puts economic activity into hibernation.
| | | |
| Market Barometer | | | |
| | | Average Annual Total Returns |
| | | Periods Ended December 31, 2016 |
| | One | Three | Five |
| | Year | Years | Years |
| Stocks | | | |
| Russell 1000 Index (Large-caps) | 12.05% | 8.59% | 14.69% |
| Russell 2000 Index (Small-caps) | 21.31 | 6.74 | 14.46 |
| Russell 3000 Index (Broad U.S. market) | 12.74 | 8.43 | 14.67 |
| FTSE All-World ex US Index (International) | 4.80 | -1.16 | 5.52 |
| |
| Bonds | | | |
| Bloomberg Barclays U.S. Aggregate Bond Index | | | |
| (Broad taxable market) | 2.65% | 3.03% | 2.23% |
| Bloomberg Barclays Municipal Bond Index | | | |
| (Broad tax-exempt market) | 0.25 | 4.14 | 3.28 |
| Citigroup Three-Month U.S. Treasury Bill Index | 0.27 | 0.09 | 0.08 |
| |
| CPI | | | |
| Consumer Price Index | 2.07% | 1.18% | 1.36% |
4
In fact, we believe that global growth could pick up modestly over time. Our expectation is based on a potential rebound in productivity as new digital technologies are used more effectively. We also anticipate a slight recovery in the labor force as the baby boom generation finishes its transition to retirement, nudging up demand for workers.
Put expansion in perspective
Looking to the United States, the world s largest economy remains firmly on a long-term-growth path of about 2% per year. That s lower than the historical average of 3.25% since 1950. We see such growth at this level as fundamentally sound, rather than abnormally low. Our evaluation takes into account lower U.S. population growth
and the reality that the economic expansion from the 1980s until the financial crisis was fueled by debt, distorting the numbers.
Turning to prices, we think that core U.S. inflation should modestly exceed 2% in 2017. That, in turn, will support further interest rate hikes by the Federal Reserve, similar to the one at the end of 2016.
We expect the Fed to raise rates in 2017 before taking an extended pause, and we see the federal funds rate staying below 2% through at least 2018.
Prepare for muted returns
And what about prospects for the markets? Vanguard s outlook for global stocks and bonds remains the most guarded in ten years, given fairly high stock valuations
Expect more modest returns, rely on time-tested principles
In Vanguard s economic and market outlook for 2017, Global Chief Economist Joseph Davis and his team offer a projection of more modest returns from the global stock and bond markets. They caution that, over the next decade, returns for a balanced portfolio are likely to be moderately below long-run historical averages.
The team s simulations indicate that for the decade ending in 2026, the average annualized return of a 60% stock/40% bond portfolio is likely to be centered in the 3% 5% range after inflation. That s below the actual average after-inflation return of 6% for the same portfolio for the nine decades since 1926.
Ultimately, our global market outlook points toward a somewhat more challenging environment, yet one in which, over time, investors with an appropriate level of discipline, diversification, and patience are likely to be rewarded with reasonable inflation-adjusted returns.
For more information about our expectations and the probability of various outcomes, see 2017 Economic and Market Outlook: Stabilization, Not Stagnation, available at vanguard.com/research.
IMPORTANT: The projections and other information generated by the Vanguard Capital Markets Model® (VCMM) regarding the likelihood of various investment outcomes are hypothetical in nature, do not reflect actual investment results, and are not guarantees of future results. Distribution of return outcomes from the VCMM are derived from 10,000 simulations for each modeled asset class. Simulations as of September 30, 2016. Results from the model may vary with each use and over time. For more information, see the note at the end of this letter.
5
and the low-interest-rate environment. We don t expect global bond yields to increase materially from year-end 2016 levels.
Our outlook for global equities is annualized returns of 5% 8% over the next decade. This outlook isn t bearish, but is actually fairly positive when you take into account the current low-rate environment. (See the box titled Expect more modest returns, rely on time-tested principles for more.)
Focus on the four keys to investment success
Significant trends often happen gradually. Like shifting tides, they re sometimes barely noticeable at first but ultimately can change the landscape entirely. Other times, apparent trends can end up receding before they have much of a long-term impact. Given the future s inherent unpredictability, it s not reasonable to expect a surefire block-buster revelation from any prognosticator or investment firm.
What to conclude, then? No matter what scenario plays out, we believe investors have the best chance for success if they stay focused on what they can control: their goals, asset allocation, and investment costs, along with the discipline to stick to a plan. As Tim Buckley, our chief investment officer, likes to say, this can be easy to say but harder to do, especially in times of uncertainty. Investors who can stay focused on those four keys will find themselves well-positioned to weather any market.
As always, thank you for investing with Vanguard.
Sincerely,

F. William McNabb III
Chairman and Chief Executive Officer
January 16, 2017
IMPORTANT: The projections and other information generated by the Vanguard Capital Markets Model regarding
the likelihood of various investment outcomes are hypothetical in nature, do not reflect actual investment results,
and are not guarantees of future results. VCMM results will vary with each use and over time.
The VCMM projections are based on a statistical analysis of historical data. Future returns may behave differently from the
historical patterns captured in the VCMM. More important, the VCMM may be underestimating extreme negative scenarios
unobserved in the historical period on which the model estimation is based.
The VCMM is a proprietary financial simulation tool developed and maintained by Vanguard s Investment Strategy Group.
The model forecasts distributions of future returns for a wide array of broad asset classes. Those asset classes include U.S.
and international equity markets, several maturities of the U.S. Treasury and corporate fixed income markets, international
fixed income markets, U.S. money markets, commodities, and certain alternative investment strategies. The theoretical and
empirical foundation for the Vanguard Capital Markets Model is that the returns of various asset classes reflect the compensation
investors require for bearing different types of systematic risk (beta). At the core of the model are estimates of the dynamic
statistical relationship between risk factors and asset returns, obtained from statistical analysis based on available monthly
financial and economic data. Using a system of estimated equations, the model then applies a Monte Carlo simulation method
to project the estimated interrelationships among risk factors and asset classes as well as uncertainty and randomness over
time. The model generates a large set of simulated outcomes for each asset class over several time horizons. Forecasts are
obtained by computing measures of central tendency in these simulations. Results produced by the tool will vary with each
use and over time.
6
Advisors Report
The broad U.S. equity market rebounded from a lackluster 2015, returning more than 12% for 2016. Small-capitalization stocks soared more than 20%, outpacing large-caps by more than 9 percentage points. Value stocks handily outperformed their growth counterparts. The broad U.S. bond market returned 2.65%.
Against that backdrop, Vanguard Market Neutral Fund achieved its mandate of exceeding the returns of 3-month U.S. Treasury bills while remaining neutral to market conditions. Results for the two halves of 2016 were in stark contrast. Your fund posted a negative return through the first half, but performance recovered in the second amid a broad stock market rally. The fund returned well over 2% for the 12 months, while 3-month Treasury bills gained 0.27%. It is important to note that the fund does not try to outperform the equity market.
The period began with steep declines in commodity prices and unanticipated sluggish economic growth around the world, especially in China; this triggered a move toward less-risky assets. Given the environment, the Federal Reserve seemed less inclined to raise interest rates as it became unclear whether its inflation and unemployment targets would be realized. The United Kingdom s June vote to leave the European Union further clouded the Fed s outlook.
However, U.S. growth shot up in the third quarter after disappointing results earlier in the year. The employment picture remained strong as the economy added 156,000 jobs
in December and wages increased 2.9% for the year. The unemployment rate finished 2016 at 4.7%. The strong economic and jobs figures were partly behind the dollar s strengthening against some international currencies and factored into the Fed s December decision to raise the federal funds rate by 0.25 percentage point, to 0.5% 0.75%.
Those factors, coupled with a turnaround in commodity prices and optimism about the potential for a new administration s policy initiatives, fueled a stock market rally that persisted into early 2017.
Although it s important to understand how our overall performance is affected by the macroeconomic factors we ve described, our approach to investing focuses on specific stock fundamentals and portfolio characteristics not on technical analysis of stock-price movements.
Our model uses five factor themes growth, quality, management decisions, momentum, and valuation to generate a composite rank for all the stocks in our investment universe. We seek to capitalize on investor biases across the market by taking long positions in the stocks that our model ranks high and by shorting those that score the lowest. We aim to keep your fund s sector exposures neutral, but we have the flexibility to slightly diverge from that positioning, depending on the model s signals.
U.S. stock market performance for 2016 was broad-based; ten out of 11 market sectors advanced, led by energy and
7
telecommunication services. Health care was the lone sector that declined. In that environment, our stock selection model generated strong results in identifying leaders and laggards. Our long positions gained more than our short positions, providing a positive total return for shareholders.
Four of our signals valuation, management decisions, quality, and growth contributed to performance, while momentum detracted. Stock selection results were positive in seven sectors, with information technology, consumer discretionary, and health care leading the way. Energy, industrials, and financials detracted the most.
Long positions in Advanced Micro Devices and AK Steel Holding were among the fund s top performers. Disappointing results from biotechnology firms Insys
Therapeutics and ImmunoGen washed out gains from the fund s short positions in that industry. Long positions in materials firms Royal Gold and Olin also performed poorly.
Your fund saw strong investor interest over the period, with assets reaching about $2 billion at year-end. Execution of the fund s strategy, though, isn t encumbered by asset flows, as it features a diversified portfolio of highly liquid stocks.
Portfolio Managers:
James P. Stetler, Principal
Michael R. Roach, CFA
Binbin Guo, Principal, Head of Equity Research and Portfolio Strategies
Vanguard Quantitative Equity Group
January 17, 2017
8
| | |
| Market Neutral Fund | |
| |
| |
| Fund Profile | | |
| As of December 31, 2016 | | |
| |
| Share-Class Characteristics | |
| | Investor Institutional |
| | Shares | Shares |
| Ticker Symbol | VMNFX | VMNIX |
| Total Expense Ratio1 | 1.46% | 1.36% |
| Management Expenses | 0.20% | 0.12% |
| Dividend Expenses on | | |
| Securities Sold Short2 | 1.06% | 1.06% |
| Borrowing Expenses on | | |
| Securities Sold Short2 | 0.15% | 0.15% |
| Other Expenses | 0.05% | 0.03% |
| |
| Portfolio Characteristics | | |
| | Long | Short |
| | Portfolio | Portfolio |
| Number of Stocks | 279 | 282 |
| Median Market Cap | $3.5B | $4.6B |
| Price/Earnings Ratio | 18.9x | 50.7x |
| Price/Book Ratio | 2.4x | 2.2x |
| Return on Equity | 10.8% | 12.3% |
| Earnings Growth | | |
| Rate | 10.7% | 4.6% |
| Foreign Holdings | 1.7% | 0.8% |
| |
| Fund Characteristics | | |
| Turnover Rate | | 64% |
| Short-Term Reserves | | 1.9% |
| | |
| Volatility Measures | | |
| | Spliced | DJ |
| | Market | U.S. Total |
| | Neutral | Market |
| | Index | FA Index |
| R-Squared | 0.00 | 0.02 |
| Beta | -5.69 | -0.07 |
These measures show the degree and timing of the fund s fluctuations compared with the index over 36 months.
Sector Diversification (% of equity exposure)
| | |
| | Long | Short |
| | Portfolio | Portfolio |
| Consumer Discretionary | 15.3% | 15.9% |
| Consumer Staples | 5.9 | 5.1 |
| Energy | 6.5 | 6.3 |
| Financials | 12.7 | 12.9 |
| Health Care | 10.2 | 9.2 |
| Industrials | 15.6 | 16.2 |
| Information Technology | 15.7 | 16.5 |
| Materials | 6.5 | 6.3 |
| Real Estate | 7.8 | 7.9 |
| Telecommunication Services | 0.9 | 1.0 |
| Utilities | 2.9 | 2.7 |
1 The total expense ratios shown are from the prospectus dated April 28, 2016, and represent estimated costs for the current fiscal year. For the fiscal year ended December 31, 2016, the total expense ratios were 1.60% for Investor Shares and 1.52% for Institutional Shares.
2 In connection with a short sale, the fund may receive income or be charged a fee based on the market value of the borrowed stock. When a cash dividend is declared on a stock the fund has sold short, the fund is required to pay an amount equal to that dividend to the party from which the fund borrowed the stock and to record the payment of the dividend as an expense.
9
Market Neutral Fund
Ten Largest Holdings1 (% of total net assets) Long Portfolio | | |
| EP Energy Corp. | Oil & Gas Exploration | |
| | & Production | 0.5% |
| Hospitality Properties | | |
| Trust | Hotel & Resort REITs | 0.5 |
| JetBlue Airways Corp. | Airlines | 0.5 |
| SpartanNash Co. | Food Distributors | 0.5 |
| JPMorgan Chase & Co. | Diversified Banks | 0.5 |
| Aspen Technology Inc. | Application Software | 0.5 |
| Advanced Micro Devices | | |
| Inc. | Semiconductors | 0.5 |
| Fifth Third Bancorp | Regional Banks | 0.5 |
| Wabash National Corp. | Construction | |
| | Machinery & Heavy | |
| | Trucks | 0.5 |
| Alaska Air Group Inc. | Airlines | 0.5 |
| Top Ten | | 5.0% |
| Ten Largest Holdings1 (% of total net assets) Short Portfolio | | |
| CF Industries Holdings | Fertilizers & | |
| Inc. | Agricultural | |
| | Chemicals | 0.6% |
| Ingevity Corp. | Specialty Chemicals | 0.5 |
| Banner Corp. | Regional Banks | 0.5 |
| Team Inc. | Environmental & | |
| | Facilities Services | 0.5 |
| RBC Bearings Inc. | Industrial | |
| | Machinery | 0.5 |
| M&T Bank Corp. | Regional Banks | 0.5 |
| Targa Resources Corp. | Oil & Gas Storage & | |
| | Transportation | 0.5 |
| Gentherm Inc. | Auto Parts & | |
| | Equipment | 0.5 |
| Clean Harbors Inc. | Environmental & | |
| | Facilities Services | 0.5 |
| Western Digital Corp. | Technology | |
| | Hardware, Storage | |
| | & Peripherals | 0.5 |
| Top Ten | | 5.1% |
1 The holdings listed exclude any temporary cash investments and equity index products.
10
Market Neutral Fund
Performance Summary
All of the returns in this report represent past performance, which is not a guarantee of future
results that may be achieved by the fund. (Current performance may be lower or higher than
the performance data cited. For performance data current to the most recent month-end, visit
our website at vanguard.com/performance.) Note, too, that both investment returns and principal
value can fluctuate widely, so an investor s shares, when sold, could be worth more or less than
their original cost. The returns shown do not reflect taxes that a shareholder would pay on fund
distributions or on the sale of fund shares.
Cumulative Performance: December 31, 2006, Through December 31, 2016
Initial Investment of $250,000
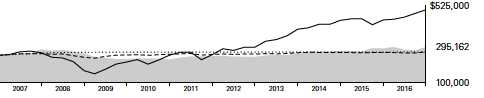
For a benchmark description, see the Glossary.
Alternative Equity Market Neutral Funds Average: Derived from data provided by Lipper, a Thomson Reuters Company.
| | | | |
| | | Average Annual Total Returns | |
| | Periods Ended December 31, 2016 | |
| |
| | | | | Final Value |
| | One | Five | Ten | of a $250,000 |
| | Year | Years | Years | Investment |
| |
| Market Neutral Fund*Investor Shares | 2.62% | 3.82% | 1.67% | $295,162 |
| |
| Spliced Market Neutral Index | 0.27 | 0.08 | 0.72 | 268,519 |
| Alternative Equity Market Neutral | | | | |
| Funds Average | 1.08 | 1.05 | 0.68 | 267,525 |
| Dow Jones U.S. Total Stock Market | | | | |
| Float Adjusted Index | 12.62 | 14.59 | 7.18 | 500,081 |
| | | | |
| | | | | Final Value |
| | One | Five | Ten | of a $5,000,000 |
| | Year | Years | Years | Investment |
| |
| Market Neutral Fund Institutional Shares | 2.70% | 3.92% | 1.78% | $5,966,319 |
| |
| Spliced Market Neutral Index | 0.27 | 0.08 | 0.72 | 5,370,381 |
| Dow Jones U.S. Total Stock Market Float | | | | |
| Adjusted Index | 12.62 | 14.59 | 7.18 | 10,001,613 |
See Financial Highlights for dividend and capital gains information.
11
Market Neutral Fund
Fiscal-Year Total Returns (%): December 31, 2006, Through December 31, 2016
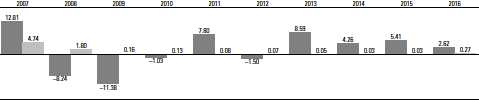
Market Neutral Fund Investor Shares
Spliced Market Neutral Index
For a benchmark description, see the Glossary.
12
Market Neutral Fund
Financial Statements
Statement of Net Assets
As of December 31, 2016
The fund reports a complete list of its holdings in regulatory filings four times in each fiscal year, at the quarter-ends. For the second and fourth fiscal quarters, the lists appear in the fund s semiannual and annual reports to shareholders. For the first and third fiscal quarters, the fund files the lists with the Securities and Exchange Commission on Form N-Q. Shareholders can look up the fund s Forms N-Q on the SEC s website at sec.gov. Forms N-Q may also be reviewed and copied at the SEC s Public Reference Room (see the back cover of this report for further information).
| | | |
| | | | Market |
| | | | Value* |
| | | Shares | ($000) |
| Common Stocks Long Positions (96.7%) | |
| Consumer Discretionary (14.7%) | |
| *, | Cooper-Standard | | |
| | Holdings Inc. | 103,242 | 10,673 |
| | Lear Corp. | 80,519 | 10,658 |
| *, | American Axle & | | |
| | Manufacturing | | |
| | Holdings Inc. | 549,334 | 10,602 |
| *, | Burlington Stores Inc. | 122,686 | 10,398 |
| | Children s Place Inc. | 102,857 | 10,383 |
| *, | Tenneco Inc. | 165,726 | 10,353 |
| | Regal Entertainment Group | | |
| | Class A | 501,129 | 10,323 |
| | Big Lots Inc. | 205,026 | 10,294 |
| *, ,^Smith & Wesson Holding | | |
| | Corp. | 486,230 | 10,250 |
| | Darden Restaurants Inc. | 140,893 | 10,246 |
| ,^ | Sturm Ruger & Co. Inc. | 193,515 | 10,198 |
| | Whirlpool Corp. | 55,789 | 10,141 |
| | Best Buy Co. Inc. | 231,484 | 9,877 |
| | Carnival Corp. | 188,675 | 9,822 |
| *, | Boyd Gaming Corp. | 476,439 | 9,610 |
| *, | Liberty Media Corp-Liberty | | |
| | SiriusXM Class A | 270,694 | 9,344 |
| | Bloomin Brands Inc. | 514,295 | 9,273 |
| *, | Yum China Holdings Inc. | 352,305 | 9,202 |
| | International Game | | |
| | Technology plc | 354,744 | 9,053 |
| | Bob Evans Farms Inc. | 159,540 | 8,489 |
| | Omnicom Group Inc. | 99,000 | 8,426 |
| | Tailored Brands Inc. | 329,563 | 8,420 |
| | Target Corp. | 114,310 | 8,257 |
| *, | Michael Kors Holdings Ltd. | 190,318 | 8,180 |
| | American Eagle | | |
| | Outfitters Inc. | 524,262 | 7,953 |
| | PVH Corp. | 87,390 | 7,886 |
| *, | Discovery Communications | | |
| | Inc. Class A | 260,678 | 7,145 |
| | News Corp. Class B | 584,145 | 6,893 |
| | Nordstrom Inc. | 132,703 | 6,361 |
| | | |
| *, | MSG Networks Inc. | 217,306 | 4,672 |
| *, | Michaels Cos. Inc. | 199,700 | 4,084 |
| *, | Express Inc. | 316,922 | 3,410 |
| * | Genesco Inc. | 52,793 | 3,279 |
| | Barnes & Noble Inc. | 290,287 | 3,237 |
| | Cooper Tire & Rubber Co. | 78,781 | 3,061 |
| *, | Dave & Buster s | | |
| | Entertainment Inc. | 53,231 | 2,997 |
| | Callaway Golf Co. | 242,610 | 2,659 |
| * | Tile Shop Holdings Inc. | 121,094 | 2,367 |
| | Cheesecake Factory Inc. | 39,238 | 2,350 |
| | Finish Line Inc. Class A | 114,625 | 2,156 |
| | Brinker International Inc. | 41,242 | 2,043 |
| | Kohl s Corp. | 36,337 | 1,794 |
| | AMC Entertainment | | |
| | Holdings Inc. | 49,467 | 1,665 |
| * | Liberty Media Corp-Liberty | | |
| | SiriusXM Class C | 27,957 | 948 |
| | | | 309,432 |
| Consumer Staples (5.7%) | | |
| | SpartanNash Co. | 285,416 | 11,285 |
| | Dean Foods Co. | 509,544 | 11,098 |
| | Conagra Brands Inc. | 265,715 | 10,509 |
| | Fresh Del Monte | | |
| | Produce Inc. | 167,140 | 10,134 |
| | Wal-Mart Stores Inc. | 137,594 | 9,510 |
| | Ingredion Inc. | 71,766 | 8,968 |
| *, | Avon Products Inc. | 1,658,886 | 8,361 |
| | Tyson Foods Inc. Class A | 135,192 | 8,338 |
| *, ,^Herbalife Ltd. | 148,894 | 7,168 |
| | Universal Corp. | 103,385 | 6,591 |
| *, | SUPERVALU Inc. | 1,171,692 | 5,472 |
| | Walgreens Boots | | |
| | Alliance Inc. | 62,960 | 5,210 |
| * | Post Holdings Inc. | 53,075 | 4,267 |
| *, | Blue Buffalo Pet | | |
| | Products Inc. | 143,871 | 3,459 |
| *, | Lamb Weston | | |
| | Holdings Inc. | 66,973 | 2,535 |
| | JM Smucker Co. | 18,814 | 2,409 |
13
Market Neutral Fund
| | | |
| | | | Market |
| | | | Value* |
| | | Shares | ($000) |
| * | Darling Ingredients Inc. | 152,344 | 1,967 |
| | Nu Skin Enterprises Inc. | | |
| | Class A | 28,174 | 1,346 |
| | | | 118,627 |
| Energy (6.3%) | | |
| *,^ | EP Energy Corp. Class A | 1,757,049 | 11,509 |
| *, | Denbury Resources Inc. | 2,815,726 | 10,362 |
| *, | Energen Corp. | 179,076 | 10,327 |
| *, | Rowan Cos. plc Class A | 529,975 | 10,011 |
| *, | McDermott | | |
| | International Inc. | 1,354,476 | 10,010 |
| *, | Chesapeake Energy Corp. | 1,422,335 | 9,985 |
| *, | Newfield Exploration Co. | 245,646 | 9,949 |
| *, | Southwestern Energy Co. | 897,744 | 9,714 |
| | Ensco plc Class A | 979,564 | 9,521 |
| | Apache Corp. | 129,371 | 8,211 |
| ^ | Ship Finance | | |
| | International Ltd. | 552,558 | 8,205 |
| *,^ | Seadrill Ltd. | 2,021,785 | 6,894 |
| * | Unit Corp. | 215,256 | 5,784 |
| * | Diamond Offshore | | |
| | Drilling Inc. | 209,695 | 3,712 |
| * | Transocean Ltd. | 197,096 | 2,905 |
| | Devon Energy Corp. | 49,995 | 2,283 |
| * | Carrizo Oil & Gas Inc. | 44,414 | 1,659 |
| * | Laredo Petroleum Inc. | 113,495 | 1,605 |
| | | | 132,646 |
| Financials (12.3%) | | |
| | JPMorgan Chase & Co. | 130,664 | 11,275 |
| | Fifth Third Bancorp | 414,286 | 11,173 |
| | Assured Guaranty Ltd. | 294,626 | 11,128 |
| | SunTrust Banks Inc. | 202,393 | 11,101 |
| | Citigroup Inc. | 184,906 | 10,989 |
| | Regions Financial Corp. | 764,407 | 10,977 |
| | Popular Inc. | 250,048 | 10,957 |
| | Unum Group | 249,048 | 10,941 |
| | Prudential Financial Inc. | 104,364 | 10,860 |
| | Bank of America Corp. | 484,624 | 10,710 |
| *, | E*TRADE Financial Corp. | 299,139 | 10,365 |
| | Primerica Inc. | 149,569 | 10,343 |
| | Navient Corp. | 627,777 | 10,314 |
| | Universal Insurance | | |
| | Holdings Inc. | 344,112 | 9,773 |
| *, | Flagstar Bancorp Inc. | 359,731 | 9,691 |
| | MSCI Inc. Class A | 117,469 | 9,254 |
| | Nelnet Inc. Class A | 176,916 | 8,979 |
| | Aflac Inc. | 128,709 | 8,958 |
| ^ | Banc of California Inc. | 449,253 | 7,795 |
| | Lincoln National Corp. | 111,649 | 7,399 |
| | Washington Federal Inc. | 207,605 | 7,131 |
| | Synovus Financial Corp. | 159,300 | 6,544 |
| | PNC Financial Services | | |
| | Group Inc. | 49,000 | 5,731 |
| | Citizens Financial | | |
| | Group Inc. | 153,553 | 5,471 |
| | | |
| | Maiden Holdings Ltd. | 307,200 | 5,361 |
| | Travelers Cos. Inc. | 42,300 | 5,178 |
| | Ameriprise Financial Inc. | 42,676 | 4,735 |
| | TCF Financial Corp. | 230,154 | 4,509 |
| | OM Asset Management plc | 249,836 | 3,623 |
| * | Essent Group Ltd. | 90,884 | 2,942 |
| | S&P Global Inc. | 19,202 | 2,065 |
| * | First BanCorp | 165,270 | 1,092 |
| | | | 257,364 |
| Health Care (9.9%) | | |
| *, | INC Research Holdings | | |
| | Inc. Class A | 207,313 | 10,905 |
| *, | WellCare Health Plans Inc. | 78,620 | 10,777 |
| *, | PRA Health Sciences Inc. | 194,051 | 10,696 |
| | Baxter International Inc. | 236,412 | 10,483 |
| *, | Quintiles IMS Holdings Inc. | 130,543 | 9,928 |
| *, | Healthways Inc. | 414,036 | 9,419 |
| *, | Five Prime Therapeutics Inc. | 182,980 | 9,169 |
| *, | HCA Holdings Inc. | 123,156 | 9,116 |
| *, | Hologic Inc. | 218,158 | 8,753 |
| | AmerisourceBergen Corp. | | |
| | Class A | 110,272 | 8,622 |
| *, | Charles River Laboratories | | |
| | International Inc. | 110,249 | 8,400 |
| *, | Cambrex Corp. | 154,611 | 8,341 |
| *, | Express Scripts Holding Co. | 116,492 | 8,014 |
| | Bruker Corp. | 361,389 | 7,654 |
| | McKesson Corp. | 54,297 | 7,626 |
| *, | FibroGen Inc. | 356,326 | 7,625 |
| *, | United Therapeutics Corp. | 51,176 | 7,340 |
| *, | Prestige Brands | | |
| | Holdings Inc. | 125,330 | 6,530 |
| | Bristol-Myers Squibb Co. | 101,164 | 5,912 |
| *, | Emergent BioSolutions Inc. | 167,711 | 5,508 |
| * | Halyard Health Inc. | 130,758 | 4,835 |
| *, | Masimo Corp. | 69,900 | 4,711 |
| | Eli Lilly & Co. | 42,000 | 3,089 |
| *,^ | Lexicon | | |
| | Pharmaceuticals Inc. | 216,808 | 2,998 |
| | Gilead Sciences Inc. | 37,918 | 2,715 |
| * | PAREXEL International | | |
| | Corp. | 34,846 | 2,290 |
| | Chemed Corp. | 13,700 | 2,198 |
| *,^ | Insys Therapeutics Inc. | 230,229 | 2,118 |
| *,^ | Medpace Holdings Inc. | 55,118 | 1,988 |
| | Aetna Inc. | 14,500 | 1,798 |
| * | Veeva Systems Inc. | | |
| | Class A | 41,015 | 1,669 |
| | UnitedHealth Group Inc. | 10,211 | 1,634 |
| | Anthem Inc. | 11,000 | 1,582 |
| | Cardinal Health Inc. | 13,985 | 1,007 |
| * | Amphastar | | |
| | Pharmaceuticals Inc. | 50,820 | 936 |
| * | HMS Holdings Corp. | 42,543 | 773 |
| | | | 207,159 |
14
Market Neutral Fund
| | | |
| | | | Market |
| | | | Value* |
| | | Shares | ($000) |
| Industrials (15.1%) | | |
| *, | JetBlue Airways Corp. | 509,488 | 11,423 |
| *, | Wabash National Corp. | 704,759 | 11,149 |
| | Alaska Air Group Inc. | 125,603 | 11,145 |
| ,^ | GATX Corp. | 180,789 | 11,133 |
| *, | Hawaiian Holdings Inc. | 193,495 | 11,029 |
| | Greenbrier Cos. Inc. | 263,870 | 10,964 |
| | Quad/Graphics Inc. | 405,890 | 10,910 |
| | Huntington Ingalls | | |
| | Industries Inc. | 59,214 | 10,907 |
| *, | United Rentals Inc. | 102,697 | 10,843 |
| | SkyWest Inc. | 296,761 | 10,817 |
| | Delta Air Lines Inc. | 217,564 | 10,702 |
| | Spirit AeroSystems | | |
| | Holdings Inc. Class A | 181,556 | 10,594 |
| | Brink s Co. | 251,297 | 10,366 |
| *, | MasTec Inc. | 266,325 | 10,187 |
| | Insperity Inc. | 139,518 | 9,899 |
| | BWX Technologies Inc. | 247,807 | 9,838 |
| * | Chart Industries Inc. | 268,177 | 9,660 |
| * | Trex Co. Inc. | 148,197 | 9,544 |
| | Owens Corning | 176,502 | 9,100 |
| | Masco Corp. | 272,411 | 8,614 |
| | West Corp. | 346,211 | 8,572 |
| ^ | American Railcar | | |
| | Industries Inc. | 183,385 | 8,305 |
| | Briggs & Stratton Corp. | 358,545 | 7,981 |
| | Herman Miller Inc. | 229,807 | 7,859 |
| | General Electric Co. | 229,919 | 7,265 |
| | Triumph Group Inc. | 272,363 | 7,218 |
| *, | SPX FLOW Inc. | 213,987 | 6,860 |
| | Copa Holdings SA Class A | 67,562 | 6,137 |
| * | Continental Building | | |
| | Products Inc. | 256,426 | 5,923 |
| * | NCI Building Systems Inc. | 317,133 | 4,963 |
| | Knoll Inc. | 176,940 | 4,942 |
| | Comfort Systems USA Inc. | 133,637 | 4,450 |
| | Chicago Bridge & Iron | | |
| | Co. NV | 139,803 | 4,439 |
| * | Hertz Global Holdings Inc. | 167,254 | 3,606 |
| *, | Meritor Inc. | 270,838 | 3,364 |
| | Brady Corp. Class A | 85,880 | 3,225 |
| * | TriNet Group Inc. | 123,981 | 3,176 |
| * | Gibraltar Industries Inc. | 59,063 | 2,460 |
| | General Cable Corp. | 101,369 | 1,931 |
| * | Avis Budget Group Inc. | 48,212 | 1,768 |
| | Aircastle Ltd. | 78,018 | 1,627 |
| * | DigitalGlobe Inc. | 51,363 | 1,472 |
| *,^ | Energy Recovery Inc. | 91,213 | 944 |
| | | | 317,311 |
| Information Technology (15.2%) | |
| *, | Aspen Technology Inc. | 205,950 | 11,261 |
| *, | Advanced Micro | | |
| | Devices Inc. | 989,994 | 11,227 |
| *, | Cardtronics plc Class A | 201,967 | 11,021 |
| | | |
| | Science Applications | | |
| | International Corp. | 129,903 | 11,016 |
| | NVIDIA Corp. | 103,000 | 10,994 |
| *, | NCR Corp. | 268,845 | 10,904 |
| * | Square Inc. | 797,856 | 10,875 |
| | CSG Systems | | |
| | International Inc. | 222,979 | 10,792 |
| | SYNNEX Corp. | 87,721 | 10,616 |
| | Booz Allen Hamilton | | |
| | Holding Corp. Class A | 293,537 | 10,588 |
| *, | CACI International Inc. | | |
| | Class A | 84,258 | 10,473 |
| | CDW Corp. | 200,760 | 10,458 |
| *, | Tech Data Corp. | 120,973 | 10,244 |
| | HP Inc. | 689,560 | 10,233 |
| | Travelport Worldwide Ltd. | 722,262 | 10,184 |
| | Computer Sciences Corp. | 171,043 | 10,164 |
| *, | TTM Technologies Inc. | 745,457 | 10,161 |
| *, | Cirrus Logic Inc. | 177,913 | 10,059 |
| *, | GoDaddy Inc. Class A | 281,480 | 9,838 |
| *, | First Data Corp. Class A | 687,266 | 9,752 |
| *, | Synaptics Inc. | 181,751 | 9,738 |
| | Avnet Inc. | 191,269 | 9,106 |
| *, | MaxLinear Inc. | 404,725 | 8,823 |
| *, | Sykes Enterprises Inc. | 303,162 | 8,749 |
| *, | RingCentral Inc. Class A | 415,875 | 8,567 |
| | CSRA Inc. | 259,454 | 8,261 |
| *, | Anixter International Inc. | 98,336 | 7,970 |
| *, | NETGEAR Inc. | 120,176 | 6,532 |
| * | Wix.com Ltd. | 146,251 | 6,516 |
| *, | Manhattan Associates Inc. | 113,638 | 6,026 |
| | TeleTech Holdings Inc. | 169,034 | 5,156 |
| | Accenture plc Class A | 40,291 | 4,719 |
| * | Amkor Technology Inc. | 395,130 | 4,169 |
| * | Teradata Corp. | 109,128 | 2,965 |
| *, | Sanmina Corp. | 65,900 | 2,415 |
| *, | Gigamon Inc. | 48,849 | 2,225 |
| * | Advanced Energy | | |
| | Industries Inc. | 38,762 | 2,122 |
| *, | Super Micro Computer Inc. | 55,000 | 1,543 |
| *, | Benchmark Electronics Inc. | 48,918 | 1,492 |
| * | Itron Inc. | 19,939 | 1,253 |
| | | | 319,207 |
| Materials (6.3%) | | |
| | Trinseo SA | 184,727 | 10,954 |
| *, | Coeur Mining Inc. | 1,171,472 | 10,649 |
| *, | AK Steel Holding Corp. | 1,037,511 | 10,593 |
| | Greif Inc. Class A | 200,026 | 10,263 |
| | Steel Dynamics Inc. | 286,874 | 10,207 |
| | Chemours Co. | 458,697 | 10,133 |
| * | Owens-Illinois Inc. | 581,612 | 10,126 |
| | Commercial Metals Co. | 458,455 | 9,985 |
| * | Freeport-McMoRan Inc. | 756,517 | 9,978 |
| | United States Steel Corp. | 297,622 | 9,825 |
| | Worthington Industries Inc. | 179,530 | 8,517 |
15
Market Neutral Fund
| | | |
| | | | Market |
| | | | Value* |
| | | Shares | ($000) |
| | Stepan Co. | 98,700 | 8,042 |
| | Cabot Corp. | 156,034 | 7,886 |
| *,^ | Cliffs Natural | | |
| | Resources Inc. | 490,058 | 4,121 |
| * | SunCoke Energy Inc. | 106,504 | 1,208 |
| | | | 132,487 |
| Real Estate (7.6%) | | |
| | Hospitality Properties | | |
| | Trust | 360,907 | 11,455 |
| | Lexington Realty Trust | 1,012,782 | 10,938 |
| | Washington Prime | | |
| | Group Inc. | 1,010,170 | 10,516 |
| | CBL & Associates | | |
| | Properties Inc. | 907,032 | 10,431 |
| | Select Income REIT | 403,227 | 10,161 |
| | Sabra Health Care | | |
| | REIT Inc. | 390,766 | 9,543 |
| | GEO Group Inc. | 252,554 | 9,074 |
| | Government Properties | | |
| | Income Trust | 473,628 | 9,030 |
| | DuPont Fabros | | |
| | Technology Inc. | 203,233 | 8,928 |
| | Care Capital Properties Inc. | 356,990 | 8,925 |
| | Medical Properties | | |
| | Trust Inc. | 720,440 | 8,861 |
| | Senior Housing | | |
| | Properties Trust | 439,439 | 8,319 |
| | Communications Sales & | | |
| | Leasing Inc. | 313,309 | 7,961 |
| | Ryman Hospitality | | |
| | Properties Inc. | 117,756 | 7,420 |
| | Mack-Cali Realty Corp. | 249,552 | 7,242 |
| | Xenia Hotels & Resorts Inc. | 314,218 | 6,102 |
| | Gaming and Leisure | | |
| | Properties Inc. | 118,100 | 3,616 |
| | Sunstone Hotel | | |
| | Investors Inc. | 205,317 | 3,131 |
| | VEREIT Inc. | 301,946 | 2,554 |
| | Global Net Lease Inc. | 318,804 | 2,496 |
| | NorthStar Realty Finance | | |
| | Corp. | 120,364 | 1,824 |
| | | | 158,527 |
| Telecommunication Services (0.8%) | |
| *, | Sprint Corp. | 1,273,052 | 10,719 |
| | Windstream Holdings Inc. | 932,378 | 6,834 |
| | | | 17,553 |
| Utilities (2.8%) | | |
| | FirstEnergy Corp. | 334,399 | 10,356 |
| | Entergy Corp. | 130,053 | 9,555 |
| | MDU Resources Group Inc. | 310,050 | 8,920 |
| | NiSource Inc. | 391,363 | 8,665 |
| | Edison International | 120,017 | 8,640 |
| | UGI Corp. | 132,351 | 6,099 |
| | CenterPoint Energy Inc. | 107,025 | 2,637 |
| | | |
| | National Fuel Gas Co. | 43,225 | 2,448 |
| | PPL Corp. | 49,401 | 1,682 |
| | | | 59,002 |
| Total Common Stocks Long Positions | |
| (Cost $1,709,792) | | 2,029,315 |
| Common Stocks Sold Short (-96.4%) | |
| Consumer Discretionary (-15.3%) | |
| * | Gentherm Inc. | (332,004) | (11,238) |
| | Tractor Supply Co. | (143,190) | (10,855) |
| * | Fiesta Restaurant | | |
| | Group Inc. | (361,927) | (10,803) |
| | Hilton Worldwide | | |
| | Holdings Inc. | (396,807) | (10,793) |
| | BorgWarner Inc. | (267,166) | (10,537) |
| * | Netflix Inc. | (83,948) | (10,393) |
| * | Charter Communications | | |
| | Inc. Class A | (36,083) | (10,389) |
| | PulteGroup Inc. | (562,800) | (10,344) |
| * | Under Armour Inc. | (409,731) | (10,313) |
| | Newell Brands Inc. | (229,248) | (10,236) |
| | CalAtlantic Group Inc. | (300,950) | (10,235) |
| | Harley-Davidson Inc. | (175,441) | (10,235) |
| * | Liberty Ventures Class A | (275,678) | (10,164) |
| | Monro Muffler Brake Inc. | (173,075) | (9,900) |
| | Advance Auto Parts Inc. | (58,288) | (9,858) |
| * | IMAX Corp. | (308,373) | (9,683) |
| | Delphi Automotive plc | (143,477) | (9,663) |
| * | Chipotle Mexican Grill Inc. | | |
| | Class A | (25,369) | (9,572) |
| * | Liberty Broadband Corp. | (126,946) | (9,403) |
| * | CarMax Inc. | (143,276) | (9,225) |
| | Expedia Inc. | (80,320) | (9,099) |
| * | Buffalo Wild Wings Inc. | (58,294) | (9,001) |
| | H&R Block Inc. | (391,475) | (9,000) |
| * | G-III Apparel Group Ltd. | (279,191) | (8,253) |
| * | Etsy Inc. | (650,793) | (7,666) |
| | Marriott International Inc. | | |
| | Class A | (87,557) | (7,239) |
| * | EW Scripps Co. Class A | (348,312) | (6,733) |
| * | Dorman Products Inc. | (92,043) | (6,725) |
| * | Liberty Expedia Holdings | | |
| | Inc. Class A | (164,117) | (6,510) |
| * | Houghton Mifflin | | |
| | Harcourt Co. | (592,767) | (6,431) |
| | Twenty-First Century | | |
| | Fox Inc. Class A | (225,208) | (6,315) |
| | Dunkin Brands Group Inc. | (98,296) | (5,155) |
| | Tribune Media Co. Class A | (128,718) | (4,503) |
| * | TripAdvisor Inc. | (97,000) | (4,498) |
| | Core-Mark Holding Co. Inc. | (93,380) | (4,022) |
| | ILG Inc. | (181,164) | (3,292) |
| | Standard Motor | | |
| | Products Inc. | (44,551) | (2,371) |
16
Market Neutral Fund
| | | |
| | | | Market |
| | | | Value* |
| | | Shares | ($000) |
| * | Loral Space & | | |
| | Communications Inc. | (56,384) | (2,315) |
| * | Meritage Homes Corp. | (61,200) | (2,130) |
| * | Vista Outdoor Inc. | (57,312) | (2,115) |
| * | Liberty Interactive Corp. | | |
| | QVC Group Class A | (105,824) | (2,114) |
| * | Groupon Inc. Class A | (561,374) | (1,864) |
| * | Liberty Broadband Corp. | | |
| | Class A | (12,803) | (928) |
| | | | (322,118) |
| Consumer Staples (-4.9%) | | |
| * | Monster Beverage Corp. | (249,533) | (11,064) |
| * | TreeHouse Foods Inc. | (146,800) | (10,597) |
| | Snyder s-Lance Inc. | (273,775) | (10,497) |
| | Pinnacle Foods Inc. | (194,644) | (10,404) |
| | Coty Inc. Class A | (557,391) | (10,206) |
| | Whole Foods Market Inc. | (302,225) | (9,296) |
| | Molson Coors Brewing Co. | | |
| | Class B | (89,300) | (8,690) |
| | Estee Lauder Cos. Inc. | | |
| | Class A | (104,815) | (8,017) |
| | Casey s General Stores Inc. | (58,200) | (6,919) |
| | Costco Wholesale Corp. | (41,612) | (6,663) |
| * | Hain Celestial Group Inc. | (109,700) | (4,282) |
| | B&G Foods Inc. | (62,668) | (2,745) |
| * | Revlon Inc. Class A | (78,640) | (2,292) |
| | Andersons Inc. | (37,580) | (1,680) |
| | | | (103,352) |
| Energy (-6.0%) | | |
| | Targa Resources Corp. | (200,628) | (11,249) |
| * | Cheniere Energy Inc. | (258,312) | (10,702) |
| * | Weatherford | | |
| | International plc | (2,073,447) | (10,347) |
| * | Synergy Resources Corp. | (1,157,240) | (10,311) |
| | National Oilwell Varco Inc. | (263,760) | (9,875) |
| * | Concho Resources Inc. | (72,845) | (9,659) |
| * | Kosmos Energy Ltd. | (1,232,417) | (8,639) |
| | Hess Corp. | (132,727) | (8,268) |
| | Cabot Oil & Gas Corp. | (327,048) | (7,640) |
| | Noble Energy Inc. | (199,145) | (7,579) |
| | Pioneer Natural | | |
| | Resources Co. | (38,100) | (6,861) |
| | SemGroup Corp. Class A | (148,249) | (6,189) |
| * | Cobalt International | | |
| | Energy Inc. | (4,881,167) | (5,955) |
| | ConocoPhillips | (107,024) | (5,366) |
| | Delek US Holdings Inc. | (169,484) | (4,079) |
| | Anadarko Petroleum Corp. | (38,159) | (2,661) |
| * | Oasis Petroleum Inc. | (104,864) | (1,588) |
| | | | (126,968) |
| Financials (-12.4%) | | |
| | Banner Corp. | (205,542) | (11,471) |
| | M&T Bank Corp. | (72,457) | (11,334) |
| | FNB Corp. | (684,438) | (10,972) |
| | | |
| | Huntington | | |
| | Bancshares Inc. | (826,309) | (10,924) |
| | Valley National Bancorp | (929,106) | (10,815) |
| | Pinnacle Financial | | |
| | Partners Inc. | (153,493) | (10,637) |
| * | Signature Bank | (70,497) | (10,589) |
| | CNA Financial Corp. | (254,794) | (10,574) |
| | American International | | |
| | Group Inc. | (161,761) | (10,565) |
| | Northwest | | |
| | Bancshares Inc. | (585,375) | (10,554) |
| * | Stifel Financial Corp. | (210,130) | (10,496) |
| * | LendingClub Corp. | (1,984,779) | (10,420) |
| | American Equity | | |
| | Investment Life | | |
| | Holding Co. | (458,318) | (10,331) |
| * | Enstar Group Ltd. | (50,289) | (9,942) |
| | Mercury General Corp. | (163,475) | (9,843) |
| | Chubb Ltd. | (73,100) | (9,658) |
| | New York Community | | |
| | Bancorp Inc. | (597,609) | (9,508) |
| | Legg Mason Inc. | (287,120) | (8,588) |
| | Wintrust Financial Corp. | (116,859) | (8,480) |
| | Renasant Corp. | (168,867) | (7,130) |
| | MetLife Inc. | (120,232) | (6,479) |
| | Financial Engines Inc. | (162,677) | (5,978) |
| | Arthur J Gallagher & Co. | (106,656) | (5,542) |
| | Bank of the Ozarks Inc. | (103,167) | (5,426) |
| | Intercontinental | | |
| | Exchange Inc. | (85,500) | (4,824) |
| | FirstCash Inc. | (97,941) | (4,603) |
| | Progressive Corp. | (118,600) | (4,210) |
| | Hope Bancorp Inc. | (183,605) | (4,019) |
| | Kemper Corp. | (82,460) | (3,653) |
| | CIT Group Inc. | (71,275) | (3,042) |
| * | PHH Corp. | (158,788) | (2,407) |
| | United Community | | |
| | Banks Inc. | (65,391) | (1,937) |
| * | Markel Corp. | (2,121) | (1,918) |
| | Chemical Financial Corp. | (33,325) | (1,805) |
| * | Texas Capital | | |
| | Bancshares Inc. | (20,600) | (1,615) |
| | | | (260,289) |
| Health Care (-8.8%) | | |
| * | Ligand | | |
| | Pharmaceuticals Inc. | (103,870) | (10,554) |
| * | Alnylam | | |
| | Pharmaceuticals Inc. | (275,540) | (10,316) |
| * | DexCom Inc. | (172,786) | (10,315) |
| | Dentsply Sirona Inc. | (176,559) | (10,193) |
| * | Centene Corp. | (179,701) | (10,155) |
| * | Acadia Healthcare Co. Inc. | (300,430) | (9,944) |
| * | Wright Medical Group NV | (431,289) | (9,911) |
| * | Ultragenyx | | |
| | Pharmaceutical Inc. | (136,400) | (9,590) |
17
Market Neutral Fund
| | | |
| | | | Market |
| | | | Value* |
| | | Shares | ($000) |
| * | Alexion | | |
| | Pharmaceuticals Inc. | (74,206) | (9,079) |
| | STERIS plc | (131,873) | (8,887) |
| * | Integer Holdings Corp. | (295,193) | (8,693) |
| | Perrigo Co. plc | (103,040) | (8,576) |
| * | BioMarin | | |
| | Pharmaceutical Inc. | (97,207) | (8,053) |
| * | Endo International plc | (475,132) | (7,825) |
| * | Aerie Pharmaceuticals Inc. | (198,498) | (7,513) |
| * | Neurocrine | | |
| | Biosciences Inc. | (192,970) | (7,468) |
| * | Acceleron Pharma Inc. | (288,675) | (7,367) |
| * | Nevro Corp. | (96,503) | (7,012) |
| * | Amicus Therapeutics Inc. | (1,336,445) | (6,642) |
| * | Endologix Inc. | (899,383) | (5,145) |
| | CONMED Corp. | (102,392) | (4,523) |
| * | Portola | | |
| | Pharmaceuticals Inc. | (123,616) | (2,774) |
| * | ACADIA | | |
| | Pharmaceuticals Inc. | (76,271) | (2,200) |
| * | Prothena Corp. plc | (40,123) | (1,974) |
| * | Achillion | | |
| | Pharmaceuticals Inc. | (193,048) | (797) |
| | | | (185,506) |
| Industrials (-15.6%) | | |
| * | Team Inc. | (292,026) | (11,462) |
| * | RBC Bearings Inc. | (123,404) | (11,453) |
| * | Clean Harbors Inc. | (201,415) | (11,209) |
| | Korn/Ferry International | (370,367) | (10,900) |
| | Graco Inc. | (129,600) | (10,769) |
| * | Spirit Airlines Inc. | (182,793) | (10,576) |
| | Dover Corp. | (140,630) | (10,537) |
| * | Beacon Roofing | | |
| | Supply Inc. | (226,139) | (10,418) |
| * | Stericycle Inc. | (134,799) | (10,385) |
| | Cubic Corp. | (215,034) | (10,311) |
| | AMETEK Inc. | (210,393) | (10,225) |
| * | Proto Labs Inc. | (197,735) | (10,154) |
| | Johnson Controls | | |
| | International plc | (245,011) | (10,092) |
| | Roper Technologies Inc. | (54,526) | (9,983) |
| | Union Pacific Corp. | (96,279) | (9,982) |
| * | Kirby Corp. | (149,575) | (9,947) |
| | Macquarie | | |
| | Infrastructure Corp. | (119,581) | (9,770) |
| | Covanta Holding Corp. | (622,617) | (9,713) |
| * | Middleby Corp. | (74,442) | (9,589) |
| * | Herc Holdings Inc. | (227,277) | (9,127) |
| | Allegion plc | (135,918) | (8,699) |
| | TransDigm Group Inc. | (34,570) | (8,607) |
| | ITT Inc. | (215,706) | (8,320) |
| | Flowserve Corp. | (168,905) | (8,116) |
| * | Echo Global Logistics Inc. | (308,746) | (7,734) |
| | Fastenal Co. | (151,470) | (7,116) |
| | Werner Enterprises Inc. | (263,093) | (7,090) |
| | Primoris Services Corp. | (302,200) | (6,884) |
| | | |
| * | KLX Inc. | (149,732) | (6,754) |
| * | BMC Stock Holdings Inc. | (342,202) | (6,673) |
| | KBR Inc. | (387,213) | (6,463) |
| * | SiteOne Landscape | | |
| | Supply Inc. | (132,661) | (4,607) |
| | Forward Air Corp. | (93,346) | (4,423) |
| * | WageWorks Inc. | (59,602) | (4,321) |
| | Matson Inc. | (113,688) | (4,023) |
| | EnPro Industries Inc. | (54,391) | (3,664) |
| | Acuity Brands Inc. | (15,101) | (3,486) |
| | Matthews International | | |
| | Corp. Class A | (36,000) | (2,767) |
| | Hubbell Inc. Class B | (20,850) | (2,433) |
| | CEB Inc. | (39,242) | (2,378) |
| * | Mercury Systems Inc. | (77,313) | (2,336) |
| | Healthcare Services | | |
| | Group Inc. | (57,169) | (2,239) |
| | Knight Transportation Inc. | (33,600) | (1,111) |
| | | | (326,846) |
| Information Technology (-16.0%) | |
| | Western Digital Corp. | (162,961) | (11,073) |
| * | Microsemi Corp. | (195,928) | (10,574) |
| | Visa Inc. Class A | (134,017) | (10,456) |
| * | Tyler Technologies Inc. | (72,459) | (10,345) |
| * | Universal Display Corp. | (183,327) | (10,321) |
| | Corning Inc. | (425,011) | (10,315) |
| * | NetScout Systems Inc. | (324,699) | (10,228) |
| | Microchip Technology Inc. | (158,635) | (10,176) |
| * | Akamai Technologies Inc. | (151,104) | (10,076) |
| * | Envestnet Inc. | (278,627) | (9,822) |
| * | WEX Inc. | (86,579) | (9,662) |
| * | comScore Inc. | (294,315) | (9,294) |
| | Fidelity National | | |
| | Information Services Inc. | (121,727) | (9,207) |
| * | Yahoo! Inc. | (235,133) | (9,093) |
| * | Rogers Corp. | (116,946) | (8,983) |
| | SS&C Technologies | | |
| | Holdings Inc. | (307,837) | (8,804) |
| * | Qorvo Inc. | (162,383) | (8,562) |
| | Global Payments Inc. | (123,035) | (8,540) |
| * | PayPal Holdings Inc. | (214,318) | (8,459) |
| | Cabot | | |
| | Microelectronics Corp. | (123,204) | (7,783) |
| * | Palo Alto Networks Inc. | (61,500) | (7,691) |
| | Activision Blizzard Inc. | (207,586) | (7,496) |
| | Littelfuse Inc. | (49,140) | (7,458) |
| * | Imperva Inc. | (192,325) | (7,385) |
| * | Twitter Inc. | (447,855) | (7,300) |
| * | salesforce.com Inc. | (104,833) | (7,177) |
| * | ViaSat Inc. | (107,592) | (7,125) |
| * | Zendesk Inc. | (321,446) | (6,815) |
| * | FleetCor | | |
| | Technologies Inc. | (47,249) | (6,687) |
| * | CoStar Group Inc. | (34,969) | (6,591) |
| * | Cavium Inc. | (100,582) | (6,280) |
| * | Trimble Inc. | (202,018) | (6,091) |
18
Market Neutral Fund
| | | |
| | | | Market |
| | | | Value* |
| | | Shares | ($000) |
| | QUALCOMM Inc. | (88,956) | (5,800) |
| | AVX Corp. | (353,551) | (5,526) |
| | j2 Global Inc. | (59,914) | (4,901) |
| * | Integrated Device | | |
| | Technology Inc. | (202,284) | (4,766) |
| * | ANSYS Inc. | (50,700) | (4,689) |
| | FLIR Systems Inc. | (127,642) | (4,619) |
| * | Diodes Inc. | (177,736) | (4,563) |
| * | Workday Inc. Class A | (67,299) | (4,448) |
| * | PTC Inc. | (71,988) | (3,331) |
| | Analog Devices Inc. | (40,406) | (2,934) |
| | National Instruments Corp. | (87,625) | (2,701) |
| * | OSI Systems Inc. | (33,979) | (2,587) |
| | Oracle Corp. | (47,753) | (1,836) |
| * | Q2 Holdings Inc. | (63,442) | (1,830) |
| | Cognex Corp. | (26,000) | (1,654) |
| * | Synchronoss | | |
| | Technologies Inc. | (29,775) | (1,140) |
| | Broadcom Ltd. | (5,781) | (1,022) |
| * | Ultimate Software | | |
| | Group Inc. | (4,946) | (902) |
| | | | (335,118) |
| Materials (-6.1%) | | |
| | CF Industries Holdings Inc. | (367,364) | (11,565) |
| * | Ingevity Corp. | (209,380) | (11,487) |
| | Mosaic Co. | (368,526) | (10,809) |
| | Scotts Miracle-Gro Co. | | |
| | Class A | (111,723) | (10,675) |
| | Olin Corp. | (415,476) | (10,640) |
| | AptarGroup Inc. | (142,878) | (10,494) |
| | WestRock Co. | (206,478) | (10,483) |
| | Compass Minerals | | |
| | International Inc. | (132,216) | (10,359) |
| | Ball Corp. | (135,408) | (10,165) |
| | Westlake Chemical Corp. | (163,139) | (9,134) |
| | Tahoe Resources Inc. | (767,750) | (7,232) |
| | Ashland Global | | |
| | Holdings Inc. | (52,790) | (5,770) |
| * | Boise Cascade Co. | (130,126) | (2,928) |
| | Ferroglobe plc | (248,208) | (2,688) |
| | Vulcan Materials Co. | (13,314) | (1,666) |
| | Southern Copper Corp. | (34,169) | (1,091) |
| * | Ferroglobe R&W Trust | (82,051) | |
| | | | (127,186) |
| Real Estate (-7.7%) | | |
| | Realogy Holdings Corp. | (417,497) | (10,742) |
| | Jones Lang LaSalle Inc. | (105,985) | (10,709) |
| | Equinix Inc. | (29,740) | (10,629) |
| | Weyerhaeuser Co. | (340,952) | (10,259) |
| | Monogram Residential | | |
| | Trust Inc. | (880,468) | (9,527) |
| * | Howard Hughes Corp. | (80,124) | (9,142) |
| | Sun Communities Inc. | (117,861) | (9,029) |
| | Vornado Realty Trust | (83,414) | (8,706) |
| | Kilroy Realty Corp. | (117,310) | (8,590) |
| | | |
| | Life Storage Inc. | (98,589) | (8,406) |
| | Rayonier Inc. | (305,246) | (8,120) |
| | Alexander & Baldwin Inc. | (173,484) | (7,784) |
| | Kennedy-Wilson | | |
| | Holdings Inc. | (340,642) | (6,983) |
| | Boston Properties Inc. | (53,374) | (6,713) |
| | Paramount Group Inc. | (386,519) | (6,181) |
| | Colony Starwood Homes | (187,349) | (5,398) |
| * | CBRE Group Inc. Class A | (136,183) | (4,288) |
| * | Marcus & Millichap Inc. | (143,303) | (3,829) |
| | Hudson Pacific | | |
| | Properties Inc. | (105,733) | (3,677) |
| | Empire State Realty | | |
| | Trust Inc. | (177,889) | (3,592) |
| | Extra Space Storage Inc. | (32,186) | (2,486) |
| | Education Realty Trust Inc. | (57,356) | (2,426) |
| | HFF Inc. Class A | (67,405) | (2,039) |
| | Taubman Centers Inc. | (21,485) | (1,588) |
| | | | (160,843) |
| Telecommunication Services (-1.0%) | |
| | Frontier Communications | | |
| | Corp. | (2,500,828) | (8,453) |
| * | Vonage Holdings Corp. | (1,111,836) | (7,616) |
| | Shenandoah | | |
| | Telecommunications Co. | (181,176) | (4,946) |
| | | | (21,015) |
| Utilities (-2.6%) | | |
| * | Dynegy Inc. | (1,156,741) | (9,786) |
| | Sempra Energy | (90,661) | (9,124) |
| | Pattern Energy Group Inc. | | |
| | Class A | (427,351) | (8,115) |
| | Aqua America Inc. | (247,624) | (7,439) |
| | Dominion Resources Inc. | (67,900) | (5,200) |
| | California Water Service | | |
| | Group | (145,036) | (4,917) |
| | New Jersey Resources | | |
| | Corp. | (88,088) | (3,127) |
| | Avangrid Inc. | (78,794) | (2,985) |
| * | TerraForm Power Inc. | | |
| | Class A | (92,560) | (1,186) |
| | WGL Holdings Inc. | (15,502) | (1,182) |
| | American States Water Co. | (23,901) | (1,089) |
| | | | (54,150) |
| Total Common Stocks Sold Short | |
| (Proceeds $1,850,265) | | (2,023,391) |
| Temporary Cash Investment (3.4%) | |
| Money Market Fund (3.4%) | | |
| 1,2 | Vanguard Market | | |
| | Liquidity Fund, 0.823% | | |
| | (Cost $72,462) | 724,554 | 72,462 |
| ,2 Other Assets and Liabilities | |
| Net (96.3%) | | 2,019,742 |
| Net Assets (100%) | | 2,098,128 |
19
Market Neutral Fund
| |
| | Amount |
| | ($000) |
| Statement of Assets and Liabilities | |
| Assets | |
| Investments in Securities, | |
| Long Positions, at Value | |
| Unaffiliated Issuers | 2,029,315 |
| Affiliated Vanguard Funds | 72,462 |
| Total Long Positions | 2,101,777 |
| Investment in Vanguard | 149 |
| Cash Segregated for Short Positions | 2,050,281 |
| Receivables for Investment | |
| Securities Sold | 19,728 |
| Receivables for Accrued Income | 2,696 |
| Receivables for Capital Shares Issued | 3,681 |
| Total Assets | 4,178,312 |
| Liabilities | |
| Securities Sold Short, at Value | 2,023,391 |
| Payables for Investment | |
| Securities Purchased | 18,586 |
| Collateral for Securities on Loan | 33,641 |
| Payables for Capital Shares Redeemed | 2,182 |
| Payables to Vanguard | 2,378 |
| Other Liabilities | 6 |
| Total Liabilities | 2,080,184 |
| Net Assets | 2,098,128 |
| |
| At December 31, 2016, net assets consisted of: |
| | Amount |
| | ($000) |
| Paid-in Capital | 2,034,761 |
| Overdistributed Net Investment Income | (28) |
| Accumulated Net Realized Losses | (83,002) |
| Unrealized Appreciation (Depreciation) | |
| Investment Securities Long Positions | 319,523 |
| Investment Securities Sold Short | (173,126) |
| Net Assets | 2,098,128 |
| |
| |
| Investor Shares Net Assets | |
| Applicable to 142,053,553 outstanding | |
| $.001 par value shares of beneficial | |
| interest (unlimited authorization) | 1,760,069 |
| Net Asset Value Per Share | |
| Investor Shares | $12.39 |
| |
| |
| Institutional Shares Net Assets | |
| Applicable to 27,397,924 outstanding | |
| $.001 par value shares of beneficial | |
| interest (unlimited authorization) | 338,059 |
| Net Asset Value Per Share | |
| Institutional Shares | $12.34 |
* See Note A in Notes to Financial Statements. * Non-income-producing security.
Long security positions with a value of $1,293,743,000 and cash of $2,050,281,000 are held in a segregated account at the fund s custodian bank and pledged to a broker-dealer as collateral for the fund s obligation to return borrowed securities. For so long as such obligations continue, the fund s access to these assets is subject to authorization from the broker-dealer.
^ Includes partial security positions on loan to broker-dealers. The total value of securities on loan is $30,992,000.
1 Affiliated money market fund available only to Vanguard funds and certain trusts and accounts managed by Vanguard. Rate shown is the 7-day yield.
2 Includes $33,641,000 of collateral received for securities on loan. REIT Real Estate Investment Trust.
See accompanying Notes, which are an integral part of the Financial Statements.
20
| |
| Market Neutral Fund | |
| |
| |
| Statement of Operations | |
| |
| | Year Ended |
| | December 31, 2016 |
| | ($000) |
| Investment Income | |
| Income | |
| Dividends | 33,231 |
| Interest1 | 224 |
| Securities Lending Net | 546 |
| Total Income | 34,001 |
| Expenses | |
| The Vanguard Group Note B | |
| Investment Advisory Services | 884 |
| Management and Administrative Investor Shares | 1,762 |
| Management and Administrative Institutional Shares | 180 |
| Marketing and Distribution Investor Shares | 387 |
| Marketing and Distribution Institutional Shares | 9 |
| Custodian Fees | 85 |
| Auditing Fees | 28 |
| Shareholders Reports Investor Shares | 54 |
| Shareholders Reports Institutional Shares | 1 |
| Trustees Fees and Expenses | 1 |
| Dividend Expense on Securities Sold Short | 22,445 |
| Borrowing Expense on Securities Sold Short | 31 |
| Total Expenses | 25,867 |
| Net Investment Income (Loss) | 8,134 |
| Realized Net Gain (Loss) | |
| Investment Securities Long Positions1 | 24,404 |
| Investment Securities Sold Short | (95,152) |
| Realized Net Gain (Loss) | (70,748) |
| Change in Unrealized Appreciation (Depreciation) | |
| Investment Securities Long Positions | 308,859 |
| Investment Securities Sold Short | (207,626) |
| Change in Unrealized Appreciation (Depreciation) of Investment Securities | 101,233 |
| Net Increase (Decrease) in Net Assets Resulting from Operations | 38,619 |
1 Interest income and realized net gain (loss) from an affiliated company of the fund were $224,000 and $3,000, respectively.
See accompanying Notes, which are an integral part of the Financial Statements.
21
| | |
| Market Neutral Fund | | |
| |
| |
| Statement of Changes in Net Assets | | |
| |
| | Year Ended December 31, |
| | 2016 | 2015 |
| | ($000) | ($000) |
| Increase (Decrease) in Net Assets | | |
| Operations | | |
| Net Investment Income (Loss) | 8,134 | 124 |
| Realized Net Gain (Loss) | (70,748) | 5,194 |
| Change in Unrealized Appreciation (Depreciation) | 101,233 | 16,470 |
| Net Increase (Decrease) in Net Assets Resulting from Operations | 38,619 | 21,788 |
| Distributions | | |
| Net Investment Income | | |
| Investor Shares | (6,469) | (103) |
| Institutional Shares | (1,526) | (100) |
| Realized Capital Gain | | |
| Investor Shares | | |
| Institutional Shares | | |
| Total Distributions | (7,995) | (203) |
| Capital Share Transactions | | |
| Investor Shares | 1,085,149 | 374,308 |
| Institutional Shares | 230,873 | 43,646 |
| Net Increase (Decrease) from Capital Share Transactions | 1,316,022 | 417,954 |
| Total Increase (Decrease) | 1,346,646 | 439,539 |
| Net Assets | | |
| Beginning of Period | 751,482 | 311,943 |
| End of Period1 | 2,098,128 | 751,482 |
1 Net Assets End of Period includes undistributed (overdistributed) net investment income of ($28,000) and ($209,000).
See accompanying Notes, which are an integral part of the Financial Statements.
22
| | | | | |
| Market Neutral Fund | | | | | |
| |
| |
| Financial Highlights | | | | | |
| |
| |
| Investor Shares | | | | | |
| |
| For a Share Outstanding | | | Year Ended December 31, |
| Throughout Each Period | 2016 | 2015 | 2014 | 2013 | 2012 |
| Net Asset Value, Beginning of Period | $12.12 | $11.50 | $11.03 | $10.16 | $10.36 |
| Investment Operations | | | | | |
| Net Investment Income (Loss) | . 050 | . 0021 | (. 032) | (. 007) | . 045 |
| Net Realized and Unrealized Gain (Loss) | | | | | |
| on Investments | . 267 | .620 | .502 | . 880 | (. 200) |
| Total from Investment Operations | .317 | .622 | .470 | .873 | (.155) |
| Distributions | | | | | |
| Dividends from Net Investment Income | (. 047) | (. 002) | | (. 002) | (. 045) |
| Distributions from Realized Capital Gains | | | | | |
| Return of Capital | | | | (.001) | |
| Total Distributions | (. 047) | (. 002) | | (. 003) | (. 045) |
| Net Asset Value, End of Period | $12.39 | $12.12 | $11.50 | $11.03 | $10.16 |
| |
| Total Return2 | 2.62% | 5.41% | 4.26% | 8.59% | -1.50% |
| |
| Ratios/Supplemental Data | | | | | |
| Net Assets, End of Period (Millions) | $1,760 | $650 | $257 | $174 | $151 |
| Ratio of Expenses to Average Net Assets | | | | | |
| Based on Total Expenses3 | 1.60% | 1.46% | 1.64% | 1.57% | 1.88% |
| Net of Dividend and Borrowing Expense on | | | | | |
| Securities Sold Short | 0.22% | 0.25% | 0.25% | 0.25% | 0.25% |
| Ratio of Net Investment Income (Loss) to | | | | | |
| Average Net Assets | 0.48% | 0.01% | (0.38%) | (0.06%) | 0.44% |
| Portfolio Turnover Rate | 64% | 68% | 73% | 68% | 89% |
1 Calculated based on average shares outstanding.
2 Total returns do not include transaction fees that may have applied in the periods shown. Fund prospectuses provide information about any applicable transaction fees.
3 Includes 2016 dividend and borrowing expense on securities sold short of 1.38% and 0.00%, respectively. Includes 2015 dividend and borrowing expense on securities sold short of 1.06% and 0.15%, respectively. Includes 2014 dividend and borrowing expense on securities sold short of 1.21% and 0.18%, respectively. Includes 2013 dividend and borrowing expense on securities sold short of 1.18% and 0.14%, respectively. Includes 2012 dividend and borrowing expense on securities sold short of 1.52% and 0.11%, respectively.
See accompanying Notes, which are an integral part of the Financial Statements.
23
| | | | | |
| Market Neutral Fund | | | | | |
| |
| |
| Financial Highlights | | | | | |
| |
| |
| Institutional Shares | | | | | |
| |
| For a Share Outstanding | | | Year Ended December 31, |
| Throughout Each Period | 2016 | 2015 | 2014 | 2013 | 2012 |
| Net Asset Value, Beginning of Period | $12.07 | $11.45 | $10.97 | $10.10 | $10.33 |
| Investment Operations | | | | | |
| Net Investment Income (Loss) | . 061 | . 0111 | (.023) | .006 | .071 |
| Net Realized and Unrealized Gain (Loss) | | | | | |
| on Investments | .265 | .621 | .503 | .868 | (.215) |
| Total from Investment Operations | .326 | .632 | .480 | .874 | (.144) |
| Distributions | | | | | |
| Dividends from Net Investment Income | (. 056) | (. 012) | | (. 003) | (. 086) |
| Distributions from Realized Capital Gains | | | | | |
| Return of Capital | | | | (.001) | |
| Total Distributions | (. 056) | (. 012) | | (. 004) | (. 086) |
| Net Asset Value, End of Period | $12.34 | $12.07 | $11.45 | $10.97 | $10.10 |
| |
| Total Return2 | 2.70% | 5.52% | 4.38% | 8.66% | -1.39% |
| |
| Ratios/Supplemental Data | | | | | |
| Net Assets, End of Period (Millions) | $338 | $102 | $55 | $35 | $31 |
| Ratio of Expenses to Average Net Assets | | | | | |
| Based on Total Expenses3 | 1.52% | 1.36% | 1.54% | 1.47% | 1.78% |
| Net of Dividend and Borrowing Expense on | | | | | |
| Securities Sold Short | 0.14% | 0.15% | 0.15% | 0.15% | 0.15% |
| Ratio of Net Investment Income (Loss) to | | | | | |
| Average Net Assets | 0.56% | 0.11% | (0.28%) | 0.04% | 0.54% |
| Portfolio Turnover Rate | 64% | 68% | 73% | 68% | 89% |
1 Calculated based on average shares outstanding.
2 Total returns do not include transaction fees that may have applied in the periods shown. Fund prospectuses provide information about any applicable transaction fees.
3 Includes 2016 dividend and borrowing expense on securities sold short of 1.38% and 0.00%, respectively. Includes 2015 dividend and borrowing expense on securities sold short of 1.06% and 0.15%, respectively. Includes 2014 dividend and borrowing expense on securities sold short of 1.21% and 0.18%, respectively. Includes 2013 dividend and borrowing expense on securities sold short of 1.18% and 0.14%, respectively. Includes 2012 dividend and borrowing expense on securities sold short of 1.52% and 0.11%, respectively.
See accompanying Notes, which are an integral part of the Financial Statements.
24
Market Neutral Fund
Notes to Financial Statements
Vanguard Market Neutral Fund is registered under the Investment Company Act of 1940 as an open-end investment company, or mutual fund. The fund offers two classes of shares: Investor Shares and Institutional Shares. Investor Shares are available to any investor who meets the fund s minimum purchase requirements. Institutional Shares are designed for investors who meet certain administrative, service, and account-size criteria.
A. The following significant accounting policies conform to generally accepted accounting principles for U.S. investment companies. The fund consistently follows such policies in preparing its financial statements.
1. Security Valuation: Securities are valued as of the close of trading on the New York Stock Exchange (generally 4 p.m., Eastern time) on the valuation date. Equity securities are valued at the latest quoted sales prices or official closing prices taken from the primary market in which each security trades; such securities not traded on the valuation date are valued at the mean of the latest quoted bid and asked prices. Securities for which market quotations are not readily available, or whose values have been materially affected by events occurring before the fund s pricing time but after the close of the securities primary markets, are valued by methods deemed by the board of trustees to represent fair value. Investments in Vanguard Market Liquidity Fund are valued at that fund s net asset value.
2. Short Sales: Short sales are the sales of securities that the fund does not own. The fund sells a security it does not own in anticipation of a decline in the value of that security. In order to deliver the security to the purchaser, the fund borrows the security from a broker-dealer. The fund must segregate, as collateral for its obligation to return the borrowed security, an amount of cash and long security positions at least equal to the market value of the security sold short, and in the absence of a default, such collateral cannot be repledged, resold, or rehypothecated. This results in the fund holding a significant portion of its assets in cash. The fund later closes out the position by returning the security to the lender, typically by purchasing the security in the open market. A gain, limited to the price at which the fund sold the security short, or a loss, theoretically unlimited in size, is recognized upon the termination of the short sale. The fund may receive a portion of the income from the investment of collateral, or be charged a fee on borrowed securities, based on the market value of each borrowed security and a variable rate that is dependent upon the availability of such security. The net amounts of income or fees are recorded as interest income (for net income received) or borrowing expense on securities sold short (for net fees charged) on the Statement of Operations. Dividends on securities sold short are reported as an expense in the Statement of Operations.
Cash collateral segregated for securities sold short is recorded as an asset in the Statement of Assets and Liabilities. Long security positions segregated as collateral are shown in the Statement of Net Assets.
3. Federal Income Taxes: The fund intends to continue to qualify as a regulated investment company and distribute all of its taxable income. Management has analyzed the fund s tax positions taken for all open federal income tax years (December 31, 2013 2016), and has concluded that no provision for federal income tax is required in the fund s financial statements.
4. Distributions: Distributions to shareholders are recorded on the ex-dividend date.
5. Securities Lending: To earn additional income, the fund lends its securities to qualified institutional borrowers. Security loans are subject to termination by the fund at any time, and are required to be secured at all times by collateral in an amount at least equal to the market value of securities loaned. Daily market fluctuations could cause the value of loaned securities to be more or less than the value of the collateral received. When this occurs, the collateral is adjusted and settled on the next business
25
Market Neutral Fund
day. The fund further mitigates its counterparty risk by entering into securities lending transactions only with a diverse group of prequalified counterparties, monitoring their financial strength, and entering into master securities lending agreements with its counterparties. The master securities lending agreements provide that, in the event of a counterparty s default (including bankruptcy), the fund may terminate any loans with that borrower, determine the net amount owed, and sell or retain the collateral up to the net amount owed to the fund; however, such actions may be subject to legal proceedings. While collateral mitigates counterparty risk, in the absence of a default the fund may experience delays and costs in recovering the securities loaned. The fund invests cash collateral received in Vanguard Market Liquidity Fund, and records a liability in the Statement of Net Assets for the return of the collateral, during the period the securities are on loan. Securities lending income represents fees charged to borrowers plus income earned on invested cash collateral, less expenses associated with the loan. During the term of the loan, the fund is entitled to all distributions made on or in respect of the loaned securities.
6. Credit Facility: The fund and certain other funds managed by The Vanguard Group ( Vanguard ) participate in a $3.1 billion committed credit facility provided by a syndicate of lenders pursuant to a credit agreement that may be renewed annually; each fund is individually liable for its borrowings, if any, under the credit facility. Borrowings may be utilized for temporary and emergency purposes, and are subject to the fund s regulatory and contractual borrowing restrictions. The participating funds are charged administrative fees and an annual commitment fee of 0.10% of the undrawn amount of the facility; these fees are allocated to the funds based on a method approved by the fund s board of trustees and included in Management and Administrative expenses on the fund s Statement of Operations. Any borrowings under this facility bear interest at a rate based upon the higher of the one-month London Interbank Offered Rate, federal funds effective rate, or overnight bank funding rate plus an agreed-upon spread.
The fund had no borrowings outstanding at December 31, 2016, or at any time during the period then ended.
7. Other: Dividend income (or dividend expense on short positions) is recorded on the ex-dividend date. Interest income includes income distributions received from Vanguard Market Liquidity Fund and is accrued daily. Security transactions are accounted for on the date securities are bought or sold. Costs used to determine realized gains (losses) on the sale of investment securities are those of the specific securities sold.
Each class of shares has equal rights as to assets and earnings, except that each class separately bears certain class-specific expenses related to maintenance of shareholder accounts (included in Management and Administrative expenses) and shareholder reporting. Marketing and distribution expenses are allocated to each class of shares based on a method approved by the board of trustees. Income, other non-class-specific expenses, and gains and losses on investments are allocated to each class of shares based on its relative net assets.
B. In accordance with the terms of a Funds Service Agreement (the FSA ) between Vanguard and the fund, Vanguard furnishes to the fund investment advisory, corporate management, administrative, marketing, and distribution services at Vanguard s cost of operations (as defined by the FSA). These costs of operations are allocated to the fund based on methods and guidelines approved by the board of trustees. Vanguard does not require reimbursement in the current period for certain costs of operations (such as deferred compensation/benefits and risk/insurance costs); the fund s liability for these costs of operations is included in Payables to Vanguard on the Statement of Assets and Liabilities.
26
Market Neutral Fund
Upon the request of Vanguard, the fund may invest up to 0.40% of its net assets as capital in Vanguard. At December 31, 2016, the fund had contributed to Vanguard capital in the amount of $149,000, representing 0.01% of the fund s net assets and 0.06% of Vanguard s capitalization. The fund s trustees and officers are also directors and employees, respectively, of Vanguard.
C. Various inputs may be used to determine the value of the fund s investments. These inputs are summarized in three broad levels for financial statement purposes. The inputs or methodologies used to value securities are not necessarily an indication of the risk associated with investing in those securities.
Level 1 Quoted prices in active markets for identical securities.
Level 2 Other significant observable inputs (including quoted prices for similar securities, interest rates, prepayment speeds, credit risk, etc.).
Level 3 Significant unobservable inputs (including the fund s own assumptions used to determine the fair value of investments).
At December 31, 2016, 100% of the market value of the fund s investments was determined based on Level 1 inputs.
D. Distributions are determined on a tax basis and may differ from net investment income and realized capital gains for financial reporting purposes. Differences may be permanent or temporary. Permanent differences are reclassified among capital accounts in the financial statements to reflect their tax character. Temporary differences arise when certain items of income, expense, gain, or loss are recognized in different periods for financial statement and tax purposes. These differences will reverse at some time in the future. Differences in classification may also result from the treatment of short-term gains as ordinary income for tax purposes.
For tax purposes, at December 31, 2016, the fund had $268,000 of ordinary income available for distribution. At December 31, 2016, the fund had available capital losses totaling $82,990,000 to offset future net capital gains. Of this amount, $12,217,000 is subject to expiration dates; $7,346,000 may be used to offset future net capital gains through December 31, 2017, and $4,871,000 through December 31, 2018. Capital losses of $70,773,000 realized beginning in fiscal 2011 may be carried forward indefinitely under the Regulated Investment Company Modernization Act of 2010, but must be used before any expiring loss carryforwards.
At December 31, 2016, the cost of long security positions for tax purposes was $1,782,279,000. Net unrealized appreciation of long security positions for tax purposes was $319,498,000, consisting of unrealized gains of $363,884,000 on securities that had risen in value since their purchase and $44,386,000 in unrealized losses on securities that had fallen in value since their purchase. Tax-basis net unrealized depreciation on securities sold short was $173,126,000, consisting of unrealized gains of $80,780,000 on securities that had fallen in value since their purchase and $253,906,000 in unrealized losses on securities that had risen in value since their sale.
E. During the year ended December 31, 2016, the fund purchased $1,984,840,000 of investment securities and sold $1,008,717,000 of investment securities, other than temporary cash investments. The proceeds of short sales and the cost of purchases to cover short sales were $2,037,811,000 and $1,312,070,000, respectively.
27
Market Neutral Fund
| | | | |
| F. Capital share transactions for each class of shares were: | | | |
| | | | Year Ended December 31, |
| | | 2016 | | 2015 |
| | Amount | Shares | Amount | Shares |
| | ($000) | (000) | ($000) | (000) |
| Investor Shares | | | | |
| Issued | 1,698,621 | 139,652 | 483,066 | 40,492 |
| Issued in Lieu of Cash Distributions | 5,571 | 449 | 92 | 8 |
| Redeemed | (619,043) | (51,631) | (108,850) | (9,253) |
| Net Increase (Decrease) Investor Shares | 1,085,149 | 88,470 | 374,308 | 31,247 |
| Institutional Shares | | | | |
| Issued | 294,960 | 24,355 | 60,931 | 5,124 |
| Issued in Lieu of Cash Distributions | 1,239 | 100 | 90 | 7 |
| Redeemed | (65,326) | (5,499) | (17,375) | (1,495) |
| Net Increase (Decrease) Institutional Shares | 230,873 | 18,956 | 43,646 | 3,636 |
At December 31, 2016, one shareholder was the record or beneficial owner of 29% of the fund s net assets. If the shareholder were to redeem its investment in the fund, the redemption might result in an increase in the fund s expense ratio, cause the fund to incur higher transaction costs, or lead to the realization of taxable capital gains.
G. Management has determined that no material events or transactions occurred subsequent to December 31, 2016, that would require recognition or disclosure in these financial statements.
28
Report of Independent Registered Public Accounting Firm
To the Board of Trustees of Vanguard Montgomery Funds and the Shareholders of Vanguard Market Neutral Fund:
In our opinion, the accompanying statement of net assets, statement of assets and liabilities and the related statements of operations and of changes in net assets and the financial highlights present fairly, in all material respects, the financial position of Vanguard Market Neutral Fund (constituting Vanguard Montgomery Funds, hereafter referred to as the Fund ) at December 31, 2016, the results of its operations for the year then ended, the changes in its net assets for each of the two years in the period then ended, and the financial highlights for each of the five years in the period then ended, in conformity with accounting principles generally accepted in the United States of America. These financial statements and financial highlights (hereafter referred to as financial statements ) are the responsibility of the Fund s management. Our responsibility is to express an opinion on these financial statements based on our audits. We conducted our audits of these financial statements in accordance with the standards of the Public Company Accounting Oversight Board (United States). Those standards require that we plan and perform the audit to obtain reasonable assurance about whether the financial statements are free of material misstatement. An audit includes examining, on a test basis, evidence supporting the amounts and disclosures in the financial statements, assessing the accounting principles used and significant estimates made by management, and evaluating the overall financial statement presentation. We believe that our audits, which included confirmation of securities at December 31, 2016 by correspondence with the custodian and brokers and by agreement to the underlying ownership records of the transfer agent, provide a reasonable basis for our opinion.
/s/PricewaterhouseCoopers LLP
Philadelphia, Pennsylvania
February 17, 2017
Special 2016 tax information (unaudited) for Vanguard Market Neutral Fund
This information for the fiscal year ended December 31, 2016, is included pursuant to provisions of the Internal Revenue Code.
The fund distributed $7,995,000 of qualified dividend income to shareholders during the fiscal year.
For corporate shareholders, 100% of investment income (dividend income plus short-term gains, if any) qualifies for the dividends-received deduction.
29
Your Fund s After-Tax Returns
This table presents returns for your fund both before and after taxes. The after-tax returns are shown in two ways: (1) assuming that an investor owned the fund during the entire period and paid taxes on the fund s distributions, and (2) assuming that an investor paid taxes on the fund s distributions and sold all shares at the end of each period.
Calculations are based on the highest individual federal income tax and capital gains tax rates in effect at the times of the distributions and the hypothetical sales. State and local taxes were not considered. After-tax returns reflect any qualified dividend income. (In the example, returns after the sale of fund shares may be higher than those assuming no sale. This occurs when the sale would have produced a capital loss. The calculation assumes that the investor received a tax deduction for the loss.)
The table shows returns for Investor Shares only; returns for other share classes will differ. Please note that your actual after-tax returns will depend on your tax situation and may differ from those shown. Also note that if you own the fund in a tax-deferred account, such as an individual retirement account or a 401(k) plan, this information does not apply to you. Such accounts are not subject to current taxes.
Finally, keep in mind that a fund s performance whether before or after taxes does not guarantee future results.
Average Annual Total Returns: Market Neutral Fund Investor Shares
Periods Ended December 31, 2016
| | | |
| | One | Five | Ten |
| | Year | Years | Years |
| Returns Before Taxes | 2.62% | 3.82% | 1.67% |
| Returns After Taxes on Distributions | 2.52 | 3.79 | 1.31 |
| Returns After Taxes on Distributions and Sale of Fund Shares | 1.56 | 2.97 | 1.26 |
30
About Your Fund s Expenses
As a shareholder of the fund, you incur ongoing costs, which include costs for portfolio management, administrative services, and shareholder reports (like this one), among others. Operating expenses, which are deducted from a fund s gross income, directly reduce the investment return of the fund.
A fund s expenses are expressed as a percentage of its average net assets. This figure is known as the expense ratio. The following examples are intended to help you understand the ongoing costs (in dollars) of investing in your fund and to compare these costs with those of other mutual funds. The examples are based on an investment of $1,000 made at the beginning of the period shown and held for the entire period.
The accompanying table illustrates your fund s costs in two ways:
* Based on actual fund return. This section helps you to estimate the actual expenses that you paid over the period. The Ending Account Value shown is derived from the fund s actual return, and the third column shows the dollar amount that would have been paid by an investor who started with $1,000 in the fund. You may use the information here, together with the amount you invested, to estimate the expenses that you paid over the period.
To do so, simply divide your account value by $1,000 (for example, an $8,600 account value divided by $1,000 = 8.6), then multiply the result by the number given for your fund under the heading Expenses Paid During Period.
* Based on hypothetical 5% yearly return. This section is intended to help you compare your fund s costs with those of other mutual funds. It assumes that the fund had a yearly return of 5% before expenses, but that the expense ratio is unchanged. In this case because the return used is not the fund s actual return the results do not apply to your investment. The example is useful in making comparisons because the Securities and Exchange Commission requires all mutual funds to calculate expenses based on a 5% return. You can assess your fund s costs by comparing this hypothetical example with the hypothetical examples that appear in shareholder reports of other funds.
Note that the expenses shown in the table are meant to highlight and help you compare ongoing costs only and do not reflect transaction costs incurred by the fund for buying and selling securities. Further, the expenses do not include any purchase, redemption, or account service fees described in the fund prospectus. If such fees were applied to your account, your costs would be higher. Your fund does not carry a sales load.
The calculations assume no shares were bought or sold during the period. Your actual costs may have been higher or lower, depending on the amount of your investment and the timing of any purchases or redemptions.
You can find more information about the fund s expenses, including annual expense ratios, in the Financial Statements section of this report. For additional information on operating expenses and other shareholder costs, please refer to your fund s current prospectus.
31
| | | |
| Six Months Ended December 31, 2016 | | | |
| | Beginning | Ending | Expenses |
| | Account Value | Account Value | Paid During |
| Market Neutral Fund | 6/30/2016 | 12/31/2016 | Period |
| Based on Actual Fund Return | | | |
| Investor Shares | $1,000.00 | $1,052.20 | $7.94 |
| Institutional Shares | 1,000.00 | 1,052.29 | 7.63 |
| Based on Hypothetical 5% Yearly Return | | | |
| Investor Shares | $1,000.00 | $1,017.39 | $7.81 |
| Institutional Shares | 1,000.00 | 1,017.70 | 7.51 |
The calculations are based on expenses incurred in the most recent six-month period. The fund s annualized six-month expense ratios for that period are 1.54% for Investor Shares and 1.48% for Institutional Shares. The dollar amounts shown as Expenses Paid are equal to the annualized expense ratio multiplied by the average account value over the period, multiplied by the number of days in the most recent six-month period, then divided by the number of days in the most recent 12-month period (184/366).
32
Glossary
Beta. A measure of the magnitude of a fund s past share-price fluctuations in relation to the ups and downs of a given market index. The index is assigned a beta of 1.00. Compared with a given index, a fund with a beta of 1.20 typically would have seen its share price rise or fall by 12% when the index rose or fell by 10%. For this report, beta is based on returns over the past 36 months for both the fund and the index. Note that a fund s beta should be reviewed in conjunction with its R-squared (see definition). The lower the R-squared, the less correlation there is between the fund and the index, and the less reliable beta is as an indicator of volatility.
Earnings Growth Rate. The average annual rate of growth in earnings over the past five years for the stocks now in a fund.
Equity Exposure. A measure that reflects a fund s investments in stocks and stock futures. Any holdings in short-term reserves are excluded.
Expense Ratio. The percentage of a fund s average net assets used to pay its annual administrative and advisory expenses. These expenses directly reduce returns to investors.
Foreign Holdings. The percentage of a fund represented by securities or depositary receipts of companies based outside the United States.
Inception Date. The date on which the assets of a fund (or one of its share classes) are first invested in accordance with the fund s investment objective. For funds with a subscription period, the inception date is the day after that period ends. Investment performance is measured from the inception date.
Median Market Cap. An indicator of the size of companies in which a fund invests; the midpoint of market capitalization (market price x shares outstanding) of a fund s stocks, weighted by the proportion of the fund s assets invested in each stock. Stocks representing half of the fund s assets have market capitalizations above the median, and the rest are below it.
Price/Book Ratio. The share price of a stock divided by its net worth, or book value, per share. For a fund, the weighted average price/book ratio of the stocks it holds.
Price/Earnings Ratio. The ratio of a stock s current price to its per-share earnings over the past year. For a fund, the weighted average P/E of the stocks it holds. P/E is an indicator of market expectations about corporate prospects; the higher the P/E, the greater the expectations for a company s future growth.
R-Squared. A measure of how much of a fund s past returns can be explained by the returns from the market in general, as measured by a given index. If a fund s total returns were precisely synchronized with an index s returns, its R-squared would be 1.00. If the fund s returns bore no relationship to the index s returns, its R-squared would be 0. For this report, R-squared is based on returns over the past 36 months for both the fund and the index.
Return on Equity. The annual average rate of return generated by a company during the past five years for each dollar of shareholder s equity (net income divided by shareholder s equity). For a fund, the weighted average return on equity for the companies whose stocks it holds.
Short-Term Reserves. The percentage of a fund invested in highly liquid, short-term securities that can be readily converted to cash.
33
Turnover Rate. An indication of the fund s trading activity. Funds with high turnover rates incur higher transaction costs and may be more likely to distribute capital gains (which may be taxable to investors). The turnover rate excludes in-kind transactions, which have minimal impact on costs.
Benchmark Information
Spliced Market Neutral Index: Citigroup 3-Month U.S. Treasury Bill Index through March 31, 2016; Citigroup 3-Month U.S. Treasury Bill Index (Daily) thereafter.
34
This page intentionally left blank.
The People Who Govern Your Fund
The trustees of your mutual fund are there to see that the fund is operated and managed in your best interests since, as a shareholder, you are a part owner of the fund. Your fund s trustees also serve on the board of directors of The Vanguard Group, Inc., which is owned by the Vanguard funds and provides services to them on an at-cost basis.
A majority of Vanguard s board members are independent, meaning that they have no affiliation with Vanguard or the funds they oversee, apart from the sizable personal investments they have made as private individuals. The independent board members have distinguished backgrounds in business, academia, and public service. Each of the trustees and executive officers oversees 198 Vanguard funds.
The following table provides information for each trustee and executive officer of the fund. The mailing address of the trustees and officers is P.O. Box 876, Valley Forge, PA 19482. More information about the trustees is in the Statement of Additional Information, which can be obtained, without charge, by contacting Vanguard at 800-662-7447, or online at vanguard.com.
InterestedTrustee1
F. William McNabb III
Born 1957. Trustee Since July 2009. Chairman of the Board. Principal Occupation(s) During the Past Five Years and Other Experience: Chairman of the Board of The Vanguard Group, Inc., and of each of the investment companies served by The Vanguard Group, since January 2010; Director of The Vanguard Group since 2008; Chief Executive Officer and President of The Vanguard Group, and of each of the investment companies served by The Vanguard Group, since 2008; Director of Vanguard Marketing Corporation; Managing Director of The Vanguard Group (1995 2008).
IndependentTrustees
Emerson U. Fullwood
Born 1948. Trustee Since January 2008. Principal Occupation(s) During the Past Five Years and Other Experience: Executive Chief Staff and Marketing Officer for North America and Corporate Vice President (retired 2008) of Xerox Corporation (document management products and services); Executive in Residence and 2009 2010 Distinguished Minett Professor at the Rochester Institute of Technology; Lead Director of SPX FLOW, Inc. (multi-industry manufacturing); Director of the United Way of Rochester, the University of Rochester Medical Center, Monroe Community College Foundation, North Carolina A&T University, and Roberts Wesleyan College.
Rajiv L. Gupta
Born 1945. Trustee Since December 2001.2 Principal Occupation(s) During the Past Five Years and Other Experience: Chairman and Chief Executive Officer (retired 2009) and President (2006 2008) of Rohm and Haas Co. (chemicals); Director of Tyco International plc (diversified manufacturing and services), HP Inc. (printer and personal computer manufacturing), and Delphi Automotive plc (automotive components); Senior Advisor at New Mountain Capital.
Amy Gutmann
Born 1949. Trustee Since June 2006. Principal Occupation(s) During the Past Five Years and Other Experience: President of the University of Pennsylvania; Christopher H. Browne Distinguished Professor of Political Science, School of Arts and Sciences, and Professor of Communication, Annenberg School for Communication, with secondary faculty appointments in the Department of Philosophy, School of Arts and Sciences, and at the Graduate School of Education, University of Pennsylvania; Trustee of the National Constitution Center; Chair of the Presidential Commission for the Study of Bioethical Issues.
JoAnn Heffernan Heisen
Born 1950. Trustee Since July 1998. Principal Occupation(s) During the Past Five Years and Other Experience: Corporate Vice President and Chief Global Diversity Officer (retired 2008) and Member of the Executive Committee (1997 2008) of Johnson & Johnson (pharmaceuticals/medical devices/consumer products); Director of Skytop Lodge Corporation (hotels) and the Robert Wood Johnson Foundation; Member of the Advisory Board of the Institute for Women s Leadership at Rutgers University.
F. Joseph Loughrey
Born 1949. Trustee Since October 2009. Principal Occupation(s) During the Past Five Years and Other Experience: President and Chief Operating Officer (retired 2009) of Cummins Inc. (industrial machinery); Chairman of the Board of Hillenbrand, Inc. (specialized consumer services), and of Oxfam America; Director of SKF AB (industrial machinery), Hyster-Yale Materials Handling, Inc. (forklift trucks), the Lumina Foundation for Education, and the V Foundation for Cancer Research; Member of the Advisory Council for the College of Arts and Letters and of the Advisory Board to the Kellogg Institute for International Studies, both at the University of Notre Dame.
Mark Loughridge
Born 1953. Trustee Since March 2012. Principal Occupation(s) During the Past Five Years and Other Experience: Senior Vice President and Chief Financial Officer (retired 2013) at IBM (information technology services); Fiduciary Member of IBM s Retirement Plan Committee (2004 2013); Director of the Dow Chemical Company; Member of the Council on Chicago Booth.
Scott C. Malpass
Born 1962. Trustee Since March 2012. Principal Occupation(s) During the Past Five Years and Other Experience: Chief Investment Officer and Vice President at the University of Notre Dame; Assistant Professor of Finance at the Mendoza College of Business at Notre Dame; Member of the Notre Dame 403(b) Investment Committee, the Board of Advisors for Spruceview Capital Partners, and the Investment Advisory Committee of Major League Baseball; Board Member of TIFF Advisory Services, Inc., and Catholic Investment Services, Inc. (investment advisors).
André F. Perold
Born 1952. Trustee Since December 2004. Principal Occupation(s) During the Past Five Years and Other Experience: George Gund Professor of Finance and Banking, Emeritus at the Harvard Business School (retired 2011); Chief Investment Officer and Managing Partner of HighVista Strategies LLC (private investment firm); Director of Rand Merchant Bank; Overseer of the Museum of Fine Arts Boston.
Peter F. Volanakis
Born 1955. Trustee Since July 2009. Principal Occupation(s) During the Past Five Years and Other Experience: President and Chief Operating Officer (retired 2010) of Corning Incorporated (communications equipment); Chairman of the Board of Trustees of Colby-Sawyer College; Member of the Advisory Board of the Norris Cotton Cancer Center.
Executive Officers
Glenn Booraem
Born 1967. Treasurer Since May 2015. Principal Occupation(s) During the Past Five Years and Other Experience: Principal of The Vanguard Group, Inc.; Treasurer of each of the investment companies served by The Vanguard Group; Controller of each of the investment companies served by The Vanguard Group (2010 2015); Assistant Controller of each of the investment companies served by The Vanguard Group (2001 2010).
Thomas J. Higgins
Born 1957. Chief Financial Officer Since September 2008. Principal Occupation(s) During the Past Five Years and Other Experience: Principal of The Vanguard Group, Inc.; Chief Financial Officer of each of the investment companies served by The Vanguard Group; Treasurer of each of the investment companies served by The Vanguard Group (1998 2008).
Peter Mahoney
Born 1974. Controller Since May 2015. Principal Occupation(s) During the Past Five Years and Other Experience: Head of Global Fund Accounting at The Vanguard Group, Inc.; Controller of each of the investment companies served by The Vanguard Group; Head of International Fund Services at The Vanguard Group (2008 2014).
Anne E. Robinson
Born 1970. Secretary Since September 2016. Principal Occupation(s) During the Past Five Years and Other Experience: Managing Director of The Vanguard Group, Inc.; General Counsel of The Vanguard Group; Secretary of The Vanguard Group and of each of the investment companies served by The Vanguard Group; Director and Senior Vice President of Vanguard Marketing Corporation; Managing Director and General Counsel of Global Cards and Consumer Services at Citigroup (2014 2016); Counsel at American Express (2003 2014).
Vanguard Senior Management Team
| |
Mortimer J. Buckley Martha G. King John T. Marcante Chris D. McIsaac James M. Norris | Thomas M. Rampulla Glenn W. Reed Karin A. Risi Michael Rollings |
Chairman Emeritus and Senior Advisor
John J. Brennan
Chairman, 1996 2009
Chief Executive Officer and President, 1996 2008
Founder
John C. Bogle
Chairman and Chief Executive Officer, 1974 1996
1 Mr. McNabb is considered an interested person, as defined in the Investment Company Act of 1940, because he is an officer of the Vanguard funds.
2 December 2002 for Vanguard Equity Income Fund, the Vanguard Municipal Bond Funds, and the Vanguard State Tax-Exempt Funds.

P.O. Box 2600
Valley Forge, PA 19482-2600
| |
| Connect with Vanguard® > vanguard.com | |
| |
| |
| |
| Fund Information > 800-662-7447 | CFA® is a registered trademark owned by CFA Institute. |
| Direct Investor Account Services > 800-662-2739 | |
| Institutional Investor Services > 800-523-1036 | |
| Text Telephone for People | |
| Who Are Deaf or Hard of Hearing> 800-749-7273 | |
| |
| This material may be used in conjunction | |
| with the offering of shares of any Vanguard | |
| fund only if preceded or accompanied by | |
| the fund s current prospectus. | |
| |
| All comparative mutual fund data are from Lipper, a | |
| Thomson Reuters Company, or Morningstar, Inc., unless | |
| otherwise noted. | |
| |
| You can obtain a free copy of Vanguard s proxy voting | |
| guidelines by visiting vanguard.com/proxyreporting or by | |
| calling Vanguard at 800-662-2739. The guidelines are | |
| also available from the SEC s website, sec.gov. In | |
| addition, you may obtain a free report on how your fund | |
| voted the proxies for securities it owned during the 12 | |
| months ended June 30. To get the report, visit either | |
| vanguard.com/proxyreporting or sec.gov. | |
| |
| You can review and copy information about your fund at | |
| the SEC s Public Reference Room in Washington, D.C. To | |
| find out more about this public service, call the SEC at | |
| 202-551-8090. Information about your fund is also | |
| available on the SEC s website, and you can receive | |
| copies of this information, for a fee, by sending a | |
| request in either of two ways: via email addressed to | |
| publicinfo@sec.gov or via regular mail addressed to the | |
| Public Reference Section, Securities and Exchange | |
| Commission, Washington, DC 20549-1520. | |
| |
| | © 2017 The Vanguard Group, Inc. |
| | All rights reserved. |
| | Vanguard Marketing Corporation, Distributor. |
| |
| | Q6340 022017 |
Item 2: Code of Ethics. The Registrant has adopted a code of ethics that applies to the Registrant s principal executive officer, principal financial officer, principal accounting officer or controller or persons performing similar functions. The Code of Ethics was amended during the reporting period covered by this report to make certain technical, non-material changes.
Item 3: Audit Committee Financial Expert. All members of the Audit Committee have been determined by the Registrant s Board of Trustees to be Audit Committee Financial Experts and to be independent: Rajiv L. Gupta, JoAnn Heffernan Heisen, F. Joseph Loughrey, Mark Loughridge, and Peter F. Volanakis.
Item 4: Principal Accountant Fees and Services.
(a) Audit Fees.
Audit Fees of the Registrant
Fiscal Year Ended December 31, 2016: $28,000
Fiscal Year Ended December 31, 2015: $53,000
Aggregate Audit Fees of Registered Investment Companies in the Vanguard Group.
Fiscal Year Ended December 31, 2016: $9,629,849
Fiscal Year Ended December 31, 2015: $7,000,200
Includes fees billed in connection with audits of the Registrant, other registered investment companies in the Vanguard complex, The Vanguard Group, Inc. and Vanguard Marketing Corporation.
(b) Audit-Related Fees.
Fiscal Year Ended December 31, 2016: $2,717,627
Fiscal Year Ended December 31, 2015: $2,899,096
Includes fees billed in connection with assurance and related services provided to the
Registrant, other registered investment companies in the Vanguard complex, The Vanguard
Group, Inc., and Vanguard Marketing Corporation.
(c) Tax Fees.
Fiscal Year Ended December 31, 2016: $254,050
Fiscal Year Ended December 31, 2015: $353,389
Includes fees billed in connection with tax compliance, planning, and advice services provided to the Registrant, other registered investment companies in the Vanguard complex, The Vanguard Group, Inc., and Vanguard Marketing Corporation.
(d) All Other Fees.
Fiscal Year Ended December 31, 2016: $214,225
Fiscal Year Ended December 31, 2015: $202,313
Includes fees billed for services related to tax reported information provided to the Registrant, other registered investment companies in the Vanguard complex, The Vanguard Group, Inc., and Vanguard Marketing Corporation.
(e) (1) Pre-Approval Policies. The policy of the Registrant s Audit Committee is to consider and, if appropriate, approve before the principal accountant is engaged for such services, all specific audit and non-audit services provided to: the Registrant, other registered investment companies in the Vanguard complex, The Vanguard Group, Inc., and entities controlled by The Vanguard Group, Inc. that provide ongoing services to the Registrant. In making a determination, the Audit Committee considers whether the services are consistent with maintaining the principal accountant s independence.
In the event of a contingency situation in which the principal accountant is needed to provide services in between scheduled Audit Committee meetings, the Chairman of the Audit Committee would be called on to consider and, if appropriate, pre-approve audit or permitted non-audit services in an amount sufficient to complete services through the next Audit Committee meeting, and to determine if such services would be consistent with maintaining the accountant s independence. At the next scheduled Audit Committee meeting, services and fees would be presented to the Audit Committee for formal consideration, and, if appropriate, approval by the entire Audit Committee. The Audit Committee would again consider whether such services and fees are consistent with maintaining the principal accountant s independence.
The Registrant s Audit Committee is informed at least annually of all audit and non-audit services provided by the principal accountant to the Vanguard complex, whether such services are provided to: the Registrant, other registered investment companies in the Vanguard complex, The Vanguard Group, Inc., or other entities controlled by The Vanguard Group, Inc. that provide ongoing services to the Registrant.
(2) No percentage of the principal accountant s fees or services were approved pursuant to the waiver provision of paragraph (c)(7)(i)(C) of Rule 2-01 of Regulation S-X.
(f) For the most recent fiscal year, over 50% of the hours worked under the principal accountant s engagement were not performed by persons other than full-time, permanent employees of the principal accountant.
(g) Aggregate Non-Audit Fees.
Fiscal Year Ended December 31, 2016: $468,275
Fiscal Year Ended December 31, 2015: $555,702
Includes fees billed for non-audit services provided to the Registrant, other registered investment companies in the Vanguard complex, The Vanguard Group, Inc., and Vanguard Marketing Corporation.
(h) For the most recent fiscal year, the Audit Committee has determined that the provision of all non-audit services was consistent with maintaining the principal accountant s independence.
Item 5: Audit Committee of Listed Registrants.
Not Applicable.
Item 6: Investments.
Not Applicable.
Item 7: Disclosure of Proxy Voting Policies and Procedures for Closed-End Management
Investment Companies.
Not Applicable.
Item 8: Portfolio Managers of Closed-End Management Investment Companies.
Not Applicable.
Item 9: Purchase of Equity Securities by Closed-End Management Investment Company and
Affiliated Purchasers.
Not Applicable.
Item 10: Submission of Matters to a Vote of Security Holders.
Not Applicable.
Item 11: Controls and Procedures.
(a) Disclosure Controls and Procedures. The Principal Executive and Financial Officers concluded that the Registrant s Disclosure Controls and Procedures are effective based on their evaluation of the Disclosure Controls and Procedures as of a date within 90 days of the filing date of this report.
(b) Internal Control Over Financial Reporting. There were no significant changes in Registrant s Internal Control Over Financial Reporting or in other factors that could significantly affect this control subsequent to the date of the evaluation, including any corrective actions with regard to significant deficiencies and material weaknesses.
Item 12: Exhibits.
(a) Code of Ethics.
(b) Certifications.
Pursuant to the requirements of the Securities Exchange Act of 1934 and the Investment Company Act of 1940, the registrant has duly caused this report to be signed on its behalf by the undersigned, thereunto duly authorized.
| |
| | VANGUARD MONTGOMERY FUNDS |
| |
| |
| BY: | /s/ F. WILLIAM MCNABB III* |
| F. WILLIAM MCNABB III |
| CHIEF EXECUTIVE OFFICER |
| |
| Date: February 16, 2017 |
Pursuant to the requirements of the Securities Exchange Act of 1934 and the Investment Company Act of 1940, this report has been signed below by the following persons on behalf of the registrant and in the capacities and on the dates indicated.
| |
| | VANGUARD MONTGOMERY FUNDS |
| |
| BY: | /s/ F. WILLIAM MCNABB III* |
| F. WILLIAM MCNABB III |
| CHIEF EXECUTIVE OFFICER |
Date: February 16, 2017 |
| | VANGUARD MONTGOMERY FUNDS |
| |
| BY: | /s/ THOMAS J. HIGGINS* |
| | THOMAS J. HIGGINS |
| CHIEF FINANCIAL OFFICER |
| Date: February 16, 2017 |
* By: /s/ Anne E. Robinson
Anne E. Robinson, pursuant to a Power of Attorney filed on October 4, 2016 see file Number
33-32548, Incorporated by Reference.