UNITED STATES
SECURITIES AND EXCHANGE COMMISSION
Washington, D.C. 20549
FORM N-CSR
CERTIFIED SHAREHOLDER REPORT
OF
REGISTERED MANAGEMENT INVESTMENT COMPANIES
| | |
| Investment Company Act file number: | 811-22114 | |
Name of Registrant: | Vanguard Montgomery Funds |
Address of Registrant: | P.O. Box 2600 |
| | Valley Forge, PA 19482 |
Name and address of agent for service: | Heidi Stam, Esquire |
| | P.O. Box 876 |
| | Valley Forge, PA 19482 |
Registrant’s telephone number, including area code: (610) 669-1000 |
Date of fiscal year end: December 31 | |
Date of reporting period: January 1, 2013 – December 31, 2013 |
Item 1: Reports to Shareholders | |

Annual Report | December 31, 2013
Vanguard Market Neutral Fund

Vanguard’s Principles for Investing Success
We want to give you the best chance of investment success. These principles,
grounded in Vanguard’s research and experience, can put you on the right path.
Goals. Create clear, appropriate investment goals.
Balance. Develop a suitable asset allocation using broadly diversified funds.
Cost. Minimize cost.
Discipline. Maintain perspective and long-term discipline.
A single theme unites these principles: Focus on the things you can control.
We believe there is no wiser course for any investor.
| |
| Contents | |
| Your Fund’s Total Returns. | 1 |
| Chairman’s Letter. | 2 |
| Advisor’s Report. | 7 |
| Fund Profile. | 9 |
| Performance Summary. | 11 |
| Financial Statements. | 13 |
| Your Fund’s After-Tax Returns. | 29 |
| About Your Fund’s Expenses. | 30 |
| Glossary. | 32 |
Please note: The opinions expressed in this report are just that—informed opinions. They should not be considered promises or advice.
Also, please keep in mind that the information and opinions cover the period through the date on the front of this report. Of course, the
risks of investing in your fund are spelled out in the prospectus.
See the Glossary for definitions of investment terms used in this report.
About the cover: The ship’s wheel represents leadership and guidance, essential qualities in navigating difficult seas.
This one is a replica based on an 18th-century British vessel. The HMSVanguard, another ship of that era, served as the
flagship for British Admiral Horatio Nelson when he defeated a French fleet at the Battle of the Nile.
Your Fund’s Total Returns
| |
| Fiscal Year Ended December 31, 2013 | |
| |
| | Total |
| | Returns |
| Vanguard Market Neutral Fund | |
| Investor Shares | 8.59% |
| Institutional Shares | 8.66 |
| Citigroup Three-Month U.S. Treasury Bill Index | 0.05 |
| Equity Market Neutral Funds Average | 3.09 |
| Equity Market Neutral Funds Average: Derived from data provided by Lipper, a Thomson Reuters Company. |
| Institutional Shares are available to certain institutional investors who meet specific administrative, service, and account-size criteria. |
| | | | | |
| Your Fund’s Performance at a Glance | | | | |
| December 31, 2012, Through December 31, 2013 | | | | |
| | | | Distributions Per Share | |
| | Starting | Ending | | | |
| | Share | Share | Income | Capital | Return of |
| | Price | Price | Dividends | Gains | Capital |
| Vanguard Market Neutral Fund | | | | | |
| Investor Shares | $10.16 | $11.03 | $0.002 | $0.000 | $0.001 |
| Institutional Shares | 10.10 | 10.97 | 0.003 | 0.000 | 0.001 |
1

Chairman’s Letter
Dear Shareholder,
Vanguard Market Neutral Fund handily outperformed its comparative standards for 2013, benefiting from the advisor’s stock choices in industries ranging from airlines to biotechnology to gold mining.
The advisor, Vanguard Equity Investment Group, has developed—and continually refines—computer models to identify the most and least attractive stocks in each sector. These models worked well in the 12 months ended December 31, as the Market Neutral Fund returned 8.59% for Investor Shares. That compares with 0.05% for the benchmark Citigroup Three-Month U.S. Treasury Bill Index and 3.09% for peer funds, on average.
It was the highest annual return for the Market Neutral Fund since 2007. The fund’s advance looks pale next to the broad U.S. stock market’s return of about 34%, but that disparity is to be expected. The fund isn’t designed to follow the returns of the broad stock market but to deliver performance that’s neutral to market conditions.
Earnings, optimism, and stimulus made it a big year for U.S. stocks
As I mentioned, U.S. stocks surged in the 12 months ended December 31, delivering their best calendar-year finish since 1995. Corporations posted solid earnings and investors placed a higher
2
premium on those earnings. The Federal Reserve’s stimulative bond-buying program also supported stock markets; in fact, markets slumped a bit in the summer when questions arose about the timing of the program’s unwinding. In December, the Fed ended the uncertainty by announcing that it would begin paring its bond purchases in January 2014.
International stocks, in aggregate, returned about 15%, with the developed markets of Europe and the Pacific region posting double-digit results and emerging-market stocks dipping into negative territory.
For 2014, Vanguard Chief Economist Joe Davis and his team are guarded in their outlook for global stock returns, and their forecast for the bond market remains
muted. While Joe readily acknowledges that such forecasts are accompanied by uncertainty, he writes, “We believe a balanced and diversified, low-cost portfolio can remain a high-value proposition in the decade ahead.” (You can read more about our expectations for bond and stock returns in Vanguard’s Economic and Investment Outlook, available at vanguard.com/ research.)
Bond returns faltered in 2013 as the Fed’s phaseout loomed
The broad U.S. taxable bond market returned –2.02%—its first negative calendar-year result since 1999 and its worst calendar-year performance since 1994. The Fed’s plans for phasing out its bond-buying program rattled investors, who sold bonds in anticipation of further
| | | |
| Market Barometer | | | |
| |
| | Average Annual Total Returns |
| | Periods Ended December 31, 2013 |
| | One | Three | Five |
| | Year | Years | Years |
| Stocks | | | |
| Russell 1000 Index (Large-caps) | 33.11% | 16.30% | 18.59% |
| Russell 2000 Index (Small-caps) | 38.82 | 15.67 | 20.08 |
| Russell 3000 Index (Broad U.S. market) | 33.55 | 16.24 | 18.71 |
| MSCI All Country World Index ex USA (International) | 15.29 | 5.14 | 12.81 |
| |
| Bonds | | | |
| Barclays U.S. Aggregate Bond Index (Broad taxable market) | -2.02% | 3.26% | 4.44% |
| Barclays Municipal Bond Index (Broad tax-exempt market) | -2.55 | 4.83 | 5.89 |
| Citigroup Three-Month U.S. Treasury Bill Index | 0.05 | 0.06 | 0.09 |
| |
| CPI | | | |
| Consumer Price Index | 1.50% | 2.07% | 2.08% |
3
price declines. Municipal bonds returned –2.55% in aggregate. The yield of the 10-year Treasury note closed at 2.97%, up from 1.76% at the close of December 2012. (Bond yields and prices move in opposite directions.)
International bond markets (as measured by the Barclays Global Aggregate Index ex USD) returned –3.08%. As for money market funds and savings accounts, returns remained tiny as the Fed held short-term interest rates between 0% and 0.25%.
For the year, the fund had success with ‘long’ and ‘short’ investments
A distinctive characteristic of Vanguard Market Neutral Fund is its “short” portfolio: The fund sells borrowed shares with the hope that the stock price will fall; then it can profit by replacing the shares at the lower price. This “short-selling” reverses what’s typically expected, because the advisor’s goal is to identify not rising stocks but those headed for declines.
The fund also invests with the traditional “long” approach, in which stocks are selected based on the advisor’s belief that they’ll outperform.
In 2013, the advisor had success with both techniques. Short investments in gold-mining companies generated outsized gains as their shares tumbled along with the steep slide in the price of gold. On the long side, the fund had success with investments in airlines, which appeared to benefit from improved business results as well as legal clearance for a high-profile merger late in the year.
In the biotechnology industry, the advisor did well with both its short and long investments. The biotech industry is extremely volatile: Shares can soar or plummet depending on the outcome of trials of experimental new therapies. During 2013, the fund held some of the group’s leading advancers in its long portfolio while having short positions in some of the biggest biotech decliners.
As for weak spots, the fund had disappointing results with short investments among high-flying internet companies as investors continued to bid up their stock prices in view of ongoing growth in online spending.
Combining short investments with offsetting long investments can enhance diversification by providing returns that aren’t closely correlated with moves of the broad stock market. However, given the Market Neutral Fund’s distinctive characteristics, investors should carefully evaluate its appropriateness for their
4
specific situations. The fund can play a role as a small portion of a large, already well-diversified portfolio.
For more about the advisor’s strategy and the fund’s positioning during the year, please see the Advisor’s Report that follows this letter.
With active management, patience can be rewarded
As I’ve discussed, 2013 was a successful year for the Market Neutral Fund. We have great confidence in our Equity Investment Group, which has been the fund’s sole advisor since August 2010. Nevertheless, we wouldn’t expect the fund to outshine its comparative standards in every single period. Indeed, it underperformed its peers and benchmark in 2012.
And that brings me to an important point for investors who choose actively managed funds, such as the Market Neutral Fund: Even the best managers can’t avoid short-term periods of underperformance. So an investor who is unwilling to endure some lean times could unwisely abandon a talented manager and miss out on long-term rewards. (You can read our research on this subject in The Bumpy Road to Outperformance at vanguard.com/research.)
| |
| Total Returns | |
| Ten Years Ended December 31, 2013 | |
| | Average |
| | Annual Return |
| Market Neutral Fund Investor Shares | 2.42% |
| Citigroup Three-Month U.S. Treasury Bill Index | 1.58 |
| Equity Market Neutral Funds Average | 1.69 |
| Equity Market Neutral Funds Average: Derived from data provided by Lipper, a Thomson Reuters Company. |
The figures shown represent past performance, which is not a guarantee of future results. (Current performance may be
lower or higher than the performance data cited. For performance data current to the most recent month-end, visit our
website at vanguard.com/performance.) Note, too, that both investment returns and principal value can fluctuate widely, so
an investor’s shares, when sold, could be worth more or less than their original cost.
5
As you can see in the table on page 5, for the decade ended December 31, the Market Neutral Fund outperformed its comparative standards. But that reward was earned only by shareholders who stood fast in the face of disappointing short-term results. We hope that, over time, the fund’s margin of outperformance will grow and that you and its other investors will be rewarded for taking the long-term view.
As always, thank you for entrusting your assets to Vanguard.
Sincerely,

F. William McNabb III
Chairman and Chief Executive Officer
January 22, 2014
6
Advisor’s Report
In the fiscal year ended December 31, 2013, the Market Neutral Fund returned 8.59% for Investor Shares, outperforming its benchmark, the Citigroup Three-Month U.S. Treasury Bill Index, by more than eight percentage points. Generally, it was a successful year, during which the fund led its benchmark in three of four quarters. Its fourth-quarter return was the strongest, at 4.15%, and its third-quarter result the weakest, at –0.38% (both results are for Investor Shares).
The broad U.S. equity market generated strong gains in 2013, producing first- and fourth-quarter returns in the double digits, about 11% and about 10%, respectively. Like the broad stock market, the Market Neutral Fund fared especially well in those two quarters (albeit with gains in the single, rather than double, digits). It is important to note that the fund’s goal is not to outperform the equity market, but rather to be neutral to market conditions and to produce returns that exceed those of 3-month U.S. Treasury bills.
The past year was a time of economic optimism, with a slowly declining unemployment rate and a 13.6% recovery in housing prices. In December, the U.S. equity market reacted positively to the Federal Reserve’s announcement that it would begin tapering its massive monthly bond purchases. Investors interpreted the move as a sign of the Fed’s confidence in the economic recovery. In addition, the market cheered the October nomination of Janet Yellen as the new chair of the Fed (her confirmation came in early January).
The market expects her to focus the Fed on job creation and reducing the stimulus program without alarming the markets and depressing economic growth.
Although our investment process has not changed, it is valuable to review the key drivers of the fund’s performance. The quantitative approach that we apply focuses on specific stock fundamentals. We believe there is no single best indicator for identifying outperforming stocks; therefore, we diversify across multiple factors: (1) Valuation is a measure of the price we pay for earnings and cash flows. (2) Growth considers the growth of earnings when evaluating how much we pay for them. (3) With management decisions, we examine the actions taken by the company leadership. (4) Market sentiment examines the way investors reflect their opinions of a company through their activity in the market. (5) Quality measures a company’s balance-sheet strength and the sustainability of earnings.
We construct the portfolio by buying stocks that we believe are undervalued—our “long” holdings—and selling short stocks that we believe are overvalued, all the while staying neutral to equity market risk. One factor we monitor is beta, which is a measure of a stock’s or a stock fund’s volatility relative to the volatility of the broad stock market. If our investment process is followed properly, a constructed portfolio should have a beta very close to 0, meaning that the market’s movement does not influence the fund’s movement. The Market Neutral Fund has been
7
successful in achieving this goal. As of December 31, the fund’s three-year beta relative to a broad equity benchmark was 0.09.
Our analysis of the 12-month period shows that our stock-selection model was effective, with four of the five indicators improving the fund’s overall performance. The valuation indicator was the strongest contributor, followed by market sentiment; the quality indicator was a slight detractor.
The stock-selection model’s effectiveness during the period was illustrated by positive performance across seven sectors. Our selections added the most value in industrials and materials. Selection in the consumer discretionary and utilities sectors detracted the most from performance.
Long positions in Delta Air Lines and RR Donnelley & Sons led the results in industrials. In materials, the top contributor was a short position in Allied Nevada Gold, whose performance was affected by sliding gold prices (the gold spot price declined by more than 28% in 2013).
The largest detractors from performance were two consumer discretionary stocks that we sold short: TripAdvisor and Harman International Industries, both of which saw their share prices increase sharply during the period.
Again, the past fiscal year was a great one for the U.S. stock market. Our model was able to effectively capture the spread between overvalued and undervalued stocks and provide positive active return across most signals and sectors. Although it is difficult to predict the direction of the stock market over the coming year, we are confident that our model should continue capturing the relative attractiveness of individual stocks. We thank you for your investment and look forward to 2014.
James D. Troyer, CFA, Principal,
Portfolio Manager
James P. Stetler, Principal,
Portfolio Manager
Michael R. Roach, CFA, Portfolio Manager
Vanguard Equity Investment Group
January 28, 2014
8
Market Neutral Fund
Fund Profile
As of December 31, 2013
| | |
| Share-Class Characteristics | | |
| | Investor | Institutional |
| | Shares | Shares |
| Ticker Symbol | VMNFX | VMNIX |
| Total Expense Ratio1 | 1.90% | 1.80% |
| Management Expenses | 0.18% | 0.09% |
| Dividend Expenses on | | |
| Securities Sold Short2 | 1.52% | 1.52% |
| Borrowing Expenses on | | |
| Securities Sold Short2 | 0.11% | 0.11% |
| Other Expenses | 0.09% | 0.08% |
| | |
| Portfolio Characteristics | | |
| | Long | Short |
| | Portfolio | Portfolio |
| Number of Stocks | 243 | 252 |
| Median Market Cap | $4.5B | $5.4B |
| Price/Earnings Ratio | 19.2x | 38.3x |
| Price/Book Ratio | 2.7x | 2.8x |
| Return on Equity | 12.0% | 13.5% |
| Earnings Growth | | |
| Rate | 15.8% | 12.0% |
| Foreign Holdings | 1.7% | 2.4% |
| | |
| Volatility Measures | | |
| | Citigroup | DJ |
| | Three-Month | U.S. Total |
| | U.S. Treasury | Stock Market |
| | Bill Index | FA Index |
| R-Squared | 0.00 | 0.09 |
| Beta | -13.74 | 0.09 |
| These measures show the degree and timing of the fund’s fluctuations compared with the index over 36 months. |
| | |
| Sector Diversification (% of equity exposure) |
| | Long | Short |
| | Portfolio | Portfolio |
| Consumer Discretionary | 16.7% | 16.4% |
| Consumer Staples | 4.7 | 4.9 |
| Energy | 5.8 | 6.2 |
| Financials | 14.6 | 14.5 |
| Health Care | 10.7 | 10.2 |
| Industrials | 18.0 | 18.2 |
| Information Technology | 18.8 | 18.8 |
| Materials | 6.7 | 6.8 |
| Telecommunication Services | 0.9 | 0.9 |
| Utilities | 3.1 | 3.1 |
| |
| Fund Characteristics | |
| Turnover Rate | 68% |
| Short-Term Reserves | 4.0% |
1 The total expense ratios shown are from the prospectus dated July 18, 2013, and represent estimated costs for the current fiscal year. For the
fiscal year ended December 31, 2013, the total expense ratios were 1.57% for Investor Shares and 1.47% for Institutional Shares.
2 In connection with a short sale, the fund may receive income or be charged a fee based on the market value of the borrowed stock. When a
cash dividend is declared on a stock the fund has sold short, the fund is required to pay an amount equal to that dividend to the party from which
the fund borrowed the stock and to record the payment of the dividend as an expense.
9
Market Neutral Fund
| | |
| Ten Largest Holdings1 (% of total net assets) |
| Long Portfolio | | |
| Huntington Ingalls | Aerospace & | |
| Industries Inc. | Defense | 0.6% |
| AMERCO | Trucking | 0.6 |
| Deluxe Corp. | Commercial Printing | 0.6 |
| Westlake Chemical | Commodity | |
| Corp. | Chemicals | 0.5 |
| Manitowoc Co. Inc. | Construction & Farm | |
| | Trucks | 0.5 |
| Home Depot Inc. | Home Improvement | |
| | Retail | 0.5 |
| Dun & Bradstreet Corp. | Research & | |
| | Consulting Services | 0.5 |
| Anixter International Inc. Technology | |
| | Distributors | 0.5 |
| Towers Watson & Co. | Human Resources & | |
| | Employment | |
| | Services | 0.5 |
| Raytheon Co. | Aerospace & | |
| | Defense | 0.5 |
| Top Ten | | 5.3% |
| | |
| Ten Largest Holdings1 (% of total net assets) |
| Short Portfolio | | |
| Freeport-McMoRan | Diversified Metals | |
| Copper & Gold Inc. | & Mining | 0.6% |
| ServiceNow Inc. | Systems Software | 0.6 |
| Bottomline Technologies | Application | |
| de Inc. | Software | 0.6 |
| Toll Brothers Inc. | Homebuilding | 0.6 |
| Interpublic Group of Cos. | | |
| Inc. | Advertising | 0.6 |
| VeriFone Systems Inc. | Data Processing & | |
| | Outsourced | |
| | Services | 0.6 |
| Equinix Inc. | Internet Software & | |
| | Services | 0.6 |
| Solera Holdings Inc. | Application | |
| | Software | 0.6 |
| ONEOK Inc. | Gas Utilities | 0.6 |
| DR Horton Inc. | Homebuilding | 0.5 |
| Top Ten | | 5.9% |
1 The holdings listed exclude any temporary cash investments and equity index products.
10
Market Neutral Fund
Performance Summary
All of the returns in this report represent past performance, which is not a guarantee of future results that may be achieved by the fund. (Current performance may be lower or higher than the performance data cited. For performance data current to the most recent month-end, visit our website at vanguard.com/performance.) Note, too, that both investment returns and principal value can fluctuate widely, so an investor’s shares, when sold, could be worth more or less than their original cost. The returns shown do not reflect taxes that a shareholder would pay on fund distributions or on the sale of fund shares.
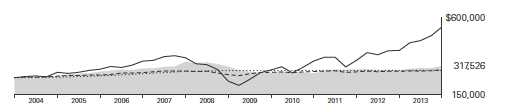
Cumulative Performance: December 31, 2003, Through December 31, 2013
Initial Investment of $250,000
| | | | | |
| | | Average Annual Total Returns | |
| | | Periods Ended December 31, 2013 | |
| | | | | | Final Value |
| | | One | Five | Ten | of a $250,000 |
| | | Year | Years | Years | Investment |
| | Market Neutral Fund*Investor Shares | 8.59% | 0.23% | 2.42% | $317,526 |
| •••••••• | Citigroup Three-Month U.S. Treasury | | | | |
| | Bill Index | 0.05 | 0.09 | 1.58 | 292,639 |
| – – – – | Equity Market Neutral Funds Average | 3.09 | 2.01 | 1.69 | 295,525 |
| | Dow Jones U.S. Total Stock Market | | | | |
| | Float Adjusted Index | 33.47 | 18.86 | 8.09 | 544,435 |
| Equity Market Neutral Funds Average: Derived from data provided by Lipper, a Thomson Reuters Company. |
| | | | |
| | | | | Final Value |
| | One | Five | Ten | of a $5,000,000 |
| | Year | Years | Years | Investment |
| |
| Market Neutral Fund Institutional Shares | 8.66% | 0.32% | 2.59% | $6,456,064 |
| Citigroup Three-Month U.S. Treasury Bill | | | | |
| Index | 0.05 | 0.09 | 1.58 | 5,852,776 |
| Dow Jones U.S. Total Stock Market Float | | | | |
| Adjusted Index | 33.47 | 18.86 | 8.09 | 10,888,699 |
See Financial Highlights for dividend and capital gains information.
11
Market Neutral Fund
Fiscal-Year Total Returns (%): December 31, 2003, Through December 31, 2013
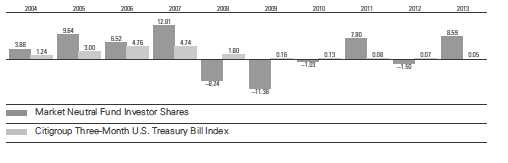
Market Neutral Fund
Financial Statements
Statement of Net Assets
As of December 31, 2013
The fund reports a complete list of its holdings in regulatory filings four times in each fiscal year, at the quarter-ends. For the second and fourth fiscal quarters, the lists appear in the fund’s semiannual and annual reports to shareholders. For the first and third fiscal quarters, the fund files the lists with the Securities and Exchange Commission on Form N-Q. Shareholders can look up the fund’s Forms N-Q on the SEC’s website at sec.gov. Forms N-Q may also be reviewed and copied at the SEC’s Public Reference Room (see the back cover of this report for further information).
| | | |
| | | | Market |
| | | | Value |
| | | Shares | ($000) |
| Common Stocks—Long Positions (96.2%) | |
| Consumer Discretionary (16.1%) | | |
| | Home Depot Inc. | 13,900 | 1,145 |
| † | Hanesbrands Inc. | 16,100 | 1,131 |
| | Goodyear Tire & Rubber Co. | 46,700 | 1,114 |
| * † | Starz | 38,000 | 1,111 |
| † | Columbia Sportswear Co. | 14,100 | 1,110 |
| † | Sturm Ruger & Co. Inc. | 15,100 | 1,104 |
| * † | Jack in the Box Inc. | 22,000 | 1,100 |
| † | Gannett Co. Inc. | 37,200 | 1,100 |
| * † | O’Reilly Automotive Inc. | 8,500 | 1,094 |
| † | PetSmart Inc. | 14,900 | 1,084 |
| † | Brinker International Inc. | 23,300 | 1,080 |
| † | Brunswick Corp. | 23,300 | 1,073 |
| | Whirlpool Corp. | 6,800 | 1,067 |
| * † | Marriott Vacations | | |
| | Worldwide Corp. | 20,200 | 1,066 |
| † | Domino’s Pizza Inc. | 15,050 | 1,048 |
| † | Cracker Barrel Old Country | | |
| | Store Inc. | 9,500 | 1,046 |
| † | Viacom Inc. Class B | 11,850 | 1,035 |
| † | TJX Cos. Inc. | 16,100 | 1,026 |
| † | Buckle Inc. | 19,300 | 1,014 |
| † | Tupperware Brands Corp. | 10,700 | 1,011 |
| † | Wynn Resorts Ltd. | 5,100 | 990 |
| † | Staples Inc. | 55,600 | 884 |
| † | Gap Inc. | 21,400 | 836 |
| † | PulteGroup Inc. | 40,350 | 822 |
| † | Dana Holding Corp. | 41,880 | 822 |
| * † | Express Inc. | 43,700 | 816 |
| † | Macy’s Inc. | 15,000 | 801 |
| * | Visteon Corp. | 9,600 | 786 |
| † | Best Buy Co. Inc. | 19,400 | 774 |
| * † | Outerwall Inc. | 11,350 | 764 |
| † | GameStop Corp. Class A | 14,500 | 714 |
| | CBS Corp. Class B | 10,700 | 682 |
| † | Dillard’s Inc. Class A | 6,670 | 648 |
| | Brown Shoe Co. Inc. | 17,400 | 490 |
| † | Comcast Corp. Class A | 9,400 | 488 |
| | | |
| * | Federal-Mogul Corp. | 24,300 | 478 |
| | Thor Industries Inc. | 4,355 | 241 |
| | | | 33,595 |
| Consumer Staples (4.5%) | | |
| * † | Pilgrim’s Pride Corp. | 64,900 | 1,055 |
| * † | Green Mountain Coffee | | |
| | Roasters Inc. | 13,900 | 1,051 |
| † | Nu Skin Enterprises Inc. | | |
| | Class A | 7,600 | 1,050 |
| † | Kroger Co. | 26,500 | 1,048 |
| | Kimberly-Clark Corp. | 10,000 | 1,045 |
| * † | Rite Aid Corp. | 195,500 | 989 |
| | Tyson Foods Inc. Class A | 23,400 | 783 |
| | Kraft Foods Group Inc. | 12,600 | 679 |
| | Sanderson Farms Inc. | 8,200 | 593 |
| † | Reynolds American Inc. | 6,000 | 300 |
| | Andersons Inc. | 3,200 | 285 |
| * | WhiteWave Foods Co. | | |
| | Class A | 11,972 | 275 |
| * | Sprouts Farmers | | |
| | Market Inc. | 5,600 | 215 |
| | | | 9,368 |
| Energy (5.6%) | | |
| † | Helmerich & Payne Inc. | 12,800 | 1,076 |
| * | SEACOR Holdings Inc. | 11,700 | 1,067 |
| † | Hess Corp. | 12,100 | 1,004 |
| † | Marathon Petroleum Corp. | 10,540 | 967 |
| † | ConocoPhillips | 13,200 | 933 |
| | Chesapeake Energy Corp. | 34,300 | 931 |
| * | Ultra Petroleum Corp. | 42,100 | 912 |
| † | Western Refining Inc. | 16,780 | 712 |
| † | Anadarko Petroleum Corp. | 8,800 | 698 |
| * | Hercules Offshore Inc. | 101,500 | 663 |
| * | Exterran Holdings Inc. | 17,000 | 581 |
| | RPC Inc. | 32,500 | 580 |
| | EXCO Resources Inc. | 108,800 | 578 |
| | Bristow Group Inc. | 7,600 | 570 |
| * | Matador Resources Co. | 21,700 | 404 |
13
Market Neutral Fund
| | | |
| | | | Market |
| | | | Value |
| | | Shares | ($000) |
| * | EXCO Resources Inc. | | |
| | Rights Exp. 01/09/2014 | 108,800 | 17 |
| | | | 11,693 |
| Financials (14.0%) | | |
| † | KeyCorp | 83,100 | 1,115 |
| † | Unum Group | 31,400 | 1,101 |
| † | Goldman Sachs Group Inc. | 6,200 | 1,099 |
| † | Montpelier Re Holdings Ltd. | 37,600 | 1,094 |
| † | Regions Financial Corp. | 110,600 | 1,094 |
| † | PrivateBancorp Inc. | 37,800 | 1,094 |
| | Lincoln National Corp. | 21,100 | 1,089 |
| † | CNO Financial Group Inc. | 61,425 | 1,087 |
| | Comerica Inc. | 22,800 | 1,084 |
| † | Ameriprise Financial Inc. | 9,300 | 1,070 |
| † | Fifth Third Bancorp | 50,700 | 1,066 |
| * | Western Alliance Bancorp | 43,800 | 1,045 |
| † | Platinum Underwriters | | |
| | Holdings Ltd. | 16,900 | 1,036 |
| † | Everest Re Group Ltd. | 6,600 | 1,029 |
| † | Nelnet Inc. Class A | 24,400 | 1,028 |
| * † | Popular Inc. | 34,100 | 980 |
| * † | Portfolio Recovery | | |
| | Associates Inc. | 18,400 | 972 |
| † | Allstate Corp. | 16,875 | 920 |
| † | Torchmark Corp. | 11,500 | 899 |
| * † | Credit Acceptance Corp. | 6,684 | 869 |
| † | State Street Corp. | 11,800 | 866 |
| | StanCorp Financial | | |
| | Group Inc. | 12,800 | 848 |
| | Huntington Bancshares Inc. | 87,400 | 843 |
| | International Bancshares | | |
| | Corp. | 26,000 | 686 |
| * | World Acceptance Corp. | 7,750 | 678 |
| † | Protective Life Corp. | 12,150 | 616 |
| † | Wells Fargo & Co. | 13,100 | 595 |
| | American Express Co. | 6,200 | 563 |
| | Washington Federal Inc. | 22,200 | 517 |
| | XL Group plc Class A | 14,100 | 449 |
| | American National | | |
| | Insurance Co. | 3,500 | 401 |
| | Cathay General Bancorp | 12,700 | 339 |
| | ING US Inc. | 8,300 | 292 |
| * | KCG Holdings Inc. | | |
| | Class A | 23,100 | 276 |
| | FBL Financial Group Inc. | | |
| | Class A | 5,700 | 255 |
| | Assurant Inc. | 3,800 | 252 |
| | | | 29,247 |
| Health Care (10.2%) | | |
| * † | Isis Pharmaceuticals Inc. | 28,300 | 1,128 |
| † | WellPoint Inc. | 12,100 | 1,118 |
| † | McKesson Corp. | 6,900 | 1,114 |
| * † | Endo Health Solutions Inc. | 16,500 | 1,113 |
| | | |
| † | West Pharmaceutical | | |
| | Services Inc. | 22,600 | 1,109 |
| * † | HCA Holdings Inc. | 23,055 | 1,100 |
| † | Eli Lilly & Co. | 21,500 | 1,097 |
| | Medtronic Inc. | 19,000 | 1,090 |
| * † | Charles River Laboratories | | |
| | International Inc. | 20,400 | 1,082 |
| † | AbbVie Inc. | 20,000 | 1,056 |
| * † | Mylan Inc. | 24,100 | 1,046 |
| * | Boston Scientific Corp. | 83,900 | 1,008 |
| * | Centene Corp. | 16,800 | 990 |
| * † | PAREXEL International Corp. | 21,400 | 967 |
| † | Select Medical Holdings | | |
| | Corp. | 71,200 | 827 |
| † | Chemed Corp. | 9,600 | 736 |
| * † | Bruker Corp. | 34,900 | 690 |
| * † | Nektar Therapeutics | 60,700 | 689 |
| * † | CareFusion Corp. | 15,800 | 629 |
| † | ResMed Inc. | 12,800 | 603 |
| | Omnicare Inc. | 9,100 | 549 |
| * | Celgene Corp. | 2,900 | 490 |
| * | VCA Antech Inc. | 8,100 | 254 |
| * † | Biogen Idec Inc. | 900 | 252 |
| * | Health Net Inc. | 8,300 | 246 |
| * | MedAssets Inc. | 10,200 | 202 |
| * | Myriad Genetics Inc. | 9,600 | 201 |
| | | | 21,386 |
| Industrials (17.3%) | | |
| † | Huntington Ingalls | | |
| | Industries Inc. | 13,083 | 1,178 |
| * † | AMERCO | 4,900 | 1,165 |
| | Deluxe Corp. | 22,200 | 1,159 |
| † | Manitowoc Co. Inc. | 49,100 | 1,145 |
| † | Dun & Bradstreet Corp. | 9,300 | 1,142 |
| † | Towers Watson & Co. | | |
| | Class A | 8,900 | 1,136 |
| | Raytheon Co. | 12,500 | 1,134 |
| † | RR Donnelley & Sons Co. | 55,700 | 1,130 |
| † | Terex Corp. | 26,800 | 1,125 |
| † | Trinity Industries Inc. | 20,220 | 1,102 |
| † | Alaska Air Group Inc. | 15,010 | 1,101 |
| † | EnerSys Inc. | 15,700 | 1,100 |
| † | Masco Corp. | 48,200 | 1,098 |
| † | Northrop Grumman Corp. | 9,230 | 1,058 |
| † | Manpowergroup Inc. | 12,300 | 1,056 |
| | Lincoln Electric Holdings Inc. | 14,800 | 1,056 |
| | Boeing Co. | 7,700 | 1,051 |
| † | Exelis Inc. | 54,900 | 1,046 |
| * | Swift Transportation Co. | 46,800 | 1,039 |
| † | Delta Air Lines Inc. | 37,200 | 1,022 |
| † | Steelcase Inc. Class A | 63,500 | 1,007 |
| | Oshkosh Corp. | 19,900 | 1,003 |
| † | Lockheed Martin Corp. | 6,600 | 981 |
| * † | USG Corp. | 34,200 | 971 |
| † | Mueller Industries Inc. | 15,000 | 945 |
14
Market Neutral Fund
| | | |
| | | | Market |
| | | | Value |
| | | Shares | ($000) |
| | Lennox International Inc. | 10,020 | 852 |
| † | UniFirst Corp. | 7,800 | 835 |
| † | Ingersoll-Rand plc | 12,100 | 745 |
| † | General Electric Co. | 26,200 | 734 |
| * | Nortek Inc. | 9,800 | 731 |
| † | Cintas Corp. | 11,800 | 703 |
| | Southwest Airlines Co. | 35,800 | 675 |
| | AAR Corp. | 21,800 | 611 |
| † | ITT Corp. | 13,700 | 595 |
| | Copa Holdings SA Class A | 3,600 | 576 |
| | Hyster-Yale Materials | | |
| | Handling Inc. | 5,400 | 503 |
| † | Union Pacific Corp. | 2,750 | 462 |
| * | Spirit Airlines Inc. | 5,900 | 268 |
| | CIRCOR International Inc. | 3,000 | 242 |
| | Barnes Group Inc. | 6,300 | 241 |
| * | AECOM Technology Corp. | 7,600 | 224 |
| * † | Allegion plc | 4,033 | 178 |
| | | | 36,125 |
| Information Technology (18.1%) | | |
| † | Anixter International Inc. | 12,700 | 1,141 |
| * † | CoreLogic Inc. | 31,900 | 1,133 |
| * † | SYNNEX Corp. | 16,406 | 1,106 |
| † | Western Digital Corp. | 13,150 | 1,103 |
| † | Jack Henry & Associates Inc. | 18,600 | 1,101 |
| * † | Gartner Inc. | 15,400 | 1,094 |
| | CA Inc. | 32,500 | 1,094 |
| † | Heartland Payment | | |
| | Systems Inc. | 21,900 | 1,091 |
| * | Alliance Data Systems Corp. | 4,100 | 1,078 |
| * † | Brocade Communications | | |
| | Systems Inc. | 120,800 | 1,071 |
| * † | Micron Technology Inc. | 49,200 | 1,070 |
| * † | CACI International Inc. | | |
| | Class A | 14,600 | 1,069 |
| * † | Rambus Inc. | 112,800 | 1,068 |
| * † | Advanced Micro | | |
| | Devices Inc. | 273,630 | 1,059 |
| † | Symantec Corp. | 44,800 | 1,056 |
| * † | Electronics For Imaging Inc. | 27,200 | 1,053 |
| * † | Tech Data Corp. | 20,400 | 1,053 |
| * | Unisys Corp. | 30,700 | 1,031 |
| † | Computer Sciences Corp. | 18,300 | 1,023 |
| † | Booz Allen Hamilton | | |
| | Holding Corp. Class A | 53,100 | 1,017 |
| * † | Freescale Semiconductor | | |
| | Ltd. | 63,210 | 1,015 |
| * † | Manhattan Associates Inc. | 8,500 | 999 |
| † | MAXIMUS Inc. | 22,500 | 990 |
| * | SunPower Corp. Class A | 33,000 | 984 |
| * † | Ciena Corp. | 41,000 | 981 |
| * † | CommVault Systems Inc. | 12,700 | 951 |
| * | Benchmark Electronics Inc. | 40,400 | 932 |
| * † | RF Micro Devices Inc. | 180,000 | 929 |
| * † | PTC Inc. | 25,500 | 902 |
| | | |
| † | Motorola Solutions Inc. | 12,975 | 876 |
| † | Avnet Inc. | 17,600 | 776 |
| | DST Systems Inc. | 8,300 | 753 |
| * | Genpact Ltd. | 39,150 | 719 |
| | Broadridge Financial | | |
| | Solutions Inc. | 17,300 | 684 |
| | Lexmark International Inc. | | |
| | Class A | 18,300 | 650 |
| * | Aspen Technology Inc. | 15,300 | 640 |
| * | Acxiom Corp. | 17,200 | 636 |
| * | ON Semiconductor Corp. | 60,500 | 499 |
| * | comScore Inc. | 17,300 | 495 |
| * | NCR Corp. | 6,900 | 235 |
| | Marvell Technology | | |
| | Group Ltd. | 15,200 | 219 |
| * | Cirrus Logic Inc. | 10,600 | 217 |
| † | Accenture plc Class A | 2,500 | 206 |
| | | | 37,799 |
| Materials (6.5%) | | |
| † | Westlake Chemical Corp. | 9,380 | 1,145 |
| † | PPG Industries Inc. | 5,951 | 1,129 |
| † | NewMarket Corp. | 3,300 | 1,103 |
| * | KapStone Paper and | | |
| | Packaging Corp. | 19,400 | 1,084 |
| * † | Louisiana-Pacific Corp. | 57,900 | 1,072 |
| † | LyondellBasell Industries NV | | |
| | Class A | 13,100 | 1,052 |
| | Schweitzer-Mauduit | | |
| | International Inc. | 17,700 | 911 |
| | Avery Dennison Corp. | 17,600 | 883 |
| † | Rock Tenn Co. Class A | 8,300 | 872 |
| | Minerals Technologies Inc. | 13,050 | 784 |
| * | Graphic Packaging | | |
| | Holding Co. | 81,200 | 779 |
| * | Owens-Illinois Inc. | 13,700 | 490 |
| | Scotts Miracle-Gro Co. | | |
| | Class A | 7,300 | 454 |
| | Sherwin-Williams Co. | 2,300 | 422 |
| * | Berry Plastics Group Inc. | 12,200 | 290 |
| | Sealed Air Corp. | 8,100 | 276 |
| | Olin Corp. | 9,300 | 268 |
| | Packaging Corp. of America | 4,100 | 259 |
| * | Ferro Corp. | 16,300 | 209 |
| | | | 13,482 |
| Telecommunication Services (0.9%) | |
| † | CenturyLink Inc. | 30,800 | 981 |
| † | AT&T Inc. | 26,000 | 914 |
| | | | 1,895 |
| Utilities (3.0%) | | |
| | Black Hills Corp. | 20,400 | 1,071 |
| † | UGI Corp. | 25,300 | 1,049 |
| | AES Corp. | 63,800 | 926 |
| † | Pinnacle West Capital Corp. | 15,900 | 841 |
| † | Portland General Electric Co. | 22,300 | 673 |
15
Market Neutral Fund
| | | |
| | | | Market |
| | | | Value |
| | | Shares | ($000) |
| | Vectren Corp. | 17,800 | 632 |
| | PG&E Corp. | 15,100 | 608 |
| | Southwest Gas Corp. | 4,200 | 235 |
| | Otter Tail Corp. | 7,400 | 217 |
| | | | 6,252 |
| Total Common Stocks—Long Positions | | |
| (Cost $144,567) | | 200,842 |
| Common Stocks Sold Short (-96.4%) | |
| Consumer Discretionary (-15.8%) | |
| * | Toll Brothers Inc. | (31,300) | (1,158) |
| | Interpublic Group of | | |
| | Cos. Inc. | (65,400) | (1,157) |
| * | DR Horton Inc. | (51,400) | (1,147) |
| * | BJ’s Restaurants Inc. | (36,500) | (1,134) |
| * | American Axle & | | |
| | Manufacturing Holdings | | |
| | Inc. | (54,700) | (1,119) |
| * | Vitamin Shoppe Inc. | (21,300) | (1,108) |
| | Allison Transmission | | |
| | Holdings Inc. | (40,000) | (1,104) |
| | Monro Muffler Brake Inc. | (19,400) | (1,093) |
| * | General Motors Co. | (26,700) | (1,091) |
| * | Liberty Ventures Class A | (8,900) | (1,091) |
| * | Tempur Sealy International | | |
| | Inc. | (20,200) | (1,090) |
| * | Panera Bread Co. Class A | (6,100) | (1,078) |
| * | Amazon.com Inc. | (2,700) | (1,077) |
| | Darden Restaurants Inc. | (19,800) | (1,076) |
| | Family Dollar Stores Inc. | (16,000) | (1,039) |
| | Hillenbrand Inc. | (35,200) | (1,035) |
| * | TripAdvisor Inc. | (12,400) | (1,027) |
| * | LKQ Corp. | (31,000) | (1,020) |
| | Harman International | | |
| | Industries Inc. | (12,250) | (1,003) |
| * | Sirius XM Holdings Inc. | (274,900) | (959) |
| * | Select Comfort Corp. | (44,100) | (930) |
| * | Sally Beauty Holdings Inc. | (30,700) | (928) |
| | PVH Corp. | (6,600) | (898) |
| * | Penn National Gaming Inc. | (61,900) | (887) |
| | John Wiley & Sons Inc. | | |
| | Class A | (15,500) | (856) |
| | Coach Inc. | (12,900) | (724) |
| | Harley-Davidson Inc. | (10,200) | (706) |
| | Abercrombie & Fitch Co. | (20,200) | (665) |
| * | Ulta Salon Cosmetics | | |
| | & Fragrance Inc. | (6,850) | (661) |
| | Wolverine World Wide Inc. | (19,400) | (659) |
| * | Chipotle Mexican Grill Inc. | | |
| | Class A | (1,070) | (570) |
| * | Discovery Communications | | |
| | Inc. Class A | (6,100) | (552) |
| | Dick’s Sporting Goods Inc. | (8,200) | (476) |
| | Signet Jewelers Ltd. | (5,600) | (441) |
| | | |
| * | Loral Space & | | |
| | Communications Inc. | (3,700) | (300) |
| | Scripps Networks Interactive | |
| | Inc. Class A | (3,200) | (277) |
| * | Netflix Inc. | (700) | (258) |
| * | CarMax Inc. | (5,271) | (248) |
| * | Liberty Global plc Class A | (2,700) | (240) |
| * | Restoration Hardware | | |
| | Holdings Inc. | (3,100) | (209) |
| | | | (33,091) |
| Consumer Staples (-4.7%) | | |
| * | Monster Beverage Corp. | (16,500) | (1,118) |
| | Beam Inc. | (16,200) | (1,103) |
| | Estee Lauder Cos. Inc. | | |
| | Class A | (14,200) | (1,069) |
| | B&G Foods Inc. | (30,100) | (1,021) |
| | Sysco Corp. | (28,050) | (1,013) |
| | Philip Morris International | | |
| | Inc. | (11,100) | (967) |
| * | Elizabeth Arden Inc. | (26,400) | (936) |
| * | Fresh Market Inc. | (21,500) | (871) |
| * | Seaboard Corp. | (126) | (352) |
| | Spectrum Brands Holdings | | |
| | Inc. | (4,200) | (296) |
| | Whole Foods Market Inc. | (5,100) | (295) |
| | Coca-Cola Co. | (7,100) | (293) |
| | Brown-Forman Corp. | | |
| | Class B | (3,500) | (264) |
| | Flowers Foods Inc. | (11,355) | (244) |
| | | | (9,842) |
| Energy (-6.0%) | | |
| * | McDermott International | | |
| | Inc. | (124,100) | (1,137) |
| | CONSOL Energy Inc. | (29,000) | (1,103) |
| * | Concho Resources Inc. | (10,000) | (1,080) |
| * | Gulfport Energy Corp. | (16,500) | (1,042) |
| * | Cheniere Energy Inc. | (22,800) | (983) |
| * | FMC Technologies Inc. | (18,500) | (966) |
| | Energen Corp. | (13,600) | (962) |
| | Spectra Energy Corp. | (24,400) | (869) |
| | Williams Cos. Inc. | (22,500) | (868) |
| * | Rowan Cos. plc Class A | (24,250) | (857) |
| | National Oilwell Varco Inc. | (8,800) | (700) |
| * | Cobalt International | | |
| | Energy Inc. | (34,400) | (566) |
| * | Cameron International Corp. | (9,100) | (542) |
| * | Dresser-Rand Group Inc. | (8,400) | (501) |
| | SemGroup Corp. Class A | (3,800) | (248) |
| | | | (12,424) |
| Financials (-14.0%) | | |
| | Fidelity National Financial | | |
| | Inc. Class A | (34,500) | (1,120) |
| | Iberiabank Corp. | (17,800) | (1,119) |
| | Mercury General Corp. | (22,300) | (1,108) |
16
Market Neutral Fund
| | | |
| | | | Market |
| | | | Value |
| | | Shares | ($000) |
| | Hartford Financial Services | | |
| | Group Inc. | (30,500) | (1,105) |
| | Charles Schwab Corp. | (42,400) | (1,102) |
| | Arthur J Gallagher & Co. | (23,400) | (1,098) |
| | Loews Corp. | (22,700) | (1,095) |
| | Hudson City Bancorp Inc. | (115,500) | (1,089) |
| | PacWest Bancorp | (25,700) | (1,085) |
| | Eaton Vance Corp. | (25,200) | (1,078) |
| | Marsh & McLennan | | |
| | Cos. Inc. | (22,100) | (1,069) |
| | Erie Indemnity Co. Class A | (14,500) | (1,060) |
| | IntercontinentalExchange | | |
| | Group Inc. | (4,700) | (1,057) |
| * | Alleghany Corp. | (2,600) | (1,040) |
| | CME Group Inc. | (12,900) | (1,012) |
| | BB&T Corp. | (26,500) | (989) |
| | T. Rowe Price Group Inc. | (11,300) | (947) |
| * | Texas Capital Bancshares | | |
| | Inc. | (15,200) | (945) |
| | Bank of the Ozarks Inc. | (16,700) | (945) |
| * | Markel Corp. | (1,500) | (871) |
| | New York Community | | |
| | Bancorp Inc. | (44,600) | (751) |
| | Leucadia National Corp. | (25,900) | (734) |
| | BOK Financial Corp. | (10,900) | (723) |
| | Solar Capital Ltd. | (31,200) | (704) |
| | Cullen/Frost Bankers Inc. | (8,800) | (655) |
| | Raymond James Financial | | |
| | Inc. | (11,400) | (595) |
| | Community Bank System | | |
| | Inc. | (14,700) | (583) |
| | Radian Group Inc. | (39,100) | (552) |
| | MetLife Inc. | (9,700) | (523) |
| | TCF Financial Corp. | (31,275) | (508) |
| | Validus Holdings Ltd. | (9,700) | (391) |
| | CNA Financial Corp. | (8,300) | (356) |
| | Trustmark Corp. | (13,100) | (352) |
| | City National Corp. | (3,900) | (309) |
| | NBT Bancorp Inc. | (10,100) | (262) |
| | FirstMerit Corp. | (9,800) | (218) |
| | | | (29,150) |
| Health Care (-9.9%) | | |
| * | Wright Medical Group Inc. | (36,700) | (1,127) |
| * | Emeritus Corp. | (51,750) | (1,119) |
| * | Pacira Pharmaceuticals Inc. | (19,400) | (1,115) |
| * | Waters Corp. | (11,000) | (1,100) |
| * | Catamaran Corp. | (22,800) | (1,083) |
| * | BioMarin Pharmaceutical | | |
| | Inc. | (15,300) | (1,075) |
| * | Synageva BioPharma Corp. | (16,500) | (1,068) |
| * | Medivation Inc. | (16,600) | (1,059) |
| * | Alexion Pharmaceuticals | | |
| | Inc. | (7,850) | (1,045) |
| * | Hologic Inc. | (45,300) | (1,013) |
| * | Volcano Corp. | (46,100) | (1,007) |
| | | |
| * | Jazz Pharmaceuticals plc | (7,500) | (949) |
| * | HMS Holdings Corp. | (36,000) | (818) |
| | Baxter International Inc. | (11,300) | (786) |
| | Teleflex Inc. | (8,300) | (779) |
| * | TESARO Inc. | (26,600) | (751) |
| * | athenahealth Inc. | (4,500) | (605) |
| * | MEDNAX Inc. | (11,100) | (593) |
| * | Varian Medical Systems Inc. | (7,100) | (552) |
| * | Theravance Inc. | (15,200) | (542) |
| * | QIAGEN NV | (21,100) | (502) |
| | Patterson Cos. Inc. | (11,800) | (486) |
| * | Forest Laboratories Inc. | (6,300) | (378) |
| | DENTSPLY International Inc. | (7,300) | (354) |
| | Zimmer Holdings Inc. | (2,600) | (242) |
| * | Allscripts Healthcare | | |
| | Solutions Inc. | (15,500) | (240) |
| * | Intuitive Surgical Inc. | (600) | (231) |
| | | | (20,619) |
| Industrials (-17.5%) | | |
| * | IHS Inc. Class A | (9,500) | (1,137) |
| | Expeditors International of | | |
| | Washington Inc. | (25,500) | (1,128) |
| | UTi Worldwide Inc. | (63,500) | (1,115) |
| | Cubic Corp. | (21,100) | (1,111) |
| | Xylem Inc. | (31,900) | (1,104) |
| * | Genesee & Wyoming Inc. | | |
| | Class A | (11,400) | (1,095) |
| * | Stericycle Inc. | (9,400) | (1,092) |
| * | Clean Harbors Inc. | (18,200) | (1,091) |
| * | DigitalGlobe Inc. | (26,400) | (1,086) |
| | Raven Industries Inc. | (26,400) | (1,086) |
| | FedEx Corp. | (7,500) | (1,078) |
| | ESCO Technologies Inc. | (31,000) | (1,062) |
| | Kennametal Inc. | (20,300) | (1,057) |
| | Precision Castparts Corp. | (3,900) | (1,050) |
| | CH Robinson Worldwide | | |
| | Inc. | (18,000) | (1,050) |
| | Fastenal Co. | (21,700) | (1,031) |
| * | WESCO International Inc. | (11,200) | (1,020) |
| | Roper Industries Inc. | (7,200) | (999) |
| * | II-VI Inc. | (56,700) | (998) |
| | KBR Inc. | (31,200) | (995) |
| | MSC Industrial Direct Co. | | |
| | Inc. Class A | (12,300) | (995) |
| | Caterpillar Inc. | (10,800) | (981) |
| * | Copart Inc. | (26,100) | (957) |
| | Joy Global Inc. | (15,100) | (883) |
| * | Tetra Tech Inc. | (31,500) | (881) |
| * | Advisory Board Co. | (13,800) | (879) |
| * | Atlas Air Worldwide | | |
| | Holdings Inc. | (20,800) | (856) |
| | Iron Mountain Inc. | (24,900) | (756) |
| | Forward Air Corp. | (17,200) | (755) |
| | Waste Connections Inc. | (17,150) | (748) |
| | Woodward Inc. | (16,350) | (746) |
17
Market Neutral Fund
| | | |
| | | | Market |
| | | | Value |
| | | Shares | ($000) |
| | Acacia Research Corp. | (50,900) | (740) |
| | Cummins Inc. | (5,100) | (719) |
| | Eaton Corp. plc | (8,700) | (662) |
| | Donaldson Co. Inc. | (11,200) | (487) |
| | Triumph Group Inc. | (6,200) | (472) |
| | Textron Inc. | (12,000) | (441) |
| | Covanta Holding Corp. | (22,900) | (407) |
| | Nordson Corp. | (5,200) | (386) |
| | Simpson Manufacturing | | |
| | Co. Inc. | (9,800) | (360) |
| * | NCI Building Systems Inc. | (17,000) | (298) |
| | Granite Construction Inc. | (7,500) | (262) |
| | TransDigm Group Inc. | (1,600) | (258) |
| | WW Grainger Inc. | (900) | (230) |
| | | | (36,544) |
| Information Technology (-18.1%) | |
| * | ServiceNow Inc. | (20,800) | (1,165) |
| * | Bottomline Technologies | | |
| | de Inc. | (32,100) | (1,161) |
| * | VeriFone Systems Inc. | (43,100) | (1,156) |
| * | Equinix Inc. | (6,500) | (1,153) |
| | Solera Holdings Inc. | (16,300) | (1,153) |
| | FLIR Systems Inc. | (37,800) | (1,138) |
| * | Teradyne Inc. | (64,400) | (1,135) |
| * | F5 Networks Inc. | (12,400) | (1,127) |
| | Analog Devices Inc. | (22,100) | (1,126) |
| * | Dealertrack | | |
| | Technologies Inc. | (23,300) | (1,120) |
| * | Palo Alto Networks Inc. | (19,400) | (1,115) |
| * | Riverbed Technology Inc. | (61,400) | (1,110) |
| | Corning Inc. | (61,700) | (1,100) |
| | Apple Inc. | (1,950) | (1,094) |
| * | Trimble Navigation Ltd. | (31,100) | (1,079) |
| | Microchip Technology Inc. | (23,700) | (1,061) |
| * | Informatica Corp. | (25,500) | (1,058) |
| * | Workday Inc. Class A | (12,700) | (1,056) |
| * | Salesforce.com Inc. | (19,080) | (1,053) |
| * | Concur Technologies Inc. | (10,000) | (1,032) |
| * | Fortinet Inc. | (53,800) | (1,029) |
| * | Citrix Systems Inc. | (15,800) | (999) |
| * | Hittite Microwave Corp. | (16,000) | (988) |
| | Altera Corp. | (30,200) | (982) |
| * | Nuance Communications | | |
| | Inc. | (58,900) | (895) |
| * | Teradata Corp. | (19,400) | (883) |
| * | Bankrate Inc. | (46,160) | (828) |
| * | Rackspace Hosting Inc. | (20,900) | (818) |
| * | BroadSoft Inc. | (29,600) | (809) |
| * | Qlik Technologies Inc. | (28,600) | (762) |
| | MKS Instruments Inc. | (24,900) | (746) |
| | QUALCOMM Inc. | (9,500) | (705) |
| * | Cognex Corp. | (17,600) | (672) |
| | Visa Inc. Class A | (2,900) | (646) |
| | | |
| | Avago Technologies Ltd. | | |
| | Class A | (11,000) | (582) |
| * | FleetCor Technologies Inc. | (4,950) | (580) |
| | AVX Corp. | (35,600) | (496) |
| | Tessera Technologies Inc. | (23,600) | (465) |
| | InterDigital Inc. | (13,800) | (407) |
| * | MICROS Systems Inc. | (6,400) | (367) |
| * | Cornerstone OnDemand Inc. (5,800) | (309) |
| | j2 Global Inc. | (5,400) | (270) |
| * | SolarWinds Inc. | (6,900) | (261) |
| * | ViaSat Inc. | (3,500) | (219) |
| | | | (37,910) |
| Materials (-6.5%) | | |
| | Freeport-McMoRan Copper | | |
| | & Gold Inc. | (31,200) | (1,178) |
| * | Stillwater Mining Co. | (92,900) | (1,147) |
| | Allegheny Technologies Inc. | (31,500) | (1,122) |
| | Southern Copper Corp. | (37,950) | (1,090) |
| | Rockwood Holdings Inc. | (14,700) | (1,057) |
| | Praxair Inc. | (7,600) | (988) |
| | Royal Gold Inc. | (21,350) | (984) |
| | Nucor Corp. | (17,300) | (924) |
| * | Coeur Mining Inc. | (80,400) | (872) |
| | FMC Corp. | (10,700) | (807) |
| | Air Products & Chemicals | | |
| | Inc. | (6,650) | (743) |
| * | Flotek Industries Inc. | (32,500) | (652) |
| | Mosaic Co. | (13,100) | (619) |
| | Hecla Mining Co. | (198,700) | (612) |
| | MeadWestvaco Corp. | (8,100) | (299) |
| | Newmont Mining Corp. | (12,400) | (286) |
| | Innophos Holdings Inc. | (5,288) | (257) |
| | | | (13,637) |
| Telecommunication Services (-0.9%) | |
| * | SBA Communications Corp. | | |
| | Class A | (12,310) | (1,106) |
| * | Crown Castle International | | |
| | Corp. | (9,400) | (690) |
| | | | (1,796) |
| Utilities (-3.0%) | | |
| | ONEOK Inc. | (18,500) | (1,150) |
| | Southern Co. | (25,800) | (1,061) |
| | South Jersey Industries Inc. | (18,400) | (1,030) |
| | NRG Energy Inc. | (23,500) | (675) |
| | FirstEnergy Corp. | (15,500) | (511) |
| | Integrys Energy Group Inc. | (7,900) | (430) |
| * | Calpine Corp. | (14,500) | (283) |
| | American Water Works | | |
| | Co. Inc. | (6,500) | (275) |
| | ALLETE Inc. | (4,500) | (224) |
| | Northwest Natural Gas Co. | (5,200) | (223) |
| | Piedmont Natural Gas Co. | | |
| | Inc. | (6,700) | (222) |
18
Market Neutral Fund
| | |
| | | Market |
| | | Value |
| | Shares | ($000) |
| ITC Holdings Corp. | (2,300) | (220) |
| Duke Energy Corp. | — | — |
| | | (6,304) |
| Total Common Stocks Sold Short | |
| (Proceeds $173,482) | | (201,317) |
| Temporary Cash Investment (4.5%) | |
| Money Market Fund (4.5%) | | |
| 1 Vanguard Market | | |
| Liquidity Fund, 0.125% | | |
| (Cost $9,489) | 9,489,163 | 9,489 |
| †Other Assets and Liabilities— | |
| Net (95.7%) | | 199,788 |
| Net Assets (100%) | | 208,802 |
| |
| At December 31, 2013, net assets consisted of: |
| | Amount |
| | ($000) |
| Paid-in Capital | 207,973 |
| Overdistributed Net Investment Income | (105) |
| Accumulated Net Realized Losses | (27,506) |
| Unrealized Appreciation (Depreciation) | |
| Investment Securities—Long Positions | 56,275 |
| Investment Securities Sold Short | (27,835) |
| Net Assets | 208,802 |
| |
| |
| Investor Shares–Net Assets | |
| Applicable to 15,747,735 outstanding | |
| $.001 par value shares of beneficial | |
| interest (unlimited authorization) | 173,646 |
| Net Asset Value Per Share— | |
| Investor Shares | $11.03 |
| |
| |
| Institutional Shares–Net Assets | |
| Applicable to 3,205,425 outstanding | |
| $.001 par value shares of beneficial | |
| interest (unlimited authorization) | 35,156 |
| Net Asset Value Per Share— | |
| Institutional Shares | $10.97 |
See Note A in Notes to Financial Statements.
* Non-income-producing security.
† Long security positions with a value of $131,830,000 and cash of $199,607,000 are held in a segregated account at the fund’s custodian
bank and pledged to a broker-dealer as collateral for the fund’s obligation to return borrowed securities. For so long as such obligations
continue, the fund’s access to these assets is subject to authorization from the broker-dealer.
1 Affiliated money market fund available only to Vanguard funds and certain trusts and accounts managed by Vanguard. Rate shown is the
7-day yield.
See accompanying Notes, which are an integral part of the Financial Statements.
19
Market Neutral Fund
Statement of Assets and Liabilities
As of December 31, 2013
| |
| | Market |
| | Value |
| | ($000) |
| Assets | |
| Investment in Securities, | |
| Long Positions, at Value | |
| Unaffiliated Issuers | 200,842 |
| Affiliated Vanguard Funds | 9,489 |
| Total Long Positions | 210,331 |
| Cash Segregated for Short Positions | 199,607 |
| Other Assets | 1,819 |
| Total Assets | 411,757 |
| Liabilities | |
| Securities Sold Short, at Value | 201,317 |
| Payables for Securities Purchased | 1,255 |
| Other Liabilities | 383 |
| Total Liabilities | 202,955 |
| Net Assets (100%) | 208,802 |
See Note A in Notes to Financial Statements.
See accompanying Notes, which are an integral part of the Financial Statements.
20
Market Neutral Fund
Statement of Operations
| |
| | Year Ended |
| | December 31, 2013 |
| | ($000) |
| Investment Income | |
| Income | |
| Dividends1 | 3,222 |
| Interest2 | 6 |
| Total Income | 3,228 |
| Expenses | |
| The Vanguard Group—Note B | |
| Investment Advisory Services | 192 |
| Management and Administrative—Investor Shares | 186 |
| Management and Administrative—Institutional Shares | — |
| Marketing and Distribution—Investor Shares | 46 |
| Marketing and Distribution—Institutional Shares | 8 |
| Custodian Fees | 21 |
| Audit Fees | 46 |
| Shareholders’ Reports—Investor Shares | 2 |
| Shareholders’ Reports—Institutional Shares | — |
| Dividend Expense on Securities Sold Short | 2,513 |
| Borrowing Expense on Securities Sold Short | 302 |
| Total Expenses | 3,316 |
| Net Investment Income (Loss) | (88) |
| Realized Net Gain (Loss) | |
| Investment Securities—Long Positions | 40,649 |
| Investment Securities Sold Short | (32,226) |
| Realized Net Gain (Loss) | 8,423 |
| Change in Unrealized Appreciation (Depreciation) | |
| Investment Securities—Long Positions | 33,393 |
| Investment Securities Sold Short | (24,294) |
| Change in Unrealized Appreciation (Depreciation) | 9,099 |
| Net Increase (Decrease) in Net Assets Resulting from Operations | 17,434 |
| 1 Dividends are net of foreign withholding taxes of $2,000. |
| 2 Interest income from an affiliated company of the fund was $6,000. |
See accompanying Notes, which are an integral part of the Financial Statements.
21
Market Neutral Fund
Statement of Changes in Net Assets
| | |
| | Year Ended December 31, |
| | 2013 | 2012 |
| | ($000) | ($000) |
| Increase (Decrease) In Net Assets | | |
| Operations | | |
| Net Investment Income (Loss) | (88) | 893 |
| Realized Net Gain (Loss) | 8,423 | (7,051) |
| Change in Unrealized Appreciation (Depreciation) | 9,099 | 2,757 |
| Net Increase (Decrease) in Net Assets Resulting from Operations | 17,434 | (3,401) |
| Distributions | | |
| Net Investment Income | | |
| Investor Shares | (33) | (666) |
| Institutional Shares | (8) | (263) |
| Realized Capital Gain | | |
| Investor Shares | — | — |
| Institutional Shares | — | — |
| Return of Capital | | |
| Investor Shares | (16) | — |
| Institutional Shares | (4) | — |
| Total Distributions | (61) | (929) |
| Capital Share Transactions | | |
| Investor Shares | 7,869 | (3,519) |
| Institutional Shares | 1,333 | 16,089 |
| Net Increase (Decrease) from Capital Share Transactions | 9,202 | 12,570 |
| Total Increase (Decrease) | 26,575 | 8,240 |
| Net Assets | | |
| Beginning of Period | 182,227 | 173,987 |
| End of Period1 | 208,802 | 182,227 |
| 1 Net Assets—End of Period includes overdistributed net investment income of ($105,000) and ($54,000). |
See accompanying Notes, which are an integral part of the Financial Statements.
22
Market Neutral Fund
Financial Highlights
| | | | | |
| Investor Shares | | | | | |
| |
| For a Share Outstanding | Year Ended December 31, |
| Throughout Each Period | 2013 | 2012 | 2011 | 2010 | 2009 |
| Net Asset Value, Beginning of Period | $10.16 | $10.36 | $9.61 | $9.71 | $10.97 |
| Investment Operations | | | | | |
| Net Investment Income (Loss) | (.007) | .045 | (.024) | (.038)1 | (.105) |
| Net Realized and Unrealized Gain (Loss) | | | | | |
| on Investments 2 | .880 | (.200) | .774 | (.062) | (1.143) |
| Total from Investment Operations | .873 | (.155) | .750 | (.100) | (1.248) |
| Distributions | | | | | |
| Dividends from Net Investment Income | (.002) | (.045) | — | — | (.012) |
| Distributions from Realized Capital Gains | — | — | — | — | — |
| Return of Capital | (.001) | — | — | — | — |
| Total Distributions | (.003) | (.045) | — | — | (.012) |
| Net Asset Value, End of Period | $11.03 | $10.16 | $10.36 | $9.61 | $9.71 |
| |
| Total Return3 | 8.59% | -1.50% | 7.80% | -1.03% | -11.38% |
| |
| Ratios/Supplemental Data | | | | | |
| Net Assets, End of Period (Millions) | $174 | $151 | $158 | $116 | $53 |
| Ratio of Expenses to Average Net Assets | | | | | |
| Based on Total Expenses4,5 | 1.57% | 1.88% | 1.69% | 1.84% | 2.80% |
| Net of Dividend and Borrowing Expense | | | | | |
| on Securities Sold Short4 | 0.25% | 0.25% | 0.25% | 0.30% | 0.39% |
| Ratio of Net Investment Income (Loss) | | | | | |
| to Average Net Assets | (0.06%) | 0.44% | (0.22%) | (0.38%) | (0.97%) |
| Portfolio Turnover Rate | 68% | 89% | 91% | 153% | 142% |
1 Calculated based on average shares outstanding.
2 Includes increases from redemption fees of $.00, $.00, $.00, $.00, and $.04. Effective May 23, 2012, the redemption fee was eliminated.
3 Total returns do not include transaction or account service fees that may have applied in the periods shown. Fund prospectuses provide
information about any applicable transaction and account service fees.
4 Includes performance-based advisory fee increases (decreases) of (0.07%) for fiscal 2010 and (0.10%) for fiscal 2009. Performance-based
investment advisory fees did not apply after fiscal 2010.
5 Includes 2013 dividend and borrowing expense on securities sold short of 1.18% and 0.14%, respectively. Includes 2012 dividend and
borrowing expense on securities sold short of 1.52% and 0.11%, respectively. Includes 2011 dividend and borrowing expense on securities
sold short of 1.30% and 0.14%, respectively. Includes 2010 dividend and borrowing expense on securities sold short of 1.49% and 0.05%,
respectively. Includes 2009 dividend and borrowing expense on securities sold short of 1.42% and 0.99%, respectively.
See accompanying Notes, which are an integral part of the Financial Statements.
23
Market Neutral Fund
Financial Highlights
| | | | | |
| Institutional Shares | | | | | |
| |
| For a Share Outstanding | Year Ended December 31, |
| Throughout Each Period | 2013 | 2012 | 2011 | 2010 | 2009 |
| Net Asset Value, Beginning of Period | $10.10 | $10.33 | $9.57 | $9.66 | $10.90 |
| Investment Operations | | | | | |
| Net Investment Income (Loss) | .006 | .071 | (.010) | (.015)1 | (. 093) |
| Net Realized and Unrealized Gain (Loss) | | | | | |
| on Investments 2 | .868 | (.215) | .770 | (.075) | (1.139) |
| Total from Investment Operations | .874 | (.144) | .760 | (.090) | (1.232) |
| Distributions | | | | | |
| Dividends from Net Investment Income | (.003) | (.086) | — | — | (.008) |
| Distributions from Realized Capital Gains | — | — | — | — | — |
| Return of Capital | (.001) | — | — | — | — |
| Total Distributions | (.004) | (.086) | — | — | (.008) |
| Net Asset Value, End of Period | $10.97 | $10.10 | $10.33 | $9.57 | $9.66 |
| |
| Total Return 3 | 8.66% | -1.39% | 7.94% | -0.93% | -11.31% |
| |
| Ratios/Supplemental Data | | | | | |
| Net Assets, End of Period (Millions) | $35 | $31 | $16 | $3 | $16 |
| Ratio of Expenses to Average Net Assets | | | | | |
| Based on Total Expenses4,5 | 1.47% | 1.78% | 1.59% | 1.74% | 2.73% |
| Net of Dividend and Borrowing Expense | | | | | |
| on Securities Sold Short4 | 0.15% | 0.15% | 0.15% | 0.20% | 0.32% |
| Ratio of Net Investment Income (Loss) | | | | | |
| to Average Net Assets | 0.04% | 0.54% | (0.12%) | (0.28%) | (0.90%) |
| Portfolio Turnover Rate | 68% | 89% | 91% | 153% | 142% |
1 Calculated based on average shares outstanding.
2 Includes increases from redemption fees of $.00, $.00, $.00, $.00, and $.03. Effective May 23, 2012, the redemption fee was eliminated.
3 Total returns do not include transaction fees that may have applied in the periods shown. Fund prospectuses provide information about any
applicable transaction fees.
4 Includes performance-based advisory fee increases (decreases) of (0.07%) for fiscal 2010 and (0.10%) for fiscal 2009. Performance-based
investment advisory fees did not apply after fiscal 2010.
5 Includes 2013 dividend and borrowing expense on securities sold short of 1.18% and 0.14%, respectively. Includes 2012 dividend and
borrowing expense on securities sold short of 1.52% and 0.11%, respectively. Includes 2011 dividend and borrowing expense on securities
sold short of 1.30% and 0.14%, respectively. Includes 2010 dividend and borrowing expense on securities sold short of 1.49% and 0.05%,
respectively. Includes 2009 dividend and borrowing expense on securities sold short of 1.42% and 0.99%, respectively.
See accompanying Notes, which are an integral part of the Financial Statements.
24
Market Neutral Fund
Notes to Financial Statements
Vanguard Market Neutral Fund is registered under the Investment Company Act of 1940 as an open-end investment company, or mutual fund. The fund offers two classes of shares, Investor Shares and Institutional Shares. Investor Shares are available to any investor who meets the fund’s minimum purchase requirements. Institutional Shares are designed for investors who meet certain administrative, service, and account-size criteria.
A. The following significant accounting policies conform to generally accepted accounting principles for U.S. mutual funds. The fund consistently follows such policies in preparing its financial statements.
1. Security Valuation: Securities are valued as of the close of trading on the New York Stock Exchange (generally 4 p.m., Eastern time) on the valuation date. Equity securities are valued at the latest quoted sales prices or official closing prices taken from the primary market in which each security trades; such securities not traded on the valuation date are valued at the mean of the latest quoted bid and asked prices. Securities for which market quotations are not readily available, or whose values have been materially affected by events occurring before the fund’s pricing time but after the close of the securities’ primary markets, are valued by methods deemed by the board of trustees to represent fair value. Investments in Vanguard Market Liquidity Fund are valued at that fund’s net asset value.
2. Short Sales: Short sales are the sales of securities that the fund does not own. The fund may sell a security it does not own in anticipation of a decline in the value of that security. In order to deliver the security to the purchaser, the fund borrows the security from a broker-dealer. The fund must segregate, as collateral for its obligation to return the borrowed security, an amount of cash and long security positions at least equal to the market value of the security sold short. This results in the fund holding a significant portion of its assets in cash. The fund later closes out the position by returning the security to the lender, typically by purchasing the security in the open market. A gain, limited to the price at which the fund sold the security short, or a loss, theoretically unlimited in size, is recognized upon the termination of the short sale. The fund may receive a portion of the income from the investment of collateral, or be charged a fee on borrowed securities, based on the market value of each borrowed security and a variable rate that is dependent upon the availability of such security. The net amounts of income or fees are recorded as interest income (for net income received) or borrowing expense on securities sold short (for net fees charged) on the Statement of Operations. Dividends on securities sold short are reported as an expense in the Statement of Operations.
Cash collateral segregated for securities sold short is recorded as an asset in the Statement of Assets and Liabilities. Long security positions segregated as collateral are shown in the Statement of Net Assets.
3. Federal Income Taxes: The fund intends to continue to qualify as a regulated investment company and distribute all of its taxable income. Management has analyzed the fund’s tax positions taken for all open federal income tax years (December 31, 2010–2013), and has concluded that no provision for federal income tax is required in the fund’s financial statements.
4. Distributions: Distributions to shareholders are recorded on the ex-dividend date.
5. Other: Dividend income (or dividend expense on short positions) is recorded on the ex-dividend date. Interest income includes income distributions received from Vanguard Market Liquidity Fund and is accrued daily. Security transactions are accounted for on the date securities are bought or sold. Costs used to determine realized gains (losses) on the sale of investment securities are those of the specific securities sold.
25
Market Neutral Fund
Each class of shares has equal rights as to assets and earnings, except that each class separately bears certain class-specific expenses related to maintenance of shareholder accounts (included in Management and Administrative expenses) and shareholder reporting. Marketing and distribution expenses are allocated to each class of shares based on a method approved by the board of trustees. Income, other non-class-specific expenses, and gains and losses on investments are allocated to each class of shares based on its relative net assets.
B. The Vanguard Group furnishes at cost investment advisory, corporate management, administrative, marketing, and distribution services. The costs of such services are allocated to the fund under methods approved by the board of trustees. The fund has committed to provide up to 0.40% of its net assets in capital contributions to Vanguard. At December 31, 2013, the fund had contributed capital of $24,000 to Vanguard (included in Other Assets), representing 0.01% of the fund’s net assets and 0.01% of Vanguard’s capitalization. The fund’s trustees and officers are also directors and officers of Vanguard.
C. Various inputs may be used to determine the value of the fund’s investments. These inputs are summarized in three broad levels for financial statement purposes. The inputs or methodologies used to value securities are not necessarily an indication of the risk associated with investing in those securities.
Level 1—Quoted prices in active markets for identical securities.
Level 2—Other significant observable inputs (including quoted prices for similar securities, interest rates, prepayment speeds, credit risk, etc.).
Level 3—Significant unobservable inputs (including the fund’s own assumptions used to determine the fair value of investments).
At December 31, 2013, 100% of the market value of the fund’s investments was based on Level 1 inputs.
D. Distributions are determined on a tax basis and may differ from net investment income and realized capital gains for financial reporting purposes. Differences may be permanent or temporary. Permanent differences are reclassified among capital accounts in the financial statements to reflect their tax character. Temporary differences arise when certain items of income, expense, gain, or loss are recognized in different periods for financial statement and tax purposes; these differences will reverse at some time in the future. Differences in classification may also result from the treatment of short-term gains as ordinary income for tax purposes.
For tax purposes, the fund had a net operating loss of $75,000 for the year ended December 31, 2013. This amount has been reclassified from overdistributed net investment income to paid-in capital. At December 31, 2013, the fund had no ordinary income available for distribution. The fund used capital loss carryforwards of $8,582,000 to offset taxable capital gains realized during the year ended December 31, 2013. At December 31, 2013, the fund had available capital losses totaling $27,320,000 to offset future net capital gains. Of this amount, $24,465,000 is subject to expiration dates; $19,593,000 may be used to offset future net capital gains through December 31, 2017, and $4,872,000 through December 31, 2018. Capital losses of $2,855,000 realized beginning in fiscal 2011 may be carried forward indefinitely under the Regulated Investment Company Modernization Act of 2010, but must be used before any expiring loss carryforwards.
26
Market Neutral Fund
At December 31, 2013, the cost of long security positions for tax purposes was $154,242,000. Net unrealized appreciation of long security positions for tax purposes was $56,090,000, consisting of unrealized gains of $57,187,000 on securities that had risen in value since their purchase and $1,097,000 in unrealized losses on securities that had fallen in value since their purchase. Tax-basis net unrealized depreciation on securities sold short was $27,835,000, consisting of unrealized gains of $4,602,000 on securities that had fallen in value since their sale and $32,437,000 in unrealized losses on securities that had risen in value since their sale.
E. During the year ended December 31, 2013, the fund purchased $138,154,000 of investment securities and sold $184,731,000 of investment securities, other than temporary cash investments. The proceeds of short sales and the cost of purchases to cover short sales were $187,046,000 and $215,803,000 respectively.
F. Capital share transactions for each class of shares were:
| | | | |
| | Year Ended December 31, |
| | 2013 | 2012 |
| | Amount | Shares | Amount | Shares |
| | ($000) | (000) | ($000) | (000) |
| Investor Shares | | | | |
| Issued | 79,310 | 7,510 | 57,126 | 5,525 |
| Issued in Lieu of Cash Distributions | 49 | 5 | 664 | 66 |
| Redeemed1 | (71,490) | (6,637) | (61,309) | (5,998) |
| Net Increase (Decrease)—Investor Shares | 7,869 | 878 | (3,519) | (407) |
| Institutional Shares | | | | |
| Issued | 3,557 | 335 | 16,536 | 1,608 |
| Issued in Lieu of Cash Distributions | 12 | 1 | 262 | 26 |
| Redeemed1 | (2,236) | (212) | (709) | (68) |
| Net Increase (Decrease) —Institutional Shares | 1,333 | 124 | 16,089 | 1,566 |
| 1 Net of redemption fees for fiscal 2012 of $8,000 (fund total). Effective May 23, 2012, the redemption fee was eliminated. |
At December 31, 2013, Vanguard Managed Payout Distribution Focus Fund and Vanguard Managed Payout Growth and Distribution Fund were each a record or beneficial owner of 28% or more of the fund’s net assets, with a combined ownership of 64%. If one of these shareholders were to redeem its investment in the fund, the redemption might result in an increase in the fund’s expense ratio, cause the fund to incur higher transaction costs, or lead to the realization of taxable capital gains. (Vanguard Managed Payout Growth and Distribution Fund acquired Vanguard Managed Payout Distribution Focus Fund on January 17, 2014.)
G. Management has determined that no material events or transactions occurred subsequent to December 31, 2013, that would require recognition or disclosure in these financial statements.
27
Report of Independent Registered
Public Accounting Firm
To the Trustees of Vanguard Montgomery Funds and the Shareholders of Vanguard Market Neutral Fund:
In our opinion, the accompanying statement of net assets, statement of assets and liabilities and the related statements of operations and of changes in net assets and the financial highlights present fairly, in all material respects, the financial position of Vanguard Market Neutral Fund (constituting Vanguard Montgomery Funds, hereafter referred to as the “Fund”) at December 31, 2013, the results of its operations for the year then ended, the changes in its net assets for each of the two years in the period then ended, and the financial highlights for each of the five years in the period then ended, in conformity with accounting principles generally accepted in the United States of America. These financial statements and financial highlights (hereafter referred to as “financial statements”) are the responsibility of the Fund’s management; our responsibility is to express an opinion on these financial statements based on our audits. We conducted our audits of these financial statements in accordance with the standards of the Public Company Accounting Oversight Board (United States). Those standards require that we plan and perform the audit to obtain reasonable assurance about whether the financial statements are free of material misstatement. An audit includes examining, on a test basis, evidence supporting the amounts and disclosures in the financial statements, assessing the accounting principles used and significant estimates made by management, and evaluating the overall financial statement presentation. We believe that our audits, which included confirmation of securities at December 31, 2013 by correspondence with the custodian and broker and by agreement to the underlying ownership records of the transfer agent, provide a reasonable basis for our opinion.
/s/PricewaterhouseCoopers LLP
Philadelphia, Pennsylvania
February 18, 2014
Special 2013 tax information (unaudited) for Vanguard Market Neutral Fund
This information for the fiscal year ended December 31, 2013, is included pursuant to provisions
of the Internal Revenue Code.
The fund distributed $41,000 of qualified dividend income to shareholders during the fiscal year.
For corporate shareholders, 100.0% of investment income (dividend income plus short-term gain,
if any) qualifies for the dividends-received deduction.
28
Your Fund’s After-Tax Returns
This table presents returns for your fund both before and after taxes. The after-tax returns are shown in two ways: (1) assuming that an investor owned the fund during the entire period and paid taxes on the fund’s distributions, and (2) assuming that an investor paid taxes on the fund’s distributions and sold all shares at the end of each period.
Calculations are based on the highest individual federal income tax and capital gains tax rates in effect at the times of the distributions and the hypothetical sales. State and local taxes were not considered. After-tax returns reflect any qualified dividend income . (In the example, returns after the sale of fund shares may be higher than those assuming no sale. This occurs when the sale would have produced a capital loss. The calculation assumes that the investor received a tax deduction for the loss.)
The table shows returns for one share class only; returns for other share classes will differ. Please note that your actual after-tax returns will depend on your tax situation and may differ from those shown. Also note that if you own the fund in a tax-deferred account, such as an individual retirement account or a 401(k) plan, this information does not apply to you. Such accounts are not subject to current taxes.
Finally, keep in mind that a fund’s performance—whether before or after taxes—does not guarantee future results.
Average Annual Total Returns: Market Neutral Fund Investor Shares
Periods Ended December 31, 2013
| | | |
| | One | Five | Ten |
| | Year | Years | Years |
| Returns Before Taxes | 8.59% | 0.23% | 2.42% |
| Returns After Taxes on Distributions | 8.59 | 0.21 | 1.87 |
| Returns After Taxes on Distributions and Sale of Fund Shares | 4.87 | 0.18 | 1.81 |
29
About Your Fund’s Expenses
As a shareholder of the fund, you incur ongoing costs, which include costs for portfolio management, administrative services, and shareholder reports (like this one), among others. Operating expenses, which are deducted from a fund’s gross income, directly reduce the investment return of the fund.
A fund’s expenses are expressed as a percentage of its average net assets. This figure is known as the expense ratio. The following examples are intended to help you understand the ongoing costs (in dollars) of investing in your fund and to compare these costs with those of other mutual funds. The examples are based on an investment of $1,000 made at the beginning of the period shown and held for the entire period.
The accompanying table illustrates your fund’s costs in two ways:
• Based on actual fund return. This section helps you to estimate the actual expenses that you paid over the period. The ”Ending Account Value“ shown is derived from the fund‘s actual return, and the third column shows the dollar amount that would have been paid by an investor who started with $1,000 in the fund. You may use the information here, together with the amount you invested, to estimate the expenses that you paid over the period.
To do so, simply divide your account value by $1,000 (for example, an $8,600 account value divided by $1,000 = 8.6), then multiply the result by the number given for your fund under the heading ”Expenses Paid During Period.“
• Based on hypothetical 5% yearly return. This section is intended to help you compare your fund‘s costs with those of other mutual funds. It assumes that the fund had a yearly return of 5% before expenses, but that the expense ratio is unchanged. In this case—because the return used is not the fund’s actual return—the results do not apply to your investment. The example is useful in making comparisons because the Securities and Exchange Commission requires all mutual funds to calculate expenses based on a 5% return. You can assess your fund’s costs by comparing this hypothetical example with the hypothetical examples that appear in shareholder reports of other funds.
Note that the expenses shown in the table are meant to highlight and help you compare ongoing costs only and do not reflect transaction costs incurred by the fund for buying and selling securities. Further, the expenses do not include any purchase, redemption, or account service fees described in the fund prospectus. If such fees were applied to your account, your costs would be higher. Your fund does not carry a “sales load.”
The calculations assume no shares were bought or sold during the period. Your actual costs may have been higher or lower, depending on the amount of your investment and the timing of any purchases or redemptions.
You can find more information about the fund’s expenses, including annual expense ratios, in the Financial Statements section of this report. For additional information on operating expenses and other shareholder costs, please refer to your fund’s current prospectus.
30
| | | |
| Six Months Ended December 31, 2013 | | | |
| | Beginning | Ending | Expenses |
| | Account Value | Account Value | Paid During |
| Market Neutral Fund | 6/30/2013 | 12/31/2013 | Period |
| Based on Actual Fund Return | | | |
| Investor Shares | $1,000.00 | $1,037.63 | $8.68 |
| Institutional Shares | 1,000.00 | 1,037.84 | 8.17 |
| Based on Hypothetical 5% Yearly Return | | | |
| Investor Shares | $1,000.00 | $1,016.69 | $8.59 |
| Institutional Shares | 1,000.00 | 1,017.19 | 8.08 |
The calculations are based on expenses incurred in the most recent six-month period. The fund’s annualized six-month expense ratios for that
period are 1.69% for Investor Shares and 1.59% for Institutional Shares. The dollar amounts shown as “Expenses Paid” are equal to the
annualized expense ratio multiplied by the average account value over the period, multiplied by the number of days in the most recent
six-month period, then divided by the number of days in the most recent 12-month period.
31
Glossary
Beta. A measure of the magnitude of a fund’s past share-price fluctuations in relation to the ups and downs of a given market index. The index is assigned a beta of 1.00. Compared with a given index, a fund with a beta of 1.20 typically would have seen its share price rise or fall by 12% when the index rose or fell by 10%. For this report, beta is based on returns over the past 36 months for both the fund and the index. Note that a fund’s beta should be reviewed in conjunction with its R-squared (see definition). The lower the R-squared, the less correlation there is between the fund and the index, and the less reliable beta is as an indicator of volatility.
Earnings Growth Rate. The average annual rate of growth in earnings over the past five years for the stocks now in a fund.
Equity Exposure. A measure that reflects a fund’s investments in stocks and stock futures. Any holdings in short-term reserves are excluded.
Expense Ratio. The percentage of a fund’s average net assets used to pay its annual administrative and advisory expenses. These expenses directly reduce returns to investors.
Foreign Holdings. The percentage of a fund represented by securities or depositary receipts of companies based outside the United States.
Inception Date. The date on which the assets of a fund (or one of its share classes) are first invested in accordance with the fund’s investment objective. For funds with a subscription period, the inception date is the day after that period ends. Investment performance is measured from the inception date.
Median Market Cap. An indicator of the size of companies in which a fund invests; the midpoint of market capitalization (market price x shares outstanding) of a fund’s stocks, weighted by the proportion of the fund’s assets invested in each stock. Stocks representing half of the fund’s assets have market capitalizations above the median, and the rest are below it.
Price/Book Ratio. The share price of a stock divided by its net worth, or book value, per share. For a fund, the weighted average price/book ratio of the stocks it holds.
Price/Earnings Ratio. The ratio of a stock’s current price to its per-share earnings over the past year. For a fund, the weighted average P/E of the stocks it holds. P/E is an indicator of market expectations about corporate prospects; the higher the P/E, the greater the expectations for a company’s future growth.
R-Squared. A measure of how much of a fund’s past returns can be explained by the returns from the market in general, as measured by a given index. If a fund’s total returns were precisely synchronized with an index’s returns, its R-squared would be 1.00. If the fund’s returns bore no relationship to the index’s returns, its R-squared would be 0. For this report, R-squared is based on returns over the past 36 months for both the fund and the index.
Return on Equity. The annual average rate of return generated by a company during the past five years for each dollar of shareholder’s equity (net income divided by shareholder’s equity). For a fund, the weighted average return on equity for the companies whose stocks it holds.
Short-Term Reserves. The percentage of a fund invested in highly liquid, short-term securities that can be readily converted to cash.
32
Turnover Rate. An indication of the fund’s trading activity. Funds with high turnover rates incur higher transaction costs and may be more likely to distribute capital gains (which may be taxable to investors). The turnover rate excludes in-kind transactions, which have minimal impact on costs.
33
This page intentionally left blank.
This page intentionally left blank.
The People Who Govern Your Fund
The trustees of your mutual fund are there to see that the fund is operated and managed in your best interests since, as a shareholder, you are a part owner of the fund. Your fund’s trustees also serve on the board of directors of The Vanguard Group, Inc., which is owned by the Vanguard funds and provides services to them on an at-cost basis.
A majority of Vanguard’s board members are independent, meaning that they have no affiliation with Vanguard or the funds they oversee, apart from the sizable personal investments they have made as private individuals. The independent board members have distinguished backgrounds in business, academia, and public service. Each of the trustees and executive officers oversees 182 Vanguard funds.
The following table provides information for each trustee and executive officer of the fund. More information about the trustees is in the Statement of Additional Information, which can be obtained, without charge, by contacting Vanguard at 800-662-7447, or online at vanguard.com.
| |
| InterestedTrustee1 | and Delphi Automotive LLP (automotive components); |
| | Senior Advisor at New Mountain Capital; Trustee of |
| F. William McNabb III | The Conference Board. |
| Born 1957. Trustee Since July 2009. Chairman of the | |
| Board. Principal Occupation(s) During the Past Five | Amy Gutmann |
| Years: Chairman of the Board of The Vanguard Group, | Born 1949. Trustee Since June 2006. Principal |
| Inc., and of each of the investment companies served | Occupation(s) During the Past Five Years: President |
| by The Vanguard Group, since January 2010; Director | of the University of Pennsylvania; Christopher H. |
| of The Vanguard Group since 2008; Chief Executive | Browne Distinguished Professor of Political Science |
| Officer and President of The Vanguard Group and of | in the School of Arts and Sciences with secondary |
| each of the investment companies served by The | appointments at the Annenberg School for |
| Vanguard Group since 2008; Director of Vanguard | Communication and the Graduate School of Education |
| Marketing Corporation; Managing Director of The | of the University of Pennsylvania; Member of the |
| Vanguard Group (1995–2008). | National Commission on the Humanities and Social |
| | Sciences; Trustee of Carnegie Corporation of New |
| IndependentTrustees | York and of the National Constitution Center; Chair |
| of the U.S. Presidential Commission for the Study |
| Emerson U. Fullwood | of Bioethical Issues. |
| Born 1948. Trustee Since January 2008. Principal | |
| Occupation(s) During the Past Five Years: Executive | JoAnn Heffernan Heisen |
| Chief Staff and Marketing Officer for North America | Born 1950. Trustee Since July 1998. Principal |
| and Corporate Vice President (retired 2008) of Xerox | Occupation(s) During the Past Five Years: Corporate |
| Corporation (document management products and | Vice President and Chief Global Diversity Officer |
| services); Executive in Residence and 2010 | (retired 2008) and Member of the Executive |
| Distinguished Minett Professor at the Rochester | Committee (1997–2008) of Johnson & Johnson |
| Institute of Technology; Director of SPX Corporation | (pharmaceuticals/medical devices/consumer |
| (multi-industry manufacturing), the United Way of | products); Director of Skytop Lodge Corporation |
| Rochester, Amerigroup Corporation (managed health | (hotels), the University Medical Center at Princeton, |
| care), the University of Rochester Medical Center, | the Robert Wood Johnson Foundation, and the Center |
| Monroe Community College Foundation, and North | for Talent Innovation; Member of the Advisory Board |
| Carolina A&T University. | of the Maxwell School of Citizenship and Public Affairs |
| | at Syracuse University. |
| |
| Rajiv L. Gupta | F. Joseph Loughrey |
| Born 1945. Trustee Since December 2001.2 | Born 1949. Trustee Since October 2009. Principal |
| Principal Occupation(s) During the Past Five Years: | Occupation(s) During the Past Five Years: President |
| Chairman and Chief Executive Officer (retired 2009) | and Chief Operating Officer (retired 2009) of Cummins |
| and President (2006–2008) of Rohm and Haas Co. | Inc. (industrial machinery); Chairman of the Board of |
| (chemicals); Director of Tyco International, Ltd. | Hillenbrand, Inc. (specialized consumer services) and |
| (diversified manufacturing and services), Hewlett- | of Oxfam America; Director of SKF AB (industrial |
| Packard Co. (electronic computer manufacturing), | |
| | |
| machinery), Hyster-Yale Materials Handling, Inc. | Executive Officers | |
| (forklift trucks), and the Lumina Foundation for | | |
| Education; Member of the Advisory Council for the | Glenn Booraem | |
| College of Arts and Letters and of the Advisory Board | Born 1967. Controller Since July 2010. Principal |
| to the Kellogg Institute for International Studies, both | Occupation(s) During the Past Five Years: Principal |
| at the University of Notre Dame. | of The Vanguard Group, Inc.; Controller of each of |
| | the investment companies served by The Vanguard |
| Mark Loughridge | Group; Assistant Controller of each of the investment |
| Born 1953. Trustee Since March 2012. Principal | companies served by The Vanguard Group (2001–2010). |
| Occupation(s) During the Past Five Years: Senior Vice | | |
| President and Chief Financial Officer at IBM (information | Thomas J. Higgins | |
| technology services); Fiduciary Member of IBM’s | Born 1957. Chief Financial Officer Since September |
| Retirement Plan Committee. | 2008. Principal Occupation(s) During the Past Five |
| | Years: Principal of The Vanguard Group, Inc.; Chief |
| Scott C. Malpass | Financial Officer of each of the investment companies |
| Born 1962. Trustee Since March 2012. Principal | served by The Vanguard Group; Treasurer of each of |
| Occupation(s) During the Past Five Years: Chief | the investment companies served by The Vanguard |
| Investment Officer and Vice President at the University | Group (1998–2008). | |
| of Notre Dame; Assistant Professor of Finance at the | | |
| Mendoza College of Business at Notre Dame; Member | Kathryn J. Hyatt | |
| of the Notre Dame 403(b) Investment Committee; | Born 1955. Treasurer Since November 2008. Principal |
| Director of TIFF Advisory Services, Inc. (investment | Occupation(s) During the Past Five Years: Principal of |
| advisor); Member of the Investment Advisory | The Vanguard Group, Inc.; Treasurer of each of the |
| Committees of the Financial Industry Regulatory | investment companies served by The Vanguard |
| Authority (FINRA) and of Major League Baseball. | Group; Assistant Treasurer of each of the investment |
| | companies served by The Vanguard Group (1988–2008). |
| André F. Perold | | |
| Born 1952. Trustee Since December 2004. Principal | Heidi Stam | |
| Occupation(s) During the Past Five Years: George | Born 1956. Secretary Since July 2005. Principal |
| Gund Professor of Finance and Banking at the Harvard | Occupation(s) During the Past Five Years: Managing |
| Business School (retired 2011); Chief Investment | Director of The Vanguard Group, Inc.; General Counsel |
| Officer and Managing Partner of HighVista Strategies | of The Vanguard Group; Secretary of The Vanguard |
| LLC (private investment firm); Director of Rand | Group and of each of the investment companies |
| Merchant Bank; Overseer of the Museum of Fine | served by The Vanguard Group; Director and Senior |
| Arts Boston. | Vice President of Vanguard Marketing Corporation. |
| |
| Alfred M. Rankin, Jr. | | |
| | Vanguard Senior ManagementTeam |
| Born 1941. Trustee Since January 1993. Principal | | |
| Occupation(s) During the Past Five Years: Chairman, | Mortimer J. Buckley | Chris D. McIsaac |
| President, and Chief Executive Officer of NACCO | Kathleen C. Gubanich | Michael S. Miller |
| Industries, Inc. (housewares/lignite) and of Hyster-Yale | Paul A. Heller | James M. Norris |
| Materials Handling, Inc. (forklift trucks); Director of | Martha G. King | Glenn W. Reed |
| the National Association of Manufacturers; Chairman | John T. Marcante | |
| of the Board of University Hospitals of Cleveland; | | |
| Advisory Chairman of the Board of The Cleveland | | |
| Museum of Art. | Chairman Emeritus and Senior Advisor |
| | |
| | John J. Brennan | |
| Chairman, 1996–2009 | |
| Peter F. Volanakis | Chief Executive Officer and President, 1996–2008 |
| Born 1955. Trustee Since July 2009. Principal | |
| Occupation(s) During the Past Five Years: President | | |
| and Chief Operating Officer (retired 2010) of Corning | | |
| Incorporated (communications equipment); Director | Founder | |
| of SPX Corporation (multi-industry manufacturing); | | |
| Overseer of the Amos Tuck School of Business | John C. Bogle | |
| Administration at Dartmouth College; Advisor to the | Chairman and Chief Executive Officer, 1974–1996 |
| Norris Cotton Cancer Center. | | |
1 Mr. McNabb is considered an “interested person,” as defined in the Investment Company Act of 1940, because he is an officer of the
Vanguard funds.
2 December 2002 for Vanguard Equity Income Fund, Vanguard Growth Equity Fund, the Vanguard Municipal Bond Funds, and the Vanguard
State Tax-Exempt Funds.
|  |
| | P.O. Box 2600 |
| | Valley Forge, PA 19482-2600 |
| |
| |
| |
| Connect with Vanguard® > vanguard.com | |
| |
| |
| |
| Fund Information > 800-662-7447 | CFA® is a trademark owned by CFA Institute. |
| Direct Investor Account Services > 800-662-2739 | |
| Institutional Investor Services > 800-523-1036 | |
| Text Telephone for People | |
| With Hearing Impairment > 800-749-7273 | |
| |
| This material may be used in conjunction | |
| with the offering of shares of any Vanguard | |
| fund only if preceded or accompanied by | |
| the fund’s current prospectus. | |
| |
| All comparative mutual fund data are from Lipper, a | |
| Thomson Reuters Company, or Morningstar, Inc., unless | |
| otherwise noted. | |
| |
| You can obtain a free copy of Vanguard’s proxy voting | |
| guidelines by visiting vanguard.com/proxyreporting or by | |
| calling Vanguard at 800-662-2739. The guidelines are | |
| also available from the SEC’s website, sec.gov. In | |
| addition, you may obtain a free report on how your fund | |
| voted the proxies for securities it owned during the 12 | |
| months ended June 30. To get the report, visit either | |
| vanguard.com/proxyreporting or sec.gov. | |
| |
| You can review and copy information about your fund at | |
| the SEC’s Public Reference Room in Washington, D.C. To | |
| find out more about this public service, call the SEC at | |
| 202-551-8090. Information about your fund is also | |
| available on the SEC’s website, and you can receive | |
| copies of this information, for a fee, by sending a | |
| request in either of two ways: via e-mail addressed to | |
| publicinfo@sec.gov or via regular mail addressed to the | |
| Public Reference Section, Securities and Exchange | |
| Commission, Washington, DC 20549-1520. | |
| |
| | © 2014 The Vanguard Group, Inc. |
| | All rights reserved. |
| | Vanguard Marketing Corporation, Distributor. |
| |
| | Q6340 022014 |
Item 2: Code of Ethics. The Registrant has adopted a code of ethics that applies to the Registrant’s principal executive officer, principal financial officer, principal accounting officer or controller or persons performing similar functions. The Code of Ethics was amended during the reporting period covered by this report to make certain technical, non-material changes.
Item 3: Audit Committee Financial Expert. The following members of the Audit Committee have been determined by the Registrant’s Board of Trustees to be Audit Committee Financial Experts serving on its Audit Committee, and to be independent: Rajiv L. Gupta, Amy Gutmann, JoAnn Heffernan Heisen, F. Joseph Loughrey, Mark Loughridge, Scott C. Malpass, André F. Perold, and Alfred M. Rankin, Jr.
Item 4: Principal Accountant Fees and Services.
(a) Audit Fees.
Audit Fees of the Registrant
Fiscal Year Ended December 31, 2013: $46,000
Fiscal Year Ended December 31, 2012: $45,000
Aggregate Audit Fees of Registered Investment Companies in the Vanguard Group.
Fiscal Year Ended December 31, 2013: $5,714,113
Fiscal Year Ended December 31, 2012: $4,809,780
Includes fees billed in connection with audits of the Registrant and other registered investment companies in the Vanguard complex. Also includes fees billed in connection with audits of The Vanguard Group, Inc. and Vanguard Marketing Corporation for Fiscal Year Ended December 31, 2013.
(b) Audit-Related Fees.
Fiscal Year Ended December 31, 2013: $1,552,950
Fiscal Year Ended December 31, 2012: $1,812,565
Includes fees billed in connection with assurance and related services provided to the Registrant, other registered investment companies in the Vanguard complex, The Vanguard Group, Inc., and Vanguard Marketing Corporation.
(c) Tax Fees.
Fiscal Year Ended December 31, 2013: $110,000
Fiscal Year Ended December 31, 2012: $490,518
Includes fees billed in connection with tax compliance, planning, and advice services provided to the Registrant, other registered investment companies in the Vanguard complex, The Vanguard Group, Inc., and Vanguard Marketing Corporation. Also includes fees billed in connection with certain tax services related to audits of the Registrant and other registered investment companies in the Vanguard complex for Fiscal Year Ended December 31, 2012.
(d) All Other Fees.
Fiscal Year Ended December 31, 2013: $132,000
Fiscal Year Ended December 31, 2012: $16,000
Includes fees billed for services related to tax reported information provided to the Registrant, other registered investment companies in the Vanguard complex, The Vanguard Group, Inc., and Vanguard Marketing Corporation.
(e) (1) Pre-Approval Policies. The policy of the Registrant’s Audit Committee is to consider and, if appropriate, approve before the principal accountant is engaged for such services, all specific audit and non-audit services provided to: the Registrant, other registered investment companies in the Vanguard complex, The Vanguard Group, Inc., and entities controlled by The Vanguard Group, Inc. that provide ongoing services to the Registrant. In making a determination, the Audit Committee considers whether the services are consistent with maintaining the principal accountant’s independence.
In the event of a contingency situation in which the principal accountant is needed to provide services in between scheduled Audit Committee meetings, the Chairman of the Audit Committee would be called on to consider and, if appropriate, pre-approve audit or permitted non-audit services in an amount sufficient to complete services through the next Audit Committee meeting, and to determine if such services would be consistent with maintaining the accountant’s independence. At the next scheduled Audit Committee meeting, services and fees would be presented to the Audit Committee for formal consideration, and, if appropriate, approval by the entire Audit Committee. The Audit Committee would again consider whether such services and fees are consistent with maintaining the principal accountant’s independence.
The Registrant’s Audit Committee is informed at least annually of all audit and non-audit services provided by the principal accountant to the Vanguard complex, whether such services are provided to: the Registrant, other registered investment companies in the Vanguard complex, The Vanguard Group, Inc., or other entities controlled by The Vanguard Group, Inc. that provide ongoing services to the Registrant.
(2) No percentage of the principal accountant’s fees or services were approved pursuant to the waiver provision of paragraph (c)(7)(i)(C) of Rule 2-01 of Regulation S-X.
(f) For the most recent fiscal year, over 50% of the hours worked under the principal accountant’s engagement were not performed by persons other than full-time, permanent employees of the principal accountant.
(g) Aggregate Non-Audit Fees.
Fiscal Year Ended December 31, 2013: $242,000
Fiscal Year Ended December 31, 2012: $506,518
Includes fees billed for non-audit services provided to the Registrant, other registered investment companies in the Vanguard complex, The Vanguard Group, Inc., and Vanguard Marketing Corporation.
(h) For the most recent fiscal year, the Audit Committee has determined that the provision of all non-audit services was consistent with maintaining the principal accountant’s independence.
Item 5: Audit Committee of Listed Registrants.
Not Applicable.
Item 6: Investments.
Not Applicable.
Item 7: Disclosure of Proxy Voting Policies and Procedures for Closed-End Management
Investment Companies.
Not Applicable.
Item 8: Portfolio Managers of Closed-End Management Investment Companies.
Not Applicable.
Item 9: Purchase of Equity Securities by Closed-End Management Investment Company and
Affiliated Purchasers.
Not Applicable.
Item 10: Submission of Matters to a Vote of Security Holders.
Not Applicable.
Item 11: Controls and Procedures.
(a) Disclosure Controls and Procedures. The Principal Executive and Financial Officers concluded that the Registrant’s Disclosure Controls and Procedures are effective based on their evaluation of the Disclosure Controls and Procedures as of a date within 90 days of the filing date of this report.
(b) Internal Control Over Financial Reporting. There were no significant changes in Registrant’s Internal Control Over Financial Reporting or in other factors that could significantly affect this control subsequent to the date of the evaluation, including any corrective actions with regard to significant deficiencies and material weaknesses.
Item 12: Exhibits.
(a) Code of Ethics.
(b) Certifications.
Pursuant to the requirements of the Securities Exchange Act of 1934 and the Investment Company Act of 1940, the registrant has duly caused this report to be signed on its behalf by the undersigned, thereunto duly authorized.
| |
| | VANGUARD MONTGOMERY FUNDS |
| |
| |
| BY: | /s/ F. WILLIAM MCNABB III* |
| F. WILLIAM MCNABB III |
| CHIEF EXECUTIVE OFFICER |
| |
| Date: February 20, 2014 |
Pursuant to the requirements of the Securities Exchange Act of 1934 and the Investment Company Act of 1940, this report has been signed below by the following persons on behalf of the registrant and in the capacities and on the dates indicated.
| |
| | VANGUARD MONTGOMERY FUNDS |
| |
BY: | /s/ F. WILLIAM MCNABB III* |
| F. WILLIAM MCNABB III |
| CHIEF EXECUTIVE OFFICER |
Date: February 20, 2014 |
| VANGUARD MONTGOMERY FUNDS |
| |
| BY: | /s/ THOMAS J. HIGGINS* |
| | THOMAS J. HIGGINS |
| CHIEF FINANCIAL OFFICER |
Date: February 20, 2014 |
* By: /s/ Heidi Stam
Heidi Stam, pursuant to a Power of Attorney filed on March 27, 2012 see file Number
2-11444, Incorporated by Reference.