UNITED STATES
SECURITIES AND EXCHANGE COMMISSION
Washington, D.C. 20549
FORM N-CSR
CERTIFIED SHAREHOLDER REPORT
OF
REGISTERED MANAGEMENT INVESTMENT COMPANIES
Investment Company Act file number: 811-22114
Name of Registrant: Vanguard Montgomery Funds
Address of Registrant:
P.O. Box 2600
Valley Forge, PA 19482
Name and address of agent for service:
Heidi Stam, Esquire
P.O. Box 876
Valley Forge, PA 19482
Registrant’s telephone number, including area code: (610) 669-1000
Date of fiscal year end: December 31
Date of reporting period: January 1, 2011 – December 31, 2011
Item 1: Reports to Shareholders
| Annual Report | December 31, 2011 |
| Vanguard Market Neutral Fund |
> For the year ended December 31, 2011, Vanguard Market Neutral Fund returned almost 8%, substantially outpacing both its benchmark and the average return of peer funds.
> The advisor made astute selections among consumer discretionary, financial, and health care stocks.
> The fund’s stock-selection methodology found success for much of 2011 as investors found it easier to draw sharp distinctions between the best and worst investments in each segment of the market.
| Contents | |
| Your Fund’s Total Returns. | 1 |
| Chairman’s Letter. | 2 |
| Advisor’s Report. | 7 |
| Fund Profile. | 9 |
| Performance Summary. | 11 |
| Financial Statements. | 13 |
| Your Fund’s After-Tax Returns. | 28 |
| About Your Fund’s Expenses. | 29 |
| Glossary. | 31 |
Please note: The opinions expressed in this report are just that—informed opinions. They should not be considered promises or advice. Also, please keep in mind that the information and opinions cover the period through the date on the front of this report. Of course, the risks of investing in your fund are spelled out in the prospectus.
See the Glossary for definitions of investment terms used in this report.
About the cover: Vanguard was named for the HMS Vanguard, flagship of British Admiral Horatio Nelson. A ship—whose performance and safety depend on the work of all hands—has served as a fitting metaphor for the Vanguard crew as we strive to help clients reach their financial goals.
Your Fund’s Total Returns
| Fiscal Year Ended December 31, 2011 | |
| Total | |
| Returns | |
| Vanguard Market Neutral Fund | |
| Investor Shares | 7.80% |
| Institutional Shares | 7.94 |
| Citigroup Three-Month U.S. Treasury Bill Index | 0.08 |
| Equity Market Neutral Funds Average | -0.62 |
| Equity Market Neutral Funds Average: Derived from data provided by Lipper Inc. | |
| Institutional Shares are available to certain institutional investors who meet specific administrative, service, and account-size criteria. | |
| Your Fund’s Performance at a Glance | ||||
| December 31, 2010 , Through December 31, 2011 | ||||
| Distributions Per Share | ||||
| Starting | Ending | Income | Capital | |
| Share Price | Share Price | Dividends | Gains | |
| Vanguard Market Neutral Fund | ||||
| Investor Shares | $9.61 | $10.36 | $0.000 | $0.000 |
| Institutional Shares | 9.57 | 10.33 | 0.000 | 0.000 |
1

Chairman’s Letter
Dear Shareholder,
The financial crisis of 2008–2009 seems to have cast a long shadow, making the prices of individual stocks more likely to march in lockstep—technically, to be highly correlated—in response to broad shocks to the global economic system.
Like any stock selection strategy, the method used by the managers of Vanguard Market Neutral Fund tries to draw sharp distinctions between stocks with the best prospects and those with the worst, in the expectation that these distinctions will ultimately be reflected in the stocks’ returns. In periods of high correlation, those differences in return are less likely to materialize.
As the fund’s advisor, Vanguard Quantitative Equity Group, observes in its report, stocks emerged from the crisis-created shadow during the earlier part of 2011. And this helped the fund’s Investor Shares return 7.80% for the year ended December 3. The Institutional Shares, because of their lower expense ratio, returned 7.94%.
Consistent with its objective, the fund outdistanced its benchmark, the Citigroup Three-Month U.S. Treasury Bill Index, which returned 0.13%. Of course, returns from Treasury bills and other short-term assets have been weighed down by the Federal Reserve’s near-zero target for the
2
shortest-term interest rates. However, the fund also substantially exceeded the average return of peer-group funds, which was negative at –0.62%.
Big dramas and small numbers in the U.S. stock market
The broad U.S. stock market finished 2011 with a modestly positive return, a result that seems surprisingly low-key in light of the economic and political dramas that monopolized investors’ attention for much of the year.
Stock prices rallied and retreated as early optimism about the global economic outlook traded places with anxiety about Europe’s debt crisis and the contentious negotiations in Washington over raising the U.S. debt ceiling to avoid default. The policymaking strife prompted Standard & Poor’s to downgrade the U.S. credit rating. (Vanguard’s confidence in the full faith and credit of the U.S. Treasury remains unshaken.) By year-end, stock prices were again on the rise, with investors refocused on signs of economic improvement.
International stock prices finished the year with a double-digit decline. The weaker performance of stocks outside the United States reflected the greater economic and financial challenges in Europe, Japan’s struggles with natural and nuclear disaster, and skittishness about emerging markets.
| Market Barometer | |||
| Average Annual Total Returns | |||
| Periods Ended December 31, 2011 | |||
| One | Three | Five | |
| Year | Years | Years | |
| Stocks | |||
| Russell 1000 Index (Large-caps) | 1.50% | 14.81% | -0.02% |
| Russell 2000 Index (Small-caps) | -4.18 | 15.63 | 0.15 |
| Dow Jones U.S. Total Stock Market Index | 0.52 | 15.24 | 0.28 |
| MSCI All Country World Index ex USA (International) | -13.71 | 10.70 | -2.92 |
| Bonds | |||
| Barclays Capital U.S. Aggregate Bond Index (Broad | |||
| taxable market) | 7.84% | 6.77% | 6.50% |
| Barclays Capital Municipal Bond Index (Broad | |||
| tax-exempt market) | 10.70 | 8.57 | 5.22 |
| Citigroup Three-Month U.S. Treasury Bill Index | 0.08 | 0.11 | 1.36 |
| CPI | |||
| Consumer Price Index | 2.96% | 2.39% | 2.26% |
3
As yields fell, bonds delivered unexpectedly strong returns
Bond returns were also a surprise, mainly because so little was expected of them. At the end of 2010, bond yields hovered near historical lows, suggesting that the scope for further declines—and rallies in bond prices—was limited. During 2011, however, rates moved lower still as investors sought shelter from stock market turmoil. The broad U.S. bond market returned 7.84%. Municipal bonds, which were battered at the end of 2010, produced even stronger returns than taxable bonds in 2011.
The returns of the 3-month U.S. Treasury bill and other money market instruments approached 0%, which was consistent with the Federal Reserve Board’s interest rate policy but nevertheless a disappointment for savers.
Consumer discretionary stocks were the fund’s top performers
The stock-market environment of the first half of 2011, the period when the Market Neutral Fund earned much of its return of nearly 8%, turned out to be conducive to the sophisticated computer models that inform the advisor’s stock choices.
The models sift through the financial characteristics of thousands of stocks and uncover those that are the best candidates for the “long” and “short” portions of the fund’s portfolio. The goal is to produce returns that are independent of general market movements, a process made easier when individual stocks aren’t following a herd instinct.
Buying “long” refers to the outright ownership of stocks that the advisor expects will appreciate in value. Selling “short” means that the stocks being sold have been borrowed with the expectation that they’ll decline in value; then the advisor would purchase the same stocks at the new, lower price and returned to the lender.
The top three sectors contributing to the fund’s return were consumer discretionary, financials, and health care.
In the consumer discretionary sector, long and short positions contributed about equally to the fund’s result, together accounting for about a third of return. Both approaches also worked well in the financial sector, although shorts added much more to return than longs. In the case of health care, however, long positions were the sole contributors to the fund’s return.
Ten-year results outpaced the benchmark and peer group
Year-to-year results aside, it’s always important, for the sake of perspective, to review fund results over longer periods. As the table shows, the fund’s ten-year returns compares favorably with the average for its peer funds and its benchmark. Overall, we are pleased with the results from the fund’s stock-selection strategy, which aims to
4
distinguish between high-quality companies with strong fundamentals and those with less attractive prospects while limiting exposure to the stock market’s overall movements.
For the ten years ended December 31, the fund’s 2.40% average annual return compares favorably with the 2.30% average for its peer funds. The past year’s hearty return of nearly 8% undoubtedly improved the long-term picture, especially versus the peer average. But it is notable that the fund outpaced the 1.85% average return of its Treasury-bill benchmark over the decade.
The fund can be a useful vehicle for portfolio diversification
Because the Market Neutral Fund seeks to provide long-term capital appreciation with a low correlation to broad stock market movements and the behavior of other assets, the fund works best as one element of a diversified portfolio. Indeed, diversification among asset classes, such as stocks, bonds, and cash investments, and also within the classes can be an investor’s best defense against the surprises that the financial markets habitually throw at us.
As recent Vanguard research has found, such diversification can help with the added layer of uncertainty created when
| Total Returns | |
| Ten Years Ended December 31, 2011 | |
| Average | |
| Annual Return | |
| Market Neutral Fund Investor Shares | 2.40% |
| Citigroup Three-Month U.S. Treasury Bill Index | 1.85 |
| Equity Market Neutral Funds Average | 2.30 |
| Equity Market Neutral Funds Average: Derived from data provided by Lipper Inc. |
The figures shown represent past performance, which is not a guarantee of future results. (Current performance may be lower or higher than the performance data cited. For performance data current to the most recent month-end, visit our website at vanguard.com/performance.) Note, too, that both investment returns and principal value can fluctuate widely, so an investor’s shares, when sold, could be worth more or less than their original cost.
5
macroeconomic events dominate the news and provoke intense volatility. These events can include, for example, a threat that nations will default on their sovereign debt (a current concern) or the market effects of the demise of major financial institutions (such as Long-Term Capital Management in 1998 and Lehman Brothers in 2008). Macroeconomic events don’t occur every day, but they do happen with enough regularity to plan for. (The study, Recent Stock Market Volatility: Extraordinary or ‘Ordinary,’ is available on our website at vanguard.com/jumppage/ researchpapers.)
Thank you for entrusting your assets to Vanguard.
Sincerely,
F. William McNabb
Chairman and Chief Executive Officer
January 23, 2012
6
Advisor’s Report
For 2011, Vanguard Market Neutral Fund returned about 8%. This result exceeded the 0.08% return of the fund’s benchmark index, the Citigroup 3-Month Treasury Bill Index, and the –0.62% average return of peer funds.
The investment environment
Volatility was the name of the game for the equity market in 2011. After the Dow Jones U.S. Total Stock Market Index delivered 6.01% gain for the first half of the year, equities turned south, falling more than 5 percentage points during the second half; the index’s 12-month return was 0.52%.
Driving the pullback were the continued worries of a weak U.S. economy, lingering deficit and debt issues, and the unresolved European sovereign-debt crisis. Investors will likely continue to be cautious until they see progress by U.S. and European leaders in tackling these difficult problems.
Management of the fund
Whether the markets are being volatile or calm, our objective is always to produce a portfolio that is neutral with respect to overall stock market risk. We seek to achieve this by purchasing equity securities that we consider undervalued and selling short those we consider overvalued, in amounts that we believe will achieve market (or “beta”) neutrality.
Beta is a measure of a stock’s volatility relative to that of the stock market.
A typical equity investment with characteristics similar to a broad market index would have a beta close to 1.0. For this fund, we try to attain a 0.0 beta relative to a broad equity benchmark. As of December 31, 2011, the three-year average beta for the fund was –0.02.
Our quantitative approach is similar to traditional security selection in that we focus on specific stock fundamentals; the difference lies in our use of models to help identify attractive and unattractive stocks.
Our process has five components:
• Valuation, which measures the price we pay for earnings and cash flows.
• Growth, which considers the growth of earnings when factoring how much we pay for them.
• Management decisions, which looks at the actions taken by company management. (Because management is privy to better knowledge of a company’s prospects and earnings than any market participant, their actions can signal their opinions of a firm’s future.)
• Market sentiment, which captures how investors reflect their opinions of a company through their activity in the market.
• Quality, which measures balance-sheet strength and the sustainability of earnings.
In our semiannual report to shareholders, we noted that the average return correlation across stocks in the market had decreased considerably from the high levels of 2008 and 2009, an indication that investors were once again focusing on stock selection, as opposed to macro risks.
7
Although correlations have again risen in the aftermath of the subsequent volatility, we believe that the renewed interest in individual stock selection was a primary factor in our model’s performance over the fiscal year.
Although we experienced differing market trends in the first and second halves of the year, our stock selection model performed well in both periods, with all five of our key components contributing positively over the entire period. The portfolio benefited most from our quality component; the growth and management-decisions components also produced strong results.
The model’s scope can be seen by its effectiveness across sectors, as we were able to produce positive results in nine of the ten of them. The portfolio’s best-performing sectors were consumer discretionary, where together long and short positions contributed 3.5 percentage points to return; financials (2.9 percentage points); and health care (2.3 percentage points). Energy was the only sector that detracted from overall return; our short positions performed poorly, more than offsetting the positive contribution of our long positions.
At the individual stock level, the largest contributions came from long positions in Biogen Idec (+64%), Humana (+62%), and Regeneron Pharmaceuticals (+64%). In addition, we benefited from shorting poorly performing stocks such as Cree (–66%), Human Genome Sciences (–69%), and WMS Industries (–55%).
Unfortunately, some of our choices led to disappointing results. Long positions in CNH Global (–43%), Westlake Chemical (–39%), and US Airways Group (–50%) directly lowered performance. So did our short positions in companies whose fundamental characteristics were not identified as positive by our model, including NVIDIA Corp. (+66%), Green Mountain Coffee Roasters Inc. (+36%), and Cabot Oil & Gas Corp. (+78%).
Outlook
While we cannot predict how the broader political or economic events will affect the markets, we are confident, looking forward, that our strategy to capture the spread in returns between attractively valued stocks and their more overvalued brethren can be a useful part of a diversified investment plan.
We thank you for your investment and look forward to the new year.
James D. Troyer, CFA,
Principal and Portfolio Manager
Vanguard Quantitative Equity Group
January 12, 2012
8
Market Neutral Fund
Fund Profile
As of December 31, 2011
| Share-Class Characteristics | ||
| Investor | Institutional | |
| Shares | Shares | |
| Ticker Symbol | VMNFX | VMNIX |
| Total Expense Ratio1 | 1.80% | 1.70% |
| Management Expenses | 0.13% | 0.02% |
| Dividend Expenses on | ||
| Securities Sold Short2 | 1.49% | 1.49% |
| Borrowing Expenses on | ||
| Securities Sold Short2 | 0.05% | 0.05% |
| Other Expenses | 0.13% | 0.14% |
| Portfolio Characteristics | ||
| Long | Short | |
| Portfolio | Portfolio | |
| Number of Stocks | 277 | 251 |
| Median Market Cap | $3.4B | $3.9B |
| Price/Earnings Ratio | 12.9x | 19.9x |
| Price/Book Ratio | 2.0x | 1.8x |
| Return on Equity | 12.7% | 13.8% |
| Earnings Growth Rate | 8.1% | 4.0% |
| Foreign Holdings | 2.8% | 1.4% |
| Volatility Measures | ||
| Citigroup | DJ | |
| Three-Month | U.S. Total | |
| U.S. Treasury | Market | |
| Bill Index | Index | |
| R-Squared | 0.17 | 0.01 |
| Beta | -96.60 | -0.02 |
These measures show the degree and timing of the fund’s fluctuations compared with the index over 36 months.
| Sector Diversification (% of equity exposure) | ||
| Long | Short | |
| Portfolio | Portfolio | |
| Consumer Discretionary | 15.4% | 14.4% |
| Consumer Staples | 7.0 | 8.0 |
| Energy | 8.1 | 7.6 |
| Financials | 15.7 | 15.5 |
| Health Care | 10.5 | 10.9 |
| Industrials | 14.0 | 13.3 |
| Information Technology | 16.1 | 16.5 |
| Materials | 5.4 | 5.3 |
| Telecommunication | ||
| Services | 1.4 | 1.6 |
| Utilities | 6.4 | 6.9 |
| Fund Characteristics | |
| Turnover Rate | 91% |
| Short-Term Reserves | -0.7% |
1 The expense ratios shown are from the prospectus dated April 29, 2011, and represent estimated costs for the current fiscal year. For the six months ended June 30, 2011, the annualized total expense ratios were 1.49% for Investor Shares and 1.39% for Institutional Shares.
2 In connection with a short sale, the fund may receive income or be charged a fee based on the market value of the borrowed stock. When a cash dividend is declared on a stock the fund has sold short, the fund is required to pay an amount equal to that dividend to the party from which the fund borrowed the stock and to record the payment of the dividend as an expense.
9
Market Neutral Fund
| Ten Largest Holdings1 (% of total net assets) | ||
| Long Portfolio | ||
| CF Industries Holdings | Fertilizers & | |
| Inc. | Agricultural | |
| Chemicals | 0.6% | |
| Alaska Air Group Inc. | Airlines | 0.5 |
| Buckeye Technologies | ||
| Inc. | Paper Products | 0.5 |
| PNC Financial Services | ||
| Group Inc. | Regional Banks | 0.5 |
| CBS Corp. Class B | Broadcasting | 0.5 |
| SUPERVALU Inc. | Food Retail | 0.5 |
| Team Health Holdings | Health Care | |
| Inc. | Services | 0.5 |
| US Bancorp | Diversified Banks | 0.5 |
| Marathon Oil Corp. | Oil & Gas | |
| Exploration & | ||
| Production | 0.5 | |
| Humana Inc. | Managed Health | |
| Care | 0.5 | |
| Top Ten | 5.1% | |
| Ten Largest Holdings1 (% of total net assets) | ||
| Short Portfolio | ||
| Akamai Technologies Inc. | Internet Software & | |
| Services | 0.6% | |
| DeVry Inc. | Education Services | 0.6 |
| MGM Resorts | Casinos & Gaming | |
| International | 0.6 | |
| McDermott International | Oil & Gas | |
| Inc. | Equipment & | |
| Services | 0.6 | |
| Masco Corp. | Building Products | 0.5 |
| SBA Communications | Wireless | |
| Corp. Class A | Telecommunication | |
| Services | 0.5 | |
| WMS Industries Inc. | Casinos & Gaming | 0.5 |
| BioMarin Pharmaceutical | Biotechnology | |
| Inc. | 0.5 | |
| Sunoco Inc. | Oil & Gas Refining | |
| & Marketing | 0.5 | |
| United Natural Foods Inc. | Food Distributors | 0.5 |
| Top Ten | 5.4% | |
1 The holdings listed exclude any temporary cash investments and equity index products.
10
Market Neutral Fund
Performance Summary
All of the returns in this report represent past performance, which is not a guarantee of future results that may be achieved by the fund. (Current performance may be lower or higher than the performance data cited. For performance data current to the most recent month-end, visit our website at vanguard.com/performance.) Note, too, that both investment returns and principal value can fluctuate widely, so an investor’s shares, when sold, could be worth more or less than their original cost. The returns shown do not reflect taxes that a shareholder would pay on fund distributions or on the sale of fund shares.
Cumulative Performance: December 31, 2001, Through December 31, 2011
Initial Investment of $250,000

| Average Annual Total Returns | ||||
| Periods Ended December 31, 2011 | ||||
| Final Value | ||||
| One | Five | Ten | of a $250,000 | |
| Year | Years | Years | Investment | |
| Market Neutral Fund Investor Shares | 7.80% | -0.43% | 2.40% | $316,859 |
| Dow Jones U.S. Total Stock Market | ||||
| Index | 0.52 | 0.28 | 3.90 | 366,413 |
| Citigroup Three-Month U.S. Treasury | ||||
| Bill Index | 0.08 | 1.36 | 1.85 | 300,366 |
| Equity Market Neutral Funds Average | -0.62 | 0.31 | 2.30 | 313,961 |
| Equity Market Neutral Funds Average: Derived from data provided by Lipper Inc. | ||||
| Final Value | ||||
| One | Five | Ten | of a $5,000,000 | |
| Year | Years | Years | Investment | |
| Market Neutral Fund Institutional Shares | 7.94% | -0.31% | 2.61% | $6,471,671 |
| Dow Jones U.S. Total Stock Market Index | 0.52 | 0.28 | 3.90 | 7,328,259 |
| Citigroup Three-Month U.S. Treasury Bill Index | 0.08 | 1.36 | 1.85 | 6,007,325 |
Vanguard fund returns do not reflect the 1% fee on redemptions of shares held for less than one year.
See Financial Highlights for dividend and capital gains information.
11
Market Neutral Fund
Fiscal-Year Total Returns (%): December 31, 2001, Through December 31, 2011
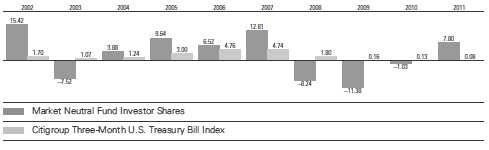
Vanguard fund returns do not reflect the 1% fee on redemptions of shares held for less than one year.
12
Market Neutral Fund
Financial Statements
Statement of Net Assets
As of December 31, 2011
The fund reports a complete list of its holdings in regulatory filings four times in each fiscal year, at the quarter-ends. For the second and fourth fiscal quarters, the lists appear in the fund’s semiannual and annual reports to shareholders. For the first and third fiscal quarters, the fund files the lists with the Securities and Exchange Commission on Form N-Q. Shareholders can look up the fund’s Forms N-Q on the SEC’s website at sec.gov. Forms N-Q may also be reviewed and copied at the SEC’s Public Reference Room (see the back cover of this report for further information).
| Market | |||
| Value | |||
| Shares | ($000) | ||
| Common Stocks—Long Positions (96.2%) | |||
| Consumer Discretionary (14.9%) | |||
| † | CBS Corp. Class B | 34,600 | 938 |
| News Corp. Class A | 51,000 | 910 | |
| * | Goodyear Tire & Rubber Co. | 63,800 | 904 |
| † | Time Warner Cable Inc. | 14,200 | 903 |
| † | Macy’s Inc. | 27,800 | 895 |
| † | Viacom Inc. Class B | 19,700 | 895 |
| † | DISH Network Corp. Class A | 30,900 | 880 |
| † | Foot Locker Inc. | 36,600 | 873 |
| * † | Coinstar Inc. | 19,000 | 867 |
| * † | Bridgepoint Education Inc. | 37,600 | 865 |
| † | Polaris Industries Inc. | 15,400 | 862 |
| † | Limited Brands Inc. | 20,550 | 829 |
| † | Brinker International Inc. | 30,900 | 827 |
| † | Buckle Inc. | 19,200 | 785 |
| * † | AutoZone Inc. | 2,400 | 780 |
| † | Dillard’s Inc. Class A | 17,270 | 775 |
| * † | Express Inc. | 38,800 | 774 |
| * † | Iconix Brand Group Inc. | 47,400 | 772 |
| * † | Domino’s Pizza Inc. | 22,150 | 752 |
| † | Starbucks Corp. | 15,800 | 727 |
| † | Weight Watchers | ||
| International Inc. | 13,050 | 718 | |
| * † | ITT Educational Services Inc. | 12,600 | 717 |
| † | Signet Jewelers Ltd. | 16,200 | 712 |
| * | Dana Holding Corp. | 57,700 | 701 |
| Wynn Resorts Ltd. | 6,100 | 674 | |
| * † | priceline.com Inc. | 1,400 | 655 |
| † | Brunswick Corp. | 35,900 | 648 |
| † | Aaron’s Inc. | 24,300 | 648 |
| * | Apollo Group Inc. Class A | 12,000 | 646 |
| * † | Tenneco Inc. | 16,200 | 482 |
| † | Leggett & Platt Inc. | 20,400 | 470 |
| † | Sotheby’s | 11,900 | 340 |
| * † | Warnaco Group Inc. | 6,000 | 300 |
| Penske Automotive Group | |||
| Inc. | 10,700 | 206 | |
| Market | |||
| Value | |||
| Shares | ($000) | ||
| * | Tempur-Pedic International | ||
| Inc. | 3,700 | 194 | |
| Harley-Davidson Inc. | 4,400 | 171 | |
| * † | Saks Inc. | 17,200 | 168 |
| * | ANN Inc. | 5,900 | 146 |
| Harman International | |||
| Industries Inc. | 2,900 | 110 | |
| * | Pier 1 Imports Inc. | 7,700 | 107 |
| * | Vitamin Shoppe Inc. | 1,400 | 56 |
| Finish Line Inc. Class A | 2,300 | 44 | |
| * | Bed Bath & Beyond Inc. | 600 | 35 |
| 25,761 | |||
| Consumer Staples (6.7%) | |||
| SUPERVALU Inc. | 115,600 | 938 | |
| † | Philip Morris International | ||
| Inc. | 11,700 | 918 | |
| † | Nu Skin Enterprises Inc. | ||
| Class A | 18,400 | 894 | |
| Universal Corp. | 19,400 | 892 | |
| * | Smithfield Foods Inc. | 36,300 | 881 |
| Lancaster Colony Corp. | 12,300 | 853 | |
| † | Lorillard Inc. | 7,300 | 832 |
| Whole Foods Market Inc. | 11,900 | 828 | |
| † | Herbalife Ltd. | 15,200 | 785 |
| † | Dr Pepper Snapple Group | ||
| Inc. | 19,667 | 776 | |
| † | Coca-Cola Enterprises Inc. | 29,800 | 768 |
| † | ConAgra Foods Inc. | 27,400 | 723 |
| † | Fresh Del Monte Produce | ||
| Inc. | 26,500 | 663 | |
| Tyson Foods Inc. Class A | 21,709 | 448 | |
| B&G Foods Inc. Class A | 17,900 | 431 | |
| Kroger Co. | 4,700 | 114 | |
| 11,744 | |||
| Energy (7.8%) | |||
| † | Marathon Oil Corp. | 31,780 | 929 |
| † | Golar LNG Ltd. | 20,500 | 911 |
| † | Helmerich & Payne Inc. | 15,300 | 893 |
13
Market Neutral Fund
| Market | |||
| Value | |||
| Shares | ($000) | ||
| * † | Helix Energy Solutions | ||
| Group Inc. | 56,113 | 887 | |
| † | W&T Offshore Inc. | 40,500 | 859 |
| * † | Stone Energy Corp. | 32,400 | 855 |
| † | Chevron Corp. | 7,600 | 809 |
| * † | Tesoro Corp. | 31,400 | 734 |
| * | Rosetta Resources Inc. | 16,800 | 731 |
| † | Patterson-UTI Energy Inc. | 36,150 | 722 |
| † | ConocoPhillips | 9,800 | 714 |
| * † | Western Refining Inc. | 53,400 | 710 |
| * † | CVR Energy Inc. | 34,800 | 652 |
| † | National Oilwell Varco Inc. | 9,500 | 646 |
| † | HollyFrontier Corp. | 27,250 | 638 |
| † | Valero Energy Corp. | 29,600 | 623 |
| † | RPC Inc. | 30,200 | 551 |
| * | C&J Energy Services Inc. | 10,100 | 211 |
| † | Marathon Petroleum Corp. | 5,840 | 194 |
| * | Denbury Resources Inc. | 8,400 | 127 |
| Murphy Oil Corp. | 1,800 | 100 | |
| SM Energy Co. | 600 | 44 | |
| 13,540 | |||
| Financials (15.1%) | |||
| † | PNC Financial Services | ||
| Group Inc. | 16,300 | 939 | |
| † | US Bancorp | 34,500 | 933 |
| Aflac Inc. | 21,200 | 917 | |
| † | Torchmark Corp. | 20,950 | 909 |
| † | Unum Group | 42,100 | 887 |
| * † | NASDAQ OMX Group Inc. | 36,000 | 882 |
| † | RLI Corp. | 12,100 | 882 |
| † | Cash America International | ||
| Inc. | 18,400 | 858 | |
| † | Discover Financial Services | 35,700 | 857 |
| * † | Credit Acceptance Corp. | 10,400 | 856 |
| † | ProAssurance Corp. | 10,700 | 854 |
| * † | CNO Financial Group Inc. | 134,900 | 851 |
| † | Capital One Financial Corp. | 19,200 | 812 |
| † | Erie Indemnity Co. Class A | 10,300 | 805 |
| CVB Financial Corp. | 79,900 | 801 | |
| † | Amtrust Financial Services | ||
| Inc. | 33,300 | 791 | |
| † | Chubb Corp. | 11,400 | 789 |
| † | Allied World Assurance | ||
| Co. Holdings AG | 12,200 | 768 | |
| † | Commerce Bancshares Inc. | 20,055 | 764 |
| BOK Financial Corp. | 12,243 | 673 | |
| † | KeyCorp | 86,000 | 661 |
| † | Moody’s Corp. | 18,600 | 626 |
| † | East West Bancorp Inc. | 31,600 | 624 |
| † | American Financial Group | ||
| Inc. | 16,800 | 620 | |
| † | Washington Federal Inc. | 43,000 | 602 |
| † | American Express Co. | 12,300 | 580 |
| † | Ameriprise Financial Inc. | 11,500 | 571 |
| † | JPMorgan Chase & Co. | 14,700 | 489 |
| Market | |||
| Value | |||
| Shares | ($000) | ||
| First Citizens BancShares | |||
| Inc. Class A | 2,264 | 396 | |
| † | Franklin Resources Inc. | 3,600 | 346 |
| † | CBL & Associates Properties | ||
| Inc. | 18,000 | 283 | |
| Brandywine Realty Trust | 29,500 | 280 | |
| Omega Healthcare Investors | |||
| Inc. | 14,200 | 275 | |
| CubeSmart | 25,300 | 269 | |
| Digital Realty Trust Inc. | 4,000 | 267 | |
| Entertainment Properties | |||
| Trust | 6,100 | 267 | |
| Hospitality Properties Trust | 11,600 | 267 | |
| Kimco Realty Corp. | 16,100 | 261 | |
| Taubman Centers Inc. | 4,200 | 261 | |
| Douglas Emmett Inc. | 14,200 | 259 | |
| Lexington Realty Trust | 33,400 | 250 | |
| Post Properties Inc. | 4,800 | 210 | |
| † | Camden Property Trust | 2,600 | 162 |
| Reinsurance Group of | |||
| America Inc. Class A | 2,900 | 152 | |
| ACE Ltd. | 1,600 | 112 | |
| Webster Financial Corp. | 5,000 | 102 | |
| * | Arch Capital Group Ltd. | 2,700 | 101 |
| Simon Property Group Inc. | 300 | 39 | |
| * | Ezcorp Inc. Class A | 1,200 | 32 |
| 26,192 | |||
| Health Care (10.1%) | |||
| * † | Team Health Holdings Inc. | 42,500 | 937 |
| † | Humana Inc. | 10,550 | 924 |
| * † | Centene Corp. | 23,088 | 914 |
| † | Bristol-Myers Squibb Co. | 25,900 | 913 |
| † | Aetna Inc. | 21,600 | 911 |
| † | UnitedHealth Group Inc. | 17,915 | 908 |
| Pfizer Inc. | 41,200 | 892 | |
| * † | WellCare Health Plans Inc. | 16,775 | 881 |
| * | Select Medical Holdings | ||
| Corp. | 98,700 | 837 | |
| * † | Biogen Idec Inc. | 7,408 | 815 |
| * † | Magellan Health Services | ||
| Inc. | 16,000 | 792 | |
| * † | Coventry Health Care Inc. | 25,900 | 787 |
| * † | Thoratec Corp. | 23,400 | 785 |
| † | Abbott Laboratories | 13,900 | 782 |
| † | AmerisourceBergen Corp. | ||
| Class A | 20,100 | 748 | |
| * † | Covance Inc. | 16,300 | 745 |
| * † | Charles River Laboratories | ||
| International Inc. | 26,000 | 711 | |
| † | Eli Lilly & Co. | 16,300 | 677 |
| * † | Health Management | ||
| Associates Inc. Class A | 86,500 | 638 | |
| † | Cigna Corp. | 15,100 | 634 |
| * † | Cubist Pharmaceuticals Inc. | 13,500 | 535 |
| * † | Jazz Pharmaceuticals Inc. | 9,800 | 379 |
14
Market Neutral Fund
| Market | |||
| Value | |||
| Shares | ($000) | ||
| † | Cooper Cos. Inc. | 2,500 | 176 |
| Chemed Corp. | 2,500 | 128 | |
| * | LifePoint Hospitals Inc. | 2,700 | 100 |
| * | Cepheid Inc. | 1,700 | 58 |
| * | Mettler-Toledo International | ||
| Inc. | 200 | 30 | |
| 17,637 | |||
| Industrials (13.4%) | |||
| * | Alaska Air Group Inc. | 12,700 | 953 |
| * | Generac Holdings Inc. | 32,900 | 921 |
| * † | United Rentals Inc. | 31,000 | 916 |
| Ryder System Inc. | 17,100 | 909 | |
| † | Lockheed Martin Corp. | 11,200 | 906 |
| * | Moog Inc. Class A | 20,600 | 905 |
| * | CNH Global NV | 24,500 | 882 |
| † | Northrop Grumman Corp. | 15,030 | 879 |
| * † | Huntington Ingalls Industries | ||
| Inc. | 27,933 | 874 | |
| † | Triumph Group Inc. | 14,700 | 859 |
| Textron Inc. | 45,700 | 845 | |
| † | Kennametal Inc. | 22,700 | 829 |
| † | Chicago Bridge & Iron Co. | ||
| NV | 21,700 | 820 | |
| * † | Colfax Corp. | 28,600 | 815 |
| * † | Sauer-Danfoss Inc. | 22,400 | 811 |
| † | Iron Mountain Inc. | 24,600 | 758 |
| † | Pitney Bowes Inc. | 40,700 | 755 |
| * † | Avis Budget Group Inc. | 62,760 | 673 |
| * | Copart Inc. | 14,013 | 671 |
| Barnes Group Inc. | 27,765 | 669 | |
| Tyco International Ltd. | 13,700 | 640 | |
| † | Towers Watson & Co. | ||
| Class A | 10,400 | 623 | |
| † | Amerco Inc. | 7,000 | 619 |
| † | L-3 Communications | ||
| Holdings Inc. | 8,900 | 593 | |
| † | KBR Inc. | 19,800 | 552 |
| * † | Old Dominion Freight Line | ||
| Inc. | 11,700 | 474 | |
| * † | AGCO Corp. | 10,800 | 464 |
| † | Parker Hannifin Corp. | 6,000 | 458 |
| † | Belden Inc. | 13,400 | 446 |
| Gardner Denver Inc. | 2,800 | 216 | |
| Copa Holdings SA Class A | 3,600 | 211 | |
| Brady Corp. Class A | 6,550 | 207 | |
| Rockwell Automation Inc. | 2,700 | 198 | |
| Norfolk Southern Corp. | 2,500 | 182 | |
| Werner Enterprises Inc. | 6,700 | 161 | |
| * | Dollar Thrifty Automotive | ||
| Group Inc. | 2,100 | 148 | |
| HEICO Corp. | 2,500 | 146 | |
| * † | Armstrong World Industries | ||
| Inc. | 2,900 | 127 | |
| JB Hunt Transport Services | |||
| Inc. | 1,700 | 77 | |
| Market | |||
| Value | |||
| Shares | ($000) | ||
| Trinity Industries Inc. | 1,700 | 51 | |
| Landstar System Inc. | 1,000 | 48 | |
| Fluor Corp. | 700 | 35 | |
| Cummins Inc. | 300 | 26 | |
| 23,352 | |||
| Information Technology (15.5%) | |||
| * † | Alliance Data Systems Corp. | 8,700 | 903 |
| * † | Booz Allen Hamilton | ||
| Holding Corp. | 52,300 | 902 | |
| * † | CACI International Inc. | ||
| Class A | 15,800 | 884 | |
| * | SYNNEX Corp. | 29,006 | 884 |
| * † | Anixter International Inc. | 14,800 | 883 |
| † | MAXIMUS Inc. | 21,300 | 881 |
| * † | Western Digital Corp. | 28,300 | 876 |
| † | Cypress Semiconductor | ||
| Corp. | 51,800 | 875 | |
| † | Motorola Solutions Inc. | 18,800 | 870 |
| * | Cadence Design Systems | ||
| Inc. | 83,600 | 869 | |
| * † | Tech Data Corp. | 17,500 | 865 |
| * † | LSI Corp. | 144,300 | 859 |
| † | Jabil Circuit Inc. | 43,400 | 853 |
| * † | Fairchild Semiconductor | ||
| International Inc. Class A | 69,498 | 837 | |
| † | Accenture plc Class A | 15,300 | 814 |
| * † | NVIDIA Corp. | 58,250 | 807 |
| * † | Dell Inc. | 54,800 | 802 |
| * | CommVault Systems Inc. | 18,500 | 790 |
| * † | Gartner Inc. | 22,200 | 772 |
| * † | Symantec Corp. | 48,200 | 754 |
| * † | Electronic Arts Inc. | 36,000 | 742 |
| * | GT Advanced Technologies | ||
| Inc. | 102,300 | 741 | |
| * † | VMware Inc. Class A | 8,100 | 674 |
| MKS Instruments Inc. | 24,015 | 668 | |
| * † | MICROS Systems Inc. | 14,100 | 657 |
| * † | NCR Corp. | 39,200 | 645 |
| * | Cardtronics Inc. | 22,400 | 606 |
| * | Unisys Corp. | 30,700 | 605 |
| * | Zebra Technologies Corp. | 16,600 | 594 |
| † | Avago Technologies Ltd. | 20,100 | 580 |
| * | Liquidity Services Inc. | 14,500 | 535 |
| † | KLA-Tencor Corp. | 8,600 | 415 |
| † | DST Systems Inc. | 7,200 | 328 |
| * † | Veeco Instruments Inc. | 14,930 | 311 |
| * | Freescale Semiconductor | ||
| Holdings I Ltd. | 24,400 | 309 | |
| * | Entegris Inc. | 33,400 | 291 |
| Fair Isaac Corp. | 7,800 | 280 | |
| † | Oracle Corp. | 9,400 | 241 |
| Lexmark International Inc. | |||
| Class A | 6,900 | 228 | |
| * | JDS Uniphase Corp. | 14,300 | 149 |
| Diebold Inc. | 4,400 | 132 | |
15
Market Neutral Fund
| Market | |||
| Value | |||
| Shares | ($000) | ||
| * † | Vishay Intertechnology Inc. | 12,700 | 114 |
| † | International Business | ||
| Machines Corp. | 600 | 110 | |
| * | VeriFone Systems Inc. | 1,880 | 67 |
| 27,002 | |||
| Materials (5.2%) | |||
| † | CF Industries Holdings Inc. | 6,700 | 971 |
| † | Buckeye Technologies Inc. | 28,400 | 950 |
| † | International Paper Co. | 31,200 | 924 |
| † | PPG Industries Inc. | 10,700 | 893 |
| * † | Rockwood Holdings Inc. | 22,583 | 889 |
| † | Westlake Chemical Corp. | 20,600 | 829 |
| * † | Coeur d’Alene Mines Corp. | 34,300 | 828 |
| † | Domtar Corp. | 10,300 | 824 |
| † | Eastman Chemical Co. | 21,000 | 820 |
| † | Hecla Mining Co. | 131,100 | 686 |
| † | Albemarle Corp. | 5,400 | 278 |
| Nucor Corp. | 4,400 | 174 | |
| 9,066 | |||
| Telecommunication Services (1.4%) | |||
| † | Verizon Communications | ||
| Inc. | 22,400 | 899 | |
| † | AT&T Inc. | 27,600 | 835 |
| † | Telephone & Data Systems | ||
| Inc. | 25,000 | 647 | |
| 2,381 | |||
| Utilities (6.1%) | |||
| † | Alliant Energy Corp. | 19,600 | 865 |
| † | NorthWestern Corp. | 24,000 | 859 |
| † | Portland General Electric Co. | 33,000 | 835 |
| † | Cleco Corp. | 21,800 | 831 |
| † | CenterPoint Energy Inc. | 41,200 | 828 |
| † | DTE Energy Co. | 15,200 | 828 |
| † | El Paso Electric Co. | 23,300 | 807 |
| † | American Electric Power | ||
| Co. Inc. | 18,900 | 781 | |
| † | PNM Resources Inc. | 38,735 | 706 |
| New Jersey Resources Corp. | 14,100 | 694 | |
| † | CMS Energy Corp. | 27,500 | 607 |
| † | Vectren Corp. | 19,400 | 586 |
| † | Northeast Utilities | 14,816 | 534 |
| † | Atmos Energy Corp. | 9,200 | 307 |
| † | Public Service Enterprise | ||
| Group Inc. | 8,700 | 287 | |
| TECO Energy Inc. | 6,500 | 124 | |
| NiSource Inc. | 4,700 | 112 | |
| Ameren Corp. | 3,300 | 109 | |
| 10,700 | |||
| Total Common Stocks—Long Positions | |||
| (Cost $155,102) | 167,375 | ||
| Market | |||
| Value | |||
| Shares | ($000) | ||
| Common Stocks Sold Short (-96.4%) | |||
| Consumer Discretionary (-13.8%) | |||
| DeVry Inc. | (25,400) | (977) | |
| * | MGM Resorts International | (93,200) | (972) |
| * | WMS Industries Inc. | (46,100) | (946) |
| * | Urban Outfitters Inc. | (33,300) | (918) |
| * | Mohawk Industries Inc. | (15,300) | (916) |
| * | LKQ Corp. | (30,300) | (911) |
| * | Liberty Interactive Corp. | ||
| Class A | (56,100) | (910) | |
| Choice Hotels International | |||
| Inc. | (23,600) | (898) | |
| * | NVR Inc. | (1,300) | (892) |
| Scripps Networks | |||
| Interactive Inc. Class A | (20,700) | (878) | |
| * | CarMax Inc. | (28,571) | (871) |
| * | Gaylord Entertainment Co. | (35,300) | (852) |
| * | Amazon.com Inc. | (4,800) | (831) |
| Walt Disney Co. | (21,800) | (818) | |
| Carnival Corp. | (25,000) | (816) | |
| * | Chipotle Mexican Grill Inc. | ||
| Class A | (2,400) | (811) | |
| Guess? Inc. | (26,500) | (790) | |
| Johnson Controls Inc. | (24,500) | (766) | |
| Thomson Reuters Corp. | (27,500) | (733) | |
| Morningstar Inc. | (12,200) | (725) | |
| * | Aeropostale Inc. | (47,300) | (721) |
| Thor Industries Inc. | (26,200) | (719) | |
| * | Big Lots Inc. | (17,300) | (653) |
| * | DreamWorks Animation | ||
| SKG Inc. Class A | (38,800) | (644) | |
| * | Deckers Outdoor Corp. | (8,300) | (627) |
| Lowe’s Cos. Inc. | (23,000) | (584) | |
| Tiffany & Co. | (8,223) | (545) | |
| Marriott International Inc. | |||
| Class A | (15,100) | (440) | |
| RadioShack Corp. | (43,000) | (418) | |
| * | Under Armour Inc. Class A | (4,600) | (330) |
| Staples Inc. | (22,900) | (318) | |
| * | Scientific Games Corp. | ||
| Class A | (23,500) | (228) | |
| * | K12 Inc. | (12,700) | (228) |
| Starwood Hotels & Resorts | |||
| Worldwide Inc. | (4,300) | (206) | |
| * | Shutterfly Inc. | (6,500) | (148) |
| * | Liberty Global Inc. Class A | (900) | (37) |
| * | Madison Square Garden Co. | ||
| Class A | (1,200) | (34) | |
| (24,111) | |||
| Consumer Staples (-7.6%) | |||
| * | United Natural Foods Inc. | (23,400) | (936) |
| Avon Products Inc. | (51,800) | (905) | |
| Molson Coors Brewing Co. | |||
| Class B | (20,300) | (884) | |
| JM Smucker Co. | (11,300) | (883) | |
16
Market Neutral Fund
| Market | |||
| Value | |||
| Shares | ($000) | ||
| Sysco Corp. | (29,950) | (878) | |
| General Mills Inc. | (21,700) | (877) | |
| * | Ralcorp Holdings Inc. | (10,200) | (872) |
| Snyders-Lance Inc. | (38,700) | (871) | |
| McCormick & Co. Inc. | (16,800) | (847) | |
| Coca-Cola Co. | (11,900) | (833) | |
| PepsiCo Inc. | (12,500) | (829) | |
| Kraft Foods Inc. | (21,400) | (800) | |
| Kellogg Co. | (14,900) | (753) | |
| Pricesmart Inc. | (10,000) | (696) | |
| Kimberly-Clark Corp. | (9,400) | (691) | |
| Archer-Daniels-Midland Co. | (19,600) | (561) | |
| CVS Caremark Corp. | (5,680) | (232) | |
| (13,348) | |||
| Energy (-7.3%) | |||
| * | McDermott International Inc. | (84,200) | (969) |
| Sunoco Inc. | (22,900) | (939) | |
| * | FMC Technologies Inc. | (17,100) | (893) |
| * | Dril-Quip Inc. | (13,500) | (889) |
| * | Dresser-Rand Group Inc. | (16,850) | (841) |
| * | Cameron International Corp. | (16,900) | (831) |
| Arch Coal Inc. | (56,800) | (824) | |
| Schlumberger Ltd. | (11,900) | (813) | |
| Tidewater Inc. | (15,900) | (784) | |
| * | Oasis Petroleum Inc. | (26,300) | (765) |
| * | Ultra Petroleum Corp. | (25,300) | (750) |
| * | Continental Resources Inc. | (10,900) | (727) |
| * | Concho Resources Inc. | (7,600) | (713) |
| * | Alpha Natural Resources | ||
| Inc. | (31,935) | (652) | |
| * | Cobalt International Energy | ||
| Inc. | (38,182) | (593) | |
| * | Forest Oil Corp. | (30,900) | (419) |
| * | Southwestern Energy Co. | (8,400) | (268) |
| (12,670) | |||
| Financials (-14.9%) | |||
| Cincinnati Financial Corp. | (30,600) | (931) | |
| TCF Financial Corp. | (88,900) | (917) | |
| * | Stifel Financial Corp. | (28,150) | (902) |
| Hartford Financial Services | |||
| Group Inc. | (55,300) | (899) | |
| Charles Schwab Corp. | (79,800) | (899) | |
| Platinum Underwriters | |||
| Holdings Ltd. | (26,200) | (894) | |
| * | E*Trade Financial Corp. | (112,150) | (893) |
| Hudson City Bancorp Inc. | (141,600) | (885) | |
| Iberiabank Corp. | (17,900) | (882) | |
| First Niagara Financial | |||
| Group Inc. | (101,900) | (879) | |
| Old Republic International | |||
| Corp. | (94,000) | (871) | |
| Northern Trust Corp. | (21,900) | (869) | |
| Axis Capital Holdings Ltd. | (27,000) | (863) | |
| American International | |||
| Group Inc. | (37,100) | (861) | |
| Market | |||
| Value | |||
| Shares | ($000) | ||
| * | Genworth Financial Inc. | ||
| Class A | (128,000) | (838) | |
| Comerica Inc. | (32,300) | (833) | |
| Hancock Holding Co. | (25,900) | (828) | |
| Hanover Insurance Group | |||
| Inc. | (23,600) | (825) | |
| * | Affiliated Managers Group | ||
| Inc. | (8,450) | (811) | |
| Greenhill & Co. Inc. | (21,800) | (793) | |
| Westamerica Bancorporation | (16,200) | (711) | |
| FirstMerit Corp. | (38,600) | (584) | |
| Brown & Brown Inc. | (23,400) | (530) | |
| Eaton Vance Corp. | (21,000) | (496) | |
| Assured Guaranty Ltd. | (37,600) | (494) | |
| Bank of New York Mellon | |||
| Corp. | (22,600) | (450) | |
| Host Hotels & Resorts Inc. | (20,900) | (309) | |
| Aspen Insurance Holdings | |||
| Ltd. | (11,400) | (302) | |
| DiamondRock Hospitality | |||
| Co. | (31,300) | (302) | |
| LaSalle Hotel Properties | (12,100) | (293) | |
| Healthcare Realty Trust Inc. | (14,700) | (273) | |
| Jones Lang LaSalle Inc. | (4,400) | (270) | |
| Alexandria Real Estate | |||
| Equities Inc. | (3,900) | (269) | |
| General Growth Properties | |||
| Inc. | (17,900) | (269) | |
| BRE Properties Inc. | (5,200) | (262) | |
| * | Howard Hughes Corp. | (5,800) | (256) |
| Kilroy Realty Corp. | (6,700) | (255) | |
| PartnerRe Ltd. | (3,800) | (244) | |
| Senior Housing Properties | |||
| Trust | (10,700) | (240) | |
| ProLogis Inc. | (8,300) | (237) | |
| MetLife Inc. | (6,900) | (215) | |
| * | MSCI Inc. Class A | (6,400) | (211) |
| * | Financial Engines Inc. | (9,300) | (208) |
| Arthur J Gallagher & Co. | (5,700) | (191) | |
| Corporate Office Properties | |||
| Trust | (8,900) | (189) | |
| Equity One Inc. | (11,100) | (188) | |
| Realty Income Corp. | (5,000) | (175) | |
| Zions Bancorporation | (5,100) | (83) | |
| BankUnited Inc. | (2,000) | (44) | |
| (25,923) | |||
| Health Care (-10.6%) | |||
| * | BioMarin Pharmaceutical | ||
| Inc. | (27,400) | (941) | |
| * | Edwards Lifesciences Corp. | (12,900) | (912) |
| * | Laboratory Corp. of America | ||
| Holdings | (10,600) | (911) | |
| * | Catalyst Health Solutions | ||
| Inc. | (17,500) | (910) | |
| * | Gen-Probe Inc. | (15,350) | (907) |
17
Market Neutral Fund
| Market | |||
| Value | |||
| Shares | ($000) | ||
| Techne Corp. | (12,900) | (881) | |
| Stryker Corp. | (17,700) | (880) | |
| * | Hospira Inc. | (28,900) | (878) |
| DENTSPLY International | |||
| Inc. | (24,600) | (861) | |
| * | Mednax Inc. | (11,700) | (843) |
| * | Henry Schein Inc. | (13,000) | (838) |
| Patterson Cos. Inc. | (28,250) | (834) | |
| * | Varian Medical Systems Inc. | (12,200) | (819) |
| * | Life Technologies Corp. | (19,953) | (776) |
| * | Celgene Corp. | (11,400) | (771) |
| * | Human Genome Sciences | ||
| Inc. | (103,500) | (765) | |
| * | ResMed Inc. | (27,500) | (699) |
| St. Jude Medical Inc. | (19,200) | (659) | |
| * | Allscripts Healthcare | ||
| Solutions Inc. | (34,300) | (650) | |
| Medtronic Inc. | (16,650) | (637) | |
| * | InterMune Inc. | (44,660) | (563) |
| * | Sirona Dental Systems Inc. | (9,700) | (427) |
| * | Pharmacyclics Inc. | (20,500) | (304) |
| * | VCA Antech Inc. | (14,700) | (290) |
| * | Illumina Inc. | (6,500) | (198) |
| * | Theravance Inc. | (4,100) | (91) |
| * | Alexion Pharmaceuticals Inc. | (1,000) | (72) |
| Quest Diagnostics Inc. | (700) | (41) | |
| (18,358) | |||
| Industrials (-12.8%) | |||
| Masco Corp. | (91,290) | (956) | |
| * | Quanta Services Inc. | (43,200) | (931) |
| * | IHS Inc. Class A | (10,400) | (896) |
| Heartland Express Inc. | (62,000) | (886) | |
| Flowserve Corp. | (8,900) | (884) | |
| * | Jacobs Engineering Group | ||
| Inc. | (21,725) | (882) | |
| * | Stericycle Inc. | (11,300) | (880) |
| Danaher Corp. | (18,700) | (880) | |
| Illinois Tool Works Inc. | (18,800) | (878) | |
| Pentair Inc. | (26,100) | (869) | |
| Lennox International Inc. | (25,553) | (862) | |
| * | Seaboard Corp. | (418) | (851) |
| Southwest Airlines Co. | (97,900) | (838) | |
| * | AECOM Technology Corp. | (40,700) | (837) |
| CH Robinson Worldwide | |||
| Inc. | (11,800) | (823) | |
| Xylem Inc. | (30,600) | (786) | |
| * | Babcock & Wilcox Co. | (32,100) | (775) |
| UTi Worldwide Inc. | (58,300) | (775) | |
| Regal-Beloit Corp. | (15,000) | (765) | |
| * | GrafTech International Ltd. | (55,700) | (760) |
| Carlisle Cos. Inc. | (17,100) | (758) | |
| Knight Transportation Inc. | (45,100) | (705) | |
| * | Terex Corp. | (51,701) | (698) |
| AO Smith Corp. | (17,000) | (682) | |
| * | Geo Group Inc. | (39,200) | (657) |
| Market | |||
| Value | |||
| Shares | ($000) | ||
| * | Oshkosh Corp. | (24,000) | (513) |
| Roper Industries Inc. | (5,700) | (495) | |
| Nordson Corp. | (9,100) | (375) | |
| Avery Dennison Corp. | (5,400) | (155) | |
| * | Tetra Tech Inc. | (5,300) | (114) |
| * | United Continental Holdings | ||
| Inc. | (4,400) | (83) | |
| (22,249) | |||
| Information Technology (-16.1%) | |||
| * | Akamai Technologies Inc. | (30,265) | (976) |
| * | AOL Inc. | (61,600) | (930) |
| * | Loral Space & | ||
| Communications Inc. | (14,300) | (928) | |
| * | Silicon Laboratories Inc. | (21,100) | (916) |
| * | Compuware Corp. | (107,700) | (896) |
| * | Concur Technologies Inc. | (17,600) | (894) |
| Texas Instruments Inc. | (30,200) | (879) | |
| * | FleetCor Technologies Inc. | (29,400) | (878) |
| * | SanDisk Corp. | (17,600) | (866) |
| * | Yahoo! Inc. | (53,300) | (860) |
| * | Viasat Inc. | (18,600) | (858) |
| * | Acme Packet Inc. | (27,700) | (856) |
| Solera Holdings Inc. | (19,200) | (855) | |
| * | Google Inc. Class A | (1,300) | (840) |
| * | Juniper Networks Inc. | (40,869) | (834) |
| * | Salesforce.com Inc. | (8,100) | (822) |
| FLIR Systems Inc. | (32,500) | (815) | |
| Factset Research Systems | |||
| Inc. | (9,100) | (794) | |
| * | Dolby Laboratories Inc. | ||
| Class A | (25,800) | (787) | |
| Corning Inc. | (60,500) | (785) | |
| * | Rovi Corp. | (31,600) | (777) |
| * | eBay Inc. | (24,400) | (740) |
| * | Finisar Corp. | (44,000) | (737) |
| * | CoreLogic Inc. | (56,900) | (736) |
| * | Diodes Inc. | (33,800) | (720) |
| Linear Technology Corp. | (23,800) | (715) | |
| Power Integrations Inc. | (21,300) | (706) | |
| * | Cree Inc. | (29,400) | (648) |
| AVX Corp. | (45,200) | (577) | |
| * | Microsemi Corp. | (33,300) | (558) |
| * | Advent Software Inc. | (22,100) | (538) |
| Paychex Inc. | (16,200) | (488) | |
| * | Trimble Navigation Ltd. | (10,800) | (469) |
| * | Ariba Inc. | (15,500) | (435) |
| * | Taleo Corp. Class A | (10,600) | (410) |
| * | Rambus Inc. | (50,000) | (378) |
| QUALCOMM Inc. | (5,200) | (284) | |
| * | PMC - Sierra Inc. | (48,800) | (269) |
| * | Monster Worldwide Inc. | (23,600) | (187) |
| * | Red Hat Inc. | (3,800) | (157) |
| * | QLIK Technologies Inc. | (3,900) | (94) |
| * | Cavium Inc. | (1,400) | (40) |
| (27,932) | |||
18
Market Neutral Fund
| Market | |||
| Value | |||
| Shares | ($000) | ||
| Materials (-5.1%) | |||
| Praxair Inc. | (8,400) | (897) | |
| * | Thompson Creek Metals | ||
| Co. Inc. | (128,700) | (896) | |
| International Flavors & | |||
| Fragrances Inc. | (16,700) | (875) | |
| Allegheny Technologies Inc. | (18,108) | (866) | |
| * | Chemtura Corp. | (74,700) | (847) |
| * | Owens-Illinois Inc. | (43,200) | (837) |
| Rock-Tenn Co. Class A | (14,500) | (837) | |
| Walter Energy Inc. | (12,900) | (781) | |
| Sonoco Products Co. | (22,200) | (732) | |
| * | Allied Nevada Gold Corp. | (21,700) | (657) |
| Bemis Co. Inc. | (13,500) | (406) | |
| * | Louisiana-Pacific Corp. | (24,500) | (198) |
| Eagle Materials Inc. | (4,300) | (110) | |
| (8,939) | |||
| Telecommunication Services (-1.6%) | |||
| * | SBA Communications | ||
| Corp. Class A | (22,100) | (949) | |
| CenturyLink Inc. | (24,600) | (915) | |
| American Tower Corp. | |||
| Class A | (14,100) | (846) | |
| (2,710) | |||
| Utilities (-6.6%) | |||
| NextEra Energy Inc. | (15,000) | (912) | |
| ITC Holdings Corp. | (12,000) | (911) | |
| South Jersey Industries Inc. | (16,000) | (909) | |
| Dominion Resources Inc. | (17,100) | (908) | |
| SCANA Corp. | (20,100) | (906) | |
| UGI Corp. | (30,700) | (903) | |
| Westar Energy Inc. | (31,300) | (901) | |
| Northwest Natural Gas Co. | (18,500) | (887) | |
| National Fuel Gas Co. | (15,600) | (867) | |
| Aqua America Inc. | (36,600) | (807) | |
| PPL Corp. | (26,000) | (765) | |
| * | Calpine Corp. | (46,400) | (758) |
| PG&E Corp. | (17,200) | (709) | |
| * | AES Corp. | (34,134) | (404) |
| (11,547) | |||
| Total Common Stocks Sold Short | |||
| (Proceeds $172,098) | (167,787) | ||
| †Other Assets and Liabilities— | |||
| Net (100.2%) | 174,399 | ||
| Net Assets (100%) | 173,987 | ||
| Market | |
| Value | |
| ($000) | |
| Statement of Assets and Liabilities | |
| Assets | |
| Investment in Securities, | |
| Long Positions, at Value | 167,375 |
| Cash Segregated for Short Positions | 176,098 |
| Receivables for Securities Sold | 4,464 |
| Other Assets | 18 |
| Total Assets | 347,955 |
| Liabilities | |
| Securities Sold Short, at Value | 167,787 |
| Payables for Securities Purchased | 5,721 |
| Other Liabilities | 460 |
| Total Liabilties | 173,968 |
| Net Assets | 173,987 |
| At December 31, 2011, net assets consisted of: | |
| Amount | |
| ($000) | |
| Paid-in Capital | 186,497 |
| Accumulated Net Investment Losses | (77) |
| Accumulated Net Realized Losses | (29,017) |
| Unrealized Appreciation (Depreciation) | |
| Investment Securities–Long Positions | 12,273 |
| Investment Securities Sold Short | 4,311 |
| Net Assets | 173,987 |
| Investor Shares—Net Assets | |
| Applicable to 15,276,325 outstanding | |
| $.001par value shares of beneficial | |
| interest (unlimited authorization) | 158,326 |
| Net Asset Value Per Share— | |
| Investor Shares | $10.36 |
| Institutional Shares—Net Assets | |
| Applicable to 1,515,914 outstanding | |
| $.001 par value shares of beneficial | |
| interest (unlimited authorization) | 15,661 |
| Net Asset Value Per Share— | |
| Institutional Shares | $10.33 |
See Note A in Notes to Financial Statements.
* Non-income-producing security.
† Long security positions with a value of $111,856,000 and cash of $176,098,000 are held in a segregated account at the fund’s custodian bank and pledged to a broker-dealer as collateral for the fund’s obligation to return borrowed securities. For so long as such obligations continue, the fund’s access to these assets is subject to authorization from the broker-dealer.
See accompanying Notes, which are an integral part of the Financial Statements.
19
Market Neutral Fund
| Statement of Operations | |
| Year Ended | |
| December 31, 2011 | |
| ($000) | |
| Investment Income | |
| Income | |
| Dividends1 | 2,129 |
| Interest 2 | 8 |
| Total Income | 2,137 |
| Expenses | |
| The Vanguard Group—Note B | |
| Investment Advisory Services | 42 |
| Management and Administrative—Investor Shares | 209 |
| Management and Administrative—Institutional Shares | 4 |
| Marketing and Distribution—Investor Shares | 38 |
| Marketing and Distribution—Institutional Shares | — |
| Custodian Fees | 19 |
| Audit Fees | 45 |
| Shareholders’ Reports—Investor Shares | 3 |
| Shareholders’ Reports—Institutional Shares | — |
| Dividend Expense on Securities Sold Short | 1,892 |
| Borrowing Expense on Securities Sold Short | 208 |
| Total Expenses | 2,460 |
| Net Investment Income (Loss) | (323) |
| Realized Net Gain (Loss) | |
| Investment Securities—Long Positions | 12,460 |
| Investment Securities Sold Short | (14,779) |
| Realized Net Gain (Loss) | (2,319) |
| Change in Unrealized Appreciation (Depreciation) | |
| Investment Securities—Long Positions | (6,227) |
| Investment Securities Sold Short | 18,889 |
| Change in Unrealized Appreciation (Depreciation) | 12,662 |
| Net Increase (Decrease) in Net Assets Resulting from Operations | 10,020 |
| 1 Dividends are net of foreign withholding taxes of $2,000. | |
| 2 Interest income from an affiliated company of the fund was $8,000. | |
See accompanying Notes, which are an integral part of the Financial Statements.
20
Market Neutral Fund
| Statement of Changes in Net Assets | ||
| Year Ended December 31, | ||
| 2011 | 2010 | |
| ($000) | ($000) | |
| Increase (Decrease) In Net Assets | ||
| Operations | ||
| Net Investment Income (Loss) | (323) | (302) |
| Realized Net Gain (Loss) | (2,319) | (4,484) |
| Change in Unrealized Appreciation (Depreciation) | 12,662 | 2,850 |
| Net Increase (Decrease) in Net Assets Resulting from Operations | 10,020 | (1,936) |
| Distributions | ||
| Net Investment Income | ||
| Investor Shares | — | — |
| Institutional Shares | — | — |
| Realized Capital Gain | ||
| Investor Shares | — | — |
| Institutional Shares | — | — |
| Total Distributions | — | — |
| Capital Share Transactions | ||
| Investor Shares | 32,263 | 65,485 |
| Institutional Shares | 12,249 | (12,484) |
| Net Increase (Decrease) from Capital Share Transactions | 44,512 | 53,001 |
| Total Increase (Decrease) | 54,532 | 51,065 |
| Net Assets | ||
| Beginning of Period | 119,455 | 68,390 |
| End of Period1 | 173,987 | 119,455 |
| 1 Net Assets—End of Period includes accumulated net investment losses of ($77,000) and ($65,000). | ||
See accompanying Notes, which are an integral part of the Financial Statements.
21
Market Neutral Fund
Financial Highlights
| Investor Shares | ||||||
| April 1, | ||||||
| 2008, to | Year Ended | |||||
| For a Share Outstanding | Year Ended December 31, | Dec. 31, | March 31, | |||
| Throughout Each Period | 2011 | 2010 | 2009 | 20081 | 20082 | 2007 |
| Net Asset Value, Beginning of Period | $9.61 | $9.71 | $10.97 | $12.45 | $12.19 | $12.12 |
| Investment Operations | ||||||
| Net Investment Income (Loss) | (0.24) | (.038)3 | (.105) | .084 | .3113 | .500 |
| Net Realized and Unrealized Gain (Loss) | ||||||
| on Investments4 | .774 | (.062) | (1.143) | (.838) | .909 | .060 |
| Total from Investment Operations | .750 | (.100) | (1.248) | (.754) | 1.220 | .560 |
| Distributions | ||||||
| Dividends from Net Investment Income | — | — | (.012) | (.132) | (.607) | (.490) |
| Distributions from Realized Capital Gains | — | — | — | (.594) | (.353) | — |
| Total Distributions | — | — | (.012) | (.726) | (.960) | (.490) |
| Net Asset Value, End of Period | $10.36 | $9.61 | $9.71 | $10.97 | $12.45 | $12.19 |
| Total Return5 | 7.80% | -1.03% | -11.38% | -6.11% | 10.15% | 4.68% |
| Ratios/Supplemental Data | ||||||
| Net Assets, End of Period (Millions) | $158 | $116 | $53 | $73 | $45 | $9 |
| Ratio of Expenses to | ||||||
| Average Net Assets | ||||||
| Based on Total Expenses8 | 1.69%7 | 1.84%7 | 2.80%7 | 2.13%6 | 3.09% | 3.46% |
| Net of Expenses Waived/Reimbursed2,8 | 1.69%7 | 1.84%7 | 2.80%7 | 2.13%6 | 2.79% | 2.98% |
| Net of Expenses Waived/Reimbursed | ||||||
| and Dividend and Borrowing | ||||||
| Expense on Securities Sold Short8 | 0.25% | 0.30% | 0.39% | 0.46%6 | 1.16% | 1.54% |
| Ratio of Net Investment Income (Loss) | ||||||
| to Average Net Assets | (0.22%) | (0.38%) | (0.97%) | 1.15%6 | 2.69% | 3.40% |
| Portfolio Turnover Rate | 91% | 153% | 142% | 161% | 214% | 169% |
1 The fund’s fiscal year-end changed from March 31 to December 31, effective December 31, 2008.
2 Laudus Rosenberg U.S. Large/Mid Capitalization Long/Short Equity Fund reorganized into Vanguard Market Neutral Fund effective December 1, 2007. Prior to December 1, 2007, the fund’s advisor and other service providers waived or reimbursed certain fund expenses.
3 Calculated based on average shares outstanding.
4 Includes increases from redemption fees of $.00, $.00, $.04, $.00, $.00, and $.01
5 Total returns do not include transaction or account service fees that may have applied in the periods shown. Fund prospectuses provide information about any applicable transaction and account service fees.
6 Annualized.
7 Includes 2011 dividend and borrowing expense on securities sold short of 1.30% and 0.14%, respectively. Includes 2010 dividend and borrowing expense on securities sold short of 1.49% and 0.05%, respectively. Includes 2009 dividend and borrowing expense on securities sold short of 1.42% and 0.99%, respectively.
8 Includes performance-based investment advisory fee increases (decreases) of (0.07%) for fiscal 2010, (0.10%) for fiscal 2009, and (0.02%) for fiscal 2008. Performance-based investment advisory fees did not apply prior to fiscal 2008 and after fiscal 2010.
See accompanying Notes, which are an integral part of the Financial Statements.
22
Market Neutral Fund
Financial Highlights
| Institutional Shares | ||||||
| April 1, | ||||||
| 2008, to | Year Ended | |||||
| For a Share Outstanding | Year Ended December 31, | Dec. 31, | March 31, | |||
| Throughout Each Period | 2011 | 2010 | 2009 | 20081 | 20082 | 2007 |
| Net Asset Value, Beginning of Period | $9.57 | $9.66 | $10.90 | $12.39 | $12.14 | $12.08 |
| Investment Operations | ||||||
| Net Investment Income (Loss) | (.010) | (.015)3 | (.093) | .085 | .3903 | .600 |
| Net Realized and Unrealized Gain (Loss) | ||||||
| on Investments4 | .770 | (.075) | (1.139) | (.846) | .864 | — |
| Total from Investment Operations | .760 | (.090) | (1.232) | (.761) | 1.254 | .600 |
| Distributions | ||||||
| Dividends from Net Investment Income | — | — | (.008) | (.138) | (.651) | (.540) |
| Distributions from Realized Capital Gains | — | — | — | (.591) | (.353) | — |
| Total Distributions | — | — | (.008) | (.729) | (1.004) | (.540) |
| Net Asset Value, End of Period | $10.33 | $9.57 | $9.66 | $10.90 | $12.39 | $12.14 |
| Total Return5 | 7.94% | -0.93% | -11.31% | -6.20% | 10.49% | 4.98% |
| Ratios/Supplemental Data | ||||||
| Net Assets, End of Period (Millions) | $16 | $3 | $16 | $17 | $12 | $10 |
| Ratio of Expenses to | ||||||
| Average Net Assets | ||||||
| Based on Total Expenses8 | 1.59%7 | 1.74%7 | 2.73%7 | 2.08%6 | 2.97% | 3.07% |
| Net of Expenses Waived/Reimbursed2,8 | 1.59%7 | 1.74%7 | 2.73%7 | 2.08%6 | 2.56% | 2.67% |
| Net of Expenses Waived/Reimbursed | ||||||
| and Dividend and Borrowing | ||||||
| Expense on Securities Sold Short8 | 0.15% | 0.20% | 0.32% | 0.41%6 | 0.93% | 1.24% |
| Ratio of Net Investment Income (Loss) | ||||||
| to Average Net Assets | (0.12%) | (0.28%) | (0.90%) | 1.20%6 | 2.92% | 3.68% |
| Portfolio Turnover Rate | 91% | 153% | 142% | 161% | 214% | 169% |
1 The fund’s fiscal year-end changed from March 31 to December 31, effective December 31, 2008.
2 Laudus Rosenberg U.S. Large/Mid Capitalization Long/Short Equity Fund reorganized into Vanguard Market Neutral Fund effective December 1, 2007. Prior to December 1, 2007, the fund’s advisor and other service providers waived or reimbursed certain fund expenses.
3 Calculated based on average shares outstanding.
4 Includes increases from redemption fees of $.00, $.00, $.03, $.00, $.00, and $.00.
5 Total returns do not include transaction fees that may have applied in the periods shown. Fund prospectuses provide information about any applicable transaction fees.
6 Annualized.
7 Includes 2011 dividend and borrowing expense on securities sold short of 1.30% and 0.14%, respectively. Includes 2010 dividend and borrowing expense on securities sold short of 1.49% and 0.05%, respectively. Includes 2009 dividend and borrowing expense on securities sold short of 1.42% and 0.99%, respectively.
8 Includes performance-based investment advisory fee increases (decreases) of (0.07%) for fiscal 2010, (0.10%) for fiscal 2009, and (0.02%) for fiscal 2008. Performance-based investment advisory fees did not apply prior to fiscal 2008 and after fiscal 2010.
See accompanying Notes, which are an integral part of the Financial Statements.
23
Market Neutral Fund
Notes to Financial Statements
Vanguard Market Neutral Fund is registered under the Investment Company Act of 1940 as an open-end investment company, or mutual fund. The fund offers two classes of shares, Investor Shares and Institutional Shares. Investor Shares are available to any investor who meets the fund’s minimum purchase requirements. Institutional Shares are designed for investors who meet certain administrative, service, and account-size criteria.
A. The following significant accounting policies conform to generally accepted accounting principles for U.S. mutual funds. The fund consistently follows such policies in preparing its financial statements.
1. Security Valuation: Securities are valued as of the close of trading on the New York Stock Exchange (generally 4 p.m., Eastern time) on the valuation date. Equity securities are valued at the latest quoted sales prices or official closing prices taken from the primary market in which each security trades; such securities not traded on the valuation date are valued at the mean of the latest quoted bid and asked prices. Securities for which market quotations are not readily available, or whose values have been affected by events occurring before the fund’s pricing time but after the close of the securities’ primary markets, are valued at their fair values calculated according to procedures adopted by the board of trustees. These procedures include obtaining quotations from an independent pricing service, monitoring news to identify significant market- or security-specific events, and evaluating changes in the values of foreign market proxies (for example, ADRs, futures contracts, or exchange-traded funds), between the time the foreign markets close and the fund’s pricing time. When fair-value pricing is employed, the prices of securities used by a fund to calculate its net asset value may differ from quoted or published prices for the same securities. Investments in Vanguard Market Liquidity Fund are valued at that fund’s net asset value.
2. Short Sales: Short sales are the sales of securities that the fund does not own. The fund may sell a security it does not own in anticipation of a decline in the value of that security. In order to deliver the security to the purchaser, the fund borrows the security from a broker-dealer. The fund must segregate, as collateral for its obligation to return the borrowed security, an amount of cash and long security positions at least equal to the market value of the security sold short. This results in the fund holding a significant portion of its assets in cash. The fund later closes out the position by returning the security to the lender, typically by purchasing the security in the open market. A gain, limited to the price at which the fund sold the security short, or a loss, theoretically unlimited in size, is recognized upon the termination of the short sale. The fund may receive a portion of the income from the investment of collateral, or be charged a fee on borrowed securities, based on the market value of each borrowed security and a variable rate that is dependent upon the availability of such security. The net amounts of income or fees are recorded as interest income (for net income received) or borrowing expense on securities sold short (for net fees charged) on the Statement of Operations. Dividends on securities sold short are reported as an expense in the Statement of Operations.
Cash collateral segregated for securities sold short is recorded as an asset in the Statement of Assets and Liabilities. Long security positions segregated as collateral are shown in the Statement of Net Assets.
3. Federal Income Taxes: The fund intends to continue to qualify as a regulated investment company and distribute all of its taxable income. Management has analyzed the fund’s tax positions taken for all open federal income tax years (March 31, 2008–December 31, 2011), and has concluded that no provision for federal income tax is required in the fund’s financial statements.
4. Distributions: Distributions to shareholders are recorded on the ex-dividend date.
24
Market Neutral Fund
5. Other: Dividend income (or dividend expense on short positions) is recorded on the ex-dividend date. Interest income includes income distributions received from Vanguard Market Liquidity Fund and is accrued daily. Security transactions are accounted for on the date securities are bought or sold. Costs used to determine realized gains (losses) on the sale of investment securities are those of the specific securities sold. Fees assessed on redemptions of capital shares are credited to paid-in capital.
Each class of shares has equal rights as to assets and earnings, except that each class separately bears certain class-specific expenses related to maintenance of shareholder accounts (included in Management and Administrative expenses) and shareholder reporting. Marketing and distribution expenses are allocated to each class of shares based on a method approved by the board of trustees. Income, other non-class-specific expenses, and gains and losses on investments are allocated to each class of shares based on its relative net assets.
B. The Vanguard Group furnishes at cost investment advisory, corporate management, administrative, marketing, and distribution services. The costs of such services are allocated to the fund under methods approved by the board of trustees. The fund has committed to provide up to 0.40% of its net assets in capital contributions to Vanguard. At December, 2011, the fund had contributed capital of $26,000 to Vanguard (included in Other Assets), representing 0.01% of the fund’s net assets and 0.01% of Vanguard’s capitalization. The fund’s trustees and officers are also directors and officers of Vanguard.
C. Various inputs may be used to determine the value of the fund’s investments. These inputs are summarized in three broad levels for financial statement purposes. The inputs or methodologies used to value securities are not necessarily an indication of the risk associated with investing in those securities.
Level 1—Quoted prices in active markets for identical securities.
Level 2—Other significant observable inputs (including quoted prices for similar securities, interest rates, prepayment speeds, credit risk, etc.).
Level 3—Significant unobservable inputs (including the fund’s own assumptions used to determine the fair value of investments).
At December 31, 2011, 100% of the market value of the fund’s investments was based on Level 1 inputs.
D. Distributions are determined on a tax basis and may differ from net investment income and realized capital gains for financial reporting purposes. Differences may be permanent or temporary. Permanent differences are reclassified among capital accounts in the financial statements to reflect their tax character. Temporary differences arise when certain items of income, expense, gain, or loss are recognized in different periods for financial statement and tax purposes; these differences will reverse at some time in the future. Differences in classification may also result from the treatment of short-term gains as ordinary income for tax purposes.
Certain of the fund’s borrowing expenses are treated as realized capital losses for tax purposes. For the year ended December 31, 2011, borrowing expenses of $200,000 have been reclassified from accumulated net investment losses to accumulated net realized losses.
For tax purposes, the fund had a net operating loss of $100,000 for the year ended December 31, 2011. This amount has been reclassified from accumulated net investment losses to paid-in-capital. At December 31, 2011, the fund had no ordinary income available for distribution. The fund had available capital losses totaling $28,829,000 to offset future net capital gains. Of this amount, $24,465,000 is subject to expiration dates; $19,593,000 may be used to offset future net capital
25
Market Neutral Fund
gains through December 31, 2017, and $4,872,000 through December 31, 2018. Capital losses of $4,364,000 realized beginning in fiscal 2011 may be carried forward indefinitely but must be used before any expiring loss carryforwards.
At December 31, 2011, the cost of long security positions for tax purposes was $155,102,000. Net unrealized appreciation of long security positions for tax purposes was $12,273,000, consisting of unrealized gains of $17,267,000 on securities that had risen in value since their purchase and $4,994,000 in unrealized losses on securities that had fallen in value since their purchase. Tax-basis net unrealized appreciation on securities sold short was $4,122,000, consisting of unrealized gains of $15,133,000 on securities that had fallen in value since their sale and $11,011,000 in unrealized losses on securities that had risen in value since their sale.
E. During the year ended December 31, 2011, the fund purchased $174,194,000 of investment securities and sold $129,518,000 of investment securities, other than temporary cash investments. The proceeds of short sales and the cost of purchases to cover short sales were $210,195,000 and $156,009,000 respectively.
F. Capital share transactions for each class of shares were:
| Year Ended December 31, | ||||
| 2011 | 2010 | |||
| Amount | Shares | Amount | Shares | |
| ($000) | (000) | ($000) | (000) | |
| Investor Shares | ||||
| Issued | 76,944 | 7,539 | 87,156 | 8,885 |
| Issued in Lieu of Cash Distributions | — | — | — | — |
| Redeemed1 | (44,681) | (4,371) | (21,671) | (2,219) |
| Net Increase (Decrease)—Investor Shares | 32,263 | 3,168 | 65,485 | 6,666 |
| Institutional Shares | ||||
| Issued | 13,291 | 1,293 | 1,379 | 141 |
| Issued in Lieu of Cash Distributions | — | — | — | — |
| Redeemed1 | (1,042) | (104) | (13,863) | (1,422) |
| Net Increase (Decrease)—Institutional Shares | 12,249 | 1,189 | (12,484) | (1,281) |
| 1 Net of redemption fees of $15,000 and $3,000 (fund totals). | ||||
At December 31, 2011, one shareholder was the record or beneficial owner of 50% of the fund’s net assets. If the shareholder were to redeem its total investment in the fund, the redemption might result in an increase in the fund’s expense ratio, cause the fund to incur higher transaction costs, or result in the realization of taxable capital gains.
G. In preparing the financial statements as of December 31, 2011, management considered the impact of subsequent events for potential recognition or disclosure in these financial statements.
26
Report of Independent Registered Public Accounting Firm
To the Trustees of Vanguard Montgomery Funds and the Shareholders of Vanguard Market Neutral Fund:
In our opinion, the accompanying statement of net assets and the statement of assets and liabilities and the related statements of operations and of changes in net assets and the financial highlights present fairly, in all material respects, the financial position of Vanguard Market Neutral Fund (constituting Vanguard Montgomery Funds, hereafter referred to as the “Fund”) at December 31, 2011, the results of its operations for the year then ended, the changes in its net assets for each of the two years in the period then ended and the financial highlights for each of the periods indicated, in conformity with accounting principles generally accepted in the United States of America. These financial statements and financial highlights (hereafter referred to as “financial statements”) are the responsibility of the Fund’s management; our responsibility is to express an opinion on these financial statements based on our audits. We conducted our audits of these financial statements in accordance with the standards of the Public Company Accounting Oversight Board (United States). Those standards require that we plan and perform the audit to obtain reasonable assurance about whether the financial statements are free of material misstatement. An audit includes examining, on a te st basis, evidence supporting the amounts and disclosures in the financial statements, assessing the accounting principles used and significant estimates made by management, and evaluating the overall financial statement presentation. We believe that our audits, which included confirmation of securities at December 31, 2011 by correspondence with the custodian and broker and by agreement to the underlying ownership records of Vanguard Market Liquidity Fund, provide a reasonable basis for our opinion.
PricewaterhouseCoopers LLP
Philadelphia, Pennsylvania
February 16, 2012
27
Your Fund’s After-Tax Returns
This table presents returns for your fund both before and after taxes. The after-tax returns are shown in two ways: (1) assuming that an investor owned the fund during the entire period and paid taxes on the fund’s distributions, and (2) assuming that an investor paid taxes on the fund’s distributions and sold all shares at the end of each period.
Calculations are based on the highest individual federal income tax and capital gains tax rates in effect at the times of the distributions and the hypothetical sales. State and local taxes were not considered. After-tax returns reflect any qualified dividend income, . (In the example, returns after the sale of fund shares may be higher than those assuming no sale. This occurs when the sale would have produced a capital loss. The calculation assumes that the investor received a tax deduction for the loss.)
The table shows returns for Investor Shares only; returns for other share classes will differ. Please note that your actual after-tax returns will depend on your tax situation and may differ from those shown. Also note that if you own the fund in a tax-deferred account, such as an individual retirement account or a 401(k) plan, this information does not apply to you. Such accounts are not subject to current taxes.
Finally, keep in mind that a fund’s performance—whether before or after taxes—does not guarantee future results.
| Average Annual Total Returns: Market Neutral Fund Investor Shares | |||
| Periods Ended December 31, 2011 | |||
| One | Five | Ten | |
| Year | Years | Years | |
| Returns Before Taxes | 7.80% | -0.43% | 2.40% |
| Returns After Taxes on Distributions | 7.80 | -1.11 | 1.85 |
| Returns After Taxes on Distributions and Sale of Fund Shares | 5.07 | -0.61 | 1.83 |
Returns do not reflect the 1% fee on redemptions of shares held for less than one year.
28
About Your Fund’s Expenses
As a shareholder of the fund, you incur ongoing costs, which include costs for portfolio management, administrative services, and shareholder reports (like this one), among others. Operating expenses, which are deducted from a fund’s gross income, directly reduce the investment return of the fund.
A fund’s expenses are expressed as a percentage of its average net assets. This figure is known as the expense ratio. The following examples are intended to help you understand the ongoing costs (in dollars) of investing in your fund and to compare these costs with those of other mutual funds. The examples are based on an investment of $1,000 made at the beginning of the period shown and held for the entire period.
The accompanying table illustrates your fund’s costs in two ways:
• Based on actual fund return. This section helps you to estimate the actual expenses that you paid over the period. The ”Ending Account Value“ shown is derived from the fund‘s actual return, and the third column shows the dollar amount that would have been paid by an investor who started with $1,000 in the fund. You may use the information here, together with the amount you invested, to estimate the expenses that you paid over the period.
To do so, simply divide your account value by $1,000 (for example, an $8,600 account value divided by $1,000 = 8.6), then multiply the result by the number given for your fund under the heading ”Expenses Paid During Period.“
• Based on hypothetical 5% yearly return. This section is intended to help you compare your fund‘s costs with those of other mutual funds. It assumes that the fund had a yearly return of 5% before expenses, but that the expense ratio is unchanged. In this case—because the return used is not the fund’s actual return—the results do not apply to your investment. The example is useful in making comparisons because the Securities and Exchange Commission requires all mutual funds to calculate expenses based on a 5% return. You can assess your fund’s costs by comparing this hypothetical example with the hypothetical examples that appear in shareholder reports of other funds.
Note that the expenses shown in the table are meant to highlight and help you compare ongoing costs only and do not reflect transaction costs incurred by the fund for buying and selling securities. Further, the expenses do not include any purchase, redemption, or account service fees described in the fund prospectus. If such fees were applied to your account, your costs would be higher. Your fund does not carry a “sales load.”
The calculations assume no shares were bought or sold during the period. Your actual costs may have been higher or lower, depending on the amount of your investment and the timing of any purchases or redemptions.
You can find more information about the fund’s expenses, including annual expense ratios, in the Financial Statements section of this report. For additional information on operating expenses and other shareholder costs, please refer to your fund’s current prospectus.
29
| Six Months Ended December 31, 2011 | |||
| Beginning | Ending | Expenses | |
| Account Value | Account Value | Paid During | |
| Market Neutral Fund | 6/30/2011 | 12/31/2011 | Period |
| Based on Actual Fund Return | |||
| Investor Shares | $1,000.00 | $0.00 | $0.00 |
| Institutional Shares | 1,000.00 | 0.00 | 0.00 |
| Based on Hypothetical 5% Yearly Return | |||
| Investor Shares | $1,000.00 | $0.00 | $0.00 |
| Institutional Shares | 1,000.00 | 0.00 | 0.00 |
The calculations are based on expenses incurred in the most recent six-month period. The fund’s annualized six-month expense ratios for that period are 1.49% for Investor Shares and 1.39% for Institutional Shares. The dollar amounts shown as “Expenses Paid” are equal to the annualized expense ratio multiplied by the average account value over the period, multiplied by the number of days in the most recent six-month period, then divided by the number of days in the most recent 12-month period.
30
Glossary
Beta. A measure of the magnitude of a fund’s past share-price fluctuations in relation to the ups and downs of a given market index. The index is assigned a beta of 1.00. Compared with a given index, a fund with a beta of 1.20 typically would have seen its share price rise or fall by 12% when the index rose or fell by 10%. For this report, beta is based on returns over the past 36 months for both the fund and the index. Note that a fund’s beta should be reviewed in conjunction with its R-squared (see definition). The lower the R-squared, the less correlation there is between the fund and the index, and the less reliable beta is as an indicator of volatility.
Earnings Growth Rate. The average annual rate of growth in earnings over the past five years for the stocks now in a fund.
Equity Exposure. A measure that reflects a fund’s investments in stocks and stock futures. Any holdings in short-term reserves are excluded.
Expense Ratio. A fund’s total annual operating expenses expressed as a percentage of the fund’s average net assets. The expense ratio includes management and administrative expenses, but does not include the transaction costs of buying and selling portfolio securities.
Foreign Holdings. The percentage of a fund represented by securities or depositary receipts of companies based outside the United States.
Inception Date. The date on which the assets of a fund (or one of its share classes) are first invested in accordance with the fund’s investment objective. For funds with a subscription period, the inception date is the day after that period ends. Investment performance is measured from the inception date.
Median Market Cap. An indicator of the size of companies in which a fund invests; the midpoint of market capitalization (market price x shares outstanding) of a fund’s stocks, weighted by the proportion of the fund’s assets invested in each stock. Stocks representing half of the fund’s assets have market capitalizations above the median, and the rest are below it.
Price/Book Ratio. The share price of a stock divided by its net worth, or book value, per share. For a fund, the weighted average price/book ratio of the stocks it holds.
Price/Earnings Ratio. The ratio of a stock’s current price to its per-share earnings over the past year. For a fund, the weighted average P/E of the stocks it holds. P/E is an indicator of market expectations about corporate prospects; the higher the P/E, the greater the expectations for a company’s future growth.
R-Squared. A measure of how much of a fund’s past returns can be explained by the returns from the market in general, as measured by a given index. If a fund’s total returns were precisely synchronized with an index’s returns, its R-squared would be 1.00. If the fund’s returns bore no relationship to the index’s returns, its R-squared would be 0. For this report, R-squared is based on returns over the past 36 months for both the fund and the index.
Return on Equity. The annual average rate of return generated by a company during the past five years for each dollar of shareholder’s equity (net income divided by shareholder’s equity). For a fund, the weighted average return on equity for the companies whose stocks it holds.
31
Short-Term Reserves. The percentage of a fund invested in highly liquid, short-term securities that can be readily converted to cash.
Turnover Rate. An indication of the fund’s trading activity. Funds with high turnover rates incur higher transaction costs and may be more likely to distribute capital gains (which may be taxable to investors). The turnover rate excludes in-kind transactions, which have minimal impact on costs.
32
This page intentionally left blank.
This page intentionally left blank.
This page intentionally left blank.
The People Who Govern Your Fund
The trustees of your mutual fund are there to see that the fund is operated and managed in your best interests since, as a shareholder, you are a part owner of the fund. Your fund’s trustees also serve on the board of directors of The Vanguard Group, Inc., which is owned by the Vanguard funds and provides services to them on an at-cost basis.
A majority of Vanguard’s board members are independent, meaning that they have no affiliation with Vanguard or the funds they oversee, apart from the sizable personal investments they have made as private individuals. The independent board members have distinguished backgrounds in business, academia, and public service. Each of the trustees and executive officers oversees 180 Vanguard funds.
The following table provides information for each trustee and executive officer of the fund. More information about the trustees is in the Statement of Additional Information, which can be obtained, without charge, by contacting Vanguard at 800-662-7447, or online at vanguard.com.
| Interested Trustee1 | and President (2006–2008) of Rohm and Haas Co. |
| (chemicals); Director of Tyco International, Ltd. | |
| F. William McNabb III | (diversified manufacturing and services) and Hewlett- |
| Born 1957. Trustee Since July 2009. Chairman of the | Packard Co. (electronic computer manufacturing); |
| Board. Principal Occupation(s) During the Past Five | Senior Advisor at New Mountain Capital; Trustee |
| Years: Chairman of the Board of The Vanguard Group, | of The Conference Board; Member of the Board of |
| Inc., and of each of the investment companies served | Managers of Delphi Automotive LLP (automotive |
| by The Vanguard Group, since January 2010; Director | components). |
| of The Vanguard Group since 2008; Chief Executive | |
| Officer and President of The Vanguard Group and of | Amy Gutmann |
| each of the investment companies served by The | Born 1949. Trustee Since June 2006. Principal |
| Vanguard Group since 2008; Director of Vanguard | Occupation(s) During the Past Five Years: President |
| Marketing Corporation; Managing Director of The | of the University of Pennsylvania; Christopher H. |
| Vanguard Group (1995–2008). | Browne Distinguished Professor of Political Science |
| in the School of Arts and Sciences with secondary | |
| appointments at the Annenberg School for Commu- | |
| Independent Trustees | nication and the Graduate School of Education |
| of the University of Pennsylvania; Director of | |
| Emerson U. Fullwood | Carnegie Corporation of New York, Schuylkill River |
| Born 1948. Trustee Since January 2008. Principal | Development Corporation, and Greater Philadelphia |
| Occupation(s) During the Past Five Years: Executive | Chamber of Commerce; Trustee of the National |
| Chief Staff and Marketing Officer for North America | Constitution Center; Chair of the Presidential |
| and Corporate Vice President (retired 2008) of Xerox | Commission for the Study of Bioethical Issues. |
| Corporation (document management products and | |
| services); Executive in Residence and 2010 | JoAnn Heffernan Heisen |
| Distinguished Minett Professor at the Rochester | Born 1950. Trustee Since July 1998. Principal |
| Institute of Technology; Director of SPX Corporation | Occupation(s) During the Past Five Years: Corporate |
| (multi-industry manufacturing), the United Way of | Vice President and Chief Global Diversity Officer |
| Rochester, Amerigroup Corporation (managed health | (retired 2008) and Member of the Executive |
| care), the University of Rochester Medical Center, | Committee (1997–2008) of Johnson & Johnson |
| Monroe Community College Foundation, and North | (pharmaceuticals/consumer products); Director of |
| Carolina A&T University. | Skytop Lodge Corporation (hotels), the University |
| Medical Center at Princeton, the Robert Wood | |
| Rajiv L. Gupta | Johnson Foundation, and the Center for Work Life |
| Born 1945. Trustee Since December 2001.2 | Policy; Member of the Advisory Board of the |
| Principal Occupation(s) During the Past Five Years: | Maxwell School of Citizenship and Public Affairs |
| Chairman and Chief Executive Officer (retired 2009) | at Syracuse University. |
| F. Joseph Loughrey | Thomas J. Higgins | |
| Born 1949. Trustee Since October 2009. Principal | Born 1957. Chief Financial Officer Since September | |
| Occupation(s) During the Past Five Years: President | 2008. Principal Occupation(s) During the Past Five | |
| and Chief Operating Officer (retired 2009) and Vice | Years: Principal of The Vanguard Group, Inc.; Chief | |
| Chairman of the Board (2008–2009) of Cummins Inc. | Financial Officer of each of the investment companies | |
| (industrial machinery); Director of SKF AB (industrial | served by The Vanguard Group since 2008; Treasurer | |
| machinery), Hillenbrand, Inc. (specialized consumer | of each of the investment companies served by The | |
| services), the Lumina Foundation for Education, and | Vanguard Group (1998–2008). | |
| Oxfam America; Chairman of the Advisory Council | ||
| for the College of Arts and Letters and Member | Kathryn J. Hyatt | |
| of the Advisory Board to the Kellogg Institute for | Born 1955. Treasurer Since November 2008. Principal | |
| International Studies at the University of Notre Dame. | Occupation(s) During the Past Five Years: Principal | |
| of The Vanguard Group, Inc.; Treasurer of each of | ||
| André F. Perold | the investment companies served by The Vanguard | |
| Born 1952. Trustee Since December 2004. Principal | Group since 2008; Assistant Treasurer of each of the | |
| Occupation(s) During the Past Five Years: George | investment companies served by The Vanguard Group | |
| Gund Professor of Finance and Banking at the Harvard | (1988–2008). | |
| Business School (retired July 2011); Chief Investment | ||
| Officer and co-Managing Partner of HighVista | Heidi Stam | |
| Strategies LLC (private investment firm); Director of | Born 1956. Secretary Since July 2005. Principal | |
| Rand Merchant Bank; Overseer of the Museum of | Occupation(s) During the Past Five Years: Managing | |
| Fine Arts Boston. | Director of The Vanguard Group, Inc., since 2006; | |
| General Counsel of The Vanguard Group since 2005; | ||
| Alfred M. Rankin, Jr. | Secretary of The Vanguard Group and of each of the | |
| Born 1941. Trustee Since January 1993. Principal | investment companies served by The Vanguard Group | |
| Occupation(s) During the Past Five Years: Chairman, | since 2005; Director and Senior Vice President of | |
| President, and Chief Executive Officer of NACCO | Vanguard Marketing Corporation since 2005; | |
| Industries, Inc. (forklift trucks/housewares/lignite); | Principal of The Vanguard Group (1997–2006). | |
| Director of Goodrich Corporation (industrial products/ | ||
| aircraft systems and services) and the National | ||
| Association of Manufacturers; Chairman of the | Vanguard Senior Management Team | |
| Federal Reserve Bank of Cleveland; Vice Chairman | ||
| of University Hospitals of Cleveland; President of | R. Gregory Barton | Chris D. McIsaac |
| the Board of The Cleveland Museum of Art. | Mortimer J. Buckley | Michael S. Miller |
| Kathleen C. Gubanich | James M. Norris | |
| Peter F. Volanakis | Paul A. Heller | Glenn W. Reed |
| Born 1955. Trustee Since July 2009. Principal | Martha G. King | George U. Sauter |
| Occupation(s) During the Past Five Years: President | ||
| and Chief Operating Officer (retired 2010) of Corning | ||
| Incorporated (communications equipment); Director of | Chairman Emeritus and Senior Advisor | |
| Corning Incorporated (2000–2010) and Dow Corning | ||
| (2001–2010); Overseer of the Amos Tuck School of | John J. Brennan | |
| Business Administration at Dartmouth College. | Chairman, 1996–2009 | |
| Chief Executive Officer and President, 1996–2008 | ||
| Executive Officers | ||
| Founder | ||
| Glenn Booraem | ||
| Born 1967. Controller Since July 2010. Principal | John C. Bogle | |
| Occupation(s) During the Past Five Years: Principal | Chairman and Chief Executive Officer, 1974–1996 | |
| of The Vanguard Group, Inc.; Controller of each of | ||
| the investment companies served by The Vanguard | ||
| Group since 2010; Assistant Controller of each of | ||
| the investment companies served by The Vanguard | ||
| Group (2001–2010). | ||
1 Mr. McNabb is considered an “interested person,” as defined in the Investment Company Act of 1940, because he is an officer of the Vanguard funds.
2 December 2002 for Vanguard Equity Income Fund, Vanguard Growth Equity Fund, the Vanguard Municipal Bond Funds, and the Vanguard State Tax-Exempt Funds.
 | |
| P.O. Box 2600 | |
| Valley Forge, PA 19482-2600 |
Connect with Vanguard® > vanguard.com
| Fund Information > 800-662-7447 | CFA® is a trademark owned by CFA Institute. |
| Direct Investor Account Services > 800-662-2739 | |
| Institutional Investor Services > 800-523-1036 | |
| Text Telephone for People | |
| With Hearing Impairment > 800-749-7273 | |
| This material may be used in conjunction | |
| with the offering of shares of any Vanguard | |
| fund only if preceded or accompanied by | |
| the fund’s current prospectus. | |
| All comparative mutual fund data are from Lipper Inc. or | |
| Morningstar, Inc., unless otherwise noted. | |
| You can obtain a free copy of Vanguard’s proxy voting | |
| guidelines by visiting vanguard.com/proxyreporting or by | |
| calling Vanguard at 800-662-2739. The guidelines are | |
| also available from the SEC’s website, sec.gov. In | |
| addition, you may obtain a free report on how your fund | |
| voted the proxies for securities it owned during the 12 | |
| months ended June 30. To get the report, visit either | |
| vanguard.com/proxyreporting or sec.gov. | |
| You can review and copy information about your fund at | |
| the SEC’s Public Reference Room in Washington, D.C. To | |
| find out more about this public service, call the SEC at | |
| 202-551-8090. Information about your fund is also | |
| available on the SEC’s website, and you can receive | |
| copies of this information, for a fee, by sending a | |
| request in either of two ways: via e-mail addressed to | |
| publicinfo@sec.gov or via regular mail addressed to the | |
| Public Reference Section, Securities and Exchange | |
| Commission, Washington, DC 20549-1520. | |
| © 2012 The Vanguard Group, Inc. | |
| All rights reserved. | |
| Vanguard Marketing Corporation, Distributor. | |
| Q6340 022012 | |
Item 2: Code of Ethics. The Registrant has adopted a code of ethics that applies to the Registrant’s principal executive officer, principal financial officer, principal accounting officer or controller or persons performing similar functions. The Code of Ethics was amended during the reporting period covered by this report to make certain technical, non-material changes.
Item 3: Audit Committee Financial Expert. The following members of the Audit Committee have been determined by the Registrant’s Board of Trustees to be Audit Committee Financial Experts serving on its Audit Committee, and to be independent: Charles D. Ellis, Rajiv L. Gupta, JoAnn Heffernan Heisen, André F. Perold, and Alfred M. Rankin, Jr.
Item 4: Principal Accountant Fees and Services.
(a) Audit Fees.
Audit Fees of the Registrant
Fiscal Year Ended December 31, 2011: $45,000
Fiscal Year Ended December 31, 2010: $44,000
Aggregate Audit Fees of Registered Investment Companies in the Vanguard Group.
Fiscal Year Ended December 31, 2011: $3,978,540
Fiscal Year Ended December 31, 2010: $3,607,060
(b) Audit-Related Fees.
Fiscal Year Ended December 31, 2011: $1,341,750
Fiscal Year Ended December 31, 2010: $791,350
Includes fees billed in connection with assurance and related services provided to the Registrant, The Vanguard Group, Inc., Vanguard Marketing Corporation, and other registered investment companies in the Vanguard Group.
(c) Tax Fees.
Fiscal Year Ended December 31, 2011: $373,830
Fiscal Year Ended December 31, 2010: $336,090
Includes fees billed in connection with tax compliance, planning and advice services provided to the Registrant, The Vanguard Group, Inc., Vanguard Marketing Corporation, and other registered investment companies in the Vanguard Group and related to income and excise taxes.
(d) All Other Fees.
Fiscal Year Ended December 31, 2011: $16,000
Fiscal Year Ended December 31, 2010: $16,000
Includes fees billed for services related to risk management and privacy matters. Services were provided to the Registrant, The Vanguard Group, Inc., Vanguard Marketing Corporation, and other registered investment companies in the Vanguard Group.
(e) (1) Pre-Approval Policies. The policy of the Registrant’s Audit Committee is to consider and, if appropriate, approve before the principal accountant is engaged for such services, all specific audit and non-audit services provided to: (1) the Registrant; (2) The Vanguard Group, Inc.; (3) other entities controlled by The Vanguard Group, Inc. that provide ongoing services to the Registrant; and (4) other registered investment companies in the Vanguard Group. In making a determination, the Audit Committee considers whether the services are consistent with maintaining the principal accountant’s independence.
In the event of a contingency situation in which the principal accountant is needed to provide services in between scheduled Audit Committee meetings, the Chairman of the Audit Committee would be called on to consider and, if appropriate, pre-approve audit or permitted non-audit services in an amount sufficient to complete services through the next Audit Committee meeting, and to determine if such services would be consistent with maintaining the accountant’s independence. At the next scheduled Audit Committee meeting, services and fees would be presented to the Audit Committee for formal consideration, and, if appropriate, approval by the entire Audit Committee. The Audit Committee would again consider whether such services and fees are consistent with maintaining the principal accountant’s independence.
The Registrant’s Audit Committee is informed at least annually of all audit and non-audit services provided by the principal accountant to the Vanguard complex, whether such services are provided to: (1) the Registrant; (2) The Vanguard Group, Inc.; (3) other entities controlled by The Vanguard Group, Inc. that provide ongoing services to the Registrant; or (4) other registered investment companies in the Vanguard Group.
(2) No percentage of the principal accountant’s fees or services were approved pursuant to the waiver provision of paragraph (c)(7)(i)(C) of Rule 2-01 of Regulation S-X.
(f) For the most recent fiscal year, over 50% of the hours worked under the principal accountant’s engagement were not performed by persons other than full-time, permanent employees of the principal accountant.
(g) Aggregate Non-Audit Fees.
Fiscal Year Ended December 31, 2011: $389,830
Fiscal Year Ended December 31, 2010: $352,090
Includes fees billed for non-audit services provided to the Registrant, The Vanguard Group, Inc., Vanguard Marketing Corporation, and other registered investment companies in the Vanguard Group.
(h) For the most recent fiscal year, the Audit Committee has determined that the provision of all non-audit services was consistent with maintaining the principal accountant’s independence.
Item 5: Audit Committee of Listed Registrants.
Not Applicable.
Item 6: Investments.
Not Applicable.
Item 7: Disclosure of Proxy Voting Policies and Procedures for Closed-End Management Investment Companies.
Not Applicable.
Item 8: Portfolio Managers of Closed-End Management Investment Companies.
Not Applicable.
Item 9: Purchase of Equity Securities by Closed-End Management Investment Company and Affiliated Purchasers.
Not Applicable.
Item 10: Submission of Matters to a Vote of Security Holders.
Not Applicable.
Item 11: Controls and Procedures.
(a) Disclosure Controls and Procedures. The Principal Executive and Financial Officers concluded that the Registrant's Disclosure Controls and Procedures are effective based on their evaluation of the Disclosure Controls and Procedures as of a date within 90 days of the filing date of this report.
(b) Internal Control Over Financial Reporting. There were no significant changes in Registrant’s Internal Control Over Financial Reporting or in other factors that could significantly affect this control subsequent to the date of the evaluation, including any corrective actions with regard to significant deficiencies and material weaknesses.
Item 12: Exhibits.
(a) Code of Ethics.
(b) Certifications.
Pursuant to the requirements of the Securities Exchange Act of 1934 and the Investment Company Act of 1940, the registrant has duly caused this report to be signed on its behalf by the undersigned, thereunto duly authorized.
| VANGUARD MONTGOMERY FUNDS | |
| By: | /s/ F. WILLIAM MCNABB III* |
| F. WILLIAM MCNABB III | |
| CHIEF EXECUTIVE OFFICER | |
| Date: February 21, 2012 | |
Pursuant to the requirements of the Securities Exchange Act of 1934 and the Investment Company Act of 1940, this report has been signed below by the following persons on behalf of the registrant and in the capacities and on the dates indicated.
| VANGUARD MONTGOMERY FUNDS | |
| By: | /s/ F. WILLIAM MCNABB III* |
| F. WILLIAM MCNABB III | |
| CHIEF EXECUTIVE OFFICER | |
| Date: February 21, 2012 | |
| VANGUARD MONTGOMERY FUNDS | |
| By: | /s/ THOMAS J. HIGGINS* |
| THOMAS J. HIGGINS | |
| CHIEF FINANCIAL OFFICER | |
| Date: February 21, 2012 | |
* By: /s/ Heidi Stam
Heidi Stam, pursuant to a Power of Attorney filed on November 28, 2011 see file Number 33-23444,
Incorporated by Reference.