UNITED STATES
SECURITIES AND EXCHANGE COMMISSION
Washington, D.C. 20549
FORM N-CSR
CERTIFIED SHAREHOLDER REPORT
OF
REGISTERED MANAGEMENT INVESTMENT COMPANIES
Investment Company Act file number: 811-22114
Name of Registrant: Vanguard Montgomery Funds
Address of Registrant: | P.O. Box 2600 |
| Valley Forge, PA 19482 |
|
|
Name and address of agent for service: | Heidi Stam, Esquire |
| P.O. Box 876 |
| Valley Forge, PA 19482 |
|
|
Registrant’s telephone number, including area code: (610) 669-1000
Date of fiscal year end: December 31
Date of reporting period: January 1, 2008– December 31, 2008
Item 1: Reports to Shareholders |
> | Vanguard Market Neutral Fund returned a little less than –6%. Its U.S. Treasury bill benchmark returned about 1%. |
> | The fund’s long positions—those stocks it bought—declined more than the stocks it sold short, producing negative returns from stock selection. |
> | The fund’s biggest disappointments were in the industrials and materials sectors. Health care, information technology, and consumer discretionary were bright spots. |
Contents |
|
|
|
Your Fund’s Total Returns | 1 |
President’s Letter | 2 |
Advisors’ Report | 6 |
Fund Profile | 9 |
Performance Summary | 11 |
Financial Statements | 13 |
Your Fund’s After-Tax Returns | 30 |
About Your Fund’s Expenses | 31 |
Trustees Approve Advisory Agreement | 33 |
Glossary | 34 |
Please note: The opinions expressed in this report are just that—informed opinions. They should not be considered promises or advice. Also, please keep in mind that the information and opinions cover the period through the date on the front of this report. Of course, the risks of investing in your fund are spelled out in the prospectus.
Your Fund’s Total Returns
March 31, 2008, Through December 31, 2008 |
|
|
| Ticker | Total |
| Symbol | Returns |
Vanguard Market Neutral Fund |
|
|
Investor Shares | VMNFX | –6.11% |
Institutional Shares1 | VMNIX | –6.20 |
Citigroup 3-Month Treasury Bill Index |
| 1.08 |
Average Equity Market Neutral Fund2 |
| –5.32 |
Your Fund’s Performance at a Glance |
|
|
|
|
March 31, 2008–December 31, 2008 |
|
|
|
|
|
|
| Distributions Per Share | |
| Starting | Ending | Income | Capital |
| Share Price | Share Price | Dividends | Gains |
Vanguard Market Neutral Fund |
|
|
|
|
Investor Shares | $12.45 | $10.97 | $0.132 | $0.594 |
Institutional Shares | 12.39 | 10.90 | 0.138 | 0.591 |
1 This class of shares carries lower expenses and is available for a minimum initial investment of $5 million.
2 Derived from data provided by Lipper Inc.
1

President’s Letter
Dear Shareholder,
During 2008, Vanguard Market Neutral Fund changed its fiscal year-end from March 31 to December 31. This change will simplify tax reporting.
This annual report covers the nine months since the publication of the fund’s last annual report, which covered the period through March 31, 2008. During the nine months ended December 31, 2008, the fund’s Investor Shares returned –6.11%; its Institutional Shares returned –6.20%.
The fund fell short of its goal, which is to minimize its exposure to the U.S. stock market and outperform the return on U.S. Treasury bills. The fund returned a bit less than the average return of its peer group.
We begin with an overview of the financial markets during the full 12 months of 2008, then review the fund’s performance over the year’s final nine months.
Global stock markets faced historic challenges
Problems that had festered in the financial markets for much of 2008 erupted in the year’s final months, leading to high-profile bankruptcies and government rescues. U.S. stocks lost about –23% for the fourth quarter. For the full 12 months, the U.S. stock market returned about –37%, the worst calendar-year performance since 1931. The financial sector, the epicenter of the crisis, was hardest hit, but no sector was safe from the market’s violent downdraft.
2
Overseas, the news was worse. Stock markets outside the United States returned about –45%, as credit-market turmoil and economic distress reverberated worldwide. Emerging markets fell especially hard, in part because of collapsing commodity prices, which put pressure on the group’s many natural-resource producers.
U.S. Treasuries provided a safe and liquid haven
Bonds provided shelter from the stock market turmoil, though strength was largely confined to U.S. Treasuries. Treasuries surged as investors bid up the highest-quality, most liquid securities. The Federal Reserve Board added fuel to the rally with repeated cuts in its target for the federal funds rate, a benchmark for short-term interest rates. At the start of
2008, the federal funds rate stood at 4.25%; by year-end, it was between 0.00% and 0.25%.
U.S. government-backed mortgage securities also performed well, though corporate and municipal bonds struggled. For the full year, the broad taxable bond market returned 5.24%.
Market turmoil overwhelmed stock-selection strategies
Vanguard Quantitative Equity Group and AXA Rosenberg Investment Management, the fund’s advisors, seek to buy stocks they consider undervalued and sell short stocks they believe to be overvalued. When the strategy works, the short sales “neutralize” the fund’s exposure to the stock market risk embedded in its
Market Barometer |
| ||
| Average Annual Total Returns | ||
| Periods Ended December 31, 2008 | ||
| One Year | Three Years | Five Years |
Stocks |
|
|
|
Russell 1000 Index (Large-caps) | –37.60% | –8.66% | –2.04% |
Russell 2000 Index (Small-caps) | –33.79 | –8.29 | –0.93 |
Dow Jones Wilshire 5000 Index (Entire market) | –37.34 | –8.43 | –1.67 |
MSCI All Country World Index ex USA (International) | –45.24 | –6.57 | 3.00 |
|
|
|
|
Bonds |
|
|
|
Barclays Capital Aggregate Bond Index (Broad taxable market) | 5.24% | 5.51% | 4.65% |
Barclays Capital Municipal Bond Index | –2.47 | 1.86 | 2.71 |
Citigroup 3-Month Treasury Bill Index | 1.80 | 3.76 | 3.10 |
|
|
|
|
CPI |
|
|
|
Consumer Price Index | 0.09% | 2.22% | 2.67% |
3
purchases. Ideally, the fund earns a bit more than U.S. Treasury bills (a proxy for the interest earned on the proceeds from its short sales) as stocks that the advisors consider mispriced return to fair value.
During the past nine months, however, those stocks that the advisor sold short held up better than those it purchased, producing negative returns. The differences were most pronounced in the industrials, materials, and consumer staples sectors. In the industrials sector, for example, the fund held a number of construction and machinery companies that lost more than half their value as the global economic outlook deteriorated. Overall, the fund’s industrial holdings returned about –42%, while those it sold short returned about –26%. The mismatch trimmed about 4.1 percentage points from the portfolio’s nine-month return.
Although they didn’t offset the fund’s shortfalls, successes included stock selections in the health care and information technology sectors. Consumer discretionary stocks were another bright spot. The fund shorted the stocks of a number of hotels, casinos, and media companies that declined sharply as consumers tightened their belts. Those stocks it owned included a number of fast-food restaurants and discount retailers that held up a bit better in the tough economic climate.
For more details on each advisor’s approach, please see the Advisors’ Report that follows.
A good long-term record, a sound design for the future
Vanguard Market Neutral Fund has relied on a multimanager strategy since the beginning of 2008, when Vanguard Quantitative Equity Group joined the fund. The fund’s longer-term record largely reflects its previous design as a single-manager portfolio, run by AXA Rosenberg Investment Management.
During the past ten years, Vanguard Market Neutral Fund has returned an average of 3.68% per year, a bit better than the return of its U.S. Treasury bill benchmark and the average return of its peer group. Over this same period, the broad U.S. stock market registered an annual average return of –0.63%.
We’re confident that, over time, the use of two talented advisors, each with distinct stock-selection strategies, will enhance the potential diversification and performance benefits of a market neutral portfolio.
Diversification remains our watchword
The financial market’s recent turmoil has been shocking not only in its violence, but also in its breadth. With the exception of U.S. government bonds, just about every segment of the investment market has lost value, even high-quality corporate and municipal bonds.
Does this broad-based decline suggest that diversification “doesn’t work”? That would be a dangerous conclusion. Diversification is a long-term strategy
4
(though it’s worth noting that even in the past year, a portfolio modeled on the broad stock and bond markets held up better than an all-stock portfolio, as the broad bond market registered a positive return). Over time, a balance of equity and fixed income assets gives you the opportunity to participate in the stock market’s potential for long-term growth while moderating its occasionally volatile ups and downs.
Vanguard Market Neutral Fund, designed both to have minimal correlation with the stock and bond markets and to provide investors with the opportunity to benefit from the advisors’ stock-selection skill, can provide additional diversification to a portfolio made up largely of traditional assets.
Thank you for your confidence in Vanguard.
Sincerely,

F. William McNabb III
President and Chief Executive Officer
January 16, 2009
Total Returns |
|
Ten Years Ended December 31, 2008 |
|
| Average |
| Annual Return |
Market Neutral Fund Investor Shares | 3.68% |
Citigroup 3-Month Treasury Bill Index | 3.30 |
Average Equity Market Neutral Fund1 | 2.71 |
The figures shown represent past performance, which is not a guarantee of future results. (Current performance may be lower or higher than the performance data cited. For performance data current to the most recent month-end, visit our website at www.vanguard.com/performance.) Note, too, that both investment returns and principal value can fluctuate widely, so an investor’s shares, when sold, could be worth more or less than their original cost.
1 Derived from data provided by Lipper Inc.
5
Advisors’ Report
During the past 12 months, Vanguard Market Neutral Fund changed its fiscal year-end from March 31 to December 31 to simplify tax reporting. The advisors’ report covers the nine months since the fund’s previous annual report through December 31.
For the past nine months, the Investor Shares of Vanguard Market Neutral Fund returned –6.11% and the Institutional Shares returned –6.20%. This performance reflects the combined returns of your fund’s two independent advisors.
The use of multiple advisors provides exposure to distinct, yet complementary, investment approaches, enhancing the fund’s diversification.
The advisors, the amount and percentage of fund assets each manages, and brief descriptions of their investment strategies are presented in the table below. Each advisor has also prepared a discussion of the investment environment and of how the portfolio’s positioning reflected this assessment. This report was prepared on January 21, 2009.
Vanguard Market Neutral Fund Investment Advisors |
| ||
|
|
|
|
| Fund Assets Managed |
| |
Investment Advisors | % | $ Million | Investment Strategy |
AXA Rosenberg Investment | 47 | 43 | Builds a portfolio based on fundamental analysis using |
Management LLC |
|
| a two-part quantitative model that considers valuations |
|
|
| and earnings forecasts. |
Vanguard Quantitative | 47 | 42 | Conducts quantitative management using models that |
Equity Group |
|
| assess valuation, marketplace sentiment, and balance- |
|
|
| sheet characteristics of companies as compared with |
|
|
| their peers. |
Cash Investments | 6 | 5 | — |
6
AXA Rosenberg Investment Management LLC
Portfolio Manager:
William E. Ricks, Americas Chief Executive and Chief Investment Officer
In 2008, weakening economic growth, the continuing financial credit crisis, declining property values, and the deterioration in consumer and business spending led the world economy into its first synchronized global recession in 50 years. Unprecedented market volatility affected global equities as venerable Wall Street institutions, including Bear Stearns, Merrill Lynch, and Lehman Brothers, disappeared or merged after ill-fated investments and punishing capital markets reduced financial titans to shadows of their former selves.
Globally, inflation fears gave way to worries about deflation as growth collapsed and commodity prices tumbled. Unemployment surged to a multi-decade high, with employers cutting payrolls at the fastest pace in many years, while financial institutions recorded over $1 trillion in losses and write-downs.
Fear of the global crisis reached its apex in the fourth quarter. U.S. government bond yields plummeted to record lows as investors moved toward the safety of government-backed bonds, while equity markets globally declined amid soaring systematic risk.
As the credit storm engulfed capital markets in 2008, our strategy benefited from underexposure to companies with high leverage and short positions in financial stocks such as AIG, Fannie Mae, and Washington Mutual, all of which were taken over after asset write-downs, capital shortages, and severe impairments to their business models. Within financials, long positions among integrated money-center banks that are likely to survive the credit crisis—such as Bank of America and JPMorgan Chase—nonetheless declined sharply.
Our stock selection was mixed among the global cyclicals. While short sales of consumer discretionary stocks such as Starwood Hotels and MGM Mirage and oil distributors and drillers such as Valero and Nabors were helpful, long positions in select metals and machinery stocks declined amid heightened fears of a slowdown in global growth.
It is our firm belief that earnings—both long-term cumulative earnings and the near-term change in earnings—drive stock prices. Our fundamentals-driven investment process evaluates each stock’s intrinsic value and earnings prospects, and we are focused on attractively valued companies with superior year-ahead earnings.
7
Vanguard Quantitative Equity Group
Portfolio Manager:
James D. Troyer, CFA, Principal
Our performance is generally unaffected by the overall return of the market, since we are equally allocated between long and short exposures. Our return will be determined by the cash return plus our model’s ability to select stocks. This year, investors’ equity risk aversion and concerns over specific companies’ exposure to the unwinding financial crisis overwhelmed our model’s ability to pick stocks.
Our process starts with the statement, “All things being equal, we prefer profitable stocks with low valuations.” Last year, most investors ignored the differences among stocks and instead punished just about all of them. In such an environment, the argument that our long portfolio, with its P/E ratio near 8 and a return on equity (ROE) of 24%, is more attractive than our short portfolio, with its P/E ratio of 11 and an ROE of 18%, is lost. Nonetheless, it’s a point we are comfortable making to investors with a long-term orientation.
Quantitative management, as we implement it, is similar to traditional stock selection, although we use computer models that we have developed to pick stocks. We attempt to identify attributes, such as cash flow ratios and earnings growth patterns, that indicate that a stock price in the market is too high or too low relative to the company’s fundamentals. We simulate scenarios using historical information to determine whether those characteristics do identify stocks that consistently outperform their peers. In the end, we hope to find several hundred stocks that individually, and as a group, will outperform their peers, unlike a traditional stock-picking approach, which typically tries to spot a small number of stocks that will outperform.
Our resulting portfolios tend to have the characteristics that we previously mentioned: growth rates similar to the overall market, purchased at a lower multiple of earnings. Conversely, our short positions trade at higher earnings multiples and offer slightly less growth. Both our investment judgment and our simulations tell us that selling a lower growth rate at a higher price in order to buy a higher growth rate at a lower price is an attractive proposition, despite the extremely unpleasant year that just passed. We cannot predict exactly when our investment views will pan out, but we are confident that, in the long run, a diversified portfolio of stocks of profitable companies purchased at low multiples will outperform one with less profitable companies sold at higher multiples.
8
Market Neutral Fund
Fund Profile
As of December 31, 2008
Portfolio Characteristics |
|
|
|
Yield1 |
|
Investor Shares | 0.9% |
Institutional Shares | 1.0% |
Short-Term Reserves | 17.0% |
Investment Characteristics |
|
|
| Long | Short |
| Portfolio | Portfolio |
Number of Stocks | 308 | 291 |
Median Market Cap | $27.7B | $22.3B |
Price/Earnings Ratio | 10.0x | 14.3x |
Price/Book Ratio | 1.5x | 1.6x |
Return on Equity | 19.6% | 20.0% |
Earnings Growth Rate | 17.2% | 18.8% |
Foreign Holdings | 0.0% | 0.0% |
Turnover Rate | 161% | — |
Estimated Expense Ratios2 |
|
|
| Investor | Institutional |
| Shares | Shares |
Management and |
|
|
Administrative Expenses | 0.50% | 0.40% |
Dividend Expense on |
|
|
Securities Sold Short3 | 1.50 | 1.50 |
Total | 2.00% | 1.90% |
Sector Diversification (% of equity exposure) | ||
| Long | Short |
| Portfolio | Portfolio |
Consumer Discretionary | 11.4% | 12.6% |
Consumer Staples | 10.5 | 4.4 |
Energy | 8.8 | 11.7 |
Financials | 11.4 | 9.7 |
Health Care | 16.0 | 11.1 |
Industrials | 13.7 | 14.4 |
Information Technology | 17.0 | 19.4 |
Materials | 4.0 | 9.2 |
Telecommunication Services | 0.9 | 1.6 |
Utilities | 6.3 | 5.9 |
Volatility Measures4 |
|
| Fund Versus |
| S&P 500 Index |
R-Squared | 0.11 |
Beta | 0.13 |
1 30-day SEC yield for the fund. See the Glossary.
2 The fund expense ratios shown are from the prospectus dated July 25, 2008, and were based on estimated expenses. For the nine months ended December 31, 2008, the annualized expense ratios were: for Investor Shares, 2.13% (0.46% management and administrative expenses plus 1.67% dividend expense on securities sold short); for Institutional Shares, 2.08% (0.41% management and administrative expenses plus 1.67% dividend expense on securities sold short).
3 When a cash dividend is declared on a stock the fund has sold short, the fund is required to pay an amount equal to that dividend to the lender of the stock. Although the payment of the dividend amount reduces the return of the short sale transaction, SEC rules call for the inclusion of such payments in the fund’s operating expenses.
4 For an explanation of R-squared, beta, and other terms used here, see the Glossary.
9
Market Neutral Fund
Ten Largest Holdings1 (% of total net assets): | ||
Long Portfolio |
|
|
|
|
|
Pfizer Inc. | pharmaceuticals | 1.8% |
Microsoft Corp. | systems software | 1.8 |
Amgen Inc. | biotechnology | 1.8 |
International Business |
|
|
Machines Corp. | computer hardware | 1.8 |
Oracle Corp. | systems software | 1.6 |
Gilead Sciences, Inc. | biotechnology | 1.5 |
Bristol-Myers Squibb Co. | pharmaceuticals | 1.5 |
CVS Caremark Corp. | drug retail | 1.3 |
Kraft Foods Inc. | packaged foods |
|
| and meats | 1.3 |
Time Warner, Inc. | movies and |
|
| entertainment | 1.2 |
Top Ten |
| 15.6% |
Ten Largest Holdings1 (% of total net assets): | ||
Short Portfolio |
|
|
|
|
|
Newmont Mining Corp. |
|
|
(Holding Co.) | gold | 2.2% |
Google Inc. | Internet software |
|
| and services | 1.8 |
Schlumberger Ltd. | oil and gas |
|
| equipment and |
|
| services | 1.8 |
PepsiCo, Inc. | soft drinks | 1.7 |
Merck & Co., Inc. | pharmaceuticals | 1.7 |
Intel Corp. | semiconductors | 1.5 |
Cisco Systems, Inc. | communications |
|
| equipment | 1.5 |
Apple Inc. | computer hardware | 1.4 |
United Parcel Service, Inc. | air freight |
|
| and logistics | 1.4 |
Exelon Corp. | electric utilities | 1.3 |
Top Ten |
| 16.3% |
1 The holdings listed exclude any temporary cash investments and equity index products.
10
Market Neutral Fund
Performance Summary
All of the returns in this report represent past performance, which is not a guarantee of future results that may be achieved by the fund. (Current performance may be lower or higher than the performance data cited. For performance data current to the most recent month-end, visit our website at www.vanguard.com/performance.) Note, too, that both investment returns and principal value can fluctuate widely, so an investor’s shares, when sold, could be worth more or less than their original cost. The returns shown do not reflect taxes that a shareholder would pay on fund distributions or on the sale of fund shares.
Cumulative Performance: December 31, 1998–December 31, 2008
Initial Investment of $250,000
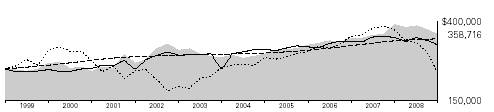
| Average Annual Total Returns | Final Value of | ||
| Periods Ended December 31, 2008 | a $250,000 | ||
| Nine Months | Five Years | Ten Years | Investment |
Market Neutral Fund Investor Shares1 | –6.11% | 4.66% | 3.68% | $358,716 |
Fee-Adjusted Returns2 | –6.99 | 4.66 | 3.68 | 358,716 |
Dow Jones Wilshire 5000 Index | –30.67 | –1.67 | –0.63 | 234,697 |
Citigroup 3-Month Treasury Bill Index | 1.08 | 3.10 | 3.30 | 345,774 |
Average Equity Market Neutral Fund3 | –5.32 | 1.67 | 2.71 | 326,770 |
|
|
|
| Final Value of |
|
|
|
| a $5,000,000 |
| Nine Months | Five Years | Ten Years | Investment |
Market Neutral Fund Institutional Shares1 | –6.20% | 4.91% | 3.95% | $7,365,897 |
Fee-Adjusted Returns2 | –7.08 | 4.91 | 3.95 | 7,365,897 |
Dow Jones Wilshire 5000 Index | –30.67 | –1.67 | –0.63 | 4,693,933 |
Citigroup 3-Month Treasury Bill Index | 1.08 | 3.10 | 3.30 | 6,915,474 |
1 Total returns do not reflect the 2% fee assessed until November 30, 2007, on redemptions of shares purchased within 30 days or the 1% fee assessed beginning December 1, 2007, on redemptions of shares held less than one year.
2 Reflective of the 1% fee assessed beginning December 1, 2007, on redemptions of shares held less than one year.
3 Derived from data provided by Lipper Inc.
11
Market Neutral Fund
Fiscal-Year Total Returns (%): December 31, 1998–December 31, 2008
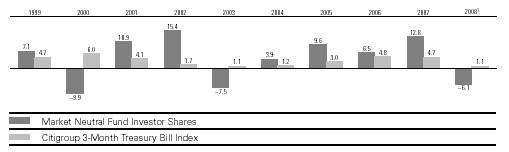
1 Returns are for the nine months ended December 31, 2008.
Note: See Financial Highlights tables for dividend and capital gains information.
12
Market Neutral Fund
Financial Statements
Statement of Net Assets
As of December 31, 2008
The fund provides a complete list of its holdings four times in each fiscal year, at the quarter-ends. For the second and fourth fiscal quarters, the lists appear in the fund’s semiannual and annual reports to shareholders. For the first and third fiscal quarters, the fund files the lists with the Securities and Exchange Commission on Form N-Q. Shareholders can look up the fund’s Forms N-Q on the SEC’s website at www.sec.gov. Forms N-Q may also be reviewed and copied at the SEC’s Public Reference Room (see the back cover of this report for further information).
|
|
| Market |
|
|
| Value• |
|
| Shares | ($000) |
Common Stocks—Long Positions (94.1%) |
|
| |
Consumer Discretionary (10.8%) |
|
| |
† | Time Warner, Inc. | 107,100 | 1,077 |
| H & R Block, Inc. | 31,300 | 711 |
| AutoZone Inc. | 4,600 | 642 |
† | The Gap, Inc. | 35,300 | 473 |
† | Family Dollar Stores, Inc. | 14,100 | 368 |
† | NIKE, Inc. Class B | 7,100 | 362 |
| Comcast Corp. Class A | 15,600 | 263 |
| Advance Auto Parts, Inc. | 7,800 | 262 |
† | Ross Stores, Inc. | 8,500 | 253 |
† | Polo Ralph Lauren Corp. | 5,400 | 245 |
* | Coach, Inc. | 11,600 | 241 |
| Pulte Homes, Inc. | 21,500 | 235 |
† | Cablevision Systems NY |
|
|
| Group Class A | 13,300 | 224 |
† | Wyndham Worldwide Corp. | 34,100 | 223 |
| Autoliv, Inc. | 9,900 | 212 |
† | Home Depot, Inc. | 9,200 | 212 |
| Apollo Group, Inc. Class A | 2,700 | 207 |
† | International Speedway Corp. | 7,100 | 204 |
| Burger King Holdings Inc. | 8,100 | 193 |
† | RadioShack Corp. | 15,000 | 179 |
† | Warner Music Group Corp. | 56,200 | 170 |
*† | DISH Network Corp. | 14,600 | 162 |
† | Limited Brands, Inc. | 15,800 | 159 |
*† | Urban Outfitters, Inc. | 10,500 | 157 |
† | Sherwin-Williams Co. | 2,600 | 155 |
*† | Dollar Tree, Inc. | 3,600 | 151 |
† | Hasbro, Inc. | 5,100 | 149 |
† | Macy’s Inc. | 14,300 | 148 |
| Harley-Davidson, Inc. | 8,700 | 148 |
† | Jones Apparel Group, Inc. | 25,100 | 147 |
† | International Game |
|
|
| Technology | 11,800 | 140 |
* | Discovery Communications |
|
|
| Inc. Class A | 9,600 | 136 |
| Big Lots Inc. | 8,700 | 126 |
† | Tiffany & Co. | 5,100 | 121 |
† | Whirlpool Corp. | 2,900 | 120 |
† | WABCO Holdings Inc. | 7,500 | 118 |
|
|
| Market |
|
|
| Value• |
|
| Shares | ($000) |
*† | NVR, Inc. | 200 | 91 |
† | McDonald’s Corp. | 1,400 | 87 |
† | Yum! Brands, Inc. | 2,200 | 69 |
† | Service Corp. International | 13,800 | 69 |
| Genuine Parts Co. | 1,400 | 53 |
* | Federal-Mogul Corp. | 12,100 | 51 |
| Foot Locker, Inc. | 4,700 | 35 |
| Snap-On Inc. | 800 | 32 |
* | Jarden Corp. | 2,200 | 25 |
| Strayer Education, Inc. | 100 | 21 |
* | AutoNation, Inc. | 2,100 | 21 |
|
|
| 9,647 |
Consumer Staples (9.8%) |
|
| |
† | CVS Caremark Corp. | 41,000 | 1,178 |
† | Kraft Foods Inc. | 42,100 | 1,130 |
† | Wal-Mart Stores, Inc. | 17,000 | 953 |
| Archer-Daniels-Midland Co. | 27,400 | 790 |
† | Colgate-Palmolive Co. | 9,600 | 658 |
† | Kellogg Co. | 13,520 | 593 |
| Avon Products, Inc. | 17,000 | 409 |
| Safeway, Inc. | 12,700 | 302 |
† | Herbalife Ltd. | 13,500 | 293 |
† | The Pepsi Bottling Group, Inc. | 12,600 | 284 |
† | Sara Lee Corp. | 27,400 | 268 |
† | The Clorox Co. | 4,300 | 239 |
† | ConAgra Foods, Inc. | 14,200 | 234 |
† | General Mills, Inc. | 3,700 | 225 |
*† | Dean Foods Co. | 11,200 | 201 |
† | Bunge Ltd. | 3,500 | 181 |
† | Campbell Soup Co. | 5,900 | 177 |
† | The Hershey Co. | 4,900 | 170 |
† | The Estee Lauder Cos. Inc. |
|
|
| Class A | 4,400 | 136 |
† | Sysco Corp. | 5,600 | 128 |
* | Constellation Brands, Inc. |
|
|
| Class A | 7,840 | 124 |
† | Church & Dwight, Inc. | 2,200 | 123 |
† | PepsiAmericas, Inc. | 900 | 18 |
| Corn Products |
|
|
| International, Inc. | 500 | 14 |
|
|
| 8,828 |
13
Market Neutral Fund
|
|
| Market |
|
|
| Value• |
|
| Shares | ($000) |
Energy (8.3%) |
|
| |
† | Marathon Oil Corp. | 26,000 | 711 |
† | El Paso Corp. | 56,600 | 443 |
*† | Southwestern Energy Co. | 14,500 | 420 |
† | Chevron Corp. | 4,800 | 355 |
† | Noble Energy, Inc. | 6,900 | 340 |
*† | Newfield Exploration Co. | 16,800 | 332 |
† | Chesapeake Energy Corp. | 19,900 | 322 |
† | Overseas Shipholding |
|
|
| Group Inc. | 6,300 | 265 |
† | Murphy Oil Corp. | 5,500 | 244 |
† | Frontline Ltd. | 7,800 | 231 |
*† | Plains Exploration & |
|
|
| Production Co. | 9,900 | 230 |
*† | Pride International, Inc. | 14,200 | 227 |
† | Teekay Shipping Corp. | 11,400 | 224 |
† | Sunoco, Inc. | 4,900 | 213 |
† | ConocoPhillips Co. | 4,000 | 207 |
† | Peabody Energy Corp. | 8,700 | 198 |
† | ENSCO International, Inc. | 6,900 | 196 |
*† | Unit Corp. | 7,200 | 192 |
*† | Mariner Energy Inc. | 18,400 | 188 |
*† | Oil States International, Inc. | 10,000 | 187 |
*† | Whiting Petroleum Corp. | 5,400 | 181 |
† | Massey Energy Co. | 12,800 | 177 |
† | Cimarex Energy Co. | 6,500 | 174 |
† | Diamond Offshore Drilling, Inc. | 2,800 | 165 |
*† | Encore Acquisition Co. | 6,300 | 161 |
| Apache Corp. | 2,100 | 157 |
† | Hess Corp. | 2,900 | 156 |
† | Helmerich & Payne, Inc. | 5,200 | 118 |
| Anadarko Petroleum Corp. | 3,000 | 116 |
*† | Alpha Natural Resources, Inc. | 6,700 | 108 |
† | Devon Energy Corp. | 1,500 | 99 |
*† | TETRA Technologies, Inc. | 18,000 | 88 |
*† | Superior Energy Services, Inc. | 1,900 | 30 |
*† | Patriot Coal Corp. | 1,500 | 9 |
|
|
| 7,464 |
Financials (10.8%) |
|
| |
† | JPMorgan Chase & Co. | 29,300 | 924 |
| Bank of America Corp. | 63,600 | 896 |
† | Wells Fargo & Co. | 24,400 | 719 |
† | State Street Corp. | 15,900 | 625 |
† | Hudson City Bancorp, Inc. | 32,793 | 523 |
† | Unum Group | 26,900 | 500 |
| Aon Corp. | 10,600 | 484 |
† | Lincoln National Corp. | 22,600 | 426 |
† | U.S. Bancorp | 16,300 | 408 |
† | Everest Re Group, Ltd. | 4,100 | 312 |
* | Reinsurance Group of |
|
|
| America, Inc. | 6,700 | 287 |
| The Chubb Corp. | 5,200 | 265 |
| American Financial |
|
|
| Group, Inc. | 11,500 | 263 |
| AFLAC Inc. | 5,500 | 252 |
† | Ameriprise Financial, Inc. | 10,700 | 250 |
|
|
| Market |
|
|
| Value• |
|
| Shares | ($000) |
† | Discover Financial Services | 25,300 | 241 |
| Bank of Hawaii Corp. | 5,100 | 230 |
† | Northern Trust Corp. | 4,400 | 229 |
| Bank of New York |
|
|
| Mellon Corp. | 8,000 | 227 |
† | SunTrust Banks, Inc. | 5,400 | 160 |
† | PNC Financial Services Group | 3,200 | 157 |
† | Capital One Financial Corp. | 4,900 | 156 |
| Loews Corp. | 5,400 | 153 |
| BB&T Corp. | 4,900 | 135 |
| Willis Group Holdings Ltd. | 5,200 | 129 |
† | Morgan Stanley | 7,900 | 127 |
| HCC Insurance Holdings, Inc. | 4,100 | 110 |
| Federated Investors, Inc. | 4,500 | 76 |
* | TD Ameritrade Holding Corp. | 5,100 | 73 |
† | Allied World Assurance |
|
|
| Holdings, Ltd. | 1,700 | 69 |
| StanCorp Financial Group, Inc. | 1,200 | 50 |
† | Wachovia Corp. | 7,700 | 43 |
| Marshall & Ilsley Corp. | 2,900 | 40 |
† | National City Corp. | 19,600 | 36 |
* | Arch Capital Group Ltd. | 500 | 35 |
* | Nasdaq Stock Market Inc. | 700 | 17 |
† | TFS Financial Corp. | 1,200 | 16 |
|
|
| 9,643 |
Health Care (15.0%) |
|
| |
† | Pfizer Inc. | 93,100 | 1,649 |
| Amgen Inc. | 27,600 | 1,594 |
*† | Gilead Sciences, Inc. | 27,200 | 1,391 |
† | Bristol-Myers Squibb Co. | 57,900 | 1,346 |
*† | Biogen Idec Inc. | 15,300 | 729 |
*† | Express Scripts Inc. | 11,800 | 649 |
*† | Forest Laboratories, Inc. | 22,300 | 568 |
*† | St. Jude Medical, Inc. | 16,700 | 550 |
*† | Genzyme Corp. | 7,800 | 518 |
*† | Cephalon, Inc. | 6,100 | 470 |
† | Omnicare, Inc. | 9,900 | 275 |
*† | Watson Pharmaceuticals, Inc. | 10,100 | 268 |
*† | Lincare Holdings, Inc. | 9,400 | 253 |
*† | Warner Chilcott Ltd. | 17,200 | 249 |
*† | DaVita, Inc. | 4,900 | 243 |
† | Quest Diagnostics, Inc. | 4,600 | 239 |
*† | Hologic, Inc. | 17,600 | 230 |
*† | Humana Inc. | 6,000 | 224 |
† | AmerisourceBergen Corp. | 6,100 | 218 |
*† | Gen-Probe Inc. | 4,600 | 197 |
*† | LifePoint Hospitals, Inc. | 8,400 | 192 |
*† | Life Technologies Corp. | 8,000 | 187 |
† | Covidien Ltd. | 5,100 | 185 |
† | Hill-Rom Holdings, Inc. | 10,400 | 171 |
*† | Varian Medical Systems, Inc. | 4,100 | 144 |
† | Teleflex Inc. | 2,800 | 140 |
† | CIGNA Corp. | 7,800 | 131 |
† | Charles River |
|
|
| Laboratories, Inc. | 5,000 | 131 |
* | Mylan Inc. | 11,400 | 113 |
14
Market Neutral Fund
|
|
| Market |
|
|
| Value• |
|
| Shares | ($000) |
| Universal Health Services |
|
|
| Class B | 2,400 | 90 |
*† | Henry Schein, Inc. | 2,100 | 77 |
* | King Pharmaceuticals, Inc. | 4,900 | 52 |
| Techne Corp. | 200 | 13 |
|
|
| 13,486 |
Industrials (12.8%) |
|
| |
† | Lockheed Martin Corp. | 12,400 | 1,043 |
† | General Dynamics Corp. | 16,600 | 956 |
† | Northrop Grumman Corp. | 16,000 | 721 |
† | Raytheon Co. | 12,100 | 618 |
† | L-3 Communications |
|
|
| Holdings, Inc. | 8,000 | 590 |
† | Dover Corp. | 15,000 | 494 |
† | Tyco International, Ltd. | 21,700 | 469 |
| Goodrich Corp. | 11,500 | 426 |
† | Fastenal Co. | 8,900 | 310 |
† | The Timken Co. | 14,200 | 279 |
† | Waste Management, Inc. | 7,700 | 255 |
† | Copa Holdings SA Class A | 8,300 | 252 |
† | Trinity Industries, Inc. | 15,900 | 251 |
† | Flowserve Corp. | 4,800 | 247 |
* | Shaw Group, Inc. | 11,900 | 244 |
† | GATX Corp. | 7,500 | 232 |
† | W.W. Grainger, Inc. | 2,900 | 229 |
† | Norfolk Southern Corp. | 4,800 | 226 |
| Fluor Corp. | 5,000 | 224 |
† | The Dun & Bradstreet Corp. | 2,900 | 224 |
† | Joy Global Inc. | 9,600 | 220 |
† | Lennox International Inc. | 6,800 | 220 |
| AGCO Corp. | 8,900 | 210 |
| Bucyrus International, Inc. | 11,300 | 209 |
† | Cummins Inc. | 7,200 | 192 |
*† | Kirby Corp. | 7,000 | 192 |
† | Ryder System, Inc. | 4,700 | 182 |
† | CSX Corp. | 5,300 | 172 |
*† | Gardner Denver Inc. | 6,800 | 159 |
*† | United Rentals, Inc. | 16,055 | 146 |
| Avery Dennison Corp. | 4,400 | 144 |
† | J.B. Hunt Transport |
|
|
| Services, Inc. | 5,400 | 142 |
| Masco Corp. | 12,400 | 138 |
† | The Brink’s Co. | 5,000 | 134 |
| Republic Services, Inc. |
|
|
| Class A | 5,200 | 129 |
† | Hubbell Inc. Class B | 3,900 | 127 |
* | URS Corp. | 3,000 | 122 |
† | R.R. Donnelley & Sons Co. | 8,500 | 115 |
* | Aecom Technology Corp. | 3,600 | 111 |
† | Union Pacific Corp. | 2,000 | 96 |
† | Armstrong Worldwide |
|
|
| Industries, Inc. | 2,500 | 54 |
| Steelcase Inc. | 4,200 | 24 |
|
|
| 11,528 |
|
|
| Market |
|
|
| Value• |
|
| Shares | ($000) |
Information Technology (16.0%) |
|
| |
† | Microsoft Corp. | 83,900 | 1,631 |
† | International Business |
|
|
| Machines Corp. | 18,700 | 1,574 |
*† | Oracle Corp. | 80,600 | 1,429 |
† | Accenture Ltd. | 24,200 | 794 |
*† | Computer Sciences Corp. | 17,000 | 597 |
*† | Intuit, Inc. | 19,900 | 473 |
† | Western Union Co. | 28,600 | 410 |
| Affiliated Computer |
|
|
| Services, Inc. Class A | 8,000 | 368 |
† | Harris Corp. | 8,500 | 323 |
*† | QLogic Corp. | 20,000 | 269 |
† | CA, Inc. | 14,000 | 259 |
*† | SAIC, Inc. | 12,900 | 251 |
*† | Sohu.com Inc. | 5,300 | 251 |
*† | Symantec Corp. | 18,300 | 247 |
*† | McAfee Inc. | 7,100 | 245 |
*† | VeriSign, Inc. | 12,700 | 242 |
*† | Lexmark International, Inc. | 8,800 | 237 |
*† | Genpact, Ltd. | 28,600 | 235 |
| Alliance Data Systems Corp. | 5,000 | 233 |
*† | Agilent Technologies, Inc. | 14,600 | 228 |
| BMC Software, Inc. | 8,400 | 226 |
† | Diebold, Inc. | 8,000 | 225 |
† | Xilinx, Inc. | 12,600 | 225 |
*† | LSI Corp. | 66,400 | 218 |
*† | Dolby Laboratories Inc. | 6,600 | 216 |
* | Fiserv, Inc. | 5,700 | 207 |
† | Intel Corp. | 13,600 | 199 |
*† | Integrated Device |
|
|
| Technology Inc. | 35,100 | 197 |
*† | Western Digital Corp. | 16,800 | 192 |
*† | eBay Inc. | 13,300 | 186 |
*† | Hewitt Associates, Inc. | 6,500 | 184 |
*† | Compuware Corp. | 25,700 | 173 |
* | Metavante Technologies | 10,400 | 168 |
*† | Marvell Technology |
|
|
| Group Ltd. | 24,800 | 165 |
| Autodesk, Inc. | 8,100 | 159 |
| Avnet, Inc. | 8,400 | 153 |
*† | NCR Corp. | 10,000 | 141 |
*† | Convergys Corp. | 20,300 | 130 |
*† | Amdocs Ltd. | 7,000 | 128 |
*† | MEMC Electronic |
|
|
| Materials, Inc. | 8,800 | 126 |
† | Hewlett-Packard Co. | 3,300 | 120 |
* | ON Semiconductor Corp. | 30,500 | 104 |
| Analog Devices, Inc. | 4,900 | 93 |
| National Semiconductor Corp. | 5,400 | 54 |
*† | Brocade Communications |
|
|
| Systems, Inc. | 19,100 | 54 |
*† | FLIR Systems, Inc. | 1,700 | 52 |
|
|
| 14,391 |
15
Market Neutral Fund
|
|
| Market |
|
|
| Value• |
|
| Shares | ($000) |
Materials (3.8%) |
|
| |
† | PPG Industries, Inc. | 9,200 | 390 |
| Schnitzer Steel |
|
|
| Industries, Inc. Class A | 6,800 | 256 |
† | FMC Corp. | 5,700 | 255 |
| Airgas, Inc. | 6,200 | 242 |
| The Mosaic Co. | 6,900 | 239 |
† | Terra Industries, Inc. | 14,000 | 233 |
| United States Steel Corp. | 6,100 | 227 |
† | Cliffs Natural Resources Inc. | 8,800 | 225 |
† | Monsanto Co. | 3,100 | 218 |
† | Reliance Steel & |
|
|
| Aluminum Co. | 9,800 | 195 |
† | Greif Inc. Class A | 5,800 | 194 |
† | Eastman Chemical Co. | 6,000 | 190 |
† | Nalco Holding Co. | 14,300 | 165 |
† | Celanese Corp. Series A | 8,000 | 99 |
| Bemis Co., Inc. | 3,400 | 81 |
| AK Steel Holding Corp. | 8,400 | 78 |
* | Owens-Illinois, Inc. | 2,100 | 57 |
† | Lubrizol Corp. | 1,400 | 51 |
|
|
| 3,395 |
Telecommunication Services (0.9%) |
|
| |
| Verizon Communications Inc. | 7,500 | 254 |
† | Windstream Corp. | 26,000 | 239 |
† | CenturyTel, Inc. | 4,100 | 112 |
* | NII Holdings Inc. | 6,000 | 109 |
*† | Level 3 Communications, Inc. | 84,700 | 59 |
|
|
| 773 |
Utilities (5.9%) |
|
| |
† | PG&E Corp. | 16,900 | 654 |
† | CenterPoint Energy Inc. | 33,100 | 418 |
† | Edison International | 10,900 | 350 |
† | Pinnacle West Capital Corp. | 10,400 | 334 |
| American Electric |
|
|
| Power Co., Inc. | 7,800 | 260 |
† | CMS Energy Corp. | 25,700 | 260 |
| Questar Corp. | 7,900 | 258 |
† | Sempra Energy | 5,900 | 252 |
† | Xcel Energy, Inc. | 13,500 | 250 |
† | Progress Energy, Inc. | 5,900 | 235 |
† | Pepco Holdings, Inc. | 13,100 | 233 |
| Atmos Energy Corp. | 9,800 | 232 |
*† | NRG Energy, Inc. | 9,700 | 226 |
*† | AES Corp. | 27,100 | 223 |
† | MDU Resources Group, Inc. | 9,800 | 212 |
† | UGI Corp. Holding Co. | 7,400 | 181 |
† | TECO Energy, Inc. | 14,100 | 174 |
| Northeast Utilities | 5,500 | 132 |
| Alliant Energy Corp. | 4,300 | 125 |
* | Mirant Corp. | 6,600 | 125 |
† | NiSource, Inc. | 11,300 | 124 |
| Duke Energy Corp. | 2,300 | 35 |
|
|
| 5,293 |
Total Common Stocks—Long Positions |
| ||
(Cost $101,654) |
| 84,448 | |
|
|
| Market |
|
|
| Value• |
|
| Shares | ($000) |
Common Stocks Sold Short (–85.0%)1 |
|
| |
Consumer Discretionary (–10.7%) |
|
| |
| Target Corp. | (29,800) | (1,029) |
* | Starbucks Corp. | (66,200) | (626) |
| Best Buy Co., Inc. | (19,400) | (545) |
| Amazon.com, Inc. | (10,100) | (518) |
* | Kohl’s Corp. | (9,400) | (340) |
| BorgWarner, Inc. | (15,200) | (331) |
* | Liberty Global, Inc. Class A | (19,100) | (304) |
* | Mohawk Industries, Inc. | (6,500) | (279) |
| Mattel, Inc. | (17,100) | (274) |
| OfficeMax, Inc. | (34,700) | (265) |
* | O’Reilly Automotive, Inc. | (8,400) | (258) |
* | Career Education Corp. | (14,300) | (257) |
| International Game |
|
|
| Technology | (21,400) | (254) |
| The Walt Disney Co. | (10,900) | (247) |
| Staples, Inc. | (13,800) | (247) |
| Nordstrom, Inc. | (18,400) | (245) |
| Williams-Sonoma, Inc. | (31,000) | (244) |
* | Time Warner Cable, Inc. | (11,200) | (240) |
* | LKQ Corp. | (20,500) | (239) |
| Bed Bath & Beyond, Inc. | (9,400) | (239) |
| Washington Post Co. |
|
|
| Class B | (600) | (234) |
| Fortune Brands, Inc. | (5,600) | (231) |
| Johnson Controls, Inc. | (12,300) | (223) |
| Brinker International, Inc. | (16,100) | (170) |
* | Dick’s Sporting Goods, Inc. | (12,000) | (169) |
| Starwood Hotels & |
|
|
| Resorts Worldwide, Inc. | (9,050) | (162) |
| Marriott International, Inc. |
|
|
| Class A | (8,000) | (156) |
| PetSmart, Inc. | (8,300) | (153) |
| Centex Corp. | (13,700) | (146) |
| J.C. Penney Co., Inc. |
|
|
| (Holding Co.) | (6,900) | (136) |
| Macy’s Inc. | (12,800) | (132) |
| Strayer Education, Inc. | (600) | (129) |
| The Stanley Works | (3,500) | (119) |
| Whirlpool Corp. | (2,500) | (103) |
* | Scientific Games Corp. | (4,700) | (82) |
| Eastman Kodak Co. | (10,100) | (66) |
* | Toll Brothers, Inc. | (2,900) | (62) |
* | Office Depot, Inc. | (13,500) | (40) |
| CBS Corp. | (4,700) | (38) |
* | Clear Channel Outdoor |
|
|
| Holdings, Inc. Class A | (6,000) | (37) |
| Abercrombie & Fitch Co. | (1,500) | (35) |
| News Corp., Class A | (2,600) | (24) |
|
|
| (9,628) |
Consumer Staples (–3.7%) |
|
| |
| PepsiCo, Inc. | (28,500) | (1,561) |
| The Coca-Cola Co. | (5,300) | (240) |
| Coca-Cola Enterprises, Inc. | (17,500) | (211) |
| Kellogg Co. | (4,600) | (202) |
16
Market Neutral Fund
|
|
| Market |
|
|
| Value• |
|
| Shares | ($000) |
| Sara Lee Corp. | (20,500) | (201) |
* | Central European |
|
|
| Distribution Corp. | (9,600) | (189) |
* | Energizer Holdings, Inc. | (2,900) | (157) |
| CVS Caremark Corp. | (4,100) | (118) |
| Brown-Forman Corp. Class B | (2,125) | (109) |
* | Smithfield Foods, Inc. | (7,600) | (107) |
| The Clorox Co. | (1,700) | (94) |
| Costco Wholesale Corp. | (700) | (37) |
* | Constellation Brands, Inc. |
|
|
| Class A | (2,200) | (35) |
| Avon Products, Inc. | (1,200) | (29) |
| Hormel Foods Corp. | (600) | (19) |
|
|
| (3,309) |
Energy (–10.0%) |
|
| |
| Schlumberger Ltd. | (37,600) | (1,592) |
| XTO Energy, Inc. | (20,400) | (719) |
| Apache Corp. | (8,900) | (663) |
| Hess Corp. | (7,900) | (424) |
| CONSOL Energy, Inc. | (12,100) | (346) |
| Spectra Energy Corp. | (21,100) | (332) |
* | Petrohawk Energy Corp. | (21,000) | (328) |
* | Oceaneering |
|
|
| International, Inc. | (9,100) | (265) |
| Frontier Oil Corp. | (19,500) | (246) |
* | Exterran Holdings, Inc. | (11,500) | (245) |
| Cabot Oil & Gas Corp. | (9,400) | (244) |
| Halliburton Co. | (13,000) | (236) |
* | CNX Gas Corp. | (8,500) | (232) |
| BJ Services Co. | (19,700) | (230) |
| Range Resources Corp. | (6,600) | (227) |
| Marathon Oil Corp. | (7,900) | (216) |
| Rowan Cos., Inc. | (13,100) | (208) |
| Noble Energy, Inc. | (4,200) | (207) |
* | National Oilwell Varco Inc. | (8,300) | (203) |
* | Weatherford |
|
|
| International Ltd. | (18,200) | (197) |
| Peabody Energy Corp. | (8,600) | (196) |
| Baker Hughes Inc. | (6,100) | (196) |
| Southern Union Co. | (13,600) | (177) |
| Foundation Coal |
|
|
| Holdings, Inc. | (11,200) | (157) |
* | Ultra Petroleum Corp. | (4,400) | (152) |
* | Nabors Industries, Inc. | (12,580) | (151) |
| Atwood Oceanics, Inc. | (9,300) | (142) |
| Murphy Oil Corp. | (1,500) | (67) |
| Occidental Petroleum Corp. | (1,100) | (66) |
* | SandRidge Energy, Inc. | (10,500) | (65) |
* | Transocean Ltd. | (1,300) | (61) |
* | Quicksilver Resources, Inc. | (10,800) | (60) |
* | Helix Energy |
|
|
| Solutions Group, Inc. | (4,000) | (29) |
| Patterson-UTI Energy, Inc. | (2,500) | (29) |
* | IHS Inc. Class A | (600) | (22) |
* | Hercules Offshore, Inc. | (3,400) | (16) |
|
|
| (8,946) |
|
|
| Market |
|
|
| Value• |
|
| Shares | ($000) |
Financials (–8.2%) |
|
| |
| AFLAC Inc. | (12,300) | (564) |
* | IntercontinentalExchange Inc. | (5,300) | (437) |
| Progressive Corp. of Ohio | (26,900) | (398) |
| American Express Co. | (20,900) | (388) |
* | Markel Corp. | (1,200) | (359) |
| T. Rowe Price Group Inc. | (8,800) | (312) |
| Fidelity National |
|
|
| Financial, Inc. Class A | (16,500) | (293) |
| KeyCorp | (34,000) | (290) |
| Old Republic |
|
|
| International Corp. | (23,800) | (284) |
| Legg Mason Inc. | (12,300) | (269) |
| Brown & Brown, Inc. | (12,600) | (263) |
| City National Corp. | (5,400) | (263) |
| Lazard Ltd. Class A | (8,500) | (253) |
| Eaton Vance Corp. | (11,600) | (244) |
| The Hartford Financial |
|
|
| Services Group Inc. | (14,500) | (238) |
| RenaissanceRe |
|
|
| Holdings Ltd. | (4,500) | (232) |
| Whitney Holdings Corp. | (14,500) | (232) |
| SEI Investments Co. | (14,200) | (223) |
| White Mountains |
|
|
| Insurance Group Inc. | (800) | (214) |
| Franklin Resources Corp. | (3,300) | (210) |
| Comerica, Inc. | (9,700) | (193) |
| Moody’s Corp. | (9,400) | (189) |
| CME Group, Inc. | (700) | (146) |
| Student Loan Corp. | (3,000) | (123) |
* | SLM Corp. | (13,600) | (121) |
| Unitrin, Inc. | (7,400) | (118) |
| The Principal |
|
|
| Financial Group, Inc. | (4,800) | (108) |
* | Leucadia National Corp. | (5,400) | (107) |
| Regions Financial Corp. | (10,900) | (87) |
| Commerce Bancshares, Inc. | (1,900) | (83) |
| Transatlantic Holdings, Inc. | (1,200) | (48) |
| Wells Fargo & Co. | (1,533) | (45) |
| PNC Financial Services Group | (768) | (38) |
| CIT Group Inc. | (4,200) | (19) |
| Washington Federal Inc. | (800) | (12) |
|
|
| (7,403) |
Health Care (–9.4%) |
|
| |
| Merck & Co., Inc. | (50,000) | (1,520) |
| Schering-Plough Corp. | (60,300) | (1,027) |
| Eli Lilly & Co. | (23,800) | (958) |
* | Vertex Pharmaceuticals, Inc. | (13,500) | (410) |
| UnitedHealth Group Inc. | (10,700) | (285) |
* | Coventry Health Care Inc. | (19,000) | (283) |
* | IDEXX Laboratories, Inc. | (7,200) | (260) |
| IMS Health, Inc. | (17,000) | (258) |
| Allergan, Inc. | (6,300) | (254) |
* | Celgene Corp. | (4,300) | (238) |
* | BioMarin |
|
|
| Pharmaceutical Inc. | (13,100) | (233) |
17
Market Neutral Fund
|
|
| Market |
|
|
| Value• |
|
| Shares | ($000) |
* | Cerner Corp. | (5,800) | (223) |
* | Hologic, Inc. | (16,800) | (220) |
* | Pediatrix Medical Group, Inc. | (6,900) | (219) |
| Cardinal Health, Inc. | (6,200) | (214) |
* | Kinetic Concepts, Inc. | (10,400) | (199) |
| Stryker Corp. | (4,900) | (196) |
* | Millipore Corp. | (3,700) | (191) |
* | Intuitive Surgical, Inc. | (1,500) | (190) |
* | VCA Antech, Inc. | (9,500) | (189) |
* | Waters Corp. | (4,600) | (169) |
| PerkinElmer, Inc. | (11,600) | (161) |
| Cooper Cos., Inc. | (7,100) | (116) |
* | Humana Inc. | (2,400) | (89) |
* | ResMed Inc. | (1,900) | (71) |
| Aetna Inc. | (2,200) | (63) |
| DENTSPLY International Inc. | (2,200) | (62) |
* | Medco Health Solutions, Inc. | (1,400) | (59) |
* | Health Net Inc. | (2,300) | (25) |
* | Illumina, Inc. | (900) | (23) |
| Pharmaceutical Product |
|
|
| Development, Inc. | (800) | (23) |
|
|
| (8,428) |
Industrials (–12.3%) |
|
| |
| United Parcel Service, Inc. | (22,200) | (1,225) |
| Illinois Tool Works, Inc. | (21,200) | (743) |
| Caterpillar, Inc. | (13,500) | (603) |
* | Iron Mountain, Inc. | (22,600) | (559) |
| Deere & Co. | (11,600) | (444) |
| FedEx Corp. | (6,700) | (430) |
| Robert Half |
|
|
| International, Inc. | (16,900) | (352) |
| Ametek, Inc. | (10,300) | (311) |
| C.H. Robinson |
|
|
| Worldwide Inc. | (5,000) | (275) |
| UTI Worldwide, Inc. | (19,100) | (274) |
| Masco Corp. | (23,600) | (263) |
| Kennametal, Inc. | (11,800) | (262) |
| IDEX Corp. | (10,800) | (261) |
| Roper Industries Inc. | (6,000) | (260) |
| Donaldson Co., Inc. | (7,400) | (249) |
* | URS Corp. | (6,100) | (249) |
| KBR Inc. | (16,300) | (248) |
* | McDermott |
|
|
| International, Inc. | (24,300) | (240) |
| Eaton Corp. | (4,800) | (239) |
| Oshkosh Truck Corp. | (26,600) | (236) |
* | General Cable Corp. | (13,300) | (235) |
| The Boeing Co. | (5,400) | (230) |
| Avery Dennison Corp. | (7,000) | (229) |
| PACCAR, Inc. | (7,800) | (223) |
| 3M Co. | (3,700) | (213) |
| Danaher Corp. | (3,600) | (204) |
| General Electric Co. | (12,100) | (196) |
* | Owens Corning Inc. | (10,600) | (183) |
* | Continental Airlines, Inc. |
|
|
| Class B | (9,900) | (179) |
|
|
| Market |
|
|
| Value• |
|
| Shares | ($000) |
* | Quanta Services, Inc. | (8,900) | (176) |
* | Spirit Aerosystems |
|
|
| Holdings Inc. | (17,300) | (176) |
| BE Aerospace, Inc. | (21,400) | (165) |
* | Jacobs Engineering |
|
|
| Group Inc. | (3,200) | (154) |
| Expeditors International of |
|
|
| Washington, Inc. | (4,400) | (146) |
| Ingersoll-Rand Co. | (8,100) | (141) |
| Emerson Electric Co. | (3,400) | (124) |
| Avis Budget Group, Inc. | (161,300) | (113) |
| Harsco Corp. | (2,700) | (75) |
| Con-way, Inc. | (1,700) | (45) |
* | Kansas City Southern | (2,100) | (40) |
| Cintas Corp. | (900) | (21) |
| Graco, Inc. | (700) | (17) |
|
|
| (11,008) |
Information Technology (–16.5%) |
|
| |
* | Google Inc. | (5,370) | (1,652) |
| Intel Corp. | (93,400) | (1,369) |
* | Cisco Systems, Inc. | (82,300) | (1,341) |
| Apple Inc. | (14,500) | (1,238) |
* | Dell Inc. | (74,400) | (762) |
* | EMC Corp. | (66,700) | (698) |
* | Yahoo! Inc. | (56,400) | (688) |
| Hewlett-Packard Co. | (15,900) | (577) |
| Visa Inc. | (9,300) | (488) |
* | Adobe Systems, Inc. | (15,800) | (336) |
* | salesforce.com, inc. | (10,300) | (330) |
* | SanDisk Corp. | (32,600) | (313) |
* | Electronic Arts Inc. | (19,200) | (308) |
* | CommScope, Inc. | (17,400) | (270) |
* | Trimble Navigation Ltd. | (11,800) | (255) |
* | Cognizant Technology |
|
|
| Solutions Corp. | (14,100) | (255) |
* | NetApp, Inc. | (17,900) | (250) |
* | IAC/InterActiveCorp | (15,600) | (245) |
* | Citrix Systems, Inc. | (10,200) | (240) |
| MasterCard, Inc. Class A | (1,600) | (229) |
| Paychex, Inc. | (8,600) | (226) |
* | Varian Semiconductor |
|
|
| Equipment Associates, Inc. | (12,400) | (225) |
* | NVIDIA Corp. | (27,500) | (222) |
* | VeriSign, Inc. | (11,400) | (217) |
| Motorola, Inc. | (47,700) | (211) |
* | LAM Research Corp. | (9,800) | (209) |
* | Sun Microsystems, Inc. | (49,100) | (188) |
* | Cadence Design |
|
|
| Systems, Inc. | (48,000) | (176) |
| Texas Instruments, Inc. | (11,000) | (171) |
| Applied Materials, Inc. | (16,000) | (162) |
| Fidelity National |
|
|
| Information Services, Inc. | (9,500) | (155) |
* | Teradyne, Inc. | (33,400) | (141) |
| KLA-Tencor Corp. | (6,100) | (133) |
| Amphenol Corp. | (5,500) | (132) |
18
Market Neutral Fund
|
|
| Market |
|
|
| Value• |
|
| Shares | ($000) |
| Molex, Inc. | (8,600) | (125) |
* | Cypress |
|
|
| Semiconductor Corp. | (20,000) | (89) |
* | Red Hat, Inc. | (6,600) | (87) |
* | Novellus Systems, Inc. | (3,100) | (38) |
| QUALCOMM Inc. | (1,000) | (36) |
* | Intuit, Inc. | (700) | (17) |
* | Vishay Intertechnology, Inc. | (4,200) | (14) |
|
|
| (14,818) |
Materials (–7.9%) |
|
| |
| Newmont Mining Corp. |
|
|
| (Holding Co.) | (48,300) | (1,966) |
| Monsanto Co. | (12,100) | (851) |
| Alcoa Inc. | (51,300) | (578) |
| Weyerhaeuser Co. | (13,500) | (413) |
* | Pactiv Corp. | (13,900) | (346) |
| Freeport-McMoRan Copper |
|
|
| & Gold, Inc. Class B | (13,100) | (320) |
| Scotts Miracle-Gro Co. | (8,500) | (253) |
| Albemarle Corp. | (10,300) | (230) |
| Commercial Metals Co. | (18,700) | (222) |
| Ecolab, Inc. | (6,000) | (211) |
| Air Products & |
|
|
| Chemicals, Inc. | (4,100) | (206) |
| Packaging Corp. of America | (13,500) | (182) |
| International Flavors & |
|
|
| Fragrances, Inc. | (5,800) | (172) |
| Dow Chemical Co. | (10,300) | (155) |
* | Owens-Illinois, Inc. | (5,500) | (150) |
| PPG Industries, Inc. | (3,300) | (140) |
| Allegheny Technologies Inc. | (5,400) | (138) |
| United States Steel Corp. | (3,700) | (138) |
| Southern Copper Corp. |
|
|
| (U.S. Shares) | (6,500) | (104) |
| Sealed Air Corp. | (6,700) | (100) |
| E.I. du Pont |
|
|
| de Nemours & Co. | (2,600) | (66) |
| AptarGroup Inc. | (1,700) | (60) |
| International Paper Co. | (2,400) | (28) |
* | Century Aluminum Co. | (2,100) | (21) |
|
|
| (7,050) |
Telecommunication Services (–1.3%) |
|
| |
| American Tower Corp. |
|
|
| Class A | (11,600) | (340) |
* | U.S. Cellular Corp. | (6,300) | (272) |
| Telephone & Data |
|
|
| Systems, Inc. | (7,300) | (232) |
* | Crown Castle |
|
|
| International Corp. | (8,500) | (149) |
|
|
| Market |
|
|
| Value• |
|
| Shares | ($000) |
| Windstream Corp. | (12,600) | (116) |
* | MetroPCS |
|
|
| Communications Inc. | (3,000) | (45) |
* | SBA Communications Corp. | (900) | (15) |
* | Sprint Nextel Corp. | (7,700) | (14) |
* | Leap Wireless |
|
|
| International, Inc. | (400) | (11) |
|
|
| (1,194) |
Utilities (–5.0%) |
|
| |
| Exelon Corp. | (21,100) | (1,173) |
| PPL Corp. | (20,100) | (617) |
| Equitable Resources, Inc. | (12,600) | (423) |
| Duke Energy Corp. | (23,100) | (347) |
| Xcel Energy, Inc. | (14,200) | (263) |
| Allegheny Energy, Inc. | (7,700) | (261) |
| DPL Inc. | (10,700) | (244) |
| Northeast Utilities | (9,700) | (233) |
| PG&E Corp. | (6,000) | (232) |
| Ameren Corp. | (6,600) | (220) |
| AGL Resources Inc. | (6,200) | (194) |
| Integrys Energy Group, Inc. | (2,100) | (90) |
* | Reliant Energy, Inc. | (15,200) | (88) |
| Great Plains Energy, Inc. | (3,700) | (72) |
| Dominion Resources, Inc. | (1,200) | (43) |
| FirstEnergy Corp. | (200) | (10) |
|
|
| (4,510) |
Total Common Stocks Sold Short |
|
| |
(Proceeds $88,353) |
| (76,294) | |
Temporary Cash Investments (16.5%)1 |
|
| |
Money Market Fund (16.4%) |
|
| |
2 | Vanguard Market Liquidity |
|
|
| Fund, 1.378% | 14,684,223 | 14,684 |
|
|
|
|
|
| Face Amount |
|
|
| ($000) |
|
U.S. Agency Obligation (0.1%) |
|
| |
3 | Federal Home Loan |
|
|
| Mortgage Corp. |
|
|
4 | 1.205%, 3/23/09 | 100 | 100 |
Total Temporary Cash Investments |
|
| |
(Cost $14,784) |
| 14,784 | |
† Other Assets and Liabilities— |
|
| |
Net (74.4%) |
| 66,842 | |
Net Assets (100%) |
| 89,780 | |
19
Market Neutral Fund
| Market |
| Value• |
| ($000) |
Statement of Assets and Liabilities |
|
Assets |
|
Investment in Securities, |
|
Long Positions at Value |
|
Common Stocks | 84,448 |
Temporary Cash Investments | 14,784 |
Cash Deposited with Broker for |
|
Short Positions | 66,726 |
Receivables for Investment |
|
Securities Sold | 3,511 |
Receivables for Capital Shares Issued | 1,433 |
Other Assets | 215 |
Total Assets | 171,117 |
Liabilities |
|
Securities Sold Short, at Value | 76,294 |
Payables for Investment |
|
Securities Purchased | 4,649 |
Other Liabilities | 394 |
Total Liabilities | 81,337 |
Net Assets (100%) | 89,780 |
At December 31, 2008, net assets consisted of: | |
| Amount |
| ($000) |
Paid-in Capital | 100,625 |
Undistributed Net Investment Income | 52 |
Accumulated Net Realized Losses | (5,745) |
Unrealized Appreciation (Depreciation) |
|
Investment Securities—Long Positions | (17,206) |
Investment Securities Sold Short | 12,059 |
Futures Contracts | (5) |
Net Assets | 89,780 |
|
|
Investor Shares—Net Assets |
|
Applicable to 6,612,731 outstanding |
|
$.001 par value shares of beneficial |
|
interest (unlimited authorization) | 72,512 |
Net Asset Value Per Share— |
|
Investor Shares | $10.97 |
|
|
Institutional Shares—Net Assets |
|
Applicable to 1,583,955 outstanding |
|
$.001 par value shares of beneficial |
|
interest (unlimited authorization) | 17,268 |
Net Asset Value Per Share— |
|
Institutional Shares | $10.90 |
• | See Note A in Notes to Financial Statements. |
* Non-income-producing security.
† Long security positions with a value of $63,568,000 and cash of $66,726,000 have been segregated in connection with securities sold short.
1 After giving effect to futures investments, the fund’s effective common stocks sold short position represents –85.2% of net assets.
2 Affiliated money market fund available only to Vanguard funds and certain trusts and accounts managed by Vanguard. Rate shown is the 7-day yield.
3 The issuer operates under a congressional charter; its securities are neither issued nor guaranteed by the U.S. government.
4 Securities with a value of $100,000 have been segregated as initial margin for open futures contracts.
See accompanying Notes, which are an integral part of the Financial Statements.
20
Market Neutral Fund
Statement of Operations
| April 1, |
|
| 2008, to | Year Ended |
| Dec. 31, | March 31, |
| 20081 | 2008 |
| ($000) | ($000) |
Investment Income |
|
|
Income |
|
|
Dividends | 1,318 | 333 |
Interest2 | 933 | 926 |
Total Income | 2,251 | 1,259 |
Expenses |
|
|
Investment Advisory Fees—Note B |
|
|
Basic Fee | 170 | 150 |
Performance Adjustment | (12) | — |
The Vanguard Group—Note C |
|
|
Management and Administrative—Investor Shares | 20 | 3 |
Management and Administrative—Institutional Shares | 1 | — |
Marketing and Distribution—Investor Shares | 10 | — |
Marketing and Distribution—Institutional Shares | 2 | — |
Fund Accounting and Administrative Fees—Note D | — | 69 |
Transfer Agency Fees—Note D | — | 19 |
Sub-accounting Fees—Investor Shares—Note D | — | 9 |
Distribution and Shareholder Service Fees—Investor Shares—Note D | — | 15 |
Custodian Fees | 62 | 7 |
Auditing Fees | 55 | 40 |
Shareholders’ Reports—Investor Shares | 3 | 5 |
Shareholders’ Reports—Institutional Shares | — | 1 |
Trustees’ Fees and Expenses | — | 6 |
Dividend Expense on Securities Sold Short | 1,143 | 375 |
Total Expenses | 1,454 | 699 |
Expense Waivers and Reimbursements—Note D | — | (78) |
Net Expenses | 1,454 | 621 |
Net Investment Income | 797 | 638 |
Realized Net Gain (Loss) |
|
|
Investment Securities—Long Positions | (21,819) | 2,190 |
Investment Securities Sold Short | 20,201 | (131) |
Futures Contracts | 584 | — |
Realized Net Gain (Loss) | (1,034) | 2,059 |
Change in Unrealized Appreciation (Depreciation) |
|
|
Investment Securities—Long Positions | (16,353) | (3,455) |
Investment Securities Sold Short | 9,891 | 2,164 |
Futures Contracts | (5) | — |
Change in Unrealized Appreciation (Depreciation) | (6,467) | (1,291) |
Net Increase (Decrease) in Net Assets Resulting from Operations | (6,704) | 1,406 |
1 The fund’s fiscal year-end changed from March 31 to December 31, effective December 31, 2008. 2 Interest income from an affiliated company of the fund was $121,000 and $40,000.
See accompanying Notes, which are an integral part of the Financial Statements.
21
Market Neutral Fund
Statement of Changes in Net Assets
| April 1, 2008, to | Year Ended | Year Ended | |
| December 31, | March 31, | March 31, | |
| 20081 | 2008 | 2007 | |
| ($000) | ($000) | ($000) | |
Increase (Decrease) in Net Assets |
|
|
| |
Operations |
|
|
| |
Net Investment Income | 797 | 638 | 993 | |
Realized Net Gain (Loss) | (1,034) | 2,059 | 594 | |
Change in Unrealized Appreciation (Depreciation) | (6,467) | (1,291) | (363) | |
Net Increase (Decrease) in Net Assets |
|
|
| |
Resulting from Operations | (6,704) | 1,406 | 1,224 | |
Distributions |
|
|
| |
Net Investment Income |
|
|
| |
Investor Shares | (819) | (344) | (405) | |
Institutional Shares | (187) | (206) | (606) | |
Realized Capital Gain2 |
|
|
| |
Investor Shares | (3,716) | (200) | — | |
Institutional Shares | (861) | (112) | — | |
Total Distributions | (5,583) | (862) | (1,011) | |
Capital Share Transactions |
|
|
| |
Investor Shares | 37,746 | 35,479 | (2,689) | |
Institutional Shares | 7,271 | 1,704 | (9,469) | |
Net Increase (Decrease) from Capital Share Transactions | 45,017 | 37,183 | (12,158) | |
Total Increase (Decrease) | 32,730 | 37,727 | (11,945) | |
Net Assets |
|
|
| |
Beginning of Period | 57,050 | 19,323 | 31,268 | |
End of Period3 | 89,780 | 57,050 | 19,323 | |
1 The fund’s fiscal year-end changed from March 31 to December 31, effective December 31, 2008.
2 Includes short-term gain distributions totaling $4,163,000 and $0, for fiscal periods ended December 31, 2008, and March 31, 2008, respectively. Short-term gain distributions are treated as ordinary income dividends for tax purposes.
3 Net Assets—End of Period includes undistributed net investment income of $52,000, $244,000, and $153,000.
See accompanying Notes, which are an integral part of the Financial Statements.
22
Market Neutral Fund
Financial Highlights
Investor Shares |
|
|
|
|
|
|
| April 1, |
|
|
|
|
|
| 2008, to |
|
|
|
|
|
For a Share Outstanding | Dec. 31, | Year Ended March 31, | ||||
Throughout Each Period | 20081 | 20082 | 2007 | 2006 | 2005 | 2004 |
Net Asset Value, Beginning of Period | $12.45 | $12.19 | $12.12 | $11.46 | $10.86 | $11.61 |
Investment Operations |
|
|
|
|
|
|
Net Investment Income (Loss) | .084 | .3113 | .500 | .220 | (.040)3 | (.100)3 |
Net Realized and Unrealized Gain |
|
|
|
|
|
|
(Loss) on Investments | (.838) | .909 | .060 | .590 | .640 | (.650) |
Total from Investment Operations | (.754) | 1.220 | .560 | .810 | .600 | (.750) |
Distributions |
|
|
|
|
|
|
Dividends from Net Investment Income | (.132) | (.607) | (.490) | (.150) | — | — |
Distributions from Realized Capital Gains | (.594) | (.353) | — | — | — | — |
Total Distributions | (.726) | (.960) | (.490) | (.150) | — | — |
Net Asset Value, End of Period | $10.97 | $12.45 | $12.19 | $12.12 | $11.46 | $10.86 |
|
|
|
|
|
|
|
Total Return4 | –6.11% | 10.15% | 4.68% | 7.09% | 5.52% | –6.46% |
|
|
|
|
|
|
|
Ratios/Supplemental Data |
|
|
|
|
|
|
Net Assets, End of Period (Millions) | $73 | $45 | $9 | $12 | $13 | $9 |
Ratio of Expenses to |
|
|
|
|
|
|
Average Net Assets |
|
|
|
|
|
|
Based on Total Expenses | 2.13%5 | 3.09% | 3.46% | 3.31% | 3.55% | 3.51% |
Net of Expenses Waived/Reimbursed2 | 2.13%5 | 2.79% | 2.98% | 3.02% | 3.26% | 3.12% |
Net of Expenses Waived/Reimbursed |
|
|
|
|
|
|
and Dividend Expense on |
|
|
|
|
|
|
Securities Sold Short | 0.46%5 | 1.16% | 1.54% | 1.59% | 1.61% | 1.55% |
Ratio of Net Investment Income (Loss) |
|
|
|
|
|
|
to Average Net Assets | 1.15%5 | 2.69% | 3.40% | 2.14% | (0.33%) | (0.93%) |
Portfolio Turnover Rate | 161% | 214% | 169% | 213% | 180% | 189% |
1 The fund’s fiscal year-end changed from March 31 to December 31, effective December 31, 2008.
2 Laudus Rosenberg U.S. Large/Mid Capitalization Long/Short Equity Fund reorganized into Vanguard Market Neutral Fund effective
December 1, 2007. For periods prior to December 1, 2007, the fund’s advisor and other service providers had agreed to waive or reimburse certain of the fund’s expenses.
3 Calculated based on average shares outstanding.
4 Total returns do not reflect the 2% fee assessed until November 30, 2007, on redemptions of shares purchased within 30 days; the 1% fee assessed beginning December 1, 2007, on redemptions of shares held less than one year; or the account service fee that may be applicable to certain accounts with balances below $10,000.
5 Annualized.
See accompanying Notes, which are an integral part of the Financial Statements.
23
Market Neutral Fund
Financial Highlights
Institutional Shares |
|
|
|
|
|
|
| April 1, |
|
|
|
|
|
| 2008, to |
|
|
|
|
|
For a Share Outstanding | Dec. 31, | Year Ended March 31, | ||||
Throughout Each Period | 20081 | 20082 | 2007 | 2006 | 2005 | 2004 |
Net Asset Value, Beginning of Period | $12.39 | $12.14 | $12.08 | $11.44 | $10.80 | $11.51 |
Investment Operations |
|
|
|
|
|
|
Net Investment Income (Loss) | .085 | .3903 | .600 | .250 | (.010)3 | (.060)3 |
Net Realized and Unrealized Gain (Loss) |
|
|
|
|
|
|
on Investments | (.846) | .864 | — | .580 | .650 | (.650) |
Total from Investment Operations | (.761) | 1.254 | .600 | .830 | .640 | (.710) |
Distributions |
|
|
|
|
|
|
Dividends from Net Investment Income | (.138) | (.651) | (.540) | (.190) | — | — |
Distributions from Realized Capital Gains | (.591) | (.353) | — | — | — | — |
Total Distributions | (.729) | (1.004) | (.540) | (.190) | — | — |
Net Asset Value, End of Period | $10.90 | $12.39 | $12.14 | $12.08 | $11.44 | $10.80 |
|
|
|
|
|
|
|
Total Return4 | –6.20% | 10.49% | 4.98% | 7.29% | 5.93% | –6.17% |
|
|
|
|
|
|
|
Ratios/Supplemental Data |
|
|
|
|
|
|
Net Assets, End of Period (Millions) | $17 | $12 | $10 | $20 | $12 | $20 |
Ratio of Expenses to |
|
|
|
|
|
|
Average Net Assets |
|
|
|
|
|
|
Based on Total Expenses | 2.08%5 | 2.97% | 3.07% | 3.01% | 3.23% | 3.22% |
Net of Expenses Waived/Reimbursed2 | 2.08%5 | 2.56% | 2.67% | 2.71% | 2.94% | 2.82% |
Net of Expenses Waived/Reimbursed |
|
|
|
|
|
|
and Dividend Expense on Securities |
|
|
|
|
|
|
Sold Short | 0.41%5 | 0.93% | 1.24% | 1.24% | 1.24% | 1.25% |
Ratio of Net Investment Income (Loss) |
|
|
|
|
|
|
to Average Net Assets | 1.20%5 | 2.92% | 3.68% | 2.50% | (0.13%) | (0.57%) |
Portfolio Turnover Rate | 161% | 214% | 169% | 213% | 180% | 189% |
1 The fund’s fiscal year-end changed from March 31 to December 31, effective December 31, 2008.
2 Laudus Rosenberg U.S. Large/Mid Capitalization Long/Short Equity Fund reorganized into Vanguard Market Neutral Fund effective
December 1, 2007. For periods prior to December 1, 2007, the fund’s advisor and other service providers had agreed to waive or reimburse certain of the fund’s expenses.
3 Calculated based on average shares outstanding.
4 Total returns do not reflect the 2% fee assessed until November 30, 2007, on redemptions of shares purchased within 30 days or the 1% fee assessed beginning December 1, 2007, on redemptions of shares held less than one year.
5 Annualized.
See accompanying Notes, which are an integral part of the Financial Statements.
24
Market Neutral Fund
Notes to Financial Statements
Vanguard Market Neutral Fund is registered under the Investment Company Act of 1940 as an open-end investment company, or mutual fund. The fund offers two classes of shares, Investor Shares and Institutional Shares. Investor Shares are available to any investor who meets the fund’s minimum purchase requirements. Institutional Shares are designed for investors who meet certain administrative and service criteria and invest a minimum of $5 million.
In September 2008, the fund’s board of trustees approved changing the fund’s fiscal year-end from March 31 to December 31, effective December 31, 2008.
A. The following significant accounting policies conform to generally accepted accounting principles for U.S. mutual funds. The fund consistently follows such policies in preparing its financial statements.
1. Security Valuation: Securities are valued as of the close of trading on the New York Stock Exchange (generally 4 p.m., Eastern time) on the valuation date. Equity securities are valued at the latest quoted sales prices or official closing prices taken from the primary market in which each security trades; such securities not traded on the valuation date are valued at the mean of the latest quoted bid and asked prices. Securities for which market quotations are not readily available, or whose values have been affected by events occurring before the fund’s pricing time but after the close of the securities’ primary markets, are valued at their fair values calculated according to procedures adopted by the board of trustees. These procedures include obtaining quotations from an independent pricing service, monitoring news to identify significant market- or security-specific events, and evaluating changes in the values of foreign market proxies (for example, ADRs, futures contracts, or exchange-traded funds), between the time the foreign markets close and the fund’s pricing time. When fair-value pricing is employed, the prices of securities used by a fund to calculate its net asset value may differ from quoted or published prices for the same securities. Investments in Vanguard Market Liquidity Fund are valued at that fund’s net asset value. Temporary cash investments acquired over 60 days to maturity are valued using the latest bid prices or using valuations based on a matrix system (which considers such factors as security prices, yields, maturities, and ratings), both as furnished by independent pricing services. Other temporary cash investments are valued at amortized cost, which approximates market value.
2. Short Sales: Short sales are the sales of securities that the fund does not own. The fund may sell a security it does not own in anticipation of a decline in the value of that security. In order to deliver the security to the purchaser, the fund borrows the security from a broker-dealer. The fund must segregate, as collateral for its obligation to return the borrowed security, an amount of cash and long security positions at least equal to the market value of the security sold short. The fund later closes out the position by returning the security to the lender, typically by purchasing the security in the open market. A gain, limited to the price at which the fund sold the security short, or a loss, theoretically unlimited in size, is recognized upon the termination of the short sale. Dividends on securities sold short are reported as an expense in the Statement of Operations.
Cash collateral segregated for securities sold short is recorded as an asset in the Statement of Assets and Liabilities. Long security positions segregated as collateral are shown in the Statement of Net Assets.
3. Futures Contracts: The fund uses index futures contracts to a limited extent, with the objective of limiting exposure to general stock market risk while maintaining liquidity. The fund may purchase or sell futures contracts to achieve a desired level of investment, whether to accommodate portfolio turnover or cash flows from capital share transactions. The primary risks associated with the use of futures contracts are imperfect correlation between changes in market values of stocks held by the fund and the prices of futures contracts, and the possibility of an illiquid market.
25
Market Neutral Fund
Futures contracts are valued at their quoted daily settlement prices. The aggregate principal amounts of the contracts are not recorded in the Statement of Net Assets. Fluctuations in the value of the contracts are recorded in the Statement of Net Assets as an asset (liability) and in the Statement of Operations as unrealized appreciation (depreciation) until the contracts are closed, when they are recorded as realized futures gains (losses).
4. Federal Income Taxes: The fund intends to continue to qualify as a regulated investment company and distribute all of its taxable income. Management has analyzed the fund’s tax positions taken on federal income tax returns for all open tax years (tax years ended March 31, 2005–2008) and for the period ended December 31, 2008, and has concluded that no provision for federal income tax is required in the fund’s financial statements.
5. Distributions: Distributions to shareholders are recorded on the ex-dividend date.
6. Other: Dividend income (or dividend expense on short positions) is recorded on the ex-dividend date. Interest income includes income distributions received from Vanguard Market Liquidity Fund and is accrued daily. Security transactions are accounted for on the date securities are bought or sold. Costs used to determine realized gains (losses) on the sale of investment securities are those of the specific securities sold. Fees assessed on redemptions of capital shares are credited to paid-in capital.
Each class of shares has equal rights as to assets and earnings, except that each class separately bears certain class-specific expenses related to maintenance of shareholder accounts (included in Management and Administrative expenses) and shareholder reporting. Marketing and distribution expenses are allocated to each class of shares based on a method approved by the board of trustees. Income, other non-class-specific expenses, and gains and losses on investments are allocated to each class of shares based on its relative net assets.
B. Effective December 1, 2007, AXA Rosenberg Investment Management LLC (AXA) provides investment advisory services to a portion of the fund for a fee calculated at an annual percentage rate of average net assets managed by the advisor. The basic fee is subject to quarterly adjustments based on performance since December 31, 2007, relative to the Citigroup 3-Month Treasury Bill Index.
For the period March 31, 2007, through November 30, 2007, Charles Schwab Investment Management, Inc. (CSIM) provided investment advisory services to the fund. CSIM, not the fund, paid AXA, the fund’s sub-advisor, a portion of the fee it received for portfolio management services.
Effective December 1, 2007, The Vanguard Group provides investment advisory services to a portion of the fund on an at-cost basis.
For the period ended December 31, 2008, the aggregate investment advisory fee represented an effective annual rate of 0.25% of the fund’s average net assets, before a decrease of $12,000 (0.02%) based on performance. For the year ended March 31, 2008, the aggregate investment advisory fee represented an effective annual rate of 0.65% of the fund’s average net assets.
C. Effective December 1, 2007, The Vanguard Group furnishes at cost corporate management, administrative, marketing, and distribution services. The costs of such services are allocated to the fund under methods approved by the board of trustees. The fund has committed to provide up to 0.40% of its net assets in capital contributions to Vanguard. At December 31, 2008, the fund had contributed capital of $26,000 to Vanguard (included in Other Assets), representing 0.03% of the fund’s net assets and 0.01% of Vanguard’s capitalization. The fund’s trustees and officers are also directors and officers of Vanguard.
26
Market Neutral Fund
D. Prior to December 1, 2007, CSIM contractually agreed to reimburse the fund for certain expenses to limit Investor Shares’ and Institutional Shares’ annual expenses (excluding dividends on securities sold short) to 1.54% and 1.24%, respectively, of average net assets. Accordingly, CSIM waived $72,000 of its fee for the period April 1, 2007, to November 30, 2007.
Prior to December 1, 2007, State Street Bank & Trust Company provided fund accounting and certain administrative services to the fund. ALPS Distributors, Inc., provided distribution and shareholder services to the fund’s Investor Shares under a plan adopted in accordance with Rule 12b-1 under the Investment Company Act of 1940. Boston Financial Data Services, Inc., provided transfer agent services to the fund and sub-accounting services to the Investor Shares. For the period April 1, 2007, to November 30, 2007, CSIM reimbursed the Investor Shares $6,000 for sub-accounting services.
E. Distributions are determined on a tax basis and may differ from net investment income and realized capital gains for financial reporting purposes. Differences may be permanent or temporary. Permanent differences are reclassified among capital accounts in the financial statements to reflect their tax character. Temporary differences arise when certain items of income, expense, gain, or loss are recognized in different periods for financial statement and tax purposes; these differences will reverse at some time in the future. Differences in classification may also result from the treatment of short-term gains as ordinary income for tax purposes.
For tax purposes, at December 31, 2008, the fund had $80,000 of ordinary income available for distribution. For federal tax purposes, capital gains required to be distributed in December 2008 included net gains realized through October 31, 2008. Subsequently, the fund realized capital losses of $3,175,000 which are available to offset future net capital gains.
The fund had realized losses totaling $2,452,000 through December 31, 2008, which are deferred for tax purposes and reduce the amount of unrealized appreciation on investment securities for tax purposes.
At December 31, 2008, the cost of long security positions for tax purposes was $118,436,000. Net unrealized depreciation of long security positions for tax purposes was $19,204,000, consisting of unrealized gains of $2,354,000 on securities that had risen in value since their purchase and $21,558,000 in unrealized losses on securities that had fallen in value since their purchase. Tax-basis net unrealized appreciation on securities sold short was $11,473,000, consisting of unrealized gains of $15,462,000 on securities that had fallen in value since their sale and $3,989,000 in unrealized losses on securities that had risen in value since their sale.
At December 31, 2008, the aggregate settlement value of open futures contracts expiring in March 2009 and the related unrealized appreciation (depreciation) were:
|
|
| ($000) |
| Number of | Aggregate | Unrealized |
| Long (Short) | Settlement | Appreciation |
Futures Contracts | Contracts | Value | (Depreciation) |
E-mini S&P 500 Index | (4) | 180 | (5) |
Unrealized appreciation (depreciation) on open futures contracts is required to be treated as realized gain (loss) for tax purposes.
F. During the period ended December 31, 2008, the fund purchased $204,278,000 of investment securities and sold $133,694,000 of investment securities, other than temporary cash investments. The proceeds of short sales and the cost of purchases to cover short sales were $233,076,000 and $197,136,000 respectively.
27
Market Neutral Fund
G. Capital share transactions for each class of shares were:
| April 1, 2008, to |
| Year Ended | Year Ended | ||
| December 31, 20081 | March 31, 2008 | March 31, 2007 | |||
| Amount | Shares | Amount | Shares | Amount | Shares |
| ($000) | (000) | ($000) | (000) | ($000) | (000) |
Investor Shares |
|
|
|
|
|
|
Issued | 63,080 | 5,143 | 42,479 | 3,395 | 6,488 | 528 |
Issued in Lieu of Cash Distributions | 4,119 | 370 | 436 | 36 | 378 | 31 |
Redeemed2 | (29,453) | (2,488) | (7,436) | (593) | (9,555) | (779) |
Net Increase (Decrease)— |
|
|
|
|
|
|
Investor Shares | 37,746 | 3,025 | 35,479 | 2,838 | (2,689) | (220) |
Institutional Shares |
|
|
|
|
|
|
Issued | 8,972 | 726 | 9,106 | 742 | 4,377 | 359 |
Issued in Lieu of Cash Distributions | 1,046 | 95 | 318 | 26 | 597 | 49 |
Redeemed2 | (2,747) | (235) | (7,720) | (608) | (14,443) | (1,185) |
Net Increase (Decrease)— |
|
|
|
|
|
|
Institutional Shares | 7,271 | 586 | 1,704 | 160 | (9,469) | (777) |
H. In September 2006, the Financial Accounting Standards Board issued Statement of Financial Accounting Standards No. 157 (“FAS 157”), “Fair Value Measurements.” FAS 157 establishes a framework for measuring fair value and expands disclosures about fair value measurements in financial statements.
The various inputs that may be used to determine the value of the fund’s investments are summarized in three broad levels. The inputs or methodologies used for valuing securities are not necessarily an indication of the risk associated with investing in those securities.
Level 1—Quoted prices in active markets for identical securities.
Level 2—Other significant observable inputs (including quoted prices for similar securities, interest rates, prepayment speeds, credit risk, etc.).
Level 3—Significant unobservable inputs (including the fund’s own assumptions used to determine the fair value of investments).
The following table summarizes the fund’s investments as of December 31, 2008, based on the inputs used to value them:
| Investments in Securities ($000) | Futures | |
| Long | Short | Contracts |
Valuation Inputs | Positions | Positions | ($000) |
Level 1—Quoted prices | 99,132 | (76,294) | (5) |
Level 2—Other significant observable inputs | 100 | — | — |
Level 3—Significant unobservable inputs | — | — | — |
Total | 99,232 | (76,294) | (5) |
1 The fund’s fiscal year-end changed from March 31 to December 31, effective December 31, 2008. 2 Net of redemption fees of $5,000, $4,000, and $9,000 (fund totals).
28
Report of Independent Registered Public Accounting Firm
To the Trustees of Vanguard Montgomery Funds and the Shareholders of Vanguard Market Neutral Fund:
In our opinion, the accompanying statement of net assets and the statement of assets and liabilities and the related statements of operations and of changes in net assets and the financial highlights present fairly, in all material respects, the financial position of Vanguard Market Neutral Fund (formerly Laudus Rosenberg U.S. Large/Mid Capitalization Long/Short Equity Fund, hereafter referred to as the “Fund”) at December 31, 2008, the results of its operations for the period April 1, 2008 to December 31, 2008 and for the year ending March 31, 2008, the changes in its net assets for the period April 1, 2008 to December 31, 2008 and for each of the two years in the period ended March 31, 2008 and the financial highlights for the period April 1, 2008 to December 31, 2008 and for each of the five years in the period ended March 31, 2008, in conformity with accounting principles generally accepted in the United States of America. These financial statements and financial highlights (hereafter referred to as “financial statements”) are the responsibility of the Fund’s management; our responsibility is to express an opinion on these financial statements based on our audits. We conducted our audits of these financial statements in accordance with the standards of the Public Company Accounting Oversight Board (United States). Those standards require that we plan and perform the audit to obtain reasonable assurance about whether the financial statements are free of material misstatement. An audit includes examining, on a test basis, evidence supporting the amounts and disclosures in the financial statements, assessing the accounting principles used and significant estimates made by management, and evaluating the overall financial statement presentation. We believe that our audits, which included confirmation of securities at December 31, 2008 by correspondence with the custodian and brokers, and by agreement to the underlying ownership records for Vanguard Market Liquidity Fund, provide a reasonable basis for our opinion.
PricewaterhouseCoopers LLP
Philadelphia, Pennsylvania
February 23, 2009
Special 2008 tax information (unaudited) for Vanguard Market Neutral Fund |
This information for the period April 1, 2008, through December 31, 2008, is included pursuant to provisions of the Internal Revenue Code.
The fund distributed $415,000 as capital gain dividends (from net long-term capital gains) to shareholders during the fiscal period.
For nonresident alien shareholders, 100% of short-term capital gain dividends distributed by the fund are qualified short-term capital gains.
The fund distributed $1,348,000 of qualified dividend income to shareholders during the fiscal period.
For corporate shareholders, 24.9% of investment income (dividend income plus short-term gains, if any) qualifies for the dividends-received deduction.
29
Your Fund’s After-Tax Returns
This table presents returns for your fund both before and after taxes. The after-tax returns are shown in two ways: (1) assuming that an investor owned the fund during the entire period and paid taxes on the fund’s distributions, and (2) assuming that an investor paid taxes on the fund’s distributions and sold all shares at the end of each period.
Calculations are based on the highest individual federal income tax and capital gains tax rates in effect at the times of the distributions and the hypothetical sales. State and local taxes were not considered. After-tax returns reflect any qualified dividend income. (In the example, returns after the sale of fund shares may be higher than those assuming no sale. This occurs when the sale would have produced a capital loss. The calculation assumes that the investor received a tax deduction for the loss.)
The table shows returns for Investor Shares only; returns for other share classes will differ. Please note that your actual after-tax returns will depend on your tax situation and may differ from those shown. Also note that if you own the fund in a tax-deferred account, such as an individual retirement account or a 401(k) plan, this information does not apply to you. Such accounts are not subject to current taxes.
Finally, keep in mind that a fund’s performance—whether before or after taxes—does not guarantee future results.
Average Annual Total Returns: Market Neutral Fund Investor Shares1 | |||
Periods Ended December 31, 2008 |
|
|
|
| One | Five | Ten |
| Year | Years | Years |
Returns Before Taxes | –8.24% | 4.66% | 3.68% |
Returns After Taxes on Distributions | –9.87 | 3.57 | 2.60 |
Returns After Taxes on Distributions and Sale of Fund Shares | –4.99 | 3.50 | 2.56 |
1 Total returns do not reflect the 2% fee assessed until November 30, 2007, on redemptions of shares purchased within 30 days or the 1% fee assessed beginning December 1, 2007, on redemptions of shares held less than one year.
30
About Your Fund’s Expenses
As a shareholder of the fund, you incur ongoing costs, which include costs for portfolio management, administrative services, and shareholder reports (like this one), among others. Operating expenses, which are deducted from a fund’s gross income, directly reduce the investment return of the fund.
A fund’s expenses are expressed as a percentage of its average net assets. This figure is known as the expense ratio. The following examples are intended to help you understand the ongoing costs (in dollars) of investing in your fund and to compare these costs with those of other mutual funds. The examples are based on an investment of $1,000 made at the beginning of the period shown and held for the entire period.
The accompanying table illustrates your fund’s costs in two ways:
• Based on actual fund return. This section helps you to estimate the actual expenses that you paid over the period. The “Ending Account Value” shown is derived from the fund’s actual return, and the third column shows the dollar amount that would have been paid by an investor who started with $1,000 in the fund. You may use the information here, together with the amount you invested, to estimate the expenses that you paid over the period.
To do so, simply divide your account value by $1,000 (for example, an $8,600 account value divided by $1,000 = 8.6), then multiply the result by the number given for your fund under the heading “Expenses Paid During Period.”
• Based on hypothetical 5% yearly return. This section is intended to help you compare your fund’s costs with those of other mutual funds. It assumes that the fund had a yearly return of 5% before expenses, but that the expense ratio is unchanged. In this case—because the return used is not the fund’s actual return—the results do not apply to your investment. The example is useful in making comparisons because the Securities and Exchange Commission requires all mutual funds to calculate expenses based on a 5% return. You can assess your fund’s costs by comparing this hypothetical example with the hypothetical examples that appear in shareholder reports of other funds.
Six Months Ended December 31, 2008 |
|
|
|
| Beginning | Ending | Expenses |
| Account Value | Account Value | Paid During |
Market Neutral Fund | 6/30/2008 | 12/31/2008 | Period1 |
Based on Actual Fund Return |
|
|
|
Investor Shares | $1,000.00 | $927.01 | $10.39 |
Institutional Shares | 1,000.00 | 926.95 | 10.30 |
Based on Hypothetical 5% Yearly Return |
|
|
|
Investor Shares | $1,000.00 | $1,014.42 | $10.87 |
Institutional Shares | 1,000.00 | 1,014.52 | 10.76 |
Note that the expenses shown in the table are meant to highlight and help you compare ongoing costs only and do not reflect transaction costs incurred by the fund for buying and selling securities. Further, the expenses do not include the 1% fee assessed on redemptions of shares held for less than one year.
1 The calculations are based on expenses incurred in the most recent six-month period. The fund’s annualized six-month expense ratios for that period are 2.14% for Investor Shares and 2.12% for Institutional Shares. The dollar amounts shown as “Expenses Paid” are equal to the annualized expense ratio multiplied by the average account value over the period, multiplied by the number of days in the most recent six-month period, then divided by the number of days in the most recent 12-month period.
31
The calculations assume no shares were bought or sold during the period. Your actual costs may have been higher or lower, depending on the amount of your investment and the timing of any purchases or redemptions.
You can find more information about the fund’s expenses, including annual expense ratios, in the Financial Statements section of this report. For additional information on operating expenses and other shareholder costs, please refer to your fund’s current prospectus.
32
Trustees Approve Advisory Agreement
The board of trustees of Vanguard Market Neutral Fund has renewed the fund’s investment advisory agreement with AXA Rosenberg Investment Management LLC (AXA Rosenberg). The board determined that renewing the fund’s advisory agreement with AXA Rosenberg was in the best interests of the fund and its shareholders. The board previously approved the fund’s investment advisory arrangement with The Vanguard Group, Inc.; please see the fund’s annual report dated March 31, 2008, for more information.
The board based its decision upon an evaluation of the advisor’s investment staff, portfolio management process, and performance. The trustees considered the factors discussed below, among others. However, no single factor determined whether the board approved the agreement. Rather, it was the totality of the circumstances that drove the board’s decision.
Nature, extent, and quality of services
The board considered the quality of the fund’s investment management over both the short and long term, and took into account the organizational depth and stability of the firm. The board noted that AXA Rosenberg, founded in 1985, is an independently operated subsidiary of the AXA Group. The firm employs an investment philosophy grounded in fundamental analysis using a two-part quantitative model: a valuation model and an earnings forecast model. The valuation model compares the current stock price with its fair value calculated through an independent asset appraisal. The earnings forecast model uses a mix of fundamental indicators and market data to identify companies that are likely to have superior year-ahead earnings. The two models are combined to develop an individual predicted return for each company. This process results in an optimized portfolio with little exposure to equity market risk, long positions in companies that are expected to outperform, and short positions in companies that are expected to underperform.
The board concluded that AXA Rosenberg’s experience, stability, depth, and performance, among other factors, warranted renewal of the advisory agreement.
Investment performance
The board considered the short- and long-term performance of the fund, including any periods of outperformance or underperformance of a relevant benchmark and peer group. The board concluded that the advisor has carried out the fund’s investment strategy in disciplined fashion, and that performance results have been strong. Information about the fund’s most recent performance can be found in the Performance Summary section of this report.
Cost
The board concluded that the fund’s expense ratio was far below the average expense ratio charged by funds in its peer group. The board noted that the fund’s advisory fee rate was also well below the peer-group average. Information about the fund’s expense ratio appears in the About Your Fund’s Expenses section of this report as well as in the Financial Statements section, which also includes information about the advisory fee rate. The board did not consider profitability of AXA Rosenberg in determining whether to approve the advisory fee, because AXA Rosenberg is independent of Vanguard, and the advisory fee is the result of arm’s-length negotiations.
The benefit of economies of scale
The board concluded that the fund’s shareholders benefit from economies of scale because of breakpoints in AXA Rosenberg’s advisory fee schedule. The breakpoints reduce the effective rate of the fee as the fund’s assets managed by AXA Rosenberg increase.
The board will consider whether to renew the advisory agreement again after a one-year period.
33
Glossary
Beta. A measure of the magnitude of a fund’s past share-price fluctuations in relation to the ups and downs of a given market index. The index is assigned a beta of 1.00. Compared with a given index, a fund with a beta of 1.20 typically would have seen its share price rise or fall by 12% when the index rose or fell by 10%. For this report, beta is based on returns over the past 36 months for both the fund and the index. Note that a fund’s beta should be reviewed in conjunction with its R-squared (see definition below). The lower the R-squared, the less correlation there is between the fund and the index, and the less reliable beta is as an indicator of volatility.
Earnings Growth Rate. The average annual rate of growth in earnings over the past five years for the stocks now in a fund.
Equity Exposure. A measure that reflects a fund’s investments in stocks and stock futures. Any holdings in short-term reserves are excluded.
Expense Ratio. The percentage of a fund’s average net assets used to pay its annual administrative and advisory expenses. These expenses directly reduce returns to investors.
Foreign Holdings. The percentage of a fund represented by stocks or depositary receipts of companies based outside the United States.
Inception Date. The date on which the assets of a fund (or one of its share classes) are first invested in accordance with the fund’s investment objective. For funds with a subscription period, the inception date is the day after that period ends. Investment performance is measured from the inception date.
Median Market Cap. An indicator of the size of companies in which a fund invests; the midpoint of market capitalization (market price x shares outstanding) of a fund’s stocks, weighted by the proportion of the fund’s assets invested in each stock. Stocks representing half of the fund’s assets have market capitalizations above the median, and the rest are below it.
Price/Book Ratio. The share price of a stock divided by its net worth, or book value, per share. For a fund, the weighted average price/book ratio of the stocks it holds.
Price/Earnings Ratio. The ratio of a stock’s current price to its per-share earnings over the past year. For a fund, the weighted average P/E of the stocks it holds. P/E is an indicator of market expectations about corporate prospects; the higher the P/E, the greater the expectations for a company’s future growth.
R-Squared. A measure of how much of a fund’s past returns can be explained by the returns from the market in general, as measured by a given index. If a fund’s total returns were precisely synchronized with an index’s returns, its R-squared would be 1.00. If the fund’s returns bore no relationship to the index’s returns, its R-squared would be 0. For this report, R-squared is based on returns over the past 36 months for both the fund and the index.
Return on Equity. The annual average rate of return generated by a company during the past five years for each dollar of shareholder’s equity (net income divided by shareholder’s equity). For a fund, the weighted average return on equity for the companies whose stocks it holds.
Short-Term Reserves. The percentage of a fund invested in highly liquid, short-term securities that can be readily converted to cash.
34
Turnover Rate. An indication of the fund’s trading activity. Funds with high turnover rates incur higher transaction costs and may be more likely to distribute capital gains (which may be taxable to investors). The turnover rate excludes in-kind transactions, which have minimal impact on costs.
Yield. A fund’s 30-day SEC yield is derived using a formula specified by the U.S. Securities and Exchange Commission. Under the formula, data related to the fund’s security holdings in the previous 30 days are used to calculate the fund’s hypothetical net income for that period, which is then annualized and divided by the fund’s estimated average net assets over the calculation period. For the purposes of this calculation, a security’s income is based on its current market yield to maturity (in the case of bonds) or its projected dividend yield (for stocks). Because the SEC yield represents hypothetical annualized income, it will differ—at times significantly—from the fund’s actual experience. As a result, the fund’s income distributions may be higher or lower than implied by the SEC yield.
35
The People Who Govern Your Fund
The trustees of your mutual fund are there to see that the fund is operated and managed in your best interests since, as a shareholder, you are a part owner of the fund. Your fund’s trustees also serve on the board of directors of The Vanguard Group, Inc., which is owned by the Vanguard funds and provides services to them on an at-cost basis.
A majority of Vanguard’s board members are independent, meaning that they have no affiliation with Vanguard or the funds they oversee, apart from the sizable personal investments they have made as private individuals. The independent board members have distinguished backgrounds in business, academia, and public service. Each of the trustees and executive officers oversees 155 Vanguard funds.
The following table provides information for each trustee and executive officer of the fund. More information about the trustees is in the Statement of Additional Information, which can be obtained, without charge, by contacting Vanguard at 800-662-7447, or online at www.vanguard.com.
Chairman of the Board and Interested Trustee | Rajiv L. Gupta |
| Born 1945. Trustee Since December 2001.2 Principal |
| Occupation(s) During the Past Five Years: Chairman, |
John J. Brennan1 | President, and Chief Executive Officer of Rohm and |
Born 1954. Trustee Since May 1987. Chairman of | Haas Co. (chemicals); Board Member of the American |
the Board. Principal Occupation(s) During the Past Five | Chemistry Council; Director of Tyco International, Ltd. |
Years: Chairman of the Board and Director/Trustee of | (diversified manufacturing and services), since 2005. |
The Vanguard Group, Inc., and of each of the investment |
|
companies served by The Vanguard Group; Chief |
|
Executive Officer and President of The Vanguard Group | Amy Gutmann |
and of each of the investment companies served by The | Born 1949. Trustee Since June 2006. Principal |
Vanguard Group (1996–2008). | Occupation(s) During the Past Five Years: President of |
| the University of Pennsylvania since 2004; Professor in |
| the School of Arts and Sciences, Annenberg School for |
Independent Trustees | Communication, and Graduate School of Education of |
| the University of Pennsylvania since 2004; Provost |
| (2001–2004) and Laurance S. Rockefeller Professor of |
Charles D. Ellis | Politics and the University Center for Human Values |
Born 1937. Trustee Since January 2001. Principal | (1990–2004), Princeton University; Director of Carnegie |
Occupation(s) During the Past Five Years: Applecore | Corporation of New York since 2005 and of Schuylkill |
Partners (pro bono ventures in education); Senior | River Development Corporation and Greater Philadelphia |
Advisor to Greenwich Associates (international business | Chamber of Commerce since 2004; Trustee of the |
strategy consulting); Successor Trustee of Yale University; | National Constitution Center since 2007. |
Overseer of the Stern School of Business at New York |
|
University; Trustee of the Whitehead Institute for |
|
Biomedical Research. | JoAnn Heffernan Heisen |
| Born 1950. Trustee Since July 1998. Principal |
| Occupation(s) During the Past Five Years: Retired |
Emerson U. Fullwood | Corporate Vice President, Chief Global Diversity Officer, |
Born 1948. Trustee Since January 2008. Principal | and Member of the Executive Committee of Johnson & |
Occupation(s) During the Past Five Years: Retired | Johnson (pharmaceuticals/consumer products); Vice |
Executive Chief Staff and Marketing Officer for | President and Chief Information Officer (1997–2005) |
North America and Corporate Vice President of | of Johnson & Johnson; Director of the University |
Xerox Corporation (photocopiers and printers); | Medical Center at Princeton and Women’s Research |
Director of SPX Corporation (multi-industry | and Education Institute. |
manufacturing), of the United Way of Rochester, |
|
and of the Boy Scouts of America. |
|
André F. Perold | F. William McNabb III1 | |
Born 1952. Trustee Since December 2004. Principal | Born 1957. Chief Executive Officer Since August 2008. | |
Occupation(s) During the Past Five Years: George Gund | President Since March 2008. Principal Occupation(s) | |
Professor of Finance and Banking, Senior Associate | During the Past Five Years: Chief Executive Officer, | |
Dean, and Director of Faculty Recruiting, Harvard | Director, and President of The Vanguard Group, Inc., | |
Business School; Director and Chairman of UNX, Inc. | since 2008; Chief Executive Officer and President of | |
(equities trading firm); Chair of the Investment | each of the investment companies served by The | |
Committee of HighVista Strategies LLC (private | Vanguard Group since 2008; Director of Vanguard | |
investment firm) since 2005. | Marketing Corporation; Managing Director of The | |
| Vanguard Group (1995–2008). | |
|
| |
Alfred M. Rankin, Jr. |
| |
Born 1941. Trustee Since January 1993. Principal | Heidi Stam1 | |
Occupation(s) During the Past Five Years: Chairman, | Born 1956. Secretary Since July 2005. Principal | |
President, Chief Executive Officer, and Director of | Occupation(s) During the Past Five Years: Managing | |
NACCO Industries, Inc. (forklift trucks/housewares/ | Director of The Vanguard Group, Inc., since 2006; | |
lignite); Director of Goodrich Corporation (industrial | General Counsel of The Vanguard Group since 2005; | |
products/aircraft systems and services). | Secretary of The Vanguard Group and of each of the | |
| investment companies served by The Vanguard Group | |
| since 2005; Director and Senior Vice President of | |
J. Lawrence Wilson | Vanguard Marketing Corporation since 2005; Principal | |
Born 1936. Trustee Since April 1985. Principal | of The Vanguard Group (1997–2006). | |
Occupation(s) During the Past Five Years: Retired |
| |
Chairman and Chief Executive Officer of Rohm and |
| |
Haas Co. (chemicals); Director of Cummins Inc. (diesel | Vanguard Senior Management Team | |
engines) and AmerisourceBergen Corp. (pharmaceutical |
| |
distribution); Trustee of Vanderbilt University and of |
| |
Culver Educational Foundation. | R. Gregory Barton | James M. Norris |
| Mortimer J. Buckley | Ralph K. Packard |
| Kathleen C. Gubanich | Glenn W. Reed |
Executive Officers | Paul A. Heller | George U. Sauter |
| Michael S. Miller |
|
|
| |
Thomas J. Higgins1 |
| |
Born 1957. Chief Financial Officer Since September | Founder | |
2008. Principal Occupation(s) During the Past Five |
| |
Years: Principal of The Vanguard Group, Inc.; Chief |
| |
Financial Officer of each of the investment companies | John C. Bogle | |
served by The Vanguard Group since 2008; Treasurer | Chairman and Chief Executive Officer, 1974–1996 | |
of each of the investment companies served by The |
| |
Vanguard Group (1998–2008). |
| |
|
| |
|
| |
Kathryn J. Hyatt1 |
| |
Born 1955. Treasurer Since November 2008. Principal |
| |
Occupation(s) During the Past Five Years: Principal of |
| |
The Vanguard Group, Inc.; Treasurer of each of the |
| |
investment companies served by The Vanguard |
| |
Group since 2008; Assistant Treasurer of each of the |
| |
investment companies served by The Vanguard Group |
| |
(1988–2008). |
| |
1 These individuals are “interested persons” as defined in the Investment Company Act of 1940.
2 December 2002 for Vanguard Equity Income Fund, Vanguard Growth Equity Fund, the Vanguard Municipal Bond Funds, and the Vanguard State Tax-Exempt Funds.
|
|
| P.O. Box 2600 |
| Valley Forge, PA 19482-2600 |

Connect with Vanguard® > www.vanguard.com
Fund Information > 800-662-7447 | All comparative mutual fund data are from Lipper Inc. |
| or Morningstar, Inc., unless otherwise noted. |
Direct Investor Account Services > 800-662-2739 |
|
|
|
Institutional Investor Services > 800-523-1036 | You can obtain a free copy of Vanguard’s proxy voting |
| guidelines by visiting our website, www.vanguard.com, |
Text Telephone for People | and searching for “proxy voting guidelines,” or by |
With Hearing Impairment > 800-952-3335 | calling Vanguard at 800-662-2739. The guidelines are |
| also available from the SEC’s website, www.sec.gov. |
| In addition, you may obtain a free report on how your |
| fund voted the proxies for securities it owned during |
This material may be used in conjunction | the 12 months ended June 30. To get the report, visit |
with the offering of shares of any Vanguard | either www.vanguard.com or www.sec.gov. |
fund only if preceded or accompanied by |
|
the fund’s current prospectus. |
|
| You can review and copy information about your fund |
| at the SEC’s Public Reference Room in Washington, D.C. |
The funds or securities referred to herein are not | To find out more about this public service, call the SEC |
sponsored, endorsed, or promoted by MSCI, and MSCI | at 202-551-8090. Information about your fund is also |
bears no liability with respect to any such funds or | available on the SEC’s website, and you can receive |
securities. For any such funds or securities, the | copies of this information, for a fee, by sending a |
prospectus or the Statement of Additional Information | request in either of two ways: via e-mail addressed to |
contains a more detailed description of the limited | publicinfo@sec.gov or via regular mail addressed to the |
relationship MSCI has with The Vanguard Group and | Public Reference Section, Securities and Exchange |
any related funds. | Commission, Washington, DC 20549-0102. |
|
|
|
|
Russell is a trademark of The Frank Russell Company. |
|
|
|
|
|
|
|
|
|
|
|
|
|
|
|
|
|
| © 2009 The Vanguard Group, Inc. |
| All rights reserved. |
| Vanguard Marketing Corporation, Distributor. |
|
|
| Q6340 022009 |
Item 2: Code of Ethics. The Registrant has adopted a code of ethics that applies to the Registrant’s principal executive officer, principal financial officer, principal accounting officer or controller or persons performing similar functions. The Code of Ethics was amended during the reporting period covered by this report to make certain technical, non-material changes.
Item 3: Audit Committee Financial Expert. The following members of the Audit Committee have been determined by the Registrant’s Board of Trustees to be Audit Committee Financial Experts serving on its Audit Committee, and to be independent: Charles D. Ellis, Rajiv L. Gupta, JoAnn Heffernan Heisen, André F. Perold, Alfred M. Rankin, Jr., and J. Lawrence Wilson.
Item 4: Principal Accountant Fees and Services.
(a) Audit Fees.
Audit Fees of the Registrant
Fiscal Year Ended December 31, 2008: $55,000*
Fiscal Year Ended March 31, 2008: $40,000
* The Fund’s fiscal year-end changed from March 21 to December 31, effective December 31, 2008.
Aggregate Audit Fees of Registered Investment Companies in the Vanguard Group.
Fiscal Year Ended December 31, 2008: $3,055,590
Fiscal Year Ended December 31, 2007: $2,835,320
(b) Audit-Related Fees.
Fiscal Year Ended December 31, 2008: $626,240
Fiscal Year Ended December 31, 2007: $630,400
Includes fees billed in connection with assurance and related services provided to the Registrant, The Vanguard Group, Inc., Vanguard Marketing Corporation, and other registered investment companies in the Vanguard Group.
(c) Tax Fees.
Fiscal Year Ended December 31, 2008: $230,400
Fiscal Year Ended December 31, 2007: $215,900
Includes fees billed in connection with tax compliance, planning and advice services provided to the Registrant, The Vanguard Group, Inc., Vanguard Marketing Corporation, and other registered investment companies in the Vanguard Group and related to income and excise taxes.
(d) All Other Fees.
Fiscal Year Ended December 31, 2008: $0
Fiscal Year Ended December 31, 2007: $0
Includes fees billed for services related to risk management and privacy matters. Services were provided to the Registrant, The Vanguard Group, Inc., Vanguard Marketing Corporation, and other registered investment companies in the Vanguard Group.
(e) (1) Pre-Approval Policies. The policy of the Registrant’s Audit Committee is to consider and, if appropriate, approve before the principal accountant is engaged for such services, all specific audit and non-audit services provided to: (1) the Registrant; (2) The Vanguard Group, Inc.; (3) other entities controlled by The Vanguard Group, Inc. that provide ongoing services to the Registrant; and (4) other registered investment companies in the Vanguard Group. In making a determination, the Audit Committee considers whether the services are consistent with maintaining the principal accountant’s independence.
In the event of a contingency situation in which the principal accountant is needed to provide services in between scheduled Audit Committee meetings, the Chairman of the Audit Committee would be called on to consider and, if appropriate, pre-approve audit or permitted non-audit services in an amount sufficient to complete services through the next Audit Committee meeting, and to determine if such services would be consistent with maintaining the accountant’s independence. At the next scheduled Audit Committee meeting, services and fees would be presented to the Audit Committee for formal consideration, and, if appropriate, approval by the entire Audit Committee. The Audit Committee would again consider whether such services and fees are consistent with maintaining the principal accountant’s independence.
The Registrant’s Audit Committee is informed at least annually of all audit and non-audit services provided by the principal accountant to the Vanguard complex, whether such services are provided to: (1) the Registrant; (2) The Vanguard Group, Inc.; (3) other entities controlled by The Vanguard Group, Inc. that provide ongoing services to the Registrant; or (4) other registered investment companies in the Vanguard Group.
(2) No percentage of the principal accountant’s fees or services were approved pursuant to the waiver provision of paragraph (c)(7)(i)(C) of Rule 2-01 of Regulation S-X.
(f) For the most recent fiscal year, over 50% of the hours worked under the principal accountant’s engagement were not performed by persons other than full-time, permanent employees of the principal accountant.
(g) Aggregate Non-Audit Fees.
Fiscal Year Ended December 31, 2008: $230,400
Fiscal Year Ended December 31, 2007: $215,900
Includes fees billed for non-audit services provided to the Registrant, The Vanguard Group, Inc., Vanguard Marketing Corporation, and other registered investment companies in the Vanguard Group.
(h) For the most recent fiscal year, the Audit Committee has determined that the provision of all non-audit services was consistent with maintaining the principal accountant’s independence.
Item 5: Not Applicable.
Item 6: Not Applicable.
Item 7: Not Applicable.
Item 8: Not Applicable.
Item 9: Not Applicable.
Item 10: Not Applicable.
Item 11: Controls and Procedures.
(a) Disclosure Controls and Procedures. The Principal Executive and Financial Officers concluded that the Registrant's Disclosure Controls and Procedures are effective based on their evaluation of the Disclosure Controls and Procedures as of a date within 90 days of the filing date of this report.
(b) Internal Control Over Financial Reporting. There were no significant changes in Registrant’s Internal Control Over Financial Reporting or in other factors that could significantly affect this control subsequent to the date of the evaluation, including any corrective actions with regard to significant deficiencies and material weaknesses.
Item 12: Exhibits.
| (a) | Code of Ethics. |
| (b) | Certifications. |
Pursuant to the requirements of the Securities Exchange Act of 1934 and the Investment Company Act of 1940, the registrant has duly caused this report to be signed on its behalf by the undersigned, thereunto duly authorized.
| VANGUARD MONTGOMERY FUNDS |
|
|
By: | /s/ F. WILLIAM MCNABB III* |
| F. WILLIAM MCNABB III |
| CHIEF EXECUTIVE OFFICER |
|
|
Date: February 13, 2009 | |
Pursuant to the requirements of the Securities Exchange Act of 1934 and the Investment Company Act of 1940, this report has been signed below by the following persons on behalf of the registrant and in the capacities and on the dates indicated.
| VANGUARD MONTGOMERY FUNDS |
|
|
By: | /s/ F. WILLIAM MCNABB III* |
| F. WILLIAM MCNABB III |
| CHIEF EXECUTIVE OFFICER |
|
|
Date: February 13, 2009 | |
| VANGUARD MONTGOMERY FUNDS |
|
|
By: | /s/ THOMAS J. HIGGINS* |
| THOMAS J. HIGGINS |
| CHIEF FINANCIAL OFFICER |
|
|
Date: February 13, 2009 | |
* By: /s/ Heidi Stam
Heidi Stam, pursuant to a Power of Attorney filed on January 18, 2008, see file Number 2-29601, Incorporated by Reference; and pursuant to a Power of Attorney filed on September 26, 2008, see File Number 2-47371, Incorporated by Reference.