UNITED STATES
SECURITIES AND EXCHANGE COMMISSION
Washington, D.C. 20549
FORM N-CSR
CERTIFIED SHAREHOLDER REPORT
OF
REGISTERED MANAGEMENT INVESTMENT COMPANIES
| Investment Company Act file number: 811-22114 | |
| Name of Registrant: Vanguard Montgomery Funds | |
| Address of Registrant: P.O. Box 2600 | |
| Valley Forge, PA 19482 | |
| Name and address of agent for service: | Heidi Stam, Esquire |
| P.O. Box 876 | |
| Valley Forge, PA 19482 | |
| Registrant’s telephone number, including area code: (610) 669-1000 | |
| Date of fiscal year end: December 31 | |
| Date of reporting period: January 1, 2009 – December 31, 2009 | |
![]()
| Vanguard Market Neutral Fund |
| Annual Report |
| December 31, 2009 |

> Vanguard Market Neutral Fund returned about –11%. Its U.S. Treasury
bill benchmark was roughly flat for the year.
> Following a dismal start, the broad U.S. stock market rallied to return
more than 29% for 2009.
> The fund’s short positions—the stocks it borrowed with the intention of
buying them back at a lower price—increased more than the stocks it held
in its long portfolio, resulting in a negative total return for the fund.
| Contents | |
| Your Fund’s Total Returns | 1 |
| Chairman’s Letter | 2 |
| Advisors’ Report | 6 |
| Results of Proxy Voting | 10 |
| Fund Profile | 11 |
| Performance Summary | 13 |
| Financial Statements | 15 |
| Your Fund’s After-Tax Returns | 33 |
| About Your Fund’s Expenses | 34 |
| Glossary | 36 |
Please note: The opinions expressed in this report are just that—informed opinions. They should not be considered promises or advice.
Also, please keep in mind that the information and opinions cover the period through the date on the front of this report. Of course, the
risks of investing in your fund are spelled out in the prospectus.
Cover photograph: Veronica Coia.
Your Fund’s Total Returns
| Fiscal Year Ended December 31, 2009 | ||
| Ticker | Total | |
| Symbol | Returns | |
| Vanguard Market Neutral Fund | ||
| Investor Shares | VMNFX | –11.38% |
| Institutional Shares1 | VMNIX | –11.31 |
| Citigroup 3-Month Treasury Bill Index | 0.16 | |
| Equity Market Neutral Funds Average2 | 5.12 | |
| Your Fund’s Performance at a Glance | ||||
| December 31, 2008–December 31, 2009 | ||||
| Distributions Per Share | ||||
| Starting | Ending | Income | Capital | |
| Share Price | Share Price | Dividends | Gains | |
| Vanguard Market Neutral Fund | ||||
| Investor Shares | $10.97 | $9.71 | $0.012 | $0.000 |
| Institutional Shares | 10.90 | 9.66 | 0.008 | 0.000 |
1 This class of shares carries lower expenses and is available for a minimum initial investment of $5 million.
2 Derived from data provided by Lipper Inc.
1

Chairman’s Letter
Dear Shareholder,
For the fiscal year ended December 31, 2009, Vanguard Market Neutral Fund returned –11.38%. (The fund’s Institutional Shares returned –11.31%.) The U.S. stock market, with its sharp course reversal and steep rally, created a challenging environment for the Market Neutral Fund. The fund’s disappointing result significantly trailed both the performance of its U.S. Treasury bill benchmark and the average return of its equity market neutral fund peers.
Impressive stock returns masked lingering uncertainties
For the 12 months ended December 31, 2009, the broad U.S. stock market returned more than 29%, its highest calendar-year return since 2003. The year began with the market searching for a bottom, and it finally hit a low point in early March. From there, stocks mounted one of their strongest rallies ever—in magnitude and duration—resulting in a check mark-shaped stock chart for 2009.
The market’s outsized result came against a backdrop of economic uncertainty. The economy, which struggled to regain its footing as the financial crisis abated, began to show signs of growth in the second half of the year, even as unemployment climbed to levels not seen since 1983.
Stock markets outside the United States fared even better during 2009, especially many emerging markets, which weathered the financial crisis in relatively better fiscal and economic shape than their developed-market counterparts.
2
Bond markets calmed down, money market funds endured
Compared with the final months of 2008, when credit markets seized up and investors fled to the safety of U.S. Treasuries, 2009 represented a return to normalcy for bonds. Investors’ appetite for risk returned, and the demand for corporate bonds increased, raising their prices and bringing down their yields. For the 12 months ended December 31, the broad taxable bond market returned about 6%, while municipal bonds returned about 13%.
Meanwhile, money market funds and other short-term savings vehicles did poorly in 2009. Interest rates at the shortest end of the maturity spectrum remained at historic lows, a casualty of the Federal Reserve Board’s efforts to
revive the economy. The Fed kept its target for the federal funds rate between 0% and 0.25% for the entire year.
When all boats rose, the fund struggled
Vanguard Market Neutral Fund seeks capital appreciation while maintaining minimal correlation with the stock and bond markets. In pursuit of this goal, the fund employs a two-sleeved approach: In the fund’s long portfolio, the advisors buy and hold stocks they believe to be undervalued. In the short portfolio, the advisors borrow and sell short stocks they believe to be overpriced.
The past year was an especially challenging period for the Market Neutral Fund. The fund’s advisors place great importance on
| Market Barometer | |||
| Average Annual Total Returns | |||
| Periods Ended December 31, 2009 | |||
| One Year | Three Years | Five Years | |
| Stocks | |||
| Russell 1000 Index (Large-caps) | 28.43% | –5.36% | 0.79% |
| Russell 2000 Index (Small-caps) | 27.17 | –6.07 | 0.51 |
| Dow Jones U.S. Total Stock Market Index | 29.35 | –5.01 | 1.09 |
| MSCI All Country World Index ex USA (International) | 42.14 | –3.04 | 6.30 |
| Bonds | |||
| Barclays Capital U.S. Aggregate Bond Index | |||
| (Broad taxable market) | 5.93% | 6.04% | 4.97% |
| Barclays Capital Municipal Bond Index | 12.91 | 4.41 | 4.32 |
| Citigroup 3-Month Treasury Bill Index | 0.16 | 2.22 | 2.88 |
| CPI | |||
| Consumer Price Index | 2.72% | 2.28% | 2.56% |
3
fundamental factors such as valuation and earnings strength. But such factors seemed to matter little after the fear-induced market sell-off early in the year. In some cases, companies that were on the verge of bankruptcy in January and February became the darlings of the market rebound later in the year. The so-called junk rally hurt fund performance in both portfolios.
In the long portfolio, the fund’s emphasis on higher-quality stocks led it to under-perform the broad market. The portfolio’s financial stocks, which were among the sector’s higher-quality companies, were notable laggards, producing the only negative sector return. Meanwhile, other, larger sectors of the portfolio, such as information technology and consumer discretionary, posted respectable results.
In the short portfolio, the types of stocks that the advisors customarily choose to sell short (those deemed to be low-quality or to have poor fundamentals) registered impressive returns. The nature of the market’s recovery also hurt the short portfolio. All stock market sectors participated in the rebound, and all finished the year with positive returns. In each sector, however, it was generally companies with weaker fundamentals that performed best. Indeed, the stocks in the short portfolio finished the period with higher returns than the stocks in the long portfolio, perhaps the most telling indication of the dissonance between the advisors’ strategies and the market dynamics of the past year.
For more details on each advisor’s approach, please see the Advisors’ Report that follows.
Focus on fundamentals remains a long-term tenet
The Market Neutral Fund’s advisors, Vanguard Quantitative Equity Group and AXA Rosenberg Investment Management LLC, have different approaches and execute different strategies. But if they share a common theme, it’s the belief that high-quality companies with strong fundamentals should outperform over time. Some years, that philosophy has been rewarded. Other years—like 2009—it hindered results. We continue to believe that philosophy is a sound one for the long term.
Over the past ten years, the fund returned an average of 1.73% per year. This trailed the result of its U.S. Treasury bill benchmark and the average return of its peer group during that span, but outpaced the –0.17% return of the broad U.S. stock market.
Diversification can mean zigging when others zag
The Market Neutral Fund offers sophisticated investors another layer of diversification in a well-balanced investment portfolio, and it does so at a relatively low cost. (Because of the accounting for short sales, the low level of the fund’s operating costs is not apparent from the headline expense ratio. On pages 26 and 27, the Financial Highlights provide information on the past year’s fund operating expenses—the more familiar measure of fund costs—and the less familiar dividend and borrowing costs.)
Of course, inherent in the concept of diversification is a guarantee that you’ll be disappointed with at least some part
4
of your portfolio. Not every holding can finish atop the performance tables each year. And while a market neutral fund can move independently of the stock and bond markets, it is not immune to the effects of internal market dynamics. In the short term, the disparity between this fund and the market in which it invests can feel disheartening. But over time, it can add an element of stability to an investment strategy.
On another matter, I would like to inform you that as of January 1, 2010, we completed a leadership transition that began in March 2008. I succeeded Jack Brennan as chairman of the Vanguard and fund boards. Jack has agreed to serve as chairman emeritus and senior advisor.
Under Jack’s leadership, Vanguard has grown to become a preeminent firm in the mutual fund industry. Jack’s energy, his relentless pursuit of perfection, and his unwavering focus on always doing the right thing for our clients are evident in every facet of Vanguard policy today.
Thank you for entrusting your assets to Vanguard.
Sincerely,

F. William McNabb III
Chairman and Chief Executive Officer
January 20, 2010
| Total Returns | |
| Ten Years Ended December 31, 2009 | |
| Average | |
| Annual Return | |
| Market Neutral Fund Investor Shares | 1.73% |
| Citigroup 3-Month Treasury Bill Index | 2.84 |
| Equity Market Neutral Funds Average1 | 3.22 |
The figures shown represent past performance, which is not a guarantee of future results. (Current performance may be lower or higher than the performance data cited. For performance data current to the most recent month-end, visit our website at www.vanguard.com/performance.) Note, too, that both investment returns and principal value can fluctuate widely, so an investor’s shares, when sold, could be worth more or less than their original cost.
1 Derived from data provided by Lipper Inc.
5
Advisors’ Report
For the 12 months ended December 31, 2009, Vanguard Market Neutral Fund returned about –11%. Your fund is managed by two independent advisors. The use of multiple advisors provides exposure to distinct, yet complementary, investment approaches, enhancing the fund’s diversification. It is not uncommon for different advisors to have different views about individual securities or the broader investment environment.
The advisors, the amount and percentage of fund assets each manages, and brief descriptions of their investment strategies are presented in the table below. Each advisor has also prepared a discussion of the investment environment and of how the portfolio’s positioning reflected this assessment. This report was prepared on January 20, 2010.
Vanguard Quantitative Equity Group
Portfolio Manager:
James D. Troyer, CFA, Principal
Our investment process struggled in this period. Our research model has five components: valuation, quality, growth, management decisions, and market sentiment. We combine the five components into an overall score, with each indicator serving as a verification of the others.
• Valuation measures the price we will pay for a stock’s earnings or cash flow. By itself, valuation can be a powerful investment tool, but our research leads us to conclude that use of other models in combination with valuation helps improve a valuation signal.
| Vanguard Market Neutral Fund Investment Advisors | |||
| Fund Assets Managed | |||
| Investment Advisor | % | $ Million | Investment Strategy |
| Vanguard Quantitative | 48 | 33 | Conducts quantitative management using models |
| Equity Group | that assess valuation, marketplace sentiment, and | ||
| balance-sheet characteristics of companies as | |||
| compared with their peers. | |||
| AXA Rosenberg Investment | 46 | 31 | Builds a portfolio based on fundamental analysis |
| Management LLC | using a two-part quantitative model that considers | ||
| valuations and earnings forecasts. | |||
| Cash Investments | 6 | 4 | The fund’s daily cash balance may be invested in |
| one or more Vanguard CMT Funds, which are very | |||
| low-cost money market funds. Each advisor may | |||
| also maintain a modest cash position. | |||
6
• The quality score separates cheap stocks that deserve their low valuations, because of poor margins, from their more profitable peers.
• The growth indicator differentiates companies with low valuations, due to poor growth prospects, from firms with more attractive prospects.
• The management-decisions model evaluates the decisions corporate managers make. Management actions (such as issuing stock, raising debt, and capital investment) often speak louder than words.
• The sentiment score measures the market’s overall evaluation of the company’s value; this indicator subscribes to the logic that a stock’s performance reflects the news around that stock, which helps to verify the results of our other scores.
Our research tells us that certain attributes, such as low price/earnings and higher ROE (return on equity), are successful over the long term, but may not work in some periods, such as this past calendar year. The panic of the first part of 2009 drove down all stocks, regardless of individual characteristics, as investors sought to exit the market. In March, once the survival of companies that had almost ceased to exist seemed more likely, these firms roared back to life. Unfortunately, these firms had attributes
that our model does not seek, such as negative earnings, low margins, negative market sentiment, and low growth.
Although the extent of our underperfor-mance was surprising, we know that our process tends to struggle when a narrow set of factors drives market returns. All investment styles endure periods of under-performance, and we can look back to an earlier period to see a similar underperfor-mance of our process. The Internet boom that began in the late 1990s was a “melt-up” as opposed to our recent meltdown. Nevertheless, as in the past year, very few factors dominated performance in that time: Little or no earnings were acceptable if a stock had an Internet-related story line. Throughout the Internet boom our model rejected many stocks that did not pass our earnings and quality models, causing our portfolios to underperform.
Last year the factor dominating investor decision-making was the credit crisis. When one or two factors dominate, our process will likely suffer. We continue our commitment to selling short a portfolio of stocks with higher price multiples and market-like growth rates, in order to purchase a long portfolio at lower price multiples with similar expected growth. We believe this is an attractive strategy that the market will reward in the long term. We thank you for your investment, and we look forward to the upcoming year.
7
AXA Rosenberg Investment Management LLC
Portfolio Manager: William E. Ricks,
Americas Chief Investment Officer
The year 2009 can be characterized by rapid market transitions as investor sentiment switched gears swiftly. Pessimistic uncertainty quickly gave way to optimistic outlooks. The significant reversal in equity market performance and the sudden shift in investor sentiment, from risk averse to risk embracing, presented a challenging market environment for our investment process.
The biggest performance driver during this period was the extraordinary returns to beaten-down stocks with weak fundamentals, which were at a level virtually unseen in the last few decades. Investors bid up companies that had declined the most in the credit crisis. Many of these companies had been priced for potential bankruptcy, or severe ongoing financial weakness, so these companies were cheap on book value and now appear to have much less downside risk, regardless of their forecasted earnings profile. These stocks exhibit poor fundamentals—weak earnings yield and declining forward earnings—and tend to be underweighted in our investment process. Over the course of 2009, this was the biggest detractor to portfolio returns.
The hazy earnings environment earlier in the year prompted us to take a defensive posture, preferring select companies in health care and consumer staples based on favorable valuation and stable earnings. Over the year, however, the portfolio’s net exposures to information technology and consumer discretionary increased as expectations of earnings yield change improved. Overall, the net long weights in these two sectors added to portfolio performance as the economic outlook turned around. Long positions in Hewlett-Packard, Walt Disney, and IBM were the top stock contributors for the year. Media positions in News Corp. and Time Warner detracted from performance.
Stock selection in financials was one of the main detractors for the portfolio in 2009. While long positions in JPMorgan Chase and Travelers contributed positively to performance, they were more than offset by the weak showing of Bank of America (a long position) and the stellar return of American Express (a short position).
As economies around the world recover and earnings visibility improves, we believe that investors will be more discerning in their focus on the relationship between earnings and prices. This is a welcome development for fundamental stock pickers like us. Many companies posted large gains in 2009 by simply staying in business.
But as the year came to a close, investors
8
became more discriminating. Valuation and superior forward earnings yield are now beginning to be rewarded by market participants. As such, we believe our portfolio is well-positioned to benefit from this continued shift.
During the fourth quarter, investors began to reassess the strength of the earnings environment and moved to a more rational review of earnings. Historically, euphoric market rallies (like we just experienced) give way to extended periods of emphasis on valuation and company fundamentals. Over the longer term, the main driver of equity performance is this focus on fundamentals and valuation, and we expect our strategies to be rewarded as investors become more willing to take on valuation risk and regain confidence in forward earnings estimates.
9
Results of Proxy Voting
At a special meeting of shareholders on July 2, 2009, fund shareholders approved the following two proposals:
Proposal 1—Elect trustees for each fund.*
The individuals listed in the table below were elected as trustees for each fund. All trustees with the exception of Messrs. McNabb and Volanakis (both of whom already served as directors of The Vanguard Group, Inc.) served as trustees to the funds prior to the shareholder meeting.
| Percentage | |||
| Trustee | For | Withheld | For |
| John J. Brennan | 7,351,976 | 47,569 | 99.4% |
| Charles D. Ellis | 7,332,602 | 66,942 | 99.1% |
| Emerson U. Fullwood | 7,331,813 | 67,732 | 99.1% |
| Rajiv L. Gupta | 7,347,546 | 51,999 | 99.3% |
| Amy Gutmann | 7,327,496 | 72,048 | 99.0% |
| JoAnn Heffernan Heisen | 7,327,496 | 72,048 | 99.0% |
| F. William McNabb III | 7,351,976 | 47,569 | 99.4% |
| André F. Perold | 7,332,602 | 66,942 | 99.1% |
| Alfred M. Rankin, Jr. | 7,351,976 | 47,569 | 99.4% |
| Peter F. Volanakis | 7,351,976 | 47,569 | 99.4% |
| * Results are for all funds within the same trust. | |||
Proposal 2—Update and standardize the funds’ fundamental policies regarding:
(a) Purchasing and selling real estate.
(b) Issuing senior securities.
(c) Borrowing money.
(d) Making loans.
(e) Purchasing and selling commodities.
(f) Concentrating investments in a particular industry or group of industries.
(g) Eliminating outdated fundamental investment policies not required by law.
The revised fundamental policies are clearly stated and simple, yet comprehensive, making oversight and compliance more efficient than under the former policies. The revised fundamental policies will allow the funds to respond more quickly to regulatory and market changes, while avoiding the costs and delays associated with successive shareholder meetings.
| Broker | Percentage | ||||
| Vanguard Fund | For | Abstain | Against | Non-Votes | For |
| Market Neutral Fund | |||||
| 2a | 5,776,114 | 11,080 | 65,900 | 1,546,451 | 78.1% |
| 2b | 5,834,687 | 11,080 | 7,327 | 1,546,451 | 78.9% |
| 2c | 5,795,502 | 11,080 | 46,512 | 1,546,451 | 78.3% |
| 2d | 5,797,693 | 11,080 | 44,322 | 1,546,450 | 78.4% |
| 2e | 5,797,693 | 11,080 | 44,322 | 1,546,450 | 78.4% |
| 2f | 5,834,687 | 11,080 | 7,327 | 1,546,451 | 78.9% |
| 2g | 5,835,056 | 11,080 | 6,959 | 1,546,450 | 78.9% |
10
Market Neutral Fund
Fund Profile
As of December 31, 2009
| Portfolio Characteristics | |
| Turnover Rate | 142% |
| Short-Term Reserves | 13.8% |
| Investment Characteristics | ||
| Long | Short | |
| Portfolio | Portfolio | |
| Number of Stocks | 327 | 297 |
| Median Market Cap | $8.9B | $9.6B |
| Price/Earnings Ratio | 37.6x | 87.2x |
| Price/Book Ratio | 2.1x | 2.1x |
| Return on Equity | 16.6% | 17.8% |
| Earnings Growth Rate | 10.5% | 7.1% |
| Foreign Holdings | 0.3% | 0.5% |
| Estimated Expense Ratios1 | ||
| Investor | Institutional | |
| Shares | Shares | |
| Management and | ||
| Administrative Expenses | 0.50% | 0.40% |
| Dividend Expense on | ||
| Securities Sold Short2 | 1.67 | 1.67 |
| Total | 2.17% | 2.07% |
| Sector Diversification (% of equity exposure) | ||
| Long | Short | |
| Portfolio | Portfolio | |
| Consumer Discretionary | 13.6% | 12.0% |
| Consumer Staples | 10.6 | 5.4 |
| Energy | 6.4 | 11.6 |
| Financials | 14.4 | 13.8 |
| Health Care | 14.7 | 12.9 |
| Industrials | 11.4 | 13.1 |
| Information Technology | 18.6 | 14.1 |
| Materials | 5.3 | 7.4 |
| Telecommunication Services | 1.1 | 4.1 |
| Utilities | 3.9 | 5.6 |
| Volatility Measures3 | |
| Fund Versus | |
| S&P 500 Index | |
| R-Squared | 0.01 |
| Beta | 0.02 |
1 The fund expense ratios shown are from the prospectus dated April 28, 2009, and represent estimated costs for the current fiscal year
based on the fund’s net assets as of the prospectus date. For the fiscal year ended December 31, 2009, the expense ratios were: for
Investor Shares, 2.80% (0.39% management and administrative expenses, plus 1.42% dividend expense on securities sold short, plus
0.99% borrowing expense for securities sold short); for Institutional Shares, 2.73% (0.32% management and administrative expenses,
plus 1.42% dividend expense on securities sold short, plus 0.99% borrowing expense for securities sold short).
2 When a cash dividend is declared on a stock the fund has sold short, the fund is required to pay an amount equal to that dividend to the
lender of the stock. Although the payment of the dividend amount reduces the return of the short sale transaction, SEC rules call for the
inclusion of such payments in the fund's operating expenses.
3 For an explanation of R-squared, beta, and other terms used here, see the Glossary.
11
Market Neutral Fund
Ten Largest Holdings1 (% of total net assets): Long Portfolio
| Hewlett-Packard Co. | computer hardware | 1.7% |
| International Business | ||
| Machines Corp. | computer hardware | 1.7 |
| Philip Morris | ||
| International Inc. | tobacco | 1.5 |
| Google Inc. Class A | Internet software | |
| and services | 1.4 | |
| Goldman Sachs | Investment banking | |
| Group Inc. | and brokerage | 1.4 |
| Raytheon Co. | aerospace | |
| and defense | 1.3 | |
| JPMorgan Chase & Co. | other diversified | |
| financial services | 1.3 | |
| Amgen Inc. | biotechnology | 1.2 |
| Computer | data processing | |
| Sciences Corp. | and outsourced | |
| services | 1.1 | |
| CVS Caremark Corp. | drug retail | 1.0 |
| Top Ten | 13.6% |
Ten Largest Holdings1 (% of total net assets): Short Portfolio
| QUALCOMM Inc. | communications | |
| equipment | 1.6% | |
| Schlumberger Ltd. | oil and gas | |
| equipment | ||
| and services | 1.5 | |
| Abbott Laboratories | pharmaceuticals | 1.5 |
| Exxon Mobil Corp. | integrated oil | |
| and gas | 1.4 | |
| Occidental | integrated oil | |
| Petroleum Corp. | and gas | 1.3 |
| McDonald’s Corp. | restaurants | 1.3 |
| Monsanto Co. | fertilizers | |
| and agricultural | ||
| chemicals | 1.2 | |
| American Express Co. | consumer finance | 1.2 |
| Verizon | integrated | |
| Communications Inc. | telecommunication | |
| services | 1.1 | |
| Celgene Corp. | biotechnology | 1.0 |
| Top Ten | 13.1% |
1 The holdings listed exclude any temporary cash investments and equity index products.
12
Market Neutral Fund
Performance Summary
All of the returns in this report represent past performance, which is not a guarantee of future results that may be achieved by the fund. (Current performance may be lower or higher than the performance data cited. For performance data current to the most recent month-end, visit our website at www.vanguard.com/performance.) Note, too, that both investment returns and principal value can fluctuate widely, so an investor’s shares, when sold, could be worth more or less than their original cost. The returns shown do not reflect taxes that a shareholder would pay on fund distributions or on the sale of fund shares.
Cumulative Performance: December 31, 1999–December 31, 2009
Initial Investment of $250,000
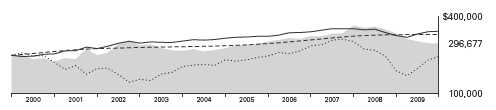
| Average Annual Total Returns | Final Value of | |||
| Periods Ended December 31, 2009 | a $250,000 | |||
| One Year | Five Years | Ten Years | Investment | |
| Market Neutral Fund Investor Shares1 | –11.38% | 1.39% | 1.73% | $296,677 |
| Dow Jones U.S. Total Stock Market Index | 29.35 | 1.09 | –0.17 | 245,689 |
| Citigroup 3-Month Treasury Bill Index | 0.16 | 2.88 | 2.84 | 330,654 |
| Equity Market Neutral Funds Average2 | 5.12 | 1.64 | 3.22 | 343,357 |
| Final Value of | ||||
| a $5,000,000 | ||||
| One Year | Five Years | Ten Years | Investment | |
| Market Neutral Fund Institutional Shares1 | –11.31% | 1.58% | 1.96% | $6,072,870 |
| Dow Jones U.S. Total Stock Market Index | 29.35 | 1.09 | –0.17 | 4,913,789 |
| Citigroup 3-Month Treasury Bill Index | 0.16 | 2.88 | 2.84 | 6,613,079 |
1 Total returns do not reflect the 2% fee assessed until November 30, 2007, on redemptions of shares purchased within 30 days or the
1% fee assessed beginning December 1, 2007, on redemptions of shares held less than one year.
2 Derived from data provided by Lipper Inc.
See Financial Highlights for dividend and capital gains information.
13
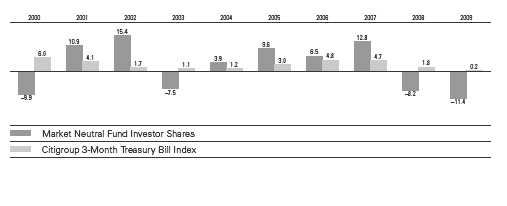
Market Neutral Fund
Fiscal Year Total Returns (%): December 31, 1999–December 31, 2009
14
Market Neutral Fund
Financial Statements
Statement of Net Assets
As of December 31, 2009
The fund reports a complete list of its holdings in regulatory filings four times in each fiscal year, at the quarter-ends. For the second and fourth fiscal quarters, the lists appear in the fund’s semiannual and annual reports to shareholders. For the first and third fiscal quarters, the fund files the lists with the Securities and Exchange Commission on Form N-Q. Shareholders can look up the fund’s Forms N-Q on the SEC’s website at www.sec.gov. Forms N-Q may also be reviewed and copied at the SEC’s Public Reference Room (see the back cover of this report for further information).
| Market | |||
| Value• | |||
| Shares | ($000) | ||
| Common Stocks—Long Positions (88.6%) | |||
| Consumer Discretionary (12.0%) | |||
| † | Home Depot Inc. | 18,300 | 529 |
| Ltd Brands Inc. | 18,200 | 350 | |
| * † | priceline.com Inc. | 1,600 | 350 |
| † | Coach Inc. | 8,900 | 325 |
| † | Gap Inc. | 13,300 | 278 |
| * † | New York Times Co. Class A | 19,200 | 237 |
| † | H&R Block Inc. | 9,400 | 213 |
| Gannett Co. Inc. | 14,200 | 211 | |
| * † | Ford Motor Co. | 20,900 | 209 |
| † | Ross Stores Inc. | 4,900 | 209 |
| † | Jarden Corp. | 6,600 | 204 |
| Johnson Controls Inc. | 7,200 | 196 | |
| † | Wyndham Worldwide Corp. | 9,500 | 192 |
| * † | Big Lots Inc. | 6,600 | 191 |
| † | DISH Network Corp. Class A | 9,200 | 191 |
| TJX Cos. Inc. | 5,200 | 190 | |
| † | Time Warner Cable Inc. | 4,500 | 186 |
| † | Phillips-Van Heusen Corp. | 4,500 | 183 |
| † | Darden Restaurants Inc. | 5,000 | 175 |
| † | Time Warner Inc. | 5,800 | 169 |
| Garmin Ltd. | 5,500 | 169 | |
| * | Starbucks Corp. | 7,200 | 166 |
| † | DR Horton Inc. | 15,200 | 165 |
| † | Advance Auto Parts Inc. | 4,000 | 162 |
| * | TRW Automotive | ||
| Holdings Corp. | 6,700 | 160 | |
| * | Liberty Media Corp.–Starz | 3,414 | 158 |
| * | Expedia Inc. | 6,000 | 154 |
| † | McGraw-Hill Cos. Inc. | 4,400 | 147 |
| † | MDC Holdings Inc. | 4,500 | 140 |
| Brinker International Inc. | 9,200 | 137 | |
| † | Yum! Brands Inc. | 3,900 | 136 |
| * † | GameStop Corp. Class A | 5,900 | 129 |
| * † | Aeropostale Inc. | 3,700 | 126 |
| † | Mattel Inc. | 6,300 | 126 |
| * | AutoNation Inc. | 6,600 | 126 |
| * | Dollar Tree Inc. | 2,500 | 121 |
| Newell Rubbermaid Inc. | 7,500 | 113 | |
| NIKE Inc. Class B | 1,700 | 112 | |
| † | PetSmart Inc. | 4,200 | 112 |
| † | Whirlpool Corp. | 1,200 | 97 |
| * | Penske Auto Group Inc. | 5,400 | 82 |
| Hasbro Inc. | 2,300 | 74 | |
| * † | Federal Mogul Corp. | 3,700 | 64 |
| * | Goodyear Tire & Rubber Co. | 4,400 | 62 |
| * | Chico’s FAS Inc. | 4,100 | 58 |
| Comcast Corp. Class A | 3,400 | 57 | |
| Thor Industries Inc. | 1,500 | 47 | |
| * | Career Education Corp. | 1,900 | 44 |
| † | Family Dollar Stores Inc. | 1,500 | 42 |
| Aaron’s Inc. | 1,100 | 31 | |
| * | Chipotle Mexican Grill Inc. | ||
| Class A | 300 | 26 | |
| Leggett & Platt Inc. | 1,100 | 22 | |
| * | DIRECTV Class A | 600 | 20 |
| * | NetFlix Inc. | 300 | 17 |
| John Wiley & Sons Inc. Class A | 300 | 13 | |
| * | Panera Bread Co. Class A | 200 | 13 |
| Weight Watchers | |||
| International Inc. | 400 | 12 | |
| 8,228 | |||
| Consumer Staples (9.4%) | |||
| † | Philip Morris International Inc. | 21,900 | 1,055 |
| † | CVS Caremark Corp. | 22,200 | 715 |
| † | Estee Lauder Cos. Inc. | ||
| Class A | 6,200 | 300 | |
| General Mills Inc. | 4,200 | 297 | |
| † | Coca-Cola Enterprises Inc. | 13,900 | 295 |
| † | Mead Johnson Nutrition Co. | 6,551 | 286 |
| † | Tyson Foods Inc. Class A | 22,500 | 276 |
| † | Sara Lee Corp. | 20,200 | 246 |
| Kellogg Co. | 4,500 | 239 | |
| Lorillard Inc. | 2,900 | 233 | |
| † | Clorox Co. | 3,600 | 220 |
| † | Hershey Co. | 6,100 | 219 |
| † | Pepsi Bottling Group Inc. | 5,600 | 210 |
| † | ConAgra Foods Inc. | 8,700 | 201 |
| * † | Rite Aid Corp. | 129,500 | 196 |
15
Market Neutral Fund
| Market | |||
| Value• | |||
| Shares | ($000) | ||
| † | Del Monte Foods Co. | 15,700 | 178 |
| † | Dr Pepper Snapple Group Inc. | 6,267 | 177 |
| † | Archer-Daniels-Midland Co. | 5,500 | 172 |
| Safeway Inc. | 8,100 | 172 | |
| Kimberly-Clark Corp. | 2,200 | 140 | |
| Avon Products Inc. | 3,800 | 120 | |
| Campbell Soup Co. | 3,400 | 115 | |
| Reynolds American Inc. | 2,100 | 111 | |
| * | Energizer Holdings Inc. | 1,600 | 98 |
| Hormel Foods Corp. | 2,200 | 85 | |
| SUPERVALU Inc. | 3,000 | 38 | |
| Herbalife Ltd. | 500 | 20 | |
| † | Wal-Mart Stores Inc. | 300 | 16 |
| 6,430 | |||
| Energy (5.6%) | |||
| Anadarko Petroleum Corp. | 7,800 | 487 | |
| Marathon Oil Corp. | 11,600 | 362 | |
| * † | Newfield Exploration Co. | 6,300 | 304 |
| Williams Cos. Inc. | 10,200 | 215 | |
| * † | Oil States International Inc. | 5,300 | 208 |
| † | Peabody Energy Corp. | 4,300 | 194 |
| † | Consol Energy Inc. | 3,900 | 194 |
| * † | Pride International Inc. | 6,000 | 191 |
| * † | Oceaneering International Inc. | 3,100 | 181 |
| * † | Rowan Cos. Inc. | 7,100 | 161 |
| EXCO Resources Inc. | 7,400 | 157 | |
| † | Helmerich & Payne Inc. | 3,700 | 148 |
| El Paso Corp. | 13,400 | 132 | |
| Apache Corp. | 1,200 | 124 | |
| * | Helix Energy | ||
| Solutions Group Inc. | 10,400 | 122 | |
| Cimarex Energy Co. | 2,200 | 117 | |
| * | Nabors Industries Ltd. | 5,200 | 114 |
| * | FMC Technologies Inc. | 1,800 | 104 |
| * | Dresser-Rand Group Inc. | 3,100 | 98 |
| * | Plains Exploration & | ||
| Production Co. | 2,600 | 72 | |
| Diamond Offshore Drilling Inc. | 600 | 59 | |
| * † | Ensco International PLC ADR | 1,183 | 47 |
| ConocoPhillips | 500 | 26 | |
| Tidewater Inc. | 500 | 24 | |
| Southern Union Co. | 1,000 | 23 | |
| 3,864 | |||
| Financials (12.7%) | |||
| † | Goldman Sachs Group Inc. | 5,500 | 929 |
| † | JPMorgan Chase & Co. | 21,300 | 888 |
| † | Wells Fargo & Co. | 24,400 | 659 |
| † | US Bancorp | 19,100 | 430 |
| † | Prudential Financial Inc. | 7,800 | 388 |
| † | Bank of America Corp. | 22,700 | 342 |
| † | Unum Group | 13,600 | 265 |
| † | Ameriprise Financial Inc. | 6,400 | 248 |
| Everest Re Group Ltd. | 2,800 | 240 | |
| † | New York Community | ||
| Bancorp Inc. | 14,500 | 210 | |
| Loews Corp. | 5,700 | 207 | |
| † | Bank of Hawaii Corp. | 4,200 | 198 |
| * † | Progressive Corp. | 10,400 | 187 |
| † | BlackRock Inc. | 800 | 186 |
| * | MBIA Inc. | 45,500 | 181 |
| † | Chubb Corp. | 3,600 | 177 |
| † | Endurance Specialty | ||
| Holdings Ltd. | 4,700 | 175 | |
| † | BOK Financial Corp. | 3,600 | 171 |
| † | Federated Investors Inc. | ||
| Class B | 6,200 | 171 | |
| † | Franklin Resources Inc. | 1,600 | 169 |
| † | American Financial Group Inc. | 6,700 | 167 |
| † | Aflac Inc. | 3,600 | 167 |
| † | Torchmark Corp. | 3,700 | 163 |
| † | Travelers Cos. Inc. | 3,200 | 160 |
| † | Discover Financial Services | 10,800 | 159 |
| * † | TD Ameritrade Holding Corp. | 8,200 | 159 |
| † | Hudson City Bancorp Inc. | 11,400 | 157 |
| Student Loan Corp. | 3,300 | 154 | |
| * | American International | ||
| Group Inc. | 4,700 | 141 | |
| † | Northern Trust Corp. | 2,700 | 141 |
| Unitrin Inc. | 6,400 | 141 | |
| † | Allied World Assurance Co. | ||
| Holdings Ltd. | 2,600 | 120 | |
| BancorpSouth Inc. | 3,000 | 70 | |
| NYSE Euronext | 2,400 | 61 | |
| Aspen Insurance Holdings Ltd. | 2,400 | 61 | |
| * | Jefferies Group Inc. | 2,400 | 57 |
| PartnerRe Ltd. | 500 | 37 | |
| First Citizens BancShares Inc. | |||
| Class A | 200 | 33 | |
| * | CNA Financial Corp. | 1,200 | 29 |
| Capitol Federal Financial | 900 | 28 | |
| RenaissanceRe Holdings Ltd. | 500 | 27 | |
| † | Cullen/Frost Bankers Inc. | 500 | 25 |
| Transatlantic Holdings Inc. | 300 | 16 | |
| Commerce Bancshares Inc. | 300 | 12 | |
| OneBeacon Insurance | |||
| Group Ltd. Class A | 900 | 12 | |
| 8,718 | |||
| Health Care (13.1%) | |||
| * † | Amgen Inc. | 14,300 | 809 |
| * † | Express Scripts Inc. | 8,000 | 692 |
| † | UnitedHealth Group Inc. | 20,600 | 628 |
| † | Eli Lilly & Co. | 16,700 | 596 |
| * † | WellPoint Inc. | 8,400 | 490 |
| * † | Forest Laboratories Inc. | 12,800 | 411 |
| * † | Mylan Inc. | 21,700 | 400 |
| Merck & Co. Inc. | 8,900 | 325 | |
| † | Pfizer Inc. | 16,600 | 302 |
| CIGNA Corp. | 8,000 | 282 | |
| * † | Watson Pharmaceuticals Inc. | 6,800 | 269 |
| * † | Boston Scientific Corp. | 27,400 | 247 |
| † | Cooper Cos. Inc. | 5,200 | 198 |
16
Market Neutral Fund
| Market | |||
| Value• | |||
| Shares | ($000) | ||
| † | AmerisourceBergen Corp. | ||
| Class A | 7,600 | 198 | |
| * † | Lincare Holdings Inc. | 5,200 | 193 |
| * † | Community Health | ||
| Systems Inc. | 5,400 | 192 | |
| * † | LifePoint Hospitals Inc. | 5,900 | 192 |
| * † | Health Management | ||
| Associates Inc. Class A | 26,300 | 191 | |
| † | Quest Diagnostics Inc. | 3,100 | 187 |
| * † | Valeant Pharmaceuticals | ||
| International | 5,700 | 181 | |
| * † | Kinetic Concepts Inc. | 4,500 | 169 |
| * † | Millipore Corp. | 2,300 | 166 |
| * † | Tenet Healthcare Corp. | 29,500 | 159 |
| * | Warner Chilcott PLC Class A | 5,400 | 154 |
| † | Universal Health Services Inc. | ||
| Class B | 5,000 | 153 | |
| * | Humana Inc. | 3,300 | 145 |
| * | Dendreon Corp. | 4,800 | 126 |
| † | Omnicare Inc. | 4,100 | 99 |
| Perrigo Co. | 2,400 | 96 | |
| * | Cephalon Inc. | 1,500 | 94 |
| * | Medco Health Solutions Inc. | 1,400 | 89 |
| † | Bristol-Myers Squibb Co. | 3,458 | 87 |
| * | CareFusion Corp. | 3,400 | 85 |
| * | Hospira Inc. | 1,600 | 82 |
| McKesson Corp. | 1,300 | 81 | |
| * | Coventry Health Care Inc. | 2,900 | 70 |
| * † | Mettler-Toledo International Inc. | 600 | 63 |
| * | ResMed Inc. | 300 | 16 |
| * | Laboratory Corp. of | ||
| America Holdings | 200 | 15 | |
| 8,932 | |||
| Industrials (10.1%) | |||
| † | Raytheon Co. | 17,300 | 891 |
| † | L-3 Communications | ||
| Holdings Inc. | 7,200 | 626 | |
| † | Northrop Grumman Corp. | 8,700 | 486 |
| † | Goodrich Corp. | 7,400 | 476 |
| Avery Dennison Corp. | 6,100 | 222 | |
| * † | Hertz Global Holdings Inc. | 16,900 | 201 |
| † | Hubbell Inc. Class B | 3,900 | 184 |
| † | Joy Global Inc. | 3,500 | 181 |
| † | Flowserve Corp. | 1,900 | 180 |
| * † | Owens Corning | 6,900 | 177 |
| † | Lockheed Martin Corp. | 2,300 | 173 |
| † | RR Donnelley & Sons Co. | 7,500 | 167 |
| † | Pitney Bowes Inc. | 7,300 | 166 |
| United Parcel Service Inc. | |||
| Class B | 2,900 | 166 | |
| † | Carlisle Cos. Inc. | 4,800 | 164 |
| † | CH Robinson Worldwide Inc. | 2,800 | 164 |
| † | Equifax Inc. | 5,200 | 161 |
| † | ITT Corp. | 3,200 | 159 |
| Lennox International Inc. | 3,900 | 152 | |
| † | Ryder System Inc. | 3,500 | 144 |
| * | Navistar International Corp. | 3,700 | 143 |
| † | Brink’s Co. | 5,700 | 139 |
| Masco Corp. | 9,800 | 135 | |
| * † | Iron Mountain Inc. | 5,500 | 125 |
| * | URS Corp. | 2,800 | 125 |
| * † | General Cable Corp. | 4,100 | 121 |
| Manpower Inc. | 2,200 | 120 | |
| 3M Co. | 1,400 | 116 | |
| Oshkosh Corp. | 3,100 | 115 | |
| * | McDermott International Inc. | 4,200 | 101 |
| * | Armstrong World | ||
| Industries Inc. | 2,600 | 101 | |
| * † | Kirby Corp. | 2,600 | 91 |
| † | Copa Holdings SA Class A | 1,300 | 71 |
| * | Alliant Techsystems Inc. | 600 | 53 |
| Crane Co. | 900 | 28 | |
| * | Thomas & Betts Corp. | 700 | 25 |
| CSX Corp. | 500 | 24 | |
| † | Dun & Bradstreet Corp. | 200 | 17 |
| Dover Corp. | 300 | 12 | |
| 6,902 | |||
| Information Technology (16.5%) | |||
| † | Hewlett-Packard Co. | 22,500 | 1,159 |
| † | International Business | ||
| Machines Corp. | 8,700 | 1,139 | |
| * † | Google Inc. Class A | 1,580 | 980 |
| * † | Computer Sciences Corp. | 12,700 | 730 |
| * † | eBay Inc. | 19,400 | 457 |
| † | CA Inc. | 18,900 | 425 |
| † | Harris Corp. | 8,500 | 404 |
| * † | Micron Technology Inc. | 32,200 | 340 |
| * | SanDisk Corp. | 8,500 | 247 |
| * | BMC Software Inc. | 6,000 | 240 |
| * | Marvell Technology | ||
| Group Ltd. | 10,300 | 214 | |
| * † | Genpact Ltd. | 13,700 | 204 |
| * † | Western Digital Corp. | 4,600 | 203 |
| * | Juniper Networks Inc. | 7,600 | 203 |
| * † | Amdocs Ltd. | 7,000 | 200 |
| * † | Tech Data Corp. | 4,200 | 196 |
| * † | Teradata Corp. | 6,200 | 195 |
| † | Xilinx Inc. | 7,600 | 190 |
| * † | Hewitt Associates Inc. | ||
| Class A | 4,500 | 190 | |
| * | Vishay Intertechnology Inc. | 21,100 | 176 |
| Broadridge Financial | |||
| Solutions Inc. | 7,600 | 171 | |
| Seagate Technology | 9,400 | 171 | |
| * † | Compuware Corp. | 22,600 | 163 |
| * | LSI Corp. | 26,100 | 157 |
| * † | Sohu.com Inc. | 2,700 | 155 |
| * † | Tellabs Inc. | 26,600 | 151 |
| * † | Ingram Micro Inc. | 8,600 | 150 |
| Fidelity National Information | |||
| Services Inc. | 5,900 | 138 | |
| * | Avnet Inc. | 4,500 | 136 |
17
Market Neutral Fund
| Market | |||
| Value• | |||
| Shares | ($000) | ||
| Xerox Corp. | 15,600 | 132 | |
| * † | NCR Corp. | 11,600 | 129 |
| Maxim Integrated | |||
| Products Inc. | 6,300 | 128 | |
| † | Oracle Corp. | 5,200 | 128 |
| * † | Synopsys Inc. | 5,500 | 123 |
| * | Cognizant Technology | ||
| Solutions Corp. Class A | 2,700 | 122 | |
| * | Teradyne Inc. | 11,100 | 119 |
| * † | Affiliated Computer | ||
| Services Inc. Class A | 1,800 | 107 | |
| * | Red Hat Inc. | 3,400 | 105 |
| * † | Alliance Data Systems Corp. | 1,600 | 103 |
| * | Electronic Arts Inc. | 5,800 | 103 |
| * | NeuStar Inc. Class A | 4,000 | 92 |
| Mastercard Inc. Class A | 300 | 77 | |
| * | Brocade Communications | ||
| Systems Inc. | 9,000 | 69 | |
| * | Sybase Inc. | 1,400 | 61 |
| * | Cisco Systems Inc. | 1,900 | 45 |
| Texas Instruments Inc. | 1,600 | 42 | |
| * | NetApp Inc. | 1,200 | 41 |
| Global Payments Inc. | 300 | 16 | |
| * | Cypress Semiconductor Corp. | 1,100 | 12 |
| Lender Processing | |||
| Services Inc. | 300 | 12 | |
| * | PMC–Sierra Inc. | 1,400 | 12 |
| Motorola Inc. | 400 | 3 | |
| �� | 11,265 | ||
| Materials (4.7%) | |||
| † | Lubrizol Corp. | 4,600 | 336 |
| † | Newmont Mining Corp. | 6,400 | 303 |
| † | Eastman Chemical Co. | 4,600 | 277 |
| International Paper Co. | 9,100 | 244 | |
| † | Valhi Inc. | 16,000 | 224 |
| † | Celanese Corp. Class A | 6,100 | 196 |
| * † | Freeport-McMoRan | ||
| Copper & Gold Inc. | 2,300 | 185 | |
| † | Ball Corp. | 3,400 | 176 |
| † | Walter Energy Inc. | 2,300 | 173 |
| PPG Industries Inc. | 2,900 | 170 | |
| * † | Pactiv Corp. | 6,500 | 157 |
| † | Bemis Co. Inc. | 5,000 | 148 |
| EI du Pont de Nemours & Co. | 4,200 | 141 | |
| Temple-Inland Inc. | 5,800 | 122 | |
| * | Owens-Illinois Inc. | 3,300 | 108 |
| Sonoco Products Co. | 3,500 | 102 | |
| FMC Corp. | 1,400 | 78 | |
| * | Crown Holdings Inc. | 1,700 | 43 |
| † | Greif Inc. Class A | 400 | 22 |
| 3,205 | |||
| Telecommunication Services (1.0%) | |||
| † | CenturyTel Inc. | 5,300 | 192 |
| † | Qwest Communications | ||
| International Inc. | 43,600 | 184 | |
| † | Windstream Corp. | 14,800 | 163 |
| Telephone & Data | |||
| Systems Inc. | 1,800 | 61 | |
| AT&T Inc. | 1,400 | 39 | |
| * † | Sprint Nextel Corp. | 6,800 | 25 |
| 664 | |||
| Utilities (3.5%) | |||
| † | Public Service Enterprise | ||
| Group Inc. | 12,100 | 402 | |
| † | NiSource Inc. | 18,800 | 289 |
| Oneok Inc. | 4,700 | 210 | |
| † | CMS Energy Corp. | 12,100 | 189 |
| † | Atmos Energy Corp. | 6,100 | 179 |
| * † | AES Corp. | 13,000 | 173 |
| † | Exelon Corp. | 3,000 | 147 |
| * † | Mirant Corp. | 8,900 | 136 |
| AGL Resources Inc. | 3,400 | 124 | |
| Ameren Corp. | 4,200 | 117 | |
| CenterPoint Energy Inc. | 6,400 | 93 | |
| MDU Resources Group Inc. | 3,600 | 85 | |
| Constellation Energy | |||
| Group Inc. | 1,900 | 67 | |
| NSTAR | 1,800 | 66 | |
| DTE Energy Co. | 1,100 | 48 | |
| Integrys Energy Group Inc. | 1,100 | 46 | |
| DPL Inc. | 800 | 22 | |
| 2,393 | |||
| Total Common Stocks—Long Positions | |||
| (Cost $52,655) | 60,601 | ||
| Common Stocks Sold Short (–85.6%) | |||
| Consumer Discretionary (–10.2%) | |||
| McDonald’s Corp. | (14,300) | (893) | |
| * | Clear Channel Outdoor | ||
| Holdings Inc. Class A | (20,800) | (216) | |
| * | Urban Outfitters Inc. | (5,800) | (203) |
| * | Las Vegas Sands Corp. | (13,500) | (202) |
| Walt Disney Co. | (6,000) | (194) | |
| BorgWarner Inc. | (5,800) | (193) | |
| Marriott International Inc. | |||
| Class A | (7,087) | (193) | |
| Staples Inc. | (7,800) | (192) | |
| Harman International | |||
| Industries Inc. | (5,300) | (187) | |
| Pulte Homes Inc. | (18,600) | (186) | |
| Wendy’s/Arby’s Group Inc. | |||
| Class A | (38,700) | (182) | |
| American Eagle | |||
| Outfitters Inc. | (10,700) | (182) | |
| * | Interpublic Group | ||
| of Cos. Inc. | (24,300) | (179) | |
| Fortune Brands Inc. | (4,100) | (177) | |
| * | Toll Brothers Inc. | (9,400) | (177) |
| Best Buy Co. Inc. | (4,400) | (174) | |
| International Speedway | |||
| Corp. Class A | (6,100) | (174) | |
| * | LKQ Corp. | (8,900) | (174) |
18
Market Neutral Fund
| Market | |||
| Value• | |||
| Shares | ($000) | ||
| * | Morningstar Inc. | (3,600) | (174) |
| Abercrombie & Fitch Co. | (4,900) | (171) | |
| * | O’Reilly Automotive Inc. | (4,400) | (168) |
| * | DreamWorks Animation | ||
| SKG Inc. Class A | (4,200) | (168) | |
| NIKE Inc. Class B | (2,500) | (165) | |
| * | Dick’s Sporting Goods Inc. | (6,500) | (162) |
| Interactive Data Corp. | (6,400) | (162) | |
| Lowe’s Cos. Inc. | (6,600) | (154) | |
| * | GameStop Corp. Class A | (7,000) | (154) |
| International Game | |||
| Technology | (7,700) | (144) | |
| * | Boyd Gaming Corp. | (16,200) | (136) |
| * | Scientific Games Corp. | ||
| Class A | (9,200) | (134) | |
| Washington Post Co. | |||
| Class B | (300) | (132) | |
| H&R Block Inc. | (5,800) | (131) | |
| Starwood Hotels & Resorts | |||
| Worldwide Inc. | (3,100) | (113) | |
| Harley-Davidson Inc. | (3,900) | (98) | |
| DeVry Inc. | (1,700) | (96) | |
| McGraw-Hill Cos. Inc. | (2,800) | (94) | |
| Virgin Media Inc. | (5,000) | (84) | |
| Wynn Resorts Ltd. | (1,200) | (70) | |
| * | ITT Educational Services Inc. | (700) | (67) |
| * | Penn National Gaming Inc. | (2,000) | (54) |
| * | MGM Mirage | (5,800) | (53) |
| Hasbro Inc. | (1,500) | (48) | |
| (7,010) | |||
| Consumer Staples (–4.7%) | |||
| Procter & Gamble Co. | (8,000) | (485) | |
| Kroger Co. | (17,600) | (362) | |
| McCormick & Co. Inc. | (7,000) | (253) | |
| JM Smucker Co. | (3,200) | (198) | |
| Coca-Cola Co. | (3,300) | (188) | |
| * | Hansen Natural Corp. | (4,900) | (188) |
| Altria Group Inc. | (8,900) | (175) | |
| CVS Caremark Corp. | (5,300) | (171) | |
| Alberto-Culver Co. Class B | (5,800) | (170) | |
| PepsiCo Inc. | (2,700) | (164) | |
| Church & Dwight Co. Inc. | (2,700) | (163) | |
| Corn Products | |||
| International Inc. | (5,400) | (158) | |
| Flowers Foods Inc. | (6,500) | (154) | |
| * | Ralcorp Holdings Inc. | (1,900) | (113) |
| Lorillard Inc. | (1,200) | (96) | |
| Costco Wholesale Corp. | (900) | (53) | |
| * | Whole Foods Market Inc. | (1,900) | (52) |
| Brown-Forman Corp. Class B | (700) | (38) | |
| (3,181) | |||
| Energy (–9.9%) | |||
| Schlumberger Ltd. | (15,700) | (1,022) | |
| Exxon Mobil Corp. | (14,200) | (968) | |
| Occidental Petroleum Corp. | (11,000) | (895) | |
| Spectra Energy Corp. | (21,100) | (433) | |
| EOG Resources Inc. | (3,800) | (370) | |
| Range Resources Corp. | (7,300) | (364) | |
| Smith International Inc. | (9,600) | (261) | |
| Peabody Energy Corp. | (5,700) | (258) | |
| * | Ultra Petroleum Corp. | (4,400) | (219) |
| Pioneer Natural | |||
| Resources Co. | (4,500) | (217) | |
| Cabot Oil & Gas Corp. | (4,400) | (192) | |
| Halliburton Co. | (6,300) | (190) | |
| St Mary Land & | |||
| Exploration Co. | (5,400) | (185) | |
| Hess Corp. | (2,900) | (175) | |
| * | CNX Gas Corp. | (5,800) | (171) |
| * | Petrohawk Energy Corp. | (7,100) | (170) |
| * | Comstock Resources Inc. | (4,100) | (166) |
| Valero Energy Corp. | (9,700) | (163) | |
| Sunoco Inc. | (6,200) | (162) | |
| * | Denbury Resources Inc. | (5,400) | (80) |
| * | Cameron International Corp. | (1,500) | (63) |
| Overseas Shipholding | |||
| Group Inc. | (500) | (22) | |
| * | Alpha Natural | ||
| Resources Inc. | (500) | (22) | |
| (6,768) | |||
| Financials (–11.8%) | |||
| American Express Co. | (20,400) | (827) | |
| Morgan Stanley | (17,700) | (524) | |
| MetLife Inc. | (14,400) | (509) | |
| Charles Schwab Corp. | (22,000) | (414) | |
| Aflac Inc. | (6,900) | (319) | |
| * | IntercontinentalExchange Inc. | (2,300) | (259) |
| Bank of New York | |||
| Mellon Corp. | (8,200) | (230) | |
| T Rowe Price Group Inc. | (4,000) | (213) | |
| * | Progressive Corp. | (11,400) | (205) |
| American National | |||
| Insurance Co. | (1,700) | (203) | |
| CME Group Inc. | (600) | (202) | |
| Invesco Ltd. | (8,200) | (193) | |
| Wesco Financial Corp. | (530) | (182) | |
| Capital One Financial Corp. | (4,700) | (180) | |
| Lincoln National Corp. | (7,200) | (179) | |
| Legg Mason Inc. | (5,700) | (172) | |
| Erie Indemnity Co. Class A | (4,400) | (172) | |
| Whitney Holding Corp. | (18,400) | (168) | |
| Arthur J Gallagher & Co. | (7,400) | (167) | |
| * | Alleghany Corp. | (600) | (166) |
| AON Corp. | (4,300) | (165) | |
| Brown & Brown Inc. | (9,000) | (162) | |
| Old Republic | |||
| International Corp. | (15,400) | (155) | |
| Marsh & McLennan | |||
| Cos. Inc. | (6,700) | (148) | |
| Fidelity National | |||
| Financial Inc. Class A | (10,900) | (147) | |
| * | MSCI Inc. Class A | (4,600) | (146) |
19
Market Neutral Fund
| Market | |||
| Value• | |||
| Shares | ($000) | ||
| CapitalSource Inc. | (33,700) | (134) | |
| * | Leucadia National Corp. | (5,400) | (129) |
| Greenhill & Co. Inc. | (1,600) | (128) | |
| Principal Financial Group Inc. | (5,300) | (127) | |
| KeyCorp | (22,600) | (126) | |
| Comerica Inc. | (4,100) | (121) | |
| * | SLM Corp. | (10,700) | (121) |
| * | Genworth Financial Inc. | ||
| Class A | (9,200) | (104) | |
| People’s United | |||
| Financial Inc. | (6,000) | (100) | |
| Huntington Bancshares Inc. | (27,200) | (99) | |
| Popular Inc. | (40,800) | (92) | |
| SunTrust Banks Inc. | (4,500) | (91) | |
| Commerce Bancshares Inc. | (1,995) | (77) | |
| XL Capital Ltd. Class A | (4,000) | (73) | |
| NYSE Euronext | (1,700) | (43) | |
| Janus Capital Group Inc. | (2,600) | (35) | |
| Regions Financial Corp. | (6,700) | (35) | |
| Wilmington Trust Corp. | (1,000) | (12) | |
| Marshall & Ilsley Corp. | (1,900) | (10) | |
| Synovus Financial Corp. | (5,100) | (10) | |
| (8,074) | |||
| Health Care (–11.0%) | |||
| Abbott Laboratories | (18,500) | (999) | |
| * | Celgene Corp. | (12,100) | (673) |
| * | Gilead Sciences Inc. | (12,800) | (554) |
| * | Intuitive Surgical Inc. | (1,400) | (424) |
| * | Genzyme Corp. | (7,300) | (358) |
| Allergan Inc. | (5,000) | (315) | |
| * | Vertex Pharmaceuticals Inc. | (7,200) | (309) |
| DENTSPLY International Inc. | (7,600) | (267) | |
| * | Covance Inc. | (4,700) | (256) |
| * | Abraxis Bioscience Inc. | (5,000) | (203) |
| * | King Pharmaceuticals Inc. | (15,900) | (195) |
| * | United Therapeutics Corp. | (3,700) | (195) |
| * | Health Net Inc. | (8,300) | (193) |
| Stryker Corp. | (3,800) | (191) | |
| * | Zimmer Holdings Inc. | (3,200) | (189) |
| Medtronic Inc. | (4,100) | (180) | |
| * | Gen-Probe Inc. | (4,200) | (180) |
| * | Patterson Cos. Inc. | (6,400) | (179) |
| * | St Jude Medical Inc. | (4,800) | (177) |
| Cardinal Health Inc. | (5,300) | (171) | |
| * | VCA Antech Inc. | (6,300) | (157) |
| Beckman Coulter Inc. | (2,300) | (151) | |
| * | OSI Pharmaceuticals Inc. | (4,800) | (149) |
| * | Boston Scientific Corp. | (14,600) | (131) |
| * | Amylin Pharmaceuticals Inc. | (8,300) | (118) |
| PerkinElmer Inc. | (5,100) | (105) | |
| * | Illumina Inc. | (3,100) | (95) |
| * | Human Genome | ||
| Sciences Inc. | (2,800) | (86) | |
| * | Alexion Pharmaceuticals Inc. | (1,600) | (78) |
| CR Bard Inc. | (1,000) | (78) | |
| * | ResMed Inc. | (1,400) | (73) |
| * | Express Scripts Inc. | (800) | (69) |
| * | Myriad Genetics Inc. | (2,100) | (55) |
| (7,553) | |||
| Industrials (–11.2%) | |||
| United Parcel Service Inc. | |||
| Class B | (10,200) | (585) | |
| Boeing Co. | (10,500) | (568) | |
| Robert Half | |||
| International Inc. | (10,700) | (286) | |
| Fastenal Co. | (5,900) | (246) | |
| Roper Industries Inc. | (4,700) | (246) | |
| * | Kansas City Southern | (6,300) | (210) |
| Southwest Airlines Co. | (18,400) | (210) | |
| Danaher Corp. | (2,600) | (196) | |
| * | Waste Connections Inc. | (5,800) | (193) |
| Eaton Corp. | (3,000) | (191) | |
| Kennametal Inc. | (7,300) | (189) | |
| Alexander & Baldwin Inc. | (5,500) | (188) | |
| IDEX Corp. | (6,000) | (187) | |
| * | AGCO Corp. | (5,700) | (184) |
| * | Continental Airlines Inc. | ||
| Class B | (10,200) | (183) | |
| Emerson Electric Co. | (4,300) | (183) | |
| Republic Services Inc. | |||
| Class A | (6,400) | (181) | |
| * | Terex Corp. | (8,900) | (176) |
| * | Covanta Holding Corp. | (9,500) | (172) |
| Manitowoc Co. Inc. | (17,200) | (172) | |
| * | Monster Worldwide Inc. | (9,700) | (169) |
| AMETEK Inc. | (4,400) | (168) | |
| Wabtec Corp. | (4,100) | (167) | |
| * | McDermott International Inc. | (6,800) | (163) |
| Deere & Co. | (3,000) | (162) | |
| Cintas Corp. | (6,100) | (159) | |
| Landstar System Inc. | (4,100) | (159) | |
| Cummins Inc. | (3,400) | (156) | |
| Caterpillar Inc. | (2,600) | (148) | |
| * | Shaw Group Inc. | (5,100) | (147) |
| Fluor Corp. | (3,100) | (140) | |
| Rockwell Automation Inc. | (2,900) | (136) | |
| Textron Inc. | (7,000) | (131) | |
| Expeditors International of | |||
| Washington Inc. | (3,600) | (125) | |
| Parker Hannifin Corp. | (2,200) | (119) | |
| * | Stericycle Inc. | (2,000) | (110) |
| Joy Global Inc. | (1,800) | (93) | |
| Dun & Bradstreet Corp. | (900) | (76) | |
| * | Jacobs Engineering Group Inc. | (2,000) | (75) |
| Bucyrus International Inc. | |||
| Class A | (1,300) | (73) | |
| * | Iron Mountain Inc. | (3,200) | (73) |
| * | Quanta Services Inc. | (3,300) | (69) |
| * | Copart Inc. | (900) | (33) |
| Stanley Works | (600) | (31) | |
| * | AMR Corp. | (1,600) | (12) |
| (7,640) | |||
20
Market Neutral Fund
| Market | |||
| Value• | |||
| Shares | ($000) | ||
| Information Technology (–12.2%) | |||
| QUALCOMM Inc. | (23,700) | (1,096) | |
| Visa Inc. Class A | (7,700) | (673) | |
| Paychex Inc. | (11,400) | (350) | |
| * | Citrix Systems Inc. | (7,700) | (321) |
| Applied Materials Inc. | (21,700) | (302) | |
| Corning Inc. | (14,200) | (274) | |
| * | Salesforce.com Inc. | (3,300) | (243) |
| Western Union Co. | (12,300) | (232) | |
| * | Agilent Technologies Inc. | (6,600) | (205) |
| * | ANSYS Inc. | (4,600) | (200) |
| * | Itron Inc. | (2,900) | (196) |
| * | Lam Research Corp. | (5,000) | (196) |
| National Instruments Corp. | (6,400) | (189) | |
| * | Autodesk Inc. | (7,100) | (180) |
| * | Atmel Corp. | (38,200) | (176) |
| * | NVIDIA Corp. | (9,400) | (176) |
| * | Trimble Navigation Ltd. | (6,900) | (174) |
| * | Intuit Inc. | (5,600) | (172) |
| * | Juniper Networks Inc. | (6,300) | (168) |
| * | Adobe Systems Inc. | (4,500) | (166) |
| Automatic Data | |||
| Processing Inc. | (3,800) | (163) | |
| * | Activision Blizzard Inc. | (14,700) | (163) |
| * | Dell Inc. | (10,900) | (157) |
| * | eBay Inc. | (6,600) | (155) |
| * | Cadence Design | ||
| Systems Inc. | (25,200) | (151) | |
| * | Electronic Arts Inc. | (8,500) | (151) |
| * | FLIR Systems Inc. | (4,500) | (147) |
| * | Synopsys Inc. | (6,300) | (140) |
| Amphenol Corp. Class A | (3,000) | (139) | |
| * | Ciena Corp. | (12,000) | (130) |
| Linear Technology Corp. | (4,100) | (125) | |
| * | MEMC Electronic | ||
| Materials Inc. | (8,100) | (110) | |
| * | Cree Inc. | (1,800) | (101) |
| * | McAfee Inc. | (2,400) | (97) |
| * | Red Hat Inc. | (3,100) | (96) |
| * | Flextronics International Ltd. | (12,900) | (94) |
| Microchip Technology Inc. | (3,000) | (87) | |
| KLA-Tencor Corp. | (2,200) | (80) | |
| * | Novellus Systems Inc. | (3,300) | (77) |
| * | F5 Networks Inc. | (1,400) | (74) |
| * | Equinix Inc. | (700) | (74) |
| * | Cisco Systems Inc. | (3,000) | (72) |
| * | DST Systems Inc. | (600) | (26) |
| * | Varian Semiconductor | ||
| Equipment Associates Inc. | (700) | (25) | |
| (8,323) | |||
| Materials (–6.3%) | |||
| Monsanto Co. | (10,400) | (850) | |
| Alcoa Inc. | (37,000) | (596) | |
| Mosaic Co. | (6,700) | (400) | |
| Weyerhaeuser Co. | (9,200) | (397) | |
| Martin Marietta Materials Inc. | (2,600) | (233) | |
| Dow Chemical Co. | (6,800) | (188) | |
| Air Products & Chemicals Inc. | (2,200) | (178) | |
| * | Intrepid Potash Inc. | (6,100) | (178) |
| Vulcan Materials Co. | (3,300) | (174) | |
| Nucor Corp. | (3,700) | (173) | |
| PPG Industries Inc. | (2,900) | (170) | |
| United States Steel Corp. | (2,500) | (138) | |
| Allegheny Technologies Inc. | (2,300) | (103) | |
| Southern Copper Corp. | (3,100) | (102) | |
| Sigma-Aldrich Corp. | (2,000) | (101) | |
| * | Titanium Metals Corp. | (6,100) | (76) |
| Aptargroup Inc. | (1,900) | (68) | |
| Walter Energy Inc. | (800) | (60) | |
| Commercial Metals Co. | (3,600) | (56) | |
| Royal Gold Inc. | (1,100) | (52) | |
| Steel Dynamics Inc. | (700) | (12) | |
| (4,305) | |||
| Telecommunication Services (–3.5%) | |||
| Verizon Communications Inc. | (23,700) | (785) | |
| * | American Tower Corp. | ||
| Class A | (9,100) | (393) | |
| AT&T Inc. | (9,300) | (261) | |
| * | SBA Communications Corp. | ||
| Class A | (6,600) | (225) | |
| Telephone & Data | |||
| Systems Inc. | (5,800) | (197) | |
| * | Crown Castle | ||
| International Corp. | (4,600) | (180) | |
| * | Leap Wireless | ||
| International Inc. | (9,500) | (167) | |
| * | NII Holdings Inc. | (2,900) | (97) |
| Windstream Corp. | (7,500) | (82) | |
| (2,387) | |||
| Utilities (–4.8%) | |||
| Southern Co. | (17,300) | (576) | |
| Exelon Corp. | (9,500) | (464) | |
| EQT Corp. | (8,500) | (373) | |
| Questar Corp. | (4,700) | (195) | |
| Alliant Energy Corp. | (6,000) | (182) | |
| Duke Energy Corp. | (10,200) | (176) | |
| ITC Holdings Corp. | (3,300) | (172) | |
| Great Plains Energy Inc. | (8,600) | (167) | |
| Westar Energy Inc. | (7,500) | (163) | |
| Wisconsin Energy Corp. | (3,100) | (155) | |
| Allegheny Energy Inc. | (6,400) | (150) | |
| * | Dynegy Inc. Class A | (76,300) | (138) |
| Energen Corp. | (2,700) | (126) | |
| * | NRG Energy Inc. | (4,500) | (106) |
| SCANA Corp. | (2,200) | (83) | |
| Dominion Resources Inc. | (1,700) | (66) | |
| (3,292) | |||
| Total Common Stocks Sold Short | |||
| (Proceeds $51,659) | (58,533) | ||
21
Market Neutral Fund
| Market | ||
| Value• | ||
| Shares | ($000) | |
| Temporary Cash Investment (13.6%) | ||
| Money Market Fund (13.6%) | ||
| 1 Vanguard Market Liquidity | ||
| Fund, 0.187% | ||
| (Cost $9,274) | 9,274,367 | 9,274 |
| †Other Assets and Liabilities— | ||
| Net (83.4%) | 57,048 | |
| Net Assets (100%) | 68,390 | |
At December 31, 2009, net assets consisted of:
| Amount | |
| ($000) | |
| Paid-in Capital | 89,313 |
| Overdistributed Net Investment Income | (50) |
| Accumulated Net Realized Losses | (21,945) |
| Unrealized Appreciation (Depreciation) | |
| Investment Securities—Long Positions | 7,946 |
| Investment Securities Sold Short | (6,874) |
| Net Assets | 68,390 |
| Investor Shares—Net Assets | |
| Applicable to 5,441,507 outstanding | |
| $.001 par value shares of beneficial | |
| interest (unlimited authorization) | 52,853 |
| Net Asset Value Per Share— | |
| Investor Shares | $9.71 |
| Institutional Shares—Net Assets | |
| Applicable to 1,607,934 outstanding | |
| $.001 par value shares of beneficial | |
| interest (unlimited authorization) | 15,537 |
| Net Asset Value Per Share— | |
| Institutional Shares | $9.66 |
• See Note A in Notes to Financial Statements.
* Non-income-producing security.
† Long security positions with a value of $38,018,000 and cash of $57,163,000 have been segregated in connection with securities sold short.
1 Affiliated money market fund available only to Vanguard funds and certain trusts and accounts managed by Vanguard. Rate shown is the
7-day yield.
See accompanying Notes, which are an integral part of the Financial Statements.
22
Market Neutral Fund
Statement of Assets and Liabilities
As of December 31, 2009
| Market Value | |
| ($000) | |
| Assets | |
| Investment in Securities, Long Positions at Value | |
| Common Stocks | 60,601 |
| Temporary Cash Investments | 9,274 |
| Cash Deposited with Broker for Short Positions | 57,163 |
| Receivables for Investment Securities Sold | 779 |
| Receivables for Capital Shares Issued | 447 |
| Other Assets | 66 |
| Total Assets | 128,330 |
| Liabilities | |
| Securities Sold Short, at Value | 58,533 |
| Payables for Investment Securities Purchased | 1,009 |
| Other Liabilities | 398 |
| Total Liabilities | 59,940 |
| Net Assets (100%) | 68,390 |
See accompanying Notes, which are an integral part of the Financial Statements.
23
Market Neutral Fund
Statement of Operations
| Year Ended | |
| December 31, 2009 | |
| ($000) | |
| Investment Income | |
| Income | |
| Dividends | 1,322 |
| Interest1 | 62 |
| Total Income | 1,384 |
| Expenses | |
| Investment Advisory Fees—Note B | |
| Basic Fee | 178 |
| Performance Adjustment | (74) |
| The Vanguard Group—Note C | |
| Management and Administrative—Investor Shares | 42 |
| Management and Administrative—Institutional Shares | 1 |
| Marketing and Distribution—Investor Shares | 22 |
| Marketing and Distribution—Institutional Shares | 4 |
| Custodian Fees | 69 |
| Auditing Fees | 42 |
| Shareholders’ Reports and Proxies—Investor Shares | 3 |
| Shareholders’ Reports and Proxies—Institutional Shares | 1 |
| Dividend Expense on Securities Sold Short | 1,070 |
| Borrowing Expense on Securities Sold Short | 750 |
| Total Expenses | 2,108 |
| Expenses Paid Indirectly | (5) |
| Net Expenses | 2,103 |
| Net Investment Income (Loss) | (719) |
| Realized Net Gain (Loss) | |
| Investment Securities—Long Positions | (8,528) |
| Investment Securities Sold Short | (7,000) |
| Futures Contracts | 2 |
| Realized Net Gain (Loss) | (15,526) |
| Change in Unrealized Appreciation (Depreciation) | |
| Investment Securities—Long Positions | 25,152 |
| Investment Securities Sold Short | (18,933) |
| Futures Contracts | 5 |
| Change in Unrealized Appreciation (Depreciation) | 6,224 |
| Net Increase (Decrease) in Net Assets Resulting from Operations | (10,021) |
1 Interest income from an affiliated company of the fund was $62,000.
See accompanying Notes, which are an integral part of the Financial Statements.
24
Market Neutral Fund
Statement of Changes in Net Assets
| Year Ended | April 1, 2008, to | Year Ended | |
| December 31, | December 31, | March 31, | |
| 2009 | 20081 | 2008 | |
| ($000) | ($000) | ($000) | |
| Increase (Decrease) in Net Assets | |||
| Operations | |||
| Net Investment Income (Loss) | (719) | 797 | 638 |
| Realized Net Gain (Loss) | (15,526) | (1,034) | 2,059 |
| Change in Unrealized Appreciation (Depreciation) | 6,224 | (6,467) | (1,291) |
| Net Increase (Decrease) in Net Assets | |||
| Resulting from Operations | (10,021) | (6,704) | 1,406 |
| Distributions | |||
| Net Investment Income | |||
| Investor Shares | (76) | (819) | (344) |
| Institutional Shares | (12) | (187) | (206) |
| Realized Capital Gain2 | |||
| Investor Shares | — | (3,716) | (200) |
| Institutional Shares | — | (861) | (112) |
| Total Distributions | (88) | (5,583) | (862) |
| Capital Share Transactions | |||
| Investor Shares | (11,487) | 37,746 | 35,479 |
| Institutional Shares | 206 | 7,271 | 1,704 |
| Net Increase (Decrease) from Capital Share Transactions | (11,281) | 45,017 | 37,183 |
| Total Increase (Decrease) | (21,390) | 32,730 | 37,727 |
| Net Assets | |||
| Beginning of Period | 89,780 | 57,050 | 19,323 |
| End of Period3 | 68,390 | 89,780 | 57,050 |
1 The fund’s fiscal year-end changed from March 31 to December 31, effective December 31, 2008.
2 Includes short-term gain distributions totaling $4,163,000 and $0, for fiscal periods ended December 31, 2008, and March 31, 2008,
respectively. Short-term gain distributions are treated as ordinary income dividends for tax purposes.
3 Net Assets—End of Period includes undistributed (overdistributed) net investment income of ($50,000), $52,000, and $244,000.
See accompanying Notes, which are an integral part of the Financial Statements.
25
Market Neutral Fund
Financial Highlights
| Investor Shares | ||||||
| Year | April 1, | |||||
| Ended | 2008, to | |||||
| For a Share Outstanding | Dec. 31, | Dec. 31, | Year Ended March 31, | |||
| Throughout Each Period | 2009 | 20081 | 20082 | 2007 | 2006 | 2005 |
| Net Asset Value, | ||||||
| Beginning of Period | $10.97 | $12.45 | $12.19 | $12.12 | $11.46 | $10.86 |
| Investment Operations | ||||||
| Net Investment Income (Loss) | (.105) | .084 | .3113 | .500 | .220 | (.040) |
| Net Realized and Unrealized Gain (Loss) | ||||||
| on Investments4 | (1.143) | (.838) | .909 | .060 | .590 | .640 |
| Total from Investment Operations | (1.248) | (.754) | 1.220 | .560 | .810 | .600 |
| Distributions | ||||||
| Dividends from Net Investment Income | (.012) | (.132) | (.607) | (.490) | (.150) | — |
| Distributions from Realized Capital Gains | — | (.594) | (.353) | — | — | — |
| Total Distributions | (.012) | (.726) | (.960) | (.490) | (.150) | — |
| Net Asset Value, End of Period | $9.71 | $10.97 | $12.45 | $12.19 | $12.12 | $11.46 |
| Total Return5 | –11.38% | –6.11% | 10.15% | 4.68% | 7.09% | 5.52% |
| Ratios/Supplemental Data | ||||||
| Net Assets, End of Period (Millions) | $53 | $73 | $45 | $9 | $12 | $13 |
| Ratio of Expenses to | ||||||
| Average Net Assets | ||||||
| Based on Total Expenses | 2.80%7 | 2.13%6 | 3.09% | 3.46% | 3.31% | 3.55% |
| Net of Expenses Waived/Reimbursed2 | 2.80%7 | 2.13%6 | 2.79% | 2.98% | 3.02% | 3.26% |
| Net of Expenses Waived/Reimbursed | ||||||
| and Dividend and Borrowing | ||||||
| Expense on Securities Sold Short | 0.39%8 | 0.46%6,8 | 1.16% | 1.54% | 1.59% | 1.61% |
| Ratio of Net Investment Income (Loss) | ||||||
| to Average Net Assets | (0.97%) | 1.15%6 | 2.69% | 3.40% | 2.14% | (0.33%) |
| Portfolio Turnover Rate | 142% | 161% | 214% | 169% | 213% | 180% |
1 The fund’s fiscal year-end changed from March 31 to December 31, effective December 31, 2008.
2 Laudus Rosenberg U.S. Large/Mid Capitalization Long/Short Equity Fund reorganized into Vanguard Market Neutral Fund effective
December 1, 2007. Prior to December 1, 2007, the fund’s advisor and other service providers waived or reimbursed certain fund expenses.
3 Calculated based on average shares outstanding.
4 Includes increases from redemption fees of $.04, $.00, $.00, $.01, $.00, and $.00.
5 Total returns do not reflect the 2% fee assessed until November 30, 2007, on redemptions of shares purchased within 30 days; the
1% fee assessed beginning December 1, 2007, on redemptions of shares held less than one year; or the account service fee that may
be applicable to certain accounts with balances below $10,000.
6 Annualized.
7 Includes 2009 dividend and borrowing expenses on securities sold short of 1.42% and 0.99%, respectively.
8 Includes performance-based investment advisory fee increases (decreases) of (0.10%) for fiscal 2009 and (0.02%) for fiscal 2008.
See accompanying Notes, which are an integral part of the Financial Statements.
26
Market Neutral Fund
Financial Highlights
| Institutional Shares | ||||||
| Year | April 1, | |||||
| Ended | 2008, to | |||||
| For a Share Outstanding | Dec. 31, | Dec. 31, | Year Ended March 31, | |||
| Throughout Each Period | 2009 | 20081 | 20082 | 2007 | 2006 | 2005 |
| Net Asset Value, | ||||||
| Beginning of Period | $10.90 | $12.39 | $12.14 | $12.08 | $11.44 | $10.80 |
| Investment Operations | ||||||
| Net Investment Income (Loss) | (.093) | .085 | .3903 | .600 | .250 | (.010)3 |
| Net Realized and Unrealized Gain (Loss) | ||||||
| on Investments4 | (1.139) | (.846) | .864 | — | .580 | .650 |
| Total from Investment Operations | (1.232) | (.761) | 1.254 | .600 | .830 | .640 |
| Distributions | ||||||
| Dividends from Net Investment Income | (.008) | (.138) | (.651) | (.540) | (.190) | — |
| Distributions from Realized Capital Gains | — | (.591) | (.353) | — | — | — |
| Total Distributions | (.008) | (.729) | (1.004) | (.540) | (.190) | — |
| Net Asset Value, End of Period | $9.66 | $10.90 | $12.39 | $12.14 | $12.08 | $11.44 |
| Total Return5 | –11.31% | –6.20% | 10.49% | 4.98% | 7.29% | 5.93% |
| Ratios/Supplemental Data | ||||||
| Net Assets, End of Period (Millions) | $16 | $17 | $12 | $10 | $20 | $12 |
| Ratio of Expenses to | ||||||
| Average Net Assets | ||||||
| Based on Total Expenses | 2.73%7 | 2.08%6 | 2.97% | 3.07% | 3.01% | 3.23% |
| Net of Expenses Waived/Reimbursed2 | 2.73%7 | 2.08%6 | 2.56% | 2.67% | 2.71% | 2.94% |
| Net of Expenses Waived/Reimbursed | ||||||
| and Dividend and Borrowing | ||||||
| Expense on Securities Sold Short | 0.32%8 | 0.41%6,8 | 0.93% | 1.24% | 1.24% | 1.24% |
| Ratio of Net Investment Income (Loss) | ||||||
| to Average Net Assets | (0.90%) | 1.20%6 | 2.92% | 3.68% | 2.50% | (0.13%) |
| Portfolio Turnover Rate | 142% | 161% | 214% | 169% | 213% | 180% |
1 The fund’s fiscal year-end changed from March 31 to December 31, effective December 31, 2008.
2 Laudus Rosenberg U.S. Large/Mid Capitalization Long/Short Equity Fund reorganized into Vanguard Market Neutral Fund effective
December 1, 2007. Prior to December 1, 2007, the fund’s advisor and other service providers waived or reimbursed certain fund expenses.
3 Calculated based on average shares outstanding.
4 Includes increases from redemption fees of $.03, $.00, $.00, $.00, $.00, and $.00.
5 Total returns do not reflect the 2% fee assessed until November 30, 2007, on redemptions of shares purchased within 30 days or the
1% fee assessed beginning December 1, 2007, on redemptions of shares held less than one year.
6 Annualized.
7 Includes 2009 dividend and borrowing expenses on securities sold short of 1.42% and 0.99%, respectively.
8 Includes performance-based investment advisory fee increases (decreases) of (0.10%) for fiscal 2009 and (0.02%) for fiscal 2008.
See accompanying Notes, which are an integral part of the Financial Statements.
27
Market Neutral Fund
Notes to Financial Statements
Vanguard Market Neutral Fund is registered under the Investment Company Act of 1940 as an open-end investment company, or mutual fund. The fund offers two classes of shares, Investor Shares and Institutional Shares. Investor Shares are available to any investor who meets the fund’s minimum purchase requirements. Institutional Shares are designed for investors who meet certain administrative and service criteria and invest a minimum of $5 million.
A. The following significant accounting policies conform to generally accepted accounting principles for U.S. mutual funds. The fund consistently follows such policies in preparing its financial statements.
1. Security Valuation: Securities are valued as of the close of trading on the New York Stock Exchange (generally 4 p.m., Eastern time) on the valuation date. Equity securities are valued at the latest quoted sales prices or official closing prices taken from the primary market in which each security trades; such securities not traded on the valuation date are valued at the mean of the latest quoted bid and asked prices. Securities for which market quotations are not readily available, or whose values have been affected by events occurring before the fund’s pricing time but after the close of the securities’ primary markets, are valued at their fair values calculated according to procedures adopted by the board of trustees. These procedures include obtaining quotations from an independent pricing service, monitoring news to identify significant market- or security-specific events, and evaluating changes in the values of foreign market proxies (for example, ADRs, futures contracts, or exchange-traded funds), between the time the foreign markets close and the fund’s pricing time. When fair-value pricing is employed, the prices of securities used by a fund to calculate its net asset value may differ from quoted or published prices for the same securities. Investments in Vanguard Market Liquidity Fund are valued at that fund’s net asset value.
2. Short Sales: Short sales are the sales of securities that the fund does not own. The fund may sell a security it does not own in anticipation of a decline in the value of that security. In order to deliver the security to the purchaser, the fund borrows the security from a broker-dealer. The fund must segregate, as collateral for its obligation to return the borrowed security, an amount of cash and long security positions at least equal to the market value of the security sold short. The fund later closes out the position by returning the security to the lender, typically by purchasing the security in the open market. A gain, limited to the price at which the fund sold the security short, or a loss, theoretically unlimited in size, is recognized upon the termination of the short sale. The fund may receive a portion of the income from the investment of collateral, or be charged a fee on borrowed securities, based on the market value of each borrowed security and a variable rate that is dependent upon the availability of such security. The net amounts of income or fees are recorded as interest income (for net income received) or borrowing expense on securities sold short (for net fees charged) on the Statement of Operations. Dividends on securities sold short are reported as an expense in the Statement of Operations.
Cash collateral segregated for securities sold short is recorded as an asset in the Statement of Assets and Liabilities. Long security positions segregated as collateral are shown in the Statement of Net Assets.
28
Market Neutral Fund
3. Futures Contracts: The fund uses index futures contracts to a limited extent, with the objective of limiting exposure to general stock market risk while maintaining liquidity. The fund may purchase or sell futures contracts to achieve a desired level of investment, whether to accommodate portfolio turnover or cash flows from capital share transactions. The primary risks associated with the use of futures contracts are imperfect correlation between changes in market values of stocks held by the fund and the prices of futures contracts, and the possibility of an illiquid market.
Futures contracts are valued at their quoted daily settlement prices. The aggregate principal amounts of the contracts are not recorded in the Statement of Net Assets. Fluctuations in the value of the contracts are recorded in the Statement of Net Assets as an asset (liability) and in the Statement of Operations as unrealized appreciation (depreciation) until the contracts are closed, when they are recorded as realized futures gains (losses).
4. Federal Income Taxes: The fund intends to continue to qualify as a regulated investment company and distribute all of its taxable income. Management has analyzed the fund’s tax positions taken for all open federal income tax years (March 31, 2006–December 31, 2009), and has concluded that no provision for federal income tax is required in the fund’s financial statements.
5. Distributions: Distributions to shareholders are recorded on the ex-dividend date.
6. Other: Dividend income (or dividend expense on short positions) is recorded on the ex-dividend date. Interest income includes income distributions received from Vanguard Market Liquidity Fund and is accrued daily. Security transactions are accounted for on the date securities are bought or sold. Costs used to determine realized gains (losses) on the sale of investment securities are those of the specific securities sold. Fees assessed on redemptions of capital shares are credited to paid-in capital.
Each class of shares has equal rights as to assets and earnings, except that each class separately bears certain class-specific expenses related to maintenance of shareholder accounts (included in Management and Administrative expenses), shareholder reporting, and proxies. Marketing and distribution expenses are allocated to each class of shares based on a method approved by the board of trustees. Income, other non-class-specific expenses, and gains and losses on investments are allocated to each class of shares based on its relative net assets.
B. AXA Rosenberg Investment Management LLC (AXA) provides investment advisory services to a portion of the fund for a fee calculated at an annual percentage rate of average net assets managed by the advisor. The basic fee for AXA is subject to quarterly adjustments based on performance since December 31, 2007, relative to the Citigroup 3-Month Treasury Bill Index.
The Vanguard Group provides investment advisory services to a portion of the fund on an at-cost basis.
For the year ended December 31, 2009, the aggregate investment advisory fee represented an effective annual basic rate of 0.24% of the fund’s average net assets, before a decrease of $74,000 (0.10%) based on performance.
29
Market Neutral Fund
C. The Vanguard Group furnishes at cost corporate management, administrative, marketing, and distribution services. The costs of such services are allocated to the fund under methods approved by the board of trustees. The fund has committed to provide up to 0.40% of its net assets in capital contributions to Vanguard. At December 31, 2009, the fund had contributed capital of $14,000 to Vanguard (included in Other Assets), representing 0.02% of the fund’s net assets and 0.01% of Vanguard’s capitalization. The fund’s trustees and officers are also directors and officers of Vanguard.
D. The fund’s custodian bank has agreed to reduce its fees when the fund maintains cash on deposit in the non-interest-bearing custody account. For the year ended December 31, 2009, custodian fee offset arrangements reduced the fund’s expenses by $5,000 (an annual rate of 0.01% of average net assets).
E. Various inputs may be used to determine the value of the fund’s investments. These inputs are summarized in three broad levels for financial statement purposes. The inputs or methodologies used to value securities are not necessarily an indication of the risk associated with investing in those securities.
Level 1—Quoted prices in active markets for identical securities.
Level 2—Other significant observable inputs (including quoted prices for similar securities, interest rates, prepayment speeds, credit risk, etc.).
Level 3—Significant unobservable inputs (including the fund’s own assumptions used to determine the fair value of investments).
At December 31, 2009, 100% of the fund’s investments were valued based on Level 1 inputs.
F. Distributions are determined on a tax basis and may differ from net investment income and realized capital gains for financial reporting purposes. Differences may be permanent or temporary. Permanent differences are reclassified among capital accounts in the financial statements to reflect their tax character. Temporary differences arise when certain items of income, expense, gain, or loss are recognized in different periods for financial statement and tax purposes; these differences will reverse at some time in the future. Differences in classification may also result from the treatment of short-term gains as ordinary income for tax purposes.
Certain of the fund's borrowing expenses are treated as realized capital losses for tax purposes. For the year ended December 31, 2009, borrowing expenses of $658,000 have been reclassified from overdistributed net investment income to accumulated net realized losses.
For tax purposes, the fund had a net operating loss of $22,000 for the year ended December 31, 2009. This amount has been reclassified from overdistributed net investment income to paid-in capital. At December 31, 2009, the fund had no ordinary income available for distribution. The fund had available realized losses of $19,593,000 to offset future net capital gains through December 31, 2017. In addition, the fund realized losses of $76,000 during the period from November 1, 2009, through December 31, 2009, which are deferred and will be treated as realized for tax purposes in fiscal 2010.
The fund had realized losses totaling $2,276,000 through December 31, 2009, which are deferred for tax purposes and reduce the amount of unrealized appreciation on investment securities for tax purposes.
30
Market Neutral Fund
At December 31, 2009, the cost of long security positions for tax purposes was $62,379,000. Net unrealized appreciation of long security positions for tax purposes was $7,497,000, consisting of unrealized gains of $9,341,000 on securities that had risen in value since their purchase and $1,844,000 in unrealized losses on securities that had fallen in value since their purchase. Tax-basis net unrealized depreciation on securities sold short was $8,701,000, consisting of unrealized gains of $1,557,000 on securities that had fallen in value since their sale and $10,258,000 in unrealized losses on securities that had risen in value since their sale.
G. During the year ended December 31, 2009, the fund purchased $97,294,000 of investment securities and sold $137,446,000 of investment securities, other than temporary cash investments. The proceeds of short sales and the cost of purchases to cover short sales were $106,720,000 and $141,733,000, respectively.
H. Capital share transactions for each class of shares were:
| Year Ended | April 1, 2008, to | Year Ended | ||||
| December 31, 2009 | December 31, 20081 | March 31, 2008 | ||||
| Amount | Shares | Amount | Shares | Amount | Shares | |
| ($000) | (000) | ($000) | (000) | ($000) | (000) | |
| Investor Shares | ||||||
| Issued | 45,232 | 4,547 | 63,080 | 5,143 | 42,479 | 3,395 |
| Issued in Lieu of Cash Distributions | 68 | 7 | 4,119 | 370 | 436 | 36 |
| Redeemed2 | (56,787) | (5,725) | (29,453) | (2,488) | (7,436) | (593) |
| Net Increase (Decrease)— | ||||||
| Investor Shares | (11,487) | (1,171) | 37,746 | 3,025 | 35,479 | 2,838 |
| Institutional Shares | ||||||
| Issued | 7,875 | 804 | 8,972 | 726 | 9,106 | 742 |
| Issued in Lieu of Cash Distributions | 12 | 1 | 1,046 | 95 | 318 | 26 |
| Redeemed2 | (7,681) | (781) | (2,747) | (235) | (7,720) | (608) |
| Net Increase (Decrease)— | ||||||
| Institutional Shares | 206 | 24 | 7,271 | 586 | 1,704 | 160 |
1 The fund’s fiscal year-end changed from March 31 to December 31, effective December 31, 2008.
2 Net of redemption fees of $257,000, $5,000, and $4,000 (fund totals).
I. In preparing the financial statements as of December 31, 2009, management considered the impact of subsequent events occurring through February 16, 2010, for potential recognition or disclosure in these financial statements.
31
Report of Independent Registered
Public Accounting Firm
To the Trustees of Vanguard Montgomery Funds and the Shareholders of Vanguard Market Neutral Fund:
In our opinion, the accompanying statement of net assets and the statement of assets and liabilities and the related statements of operations and of changes in net assets and the financial highlights present fairly, in all material respects, the financial position of Vanguard Market Neutral Fund (constituting Vanguard Montgomery Funds, hereafter referred to as the “Fund”) at December 31, 2009, the results of its operations for the year then ended, and the changes in its net assets and the financial highlights for the periods indicated, in conformity with accounting principles generally accepted in the United States of America. These financial statements and financial highlights (hereafter referred to as “financial statements”) are the responsibility of the Fund’s management; our responsibility is to express an opinion on these financial statements based on our audits. We conducted our audits of these financial statements in accordance with the standards of the Public Company Accounting Oversight Board (United States). Those standards require that we plan and perform the audit to obtain reasonable assurance about whether the financial statements are free of material misstatement. An audit includes examining, on a test basis, evidence supporting the amounts and disclosures in the financial statements, assessing the accounting principles used and significant estimates made by management, and evaluating the overall financial statement presentation. We believe that our audits, which included confirmation of securities at December 31, 2009 by correspondence with the custodian and brokers and by agreement to the underlying ownership records of Vanguard Market Liquidity Fund, provide a reasonable basis for our opinion.
PricewaterhouseCoopers LLP
Philadelphia, Pennsylvania
February 16, 2010

Special 2009 tax information (unaudited) for Vanguard Market Neutral Fund
This information for the fiscal year ended December 31, 2009, is included pursuant to provisions of the
Internal Revenue Code.
The fund distributed $88,000 of qualified dividend income to shareholders during the fiscal year.
For corporate shareholders, 0.0% of investment income (dividend income plus short-term gains, if any)
qualifies for the dividends-received deduction.
32
Your Fund’s After-Tax Returns
This table presents returns for your fund both before and after taxes. The after-tax returns are shown in two ways: (1) assuming that an investor owned the fund during the entire period and paid taxes on the fund’s distributions, and (2) assuming that an investor paid taxes on the fund’s distributions and sold all shares at the end of each period.
Calculations are based on the highest individual federal income tax and capital gains tax rates in effect at the times of the distributions and the hypothetical sales. State and local taxes were not considered. After-tax returns reflect any qualified dividend income. (In the example, returns after the sale of fund shares may be higher than those assuming no sale. This occurs when the sale would have produced a capital loss. The calculation assumes that the investor received a tax deduction for the loss.)
The table shows returns for Investor Shares only; returns for other share classes will differ. Please note that your actual after-tax returns will depend on your tax situation and may differ from those shown. Also note that if you own the fund in a tax-deferred account, such as an individual retirement account or a 401(k) plan, this information does not apply to you. Such accounts are not subject to current taxes.
Finally, keep in mind that a fund’s performance—whether before or after taxes—does not guarantee future results.
Average Annual Total Returns: Market Neutral Fund Investor Shares1
Periods Ended December 31, 2009
| One | Five | Ten | |
| Year | Years | Years | |
| Returns Before Taxes | –11.38% | 1.39% | 1.73% |
| Returns After Taxes on Distributions | –11.40 | 0.33 | 0.81 |
| Returns After Taxes on Distributions and Sale of Fund Shares | –7.38 | 0.75 | 1.01 |
1 Total returns do not reflect the 2% fee assessed until November 30, 2007, on redemptions of shares purchased within 30 days or the 1% fee
assessed beginning December 1, 2007, on redemptions of shares held less than one year.
33
About Your Fund’s Expenses
As a shareholder of the fund, you incur ongoing costs, which include costs for portfolio management, administrative services, and shareholder reports (like this one), among others. Operating expenses, which are deducted from a fund’s gross income, directly reduce the investment return of the fund.
A fund’s expenses are expressed as a percentage of its average net assets. This figure is known as the expense ratio. The following examples are intended to help you understand the ongoing costs (in dollars) of investing in your fund and to compare these costs with those of other mutual funds. The examples are based on an investment of $1,000 made at the beginning of the period shown and held for the entire period.
The accompanying table illustrates your fund’s costs in two ways:
• Based on actual fund return. This section helps you to estimate the actual expenses that you paid over the period. The “Ending Account Value” shown is derived from the fund’s actual return, and the third column shows the dollar amount that would have been paid by an investor who started with $1,000 in the fund. You may use the information here, together with the amount you invested, to estimate the expenses that you paid over the period.
To do so, simply divide your account value by $1,000 (for example, an $8,600 account value divided by $1,000 = 8.6), then multiply the result by the number given for your fund under the heading “Expenses Paid During Period.”
• Based on hypothetical 5% yearly return. This section is intended to help you compare your fund’s costs with those of other mutual funds. It assumes that the fund had a yearly return of 5% before expenses, but that the expense ratio is unchanged. In this case—because the return used is not the fund’s actual return—the results do not apply to your investment. The example is useful in making comparisons because the Securities and Exchange Commission requires all mutual funds to calculate expenses based on a 5% return. You can assess your fund’s costs by comparing this hypothetical example with the hypothetical examples that appear in shareholder reports of other funds.
Note that the expenses shown in the table are meant to highlight and help you compare ongoing costs only and do not reflect transaction costs incurred by the fund for buying and selling securities. Further, the expenses do not include the 1% fee assessed on redemptions of shares held for less than one year.
The calculations assume no shares were bought or sold during the period. Your actual costs may have been higher or lower, depending on the amount of your investment and the timing of any purchases or redemptions.
You can find more information about the fund’s expenses, including annual expense ratios, in the Financial Statements section of this report. For additional information on operating expenses and other shareholder costs, please refer to your fund’s current prospectus.
34
| Six Months Ended December 31, 2009 | |||
| Beginning | Ending | Expenses | |
| Account Value | Account Value | Paid During | |
| Market Neutral Fund | 6/30/2009 | 12/31/2009 | Period1 |
| Based on Actual Fund Return | |||
| Investor Shares | $1,000.00 | $977.84 | $10.72 |
| Institutional Shares | 1,000.00 | 977.73 | 10.57 |
| Based on Hypothetical 5% Yearly Return | |||
| Investor Shares | $1,000.00 | $1,014.37 | $10.92 |
| Institutional Shares | 1,000.00 | 1,014.52 | 10.76 |
1 The calculations are based on expenses incurred in the most recent six-month period. The fund’s annualized six-month expense ratios for
that period are 2.15% for Investor Shares and 2.12% for Institutional Shares. The dollar amounts shown as “Expenses Paid” are equal to
the annualized expense ratio multiplied by the average account value over the period, multiplied by the number of days in the most recent
six-month period, then divided by the number of days in the most recent 12-month period.
35
Glossary
Beta. A measure of the magnitude of a fund’s past share-price fluctuations in relation to the ups and downs of a given market index. The index is assigned a beta of 1.00. Compared with a given index, a fund with a beta of 1.20 typically would have seen its share price rise or fall by 12% when the index rose or fell by 10%. For this report, beta is based on returns over the past 36 months for both the fund and the index. Note that a fund’s beta should be reviewed in conjunction with its R-squared (see definition below). The lower the R-squared, the less correlation there is between the fund and the index, and the less reliable beta is as an indicator of volatility.
Earnings Growth Rate. The average annual rate of growth in earnings over the past five years for the stocks now in a fund.
Equity Exposure. A measure that reflects a fund’s investments in stocks and stock futures. Any holdings in short-term reserves are excluded.
Expense Ratio. The percentage of a fund’s average net assets used to pay its annual administrative and advisory expenses. These expenses directly reduce returns to investors.
Foreign Holdings. The percentage of a fund represented by stocks or depositary receipts of companies based outside the United States.
Inception Date. The date on which the assets of a fund (or one of its share classes) are first invested in accordance with the fund’s investment objective. For funds with a subscription period, the inception date is the day after that period ends. Investment performance is measured from the inception date.
Median Market Cap. An indicator of the size of companies in which a fund invests; the midpoint of market capitalization (market price x shares outstanding) of a fund’s stocks, weighted by the proportion of the fund’s assets invested in each stock. Stocks representing half of the fund’s assets have market capitalizations above the median, and the rest are below it.
Price/Book Ratio. The share price of a stock divided by its net worth, or book value, per share. For a fund, the weighted average price/book ratio of the stocks it holds.
Price/Earnings Ratio. The ratio of a stock’s current price to its per-share earnings over the past year. For a fund, the weighted average P/E of the stocks it holds. P/E is an indicator of market expectations about corporate prospects; the higher the P/E, the greater the expectations for a company’s future growth.
R-Squared. A measure of how much of a fund’s past returns can be explained by the returns from the market in general, as measured by a given index. If a fund’s total returns were precisely synchronized with an index’s returns, its R-squared would be 1.00. If the fund’s returns bore no relationship to the index’s returns, its R-squared would be 0. For this report, R-squared is based on returns over the past 36 months for both the fund and the index.
Return on Equity. The annual average rate of return generated by a company during the past five years for each dollar of shareholder’s equity (net income divided by shareholder’s equity). For a fund, the weighted average return on equity for the companies whose stocks it holds.
36
Short-Term Reserves. The percentage of a fund invested in highly liquid, short-term securities that can be readily converted to cash.
Turnover Rate. An indication of the fund’s trading activity. Funds with high turnover rates incur higher transaction costs and may be more likely to distribute capital gains (which may be taxable to investors). The turnover rate excludes in-kind transactions, which have minimal impact on costs.
37
This page intentionally left blank.
This page intentionally left blank.
The People Who Govern Your Fund
The trustees of your mutual fund are there to see that the fund is operated and managed in your best interests since, as a shareholder, you are a part owner of the fund. Your fund’s trustees also serve on the board of directors of The Vanguard Group, Inc., which is owned by the Vanguard funds and provides services to them on an at-cost basis.
A majority of Vanguard’s board members are independent, meaning that they have no affiliation with Vanguard or the funds they oversee, apart from the sizable personal investments they have made as private individuals. The independent board members have distinguished backgrounds in business, academia, and public service. Each of the trustees and executive officers oversees 163 Vanguard funds.
The following table provides information for each trustee and executive officer of the fund. More information about the trustees is in the Statement of Additional Information, which can be obtained, without charge, by contacting Vanguard at 800-662-7447, or online at www.vanguard.com.
| Interested Trustee1 | Rajiv L. Gupta |
| Born 1945. Trustee Since December 2001.2 Principal | |
| F. William McNabb III | Occupation(s) During the Past Five Years: Chairman |
| Born 1957. Trustee Since July 2009. Chairman of the | and Chief Executive Officer (retired 2009) and President |
| Board. Principal Occupation(s) During the Past Five | (2006–2008) of Rohm and Haas Co. (chemicals); Board |
| Years: Chairman of the Board of The Vanguard Group, | Member of American Chemistry Council; Director of |
| Inc., and of each of the investment companies served | Tyco International, Ltd. (diversified manufacturing and |
| by The Vanguard Group, since January 2010; Director of | services) and Hewlett-Packard Co. (electronic computer |
| The Vanguard Group since 2008; Chief Executive Officer | manufacturing); Trustee of The Conference Board. |
| and President of The Vanguard Group and of each of the | |
| investment companies served by The Vanguard Group | Amy Gutmann |
| since 2008; Director of Vanguard Marketing Corporation; | Born 1949. Trustee Since June 2006. Principal |
| Managing Director of The Vanguard Group (1995–2008). | Occupation(s) During the Past Five Years: President of |
| the University of Pennsylvania; Christopher H. Browne | |
| Distinguished Professor of Political Science in the School | |
| Independent Trustees | of Arts and Sciences with secondary appointments |
| at the Annenberg School for Communication and the | |
| Emerson U. Fullwood | Graduate School of Education of the University of |
| Born 1948. Trustee Since January 2008. Principal | Pennsylvania; Director of Carnegie Corporation of |
| Occupation(s) During the Past Five Years: Executive | New York, Schuylkill River Development Corporation, |
| Chief Staff and Marketing Officer for North America | and Greater Philadelphia Chamber of Commerce; |
| and Corporate Vice President (retired 2008) of Xerox | Trustee of the National Constitution Center. |
| Corporation (photocopiers and printers); Director of | |
| SPX Corporation (multi-industry manufacturing), the | |
| United Way of Rochester, the Boy Scouts of America, | |
| Amerigroup Corporation (direct health and medical | |
| insurance carriers), and Monroe Community College | |
| Foundation. |
| JoAnn Heffernan Heisen | Executive Officers | |
| Born 1950. Trustee Since July 1998. Principal | ||
| Occupation(s) During the Past Five Years: Corporate | Thomas J. Higgins | |
| Vice President and Chief Global Diversity Officer since | Born 1957. Chief Financial Officer Since September | |
| 2006 (retired 2008) and Member of the Executive | 2008. Principal Occupation(s) During the Past Five | |
| Committee (retired 2008) of Johnson & Johnson | Years: Principal of The Vanguard Group, Inc.; Chief | |
| (pharmaceuticals/consumer products); Vice President | Financial Officer of each of the investment companies | |
| and Chief Information Officer of Johnson & Johnson | served by The Vanguard Group since 2008; Treasurer | |
| (1997–2005); Director of the University Medical Center | of each of the investment companies served by The | |
| at Princeton and Women’s Research and Education | Vanguard Group (1998–2008). | |
| Institute; Member of the Advisory Board of the Maxwell | ||
| School of Citizenship and Public Affairs at Syracuse | Kathryn J. Hyatt | |
| University. | Born 1955. Treasurer Since November 2008. Principal | |
| Occupation(s) During the Past Five Years: Principal of | ||
| F. Joseph Loughrey | The Vanguard Group, Inc.; Treasurer of each of the | |
| Born 1949. Trustee Since October 2009. Principal | investment companies served by The Vanguard | |
| Occupation(s) During the Past Five Years: President and | Group since 2008; Assistant Treasurer of each of the | |
| Chief Operating Officer since 2005 (retired 2009) and | investment companies served by The Vanguard Group | |
| Vice Chairman of the Board (2008–2009) of Cummins | (1988–2008). | |
| Inc. (industrial machinery); Director of SKF AB (industrial | ||
| machinery), Hillenbrand, Inc. (specialized consumer | Heidi Stam | |
| services), Sauer-Danfoss Inc. (machinery), the Lumina | Born 1956. Secretary Since July 2005. Principal | |
| Foundation for Education, and the Columbus Community | Occupation(s) During the Past Five Years: Managing | |
| Education Coalition; Chairman of the Advisory Council | Director of The Vanguard Group, Inc., since 2006; | |
| for the College of Arts and Letters at the University of | General Counsel of The Vanguard Group since 2005; | |
| Notre Dame. | Secretary of The Vanguard Group and of each of the | |
| investment companies served by The Vanguard Group | ||
| André F. Perold | since 2005; Director and Senior Vice President of | |
| Born 1952. Trustee Since December 2004. Principal | Vanguard Marketing Corporation since 2005; Principal | |
| Occupation(s) During the Past Five Years: George Gund | of The Vanguard Group (1997–2006). | |
| Professor of Finance and Banking, Harvard Business | ||
| School; Chair of the Investment Committee of HighVista | ||
| Strategies LLC (private investment firm). | Vanguard Senior Management Team | |
| Alfred M. Rankin, Jr. | R. Gregory Barton | Michael S. Miller |
| Born 1941. Trustee Since January 1993. Principal | Mortimer J. Buckley | James M. Norris |
| Occupation(s) During the Past Five Years: Chairman, | Kathleen C. Gubanich | Glenn W. Reed |
| President, and Chief Executive Officer of NACCO | Paul A. Heller | George U. Sauter |
| Industries, Inc. (forklift trucks/housewares/lignite); | ||
| Director of Goodrich Corporation (industrial products/ | ||
| aircraft systems and services); Deputy Chairman of | Chairman Emeritus and Senior Advisor | |
| the Federal Reserve Bank of Cleveland; Trustee of | ||
| University Hospitals of Cleveland, The Cleveland | John J. Brennan | |
| Museum of Art, and Case Western Reserve University. | Chairman, 1996–2009 | |
| Chief Executive Officer and President, 1996–2008 | ||
| Peter F. Volanakis | ||
| Born 1955. Trustee Since July 2009. Principal | ||
| Occupation(s) During the Past Five Years: President | Founder | |
| since 2007 and Chief Operating Officer since 2005 | ||
| of Corning Incorporated (communications equipment); | John C. Bogle | |
| President of Corning Technologies (2001–2005); Director | Chairman and Chief Executive Officer, 1974–1996 | |
| of Corning Incorporated and Dow Corning; Trustee of | ||
| the Corning Incorporated Foundation and the Corning | ||
| Museum of Glass; Overseer of the Amos Tuck School | ||
| of Business Administration at Dartmouth College. | ||
1 Mr. McNabb is considered an “interested person,” as defined in the Investment Company Act of 1940, because he is an officer of the
Vanguard funds.
2 December 2002 for Vanguard Equity Income Fund, Vanguard Growth Equity Fund, the Vanguard Municipal Bond Funds, and the Vanguard
State Tax-Exempt Funds.

P.O. Box 2600
Valley Forge, PA 19482-2600
Connect with Vanguard® > www.vanguard.com
| Fund Information > 800-662-7447 | All comparative mutual fund data are from Lipper Inc. |
| or Morningstar, Inc., unless otherwise noted. | |
| Direct Investor Account Services > 800-662-2739 | |
| Institutional Investor Services > 800-523-1036 | You can obtain a free copy of Vanguard’s proxy voting |
| guidelines by visiting our website, www.vanguard.com, | |
| Text Telephone for People | and searching for “proxy voting guidelines,” or by |
| With Hearing Impairment > 800-749-7273 | calling Vanguard at 800-662-2739. The guidelines are |
| also available from the SEC’s website, www.sec.gov. | |
| In addition, you may obtain a free report on how your | |
| fund voted the proxies for securities it owned during | |
| the 12 months ended June 30. To get the report, visit | |
| This material may be used in conjunction | either www.vanguard.com or www.sec.gov. |
| with the offering of shares of any Vanguard | |
| fund only if preceded or accompanied by | |
| the fund’s current prospectus. | You can review and copy information about your fund |
| at the SEC’s Public Reference Room in Washington, D.C. | |
| CFA® is a trademark owned by CFA Institute. | To find out more about this public service, call the SEC |
| at 202-551-8090. Information about your fund is also | |
| available on the SEC’s website, and you can receive | |
| copies of this information, for a fee, by sending a | |
| request in either of two ways: via e-mail addressed to | |
| publicinfo@sec.gov or via regular mail addressed to the | |
| Public Reference Section, Securities and Exchange | |
| Commission, Washington, DC 20549-1520. |
© 2010 The Vanguard Group, Inc.
All rights reserved.
Vanguard Marketing Corporation, Distributor.
Q6340 022010
Item 2: Code of Ethics. The Registrant has adopted a code of ethics that applies to the Registrant’s principal executive officer, principal financial officer, principal accounting officer or controller or persons performing similar functions. The Code of Ethics was amended during the reporting period covered by this report to make certain technical, non-material changes.
Item 3: Audit Committee Financial Expert. The following members of the Audit Committee have been determined by the Registrant’s Board of Trustees to be Audit Committee Financial Experts serving on its Audit Committee, and to be independent: Charles D. Ellis, Rajiv L. Gupta, JoAnn Heffernan Heisen, André F. Perold, and Alfred M. Rankin, Jr.
Item 4: Principal Accountant Fees and Services.
(a) Audit Fees.
Audit Fees of the Registrant
Fiscal Year Ended December 31, 2009: $42,000
Fiscal Year Ended December 31, 2008: $55,000*
* The Fund’s fiscal year-end changed from March 31 to December 31, effective December 31, 2008
Aggregate Audit Fees of Registered Investment Companies in the Vanguard Group.
Fiscal Year Ended December 31, 2009: $3,354,640
Fiscal Year Ended December 31, 2008: $3,055,590
(b) Audit-Related Fees.
Fiscal Year Ended December 31, 2009: $876,210
Fiscal Year Ended December 31, 2008: $626,240
Includes fees billed in connection with assurance and related services provided to the Registrant, The Vanguard Group, Inc., Vanguard Marketing Corporation, and other registered investment companies in the Vanguard Group.
(c) Tax Fees.
Fiscal Year Ended December 31, 2009: $423,070
Fiscal Year Ended December 31, 2008: $230,400
Includes fees billed in connection with tax compliance, planning and advice services provided to the Registrant, The Vanguard Group, Inc., Vanguard Marketing Corporation, and other registered investment companies in the Vanguard Group and related to income and excise taxes.
(d) All Other Fees.
Fiscal Year Ended December 31, 2009: $0
Fiscal Year Ended December 31, 2008: $0
Includes fees billed for services related to risk management and privacy matters. Services were provided to the Registrant, The Vanguard Group, Inc., Vanguard Marketing Corporation, and other registered investment companies in the Vanguard Group.
(e) (1) Pre-Approval Policies. The policy of the Registrant’s Audit Committee is to consider and, if appropriate, approve before the principal accountant is engaged for such services, all specific audit and non-audit services provided to: (1) the Registrant; (2) The Vanguard Group, Inc.; (3) other entities controlled by The Vanguard Group, Inc. that provide ongoing services to the Registrant; and (4) other registered investment companies in the Vanguard Group. In making a determination, the Audit Committee considers whether the services are consistent with maintaining the principal accountant’s independence.
In the event of a contingency situation in which the principal accountant is needed to provide services in between scheduled Audit Committee meetings, the Chairman of the Audit Committee would be called on to consider and, if appropriate, pre-approve audit or permitted non-audit services in an amount sufficient to complete services through the next Audit Committee meeting, and to determine if such services would be consistent with maintaining the accountant’s independence. At the next scheduled Audit Committee meeting, services and fees would be presented to the Audit Committee for formal consideration, and, if appropriate, approval by the entire Audit Committee. The Audit Committee would again consider whether such services and fees are consistent with maintaining the principal accountant’s independence.
The Registrant’s Audit Committee is informed at least annually of all audit and non-audit services provided by the principal accountant to the Vanguard complex, whether such services are provided to: (1) the Registrant; (2) The Vanguard Group, Inc.; (3) other entities controlled by The Vanguard Group, Inc. that provide ongoing services to the Registrant; or (4) other registered investment companies in the Vanguard Group.
(2) No percentage of the principal accountant’s fees or services were approved pursuant to the waiver provision of paragraph (c)(7)(i)(C) of Rule 2-01 of Regulation S-X.
(f) For the most recent fiscal year, over 50% of the hours worked under the principal accountant’s engagement were not performed by persons other than full-time, permanent employees of the principal accountant.
(g) Aggregate Non-Audit Fees.
Fiscal Year Ended December 31, 2009: $423,070
Fiscal Year Ended December 31, 2008: $230,400
Includes fees billed for non-audit services provided to the Registrant, The Vanguard Group, Inc., Vanguard Marketing Corporation, and other registered investment companies in the Vanguard Group.
(h) For the most recent fiscal year, the Audit Committee has determined that the provision of all non-audit services was consistent with maintaining the principal accountant’s independence.
Item 5: Not Applicable.
Item 6: Not Applicable.
Item 7: Not Applicable.
Item 8: Not Applicable.
Item 9: Not Applicable.
Item 10: Not Applicable.
Item 11: Controls and Procedures.
(a) Disclosure Controls and Procedures. The Principal Executive and Financial Officers concluded that the Registrant's Disclosure Controls and Procedures are effective based on their evaluation of the Disclosure Controls and Procedures as of a date within 90 days of the filing date of this report.
(b) Internal Control Over Financial Reporting. There were no significant changes in Registrant’s Internal Control Over Financial Reporting or in other factors that could significantly affect this control subsequent to the date of the evaluation, including any corrective actions with regard to significant deficiencies and material weaknesses.
Item 12: Exhibits.
(a) Code of Ethics.
(b) Certifications.
Pursuant to the requirements of the Securities Exchange Act of 1934 and the Investment Company Act of 1940, the registrant has duly caused this report to be signed on its behalf by the undersigned, thereunto duly authorized.
| VANGUARD MONTGOMERY FUNDS | |
| BY: | /s/ F. WILLIAM MCNABB III* |
| F. WILLIAM MCNABB III | |
| CHIEF EXECUTIVE OFFICER | |
| Date: February 22, 2010 | |
Pursuant to the requirements of the Securities Exchange Act of 1934 and the Investment Company Act of 1940, this report has been signed below by the following persons on behalf of the registrant and in the capacities and on the dates indicated.
| VANGUARD MONTGOMERY FUNDS | |
| BY: | /s/ F. WILLIAM MCNABB III* |
| F. WILLIAM MCNABB III | |
| CHIEF EXECUTIVE OFFICER | |
| Date: February 22, 2010 | |
| VANGUARD MONTGOMERY FUNDS | |
| BY: | /s/ THOMAS J. HIGGINS* |
| THOMAS J. HIGGINS | |
| CHIEF FINANCIAL OFFICER | |
| Date: February 22, 2010 | |
* By: /s/ Heidi Stam
Heidi Stam, pursuant to a Power of Attorney filed on July 24, 2009, see file Number
2-88373, and a Power of Attorney filed on October 16, 2009, see File Number 2-52698,
both Incorporated by Reference.