UNITED STATES
SECURITIES AND EXCHANGE COMMISSION
Washington, D.C. 20549
FORM N-CSR
CERTIFIED SHAREHOLDER REPORT OF REGISTERED
MANAGEMENT INVESTMENT COMPANIES
Investment Company Act file number:
811-22175
ALPS ETF TRUST
(Exact name of registrant as specified in charter)
1290 Broadway, Suite 1100, Denver, Colorado 80203
(Address of principal executive offices) (Zip code)
Tané T. Tyler, Esq.
ALPS ETF Trust
1290 Broadway, Suite 1100
Denver, Colorado 80203
(Name and address of agent for service)
Registrant’s Telephone Number, including Area Code: (303) 623-2577
Date of fiscal year end: November 30
Date of reporting period: January 1, 2011 – November 30, 2011
| Item 1. | Reports to Stockholders. |


Dear Shareholders:
When ALPS launched its ETF(1) Trust in 2008 our goal was to bring innovative solutions to the ETF industry that provide investors with access to a unique market segment or strategy. Our first portfolio – the Cohen & Steers Global Realty Majors ETF (“GRI”) – is one of the first ETFs to provide investors with access to a diversified portfolio of global real estate securities. US real estate, while already a mainstream asset class, only covers 1/3 of the global real estate universe. Furthermore, development of Real Estate Investment Trusts (“REITs”) in the global market continues to be strong as foreign countries seek to securitize their private real estate holdings. As a result, real estate fund that is global in scope can provide investors with a wider range of opportunities than a purely domestic fund while preserving the diversification and income benefits of US REITs.
By partnering with Cohen & Steers, we have secured a best in breed real estate manager with a great track record and reputation. Furthermore, the transparency(2), low cost and tax efficiency of the ETF structure provides access to global real estate in a very efficient manner. We believe access to global real estate, the benefits of the ETF structure, and the expertise of Cohen & Steers make for a powerful investment combination that will allow investors to build better portfolios.
In the pages that follow our Fund managers have provided a performance overview.
We thank you for your investment and for being a GRI shareholder.
Thomas A. Carter*
President, ALPS ETF Trust
| * | Registered representative of ALPS Distributors, Inc. |
| (1) | Exchange Traded Fund (“ETF”). |
| (2) | ETFs are considered transparent because their portfolio holdings are disclosed daily. |
| | Ordinary brokerage commissions apply. |


FUND DESCRIPTION
The Cohen & Steers Global Realty Majors ETF (the “Fund”) seeks investment results that correspond generally to the performance (before the Fund’s fees and expenses) of an equity index called the Cohen & Steers Global Realty Majors Index (the “Index”). The Shares of the Fund are listed and trade on the NYSE Arca under the ticker symbol “GRI.” The Fund will normally invest substantially all of its assets in the 75 stocks that comprise the Cohen & Steers Global Realty Majors Index. The Fund began trading on May 9, 2008.
The Index is a free-float, market-cap-weighted total return index of selected real estate equity securities maintained by Cohen & Steers. It is quoted intraday on a realtime basis by the Chicago Mercantile Exchange under the symbol GRM. The Index’s free-float market capitalization approach and qualitative screening process emphasize companies that the Cohen & Steers Index Committee believes are leading the securitization of real estate globally.
PERFORMANCE OVERVIEW
Global real estate securities suffered through a volatile year that plagued many risky assets, particularly securities with smaller capitalizations or those domiciled overseas. After a roller-coaster ride, global real estate securities lost 5.53% for the 11-month period ended November 30, 2011. Worries about fiscal contagion in Europe and a hiccup in the US recovery impacted all equities, including global real estate securities. US real estate securities lead the way, rising 3.7%. Both the European and Asian property sectors lost value, with Europe losing 8.5% and Asia falling 18.0%.
Overall results for the US property sector were mixed, as increasing economic uncertainty and more conservative expectations for future growth weighed heavily on the more cyclical sectors of the market. Shopping centers underperformed on fears of slow income growth and the Industrial sector was negatively impacted by ProLogis, whose European business unit continued to suffer. The Regional Mall sector declined in value as well but was insulated somewhat by its concentration in higher quality locations. The more defensive Self-Storage sector was the leader in the group and benefited from peak level occupancies and the pricing power to raise rents for existing tenants.
The European real estate market was plagued by continued uncertainty surrounding the sovereign debt crisis and the fate of the Euro. Despite the installation of new fiscal-minded governments in Italy and Greece, rapid economic deceleration across the continent put additional strain on government budgets. The United Kingdom was one of the more resilient markets (-2.5%) as investors focused on London’s prime office and retail locations. French real estate securities lost 8.9% of their value and reflected the rise in yields on French sovereign debt and its increased vulnerability to deteriorating capital markets. The Netherlands property market suffered the greatest losses (-24.6%) due to the pan-European exposure of its companies.
The Asian property market saw steep declines in 2011 amid fears of recession and high inflation. The Australian sector was the only region to show positive results, rising 0.9% for the 11-month period. Australia benefited from the Reserve Bank of Australia’s rate cut after a long period of stable monetary policy. The remaining real estate markets suffered, with Japan faring next best (-17.8%). Slowing exports to


Europe and China, sluggish domestic growth and rising vacancies in Tokyo all contributed to declines in the Japanese property market. Weak residential demand hurt property developers in Singapore (-21.5%). In addition, lower 2012 growth expectations impacted many of the export-sensitive sectors. Hong Kong was the worst performing property sector (-27.8%) and real estate securities were plagued by a deceleration in rent growth and weak demand.
For the eleven months ended November 30, 2011 the Fund’s market price decreased 4.37% and the Fund’s net asset value (“NAV”) decreased 5.53%. Over the same time period the Fund’s benchmark decreased 6.70%.
Performance as of November 30, 2011
| | | | | | | | | | | | | | | | | | | | | | | | | |
| | | 5 Month | | YTD | | 1 Year | | 3 Year | | Since Inception Annualized* |
Fund Performance | | | | | | | | | | | | | | | | | | | | | | | | | |
NAV | | | | -11.33 | % | | | | -5.53 | % | | | | 0.34 | % | | | | 17.83 | % | | | | -7.16 | % |
Market Price** | | | | -10.54 | % | | | | -4.37 | % | | | | 1.59 | % | | | | 18.58 | % | | | | -6.74 | % |
Index Performance | | | | | | | | | | | | | | | | | | | | | | | | | |
Cohen & Steers Global Realty | | | | -11.19 | % | | | | -4.85 | % | | | | 1.16 | % | | | | 18.96 | % | | | | -6.32 | % |
Majors Portfolio Index | | | | | | | | | | | | | | | | | | | | | | | | | |
FTSE EPRA/NAREIT Developed | | | | -12.04 | % | | | | -6.70 | % | | | | -0.81 | % | | | | 19.42 | % | | | | -6.34 | % |
Real Estate Index | | | | | | | | | | | | | | | | | | | | | | | | | |
S&P 500 Total Return Index | | | | -4.67 | % | | | | 1.08 | % | | | | 7.83 | % | | | | 14.13 | % | | | | -1.34 | % |
Total Expense Ratio (per the current prospectus) 0.55%.
Performance data quoted represents past performance. Past performance does not guarantee future results. Investment return and principal value of an investment will fluctuate so that an investor’s shares, when sold or redeemed, may be worth more or less than the original cost. Current performance data may be higher or lower than actual data quoted. For most current month-end performance data please visit www.alpsfunds.com.
NAV is an exchange-traded fund’s per-share value. The per-share dollar amount of the fund is derived by dividing the total value of all the securities in its portfolio, less any liabilities, by the number of fund shares outstanding. Information detailing the number of days the Market Price of the Fund was greater than the Fund’s NAV and the number of days it was less than the Fund’s NAV can be obtained at www.alpsfunds.com.
| ** | Market Price is the price at which a share can currently be traded in the market. |
Cohen & Steers Global Realty Majors® Portfolio Index: A free-float adjusted, modified market capitalization-weighted index of global real estate equities. The modified market capitalization weighting approach and qualitative screening process emphasize those companies that, in the opinion of the Cohen & Steers investment committee, are leading the securitization of real estate globally.
FTSE EPRA/NAREIT Developed Real Estate Index: An unmanaged market-weighted total return index that consists of many companies from developed markets whose floats are larger than $100 million and which derive more than half of their revenue from property-related activities.
S&P 500 Index: The Standard & Poor’s composite index of 500 stocks, a widely recognized, unmanaged index of common stock prices.
An investor cannot invest directly in an index.


TOP 10 HOLDINGS (as a % of Net Assets)* as of November 30, 2011
| | | | | |
Simon Property Group, Inc. | | | | 4.02 | % |
Mitsubishi Estate Co., Ltd. | | | | 3.87 | |
Public Storage | | | | 3.75 | |
Sun Hung Kai Properties, Ltd. | | | | 3.61 | |
Westfield Group | | | | 3.58 | |
Unibail-Rodamco | | | | 3.42 | |
Equity Residential | | | | 3.29 | |
| | | | | |
HCP, Inc. | | | | 3.16 | % |
Ventas, Inc. | | | | 3.05 | |
Boston Properties, Inc. | | | | 2.82 | |
Percent of Net Assets
in Top Ten Holdings: | | | | 34.57 | % |
* Future holdings are subject to change. | | | | | |
GEOGRAPHIC BREAKDOWN**
| | | | | |
United States | | | | 48.42 | % |
Hong Kong | | | | 12.54 | |
Australia | | | | 9.86 | |
Japan | | | | 9.19 | |
Great Britain | | | | 5.88 | |
France | | | | 5.32 | |
Singapore | | | | 3.66 | |
| | | | | |
Canada | | | | 2.16 | % |
Netherlands | | | | 1.07 | |
Brazil | | | | 0.87 | |
Switzerland | | | | 0.60 | |
Sweden | | | | 0.43 | |
** % of Total Investments | | | | | |
GROWTH OF $10K as of November 30, 2011
Comparison of Change in Value of $10,000 Investment in Cohen & Steers Global Realty Majors ETF and Cohen & Steers Global Realty Majors Index.
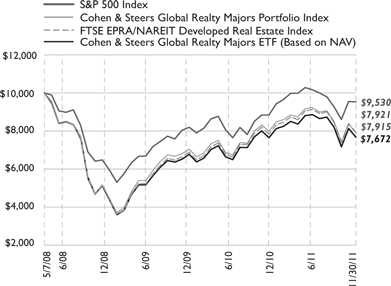
The chart above represents historical performance of a hypothetical investment of $10,000 in the Fund over the life of the Fund. Performance calculations are as of the end of each month. Past performance does not guarantee future results. This chart does not reflect the deduction of taxes that a shareholder would pay on Fund distributions or the redemption of Fund shares.


Shareholder Expense Example: As a shareholder of the Fund, you incur two types of costs: (1) transaction costs which may include creation and redemption fees or brokerage charges, and (2) ongoing costs, including management fees and other Fund expenses. These examples are intended to help you understand your ongoing costs (in dollars) of investing in the Fund and to compare these costs with the ongoing costs of investing in other funds. It is based on an investment of $1,000 invested at July 1, 2011, and held through the period ended November 30, 2011.
Actual Return: The first line of the table provides information about actual account values and actual expenses. You may use the information in this table, together with the amount you invested, to estimate the expenses that you incurred over the period. Simply divide your account value by $1,000 (for example, an $8,600 account value divided by $1,000 = 8.6), then multiply the result by the number in the first line under the heading entitled “Expenses Paid During the Period” to estimate the expenses attributable to your investment during this period.
Hypothetical 5% Return: The second line of the table provides information about hypothetical account values and hypothetical expenses based on the Fund’s actual expense ratio and an assumed rate of return of 5% per year before expenses, which is not the Fund’s actual return. The hypothetical account values and expenses may not be used to estimate the actual ending account balance or expenses you paid for the period. You may use this information to compare ongoing costs of investing in the Fund and other funds. To do so, compare this 5% hypothetical example with the 5% hypothetical examples that appear in the shareholder reports of the other funds.
The expenses shown in the table are meant to highlight ongoing Fund costs only and do not reflect any transaction costs, such as creation and redemption fees, or brokerage charges. Therefore, the second line is useful in comparing ongoing costs only, and will not help you determine the relative total costs of owning different funds. In addition, if these costs were included, your costs would have been higher.
| | | | | | | | | | | | | | | | | | | | |
| | | |
| Beginning
Account Value
7/01/11 |
| | |
| Ending
Account Value
11/30/11 |
| | |
| Expense
Ratio |
| | |
| Expenses Paid
During the Period(a) 7/01/11-11/30/11 |
|
Actual | | | $ | 1,000.00 | | | | $ | 886.70 | | | | | 0.55 | % | | | $ | 2.17 | (a) |
Hypothetical (5% return before expenses) | | | $ | 1,000.00 | | | | $ | 1,022.43 | | | | | 0.55 | % | | | $ | 2.80 | (b) |
| (a) | Effective March 7, 2011, the Board approved changing the fiscal year end of the Fund from December 31 to November 30. Actual expenses are equal to the Fund’s annualized expense ratio multiplied by the average account value over the period, multiplied by the number of days in the most recent fiscal half year (153), then divided by 365. |
| (b) | Expenses are equal to the Fund’s annualized expense ratio multiplied by the average account value over the period, multiplied by the number of days in the most recent fiscal half year (184), then divided by 365 |


To the Board of Trustees and Shareholders of ALPS ETF Trust:
We have audited the accompanying statement of assets and liabilities, including the schedule of investments, of Cohen & Steers Global Realty Majors ETF, one of the funds constituting the ALPS ETF Trust (the “Trust”) as of November 30, 2011, and the related statements of operations for the period ended November 30, 2011 and the year ended December 31, 2010, the statement of changes in net assets for the period ended November 30, 2011 and each of the two years in the period ended December 31, 2010, and the financial highlights for the period ended November 30, 2011, each of the two years in the period ended December 31, 2010, and the period May 7, 2008 (inception) to December 31, 2008. These financial statements and financial highlights are the responsibility of the Trust’s management. Our responsibility is to express an opinion on these financial statements and financial highlights based on our audits.
We conducted our audits in accordance with the standards of the Public Company Accounting Oversight Board (United States). Those standards require that we plan and perform the audit to obtain reasonable assurance about whether the financial statements and financial highlights are free of material misstatement. The Trust is not required to have, nor were we engaged to perform, an audit of its internal control over financial reporting. Our audits included consideration of internal control over financial reporting as a basis for designing audit procedures that are appropriate in the circumstances, but not for the purpose of expressing an opinion on the effectiveness of the Trust’s internal control over financial reporting. Accordingly, we express no such opinion. An audit also includes examining, on a test basis, evidence supporting the amounts and disclosures in the financial statements, assessing the accounting principles used and significant estimates made by management, as well as evaluating the overall financial statement presentation. Our procedures included confirmation of securities owned as of November 30, 2011, by correspondence with the custodian. We believe that our audits provide a reasonable basis for our opinion.
In our opinion, the financial statements and financial highlights referred to above present fairly, in all material respects, the financial position of Cohen & Steers Global Realty Majors ETF of the ALPS ETF Trust as of November 30, 2011, the results of its operations for the period ended November 30, 2011 and the year ended December 31, 2010, the changes in its net assets for the period ended November 30, 2011 and each of the two years in the period ended December 31, 2010, and the financial highlights for the period ended November 30, 2011, each of the two years in the period ended December 31, 2010, and the period May 7, 2008 (inception) to December 31, 2008, in conformity with accounting principles generally accepted in the United States of America.
DELOITTE & TOUCHE LLP
Denver, Colorado
January 27, 2012


| | | | | | | | |
Security Description | | | Shares | | | | Value | |
| | |
COMMON STOCKS (99.63%) | | | | | | | | |
| | |
Australia (9.82%) | | | | | | | | |
CFS Retail Property Trust | | | 237,919 | | | $ | 449,722 | |
Dexus Property Group | | | 490,310 | | | | 435,697 | |
Goodman Group | | | 666,909 | | | | 407,644 | |
GPT Group | | | 173,381 | | | | 559,279 | |
Mirvac Group | | | 346,054 | | | | 451,487 | |
Stockland Trust Group | | | 241,459 | | | | 840,893 | |
Westfield Group | | | 214,546 | | | | 1,807,306 | |
| | | | | | | | |
| | | | | | | 4,952,028 | |
| | | | | | | | |
| | |
Brazil (0.87%) | | | | | | | | |
BR Malls Participacoes SA | | | 43,000 | | | | 436,859 | |
| | | | | | | | |
| | |
Canada (2.15%) | | | | | | | | |
Boardwalk Real Estate Investment Trust | | | 3,969 | | | | 202,871 | |
Dundee Real Estate Investment Trust | | | 6,225 | | | | 200,143 | |
RioCan Real Estate Investment Trust | | | 27,231 | | | | 683,219 | |
| | | | | | | | |
| | | | | | | 1,086,233 | |
| | | | | | | | |
| | |
France (5.30%) | | | | | | | | |
Fonciere des Regions | | | 3,956 | | | | 262,781 | |
Gecina SA | | | 2,647 | | | | 228,298 | |
ICADE | | | 2,317 | | | | 184,990 | |
Klepierre | | | 9,433 | | | | 273,139 | |
Unibail-Rodamco | | | 9,252 | | | | 1,721,846 | |
| | | | | | | | |
| | | | | | | 2,671,054 | |
| | | | | | | | |
| | |
Hong Kong (12.49%) | | | | | | | | |
China Overseas Land & Investment, Ltd. | | | 388,000 | | | | 643,714 | |
China Resources Land, Ltd. | | | 204,500 | | | | 299,826 | |
Hang Lung Properties, Ltd. | | | 203,000 | | | | 595,254 | |
Henderson Land Development Co., Ltd. | | | 94,000 | | | | 450,929 | |
Hongkong Land Holdings, Ltd. | | | 118,000 | | | | 533,360 | |
The Link Real Estate Investment Trust | | | 228,000 | | | | 807,845 | |
Sino Land Co., Ltd. | | | 348,000 | | | | 423,392 | |
Sun Hung Kai Properties, Ltd. | | | 152,000 | | | | 1,821,928 | |
The Wharf Holdings, Ltd. | | | 153,700 | | | | 722,492 | |
| | | | | | | | |
| | | | | | | 6,298,740 | |
| | | | | | | | |


| | | | | | | | |
Security Description | | | Shares | | | | Value | |
| | |
Japan (9.16%) | | | | | | | | |
Mitsubishi Estate Co., Ltd. | | | 120,000 | | | $ | 1,950,792 | |
Mitsui Fudosan Co., Ltd. | | | 84,000 | | | | 1,317,944 | |
Nippon Building Fund, Inc. | | | 55 | | | | 503,027 | |
Sumitomo Realty & Development Co., Ltd. | | | 44,000 | | | | 845,086 | |
| | | | | | | | |
| | | | | | | 4,616,849 | |
| | | | | | | | |
| | |
Netherlands (1.07%) | | | | | | | | |
Corio N.V. | | | 9,351 | | | | 415,714 | |
Eurocommercial Properties N.V. | | | 3,618 | | | | 122,149 | |
| | | | | | | | |
| | | | | | | 537,863 | |
| | | | | | | | |
| | |
Singapore (3.64%) | | | | | | | | |
Ascendas Real Estate Investment Trust | | | 172,066 | | | | 273,963 | |
CapitaLand, Ltd. | | | 262,000 | | | | 515,309 | |
CapitaMall Trust | | | 265,347 | | | | 361,390 | |
City Developments, Ltd. | | | 47,000 | | | | 355,824 | |
Global Logistic Properties, Ltd.* | | | 232,000 | | | | 329,553 | |
| | | | | | | | |
| | | | | | | 1,836,039 | |
| | | | | | | | |
| | |
Sweden (0.43%) | | | | | | | | |
Castellum AB | | | 17,428 | | | | 218,241 | |
| | | | | | | | |
| | |
Switzerland (0.61%) | | | | | | | | |
PSP Swiss Property AG* | | | 3,522 | | | | 305,899 | |
| | | | | | | | |
| | |
United Kingdom (5.85%) | | | | | | | | |
British Land Co., Plc | | | 89,899 | | | | 700,320 | |
Capital Shopping Centres Group Plc | | | 60,684 | | | | 306,470 | |
Derwent London Plc | | | 8,275 | | | | 208,239 | |
Great Portland Estates Plc | | | 31,768 | | | | 176,126 | |
Hammerson Plc | | | 72,362 | | | | 445,114 | |
Land Securities Group Plc | | | 78,513 | | | | 848,343 | |
Segro Plc | | | 75,354 | | | | 267,018 | |
| | | | | | | | |
| | | | | | | 2,951,630 | |
| | | | | | | | |
| | |
United States (48.24%) | | | | | | | | |
Alexandria Real Estate Equities, Inc. | | | 6,278 | | | | 411,586 | |
American Campus Communities, Inc. | | | 7,045 | | | | 277,150 | |
AvalonBay Communities, Inc. | | | 9,529 | | | | 1,189,696 | |
Boston Properties, Inc. | | | 14,885 | | | | 1,419,731 | |
BRE Properties, Inc. | | | 7,573 | | | | 368,502 | |
Brookfield Office Properties, Inc. | | | 21,906 | | | | 322,675 | |


| | | | | | | | |
Security Description | | | Shares | | | | Value | |
| | |
United States (continued) | | | | | | | | |
Camden Property Trust | | | 7,212 | | | $ | 416,349 | |
Corporate Office Properties Trust | | | 7,286 | | | | 151,913 | |
Digital Realty Trust, Inc. | | | 10,069 | | | | 639,382 | |
Douglas Emmett, Inc. | | | 12,931 | | | | 232,499 | |
Duke Realty Corp. | | | 25,677 | | | | 297,853 | |
Equity Residential | | | 30,041 | | | | 1,657,963 | |
Essex Property Trust, Inc. | | | 3,312 | | | | 439,999 | |
Federal Realty Investment Trust | | | 6,364 | | | | 562,769 | |
General Growth Properties, Inc. | | | 61,715 | | | | 868,947 | |
HCP, Inc. | | | 41,269 | | | | 1,595,047 | |
Health Care REIT, Inc. | | | 19,094 | | | | 957,946 | |
Host Hotels & Resorts, Inc. | | | 71,549 | | | | 1,012,418 | |
Kimco Realty Corp. | | | 41,237 | | | | 650,307 | |
Liberty Property Trust | | | 11,713 | | | | 349,165 | |
The Macerich Co. | | | 13,366 | | | | 669,637 | |
ProLogis | | | 46,508 | | | | 1,293,853 | |
Public Storage | | | 14,353 | | | | 1,893,161 | |
Regency Centers Corp. | | | 9,137 | | | | 339,531 | |
Simon Property Group, Inc. | | | 16,308 | | | | 2,027,737 | |
SL Green Realty Corp. | | | 8,660 | | | | 570,174 | |
UDR, Inc. | | | 22,198 | | | | 521,653 | |
Ventas, Inc. | | | 29,173 | | | | 1,539,167 | |
Vornado Realty Trust | | | 18,687 | | | | 1,391,247 | |
Weingarten Realty Investors | | | 12,272 | | | | 253,908 | |
| | | | | | | | |
| | | | | | | 24,321,965 | |
| | | | | | | | |
| | |
TOTAL COMMON STOCKS
(Cost $50,622,454) | | | | | | | 50,233,400 | |
| | | | | | | | |
| | |
TOTAL INVESTMENTS (99.63%)
(Cost $50,622,454) | | | | | | | 50,233,400 | |
| | |
NET OTHER ASSETS AND LIABILITIES (0.37%) | | | | | | | 184,620 | |
| | | | | | | | |
| | |
NET ASSETS (100.00%) | | | | | | $ | 50,418,020 | |
| | | | | | | | |
| | |
* Non-income producing security. | | | | | | | | |


Common Abbreviations:
| AB - | Aktiebolag is the Swedish equivalent of the term corporation. |
| AG - | Aktiengesellschaft is a German term that refers to a corporation that is limited by shares, i.e., owned by shareholders. |
| N.V. - | Naamloze Vennootschap is the Dutch term for a public limited liability corporation. |
| REIT - | Real Estate Investment Trust. |
| SA - | Generally designated corporations in various countries, mostly those employing the civil law. |
See Notes to Financial Statements.


| | | | |
ASSETS: | | | | |
Investments, at value | | $ | 50,233,400 | |
Cash | | | 112,895 | |
Foreign currency, at value (Cost $12,703) | | | 12,801 | |
Receivable for investments sold | | | 246 | |
Foreign tax reclaims | | | 7,350 | |
Interest and dividends receivable | | | 74,540 | |
Total Assets | | | 50,441,232 | |
| |
LIABILITIES: | | | | |
Payable for investments purchased | | | 422 | |
Payable to advisor | | | 22,790 | |
Total Liabilities | | | 23,212 | |
NET ASSETS | | $ | 50,418,020 | |
| | | | | |
| |
NET ASSETS CONSIST OF: | | | | |
Paid-in capital | | $ | 54,842,555 | |
Overdistributed net investment income | | | (728,017 | ) |
Accumulated net realized loss on investments and foreign currency transactions | | | (3,307,003 | ) |
Net unrealized depreciation on investments and translation of assets and liabilities denominated in foreign currencies | | | (389,515 | ) |
NET ASSETS | | $ | 50,418,020 | |
| | | | | |
| |
INVESTMENTS, AT COST | | $ | 50,622,454 | |
| |
PRICING OF SHARES | | | | |
Net Assets | | $ | 50,418,020 | |
Shares of beneficial interest outstanding (Unlimited number of shares authorized, par value $0.01 per share) | | | 1,550,000 | |
Net Asset Value, offering and redemption price per share | | $ | 32.53 | |


| | | | | | | | |
| | | For the Period
January 1, 2011 to
November 30, 2011(a) | | | For the Year Ended
December 31, 2010 | |
INVESTMENT INCOME: | | | | | | | | |
Dividends(b) | | $ | 1,697,951 | | | $ | 1,244,995 | |
Total Investment Income | | | 1,697,951 | | | | 1,244,995 | |
| | |
EXPENSES: | | | | | | | | |
Investment advisory fee | | | 261,699 | | | | 140,275 | |
Total Net Expenses | | | 261,699 | | | | 140,275 | |
NET INVESTMENT INCOME | | | 1,436,252 | | | | 1,104,720 | |
| | |
Net realized gain/(loss) on investments | | | 777,361 | | | | (962,358 | ) |
Net realized gain/(loss) on foreign currency transactions | | | (5,226 | ) | | | 729 | |
Net change in unrealized appreciation/(depreciation) on investments | | | (5,846,321 | ) | | | 5,068,972 | |
Net change in unrealized appreciation/(depreciation) on translation of assets and liabilities denominated in foreign currencies | | | (1,971 | ) | | | 1,768 | |
NET REALIZED AND UNREALIZED GAIN/(LOSS) ON INVESTMENTS | | | (5,076,157 | ) | | | 4,109,111 | |
NET INCREASE/(DECREASE) IN NET ASSETS RESULTING FROM OPERATIONS | | $ | (3,639,905 | ) | | $ | 5,213,831 | |
| | | | | | | | | |
| (a) | Effective March 7, 2011, the Board approved changing the fiscal year end of the Fund from December 31 to November 30. |
| (b) | Net of foreign withholding tax of $77,454 and $33,498, respectively. |


| | | | | | | | | | | | |
| | |
| For the Period
January 1, 2011 to
November 30,
2011(a) |
| |
| For the Year
Ended
December 31,
2010 |
| |
| For the Year
Ended
December 31,
2009 |
|
OPERATIONS: | | | | | | | | | | | | |
| | | |
Net investment income | | $ | 1,436,252 | | | $ | 1,104,720 | | | $ | 212,230 | |
Net realized gain/(loss) on investments and foreign currency transactions | | | 772,135 | | | | (961,629 | ) | | | (1,175,772 | ) |
Net change in unrealized appreciation/(depreciation) on investments and foreign currency | | | (5,848,292 | ) | | | 5,070,740 | | | | 2,832,094 | |
Net increase/(decrease) in net assets resulting from operations | | | (3,639,905 | ) | | | 5,213,831 | | | | 1,868,552 | |
| | | |
DISTRIBUTIONS TO SHAREHOLDERS: | | | | | | | | | | | | |
From net investment income | | | (1,593,186 | ) | | | (1,865,795 | ) | | | (504,174 | ) |
Total distributions | | | (1,593,186 | ) | | | (1,865,795 | ) | | | (504,174 | ) |
| | | |
SHARE TRANSACTIONS: | | | | | | | | | | | | |
| | | |
Proceeds from sale of shares | | | 19,906,094 | | | | 26,743,914 | | | | 6,176,164 | |
Cost of shares redeemed | | | (6,881,318 | ) | | | (68,866 | ) | | | – | |
Net increase from share transactions | | | 13,024,776 | | | | 26,675,048 | | | | 6,176,164 | |
Net increase in net assets | | | 7,791,685 | | | | 30,023,084 | | | | 7,540,542 | |
| | | |
NET ASSETS: | | | | | | | | | | | | |
Beginning of year | | | 42,626,335 | | | | 12,603,251 | | | | 5,062,709 | |
End of period* | | $ | 50,418,020 | | | $ | 42,626,335 | | | $ | 12,603,251 | |
| | | | | | | | | | | | | |
| | | |
*Including overdistributed net investment income of: | | $ | (728,017 | ) | | $ | (1,044,296 | ) | | $ | (294,951 | ) |
| | | |
Other Information: | | | | | | | | | | | | |
SHARE TRANSACTIONS: | | | | | | | | | | | | |
Beginning shares | | | 1,200,000 | | | | 402,000 | | | | 202,000 | |
Shares sold | | | 550,000 | | | | 800,000 | | | | 200,000 | |
Shares redeemed | | | (200,000 | ) | | | (2,000 | ) | | | – | |
Shares outstanding, end of period | | | 1,550,000 | | | | 1,200,000 | | | | 402,000 | |
| | | | | | | | | | | | | |
| (a) | Effective March 7, 2011, the Board approved changing the fiscal year end of the Fund from December 31 to November 30. |

Intentionally Left Blank

| | |
| | |
| | |
| | |
NET ASSET VALUE, BEGINNING OF PERIOD | | |
| |
INCOME/(LOSS) FROM OPERATIONS: | | |
Net investment income | | |
Net realized and unrealized gain/(loss) on investments | | |
Total from Investment Operations | | |
| |
LESS DISTRIBUTIONS: | | |
From net investment income | | |
Total Distributions | | |
NET INCREASE/(DECREASE) IN NET ASSET VALUE | | |
NET ASSET VALUE, END OF PERIOD | | |
| | | |
TOTAL RETURN(c) | | |
| |
RATIOS/ SUPPLEMENTAL DATA: | | |
Net assets, end of period (in 000s) | | |
| |
RATIOS TO AVERAGE NET ASSETS: | | |
Net investment income including reimbursement/waiver | | |
Operating expenses including reimbursement/waiver | | |
Operating expenses excluding reimbursement/waiver | | |
PORTFOLIO TURNOVER RATE(e) | | |
| (a) | Effective March 7, 2011, the Board approved changing the fiscal year end of the Fund from December 31 to November 30. |
| (b) | Calculated using average shares outstanding. |
| (c) | Total return is calculated assuming an initial investment made at the net asset value at the beginning of the period and redemption at the net asset value on the last day of the period and assuming all distributions are reinvested at actual reinvestment prices. Total return calculated for a period of less than one year is not annualized. |
| (e) | Portfolio turnover is not annualized and does not include securities received or delivered from processing creations or redemptions. |


| | | | | | | | | | | | | | |
| For the Period
January 1, 2011 to
November 30, 2011(a) |
| |
| For the Year
Ended
December 31, 2010 |
| |
| For the Year
Ended
December 31, 2009 |
| |
| For the Period
May 7, 2008
(Inception) through
December 31, 2008 |
|
| $ | 35.52 | | | $ | 31.35 | | | $ | 25.06 | | | $ | 50.00 | |
| | | |
| | | | | | | | | | | | | | | |
| | 0.97 | (b) | | | 1.43 | (b) | | | 0.98 | | | | 0.47 | |
| | (2.87 | ) | | | 4.68 | | | | 7.00 | | | | (24.92 | ) |
| | (1.90 | ) | | | 6.11 | | | | 7.98 | | | | (24.45 | ) |
| | | |
| | | | | | | | | | | | | | | |
| | (1.09 | ) | | | (1.94 | ) | | | (1.69 | ) | | | (0.49 | ) |
| | (1.09 | ) | | | (1.94 | ) | | | (1.69 | ) | | | (0.49 | ) |
| | (2.99 | ) | | | 4.17 | | | | 6.29 | | | | (24.94 | ) |
| $ | 32.53 | | | $ | 35.52 | | | $ | 31.35 | | | $ | 25.06 | |
| | | | | | | | | | | | | | | |
| | (5.53 | )% | | | 19.91 | % | | | 32.51 | % | | | (48.90 | )% |
| | | |
| | | | | | | | | | | | �� | | | |
| $ | 50,418 | | | $ | 42,626 | | | $ | 12,603 | | | $ | 5,063 | |
| | | |
| | | | | | | | | | | | | | | |
| | 3.02 | %(d) | | | 4.33 | % | | | 3.24 | % | | | 3.49 | %(d) |
| | 0.55 | %(d) | | | 0.55 | % | | | 0.55 | % | | | 0.55 | %(d) |
| | 0.55 | %(d) | | | 0.55 | % | | | 0.55 | % | | | 0.55 | %(d) |
| | 15% | | | | 14 | % | | | 18 | % | | | 18 | % |


1. ORGANIZATION
The ALPS ETF Trust (the “Trust”) is an open-end management investment company organized as a Delaware statutory trust on September 13, 2007 and is registered with the Securities and Exchange Commission (“SEC”) under the Investment Company Act of 1940, as amended (the “1940 Act”). As of November 30, 2011, the Trust consists of seven separate portfolios. Each portfolio represents a separate series of the Trust. This report pertains solely to the Cohen & Steers Global Realty Majors ETF (the “Fund”), which commenced operations on May 7, 2008. The investment objective of the Fund is to seek investment results that correspond generally to the price and yield (before the Fund’s fees and expenses) of the Cohen & Steers Global Realty Majors Index.
The Fund’s Shares (“Shares”) are listed on the New York Stock Exchange (“NYSE”) Arca. The Fund issues and redeems Shares at Net Asset Value (“NAV”) in blocks of 50,000 Shares, each of which is called a “Creation Unit.” Creation Units are issued and redeemed principally in-kind for securities included in a specified index. Except when aggregated in Creation Units, Shares are not redeemable securities of the Fund.
2. SIGNIFICANT ACCOUNTING POLICIES
The following is a summary of significant accounting policies consistently followed by the Fund in the preparation of the financial statements. The accompanying financial statements were prepared in accordance with accounting principles generally accepted in the United States of America (“U.S. GAAP”). The preparation of financial statements in conformity with U.S. GAAP requires management to make certain estimates and assumptions that affect the reported amounts of assets and liabilities and disclosures of contingent assets and liabilities at the date of the financial statements and the reported amounts of revenue and expenses during the period. Actual results could differ from those estimates.
A. Portfolio Valuation
The Fund’s NAV is determined daily, as of the close of regular trading on the NYSE, normally 4:00 p.m. Eastern time, on each day the NYSE is open for trading. The NAV is computed by dividing the value of all assets of the Fund (including accrued interest and dividends), less all liabilities (including accrued expenses and dividends declared but unpaid), by the total number of shares outstanding.
Portfolio securities listed on any exchange other than the National Association of Securities Dealer Automated Quotation (“NASDAQ”) exchange are valued at the last sale price on the business day as of which such value is being determined. If there has been no sale on such day, the securities are valued at the mean of the most recent bid and asked prices on such day. Securities traded on the NASDAQ are valued at the NASDAQ Official Closing Price as determined by NASDAQ. Short-term investments that mature in less than 60 days are valued at amortized cost, which approximates market value.


The Fund’s investments are valued at market value or, in the absence of market value with respect to any portfolio securities, at fair value according to procedures adopted by the Trust’s Board of Trustees (the “Board”). When market quotations are not readily available or when events occur that make established valuation methods unreliable, securities of the Fund may be valued in good faith by or under the direction of the Board. These securities generally include, but are not limited to, restricted securities (securities which may not be publicly sold without registration under the Securities Act of 1933) for which a pricing service is unable to provide a market price; securities whose trading has been formally suspended; a security whose market price is not available from a pre-established primary pricing source or the pricing source is not willing to provide a price; a security with respect to which an event has occurred that is most likely to materially affect the value of the security after the market has closed but before the calculation of the Fund’s NAV or make it difficult or impossible to obtain a reliable market quotation; or a security whose price, as provided by the pricing service, does not reflect the security’s “fair value” due to the security being de-listed from a national exchange or the security’s primary trading market is temporarily closed at a time when, under normal conditions, it would be open. As a general principle, the current “fair value” of a security would be the amount which the owner might reasonably expect to receive from the closing sale prices on the applicable exchange and fair value prices may not reflect the actual value of a security. A variety of factors may be considered in determining the fair value of such securities.
B. Foreign Currency Translation and Foreign Investments
The Fund invests in foreign securities which may involve a number of risk factors and special considerations not present with investments in securities of U.S. corporations.
Investment in non-U.S. issuers may involve unique risks compared to investing in securities of U.S. issuers. These risks may include, but are not limited to: (i) less information about non-U.S. issuers or markets may be available due to less rigorous disclosure, accounting standards or regulatory practices; (ii) many non-U.S. markets are smaller, less liquid and more volatile thus, in a changing market, the advisers may not be able to sell the Fund’s portfolio securities at times, in amounts and at prices they consider reasonable; (iii) currency exchange rates or controls may adversely affect the value of the Fund’s investments; (iv) the economies of non-U.S. countries may grow at slower rates than expected or may experience downturns or recessions; and, (v) withholdings and other non-U.S. taxes may decrease the Fund’s return.
The accounting records of the Fund are maintained in U.S. dollars. Portfolio securities and other assets and liabilities denominated in a foreign currency are translated to U.S. dollars at the prevailing rates of exchange at period end. Amounts related to the purchases and sales of securities and investment income are translated into U.S.


dollars at the prevailing exchange rate on the respective dates of transactions. The effects of changes in foreign currency exchange rates on portfolio investments are included in the net realized and unrealized gains and losses on investments. Net gains and losses on foreign currency transactions include disposition of foreign currencies, and currency gains and losses between the accrual and receipt dates of portfolio investment income and between the trade and settlement dates of portfolio investment transactions.
C. Securities Transactions and Investment Income
Securities transactions are recorded as of the trade date. Realized gains and losses from securities transactions are recorded on the identified cost basis. Dividend income is recorded on the ex-dividend date. Interest income, if any, is recorded on the accrual basis.
D. Federal Tax Information
The timing and character of income and capital gain distributions are determined in accordance with income tax regulations, which may differ from U.S. GAAP. Reclassifications are made to the Fund’s capital accounts for permanent tax differences to reflect income and gains available for distribution (or available capital loss carryforwards) under income tax regulations.
For the period ended November 30, 2011, permanent book and tax differences resulting primarily from differing treatment of foreign currency and in-kind transactions were identified and reclassified among the components of the Fund’s net assets as follows:
| | | | |
Undistributed Net Investment Income | | Accumulated Net Realized loss | | Paid-in Capital |
$473,213 | | $(1,697,434) | | $1,224,221 |
Net investment income and net realized (loss), as disclosed on the Statement of Operations, and net assets were not affected by this reclassification.
Under the Regulated Investment Company Modernization Act of 2010 (“the Modernization Act”), net capital losses recognized in tax years beginning after December 22, 2010 may be carried forward indefinitely, and the character of the losses is retained as short-term and/or long-term. Under the law in effect prior to the Modernization Act, net capital losses were carried forward for eight years and treated as short-term. As a transition rule, the Modernization Act requires that post-enactment net capital losses be used before pre-enactment net capital losses. Additionally, post-enactment capital losses that are carried forward will retain their character as either short-term or long-term losses rather than being considered all short-term as under previous law.


At November 30, 2011, the Fund had available for tax purposes unused pre-enactment capital loss carryforwards as follows:
| | | | | | |
Year of Expiration | | |
2016 | | 2017 | | 2018 | | Total |
| $176,692 | | $809,982 | | $187,815 | | $1,174,489 |
At November 30, 2011, the Fund had available for tax purposes unused post-enactment capital loss carryforwards as follows:
E. Dividends and Distributions to Shareholders
Dividends from net investment income of the Fund, if any, are declared and paid quarterly or as the Board of Trustees may determine from time to time. Distributions of net realized capital gains earned by the Fund, if any, are distributed at least annually.
Distributions from net investment income and capital gains are determined in accordance with income tax regulations, which may differ from U.S. GAAP. These differences are primarily due to differing treatments of income and gains on various investment securities held by the Fund, timing differences and differing characterization of distributions made by the Fund.
The tax character of the distributions paid was as follows:
| | | | | | | | |
| | |
| For the Period Ended
November 30, 2011 |
| |
| For the Year Ended
December 31, 2010 |
|
Distributions paid from: | | | | | | | | |
Ordinary income | | | $ 1,593,186 | | | | $ 1,865,795 | |
Total | | | $ 1,593,186 | | | | $ 1,865,795 | |
| |
As of November 30, 2011, the components of distributable earnings on a tax basis for the Fund were as follows:
| | | | |
Undistributed net investment income | | $ | 145,438 | |
Accumulated net realized loss on investments
and foreign currency transactions | | | (2,003,640) | |
Net unrealized depreciation on investments and translation
of assets and liabilities denominated in foreign currencies | | | (2,566,425) | |
Other Cumulative Effect of Timing Differences | | | 92 | |
Total | | $ | (4,424,535) | |
| |
The differences between book-basis and tax-basis are primarily due to deferral of losses from wash sales and the differing treatment of certain other investments.

F. Income Taxes
No provision for income taxes is included in the accompanying financial statements, as the Fund intends to distribute to shareholders all taxable investment income and realized gains and otherwise comply with Subchapter M of the Internal Revenue Code applicable to regulated investment companies.
The Fund evaluates tax positions taken (or expected to be taken) in the course of preparing the Fund’s tax returns to determine whether these positions meet a “more-likely-than-not” standard that, based on the technical merits, have a more than fifty percent likelihood of being sustained by a taxing authority upon examination. A tax position that meets the “more-likely-than-not” recognition threshold is measured to determine the amount of benefit to recognize in the financial statements.
Management of the Fund analyzes all open tax years, as defined by the Statute of Limitations, for all major jurisdictions, including federal tax authorities and certain state tax authorities. As of and during the fiscal year ended November 30, 2011, the Fund did not have a liability for any unrecognized tax benefits. The Fund will file income tax returns in the U.S. federal jurisdiction and Colorado. For the years ended December 31, 2008 through November 30, 2011, the Fund’s returns are still open to examination by the appropriate taxing authority.
G. Fair Value Measurements
The Fund discloses the classification of its fair value measurements following a three-tier hierarchy based on the inputs used to measure fair value. Inputs refer broadly to the assumptions that market participants would use in pricing the asset or liability, including assumptions about risk. Inputs may be observable or unobservable. Observable inputs reflect the assumptions market participants would use in pricing the asset or liability that are developed based on market data obtained from sources independent of the reporting entity. Unobservable inputs reflect the reporting entity’s own assumptions about the assumptions market participants would use in pricing the asset or liability that are developed based on the best information available.
Various inputs are used in determining the value of the Fund’s investments as of the end of the reporting period. When inputs used fall into different levels of the fair value hierarchy, the level in the hierarchy within which the fair value measurement falls is determined based on the lowest level input that is significant to the fair value measurement in its entirety. The designated input levels are not necessarily an indication of the risk or liquidity associated with these investments. These inputs are categorized in the following hierarchy under applicable financial accounting standards:


| | |
Level 1 - | | Unadjusted quoted prices in active markets for identical assets or liabilities that the Fund has the ability to access. |
| |
Level 2 - | | Observable inputs other than quoted prices included in level 1 that are observable for the asset or liability, either directly or indirectly. These inputs may include quoted prices for the identical instrument on an inactive market, prices for similar instruments, interest rates, prepayment speeds, credit risk, yield curves, default rates, and similar data. |
| |
Level 3 - | | Unobservable inputs for the asset or liability, to the extent relevant observable inputs are not available, representing the Fund’s own assumptions about the assumptions a market participant would use in valuing the asset or liability, and would be based on the best information available. |
| | | | | | | | | | | | | | | | |
| Investments in Securities at Value* | | Level 1-
Unadjusted
Quoted Prices | | | Level 2-
Other
Significant
Observable
Inputs | | | Level 3-
Significant
Unobservable
Inputs | | | Total | |
Common Stocks | | $ | 50,233,400 | | | $ | – | | | $ | – | | | $ | 50,233,400 | |
TOTAL | | $ | 50,233,400 | | | $ | – | | | $ | – | | | $ | 50,233,400 | |
| | | | | | | | | | | | | | | | | |
* For a detailed geographical breakdown, see the accompanying Schedule of Investments.
For the period ended November 30, 2011, the Fund did not have any significant transfers between Level 1 and Level 2 securities. The Fund did not have any securities which used significant unobservable inputs (Level 3) in determining fair value.
3. INVESTMENT ADVISORY FEE AND
OTHER AFFILIATED TRANSACTIONS
ALPS Advisors, Inc. (the “Investment Adviser”) acts as the Fund’s investment adviser pursuant to an Advisory Agreement with the Trust on behalf of the Fund (the “Advisory Agreement”). Pursuant to the Advisory Agreement, the Fund pays the Investment Adviser a unitary fee for the services and facilities it provides payable on a monthly basis at the annual rate of 0.55% of the Fund’s average daily net assets. From time to time, the Investment Adviser may waive all or a portion of its fee.
Out of the unitary management fee, the Investment Adviser pays substantially all expenses of the Fund, including the fees of the Sub-Adviser, the licensing fee of the Index provider, and the cost of transfer agency, custody, fund administration, legal, audit and other services, except for interest expenses, distribution fees or expenses, brokerage expenses, taxes and extraordinary expenses not incurred in the ordinary course of the Fund’s business. In addition, the Investment Adviser’s unitary management fee is designed to compensate the Investment Adviser for providing services for the Fund.


Prior to June 30, 2011 Mellon Capital Management Corporation acted as the Fund’s sub-adviser pursuant to a sub-advisory agreement with the Investment Adviser. According to this agreement, the Investment Adviser paid the sub-adviser on a monthly basis, an annual rate of 0.10% of the Fund’s average daily net assets subject to an annual minimum of $125,000. Effective July 1, 2011, the sub-advisory agreement was terminated and all responsibilities were assumed by the Investment Adviser.
ALPS Fund Services, Inc. (“ALPS”), an affiliate of the Investment Adviser, is the administrator of the Fund.
The Bank of New York Mellon is the custodian, fund accounting agent and transfer agent for the Fund.
Each Trustee who is not an officer or employee of the Investment Adviser, any subadviser or any of their affiliates (“Independent Trustees”) is paid a quarterly retainer of $3,500, $1,500 for each regularly scheduled Board meeting attended and $750 for each special meeting held outside of regularly scheduled meetings.
4. PURCHASES AND SALES OF SECURITIES
For the period ended November 30, 2011, the cost of purchases and proceeds from sales of investment securities, excluding in-kind transactions and short-term investments, were as follows:
| | |
| Purchases | | Sales |
$10,773,078 | | $7,832,726 |
For the period ended November 30, 2011, the cost of in-kind purchases and proceeds from in-kind sales were as follows:
| | |
| Purchases | | Sales |
$14,925,064 | | $4,808,797 |
Gains on in-kind transactions are not considered taxable for federal income tax purposes.


As of November 30, 2011, the costs of investments for federal income tax purposes and accumulated net unrealized appreciation/(depreciation) on investments were as follows:
| | | | |
Gross Appreciation (excess of value over tax cost) | | $ | 2,737,032 | |
Gross Depreciation (excess of tax cost over value) | | | (5,302,996 | ) |
Gross Depreciation of foreign currency and other derivatives | | | (461 | ) |
Net unrealized depreciation | | $ | (2,566,425 | ) |
| | | | | |
Cost of investment for income tax purposes | | $ | 52,799,364 | |
| | | | | |
5. CAPITAL SHARE TRANSACTIONS
Shares are created and redeemed by the Fund only in Creation Unit size aggregations of 50,000 shares. Only broker-dealers or large institutional investors with creation and redemption agreements called Authorized Participants (“AP”) are permitted to purchase or redeem Creation Units from the Fund. Such transactions are generally permitted on an in-kind basis, with a balancing cash component to equate the transaction to the net asset value per unit of the Fund on the transaction date. Cash may be substituted equivalent to the value of certain securities generally when they are not available in sufficient quantity for delivery, not eligible for trading by the AP or as a result of other market circumstances.
6. INDEMNIFICATIONS
Under the Trust’s organizational documents, its officers and Trustees are indemnified against certain liability arising out of the performance of their duties to the Trust. Additionally, in the normal course of business, the Trust enters into contracts with service providers that contain general indemnification clauses. The Trust’s maximum exposure under these arrangements is unknown, as this would involve future claims that may be made against the Trust that have not yet occurred.
7. NEW ACCOUNTING PRONOUNCEMENTS
In May 2011, the FASB issued ASU No. 2011-04 “Amendments to Achieve Common Fair Value Measurement and Disclosure Requirements” in GAAP and the International Financial Reporting Standards (“IFRSs”). ASU No.2011-04 amends FASB ASC Topic 820, “Fair Value Measurements and Disclosures”, to establish common requirements for measuring fair value and for disclosing information about fair value measurements in accordance with GAAP and IFRSs. ASU No.2011-04 is effective for fiscal years beginning after December 15, 2011 and for interim periods within those fiscal years. Management is currently evaluating the impact these amendments may have on the Fund’s financial statements.


PROXY VOTING POLICIES AND PROCEDURES
A description of the Fund’s proxy voting policies and procedures used in determining how to vote for proxies and information regarding how the Fund voted proxies related to portfolio securities during the most recent 12-month period ended June 30th is available without charge, (1) on the Securities and Exchange Commission’s (“SEC”) website at http://www.sec.gov; (2) upon request, by calling 1-866-513-5856; and (3) on the Trust’s website located at http://www.alpsfunds.com.
PORTFOLIO HOLDINGS
The Trust will file its complete schedule of portfolio holdings with the SEC for the first and third quarters of each fiscal year on Form N-Q. The Trust’s Form N-Q will be available (1) on the SEC’s website at http://www.sec.gov; (2) by calling 1-866- 513-5856; (3) on the Trust’s website located at http://www.alpsfunds.com; and (4) for review and copying at the SEC’s Public Reference Room (“PRR”) in Washington D.C. Information regarding the operation of the PRR may be obtained by calling 1-800-732-0330.
Shareholder Meeting
A Special Meeting of the Shareholders was held on October 14, 2011 for the purpose of voting on a proposal to approve a new Investment Advisory Agreement between ALPS ETF Trust, on behalf of the Fund, and ALPS Advisors, Inc. The proposal passed and the results are noted below.
Proposal 1: To approve a new Investment Advisory Agreement between ALPS ETF Trust, on behalf of the Fund, and ALPS Advisors, Inc.:
| | | | | | | | |
| Number of Votes |
| Record Date Votes | | Affirmative | | Against | | Abstain | | Uninstructed |
922,428.975 | | 786,612.124 | | 15,975.000 | | 18,032.851 | | 101,809.000 |
| | | | | | | | | | | | | | |
| Percentages of Total Outstanding | | Percentages of Voted |
| Affirmative | | Against | | Abstain | | Uninstructed | | Affirmative | | Against | | Abstain | | Uninstructed |
49.163% | | 0.998% | | 1.128% | | 6.363% | | 85.276% | | 1.732% | | 1.955% | | 11.037% |


INDEPENDENT TRUSTEES
| | | | | | | | | | |
Name, Address and Age of Management Trustee* | | Position(s) Held with Trust | | Term of Office and Length of Time Served** | | Principal Occupation(s) During Past 5 Years | | Number of
Portfolios in Fund Com- plex Overseen by Trustees*** | | Other Directorships Held by Trustees |
Mary K. Anstine, age 71 | | Trustee | | Since March 2008 | | Ms. Anstine was President/ Chief Executive Officer of HealthONE Alliance, Denver, Colorado, and former Executive Vice President of First Interstate Bank of Denver. Ms. Anstine is also Trustee/ Director of the following: AV Hunter Trust; Colorado Uplift Board. Ms. Anstine was formerly a Director of the Trust Bank of Colorado (later purchased and now known as Northern Trust Bank), HealthONE and Denver Area Council of the Boy Scouts of America and a member of the American Bankers Association Trust Executive Committee. | | 21 | | Ms. Anstine is a Trustee of Financial Investors Variable Insurance Trust (5 funds); Financial Investors Trust (17 funds); Reaves Utility Income Fund; and Westcore Trust (12 funds). |
Jeremy W. Deems, age 35 | | Trustee | | Since March 2008 | | Mr. Deems is the Co-Founder, Chief Compliance Officer and Chief Financial Officer of Green Alpha Advisors, LLC. Prior to joining Green Alpha Advisors, Mr. Deems was CFO and Treasurer of Forward Management, LLC, ReFlow Management Co., LLC, ReFlow Fund, LLC, a private investment fund, and Sutton Place Management, LLC, an administrative services company, from 2004 to June 2007. Prior to this, Mr. Deems served as Controller of Forward Management, LLC, ReFlow Management Co., LLC, ReFlow Fund, LLC and Sutton Place Management, LLC. | | 21 | | Mr. Deems is a Trustee of Financial Investors Trust (17 funds); Financial Investors Variable Insurance Trust (5 funds); and Reaves Utility Income Fund. |


INDEPENDENT TRUSTEES Continued
| | | | | | | | | | |
Name, Address and Age of Management Trustee* | | Position(s) Held with Trust | | Term of Office and Length of Time Served** | | Principal Occupation(s) During Past 5 Years | | Number of
Portfolios in Fund Com- plex Overseen by Trustees*** | | Other Directorships Held by Trustees |
Rick A. Pederson, age 59 | | Trustee | | Since March 2008 | | President, Foundation Properties, Inc. (a real estate investment management company), 1994 - present; Partner, Western Capital Partners (a prime lending company), 2000 - present; Partner, Bow River Capital Partners (investment manager), 2003 - present; Principal, The Pauls Corporation (real estate development), 2008 - present; Director, Guaranty Bank and Trust (a community bank), 1999 – 2007; Winter Park Recreational Association (an entity that operates, maintains and develops Winter Park Resort), 2002 – 2008; Neenan Co. (an integrated real estate development, architecture and construction company), 2002 – present; NexCore Properties LLC (a real estate investment company), 2004 – present; Urban Land Conservancy (a not-for-profit organization), 2004 – present. | | 7 | | Mr. Pederson is Trustee of Westcore Trust (12 funds) |
| * | The business address of the Trustee is c/o ALPS Advisors, Inc., 1290 Broadway, Suite 1100, Denver, Colorado 80203. |
| ** | This is the period for which the Trustee began serving the Trust. Each Trustee serves an indefinite term, until his successor is elected. |
| *** | The Fund Complex includes all series of the Trust and any other investment companies for which ALPS Advisors, Inc. provides investment advisory services. |


INTERESTED TRUSTEE***
| | | | | | | | | | |
Name, Address and Age of Management Trustee* | | Position(s) Held with Trust | | Term of Office and Length of Time Served** | | Principal Occupation(s) During Past 5 Years | | Number of
Portfolios in Fund Com- plex Overseen by Trustees**** | | Other Directorships Held by Trustees |
Thomas A. Carter, age 45 | | Trustee and President | | Since March 2008 | | Mr. Carter joined ALPS Fund Services, Inc. (“ALPS”) in 1994 and is currently President and Director of ALPS Advisors, Inc. (“AAI”), ALPS Distributors, Inc. (“ADI”) and FTAM Funds Distributor, Inc. (“FDI”) and Executive Vice President and Director of ALPS and ALPS Holdings, Inc. (“AHI”). Because of his position with AHI, ALPS, ADI, FDI and AAI, Mr. Carter is deemed an affiliate of the Fund as defined under the 1940 Act. Before joining ALPS, Mr. Carter was with Deloitte & Touché LLP, where he worked with a diverse group of clients, primarily within the financial services industry. Mr. Carter is a Certified Public Accountant and received his Bachelor of Science in Accounting from the University of Colorado at Boulder. | | 12 | | Mr. Carter is a Trustee of Financial Investors Variable Insurance Trust (5 funds) |
| * | The business address of the Trustee is c/o ALPS Advisors, Inc., 1290 Broadway, Suite 1100, Denver, Colorado 80203. |
| ** | This is the period for which the Trustee began serving the Trust. Each Trustee serves an indefinite term, until his successor is elected. |
| *** | Mr. Carter is an interested person of the Trust because of his affiliation with ALPS. |
| **** | The Fund Complex includes all series of the Trust and any other investment companies for which ALPS Advisors, Inc. provides investment advisory services. |


OFFICERS
| | | | | | |
Name, Address and Age of Executive Officer* | | Position(s) Held with Trust | | Length of Time Served** | | Principal Occupation(s) During Past 5 Years |
Melanie Zimdars, age 35 | | Chief Compliance Officer (“CCO”) | | Since December 2009 | | Ms. Zimdars currently serves as a Deputy Chief Compliance Officer with ALPS. Prior to joining ALPS in September 2009, Ms. Zimdars served as Principal Financial Officer, Treasurer and Secretary for the Wasatch Funds from February 2007 to December 2008. From November 2006 to February 2007, she served as Assistant Treasurer for the Wasatch Funds and served as a Senior Compliance Officer for Wasatch Advisors, Inc. since 2005. From 2001 until joining Wasatch in 2005, she was a Compliance Officer for U.S. Bancorp Fund Services, LLC. Because of her position with ALPS, Ms. Zimdars is deemed an affiliate of the Trust as defined under the 1940 Act. Ms. Zimdars is also the CCO of Financial Investors Variable Insurance Trust, Liberty All-Star Growth Fund, Inc. and Liberty All-Star Equity Fund. |
Kimberly R. Storms, age 39 | | Treasurer | | Since March 2008 | | Ms. Storms is Director of Fund Administration and Senior Vice President of ALPS. Ms. Storms joined ALPS in 1998 as Assistant Controller. Because of her position with ALPS, Ms. Storms is deemed an affiliate of the Trust as defined under the 1940 Act. Ms. Storms is also Assistant Treasurer of the Liberty All-Star Equity Fund, Liberty All-Star Growth Fund and Financial Investors Trust; and Assistant Secretary of Ameristock Mutual Fund, Inc. |
William Parmentier, age 59 | | Vice President | | Since March 2008 | | Mr. Parmentier is Chief Investment Officer, ALPS Advisors, Inc. (since 2006); President of the Liberty All-Star Funds (since April 1999); Senior Vice President (2005-2006), Banc of America Investment Advisors, Inc. |
Tané T. Tyler, age 47 | | Secretary | | Since December 2008 | | Ms.Tyler is Senior Vice President, General Counsel and Secretary of ALPS. Ms.Tyler joined ALPS in 2004. She served as Secretary, Reaves Utility Income Fund from December 2004–2007; Secretary, Westcore Funds from February 2005–2007; Secretary, First Funds from November 2004 to January 2007; Secretary, Financial Investors Variable Insurance Trust from December 2004–December 2006; Vice President and Associate Counsel, Oppenheimer Funds from January 2004 to August 2004; Vice President and Assistant General Counsel, INVESCO Funds from September 1991 to December 2003. Ms. Tyler also serves as Secretary, Liberty All-Star Equity Fund and Liberty All-Star Growth Fund. |


OFFICERS Continued
| | | | | | |
Name, Address and Age of Executive Officer* | | Position(s) Held with Trust | | Length of Time Served** | | Principal Occupation(s) During Past 5 Years |
Monette R. Nickels, age 40 | | Tax Officer | | Since December 2009 | | Ms. Nickels is Senior Vice President and Director of Tax Administration of ALPS. Ms. Nickels joined ALPS in 2004 as Director of Tax Administration. Because of her position with ALPS, Ms. Nickels is deemed an affiliate of the Trust as defined under the 1940 Act. Ms. Nickels is also Tax Officer of Financial Investors Trust, Liberty All-Star Equity Fund, Liberty All-Star Growth Fund, Inc., and Financial Investors Variable Insurance Trust. |
| * | The business address of each Officer is c/o ALPS Advisors, Inc., 1290 Broadway, Suite 1100, Denver, Colorado 80203. |
| ** | This is the period for which the Officer began serving the Trust. Each Officer serves an indefinite term, until his successor is elected. |

Investment Advisory Agreement
At an in-person meeting held on July 26, 2011, the Board of Trustees of the Trust (the “Board”), including the Trustees who are not “interested persons” of the Trust within the meaning of the Investment Company Act of 1940, as amended (the “1940 Act”), evaluated a proposal to approve a new Investment Advisory Agreement (the “Advisory Agreement”) between the Trust and ALPS Advisors, Inc. (the “Investment Adviser”) with respect to Cohen & Steers Global Realty Majors ETF (the “Fund”).
Consideration by the Board of this new Advisory Agreement was necessary because ALPS Holdings, Inc. (“ALPS Holdings”), parent company to the Investment Adviser, had agreed to be acquired by DST Systems, Inc. (“DST”) (the “Transaction”). Because ALPS Holdings would be acquired by DST, the Investment Adviser would thereby undergo a change in control, which would be deemed to be an “assignment” of the existing investment advisory agreement under the 1940 Act. As required by the 1940 Act, the existing investment advisory agreement provided for its automatic termination in the event of an assignment, and would therefore terminate upon the closing of the Transaction. In order for the Investment Adviser to continue as the Fund’s investment adviser, the Board and the Fund’s shareholders would have to approve a new Advisory Agreement with the Investment Adviser, which would take effect upon the closing of the Transaction.
In evaluating the new Advisory Agreement, the Board did not identify any single factor as all-important or controlling. The following summary does not identify all the matters considered by the Board, but includes the principal matters it considered. The Board considered whether the new Advisory Agreement would be in the best interests of the Fund and its shareholders, based on: (i) the nature, extent and quality of the services to be provided by the Investment Adviser under the Advisory Agreement; (ii) the investment performance of the Fund; (iii) the expenses borne by the Fund under the unitary fee arrangement of the Advisory Agreement; (iv) the estimated profitability of the Investment Adviser and its affiliates from their relationship with the Fund; (v) potential fall-out benefits to the Investment Adviser from its relationship with the Fund; and (vi) other general information about the Investment Adviser and its affiliates. The following is a summary of the Board’s consideration and conclusions regarding these matters.
Nature, Extent and Quality of the Services to be Provided
The Board considered the nature, extent and quality of the services to be provided by the Investment Adviser, including the portfolio management services to be provided, in light of the investment objective of the Fund. The Board considered that, following the Transaction, the Fund would be managed by senior personnel at the Investment Adviser. In that regard, the Board considered the history of care and conscientiousness in supervising the management of the Fund provided by such personnel. The Board considered the background and capabilities of such personnel in connection with the advisory services that they would provide to the Fund following

the Transaction. The Board also considered the compliance records of the Investment Adviser. The Board considered representations from DST that it intended to retain all key management and personnel of ALPS Holdings and the Investment Adviser, and that DST did not anticipate that the Investment Adviser would undergo any changes to its structure, business strategy or services as a result of the Transaction. The Board also considered the Investment Adviser’s representation that the manner in which the Fund’s assets would be managed would not change as a result of the Transaction. Finally, the Board also considered its and the Fund’s association with the current personnel employed by the Investment Adviser.
The Board concluded that the nature, extent and quality of the services to be provided by the Investment Adviser to the Fund were appropriate and consistent with the terms of the new Advisory Agreement, and that the Fund was likely to benefit from services provided under its new Advisory Agreement. The Board also concluded that the quality of the services to be provided by the senior advisory personnel employed by the Investment Adviser was expected to be consistent with or superior to quality norms in the industry, and that the Investment Adviser would have sufficient personnel, with the appropriate education and experience, to serve the Fund effectively. The Board also concluded that the Investment Adviser had demonstrated a continuing ability to attract and retain well-qualified personnel (and noted the Investment Adviser’s representations that no changes were anticipated with respect to the Investment Adviser’s compensation and incentive programs), and that the structure of the Investment Adviser’s operations was sufficient to retain and properly motivate the Fund’s current senior advisory personnel. Finally, the Board concluded that the financial condition of DST, ALPS Holdings and the Investment Adviser was sound.
Investment Performance
The Board also reviewed investment performance information of the Fund and its benchmark index. The Board evaluated the correlation and tracking error between the underlying index and the Fund.
Costs of the Services to be Provided to the Fund
The Board reviewed the fees to be paid by the Fund to the Investment Adviser, noting that the rate of fees to be paid under the new Advisory Agreement was the same fee rate the Fund currently paid. The Board noted that the advisory fee paid to the Investment Adviser by the Fund was a unitary fee pursuant to which the Investment Adviser assumes all expenses of the Fund (including the cost of transfer agency, custody, advisory, fund administration, legal, audit and other services) other than the payments under the new Advisory Agreement, brokerage expenses, taxes, interest, litigation expenses and other extraordinary expenses. The Board considered the Investment Adviser’s representation that it did not intend to raise any of its advisory or administration fees paid by the Fund for at least two years following the Transaction. The Board reviewed comparative fee information of the Fund’s advisory contracts, including information about the rates of compensation paid to investment advisers,


and overall expense ratios, for funds comparable in size, character and investment strategy to the Fund. The Board considered the fact that the Fund’s fees were generally comparable to the fees charged to similar funds. The Board concluded that the management fees payable by the Fund to the Investment Adviser were reasonable in relation to the nature and quality of the services expected to be provided, taking into account the fees charged by other advisers for managing comparable funds with similar strategies.
Projected Profitability and Costs of Services to the Investment Adviser and Potential “Fall-Out” Benefits
The Board reviewed reports of the financial position of the Investment Adviser. The Board considered the projected profitability of ALPS Holdings’ overall relationship with the Fund, which included fees payable to the Investment Adviser for advisory services. The Board noted that since the Fund was subject to a unitary fee arrangement with the Investment Adviser pursuant to the new Advisory Agreement, there were no other fees payable to other ALPS Holdings affiliates for non-advisory services, and concluded that the projected profitability of ALPS Holdings was reasonable in relation to the services to be provided and to the costs of providing services to the Fund.
The Board also considered any potential “fall-out” benefits that the Investment Adviser might receive because of its relationship with the Fund and concluded that the advisory fees were reasonable taking into account any such benefits. The Board acknowledged the Investment Adviser’s well-established stand-alone management relationships independent of the Fund and the regulatory and entrepreneurial risks each assumed in connection with the management of the Fund.
Economies of Scale
The Board reviewed the Fund’s assets under management, and noted that because of the Fund’s unitary fee arrangement, consideration of economies of scale was not a relevant factor to the Fund.
Conclusion
Based on its evaluation, the Board unanimously concluded that the terms of the new Advisory Agreement were reasonable, fair and in the best interests of the Fund and its shareholders. The Board believed that the new Advisory Agreement would enable the Fund to continue to enjoy the high-quality investment management services it had received in the past from the Investment Adviser, at a fee rate identical to the present rate, which the Board deemed appropriate, reasonable and in the best interests of the Fund and its shareholders.


ALPS Equal Sector Weight ETF
| | |

| | ALPS Equal Sector Weight ETF | www.alpsfunds.com |

Dear Shareholders:
When ALPS launched its ETF(1) Trust in 2008 our goal was to bring innovative solutions to the ETF industry that provide investors with access to a unique market segment or strategy. With the launch of EQL in July of 2009 we fulfilled that promise by bringing to market the world’s first ETF that provides access to an Equal Sector Strategy.
Sectors are one of the most important drivers of risk and return. An equal sector strategy can minimize the negative impact that any one sector can have on a portfolio. At the same time by offering meaningful exposure to each sector of the market, it allows investors the ability to participate in market rallies regardless of where they occur. We believe the consistency of the historical returns delivered by an equal sector strategy combined with the transparency(2), liquidity(3) and low fees of the ETF structure make EQL a viable alternative for US large-cap investing.
In the pages that follow our Fund managers have provided a performance overview.
We thank you for your investment and for being a EQL shareholder.
Thomas A. Carter*
President, ALPS ETF Trust
| * | Registered representative of ALPS Distributors, Inc. |
| (1) | Exchange Traded Fund (“ETF”). |
| (2) | ETFs are considered transparent because their portfolio holdings are disclosed daily. |
| (3) | ETFs are considered to have continuous liquidity because they allow for an individual to trade throughout the day. |
Ordinary brokerage commissions apply.
| | | | |
Annual Report | November 30, 2011 | | 2 | |  |
|
| Performance Overview |
| November 30, 2011 (Unaudited) |
INVESTMENT OBJECTIVE
The Fund seeks investment results that replicate as closely as possible, before fees and expenses, the performance of the Banc of America Securities – Merrill Lynch Equal Sector Weight Index (the “Underlying Index”). The Fund’s investment objective is not fundamental and may be changed by the Board of Trustees without shareholder approval.
PRIMARY INVESTMENT STRATEGIES
The Adviser will seek to match the performance of the Underlying Index. The Underlying Index is an index of indexes comprised in equal proportions of the nine Select Sector SPDR Indexes (“The Underlying Sector Indexes”). In order to track the securities in the Underlying Index, the Fund will use a “fund of funds” approach, and seek to achieve its investment objective by investing at least 90% of its total assets in the shares of Select Sector SPDR exchange-traded funds (each, an “Underlying Sector ETF” and collectively the “Underlying Sector ETFs”) that track the Underlying Sector indexes of which the Underlying Index is comprised.
PERFORMANCE OVERVIEW
For the period ended November, 2011 the Fund generated a total return of 1.67%, outperforming the Fund’s benchmark as well as the S&P 500 which returned 1.08% over the same time period. While the overall market ended close to where it began, there was a great deal of volatility in between. All nine sectors of the S&P 500 lost money in the 3rd quarter of the year and all nine sectors had positive returns in the two month period ending November 30, 2011. There was also a wide variation in sector performance, with the defensive sectors leading the way. Utilities (15.52%), Consumer Staples (11.01%) and Healthcare (9.15%) were the top three performing sectors. Financials were the worst performing sector (-18.61%) followed by the more expansionary sectors Materials (-9.00%) and Industrials (-1.55%).
Compared to the S&P 500 the fund benefited from its relative overweight in the Utilities and Consumer Staples sectors and its underweight in the Financial and Technology sectors. The Fund was negatively impacted by its overweight in Materials which was the 2nd worst performing sector in the S&P 500. Overall, the Fund’s sector weights relative to the S&P 500 resulted in positive out-performance above the index in 5 of the 9 sectors.
| | | | |
| | 3 | | ALPS Equal Sector Weight ETF | www.alpsfunds.com |

PERFORMANCE as of November 30, 2011
| | | | | | | | |
| | | 1 Month | | 1 Year | | YTD | | Since
Inception
Annualized* |
|
ALPS Equal Sector Weight ETF | | | | | | | | |
|
NAV (Net Asset Value) | | 0.00% | | 8.38% | | 1.67% | | 17.63% |
|
Market Price** | | -0.03% | | 8.38% | | 1.67% | | 17.72% |
|
Banc of America Securities Merrill Lynch Equal Sector Weight Index | | -0.17% | | 6.60% | | 0.16% | | 15.67% |
|
S&P 500 Total Return Index | | -0.22% | | 7.83% | | 1.08% | | 17.00% |
|
Total Expense Ratio (per the current Prospectus) | | 0.54% | | | | | | |
Performance data quoted represents past performance. Past performance does not guarantee future results. Current performance may be higher or lower than actual data quoted. Call 1.866.675.2639 or visit www.alpsfunds.com for current month end performance. The investment return and principal value of an investment will fluctuate so that an investor’s shares, when redeemed, may be worth more or less than their original cost.
NAV is an exchange-traded fund’s per-share value. The per-share dollar amount of the fund is derived by dividing the total value of all the securities in its portfolio, less any liabilities, by the number of fund shares outstanding. Market Price is the price at which a share can currently be traded in the market. Information detailing the number of days the Market Price of the Fund was greater than the Fund’s NAV and the number of days it was less than the Fund’s NAV can be obtained at www.alpsfunds.com.
| * | The Fund commenced Investment Operations on July 06, 2009 with an Inception Date, the first day of trading on the Exchange, of July 7, 2009. |
| ** | Market Price is based on the midpoint of the bid/ask spread at 4 p.m. ET and does not represent the returns an investor would receive if shares were traded at other times. |
Banc of America Securities Merrill Lynch Equal Sector Weight Index: a U.S. equity index comprised, in equal weights, of nine sub-indices, and is a price-return index.
S&P 500 Index: the Standard & Poor’s composite index of 500 stocks, a widely recognized, unmanaged index of common stock prices.
An investor cannot invest directly in an index.
The following table shows the sector weights of both the Fund and the S&P 500 as of November 30, 2011:
SECTOR WEIGHTING COMPARISON as of November 30, 2011
| | | | | | | | |
| | |
| | | EQL | | | | S&P 500 | |
| |
Energy (XLE) | | | 11.4 | % | | | 12.5 | % |
| |
Industrials (XLI) | | | 11.4 | | | | 10.7 | |
| |
Utilities (XLU) | | | 11.2 | | | | 3.7 | |
| |
Consumer Staples (XLP) | | | 11.2 | | | | 11.4 | |
| |
Consumer Discretionary (XLY) | | | 11.1 | | | | 10.6 | |
| |
Technology (XLK) | | | 11.1 | | | | 22.5 | |
| |
Healthcare (XLV) | | | 11.1 | | | | 11.6 | |
| |
Materials (XLB) | | | 10.8 | | | | 3.6 | |
| |
Financials (XLF) | | | 10.7 | | | | 13.4 | |
| |
Source: S&P 500.
| | | | |
Annual Report | November 30, 2011 | | 4 | | |
|
| Performance Overview |
| November 30, 2011 (Unaudited) |
SECTOR ALLOCATION as of November 30, 2011
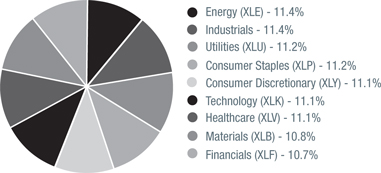
GROWTH OF $10,000 as of November 30, 2011
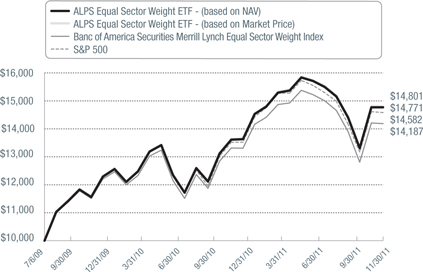
The chart above represents historical performance of a hypothetical investment of $10,000 in the Fund over the life of the Fund. Performance calculations are as of the end of each month. Past performance does not guarantee future results. This chart does not reflect the deduction of taxes that a shareholder would pay on Fund distributions or the redemption of Fund shares.
| | | | |
| | 5 | | ALPS Equal Sector Weight ETF | www.alpsfunds.com |
Shareholder Expense Example: As a shareholder of the Fund, you incur two types of costs: (1) transaction costs which may include creation and redemption fees or brokerage charges, and (2) ongoing costs, including management fees and other Fund expenses. These examples are intended to help you understand your ongoing costs (in dollars) of investing in the Fund and to compare these costs with the ongoing costs of investing in other funds. It is based on an investment of $1,000 invested at July 1, 2011 and held through the period ended November 30, 2011.
Actual Return: The first line of the table provides information about actual account values and actual expenses. You may use the information in this table, together with the amount you invested, to estimate the expenses that you incurred over the period. Simply divide your account value by $1,000 (for example, an $8,600 account value divided by $1,000 = 8.6), then multiply the result by the number in the first line under the heading entitled “Expenses Paid During the Period” to estimate the expenses attributable to your investment during this period.
Hypothetical 5% Return: The second line of the table provides information about hypothetical account values and hypothetical expenses based on the Fund’s actual expense ratio and an assumed rate of return of 5% per year before expenses, which is not the Fund’s actual return. The hypothetical account values and expenses may not be used to estimate the actual ending account balance or expenses you paid for the period. You may use this information to compare ongoing costs of investing in the Fund and other funds. To do so, compare this 5% hypothetical example with the 5% hypothetical examples that appear in the shareholder reports of the other funds.
The expenses shown in the table are meant to highlight ongoing Fund costs only and do not reflect any transaction costs, such as creation and redemption fees, or brokerage charges. Therefore, the second table is useful in comparing ongoing costs only, and will not help you determine the relative total costs of owning different funds. In addition, if these costs were included, your costs would have been higher.
| | | | | | | | |
| | | Beginning Account Value 7/01/11 | | Ending Account Value 11/30/11 | | Expense Ratio | | Expenses Paid During the Period 7/01/11- 11/30/11 |
Actual | | $1,000.00 | | $953.10 | | 0.34% | | $1.39 (a) |
Hypothetical (5% return before expenses) | | $1,000.00 | | $1,023.49 | | 0.34% | | $1.73 (b) |
| (a) | Effective March 7, 2011, the Board approved changing the fiscal year end of the Fund from December 31 to November 30. Actual expenses are equal to the Fund’s annualized expense ratio multiplied by the average account value over the period, multiplied by the number of days in the most recent fiscal year (153), then divided by 365. |
| (b) | Expenses are equal to the Fund’s annualized expense ratio multiplied by the average account value over the period, multiplied by the number of days in the most recent fiscal half year (184), then divided by 365. |
| | | | |
Annual Report | November 30, 2011 | | 6 | | |
|
| Report of Independent Registered Public Accounting Firm |
|
To the Board of Trustees and Shareholders of ALPS ETF Trust:
We have audited the accompanying statement of assets and liabilities, including the statement of investments, of ALPS Equal Sector Weight ETF, one of the funds constituting the ALPS ETF Trust (the “Trust”) as of November 30, 2011, and the related statements of operations for the period ended November 30, 2011 and the year ended December 31, 2010, and the statement of changes in net assets and the financial highlights for the period ended November 30, 2011, the year ended December 31, 2010, and the period July 7, 2009 (inception) to December 31, 2009. These financial statements and financial highlights are the responsibility of the Trust’s management. Our responsibility is to express an opinion on these financial statements and financial highlights based on our audits.
We conducted our audits in accordance with the standards of the Public Company Accounting Oversight Board (United States). Those standards require that we plan and perform the audit to obtain reasonable assurance about whether the financial statements and financial highlights are free of material misstatement. The Trust is not required to have, nor were we engaged to perform, an audit of its internal control over financial reporting. Our audits included consideration of internal control over financial reporting as a basis for designing audit procedures that are appropriate in the circumstances, but not for the purpose of expressing an opinion on the effectiveness of the Trust’s internal control over financial reporting. Accordingly, we express no such opinion. An audit also includes examining, on a test basis, evidence supporting the amounts and disclosures in the financial statements, assessing the accounting principles used and significant estimates made by management, as well as evaluating the overall financial statement presentation. Our procedures included confirmation of securities owned as of November 30, 2011, by correspondence with the custodian. We believe that our audits provide a reasonable basis for our opinion.
In our opinion, the financial statements and financial highlights referred to above present fairly, in all material respects, the financial position of ALPS Equal Sector Weight ETF of the ALPS ETF Trust as of November 30, 2011, the results of its operations for the period ended November 30, 2011 and the year ended December 31, 2010, and changes in its net assets and the financial highlights for the period ended November 30, 2011, the year ended December 31, 2010, and the period July 7, 2009 (inception) to December 31, 2009, in conformity with accounting principles generally accepted in the United States of America.
DELOITTE & TOUCHE LLP
Denver, Colorado
January 27, 2012
| | | | |
| | 7 | | ALPS Equal Sector Weight ETF | www.alpsfunds.com |

| | | | | | | | |
| Security Description | | Shares | | | Value | |
| | |
EXCHANGE TRADED FUNDS (99.98%) | | | | | | | | |
Consumer Discretionary (11.09%) | | | | | | | | |
Consumer Discretionary Select Sector SPDR Fund | | | 177,783 | | | $ | 6,887,313 | |
| | | | | | | | |
| | |
Consumer Staples (11.17%) | | | | | | | | |
Consumer Staples Select Sector SPDR Fund | | | 217,430 | | | | 6,936,017 | |
| | | | | | | | |
| | |
Energy (11.41%) | | | | | | | | |
Energy Select Sector SPDR Fund | | | 99,980 | | | | 7,081,583 | |
| | | | | | | | |
| | |
Financials (10.72%) | | | | | | | | |
Financial Select Sector SPDR Fund | | | 519,569 | | | | 6,655,679 | |
| | | | | | | | |
| | |
Healthcare (11.08%) | | | | | | | | |
Health Care Select Sector SPDR Fund | | | 203,140 | | | | 6,880,352 | |
| | | | | | | | |
| | |
Industrials (11.46%) | | | | | | | | |
Industrial Select Sector SPDR Fund | | | 210,011 | | | | 7,117,273 | |
| | | | | | | | |
| | |
Materials (10.80%) | | | | | | | | |
Materials Select Sector SPDR Fund | | | 194,198 | | | | 6,703,715 | |
| | | | | | | | |
| | |
Technology (11.06%) | | | | | | | | |
Technology Select Sector SPDR Fund | | | 268,521 | | | | 6,868,767 | |
| | | | | | | | |
| | |
Utilities (11.19%) | | | | | | | | |
Utilities Select Sector SPDR Fund | | | 197,398 | | | | 6,950,384 | |
| | | | | | | | |
| | |
TOTAL EXCHANGE TRADED FUNDS (Cost $59,452,702) | | | | | | | 62,081,083 | |
| | | | | | | | |
| | | | | | | | |
TOTAL INVESTMENTS (99.98%) (Cost $59,452,702) | | | | | | | 62,081,083 | |
| | |
NET OTHER ASSETS AND LIABILITIES (0.02%) | | | | | | | 10,339 | |
| | | | | | | | |
| | | | | | | | |
NET ASSETS (100.00%) | | | | | | $ | 62,091,422 | |
| | | | | | | | |
Common Abbreviations:
SPDR - Standard & Poor’s Depositary Receipts
See Notes to Financial Statements.
| | | | |
Annual Report | November 30, 2011 | | 8 | | |
|
| Statement of Assets and Liabilities |
| November 30, 2011 |
| | | | |
ASSETS: | | | | |
Investments, at value | | $ | 62,081,083 | |
Cash | | | 27,851 | |
Receivable for investments sold | | | 5,322,085 | |
| |
Total Assets | | | 67,431,019 | |
| |
| |
LIABILITIES: | | | | |
Payable for shares redeemed | | | 5,322,122 | |
Payable to advisor | | | 17,475 | |
| |
Total Liabilities | | | 5,339,597 | |
| |
NET ASSETS | | $ | 62,091,422 | |
| |
| | | | |
NET ASSETS CONSIST OF: | | | | |
Paid-in capital | | $ | 59,575,055 | |
Undistributed net investment income | | | 9,526 | |
Accumulated net realized loss on investments | | | (121,540) | |
Net unrealized appreciation on investments | | | 2,628,381 | |
| |
NET ASSETS | | $ | 62,091,422 | |
| |
| | | | |
INVESTMENTS, AT COST | | $ | 59,452,702 | |
| | | | |
PRICING OF SHARES | | | | |
Net Assets | | $ | 62,091,422 | |
Shares of beneficial interest outstanding
(Unlimited number of shares authorized, par value $0.01 per share) | | | 1,750,000 | |
Net Asset Value, offering and redemption price per share | | $ | 35.48 | |
See Notes to Financial Statements.
| | | | |
| | 9 | | ALPS Equal Sector Weight ETF | www.alpsfunds.com |

| | | | | | | | |
| | | For the Period
January 1, 2011 to
November 30, 2011(a) | | | For the Year Ended December 31, 2010 | |
| | | | | | | | |
INVESTMENT INCOME: | | | | | | | | |
Dividends | | $ | 833,225 | | | $ | 879,055 | |
| |
Total Investment Income | | | 833,225 | | | | 879,055 | |
| |
| | |
EXPENSES: | | | | | | | | |
Investment advisory fee | | | 194,193 | | | | 131,355 | |
| |
Total expenses before reimbursement | | | 194,193 | | | | 131,355 | |
| |
Expenses reimbursed/waived by: Investment advisor | | | (15,745) | | | | (10,650) | |
| |
NET EXPENSES | | | 178,448 | | | | 120,705 | |
| |
NET INVESTMENT INCOME | | | 654,777 | | | | 758,350 | |
| |
| | |
Net realized gain on investments | | | 4,757,896 | | | | 298,723 | |
Net change in unrealized appreciation /(depreciation) on investments | | | (4,697,555) | | | | 5,854,347 | |
| |
NET REALIZED AND UNREALIZED GAIN ON INVESTMENTS | | | 60,341 | | | | 6,153,070 | |
| |
NET INCREASE IN NET ASSETS RESULTING FROM OPERATIONS | | $ | 715,118 | | | $ | 6,911,420 | |
| |
| (a) | Effective March 7, 2011, the Board approved changing the fiscal year end of the Fund from December 31 to November 30. |
See Notes to Financial Statements.
| | | | |
Annual Report | November 30, 2011 | | 10 | | |
Intentionally Left Blank Page

| | | | |
| | | For the Period
January 1, 2011 to
November 30, 2011(a) | |
OPERATIONS: | | | | |
Net investment income | | $ | 654,777 | |
Net realized gain on investments | | | 4,757,896 | |
Net change in unrealized appreciation/(depreciation) on investments | | | (4,697,555) | |
| |
Net increase in net assets resulting from operations | | | 715,118 | |
| |
| |
DISTRIBUTIONS TO SHAREHOLDERS: | | | | |
From net investment income | | | (695,943) | |
From net realized gains on investments | | | – | |
| |
Total distributions | | | (695,943) | |
| |
| |
SHARE TRANSACTIONS: | | | | |
Proceeds from sale of shares | | | 36,054,358 | |
Cost of shares redeemed | | | (26,993,801) | |
| |
Net increase from share transactions | | | 9,060,557 | |
| |
Net increase in net assets | | | 9,079,732 | |
| |
| | | | |
NET ASSETS: | | | | |
Beginning of period | | | 53,011,690 | |
| |
End of period* | | $ | 62,091,422 | |
| |
| |
* Including undistributed net investment income of: | | $ | 9,526 | |
| | | | |
OTHER INFORMATION: | | | | |
SHARE TRANSACTIONS: | | | | |
Beginning shares | | | 1,500,000 | |
Shares sold | | | 1,000,000 | |
Shares redeemed | | | (750,000) | |
| |
Shares outstanding, end of period | | | 1,750,000 | |
| |
| (a) | Effective March 7, 2011, the Board approved changing the fiscal year end of the Fund from December 31 to November 30. |
See Notes to Financial Statements.
| | | | |
Annual Report | November 30, 2011 | | 12 | | |
|
| Statements of Changes in Net Assets |
|
| | | | | | | | |
For the Year Ended December 31, 2010 | | | For the Period Ended July 7, 2009 (Inception) through December 31, 2009 | | | |
| | | | | | | | | |
| $ | 758,350 | | | $ | 124,209 | | | |
| | 298,723 | | | | 9,220 | | | |
| | 5,854,347 | | | | 1,471,589 | | | |
| |
| | 6,911,420 | | | | 1,605,018 | | | |
| |
| | | | | | | | | |
| | | | | | | | | |
| | (758,546) | | | | (124,168 | ) | | |
| | – | | | | (3,593 | ) | | |
| |
| | (758,546) | | | | (127,761 | ) | | |
| |
| | | | | | | | | |
| | | | | | | | | |
| | 34,389,889 | | | | 12,530,970 | | | |
| | (1,539,300) | | | | – | | | |
| |
| | 32,850,589 | | | | 12,530,970 | | | |
| |
| | 39,003,463 | | | | 14,008,227 | | | |
| |
| | | | | | | | | |
| | | | | | | | | |
| | 14,008,227 | | | | – | | | |
| |
| $ | 53,011,690 | | | $ | 14,008,227 | | | |
| |
| | |
| $ | 5,557 | | | $ | 41 | | | |
| | | | | | | | | |
| | | | | | | | | |
| | | | | | | | | |
| | 450,000 | | | | – | | | |
| | 1,100,000 | | | | 450,000 | | | |
| | (50,000) | | | | – | | | |
| |
| | 1,500,000 | | | | 450,000 | | | |
| |
| | | | |
| | 13 | | ALPS Equal Sector Weight ETF | www.alpsfunds.com |
| | | | |
| | | For the Period
January 1, 2011 to
November 30, 2011(a) | |
NET ASSET VALUE, BEGINNING OF PERIOD | | $ | 35.34 | |
| | | | |
INCOME FROM OPERATIONS: | | | | |
| | | | |
Net investment income | | | 0.41 | (b) |
Net realized and unrealized gain on investments | | | 0.18 | |
| |
Total from Investment Operations | | | 0.59 | |
| |
| |
LESS DISTRIBUTIONS: | | | | |
From net investment income | | | (0.45 | ) |
From capital gains | | | – | |
| |
Total Distributions | | | (0.45 | ) |
| |
NET INCREASE IN NET ASSET VALUE | | | 0.14 | |
| |
NET ASSET VALUE, END OF PERIOD | | $ | 35.48 | |
| |
TOTAL RETURN(c) | | | 1.67 | % |
| | | | |
RATIOS/SUPPLEMENTAL DATA: | | | | |
Net assets, end of period (in 000s) | | $ | 62,091 | |
| | | | |
RATIOS TO AVERAGE NET ASSETS: | | | | |
Net investment income including reimbursement/waiver | | | 1.25 | %(d) |
Net investment income excluding reimbursement/waiver | | | 1.22 | %(d) |
Expenses including reimbursement/waiver | | | 0.34 | %(d) |
Expenses excluding reimbursement/waiver | | | 0.37 | %(d) |
PORTFOLIO TURNOVER RATE(e) | | | 4 | % |
| (a) | Effective March 7, 2011, the Board approved changing the fiscal year end of the Fund from December 31 to November 30. |
| (b) | Calculated using average shares outstanding. |
| (c) | Total return is calculated assuming an initial investment made at the net asset value at the beginning of the period and redemption at the net asset value on the last day of the period and assuming all distributions are reinvested at actual reinvestment prices. Total return calculated for a period of less than one year is not annualized. |
| (e) | Portfolio turnover is not annualized and does not include securities received or delivered from processing creations or redemptions. |
See Notes to Financial Statements.
| | | | |
Annual Report | November 30, 2011 | | 14 | | |
|
| Financial Highlights |
| For a Share Outstanding Throughout the Periods Presented |
| | | | | | | | | | |
For the Year Ended December 31, 2010 | | | For the Period
July 7, 2009
(Inception) through
December 31, 2009 | | | | | |
| $ | 31.13 | | | $ | 25.04 | | | | | |
| | | | | | | | | | | |
| | | | | | | | | | | |
| | | | | | | | | | | |
| | 0.68 | (b) | | | 0.31 | | | | | |
| | 4.14 | | | | 6.10 | | | | | |
| |
| | 4.82 | | | | 6.41 | | | | | |
| |
| | | | | | | | | | | |
| | | | | | | | | | | |
| | (0.61 | ) | | | (0.31 | ) | | | | |
| | – | | | | (0.01 | ) | | | | |
| |
| | (0.61 | ) | | | (0.32 | ) | | | | |
| |
| | 4.21 | | | | 6.09 | | | | | |
| |
| $ | 35.34 | | | $ | 31.13 | | | | | |
| |
| | 15.67 | % | | | 25.60 | % | | | | |
| | | | | | | | | | | |
| | | | | | | | | | | |
| $ | 53,012 | | | $ | 14,008 | | | | | |
| | | | | | | | | | | |
| | | | | | | | | | | |
| | 2.14 | % | | | 2.60 | %(d) | | | | |
| | 2.11 | % | | | 2.57 | %(d) | | | | |
| | 0.34 | % | | | 0.34 | %(d) | | | | |
| | 0.37 | % | | | 0.37 | %(d) | | | | |
| | 7 | % | | | 4 | % | | | | |
| | | | |
| | 15 | | ALPS Equal Sector Weight ETF | www.alpsfunds.com |

1. ORGANIZATION
The ALPS ETF Trust (the “Trust”) is an open-end management investment company organized as a Delaware statutory trust on September 13, 2007 and is registered with the Securities and Exchange Commission (“SEC”) under the Investment Company Act of 1940, as amended (the “1940 Act”). As of November 30, 2011, the Trust consists of seven separate portfolios. Each portfolio represents a separate series of the Trust. This report pertains solely to the ALPS Equal Sector Weight ETF (the “Fund”), which commenced on July 7, 2009. The investment objective of the Fund is to seek investment results that correspond generally to the price and yield (before the Fund’s fees and expenses) of the Banc of America Securities Merrill Lynch Equal Sector Weight Index.
The Fund’s Shares (“Shares”) are listed on the New York Stock Exchange (“NYSE”) Arca. The Fund issues and redeems Shares at Net Asset Value (“NAV”) in blocks of 50,000 Shares each of which is called a “Creation Unit.” Creation Units are issued and redeemed principally in-kind for securities included in a specified index. Except when aggregated in Creation Units, Shares are not redeemable securities of the Fund.
2. SIGNIFICANT ACCOUNTING POLICIES
The following is a summary of significant accounting policies consistently followed by the Fund in the preparation of the financial statements. The accompanying financial statements were prepared in accordance with accounting principles generally accepted in the United States of America (“U.S. GAAP”). The preparation of financial statements in conformity with U.S. GAAP requires management to make certain estimates and assumptions that affect the reported amounts of assets and liabilities and disclosures of contingent assets and liabilities at the date of the financial statements and the reported amounts of revenue and expenses during the period. Actual results could differ from those estimates.
A. Portfolio Valuation
The Fund’s NAV is determined daily, as of the close of regular trading on the NYSE, normally 4:00 p.m. Eastern time, on each day the NYSE is open for trading. The NAV is computed by dividing the value of all assets of the Fund (including accrued interest and dividends), less all liabilities (including accrued expenses and dividends declared but unpaid), by the total number of shares outstanding.
Portfolio securities listed on any exchange other than the National Association of Securities Dealer Automated Quotation (“NASDAQ”) exchange are valued at the last sale price on the business day as of which such value is being determined. If there has been no sale on such day, the securities are valued at the mean of the most recent bid and asked prices on such day. Securities traded on the NASDAQ are valued at the NASDAQ Official Closing Price as determined by NASDAQ. Short-term investments that mature in less than 60 days are valued at amortized cost, which approximates market value.
| | | | |
Annual Report | November 30, 2011 | | 16 | | |
|
| Notes to Financial Statements |
| November 30, 2011 |
The Fund’s investments are valued at market value or, in the absence of market value with respect to any portfolio securities, at fair value according to procedures adopted by the Trust’s Board of Trustees (the “Board”). When market quotations are not readily available or when events occur that make established valuation methods unreliable, securities of the Fund may be valued in good faith by or under the direction of the Board.
B. Securities Transactions and Investment Income
Securities transactions are recorded as of the trade date. Realized gains and losses from securities transactions are recorded on the identified cost basis. Dividend income is recorded on the ex-dividend date. Interest income, if any, is recorded on the accrual basis.
C. Federal Tax Information
The timing and character of income and capital gain distributions are determined in accordance with income tax regulations, which may differ from U.S. GAAP. Reclassifications are made to the Fund’s capital accounts for permanent tax differences to reflect income and gains available for distribution (or available capital loss carryforwards) under income tax regulations.
For the period ended November 30, 2011, permanent book and tax differences resulting primarily from in-kind transactions were identified and reclassified among the components of the Fund’s net assets as follows:
| | | | |
Undistributed Net Investment Income | | Accumulated Net Realized Loss | | Paid-in Capital |
|
$45,135 | | $(4,897,183) | | $4,852,048 |
Net investment income and net realized gain, as disclosed on the Statement of Operations, and net assets were not affected by these reclassifications.
Under the Regulated Investment Company Modernization Act of 2010 (“the Modernization Act”), net capital losses recognized in tax years beginning after December 22, 2010 may be carried forward indefinitely, and the character of the losses is retained as short-term and/or long-term. Under the law in effect prior to the Modernization Act, net capital losses were carried forward for eight years and treated as short-term. As a transition rule, the Modernization Act requires that post-enactment net capital losses be used before pre-enactment net capital losses. Additionally, post-enactment capital losses that are carried forward will retain their character as either short-term or long-term losses rather than being considered all short-term as under previous law.
| | | | |
| | 17 | | ALPS Equal Sector Weight ETF | www.alpsfunds.com |

At November 30, 2011, the Fund had available for tax purposes unused post-enactment capital loss carryforwards as follows:
D. Dividends and Distributions to Shareholders
Dividends from net investment income of the Fund, if any, are declared and paid quarterly or as the Board of Trustees may determine from time to time. Distributions of net realized capital gains earned by the Fund, if any, are distributed at least annually.
Distributions from net investment income and capital gains are determined in accordance with income tax regulations, which may differ from U.S GAAP. These differences are primarily due to differing treatments of income and gains on various investment securities held by the Fund, timing differences and differing characterization of distributions made by the Fund.
The tax character of the distributions paid was as follows:
| | | | | | | | |
| | | Period Ended
November 30, 2011 | | | Period Ended
December 31, 2010 | |
| |
Distributions paid from: | | | | | | | | |
| | |
Ordinary Income | | $ | 695,943 | | | $ | 758,546 | |
| |
Total | | $ | 695,943 | | | $ | 758,546 | |
| |
As of November 30, 2011, the components of distributable earnings on a tax basis for the Fund were as follows:
| | | | |
Undistributed net investment income | | $ | 9,526 | |
Accumulated Capital Losses | | $ | (16,008) | |
Net unrealized appreciation on investments | | | 2,522,849 | |
| |
Total | | $ | 2,516,367 | |
| |
The differences between book-basis and tax-basis are primarily due to the deferral of losses from wash sales.
E. Income Taxes
No provision for income taxes is included in the accompanying financial statements, as the Fund intends to distribute to shareholders all taxable investment income and realized gains and otherwise comply with Subchapter M of the Internal Revenue Code applicable to regulated investment companies.
| | | | |
Annual Report | November 30, 2011 | | 18 | | |
|
| Notes to Financial Statements |
| November 30, 2011 |
The Fund evaluates tax positions taken (or expected to be taken) in the course of preparing the Fund’s tax returns to determine whether these positions meet a “more-likely-than-not” standard that, based on the technical merits, have a more than fifty percent likelihood of being sustained by a taxing authority upon examination. A tax position that meets the “more-likely-than-not” recognition threshold is measured to determine the amount of benefit to recognize in the financial statements.
Management of the Fund analyzes all open tax years, as defined by the Statute of Limitations, for all major jurisdictions, including federal tax authorities and certain state tax authorities. As of, and during the period ended November 30, 2011, the Fund did not have a liability for any unrecognized tax benefits. The Fund will file income tax returns in the U.S. federal jurisdiction and Colorado. For the tax years ended December 31, 2009, December 31, 2010, and November 30, 2011, the Fund’s returns are open to examination by the appropriate taxing authority.
F. Fair Value Measurements
The Fund discloses the classification of its fair value measurements following a three-tier hierarchy based on the inputs used to measure fair value. Inputs refer broadly to the assumptions that market participants would use in pricing the asset or liability, including assumptions about risk. Inputs may be observable or unobservable. Observable inputs reflect the assumptions market participants would use in pricing the asset or liability that are developed based on market data obtained from sources independent of the reporting entity. Unobservable inputs reflect the reporting entity’s own assumptions about the assumptions market participants would use in pricing the asset or liability that are developed based on the best information available.
Various inputs are used in determining the value of the Fund’s investments as of the end of the reporting period. When inputs used fall into different levels of the fair value hierarchy, the level in the hierarchy within which the fair value measurement falls is determined based on the lowest level input that is significant to the fair value measurement in its entirety. The designated input levels are not necessarily an indication of the risk or liquidity associated with these investments. These inputs are categorized in the following hierarchy under applicable financial accounting standards:
| | |
| Level 1 – | | Unadjusted quoted prices in active markets for identical assets or liabilities that the Fund has the ability to access. |
| |
| Level 2 – | | Observable inputs other than quoted prices included in level 1 that are observable for the asset or liability, either directly or indirectly These inputs may include quoted prices for the identical instrument on an inactive market, prices for similar instruments, interest rates, prepayment speeds, credit risk, yield curves, default rates, and similar data. |
| | | | |
| | 19 | | ALPS Equal Sector Weight ETF | www.alpsfunds.com |

| | |
Level 3 – | | Unobservable inputs for the asset or liability, to the extent relevant observable inputs are not available, representing the Fund’s own assumptions about the assumptions a market participant would use in valuing the asset or liability, and would be based on the best information available. |
| | | | | | | | |
Investments in Securities at Value* | | Level 1 – Unadjusted Quoted Prices | | Level 2 - Other Significant
Observable Inputs | | Level 3 - Significant
Unobservable Inputs | | Total |
|
Exchange
Traded Funds | | $ 62,081,083 | | $ – | | $ – | | $ 62,081,083 |
|
TOTAL | | $ 62,081,083 | | $ – | | $ – | | $ 62,081,083 |
|
| * | For detailed descriptions of the sectors, see the accompanying Statement of Investments. |
For the period ended November 30, 2011, the Fund did not have any significant transfers between Level 1 and Level 2 securities. The Fund did not have any securities which used significant unobservable inputs (Level 3) in determining fair value.
| 3. | INVESTMENT ADVISORY FEE AND |
OTHER AFFILIATED TRANSACTIONS
ALPS Advisors, Inc. (the “Investment Adviser”) acts as the Fund’s investment adviser pursuant to an Advisory Agreement with the Trust on behalf of the Fund (the “Advisory Agreement”). Pursuant to the Advisory Agreement, the Fund pays the Investment Adviser a unitary fee for the services and facilities it provides payable on a monthly basis at the annual rate of 0.37% of the Fund’s average daily net assets. ALPS Distributors Inc. (“ADI”) is both the distributor for the Fund as well as the Select Sector SPDR exchange traded funds (“Underlying Sector ETFs”) that the Fund invests in. As required by exemptive relief obtained by the Underlying Sector ETFs, the Investment Adviser will reimburse the Fund an amount equal to the distribution fee received by ADI from the Underlying Sector ETFs attributable to the Fund’s investment in the Underlying Sector ETFs, for so long as ADI acts as the distributor to the Fund and the Underlying Sector ETFs. From time to time, the Investment Adviser may waive all or a portion of its fee.
Out of the unitary management fee, the Investment Adviser pays substantially all expenses of the Fund, including the licensing fee of the Index provider, and the cost of transfer agency, custody, fund administration, legal, audit, trustees and other services, except for interest expenses, distribution fees or expenses, brokerage expenses, taxes and extraordinary expenses not incurred in the ordinary course of the Fund’s business. In addition, the Investment Adviser’s unitary management fee is designed to compensate the Investment Adviser for providing services for the Fund.
| | | | |
Annual Report | November 30, 2011 | | 20 | | |
|
| Notes to Financial Statements |
| November 30, 2011 |
ALPS Fund Services, Inc. (“ALPS”), an affiliate of the Investment Adviser, is the administrator of the Fund.
The Bank of New York Mellon is the custodian, fund accounting agent and transfer agent for the Fund.
Each Trustee who is not an officer or employee of the Investment Adviser, or any of its affiliates (“Independent Trustees”) is paid a quarterly retainer of $3,500, $1,500 for each regularly scheduled Board meeting attended and $750 for each special meeting held outside of regularly scheduled meetings.
4. PURCHASES AND SALES OF SECURITIES
For the period ended November 30, 2011, the cost of purchases and proceeds from sales of investment securities, excluding short-term investments and in-kind transactions, were as follows:
| | |
| Purchases | | Sales |
|
$ 2,452,157 | | $ 2,857,527 |
For the period ended November 30, 2011, the cost of in-kind purchases and proceeds from in-kind sales were as follows:
| | |
| Purchases | | Sales |
|
$ 33,521,336 | | $ 24,064,460 |
Gains on in-kind transactions are generally not considered taxable gains for federal income tax purposes.
As of November 30, 2011, the costs of investments for federal income tax purposes and accumulated net unrealized appreciation/(depreciation) on investments were as follows:
| | | | |
Gross Appreciation (excess of value over tax cost) | | $ | 3,774,073 | |
Gross Depreciation (tax cost over value) | | $ | (1,251,224) | |
| |
Net Unrealized Appreciation | | $ | 2,522,849 | |
| |
Cost of investments for income tax purposes | | $ | 59,558,234 | |
| |
5. CAPITAL SHARE TRANSACTIONS
Shares are created and redeemed by the Fund only in Creation Unit size aggregations of 50,000. Only broker-dealers or large institutional investors with creation and redemption agreements called Authorized Participants (“AP”) are permitted to purchase or redeem Creation Units from the Fund. Such transactions
| | | | |
| | 21 | | ALPS Equal Sector Weight ETF | www.alpsfunds.com |

are generally permitted on an in-kind basis, with a balancing cash component to equate the transaction to the net asset value per unit of the Fund on the transaction date. Cash may be substituted equivalent to the value of certain securities generally when they are not available in sufficient quantity for delivery, not eligible for trading by the AP or as a result of other market circumstances.
6. INDEMNIFICATIONS
Under the Trust’s organizational documents, its Trustees and Officers are indemnified against certain liability arising out of the performance of their duties to the Trust. Additionally, in the normal course of business, the Trust enters into contracts with service providers that contain general indemnification clauses. The Trust’s maximum exposure under these arrangements is unknown, as this would involve future claims that may be made against the Trust that have not yet occurred.
7. NEW ACCOUNTING PRONOUNCEMENTS
In May 2011, the FASB issued ASU No. 2011-04 “Amendments to Achieve Common Fair Value Measurement and Disclosure Requirements” in GAAP and the International Financial Reporting Standards (“IFRSs”). ASU No.2011-04 amends FASB ASC Topic 820, “Fair Value Measurements and Disclosures”, to establish common requirements for measuring fair value and for disclosing information about fair value measurements in accordance with GAAP and IFRSs. ASU No.2011-04 is effective for fiscal years beginning after December 15, 2011 and for interim periods within those fiscal years. Management is currently evaluating the impact these amendments may have on the Fund’s financial statements.
| | | | |
Annual Report | November 30, 2011 | | 22 | | |
|
| Additional Information |
| November 30, 2011 (Unaudited) |
PROXY VOTING POLICIES AND PROCEDURES
A description of the Fund’s proxy voting policies and procedures used in determining how to vote for proxies and information regarding how the Fund voted proxies related to portfolio securities during the most recent 12-month period ended June 30th is available without charge, (1) on the Securities and Exchange Commission’s (“SEC”) website at http://www.sec.gov; (2) upon request, by calling 1-866-513-5856; and (3) on the Trust’s website located at http://www.alpsfunds.com.
PORTFOLIO HOLDINGS
The Trust will file its complete schedule of portfolio holdings with the SEC for the first and third quarters of each fiscal year on Form N-Q. The Trust’s Form N-Q will be available (1) on the SEC’s website at http://www.sec.gov; (2) by calling 1-866-513-5856; (3) on the Trust’s website located at http://www.alpsfunds.com; and (4) for review and copying at the SEC’s Public Reference Room (“PRR”) in Washington D.C. Information regarding the operation of the PRR may be obtained by calling 1-800-732-0330.
SHAREHOLDER MEETING
A Special Meeting of the Shareholders was held on October 14, 2011 for the purpose of voting on a proposal to approve a new Investment Advisory Agreement between ALPS ETF Trust, on behalf of the Fund, and ALPS Advisors, Inc. The proposal passed and the results are noted below.
Proposal 1: To approve a new Investment Advisory Agreement between ALPS ETF Trust, on behalf of the Fund, and ALPS Advisors, Inc.:
| | | | | | | | |
Number of Votes |
|
| Record Date Votes | | Affirmative | | Against | | Abstain | | Uninstructed |
|
862,129.456 | | 692,739.980 | | 6,045.000 | | 27,513.476 | | 135,831.000 |
| | | | | | |
Percentages of Total Outstanding |
|
Affirmative | | Against | | Abstain | | Uninstructed |
|
43.296% | | 0.378% | | 1.720% | | 8.489% |
|
Percentages of Voted |
|
Affirmative | | Against | | Abstain | | Uninstructed |
|
80.352% | | 0.701% | | 3.192% | | 15.755% |
| | | | |
| | 23 | | ALPS Equal Sector Weight ETF | www.alpsfunds.com |

At an in-person meeting held on July 26, 2011, the Board of Trustees of the Trust (the “Board”), including the Trustees who are not “interested persons” of the Trust within the meaning of the Investment Company Act of 1940, as amended (the “1940 Act”), evaluated a proposal to approve a new Investment Advisory Agreement (the “Advisory Agreement”) between the Trust and ALPS Advisors, Inc. (the “Investment Adviser”) with respect to ALPS Equal Sector Weight ETF (the “Fund”).
Consideration by the Board of this new Advisory Agreement was necessary because ALPS Holdings, Inc. (“ALPS Holdings”), parent company to the Investment Adviser, had agreed to be acquired by DST Systems, Inc. (“DST”) (the “Transaction”). Because ALPS Holdings would be acquired by DST, the Investment Adviser would thereby undergo a change in control, which would be deemed to be an “assignment” of the existing investment advisory agreement under the 1940 Act. As required by the 1940 Act, the existing investment advisory agreement provided for its automatic termination in the event of an assignment, and would therefore terminate upon the closing of the Transaction. In order for the Investment Adviser to continue as the Fund’s investment adviser, the Board and the Fund’s shareholders would have to approve a new Advisory Agreement with the Investment Adviser, which would take effect upon the closing of the Transaction.
In evaluating the new Advisory Agreement, the Board did not identify any single factor as all-important or controlling. The following summary does not identify all the matters considered by the Board, but includes the principal matters it considered. The Board considered whether the new Advisory Agreement would be in the best interests of the Fund and its shareholders, based on: (i) the nature, extent and quality of the services to be provided by the Investment Adviser under the Advisory Agreement; (ii) the investment performance of the Fund; (iii) the expenses borne by the Fund under the unitary fee arrangement of the Advisory Agreement; (iv) the estimated profitability of the Investment Adviser and its affiliates from their relationship with the Fund; (v) potential fall-out benefits to the Investment Adviser from its relationship with the Fund; and (vi) other general information about the Investment Adviser and its affiliates. The following is a summary of the Board’s consideration and conclusions regarding these matters.
Nature, Extent and Quality of the Services to be Provided
The Board considered the nature, extent and quality of the services to be provided by the Investment Adviser, including the portfolio management services to be provided, in light of the investment objective of the Fund. The Board considered that, following the Transaction, the Fund would be managed by senior personnel at the Investment Adviser. In that regard, the Board considered the history of care and conscientiousness in supervising the management of the Fund provided by such personnel. The Board considered the background and capabilities of such personnel in connection with the advisory services that they would provide to the Fund following the Transaction. The Board also considered the compliance records of the Investment Adviser. The Board considered representations from DST that it intended to retain all key management and personnel of ALPS Holdings and the Investment Adviser, and that DST did not anticipate that the Investment Adviser
| | | | |
Annual Report | November 30, 2011 | | 24 | | |
|
Board Considerations Regarding Approval of Investment Advisory Agreement |
| November 30, 2011 (Unaudited) |
would undergo any changes to its structure, business strategy or services as a result of the Transaction. The Board also considered the Investment Adviser’s representation that the manner in which the Fund’s assets would be managed would not change as a result of the Transaction. Finally, the Board also considered its and the Fund’s association with the current personnel employed by the Investment Adviser.
The Board concluded that the nature, extent and quality of the services to be provided by the Investment Adviser to the Fund were appropriate and consistent with the terms of the new Advisory Agreement, and that the Fund was likely to benefit from services provided under its new Advisory Agreement. The Board also concluded that the quality of the services to be provided by the senior advisory personnel employed by the Investment Adviser was expected to be consistent with or superior to quality norms in the industry, and that the Investment Adviser would have sufficient personnel, with the appropriate education and experience, to serve the Fund effectively. The Board also concluded that the Investment Adviser had demonstrated a continuing ability to attract and retain well-qualified personnel (and noted the Investment Adviser’s representations that no changes were anticipated with respect to the Investment Adviser’s compensation and incentive programs), and that the structure of the Investment Adviser’s operations was sufficient to retain and properly motivate the Fund’s current senior advisory personnel. Finally, the Board concluded that the financial condition of DST, ALPS Holdings and the Investment Adviser was sound.
Investment Performance
The Board also reviewed investment performance information of the Fund and its benchmark index. The Board evaluated the correlation and tracking error between the underlying index and the Fund.
Costs of the Services to be Provided to the Fund
The Board reviewed the fees to be paid by the Fund to the Investment Adviser, noting that the rate of fees to be paid under the new Advisory Agreement was the same fee rate the Fund currently paid. The Board noted that the advisory fee paid to the Investment Adviser by the Fund was a unitary fee pursuant to which the Investment Adviser assumes all expenses of the Fund (including the cost of transfer agency, custody, advisory, fund administration, legal, audit and other services) other than the payments under the new Advisory Agreement, brokerage expenses, taxes, interest, litigation expenses and other extraordinary expenses. The Board considered the Investment Adviser’s representation that it did not intend to raise any of its advisory or administration fees paid by the Fund for at least two years following the Transaction.
The Board reviewed comparative fee information of the Fund’s advisory contracts, including information about the rates of compensation paid to investment advisers, and overall expense ratios, for funds comparable in size, character and investment strategy to the Fund. The Board considered the fact that the Fund’s fees were generally comparable to
| | | | |
| | 25 | | ALPS Equal Sector Weight ETF | www.alpsfunds.com |
the fees charged to similar funds. The Board concluded that the management fees payable by the Fund to the Investment Adviser were reasonable in relation to the nature and quality of the services expected to be provided, taking into account the fees charged by other advisers for managing comparable funds with similar strategies.
Projected Profitability and Costs of Services to the Investment Adviser and Potential “Fall-Out” Benefits
The Board reviewed reports of the financial position of the Investment Adviser. The Board considered the projected profitability of ALPS Holdings’ overall relationship with the Fund, which included fees payable to the Investment Adviser for advisory services. The Board noted that since the Fund was subject to a unitary fee arrangement with the Investment Adviser pursuant to the new Advisory Agreement, there were no other fees payable to other ALPS Holdings affiliates for non-advisory services, and concluded that the projected profitability of ALPS Holdings was reasonable in relation to the services to be provided and to the costs of providing services to the Fund.
The Board also considered any potential “fall-out” benefits that the Investment Adviser might receive because of its relationship with the Fund and concluded that the advisory fees were reasonable taking into account any such benefits. The Board acknowledged the Investment Adviser’s well-established stand-alone management relationships independent of the Fund and the regulatory and entrepreneurial risks each assumed in connection with the management of the Fund.
Economies of Scale
The Board reviewed the Fund’s assets under management, and noted that because of the Fund’s unitary fee arrangement, consideration of economies of scale was not a relevant factor to the Fund.
Conclusion
Based on its evaluation, the Board unanimously concluded that the terms of the new Advisory Agreement were reasonable, fair and in the best interests of the Fund and its shareholders. The Board believed that the new Advisory Agreement would enable the Fund to continue to enjoy the high-quality investment management services it had received in the past from the Investment Adviser, at a fee rate identical to the present rate, which the Board deemed appropriate, reasonable and in the best interests of the Fund and its shareholders.
| | | | |
Annual Report | November 30, 2011 | | 26 | | |
|
| Trustees & Officers |
| November 30, 2011 (Unaudited) |
INDEPENDENT TRUSTEES
| | | | | | | | | | |
Name, Address and Age of Management Trustee* | | Position(s) Held with Trust | | Term of Office and Length of Time Served** | | Principal Occupation(s) During Past 5 Years | | Number of
Portfolios in Fund
Complex
Overseen by
Trustees*** | | Other Directorships Held by Trustees |
| | | | | |
Mary K. Anstine, age 71 | | Trustee | | Since March 2008 | | Ms. Anstine was President/Chief Executive Officer of HealthONE Alliance, Denver, Colorado, and former Executive Vice President of First Interstate Bank of Denver. Ms. Anstine is also Trustee/ Director of the following: AV Hunter Trust; Colorado Uplift Board. Ms. Anstine was formerly a Director of the Trust Bank of Colorado (later purchased and now known as Northern Trust Bank), HealthONE and Denver Area Council of the Boy Scouts of America and a member of the American Bankers Association Trust Executive Committee. | | 21 | | Ms. Anstine is a Trustee of Financial Investors Variable Insurance Trust (5 funds); Financial Investors Trust (17 funds); Reaves Utility Income Fund; and Westcore Trust (12 funds). |
| | | | | |
Jeremy W. Deems, age 35 | | Trustee | | Since March 2008 | | Mr. Deems is the Co- Founder, Chief Compliance Officer and Chief Financial Officer of Green Alpha Advisors, LLC. Prior to joining Green Alpha Advisors, Mr. Deems was CFO and Treasurer of Forward Management, LLC, ReFlow Management Co., LLC, ReFlow Fund, LLC, a private investment fund, and Sutton Place Management, LLC, an administrative services company, from 2004 to June 2007. Prior to this, Mr. Deems served as Controller of Forward Management, LLC, Re- Flow Management Co., LLC, ReFlow Fund, LLC and Sutton Place Management, LLC. | | 21 | | Mr. Deems is a Trustee of Financial Investors Trust (17 funds); Financial Investors Variable Insurance Trust (5 funds); and Reaves Utility Income Fund. |
| | | | |
| | 27 | | ALPS Equal Sector Weight ETF | www.alpsfunds.com |

INDEPENDENT TRUSTEES Continued
| | | | | | | | | | |
Name, Address and Age of Management Trustee* | | Position(s)
Held with Trust | | Term of Office and Length of Time Served** | | Principal Occupation(s) During Past 5 Years | | Number of Portfolios in Fund Complex Overseen by Trustees*** | | Other Directorships Held by Trustees |
| | | | | |
Rick A. Pederson, age 59 | | Trustee | | Since March 2008 | | President, Foundation Properties, Inc. (a real estate investment management company), 1994 - present; Partner, Western Capital Partners (a prime lending company), 2000 - present; Partner, Bow River Capital Partners (investment manager), 2003 - present; Principal, The Pauls Corporation (real estate development), 2008 - present; Director, Guaranty Bank and Trust (a community bank), 1999 – 2007; Winter Park Recreational Association (an entity that operates, maintains and develops Winter Park Resort), 2002 – 2008; Neenan Co. (an integrated real estate development, architecture and construction company), 2002 – present; NexCore Properties LLC (a real estate investment company), 2004 – present; Urban Land Conservancy (a not-for-profit organization), 2004 – present. | | 7 | | Mr. Pederson is Trustee of Westcore Trust (12 funds) |
| * | The business address of the Trustee is c/o ALPS Advisors, Inc., 1290 Broadway, Suite 1100, Denver, Colorado 80203. |
| ** | This is the period for which the Trustee began serving the Trust. Each Trustee serves an indefinite term, until his successor is elected. |
| *** | The Fund Complex includes all series of the Trust and any other investment companies for which ALPS Advisors, Inc. provides investment advisory services. |
| | | | |
Annual Report | November 30, 2011 | | 28 | | |
|
| Trustees & Officers |
| November 30, 2011 (Unaudited) |
INTERESTED TRUSTEE***
| | | | | | | | | | |
Name, Address and Age of Management Trustee* | | Position(s)
Held with Trust | | Term of Office and Length of Time Served** | | Principal Occupation(s) During Past 5 Years | | Number of Portfolios in Fund Complex Overseen by Trustees**** | | Other Directorships Held by Trustees |
| | | | | |
Thomas A. Carter, age 45 | | Trustee and President | | Since March 2008 | | Mr. Carter joined ALPS Fund Services, Inc. (“ALPS”) in 1994 and is currently President and Director of ALPS Advisors, Inc. (“AAI”), ALPS Distributors, Inc. (“ADI”) and FTAM Funds Distributor, Inc. (“FDI”) and Executive Vice President and Director of ALPS and ALPS Holdings, Inc. (“AHI”). Because of his position with AHI, ALPS, ADI, FDI and AAI, Mr. Carter is deemed an affiliate of the Fund as defined under the 1940 Act. Before joining ALPS, Mr. Carter was with Deloitte & Touché LLP, where he worked with a diverse group of clients, primarily within the financial services industry. Mr. Carter is a Certified Public Accountant and received his Bachelor of Science in Accounting from the University of Colorado at Boulder. | | 12 | | Mr. Carter is a Trustee of Financial Investors Variable Insurance Trust (5 funds) |
| * | The business address of the Trustee is c/o ALPS Advisors, Inc., 1290 Broadway, Suite 1100, Denver, Colorado 80203. |
| ** | This is the period for which the Trustee began serving the Trust. Each Trustee serves an indefinite term, until his successor is elected. |
| *** | Mr. Carter is an interested person of the Trust because of his affiliation with ALPS. |
| **** | The Fund Complex includes all series of the Trust and any other investment companies for which ALPS Advisors, Inc. provides investment advisory services |
| | | | |
| | 29 | | ALPS Equal Sector Weight ETF | www.alpsfunds.com |

OFFICERS
| | | | | | |
Name, Address and Age of Executive Officer* | | Position(s) Held with Trust | | Length of Time Served** | | Principal Occupation(s) During Past 5 Years |
Melanie Zimdars, age 35 | | Chief Compliance Officer (“CCO”) | | Since December 2009 | | Ms. Zimdars currently serves as a Deputy Chief Compliance Officer with ALPS. Prior to joining ALPS in September 2009, Ms. Zimdars served as Principal Financial Officer, Treasurer and Secretary for the Wasatch Funds from February 2007 to December 2008. From November 2006 to February 2007, she served as Assistant Treasurer for the Wasatch Funds and served as a Senior Compliance Officer for Wasatch Advisors, Inc. since 2005. From 2001 until joining Wasatch in 2005, she was a Compliance Officer for U.S. Bancorp Fund Services, LLC. Because of her position with ALPS, Ms. Zimdars is deemed an affiliate of the Trust as defined under the 1940 Act. Ms. Zimdars is also the CCO of Financial Investors Variable Insurance Trust, Liberty All-Star Growth Fund, Inc. and Liberty All-Star Equity Fund. |
Kimberly R. Storms, age 39 | | Treasurer | | Since March 2008 | | Ms. Storms is Director of Fund Administration and Senior Vice President of ALPS. Ms. Storms joined ALPS in 1998 as Assistant Controller. Because of her position with ALPS, Ms. Storms is deemed an affiliate of the Trust as defined under the 1940 Act. Ms. Storms is also Assistant Treasurer of the Liberty All-Star Equity Fund, Liberty All-Star Growth Fund and Financial Investors Trust; and Assistant Secretary of Ameristock Mutual Fund, Inc. |
William Parmentier, age 59 | | Vice President | | Since March 2008 | | Mr. Parmentier is Chief Investment Officer, ALPS Advisors, Inc. (since 2006); President of the Liberty All-Star Funds (since April 1999); Senior Vice President (2005- 2006), Banc of America Investment Advisors, Inc. |
Tané T. Tyler, age 47 | | Secretary | | Since December 2008 | | Ms.Tyler is Senior Vice President, General Counsel and Secretary of ALPS. Ms.Tyler joined ALPS in 2004.She served as Secretary, Reaves Utility Income Fund from December 2004–2007; Secretary, Westcore Funds from February 2005–2007; Secretary, First Funds from November 2004 to January 2007; Secretary, Financial Investors Variable Insurance Trust from December 2004–December 2006; Vice President and Associate Counsel, Oppenheimer Funds from January 2004 to August 2004; Vice President and Assistant General Counsel, INVESCO Funds from September 1991 to December 2003. Ms. Tyler also serves as Secretary, Liberty All-Star Equity Fund and Liberty All-Star Growth Fund. |
| | | | |
Annual Report | November 30, 2011 | | 30 | | |
|
| Trustees & Officers |
| November 30, 2011 (Unaudited) |
OFFICERS Continued
| | | | | | |
Name, Address and Age of Executive Officer* | | Position(s) Held with Trust | | Length of Time Served** | | Principal Occupation(s) During Past 5 Years |
| | | |
Monette R. Nickels, age 40 | | Tax Officer | | Since December 2009 | | Ms. Nickels is Senior Vice President and Director of Tax Administration of ALPS. Ms. Nickels joined ALPS in 2004 as Director of Tax Administration. Because of her position with ALPS, Ms. Nickels is deemed an affiliate of the Trust as defined under the 1940 Act. Ms. Nickels is also Tax Officer of Financial Investors Trust, Liberty All-Star Equity Fund, Liberty All-Star Growth Fund, Inc., and Financial Investors Variable Insurance Trust. |
| * | The business address of each Officer is c/o ALPS Advisors, Inc., 1290 Broadway, Suite 1100, Denver, Colorado 80203. |
| ** | This is the period for which the Officer began serving the Trust. Each Officer serves an indefinite term, until his successor is elected. |
| | | | |
| | 31 | | ALPS Equal Sector Weight ETF | www.alpsfunds.com |

| | | | |
Annual Report | November 30, 2011 | | 32 | | |
| | | | |
| | 33 | | ALPS Equal Sector Weight ETF ��| www.alpsfunds.com |
| | | | |

| | THE FIRST NAME IN COMMODITY EQUITIES | | |
| | | | |
| | | | |
| | THE FIRST NAME IN COMMODITY EQUITIES | | PERFORMANCE OVERVIEW (UNAUDITED) |
| | | | JEFFERIES | TR/J CRB GLOBAL COMMODITY EQUITY INDEX FUND | November 30, 2011 |
The Jefferies | TR/J CRB Global Commodity Equity Index Fund is an Exchange Traded Fund (“ETF”), which provides exposure to the equity securities of a global universe of listed companies engaged in the production and distribution of commodities and commodity-related products and services in the agriculture, base/industrial metals, energy and precious metals sectors. The ETF seeks investment results that replicate as closely as possible, before fees and expenses, the price and yield performance of the Thomson Reuters/Jefferies CRB In-The-Ground Global Commodity Equity Index.
For the eleven-month period ended November 30, 2011, the ETF’s market price decreased 10.42% and its net asset value (“NAV”) decreased 10.67%. Over the same time period the ETF’s benchmark was down 10.58%.
| | | | |
| TOP 10 HOLDINGS^ (% of Total Investments) | |
Exxon Mobil Corp. | | | 6.6 | % |
Monsanto Co. | | | 5.3 | |
Potash Corp. of Saskatchewan, Inc. | | | 5.0 | |
Deere & Co. | | | 4.4 | |
Syngenta AG | | | 3.7 | |
Chevron Corp. | | | 3.5 | |
Archer-Daniels-Midland Co. | | | 2.7 | |
BP Plc | | | 2.3 | |
Gazprom OAO, ADR | | | 2.3 | |
Royal Dutch Shell Plc, Class A | | | 2.1 | |
Total % of Top 10 Holdings | | | 37.9 | % |
^ Future holdings are subject to change | | | | |
| | | | |
COUNTRY ALLOCATION (% of Total Investments) | |
United States | | | 38.8 | % |
Canada | | | 16.5 | |
United Kingdom | | | 10.6 | |
Russia | | | 4.4 | |
Switzerland | | | 4.1 | |
Australia | | | 2.3 | |
Netherlands | | | 2.2 | |
South Africa | | | 2.1 | |
France | | | 1.9 | |
Singapore | | | 1.7 | |
Other | | | 15.4 | |
PERFORMANCE as of 11.30.11
| | | | | | | | | | | | | | |
| | | 5 Month | | | | YTD | | | | 1 Year | | | | Since Inception*
Annualized |
Jefferies | TR/J CRB Global Commodity Equity Index Fund | | | | | | | | | | | | | | |
NAV | | -10.67% | | | | -8.56% | | | | 0.61% | | | | 6.65% |
Market Price** | | -10.42% | | | | -8.58% | | | | 1.02% | | | | 6.52% |
Thomson Reuters/Jefferies CRB In-The-Ground Global Commodity Equity Index | | -10.58% | | | | -8.02% | | | | 1.30% | | | | 7.49% |
S&P GSCI Commodity Index | | -1.71% | | | | 0.95% | | | | 10.44% | | | | 7.71% |
S&P 500 Index | | -4.67% | | | | 1.08% | | | | 7.83% | | | | 9.50% |
Total Expense Ratio (per the current prospectus) 0.65%
| * | The Fund commenced Investment Operations on September 18, 2009 with an Inception Date, the first day of trading on the Exchange, of September 21, 2009. |
| ** | Market Price is based on the midpoint of the bid/ask spread at 4 p.m. ET and does not represent the returns an investor would receive if shares were traded at other times. |
Performance data quoted represents past performance. Past performance does not guarantee future results. Investment return and principal value of an investment will fluctuate so that an investor’s shares, when sold or redeemed, may be worth more or less than the original cost. Current performance data may be higher or lower than actual data quoted. For the most current month-end performance data please visit JAMFUNDS.COM.
NAV is an exchange-traded fund’s per-share value. The per-share dollar amount of the fund is derived by dividing the total value of all the securities in its portfolio, less any liabilities, by the number of fund shares outstanding. Market Price is the price at which a share can currently be traded in the market. Information detailing the number of days the Market Price of the Fund was greater than the Fund’s NAV and the number of days it was less than the Fund’s NAV can be obtained at www.alpsfunds.com.
Thomson Reuters/Jefferies CRB In-The-Ground Global Commodity Equity Index: measures the performance of equity securities of companies engaged in the production and distribution of certain commodities and commodity-related products. S&P GSCI Commodity Index: A composite index of commodity sector returns which represents a broadly diversified, unleveraged, long-only position in commodity futures. S&P 500 Index: the Standard & Poor’s composite index of 500 stocks, a widely recognized, unmanaged index of common stock prices. Index return does not represent fund return. An investor can not invest directly in an index.
GROWTH OF A HYPOTHETICAL $10,000 INVESTMENT as of 11.30.11
Comparison of Change in Value of a hypothetical $10,000 investment in the Jefferies | TR/J CRB Global Commodity Equity Index Fund.
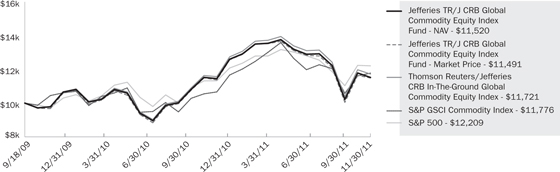
| | |
2 | | Annual Report | November 30, 2011 |
| | | | |
| | THE FIRST NAME IN COMMODITY EQUITIES | | PERFORMANCE OVERVIEW (UNAUDITED) |
| | | | JEFFERIES | TR/J CRB GLOBAL AGRICULTURE EQUITY INDEX FUND | November 30, 2011 |
The Jefferies | TR/J CRB Global Agriculture Equity Index Fund is an Exchange Traded Fund (“ETF”), which provides exposure to the equity securities of a global universe of listed companies engaged in the production and distribution of agricultural commodities and agricultural commodity-related products and services in the following sectors: producers of traits (characteristics attained through genetic modification), chemicals and fertilizers, farm machinery, equipment and irrigation, agricultural products, and live-stock and aquaculture. The ETF seeks investment results that replicate, as closely as possible, before fees and expenses, the price and yield performance of the Thomson Reuters/Jefferies CRB In-The-Ground Global Agriculture Equity Index.
For the eleven-month period ended November 30, 2011, the ETF’s market price decreased 13.61% and its net asset value (“NAV”) decreased 13.93%. Over the same time period the ETF’s benchmark was down 14.08%.
| | | | |
| TOP 10 HOLDINGS^ (% of Total Investments) | |
Monsanto Co. | | | 6.7 | % |
Potash Corp. of Saskatchewan, Inc. | | | 6.4 | |
Archer-Daniels-Midland Co. | | | 5.8 | |
Deere & Co. | | | 5.6 | |
Syngenta AG | | | 5.4 | |
Bunge, Ltd. | | | 4.7 | |
Wilmar International, Ltd. | | | 4.6 | |
Uralkali, Sponsored GDR | | | 4.2 | |
K+S AG | | | 4.1 | |
Agrium, Inc. | | | 4.1 | |
Total % of Top 10 Holdings | | | 51.6 | % |
^ Future holdings are subject to change | | | | |
| | | | |
COUNTRY ALLOCATION (% of Total Investments) | |
United States | | | 32.2 | % |
Canada | | | 12.8 | |
Singapore | | | 7.0 | |
Malaysia | | | 6.9 | |
Switzerland | | | 5.4 | |
Bermuda | | | 5.1 | |
Israel | | | 5.1 | |
Australia | | | 4.4 | |
Russia | | | 4.2 | |
Germany | | | 4.1 | |
Other | | | 12.8 | |
PERFORMANCE as of 11.30.11
| | | | | | | | | | | | | | |
| | | 5 Month | | | | YTD | | | | 1 Year | | | | Since Inception*
Annualized |
Jefferies | TR/J CRB Global Agriculture Equity Index Fund | | | | | | | | | | | | | | |
NAV | | -13.93% | | | | -11.97% | | | | -2.70% | | | | 8.88% |
Market Price** | | -13.61% | | | | -12.54% | | | | -2.71% | | | | 8.30% |
Thomson Reuters/Jefferies CRB In-The-Ground Global Agriculture Equity Index | | -14.08% | | | | -11.81% | | | | -2.44% | | | | 9.44% |
Total Expense Ratio (per the current prospectus) 0.65%
| * | The Fund commenced Investment Operations on October 26, 2009 with an Inception Date, the first day of trading on the Exchange, of October 27, 2009. |
| ** | Market Price is based on the midpoint of the bid/ask spread at 4 p.m. ET and does not represent the returns an investor would receive if shares were traded at other times. |
Performance data quoted represents past performance. Past performance does not guarantee future results. Investment return and principal value of an investment will fluctuate so that an investor’s shares, when sold or redeemed, may be worth more or less than the original cost. Current performance data may be higher or lower than actual data quoted. For the most current month-end performance data please visit JAMFUNDS.COM.
NAV is an exchange-traded fund’s per-share value. The per-share dollar amount of the fund is derived by dividing the total value of all the securities in its portfolio, less any liabilities, by the number of fund shares outstanding. Market Price is the price at which a share can currently be traded in the market. Information detailing the number of days the Market Price of the Fund was greater than the Fund’s NAV and the number of days it was less than the Fund’s NAV can be obtained at www.alpsfunds.com.
Thomson Reuters/Jefferies CRB In-The-Ground Global Agriculture Equity Index: measures the performance of equity securities of companies engaged in the production and distribution of agricultural products, including grains, livestock, fertilizers, chemicals, seeds, traits and equipment. Index return does not represent fund return. An investor can not invest directly in an index.
GROWTH OF A HYPOTHETICAL $10,000 INVESTMENT as of 11.30.11
Comparison of Change in Value of a hypothetical $10,000 investment in the Jefferies | TR/J CRB Global Agriculture Equity Index Fund.
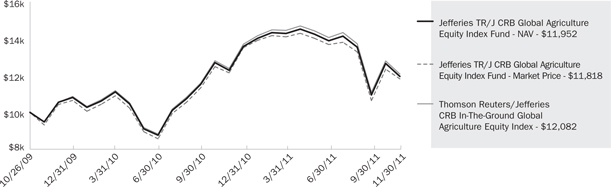
| | | | |
| | THE FIRST NAME IN COMMODITY EQUITIES | | PERFORMANCE OVERVIEW (UNAUDITED) |
| | | | JEFFERIES | TR/J CRB GLOBAL INDUSTRIAL METALS EQUITY INDEX FUND | November 30, 2011 |
The Jefferies | TR/J CRB Global Industrial Metals Equity Index Fund is an Exchange Traded Fund (“ETF”), which provides exposure to the equity securities of a global universe of listed companies engaged in the production and distribution of base/industrial metals and base/industrial metals products, including copper, aluminum, iron ore, steel and others. The ETF seeks investment results that replicate, as closely as possible, before fees and expenses, the price and yield performance of the Thomson Reuters/Jefferies CRB In-The-Ground Global Industrial Metals Equity Index.
For the eleven-month period ended November 30, 2011, the ETF’s market price declined 26.82% and its net asset value (“NAV”) decreased 27.16%.Over the same time period the ETF’s benchmark was down 27.14%.
| | | | |
| TOP 10 HOLDINGS^ (% of Total Investments) | |
Rio Tinto Plc | | | 8.0 | % |
BHP Billiton Plc | | | 7.0 | |
Anglo American Plc | | | 5.3 | |
Xstrata Plc | | | 5.0 | |
Freeport-McMoRan Copper & Gold, Inc. | | | 4.9 | |
Teck Resources, Ltd., Class B | | | 4.4 | |
Vale SA, ADR | | | 4.4 | |
ArcelorMittal | | | 4.4 | |
POSCO | | | 4.2 | |
Nucor Corp. | | | 3.7 | |
Total % of Top 10 Holdings | | | 51.3 | % |
^ Future holdings are subject to change | | | | |
| | | | |
COUNTRY ALLOCATION (% of Total Investments) | |
United Kingdom | | | 28.4 | % |
United States | | | 18.9 | |
Canada | | | 9.5 | |
Brazil | | | 8.3 | |
Japan | | | 8.0 | |
Luxembourg | | | 4.4 | |
South Korea | | | 4.2 | |
Russia | | | 4.0 | |
Mexico | | | 3.0 | |
Germany | | | 2.8 | |
Other | | | 8.5 | |
PERFORMANCE as of 11.30.11
| | | | | | | | | | | | | | | | |
| | | | | 5 Month | | | | YTD | | | | 1 Year | | | | Since Inception*
Annualized |
Jefferies | TR/J CRB Global Industrial Metals Equity Index Fund | | | | | | | | | | | | | | | | |
NAV | | | | -27.16% | | | | -31.01% | | | | -21.06% | | | | -6.45% |
Market Price** | | | | -26.82% | | | | -30.51% | | | | -20.95% | | | | -6.76% |
Thomson Reuters/Jefferies CRB In-The-Ground Global Industrial Metals Equity Index | | | | -27.14% | | | | -30.67% | | | | -20.52% | | | | -5.77% |
Total Expense Ratio (per the current prospectus) 0.65%
| * | The Fund commenced Investment Operations on October 26, 2009 with an Inception Date, the first day of trading on the Exchange, of October 27, 2009. |
| ** | Market Price is based on the midpoint of the bid/ask spread at 4 p.m. ET and does not represent the returns an investor would receive if shares were traded at other times. |
Performance data quoted represents past performance. Past performance does not guarantee future results. Investment return and principal value of an investment will fluctuate so that an investor’s shares, when sold or redeemed, may be worth more or less than the original cost. Current performance data may be higher or lower than actual data quoted. For the most current month-end performance data please visit JAMFUNDS.COM.
NAV is an exchange-traded fund’s per-share value. The per-share dollar amount of the fund is derived by dividing the total value of all the securities in its portfolio, less any liabilities, by the number of fund shares outstanding. Market Price is the price at which a share can currently be traded in the market. Information detailing the number of days the Market Price of the Fund was greater than the Fund’s NAV and the number of days it was less than the Fund’s NAV can be obtained at www.alpsfunds.com.
Thomson Reuters/Jefferies CRB In-The-Ground Global Industrial Metals Equity Index: measures the performance of equity securities of companies engaged in the production and distribution of base/industrial metals and related products and services including copper, aluminum, iron ore, steel, uranium and others. Index return does not represent fund return. An investor can not invest directly in an index.
GROWTH OF A HYPOTHETICAL $10,000 INVESTMENT as of 11.30.11
Comparison of Change in Value of a hypothetical $10,000 investment in the Jefferies | TR/J CRB Global Industrial Metals Equity Index Fund.
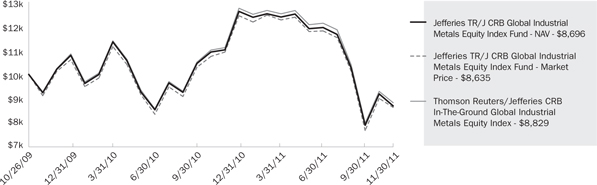
| | |
4 | | Annual Report | November 30, 2011 |
| | | | |
| | THE FIRST NAME IN COMMODITY EQUITIES | | PERFORMANCE OVERVIEW (UNAUDITED) |
| | | | JEFFERIES | TR/J CRB WILDCATTERS EXPLORATION & PRODUCTION EQUITY ETF | November 30, 2011 |
The Jefferies | TR/J CRB Wildcatters Exploration & Production Equity ETF is an Exchange Traded Fund (“ETF”), which provides exposure to the equity securities of a universe of listed U.S. and Canadian small capitalization companies engaged in the exploration and production (i.e., extraction) of oil and natural gas. The ETF seeks investment results that replicate, as closely as possible, before fees and expenses, the price and yield performance of the Thomson Reuters/Jefferies CRB Wildcatters Energy Exploration & Production Equity Index.
For the eleven-month period ended November 30, 2011, the ETF’s market price decreased 15.64% and its net asset value (“NAV”) decreased 15.39%. Over the same time period the ETF’s benchmark was down 15.17%.
| | | | |
| TOP 10 HOLDINGS^ (% of Total Investments) | |
Rosetta Resources, Inc. | | | 6.3 | % |
Energy XXI (Bermuda), Ltd. | | | 5.0 | |
Daylight Energy, Ltd. | | | 4.5 | |
Celtic Exploration, Ltd. | | | 4.3 | |
Bill Barrett Corp. | | | 4.1 | |
Gran Tierra Energy, Inc. | | | 3.6 | |
Northern Oil and Gas, Inc. | | | 3.0 | |
Gulfport Energy Corp. | | | 3.0 | |
Crew Energy, Inc. | | | 3.0 | |
Stone Energy Corp. | | | 2.9 | |
Total % of Top 10 Holdings | | | 39.7 | % |
^ Future holdings are subject to change | | | | |
| | | | |
COUNTRY ALLOCATION (% of Total Investments) | |
United States | | | 61.6 | % |
Canada | | | 38.4 | |
PERFORMANCE as of 11.30.11
| | | | | | | | | | | | | | |
| | | 5 Month | | | | YTD | | | | 1 Year | | | | Since Inception*
Annualized |
Jefferies | TR/J CRB Wildcatters Exploration & Production Equity ETF | | | | | | | | | | | | | | |
NAV | | -15.39% | | | | -14.12% | | | | -4.16% | | | | 2.86% |
Market Price** | | -15.64% | | | | -14.75% | | | | -5.04% | | | | 2.89% |
Thomson Reuters/Jefferies CRB Wildcatters Energy Exploration & Production Equity Index | | -15.17% | | | | -13.42% | | | | -3.36% | | | | 3.67% |
Total Expense Ratio (per the current prospectus) 0.65%
| * | The Fund commenced Investment Operations on January 19, 2010 with an Inception Date, the first day of trading on the Exchange, of January 20, 2010. |
| ** | Market Price is based on the midpoint of the bid/ask spread at 4 p.m. ET and does not represent the returns an investor would receive if shares were traded at other times. |
Performance data quoted represents past performance. Past performance does not guarantee future results. Investment return and principal value of an investment will fluctuate so that an investor’s shares, when sold or redeemed, may be worth more or less than the original cost. Current performance data may be higher or lower than actual data quoted. For the most current month-end performance data please visit JAMFUNDS.COM.
NAV is an exchange-traded fund’s per-share value. The per-share dollar amount of the fund is derived by dividing the total value of all the securities in its portfolio, less any liabilities, by the number of fund shares outstanding. Market Price is the price at which a share can currently be traded in the market. Information detailing the number of days the Market Price of the Fund was greater than the Fund’s NAV and the number of days it was less than the Fund’s NAV can be obtained at www.alpsfunds.com.
Thomson Reuters/Jefferies CRB Wildcatters Energy Exploration & Production Equity Index: measures the performance of equity securities of companies engaged in the exploration and production of oil and natural gas. Index return does not represent fund return. An investor can not invest directly in an index.
GROWTH OF A HYPOTHETICAL $10,000 INVESTMENT as of 11.30.11
Comparison of Change in Value of a hypothetical $10,000 investment in the Jefferies | TR/J CRB Wildcatters Exploration & Production Equity ETF.
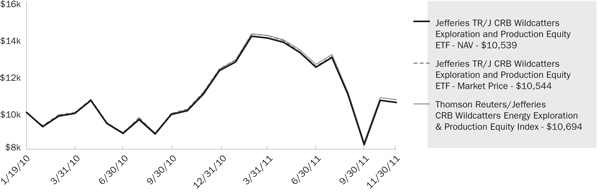
| | | | |
| | THE FIRST NAME IN COMMODITY EQUITIES | | DISCLOSURE OF FUND EXPENSES |
| | | | (Unaudited) |
Shareholder Expense Example: As a shareholder of the Fund, you incur two types of costs: (1) transaction costs which may include creation and redemption fees or brokerage charges, and (2) ongoing costs, including management fees and other Fund expenses. These examples are intended to help you understand your ongoing costs (in dollars) of investing in the Fund and to compare these costs with the ongoing costs of investing in other funds. It is based on an investment of $1,000 invested at July 1, 2011 and held through the period ended November 30, 2011.
Actual Return: The first line of the table provides information about actual account values and actual expenses. You may use the information in this table, together with the amount you invested, to estimate the expenses that you incurred over the period. Simply divide your account value by $1,000 (for example, an $8,600 account value divided by $1,000 = 8.6), then multiply the result by the number in the first table under the heading entitled “Expenses Paid During the Period” to estimate the expenses attributable to your investment during this period.
Hypothetical 5% Return: The second line of the table provides information about hypothetical account values and hypothetical expenses based on the Fund’s actual expense ratio and an assumed rate of return of 5% per year before expenses, which is not the Fund’s actual return. The hypothetical account values and expenses may not be used to estimate the actual ending account balance or expenses you paid for the period. You may use this information to compare ongoing costs of investing in the Fund and other funds. To do so, compare this 5% hypothetical example with the 5% hypothetical examples that appear in the shareholder reports of the other funds.
The expenses shown in the table are meant to highlight ongoing Fund costs only and do not reflect any transaction costs, such as creation and redemption fees, or brokerage charges. Therefore, the second table is useful in comparing ongoing costs only, and will not help you determine the relative total costs of owning different funds. In addition, if these costs were included, your costs would have been higher.
| | | | | | | | | | | | |
| | | Beginning
Account Value
7/01/11 | | | Ending
Account Value
11/30/11 | | | Expense Ratio | | Expenses Paid
During the Period 7/01/11 - 11/30/11 |
Jefferies | TR/J CRB Global Commodity Equity Index Fund | | | | | | | | | | | | |
Actual | | $ | 1,000.00 | | | $ | 893.30 | | | 0.65% | | $2.58(a) |
Hypothetical (5% return before expenses) | | $ | 1,000.00 | | | $ | 1,021.93 | | | 0.65% | | $3.31(b) |
Jefferies | TR/J CRB Global Agriculture Equity Index Fund | | | | | | | | | | | | |
Actual | | $ | 1,000.00 | | | $ | 860.70 | | | 0.65% | | $2.53(a) |
Hypothetical (5% return before expenses) | | $ | 1,000.00 | | | $ | 1,021.93 | | | 0.65% | | $3.31(b) |
Jefferies | TR/J CRB Global Industrial Metals Equity Index Fund | | | | | | | | | | | | |
Actual | | $ | 1,000.00 | | | $ | 728.40 | | | 0.65% | | $2.35(a) |
Hypothetical (5% return before expenses) | | $ | 1,000.00 | | | $ | 1,021.93 | | | 0.65% | | $3.31(b) |
Jefferies | TR/J CRB Wildcatters Exploration & Production Equity ETF | | | | | | | | | | | | |
Actual | | $ | 1,000.00 | | | $ | 846.10 | | | 0.65% | | $2.51(a) |
Hypothetical (5% return before expenses) | | $ | 1,000.00 | | | $ | 1,021.93 | | | 0.65% | | $3.31(b) |
| (a) | Effective March 7, 2011, the Board approved changing the fiscal year end of the Fund from December 31 to November 30. Actual expenses are equal to the Fund’s annualized expense ratio multiplied by the average account value over the period, multiplied by the number of days in the most recent fiscal half year (153), then divided by 365. |
| (b) | The example in the table above is equal to the Fund’s annualized expense ratio multiplied by the average account value over the period, multiplied by the number of days in the most recent fiscal half year (184), then divided by 365. |
| | |
6 | | Annual Report | November 30, 2011 |
| | | | |
| | THE FIRST NAME IN COMMODITY EQUITIES | | REPORT OF INDEPENDENT REGISTERED PUBLIC ACCOUNTING FIRM |
| | | | |
To the Board of Trustees and Shareholders of ALPS ETF Trust:
We have audited the accompanying statements of assets and liabilities, including the schedules of investments, of the Jefferies TR/J CRB Global Commodity Equity Index Fund, Jefferies TR/J CRB Global Agriculture Equity Index Fund, and Jefferies TR/J CRB Global Industrial Metals Equity Index Fund of the ALPS ETF Trust (the “Trust”) as of November, 30, 2011, and the related statements of operations, statements of changes in net assets and the financial highlights for the period ended November, 30, 2011 and the year ended December 31, 2010. We have also audited the statements of changes in net assets and the financial highlights for the period September 21, 2009 (inception) to December 31, 2009 for the Jefferies TR/J CRB Global Commodity Equity Index Fund, and the period October 27, 2009 (inception) to December 31, 2009 for the Jefferies TR/J CRB Global Agriculture Equity Index Fund and Jefferies TR/J CRB Global Industrial Metals Equity Index Fund. We have also audited the accompanying statement of assets and liabilities, including the schedule of investments, of the Jefferies TR/J CRB Wildcatters Exploration & Production Equity ETF of the Trust as of November 30, 2011, and the related statements of operations, statements of changes in net assets, and the financial highlights for the period ended November 30, 2011 and the period January 20, 2010 (inception) to December 31, 2010. These financial statements and financial highlights are the responsibility of the Trust’s management. Our responsibility is to express an opinion on these financial statements and financial highlights based on our audits.
We conducted our audits in accordance with the standards of the Public Company Accounting Oversight Board (United States). Those standards require that we plan and perform the audit to obtain reasonable assurance about whether the financial statements and financial highlights are free of material misstatement. The Trust is not required to have, nor were we engaged to perform, an audit of its internal control over financial reporting. Our audits included consideration of internal control over financial reporting as a basis for designing audit procedures that are appropriate in the circumstances, but not for the purpose of expressing an opinion on the effectiveness of the Trust’s internal control over financial reporting. Accordingly, we express no such opinion. An audit also includes examining, on a test basis, evidence supporting the amounts and disclosures in the financial statements, assessing the accounting principles used and significant estimates made by management, as well as evaluating the overall financial statement presentation. Our procedures included confirmation of securities owned as of December 31, 2010, by correspondence with the custodian and brokers; where replies were not received from brokers, we performed other auditing procedures. We believe that our audits provide a reasonable basis for our opinion.
In our opinion, the financial statements and financial highlights referred to above present fairly, in all material respects, the financial position of the Jefferies TR/J CRB Global Commodity Equity Index Fund, Jefferies TR/J CRB Global Agriculture Equity Index Fund, Jefferies TR/J CRB Global Industrial Metals Equity Index Fund and Jefferies TR/J CRB Wildcatters Exploration & Production Equity Index ETF of the ALPS ETF Trust as of November 31, 2011, the results of their operations, the changes in their net assets, and the financial highlights for each of the respective periods referred to above, in conformity with accounting principles generally accepted in the United States of America.
As discussed in Note 8 to the financial statements, subsequent to yearend, on December 12, 2011, the Board of Trustees authorized an orderly liquidation of the Jefferies TR/J CRB Global Agriculture Equity Index Fund and Jefferies TR/J CRB Global Industrial Metals Equity Index Fund of the ALPS ETF Trust, which was completed on December 28, 2011.
DELOITTE & TOUCHE LLP
Denver, Colorado
January 27, 2012
| | | | |
| | THE FIRST NAME IN COMMODITY EQUITIES | | SCHEDULE OF INVESTMENTS |
| | | | JEFFERIES | TR/J CRB GLOBAL COMMODITY EQUITY INDEX FUND | November 30, 2011 |
| | | | | | | | |
| Security Description | | Shares | | | Value | |
COMMON STOCKS (99.59%) | | | | | |
Australia (2.25%) | | | | | | | | |
Fortescue Metals Group, Ltd. | | | 21,670 | | | $ | 101,068 | |
Incitec Pivot, Ltd. | | | 200,316 | | | | 660,569 | |
Newcrest Mining, Ltd. | | | 23,833 | | | | 847,134 | |
Nufarm, Ltd.* | | | 28,414 | | | | 138,651 | |
Woodside Petroleum, Ltd. | | | 9,330 | | | | 314,379 | |
| | | | | | | | |
| | | | | | | 2,061,801 | |
| | | | | | | | |
| | | | | | | | |
Bermuda (1.31%) | | | | | | | | |
Bunge, Ltd. | | | 18,100 | | | | 1,131,250 | |
Sinofert Holdings, Ltd. | | | 218,000 | | | | 65,326 | |
| | | | | | | | |
| | | | | | | 1,196,576 | |
| | | | | | | | |
| | | | | | | | |
Brazil (1.65%) | | | | | | | | |
Companhia Siderurgica Nacional SA, ADR | | | 15,989 | | | | 132,709 | |
Gerdau SA, ADR | | | 16,239 | | | | 124,716 | |
Petroleo Brasileiro SA, ADR | | | 23,364 | | | | 630,594 | |
Vale SA, ADR | | | 26,632 | | | | 619,194 | |
| | | | | | | | |
| | | | | | | 1,507,213 | |
| | | | | | | | |
| | | | | | | | |
Canada (16.42%) | | | | | | | | |
Agnico-Eagle Mines, Ltd. | | | 5,250 | | | | 236,179 | |
Agrium, Inc. | | | 19,333 | | | | 1,361,249 | |
Barrick Gold Corp. | | | 31,150 | | | | 1,655,921 | |
Cameco Corp. | | | 7,832 | | | | 148,822 | |
Canadian Natural Resources, Ltd. | | | 16,243 | | | | 612,018 | |
Eldorado Gold Corp. | | | 17,064 | | | | 310,819 | |
EnCana Corp. | | | 11,344 | | | | 229,279 | |
First Quantum Minerals, Ltd. | | | 9,271 | | | | 187,836 | |
Goldcorp, Inc. | | | 24,966 | | | | 1,349,281 | |
IAMGOLD Corp. | | | 11,268 | | | | 228,519 | |
Inmet Mining Corp. | | | 1,733 | | | | 101,909 | |
Ivanhoe Mines, Ltd.* | | | 7,774 | | | | 168,210 | |
Kinross Gold Corp. | | | 35,414 | | | | 500,167 | |
New Gold, Inc.* | | | 13,507 | | | | 151,709 | |
Osisko Mining Corp.* | | | 11,813 | | | | 130,939 | |
Pan American Silver Corp. | | | 3,293 | | | | 86,021 | |
Potash Corp. of Saskatchewan, Inc. | | | 105,090 | | | | 4,595,330 | |
SEMAFO, Inc.* | | | 8,421 | | | | 63,691 | |
Silver Wheaton Corp. | | | 10,965 | | | | 370,227 | |
Suncor Energy, Inc. | | | 24,282 | | | | 733,654 | |
Talisman Energy, Inc. | | | 15,892 | | | | 218,198 | |
Teck Resources, Ltd., Class B | | | 9,505 | | | | 349,163 | |
TransCanada Corp. | | | 10,837 | | | | 457,035 | |
Viterra, Inc. | | | 38,789 | | | | 397,523 | |
Yamana Gold, Inc. | | | 23,080 | | | | 390,436 | |
| | | | | | | | |
| | | | | | | 15,034,135 | |
| | | | | | | | |
| | | | | | | | |
Cayman Islands (0.00%)(a) | | | | | |
Chaoda Modern Agriculture Holdings, Ltd. | | | 348,000 | | | | 448 | |
| | | | | | | | |
| | | | | | | | |
| Security Description | | Shares | | | Value | |
Chile (0.33%) | | | | | | | | |
Sociedad Quimica y Minera de Chile SA, ADR | | | 5,302 | | | $ | 304,017 | |
| | | | | | | | |
| | | | | | | | |
China (1.31%) | | | | | | | | |
China BlueChemical, Ltd., Class H | | | 216,000 | | | | 168,622 | |
China Petroleum & Chemical Corp., Class H | | | 262,000 | | | | 265,858 | |
China Shenhua Energy Co., Ltd., Class H | | | 53,500 | | | | 224,651 | |
Jiangxi Copper Co., Ltd., Class H | | | 26,000 | | | | 57,314 | |
PetroChina Co., Ltd.,
Class H | | | 324,000 | | | | 398,359 | |
Zijin Mining Group Co., Ltd., Class H | | | 189,000 | | | | 78,998 | |
| | | | | | | | |
| | | | | | | 1,193,802 | |
| | | | | | | | |
| | | | | | | | |
France (1.85%) | | | | | | | | |
Total SA | | | 32,858 | | | | 1,695,626 | |
| | | | | | | | |
| | | | | | | | |
Germany (1.25%) | | | | | | | | |
K+S AG | | | 17,669 | | | | 958,303 | |
ThyssenKrupp AG | | | 7,325 | | | | 188,534 | |
| | | | | | | | |
| | | | | | | 1,146,837 | |
| | | | | | | | |
| | | | | | | | |
Great Britain (0.05%) | | | | | | | | |
Evraz Plc* | | | 7,170 | | | | 43,304 | |
| | | | | | | | |
| | | | | | | | |
Hong Kong (0.64%) | | | | | | | | |
China Agri-Industries Holdings, Ltd. | | | 192,000 | | | | 140,997 | |
CNOOC, Ltd. | | | 246,000 | | | | 443,562 | |
| | | | | | | | |
| | | | | | | 584,559 | |
| | | | | | | | |
| | | | | | | | |
India (0.88%) | | | | | | | | |
Reliance Industries, Ltd., GDR(b) | | | 25,856 | | | | 775,680 | |
Sterlite Industries India, Ltd., ADR | | | 3,993 | | | | 32,184 | |
| | | | | | | | |
| | | | | | | 807,864 | |
| | | | | | | | |
| | | | | | | | |
Israel (0.95%) | | | | | | | | |
Israel Chemicals, Ltd. | | | 52,845 | | | | 564,139 | |
The Israel Corp., Ltd. | | | 465 | | | | 304,148 | |
| | | | | | | | |
| | | | | | | 868,287 | |
| | | | | | | | |
| | | | | | | | |
Italy (0.89%) | | | | | | | | |
Eni SpA | | | 38,615 | | | | 815,071 | |
| | | | | | | | |
| | | | | | | | |
Japan (0.82%) | | | | | | | | |
INPEX Corp. | | | 32 | | | | 207,755 | |
JFE Holdings, Inc. | | | 9,800 | | | | 175,347 | |
Nippon Steel Corp. | | | 108,000 | | | | 254,592 | |
Sumitomo Metal Industries, Ltd. | | | 68,000 | | | | 116,501 | |
| | | | | | | | |
| | | | | | | 754,195 | |
| | | | | | | | |
| | | | | | | | |
Jersey (0.31%) | | | | | | | | |
Randgold Resources, Ltd. | | | 2,635 | | | | 278,291 | |
| | | | | | | | |
| | |
8 | | Annual Report | November 30, 2011 |
| | | | |
| | THE FIRST NAME IN COMMODITY EQUITIES | | SCHEDULE OF INVESTMENTS |
| | | | JEFFERIES | TR/J CRB GLOBAL COMMODITY EQUITY INDEX FUND | November 30, 2011 |
| | | | | | | | |
| Security Description | | Shares | | | Value | |
Luxembourg (0.50%) | | | | | | | | |
ArcelorMittal | | | 17,312 | | | $ | 325,098 | |
Tenaris SA, ADR | | | 3,631 | | | | 135,364 | |
| | | | | | | | |
| | | | | | | 460,462 | |
| | | | | | | | |
| | | | | | | | |
Malaysia (1.31%) | | | | | | | | |
Genting Plantations BHD | | | 29,700 | | | | 75,967 | |
IOI Corp. BHD | | | 296,400 | | | | 467,190 | |
Kuala Lumpur Kepong BHD | | | 54,420 | | | | 368,108 | |
PPB Group BHD | | | 57,500 | | | | 290,530 | |
| | | | | | | | |
| | | | | | | 1,201,795 | |
| | | | | | | | |
| | | | | | | | |
Mauritius (0.45%) | | | | | | | | |
Golden Agri-Resources, Ltd. | | | 749,000 | | | | 409,210 | |
| | | | | | | | |
| | | | | | | | |
Mexico (0.22%) | | | | | | | | |
Grupo Mexico SAB de CV, Series B | | | 75,206 | | | | 202,440 | |
| | | | | | | | |
| | | | | | | | |
Netherlands (2.15%) | | | | | | | | |
CNH Global N.V.* | | | 3,369 | | | | 133,817 | |
Nutreco Holding N.V. | | | 3,967 | | | | 259,666 | |
Schlumberger, Ltd. | | | 20,900 | | | | 1,574,397 | |
| | | | | | | | |
| | | | | | | 1,967,880 | |
| | | | | | | | |
| | | | | | | | |
Norway (0.98%) | | | | | | | | |
Norsk Hydro ASA | | | 15,000 | | | | 71,924 | |
Yara International ASA | | | 20,412 | | | | 825,878 | |
| | | | | | | | |
| | | | | | | 897,802 | |
| | | | | | | | |
| | | | | | | | |
Peru (0.29%) | | | | | | | | |
Companhia de Minas Buenaventura SA, ADR | | | 6,642 | | | | 260,034 | |
| | | | | | | | |
| | | | | | | | |
Russia (4.41%) | | | | | | | | |
Gazprom OAO, ADR | | | 183,522 | | | | 2,110,503 | |
LUKOIL OAO, ADR | | | 6,561 | | | | 368,072 | |
Mechel Steel Group, ADR | | | 2,721 | | | | 29,632 | |
MMC Norilsk Nickel, ADR | | | 16,117 | | | | 283,176 | |
Rosneft Oil Co., GDR(c) | | | 25,305 | | | | 184,220 | |
Uralkali, GDR(c) | | | 26,238 | | | | 1,059,753 | |
| | | | | | | | |
| | | | | | | 4,035,356 | |
| | | | | | | | |
| | | | | | | | |
Singapore (1.73%) | | | | | | | | |
Olam International, Ltd. | | | 234,000 | | | | 418,232 | |
Wilmar International, Ltd. | | | 295,000 | | | | 1,165,034 | |
| | | | | | | | |
| | | | | | | 1,583,266 | |
| | | | | | | | |
| | | | | | | | |
South Africa (2.07%) | | | | | | | | |
Anglo Platinum, Ltd. | | | 1,255 | | | | 85,384 | |
AngloGold Ashanti, Ltd., ADR | | | 11,819 | | | | 566,839 | |
Gold Fields, Ltd. | | | 20,306 | | | | 342,272 | |
Harmony Gold Mining Co., Ltd. | | | 11,338 | | | | 160,114 | |
Impala Platinum Holdings, Ltd. | | | 14,182 | | | | 300,512 | |
Kumba Iron Ore, Ltd. | | | 1,134 | | | | 71,131 | |
Sasol, Ltd. | | | 7,676 | | | | 368,818 | |
| | | | | | | | |
| | | | | | | 1,895,070 | |
| | | | | | | | |
| | | | | | | | |
| Security Description | | Shares | | | Value | |
South Korea (0.45%) | | | | | | | | |
POSCO | | | 1,272 | | | $ | 414,649 | |
| | | | | | | | |
| | | | | | | | |
Spain (0.44%) | | | | | | | | |
Repsol YPF SA | | | 13,262 | | | | 399,810 | |
| | | | | | | | |
| | | | | | | | |
Switzerland (4.10%) | | | | | | | | |
Syngenta AG* | | | 11,472 | | | | 3,372,968 | |
Transocean, Ltd. | | | 4,923 | | | | 210,951 | |
Weatherford International, Ltd.* | | | 11,400 | | | | 172,824 | |
| | | | | | | | |
| | | | | | | 3,756,743 | |
| | | | | | | | |
| | | | | | | | |
Taiwan (0.41%) | | | | | | | | |
China Steel Corp. | | | 195,258 | | | | 187,321 | |
Taiwan Fertilizer Co., Ltd. | | | 80,000 | | | | 185,409 | |
| | | | | | | | |
| | | | | | | 372,730 | |
| | | | | | | | |
| | | | | | | | |
United Kingdom (10.56%) | | | | | | | | |
Anglo American Plc | | | 22,566 | | | | 858,901 | |
Antofagasta Plc | | | 6,847 | | | | 127,505 | |
BG Group Plc | | | 52,491 | | | | 1,121,548 | |
BHP Billiton Plc | | | 40,162 | | | | 1,231,120 | |
BP Plc | | | 293,668 | | | | 2,128,116 | |
Kazakhmys Plc | | | 5,051 | | | | 73,484 | |
Lonmin Plc | | | 4,724 | | | | 79,500 | |
Petropavlosk Plc | | | 5,080 | | | | 57,926 | |
Rio Tinto Plc | | | 26,921 | | | | 1,413,777 | |
Royal Dutch Shell Plc, Class A | | | 56,104 | | | | 1,954,572 | |
Xstrata Plc | | | 38,925 | | | | 622,620 | |
| | | | | | | | |
| | | | | | | 9,669,069 | |
| | | | | | | | |
| | | | | | | | |
United States (38.61%) | | | | | | | | |
AGCO Corp.* | | | 11,689 | | | | 534,772 | |
Alcoa, Inc. | | | 21,164 | | | | 212,063 | |
Allegheny Technologies, Inc. | | | 1,858 | | | | 93,309 | |
Anadarko Petroleum Corp. | | | 7,634 | | | | 620,415 | |
Apache Corp. | | | 5,877 | | | | 584,409 | |
Archer-Daniels-Midland Co. | | | 81,566 | | | | 2,456,768 | |
Baker Hughes, Inc. | | | 6,686 | | | | 365,122 | |
Cameron International Corp.* | | | 3,722 | | | | 200,951 | |
CF Industries Holdings, Inc. | | | 8,734 | | | | 1,221,013 | |
Chesapeake Energy Corp. | | | 10,025 | | | | 254,033 | |
Chevron Corp. | | | 31,044 | | | | 3,191,944 | |
Cliffs Natural Resources, Inc. | | | 2,864 | | | | 194,208 | |
Coeur d’Alene Mines Corp.* | | | 2,764 | | | | 80,902 | |
ConocoPhillips | | | 21,265 | | | | 1,516,620 | |
Consol Energy, Inc. | | | 3,475 | | | | 144,699 | |
Corn Products International, Inc. | | | 9,299 | | | | 483,455 | |
Deere & Co. | | | 50,958 | | | | 4,038,422 | |
Devon Energy Corp. | | | 5,997 | | | | 392,564 | |
Diamond Offshore Drilling, Inc. | | | 1,060 | | | | 63,759 | |
El Paso Corp. | | | 11,775 | | | | 294,493 | |
EOG Resources, Inc. | | | 4,093 | | | | 424,608 | |
Exxon Mobil Corp. | | | 75,227 | | | | 6,051,260 | |
Freeport-McMoRan Copper & Gold, Inc. | | | 18,762 | | | | 742,975 | |
| | | | |
| | THE FIRST NAME IN COMMODITY EQUITIES | | SCHEDULE OF INVESTMENTS |
| | | | JEFFERIES | TR/J CRB GLOBAL COMMODITY EQUITY INDEX FUND | November 30, 2011 |
| | | | | | | | |
| Security Description | | Shares | | | Value | |
United States (continued) | | | | | | | | |
Halliburton Co. | | | 14,221 | | | $ | 523,333 | |
Hecla Mining Co. | | | 8,623 | | | | 53,376 | |
Hess Corp. | | | 4,947 | | | | 297,908 | |
Intrepid Potash, Inc.* | | | 6,427 | | | | 148,849 | |
Marathon Oil Corp. | | | 10,949 | | | | 306,134 | |
Monsanto Co. | | | 65,711 | | | | 4,826,473 | |
The Mosaic Co. | | | 11,709 | | | | 617,767 | |
National Oilwell Varco, Inc. | | | 6,497 | | | | 465,835 | |
Newmont Mining Corp. | | | 15,191 | | | | 1,046,356 | |
Noble Energy, Inc. | | | 2,667 | | | | 262,406 | |
Nucor Corp. | | | 6,227 | | | | 245,531 | |
Occidental Petroleum Corp. | | | 12,420 | | | | 1,228,338 | |
Peabody Energy Corp. | | | 4,154 | | | | 162,961 | |
Royal Gold, Inc. | | | 1,593 | | | | 129,750 | |
Southern Copper Corp. | | | 3,271 | | | | 101,826 | |
Southwestern Energy Co.* | | | 5,240 | | | | 199,382 | |
United States Steel Corp. | | | 2,834 | | | | 77,368 | |
Valero Energy Corp. | | | 8,770 | | | | 195,308 | |
The Williams Co., Inc. | | | 9,031 | | | | 291,521 | |
| | | | | | | | |
| | | | | | | 35,343,186 | |
| | | | | | | | |
| | | | | | | | |
TOTAL COMMON STOCKS (Cost $99,844,984) | | | | | | | 91,161,528 | |
| | | | | | | | |
| | | | | | | | |
TOTAL INVESTMENTS (99.59%) (Cost $99,844,984) | | | | 91,161,528 | |
| | | | | | | | |
NET OTHER ASSETS AND LIABILITIES (0.41%) | | | | | | | 377,816 | |
| | | | | | | | |
| | | | | | | | |
NET ASSETS (100.00%) | | | | | | $ | 91,539,344 | |
| | | | | | | | |
| * | Non-income producing security. |
| (a) | Less than 0.005% of Net Assets. |
| (b) | Security exempt from registration under Rule 144A of the Securities Act of 1933. This security may be resold in transactions exempt from registration, normally to qualified institutional buyers. At period end, the market value of this security restricted under Rule 144A was $775,680, representing 0.85% of the Fund’s net assets. |
| (c) | These securities initially sold to other parties pursuant to Regulation S under the 1933 Act and subsequently resold to the Fund. At the period end, the aggregate market value of this security was $1,243,973, representing 1.36% of the Fund’s net assets. |
Common Abbreviations:
| ADR | - American Depositary Receipt. |
| AG | - Aktiengesellschaft is a German term that refers to a corporation that is limited by shares, i.e., owned by shareholders. |
| ASA | - Allmennaksjeselskap is the Norwegian term for public limited company. |
| BHD | - Berhad (in Malaysia; equivalent to Public Limited Company). |
| GDR | - Global Depository Receipt. |
| N.V. | - Naamloze Vennootschap is the Dutch term for a public limited liability corporation. |
| OAO | - Otkytoe Aktsionernoe Obshchestvo (open Joint Stock Corporation) is a Russian term for a stock-based corporation. |
| SA | - Generally designated corporations in various countries, mostly those employing the civil law. |
SAB de CV -A variable capital company.
| SpA | - Società Per Azioni is an Italian shared company. |
See Notes to Financial Statements.
| | |
10 | | Annual Report | November 30, 2011 |
| | | | |
| | THE FIRST NAME IN COMMODITY EQUITIES | | SCHEDULE OF INVESTMENTS |
| | | | JEFFERIES | TR/J CRB GLOBAL AGRICULTURE EQUITY INDEX FUND | November 30, 2011 |
| | | | | | | | |
| Security Description | | Shares | | | Value | |
COMMON STOCKS (99.50%) | | | | | |
Australia (4.35%) | | | | | | | | |
Incitec Pivot, Ltd. | | | 98,157 | | | $ | 323,686 | |
Nufarm, Ltd.* | | | 15,098 | | | | 73,673 | |
| | | | | | | | |
| | | | | | | 397,359 | |
| | | | | | | | |
| | | | | | | | |
Bermuda (5.10%) | | | | | | | | |
Bunge, Ltd. | | | 6,900 | | | | 431,250 | |
Sinofert Holdings, Ltd. | | | 116,000 | | | | 34,760 | |
| | | | | | | | |
| | | | | | | 466,010 | |
| | | | | | | | |
| | | | | | | | |
Canada (12.75%) | | | | | | | | |
Agrium, Inc. | | | 5,235 | | | | 368,600 | |
Potash Corp. of Saskatchewan, Inc. | | | 13,382 | | | | 585,162 | |
Viterra, Inc. | | | 20,542 | | | | 210,521 | |
| | | | | | | | |
| | | | | | | 1,164,283 | |
| | | | | | | | |
| | | | | | | | |
Cayman Islands (0.00%)(a) | | | | | | | | |
Chaoda Modern Agriculture Holdings, Ltd. | | | 172,000 | | | | 221 | |
| | | | | | | | |
| | | | | | | | |
Chile (1.77%) | | | | | | | | |
Sociedad Quimica y Minera de Chile SA, ADR | | | 2,821 | | | | 161,756 | |
| | | | | | | | |
| | | | | | | | |
China (0.99%) | | | | | | | | |
China BlueChemical, Ltd., Class H | | | 116,000 | | | | 90,556 | |
| | | | | | | | |
| | | | | | | | |
Germany (4.05%) | | | | | | | | |
K+S AG | | | 6,824 | | | | 370,109 | |
| | | | | | | | |
| | | | | | | | |
Hong Kong (0.82%) | | | | | | | | |
China Agri-Industries Holdings, Ltd. | | | 102,000 | | | | 74,905 | |
| | | | | | | | |
| | | | | | | | |
Israel (5.04%) | | | | | | | | |
Israel Chemicals, Ltd. | | | 28,071 | | | | 299,668 | |
The Israel Corp., Ltd. | | | 246 | | | | 160,904 | |
| | | | | | | | |
| | | | | | | 460,572 | |
| | | | | | | | |
| | | | | | | | |
Malaysia (6.91%) | | | | | | | | |
Genting Plantations BHD | | | 15,600 | | | | 39,902 | |
IOI Corp. BHD | | | 155,800 | | | | 245,574 | |
Kuala Lumpur Kepong BHD | | | 28,545 | | | | 193,084 | |
PPB Group BHD | | | 30,200 | | | | 152,592 | |
| | | | | | | | |
| | | | | | | 631,152 | |
| | | | | | | | |
| | | | | | | | |
Mauritius (2.36%) | | | | | | | | |
Golden Agri-Resources, Ltd. | | | 395,000 | | | | 215,805 | |
| | | | | | | | |
| | | | | | | | |
Netherlands (2.29%) | | | | | | | | |
CNH Global N.V.* | | | 1,792 | | | | 71,178 | |
Nutreco Holding N.V. | | | 2,110 | | | | 138,114 | |
| | | | | | | | |
| | | | | | | 209,292 | |
| | | | | | | | |
| | | | | | | | |
| Security Description | | Shares | | | Value | |
Norway (3.52%) | | | | | | | | |
Yara International ASA | | | 7,932 | | | $ | 320,932 | |
| | | | | | | | |
| | | | | | | | |
Russia (4.14%) | | | | | | | | |
Uralkali, Sponsored GDR(b) | | | 9,355 | | | | 377,848 | |
| | | | | | | | |
| | | | | | | | |
Singapore (6.97%) | | | | | | | | |
Olam International, Ltd. | | | 124,000 | | | | 221,628 | |
Wilmar International, Ltd. | | | 105,000 | | | | 414,673 | |
| | | | | | | | |
| | | | | | | 636,301 | |
| | | | | | | | |
| | | | | | | | |
Switzerland (5.36%) | | | | | | | | |
Syngenta AG* | | | 1,666 | | | | 489,833 | |
| | | | | | | | |
| | | | | | | | |
Taiwan (1.07%) | | | | | | | | |
Taiwan Fertilizer Co., Ltd. | | | 42,000 | | | | 97,340 | |
| | | | | | | | |
| | | | | | | | |
United States (32.01%) | | | | | | | | |
AGCO Corp.* | | | 6,219 | | | | 284,519 | |
Archer-Daniels-Midland Co. | | | 17,570 | | | | 529,208 | |
CF Industries Holdings, Inc. | | | 2,467 | | | | 344,887 | |
Corn Products International, Inc. | | | 4,946 | | | | 257,143 | |
Deere & Co. | | | 6,466 | | | | 512,430 | |
Intrepid Potash, Inc.* | | | 3,419 | | | | 79,184 | |
Monsanto Co. | | | 8,338 | | | | 612,426 | |
The Mosaic Co. | | | 5,754 | | | | 303,581 | |
| | | | | | | | |
| | | | | | | 2,923,378 | |
| | | | | | | | |
| | | | | | | | |
TOTAL COMMON STOCKS (Cost $10,256,587) | | | | | | | 9,087,652 | |
| | | | | | | | |
| | | | | | | | |
TOTAL INVESTMENTS (99.50%) (Cost $10,256,587) | | | | 9,087,652 | |
| | | | | |
NET OTHER ASSETS AND LIABILITIES (0.50%) | | | | | | | 45,727 | |
| | | | | | | | |
| | | | | | | | |
NET ASSETS (100.00%) | | | | | | $ | 9,133,379 | |
| | | | | | | | |
| * | Non-income producing security. |
| (a) | Less than 0.005% of Net Assets. |
| (b) | These securities initially sold to other parties pursuant to Regulation S under the 1933 Act and subsequently resold to the Fund. At the period end, the aggregate market value of this security was $377,848, representing 4.14% of the Fund’s net assets. |
| | | | |
| | THE FIRST NAME IN COMMODITY EQUITIES | | SCHEDULE OF INVESTMENTS |
| | | | JEFFERIES | TR/J CRB GLOBAL AGRICULTURE EQUITY INDEX FUND | November 30, 2011 |
Common Abbreviations:
| ADR | - American Depositary Receipt. |
| AG | - Aktiengesellschaft is a German term that refers to a corporation that is limited by shares, i.e., owned by shareholders. |
| ASA | - Allmennaksjeselskap is the Norwegian term for public limited company. |
| BHD | - Berhad (in Malaysia; equivalent to Public Limited Company). |
| GDR | - Global Depository Receipt. |
| N.V. | - Naamloze Vennootschap is the Dutch term for a public limited liability corporation. |
| SA | - Generally designated corporations in various countries, mostly those employing the civil law. |
See Notes to Financial Statements.
| | |
12 | | Annual Report | November 30, 2011 |
| | | | |
| | THE FIRST NAME IN COMMODITY EQUITIES | | SCHEDULE OF INVESTMENTS |
| | | | JEFFERIES | TR/J CRB GLOBAL INDUSTRIAL METALS EQUITY INDEX FUND | November 30, 2011 |
| | | | | | | | |
| Security Description | | Shares | | | Value | |
COMMON STOCKS (99.11%) | | | | | | | | |
Australia (1.51%) | | | | | | | | |
Fortescue Metals Group, Ltd. | | | 10,765 | | | $ | 50,207 | |
| | | | | | | | |
| | | | | | | | |
Brazil (8.20%) | | | | | | | | |
Companhia Siderurgica Nacional SA, ADR | | | 7,886 | | | | 65,454 | |
Gerdau SA, ADR | | | 8,009 | | | | 61,509 | |
Vale SA, ADR | | | 6,264 | | | | 145,638 | |
| | | | | | | | |
| | | | | | | 272,601 | |
| | | | | | | | |
| | | | | | | | |
Canada (9.43%) | | | | | | | | |
Cameco Corp. | | | 3,890 | | | | 73,917 | |
First Quantum Minerals, Ltd. | | | 4,607 | | | | 93,341 | |
Teck Resources, Ltd., Class B | | | 3,980 | | | | 146,204 | |
| | | | | | | | |
| | | | | | | 313,462 | |
| | | | | | | | |
| | | | | | | | |
China (0.86%) | | | | | | | | |
Jiangxi Copper Co., Ltd.,
Class H | | | 13,000 | | | | 28,657 | |
| | | | | | | | |
| | | | | | | | |
Germany (2.82%) | | | | | | | | |
ThyssenKrupp AG | | | 3,640 | | | | 93,688 | |
| | | | | | | | |
| | | | | | | | |
Great Britain (0.65%) | | | | | | | | |
Evraz Plc* | | | 3,570 | | | | 21,561 | |
| | | | | | | | |
| | | | | | | | |
India (0.48%) | | | | | | | | |
Sterlite Industries India, Ltd., ADR | | | 1,986 | | | | 16,007 | |
| | | | | | | | |
| | | | | | | | |
Japan (7.88%) | | | | | | | | |
JFE Holdings, Inc. | | | 4,800 | | | | 85,884 | |
Nippon Steel Corp. | | | 50,000 | | | | 117,867 | |
Sumitomo Metal Industries, Ltd. | | | 34,000 | | | | 58,251 | |
| | | | | | | | |
| | | | | | | 262,002 | |
| | | | | | | | |
| | | | | | | | |
Luxembourg (4.37%) | | | | | | | | |
ArcelorMittal | | | 7,733 | | | | 145,216 | |
| | | | | | | | |
| | | | | | | | |
Mexico (3.00%) | | | | | | | | |
Grupo Mexico SAB de CV, Series B | | | 36,994 | | | | 99,581 | |
| | | | | | | | |
| | | | | | | | |
Norway (1.07%) | | | | | | | | |
Norsk Hydro ASA | | | 7,400 | | | | 35,482 | |
| | | | | | | | |
| | | | | | | | |
Russia (3.98%) | | | | | | | | |
Mechel Steel Group, ADR | | | 1,353 | | | | 14,734 | |
Mining and Metallurgical Co. Norilsk Nickel OJSC, ADR | | | 6,699 | | | | 117,702 | |
| | | | | | | | |
| | | | | | | 132,436 | |
| | | | | | | | |
| | | | | | | | |
South Africa (1.06%) | | | | | | | | |
Kumba Iron Ore, Ltd. | | | 564 | | | | 35,377 | |
| | | | | | | | |
| | | | | | | | |
South Korea (4.20%) | | | | | | | | |
POSCO | | | 428 | | | | 139,520 | |
| | | | | | | | |
| | | | | | | | |
| Security Description | | Shares | | | Value | |
Taiwan (2.79%) | | | | | | | | |
China Steel Corp. | | | 96,583 | | | $ | 92,657 | |
| | | | | | | | |
| | | | | | | | |
United Kingdom (28.12%) | | | | | | | | |
Anglo American Plc | | | 4,597 | | | | 174,970 | |
Antofagasta Plc | | | 3,404 | | | | 63,389 | |
BHP Billiton Plc | | | 7,529 | | | | 230,793 | |
Kazakhmys Plc | | | 2,512 | | | | 36,545 | |
Rio Tinto Plc | | | 5,047 | | | | 265,047 | |
Xstrata Plc | | | 10,235 | | | | 163,713 | |
| | | | | | | | |
| | | | | | | 934,457 | |
| | | | | | | | |
| | | | | | | | |
United States (18.69%) | | | | | | | | |
Alcoa, Inc. | | | 10,437 | | | | 104,579 | |
Allegheny Technologies, Inc. | | | 924 | | | | 46,403 | |
Cliffs Natural Resources, Inc. | | | 1,423 | | | | 96,494 | |
Freeport-McMoRan Copper & Gold, Inc. | | | 4,103 | | | | 162,479 | |
Nucor Corp. | | | 3,096 | | | | 122,075 | |
Southern Copper Corp. | | | 1,626 | | | | 50,617 | |
United States Steel Corp. | | | 1,409 | | | | 38,466 | |
| | | | | | | | |
| | | | | | | 621,113 | |
| | | | | | | | |
| | | | | | | | |
TOTAL COMMON STOCKS (Cost $4,320,765) | | | | | | | 3,294,024 | |
| | | | | | | | |
| | | | | | | | |
TOTAL INVESTMENTS (99.11%) (Cost $4,320,765) | | | | 3,294,024 | |
| | | | | | | | |
NET OTHER ASSETS AND LIABILITIES (0.89%) | | | | | | | 29,595 | |
| | | | | | | | |
| | | | | | | | |
NET ASSETS (100.00%) | | | | | | $ | 3,323,619 | |
| | | | | | | | |
| * | Non-income producing security. |
Common Abbreviations:
| ADR | - American Depositary Receipt. |
| AG | - Aktiengesellschaft is a German term that refers to a corporation that is limited by shares, i.e., owned by shareholders. |
| ASA | - Allmennaksjeselskap is the Norwegian term for public limited company. |
| OJSC | - Opened Joint Stock Company. |
| SA | - Generally designated corporations in various countries, mostly those employing the civil law. |
SAB de CV - A variable capital company.
See Notes to Financial Statements.
| | | | |
| | THE FIRST NAME IN COMMODITY EQUITIES | | SCHEDULE OF INVESTMENTS |
| | | | JEFFERIES | TR/J CRB WILDCATTERS EXPLORATION & PRODUCTION EQUITY ETF | November 30, 2011 |
| | | | | | | | |
| Security Description | | Shares | | | Value | |
COMMON STOCKS (99.84%) | | | | | |
Canada (38.31%) | | | | | | | | |
Advantage Oil & Gas, Ltd.* | | | 46,884 | | | $ | 216,725 | |
Angle Energy, Inc.* | | | 18,253 | | | | 126,205 | |
Bankers Petroleum, Ltd.* | | | 68,344 | | | | 342,140 | |
Birchcliff Energy, Ltd.* | | | 25,472 | | | | 349,982 | |
BNK Petroleum, Inc.* | | | 29,679 | | | | 45,244 | |
Canadian Energy Services & Technology Corp. | | | 12,262 | | | | 148,941 | |
Celtic Exploration, Ltd.* | | | 22,689 | | | | 551,186 | |
Cequence Energy, Ltd.* | | | 26,619 | | | | 88,228 | |
Crew Energy, Inc.* | | | 32,973 | | | | 378,131 | |
Daylight Energy, Ltd. | | | 58,788 | | | | 574,148 | |
Delphi Energy Corp.* | | | 32,425 | | | | 70,160 | |
Fairborne Energy, Ltd.* | | | 27,843 | | | | 90,916 | |
Guide Exploration, Ltd., Class A* | | | 22,869 | | | | 70,401 | |
Ivanhoe Energy, Inc.* | | | 82,081 | | | | 82,343 | |
Legacy Oil & Gas, Inc.* | | | 36,388 | | | | 328,181 | |
Midway Energy, Ltd.* | | | 20,960 | | | | 65,761 | |
NAL Energy Corp. | | | 42,575 | | | | 316,564 | |
NuVista Energy, Ltd. | | | 26,249 | | | | 116,691 | |
Open Range Energy Corp.* | | | 18,710 | | | | 36,803 | |
Petrobank Energy & Resources, Ltd.* | | | 28,588 | | | | 258,677 | |
Southern Pacific Resource Corp.* | | | 96,430 | | | | 138,468 | |
TransGlobe Energy Corp.* | | | 18,603 | | | | 153,142 | |
Twin Butte Energy, Ltd.* | | | 36,812 | | | | 83,273 | |
Westfire Energy, Ltd.* | | | 16,780 | | | | 77,402 | |
Whitecap Resources, Inc.* | | | 19,284 | | | | 162,352 | |
| | | | | | | | |
| | | | | | | 4,872,064 | |
| | | | | | | | |
| | | | | | | | |
United States (61.53%) | | | | | | | | |
Abraxas Petroleum Corp.* | | | 22,898 | | | | 82,662 | |
Approach Resources, Inc.* | | | 7,196 | | | | 225,091 | |
ATP Oil & Gas Corp.* | | | 12,743 | | | | 93,534 | |
Bill Barrett Corp.* | | | 13,286 | | | | 518,154 | |
BPZ Resources, Inc.* | | | 25,348 | | | | 80,860 | |
C&J Energy Services, Inc.* | | | 4,459 | | | | 87,575 | |
Callon Petroleum Co.* | | | 11,022 | | | | 59,188 | |
Carrizo Oil & Gas, Inc.* | | | 10,334 | | | | 294,106 | |
Clayton Williams Energy, Inc.* | | | 1,587 | | | | 117,374 | |
Comstock Resources, Inc.* | | | 12,815 | | | | 213,113 | |
Contango Oil & Gas Co.* | | | 3,781 | | | | 238,203 | |
Endeavour International Corp.* | | | 9,434 | | | | 65,189 | |
Energy Partners, Ltd.* | | | 8,236 | | | | 113,822 | |
Energy XXI (Bermuda), Ltd.* | | | 20,180 | | | | 634,459 | |
FX Energy, Inc.* | | | 14,230 | | | | 67,877 | |
GeoResources, Inc.* | | | 5,645 | | | | 160,939 | |
GMX Resources, Inc.* | | | 16,521 | | | | 21,808 | |
Goodrich Petroleum Corp.* | | | 7,422 | | | | 108,213 | |
Gran Tierra Energy, Inc.* | | | 71,279 | | | | 454,980 | |
Gulfport Energy Corp.* | | | 11,916 | | | | 378,333 | |
Harvest Natural Resources, Inc.* | | | 9,312 | | | | 85,205 | |
Houston American Energy Corp. | | | 5,088 | | | | 71,283 | |
| | | | | | | | |
| Security Description | | Shares | | | Value | |
United States (continued) | | | | | | | | |
Hyperdynamics Corp.* | | | 40,618 | | | $ | 149,474 | |
Magnum Hunter Resources Corp.* | | | 30,941 | | | | 148,826 | |
Northern Oil and Gas, Inc.* | | | 15,666 | | | | 383,660 | |
Penn Virginia Corp. | | | 12,941 | | | | 68,587 | |
Petroleum Development Corp.* | | | 6,634 | | | | 222,571 | |
Petroquest Energy, Inc.* | | | 15,929 | | | | 109,432 | |
Quicksilver Resources, Inc.* | | | 33,775 | | | | 273,577 | |
Rex Energy Corp.* | | | 9,277 | | | | 149,824 | |
Rosetta Resources, Inc.* | | | 14,791 | | | | 803,743 | |
Stone Energy Corp.* | | | 13,038 | | | | 368,845 | |
Swift Energy Co.* | | | 11,850 | | | | 348,271 | |
Vaalco Energy, Inc.* | | | 15,771 | | | | 99,357 | |
Vanguard Natural Resources LLC | | | 7,408 | | | | 196,016 | |
Venoco, Inc.* | | | 8,555 | | | | 79,733 | |
W&T Offshore, Inc. | | | 9,810 | | | | 196,396 | |
Warren Resources, Inc.* | | | 19,713 | | | | 56,182 | |
| | | | | | | | |
| | | | | | | 7,826,462 | |
| | | | | | | | |
| | | | | | | | |
TOTAL COMMON STOCKS (Cost $16,121,783) | | | | | | | 12,698,526 | |
| | | | | | | | |
| | | | | | | | |
WARRANTS (0.00%) | | | | | | | | |
United States (0.00%) | | | | | | | | |
Magnum Hunter Resources Corp.,strike price $10.50, Expires 10/14/13* | | | 3,271 | | | | 0 | |
| | | | | | | | |
| | | | | | | | |
TOTAL WARRANTS (Cost $0) | | | | | | | 0 | |
| | | | | | | | |
| | | | | | | | |
TOTAL INVESTMENTS (99.84%) (Cost $16,121,783) | | | | 12,698,526 | |
| | | | | |
NET OTHER ASSETS AND LIABILITIES (0.16%) | | | | | | | 20,610 | |
| | | | | | | | |
| | | | | | | | |
NET ASSETS (100.00%) | | | | | | $ | 12,719,136 | |
| | | | | | | | |
| * | Non-income producing security. |
Common Abbreviations:
LLC - Limited Liability Company.
Ltd. - Limited.
See Notes to Financial Statements.
| | |
14 | | Annual Report | November 30, 2011 |
| | | | |
| | THE FIRST NAME IN COMMODITY EQUITIES | | STATEMENTS OF ASSETS & LIABILITIES |
| | | | November 30, 2011 |
| | | | | | | | | | | | | | | | |
| | | Jefferies | TR/J CRB Global Commodity
Equity Index Fund | | | Jefferies | TR/J CRB
Global Agriculture
Equity Index Fund | | | Jefferies | TR/J CRB
Global Industrial Metals
Equity Index Fund | | | Jefferies | TR/J CRB
Wildcatters Exploration
& Production Equity ETF | |
ASSETS: | | | | | | | | | | | | | | | | |
Investments, at value | | $ | 91,161,528 | | | $ | 9,087,652 | | | $ | 3,294,024 | | | $ | 12,698,526 | |
Cash | | | 138,052 | | | | 26,982 | | | | 22,871 | | | | 13,013 | |
Foreign currency, at value (Cost $25,086, $2,749, $4,184 and $10,858, respectively) | | | 25,181 | | | | 2,710 | | | | 4,135 | | | | 10,906 | |
Foreign tax reclaims | | | 43,184 | | | | 2,673 | | | | 1,691 | | | | – | |
Interest and dividends receivable | | | 222,442 | | | | 18,281 | | | | 2,656 | | | | 3,345 | |
| |
Total Assets | | | 91,590,387 | | | | 9,138,298 | | | | 3,325,377 | | | | 12,725,790 | |
| |
| | | | |
LIABILITIES: | | | | | | | | | | | | | | | | |
Payable to advisor | | | 51,043 | | | | 4,919 | | | | 1,758 | | | | 6,654 | |
| |
Total Liabilities | | | 51,043 | | | | 4,919 | | | | 1,758 | | | | 6,654 | |
| |
NET ASSETS | | $ | 91,539,344 | | | $ | 9,133,379 | | | $ | 3,323,619 | | | $ | 12,719,136 | |
| |
|
NET ASSETS CONSIST OF: | |
Paid-in capital | | $ | 102,379,141 | | | $ | 10,398,137 | | | $ | 4,551,725 | | | $ | 16,593,808 | |
Undistributed net investment income | | | 192,426 | | | | 28,609 | | | | 6,499 | | | | – | |
Accumulated net realized loss on investments and foreign currency transactions | | | (2,350,619) | | | | (124,696) | | | | (207,798) | | | | (451,487) | |
Net unrealized depreciation on investments and translation of assets and liabilities denominated in foreign currencies | | | (8,681,604) | | | | (1,168,671) | | | | (1,026,807) | | | | (3,423,185) | |
| |
NET ASSETS | | $ | 91,539,344 | | | $ | 9,133,379 | | | $ | 3,323,619 | | | $ | 12,719,136 | |
| |
| | | | |
INVESTMENTS, AT COST | | $ | 99,844,984 | | | $ | 10,256,587 | | | $ | 4,320,765 | | | $ | 16,121,783 | |
|
| |
PRICING OF SHARES | |
Net Assets | | $ | 91,539,344 | | | $ | 9,133,379 | | | $ | 3,323,619 | | | $ | 12,719,136 | |
Shares of beneficial interest outstanding (Unlimited number of shares authorized, par value $0.01 per share) | | | 2,050,017 | | | | 200,001 | | | | 100,000 | | | | 300,000 | |
Net Asset Value, offering and redemption price per share | | $ | 44.65 | | | $ | 45.67 | | | $ | 33.24 | | | $ | 42.40 | |
See Notes to Financial Statements.
| | | | |
| | THE FIRST NAME IN COMMODITY EQUITIES | | STATEMENTS OF OPERATIONS |
| | | | November 30, 2011 |
| | | | | | | | | | | | | | | | |
| | | Jefferies | TR/J CRB Global Commodity Equity Index Fund | | | Jefferies | TR/J CRB Global Agriculture Equity Index Fund | |
| | | | |
| | | For the Period
January 1, 2011 to
November 30, 2011(a) | | | For the Year Ended
December 31, 2010 | | | For the Period
January 1, 2011 to
November 30, 2011(a) | | | For the Year Ended
December 31, 2010 | |
INVESTMENT INCOME: | |
Dividends(b) | | $ | 2,270,769 | | | $ | 1,317,325 | | | $ | 164,184 | | | $ | 62,852 | |
| |
Total Investment Income | | | 2,270,769 | | | | 1,317,325 | | | | 164,184 | | | | 62,852 | |
| |
| | | | |
EXPENSES: | | | | | | | | | | | | | | | | |
Investment advisory fee | | | 760,339 | | | | 493,500 | | | | 66,309 | | | | 27,743 | |
| |
Total Net Expenses | | | 760,339 | | | | 493,500 | | | | 66,309 | | | | 27,743 | |
| |
NET INVESTMENT INCOME | | | 1,510,430 | | | | 823,825 | | | | 97,875 | | | | 35,109 | |
| |
| | | | |
Net realized gain/(loss) on investments | | | 7,331,222 | | | | (422,061) | | | | 521,182 | | | | 136,139 | |
Net realized loss on foreign currency transactions | | | (78,592) | | | | (42,429) | | | | (5,001) | | | | (1,549) | |
Net change in unrealized appreciation/ (depreciation) on investments | | | (23,593,900) | | | | 11,819,513 | | | | (2,332,587) | | | | 898,923 | |
Net change in unrealized appreciation/(depreciation) on translation of assets and liabilities denominated in foreign currencies | | | (888) | | | | 2,613 | | | | 67 | | | | 163 | |
| |
| | | | |
NET REALIZED AND UNREALIZED GAIN/(LOSS) ON INVESTMENTS | | | (16,342,158) | | | | 11,357,636 | | | | (1,816,339) | | | | 1,033,676 | |
| |
| | | | |
| | | | | | | | | | | | | | | | |
NET INCREASE/(DECREASE) IN NET ASSETS RESULTING FROM OPERATIONS | | $ | (14,831,728) | | | $ | 12,181,461 | | | $ | (1,718,464) | | | $ | 1,068,785 | |
| |
| (a) | Effective March 7, 2011, the Board approved changing the fiscal year end of the Fund from December 31 to November 30. |
| (b) | Net of foreign tax withholdings of $143,298, $98,777, $11,396 and $4,626, respectively. |
See Notes to Financial Statements.
| | |
16 | | Annual Report | November 30, 2011 |
| | | | |
| | THE FIRST NAME IN COMMODITY EQUITIES | | STATEMENTS OF OPERATIONS |
| | | | |
| | | | | | | | | | | | | | | | |
| | | Jefferies | TR/J CRB Global Industrial Metals Equity Index Fund | | | Jefferies | TR/J CRB
Wildcatters Exploration & Production Equity ETF | |
| | | | |
| | | For the Period
January 1, 2011 to
November 30, 2011(a) | | | For the Year Ended
December 31, 2010 | | | For the Period
January 1, 2011 to
November 30, 2011(a) | | | For the Period Ended
January 20, 2010
(Inception) through
December 31, 2010 | |
INVESTMENT INCOME: | | | | | | | | | | | | | | | | |
Dividends(b) | | $ | 111,124 | | | $ | 83,798 | | | $ | 89,131 | | | $ | 32,611 | |
| |
Total Investment Income | | | 111,124 | | | | 83,798 | | | | 89,131 | | | | 32,611 | |
| |
| | | | |
EXPENSES: | | | | | | | | | | | | | | | | |
Investment advisory fee | | | 28,644 | | | | 32,116 | | | | 118,868 | | | | 37,261 | |
| |
Total Net Expenses | | | 28,644 | | | | 32,116 | | | | 118,868 | | | | 37,261 | |
| |
NET INVESTMENT INCOME/(LOSS) | | | 82,480 | | | | 51,682 | | | | (29,737) | | | | (4,650) | |
| |
| | | | |
Net realized gain/(loss) on investments | | | 371,001 | | | | (337,596) | | | | 1,767,593 | | | | 330,002 | |
Net realized gain/(loss) on foreign currency transactions | | | (3,128) | | | | (1,931) | | | | (3,822) | | | | 833 | |
Net change in unrealized appreciation/ (depreciation) on investments | | | (1,929,298) | | | | 591,980 | | | | (5,512,185) | | | | 2,088,928 | |
Net change in unrealized appreciation/(depreciation) on translation of assets and liabilities denominated in foreign currencies | | | (117) | | | | 56 | | | | 4 | | | | 68 | |
| |
| | | | |
NET REALIZED AND UNREALIZED GAIN/(LOSS) ON INVESTMENTS | | | (1,561,542) | | | | 252,509 | | | | (3,748,410) | | | | 2,419,831 | |
| |
| | | | |
| | | | | | | | | | | | | | | | |
NET INCREASE/(DECREASE) IN NET ASSETS RESULTING FROM OPERATIONS | | $ | (1,479,062) | | | $ | 304,191 | | | $ | (3,778,147) | | | $ | 2,415,181 | |
| |
| (a) | Effective March 7, 2011, the Board approved changing the fiscal year end of the Fund from December 31 to November 30. |
| (b) | Net of foreign tax withholdings of $7,523, $6,191, $10,542 and $3,316, respectively. |
See Notes to Financial Statements.
| | | | |
| | THE FIRST NAME IN COMMODITY EQUITIES | | STATEMENTS OF CHANGES IN NET ASSETS |
| | | | JEFFERIES | TR/J CRB GLOBAL COMMODITY EQUITY INDEX FUND |
| | | | | | | | | | | | |
| | | For the Period January 1, 2011 to November 30, 2011(a) | | | For the Year Ended December 31, 2010 | | | For the Period September 21, 2009 (Inception) through December 31, 2009 | |
OPERATIONS: | | | | | | | | | | | | |
Net investment income | | $ | 1,510,430 | | | $ | 823,825 | | | $ | 199,284 | |
Net realized gain/(loss) on investments and foreign currency transactions | | | 7,252,630 | | | | (464,490 | ) | | | (58,266 | ) |
Net change in unrealized appreciation/ (depreciation) on investments and foreign currency | | | (23,594,788 | ) | | | 11,822,126 | | | | 3,091,058 | |
| |
Net increase/(decrease) in net assets resulting from operations | | | (14,831,728 | ) | | | 12,181,461 | | | | 3,232,076 | |
| |
| | | |
DISTRIBUTIONS TO SHAREHOLDERS: | | | | | | | | | | | | |
From net investment income | | | (1,248,722 | ) | | | (873,185 | ) | | | (202,000 | ) |
| |
Total distributions | | | (1,248,722 | ) | | | (873,185 | ) | | | (202,000 | ) |
| |
| | | | | | | | | | | | |
SHARE TRANSACTIONS: | | | | | | | | | | | | |
Proceeds from sale of shares | | | 55,309,332 | | | | 51,567,090 | | | | 69,712,566 | |
Cost of shares redeemed | | | (58,690,822 | ) | | | (22,531,834 | ) | | | (2,084,890 | ) |
| |
Net increase/(decrease) from share transactions | | | (3,381,490 | ) | | | 29,035,256 | | | | 67,627,676 | |
| |
Net increase/(decrease) in net assets | | | (19,461,940 | ) | | | 40,343,532 | | | | 70,657,752 | |
| |
| | | |
NET ASSETS: | | | | | | | | | | | | |
Beginning of period | | | 111,001,284 | | | | 70,657,752 | | | | – | |
| |
End of period* | | $ | 91,539,344 | | | $ | 111,001,284 | | | $ | 70,657,752 | |
| |
| | | | | | | | | | | | |
*Including (over)/undistributed net investment income of: | | $ | 192,426 | | | $ | (27,176 | ) | | $ | (9,317 | ) |
| | | |
Other Information: | | | | | | | | | | | | |
SHARE TRANSACTIONS: | | | | | | | | | | | | |
Beginning shares | | | 2,250,001 | | | | 1,650,000 | | | | – | |
Shares sold | | | 1,050,016 | | | | 1,150,001 | | | | 1,700,000 | |
Shares redeemed | | | (1,250,000 | ) | | | (550,000 | ) | | | (50,000 | ) |
| |
Shares outstanding, end of period | | | 2,050,017 | | | | 2,250,001 | | | | 1,650,000 | |
| |
| (a) | Effective March 7, 2011, the Board approved changing the fiscal year end of the Fund from December 31 to November 30. |
See Notes to Financial Statements.
| | |
18 | | Annual Report | November 30, 2011 |
| | | | |
| | THE FIRST NAME IN COMMODITY EQUITIES | | STATEMENTS OF CHANGES IN NET ASSETS |
| | | | JEFFERIES | TR/J CRB GLOBAL AGRICULTURE EQUITY INDEX FUND |
| | | | | | | | | | | | |
| | | For the Period January 1, 2011 to November 30, 2011(a) | | | For the Year Ended December 31, 2010 | | | For the Period October 27, 2009 (Inception) through December 31, 2009 | |
OPERATIONS: | | | | | | | | | | | | |
Net investment income | | $ | 97,875 | | | $ | 35,109 | | | $ | 22,578 | |
Net realized gain on investments and foreign currency transactions | | | 516,181 | | | | 134,590 | | | | 30,997 | |
Net change in unrealized appreciation/ (depreciation) on investments and foreign currency | | | (2,332,520 | ) | | | 899,086 | | | | 264,763 | |
| |
Net increase/(decrease) in net assets resulting from operations | | | (1,718,464 | ) | | | 1,068,785 | | | | 318,338 | |
| |
| | | |
DISTRIBUTIONS TO SHAREHOLDERS: | | | | | | | | | | | | |
From net investment income | | | (73,725 | ) | | | (71,522 | ) | | | (25,500 | ) |
| |
Total distributions | | | (73,725 | ) | | | (71,522 | ) | | | (25,500 | ) |
| |
| | | | | | | | | | | | |
SHARE TRANSACTIONS: | | | | | | | | | | | | |
Proceeds from sale of shares | | | 13,283,828 | | | | 7,283,996 | | | | 3,930,030 | |
Cost of shares redeemed | | | (10,188,456 | ) | | | (4,673,931 | ) | | | – | |
| |
Net increase from share transactions | | | 3,095,372 | | | | 2,610,065 | | | | 3,930,030 | |
| |
Net increase in net assets | | | 1,303,183 | | | | 3,607,328 | | | | 4,222,868 | |
| |
| | | |
NET ASSETS: | | | | | | | | | | | | |
Beginning of period | | | 7,830,196 | | | | 4,222,868 | | | | – | |
| |
End of period* | | $ | 9,133,379 | | | $ | 7,830,196 | | | $ | 4,222,868 | |
| |
| | | | | | | | | | | | |
*Including (over)/undistributed net investment income of: | | $ | 28,609 | | | $ | (58 | ) | | $ | (2,653 | ) |
| | | |
Other Information: | | | | | | | | | | | | |
SHARE TRANSACTIONS: | | | | | | | | | | | | |
Beginning shares | | | 150,000 | | | | 100,000 | | | | – | |
Shares sold | | | 250,001 | | | | 150,000 | | | | 100,000 | |
Shares redeemed | | | (200,000 | ) | | | (100,000 | ) | | | – | |
| |
Shares outstanding, end of period | | | 200,001 | | | | 150,000 | | | | 100,000 | |
| |
| (a) | Effective March 7, 2011, the Board approved changing the fiscal year end of the Fund from December 31 to November 30. |
See Notes to Financial Statements.
| | | | |
| | THE FIRST NAME IN COMMODITY EQUITIES | | STATEMENTS OF CHANGES IN NET ASSETS |
| | | | JEFFERIES | TR/J CRB GLOBAL INDUSTRIAL METALS EQUITY INDEX FUND |
| | | | | | | | | | | | |
| | | For the Period
January 1, 2011 to
November 30, 2011(a) | | | For the Year Ended
December 31, 2010 | | | For the Period
October 27, 2009 (Inception)
through December 31, 2009 | |
OPERATIONS: | | | | | | | | | | | | |
Net investment income/(loss) | | $ | 82,480 | | | $ | 51,682 | | | $ | (264 | ) |
Net realized gain/(loss) on investments and foreign currency transactions | | | 367,873 | | | | (339,527 | ) | | | (503 | ) |
Net change in unrealized appreciation/ (depreciation) on investments and foreign currency | | | (1,929,415 | ) | | | 592,036 | | | | 310,572 | |
| |
Net increase/(decrease) in net assets resulting from operations | | | (1,479,062 | ) | | | 304,191 | | | | 309,805 | |
| |
| | | |
DISTRIBUTIONS TO SHAREHOLDERS: | | | | | | | | | | | | |
From net investment income | | | (74,108 | ) | | | (50,139 | ) | | | – | |
| |
Total distributions | | | (74,108 | ) | | | (50,139 | ) | | | – | |
| |
| | | | | | | | | | | | |
SHARE TRANSACTIONS: | | | | | | | | | | | | |
Proceeds from sale of shares | | | 6,652,719 | | | | 8,585,907 | | | | 3,941,376 | |
Cost of shares redeemed | | | (6,680,517 | ) | | | (8,186,553 | ) | | | – | |
| |
Net increase/(decrease) from share transactions | | | (27,798 | ) | | | 399,354 | | | | 3,941,376 | |
| |
Net increase/(decrease) in net assets | | | (1,580,968 | ) | | | 653,406 | | | | 4,251,181 | |
| |
| | | |
NET ASSETS: | | | | | | | | | | | | |
Beginning of period | | | 4,904,587 | | | | 4,251,181 | | | | – | |
| |
End of period* | | $ | 3,323,619 | | | $ | 4,904,587 | | | $ | 4,251,181 | |
| |
| | | | | | | | | | | | |
*Including (over)/undistributed net investment income of: | | $ | 6,499 | | | $ | 1,255 | | | $ | (1,010 | ) |
| | | |
Other Information: | | | | | | | | | | | | |
SHARE TRANSACTIONS: | | | | | | | | | | | | |
Beginning shares | | | 100,000 | | | | 100,000 | | | | – | |
Shares sold | | | 150,000 | | | | 200,000 | | | | 100,000 | |
Shares redeemed | | | (150,000 | ) | | | (200,000 | ) | | | – | |
| |
Shares outstanding, end of period | | | 100,000 | | | | 100,000 | | | | 100,000 | |
| |
| (a) | Effective March 7, 2011, the Board approved changing the fiscal year end of the Fund from December 31 to November 30. |
See Notes to Financial Statements.
| | |
20 | | Annual Report | November 30, 2011 |
| | | | |
| | THE FIRST NAME IN COMMODITY EQUITIES | | STATEMENTS OF CHANGES IN NET ASSETS |
| | | | JEFFERIES | TR/J CRB WILDCATTERS EXPLORATION & PRODUCTION EQUITY ETF |
| | | | | | | | |
| | | For the Period
January 1, 2011 to
November 30, 2011(a) | | | For the Period Ended
January 20, 2010
(Inception) through
December 31, 2010 | |
OPERATIONS: | | | | | | | | |
Net investment loss | | $ | (29,737 | ) | | $ | (4,650 | ) |
Net realized gain on investments and foreign currency transactions | | | 1,763,771 | | | | 330,835 | |
Net change in unrealized appreciation/(depreciation) on investments and foreign currency | | | (5,512,181 | ) | | | 2,088,996 | |
| |
Net increase/(decrease) in net assets resulting from operations | | | (3,778,147 | ) | | | 2,415,181 | |
| |
| | |
SHARE TRANSACTIONS: | | | | | | | | |
Proceeds from sale of shares | | | 21,212,244 | | | | 18,794,978 | |
Cost of shares redeemed | | | (19,525,348 | ) | | | (6,399,772 | ) |
| |
Net increase from share transactions | | | 1,686,896 | | | | 12,395,206 | |
| |
Net increase/(decrease) in net assets | | | (2,091,251 | ) | | | 14,810,387 | |
| |
| | | | | | | | |
NET ASSETS: | | | | | | | | |
Beginning of period | | | 14,810,387 | | | | – | |
| |
End of period* | | $ | 12,719,136 | | | $ | 14,810,387 | |
| |
| | |
*Including overdistributed net investment income of: | | $ | – | | | $ | – | |
| | | | | | | | |
Other Information: | | | | | | | | |
SHARE TRANSACTIONS: | | | | | | | | |
Beginning shares | | | 300,000 | | | | – | |
Shares sold | | | 400,000 | | | | 450,000 | |
Shares redeemed | | | (400,000 | ) | | | (150,000 | ) |
| |
Shares outstanding, end of period | | | 300,000 | | | | 300,000 | |
| |
| (a) | Effective March 7, 2011, the Board approved changing the fiscal year end of the Fund from December 31 to November 30. |
See Notes to Financial Statements.
| | | | |
| | THE FIRST NAME IN COMMODITY EQUITIES | | FINANCIAL HIGHLIGHTS |
| | | | JEFFERIES | TR/J CRB GLOBAL COMMODITY EQUITY INDEX FUND For a Share Outstanding Throughout the Periods Presented |
| | | | | | | | | | | | | | | |
| | | For the Period January 1, 2011 to November 30, 2011(a) | | For the Year Ended December 31, 2010 | | For the Period Ended September 21, 2009
(Inception) through December 31, 2009 |
NET ASSET VALUE, BEGINNING OF PERIOD | | | $ | 49.33 | | | | $ | 42.82 | | | | $ | 39.74 | |
| | | |
INCOME/(LOSS) FROM OPERATIONS: | | | | | | | | | | | | | | | |
Net investment income | | | | 0.58 | (b) | | | | 0.46 | (b) | | | | 0.12 | |
Net realized and unrealized gain/(loss) on investments | | | | (4.78 | ) | | | | 6.54 | | | | | 3.08 | |
Total from Investment Operations | | | | (4.20 | ) | | | | 7.00 | | | | | 3.20 | |
| | | |
LESS DISTRIBUTIONS: | | | | | | | | | | | | | | | |
From net investment income | | | | (0.48 | ) | | | | (0.49 | ) | | | | (0.12 | ) |
Total Distributions | | | | (0.48 | ) | | | | (0.49 | ) | | | | (0.12 | ) |
NET INCREASE/(DECREASE) IN NET ASSET VALUE | | | | (4.68 | ) | | | | 6.51 | | | | | 3.08 | |
NET ASSET VALUE, END OF PERIOD | | | $ | 44.65 | | | | $ | 49.33 | | | | $ | 42.82 | |
TOTAL RETURN(c) | | | | (8.56 | )% | | | | 16.60 | % | | | | 8.06 | % |
| | | |
RATIOS/ SUPPLEMENTAL DATA: | | | | | | | | | | | | | | | |
Net assets, end of period (in 000s) | | | $ | 91,539 | | | | $ | 111,001 | | | | $ | 70,658 | |
| | | |
RATIOS TO AVERAGE NET ASSETS: | | | | | | | | | | | | | | | |
Net investment income | | | | 1.29 | %(d) | | | | 1.09 | % | | | | 1.53 | %(d) |
Operating Expenses | | | | 0.65 | %(d) | | | | 0.65 | % | | | | 0.65 | %(d) |
PORTFOLIO TURNOVER RATE(e) | | | | 10 | % | | | | 18 | % | | | | 7 | % |
| (a) | Effective March 7, 2011, the Board approved changing the fiscal year end of the Fund from December 31 to November 30. |
| (b) | Calculated using average shares outstanding. |
| (c) | Total return is calculated assuming an initial investment made at the net asset value at the beginning of the period and redemption at the net asset value on the last day of the period and assuming all distributions are reinvested at actual reinvestment prices. Total return calculated for a period of less than one year is not annualized. |
| (e) | Portfolio turnover is not annualized and does not include securities received or delivered from processing creations or redemptions. |
See Notes to Financial Statements.
| | |
22 | | Annual Report | November 30, 2011 |
| | | | |
| | THE FIRST NAME IN COMMODITY EQUITIES | | FINANCIAL HIGHLIGHTS |
| | | | JEFFERIES | TR/J CRB GLOBAL AGRICULTURE EQUITY INDEX FUND For a Share Outstanding Throughout the Periods Presented |
| | | | | | | | | | | | | | | |
| | | For the Period January 1, 2011 to
November 30, 2011(a) | | For the Year Ended December 31, 2010 | | For the Period Ended October 27, 2009 (Inception) through
December 31, 2009 |
NET ASSET VALUE, BEGINNING OF PERIOD | | | $ | 52.20 | | | | $ | 42.23 | | | | $ | 39.30 | |
| | | |
INCOME/(LOSS) FROM OPERATIONS: | | | | | | | | | | | | | | | |
Net investment income | | | | 0.45 | (b) | | | | 0.35 | (b) | | | | 0.23 | |
Net realized and unrealized gain/(loss) on investments | | | | (6.67 | ) | | | | 10.34 | | | | | 2.96 | |
Total from Investment Operations | | | | (6.22 | ) | | | | 10.69 | | | | | 3.19 | |
| | | |
LESS DISTRIBUTIONS: | | | | | | | | | | | | | | | |
From net investment income | | | | (0.31 | ) | | | | (0.72 | ) | | | | (0.26 | ) |
Total Distributions | | | | (0.31 | ) | | | | (0.72 | ) | | | | (0.26 | ) |
NET INCREASE/(DECREASE) IN NET ASSET VALUE | | | | (6.53 | ) | | | | 9.97 | | | | | 2.93 | |
NET ASSET VALUE, END OF PERIOD | | | $ | 45.67 | | | | $ | 52.20 | | | | $ | 42.23 | |
TOTAL RETURN(c) | | | | (11.97 | )% | | | | 25.60 | % | | | | 8.10 | % |
| | | |
RATIOS/ SUPPLEMENTAL DATA: | | | | | | | | | | | | | | | |
Net assets, end of period (in 000s) | | | $ | 9,133 | | | | $ | 7,830 | | | | $ | 4,223 | |
| | | |
RATIOS TO AVERAGE NET ASSETS: | | | | | | | | | | | | | | | |
Net investment income | | | | 0.96 | %(d) | | | | 0.82 | % | | | | 3.03 | %(d) |
Operating Expenses | | | | 0.65 | %(d) | | | | 0.65 | % | | | | 0.65 | %(d) |
PORTFOLIO TURNOVER RATE(e) | | | | 10 | % | | | | 16 | % | | | | 9 | % |
| (a) | Effective March 7, 2011, the Board approved changing the fiscal year end of the Fund from December 31 to November 30. |
| (b) | Calculated using average shares outstanding. |
| (c) | Total return is calculated assuming an initial investment made at the net asset value at the beginning of the period and redemption at the net asset value on the last day of the period and assuming all distributions are reinvested at actual reinvestment prices. Total return calculated for a period of less than one year is not annualized. |
| (e) | Portfolio turnover is not annualized and does not include securities received or delivered from processing creations or redemptions. |
See Notes to Financial Statements.
| | | | |
| | THE FIRST NAME IN COMMODITY EQUITIES | | FINANCIAL HIGHLIGHTS |
| | | | JEFFERIES | TR/J CRB GLOBAL INDUSTRIAL METALS EQUITY INDEX FUND For a Share Outstanding Throughout the Periods Presented |
| | | | | | | | | | | | |
| | | For the Period
January 1, 2011 to
November 30, 2011(a) | | | For the Year Ended
December 31, 2010 | | | For the Period Ended
October 27, 2009
(Inception) through
December 31, 2009 | |
NET ASSET VALUE, BEGINNING OF PERIOD | | $ | 49.05 | | | $ | 42.51 | | | $ | 39.41 | |
|
INCOME/(LOSS) FROM OPERATIONS: | |
Net investment income/(loss) | | | 0.74 | (b) | | | 0.42 | (b) | | | (0.00 | )(c) |
Net realized and unrealized gain/(loss) on investments | | | (15.85 | ) | | | 6.59 | | | | 3.10 | |
Total from Investment Operations | | | (15.11 | ) | | | 7.01 | | | | 3.10 | |
| | | |
LESS DISTRIBUTIONS: | | | | | | | | | | | | |
From net investment income | | | (0.70 | ) | | | (0.47 | ) | | | – | |
Total Distributions | | | (0.70 | ) | | | (0.47 | ) | | | – | |
NET INCREASE/(DECREASE) IN NET ASSET VALUE | | | (15.81 | ) | | | 6.54 | | | | 3.10 | |
NET ASSET VALUE, END OF PERIOD | | $ | 33.24 | | | $ | 49.05 | | | $ | 42.51 | |
| | | | | | | | | | | | | |
TOTAL RETURN(d) | | | (31.01 | )% | | | 16.86 | % | | | 7.87 | % |
|
RATIOS/ SUPPLEMENTAL DATA: | |
Net assets, end of period (in 000s) | | $ | 3,324 | | | $ | 4,905 | | | $ | 4,251 | |
|
RATIOS TO AVERAGE NET ASSETS: | |
Net investment income/(loss) | | | 1.87 | %(e) | | | 1.05 | % | | | (0.04 | )%(e) |
Operating Expenses | | | 0.65 | %(e) | | | 0.65 | % | | | 0.65 | %(e) |
PORTFOLIO TURNOVER RATE(f) | | | 14 | % | | | 17 | % | | | 5 | % |
| (a) | Effective March 7, 2011, the Board approved changing the fiscal year end of the Fund from December 31 to November 30. |
| (b) | Calculated using average shares outstanding. |
| (c) | Less than $(0.005) per share. |
| (d) | Total return is calculated assuming an initial investment made at the net asset value at the beginning of the period and redemption at the net asset value on the last day of the period and assuming all distributions are reinvested at actual reinvestment prices. Total return calculated for a period of less than one year is not annualized. |
| (f) | Portfolio turnover is not annualized and does not include securities received or delivered from processing creations or redemptions. |
See Notes to Financial Statements.
| | |
24 | | Annual Report | November 30, 2011 |
| | | | |
| | THE FIRST NAME IN COMMODITY EQUITIES | | FINANCIAL HIGHLIGHTS |
| | | | JEFFERIES | TR/J CRB WILDCATTERS EXPLORATION & PRODUCTION EQUITY ETF For a Share Outstanding Throughout the Period Presented |
| | | | | | | | |
| | | For the Period
January 1, 2011 to
November 30, 2011(a) | | | For the Period
January 20, 2010
(Inception) through
December 31, 2010 | |
NET ASSET VALUE, BEGINNING OF PERIOD | | $ | 49.37 | | | $ | 40.23 | |
|
INCOME/(LOSS) FROM OPERATIONS: | |
Net investment loss(b) | | | (0.07 | ) | | | (0.03 | ) |
Net realized and unrealized gain/(loss) on investments | | | (6.90 | ) | | | 9.17 | |
Total from Investment Operations | | | (6.97 | ) | | | 9.14 | |
| | |
NET INCREASE IN NET ASSET VALUE | | | (6.97 | ) | | | 9.14 | |
NET ASSET VALUE, END OF PERIOD | | $ | 42.40 | | | $ | 49.37 | |
| | | | | | | | | |
TOTAL RETURN(c) | | | (14.12 | )% | | | 22.72 | % |
| | |
| | | | | | | | |
RATIOS/ SUPPLEMENTAL DATA: | | | | | | | | |
Net assets, end of period (in 000s) | | $ | 12,719 | | | $ | 14,810 | |
| | |
| | | | | | | | |
RATIOS TO AVERAGE NET ASSETS: | | | | | | | | |
Net investment loss | | | (0.16 | )%(d) | | | (0.08 | )%(d) |
Operating Expenses | | | 0.65 | %(d) | | | 0.65 | %(d) |
PORTFOLIO TURNOVER RATE(e) | | | 14 | % | | | 34 | % |
| (a) | Effective March 7, 2011, the Board approved changing the fiscal year end of the Fund from December 31 to November 30. |
| (b) | Calculated using average shares outstanding. |
| (c) | Total return is calculated assuming an initial investment made at the net asset value at the beginning of the period and redemption at the net asset value on the last day of the period and assuming all distributions are reinvested at actual reinvestment prices. Total return calculated for a period of less than one year is not annualized. |
| (e) | Portfolio turnover is not annualized and does not include securities received or delivered from processing creations or redemptions. |
See Notes to Financial Statements.
| | | | |
| | THE FIRST NAME IN COMMODITY EQUITIES | | NOTES TO FINANCIAL STATEMENTS |
| | | | November 30, 2011 |
1. ORGANIZATION
The ALPS ETF Trust (the “Trust”) is an open-end management investment company organized as a Delaware statutory trust on September 13, 2007 and is registered with the Securities and Exchange Commission (“SEC”) under the Investment Company Act of 1940, as amended (the “1940 Act”). As of November 30, 2011, the Trust consists of seven separate portfolios. Each portfolio represents a separate series of the Trust. This report pertains to the Jefferies | TR/J CRB Global Commodity Equity Index Fund, Jefferies | TR/J CRB Global Agriculture Equity Index Fund, Jefferies | TR/J CRB Global Industrial Metals Equity Index Fund and Jefferies | TR/J CRB Wildcatters Exploration & Production Equity ETF (the “Funds”). The investment objective of the Funds is to seek investment results that correspond generally to the price and yield (before the Funds’ fees and expenses) of the Thomson Reuters/Jefferies CRB In-The-Ground Global Commodity Equity Index, the Thomson Reuters/Jefferies CRB In-The-Ground Global Agriculture Equity Index Thomson Reuters/Jefferies CRB In-The-Ground Global Industrial Metals Equity Index and the Thomson Reuters/Jefferies CRB Wildcatters Energy Exploration & Production Equity Index (the “Underlying Indices”), respectively.
The Funds’ Shares (“Shares”) are listed on the New York Stock Exchange (“NYSE”) Arca. The Funds issue and redeem Shares, at net asset value (“NAV”) in blocks of 50,000 Shares, each of which is called a “Creation Unit.” Creation Units are issued and redeemed principally in-kind for securities included in a specified index. Except when aggregated in Creation Units, Shares are not redeemable securities of the Funds.
2. SIGNIFICANT ACCOUNTING POLICIES
The following is a summary of significant accounting policies consistently followed by the Funds in the preparation of the financial statements. The accompanying financial statements were prepared in accordance with accounting principles generally accepted in the United States of America (“U.S. GAAP”). The preparation of financial statements in conformity with U.S. GAAP requires management to make certain estimates and assumptions that affect the reported amounts of assets and liabilities and disclosures of contingent assets and liabilities at the date of the financial statements and the reported amounts of revenue and expenses during the period. Actual results could differ from those estimates.
A. Portfolio Valuation
The Funds’ NAV is determined daily, as of the close of regular trading on the NYSE, normally 4:00 p.m. Eastern time, on each day the NYSE is open for trading. The NAV is computed by dividing the value of all assets of the Fund (including accrued interest and dividends), less all liabilities (including accrued expenses and dividends declared but unpaid), by the total number of shares outstanding.
Portfolio securities listed on any exchange other than the National Association of Securities Dealer Automated Quotation (“NAS-DAQ”) exchange are valued at the last sale price on the business day as of which such value is being determined. If there has been no sale on such day, the securities are valued at the mean of the most recent bid and asked prices on such day. Securities traded on the NASDAQ are valued at the NASDAQ Official Closing Price as determined by NASDAQ. Portfolio securities traded on more than one securities exchange are valued at the last sale price on the business day as of which such value is being determined at the close of the exchange representing the principal market for such securities. Portfolio securities traded in the over-the-counter market, but excluding securities traded on the NASDAQ, are valued at the closing bid prices. Short-term investments that mature in less than 60 days are valued at amortized cost, which approximates market value.
The Funds’ investments are valued at market value or, in the absence of market value with respect to any portfolio securities, at fair value according to procedures adopted by the Trust’s Board of Trustees (the “Board”). When market quotations are not readily available or when events occur that make established valuation methods unreliable, securities of the Funds may be valued in good faith by or under the direction of the Board. These securities generally include, but are not limited to, restricted securities (securities which may not be publicly sold without registration under the Securities Act of 1933) for which a pricing service is unable to provide a market price; securities whose trading has been formally suspended; a security whose market price is not available from a pre-established primary pricing source or the pricing source is not willing to provide a price; a security with respect to which an event has occurred that is most likely to materially affect the value of the security after the market has closed but before the calculation of the Funds’ NAV or make it difficult or impossible to obtain a reliable market quotation; or a security whose price, as provided by the pricing service, does not reflect the security’s “fair value” due to the security being de-listed from a national exchange or the security’s primary trading market is temporarily closed at a time when, under normal conditions, it would be open. As a general principle, the current “fair value” of a security would be the amount which the owner might reasonably expect to receive from the closing sale prices on the applicable exchange and fair value prices may not reflect the actual value of a security. A variety of factors may be considered in determining the fair value of such securities.
| | |
26 | | Annual Report | November 30, 2011 |
| | | | |
| | THE FIRST NAME IN COMMODITY EQUITIES | | NOTES TO FINANCIAL STATEMENTS |
| | | | November 30, 2011 |
B. Foreign Currency Translation and Foreign Investments
The Funds invest in foreign securities which may involve a number of risk factors and special considerations not present with investments in securities of U.S. Corporations. The accounting records of the Funds are maintained in U.S. dollars. Investment in non-U.S. issuers may involve unique risks compared to investing in securities of U.S. issuers. These risks may include, but are not limited to: (i) less information about non-U.S. issuers or markets may be available due to less rigorous disclosure, accounting standards or regulatory practices; (ii) many non-U.S. markets are smaller, less liquid and more volatile thus, in a changing market, the advisers may not be able to sell the Fund’s portfolio securities at times, in amounts and at prices they consider reasonable; (iii) currency exchange rates or controls may adversely affect the value of the Fund’s investments; (iv) the economies of non-U.S. countries may grow at slower rates than expected or may experience downturns or recessions; and, (v) withholdings and other non-U.S. taxes may decrease the Fund’s return.
Portfolio securities and other assets and liabilities denominated in a foreign currency are translated to U.S. dollars at the prevailing rates of exchange at period end. Amounts related to the purchases and sales of securities and investment income are translated into U.S. dollars at the prevailing exchange rate on the respective dates of transactions. The effects of changes in foreign currency exchange rates on portfolio investments are included in the net realized and unrealized gains and losses on investments. Net gains and losses on foreign currency transactions include disposition of foreign currencies, and currency gains and losses between the accrual and receipt dates of portfolio investment income and between the trade and settlement dates of portfolio investment transactions.
C. Securities Transactions and Investment Income
Securities transactions are recorded as of the trade date. Realized gains and losses from securities transactions are recorded on the identified cost basis. Dividend income is recorded on the ex-dividend date. Interest income, if any, is recorded on the accrual basis.
D. Federal Tax Information
The timing and character of income and capital gain distributions are determined in accordance with income tax regulations, which may differ from U.S. GAAP. Reclassifications are made to the Funds’ capital accounts for permanent tax differences to reflect income and gains available for distribution (or available capital loss carryforwards) under income tax regulations.
For the period ended November 30, 2011, permanent book and tax differences resulting primarily from differing treatment of foreign currency and in-kind transactions were identified and reclassified among the components of the Funds’ net assets as follows:
| | | | | | | | | | | | |
| | | Undistributed
Net Investment
Income/(Loss) | | | Accumulated Net Realized Gain/(Loss) | | | Paid-in Capital | |
Jefferies | TR/J CRB Global Commodity Equity Index Fund | | $ | (42,106 | ) | | $ | (8,114,581 | ) | | $ | 8,156,687 | |
Jefferies | TR/J CRB Global Agriculture Equity Index Fund | | | 4,517 | | | | (638,131 | ) | | | 633,614 | |
Jefferies | TR/J CRB Global Industrial Metals Equity Index Fund | | | (3,128 | ) | | | (408,574 | ) | | | 411,702 | |
Jefferies | TR/J CRB Wildcatters Exploration & Production Equity ETF | | | 29,737 | | | | (2,198,570 | ) | | | 2,168,833 | |
Included in the amounts reclassified was a net operating loss offset to Paid in Capital of:
| | | | | | |
Jefferies | TR/J CRB Wildcatters Exploration & Production Equity ETF | | | | $ | 49,926 | |
Net investment income/(loss) and net realized (loss), as disclosed on the Statements of Operations, and net assets were not affected by this reclassification.
Under the Regulated Investment Company Modernization Act of 2010 (“the Modernization Act”), net capital losses recognized in tax years beginning after December 22, 2010 may be carried forward indefinitely, and the character of the losses is retained as short-term and/or long-term. Under the law in effect prior to the Modernization Act, net capital losses were carried forward for eight years and treated as short-term. As a transition rule, the Modernization Act requires that post-enactment net capital losses be used before pre-enactment net capital losses. Additionally, post-enactment capital losses that are carried forward will retain their character as either short-term or long-term losses rather than being considered all short-term as under previous law.
| | | | |
| | THE FIRST NAME IN COMMODITY EQUITIES | | NOTES TO FINANCIAL STATEMENTS |
| | | | November 30, 2011 |
At November 30, 2011, the Funds had available for tax purposes unused pre-enactment capital loss carryforwards as follows:
| | | | | | |
| | | | | Expiring December 31, 2018 | |
Jefferies | TR/J CRB Global Commodity Equity Index Fund | | | | $ | 684,426 | |
Jefferies | TR/J CRB Global Agriculture Equity Index Fund | | | | | 0 | |
Jefferies | TR/J CRB Global Industrial Metals Equity Index Fund | | | | | 110,168 | |
Jefferies | TR/J CRB Wildcatters Exploration & Production Equity ETF | | | | | 0 | |
At November 30, 2011, the Funds have available for tax purposes unused post-enactment capital loss carryforwards as follows:
| | | | | | | | |
| | | Short-Term | | | Long-Term | |
Jefferies | TR/J CRB Global Commodity Equity Index Fund | | $ | 856,228 | | | $ | 177,522 | |
Jefferies | TR/J CRB Global Agriculture Equity Index Fund | | | 105,872 | | | | 3,014 | |
Jefferies | TR/J CRB Global Industrial Metals Equity Index Fund | | | 29,207 | | | | 41,384 | |
Jefferies | TR/J CRB Wildcatters Exploration & Production Equity ETF | | | 353,754 | | | | 192,142 | |
E. Dividends and Distributions to Shareholders
Dividends from net investment income of the Funds, if any, are declared and paid quarterly or as the Board of Trustees may determine from time to time. Distributions of net realized capital gains earned by the Funds, if any, are distributed at least annually.
Distributions from net investment income and capital gains are determined in accordance with income tax regulations, which may differ from U.S. GAAP. These differences are primarily due to differing treatments of income and gains on various investment securities held by the Funds, timing differences and differing characterization of distributions made by the Funds.
The tax character of the distributions paid was as follows:
| | | | | | | | | | | | |
| | | | | Period Ended November 30, 2011
Distributions paid from:
Ordinary Income | | | | | Period Ended December 31, 2010 Distributions paid from:
Ordinary Income | |
Jefferies | TR/J CRB Global Commodity Equity Index Fund | | | | $ | 1,248,722 | | | | | $ | 873,185 | |
Jefferies | TR/J CRB Global Agriculture Equity Index Fund | | | | | 73,725 | | | | | | 71,522 | |
Jefferies | TR/J CRB Global Industrial Metals Equity Index Fund | | | | | 74,108 | | | | | | 50,139 | |
Jefferies | TR/J CRB Wildcatters Exploration & Production Equity ETF | | | | | 0 | | | | | | 0 | |
As of November 30, 2011, the components of distributable earnings on a tax basis for the Funds were as follows:
| | | | | | | | | | | | | | | | |
| | | Jefferies | TR/J CRB Global Commodity
Equity Index Fund | | | Jefferies | TR/J CRB
Global Agriculture
Equity Index Fund | | | Jefferies | TR/J CRB
Global Industrial
Metals Equity Index Fund | | | Jefferies | TR/J CRB
Wildcatters Exploration & Production Equity ETF | |
Undistributed net investment income | | $ | 192,405 | | | $ | 28,609 | | | $ | 6,487 | | | $ | 71,709 | |
Accumulated Capital (losses) | | | (1,718,176) | | | | (107,107) | | | | (180,759) | | | | (545,896) | |
Net unrealized depreciation on investments and translation of assets and liabilities denominated in foreign currencies | | | (9,314,047) | | | | (1,186,260) | | | | (1,053,846) | | | | (3,400,485) | |
Other Cumulative Effect of Timing Differences | | | 21 | | | | 0 | | | | 12 | | | | 0 | |
Total | | $ | (10,839,797) | | | $ | (1,264,758) | | | $ | (1,228,106) | | | $ | (3,874,672) | |
The differences between book-basis and tax-basis are primarily due to the deferral of post-October losses and the differing treatment of certain other investments.
F. Income Taxes
No provision for income taxes is included in the accompanying financial statements, as the Funds intend to distribute to shareholders all taxable investment income and realized gains and otherwise comply with Subchapter M of the Internal Revenue Code applicable to regulated investment companies.
| | |
28 | | Annual Report | November 30, 2011 |
| | | | |
| | THE FIRST NAME IN COMMODITY EQUITIES | | NOTES TO FINANCIAL STATEMENTS |
| | | | November 30, 2011 |
The Funds evaluate tax positions taken (or expected to be taken) in the course of preparing the Funds’ tax returns to determine whether these positions meet a “more-likely-than-not” standard that, based on the technical merits, have a more than fifty percent likelihood of being sustained by a taxing authority upon examination. A tax position that meets the “more-likely-than-not” recognition threshold is measured to determine the amount of benefit to recognize in the financial statements.
Management of the Funds analyzes all open tax years, as defined by the Statute of Limitations, for all major jurisdictions, including federal tax authorities and certain state tax authorities. As of and during the fiscal year ended November 30, 2011, the Funds did not have a liability for any unrecognized tax benefits. The Funds will file income tax returns in the U.S. federal jurisdiction and Colorado. For the years ended December 31, 2009 through November 30, 2011, the Funds’ returns will be open to examination by the appropriate taxing authority.
G. Fair Value Measurements
The Funds disclose the classification of their fair value measurements following a three-tier hierarchy based on the inputs used to measure fair value. Inputs refer broadly to the assumptions that market participants would use in pricing the asset or liability, including assumptions about risk. Inputs may be observable or unobservable. Observable inputs reflect the assumptions market participants would use in pricing the asset or liability that are developed based on market data obtained from sources independent of the reporting entity. Unobservable inputs reflect the reporting entity’s own assumptions about the assumptions market participants would use in pricing the asset or liability that are developed based on the best information available.
Various inputs are used in determining the value of the Funds’ investments as of the end of the reporting period. When inputs used fall into different levels of the fair value hierarchy, the level in the hierarchy within which the fair value measurement falls is determined based on the lowest level input that is significant to the fair value measurement in its entirety. The designated input levels are not necessarily an indication of the risk or liquidity associated with these investments. These inputs are categorized in the following hierarchy under applicable financial accounting standards:
| | |
| Level 1 – | | Unadjusted quoted prices in active markets for identical assets or liabilities that the Fund has the ability to access. |
| Level 2 – | | Observable inputs other than quoted prices included in level 1 that are observable for the asset or liability, either directly or indirectly. These inputs may include quoted prices for the identical instrument on an inactive market, prices for similar instruments, interest rates, prepayment speeds, credit risk, yield curves, default rates, and similar data. |
| Level 3 – | | Unobservable inputs for the asset or liability, to the extent relevant observable inputs are not available, representing the Fund’s own assumptions about the assumptions a market participant would use in valuing the asset or liability, and would be based on the best information available. |
Jefferies | TR/J CRB Global Commodity Equity Index Fund
| | | | | | | | | | | | | | | | |
| Investments in Securities at Value* | | Level 1 -
Unadjusted
Quoted Prices | | | Level 2 - Other Significant
Observable Inputs | | | Level 3 -
Significant
Unobservable
Inputs | | | Total | |
Common Stocks | | $ | 91,161,528 | | | $ | – | | | $ | – | | | $ | 91,161,528 | |
TOTAL | | $ | 91,161,528 | | | $ | – | | | $ | – | | | $ | 91,161,528 | |
| Jefferies | TR/J CRB Global Agriculture Equity Index Fund | | | | | |
| Investments in Securities at Value* | | Level 1 -
Unadjusted
Quoted Prices | | | Level 2 - Other Significant
Observable Inputs | | | Level 3 -
Significant
Unobservable
Inputs | | | Total | |
Common Stocks | | $ | 9,087,652 | | | $ | – | | | $ | – | | | $ | 9,087,652 | |
TOTAL | | $ | 9,087,652 | | | $ | – | | | $ | – | | | $ | 9,087,652 | |
Jefferies | TR/J CRB Global Industrial Metals Equity Index Fund | | | | | |
| Investments in Securities at Value* | | Level 1 -
Unadjusted
Quoted Prices | | | Level 2 - Other Significant
Observable Inputs | | | Level 3 -
Significant
Unobservable
Inputs | | | Total | |
Common Stocks | | $ | 3,294,024 | | | $ | – | | | $ | – | | | $ | 3,294,024 | |
TOTAL | | $ | 3,294,024 | | | $ | – | | | $ | – | | | $ | 3,294,024 | |
| | | | |
| | THE FIRST NAME IN COMMODITY EQUITIES | | NOTES TO FINANCIAL STATEMENTS |
| | | | November 30, 2011 |
Jefferies | TR/J CRB Wildcatters Exploration & Production Equity ETF
| | | | | | | | | | | | | | | | |
| Investments in Securities at Value* | | Level 1 - Unadjusted Quoted Prices | | | Level 2 - Other Significant Observable Inputs | | | Level 3 - Significant
Unobservable Inputs | | | Total | |
Common Stocks | | $ | 12,698,526 | | | $ | – | | | $ | – | | | $ | 12,698,526 | |
Warrants | | | – | | | | – | | | | – | | | | – | |
TOTAL | | $ | 12,698,526 | | | $ | – | | | $ | – | | | $ | 12,698,526 | |
| * | For detailed country descriptions, see the accompanying Schedule of Investments. |
For the period ended November 30, 2011, the Funds did not have any significant transfers between Level 1 and Level 2 securities. The Funds did not have any securities which used significant unobservable inputs (Level 3) in determining fair value.
3. INVESTMENT ADVISORY FEE AND OTHER AFFILIATED TRANSACTIONS
ALPS Advisors, Inc. (the “Investment Adviser”) acts as the Funds’ investment adviser pursuant to an advisory agreement with the Trust on behalf of the Fund (the “Advisory Agreement”). Pursuant to the Advisory Agreement, the Funds pay the Investment Adviser a unitary fee for the services and facilities it provides payable on a monthly basis at the annual rate of 0.65% of the Funds’ average daily net assets. From time to time, the Investment Adviser may waive all or a portion of its fee.
Out of the unitary management fee, the Investment Adviser pays substantially all expenses of the Funds, including the licensing fee of the Index provider, and the cost of transfer agency, custody, fund administration, legal, audit, trustees and other services, except for interest expenses, distribution fees or expenses, brokerage expenses, taxes and extraordinary expenses not incurred in the ordinary course of the Funds’ business. In addition, the Investment Adviser’s unitary management fee is designed to compensate the Investment Adviser for providing services for the Funds.
ALPS Fund Services, Inc. (“ALPS”), an affiliate of the Investment Adviser, is the administrator of the Funds.
The Bank of New York Mellon is the custodian, fund accounting agent and transfer agent for the Funds.
Each Trustee who is not an officer or employee of the Investment Adviser, any sub-adviser or any of their affiliates (“Independent Trustees”) is paid a quarterly retainer of $3,500, $1,500 for each regularly scheduled Board meeting attended and $750 for each special meeting held outside of regularly scheduled meetings.
4. PURCHASES AND SALES OF SECURITIES
For the period ended November 30, 2011, the cost of purchases and proceeds from sales of investment securities, excluding short-term investments and in-kind transactions, were as follows:
| | | | | | | | |
| | | Purchases | | | Sales | |
Jefferies | TR/J CRB Global Commodity Equity Index Fund | | $ | 12,970,251 | | | $ | 13,518,207 | |
Jefferies | TR/J CRB Global Agriculture Equity Index Fund | | | 1,224,699 | | | | 1,108,832 | |
Jefferies | TR/J CRB Global Industrial Metals Equity Index Fund | | | 678,389 | | | | 706,497 | |
Jefferies | TR/J CRB Wildcatters Exploration & Production Equity ETF | | | 2,802,974 | | | | 2,835,513 | |
For the period ended November 30, 2011, the cost of in-kind purchases and proceeds from in-kind sales were as follows:
| | | | | | | | |
| | | Purchases | | | Sales | |
Jefferies | TR/J CRB Global Commodity Equity Index Fund | | $ | 51,637,309 | | | $ | 54,640,289 | |
Jefferies | TR/J CRB Global Agriculture Equity Index Fund | | | 5,937,328 | | | | 2,747,705 | |
Jefferies | TR/J CRB Global Industrial Metals Equity Index Fund | | | 2,175,264 | | | | 2,207,885 | |
Jefferies | TR/J CRB Wildcatters Exploration & Production Equity ETF | | | 17,648,778 | | | | 15,953,141 | |
Gains on in-kind transactions are not considered taxable for federal income tax purposes.
| | |
30 | | Annual Report | November 30, 2011 |
| | | | |
| | THE FIRST NAME IN COMMODITY EQUITIES | | NOTES TO FINANCIAL STATEMENTS |
| | | | November 30, 2011 |
As of November 30, 2011, the costs of investments for federal income tax purposes and accumulated net unrealized appreciation/(depreciation) on investments were as follows:
| | | | | | | | | | | | | | | | |
| | | Jefferies | TR/J CRB Global Commodity Equity Index Fund | | | Jefferies | TR/J CRB Global Agriculture Equity Index Fund | | | Jefferies | TR/J CRB Global Industrial Metals Equity Index Fund | | | Jefferies | TR/J CRB Wildcatters Exploration & Production Equity ETF | |
Gross Appreciation (excess of value over tax cost) | | $ | 2,799,615 | | | $ | 93,403 | | | $ | 2,020 | | | $ | 616,349 | |
Gross Depreciation (excess of tax cost over value) | | | (12,115,514 | ) | | | (1,279,927 | ) | | | (1,055,800 | ) | | | (4,016,906 | ) |
| | |
Net Appreciation (depreciation) of foreign currency and derivatives | | | 1,852 | | | | 264 | | | | (66 | ) | | | 72 | |
| | |
Net Unrealized (Depreciation) | | $ | (9,314,047 | ) | | $ | (1,186,260 | ) | | $ | (1,053,846 | ) | | $ | (3,400,485 | ) |
| | |
Cost of investments for income tax purposes | | $ | 100,477,427 | | | $ | 10,274,176 | | | $ | 4,347,804 | | | $ | 16,099,083 | |
| | |
5. CAPITAL SHARE TRANSACTIONS
Shares are created and redeemed by the Funds only in Creation Unit size aggregations of 50,000. Only broker-dealers or large institutional investors with creation and redemption agreements called Authorized Participants (“AP”) are permitted to purchase or redeem Creation Units from the Funds. Such transactions are generally permitted on an in-kind basis, with a balancing cash component to equate the transaction to the net asset value per unit of the Funds on the transaction date. Cash may be substituted equivalent to the value of certain securities generally when they are not available in sufficient quantity for delivery, not eligible for trading by the AP or as a result of other market circumstances.
6.INDEMNIFICATIONS
Under the Trust’s organizational documents, its officers and Trustees are indemnified against certain liability arising out of the performance of their duties to the Trust. Additionally, in the normal course of business, the Trust enters into contracts with service providers that contain general indemnification clauses. The Trust’s maximum exposure under these arrangements is unknown, as this would involve future claims that may be made against the Trust that have not yet occurred.
7. NEW ACCOUNTING PRONOUNCEMENTS
In May 2011, the FASB issued ASU No. 2011-04 “Amendments to Achieve Common Fair Value Measurement and Disclosure Requirements” in GAAP and the International Financial Reporting Standards (“IFRSs”). ASU No.2011-04 amends FASB ASC Topic 820, “Fair Value Measurements and Disclosures”, to establish common requirements for measuring fair value and for disclosing information about fair value measurements in accordance with GAAP and IFRSs. ASU No.2011-04 is effective for fiscal years beginning after December 15, 2011 and for interim periods within those fiscal years. Management is currently evaluating the impact these amendments may have on the Funds’ financial statements.
8.SUBSEQUENT EVENTS
On December 12, 2011, during a meeting of the Board of Trustees, it was decided to liquidate Jefferies| TR/J CRB Global Agriculture Equity Index Fund (CRBA) and Jefferies | TR/J CRB Global Industrial Metals Equity Index Fund (CRBI) (collectively, the “Funds”). The Funds closed to new investors on December 22, 2011 and liquidated on December 28, 2011.
| | | | |
| | THE FIRST NAME IN COMMODITY EQUITIES | | ADDITIONAL INFORMATION |
| | | | November 30, 2011 (Unaudited) |
PROXY VOTING POLICIES AND PROCEDURES
A description of the Funds’ proxy voting policies and procedures used in determining how to vote for proxies and information regarding how the Funds voted proxies related to portfolio securities during the most recent 12-month period ended June 30th is available without charge, (1) on the Securities and Exchange Commission’s (“SEC”) website at http://www.sec.gov; (2) upon request, by calling 1-866-513-5856; and (3) on the Trust’s website located at http://www.alpsfunds.com.
PORTFOLIO HOLDINGS
The Trust will file its complete schedule of portfolio holdings with the SEC for the first and third quarters of each fiscal year on Form N-Q. The Trust’s Form N-Q will be available (1) on the SEC’s website at http://www.sec.gov; (2) by calling 1-866-513-5856; (3) on the Trust’s website located at http://www.alpsfunds.com; and (4) for review and copying at the SEC’s Public Reference Room (“PRR”) in Washington D.C. Information regarding the operation of the PRR may be obtained by calling 1-800-732-0330.
Shareholder Meeting
A Special Meeting of the Shareholders was held on October 14, 2011 for the purpose of voting on a proposal to approve a new Investment Advisory Agreement between ALPS ETF Trust, on behalf of the Funds, and ALPS Advisors, Inc. The proposal passed and the results are noted below.
Proposal 1: To approve a new Investment Advisory Agreement between ALPS ETF Trust, on behalf of the Funds, and ALPS Advisors, Inc.:
| | | | | | | | | | | | | | | | | | | | |
| | | Number of Votes | |
| | | Record Date
Votes | | | Affirmative | | | Against | | | Abstain | | | Uninstructed | |
Jefferies | TR/J CRB Global Commodity
Equity Index Fund | | | 1,436,536.627 | | | | 1,308,544.328 | | | | 49,602.098 | | | | 14,388.201 | | | | 64,002.000 | |
Jefferies | TR/J CRB Global Agriculture
Equity Index Fund | | | 128,019.101 | | | | 101,997.101 | | | | 1,129.000 | | | | 1,729.000 | | | | 23,164.000 | |
Jefferies | TR/J CRB Global Industrial Metals
Equity Index Fund | | | 52,757.991 | | | | 40,587.991 | | | | 500.000 | | | | 440.000 | | | | 11,230.000 | |
Jefferies | TR/J CRB Wildcatters
Exploration & Production Equity ETF | | | 179,026.283 | | | | 137,608.283 | | | | 4,247.000 | | | | 4,646.000 | | | | 32,525.000 | |
| | | | | | | | | | | | | | | | |
| | | Percentages of Total Outstanding | |
| | | Affirmative | | | Against | | | Abstain | | | Uninstructed | |
Jefferies | TR/J CRB Global Commodity Equity Index Fund | | | 48.464 | % | | | 1.837 | % | | | 0.534 | % | | | 2.370 | % |
Jefferies | TR/J CRB Global Agriculture Equity Index Fund | | | 40.799 | % | | | 0.452 | % | | | 0.690 | % | | | 9.266 | % |
Jefferies | TR/J CRB Global Industrial Metals Equity Index Fund | | | 40.588 | % | | | 0.500 | % | | | 0.440 | % | | | 11.230 | % |
Jefferies | TR/J CRB Wildcatters Exploration & Production Equity ETF | | | 39.317 | % | | | 1.213 | % | | �� | 1.327 | % | | | 9.293 | % |
| |
| | | Percentages of Voted | |
| | | Affirmative | | | Against | | | Abstain | | | Uninstructed | |
Jefferies | TR/J CRB Global Commodity Equity Index Fund | | | 91.090 | % | | | 3.453 | % | | | 1.002 | % | | | 4.455 | % |
Jefferies | TR/J CRB Global Agriculture Equity Index Fund | | | 79.673 | % | | | 0.882 | % | | | 1.351 | % | | | 18.094 | % |
Jefferies | TR/J CRB Global Industrial Metals Equity Index Fund | | | 76.932 | % | | | 0.948 | % | | | 0.834 | % | | | 21.286 | % |
Jefferies | TR/J CRB Wildcatters Exploration & Production Equity ETF | | | 76.865 | % | | | 2.372 | % | | | 2.595 | % | | | 18.168 | % |
| | |
32 | | Annual Report | November 30, 2011 |
| | | | |
| | THE FIRST NAME IN COMMODITY EQUITIES | | BOARD CONSIDERATIONS REGARDING APPROVAL OF INVESTMENT ADVISORY AGREEMENT (UNAUDITED) |
| | | | November 30, 2011 |
At an in-person meeting held on July 26, 2011, the Board of Trustees of the Trust (the “Board”), including the Trustees who are not “interested persons” of the Trust within the meaning of the Investment Company Act of 1940, as amended (the “1940 Act”), evaluated a proposal to approve a new Investment Advisory Agreement (the “Advisory Agreement”) between the Trust and ALPS Advisors, Inc. (the “Investment Adviser”) with respect to the Jefferies|TR/J CRB Global Agriculture Equity Index Fund, Jefferies |TR/J CRB Global Commodity Equity Index Fund, Jefferies|TR/J CRB Global Industrial Metals Equity Index Fund, and Jefferies/TR/J CRB Wildcatters Exploration & Production Equity ETF (the “Funds”).
Consideration by the Board of this new Advisory Agreement was necessary because ALPS Holdings, Inc. (“ALPS Holdings”), parent company to the Investment Adviser, had agreed to be acquired by DST Systems, Inc. (“DST”) (the “Transaction”). Because ALPS Holdings would be acquired by DST, the Investment Adviser would thereby undergo a change in control, which would be deemed to be an “assignment” of the existing investment advisory agreement under the 1940 Act. As required by the 1940 Act, the existing investment advisory agreement provided for its automatic termination in the event of an assignment, and would therefore terminate upon the closing of the Transaction. In order for the Investment Adviser to continue as each Fund’s investment adviser, the Board and the Funds’ shareholders would have to approve a new Advisory Agreement with the Investment Adviser, which would take effect upon the closing of the Transaction.
In evaluating the new Advisory Agreement, the Board did not identify any single factor as all-important or controlling. The following summary does not identify all the matters considered by the Board, but includes the principal matters it considered. The Board considered whether the new Advisory Agreement would be in the best interests of each Fund and its shareholders, based on: (i) the nature, extent and quality of the services to be provided by the Investment Adviser under the Advisory Agreement; (ii) the investment performance of the Funds; (iii) the expenses borne by each Fund under the unitary fee arrangement of the Advisory Agreement; (iv) the estimated profitability of the Investment Adviser and its affiliates from their relationship with the Funds; (v) potential fall-out benefits to the Investment Adviser from its relationship with each Fund; and (vi) other general information about the Investment Adviser and its affiliates. The following is a summary of the Board’s consideration and conclusions regarding these matters.
Nature, Extent and Quality of the Services to be Provided
The Board considered the nature, extent and quality of the services to be provided by the Investment Adviser, including the portfolio management services to be provided, in light of the investment objective of the respective Fund. The Board considered that, following the Transaction, each Fund would be managed by senior personnel at the Investment Adviser. In that regard, the Board considered the history of care and conscientiousness in supervising the management of each Fund provided by such personnel. The Board considered the background and capabilities of such personnel in connection with the advisory services that they would provide to each Fund following the Transaction. The Board also considered the compliance records of the Investment Adviser. The Board considered representations from DST that it intended to retain all key management and personnel of ALPS Holdings and the Investment Adviser, and that DST did not anticipate that the Investment Adviser would undergo any changes to its structure, business strategy or services as a result of the Transaction. The Board also considered the Investment Adviser’s representation that the manner in which each Fund’s assets would be managed would not change as a result of the Transaction. Finally, the Board also considered its and the Funds’ association with the current personnel employed by the Investment Adviser.
The Board concluded that the nature, extent and quality of the services to be provided by the Investment Adviser to the Funds were appropriate and consistent with the terms of the new Advisory Agreement, and that each Fund was likely to benefit from services provided under its new Advisory Agreement. The Board also concluded that the quality of the services to be provided by the senior advisory personnel employed by the Investment Adviser was expected to be consistent with or superior to quality norms in the industry, and that the Investment Adviser would have sufficient personnel, with the appropriate education and experience, to serve each Fund effectively. The Board also concluded that the Investment Adviser had demonstrated a continuing ability to attract and retain well-qualified personnel (and noted the Investment Adviser’s representations that no changes were anticipated with respect to the Investment Adviser’s compensation and incentive programs), and that the structure of the Investment Adviser’s operations was sufficient to retain and properly motivate the Funds’ current senior advisory personnel. Finally, the Board concluded that the financial condition of DST, ALPS Holdings and the Investment Adviser was sound.
Investment Performance
The Board also reviewed investment performance information of each Fund and its benchmark index. The Board evaluated the correlation and tracking error between the underlying index and each Fund.
| | | | |
| | THE FIRST NAME IN COMMODITY EQUITIES | | BOARD CONSIDERATIONS REGARDING APPROVAL OF INVESTMENT ADVISORY AGREEMENT (UNAUDITED) |
| | | | November 30, 2011 |
Costs of the Services to be Provided to the Funds
The Board reviewed the fees to be paid by each Fund to the Investment Adviser, noting that the rates of fees to be paid under the new Advisory Agreement were the same fee rates the Funds currently paid. The Board noted that the advisory fee paid to the Investment Adviser by each Fund was a unitary fee pursuant to which the Investment Adviser assumes all expenses of the Fund (including the cost of transfer agency, custody, advisory, fund administration, legal, audit and other services) other than the payments under the new Advisory Agreement, brokerage expenses, taxes, interest, litigation expenses and other extraordinary expenses. The Board considered the Investment Adviser’s representation that it did not intend to raise any of its advisory or administration fees paid by the Funds for at least two years following the Transaction.
The Board reviewed comparative fee information of each Fund’s advisory contracts, including information about the rates of compensation paid to investment advisers, and overall expense ratios, for funds comparable in size, character and investment strategy to the Funds. The Board considered the fact that each Fund’s fees were generally comparable to the fees charged to similar funds. The Board concluded that the management fees payable by each Fund to the Investment Adviser were reasonable in relation to the nature and quality of the services expected to be provided, taking into account the fees charged by other advisers for managing comparable funds with similar strategies.
Projected Profitability and Costs of Services to the Investment Adviser and Potential “Fall-Out” Benefits
The Board reviewed reports of the financial position of the Investment Adviser. The Board considered the projected profitability of ALPS Holdings’ overall relationship with the Funds, which included fees payable to the Investment Adviser for advisory services. The Board noted that since the Funds were subject to a unitary fee arrangement with the Investment Adviser pursuant to the new Advisory Agreement, there were no other fees payable to other ALPS Holdings affiliates for non-advisory services, and concluded that the projected profitability of ALPS Holdings was reasonable in relation to the services to be provided and to the costs of providing services to each Fund.
The Board also considered any potential “fall-out” benefits that the Investment Adviser might receive because of its relationship with the Funds and concluded that the advisory fees were reasonable taking into account any such benefits. The Board acknowledged the Investment Adviser’s well-established stand-alone management relationships independent of each Fund and the regulatory and entrepreneurial risks each assumed in connection with the management of each Fund.
Economies of Scale
The Board reviewed each Fund’s assets under management, and noted that because of each Fund’s unitary fee arrangement, consideration of economies of scale was not a relevant factor to each Fund.
Conclusion
Based on its evaluation, the Board unanimously concluded that the terms of the new Advisory Agreement were reasonable, fair and in the best interests of each Fund and its shareholders. The Board believed that the new Advisory Agreement would enable each Fund to continue to enjoy the high-quality investment management services it had received in the past from the Investment Adviser, at fee rates identical to the present rates, which the Board deemed appropriate, reasonable and in the best interests of each Fund and its shareholders.
| | |
34 | | Annual Report | November 30, 2011 |
| | | | |
| | THE FIRST NAME IN COMMODITY EQUITIES | | TRUSTEES & OFFICERS |
| | | | November 30, 2011 (Unaudited) |
INDEPENDENT TRUSTEES
| | | | | | | | | | |
Name, Address and Age of Management Trustee* | | Position(s) Held with Trust | | Term of Office and Length of Time Served** | | Principal Occupation(s) During Past 5 Years | | Number of Portfolios in Fund Complex Overseen by Trustees*** | | Other Directorships Held by Trustees |
Mary K. Anstine, age 71 | | Trustee | | Since
March 2008 | | Ms. Anstine was President/Chief Executive Officer of HealthONE Alliance, Denver, Colorado, and former Executive Vice President of First Interstate Bank of Denver. Ms. Anstine is also Trustee/Director of the following: AV Hunter Trust; Colorado Uplift Board. Ms. Anstine was formerly a Director of the Trust Bank of Colorado (later purchased and now known as Northern Trust Bank), HealthONE and Denver Area Council of the Boy Scouts of America and a member of the American Bankers Association Trust Executive Committee. | | 21 | | Ms. Anstine is a Trustee of Financial Investors Variable Insurance Trust (5 funds); Financial Investors Trust (17 funds); Reaves Utility Income Fund; and Westcore Trust (12 funds). |
Jeremy W. Deems, age 35 | | Trustee | | Since
March 2008 | | Mr. Deems is the Co-Founder, Chief Compliance Officer and Chief Financial Officer of Green Alpha Advisors, LLC. Prior to joining Green Alpha Advisors, Mr. Deems was CFO and Treasurer of Forward Management, LLC, ReFlow Management Co., LLC, ReFlow Fund, LLC, a private investment fund, and Sutton Place Management, LLC, an administrative services company, from 2004 to June 2007. Prior to this, Mr. Deems served as Controller of Forward Management, LLC, ReFlow Management Co., LLC, ReFlow Fund, LLC and Sutton Place Management, LLC. | | 21 | | Mr. Deems is a Trustee of Financial Investors Trust (17 funds); Financial Investors Variable Insurance Trust (5 funds); and Reaves Utility Income Fund. |
Rick A. Pederson, age 59 | | Trustee | | Since
March 2008 | | President, Foundation Properties, Inc. (a real estate investment management company), 1994 - present; Partner, Western Capital Partners (a prime lending company), 2000 - present; Partner, Bow River Capital Partners (investment manager), 2003 - present; Principal, The Pauls Corporation (real estate development), 2008 - present; Director, Guaranty Bank and Trust (a community bank), 1999 – 2007; Winter Park Recreational Association (an entity that operates, maintains and develops Winter Park Resort), 2002 – 2008; Neenan Co. (an integrated real estate development, architecture and construction company), 2002 – present; NexCore Properties LLC (a real estate investment company), 2004 – present; Urban Land Conservancy (a not- for-profit organization), 2004 – present. | | 7 | | Mr. Pederson is Trustee of Westcore Trust (12 funds) |
| * | The business address of the Trustee is c/o ALPS Advisors, Inc., 1290 Broadway, Suite 1100, Denver, Colorado 80203. |
| ** | This is the period for which the Trustee began serving the Trust. Each Trustee serves an indefinite term, until his successor is elected. |
| *** | The Fund Complex includes all series of the Trust and any other investment companies for which ALPS Advisors, Inc. provides investment advisory services. |
| | | | |
| | THE FIRST NAME IN COMMODITY EQUITIES | | TRUSTEES & OFFICERS |
| | | | November 30, 2011 (Unaudited) |
INTERESTED TRUSTEE***
| | | | | | | | | | |
Name, Address and Age of Management Trustee* | | Position(s) Held with Trust | | Term of Office and Length of Time Served** | | Principal Occupation(s) During Past 5 Years | | Number of Portfolios in Fund Complex Overseen by Trustees*** | | Other Directorships Held by Trustees |
Thomas A. Carter, age 45 | | Trustee and
President | | Since
March 2008 | | Mr. Carter joined ALPS Fund Services, Inc. (“ALPS”) in 1994 and is currently President and Director of ALPS Advisors, Inc. (“AAI”), ALPS Distributors, Inc. (“ADI”) and FTAM Funds Distributor, Inc. (“FDI”) and Executive Vice President and Director of ALPS and ALPS Holdings, Inc. (“AHI”). Because of his position with AHI, ALPS, ADI, FDI and AAI, Mr. Carter is deemed an affiliate of the Fund as defined under the 1940 Act. Before joining ALPS, Mr. Carter was with Deloitte & Touché LLP, where he worked with a diverse group of clients, primarily within the financial services industry. Mr. Carter is a Certified Public Accountant and received his Bachelor of Science in Accounting from the University of Colorado at Boulder. | | 12 | | Mr. Carter is a Trustee of Financial Investors Variable Insurance Trust (5 funds) |
| * | The business address of the Trustee is c/o ALPS Advisors, Inc., 1290 Broadway, Suite 1100, Denver, Colorado 80203. |
| ** | This is the period for which the Trustee began serving the Trust. Each Trustee serves an indefinite term, until his successor is elected. |
| *** | Mr. Carter is an interested person of the Trust because of his affiliation with ALPS. |
| **** | The Fund Complex includes all series of the Trust and any other investment companies for which ALPS Advisors, Inc. provides investment advisory services. |
| | |
36 | | Annual Report | November 30, 2011 |
| | | | |
| | THE FIRST NAME IN COMMODITY EQUITIES | | TRUSTEES & OFFICERS |
| | | | November 30, 2011 (Unaudited) |
OFFICERS
| | | | | | | | | | |
Name, Address and Age of Executive Officer* | | Position(s) Held with Trust | | | | Length of Time Served** | | | | Principal Occupation(s) During Past 5 Years |
Melanie Zimdars, age 35 | | Chief Compliance Officer (“CCO”) | | | | Since December 2009 | | | | Ms. Zimdars currently serves as a Deputy Chief Compliance Officer with ALPS. Prior to joining ALPS in September 2009, Ms. Zimdars served as Principal Financial Officer, Treasurer and Secretary for the Wasatch Funds from February 2007 to December 2008. From November 2006 to February 2007, she served as Assistant Treasurer for the Wasatch Funds and served as a Senior Compliance Officer for Wasatch Advisors, Inc. since 2005. From 2001 until joining Wasatch in 2005, she was a Compliance Officer for U.S. Bancorp Fund Services, LLC. Because of her position with ALPS, Ms. Zimdars is deemed an affiliate of the Trust as defined under the 1940 Act. Ms. Zimdars is also the CCO of Financial Investors Variable Insurance Trust, Liberty All-Star Growth Fund, Inc. and Liberty All-Star Equity Fund. |
Kimberly R. Storms, age 39 | | Treasurer | | | | Since March 2008 | | | | Ms. Storms is Director of Fund Administration and Senior Vice President of ALPS. Ms. Storms joined ALPS in 1998 as Assistant Controller. Because of her position with ALPS, Ms. Storms is deemed an affiliate of the Trust as defined under the 1940 Act. Ms. Storms is also Assistant Treasurer of the Liberty All-Star Equity Fund, Liberty All-Star Growth Fund and Financial Investors Trust; and Assistant Secretary of Ameristock Mutual Fund, Inc. |
William Parmentier, age 59 | | Vice President | | | | Since March 2008 | | | | Mr. Parmentier is Chief Investment Officer, ALPS Advisors, Inc. (since 2006); President of the Liberty All-Star Funds (since April 1999); Senior Vice President (2005-2006), Banc of America Investment Advisors, Inc. |
Tané T. Tyler, age 47 | | Secretary | | | | Since December 2008 | | | | Ms.Tyler is Senior Vice President, General Counsel and Secretary of ALPS. Ms.Tyler joined ALPS in 2004. EShe served as Secretary, Reaves Utility Income Fund from December 2004–2007; Secretary, Westcore Funds from February 2005–2007; Secretary, First Funds from November 2004 to January 2007; Secretary, Financial Investors Variable Insurance Trust from December 2004–December 2006; Vice President and Associate Counsel, Oppenheimer Funds from January 2004 to August 2004; Vice President and Assistant General Counsel, INVESCO Funds from September 1991 to December 2003. Ms. Tyler also serves as Secretary, Liberty All-Star Equity Fund and Liberty All-Star Growth Fund. |
Monette R. Nickels, age 40 | | Tax Officer | | | | Since December 2009 | | | | Ms. Nickels is Senior Vice President and Director of Tax Administration of ALPS. Ms. Nickels joined ALPS in 2004 as Director of Tax Administration. Because of her position with ALPS, Ms. Nickels is deemed an affiliate of the Trust as defined under the 1940 Act. Ms. Nickels is also Tax Officer of Financial Investors Trust, Liberty All- Star Equity Fund, Liberty All-Star Growth Fund, Inc., and Financial Investors Variable Insurance Trust. |
| * | The business address of each Officer is c/o ALPS Advisors, Inc., 1290 Broadway, Suite 1100, Denver, Colorado 80203. |
| ** | This is the period for which the Officer began serving the Trust. Each Officer serves an indefinite term, until his successor is elected. |
| | | | |
| | THE FIRST NAME IN COMMODITY EQUITIES | | NOTES |
| | | | |
| | |
38 | | Annual Report | November 30, 2011 |
| | | | |
| | THE FIRST NAME IN COMMODITY EQUITIES | | NOTES |
| | | | |
| | | | |
| | THE FIRST NAME IN COMMODITY EQUITIES | | NOTES |
| | | | |
| | |
40 | | Annual Report | November 30, 2011 |
| | | | |
 | | Alerian MLP ETF | | Table of Contents |
| | | | |
| | | | |
| | | | www.alpsfunds.com | 866.513.5856 |
| | | | |
| | Alerian MLP ETF | | Shareholder Letter |
| | | | November 30, 2011 |
Dear Shareholders:
When ALPS launched its Exchange Traded Fund (“ETF”) Trust in 2008 our goal was to bring innovative solutions to the ETF industry that provide investors with access to a unique market segment or strategy. The launch of Alerian MLP ETF in August of 2010 epitomized that philosophy as we were able to bring the market the world’s first Master Limited Partnership (“MLP”) ETF under the ticker symbol AMLP.
Investors have long been attracted to the high historical distribution yields and tax efficiency of the MLP asset class. However, investing in individual MLPs can be complex from a diversification and tax reporting perspective. AMLP provides diversified access to the MLP asset class with 1099 Tax Reporting, IRA and 401-k eligibility, and the transparency(1), liquidity(2) and low cost benefits(3) of the ETF structure. We believe this combination of factors makes AMLP a viable option for many investors that are looking to participate in the MLP sector.
In the pages that follow our Fund managers have provided a performance overview. We thank you for your investment and for being an AMLP shareholder.
Thomas A. Carter*
President, ALPS ETF Trust
| * | Registered representative of ALPS Distributors, Inc. |
| (1) | ETFs are considered transparent because their portfolio holdings are disclosed daily. |
| (2) | Liquidity is the degree to which an asset or security can be bought or sold in the market without affecting the asset’ price. Liquidity is characterized by a high level of trading activity. |
| (3) | Ordinary Brokerage Fees Apply. |
Investments in securities of MLPs involve risks that differ from an investment in common stock. MLPs are controlled by their general partners, which generally have conflicts of interest and limited fiduciary duties to the MLP, which may permit the general partner to favor its own interests over the MLPs.
The benefit you are expected to derive from the Fund’s investment in MLPs depends largely on the MLPs being treated as partnerships for federal income tax purposes. As a partnership, an MLP has no federal income tax liability at the entity level. Therefore, treatment of one or more MLPs as a corporation for federal income tax purposes could affect the Fund’s ability to meet its investment objective and would reduce the amount of cash available to pay or distribute to you. Legislative, judicial, or administrative changes and differing interpretations, possibly on a retroactive basis, could negatively impact the value of an investment in MLPs and therefore the value of your investment in the Fund.
The Fund invests primarily in energy infrastructure companies which may be adversely affected by changes in worldwide energy prices, exploration, production spending, government regulation, changes in exchange rates and depletion of natural resources.
All K-1s are received and processed by the Alerian MLP ETF. The Alerian MLP ETF distributes a single Form 1099 to its shareholders. This notice is provided to you for informational purposes only, and should not be considered tax advice. Please consult your tax advisor for further assistance.
There are risks involved with investing in ETFs including the loss of money. An investment in the Fund is subject to investment risk including the possible loss of the entire principal amount that you invest.
| | |
| | 1 |
Annual | November 30, 2011 | |
| | | | |
| | Alerian MLP ETF | | Performance Overview |
| | | | November 30, 2011 |
Fund Description
The Alerian MLP ETF (the “Fund”) seeks investment results that correspond (before fees and expenses) generally to the price and yield performance of its underlying index, the Alerian MLP Infrastructure Index (the “Index”). The Shares of the Fund are listed and trade on the New York Stock Exchange (“NYSE”) Arca under the ticker symbol AMLP. The Fund generally will invest in all of the securities that comprise the Index in proportion to their weightings in the Index. The Fund began trading on August 25, 2010.
The Index is a rules based, modified capitalization weighted, float adjusted index intended to give investors a means of tracking the overall performance of the United States energy infrastructure Master Limited Partnership (“MLP”) asset class. The Index is comprised of 25 energy infrastructure MLPs that earn a majority of their cash flow from the transportation and storage of energy commodities.
Performance Overview
For the 11 month period ended November 30, 2011, the Alerian MLP Infrastructure Index (AMZI) gained 10.3% on a total return basis, as compared to the S&P 500 return of 0.9%. In a year where U.S. Treasuries fell below 2%, investors sought out higher-yielding asset classes with records of stable and growing distributions more than ever. With yields averaging 6% for the year and distribution growth of 5.2% (third quarter 2011 versus third quarter 2010) for the AMZI, Master Limited Partnerships fit the profile for many investors’ appetite for yield.
Various MLP pooled products – such as exchange traded funds (ETFs), exchange traded notes (ETNs), mutual funds, and closed-end funds – have created more accessibility to the asset class. For the year, total assets from such products increased by $4.1 billion to $16.2 billion, of which, roughly $1.4 billion of the increase was from the Alerian MLP ETF (AMLP).
MLPs raised $12.8 billion in total equity via 57 follow-on offerings, an increase from the $11.9 billion raised in 2010. Also, this was the first year that an MLP raised over $600 million overnight, an event that occurred not only once, but on two occasions. Additionally, nearly $4.7 billion was raised between twelve initial public offerings (IPOs) in 2011.
While the infrastructure focus for the past few years has been largely natural gas related in areas such as the Barnett, Haynesville, and Fayetteville, this year’s focus has primarily been on natural gas liquids (NGL) takeaway from areas such as the Eagle Ford, Marcellus, and Niobrara or crude oil takeaway from the Canada, the Bakken, the Permian, and particularly at the Cushing, Oklahoma hub.
Given the highly competitive environment for infrastructure in such areas, there has been a growing trend of MLP-MLP or MLP-producer joint ventures utilized to minimize risk. On the liquids front, several projects have been announced to take NGLs to the Mont Belvieu NGL hub in Texas, both from Conway, Kansas and from the Marcellus, areas where liquids drilling continue to increase. On the crude front, the largest story for the year has been solutions to relieve the supply glut at the Cushing, Oklahoma hub from crude flowing southward from the oil sands in Canada and the Bakken in Montana. As the Keystone XL pipeline’s future remains in legislative limbo, it has created opportunities for several MLPs to enter the “crude oil takeaway from Oklahoma to the Gulf Coast” race – either by reversing current
crude oil pipelines, converting current natural gas pipelines, or building a new pipeline.
| | |
2 | | |
| | www.alpsfunds.com | 866.513.5856 |
| | | | |
| | Alerian MLP ETF | | Performance Overview |
| | | | November 30, 2011 |
This year marked a major year for MLP corporate acquisitions (proposals, at least). Notably, two of the larger proposals have been made at the publicly traded MLP general partner level, rather than the LP level: Kinder Morgan Inc (KMI) for El Paso Corporation (EP) and Energy Transfer Equity (ETE) for Southern Union (SUG).
Looking forward to 2012, some trends that may emerge include exploration and production (E&P) companies or private equity firms spinning off their midstream assets into MLPs, infrastructure projects in the Utica, or more export capacity out of Mont Belvieu (potentially internationally).
Overall, with plenty of organic investment opportunities and low cost of capital to pursue acquisitions, MLPs are expected to continue generating stable cash flows and distributing consistent distributions over the next several decades.
Alerian MLP ETF Performance as of November 30, 2011
| | | | | | | | | | | | | | | | | | | | |
| | | 5 Month | | YTD | | 1 Year | | Since Inception Annualized* |
NAV | | | | 2.83 | % | | | | 5.93 | % | | | | 7.20 | % | | | | 11.73 | % |
Market Price** | | | | 2.77 | % | | | | 5.80 | % | | | | 7.13 | % | | | | 11.68 | % |
Alerian MLP Infrastructure Index | | | | 4.76 | % | | | | 10.29 | % | | | | 12.46 | % | | | | 19.36 | % |
Total Expense Ratio (per the current prospectus) 0.85%.
Performance data quoted represents past performance. Past performance does not guarantee future results. Investment return and principal value of an investment will fluctuate so that an investor’s shares, when sold or redeemed, may be worth more or less than the original cost. Current performance data may be higher or lower than actual data quoted. For most current month-end performance data please visit www.alpsfunds.com.
NAV is an exchange-traded fund’s per-share value. The per-share dollar amount of the fund is derived by dividing the total value of all the securities in its portfolio, less any liabilities, by the number of fund shares outstanding. Market Price is the price at which a share can currently be traded in the market. Information detailing the number of days the Market Price of the Fund was greater than the Fund’s NAV and the number of days it was less than the Fund’s NAV can be obtained at www.alpsfunds.com.
S&P 500 Index is the Standard & Poor’s composite index of 500 stocks, a widely recognized, unmanaged index of common stock prices. One cannot invest directly in an index. Index performance does not reflect fund performance.
| * | The Fund commenced Investment Operations on August 24, 2010 with an Inception Date, the first day of trading on the Exchange, of August 25, 2010. |
| ** | Market Price is based on the midpoint of the bid-ask spread at 4 p.m. ET and does not represent the returns an investor would receive if shares were traded at other times. |
The Alerian MLP Infrastructure Index is comprised of 25 midstream energy Master Limited Partnerships.
| | |
| | 3 |
Annual | November 30, 2011 | |
| | | | |
| | Alerian MLP ETF | | Performance Overview |
| | | | November 30, 2011 |
Top 10 Holdings* as of November 30, 2011
| | | | |
Kinder Morgan Energy Partners LP | | | 10.1% | |
Enterprise Products Partners LP | | | 9.9% | |
Magellan Midstream Partners LP | | | 7.0% | |
Plains All American Pipeline LP | | | 7.0% | |
Energy Transfer Partners LP | | | 6.5% | |
Buckeye Partners LP | | | 6.1% | |
| | | | |
ONEOK Partners LP | | | 5.2% | |
MarkWest Energy Partners LP | | | 5.0% | |
Enbridge Energy Partners LP | | | 4.9% | |
Williams Partners LP | | | 4.8% | |
Percent of Total Investments in
Top Ten Holdings: | | | 66.5% | |
* % of Total Investments.
Holdings are subject to change.
Growth of $10k as of November 30, 2011
Comparison of Change in Value of $10,000 Investment in Alerian MLP ETF and Alerian MLP Infrastructure Index.
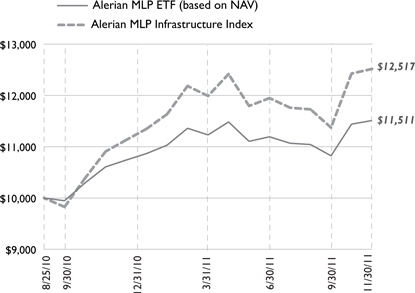
The chart above represents historical performance of a hypothetical investment of $10,000 in the Fund over the life of the Fund. Performance calculations are as of the end of each month. Past performance does not guarantee future results. This chart does not reflect the deduction of taxes that a shareholder would pay on Fund distributions or the redemption of Fund shares.
| | |
4 | | |
| | www.alpsfunds.com | 866.513.5856 |
| | | | |
| | Alerian MLP ETF | | Disclosure of Fund Expenses (Unaudited) |
| | | | |
Shareholder Expense Example: As a shareholder of the Fund, you incur two types of costs: (1) transaction costs which may include creation and redemption fees or brokerage charges, and (2) ongoing costs, including management fees and other Fund expenses. These examples are intended to help you understand your ongoing costs (in dollars) of investing in the Fund and to compare these costs with the ongoing costs of investing in other funds. It is based on an investment of $1,000 invested at July 1, 2011, and held through the period ended November 30, 2011.
Actual Return: The first line of the table provides information about actual account values and actual expenses. You may use the information in this table, together with the amount you invested, to estimate the expenses that you incurred over the period. Simply divide your account value by $1,000 (for example, an $8,600 account value divided by $1,000 = 8.6), then multiply the result by the number in the first line under the heading entitled “Expenses Paid During the Period” to estimate the expenses attributable to your investment during this period.
Hypothetical 5% Return: The second line of the table provides information about hypothetical account values and hypothetical expenses based on the Fund’s actual expense ratio and an assumed rate of return of 5% per year before expenses, which is not the Fund’s actual return. The hypothetical account values and expenses may not be used to estimate the actual ending account balance or expenses you paid for the period. You may use this information to compare ongoing costs of investing in the Fund and other funds. To do so, compare this 5% hypothetical example with the 5% hypothetical examples that appear in the shareholder reports of the other funds.
The expenses shown in the table are meant to highlight ongoing Fund costs only and do not reflect any transaction costs, such as creation and redemption fees, or brokerage charges. Therefore, the second line is useful in comparing ongoing costs only, and will not help you determine the relative total costs of owning different funds. In addition, if these costs were included, your costs would have been higher.
| | | | | | | | | | | | | | | | | | | | |
| | | Beginning Account Value 7/1/11 | | Ending Account Value 11/30/11 | | Expense Ratio | | Expenses Paid During the Period 7/1/11 - 11/30/11 |
Actual | | | $ | 1,000.00 | | | | $ | 1,028.30 | | | | | 0.85 | % | | | $ | 3.61 | (a) |
Hypothetical | | | $ | 1,000.00 | | | | $ | 1,020.92 | | | | | 0.85 | % | | | $ | 4.33 | (b) |
| (a) | Effective March 7, 2011, the Board approved changing the fiscal year end of the the Fund from December 31 to November 30. Actual expenses are equal to the Fund’s annualized expense ratio multiplied by the average account value over the period, multiplied by the number of days in the most recent fiscal half year (153), then divided by 365. |
| (b) | Expenses are equal to the Fund’s annualized expense ratio multiplied by the average account value over the period, multiplied by the number of days in the most recent fiscal half year (184), then divided by 365. |
| | |
| | 5 |
Annual | November 30, 2011 | |
| | | | |
| | Alerian MLP ETF | | Report of Independent Registered Public Accounting Firm |
| | | | |
To the Board of Trustees and Shareholders of ALPS ETF Trust:
We have audited the accompanying statement of assets and liabilities, including the schedule of investments, of Alerian MLP ETF, one of the funds constituting the ALPS ETF Trust (the “Trust”) as of November 30, 2011, and the related statements of operations and changes in net assets, and the financial highlights for the period then ended and the period August 25, 2010 (inception) to December 31, 2010. These financial statements and financial highlights are the responsibility of the Trust’s management. Our responsibility is to express an opinion on these financial statements and financial highlights based on our audits.
We conducted our audits in accordance with the standards of the Public Company Accounting Oversight Board (United States). Those standards require that we plan and perform the audit to obtain reasonable assurance about whether the financial statements and financial highlights are free of material misstatement. The Trust is not required to have, nor were we engaged to perform, an audit of its internal control over financial reporting. Our audits included consideration of internal control over financial reporting as a basis for designing audit procedures that are appropriate in the circumstances, but not for the purpose of expressing an opinion on the effectiveness of the Trust’s internal control over financial reporting. Accordingly, we express no such opinion. An audit also includes examining, on a test basis, evidence supporting the amounts and disclosures in the financial statements, assessing the accounting principles used and significant estimates made by management, as well as evaluating the overall financial statement presentation. Our procedures included confirmation of securities owned as of November 30, 2011, by correspondence with the custodian and brokers; where replies were not received from brokers, we performed other auditing procedures. We believe that our audits provide a reasonable basis for our opinion.
In our opinion, the financial statements and financial highlights referred to above present fairly, in all material respects, the financial position of Alerian MLP ETF of the ALPS ETF Trust as of November 30, 2011, the results of its operations, the changes in its net assets, and the financial highlights for the period then ended and the period August 25, 2010 (inception) to December 31, 2010, in conformity with accounting principles generally accepted in the United States of America.
DELOITTE & TOUCHE LLP
Denver, Colorado
January 27, 2012
| | |
6 | | |
| | www.alpsfunds.com | 866.513.5856 |
| | | | |
| | Alerian MLP ETF | | Schedule of Investments |
| | | | November 30, 2011 |
| | | | | | | | |
| Security Description | | Shares | | | Value | |
| | |
Master Limited Partnerships Shares (102.99%) | | | | | | | | |
Energy (1.51%) | | | | | | | | |
Chesapeake Midstream Partners LP | | | 536,536 | | | $ | 14,062,609 | |
Exterran Partners LP | | | 542,382 | | | | 11,775,113 | |
| | | | | | | | |
| | | | | | | 25,837,722 | |
| | | | | | | | |
| | |
Gathering & Processing (20.36%) | | | | | | | | |
Copano Energy LLC | | | 1,441,926 | | | | 47,727,751 | |
DCP Midstream Partners LP | | | 717,557 | | | | 30,790,371 | |
MarkWest Energy Partners LP | | | 1,656,739 | | | | 88,867,480 | |
Targa Resources Partners LP | | | 1,604,251 | | | | 60,207,540 | |
Western Gas Partners LP | | | 964,505 | | | | 36,342,548 | |
Williams Partners LP | | | 1,463,114 | | | | 84,948,399 | |
| | | | | | | | |
| | | | | | | 348,884,089 | |
| | | | | | | | |
| | |
Natural Gas Pipelines (35.98%) | | | | | | | | |
Boardwalk Pipeline Partners LP | | | 1,606,551 | | | | 41,706,064 | |
El Paso Pipeline Partners LP | | | 2,153,044 | | | | 70,555,252 | |
Energy Transfer Partners LP | | | 2,635,015 | | | | 115,308,256 | |
Enterprise Products Partners LP | | | 3,848,958 | | | | 175,089,099 | |
ONEOK Partners LP | | | 1,807,858 | | | | 91,405,301 | |
Regency Energy Partners LP | | | 2,633,280 | | | | 60,591,773 | |
Spectra Energy Partners LP | | | 778,435 | | | | 23,563,227 | |
TC Pipelines LP | | | 802,083 | | | | 38,163,109 | |
| | | | | | | | |
| | | | | | | 616,382,081 | |
| | | | | | | | |
| | |
Petroleum Transportation (45.14%) | | | | | | | | |
Buckeye Partners LP | | | 1,683,476 | | | | 107,405,769 | |
Crosstex Energy LP | | | 732,987 | | | | 11,383,288 | |
Enbridge Energy Partners LP | | | 2,764,518 | | | | 85,617,123 | |
Genesis Energy LP | | | 999,774 | | | | 26,084,104 | |
Kinder Morgan Energy Partners LP | | | 2,276,800 | | | | 178,045,760 | |
Magellan Midstream Partners LP | | | 1,941,000 | | | | 124,185,180 | |
NuStar Energy LP | | | 1,166,005 | | | | 63,943,714 | |
Plains All American Pipeline LP | | | 1,912,722 | | | | 124,059,149 | |
Sunoco Logistics Partners LP | | | 510,490 | | | | 52,713,197 | |
| | | | | | | | |
| | | | | | | 773,437,284 | |
| | | | | | | | |
| | |
Total Master Limited Partnerships Shares
(Cost $1,633,843,730) | | | | | | | 1,764,541,176 | |
| | | | | | | | |
| | |
| | 7 |
Annual | November 30, 2011 | |
| | | | |
| | Alerian MLP ETF | | Schedule of Investments |
| | | | November 30, 2011 |
| | | | | |
| | | Value |
Total Investments (102.99%)
(Cost $1,633,843,730) | | | $ | 1,764,541,176 | |
| |
Net Liabilities Less Other Assets (-2.99%) | | | | (51,154,065 | ) |
| | | | | |
| |
Net Assets (100.00%) | | | $ | 1,713,387,111 | |
| | | | | |
Common Abbreviations:
LLC - Limited Liability Company.
LP - Limited Partnerships.
| | |
| | See Notes to Financial Statements. |
8 | | |
| | www.alpsfunds.com | 866.513.5856 |
| | | | |
| | Alerian MLP ETF | | Statement of Assets & Liabilities |
| | | | November 30, 2011 |
| | | | |
Assets: | | | | |
Investments, at value | | $ | 1,764,541,176 | |
Cash | | | 3,827,223 | |
Receivable for shares sold | | | 20,723,520 | |
Deferred tax asset | | | 2,494,257 | |
| |
Total Assets | | | 1,791,586,176 | |
| |
| |
Liabilities: | | | | |
Payable for investments purchased | | | 20,743,626 | |
Current tax payable | | | 5,635,571 | |
Deferred tax liability | | | 50,683,811 | |
Payable to advisor | | | 1,136,057 | |
| |
Total Liabilities | | | 78,199,065 | |
| |
Net Assets | | $ | 1,713,387,111 | |
| |
| |
Net Assets Consist Of: | | | | |
Paid-in capital | | $ | 1,633,880,245 | |
Distributions in excess of net investment loss, net of income taxes | | | (5,968,191 | ) |
Accumulated net realized gain on investments, net of income taxes | | | 3,779,994 | |
Net unrealized appreciation on investments, net of income taxes | | | 81,695,063 | |
| |
Net Assets | | $ | 1,713,387,111 | |
| |
| |
Investments, At Cost | | $ | 1,633,843,730 | |
| |
Pricing Of Shares | | | | |
Net Assets | | $ | 1,713,387,111 | |
Shares of beneficial interest outstanding (Unlimited number of shares authorized, par value $0.01 per share) | | | 107,276,019 | |
Net Asset Value, offering and redemption price per share | | $ | 15.97 | |
| | | | |
See Notes to Financial Statements.
| | |
| | 9 |
Annual | November 30, 2011 | |
| | | | |
| | Alerian MLP ETF | | Statements of Operations |
| | | | |
| | | | | | | | |
| | | For the Period January 1, 2011 to November 30, 2011(a) | | | For the Period
August 25, 2010
(Inception) to
December 31, 2010 | |
| |
Investment Income: | | | | | | | | |
Distributions from master limited partnerships | | $ | 71,324,489 | | | $ | 5,103,415 | |
Less return of capital distributions | | | (71,324,489 | ) | | | (5,103,415 | ) |
| |
Total Investment Income | | | – | | | | – | |
| |
| | |
Expenses: | | | | | | | | |
Investment advisory fee | | | 8,693,575 | | | | 854,455 | |
| |
Total Expenses | | | 8,693,575 | | | | 854,455 | |
| |
Net Investment Loss, before Income Taxes | | | (8,693,575 | ) | | | (854,455 | ) |
| |
Income tax (expense)/benefit | | | 3,251,178 | | | | 328,661 | |
| |
Net Investment Loss | | | (5,442,397 | ) | | | (525,794 | ) |
| |
| | |
Realized and Unrealized Gain/(Loss): | | | | | | | | |
Net realized gain/(loss) on investments, before income taxes | | | 23,993,717 | | | | (1,582,645 | ) |
Income tax (expense)/benefit | | | (9,011,335 | ) | | | 608,754 | |
| |
Net realized gain/(loss) on investments | | | 14,982,382 | | | | (973,891 | ) |
| |
Net change in unrealized appreciation on investments, before income taxes | | | 95,035,171 | | | | 35,662,275 | |
Income tax (expense)/benefit | | | (35,285,113 | ) | | | (13,717,270 | ) |
| |
Net change in unrealized appreciation on investments | | | 59,750,058 | | | | 21,945,005 | |
| |
Net Realized and Unrealized Gain | | | 74,732,440 | | | | 20,971,114 | |
| |
Net Increase in Net Assets from Operations | | $ | 69,290,043 | | | $ | 20,445,320 | |
| |
| (a) | Effective March 7, 2011 the Board approved changing the fiscal year end of the Fund from December 31 to November 30. |
See Notes to Financial Statements.
| | |
10 | | |
| | www.alpsfunds.com | 866.513.5856 |
| | | | |
| | Alerian MLP ETF | | Statements of Changes in Net Assets |
| | | | |
| | | | | | | | |
| | | For the Period January 1, 2011 to November 30, 2011(a) | | | For the Period
August 25, 2010
(Inception) to
December 31, 2010 | |
| |
Operations: | | | | | | | | |
Net investment loss | | $ | (5,442,397 | ) | | $ | (525,794 | ) |
Net realized gain/(loss) on investments | | | 14,982,382 | | | | (973,891 | ) |
Net change in unrealized appreciation on investments | | | 59,750,058 | | | | 21,945,005 | |
| |
Net increase in net assets resulting from operations | | | 69,290,043 | | | | 20,445,320 | |
| |
| | |
Distributions To Shareholders: | | | | | | | | |
From net realized gains | | | (10,228,497 | ) | | | – | |
Tax return of capital | | | (62,790,879 | ) | | | (5,380,298 | ) |
| |
Total distributions | | | (73,019,376 | ) | | | (5,380,298 | ) |
| |
| | |
Share Transactions: | | | | | | | | |
Proceeds from sale of shares | | | 1,189,599,389 | | | | 596,401,556 | |
Cost of shares redeemed | | | (83,949,523 | ) | | | – | |
| |
Net increase from share transactions | | | 1,105,649,866 | | | | 596,401,556 | |
| |
Net increase in net assets | | | 1,101,920,533 | | | | 611,466,578 | |
| | |
Net Assets: | | | | | | | | |
Beginning of period | | | 611,466,578 | | | | – | |
| |
End of period* | | $ | 1,713,387,111 | | | $ | 611,466,578 | |
| |
| | |
*Including distributions in excess of net investment loss, net of income taxes of: | | $ | (5,968,191 | ) | | $ | (525,794 | ) |
| | |
Other Information: | | | | | | | | |
Share Transactions: | | | | | | | | |
Beginning shares | | | 38,100,000 | | | | – | |
Shares sold | | | 74,576,019 | | | | 38,100,000 | |
Shares redeemed | | | (5,400,000 | ) | | | – | |
| |
Shares outstanding, end of period | | | 107,276,019 | | | | 38,100,000 | |
| |
| (a) | Effective March 7, 2011 the Board approved changing the fiscal year end of the Fund from December 31 to November 30. |
See Notes to Financial Statements.
| | |
| | 11 |
Annual | November 30, 2011 | |
| | | | |
| | Alerian MLP ETF | | Financial Highlights |
| | | | For a Share Outstanding Throughout the Periods Presented |
| | | | | | | | |
| | | For the Period Janurary 1, 2011 to November 30, 2011(a) | | | For the Period
August 25, 2010
(Inception) to
December 31, 2010 | |
Net Asset Value, Beginning of Period | | $ | 16.05 | | | $ | 15.00 | |
| | |
Income From Operations: | | | | | | | | |
Net investment loss(b) | | | (0.08 | ) | | | (0.03 | ) |
Net realized and unrealized gain on investments | | | 1.00 | | | | 1.33 | |
Total from Investment Operations | | | 0.92 | | | | 1.30 | |
| | |
Less Distributions: | | | | | | | | |
From net realized gains | | | (0.14 | )(b) | | | – | |
From tax return of capital | | | (0.86 | ) | | | (0.25 | ) |
Total Distributions | | | (1.00 | ) | | | (0.25 | ) |
Net Increase/(Decrease) In Net Asset Value | | | (0.08 | ) | | | 1.05 | |
| | | | | | | | | |
Net Asset Value, End Of Period | | $ | 15.97 | | | $ | 16.05 | |
| | |
Total Return(c) | | | 5.93 | % | | | 8.66 | % |
| | |
Ratios/Supplemental Data: | | | | | | | | |
Net assets, end of period (in 000s) | | $ | 1,713,387 | | | $ | 611,467 | |
| | |
Ratios To Average Net Assets: | | | | | | | | |
Ratio of expenses (including net deferred tax expense) to average net assets(e) | | | 4.86 | %(d) | | | 13.56 | %(d) |
Ratio of expenses (including deferred tax benefit) to average net assets(f) | | | 0.53 | %(d) | | | 0.52 | %(d) |
Ratio of expenses (excluding net deferred tax expenses/benefits) to average net assets | | | 0.85 | %(d) | | | 0.85 | %(d) |
Ratio of net investment loss (including deferred tax benefit) to average net assets | | | (0.53 | %)(d) | | | (0.52 | %)(d) |
Ratio of net investment loss (excluding deferred tax benefit) to average net assets | | | (0.85 | %)(d) | | | (0.85 | %)(d) |
Portfolio Turnover Rate(g) | | | 10 | % | | | 12 | % |
| (a) | Effective March 7, 2011 the Board approved changing the fiscal year end of the Fund from December 31 to November 30. |
| (b) | Calculated using average shares outstanding. |
| (c) | Total return is calculated assuming an initial investment made at the net asset value at the beginning of the period and redemption at the net asset value on the last day of the period, and assuming all distributions are reinvested at actual reinvestment prices. Total return calculated for a period of less than one year is not annualized. |
| (e) | Includes amount of deferred taxes/benefits for all components of the Statement of Operations. |
| (f) | Includes amount of deferred tax benefit associated with net investment income. |
| (g) | Portfolio turnover is not annualized and does not include securities received or delivered from processing creations or redemptions. |
See Notes to Financial Statements.
| | |
12 | | |
| | www.alpsfunds.com | 866.513.5856 |
| | | | |
| | Alerian MLP ETF | | Notes to Financial Statements |
| | | | November 30, 2011 |
1. Organization
The ALPS ETF Trust (the “Trust”) is an open-end management investment company organized as a Delaware statutory trust on September 13, 2007 and is registered with the Securities and Exchange Commission (“SEC”) under the Investment Company Act of 1940, as amended (the “1940 Act”). As of November 30, 2011, the Trust consists of seven separate portfolios. Each portfolio represents a separate series of the Trust. This report pertains to the Alerian MLP ETF (the “Fund”), which commenced investment operations on August 24, 2010 and began trading on the exchange on August 25, 2010. The investment objective of the Fund is to seek investment results that correspond generally to the price and yield performance (before the Fund’s fees and expenses) of its underlying index, the Alerian MLP Infrastructure Index (the “Index”).
The Fund’s Shares (“Shares”) are listed on the New York Stock Exchange (“NYSE”) Arca. The Fund issues and redeems Shares at Net Asset Value (“NAV”), in blocks of 50,000 Shares, each of which is called a “Creation Unit.” Creation Units are issued and redeemed principally in-kind for securities included in a specified index. Except when aggregated in Creation Units, Shares are not redeemable securities of the Fund.
2. Significant Accounting Policies
A. Use of Estimates
The following is a summary of significant accounting policies consistently followed by the Fund in the preparation of the financial statements. The accompanying financial statements were prepared in accordance with accounting principles generally accepted in the United States of America (“U.S. GAAP”). The preparation of financial statements in conformity with U.S. GAAP requires management to make certain estimates and assumptions that affect the reported amounts of assets and liabilities and disclosures of contingent assets and liabilities at the date of the financial statements and the reported amounts of revenue and expenses during the period. Actual results could differ from those estimates.
B. Portfolio Valuation
The Fund’s NAV is determined daily, as of the close of regular trading on the NYSE, normally 4:00 p.m. Eastern time, on each day the NYSE is open for trading. The NAV is computed by dividing the value of all assets of the Fund (including accrued interest and dividends), less all liabilities (including accrued expenses and dividends declared but unpaid), by the total number of shares outstanding.
Portfolio securities listed on any exchange other than the National Association of Securities Dealer Automated Quotation (“NASDAQ”) exchange are valued at the last sale price on the business day as of which such value is being determined. If there has been no sale on such day, the securities are valued at the mean of the most recent bid and asked prices on such day. Securities traded on the NASDAQ are valued at the NASDAQ Official Closing Price as determined by NASDAQ. Short-term investments that mature in less than 60 days are valued at amortized cost, which approximates market value.
| | |
| | 13 |
Annual | November 30, 2011 | |
| | | | |
| | Alerian MLP ETF | | Notes to Financial Statements |
| | | | November 30, 2011 |
The Fund’s investments are valued at market value or, in the absence of market value with respect to any portfolio securities, at fair value according to procedures adopted by the Trust’s Board of Trustees (the “Board”). When market quotations are not readily available or when events occur that make established valuation methods unreliable, securities of the Fund may be valued in good faith by or under the direction of the Board. These securities generally include, but are not limited to, restricted securities (securities which may not be publicly sold without registration under the Securities Act of 1933) for which a pricing service is unable to provide a market price; securities whose trading has been formally suspended; a security whose market price is not available from a pre-established primary pricing source or the pricing source is not willing to provide a price; a security with respect to which an event has occurred that is most likely to materially affect the value of the security after the market has closed but before the calculation of the Fund’s NAV or make it difficult or impossible to obtain a reliable market quotation; or a security whose price, as provided by the pricing service, does not reflect the security’s “fair value” due to the security being de-listed from a national exchange or the security’s primary trading market is temporarily closed at a time when, under normal conditions, it would be open. As a general principle, the current “fair value” of a security would be the amount which the owner might reasonably expect to receive from the closing sale prices on the applicable exchange and fair value prices may not reflect the actual value of a security. A variety of factors may be considered in determining the fair value of such securities.
C. Securities Transactions and Investment Income
Securities transactions are recorded as of the trade date. Realized gains and losses from securities transactions are recorded on the identified cost basis. Dividend income is recorded on the ex-dividend date. Interest income, if any, is recorded on the accrual basis, including amortization of premiums and accretion of discounts.
D. Dividends and Distributions to Shareholders
The Fund intends to declare and make quarterly distributions, or as the Board of Trustees may determine from time to time. Distributions of net realized capital gains earned by the Fund, if any, are distributed at least annually. Distributions from net investment income and capital gains are determined in accordance with income tax regulations, which may differ from U.S. GAAP. These differences are primarily due to differing treatments of income and gains on various investment securities held by the Fund, timing differences and differing characterization of distributions made by the Fund.
Distributions received from the Fund’s investments in Master Limited Partnerships (“MLPs”) generally are comprised of income and return of capital. The Fund records investment income and return of capital based on estimates made at the time such distributions are received. Such estimates are based on historical information available from each MLP and other industry sources. These estimates may subsequently be revised based on information received from MLPs after their tax reporting periods are concluded. For the period ended November 30, 2011, the Fund distributed $73,019,376 of which $62,790,879 was characterized as return of capital and $10,228,497 characterized as net investment income from MLP distributions received.
| | |
14 | | |
| | www.alpsfunds.com | 866.513.5856 |
| | | | |
| | Alerian MLP ETF | | Notes to Financial Statements |
| | | | November 30, 2011 |
The Fund also expects that a portion of the distributions it receives from MLPs may be treated as a tax deferred return of capital, thus reducing the Fund’s current tax liability. Return of capital distributions are not taxable income to the shareholder, but reduce the investor’s tax basis in the investor’s Fund Shares. Such a reduction in tax basis will result in larger taxable gains and/or lower tax losses on a subsequent sale of Fund Shares. Shareholders who periodically receive the payment of dividends or other distributions consisting of a return of capital may be under the impression that they are receiving net profits from the Fund when, in fact, they are not. Shareholders should not assume that the source of the distributions is from the net profits of the Fund.
E. Federal Income Taxation
The Fund is taxed as a regular C-corporation for federal income tax purposes. Currently, the maximum marginal regular federal income tax rate for a corporation is 35 percent. The Fund may be subject to a 20 percent federal alternative minimum tax on its federal alternative taxable income to the extent that its alternative minimum tax exceeds its regular federal income tax. This differs from most investment companies, which elect to be treated as “regulated investment companies” under the Code in order to avoid paying entity level income taxes. Under current law, the Fund is not eligible to elect treatment as a regulated investment company due to its investments primarily in MLPs invested in energy assets. As a result, the Fund will be obligated to pay applicable federal and state corporate income taxes on its taxable income as opposed to most other investment companies which are not so obligated. The Fund expects that a portion of the distributions it receives from MLPs may be treated as a tax-deferred return of capital, thus reducing the Fund’s current tax liability. However, the amount of taxes currently paid by the Fund will vary depending on the amount of income and gains derived from investments and/or sales of MLP interests and such taxes will reduce your return from an investment in the Fund.
Cash distributions from MLPs to the Fund that exceed such Fund’s allocable share of such MLP’s net taxable income are considered a tax-deferred return of capital that will reduce the Fund’s adjusted tax basis in the equity securities of the MLP. These reductions in such Fund’s adjusted tax basis in the MLP equity securities will increase the amount of gain (or decrease the amount of loss) recognized by the Fund on a subsequent sale of the securities. The Fund will accrue deferred income taxes for any future tax liability associated with (i) that portion of MLP distributions considered to be a tax-deferred return of capital as well as (ii) capital appreciation of its investments. Upon the sale of an MLP security, the Fund may be liable for previously deferred taxes. The Fund will rely to some extent on information provided by the MLPs, which is not necessarily timely, to estimate deferred tax liability for purposes of financial statement reporting and determining the NAV. From time to time, ALPS Advisors, Inc. will modify the estimates or assumptions related to the Fund’s deferred tax liability as new information becomes available. The Fund will generally compute deferred income taxes based on the marginal regular federal income tax rate applicable to corporations and an assumed rate attributable to state taxes.
| | |
| | 15 |
Annual | November 30, 2011 | |
| | | | |
| | Alerian MLP ETF | | Notes to Financial Statements |
| | | | November 30, 2011 |
The Fund recognizes interest and penalties related to unrecognized tax benefits within the income tax expense line in the accompanying statement of operations. Accrued interest and penalties are included within the related tax liability line in the balance sheet.
Since the Fund will be subject to taxation on its taxable income, the NAV of Fund shares will also be reduced by the accrual of any deferred tax liabilities. The Index however is calculated without any adjustments for taxes. As a result, the Fund’s after tax performance could differ significantly from the Index even if the pretax performance of the Fund and the performance of the Index are closely correlated.
The Fund’s income tax expense/(benefit) consists of the following:
| | | | | | | | | | | | |
| | | November 30, 2011 | |
| | | Current | | | Deferred | | | Total | |
Federal | | | 5,304,722 | | | | 33,251,895 | | | | 38,556,617 | |
| | | |
State | | | 330,849 | | | | 2,157,804 | | | | 2,488,653 | |
Total tax expense | | | 5,635,571 | | | | 35,409,699 | | | | 41,045,270 | |
| |
| | | December 31, 2010 | |
| | | Current | | | Deferred | | | Total | |
Federal | | | 0 | | | | 12,779,885 | | | | 12,779,885 | |
State | | | 0 | | | | 0 | | | | 0 | |
Total tax expense | | | 0 | | | | 12,779,885 | | | | 12,779,885 | |
Deferred income taxes reflect the net tax effect of temporary differences between the carrying amount of assets and liabilities for financial reporting and tax purposes.
Components of the Fund’s deferred tax assets and liabilities are as follows:
| | | | | | | | |
| | | As of November 30, 2011 | | | As of December 31, 2010 | |
Deferred tax assets: | | | | | | | | |
| | |
Income recognized from MLP investments | | | 2,494,257 | | | | 0 | |
Loss carryforwards | | | 0 | | | | 937,415 | |
| | |
Less Deferred tax liabilities: | | | | | | | | |
| | |
Net unrealized gain on investment securities | | | (50,683,811) | | | | (13,717,270) | |
Net Deferred tax liability | | | (48,189,554) | | | | (12,779,855) | |
Although the Fund currently has a net deferred tax liability, it reviews the recoverability of its deferred tax assets based upon the weight of available evidence. When assessing the recoverability of its deferred tax assets, significant weight was given to the effects of potential future realized and unrealized gains on investments and the period over which these deferred tax assets can be realized.
| | |
16 | | |
| | www.alpsfunds.com | 866.513.5856 |
| | | | |
| | Alerian MLP ETF | | Notes to Financial Statements |
| | | | November 30, 2011 |
Currently, any capital losses that may be generated by the Fund in the future are eligible to be carried back up to three years and can be carried forward for five years to offset capital gains recognized by the fund in those years. Net operating losses that may be generated by the Fund in the future are eligible to be carried back up to two years and can be carried forward for 20 years to offset income generated by the Fund in those years.
Based upon the Fund’s assessment, it has determined that it is more likely than not that its deferred tax assets will be realized through future taxable income of the appropriate character. Accordingly, no valuation allowance has been established for the Fund’s deferred tax assets. The Fund will continue to assess the need for a valuation allowance in the future. Significant declines in the fair value of its portfolio of investments may change the Fund’s assessment of the recoverability of these assets and may result in the recording of a valuation allowance against all or a portion of the Fund’s gross deferred tax assets.
Total income tax benefit (current and deferred) differs from the amount computed by applying the federal statutory income tax rate of 35% to net investment and realized and unrealized gain/(losses) on investment before taxes as follows:
| | | | | | | | |
| | | January 1 to
November 30, 2011 | | | Inception to
December 31, 2010 | |
| | |
Income tax expense at statutory rate | | | 38,617,363 | | | | 11,628,811 | |
| | |
State income taxes (net of federal benefit) | | | 2,795,518 | | | | 1,151,044 | |
| | |
Change in estimated state deferred rate | | | (320,414) | | | | 0 | |
| | |
Other | | | (47,197) | | | | 0 | |
Net income tax expense | | | 41,045,270 | | | | 12,779,855 | |
The following is a tabular reconciliation of the total amounts of unrecognized tax benefits:
| | | | |
| | | January 1 to
November 30, 2011 | | Inception to
December 31, 2010 |
| | |
Unrecognized tax benefit – Beginning | | 0 | | 0 |
| | |
Gross increases – tax positions in prior period | | 0 | | 0 |
| | |
Gross decreases – tax positions in prior period | | 0 | | 0 |
| | |
Gross increases – tax positions in current period | | 0 | | 0 |
| | |
Settlement | | 0 | | 0 |
| | |
Lapse of statute of limitations | | 0 | | 0 |
| | |
Unrecognized tax benefit – Ending | | 0 | | 0 |
| | |
| | 17 |
Annual | November 30, 2011 | |
| | | | |
| | Alerian MLP ETF | | Notes to Financial Statements |
| | | | November 30, 2011 |
The Fund recognizes interest accrued related to unrecognized tax benefits and penalties as income tax expense. For the period from Inception to November 30, 2011, the Fund had no accrued penalties or interest.
The Fund recognizes the tax benefits of uncertain tax positions only where the position is “more likely than not” to be sustained assuming examination by tax authorities. Management has analyzed the Fund’s tax positions, and has concluded that no liability for unrecognized tax benefits should be recorded related to uncertain tax positions taken on U.S. tax returns and state tax returns filed since inception of the fund. No U.S. federal or state income tax returns are currently under examination. The tax periods ended November 30, 2010 and 2011 remain subject to examination by tax authorities in the United States. Due to the nature of the Fund’s investments, the Fund may be required to file income tax returns in several states. The Fund is not aware of any tax positions for which it is reasonably possible that the total amounts of unrecognized tax benefits will change materially in the next 12 months.
The adjusted cost basis of investment and gross unrealized appreciation and depreciation of investments for federal income tax purposes were as follows:
| | | | | | | | |
| | | As of November 30, 2011 | | | As of December 31, 2010 | |
| | |
Gross unrealized appreciation – investment securities | | | 164,199,507 | | | | 34,573,293 | |
| | |
Gross unrealized depreciation – investment securities | | | (29,342,979 | ) | | | (448,944 | ) |
Net Unrealized appreciation – investment securities | | | 134,856,528 | | | | 34,124,349 | |
Cost basis of investments | | | 1,629,684,649 | | | | 590,516,205 | |
F. Fair Value Measurements
The Fund discloses the classification of its fair value measurements following a three-tier hierarchy based on the inputs used to measure fair value. Inputs refer broadly to the assumptions that market participants would use in pricing the asset or liability, including assumptions about risk. Inputs may be observable or unobservable. Observable inputs reflect the assumptions market participants would use in pricing the asset or liability that are developed based on market data obtained from sources independent of the reporting entity. Unobservable inputs reflect the reporting entity’s own assumptions about the assumptions market participants would use in pricing the asset or liability that are developed based on the best information available.
Various inputs are used in determining the value of the Fund’s investments as of the end of the reporting period. When inputs used fall into different levels of the fair value hierarchy, the level in the hierarchy within which the fair value measurement falls is determined based on the lowest level input that is significant to the fair value measurement in its entirety. The designated input levels are not necessarily an indication of the risk or liquidity associated with these investments. These inputs are categorized in the following hierarchy under applicable financial accounting standards:
| | |
18 | | |
| | www.alpsfunds.com | 866.513.5856 |
| | | | |
| | Alerian MLP ETF | | Notes to Financial Statements |
| | | | November 30, 2011 |
| | |
Level 1 — | | Unadjusted quoted prices in active markets for identical assets or liabilities that the Fund has the ability to access. |
Level 2 — | | Observable inputs other than quoted prices included in level 1 that are observable for the asset or liability, either directly or indirectly. These inputs may include quoted prices for the identical instrument on an inactive market, prices for similar instruments, interest rates, prepayment speeds, credit risk, yield curves, default rates, and similar data. |
Level 3 — | | Unobservable inputs for the asset or liability, to the extent relevant observable inputs are not available, representing the Fund’s own assumptions about the assumptions a market participant would use in valuing the asset or liability, and would be based on the best information available. |
| | | | | | | | | | | | | | | | |
Investments in Securities at Value* | | Level 1 - Unadjusted
Quoted Prices | | | Level 2 - Other
Significant
Observable
Inputs | | | Level 3 - Significant
Unobservable
Inputs | | | Total | |
Master Limited Partnerships Shares | | $ | 1,764,541,176 | | | $ | – | | | $ | – | | | $ | 1,764,541,176 | |
TOTAL | | $ | 1,764,541,176 | | | $ | – | | | $ | – | | | $ | 1,764,541,176 | |
| | |
| * | For detailed descriptions of sectors, see the accompanying Schedule of Investments. |
For the period ended November 30, 2011, the Fund did not have any significant transfers between Level 1 and Level 2 securities. The Fund did not have any securities which used significant unobservable inputs (Level 3) in determining fair value.
3. Investment Advisory Fee and Other Affiliated Transactions
ALPS Advisors, Inc. (the “Investment Adviser”) acts as the Fund’s investment adviser pursuant to an advisory agreement with the Trust on behalf of the Fund (the “Advisory Agreement”). Pursuant to the Advisory Agreement, the Fund pays the Investment Adviser a unitary fee for the services and facilities it provides payable on a monthly basis at the annual rate of 0.85% of the Fund’s average daily net assets. From time to time, the Investment Adviser may waive all or a portion of its fee.
Out of the unitary management fee, the Investment Adviser pays substantially all expenses of the Fund, including the fee of the Index Provider, and the cost of transfer agency, custody, fund administration, legal, audit, trustees and other services, other than taxes, interest expenses, distribution fees or expenses, brokerage expenses, and extraordinary expenses such as litigation not incurred in the ordinary course of the Fund’s business.
ALPS Fund Services, Inc. (“ALPS”), an affiliate of the Investment Adviser, is the administrator of the Fund.
| | |
| | 19 |
Annual | November 30, 2011 | |
| | | | |
| | Alerian MLP ETF | | Notes to Financial Statements |
| | | | November 30, 2011 |
The Bank of New York Mellon is the custodian, fund accounting agent and transfer agent for the Fund.
Each Trustee who is not an officer or employee of the Investment Adviser, any sub-adviser or any of their affiliates (“Independent Trustees”) is paid a quarterly retainer of $3,500, $1,500 for each regularly scheduled Board meeting attended and $750 for each special meeting held outside of regularly scheduled meetings.
4. Purchases and Sales of Securities
For the period ended November 30, 2011, the cost of purchases and proceeds from sales of investment securities, excluding short-term investments and in-kind transactions, were as follows:
| | |
Purchases | | Sales |
|
$113,254,478 | | $185,567,655 |
For the period ended November 30, 2011, the cost of in-kind purchases and proceeds from in-kind sales were as follows:
| | |
Purchases | | Sales |
|
$1,190,142,601 | | $25,633,201 |
Gains on in-kind transactions are not considered taxable for federal income tax purposes.
5. Capital Share Transactions
Shares are created and redeemed by the Fund only in Creation Unit size aggregations of 50,000. Only broker-dealers or large institutional investors with creation and redemption agreements called Authorized Participants (“AP”) are permitted to purchase or redeem Creation Units from the Fund. Such transactions are generally permitted on an in-kind basis, with a balancing cash component to equate the transaction to the net asset value per unit of the Fund on the transaction date. Cash may be substituted equivalent to the value of certain securities generally when they are not available in sufficient quantity for delivery, not eligible for trading by the AP or as a result of other market circumstances.
6. Master Limited Partnerships
MLPs are publicly traded partnerships engaged in the transportation, storage and processing of minerals and natural resources. By confining their operations to these specific activities, their interests, or units, are able to trade on public securities exchanges exactly like the shares of a corporation, without entity level taxation. Of the seventy MLPs eligible for inclusion in the Index, approximately two-thirds trade on the NYSE and the rest trade on the NASDAQ. To qualify as a MLP and to not be taxed as a corporation, a partnership must receive at least 90% of its income from qualifying sources as set forth in Section 7704(d) of the Internal Revenue Code of 1986, as amended (the “Code”). These qualifying sources include natural resource based activities such as the processing, transportation and storage of mineral or natural resources. MLPs generally have two classes of owners, the general partner
| | |
20 | | |
| | www.alpsfunds.com | 866.513.5856 |
| | | | |
| | Alerian MLP ETF | | Notes to Financial Statements |
| | | | November 30, 2011 |
and limited partners. The general partner of an MLP is typically owned by a major energy company, an investment fund, the direct management of the MLP, or is an entity owned by one or more of such parties. The general partner may be structured as a private or publicly traded corporation or other entity. The general partner typically controls the operations and management of the MLP through an up to 2% equity interest in the MLP plus, in many cases, ownership of common units and subordinated units. Limited partners typically own the remainder of the partnership, through ownership of common units, and have a limited role in the partnership’s operations and management. MLPs are typically structured such that common units and general partner interests have first priority to receive quarterly cash distributions up to an established minimum amount (“minimum quarterly distributions” or “MQD”). Common and general partner interests also accrue arrearages in distributions to the extent the MQD is not paid. Once common and general partner interests have been paid, subordinated units receive distributions of up to the MQD; however, subordinated units do not accrue arrearages. Distributable cash in excess of the MQD is paid to both common and subordinated units and is distributed to both common and subordinated units generally on a pro rata basis. The general partner is also eligible to receive incentive distributions if the general partner operates the business in a manner which results in distributions paid per common unit surpassing specified target levels. As the general partner increases cash distributions to the limited partners, the general partner receives an increasingly higher percentage of the incremental cash distributions.
7. Indemnifications
Under the Trust’s organizational documents, its officers and Trustees are indemnified against certain liability arising out of the performance of their duties to the Trust. Additionally, in the normal course of business, the Trust enters into contracts with service providers that contain general indemnification clauses. The Trust’s maximum exposure under these arrangements is unknown, as this would involve future claims that may be made against the Trust that have not yet occurred.
8. New Accounting Pronouncements
In May 2011, the FASB issued ASU No. 2011-04 “Amendments to Achieve Common Fair Value Measurement and Disclosure Requirements” in GAAP and the International Financial Reporting Standards (“IFRSs”). ASU No.2011-04 amends FASB ASC Topic 820, “Fair Value Measurements and Disclosures”, to establish common requirements for measuring fair value and for disclosing information about fair value measurements in accordance with GAAP and IFRSs. ASU No.2011-04 is effective for fiscal years beginning after December 15, 2011 and for interim periods within those fiscal years. Management is currently evaluating the impact these amendments may have on the Fund’s financial statements.
| | |
| | 21 |
Annual | November 30, 2011 | |
| | | | |
| | Alerian MLP ETF | | Additional Information |
| | | | November 30, 2011 (Unaudited) |
Proxy Voting Policies And Procedures
A description of the Fund’s proxy voting policies and procedures used in determining how to vote for proxies and information regarding how the Fund voted proxies related to portfolio securities during the most recent 12-month period ended June 30th is available without charge, (1) on the Securities and Exchange Commission’s (“SEC”) website at http://www.sec.gov; (2) upon request, by calling 1-866-513-5856; and (3) on the Trust’s website located at http://www.alpsfunds.com.
Portfolio Holdings
The Trust will file its complete schedule of portfolio holdings with the SEC for the first and third quarters of each fiscal year on Form N-Q. The Trust’s Form N-Q will be available (1) on the SEC’s website at http:// www.sec.gov; (2) by calling 1-866-513-5856; (3) on the Trust’s website located at http://www.alpsfunds. com; and (4) for review and copying at the SEC’s Public Reference Room (“PRR”) in Washington D.C. Information regarding the operation of the PRR may be obtained by calling 1-800-732-0330.
Shareholder Meeting
A Special Meeting of the Shareholders was held on October 14, 2011 for the purpose of voting on a proposal to approve a new Investment Advisory Agreement between ALPS ETF Trust, on behalf of the Fund, and ALPS Advisors, Inc. The proposal passed and the results are noted below.
Proposal 1: To approve a new Investment Advisory Agreement between ALPS ETF Trust, on behalf of the Fund, and ALPS Advisors, Inc.:
| | | | | | | | |
| Number of Votes |
| Record Date Votes | | Affirmative | | Against | | Abstain | | Uninstructed |
| 43,493,935,378 | | 41,288,133,282 | | 728,509,294 | | 802,421,802 | | 674,871,000 |
| | | | | | | | | | | | | | | | |
| Percentages of Total Outstanding | | | | Percentages of Voted |
| Affirmative | | Against | | Abstain | | Uninstructed | | | | Affirmative | | Against | | Abstain | | Uninstructed |
| 52.726% | | 0.930% | | 1.025% | | 0.862% | | | | 94.928% | | 1.675% | | 1.845% | | 1.552% |
| | |
22 | | |
| | www.alpsfunds.com | 866.513.5856 |
| | | | |
| | Alerian MLP ETF | | Board Considerations Regarding Approval of Investment Advisory Agreement |
| | | | November 30, 2011 (Unaudited) |
At an in-person meeting held on July 26, 2011, the Board of Trustees of the Trust (the “Board”), including the Trustees who are not “interested persons” of the Trust within the meaning of the Investment Company Act of 1940, as amended (the “1940 Act”), evaluated a proposal to approve a new Investment Advisory Agreement (the “Advisory Agreement”) between the Trust and ALPS Advisors, Inc. (the “Investment Adviser”) with respect to Alerian MLP ETF (the “Fund”).
Consideration by the Board of this new Advisory Agreement was necessary because ALPS Holdings, Inc. (“ALPS Holdings”), parent company to the Investment Adviser, had agreed to be acquired by DST Systems, Inc. (“DST”) (the “Transaction”). Because ALPS Holdings would be acquired by DST, the Investment Adviser would thereby undergo a change in control, which would be deemed to be an “assignment” of the existing investment advisory agreement under the 1940 Act. As required by the 1940 Act, the existing investment advisory agreement provided for its automatic termination in the event of an assignment, and would therefore terminate upon the closing of the Transaction. In order for the Investment Adviser to continue as the Fund’s investment adviser, the Board and the Fund’s shareholders would have to approve a new Advisory Agreement with the Investment Adviser, which would take effect upon the closing of the Transaction.
In evaluating the new Advisory Agreement, the Board did not identify any single factor as all-important or controlling. The following summary does not identify all the matters considered by the Board, but includes the principal matters it considered. The Board considered whether the new Advisory Agreement would be in the best interests of the Fund and its shareholders, based on: (i) the nature, extent and quality of the services to be provided by the Investment Adviser under the Advisory Agreement; (ii) the investment performance of the Fund; (iii) the expenses borne by the Fund under the unitary fee arrangement of the Advisory Agreement; (iv) the estimated profitability of the Investment Adviser and its affiliates from their relationship with the Fund; (v) potential fall-out benefits to the Investment Adviser from its relationship with the Fund; and (vi) other general information about the Investment Adviser and its affiliates. The following is a summary of the Board’s consideration and conclusions regarding these matters.
Nature, Extent and Quality of the Services to be Provided
The Board considered the nature, extent and quality of the services to be provided by the Investment Adviser, including the portfolio management services to be provided, in light of the investment objective of the Fund. The Board considered that, following the Transaction, the Fund would be managed by senior personnel at the Investment Adviser. In that regard, the Board considered the history of care and conscientiousness in supervising the management of the Fund provided by such personnel. The Board considered the background and capabilities of such personnel in connection with the advisory services that they would provide to the Fund following the Transaction. The Board also considered the compliance records of the Investment Adviser. The Board considered representations from DST that it intended to retain all key management and personnel of ALPS Holdings and the Investment Adviser, and that DST did not anticipate that the Investment Adviser would undergo any changes to its structure, business strategy or services as a result of the Transaction. The Board also considered the Investment Adviser’s representation that the manner in which the Fund’s assets would be managed would not change as a result of the Transaction. Finally, the Board also considered its and the Fund’s association with the current personnel employed by the Investment Adviser.
The Board concluded that the nature, extent and quality of the services to be provided by the Investment Adviser to the Fund were appropriate and consistent with the terms of the new Advisory Agreement, and that the Fund was likely to benefit from services provided under its new Advisory Agreement. The Board also concluded that the quality of the services to be provided by the senior advisory personnel employed by the Investment Adviser was expected to be consistent with or superior to quality norms in the industry, and that the Investment Adviser would have sufficient personnel, with the appropriate education and experience, to serve the Fund effectively. The Board also concluded that the Investment Adviser had demonstrated a continuing ability to attract and retain well-qualified personnel (and noted the Investment Adviser’s representations that no changes were anticipated with respect to the Investment Adviser’s
| | |
| | 23 |
Annual | November 30, 2011 | |
| | | | |
| | Alerian MLP ETF | | Board Considerations Regarding Approval of Investment Advisory Agreement |
| | | | November 30, 2011 (Unaudited) |
compensation and incentive programs), and that the structure of the Investment Adviser’s operations was sufficient to retain and properly motivate the Fund’s current senior advisory personnel. Finally, the Board concluded that the financial condition of DST, ALPS Holdings and the Investment Adviser was sound.
Investment Performance
The Board also reviewed investment performance information of the Fund and its benchmark index. The Board evaluated the correlation and tracking error between the underlying index and the Fund.
Costs of the Services to be Provided to the Fund
The Board reviewed the fees to be paid by the Fund to the Investment Adviser, noting that the rate of fees to be paid under the new Advisory Agreement was the same fee rate the Fund currently paid. The Board noted that the advisory fee paid to the Investment Adviser by the Fund was a unitary fee pursuant to which the Investment Adviser assumes all expenses of the Fund (including the cost of transfer agency, custody, advisory, fund administration, legal, audit and other services) other than the payments under the new Advisory Agreement, brokerage expenses, taxes, interest, litigation expenses and other extraordinary expenses. The Board considered the Investment Adviser’s representation that it did not intend to raise any of its advisory or administration fees paid by the Fund for at least two years following the Transaction.
The Board reviewed comparative fee information of the Fund’s advisory contracts, including information about the rates of compensation paid to investment advisers, and overall expense ratios, for funds comparable in size, character and investment strategy to the Fund. The Board considered the fact that the Fund’s fees were generally comparable to the fees charged to similar funds. The Board concluded that the management fees payable by the Fund to the Investment Adviser were reasonable in relation to the nature and quality of the services expected to be provided, taking into account the fees charged by other advisers for managing comparable funds with similar strategies.
Projected Profitability and Costs of Services to the Investment Adviser and Potential “Fall-Out” Benefits
The Board reviewed reports of the financial position of the Investment Adviser. The Board considered the projected profitability of ALPS Holdings’ overall relationship with the Fund, which included fees payable to the Investment Adviser for advisory services. The Board noted that since the Fund was subject to a unitary fee arrangement with the Investment Adviser pursuant to the new Advisory Agreement, there were no other fees payable to other ALPS Holdings affiliates for non-advisory services, and concluded that the projected profitability of ALPS Holdings was reasonable in relation to the services to be provided and to the costs of providing services to the Fund.
The Board also considered any potential “fall-out” benefits that the Investment Adviser might receive because of its relationship with the Fund and concluded that the advisory fees were reasonable taking into account any such benefits. The Board acknowledged the Investment Adviser’s well-established stand-alone management relationships independent of the Fund and the regulatory and entrepreneurial risks each assumed in connection with the management of the Fund.
Economies of Scale
The Board reviewed the Fund’s assets under management, and noted that because of the Fund’s unitary fee arrangement, consideration of economies of scale was not a relevant factor to the Fund.
Conclusion
Based on its evaluation, the Board unanimously concluded that the terms of the new Advisory Agreement were reasonable, fair and in the best interests of the Fund and its shareholders. The Board believed that the new Advisory Agreement would enable the Fund to continue to enjoy the high-quality investment management services it had received in the past from the Investment Adviser, at a fee rate identical to the present rate, which the Board deemed appropriate, reasonable and in the best interests of the Fund and its shareholders.
| | |
24 | | |
| | www.alpsfunds.com | 866.513.5856 |
| | | | |
| | Alerian MLP ETF | | Trustees & Officers |
| | | | November 30, 2011 (Unaudited) |
Independent Trustees
| | | | | | | | | | |
Name, Address and Age of Management Trustee* | | Position(s) Held with Trust | | Term of Office and Length of Time Served** | | Principal Occupation(s) During Past 5 Years | | Number of Portfolios in Fund Complex Overseen by Trustees*** | | Other Directorships Held by Trustees |
Mary K. Anstine, age 71 | | Trustee | | Since
March 2008 | | Ms. Anstine was President/Chief Executive Officer of Health ONE Alliance, Denver, Colorado, and former Executive Vice President of First Interstate Bank of Denver. Ms. Anstine is also Trustee/ Director of the following: AV Hunter Trust; Colorado Uplift Board. Ms. Anstine was formerly a Director of the Trust Bank of Colorado (later purchased and now known as Northern Trust Bank), HealthONE and Denver Area Council of the Boy Scouts of America and a member of the American Bankers Association Trust Executive Committee. | | 21 | | Ms. Anstine is a Trustee of Financial Investors Variable Insurance Trust (5 funds); Financial Investors Trust (17 funds); Reaves Utility Income Fund; and Westcore Trust (12 funds). |
Jeremy W. Deems, age 35 | | Trustee | | Since
March 2008 | | Mr. Deems is the Co-Founder, Chief Compliance Officer and Chief Financial Officer of Green Alpha Advisors, LLC. Prior to joining Green Alpha Advisors, Mr. Deems was CFO and Treasurer of Forward Management, LLC, ReFlow Management Co., LLC, ReFlow Fund, LLC, a private investment fund, and Sutton Place Management, LLC, an administrative services company, from 2004 to June 2007. Prior to this, Mr. Deems served as Controller of Forward Management, LLC, ReFlow Management Co., LLC, ReFlow Fund, LLC and Sutton Place Management, LLC. | | 21 | | Mr. Deems is a Trustee of Financial Investors Trust (17 funds); Financial Investors Variable Insurance Trust (5 funds); and Reaves Utility Income Fund. |
| | |
| | 25 |
Annual | November 30, 2011 | |
| | | | |
| | Alerian MLP ETF | | Trustees & Officers |
| | | | November 30, 2011 (Unaudited) |
Independent Trustees (continued)
| | | | | | | | | | |
Name, Address and Age of Management Trustee* | | Position(s) Held with Trust | | Term of Office and Length of Time Served** | | Principal Occupation(s) During Past 5 Years | | Number of Portfolios in Fund Complex Overseen by Trustees*** | | Other Directorships Held by Trustees |
| Rick A. Pederson, age 59 | | Trustee | | Since
March
2008 | | President, Foundation Properties, Inc. (a real estate investment management company), 1994 - present; Partner, Western Capital Partners (a prime lending company), 2000 - present; Partner, Bow River Capital Partners (investment manager), 2003 - present; Principal, The Pauls Corporation (real estate development), 2008 - present; Director, Guaranty Bank and Trust (a community bank), 1999 – 2007; Winter Park Recreational Association (an entity that operates, maintains and develops Winter Park Resort), 2002 – 2008; Neenan Co. (an integrated real estate development, architecture and construction company), 2002 – present; NexCore Properties LLC (a real estate investment company), 2004 – present; Urban Land Conservancy (a not-for-profit organization), 2004 – present. | | 7 | | Mr. Pederson is Trustee of Westcore Trust (12 funds) |
| * | The business address of the Trustee is c/o ALPS Advisors, Inc., 1290 Broadway, Suite 1100, Denver, Colorado 80203. |
| ** | This is the period for which the Trustee began serving the Trust. Each Trustee serves an indefinite term, until his successor is elected. |
| *** | The Fund Complex includes all series of the Trust and any other investment companies for which ALPS Advisors, Inc. provides investment advisory services. |
| | |
26 | | |
| | www.alpsfunds.com | 866.513.5856 |
| | | | |
| | Alerian MLP ETF | | Trustees & Officers |
| | | | November 30, 2011 (Unaudited) |
Interested Trustee***
| | | | | | | | | | |
Name, Address and Age of Management Trustee* | | Position(s) Held with Trust | | Term of Office and Length of Time Served** | | Principal Occupation(s) During Past 5 Years | | Number of Portfolios in Fund Complex Overseen by Trustees**** | | Other Directorships Held by Trustees |
Thomas A. Carter, age 45 | | Trustee and
President | | Since
March 2008 | | Mr. Carter joined ALPS Fund Services, Inc. (“ALPS”) in 1994 and is currently President and Director of ALPS Advisors, Inc. (“AAI”), ALPS Distributors, Inc. (“ADI”) and FTAM Funds Distributor, Inc. (“FDI”) and Executive Vice President and Director of ALPS and ALPS Holdings, Inc. (“AHI”). Because of his position with AHI, ALPS, ADI, FDI and AAI, Mr. Carter is deemed an affiliate of the Fund as defined under the 1940 Act. Before joining ALPS, Mr. Carter was with Deloitte & Touché LLP, where he worked with a diverse group of clients, primarily within the financial services industry. Mr. Carter is a Certified Public Accountant and received his Bachelor of Science in Accounting from the University of Colorado at Boulder. | | 12 | | Mr. Carter is a Trustee of Financial Investors Variable Insurance Trust (5 funds) |
| * | The business address of the Trustee is c/o ALPS Advisors, Inc., 1290 Broadway, Suite 1100, Denver, Colorado 80203. |
| ** | This is the period for which the Trustee began serving the Trust. Each Trustee serves an indefinite term, until his successor is elected. |
| *** | Mr. Carter is an interested person of the Trust because of his affiliation with ALPS. |
| **** | The Fund Complex includes all series of the Trust and any other investment companies for which ALPS Advisors, Inc. provides investment advisory services |
| | |
| | 27 |
Annual | November 30, 2011 | |
| | | | |
| | Alerian MLP ETF | | Trustees & Officers |
| | | | November 30, 2011 (Unaudited) |
Officers
| | | | | | | | |
Name, Address and Age of Executive Officer* | | Position(s) Held with Trust | | Length of Time Served** | | | | Principal Occupation(s) During Past 5 Years |
Melanie Zimdars, age 35 | | Chief Compliance Officer (“CCO”) | | Since December 2009 | | | | Ms. Zimdars currently serves as a Deputy Chief Compliance Officer with ALPS. Prior to joining ALPS in September 2009, Ms. Zimdars served as Principal Financial Officer, Treasurer and Secretary for the Wasatch Funds from February 2007 to December 2008. From November 2006 to February 2007, she served as Assistant Treasurer for the Wasatch Funds and served as a Senior Compliance Officer for Wasatch Advisors, Inc. since 2005. From 2001 until joining Wasatch in 2005, she was a Compliance Officer for U.S. Bancorp Fund Services, LLC. Because of her position with ALPS, Ms. Zimdars is deemed an affiliate of the Trust as defined under the 1940 Act. Ms. Zimdars is also the CCO of Financial Investors Variable Insurance Trust, Liberty All-Star Growth Fund, Inc. and Liberty All-Star Equity Fund. |
Kimberly R. Storms, age 39 | | Treasurer | | Since March 2008 | | | | Ms. Storms is Director of Fund Administration and Senior Vice President of ALPS. Ms. Storms joined ALPS in 1998 as Assistant Controller. Because of her position with ALPS, Ms. Storms is deemed an affiliate of the Trust as defined under the 1940 Act. Ms. Storms is also Assistant Treasurer of the Liberty All-Star Equity Fund, Liberty All-Star Growth Fund and Financial Investors Trust; and Assistant Secretary of Ameristock Mutual Fund, Inc. |
William Parmentier, age 59 | | Vice President | | Since March 2008 | | | | Mr. Parmentier is Chief Investment Officer, ALPS Advisors, Inc. (since 2006); President of the Liberty All-Star Funds (since April 1999); Senior Vice President (2005-2006), Banc of America Investment Advisors, Inc. |
Tané T. Tyler, age 47 | | Secretary | | Since December 2008 | | | | Ms.Tyler is Senior Vice President, General Counsel and Secretary of ALPS. Ms. Tyler joined ALPS in 2004. She served as Secretary,Reaves Utility Income Fund from December 2004–2007; Secretary, Westcore Funds from February 2005–2007; Secretary, First Funds from November 2004 to January 2007; Secretary, Financial Investors Variable Insurance Trust from December 2004–December 2006; Vice President and Associate Counsel, Oppenheimer Funds from January 2004 to August 2004; Vice President and Assistant General Counsel,INVESCO Funds from September 1991 to December 2003. Ms. Tyler also serves as Secretary, Liberty All-Star Equity Fund and Liberty All-Star Growth Fund. |
Monette R. Nickels, age 40 | | Tax Officer | | Since December 2009 | | | | Ms. Nickels is Senior Vice President and Director of Tax Administration of ALPS. Ms. Nickels joined ALPS in 2004 as Director of Tax Administration. Because of her position with ALPS, Ms. Nickels is deemed an affiliate of the Trust as defined under the 1940 Act. Ms. Nickels is also Tax Officer of Financial Investors Trust, Liberty All-Star Equity Fund, Liberty All-Star Growth Fund, Inc., and Financial Investors Variable Insurance Trust. |
| * | The business address of each Officer is c/o ALPS Advisors, Inc., 1290 Broadway, Suite 1100, Denver, Colorado 80203. |
| ** | This is the period for which the Officer began serving the Trust. Each Officer serves an indefinite term, until his successor is elected. |
| | |
28 | | |
| | www.alpsfunds.com | 866.513.5856 |
This report has been prepared for Alerian MLP ETF shareholders and may be distributed to others only if preceded or accompanied by a prospectus.
ALPS Distributors, Inc., distributor for the Alerian MLP ETF.
ALR000188 07/31/12
(a) The Registrant, as of the end of the period covered by this report, has adopted a code of ethics that applies to the Registrant’s principal executive officer, principal financial officer, principal accounting officer or controller or any persons performing similar functions on behalf of the Registrant.
(b) Not applicable.
(c) During the period covered by this report, no amendments to the provisions of the code of ethics adopted in 2(a) above were made.
(d) During the period covered by this report, no implicit or explicit waivers to the provisions of the code of ethics adopted in 2(a) above were granted.
(e) Not applicable.
(f) The Registrant’s Code of Ethics is attached as an Exhibit hereto.
| Item 3. | Audit Committee Financial Expert. |
The Board of Trustees of the Registrant has determined that the Registrant has at least one Audit Committee Financial Expert serving on its audit committee. The Board of Trustees of the Registrant has designated Jeremy W. Deems as the Registrant’s “Audit Committee Financial Expert”. Mr. Deems is “independent” as defined in paragraph (a)(2) of Item 3 to Form N-CSR.
| Item 4. | Principal Accountant Fees and Services. |
| | (a) | Audit Fees: For the Registrant’s fiscal year ended November 30, 2011 and December 31, 2010, the aggregate fees billed for professional services rendered by the principal accountant for the audit of the Registrant’s annual financial statements were $149,100 and $124,000, respectively. |
| | (b) | Audit-Related Fees: For the Registrant’s fiscal year ended November 30, 2011 and December 31, 2010, the aggregate fees billed for professional services rendered by the principal accountant for the verification of the Registrant’s securities and similar investments in accordance with Rule 17f-2 under the Investment Company Act of 1940 were $4,000 and $6,000, respectively. |
| | (c) | Tax Fees: For the Registrant’s fiscal year ended November 30, 2011 and December 31, 2010, the aggregate fees billed for professional services rendered by the principal accountant for tax compliance, tax advice and tax planning were $36,480 and $35,420, respectively. The fiscal year 2011 and 2010 tax fees were for services pertaining to federal and state income tax return review, review of year end dividend distributions and excise tax preparation. |
| | (d) | All Other Fees: For the Registrant’s fiscal year ended November 30, 2011 and December 31, 2010, aggregate fees billed to the Registrant by the principal accountant for services provided by the principal accountant other than the services reported in paragraphs (a) through (c) of this Item 4 were $0 and $1,500, respectively. |
| | (e)(1) | Audit Committee Pre-Approval Policies and Procedures: All services to be performed by the Registrant’s principal accountant must be pre-approved by the Registrant’s audit committee. |
| | (e)(2) | No services described in paragraphs (b) through (d) of this Item were approved by the Registrant’s audit committee pursuant to paragraph (c)(7)(i)(C) of Rule 2-01 of Regulation S-X. |
| | (g) | The aggregate non-audit fees billed by the Registrant’s accountant for the fiscal year ended November 30, 2011 and December 31, 2010 of the Registrant were $199,480 and $231,920, respectively. These fees consisted of non-audit fees billed to (i) the Registrant of $36,480 and $36, 920 as described in response to paragraph (c) above and (ii) to ALPS Fund Services, Inc. (“AFS”), an entity under common control with ALPS Advisors, Inc., the Registrant’s investment adviser, of $163,000 and $195,000, respectively. The non-audit fees billed to AFS related to SSAE 16 services and other compliance-related matters. |
| | (h) | The Registrant’s audit committee has considered whether the provision of non-audit services that were rendered to the Registrant’s investment adviser (not including any sub-adviser whose role is primarily portfolio management and is subcontracted with or overseen by another investment adviser), and any entity controlling, controlled by, or under common control with the investment adviser that provides ongoing services to the Registrant that were not pre-approved pursuant to paragraph (c)(7)(ii) of Rule 2-01 of Regulation S-X, is compatible with maintaining the principal accountant’s independence. The Registrant’s audit committee determined that the provision of such non-audit services is compatible with maintaining the principal accountant’s independence. |
| Item 5. | Audit Committee of Listed Registrants. |
Not applicable.
| | (a) | Schedule of Investments is included as part of the Report to Stockholders filed under Item 1 of this Form N-CSR. |
| Item 7. | Disclosure of Proxy Voting Policies and Procedures for Closed-End Management Investment Companies. |
Not applicable.
| Item 8. | Portfolio Managers of Closed-End Management Investment Companies. |
Not applicable.
| Item 9. | Purchases of Equity Securities by Closed-End Management Investment Company and Affiliated Purchasers. |
Not applicable.
| Item 10. | Submission of Matters to Vote of Security Holders. |
There have been no material changes to the procedures by which shareholders may recommend nominees to the Registrant’s Board of Trustees, where those changes were implemented after the Registrant last provided disclosure in response to the requirements of Item 407(c)(2) of Regulation S-K, or this Item.
| Item 11. | Controls and Procedures. |
| | (a) | The Registrant’s principal executive officer and principal financial officer have concluded that the Registrant’s disclosure controls and procedures (as defined in Rule 30a-3(c) under the Investment Company Act of 1940, as amended) are effective based on their evaluation of these controls and procedures as of a date within 90 days of the filing date of this report. |
| | (b) | There was no change in the Registrant’s internal control over financial reporting (as defined in Rule 30a-3(d) under the Investment Company Act of 1940, as amended) during the second fiscal quarter of the period covered by this report that has materially affected, or is reasonably likely to materially affect, the Registrant’s internal control over financial reporting. |
| | (a)(1) | Registrant’s Code of Ethics for Senior Financial Officers, which is the subject of the disclosure required by Item 2 of Form N-CSR, was filed as Exhibit 12(a)(1) to the Registrant’s Certified Shareholder Report on Form N-CSR, File No. 811-22175, on March 6, 2009. |
| | (a)(2) | The certifications required by Rule 30a-2(a) of the Investment Company Act of 1940, as amended, and Section 302 of the Sarbanes-Oxley Act of 2002 are attached hereto as Exhibit 99.Cert. |
| | (b) | The certifications by the Registrant’s principal executive officer and principal financial officer, as required by Rule 30a-2(b) of the Investment Company Act of 1940, as amended, and Section 906 of the Sarbanes-Oxley Act of 2002 are attached hereto as Exhibit 99.906Cert. |
SIGNATURES
Pursuant to the requirements of the Securities Exchange Act of 1934 and the Investment Company Act of 1940, the registrant has duly caused this report to be signed on its behalf by the undersigned, thereunto duly authorized.
| | |
| ALPS ETF TRUST |
| |
| By: | | /s/ Thomas A. Carter |
| | Thomas A. Carter |
| | President (Principal Executive Officer) |
| |
| Date: | | February 6, 2012 |
Pursuant to the requirements of the Securities Exchange Act of 1934 and the Investment Company Act of 1940, this report has been signed below by the following persons on behalf of the registrant and in the capacities and on the dates indicated.
| | |
| By: | | /s/ Thomas A. Carter |
| | Thomas A. Carter |
| | President (Principal Executive Officer) |
| |
| Date: | | February 6, 2012 |
| | |
| By: | | /s/ Kimberly R. Storms |
| | Kimberly R. Storms |
| | Treasurer (Principal Financial Officer) |
| |
| Date: | | February 6, 2012 |