united states
securities and exchange commission
washington, d.c. 20549
form n-csr
certified shareholder report of registered management
investment companies
Investment Company Act file number 811-22153
Dunham Funds
(Exact name of registrant as specified in charter)
10251 Vista Sorrento Pkwy, Ste. 200, San Diego, CA 92121
(Address of principal executive offices) (Zip code)
James Ash
Gemini Fund Services, LLC., 80 Arkay Drive, Suite 110, Hauppauge, NY 11788
(Name and address of agent for service)
Registrant's telephone number, including area code: 631-470-2619
Date of fiscal year end: 10/31
Date of reporting period: 4/30/16
Item 1. Reports to Stockholders.
This Semi-Annual Report contains “forward-looking statements” within the meaning of the Private Securities Litigation Reform Act of 1995. Forward-looking statements also include those preceded by, followed by or that include the words “believes”, “expects”, “anticipates” or similar expressions. Such statements should be viewed with caution. Actual results or experience could differ materially from the forward-looking statements as a result of many factors. Each Fund makes no commitments to disclose any revisions to forward-looking statements, or any facts, events or circumstances after the date hereof that may bear upon forward-looking statements. In addition, prospective purchasers of the Funds should consider carefully the information set forth herein and the applicable fund’s prospectus. Other factors and assumptions not identified above may also have been involved in the derivation of these forward-looking statements, and the failure of these other assumptions to be realized may also cause actual results to differ materially from those projected.
Dunham Floating Rate Bond Fund
Message from the Sub-Adviser (Newfleet Asset Management, LLC)
Despite a December increase in interest rates by the U.S. Federal Reserve for the first time in nearly a decade, interest rates decreased over the first half of the fiscal year ended April 30, 2016. While there was a slight increase towards the beginning of the fiscal period, interest rates generally declined thereafter. The yield on 10-year Treasuries began the fiscal year at 2.14 percent, rose to a high of 2.34 in early November, and ended the first fiscal quarter at 1.92 percent. The beginning of the second fiscal quarter saw interest rates hit a low of 1.66 percent in early February, before finishing the fiscal six-month period at 1.83 percent. The performance of bank loans, as measured by the S&P/LSTA Leveraged Loan Index, generally followed interest rates downward during the first half of the fiscal six-month period, but subsequently reversed course while interest rates continued to decline. Bank loans gained 1.6 percent over the fiscal period, after falling 1.8 percent over the prior fiscal six-month period. Although interest rates fell, the London Interbank Offered Rate (“LIBOR”) rose over the fiscal period. Three-month LIBOR began the fiscal period at 0.33 percent, hit a low of 0.33 percent in early November, then began a steady increase, hitting a high of 0.64 percent in mid-March, before ending the fiscal six-month period at 0.64 percent, nearly 91 percent higher than it began the fiscal period.
There were two quite different stories for U.S. stocks between the first and second halves of the fiscal six-month period, and bank loan returns generally mirrored both plots. The first half of the fiscal year saw a decline in U.S. stocks and bank loans, as investors sold risk. The second half of the fiscal year began with a generally flat February for both U.S. stocks and bank loans before turning sharply positive as investors bought risk. At the beginning of the fiscal period, the average bank loan in the Fund had a price of $96.79. By the middle of the fiscal period, the average bank loan price dropped to $94.50, before rebounding to $96.72 by the end of the fiscal six-month period. The Sub-Adviser remains optimistic about the asset class’ potential as interest rates rise and investor sentiment towards the loan space allows the price to continue to increase. At the beginning of the fiscal six-month period, approximately 36 bank loans in the Fund had a price lower than $95, which represented approximately 13 percent of the bank loans in the Fund. By the end of the fiscal six-month period, the Fund held approximately 29 bank loans with a price below $95, which represented approximately 11 percent of the bank loans in the Fund.
The yields on bank loans, as measured by the S&P / LSTA Leveraged Loan 100 Index, generally moved in the opposite direction from broader Treasury yield movements for the majority of the fiscal period, although they still ended slightly lower by the end. Bank loans, in general, began the fiscal six-month period with a yield-to-maturity of 5.9 percent, approximately 1.7 percent less than their traditional high-yield bond counterparts, as measured by the BofA Merrill Lynch High-Yield Bond Cash Pay Index. Bank loans outperformed traditional high-yield bonds over the first half of fiscal period by 3.7 percent, but trailed by 4.8 percent over the second half of the fiscal six-month period. Over the entire period, bank loans underperformed traditional high-yield bonds by 0.7 percent. The yield gap between the bank loans and traditional high-yield bonds saw an overall expansion over the fiscal period. At the end of the fiscal six months, the yields on bank loans stood at 5.8 percent and traditional high-yield bonds ended at 7.7 percent. The Fund held approximately 4.5 percent of its assets in traditional high-yield bonds which, from an allocation perspective, enhanced relative performance during the fiscal period.
The Sub-Adviser continued to focus on higher rated first lien loans within the bank loan space, limiting its exposure to bank loans rated CCC and lower. The exposure to lower-rated loans, second lien loans, and traditional bonds has been limited to instances where the Sub-Adviser has determined that the additional reward is expected to significantly outweigh the additional risk. However, with the significant increase in lower-rated securities over the second half of the six-month period, some of the Fund’s bonds also benefitted. For example, the Fund held the CCC-rated traditional bonds issued by Beverage Packaging Holdings Luxembourg I SA (08783AAC7) (holding percentage*: 0.15 percent), a joint issuer of debt that operates as a dual issuer of senior notes. The company is a subsidiary of Reynolds Group Holdings Limited, which is a leading global manufacturer and supplier of consumer beverage and foodservice packaging products, based in Auckland, New Zealand. The Beverage Packaging Holdings bonds increased 2.7 percent on a total return basis over the six-month period. In addition, the Fund held the traditional CCC-rated bond issued by iHeartCommunications, Inc. (184502BL5) (holding percentage*: 0.08 percent), a mobile and on-demand entertainment and information services provider. Over the first half of the six-month period the company’s bonds took a hit, losing a painful 15.6 percent on a total return basis. The second half of the six-month period saw a reversal, however, with the company’s bonds gaining 15.9 percent on a total return basis. On a net basis, the bonds were down 2.1 percent over the entire six-month period. As oil prices fell over the first half of the six-month period, so did many energy-related issuers in the Fund. However, as oil prices rallied from their January lows, these same issuers saw substantial increases in their bank loans. One such issuer was MEG Energy Corporation (BL0932949) (holding percentage*: 0.28 percent), an oil and gas company that is primarily involved in oil sands development and leases. Over the first fiscal quarter, the MED Energy Corp. bank loan saw a price decrease of 17 percent, but saw a rebound of 11.8 percent over the second fiscal quarter, paring overall losses for the six-month period to 4.5 percent.
The Sub-Adviser also analyzes recovery expectations for bank loans that are issued by companies proceeding through restructurings or defaults. For example, the Fund continued to hold the Caesars Entertainment Operating Co., Inc. bank loan (BL1302209) (holding percentage*: 0.15 percent), a casino, restaurant, and convention-space operator, which defaulted on its debt over a year ago. The bank loan was priced at $89.71 at the beginning of the six-month period, but rebounded by the end of the period to a price to just below $94.50.
The Sub-Adviser remains optimistic that interest rates, in general, will eventually rise and that bank loan investors may benefit from a highly-correlated increase in LIBOR. Although the Federal Open Market Committee’s planned four interest rate increases have been reduced to two for 2016, the Sub-Adviser believes we are in the late innings of the credit cycle. They are, however, incrementally dialing up risk in the Fund, albeit cautiously. The Sub-Adviser remains encouraged by the historically low default rates combined with the floating rate feature offered by bank loans.
| * | Holdings percentage(s) as of 4/30/2016. |
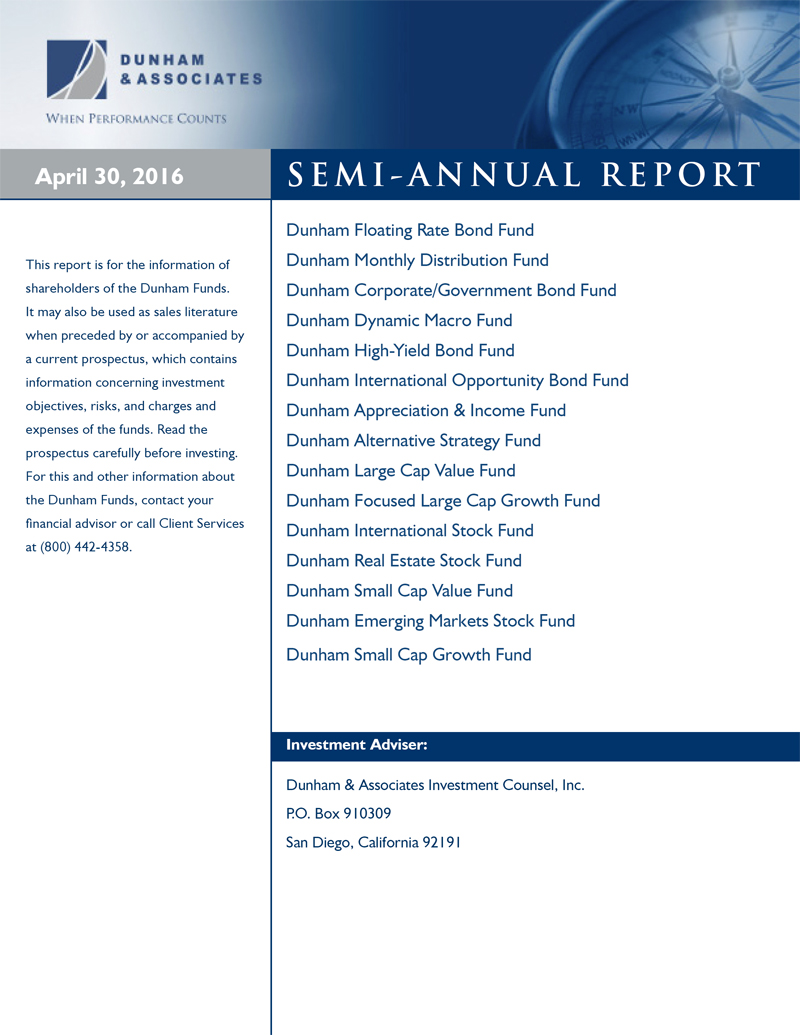
Growth of $100,000 Investment - (Unaudited)
Total Returns as of April 30, 2016
| | | | Annualized |
| | Six | One | Since Inception |
| | Months | Year | (11/1/13) |
| Class N | 1.58% | 0.21% | 1.41% |
| Class C | 1.21% | (0.53)% | 0.65% |
| Class A with load of 4.50% | (2.99)% | (4.48)% | (0.68)% |
| Class A without load | 1.57% | 0.07% | 1.17% |
| S&P/LSTA Leverage Loan Index | 1.88% | (0.07)% | 2.31% |
| Morningstar Bank Loan Category | 0.96% | (0.88)% | 1.35% |
The S&P/LSTA U.S. Leveraged Loan 100 Index is designed to reflect the performance of the largest facilities in the leveraged loan market. Investors cannot invest directly in an index or benchmark.
The Morningstar Bank Loan Category is generally representative of mutual funds that primarily invest in floating-rate bank loans instead of bonds. These bank loans generally offer interest payments that typically float above a common short-term benchmark such as the London interbank offered rate, or LIBOR.
As disclosed in the Trust’s latest registration statement, the Fund’s total annual operating expenses, including cost of underlying funds, are 1.27% for Class N, 2.02% for Class C and 1.52% for Class A. Class A shares are subject to a sales load of 4.50% and a deferred sales charge of up to 0.75%. The performance data quoted here represents past performance, which is not indicative of future results. Current performance may be lower or higher than the performance data quoted. The investment return and NAV will fluctuate, so that an investor’s shares, when redeemed, may be worth more or less than their original cost. Total returns are calculated assuming reinvestment of all dividends and capital gains distributions, if any. The returns do not reflect the deductions of taxes a shareholder would pay on the redemption of fund shares or fund distributions. For performance information current to the most recent month-end, please call 1-800-442-4358 or visit our website www.dunham.com
SCHEDULE OF INVESTMENTS (Unaudited)
Dunham Floating Rate Bond Fund
April 30, 2016
| | | Principal | | | Interest | | | Maturity | | | |
| Security | | Amount | | | Rate | | | Date | | Value | |
| BANK LOANS - 92.7% | | | | | | | | | | | | | | |
| CONSUMER DISCRETIONARY - 26.0% | | | | | | | | | | | | | | |
| Acosta Holdco, Inc. | | $ | 239,761 | | | | 4.2500 | % | | 9/26/2021 | | $ | 237,864 | |
| Advantage Sales & Marketing, Inc. | | | 97,000 | | | | 7.5000 | | | 7/24/2022 | | | 92,150 | |
| Allison Transmission, Inc. | | | 583,827 | | | | 3.5000 | | | 8/24/2019 | | | 585,508 | |
| Aristocrat International Property | | | 366,000 | | | | 4.7500 | | | 10/20/2021 | | | 368,353 | |
| Boyd Gaming Corp. | | | 467,297 | | | | 4.0000 | | | 8/14/2020 | | | 469,049 | |
| Caesars Entertainment Operating Co., Inc.* | | | 203,234 | | | | 10.2500 | | | 2/28/2017 | | | 190,024 | |
| Caesars Entertainment Operating Co., Inc.* | | | 137,310 | | | | 13.2500 | | | 2/28/2017 | | | 129,700 | |
| Caesars Entertainment Resort Properties, Inc. | | | 272,860 | | | | 7.0000 | | | 10/12/2020 | | | 258,622 | |
| Caesars Growth Properties Holdings, LLC | | | 152,026 | | | | 6.2500 | | | 5/8/2021 | | | 136,824 | |
| CBAC Borrower LLC | | | 99,750 | | | | 8.2500 | | | 7/2/2020 | | | 93,516 | |
| CCO Safari III LLC | | | 138,000 | | | | 3.2500 | | | 8/24/2021 | | | 138,421 | |
| CCO Safari III LLC | | | 708,000 | | | | 3.5000 | | | 1/24/2023 | | | 712,174 | |
| CDS US Intermediate Holdings | | | 175,120 | | | | 5.0000 | | | 7/8/2022 | | | 170,013 | |
| Charter Communications Operations, LLC | | | 326,812 | | | | 3.0000 | | | 6/30/2020 | | | 326,684 | |
| CityCenter Holdings LLC | | | 301,249 | | | | 4.2500 | | | 10/16/2020 | | | 302,605 | |
| Clear Channel Communications | | | 480,000 | | | | 7.3866 | | | 1/30/2019 | | | 360,468 | |
| CS Intermediate Holdco 2 LLC | | | 410,689 | | | | 4.0000 | | | 4/4/2021 | | | 411,333 | |
| CSC Holdings LLC | | | 723,149 | | | | 3.1366 | | | 4/16/2020 | | | 722,550 | |
| CSC Holdings LLC | | | 620,000 | | | | 5.0000 | | | 10/8/2022 | | | 624,005 | |
| Delta, Inc. | | | 310,000 | | | | 4.7500 | | | 7/30/2021 | | | 305,128 | |
| Eldorado Resorts, Inc. | | | 129,025 | | | | 4.2500 | | | 7/24/2022 | | | 129,186 | |
| Federal-Mogul Holdings Corp. | | | 293,261 | | | | 4.7500 | | | 4/16/2021 | | | 279,771 | |
| Gates Global LLC | | | 318,003 | | | | 4.2500 | | | 7/6/2021 | | | 305,623 | |
| Graton Economic Development Authority | | | 137,622 | | | | 4.7500 | | | 8/31/2022 | | | 137,966 | |
| Hilton Worldwide Finance LLC | | | 1,575,784 | | | | 3.5000 | | | 10/26/2020 | | | 1,583,490 | |
| Hudson’s Bay Co | | | 250,000 | | | | 4.7500 | | | 9/30/2022 | | | 251,563 | |
| Ineos Group Holdings Ltd | | | 327,265 | | | | 4.2500 | | | 12/14/2022 | | | 327,756 | |
| Infiltrator Systems Integrated | | | 78,408 | | | | 5.2500 | | | 5/28/2022 | | | 78,604 | |
| Intelsat Jackson Holdings S.A. | | | 200,000 | | | | 3.7500 | | | 6/30/2019 | | | 188,178 | |
| KAR Auction Services, Inc. | | | 311,188 | | | | 3.9375 | | | 3/12/2021 | | | 312,873 | |
| KAR Auction Services, Inc. | | | 75,000 | | | | 4.2500 | | | 3/8/2023 | | | 75,438 | |
| Laureate Education, Inc. | | | 476,428 | | | | 5.0000 | | | 6/16/2018 | | | 443,674 | |
| Leslie’s Poolmart, Inc. | | | 266,262 | | | | 4.2500 | | | 10/16/2019 | | | 265,932 | |
| Libbey Glass, Inc. | | | 258,609 | | | | 3.7500 | | | 4/8/2021 | | | 258,664 | |
| LTF Merger Sub, Inc. | | | 221,116 | | | | 4.2500 | | | 6/10/2022 | | | 220,357 | |
| Mattress Holding Corp. | | | 288,000 | | | | 6.2500 | | | 10/20/2021 | | | 289,080 | |
| MCC Georgia LLC | | | 299,738 | | | | 3.2500 | | | 1/28/2021 | | | 299,988 | |
| MCC Georgia LLC | | | 61,898 | | | | 3.7500 | | | 6/30/2021 | | | 61,975 | |
| MCC Georgia LLC | | | 155,630 | | | | 3.5000 | | | 6/30/2021 | | | 156,020 | |
| MGM Growth Properties Operating, LLC | | | 377,000 | | | | 4.0000 | | | 4/24/2023 | | | 379,631 | |
| Michaels Stores, Inc. | | | 531,529 | | | | 3.7500 | | | 1/28/2020 | | | 532,999 | |
| Mohegan Tribal Gaming Authority | | | 325,917 | | | | 5.5000 | | | 6/16/2018 | | | 324,830 | |
| MPG Holdco I, Inc. | | | 286,885 | | | | 3.7500 | | | 10/20/2021 | | | 285,604 | |
| Neiman Marcus Group LTD, Inc. | | | 270,000 | | | | 4.2500 | | | 10/24/2020 | | | 257,850 | |
| Numericable US LLC | | | 143,000 | | | | 4.7500 | | | 2/10/2023 | | | 143,409 | |
| Numericable US LLC | | | 325,000 | | | | 5.0000 | | | 1/16/2024 | | | 327,200 | |
| Party City Holdings, Inc. | | | 434,232 | | | | 4.2500 | | | 8/20/2022 | | | 433,720 | |
| Penn National Gaming, Inc. | | | 455,789 | | | | 3.2500 | | | 10/30/2020 | | | 456,358 | |
| Petsmart, Inc. | | | 541,905 | | | | 4.2500 | | | 3/12/2022 | | | 541,252 | |
| Scientific Games International, Inc. | | | 681,732 | | | | 6.0000 | | | 9/30/2021 | | | 673,105 | |
| ServiceMasterCo.LLC/The | | | 897,233 | | | | 4.2500 | | | 6/30/2021 | | | 902,002 | |
| SInc.lair Television Group, Inc. | | | 372,188 | | | | 3.5000 | | | 7/30/2021 | | | 372,031 | |
| Six Flags Theme Parks, Inc. | | | 397,254 | | | | 3.5006 | | | 6/30/2022 | | | 400,150 | |
See accompanying notes to financial statements.
SCHEDULE OF INVESTMENTS (Unaudited)
Dunham Floating Rate Bond Fund (Continued)
April 30, 2016
| | | Principal | | | Interest | | | Maturity | | | |
| Security | | Amount | | | Rate | | | Date | | Value | |
| CONSUMER DISCRETIONARY (Continued) - 26.0% | | | | | | | | | | | | | | |
| SRAM Corporation | | $ | 282,400 | | | | 4.0124 | % | | 4/10/2020 | | $ | 249,218 | |
| Staples, Inc. | | | 945,000 | | | | 4.7500 | | | 2/2/2022 | | | 949,134 | |
| Station Casinos LLC | | | 247,370 | | | | 4.2500 | | | 3/2/2020 | | | 248,220 | |
| TI Group Automotive Systems LLC | | | 181,464 | | | | 4.5000 | | | 6/30/2022 | | | 181,692 | |
| Transtar Holding Co | | | 34,213 | | | | 7.7500 | | | 10/8/2018 | | | 23,493 | |
| Tribune Co | | | 368,952 | | | | 3.7500 | | | 12/28/2020 | | | 369,626 | |
| Univision Communications, Inc. | | | 262,667 | | | | 4.0000 | | | 2/29/2020 | | | 263,314 | |
| Univision Communications, Inc. | | | 1,331,185 | | | | 4.0000 | | | 2/29/2020 | | | 1,330,955 | |
| US Farathane LLC | | | 154,791 | | | | 6.7500 | | | 12/24/2021 | | | 155,371 | |
| Ziggo BV | | | 154,941 | | | | 3.6519 | | | 1/16/2022 | | | 154,622 | |
| Ziggo BV | | | 99,847 | | | | 3.6478 | | | 1/16/2022 | | | 99,641 | |
| Ziggo BV | | | 164,212 | | | | 3.6013 | | | 1/16/2022 | | | 163,874 | |
| | | | | | | | | | | | | | 22,520,430 | |
| CONSUMER STAPLES - 7.3% | | | | | | | | | | | | | | |
| Albertson’s Holdings LLC | | | 278,190 | | | | 5.5000 | | | 8/24/2021 | | | 279,614 | |
| Albertsons LLC | | | 252,368 | | | | 5.5000 | | | 12/20/2022 | | | 253,665 | |
| ARAMARK Corp. | | | 800,682 | | | | 3.2500 | | | 2/24/2021 | | | 802,684 | |
| Coty, Inc. | | | 102,976 | | | | 3.7500 | | | 10/28/2022 | | | 103,877 | |
| Dole Food Co, Inc. | | | 557,688 | | | | 4.5020 | | | 10/31/2018 | | | 558,087 | |
| Galleria Co | | | 205,952 | | | | 3.7500 | | | 1/26/2023 | | | 206,564 | |
| Hostess Brands LLC | | | 319,395 | | | | 4.1366 | | | 8/4/2022 | | | 321,059 | |
| Hostess Brands LLC | | | 235,000 | | | | 8.5000 | | | 8/4/2023 | | | 231,769 | |
| Kronos, Inc./MA | | | 60,875 | | | | 9.7500 | | | 4/30/2020 | | | 61,839 | |
| Kronos, Inc./MA | | | 820,590 | | | | 4.5000 | | | 10/30/2019 | | | 820,417 | |
| Oak Tea, Inc. | | | 59,901 | | | | 4.2500 | | | 7/2/2022 | | | 60,225 | |
| Pinnacle Foods Finance LLC | | | 802,277 | | | | 3.0000 | | | 4/28/2020 | | | 802,610 | |
| Pinnacle Foods Finance LLC | | | 22,943 | | | | 3.7500 | | | 1/12/2023 | | | 23,094 | |
| Prestige Brands, Inc. | | | 635,634 | | | | 3.5218 | | | 9/4/2021 | | | 638,151 | |
| Reynolds Group Holdings, Inc. | | | 445,370 | | | | 4.5000 | | | 11/30/2018 | | | 447,157 | |
| Rite Aid Corp. | | | 430,000 | | | | 4.8750 | | | 6/20/2021 | | | 431,479 | |
| Spectrum Brands, Inc. | | | 280,321 | | | | 3.5000 | | | 6/24/2022 | | | 281,828 | |
| | | | | | | | | | | | | | 6,324,119 | |
| ENERGY - 1.4% | | | | | | | | | | | | | | |
| Chelsea Petroleum | | | 199,179 | | | | 5.2500 | | | 10/28/2022 | | | 194,199 | |
| Chief Exploration & Development LLC | | | 172,000 | | | | 7.5000 | | | 5/16/2021 | | | 130,505 | |
| Drillships Financing Holding Inc. | | | 141,366 | | | | 6.0000 | | | 4/1/2021 | | | 69,269 | |
| Drillships Ocean Ventures, Inc. | | | 110,040 | | | | 5.5000 | | | 7/24/2021 | | | 65,611 | |
| Fieldwood Energy LLC | | | 215,850 | | | | 8.3750 | | | 9/30/2020 | | | 59,089 | |
| Jonah Energy LLC | | | 243,000 | | | | 7.5000 | | | 5/12/2021 | | | 164,835 | |
| MEG Energy Corp. | | | 276,394 | | | | 3.7500 | | | 4/1/2020 | | | 248,983 | |
| Paragon Offshore Finance Co | | | 174,258 | | | | 5.2500 | | | 7/16/2021 | | | 47,268 | |
| Seadrill Operating LP | | | 492,086 | | | | 4.0000 | | | 2/20/2021 | | | 246,043 | |
| | | | | | | | | | | | | | 1,225,802 | |
See accompanying notes to financial statements.
SCHEDULE OF INVESTMENTS (Unaudited)
Dunham Floating Rate Bond Fund (Continued)
April 30, 2016
| | | Principal | | | Interest | | | Maturity | | | |
| Security | | Amount | | | Rate | | | Date | | Value | |
| FINANCIALS - 5.2% | | | | | | | | | | | | | | |
| Alixpartners LLP | | $ | 515,410 | | | | 4.5000 | % | | 7/28/2022 | | $ | 518,201 | |
| Asurion LLC | | | 82,794 | | | | 5.0000 | | | 5/24/2019 | | | 82,639 | |
| Asurion LLC | | | 189,120 | | | | 5.0000 | | | 8/4/2022 | | | 188,157 | |
| Capital Automotive L.P. | | | 93,064 | | | | 4.0000 | | | 4/10/2019 | | | 93,541 | |
| Capital Automotive LP | | | 197,005 | | | | 6.0000 | | | 4/30/2020 | | | 198,359 | |
| Delos Finance | | | 381,000 | | | | 3.5000 | | | 3/6/2021 | | | 383,000 | |
| DTZ US Borrower LLC | | | 595,499 | | | | 4.2500 | | | 11/4/2021 | | | 595,747 | |
| Realogy Group LLC | | | 773,336 | | | | 3.7500 | | | 3/4/2020 | | | 774,384 | |
| Starwood Property Trust, Inc. | | | 476,516 | | | | 3.5000 | | | 4/16/2020 | | | 474,729 | |
| TransUnion LLC | | | 892,339 | | | | 3.5000 | | | 4/8/2021 | | | 889,884 | |
| Walter Investment Management Corp. | | | 373,471 | | | | 4.7500 | | | 12/18/2020 | | | 328,772 | |
| | | | | | | | | | | | | | 4,527,413 | |
| HEALTHCARE - 16.7% | | | | | | | | | | | | | | |
| 21st Century Oncology, Inc. | | | 208,425 | | | | 6.5000 | | | 4/30/2022 | | | 186,019 | |
| Acadia Healthcare Co, Inc. | | | 226,433 | | | | 4.5000 | | | 2/16/2023 | | | 228,449 | |
| Akorn, Inc. | | | 258,134 | | | | 6.0000 | | | 4/16/2021 | | | 259,103 | |
| Alere, Inc. | | | 172,038 | | | | 4.2500 | | | 6/20/2022 | | | 170,774 | |
| American Renal Holdings Co, Inc. | | | 134,000 | | | | 4.7500 | | | 8/20/2019 | | | 134,084 | |
| Amneal Pharmaceuticals LLC | | | 344,403 | | | | 4.5007 | | | 10/31/2019 | | | 344,546 | |
| Amsurg Corp. | | | 101,197 | | | | 3.5000 | | | 7/16/2021 | | | 101,667 | |
| Ardent Legacy Acquisitions, Inc. | | | 194,025 | | | | 6.5000 | | | 8/4/2021 | | | 194,995 | |
| Capsugel Holdings US, Inc. | | | 410,809 | | | | 4.0000 | | | 8/1/2021 | | | 412,029 | |
| CHG Buyer Corp. | | | 397,008 | | | | 4.2500 | | | 11/20/2019 | | | 397,957 | |
| CHS/Community Health Systems Inc. | | | 282,504 | | | | 3.7500 | | | 1/1/2020 | | | 278,846 | |
| CHS/Community Health Systems Inc. | | | 519,800 | | | | 4.0000 | | | 1/28/2021 | | | 513,126 | |
| CHS/Community Health Systems Inc. | | | 218,666 | | | | 3.8855 | | | 1/1/2019 | | | 218,096 | |
| Concordia Healthcare Corp. | | | 149,625 | | | | 5.2500 | | | 10/20/2021 | | | 148,652 | |
| ConvaTec, Inc. | | | 10,800 | | | | 4.2500 | | | 6/16/2020 | | | 10,826 | |
| DaVita, Inc. | | | 748,589 | | | | 3.5000 | | | 6/24/2021 | | | 753,549 | |
| DJO Finance LLC | | | 158,800 | | | | 4.2500 | | | 6/8/2020 | | | 154,979 | |
| Emdeon, Inc. | | | 43,446 | | | | 3.7500 | | | 11/2/2018 | | | 43,746 | |
| Emdeon, Inc. | | | 492,500 | | | | 3.7500 | | | 11/2/2018 | | | 492,810 | |
| Emergency Medical Svcs Corp. | | | 190,010 | | | | 4.2500 | | | 5/24/2018 | | | 190,560 | |
| Endo Luxembourg Finance ICo. | | | 620,445 | | | | 3.7500 | | | 9/26/2022 | | | 619,437 | |
| Envision Healthcare Corp. | | | 161,595 | | | | 4.5000 | | | 10/28/2022 | | | 162,330 | |
| FHC Health Systems, Inc. | | | 247,500 | | | | 5.0000 | | | 12/24/2021 | | | 244,406 | |
| Greatbatch Ltd | | | 100,748 | | | | 5.2500 | | | 10/28/2022 | | | 101,393 | |
| HCA, Inc. | | | 203,925 | | | | 3.8866 | | | 3/16/2023 | | | 205,653 | |
| Horizon Pharma, Inc. | | | 131,010 | | | | 4.5000 | | | 5/8/2021 | | | 128,062 | |
| IASIS Healthcare LLC | | | 299,227 | | | | 4.5000 | | | 5/4/2018 | | | 299,351 | |
| IMS Health, Inc. | | | 450,311 | | | | 3.5000 | | | 3/16/2021 | | | 451,275 | |
| inVentiv Health, Inc. | | | 233,269 | | | | 7.7500 | | | 5/16/2018 | | | 234,291 | |
| Kinetic Concepts, Inc. | | | 417,411 | | | | 4.5000 | | | 5/4/2018 | | | 417,978 | |
| Mallinckrodt International Finance | | | 154,840 | | | | 3.2500 | | | 3/20/2021 | | | 151,744 | |
| Mallinckrodt International Finance | | | 225,074 | | | | 3.5000 | | | 3/20/2021 | | | 222,635 | |
| MJ Acquisition Corp. | | | 230,260 | | | | 4.0004 | | | 5/31/2022 | | | 229,397 | |
| MPH Acquisition Holdings LLC | | | 245,417 | | | | 3.7500 | | | 4/1/2021 | | | 244,711 | |
See accompanying notes to financial statements.
SCHEDULE OF INVESTMENTS (Unaudited)
Dunham Floating Rate Bond Fund (Continued)
April 30, 2016
| | | Principal | | | Interest | | | Maturity | | | |
| Security | | Amount | | | Rate | | | Date | | Value | |
| HEALTHCARE (Continued) - 16.7% | | | | | | | | | | | | | | |
| National Mentor Holdings, Inc. | | $ | 266,797 | | | | 4.2500 | % | | 2/1/2021 | | $ | 266,397 | |
| National Surgical Hospitals Inc. | | | 117,115 | | | | 4.5000 | | | 5/31/2022 | | | 116,676 | |
| NBTY, Inc. | | | 56,000 | | | | 5.0000 | | | 4/26/2023 | | | 56,251 | |
| NVA Holdings, Inc. | | | 92,000 | | | | 8.0000 | | | 8/14/2022 | | | 90,006 | |
| NVA Holdings, Inc. | | | 115,000 | | | | 5.5000 | | | 8/14/2021 | | | 115,431 | |
| Onex Schumacher Finance LP | | | 223,875 | | | | 5.0000 | | | 7/28/2022 | | | 223,409 | |
| Ortho-Clinical Diag Holdings | | | 335,878 | | | | 4.7500 | | | 6/30/2021 | | | 318,934 | |
| Pharmaceutical Product Development | | | 294,335 | | | | 4.2500 | | | 8/18/2022 | | | 294,275 | |
| PRA Holdings, Inc. | | | 367,438 | | | | 4.5000 | | | 9/24/2020 | | | 369,826 | |
| Quintiles Transnational Corp. | | | 122,078 | | | | 3.2500 | | | 5/12/2022 | | | 122,535 | |
| Quorum Health Corp. | | | 226,000 | | | | 6.7500 | | | 4/12/2022 | | | 226,318 | |
| RegionalCare Hospital Partners | | | 313,762 | | | | 6.7500 | | | 4/23/2019 | | | 314,351 | |
| RPI Finance Trust | | | 296,992 | | | | 3.5000 | | | 11/8/2020 | | | 298,755 | |
| Select Medical Corp. | | | 255,000 | | | | 6.0000 | | | 3/4/2021 | | | 256,275 | |
| Sterigenics-Nordion Holdings LLC | | | 119,400 | | | | 4.2500 | | | 5/16/2022 | | | 119,400 | |
| Surgery Center Holdings, Inc. | | | 46,412 | | | | 5.2500 | | | 11/4/2020 | | | 46,572 | |
| Surgery Center Holdings, Inc. | | | 164,000 | | | | 5.2500 | | | 11/4/2020 | | | 164,564 | |
| Surgical Care Affiliates LLC | | | 270,776 | | | | 4.2500 | | | 3/16/2022 | | | 271,115 | |
| Team Health, Inc. | | | 243,390 | | | | 4.5000 | | | 11/24/2022 | | | 245,520 | |
| US Renal Care, Inc. | | | 354,113 | | | | 5.2500 | | | 12/30/2022 | | | 355,497 | |
| Valeant Pharmaceuticals International | | | 296,703 | | | | 4.7500 | | | 8/4/2020 | | | 292,359 | |
| Valeant Pharmaceuticals International | | | 409,899 | | | | 5.0000 | | | 3/31/2022 | | | 397,250 | |
| Valeant Pharmaceuticals International | | | 654,744 | | | | 4.5000 | | | 2/12/2019 | | | 637,286 | |
| | | | | | | | | | | | | | 14,546,478 | |
| INDUSTRIALS - 12.3% | | | | | | | | | | | | | | |
| Air Canada | | | 400,905 | | | | 4.0000 | | | 9/26/2019 | | | 403,244 | |
| Allied Security Holdings LLC | | | 302,473 | | | | 4.2500 | | | 2/12/2021 | | | 300,583 | |
| Allied Security Holdings LLC | | | 38,479 | | | | 8.0000 | | | 8/12/2021 | | | 37,686 | |
| American Airlines, Inc. | | | 436,545 | | | | 3.2500 | | | 6/28/2020 | | | 434,910 | |
| American Airlines, Inc. | | | 89,000 | | | | 3.5000 | | | 4/28/2023 | | | 88,722 | |
| Brickman Group Holdings, Inc. | | | 491,179 | | | | 4.0000 | | | 12/18/2020 | | | 489,134 | |
| Brickman Group Holdings, Inc. | | | 249,000 | | | | 7.5000 | | | 12/16/2021 | | | 244,954 | |
| Brock Holdings III, Inc. | | | 214,562 | | | | 6.0000 | | | 3/16/2017 | | | 208,393 | |
| Builders FirstSource, Inc. | | | 271,749 | | | | 6.0000 | | | 7/28/2022 | | | 272,258 | |
| DynCorp International, Inc. | | | 227,868 | | | | 6.2500 | | | 7/8/2016 | | | 221,602 | |
| Filtration Group, Inc. | | | 20,950 | | | | 8.2500 | | | 11/22/2021 | | | 20,701 | |
| Filtration Group, Inc. | | | 162,260 | | | | 4.2500 | | | 11/24/2020 | | | 162,178 | |
| Gardner Denver, Inc. | | | 265,000 | | | | 4.2500 | | | 7/30/2020 | | | 248,619 | |
| Harland Clarke Holdings Corp. | | | 173,518 | | | | 7.0000 | | | 5/22/2018 | | | 172,087 | |
| Harland Clarke Holdings Corp. | | | 65,119 | | | | 6.0000 | | | 8/4/2019 | | | 64,012 | |
| HD Supply, Inc. | | | 546,691 | | | | 3.7500 | | | 8/12/2021 | | | 547,990 | |
| Headwaters, Inc. | | | 422,660 | | | | 4.5000 | | | 3/24/2022 | | | 425,830 | |
| Husky Injection Molding | | | 171,490 | | | | 4.2500 | | | 6/30/2021 | | | 170,704 | |
| McJunkin Red Man Corp. | | | 139,284 | | | | 4.7500 | | | 11/8/2019 | | | 135,918 | |
| Navistar, Inc. | | | 61,845 | | | | 6.5000 | | | 8/8/2020 | | | 58,598 | |
| Nortek, Inc. | | | 606,433 | | | | 3.5000 | | | 10/30/2020 | | | 597,588 | |
| PQ Corp. | | | 93,000 | | | | 5.7500 | | | 10/28/2022 | | | 93,614 | |
| Prime Security Services | | | 39,000 | | | | 5.5000 | | | 5/2/2022 | | | 39,225 | |
| Quikrete Co, Inc. | | | 384,342 | | | | 4.0000 | | | 9/28/2020 | | | 384,583 | |
| Rexnord LLC | | | 655,325 | | | | 4.0000 | | | 8/20/2020 | | | 652,846 | |
| Science Applications International | | | 308,130 | | | | 3.7500 | | | 5/4/2022 | | | 309,672 | |
| Sedgwick, Inc. | | | 677,102 | | | | 3.7500 | | | 2/28/2021 | | | 666,665 | |
| Sedgwick, Inc. | | | 195,000 | | | | 6.7500 | | | 2/28/2022 | | | 186,225 | |
| SiteOne Landscape Supply Holdings | | | 176,000 | | | | 6.5000 | | | 4/28/2022 | | | 176,660 | |
| Spin Holdco, Inc. | | | 283,261 | | | | 4.2500 | | | 11/14/2019 | | | 278,421 | |
| TransDigm, Inc. | | | 815,831 | | | | 3.7500 | | | 2/28/2020 | | | 816,340 | |
See accompanying notes to financial statements.
SCHEDULE OF INVESTMENTS (Unaudited)
Dunham Floating Rate Bond Fund (Continued)
April 30, 2016
| | | Principal | | | Interest | | | Maturity | | | |
| Security | | Amount | | | Rate | | | Date | | Value | |
| INDUSTRIALS (Continued) - 12.3% | | | | | | | | | | | | | | |
| TransDigm, Inc. | | $ | 81,547 | | | | 3.7500 | % | | 6/4/2021 | | $ | 81,267 | |
| TransDigm, Inc. | | | 396,192 | | | | 3.5000 | | | 5/16/2022 | | | 392,797 | |
| United Airlines, Inc. | | | 518,409 | | | | 3.5000 | | | 9/16/2021 | | | 519,612 | |
| US Airways, Inc. | | | 504,700 | | | | 3.5000 | | | 5/24/2019 | | | 505,490 | |
| Waste Industries USA, Inc. | | | 294,629 | | | | 4.2500 | | | 2/28/2020 | | | 295,917 | |
| | | | | | | | | | | | | | 10,705,045 | |
| INFORMATION TECHNOLOGY - 8.9% | | | | | | | | | | | | | | |
| Allflex Holdings III, Inc. | | | 282,750 | | | | 4.2500 | | | 7/16/2020 | | | 282,220 | |
| Applied Systems, Inc. | | | 221,058 | | | | 4.2605 | | | 1/24/2021 | | | 219,037 | |
| Applied Systems, Inc. | | | 158,197 | | | | 7.5000 | | | 1/24/2022 | | | 157,878 | |
| Avago Technologies Cayman Ltd. | | | 705,000 | | | | 4.2500 | | | 1/31/2023 | | | 706,449 | |
| Blue Coat Systems, Inc. | | | 263,340 | | | | 4.5000 | | | 5/20/2022 | | | 262,462 | |
| CCC Holdings,, Inc. | | | 335,409 | | | | 4.0000 | | | 12/20/2019 | | | 334,152 | |
| CDW LLC | | | 1,062,140 | | | | 3.2500 | | | 4/28/2020 | | | 1,063,287 | |
| Deltek, Inc. | | | 126,852 | | | | 5.0000 | | | 6/24/2022 | | | 127,328 | |
| Deltek, Inc. | | | 94,000 | | | | 9.5000 | | | 6/26/2023 | | | 93,530 | |
| Ensemble S Merger Sub, Inc. | | | 318,400 | | | | 4.7500 | | | 9/30/2022 | | | 318,333 | |
| First Data Corp. | | | 198,000 | | | | 4.3839 | | | 7/8/2022 | | | 198,421 | |
| First Data Corp. | | | 1,209,841 | | | | 4.6339 | | | 3/24/2021 | | | 1,214,626 | |
| Infinity Acquisition, LLC | | | 305,982 | | | | 4.0000 | | | 8/6/2021 | | | 292,787 | |
| Infor US, Inc. | | | 243,327 | | | | 3.7500 | | | 6/4/2020 | | | 239,069 | |
| Infor US, Inc. | | | 306,676 | | | | 3.7500 | | | 6/4/2020 | | | 300,288 | |
| Mitchell International, Inc. | | | 369,375 | | | | 4.5000 | | | 10/12/2020 | | | 368,220 | |
| Mitchell International, Inc. | | | 221,000 | | | | 8.5000 | | | 10/12/2021 | | | 206,083 | |
| MKS Instruments, Inc. | | | 91,000 | | | | 4.7500 | | | 4/30/2023 | | | 91,417 | |
| NXP BV | | | 237,405 | | | | 3.7500 | | | 12/8/2020 | | | 238,414 | |
| ON Semiconductor Corp. | | | 139,000 | | | | 5.2500 | | | 4/1/2023 | | | 139,840 | |
| Presidio, Inc. | | | 202,554 | | | | 5.2500 | | | 2/2/2022 | | | 201,896 | |
| SS&C European Holdings SARL | | | 25,225 | | | | 3.3866 | | | 7/8/2020 | | | 25,036 | |
| SS&C European Holdings SARL | | | 39,125 | | | | 3.3866 | | | 7/8/2020 | | | 38,831 | |
| SS&C Technologies, Inc. | | | 277,489 | | | | 4.0000 | | | 7/8/2022 | | | 278,790 | |
| SS&C Technologies, Inc. | | | 40,224 | | | | 4.0000 | | | 7/8/2022 | | | 40,412 | |
| Western Digital Corp. | | | 290,000 | | | | 6.2500 | | | 4/28/2023 | | | 283,656 | |
| | | | | | | | | | | | | | 7,722,462 | |
| MATERIALS- 7.3% | | | | | | | | | | | | | | |
| American Builders & Contractor Supply Co., Inc. | | | 553,612 | | | | 3.5000 | | | 4/16/2020 | | | 555,549 | |
| Anchor Glass Container Corp. | | | 428,352 | | | | 4.2500 | | | 6/30/2022 | | | 430,094 | |
| Ardagh Holdings USA, Inc. | | | 260,513 | | | | 4.0000 | | | 12/16/2019 | | | 260,553 | |
| Berlin Packaging LLC | | | 291,062 | | | | 4.5000 | | | 9/30/2021 | | | 291,971 | |
| Berry Plastics Corp. | | | 147,971 | | | | 4.0000 | | | 10/4/2022 | | | 152,474 | |
| Berry Plastics Group, Inc. | | | 238,843 | | | | 3.5000 | | | 2/8/2020 | | | 239,132 | |
| Berry Plastics Group, Inc. | | | 417,784 | | | | 3.7500 | | | 1/6/2021 | | | 414,999 | |
| CPG International, Inc. | | | 277,863 | | | | 4.7500 | | | 9/30/2020 | | | 276,821 | |
| Fortescue Metals Group Ltd | | | 700,929 | | | | 4.2500 | | | 6/30/2019 | | | 662,476 | |
| Huntsman International LLC | | | 485,870 | | | | 3.7500 | | | 9/30/2021 | | | 487,896 | |
| Huntsman International LLC | | | 112,000 | | | | 4.2500 | | | 3/31/2023 | | | 112,911 | |
| Ineos Group Holdings Ltd | | | 625,220 | | | | 3.7500 | | | 12/16/2020 | | | 620,140 | |
| Ineos US Finance LLC | | | 395,702 | | | | 4.2500 | | | 4/1/2022 | | | 394,220 | |
| Owens-Brockway Glass Container | | | 286,870 | | | | 3.5000 | | | 8/31/2022 | | | 287,825 | |
| Royal Holdings, Inc./IN | | | 236,215 | | | | 4.5000 | | | 6/20/2022 | | | 234,850 | |
See accompanying notes to financial statements.
SCHEDULE OF INVESTMENTS (Unaudited)
Dunham Floating Rate Bond Fund (Continued)
April 30, 2016
| | | Principal | | | Interest | | | Maturity | | | |
| Security | | Amount | | | Rate | | | Date | | Value | |
| MATERIALS (Continued) - 7.3% | | | | | | | | | | | | | | |
| Solenis International LP | | $ | 153,660 | | | | 4.2500 | % | | 8/1/2021 | | $ | 152,508 | |
| Summit Materials | | | 390,053 | | | | 4.0000 | | | 7/18/2022 | | | 390,499 | |
| Univar, Inc. | | | 300,490 | | | | 4.2500 | | | 6/30/2022 | | | 297,646 | |
| WR Grace & Co | | | 111,773 | | | | 2.7500 | | | 2/4/2021 | | | 111,513 | |
| | | | | | | | | | | | | | 6,374,077 | |
| TELECOMMUNICATION SERVICES - 4.2% | | | | | | | | | | | | | | |
| Global Tel*Link Corp. | | | 302,023 | | | | 5.0000 | | | 5/24/2020 | | | 282,344 | |
| Level 3 Financing Inc | | | 355,000 | | | | 4.0000 | | | 1/16/2020 | | | 356,731 | |
| Level 3 Financing, Inc. | | | 986,000 | | | | 3.5000 | | | 6/1/2022 | | | 988,204 | |
| Sable International Finance Lt | | | 165,550 | | | | 5.5000 | | | 12/2/2022 | | | 166,533 | |
| Sable International Finance Lt | | | 135,450 | | | | 5.5000 | | | 12/2/2022 | | | 136,254 | |
| SBA Senior Finance II LLC | | | 210,255 | | | | 3.2500 | | | 3/24/2021 | | | 210,367 | |
| SBA Senior Finance II LLC | | | 159,793 | | | | 3.2500 | | | 6/10/2022 | | | 159,464 | |
| Securus Technologies Holdings | | | 141,376 | | | | 4.7500 | | | 4/30/2020 | | | 134,859 | |
| Securus Technologies Holdings | | | 84,788 | | | | 5.2500 | | | 4/30/2020 | | | 80,880 | |
| T-Mobile USA, Inc. | | | 199,500 | | | | 3.5000 | | | 11/8/2022 | | | 200,947 | |
| Virgin Media Investment Holdings | | | 445,962 | | | | 3.6519 | | | 6/30/2023 | | | 445,683 | |
| West Corporation | | | 232,707 | | | | 3.2500 | | | 6/30/2018 | | | 231,601 | |
| XO Communications LLC | | | 259,700 | | | | 4.2500 | | | 3/20/2021 | | | 259,917 | |
| | | | | | | | | | | | | | 3,653,784 | |
| UTILITIES - 3.4% | | | | | | | | | | | | | | |
| APLP Holdings LP | | | 445,000 | | | | 6.0000 | | | 4/12/2023 | | | 443,888 | |
| Calpine Construction Finance Co., LP | | | 470,708 | | | | 3.0000 | | | 5/4/2020 | | | 465,120 | |
| Calpine Construction Finance Co., LP | | | 258,836 | | | | 3.2500 | | | 2/1/2022 | | | 256,138 | |
| Calpine Corp. | | | 230,673 | | | | 4.0000 | | | 10/8/2019 | | | 231,366 | |
| Calpine Corp. | | | 618,328 | | | | 3.5000 | | | 5/28/2022 | | | 615,953 | |
| NRG Energy, Inc. | | | 723,690 | | | | 2.7500 | | | 6/30/2018 | | | 723,173 | |
| Texas Comp Elec Hold LLC | | | 635,000 | | | | 5.1291 | | | 10/10/2017 | | | 218,048 | |
| | | | | | | | | | | | | | 2,953,686 | |
| | | | | | | | | | | | | | | |
| TOTAL BANK LOANS (Cost - $81,956,720) | | | | | | | | | | | | | 80,553,296 | |
| | | | | | | | | | | | | | | |
| BONDS & NOTES - 4.6% | | | | | | | | | | | | | | |
| AIRLINES - 0.2% | | | | | | | | | | | | | | |
| Air Canada - 144A | | | 75,000 | | | | 6.7500 | | | 10/1/2019 | | | 78,750 | |
| American Airlines Group, Inc. - 144A | | | 45,000 | | | | 4.6250 | | | 3/1/2020 | | | 44,381 | |
| | | | | | | | | | | | | | 123,131 | |
| BUILDING MATERIALS - 0.0% | | | | | | | | | | | | | | |
| Standard Industries, Inc./NJ - 144A | | | 5,000 | | | | 5.1250 | | | 2/15/2021 | | | 5,225 | |
| | | | | | | | | | | | | | | |
| CHEMICALS - 0.1% | | | | | | | | | | | | | | |
| Hexion, Inc. | | | 150,000 | | | | 6.6250 | | | 4/15/2020 | | | 126,375 | |
| | | | | | | | | | | | | | | |
| DIVERSIFIED FINANCIAL SERVICES - 0.5% | | | | | | | | | | | | | | |
| Ally Financial, Inc. | | | 80,000 | | | | 3.2500 | | | 2/13/2018 | | | 80,200 | |
| Ally Financial, Inc. | | | 50,000 | | | | 4.1250 | | | 2/13/2022 | | | 50,875 | |
| International Lease Finance Corp | | | 120,000 | | | | 3.8750 | | | 4/15/2018 | | | 122,100 | |
| Springleaf Finance Corp. | | | 170,000 | | | | 5.2500 | | | 12/15/2019 | | | 161,925 | |
| | | | | | | | | | | | | | 415,100 | |
| ELECTRIC - 0.1% | | | | | | | | | | | | | | |
| Talen Energy Supply LLC | | | 100,000 | | | | 4.6250 | | | 7/15/2019 | | | 93,500 | |
| | | | | | | | | | | | | | | |
| ENTERTAINMENT - 0.1% | | | | | | | | | | | | | | |
| GLP Capital LP | | | 50,000 | | | | 4.8750 | | | 11/1/2020 | | | 53,000 | |
| GLP Capital LP . | | | 10,000 | | | | 4.3750 | | | 4/15/2021 | | | 10,250 | |
| | | | | | | | | | | | | | 63,250 | |
| FOOD - 0.1% | | | | | | | | | | | | | | |
| Dole Food Co., Inc. - 144A | | | 70,000 | | | | 7.2500 | | | 5/1/2019 | | | 70,525 | |
See accompanying notes to financial statements.
SCHEDULE OF INVESTMENTS (Unaudited)
Dunham Floating Rate Bond Fund (Continued)
April 30, 2016
| | | Principal | | | Interest | | | Maturity | | | |
| Security | | Amount | | | Rate | | | Date | | Value | |
| HEALTHCARE-PRODUCTS - 0.8% | | | | | | | | | | | | | | |
| Kinetic Concepts, Inc. - 144A | | $ | 10,000 | | | | 7.8750 | % | | 2/15/2021 | | $ | 10,838 | |
| Centene Corp. - 144A | | | 75,000 | | | | 5.6250 | | | 2/15/2021 | | | 79,125 | |
| CHS/Community Health Systems, Inc. | | | 75,000 | | | | 5.1250 | | | 8/15/2018 | | | 76,125 | |
| HCA, Inc. | | | 200,000 | | | | 3.7500 | | | 3/15/2019 | | | 206,000 | |
| Surgery Center Holdings, Inc. - 144A | | | 130,000 | | | | 8.8750 | | | 4/15/2021 | | | 130,325 | |
| Tenet Healthcare Corp. - 144A | | | 25,000 | | | | 5.0000 | | | 3/1/2019 | | | 24,875 | |
| Tenet Healthcare Corp. | | | 75,000 | | | | 6.0000 | | | 10/1/2020 | | | 79,875 | |
| Tenet Healthcare Corp. | | | 80,000 | | | | 3.7841 | | | 6/15/2020 | | | 80,500 | |
| | | | | | | | | | | | | | 687,663 | |
| HOLDING COMPANIES - DIVERSIFICATION - 0.2% | | | | | | | | | | | | | | |
| Argos Merger Sub, Inc. - 144A ^ | | | 140,000 | | | | 7.1250 | | | 3/15/2023 | | | 143,500 | |
| | | | | | | | | | | | | | | |
| HOME BUILDERS - 0.1% | | | | | | | | | | | | | | |
| TRI Pointe Group, Inc. | | | 70,000 | | | | 4.3750 | | | 6/15/2019 | | | 70,525 | |
| | | | | | | | | | | | | | | |
| LODGING - 0.0% | | | | | | | | | | | | | | |
| Boyd Gaming Corp. | | | 40,000 | | | | 6.8750 | | | 5/15/2023 | | | 41,700 | |
| | | | | | | | | | | | | | | |
| MEDIA - 1.1% | | | | | | | | | | | | | | |
| Altice Financing SA - 144A | | | 200,000 | | | | 6.6250 | | | 2/15/2023 | | | 198,510 | |
| CCO Safari II LLC - 144A | | | 300,000 | | | | 3.5790 | | | 7/23/2020 | | | 311,658 | |
| Cequel Capital Corp - 144A | | | 50,000 | | | | 6.3750 | | | 9/15/2020 | | | 51,377 | |
| iHeartCommunications, Inc. | | | 95,000 | | | | 9.0000 | | | 12/15/2019 | | | 73,981 | |
| Numericable-SFR SA - 144A | | | 200,000 | | | | 6.0000 | | | 5/15/2022 | | | 201,010 | |
| RCN Telecom Services LLC - 144A | | | 110,000 | | | | 8.5000 | | | 8/15/2020 | | | 111,788 | |
| | | | | | | | | | | | | | 948,324 | |
| MINING - 0.1% | | | | | | | | | | | | | | |
| Vedanta Resources PLC - 144A | | | 100,000 | | | | 9.5000 | | | 7/18/2018 | | | 93,750 | |
| | | | | | | | | | | | | | | |
| OIL & GAS SERVICES - 0.1% | | | | | | | | | | | | | | |
| FTS International, Inc. - 144A | | | 50,000 | | | | 6.2500 | | | 5/1/2022 | | | 8,025 | |
| FTS International, Inc. | | | 120,000 | | | | 8.1182 | | | 6/15/2020 | | | 87,643 | |
| | | | | | | | | | | | | | 95,668 | |
| PACKAGING & CONTAINERS - 0.4% | | | | | | | | | | | | | | |
| Ardagh Holdings USA, Inc. - 144A | | | 200,000 | | | | 6.2500 | | | 1/31/2019 | | | 205,500 | |
| Beverage Packaging Holdings Luxembourg II SA - 144A | | | 130,000 | | | | 6.0000 | | | 6/15/2017 | | | 129,838 | |
| Reynolds Group Issuer, Inc. ^ | | | 50,000 | | | | 5.7500 | | | 10/15/2020 | | | 52,000 | |
| | | | | | | | | | | | | | 387,338 | |
| PHARMACEUTICALS - 0.2% | | | | | | | | | | | | | | |
| Capsugel SA - 144A | | | 19,000 | | | | 7.0000 | | | 5/15/2019 | | | 19,143 | |
| Quintiles Transnational Corp. - 144A | | | 40,000 | | | | 4.8750 | | | 5/15/2023 | | | 41,150 | |
| Valeant Pharmaceuticals International, Inc | | | 70,000 | | | | 5.3750 | | | 3/15/2020 | | | 62,344 | |
| | | | | | | | | | | | | | 122,637 | |
| PRIVATE EQUITY - 0.0% | | | | | | | | | | | | | | |
| Icahn Enterprises LP | | | 10,000 | | | | 4.8750 | | | 3/15/2019 | | | 9,975 | |
| | | | | | | | | | | | | | | |
| REITS - 0.2% | | | | | | | | | | | | | | |
| iStar, Financial, Inc. | | | 30,000 | | | | 4.8750 | | | 7/1/2018 | | | 29,362 | |
| iStar, Financial, Inc. | | | 60,000 | | | | 5.0000 | | | 7/1/2019 | | | 58,500 | |
| iStar, Financial, Inc. | | | 100,000 | | | | 4.0000 | | | 11/1/2017 | | | 99,000 | |
| | | | | | | | | | | | | | 186,862 | |
| SOFTWARE - 0.1% | | | | | | | | | | | | | | |
| First Data Corp. - 144A | | | 90,000 | | | | 5.0000 | | | 1/15/2024 | | | 91,238 | |
| First Data Corp. - 144A | | | 25,000 | | | | 5.7500 | | | 1/15/2024 | | | 25,469 | |
| | | | | | | | | | | | | | 116,707 | |
See accompanying notes to financial statements.
SCHEDULE OF INVESTMENTS (Unaudited)
Dunham Floating Rate Bond Fund (Continued)
April 30, 2016
| | | Principal | | | Interest | | | Maturity | | | |
| Security | | Amount | | | Rate | | | Date | | Value | |
| TELECOMMUNICATIONS - 0.2% | | | | | | | | | | | | | | |
| Frontier Communications Corp. | | $ | 155,000 | | | | 6.2500 | % | | 9/15/2021 | | $ | 144,924 | |
| Intelsat Jackson Holdings SA | | | 85,000 | | | | 6.6250 | | | 12/15/2022 | | | 55,355 | |
| | | | | | | | | | | | | | 200,279 | |
| | | | | | | | | | | | | | | |
| TOTAL BONDS & NOTES (Cost - $4,153,334) | | | | | | | | | | | | | 4,002,034 | |
| | | | | | | | | | | | | | | |
| ASSET BACKED SECURITIES - 1.6% | | | | | | | | | | | | | | |
| Drive Auto Receivables Trust 2016-A | | | 250,000 | | | | 2.1100 | | | 5/15/2019 | | | 251,375 | |
| Flagship Credit Auto Trust 2016-1 | | | 281,227 | | | | 2.7700 | | | 12/15/2020 | | | 282,448 | |
| Hertz Vehicle Financing LLC 2016-1 | | | 250,000 | | | | 2.3200 | | | 3/25/2020 | | | 250,214 | |
| Home Equity Loan Trust 2007-HSA3 | | | 125,083 | | | | 6.1100 | | | 6/25/2037 | | | 123,263 | |
| JP Morgan Chase Commercial Mortgage Securities Trust 2007-LDP10 | | | 192,000 | | | | 5.4640 | | | 1/15/2049 | | | 189,587 | |
| OneMain Financial Issuance Trust 2015-1 | | | 250,000 | | | | 3.1900 | | | 3/18/2026 | | | 250,916 | |
| | | | | | | | | | | | | | | |
| TOTAL ASSET BACKED SECURITIES (Cost - $1,345,176) | | | | | | | | | | | | | 1,347,803 | |
| | | | | | | | | | | | | | | |
| | | Shares | | | | | | | | | | | |
| SHORT-TERM INVESTMENT - 3.6% | | | | | | | | | | | | | | |
| MONEY MARKET FUND - 3.6% | | | | | | | | | | | | | | |
| Fidelity Institutional Money Market Funds - Government Portfolio | | | 3,122,938 | | | | 0.0100 | + | | | | | 3,122,938 | |
| TOTAL SHORT-TERM INVESTMENT - (Cost - $3,122,938) | | | | | | | | | | | | | | |
| | | | | | | | | | | | | | | |
| COLLATERAL FOR SECURITIES LOANED - 0.1% | | | | | | | | | | | | | | |
| Mount Vernon Prime Portfolio + (Cost - $105,750) | | | 105,750 | | | | 0.51 | % | | | | | 105,750 | |
| | | | | | | | | | | | | | | |
| TOTAL INVESTMENTS - 102.6% (Cost - $90,683,918) | | | | | | | | | | | | $ | 89,131,821 | |
| LIABILITIES IN EXCESS OF OTHER ASSETS - (2.6)% | | | | | | | | | | | | | (2,226,757 | ) |
| NET ASSETS - 100.0% | | | | | | | | | | | | $ | 86,905,064 | |
REITS - Real Estate Investment Trusts.
| ^ | All or a portion of these securities are on loan. Total loaned securities had a value of $103,583 at April 30, 2016. |
| + | Variable rate security. Interest rate is as of April 30, 2016. |
144A - Security exempt from registration under Rule 144A of the Securities Act of 1933. These securities may be sold in transactions exempt from registration, normally to qualified institutional buyers.
| Portfolio Composition * - (Unaudited) |
| Bank Loans | | | 90.4 | % | | Diversified Financial Services | | | 0.5 | % |
| Asset Backed Securities | | | 3.5 | % | | Packaging & Containers | | | 0.4 | % |
| Short-Term Investment | | | 1.5 | % | | Pharmaceuticals | | | 0.2 | % |
| Media | | | 1.1 | % | | Telecommunications | | | 0.2 | % |
| Healthcare-Products | | | 0.8 | % | | Other ** | | | 1.4 | % |
| | | | | | | Total | | | 100.0 | % |
| * | Based on total value of investments as of April 30, 2016. |
| ** | Groupings less than 0.20% of holdings. |
Percentage may differ from Schedule of Investments which are based on Fund net assets.
See accompanying notes to financial statements.
Dunham Monthly Distribution Fund
Message from the Sub-Adviser (Westchester Capital Management, LLC)
While “higher” market volatility has been a prominent theme across the past few periods, there have been relatively short periods that have experienced significant spikes. For example, market volatility, as measured by the CBOE Volatility Index (“VIX”) ended the first three months of the six-month period 34 percent higher than it began. At one point during this period, the VIX nearly doubled, while equity market prices widely tumbled. Generally, large increases in the VIX coincide with sizeable declines in the equity markets. Equity markets rallied during the fourth and fifth months of the six-month period as volatility generally subsided. The VIX decreased 30.9 percent over this time period. In the final month of the six-month period ended April 30, 2016, the VIX spiked once again, albeit less than the previous spike. The VIX increased 12.5 percent in the month of April. After the higher volatility levels during the first three months generally continued to result in investors attempting to reduce risk and making indiscriminate sell decisions, the decrease in volatility in the most recent fiscal quarter may have increased investor optimism. Event-driven strategies, as measured by the Credit Suisse Event Driven Index, decreased 2.3 percent, while market-neutral strategies, as measured by the IQ Hedge Market Neutral Beta Index, increased 1.5 percent.
Similar to the previous periods, merger arbitrage strategies, as measured by the Credit Suisse Merger Arbitrage Index, provided a slight positive contribution to absolute performance during the final three months of the six-month fiscal period. Merger arbitrage strategies increased 1.0 percent in this period and increased 0.6 percent in the first three months of the fiscal six-month period. Although the broad merger arbitrage space experienced a slight positive return, many merger spreads saw significant widening during the period. However, deals continued to close during this volatility. For example, the cash and stock acquisition of Jarden Corporation (JAH) (holding percentage*: 3.59 percent) by Newell Rubbermaid Inc. (NWL) (holding percentage*: -0.76 percent) began the most recent fiscal quarter with a 2.6 percent spread and completed towards the end of the six-month period. These significant spreads on deals that ultimately proved to successfully close helps to illustrate how this ongoing volatility significantly impacted deal spreads within the event driven space.
As volatility peaked during the first three months of the period, many deal spreads widened substantially. For example, the cash and stock acquisition of Baker Hughes Inc. (BHI) (holding percentage**: 0.06 percent) by Halliburton Co. (HAL) (holding percentage**: -0.03 percent) continued to experience its deal spread widen. At the start of the period, the spread stood at 17.7 percent and by the end of the first three months, it had widened further to a spread of 25.5 percent. Even though volatility generally subsided, the spread did not improve during the final three months. The deal completion date was pushed back to midsummer due regulatory request from the U.S. government and European Commission. The Sub-Adviser believed the risk present in the position no longer warranted a place in the Fund and sold out of the position on March 3, 2016. The Justice Department denied the approval of this acquisition on April 6, 2016. Conversely, as volatility generally subsided during the final three months of the fiscal period many spreads tightened. The cash and stock acquisition of Time Warner Cable Inc. (TWC) (holding percentage*: 1.31 percent) by Charter Communications, Inc. (CHTR) (holding percentage*: -2.84 percent) saw its deal spread tighten from 7.3 percent at the end of October to slightly less than 1.2 percent at the end of April.
The Sub-Adviser generally implements risk-reversals, a risk-management technique using call and put options, on event-driven opportunities outside of the merger arbitrage strategy. The Sub-Adviser does this in order to help keep the risk within what it believes are acceptable bounds. A special situation event example that has spanned multiple periods included Hertz Global Holdings, Inc.’s (HTZ) (holding percentage*: 2.09 percent) spin-off of its equipment rental business. In this particular example, HTZ experienced a substantial decline during the first three months of the six-month period, primarily due to concerns over the company’s leverage and its growing competition from smart-phone oriented ride-hailing companies. However, the Sub-Adviser’s implementation of the risk reversals during this time served well to offset a meaningful amount of the downturn. The risk reversal detracted slightly in the final three months of the period as HTZ increased 2.0 percent. During the six-month period, buy/write strategies, as measured by the CBOE S&P 500 Buy/Write Index, declined 0.6 percent. The difference in utilizing a risk-reversal instead of a buy/write strategy is that it uses the majority of the proceeds of the written call to purchase protective put options. Therefore, in the declining periods during the first three months of the period, the risk-reversal generally helped to reduce the downside (leaving less to be recovered).
The Sub-Adviser continued to maintain a small position in credit opportunities during the most recent six-month period. Similar to the prior fiscal period, the strategy as a whole generally contributed positively to Fund performance during the most recent six-month period. During this period, corporate bonds in general, as measured by the Bank of America Merrill Lynch Corporate Bond Master Index, increased 4.2 percent. Fund holdings such as the corporate bond issued by U.S. Foods Inc. (90290MAA9) (holding percentage*: 1.20 percent) aided positive performance. The U.S Foods Inc. bond price increased 3.6 percent over the fiscal period.
The Sub-Adviser believes that the increased volatility across the markets has generally increased the potential rewards from many of these event-driven opportunities. However, while the core tenets for many of these events have not substantially changed, the Sub-Adviser is optimistic that the overall risk-reward profile has improved. The Sub-Adviser continues to implement its disciplined risk controls while taking advantage of these perceived opportunities going forward.
*Holdings percentage(s) as of 4/30/2016.
**Holdings percentage(s) as of the date prior to the sale of the security.
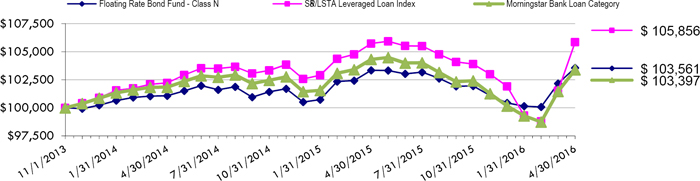
Growth of $10,000 Investment - (Unaudited)
Total Returns as of April 30, 2016
| | Six | | Annualized | Annualized | Annualized Since |
| | Months | One Year | Three Years | Five Years | Inception (8/1/08)* |
| Class N | (0.32)% | (4.40)% | 0.92% | 2.51% | 4.06%** |
| Class C | (0.86)% | (5.40)% | (0.09)% | 1.48% | 2.04% |
| Class A with load of 5.75% | (6.15)% | (10.13)% | (1.30)% | 1.04% | (0.40)% |
| Class A without load | (0.44)% | (4.65)% | 0.66% | 2.25% | 2.82% |
| IQ Hedge Market Neutral Beta Index | (0.88)% | 1.88% | 2.44% | 1.52% | 2.50% |
| Morningstar Multialternative Category | (2.12)% | (4.82)% | (0.18)% | (0.14)% | 0.37% |
| * | Westchester Capital Management, Inc. was named Sub-Adviser to the Fund on August 1, 2008. Prior to August 1, 2008, the Fund was named Kelmoore Strategy Liberty Fund and was managed under a different adviser. |
| ** | Class N commenced operations on September 29, 2008. |
IQ Hedge Market Neutral Beta Index is a benchmark index designed to replicate the risk-adjusted return characteristics of the collective hedge funds using a market neutral investment style. Investors cannot invest directly in an index or benchmark.
The Morningstar Multialternative Category is generally representative of mutual funds with static allocations to alternative strategies and mutual funds that tactically allocate among alternative strategies and asset classes. The gross short exposure in these mutual funds is generally greater than 20%.
As disclosed in the Trust’s latest registration statement, the Fund’s total annual operating expenses before any fee waiver, including the cost of underlying funds, are 2.11% for Class N, 3.11% for Class C and 2.36% for Class A. Class A shares are subject to a sales load of 5.75% and a deferred sales charge of up to 0.75%. The performance data quoted here represents past performance, which is not indicative of future results. Current performance may be lower or higher than the performance data quoted. The investment return and NAV will fluctuate, so that an investor’s shares, when redeemed, may be worth more or less than their original cost. Total returns are calculated assuming reinvestment of all dividends and capital gains distributions, if any. The returns do not reflect the deductions of taxes a shareholder would pay on the redemption of fund shares or fund distributions. For performance information current to the most recent month-end, please call 1-800-442-4358 or visit our website www.dunham.com.
SCHEDULE OF INVESTMENTS (Unaudited)
Dunham Monthly Distribution Fund
April 30, 2016
| Security | | Shares | | | | | | Value | |
| COMMON STOCK - 84.3% | | | | | | | | | | | | |
| AIRLINES - 0.0% | | | | | | | | | | | | |
| American Airlines Group, Inc. | | | 101,283 | | | | | | | $ | 84,065 | |
| | | | | | | | | | | | | |
| AUTO MANUFACTURERS - 0.9% | | | | | | | | | | | | |
| General Motors Co. | | | 72,000 | | | | | | | | 2,289,600 | |
| | | | | | | | | | | | | |
| BUILDING MATERIALS - 2.0% | | | | | | | | | | | | |
| West China Cement Ltd. | | | 24,035,911 | | | | | | | | 5,081,784 | |
| | | | | | | | | | | | | |
| CHEMICALS - 12.0% | | | | | | | | | | | | |
| Airgas, Inc. # | | | 63,076 | | | | | | | | 8,984,545 | |
| Dow Chemical Co. # | | | 88,648 | | | | | | | | 4,663,771 | |
| EI du Pont de Nemours & Co. # | | | 105,752 | | | | | | | | 6,970,114 | |
| Syngenta AG - ADR | | | 37,350 | | | | | | | | 3,009,290 | |
| Valspar Corp. # | | | 57,909 | | | | | | | | 6,178,311 | |
| | | | | | | | | | | | 29,806,031 | |
| COMMERCIAL SERVICES - 3.8% | | | | | | | | | | | | |
| ADT Corp. | | | 102,413 | | | | | | | | 4,299,298 | |
| Global Payments, Inc. | | | 89 | | | | | | | | 6,419 | |
| Hertz Global Holdings, Inc. # | | | 561,800 | | | | | | | | 5,202,268 | |
| SFX Entertainment, Inc. # | | | 536,171 | | | | | | | | 13,404 | |
| | | | | | | | | | | | 9,521,389 | |
| COMPUTERS - 6.1% | | | | | | | | | | | | |
| EMC Corp./MA # | | | 417,394 | | | | | | | | 10,898,157 | |
| SanDisk Corp. # | | | 56,155 | | | | | | | | 4,218,925 | |
| | | | | | | | | | | | 15,117,082 | |
| DISTRIBUTION / WHOLESALE - 3.3% | | | | | | | | | | | | |
| Ingram Micro, Inc. # | | | 233,589 | | | | | | | | 8,163,936 | |
| | | | | | | | | | | | | |
| ELECTRONICS - 2.9% | | | | | | | | | | | | |
| Tyco International PLC # | | | 188,088 | | | | | | | | 7,245,150 | |
| | | | | | | | | | | | | |
| ENVIRONMENTAL CONTROL - 0.4% | | | | | | | | | | | | |
| Progressive Waste Solutions Ltd. | | | 31,774 | | | | | | | | 1,023,441 | |
| | | | | | | | | | | | | |
| FOOD - 2.6% | | | | | | | | | | | | |
| ConAgra Foods, Inc. # | | | 143,000 | | | | | | | | 6,372,080 | |
| | | | | | | | | | | | | |
| HEALTHCARE-PRODUCTS - 3.0% | | | | | | | | | | | | |
| Alere, Inc. # | | | 110,629 | | | | | | | | 4,314,531 | |
| Baxter International, Inc. | | | 44,800 | | | | | | | | 1,981,056 | |
| St Jude Medical, Inc. | | | 16,162 | | | | | | | | 1,231,544 | |
| | | | | | | | | | | | 7,527,131 | |
| HEALTHCARE-SERVICES - 2.6% | | | | | | | | | | | | |
| Centene Corp. | | | 1 | | | | | | | | 57 | |
| Humana, Inc. # | | | 36,997 | | | | | | | | 6,551,059 | |
| | | | | | | | | | | | 6,551,116 | |
| HOLDING COMPANIES-DIVERSIFICATION - 0.9% | | | | | | | | | | | | |
| Hennessy Capital Acquisition Corp. II | | | 104,074 | | | | | | | | 1,027,210 | |
| Pacific Special Acquisition Corp. | | | 105,552 | | | | | | | | 1,062,909 | |
| | | | | | | | | | | | 2,090,119 | |
| HOUSEHOLD PRODUCTS / WARES - 3.5% | | | | | | | | | | | | |
| Jarden Corp. | | | 148,157 | | | | | | | | 8,736,818 | |
| | | | | | | | | | | | | |
| INSURANCE - 0.3% | | | | | | | | | | | | |
| American International Group, Inc. | | | 13,200 | | | | | | | | 736,824 | |
See accompanying notes to financial statements.
SCHEDULE OF INVESTMENTS (Unaudited)
Dunham Monthly Distribution Fund (Continued)
April 30, 2016
| Security | | Shares | | | | | | Value | |
| INTERNET - 4.7% | | | | | | | | | | | | |
| Qihoo 360 Technology Co., Ltd. # | | | 16,319 | | | | | | | $ | 1,239,265 | |
| Yahoo!, Inc. # | | | 288,544 | | | | | | | | 10,560,710 | |
| | | | | | | | | | | | 11,799,975 | |
| LODGING - 9.0% | | | | | | | | | | | | |
| Hilton Worldwide Holdings, Inc. | | | 118,800 | | | | | | | | 2,619,540 | |
| MGM Resorts International | | | 239,000 | | | | | | | | 5,090,700 | |
| Starwood Hotels & Resorts Worldwide, Inc. # | | | 178,867 | | | | | | | | 14,645,630 | |
| | | | | | | | | | | | 22,355,870 | |
| MEDIA - 8.5% | | | | | | | | | | | | |
| Cablevision Systems Corp. # | | | 97,079 | | | | | | | | 3,241,468 | |
| CBS Corp. # | | | 74,139 | | | | | | | | 4,145,111 | |
| Liberty Braves Group | | | 21,240 | | | | | | | | 332,198 | |
| Liberty Media Group | | | 53,100 | | | | | | | | 971,744 | |
| Liberty SiriusXM Group | | | 212,403 | | | | | | | | 6,960,446 | |
| Markit Ltd. # | | | 12,422 | | | | | | | | 433,404 | |
| Media General, Inc. # | | | 107,359 | | | | | | | | 1,860,531 | |
| Time Warner Cable, Inc. | | | 15,353 | | | | | | | | 3,256,525 | |
| | | | | | | | | | | | 21,201,427 | |
| MINING - 1.3% | | | | | | | | | | | | |
| Alcoa, Inc. | | | 292,000 | | | | | | | | 3,261,640 | |
| Freeport-McMoRan, Inc. | | | 1 | | | | | | | | 14 | |
| | | | | | | | | | | | 3,261,654 | |
| MISCELLANEOUS MANUFACTURING - 1.7% | | | | | | | | | | | | |
| General Electric Co. # | | | 136,300 | | | | | | | | 4,191,225 | |
| | | | | | | | | | | | | |
| OIL & GAS - 1.0% | | | | | | | | | | | | |
| Northern Tier Energy LP # | | | 109,406 | | | | | | | | 2,499,927 | |
| | | | | | | | | | | | | |
| PHARMACEUTICALS - 4.1% | | | | | | | | | | | | |
| Allergan PLC # | | | 135 | | | | | | | | 29,236 | |
| Baxalta, Inc. # | | | 216,379 | | | | | | | | 9,077,099 | |
| Mylan NV | | | 463 | | | | | | | | 19,312 | |
| Pfizer, Inc. # | | | 35,600 | | | | | | | | 1,164,476 | |
| | | | | | | | | | | | 10,290,123 | |
| PIPELINES - 0.3% | | | | | | | | | | | | |
| Williams Cos, Inc. # | | | 41,925 | | | | | | | | 812,926 | |
| | | | | | | | | | | | | |
| REITS - 3.6% | | | | | | | | | | | | |
| Blackstone Mortgage Trust, Inc. # | | | 4,944 | | | | | | | | 135,862 | |
| CYS Investments, Inc. | | | 9,500 | | | | | | | | 77,046 | |
| NorthStar Realty Finance Corp. # | | | 118,000 | | | | | | | | 1,509,220 | |
| Starwood Property Trust, Inc. # | | | 247,078 | | | | | | | | 4,783,430 | |
| Wheeler Real Estate Investment Trust, Inc. | | | 850,746 | | | | | | | | 1,199,552 | |
| Winthrop Realty Trust # | | | 102,617 | | | | | | | | 1,305,288 | |
| | | | | | | | | | | | 9,010,398 | |
| RETAIL - 0.0% | | | | | | | | | | | | |
| Restaurant Brands International, Inc. | | | 1 | | | | | | | | 43 | |
| | | | | | | | | | | | | |
| SAVINGS & LOANS - 1.7% | | | | | | | | | | | | |
| First Niagara Financial Group, Inc. # | | | 406,657 | | | | | | | | 4,294,298 | |
| | | | | | | | | | | | | |
| SEMICONDUCTORS - 3.9% | | | | | | | | | | | | |
| KLA-Tencor Corp. # | | | 137,343 | | | | | | | | 9,605,769 | |
| Microchip Technology, Inc. | | | 2 | | | | | | | | 97 | |
| | | | | | | | | | | | 9,605,866 | |
| TELECOMMUNICATIONS - 0.2% | | | | | | | | | | | | |
| T-Mobile US, Inc. | | | 15,190 | | | | | | | | 596,663 | |
| | | | | | | | | | | | | |
| TOTAL COMMON STOCK (Cost - $221,693,465) | | | | | | | | | | | 210,266,961 | |
See accompanying notes to financial statements.
SCHEDULE OF INVESTMENTS (Unaudited)
Dunham Monthly Distribution Fund (Continued)
April 30, 2016
| Security | | | | | Shares | | | | | Value | |
| RIGHTS - 0.0% | | | | | | | | | | | | | | |
| Leap Wireless International, Inc. * | | | | | | | 4,071 | | | | | $ | 13,231 | |
| Pacific Special Acquisition Corp. | | | | | | | 105,552 | | | | | | 17,727 | |
| Safeway Casa Ley CVR * | | | | | | | 90,955 | | | | | | 4,548 | |
| Safeway PDC, LLC CVR * | | | | | | | 90,955 | | | | | | 40,930 | |
| TOTAL RIGHTS (Cost - $125,879) | | | | | | | | | | | | | 76,436 | |
| | | | | | | | | | | | | | | |
| WARRANTS - 0.0% | | | | | | | | | | | | | | |
| Hennessy Capital Acquisition Corp. II | | | | | | | 104,074 | | | | | | 29,141 | |
| Pacific Special Acquisition Corp. | | | | | | | 105,552 | | | | | | 9,500 | |
| TOTAL WARRANTS (Cost - $32,028) | | | | | | | | | | | | | 38,641 | |
| | | | | | | | | | | | | | | |
| CLOSED-END FUNDS - 3.9% | | | | | | | | | | | | | | |
| BlackRock Floating Rate Income Strategies Fund, Inc. | | | | | | | 103,341 | | | | | | 1,368,235 | |
| DoubleLine Income Solutions Fund # | | | | | | | 73,612 | | | | | | 1,295,571 | |
| Eaton Vance Floating-Rate Income Trust | | | | | | | 104,551 | | | | | | 1,376,937 | |
| First Trust Senior Floating Rate Income Fund II ^ | | | | | | | 67,775 | | | | | | 869,553 | |
| Invesco Senior Income Trust # | | | | | | | 703,160 | | | | | | 2,868,893 | |
| Voya Prime Rate Trust # | | | | | | | 275,084 | | | | | | 1,389,174 | |
| Western Asset High Income Opportunity Fund, Inc. | | | | | | | 106,644 | | | | | | 506,559 | |
| TOTAL CLOSED-END FUNDS (Cost - $9,913,936) | | | | | | | | | | | | | 9,674,922 | |
| | | | | | | | | | | | | | | |
| | | | | | | Dividend | | | | | | | |
| | | Shares | | | Rate | | | | | | | |
| PREFERRED STOCK - 2.3% | | | | | | | | | | | | | | |
| DIVERSIFIED FINANCIAL SERVICES - 0.8% | | | | | | | | | | | | | | |
| Kinder Morgan GP, Inc. - 144A # | | | 2,000 | | | | 4.5157 | % | | | | | 1,825,000 | |
| | | | | | | | | | | | | | | |
| REAL ESTATE INVESTMENT TRUSTS - 1.5% | | | | | | | | | | | | | | |
| Equity CommonWealth # | | | 150,000 | | | | 7.2500 | | | | | | 3,750,000 | |
| | | | | | | | | | | | | | | |
| TOTAL PREFERRED STOCK (Cost - $5,739,425) | | | | | | | | | | | | | 5,575,000 | |
| | | | | | | | | | | | | | | |
| | | Principal | | | Interest | | | Maturity | | | | |
| | Amount | | | Rate | | | Date | | | | |
| BONDS & NOTES - 4.9% | | | | | | | | | | | | |
| COMMERCIAL SERVICES - 0.8% | | | | | | | | | | | | | | |
| ADT Corp. | | $ | 1,834,000 | | | | 4.125 | % | | 4/15/2019 | | | 1,969,258 | |
| | | | | | | | | | | | | | | |
| ENGINEERING & CONSTRUCTION - 0.1% | | | | | | | | | | | | | | |
| Aeropuertos Dominicanos Siglo XXI SA | | | 192,000 | | | | 9.2500 | | | 11/13/2019 | | | 204,960 | |
| | | | | | | | | | | | | | | |
| ELECTRIC - 2.0% | | | | | | | | | | | | | | |
| Energy Future Intermediate Holding Co. LLC - 144A | | | 4,761,350 | | | | 11.7500 | | | 3/1/2022 | | | 5,106,548 | |
| | | | | | | | | | | | | | | |
| MEDIA - 0.8% | | | | | | | | | | | | | | |
| LIN Television Corp. | | | 2,000,000 | | | | 5.8750 | | | 11/15/2022 | | | 2,050,000 | |
| | | | | | | | | | | | | | | |
| FOOD - 1.2% | | | | | | | | | | | | | | |
| US Foods, Inc. | | | 2,887,000 | | | | 8.5000 | | | 6/30/2019 | | | 2,973,610 | |
| | | | | | | | | | | | | | | |
| TOTAL BONDS & NOTES (Cost - $12,495,890) | | | | | | | | | | | | | 12,304,376 | |
| | | | | | | | | | | | | | | |
| | | | | | | | | | | Contracts** | | Value | |
| PURCHASED PUT OPTIONS - 0.9% | | | | | | | | | | | | | | |
| Alcoa Inc, Expiration June 2016, Exercise Price $6 | | | | | | | | | | 2,374 | | | 2,374 | |
| Alcoa Inc., Expiration May 2016, Exercise Price $7 | | | | | | | | | | 546 | | | 540 | |
| Allergan Public, Expiration May 2016, Exercise Price $240 | | | | | | | | | | 31 | | | 77,500 | |
| American Intl Group, Expiration May 2016, Exercise Price $47.5 | | | | | | | | | | 125 | | | 1,187 | |
| AIG, Expiration June 2016, Exercise Price $45 | | | | | | | | | | 211 | | | 3,165 | |
| AIG, Expiration June 2016, Exercise Price $50 | | | | | | | | | | 274 | | | 11,371 | |
| BAX, Expiration August 2016, Exercise Price $55 | | | | | | | | | | 448 | | | 504,000 | |
| BAY, Expiration June 2016, Exercise Price $92 | | | | | | | | | | 196 | | | 40,173 | |
| CAG, Expiration June 2016, Exercise Price $40 | | | | | | | | | | 1,430 | | | 35,750 | |
| CBS Corp, Expiration June 2016, Exercise Price $40 | | | | | | | | | | 741 | | | 12,228 | |
| Dow Chemical Co., Expiration June 2016, Exercise Price $43 | | | | | | | | | | 1,356 | | | 16,273 | |
| VIVENDI, Expiration June 2016, Exercise Price $15 | | | | | | | | | | 1,259 | | | 34,599 | |
| General Electric Co., Expiration May 2016, Exercise Price $28 | | | | | | | | | | 1,227 | | | 3,069 | |
See accompanying notes to financial statements.
SCHEDULE OF INVESTMENTS (Unaudited)
Dunham Monthly Distribution Fund (Continued)
April 30, 2016
| Security | | | | | | | | Contracts** | | Value | |
| PURCHASED PUT OPTIONS - 0.9% (Continued) | | | | | | | | | | | | | | |
| General Motors Co., Expiration June 2016, Exercise Price $27 | | | | | | | | | | 1,438 | | $ | 24,446 | |
| HLT, Expiration July 2016, Exercise Price $19 | | | | | | | | | | 1,188 | | | 32,670 | |
| Starwood Hotels & Resorts Worldwide, Inc., Expiration May 2016, Exercise Price $55 | | | | | | | | | | 283 | | | 284 | |
| HTZ, Expiration June 2016, Exercise Price $8 | | | | | | | | | | 5,182 | | | 168,415 | |
| Huntsman Corp, Expiration May 2016, Exercise Price $8 | | | | | | | | | | 447 | | | 1,342 | |
| iShares iBoxx High Yield, Expiration June 2016, Exercise Price $75 | | | | | | | | | | 263 | | | 2,630 | |
| iShares iBoxx High Yield, Expiration June 2016, Exercise Price $77 | | | | | | | | | | 520 | | | 7,280 | |
| MGM, Expiration June 2016, Exercise Price $16 | | | | | | | | | | 2,390 | | | 22,705 | |
| NRF, Expiration June 2016, Exercise Price $12 | | | | | | | | | | 1,180 | | | 76,700 | |
| Pfizer, Expiration June 2016, Exercise Price $27 | | | | | | | | | | 267 | | | 1,335 | |
| SPY, Expiration May 2016, Exercise Price $206 | | | | | | | | | | 105 | | | 26,040 | |
| SPY, Expiration June 2016, Exercise Price $184 | | | | | | | | | | 210 | | | 24,360 | |
| SPY, Expiration May 2016, Exercise Price $204 | | | | | | | | | | 610 | | | 116,510 | |
| SPY, Expiration June 2016, Exercise Price $204 | | | | | | | | | | 210 | | | 94,710 | |
| T-Mobile, Inc., Expiration May 2016, Exercise Price $31 | | | | | | | | | | 1,167 | | | 12,837 | |
| Vmware, Inc., Expiration September 2016, Exercise Price $95 | | | | | | | | | | 290 | | | 1,133,900 | |
| TOTAL PURCHASED PUT OPTIONS (Cost - $3,473,288) | | | | | | | | | | | | | 2,488,393 | |
| | | | | | | | | | | | | | | |
| SHORT-TERM INVESTMENT - 11.9% | | | | | | | | | | Interest | | | | |
| MONEY MARKET FUND - 11.9% | | Shares | | | | | | | Rate | | Value | |
| First American Government Obligations Fund | | | 29,646,669 | | | | | | | 0.21 | %+ | $ | 29,646,669 | |
| TOTAL SHORT-TERM INVESTMENT (Cost - $29,646,669) | | | | | | | | | | | | | | |
| | | | | | | | | | | | | | | |
| COLLATERAL FOR SECURITIES LOANED - 3.7% | | | | | | | | | | | | | | |
| Mount Vernon Prime Portfolio + (Cost - $9,209,035) | | | 9,209,035 | | | | | | | 0.51 | %+ | | 9,209,035 | |
| | | | | | | | | | | | | | | |
| TOTAL INVESTMENTS - 111.9% (Cost - $292,329,615) | | | | | | | | | | | | $ | 279,280,433 | |
| LIABILITIES IN EXCESS OF OTHER ASSETS - (11.9)% | | | | | | | | | | | | | (29,827,617 | ) |
| NET ASSETS - 100.0% | | | | | | | | | | | | $ | 249,452,816 | |
| * | Non-Income producing security. |
| ** | Each Purchased Option contract allows the Fund to sell 100 shares of the underlying security at the exercise price. |
| *** | Issuer in default on interest payments, non-interest producing security. |
REITS - Real Estate Investment Trusts
ADR- American Depositary Receipt.
| + | Variable rate security. Interest rate is as of April 30, 2016. |
| ++ | Each Written Call/Put Option contract allows the holder to purchase/sell 100 shares of the underlying security from/to the Fund at the stated exercise price. |
| ^ | All or a portion of these securities are on loan. Total loaned securities had a value of $8,949,290 at April 30, 2016. |
| # | All or a portion of the security is segregated as collateral for securities sold short and/or options purchased/written at April 30, 2016. Total collateral had a value of $49,627,303 at April 30, 2016. |
144A - Security exempt from registration under Rule 144A of the Securities Act of 1933. These securities may be sold in transactions exempt from registration, normally to qualified institutional buyers.
| Security | | Contracts ++ | | | Value | |
| WRITTEN CALL OPTIONS - (2.5)% | | | | | | | | |
| Alcoa Inc., Expiration June 2016, Exercise Price $8 | | | 546 | | | $ | 170,352 | |
| Alcoa Inc., Expiration May 2016, Exercise Price $8 | | | 2,374 | | | | 759,680 | |
| Allergan, Expiration May 2016, Exercise Price $265 | | | 8 | | | | 64 | |
| Allergan, Expiration May 2016, Exercise Price $275 | | | 57 | | | | 570 | |
| American Intl Group, Expiration May 2016, Exercise Price $45 | | | 421 | | | | 151,560 | |
| American Intl Group, Expiration May 2016, Exercise Price $55 | | | 125 | | | | 27,125 | |
| AIG, Expiration June 2016, Exercise Price $52.5 | | | 307 | | | | 336,933 | |
| AIG, Expiration June 2016, Exercise Price $55 | | | 260 | | | | 48,620 | |
| Alere Inc, Expiration May 2016, Exercise Price $60 | | | 51 | | | | 255 | |
| BAX, Expiration August 2016, Exercise Price $55 | | | 448 | | | | 2,688 | |
See accompanying notes to financial statements.
SCHEDULE OF INVESTMENTS (Unaudited)
Dunham Monthly Distribution Fund (Continued)
April 30, 2016
| Security | | Contracts ++ | | | Value | |
| WRITTEN CALL OPTIONS (Continued) - (2.5)% | | | | | | | | |
| CAG, Expiration June 2016, Exercise Price $44 | | | 867 | | | $ | 130,050 | |
| CAG, Expiration June 2016, Exercise Price $45 | | | 563 | | | | 56,300 | |
| CBS Corp, Expiration June 2016, Exercise Price $50 | | | 741 | | | | 463,125 | |
| Dow Chemical, Expiration June 2016, Exercise Price $48 | | | 1,507 | | | | 768,570 | |
| General Electric Co., Expiration May 2016, Exercise Price $30 | | | 1,363 | | | | 122,670 | |
| General Motors Co., Expiration June 2016, Exercise Price $33 | | | 62 | | | | 1,674 | |
| GM, Expiration June 2016, Exercise Price $34 | | | 2,187 | | | | 102,789 | |
| HLT, Expiration July 2016, Exercise Price $21 | | | 1,188 | | | | 204,930 | |
| Starwood Hotels & Resorts Worldwide, Inc., Expiration May 2016, Exercise Price $60 | | | 83 | | | | 182,808 | |
| Starwood Hotels & Resorts Worldwide, Inc., Expiration May 2016, Exercise Price $67.5 | | | 284 | | | | 433,810 | |
| HTZ, Expiration June 2016, Exercise Price $9 | | | 5,618 | | | | 500,002 | |
| Humana Inc, Expiration May 2016, Exercise Price $170 | | | 148 | | | | 148,740 | |
| Humana Inc, Expiration May 2016, Exercise Price $175 | | | 125 | | | | 76,250 | |
| Huntsman Corp, Expiration May 2016, Exercise Price $10 | | | 447 | | | | 252,555 | |
| MAR, Expiration June 2016, Exercise Price $70 | | | 77 | | | | 17,710 | |
| MGM, Expiration June 2016, Exercise Price $19 | | | 2,390 | | | | 651,275 | |
| NRF, Expiration June 2016, Exercise Price $14 | | | 1,180 | | | | 41,300 | |
| Pfizer Inc, Expiration June 2016, Exercise Price $30 | | | 356 | | | | 97,188 | |
| SIRI, Expiration June 2016, Exercise Price $4 | | | 937 | | | | 6,559 | |
| T-Mobile Inc, Expiration May 2016, Exercise Price $36 | | | 1,297 | | | | 450,708 | |
| WRITTEN CALL OPTIONS - (Premiums Received - $5,732,588) | | | | | | | 6,206,860 | |
| | | | | | | | | |
| WRITTEN PUT OPTIONS - (0.1)% | | | | | | | | |
| BAY, Expiration June 2016, Exercise Price $98 | | | 196 | | | | 81,468 | |
| iShares iBoxx High Yield, Expiration June 2016, Exercise Price $71 | | | 288 | | | | 2,160 | |
| iShares iBoxx High Yield, Expiration June 2016, Exercise Price $72 | | | 520 | | | | 3,900 | |
| SPY, Expiration May 2016, Exercise Price $196 | | | 715 | | | | 38,610 | |
| SPY, Expiration June 2016, Exercise Price $194 | | | 420 | | | | 89,880 | |
| VIVENDI, Expiration June 2016, Exercise Price $17 | | | 1,259 | | | | 131,187 | |
| TOTAL WRITTEN PUT OPTIONS - (Premiums Received - $475,993) | | | | | | | 347,205 | |
| | | | | | | | | |
| | | Shares | | | | | |
| SECURITIES SOLD SHORT * - (28.8)% | | | | | | | | |
| Abbott Laboratories | | | 14,073 | | | | 547,440 | |
| Aetna, Inc. | | | 7,700 | | | | 864,479 | |
| Alibaba Group Holding Ltd. - ADR | | | 115,210 | | | | 8,864,257 | |
| American Airlines Group, Inc. | | | 5,300 | | | | 183,857 | |
| Apollo Commercial Real Estate Finance, Inc. | | | 53,000 | | | | 844,290 | |
| AT&T, Inc. | | | 34,900 | | | | 1,354,818 | |
| Charter Communications, Inc. | | | 33,213 | | | | 7,049,127 | |
| Dow Chemical Co. | | | 135,689 | | | | 7,138,598 | |
| Energy Transfer Equity LP | | | 50,028 | | | | 621,848 | |
| Global Payments, Inc. | | | 96 | | | | 6,929 | |
| IHS, Inc. | | | 3,490 | | | | 429,898 | |
| Interval Leisure Group, Inc. | | | 61,124 | | | | 863,071 | |
| Johnson Controls, Inc. | | | 216,713 | | | | 8,971,918 | |
| KeyCorp | | | 276,525 | | | | 3,398,492 | |
| Lam Research Corp. | | | 68,671 | | | | 5,246,464 | |
| Liberty Global Plc LiLAC | | | 0 | + | | | 17 | |
| Live Nation Entertainment, Inc. | | | 44,007 | | | | 945,270 | |
| Marriott International, Inc. | | | 75,031 | | | | 5,258,923 | |
| Microchip Technology, Inc. | | | 5 | | | | 243 | |
| Newell Brands, Inc. | | | 41,404 | | | | 1,885,538 | |
| Nexstar Broadcasting Group, Inc. | | | 13,409 | | | | 688,284 | |
| Pfizer, Inc. | | | 18,260 | | | | 597,285 | |
| Shire PLC | | | 27,649 | | | | 5,181,976 | |
| Sirius XM Holdings, Inc. | | | 1,866,964 | | | | 7,374,508 | |
| VMware, Inc. | | | 17,329 | | | | 986,193 | |
| Waste Connections, Inc. | | | 15,256 | | | | 1,026,424 | |
| Western Digital Corp. | | | 12,984 | | | | 530,591 | |
| Western Refining, Inc. | | | 32,668 | | | | 874,196 | |
| TOTAL SECURITIES SOLD SHORT - (Proceeds - $67,286,631) | | | | | | | 71,734,934 | |
See accompanying notes to financial statements.
SCHEDULE OF INVESTMENTS (Unaudited)
Dunham Monthly Distribution Fund (Continued)
April 30, 2016
| | | Unrealized | |
| | | Appreciation/ | |
| LONG EQUITY SWAP CONTRACTS - 0.7% | | (Depreciation) | |
| Allergan PLC Equity Swap, Bank of America - January 22, 2018 | | $ | (470,844 | ) |
| to receive total return of Allergan PLC less USD- 3 Month LIBOR plus 0.72% | | | | |
| (NOTIONAL AMOUNT $1,810,500) | | | | |
| | | | | |
| American International Group Equity Swap, JP Morgan - April 12, 2017 | | | 327,118 | |
| to receive total return of American International Group less USD- 3 Month LIBOR plus 0.69% | | | | |
| (NOTIONAL AMOUNT $7,257,831) | | | | |
| | | | | |
| Apollo Residential Mortgage Equity Swap, JP Morgan - January 21, 2017 | | | 194,684 | |
| to receive total return of Apollo Residential Mortgage less USD- 3 Month LIBOR plus 0.79% | | | | |
| (NOTIONAL AMOUNT $1,297,393) | | | | |
| | | | | |
| Apollo Residential Mortgage Equity Swap, JP Morgan - April 27, 2016 | | | (35,652 | ) |
| to receive total return of Apollo Residential Mortgage less USD- 3 Month LIBOR plus 0.79% | | | | |
| (NOTIONAL AMOUNT $265,089) | | | | |
| | | | | |
| Asciano Group Equity Swap, JP Morgan - August 21, 2016 | | | 181,104 | |
| to receive total return of Asciano Group less USD- 3 Month LIBOR plus 0.74% | | | | |
| (NOTIONAL AMOUNT $2,550,984) | | | | |
| | | | | |
| AT&T, Inc. Equity Swap, JP Morgan - July 27, 2016 | | | 287,940 | |
| to receive total return of AT&T, Inc. less USD- 3 Month LIBOR plus 0.66% | | | | |
| (NOTIONAL AMOUNT $1,084,643) | | | | |
| | | | | |
| Charter Communication CL Equity Swap, JP Morgan - August 26, 2016 | | | (199,467 | ) |
| to receive total return of Charter Communication CL less USD- 3 Month LIBOR plus 0.97% | | | | |
| (NOTIONAL AMOUNT $1,412,070) | | | | |
| | | | | |
| CYS Investments, Inc. Equity Swap, JP Morgan - May 06, 2016 | | | (215,379 | ) |
| to receive total return of CYS Investments, Inc. less USD- 3 Month LIBOR plus 0.79% | | | | |
| (NOTIONAL AMOUNT $2,421,547) | | | | |
| | | | | |
| Dow Chemical Co. Equity Swap, JP Morgan - February 03, 2017 | | | 362,196 | |
| to receive total return of Dow Chemical Co less USD- 3 Month LIBOR plus 0.64% | | | | |
| (NOTIONAL AMOUNT $2,911,902) | | | | |
| | | | | |
| Eaton Vance Floating Rate, Inc. Equity Swap, JP Morgan - January 04, 2017 | | | 11,728 | |
| to receive total return of Eaton Vance Floating Rate, Inc. less USD- 3 Month LIBOR plus 1.14% | | | | |
| (NOTIONAL AMOUNT $195,346) | | | | |
| | | | | |
| Eaton Vance Floating Rate, Inc. Equity Swap, JP Morgan - December 21, 2016 | | | 159,725 | |
| to receive total return of Eaton Vance Floating Rate, Inc. less USD- 3 Month LIBOR plus 1.14% | | | | |
| (NOTIONAL AMOUNT $2,820,261) | | | | |
| | | | | |
| Equity Commonwealth Equity Swap, JP Morgan - March 16, 2017 | | | 48,522 | |
| to receive total return of Equity Commonwealth less USD- 3 Month LIBOR plus 0.79% | | | | |
| (NOTIONAL AMOUNT $1,942,162) | | | | |
| | | | | |
| First Trust Four Corners Senior Floating Rate Equity Swap, JP Morgan - December 21, 2016 | | | 2,092 | |
| to receive total return of First Trust Four Corners Senior Floating Rate less USD- 3 Month LIBOR plus 1.03% | | | | |
| (NOTIONAL AMOUNT $45,325) | | | | |
| | | | | |
| First Trust Four Corners Senior Floating Rate Equity Swap, JP Morgan - December 30, 2016 | | | 32,610 | |
| to receive total return of First Trust Four Corners Senior Floating Rate less USD- 3 Month LIBOR plus 1.03% | | | | |
| (NOTIONAL AMOUNT $688,241) | | | | |
| | | | | |
| First Trust Four Corners Senior Floating Rate Equity Swap, JP Morgan - January 04, 2017 | | | 15,243 | |
| to receive total return of First Trust Four Corners Senior Floating Rate less USD- 3 Month LIBOR plus 1.03% | | | | |
| (NOTIONAL AMOUNT $312,869) | | | | |
| | | | | |
| General Motors Co. Equity Swap, JP Morgan - December 14, 2016 | | | (669,111 | ) |
| to receive total return of General Motors Co. less USD- 3 Month LIBOR plus 0.69% | | | | |
| (NOTIONAL AMOUNT $6,423,540) | | | | |
| | | | | |
| Huntsman Corp. Equity Swap, JP Morgan - April 12, 2017 | | | 119,857 | |
| to receive total return of Huntsman Corp. less USD- 3 Month LIBOR plus 0.69% | | | | |
| (NOTIONAL AMOUNT $584,226) | | | | |
See accompanying notes to financial statements.
SCHEDULE OF INVESTMENTS (Unaudited)
Dunham Monthly Distribution Fund (Continued)
April 30, 2016
| | | Unrealized | |
| | | Appreciation/ | |
| LONG EQUITY SWAP CONTRACTS (Continued) - 0.7% | | (Depreciation) | |
| Meda AB - February 15, 2017 | | $ | 190,806 | |
| to receive total return of Meda AB Fund less USD- 3 Month LIBOR plus 1.14% | | | | |
| (NOTIONAL AMOUNT $3,073,722) | | | | |
| | | | | |
| Rexam PLC - April 11, 2017 | | | 7,724 | |
| to receive total return of Rexam PLC less USD- 3 Month LIBOR plus 0.53% | | | | |
| (NOTIONAL AMOUNT $233,804) | | | | |
| | | | | |
| Sabmiller PLC Equity Swap, Bank of America - December 09, 2016 | | | 140,236 | |
| to receive total return of Sabmiller PLC less USD- 3 Month LIBOR plus 0.75% | | | | |
| (NOTIONAL AMOUNT $7,812,447) | | | | |
| | | | | |
| Syngenta AG - February 15, 2017 | | | 25,727 | |
| to receive total return of Syngenta AG less USD- 3 Month LIBOR plus 0.74% | | | | |
| (NOTIONAL AMOUNT $1,720,145) | | | | |
| | | | | |
| T-Mobile US, Inc. Equity Swap, JP Morgan - April 28, 2017 | | | (48,094 | ) |
| to receive total return of T-Mobile US, Inc. less USD- 3 Month LIBOR plus 0.69% | | | | |
| (NOTIONAL AMOUNT $4,546,047) | | | | |
| | | | | |
| TNT, Inc. Equity Swap, JP Morgan - August 13, 2016 | | | 55,243 | |
| to receive total return of TNT, Inc. less USD- 3 Month LIBOR plus 0.73% | | | | |
| (NOTIONAL AMOUNT $619,599) | | | | |
| | | | | |
| Time Warner Cable, Inc. Equity Swap, JP Morgan - March 17, 2016 | | | 334,187 | |
| to receive total return of Time Warner Cable, Inc. less USD- 3 Month LIBOR plus 0.63% | | | | |
| (NOTIONAL AMOUNT $2,643,040) | | | | |
| | | | | |
| Time Warner Cable, Inc. Equity Swap, JP Morgan - March 18, 2017 | | | 811,104 | |
| to receive total return of Time Warner Cable, Inc. less USD- 3 Month LIBOR plus 0.63% | | | | |
| (NOTIONAL AMOUNT $9,285,332) | | | | |
| | | | | |
| Vivendi Equity Swap, JP Morgan - July 01, 2016 | | | (2,324 | ) |
| to receive total return of Vivendi less USD- 3 Month LIBOR plus 0.74% | | | | |
| (NOTIONAL AMOUNT $969) | | | | |
| | | | | |
| Voya Prime Rate Equity Swap, JP Morgan - December 21, 2016 | | | (1,065,282 | ) |
| to receive total return of Voya Prime Rate less USD- 3 Month LIBOR plus 0.64% | | | | |
| (NOTIONAL AMOUNT $804,134) | | | | |
| | | | | |
| Voya Prime Rate Equity Swap, JP Morgan - December 21, 2016 | | | 1,073,999 | |
| to receive total return of Voya Prime Rate less USD- 3 Month LIBOR plus 0.64% | | | | |
| (NOTIONAL AMOUNT $160,173) | | | | |
| TOTAL LONG EQUITY SWAP CONTRACTS | | | 1,675,692 | |
| | | | | |
| SHORT EQUITY SWAP CONTRACTS- (0.1)% | | | | |
| Ball Corp. - April 11, 2017 | | | 459 | |
| to pay total return of Ball Corp. less USD- 3 Month LIBOR plus 0.74% | | | | |
| (NOTIONAL AMOUNT $86,686) | | | | |
See accompanying notes to financial statements.
SCHEDULE OF INVESTMENTS (Unaudited)
Dunham Monthly Distribution Fund (Continued)
April 30, 2016
| | | Unrealized | |
| | | Appreciation/ | |
| SHORT EQUITY SWAP CONTRACTS- (0.1)% (Continued) | | (Depreciation) | |
| Mylan NV - February 17, 2017 | | $ | (563 | ) |
| to pay total return of Mylan NV Fund less USD- 3 Month LIBOR plus 1.14% | | | | |
| (NOTIONAL AMOUNT $359,884) | | | | |
| | | | | |
| Shire PLC. Equity Swap, JP Morgan - February 01, 2017 | | | (119,692 | ) |
| to pay total return of Shire PLC. less USD- 3 Month LIBOR plus 0.64% | | | | |
| (NOTIONAL AMOUNT $698,065) | | | | |
| | | | | |
| TOTAL SHORT EQUITY SWAP CONTRACTS | | | (119,796 | ) |
| | | | | |
| TOTAL EQUITY SWAP CONTRACTS | | $ | 1,555,896 | |
| Portfolio Composition * - (Unaudited) |
| Consumer, Non-cyclical | | | 18.5 | % | | Financial | | | 11.1 | % |
| Communications | | | 12.8 | % | | Technology | | | 9.5 | % |
| Basic Materials | | | 12.5 | % | | Industrial | | | 6.8 | % |
| Consumer, Cyclical | | | 12.5 | % | | Collateral For Securities Loaned | | | 3.6 | % |
| Short-Term Investment | | | 11.3 | % | | Energy | | | 1.4 | % |
| | | | | | | Total | | | 100.0 | % |
| * | Based on total value of investments as of April 30, 2016. |
Percentage may differ from Schedule of Investments which is based on Fund net assets.
See accompanying notes to financial statements.
Dunham Corporate/Government Bond Fund
Message from the Sub-Adviser (Newfleet Asset Management, LLC)
Investment-grade bonds, as measured by the Barclays Aggregate Bond Index, gained 2.8 percent in the six-month period ended April 30, 2016 after a 0.1 percent decrease during the previous fiscal six-month period. Treasuries in the middle of the yield curve, as measured by the BofA ML Treasuries 5-7 Years Index, ended the fiscal six-month period up 2.8 percent as well, while long-term Treasuries, as measured by the BofA ML Treasuries 10+ Years Index, saw an increase of 6.4 percent over the same six months. Corporate bonds, as measured by the BofA ML U.S. Corporate Bond Master Index, outpaced intermediate-term Treasury bonds, rising 4.2 percent over the fiscal six-month period. High-yield bonds, as measured by the BofA ML High-Yield Bond Cash Pay Index, gained 2.3 percent, underperforming the intermediate-term Treasury bonds by 0.5 percent during the period.
The Fund continued to balance risk versus reward by choosing to emphasize lower duration bonds and overweighting lower credit quality securities, in anticipation of rising interest rates which did not materialize. The Fund began the six-month period with an average effective duration of 4.81 years and ended the period with an average effective duration of 4.85 years, while the benchmark index had an average effective duration of 5.64 years and 5.51 years, respectively. This allocation generally detracted from performance of the Fund as Treasury yields fluctuated in a relatively wide range of 68 basis points. The 10-year Treasury yield went from a high of 2.34 percent in early November to a low of 1.66 percent in mid-February, before settling at 1.83 percent to end the fiscal six-month period. The overweight to residential mortgage-backed securities was the single largest contributor to performance over the six-month period. The Sub-Adviser maintained an overweight to the sector, investing over six percent of the Fund in such securities while the index held less than one percent.
A contributors to the Fund during the first half of the fiscal six-month period included Bayview Financial Acquisition Trust 6.078% due 2/28/2041 (07325NCS9) (holding percentage*: 1.14 percent), a mortgage investment firm focused on investments in mortgage credit, including whole loans, mortgage and asset-backed securities, servicing rights, and mortgage-related equities. The residential mortgage-backed security did well, returning 0.5 percent through January 31, 2016. This was due to the high quality rating of AAA/A2, strong fixed coupo n of 6 percent, and limited global macro correlation of non-agency residential mortgage securities. A contributor to the Fund during the second half of the fiscal six-month period included Hess Corporation 5.600% due 2/15/2041 (42809HAD9) (holding percentage*: 0.21 percent), a global independent energy company engaged in the exploration and production of crude oil and natural gas. The rally in oil prices since 1/31/2016 through the end of the fiscal quarter significantly benefited the company. From the time the Sub-Adviser bought the bonds on 3/8/2016 through the end of the fiscal six-month period, the bonds returned 13.9 percent.
A detractor from the Fund during the first half of the fiscal six-month period included Scientific International, Inc. 6.625% due 5/15/2021 (80874YAQ3) (holding percentage*: 0.08 percent), develops and services lottery games and wagering systems. The company reported weaker than expected top line and EBITDA results in the third quarter due to weaker than expected gaming machine sales as a result of challenging industry conditions and a lengthening slot machine replacement cycle. Combined with high leverage, this led to the underperformance of the subordinated notes, which reside at the bottom of the company’s capital structure. The bonds declined 29.3 percent by January 31, 2016. A detractor from the Fund during the second half of the fiscal six-month period was York Risk Services Holding Corp. 8.500% due 10/1/2022 (68276KAA7) (holding percentage**: 0.09 percent), a company that administers workers compensation claims and tries to reduce associated healthcare costs. Following weak full-year 2015 earnings, York continued to underperform. The company is struggling to grow organically and has been unable to produce meaningful cash flows. The bonds are not followed by many investors, meaning that bond price moves tend to be large. The bonds declined 14.4 percent in the second half of the fiscal period through 4/5/2016, at which time the Sub-Adviser sold the bonds.
The Sub-Adviser continued to heavily underweight government bonds which detracted from performance relative to the benchmark, despite a positive impact from security selection, as Treasuries rose over the fiscal six-month period.
The Fund’s investment-grade corporate bond holdings generally hindered performance. The slight underperformance of investment-grade corporate bonds in the Fund relative to the benchmark was primarily due to a lower duration bias. Considering the Fund was overweight the sector relative to the benchmark, this detracted from performance for the fiscal six-month period.
The Sub-Adviser believes that we will continue to experience the same challenges that have been at the forefront for the past year or longer, including global economic concerns and oil prices. The Sub-Adviser expects that GDP growth in the U.S. will be adequate to support corporate America and believes that two subsequent interest rate increases are likely in 2016, although the timing of each remains uncertain. The Sub-Adviser expects interest rates on the 10-year U.S. Treasury to be in the range of 1.75 percent to 2.50 percent by the end of the year. The Sub-Adviser continues to believe it is important to stay diversified and granular, keeping small positions and maintaining liquidity. The Sub-Adviser has reduced its below-investment-grade and oil exposure and upgraded to more conservative industries, although it does not expect default levels, ex-energy, to increase too much. The Sub-Adviser believes that the prospect of continued volatility in the bond market will present opportunities and feels they are positioned well to take advantage of those opportunities as they arise.
| * | Holdings Percentage(s) as of 4/30/2016. |
| ** | Holdings Percentage(s) as of the date prior to the sales of the security. |
Growth of $100,000 Investment - (Unaudited)
Total Returns as of April 30, 2016
| | | | Annualized | Annualized | Annualized | Annualized Since Inception |
| | Six Months | One Year | Three Years | Five Years | Ten Years | (12/10/04) |
| Class N | 1.79% | 0.86% | 1.28% | 3.07% | 4.73% | 4.23% |
| Class C | 1.43% | 0.11% | 0.52% | 2.30% | 3.95% | 3.46% |
| Class A with load of 4.50% | (2.93)% | (3.96)% | (0.54)% | 1.87% | N/A | 3.64%* |
| Class A without load | 1.66% | 0.54% | 1.01% | 2.81% | N/A | 4.15%* |
| Barclays Aggregate Bond Index | 2.82% | 2.72% | 2.29% | 3.60% | 4.95% | 4.72% |
| Morningstar Intermediate-Term Bond Category | 2.33% | 1.60% | 1.72% | 3.34% | 4.38% | 3.95% |
| * | Class A commenced operations on January 3, 2007. |
The Barclays Aggregate Bond Index is an unmanaged index which represents the U.S. investment-grade fixed-rate bond market (including government and corporate securities, mortgage pass-through securities and asset-backed securities). Investors cannot invest directly in an index or benchmark.
The Morningstar Intermediate-Term Bond Category is generally representative of intermediate-term bond mutual funds that primarily invest in corporate and other investment-grade U.S. fixed-income securities and typically have durations of 3.5 to 6.0 years.
As disclosed in the Trust’s latest registration statement, the Fund’s total annual operating expenses, including underlying funds, are 1.06% for Class N, 1.81% for Class C and 1.31% for Class A. Class A shares are subject to a sales load of 4.50% and a deferred sales charge of up to 0.75%. The performance data quoted here represents past performance, which is not indicative of future results. Current performance may be lower or higher than the performance data quoted. The investment return and NAV will fluctuate, so that an investor’s shares, when redeemed, may be worth more or less than their original cost. Total returns are calculated assuming reinvestment of all dividends and capital gains distributions, if any. The returns do not reflect the deductions of taxes a shareholder would pay on the redemption of fund shares or fund distributions. For performance information current to the most recent month-end, please call 1-800-442-4358 or visit our website www.dunham.com.
| SCHEDULE OF INVESTMENTS (Unaudited) |
| Dunham Corporate/Government Bond Fund |
| April 30, 2016 |
| | | Principal | | | Interest | | | Maturity | | | |
| Security | | Amount | | | Rate | | | Date | | Value | |
| CORPORATE BONDS & NOTES - 57.5% | | | | | | | | | | | | | | |
| AEROSPACE / DEFENSE - 0.2% | | | | | | | | | | | | | | |
| TransDigm, Inc. | | $ | 75,000 | | | | 6.000 | % | | 7/15/2022 | | $ | 76,290 | |
| TransDigm, Inc. | | | 35,000 | | | | 6.500 | | | 5/15/2025 | | | 35,306 | |
| | | | | | | | | | | | | | 111,596 | |
| AIRLINES ABS - 0.6% | | | | | | | | | | | | | | |
| Air Canada 2013-1 Class B Pass Through Trust - 144A | | | 96,907 | | | | 5.375 | | | 5/15/2021 | | | 96,815 | |
| Continental Airlines 2009-2 Class A Pass Through Trust | | | 216,156 | | | | 7.250 | | | 11/10/2019 | | | 244,526 | |
| | | | | | | | | | | | | | 341,341 | |
| AUTO MANUFACTURERS - 0.9% | | | | | | | | | | | | | | |
| Ford Motor Credit Co. LLC. | | | 270,000 | | | | 5.750 | | | 2/1/2021 | | | 308,078 | |
| General Motors Financial Co., Inc. | | | 105,000 | | | | 3.500 | | | 7/10/2019 | | | 108,658 | |
| General Motors Financial Co., Inc. | | | 60,000 | | | | 4.200 | | | 3/1/2021 | | | 63,299 | |
| | | | | | | | | | | | | | 480,035 | |
| AUTO PARTS & EQUIPMENT - 0.8% | | | | | | | | | | | | | | |
| Delphi Automotive PLC | | | 105,000 | | | | 3.150 | | | 11/19/2020 | | | 107,066 | |
| Meritor, Inc. | | | 160,000 | | | | 6.750 | | | 6/15/2021 | | | 152,000 | |
| MPG Holdco I, Inc. ^ | | | 105,000 | | | | 7.375 | | | 10/15/2022 | | | 105,525 | |
| TI Group Automotive Systems, LLC - 144A | | | 60,000 | | | | 8.750 | | | 7/15/2023 | | | 59,100 | |
| | | | | | | | | | | | | | 423,691 | |
| AUTOMOBILE ABS - 2.9% | | | | | | | | | | | | | | |
| California Republic Auto Receivables Trust 2014-3 A4 | | | 390,000 | | | | 1.790 | | | 3/16/2020 | | | 390,783 | |
| Capital Auto Receivables Asset Trust / Ally 2013-1 C | | | 590,000 | | | | 1.740 | | | 10/22/2018 | | | 590,675 | |
| Drive Auto Receivables Trust 2015-D - 144A | | | 165,000 | | | | 3.380 | | | 11/15/2021 | | | 164,280 | |
| Flagship Credit Auto Trust 2016-1 A - 144A | | | 168,736 | | | | 2.770 | | | 12/15/2020 | | | 169,469 | |
| Ford Credit Auto Owner Trust 2013-B D | | | 194,000 | | | | 1.820 | | | 11/15/2019 | | | 193,956 | |
| | | | | | | | | | | | | | 1,509,163 | |
| BANKS - 8.8% | | | | | | | | | | | | | | |
| Banco de Credito del Peru - 144A | | | 120,000 | | | | 6.125 | + | | 4/24/2027 | | | 130,440 | |
| Banco de Credito e Inversiones - 144A | | | 325,000 | | | | 4.000 | | | 2/11/2023 | | | 337,823 | |
| Banco Internacional del Peru SAA -144A | | | 200,000 | | | | 6.625 | + | | 3/19/2029 | | | 209,000 | |
| Banco Santander Chile - 144A | | | 150,000 | | | | 3.875 | | | 9/20/2022 | | | 157,712 | |
| Bank of America Corp. | | | 55,000 | | | | 2.000 | | | 1/11/2018 | | | 55,278 | |
| Bank of America Corp. | | | 175,000 | | | | 5.625 | | | 7/1/2020 | | | 196,838 | |
| Bank of America Corp. ^ | | | 285,000 | | | | 4.450 | | | 3/3/2026 | | | 295,492 | |
| Bank of New York Mellon | | | 135,000 | | | | 2.800 | | | 5/4/2026 | | | 136,165 | |
| Bank of New York Mellon | | | 110,000 | | | | 4.950 | + | | Perpetual | | | 109,978 | |
| Barclays Bank PLC - 144A | | | 270,000 | | | | 6.050 | | | 12/4/2017 | | | 286,063 | |
| Capital One Financial Corp. | | | 135,000 | | | | 4.200 | | | 10/29/2025 | | | 138,244 | |
| Citigroup, Inc. | | | 130,000 | | | | 4.050 | | | 7/30/2022 | | | 136,271 | |
| Citigroup, Inc. | | | 160,000 | | | | 6.250 | + | | Perpetual | | | 164,800 | |
| Citizens Financial Group, Inc. - 144A | | | 110,000 | | | | 5.500 | + | | Perpetual | | | 105,325 | |
| Goldman Sachs Group, Inc. | | | 185,000 | | | | 5.750 | + | | 1/24/2022 | | | 213,178 | |
| Goldman Sachs Group, Inc. | | | 75,000 | | | | 5.700 | + | | Perpetual | | | 73,125 | |
| JPMorgan Chase & Co. | | | 40,000 | | | | 6.125 | | | 6/27/2017 | | | 42,139 | |
| JPMorgan Chase & Co. | | | 35,000 | | | | 5.300 | + | | Perpetual | | | 35,087 | |
| Macquarie Bank Ltd. - 144A | | | 17,000 | | | | 6.625 | | | 4/7/2021 | | | 19,361 | |
| Morgan Stanley | | | 185,000 | | | | 4.100 | | | 5/22/2023 | | | 191,564 | |
| Morgan Stanley | | | 150,000 | | | | 4.350 | | | 9/8/2026 | | | 155,321 | |
| Morgan Stanley | | | 225,000 | | | | 6.375 | | | 7/24/2042 | | | 298,384 | |
| PNC Financial Services Group, Inc. | | | 255,000 | | | | 4.850 | + | | Perpetual | | | 244,800 | |
| SunTrust Banks, Inc. | | | 30,000 | | | | 5.625 | + | | Perpetual | | | 29,775 | |
| UBS AG | | | 650,000 | | | | 7.625 | | | 8/17/2022 | | | 749,265 | |
| Zions Bancorporation | | | 115,000 | | | | 4.500 | | | 6/13/2023 | | | 116,500 | |
| | | | | | | | | | | | | | 4,627,928 | |
| BEVERAGES - 0.4% | | | | | | | | | | | | | | |
| Anheuser-Busch InBev Finance, Inc. | | | 65,000 | | | | 3.3000 | | | 2/1/2023 | | | 67,803 | |
| Anheuser-Busch InBev Finance, Inc. | | | 135,000 | | | | 3.6500 | | | 2/1/2026 | | | 142,474 | |
| Constellation Brands, Inc. | | | 25,000 | | | | 4.7500 | | | 12/1/2025 | | | 26,656 | |
| | | | | | | | | | | | | | 236,933 | |
| BIOTECHNOLOGY - 0.0% | | | | | | | | | | | | | | |
| Concordia Healthcare Corp. - 144A | | | 5,000 | | | | 7.000 | | | 4/15/2023 | | | 4,662 | |
See accompanying notes to financial statements.
| SCHEDULE OF INVESTMENTS (Unaudited) |
| Dunham Corporate/Government Bond Fund (Continued) |
| April 30, 2016 |
| | | Principal | | | Interest | | | Maturity | | | |
| Security | | Amount | | | Rate | | | Date | | Value | |
| BUILDING MATERIALS - 0.3% | | | | | | | | | | | | | | |
| Masco Corp. | | $ | 50,000 | | | | 3.500 | % | | 4/1/2021 | | $ | 51,000 | |
| Masco Corp. | | | 60,000 | | | | 5.950 | | | 3/15/2022 | | | 67,425 | |
| Masco Corp. | | | 25,000 | | | | 4.450 | | | 4/1/2025 | | | 26,219 | |
| | | | | | | | | | | | | | 144,644 | |
| CHEMICALS - 0.8% | | | | | | | | | | | | | | |
| Methanex Corp. | | | 130,000 | | | | 4.250 | | | 12/1/2024 | | | 111,813 | |
| New Market Corp. | | | 305,000 | | | | 4.100 | | | 12/15/2022 | | | 309,964 | |
| | | | | | | | | | | | | | 421,777 | |
| COMMERCIAL MBS - 5.8% | | | | | | | | | | | | | | |
| Aventura Mall Trust 2013-AVM A - 144A | | | 155,000 | | | | 3.743 | + | | 12/5/2032 | | | 166,713 | |
| Aventura Mall Trust 2013-AVM C - 144A | | | 100,000 | | | | 3.743 | + | | 12/5/2032 | | | 103,982 | |
| CD 2007-CD4 Commercial Mortgage Trust | | | 103,690 | | | | 5.322 | | | 12/11/2049 | | | 105,460 | |
| Citigroup Commercial Mortgage Trust 2007-C6 A4 | | | 290,000 | | | | 5.711 | + | | 12/10/2049 | | | 300,674 | |
| Citigroup Commercial Mortgage Trust 2008-C7 AM | | | 95,000 | | | | 6.140 | + | | 12/10/2049 | | | 97,743 | |
| DBUBS 2011-LC3 Mortgage Trust -LC3A Class D - 144A | | | 105,000 | | | | 5.468 | + | | 8/10/2044 | | | 108,223 | |
| FREMF 2015-K720 Mortgage Trust - 144A | | | 115,000 | | | | 3.389 | + | | 7/25/2022 | | | 107,624 | |
| GAHR Commercial Mortgage Trust 2015-NRF CFX - 144A | | | 105,000 | | | | 3.382 | + | | 12/15/2019 | | | 105,185 | |
| JP Morgan Chase Commercial Mortgage Securities Trust 2007-LDP12 A4 | | | 470,000 | | | | 5.882 | + | | 2/15/2051 | | | 484,444 | |
| JP Morgan Chase Commercial Mortgage Securities Trust 2011-C4 A3 - 144A | | | 98,709 | | | | 4.106 | | | 7/15/2046 | | | 103,047 | |
| JP Morgan Chase Commercial Mortgage Securities Trust 2011-C4 A4 - 144A | | | 100,000 | | | | 4.388 | | | 7/15/2046 | | | 109,096 | |
| LB Commercial Mortgage Trust 2007- C3 A4 | | | 107,922 | | | | 5.923 | + | | 7/15/2044 | | | 112,698 | |
| LB-UBS Commercial Mortgage Trust 2007-C7 A3 | | | 62,414 | | | | 5.866 | + | | 9/15/2045 | | | 65,721 | |
| Morgan Stanley Bank of America Merrill Lynch Trust 2013-C13 AS | | | 240,000 | | | | 4.266 | | | 11/15/2046 | | | 264,408 | |
| Morgan Stanley Bank of America Merrill Lynch Trust 2015-C26 C | | | 135,000 | | | | 4.411 | + | | 10/15/2048 | | | 134,186 | |
| Morgan Stanley Capital I Trust 2007-IQ14 AM | | | 224,000 | | | | 5.681 | + | | 4/15/2049 | | | 223,419 | |
| Motel 6 Trust CMO 2015-MTL6 Class B - 144A | | | 170,000 | | | | 3.298 | | | 2/5/2030 | | | 171,084 | |
| Wells Fargo Commercial Mortgage Trust 2015-LC20 B | | | 165,000 | | | | 3.719 | | | 4/15/2050 | | | 168,714 | |
| WFRBS Commercial Mortgage Trust 2011-C5 - 144A | | | 100,000 | | | | 5.654 | + | | 11/15/2044 | | | 108,518 | |
| | | | | | | | | | | | | | 3,040,939 | |
| COMMERCIAL SERVICES - 1.4% | | | | | | | | | | | | | | |
| ADT Corp. | | | 100,000 | | | | 6.250 | | | 10/15/2021 | | | 103,952 | |
| Ahern Rentals, Inc.- 144A | | | 115,000 | | | | 7.375 | | | 5/15/2023 | | | 88,262 | |
| Harland Clarke Holdings Corp. - 144A | | | 70,000 | | | | 6.875 | | | 3/1/2020 | | | 64,050 | |
| New York University | | | 55,000 | | | | 4.142 | | | 7/1/2048 | | | 54,226 | |
| Prime Security Services Borrower LLC / Prime Finance, Inc. - 144A | | | 55,000 | | | | 9.250 | | | 5/15/2023 | | | 57,338 | |
| S&P Global, Inc. | | | 140,000 | | | | 4.000 | | | 6/15/2025 | | | 148,557 | |
| Team Health, Inc. - 144A | | | 5,000 | | | | 7.250 | | | 12/15/2023 | | | 5,322 | |
| United Rentals North America, Inc. | | | 55,000 | | | | 5.500 | | | 7/15/2025 | | | 54,902 | |
| Verisk Analytics, Inc. | | | 135,000 | | | | 4.000 | | | 6/15/2025 | | | 138,410 | |
| | | | | | | | | | | | | | 715,019 | |
| COMPUTERS - 0.5% | | | | | | | | | | | | | | |
| Apple, Inc. | | | 45,000 | | | | 2.850 | | | 2/23/2023 | | | 46,471 | |
| Apple, Inc. | | | 125,000 | | | | 3.250 | | | 2/23/2026 | | | 130,932 | |
| Hewlett Packard Enterprise Co. - 144A ^ | | | 80,000 | | | | 4.900 | | | 10/15/2025 | | | 83,186 | |
| Western Digital Corp. - 144A | | | 15,000 | | | | 7.375 | | | 4/1/2023 | | | 15,178 | |
| | | | | | | | | | | | | | 275,767 | |
| DIVERSIFIED FINANCIAL SERVICES - 0.8% | | | | | | | | | | | | | | |
| Air Lease Corp. | | | 140,000 | | | | 2.625 | | | 9/4/2018 | | | 139,141 | |
| Ally Financial, Inc. ^ | | | 70,000 | | | | 3.250 | | | 11/5/2018 | | | 70,000 | |
| Jefferies Group LLC | | | 60,000 | | | | 6.875 | | | 4/15/2021 | | | 67,304 | |
| Macquarie Group Ltd.- 144A | | | 125,000 | | | | 6.250 | | | 1/14/2021 | | | 142,427 | |
| | | | | | | | | | | | | | 418,872 | |
| ELECTRIC - 1.2% | | | | | | | | | | | | | | |
| Calpine Corp. | | | 89,000 | | | | 5.375 | | | 1/15/2023 | | | 90,224 | |
| Dynegy, Inc. | | | 145,000 | | | | 7.375 | | | 11/1/2022 | | | 143,953 | |
| Electricite de France SA - 144A | | | 165,000 | | | | 5.250 | + | | Perpetual | | | 159,662 | |
| NRG Yield Operating LLC | | | 40,000 | | | | 5.375 | | | 8/15/2024 | | | 37,800 | |
| Southern Power Co. | | | 170,000 | | | | 4.150 | | | 12/1/2025 | | | 177,939 | |
| | | | | | | | | | | | | | 609,578 | |
| ELECTRONICS - 0.3% | | | | | | | | | | | | | | |
| Flextronics International Ltd. | | | 135,000 | | | | 4.750 | | | 6/15/2025 | | | 135,338 | |
See accompanying notes to financial statements.
| SCHEDULE OF INVESTMENTS (Unaudited) |
| Dunham Corporate/Government Bond Fund (Continued) |
| April 30, 2016 |
| | | Principal | | | Interest | | | Maturity | | | |
| Security | | Amount | | | Rate | | | Date | | Value | |
| ENERGY - ALTERNATE RESOURCES - 0.2% | | | | | | | | | | | | | | |
| TerraForm Power Operating LLC. - 144A | | $ | 110,000 | | | | 5.875 | % | | 2/1/2023 | | $ | 96,525 | |
| | | | | | | | | | | | | | | |
| ENTERTAINMENT - 0.7% | | | | | | | | | | | | | | |
| Churchill Downs, Inc. - 144A | | | 35,000 | | | | 5.375 | | | 12/15/2021 | | | 36,137 | |
| GLP Capital LP / GLP Financing II Inc. | | | 50,000 | | | | 4.875 | | | 11/1/2020 | | | 53,000 | |
| GLP Capital LP / GLP Financing II Inc. | | | 5,000 | | | | 4.375 | | | 4/15/2021 | | | 5,125 | |
| GLP Capital LP / GLP Financing II Inc. | | | 10,000 | | | | 5.375 | | | 11/1/2023 | | | 10,463 | |
| GLP Capital LP / GLP Financing II Inc. | | | 15,000 | | | | 5.375 | | | 4/15/2026 | | | 15,675 | |
| Penn National Gaming Inc. ^ | | | 120,000 | | | | 5.875 | | | 11/1/2021 | | | 123,300 | |
| Pinnacle Entertainment, Inc. - 144A | | | 80,000 | | | | 5.625 | | | 5/1/2024 | | | 80,100 | |
| Scientific Games International, Inc. | | | 65,000 | | | | 6.625 | | | 5/15/2021 | | | 41,438 | |
| | | | | | | | | | | | | | 365,238 | |
| FOOD - 0.4% | | | | | | | | | | | | | | |
| Safeway, Inc. | | | 85,000 | | | | 7.250 | | | 2/1/2031 | | | 83,513 | |
| Whole Foods Market, Inc. - 144A | | | 110,000 | | | | 5.200 | | | 12/3/2025 | | | 116,062 | |
| | | | | | | | | | | | | | 199,575 | |
| GAS - 0.2% | | | | | | | | | | | | | | |
| NGL Energy Partners LP | | | 105,000 | | | | 5.125 | | | 7/15/2019 | | | 88,725 | |
| | | | | | | | | | | | | | | |
| HEALTHCARE PRODUCTS - 0.5% | | | | | | | | | | | | | | |
| Alere, Inc. - 144A | | | 40,000 | | | | 6.375 | | | 7/1/2023 | | | 41,000 | |
| Crimson Merger Sub, Inc. - 144A | | | 80,000 | | | | 6.625 | | | 5/15/2022 | | | 67,200 | |
| Fresenius US Finance II, Inc. - 144A | | | 25,000 | | | | 4.500 | | | 1/15/2023 | | | 25,750 | |
| Kinetic Concepts, Inc. / KCI USA, Inc. - 144A | | | 10,000 | | | | 7.875 | | | 2/15/2021 | | | 10,838 | |
| Mallinckrodt International Finance SA -144A | | | 115,000 | | | | 5.625 | | | 10/15/2023 | | | 108,388 | |
| | | | | | | | | | | | | | 253,176 | |
| HEALTHCARE - SERVICES - 1.6% | | | | | | | | | | | | | | |
| Acadia Healthcare Co., Inc. | | | 45,000 | | | | 5.125 | | | 7/1/2022 | | | 45,844 | |
| Acadia Healthcare Co., Inc. | | | 10,000 | | | | 5.625 | | | 2/15/2023 | | | 10,275 | |
| Centene Escrow Corp. - 144A | | | 50,000 | | | | 5.625 | | | 2/15/2021 | | | 52,750 | |
| CHS/Community Health Systems, Inc. | | | 30,000 | | | | 5.125 | | | 8/1/2021 | | | 30,237 | |
| HCA, Inc. | | | 170,000 | | | | 5.375 | | | 2/1/2025 | | | 174,038 | |
| HCA, Inc. | | | 50,000 | | | | 5.250 | | | 6/15/2026 | | | 52,063 | |
| IASIS Healthcare LLC / IASIS Capital Corp. | | | 70,000 | | | | 8.375 | | | 5/15/2019 | | | 67,200 | |
| MEDNAX, Inc. - 144A | | | 65,000 | | | | 5.250 | | | 12/1/2023 | | | 67,437 | |
| Surgery Center Holdings, Inc. - 144A | | | 80,000 | | | | 8.875 | | | 4/15/2021 | | | 80,200 | |
| Surgical Care Affiliates, Inc. - 144A | | | 110,000 | | | | 6.000 | | | 4/1/2023 | | | 111,650 | |
| Tenet Healthcare Corp. - 144A | | | 130,000 | | | | 4.134 | + | | 6/15/2020 | | | 130,812 | |
| | | | | | | | | | | | | | 822,506 | |
| HOLDING COMPANIES - DIVERSIFIED - 0.8% | | | | | | | | | | | | | | |
| Argos Merger Sub, Inc. - 144A ^ | | | 100,000 | | | | 7.125 | | | 3/15/2023 | | | 102,500 | |
| Hutchison Whampoa International 12 Ltd. - 144A | | | 185,000 | | | | 6.000 | + | | Perpetual | | | 191,938 | |
| Leucadia National Corp. | | | 105,000 | | | | 5.500 | | | 10/18/2023 | | | 103,900 | |
| | | | | | | | | | | | | | 398,338 | |
| HOME BUILDERS - 0.9% | | | | | | | | | | | | | | |
| M/I Homes, Inc. - 144A | | | 70,000 | | | | 6.750 | | | 1/15/2021 | | | 70,350 | |
| MDC Holdings, Inc. | | | 130,000 | | | | 5.500 | | | 1/15/2024 | | | 126,750 | |
| Toll Brothers Finance Corp. | | | 155,000 | | | | 4.875 | | | 11/15/2025 | | | 156,550 | |
| TRI Pointe Holdings, Inc. | | | 110,000 | | | | 5.875 | | | 6/15/2024 | | | 111,100 | |
| | | | | | | | | | | | | | 464,750 | |
| HOME EQUITY ABS - 2.0% | | | | | | | | | | | | | | |
| Bayview Financial Mortgage Pass-Through Trust 2006-A 1A4 (a) | | | 560,000 | | | | 6.087 | | | 2/28/2041 | | | 598,657 | |
| GSAA Trust 2005-1 AF4 (a) | | | 304,051 | | | | 5.619 | | | 11/25/2034 | | | 315,740 | |
| NovaStar Mortgage Funding Trust Series 2004-4 | | | 140,000 | | | | 2.171 | + | | 3/25/2035 | | | 136,414 | |
| | | | | | | | | | | | | | 1,050,811 | |
| HOUSEWARES - 0.1% | | | | | | | | | | | | | | |
| Newell Brands, Inc. - 144A | | | 15,000 | | | | 5.000 | | | 11/15/2023 | | | 15,903 | |
| Newell Brands, Inc. | | | 15,000 | | | | 4.200 | | | 4/1/2026 | | | 15,866 | |
| Newell Brands, Inc. | | | 40,000 | | | | 5.500 | | | 4/1/2046 | | | 44,604 | |
| | | | | | | | | | | | | | 76,373 | |
See accompanying notes to financial statements.
| SCHEDULE OF INVESTMENTS (Unaudited) |
| Dunham Corporate/Government Bond Fund (Continued) |
| April 30, 2016 |
| | | Principal | | | Interest | | | Maturity | | | |
| Security | | Amount | | | Rate | | | Date | | Value | |
| INSURANCE - 1.8% | | | | | | | | | | | | | | |
| Allstate Corp. | | $ | 200,000 | | | | 5.750 | %, + | | 8/15/2053 | | $ | 206,125 | |
| Berkshire Hathaway, Inc. | | | 15,000 | | | | 2.750 | | | 3/15/2023 | | | 15,486 | |
| Berkshire Hathaway, Inc. | | | 30,000 | | | | 3.125 | | | 3/15/2026 | | | 31,280 | |
| Manulife Financial Corp. | | | 130,000 | | | | 4.150 | | | 3/4/2026 | | | 135,461 | |
| Prudential Financial, Inc. | | | 245,000 | | | | 5.625 | + | | 6/15/2043 | | | 255,662 | |
| Teachers Insurance & Annuity Association of America - 144A | | | 110,000 | | | | 4.375 | + | | 9/15/2054 | | | 105,374 | |
| Trinity Acquisition PLC | | | 10,000 | | | | 3.500 | | | 9/15/2021 | | | 10,216 | |
| Trinity Acquisition PLC | | | 50,000 | | | | 4.400 | | | 3/15/2026 | | | 51,102 | |
| Voya Financial, Inc. | | | 125,000 | | | | 5.650 | + | | 5/15/2053 | | | 117,219 | |
| | | | | | | | | | | | | | 927,925 | |
| INTERNET - 0.3% | | | | | | | | | | | | | | |
| Priceline Group, Inc. | | | 140,000 | | | | 3.650 | | | 3/15/2025 | | | 143,625 | |
| | | | | | | | | | | | | | | |
| INVESTMENT COMPANIES - 0.4% | | | | | | | | | | | | | | |
| Ares Capital Corp. | | | 18,000 | | | | 4.875 | | | 11/30/2018 | | | 18,598 | |
| Ares Capital Corp. | | | 49,000 | | | | 3.870 | | | 1/15/2020 | | | 50,148 | |
| FS Investment Corp. | | | 110,000 | | | | 4.250 | | | 1/15/2020 | | | 111,658 | |
| FS Investment Corp. | | | 40,000 | | | | 4.750 | | | 5/15/2022 | | | 39,580 | |
| | | | | | | | | | | | | | 219,984 | |
| IRON / STEEL - 0.5% | | | | | | | | | | | | | | |
| Carpenter Technology Corp. | | | 300,000 | | | | 4.450 | | | 3/1/2023 | | | 281,980 | |
| | | | | | | | | | | | | | | |
| LODGING - 0.7% | | | | | | | | | | | | | | |
| Boyd Gaming Corp. | | | 110,000 | | | | 9.000 | | | 7/1/2020 | | | 116,132 | |
| Boyd Gaming Corp. | | | 55,000 | | | | 6.875 | | | 5/15/2023 | | | 57,337 | |
| MGM Growth Properties Operating Partnerships LP - 144A | | | 15,000 | | | | 5.625 | | | 5/1/2024 | | | 15,675 | |
| Station Casinos LLC | | | 170,000 | | | | 7.500 | | | 3/1/2021 | | | 180,168 | |
| | | | | | | | | | | | | | 369,312 | |
| MEDIA - 1.0% | | | | | | | | | | | | | | |
| CCO Holdings LLC - 144A | | | 140,000 | | | | 5.125 | | | 5/1/2023 | | | 143,150 | |
| CCO Holdings LLC - 144A | | | 90,000 | | | | 5.750 | | | 2/15/2026 | | | 93,150 | |
| CCO Holdings LLC - 144A | | | 85,000 | | | | 5.500 | | | 5/1/2026 | | | 86,913 | |
| Cequel Communications Holdings I LLC / Cequel Capital Corp. - 144A | | | 105,000 | | | | 5.125 | | | 12/15/2021 | | | 99,487 | |
| Clear Channel Worldwide Holdings, Inc. | | | 115,000 | | | | 7.625 | | | 3/15/2020 | | | 107,166 | |
| | | | | | | | | | | | | | 529,866 | |
| MINING - 0.1% | | | | | | | | | | | | | | |
| Freeport-McMoran, Inc. | | | 70,000 | | | | 3.875 | | | 3/15/2023 | | | 58,975 | |
| | | | | | | | | | | | | | | |
| MISCELLANEOUS MANUFACTURING - 0.9% | | | | | | | | | | | | | | |
| Bombardier, Inc. - 144A | | | 105,000 | | | | 4.750 | | | 4/15/2019 | | | 98,175 | |
| General Electric Co. | | | 341,000 | | | | 5.000 | + | | Perpetual | | | 354,640 | |
| | | | | | | | | | | | | | 452,815 | |
| OIL & GAS - 2.3% | | | | | | | | | | | | | | |
| Anadarko Petroleum Corp. | | | 25,000 | | | | 4.850 | | | 3/15/2021 | | | 26,105 | |
| Anadarko Petroleum Corp. | | | 40,000 | | | | 5.550 | | | 3/15/2026 | | | 42,955 | |
| Anadarko Petroleum Corp. | | | 50,000 | | | | 6.600 | | | 3/15/2046 | | | 56,788 | |
| Antero Resources Corp. - 144A | | | 60,000 | | | | 5.625 | | | 6/1/2023 | | | 58,500 | |
| Carrizo Oil & Gas, Inc. | | | 120,000 | | | | 6.250 | | | 4/15/2023 | | | 115,800 | |
| Cimarex Energy Co. | | | 80,000 | | | | 4.375 | | | 6/1/2024 | | | 81,636 | |
| Concho Resources, Inc. | | | 55,000 | | | | 5.500 | | | 4/1/2023 | | | 55,688 | |
| ConocoPhillips Co. | | | 65,000 | | | | 4.950 | | | 3/15/2026 | | | 71,989 | |
| ConocoPhillips Co. ^ | | | 25,000 | | | | 5.950 | | | 3/15/2046 | | | 30,392 | |
| Continental Resources, Inc. ^ | | | 75,000 | | | | 5.000 | | | 9/15/2022 | | | 70,406 | |
| Continental Resources, Inc. | | | 45,000 | | | | 4.500 | | | 4/15/2023 | | | 40,416 | |
| Exxon Mobil Corp. | | | 35,000 | | | | 2.726 | | | 3/1/2023 | | | 35,852 | |
| Exxon Mobil Corp. | | | 70,000 | | | | 3.043 | | | 3/1/2026 | | | 72,589 | |
| Helmerich & Payne International Drilling Co. | | | 80,000 | | | | 4.650 | | | 3/15/2025 | | | 82,768 | |
| Hess Corp. | | | 110,000 | | | | 5.600 | | | 2/15/2041 | | | 108,380 | |
| Occidental Petroleum Corp. | | | 15,000 | | | | 3.400 | | | 4/15/2026 | | | 15,537 | |
| Range Resources Corp. | | | 90,000 | | | | 5.000 | | | 3/15/2023 | | | 83,475 | |
| Sunoco Finance Corp. - 144A | | | 155,000 | | | | 6.375 | | | 4/1/2023 | | | 158,100 | |
| | | | | | | | | | | | | | 1,207,376 | |
See accompanying notes to financial statements.
| SCHEDULE OF INVESTMENTS (Unaudited) |
| Dunham Corporate/Government Bond Fund (Continued) |
| April 30, 2016 |
| | | Principal | | | Interest | | | Maturity | | | |
| Security | | Amount | | | Rate | | | Date | | Value | |
| OIL & GAS SERVICES - 0.2% | | | | | | | | | | | | | | |
| Weatherford International Ltd. | | $ | 110,000 | | | | 9.625 | % | | 3/1/2019 | | $ | 116,050 | |
| | | | | | | | | | | | | | | |
| PACKAGING & CONTAINERS - 0.2% | | | | | | | | | | | | | | |
| Berry Plastics Corp. | | | 105,000 | | | | 5.125 | | | 7/15/2023 | | | 106,313 | |
| | | | | | | | | | | | | | | |
| PHARMACEUTICALS - 0.7% | | | | | | | | | | | | | | |
| AbbVie, Inc. ^ | | | 45,000 | | | | 3.600 | | | 5/14/2025 | | | 47,241 | |
| Capsugel SA - 144A (b) | | | 15,000 | | | | 7.000 | | | 5/15/2019 | | | 15,112 | |
| Endo Ltd. - 144A ^ | | | 80,000 | | | | 6.000 | | | 7/15/2023 | | | 78,900 | |
| JLL/Delta Dutch Pledge Co. BV - 144A (b) | | | 55,000 | | | | 8.750 | | | 5/1/2020 | | | 54,588 | |
| Mylan NV - 144A | | | 35,000 | | | | 3.000 | | | 12/15/2018 | | | 35,626 | |
| Owens & Minor, Inc. | | | 25,000 | | | | 3.875 | | | 9/15/2021 | | | 25,696 | |
| Quintiles Transnational Corp. - 144A | | | 55,000 | | | | 4.875 | | | 5/15/2023 | | | 56,581 | |
| Valeant Pharmaceuticals International, Inc. - 144A | | | 40,000 | | | | 5.500 | | | 3/1/2023 | | | 34,200 | |
| Zoetis, Inc. | | | 35,000 | | | | 3.450 | | | 11/13/2020 | | | 36,087 | |
| | | | | | | | | | | | | | 384,031 | |
| PIPELINES - 0.9% | | | | | | | | | | | | | | |
| Blue Racer Midstream LLC - 144A | | | 30,000 | | | | 6.125 | | | 11/15/2022 | | | 26,700 | |
| Kinder Morgan, Inc. ^ | | | 130,000 | | | | 4.300 | | | 6/1/2025 | | | 129,094 | |
| MPLX LP - 144A | | | 110,000 | | | | 4.875 | | | 12/1/2024 | | | 107,399 | |
| Sabine Pass Liquefaction LLC | | | 100,000 | | | | 6.250 | | | 3/15/2022 | | | 101,750 | |
| TransCanada Trust | | | 110,000 | | | | 5.625 | + | | 5/20/1975 | | | 99,000 | |
| | | | | | | | | | | | | | 463,943 | |
| PRIVATE EQUITY - 0.4% | | | | | �� | | | | | | | | | |
| Apollo Management Holdings LP - 144A | | | 135,000 | | | | 4.000 | | | 5/30/2024 | | | 136,574 | |
| Icahn Enterprises Finance Corp. | | | 10,000 | | | | 4.875 | | | 3/15/2019 | | | 9,975 | |
| Icahn Enterprises Finance Corp. | | | 45,000 | | | | 5.875 | | | 2/1/2022 | | | 43,144 | |
| | | | | | | | | | | | | | 189,693 | |
| REAL ESTATE - 1.3% | | | | | | | | | | | | | | |
| American Campus Communities Operating Partnership LP | | | 20,000 | | | | 3.350 | | | 10/1/2020 | | | 20,534 | |
| American Homes 4 Rent 2014-SFR2 C Trust - 144A | | | 130,000 | | | | 4.705 | | | 10/17/2036 | | | 136,356 | |
| American Homes 4 Rent 2015-SFR2 C Trust - 144A | | | 120,000 | | | | 4.691 | | | 10/17/2045 | | | 125,168 | |
| B2R Mortgage Trust 2015-1 A1 - 144A | | | 96,674 | | | | 2.524 | | | 5/15/2048 | | | 94,168 | |
| CWABS Asset-Backed Certificates 2005-1 AF5A (a) | | | 281,086 | | | | 5.147 | | | 7/25/2035 | | | 278,956 | |
| Sierra Timeshare 2014-2A A Receivables Funding LLC - 144A | | | 38,223 | | | | 2.050 | | | 6/20/2031 | | | 38,045 | |
| | | | | | | | | | | | | | 693,227 | |
| REITS - 4.6% | | | | | | | | | | | | | | |
| American Tower Corp. | | | 120,000 | | | | 3.300 | | | 2/15/2021 | | | 123,836 | |
| Brixmor Operating Partnership LP | | | 35,000 | | | | 3.875 | | | 8/15/2022 | | | 35,424 | |
| Corporate Office Properties LP | | | 90,000 | | | | 3.700 | | | 6/15/2021 | | | 89,785 | |
| Corporate Office Properties LP | | | 315,000 | | | | 3.600 | | | 5/15/2023 | | | 298,908 | |
| Corrections Corp of America | | | 90,000 | | | | 5.000 | | | 10/15/2022 | | | 94,387 | |
| Crown Castel International Corp. | | | 15,000 | | | | 3.700 | | | 6/15/2026 | | | 15,262 | |
| Digital Realty Trust LP | | | 160,000 | | | | 5.250 | | | 3/15/2021 | | | 176,580 | |
| Digital Realty Trust LP | | | 55,000 | | | | 3.950 | | | 7/1/2022 | | | 56,310 | |
| Education Realty Operating Partnership LP | | | 135,000 | | | | 4.600 | | | 12/1/2024 | | | 135,480 | |
| ESH Hospitality, Inc. - 144A | | | 100,000 | | | | 5.250 | | | 5/1/2025 | | | 99,125 | |
| Healthcare Realty Trust, Inc. | | | 90,000 | | | | 3.875 | | | 5/1/2025 | | | 87,976 | |
| Healthcare Trust of America Holdings LP | | | 50,000 | | | | 3.375 | | | 7/15/2021 | | | 50,206 | |
| Highwoods Realty LP | | | 150,000 | | | | 3.625 | | | 1/15/2023 | | | 150,002 | |
| iStar Financial, Inc. | | | 140,000 | | | | 5.000 | | | 7/1/2019 | | | 136,500 | |
| Kilroy Realty LP | | | 135,000 | | | | 4.375 | | | 10/1/2025 | | | 142,841 | |
| Kimco Realty Corp. | | | 135,000 | | | | 3.400 | | | 11/1/2022 | | | 138,396 | |
| MPT Operating Partnership LP / MPT Finance Corp. | | | 15,000 | | | | 6.375 | | | 3/1/2024 | | | 16,050 | |
| MPT Operating Partnership LP / MPT Finance Corp. | | | 60,000 | | | | 5.500 | | | 5/1/2024 | | | 60,900 | |
| National Retail Properties, Inc. | | | 40,000 | | | | 4.000 | | | 11/15/2025 | | | 41,534 | |
| Retail Opportunity Investments Partnership LP | | | 105,000 | | | | 4.000 | | | 12/15/2024 | | | 100,524 | |
| Select Income REIT | | | 140,000 | | | | 4.500 | | | 2/1/2025 | | | 135,419 | |
| Welltower, Inc. | | | 145,000 | | | | 4.000 | | | 6/1/2025 | | | 148,967 | |
| WP Carey, Inc. | | | 110,000 | | | | 4.600 | | | 4/1/2024 | | | 111,389 | |
| | | | | | | | | | | | | | 2,445,801 | |
See accompanying notes to financial statements.
| SCHEDULE OF INVESTMENTS (Unaudited) |
| Dunham Corporate/Government Bond Fund (Continued) |
| April 30, 2016 |
| | | Principal | | | Interest | | | Maturity | | | |
| Security | | Amount | | | Rate | | | Date | | Value | |
| RETAIL - 1.5% | | | | | | | | | | | | | | |
| AmeriGas Finance Corp. ^ | | $ | 95,000 | | | | 7.000 | % | | 5/20/2022 | | $ | 100,819 | |
| Landry’s, Inc. - 144A | | | 115,000 | | | | 9.375 | | | 5/1/2020 | | | 121,037 | |
| Party City Holdings, Inc. - 144A | | | 15,000 | | | | 6.125 | | | 8/15/2023 | | | 15,755 | |
| QVC, Inc. | | | 310,000 | | | | 4.375 | | | 3/15/2023 | | | 309,990 | |
| Rite Aid Corp. - 144A | | | 30,000 | | | | 6.125 | | | 4/1/2023 | | | 32,081 | |
| Signet UK Finance PLC | | | 135,000 | | | | 4.700 | | | 6/15/2024 | | | 133,236 | |
| Tops Holding LLC / Tops Markets II Corp. - 144A | | | 110,000 | | | | 8.000 | | | 6/15/2022 | | | 99,000 | |
| | | | | | | | | | | | | | 811,918 | |
| SEMICONDUCTOR - 0.3% | | | | | | | | | | | | | | |
| KLA-Tencor Corp. | | | 140,000 | | | | 4.650 | | | 11/1/2024 | | | 146,421 | |
| | | | | | | | | | | | | | | |
| SOFTWARE - 0.4% | | | | | | | | | | | | | | |
| Electronic Arts, Inc. | | | 20,000 | | | | 3.700 | | | 3/1/2021 | | | 20,933 | |
| Fidelity National Information Services, Inc. | | | 50,000 | | | | 3.625 | | | 10/15/2020 | | | 52,365 | |
| First Data Corp. - 144A | | | 155,000 | | | | 5.000 | | | 1/15/2024 | | | 157,131 | |
| | | | | | | | | | | | | | 230,429 | |
| TELECOMMUNICATIONS - 2.2% | | | | | | | | | | | | | | |
| AT&T, Inc. | | | 315,000 | | | | 3.875 | | | 8/15/2021 | | | 338,189 | |
| CenturyLink, Inc. | | | 95,000 | | | | 7.500 | | | 4/1/2024 | | | 95,475 | |
| Frontier Communications Corp. | | | 75,000 | | | | 6.250 | | | 9/15/2021 | | | 70,125 | |
| Frontier Communications Corp. - 144A | | | 15,000 | | | | 10.500 | | | 9/15/2022 | | | 15,489 | |
| Sprint Corp. | | | 170,000 | | | | 7.250 | | | 9/15/2021 | | | 138,125 | |
| Telefonica Emisiones SAU | | | 265,000 | | | | 4.570 | | | 4/27/2023 | | | 292,032 | |
| T-Mobile USA, Inc. | | | 100,000 | | | | 6.500 | | | 1/15/2026 | | | 106,375 | |
| Windstream Corp. | | | 115,000 | | | | 7.750 | | | 10/15/2020 | | | 104,591 | |
| | | | | | | | | | | | | | 1,160,401 | |
| TRUCKING & LEASING - 0.1% | | | | | | | | | | | | | | |
| Penske Truck Leasing Co. LP - 144A | | | 55,000 | | | | 3.375 | | | 2/1/2022 | | | 55,391 | |
| | | | | | | | | | | | | | | |
| WHOLE LOAN COLLATERAL CMO - 3.6% | | | | | | | | | | | | | | |
| Agate Bay Mortgage Trust 2016-2 A3 - 144A | | | 96,584 | | | | 3.500 | + | | 3/25/2046 | | | 98,590 | |
| Banc of America Funding 2005-1 1A1 | | | 65,660 | | | | 5.500 | | | 2/25/2035 | | | 65,897 | |
| Citigroup Mortgage Loan Trust, Inc. 2004-NCM2 2CB2 | | | 71,336 | | | | 6.750 | | | 8/25/2034 | | | 74,686 | |
| Citigroup Mortgage Loan Trust, Inc. 2004-UST1 A3 | | | 88,656 | | | | 2.413 | + | | 8/25/2034 | | | 88,562 | |
| CSMLT 2015-1 A9 - 144A | | | 91,030 | | | | 3.500 | + | | 5/25/2045 | | | 92,897 | |
| Freddie Mac Structured Agency Credit Risk Debt Notes | | | 250,000 | | | | 2.096 | + | | 4/25/2024 | | | 248,410 | |
| JP Morgan Mortgage Trust 2015-4 1A4 | | | 96,743 | | | | 3.500 | + | | 6/25/2045 | | | 98,751 | |
| MASTR Alternative Loans Trust 2004-4 6A1 | | | 88,552 | | | | 5.500 | | | 4/25/2034 | | | 92,008 | |
| Residential Asset Securitization Trust 2005-A1 | | | 116,867 | | | | 5.500 | | | 4/25/2035 | | | 116,930 | |
| Sequoia Mortgage trust 2015-1 A1 - 144A | | | 122,801 | | | | 3.500 | + | | 1/25/2045 | | | 124,833 | |
| Structured Adjustable Rate Mortgage Loan Trust 2004-4 3A2 | | | 163,947 | | | | 2.896 | + | | 4/25/2034 | | | 162,669 | |
| Towd Point Mortgage Trust 2015-3 A1B - 144A | | | 162,071 | | | | 3.000 | + | | 3/25/2054 | | | 163,906 | |
| WaMu Mortgage Pass-Through Certificates Series 2003-S8 A2 Trust | | | 66,015 | | | | 5.000 | | | 9/25/2018 | | | 66,810 | |
| WinWater Mortgage Loan Trust 2014-1 A1 - 144A | | | 66,884 | | | | 3.942 | + | | 6/20/2044 | | | 69,657 | |
| WinWater Mortgage Loan Trust 2014-3 A4 - 144A | | | 138,978 | | | | 3.500 | + | | 11/20/2044 | | | 142,245 | |
| WinWater Mortgage Loan Trust 2016-1 1A5 - 144A | | | 194,725 | | | | 3.500 | + | | 1/20/2046 | | | 201,108 | |
| | | | | | | | | | | | | | 1,907,959 | |
| | | | | | | | | | | | | | | |
| TOTAL CORPORATE BONDS & NOTES (Cost - $29,819,258) | | | | | | | | | | | | | 30,216,735 | |
| | | | | | | | | | | | | | | |
| FOREIGN GOVERNMENT BONDS - 0.8% | | | | | | | | | | | | | | |
| Argentine Republic Government International Bond - 144A | | | 150,000 | | | | 7.625 | | | 4/22/2046 | | | 147,900 | |
| El Salvador Government International Bond - 144A | | | 105,000 | | | | 6.375 | | | 1/18/2027 | | | 92,925 | |
| Hungary Government International Bond | | | 95,000 | | | | 6.375 | | | 3/29/2021 | | | 108,318 | |
| Poland Government International Bond | | | 85,000 | | | | 3.250 | | | 4/6/2026 | | | 85,111 | |
| TOTAL FOREIGN GOVERNMENT BONDS (Cost - $ 442,291) | | | | | | | | | | | | | 434,254 | |
| | | | | | | | | | | | | | | |
| MUNICIPAL - 1.8% | | | | | | | | | | | | | | |
| City of Chicago IL Wastewater Transmission Revenue | | | 25,000 | | | | 5.180 | | | 1/1/2027 | | | 26,443 | |
| Rockdale County Water & Sewerage Authority | | | 305,000 | | | | 3.060 | | | 7/1/2024 | | | 319,326 | |
| San Diego County Regional Airport Authority | | | 325,000 | | | | 5.594 | | | 7/1/2043 | | | 356,684 | |
| State of Texas | | | 245,000 | | | | 3.011 | | | 10/1/2026 | | | 252,277 | |
| TOTAL MUNICIPAL - (Cost - $900,000) | | | | | | | | | | | | | 954,730 | |
See accompanying notes to financial statements.
| SCHEDULE OF INVESTMENTS (Unaudited) |
| Dunham Corporate/Government Bond Fund (Continued) |
| April 30, 2016 |
| | | Principal | | | Interest | | | Maturity | | | |
| Security | | Amount | | | Rate | | | Date | | Value | |
| U.S. GOVERNMENT & AGENCY - 31.9% | | | | | | | | | | | | | | |
| U.S. GOVERNMENT AGENCY - 10.9% | | | | | | | | | | | | | | |
| Fannie Mae Pool 310041 | | $ | 124,362 | | | | 6.500 | % | | 5/1/2037 | | $ | 144,984 | |
| Fannie Mae Pool 735061 | | | 38,789 | | | | 6.000 | | | 11/1/2034 | | | 44,577 | |
| Fannie Mae Pool 866009 | | | 43,915 | | | | 6.000 | | | 3/1/2036 | | | 50,111 | |
| Fannie Mae Pool 909175 | | | 50,419 | | | | 5.500 | | | 4/1/2038 | | | 58,498 | |
| Fannie Mae Pool 909220 | | | 120,293 | | | | 6.000 | | | 8/1/2038 | | | 139,607 | |
| Fannie Mae Pool 938574 | | | 294,646 | | | | 5.500 | | | 9/1/2036 | | | 332,036 | |
| Fannie Mae Pool 962752 | | | 39,554 | | | | 5.000 | | | 4/1/2038 | | | 44,669 | |
| Fannie Mae Pool AA7001 | | | 231,067 | | | | 5.000 | | | 6/1/2039 | | | 257,954 | |
| Fannie Mae Pool AL3166 | | | 262,493 | | | | 3.000 | | | 3/1/2043 | | | 269,013 | |
| Fannie Mae Pool AS 5596 | | | 437,098 | | | | 3.500 | | | 8/1/2045 | | | 458,344 | |
| Fannie Mae Pool AS 5634 | | | 400,523 | | | | 3.000 | | | 8/1/2045 | | | 411,054 | |
| Fannie Mae Pool AS 5696 | | | 441,105 | | | | 3.500 | | | 8/1/2045 | | | 462,545 | |
| Fannie Mae Pool AS 6386 | | | 1,060,645 | | | | 3.000 | | | 12/1/2045 | | | 1,088,533 | |
| Fannie Mae Pool AS 7003 | | | 499,497 | | | | 3.000 | | | 4/1/2046 | | | 512,631 | |
| Fannie Mae Pool AX3195 | | | 462,242 | | | | 4.000 | | | 9/1/2044 | | | 493,854 | |
| Fannie Mae Pool MA 2495 | | | 529,726 | | | | 3.500 | | | 1/1/2046 | | | 555,475 | |
| Federal Home Loan Pool G01980 | | | 293,013 | | | | 5.000 | | | 12/1/2035 | | | 329,712 | |
| Freddie Mac Gold Pool G05888 | | | 64,648 | | | | 5.500 | | | 10/1/2039 | | | 72,833 | |
| | | | | | | | | | | | | | 5,726,430 | |
| U.S. TREASURY OBLIGATIONS - 21.0% | | | | | | | | | | | | | | |
| United States Treasury Bond | | | 1,195,000 | | | | 3.125 | | | 2/15/2043 | | | 1,313,473 | |
| United States Treasury Note | | | 1,660,000 | | | | 0.750 | | | 12/31/2017 | | | 1,660,389 | |
| United States Treasury Note | | | 2,515,000 | | | | 1.375 | | | 4/30/2020 | | | 2,536,908 | |
| United States Treasury Note | | | 3,205,000 | | | | 2.375 | | | 8/15/2024 | | | 3,366,814 | |
| United States Treasury Note | | | 665,000 | | | | 2.250 | | | 11/15/2024 | | | 691,626 | |
| United States Treasury Note | | | 380,000 | | | | 2.000 | | | 2/15/2025 | | | 387,185 | |
| United States Treasury Note ^ | | | 1,100,000 | | | | 1.625 | | | 2/15/2026 | | | 1,080,964 | |
| | | | | | | | | | | | | | 11,037,359 | |
| | | | | | | | | | | | | | | |
| TOTAL U.S. GOVERNMENT & AGENCY (Cost - $16,317,421) | | | | | | | | | | | | | 16,763,789 | |
| | | | | | | | | | | | | | | |
| BANK LOANS - 3.2% | | | | | | | | | | | | | | |
| AGRICULTURE - 0.1% | | | | | | | | | | | | | | |
| NVA Holdings, Inc. | | | 40,000 | | | | 7.000 | + | | 8/14/2022 | | | 39,133 | |
| | | | | | | | | | | | | | | |
| BIOTECHNOLOGY - 0.1% | | | | | | | | | | | | | | |
| Concordia Healthcare Corp. | | | 45,885 | | | | 4.250 | + | | 10/21/2021 | | | 45,587 | |
| | | | | | | | | | | | | | | |
| CHEMICALS - 0.1% | | | | | | | | | | | | | | |
| Ineos US Finance LLC | | | 6,930 | | | | 3.250 | + | | 3/11/2022 | | | 6,904 | |
| PolyOne Corp. | | | 33,915 | | | | 3.000 | + | | 11/11/2022 | | | 34,099 | |
| | | | | | | | | | | | | | 41,003 | |
| COMMERCIAL SERVICES - 0.2% | | | | | | | | | | | | | | |
| Laureate Education, Inc. | | | 59,380 | | | | 3.750 | + | | 6/15/2018 | | | 55,298 | |
| Sedgwick Claims Management Services, Inc. | | | 85,000 | | | | 5.750 | + | | 2/28/2022 | | | 81,175 | |
| | | | | | | | | | | | | | 136,473 | |
| ELECTRIC - 0.3% | | | | | | | | | | | | | | |
| NRG Energy, Inc. | | | 143,887 | | | | 2.000 | + | | 7/1/2018 | | | 143,785 | |
| | | | | | | | | | | | | | | |
| ENTERTAINMENT - 0.1% | | | | | | | | | | | | | | |
| CDS US Intermediate Holdings, Inc. | | | 28,855 | | | | 4.000 | + | | 7/8/2022 | | | 28,013 | |
| Eldorado Resorts, Inc. | | | 24,813 | | | | 3.250 | + | | 7/25/2022 | | | 24,843 | |
| | | | | | | | | | | | | | 52,856 | |
| FOOD - 0.3% | | | | | | | | | | | | | | |
| Albertsons LLC | | | 75,240 | | | | 4.500 | + | | 8/25/2021 | | | 75,625 | |
| Hostess Brands LLC | | | 110,000 | | | | 7.500 | + | | 8/3/2023 | | | 108,487 | |
| | | | | | | | | | | | | | 184,112 | |
See accompanying notes to financial statements.
| SCHEDULE OF INVESTMENTS (Unaudited) |
| Dunham Corporate/Government Bond Fund (Continued) |
| April 30, 2016 |
| | | Principal | | | Interest | | | Maturity | | | |
| Security | | Amount | | | Rate | | | Date | | Value | |
| HEALTHCARE - 0.8% | | | | | | | | | | | | | | |
| American Renal Holdings, Inc. | | $ | 39,000 | | | | 3.500 | %, + | | 8/20/2019 | | $ | 39,024 | |
| Ardent Legacy Acquisitions, Inc. | | | 55,720 | | | | 5.500 | + | | 8/4/2021 | | | 55,999 | |
| inVentiv Health, Inc. | | | 119,990 | | | | 6.250 | + | | 5/15/2018 | | | 120,515 | |
| Onex Schumacher Finance LP | | | 57,710 | | | | 4.000 | + | | 7/29/2022 | | | 57,590 | |
| Quorum Health Corp. | | | 61,000 | | | | 5.750 | + | | 4/12/2022 | | | 61,086 | |
| Regional Care Hospital, Inc. | | | 46,178 | | | | 6.000 | + | | 3/24/2019 | | | 46,264 | |
| Surgery Center | | | 68,274 | | | | 4.250 | + | | 11/3/2020 | | | 68,509 | |
| | | | | | | | | | | | | | 448,987 | |
| MISCELLANEOUS MANUFACTURING - 0.1% | | | | | | | | | | | | | | |
| US Farathane LLC | | | 55,350 | | | | 5.750 | + | | 12/23/2021 | | | 55,557 | |
| | | | | | | | | | | | | | | |
| OIL & GAS - 0.1% | | | | | | | | | | | | | | |
| Jonah Energy LLC | | | 62,000 | | | | 6.500 | + | | 5/12/2021 | | | 42,057 | |
| | | | | | | | | | | | | | | |
| PHARMACEUTICALS - 0.1% | | | | | | | | | | | | | | |
| Amneal Pharmaceuticals | | | 41,580 | | | | 3.500 | + | | 11/1/2019 | | | 41,597 | |
| | | | | | | | | | | | | | | |
| REAL ESTATE - 0.1% | | | | | | | | | | | | | | |
| Capital Automotive LP | | | 31,564 | | | | 5.000 | + | | 4/30/2020 | | | 31,781 | |
| | | | | | | | | | | | | | | |
| RETAIL - 0.5% | | | | | | | | | | | | | | |
| Chelsea Petroleum Products LLC | | | 66,720 | | | | 4.250 | + | | 10/28/2022 | | | 65,052 | |
| PetSmart | | | 14,888 | | | | 3.250 | + | | 3/11/2022 | | | 14,869 | |
| Staples, Inc. | | | 165,000 | | | | 4.000 | + | | 2/2/2022 | | | 165,722 | |
| | | | | | | | | | | | | | 245,643 | |
| SEMICONDUCTORS - 0.1% | | | | | | | | | | | | | | |
| MKS Instruments, Inc. | | | 22,000 | | | | 4.000 | + | | 4/19/2023 | | | 22,101 | |
| ON Semiconductor Corp. | | | 34,000 | | | | 4.500 | + | | 3/31/2023 | | | 34,206 | |
| | | | | | | | | | | | | | 56,307 | |
| SOFTWARE - 0.2% | | | | | | | | | | | | | | |
| First Data Corp. | | | 94,000 | | | | 3.750 | + | | 7/8/2022 | | | 94,200 | |
| | | | | | | | | | | | | | | |
| TOTAL BANK LOANS - (Cost - $1,678,740) | | | | | | | | | | | | | 1,659,078 | |
| | | | | | | | | | | | | | | |
| PREFERRED STOCK - 1.5% | | | | | | | | | | | | | | |
| BANKS - 1.5% | | | | | | | | | | | | | | |
| GMAC Capital Trust I | | | 17,600 | | | | 6.411 | + | | 2/15/2040 | | | 441,232 | |
| Zions Bancorporation | | | 10,800 | | | | 6.950 | + | | 9/15/2028 | | | 316,548 | |
| TOTAL PREFERRED STOCK - (Cost - $710,000) | | | | | | | | | | | | | 757,780 | |
| | | | | | | | | | | | | | | |
| SHORT-TERM INVESTMENT - 3.2% | | | | | | | | | | | | | | |
| MONEY MARKET FUND - 3.2% | | | | | | | | | | | | | | |
| Fidelity Institutional Money Market Funds - Government Portfolio + | | | | | | | | | | | | | | |
| (Cost - $1,681,431) | | | 1,681,431 | | | | 0.120 | + | | | | | 1,681,431 | |
| | | | | | | | | | | | | | | |
| COLLATERAL FOR SECURITIES LOANED - 4.5% | | | | | | | | | | | | | | |
| Mount Vernon Prime Portfolio + (Cost - $2,379,575) | | | 2,379,575 | | | | 0.510 | + | | | | | 2,379,575 | |
| | | | | | | | | | | | | | | |
| TOTAL INVESTMENTS - 104.4% (Cost - $53,928,716) | | | | | | | | | | | | $ | 54,847,372 | |
| LIABILITIES IN EXCESS OF OTHER ASSETS - (4.4)% | | | | | | | | | | | | | (2,325,674 | ) |
| NET ASSETS - 100.0% | | | | | | | | | | | | $ | 52,521,698 | |
ABS - Asset Backed Security
MBS - Mortgage Back Security
CMO - Collateralized Mortgage Obligation
REIT - Real Estate Investment Trust
Perpetual - Perpetual bonds are fixed income instruments without defined maturity dates
| ^ | All or a portion of these securities are on loan. Total loaned securities had a value of $2,333,746 at April 30, 2016. |
| + | Variable rate security. Interest rate is as of April 30, 2016. |
144A - Security exempt from registration under Rule 144A of the Securities Act of 1933. These securities may be sold in transactions exempt from registration, normally to qualified institutional buyers.
| (a) | Step-Up Bond; the interest rate shown is the rate in effect as of April 30, 2016. |
See accompanying notes to financial statements.
| SCHEDULE OF INVESTMENTS (Unaudited) |
| Dunham Corporate/Government Bond Fund (Continued) |
| April 30, 2016 |
| Portfolio Composition * - (Unaudited) |
| Corporate Bonds & Notes | | | 55.1 | % | | Municipal | | | 1.7 | % |
| U.S. Government & Agencies Notes & Bonds | | | 30.6 | % | | Preferred Stock | | | 1.4 | % |
| Short - Term Investments | | | 4.3 | % | | Foreign Government Bonds | | | 0.8 | % |
| Collateral For Securities Loaned | | | 3.1 | % | | Total | | | 100.0 | % |
| Bank Loans | | | 3.0 | % | | | | | | |
| * | Based on total value of investments as of April 30, 2016. |
Percentage may differ from Schedule of Investments which is based on Fund net assets.
See accompanying notes to financial statements.
Dunham Dynamic Macro Fund
Message from the Sub-Adviser (Mellon Capital Management Corporation)
Equity markets were up for the six-month period ended April 30, 2016 but taking a more introspective look would identify a V shaped trajectory to stocks. The downward leg of this path initially began in December after the Federal Reserve raised interest rates and started normalizing its policy, the European Central Bank (ECB) came to the market and disappointed with the delivery of its stimulus package, and the Chinese economy continued to show signs of weakness. This trend lingered through mid-February until the world’s major central banks took additional action. The Federal Reserve acknowledged some of the challenges presented by the global economy and reduced expectations in regards to future rate rises. The Bank of Japan (BOJ) transitioned to a negative interest rate policy and the ECB followed-up by expanding their stimulus package. April was also an eventful month. The BOJ unexpectedly made no changes to its stimulus despite slowing inflation and a strengthening Yen. The Federal Reserve also made no changes but its tone became more hawkish. Global macro strategies generally detracted throughout the beginning of the fiscal six-month period, but rebounded in March and April, resulting in a positive fiscal period. Global macro strategies, as measured by the IQ Hedge Global Macro Beta Index, increased 0.1 percent over the period ended April 30, 2016. Bonds, as measured by the Barclays Aggregate Bond Index, increased 2.8 percent. Global macro strategies underperformed the S&P 500 Index which increased 0.4 percent over the fiscal period. Most of the positive performance for the S&P 500 Index came in March, when it increased 6.8 percent.
The Sub-Adviser seeks to construct a balanced growth portfolio that aims to deliver equity-like total returns with less risk and improved downside control. It attempts to achieve this goal by utilizing a multi-asset strategy that allocates dynamically across global equities, bonds, and real assets. The current strategy’s exposure is broken down into three different categories: growth assets which include developed market equities, emerging market equities, high-yield bonds, and emerging market debt; hedging assets which include developed and emerging market currency, global cash, investment-grade bonds, and global developed and sovereign bonds; and real assets which include global commodities, global inflation-linked bonds, and inflation-sensitive derivatives.
Of the three strategy exposures, the strongest performer over the six-month period ended April 30, 2016 was the hedging strategy. The hedging assets exposure helped shield some of the volatility during the first three months of the six-month period, most notably the position to U.S. Treasuries. The Fund had approximately 45 percent allocated to U.S. Treasuries. The options strategy within this exposure also benefited the Fund, especially during the height of the downturn in mid January. As global bond yields fell, the Sub-Adviser decreased the allocation to global bonds. The allocation reached a low of approximately 6 percent during the final three months of the six-month period. Bonds retreated and the Sub-Adviser slowly increased the position, reaching an overall exposure of 32 percent by the end of April. Although the allocation to global bonds recently increased, the Sub-Adviser is selective within this space. Holdings that positively contributed to Fund performance over the fiscal period were long positions in U.S. Treasuries, a long position in Japanese bonds, and a long position in Australian bonds. The Fund also took a short position in Canadian bonds late in the fiscal period as Canadian bonds fell. Therefore, this position also positively contributed to Fund performance.
The growth asset strategy detracted from Fund performance over the six-month period. The volatility over the beginning of the six-month period significantly affected the growth asset strategy exposure. However, going into December the Sub-Adviser saw an increase in risk on the horizon, especially considering the fact that the ECB has historically exhibited its propensity to disappoint. On the first day of December the Sub-Adviser worked towards cutting risk in half over the entire Fund due to this concern, which somewhat shielded the Fund. With the uncertainty and volatility in growth assets rising over the final three months of the six-month period, the Sub-Adviser reduced and diversified the positions within growth assets. The Sub-Adviser increased the allocation to high yield bonds over the latest fiscal quarter as high-yield bonds have traditionally had a lower beta to the broad U.S. equity markets. The SPDR Barclays High Yield Bond ETF (JNK) (holding percentage*: 10.06 percent) fell 0.1 percent over the six-month period despite increasing 8.0 percent over the final three months of the period. A holding that positively contributed to Fund performance was the SPDR S&P 500 ETF Trust (SPY) (holding percentage*: 24.29 percent), which increased 0.3 percent. The exposure to Japanese stocks detracted from Fund performance. Over the fiscal quarter, the iShares Currency Hedged MSCI Japan ETF (HEWJ) (holding percentage*: 8.48 percent) fell 17.9 percent. Based on the risk present in emerging markets, the Fund had no direct exposure to emerging market equities and has not been invested in them since August 2015.
The Sub-Adviser completely divested the position in real assets during the fiscal year, as it believes the current risk/reward characteristics of this strategy do not currently warrant a place in the Fund. Although the Sub-Adviser believes that positions in commodities do not warrant an allocation due to its risk, certain attributes that this strategy generally provides are still desired within the Fund. The Sub-Adviser believes that commodities are currently too expensive; therefore in order to add a hedge against inflation, the Sub-Adviser added Treasury Inflation-Protected Securities to the portfolio. Over the most recent six-month period ended April 30, 2016, this allocation contributed positively to Fund performance. For example, the iShares TIPS ETF (TIP) (holding percentage*: 4.65 percent) increased 4.9 percent since the Fund purchased the holding on December 30, 2015. Due to the Fund’s dynamic nature, the Sub-Adviser’s view on real assets can change quickly.
The Sub-Adviser is optimistic for the coming fiscal quarter and the remainder of the fiscal year. The Sub-Adviser believes that this volatility-targeted strategy may provide investors with more consistent returns than traditional asset classes. It believes that through the flexibility of the strategy and the use of alternative investments, the Fund may provide what may be considered to be attractive returns with lower market-related risk and less correlation than traditional equity investments.
| * | Holdings Percentage(s) as of 4/30/2016. |
Growth of $100,000 Investment - (Unaudited)
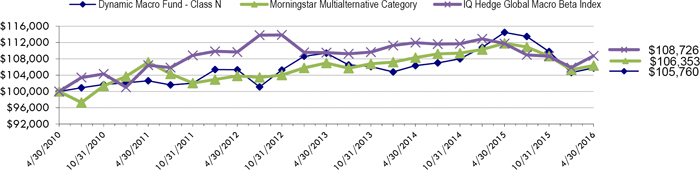
Total Returns as of April 30, 2016
| | | | Annualized | | Annualized Since |
| | Six | One | Three | Annualized | Inception |
| | Months | Year | Years | Five Years | (4/30/2010) |
| Class N | (3.77)% | (7.62)% | (1.12)% | 0.61% | 0.94% |
| Class C | (4.18)% | (8.56)% | (2.09)% | (0.40)% | (0.05)% |
| Class A with load of 5.75% | (9.32)% | (13.24)% | (3.33)% | (0.86)% | (0.32)% |
| Class A without load | (3.88)% | (7.90)% | (1.39)% | 0.32% | 0.67% |
| IQ Hedge Global Macro Beta Index | 0.09% | (2.70)% | (0.24)% | 0.43% | 1.53% |
| Morningstar Multialternative Category | (2.12)% | (4.87)% | (0.19)% | (0.15)% | 1.03% |
The IQ Hedge Global Macro Beta Index seeks to replicate the risk-adjusted return characteristics of a combination of hedge funds pursuing a macro strategy and hedge funds pursuing an emerging markets strategy. Investors cannot invest directly in an index or benchmark.
The Morningstar Multialternative Category is generally representative of mutual funds with static allocations to alternative strategies and asset classes. The gross short exposure in these mutual funds is generally greater than 20%.
As disclosed in the Trust’s latest registration statement, the Fund’s total annual operating expenses, including underlying funds, are 2.26% for Class N, 3.26% for Class C and 2.51% for Class A. Class A shares are subject to a sales load of 5.75% and a deferred sales charge of up to 0.75%. The performance data quoted here represents past performance, which is not indicative of future results. Current performance may be lower or higher than the performance data quoted. The investment return and NAV will fluctuate, so that an investor’s shares, when redeemed, may be worth more or less than their original cost. Total returns are calculated assuming reinvestment of all dividends and capital gains distributions, if any. The returns do not reflect the deductions of taxes a shareholder would pay on the redemption of fund shares or fund distributions. For performance information current to the most recent month-end, please call 1-800-442-4358 or visit our website www.dunham.com.
| SCHEDULE OF INVESTMENTS (Unaudited) |
| Dunham Dynamic Macro Fund |
| April 30, 2016 |
| Security | | | | | | | | Shares | | Value | |
| EXCHANGE TRADED FUNDS - 56.6% | | | | | | | | | | | | | | |
| DEBT FUND - 14.7% | | | | | | | | | | | | | | |
| iShares TIPS Bond ETF | | | | | | | | | | 14,721 | | $ | 1,691,148 | |
| SPDR Barclays High Yield Bond ETF | | | | | | | | | | 103,619 | | | 3,657,750 | |
| | | | | | | | | | | | | | 5,348,898 | |
| EQUITY FUNDS - 41.9% | | | | | | | | | | | | | | |
| iShares Currency Hedged MSCI Germany ETF | | | | | | | | | | 141,131 | | | 3,291,161 | |
| iShares Currency Hedged MSCI Japan ETF | | | | | | | | | | 129,527 | | | 3,084,038 | |
| SPDR S&P 500 ETF Trust | | | | | | | | | | 42,810 | | | 8,831,703 | |
| | | | | | | | | | | | | | 15,206,902 | |
| TOTAL EXCHANGE TRADED FUNDS (Cost - $19,840,579) | | | | | | | | | | | | | 20,555,800 | |
| | | | | | | | | | | | | | | |
| | | | | | | | | | | Contacts + | | | | |
| OPTIONS * - 7.6% | | | | | | | | | | | | | | |
| CALL OPTION ON FUTURES PURCHASED - 6.1% | | | | | | | | | | | | | | |
| Swiss Market IX, Expiration June 18, 2016 | | | | | | | | | | | | | | |
| Exercise Price CHF 7,619.75 | | | | | | | | | | 50 | | | 20,863 | |
| Swiss Market IX, Expiration June 18, 2016 | | | | | | | | | | | | | | |
| Exercise Price CHF 7,639.18 | | | | | | | | | | 30 | | | 12,046 | |
| Swiss Market IX, Expiration June 18, 2016 | | | | | | | | | | | | | | |
| Exercise Price CHF 7,759.00 | | | | | | | | | | 10 | | | 3,092 | |
| Swiss Market IX, Expiration June 18, 2016 | | | | | | | | | | | | | | |
| Exercise Price CHF 8,022.89 | | | | | | | | | | 60 | | | 8,641 | |
| US 10 Year Future, Expiration June 16, 2016 | | | | | | | | | | | | | | |
| Exercise Price $118 | | | | | | | | | | 181 | | | 2,183,312 | |
| | | | | | | | | | | | | | 2,227,954 | |
| PUT OPTIONS ON FUTURES PURCHASED - 1.5% | | | | | | | | | | | | | | |
| S&P 500 E-Mini Option, Expiration June 17, 2016 | | | | | | | | | | | | | | |
| Exercise Price $1,950 | | | | | | | | | | 141 | | | 111,038 | |
| Euro-Bund Option, Expiration June 16,2016 | | | | | | | | | | | | | | |
| Exercise Price $172 | | | | | | | | | | 37 | | | 428,865 | |
| | | | | | | | | | | | | | 539,903 | |
| | | | | | | | | | | | | | | |
| TOTAL OPTIONS (Cost - $2,609,259) | | | | | | | | | | | | | 2,767,857 | |
| | | | | | | | | | | | | | | |
| | | Principal | | | Discount | | | | | | | |
| | | Amount ($) | | | Rate | | | Maturity | | | | |
| SHORT-TERM INVESTMENTS - 37.3% | | | | | | | | | | | | | | |
| U.S. GOVERNMENT SECURITIES - 25.7% | | | | | | | | | | | | | | |
| US Treasury Bill ++ | | | 8,175,000 | | | | 0.2750 | % | | 5/26/2016 | | | 8,173,530 | |
| US Treasury Bill | | | 1,140,000 | | | | 0.2600 | % | | 6/23/2016 | | | 1,139,536 | |
| | | | | | | | | | | | | | 9,313,066 | |
| | | Shares | | | Interest Rate | | | | | | | |
| MONEY MARKET - 11.6% | | | | | | | | | | | | | | |
| STIT- Liquid Assets - Institutional Class | | | 4,223,743 | | | | 0.2600 | % ^^ | | | | | 4,223,743 | |
| | | | | | | | | | | | | | | |
| TOTAL SHORT-TERM INVESTMENTS - (Cost - $13,536,809) | | | | | | | | | | | | | 13,536,809 | |
| | | | | | | | | | | | | | | |
| TOTAL INVESTMENTS - 101.5% (Cost - $35,986,647) | | | | | | | | | | | | $ | 36,860,466 | |
| LIABILITIES IN EXCESS OF OTHER ASSETS - (1.5)% | | | | | | | | | | | | | (549,990 | ) |
| NET ASSETS - 100.0% | | | | | | | | | | | | $ | 36,310,476 | |
| | | | | | | | | | | | | | | |
| | | | | | | | | | | | | Unrealized | |
| | | | | | | | | | | | | Appreciation | |
| Open Futures Contracts | | | | | | | | | | Contracts | | (Depreciation) | |
| LONG FUTURES CONTRACTS ** - (1.0)% | | | | | | | | | | | | | | |
| 10 YR AUD Government Bond, June 2016 | | | | | | | | | | | | | | |
| (Underlying Face Amount at Value $416.533.908) | | | | | | | | | | 56 | | $ | 39,219 | |
| 10 YR Mini JBG Future, June 2016 | | | | | | | | | | | | | | |
| (Underlying Face Amount at Value $5,104,151) | | | | | | | | | | 36 | | | 13,331 | |
| CAC 40 10 Euro Future, May 2016 | | | | | | | | | | | | | | |
| (Underlying Face Amount at Value $751,492) | | | | | | | | | | 15 | | | (5,443 | ) |
| CAN 10 YR Bond Future, June 2016 | | | | | | | | | | | | | | |
| (Underlying Face Amount at Value $1,221,286) | | | | | | | | | | 11 | | | 5,201 | |
| FTSE/MIB Index Future, June 2016 | | | | | | | | | | | | | | |
| (Underlying Face Amount at Value $208,951) | | | | | | | | | | 2 | | | (529 | ) |
See accompanying notes to financial statements.
| SCHEDULE OF INVESTMENTS (Unaudited) |
| Dunham Dynamic Macro Fund (Continued) |
| April 30, 2016 |
| | | | | | Unrealized | |
| | | | | | Appreciation | |
| Open Futures Contracts | | Contracts | | | (Depreciation) | |
| LONG FUTURES CONTRACTS ** - (1.0)% (Continued) | | | | | | | | |
| Hang Seng Index Future, May 2016 | | | | | | | | |
| (Underlying Face Amount at Value $403,256) | | | 3 | | | $ | (5,006 | ) |
| IBEX - 35 Index Future, May 2016 | | | | | | | | |
| (Underlying Face Amount at Value $824,858) | | | 8 | | | | 36,425 | |
| Long Gilt Future, June 2016 | | | | | | | | |
| (Underlying Face Amount at Value $1,050,853) | | | 6 | | | | 843 | |
| S&P E-Mini Future, June 2016 | | | | | | | | |
| (Underlying Face Amount at Value $4,323,900) | | | 42 | | | | (31,286 | ) |
| SPI 200 Future, June 2016 | | | | | | | | |
| (Underlying Face Amount at Value $199,563) | | | 2 | | | | 4,050 | |
| TOPIX Index Future, June 2016 | | | | | | | | |
| (Underlying Face Amount at Value $372,055) | | | 3 | | | | (7,371 | ) |
| TOTAL FUTURES CONTRACTS PURCHASED | | | | | | | 49,434 | |
| | | | | | | | | |
| SHORT FUTURES CONTRACTS ** - (0.7)% | | | | | | | | |
| 10-Year US Treasury Note Future, June 2016 | | | | | | | | |
| (Underlying Face Amount at Value $5,591,203) | | | (6 | ) | | | (4,990 | ) |
| DAX Index Future, June 2016 | | | | | | | | |
| (Underlying Face Amount at Value $5,591,203) | | | (2 | ) | | | 20,886 | |
| Euro-Bund Future, June 2016 | | | | | | | | |
| (Underlying Face Amount at Value $8,838,369) | | | (45 | ) | | | 49,907 | |
| FTSE 100 Index, June 2016 | | | | | | | | |
| (Underlying Face Amount at Value $2,983,797) | | | (8 | ) | | | (5,895 | ) |
| S&P/TSX 60 IX Future, June 2016 | | | | | | | | |
| (Underlying Face Amount at Value $129,578) | | | (1 | ) | | | (1,324 | ) |
| TOTAL FUTURES CONTRACTS SOLD | | | | | | | 58,584 | |
| | | | | | | | | |
| WRITTEN PUT FUTURE OPTIONS - 0.1% | | | | | | | | |
| Swiss Market IX, Expiration June 18, 2016 | | | | | | | | |
| Exercise Price CHF 7,619.75 | | | (50 | ) | | | (5,270 | ) |
| Swiss Market IX, Expiration June 18, 2016 | | | | | | | | |
| Exercise Price CHF 7,639.18 | | | (30 | ) | | | (3,298 | ) |
| Swiss Market IX, Expiration June 18, 2016 | | | | | | | | |
| Exercise Price CHF 7,759 | | | (10 | ) | | | (1,428 | ) |
| Swiss Market IX, Expiration June 18, 2016 | | | | | | | | |
| Exercise Price CHF 8,022.89 | | | (60 | ) | | | (15,184 | ) |
| WRITTEN PUT FUTURE OPTIONS (Proceeds - $34,684) | | | | | | | (25,180 | ) |
ETF - Exchange Traded Fund
| * | Non income producing security. |
| + | Each option contract allows holder to purchase/sell 100 shares of the underlying security at the exercise price. |
| ++ | All or part of the security was held as collateral for futures outstanding as of April 30, 2016. |
| ^^ | Variable rate security. Interest rate is as of April 30, 2016. |
| ** | The amounts shown are the underlying reference notional amounts to stock exchange indices, debt securities and equities upon which the fair value of the futures contracts held by the Fund are based. Notional values do not represent the current fair value of, and are not necessarily indicative of the future cash flows futures contracts. Further, the underlying price changes in relation to the variables specified by the notional values affects the fair value of these derivative financial instruments. The notional values as set forth within this schedule do not purport to represent economic value at risk to the Fund. |
| Portfolio Composition * - (Unaudited) |
| Equity Funds | | | 41.3 | % | | Call Options On Futures Purchased | | | 6.0 | % |
| U.S. Government Securities | | | 25.3 | % | | Put Option On Futures Purchased | | | 1.4 | % |
| Debt Funds | | | 14.5 | % | | Total | | | 100.0 | % |
| Money Market Fund | | | 11.5 | % | | | | | | |
| * | Based on total value of investments as of April 30, 2016. |
Percentage may differ from Schedule of Investments which is based on Fund net assets.
See accompanying notes to financial statements.
Dunham High-Yield Bond Fund
Message from the Sub-Adviser (PENN Capital Management Company, Inc.)
High-yield bonds, as measured by the BofA ML High-Yield Bond Cash Pay Index, underperformed investment-grade corporate bonds, as measured by the BofA ML Corporate Master Index, and Treasury bonds, as measured by the BofA ML US Treasury Master Index over the six-months ended April 30, 2016. Interest rates decreased during the fiscal period, which benefitted longer duration bonds while shorter duration bonds suffered. During this fiscal period, corporate bonds increased 4.2 percent, Treasury bonds increased 2.6 percent, while high-yield bonds increased 2.3 percent.
Interest rates on 10-year Treasury bonds fluctuated within a 70 basis point range over the fiscal six-month period. The 10-year Treasury yield went from a high of 2.34 percent on November 11, 2015 to a low of 1.64 percent on February 11, 2016, before settling at 1.82 percent to end the fiscal six-month period. The Fund’s double-B focus benefited performance but the shorter duration bias detracted somewhat from performance in the six-month period ended April 30, 2016, as double-B rated bonds and longer duration credit generally outperformed. Currently, the Fund is focused on single-B and above rated debt and has no exposure to triple-C rated bonds as default rates on below investment-grade bonds are near historic lows and if they rise, bonds rated triple-C and lower could be adversely affected.
The Fund continued to maintain a shorter duration relative to the benchmark index, with a bias toward the intermediate segment of the credit curve that matures in three to seven years and historically has exhibited less volatility. The average duration of positions held by the Fund moved somewhat lower during the fiscal six-month period from 4.0 years at the beginning of the period to end at 3.7 years. Bonds in the benchmark index maintained a fairly steady duration, beginning the fiscal period at 4.4 years and ending at 4.3 years. Bonds that have a maturity of more than 10 years have generally been avoided by the Fund unless purchased at a significant discount to par.
Holdings in the media & broadcasting sector added value on a relative and absolute basis, due to both an overweight to the sector and security selection. Sinclair Television Group, Inc. (829259AQ3) (holding percentage*: 0.63 percent), a television broadcasting company that owns or provides various programming, operating or sales services to television stations, was one of the better performing bonds in this sector, achieving a 6.3 percent return in the six-month period ending April 30, 2016.
Exposure to the energy sector was generally a positive for the Fund, mainly due to outperformance in the latter part of the six-month period ended April 30, 2016. A 3 percent overweight to the energy distribution sector was of particular benefit, though security selection in that area lagged somewhat. No exposure to energy services firms detracted slightly from performance, however, the benchmark only has a 0.68 percent weighting to these types of energy companies. Energy exploration and production firms also negatively impacted performance due to security selection. Targa Resources Partners LP. (87612BAH5) (holding percentage*: 0.47 percent), a Houston, TX based midstream oil and natural gas pipeline partnership, was a good performer in the energy distribution segment. The bonds gained 5.3 percent over the fiscal six-month period.
Going forward, the Sub-Adviser expects moderate gross domestic product growth of between 2 to 3 percent and U.S. economic momentum to continue. The Sub-Adviser believes the U.S. is not heading into a recession and believes that the U.S. Federal Reserve will not raise interest rates four times this year, but will be more patient. The Sub-Adviser plans to continue to underweight international high-yield bonds as yields are exceedingly low, with some developed countries having negative interest rates on government bonds. The Fund plans to focus on middle tier, single-B quality with a tactical allocation to bank loans, convertibles, and lower quality. Any pull-back in the high-yield market due to interest rate volatility should be considered a buying opportunity.
| * | Holdings percentage(s) as of 4/30/2016. |
Growth of $100,000 Investment - (Unaudited)
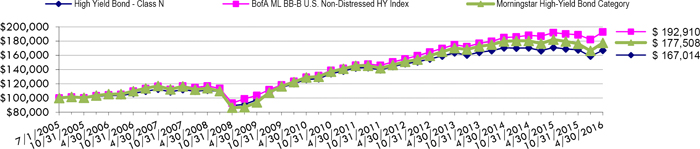
Total Returns as of April 30, 2016
| | | | Annualized | Annualized | Annualized | Annualized Since |
| | Six Months | One Year | Three Years | Five Years | Ten Years | Inception(7/1/05) |
| Class N | (0.38)% | (2.32)% | 0.71% | 3.26% | 4.89% | 4.85% |
| Class C | (0.63)% | (2.95)% | (0.03)% | 2.50% | 4.11% | 4.07% |
| Class A with load of 4.50% | (4.94)% | (7.00)% | (1.09)% | 2.08% | N/A | 4.24%* |
| Class A without load | (0.49)% | (2.65)% | 0.45% | 3.01% | N/A | 4.24%* |
| BofA ML BB-B U.S. Non-Distressed HY Index | 2.09% | 0.52% | 3.29% | 5.71% | 6.32% | 6.25% |
| Morningstar High-Yield Bond Category | 0.70% | (2.55)% | 1.39% | 4.07% | 5.33% | 5.44% |
| * | Class A commenced operations on January 3, 2007. |
BofA ML BB-B U.S. Non-Distressed HY Index is an unmanaged portfolio constructed to mirror the public high-yield corporate debt market and is a subset of the Merrill Lynch High Yield Master II Index. Investors cannot invest directly in an index or benchmark.
The Morningstar High-Yield Bond Category is generally representative of mutual funds that primarily invest in U.S. high-income debt securities where at least 65% or more of bond assets are not rated or are rated by a major agency such as Standard & Poor’s or Moody’s at the level of BB (considered speculative for taxable bonds) and below.
As disclosed in the Trust’s latest registration statement, the Fund’s total annual operating expenses, including the cost of underlying funds, are 1.02% for Class N, 1.77% for Class C and 1.27% for Class A. Class A shares are subject to a sales load of 4.50% and a deferred sales charge of up to 0.75%. The performance data quoted here represents past performance, which is not indicative of future results. Current performance may be lower or higher than the performance data quoted. The investment return and NAV will fluctuate, so that an investor’s shares, when redeemed, may be worth more or less than their original cost. Total returns are calculated assuming reinvestment of all dividends and capital gains distributions, if any. The returns do not reflect the deductions of taxes a shareholder would pay on the redemption of fund shares or fund distributions. For performance information current to the most recent month-end, please call 1-800-442-4358 or visit our website www.dunham.com
| SCHEDULE OF INVESTMENTS (Unaudited) |
| Dunham High-Yield Bond Fund |
| April 30, 2016 |
| | | Principal | | | Interest | | | Maturity | | | |
| Security | | Amount | | | Rate | | | Date | | Value | |
| BONDS & NOTES - 95.3% | | | | | | | | | | | | | | |
| AEROSPACE/DEFENSE - 0.5% | | | | | | | | | | | | | | |
| Triumph Group, Inc. | | $ | 520,000 | | | | 4.8750 | % | | 4/1/2021 | | $ | 496,600 | |
| | | | | | | | | | | | | | | |
| AIRLINES - 2.0% | | | | | | | | | | | | | | |
| Air Canada - 144A | | | 325,000 | | | | 8.7500 | | | 4/1/2020 | | | 349,781 | |
| Air Canada - 144A | | | 360,000 | | | | 7.7500 | | | 4/15/2021 | | | 375,300 | |
| American Airlines Group, Inc. - 144A | | | 535,000 | | | | 4.6250 | | | 3/1/2020 | | | 527,643 | |
| UAL 2007-1 Pass Through Trust | | | 577,598 | | | | 6.6360 | | | 7/2/2022 | | | 607,199 | |
| | | | | | | | | | | | | | 1,859,923 | |
| AUTO MANUFACTURERS - 0.6% | | | | | | | | | | | | | | |
| Fiat Chrysler Automobiles NV | | | 565,000 | | | | 5.2500 | | | 4/15/2023 | | | 573,498 | |
| | | | | | | | | | | | | | | |
| AUTO PARTS & EQUIPMENT - 0.4% | | | | | | | | | | | | | | |
| TI Group Automotive Systems LLC - 144A | | | 350,000 | | | | 8.7500 | | | 7/15/2023 | | | 344,750 | |
| | | | | | | | | | | | | | | |
| BANKS - 1.1% | | | | | | | | | | | | | | |
| CIT Group, Inc. ^ | | | 295,000 | | | | 5.3750 | | | 5/15/2020 | | | 310,118 | |
| Synovus Financial Corp. | | | 626,000 | | | | 7.8750 | | | 2/15/2019 | | | 697,207 | |
| | | | | | | | | | | | | | 1,007,325 | |
| BEVERAGES - 0.8% | | | | | | | | | | | | | | |
| Cott Beverages, Inc. | | | 445,000 | | | | 5.3750 | | | 7/1/2022 | | | 458,905 | |
| Cott Beverages, Inc. | | | 300,000 | | | | 6.7500 | | | 1/1/2020 | | | 315,374 | |
| | | | | | | | | | | | | | 774,279 | |
| BUILDING MATERIALS - 1.8% | | | | | | | | | | | | | | |
| Builders FirstSource, Inc. - 144A | | | 390,000 | | | | 7.6250 | | | 6/1/2021 | | | 412,424 | |
| Griffon Corp. | | | 525,000 | | | | 5.2500 | | | 3/1/2022 | | | 529,593 | |
| James Hardie International Finance Ltd - 144A | | | 500,000 | | | | 5.8750 | | | 2/15/2023 | | | 511,250 | |
| Masonite International Corp. - 144A^ | | | 265,000 | | | | 5.6250 | | | 3/15/2023 | | | 278,250 | |
| | | | | | | | | | | | | | 1,731,517 | |
| CHEMICALS - 0.6% | | | | | | | | | | | | | | |
| Blue Cube Spinco, Inc. - 144A | | | 350,000 | | | | 9.7500 | | | 10/15/2023 | | | 401,187 | |
| Blue Cube Spinco, Inc. - 144A^ | | | 180,000 | | | | 10.0000 | | | 10/15/2025 | | | 208,350 | |
| | | | | | | | | | | | | | 609,537 | |
| COMMERCIAL SERVICES - 5.6% | | | | | | | | | | | | | | |
| ADT Corp. | | | 160,000 | | | | 3.5000 | | | 7/15/2022 | | | 147,600 | |
| ADT Corp. | | | 280,000 | | | | 4.8750 | | | 7/15/2042 | | | 210,700 | |
| ADT Corp. | | | 275,000 | | | | 6.2500 | | | 10/15/2021 | | | 285,867 | |
| Ahern Rentals, Inc. - 144A | | | 420,000 | | | | 7.3750 | | | 5/15/2023 | | | 322,350 | |
| Avis Budget Car Rental LLC / Avis Budget Finance, Inc. - 144A | | | 495,000 | | | | 5.1250 | | | 6/1/2022 | | | 471,796 | |
| Cardtronics, Inc. | | | 570,000 | | | | 5.1250 | | | 8/1/2022 | | | 574,280 | |
| Hertz Corp. | | | 225,000 | | | | 7.5000 | | | 10/15/2018 | | | 229,333 | |
| Hertz Corp. | | | 265,000 | | | | 6.7500 | | | 4/15/2019 | | | 270,315 | |
| Jaguar Holding Co II - 144A | | | 505,000 | | | | 6.3750 | | | 8/1/2023 | | | 525,957 | |
| Live Nation Entertainment, Inc. - 144A | | | 325,000 | | | | 7.0000 | | | 9/1/2020 | | | 340,714 | |
| Live Nation Entertainment, Inc. - 144A | | | 555,000 | | | | 5.3750 | | | 6/15/2022 | | | 575,812 | |
| Team Health, Inc. - 144A | | | 525,000 | | | | 7.2500 | | | 12/15/2023 | | | 558,796 | |
| United Rentals North America, Inc.^ | | | 710,000 | | | | 6.1250 | | | 6/15/2023 | | | 740,174 | |
| | | | | | | | | | | | | | 5,253,694 | |
See accompanying notes to financial statements.
| SCHEDULE OF INVESTMENTS (Unaudited) |
| Dunham High-Yield Bond Fund (Continued) |
| April 30, 2016 |
| | | Principal | | | Interest | | | Maturity | | | |
| Security | | Amount | | | Rate | | | Date | | Value | |
| COMPUTERS - 1.1% | | | | | | | | | | | | | | |
| Western Digital Corp. - 144A | | $ | 700,000 | | | | 7.3750 | % | | 4/1/2023 | | $ | 708,313 | |
| Western Digital Corp. - 144A | | | 350,000 | | | | 10.5000 | | | 4/1/2024 | | | 341,250 | |
| | | | | | | | | | | | | | 1,049,563 | |
| COSMETICS/PERSONAL CARE - 0.8% | | | | | | | | | | | | | | |
| Revlon Consumer Products Corp. | | | 760,000 | | | | 5.7500 | | | 2/15/2021 | | | 776,150 | |
| | | | | | | | | | | | | | | |
| DISTRIBUTION/WHOLESALE - 0.6% | | | | | | | | | | | | | | |
| HD Supply, Inc. | | | 205,000 | | | | 7.5000 | | | 7/15/2020 | | | 218,068 | |
| HD Supply, Inc. - 144A | | | 360,000 | | | | 5.2500 | | | 12/15/2021 | | | 379,350 | |
| | | | | | | | | | | | | | 597,418 | |
| DIVERSIFIED FINANCIAL SERVICES - 4.5% | | | | | | | | | | | | | | |
| Ally Financial, Inc. | | | 640,000 | | | | 5.7500 | | | 11/20/2025 | | | 650,400 | |
| Ally Financial, Inc. | | | 345,000 | | | | 4.2500 | | | 4/15/2021 | | | 351,900 | |
| Ally Financial, Inc. | | | 790,000 | | | | 8.0000 | | | 11/1/2031 | | | 949,975 | |
| Credit Acceptance Corp. | | | 250,000 | | | | 6.1250 | | | 2/15/2021 | | | 239,375 | |
| E*TRADE Financial Corp. | | | 270,000 | | | | 4.6250 | | | 9/15/2023 | | | 274,644 | |
| Fly Leasing Ltd. | | | 420,000 | | | | 6.7500 | | | 12/15/2020 | | | 423,150 | |
| Fly Leasing Ltd. | | | 410,000 | | | | 6.3750 | | | 10/15/2021 | | | 403,338 | |
| International Lease Finance Corp. | | | 760,000 | | | | 8.6250 | | | 1/15/2022 | | | 922,450 | |
| | | | | | | | | | | | | | 4,215,232 | |
| ELECTRIC - 3.3% | | | | | | | | | | | | | | |
| Calpine Corp. | | | 515,000 | | | | 5.3750 | | | 1/15/2023 | | | 522,081 | |
| Calpine Corp. | | | 350,000 | | | | 5.7500 | | | 1/15/2025 | | | 354,813 | |
| Dynegy, Inc.^ | | | 540,000 | | | | 6.7500 | | | 11/1/2019 | | | 547,290 | |
| NRG Energy, Inc. | | | 580,000 | | | | 8.2500 | | | 9/1/2020 | | | 603,200 | |
| NRG Energy, Inc. | | | 365,000 | | | | 7.6250 | | | 1/15/2018 | | | 392,375 | |
| NRG Energy, Inc.^ | | | 375,000 | | | | 7.8750 | | | 5/15/2021 | | | 391,725 | |
| NRG Energy, Inc. | | | 270,000 | | | | 6.2500 | | | 7/15/2022 | | | 266,036 | |
| | | | | | | | | | | | | | 3,077,520 | |
| ELECTRICAL COMPONENTS & EQUIPMENT - 1.9% | | | | | | | | | | | | | | |
| Anixter, Inc. | | | 425,000 | | | | 5.1250 | | | 10/1/2021 | | | 431,375 | |
| Anixter, Inc. - 144A | | | 255,000 | | | | 5.5000 | | | 3/1/2023 | | | 261,694 | |
| Belden, Inc. - 144A | | | 625,000 | | | | 5.5000 | | | 9/1/2022 | | | 634,375 | |
| WESCO Distribution, Inc. | | | 435,000 | | | | 5.3750 | | | 12/15/2021 | | | 443,700 | |
| | | | | | | | | | | | | | 1,771,144 | |
| ENGINEERING & CONSTRUCTION - 0.2% | | | | | | | | | | | | | | |
| Tutor Perini Corp. | | | 220,000 | | | | 7.6250 | | | 11/1/2018 | | | 218,900 | |
| | | | | | | | | | | | | | | |
| ENTERTAINMENT - 3.8% | | | | | | | | | | | | | | |
| Eldorado Resorts, Inc. - 144A | | | 335,000 | | | | 7.0000 | | | 8/1/2023 | | | 350,913 | |
| Isle of Capri Casinos, Inc. | | | 445,000 | | | | 5.8750 | | | 3/15/2021 | | | 466,138 | |
| Palace Entertainment Holdings LLC / Palace Entertainment Holdings Corp. - 144A | | | 1,140,000 | | | | 8.8750 | | | 4/15/2017 | | | 1,140,000 | |
| Penn National Gaming, Inc. | | | 370,000 | | | | 5.8750 | | | 11/1/2021 | | | 380,175 | |
| Pinnacle Entertainment, Inc. - 144A | | | 160,000 | | | | 5.6250 | | | 5/1/2024 | | | 160,200 | |
| Regal Entertainment Group | | | 550,000 | | | | 5.7500 | | | 6/15/2023 | | | 565,813 | |
| Scientific Games International, Inc. - 144A | | | 480,000 | | | | 7.0000 | | | 1/1/2022 | | | 491,700 | |
| | | | | | | | | | | | | | 3,554,939 | |
| FOOD - 0.9% | | | | | | | | | | | | | | |
| JBS USA LLC - 144A | | | 265,000 | | | | 7.2500 | | | 6/1/2021 | | | 272,950 | |
| JBS USA LLC - 144A | | | 90,000 | | | | 7.2500 | | | 6/1/2021 | | | 92,700 | |
| JBS USA LLC - 144A | | | 475,000 | | | | 5.8750 | | | 7/15/2024 | | | 444,125 | |
| | | | | | | | | | | | | | 809,775 | |
See accompanying notes to financial statements.
| SCHEDULE OF INVESTMENTS (Unaudited) |
| Dunham High-Yield Bond Fund (Continued) |
| April 30, 2016 |
| | | Principal | | | Interest | | | Maturity | | | |
| Security | | Amount | | | Rate | | | Date | | Value | |
| HEALTHCARE-PRODUCTS - 0.5% | | | | | | | | | | | | | | |
| Kinetic Concepts, Inc. / KCI USA, Inc. | | $ | 460,000 | | | | 10.5000 | % | | 11/1/2018 | | $ | 467,199 | |
| | | | | | | | | | | | | | | |
| HEALTHCARE-SERVICES - 5.1% | | | | | | | | | | | | | | |
| Amsurg Corp. | | | 365,000 | | | | 5.6250 | | | 7/15/2022 | | | 375,950 | |
| Centene Corp. - 144A | | | 270,000 | | | | 5.6250 | | | 2/15/2021 | | | 284,850 | |
| Centene Corp. - 144A | | | 95,000 | | | | 6.1250 | | | 2/15/2024 | | | 100,463 | |
| CHS/Community Health Systems, Inc. | | | 105,000 | | | | 5.1250 | | | 8/15/2018 | | | 106,575 | |
| CHS/Community Health Systems, Inc. | | | 595,000 | | | | 5.1250 | | | 8/1/2021 | | | 599,706 | |
| Envision Healthcare Corp. - 144A | | | 475,000 | | | | 5.1250 | | | 7/1/2022 | | | 485,688 | |
| HCA, Inc. | | | 260,000 | | | | 5.3750 | | | 2/1/2025 | | | 266,175 | |
| HCA, Inc. | | | 455,000 | | | | 7.5000 | | | 2/15/2022 | | | 517,563 | |
| MEDNAX, Inc. - 144A | | | 290,000 | | | | 5.2500 | | | 12/1/2023 | | | 300,875 | |
| Select Medical Corp. | | | 405,000 | | | | 6.3750 | | | 6/1/2021 | | | 386,269 | |
| Tenet Healthcare Corp.^ | | | 400,000 | | | | 6.0000 | | | 10/1/2020 | | | 426,000 | |
| Tenet Healthcare Corp.^ | | | 635,000 | | | | 8.1250 | | | 4/1/2022 | | | 661,988 | |
| Tenet Healthcare Corp. | | | 340,000 | | | | 5.0000 | | | 3/1/2019 | | | 338,300 | |
| | | | | | | | | | | | | | 4,850,402 | |
| HOLDING COMPANIES-DIVERSIFIED - 0.4% | | | | | | | | | | | | | | |
| Argos Merger Sub, Inc. - 144A | | | 400,000 | | | | 7.1250 | | | 3/15/2023 | | | 410,000 | |
| | | | | | | | | | | | | | | |
| HOME BUILDERS - 1.1% | | | | | | | | | | | | | | |
| Taylor Morrison Communities, Inc. - 144A ^ | | | 385,000 | | | | 5.2500 | | | 4/15/2021 | | | 385,963 | |
| William Lyon Homes, Inc. | | | 655,000 | | | | 8.5000 | | | 11/15/2020 | | | 682,838 | |
| | | | | | | | | | | | | | 1,068,801 | |
| HOME FURNISHINGS - 0.7% | | | | | | | | | | | | | | |
| Tempur Sealy International, Inc. | | | 270,000 | | | | 6.8750 | | | 12/15/2020 | | | 285,863 | |
| Tempur Sealy International, Inc. - 144A | | | 390,000 | | | | 5.6250 | | | 10/15/2023 | | | 407,550 | |
| | | | | | | | | | | | | | 693,413 | |
| INTERNET - 0.8% | | | | | | | | | | | | | | |
| Match Group, Inc. - 144A | | | 485,000 | | | | 6.7500 | | | 12/15/2022 | | | 497,125 | |
| Netflix, Inc. | | | 235,000 | | | | 5.3750 | | | 2/1/2021 | | | 249,688 | |
| | | | | | | | | | | | | | 746,813 | |
| LEISURE TIME - 0.4% | | | | | | | | | | | | | | |
| NCL Corp. Ltd. - 144A | | | 400,000 | | | | 4.6250 | | | 11/15/2020 | | | 408,500 | |
| | | | | | | | | | | | | | | |
| LODGING - 3.1% | | | | | | | | | | | | | | |
| Boyd Gaming Corp. | | | 700,000 | | | | 9.0000 | | | 7/1/2020 | | | 739,024 | |
| FelCor Lodging LP | | | 720,000 | | | | 5.6250 | | | 3/1/2023 | | | 743,400 | |
| MGM Resorts International | | | 950,000 | | | | 7.7500 | | | 3/15/2022 | | | 1,065,188 | |
| MGM Resorts International | | | 390,000 | | | | 6.7500 | | | 10/1/2020 | | | 418,275 | |
| | | | | | | | | | | | | | 2,965,887 | |
| MEDIA - 13.8% | | | | | | | | | | | | | | |
| Altice Financing SA - 144A | | | 545,000 | | | | 6.6250 | | | 2/15/2023 | | | 540,940 | |
| Cablevision Systems Corp. | | | 225,000 | | | | 8.6250 | | | 9/15/2017 | | | 239,344 | |
| Cequel Communications Holdings I LLC / Cequel Capital Corp. - 144A | | | 830,000 | | | | 6.3750 | | | 9/15/2020 | | | 852,850 | |
| Clear Channel Worldwide Holdings, Inc. | | | 495,000 | | | | 7.6250 | | | 3/15/2020 | | | 461,281 | |
| Clear Channel Worldwide Holdings, Inc. | | | 740,000 | | | | 6.5000 | | | 11/15/2022 | | | 747,400 | |
| CSC Holdings LLC | | | 125,000 | | | | 7.8750 | | | 2/15/2018 | | | 135,313 | |
| CSC Holdings LLC | | | 550,000 | | | | 8.6250 | | | 2/15/2019 | | | 611,875 | |
| CSC Holdings LLC | | | 180,000 | | | | 6.7500 | | | 11/15/2021 | | | 186,188 | |
| DISH DBS Corp. | | | 510,000 | | �� | | 7.8750 | | | 9/1/2019 | | | 564,188 | |
See accompanying notes to financial statements.
| SCHEDULE OF INVESTMENTS (Unaudited) |
| Dunham High-Yield Bond Fund (Continued) |
| April 30, 2016 |
| | | Principal | | | Interest | | | Maturity | | | |
| Security | | Amount | | | Rate | | | Date | | Value | |
| MEDIA (CONTINUED) - 13.8% | | | | | | | | | | | | | | |
| DISH DBS Corp. | | $ | 280,000 | | | | 6.7500 | % | | 6/1/2021 | | $ | 289,159 | |
| Entercom Radio LLC | | | 620,000 | | | | 10.5000 | | | 12/1/2019 | | | 651,910 | |
| Gray Television, Inc. | | | 1,155,000 | | | | 7.5000 | | | 10/1/2020 | | | 1,215,638 | |
| LIN Television Corp. | | | 390,000 | | | | 6.3750 | | | 1/15/2021 | | | 409,013 | |
| Mediacom LLC / Mediacom Capital Corp. | | | 660,000 | | | | 7.2500 | | | 2/15/2022 | | | 693,825 | |
| Nexstar Broadcasting, Inc. | | | 1,140,000 | | | | 6.8750 | | | 11/15/2020 | | | 1,199,850 | |
| Nexstar Broadcasting, Inc. - 144A | | | 325,000 | | | | 6.1250 | | | 2/15/2022 | | | 327,438 | |
| Numericable-SFR SA - 144A | | | 210,000 | | | | 6.0000 | | | 5/15/2022 | | | 211,061 | |
| Numericable-SFR SA - 144A | | | 630,000 | | | | 6.2500 | | | 5/15/2024 | | | 611,888 | |
| Radio One, Inc. - 144A | | | 650,000 | | | | 7.3750 | | | 4/15/2022 | | | 602,875 | |
| Sinclair Television Group, Inc.^ | | | 560,000 | | | | 6.3750 | | | 11/1/2021 | | | 595,000 | |
| Sinclair Television Group, Inc. - 144A | | | 265,000 | | | | 5.6250 | | | 8/1/2024 | | | 273,281 | |
| TEGNA, Inc. - 144A | | | 85,000 | | | | 5.5000 | | | 9/15/2024 | | | 88,081 | |
| Time, Inc. - 144A | | | 350,000 | | | | 5.7500 | | | 4/15/2022 | | | 334,751 | |
| Townsquare Media, Inc. - 144A | | | 400,000 | | | | 6.5000 | | | 4/1/2023 | | | 388,500 | |
| Tribune Media Co. - 144A | | | 380,000 | | | | 5.8750 | | | 7/15/2022 | | | 379,050 | |
| Videotron Ltd | | | 425,000 | | | | 5.0000 | | | 7/15/2022 | | | 442,531 | |
| | | | | | | | | | | | | | 13,053,230 | |
| MINING - 0.9% | | | | | | | | | | | | | | |
| FMG Resources August 2006 Pty Ltd. - 144A | | | 250,000 | | | | 9.7500 | | | 3/1/2022 | | | 264,075 | |
| Freeport-McMoRan, Inc. | | | 420,000 | | | | 2.3750 | | | 3/15/2018 | | | 405,300 | |
| Freeport-McMoRan, Inc. | | | 150,000 | | | | 3.1000 | | | 3/15/2020 | | | 135,992 | |
| | | | | | | | | | | | | | 805,367 | |
| MISCELLANEOUS MANUFACTURERS - 0.5% | | | | | | | | | | | | | | |
| EnPro Industries, Inc. | | | 445,000 | | | | 5.8750 | | | 9/15/2022 | | | 466,138 | |
| | | | | | | | | | | | | | | |
| OFFICE/BUSINESS EQUIPMENT - 0.3% | | | | | | | | | | | | | | |
| CDW LLC | | | 240,000 | | | | 5.5000 | | | 12/1/2024 | | | 253,800 | |
| | | | | | | | | | | | | | | |
| OIL & GAS - 4.8% | | | | | | | | | | | | | | |
| Antero Resources Corp. | | | 580,000 | | | | 5.3750 | | | 11/1/2021 | | | 564,050 | |
| Carrizo Oil & Gas, Inc.^ | | | 525,000 | | | | 7.5000 | | | 9/15/2020 | | | 530,250 | |
| Continental Resources, Inc./OK | | | 240,000 | | | | 7.1250 | | | 4/1/2021 | | | 244,800 | |
| Continental Resources, Inc. | | | 255,000 | | | | 5.0000 | | | 9/15/2022 | | | 239,381 | |
| Gulfport Energy Corp. | | | 825,000 | | | | 7.7500 | | | 11/1/2020 | | | 837,375 | |
| Rice Energy, Inc. | | | 375,000 | | | | 6.2500 | | | 5/1/2022 | | | 373,125 | |
| Southwestern Energy Co. | | | 245,000 | | | | 7.5000 | | | 2/1/2018 | | | 241,938 | |
| Sunoco LP - 144A | | | 425,000 | | | | 5.5000 | | | 8/1/2020 | | | 425,531 | |
| Sunoco LP - 144A | | | 95,000 | | | | 6.2500 | | | 4/15/2021 | | | 96,425 | |
| Western Refining, Inc. | | | 840,000 | | | | 6.2500 | | | 4/1/2021 | | | 781,200 | |
| WPX Energy, Inc. | | | 170,000 | | | | 6.0000 | | | 1/15/2022 | | | 153,425 | |
| | | | | | | | | | | | | | 4,487,500 | |
| PACKAGING & CONTAINERS - 0.8% | | | | | | | | | | | | | | |
| Reynolds Group Issuer, Inc.^ | | | 750,000 | | | | 5.7500 | | | 10/15/2020 | | | 780,000 | |
| | | | | | | | | | | | | | | |
| PHARMACEUTICALS - 2.3% | | | | | | | | | | | | | | |
| Endo Ltd - 144A | | | 525,000 | | | | 6.0000 | | | 2/1/2025 | | | 504,000 | |
| Endo Ltd - 144A | | | 200,000 | | | | 6.0000 | | | 7/15/2023 | | | 197,250 | |
| Valeant Pharmaceuticals International - 144A | | | 800,000 | | | | 6.3750 | | | 10/15/2020 | | | 729,000 | |
| Valeant Pharmaceuticals International - 144A | | | 375,000 | | | | 6.7500 | | | 8/15/2021 | | | 331,875 | |
| Valeant Pharmaceuticals International, Inc. - 144A | | | 445,000 | | | | 5.3750 | | | 3/15/2020 | | | 396,328 | |
| | | | | | | | | | | | | | 2,158,453 | |
See accompanying notes to financial statements.
| SCHEDULE OF INVESTMENTS (Unaudited) |
| Dunham High-Yield Bond Fund (Continued) |
| April 30, 2016 |
| | | Principal | | | Interest | | | Maturity | | | |
| Security | | Amount | | | Rate | | | Date | | Value | |
| PIPELINES - 7.1% | | | | | | | | | | | | | | |
| Blue Racer Midstream LLC / Blue Racer Finance Corp. - 144A | | $ | 400,000 | | | | 6.1250 | % | | 11/15/2022 | | $ | 356,000 | |
| DCP Midstream LLC - 144A | | | 105,000 | | | | 5.3500 | | | 3/15/2020 | | | 100,006 | |
| DCP Midstream LLC - 144A | | | 180,000 | | | | 4.7500 | | | 9/30/2021 | | | 164,700 | |
| DCP Midstream LLC - 144A | | | 195,000 | | | | 5.8500 | | | 5/21/2043 | | | 123,825 | |
| DCP Midstream Operating LP | | | 260,000 | | | | 3.8750 | | | 3/15/2023 | | | 230,100 | |
| Energy Transfer Partners LP | | | 250,000 | | | | 4.1500 | | | 10/1/2020 | | | 247,287 | |
| MPLX LP - 144A | | | 240,000 | | | | 5.5000 | | | 2/15/2023 | | | 239,722 | |
| MPLX LP - 144A | | | 600,000 | | | | 4.5000 | | | 7/15/2023 | | | 583,383 | |
| NGPL PipeCo LLC - 144A | | | 270,000 | | | | 7.1190 | | | 12/15/2017 | | | 280,125 | |
| Rockies Express Pipeline LLC - 144A | | | 525,000 | | | | 5.6250 | | | 4/15/2020 | | | 523,688 | |
| Rockies Express Pipeline LLC - 144A | | | 985,000 | | | | 6.8750 | | | 4/15/2040 | | | 871,725 | |
| Sabine Pass Liquefaction LLC | | | 870,000 | | | | 5.6250 | | | 2/1/2021 | | | 868,913 | |
| Sabine Pass Liquefaction LLC | | | 860,000 | | | | 6.2500 | | | 3/15/2022 | | | 875,050 | |
| Targa Resources Partners LP | | | 430,000 | | | | 6.8750 | | | 2/1/2021 | | | 441,825 | |
| Targa Resources Partners LP | | | 755,000 | | | | 5.0000 | | | 1/15/2018 | | | 763,018 | |
| | | | | | | | | | | | | | 6,669,367 | |
| REAL ESTATE - 1.0% | | | | | | | | | | | | | | |
| Realogy Group LLC - 144A^ | | | 855,000 | | | | 5.2500 | | | 12/1/2021 | | | 897,750 | |
| | | | | | | | | | | | | | | |
| REITS - 2.9% | | | | | | | | | | | | | | |
| Equinix, Inc. | | | 145,000 | | | | 5.3750 | | | 4/1/2023 | | | 152,250 | |
| Equinix, Inc. | | | 575,000 | | | | 5.3750 | | | 1/1/2022 | | | 603,750 | |
| Equinix, Inc. | | | 250,000 | | | | 5.8750 | | | 1/15/2026 | | | 265,155 | |
| iStar, Inc. | | | 630,000 | | | | 7.1250 | | | 2/15/2018 | | | 649,688 | |
| iStar, Inc. | | | 545,000 | | | | 5.0000 | | | 7/1/2019 | | | 531,375 | |
| RHP Hotel Properties LP | | | 480,000 | | | | 5.0000 | | | 4/15/2021 | | | 498,000 | |
| | | | | | | | | | | | | | 2,700,218 | |
| RETAIL - 0.7% | | | | | | | | | | | | | | |
| Dollar Tree, Inc. - 144A^ | | | 420,000 | | | | 5.7500 | | | 3/1/2023 | | | 450,576 | |
| GameStop Corp. - 144A | | | 225,000 | | | | 5.5000 | | | 10/1/2019 | | | 220,781 | |
| | | | | | | | | | | | | | 671,357 | |
| SEMICONDUCTORS - 0.9% | | | | | | | | | | | | | | |
| Micron Technology, Inc. - 144A | | | 135,000 | | | | 5.8750 | | | 2/15/2022 | | | 119,813 | |
| Micron Technology, Inc. - 144A | | | 335,000 | | | | 5.2500 | | | 8/1/2023 | | | 272,358 | |
| Micron Technology, Inc. - 144A | | | 90,000 | | | | 7.5000 | | | 9/15/2023 | | | 93,375 | |
| Qorvo, Inc. - 144A | | | 330,000 | | | | 6.7500 | | | 12/1/2023 | | | 339,900 | |
| | | | | | | | | | | | | | 825,446 | |
| SOFTWARE - 2.4% | | | | | | | | | | | | | | |
| First Data Corp. - 144A | | | 930,000 | | | | 7.0000 | | | 12/1/2023 | | | 959,063 | |
| First Data Corp. - 144A | | | 220,000 | | | | 5.0000 | | | 1/15/2024 | | | 223,025 | |
| Nuance Communications, Inc. - 144A | | | 1,075,000 | | | | 5.3750 | | | 8/15/2020 | | | 1,104,563 | |
| | | | | | | | | | | | | | 2,286,651 | |
| TELECOMMUNICATIONS - 12.4% | | | | | | | | | | | | | | |
| CenturyLink, Inc. | | | 70,000 | | | | 6.4500 | | | 6/15/2021 | | | 71,750 | |
| CenturyLink, Inc. | | | 370,000 | | | | 5.6250 | | | 4/1/2020 | | | 381,563 | |
| CenturyLink, Inc. | | | 80,000 | | | | 7.5000 | | | 4/1/2024 | | | 80,400 | |
| Cincinnati Bell, Inc. | | | 575,000 | | | | 8.3750 | | | 10/15/2020 | | | 592,250 | |
| Cogent Communications Finance, Inc. - 144A | | | 460,000 | | | | 5.6250 | | | 4/15/2021 | | | 453,100 | |
| CommScope, Inc. - 144A | | | 200,000 | | | | 5.5000 | | | 6/15/2024 | | | 201,380 | |
| CyrusOne LP | | | 840,000 | | | | 6.3750 | | | 11/15/2022 | | | 890,921 | |
| EarthLink Holdings Corp. | | | 536,000 | | | | 8.8750 | | | 5/15/2019 | | | 550,070 | |
| EarthLink Holdings Corp. | | | 960,000 | | | | 7.3750 | | | 6/1/2020 | | | 1,008,000 | |
See accompanying notes to financial statements.
| SCHEDULE OF INVESTMENTS (Unaudited) |
| Dunham High-Yield Bond Fund (Continued) |
| April 30, 2016 |
| | | Principal | | | Interest | | | Maturity | | | |
| Security | | Amount | | | Rate | | | Date | | Value | |
| TELECOMMUNICATIONS (Continued) - 12.4% | | | | | | | | | | | | | | |
| FairPoint Communications, Inc. - 144A | | $ | 1,050,000 | | | | 8.7500 | % | | 8/15/2019 | | $ | 996,188 | |
| Frontier Communications Corp. | | | 480,000 | | | | 8.5000 | | | 4/15/2020 | | | 509,400 | |
| Frontier Communications Corp.^ | | | 855,000 | | | | 9.2500 | | | 7/1/2021 | | | 894,544 | |
| Frontier Communications Corp.^ | | | 115,000 | | | | 6.2500 | | | 9/15/2021 | | | 107,525 | |
| Frontier Communications Corp. | | | 465,000 | | | | 6.8750 | | | 1/15/2025 | | | 388,855 | |
| Frontier Communications Corp. - 144A | | | 265,000 | | | | 10.5000 | | | 9/15/2022 | | | 273,642 | |
| GCI, Inc. | | | 335,000 | | | | 6.8750 | | | 4/15/2025 | | | 340,025 | |
| Level 3 Financing, Inc. | | | 520,000 | | | | 5.3750 | | | 8/15/2022 | | | 533,650 | |
| Level 3 Financing, Inc. | | | 330,000 | | | | 5.1250 | | | 5/1/2023 | | | 337,013 | |
| Qwest Corp. | | | 210,000 | | | | 6.7500 | | | 12/1/2021 | | | 227,367 | |
| Sprint Communications, Inc. - 144A | | | 315,000 | | | | 9.0000 | | | 11/15/2018 | | | 334,294 | |
| Sprint Communications, Inc. - 144A | | | 435,000 | | | | 7.0000 | | | 3/1/2020 | | | 448,594 | |
| Sprint Communications, Inc. | | | 385,000 | | | | 7.0000 | | | 8/15/2020 | | | 321,475 | |
| Sprint Communications, Inc. | | | 495,000 | | | | 7.2500 | | | 9/15/2021 | | | 402,188 | |
| ViaSat, Inc. | | | 220,000 | | | | 6.8750 | | | 6/15/2020 | | | 227,425 | |
| West Corp. - 144A | | | 410,000 | | | | 5.3750 | | | 7/15/2022 | | | 372,588 | |
| Windstream Services LLC | | | 350,000 | | | | 7.7500 | | | 10/15/2020 | | | 318,322 | |
| Windstream Services LLC | | | 555,000 | | | | 7.7500 | | | 10/1/2021 | | | 473,138 | |
| | | | | | | | | | | | | | 11,735,667 | |
| TRANSPORTATION - 1.9% | | | | | | | | | | | | | | |
| Navios Maritime Acquisition Corp. / Navios Acquisition Finance US, Inc. - 144A | | | 420,000 | | | | 8.1250 | | | 11/15/2021 | | | 347,550 | |
| Watco Cos LLC / Watco Finance Corp. - 144A | | | 730,000 | | | | 6.3750 | | | 4/1/2023 | | | 730,000 | |
| XPO CNW, Inc. | | | 665,000 | | | | 7.2500 | | | 1/15/2018 | | | 678,300 | |
| | | | | | | | | | | | | | 1,755,850 | |
| | | | | | | | | | | | | | | |
| TOTAL BONDS & NOTES (Cost - $89,208,204) | | | | | | | | | | | | | 89,879,573 | |
| | | | | | | | | | | | | | | |
| | | | | | | Interest | | | | | | | |
| Security | | Shares | | | Rate | | | | | | | |
| SHORT-TERM INVESTMENT - 4.7% | | | | | | | | | | | | | | |
| MONEY MARKET FUND - 4.7% | | | | | | | | | | | | | | |
| First American Government Obligations Fund | | | 4,417,375 | | | | 0.01 | % + | | | | | 4,417,375 | |
| TOTAL SHORT-TERM INVESTMENT (Cost - $4,417,375) | | | | | | | | | | | | | | |
| | | | | | | | | | | | | | | |
| COLLATERAL FOR SECURITIES LOANED - 14.8% | | | | | | | | | | | | | | |
| Mount Vernon Prime Portfolio + (Cost - $13,974,490) | | | 13,974,490 | | | | 0.51 | % | | | | | 13,974,490 | |
| | | | | | | | | | | | | | | |
| TOTAL INVESTMENTS - 114.8% (Cost - $107,600,069) | | | | | | | | | | | | $ | 108,271,438 | |
| LIABILITIES IN EXCESS OF OTHER ASSETS - (14.8)% | | | | | | | | | | | | | (13,922,726 | ) |
| NET ASSETS - 100.0% | | | | | | | | | | | | $ | 94,348,712 | |
| ^ | All or a portion of these securities are on loan. Total loaned securities had a value of $13,672,961 at April 30, 2016 . |
| + | Variable rate security. Interest rate is as of April 30, 2016. |
144A- Security exempt from registration under Rule 144A of the Securities Act of 1933. These securities may be sold in transactions exempt from registration, normally to qualified institutional buyers.
REITS - Real Estate Investment Trusts.
| Portfolio Composition - (Unaudited) |
| B1 | | | 18.3 | % | | Ba2 | | | 9.5 | % |
| B3 | | | 17.2 | % | | Ba1 | | | 4.5 | % |
| Baa3 | | | 14.9 | % | | Caa1 | | | 4.3 | % |
| B2 | | | 13.5 | % | | Caa2 | | | 0.8 | % |
| Collateral For Securities Loaned | | | 12.9 | % | | Short-Term Investment | | | 4.1 | % |
| | | | | | | Total | | | 100.0 | % |
| * | Based on total value of investments as of April 30, 2016. |
| ** | Bond Ratings provided by Fitch Ratings. |
Percentage may differ from Schedule of Investments which is based on Fund net assets.
See accompanying notes to financial statements.
Dunham International Opportunity Bond Fund
Message from the Sub-Adviser (Rogge Global Partners PLC)
International bonds, as measured by the Barclays Global Aggregate Ex-U.S. Bond Index, continued to experience a higher correlation to U.S. dollar movements relative to foreign currencies than from changing expectations on default rates or interest rate increases in foreign countries. During the six-month period ended April 30, 2016, international bonds increased 8.7 percent, while the U.S. dollar generally declined 4.2 percent against a basket of major world currencies. This relative depreciation of the U.S. dollar was not consistent across foreign markets, as its 4.0 percent decline versus the euro was met with an 11.7 percent depreciation versus the yen. Conversely, the British Pound decreased versus the U.S. dollar, losing 5.3 percent over the six-month period. While foreign interest rate movements had a lesser effect on bond prices, with the exception of the Bank of Japan’s move to negative interest rates, the focus on U.S. interest rate prospects and vague enigmatically worded insights from the U.S. Federal Open Market Committee coincided with a thriving or tumbling U.S. dollar.
While the Sub-Adviser primarily focuses on developed markets, developing countries generally saw their sovereign debt surge beyond their developed counterparts during the most recent three-month period. Emerging markets bonds, as measured by the Barclays Emerging Markets Ex-U.S. Aggregate Bond Index, decreased 2.4 percent during the first fiscal quarter, but rebounded 8.5 percent in the second fiscal quarter. The Sub-Adviser believes that while developed countries appear to have emerged from their deleveraging cycle after the financial crisis, developing market countries are still mid-cycle. Fund holdings in emerging market countries included the Mexico sovereign bond, Mex Bonos Desrr Fix Rate 10% 12/5/2024 (B05QN14) (holding percentage*: 1.58 percent). During the six-month period, these peso-denominated bonds increased 4.5 percent in local currency terms. However, the Mexican peso declined versus the U.S. dollar during the six-month period, detracting 4.1 percent from the local currency-denominated increase. The relative decline in the value of the peso was not consistent across the six-month period. In the first three months of the fiscal year, the peso declined 8.9 percent versus the U.S. dollar before bouncing up 5.4 percent in the second fiscal quarter.
The Fund continued to focus on peripheral Europe, as the Sub-Adviser believes the countries in peripheral Europe are under pressure but are committed to keeping the countries solvent. The Sub-Adviser maintained allocations to Spain and Italy, which were two of the most positive contributors to performance on a country level in the first fiscal quarter. The Fund continued to hold the Italian bond, Buoni Poliennali Del Tesoro 4.5% 3/1/2024 (BCRYKK8) (holding percentage*: 1.37 percent) and the Spanish bond, Bonos Y Oblig Del Estado 4.2% Due 01/21/2037 (B05L4R2) (holding percentage*: 0.50 percent). During the six-month period, the Italian bond returned 1.7 percent and the Spanish bond increased 2.6 percent in local currency terms. As both of these countries are members of the euro-zone the appreciation of the euro versus the U.S. dollar added 4.0 percent to the performance for each of these two bonds.
Although Japanese bonds saw a significant rise in the first fiscal quarter, the Sub-Adviser maintained a negative view on Japan during the entire six-month period, retaining the Fund’s underweight to the country’s debt. This was primarily fueled by the Bank of Japan’s 0.1 percent penalty on excess cash imposed on its private sector lenders and the yen’s stunning 12.1 percent increase versus the U.S. dollar in the second fiscal quarter. On an absolute basis, the Fund continued to benefit from its exposure to Japan, as bonds such as the Japan 99 2.1% 12/20/2027 (B2B35B7) (holding percentage*: 4.41 percent) returned 5.6 percent during the six-month period. This gain paled in comparison to the added return benefits from the yen’s appreciation versus the U.S. dollar. Furthermore, this most recent increase in the Japanese sovereign bond price resulted in the yield to maturity shifting into negative territory, joining other countries with negative bond yields such as Sweden and Switzerland.
The less than exciting global economic growth backdrop has led the Sub-Adviser to focus even more on how central banks attempt to jump-start their local economies. As these actions often coincide with shifts in the respective country’s local currency versus its primary trading partners, the ripple-effects may be widespread. The Sub-Adviser also believes that lower energy prices continue to provide a tailwind for developed economies, while key emerging markets are still in a deleveraging phase. The Sub-Adviser continues to believe that the key risks moving forward are further devaluation of the Chinese yuan, slowing growth in China, and volatility and illiquidity in credit markets.
| * | Holdings Percentage(s) as of 4/30/2016. |
Growth of $100,000 Investment – (Unaudited)
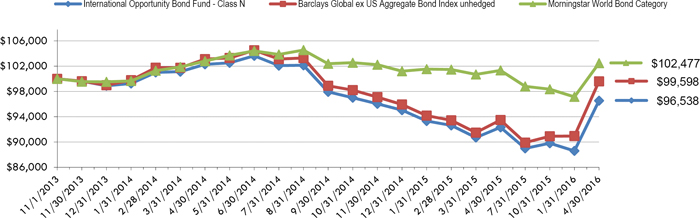
Total Returns as of April 30, 2016
| | | | Annualized Since |
| | Six Months | One Year | Inception (11/1/13) |
| Class N | 7.38% | 4.56% | (1.40)% |
| Class C | 6.91% | 3.84% | (2.13)% |
| Class A with load of 4.50% | 2.52% | (0.37)% | (3.44)% |
| Class A without load | 7.24% | 4.31% | (1.64)% |
| Barclays Global ex-US Aggregate Bond Index Unhedged | 8.72% | 6.58% | (0.16)% |
| Morningstar World Bond Category | 4.19% | 1.12% | 0.99% |
The Barclays Global ex US Aggregate Bond Index Unhedged is designed to be a broad based measure of the global investment-grade, fixed rate, fixed income corporate markets outside the United States. Investors cannot invest directly in an index or benchmark.
The Morningstar World Bond Category is generally representative of funds that invest at least 40% of bonds in foreign markets. Investors cannot invest directly in an index or benchmark.
As disclosed in the Trust’s latest registration statement, the Fund’s total annual operating expenses, including underlying funds, are 1.38% for Class N, 2.13% for Class C and 1.63% for Class A. Class A shares are subject to a sales load of 4.50% and a deferred sales charge of up to 0.75%. The performance data quoted here represents past performance, which is not indicative of future results. Current performance may be lower or higher than the performance data quoted. The investment return and NAV will fluctuate, so that an investor’s shares, when redeemed, may be worth more or less than their original cost. Total returns are calculated assuming reinvestment of all dividends and capital gains distributions, if any. The returns do not reflect the deductions of taxes a shareholder would pay on the redemption of fund shares or fund distributions. For performance information current to the most recent month-end, please call 1-800-442-4358 or visit our website www.dunham.com.
| SCHEDULE OF INVESTMENTS (Unaudited) |
| Dunham International Opportunity Bond Fund |
| April 30, 2016 |
| Security | | Principal Amount | | | | Interest Rate | | | Maturity Date | | Value | |
| CORPORATE BONDS & NOTES - 35.4% | | | | | | | | | | | | | | | |
| AGRICULTURE - 1.4% | | | | | | | | | | | | | | | |
| BAT International Finance PLC | | | 200,000 | | EUR | | | 0.8750 | % | | 10/13/2023 | | $ | 227,379 | |
| Imperial Tobacco Finance PLC - 144A | | | 200,000 | | USD | | | 2.9500 | | | 7/21/2020 | | | 206,335 | |
| | | | | | | | | | | | | | | 433,714 | |
| AUTO MANUFACTURERS - 1.0% | | | | | | | | | | | | | | | |
| Daimler AG | | | 150,000 | | EUR | | | 4.1250 | | | 1/19/2017 | | | 176,878 | |
| Fiat Chrystler Finance | | | 100,000 | | EUR | | | 4.7500 | | | 7/15/2022 | | | 125,072 | |
| | | | | | | | | | | | | | | 301,950 | |
| BANKS - 16.6% | | | | | | | | | | | | | | | |
| Abbey National Treasury Services PLC | | | 100,000 | | EUR | | | 2.0000 | | | 1/14/2019 | | | 119,054 | |
| ABN AMRO Bank NV | | | 200,000 | | EUR | | | 6.3750 | | | 4/27/2021 | | | 278,092 | |
| Banco de Sabadell SA | | | 200,000 | | EUR | | | 0.6250 | | | 11/3/2020 | | | 231,993 | |
| Barclays Bank PLC | | | 200,000 | | EUR | | | 6.0000 | | | 1/14/2021 | | | 261,207 | |
| BNP Paribas SA | | | 200,000 | | EUR | | | 2.8750 | | | 9/26/2023 | | | 261,319 | |
| BPCE SA | | | 200,000 | | EUR | | | 4.6250 | | | 7/18/2023 | | | 265,320 | |
| Caixa Bank SA | | | 300,000 | | EUR | | | 0.6250 | | | 11/12/2020 | | | 349,369 | |
| Credit Agricole SA | | | 100,000 | | EUR | | | 3.8750 | | | 2/13/2019 | | | 126,508 | |
| HSBC Holdings PLC | | | 200,000 | | EUR | | | 6.0000 | | | 6/10/2019 | | | 263,876 | |
| Intesa Sanpaolo SpA | | | 200,000 | | EUR | | | 4.3750 | | | 10/15/2019 | | | 258,466 | |
| KBC Groep NV | | | 200,000 | | EUR | | | 2.3750 | + | | 11/25/2024 | | | 234,218 | |
| KBC IFIMA SA | | | 250,000 | | EUR | | | 2.1250 | | | 9/10/2018 | | | 300,242 | |
| Lloyds Bank PLC | | | 150,000 | | EUR | | | 6.5000 | | | 3/24/2020 | | | 202,923 | |
| National Australia Bank Ltd. | | | 100,000 | | GBP | | | 5.1250 | | | 12/9/2021 | | | 167,782 | |
| Societe Generale SA | | | 350,000 | | USD | | | 2.7500 | | | 10/12/2017 | | | 356,153 | |
| Societe Generale SA | | | 200,000 | | EUR | | | 4.0000 | | | 6/7/2023 | | | 255,159 | |
| Sumitomo Mitsui Banking Corp. | | | 350,000 | | USD | | | 1.5000 | | | 1/18/2018 | | | 349,050 | |
| Toronto-Dominion Bank | | | 300,000 | | USD | | | 1.4000 | | | 4/30/2018 | | | 300,263 | |
| UBS AG/London | | | 200,000 | | GBP | | | 6.6250 | | | 4/11/2018 | | | 323,198 | |
| Westpac Banking Corp. | | | 250,000 | | EUR | | | 2.1250 | | | 7/9/2019 | | | 305,758 | |
| | | | | | | | | | | | | | | 5,209,950 | |
| BUILDING MATERIALS - 0.4% | | | | | | | | | | | | | | | |
| Cemex Finance LLC | | | 100,000 | | EUR | | | 5.2500 | | | 4/1/2021 | | | 118,782 | |
| | | | | | | | | | | | | | | | |
| DIVERSIFIED FINANCIAL SERVICES - 1.4% | | | | | | | | | | | | | | | |
| Arkle Master Issuer PLC | | | 150,000 | | GBP | | | 4.6810 | | | 2/17/2017 | | | 225,749 | |
| Arkle Master Issuer PLC | | | 150,000 | | GBP | | | 3.9860 | | | 8/17/2017 | | | 226,805 | |
| | | | | | | | | | | | | | | 452,554 | |
| ELECTRIC - 2.3% | | | | | | | | | | | | | | | |
| Enel Finance International NV | | | 200,000 | | EUR | | | 1.9660 | | | 1/27/2025 | | | 245,478 | |
| Engie SA | | | 100,000 | | GBP | | | 7.0000 | | | 10/30/2028 | | | 210,658 | |
| Iberdrola Finanzas | | | 200,000 | | EUR | | | 4.1250 | | | 3/23/2020 | | | 263,369 | |
| | | | | | | | | | | | | | | 719,505 | |
| ELECTRONICS - 0.4% | | | | | | | | | | | | | | | |
| Trionista Holdco GmbH | | | 100,000 | | EUR | | | 5.0000 | | | 4/30/2020 | | | 117,822 | |
| | | | | | | | | | | | | | | | |
| FOOD - 0.4% | | | | | | | | | | | | | | | |
| Agrokor dd | | | 100,000 | | EUR | | | 9.1250 | | | 2/1/2020 | | | 122,573 | |
| | | | | | | | | | | | | | | | |
| GAS - 1.0% | | | | | | | | | | | | | | | |
| National Grid PLC | | | 250,000 | | EUR | | | 4.3750 | | | 3/10/2020 | | | 330,436 | |
| | | | | | | | | | | | | | | | |
| INSURANCE - 2.7% | | | | | | | | | | | | | | | |
| Allianz Finance II BV | | | 100,000 | | EUR | | | 4.7500 | | | 7/22/2019 | | | 131,968 | |
| Allianz Finance II BV | | | 200,000 | | EUR | | | 5.7500 | + | | 7/8/2041 | | | 267,438 | |
| AXA SA | | | 150,000 | | EUR | | | 5.2500 | + | | 4/16/2040 | | | 190,777 | |
| Willow No 2 Ireland PLC for Zurich Insurance Co. Ltd. | | | 200,000 | | EUR | | | 3.3750 | | | 6/27/2022 | | | 265,316 | |
| | | | | | | | | | | | | | | 855,499 | |
| MEDIA - 1.2% | | | | | | | | | | | | | | | |
| Sky PLC | | | 200,000 | | EUR | | | 1.5000 | | | 9/15/20/21 | | | 233,273 | |
| Virgin Media Secured Finance PLC | | | 100,000 | | GBP | | | 5.5000 | | | 1/15/2021 | | | 156,012 | |
| | | | | | | | | | | | | | | 389,285 | |
See accompanying notes to financial statements.
| SCHEDULE OF INVESTMENTS (Unaudited) |
| Dunham International Opportunity Bond Fund (Continued) |
| April 30, 2016 |
| Security | | Principal Amount | | | | Interest Rate | | | Maturity Date | | Value | |
| MINING - 0.4% | | | | | | | | | | | | | | | |
| Anglo American Capital PLC | | | 100,000 | | EUR | | | 2.7500 | % | | 6/7/2019 | | $ | 112,204 | |
| | | | | | | | | | | | | | | | |
| PACKAGING & CONTAINERS - 0.4% | | | | | | | | | | | | | | | |
| Crown European Holdings SA | | | 100,000 | | EUR | | | 4.0000 | | | 7/15/2022 | | | 123,623 | |
| | | | | | | | | | | | | | | | |
| REAL ESTATE - 0.4% | | | | | | | | | | | | | | | |
| Deutsche Rastataetten Gruppe IV GmBH | | | 100,000 | | EUR | | | 6.7500 | | | 12/30/2020 | | | 122,793 | |
| | | | | | | | | | | | | | | | |
| RETAIL - 0.4% | | | | | | | | | | | | | | | |
| Dufry Finance SCA | | | 100,000 | | EUR | | | 4.5000 | | | 7/15/2022 | | | 122,409 | |
| | | | | | | | | | | | | | | | |
| SAVINGS & LOANS - 2.5% | | | | | | | | | | | | | | | |
| Coventry Building Society | | | 150,000 | | EUR | | | 2.2500 | | | 12/4/2017 | | | 177,126 | |
| Nationwide Building Society | | | 250,000 | | GBP | | | 1.6250 | | | 4/3/2019 | | | 296,733 | |
| Nationwide Building Society | | | 100,000 | | GBP | | | 5.6250 | | | 9/9/2019 | | | 165,237 | |
| Silverstone Master Issuer PLC | | | 100,000 | | GBP | | | 5.0630 | + | | 1/21/2055 | | | 149,519 | |
| | | | | | | | | | | | | | | 788,615 | |
| TELECOMMUNICATIONS - 2.5% | | | | | | | | | | | | | | | |
| America Movil SAB de CV | | | 200,000 | | EUR | | | 3.0000 | | | 7/12/2021 | | | 252,016 | |
| Play Finance 2 SA | | | 100,000 | | EUR | | | 5.2500 | | | 2/1/2019 | | | 117,973 | |
| Telecom Italia SpA | | | 50,000 | | GBP | | | 6.3750 | | | 6/24/2019 | | | 81,352 | |
| Telefonica Emisiones SAU | | | 200,000 | | EUR | | | 1.4770 | | | 9/14/2021 | | | 236,763 | |
| Wind Acquisition Finance SA | | | 100,000 | | EUR | | | 4.0000 | | | 7/15/2020 | | | 112,244 | |
| | | | | | | | | | | | | | | 800,348 | |
| | | | | | | | | | | | | | | | |
| TOTAL CORPORATE BONDS & NOTES (Cost - $11,276,590) | | | | | | | | | | | | | | 11,122,062 | |
| | | | | | | | | | | | | | | | |
| FOREIGN GOVERNMENT BONDS - 60.5% | | | | | | | | | | | | | | | |
| Austria Government Bond - 144A | | | 250,000 | | EUR | | | 1.2000 | | | 10/20/2025 | | | 305,216 | |
| Belgium Government Bond | | | 150,000 | | EUR | | | 4.2500 | | | 9/28/2022 | | | 218,089 | |
| Belgium Government Bond - 144A | | | 100,000 | | EUR | | | 5.0000 | | | 3/28/2035 | | | 184,808 | |
| Bundesrepublik Deutschland | | | 20,000 | | EUR | | | 3.2500 | | | 7/4/2042 | | | 35,008 | |
| Canadian Government Bond | | | 250,000 | | CAD | | | 5.7500 | | | 6/1/2033 | | | 308,820 | |
| Canadian Government Bond | | | 250,000 | | CAD | | | 4.0000 | | | 6/1/2041 | | | 273,559 | |
| Denmark Government Bond | | | 1,850,000 | | DKK | | | 3.0000 | | | 11/15/2021 | | | 332,340 | |
| France Government Bond OAT | | | 120,000 | | EUR | | | 4.7500 | | | 4/25/2035 | | | 217,361 | |
| France Government Bond OAT | | | 150,000 | | EUR | | | 4.5000 | | | 4/25/2041 | | | 278,376 | |
| Hungary Government International Bond | | | 100,000 | | USD | | | 5.3750 | | | 3/25/2024 | | | 111,338 | |
| Indonesia Government International Bond - 144A | | | 150,000 | | EUR | | | 2.8750 | | | 7/8/2021 | | | 178,438 | |
| Ireland Government Bond | | | 100,000 | | EUR | | | 5.4000 | | | 3/13/2025 | | | 158,592 | |
| Italy Buoni Poliennali Del Tesoro | | | 650,000 | | EUR | | | 0.7500 | | | 1/15/2018 | | | 754,830 | |
| Italy Buoni Poliennali Del Tesoro | | | 250,000 | | EUR | | | 4.5000 | | | 2/1/2020 | | | 332,083 | |
| Italy Buoni Poliennali Del Tesoro | | | 100,000 | | EUR | | | 5.5000 | | | 11/1/2022 | | | 147,882 | |
| Italy Buoni Poliennali Del Tesoro | | | 340,000 | | EUR | | | 4.5000 | | | 3/1/2024 | | | 485,100 | |
| Italy Buoni Poliennali Del Tesoro | | | 240,000 | | EUR | | | 3.7500 | | | 9/1/2024 | | | 327,719 | |
| Italy Buoni Poliennali Del Tesoro | | | 240,000 | | EUR | | | 5.0000 | | | 9/1/2040 | | | 398,316 | |
| Japan Government Ten Year Bond | | | 129,500,000 | | JPY | | | 1.4000 | | | 9/20/2019 | | | 1,277,359 | |
| Japan Government Thirty Year Bond | | | 100,450,000 | | JPY | | | 2.5000 | | | 6/20/2036 | | | 1,342,474 | |
| Japan Government Thirty Year Bond | | | 80,300,000 | | JPY | | | 2.0000 | | | 9/20/2041 | | | 1,053,752 | |
| Japan Government Twenty Year Bond | | | 241,150,000 | | JPY | | | 1.9000 | | | 9/20/2023 | | | 2,604,050 | |
| Japan Government Twenty Year Bond | | | 133,800,000 | | JPY | | | 2.1000 | | | 12/20/2027 | | | 1,560,802 | |
| Korea Treasury Bond | | | 832,150,000 | | KRW | | | 3.0000 | | | 9/10/2024 | | | 801,619 | |
| Malaysia Government Bond | | | 1,400,000 | | MYR | | | 3.8000 | | | 8/17/2023 | | | 358,023 | |
| Mexican Bonos | | | 14,900,000 | | MXN | | | 6.5000 | | | 6/9/2022 | | | 916,499 | |
| Mexican Bonos | | | 7,400,000 | | MXN | | | 10.0000 | | | 12/5/2024 | | | 557,636 | |
| Poland Government Bond | | | 300,000 | | PLN | | | 5.7500 | | | 9/23/2022 | | | 93,618 | |
| Romanian Government International Bond | | | 100,000 | | EUR | | | 2.8750 | | | 10/28/2024 | | | 120,104 | |
| Spain Government Bond - 144A | | | 80,000 | | EUR | | | 5.4000 | | | 1/31/2023 | | | 118,573 | |
| Spain Government Bond - 144A | | | 200,000 | | EUR | | | 4.4000 | | | 10/31/2023 | | | 283,121 | |
| Spain Government Bond - 144A | | | 250,000 | | EUR | | | 3.8000 | | | 4/30/2024 | | | 340,582 | |
| Spain Government Bond - 144A | | | 120,000 | | EUR | | | 4.2000 | | | 1/31/2037 | | | 175,260 | |
| Sweden Government Bond | | | 3,600,000 | | SEK | | | 4.2500 | | | 3/12/2019 | | | 508,929 | |
| Switzerland Government Bond | | | 400,000 | | CHF | | | 4.0000 | | | 2/11/2023 | | | 548,552 | |
| United Kingdom Gilt | | | 250,000 | | GBP | | | 4.2500 | | | 6/7/2032 | | | 473,339 | |
| United Kingdom Gilt | | | 235,000 | | GBP | | | 4.5000 | | | 12/7/2042 | | | 488,756 | |
| United Kingdom Gilt | | | 150,000 | | GBP | | | 4.2500 | | | 12/7/2055 | | | 335,975 | |
| TOTAL FOREIGN GOVERNMENT BONDS (Cost - $18,569,974) | | | | | | | | | | | | | | 19,006,898 | |
See accompanying notes to financial statements.
| SCHEDULE OF INVESTMENTS (Unaudited) |
| Dunham International Opportunity Bond Fund (Continued) |
| April 30, 2016 |
| Security | | Principal Amount | | | | Interest Rate | | | Maturity | | Value | |
| ASSET BACKED SECURITIES - 0.4% | | | | | | | | | | | | | | | |
| Sunrise SRL + (Cost - $111,835) | | | 100,000 | | EUR | | | 0.5580 | % | | 5/27/2035 | | $ | 115,271 | |
| | | | | | | | | | | | | | | | |
| MORTGAGE BACKED SECURITIES - 0.7% | | | | | | | | | | | | | | | |
| German Residential Funding 2013-2 Ltd. | | | 92,322 | | EUR | | | 0.9190 | + | | 8/27/2024 | | | 106,693 | |
| Taurus 2013 GMF1 PLC | | | 95,773 | | EUR | | | 0.8550 | + | | 5/21/2024 | | | 110,763 | |
| TOTAL MORTGAGE BACKED SECURITIES (Cost - $213,024) | | | | | | | | | | | | | | 217,456 | |
| | | | | | | | | | | | | | | | |
| WHOLE LOAN COLLATERAL - 0.9% | | | | | | | | | | | | | | | |
| Bankinter 10 Fondo de Titulizacion de Activos | | | 126,846 | | EUR | | | 0.0270 | + | | 6/21/2043 | | | 140,683 | |
| Fondo de Titulizacion de Activos Santander Hipotecario 2 | | | 58,150 | | EUR | | | 0.0070 | + | | 1/18/2049 | | | 64,258 | |
| Silverstone Master Issuer PLC - 144A | | | 50,000 | | GBP | | | 0.9575 | + | | 1/20/2070 | | | 72,924 | |
| TOTAL WHOLE LOAN COLLATERAL (Cost - $271,940) | | | | | | | | | | | | | | 277,865 | |
| | | | | | | | | | | | | | | | |
| | | Shares | | | | | | | | | | | | |
| SHORT-TERM INVESTMENTS - 0.6% | | | | | | | | | | | | | | | |
| MONEY MARKET FUND - 0.6% | | | | | | | | | | | | | | | |
| Fidelity Institutional Money Market Funds - Government Portfolio | | | | | | | | | | | | | | | |
| (Cost - $198,538) | | | 198,538 | | | | | 0.0800 | + | | | | | 198,538 | |
| | | | | | | | | | | | | | | | |
| TOTAL INVESTMENTS - 98.5% (Cost - $30,641,901) | | | | | | | | | | | | | $ | 30,938,090 | |
| OTHER ASSETS LESS LIABILITIES - 1.5% | | | | | | | | | | | | | | 464,246 | |
| NET ASSETS - 100.0% | | | | | | | | | | | | | $ | 31,402,336 | |
| CAD - Canadian Dollar | EUR - EURO | MXN - Mexican Peso |
| | | |
| CHF - Swiss Franc | GBP - United Kingdom Pound | PLN - Polish Zloty |
| | | |
| DKK - Danish Krone | JPY - Japanese Yen | SEK - Swedish Krona |
| + | Variable rate security. Interest rate is as of April 30, 2016. |
144A - Security exempt from registration under Rule 144A of the Securities Act of 1933. These securities may be sold in transactions exempt from registration, normally to qualified institutional buyers.
Perpetual - Perpetual bonds are fixed income instruments without defined maturity dates.
| | | | | | | | | | | | Unrealized | |
| | | | | | | | | | | | Appreciation | |
| Futures Contracts | | Contracts | | | | | | | | | (Depreciation) | |
| FUTURES CONTRACTS PURCHASED* | | | | | | | | | | | | | | | | |
| 10 YR AUD Government Bond maturing June, 2016 | | | | | | | | | | | | | | | | |
| (Underlying Face Amount at Value $37,190,528) | | | 5 | | | | | | | | | | | $ | 94,608 | |
| Canadian 10 Year Bond maturing June, 2016 | | | | | | | | | | | | | | | | |
| (Underlying Face Amount at Value ($333,078) | | | 3 | | | | | | | | | | | | 6,370 | |
| Euro Buxl Future maturing June, 2016 | | | | | | | | | | | | | | | | |
| (Underlying Face Amount at Value $748,738) | | | 4 | | | | | | | | | | | | 6,792 | |
| Long Gilt Future maturing June, 2016 | | | | | | | | | | | | | | | | |
| (Underlying Face Amount at Value $239,200) | | | 2 | | | | | | | | | | | | 7,170 | |
| NET UNREALIZED GAIN FROM FUTURES CONTRACTS PURCHASED | | | | | | | | | | | | | | | 114,940 | |
| | | | | | | | | | | | | | | | | |
| FUTURES CONTRACTS SOLD * | | | | | | | | | | | | | | | | |
| Euro Bobl Future maturing June, 2016 | | | | | | | | | | | | | | | | |
| (Underlying Face Amount at Value ($149,823) | | | (1 | ) | | | | | | | | | | | (2,872 | ) |
| Euro Bund Future maturing June, 2016 | | | | | | | | | | | | | | | | |
| (Underlying Face Amount at Value ($185,353) | | | (1 | ) | | | | | | | | | | | 372 | |
| Japan 10 year Future, maturing June, 2016 | | | | | | | | | | | | | | | | |
| (Underlying Face Amount at Value ($151,490,000) | | | (1 | ) | | | | | | | | | | | (77,569 | ) |
| NET UNREALIZED LOSS FROM FUTURES CONTRACTS SOLD | | | | | | | | | | | | | | | (80,069 | ) |
| | | | | | | | | | | | | | | | | |
| NET UNREALIZED GAIN FROM FUTURES CONTRACTS | | | | | | | | | | | | | | $ | 34,871 | |
| * | Face amounts are the underlying reference notional amounts to stock exchange indices and bonds upon which the fair value of the futures contracts traded by the Fund are based. While face amounts do not represent the current fair value and are not necessarily indicative of the future cash flows of the Fund’s futures contracts, the underlying price changes in relation to the variables specified by the face amounts affect the fair value of these derivative financial instruments. |
| Portfolio Composition ** - (Unaudited) |
| Japan | | | 26.5 | % | | Netherlands | | | 3.0 | % |
| Britain | | | 15.6 | % | | Canada | | | 2.8 | % |
| Italy | | | 9.4 | % | | Switzerland | | | 2.8 | % |
| France | | | 7.4 | % | | South Korea | | | 2.6 | % |
| Spain | | | 7.1 | % | | Other Countries | | | 17.2 | % |
| Mexico | | | 5.6 | % | | Total | | | 100.00 | % |
| ** | Based on total value of investments as of April 30, 2016. |
Percentage may differ from Schedule of Investments which are based on Fund net assets.
See accompanying notes to financial statements.
Dunham Appreciation & Income Fund
Message from the Sub-Adviser (PENN Capital Management Company, Inc.)
The first half of the fiscal year was characterized by steep declines across market capitalizations, before finding a bottom less than half-way through the month of February. From that point forward, equity markets made an abrupt turn and generally surged through the end of the six-month period ended April 30, 2016. U.S. large cap stocks, as measured by the Russell 1000 Index, rose 0.2 percent during the six-month, period while U.S. small cap stocks, as measured by the Russell 2000 Index, declined 1.9 percent. Less than one-third of the convertible securities in the Bank of America/Merrill Lynch All Convertibles All Qualities Index are issued by large capitalization companies. Therefore, the majority are more closely related to the movements in small capitalization and mid capitalization stocks. During the six-month period, convertible securities fell 2.9 percent. Most convertible securities are considered to be “equity-sensitive,” meaning significant amounts of a convertible security’s price movements are related to the movements of the underlying common stock rather than the bond itself. However, the bond component may still play a meaningful role in the pricing of the convertible security. Bonds in general, as measured by the Barclays Aggregate Bond Index, gained 2.8 percent during the fist half of the fiscal year.
The Sub-Adviser generally focused on small and mid capitalization companies, and primarily in convertible securities that were considered to be in the “total return” equity sensitivity range. This area of the range is between convertible securities that are primarily trading based upon the value of their fixed income features (i.e. coupon rate, default risk, etc.) and other convertible securities that are primarily trading based upon the price changes of the underlying common stock. The Sub-Adviser believes that by focusing on this area of the convertible securities spectrum, it can reduce the volatility experienced from the common stocks while benefitting from the support offered by the bond features.
During the six-month period, the best performing sectors in the benchmark index shifted dramatically. During the first three months, consumer staples, utilities, and telecommunications sectors led the way, while in the latter three-month period, materials, energy, and consumer discretionary sectors boasted the highest returns. However, these sectors generally have far fewer constituents represented in the convertible securities space, with all five of these sectors, in aggregate, only representing less than 25 percent of the benchmark index. The largest sector exposures are technology, healthcare, and financial services. These three, in aggregate, make up more than two-thirds of the benchmark index. Similarly, the Sub-Adviser allocated approximately 73 percent of the Fund to these same three sectors.
Within the healthcare sector, NuVasive, Inc. (670704AF2) (holding percentage*: 4.39 percent), a developer of devices used primary for spine-related surgeries, was one of the strongest performers in the Fund during the rebound in the final months of the period. However, other healthcare holdings detracted from absolute performance, as Molina Healthcare, Inc. (60855RAD2) (holding percentage*: 3.50 percent), a managed care organization, Acorda Therapeutics, Inc. (00484MAA4) (holding percentage*: 3.29 percent), a biotechnology company that develops therapies for spinal cord injuries, and Allergan PLC (EP0481507), (holding percentage*: 2.27 percent), a global pharmaceutical developer and distributor, declined during the six-month period. Since it was added to the Fund mid-March, the NuVasive Inc. convertible bond increased 8.2 percent. Conversely, during the six-month period, the Molina Healthcare, Inc. and Acorda Therapeutics, Inc. convertible bonds and the Allergan PLC convertible preferred stock declined 8.2 percent, 11.4 percent, and 19.8 percent, respectively. While detracting from absolute performance, these declines do help to highlight how the convertible securities can significantly protect on the downside when the underlying common stock falls. For example, the common stocks of Molina Healthcare, Inc. (MOH) (holding percentage*: not held), Acorda Therapeutics, Inc. (ACOR) (holding percentage*: not held), and Allergan PLC (AGN) (holding percentage*: not held) dropped 16.5 percent, 28.3 percent, and 29.8 percent, respectively, during the six-month period.
The Sub-Adviser expects global economic headwinds to persist and for moderate gross domestic product growth in the United States to continue. As most convertible securities are originated by high-yield issuers, the Sub-Adviser also considers how default rates may impact the market. The Sub-Adviser believes that there may be a continued increase in defaults for the commodity industry, but this backdrop may provide additional opportunities within the space due to market inefficiencies.
| * | Holdings percentage(s) as of 4/30/2016. |
Growth of $100,000 Investment – (Unaudited)
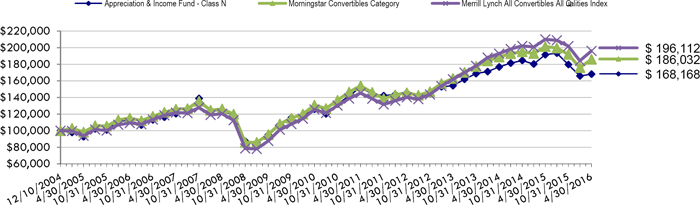
Total Returns as of April 30, 2016
| | Six | | Annualized | Annualized | Annualized | Annualized Since |
| | Months | One Year | Three Years | Five Years | Ten Years | Inception (12/10/04) |
| Class N | (6.42)% | (12.24)% | 2.92% | 2.02% | 4.06% | 4.67% |
| Class C | (7.02)% | (13.21)% | 1.83% | 0.99% | 3.01% | 3.63% |
| Class A with load of 5.75% | (12.04)% | (17.64)% | 0.61% | 0.56% | N/A | 3.20%* |
| Class A without load | (6.70)% | (12.61)% | 2.61% | 1.77% | N/A | 3.85%* |
| Bof A Merrill Lynch All Convertibles All Qualifies Index | (2.88)% | (6.64)% | 6.59% | 6.17% | 6.02% | 6.09% |
| Morningstar Convertibles Category | (3.09)% | (7.63)% | 4.50% | 3.83% | 4.90% | 5.60% |
| * | Class A commenced operations on January 3, 2007. |
The Merrill Lynch All Convertibles All Qualities Index is a widely used index that measures convertible securities’ performance. It measures the performance of U.S. dollar-denominated convertible securities not currently in bankruptcy with a total market value greater than $50 million at issuance.
The Morningstar Convertibles Category is generally representative of convertible bond portfolios that are designed to offer some of the capital-appreciation of stock portfolios, while also supplying some of the safety and yield of bond portfolios.
As disclosed in the Trust’s latest registration statement, the Fund’s total annual operating expenses, including the cost of underlying funds, are 1.34% for Class N, 2.34% for Class C and 1.59% for Class A. Class A shares are subject to a sales load of 5.75% and a deferred sales charge of up to 0.75%. The performance data quoted here represents past performance, which is not indicative of future results. Current performance may be lower or higher than the performance data quoted. The investment return and NAV will fluctuate, so that an investor’s shares, when redeemed, may be worth more or less than their original cost. Total returns are calculated assuming reinvestment of all dividends and capital gains distributions, if any. The returns do not reflect the deductions of taxes a shareholder would pay on the redemption of fund shares or fund distributions. For performance information current to the most recent month-end, please call 1-800-442-4358 or visit our website www.dunham.com.
| SCHEDULE OF INVESTMENTS (Unaudited) |
| Dunham Appreciation & Income Fund |
| April 30, 2016 |
| | | Principal | | | Interest | | | Maturity | | | |
| Security | | Amount | | | Rate | | | Date | | Value | |
| CONVERTIBLE BONDS - 74.9% | | | | | | | | | | | | | | |
| BIOTECHNOLOGY - 3.3% | | | | | | | | | | | | | | |
| Acorda Therapeutics, Inc. | | $ | 965,000 | | | | 1.7500 | % | | 6/15/2021 | | $ | 865,484 | |
| | | | | | | | | | | | | | | |
| DIVERSIFIED FINANCIAL SERVICES - 4.7% | | | | | | | | | | | | | | |
| FXCM, Inc. | | | 715,000 | | | | 2.2500 | | | 6/15/2018 | | | 411,125 | |
| PRA Group, Inc. | | | 960,000 | | | | 3.0000 | | | 8/1/2020 | | | 829,200 | |
| | | | | | | | | | | | | | 1,240,325 | |
| ELECTRICAL COMPONENTS & EQUIPMENT - 3.4% | | | | | | | | | | | | | | |
| SunPower Corp. | | | 1,120,000 | | | | 0.8750 | | | 6/1/2021 | | | 898,100 | |
| | | | | | | | | | | | | | | |
| HEALTHCARE-PRODUCTS - 11.8% | | | | | | | | | | | | | | |
| Cepheid, Inc. | | | 1,040,000 | | | | 1.2500 | | | 2/1/2021 | | | 897,000 | |
| NuVasive, Inc. - 144A | | | 1,020,000 | | | | 2.2500 | | | 3/15/2021 | | | 1,153,237 | |
| Wright Medical Group, Inc. | | | 1,115,000 | | | | 2.0000 | | | 6/15/2019 | | | 1,065,522 | |
| | | | | | | | | | | | | | 3,115,759 | |
| HEALTHCARE-SERVICES - 3.5% | | | | | | | | | | | | | | |
| Molina Healthcare, Inc. | | | 820,000 | | | | 1.6250 | | | 8/15/2044 | | | 919,425 | |
| | | | | | | | | | | | | | | |
| HOME BUILDERS - 2.8% | | | | | | | | | | | | | | |
| CalAtlantic Group, Inc. | | | 700,000 | | | | 1.2500 | | | 8/1/2032 | | | 738,063 | |
| | | | | | | | | | | | | | | |
| INSURANCE - 2.1% | | | | | | | | | | | | | | |
| AmTrust Financial Services, Inc. | | | 745,000 | | | | 2.7500 | | | 12/15/2044 | | | 566,666 | |
| | | | | | | | | | | | | | | |
| INTERNET - 7.7% | | | | | | | | | | | | | | |
| FireEye, Inc. - 144A | | | 990,000 | | | | 1.0000 | | | 6/1/2035 | | | 860,681 | |
| LinkedIn Corp. | | | 595,000 | | | | 0.5000 | | | 11/1/2019 | | | 558,556 | |
| Pandora Media, Inc. - 144A | | | 670,000 | | | | 1.7500 | | | 12/1/2020 | | | 613,469 | |
| | | | | | | | | | | | | | 2,032,706 | |
| MACHINERY-DIVERSIFIED - 1.6% | | | | | | | | | | | | | | |
| Chart Industries, Inc. ^ | | | 450,000 | | | | 2.0000 | | | 8/1/2018 | | | 415,406 | |
| | | | | | | | | | | | | | | |
| PHARMACEUTICALS - 6.5% | | | | | | | | | | | | | | |
| Akorn, Inc. | | | 110,000 | | | | 3.5000 | | | 6/1/2016 | | | 319,756 | |
| Depomed, Inc. | | | 405,000 | | | | 2.5000 | | | 9/1/2021 | | | 448,284 | |
| Impax Laboratories, Inc. - 144A | | | 1,020,000 | | | | 2.0000 | | | 6/15/2022 | | | 949,238 | |
| | | | | | | | | | | | | | 1,717,278 | |
| RETAIL - 2.7% | | | | | | | | | | | | | | |
| GNC Holdings, Inc. - 144A ^ | | | 895,000 | | | | 1.5000 | | | 8/15/2020 | | | 704,253 | |
| | | | | | | | | | | | | | | |
| SEMICONDUCTORS - 9.9% | | | | | | | | | | | | | | |
| Micron Technology, Inc. ^ | | | 690,000 | | | | 3.0000 | | | 11/15/2043 | | | 492,056 | |
| ON Semiconductor Corp. - 144A | | | 1,205,000 | | | | 1.0000 | | | 12/1/2020 | | | 1,098,809 | |
| Rambus, Inc. | | | 900,000 | | | | 1.1250 | | | 8/15/2018 | | | 1,032,188 | |
| | | | | | | | | | | | | | 2,623,053 | |
See accompanying notes to financial statements.
| SCHEDULE OF INVESTMENTS (Unaudited) |
| Dunham Appreciation & Income Fund (Continued) |
| April 30, 2016 |
| | | Principal | | | Interest | | | Maturity | | | |
| Security | | Amount | | | Rate | | | Date | | Value | |
| SOFTWARE - 11.5% | | | | | | | | | | | | | | |
| Akamai Technologies, Inc. | | $ | 820,000 | | | | 0.0000 | % | | 2/15/2019 | | $ | 793,350 | |
| Interactive Intelligence Group, Inc. - 144A | | | 145,000 | | | | 1.2500 | | | 6/1/2020 | | | 126,694 | |
| Medidata Solutions, Inc. | | | 760,000 | | | | 1.0000 | | | 8/1/2018 | | | 803,225 | |
| Pros Holdings, Inc. | | | 950,000 | | | | 2.0000 | | | 12/1/2019 | | | 755,250 | |
| ServiceNow, Inc. | | | 470,000 | | | | 0.0000 | | | 11/1/2018 | | | 546,669 | |
| | | | | | | | | | | | | | 3,025,188 | |
| TELECOMMUNICATIONS - 3.4% | | | | | | | | | | | | | | |
| Finisar Corp. | | | 932,000 | | | | 0.5000 | | | 12/15/2033 | | | 890,643 | |
| | | | | | | | | | | | | | | |
| TOTAL CONVERTIBLE BONDS (Cost - $22,690,283) | | | | | | | | | | | | | 19,752,349 | |
| | | | | | | | | | | | | | | |
| | | | | | | | | | | Dividend | | | | |
| | | | | | | Shares | | | Rate | | | | |
| PREFERRED STOCK - 12.5% | | | | | | | | | | | | | | |
| INSURANCE - 1.4% | | | | | | | | | | | | | | |
| Maiden Holding Ltd. | | | | | | | 7,870 | | | 7.25 | % | | 372,723 | |
| | | | | | | | | | | | | | | |
| PHARMACEUTICALS - 2.3% | | | | | | | | | | | | | | |
| Allergan plc | | | | | | | 735 | | | 5.5000 | | | 596,445 | |
| | | | | | | | | | | | | | | |
| REITS - 4.7% | | | | | | | | | | | | | | |
| Crown Castle International Corp. | | | | | | | 5,750 | | | 4.5000 | | | 610,736 | |
| iStar Financial, Inc. | | | | | | | 15,000 | | | 4.5000 | | | 640,200 | |
| | | | | | | | | | | | | | 1,250,936 | |
| TELECOMUNICATIONS - 4.1% | | | | | | | | | | | | | | |
| Frontier Communications Corp. ^ | | | | | | | 10,500 | | | 11.1250 | | | 1,093,313 | |
| | | | | | | | | | | | | | | |
| TOTAL PREFERRED STOCK (Cost - $3,596,921) | | | | | | | | | | | | | 3,313,417 | |
| | | | | | | | | | | | | | | |
| | | | | | | | | | | Interest | | | | |
| | | | | | | | | | | Rate | | | | |
| SHORT-TERM INVESTMENT - 12.2% | | | | | | | | | | | | | | |
| MONEY MARKET FUND - 12.2% | | | | | | | | | | | | | | |
| First American Government Obligations Fund | | | | | | | 3,223,250 | | | 0.01 | % + | | 3,223,250 | |
| TOTAL SHORT-TERM INVESTMENT (Cost - $3,223,250) | | | | | | | | | | | | | | |
| | | | | | | | | | | | | | | |
| COLLATERAL FOR SECURITIES LOANED - 10.5% | | | | | | | | | | | | | | |
| Mount Vernon Prime Portfolio + (Cost - $2,769,760) | | | | | | | 2,769,760 | | | 0.51 | % | | 2,769,760 | |
| | | | | | | | | | | | | | | |
| TOTAL INVESTMENTS - 110.1% (Cost - $32,280,214) | | | | | | | | | | | | $ | 29,058,776 | |
| LIABILITIES IN EXCESS OF OTHER ASSETS - (10.1)% | | | | | | | | | | | | | (2,697,816 | ) |
| TOTAL NET ASSETS - 100.0% | | | | | | | | | | | | $ | 26,360,960 | |
| ^ | All or a portion of these securities are on loan. Total loaned securies had a value of $2,688,014 at April 30, 3016. |
| * | Non-income producing security. |
| + | Variable rate security. Interest rate is as of April 30, 2016. |
REITS - Real Estate Investment Trusts.
144A- Security exempt from registration under Rule 144A of the Securities Act of 1933. These securities may be sold in transactions exempt from registration, normally to qualified institutional buyers.
See accompanying notes to financial statements.
| SCHEDULE OF INVESTMENTS (Unaudited) |
| Dunham Appreciation & Income Fund (Continued) |
| April 30, 2016 |
| Portfolio Composition * - (Unaudited) |
| Convertible Bonds | | | 68.0 | % |
| Preferred Stock | | | 11.4 | % |
| Short-Term Investment | | | 11.1 | % |
| Collateral For Securities Loaned | | | 9.5 | % |
| Total | | | 100.0 | % |
| * | Based on total value of investments as of April 30, 2016. |
Percentage may differ from Schedule of Investments which are based on Fund net assets.
See accompanying notes to financial statements.
Dunham Alternative Strategy Fund
Message from the Sub-Adviser (Market Concepts, LLC)
Managed futures strategies, as measured by the Credit Suisse Managed Futures Liquid Index, increased 6.9 percent in the six-month period ending April 30, 2016. In the first three months of the period, or the first fiscal quarter, the index increased 4.7 percent. The second fiscal quarter was less dramatic as managed futures rose only 2.0 percent. Still, it was a significant improvement from the three fiscal quarters of declines previous to that. Domestic equity markets, as measured by the S&P 500 Index, didn’t fare quite as well, increasing 0.4 percent during the six-month period. Emerging markets equities, as measured by the MSCI Emerging Markets Index, showed a negative return, falling 0.1 percent. However, this moderate overall return was not indicative of the excitement that emerging markets equities experienced during the period as they had a weak first fiscal quarter, dropping 12.1 percent, followed by a strong second fiscal quarter, rising 13.7 percent. Foreign developed markets, as measured by the MSCI EAFE Index, had the poorest performance with a 3.1 percent decline during the six-month period. As with the other equity indexes, foreign developed stocks suffered during the first fiscal quarter, losing 9.9 percent, but were not able to recover the lost ground, gaining only 7.6 percent in the second fiscal quarter. With the diversified nature of managed futures, exposure to multiple asset classes may provide non-correlated returns as reflected in the performance of the Credit Suisse Managed Futures Liquid Index. The Sub-Adviser continues to believe that the trend conditions of the various asset classes offer the Fund an advantageous investment environment on the back-drop of the multiple year divergence that has occurred between the domestic equity markets and other investment asset classes.
In the later part of the first fiscal quarter, the Sub-Adviser launched a newly updated investment strategy that is made up of eight individual components, or modules, that seek long and short exposure based on a relative strength indicator. Two of these modules were suspended, however, mainly due to a drastic change of market environment. Wild volatility in the commodities markets saw Crude Oil drop to levels not seen since 2002, while Gold saw rapid out-of-trend advances over a series of single-day rallies. Consequently, both the Gold and Oil modules have been suspended in the portfolio for the time being. Modules related to the S&P 500 Index and U.S. Treasuries performed well for the environment and profits were also found in the Euro currency. While commodity exposure has been reduced temporarily, the Sub-Adviser expects the portfolio to produce non-correlated returns overall by systematically applying long/short positions in equity, currency and fixed income based areas.
The Fund experienced its largest gains in the newly added fixed income module, which was not implemented until early January. The Sub-Adviser attempted to exploit both positive and negative trends in the 20+ year U.S. Treasury exclusively in the fixed income area. When going long, iShares 20+ Year Treasury Bond (TLT) (holding percentage**: 20.22 percent) was used. Conversely, ProShares Short 20+ Year Treasury (TBF) (holding percentage**: 17.97 percent) was employed when a rise in long-term Treasury rates was expected. Both strategies had positive results for the Fund.
Long and short strategies in the equity market had mixed results as trades related to the S&P 500 Index, as represented by the SPDR S&P 500 ETF (SPY) (holding percentage**: 17.99 percent) when going long and the ProShares Short S&P 500 ETF (SH) (holding percentage**: 17.99 percent) when shorting, were generally positive. Trades tied to the MSCI EAFE Index, as represented by the iShares MSCI EAFE ETF (EFA) (holding percentage**: 17.98 percent) on long trades and by the ProShares Short MSCI EAFE ETF (EFZ) (holding percentage**: 7.99 percent) on short trades, had a negative impact. The MSCI EAFE Index contains stocks of developed countries, such as those in Western Europe, Japan and Australia. Strategies in emerging markets countries, as represented by long and short ETFs that track the MSCI Emerging Markets Index, didn’t fair as poorly as the developed markets, but still were slightly negative.
The Sub-Adviser continued to focus on currency movements as well, particularly in the Yen and Euro. Trades were made in the CurrencyShares Japanese Yen Trust (FXY) (holding percentage**: 13.63 percent) and the CurrencyShares Euro Trust (FXE) (holding percentage**: 18.36 percent), which attempt to track the performance of the Yen and Euro, respectively. However, when the Sub-Adviser sought to exploit negative trends in these currencies, it utilized the ProShares UltraShort Yen (YCS) (holding percentage**: 8.21 percent) and the ProShares UltraShort Euro (EUO) (holding percentage**: 6.89 percent), which attempt to track the inverse performance of the Yen and Euro, respectively. The trades in both FXE and EUO generally resulted in positive contributions to performance for the Fund, while the trades in both FXY and YCS detracted.
The Sub-Adviser’s focus on both short-term and long-term trends provided mixed results, as volatility and concern in the markets generally caused some sharp reversals in trends. While these dramatic shifts may provide opportunities for the Sub-Adviser to find another short-term trend, they may also cause additional losses, especially in the holdings that were established by longer-term trends. Therefore, the Sub-Adviser’s selection of established trends that meet strict requirements generally detracted from the Fund’s performance relative to the benchmark index during the fiscal quarter.
| * | Holdings Percentage(s) as of 4/30/2016. |
| ** | Holdings Percentage(s) as of the date prior to the sales of the security. |
Growth of $100,000 Investment - (Unaudited)
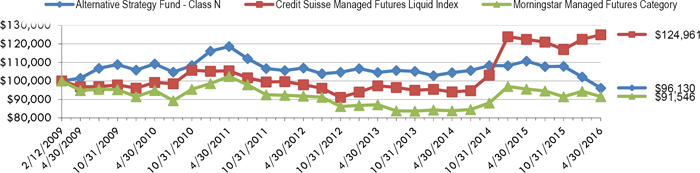
Total Returns as of April 30, 2016
| | Six | | Annualized | Annualized | Annualized Since |
| | Months | One Year | Three Years | Five Years | Inception (2/12/09) |
| Class N | (10.88)% | (13.17)% | (2.77)% | (4.11)% | (0.55)% |
| Class C | (11.34)% | (14.07)% | (3.76)% | (5.11)% | (2.08)% * |
| Class A with load of 5.75% | (11.01)% | (18.40)% | (4.91)% | (5.49)% | (1.47)% ** |
| Class A without load | (11.01)% | (13.43)% | (3.02)% | (4.37)% | (0.65)% ** |
| Dow Jones Credit Suisse Managed Futures Liquid Index | 6.86% | 2.08% | 8.65% | 3.45% | 3.37% |
| Morningstar Managed Futures Category | 0.05% | (4.27)% | 1.64% | (2.22)% | (1.22)% |
| * | Inception date for Class C is May 14, 2009. |
| ** | Inception date for Class A is March 25, 2009, performance for Class A includes the operations of the predecessor, Sherwood Forest Alternative Fund (formerly Class P). |
Class N and Class C performance includes the operations of the predecessor, Sherwood Forest Alternative Fund (formerly Class I and Class C, respectively).
The Dow Jones Credit Suisse Managed Futures Liquid Index allocates assets among four major asset classes (equities, fixed-income, commodities and currencies) represented by 18 trading vehicles using a methodology that, in part, seeks to replicate a managed futures strategy that historically has produced gains during periods of rising and declining markets. Investors cannot invest directly in an index or benchmark.
The Morningstar Managed Futures Category is generally representative of funds that trade liquid global futures, options, swaps, and foreign exchange contracts, both listed and over-the-counter. A majority of these funds follow trend-following, price-momentum strategies.
As disclosed in the Trust’s latest registration statement, the Fund’s total annual operating expenses before and after fee waiver, including underlying funds, are 1.80% for Class N, 2.80% for Class C and 2.05% for Class A. Class A shares are subject to a sales load of 5.75% and a deferred sales charge of up to 0.75%. The performance data quoted here represents past performance, which is not indicative of future results. Current performance may be lower or higher than the performance data quoted. The investment return and NAV will fluctuate, so that an investor’s shares, when redeemed, may be worth more or less than their original cost. Total returns are calculated assuming reinvestment of all dividends and capital gains distributions, if any. The returns do not reflect the deductions of taxes a shareholder would pay on the redemption of fund shares or fund distributions. For performance information current to the most recent month-end, please call 1-800-442-4358 or visit our website www.dunham.com
| SCHEDULE OF INVESTMENTS (Unaudited) |
| Dunham Alternative Strategy Fund |
| April 30, 2016 |
| Security | | Shares | | | | | | | | Value | |
| EXCHANGE TRADED FUNDS - 80.6% | | | | | | | | | | | | | | |
| ASSET ALLOCATION FUND - 26.6% | | | | | | | | | | | | | | |
| CurrencyShares Euro Trust * | | | 36,300 | | | | | | | | | $ | 4,059,791 | |
| ProShares UltraShort Yen * | | | 26,700 | | | | | | | | | | 1,816,134 | |
| | | | | | | | | | | | | | 5,875,925 | |
| DEBT FUND - 18.0% | | | | | | | | | | | | | | |
| ProShares Short 20+ Year Treasury * | | | 174,300 | | | | | | | | | | 3,972,297 | |
| | | | | | | | | | | | | | | |
| EQUITY FUNDS - 36.0% | | | | | | | | | | | | | | |
| iShares MSCI EAFE ETF | | | 68,000 | | | | | | | | | | 3,973,240 | |
| ProShares Short S&P 500 * | | | 195,800 | | | | | | | | | | 3,976,698 | |
| | | | | | | | | | | | | | 7,949,938 | |
| | | | | | | | | | | | | | | |
| TOTAL EXCHANGE TRADED FUNDS (Cost - 17,973,365) | | | | | | | | | | | | | 17,798,160 | |
| | | | | | | | | | | | | | | |
| SHORT -TERM INVESTMENT - 19.5% | | | | | | | | | | | | | | |
| MONEY MARKET FUND - 19.5% | | | | | | | | | | | | | | |
| STIT-Treasury Portfolio - 0.21% + (a) | | | | | | | | | | | | | | |
| (Cost - $4,309,853) | | | 4,309,853 | | | | | | | | | | 4,309,853 | |
| | | | | | | | | | | | | | | |
| TOTAL INVESTMENTS - 100.1% (Cost - $22,283,218) | | | | | | | | | | | | $ | 22,108,013 | |
| LIABILITIES IN EXCESS OF OTHER ASSETS - (0.1)% | | | | | | | | | | | | | (31,816 | ) |
| NET ASSETS - 100.0% | | | | | | | | | | | | $ | 22,076,197 | |
ETF - Exchange Traded Fund
| * | Non income producing security. |
| + | Variable rate security. Interest rate is as of April 30, 2016. |
| (a) | Represents annualized yield at date of purchase for discount securities and coupon for coupon based securities. |
| Portfolio Composition * - (Unaudited) |
| Equity Funds | | | 36.0 | % | | | | | | |
| Asset Allocation Funds | | | 26.5 | % | | | | | | |
| Money Market Funds | | | 19.5 | % | | | | | | |
| Debt Fund | | | 18.0 | % | | | | | | |
| Total | | | 100.0 | % | | | | | | |
| * | Based on total value of investments as of April 30, 2016. |
Percentage may differ from Schedule of Investments which are based on Fund net assets.
See accompanying notes to financial statements.
Dunham Large Cap Value Fund
Message from the Sub-Adviser (Rothschild Asset Management, Inc.)
U.S. equity markets provided mixed rewards across the major sectors during the six-month period ended April 30, 2016. Despite the divergence in the underlying sector performance, large cap value stocks, as measured by the Russell 1000 Value Index, increased 1.9 percent. However, the dispersion between the best performing large cap value sector (telecommunication services) and the worst performing sector (consumer discretionary) was more than 17 percent. The primary macro-oriented themes that influenced this polarized performance were the energy price resurgence and concerns surrounding the Fed’s view on “how soon is too soon” to raise interest rates again now that Fed Chair Janet Yellen showed in December that interest rate increases are a reality under her reign. Global market concerns and a widespread absence of revenue growth contributed to investor unease, but were not as impactful on a day-to-day basis as oscillating oil prices or the intense interpolation of the Fed’s primary economic indicators and the potential justification for a near-term increase in interest rates.
The overall 1.8 percent increase in the energy sector during the six-month period provides little transparency into the 18.8 percent decline experienced from the beginning of the fiscal year through mid-February, before the sector surged 25.3 percent. The Sub-Adviser generally avoided most energy services companies, as its risk controls generally deemed those to be less attractive. However, the Fund did hold energy related stocks, such as ConocoPhillips (COP) (holding percentage*: 2.50 percent), Exxon Mobil Corp. (XOM) (holding percentage*: 4.86 percent), and EOG Resources Inc. (EOG) (holding percentage*: 2.05 percent). All three of these companies are engaged in the exploration, development, production and marketing of crude oil and natural gas, although their predominant proficiencies range from shale fracking to deep ocean drilling to refining. Therefore, their prices were still impacted by the fall and subsequent surge in oil prices, albeit to a lesser extent than those companies that derive the majority of their revenues from providing the machinery and technology to exploration and refining companies. During the six-month period, COP and EOG decreased 9.7 percent and 3.3 percent, respectively. Conversely, XOM rose 8.8 percent during the same time period.
The utilities sector was significantly affected by the interest rate excitement during the six-month period. The Sub-Adviser generally exercised a significant overweight to the sector during the first fiscal quarter. However, after the sector surged close to 4.5 percent before the final trading days of February, the Sub-Adviser used the opportunity to reduce the overweight and allocate to areas that exhibited what it believed to be better risk-reward profiles. Some of the industries that the Sub-Adviser viewed as having a more attractive profile were in the areas of media and telecommunications. Within the telecommunications sector, AT&T Inc. (T) (holding percentage*: 2.00 percent), increased 9.0 percent in the second fiscal quarter after increasing 9.1 percent in the previous fiscal quarter. Within the media industry, CBS Corp. (CBS) (holding percentage*: 1.17 percent) increased 18.0 percent in the second fiscal quarter, after rising 2.4 percent in the previous fiscal quarter. When viewing the six-month period in its entirety, T and CBS boasted 18.9 percent and 20.9 percent returns, respectively.
While the financial services sector was one of the largest detractors in the first fiscal quarter, it only slightly lagged in the second fiscal quarter. In the first fiscal quarter, holdings such as American Express Co. (AXP) (holding percentage*: 1.04 percent) and Discover Financial Services (DFS) (holding percentage*: 1.41 percent) declined 26.6 percent and 18.2 percent, respectively. The Sub-Adviser re-evaluated these holdings in-line with its strict process and perceived the extreme magnitude of these declines to be unwarranted. During the second fiscal quarter, AXP and DFS increased 22.9 percent and 23.7 percent, respectively. The most recent rebound for AXP was not enough to offset the earlier loss, but it did bring the six-month performance to a negative 9.9 percent. However, the rebound in DFS was enough to offset the prior period’s decline, ending the six-month period up 1.2 percent. The Sub-Adviser believes that the financial services sector will continue to fluctuate with the transitioning views on interest rates – particularly the timing of the rate increases and the magnitude of each increase.
Although the Sub-Adviser anticipates that the balance of 2016 is likely to have similar volatility to what we have recently witnessed, its disciplined use of risk controls and desire to minimize the influence of factor-based risks are expected to meaningfully mitigate downward pressures in the large cap value space. The Sub-Adviser continues to believe that U.S. companies will provide lackluster earnings for the next two to three years, with the status of the global economy dictating the duration of this anemic growth environment. Therefore, the Sub-Adviser’s combination of fundamental analysis with quantitative tools driving its stock selection is designed to potentially identify stocks that it believes will prevail in a low-growth environment.
| * | Holdings Percentage(s) as of 4/30/2016. |
Growth of $100,000 Investment - (Unaudited)
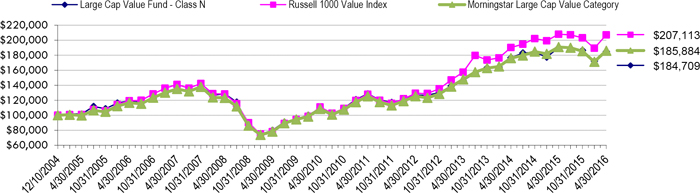
Total Returns as of April 30, 2016
| | Six | | Annualized | Annualized | Annualized | Annualized Since Inception |
| | Months | One Year | Three Years | Five Years | Ten Years | (12/10/04) |
| Class N | (0.93)% | (2.72)% | 8.11% | 7.52% | 4.48% | 5.54% |
| Class C | (1.41)% | (3.68)% | 7.03% | 6.45% | 3.44% | 4.50% |
| Class A with load of 5.75% | (1.08)% | (8.55)% | 5.72% | 5.98% | N/A | 3.16%* |
| Class A without load | (6.75% | (2.98)% | 7.82% | 7.25% | N/A | 3.82%* |
| Russell 1000 Value Index | 1.93% | (0.40)% | 9.59% | 10.13% | 5.67% | 4.79% |
| Morningstar Large Cap Value Category | 0.29% | (2.64)% | 7.92% | 8.22% | 4.78% | 5.59% |
| * | Class A commenced operations on January 3, 2007. |
The Russell 1000 Value Index measures the performance of the 1,000 largest companies in the Russell 3000 Index with lower price-to-book ratios and lower forecasted growth values. Investors cannot invest directly in an index or benchmark.
The Morningstar Large Cap Value Category is generally representative of mutual funds that primarily invest in big (large capitalization) U.S. companies that are less expensive or growing more slowly than other large-cap stocks.
As disclosed in the Trust’s latest registration statement, the Fund’s total annual operating expenses, including underlying funds, are 1.25% for Class N, 2.25% for Class C and 1.50% for Class A. Class A shares are subject to a sales load of 5.75% and a deferred sales charge of up to 0.75%. The performance data quoted here represents past performance, which is not indicative of future results. Current performance may be lower or higher than the performance data quoted. The investment return and NAV will fluctuate, so that an investor’s shares, when redeemed, may be worth more or less than their original cost. Total returns are calculated assuming reinvestment of all dividends and capital gains distributions, if any. The returns do not reflect the deductions of taxes a shareholder would pay on the redemption of fund shares or fund distributions. For performance information current to the most recent month-end, please call 1-800-442-4358 or visit our website www.dunham.com.
| SCHEDULE OF INVESTMENTS (Unaudited) |
| Dunham Large Cap Value Fund |
| April 30, 2016 |
| Security | | Shares | | | Value | |
| COMMON STOCK -97.4% | | | | | | | | |
| AEROSPACE/DEFENSE - 2.5% | | | | | | | | |
| Northrop Grumman Corp. | | | 4,758 | | | $ | 981,385 | |
| Raytheon Co. | | | 3,226 | | | | 407,605 | |
| | | | | | | | 1,388,990 | |
| AIRLINES - 0.8% | | | | | | | | |
| JetBlue Airways Corp. * ^ | | | 22,092 | | | | 437,201 | |
| | | | | | | | | |
| BANKS - 10.7% | | | | | | | | |
| Bank of America Corp. | | | 96,111 | | | | 1,399,376 | |
| JPMorgan Chase & Co. | | | 27,870 | | | | 1,761,384 | |
| M&T Bank Corp ^ | | | 7,633 | | | | 903,137 | |
| SunTrust Banks, Inc. | | | 15,320 | | | | 639,457 | |
| Wells Fargo & Co. | | | 24,487 | | | | 1,223,860 | |
| | | | | | | | 5,927,214 | |
| BEVERAGES - 2.0% | | | | | | | | |
| Coca-Cola Enterprises, Inc. ^ | | | 7,645 | | | | 401,210 | |
| PepsiCo, Inc. | | | 6,818 | | | | 701,981 | |
| | | | | | | | 1,103,191 | |
| BIOTECHNOLOGY - 2.9% | | | | | | | | |
| Amgen, Inc. | | | 3,231 | | | | 511,467 | |
| Biogen, Inc. * | | | 1,647 | | | | 452,909 | |
| Gilead Sciences, Inc. | | | 7,103 | | | | 628,938 | |
| | | | | | | | 1,593,314 | |
| CHEMICALS - 2.2% | | | | | | | | |
| Dow Chemical Co. ^ | | | 17,755 | | | | 934,091 | |
| LyondellBasell Industries NV - Class A | | | 3,642 | | | | 301,084 | |
| | | | | | | | 1,235,175 | |
| COMMERCIAL SERVICES - 1.3% | | | | | | | | |
| ManpowerGroup, Inc. | | | 9,216 | | | | 709,908 | |
| | | | | | | | | |
| COMPUTERS - 2.2% | | | | | | | | |
| Amdocs Ltd. | | | 11,586 | | | | 655,072 | |
| Apple, Inc. | | | 5,797 | | | | 543,411 | |
| | | | | | | | 1,198,483 | |
| COSMETICS / PERSONAL CARE - 1.5% | | | | | | | | |
| Procter & Gamble Co. ^ | | | 10,353 | | | | 829,482 | |
| | | | | | | | | |
| DIVERSIFIED FINANCIAL SERVICES - 4.3% | | | | | | | | |
| American Express Co. ^ | | | 8,744 | | | | 572,120 | |
| Ameriprise Financial, Inc. | | | 6,039 | | | | 579,140 | |
| Discover Financial Services | | | 13,722 | | | | 772,137 | |
| Raymond James Financial, Inc. | | | 8,079 | | | | 421,481 | |
| | | | | | | | 2,344,878 | |
| ELECTRIC - 4.9% | | | | | | | | |
| American Electric Power Co., Inc. | | | 16,815 | | | | 1,067,753 | |
| DTE Energy Co. ^ | | | 7,951 | | | | 708,911 | |
| Edison International ^ | | | 13,141 | | | | 929,200 | |
| | | | | | | | 2,705,864 | |
| Security | | Shares | | | Value | |
| | | | | | | | | |
| ENGINEERING & CONSTRUCTION - 1.0% | | | | | | | | |
| Fluor Corp. ^ | | | 10,149 | | | $ | 554,744 | |
| | | | | | | | | |
| ENVIRONMENTAL CONTROL - 1.3% | | | | | | | | |
| Waste Management, Inc. | | | 11,711 | | | | 688,490 | |
| | | | | | | | | |
| FOOD - 1.4% | | | | | | | | |
| Kroger Co. | | | 8,233 | | | | 291,366 | |
| Pinnacle Foods, Inc. | | | 10,640 | | | | 453,158 | |
| | | | | | | | 744,524 | |
| FOREST PRODUCTS & PAPER - 1.8% | | | | | | | | |
| International Paper Co. ^ | | | 22,532 | | | | 974,960 | |
| | | | | | | | | |
| HEALTHCARE-PRODUCTS - 1.1% | | | | | | | | |
| Becton Dickinson and Co. ^ | | | 3,701 | | | | 596,823 | |
| | | | | | | | | |
| HOME BUILDERS - 1.3% | | | | | | | | |
| PulteGroup, Inc. ^ | | | 38,008 | | | | 698,967 | |
| | | | | | | | | |
| INSURANCE - 6.4% | | | | | | | | |
| Allstate Corp. | | | 13,827 | | | | 899,446 | |
| American International Group, Inc. | | | 12,046 | | | | 672,408 | |
| Berkshire Hathaway, Inc. * | | | 2,426 | | | | 352,934 | |
| Chubb Ltd. | | | 6,804 | | | | 801,919 | |
| MetLife, Inc. | | | 18,156 | | | | 818,836 | |
| | | | | | | | 3,545,543 | |
| MEDIA - 3.2% | | | | | | | | |
| CBS Corp. ^ | | | 11,506 | | | | 643,300 | |
| Comcast Corp. - Class A | | | 9,820 | | | | 596,663 | |
| Time Warner, Inc. | | | 7,115 | | | | 534,621 | |
| | | | | | | | 1,774,584 | |
| MISCELLANEOUS MANUFACTURING - 2.0% | | | | | | | | |
| 3M Co. | | | 1,765 | | | | 295,426 | |
| General Electric Co. ^ | | | 26,886 | | | | 826,744 | |
| | | | | | | | 1,122,170 | |
| OIL & GAS - 12.4% | | | | | | | | |
| Chevron Corp. ^ | | | 10,179 | | | | 1,040,090 | |
| ConocoPhillips ^ | | | 28,762 | | | | 1,374,536 | |
| EOG Resources, Inc. | | | 13,668 | | | | 1,129,250 | |
| Exxon Mobil Corp. ^ | | | 30,205 | | | | 2,670,122 | |
| Valero Energy Corp. | | | 10,498 | | | | 618,017 | |
| | | | | | | | 6,832,015 | |
| PHARMACEUTICALS - 9.4% | | | | | | | | |
| Cardinal Health, Inc. | | | 8,126 | | | | 637,566 | |
| Johnson & Johnson | | | 11,909 | | | | 1,334,761 | |
| Merck & Co., Inc. ^ | | | 24,793 | | | | 1,359,648 | |
| Pfizer, Inc. | | | 57,109 | | | | 1,868,035 | |
| | | | | | | | 5,200,010 | |
See accompanying notes to financial statements.
| SCHEDULE OF INVESTMENTS (Unaudited)(Continued) |
| Dunham Large Cap Value Fund |
| April 30, 2016 |
| | | Shares | | | Value | |
| REITS - 3.0% | | | | | | | | |
| Boston Properties, Inc. | | | 4,576 | | | $ | 589,663 | |
| Equity LifeStyle Properties, Inc. | | | 9,475 | | | | 648,943 | |
| Public Storage ^ | | | 1,771 | | | | 435,272 | |
| | | | | | | | 1,673,878 | |
| RETAIL - 4.1% | | | | | | | | |
| Home Depot, Inc. ^ | | | 5,167 | | | | 691,810 | |
| Macy’s, Inc. | | | 12,358 | | | | 489,253 | |
| Target Corp. ^ | | | 13,386 | | | | 1,064,187 | |
| | | | | | | | 2,245,250 | |
| SAVINGS & LOANS - 1.0% | | | | | | | | |
| New York Community Bancorp, Inc. | | | 38,353 | | | | 576,446 | |
| | | | | | | | | |
| SEMICONDUCTORS - 2.6% | | | | | | | | |
| Intel Corp. ^ | | | 20,604 | | | | 623,889 | |
| QUALCOMM, Inc. | | | 15,988 | | | | 807,714 | |
| | | | | | | | 1,431,603 | |
| SOFTWARE - 3.9% | | | | | | | | |
| Microsoft Corp. | | | 32,950 | | | | 1,643,217 | |
| Nuance Communications, Inc. * | | | 30,253 | | | | 519,747 | |
| | | | | | | | 2,162,964 | |
| TELECOMMUNICATIONS - 6.2% | | | | | | | | |
| AT&T, Inc. | | | 28,315 | | | | 1,099,188 | |
| Cisco Systems, Inc. ^ | | | 46,600 | | | | 1,281,034 | |
| Juniper Networks, Inc. | | | 14,438 | | | | 337,849 | |
| Verizon Communications | | | 14,322 | | | | 729,563 | |
| | | | | | | | 3,447,634 | |
| | | | | | | | | |
| TOTAL COMMON STOCK (Cost - $48,430,515) | | | | | | | 53,744,305 | |
| Security | | Shares | | | Value | |
| SHORT - TERM INVESTMENT - 2.2% | | | | | | | | |
| MONEY MARKET FUND - 2.2% | | | | | | | | |
| STIT-STIC Prime Portfolio - 0.21% + | | | | | | | | |
| (Cost - $1,211,460) | | | 1,211,460 | | | $ | 1,211,460 | |
| | | | | | | | | |
| COLLATERAL FOR SECURITIES LOANED - 16.2% | | | | | | | | |
| Mount Vernon Prime Portfolio 0.51% + | | | | | | | | |
| (Cost - 8,965,266) | | | 8,965,266 | | | | 8,965,266 | |
| | | | | | | | | |
| TOTAL INVESTMENTS - 115.8% (Cost - $58,607,241) | | | | | | $ | 63,921,031 | |
| LIABILITIES LESS OTHER ASSETS - (15.8)% | | | | | | | (8,721,497 | ) |
| NET ASSETS - 100.0% | | | | | | $ | 55,199,534 | |
| ^ | All or a portion of these securities are on loan. Total loaned securities had a value of $8,900,203 at April 30, 2016. |
| * | Non-income producing security. |
| + | Variable rate security. Interest rate is as of April 30, 2016. |
| Portfolio Composition * - (Unaudited) |
| Financial | | | 22.0 | % | | Industrial | | | 5.9 | % |
| Consumer, Non-Cyclical | | | 16.9 | % | | Consumer, Cyclical | | | 5.3 | % |
| Collateral for Securities Loaned | | | 14.0 | % | | Utilities | | | 4.2 | % |
| Energy | | | 10.7 | % | | Basic Materials | | | 3.4 | % |
| Communications | | | 8.2 | % | | Funds | | | 1.9 | % |
| Technology | | | 7.5 | % | | Total | | | 100.0 | % |
| * | Based on total value of investments as of April 30, 2016. |
Percentage may differ from Schedule of Investments which are based on Fund net assets.
See accompanying notes to financial statements.
Dunham Focused Large Cap Growth Fund
Message from the Sub-Adviser (The Ithaka Group, LLC)
Volatility in Chinese markets and increased interest rates in the United States dominated attention during the first half of the fiscal year, with global markets experiencing backlash from some of the events. Market sell-offs occurred, hinging on data concerning China’s market health, while global markets were whipsawed by the ensuing volatility. The price of oil also played a large role in the global decline during the first half of the fiscal six-month period, as the commodity’s surplus continued to overflow. Political events preceding the U.S. presidential election, the risk of a “Brexit” in Europe, and a suddenly weakening U.S. dollar also occupied the focus of volatility in global markets. A risk-off investor sentiment detracted from money flowing into many riskier parts of the U.S. market. U.S. equities bottomed out in January and February but, managed to return to previous levels near the end of the first half of the fiscal year. Large cap growth stocks, as measured by the Russell 1000 Growth Index, had a volatile six-month period with a decline of 1.4 percent for the fiscal period that ended April 30, 2016. The most recent performance fell behind other broader equity indexes, such as the S&P 500 Index, which increased 0.4 percent.
The technology sector struggled over the fiscal six-month period. A large detractor from performance was LinkedIn, Corp. (LNKD) (holding percent*: 1.1 percent), which operates a social networking website used for professional networking. The website allows members to post profiles of their professional expertise and accomplishments. It also lets members network with potential clients, service providers and subject experts. The Sub-Adviser believes recent poor performance has stemmed from unclear guidance estimates by the company’s management. The holding declined 48.0 percent over the first half of the fiscal year. A holding that helped slow the decline in the technology sector was Facebook, Inc. (FB) (holding percentage*: 8.1 percent), an online social networking service. FB gained 15.3 percent during the fiscal six-month period. The Sub-Adviser has strong conviction in the holding and believes there is a great deal of potential future growth.
The consumer discretionary sector was also responsible for detracting from the Funds performance. Contributing to this poor performance was Starbucks Corp. (SBUX) (holding percentage*: 5.9 percent), a premier roaster, marketer, and retailer of specialty coffee in the world, which decreased 9.5 percent over the most recent fiscal six-month period. The Sub-Adviser thinks the recent underperformance can be attributed to not meeting investors’ unrealistic expectations during a slowdown in growth, after a year of massive buildup. Strong performance in the consumer discretionary sector came from Amazon.com Inc. (AMZN) (holding percentage*: 4.9 percent), an online retailer that offers a wide range of products, personalized shopping services, Web-based credit card payment and direct shipping to customers. The Sub-Adviser sees the company’s continued commitment to build out their logistics infrastructure during the fiscal six-month period as evidence of strong long-term growth. The Sub-Adviser also believes the continued improvement of benefits for Amazon Prime members has aided in the attraction of new customers and is a strong catalyst for establishing loyal customers. The company experienced an increase of 5.4 percent over the fiscal first half of the year.
A lagging sector in the Fund came from healthcare. Illumina, Inc. (ILMN) (holding percentage*: 2.3 percent) hurt the sectors performance with a 5.8 percent decline during the fiscal first half of the year. The company develops, manufactures, and sells systems for the analysis of genetic variation and biological function. The Sub-Adviser attributes the decline to a transitioning of the company’s business model as well as missteps by management in the European market. The sales focus changed from being an equipment provider to centering on consumables products, and the Sub-Adviser believes it has taken time for the adjustment to get up to full speed. In the European market, veteran managers have been appointed to handle issues and oversee improvements. The Sub-Adviser regards the company’s large market share, compared to their competition, as a stimulant for strong long-term performance.
The Sub-Adviser claims no expertise in economic or market predictions, and top-down analysis plays no part in their approach to investing. The Sub-Adviser does not try to “guess” where the market is heading in the next fiscal quarter or fiscal year and therefore chooses to stay fully invested at all times in what it believes are high-quality growth companies. The Sub-Adviser strives to own companies with robust business models and balance sheets that it believes are built to withstand difficult economic environments. With few exceptions, each of the companies in the current portfolio historically exhibited strong fundamentals during the 2008/2009 downturn. Those few that did not have since then significantly strengthened their balance sheets. The Sub-Adviser uses a fundamentals-driven, bottom–up process to identify and own companies that may outperform over the long-term. The Sub-Adviser continues to believe that many of the stocks in the Fund are well-positioned to outperform over the economic cycle due to the strength of the long-term secular trends underpinning them, coupled with the Sub-Adviser’s unique abilities to take advantage of these trends.
| * | Holdings percentage(s) as of 4/30/2016. |
Growth of $100,000 Investment - (Unaudited)
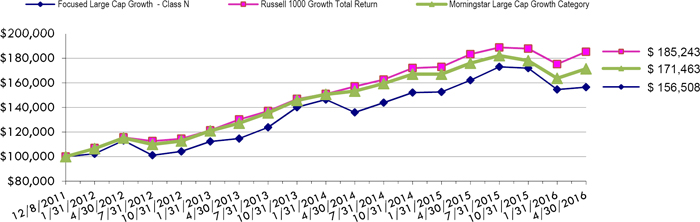
Total Returns as of April 30, 2016
| | | | Annualized | Annualized Since |
| | Six | One | Three | Inception |
| | Months | Year | Years | (12/8/11) |
| Class N | (8.98)% | (3.46)% | 10.92% | 10.73% |
| Class C | (9.46)% | (4.49)% | 9.80% | 9.64% |
| Class A with load of 5.75% | (14.28)% | (9.29)% | 8.44% | 8.98% |
| Class A without load | (9.07)% | (3.74)% | 10.61% | 10.45% |
| Russell 1000 Growth Index | (1.37)% | 1.07% | 12.47% | 15.06% |
| Morningstar Large Cap Growth Category | (3.70)% | (2.58)% | 10.45% | 13.05% |
The Russell 1000 Growth Index is a subset of the Russell 1000 Index which measures the performance of the stocks of the 1000 largest companies in the Russell 3000 Index based on market capitalization. The Russell 1000 Growth Index measures the performance of those stocks of the Russell 1000 with higher price-to-book ratios and higher relative forecasted growth rates. Investors cannot invest directly in an index or benchmark.
The Morningstar Large Cap Growth Category is generally representative of mutual funds that primarily invest in big (large capitalization) U.S. companies that are projected to grow faster than other large-cap stocks.
As disclosed in the Trust’s latest registration statement, the Fund’s total annual operating expenses, including the cost of underlying funds, are 1.34% for Class N, 2.34% for Class C and 1.59% for Class A. Class A shares are subject to a sales load of 5.75% and a deferred sales charge of up to 0.75%. The performance data quoted here represents past performance, which is not indicative of future results. Current performance may be lower or higher than the performance data quoted. The investment return and NAV will fluctuate, so that an investor’s shares, when redeemed, may be worth more or less than their original cost. Total returns are calculated assuming reinvestment of all dividends and capital gains distributions, if any. The returns do not reflect the deductions of taxes a shareholder would pay on the redemption of fund shares or fund distributions. For performance information current to the most recent month-end, please call 1-800-442-4358 or visit our websitewww.dunham.com.
SCHEDULE OF INVESTMENTS (Unaudited)
Dunham Focused Large Cap Growth Fund
April 30, 2016
| Security | | Shares | | | Value | |
| COMMON STOCK - 99.2% | | | | | | | | |
| AEROSPACE/DEFENSE - 2.6% | | | | | | | | |
| TransDigm Group, Inc. * | | | 7,392 | | | $ | 1,684,415 | |
| | | | | | | | | |
| APPAREL - 5.2% | | | | | | | | |
| NIKE, Inc. | | | 15,979 | | | | 941,802 | |
| Under Armour, Inc. - Class A * ^ | | | 28,624 | | | | 1,257,739 | |
| Under Armour, Inc. - Class C * ^ | | | 28,624 | | | | 1,167,859 | |
| | | | | | | | 3,367,400 | |
| BIOTECHNOLOGY - 13.8% | | | | | | | | |
| Alexion Pharmaceuticals, Inc. * | | | 12,279 | | | | 1,710,219 | |
| Biogen Idec, Inc. * | | | 2,265 | | | | 622,852 | |
| BioMarin Pharmaceutical, Inc. * | | | 5,605 | | | | 474,631 | |
| Celgene Corp. * ^ | | | 23,206 | | | | 2,399,732 | |
| Illumina, Inc. * | | | 10,687 | | | | 1,442,638 | |
| Regeneron Pharmaceuticals, Inc. * | | | 5,919 | | | | 2,229,747 | |
| | | | | | | | 8,879,819 | |
| COMMERCIAL SERVICES - 2.2% | | | | | | | | |
| PayPal Holdings, Inc. * | | | 36,300 | | | | 1,422,234 | |
| | | | | | | | | |
| DIVERSIFIED FINANCIAL SERVICES - 10.1% | | | | | | | | |
| MasterCard, Inc. | | | 29,088 | | | | 2,821,245 | |
| Visa, Inc. - Class A ^ | | | 47,226 | | | | 3,647,736 | |
| | | | | | | | 6,468,981 | |
| HEALTHCARE_PRODUCTS - 1.0% | | | | | | | | |
| Edwards Lifesciences Corp. * | | | 5,995 | | | | 636,729 | |
| | | | | | | | | |
| INTERNET - 29.3% | | | | | | | | |
| Alphabet, Inc. * | | | 4,230 | | | | 2,931,432 | |
| Amazon.com, Inc. * | | | 4,731 | | | | 3,120,520 | |
| Baidu, Inc. - ADR * ^ | | | 5,381 | | | | 1,045,528 | |
| Facebook, Inc. - Class A * | | | 43,931 | | | | 5,165,407 | |
| LinkedIn Corp. - Class A * | | | 5,800 | | | | 726,798 | |
| Netflix, Inc. * | | | 4,125 | | | | 371,374 | |
| Priceline Group, Inc. * | | | 2,601 | | | | 3,494,860 | |
| Splunk, Inc. * ^ | | | 21,151 | | | | 1,099,429 | |
| TripAdvisor, Inc. * | | | 12,855 | | | | 830,305 | |
| | | | | | | | 18,785,653 | |
| MACHINERY-DIVERSIFIED - 2.1% | | | | | | | | |
| The Middleby Corp. * | | | 12,205 | | | | 1,338,156 | |
| Security | | Shares | | | Value | |
| MEDIA - 2.7% | | | | | | | | |
| Walt Disney Co. ^ | | | 16,539 | | | $ | 1,707,817 | |
| | | | | | | | | |
| RETAIL - 16.4% | | | | | | | | |
| Domino’s Pizza Inc.^ | | | 6,099 | | | | 737,247 | |
| Home Depot, Inc. | | | 4,779 | | | | 639,860 | |
| O’Reilly Automotive, Inc. * | | | 2,317 | | | | 608,630 | |
| Starbucks Corp. ^ | | | 67,208 | | | | 3,779,106 | |
| TJX Cos. Inc. ^ | | | 21,472 | | | | 1,628,007 | |
| Ulta Salon, Cosmetics & Frag. * | | | 15,127 | | | | 3,150,652 | |
| | | | | | | | 10,543,502 | |
| SOFTWARE - 11.5% | | | | | | | | |
| Adobe Systems, Inc.* | | | 18,034 | | | | 1,699,164 | |
| Salesforce.com, Inc. * | | | 47,645 | | | | 3,611,491 | |
| Ultimate Software Group, Inc. * | | | 5,269 | | | | 1,035,833 | |
| Workday, Inc. - Class A * ^ | | | 13,901 | | | | 1,042,297 | |
| | | | | | | | 7,388,785 | |
| TELECOMMUNICATIONS - 2.3% | | | | | | | | |
| Palo Alto Networks, Inc. * ^ | | | 9,858 | | | | 1,487,276 | |
| | | | | | | | | |
| TOTAL COMMON STOCK (Cost - $52,580,832) | | | | | | | 63,710,767 | |
| | | | | | | | | |
| SHORT-TERM INVESTMENT - 0.8% | | | | | | | | |
| MONEY MARKET FUND - 0.8% | | | | | | | | |
| First American Obligations Fund, 0.06% + | | | 491,625 | | | | 491,625 | |
| TOTAL SHORT-TERM INVESTMENT (Cost - $491,625) | | | | | | | | |
| | | | | | | | | |
| COLLATERAL FOR SECURITIES LOANED - 19.8% | | | | | | | | |
| Mount Vernon Prime Portfolio 0.51% + (Cost - $12,704,917) | | | 12,704,917 | | | | 12,704,917 | |
| | | | | | | | | |
| TOTAL INVESTMENTS - 119.8% (Cost - $65,777,374) | | | | | | $ | 76,907,309 | |
| LIABILITIES LESS OTHER ASSETS - (19.8%) | | | | | | | (12,724,259 | ) |
| NET ASSETS - 100.0% | | | | | | $ | 64,183,050 | |
| ^ | All or a portion of these securities are on loan. Total loaned securities had a value of $12,339,117 at April 30, 2016. |
| * | Non-Income producing security. |
ADR - American Depositary Receipt.
| + | Variable rate security. Interest rate is as of April 30, 2016. |
| Portfolio Composition * - (Unaudited) |
| Communications | | | 28.6 | % | | Technology | | | 9.6 | % |
| Consumer, Cyclical | | | 18.1 | % | | Financial | | | 8.4 | % |
| Collateral For Securities Loaned | | | 16.5 | % | | Industrial | | | 3.9 | % |
| Consumer, Non-Cyclical | | | 14.2 | % | | Short-Term Investments | | | 0.7 | % |
| | | | | | | Total | | | 100.0 | % |
| * | Based on total value of investments as of April 30, 2016. |
Percentage may differ from Schedule of Investments which is based on Fund net assets.
See accompanying notes to financial statements.
Dunham International Stock Fund
Message from the Sub-Adviser (Arrowstreet Capital, L.P.)
International equity markets, as measured by the MSCI All Country World ex USA Index (Net) (referred to as the “Index”), fell 1.75 percent during the six month period ending April 30, 2016 (the “six month period”). For the month of November 2015 and December 2015, the Index was down 2.06 percent and 1.88 percent, respectively. The principal story for the markets in November and December were worries about sluggish economic growth and expectations for higher U.S. interest rates. Conversely, central banks in Europe and Japan ramped up stimulus measures in an attempt to jumpstart lackluster economies. In January, the Index lost 6.80 percent and in February the Index lost 1.14 percent. In March and April, the Index was up 8.13 percent and up 2.63 percent, respectively. Global stocks tumbled into the new year amid worries about China’s slowing economy, rapidly falling oil prices and disappointing U.S. corporate earnings growth. Financial stocks experienced the sharpest declines, weighed down by concerns about risky loans in the energy sector and low interest rates. February produced mixed returns amid investor concerns about slowing global economy, low oil prices, and ongoing turmoil in the banking sector. March experienced a “risk-on” mentality as global equities experienced a strong rally, particularly within emerging markets. The market reversed in March and April with increasing oil prices, the Federal Reserve’s dovish stance on monetary policy, and interest rates were left unchanged.
The Sub-Adviser’s investment process is best characterized as a dynamic process that uses quantitative models to evaluate securities to exploit opportunities across companies, sectors, and countries while seeking to avoid long term systematic biases toward any particular country, sector, style, or market capitalization. These stock selection models are designed to understand what information is likely to impact stock prices with a predictable and measurable lag that allows time to invest and profit. The models obtain the information to forecast individual stock returns by evaluating a stock’s potential on the basis of: (1) direct effects - characteristics of the company itself; and (2) indirect effects - characteristics of other companies that are related by virtue of a common country affiliation and sector affiliation (called country/sector baskets); a common country affiliation; and a common global sector affiliation, and/or other common linkages. Over any time period, the strategy’s performance relative to the Index is driven by allocations to country/sector baskets, stock selection, and the effects of currency exposures differing from those of the Index.
Countries contributing most to the Arrowstreet portfolio’s returns relative to the Index during the six month period included Russia (primarily due to energy sector overweights), South Korea (primarily due to energy and consumer staples sector overweights), and Denmark (primarily due to consumer staples and health care sector overweights). Countries contributing most to the Arrowstreet portfolio’s underperformance relative to the Index included the United Kingdom (primarily due to health care and energy sector underweights), Australia (primarily due to financials and materials sector underweights), and China (primarily due to information technology underweights).
Sectors contributing most to the Arrowstreet portfolio’s returns relative to the Index during the six month period included consumer staples (primarily due to Belgium, Portugal, and Denmark overweights), energy (primarily due to Russia and South Korea overweights), and health care (primarily due to Switzerland and Denmark overweights). Sectors contributing most to the Arrowstreet portfolio’s underperformance relative to the Index included information technology (primarily due to Japan and Finland overweights as well as China underweights), and materials (primarily due to Australia and United Kingdom underweights).
The stocks contributing most to the Arrowstreet portfolio returns relative to the Index during the six month period included Public Joint-Stock Company Gazprom (Russia energy) (holding percentage*: 1.96 percent), Oil Company Lukoil Pjsc (Russia energy), and Jeronimo Martins, Sgps S.A. (Portugal consumer staples) (holding percentage*: 1.14 percent). Stocks contributing most to the Arrowstreet portfolio’s underperformance relative to the Index included Nokia Oyj (Finland information technology) (holding percentage*: 0.76 percent), Dai-Ichi Life Insurance Company, Limited (Japan financials) (holding percentage*: not held), and Tokio Marine Holdings, Inc. (Japan financials) (holding percentage*: 0.54 percent).
The foregoing Insights from the Sub-Advisor are provided by Arrowstreet Capital, Limited Partnership (“Arrowstreet”) through April 30, 2016 for informational purposes only and solely with respect to the portfolio of assets within the Fund managed by Arrowstreet. References to specific stocks, countries or sectors are shown for informational purposes only and are not intended as investment advice. Arrowstreet is not responsible for, and makes no representation with respect to, any other information or performance data set forth herein.
| * | Holdings Percentage(s) as of 4/30/2016. |
Growth of $100,000 Investment - (Unaudited)
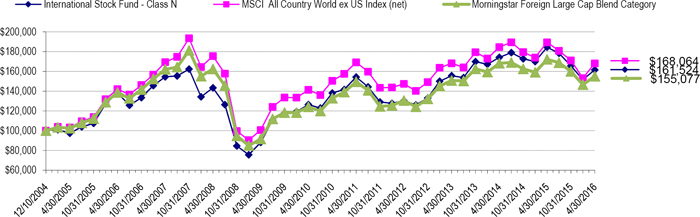
Total Returns as of April 30, 2016
| | Six | | Annualized | Annualized | Annualized | Annualized Since Inception |
| | Months | One Year | Three Years | Five Years | Ten Years | (12/10/04) |
| Class N | (2.54)% | (12.43)% | 0.26% | 0.93% | 1.57% | 4.30% |
| Class C | (2.99)% | (13.34)% | 0.25% | (0.09)% | 0.55% | 3.27% |
| Class A with load of 5.75% | (8.29)% | (17.73)% | (0.99)% | (0.54)% | N/A | 0.29%* |
| Class A without load | (2.67)% | (12.69)% | 0.98% | 0.65% | N/A | 0.93%* |
| MSCI All Country World ex US Index (net) | (1.75)% | (11.28)% | (0.02)% | (0.13)% | 1.70% | 4.67% |
| Morningstar Foreign Large Cap Blend Category | (3.06)% | (9.92)% | 0.96% | 0.75% | 1.12% | 3.93% |
| * | Class A commenced operations on January 3, 2007. |
The MSCI All Country World ex US Index (net) is a free float-adjusted market capitalization index designed to measure equity market performance in the global developed and emerging markets excluding holdings in the United States and is net of any withholding taxes. Investors cannot invest directly in an index or benchmark.
The Morningstar Foreign Large Cap Blend Category is generally representative of mutual funds that primarily invest in non-U.S. stocks that have market caps in the top 70% of each economically integrated market (such as Europe or Asia ex-Japan). The blend style is generally applicable where neither growth nor value characteristics dominate.
As disclosed in the Trust’s latest registration statement, the Fund’s total annual operating expenses, including underlying funds, are 2.04% for Class N, 3.04% for Class C and 2.29% for Class A. Class A shares are subject to a sales load of 5.75% and a deferred sales charge of up to 0.75%.The performance data quoted here represents past performance, which is not indicative of future results. Current performance may be lower or higher than the performance data quoted. The investment return and NAV will fluctuate, so that an investor’s shares, when redeemed, may be worth more or less than their original cost. Total returns are calculated assuming reinvestment of all dividends and capital gains distributions, if any. The returns do not reflect the deductions of taxes a shareholder would pay on the redemption of fund shares or fund distribution. For performance information current to the most recent month-end, please call 1-800-442-4358 or visit our website www.dunham.com.
| SCHEDULE OF INVESTMENTS (Unaudited) |
| Dunham International Stock Fund |
| April 30, 2016 |
| Security | | Shares | | | Value | |
| COMMON STOCK - 96.0% | | | | | | | | |
| ADVERTISING - 0.6% | | | | | | | | |
| WPP PLC | | | 24,372 | | | $ | 570,855 | |
| | | | | | | | | |
| AEROSPACE / DEFENSE - 0.9% | | | | | | | | |
| Airbus Group SE | | | 9,682 | | | | 605,454 | |
| Airbus Group SE - ADR | | | 1,260 | | | | 19,366 | |
| Safran SA | | | 2,792 | | | | 192,530 | |
| | | | | | | | 817,350 | |
| AGRICULTURE - 2.6% | | | | | | | | |
| British American Tobacco PLC - ADR ^ | | | 4,585 | | | | 560,058 | |
| Imperial Brands PLC - ADR | | | 518 | | | | 56,255 | |
| Japan Tobacco, Inc. | | | 20,600 | | | | 836,993 | |
| KT&G Corp. | | | 502 | | | | 54,083 | |
| Swedish Match AB ^ | | | 26,881 | | | | 854,641 | |
| | | | | | | | 2,362,030 | |
| AIRLINES - 0.4% | | | | | | | | |
| Deutsche Lufthansa AG * | | | 24,400 | | | | 380,004 | |
| Turk Hava Yollari * | | | 1 | | | | 2 | |
| | | | | | | | 380,006 | |
| APPAREL - 0.7% | | | | | | | | |
| Christian Dior SE | | | 377 | | | | 66,264 | |
| LVMH Moet Hennessy Louis Vuitton | | | 3,280 | | | | 546,629 | |
| LVMH Moet Hennessy Louis Vuitton - ADR | | | 678 | | | | 22,523 | |
| | | | | | | | 635,416 | |
| AUTO MANUFACTURERS - 0.7% | | | | | | | | |
| Fiat Chrysler Automobiles NV | | | 22,406 | | | | 180,431 | |
| Hyundai Motor Co. - GDR | | | 2,288 | | | | 96,554 | |
| Porsche Automobil Holding SE - ADR | | | 8,533 | | | | 47,955 | |
| Renault SA | | | 3,047 | | | | 294,075 | |
| | | | | | | | 619,015 | |
| AUTO PARTS & EQUIPMENT - 2.3% | | | | | | | | |
| Cie Generale des Etablissements Michelin | | | 2,615 | | | | 273,209 | |
| Cie Generale des Etablissements Michelin - ADR | | | 2,882 | | | | 60,349 | |
| Continental AG | | | 2,190 | | | | 482,394 | |
| GKN PLC | | | 95,089 | | | | 389,047 | |
| JTEKT Corp | | | 14,891 | | | | 188,562 | |
| Nokian Renkaat OYJ | | | 5,729 | | | | 211,662 | |
| Sumitomo Electric Industries Ltd. | | | 15,100 | | | | 180,638 | |
| Toyota Gosei Co. Ltd. | | | 8,400 | | | | 154,025 | |
| Valeo SA | | | 965 | | | | 153,108 | |
| | | | | | | | 2,092,994 | |
| BANKS - 5.4% | | | | | | | | |
| Agricultural Bank of China Ltd. | | | 411,000 | | | | 148,330 | |
| Akbank TAS | | | 38,756 | | | | 119,242 | |
| Banco do Brasil SA | | | 19,000 | | | | 120,085 | |
| Banco Santander SA | | | 15,252 | | | | 77,175 | |
| Bangkok Bank PCL | | | 39,900 | | | | 186,947 | |
| Bangkok Bank PCL | | | 37,300 | | | | 176,837 | |
| Bank Hapoalim BM | | | 92,680 | | | | 477,930 | |
| Bank Leumi Le-Israel BM * | | | 54,789 | | | | 203,828 | |
| Bank of Communications Co. Ltd. | | | 384,000 | | | | 242,013 | |
| China CITIC Bank Corp. Ltd. * | | | 344,000 | | | | 215,732 | |
| Commerzbank AG * | | | 19,043 | | | | 178,620 | |
| Deutsche Bank AG | | | 13,648 | | | | 258,737 | |
| DNB ASA - ADR ^ | | | 900 | | | | 115,398 | |
| Gentera SAB de CV | | | 157,400 | | | | 313,711 | |
| Hachijuni Bank Ltd. | | | 25,000 | | | | 108,688 | |
| KBC Groep NV | | | 8,289 | | | | 466,479 | |
| Krung Thai Bank PCL | | | 121,100 | | | | 60,513 | |
| Nordea Bank AB | | | 32,468 | | | | 315,908 | |
| Nordea Bank AB - ADR | | | 13,000 | | | | 126,230 | |
| Sberbank of Russia - ADR | | | 13,891 | | | | 111,406 | |
| Turkiye Garanti Bankasi AS | | | 41,645 | | | | 128,362 | |
| Turkiye Halk Bankasi AS | | | 33,928 | | | | 130,469 | |
| Security | | Shares | | | Value | |
| BANKS (Continued) - 5.4% | | | | | | | | |
| Turkiye Is Bankasi | | | 152,254 | | | $ | 267,307 | |
| Turkiye Vakiflar Bankasi TAO | | | 56,993 | | | | 100,721 | |
| Yapi ve Kredi Bankasi AS * | | | 129,421 | | | | 198,138 | |
| | | | | | | | 4,848,806 | |
| BEVERAGES - 4.4% | | | | | | | | |
| Anheuser-Busch InBev NV | | | 6,197 | | | | 768,964 | |
| Anheuser-Busch InBev NV - ADR ^ | | | 5,980 | | | | 742,596 | |
| Asahi Group Holdings Ltd. | | | 4,900 | | | | 154,647 | |
| Carlsberg A/S | | | 6,012 | | | | 586,190 | |
| Coca-Cola HBC AG | | | 6,346 | | | | 129,216 | |
| Diageo PLC - ADR | | | 3,670 | | | | 397,571 | |
| Fomento Economico Mexicano SAB de CV - ADR | | | 2,638 | | | | 245,888 | |
| Heineken Holding NV | | | 2,258 | | | | 186,462 | |
| Heineken NV | | | 6,541 | | | | 613,887 | |
| Kirin Holdings Co. Ltd. | | | 5,300 | | | | 78,835 | |
| Suntory Beverage & Food Ltd. | | | 900 | | | | 39,095 | |
| | | | | | | | 3,943,349 | |
| BUILDING MATERIALS - 2.3% | | | | | | | | |
| Asahi Glass Co., Ltd. | | | 55,000 | | | | 320,314 | |
| Asia Cement Corp. | | | 301000 | | | | 267794 | |
| Cemex SAB de CV - ADR * | | | 29582 | | | | 220385 | |
| Cie de Saint-Gobain | | | 4,573 | | | | 209,602 | |
| Geberit AG | | | 443 | | | | 170579 | |
| HeidelbergCement AG | | | 3,171 | | | | 282,424 | |
| Lafarge SA | | | 5,551 | | | | 282,090 | |
| Sika AG | | | 74 | | | | 315,647 | |
| | | | | | | | 2,068,835 | |
| CHEMICALS - 2.9% | | | | | | | | |
| EMS-Chemie Holding AG | | | 1,073 | | | | 531,435 | |
| Givaudan SA | | | 85 | | | | 167,918 | |
| Grupa Azoty SA * | | | 1,810 | | | | 41,189 | |
| Hanwha Chemical Corp. | | | 6,573 | | | | 143,937 | |
| K+S AG | | | 5,344 | | | | 133,423 | |
| LG Chem Ltd. | | | 529 | | | | 137,220 | |
| Lonza Group AG | | | 1,363 | | | | 227,522 | |
| Mexichem SAB de CV | | | 120,600 | | | | 307,674 | |
| Mitsubishi Chemical Holdings Corp. | | | 22,500 | | | | 116,764 | |
| Novozymes A/S - ADR ^ | | | 7,260 | | | | 344,995 | |
| Potash Corp of Saskatchewan, Inc. | | | 7,000 | | | | 124,062 | |
| Solvay SA | | | 855 | | | | 86,643 | |
| Yara International ASA | | | 6,592 | | | | 263,651 | |
| | | | | | | | 2,626,433 | |
| COMMERCIAL SERVICES - 1.6% | | | | | | | | |
| Adecco SA | | | 3,969 | | | | 256,427 | |
| Edenred | | | 6,784 | | | | 133,854 | |
| Experian PLC | | | 12,063 | | | | 221,619 | |
| S-1 Corp. | | | 8,349 | | | | 680,958 | |
| SGS SA | | | 38 | | | | 83,855 | |
| Toppan Printing Co. Ltd. | | | 9,000 | | | | 79,658 | |
| | | | | | | | 1,456,371 | |
| COMPUTERS - 0.6% | | | | | | | | |
| BlackBerry Ltd. * | | | 26,200 | | | | 185,320 | |
| Cap Gemini SA | | | 877 | | | | 81,883 | |
| Fujitsu Ltd. | | | 62,000 | | | | 215,429 | |
| TDK Corp. | | | 1,300 | | | | 75,645 | |
| | | | | | | | 558,277 | |
| COSMETICS / PERSONAL CARE - 4.1% | | | | | | | | |
| Beiersdorf AG | | | 855 | | | | 76,795 | |
| Kao Corp. | | | 2,200 | | | | 121,021 | |
| L’Oreal SA | | | 2,925 | | | | 531,453 | |
| L’Oreal SA - ADR ^ | | | 2,000 | | | | 72,780 | |
| Shiseido Co. Ltd. | | | 7,000 | | | | 154,818 | |
| Svenska Cellulosa AB SCA | | | 3,916 | | | | 123,679 | |
| Svenska Cellulosa AB SCA - ADR | | | 3,200 | | | | 101,248 | |
See accompanying notes to financial statements.
| SCHEDULE OF INVESTMENTS (Unaudited) |
| Dunham International Stock Fund (Continued) |
| April 30, 2016 |
| Security | | Shares | | | Value | |
| COSMETICS / PERSONAL CARE - 4.1% (Continued) | | | | | | | | |
| Unilever NV - Dutch Cert | | | 19,430 | | | $ | 846,580 | |
| Unilever NV - NY Reg. Shares ^ | | | 13,957 | | | | 614,387 | |
| Unilever PLC | | | 4,648 | | | | 208,215 | |
| Unilever PLC - ADR ^ | | | 19,193 | | | | 860,998 | |
| | | | | | | | 3,711,974 | |
| DISTRIBUTION / WHOLESALE - 0.5% | | | | | | | | |
| Mitsubishi Corp. | | | 18,100 | | | | 302,544 | |
| Sumitomo Corp. | | | 11,200 | | | | 117,751 | |
| | | | | | | | 420,295 | |
| DIVERSIFIED FINANANCIAL SERVICES - 1.4% | | | | | | | | |
| AerCap Holdings NV * | | | 1,100 | | | | 44,011 | |
| CETIP SA - Mercados Organizados | | | 8,200 | | | | 102,536 | |
| Deutsche Boerse AG | | | 3,727 | | | | 306,770 | |
| Hana Financial Group, Inc. | | | 11,900 | | | | 266,852 | |
| Partners Group Holding AG | | | 469 | | | | 193,595 | |
| Samsung Card Co. Ltd. | | | 8,552 | | | | 290,615 | |
| Shinhan Financial Group Co. Ltd. | | | 2,204 | | | | 80,578 | |
| | | | | | | | 1,284,957 | |
| ELECTRIC - 3.3% | | | | | | | | |
| CEZ AS | | | 4,959 | | | | 96,860 | |
| Chubu Electric Power Co., Inc. | | | 5,500 | | | | 72,044 | |
| Cia Paranaense de Energia | | | 3,000 | | | | 16,161 | |
| CPFL Energia SA | | | 18,800 | | | | 110,540 | |
| E.ON SE - ADR | | | 21,400 | | | | 222,774 | |
| Endesa SA | | | 4,395 | | | | 92,495 | |
| Enea SA | | | 22,235 | | | | 68,692 | |
| Enel SpA | | | 50,342 | | | | 228,856 | |
| Energa SA | | | 27,618 | | | | 89,916 | |
| Enersis Americas SA - ADR | | | 6,300 | | | | 53,928 | |
| Enersis Chile SA - ADR | | | 6,300 | | | | 40,131 | |
| Equatorial Energia SA | | | 300 | | | | 3,708 | |
| Fortis Inc/Canada | | | 7,200 | | | | 228,772 | |
| Fortum OYJ | | | 11,237 | | | | 169,459 | |
| Iberdrola SA | | | 66,572 | | | | 474,033 | |
| Iberdrola SA - ADR | | | 3,500 | | | | 99,750 | |
| Korea Electric Power Corp. - ADR | | | 3,799 | | | | 206,357 | |
| Korea Electric Power Corp. - ADR | | | 12,167 | | | | 327,292 | |
| Tohoku Electric Power Co., Inc. | | | 15,000 | | | | 190,708 | |
| Tokyo Electric Power Co Holdings Inc. | | | 36,500 | | | | 194,403 | |
| | | | | | | | 2,986,879 | |
| ELECTRICAL COMPONENTS & EQUIPMENT - 1.1% | | | | | | | | |
| Legrand A | | | 2,937 | | | | 167,446 | |
| LG Electronics, Inc. | | | 2499 | | | | 127161 | |
| Osram Licht AG * | | | 3,407 | | | | 177,957 | |
| Schneider Electric SE | | | 7,618 | | | | 498,253 | |
| | | | | | | | 970,817 | |
| ELECTRONICS - 0.6% | | | | | | | | |
| AU Optronics Corp. | | | 1,197,000 | | | | 342,524 | |
| Hoya Corp. | | | 4,300 | | | | 163,750 | |
| | | | | | | | 506,274 | |
| ENERGY - ALTERNATE SOURCES - 0.4% | | | | | | | | |
| Vestas Wind Systems A/S | | | 4,651 | | | | 333,000 | |
| | | | | | | | | |
| ENGINEERING & CONSTRUCTION - 0.9% | | | | | | | | |
| ACS Actividades de Construccion y Servicios SA | | | 4,892 | | | | 162,293 | |
| Aena SA * | | | 2,277 | | | | 325,367 | |
| Enka Insaat ve Sanayi AS | | | 94,564 | | | | 164,376 | |
| Grupo Aeroportuario del Pacifico SAB de CV | | | 13,000 | | | | 119,912 | |
| Promotora y Operadora de Infraestructura SAB de CV | | | 5,639 | | | | 71,644 | |
| | | | | | | | 843,592 | |
| ENTERTAINMENT - 0.1% | | | | | | | | |
| Sankyo Co. Ltd. | | | 1,000 | | | | 37,651 | |
| Security | | Shares | | | Value | |
| ENVIRONMENTAL CONTROL - 0.2% | | | | | | | | |
| Kurita Water Industries Ltd. | | | 6,900 | | | $ | 164,994 | |
| | | | | | | | | |
| FOOD - 10.8% | | | | | | | | |
| Ajinomoto Co., Inc. | | | 11,000 | | | | 252,143 | |
| Aryzta AG | | | 3,395 | | | | 132,163 | |
| BIM Birlesik Magazalar AS | | | 4,129 | | | | 90,986 | |
| Carrefour SA | | | 5,076 | | | | 143,845 | |
| Casino Guichard Perrachon SA | | | 3,672 | | | | 218,596 | |
| Chocoladefabriken Lindt & Sprungli AG | | | 39 | | | | 239,167 | |
| Danone SA | | | 2,141 | | | | 150,045 | |
| Delhaize Group - ADR | | | 12,693 | | | | 332,303 | |
| ICA Gruppen AB | | | 7,703 | | | | 253,519 | |
| JBS SA | | | 48,500 | | | | 128,882 | |
| Jeronimo Martins SGPS SA | | | 62,578 | | | | 1,024,817 | |
| Kerry Group PLC | | | 1,389 | | | | 123,893 | |
| Koninklijke Ahold NV | | | 4,533 | | | | 98,729 | |
| Koninklijke Ahold NV - ADR | | | 1,900 | | | | 41,477 | |
| MEIJI Holdings Co. Ltd. | | | 2,000 | | | | 153,266 | |
| Nestle SA | | | 19,903 | | | | 1,486,794 | |
| Nestle SA - ADR | | | 19,350 | | | | 1,442,930 | |
| NH Foods Ltd. | | | 6,000 | | | | 132,993 | |
| Nisshin Seifun Group, Inc. | | | 20,600 | | | | 335,369 | |
| Nissin Foods Holdings Co. Ltd. | | | 5,100 | | | | 235,441 | |
| Orkla ASA | | | 97,257 | | | | 848,994 | |
| Orkla ASA - ADR | | | 17,173 | | | | 149,405 | |
| Pioneer Foods Group Ltd. | | | 5,873 | | | | 69,026 | |
| Seven & I Holdings Co. Ltd. | | | 13,900 | | | | 564,000 | |
| Seven & I Holdings Co. Ltd. - ADR | | | 4,892 | | | | 100,286 | |
| Toyo Suisan Kaisha Ltd. | | | 6,100 | | | | 214,240 | |
| Uni-President Enterprises Corp. | | | 376,000 | | | | 676,871 | |
| Yamazaki Baking Co. Ltd. | | | 6,000 | | | | 141,247 | |
| | | | | | | | 9,781,427 | |
| GAS - 1.6% | | | | | | | | |
| Gas Natural SDG SA | | | 5,574 | | | | 116,265 | |
| National Grid PLC | | | 16,953 | | | | 242,517 | |
| National Grid PLC - ADR | | | 8,365 | | | | 602,364 | |
| Snam SpA | | | 71,665 | | | | 438,375 | |
| | | | | | | | 1,399,521 | |
| HAND / MACHINE TOOLS - 0.6% | | | | | | | | |
| Sandvik AB ^ | | | 35,754 | | | | 367,706 | |
| Schindler Holding AG | | | 1,047 | | | | 192,785 | |
| | | | | | | | 560,491 | |
| HEALTHCARE - PRODUCTS - 0.7% | | | | | | | | |
| Coloplast A/S | | | 2,282 | | | | 170,994 | |
| Essilor International SA | | | 1,861 | | | | 240,981 | |
| Sonova Holding AG | | | 647 | | | | 86,691 | |
| Sysmex Corp. | | | 1,400 | | | | 87,068 | |
| Terumo Corp. | | | 2,100 | | | | 79,388 | |
| | | | | | | | 665,122 | |
| HOLDING COMPANIES-DIVERSIFIED - 0.2% | | | | | | | | |
| Haci Omer Sabanci Holdings AS | | | 1 | | | | 2 | |
| Industrivarden AB - C shares | | | 4,303 | | | | 78,512 | |
| KOC Holding AS | | | 16,174 | | | | 84,620 | |
| Swire Pacific Ltd. | | | 5,000 | | | | 9,735 | |
| | | | | | | | 172,869 | |
| HOME FURNISHINGS - 0.3% | | | | | | | | |
| Arcelik AS | | | 1 | | | | 7 | |
| Electrolux AB - Series B | | | 9,343 | | | | 271,776 | |
| Hanssem Co. Ltd. * | | | 145 | | | | 24,227 | |
| | | | | | | | 296,010 | |
| HOUSEHOLD PRODUCTS - 0.6% | | | | | | | | |
| Henkel AG & Co KGaA | | | 2,766 | | | | 281,444 | |
| Kimberly-Clark de Mexico SAB de CV | | | 49,022 | | | | 118,883 | |
| Societe BIC SA | | | 978 | | | | 138,896 | |
| | | | | | | | 539,223 | |
See accompanying notes to financial statements.
| SCHEDULE OF INVESTMENTS (Unaudited) |
| Dunham International Stock Fund (Continued) |
| April 30, 2016 |
| Security | | Shares | | | Value | |
| INSURANCE - 3.6% | | | | | | | | |
| Ageas | | | 10,347 | | | $ | 406,710 | |
| Dai-ichi Life Insurance Co. Ltd. | | | 29,500 | | | | 352,609 | |
| Hannover Rueck SE | | | 2,506 | | | | 286,564 | |
| MS&AD Insurance Group Holdings, Inc. | | | 10,500 | | | | 275,779 | |
| Muenchener Rueckversicherungs-Gesellschaft AG | | | 1,340 | | | | 249,179 | |
| New China Life Insurance Co. Ltd. | | | 6,000 | | | | 19,559 | |
| Sampo Oyj | | | 2,275 | | | | 99,537 | |
| Sompo Japan Nipponkoa Holdings, Inc. | | | 2,600 | | | | 67,886 | |
| Sony Financial Holdings, Inc. | | | 12,900 | | | | 158,595 | |
| Sun Life Financial, Inc. | | | 6,900 | | | | 235,766 | |
| Swiss Re AG | | | 2,912 | | | | 259,031 | |
| T&D Holdings, Inc. | | | 16,400 | | | | 156,116 | |
| Tokio Marine Holdings, Inc. | | | 14,800 | | | | 481,600 | |
| Tokio Marine Holdings, Inc. - ADR | | | 6,248 | | | | 202,935 | |
| | | | | | | | 3,251,866 | |
| INTERNET - 0.2% | | | | | | | | |
| United Internet AG | | | 3,514 | | | | 171,803 | |
| | | | | | | | | |
| IRON / STEEL - 1.8% | | | | | | | | |
| ArcelorMittal * | | | 39,810 | | | | 224,791 | |
| China Steel Corp. | | | 339,000 | | | | 237,664 | |
| Eregli Demir ve Celik Fabrikalari TAS | | | 160,101 | | | | 267,414 | |
| Hyundai Steel Co. | | | 6,530 | | | | 358,181 | |
| POSCO | | | 1,362 | | | | 287,486 | |
| POSCO - ADR | | | 4,701 | | | | 244,546 | |
| | | | | | | | 1,620,082 | |
| LEISURE TIME - 0.3% | | | | | | | | |
| Carnival PLC | | | 6,000 | | | | 303,300 | |
| | | | | | | | | |
| MACHINERY CONSTRUCTION & MINING - 1.3% | | | | | | | | |
| ABB Ltd. | | | 33,438 | | | | 708,483 | |
| ABB Ltd. - ADR | | | 1,160 | | | | 24,488 | |
| Atlas Copco AB - A Shares ^ | | | 6,565 | | | | 170,251 | |
| Atlas Copco AB - B Shares | | | 5,645 | | | | 135,762 | |
| Hitachi Ltd. | | | 30,000 | | | | 136,702 | |
| | | | | | | | 1,175,686 | |
| MACHINERY - DIVERSIFIED - 0.1% | | | | | | | | |
| Hexagon AB - B Shares | | | 111 | | | | 4,438 | |
| Kone OYJ | | | 2,252 | | | | 102,926 | |
| | | | | | | | 107,364 | |
| MEDIA - 0.5% | | | | | | | | |
| ITV PLC | | | 54,584 | | | | 180,385 | |
| Lagardere SCA | | | 3,000 | | | | 79,634 | |
| Rizzoli Corriere Della Sera Mediagroup SpA * | | | 1,517 | | | | 977 | |
| Telenet Group Holding NV * | | | 370 | | | | 18,424 | |
| Vivendi SA ^ | | | 10,120 | | | | 194,459 | |
| | | | | | | | 473,879 | |
| METAL FABRICATE / HARDWARE - 1.0% | | | | | | | | |
| SKF AB | | | 17,391 | | | | 320,795 | |
| Tenaris SA - ADR | | | 20,823 | | | | 563,679 | |
| | | | | | | | 884,474 | |
| MINING - 3.6% | | | | | | | | |
| Agnico Eagle Mines Ltd. | | | 3,800 | | | | 179,928 | |
| Anglo American PLC | | | 17,111 | | | | 191,353 | |
| AngloGold Ashanti Ltd. - ADR * | | | 13,848 | | | | 227,800 | |
| AngloGold Ashanti Ltd. * | | | 11,904 | | | | 194,259 | |
| Barrick Gold Corp. | | | 15,684 | | | | 304,139 | |
| Barrick Gold Corp. ^ | | | 4,688 | | | | 90,806 | |
| First Quantum Minerals Ltd. | | | 16,200 | | | | 138,255 | |
| Franco-Nevada Corp. | | | 1,600 | | | | 112,534 | |
| Glencore PLC | | | 89,902 | | | | 215,410 | |
| Gold Fields Ltd. | | | 17,264 | | | | 80,182 | |
| Gold Fields Ltd. - ADR | | | 15,736 | | | | 73,959 | |
| Goldcorp, Inc. | | | 10,016 | | | | 202,143 | |
| Security | | Shares | | | Value | |
| MINING (Continued) - 3.6% | | | | | | | | |
| Industrias Penoles SAB de CV | | | 8,333 | | | $ | 127,798 | |
| Kinross Gold Corp. * | | | 46,000 | | | | 262,574 | |
| Korea Zinc Co. Ltd. | | | 621 | | | | 269,285 | |
| Randgold Resources Ltd. | | | 1,186 | | | | 118,772 | |
| Randgold Resources Ltd. - ADR | | | 1,334 | | | | 134,067 | |
| Sibanye Gold Ltd. - ADR | | | 5,778 | | | | 88,981 | |
| Silver Wheaton Corp. | | | 3,900 | | | | 81,854 | |
| Sumitomo Metal Mining Co. Ltd. | | | 11,000 | | | | 128,716 | |
| | | | | | | | 3,222,815 | |
| MISCELLANEOUS MANUFACTURING - 0.5% | | | | | | | | |
| Doosan Corp. | | | 2,301 | | | | 216,269 | |
| FUJIFILM Holdings Corp. | | | 800 | | | | 32,656 | |
| Konica Minolta Holdings, Inc. | | | 24,000 | | | | 206,006 | |
| | | | | | | | 454,931 | |
| OFFICE / BUSINESS EQUIPMENT - 0.2% | | | | | | | | |
| Ricoh Co. Ltd. | | | 18,800 | | | | 190,524 | |
| | | | | | | | | |
| OIL & GAS - 6.2% | | | | | | | | |
| Formosa Petrochemical Corp. | | | 87,000 | | | | 246,764 | |
| Gazprom OAO - ADR | | | 340,311 | | | | 1,766,214 | |
| Lukoil OAO - ADR | | | 19,435 | | | | 825,987 | |
| Neste Oil OYJ | | | 8,670 | | | | 277,899 | |
| OMV AG | | | 3,516 | | | | 105,824 | |
| Petroleo Brasileiro SA * | | | 107,300 | | | | 421,949 | |
| Repsol SA | | | 13,474 | | | | 177,586 | |
| Rosneft OAO - GDR | | | 15,031 | | | | 82,069 | |
| Sasol Ltd. | | | 8,548 | | | | 280,681 | |
| SK Innovation Co. Ltd. * | | | 2,918 | | | | 394,098 | |
| S-Oil Corp. | | | 3,242 | | | | 246,402 | |
| Surgutneftegas OAO - ADR | | | 24,000 | | | | 152,400 | |
| Surgutneftegas OAO - ADR | | | 22,795 | | | | 120,586 | |
| Tupras Turkiye Petrol Rafinerileri AS * | | | 16,976 | | | | 448,343 | |
| | | | | | | | 5,546,802 | |
| PHARMACEUTICALS - 6.2% | | | | | | | | |
| Actelion Ltd. | | | 4,148 | | | | 672,869 | |
| Astellas Pharma, Inc. | | | 30,000 | | | | 402,229 | |
| AstraZeneca PLC - ADR | | | 6,287 | | | | 361,627 | |
| Chugai Pharmaceutical Co. Ltd. | | | 4,500 | | | | 150,810 | |
| Daiichi Sankyo Co. Ltd. | | | 8,400 | | | | 196,865 | |
| Eaisai Co. Ltd. | | | 4,400 | | | | 270,844 | |
| Grifols SA - ADR | | | 5,304 | | | | 83,379 | |
| Kyowa Hakko Kirin Co. Ltd. | | | 14,000 | | | | 247,508 | |
| Medipal Holdings Corp. | | | 9,900 | | | | 155,759 | |
| Novo Nordisk A/S | | | 10,922 | | | | 609,955 | |
| Novo Nordisk A/S - ADR ^ | | | 4,229 | | | | 235,936 | |
| Otsuka Holdings Co Ltd | | | 6,200 | | | | 240,360 | |
| Richter Gedeon Nyrt | | | 23,604 | | | | 469,527 | |
| Roche Holding AG - Genusschein | | | 2,329 | | | | 589,750 | |
| Roche Holding AG -BR | | | 848 | | | | 217,578 | |
| Shire PLC | | | 3,647 | | | | 228,164 | |
| Shire PLC - ADR ^ | | | 1,455 | | | | 272,696 | |
| Takeda Pharmaceutical Co. Ltd. | | | 4,800 | | | | 227,982 | |
| | | | | | | | 5,633,838 | |
| PIPELINES - 0.3% | | | | | | | | |
| Petronas Gas Bhd | | | 40,800 | | | | 229,391 | |
| | | | | | | | | |
| REAL ESTATE - 0.3% | | | | | | | | |
| BR Malls Participacoes SA | | | 49,700 | | | | 243,257 | |
| | | | | | | | | |
| REITS - 0.9% | | | | | | | | |
| H&R Real Estate Investment Trust | | | 13,900 | | | | 243,244 | |
| Smart Real Estate Investment Trust | | | 20,500 | | | | 551,205 | |
| | | | | | | | 794,449 | |
See accompanying notes to financial statements.
| SCHEDULE OF INVESTMENTS (Unaudited) |
| Dunham International Stock Fund (Continued) |
| April 30, 2016 |
| Security | | Shares | | | Value | |
| RETAIL - 2.7% | | | | | | | | |
| Aeon Co. Ltd. | | | 11,800 | | | $ | 175,844 | |
| Hennes & Mauritz AB - B Shares | | | 6,163 | | | | 219,686 | |
| Home Product Center PCL | | | 2,072,100 | | | | 476,415 | |
| Industria de Diseno Textil SA | | | 25,698 | | | | 827,322 | |
| Kering | | | 6 | | | | 1,029 | |
| Lawson, Inc. | | | 3,700 | | | | 284,799 | |
| Pandora A/S | | | 592 | | | | 76,984 | |
| Swatch Group AG/THE - REG | | | 232 | | | | 15,535 | |
| Wal-Mart de Mexico SAB de CV | | | 89,400 | | | | 226,511 | |
| Wal-Mart de Mexico SAB de CV - ADR | | | 5,000 | | | | 123,850 | |
| | | | | | | | 2,427,975 | |
| SEMICONDUCTORS - 1.4% | | | | | | | | |
| ARM Holdings PLC - ADR ^ | | | 3,250 | | | | 133,868 | |
| Infineon Technologies AG | | | 26,781 | | | | 382,200 | |
| Samsung Electronics Co. Ltd. - GDR | | | 57 | | | | 31,065 | |
| Samsung Electronics Co. Ltd. - GDR - Reg S | | | 375 | | | | 171,636 | |
| Siliconware Precision Industries Co. Ltd. | | | 18,000 | | | | 26,651 | |
| SK Hynix, Inc. | | | 10,874 | | | | 266,715 | |
| STMicroelectronics NV | | | 28,573 | | | | 175,725 | |
| STMicroelectronics NV - NY Shares | | | 12,884 | | | | 79,108 | |
| | | | | | | | 1,266,968 | |
| SOFTWARE - 0.7% | | | | | | | | |
| Amadeus IT Holding SA | | | 10,559 | | | | 481,621 | |
| SAP SE | | | 2,207 | | | | 173,209 | |
| | | | | | | | 654,830 | |
| TELECOMMUNICATIONS - 10.0% | | | | | | | | |
| BCE, Inc. | | | 6,759 | | | | 317,499 | |
| China Mobile Ltd. | | | 46,500 | | | | 533,835 | |
| China Telecom Corp. Ltd. | | | 236,000 | | | | 116,831 | |
| China Unicom Hong Kong Ltd. | | | 120,000 | | | | 140,429 | |
| Chunghwa Telecom Co Ltd. - ADR | | | 10,272 | | | | 350,275 | |
| Elisa OYJ | | | 907 | | | | 33,923 | |
| Emirates Telecommunications Group Co PJSC | | | 46,988 | | | | 241,240 | |
| Far EasTone Telecommunications Co. Ltd. | | | 67,000 | | | | 151,079 | |
| KDDI Corp. | | | 23,300 | | | | 667,441 | |
| KT Corp. - ADR | | | 5,497 | | | | 74,814 | |
| Nippon Telegraph & Telephone Corp. | | | 7,800 | | | | 347,112 | |
| Nippon Telegraph & Telephone Corp. - ADR | | | 17,527 | | | | 781,178 | |
| Nokia OYJ | | | 111,771 | | | | 660,013 | |
| NTT DOCOMO, Inc. | | | 32,500 | | | | 775,145 | |
| NTT DOCOMO, Inc. - ADR ^ | | | 3,658 | | | | 89,036 | |
| Ooredoo QSC | | | 9,143 | | | | 230,032 | |
| Orange SA - ADR ^ | | | 9,871 | | | | 163,760 | |
| Proximus | | | 6,096 | | | | 205,512 | |
| Rogers Communications, Inc. | | | 9,000 | | | | 350,631 | |
| SoftBank Group Corp. | | | 9,300 | | | | 497,285 | |
| Swisscom AG | | | 635 | | | | 322,963 | |
| TDC A/S | | | 17,771 | | | | 91,012 | |
| Telecom Italia - RSP | | | 227,627 | | | | 179,091 | |
| Telecom Italia SpA * | | | 299,775 | | | | 292,799 | |
| Telefonaktiebolaget LM Ericsson | | | 13,747 | | | | 111,495 | |
| Telefonaktiebolaget LM Ericsson - ADR | | | 1,536 | | | | 12,426 | |
| Telekomunikasi Indonesia Persero Tbk PT | | | 1,285,200 | | | | 344,810 | |
| Telia Co AB | | | 42,393 | | | | 202,950 | |
| Telus Corp. | | | 6,600 | | | | 209,602 | |
| Turk Telekomunikasyon AS | | | 37,604 | | | | 90,939 | |
| Turkcell Iletisim Hizmetleri AS - ADR * | | | 6,577 | | | | 71,032 | |
| Vodafone Group PLC - ADR | | | 6,979 | | | | 228,492 | |
| XL Axiata Tbk PT | | | 596,400 | | | | 158,930 | |
| | | | | | | | 9,043,611 | |
| TEXTILES - 0.1% | | | | | | | | |
| Formosa Taffeta Co. Ltd. | | | 94,000 | | | | 85,996 | |
| Security | | | | | Shares | | | Value | |
| TRANSPORTATION - 0.9% | | | | | | | | | | | | |
| Aurizon Holdings Ltd. | | | | | | | 27,572 | | | $ | 89,408 | |
| DSV A/S | | | | | | | 8,466 | | | | 356,480 | |
| Hankyu Hanshin Holdings, Inc. | | | | | | | 41,000 | | | | 258,434 | |
| Nippon Express Co. Ltd. | | | | | | | 27,000 | | | | 122,527 | |
| | | | | | | | | | | | 826,849 | |
| WATER - 0.4% | | | | | | | | | | | | |
| Cia de Saneamento Basico do Estado de Sao Paulo | | | | | | | 52,200 | | | | 401,015 | |
| | | | | | | | | | | | | |
| TOTAL COMMON STOCK (Cost - $83,456,108) | | | | | | | | | | | 86,666,540 | |
| | | | | | | | | | | | | |
| CLOSED END FUND - 0.4% | | | | | | | | | | | | |
| EQUITY FUND - 0.4% | | | | | | | | | | | | |
| Aireports of Thailand PLC (Cost - $338,099) | | | | | | | 30,700 | | | | 344,168 | |
| | | | | | | | | | | | | |
| PREFERRED STOCK - 1.5% | | Dividend Rate | | | | | | | | | |
| AUTO MANUFACTURERS - 0.3% | | | | | | | | | | | | |
| Porsche Automobil Holding SE | | | 2.0100 | % | | | 547 | | | | 30,565 | |
| Volkswagon AG | | | 4.8600 | | | | 1,966 | | | | 284,735 | |
| | | | | | | | | | | | 315,300 | |
| COSMETICS - 0.8% | | | | | | | | | | | | |
| Amorepacific Corp. | | | 0.4600 | | | | 3,580 | | | | 711,589 | |
| | | | | | | | | | | | | |
| ELECTRIC - 0.2% | | | | | | | | | | | | |
| Cia Energetica de Minas Gerais | | | 0.5038 | | | | 36000 | | | | 74,800 | |
| Cia Energetica de Sao Paulo | | | 0.0867 | | | | 20600 | | | | 90,022 | |
| RWE AG | | | 0.1300 | | | | 353 | | | | 3,872 | |
| | | | | | | | | | | | 168,694 | |
| FOOD - 0.1% | | | | | | | | | | | | |
| CJ CheilJedang Corp | | | 2.5500 | | | | 362 | | | | 66,549 | |
| | | | | | | | | | | | | |
| MISCELLANEOUS MANUFACTURING - 0.1% | | | | | | | | | | | | |
| Doosan Corp. | | | 4.6000 | | | | 1,070 | | | | 60,933 | |
| | | | | | | | | | | | | |
| TOTAL PREFERRED STOCK (Cost - $1,669,685) | | | | | | | | | | | 1,323,065 | |
| | | | | | | | | | | | | |
| SHORT-TERM INVESTMENT -1.8% | | | | | | | | | | | | |
| MONEY MARKET FUND - 1.8% | | | | | | | | | | | | |
| Fidelity Institutional Money Market Funds - Government Portfolio 0.09% +, ^^ (Cost - $1,626,200) | | | | | | | 1,626,200 | | | | 1,626,200 | |
| | | | | | | | | | | | | |
| COLLATERAL FOR SECURITIES LOANED - 5.1% | | | | | | | | | | | | |
| Mount Vernon Prime Portfolio 0.51% + (Cost - $4,645,326) | | | | | | | 4,645,326 | | | | 4,645,326 | |
| | | | | | | | | | | | | |
TOTAL INVESTMENTS - 104.8%
(Cost - $91,735,418) | | | | | | | | | | $ | 94,605,299 | |
| LIABILITIES IN EXCESS OF OTHER ASSETS - (4.8)% | | | | | | | | | | | (4,362,785 | ) |
| NET ASSETS - 100.0% | | | | | | | | | | $ | 90,242,512 | |
| ^ | All or a portion of these securities are on loan. Total loaned securities had a value of $4,425,130 at April 30, 2016. |
| * | Non-income producing security. |
ADR - American Depositary Receipt.
GDR - Global Depositary Receipt.
NV - Non-Voting
REIT - Real Estate Investment Trust.
| + | Variable rate security. Interest rate is as of April 30, 2016. |
| ^^ | All or part of the security was held as collateral for forward foreign currency contracts outstanding as of April 30, 2016. |
| Portfolio Composition * - (Unaudited) |
| Japan | | | 16.3 | % | | Canada | | | 4.2 | % |
| Switzerland | | | 10.2 | % | | Sweden | | | 4.1 | % |
| Britain | | | 7.4 | % | | Russia | | | 3.4 | % |
| South Korea | | | 6.9 | % | | Belgium | | | 3.4 | % |
| France | | | 5.8 | % | | Other Countries | | | 33.4 | % |
| Germany | | | 4.9 | % | | Total | | | 100.0 | % |
| * | Based on total value of investments as of April 30, 2016. |
Percentage may differ from Schedule of Investments which are based on Fund net assets.
See accompanying notes to financial statements.
Dunham Real Estate Stock Fund
Message from the Sub-Adviser (Cornerstone Real Estate Advisers LLC)
The real estate investment trust (REIT) market had a disappointing three-month period ended January 31, 2016 amid the Federal Reserve raising interesting rates, China showing continued weakness, and a disappointing stimulus package delivered by the European Central Bank. These concerns may have spurred a systematic decline in equities. This trend continued until mid-February when the Federal Reserve acknowledged the challenges present in the global economy and lifted some expectations in regard to future interest rate rises. REITs, as measured by the FTSE NAREIT All REIT Index, rebounded in the final three months resulting in a 5.2 percent gain for the six-month period ended April 30, 2016. Most of the returns were generated in March when REITs increased 10.1 percent. This strong performance comes on the heels of a 2.2 percent drop in the prior six-month fiscal period. REITs outperformed other broad equity indexes, such as the S&P 500 Index, for the second six-month period in a row as the S&P 500 increased 0.4 percent.
The Sub-Adviser believes that the intrinsic value of a listed real estate company is a function of the quality of its real estate portfolio, management team, and capital plan. Achieving a thorough understanding of the real estate assets owned by an investment candidate is the foundation of establishing the value of that enterprise. Evaluating management’s ability to drive earnings and add value to underlying real estate assets is vital to the Sub-Adviser developing an understanding of the sustainable future success of the company. Assessing a firm’s financial structure within the context of the prevailing financial environment provides the Sub-Adviser a framework to understand the risk and long-term potential of a firm’s business strategy. Over the six-month period ended April 30, 2016, self storage REITs and apartment REITs were top contributors to the Fund. Sectors that detracted from performance over the six-month period were regional mall REITs, and lodging/resorts REITs.
The apartment REIT sector has outperformed in six consecutive fiscal quarters. Security selection detracted slightly, as holdings in the Fund underperformed the overall apartment REITs sector. However, the allocation to this sector more than made up for the shortfall in stock selection. Overall, this sector within the Fund increased 1.6 percent. Apartment Investment and Management Company (ACC) (holding percentage*: 3.15 percent), a REIT that engages in on and off-campus housing properties within close proximity to colleges and universities, was one of the better performing apartment REITs in the Fund, with a 12.4 percent return in the six-month period ended April 30, 2016. After five consecutive quarters of an overweight to this sector, the Sub-Adviser has lowered the allocation to apartment REITs. By the end of the most recent fiscal quarter, the Fund was 2.0 percent below the benchmark weighting. The Sub-Adviser believes that landlords are losing pricing power due to an increase in supply. This increase in supply is most evident in the New York and San Francisco markets.
Lodging/resort REITs dragged on performance over the six-month period ended April 30, 2016. Both security selection and allocation to this sector detracted from Fund performance. The Sub-Adviser noted that fundamentals in the sector have been weak and that the Fund has been scaling back exposure. The Fund’s allocation is in line with the benchmark thus having very little impact on relative performance. A holding that detracted from overall performance within this sector was Chesapeake Lodging Trust (CHSP) (holding percentage*: 1.4 percent), a firm that owns upscale hotels in major business and convention markets. Chesapeake Lodging Trust declined 7.8 percent over the six-month period. The Sub-Adviser believes that the economy will continue to recover and that a boost in consumer spending should elevate lodging REITs.
The regional mall sector also detracted from Fund performance over the six-month period. This sector generally detracted from relative performance, as the Fund maintained over a 5 percent overweight. Both stock selection and allocation effect for this sector was negative as this sector fell 1.4 percent within the Fund. Macerich Co. (MAC) (holding percentage*: 3.79 percent), which engages in the acquisition, ownership, development, management and leasing of regional and community shopping centers, detracted from performance in this sector, with a 4.0 percent loss in the six-month period ended April 30, 2016. The Sub-Adviser plans to maintain an overweight to this sector, noting that regional mall REITs are trading at a discount relative to historical measures.
Holdings in the self-storage REIT sector contributed to Fund performance over the first three months, but detracted from Fund performance in the final three months of the six-month fiscal period. A significant overweight to the sector was mainly responsible for the outperformance, while security selection in this sector also detracted. This sector increased 7.8 percent within the Fund over the six-month period. Despite the underperformance in the final three months of the six-month period, the Sub-Adviser is still bullish on the sector and retains the overweight. The Sub-Adviser noted that undersupply in the sector allows companies to have minimal vacancies and charge higher rent. Only 300 to 400 facilities have been built in recent years while approximately 3,500 were built at the peak in 2005. The Sub-Adviser believes that about 1,000 self-storage facilities per year need to be built to have a substantial effect on supply. Extra Space Storage, Inc. (EXR) (holding percentage*: 3.26 percent), a self-storage REIT that focuses primarily on the ownership and operation of self-storage facilities, was one of the strongest performing Fund holdings in this sector, increasing 8.6 percent.
Going forward, the Sub-Adviser expects REITs to generate attractive returns in 2016. It also anticipates that equity markets will remain volatile as uncertainty remains for U.S. Fed policy, global growth uncertainty, volatility in commodities, and a stronger U.S. dollar. Economic growth, rising interest rates, and inflation, my support real estate fundamentals, rent growth, and in turn help REITs. The Sub-Adviser believes that real estate fundamentals remain positive in the U.S. and in Europe, and that global valuations are attractive.
| * | Holdings percentage(s) as of 4/30/2016. |
Growth of $100,000 Investment - (Unaudited)
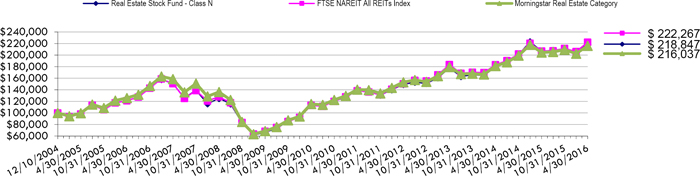
Total Returns as of April 30, 2016
| | Six | One | Annualized | Annualized | Annualized | Annualized Since Inception |
| | Months | Year | Three Years | Five Years | Ten Years | (12/10/04) |
| Class N | 3.46% | 5.66% | 7.12% | 9.51% | 5.74% | 7.11% |
| Class C | 2.94% | 4.57% | 6.05% | 8.40% | 4.68% | 6.04% |
| Class A with load of 5.75% | 3.35% | (0.67)% | 4.75% | 7.94% | N/A | 3.46%* |
| Class A without load | (2.61)% | 5.38% | 6.83% | 9.21% | N/A | 4.12%* |
| FTSE NAREIT All REITs Index | 5.07% | 7.39% | 6.57% | 9.96% | 6.25% | 7.27% |
| Morningstar Real Estate Category | 3.25% | 5.67% | 6.38% | 9.01% | 5.55% | 6.99% |
| * | Class A commenced operations on January 3, 2007. |
The FTSE NAREIT All REITs Index is a free float adjusted market capitalization weighted index that includes all tax qualified REITs listed on the NYSE and NASDAQ National Market. Investors cannot invest directly in an index or benchmark.
The Morningstar Real Estate Category is generally representative of mutual funds that primarily invest in REITS of various types. REITs are companies that develop and manage real estate properties.
As disclosed in the Trust’s latest registration statement, the Fund’s total annual operating expenses, including the cost of underlying funds, are 1.64% for Class N, 2.64% for Class C and 1.89% for Class A. Class A shares are subject to a sales load of 5.75% and a deferred sales charge of up to 0.75% The performance data quoted here represents past performance, which is not indicative of future results. Current performance may be lower or higher than the performance data quoted. The investment return and NAV will fluctuate, so that an investor’s shares, when redeemed, may be worth more or less than their original cost. Total returns are calculated assuming reinvestment of all dividends and capital gains distributions, if any. The returns do not reflect the deductions of taxes a shareholder would pay on the redemption of fund shares or fund distributions. For performance information current to the most recent month-end, please call 1-800-442-4358 or visit our website www.dunham.com.
| SCHEDULE OF INVESTMENTS (Unaudited) |
| Dunham Real Estate Stock Fund |
| April 30, 2016 |
| Security | | Shares | | | Value | |
| COMMON STOCK - 1.2% | | | | | | | | |
| LODGING - 1.2% | | | | | | | | |
| Hilton Worldwide Holdings, Inc. ^ | | | 23,060 | | | $ | 508,473 | |
| | | | | | | | | |
| TOTAL COMMON STOCK (Cost - $541,154) | | | | | | | | |
| | | | | | | | | |
| REITS - 96.8% | | | | | | | | |
| APARTMENTS - 9.0% | | | | | | | | |
| American Campus Communities, Inc. | | | 30,140 | | | | 1,348,765 | |
| Apartment Investment & Management Co. | | | 23,470 | | | | 940,208 | |
| Essex Property Trust, Inc. ^ | | | 7,130 | | | | 1,571,809 | |
| | | | | | | | 3,860,782 | |
| DATA CENTER - 11.4% | | | | | | | | |
| Digital Realty Trust, Inc. | | | 19,140 | | | | 1,683,937 | |
| CyrusOne, Inc. | | | 32,240 | | | | 1,422,751 | |
| Equinix Inc | | | 5,320 | | | | 1,757,462 | |
| | | | | | | | 4,864,150 | |
| HEALTHCARE - 10.9% | | | | | | | | |
| National Health Investors, Inc. | | | 7,100 | | | | 483,439 | |
| Physicians Realty Trust | | | 42,600 | | | | 772,338 | |
| Ventas, Inc. ^ | | | 20,140 | | | | 1,251,097 | |
| Welltower, Inc. | | | 31,060 | | | | 2,156,185 | |
| | | | | | | | 4,663,059 | |
| HOTELS - 4.1% | | | | | | | | |
| Chatham Lodging Trust | | | 9,340 | | | | 199,035 | |
| Chesapeake Lodging Trust | | | 24,290 | | | | 598,263 | |
| DiamondRock Hospitality Co. | | | 33,280 | | | | 296,525 | |
| FelCor Lodging Trust, Inc. | | | 95,300 | | | | 682,348 | |
| | | | | | | | 1,776,171 | |
| MANUFACTURED HOMES - 2.3% | | | | | | | | |
| Sun Communities, Inc. | | | 14,310 | | | | 971,220 | |
| | | | | | | | | |
| OFFICE - 13.8% | | | | | | | | |
| Boston Properties, Inc. | | | 14,200 | | | | 1,829,812 | |
| Highwoods Properties, Inc. | | | 18,430 | | | | 861,234 | |
| Kilroy Realty Corp. ^ | | | 20,413 | | | | 1,322,967 | |
| Paramount Group Inc. | | | 71,030 | | | | 1,186,201 | |
| SL Green Realty Corp. | | | 6,730 | | | | 707,188 | |
| | | | | | | | 5,907,402 | |
| Security | | Shares | | | Value | |
| REGIONAL MALLS - 16.7% | | | | | | | | |
| Macerich Co. | | | 21,330 | | | $ | 1,622,786 | |
| Simon Property Group, Inc. | | | 22,711 | | | | 4,568,772 | |
| Taubman Centers, Inc. | | | 14,090 | | | | 978,551 | |
| | | | | | | | 7,170,109 | |
| SHOPPING CENTERS - 13.1% | | | | | | | | |
| Acadia Realty Trust | | | 35,288 | | | | 1,189,205 | |
| Equity One, Inc. | | | 25,600 | | | | 724,480 | |
| Kimco Realty Corp. | | | 40,730 | | | | 1,145,328 | |
| Regency Centers Corp. | | | 25,750 | | | | 1,897,775 | |
| Tanger Factory Outlet Centers, Inc. ^ | | | 18,730 | | | | 657,048 | |
| | | | | | | | 5,613,836 | |
| SELF STORAGE - 7.5% | | | | | | | | |
| Extra Space Storage, Inc. ^ | | | 16,450 | | | | 1,397,428 | |
| Public Storage, Inc. | | | 7,430 | | | | 1,818,938 | |
| | | | | | | | 3,216,366 | |
| INDUSTRIAL 8.0% | | | | | | | | |
| Duke Realty Corp. | | | 49,320 | | | | 1,078,628 | |
| First Industrial Realty Trust, Inc. | | | 18,820 | | | | 431,731 | |
| Prologis, Inc. ^ | | | 41,910 | | | | 1,903,133 | |
| | | | | | | | 3,413,492 | |
| TOTAL REITS (Cost - $34,199,469) | | | | | | | 41,456,587 | |
| | | | | | | | | |
| SHORT-TERM INVESTMENT - 2.0% | | | | | | | | |
| MONEY MARKET FUND - 2.0% | | | | | | | | |
| Fidelity Institutional Money Market | | | | | | | | |
| Fund - Government Portfolio, 0.01% + | | | 857,395 | | | | 857,395 | |
| TOTAL SHORT-TERM INVESTMENT (Cost - $857,395) | | | | | | | | |
| | | | | | | | | |
| COLLATERAL FOR SECURITIES LOANED - 16.8% | | | | | | | | |
| Mount Vernon Prime Portfolio 0.51% + (Cost - $7,173,911) | | | 7,173,911 | | | | 7,173,911 | |
| | | | | | | | | |
| TOTAL INVESTMENTS - 116.9% (Cost - $42,771,929) | | | | | | $ | 49,996,366 | |
| LIABILITIES LESS OTHER ASSETS - (16.9)% | | | | | | | (7,233,741 | ) |
| TOTAL NET ASSETS - 100.00% | | | | | | $ | 42,762,625 | |
| ^ | All or a portion of these securities are on loan. Total loaned securities had a value of $6,928,648 at April 30, 2016. |
REITS - Real Estate Investment Trusts
| + | Variable rate security. Interest rate is as of April 30, 2016. |
| Portfolio Composition * - (Unaudited) |
| Regional Mall | | | 16.7 | % | | Industrial | | | 8.0 | % |
| Office | | | 13.8 | % | | Self Storage | | | 7.5 | % |
| Shopping Centers | | | 13.1 | % | | Hotels | | | 4.1 | % |
| Data Cebter | | | 11.4 | % | | Manufactured Homes | | | 2.3 | % |
| Healthcare | | | 10.9 | % | | Short-Term Investment | | | 2.0 | % |
| Apartments | | | 9.0 | % | | Common Stock - Lodging | | | 1.2 | % |
| | | | | | | | | | 100.0 | % |
| * | Based on total value of investments as of April 30, 2016. |
Percentage may differ from Schedule of Investments which are based on Fund net assets.
See accompanying notes to financial statements.
Dunham Small Cap Value Fund
Message from the Sub-Adviser (Piermont Capital Management LLC)
Small cap value stocks, as measured by the Russell 2000 Value Index, increased 1.2 percent in the six-month period ended April 30, 2016. Small-cap growth stocks in the Russell 2000 Growth Index significantly underperformed, falling 5.0 percent over the same time period. Small cap stocks in general, as measured by the Russell 2000 Index, fared in the middle of the two, as would be expected, dropping 2.0 percent over the fiscal six-month period. Larger capitalization stocks, as measured by the S&P 500 Index, produced a 0.4 percent return, outperforming small cap stocks in general, by 2.4 percent, but underperformed small cap value stocks by 80 basis points. Some of the top contributors to the Fund’s performance were the technology and basic materials sectors, while the healthcare and consumer products sectors lagged somewhat.
The Sub-Adviser’s strategy continued to focus on, what it believes to be, high quality firms, using 14 sector-specific models consisting of a combination of five to nine factors for each sector model, which measure both fundamental and technical metrics. Stocks must rank in the top 20 percent to be considered for purchase and also undergo a qualitative red flag review. The red flag review may include reviewing news stories that could adversely affect a stock, high turnover in senior management, and an accelerating debt ratio, among other factors. Another core premise of the strategy is that the Fund should remain sector and industry neutral, so as to avoid large risks by overweighting or underweighting a particular sector. This allows the Sub-Adviser to focus solely on picking the best stocks in each sector and industry rather than trying to predict macroeconomic trends. It is this complete bottom-up selection approach that makes the Sub-Adviser’s investment process somewhat unique.
A holding in the technology sector that contributed to Fund performance during the first half of the fiscal six-month period was Rovi Corporation (ROVI) (holding percentage**: 1.0 percent), a multimedia and graphics software firm, was the best performing tech stock in the Fund and added 16 basis points to relative performance during the first half of the fiscal six-month period. The stock increased by more than 80 percent from the beginning of the fiscal period until it was sold by the Fund in early January. A positive earnings announcement and the renewal of a contract with a large telecommunications firm led to the sharp increase, according to the Sub-Adviser. However, the stock’s ranking dropped significantly enough that it was considered to be overvalued and subsequently sold.
A holding in the basic materials sector that contributed to Fund performance during the second half of the fiscal six-month period was Stillwater Mining Company (SWC) (holding percentage*: 0.67 percent). The company explores for, develops, extracts, processes, and refines platinum, palladium, and associated metals from the J-M Reef located in Stillwater and the East Boulder Mine near McLeod, Montana. The stock hit bottom in mid-January but, like other mining companies, began to rally with commodities. Additionally, the company reported strong earnings in February, which made it the top performing basic materials stock in the Fund and added 35 basis points to relative performance. The stock increased by more than 86 percent during the second half of the fiscal six-month period.
Stocks in the healthcare sector generally detracted from Fund performance over the fiscal six-month period. Progenics Pharmaceuticals, Inc. (PGNX) (holding percentage**: 0.5 percent), which develops medicines for oncology in the U.S. and internationally, was a company that detracted from Fund performance for the majority of the fiscal period. The Sub-Adviser said an earnings report that did not meet analyst expectations, in addition to the large downturn in biotech stocks in general, was mainly responsible for the decline. In early April, the stocks ranking dropped to a level that met the Sub-Adviser’s criteria to be sold. The Sub-Adviser subsequently liquidated all positions in the stock on April 8, 2016, by which time the stock had declined 35 percent.
During the second half of the fiscal six-month period, a detractor from Fund performance was John B. Sanfilippo & Sons, Inc. (JBSS) (holding percentage*: 0.91 percent). The company processes, packages, markets, and distributes shelled nuts, in-shell nuts, and sesame sticks. Their nuts are marketed under the well-known brand of Fisher nuts. The Sub-Adviser initiated positions in JBSS in March 2016, about midway through the second half of the fiscal period, when the stock was near an all-time high. The company subsequently reported disappointing earnings in late April and the stock took a substantial hit. From the time the Sub-Adviser bought the stock on March 11, 2016 through the end of the fiscal period, the stock lost more than 20 percent. Although the impact to the Fund on a relative basis was a negative 21 basis points, the stock still ranks within the range the Sub-Adviser requires for a stock to remain in the Fund.
Going forward, the Sub-Adviser plans to continue its sector-, beta-, and market-capitalization-neutral bottom-up stock picking strategy without regard to outside economic factors, interest rate changes or any other top-down methodology. The qualitative review of small-cap stocks that meet the criteria for consideration for investment within the Fund may, however, lead the Sub-Adviser to consider the impact of macroeconomic factors when assessing various risks specific to each company. The Sub-Adviser will continue to analyze its multi-factor model, only making adjustments when it is deemed that a particular metric is no longer working properly or it is found that a new fundamental or technical indicator may be more useful.
| * | Holdings Percentage(s) as of 4/30/2016. |
| ** | Holdings Percentage(s) as of the date prior to the sales of the security. |
Growth of $100,000 Investment – (Unaudited)
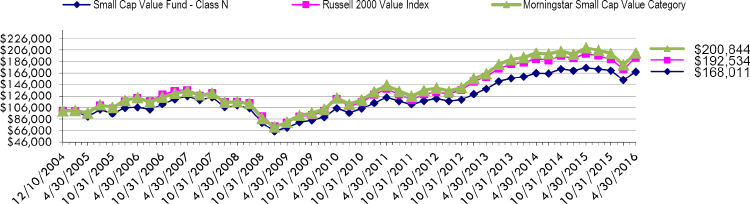
Total Returns as of April 30, 2016
| | | | | | | Annualized Since |
| | | | Annualized | Annualized | Annualized | Inception |
| | Six Months | One Year | Three Years | Five Years | Ten Years | (12/10/04) |
| Class N | (1.30)% | (4.06)% | 6.67% | 6.33% | 4.68% | 4.66% |
| Class C | (1.88)% | (5.08)% | 5.61% | 5.27% | 3.64% | 3.63% |
| Class A with load of 5.75% | (7.21)% | (9.84)% | 4.29% | 4.84% | N/A | 2.96%* |
| Class A without load | (1.52)% | (4.35)% | 6.38% | 6.09% | N/A | 3.62%* |
| Russell 2000 Value Index | 1.18% | (3.71)% | 6.50% | 6.77% | 4.61% | 4.03% |
| Morningstar Small Cap Value Category | 0.42% | (4.34)% | 6.87% | 6.78% | 5.00% | 6.31% |
| * | Class A commenced operations on January 3, 2007. |
The Russell 2000 Value Index is an unmanaged index that measures the performance of small cap companies in the Russell 2000 Index with lower price-to-book ratios and lower forecasted growth rates. Investors cannot invest directly in an index or benchmark.
The Morningstar Small Cap Value Category is generally representative of mutual funds that primarily invest in small (small capitalization) U.S. companies that are less expensive or growing more slowly than other small-cap stocks.
As disclosed in the Trust’s latest registration statement, the Fund’s total annual operating expenses, including underlying funds, are 1.80% for Class N, 2.80% for Class C and 2.05% for Class A. Class A shares are subject to a sales load of 5.75% and a deferred sales charge of up to 0.75%. The performance data quoted here represents past performance, which is not indicative of future results. Current performance may be lower or higher than the performance data quoted. The investment return and NAV will fluctuate, so that an investor’s shares, when redeemed, may be worth more or less than their original cost. Total returns are calculated assuming reinvestment of all dividends and capital gains distributions, if any. The returns do not reflect the deductions of taxes a shareholder would pay on the redemption of fund shares or fund distributions. For performance information current to the most recent month-end, please call 1-800-442-4358 or visit our website www.dunham.com.
| SCHEDULE OF INVESTMENTS (Unaudited) |
| Dunham Small Cap Value Fund |
| April 30, 2016 |
| Security | | Shares | | | Value | |
| COMMON STOCK - 99.9% | | | | | | | | |
| AEROSPACE / DEFENSE - 1.2% | | | | | | | | |
| Aerojet Rocketdyne Holdings, Inc. ^* | | | 18,500 | | | $ | 335,220 | |
| | | | | | | | | |
| AUTO PARTS & EQUIPMENT - 1.0% | | | | | | | | |
| Cooper Tire & Rubber Co. | | | 8,170 | | | | 282,192 | |
| | | | | | | | | |
| BANKS - 17.8% | | | | | | | | |
| BancFirst Corp. | | | 2,200 | | | | 137,214 | |
| CenterState Banks, Inc. | | | 12,670 | | | | 206,394 | |
| Central Pacific Financial Corp | | | 12,519 | | | | 292,193 | |
| Chemical Financial Corp ^ | | | 5,017 | | | | 192,954 | |
| Columbia Banking System, Inc. | | | 9,296 | | | | 274,139 | |
| First Citizens BancShares, Inc. - Class B | | | 1,110 | | | | 283,050 | |
| First Commonwealth Financial Corp. | | | 18,890 | | | | 173,410 | |
| First Interstate BancSystem, Inc. | | | 8,468 | | | | 229,483 | |
| IBERIABANK Corp. | | | 4,870 | | | | 287,281 | |
| MB Financial, Inc. | | | 9,700 | | | | 337,172 | |
| Old National Bancorp ^ | | | 25,177 | | | | 337,372 | |
| Prosperity Bancshares, Inc. ^ | | | 5,990 | | | | 316,092 | |
| Simmons First National Corp. | | | 4,970 | | | | 232,099 | |
| TCF Financial Corp. | | | 24,460 | | | | 333,634 | |
| TriCo Bancshares | | | 6,711 | | | | 180,660 | |
| Trustmark Corp. ^ | | | 14,210 | | | | 348,287 | |
| Umpqua Holdings Corp. | | | 16,150 | | | | 255,655 | |
| United Community Banks, Inc. | | | 11,458 | | | | 230,650 | |
| WesBanco, Inc. | | | 6,500 | | | | 208,845 | |
| | | | | | | | 4,856,584 | |
| CHEMICALS - 1.7% | | | | | | | | |
| Cabot Corp. | | | 4,508 | | | | 219,945 | |
| Innophos Holdings, Inc. | | | 6,579 | | | | 243,160 | |
| | | | | | | | 463,105 | |
| COMMERCIAL SERVICES - 3.3% | | | | | | | | |
| CRA International, Inc. * | | | 5,985 | | | | 129,875 | |
| Ennis, Inc. | | | 9,262 | | | | 180,979 | |
| LendingTree, Inc. ^* | | | 3,100 | | | | 277,357 | |
| McGrath RentCorp | | | 12,500 | | | | 304,750 | |
| | | | | | | | 892,961 | |
| COMPUTERS - 4.5% | | | | | | | | |
| Brocade Communications Systems, Inc. | | | 22,000 | | | | 211,420 | |
| DST Systems, Inc. | | | 3,070 | | | | 370,488 | |
| Insight Enterprises, Inc. * | | | 13,390 | | | | 330,867 | |
| Mentor Graphics Corp. | | | 15,190 | | | | 303,192 | |
| | | | | | | | 1,215,967 | |
| DISTRIBUTION/WHOLESALE - 1.0% | | | | | | | | |
| Fossil Group, Inc. ^* | | | 6,680 | | | | 270,540 | |
| | | | | | | | | |
| DIVERSIFIED FINANCIAL SERVICES - 1.3% | | | | | | | | |
| KCG Holdings, Inc. | | | 26,000 | | | | 356,200 | |
| | | | | | | | | |
| ELECTRIC - 3.7% | | | | | | | | |
| ALLETE, Inc. | | | 6,720 | | | | 377,597 | |
| PNM Resources, Inc. | | | 10,190 | | | | 322,819 | |
| Portland General Electric Co. | | | 8,050 | | | | 319,746 | |
| | | | | | | | 1,020,162 | |
| Security | | Shares | | | Value | |
| | | | | | | | | |
| ELECTRONICS - 4.8% | | | | | | | | |
| Brady Corp. | | | 12,220 | | | $ | 323,708 | |
| FARO Technologies, Inc. * | | | 5,623 | | | | 163,292 | |
| II-VI, Inc. * | | | 14,840 | | | | 309,711 | |
| OSI Systems, Inc. * | | | 4,110 | | | | 209,158 | |
| Sanmina Corp. * | | | 12,975 | | | | 306,859 | |
| | | | | | | | 1,312,728 | |
| ENGINEERING & CONSTRUCTION - 1.2% | | | | | | | | |
| KBR, Inc. | | | 20,120 | | | | 313,067 | |
| | | | | | | | | |
| ENTERTAINMENT - 0.7% | | | | | | | | |
| International Speedway Corp. | | | 5,900 | | | | 197,591 | |
| | | | | | | | | |
| FOOD - 2.6% | | | | | | | | |
| Ingles Markets, Inc. - Class A | | | 5,608 | | | | 202,281 | |
| John B Sanfilippo & Son, Inc. | | | 4,476 | | | | 247,657 | |
| Lancaster Colony Corp. | | | 2,330 | | | | 271,445 | |
| | | | | | | | 721,383 | |
| GAS - 2.7% | | | | | | | | |
| Northwest Natural Gas Co. | | | 5,997 | | | | 309,085 | |
| Southwest Gas Corp. | | | 6,410 | | | | 416,073 | |
| | | | | | | | 725,158 | |
| HEALTHCARE - PRODUCTS - 2.0% | | | | | | | | |
| Haemonetics Corp. * | | | 9,250 | | | | 299,977 | |
| Meridian Bioscience, Inc. ^ | | | 13,050 | | | | 249,385 | |
| | | | | | | | 549,362 | |
| HEALTHCARE - SERVICES - 1.2% | | | | | | | | |
| Healthways, Inc. * | | | 27,529 | | | | 320,713 | |
| | | | | | | | | |
| HOME BUILDERS - 1.7% | | | | | | | | |
| M/I Homes, Inc. ^* | | | 10,658 | | | | 214,226 | |
| Taylor Morrison Home Corp. Class A ^ | | | 17,130 | | | | 246,672 | |
| | | | | | | | 460,898 | |
| INSURANCE - 5.5% | | | | | | | | |
| American Equity Investment Life Holding Co. | | | 21,288 | | | | 298,032 | |
| Aspen Insurance Holdings Ltd. | | | 6,600 | | | | 305,910 | |
| Maiden Holdings Ltd. ^ | | | 21,107 | | | | 258,139 | |
| Selective Insurance Group, Inc. | | | 9,500 | | | | 329,745 | |
| Stewart Information Services Corp. | | | 8,579 | | | | 298,721 | |
| | | | | | | | 1,490,547 | |
| METAL FABRICATE / HARDWARE - 1.1% | | | | | | | | |
| Timken Co. | | | 8,450 | | | | 301,072 | |
| | | | | | | | | |
| MINING - 1.4% | | | | | | | | |
| Materion Corp. | | | 6,620 | | | | 191,914 | |
| Stillwater Mining Co. ^* | | | 15,038 | | | | 183,464 | |
| | | | | | | | 375,378 | |
| MISCELLANEOUS MANUFACTURING - 3.0% | | | | | | | | |
| Crane Co. | | | 4,400 | | | | 244,508 | |
| Federal Signal Corp. | | | 19,850 | | | | 271,746 | |
| ITT Corp. | | | 7,470 | | | | 286,624 | |
| | | | | | | | 802,878 | |
| OIL & GAS - 2.7% | | | | | | | | |
| PDC Energy, Inc. * ^ | | | 5,569 | | | | 349,677 | |
| Unit Corp. * | | | 9,580 | | | | 121,283 | |
| WPX Energy, Inc. ^ | | | 26,180 | | | | 252,899 | |
| | | | | | | | 723,859 | |
See accompanying notes to financial statements.
| SCHEDULE OF INVESTMENTS (Unaudited) |
| Dunham Small Cap Value Fund (Continued) |
| April 30, 2016 |
| Security | | Shares | | | Value | |
| OIL & GAS SERVICES - 1.2% | | | | | | | | |
| Gulf Island Fabrication, Inc. | | | 11,440 | | | $ | 85,914 | |
| Oceaneering International, Inc. | | | 6,840 | | | | 250,686 | |
| | | | | | | | 336,600 | |
| PACKAGING & CONTAINERS - 1.1% | | | | | | | | |
| Owens-Illinois, Inc. * | | | 15,412 | | | | 284,506 | |
| | | | | | | | | |
| PHARMACEUTICALS - 1.4% | | | | | | | | |
| Anika Therpeutics, Inc. * | | | 5,373 | | | | 245,331 | |
| Sagent Pharmaceuticals, Inc. * | | | 11,590 | | | | 134,908 | |
| | | | | | | | 380,239 | |
| REAL ESTATE - 1.0% | | | | | | | | |
| Alexander & Baldwin, Inc. ^ | | | 7,110 | | | | 271,886 | |
| | | | | | | | | |
| REITS - 15.7% | | | | | | | | |
| Cedar Realty Trust, Inc. | | | 45,120 | | | | 312,230 | |
| Chimera Investment Corp. | | | 21,150 | | | | 300,330 | |
| Cousins Properties, Inc. | | | 33,480 | | | | 346,518 | |
| DCT Industrial Trust, Inc. | | | 8,500 | | | | 343,145 | |
| EastGroup Properties, Inc. | | | 4,860 | | | | 290,385 | |
| First Industrial Realty Trust, Inc. | | | 13,750 | | | | 315,425 | |
| Franklin Street Properties Corp. ^ | | | 26,937 | | | | 286,071 | |
| Healthcare Trust of America, Inc. - Class A | | | 10,210 | | | | 294,967 | |
| Hersha Hospitality Trust | | | 13,083 | | | | 252,371 | |
| Invesco Mortgage Capital, Inc. | | | 25,200 | | | | 323,820 | |
| Mack-Cali Realty Corp. | | | 14,760 | | | | 377,266 | |
| Pebblebrook Hotel Trust | | | 8,466 | | | | 234,000 | |
| Piedmont Office Realty Trust, Inc. | | | 17,000 | | | | 338,470 | |
| Summit Hotel Properties, Inc. | | | 21,499 | | | | 245,089 | |
| | | | | | | | 4,260,087 | |
| RETAIL - 5.8% | | | | | | | | |
| Big Lots, Inc. | | | 5,430 | | | | 249,020 | |
| Bob Evans Farms, Inc. | | | 6,240 | | | | 284,170 | |
| Build-A-Bear Workshop, Inc. * | | | 16,132 | | | | 212,458 | |
| Express, Inc. * | | | 15,160 | | | | 275,609 | |
| Group 1 Automotive, Inc. | | | 3,840 | | | | 252,826 | |
| Ruth’s Hospitality Group, Inc. ^ | | | 8,310 | | | | 131,963 | |
| Shoe Carnival, Inc. | | | 6,850 | | | | 175,566 | |
| | | | | | | | 1,581,612 | |
| SAVINGS & LOANS - 2.2% | | | | | | | | |
| Berkshire Hills Bancorp, Inc. | | | 5,300 | | | | 143,842 | |
| Flagstar Bancorp, Inc. * | | | 7,982 | | | | 188,934 | |
| HomeStreet, Inc. * | | | 12,335 | | | | 265,819 | |
| | | | | | | | 598,595 | |
| Security | | Shares | | | Value | |
| SEMICONDUCTORS - 2.1% | | | | | | | | |
| Exar Corp. * | | | 24,756 | | | $ | 151,012 | |
| Tessera Technologies, Inc. | | | 9,850 | | | | 282,892 | |
| Xcerra Corp. * | | | 22,751 | | | | 134,231 | |
| | | | | | | | 568,135 | |
| TELECOMMUNICATIONS - 1.5% | | | | | | | | |
| Spok Holdings, Inc. | | | 10,330 | | | | 175,507 | |
| West Corp. | | | 10,880 | | | | 233,158 | |
| | | | | | | | 408,665 | |
| TRANSPORTATION - 1.8% | | | | | | | | |
| ArcBest Corp. ^ | | | 10,390 | | | | 198,345 | |
| Werner Enterprises, Inc. | | | 11,320 | | | | 286,849 | |
| | | | | | | | 485,194 | |
| | | | | | | | | |
| TOTAL COMMON STOCK - (Cost - $27,225,079) | | | | | | | 27,163,084 | |
| | | | | | | | | |
| SHORT-TERM INVESTMENT - 0.1% | | | | | | | | |
| MONEY MARKET FUND - 0.1% | | | | | | | | |
| Invesco STIT-Treasury Portfolio Institutional - 0.21% + | | | 42,094 | | | | 42,094 | |
| (Cost - $42,094) | | | | | | | | |
| | | | | | | | | |
| COLLATERAL FOR SECURITIES LOANED - 15.2% | | | | | | | | |
| Mount Vernon Prime Portfolio 0.51% + | | | 4,121,138 | | | | 4,121,138 | |
| (Cost - $4,121,138) | | | | | | | | |
| TOTAL INVESTMENTS - 115.2% (Cost - $31,388,311) | | | | | | $ | 31,326,316 | |
| LIABILITIES IN EXCESS OF OTHER ASSETS - (15.2)% | | | | | | | (4,123,162 | ) |
| NET ASSETS - 100.0% | | | | | | $ | 27,203,154 | |
REIT - Real Estate Investment Trust
| ^ | All or a portion of these securiites are on loan. Total loaned securities had a value of $3,900,033 at April 30, 2016. |
| * | Non Income producing security. |
| + | Variable rate security - interest rate is as April 30, 2016. |
| Portfolio Composition * - (Unaudited) |
| Financial | | | 37.8 | % | | Utilities | | | 5.6 | % |
| Collateral for Securities Loaned | | | 13.2 | % | | Energy | | | 3.4 | % |
| Industrial | | | 12.2 | % | | Basic Materials | | | 2.7 | % |
| Consumer, Non-Cyclical | | | 9.1 | % | | Communications | | | 1.3 | % |
| Consumer, Cyclical | | | 8.9 | % | | Short Term Investment | | | 0.1 | % |
| Technology | | | 5.7 | % | | Total | | | 100.0 | % |
| * | Based on total value of investments as of April 30, 2016. |
Percentage may differ from Schedule of Investments which are based on Fund net assets.
See accompanying notes to financial statements.
Dunham Emerging Markets Stock Fund
Message from the Sub-Adviser (Bailard, Inc.)
Emerging markets equities, as measured by the MSCI Emerging Markets Index, had a volatile six-month period ended April 30, 2016, decreasing 0.1 percent. During the first three months of the fiscal period, emerging markets equities declined 12.1 percent amid volatility in China and a decline in commodities. In the final three months of the fiscal period, emerging markets rallied 13.7 percent, as global oil prices rebounded and investors poured into Brazil with hopes of a presidential impeachment. The index underperformed its U.S. counterpart, as measured by the S&P 500 Index, which increased 0.4 percent over the same time period.
The Sub-Adviser continued to focus on individual countries and bottom-up stock selection within those countries, with overweights or underweights to economic sectors being largely incidental. On an absolute basis, top performing countries in the Fund included Hungary, Turkey, and Russia, while Egypt, Vietnam, and Argentina lagged. For the fiscal six-month period, overall country selection added to performance relative to the benchmark index, while stock selection detracted.
Throughout the fiscal six-month period the Sub-Adviser maintained an underweight to China. Even with this underweighting, Chinese holdings detracted from performance over the fiscal period. China Resources Power Holdings Co., Ltd. (836 HK) (holding percentage* 0.47 percent), a power generation company that invests, develops, owns, and operates coal-fired power plants in China, was one of the Fund’s detractors over the fiscal period. Over the six-month period China Resources Power Holdings Co. Ltd. decreased 25.4 percent. Another Chinese holding that detracted from the Fund’s performance was PICC Property & Casualty Co., Ltd. (2328 HK) (holding percentage**: 1.37 percent), which provides a broad range of property and casualty insurance products for a wide variety of customers throughout China. The Sub-Adviser chose to exit the position near the end of February after losing confidence in the holding. By the time the Sub-Adviser had fully exited the position it had declined 29.4 percent. The Sub-Adviser believes this is currently a challenging country to invest in due to the difficulty in deciphering and determining the validity of the available data.
One of the largest overweights and strongest positive contributors to performance over the most recent fiscal period was the Fund’s investment in Russia. A strong contribution to performance came from Sberbank of Russia PJSC (SBER LI) (holding percentage*: 1.78 percent), which is a bank that attracts deposits and offers commercial banking services. The bank offers time deposits, corporate banking, securities brokerage, credit, foreign exchange services and sponsors credit cards. Over the fiscal six-month period, the holding increased 30.7 percent. Another Russian holding that positively contributed to performance over the fiscal semi-annual period was Mobile TeleSystems PJSC ADR (MBT) (holding percentage*: 1.03 percent), which is a telecommunications group that offers mobile and fixed voice, broadband, and pay TV services. Through the company’s subsidiaries it is able to offer services to mobile subscribers in Russia, Ukraine, Turkmenistan, Armenia, and Belarus. The position gained 31.7 percent over the fiscal six-month period.
The Fund’s overweight to Hungary enhanced performance on both a relative and absolute basis, with the absolute return being the highest in the portfolio over the fiscal six-month period. A strong contributor in the country was OTP Bank Nyrt (OTP HB) (holding percentage*: 4.17 percent). OTP Bank Nyrt offers currency exchange, private banking, insurance, personal and mortgage loans, and internet banking. The bank operates through a nationwide network of branches in Hungary. The holding increased 31.8 percent over the fiscal semi-annual period.
Going forward, the Sub-Adviser is optimistic for emerging markets companies and believes growth can be found. The Sub-Adviser believes that we may see a headwind from a slowdown in growth of the U.S. market which could cause investors to flee high-risk assets, such as emerging markets countries. China is still a concern as its issues may never go away in terms of growth, but investors are slowly getting accustomed to this slowdown. The Sub-Adviser also believes that emerging markets stocks are still cheaply valued because of a lack of outperformance in comparison to earnings reports, which provides a strong opportunity for investors. Additionally, political change all over the world will need to be monitored closely as these changes could potentially contribute to the volatility of many emerging markets countries.
| * | Holdings Percentage(s) as of 4/30/2016. |
| ** | Holdings Percentage(s) as of the date prior to the sales of the security. |
Growth of $100,000 Investment - (Unaudited)
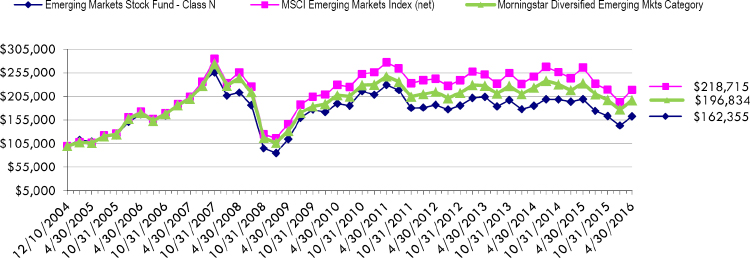
Total Returns as of April 30, 2016
| | Six | | Annualized | Annualized | Annualized | Annualized Since Inception |
| | Months | One Year | Three Years | Five Years | Ten Years | (12/10/04) |
| Class N | (0.44)% | (18.38)% | (7.29)% | (6.68)% | (0.27)% | 4.35% |
| Class C | (0.90)% | (19.18)% | (8.22)% | (7.61)% | (1.26)% | 3.32% |
| Class A with load of 5.75% | (6.23)% | (23.18)% | (9.29)% | (7.99)% | N/A | (2.24)%* |
| Class A without load | (0.55% | (18.50)% | (7.48)% | (6.89)% | N/A | (1.62)%* |
| MSCI Emerging Markets Index (net) | (0.13)% | (17.87)% | (4.57)% | (4.61)% | 2.37% | 1.38% |
| Morningstar Diversified Emerging Markets Category | (0.28)% | (15.49)% | (4.76)% | (4.48)% | 1.48% | 6.12% |
| * | Class A commenced operations on January 3, 2007. |
The MSCI Emerging Markets Index (net) is a free float-adjusted market capitalization index that is designed to measure equity market performance in the global emerging markets. Investors cannot invest directly in an index or benchmark.
The Morningstar Diversified Emerging Markets Category is generally representative of mutual funds that primarily invest among 20 or more developing nations, with a general focus on the emerging markets of Asia and Latin America rather than on the emerging markets countries in the Middle East, Africa, or Europe.
As disclosed in the Trust’s latest registration statement, the Fund’s total annual operating expenses, including underlying funds, are 1.80% for Class N, 2.80% for Class C and 2.05% for Class A. Class A shares are subject to a sales load of 5.75% and a deferred sales charge of up to 0.75%. The performance data quoted here represents past performance, which is not indicative of future results. Current performance may be lower or higher than the performance data quoted. The investment return and NAV will fluctuate, so that an investor’s shares, when redeemed, may be worth more or less than their original cost. Total returns are calculated assuming reinvestment of all dividends and capital gains distributions, if any. The returns do not reflect the deductions of taxes a shareholder would pay on the redemption of fund shares or fund distributions. For performance information current to the most recent month-end, please call 1-800-442-4358 or visit our website www.dunham.com.
| SCHEDULE OF INVESTMENTS (Unaudited) |
| Dunham Emerging Markets Stock Fund |
| April 30, 2016 |
| Security | | Shares | | | Value | |
| COMMON STOCK - 93.0% | | | | | | | | |
| AGRICULTURE - 2.0% | | | | | | | | |
| KT&G Corp. | | | 10,000 | | | $ | 1,077,352 | |
| | | | | | | | | |
| AIRLINES - 1.3% | | | | | | | | |
| AirAsia Bhd | | | 700,000 | | | | 339,801 | |
| Turk Hava Yollari AO * | | | 150,000 | | | | 370,161 | |
| | | | | | | | 709,962 | |
| AUTO MANUFACTURERS - 0.5% | | | | | | | | |
| Dongfeng Motor Group Co. Ltd. | | | 250,000 | | | | 273,187 | |
| | | | | | | | | |
| BANKS - 20.3% | | | | | | | | |
| Banco Macro SA -ADR | | | 5,000 | | | | 313,150 | |
| Bancolombia SA - ADR | | | 42,000 | | | | 1,624,980 | |
| China Construction Bank Corp. | | | 1,250,000 | | | | 793,878 | |
| China Merchants Bank Co. Ltd. | | | 170,000 | | | | 372,392 | |
| Commercial International Bank Egypt SAE - GDR | | | 274,999 | | | | 1,025,746 | |
| FirstRand Ltd. | | | 150,000 | | | | 483,970 | |
| Industrial & Commercial Bank of China Ltd. | | | 600,000 | | | | 321,228 | |
| OTP Bank PLC | | | 85,000 | | | | 2,255,228 | |
| Public Bank Bhd | | | 100,000 | | | | 478,344 | |
| Sberbank of Russia - ADR | | | 120,000 | | | | 962,400 | |
| Turkiye Garanti Bankasi AS | | | 300,000 | | | | 924,688 | |
| Turkiye Halk Bankasi AS | | | 125,000 | | | | 480,683 | |
| Turkiye Vakilflar Bankasi TAO | | | 285,000 | | | | 503,669 | |
| Woori Bank | | | 30,000 | | | | 275,641 | |
| | | | | | | | 10,815,997 | |
| CHEMICALS - 5.4% | | | | | | | | |
| Engro Corp Ltd. | | | 450,000 | | | | 1,341,843 | |
| Formosa Chemicals & Fibre Corp. | | | 95,000 | | | | 242,078 | |
| Kingboard Chemcial Holdings Ltd. | | | 150,000 | | | | 288,480 | |
| Lotte Chemical Corp. | | | 2,000 | | | | 510,139 | |
| UPL Ltd. | | | 60,000 | | | | 485,385 | |
| | | | | | | | 2,867,925 | |
| COAL - 0.3% | | | | | | | | |
| Coal India Ltd. | | | 40,000 | | | | 173,538 | |
| | | | | | | | | |
| COMMERCIAL SERVICES - 0.6% | | | | | | | | |
| Zhejiang Expressway Co., Ltd. | | | 300,000 | | | | 306,109 | |
| | | | | | | | | |
| COMPUTERS - 1.4% | | | | | | | | |
| Datatec Ltd. | | | 55,000 | | | | 174,625 | |
| Infosys Ltd. - ADR ^ | | | 30,000 | | | | 564,000 | |
| | | | | | | | 738,625 | |
| DISTRIBUTION / WHOLESALE - 1.3% | | | | | | | | |
| Hanwha Corp. | | | 21,200 | | | | 699,354 | |
| | | | | | | | | |
| DIVERSIFIED FINANCIAL SERVICES - 1.5% | | | | | | | | |
| Capitec Bank Holdings Ltd. | | | 13,500 | | | | 562,318 | |
| Haitong Securities Co. Ltd. | | | 150,000 | | | | 247,883 | |
| | | | | | | | 810,201 | |
| ELECTRIC - 2.4% | | | | | | | | |
| China Resources Power Holdings Co. Ltd. | | | 150,000 | | | | 252,628 | |
| Korea Electric Power Corp. | | | 13,700 | | | | 744,167 | |
| Tenaga Nassional Bhd | | | 80,000 | | | | 293,878 | |
| | | | | | | | 1,290,673 | |
| ELECTRICAL COMPONENTS & EQUIPMENT - 0.5% | | | | | | | | |
| China High Speed Transmission Equipment Group Co. Ltd. * | | | 350,000 | | | | 271,235 | |
| Security | | Shares | | | Value | |
| ELECTRONICS - 3.8% | | | | | | | | |
| Hon Hai Precision Industry Co., Ltd. | | | 420,000 | | | $ | 1,000,467 | |
| Micro-Star International Co. Ltd. | | | 170,000 | | | | 270,574 | |
| Pegatron Corp. | | | 350,000 | | | | 737,333 | |
| | | | | | | | 2,008,374 | |
| ENGINEERING & CONSTRUCTION - 2.5% | | | | | | | | |
| Hyundai Engineering & Construction Co. Ltd. | | | 25,000 | | | | 875,787 | |
| TAV Havalimanlari Holding AS | | | 75,000 | | | | 437,645 | |
| | | | | | | | 1,313,432 | |
| FOOD - 1.1% | | | | | | | | |
| Bidvest Group Ltd. | | | 15,000 | | | | 382,562 | |
| BIM Birlesik Magazalar AS | | | 10,000 | | | | 220,357 | |
| | | | | | | | 602,919 | |
| FOREST PRODUCTS & PAPER - 0.9% | | | | | | | | |
| Mondi Ltd. | | | 25,000 | | | | 483,195 | |
| | | | | | | | | |
| HOLDING COMPANIES - DIVERSIFIED - 1.7% | | | | | | | | |
| Avi Ltd. | | | 90,000 | | | | 560,553 | |
| Tekfen Holding AS | | | 150,000 | | | | 320,887 | |
| | | | | | | | 881,440 | |
| HOME FURNISHINGS - 2.2% | | | | | | | | |
| Arcelik AS | | | 70,000 | | | | 470,584 | |
| Steinhoff International Holdings Ltd. | | | 115,000 | | | | 722,151 | |
| | | | | | | | 1,192,735 | |
| HOUSEHOLD PRODUCTS / WARES - 0.4% | | | | | | | | |
| Biostime International Holdings Ltd. * | | | 80,000 | | | | 222,217 | |
| | | | | | | | | |
| INSURANCE - 0.5% | | | | | | | | |
| People’s Insurance Co. Group of China ltd. | | | 600,000 | | | | 241,290 | |
| | | | | | | | | |
| INTERNET- 0.6% | | | | | | | | |
| Baidu, Inc. - ADR * | | | 1,500 | | | | 291,450 | |
| | | | | | | | | |
| IRON / STEEL- 2.3% | | | | | | | | |
| Eregli Demir ve Celik Fabrikalari TAS | | | 300,000 | | | | 501,084 | |
| Severstal PAO - GDR | | | 62,000 | | | | 720,440 | |
| | | | | | | | 1,221,524 | |
| LEISURE TIME - 0.6% | | | | | | | | |
| Bajaj Auto Ltd. | | | 8,000 | | | | 300,001 | |
| | | | | | | | | |
| LODGING - 0.9% | | | | | | | | |
| Kangwon Land, Inc. | | | 12,500 | | | | 467,272 | |
| | | | | | | | | |
| MEDIA - 0.8% | | | | | | | | |
| Naspers Ltd. | | | 3,200 | | | | 442,049 | |
| | | | | | | | | |
| MINING - 1.4% | | | | | | | | |
| AngloGold Ashanti Ltd. - ADR * | | | 18,000 | | | | 296,100 | |
| Gold Fields Ltd. - ADR * | | | 100,000 | | | | 470,000 | |
| | | | | | | | 766,100 | |
| MISCELLANEOUS MANUFACTURING - 0.5% | | | | | | | | |
| Top Glove Corp Bhd | | | 220,000 | | | | 279,138 | |
| | | | | | | | | |
| OIL & GAS - 11.9% | | | | | | | | |
| China Petroleum & Chemical Corp. | | | 800,000 | | | | 563,726 | |
| Ecopetrol SA - ADR ^ | | | 105,000 | | | | 1,043,700 | |
| Gazprom OAO - ADR | | | 220,000 | | | | 1,140,920 | |
| Lukoil OAO - ADR | | | 37,000 | | | | 1,572,500 | |
| MOL Hungarian Oil & Gas PLC | | | 12,000 | | | | 734,181 | |
| Pakistan Petroleum Ltd. | | | 200,000 | | | | 278,396 | |
| SK Innovation Co. Ltd. | | | 5,000 | | | | 675,287 | |
| YPF SA - ADR | | | 16,000 | | | | 322,400 | |
| | | | | | | | 6,331,110 | |
See accompanying notes to financial statements.
| SCHEDULE OF INVESTMENTS (Unaudited) |
| Dunham Emerging Markets Stock Fund (Continued) |
| April 30, 2016 |
| Security | | Shares | | | Value | |
| PACKAGING & CONTAINERS - 0.6% | | | | | | | | |
| Lee & Man Paper Manufacturing Ltd. | | | 500,000 | | | $ | 327,699 | |
| | | | | | | | | |
| PHARMACEUTICALS - 2.2% | | | | | | | | |
| Richter Gedeon Nyrt | | | 45,000 | | | | 895,132 | |
| Sinopharm Group Co. Ltd. | | | 66,800 | | | | 285,508 | |
| | | | | | | | 1,180,640 | |
| REAL ESTATE - 3.9% | | | | | | | | |
| China Overseas Land & Investment Ltd. | | | 160,000 | | | | 507,863 | |
| Country Garden Holdings Co. Ltd. | | | 750,000 | | | | 295,917 | |
| Guangzhou R&F Properties Co. Ltd. | | | 170,000 | | | | 237,059 | |
| Highwealth Construction Corp. | | | 320,000 | | | | 479,677 | |
| Redefine Properties Ltd. | | | 670,000 | | | | 580,560 | |
| | | | | | | | 2,101,076 | |
| RETAIL - 1.0% | | | | | | | | |
| ANTA Sports Products Ltd. | | | 100,000 | | | | 254,713 | |
| Xtep International Holdings Ltd. | | | 500,000 | | | | 294,917 | |
| | | | | | | | 549,630 | |
| SEMICONDUCTORS - 5.8% | | | | | | | | |
| Dongbu HiTek Co. Ltd. * | | | 15,000 | | | | 254,656 | |
| Powertech Technology, Inc. | | | 120,000 | | | | 242,184 | |
| Samsung Electronics Co. Ltd. | | | 1,200 | | | | 1,307,798 | |
| Taiwan Semiconductor Manufacturing Co. Ltd. - ADR ^ | | | 55,000 | | | | 1,297,450 | |
| | | | | | | | 3,102,088 | |
| SOFTWARE - 2.0% | | | | | | | | |
| HCL Technologies Ltd. | | | 40,000 | | | | 451,571 | |
| NetEase, Inc. - ADR | | | 4,500 | | | | 633,150 | |
| | | | | | | | 1,084,721 | |
| TELECOMMUNICATIONS - 6.9% | | | | | | | | |
| Axiata Group Bhd | | | 200,000 | | | | 288,882 | |
| China Mobile Ltd. | | | 130,000 | | | | 1,492,443 | |
| Mobile TeleSystems PJSC - ADR ^ | | | 60,000 | | | | 555,600 | |
| MTN Group Ltd. | | | 35,000 | | | | 367,806 | |
| Partron Co. Ltd. | | | 25,000 | | | | 243,438 | |
| Turkcell Iletisim Hizmetleri AS | | | 80,000 | | | | 346,652 | |
| Vodacom Group Ltd | | | 35,000 | | | | 408,507 | |
| | | | | | | | 3,703,328 | |
| Security | | Shares | | | Value | |
| TRANSPORTATION - 1.0% | | | | | | | | |
| Super Group Ltd. * | | | 185,000 | | | $ | 536,968 | |
| | | | | | | | | |
| TOTAL COMMON STOCK (Cost - $47,745,434) | | | | | | | 49,664,554 | |
| | | | | | | | | |
| EXCHANGE TRADED FUNDS - 4.9% | | | | | | | | |
| EQUITY FUNDS - 4.9% | | | | | | | | |
| iShares MSCI South Africa ETF | | | 25,000 | | | | 1,390,000 | |
| Market Vectors Russia ETF | | | 70,000 | | | | 1,241,800 | |
| TOTAL EXCHANGE TRADED FUNDS (Cost - $2,452,212) | | | | | | | 2,631,800 | |
| | | | | | | | | |
| SHORT-TERM INVESTMENT - 3.4% | | | | | | | | |
| MONEY MARKET - 3.4% | | | | | | | | |
| First American Government Obligations Fund 0.02% + | | | | | | | | |
| (Cost - $1,825,888) | | | 1,825,888 | | | | 1,825,888 | |
| | | | | | | | | |
| COLLATERAL FOR SECURITIES LOANED - 3.3% | | | | | | | | |
| Mount Vernon Prime Portfolio 0.51% + | | | | | | | | |
| (Cost - $1,774,767) | | | 1,774,767 | | | | 1,774,767 | |
| | | | | | | | | |
| TOTAL INVESTMENTS - 104.6% (Cost - $53,798,301) | | | | | | $ | 55,897,009 | |
| LIABILITIES IN EXCESS OTHER ASSETS - (4.6)% | | | | | | | (2,485,404 | ) |
| NET ASSETS - 100.0% | | | | | | $ | 53,411,605 | |
| ^ | All or a portion of these securities are on loan. Total loaned securities had a value of $1,695,275 at April 30, 2016. |
| * | Non-income producing security. |
| + | Variable rate security. Interest rate is as of April 30, 2016. |
| ADR - American Depositary Receipt. | ETF - Exchange Traded Funds |
| | |
| GDR - Global Depositary Receipt. | NVDR - Non-Voting Depositary Receipt |
| Portfolio Composition * - (Unaudited) |
| South Korea | | | 12.8 | % | | Turkey | | | 8.2 | % |
| United States | | | 11.2 | % | | Taiwan | | | 7.6 | % |
| South Africa | | | 10.3 | % | | Hungary | | | 7.0 | % |
| China | | | 10.1 | % | | Hong Kong | | | 5.6 | % |
| Russia | | | 8.9 | % | | Other Countries | | | 18.3 | % |
| | | | | | | Total | | | 100.0 | % |
| * | Based on total value of investments as of April 30, 2016. |
Percentage may differ from Schedule of Investments which is based on Fund net assets.
See accompanying notes to financial statements.
Dunham Small Cap Growth Fund
Message from the Sub-Adviser (Pier Capital, LLC)
Small cap growth stocks, as measured by the Russell 2000 Growth Index, ended a volatile first half of the fiscal year in negative territory, declining 5.0 percent for the six-month period ended April 30, 2016. The beginning of the fiscal year saw gains, as November posted positive results of 3.7 percent. December and January took a downturn which resulted in losses of 4.8 percent and 10.8 percent, respectively. February continued the decline with a 0.7 percent loss. March and April turned around for the end of the first half of the fiscal year with positive gains of 7.7 percent and 1.0 percent, respectively.
During the fiscal year, there were no material changes to the Sub-Adviser’s investment decision making process. The Sub-Adviser continues to implement a bottom-up process to selecting stocks for the Fund, focusing on individual firm characteristics rather than sector weightings or the economy as a whole. It seeks companies on the verge of experiencing large increases in market share. By seeking out and identifying market catalysts, the Sub-Adviser believes that the securities it selects for the Fund are tailored towards organic growth due to some kind of market advantage. The Sub-Adviser feels that small cap growth stocks may have been impeded by high market volatility over the first half of the fiscal year. The volatility may have been driven by sporadic oil prices, a weak U.S. earnings season, and uncertainty in global markets. Small cap growth stocks underperformed versus large cap growth stocks over the first half of the fiscal year. From a Fund-specific perspective, U.S. economic factors are much more impactful than economic factors from outside the U.S. Given that the U.S. economy is on more solid ground than many economies around the globe bodes well for the companies in which the Fund invests.
Positive contributing sectors within the Fund were consumer staples and information technology. Small cap growth consumer staples stocks in the Fund were helped by Blue Buffalo Pet Products, Inc. (BUFF) (holding percentage*: 0.95 percent), a provider of dog and cat food made with meats, fruits and vegetables, and natural ingredients in the United States. The Sub-Adviser believes that natural organic pet food is a new niche market within the pet product industry and that the company has solidified a strong foothold within that niche. The Sub-Adviser sees strong potential growth for the company because of how natural organic pet food is still relatively new and has room to grow in the industry. The company gained 38.0 percent over the first half of the fiscal year. Aiding Fund performance from the information technology sector was Zendesk, Inc. (ZEN) (holding percentage*: 0.98 percent), a provider of web-based help desk software with a customer support platform. The company offers applications that allow clients to manage incoming support requests from end customers’ computers. The company gained 12.3 percent over the six-month period ended April 30, 2016. A negative performer for the information technology sector came from Shopify, Inc. (SHOP) (holding percentage*: 1.00 percent), which provides a cloud-based commerce platform. The platform is offered to merchants to create an omni-channel experience that helps showcase the merchant’s brand. The Sub-Adviser believes the company is gaining strength by hosting their services on Amazons Web Services, Inc., after Amazon chose to remove their own version of the business. The company declined 1.2 percent over the first half of the fiscal quarter.
A volatile sector for Fund returns came from healthcare. Small cap growth healthcare stocks in the Fund were helped by Edwards Lifesciences Corp. (EW) (holding percentage*: 1.16 percent), which designs, develops, manufactures, and markets products and services to treat late-stage cardiovascular disease. Their products include tissue replacement heart valves, heart valve repair products, hemodynamic monitoring devices, angioscopy equipment, oxygenators, and pharmaceuticals. The Sub-Adviser believes the company is just gaining traction in its industry and is approaching an explosion of growth and profitability. The holding gained 35.2 percent over the six-month period ended April 30, 2016. A negative performer for the Fund from the healthcare sector was Glaukos Corp. (GKOS) (holding percentage*: 0.56 percent). The company operates as an ophthalmic medical technology company and develops, manufactures, and markets medical devices for the treatment of glaucoma. It offers micro-scale injectable therapies designed to address the complete range of glaucoma disease states and progression. The stock detracted from the performance of the Fund, falling 6.0 percent over the first half of the fiscal year period.
The Sub-Adviser is hesitant about short-term U.S. economic improvement after seeing weak earnings growth from companies, volatility over the coming U.S. presidential election, and market pressure from a possible “Brexit” in Europe. The Sub-Adviser believes these events have created negative investor sentiment, which will slowly change as these events conclude. The Sub-Adviser sees the recent downturn in the U.S. market as a correct evaluation of pricing and regards it as a healthy event because of the market’s constant rise since 2009. On a macroeconomic level, the Sub-Adviser has seen contractions in major technology companies, which has spread and hurt performance throughout the technology sector. The Sub-Adviser believes that the market stall has allowed companies to consolidate their businesses, which will reflect positively for future growth of small cap stocks. * Holdings percentage(s) as of 4/30/2016.
| * | Holdings percentage(s) as of 4/30/2016. |
| ** | Holdings percentage(s) as of the date prior to the sale of the security. |
Growth of $100,000 Investment - (Unaudited)
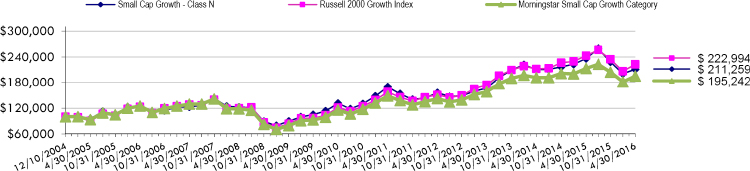
Total Returns as of April 30, 2016
| | Six | | Annualized | Annualized | Annualized | Annualized Since Inception |
| | Months | One Year | Three Years | Five Years | Ten Years | (12/10/04) |
| Class N | (7.57)% | (10.60)% | 8.15% | 4.47% | 5.42% | 6.79% |
| Class C | (7.99)% | (11.44)% | 7.10% | 3.45% | 4.38% | 5.74% |
| Class A with load of 5.75% | (12.95)% | (15.91)% | 5.78% | 2.99% | N/A | 5.48%* |
| Class A without load | (7.66)% | (10.77)% | 7.89% | 4.22% | N/A | 6.16%* |
| Russell 2000 Growth Index | (4.96)% | (8.27)% | 8.50% | 7.15% | 6.14% | 7.30% |
| Morningstar Small Cap Growth Category | (4.56)% | (8.42)% | 7.22% | 5.62% | 4.56% | 6.70% |
| * | Class A commenced operations on January 3, 2007. |
The Russell 2000 Growth Index measures the performance of the Russell 2000 companies with higher price-to-book ratios and higher forecasted growth values. Investors cannot invest directly in an index or benchmark.
The Morningstar Small Cap Growth Category is generally representative of mutual funds that primarily invest in small (small capitalization) U.S. companies that are projected to grow faster than other small-cap stocks.
As disclosed in the Trust’s latest registration statement, the Fund’s total annual operating expenses, including the cost of underlying funds, are 1.58% for Class N, 2.58% for Class C and 1.83% for Class A. Class A shares are subject to a sales load of 5.75% and a deferred sales charge of up to 0.75%. The performance data quoted here represents past performance, which is not indicative of future results. Current performance may be lower or higher than the performance data quoted. The investment return and NAV will fluctuate, so that an investor’s shares, when redeemed, may be worth more or less than their original cost. Total returns are calculated assuming reinvestment of all dividends and capital gains distributions, if any. The returns do not reflect the deductions of taxes a shareholder would pay on the redemption of fund shares or fund distributions. For performance information current to the most recent month-end, please call 1-800-442-4358 or visit our website www.dunham.com
| SCHEDULE OF INVESTMENTS (Unaudited) |
| Dunham Small Cap Growth Fund |
| April 30, 2016 |
| Security | | Shares | | | Value | |
| COMMON STOCK - 96.9% | | | | | | | | |
| AEROSPACE/DEFENSE - 2.0% | | | | | | | | |
| Aerojet Rocketdyne Holdings, Inc. * | | | 16,582 | | | $ | 300,466 | |
| HEICO Corp. | | | 5,457 | | | | 334,569 | |
| | | | | | | | 635,035 | |
| AIRLINES - 0.9% | | | | | | | | |
| Allegiant Travel Co. | | | 1,802 | | | | 289,347 | |
| | | | | | | | | |
| AUTO PARTS & EQUIPMENT 0.6% | | | | | | | | |
| Motorcar Parts of America, Inc. * | | | 6,132 | | | | 196,653 | |
| | | | | | | | | |
| BANKS - 4.4% | | | | | | | | |
| Bank of the Ozarks ^ | | | 6,788 | | | | 280,344 | |
| BankUnited, Inc. | | | 9,198 | | | | 317,331 | |
| FCB Financial Holdings, Inc. * | | | 10,143 | | | | 354,498 | |
| Webster Financial Corp. | | | 4,003 | | | | 146,670 | |
| Western Alliance Bancorp * | | | 8,625 | | | | 315,503 | |
| | | | | | | | 1,414,346 | |
| BIOTECHNOLOGY - 0.7% | | | | | | | | |
| NeoGenomics, Inc. * | | | 28,930 | | | | 235,490 | |
| | | | | | | | | |
| BUILDING MATERIALS - 1.3% | | | | | | | | |
| Apogee Enterprises, Inc. | | | 6,784 | | | | 281,129 | |
| Trex Co., Inc. * | | | 2,958 | | | | 140,357 | |
| | | | | | | | 421,486 | |
| COMMERCIAL SERVICES - 7.0% | | | | | | | | |
| AMN Healthcare Services, Inc. * | | | 9,339 | | | | 331,628 | |
| Booz Allen Hamilton Holding Corp. | | | 5,087 | | | | 140,249 | |
| Bright Horizons Family Solutions, Inc. * | | | 4,289 | | | | 281,444 | |
| Healthcare Services Group, Inc. | | | 6,964 | | | | 263,587 | |
| ICF International, Inc. * | | | 2,104 | | | | 82,835 | |
| Korn Ferry International | | | 8,884 | | | | 241,112 | |
| Nord Anglia Education, Inc. * | | | 13,495 | | | | 286,499 | |
| Sabre Corp. | | | 11,097 | | | | 321,258 | |
| Vantiv, Inc. * | | | 5,773 | | | | 314,859 | |
| | | | | | | | 2,263,471 | |
| COMPUTERS - 7.4% | | | | | | | | |
| Cray, Inc. * | | | 8,186 | | | | 310,004 | |
| CSRA, Inc. | | | 10,628 | | | | 275,903 | |
| Electronics For Imaging, Inc. * | | | 6,615 | | | | 263,542 | |
| Exlservice Holdings, Inc. * | | | 5,763 | | | | 278,871 | |
| Globant SA * ^ | | | 8,977 | | | | 318,594 | |
| Leidos Holdings, Inc. | | | 6,045 | | | | 299,892 | |
| Manhattan Associates, Inc. * | | | 4,707 | | | | 284,962 | |
| Mercury Systems, Inc. * | | | 17,959 | | | | 377,498 | |
| | | | | | | | 2,409,266 | |
| DISTRIBUTION/WHOLESALE - 0.9% | | | | | | | | |
| Beacon Roofing Supply, Inc. * | | | 6,529 | | | | 278,984 | |
| | | | | | | | | |
| DIVERSIFIED FINANCIAL SERVICES - 3.1% | | | | | | | | |
| Evercore Partners, Inc. | | | 5,776 | | | | 298,273 | |
| MarketAxess Holdings, Inc. | | | 2,675 | | | | 328,383 | |
| WageWorks, Inc. * ^ | | | 7,072 | | | | 380,898 | |
| | | | | | | | 1,007,554 | |
| ELECTRONICS - 3.9% | | | | | | | | |
| Coherent, Inc. * | | | 3,163 | | | | 295,424 | |
| Fitbit, Inc. * | | | 16052 | | | | 292,949 | |
| FLIR Systems, Inc. | | | 8325 | | | | 251,498 | |
| IMAX Corp. * ^ | | | 8704 | | | | 278,528 | |
| Orbotech Ltd. * | | | 5769 | | | | 138,918 | |
| | | | | | | | 1,257,317 | |
| Security | | Shares | | | Value | |
| ENGINEERING & CONSTRUCTION - 1.3% | | | | | | | | |
| Comfort Systems USA, Inc. | | | 9,215 | | | $ | 271,750 | |
| MasTec, Inc. * | | | 6,318 | | | | 143,166 | |
| | | | | | | | 414,916 | |
| ENTERTAINMENT - 0.5% | | | | | | | | |
| Dolby Laboratories, Inc. | | | 3,186 | | | | 151,685 | |
| | | | | | | | | |
| ENVIRONMENTAL CONTROL - 0.5% | | | | | | | | |
| US Ecology, Inc. | | | 3,326 | | | | 149,770 | |
| | | | | | | | | |
| FOOD - 0.9% | | | | | | | | |
| Blue Buffalo Pet Products, Inc. * ^ | | | 12,398 | | | | 306,974 | |
| | | | | | | | | |
| HEALTHCARE-PRODUCTS - 8.4% | | | | | | | | |
| AltriCure, Inc. * | | | 14,626 | | | | 232,553 | |
| Cerus Corp. * | | | 47,428 | | | | 296,899 | |
| ConforMIS, Inc. * | | | 23,405 | | | | 289,988 | |
| Edwards Lifesciences Corp. * | | | 3,533 | | | | 375,240 | |
| Glaukos Corp. * ^ | | | 9,578 | | | | 180,450 | |
| Nanostring Technologies, Inc. * | | | 10,965 | | | | 174,563 | |
| Nevro Corp. * | | | 3,446 | | | | 231,743 | |
| NuVasive, Inc. * | | | 2,703 | | | | 143,097 | |
| West Pharmaceutical Services | | | 5,818 | | | | 414,242 | |
| Zeltiq Aesthetics, Inc. * ^ | | | 12,702 | | | | 379,790 | |
| | | | | | | | 2,718,565 | |
| HEALTHCARE-SERVICES - 4.2% | | | | | | | | |
| Amedisys, Inc. * | | | 6,339 | | | | 326,395 | |
| American Renal Associates Holdings, Inc. * | | | 2,834 | | | | 79,692 | |
| Amsurg Corp. * ^ | | | 4,051 | | | | 328,050 | |
| LCH Group, Inc. * | | | 8,371 | | | | 337,686 | |
| Surgical Care Affiliates, Inc. * | | | 6,211 | | | | 300,302 | |
| | | | | | | | 1,372,125 | |
| HOME BUILDERS - 1.8% | | | | | | | | |
| Installed Building Products, Inc. * | | | 11,427 | | | | 303,729 | |
| LGI Homes, Inc. * ^ | | | 10,272 | | | | 287,719 | |
| | | | | | | | 591,448 | |
| HOME FURNISHINGS - 2.4% | | | | | | | | |
| American Woodmark Corp. * | | | 3,977 | | | | 289,685 | |
| Ethan Allen Interiors, Inc. | | | 5,987 | | | | 203,797 | |
| Tempur Sealy International, Inc. * | | | 4,899 | | | | 297,222 | |
| | | | | | | | 790,704 | |
| HOUSEWARES - 0.9% | | | | | | | | |
| Scotts Miracle-Gro Co. | | | 4,182 | | | | 296,002 | |
| | | | | | | | | |
| INTERNET - 7.6% | | | | | | | | |
| 8x8, Inc. * | | | 22,771 | | | | 258,223 | |
| HealthStream, Inc. * | | | 6,457 | | | | 146,057 | |
| Marketo, Inc. * ^ | | | 11,531 | | | | 253,567 | |
| Quotient Technology, Inc. * | | | 21,947 | | | | 255,024 | |
| Ringcentral, Inc. * ^ | | | 16,043 | | | | 306,100 | |
| Shopify, Inc. * ^ | | | 10,167 | | | | 323,819 | |
| Splunk, Inc. * | | | 6,216 | | | | 323,108 | |
| WebMD Health Corp. * | | | 4,739 | | | | 297,325 | |
| Zendesk, Inc. * | | | 14,097 | | | | 318,592 | |
| | | | | | | | 2,481,815 | |
| LEISURE TIME - 1.8% | | | | | | | | |
| Norwegian Cruise Line Holdings Ltd. * | | | 5,986 | | | | 292,656 | |
| Planet Fitness, Inc. * ^ | | | 19,426 | | | | 298,383 | |
| | | | | | | | 591,039 | |
| LODGING - 0.2% | | | | | | | | |
| Red Rock Resorts, Inc. * | | | 3,995 | | | | 74,467 | |
See accompanying notes to financial statements.
| SCHEDULE OF INVESTMENTS (Unaudited) |
| Dunham Small Cap Growth Fund (Continued) |
| April 30, 2016 |
| Security | | Shares | | | Value | |
| MISCELLANEOUS MANUFACTURING - 1.8% | | | | | | | | |
| Fabrinet * | | | 9,309 | | | $ | 297,609 | |
| Hexcel Corp. | | | 6,039 | | | | 273,385 | |
| | | | | | | | 570,994 | |
| OIL & GAS - 2.9% | | | | | | | | |
| Gulfport Energy Corp. * | | | 9,766 | | | | 305,676 | |
| Parsley Energy , Inc. * | | | 13,327 | | | | 312,118 | |
| PDC Energy, Inc. * ^ | | | 4,940 | | | | 310,183 | |
| | | | | | | | 927,977 | |
| PHARMACEUTICALS - 4.1% | | | | | | | | |
| Impax Laboratores, Inc. * | | | 4,211 | | | | 140,437 | |
| Ophthotech Corp. * | | | 5,951 | | | | 278,150 | |
| PRA Health Sciences, Inc. * ^ | | | 6,583 | | | | 312,363 | |
| Premier, Inc. * | | | 8,001 | | | | 270,514 | |
| Quintiles Transnational Holdings, Inc. * | | | 4,755 | | | | 328,428 | |
| | | | | | | | 1,329,892 | |
| RETAIL - 3.9% | | | | | | | | |
| Burlington Stores, Inc. * ^ | | | 5,202 | | | | 296,358 | |
| Casey’s General Stores, Inc. | | | 3,273 | | | | 366,576 | |
| Panera Bread Co. * | | | 1,532 | | | | 328,599 | |
| Texas Roadhouse, Inc. | | | 6,963 | | | | 283,533 | |
| | | | | | | | 1,275,066 | |
| SAVINGS & LOANS - 1.0% | | | | | | | | |
| Sterling Bancorp. | | | 19,248 | | | | 314,512 | |
| | | | | | | | | |
| SEMICONDUCTORS - 5.3% | | | | | | | | |
| CEVA, Inc. * ^ | | | 8,639 | | | | 199,215 | |
| Inphi Corp. * | | | 10,570 | | | | 313,612 | |
| MA-COM Technology Solutions Holdings, Inc. * | | | 8,106 | | | | 331,454 | |
| Monolithic Power Systems, Inc. ^ | | | 4,455 | | | | 278,081 | |
| NVIDIA Corp. | | | 9,069 | | | | 322,222 | |
| Silicon Motion Technology Corp ADR | | | 7,114 | | | | 274,245 | |
| | | | | | | | 1,718,829 | |
| SOFTWARE - 10.7% | | | | | | | | |
| Activision Blizzard, Inc. | | | 9,620 | | | | 331,601 | |
| Blackbaud, Inc. | | | 4,799 | | | | 296,434 | |
| Broadsoft, Inc. * ^ | | | 9,260 | | | | 362,668 | |
| Callidus Software, Inc. * | | | 19,860 | | | | 363,438 | |
| CommVault Systems, Inc. * | | | 7,048 | | | | 308,491 | |
| Security | | Shares | | | Value | |
| SOFTWARE (CONTINUED) - 10.7% | | | | | | | | |
| HubSpot, Inc. * | | | 8,118 | | | $ | 359,546 | |
| inContact, Inc. * | | | 16,679 | | | | 155,282 | |
| Press Ganey Holdings, Inc. * | | | 9,182 | | | | 279,776 | |
| Proofpoint, Inc. * ^ | | | 6,404 | | | | 373,097 | |
| Red Hat, Inc. * ^ | | | 4,444 | | | | 326,056 | |
| Take-Two Interavtive Software, Inc. * | | | 8,866 | | | | 303,040 | |
| | | | | | | | 3,459,429 | |
| TELECOMMUNICATIONS - 1.6% | | | | | | | | |
| Gigamon, Inc. * | | | 8,726 | | | | 284,381 | |
| Infinera Corp. * | | | 18,670 | | | | 221,986 | |
| | | | | | | | 506,367 | |
| TRANSPORTATION - 2.9% | | | | | | | | |
| Air Transport Services Group, Inc. * | | | 19,665 | | | | 277,080 | |
| Covenant Transportation Group, Inc. * | | | 6,506 | | | | 129534 | |
| Old Dominion Freight Line, Inc. * | | | 4,317 | | | | 285138 | |
| Swift Transportation Co. * | | | 14,498 | | | | 240,957 | |
| | | | | | | | 932,709 | |
| | | | | | | | | |
| TOTAL COMMON STOCK (Cost - $29,511,289) | | | | | | | 31,384,234 | |
| | | | | | | | | |
| SHORT-TERM INVESTMENT - 3.3% | | | | | | | | |
| MONEY MARKET FUND - 3.3% | | | | | | | | |
| Fidelity Institutional Money Market Funds - | | | | | | | | |
| Government Portfolio, 0.01% + | | | 1,071,486 | | | | 1,071,486 | |
| TOTAL SHORT-TERM INVESTMENT (Cost - $1,071,486) | | | | | | | | |
| | | | | | | | | |
| COLLATERAL FOR SECURITIES LOANED - 36.9% | | | | | | | | |
| Mount Vernon Prime Portfolio, 0.51% + (Cost - $11,966,485) | | | 11,966,485 | | | | 11,966,485 | |
| | | | | | | | | |
| TOTAL INVESTMENTS - 137.1% (Cost - $42,549,260) | | | | | | $ | 44,422,205 | |
| LIABILITIES IN EXCESS OF OTHER ASSETS - (37.1)% | | | | | | | (12,015,932 | ) |
| NET ASSETS - 100.0% | | | | | | $ | 32,406,273 | |
| ^ | All or a portion of these securities are on loan. Total loaned securies had a value of $11,617,520 at April 30, 2016. |
| * | Non-Income producing security. |
| + | Variable rate security. Interest rate is as of April 30, 2016. |
| Portfolio Composition * - (Unaudited) |
| Collateral For Securities Loaned | | | 26.9 | % | | Industrial | | | 9.9 | % |
| Consumer, Non-cyclical | | | 18.5 | % | | Communications | | | 6.7 | % |
| Technology | | | 17.1 | % | | Financial | | | 6.2 | % |
| Consumer, Cyclical | | | 10.2 | % | | Short-Term Investment | | | 2.4 | % |
| | | | | | | Energy | | | 2.1 | % |
| | | | | | | Total | | | 100.0 | % |
| * | Based on total value of investments as of April 30, 2016. |
Percentage may differ from Schedule of Investments which is based on Fund net assets.
See accompanying notes to financial statements.
| STATEMENTS OF ASSETS AND LIABILITIES (Unaudited) |
| April 30, 2016 |
| | | | | | Dunham | | | Dunham | | | | | | | | | Dunham | | | | | | | |
| | | Dunham | | | Monthly | | | Corporate / | | | Dunham | | | Dunham | | | International | | | Dunham | | | Dunham | |
| | | Floating Rate | | | Distribution | | | Government | | | Dynamic Macro | | | High-Yield | | | Opportunity | | | Appreciation & | | | Alternative | |
| | | Bond Fund | | | Fund | | | Bond Fund | | | Fund | | | Bond Fund | | | Bond Fund | | | Income Fund | | | Strategy Fund | |
| Assets: | | | | | | | | | | | | | | | | | | | | | | | | | | | | | | | | |
| Investments in securities, at cost | | $ | 90,683,918 | | | $ | 292,329,615 | | | $ | 53,928,716 | | | $ | 35,986,647 | | | $ | 107,600,069 | | | $ | 30,641,901 | | | $ | 32,280,214 | | | $ | 22,283,218 | |
| Investments in securities, at value | | $ | 89,131,821 | | | $ | 279,280,433 | | | $ | 54,847,372 | | | $ | 36,860,466 | | | $ | 108,271,438 | | | $ | 30,938,090 | | | $ | 29,058,776 | | | $ | 22,108,013 | |
| Foreign currency, at value (Cost $90,676, $104,611 and $87,053, respectively) | | | — | | | | 87,973 | | | | — | | | | 11,174 | | | | — | | | | 30,291 | | | | — | | | | — | |
| Deposits with brokers | | | — | | | | 41,695,159 | | | | — | | | | — | | | | — | | | | 76,865 | | | | — | | | | — | |
| Unrealized appreciation on swap contracts | | | — | | | | 4,382,304 | | | | — | | | | — | | | | — | | | | — | | | | — | | | | — | |
| Unrealized appreciation on futures | | | — | | | | — | | | | — | | | | 108,018 | | | | — | | | | — | | | | — | | | | — | |
| Cash | | | — | | | | 13,640,000 | | | | 17,290 | | | | — | | | | — | | | | — | | | | — | | | | 493 | |
| Receivable for securities sold | | | 151,683 | | | | 3,159,551 | | | | 186,918 | | | | 11,208 | | | | 465,579 | | | | — | | | | — | | | | 24,466,545 | |
| Interest and dividends receivable | | | 621,215 | | | | 1,173,648 | | | | 433,037 | | | | 1,345 | | | | 1,447,508 | | | | 347,119 | | | | 109,876 | | | | — | |
| Receivable for fund shares sold | | | 1,076 | | | | 6,846 | | | | 4,664 | | | | 17,226 | | | | 909 | | | | 341 | | | | 9,890 | | | | 6,460 | |
| Receivable for open forward foreign currency contracts | | | — | | | | 24,068,965 | | | | — | | | | — | | | | — | | | | 283,346 | | | | — | | | | — | |
| Prepaid expenses and other assets | | | 34,886 | | | | 173,117 | | | | 32,800 | | | | 24,771 | | | | 26,354 | | | | 5,604 | | | | 24,879 | | | | 20,345 | |
| Total Assets | | | 89,940,681 | | | | 367,667,996 | | | | 55,522,081 | | | | 37,034,208 | | | | 110,211,788 | | | | 31,681,656 | | | | 29,203,421 | | | | 46,601,856 | |
| | | | | | | | | | | | | | | | | | | | | | | | | | | | | | | | | |
| Liabilities: | | | | | | | | | | | | | | | | | | | | | | | | | | | | | | | | |
| Option contracts written (premiums received $6,208,581 and $25,180,respectively | | | — | | | | 6,554,065 | | | | — | | | | 25,180 | | | | — | | | | — | | | | — | | | | — | |
| Payable upon return of securities loaned | | | 105,750 | | | | 9,209,035 | | | | 2,379,575 | | | | — | | | | 13,974,490 | | | | — | | | | 2,769,760 | | | | — | |
| Securities sold short (proceeds $67,286,631) | | | — | | | | 71,734,934 | | | | — | | | | — | | | | — | | | | — | | | | — | | | | — | |
| Unrealized depreciation on swaps | | | — | | | | 2,826,408 | | | | — | | | | — | | | | — | | | | — | | | | — | | | | — | |
| Unrealized depreciation on futures | | | — | | | | — | | | | — | | | | — | | | | — | | | | 22,371 | | | | — | | | | — | |
| Payable for dividends on short sales | | | — | | | | 31,261 | | | | — | | | | — | | | | — | | | | — | | | | — | | | | — | |
| Payable to broker for futures | | | — | | | | — | | | | — | | | | 633,511 | | | | — | | | | — | | | | — | | | | — | |
| Payable for securities purchased | | | 2,780,068 | | | | 2,448,470 | | | | 564,689 | | | | 11,209 | | | | 1,627,895 | | | | — | | | | — | | | | 24,489,712 | |
| Payable for fund shares redeemed | | | 47,528 | | | | 477,573 | | | | 6,697 | | | | 2,593 | | | | 88,534 | | | | 21,134 | | | | 21,808 | | | | 832 | |
| Payable for open forward foreign currency contracts | | | — | | | | 24,513,923 | | | | — | | | | — | | | | — | | | | 176,101 | | | | — | | | | — | |
| Distributions payable | | | 2,226 | | | | 71,648 | | | | 1,333 | | | | — | | | | 8,913 | | | | — | | | | — | | | | — | |
| Payable to adviser | | | 42,656 | | | | 136,503 | | | | 21,480 | | | | 19,203 | | | | 46,434 | | | | 15,425 | | | | 14,310 | | | | 11,986 | |
| Payable to sub-adviser | | | 31,987 | | | | 47,509 | | | | 6,869 | | | | 14,388 | | | | 14,988 | | | | 4,175 | | | | 4,082 | | | | 5,678 | |
| Payable for distribution fees | | | 1,485 | | | | 47,635 | | | | 5,402 | | | | 3,236 | | | | 3,204 | | | | — | | | | 5,784 | | | | 953 | |
| Payable for administration fees | | | 8,945 | | | | 16,612 | | | | 2,400 | | | | 1,521 | | | | 14,976 | | | | 2,578 | | | | 6,480 | | | | 1,200 | |
| Payable for fund accounting fees | | | 2,728 | | | | 12,282 | | | | 947 | | | | 851 | | | | 10,191 | | | | 3,078 | | | | 10,993 | | | | 900 | |
| Payable for transfer agent fees | | | 736 | | | | — | | | | 1,750 | | | | 1,367 | | | | 18,443 | | | | 1,930 | | | | 1,947 | | | | 2,100 | |
| Payable for custody fees | | | 1,467 | | | | 60,381 | | | | 500 | | | | 450 | | | | 1,722 | | | | — | | | | 408 | | | | 500 | |
| Payable for non 12b-1 shareholder servicing fees | | | — | | | | — | | | | — | | | | — | | | | 2,742 | | | | — | | | | — | | | | — | |
| Accrued expenses and other liabilities | | | 10,041 | | | | 26,941 | | | | 8,741 | | | | 10,223 | | | | 50,544 | | | | 32,528 | | | | 6,889 | | | | 11,798 | |
| Total Liabilities | | | 3,035,617 | | | | 118,215,180 | | | | 3,000,383 | | | | 723,732 | | | | 15,863,076 | | | | 279,320 | | | | 2,842,461 | | | | 24,525,659 | |
| | | | | | | | | | | | | | | | | | | | | | | | | | | | | | | | | |
| Net Assets | | $ | 86,905,064 | | | $ | 249,452,816 | | | $ | 52,521,698 | | | $ | 36,310,476 | | | $ | 94,348,712 | | | $ | 31,402,336 | | | $ | 26,360,960 | | | $ | 22,076,197 | |
| | | | | | | | | | | | | | | | | | | | | | | | | | | | | | | | | |
| Net Assets: | | | | | | | | | | | | | | | | | | | | | | | | | | | | | | | | |
| Paid in capital | | $ | 90,400,438 | | | $ | 278,654,164 | | | $ | 53,633,535 | | | $ | 38,089,519 | | | $ | 106,716,578 | | | $ | 32,191,243 | | | $ | 29,886,777 | | | $ | 25,727,836 | |
| Accumulated net investment income (loss) | | | 55,697 | | | | 326,230 | | | | (19,396 | ) | | | (145,413 | ) | | | 133,697 | | | | (21,813 | ) | | | (47,695 | ) | | | (196,645 | ) |
| Accumulated net realized gain (loss) on investments, options, securities sold short, futures, swap contracts, and foreign currency transactions | | | (1,998,974 | ) | | | (12,930,984 | ) | | | (2,011,097 | ) | | | (2,624,971 | ) | | | (13,172,932 | ) | | | (1,082,368 | ) | | | (256,684 | ) | | | (3,279,789 | ) |
| Net unrealized appreciation (depreciation) on investments, options, securities sold short, futures, swap contracts, and foreign currency translations | | | (1,552,097 | ) | | | (16,596,594 | ) | | | 918,656 | | | | 991,341 | | | | 671,369 | | | | 315,274 | | | | (3,221,438 | ) | | | (175,205 | ) |
| | | | | | | | | | | | | | | | | | | | | | | | | | | | | | | | | |
| Net Assets | | $ | 86,905,064 | | | $ | 249,452,816 | | | $ | 52,521,698 | | | $ | 36,310,476 | | | $ | 94,348,712 | | | $ | 31,402,336 | | | $ | 26,360,960 | | | $ | 22,076,197 | |
| | | | | | | | | | | | | | | | | | | | | | | | | | | | | | | | | |
| Net Asset Value Per Share | | | | | | | | | | | | | | | | | | | | | | | | | | | | | | | | |
| Class N Shares: | | | | | | | | | | | | | | | | | | | | | | | | | | | | | | | | |
| Net Assets | | $ | 73,842,740 | | | $ | 150,116,337 | | | $ | 43,363,260 | | | $ | 30,413,612 | | | $ | 75,916,456 | | | $ | 27,372,216 | | | $ | 18,449,698 | | | $ | 19,605,821 | |
| Shares of beneficial interest outstanding (no par value; unlimited shares authorized) | | | 7,698,206 | | | | 4,216,056 | | | | 3,144,794 | | | | 3,220,807 | | | | 8,752,057 | | | | 2,860,186 | | | | 2,403,842 | | | | 903,658 | |
| Net asset value, offering and redemption price per share | | $ | 9.59 | | | $ | 35.60 | | | $ | 13.79 | | | $ | 9.44 | | | $ | 8.67 | | | $ | 9.57 | | | $ | 7.68 | | | $ | 21.70 | |
| | | | | | | | | | | | | | | | | | | | | | | | | | | | | | | | | |
| Class A Shares: | | | | | | | | | | | | | | | | | | | | | | | | | | | | | | | | |
| Net Assets | | $ | 9,228,255 | | | $ | 56,270,860 | | | $ | 5,580,293 | | | $ | 3,643,952 | | | $ | 10,313,896 | | | $ | 2,773,308 | | | $ | 3,988,243 | | | $ | 1,674,468 | |
| Shares of beneficial interest outstanding (no par value; unlimited shares authorized) | | | 962,617 | | | | 1,615,356 | | | | 405,164 | | | | 386,228 | | | | 1,179,315 | | | | 290,767 | | | | 520,471 | | | | 78,686 | |
| Net asset value and redemption price per share * | | $ | 9.59 | | | $ | 34.83 | | | $ | 13.77 | | | $ | 9.43 | | | $ | 8.75 | | | $ | 9.54 | | | $ | 7.66 | | | $ | 21.28 | |
| Front-end sales charge factor | | | 0.9550 | | | | 0.9425 | | | | 0.9550 | | | | 0.9425 | | | | 0.9550 | | | | 0.9550 | | | | 0.9425 | | | | 0.9425 | |
| Offering price per share (Net asset value per share / front-end sales charge factor) | | $ | 10.18 | | | $ | 36.95 | | | $ | 14.42 | | | $ | 10.01 | | | $ | 9.16 | | | $ | 9.99 | | | $ | 8.13 | | | $ | 22.58 | |
| | | | | | | | | | | | | | | | | | | | | | | | | | | | | | | | | |
| Class C Shares: | | | | | | | | | | | | | | | | | | | | | | | | | | | | | | | | |
| Net Assets | | $ | 3,834,069 | | | $ | 43,065,619 | | | $ | 3,578,145 | | | $ | 2,252,912 | | | $ | 8,118,360 | | | $ | 1,256,812 | | | $ | 3,923,019 | | | $ | 795,908 | |
| Shares of beneficial interest outstanding (no par value; unlimited shares authorized) | | | 400,075 | | | | 1,479,909 | | | | 261,434 | | | | 245,411 | | | | 941,981 | | | | 132,951 | | | | 520,845 | | | | 39,610 | |
| Net asset value, offering and redemption price per share | | $ | 9.58 | | | $ | 29.10 | | | $ | 13.69 | | | $ | 9.18 | | | $ | 8.62 | | | $ | 9.45 | | | $ | 7.53 | | | $ | 20.09 | |
| * | For certain purchases of $1 million or more, a 0.75% contingent deferred sales charge may apply to redemptions made within eighteen months of purchase. |
See accompanying notes to financial statements.
| STATEMENTS OF ASSETS AND LIABILITIES (Unaudited) (Continued) |
| April 30, 2016 |
| | | | | | Dunham | | | | | | | | | | | | Dunham | | | | |
| | | Dunham | | | Focused | | | Dunham | | | Dunham | | | Dunham | | | Emerging | | | Dunham | |
| | | Large Cap | | | Large Cap | | | International | | | Real Estate | | | Small Cap | | | Markets | | | Small Cap | |
| | | Value Fund | | | Growth Fund | | | Stock Fund | | | Stock Fund | | | Value Fund | | | Stock Fund | | | Growth Fund | |
| Assets: | | | | | | | | | | | | | | | | | | | | | | | | | | | | |
| Investments in securities, at cost | | $ | 58,607,241 | | | $ | 65,777,374 | | | $ | 91,735,418 | | | $ | 42,771,929 | | | $ | 31,388,311 | | | $ | 53,798,301 | | | $ | 42,549,260 | |
| Investments in securities, at value | | $ | 63,921,031 | | | $ | 76,907,309 | | | $ | 94,605,299 | | | $ | 49,996,366 | | | $ | 31,326,316 | | | $ | 55,897,009 | | | $ | 44,422,205 | |
| Foreign currency, at value (Cost $5, $422,311 and $3,808, respectively) | | | — | | | | — | | | | 420,151 | | | | — | | | | — | | | | 3,805 | | | | — | |
| Cash | | | 18,474 | | | | — | | | | — | | | | — | | | | — | | | | — | | | | — | |
| Receivable for securities sold | | | 203,387 | | | | — | | | | 1,380,883 | | | | — | | | | — | | | | 696,738 | | | | 1,258,505 | |
| Interest and dividends receivable | | | 33,457 | | | | 5,894 | | | | 585,126 | | | | 13,796 | | | | 14,343 | | | | 41,018 | | | | 4,527 | |
| Receivable for fund shares sold | | | 27,841 | | | | 36,649 | | | | 19,568 | | | | 16,563 | | | | 11,455 | | | | 614 | | | | 847 | |
| Receivable for open forward foreign currency contracts | | | — | | | | — | | | | 897,743 | | | | — | | | | — | | | | 740,129 | | | | — | |
| Prepaid expenses and other assets | | | 27,181 | | | | 41,411 | | | | 23,046 | | | | 28,910 | | | | 19,850 | | | | 27,987 | | | | 29,998 | |
| Total Assets | | | 64,231,371 | | | | 76,991,263 | | | | 97,931,816 | | | | 50,055,635 | | | | 31,371,964 | | | | 57,407,300 | | | | 45,716,082 | |
| | | | | | | | | | | | | | | | | | | | | | | | | | | | | |
| Liabilities: | | | | | | | | | | | | | | | | | | | | | | | | | | | | |
| Cash overdraft | | | — | | | | — | | | | 10,651 | | | | — | | | | — | | | | — | | | | — | |
| Foreign currency overdraft | | | — | | | | — | | | | — | | | | — | | | | — | | | | — | | | | — | |
| Payable upon return of securities loaned | | | 8,965,266 | | | | 12,704,917 | | | | 4,645,326 | | | | 7,173,911 | | | | 4,121,138 | | | | 1,774,767 | | | | 11,966,485 | |
| Payable to custodian for cash overdraft | | | — | | | | — | | | | — | | | | — | | | | — | | | | — | | | | — | |
| Payable for securities purchased | | | — | | | | — | | | | 1,750,593 | | | | — | | | | — | | | | 1,386,863 | | | | 1,291,668 | |
| Payable for fund shares redeemed | | | 4,437 | | | | 42,142 | | | | 32,295 | | | | 82,212 | | | | 2,085 | | | | 21,203 | | | | 7,009 | |
| Payable for open forward foreign currency contracts | | | — | | | | — | | | | 1,066,025 | | | | — | | | | — | | | | 728,966 | | | | — | |
| Payable to adviser | | | 29,288 | | | | 34,363 | | | | 47,662 | | | | 23,022 | | | | 14,443 | | | | 26,891 | | | | 17,267 | |
| Payable to sub-adviser | | | 9,694 | | | | 10,705 | | | | 30,734 | | | | 2,624 | | | | 9,579 | | | | 16,692 | | | | — | |
| Payable for distribution fees | | | 6,337 | | | | 6,221 | | | | 10,797 | | | | 3,102 | | | | 3,353 | | | | 6,174 | | | | — | |
| Payable for administration fees | | | 2,397 | | | | 1,662 | | | | 2,750 | | | | 1,819 | | | | 1,840 | | | | 2,641 | | | | 4,324 | |
| Payable for fund accounting fees | | | 1,125 | | | | 1,020 | | | | 1,725 | | | | 1,321 | | | | 895 | | | | 1,425 | | | | 5,617 | |
| Payable for transfer agent fees | | | 1,125 | | | | 442 | | | | 1,575 | | | | 405 | | | | 1,225 | | | | 1,651 | | | | 1,234 | |
| Payable for custody fees | | | 1,568 | | | | 2,433 | | | | 15,850 | | | | — | | | | 900 | | | | 8,021 | | | | 2,413 | |
| Accrued expenses and other liabilities | | | 10,600 | | | | 4,308 | | | | 73,321 | | | | 4,594 | | | | 13,352 | | | | 20,401 | | | | 13,792 | |
| Total Liabilities | | | 9,031,837 | | | | 12,808,213 | | | | 7,689,304 | | | | 7,293,010 | | | | 4,168,810 | | | | 3,995,695 | | | | 13,309,809 | |
| | | | | | | | | | | | | | | | | | | | | | | | | | | | | |
| Net Assets | | $ | 55,199,534 | | | $ | 64,183,050 | | | $ | 90,242,512 | | | $ | 42,762,625 | | | $ | 27,203,154 | | | $ | 53,411,605 | | | $ | 32,406,273 | |
| | | | | | | | | | | | | | | | | | | | | | | | | | | | | |
| Net Assets: | | | | | | | | | | | | | | | | | | | | | | | | | | | | |
| Paid in capital | | $ | 51,149,983 | | | $ | 56,041,165 | | | $ | 92,476,281 | | | $ | 34,635,417 | | | $ | 26,957,299 | | | $ | 62,709,261 | | | $ | 32,933,390 | |
| Accumulated net investment income (loss) | | | 328,393 | | | | (938,307 | ) | | | 93,735 | | | | 556,544 | | | | 41,135 | | | | 2,497 | | | | (157,405 | ) |
| Accumulated net realized gain (loss) on investments and foreign currency transactions | | | (1,592,632 | ) | | | (2,049,743 | ) | | | (5,081,910 | ) | | | 346,227 | | | | 66,715 | | | | (11,398,861 | ) | | | (2,242,657 | ) |
| Net unrealized appreciation (depreciation) on investments and foreign currency translations | | | 5,313,790 | | | | 11,129,935 | | | | 2,754,406 | | | | 7,224,437 | | | | 138,005 | | | | 2,098,708 | | | | 1,872,945 | |
| | | | | | | | | | | | | | | | | | | | | | | | | | | | | |
| Net Assets | | $ | 55,199,534 | | | $ | 64,183,050 | | | $ | 90,242,512 | | | $ | 42,762,625 | | | $ | 27,203,154 | | | $ | 53,411,605 | | | $ | 32,406,273 | |
| | | | | | | | | | | | | | | | | | | | | | | | | | | | | |
| Net Asset Value Per Share | | | | | | | | | | | | | | | | | | | | | | | | | | | | |
| Class N Shares: | | | | | | | | | | | | | | | | | | | | | | | | | | | | |
| Net Assets | | $ | 43,364,052 | | | $ | 48,964,675 | | | $ | 74,148,785 | | | $ | 29,338,071 | | | $ | 21,205,572 | | | $ | 45,236,808 | | | $ | 23,827,615 | |
| Shares of beneficial interest outstanding (no par value; unlimited shares authorized) | | | 3,643,790 | | | | 3,188,628 | | | | 5,344,252 | | | | 1,638,268 | | | | 1,559,786 | | | | 3,822,523 | | | | 1,648,896 | |
| Net asset value, offering and redemption price per share | | $ | 11.90 | | | $ | 15.36 | | | $ | 13.87 | | | $ | 17.91 | | | $ | 13.60 | | | $ | 11.83 | | | $ | 14.45 | |
| | | | | | | | | | | | | | | | | | | | | | | | | | | | | |
| Class A Shares: | | | | | | | | | | | | | | | | | | | | | | | | | | | | |
| Net Assets | | $ | 6,436,829 | | | $ | 9,978,376 | | | $ | 9,165,776 | | | $ | 10,047,029 | | | $ | 3,684,421 | | | $ | 4,976,538 | | | $ | 5,650,021 | |
| Shares of beneficial interest outstanding (no par value; unlimited shares authorized) | | | 542,585 | | | | 657,113 | | | | 662,701 | | | | 559,111 | | | | 273,040 | | | | 429,438 | | | | 403,401 | |
| Net asset value, and redemption price per share * | | $ | 11.86 | | | $ | 15.19 | | | $ | 13.83 | | | $ | 17.97 | | | $ | 13.49 | | | $ | 11.59 | | | $ | 14.01 | |
| Front-end sales charge factor | | | 0.9425 | | | | 0.9425 | | | | 0.9425 | | | | 0.9425 | | | | 0.9425 | | | | 0.9425 | | | | 0.9425 | |
| Offering price per share (Net asset value per share / front-end sales charge factor) | | $ | 12.59 | | | $ | 16.12 | | | $ | 14.67 | | | $ | 19.07 | | | $ | 14.32 | | | $ | 12.30 | | | $ | 14.86 | |
| Class C Shares: | | | | | | | | | | | | | | | | | | | | | | | | | | | | |
| Net Assets | | $ | 5,398,653 | | | $ | 5,239,999 | | | $ | 6,927,951 | | | $ | 3,377,525 | | | $ | 2,313,161 | | | $ | 3,198,259 | | | $ | 2,928,637 | |
| Shares of beneficial interest outstanding (no par value; unlimited shares authorized) | | | 473,161 | | | | 356,415 | | | | 520,215 | | | | 195,785 | | | | 187,439 | | | | 289,647 | | | | 241,900 | |
| Net asset value, offering and redemption price per share | | $ | 11.41 | | | $ | 14.70 | | | $ | 13.32 | | | $ | 17.25 | | | $ | 12.34 | | | $ | 11.04 | | | $ | 12.11 | |
| * | For certain purchases of $1 million or more, a 0.75% contingent deferred sales charge may apply to redemptions made within eighteen months of purchase. |
See accompanying notes to financial statements.
| STATEMENTS OF OPERATIONS (Unaudited) |
| For the Six Months Ended April 30, 2016 |
| | | | | | Dunham | | | Dunham | | | | | | | | | Dunham | | | | | | | |
| | | Dunham | | | Monthly | | | Corporate / | | | Dunham | | | Dunham | | | International | | | Dunham | | | Dunham | |
| | | Floating Rate | | | Distribution | | | Government | | | Dynamic Macro | | | High-Yield | | | Opportunity | | | Appreciation & | | | Alternative | |
| | | Bond Fund | | | Fund | | | Bond Fund | | | Fund | | | Bond Fund | | | Bond Fund | | | Income Fund | | | Strategy Fund | |
| | | | | | | | | | | | | | | | | | | | | | | | | | | | | | | | | |
| Investment Income: | | | | | | | | | | | | | | | | | | | | | | | | | | | | | | | | |
| Interest income | | $ | 2,077,800 | | | $ | 583,970 | | | $ | 970,842 | | | $ | 11,287 | | | $ | 2,825,468 | | | $ | 304,840 | | | $ | 194,924 | | | $ | 4,286 | |
| Dividend income | | | 296 | | | | 3,319,572 | | | | 27,393 | | | | 182,854 | | | | 924 | | | | 0 | | | | 126,778 | | | | 80,388 | |
| Securities Lending Income | | | — | | | | — | | | | 3,326 | | | | 15,548 | | | | 15,151 | | | | 0 | | | | 9,684 | | | | 12,697 | |
| Less: Foreign withholding taxes | | | — | | | | (14,659 | ) | | | — | | | | — | | | | — | | | | (292 | ) | | | — | | | | — | |
| Total Investment Income | | | 2,078,096 | | | | 3,888,883 | | | | 1,001,561 | | | | 209,689 | | | | 2,841,543 | | | | 304,548 | | | | 331,386 | | | | 97,371 | |
| | | | | | | | | | | | | | | | | | | | | | | | | | | | | | | | | |
| Operating Expenses: | | | | | | | | | | | | | | | | | | | | | | | | | | | | | | | | |
| Investment advisory fees | | | 256,278 | | | | 860,158 | | | | 127,058 | | | | 113,041 | | | | 278,642 | | | | 99,012 | | | | 87,154 | | | | 73,383 | |
| Sub-advisory fees | | | 170,852 | | | | 998,468 | | | | 76,235 | | | | 129,737 | | | | 185,762 | | | | 74,259 | | | | 60,338 | | | | 56,448 | |
| Sub-advisory performance fees | | | 38,436 | | | | (718,947 | ) | | | (31,554 | ) | | | (12,429 | ) | | | (98,749 | ) | | | (49,212 | ) | | | (15,794 | ) | | | (22,187 | ) |
| Fund accounting fees | | | 13,590 | | | | 46,324 | | | | 3,500 | | | | 4,970 | | | | 30,299 | | | | 5,573 | | | | 14,446 | | | | 3,640 | |
| Distribution fees- Class C Shares | | | 13,777 | | | | 228,018 | | | | 4,208 | | | | 10,422 | | | | 31,004 | | | | 5,469 | | | | 18,726 | | | | 4,111 | |
| Distribution fees- Class A Shares | | | 11,020 | | | | 79,485 | | | | 13,538 | | | | 4,322 | | | | 12,279 | | | | 3,562 | | | | 4,967 | | | | 2,033 | |
| Administration fees | | | 53,519 | | | | 89,604 | | | | 16,769 | | | | 11,281 | | | | 43,330 | | | | 14,020 | | | | 12,640 | | | | 7,367 | |
| Registration fees | | | 13,046 | | | | 30,297 | | | | 36,661 | | | | 21,027 | | | | 25,157 | | | | 21,476 | | | | 20,465 | | | | 13,413 | |
| Transfer agent fees | | | 12,245 | | | | 23,344 | | | | 11,146 | | | | 9,234 | | | | 13,780 | | | | 8,584 | | | | 9,540 | | | | 7,763 | |
| Custodian fees | | | 15,969 | | | | 174,998 | | | | 8,331 | | | | — | | | | 5,849 | | | | — | | | | 1,978 | | | | 2,670 | |
| Professional fees | | | 14,995 | | | | 11,504 | | | | 6,500 | | | | — | | | | 7,984 | | | | 9,697 | | | | 7,319 | | | | — | |
| Chief Compliance Officer fees | | | 5,913 | | | | 21,627 | | | | 5,580 | | | | 7,938 | | | | 9,139 | | | | 0 | | | | 2,019 | | | | 8,676 | |
| Printing and postage expense | | | 9,524 | | | | 48,453 | | | | 2,000 | | | | — | | | | 8,027 | | | | 1,073 | | | | 2,177 | | | | 3,182 | |
| Trustees’ fees | | | 2,725 | | | | 9,168 | | | | 4,266 | | | | 892 | | | | 2,996 | | | | 927 | | | | 1,869 | | | | 865 | |
| Insurance expense | | | 2,151 | | | | 10,604 | | | | 1,080 | | | | 207 | | | | 603 | | | | 653 | | | | 387 | | | | 246 | |
| Non 12b-1 shareholder servicing fees | | | 212 | | | | 39,060 | | | | 684 | | | | — | | | | 3,908 | | | | 1,305 | | | | 3,255 | | | | 1,231 | |
| Dividend expenses on short sales | | | — | | | | 207,302 | | | | 1,305 | | | | — | | | | — | | | | — | | | | — | | | | — | |
| Interest expense | | | — | | | | 3,905 | | | | — | | | | — | | | | — | | | | — | | | | — | | | | — | |
| Miscellaneous expenses | | | 3,822 | | | | 4,612 | | | | 9,227 | | | | 11,801 | | | | 6,776 | | | | 32,067 | | | | 2,434 | | | | 5,153 | |
| Net Operating Expenses | | | 638,074 | | | | 2,167,984 | | | | 296,534 | | | | 312,443 | | | | 566,786 | | | | 228,465 | | | | 233,920 | | | | 167,994 | |
| | | | | | | | | | | | | | | | | | | | | | | | | | | | | | | | | |
| Net Investment Income (Loss) | | | 1,440,022 | | | | 1,720,899 | | | | 705,027 | | | | (102,754 | ) | | | 2,274,757 | | | | 76,083 | | | | 97,466 | | | | (70,623 | ) |
| | | | | | | | | | | | | | | | | | | | | | | | | | | | | | | | | |
| Realized and Unrealized Gain (Loss) on Investments, Options Purchased, Securities Sold Short, Futures, Written Options, Foreign Currency Transactions and Swap Contracts: | | | | | | | | | | | | | | | | | | | | | | | | | | | | | | | | |
| Net realized gain (loss) from: | | | | | | | | | | | | | | | | | | | | | | | | | | | | | | | | |
| Investments | | | (916,042 | ) | | | (11,475,774 | ) | | | (662,352 | ) | | | (262,055 | ) | | | (5,077,538 | ) | | | 176,055 | | | | (220,758 | ) | | | (1,954,430 | ) |
| Futures | | | — | | | | — | | | | — | | | | (670,765 | ) | | | — | | | | (56,290 | ) | | | — | | | | — | |
| Options purchased | | | — | | | | 6,166,726 | | | | — | | | | 159,653 | | | | — | | | | — | | | | — | | | | — | |
| Securities sold short | | | — | | | | (68,583 | ) | | | — | | | | — | | | | — | | | | — | | | | — | | | | — | |
| Written options | | | — | | | | 693,396 | | | | — | | | | (48,795 | ) | | | — | | | | — | | | | — | | | | — | |
| Swap contracts | | | — | | | | (3,482,881 | ) | | | | | | | — | | | | — | | | | — | | | | — | | | | — | |
| Capital gain distributions received from | | | | | | | | | | | | | | | | | | | | | | | | | | | | | | | | |
| Foreign currency transactions | | | — | | | | 183,425 | | | | — | | | | (300,502 | ) | | | — | | | | (1,100,996 | ) | | | — | | | | — | |
| Foreign currency exchange contracts | | | — | | | | 856,359 | | | | — | | | | — | | | | — | | | | (30,221 | ) | | | — | | | | — | |
| Net change in unrealized appreciation (depreciation) on: | | | | | | | | | | | | | | | | | | | | | | | | | | | | | | | | |
| Investments | | | 841,493 | | | | 2,914,815 | | | | 881,304 | | | | (81,335 | ) | | | 2,448,359 | | | | 3,125,817 | | | | (1,753,445 | ) | | | (596,459 | ) |
| Futures | | | — | | | | — | | | | — | | | | (232,566 | ) | | | — | | | | (12,446 | ) | | | — | | | | — | |
| Options purchased | | | — | | | | 212,565 | | | | — | | | | 196,070 | | | | — | | | | — | | | | — | | | | — | |
| Securities sold short | | | — | | | | (2,350,131 | ) | | | — | | | | — | | | | — | | | | — | | | | — | | | | — | |
| Written options | | | — | | | | 2,036,766 | | | | — | | | | (1,956 | ) | | | — | | | | — | | | | — | | | | — | |
| Swap contracts | | | — | | | | 1,264,970 | | | | — | | | | — | | | | — | | | | — | | | | — | | | | — | |
| Foreign currency translations | | | — | | | | (2,703 | ) | | | — | | | | (33,968 | ) | | | — | | | | (18,744 | ) | | | — | | | | — | |
| Foreign currency exchange contracts | | | — | | | | (444,958 | ) | | | — | | | | — | | | | — | | | | 45,715 | | | | — | | | | — | |
| Net Realized and Unrealized Gain (Loss) | | | (74,549 | ) | | | (3,496,008 | ) | | | 218,952 | | | | (1,276,219 | ) | | | (2,629,179 | ) | | | 2,128,890 | | | | (1,974,203 | ) | | | (2,550,889 | ) |
| | | | | | | | | | | | | | | | | | | | | | | | | | | | | | | | | |
| Net Increase (Decrease) in Net Assets Resulting From Operations | | $ | 1,365,473 | | | $ | (1,775,109 | ) | | $ | 923,979 | | | $ | (1,378,973 | ) | | $ | (354,422 | ) | | $ | 2,204,973 | | | $ | (1,876,737 | ) | | $ | (2,621,512 | ) |
See accompanying notes to financial statements.
| STATEMENTS OF OPERATIONS (Unaudited) (Continued) |
| For the Six Months Ended April 30, 2016 |
| | | | | | Dunham | | | | | | | | | | | | Dunham | | | | |
| | | Dunham | | | Focused | | | Dunham | | | Dunham | | | Dunham | | | Emerging | | | Dunham | |
| | | Large Cap | | | Large Cap | | | International | | | Real Estate | | | Small Cap | | | Markets | | | Small Cap | |
| | | Value Fund | | | Growth Fund | | | Stock Fund | | | Stock Fund | | | Value Fund | | | Stock Fund | | | Growth Fund | |
| | | | | | | | | | | | | | | | | | | | | | |
| Investment Income: | | | | | | | | | | | | | | | | | | | | | | | | | | | | |
| Interest income | | $ | 961 | | | $ | 929 | | | $ | 1,019 | | | $ | 451 | | | $ | 238 | | | $ | 847 | | | $ | 656 | |
| Dividend income | | | 5,524 | | | | 87,457 | | | | 1,376,835 | | | | 1,093,847 | | | | 292,239 | | | | 599,458 | | | | 53,209 | |
| Securities lending income | | | 768,480 | | | | 8,378 | | | | 15,237 | | | | 3,844 | | | | 4,116 | | | | 4,436 | | | | 17,044 | |
| Less: Foreign withholding taxes | | | — | | | | (100 | ) | | | (154,148 | ) | | | — | | | | — | | | | (72,891 | ) | | | — | |
| Total Investment Income | | | 774,965 | | | | 96,664 | | | | 1,238,943 | | | | 1,098,142 | | | | 296,593 | | | | 531,850 | | | | 70,909 | |
| | | | | | | | | | | | | | | | | | | | | | | | | | | | | |
| Operating Expenses: | | | | | | | | | | | | | | | | | | | | | | | | | | | | |
| Investment advisory fees | | | 173,996 | | | | 202,020 | | | | 283,542 | | | | 142,587 | | | | 86,085 | | | | 155,369 | | | | 99,431 | |
| Sub-advisory fees | | | 80,306 | | | | 108,780 | | | | 283,541 | | | | 87,485 | | | | 59,597 | | | | 120,209 | | | | 76,933 | |
| Sub-advisory performance fees | | | (116,419 | ) | | | (7,533 | ) | | | (5,987 | ) | | | (38,201 | ) | | | 16,870 | | | | (81,025 | ) | | | (42,320 | ) |
| Fund accounting fees | | | 8,404 | | | | 9,339 | | | | 13,596 | | | | 7,049 | | | | 4,942 | | | | 6,797 | | | | 9,473 | |
| Distribution fees- Class C Shares | | | 27,883 | | | | 26,350 | | | | 34,377 | | | | 15,754 | | | | 11,463 | | | | 15,286 | | | | 12,777 | |
| Distribution fees- Class A Shares | | | 7,712 | | | | 11,514 | | | | 10,525 | | | | 12,425 | | | | 4,387 | | | | 5,585 | | | | 6,896 | |
| Administration fees | | | 16,799 | | | | 18,878 | | | | 50,600 | | | | 13,756 | | | | 4,183 | | | | 20,911 | | | | 10,978 | |
| Registration fees | | | 20,918 | | | | 12,743 | | | | 28,623 | | | | 19,945 | | | | 26,199 | | | | 21,896 | | | | 20,153 | |
| Transfer agent fees | | | 7,522 | | | | 9,796 | | | | 13,407 | | | | 9,207 | | | | 9,155 | | | | 9,632 | | | | 8,976 | |
| Custodian fees | | | 5,845 | | | | 5,406 | | | | 18,000 | | | | 7,181 | | | | 2,651 | | | | 21,050 | | | | 6,480 | |
| Professional fees | | | 8,083 | | | | 9,268 | | | | 12,137 | | | | 10,224 | | | | — | | | | 3,500 | | | | 8,553 | |
| Chief Compliance Officer fees | | | 2,700 | | | | 5,154 | | | | 3,500 | | | | 3,737 | | | | 8,884 | | | | 10,430 | | | | 2,745 | |
| Printing and postage expense | | | 3,833 | | | | 4,873 | | | | 3,629 | | | | 3,740 | | | | 2,537 | | | | 7,591 | | | | 1,740 | |
| Trustees’ fees | | | 1,894 | | | | 2,407 | | | | 2,460 | | | | 1,542 | | | | 1,429 | | | | 3,316 | | | | 997 | |
| Insurance expense | | | 744 | | | | 560 | | | | — | | | | 238 | | | | 388 | | | | 548 | | | | 450 | |
| Non 12b-1 shareholder servicing fees | | | 83 | | | | 2,019 | | | | 683 | | | | 1,200 | | | | 983 | | | | 383 | | | | 748 | |
| Miscellaneous expenses | | | 5,652 | | | | 485 | | | | 26,373 | | | | 5,072 | | | | 2,703 | | | | 8,888 | | | | 3,304 | |
| Net Operating Expenses | | | 255,955 | | | | 422,059 | | | | 779,006 | | | | 302,941 | | | | 242,456 | | | | 330,366 | | | | 228,314 | |
| | | | | | | | | | | | | | | | | | | | | | | | | | | | | |
| Net Investment Income (Loss) | | | 519,010 | | | | (325,395 | ) | | | 459,937 | | | | 795,201 | | | | 54,137 | | | | 201,484 | | | | (157,405 | ) |
| | | | | | | | | | | | | | | | | | | | | | | | | | | | | |
| Realized and Unrealized Gain (Loss) on Investments, Options and Foreign Currency: | | | | | | | | | | | | | | | | | | | | | | | | | | | | |
| Net realized gain (loss) from: | | | | | | | | | | | | | | | | | | | | | | | | | | | | |
| Investments | | | (842,416 | ) | | | (1,529,752 | ) | | | (3,487,614 | ) | | | 944,159 | | | | 136,664 | | | | (2,246,610 | ) | | | (1,975,171 | ) |
| Foreign currency transactions | | | — | | | | — | | | | — | | | | — | | | | — | | | | — | | | | — | |
| Foreign currency exchange contracts | | | — | | | | — | | | | (816,147 | ) | | | — | | | | — | | | | (1,020,509 | ) | | | — | |
| Net change in unrealized appreciation (depreciation) on: | | | | | | | | | | | | | | | | | | | | | | | | | | | | |
| Investments | | | (192,931 | ) | | | (4,052,743 | ) | | | 1,936,327 | | | | (193,308 | ) | | | (544,218 | ) | | | 2,981,499 | | | | (212,333 | ) |
| Foreign currency translations | | | — | | | | — | | | | — | | | | — | | | | — | | | | 11,027 | | | | — | |
| Foreign currency exchange contracts | | | — | | | | — | | | | (399,475 | ) | | | — | | | | — | | | | — | | | | — | |
| Net Realized and Unrealized Gain (Loss) | | | (1,035,347 | ) | | | (5,582,495 | ) | | | (2,766,909 | ) | | | 750,851 | | | | (407,554 | ) | | | (274,593 | ) | | | (2,187,504 | ) |
| | | | | | | | | | | | | | | | | | | | | | | | | | | | | |
| Net Increase (Decrease) in Net Assets Resulting From Operations | | $ | (516,337 | ) | | $ | (5,907,890 | ) | | $ | (2,306,972 | ) | | $ | 1,546,052 | | | $ | (353,417 | ) | | $ | (73,109 | ) | | $ | (2,344,909 | ) |
See accompanying notes to financial statements.
| STATEMENTS OF CHANGES IN NET ASSETS |
| | | Dunham | | | Dunham | | | Dunham | | | Dunham | | | Dunham | | | Dunham | |
| | | Floating Rate | | | Monthly Distribution | | | Corporate/Government | | | Dynamic Macro | | | High-Yield | | | International Opportunity | |
| | | Bond Fund | | | Fund | | | Bond Fund | | | Fund | | | Bond Fund | | | Bond Fund | |
| | | Six Months | | | | | | Six Months | | | | | | Six Months | | | | | | Six Months | | | | | | Six Months | | | | | | Six Months | | | | |
| | | Ended | | | Year Ended | | | Ended | | | Year Ended | | | Ended | | | Year Ended | | | Ended | | | Year Ended | | | Ended | | | Year Ended | | | Ended | | | Year Ended | |
| | | Apr. 30, 2016 | | | Oct. 31, 2015 | | | Apr. 30, 2016 | | | Oct. 31, 2015 | | | Apr. 30, 2016 | | | Oct. 31, 2015 | | | Apr. 30, 2016 | | | Oct. 31, 2015 | | | Apr. 30, 2016 | | | Oct. 31, 2015 | | | Apr. 30, 2016 | | | Oct. 31, 2015 | |
| | | (Unaudited) | | | | | | (Unaudited) | | | | | | (Unaudited) | | | | | | (Unaudited) | | | | | | (Unaudited) | | | | | | (Unaudited) | | | | |
| | | | | | | | | | | | | | | | | | | | | | | | | | | | | | | | | | | | | |
| Operations: | | | | | | | | | | | | | | | | | | | | | | | | | | | | | | | | | | | | | | | | | | | | | | | | |
| Net investment income (loss) | | $ | 1,440,022 | | | $ | 2,659,546 | | | $ | 1,720,899 | | | $ | (2,091,574 | ) | | $ | 705,027 | | | $ | 1,579,986 | | | $ | (102,754 | ) | | $ | (367,594 | ) | | $ | 2,274,757 | | | $ | 5,358,316 | | | $ | 76,083 | | | $ | 219,651 | |
| Net realized gain (loss) from investments, foreign currency, securities sold short, futures, swap contracts and options | | | (916,042 | ) | | | (989,927 | ) | | | (7,127,332 | ) | | | 8,665,171 | | | | (662,352 | ) | | | (802,542 | ) | | | (1,122,464 | ) | | | (784,599 | ) | | | (5,077,538 | ) | | | (4,691,852 | ) | | | (1,011,452 | ) | | | (3,043,314 | ) |
| Net change in unrealized appreciation (depreciation) on investments, foreign currency, securities sold short, futures, swap contracts and options | | | 841,493 | | | | (1,351,525 | ) | | | 3,631,324 | | | | (12,530,696 | ) | | | 881,304 | | | | (628,811 | ) | | | (153,755 | ) | | | 885,984 | | | | 2,448,359 | | | | (2,895,283 | ) | | | 3,140,342 | | | | (1,185,869 | ) |
| Net Increase (Decrease) in Net Assets Resulting From Operations | | | 1,365,473 | | | | 318,094 | | | | (1,775,109 | ) | | | (5,957,099 | ) | | | 923,979 | | | | 148,633 | | | | (1,378,973 | ) | | | (266,209 | ) | | | (354,422 | ) | | | (2,228,819 | ) | | | 2,204,973 | | | | (4,009,532 | ) |
| | | | | | | | | | | | | | | | | | | | | | | | | | | | | | | | | | | | | | | | | | | | | | | | | |
| Distributions to Shareholders From: | | | | | | | | | | | | | | | | | | | | | | | | | | | | | | | | | | | | | | | | | | | | | | | | |
| Net Realized Gains: | | | | | | | | | | | | | | | | | | | | | | | | | | | | | | | | | | | | | | | | | | | | | | | | |
| Class N | | | — | | | | — | | | | (2,695,636 | ) | | | (3,465,984 | ) | | | — | | | | — | | | | — | | | | — | | | | — | | | | — | | | | — | | | | — | |
| Class A | | | — | | | | — | | | | (1,107,324 | ) | | | (1,580,917 | ) | | | — | | | | — | | | | — | | | | — | | | | — | | | | — | | | | — | | | | — | |
| Class C | | | — | | | | — | | | | (959,489 | ) | | | (1,315,549 | ) | | | — | | | | — | | | | — | | | | — | | | | — | | | | — | | | | — | | | | — | |
| Net Investment Income: | | | | | | | | | | | | | | | | | | | | | | | | | | | | | | | | | | | | | | | | | | | | | | | | |
| Class N | | | (1,226,062 | ) | | | (2,306,306 | ) | | | — | | | | — | | | | (627,973 | ) | | | (1,444,152 | ) | | | — | | | | — | | | | (1,847,379 | ) | | | (4,206,990 | ) | | | (26,161 | ) | | | (20,234 | ) |
| Class A | | | (137,309 | ) | | | (280,234 | ) | | | — | | | | — | | | | (72,515 | ) | | | (123,639 | ) | | | — | | | | — | | | | (229,783 | ) | | | (633,882 | ) | | | (1,468 | ) | | | (1,136 | ) |
| Class C | | | (48,354 | ) | | | (90,378 | ) | | | — | | | | — | | | | (40,277 | ) | | | (89,766 | ) | | | — | | | | — | | | | (172,893 | ) | | | (426,203 | ) | | | (112 | ) | | | — | |
| Distributions From Paid In Capital: | | | | | | | | | | | | | | | | | | | | | | | | | | | | | | | | | | | | | | | | | | | | | | | | |
| Class N | | | — | | | | — | | | | — | | | | (1,924,706 | ) | | | — | | | | — | | | | — | | | | — | | | | — | | | | — | | | | — | | | | — | |
| Class A | | | — | | | | — | | | | — | | | | (906,907 | ) | | | — | | | | — | | | | — | | | | — | | | | — | | | | — | | | | — | | | | — | |
| Class C | | | — | | | | — | | | | — | | | | (731,788 | ) | | | — | | | | — | | | | — | | | | — | | | | — | | | | — | | | | — | | | | — | |
| Total Distributions to Shareholders | | | (1,411,725 | ) | | | (2,676,918 | ) | | | (4,762,449 | ) | | | (9,925,851 | ) | | | (740,765 | ) | | | (1,657,557 | ) | | | — | | | | — | | | | (2,250,055 | ) | | | (5,267,075 | ) | | | (27,741 | ) | | | (21,370 | ) |
| | | | | | | | | | | | | | | | | | | | | | | | | | | | | | | | | | | | | | | | | | | | | | | | | |
| Share Transactions of Beneficial Interest: | | | | | | | | | | | | | | | | | | | | | | | | | | | | | | | | | | | | | | | | | | | | | | | | |
| Net proceeds from shares sold | | | | | | | | | | | | | | | | | | | | | | | | | | | | | | | | | | | | | | | | | | | | | | | | |
| Class N | | | 9,673,248 | | | | 26,805,380 | | | | 14,655,975 | | | | 59,506,155 | | | | 6,656,560 | | | | 11,821,827 | | | | 5,925,389 | | | | 19,642,140 | | | | 5,665,895 | | | | 14,380,469 | | | | 1,834,465 | | | | 12,663,574 | |
| Class A | | | 2,082,257 | | | | 7,478,894 | | | | 5,865,139 | | | | 32,835,909 | | | | 2,122,802 | | | | 2,730,333 | | | | 1,978,966 | | | | 2,239,845 | | | | 1,484,626 | | | | 7,270,669 | | | | 534,072 | | | | 4,644,903 | |
| Class C | | | 679,501 | | | | 1,313,889 | | | | 3,891,987 | | | | 20,947,149 | | | | 423,949 | | | | 982,704 | | | | 639,897 | | | | 671,518 | | | | 489,540 | | | | 1,348,348 | | | | 117,974 | | | | 674,903 | |
| Reinvestment of distributions | | | | | | | | | | | | | | | | | | | | | | | | | | | | | | | | | | | | | | | | | | | | | | | | |
| Class N | | | 1,222,177 | | | | 2,305,799 | | | | 2,561,885 | | | | 5,020,988 | | | | 627,908 | | | | 1,443,731 | | | | — | | | | — | | | | 1,807,080 | | | | 4,059,205 | | | | 26,161 | | | | 20,234 | |
| Class A | | | 126,451 | | | | 263,845 | | | | 954,576 | | | | 2,064,283 | | | | 65,501 | | | | 118,869 | | | | — | | | | — | | | | 190,040 | | | | 539,405 | | | | 1,390 | | | | 1,098 | |
| Class C | | | 47,800 | | | | 89,580 | | | | 775,169 | | | | 1,582,690 | | | | 38,260 | | | | 87,339 | | | | — | | | | — | | | | 147,795 | | | | 362,639 | | | | 111 | | | | — | |
| Cost of shares redeemed | | | | | | | | | | | | | | | | | | | | | | | | | | | | | | | | | | | | | | | | | | | | | | | | |
| Class N | | | (10,314,536 | ) | | | (16,957,527 | ) | | | (27,578,391 | ) | | | (49,477,110 | ) | | | (6,040,793 | ) | | | (13,876,442 | ) | | | (2,884,724 | ) | | | (2,621,968 | ) | | | (8,130,912 | ) | | | (36,343,091 | ) | | | (8,328,789 | ) | | | (19,792,147 | ) |
| Class A | | | (1,581,478 | ) | | | (12,506,881 | ) | | | (23,117,476 | ) | | | (35,643,072 | ) | | | (1,438,155 | ) | | | (1,627,587 | ) | | | (1,474,414 | ) | | | (658,270 | ) | | | (1,321,818 | ) | | | (18,668,200 | ) | | | (1,154,322 | ) | | | (4,479,173 | ) |
| Class C | | | (471,057 | ) | | | (1,119,025 | ) | | | (10,323,557 | ) | | | (16,937,091 | ) | | | (592,486 | ) | | | (958,740 | ) | | | (248,064 | ) | | | (453,699 | ) | | | (1,487,423 | ) | | | (3,431,763 | ) | | | (586,230 | ) | | | (753,425 | ) |
| Net Increase (Decrease) in Net Assets From Share Transactions of Beneficial Interest | | | 1,464,363 | | | | 7,673,954 | | | | (32,314,693 | ) | | | 19,899,901 | | | | 1,863,546 | | | | 722,034 | | | | 3,937,050 | | | | 18,819,566 | | | | (1,155,177 | ) | | | (30,482,319 | ) | | | (7,555,168 | ) | | | (7,020,033 | ) |
| | | | | | | | | | | | | | | | | | | | | | | | | | | | | | | | | | | | | | | | | | | | | | | | | |
| Total Increase (Decrease) in Net Assets | | | 1,418,111 | | | | 5,315,130 | | | | (38,852,251 | ) | | | 4,016,951 | | | | 2,046,760 | | | | (786,890 | ) | | | 2,558,077 | | | | 18,553,357 | | | | (3,759,654 | ) | | | (37,978,213 | ) | | | (5,377,936 | ) | | | (11,050,935 | ) |
| | | | | | | | | | | | | | | | | | | | | | | | | | | | | | | | | | | | | | | | | | | | | | | | | |
| Net Assets: | | | | | | | | | | | | | | | | | | | | | | | | | | | | | | | | | | | | | | | | | | | | | | | | |
| Beginning of Period | | | 85,486,953 | | | | 80,171,823 | | | | 288,305,067 | | | | 284,288,116 | | | | 50,474,938 | | | | 51,261,828 | | | | 33,752,399 | | | | 15,199,042 | | | | 98,108,366 | | | | 136,086,579 | | | | 36,780,272 | | | | 47,831,207 | |
| End of Period * | | $ | 86,905,064 | | | $ | 85,486,953 | | | $ | 249,452,816 | | | $ | 288,305,067 | | | $ | 52,521,698 | | | $ | 50,474,938 | | | $ | 36,310,476 | | | $ | 33,752,399 | | | $ | 94,348,712 | | | $ | 98,108,366 | | | $ | 31,402,336 | | | $ | 36,780,272 | |
| * Includes undistributed net investment income (loss) at end of year | | $ | 55,697 | | | $ | 20,255 | | | $ | 326,230 | | | $ | 1,364,137 | | | $ | (19,396 | ) | | $ | 16,342 | | | $ | (145,413 | ) | | $ | (42,659 | ) | | $ | 133,697 | | | $ | 17,754 | | | $ | (21,813 | ) | | $ | — | |
See accompanying notes to financial statements.
| STATEMENTS OF CHANGES IN NET ASSETS (Continued) |
| | | Dunham | | | Dunham | | | Dunham | | | Dunham | |
| | | Appreciation & | | | Alternative | | | Large Cap | | | Focused Large Cap | |
| | | Income Fund | | | Strategy Fund | | | Value Fund | | | Growth Fund | |
| | | Six Months | | | | | | Six Months | | | | | | Six Months | | | | | | Six Months | | | | |
| | | Ended | | | Year Ended | | | Ended | | | Year Ended | | | Ended | | | Year Ended | | | Ended | | | Year Ended | |
| | | Apr. 30, 2016 | | | Oct. 31, 2015 | | | Apr. 30, 2016 | | | Oct. 31, 2015 | | | Apr. 30, 2016 | | | Oct. 31, 2015 | | | Apr. 30, 2016 | | | Oct. 31, 2015 | |
| | | (Unaudited) | | | | | | (Unaudited) | | | | | | (Unaudited) | | | | | | (Unaudited) | | | | |
| | | | | | | | | | | | | | | | | | | | | | | | | |
| Operations: | | | | | | | | | | | | | | | | | | | | | | | | | | | | | | | | |
| Net investment income (loss) | | $ | 97,466 | | | $ | 765,356 | | | $ | (70,623 | ) | | $ | (34,985 | ) | | $ | 519,010 | | | $ | 496,880 | | | $ | (325,395 | ) | | $ | (678,553 | ) |
| Net realized gain (loss) from investments and foreign currency transactions | | | (220,758 | ) | | | 898,618 | | | | (1,954,430 | ) | | | (95,801 | ) | | | (842,416 | ) | | | 15,237,873 | | | | (1,529,752 | ) | | | 638,277 | |
| Capital gain distributions received from other investment companies | | | — | | | | — | | | | — | | | | 51,809 | | | | — | | | | — | | | | — | | | | — | |
| Net change in unrealized appreciation (depreciation) on investments and foreign currency translations | | | (1,753,445 | ) | | | (2,532,611 | ) | | | (596,459 | ) | | | (231,388 | ) | | | (192,931 | ) | | | (15,021,215 | ) | | | (4,052,743 | ) | | | 7,298,519 | |
| Net Increase (Decrease) in Net Assets Resulting From Operations | | | (1,876,737 | ) | | | (868,637 | ) | | | (2,621,512 | ) | | | (310,365 | ) | | | (516,337 | ) | | | 713,538 | | | | (5,907,890 | ) | | | 7,258,243 | |
| | | | | | | | | | | | | | | | | | | | | | | | | | | | | | | | | |
| Distributions to Shareholders From: | | | | | | | | | | | | | | | | | | | | | | | | | | | | | | | | |
| Net Realized Gains: | | | | | | | | | | | | | | | | | | | | | | | | | | | | | | | | |
| Class N | | | (403,190 | ) | | | (2,968,783 | ) | | | — | | | | — | | | | (11,078,720 | ) | | | — | | | | (291,262 | ) | | | — | |
| Class A | | | (86,592 | ) | | | (748,302 | ) | | | — | | | | — | | | | (1,618,488 | ) | | | — | | | | (56,919 | ) | | | — | |
| Class C | | | (104,911 | ) | | | (649,083 | ) | | | — | | | | — | | | | (1,560,943 | ) | | | — | | | | (33,681 | ) | | | — | |
| Net Investment Income: | | | | | | | | | | | | | | | | | | | | | | | | | | | | | | | | |
| Class N | | | (786,055 | ) | | | (287,785 | ) | | | — | | | | — | | | | (494,656 | ) | | | (323,640 | ) | | | — | | | | — | |
| Class A | | | (158,001 | ) | | | (61,328 | ) | | | — | | | | — | | | | (56,644 | ) | | | (42,004 | ) | | | — | | | | — | |
| Class C | | | (157,682 | ) | | | (23,109 | ) | | | — | | | | — | | | | (12,668 | ) | | | — | | | | — | | | | — | |
| Total Distributions to Shareholders | | | (1,696,431 | ) | | | (4,738,390 | ) | | | — | | | | — | | | | (14,822,119 | ) | | | (365,644 | ) | | | (381,862 | ) | | | — | |
| | | | | | | | | | | | | | | | | | | | | | | | | | | | | | | | | |
| Share Transactions of Beneficial Interest: | | | | | | | | | | | | | | | | | | | | | | | | | | | | | | | | |
| Net proceeds from shares sold | | | | | | | | | | | | | | | | | | | | | | | | | | | | | | | | |
| Class N | | | 2,152,193 | | | | 6,612,666 | | | | 2,137,725 | | | | 10,062,695 | | | | 3,829,738 | | | | 10,056,662 | | | | 6,854,209 | | | | 18,681,958 | |
| Class A | | | 355,197 | | | | 1,658,013 | | | | 310,810 | | | | 2,168,236 | | | | 998,391 | | | | 2,688,351 | | | | 3,446,716 | | | | 9,683,964 | |
| Class C | | | 846,648 | | | | 2,201,019 | | | | 183,841 | | | | 368,291 | | | | 418,438 | | | | 1,091,246 | | | | 1,481,073 | | | | 1,171,037 | |
| Reinvestment of distributions | | | | | | | | | | | | | | | | | | | | | | | | | | | | | | | | |
| Class N | | | 1,183,250 | | | | 3,247,305 | | | | — | | | | — | | | | 11,569,073 | | | | 323,513 | | | | 289,776 | | | | — | |
| Class A | | | 190,061 | | | | 583,948 | | | | — | | | | — | | | | 1,655,337 | | | | 41,709 | | | | 55,382 | | | | — | |
| Class C | | | 230,784 | | | | 669,690 | | | | — | | | | — | | | | 1,571,854 | | | | — | | | | 30,681 | | | | — | |
| Cost of shares redeemed | | | | | | | | | | | | | | | | | | | | | | | | | | | | | | | | |
| Class N | | | (2,648,417 | ) | | | (4,405,250 | ) | | | (1,386,392 | ) | | | (4,021,907 | ) | | | (4,712,878 | ) | | | (8,002,850 | ) | | | (4,748,168 | ) | | | (9,982,425 | ) |
| Class A | | | (247,649 | ) | | | (1,625,832 | ) | | | (160,686 | ) | | | (2,375,119 | ) | | | (1,054,032 | ) | | | (3,835,677 | ) | | | (1,320,203 | ) | | | (22,089,093 | ) |
| Class C | | | (1,504,964 | ) | | | (1,088,712 | ) | | | (150,023 | ) | | | (550,889 | ) | | | (739,720 | ) | | | (950,437 | ) | | | (912,958 | ) | | | (843,277 | ) |
| Net Increase (Decrease) in Net Assets From Share Transactions of Beneficial Interest | | | 557,103 | | | | 7,852,847 | | | | 935,275 | | | | 5,651,307 | | | | 13,536,201 | | | | 1,412,517 | | | | 5,176,508 | | | | (3,377,836 | ) |
| | | | | | | | | | | | | | | | | | | | | | | | | | | | | | | | | |
| Total Increase (Decrease) in Net Assets | | | (3,016,065 | ) | | | 2,245,820 | | | | (1,686,237 | ) | | | 5,340,942 | | | | (1,802,255 | ) | | | 1,760,411 | | | | (1,113,244 | ) | | | 3,880,407 | |
| | | | | | | | | | | | | | | | | | | | | | | | | | | | | | | | | |
| Net Assets: | | | | | | | | | | | | | | | | | | | | | | | | | | | | | | | | |
| Beginning of Period | | | 29,377,025 | | | | 27,131,205 | | | | 23,762,434 | | | | 18,421,492 | | | | 57,001,789 | | | | 55,241,378 | | | | 65,296,294 | | | | 61,415,887 | |
| End of Period * | | $ | 26,360,960 | | | $ | 29,377,025 | | | $ | 22,076,197 | | | $ | 23,762,434 | | | $ | 55,199,534 | | | $ | 57,001,789 | | | $ | 64,183,050 | | | $ | 65,296,294 | |
| * Includes undistributed net investment income (loss) at end of year | | $ | (47,695 | ) | | $ | 259,459 | | | $ | (196,645 | ) | | $ | (259,611 | ) | | $ | 328,393 | | | $ | 373,351 | | | $ | (938,307 | ) | | $ | (390,591 | ) |
See accompanying notes to financial statements.
| STATEMENTS OF CHANGES IN NET ASSETS (Continued) |
| | | Dunham | | | Dunham | | | Dunham | | | Dunham | | | Dunham | |
| | | International | | | Real Estate | | | Small Cap | | | Emerging Markets | | | Small Cap | |
| | | Stock Fund | | | Stock Fund | | | Value Fund | | | Stock Fund | | | Growth Fund | |
| | | Six Months | | | | | | Six Months | | | | | | Six Months | | | | | | Six Months | | | | | | Six Months | | | | |
| | | Ended | | | Year Ended | | | Ended | | | Year Ended | | | Ended | | | Year Ended | | | Ended | | | Year Ended | | | Ended | | | Year Ended | |
| | | Apr. 30, 2016 | | | Oct. 31, 2015 | | | Apr. 30, 2016 | | | Oct. 31, 2015 | | | Apr. 30, 2016 | | | Oct. 31, 2015 | | | Apr. 30, 2016 | | | Oct. 31, 2015 | | | Apr. 30, 2016 | | | Oct. 31, 2015 | |
| | | (Unaudited) | | | | | | (Unaudited) | | | | | | (Unaudited) | | | | | | (Unaudited) | | | | | | (Unaudited) | | | | |
| | | | | | | | | | | | | | | | | | | | | | | | | | | | | | | |
| Operations: | | | | | | | | | | | | | | | | | | | | | | | | | | | | | | | | | | | | | | | | |
| Net investment income (loss) | | $ | 459,937 | | | $ | (61,967 | ) | | $ | 795,201 | | | $ | 330,722 | | | $ | 54,137 | | | $ | (62,459 | ) | | $ | 201,484 | | | $ | 220,476 | | | $ | (157,405 | ) | | $ | (481,979 | ) |
| Net realized gain (loss) from investments and foreign currency transactions | | | (4,303,761 | ) | | | (522,400 | ) | | | 944,159 | | | | 4,411,509 | | | | 136,664 | | | | 960,175 | | | | (3,267,119 | ) | | | (4,267,938 | ) | | | (1,975,171 | ) | | | 3,247,630 | |
| Net change in unrealized appreciation (depreciation) on investments and foreign currency translations | | | 1,536,852 | | | | (2,388,134 | ) | | | (193,308 | ) | | | (2,058,419 | ) | | | (544,218 | ) | | | (1,248,260 | ) | | | 2,992,526 | | | | (4,292,625 | ) | | | (212,333 | ) | | | (1,058,568 | ) |
| | | | | | | | | | | | | | | | | | | | | | | | | | | | | | | | | | | | | | | | | |
| Net Increase (Decrease) in Net Assets Resulting From Operations | | | (2,306,972 | ) | | | (2,972,501 | ) | | | 1,546,052 | | | | 2,683,812 | | | | (353,417 | ) | | | (350,544 | ) | | | (73,109 | ) | | | (8,340,087 | ) | | | (2,344,909 | ) | | | 1,707,083 | |
| | | | | | | | | | | | | | | | | | | | | | | | | | | | | | | | | | | | | | | | | |
| Distributions to Shareholders From: | | | | | | | | | | | | | | | | | | | | | | | | | | | | | | | | | | | | | | | | |
| Net Realized Gains: | | | | | | | | | | | | | | | | | | | | | | | | | | | | | | | | | | | | | | | | |
| Class N | | | — | | | | (213,428 | ) | | | (2,998,341 | ) | | | (1,801,657 | ) | | | (721,628 | ) | | | (1,480,348 | ) | | | — | | | | — | | | | (1,944,913 | ) | | | (1,843,030 | ) |
| Class A | | | — | | | | (29,714 | ) | | | (955,297 | ) | | | (494,611 | ) | | | (123,232 | ) | | | (199,656 | ) | | | — | | | | — | | | | (515,354 | ) | | | (582,886 | ) |
| Class C | | | — | | | | (24,848 | ) | | | (377,983 | ) | | | (214,050 | ) | | | (87,966 | ) | | | (163,574 | ) | | | — | | | | — | | | | (314,231 | ) | | | (313,703 | ) |
| Net Investment Income: | | | | | | | | | | | | | | | | | | | | | | | | | | | | | | | | | | | | | | | | |
| Class N | | | (43,319 | ) | | | (1,143,359 | ) | | | (353,676 | ) | | | (214,891 | ) | | | (13,002 | ) | | | (55,192 | ) | | | (286,568 | ) | | | (471,950 | ) | | | — | | | | — | |
| Class A | | | — | | | | (136,048 | ) | | | (86,476 | ) | | | (48,514 | ) | | | — | | | | — | | | | (20,580 | ) | | | (46,968 | ) | | | — | | | | — | |
| Class C | | | — | | | | (70,549 | ) | | | (4,842 | ) | | | — | | | | — | | | | — | | | | — | | | | (18,608 | ) | | | — | | | | — | |
| Total Distributions to Shareholders | | | (43,319 | ) | | | (1,617,946 | ) | | | (4,776,615 | ) | | | (2,773,723 | ) | | | (945,828 | ) | | | (1,898,770 | ) | | | (307,148 | ) | | | (537,526 | ) | | | (2,774,498 | ) | | | (2,739,619 | ) |
| | | | | | | | | | | | | | | | | | | | | | | | | | | | | | | | | | | | | | | | | |
| Share Transactions of Beneficial Interest: | | | | | | | | | | | | | | | | | | | | | | | | | | | | | | | | | | | | | | | | |
| Net proceeds from shares sold | | | | | | | | | | | | | | | | | | | | | | | | | | | | | | | | | | | | | | | | |
| Class N | | | 3,131,249 | | | | 30,030,021 | | | | 2,095,559 | | | | 10,087,909 | | | | 1,243,171 | | | | 5,052,309 | | | | 7,970,929 | | | | 18,180,906 | | | | 4,127,139 | | | | 6,472,774 | |
| Class A | | | 1,527,953 | | | | 4,446,411 | | | | 748,134 | | | | 9,349,776 | | | | 561,949 | | | | 1,406,383 | | | | 1,209,115 | | | | 2,545,109 | | | | 774,141 | | | | 1,939,467 | |
| Class C | | | 582,813 | | | | 1,892,802 | | | | 331,186 | | | | 1,047,720 | | | | 200,964 | | | | 373,937 | | | | 427,029 | | | | 1,043,954 | | | | 309,142 | | | | 650,423 | |
| Reinvestment of distributions | | | | | | | | | | | | | | | | | | | | | | | | | | | | | | | | | | | | | | | | |
| Class N | | | 43,140 | | | | 1,356,407 | | | | 3,276,127 | | | | 1,959,665 | | | | 734,047 | | | | 1,534,285 | | | | 286,387 | | | | 471,942 | | | | 1,940,454 | | | | 1,836,187 | |
| Class A | | | — | | | | 146,152 | | | | 1,027,941 | | | | 537,515 | | | | 119,701 | | | | 197,400 | | | | 20,108 | | | | 46,050 | | | | 363,529 | | | | 414,220 | |
| Class C | | | — | | | | 94,504 | | | | 351,559 | | | | 205,692 | | | | 87,856 | | | | 163,312 | | | | — | | | | 18,512 | | | | 313,976 | | | | 312,902 | |
| Cost of shares redeemed | | | | | | | | | | | | | | | | | | | | | | | | | | | | | | | | | | | | | | | | |
| Class N | | | (4,105,243 | ) | | | (8,142,350 | ) | | | (7,167,330 | ) | | | (15,912,244 | ) | | | (1,838,475 | ) | | | (6,542,402 | ) | | | (5,501,197 | ) | | | (4,402,409 | ) | | | (1,795,139 | ) | | | (5,627,001 | ) |
| Class A | | | (1,172,589 | ) | | | (2,889,429 | ) | | | (1,407,688 | ) | | | (3,240,007 | ) | | | (625,337 | ) | | | (801,068 | ) | | | (832,313 | ) | | | (1,122,138 | ) | | | (860,113 | ) | | | (2,284,547 | ) |
| Class C | | | (706,046 | ) | | | (833,335 | ) | | | (874,145 | ) | | | (1,555,919 | ) | | | (233,081 | ) | | | (428,369 | ) | | | (429,118 | ) | | | (764,943 | ) | | | (287,900 | ) | | | (801,682 | ) |
| Net Increase (Decrease) in Net Assets From Share Transactions of Beneficial Interest | | | (698,723 | ) | | | 26,101,183 | | | | (1,618,657 | ) | | | 2,480,107 | | | | 250,795 | | | | 955,787 | | | | 3,150,940 | | | | 16,016,983 | | | | 4,885,229 | | | | 2,912,743 | |
| | | | | | | | | | | | | | | | | | | | | | | | | | | | | | | | | | | | | | | | | |
| Total Increase (Decrease) in Net Assets | | | (3,049,014 | ) | | | 21,510,736 | | | | (4,849,220 | ) | | | 2,390,196 | | | | (1,048,450 | ) | | | (1,293,527 | ) | | | 2,770,683 | | | | 7,139,370 | | | | (234,178 | ) | | | 1,880,207 | |
| | | | | | | | | | | | | | | | | | | | | | | | | | | | | | | | | | | | | | | | | |
| Net Assets: | | | | | | | | | | | | | | | | | | | | | | | | | | | | | | | | | | | | | | | | |
| Beginning of Period | | | 93,291,526 | | | | 71,780,790 | | | | 47,611,845 | | | | 45,221,649 | | | | 28,251,604 | | | | 29,545,131 | | | | 50,640,922 | | | | 43,501,552 | | | | 32,640,451 | | | | 30,760,244 | |
| End of Period * | | $ | 90,242,512 | | | $ | 93,291,526 | | | $ | 42,762,625 | | | $ | 47,611,845 | | | $ | 27,203,154 | | | $ | 28,251,604 | | | $ | 53,411,605 | | | $ | 50,640,922 | | | $ | 32,406,273 | | | $ | 32,640,451 | |
| * Includes undistributed net investment income (loss) at end of year | | $ | 93,735 | | | $ | 322,883 | | | $ | 556,544 | | | $ | 139,020 | | | $ | 41,135 | | | $ | — | | | $ | 2,497 | | | $ | 108,161 | | | $ | (157,405 | ) | | $ | — | |
See accompanying notes to financial statements.
| FINANCIAL HIGHLIGHTS |
| Dunham Floating Rate Bond Fund |
| |
| The table sets forth financial data for one share of beneficial interest outstanding throughout each period. |
| | | Class N | | | Class A | | | Class C | |
| | | Six Months | | | | | | | | | Six Months | | | | | | | | | Six Months | | | | | | | |
| | | Ended | | | Year Ended | | | Year Ended | | | Ended | | | Year Ended | | | Year Ended | | | Ended | | | Year Ended | | | Year Ended | |
| | | April 30, | | | October 31, | | | October 31, | | | April 30, | | | October 31, | | | October 31, | | | April 30, | | | October 31, | | | October 31, | |
| | | 2016 | | | 2015 | | | 2014* | | | 2016 | | | 2015 | | | 2014* | | | 2016 | | | 2015 | | | 2014* | |
| | | (Unaudited) | | | | | | | | | (Unaudited) | | | | | | | | | (Unaudited) | | | | | | | |
| | | | | | | | | | | | | | | | | | | | | | | | | | | | |
| Net asset value, beginning of period | | $ | 9.60 | | | $ | 9.87 | | | $ | 10.00 | | | $ | 9.59 | | | $ | 9.87 | | | $ | 10.00 | | | $ | 9.59 | | | $ | 9.86 | | | $ | 10.00 | |
| Income (loss) from investment operations: | | | | | | | | | | | | | | | | | | | | | | | | | | | | | | | | | | | | |
| Net investment income** | | | 0.16 | | | | 0.32 | | | | 0.29 | | | | 0.15 | | | | 0.30 | | | | 0.28 | | | | 0.13 | | | | 0.24 | | | | 0.22 | |
| Net realized and unrealized loss | | | (0.01 | ) | | | (0.27 | ) | | | (0.15 | ) | | | (0.00 | ) | | | (0.28 | ) | | | (0.16 | ) | | | (0.01 | ) | | | (0.26 | ) | | | (0.16 | ) |
| Total income (loss) from investment operations | | | 0.15 | | | | 0.05 | | | | 0.14 | | | | 0.15 | | | | 0.02 | | | | 0.12 | | | | 0.12 | | | | (0.02 | ) | | | 0.06 | |
| Less distributions: | | | | | | | | | | | | | | | | | | | | | | | | | | | | | | | | | | | | |
| Distributions from net investment income | | | (0.16 | ) | | | (0.32 | ) | | | (0.27 | ) | | | (0.15 | ) | | | (0.30 | ) | | | (0.25 | ) | | | (0.13 | ) | | | (0.25 | ) | | | (0.20 | ) |
| Total distributions | | | (0.16 | ) | | | (0.32 | ) | | | (0.27 | ) | | | (0.15 | ) | | | (0.30 | ) | | | (0.25 | ) | | | (0.13 | ) | | | (0.25 | ) | | | (0.20 | ) |
| Net asset value, end of period | | $ | 9.59 | | | $ | 9.60 | | | $ | 9.87 | | | $ | 9.59 | | | $ | 9.59 | | | $ | 9.87 | | | $ | 9.58 | | | $ | 9.59 | | | $ | 9.86 | |
| | | | | | | | | | | | | | | | | | | | | | | | | | | | | | | | | | | | | |
| Total return + | | | 1.58 | % | | | 0.51 | % | | | 1.43 | % | | | 1.57 | % | | | 0.16 | % | | | 1.20 | % | | | 1.21 | % | | | (0.23 | )% | | | 0.63 | % |
| Ratios/Supplemental Data: | | | | | | | | | | | | | | | | | | | | | | | | | | | | | | | | | | | | |
| Net assets, end of period (in 000s) | | $ | 73,843 | | | $ | 73,316 | | | $ | 63,120 | | | $ | 9,228 | | | $ | 8,598 | | | $ | 13,664 | | | $ | 3,834 | | | $ | 3,573 | | | $ | 3,888 | |
| | | | | | | | | | | | | | | | | | | | | | | | | | | | | | | | | | | | | |
| Ratios of expenses to average net assets: ^ | | | 1.44 | % | | | 1.27 | % | | | 1.27 | % | | | 1.69 | % | | | 1.52 | % | | | 1.52 | % | | | 2.19 | % | | | 2.02 | % | | | 2.02 | % |
| Ratios of net investment income to average net assets: ^ | | | 3.43 | % | | | 3.24 | % | | | 2.87 | % | | | 3.18 | % | | | 2.99 | % | | | 2.84 | % | | | 2.67 | % | | | 2.49 | % | | | 2.24 | % |
| | | | | | | | | | | | | | | | | | | | | | | | | | | | | | | | | | | | | |
| Portfolio turnover rate | | | 23 | % (1) | | | 51 | % | | | 50 | % (1) | | | 23 | % (1) | | | 51 | % | | | 50 | % (1) | | | 23 | % (1) | | | 51 | % | | | 50 | % (1) |
| * | The Fund commenced operations on November 1, 2013. |
| ** | The net investment income per share data was determined using the average shares outstanding throughout each period. |
| + | Assumes reinvestment of all dividends and distributions, if any. Aggregate (not annualized) total return is shown for any period shorter than one year. Total return does not reflect the deductions of taxes that a shareholder would pay on distributions or on the redemption of shares. |
| ^ | Annualized for periods less than one year. |
See accompanying notes to financial statements.
| FINANCIAL HIGHLIGHTS |
| Dunham Monthly Distribution Fund |
| |
| The table sets forth financial data for one share of beneficial interest outstanding throughout each period. |
| | | Class N | | | | | | | | | | | | | | | | | | | | | | | | | |
| | | Six Months | | | | | | | | | | | | | | | | | | | | | | | | | | | | | | | | | | | | | | | | |
| | | Ended | | | Year Ended | | | | | | | | | | | | | | | | | | | | | | | | | |
| | | April 30, | | | October 31, | | | | | | | | | | | | | | | | | | | | | | | | | |
| | | 2016 | | | 2015 | | | 2014 | | | 2013 | | | 2012 | | | 2011 | | | | | | | | | | | | | | | | | | | | | | | | | |
| | | (Unaudited) | | | | | | | | | | | | | | | | | | | | | | | | | | | | | | | | | | | | | | | | |
| Net asset value, beginning of period | | $ | 36.36 | | | $ | 38.16 | | | $ | 38.47 | | | $ | 37.22 | | | $ | 35.87 | | | $ | 36.52 | | | | | | | | | | | | | | | | | | | | | | | | | |
| Income (loss) from investment operations: | | | | | | | | | | | | | | | | | | | | | | | | | | | | | | | | | | | | | | | | | | | | | | | | |
| Net investment income (loss)* | | | 0.44 | | | | (0.18 | ) | | | 0.17 | | | | 0.36 | | | | 0.14 | | | | 0.01 | | | | | | | | | | | | | | | | | | | | | | | | | |
| Net realized and unrealized gain (loss) | | | (0.58 | ) | | | (0.39 | ) | | | 1.35 | | | | 2.13 | | | | 2.41 | | | | 0.53 | | | | | | | | | | | | | | | | | | | | | | | | | |
| Total income (loss) from investment operations | | | (0.14 | ) | | | (0.57 | ) | | | 1.52 | | | | 2.49 | | | | 2.55 | | | | 0.54 | | | | | | | | | | | | | | | | | | | | | | | | | |
| Less distributions: | | | | | | | | | | | | | | | | | | | | | | | | | | | | | | | | | | | | | | | | | | | | | | | | |
| Distributions from net investment income | | | 0.00 | | | | 0.00 | | | | 0.00 | | | | (0.41 | ) | | | (0.22 | ) | | | 0.00 | | | | | | | | | | | | | | | | | | | | | | | | | |
| Distributions from net realized gains | | | (0.62 | ) | | | (0.80 | ) | | | (1.59 | ) | | | (0.83 | ) | | | (0.32 | ) | | | (1.19 | ) | | | | | | | | | | | | | | | | | | | | | | | | |
| Tax return of capital | | | 0.00 | | | | (0.43 | ) | | | (0.24 | ) | | | 0.00 | | | | (0.66 | ) | | | 0.00 | | | | | | | | | | | | | | | | | | | | | | | | | |
| Total distributions | | | (0.62 | ) | | | (1.23 | ) | | | (1.83 | ) | | | (1.24 | ) | | | (1.20 | ) | | | (1.19 | ) | | | | | | | | | | | | | | | | | | | | | | | | |
| Net asset value, end of period | | $ | 35.60 | | | $ | 36.36 | | | $ | 38.16 | | | $ | 38.47 | | | $ | 37.22 | | | $ | 35.87 | | | | | | | | | | | | | | | | | | | | | | | | | |
| | | | | | | | | | | | | | | | | | | | | | | | | | | | | | | | | | | | | | | | | | | | | | | | | |
| Total return + | | | (0.32 | )% | | | (1.53 | )% | | | 4.01 | % | | | 6.75 | % | | | 7.19 | % | | | 1.47 | % | | | | | | | | | | | | | | | | | | | | | | | | |
| Ratios/Supplemental Data: | | | | | | | | | | | | | | | | | | | | | | | | | | | | | | | | | | | | | | | | | | | | | | | | |
| Net assets, end of period (in 000s) | | $ | 150,116 | | | $ | 163,843 | | | $ | 156,964 | | | $ | 161,347 | | | $ | 127,346 | | | $ | 65,621 | | | | | | | | | | | | | | | | | | | | | | | | | |
| Ratios of expenses to average net assets: | | | | | | | | | | | | | | | | | | | | | | | | | | | | | | | | | | | | | | | | | | | | | | | | |
| After waivers | | | 1.40 | % | | | 2.09 | % | | | 2.53 | % | | | 2.23 | % | | | 2.75 | % | | | 2.57 | % | | | | | | | | | | | | | | | | | | | | | | | | |
| Dividends/borrowings on short sales | | | 0.67 | % | | | 0.47 | % | | | 0.59 | % | | | 0.24 | % | | | 0.52 | % | | | 0.30 | % | | | | | | | | | | | | | | | | | | | | | | | | |
| Excluding dividends/borrowings on short sales: | | | | | | | | | | | | | | | | | | | | | | | | | | | | | | | | | | | | | | | | | | | | | | | | |
| Before fee waivers ^ | | | 0.73 | % | | | 2.17 | % | | | 2.11 | % | | | 2.10 | % | | | 2.23 | % | | | 2.27 | % | | | | | | | | | | | | | | | | | | | | | | | | |
| After fee waivers ^ | | | 0.73 | % | | | 1.62 | % | | | 1.94 | % | | | 1.99 | % | | | 2.23 | % | | | 2.27 | % | | | | | | | | | | | | | | | | | | | | | | | | |
| Ratios of net investment income (loss) to average net assets: | | | | | | | | | | | | | | | | | | | | | | | | | | | | | | | | | | | | | | | | | | | | | | | | |
| Before fee waivers ^ | | | 2.46 | % | | | (0.56 | )% | | | 0.26 | % | | | 0.84 | % | | | 0.39 | % | | | 0.03 | % | | | | | | | | | | | | | | | | | | | | | | | | |
| After fee waivers ^ | | | 2.46 | % | | | (0.48 | )% | | | 0.43 | % | | | 0.95 | % | | | 0.39 | % | | | 0.03 | % | | | | | | | | | | | | | | | | | | | | | | | | |
| Portfolio turnover rate | | | 130 | % (1) | | | 155 | % | | | 229 | % | | | 227 | % | | | 205 | % | | | 277 | % | | | | | | | | | | | | | | | | | | | | | | | | |
| | | | | | | | | | | | | | | | | | | | | | | | | | | | | | | | | | | | | | | | | | | | | | | | | |
| | | Class A | | | Class C | |
| | | Six Months | | | | | | | | | | | | | | | | | | Six Months | | | | | | | | | | | | | | | | |
| | | Ended | | | Year Ended | | | Ended | | | Year Ended | |
| | | April 30, | | | October 31, | | | April 30, | | | October 31, | |
| | | 2016 | | | 2015 | | | 2014 | | | 2013 | | | 2012 | | | 2011 | | | 2016 | | | 2015 | | | 2014 | | | 2013 | | | 2012 | | | 2011 | |
| | | (Unaudited) | | | | | | | | | | | | | | | | | | (Unaudited) | | | | | | | | | | | | | | | | |
| | | | | | | | | | | | | | | | | | | | | | | | | | | | | | | | | | | | | |
| Net asset value, beginning of period | | $ | 35.63 | | | $ | 37.52 | | | $ | 37.95 | | | $ | 36.82 | | | $ | 35.58 | | | $ | 36.32 | | | $ | 29.99 | | | $ | 32.01 | | | $ | 32.87 | | | $ | 32.29 | | | $ | 31.55 | | | $ | 32.59 | |
| Income (loss) from investment operations: | | | | | | | | | | | | | | | | | | | | | | | | | | | | | | | | | | | | | | | | | | | | | | | | |
| Net investment income (loss)* | | | 0.42 | | | | (0.27 | ) | | | 0.07 | | | | 0.24 | | | | 0.03 | | | | (0.09 | ) | | | 0.23 | | | | (0.46 | ) | | | (0.20 | ) | | | (0.07 | ) | | | (0.18 | ) | | | (0.32 | ) |
| Net realized and unrealized gain (loss) | | | (0.60 | ) | | | (0.39 | ) | | | 1.33 | | | | 2.13 | | | | 2.40 | | | | 0.54 | | | | (0.50 | ) | | | (0.33 | ) | | | 1.17 | | | | 1.89 | | | | 2.09 | | | | 0.47 | |
| Total income (loss) from investment operations | | | (0.18 | ) | | | (0.66 | ) | | | 1.40 | | | | 2.37 | | | | 2.43 | | | | 0.45 | | | | (0.27 | ) | | | (0.79 | ) | | | 0.97 | | | | 1.82 | | | | 1.91 | | | | 0.15 | |
| Less distributions: | | | | | | | | | | | | | | | | | | | | | | | | | | | | | | | | | | | | | | | | | | | | | | | | |
| Distributions from net investment income | | | 0.00 | | | | 0.00 | | | | 0.00 | | | | (0.41 | ) | | | (0.21 | ) | | | 0.00 | | | | 0.00 | | | | 0.00 | | | | 0.00 | | | | (0.41 | ) | | | (0.19 | ) | | | 0.00 | |
| Distributions from net realized gains | | | (0.62 | ) | | | (0.80 | ) | | | (1.59 | ) | | | (0.83 | ) | | | (0.32 | ) | | | (1.19 | ) | | | (0.62 | ) | | | (0.80 | ) | | | (1.59 | ) | | | (0.83 | ) | | | (0.32 | ) | | | (1.19 | ) |
| Tax return of capital | | | 0.00 | | | | (0.43 | ) | | | (0.24 | ) | | | 0.00 | | | | (0.66 | ) | | | 0.00 | | | | 0.00 | | | | (0.43 | ) | | | (0.24 | ) | | | 0.00 | | | | (0.66 | ) | | | 0.00 | |
| Total distributions | | | (0.62 | ) | | | (1.23 | ) | | | (1.83 | ) | | | (1.24 | ) | | | (1.19 | ) | | | (1.19 | ) | | | (0.62 | ) | | | (1.23 | ) | | | (1.83 | ) | | | (1.24 | ) | | | (1.17 | ) | | | (1.19 | ) |
| Net asset value, end of period | | $ | 34.83 | | | $ | 35.63 | | | $ | 37.52 | | | $ | 37.95 | | | $ | 36.82 | | | $ | 35.58 | | | $ | 29.10 | | | $ | 29.99 | | | $ | 32.01 | | | $ | 32.87 | | | $ | 32.29 | | | $ | 31.55 | |
| | | | | | | | | | | | | | | | | | | | | | | | | | | | | | | | | | | | | | | | | | | | | | | | | |
| Total return + | | | (0.44 | )% | | | (1.80 | )% | | | 3.74 | % | | | 6.50 | % | | | 6.92 | % | | | 1.22 | % | | | (0.86 | )% | | | (2.53 | )% | | | 2.99 | % | | | 5.71 | % | | | 6.13 | % | | | 0.43 | % |
| Ratios/Supplemental Data: | | | | | | | | | | | | | | | | | | | | | | | | | | | | | | | | | | | | | | | | | | | | | | | | |
| Net assets, end of period (in 000s) | | $ | 56,271 | | | $ | 74,247 | | | $ | 79,132 | | | $ | 68,427 | | | $ | 51,485 | | | $ | 32,381 | | | $ | 43,066 | | | $ | 50,215 | | | $ | 48,193 | | | $ | 37,577 | | | $ | 30,206 | | | $ | 27,701 | |
| Ratios of expenses to average net assets: | | | | | | | | | | | | | | | | | | | | | | | | | | | | | | | | | | | | | | | | | | | | | | | | |
| After waivers | | | 1.65 | % | | | 2.33 | % | | | 2.78 | % | | | 2.48 | % | | | 3.00 | % | | | 2.82 | % | | | 2.40 | % | | | 3.09 | % | | | 3.53 | % | | | 3.23 | % | | | 3.75 | % | | | 3.57 | % |
| Dividends/borrowings on short sales | | | 0.67 | % | | | 0.47 | % | | | 0.59 | % | | | 0.24 | % | | | 0.52 | % | | | 0.30 | % | | | 0.67 | % | | | 0.47 | % | | | 0.59 | % | | | 0.24 | % | | | 0.52 | % | | | 0.30 | % |
| Excluding dividends/borrowings on short sales: | | | | | | | | | | | | | | | | | | | | | | | | | | | | | | | | | | | | | | | | | | | | | | | | |
| Before fee waivers ^ | | | 0.98 | % | | | 2.42 | % | | | 2.36 | % | | | 2.34 | % | | | 2.48 | % | | | 2.52 | % | | | 1.73 | % | | | 3.16 | % | | | 3.11 | % | | | 3.10 | % | | | 3.23 | % | | | 3.27 | % |
| After fee waivers ^ | | | 0.98 | % | | | 1.86 | % | | | 2.19 | % | | | 2.24 | % | | | 2.48 | % | | | 2.52 | % | | | 1.73 | % | | | 2.62 | % | | | 2.94 | % | | | 2.99 | % | | | 3.23 | % | | | 3.27 | % |
| Ratios of net investment income (loss) to average net assets: | | | | | | | | | | | | | | | | | | | | | | | | | | | | | | | | | | | | | | | | | | | | | | | | |
| Before fee waivers ^ | | | 2.44 | % | | | (0.79 | )% | | | 0.01 | % | | | 0.52 | % | | | 0.14 | % | | | (0.22 | )% | | | 1.60 | % | | | (1.54 | )% | | | (0.74 | )% | | | (0.32 | )% | | | (0.61 | )% | | | (0.97 | )% |
| After fee waivers ^ | | | 2.44 | % | | | (0.71 | )% | | | 0.18 | % | | | 0.63 | % | | | 0.14 | % | | | (0.22 | )% | | | 1.60 | % | | | (1.46 | )% | | | (0.57 | )% | | | (0.21 | )% | | | (0.61 | )% | | | (0.97 | )% |
| Portfolio turnover rate | | | 130 | % (1) | | | 155 | % | | | 229 | % | | | 227 | % | | | 205 | % | | | 277 | % | | | 130 | % (1) | | | 155 | % | | | 229 | % | | | 227 | % | | | 205 | % | | | 277 | % |
| * | The net investment income (loss) per share data was determined using the average shares outstanding throughout each period. |
| + | Assumes reinvestment of all dividends and distributions, if any. Aggregate (not annualized) total return is shown for any period shorter than one year. Total return does not reflect the deductions of taxes that a shareholder would pay on distributions or on the redemption of shares. |
| ^ | Annualized for periods of less than one year. |
See accompanying notes to financial statements.
| FINANCIAL HIGHLIGHTS |
| Dunham Corporate/Government Bond Fund |
| |
| The table sets forth financial data for one share of beneficial interest outstanding throughout each year. |
| | | Class N | | | | | | | | | | | | | | | | | | | | | | | | | |
| | | Six Months | | | | | | | | | | | | | | | | | | | | | | | | | | | | | | | | | | | | | | | | |
| | | Ended | | | | | | | | | | | | | | | | | | | | | | | | | | | | | | | | | | | | | | | | |
| | | April 30, | | | Year Ended October 31, | | | | | | | | | | | | | | | | | | | | | | | | | |
| | | 2016 | | | 2015 | | | 2014 | | | 2013 | | | 2012 | | | 2011 | | | | | | | | | | | | | | | | | | | | | | | | | |
| | | (Unaudited) | | | | | | | | | | | | | | | | | | | | | | | | | | | | | | | | | | | | | | | | |
| | | | | | | | | | | | | | | | | | | | | | | | | | | | | | | | | | | | | | | | | | | |
| Net asset value, beginning of period | | $ | 13.75 | | | $ | 14.14 | | | $ | 14.07 | | | $ | 14.74 | | | $ | 14.32 | | | $ | 14.99 | | | | | | | | | | | | | | | | | | | | | | | | | |
| Income from investment operations: | | | | | | | | | | | | | | | | | | | | | | | | | | | | | | | | | | | | | | | | | | | | | | | | |
| Net investment income* | | | 0.19 | | | | 0.42 | | | | 0.38 | | | | 0.37 | | | | 0.36 | | | | 0.52 | | | | | | | | | | | | | | | | | | | | | | | | | |
| Net realized and unrealized gain (loss) | | | 0.05 | | | | (0.37 | ) | | | 0.16 | | | | (0.36 | ) | | | 0.77 | | | | (0.20 | ) | | | | | | | | | | | | | | | | | | | | | | | | |
| Total income from investment operations | | | 0.24 | | | | 0.05 | | | | 0.54 | | | | 0.01 | | | | 1.13 | | | | 0.32 | | | | | | | | | | | | | | | | | | | | | | | | | |
| Less distributions: | | | | | | | | | | | | | | | | | | | | | | | | | | | | | | | | | | | | | | | | | | | | | | | | |
| Distributions from net investment income | | | (0.20 | ) | | | (0.44 | ) | | | (0.42 | ) | | | (0.41 | ) | | | (0.42 | ) | | | (0.56 | ) | | | | | | | | | | | | | | | | | | | | | | | | |
| Distributions from net realized gains | | | 0.00 | | | | 0.00 | | | | (0.05 | ) | | | (0.27 | ) | | | (0.29 | ) | | | (0.43 | ) | | | | | | | | | | | | | | | | | | | | | | | | |
| Total distributions | | | (0.20 | ) | | | (0.44 | ) | | | (0.47 | ) | | | (0.68 | ) | | | (0.71 | ) | | | (0.99 | ) | | | | | | | | | | | | | | | | | | | | | | | | |
| Net asset value, end of period | | $ | 13.79 | | | $ | 13.75 | | | $ | 14.14 | | | $ | 14.07 | | | $ | 14.74 | | | $ | 14.32 | | | | | | | | | | | | | | | | | | | | | | | | | |
| | | | | | | | | | | | | | | | | | | | | | | | | | | | | | | | | | | | | | | | | | | | | | | | | |
| Total return +# | | | 1.79 | % | | | 0.36 | % | | | 3.85 | % | | | 0.09 | % | | | 8.10 | % | | | 2.33 | % | | | | | | | | | | | | | | | | | | | | | | | | |
| Ratios/Supplemental Data: | | | | | | | | | | | | | | | | | | | | | | | | | | | | | | | | | | | | | | | | | | | | | | | | |
| Net assets, end of period (in 000s) | | $ | 43,363 | | | $ | 41,989 | | | $ | 43,888 | | | $ | 81,201 | | | $ | 103,912 | | | $ | 58,810 | | | | | | | | | | | | | | | | | | | | | | | | | |
| Ratios of expenses to average net assets:^ | | | 1.09 | % | | | 1.06 | % | | | 1.37 | % | | | 1.21 | % | | | 1.14 | % | | | 1.30 | % | | | | | | | | | | | | | | | | | | | | | | | | |
| Ratios of net investment income to average net assets:^ | | | 2.86 | % | | | 3.00 | % | | | 2.69 | % | | | 2.56 | % | | | 2.50 | % | | | 3.62 | % | | | | | | | | | | | | | | | | | | | | | | | | |
| Portfolio turnover rate | | | 36 | % (1) | | | 54 | % | | | 60 | % | | | 173 | % | | | 211 | % | | | 178 | % | | | | | | | | | | | | | | | | | | | | | | | | |
| | | | | | | | | | | | | | | | | | | | | | | | | | | | | | | | | | | | | | | | | | | | | | | | | |
| | | Class A | | | Class C | |
| | | Six Months | | | | | | | | | | | | | | | | | | Six Months | | | | | | | | | | | | | | | | |
| | | Ended | | | | | | | | | | | | | | | | | | Ended | | | | | | | | | | | | | | | | |
| | | April 30, | | | Year Ended October 31, | | | April 30, | | | Year Ended October 31, | |
| | | 2016 | | | 2015 | | | 2014 | | | 2013 | | | 2012 | | | 2011 | | | 2016 | | | 2015 | | | 2014 | | | 2013 | | | 2012 | | | 2011 | |
| | | (Unaudited) | | | | | | | | | | | | | | | | | | (Unaudited) | | | | | | | | | | | | | | | | |
| | | | | | | | | | | | | | | | | | | | | | | | | | | | | | | | | | | | | |
| Net asset value, beginning of period | | $ | 13.73 | | | $ | 14.13 | | | $ | 14.06 | | | $ | 14.73 | | | $ | 14.31 | | | $ | 14.98 | | | $ | 13.65 | | | $ | 14.05 | | | $ | 13.98 | | | $ | 14.64 | | | $ | 14.23 | | | $ | 14.90 | |
| Income (loss) from investment operations: | | | | | | | | | | | | | | | | | | | | | | | | | | | | | | | | | | | | | | | | | | | | | | | | |
| Net investment income* | | | 0.17 | | | | 0.38 | | | | 0.35 | | | | 0.34 | | | | 0.29 | | | | 0.49 | | | | 0.14 | | | | 0.31 | | | | 0.27 | | | | 0.26 | | | | 0.27 | | | | 0.41 | |
| Net realized and unrealized gain (loss) | | | 0.06 | | | | (0.37 | ) | | | 0.15 | | | | (0.36 | ) | | | 0.79 | | | | (0.20 | ) | | | 0.05 | | | | (0.37 | ) | | | 0.16 | | | | (0.35 | ) | | | 0.74 | | | | (0.20 | ) |
| Total income (loss) from investment operations | | | 0.23 | | | | 0.01 | | | | 0.50 | | | | (0.02 | ) | | | 1.08 | | | | 0.29 | | | | 0.19 | | | | (0.06 | ) | | | 0.43 | | | | (0.09 | ) | | | 1.01 | | | | 0.21 | |
| Less distributions: | | | | | | | | | | | | | | | | | | | | | | | | | | | | | | | | | | | | | | | | | | | | | | | | |
| Distributions from net investment income | | | (0.19 | ) | | | (0.41 | ) | | | (0.38 | ) | | | (0.38 | ) | | | (0.37 | ) | | | (0.53 | ) | | | (0.15 | ) | | | (0.34 | ) | | | (0.31 | ) | | | (0.30 | ) | | | (0.31 | ) | | | (0.45 | ) |
| Distributions from net realized gains | | | 0.00 | | | | 0.00 | | | | (0.05 | ) | | | (0.27 | ) | | | (0.29 | ) | | | (0.43 | ) | | | 0.00 | | | | 0.00 | | | | (0.05 | ) | | | (0.27 | ) | | | (0.29 | ) | | | (0.43 | ) |
| Total distributions | | | (0.19 | ) | | | (0.41 | ) | | | (0.43 | ) | | | (0.65 | ) | | | (0.66 | ) | | | (0.96 | ) | | | (0.15 | ) | | | (0.34 | ) | | | (0.36 | ) | | | (0.57 | ) | | | (0.60 | ) | | | (0.88 | ) |
| Net asset value, end of period | | $ | 13.77 | | | $ | 13.73 | | | $ | 14.13 | | | $ | 14.06 | | | $ | 14.73 | | | $ | 14.31 | | | $ | 13.69 | | | $ | 13.65 | | | $ | 14.05 | | | $ | 13.98 | | | $ | 14.64 | | | $ | 14.23 | |
| | | | | | | | | | | | | | | | | | | | | | | | | | | | | | | | | | | | | | | | | | | | | | | | | |
| Total return + # | | | 1.66 | % | | | 0.04 | % | | | 3.59 | % | | | (0.15 | )% | | | 7.78 | % | | | 2.15 | % | | | 1.43 | % | | | (0.45 | )% | | | 3.08 | % | | | (0.59 | )% | | | 7.30 | % | | | 1.57 | % |
| Ratios/Supplemental Data: | | | | | | | | | | | | | | | | | | | | | | | | | | | | | | | | | | | | | | | | | | | | | | | | |
| Net assets, end of period (in 000s) | | $ | 5,580 | | | $ | 4,788 | | | $ | 3,684 | | | $ | 6,888 | | | $ | 3,598 | | | $ | 610 | | | $ | 3,578 | | | $ | 3,698 | | | $ | 3,690 | | | $ | 7,733 | | | $ | 9,007 | | | $ | 9,250 | |
| Ratios of expenses to average net assets:^ | | | 1.34 | % | | | 1.31 | % | | | 1.62 | % | | | 1.46 | % | | | 1.39 | % | | | 1.55 | % | | | 1.84 | % | | | 1.81 | % | | | 2.12 | % | | | 1.96 | % | | | 1.89 | % | | | 2.05 | % |
| Ratios of net investment income to average net assets:^ | | | 2.60 | % | | | 2.74 | % | | | 2.44 | % | | | 2.37 | % | | | 2.25 | % | | | 3.37 | % | | | 2.11 | % | | | 2.27 | % | | | 1.94 | % | | | 1.80 | % | | | 1.75 | % | | | 2.87 | % |
| Portfolio turnover rate | | | 36 | % (1) | | | 54 | % | | | 60 | % | | | 173 | % | | | 211 | % | | | 178 | % | | | 36 | % (1) | | | 54 | % | | | 60 | % | | | 173 | % | | | 211 | % | | | 178 | % |
| * | The net investment income per share data was determined using the average shares outstanding throughout each period. |
| + | Assumes reinvestment of all dividends and distributions, if any. Total return does not reflect the deductions of taxes that a shareholder would pay on distributions or on the redemption of shares. |
| # | Includes adjustments in accordance with accounting principles generally accepted in the United States and, consequently, the net asset value for financial reporting purposes and the returns based upon those net asset values may differ from the net asset values and returns for shareholder transactions. |
| ^ | Annualized for periods less than one year. |
See accompanying notes to financial statements.
| FINANCIAL HIGHLIGHTS |
| Dunham Dynamic Macro Fund |
| |
| The table sets forth financial data for one share of beneficial interest outstanding throughout each year or period |
| | | Class N | | | | | | | | | | | | | | | | | | | | | | | | | |
| | | Six Months | | | | | | | | | | | | | | | | | | | | | | | | | | | | | | | | | | | | | | | | |
| | | Ended | | | | | | | | | | | | | | | | | | | | | | | | | | | | | | | | | | | | | | | | |
| | | April 30, | | | Year Ended October 31, | | | | | | | | | | | | | | | | | | | | | | | | | |
| | | 2016 | | | 2015 | | | 2014 | | | 2013 | | | 2012 | | | 2011 | | | | | | | | | | | | | | | | | | | | | | | | | |
| | | (Unaudited) | | | | | | | | | | | | | | | | | | | | | | | | | | | | | | | | | | | | | | | | |
| | | | | | | | | | | | | | | | | | | | | | | | | | | | | | | | | | | | | | | | | | | |
| Net asset value, beginning of period | | $ | 9.81 | | | $ | 9.65 | | | $ | 9.67 | | | $ | 9.95 | | | $ | 10.10 | | | $ | 10.17 | | | | | | | | | | | | | | | | | | | | | | | | | |
| Income from investment operations: | | | | | | | | | | | | | | | | | | | | | | | | | | | | | | | | | | | | | | | | | | | | | | | | |
| Net investment income (loss) * | | | (0.02 | ) | | | (0.14 | ) | | | 0.19 | | | | 0.33 | | | | 0.30 | | | | 0.17 | | | | | | | | | | | | | | | | | | | | | | | | | |
| Net realized and unrealized gain (loss) ** | | | (0.35 | ) | | | 0.30 | | | | (0.02 | ) | | | (0.25 | ) | | | 0.02 | | | | (0.15 | ) | | | | | | | | | | | | | | | | | | | | | | | | |
| Total income from investment operations | | | (0.37 | ) | | | 0.16 | | | | 0.17 | | | | 0.08 | | | | 0.32 | | | | 0.02 | | | | | | | | | | | | | | | | | | | | | | | | | |
| Less distributions: | | | | | | | | | | | | | | | | | | | | | | | | | | | | | | | | | | | | | | | | | | | | | | | | |
| Distributions from net investment income | | | 0.00 | | | | 0.00 | | | | (0.19 | ) | | | (0.33 | ) | | | (0.35 | ) | | | 0.00 | | | | | | | | | | | | | | | | | | | | | | | | | |
| Distributions from net realized gains | | | 0.00 | | | | 0.00 | | | | 0.00 | | | | 0.00 | | | | 0.00 | | | | (0.09 | ) | | | | | | | | | | | | | | | | | | | | | | | | |
| Tax return of capital | | | 0.00 | | | | 0.00 | | | | 0.00 | | | | (0.03 | ) | | | (0.12 | ) | | | 0.00 | | | | | | | | | | | | | | | | | | | | | | | | | |
| Total distributions | | | 0.00 | | | | 0.00 | | | | (0.19 | ) | | | (0.36 | ) | | | (0.47 | ) | | | (0.09 | ) | | | | | | | | | | | | | | | | | | | | | | | | |
| Net asset value, end of period | | $ | 9.44 | | | $ | 9.81 | | | $ | 9.65 | | | $ | 9.67 | | | $ | 9.95 | | | $ | 10.10 | | | | | | | | | | | | | | | | | | | | | | | | | |
| | | | | | | | | | | | | | | | | | | | | | | | | | | | | | | | | | | | | | | | | | | | | | | | | |
| Total return + # | | | (3.77 | )% | | | 1.66 | % | | | 1.80 | % | | | 0.80 | % | | | 3.29 | % | | | 0.20 | % | | | | | | | | | | | | | | | | | | | | | | | | |
| Ratios/Supplemental Data: | | | | | | | | | | | | | | | | | | | | | | | | | | | | | | | | | | | | | | | | | | | | | | | | |
| Net assets, end of period (in 000s) | | $ | 30,414 | | | $ | 28,518 | | | $ | 11,758 | | | $ | 7,185 | | | $ | 9,002 | | | $ | 8,798 | | | | | | | | | | | | | | | | | | | | | | | | | |
| Ratios of expenses to average net assets:^ | | | 1.72 | % | | | 2.15 | % | | | 1.90 | % | | | 1.67 | % | | | 2.28 | % | | | 1.98 | % | | | | | | | | | | | | | | | | | | | | | | | | |
| Ratios of net investment income (loss) to average net assets:^ | | | (0.52 | )% | | | (1.37 | )% | | | 1.96 | % | | | 3.35 | % | | | 2.94 | % | | | 1.71 | % | | | | | | | | | | | | | | | | | | | | | | | | |
| Portfolio turnover rate | | | 43 | % (1) | | | 70 | % | | | 238 | % | | | 292 | % | | | 418 | % | | | 704 | % | | | | | | | | | | | | | | | | | | | | | | | | |
| | | | | | | | | | | | | | | | | | | | | | | | | | | | | | | | | | | | | | | | | | | | | | | | | |
| | | Class A | | | Class C | |
| | | Six Months | | | | | | | | | | | | | | | | | | Six Months | | | | | | | | | | | | | | | | |
| | | Ended | | | | | | | | | | | | | | | | | | Ended | | | | | | | | | | | | | | | | |
| | | April 30, | | | Year Ended October 31, | | | April 30, | | | Year Ended October 31, | |
| | | 2016 | | | 2015 | | | 2014 | | | 2013 | | | 2012 | | | 2011 | | | 2016 | | | 2015 | | | 2014 | | | 2013 | | | 2012 | | | 2011 | |
| | | (Unaudited) | | | | | | | | | | | | | | | | | | (Unaudited) | | | | | | | | | | | | | | | | |
| | | | | | | | | | | | | | | | | | | | | | | | | | | | | | | | | | | | | |
| Net asset value, beginning of period | | $ | 9.81 | | | $ | 9.68 | | | $ | 9.70 | | | $ | 9.98 | | | $ | 10.06 | | | $ | 10.16 | | | $ | 9.58 | | | $ | 9.52 | | | $ | 9.56 | | | $ | 9.86 | | | $ | 9.96 | | | $ | 10.13 | |
| Income (loss) from investment operations: | | | | | | | | | | | | | | | | | | | | | | | | | | | | | | | | | | | | | | | | | | | | | | | | |
| Net investment income (loss) * | | | (0.03 | ) | | | (0.14 | ) | | | 0.18 | | | | 0.31 | | | | 0.26 | | | | 0.02 | | | | (0.07 | ) | | | (0.26 | ) | | | 0.11 | | | | 0.23 | | | | 0.17 | | | | 0.07 | |
| Net realized and unrealized gain (loss) ** | | | (0.35 | ) | | | 0.27 | | | | (0.04 | ) | | | (0.25 | ) | | | 0.03 | | | | (0.03 | ) | | | (0.33 | ) | | | 0.32 | | | | (0.04 | ) | | | (0.26 | ) | | | 0.05 | | | | (0.15 | ) |
| Total income (loss) from investment operations | | | (0.38 | ) | | | 0.13 | | | | 0.14 | | | | 0.06 | | | | 0.29 | | | | (0.01 | ) | | | (0.40 | ) | | | 0.06 | | | | 0.07 | | | | (0.03 | ) | | | 0.22 | | | | (0.08 | ) |
| Less distributions: | | | | | | | | | | | | | | | | | | | | | | | | | | | | | | | | | | | | | | | | | | | | | | | | |
| Distributions from net investment income | | | 0.00 | | | | 0.00 | | | | (0.16 | ) | | | (0.31 | ) | | | (0.25 | ) | | | 0.00 | | | | 0.00 | | | | 0.00 | | | | (0.11 | ) | | | (0.24 | ) | | | (0.20 | ) | | | 0.00 | |
| Distributions from net realized gains | | | 0.00 | | | | 0.00 | | | | 0.00 | | | | 0.00 | | | | 0.00 | | | | (0.09 | ) | | | 0.00 | | | | 0.00 | | | | 0.00 | | | | 0.00 | | | | 0.00 | | | | (0.09 | ) |
| Tax return of capital | | | 0.00 | | | | 0.00 | | | | 0.00 | | | | (0.03 | ) | | | (0.12 | ) | | | 0.00 | | | | 0.00 | | | | 0.00 | | | | 0.00 | | | | (0.03 | ) | | | (0.12 | ) | | | 0.00 | |
| Total distributions | | | 0.00 | | | | 0.00 | | | | (0.16 | ) | | | (0.34 | ) | | | (0.37 | ) | | | (0.09 | ) | | | 0.00 | | | | 0.00 | | | | (0.11 | ) | | | (0.27 | ) | | | (0.32 | ) | | | (0.09 | ) |
| Net asset value, end of period | | $ | 9.43 | | | $ | 9.81 | | | $ | 9.68 | | | $ | 9.70 | | | $ | 9.98 | | | $ | 10.06 | | | $ | 9.18 | | | $ | 9.58 | | | $ | 9.52 | | | $ | 9.56 | | | $ | 9.86 | | | $ | 9.96 | |
| | | | | | | | | | | | | | | | | | | | | | | | | | | | | | | | | | | | | | | | | | | | | | | | | |
| Total return + # | | | (3.86 | )% | | | 1.34 | % | | | 1.52 | % | | | 0.55 | % | | | 3.00 | % | | | (0.10 | )% | | | (4.18 | )% | | | 0.63 | % | | | 0.78 | % | | | (0.29 | )% | | | 2.27 | % | | | (0.79 | )% |
| Ratios/Supplemental Data: | | | | | | | | | | | | | | | | | | | | | | | | | | | | | | | | | | | | | | | | | | | | | | | | |
| Net assets, end of period (in 000s) | | $ | 3,644 | | | $ | 3,296 | | | $ | 1,729 | | | $ | 1,782 | | | $ | 2,230 | | | $ | 1,788 | | | $ | 2,253 | | | $ | 1,938 | | | $ | 1,712 | | | $ | 2,053 | | | $ | 1,786 | | | $ | 1,067 | |
| Ratios of expenses to average net assets:^ | | | 1.97 | % | | | 2.40 | % | | | 2.15 | % | | | 1.92 | % | | | 2.53 | % | | | 2.23 | % | | | 2.72 | % | | | 3.15 | % | | | 2.90 | % | | | 2.67 | % | | | 3.28 | % | | | 2.98 | % |
| Ratios of net investment income (loss) to average net assets:^ | | | (0.73 | )% | | | (1.63 | )% | | | 1.92 | % | | | 3.13 | % | | | 2.69 | % | | | 1.46 | % | | | (1.51 | )% | | | (2.35 | )% | | | 1.19 | % | | | 2.38 | % | | | 1.94 | % | | | 0.71 | % |
| Portfolio turnover rate | | | 43 | % (1) | | | 70 | % | | | 238 | % | | | 292 | % | | | 418 | % | | | 704 | % | | | 43 | % (1) | | | 70 | % | | | 238 | % | | | 292 | % | | | 418 | % | | | 704 | % |
| * | The net investment income (loss) per share data was determined using the average shares outstanding throughout each period. |
| ** | The amount of net realized and unrealized gain (loss) on investment per share for the years ended October 31, 2015 and 2014 does not accord with the amounts in the Statements Operations due to the timing of purchases and sales of Fund shares in relation to fluctuating market values. |
| + | Assumes reinvestment of all dividends and distributions, if any. Total return does not reflect the deductions of taxes that a shareholder would pay on distributions or on the redemption of shares. |
| # | Includes adjustments in accordance with accounting principles generally accepted in the United States and, consequently, the net asset value for financial reporting purposes and the returns based upon those net asset values may differ from the net asset values and returns for shareholder transactions. |
| ^ | Annualized for periods less than one year.. |
See accompanying notes to financial statements.
| FINANCIAL HIGHLIGHTS |
| Dunham High-Yield Bond Fund |
| |
| The table sets forth financial data for one share of beneficial interest outstanding throughout each period |
| | | Class N | | | | | | | | | | | | | | | | | | | | | | | | | |
| | | Six Months | | | | | | | | | | | | | | | | | | | | | | | | | | | | | | | | | | | | | | | | |
| | | Ended | | | Year Ended | | | | | | | | | | | | | | | | | | | | | | | | | |
| | | April 30, | | | October 31, | | | | | | | | | | | | | | | | | | | | | | | | | |
| | | 2016 | | | 2015 | | | 2014 | | | 2013 | | | 2012 | | | 2011 | | | | | | | | | | | | | | | | | | | | | | | | | |
| | | (Unaudited) | | | | | | | | | | | | | | | | | | | | | | | | | | | | | | | | | | | | | | | | |
| | | | | | | | | | | | | | | | | | | | | | | | | | | | | | | | | | | | | | | | | | | |
| Net asset value, beginning of period | | $ | 8.92 | | | $ | 9.51 | | | $ | 9.61 | | | $ | 9.52 | | | $ | 9.08 | | | $ | 9.36 | | | | | | | | | | | | | | | | | | | | | | | | | |
| Income (loss) from investment operations: | | | | | | | | | | | | | | | | | | | | | | | | | | | | | | | | | | | | | | | | | | | | | | | | |
| Net investment income* | | | 0.21 | | | | 0.44 | | | | 0.46 | | | | 0.47 | | | | 0.53 | | | | 0.65 | | | | | | | | | | | | | | | | | | | | | | | | | |
| Net realized and unrealized gain (loss) | | | (0.25 | ) | | | (0.59 | ) | | | (0.10 | ) | | | 0.09 | | | | 0.44 | | | | (0.28 | ) | | | | | | | | | | | | | | | | | | | | | | | | |
| Total income (loss) from investment operations | | | (0.04 | ) | | | (0.15 | ) | | | 0.36 | | | | 0.56 | | | | 0.97 | | | | 0.37 | | | | | | | | | | | | | | | | | | | | | | | | | |
| Less distributions: | | | | | | | | | | | | | | | | | | | | | | | �� | | | | | | | | | | | | | | | | | | | | | | | | | |
| Distributions from net investment income | | | (0.21 | ) | | | (0.44 | ) | | | (0.46 | ) | | | (0.47 | ) | | | (0.53 | ) | | | (0.65 | ) | | | | | | | | | | | | | | | | | | | | | | | | |
| Total distributions | | | (0.21 | ) | | | (0.44 | ) | | | (0.46 | ) | | | (0.47 | ) | | | (0.53 | ) | | | (0.65 | ) | | | | | | | | | | | | | | | | | | | | | | | | |
| Net asset value, end of period | | $ | 8.67 | | | $ | 8.92 | | | $ | 9.51 | | | $ | 9.61 | | | $ | 9.52 | | | $ | 9.08 | | | | | | | | | | | | | | | | | | | | | | | | | |
| | | | | | | | | | | | | | | | | | | | | | | | | | | | | | | | | | | | | | | | | | | | | | | | | |
| Total return + | | | (0.38 | )% | | | (1.63 | )% | | | 3.77 | % | | | 6.05 | % | | | 10.96 | % | | | 4.03 | % | | | | | | | | | | | | | | | | | | | | | | | | |
| Ratios/Supplemental Data: | | | | | | | | | | | | | | | | | | | | | | | | | | | | | | | | | | | | | | | | | | | | | | | | |
| Net assets, end of period (in 000s) | | $ | 75,916 | | | $ | 78,654 | | | $ | 102,412 | | | $ | 134,487 | | | $ | 114,810 | | | $ | 45,586 | | | | | | | | | | | | | | | | | | | | | | | | | |
| Ratios of expenses to average net assets: ^ | | | 1.13 | % | | | 1.02 | % | | | 1.09 | % | | | 1.11 | % | | | 1.23 | % | | | 1.38 | % | | | | | | | | | | | | | | | | | | | | | | | | |
| Ratios of net investment income to average net assets: | | | 4.99 | % | | | 4.77 | % | | | 4.72 | % | | | 4.89 | % | | | 5.70 | % | | | 6.92 | % | | | | | | | | | | | | | | | | | | | | | | | | |
| Portfolio turnover rate | | | 27 | % (1) | | | 51 | % | | | 62 | % | | | 94 | % | | | 58 | % | | | 49 | % | | | | | | | | | | | | | | | | | | | | | | | | |
| | | | | | | | | | | | | | | | | | | | | | | | | | | | | | | | | | | | | | | | | | | | | | | | | |
| | | Class A | | | Class C | |
| | | Six Months | | | | | | | | | | | | | | | | | | Six Months | | | | | | | | | | | | | | | | |
| | | Ended | | | Year Ended | | | Ended | | | Year Ended | |
| | | April 30, | | | October 31, | | | April 30, | | | October 31, | |
| | | 2016 | | | 2015 | | | 2014 | | | 2013 | | | 2012 | | | 2011 | | | 2016 | | | 2015 | | | 2014 | | | 2013 | | | 2012 | | | 2011 | |
| | | (Unaudited) | | | | | | | | | | | | | | | | | | (Unaudited) | | | | | | | | | | | | | | | | |
| | | | | | | | | | | | | | | | | | | | | | | | | | | | | | | | | | | | | |
| Net asset value, beginning of period | | $ | 8.99 | | | $ | 9.58 | | | $ | 9.68 | | | $ | 9.59 | | | $ | 9.15 | | | $ | 9.42 | | | $ | 8.86 | | | $ | 9.46 | | | $ | 9.55 | | | $ | 9.47 | | | $ | 9.04 | | | $ | 9.31 | |
| Income (loss) from investment operations: | | | | | | | | | | | | | | | | | | | | | | | | | | | | | | | | | | | | | | | | | | | | | | | | |
| Net investment income* | | | 0.21 | | | | 0.41 | | | | 0.44 | | | | 0.45 | | | | 0.51 | | | | 0.63 | | | | 0.18 | | | | 0.37 | | | | 0.38 | | | | 0.40 | | | | 0.47 | | | | 0.58 | |
| Net realized and unrealized gain (loss) | | | (0.25 | ) | | | (0.59 | ) | | | (0.10 | ) | | | 0.09 | | | | 0.44 | | | | (0.27 | ) | | | (0.24 | ) | | | (0.60 | ) | | | (0.08 | ) | | | 0.08 | | | | 0.43 | | | | (0.28 | ) |
| Total income (loss) from investment operations | | | (0.04 | ) | | | (0.18 | ) | | | 0.34 | | | | 0.54 | | | | 0.95 | | | | 0.36 | | | | (0.06 | ) | | | (0.23 | ) | | | 0.30 | | | | 0.48 | | | | 0.90 | | | | 0.30 | |
| Less distributions: | | | | | | | | | | | | | | | | | | | | | | | | | | | | | | | | | | | | | | | | | | | | | | | | |
| Distributions from net investment income | | | (0.20 | ) | | | (0.41 | ) | | | (0.44 | ) | | | (0.45 | ) | | | (0.51 | ) | | | (0.63 | ) | | | (0.18 | ) | | | (0.37 | ) | | | (0.39 | ) | | | (0.40 | ) | | | (0.47 | ) | | | (0.57 | ) |
| Total distributions | | | (0.20 | ) | | | (0.41 | ) | | | (0.44 | ) | | | (0.45 | ) | | | (0.51 | ) | | | (0.63 | ) | | | (0.18 | ) | | | (0.37 | ) | | | (0.39 | ) | | | (0.40 | ) | | | (0.47 | ) | | | (0.57 | ) |
| Net asset value, end of period | | $ | 8.75 | | | $ | 8.99 | | | $ | 9.58 | | | $ | 9.68 | | | $ | 9.59 | | | $ | 9.15 | | | $ | 8.62 | | | $ | 8.86 | | | $ | 9.46 | | | $ | 9.55 | | | $ | 9.47 | | | $ | 9.04 | |
| | | | | | | | | | | | | | | | | | | | | | | | | | | | | | | | | | | | | | | | | | | | | | | | | |
| Total return + | | | (0.49 | )% | | | (1.88 | )% | | | 3.49 | % | | | 5.74 | % | | | 10.70 | % | | | 3.84 | % | | | (0.63 | )% | | | (2.47 | )% | | | 3.13 | % | | | 5.17 | % | | | 10.19 | % | | | 3.28 | % |
| Ratios/Supplemental Data: | | | | | | | | | | | | | | | | | | | | | | | | | | | | | | | | | | | | | | | | | | | | | | | | |
| Net assets, end of period (in 000s) | | $ | 10,314 | | | $ | 10,224 | | | $ | 22,022 | | | $ | 19,888 | | | $ | 13,722 | | | $ | 6,457 | | | $ | 8,118 | | | $ | 9,231 | | | $ | 11,652 | | | $ | 13,741 | | | $ | 14,457 | | | $ | 10,404 | |
| Ratios of expenses to average net assets: ^ | | | 1.38 | % | | | 1.27 | % | | | 1.34 | % | | | 1.36 | % | | | 1.48 | % | | | 1.63 | % | | | 1.88 | % | | | 1.77 | % | | | 1.84 | % | | | 1.86 | % | | | 1.98 | % | | | 2.13 | % |
| Ratios of net investment income to average net assets: ^ | | | 4.74 | % | | | 4.52 | % | | | 4.47 | % | | | 4.64 | % | | | 5.45 | % | | | 6.67 | % | | | 4.24 | % | | | 4.02 | % | | | 3.97 | % | | | 4.15 | % | | | 4.95 | % | | | 6.17 | % |
| Portfolio turnover rate | | | 27 | % (1) | | | 51 | % | | | 62 | % | | | 94 | % | | | 58 | % | | | 49 | % | | | 27 | % (1) | | | 51 | % | | | 62 | % | | | 94 | % | | | 58 | % | | | 49 | % |
| * | The net investment income per share data was determined using the average shares outstanding throughout each period. |
| + | Assumes reinvestment of all dividends and distributions, if any. Total return does not reflect the deductions of taxes that a shareholder would pay on distributions or on the redemption of shares. |
| ^ | Annualized for periods less than one year. |
See accompanying notes to financial statements.
| FINANCIAL HIGHLIGHTS |
| Dunham International Opportunity Bond Fund |
| |
| The table sets forth financial data for one share of beneficial interest outstanding for each year. |
| | | Class N | | | Class A | | | Class C | |
| | | Six Months | | | | | | | | | Six Months | | | | | | | | | Six Months | | | | | | | |
| | | Ended | | | | | | | | | Ended | | | | | | | | | Ended | | | | | | | |
| | | April 30, | | | Year Ended October 31, | | | April 30, | | | Year Ended October 31, | | | April 30, | | | Year Ended October 31, | |
| | | 2016 | | | 2015 | | | 2014* | | | 2016 | | | 2015 | | | 2014* | | | 2016 | | | 2015 | | | 2014* | |
| | | (Unaudited) | | | | | | | | | (Unaudited) | | | | | | | | | (Unaudited) | | | | | | | |
| | | | | | | | | | | | | | | | | | | | | | | | | | | | |
| Net asset value, beginning of year | | $ | 8.92 | | | $ | 9.64 | | | $ | 10.00 | | | $ | 8.90 | | | $ | 9.64 | | | $ | 10.00 | | | $ | 8.84 | | | $ | 9.62 | | | $ | 10.00 | |
| Income (Loss) from investment operations: | | | | | | | | | | | | | | | | | | | | | | | | | | | | | | | | | | | | |
| Net investment income (loss)** | | | 0.02 | | | | 0.05 | | | | 0.07 | | | | 0.01 | | | | 0.02 | | | | 0.04 | | | | (0.01 | ) | | | (0.02 | ) | | | (0.01 | ) |
| Net realized and unrealized gain (loss) | | | 0.64 | | | | (0.77 | ) | | | (0.37 | ) | | | 0.63 | | | | (0.76 | ) | | | (0.36 | ) | | | 0.62 | | | | (0.76 | ) | | | (0.36 | ) |
| Total income (loss) from investment operations | | | 0.66 | | | | (0.72 | ) | | | (0.30 | ) | | | 0.64 | | | | (0.74 | ) | | | (0.32 | ) | | | 0.61 | | | | (0.78 | ) | | | (0.37 | ) |
| Less distributions: | | | | | | | | | | | | | | | | | | | | | | | | | | | | | | | | | | | | |
| Distributions from net investment income | | | (0.01 | ) | | | 0.00 | | | | 0.00 | | | | (0.00 | ) (a) | | | 0.00 | | | | 0.00 | | | | (0.00 | ) (a) | | | 0.00 | | | | 0.00 | |
| Tax return of capital | | | (0.00 | ) | | | (0.00 | ) | | | (0.06 | ) | | | (0.00 | ) | | | (0.00 | ) | | | (0.04 | ) | | | 0.00 | | | | 0.00 | | | | (0.01 | ) |
| Total distributions | | | (0.01 | ) | | | (0.00 | ) | | | (0.06 | ) | | | (0.00 | ) | | | (0.00 | ) | | | (0.04 | ) | | | (0.00 | ) | | | 0.00 | | | | (0.01 | ) |
| Net asset value, end of year | | $ | 9.57 | | | $ | 8.92 | | | $ | 9.64 | | | $ | 9.54 | | | $ | 8.90 | | | $ | 9.64 | | | $ | 9.45 | | | $ | 8.84 | | | $ | 9.62 | |
| | | | | | | | | | | | | | | | | | | | | | | | | | | | | | | | | | | | | |
| Total return + | | | 7.38 | % | | | (7.42 | )% | | | (2.99 | )% | | | 7.24 | % | | | (7.65 | )% | | | (3.22 | )% | | | 6.91 | % | | | (8.11 | )% | | | (3.72 | )% |
| Ratios/Supplemental Data: | | | | | | | | | | | | | | | | | | | | | | | | | | | | | | | | | | | | |
| Net assets, end of year (in 000s) | | $ | 27,372 | | | $ | 31,935 | | | $ | 42,440 | | | $ | 2,773 | | | $ | 3,208 | | | $ | 3,513 | | | $ | 1,257 | | | $ | 1,638 | | | $ | 1,879 | |
| Ratios of expenses to average net assets | | | 1.33 | % | | | 1.38 | % | | | 1.38 | % | | | 1.57 | % | | | 1.63 | % | | | 1.63 | % | | | 2.08 | % | | | 2.13 | % | | | 2.13 | % |
| Ratios of net investment income (loss) to average net assets | | | 0.53 | % | | | 0.52 | % | | | 0.66 | % | | | 0.16 | % | | | 0.29 | % | | | 0.41 | % | | | (0.23 | )% | | | (0.24 | )% | | | (0.09 | )% |
| Portfolio turnover rate | | | 27 | % (1) | | | 52 | % | | | 60 | % (1) | | | 27 | % (1) | | | 52 | % | | | 60 | % (1) | | | 27 | % (1) | | | 52 | % | | | 60 | % (1) |
| * | The Fund commenced operations on November 1, 2013. |
| ** | The net investment income (loss) per share data was determined using the average shares outstanding throughout the period. |
| (a) | Represents less than $0.01 per share. |
| + | Assumes reinvestment of all dividends and distributions, if any. Total return does not reflect the deductions of taxes that a shareholder would pay on distributions or on the redemption of shares. |
See accompanying notes to financial statements.
| FINANCIAL HIGHLIGHTS |
| Dunham Appreciation & Income Fund |
| |
| The table sets forth financial data for one share of beneficial interest outstanding throughout each period |
| | | Class N | | | | | | | | | | | | | | | | | | | | | | | | | |
| | | Six Months | | | | | | | | | | | | | | | | | | | | | | | | | | | | | | | | | | | | | | | | |
| | | Ended | | | Year Ended | | | | | | | | | | | | | | | | | | | | | | | | | |
| | | April 30, | | | October 31, | | | | | | | | | | | | | | | | | | | | | | | | | |
| | | 2016 | | | 2015 | | | 2014 | | | 2013 | | | 2012 | | | 2011 | | | | | | | | | | | | | | | | | | | | | | | | | |
| | | (Unaudited) | | | | | | | | | | | | | | | | | | | | | | | | | | | | | | | | | | | | | | | | |
| | | | | | | | | | | | | | | | | | | | | | | | | | | | | | | | | | | | | | | | | | | |
| Net asset value, beginning of period | | $ | 8.75 | | | $ | 10.88 | | | $ | 10.09 | | | $ | 8.90 | | | $ | 8.86 | | | $ | 8.47 | | | | | | | | | | | | | | | | | | | | | | | | | |
| Income (loss) from investment operations: | | | | | | | | | | | | | | | | | | | | | | | | | | | | | | | | | | | | | | | | | | | | | | | | |
| Net investment income* | | | 0.04 | | | | 0.27 | | | | 0.11 | | | | 0.16 | | | | 0.10 | | | | 0.08 | | | | | | | | | | | | | | | | | | | | | | | | | |
| Net realized and unrealized gain (loss) | | | (0.56 | ) | | | (0.51 | ) | | | 0.83 | | | | 1.28 | | | | 0.05 | | | | 0.55 | | | | | | | | | | | | | | | | | | | | | | | | | |
| Total income (loss) from investment operations | | | (0.52 | ) | | | (0.24 | ) | | | 0.94 | | | | 1.44 | | | | 0.15 | | | | 0.63 | | | | | | | | | | | | | | | | | | | | | | | | | |
| Less distributions: | | | | | | | | | | | | | | | | | | | | | | | | | | | | | | | | | | | | | | | | | | | | | | | | |
| Distributions from net investment income | | | (0.37 | ) | | | (0.17 | ) | | | (0.15 | ) | | | (0.25 | ) | | | (0.11 | ) | | | (0.24 | ) | | | | | | | | | | | | | | | | | | | | | | | | |
| Distributions from net realized gains | | | (0.18 | ) | | | (1.72 | ) | | | 0.00 | | | | 0.00 | | | | 0.00 | | | | 0.00 | | | | | | | | | | | | | | | | | | | | | | | | | |
| Total distributions | | | (0.55 | ) | | | (1.89 | ) | | | (0.15 | ) | | | (0.25 | ) | | | (0.11 | ) | | | (0.24 | ) | | | | | | | | | | | | | | | | | | | | | | | | |
| Net asset value, end of period | | $ | 7.68 | | | $ | 8.75 | | | $ | 10.88 | | | $ | 10.09 | | | $ | 8.90 | | | $ | 8.86 | | | | | | | | | | | | | | | | | | | | | | | | | |
| | | | | | | | | | | | | | | | | | | | | | | | | | | | | | | | | | | | | | | | | | | | | | | | | |
| Total return + | | | (6.42 | )% | | | (2.67 | )% | | | 9.37 | % | | | 16.59 | % | | | 1.83 | % | | | 7.56 | % | | | | | | | | | | | | | | | | | | | | | | | | |
| Ratios/Supplemental Data: | | | | | | | | | | | | | | | | | | | | | | | | | | | | | | | | | | | | | | | | | | | | | | | | |
| Net assets, end of period (in 000s) | | $ | 18,450 | | | $ | 20,210 | | | $ | 18,576 | | | $ | 15,855 | | | $ | 23,843 | | | $ | 24,475 | | | | | | | | | | | | | | | | | | | | | | | | | |
| Ratios of expenses to average net assets: ^ | | | 1.55 | % | | | 1.34 | % | | | 1.44 | % | | | 1.39 | % | | | 1.60 | % | | | 1.91 | % | | | | | | | | | | | | | | | | | | | | | | | | |
| Ratios of net investment income to average net assets: ^ | | | 0.93 | % | | | 2.83 | % | | | 1.07 | % | | | 1.70 | % | | | 1.13 | % | | | 0.90 | % | | | | | | | | | | | | | | | | | | | | | | | | |
| Portfolio turnover rate | | | 24 | % (1) | | | 82 | % | | | 129 | % | | | 62 | % | | | 51 | % | | | 69 | % | | | | | | | | | | | | | | | | | | | | | | | | |
| | | | | | | | | | | | | | | | | | | | | | | | | | | | | | | | | | | | | | | | | | | | | | | | | |
| | | Class A | | | Class C | |
| | | Six Months | | | | | | | | | | | | | | | | | | Six Months | | | | | | | | | | | | | | | | |
| | | Ended | | | Year Ended | | | Ended | | | Year Ended | |
| | | April 30, | | | October 31, | | | April 30, | | | October 31, | |
| | | 2016 | | | 2015 | | | 2014 | | | 2013 | | | 2012 | | | 2011 | | | 2016 | | | 2015 | | | 2014 | | | 2013 | | | 2012 | | | 2011 | |
| | | (Unaudited) | | | | | | | | | | | | | | | | | | (Unaudited) | | | | | | | | | | | | | | | | |
| | | | | | | | | | | | | | | | | | | | | | | | | | | | | | | | | | | | | |
| Net asset value, beginning of period | | $ | 8.73 | | | $ | 10.85 | | | $ | 10.06 | | | $ | 8.88 | | | $ | 8.83 | | | $ | 8.45 | | | $ | 8.56 | | | $ | 10.66 | | | $ | 9.90 | | | $ | 8.74 | | | $ | 8.70 | | | $ | 8.32 | |
| Income (loss) from investment operations: | | | | | | | | | | | | | | | | | | | | | | | | | | | | | | | | | | | | | | | | | | | | | | | | |
| Net investment income (loss)* | | | 0.03 | | | | 0.24 | | | | 0.09 | | | | 0.13 | | | | 0.08 | | | | 0.06 | | | | 0.00 | | | | 0.18 | | | | 0.01 | | | | 0.06 | | | | 0.01 | | | | (0.01 | ) |
| Net realized and unrealized gain (loss) | | | (0.60 | ) | | | (0.50 | ) | | | 0.82 | | | | 1.27 | | | | 0.06 | | | | 0.55 | | | | (0.57 | ) | | | (0.50 | ) | | | 0.80 | | | | 1.26 | | | | 0.06 | | | | 0.55 | |
| Total income (loss) from investment operations | | | (0.57 | ) | | | (0.26 | ) | | | 0.91 | | | | 1.40 | | | | 0.14 | | | | 0.61 | | | | (0.57 | ) | | | (0.32 | ) | | | 0.81 | | | | 1.32 | | | | 0.07 | | | | 0.54 | |
| Less distributions: | | | | | | | | | | | | | | | | | | | | | | | | | | | | | | | | | | | | | | | | | | | | | | | | |
| Distributions from net investment income | | | (0.32 | ) | | | (0.14 | ) | | | (0.12 | ) | | | (0.22 | ) | | | (0.09 | ) | | | (0.23 | ) | | | (0.28 | ) | | | (0.06 | ) | | | (0.05 | ) | | | (0.16 | ) | | | (0.03 | ) | | | (0.16 | ) |
| Distributions from net realized gains | | | (0.18 | ) | | | (1.72 | ) | | | 0.00 | | | | 0.00 | | | | 0.00 | | | | 0.00 | | | | (0.18 | ) | | | (1.72 | ) | | | 0.00 | | | | 0.00 | | | | 0.00 | | | | 0.00 | |
| Total distributions | | | (0.50 | ) | | | (1.86 | ) | | | (0.12 | ) | | | (0.22 | ) | | | (0.09 | ) | | | (0.23 | ) | | | (0.46 | ) | | | (1.78 | ) | | | (0.05 | ) | | | (0.16 | ) | | | (0.03 | ) | | | (0.16 | ) |
| Net asset value, end of period | | $ | 7.66 | | | $ | 8.73 | | | $ | 10.85 | | | $ | 10.06 | | | $ | 8.88 | | | $ | 8.83 | | | $ | 7.53 | | | $ | 8.56 | | | $ | 10.66 | | | $ | 9.90 | | | $ | 8.74 | | | $ | 8.70 | |
| | | | | | | | | | | | | | | | | | | | | | | | | | | | | | | | | | | | | | | | | | | | | | | | | |
| Total return + | | | (6.70 | )% | | | (2.84 | )% | | | 9.10 | % | | | 16.21 | % | | | 1.63 | % | | | 7.33 | % | | | (7.02 | )% | | | (3.53 | )% | | | 8.21 | % | | | 15.35 | % | | | 0.84 | % | | | 6.49 | % |
| Ratios/Supplemental Data: | | | | | | | | | | | | | | | | | | | | | | | | | | | | | | | | | | | | | | | | | | | | | | | | |
| Net assets, end of period (in 000s) | | $ | 3,988 | | | $ | 4,211 | | | $ | 4,509 | | | $ | 4,368 | | | $ | 4,470 | | | $ | 2,994 | | | $ | 3,923 | | | $ | 4,956 | | | $ | 4,046 | | | $ | 3,765 | | | $ | 3,867 | | | $ | 4,130 | |
| Ratios of expenses to average net assets: ^ | | | 1.80 | % | | | 1.59 | % | | | 1.69 | % | | | 1.64 | % | | | 1.85 | % | | | 2.16 | % | | | 2.57 | % | | | 2.34 | % | | | 2.44 | % | | | 2.39 | % | | | 2.60 | % | | | 2.91 | % |
| Ratios of net investment income (loss) to average net assets: ^ | | | 0.67 | % | | | 2.56 | % | | | 0.83 | % | | | 1.45 | % | | | 0.88 | % | | | 0.65 | % | | | (0.11 | )% | | | 1.91 | % | | | 0.08 | % | | | 0.70 | % | | | 0.13 | % | | | (0.10 | )% |
| Portfolio turnover rate | | | 24 | % (1) | | | 82 | % | | | 129 | % | | | 62 | % | | | 51 | % | | | 69 | % | | | 24 | % (1) | | | 82 | % | | | 129 | % | | | 62 | % | | | 51 | % | | | 69 | % |
| * | The net investment income (loss) per share data was determined using the average shares outstanding throughout each period. |
| + | Assumes reinvestment of all dividends and distributions, if any. Total return does not reflect the deductions of taxes that a shareholder would pay on distributions or on the redemption of shares. |
| ^ | Annualized for periods less than one year. |
See accompanying notes to financial statements.
| FINANCIAL HIGHLIGHTS |
| Dunham Alternative Strategy Fund |
| |
| The table sets forth financial data for one share of beneficial interest outstanding throughout each period. |
| | | Class N | | | | | | | | | | | | | | | | | | | | | | | | | | | | | |
| | | Six Months | | | | | | | | | | | | | | | | | | | | | | | | | | | | | | | | | | | | | | | | | | | | | | | |
| | | Ended | | | Year Ended | | | Period Ended | | | | | | | | | | | | | | | | | | | | | | | | | | | | | | | | | | | | | | |
| | | April 30, | | | October 31, | | | October 31, | | | Year Ended July 31, | | | | | | | | | | | | | | | | | | | | | | | | | | | | | |
| | | 2016 | | | 2015 | | | 2014 | | | 2013* | | | 2013 | | | 2012 | | | 2011 | | | | | | | | | | | | | | | | | | | | | | | | | | | | | |
| | | (Unaudited) | | | | | | | | | | | | | | | | | | | | | | | | | | | | | | | | | | | | | | | | | | | | | | | |
| | | | | | | | | | | | | | | | | | | | | | | | | | | | | | | | | | | | | | | | | | | | | | | | | | |
| Net asset value, beginning of period | | $ | 24.35 | | | $ | 24.45 | | | $ | 23.74 | | | $ | 23.85 | | | $ | 23.45 | | | $ | 26.90 | | | $ | 25.15 | | | | | | | | | | | | | | | | | | | | | | | | | | | | | |
| Income (loss) from investment operations: | | | | | | | | | | | | | | | | | | | | | | | | | | | | | | | | | | | | | | | | | | | | | | | | | | | | | | | | |
| Net investment loss ** | | | (0.07 | ) | | | (0.03 | ) | | | (0.21 | ) | | | (0.07 | ) | | | (0.10 | ) | | | (0.29 | ) | | | (0.21 | ) | | | | | | | | | | | | | | | | | | | | | | | | | | | | |
| Net realized and unrealized gain (loss) | | | (2.58 | ) | | | (0.07 | ) | | | 0.92 | | | | (0.04 | ) | | | 0.50 | | | | (1.66 | ) | | | 1.96 | | | | | | | | | | | | | | | | | | | | | | | | | | | | | |
| Total income (loss) from investment operations | | | (2.65 | ) | | | (0.10 | ) | | | 0.71 | | | | (0.11 | ) | | | 0.40 | | | | (1.95 | ) | | | 1.75 | | | | | | | | | | | | | | | | | | | | | | | | | | | | | |
| Less distributions: | | | | | | | | | | | | | | | | | | | | | | | | | | | | | | | | | | | | | | | | | | | | | | | | | | | | | | | | |
| Distributions from net investment income | | | 0.00 | | | | 0.00 | | | | 0.00 | | | | 0.00 | | | | 0.00 | | | | (1.50 | ) | | | 0.00 | | | | | | | | | | | | | | | | | | | | | | | | | | | | | |
| Distributions from net realized gains | | | 0.00 | | | | 0.00 | | | | 0.00 | | | | 0.00 | | | | 0.00 | | | | 0.00 | | | | 0.00 | | | | | | | | | | | | | | | | | | | | | | | | | | | | | |
| Total distributions | | | 0.00 | | | | 0.00 | | | | 0.00 | | | | 0.00 | | | | 0.00 | | | | (1.50 | ) | | | 0.00 | | | | | | | | | | | | | | | | | | | | | | | | | | | | | |
| Net asset value, end of period | | $ | 21.70 | | | $ | 24.35 | | | $ | 24.45 | | | $ | 23.74 | | | $ | 23.85 | | | $ | 23.45 | | | $ | 26.90 | | | | | | | | | | | | | | | | | | | | | | | | | | | | | |
| | | | | | | | | | | | | | | | | | | | | | | | | | | | | | | | | | | | | | | | | | | | | | | | | | | | | | | | | |
| Total return +, # | | | (10.88 | )% | | | (0.41 | )% | | | 2.99 | % | | | (0.46 | )% | | | 1.71 | % | | | (7.23 | )% | | | 6.96 | % | | | | | | | | | | | | | | | | | | | | | | | | | | | | |
| Ratios/Supplemental Data: | | | | | | | | | | | | | | | | | | | | | | | | | | | | | | | | | | | | | | | | | | | | | | | | | | | | | | | | |
| Net assets, end of period (in 000s) | | $ | 19,606 | | | $ | 21,184 | | | $ | 15,355 | | | $ | 15,873 | | | $ | 15,641 | | | $ | 10,818 | | | $ | 15,716 | | | | | | | | | | | | | | | | | | | | | | | | | | | | | |
| Ratios of expenses to average net assets: | | | | | | | | | | | | | | | | | | | | | | | | | | | | | | | | | | | | | | | | | | | | | | | | | | | | | | | | |
| Before fee waivers ^(1) | | | 1.44 | % | | | 1.43 | % | | | 1.84 | % | | | 1.85 | % | | | 2.35 | % | | | 2.29 | % | | | 1.94 | % | | | | | | | | | | | | | | | | | | | | | | | | | | | | |
| After fee waivers ^(1) | | | 1.44 | % | | | 1.43 | % | | | 1.84 | % | | | 1.85 | % | | | 1.67 | % | | | 1.65 | % | | | 1.65 | % | | | | | | | | | | | | | | | | | | | | | | | | | | | | |
| Ratios of net investment loss to average net assets: | | | | | | | | | | | | | | | | | | | | | | | | | | | | | | | | | | | | | | | | | | | | | | | | | | | | | | | | |
| Before fee waivers ^(1,2) | | | (0.57 | )% | | | (0.11 | )% | | | (0.87 | )% | | | (1.13 | )% | | | (1.11 | )% | | | (1.79 | )% | | | (1.06 | )% | | | | | | | | | | | | | | | | | | | | | | | | | | | | |
| After fee waivers ^(1,2) | | | (0.57 | )% | | | (0.11 | )% | | | (0.87 | )% | | | (1.13 | )% | | | (0.43 | )% | | | (1.15 | )% | | | (0.77 | )% | | | | | | | | | | | | | | | | | | | | | | | | | | | | |
| Portfolio turnover rate | | | 4,368 | % (3) | | | 4,847 | % | | | 4,686 | % | | | 934 | % | | | 2,340 | % | | | 5,840 | % | | | 1,959 | % | | | | | | | | | | | | | | | | | | | | | | | | | | | | |
| | | | | | | | | | | | | | | | | | | | | | | | | | | | | | | | | | | | | | | | | | | | | | | | | | | | | | | | | |
| | | Class A | | | Class C | |
| | | Six Months | | | | | | | | | | | | | | | | | | | | | Six Months | | | | | | | | | | | | | | | | | | | |
| | | Ended | | | Year Ended | | | Period Ended | | | | | | | | | | | | Ended | | | Year Ended | | | Period Ended | | | | | | | | | | |
| | | April 30, | | | October 31, | | | October 31, | | | Year Ended July 31, | | | April 30, | | | October 31, | | | October 31, | | | Year Ended July 31, | |
| | | 2016 | | | 2015 | | | 2014 | | | 2013* | | | 2013 | | | 2012 | | | 2011 | | | 2016 | | | 2015 | | | 2014 | | | 2013* | | | 2013 | | | 2012 | | | 2011 | |
| | | (Unaudited) | | | | | | | | | | | | | | | | | | | | | (Unaudited) | | | | | | | | | | | | | | | | | | | |
| | | | | | | | | | | | | | | | | | | | | | | | | | | | | | | | | | | | | | | | | | | |
| Net asset value, beginning of period | | $ | 23.91 | | | $ | 24.07 | | | $ | 23.43 | | | $ | 23.55 | | | $ | 23.22 | | | $ | 26.73 | | | $ | 25.07 | | | $ | 22.66 | | | $ | 22.98 | | | $ | 22.55 | | | $ | 22.71 | | | $ | 22.55 | | | $ | 26.22 | | | $ | 24.77 | |
| Income (loss) from investment operations: | | | | | | | | | | | | | | | | | | | | | | | | | | | | | | | | | | | | | | | | | | | | | | | | | | | | | | | | |
| Net investment loss ** | | | (0.09 | ) | | | (0.06 | ) | | | (0.22 | ) | | | (0.07 | ) | | | (0.11 | ) | | | (0.35 | ) | | | (0.27 | ) | | | (0.17 | ) | | | (0.25 | ) | | | (0.42 | ) | | | (0.12 | ) | | | (0.35 | ) | | | (0.53 | ) | | | (0.47 | ) |
| Net realized and unrealized gain (loss) | | | (2.54 | ) | | | (0.10 | ) | | | 0.86 | | | | (0.05 | ) | | | 0.44 | | | | (1.66 | ) | | | 1.93 | | | | (2.40 | ) | | | (0.07 | ) | | | 0.85 | | | | (0.04 | ) | | | 0.51 | | | | (1.64 | ) | | | 1.92 | |
| Total income (loss) from investment operations | | | (2.63 | ) | | | (0.16 | ) | | | 0.64 | | | | (0.12 | ) | | | 0.33 | | | | (2.01 | ) | | | 1.66 | | | | (2.57 | ) | | | (0.32 | ) | | | 0.43 | | | | (0.16 | ) | | | 0.16 | | | | (2.17 | ) | | | 1.45 | |
| Less distributions: | | | | | | | | | | | | | | | | | | | | | | | | | | | | | | | | | | | | | | | | | | | | | | | | | | | | | | | | |
| Distributions from net investment income | | | 0.00 | | | | 0.00 | | | | 0.00 | | | | 0.00 | | | | 0.00 | | | | (1.50 | ) | | | 0.00 | | | | 0.00 | | | | 0.00 | | | | 0.00 | | | | 0.00 | | | | 0.00 | | | | (1.50 | ) | | | 0.00 | |
| Distributions from net realized gains | | | 0.00 | | | | 0.00 | | | | 0.00 | | | | 0.00 | | | | 0.00 | | | | 0.00 | | | | 0.00 | | | | 0.00 | | | | 0.00 | | | | 0.00 | | | | 0.00 | | | | 0.00 | | | | 0.00 | | | | 0.00 | |
| Total distributions | | | 0.00 | | | | 0.00 | | | | 0.00 | | | | 0.00 | | | | 0.00 | | | | (1.50 | ) | | | 0.00 | | | | 0.00 | | | | 0.00 | | | | 0.00 | | | | 0.00 | | | | 0.00 | | | | (1.50 | ) | | | 0.00 | |
| Net asset value, end of period | | $ | 21.28 | | | $ | 23.91 | | | $ | 24.07 | | | $ | 23.43 | | | $ | 23.55 | | | $ | 23.22 | | | $ | 26.73 | | | $ | 20.09 | | | $ | 22.66 | | | $ | 22.98 | | | $ | 22.55 | | | $ | 22.71 | | | $ | 22.55 | | | $ | 26.22 | |
| | | | | | | | | | | | | | | | | | | | | | | | | | | | | | | | | | | | | | | | | | | | | | | | | | | | | | | | | |
| Total return +, # | | | (11.01 | )% | | | (0.66 | )% | | | 2.73 | % | | | (0.51 | )% | | | 1.42 | % | | | (7.51 | )% | | | 6.62 | % | | | (11.34 | )% | | | (1.39 | )% | | | 1.91 | % | | | (0.70 | )% | | | 0.71 | % | | | (8.33 | )% | | | 5.85 | % |
| Ratios/Supplemental Data: | | | | | | | | | | | | | | | | | | | | | | | | | | | | | | | | | | | | | | | | | | | | | | | | | | | | | | | | |
| Net assets, end of period (in 000s) | | $ | 1,674 | | | $ | 1,715 | | | $ | 2,008 | | | $ | 15,484 | | | $ | 10,591 | | | $ | 1,016 | | | $ | 12,069 | | | $ | 796 | | | $ | 863 | | | $ | 1,058 | | | $ | 1,150 | | | $ | 972 | | | $ | 212 | | | $ | 1,854 | |
| Ratios of expenses to average net assets: | | | | | | | | | | | | | | | | | | | | | | | | | | | | | | | | | | | | | | | | | | | | | | | | | | | | | | | | |
| Before fee waivers ^(1) | | | 1.69 | % | | | 1.68 | % | | | 2.09 | % | | | 2.10 | % | | | 2.36 | % | | | 2.54 | % | | | 2.19 | % | | | 2.44 | % | | | 2.43 | % | | | 2.84 | % | | | 2.85 | % | | | 3.11 | % | | | 3.29 | % | | | 2.94 | % |
| After fee waivers ^(1) | | | 1.69 | % | | | 1.68 | % | | | 2.09 | % | | | 2.10 | % | | | 1.98 | % | | | 1.90 | % | | | 1.90 | % | | | 2.44 | % | | | 2.43 | % | | | 2.84 | % | | | 2.85 | % | | | 2.67 | % | | | 2.65 | % | | | 2.65 | % |
| Ratios of net investment loss to average net assets: | | | | | | | | | | | | | | | | | | | | | | | | | | | | | | | | | | | | | | | | | | | | | | | | | | | | | | | | |
| Before fee waivers ^(1,2) | | | (0.83 | )% | | | (0.19 | )% | | | (1.25 | )% | | | (1.14 | )% | | | (0.85 | )% | | | (2.04 | )% | | | (1.31 | )% | | | (1.59 | )% | | | (1.05 | )% | | | (1.87 | )% | | | (2.06 | )% | | | (1.99 | )% | | | (2.80 | )% | | | (2.06 | )% |
| After fee waivers ^(1,2) | | | (0.83 | )% | | | (0.19 | )% | | | (1.25 | )% | | | (1.14 | )% | | | (0.48 | )% | | | (1.40 | )% | | | (1.02 | )% | | | (1.59 | )% | | | (1.05 | )% | | | (1.87 | )% | | | (2.06 | )% | | | (1.56 | )% | | | (2.16 | )% | | | (1.77 | )% |
| Portfolio turnover rate | | | 4,368 | % (3) | | | 4,847 | % | | | 4,686 | % | | | 934 | % | | | 2,340 | % | | | 5,840 | % | | | 1,959 | % | | | 4,368 | % (3) | | | 4,847 | % | | | 4,686 | % | | | 934 | % | | | 2,340 | % | | | 5,840 | % | | | 1,959 | % |
| * | The Fund’s fiscal year end changed from July 31 to October 31 effective August 1, 2013. |
| ** | The net investment loss per share data was determined using the average shares outstanding throughout each period. |
| (a) | Represents less than $0.01 per share. |
| + | Assumes reinvestment of all dividends and distributions, if any. Aggregate (not annualized) total return is shown for any period shorter than one year. Total return does not reflect the deductions of taxes that a shareholder would pay on distributions or on the redemption of shares. |
| # | Includes adjustments in accordance with accounting principles generally accepted in the United States and, consequently, the net asset value for financial reporting purposes and the returns based upon those net asset values may differ from the net asset values and returns for shareholder transactions. |
| ^ | Annualized for periods less than one year. |
| (1) | The ratios of expenses to average net assets and net investment loss to average net assets do not reflect the expenses of the underlying investment companies in which the Fund invests. |
| (2) | Recognition of net investment loss by the Fund is affected by the timing and declaration of dividends by the underlying investment companies in which the Fund invests. Includes adjustments in accordance with accounting principles generally accepted in the United States and consequently the net asset value for financial reporting purposes and the returns based upon those net asset values may differ from the net asset values and returns for shareholder transactions. |
See accompanying notes to financial statements.
| FINANCIAL HIGHLIGHTS |
| Dunham Large Cap Value Fund |
| |
| The table sets forth financial data for one share of beneficial interest outstanding throughout each year or period. |
| | | Class N | | | | | | | | | | | | | | | | | | | | | | | | | |
| | | Six Months | | | | | | | | | | | | | | | | | | | | | | | | | | | | | | | | | | | | | | | | |
| | | Ended | | | | | | | | | | | | | | | | | | | | | | | | | | | | | | | | | | | | | | | | |
| | | April 30, | | | Year Ended October 31, | | | | | | | | | | | | | | | | | | | | | | | | | |
| | | 2016 | | | 2015 | | | 2014 | | | 2013 | | | 2012 | | | 2011 | | | | | | | | | | | | | | | | | | | | | | | | | |
| | | (Unaudited) | | | | | | | | | | | | | | | | | | | | | | | | | | | | | | | | | | | | | | | | |
| | | | | | | | | | | | | | | | | | | | | | | | | | | | | | | | | | | | | | | | | | | |
| Net asset value, beginning of period | | $ | 16.32 | | | $ | 16.21 | | | $ | 14.55 | | | $ | 11.74 | | | $ | 10.60 | | | $ | 9.96 | | | | | | | | | | | | | | | | | | | | | | | | | |
| Income from investment operations: | | | | | | | | | | | | | | | | | | | | | | | | | | | | | | | | | | | | | | | | | | | | | | | | |
| Net investment income * | | | 0.12 | | | | 0.17 | | | | 0.13 | | | | 0.16 | | | | 0.12 | | | | 0.06 | | | | | | | | | | | | | | | | | | | | | | | | | |
| Net realized and unrealized gain (loss) | | | (0.26 | ) | | | 0.06 | | | | 1.70 | | | | 2.78 | | | | 1.07 | | | | 0.64 | | | | | | | | | | | | | | | | | | | | | | | | | |
| Total income (loss) from investment operations | | | (0.14 | ) | | | 0.23 | | | | 1.83 | | | | 2.94 | | | | 1.19 | | | | 0.70 | | | | | | | | | | | | | | | | | | | | | | | | | |
| Less distributions: | | | | | | | | | | | | | | | | | | | | | | | | | | | | | | | | | | | | | | | | | | | | | | | | |
| Distributions from net investment income | | | (0.18 | ) | | | (0.12 | ) | | | (0.17 | ) | | | (0.13 | ) | | | (0.05 | ) | | | (0.06 | ) | | | | | | | | | | | | | | | | | | | | | | | | |
| Distributions from net realized gains | | | (4.10 | ) | | | 0.00 | | | | 0.00 | | | | 0.00 | | | | 0.00 | | | | 0.00 | | | | | | | | | | | | | | | | | | | | | | | | | |
| Total distributions | | | (4.28 | ) | | | (0.12 | ) # | | | (0.17 | ) | | | (0.13 | ) | | | (0.05 | ) | | | (0.06 | ) | | | | | | | | | | | | | | | | | | | | | | | | |
| Net asset value, end of period | | $ | 11.90 | | | $ | 16.32 | | | $ | 16.21 | | | $ | 14.55 | | | $ | 11.74 | | | $ | 10.60 | | | | | | | | | | | | | | | | | | | | | | | | | |
| | | | | | | | | | | | | | | | | | | | | | | | | | | | | | | | | | | | | | | | | | | | | | | | | |
| Total return +,# | | | (0.93 | )% | | | 1.41 | % | | | 12.64 | % | | | 25.30 | % | | | 11.29 | % | | | 7.06 | % | | | | | | | | | | | | | | | | | | | | | | | | |
| Ratios/Supplemental Data: | | | | | | | | | | | | | | | | | | | | | | | | | | | | | | | | | | | | | | | | | | | | | | | | |
| Net assets, end of period (in 000s) | | $ | 43,364 | | | $ | 44,620 | | | $ | 41,917 | | | $ | 37,688 | | | $ | 37,650 | | | $ | 34,171 | | | | | | | | | | | | | | | | | | | | | | | | | |
| Ratios of expenses to average net assets: ^ | | | 1.05 | % | | | 1.12 | % | | | 1.26 | % | | | 1.00 | % | | | 1.17 | % | | | 1.62 | % | | | | | | | | | | | | | | | | | | | | | | | | |
| Ratios of net investment income ^ to average net assets: | | | 1.83 | % | | | 1.03 | % | | | 0.82 | % | | | 1.25 | % | | | 1.04 | % | | | 0.53 | % | | | | | | | | | | | | | | | | | | | | | | | | |
| Portfolio turnover rate | | | 29 | % (1) | | | 101 | % | | | 22 | % | | | 16 | % | | | 30 | % | | | 30 | % | | | | | | | | | | | | | | | | | | | | | | | | |
| | | | | | | | | | | | | | | | | | | | | | | | | | | | | | | | | | | | | | | | | | | | | | | | | |
| | | Class A | | | Class C | |
| | | Six Months | | | | | | | | | | | | | | | | | | Six Months | | | | | | | | | | | | | | | | |
| | | Ended | | | | | | | | | | | | | | | | | | Ended | | | | | | | | | | | | | | | | |
| | | April 30, | | | Year Ended October 31, | | | April 30, | | | Year Ended October 31, | |
| | | 2016 | | | 2015 | | | 2014 | | | 2013 | | | 2012 | | | 2011 | | | 2016 | | | 2015 | | | 2014 | | | 2013 | | | 2012 | | | 2011 | |
| | | (Unaudited) | | | | | | | | | | | | | | | | | | (Unaudited) | | | | | | | | | | | | | | | | |
| | | | | | | | | | | | | | | | | | | | | | | | | | | | | | | | | | | | | |
| Net asset value, beginning of period | | $ | 16.26 | | | $ | 16.16 | | | $ | 14.52 | | | $ | 11.72 | | | $ | 10.57 | | | $ | 9.95 | | | $ | 15.74 | | | $ | 15.68 | | | $ | 14.09 | | | $ | 11.36 | | | $ | 10.31 | | | $ | 9.73 | |
| Income from investment operations: | | | | | | | | | | | | | | | | | | | | | | | | | | | | | | | | | | | | | | | | | | | | | | | | |
| Net investment income (loss)* | | | 0.10 | | | | 0.13 | | | | 0.09 | | | | 0.13 | | | | 0.09 | | | | 0.04 | | | | 0.05 | | | | 0.00 | (a) | | | (0.03 | ) | | | 0.03 | | | | 0.00 | (a) | | | (0.05 | ) |
| Net realized and unrealized gain | | | (0.26 | ) | | | 0.06 | | | | 1.69 | | | | 2.77 | | | | 1.08 | | | | 0.64 | | | | (0.25 | ) | | | 0.06 | | | | 1.65 | | | | 2.71 | | | | 1.05 | | | | 0.63 | |
| Total income from investment operations | | | (0.16 | ) | | | 0.19 | | | | 1.78 | | | | 2.90 | | | | 1.17 | | | | 0.68 | | | | (0.20 | ) | | | 0.06 | | | | 1.62 | | | | 2.74 | | | | 1.05 | | | | 0.58 | |
| Less distributions: | | | | | | | | | | | | | | | | | | | | | | | | | | | | | | | | | | | | | | | | | | | | | | | | |
| Distributions from net investment income | | | (0.14 | ) | | | (0.09 | ) | | | (0.14 | ) | | | (0.10 | ) | | | (0.02 | ) | | | (0.06 | ) | | | (0.03 | ) | | | 0.00 | | | | (0.03 | ) | | | (0.01 | ) | | | 0.00 | | | | 0.00 | |
| Distributions from net realized gains | | | (4.10 | ) | | | 0.00 | | | | 0.00 | | | | 0.00 | | | | 0.00 | | | | 0.00 | | | | (4.10 | ) | | | 0.00 | | | | 0.00 | | | | 0.00 | | | | 0.00 | | | | 0.00 | |
| Total distributions | | | (4.24 | ) | | | (0.09 | ) # | | | (0.14 | ) | | | (0.10 | ) | | | (0.02 | ) | | | (0.06 | ) | | | (4.13 | ) | | | 0.00 | | | | (0.03 | ) | | | (0.01 | ) | | | 0.00 | | | | 0.00 | |
| Net asset value, end of period | | $ | 11.86 | | | $ | 16.26 | | | $ | 16.16 | | | $ | 14.52 | | | $ | 11.72 | | | $ | 10.57 | | | $ | 11.41 | | | $ | 15.74 | | | $ | 15.68 | | | $ | 14.09 | | | $ | 11.36 | | | $ | 10.31 | |
| | | | | | | | | | | | | | | | | | | | | | | | | | | | | | | | | | | | | | | | | | | | | | | | | |
| Total return +, # | | | (0.93 | )% | | | 1.15 | % | | | 12.31 | % | | | 24.99 | % | | | 11.04 | % | | | 6.78 | % | | | (1.41 | )% | | | 0.38 | % | | | 11.49 | % | | | 24.09 | % | | | 10.18 | % | | | 5.96 | % |
| Ratios/Supplemental Data: | | | | | | | | | | | | | | | | | | | | | | | | | | | | | | | | | | | | | | | | | | | | | | | | |
| Net assets, end of period (in 000s) | | $ | 6,437 | | | $ | 6,577 | | | $ | 7,685 | | | $ | 4,980 | | | $ | 2,969 | | | $ | 2,874 | | | $ | 5,399 | | | $ | 5,805 | | | $ | 5,639 | | | $ | 5,029 | | | $ | 5,431 | | | $ | 6,129 | |
| Ratios of expenses to average net assets: ^ | | | 1.30 | % | | | 1.37 | % | | | 1.51 | % | | | 1.25 | % | | | 1.42 | % | | | 1.87 | % | | | 2.05 | % | | | 2.12 | % | | | 2.26 | % | | | 2.00 | % | | | 2.17 | % | | | 2.62 | % |
| Ratios of net investment income (loss) ^ to average net assets: | | | 1.58 | % | | | 0.78 | % | | | 0.57 | % | | | 0.99 | % | | | 0.79 | % | | | 0.28 | % | | | 0.83 | % | | | 0.03 | % | | | (0.18 | )% | | | 0.25 | % | | | 0.04 | % | | | (0.47 | )% |
| Portfolio turnover rate | | | 29 | % (1) | | | 101 | % | | | 22 | % | | | 16 | % | | | 30 | % | | | 30 | % | | | 29 | % (1) | | | 101 | % | | | 22 | % | | | 16 | % | | | 30 | % | | | 30 | % |
| * | The net investment income (loss) per share data was determined using the average shares outstanding throughout each period. |
| + | Assumes reinvestment of all dividends and distributions, if any. Total return does not reflect the deductions of taxes that a shareholder would pay on distributions or on the redemption of shares |
| (a) | Represents less than $0.01 per share. |
| # | Includes adjustments in accordance with accounting principles generally accepted in the United States and, consequently, the net asset value for financial reporting purposes and the returns based upon those net asset values may differ from the net asset values and returns for shareholder transactions. |
| ^ | Annualized for periods less than one year. |
See accompanying notes to financial statements.
| FINANCIAL HIGHLIGHTS |
| Dunham Focused Large Cap Growth Fund |
| |
| The table sets forth financial data for one share of beneficial interest outstanding throughout each period. |
| | | Class N | | | | | | | | | | | | | | | | | | | | | |
| | | Six Months | | | | | | | | | | | | | | | | | | | | | | | | | | | | | | | | | |
| | | Ended | | | Year Ended | | | Year Ended | | | Year Ended | | | Period Ended | | | | | | | | | | | | | | | | | | | | | |
| | | April 30, | | | October 31, | | | October 31, | | | October 31, | | | October 31, | | | | | | | | | | | | | | | | | | | | | |
| | | 2016 | | | 2015 | | | 2014 | | | 2013 | | | 2012* | | | | | | | | | | | | | | | | | | | | | |
| | | (Unaudited) | | | | | | | | | | | | | | | | | | | | | | | | | | | | | | | | | |
| | | | | | | | | | | | | | | | | | | | | | | | | | | | | | | | | | | | |
| Net asset value, beginning of period | | $ | 16.97 | | | $ | 15.01 | | | $ | 14.02 | | | $ | 10.42 | | | $ | 10.00 | | | | | | | | | | | | | | | | | | | | | |
| Income from investment operations: | | | | | | | | | | | | | | | | | | | | | | | | | | | | | | | | | | | | | | | | |
| Net investment loss** | | | (1.45 | ) | | | (0.16 | ) | | | (0.11 | ) | | | (0.10 | ) | | | (0.16 | ) | | | | | | | | | | | | | | | | | | | | |
| Net realized and unrealized gain (loss) | | | (0.07 | ) | | | 2.12 | | | | 1.29 | | | | 3.70 | | | | 0.58 | | | | | | | | | | | | | | | | | | | | | |
| Total income (loss) from investment operations | | | (1.52 | ) | | | 1.96 | | | | 1.18 | | | | 3.60 | | | | 0.42 | | | | | | | | | | | | | | | | | | | | | |
| Less distributions: | | | | | | | | | | | | | | | | | | | | | | | | | | | | | | | | | | | | | | | | |
| Distributions from net realized gains | | | (0.09 | ) | | | 0.00 | | | | (0.19 | ) | | | 0.00 | | | | 0.00 | | | | | | | | | | | | | | | | | | | | | |
| Total distributions | | | (0.09 | ) | | | 0.00 | | | | (0.19 | ) | | | 0.00 | | | | 0.00 | | | | | | | | | | | | | | | | | | | | | |
| Net asset value, end of period | | $ | 15.36 | | | $ | 16.97 | | | $ | 15.01 | | | $ | 14.02 | | | $ | 10.42 | | | | | | | | | | | | | | | | | | | | | |
| | | | | | | | | | | | | | | | | | | | | | | | | | | | | | | | | | | | | | | | | |
| Total return + | | | (8.98 | )% | | | 13.06 | % | | | 8.48 | % | | | 34.55 | % | | | 4.20 | % | | | | | | | | | | | | | | | | | | | | |
| Ratios/Supplemental Data: | | | | | | | | | | | | | | | | | | | | | | | | | | | | | | | | | | | | | | | | |
| Net assets, end of period (in 000s) | | $ | 48,965 | | | $ | 51,312 | | | $ | 37,106 | | | $ | 814 | | | $ | 450 | | | | | | | | | | | | | | | | | | | | | |
| Ratios of expenses to average net assets: | | | | | | | | | | | | | | | | | | | | | | | | | | | | | | | | | | | | | | | | |
| Before fee waivers ^ | | | 1.21 | % | | | 1.34 | % | | | 1.16 | % | | | 1.71 | % | | | 2.11 | % | | | | | | | | | | | | | | | | | | | | |
| After fee waivers ^ | | | 1.21 | % | | | 1.34 | % | | | 1.16 | % | | | 1.69 | % | | | 1.80 | % | | | | | | | | | | | | | | | | | | | | |
| Ratios of net investment loss to average net assets: | | | | | | | | | | | | | | | | | | | | | | | | | | | | | | | | | | | | | | | | |
| Before fee waivers ^ | | | (0.82 | )% | | | (1.00 | )% | | | (0.76 | )% | | | (0.70 | )% | | | (1.06 | )% | | | | | | | | | | | | | | | | | | | | |
| After fee waivers ^ | | | (0.82 | )% | | | (1.00 | )% | | | (0.76 | )% | | | (0.67 | )% | | | (0.75 | )% | | | | | | | | | | | | | | | | | | | | |
| Portfolio turnover rate | | | 15 | % (1) | | | 45 | % | | | 29 | % | | | 91 | % | | | 27 | % (1) | | | | | | | | | | | | | | | | | | | | |
| | | | | | | | | | | | | | | | | | | | | | | | | | | | | | | | | | | | | | | | | |
| | | Class A | | | Class C | |
| | | Six Months | | | | | | | | | | | | | | | Six Months | | | | | | | | | | | | | |
| | | Ended | | | Year Ended | | | Year Ended | | | Year Ended | | | Period Ended | | | Ended | | | Year Ended | | | Year Ended | | | Year Ended | | | Period Ended | |
| | | April 30, | | | October 31, | | | October 31, | | | October 31, | | | October 31, | | | April 30, | | | October 31, | | | October 31, | | | October 31, | | | October 31, | |
| | | 2016 | | | 2015 | | | 2014 | | | 2013 | | | 2012* | | | 2016 | | | 2015 | | | 2014 | | | 2013 | | | 2012* | |
| | | (Unaudited) | | | | | | | | | | | | | | | (Unaudited) | | | | | | | | | | | | | |
| | | | | | | | | | | | | | | | | | | | | | | | | | | | | | | |
| Net asset value, beginning of period | | $ | 16.80 | | | $ | 14.91 | | | $ | 13.96 | | | $ | 10.39 | | | $ | 10.00 | | | $ | 16.33 | | | $ | 14.59 | | | $ | 13.76 | | | $ | 10.33 | | | $ | 10.00 | |
| Income from investment operations: | | | | | | | | | | | | | | | | | | | | | | | | | | | | | | | | | | | | | | | | |
| Net investment loss** | | | (1.43 | ) | | | (0.19 | ) | | | (0.21 | ) | | | (0.11 | ) | | | (0.09 | ) | | | (1.40 | ) | | | (0.31 | ) | | | (0.26 | ) | | | (0.26 | ) | | | (0.30 | ) |
| Net realized and unrealized gain (loss) | | | (0.09 | ) | | | 2.08 | | | | 1.35 | | | | 3.68 | | | | 0.48 | | | | (0.14 | ) | | | 2.05 | | | | 1.28 | | | | 3.69 | | | | 0.63 | |
| Total income (loss) from investment operations | | | (1.52 | ) | | | 1.89 | | | | 1.14 | | | | 3.57 | | | | 0.39 | | | | (1.54 | ) | | | 1.74 | | | | 1.02 | | | | 3.43 | | | | 0.33 | |
| Less distributions: | | | | | | | | | | | | | | | | | | | | | | | | | | | | | | | | | | | | | | | | |
| Distributions from net realized gains | | | (0.09 | ) | | | 0.00 | | | | (0.19 | ) | | | 0.00 | | | | 0.00 | | | | (0.09 | ) | | | 0.00 | | | | (0.19 | ) | | | 0.00 | | | | 0.00 | |
| Total distributions | | | (0.09 | ) | | | 0.00 | | | | (0.19 | ) | | | 0.00 | | | | 0.00 | | | | (0.09 | ) | | | 0.00 | | | | (0.19 | ) | | | 0.00 | | | | 0.00 | |
| Net asset value, end of period | | $ | 15.19 | | | $ | 16.80 | | | $ | 14.91 | | | $ | 13.96 | | | $ | 10.39 | | | $ | 14.70 | | | $ | 16.33 | | | $ | 14.59 | | | $ | 13.76 | | | $ | 10.33 | |
| | | | | | | | | | | | | | | | | | | | | | | | | | | | | | | | | | | | | | | | | |
| Total return + | | | (9.07 | )% | | | 12.68 | % | | | 8.23 | % | | | 34.36 | % | | | 3.90 | % | | | (9.46 | )% | | | 11.93 | % | | | 7.47 | % | | | 33.20 | % | | | 3.30 | % |
| Ratios/Supplemental Data: | | | | | | | | | | | | | | | | | | | | | | | | | | | | | | | | | | | | | | | | |
| Net assets, end of period (in 000s) | | $ | 9,978 | | | $ | 8,762 | | | $ | 19,949 | | | $ | 11,399 | | | $ | 10,344 | | | $ | 5,240 | | | $ | 5,222 | | | $ | 4,361 | | | $ | 510 | | | $ | 146 | |
| Ratios of expenses to average net assets: | | | | | | | | | | | | | | | | | | | | | | | | | | | | | | | | | | | | | | | | |
| Before fee waivers ^ | | | 1.44 | % | | | 1.59 | % | | | 1.41 | % | | | 1.96 | % | | | 2.36 | % | | | 2.24 | % | | | 2.34 | % | | | 2.16 | % | | | 2.71 | % | | | 3.11 | % |
| After fee waivers ^ | | | 1.44 | % | | | 1.59 | % | | | 1.41 | % | | | 1.94 | % | | | 2.05 | % | | | 2.24 | % | | | 2.34 | % | | | 2.16 | % | | | 2.69 | % | | | 2.80 | % |
| Ratios of net investment loss to average net assets: | | | | | | | | | | | | | | | | | | | | | | | | | | | | | | | | | | | | | | | | |
| Before fee waivers ^ | | | (1.02 | )% | | | (1.20 | )% | | | (1.48 | )% | | | (0.95 | )% | | | (1.31 | )% | | | (1.93 | )% | | | (2.00 | )% | | | (1.87 | )% | | | (1.70 | )% | | | (2.06 | )% |
| After fee waivers ^ | | | (1.02 | )% | | | (1.20 | )% | | | (1.48 | )% | | | (0.92 | )% | | | (1.00 | )% | | | (1.93 | )% | | | (2.00 | )% | | | (1.87 | )% | | | (1.67 | )% | | | (1.75 | )% |
| Portfolio turnover rate | | | 15 | % (1) | | | 45 | % | | | 29 | % | | | 91 | % | | | 27 | % (1) | | | 15 | % (1) | | | 45 | % | | | 29 | % | | | 91 | % | | | 27 | % (1) |
| * | The Fund commenced operations on December 8, 2011. |
| ** | The net investment loss per share data was determined using the average shares outstanding throughout each period |
| ^ | Annualized for periods less than a year. |
| + | Assumes reinvestment of all dividends and distributions, if any. Aggregate (not annualized) total return is shown for any period shorter than one year. Total return does not reflect the deductions of taxes that a shareholder would pay on distributions or on the redemption of shares. |
See accompanying notes to financial statements.
| FINANCIAL HIGHLIGHTS |
| Dunham International Stock Fund |
| |
| The table sets forth financial data for one share of beneficial interest outstanding throughout each year or period. |
| | | Class N | | | | | | | | | | | | | | | | | | | | | | | | | |
| | | Six Months | | | | | | | | | | | | | | | | | | | | | | | | | | | | | | | | | | | | | | | | |
| | | Ended | | | | | | | | | | | | | | | | | | | | | | | | | | | | | | | | | | | | | | | | |
| | | April 30, | | | Year Ended October 31, | | | | | | | | | | | | | | | | | | | | | | | | | |
| | | 2016 | | | 2015 | | | 2014 | | | 2013 | | | 2012 | | | 2011 | | | | | | | | | | | | | | | | | | | | | | | | | |
| | | (Unaudited) | | | | | | | | | | | | | | | | | | | | | | | | | | | | | | | | | | | | | | | | |
| | | | | | | | | | | | | | | | | | | | | | | | | | | | | | | | | | | | | | | | | | | |
| Net asset value, beginning of period | | $ | 14.24 | | | $ | 15.21 | | | $ | 15.22 | | | $ | 12.05 | | | $ | 11.85 | | | $ | 12.79 | | | | | | | | | | | | | | | | | | | | | | | | | |
| Income (loss) from investment operations: | | | | | | | | | | | | | | | | | | | | | | | | | | | | | | | | | | | | | | | | | | | | | | | | |
| Net investment income * | | | 0.10 | | | | 0.00 | | | | 0.15 | | | | 0.07 | | | | 0.14 | | | | 0.15 | | | | | | | | | | | | | | | | | | | | | | | | | |
| Net realized and unrealized gain (loss) | | | (0.46 | ) | | | (0.61 | ) | | | 0.10 | | | | 3.24 | | | | 0.22 | | | | (0.98 | ) | | | | | | | | | | | | | | | | | | | | | | | | |
| Total income (loss) from investment operations | | | (0.36 | ) | | | (0.61 | ) | | | 0.25 | | | | 3.31 | | | | 0.36 | | | | (0.83 | ) | | | | | | | | | | | | | | | | | | | | | | | | |
| Less distributions: | | | | | | | | | | | | | | | | | | | | | | | | | | | | | | | | | | | | | | | | | | | | | | | | |
| Distributions from net investment income | | | (0.01 | ) | | | (0.30 | ) | | | (0.26 | ) | | | (0.14 | ) | | | (0.16 | ) | | | (0.11 | ) | | | | | | | | | | | | | | | | | | | | | | | | |
| Distributions from net realized gains | | | 0.00 | | | | (0.06 | ) | | | 0.00 | | | | 0.00 | | | | 0.00 | | | | 0.00 | | | | | | | | | | | | | | | | | | | | | | | | | |
| Total distributions | | | (0.01 | ) | | | (0.36 | ) | | | (0.26 | ) | | | (0.14 | ) | | | (0.16 | ) | | | (0.11 | ) | | | | | | | | | | | | | | | | | | | | | | | | |
| Net asset value, end of period | | $ | 13.87 | | | $ | 14.24 | | | $ | 15.21 | | | $ | 15.22 | | | $ | 12.05 | | | $ | 11.85 | | | | | | | | | | | | | | | | | | | | | | | | | |
| | | | | | | | | | | | | | | | | | | | | | | | | | | | | | | | | | | | | | | | | | | | | | | | | |
| Total return + # | | | (2.54 | )% | | | (4.10 | )% | | | 1.66 | % | | | 27.64 | % | | | 3.16 | % | | | (6.56 | )% | | | | | | | | | | | | | | | | | | | | | | | | |
| Ratios/Supplemental Data: | | | | | | | | | | | | | | | | | | | | | | | | | | | | | | | | | | | | | | | | | | | | | | | | |
| Net assets, end of period (in 000s) | | $ | 74,149 | | | $ | 76,992 | | | $ | 57,359 | | | $ | 49,815 | | | $ | 44,947 | | | $ | 39,163 | | | | | | | | | | | | | | | | | | | | | | | | | |
| Ratios of expenses to average net assets: ^ | | | 1.68 | % | | | 2.04 | % | | | 2.04 | % | | | 2.11 | % | | | 1.97 | % | | | 2.28 | % | | | | | | | | | | | | | | | | | | | | | | | | |
| Ratios of net investment income to average net assets: ^ | | | 1.54 | % | | | 0.03 | % | | | 0.99 | % | | | 0.52 | % | | | 1.24 | % | | | 1.19 | % | | | | | | | | | | | | | | | | | | | | | | | | |
| Portfolio turnover rate | | | 61 | % (1) | | | 125 | % | | | 117 | % | | | 131 | % | | | 142 | % | | | 110 | % | | | | | | | | | | | | | | | | | | | | | | | | |
| | | | | | | | | | | | | | | | | | | | | | | | | | | | | | | | | | | | | | | | | | | | | | | | | |
| | | Class A | | | Class C | |
| | | Six Months | | | | | | | | | | | | | | | | | | Six Months | | | | | | | | | | | | | | | | |
| | | Ended | | | | | | | | | | | | | | | | | | Ended | | | | | | | | | | | | | | | | |
| | | April 30, | | | Year Ended October 31, | | | April 30, | | | Year Ended October 31, | |
| | | 2016 | | | 2015 | | | 2014 | | | 2013 | | | 2012 | | | 2011 | | | 2016 | | | 2015 | | | 2014 | | | 2013 | | | 2012 | | | 2011 | |
| | | (Unaudited) | | | | | | | | | | | | | | | | | | (Unaudited) | | | | | | | | | | | | | | | | |
| | | | | | | | | | | | | | | | | | | | | | | | | | | | | | | | | | | | | |
| Net asset value, beginning of period | | $ | 14.21 | | | $ | 15.16 | | | $ | 15.19 | | | $ | 12.03 | | | $ | 11.84 | | | $ | 12.79 | | | $ | 13.73 | | | $ | 14.68 | | | $ | 14.70 | | | $ | 11.64 | | | $ | 11.44 | | | $ | 12.37 | |
| Income (loss) from investment operations: | | | | | | | | | | | | | | | | | | | | | | | | | | | | | | | | | | | | | | | | | | | | | | | �� | |
| Net investment income (loss)* | | | 0.09 | | | | (0.03 | ) | | | 0.15 | | | | 0.06 | | | | 0.10 | | | | 0.18 | | | | 0.03 | | | | (0.14 | ) | | | (0.00 | ) (a) | | | (0.06 | ) | | | 0.03 | | | | 0.02 | |
| Net realized and unrealized gain (loss) | | | (0.47 | ) | | | (0.60 | ) | | | 0.06 | | | | 3.22 | | | | 0.22 | | | | (1.04 | ) | | | (0.44 | ) | | | (0.59 | ) | | | 0.10 | | | | 3.13 | | | | 0.21 | | | | (0.95 | ) |
| Total income (loss) from investment operations | | | (0.38 | ) | | | (0.63 | ) | | | 0.21 | | | | 3.28 | | | | 0.32 | | | | (0.86 | ) | | | (0.41 | ) | | | (0.73 | ) | | | 0.10 | | | | 3.07 | | | | 0.24 | | | | (0.93 | ) |
| Less distributions: | | | | | | | | | | | | | | | | | | | | | | | | | | | | | | | | | | | | | | | | | | | | | | | | |
| Distributions from net investment income | | | 0.00 | | | | (0.26 | ) | | | (0.24 | ) | | | (0.12 | ) | | | (0.13 | ) | | | (0.09 | ) | | | 0.00 | | | | (0.16 | ) | | | (0.12 | ) | | | (0.01 | ) | | | (0.04 | ) | | | 0.00 | |
| Distributions from net realized gains | | | 0.00 | | | | (0.06 | ) | | | 0.00 | | | | 0.00 | | | | 0.00 | | | | 0.00 | | | | 0.00 | | | | (0.06 | ) | | | 0.00 | | | | 0.00 | | | | 0.00 | | | | 0.00 | |
| Total distributions | | | 0.00 | | | | (0.32 | ) | | | (0.24 | ) | | | (0.12 | ) | | | (0.13 | ) | | | (0.09 | ) | | | 0.00 | | | | (0.22 | ) | | | (0.12 | ) | | | (0.01 | ) | | | (0.04 | ) | | | 0.00 | |
| Net asset value, end of period | | $ | 13.83 | | | $ | 14.21 | | | $ | 15.16 | | | $ | 15.19 | | | $ | 12.03 | | | $ | 11.84 | | | $ | 13.32 | | | $ | 13.73 | | | $ | 14.68 | | | $ | 14.70 | | | $ | 11.64 | | | $ | 11.44 | |
| | | | | | | | | | | | | | | | | | | | | | | | | | | | | | | | | | | | | | | | | | | | | | | | | |
| Total return + # | | | (2.87 | )% | | | (4.26 | )% | | | 1.35 | % | | | 27.40 | % | | | 2.80 | % | | | (6.78 | )% | | | (2.99 | )% | | | (5.06 | )% | | | 0.67 | % | | | 26.40 | % | | | 2.10 | % | | | (7.52 | )% |
| Ratios/Supplemental Data: | | | | | | | | | | | | | | | | | | | | | | | | | | | | | | | | | | | | | | | | | | | | | | | | |
| Net assets, end of period (in 000s) | | $ | 9,166 | | | $ | 9,032 | | | $ | 7,871 | | | $ | 4,741 | | | $ | 1,580 | | | $ | 1,309 | | | $ | 6,928 | | | $ | 7,268 | | | $ | 6,551 | | | $ | 5,627 | | | $ | 5,881 | | | $ | 6,849 | |
| Ratios of expenses to average net assets:^ | | | 1.93 | % | | | 2.29 | % | | | 2.29 | % | | | 2.36 | % | | | 2.22 | % | | | 2.53 | % | | | 2.68 | % | | | 3.04 | % | | | 3.04 | % | | | 3.11 | % | | | 2.97 | % | | | 3.28 | % |
| Ratios of net investment income (loss) to average net assets:^ | | | 1.36 | % | | | (0.19 | )% | | | 0.97 | % | | | 0.41 | % | | | 0.99 | % | | | 0.94 | % | | | 0.51 | % | | | (0.94 | )% | | | (0.02 | )% | | | (0.46 | )% | | | 0.24 | % | | | 0.19 | % |
| Portfolio turnover rate | | | 61 | % (1) | | | 125 | % | | | 117 | % | | | 131 | % | | | 142 | % | | | 110 | % | | | 61 | % (1) | | | 125 | % | | | 117 | % | | | 131 | % | | | 142 | % | | | 110 | % |
| * | The net investment income (loss) per share data was determined using the average shares outstanding throughout each period |
| + | Assumes reinvestment of all dividends and distributions, if any. Total return does not reflect the deductions of taxes that a shareholder would pay on distributions or on the redemption of shares |
| # | Includes adjustments in accordance with accounting principles generally accepted in the United States and, consequently, the net asset value for financial reporting purposes and the returns based upon those net asset values may differ from the net asset values and returns for shareholder transactions |
| (a) | Represents less than $0.01 per share. |
| ^ | Annualized for periods less than one year. |
See accompanying notes to financial statements.
| FINANCIAL HIGHLIGHTS |
| Dunham Real Estate Stock Fund |
| |
| The table sets forth financial data for one share of beneficial interest outstanding throughout each period |
| | | Class N | | | | | | | | | | | | | | | | | | | | | | | | | |
| | | Six Months | | | | | | | | | | | | | | | | | | | | | | | | | | | | | | | | | | | | | | | | |
| | | Ended | | | Year Ended | | | | | | | | | | | | | | | | | | | | | | | | | |
| | | April 30, | | | October 31, | | | | | | | | | | | | | | | | | | | | | | | | | |
| | | 2016 | | | 2015 | | | 2014 | | | 2013 | | | 2012 | | | 2011 | | | | | | | | | | | | | | | | | | | | | | | | | |
| | | (Unaudited) | | | | | | | | | | | | | | | | | | | | | | | | | | | | | | | | | | | | | | | | |
| | | | | | | | | | | | | | | | | | | | | | | | | | | | | | | | | | | | | | | | | | | |
| Net asset value, beginning of period | | $ | 19.23 | | | $ | 19.27 | | | $ | 16.53 | | | $ | 15.79 | | | $ | 13.80 | | | $ | 12.84 | | | | | | | | | | | | | | | | | | | | | | | | | |
| Income from investment operations: | | | | | | | | | | | | | | | | | | | | | | | | | | | | | | | | | | | | | | | | | | | | | | | | |
| Net investment income * | | | 0.34 | | | | 0.15 | | | | 0.13 | | | | 0.23 | | | | 0.21 | | | | 0.14 | | | | | | | | | | | | | | | | | | | | | | | | | |
| Net realized and unrealized gain | | | 0.31 | | | | 0.85 | | | | 3.20 | | | | 1.27 | | | | 1.90 | | | | 0.98 | | | | | | | | | | | | | | | | | | | | | | | | | |
| Total income from investment operations | | | 0.65 | | | | 1.00 | | | | 3.33 | | | | 1.50 | | | | 2.11 | | | | 1.12 | | | | | | | | | | | | | | | | | | | | | | | | | |
| Less distributions: | | | | | | | | | | | | | | | | | | | | | | | | | | | | | | | | | | | | | | | | | | | | | | | | |
| Distributions from net investment income | | | (0.21 | ) | | | (0.11 | ) | | | (0.20 | ) | | | (0.23 | ) | | | (0.12 | ) | | | (0.16 | ) | | | | | | | | | | | | | | | | | | | | | | | | |
| Distributions from net realized gains | | | (1.76 | ) | | | (0.93 | ) | | | (0.39 | ) | | | (0.53 | ) | | | 0.00 | | | | 0.00 | | | | | | | | | | | | | | | | | | | | | | | | | |
| Total distributions | | | (1.97 | ) | | | (1.04 | ) | | | (0.59 | ) | | | (0.76 | ) | | | (0.12 | ) | | | (0.16 | ) | | | | | | | | | | | | | | | | | | | | | | | | |
| Net asset value, end of period | | $ | 17.91 | | | $ | 19.23 | | | $ | 19.27 | | | $ | 16.53 | | | $ | 15.79 | | | $ | 13.80 | | | | | | | | | | | | | | | | | | | | | | | | | |
| | | | | | | | | | | | | | | | | | | | | | | | | | | | | | | | | | | | | | | | | | | | | | | | | |
| Total return + | | | 3.46 | % | | | 5.13 | % | | | 21.09 | % | | | 9.85 | % | | | 15.46 | % | | | 8.82 | % | | | | | | | | | | | | | | | | | | | | | | | | |
| Ratios/Supplemental Data: | | | | | | | | | | | | | | | | | | | | | | | | | | | | | | | | | | | | | | | | | | | | | | | | |
| Net assets, end of period (in 000s) | | $ | 29,338 | | | $ | 33,379 | | | $ | 37,143 | | | $ | 33,545 | | | $ | 20,424 | | | $ | 12,507 | | | | | | | | | | | | | | | | | | | | | | | | | |
| Ratios of expenses to average net assets: ^ | | | 1.24 | % | | | 1.64 | % | | | 1.59 | % | | | 1.30 | % | | | 1.46 | % | | | 1.51 | % | | | | | | | | | | | | | | | | | | | | | | | | |
| Ratios of net investment income to average net assets: ^ | | | 3.78 | % | | | 0.80 | % | | | 0.77 | % | | | 1.40 | % | | | 1.42 | % | | | 1.09 | % | | | | | | | | | | | | | | | | | | | | | | | | |
| Portfolio turnover rate | | | 38 | % (1) | | | 110 | % | | | 97 | % | | | 163 | % | | | 123 | % | | | 59 | % | | | | | | | | | | | | | | | | | | | | | | | | |
| | | | | | | | | | | | | | | | | | | | | | | | | | | | | | | | | | | | | | | | | | | | | | | | | |
| | | Class A | | | Class C | |
| | | Six Months | | | | | | | | | | | | | | | | | | Six Months | | | | | | | | | | | | | | | | |
| | | Ended | | | Year Ended | | | Ended | | | Year Ended | |
| | | April 30, | | | October 31, | | | April 30, | | | October 31, | |
| | | 2016 | | | 2015 | | | 2014 | | | 2013 | | | 2012 | | | 2011 | | | 2016 | | | 2015 | | | 2014 | | | 2013 | | | 2012 | | | 2011 | |
| | | (Unaudited) | | | | | | | | | | | | | | | | | | (Unaudited) | | | | | | | | | | | | | | | | |
| | | | | | | | | | | | | | | | | | | | | | | | | | | | | | | | | | | | | |
| Net asset value, beginning of period | | $ | 19.26 | | | $ | 19.33 | | | $ | 16.55 | | | $ | 15.77 | | | $ | 13.80 | | | $ | 12.85 | | | $ | 18.50 | | | $ | 18.65 | | | $ | 16.02 | | | $ | 15.33 | | | $ | 13.40 | | | $ | 12.49 | |
| Income from investment operations: | | | | | | | | | | | | | | | | | | | | | | | | | | | | | | | | | | | | | | | | | | | | | | | | |
| Net investment income (loss) * | | | 0.31 | | | | 0.10 | | | | 0.08 | | | | 0.15 | | | | 0.21 | | | | 0.13 | | | | 0.24 | | | | (0.04 | ) | | | (0.04 | ) | | | 0.07 | | | | 0.07 | | | | 0.01 | |
| Net realized and unrealized gain | | | 0.33 | | | | 0.85 | | | | 3.22 | | | | 1.31 | | | | 1.87 | | | | 0.95 | | | | 0.29 | | | | 0.82 | | | | 3.11 | | | | 1.23 | | | | 1.86 | | | | 0.94 | |
| Total income from investment operations | | | 0.64 | | | | 0.95 | | | | 3.30 | | | | 1.46 | | | | 2.08 | | | | 1.08 | | | | 0.53 | | | | 0.78 | | | | 3.07 | | | | 1.30 | | | | 1.93 | | | | 0.95 | |
| Less distributions: | | | | | | | | | | | | | | | | | | | | | | | | | | | | | | | | | | | | | | | | | | | | | | | | |
| Distributions from net investment income | | | (0.17 | ) | | | (0.09 | ) | | | (0.13 | ) | | | (0.15 | ) | | | (0.11 | ) | | | (0.13 | ) | | | (0.02 | ) | | | 0.00 | | | | (0.05 | ) | | | (0.08 | ) | | | 0.00 | | | | (0.04 | ) |
| Distributions from net realized gains Total | | | (1.76 | ) | | | (0.93 | ) | | | (0.39 | ) | | | (0.53 | ) | | | 0.00 | | | | 0.00 | | | | (1.76 | ) | | | (0.93 | ) | | | (0.39 | ) | | | (0.53 | ) | | | 0.00 | | | | 0.00 | |
| distributions | | | (1.93 | ) | | | (1.02 | ) | | | (0.52 | ) | | | (0.68 | ) | | | (0.11 | ) | | | (0.13 | ) | | | (1.78 | ) | | | (0.93 | ) | | | (0.44 | ) | | | (0.61 | ) | | | 0.00 | | | | (0.04 | ) |
| Net asset value, end of period | | $ | 17.97 | | | $ | 19.26 | | | $ | 19.33 | | | $ | 16.55 | | | $ | 15.77 | | | $ | 13.80 | | | $ | 17.25 | | | $ | 18.50 | | | $ | 18.65 | | | $ | 16.02 | | | $ | 15.33 | | | $ | 13.40 | |
| | | | | | | | | | | | | | | | | | | | | | | | | | | | | | | | | | | | | | | | | | | | | | | | | |
| Total return + | | | 3.35 | % | | | 4.85 | % | | | 20.73 | % | | | 9.60 | % | | | 15.20 | % | | | 8.48 | % | | | 2.94 | % | | | 4.08 | % | | | 19.88 | % | | | 8.73 | % | | | 14.40 | % | | | 7.65 | % |
| Ratios/Supplemental Data: | | | | | | | | | | | | | | | | | | | | | | | | | | | | | | | | | | | | | | | | | | | | | | | | |
| Net assets, end of period (in 000s) | | $ | 10,047 | | | $ | 10,386 | | | $ | 3,913 | | | $ | 2,539 | | | $ | 709 | | | $ | 6,962 | | | $ | 3,378 | | | $ | 3,847 | | | $ | 4,166 | | | $ | 2,684 | | | $ | 2,370 | | | $ | 1,944 | |
| | | | | | | | | | | | | | | | | | | | | | | | | | | | | | | | | | | | | | | | | | | | | | | | | |
| Ratios of expenses to average net assets: ^ | | | 1.49 | % | | | 1.89 | % | | | 1.84 | % | | | 1.55 | % | | | 1.71 | % | | | 1.76 | % | | | 2.24 | % | | | 2.64 | % | | | 2.59 | % | | | 2.30 | % | | | 2.46 | % | | | 2.51 | % |
| Ratios of net investment income (loss) to average net assets: ^ | | | 3.49 | % | | | 0.53 | % | | | 0.48 | % | | | 1.15 | % | | | 1.17 | % | | | 0.81 | % | | | 2.75 | % | | | (0.21 | )% | | | (0.24 | )% | | | 0.40 | % | | | 0.42 | % | | | 0.07 | % |
| Portfolio turnover rate | | | 38 | % (1) | | | 110 | % | | | 97 | % | | | 163 | % | | | 123 | % | | | 59 | % | | | 38 | % (1) | | | 110 | % | | | 97 | % | | | 163 | % | | | 123 | % | | | 59 | % |
| * | The net investment income (loss) per share data was determined using the average shares outstanding throughout each period. |
| + | Assumes reinvestment of all dividends and distributions, if any. Total return does not reflect the deductions of taxes that a shareholder would pay on distributions or on the redemption of shares. |
| ^ | Annualized for periods less than one year. |
See accompanying notes to financial statements.
| FINANCIAL HIGHLIGHTS |
| Dunham Small Cap Value Fund |
| |
| The table sets forth financial data for one share of beneficial interest outstanding throughout each year or period. |
| | | Class N | | | | | | | | | | | | | | | | | | | | | | | | | |
| | | Six Months | | | | | | | | | | | | | | | | | | | | | | | | | | | | | | | | | | | | | | | | |
| | | Ended | | | | | | | | | | | | | | | | | | | | | | | | | | | | | | | | | | | | | | | | |
| | | April 30, | | | Year Ended October 31, | | | | | | | | | | | | | | | | | | | | | | | | | |
| | | 2016 | | | 2015 | | | 2014 | | | 2013 | | | 2012 | | | 2011 | | | | | | | | | | | | | | | | | | | | | | | | | |
| | | (Unaudited) | | | | | | | | | | | | | | | | | | | | | | | | | | | | | | | | | | | | | | | | |
| | | | | | | | | | | | | | | | | | | | | | | | | | | | | | | | | | | | | | | | | | | |
| Net asset value, beginning of period | | $ | 14.27 | | | $ | 15.45 | | | $ | 14.65 | | | $ | 11.21 | | | $ | 10.44 | | | $ | 9.78 | | | | | | | | | | | | | | | | | | | | | | | | | |
| Income (loss) from investment operations: | | | | | | | | | | | | | | | | | | | | | | | | | | | | | | | | | | | | | | | | | | | | | | | | |
| Net investment income (loss) * | | | 0.03 | | | | (0.01 | ) | | | 0.04 | | | | 0.07 | | | | 0.00 | (a) | | | 0.02 | | | | | | | | | | | | | | | | | | | | | | | | | |
| Net realized and unrealized gain (loss) | | | (0.21 | ) | | | (0.18 | ) | | | 1.45 | | | | 3.40 | | | | 0.77 | | | | 0.66 | | | | | | | | | | | | | | | | | | | | | | | | | |
| Total income (loss) from investment operations | | | (0.18 | ) | | | (0.19 | ) | | | 1.49 | | | | 3.47 | | | | 0.77 | | | | 0.68 | | | | | | | | | | | | | | | | | | | | | | | | | |
| Less distributions: | | | | | | | | | | | | | | | | | | | | | | | | | | | | | | | | | | | | | | | | | | | | | | | | |
| Distributions from net investment income | | | (0.01 | ) | | | (0.04 | ) | | | (0.02 | ) | | | (0.03 | ) | | | 0.00 | | | | (0.02 | ) | | | | | | | | | | | | | | | | | | | | | | | | |
| Distributions from net realized gains | | | (0.48 | ) | | | (0.95 | ) | | | (0.67 | ) | | | 0.00 | | | | 0.00 | | | | 0.00 | | | | | | | | | | | | | | | | | | | | | | | | | |
| Total distributions | | | (0.49 | ) | | | (0.99 | ) | | | (0.69 | ) | | | (0.03 | ) | | | 0.00 | | | | (0.02 | ) | | | | | | | | | | | | | | | | | | | | | | | | |
| Net asset value, end of period | | $ | 13.60 | | | $ | 14.27 | | | $ | 15.45 | | | $ | 14.65 | | | $ | 11.21 | | | $ | 10.44 | | | | | | | | | | | | | | | | | | | | | | | | | |
| | | | | | | | | | | | | | | | | | | | | | | | | | | | | | | | | | | | | | | | | | | | | | | | | |
| Total return + # | | | (1.30 | )% | | | (1.59 | )% | | | 10.30 | % | | | 31.05 | % | | | 7.38 | % | | | 6.94 | % | | | | | | | | | | | | | | | | | | | | | | | | |
| Ratios/Supplemental Data: | | | | | | | | | | | | | | | | | | | | | | | | | | | | | | | | | | | | | | | | | | | | | | | | |
| Net assets, end of period (in 000s) | | $ | 21,206 | | | $ | 22,068 | | | $ | 23,783 | | | $ | 16,640 | | | $ | 15,764 | | | $ | 14,739 | | | | | | | | | | | | | | | | | | | | | | | | | |
| Ratios of expenses to average net assets: ^ | | | 1.72 | % | | | 1.79 | % | | | 1.45 | % | | | 1.29 | % | | | 2.02 | % | | | 2.10 | % | | | | | | | | | | | | | | | | | | | | | | | | |
| Ratios of net investment income (loss) to ^ average net assets: | | | 0.53 | % | | | (0.10 | )% | | | 0.27 | % | | | 0.62 | % | | | 0.04 | % | | | 0.06 | % | | | | | | | | | | | | | | | | | | | | | | | | |
| Portfolio turnover rate | | | 58 | % (1) | | | 122 | % | | | 106 | % | | | 147 | % | | | 62 | % | | | 50 | % | | | | | | | | | | | | | | | | | | | | | | | | |
| | | | | | | | | | | | | | | | | | | | | | | | | | | | | | | | | | | | | | | | | | | | | | | | | |
| | | Class A | | | Class C | |
| | | Six Months | | | | | | | | | | | | | | | | | | Six Months | | | | | | | | | | | | | | | | |
| | | Ended | | | | | | | | | | | | | | | | | | Ended | | | | | | | | | | | | | | | | |
| | | April 30, | | | Year Ended October 31, | | | April 30, | | | Year Ended October 31, | |
| | | 2016 | | | 2015 | | | 2014 | | | 2013 | | | 2012 | | | 2011 | | | 2016 | | | 2015 | | | 2014 | | | 2013 | | | 2012 | | | 2011 | |
| | | (Unaudited) | | | | | | | | | | | | | | | | | | (Unaudited) | | | | | | | | | | | | | | | | |
| | | | | | | | | | | | | | | | | | | | | | | | | | | | | | | | | | | | | |
| Net asset value, beginning of period | | $ | 14.18 | | | $ | 15.36 | | | $ | 14.59 | | | $ | 11.16 | | | $ | 10.40 | | | $ | 9.75 | | | $ | 13.06 | | | $ | 14.32 | | | $ | 10.59 | | | $ | 10.59 | | | $ | 9.96 | | | $ | 9.40 | |
| Income (loss) from investment operations: | | | | | | | | | | | | | | | | | | | | | | | | | | | | | | | | | | | | | | | | | | | | | | | | |
| Net investment income (loss)* | | | 0.02 | | | | (0.05 | ) | | | (0.00 | ) | | | 0.01 | | | | 0.00 | (a) | | | (0.01 | ) | | | (0.03 | ) | | | (0.15 | ) | | | (0.10 | ) | | | (0.03 | ) | | | (0.10 | ) | | | (0.09 | ) |
| Net realized and unrealized gain (loss) | | | (0.23 | ) | | | (0.18 | ) | | | 1.44 | | | | 3.42 | | | | 0.76 | | | | 0.66 | | | | (0.21 | ) | | | (0.16 | ) | | | 1.35 | | | | 3.18 | | | | 0.73 | | | | 0.65 | |
| Total income (loss) from investment operations | | | (0.21 | ) | | | (0.23 | ) | | | 1.44 | | | | 3.43 | | | | 0.76 | | | | 0.65 | | | | (0.24 | ) | | | (0.31 | ) | | | 1.25 | | | | 3.15 | | | | 0.63 | | | | 0.56 | |
| Less distributions: | | | | | | | | | | | | | | | | | | | | | | | | | | | | | | | | | | | | | | | | | | | | | | | | |
| Distributions from net realized gains | | | (0.48 | ) | | | (0.95 | ) | | | (0.67 | ) | | | 0.00 | | | | 0.00 | | | | 0.00 | | | | (0.48 | ) | | | (0.95 | ) | | | (0.67 | ) | | | 0.00 | | | | 0.00 | | | | 0.00 | |
| Total distributions | | | (0.48 | ) | | | (0.95 | ) | | | (0.67 | ) | | | 0.00 | | | | 0.00 | | | | 0.00 | | | | (0.48 | ) | | | (0.95 | ) | | | (0.67 | ) | | | 0.00 | | | | 0.00 | | | | 0.00 | |
| Net asset value, end of period | | $ | 13.49 | | | $ | 14.18 | | | $ | 15.36 | | | $ | 14.59 | | | $ | 11.16 | | | $ | 10.40 | | | $ | 12.34 | | | $ | 13.06 | | | $ | 11.17 | | | $ | 13.74 | | | $ | 10.59 | | | $ | 9.96 | |
| | | | | | | | | | | | | | | | | | | | | | | | | | | | | | | | | | | | | | | | | | | | | | | | | |
| Total return + # | | | (1.52 | )% | | | (1.83 | )% | | | 10.02 | % | | | 30.74 | % | | | 7.31 | % | | | 6.67 | % | | | (1.88 | )% | | | (2.56 | )% | | | 9.22 | % | | | 29.75 | % | | | 6.33 | % | | | 5.96 | % |
| Ratios/Supplemental Data: | | | | | | | | | | | | | | | | | | | | | | | | | | | | | | | | | | | | | | | | | | | | | | | | |
| Net assets, end of period iin 000s) | | $ | 3,684 | | | $ | 3,801 | | | $ | 3,268 | | | $ | 1,756 | | | $ | 567 | | | $ | 193 | | | $ | 2,313 | | | $ | 2,383 | | | $ | 2,494 | | | $ | 2,057 | | | $ | 2,099 | | | $ | 2,574 | |
| Ratios of expenses to average net assets: ^ | | | 1.97 | % | | | 2.04 | % | | | 1.70 | % | | | 1.54 | % | | | 2.27 | % | | | 2.35 | % | | | 2.72 | % | | | 2.79 | % | | | 2.45 | % | | | 2.29 | % | | | 3.02 | % | | | 3.10 | % |
| Ratios of net investment income (loss) to ^ average net assets: | | | 0.29 | % | | | (0.36 | )% | | | (0.06 | )% | | | 0.15 | % | | | (0.21 | )% | | | (0.22 | )% | | | (0.47 | )% | | | (1.11 | )% | | | (0.70 | )% | | | (0.37 | )% | | | (0.96 | )% | | | (0.95 | )% |
| Portfolio turnover rate | | | 58 | % (1) | | | 122 | % | | | 106 | % | | | 147 | % | | | 62 | % | | | 50 | % | | | 58 | % (1) | | | 122 | % | | | 106 | % | | | 147 | % | | | 62 | % | | | 50 | % |
| * | The net investment income (loss) per share data was determined using the average shares outstanding throughout each period. |
| + | Assumes reinvestment of all dividends and distributions, if any. Total return does not reflect the deductions of taxes that a shareholder would pay on distributions or on the redemption of shares. |
| (a) | Represents less than $0.01 per share. |
| # | Includes adjustments in accordance with accounting principles generally accepted in the United States and, consequently, the net asset value for financial reporting purposes and the returns based upon those net asset values may differ from the net asset values and returns for shareholder transactions. |
| ^ | Annualized for periods less than one year. |
See accompanying notes to financial statements.
| FINANCIAL HIGHLIGHTS |
| Dunham Emerging Markets Stock Fund |
| |
| The table sets forth financial data for one share of beneficial interest outstanding throughout each year. |
| | | Class N | | | | | | | | | | | | | | | | | | | | | | | | | |
| | | Six Months | | | | | | | | | | | | | | | | | | | | | | | | | | | | | | | | | | | | | | | | |
| | | Ended | | | | | | | | | | | | | | | | | | | | | | | | | | | | | | | | | | | | | | | | |
| | | April 30, | | | Year Ended October 31, | | | | | | | | | | | | | | | | | | | | | | | | | |
| | | 2016 | | | 2015 | | | 2014 | | | 2013 | | | 2012 | | | 2011 | | | | | | | | | | | | | | | | | | | | | | | | | |
| | | (Unaudited) | | | | | | | | | | | | | | | | | | | | | | | | | | | | | | | | | | | | | | | | |
| | | | | | | | | | | | | | | | | | | | | | | | | | | | | | | | | | | | | | | | | | | |
| Net asset value, beginning of period | | $ | 11.97 | | | $ | 14.75 | | | $ | 14.66 | | | $ | 13.82 | | | $ | 13.43 | | | $ | 16.03 | | | | | | | | | | | | | | | | | | | | | | | | | |
| Income (loss) from investment operations: | | | | | | | | | | | | | | | | | | | | | | | | | | | | | | | | | | | | | | | | | | | | | | | | |
| Net investment income (loss)* | | | 0.05 | | | | 0.08 | | | | 0.20 | | | | 0.00 | (a) | | | 0.04 | | | | (0.05 | ) | | | | | | | | | | | | | | | | | | | | | | | | |
| Net realized and unrealized gain (loss) ** | | | (0.11 | ) | | | (2.67 | ) | | | (0.11 | ) | | | 0.84 | | | | 0.35 | | | | (2.55 | ) | | | | | | | | | | | | | | | | | | | | | | | | |
| Total income (loss) from investment operations | | | (0.06 | ) | | | (2.59 | ) | | | 0.09 | | | | 0.84 | | | | 0.39 | | | | (2.60 | ) | | | | | | | | | | | | | | | | | | | | | | | | |
| Less distributions: | | | | | | | | | | | | | | | | | | | | | | | | | | | | | | | | | | | | | | | | | | | | | | | | |
| Distributions from net investment income | | | (0.08 | ) | | | (0.19 | ) | | | 0.00 | | | | 0.00 | | | | 0.00 | | | | 0.00 | | | | | | | | | | | | | | | | | | | | | | | | | |
| Total distributions | | | (0.08 | ) | | | (0.19 | ) | | | 0.00 | | | | 0.00 | | | | 0.00 | | | | 0.00 | | | | | | | | | | | | | | | | | | | | | | | | | |
| Net asset value, end of period | | $ | 11.83 | | | $ | 11.97 | | | $ | 14.75 | | | $ | 14.66 | | | $ | 13.82 | | | $ | 13.43 | | | | | | | | | | | | | | | | | | | | | | | | | |
| | | | | | | | | | | | | | | | | | | | | | | | | | | | | | | | | | | | | | | | | | | | | | | | | |
| Total return +, # | | | (0.44 | )% | | | (17.73 | )% | | | 0.61 | % | | | 6.08 | % | | | 2.90 | % | | | (16.22 | )% | | | | | | | | | | | | | | | | | | | | | | | | |
| Ratios/Supplemental Data: | | | | | | | | | | | | | | | | | | | | | | | | | | | | | | | | | | | | | | | | | | | | | | | | |
| Net assets, end of period (in 000s) | | $ | 45,237 | | | $ | 42,831 | | | $ | 35,872 | | | $ | 24,736 | | | $ | 16,017 | | | $ | 14,616 | | | | | | | | | | | | | | | | | | | | | | | | | |
| Ratios of expenses to average net assets: ^ | | | 1.30 | % | | | 1.76 | % | | | 1.29 | % | | | 2.00 | % | | | 1.75 | % | | | 2.10 | % | | | | | | | | | | | | | | | | | | | | | | | | |
| Ratios of net investment income (loss) to ^ average net assets: | | | 0.93 | % | | | 0.59 | % | | | 1.39 | % | | | 0.03 | % | | | 0.29 | % | | | (0.35 | )% | | | | | | | | | | | | | | | | | | | | | | | | |
| Portfolio turnover rate | | | 59 | % (1) | | | 137 | % | | | 108 | % | | | 166 | % | | | 104 | % | | | 98 | % | | | | | | | | | | | | | | | | | | | | | | | | |
| | | | | | | | | | | | | | | | | | | | | | | | | | | | | | | | | | | | | | | | | | | | | | | | | |
| | | Class A | | | Class C | |
| | | Six Months | | | | | | | | | | | | | | | | | | Six Months | | | | | | | | | | | | | | | | |
| | | Ended | | | | | | | | | | | | | | | | | | Ended | | | | | | | | | | | | | | | | |
| | | April 30, | | | Year Ended October 31, | | | April 30, | | | Year Ended October 31, | |
| | | 2016 | | | 2015 | | | 2014 | | | 2013 | | | 2012 | | | 2011 | | | 2016 | | | 2015 | | | 2014 | | | 2013 | | | 2012 | | | 2011 | |
| | | (Unaudited) | | | | | | | | | | | | | | | | | | (Unaudited) | | | | | | | | | | | | | | | | |
| | | | | | | | | | | | | | | | | | | | | | | | | | | | | | | | | | | | | |
| Net asset value, beginning of period | | $ | 11.71 | | | $ | 14.44 | | | $ | 14.39 | | | $ | 13.59 | | | $ | 13.23 | | | $ | 15.83 | | | $ | 11.14 | | | $ | 13.76 | | | $ | 13.82 | | | $ | 13.16 | | | $ | 12.90 | | | $ | 15.56 | |
| Income (loss) from investment operations: | | | | | | | | | | | | | | | | | | | | | | | | | | | | | | | | | | | | | | | | | | | | | | | | |
| Net investment income (loss)* | | | 0.04 | | | | 0.05 | | | | 0.16 | | | | (0.07 | ) | | | 0.05 | | | | (0.12 | ) | | | 0.00 | | | | (0.06 | ) | | | 0.04 | | | | (0.14 | ) | | | (0.09 | ) | | | (0.20 | ) |
| Net realized and unrealized gain (loss) ** | | | (0.11 | ) | | | (2.62 | ) | | | (0.11 | ) | | | 0.87 | | | | 0.31 | | | | (2.48 | ) | | | (0.10 | ) | | | (2.49 | ) | | | (0.10 | ) | | | 0.80 | | | | 0.35 | | | | (2.46 | ) |
| Total income (loss) from investment operations | | | (0.07 | ) | | | (2.57 | ) | | | 0.05 | | | | 0.80 | | | | 0.36 | | | | (2.60 | ) | | | (0.10 | ) | | | (2.55 | ) | | | (0.06 | ) | | | 0.66 | | | | 0.26 | | | | (2.66 | ) |
| Less distributions: | | | | | | | | | | | | | | | | | | | | | | | | | | | | | | | | | | | | | | | | | | | | | | | | |
| Distributions from net investment income | | | (0.05 | ) | | | (0.16 | ) | | | 0.00 | | | | 0.00 | | | | 0.00 | | | | 0.00 | | | | 0.00 | | | | (0.07 | ) | | | 0.00 | | | | 0.00 | | | | 0.00 | | | | 0.00 | |
| Total distributions | | | (0.05 | ) | | | (0.16 | ) | | | 0.00 | | | | 0.00 | | | | 0.00 | | | | 0.00 | | | | 0.00 | | | | (0.07 | ) | | | 0.00 | | | | 0.00 | | | | 0.00 | | | | 0.00 | |
| Net asset value, end of period | | $ | 11.59 | | | $ | 11.71 | | | $ | 14.44 | | | $ | 14.39 | | | $ | 13.59 | | | $ | 13.23 | | | $ | 11.04 | | | $ | 11.14 | | | $ | 13.76 | | | $ | 13.82 | | | $ | 13.16 | | | $ | 12.90 | |
| | | | | | | | | | | | | | | | | | | | | | | | | | | | | | | | | | | | | | | | | | | | | | | | | |
| Total return +, # | | | (0.55 | )% | | | (17.94 | )% | | | 0.35 | % | | | 5.89 | % | | | 2.72 | % | | | (16.42 | )% | | | (0.90 | )% | | | (18.60 | )% | | | (0.43 | )% | | | 5.02 | % | | | 2.02 | % | | | (17.10 | )% |
| Ratios/Supplemental Data: | | | | | | | | | | | | | | | | | | | | | | | | | | | | | | | | | | | | | | | | | | | | | | | | |
| Net assets, end of period (in 000s) | | $ | 4,977 | | | $ | 4,594 | | | $ | 4,036 | | | $ | 2,475 | | | $ | 11,364 | | | $ | 951 | | | $ | 3,198 | | | $ | 3,216 | | | $ | 3,593 | | | $ | 2,735 | | | $ | 2,497 | | | $ | 2,755 | |
| Ratios of expenses to average net assets:^ | | | 1.55 | % | | | 2.01 | % | | | 1.54 | % | | | 2.25 | % | | | 2.00 | % | | | 2.35 | % | | | 2.30 | % | | | 2.76 | % | | | 2.29 | % | | | 3.00 | % | | | 2.75 | % | | | 3.10 | % |
| Ratios of net investment income (loss) to average net assets: ^ | | | 0.68 | % | | | 0.40 | % | | | 1.14 | % | | | (0.48 | )% | | | 0.04 | % | | | (0.80 | )% | | | (0.07 | )% | | | (0.48 | )% | | | 0.34 | % | | | (1.03 | )% | | | (0.71 | )% | | | (1.35 | )% |
| Portfolio turnover rate | | | 59 | % (1) | | | 137 | % | | | 108 | % | | | 166 | % | | | 104 | % | | | 98 | % | | | 59 | % (1) | | | 137 | % | | | 108 | % | | | 166 | % | | | 104 | % | | | 98 | % |
| (a) | Represents less than $0.01 per share. |
| * | The net investment income (loss) per share data was determined using the average shares outstanding throughout each period. |
| ** | The amount of net realized and unrealized loss on investment per share for the year ended October 31, 2014 does not accord with the amounts in the Statements of Operations due to the timing of purchases and sales of Fund shares in relation to fluctuating market values. |
| + | Assumes reinvestment of all dividends and distributions, if any. Total return does not reflect the deductions of taxes that a shareholder would pay on distributions or on the redemption of shares. |
| # | Includes adjustments in accordance with accounting principles generally accepted in the United States and, consequently, the net asset value for financial reporting purposes and the returns based upon those net asset values may differ from the net asset values and returns for shareholder transactions. |
| ^ | Annualized for periods less than one year. |
See accompanying notes to financial statements.
| FINANCIAL HIGHLIGHTS |
| Dunham Small Cap Growth Fund |
| |
| The table sets forth financial data for one share of beneficial interest outstanding throughout each period. |
| | | Class N | | | | | | | | | | | | | | | | | | | | | | | | | |
| | | Six Months | | | | | | | | | | | | | | | | | | | | | | | | | | | | | | | | | | | | | | | | |
| | | Ended | | | Year Ended | | | | | | | | | | | | | | | | | | | | | | | | | |
| | | April 30, | | | October 31, | | | | | | | | | | | | | | | | | | | | | | | | | |
| | | 2016 | | | 2015 | | | 2014 | | | 2013 | | | 2012 | | | 2011 | | | | | | | | | | | | | | | | | | | | | | | | | |
| | | (Unaudited) | | | | | | | | | | | | | | | | | | | | | | | | | | | | | | | | | | | | | | | | |
| | | | | | | | | | | | | | | | | | | | | | | | | | | | | | | | | | | | | | | | | | | |
| Net asset value, beginning of period | | $ | 17.08 | | | $ | 17.71 | | | $ | 20.62 | | | $ | 15.69 | | | $ | 14.75 | | | $ | 13.67 | | | | | | | | | | | | | | | | | | | | | | | | | |
| Income from investment operations: | | | | | | | | | | | | | | | | | | | | | | | | | | | | | | | | | | | | | | | | | | | | | | | | |
| Net investment loss* | | | (0.07 | ) | | | (0.24 | ) | | | (0.29 | ) | | | (0.19 | ) | | | (0.17 | ) | | | (0.18 | ) | | | | | | | | | | | | | | | | | | | | | | | | |
| Net realized and unrealized gain (loss) | | | (1.12 | ) | | | 1.19 | | | | 1.11 | | | | 6.10 | | | | 1.11 | | | | 1.26 | | | | | | | | | | | | | | | | | | | | | | | | | |
| Total income (loss) from investment operations | | | (1.19 | ) | | | 0.95 | | | | 0.82 | | | | 5.91 | | | | 0.94 | | | | 1.08 | | | | | | | | | | | | | | | | | | | | | | | | | |
| Less distributions: | | | | | | | | | | | | | | | | | | | | | | | | | | | | | | | | | | | | | | | | | | | | | | | | |
| Distributions from net realized gains | | | (1.44 | ) | | | (1.58 | ) | | | (3.73 | ) | | | (0.98 | ) | | | 0.00 | | | | 0.00 | | | | | | | | | | | | | | | | | | | | | | | | | |
| Total distributions | | | (1.44 | ) | | | (1.58 | ) | | | (3.73 | ) | | | (0.98 | ) | | | 0.00 | | | | 0.00 | | | | | | | | | | | | | | | | | | | | | | | | | |
| Net asset value, end of period | | $ | 14.45 | | | $ | 17.08 | | | $ | 17.71 | | | $ | 20.62 | | | $ | 15.69 | | | $ | 14.75 | | | | | | | | | | | | | | | | | | | | | | | | | |
| | | | | | | | | | | | | | | | | | | | | | | | | | | | | | | | | | | | | | | | | | | | | | | | | |
| Total return + # | | | (7.57 | )% | | | 5.36 | % | | | 3.64 | % | | | 40.28 | % | | | 6.37 | % | | | 7.90 | % | | | | | | | | | | | | | | | | | | | | | | | | |
| Ratios/Supplemental Data: | | | | | | | | | | | | | | | | | | | | | | | | | | | | | | | | | | | | | | | | | | | | | | | | |
| Net assets, end of period (in 000s) | | $ | 23,828 | | | $ | 23,152 | | | $ | 21,153 | | | $ | 16,146 | | | $ | 14,627 | | | $ | 14,975 | | | | | | | | | | | | | | | | | | | | | | | | | |
| Ratios of expenses to average net assets: ^ | | | 1.35 | % | | | 1.58 | % | | | 1.84 | % | | | 1.35 | % | | | 1.34 | % | | | 1.45 | % | | | | | | | | | | | | | | | | | | | | | | | | |
| Ratios of net investment loss to average net assets: ^ | | | (0.89 | )% | | | (1.30 | )% | | | (1.61 | )% | | | (1.08 | )% | | | (1.12 | )% | | | (1.15 | )% | | | | | | | | | | | | | | | | | | | | | | | | |
| Portfolio turnover rate | | | 74 | % (1) | | | 138 | % | | | 192 | % | | | 231 | % | | | 211 | % | | | 235 | % | | | | | | | | | | | | | | | | | | | | | | | | |
| | | | | | | | | | | | | | | | | | | | | | | | | | | | | | | | | | | | | | | | | | | | | | | | | |
| | | Class A | | | Class C | |
| | | Six Months | | | | | | | | | | | | | | | | | | Six Months | | | | | | | | | | | | | | | | |
| | | Ended | | | Year Ended | | | Ended | | | Year Ended | |
| | | April 30, | | | October 31, | | | April 30, | | | October 31, | |
| | | 2016 | | | 2015 | | | 2014 | | | 2013 | | | 2012 | | | 2011 | | | 2016 | | | 2015 | | | 2014 | | | 2013 | | | 2012 | | | 2011 | |
| | | (Unaudited) | | | | | | | | | | | | | | | | | | (Unaudited) | | | | | | | | | | | | | | | | |
| | | | | | | | | | | | | | | | | | | | | | | | | | | | | | | | | | | | | |
| Net asset value, beginning of period | | $ | 16.62 | | | $ | 17.31 | | | $ | 20.28 | | | $ | 15.49 | | | $ | 14.59 | | | $ | 13.56 | | | $ | 14.61 | | | $ | 15.51 | | | $ | 18.66 | | | $ | 14.43 | | | $ | 13.69 | | | $ | 12.82 | |
| Income from investment operations: | | | | | | | | | | | | | | | | | | | | | | | | | | | | | | | | | | | | | | | | | | | | | | | | |
| Net investment loss* | | | (0.08 | ) | | | (0.27 | ) | | | (0.34 | ) | | | (0.24 | ) | | | (0.21 | ) | | | (0.24 | ) | | | (0.12 | ) | | | (0.36 | ) | | | (0.42 | ) | | | (0.32 | ) | | | (0.30 | ) | | | (0.31 | ) |
| Net realized and unrealized gain (loss) | | | (1.09 | ) | | | 1.16 | | | | 1.10 | | | | 6.01 | | | | 1.11 | | | | 1.27 | | | | (0.94 | ) | | | 1.04 | | | | 1.00 | | | | 5.53 | | | | 1.04 | | | | 1.18 | |
| Total income (loss) from investment operations | | | (1.17 | ) | | | 0.89 | | | | 0.76 | | | | 5.77 | | | | 0.90 | | | | 1.03 | | | | (1.06 | ) | | | 0.68 | | | | 0.58 | | | | 5.21 | | | | 0.74 | | | | 0.87 | |
| Less distributions: | | | | | | | | | | | | | | | | | | | | | | | | | | | | | | | | | | | | | | | | | | | | | | | | |
| Distributions from net realized gains | | | (1.44 | ) | | | (1.58 | ) | | | (3.73 | ) | | | (0.98 | ) | | | 0.00 | | | | 0.00 | | | | (1.44 | ) | | | (1.58 | ) | | | (3.73 | ) | | | (0.98 | ) | | | 0.00 | | | | 0.00 | |
| Total distributions | | | (1.44 | ) | | | (1.58 | ) | | | (3.73 | ) | | | (0.98 | ) | | | 0.00 | | | | 0.00 | | | | (1.44 | ) | | | (1.58 | ) | | | (3.73 | ) | | | (0.98 | ) | | | 0.00 | | | | 0.00 | |
| Net asset value, end of period | | $ | 14.01 | | | $ | 16.62 | | | $ | 17.31 | | | $ | 20.28 | | | $ | 15.49 | | | $ | 14.59 | | | $ | 12.11 | | | $ | 14.61 | | | $ | 15.51 | | | $ | 18.66 | | | $ | 14.43 | | | $ | 13.69 | |
| | | | | | | | | | | | | | | | | | | | | | | | | | | | | | | | | | | | | | | | | | | | | | | | | |
| Total return + # | | | (7.66 | )% | | | 5.12 | % | | | 3.36 | % | | | 39.88 | % | | | 6.17 | % | | | 7.60 | % | | | (7.99 | )% | | | 4.29 | % | | | 2.56 | % | | | 38.87 | % | | | 5.41 | % | | | 6.79 | % |
| Ratios/Supplemental Data: | | | | | | | | | | | | | | | | | | | | | | | | | | | | | | | | | | | | | | | | | | | | | | | | |
| Net assets, end of period (in 000s) | | $ | 5,650 | | | $ | 6,326 | | | $ | 6,443 | | | $ | 5,890 | | | $ | 2,418 | | | $ | 1,950 | | | $ | 2,929 | | | $ | 3,163 | | | $ | 3,165 | | | $ | 2,685 | | | $ | 2,694 | | | $ | 3,193 | |
| Ratios of expenses to average net assets: ^ | | | 1.60 | % | | | 1.83 | % | | | 2.09 | % | | | 1.60 | % | | | 1.59 | % | | | 1.70 | % | | | 2.35 | % | | | 2.58 | % | | | 2.84 | % | | | 2.35 | % | | | 2.34 | % | | | 2.45 | % |
| Ratios of net investment loss to average net assets: ^ | | | (1.14 | )% | | | (1.53 | )% | | | (1.86 | )% | | | (1.33 | )% | | | (1.37 | )% | | | (1.40 | )% | | | (1.89 | )% | | | (2.29 | )% | | | (2.61 | )% | | | (2.08 | )% | | | (2.12 | )% | | | (2.15 | )% |
| Portfolio turnover rate | | | 74 | % (1) | | | 138 | % | | | 192 | % | | | 231 | % | | | 211 | % | | | 235 | % | | | 74 | % (1) | | | 138 | % | | | 192 | % | | | 231 | % | | | 211 | % | | | 235 | % |
| * | The net investment loss per share data was determined using the average shares outstanding throughout each period. |
| + | Assumes reinvestment of all dividends and distributions, if any. Total return does not reflect the deductions of taxes that a shareholder would pay on distributions or on the redemption of shares. |
| # | Includes adjustments in accordance with accounting principles generally accepted in the United States and, consequently, the net asset value for financial reporting purposes and the returns based upon those net asset values may differ from the net asset values and returns for shareholder transactions. |
| ^ | Annualized for periods less than one year. |
See accompanying notes to financial statements.
| NOTES TO FINANCIAL STATEMENTS (Unaudited) |
| April 30, 2016 |
Each Dunham Fund (each, a “Fund” and collectively the “Funds”) is a series of shares of beneficial interest in the Dunham Funds (the “Trust”), a Delaware Business Trust organized on November 28, 2007 and registered under the Investment Company Act of 1940, as amended, (the “1940 Act”) as an open-end management investment company. Prior to that date, the Dunham Funds were a series of AdvisorOne Funds, also a Delaware Business Trust. The Dunham Funds currently consist of fifteen funds: Corporate/Government Bond Fund; Monthly Distribution Fund; Floating Rate Bond Fund; High-Yield Bond Fund; International Opportunity Bond Fund; Dynamic Macro Fund; Alternative Strategy Fund; Appreciation & Income Fund; Large Cap Value Fund; Focused Large Cap Growth Fund; International Stock Fund; Real Estate Stock Fund; Small Cap Value Fund; Emerging Markets Stock Fund and Small Cap Growth Fund. Alternative Strategy Fund, Focused Large Cap Growth Fund, International Opportunity Bond Fund, and Real Estate Stock Fund are non-diversified funds within the meaning of the 1940 Act. The remaining Funds are diversified funds within the meaning of the 1940 Act.
| Fund | | Primary Objective |
| Floating Rate Bond | | High level of current income |
| Monthly Distribution | | Positive returns in rising and falling market environments |
| Corporate/Government Bond | | Current income and capital appreciation |
| Dynamic Macro | | Maximize total return from capital appreciation and dividends |
| High-Yield Bond | | High level of current income |
| International Opportunity Bond | | High level of current income |
| Appreciation & Income | | Total return under varying market conditions through both current income and capital appreciation |
| Alternative Strategy | | Long-term capital appreciation by realizing gains during periods of rising and declining Markets |
| Large Cap Value | | Maximize total return from capital appreciation and dividends |
| Focused Large Cap Growth | | Maximize capital appreciation |
| International Stock | | Maximize total return from capital appreciation and dividends |
| Real Estate Stock | | Maximize total return from capital appreciation and dividends |
| Small Cap Value | | Maximize total return from capital appreciation and income |
| Emerging Markets Stock | | Maximize capital appreciation |
| Small Cap Growth | | Maximize capital appreciation |
Currently, each Fund offers Class A, Class C and Class N shares. Each class represents an interest in the same assets of the applicable Fund with the only differences being that Class A shares are subject to a front-end sales charge and an annual service fee, Class C shares are subject to an annual service and distribution fee and Class N shares have a higher minimum investment amount. Investors that purchase $1,000,000 or more of Class A shares will not pay any initial sales charge on the purchase. However, purchases of $1,000,000 or more of Class A shares may be subject to a contingent deferred sales charge (“CDSC”) on shares redeemed during the first 18 months after their purchase in the amount of the commissions paid on the shares redeemed. The Class C and Class N shares, with the exception of Monthly Distribution, High-Yield Bond, Dynamic Macro, Focused Large Cap Growth, Alternative Strategy, Floating Rate Bond, and International Opportunity Bond commenced operations on December 10, 2004 and were formed as a result of tax-free conversions from common trusts. The conversions were accomplished through the exchange of the common trust securities, cash, and other assets for equivalent value of the Funds’ shares. High-Yield Bond Class C and Class N shares commenced operations on July 1, 2005. The Class A shares for all Funds except Monthly Distribution, Dynamic Macro, Focused Large Cap Growth, Alternative Strategy, Floating Rate Bond, and International Opportunity Bond commenced operations on January 3, 2007. Monthly Distribution’s Predecessor Fund’s Class A shares and Class C shares commenced operations on December 26, 2000. Monthly Distribution’s Class N shares commenced operations on September 29, 2008. Dynamic Macro commenced operations on April 30, 2010. Focused Large Cap Growth commenced operations on December 8, 2011.. Effective October 1, 2014, Dynamic Macro changed its name from Loss Averse Equity Income. Alternative Strategy’s Predecessor Fund’s Class N shares commenced operations on February 13, 2009 and Alternative Strategy Class A shares commenced operations on March 25, 2009. Alternative Strategy Class C shares commenced operations on May 14, 2009. Floating Rate Bond and International Opportunity Bond commenced operations on November 1, 2013.
| 2. | SUMMARY OF SIGNIFICANT ACCOUNTING POLICIES |
The preparation of financial statements in conformity with accounting principles generally accepted in the United States of America (“GAAP”) requires management to make estimates and assumptions that affect the reported amounts of assets and liabilities and disclosure of contingent assets and liabilities at the date of the financial statements and the reported amounts of increases and
| NOTES TO FINANCIAL STATEMENTS (Unaudited) |
| April 30, 2016 (Continued) |
decreases in net assets from operations during the reporting period. Actual results could differ from those estimates. The Funds follow the specialized accounting and reporting requirements under GAAP that are applicable to investment companies.
The following is a summary of significant accounting policies followed by the Fund in preparation of their financial statements.
a. Security Valuation – In determining each Fund’s Net Asset Value (“NAV”) per share, equity securities for which market quotations are readily available are valued at current market value using the last reported sales price. NASDAQ traded securities are valued using the NASDAQ official closing price (“NOCP”). If no sale price is reported, the mean between the current bid and ask price is used. If market quotations are not readily available, then securities are valued at fair value as determined by the Board of Trustees of the Trust (the “Board”) (or its delegate). U.S. Government and agency securities are valued at the mean between the most recent bid and ask prices. Short-term debt instruments with a remaining maturity of more than 60 days, intermediate and long-term bonds, convertible bonds, bank loans and other debt securities are generally valued on the basis of dealer supplied quotations or by a pricing system selected by Dunham & Associates Investment Counsel, Inc. (“Dunham & Associates” or the “Adviser”) and approved by the Board. Where such prices are not available, valuations will be obtained from brokers who are market makers for such securities. However, in circumstances where the Adviser deems it appropriate to do so, the mean of the bid and ask prices for over-the-counter securities or the last available sale price for exchange-traded debt securities may be used. Where no last sale price for exchange traded debt securities is available, the mean of the bid and ask prices may be used. Short-term debt securities with a remaining maturity of 60 days or less may be valued at amortized cost, provided such valuations represent fair value.
Options are valued at the last reported sale price at the close of the exchange on which the security is primarily traded. If no sales are reported for the exchange-traded options, or the options are not exchange-traded, then they are valued at the mean of their most recent quoted bid and ask price.
Equity swaps are valued at the last reported sale price at the close of the exchange on which the underlying security is primarily traded. If no sale price is reported, then they are valued at the mean of their most recent quoted bid and asked price.
Futures and future options are valued at the final settled price or, in the absence of a settled price, at the mean between the current bid and ask prices on the day of valuation.
Trading in securities on far eastern securities exchanges and over-the-counter markets is normally completed well before the close of business on each business day in New York (i.e., a day on which the New York Stock Exchange (“NYSE”) is open). In addition, far eastern securities trading generally, or in a particular country or countries, may not take place on all business days in New York. Furthermore, trading takes place in Japanese markets on certain Saturdays and in various foreign markets on days, which are not business days in New York, and on which a Fund’s NAV is not calculated. Each Fund calculates NAV per share, and therefore effects sales, redemptions and repurchases of its shares, as of the close of regular trading on the NYSE once on each day on which the NYSE is open. Such calculation may not take place contemporaneously with the determination of the prices of the majority of the portfolio securities used in such calculation. If events that may materially affect the value of such securities occur between the time when their price is determined and the time when the Fund’s NAV is calculated, such securities may be valued at fair value as determined in good faith in accordance with procedures approved by the Board.
Securities in which the Funds invest may be traded in markets that close before 4:00 p.m. Eastern Time (“ET”). Normally, developments that occur between the close of the foreign markets and 4:00 p.m. ET will not be reflected in a Fund’s NAV. However, Funds may determine that such developments are so significant that they will materially affect the value of a Fund’s securities, and the Fund may adjust the previous closing prices to reflect what the Board believes to be the fair value of these securities as of 4:00 p.m. ET. Effective July 1, 2009, both International Stock and Emerging Markets Stock began using fair value prices as provided by an independent pricing vendor on a daily basis for those securities traded on a foreign exchange.
Securities for which current market quotations are not readily available, or for which quotations are not deemed to be representative of market values, are valued at fair value as determined in good faith by or under the direction of the Board in accordance with the Trust’s Portfolio Securities Valuation Procedures (the “Procedures”). The Procedures consider, among others, the following factors to determine a security’s fair value: the nature and pricing history (if any) of the security; whether any dealer quotations for the security are available; and possible valuation methodologies that could be used to determine the fair value of the security.
Valuation of Fund of Funds - The Funds may invest in portfolios of open-end investment companies. Open-end investment companies are valued at their respective net asset values as reported by such investment companies. Open-end investment companies value securities in their portfolios for which market quotations are readily available at their market values (generally the last reported sale price) and all other securities and assets at their fair value based on the methods established by the board of directors of the open-end funds.
The Funds utilize various methods to measure the fair value of most of their investments on a recurring basis. GAAP establishes a hierarchy that prioritizes inputs to valuation methods. The three levels of input are:
| NOTES TO FINANCIAL STATEMENTS (Unaudited) |
| April 30, 2016 (Continued) |
Level 1 – Unadjusted quoted prices in active markets for identical assets and liabilities.
Level 2 – Observable inputs other than quoted prices included in Level 1 that are observable for the asset or liability, either directly or indirectly. These inputs may include quoted prices for the identical instrument on an inactive market, prices for similar instruments, interest rates, prepayment speeds, credit risk, yield curves, default rates and similar data.
Level 3 – Unobservable inputs for the asset or liability, to the extent relevant observable inputs are not available, representing the Funds’ own assumptions about the assumptions a market participant would use in valuing the asset or liability, and would be based on the best information available.
The availability of observable inputs can vary from security to security and is affected by a wide variety of factors, including, for example, the type of security, whether the security is new and not yet established in the marketplace, the liquidity of markets, and other characteristics particular to the security. To the extent that valuation is based on models or inputs that are less observable or unobservable in the market, the determination of fair value requires more judgment. Accordingly, the degree of judgment exercised in determining fair value is greatest for instruments categorized in Level 3.
The inputs used to measure fair value may fall into different levels of the fair value hierarchy. In such cases, for disclosure purposes, the level in the fair value hierarchy within which the fair value measurement falls in its entirety, is determined based on the lowest level input that is significant to the fair value measurement in its entirety.
The inputs or methodology used for valuing securities are not necessarily an indication of the risk associated with investing in those securities. The following tables summarize the inputs used as of April 30, 2016 for the Funds’ assets and liabilities measured at fair value:
Floating Rate Bond
| Assets | | Level 1 | | | Level 2 | | | Level 3 | | | Total | |
| Bank Loans * | | $ | — | | | $ | 80,553,296 | | | $ | — | | | $ | 80,553,296 | |
| Bonds & Notes * | | | — | | | | 4,002,034 | | | | — | | | | 4,002,034 | |
| Asset Backed Securities | | | 1,347,803 | | | | | | | | | | | | | |
| Short-Term Investment | | | 3,122,938 | | | | — | | | | — | | | | 3,122,938 | |
| Collateral for Securities Loaned | | | 105,750 | | | | — | | | | — | | | | 105,750 | |
| Total | | $ | 4,576,491 | | | $ | 84,555,330 | | | $ | — | | | $ | 87,784,018 | |
Monthly Distribution
| Assets | | Level 1 | | | Level 2 | | | Level 3 | | | Total | |
| Common Stock * | | $ | 210,266,961 | | | $ | — | | | $ | — | | | $ | 210,266,961 | |
| Rights | | | 76,436 | | | | — | | | | — | | | | 76,436 | |
| Warrants | | | 38,641 | | | | — | | | | — | | | | 38,641 | |
| Closed End Funds | | | 9,674,922 | | | | — | | | | — | | | | 9,674,922 | |
| Preferred Stock * | | | 5,575,000 | | | | — | | | | — | | | | 5,575,000 | |
| Bonds & Notes * | | | — | | | | 12,304,376 | | | | — | | | | 12,304,376 | |
| Purchased Put Options | | | 2,488,393 | | | | — | | | | — | | | | 2,488,393 | |
| Short-Term Investment | | | 29,646,669 | | | | — | | | | — | | | | 29,646,669 | |
| Collateral for Securities Loaned | | | 9,209,035 | | | | | | | | | | | | 9,209,035 | |
| Total Assets | | $ | 266,976,057 | | | $ | 12,304,376 | | | $ | — | | | $ | 279,280,433 | |
| Derivatives | | | | | | | | | | | | | | | | |
| Forward Currency Exchange Contracts | | | — | | | | 24,068,965 | | | | — | | | | 24,068,965 | |
| Equity Swap Contracts | | | 4,382,304 | | | | | | | | — | | | | 4,382,304 | |
| Total Derivatives | | $ | 4,382,304 | | | $ | 24,068,965 | | | $ | — | | | $ | 28,451,269 | |
| Liabilities-Securities Sold Short | | | 71,734,934 | | | | | | | | — | | | | 71,734,934 | |
| Total Liabilities | | $ | 71,734,934 | | | $ | — | | | $ | — | | | $ | 71,734,934 | |
| Liabilities-Derivatives | | | | | | | | | | | | | | | | |
| Written Call Options | | | 6,206,860 | | | | — | | | | — | | | | 6,206,860 | |
| Written Put Options | | | 347,205 | | | | — | | | | — | | | | 347,205 | |
| Equity Swap Contracts | | | 2,826,408 | | | | — | | | | — | | | | 2,826,408 | |
| Forward Currency Exchange Contracts | | | — | | | | 24,513,923 | | | | — | | | | 24,513,923 | |
| Total Derivatives | | $ | 9,380,473 | | | $ | 24,513,923 | | | $ | — | | | $ | 33,894,396 | |
| NOTES TO FINANCIAL STATEMENTS (Unaudited) |
| April 30, 2016 (Continued) |
Corporate/Government Bond
| Assets | | Level 1 | | | Level 2 | | | Level 3 | | | Total | |
| Corporate Bonds & Notes * | | $ | — | | | $ | 30,216,735 | | | $ | — | | | $ | 30,216,735 | |
| Foreign Government Bonds | | | — | | | | 434,254 | | | | — | | | | 434,254 | |
| Municipal | | | — | | | | 954,730 | | | | — | | | | 954,730 | |
| U.S. Government & Agency | | | — | | | | 16,763,789 | | | | — | | | | 16,763,789 | |
| Bank Loans * | | | — | | | | 1,659,078 | | | | — | | | | 1,659,078 | |
| Preferred Stock * | | | 757,780 | | | | — | | | | — | | | | 757,780 | |
| Short-Term Investment | | | 1,681,431 | | | | — | | | | — | | | | 1,681,431 | |
| Collateral for Securities Loaned | | | 2,379,575 | | | | — | | | | — | | | | 2,379,575 | |
| Total | | $ | 4,818,786 | | | $ | 50,028,586 | | | $ | — | | | $ | 54,847,372 | |
Dynamic Macro
| Assets | | Level 1 | | | Level 2 | | | Level 3 | | | Total | |
| Exchange Traded Funds * | | $ | 20,555,800 | | | $ | — | | | $ | — | | | $ | 20,555,800 | |
| Short-Term Investments | | | 13,536,809 | | | | — | | | | — | | | | 13,536,809 | |
| Derivatives | | | | | | | | | | | | | | | | |
| Purchased Options | | | 2,767,857 | | | | — | | | | — | | | | 2,767,857 | |
| Futures | | | 169,862 | | | | — | | | | — | | | | 169,862 | |
| Foreign Currency Exchange Contracts | | | — | | | | — | | | | — | | | | — | |
| Total | | $ | 37,030,328 | | | $ | — | | | $ | — | | | $ | 37,030,328 | |
| Liabilities - Derivatives | | | | | | | | | | | | | | | | |
| Futures | | $ | 61,844 | | | $ | — | | | $ | — | | | $ | 61,844 | |
| Written Options | | | 25,180 | | | | — | | | | — | | | | 25,180 | |
| Total | | $ | 87,024 | | | $ | — | | | $ | — | | | $ | 87,024 | |
High-Yield Bond
| Assets | | Level 1 | | | Level 2 | | | Level 3 | | | Total | |
| Bonds & Notes * | | $ | — | | | $ | 89,879,573 | | | $ | — | | | $ | 89,879,573 | |
| Short-Term Investment | | | 4,417,375 | | | | — | | | | — | | | | 4,417,375 | |
| Collateral for Securities Loaned | | | 13,974,490 | | | | — | | | | — | | | | 13,974,490 | |
| Total | | $ | 18,391,865 | | | $ | 89,879,573 | | | $ | — | | | $ | 108,271,438 | |
International Opportunity Bond
| Assets | | Level 1 | | | Level 2 | | | Level 3 | | | Total | |
| Corporate Bonds & Notes * | | $ | 671,061 | | | $ | 10,451,001 | | | $ | — | | | $ | 11,122,062 | |
| Foreign Government Bonds * | | | 2,056,514 | | | | 16,950,384 | | | | — | | | | 19,006,898 | |
| Asset Backed Securities | | | | | | | 115,271 | | | | | | | | 115,271 | |
| Collateral Mortgage Backed Security | | | — | | | | 217,456 | | | | — | | | | 217,456 | |
| Whole Loan Collateral | | | — | | | | 277,865 | | | | — | | | | 277,865 | |
| Short-Term Investment | | | 198,538 | | | | — | | | | — | | | | 198,538 | |
| Total Assets | | $ | 2,926,113 | | | $ | 28,011,977 | | | $ | — | | | $ | 30,938,090 | |
| Derivatives | | | | | | | | | | | | | | | | |
| Futures Contracts | | $ | 115,312 | | | $ | — | | | $ | — | | | $ | 115,312 | |
| Foreign Currency Exchange Contracts | | | — | | | | 283,346 | | | | — | | | | 283,346 | |
| Total Derivatives | | $ | 115,312 | | | $ | 283,346 | | | $ | — | | | $ | 398,658 | |
| Liabilities-Derivatives | | | | | | | | | | | | | | | | |
| Futures Contracts | | $ | 80,411 | | | $ | — | | | $ | — | | | $ | 80,411 | |
| Foreign Currency Exchange Contracts | | | — | | | | 176,101 | | | | — | | | | 176,101 | |
| Total Derivatives | | $ | 80,411 | | | $ | 176,101 | | | $ | — | | | $ | 256,512 | |
| NOTES TO FINANCIAL STATEMENTS (Unaudited) |
| April 30, 2016 (Continued) |
Appreciation & Income
| Assets | | Level 1 | | | Level 2 | | | Level 3 | | | Total | |
| Convertible Bonds * | | $ | — | | | $ | 19,752,349 | | | $ | — | | | $ | 19,752,349 | |
| Preferred Stock * | | | 3,313,417 | | | | — | | | | — | | | | 3,313,417 | |
| Short-Term Investment | | | 3,223,250 | | | | — | | | | — | | | | 3,223,250 | |
| Collateral for Securities Loaned | | | 2,769,760 | | | | — | | | | — | | | | 2,769,760 | |
| Total | | $ | 9,306,427 | | | $ | 19,752,349 | | | $ | — | | | $ | 29,058,776 | |
Alternative Strategy
| Assets | | Level 1 | | | Level 2 | | | Level 3 | | | Total | |
| Exchange Traded Funds * | | $ | 17,798,160 | | | $ | — | | | $ | — | | | $ | 17,798,160 | |
| Short-Term Investment | | | 4,309,853 | | | | — | | | | — | | | | 4,309,853 | |
| Total | | $ | 22,108,013 | | | $ | — | | | $ | — | | | $ | 22,108,013 | |
Large Cap Value
| Assets | | Level 1 | | | Level 2 | | | Level 3 | | | Total | |
| Common Stock * | | $ | 53,744,305 | | | $ | — | | | $ | — | | | $ | 53,744,305 | |
| Short-Term Investment | | | 1,211,460 | | | | — | | | | — | | | | 1,211,460 | |
| Collateral for Securities Loaned | | | 8,965,266 | | | | — | | | | — | | | | 8,965,266 | |
| Total | | $ | 63,921,031 | | | $ | — | | | $ | — | | | $ | 63,921,031 | |
Focused Large Cap Growth
| Assets | | Level 1 | | | Level 2 | | | Level 3 | | | Total | |
| Common Stock * | | $ | 63,710,767 | | | $ | — | | | $ | — | | | $ | 63,710,767 | |
| Short-Term Investment | | | 491,625 | | | | — | | | | — | | | | 491,625 | |
| Collateral for Securities Loaned | | | 12,704,917 | | | | — | | | | — | | | | 12,704,917 | |
| Total | | $ | 76,907,309 | | | $ | — | | | $ | — | | | $ | 76,907,309 | |
International Stock
| Assets | | Level 1 | | | Level 2 | | | Level 3 | | | Total | |
| Common Stock * | | $ | 21,401,617 | | | $ | 65,264,921 | | | $ | — | | | $ | 86,666,538 | |
| Closed End Fund | | | — | | | | 344,168 | | | | | | | | 344,168 | |
| Preferred Stock * | | | 164,822 | | | | 1,158,243 | | | | — | | | | 1,323,065 | |
| Short-Term Investment | | | 1,626,200 | | | | — | | | | — | | | | 1,626,200 | |
| Collateral for Securities Loaned | | | 4,645,326 | | | | — | | | | — | | | | 4,645,326 | |
| Total Assets | | $ | 27,837,965 | | | $ | 66,767,332 | | | $ | — | | | $ | 94,605,297 | |
| Assets - Derivatives | | | | | | | | | | | | | | | | |
| Forward Currency Exchange Contracts | | $ | — | | | $ | 897,743 | | | $ | — | | | $ | 897,743 | |
| | | | | | | | | | | | | | | | | |
| Liabilities - Derivatives | | | | | | | | | | | | | | | | |
| Forward Currency Exchange Contracts | | $ | — | | | $ | 1,066,025 | | | $ | — | | | $ | 1,066,025 | |
Real Estate Stock
| Assets | | Level 1 | | | Level 2 | | | Level 3 | | | Total | |
| Common Stock* | | $ | 508,473 | | | $ | — | | | $ | — | | | $ | 508,473 | |
| REITS * | | | 41,456,587 | | | | — | | | | — | | | | 41,456,587 | |
| Short-Term Investment | | | 857,395 | | | | — | | | | — | | | | 857,395 | |
| Collateral for Securities Loaned | | | 7,173,911 | | | | — | | | | — | | | | 7,173,911 | |
| Total | | $ | 49,996,366 | | | $ | — | | | $ | — | | | $ | 49,996,366 | |
| NOTES TO FINANCIAL STATEMENTS (Unaudited) |
| April 30, 2016 (Continued) |
Small Cap Value
| Assets | | Level 1 | | | Level 2 | | | Level 3 | | | Total | |
| Common Stock * | | $ | 27,163,084 | | | $ | — | | | $ | — | | | $ | 27,163,084 | |
| Short-Term Investment | | | 42,094 | | | | — | | | | — | | | | 42,094 | |
| Collateral for Securities Loaned | | | 4,121,138 | | | | — | | | | — | | | | 4,121,138 | |
| Total | | $ | 31,326,316 | | | $ | — | | | $ | — | | | $ | 31,326,316 | |
Emerging Markets Stock
| Assets | | Level 1 | | | Level 2 | | | Level 3 | | | Total | |
| Common Stock * | | $ | 8,346,180 | | | $ | 41,318,374 | | | $ | — | | | $ | 49,664,554 | |
| Exchange Traded Funds | | | 2,631,800 | | | | — | | | | — | | | | 2,631,800 | |
| Short-Term Investment | | | 1,825,888 | | | | — | | | | — | | | | 1,825,888 | |
| Collateral for Securities Loaned | | | 1,774,767 | | | | — | | | | — | | | | 1,774,767 | |
| Total | | $ | 14,578,635 | | | $ | 41,318,374 | | | $ | — | | | $ | 55,897,009 | |
Small Cap Growth
| Assets | | Level 1 | | | Level 2 | | | Level 3 | | | Total | |
| Common Stock * | | $ | 31,384,234 | | | $ | — | | | $ | — | | | $ | 31,384,234 | |
| Short-Term Investment | | | 1,071,486 | | | | — | | | | — | | | | 1,071,486 | |
| Collateral for Securities Loaned | | | 11,966,485 | | | | — | | | | — | | | | 11,966,485 | |
| Total | | $ | 44,422,205 | | | $ | — | | | $ | — | | | $ | 44,422,205 | |
| * | See each Fund’s Schedule of Investments for breakdown by industry. |
The Funds did not hold any Level 3 securities during the period.
There were no transfers into or out of Level 1 or Level 2 during the period. It is the Funds’ policy to recognize transfers into and out of Level 1 and Level 2 at the end of the reporting period.
b. Foreign Currency Translations – The accounting records of the Funds are maintained in U.S. dollars. Investment securities and other assets and liabilities denominated in a foreign currency, and income receipts and expense payments, are translated into U.S. dollars using the prevailing exchange rate at the London market close. Purchases and sales of securities are translated into U.S. dollars at the contractual currency rates established at the approximate time of the trade.
Net realized gains and losses on foreign currency transactions represent net gains and losses from currency realized between the trade and settlement dates on securities transactions and the difference between income accrued versus income received. The effects of changes in foreign currency exchange rates on investments in securities are included with the net realized and unrealized gain or loss on investment securities.
c. Forward Currency Contracts – As foreign securities are purchased, a Fund generally enters into forward currency exchange contracts in order to hedge against foreign currency exchange rate risks. The market value of the contract fluctuates with changes in currency exchange rates. The contract is marked-to-market daily and the change in market value is recorded by a Fund as an unrealized gain or loss. As foreign securities are sold, a portion of the contract is generally closed and the Fund records a realized gain or loss equal to the difference between the value of the contract at the time it was opened and the value at the time it was closed. A Fund may also enter into forward currency contracts as an investment strategy consistent with that Fund’s investment objective. Realized gains and losses from contract transactions are included as a component of net realized gains (losses) from investments and foreign currency in the Statements of Operations.
d. Options – Monthly Distribution and Dynamic Macro are subject to stock market risk in the normal course of pursuing their investment objectives and may purchase or sell options to help hedge against this risk.
A Fund may write call options only if it (i) owns an offsetting position in the underlying security or (ii) has an absolute or immediate right to acquire that security without additional cash consideration or exchange of other securities held in its portfolio. When a Fund writes an option, there is no taxable event and an amount equal to the premium received is recorded by that Fund as a liability. The liability is thereafter valued to reflect the current value of the option. If the option is not exercised and expires, or if a Fund effects a closing purchase transaction, the Fund realizes a gain (or loss in the case of a closing purchase transaction where the cost to close the transaction exceeds the original premium received), and the liability related to the option is extinguished. Any such gain or loss generally is a short-term capital gain or loss for federal income tax purposes. If a call option that a Fund has written on any equity security is exercised, that Fund will realizes a capital gain or loss (long-term or short-term, depending on the holding period of the
| NOTES TO FINANCIAL STATEMENTS (Unaudited) |
| April 30, 2016 (Continued) |
underlying security) from the sale of the underlying security, and the proceeds from such sale are increased by the premium originally received. If a put option that a Fund has written on an equity security is exercised, the amount of the premium originally received reduces the cost of the security that a Fund purchases upon exercise of the option. When a Fund writes a put option, that Fund must deposit cash or liquid securities into a segregated account equal to the put option’s exercise value (number of shares times strike price).
A Fund may purchase put and call options. Put options are purchased to hedge against a decline in the value of securities held in that Fund’s portfolio. If such a decline occurs, the put options will permit that Fund to sell the securities underlying such options at the exercise price, or to close out the options at a profit. The premium paid for a put or call option plus any transaction costs will reduce the benefit, if any, realized by that Fund upon exercise of the option, and, unless the price of the underlying security rises or declines sufficiently, the option may expire worthless to that Fund. In addition, in the event that the price of the security in connection with which an option was purchased moves in a direction favorable to that Fund, the benefits realized by that Fund as a result of such favorable movement will be reduced by the amount of the premium paid for the option and related transaction costs. Written and purchased options are non-income producing securities.
e. Swap Agreements – Monthly Distribution is subject to stock market risk in the normal course of pursuing its investment objectives. The Fund may enter into various swap transactions for investment purposes to manage equity risk. These are two-party contracts entered into primarily to exchange the returns (or differentials in rates of returns) earned or realized on particular predetermined investments or instruments. The gross returns to be exchanged or “swapped” between parties are calculated with respect to a notional amount, i.e., the return on or increase in value of a particular dollar amount invested at a particular interest rate, in a particular foreign currency, or in a “basket” of securities representing a particular index or market segment. Changes in the value of swap agreements are recognized as unrealized gains or losses in the Statement of Operations by “marking to market” on a daily basis to reflect the value of the swap agreement at the end of each trading day. Payments received or paid at the beginning of the agreement are reflected as such on the Statement of Assets and Liabilities and may be referred to as upfront payments. The Fund amortizes upfront payments and/or accrues for the fixed payment stream on swap agreements on a daily basis with the net amount recorded as a component of unrealized gain or loss on the Statement of Operations. A liquidation payment received or made at the termination of the swap agreement is recorded as a realized gain or loss on the Statement of Operations. The Fund segregates liquid securities having a value at least equal to the amount of its current obligation under any swap transaction. Entering into these agreements involves, to varying degrees, lack of liquidity and elements of credit, market, and counterparty risk in excess of amounts recognized on the Statements of Assets and Liabilities. The Fund’s maximum risk of loss from counterparty credit risk is the discounted net value of the cash flows to be received from/paid to the counterparty over the contract’s remaining life, to the extent that that amount is positive.
f. Futures Contracts – International Opportunity Bond and Dynamic Macro are subject to equity interest rate risk and forward currency exchange rate risk in the normal course of pursuing their investment objectives. The Funds may purchase or sell futures contracts to gain exposure to, or hedge against, changes in the value of equities and interest rates. Initial margin deposits required upon entering into futures contracts are satisfied by the segregation of specific securities or cash as collateral for the account of the broker (the Fund’s agent in acquiring the futures position). During the period the futures contracts are open, changes in the value of the contracts are recognized as unrealized gains or losses by “marking to market” on a daily basis to reflect the market value of the contracts at the end of each day’s trading. Variation margin payments are received or made depending upon whether unrealized gains or losses are incurred. When the contracts are closed, the Funds recognize a realized gain or loss equal to the difference between the proceeds from, or cost of, the closing transaction and the Fund’s basis in the contract. If the Funds were unable to liquidate a futures contract and/or enter into an offsetting closing transaction, the Funds would continue to be subject to market risk with respect to the value of the contracts and continue to be required to maintain the margin deposits on the futures contracts. The Funds segregate cash having a value at least equal to the amount of the current obligation under any open futures contract. Risks may exceed amounts recognized in the Statement of Assets and Liabilities. With futures, there is minimal counterparty credit risk to the Funds since futures are exchange traded and the exchange’s clearinghouse, as counterparty to all exchange traded futures, guarantees the futures against default.
The notional value of the derivative instruments outstanding as of April 30, 2016 as disclosed in the Schedule of Investments and the amounts realized and changes in unrealized gains and losses on derivative instruments during the period as disclosed above and within the Statement of Operations serve as indicators of the volume of derivative activity for the Funds.
g. Short Sales – A “short sale” is a transaction in which a Fund sells a security it does not own but has borrowed in anticipation that the market price of that security will decline. The Fund would be obligated to replace the security borrowed by purchasing it on the open market at a later date. If the price of the security sold short increases between the time of the short sale and the time the Fund replaces the borrowed security, the Fund will incur a loss. Conversely, if the price declines, the Fund will realize a gain.
h. Impact of Derivatives on the Statements of Assets and Liabilities and Statements of Operations – The following is a summary of the location of derivative investments of each Fund in the Statement of Assets and Liabilities as of April 30, 2016:
| NOTES TO FINANCIAL STATEMENTS (Unaudited) |
| April 30, 2016 (Continued) |
| Location on the Statements of Assets and Liabilities |
| Derivates Investment Type | | Asset Derivatives | | Liability Derivatives |
| Equity/Currency/Commodity | | Investment securites | | Options contracts written |
| Interest rate contracts | | Unrealized appreciation on Swap Contracts Unrealized appreciation on futures | | Unrealized depreciation on Swap Contracts Unrealized depreciation on futures |
| | | Receivable for open forward foreign currency contracts | | Payable for open forward foreign currency contracts |
The following table sets forth the fair value of each Fund’s derivative contracts by primary risk exposure as of April 30, 2016:
| Asset Derivatives Investment value |
| | | Equity | | | Currency | | | Commodity | | | Interest Rate | | | Total value at | |
| | | Contracts | | | Contracts | | | Contracts | | | Contracts | | | April 30, 2016 | |
| Monthly Distribution | | | | | | | | | | | | | | | | | | | | |
| Forward Foreign Currency Contra | | $ | — | | | $ | 24,068,465 | | | $ | — | | | $ | — | | | $ | 24,068,465 | |
| Swaps | | | 4,382,304 | | | | — | | | | — | | | | — | | | | 4,382,304 | |
| Purchased Options | | | 2,488,393 | | | | — | | | | — | | | | — | | | | 2,488,393 | |
| International Opportunity Bond | | | | | | | | | | | | | | | | | | | | |
| Forward Foreign Currency Contra | | $ | — | | | $ | 283,346 | | | $ | — | | | $ | — | | | $ | 283,346 | |
| Futures | | | — | | | | 7,170 | | | | — | | | | 108,142 | | | | 115,312 | |
| Dynamic Macro | | | | | | | | | | | | | | | | | | | | |
| Futures | | $ | 10,479 | | | $ | (5,129 | ) | | $ | — | | | $ | 102,668 | | | $ | 108,018 | |
| Purchase Options | | | 155,680 | | | | — | | | | — | | | | 2,612,177 | | | | 2,767,857 | |
| International Stock | | | | | | | | | | | | | | | | | | | | |
| Forward Foreign Currency Contra | | $ | — | | | $ | 897,743 | | | $ | — | | | $ | — | | | $ | 897,743 | |
The following is a summary of the location of derivative investments of each Fund in the Statements of Assets and Liabilities for the year ended April 30, 2016.
| Liability Derivatives Investment value |
| | | Equity | | | Currency | | | Commodity | | | Interest Rate | | | Total value at | |
| | | Contracts | | | Contracts | | | Contracts | | | Contracts | | | April 30, 2016 | |
| Monthly Distribution | | | | | | | | | | | | | | | | | | | | |
| Forward Foreign Currency Contracts | | $ | — | | | $ | 24,513,923 | | | $ | — | | | $ | — | | | $ | 24,513,923 | |
| Swaps | | | 2,826,408 | | | | — | | | | — | | | | — | | | | 2,826,408 | |
| Written Options | | | 6,554,065 | | | | — | | | | — | | | | — | | | | 6,554,065 | |
| International Opportunity Bond | | | | | | | | | | | | | | | | | | | | |
| Forward Foreign Currency Contracts | | $ | — | | | $ | 176,101 | | | $ | — | | | $ | — | | | $ | 176,101 | |
| Futures | | | — | | | | — | | | | — | | | | 80,441 | | | | 80,441 | |
| Dynamic Macro | | | | | | | | | | | | | | | | | | | | |
| Written Options | | | 25,180 | | | | — | | | | — | | | | — | | | | 25,180 | |
International Stock
Forward Foreign Currency Contracts | | $ | — | | | $ | 1,066,025 | | | $ | — | | | $ | — | | | $ | 1,066,025 | |
NOTES TO FINANCIAL STATEMENTS (Unaudited)
April 30, 2016 (Continued)
| Derivative Investment Type | | Location of Gain (Loss) on Derivatives |
| Equity/Currency/Commodity/Interest rate contracts | | Net Realized gain (loss) from: Futures, Options purchased, Written options, Swap contracts, Foreign currency exchange contracts |
| | | Net change in unrealized appreciation (depreciation) on: Futures, Options purchased, Written options, Swap contracts, Foreign currency exchange contracts |
The following is a summary of each Fund’s realized gain (loss) and change in unrealized appreciation (depreciation) on derivative investments recognized in the Statements of Operations categorized by primary risk exposure for the six months ended April 30, 2016:
| Realized gain/(loss) on derivatives recognized in the Statements of Operations |
| | | Equity | | | Currency | | | Commodity | | | Interest Rate | | | Total value at | |
| Derivative Investment type | | Contracts | | | Contracts | | | Contracts | | | Contracts | | | April 30, 2016 | |
| Monthly Distribution | | | | | | | | | | | | | | | | | | | | |
| Forward Foreign Currency Contracts | | $ | — | | | $ | 856,359 | | | $ | — | | | $ | — | | | $ | 856,359 | |
| Foreign Currency Transactions | | | — | | | | 183,425 | | | | — | | | | — | | | | 183,425 | |
| Swaps | | | (3,482,881 | ) | | | — | | | | — | | | | — | | | | (3,482,881 | ) |
| Purchased Options | | | 6,166,726 | | | | — | | | | — | | | | — | | | | 6,166,726 | |
| Written Options | | | 693,396 | | | | — | | | | — | | | | — | | | | 693,396 | |
| International Opportunity Bond | | | | | | | | | | | | | | | | | | | | |
| Forward Foreign Currency Contracts | | $ | — | | | $ | (30,221 | ) | | $ | — | | | $ | — | | | $ | (30,221 | ) |
| Futures | | | — | | | | — | | | | — | | | | (56,290 | ) | | | (56,290 | ) |
| Dynamic Macro | | | | | | | | | | | | | | | | | | | | |
| Futures | | $ | (670,766 | ) | | $ | — | | | $ | — | | | $ | — | | | $ | (670,766 | ) |
| Purchased Options | | | 159,653 | | | | — | | | | — | | | | — | | | | 159,653 | |
| Written Options | | | (48,795 | ) | | | — | | | | — | | | | — | | | | (48,795 | ) |
| International Stock | | | | | | | | | | | | | | | | | | | | |
| Forward Foreign Currency Contracts | | $ | — | | | $ | (816,147 | ) | | $ | — | | | $ | — | | | $ | (816,147 | ) |
| Emerging Markets Stock | | | | | | | | | | | | | | | | | | | | |
| Forward Foreign Currency Contracts | | $ | — | | | $ | (1,020,509 | ) | | $ | — | | | $ | — | | | $ | (1,020,509 | ) |
| Changes in unrealized appreciation/(depreciation) on derivatives recognized in the Statements of Operations |
| | | Equity | | | Currency | | | Commodity | | | Interest Rate | | | Total value at | |
| Derivative Investment type | | Contracts | | | Contracts | | | Contracts | | | Contracts | | | April 30, 2016 | |
| Monthly Distribution | | | | | | | | | | | | | | | | | | | | |
| Forward Foreign Currency Contracts | | $ | — | | | $ | (444,958 | ) | | $ | — | | | $ | — | | | $ | (444,958 | ) |
| Foreign Currency Transactions | | | — | | | | (2,703 | ) | | | — | | | | — | | | | (2,703 | ) |
| Swaps | | | 1,264,970 | | | | — | | | | — | | | | — | | | | 1,264,970 | |
| Purchased Options | | | 212,565 | | | | — | | | | — | | | | — | | | | 212,565 | |
| Written Options | | | 2,036,766 | | | | — | | | | — | | | | — | | | | 2,036,766 | |
| International Opportunity Bond | | | | | | | | | | | | | | | | | | | | |
| Forward Foreign Currency Contracts | | $ | — | | | $ | 45,715 | | | $ | — | | | $ | — | | | $ | 45,715 | |
| Futures | | | — | | | | | | | | — | | | | (12,446 | ) | | | (12,446 | ) |
| Dynamic Macro | | | | | | | | | | | | | | | | | | | | |
| Futures | | | — | | | | — | | | | — | | | | (232,566 | ) | | | (232,566 | ) |
| Purchased Options | | | 196,070 | | | | — | | | | — | | | | — | | | | 196,070 | |
| Written Options | | | (1,956 | ) | | | — | | | | — | | | | — | | | | (1,956 | ) |
| International Stock | | | | | | | | | | | | | | | | | | | | |
| Forward Foreign Currency Contracts | | $ | — | | | $ | (424,410 | ) | | $ | — | | | $ | — | | | $ | (424,410 | ) |
| | | | | | | | | | | | | | | | | | | | | |
| NOTES TO FINANCIAL STATEMENTS (Unaudited) |
| April 30, 2016 (Continued) |
i. Offsetting of Financial Assets and Derivative Assets – Monthly Distribution, International Opportunity Bond, Dynamic Macro and International Stock policies are to recognize a net asset or liability equal to the unrealized on futures contracts, forward foreign currency contracts, swaps and written options. During the six months ended April 30, 2016, the Funds are subject to a master netting arrangement for the swaps. The following table shows additional information regarding the offsetting of assets and liabilities at April 30, 2016.
Monthly Distribution
| Assets: | | | | | | | | | | | Gross Amounts Not Offset in the
Statement of Assets & Liabilities | | | | |
| Description | | Gross Amounts of
Recognized Assets | | | Gross Amounts
Offset in the
Statement of Assets
& Liabilities | | | Net Amounts of Assets
Presented in the
Statement of Assets &
Liabilities | | | Financial
Instruments | | | Cash
Collateral
Received | | | Net Amount | |
| Equity Swap Contracts | | $ | 4,382,304 | | | $ | — | | | $ | 4,382,304 | | | $ | (2,826,408 | ) | | $ | — | | | $ | 1,555,896 | |
| Forward Foreign Currency Contracts | | | 24,068,965 | | | | — | | | | 24,068,965 | | | | (24,068,965 | ) | | | — | | | | — | |
| Total | | $ | 28,451,269 | | | $ | — | | | $ | 28,451,269 | | | $ | (26,895,373 | ) | | $ | — | | | $ | 1,555,896 | |
| Liabilities: | | | | | | | | | | | Gross Amounts Not Offset in the
Statement of Assets & Liabilities | | | | |
| Description | | Gross Amounts of
Recognized
Liabilities | | | Gross Amounts
Offset in the
Statement of Assets
& Liabilities | | | Net Amounts of
Liabilities Presented in
the Statement of
Assets & Liabilities | | | Financial
Instruments | | | Cash
Collateral
Pledged (1) | | | Net Amount | |
| Written Options | | | (6,554,065 | ) | | | — | | | | (6,554,065 | ) | | | 6,554,065 | | | | — | | | | — | |
| Equity Swap Contracts | | | (2,826,408 | ) | | | — | | | | (2,826,408 | ) | | | 2,826,408 | | | | — | | | | — | |
| Forward Foreign Currency Contracts | | | (24,513,923 | ) | | | — | | | | (24,513,923 | ) | | | 24,068,965 | | | | — | | | | (444,958 | ) |
| Total | | $ | (33,894,396 | ) | | $ | — | | | $ | (33,894,396 | ) | | $ | 33,449,438 | | | $ | — | | | $ | (444,958 | ) |
| (1) | The amount is limited to the derivative liability balance and accordingly, does not include excess collateral pledged. |
Dynamic Macro
| Assets: | | | | | | | | | | | Gross Amounts Not Offset in
the Statement of Assets &
Liabilities | | | | |
| Description | | Gross
Amounts of
Recognized
Assets | | | Gross Amounts
Offset in the
Statement of Assets
& Liabilities | | | Net Amounts of
Assets Presented in
the Statement of
Assets & Liabilities | | | Financial
Instruments | | | Cash
Collateral
Pledged | | | Net Amount | |
| Futures Contracts | | $ | 108,018 | | | $ | — | | | $ | 108,018 | | | $ | — | | | $ | — | | | $ | 108,018 | |
| Total | | $ | 108,018 | | | $ | — | | | $ | 108,018 | | | $ | — | | | $ | — | | | $ | 108,018 | |
| Liabilities: | | | | | | | | | | | Gross Amounts Not Offset in
the Statement of Assets &
Liabilities | | | | |
| Description | | Gross
Amounts of
Recognized
Liabilities | | | Gross Amounts
Offset in the
Statement of Assets
& Liabilities | | | Net Amounts of
Liabilities Presented
in the Statement of
Assets & Liabilities | | | Financial
Instruments | | | Cash
Collateral
Pledged (1) | | | Net Amount | |
| Written Options | | | (25,180 | ) | | | — | | | $ | (25,180 | ) | | | — | | | | 25,180 | | | | — | |
| Total | | $ | (25,180 | ) | | $ | — | | | $ | (25,180 | ) | | $ | — | | | $ | 25,180 | | | $ | — | |
NOTES TO FINANCIAL STATEMENTS (Unaudited)
April 30, 2016 (Continued)
| International Opportunity Bond | | | | | | | |
| | | | | | | | | | | | | | | | |
| Assets: | | | | | | | | | | | Gross Amounts Not Offset in
the Statement of Assets &
Liabilities | | | | |
| Description | | Gross
Amounts of
Recognized
Assets | | | Gross Amounts
Offset in the
Statement of Assets
& Liabilities | | | Net Amounts of
Assets Presented in
the Statement of
Assets & Liabilities | | | Financial
Instruments | | | Cash
Collateral
Pledged | | | Net Amount | |
| Forward Foreign Currency Contracts | | $ | 283,346 | | | | | | | $ | 283,346 | | | $ | (176,101 | ) | | | | | | $ | 107,245 | |
| Futures Contracts | | | 115,312 | | | $ | — | | | | 115,312 | | | | (80,441 | ) | | $ | — | | | | 34,871 | |
| Total | | $ | 398,658 | | | $ | — | | | $ | 398,658 | | | $ | (256,542 | ) | | $ | — | | | $ | 142,116 | |
| | | | | | | | | | | | | | | | | | | | | | | | | |
| Liabilities: | | | | | | | | | | | Gross Amounts Not Offset in
the Statement of Assets &
Liabilities | | | | |
| Description | | Gross
Amounts of
Recognized
Liabilities | | | Gross Amounts
Offset in the
Statement of Assets
& Liabilities | | | Net Amounts of
Liabilities Presented
in the Statement of
Assets & Liabilities | | | Financial
Instruments | | | Cash
Collateral
Pledged (1) | | | Net Amount | |
| Forward Foreign Curency Contracts | | $ | (176,101 | ) | | $ | — | | | $ | (176,101 | ) | | $ | 176,101 | | | $ | — | | | $ | — | |
| Futures Contracts | | $ | (80,441 | ) | | $ | — | | | $ | (80,441 | ) | | $ | 80,441 | | | $ | — | | | $ | — | |
| Total | | $ | (256,542 | ) | | $ | — | | | $ | (256,542 | ) | | $ | 256,542 | | | $ | — | | | $ | — | |
| | | | | | | | | | | | | | | | | | | | | | | | | |
| International Stock | | | | | | | | | | |
| | | | | | | | | | | | | | | | |
| Assets: | | | | | | | | | | | Gross Amounts Not Offset in
the Statement of Assets &
Liabilities | | | | |
| Description | | Gross
Amounts of
Recognized
Assets | | | Gross Amounts
Offset in the
Statement of Assets
& Liabilities | | | Net Amounts of
Assets Presented in
the Statement of
Assets & Liabilities | | | Financial
Instruments | | | Cash
Collateral
Pledged | | | Net Amount | |
| Forward Foreign Currency Contracts | | $ | 897,743 | | | $ | (1,066,025 | ) | | $ | (168,282 | ) | | $ | 168,282 | | | $ | — | | | $ | — | |
| Total | | $ | 897,743 | | | $ | (1,066,025 | ) | | $ | (168,282 | ) | | $ | 168,282 | | | $ | — | | | $ | — | |
| | | | | | | | | | | | | | | | | | | | | | | | | |
| Liabilities: | | | | | | | | | | | Gross Amounts Not Offset in
the Statement of Assets &
Liabilities | | | | |
| Description | | Gross
Amounts of
Recognized
Liabilities | | | Gross Amounts
Offset in the
Statement of Assets
& Liabilities | | | Net Amounts of
Liabilities Presented
in the Statement of
Assets & Liabilities | | | Financial
Instruments | | | Cash
Collateral
Pledged (1) | | | Net Amount | |
| Forward Foreign Currency Contracts | | $ | (1,066,025 | ) | | $ | 897,743 | | | $ | (168,282 | ) | | $ | — | | | $ | 168,282 | | | $ | — | |
| Total | | $ | (1,066,025 | ) | | $ | 897,743 | | | $ | (168,282 | ) | | $ | — | | | $ | 168,282 | | | $ | — | |
| | | | | | | | | | | | | | | | | | | | | | | | | |
| (1) | The amount is limited to the derivative liability balance and accordingly, does not include excess collateral pledged. |
NOTES TO FINANCIAL STATEMENTS (Unaudited)
April 30, 2016 (Continued)
j. Exchange Traded Funds – The Funds may invest in exchange traded funds (“ETFs”). ETFs are a type of index fund bought and sold on a securities exchange. An ETF trades like common stock and represents a fixed portfolio of securities designed to track the performance and dividend yield of a particular domestic or foreign market index. A Fund may purchase an ETF to temporarily gain exposure to a portion of the U.S. or a foreign market while awaiting purchase of underlying securities. The risks of owning an ETF generally reflect the risks of owning the underlying securities they are designed to track, although the lack of liquidity on an ETF could result in it being more volatile. Additionally, ETFs have fees and expenses that reduce their value.
k. Investment Transactions, Investment Income and Expenses – Investment transactions are recorded on a trade date basis. Realized gains and losses from investment transactions and foreign exchange transactions are calculated using the identified cost method. Dividend income and expense is recorded on the ex-dividend date (“ex-date”) except in the case of certain dividends from foreign securities, which are recorded as soon after the ex-date as the respective Fund, using reasonable diligence, becomes aware of such dividends. Interest income is recorded on an accrual basis. Discounts are accreted and premiums are amortized as adjustments to interest income and the identified cost of investments. Expenses of the Trust that are directly identifiable to a specific fund are charged to that fund. Expenses, which are not readily identifiable to a specific fund, are allocated in such a manner as deemed equitable, taking into consideration the nature and type of expense and the relative sizes of the funds. Each Fund’s income, expenses (other than the class specific distribution fees) and realized and unrealized gains and losses are allocated proportionally each day between the classes based upon the relative net assets of each class.
l. Concentration of Risk – Investing in securities of foreign issuers and currency transactions may involve certain considerations and risks not typically associated with investments in the United States. These risks include revaluation of currencies, adverse fluctuations in foreign currency values and possible adverse political, social and economic developments, including those particular to a specific industry, country or region. These conditions could cause the securities and their markets to be less liquid and prices more volatile than those of comparable U.S. companies and U.S. government securities.
Small capitalization (“small cap”) companies may be more vulnerable than larger capitalization companies to adverse business or economic developments. Small cap companies may also have limited product lines, markets or financial resources, and may be dependent on a relatively small management group. Securities of such companies may be less liquid and more volatile than securities of larger capitalization companies or the market averages in general and therefore may involve greater risk than investing in larger capitalization companies.
The ability of issuers of debt securities held by the Funds to meet their obligations may be affected by economic and political developments particular to a specific industry, country, state or region. Investments in lower grade debt securities are subject to special risks, including greater price volatility and a greater risk of loss of principal and interest.
Certain Funds may invest in collateralized mortgage obligations which are secured by groups of individual mortgages, but are similar to a conventional bond where the investor looks only to the issuer for payment of principal and interest. Although the obligations are recourse obligations to the issuer, the issuer typically has no significant assets, other than assets pledged as collateral for the obligations, and the market value of the collateral, which is sensitive to interest rate movements, may affect the market value of the obligations. A public market for a particular collateralized mortgage obligation may or may not develop and thus, there can be no guarantee of liquidity of an investment in such obligations.
The risk in writing a call option is that a Fund may forgo the opportunity of profit if the market value of the underlying security increases and the option is exercised, although any potential loss is reduced by the amount of option premium received. The risk in writing a put option is that a Fund may be called on to pay the exercise price of the option for a security that has decreased (potentially to zero) in market price, although any potential loss is reduced by the amount of option premium received. Generally, option transactions also involve risks concerning liquidity of the options market. An illiquid market for an option may limit a Fund’s ability to write options or enter closing transactions. As the options written by the Funds are traded on a national exchange, counterparty and credit risk are limited to the failure of the exchange on which the options are traded.
m. Federal Income Taxes – It is each Fund’s policy to continue to comply with all sections of the Internal Revenue Code applicable to regulated investment companies and to distribute all of its taxable income and gains, if any, to its shareholders and therefore, no provision for federal income tax has been made. Each Fund is treated as a separate taxpayer for federal income tax purposes. The Funds recognize the tax benefits of uncertain tax positions only when the position is “more likely than not” to be sustained assuming examination by tax authorities. Management has reviewed the tax positions in the open tax years of 2012 to 2014 (and July 31, 2013 for Alternative Strategy), and expected to be taken in tax year 2015 and concluded that no liability for unrecognized tax benefits should be recorded related to uncertain tax positions taken in the above open tax years. The Funds identify their major tax jurisdictions as U.S. Federal. The Funds recognize interest and penalties, if any, related to unrecognized tax benefits as income tax expense in the Statements of Operations. During the year, the Funds did not incur any interest or penalties. Generally tax authorities can examine tax returns filed for the last three years.
| NOTES TO FINANCIAL STATEMENTS (Unaudited) |
| April 30, 2016 (Continued) |
n. Distributions to Shareholders – It is each Fund’s policy to distribute its respective net investment income and net capital gains, if any, annually except for Monthly Distribution, Corporate/Government Bond, High-Yield Bond, Floating Rate Bond and International Opportunity Bond which will distribute their respective net investment income, if any, monthly. For Dynamic Macro dividends attributable to earned income, if any, will be declared and paid quarterly. Distributions of net investment income and net capital gains are determined in accordance with income tax regulations which may differ from GAAP. Differences in dividends from net investment income per share between the classes are due to service and distribution related expenses. Dividends and distributions to shareholders are recorded on ex-date. The Monthly Distribution Fund’s distribution policy is to make twelve monthly distributions to shareholders. The level of monthly distributions (including any return of capital) is not fixed but is expected to be at or near the level of the prime interest rate (“Prime Rate”). Additionally, the Monthly Distribution Fund’s distribution policy is not designed to generate, and is not expected to result in distributions that equal a fixed percentage of the Monthly Distribution’s Fund’s current net asset value per share. Shareholders receiving periodic payments form the Monthly Distribution Fund may be under the impression that they are receiving net profits. However, all or a portion of a distribution may consist of a return of capital. Shareholders should not assume that the source of a distribution from the Monthly Distribution is net profit.
o. Indemnification – The Trust indemnifies its officers and Trustees for certain liabilities that may arise from the performance of their duties to the Trust. Additionally, in the normal course of business, each Fund enters into contracts that contain a variety of representations and warranties and which provide general indemnities. A Fund’s maximum exposure under these arrangements is unknown, as this would involve future claims that may be made against the Fund that have not yet occurred. However, based on experience, the Funds expect the risk of loss due to these warranties and indemnities to be remote.
| 3. | INVESTMENT ADVISORY FEES AND OTHER TRANSACTIONS WITH AFFILIATES |
| a. | Management Fees – Dunham & Associates serves as each Fund’s investment adviser. Pursuant to an investment advisory agreement with the Trust, on behalf of the Funds, Dunham & Associates, subject to the supervision of the Board and in conformity with the stated policies of the Funds, manages the operations of the Funds. The Adviser, subject to the review and approval of the Board, selects Sub-Advisers for each Fund and supervises and monitors the performance of each Sub-Adviser. As compensation for its services, each Fund pays the Adviser a fixed fee, accrued daily and paid monthly, based on each Fund’s respective average daily net assets. The Adviser has entered into a Sub-Advisory Agreement with each Sub-Adviser and the Trust, on behalf of each Fund. Under the Sub-Advisory Agreements, each Fund pays the Sub-Adviser a “Fulcrum Fee.” A Fulcrum Fee is a performance fee whereby the Sub-Adviser is rewarded when out-performing, or is penalized when under-performing, a Fund’s benchmark index. As a result of the Fulcrum Fee arrangement, the total annual management fee for a Fund will have a range as shown in the table below. |
| | | Adviser’s | Sub-Adviser’s |
| | Management Fee | Portion | Portion |
| Floating Rate Bond | 0.80% – 1.20% | 0.60% | 0.20% – 0.60% |
| Monthly Distribution | 0.90% – 1.90% | 0.65% | 0.25% – 1.25% * |
| Corporate/Government Bond | 0.65% – 0.95% | 0.50% | 0.15% – 0.45% |
| Dynamic Macro | 1.05% – 1.75% | 0.65% | 0.40% – 1.10% |
| High-Yield Bond | 0.80% – 1.20% | 0.60% | 0.20% – 0.60% |
| International Opportunity Bond | 0.80% – 1.30% | 0.60% | 0.20% – 0.70% |
| Appreciation & Income | 0.85% – 1.35% | 0.65% | 0.20% – 0.70% |
| Alternative Strategy | 0.95% – 1.35% | 0.65% | 0.30% – 0.70% |
| Large Cap Value | 0.75% – 1.35% | 0.65% | 0.10% – 0.50% |
| Focused Large Cap Growth | 0.85% – 1.15% | 0.65% | 0.20% – 0.50% |
| International Stock | 0.95% – 1.65% | 0.65% | 0.30% – 1.00% |
| Real Estate Stock | 0.75% – 1.35% | 0.65% | 0.10% – 0.70% |
| Small Cap Value | 0.75% – 1.45% | 0.65% | 0.10% – 0.80% |
| Emerging Markets Stock | 0.75% – 1.55% | 0.65% | 0.10% – 0.90% |
| Small Cap Growth | 0.65% – 1.65% | 0.65% | 0.00% – 1.00% |
| * | Effective April 1, 2013, the Sub-Adviser had contractually agreed to waive a portion of its sub-advisory fee (excluding 12b-1 fees) until at least February 29, 2017, so that such fees, on annual basis will have a range of 0.25%-1.05%, of the Fund’s aggregate average daily net assets of its Class N, Class A and Class C shares. |
| NOTES TO FINANCIAL STATEMENTS (Unaudited) |
| April 30, 2016 (Continued) |
Each Fund’s Sub-Advisory Fulcrum Fee is calculated daily using an annual base Sub-Advisory fee of a specified amount of the average daily net assets of the Fund (the “Base Fee”), adjusted by the Fund’s Class N share performance relative to the Fund’s benchmark (the “Performance Fee”). Depending on a Fund’s net performance versus its benchmark, the Sub-Adviser will receive a fee adjustment in accordance with a formula that equates a percentage of out- or under-performance to a percentage of fee increases or decreases, respectively. In addition, most Fulcrum Fees employ a “null zone” around the base fee, whereby small differences in performance versus the benchmark will not trigger a fee increase or decrease. During the first 12 months of the Fulcrum Fee arrangement, the Performance Fee is calculated daily from inception date of the agreement to the calculation date and is applied to the average daily net assets of the Funds during the calculation period. After the initial 12 months, the Performance Fee is calculated on a daily basis based on comparative performance over a rolling 12-month period. All Funds, with the exception of Large Cap Value which is in its initial year of the Fulcrum Fee arrangement, are calculating Performance Fees on a rolling 12-month basis as of April 30, 2016.
Depending on the particular Sub-Advisory Agreement, the Performance Fee can adjust the Base Fee up or down by as much as 100% of the Base Fee, such that the Sub-Advisory fee can vary anywhere from 0.00% (the “Minimum Fee”) to twice the Base Fee (the “Maximum Fee”). However, because each such Sub-Advisory Agreement requires that the Sub-Adviser only be paid out the monthly Minimum Fee during the first year (in most cases, 0.10%), the Sub-Adviser, in most cases, will receive less compensation until the end of the first year. At the end of the first year of the agreement, the Sub-Adviser will be paid a lump sum that reflects the accrued Fulcrum Fee over the year, less any Minimum Fees paid out during the first year. Therefore, in the first year, the Fulcrum Fee methodology has three elements: 1) daily calculation of the Performance Fee and daily accrual of the Fulcrum Fee; 2) monthly payment of the Minimum Fee only (if any); and 3) a lump sum payment at the end of the initial 12-month period of the accrued Fulcrum Fee less the Minimum Fee.
By virtue of using average daily net assets over a “rolling” 12-month period for purposes of calculating the Performance Fee while using average daily net assets for the most recent month for purposes of calculating the Base Fee, the actual total Fulcrum Fee paid by the Fund to the Sub-Adviser may be higher or lower than the maximum or minimum annual rates described above if the average daily net assets do not remain constant during the rolling 12-month period. If the Fund is significantly underperforming versus the Index and the Fund’s net assets have declined significantly, the monthly total Fulcrum Fee can be a negative number (although the performance fee rate can never be negative, the Performance Fee can be negative). In such instances, if the negative Fulcrum Fee is not earned back or offset the following month, the Sub-Adviser must reimburse the Fund the amount of the negative Fulcrum Fee within an agreed upon time. Likewise, in the case where the Fund has significantly underperformed versus the Index but net assets have increased significantly, the monthly total Fulcrum Fee can be positive although the performance fee rate may be 0.00%. In such instances, the Fund will pay the Sub-Adviser the monthly Fulcrum Fee.
The table below lists the current Sub-Advisers along with their Fulcrum Fee arrangements.
NOTES TO FINANCIAL STATEMENTS (Unaudited)
April 30, 2016 (Continued)
| | | | | Null | Minimum | Maximum |
| Fund | Sub-Adviser | Benchmark | Base Fee | Zone | Fee | Fee |
| Floating Rate Bond | Newfleet Asset Management, LLC | S&P/LSTA Leveraged Loan Index | 0.40% | +/- 0.00% | 0.20% | 0.60% |
| Monthly Distribution* | Westchester Capital Management, LLC | IQ Hedge Market Neutral Beta Index | 0.75% | +/- 0.15% | 0.25% | 1.25% |
| Corporate/Government Bond | Newfleet Asset Management, LLC | Barclays Aggregate Bond Index | 0.30% | +/- 0.10% | 0.15% | 0.45% |
| Dynamic Macro | Mellon Capital Management Corporation | IQ Hedge Global Macro Beta Index | 0.75% | +/- 0.00% | 0.40% | 1.10% |
| High-Yield Bond | PENN Capital Management Co., Inc. | BofA Merrill Lynch U.S. Non- Distressed BB-B High-Yield Index | 0.40% | +/- 0.20% | 0.20% | 0.60% |
| International Opportunity Bond | Rogge Global Partners PLC | Barclays Global ex US Aggregate Bond Index | 0.45% | +/- 0.00% | 0.20% | 0.70% |
| Appreciation & Income | PENN Capital Management Co., Inc. | Merrill Lynch All Convertibles All Qualities Index | 0.45% | +/- 0.25% | 0.20% | 0.70% |
| Alternative Strategy | Market Concepts, LLC | Dow Jones Credit Suisse Managed Futures Liquid Index | 0.50% | +/- 0.15% | 0.30% | 0.70% |
| Large Cap Value | Rothschild Asset Management, Inc. | Russell 1000 Value Index | 0.30% | +/- 0.00% | 0.10% | 0.50% |
| Focused Large Cap Growth | The Ithaka Group, LLC | Russell 1000 Growth Index | 0.35% | +/- 0.30% | 0.20% | 0.50% |
| International Stock | Arrowstreet Capital L.P. | MSCI All Country World Index ex USA (Net) | 0.65% | +/- 0.20% | 0.30% | 1.00% |
| Real Estate Stock | Cornerstone Real Estate Advisers LLC | FTSE NAREIT All REITs Index | 0.40% | +/- 0.00% | 0.10% | 0.70% |
| Small Cap Value | Piermont Capital Management, LLC | Russell 2000 Value Index | 0.45% | +/- 0.00% | 0.10% | 0.80% |
| Emerging Markets Stock | Bailard, Inc. | MSCI Emerging Markets Index USD (Net) | 0.50% | +/- 0.00% | 0.10% | 0.90% |
| Small Cap Growth | Pier Capital, LLC | Russell 2000 Growth Index | 0.50% | +/- 0.20% | 0.00% | 1.00% |
| * | Effective April 1, 2013, the Sub-Adviser had contractually agreed to waive a portion of its fee (excluding 12b-1 fees) until at least February 29, 2016, so |
b. Administration, Fund Accounting and Transfer Agency Fees – Gemini Fund Services, LLC (“GFS” or the “Administrator”) serves as the administrator, fund accountant and transfer agent for the Funds. GFS receives from each Fund a monthly fee based on the combined average daily net assets at the following annual rates: 0.07% on the first $250 million of average net assets; 0.06% on average net assets between $250 million and $500 million; 0.05% on average net assets over $500 million; 0.3% on average net assets over $1 billion. Such fees are subject to an annual minimum of $400,000 in total for the entire Trust. For providing fund accounting services, the Administrator receives from each Fund a monthly fee based on the combined average daily net assets at the following rates: 0.03% on the first $500 million of average net assets; 0.01% on average net assets over $500 million. Such fees are subject to an annual minimum $300,000 in total for the entire Trust. For providing transfer agent services, the Administrator receives from the Trust a minimum annual fee of $200,000.
Pursuant to the terms of a Custody Administration Agreement, Monthly Distribution pays GFS a monthly fee of $300.
Blu Giant, LLC, (“Blu Giant”), (formally “Gemcom”), an affiliate of GFS, provides EDGAR conversion and filing services as well as some print management services for the Funds on an ad-hoc basis. For the provision of these services, Blu Giant receives customary fees from the Funds.
An officer of GFS is also an officer of the Trust and is not paid by the Trust.
c. Distributor – The Distributor of the Funds is Dunham & Associates (the “Distributor”). The Funds have adopted a Plan of Distribution (the “Plan”) pursuant to Rule 12b-1 under the 1940 Act, for Class A and Class C shares. The Plan provides for the monthly payment of a distribution fee to the Distributor or other entities at an annualized rate of 0.75% for the equity Funds and 0.50% for the fixed-income Funds, based on the average daily net assets attributable to Class C shares, and 0.25% of the average daily net assets attributable to Class A shares. In addition, the Funds have adopted a Shareholder Servicing Plan which provides for the payment of a shareholder service fee at an annualized rate of up to 0.25% of the average daily net assets attributable to the Class C shares. Class N shares do not pay 12b-1 distribution or shareholder servicing fees.
| NOTES TO FINANCIAL STATEMENTS (Unaudited) |
| April 30, 2016 (Continued) |
d. Trustees’ Fees – The Board has approved the following Trustee compensation schedule: Each Trustee who is not an interested person of the trust will receive $4,250 for each Board meeting attended in-person; $250 for all telephonic Board meetings; $500 for in-person committee meetings and $250 for telephonic committee meetings, unless the committee meeting is on the same day as a Board meeting, in which case the Trustee will not be compensated. The Funds also reimburse each such Trustee for travel and other expenses incurred in attending meetings of the Board.
With the exception of the Trust’s Chief Compliance Officer as discussed below, officers of the Trust and Trustees who are interested persons of the Trust do not receive any compensation from the Trust or any other Funds managed by the Adviser. The Trust has agreed to pay the Adviser a fee in the amount of $142,000 per annum plus an annual discretionary bonus as may be awarded as compensation for providing an officer or employee of the Adviser to serve as Chief Compliance Officer for the Funds (each Fund bearing its pro rata share of the fee), plus the cost of reasonable expenses related to the performance of the Chief Compliance Officer’s duties, including travel expenses, and may compensate the Adviser for the time of other officers or employees of the Adviser who serve in other compliance capacities for the Funds.
e. Other Affiliates – During the six months ended April 30, 2016, Gar Wood Securities, LLC a registered broker/dealer and an affiliate of the Market Concepts, LLC, Alternative Strategy’s Sub-Adviser, executed trades on behalf of Alternative Strategy. The affiliated broker for Alternative Strategy received $148,018 in trade commissions for the six months ended April 30, 2016.
| 4. | INVESTMENT TRANSACTIONS |
The cost of purchases and the proceeds from sales of investments, other than short-term investments, for the six months ended April 30, 2016 were as follows:
| | | Purchases | | | Sale Proceeds | | | | | | Proceeds of | |
| | | (excluding U.S. | | | (excluding U.S. | | | Purchases of | | | U.S. | |
| | | Government | | | Government | | | U.S. Government | | | Government | |
| Fund | | Securities) | | | Securities) | | | Securities | | | Securities | |
| Floating Rate Bond | | $ | 19,621,839 | | | $ | 18,936,398 | | | $ | — | | | $ | — | |
| Monthly Distribution | | | 322,500,030 | | | | 326,246,999 | | | | — | | | | — | |
| Corporate/Government Bond | | | 17,890,325 | | | | 22,766,816 | | | | 6,313,547 | | | | 3,743,287 | |
| Dynamic Macro | | | 13,731,822 | | | | 7,065,527 | | | | — | | | | — | |
| High-Yield Bond | | | 23,586,933 | | | | 34,196,100 | | | | — | | | | — | |
| International Opportunity Bond | | | 8,550,921 | | | | 16,652,578 | | | | — | | | | — | |
| Appreciation & Income | | | 5,683,935 | | | | 7,871,438 | | | | — | | | | — | |
| Alternative Strategy | | | 726,997,490 | | | | 732,748,690 | | | | — | | | | — | |
| Large Cap Value | | | 15,915,494 | | | | 17,587,934 | | | | — | | | | — | |
| Focused Large Cap Growth | | | 13,906,033 | | | | 9,585,081 | | | | — | | | | — | |
| International Stock | | | 54,114,449 | | | | 56,611,073 | | | | — | | | | — | |
| Real Estate Stock | | | 16,680,102 | | | | 22,646,788 | | | | — | | | | — | |
| Small Cap Value | | | 15,786,425 | | | | 16,057,135 | | | | — | | | | — | |
| Emerging Markets Stock | | | 28,575,180 | | | | 28,149,043 | | | | — | | | | — | |
| Small Cap Growth | | | 24,888,757 | | | | 22,220,409 | | | | — | | | | — | |
| NOTES TO FINANCIAL STATEMENTS (Unaudited) |
| April 30, 2016 (Continued) |
Transactions in option contracts purchased/written during the six months ended April 30, 2016 were as follows:
Monthly Distribution
| | | Options Purchased | | | Options Written | |
| | | Contracts | | | Premium | | | Contracts | | | Premium | |
| Outstanding at October 31, 2015 | | | 29,327 | | | $ | 3,546,892 | | | | 42,025 | | | $ | 8,570,827 | |
| Options purchased/written during period | | | 75,572 | | | | 11,592,244 | | | | 88,021 | | | | 17,307,001 | |
| Options exercised during period | | | (4,571 | ) | | | (2,266,417 | ) | | | (8,996 | ) | | | (1,550,793 | ) |
| Options expired during period | | | (37,056 | ) | | | (2,784,178 | ) | | | (20,763 | ) | | | (2,620,985 | ) |
| Options closed during period | | | (37,304 | ) | | | (6,615,253 | ) | | | (75,469 | ) | | | (15,497,469 | ) |
| Outstanding at April 30, 2016 | | | 25,968 | | | $ | 3,473,288 | | | | 24,818 | | | $ | 6,208,581 | |
Dynamic Macro
| | | Options Purchased | | | Options Written | |
| | | Contracts | | | Premium | | | Contracts | | | Premium | |
| Outstanding at October 31, 2015 | | | 351 | | | $ | 1,883,439 | | | | 70 | | | $ | 18,703 | |
| Options purchased/written during period | | | 1,545 | | | | 5,425,036 | | | | 320 | | | | 80,279 | |
| Options exercised during period | | | — | | | | — | | | | — | | | | — | |
| Options expired during period | | | (1,113 | ) | | | (4,498,307 | ) | | | (210 | ) | | | (56,791 | ) |
| Options closed during period | | | (274 | ) | | | (200,909 | ) | | | (30 | ) | | | (7,507 | ) |
| Outstanding at April 30, 2016 | | | 509 | | | $ | 2,609,259 | | | | 150 | | | $ | 34,684 | |
| 5. | AGGREGATE UNREALIZED APPRECIATION AND DEPRECIATION – TAX BASIS |
The identified cost of investments in securities owned by each Fund for federal income tax purposes, and its respective gross unrealized appreciation and depreciation at April 30, 2016, were as follows:
| | | | | | Gross | | | Gross | | | Net Unrealized | |
| | | Tax | | | Unrealized | | | Unrealized | | | Appreciation | |
| Fund | | Cost | | | Appreciation | | | Depreciation | | | (Depreciation) | |
| Floating Rate Bond | | $ | 90,683,918 | | | $ | 379,956 | | | $ | (1,932,053 | ) | | $ | (1,552,097 | ) |
| Monthly Distribution | | | 297,891,731 | | | | 9,796,848 | | | | (28,408,146 | ) | | | (18,611,298 | ) |
| Corporate/Government Bond | | | 53,928,789 | | | | 1,404,268 | | | | (485,685 | ) | | | 918,583 | |
| Dynamic Macro | | | 36,180,912 | | | | 983,919 | | | | (304,430 | ) | | | 679,489 | |
| High-Yield Bond | | | 93,601,420 | | | | 2,062,060 | | | | (1,366,533 | ) | | | 695,527 | |
| International Opportunity Bond | | | 38,963,131 | | | | 142,690 | | | | (2,979,318 | ) | | | (2,836,628 | ) |
| Appreciation & Income | | | 29,060,672 | | | | 293,967 | | | | (3,065,624 | ) | | | (2,771,657 | ) |
| Alternative Strategy | | | 22,409,849 | | | | 57,898 | | | | (359,734 | ) | | | (301,836 | ) |
| Large Cap Value | | | 59,357,383 | | | | 7,177,139 | | | | (2,613,491 | ) | | | 4,563,648 | |
| Focused Large Cap Growth | | | 52,697,568 | | | | 13,036,169 | | | | (1,531,245 | ) | | | 11,504,924 | |
| International Stock | | | 94,147,836 | | | | 3,846,293 | | | | (8,148,548 | ) | | | (4,302,255 | ) |
| Real Estate Stock | | | 41,216,457 | | | | 7,981,858 | | | | (35,045 | ) | | | 7,946,813 | |
| Small Cap Value | | | 31,239,050 | | | | 1,781,836 | | | | (1,694,570 | ) | | | 87,266 | |
| Emerging Markets Stock | | | 53,807,670 | | | | 4,586,255 | | | | (2,496,916 | ) | | | 2,089,339 | |
| Small Cap Growth | | | 30,393,643 | | | | 2,988,579 | | | | (926,501 | ) | | | 2,062,078 | |
| NOTES TO FINANCIAL STATEMENTS (Unaudited) |
| April 30, 2016 (Continued) |
| 6. | FORWARD FOREIGN CURRENCY CONTRACTS |
At April 30, 2016, Monthly Distribution, International Opportunity Bond, Dynamic Macro and International Stock had the following open forward foreign currency contracts:
Monthly Distribution:
| | | | | | | | | | | | | Unrealized | |
| | | Settlement | | | | Local | | | U.S. Dollar | | | Appreciation | |
| Foreign Currency | | Date | | Counterparty | | Currency | | | Value | | | (Depreciation) | |
| To Sell: | | | | | | | | | | | | | | | | |
| British Pound | | 4/20/2016 | | JP Morgan | | | 2,141 | | | $ | 2,191 | | | $ | 51 | |
| Euro | | 5/4/2016 | | JP Morgan | | | 2,140,474 | | | | 2,154,150 | | | | 13,676 | |
| Australian Dollar | | 6/7/2016 | | JP Morgan | | | 5,338 | | | | 5,606 | | | | 268 | |
| | | | | | | | | | | $ | 2,161,947 | | | $ | 13,995 | |
Monthly Distribution:
| | | | | | | | | | | | | Unrealized | |
| | | Settlement | | | | Local | | | U.S. Dollar | | | Appreciation | |
| Foreign Currency | | Date | | Counterparty | | Currency | | | Value | | | (Depreciation) | |
| To Sell: | | | | | | | | | | | | | | | | |
| Euro | | 5/4/2016 | | JP Morgan | | | 1,880,988 | | | $ | 2,130,652 | | | $ | (23,498 | ) |
| British Pound | | 4/20/2016 | | JP Morgan | | | 1,503 | | | | 2,134 | | | | (62 | ) |
| Australian Dollar | | 6/7/2016 | | JP Morgan | | | 3,735,370 | | | | 2,731,829 | | | | (103,652 | ) |
| Euro | | 6/14/2016 | | JP Morgan | | | 595,440 | | | | 671,144 | | | | (11,659 | ) |
| Hong Kong Dollar | | 6/15/2016 | | JP Morgan | | | 40,576,420 | | | | 5,236,037 | | | | 2,707 | |
| British Pound | | 7/21/2016 | | JP Morgan | | | 107,644 | | | | 153,492 | | | | (3,834 | ) |
| Swedish Krona | | 8/10/2016 | | JP Morgan | | | 23,411,766 | | | | 2,800,771 | | | | (125,833 | ) |
| British Pound | | 10/4/2016 | | JP Morgan | | | 5,727,127 | | | | 8,044,388 | | | | (193,234 | ) |
| | | | | | | | | | | $ | 21,770,447 | | | $ | (459,065 | ) |
International Opportunity Bond:
| | | | | | | | | | | | | Unrealized | |
| | | Settlement | | | | Local | | | U.S. Dollar | | | Appreciation | |
| Foreign Currency | | Date | | Counterparty | | Currency | | | Value | | | (Depreciation) | |
| To Buy: | | | | | | | | | | | | | | | | |
| Australian Dollar | | 6/20/2016 | | Barclays | | | 810,000 | | | $ | 616,800 | | | $ | (3,127 | ) |
| Australian Dollar | | 6/20/2016 | | Citigroup | | | 52,626 | | | | 40,074 | | | | 478 | |
| British Pound | | 6/20/2016 | | Barclays | | | 87,300 | | | | 127,906 | | | | 3,519 | |
| British Pound | | 6/20/2016 | | Citigroup | | | 516,321 | | | | 756,481 | | | | 24,656 | |
| Canadian Dollar | | 6/20/2016 | | Barclays | | | 429,995 | | | | 343,283 | | | | 16,759 | |
| Canadian Dollar | | 6/20/2016 | | Citigroup | | | 657,274 | | | | 524,729 | | | | 25,617 | |
| Czech Koruna | | 6/14/2016 | | Barclays | | | 1,780,000 | | | | 75,459 | | | | 3,895 | |
| Euro | | 6/20/2016 | | Barclays | | | 352,732 | | | | 404,659 | | | | 3,429 | |
| Euro | | 6/20/2016 | | Citigroup | | | 392,696 | | | | 450,510 | | | | 3,655 | |
| Indonesian Rupiah | | 6/14/2016 | | Citigroup | | | 4,080,000,000 | | | | 307,057 | | | | (844 | ) |
| Israeli Shekel | | 6/14/2016 | | Citigroup | | | 380,000 | | | | 101,893 | | | | 3,913 | |
| Japanese Yen | | 6/20/2016 | | Barclays | | | 199,245,587 | | | | 1,864,928 | | | | 57,763 | |
| Japanese Yen | | 6/20/2016 | | Citigroup | | | 51,572,671 | | | | 482,717 | | | | 13,363 | |
| Malaysian Ringgit | | 6/14/2016 | | Citigroup | | | 680,000 | | | | 173,439 | | | | 10,728 | |
| New Zealand Dollar | | 6/20/2016 | | Barclays | | | 140,863 | | | | 98,224 | | | | 2,904 | |
| Norwegian Krone | | 6/20/2016 | | Citigroup | | | 650,053 | | | | 80,707 | | | | 2,745 | |
| Polish Zloty | | 6/14/2016 | | Barclays | | | 220,000 | | | | 57,537 | | | | 2,482 | |
| Russian Ruble | | 6/14/2016 | | Citigroup | | | 68,459,000 | | | | 1,045,123 | | | | 77,651 | |
| Singapore Dollar | | 6/14/2016 | | Barclays | | | 120,000 | | | | 89,191 | | | | 3,794 | |
| Singapore Dollar | | 6/14/2016 | | Citigroup | | | 40,000 | | | | 29,730 | | | | 1,267 | |
| South African Rand | | 6/14/2016 | | Barclays | | | 70,000 | | | | 4,889 | | | | 536 | |
| South African Rand | | 6/14/2016 | | Citigroup | | | 1,930,000 | | | | 134,809 | | | | 14,768 | |
| Turkish Lira New | | 6/14/2016 | | Citigroup | | | 300,000 | | | | 105,993 | | | | 7,035 | |
| | | | | | | | | | | $ | 7,916,138 | | | $ | 276,986 | |
| NOTES TO FINANCIAL STATEMENTS (Unaudited) |
| April 30, 2016 (Continued) |
International Opportunity Bond:
| | | | | | | | | | | | | Unrealized | |
| | | Settlement | | | | Local | | | U.S. Dollar | | | Appreciation | |
| Foreign Currency | | Date | | Counterparty | | Currency | | | Value | | | (Depreciation) | |
| To Sell: | | | | | | | | | | | | | | | | |
| British Pound | | 6/20/2016 | | Barclays | | | (434,504 | ) | | $ | (636,606 | ) | | $ | (23,207 | ) |
| British Pound | | 6/20/2016 | | Citigroup | | | (180,476 | ) | | | (264,421 | ) | | | (9,125 | ) |
| Canadian Dollar | | 6/20/2016 | | Deutsche | | | (40,000 | ) | | | (31,934 | ) | | | (657 | ) |
| Danish Krone | | 6/20/2016 | | Barclays | | | (1,058,202 | ) | | | (163,106 | ) | | | (1,099 | ) |
| Euro | | 6/14/2016 | | Barclays | | | (116,263 | ) | | | (133,350 | ) | | | (6,731 | ) |
| Euro | | 6/20/2016 | | Barclays | | | (649,910 | ) | | | (745,591 | ) | | | (6,215 | ) |
| Euro | | 6/20/2016 | | Citigroup | | | (412,697 | ) | | | (473,455 | ) | | | (3,758 | ) |
| Israeli Shekel | | 6/14/2016 | | Barclays | | | (110,000 | ) | | | (29,495 | ) | | | (1,138 | ) |
| Japanese Yen | | 6/20/2016 | | Citigroup | | | (28,843,296 | ) | | | (269,972 | ) | | | (4,111 | ) |
| Malaysian Ringgit | | 6/14/2016 | | Deutsche | | | (1,410,000 | ) | | | (359,630 | ) | | | 2,373 | |
| Mexican Peso | | 6/14/2016 | | Barclays | | | (11,965,991 | ) | | | (695,365 | ) | | | (32,771 | ) |
| Mexican Peso | | 6/14/2016 | | Citigroup | | | (2,225,834 | ) | | | (129,347 | ) | | | (3,305 | ) |
| Polish Zloty | | 6/14/2016 | | Barclays | | | (60,000 | ) | | | (15,692 | ) | | | (727 | ) |
| Russian Ruble | | 6/14/2016 | | Barclays | | | (2,510,000 | ) | | | (38,319 | ) | | | (2,021 | ) |
| Russian Ruble | | 6/14/2016 | | Citigroup | | | (43,040,000 | ) | | | (657,066 | ) | | | (21,803 | ) |
| South African Rand | | 6/14/2016 | | Citigroup | | | (440,000 | ) | | | (30,734 | ) | | | (2,461 | ) |
| South Korean Won | | 6/14/2016 | | Barclays | | | (159,375,000 | ) | | | (139,778 | ) | | | (8,526 | ) |
| Swedish Krona | | 6/20/2016 | | Barclays | | | (1,820,836 | ) | | | (227,403 | ) | | | (3,145 | ) |
| Swiss Franc | | 6/20/2016 | | Citigroup | | | (130,647 | ) | | | (136,623 | ) | | | 17 | |
| Taiwan Dollar | | 6/14/2016 | | Citigroup | | | (41,366,000 | ) | | | (1,283,124 | ) | | | (41,331 | ) |
| | | | | | | | | | | $ | (6,461,011 | ) | | $ | (169,741 | ) |
| NOTES TO FINANCIAL STATEMENTS (Unaudited) |
| April 30, 2016 (Continued) |
International Stock:
| | | | | | | | | | | | | Unrealized | |
| | | Settlement | | | | Local | | | U.S. Dollar | | | Appreciation | |
| Foreign Currency | | Date | | Counterparty | | Currency | | | Value | | | (Depreciation) | |
| To Buy: | | | | | | | | | | | | | | | | |
| Australian Dollar | | 6/15/2016 | | Bank of New York/Mellon | | $ | 34,971 | | | $ | 26,636 | | | $ | — | |
| Australian Dollar | | 6/15/2016 | | Royal Bank of Scotland | | | 6,549,774 | | | | 4,988,625 | | | | 116,850 | |
| Australian Dollar | | 6/15/2016 | | Royal Bank of Scotland | | | 339,762 | | | | 258,779 | | | | (2,527 | ) |
| Australian Dollar | | 6/15/2016 | | UBS | | | 17,800 | | | | 13,557 | | | | — | |
| Brazilian Real | | 5/2/2016 | | USB | | | 1,420,987 | | | | 411,785 | | | | — | |
| British Pound | | 6/15/2016 | | Bank of New York/Mellon | | | 5,440,109 | | | | 7,970,357 | | | | 241,285 | |
| British Pound | | 6/15/2016 | | Royal Bank of Scotland | | | 6,240 | | | | 9,142 | | | | — | |
| British Pound | | 6/15/2016 | | UBS | | | 27,434 | | | | 40,194 | | | | — | |
| Canadian Dollar | | 6/15/2016 | | Bank of New York/Mellon | | | 498,591 | | | | 398,046 | | | | 22,710 | |
| Canadian Dollar | | 6/15/2016 | | UBS | | | 4,376,284 | | | | 3,493,768 | | | | — | |
| Danish Krone | | 6/15/2016 | | UBS | | | 9,758,275 | | | | 1,503,830 | | | | 41,829 | |
| Euro | | 6/15/2016 | | Bank of New York/Mellon | | | 2,824,062 | | | | 3,239,179 | | | | 66,052 | |
| Euro | | 6/15/2016 | | Royal Bank of Scotland | | | 280,038 | | | | 321,209 | | | | 7,974 | |
| Euro | | 6/15/2016 | | UBS | | | 217,030 | | | | 248,938 | | | | 1,704 | |
| Hong Kong Dollar | | 6/15/2016 | | Bank of New York/Mellon | | | 1,079,215 | | | | 139,185 | | | | 281 | |
| Hong Kong Dollar | | 6/15/2016 | | Bank of New York/Mellon | | | 1,686,273 | | | | 217,476 | | | | (114 | ) |
| Hong Kong Dollar | | 6/15/2016 | | Royal Bank of Scotland | | | 13,539,833 | | | | 1,746,215 | | | | — | |
| Hong Kong Dollar | | 6/15/2016 | | UBS | | | 870,298 | | | | 112,241 | | | | 4 | |
| Israeli Shekel | | 6/15/2016 | | Bank of New York/Mellon | | | 206,872 | | | | 55,472 | | | | — | |
| Israeli Shekel | | 6/15/2016 | | UBS | | | 932,519 | | | | 250,052 | | | | 10,674 | |
| Japanese Yen | | 5/6/2016 | | Bank of New York/Mellon | | | 14,770,780 | | | | 138,070 | | | | — | |
| Japanese Yen | | 6/15/2016 | | Bank of New York/Mellon | | | 197,389,176 | | | | 1,847,215 | | | | 87,010 | |
| Japanese Yen | | 5/9/2016 | | Citigroup | | | 21,472,310 | | | | 200,727 | | | | — | |
| Japanese Yen | | 6/15/2016 | | UBS | | | 41,659,560 | | | | 389,860 | | | | 22,261 | |
| Mexican Peso | | 5/2/2016 | | Citigroup | | | 584,271 | | | | 34,110 | | | | — | |
| New Zealand Dollar | | 6/15/2016 | | Bank of New York/Mellon | | | 41,056 | | | | 28,636 | | | | 685 | |
| New Zealand Dollar | | 6/15/2016 | | Royal Bank of Scotland | | | 259,819 | | | | 181,221 | | | | — | |
| Norwegian Krone | | 6/15/2016 | | Bank of New York/Mellon | | | 1,319,676 | | | | 163,848 | | | | — | |
| Norwegian Krone | | 6/15/2016 | | Royal Bank of Scotland | | | 73,711 | | | | 9,152 | | | | — | |
| Singapore Dollar | | 6/15/2016 | | Bank of New York/Mellon | | | 1,026,746 | | | | 763,129 | | | | 19,838 | |
| Singapore Dollar | | 6/15/2016 | | Royal Bank of Scotland | | | 11,935 | | | | 8,871 | | | | — | |
| Singapore Dollar | | 6/15/2016 | | UBS | | | 12,406 | | | | 9,221 | | | | — | |
| Singapore Dollar | | 6/15/2016 | | UBS | | | 16,412 | | | | 12,198 | | | | — | |
| South African Rand | | 5/5/2016 | | Bank of New York/Mellon | | | 424,238 | | | | 29,883 | | | | — | |
| South African Rand | | 5/3/2016 | | Royal Bank of Scotland | | | 792,331 | | | | 55,836 | | | | — | |
| South African Rand | | 5/4/2016 | | Royal Bank of Scotland | | | 961,589 | | | | 67,749 | | | | — | |
| South Korean Won | | 5/2/2016 | | USB | | | 69,878,696 | | | | 61,329 | | | | — | |
| Swedish Krona | | 6/15/2016 | | Bank of New York/Mellon | | | 2,288,309 | | | | 285,728 | | | | 3,120 | |
| Swedish Krona | | 6/15/2016 | | UBS | | | 2,013,955 | | | | 251,471 | | | | — | |
| Swiss Franc | | 6/15/2016 | | Bank of New York/Mellon | | | 603,935 | | | | 631,404 | | | | 5,219 | |
| Swiss Franc | | 6/15/2016 | | UBS | | | 38,812 | | | | 40,577 | | | | — | |
| Swiss Franc | | 6/15/2016 | | USB | | | 30,733 | | | | 32,131 | | | | 6 | |
| | | | | | | | | | | $ | 30,687,055 | | | $ | 644,861 | |
| NOTES TO FINANCIAL STATEMENTS (Unaudited) |
| April 30, 2016 (Continued) |
International Stock:
| | | | | | | | | | | | | Unrealized | |
| | | Settlement | | | | Local | | | U.S. Dollar | | | Appreciation | |
| Foreign Currency | | Date | | Counterparty | | Currency | | | Value | | | (Depreciation) | |
| To Sell: | | | | | | | | | | | | | | | | |
| Australian Dollar | | 6/15/2016 | | Bank of New York/Mellon | | | (63,193 | ) | | $ | (48,131 | ) | | $ | (979 | ) |
| Australian Dollar | | 6/15/2016 | | Bank of New York/Mellon | | | (137,080 | ) | | | (104,407 | ) | | | 421 | |
| Australian Dollar | | 6/15/2016 | | UBS | | | (255,695 | ) | | | (194,750 | ) | | | (3,333 | ) |
| Brazilian Real | | 5/2/2016 | | USB | | | (47,851 | ) | | | (13,867 | ) | | | (355 | ) |
| British Pound | | 6/15/2016 | | Bank of New York/Mellon | | | (759,974 | ) | | | (1,113,445 | ) | | | (31,369 | ) |
| British Pound | | 6/15/2016 | | UBS | | | (41,414 | ) | | | (60,676 | ) | | | (1,830 | ) |
| Canadian Dollar | | 5/2/2016 | | Bank of New York/Mellon | | | (16,171 | ) | | | (12,910 | ) | | | (38 | ) |
| Canadian Dollar | | 6/15/2016 | | Bank of New York/Mellon | | | (1,578,201 | ) | | | (1,259,941 | ) | | | (69,799 | ) |
| Canadian Dollar | | 6/15/2016 | | USB | | | (93,903 | ) | | | (74,967 | ) | | | (3,053 | ) |
| Danish Krone | | 6/15/2016 | | Bank of New York/Mellon | | | (20,400,632 | ) | | | (3,143,905 | ) | | | (128,476 | ) |
| Euro | | 6/15/2016 | | Bank of New York/Mellon | | | (184,999 | ) | | | (212,198 | ) | | | (9,695 | ) |
| Euro | | 6/15/2016 | | Royal Bank of Scotland | | | (6,476,101 | ) | | | (7,428,219 | ) | | | (294,426 | ) |
| Hong Kong Dollar | | 6/15/2016 | | Bank of New York/Mellon | | | (78,674 | ) | | | (10,146 | ) | | | (13 | ) |
| Hong Kong Dollar | | 6/15/2016 | | UBS | | | (136,969 | ) | | | (17,665 | ) | | | (1 | ) |
| Israeli Shekel | | 6/15/2016 | | Royal Bank of Scotland | | | (2,350,140 | ) | | | (630,183 | ) | | | (26,393 | ) |
| Japanese Yen | | 5/2/2016 | | Bank of New York/Mellon | | | (34,552,287 | ) | | | (322,934 | ) | | | (12,393 | ) |
| Japanese Yen | | 6/15/2016 | | Bank of New York/Mellon | | | (286,730,399 | ) | | | (2,683,292 | ) | | | (144,817 | ) |
| Japanese Yen | | 5/6/2016 | | Citigroup | | | (21,102,362 | ) | | | (197,255 | ) | | | (2,920 | ) |
| Japanese Yen | | 6/15/2016 | | UBS | | | (11,641,494 | ) | | | (108,944 | ) | | | (2,701 | ) |
| New Zealand Dollar | | 6/15/2016 | | Royal Bank of Scotland | | | (13,186 | ) | | | (9,197 | ) | | | (180 | ) |
| New Zealand Dollar | | 6/15/2016 | | UBS | | | (12,892 | ) | | | (8,992 | ) | | | (222 | ) |
| Norwegian Krone | | 6/15/2016 | | Bank of New York/Mellon | | | (9,685,409 | ) | | | (1,202,522 | ) | | | (63,527 | ) |
| Norwegian Krone | | 6/15/2016 | | UBS | | | (571,827 | ) | | | (70,997 | ) | | | (3,994 | ) |
| Singapore Dollar | | 6/15/2016 | | UBS | | | (25,869 | ) | | | (19,227 | ) | | | (320 | ) |
| South Korean Won | | 5/2/2016 | | USB | | | (14,296,649 | ) | | | (12,548 | ) | | | (97 | ) |
| Swedish Krona | | 6/15/2016 | | Bank of New York/Mellon | | | (10,636,523 | ) | | | (1,328,122 | ) | | | (69,376 | ) |
| Swedish Krona | | 6/15/2016 | | UBS | | | (9,400,853 | ) | | | (1,173,832 | ) | | | (62,456 | ) |
| Swedish Krona | | 6/15/2016 | | USB | | | (334,056 | ) | | | (41,712 | ) | | | (506 | ) |
| Swiss Franc | | 6/15/2016 | | Bank of New York/Mellon | | | (597,702 | ) | | | (624,888 | ) | | | (22,391 | ) |
| Swiss Franc | | 6/15/2016 | | UBS | | | (2,720,396 | ) | | | (2,844,130 | ) | | | (107,451 | ) |
| | | | | | | | | | | $ | (24,974,002 | ) | | $ | (1,062,690 | ) |
| 7. | SHARES OF BENEFICIAL INTEREST |
At April 30, 2016, each Fund had an unlimited number of shares authorized with no par value.
Following is a summary of shareholder transactions for each Fund for the six months ended April 30, 2016 and the year ended and October 31, 2015, respectively:
| NOTES TO FINANCIAL STATEMENTS (Unaudited) |
| April 30, 2016 (Continued) |
| |
For the Six Months Ended April 30, 2016:
| | | Class N Shares | | | Class A Shares | |
| | | | | | | | | | | | Net Increase | | | | | | | | | | | | Net Increase | |
| | | | | | Distributions | | | | | | (Decrease) in | | | | | | Distributions | | | | | | (Decrease) in | |
| Fund | | Issued | | | Reinvested | | | Redeemed | | | Shares | | | Issued | | | Reinvested | | | Redeemed | | | Shares | |
| Floating Rate Bond | | | 1,026,178 | | | | 123,862 | | | | (1,099,294 | ) | | | 50,746 | | | | 221,375 | | | | 12,590 | | | | (167,937 | ) | | | 66,028 | |
| Monthly Distribution | | | 415,269 | | | | 71,996 | | | | (777,347 | ) | | | (290,082 | ) | | | 168,519 | | | | 27,384 | | | | (664,005 | ) | | | (468,102 | ) |
| Corporate/Government Bond | | | 490,242 | | | | 46,254 | | | | (445,404 | ) | | | 91,092 | | | | 157,154 | | | | 4,830 | | | | (105,442 | ) | | | 56,542 | |
| Dynamic Macro | | | 621,947 | | | | — | | | | (308,913 | ) | | | 313,034 | | | | 206,861 | | | | — | | | | (156,603 | ) | | | 50,258 | |
| High-Yield Bond | | | 671,503 | | | | 212,105 | | | | (953,637 | ) | | | (70,029 | ) | | | 173,282 | | | | 22,125 | | | | (153,611 | ) | | | 41,796 | |
| International Opportunity Bond | | | 207,572 | | | | 2,986 | | | | (930,749 | ) | | | (720,191 | ) | | | 59,873 | | | | 159 | | | | (129,793 | ) | | | (69,761 | ) |
| Appreciation & Income | | | 276,644 | | | | 145,362 | | | | (326,820 | ) | | | 95,186 | | | | 45,733 | | | | 23,349 | | | | (31,085 | ) | | | 37,997 | |
| Alternative Strategy | | | 94,509 | | | | — | | | | (61,010 | ) | | | 33,499 | | | | 13,956 | | | | — | | | | (7,020 | ) | | | 6,936 | |
| Large Cap Value | | | 308,796 | | | | 968,124 | | | | (367,094 | ) | | | 909,826 | | | | 78,947 | | | | 138,870 | | | | (79,711 | ) | | | 138,106 | |
| Focused Large Cap Growth | | | 445,051 | | | | 17,116 | | | | (300,944 | ) | | | 161,223 | | | | 216,455 | | | | 3,304 | | | | (83,849 | ) | | | 135,910 | |
| International Stock | | | 239,451 | | | | 3,084 | | | | (304,510 | ) | | | (61,975 | ) | | | 113,221 | | | | — | | | | (86,293 | ) | | | 26,928 | |
| Real Estate Stock | | | 118,855 | | | | 184,156 | | | | (400,790 | ) | | | (97,779 | ) | | | 41,331 | | | | 57,555 | | | | (76,979 | ) | | | 21,907 | |
| Small Cap Value | | | 97,528 | | | | 52,868 | | | | (136,751 | ) | | | 13,645 | | | | 43,010 | | | | 8,834 | | | | (46,841 | ) | | | 5,003 | |
| Emerging Markets Stock | | | 704,872 | | | | 25,824 | | | | (486,499 | ) | | | 244,197 | | | | 110,557 | | | | 1,850 | | | | (75,370 | ) | | | 37,037 | |
| Small Cap Growth | | | 290,028 | | | | 124,708 | | | | (122,170 | ) | | | 292,566 | | | | 55,173 | | | | 24,091 | | | | (56,076 | ) | | | 23,188 | |
| | | | | | | | | | | | | | | | | | | | | | | | | | | | | | | | | |
| | | Class C Shares | | | | | | | | | | | | | | | | | |
| | | | | | | | | | | | Net Increase | | | | | | | | | | | | | | | | | |
| | | | | | Distributions | | | | | | (Decrease) | | | | | | | | | | | | | | | | | |
| Fund | | Issued | | | Reinvested | | | Redeemed | | | in Shares | | | | | | | | | | | | | | | | | |
| Floating Rate Bond | | | 72,755 | | | | 4,719 | | | | (49,647 | ) | | | 27,827 | | | | | | | | | | | | | | | | | |
| Monthly Distribution | | | 133,217 | | | | 26,541 | | | | (354,079 | ) | | | (194,321 | ) | | | | | | | | | | | | | | | | |
| Corporate/Government Bond | | | 31,524 | | | | 2,841 | | | | (43,853 | ) | | | (9,488 | ) | | | | | | | | | | | | | | | | |
| Dynamic Macro | | | 69,976 | | | | — | | | | (26,804 | ) | | | 43,172 | | | | | | | | | | | | | | | | | |
| High-Yield Bond | | | 57,532 | | | | 17,460 | | | | (174,903 | ) | | | (99,911 | ) | | | | | | | | | | | | | | | | |
| International Opportunity Bond | | | 13,371 | | | | 12 | | | | (65,776 | ) | | | (52,393 | ) | | | | | | | | | | | | | | | | |
| Appreciation & Income | | | 106,227 | | | | 28,776 | | | | (193,121 | ) | | | (58,118 | ) | | | | | | | | | | | | | | | | |
| Alternative Strategy | | | 8,562 | | | | — | | | | (7,024 | ) | | | 1,538 | | | | | | | | | | | | | | | | | |
| Large Cap Value | | | 31,762 | | | | 136,802 | | | | (64,211 | ) | | | 104,353 | | | | | | | | | | | | | | | | | |
| Focused Large Cap Growth | | | 96,452 | | | | 1,886 | | | | (62,357 | ) | | | 35,981 | | | | | | | | | | | | | | | | | |
| International Stock | | | 45,230 | | | | — | | | | (54,339 | ) | | | (9,109 | ) | | | | | | | | | | | | | | | | |
| Real Estate Stock | | | 19,226 | | | | 20,451 | | | | (51,431 | ) | | | (11,754 | ) | | | | | | | | | | | | | | | | |
| Small Cap Value | | | 16,667 | | | | 7,074 | | | | (18,822 | ) | | | 4,919 | | | | | | | | | | | | | | | | | |
| Emerging Markets Stock | | | 41,333 | | | | — | | | | (40,273 | ) | | | 1,060 | | | | | | | | | | | | | | | | | |
| Small Cap Growth | | | 24,868 | | | | 24,004 | | | | (23,227 | ) | | | 25,645 | | | | | | | | | | | | | | | | | |
| NOTES TO FINANCIAL STATEMENTS (Unaudited) |
| April 30, 2016 (Continued) |
| |
Year Ended October 31, 2015:
| | | Class N Shares | | | Class A Shares | |
| | | | | | | | | | | | Net Increase | | | | | | | | | | | | Net Increase | |
| | | | | | Distributions | | | | | | (Decrease) in | | | | | | Distributions | | | | | | (Decrease) in | |
| Fund | | Issued | | | Reinvested | | | Redeemed | | | Shares | | | Issued | | | Reinvested | | | Redeemed | | | Shares | |
| Floating Rate Bond | | | 2,743,474 | | | | 235,935 | | | | (1,738,796 | ) | | | 1,240,613 | | | | 762,696 | | | | 27,014 | | | | (1,278,597 | ) | | | (488,887 | ) |
| Monthly Distribution | | | 1,565,620 | | | | 133,194 | | | | (1,305,539 | ) | | | 393,275 | | | | 877,718 | | | | 55,831 | | | | (959,070 | ) | | | (25,521 | ) |
| Corporate/Government Bond | | | 845,565 | | | | 103,425 | | | | (998,123 | ) | | | (49,133 | ) | | | 196,543 | | | | 8,530 | | | | (117,162 | ) | | | 87,911 | |
| Dynamic Macro | | | 1,956,574 | | | | — | | | | (267,309 | ) | | | 1,689,265 | | | | 224,440 | | | | — | | | | (67,122 | ) | | | 157,318 | |
| High-Yield Bond | | | 1,563,647 | | | | 443,465 | | | | (3,951,501 | ) | | | (1,944,389 | ) | | | 792,543 | | | | 58,311 | | | | (2,010,978 | ) | | | (1,160,124 | ) |
| International Opportunity Bond | | | 1,385,937 | | | | 2,121 | | | | (2,208,993 | ) | | | (820,935 | ) | | | 499,486 | | | | 115 | | | | (503,468 | ) | | | (3,867 | ) |
| Appreciation & Income | | | 708,844 | | | | 362,827 | | | | (471,083 | ) | | | 600,588 | | | | 175,495 | | | | 65,318 | | | | (174,098 | ) | | | 66,715 | |
| Alternative Strategy | | | 407,011 | | | | — | | | | (164,945 | ) | | | 242,066 | | | | 88,643 | | | | — | | | | (100,328 | ) | | | (11,685 | ) |
| Large Cap Value | | | 620,117 | | | | 19,465 | | | | (491,285 | ) | | | 148,297 | | | | 166,148 | | | | 2,513 | | | | (239,724 | ) | | | (71,063 | ) |
| Alternative Income | | | 113,565 | | | | 7,349 | | | | (157,679 | ) | | | (36,765 | ) | | | 20,645 | | | | 4,600 | | | | (20,095 | ) | | | 5,150 | |
| Focused Large Cap Growth | | | 1,177,969 | | | | — | | | | (625,830 | ) | | | 552,139 | | | | 626,283 | | | | — | | | | (1,443,105 | ) | | | (816,822 | ) |
| International Stock | | | 2,084,717 | | | | 92,841 | | | | (543,221 | ) | | | 1,634,337 | | | | 302,319 | | | | 10,011 | | | | (195,629 | ) | | | 116,701 | |
| Real Estate Stock | | | 525,476 | | | | 100,754 | | | | (817,583 | ) | | | (191,353 | ) | | | 476,856 | | | | 27,523 | | | | (167,669 | ) | | | 336,710 | |
| Small Cap Value | | | 348,595 | | | | 101,946 | | | | (443,428 | ) | | | 7,113 | | | | 96,740 | | | | 13,178 | | | | (54,638 | ) | | | 55,280 | |
| Emerging Markets Stock | | | 1,440,620 | | | | 33,977 | | | | (327,502 | ) | | | 1,147,095 | | | | 197,080 | | | | 3,384 | | | | (87,560 | ) | | | 112,904 | |
| Small Cap Growth | | | 363,216 | | | | 107,442 | | | | (309,334 | ) | | | 161,324 | | | | 111,426 | | | | 24,863 | | | | (127,706 | ) | | | 8,583 | |
| | | | | | | | | | | | | | | | | | | | | | | | | | | | | | | | | |
| | | Class C Shares | | | | | | | | | | | | | | | | | |
| | | | | | | | | | | | Net Increase | | | | | | | | | | | | | | | | | |
| | | | | | Distributions | | | | | | (Decrease) in | | | | | | | | | | | | | | | | | |
| Fund | | Issued | | | Reinvested | | | Redeemed | | | Shares | | | | | | | | | | | | | | | | | |
| Floating Rate Bond | | | 134,346 | | | | 9,176 | | | | (114,562 | ) | | | 28,960 | | | | | | | | | | | | | | | | | |
| Monthly Distribution | | | 660,112 | | | | 50,517 | | | | (542,015 | ) | | | 168,614 | | | | | | | | | | | | | | | | | |
| Corporate/Government Bond | | | 71,275 | | | | 6,301 | | | | (69,409 | ) | | | 8,167 | | | | | | | | | | | | | | | | | |
| Dynamic Macro | | | 68,579 | | | | — | | | | (46,093 | ) | | | 22,486 | | | | | | | | | | | | | | | | | |
| High-Yield Bond | | | 147,503 | | | | 39,862 | | | | (377,837 | ) | | | (190,472 | ) | | | | | | | | | | | | | | | | |
| International Opportunity Bond | | | 74,858 | | | | — | | | | (84,776 | ) | | | (9,918 | ) | | | | | | | | | | | | | | | | |
| Appreciation & Income | | | 243,786 | | | | 75,929 | | | | (120,326 | ) | | | 199,389 | | | | | | | | | | | | | | | | | |
| Alternative Strategy | | | 16,033 | | | | — | | | | (24,003 | ) | | | (7,970 | ) | | | | | | | | | | | | | | | | |
| Large Cap Value | | | 69,089 | | | | — | | | | (59,967 | ) | | | 9,122 | | | | | | | | | | | | | | | | | |
| Alternative Income | | | 66,949 | | | | 3,224 | | | | (38,172 | ) | | | 32,001 | | | | | | | | | | | | | | | | | |
| Focused Large Cap Growth | | | 75,706 | | | | — | | | | (54,770 | ) | | | 20,936 | | | | | | | | | | | | | | | | | |
| International Stock | | | 133,023 | | | | 6,655 | | | | (56,755 | ) | | | 82,923 | | | | | | | | | | | | | | | | | |
| Real Estate Stock | | | 56,624 | | | | 10,900 | | | | (82,900 | ) | | | (15,376 | ) | | | | | | | | | | | | | | | | |
| Small Cap Value | | | 27,913 | | | | 11,766 | | | | (31,345 | ) | | | 8,334 | | | | | | | | | | | | | | | | | |
| Emerging Markets Stock | | | 85,900 | | | | 1,420 | | | | (59,863 | ) | | | 27,457 | | | | | | | | | | | | | | | | | |
| Small Cap Growth | | | 41,709 | | | | 21,228 | | | | (50,521 | ) | | | 12,416 | | | | | | | | | | | | | | | | | |
| NOTES TO FINANCIAL STATEMENTS (Unaudited) |
| April 30, 2016 (Continued) |
| |
| 8. | DISTRIBUTIONS TO SHAREHOLDERS AND TAX COMPONENTS OF CAPITAL |
The tax character of dividends paid during the year ended October 31, 2015 and October 31, 2014 was as follows:
| | | For the period year October 31, 2015 | | | | | | For the period ended October 31, 2014 | | | | |
| | | Ordinary | | | Long-Term | | | Return of | | | | | | Ordinary | | | Long-Term | | | Return of | | | | |
| Fund | | Income | | | Capital Gains | | | Capital | | | Total | | | Income | | | Capital Gains | | | Capital | | | Total | |
| Floating Rate Bond | | $ | 2,676,918 | | | $ | — | | | $ | — | | | $ | 2,676,918 | | | $ | 1,836,066 | | | $ | — | | | $ | — | | | $ | 1,836,066 | |
| Monthly Distribution | | | 6,276,573 | | | | — | | | | 3,563,401 | | | | 9,839,974 | | | | 6,127,602 | | | | 4,836,787 | | | | 1,672,242 | | | | 12,636,631 | |
| Corporate/Government Bond | | | 1,657,557 | | | | — | | | | — | | | | 1,657,557 | | | | 1,609,392 | | | | 223,663 | | | | — | | | | 1,833,055 | |
| Dynamic Macro | | | — | | | | — | | | | — | | | | — | | | | 171,273 | | | | — | | | | — | | | | 171,273 | |
| High- Yield Bond | | | 5,267,075 | | | | — | | | | — | | | | 5,267,075 | | | | 6,632,924 | | | | — | | | | — | | | | 6,632,924 | |
| International Opportunity Bond | | | — | | | | — | | | | 21,370 | | | | 21,370 | | | | — | | | | — | | | | 236,377 | | | | 236,377 | |
| Appreciation & Income | | | 821,516 | | | | 3,916,874 | | | | — | | | | 4,738,390 | | | | 300,034 | | | | — | | | | — | | | | 300,034 | |
| Alternative Strategy | | | — | | | | — | | | | — | | | | — | | | | — | | | | — | | | | — | | | | — | |
| Large Cap Value | | | 365,644 | | | | — | | | | — | | | | 365,644 | | | | 488,166 | | | | — | | | | — | | | | 488,166 | |
| Alternative Income | | | 112,295 | | | | 93,728 | | | | — | | | | 206,023 | | | | 42,433 | | | | 191,793 | | | | — | | | | 234,226 | |
| Focused Large Cap Growth | | | — | | | | — | | | | — | | | | — | | | | 156,567 | | | | 22,778 | | | | — | | | | 179,345 | |
| International Stock | | | 1,350,442 | | | | 267,504 | | | | — | | | | 1,617,946 | | | | 986,428 | | | | — | | | | — | | | | 986,428 | |
| Real Estate Stock | | | 1,742,000 | | | | 1,031,723 | | | | — | | | | 2,773,723 | | | | 441,893 | | | | 935,096 | | | | — | | | | 1,376,989 | |
| Small Cap Value | | | 1,508,308 | | | | 390,462 | | | | — | | | | 1,898,770 | | | | 20,015 | | | | 1,033,666 | | | | — | | | | 1,053,681 | |
| Emerging Markets Stock | | | 537,526 | | | | — | | | | — | | | | 537,526 | | | | — | | | | — | | | | — | | | | — | |
| Small Cap Growth | | | 407,082 | | | | 2,332,537 | | | | — | | | | 2,739,619 | | | | 3,200,033 | | | | 1,364,027 | | | | — | | | | 4,564,060 | |
| | | | | | | | | | | | | | | | | | | | | | | | | | | | | | | | | |
Permanent book and tax differences, primarily attributable to the reclass of net operating losses and short-term capital gains, and fund distributions and adjustments for non-deductible expenses, book/tax treatment of foreign currency exchange gains (losses), section 305(c) deemed dividend distributions, paydown gains (losses), C Corp return of capital, swap gains (losses), passive foreign investment companies, reclassifications of gains on contingent payment debt securities, real estate investment trusts, partnerships, grantor trusts, royalty trusts, corporation mergers, and the capitalization of in lieu dividend payments made in connection with short sales of stock that have not been held open for more than 45 days resulted in reclassification for the tax year ended October 31, 2015 as follows:
| | | Paid | | | Accumulated | | | Accumulated | |
| | | In | | | Net Investment | | | Net Realized | |
| Fund | | Capital | | | Income (Loss) | | | Gains (Loss) | |
| Floating Rate Bond | | $ | — | | | $ | 24,517 | | | $ | (24,517 | ) |
| Monthly Distribution | | | (647,128 | ) | | | (667,232 | ) | | | 1,314,360 | |
| Corporate/Government Bond | | | — | | | | 80,502 | | | | (80,502 | ) |
| Dynamic Macro | | | — | | | | 324,935 | | | | (324,935 | ) |
| High-Yield Bond | | | — | | | | — | | | | — | |
| International Opportunity Bond | | | (2,610,135 | ) | | | (362,263 | ) | | | 2,972,398 | |
| Appreciation & Income | | | — | | | | 303,984 | | | | (303,984 | ) |
| Alternative Strategy | | | (206,092 | ) | | | 168,574 | | | | 37,518 | |
| Large Cap Value | | | — | | | | — | | | | — | |
| Alternative Income | | | — | | | | (44,208 | ) | | | 44,208 | |
| Focused Large Cap Growth | | | (456,232 | ) | | | 456,232 | | | | — | |
| International Stock | | | — | | | | 214,103 | | | | (214,103 | ) |
| Real Estate Stock | | | — | | | | — | | | | — | |
| Small Cap Value | | | — | | | | 80,269 | | | | (80,269 | ) |
| Emerging Markets Stock | | | — | | | | (110,189 | ) | | | 110,189 | |
| Small Cap Growth | | | — | | | | 481,979 | | | | (481,979 | ) |
| | | | | | | | | | | | | |
Net assets were unaffected by the above reclassifications.
As of each of the Fund’s tax year-ended October 31, 2015, the components of distributable earnings on a tax basis were as follows:
| NOTES TO FINANCIAL STATEMENTS (Unaudited) |
| April 30, 2016 (Continued) |
| | | Undistributed | | | Undistributed | | | Capital Loss | | | Other | | | | | | Unrealized | | | Total | |
| | | Ordinary | | | Long-Term | | | Carry | | | Book/Tax | | | | | | Appreciation | | | Accumulated | |
| Fund | | Income | | | Capital Gains | | | Forwards | | | Differences | | | Late Year Loss | | | (Depreciation) | | | Earnings(Deficits | |
| Floating Rate Bond | | $ | 27,400 | | | $ | — | | | $ | (1,082,415 | ) | | $ | — | | | $ | — | | | $ | (2,394,107 | ) | | $ | (3,449,122 | ) |
| Monthly Distribution | | | — | | | | — | | | | — | | | | (737,546 | ) | | | (1,099,608 | ) | | | (20,826,636 | ) | | | (22,663,790 | ) |
| Corporate/Government Bond | | | 17,268 | | | | — | | | | (1,348,743 | ) | | | (926 | ) | | | — | | | | 37,350 | | | | (1,295,051 | ) |
| Dynamic Macro | | | — | | | | — | | | | (1,327,645 | ) | | | — | | | | (42,659 | ) | | | 970,234 | | | | (400,070 | ) |
| High-Yield Bond | | | 108,995 | | | | — | | | | (8,071,244 | ) | | | — | | | | — | | | | (1,801,140 | ) | | | (9,763,389 | ) |
| International Opportunity Bond | | | — | | | | — | | | | (70,916 | ) | | | — | | | | — | | | | (2,895,223 | ) | | | (2,966,139 | ) |
| Appreciation & Income | | | 1,513,898 | | | | 6,372 | | | | — | | | | — | | | | — | | | | (1,472,919 | ) | | | 47,351 | |
| Alternative Strategy | | | — | | | | — | | | | (1,198,728 | ) | | | — | | | | (126,022 | ) | | | 294,623 | | | | (1,030,127 | ) |
| Large Cap Value | | | 373,351 | | | | 14,258,077 | | | | — | | | | — | | | | — | | | | 4,756,579 | | | | 19,388,007 | |
| Alternative Income | | | 81,323 | | | | — | | | | (140,427 | ) | | | — | | | | — | | | | (116,082 | ) | | | (175,186 | ) |
| Focused Large Cap Growth | | | — | | | | 381,547 | | | | — | | | | — | | | | (612,912 | ) | | | 14,663,002 | | | | 14,431,637 | |
| International Stock | | | 43,150 | | | | — | | | | (747,547 | ) | | | — | | | | — | | | | 820,919 | | | | 116,522 | |
| Real Estate Stock | | | 1,880,234 | | | | 2,657,565 | | | | — | | | | — | | | | — | | | | 6,819,972 | | | | 11,357,771 | |
| Small Cap Value | | | 51,644 | | | | 847,192 | | | | — | | | | — | | | | — | | | | 646,264 | | | | 1,545,100 | |
| Emerging Markets Stock | | | 117,530 | | | | — | | | | (8,131,742 | ) | | | — | | | | — | | | | (903,187 | ) | | | (8,917,399 | ) |
| Small Cap Growth | | | 911,397 | | | | 1,784,747 | | | | — | | | | — | | | | — | | | | 1,896,146 | | | | 4,592,290 | |
| | | | | | | | | | | | | | | | | | | | | | | | | | | | | |
The difference between book basis and tax basis unrealized appreciation (depreciation), undistributed net investment income/(loss) and accumulated net realized gain (loss) from security transactions are primarily attributable to the tax deferral of losses on wash sales and straddles, adjustments for gains on contingent convertible debt securities, the mark-to-market treatment of open forward foreign currency contracts, options, futures and swap contracts, and adjustments for section 305(c) deemed dividend distributions, accrued dividend payable, real estate investment trusts, partnerships, passive foreign investment companies, royalty trusts, constructive sales of securities held short, straddles and C Corporation return of capital distributions. In addition, the amount listed under other book/tax differences for the Monthly Distribution Fund is primarily attributable to the tax deferral of losses on straddles and constructive sales.
Late year losses incurred after December 31 within the fiscal year are deemed to arise on the first business day of the following fiscal year for tax purposes. The Funds incurred and elected to defer such late year losses as follows:
| | | Late Year | |
| Fund | | Losses | |
| Floating Rate Bond | | | — | |
| Monthly Distribution | | | 1,099,608 | |
| Corporate/Government Bond | | | — | |
| Dynamic Macro | | | 42,659 | |
| High-Yield Bond | | | — | |
| International Opportunity Bond | | | — | |
| Appreciation & Income | | | — | |
| Alternative Strategy | | | 126,022 | |
| Large Cap Value | | | — | |
| Alternative Income | | | — | |
| Focused Large Cap Growth | | | 612,912 | |
| International Stock | | | — | |
| Real Estate Stock | | | — | |
| Small Cap Value | | | — | |
| Emerging Markets Stock | | | — | |
| Small Cap Growth | | | — | |
| NOTES TO FINANCIAL STATEMENTS (Unaudited) |
| April 30, 2016 (Continued) |
| |
At October 31, 2015, the following Funds had capital loss carryforwards for federal income tax purposes available to offset future capital gains through the indicated expiration date as follows:
| | | Expiring October 31, | | | Non-Expiring | | | Non-Expiring | | | | |
| Fund | | 2017 | | | 2019 | | | Short-Term | | | Long-Term | | | Total | |
| Floating Rate Bond | | | | | | | | | | $ | 476,057 | | | $ | 606,358 | | | $ | 1,082,415 | |
| Monthly Distribution | | | | | | | | | | | — | | | | — | | | | — | |
| Corporate/Government Bond | | | | | | | | | | | 637,440 | | | | 711,303 | | | | 1,348,743 | |
| Dynamic Macro | | | | | | | 152,058 | | | | 1,009,210 | | | | 166,377 | | | | 1,327,645 | |
| High-Yield Bond | | | 3,403,542 | | | | | | | | 1,925,789 | | | | 2,741,913 | | | | 8,071,244 | |
| International Opportunity Bond | | | | | | | | | | | 70,916 | | | | — | | | | 70,916 | |
| Appreciation & Income | | | | | | | | | | | | | | | | | | | — | |
| Alternative Strategy | | | | | | | | | | | 1,198,728 | | | | | | | | 1,198,728 | |
| Large Cap Value | | | | | | | | | | | | | | | | | | | — | |
| Alternative Income | | | | | | | | | | | 140,427 | | | | | | | | 140,427 | |
| Focused Large Cap Growth | | | | | | | | | | | — | | | | — | | | | — | |
| International Stock | | | | | | | | | | | 747,547 | | | | | | | | 747,547 | |
| Real Estate Stock | | | | | | | | | | | | | | | | | | | — | |
| Small Cap Value | | | | | | | | | | | | | | | | | | | — | |
| Emerging Markets Stock | | | 3,386,845 | | | | 351,019 | | | | 3,996,932 | | | | 396,946 | | | | 8,131,742 | |
| Small Cap Growth | | | | | | | | | | | | | | | | | | | — | |
| | | | | | | | | | | | | | | | | | | | | |
For Monthly Distribution, $674,128 of capital loss carryforward expired in the current fiscal year.
Currently, the Funds have a $40,000,000 uncommitted line of credit provided by U.S. Bank National Association (the “Bank”) under an agreement (the “Uncommitted Line”). Any advance under the Uncommitted Line is contemplated primarily for temporary or emergency purposes, including the meeting of redemption requests that otherwise might require the untimely disposition of securities. Interest on borrowings is payable on an annualized basis. The Uncommitted Line is not a “committed” line of credit, which is to say that the Bank is not obligated to lend money to a Fund. Accordingly, it is possible that a Fund may wish to borrow money for a temporary or emergency purpose but may not be able to do so.
The Funds have entered into a Securities Lending Agreement (“Agreement”) with the Bank. Each participating fund can lend their securities to brokers, dealers and other financial institutions approved by the Board to earn additional income. Loans are collateralized at a value at least equal to 105% of the then current Market Value of any loaned security that are foreign, or 102% of the then current market value of any other loaned security. All interest and dividend payments received on securities which are held as collateral, provided that there is no material default, will be paid to the respective Fund. A portion of the income generated by the investment in the collateral, net of any rebates paid by the Bank to the borrowers is remitted to the Bank as lending agent and the remainder is paid to the Fund(s).
Securities lending income, if any, is disclosed in the Fund’s Statement of Operations. Although risk is mitigated by the collateral, the Fund could experience a delay in recovering its securities and possible loss of income or value if the Borrower fails to return them. Should the borrower of the securities fail financially, each Fund has the right to repurchase the securities using the collateral in the open market.
| NOTES TO FINANCIAL STATEMENTS (Unaudited) |
| April 30, 2016 (Continued) |
| |
The following table presents financial instruments that are subject to enforceable netting arrangements as of April 30, 2016.
| Gross Amounts of Assets Presented in the Statements of Assets and Liabilities |
| | | Market Value of | | | Market Value of | | | Percentage of Total | |
| Fund | | Loaned Securities | | | collateral (1) | | | Investment Income | |
| Floating Rate Bond | | $ | 103,583 | | | $ | 103,583 | | | | 0.00 | % |
| Monthly Distribution | | | 8,949,290 | | | | 8,949,290 | | | | 0.00 | % |
| Corporate/Government Bond | | | 2,333,746 | | | | 2,333,746 | | | | 0.00 | % |
| Dynamic Macro | | | — | | | | — | | | | 0.00 | % |
| High-Yield Bond | | | 13,672,961 | | | | 13,672,961 | | | | 0.00 | % |
| International Opportunity Bond | | | — | | | | — | | | | 0.00 | % |
| Appreciation & Income | | | 2,688,014 | | | | 2,688,014 | | | | 0.00 | % |
| Alternative Strategy | | | — | | | | — | | | | 0.00 | % |
| Large Cap Value | | | 16,460,333 | | | | 16,460,333 | | | | 0.00 | % |
| Focused Large Cap Growth | | | 12,339,117 | | | | 12,339,117 | | | | 0.00 | % |
| International Stock | | | 4,425,130 | | | | 4,425,130 | | | | 0.00 | % |
| Real Estate Stock | | | 6,928,648 | | | | 6,928,648 | | | | 0.00 | % |
| Small Cap Value | | | 3,990,033 | | | | 3,990,033 | | | | 0.00 | % |
| Emerging Markets Stock | | | 1,695,275 | | | | 1,695,275 | | | | 0.00 | % |
| Small Cap Growth | | | 11,617,520 | | | | 11,617,520 | | | | 0.00 | % |
| | | | | | | | | | | | | |
| (1) The amount is limited to the loaned securities and accordingly, does not include excess collateral pledged |
| | | | | | | | | | | | | |
Subsequent events after the date of the Statements of Assets and Liabilities have been evaluated through the date the financial statements were issued. Management has concluded that there is no impact requiring adjustment or disclosure in the financial statements relating to the Funds presented in this report.
FACTORS CONSIDERED BY THE INDEPENDENT TRUSTEES IN APPROVAL OF INVESTMENT ADVISORY AND SUB-ADVISORY AGREEMENTS
Meeting of the Board of Trustees Held on December 15, 2015
At a regular meeting of the Board of Trustees (the “Board”) of the Trust held on December 15, 2015 (the “Meeting”), the Board, including all of the Trustees who are not interested persons of the Trust (the “Independent Trustees���), considered the renewal of an investment advisory agreement between the Trust, on behalf of each series of the Trust, and the Adviser (the “Investment Advisory Agreement”) and continuance of certain Sub-Advisory Agreements (the “Sub-Advisory Agreements”) among the Trust, the Adviser and the following Sub-Advisers for the indicated Funds: 1) Newfleet Asset Management LLC (“Newfleet”) with respect to Corporate/Government Bond and Floating Rate Bond; 2) Westchester Capital Management, LLC (“Westchester”) with respect to Monthly Distribution; 3) PENN Capital Management Co., Inc. (“PENN”) with respect to High-Yield Bond; 4) Market Concepts, LLC (“Market Concepts”) with respect to Alternative Strategy; 5) The Ithaka Group, LLC (“Ithaka”) with respect to Focused Large Cap Growth; 6) Cornerstone Real Estate Advisers LLC (“Cornerstone”) with respect to Real Estate Stock; 7) Arrowstreet Capital, L.P. (“Arrowstreet”) with respect to International Stock; 8) Piermont Capital Management, LLC (“Piermont”) with respect to Small Cap Value; 9) Bailard, Inc. (“Bailard”) with respect to Emerging Markets Stock; 11) Pier Capital, LLC (“Pier”) with respect to Small Cap Growth; 10) Rogge Global Partners PLC (“Rogge”) with respect to International Opportunity Bond.
Continuance of Investment Advisory Agreement for each of Monthly Distribution, Corporate/Government Bond, High-Yield Bond, Dynamic Macro, Appreciation & Income, Large Cap Value, Floating Rate Bond, International Opportunity Bond, Focused Large Cap Growth, International Stock, Real Estate Stock, Small Cap Value, Small Cap Growth, Emerging Markets Stock and Alternative Strategy
The Trustees reviewed information related to the proposed renewal of the Investment Advisory Agreement with the Trust, including (a) the investment performance of each Fund, a peer group of funds and appropriate indices; (b) the Adviser’s personnel and resources; and (c) comparative fees and expenses of a peer group of funds. The Board relied upon the advice of independent legal counsel and their own business judgment in determining the material factors to be considered in evaluating the Investment Advisory Agreement and the weight to be given to each factor. The conclusions reached by the Board were based on a comprehensive evaluation of all of the information provided and were not the result of any one factor. Matters considered by the Board, including the Independent Trustees, in connection with its approval of the continuance of the Investment Advisory Agreement included the following:
Nature, Extent and Quality of Services. The Independent Trustees considered the nature, extent and quality of services provided to the Funds by the Adviser. Among other things, the Board discussed the Adviser’s investment in the hiring, and retention, of high quality personnel, including the addition of an in-house CCO with in-depth knowledge of the 1940 Act and mutual funds, which it considered reflective of the Adviser’s strong emphasis on compliance. In this regard, the Board noted that while there was one minor litigation issue during the past year, there have been no material compliance or regulatory issues involving the Adviser or the Dunham Funds. The Independent Trustees agreed that the Adviser is accessible, encourages open discussion and provides the Board with thorough and meaningful reports. The Trustees considered the Adviser’s very active monitoring of the Funds’ Sub-Advisers and other service providers, the Adviser’s consistent focus on managing expenses and for vetting and negotiating with Sub-Advisers and other service providers for the benefit of shareholders. The Independent Trustees noted that the Adviser continues to demonstrate that it has the skills, experience, and quality and depth of personnel, resources, investment methods and compliance policies and procedures for performing its duties under the Advisory Agreement and that the nature, overall quality and extent of the management services provided by the Adviser to the Funds is consistent and satisfactory.
Performance. As to investment performance, the Board reviewed the performance of each Fund as compared to the average performance of its respective peer group (the “Peer Group”) and Morningstar category (“Morningstar Average”) (collectively, the “Comparison Groups”) for 1-year, 3-year, 5-year and since inception time periods (as applicable) through September 30, 2015:
With respect to Monthly Distribution the Board noted that the Fund has outperformed its Peer Group and Morningstar Average across all the time periods since its inception in 2008, except for the last 1-year period. The Trustees noted the negative impact on the Fund of declines in oil and energy prices and other market factors during the last year and concluded that the Fund’s performance is satisfactory.
With respect to Corporate/Government Bond the Board noted that since the Fund’s inception in 2004, it has outperformed or performed in-line with its Peer Group and Morningstar Average with the exception of the most recent 1-year period where it underperformed both the Peer Group and Morningstar Average, as well as the 3-year period where it underperformed the Morningstar Average. The Trustees considered that the Fund has consistently performed
well since inception, especially compared to the Peer Group. The Independent Trustees considered the Adviser’s explanation that the Fund’s recent underperformance was primarily due to lower allocation to Treasuries and higher allocation to high-yield bonds and positioning for Federal interest rate increases that did not materialize. The Independent Trustees concluded that the Fund’s performance is satisfactory.
With respect to High-Yield Bond the Board noted that the Fund has underperformed its Peer Group and Morningstar Average across the relevant time periods with the exception of performing in-line with its Peer Group over the past 5-year period. The Board noted that the Fund’s short-term performance was impaired by its significant exposure to the energy market’s decline. A representative of the Adviser noted that the Fund’s strategy is generally more conservative in nature than a majority of the funds in its Morningstar Average, which had benefited from significantly higher exposure to CCC-rated bonds than the Fund. The Trustees agreed that in light of the risk characteristics of the Fund, they were satisfied with the Fund’s performance.
With respect to Dynamic Macro, the Board noted that there was a change in sub-adviser and investment strategy as of October 1, 2014 and that the Fund outperformed its Peer Group and Morningstar Average over the past 1-year period. The Board further noted that the Fund’s underperformance in the 3-, 5- and since inception time periods was tied to its former sub-adviser. The Trustees concluded that the Fund’s short-term performance is satisfactory and expressed optimism for continuing improvement.
With respect to Appreciation & Income, the Board noted that the Fund had performed in-line with or outperformed its Morningstar Average for the 1-, 10- and since inception time periods, and outperformed its Peer Group for the 3-year period, but underperformed over the one-year period. The Board further noted that the Fund’s Sub-Adviser and strategy was changed on October 1, 2014 and expressed optimism for the Fund’s longer-term track record.
With respect to Large Cap Value, the Board noted that the Fund outperformed or was in-line with its Peer Group for the 1- 3-, 5 -, 10- and since inception time periods and outperformed or was in-line with its Morningstar Average for the 1-year, 5-year and since inception time periods. The Board further noted that the Fund’s Sub-Adviser was changed on July 1, 2015 and that most of the Fund’s underperformance versus the Morningstar Average over the 3- and 10-year periods may be attributed to the previous Sub-Adviser’s track record. The Trustees considered information from the Adviser that over the two-month period ended September 30, 2015, the Fund’s outperformance was enough to put the 1-year performance ahead of the Peer Group and in-line with the Category Average. Overall, the Trustees were satisfied with the Fund’s performance and expressed optimism for the Fund’s longer-term track record under the new Sub-Adviser.
With respect to International Opportunity Bond the Board, noted that the Fund underperformed its Peer Group and Morningstar Average over the 1-year and since inception time periods. The Trustees considered the Adviser’s explanation that the Fund invests strictly in international bonds and, therefore, did not benefit from the performance of U.S. Bonds. The Trustees agreed performance was satisfactory, but also agreed to monitor the Fund’s performance as it would be more meaningful to re-evaluate the Fund over longer time periods.
With respect to Focused Large Cap Growth, the Board noted that Fund outperformed or was in-line with its Peer Group and Morningstar Average for the 1-year, 3-year and since inception time periods with the exception of underperforming the Morningstar Average during the since inception timeframe when it returned 12.52% versus 14.06% for the Morningstar Average. The Trustees noted that this underperformance was primarily attributable to the first few months of initial operations and were gratified that the outperformance of the Fund over the other time periods has helped to reduce this adverse performance differential.
With respect to International Stock, the Board noted that the Fund outperformed its Comparison Groups across all the time periods with the exception of the most recent 1-year period, when it returned -10.91% versus -7.72% and -8.05% for the Peer Group and Morningstar Average, respectively. The Trustees noted that the Sub-Adviser maintained the same strategy and process over the past 1-year period as it did on the longer-term periods and expressed satisfaction with the Fund’s overall performance.
With respect to Real Estate Stock, the Board noted that the Fund outperformed its Comparison Groups for the 1-, 3-, 5- and 10-years and since inception time periods, with the exception of slight underperformance of 6.68% versus the Morningstar Average’s return of 7.05% for the since inception timeframe. The Trustees indicated that they were pleased with the Fund’s performance.
With respect to Small Cap Value, the Board noted that the Fund outperformed its Comparison Groups over the one-year period at -0.69% versus -4.08% and -2.99% for the Peer Group and Morningstar Average, respectively. The Trustees further noted that for the 3-year period, the Fund slightly underperformed the Comparison Groups, while the Fund’s performance for the 5- and 10 years was in-line with the Peer Group and slightly under the Morningstar Average. The Trustees considered that the current Sub-Adviser took over management of the Fund on July 1, 2013 and were satisfied with the Fund’s performance since that time.
With respect to Small Cap Growth the Board noted that the Fund outperformed its Comparison Groups for the 1-, 3-, 5- and 10-years and since inception time periods. The Trustees were satisfied with the Fund’s performance.
With respect to Emerging Markets Stock, the Board noted that the Fund outperformed its Morningstar Average and Peer Group over the past 1-year period, but underperformed during the longer-term time periods and considered that the underperformance was primarily attributable to the previous Sub-Adviser that managed the Fund prior to July 1, 2013 when the current Sub-Adviser took over management of the Fund. The Trustees further noted that the Fund’s 3-year performance indicates that the current Sub-Adviser is gaining ground and while overall performance was satisfactory, they look forward to an improvement in the Fund’s longer-term performance.
With respect to Alternative Strategy, the Board noted that the Fund outperformed its Morningstar Average since inception and underperformed the Morningstar Average for the 1-, 3- and 5-year periods and underperformed its Peer Group for the 1- and 3-year periods provided. The Trustees considered the Adviser’s explanation that the Fund’s most recent underperformance is primarily attributable to the significant downturn in oil and energy prices that occurred in the final quarters of 2014. The Trustees also noted the recent changes to the Fund’s investment strategy and the flexibility it gives the Sub-Adviser, which was aimed at improving performance. The Trustees noted that the Fund’s long-term performance is satisfactory and agreed to monitor the Fund for continued improvement.
With respect to Floating Rate Bond the Board noted that the Fund outperformed its Morningstar Average and Peer Group over the past 1-year time period, but underperformed its Category Average and Peer Group since inception. The Trustees considered the Adviser’s explanation that the underperformance was primarily attributable to the first few months of operations when the Sub-Adviser was initially implementing its strategy and the longer settlement timeframe for bank loans hindered performance. The Trustees considered the Fund’s recent relative performance and the specialized nature of the Fund and concluded that the Fund’s performance was satisfactory.
As a result of their review, the Independent Trustees concluded that the Adviser, through its Sub-Advisers, had generally provided acceptable returns to shareholders.
Cost of Services and Profitability. As to the costs of the services provided and profits realized by DAIC, the Board discussed the management fees and total operating expense data and reviewed each Fund’s fees and overall expenses as compared to the Peer Group and Morningstar Average.
The Board reviewed for each Fund the fee paid to the Adviser, as well as the total of the advisory fee and sub-advisory fee (the “Management Fees”). They observed that in the case of Corporate/Government Bond, Dynamic Macro, Large Cap Value, International Opportunity Bond, Focused Large Cap Growth and Small Cap Growth, the Management Fees were higher than the peer group and Morningstar category averages, but within the range of advisory fees paid by the funds in the peer group. They discussed the impact of the performance fee on various Funds’ Management Fees. They noted that Large Cap Value’s current sub-adviser began managing the Fund in July 2015, and the Fund’s superior performance resulted in higher Management Fees. They also discussed the impact of the performance fee on Small Cap Growth, where strong performances resulted in a significant performance fee.
The Trustees noted that the Management Fees of International Stock, Real Estate Stock and Monthly Distribution were higher than the Morningstar average fees, and higher than the peer funds. With respect to International Stock and Real Estate Stock, the Board considered that each Sub-Adviser is earning close to its maximum performance fee due to very good performance, which results in higher than average fees. With respect to Monthly Distribution, the Trustees noted that the Adviser is negotiating with the Sub-Adviser for a continuation of the fee waiver agreement that is in place through the end of February 2016 and that the funds in the Comparison Group generally have significant waivers. The Board considered that the Fund’s investment strategy of short-selling, option writing, etc., requires more resources.
The Trustees then discussed the Management Fees paid by the High Yield Bond, Appreciation & Income, Small Cap Value and Floating Rate Bond, noting that in each case the Management Fees are lower than or equal to the peer group average and, while higher than the Morningstar average, well within the range of its peer group. They also discussed Emerging Markets and Alternative Strategy, each of which pays Management Fees lower than the applicable peer group and Morningstar averages. They discussed the impact of each Fund’s performance on the fees paid, and reviewed a chart provided by the Adviser that demonstrated the relationship between fees and performance.
The Trustees discussed the advisory fee relative to the sub-adviser fees, as well as each Fund’s expense ratio. They considered the impact of Fund net assets on total expenses, and where expense caps are in place. The Trustees also considered the underwriting and 12b-1 fees paid to DAIC. The Trustees reviewed an analysis of profitability provided by the Adviser. The Trustees took into account possible related benefits derived by the Adviser from its relationship with the Funds. The Trustees acknowledged that the Adviser, in its capacity as a broker, receives commissions and
distribution fees when its customers purchase the Funds, but the Adviser does not execute trades on behalf of the Funds and therefore receives no compensation on portfolio trades. They concluded that profits from the Adviser’s relationship with each Fund was not unreasonable and is at a level to adequately incentivize DAIC to continue to provide high quality services. It was the consensus of the Board that, based on DAIC’s expertise, the fees charged by the Adviser and its Sub-Advisers were reasonable.
Economies of Scale. As to economies of scale, the Trustees noted that the Advisory Agreement does not contain breakpoints that reduce the fee rate on assets above specified levels. The Trustees agreed that breakpoints may be an appropriate way for the Adviser to share its economies of scale with the Funds and the shareholders if the Funds experience a substantial growth in assets, however, the Trustees recognized that no Fund had yet reached an asset level where the Adviser could realize significant economies of scale. The Trustees noted that economies of scale would need to be considered in the future as net asset levels of the Funds grow. The Trustees further noted that at a previous contracts renewal meeting, the Adviser explained that it is prepared to offer concessions to the Funds at appropriate asset levels, and in anticipation of such, had discussed a proposed breakpoint schedule that reflects the economies of scale that the Adviser anticipates realizing. The Trustees concluded that the absence of breakpoints was still acceptable under the current circumstances, and they agreed to continue to evaluate the issue with respect to each Fund as assets increase, and to work with the Adviser to negotiate reasonable breakpoints when appropriate
Continuance of Sub-Advisory Agreements for each of Corporate/Government Bond, Floating Rate Bond, Monthly Distribution, High-Yield Bond, Alternative Strategy, Focused Large Cap Growth, Real Estate Stock, International Stock, Small Cap Value, Emerging Markets Stock and Small Cap Growth, International Opportunity Bond
The Trustees relied upon the advice of legal counsel and their own business judgment in evaluating the Sub-Advisory Agreements and the weight to be given to each factor considered. The conclusions reached by the Board were based on a comprehensive evaluation of all of the information provided and were not the result of any one factor. Moreover, each Trustee may have afforded different weight to the various factors in reaching his conclusions. Matters considered by the Board, including the Independent Trustees, in connection with its approval of the continuance of each of the Sub-Advisory Agreements included the following:
Nature, Extent and Quality of Services. As to the nature, extent and quality of the services provided by the Sub-Advisers, the Board reviewed and discussed at length each Sub-Adviser’s presentation materials, including reviews and information regarding any changes to professional staffing, advisory services, compliance monitoring, regulatory or legal matters, insurance coverage, cost of services, and profitability. The Trustees noted that the Sub-Adviser to International Stock does not provide a profitability analysis and reported to the Board that it believes that the fees it charges to all clients are reasonable and consistent with industry averages and that it reassesses fees periodically. In addition, representatives of the Adviser reviewed their working relationship with each Sub-Adviser, including the observation of the Trust’s CCO with respect to compliance matters. The Trustees noted that the Adviser actively and continuously evaluates quality of service delivered by the Sub-Advisers and is generally satisfied with the current line-up of Sub-Advisers. The Trustees concluded that each of the Sub-Advisers provides a level of service that is consistent with the Board’s expectations.
Performance. As to the performance of each Sub-Adviser, the Trustees noted its thorough review and discussion of each Fund’s performance during its earlier evaluation of the Advisory Agreement and their conclusion that the performance was satisfactory or, where less than satisfactory, the Adviser is carefully monitoring the Sub-Adviser and is considering alternatives, including a possible change in sub-adviser.
Cost of Services. As to the cost of the services provided and the profits realized by each Sub-Adviser, the Board considered the Base Fee (as defined in the Sub-Advisory Agreements) paid to each Sub-Adviser when the performance of the Fund is equal to that of the Index plus or minus a “null” zone. Where provided, the Trustees compared advisory (and sub-advisory) fees (both flat fee rates and performance fee rates) charged by each Sub-Adviser to its other accounts, and concluded that each Sub-Adviser’s base fee compared favorably. The Trustees also discussed at length the operation of the Performance Fee and the impact on fees and expenses based on various performance results. They discussed the unique nature of the performance fee, which results in higher fees when the sub-adviser delivers results, and how this fact must be integrated into their analysis of fees. The Board noted its thorough review and discussion of each Fund’s fees and expenses during its earlier evaluation of the Advisory Agreement and their conclusion the fees were within a reasonable range.
Profitability. The Board then considered the potential fee adjustments to be made to each Fund’s Base Fee based on performance. The Trustees affirmed their belief that the 12-month period over which performance is computed is sufficiently long to provide a reasonable basis for indicating performance. The Trust officers confirmed that the performance adjustment to the Base Fee had been calculated daily during the first twelve months, based on
the average net assets of each Fund from inception of the contract to date, and the comparative performance of each Fund (based on Class N shares) to the relevant Index. The Trustees confirmed their belief that the method by which the Performance Fee is calculated under the Sub-Advisory Agreements ensures that any significant fee adjustments are attributable to Sub-Adviser’s skill or lack thereof, rather than to random fluctuations, and the performance fee clearly aligns the Sub-Advisers’ interest with those of the shareholders. It was the consensus of the Board that the maximum performance adjustment under each Sub-Advisory Agreement continues to reflect performance differences that could reasonably be considered meaningful and significant taking into account each Fund’s size, volatility, diversification and variability of performance differences. After consideration, the Board was satisfied that in each case, the relationship of the fee adjustments to the Base Fee was not disproportionately large and that each Fund’s sub-advisory fee was acceptable in light of all of the factors discussed. The Board reviewed a profit analysis provided by each Sub-Adviser and agreed that no Sub-Adviser was excessively profitable. Where profitability information was not provided by the Sub-Adviser, the Board noted the arm’s length negotiations over fees between the Adviser and Sub-Adviser.
Economies of Scale. The Trustees discussed the relevance of economies of scale in the context of Sub-Advisers that receive a performance based fee. They agreed that the Adviser had successfully negotiated a favorable Base Fee with each Sub-Adviser, and noted the Adviser’s negotiation of a new reduced fee schedule during the past year with respect to Alternative Strategy and the Adviser’s continued monitoring to effect similar fee reductions when warranted.
Conclusion. Having requested and received such information from the Adviser and Sub-Advisers as the Board believed to be reasonably necessary to evaluate the terms of the proposed Advisory Agreements, and as assisted by the advice of counsel, the Board, including all of the Independent Trustees, unanimously concluded that (a) the terms of each of the Advisory Agreements are fair and reasonable; (b) that the Advisory fee and Sub-Advisory fees were for services different than those provided by any underlying Fund’s adviser and are not duplicative; and (c) renewal of the Advisory Agreement and Sub-Advisory Agreements is in the best interests of the Funds, their shareholders and their prospective shareholders.
Meeting of the Board of Trustees Held on March 23, 2016
At a meeting held on December 15, 2015, the Board of Trustees of the Dunham Funds (the “Board”), including a majority of the trustees who are not “interested persons,” as that term is defined in the Investment Company Act of 1940 (the “1940 Act”) (the “Independent Trustees”), renewed the sub-advisory agreement with Rogge Global Partners PLC (“Rogge” or the “Sub-Adviser”) as Sub-Adviser to International Opportunity Bond. Subsequent to that meeting, the Board was informed of a planned change of control that is expected to occur during the second quarter of 2016 whereby Rogge will be 100% owned by Allianz Global Investors. Because Rogge’s expected ownership change may be deemed to be a “change in control,” at a meeting held on March 23, 2016 (the “Meeting’), the Independent Trustees unanimously elected to approve a new sub-advisory agreement with Rogge to take effect concurrent with Rogge’s change of control (the “New Sub-Advisory Agreement”) on materially identical terms, including the schedule of fees and compensation, which was last approved by the Board at its meeting held on December 15, 2015 (the “Prior Sub-Advisory Agreement”). In connection with their review and approval of the New Sub-Advisory Agreement with Rogge at the Meeting, the Independent Trustees considered materials furnished by Rogge, including information about, but not limited to, Rogge’s personnel and operations. The Independent Trustees discussed that the terms of the New Sub-Advisory Agreement and the performance goals and fulcrum fee arrangements set forth in the New Sub-Advisory Agreement were not being changed. After reviewing the materials in light of the New Sub-Advisory Agreement, it was the consensus of the Independent Trustees that their conclusions with respect to approving continuation of the Sub-Advisory Agreement with Rogge that were discussed at the Board meeting held on December 15, 2015 were largely unchanged and pertinent to approving the New Sub-Advisory Agreement with Rogge:
Nature, Extent and Quality of Services. The Trustees reviewed the nature, extent and quality of the services provided by Rogge and evaluated the nature, quality and extent of the services to be provided by Rogge after the change of control that was scheduled to take effect in the second quarter of 2016 and pursuant to the New Sub-Advisory Agreement. They considered, among other things, the expected impact of the change of control on the operations, facilities, organization and personnel of Rogge and how it would affect the Fund, the ability of Rogge to perform its duties after the change of control and any anticipated changes to the current investment practices and related services provided to the Fund. The Trustees noted that it was anticipated that the change of control would not result in a change in the portfolio management of the Fund, or to Rogge’s compliance or investment processes. The Trustees concluded that it was satisfied with the nature, quality and extent of the services currently provided by Rogge under the current Sub-Advisory Agreement and expected to be provided by Rogge under the New Sub-Advisory Agreement, and such services were reasonable and appropriate in relation to the Sub-Advisory fee.
Performance. As to investment performance, the Board reviewed the performance of the Fund as compared to a peer group, benchmark index, and its Morningstar category average (“Morningstar Average”) (collectively, the “Comparison Groups”) for the 1-year and since inception (November 5, 2013) through December 31, 2015 time periods. The Board noted that the Fund underperformed the Comparison Groups over the 1-year period. The Board further noted that although the Fund underperformed its benchmark index net of fees over the same period, it outperformed the benchmark index gross of fees and that the benchmark index does not include fees. The Trustees considered the Adviser’s explanation that the Fund’s underperformance versus its Morningstar Average was primarily due to the fact that the Fund invests strictly in international bonds and, therefore, did not benefit from the performance of U.S. bonds. The Trustees agreed performance was satisfactory, but also agreed to monitor the Fund’s performance as it would be more meaningful to re-evaluate the Fund over longer time periods.
Cost of Services. The Trustees noted that the schedule of fees and compensation in the New Sub-Advisory Agreement is the same as in the current Sub-Advisory Agreement. As to the cost of the services provided and the profits realized by the Sub-Adviser, the Board considered the Base Fee and Performance Fee components of the fulcrum fee. They noted that the fulcrum fee results in a +/-25 basis points adjustment to the Base Fee of 45 basis points based on the performance of the Fund’s Class N share versus the performance of the benchmark. The Trustees compared the Base Fee to the Sub-Adviser’s fee for two other accounts with similar strategies and discussed the Sub-Adviser’s explanation for fee differences. The Trustees also discussed at length the operation of the Performance Fee and the impact on fees and expenses based on various performance results. They discussed the unique nature of the Performance Fee, which results in higher fees when the Sub-Adviser delivers results, and how this fact must be integrated into their analysis of fees. The Independent Trustees concluded that the sub-advisory fee is within a reasonable range.
Profitability. The Board then considered the potential fee adjustments to be made to the Fund’s Base Fee based on performance. The Trustees affirmed their belief that the 12-month period over which performance is computed is sufficiently long to provide a reasonable basis for indicating performance. The Trust officers confirmed that the performance adjustment to the Base Fee had been calculated daily during the first twelve months, based on the average net assets of the Fund from inception of the Sub-Advisory Agreement to date, and the comparative performance of the Fund (based on Class N shares) to the Fund’s performance benchmark. The Trustees confirmed their belief that the method by which the Performance Fee is calculated under the New Sub-Advisory Agreement ensures that any significant fee adjustments are attributable to the Sub-Adviser’s skill or lack thereof, rather than to random fluctuations, and the Performance Fee clearly aligns the Sub-Adviser’s interest with those of the shareholders. After consideration, the Board was satisfied that the relationship of the fee adjustments to the Base Fee was not disproportionately large and that the Fund’s sub-advisory fee was acceptable in light of all of the factors discussed. The Board reviewed a profit analysis provided by the Sub-Adviser and agreed that the Sub-Adviser’s profits were not excessive.
Economies of Scale. As to the extent to which the Fund will realize economies of scale, the Board, including he Independent Trustees, concurred that any material economies of scale would not be achieved by the Fund in the near term. The Independent Trustees further considered that the Adviser had successfully negotiated a reasonable Base Fee with the Sub-Adviser and monitors sub-advisory fees to effect reductions when warranted.
Conclusion. Having requested and received such information from the Adviser and Sub-Adviser as the Board believed to be reasonably necessary to evaluate the terms of the proposed New Sub-Advisory Agreement, and as assisted by the advice of counsel, the Board, including all of the Independent Trustees, unanimously concluded that (a) the terms of the of the New Sub-Advisory Agreement is fair and reasonable and approval of the New Sub-Advisory Agreement is in the best interests of International Opportunity Bond, its shareholders and prospective shareholders.
| DUNHAM FUNDS’ EXPENSES (Unaudited) |
| |
| Example |
| |
Shareholders of mutual funds will pay (1) transitional costs, such as sales load, and (2) ongoing expenses, such as advisory fees, distribution and service fees (12b-1), and other fund expenses. The following examples are intended to help you understand the ongoing cost (in dollars) of investing in a fund and to compare these costs with the ongoing costs of investing in other mutual funds. Please note, the expenses shown in the tables are meant to highlight ongoing costs only and do not reflect any transactional costs, such as sales charges (loads), or contingent deferred sales charges on redemptions which may be assessed by mutual funds. This Example is based on an investment of $1,000 invested at the beginning of the period and held for the entire period as indicated below.
Actual Expenses
The columns under the heading entitled “Actual” help you estimate the actual expenses you paid over the period. The “Actual-Ending Account Value” shown is derived from the Fund’s actual return, and the “Actual- Expenses Paid During Period” shows the dollar amount that would have been paid by an investor who started with $1,000 in the Fund. To estimate the expenses you paid on your account during this period, simply divide your account value by $1,000 (for example, an $8,600 account value divided by $1,000 = 8.6), then multiply the result by the number in the column under the heading entitled “Actual-Expenses Paid During Period”.
Hypothetical Examples for Comparison Purposes
The columns under the heading entitled “Hypothetical” provide information about hypothetical account value and hypothetical expenses based on the Fund’s actual expense ratio and an assumed rate of return of 5% per year before expenses, which is not the Fund’s actual return. The hypothetical account values and expenses may not be used to estimate the actual ending account balance or expenses you paid for the period. You may use this information to compare the ongoing costs of investing in the Fund and other funds. To do so, compare this 5% hypothetical example with the 5% hypothetical examples that appear in the shareholder reports of other funds.
Please note that the expenses shown in the table are meant to highlight your ongoing costs only and do not reflect any transactional costs which may be applicable to your account. Therefore, the last column of the table (Hypothetical- Expenses Paid During Period) is useful in comparing ongoing costs only, and will not help you determine the relative total costs of owning different funds. In addition, if these transactional costs were included, your costs would have been higher.
| | | | | | | Hypothetical |
| | | | Actual | | (5% return before expenses) |
| | Fund’s | Beginning | Ending | Expenses | | Ending | Expenses |
| | Annualized | Account Value | Account Value | Paid During | | Account Value | Paid During |
| | Expense Ratio | 11/1/15 | 4/30/16 | Period* | | 4/30/16 | Period* |
| Class N: | | | | | | | |
| Floating Rate Bond Fund | 1.44% | $1,000.00 | $1,015.80 | $7.18 | | $1,017.16 | $7.77 |
| Monthly Distribution Fund | 1.40% | $1,000.00 | $ 996.80 | $6.95 | | $1,018.35 | $6.07 |
| Corporate/Government Bond Fund | 1.09% | $1,000.00 | $1,017.90 | $5.47 | | $1,019.44 | $5.47 |
| Dynamic Macro Fund | 1.73% | $1,000.00 | $ 962.30 | $8.44 | | $1,016.26 | $8.67 |
| High-Yield Bond Fund | 1.13% | $1,000.00 | $ 996.20 | $5.61 | | $1,019.24 | $5.67 |
| International Opportunity Bond Fund | 1.33% | $1,000.00 | $1,073.80 | $6.86 | | $1,018.25 | $6.67 |
| Appreciation & Income Fund | 1.55% | $1,000.00 | $ 935.80 | $7.46 | | $1,017.16 | $7.77 |
| Alternative Strategy Fund | 1.44% | $1,000.00 | $ 891.20 | $6.76 | | $1,017.71 | $7.21 |
| Large Cap Value Fund | 1.05% | $1,000.00 | $ 990.70 | $5.22 | | $1,019.62 | $5.29 |
| Focused Large Cap Growth Fund | 1.21% | $1,000.00 | $ 910.20 | $5.75 | | $1,018.85 | $6.07 |
| International Stock Fund | 1.68% | $1,000.00 | $ 974.60 | $8.25 | | $1,016.51 | $8.42 |
| Real Estate Stock Fund | 1.24% | $1,000.00 | $1,034.60 | $6.27 | | $1,018.70 | $6.22 |
| Small Cap Value Fund | 1.72% | $1,000.00 | $ 987.00 | $8.48 | | $1,016.33 | $8.60 |
| Emerging Markets Stock Fund | 1.30% | $1,000.00 | $ 995.60 | $6.45 | | $1,018.40 | $6.52 |
| Small Cap Growth Fund | 1.35% | $1,000.00 | $ 924.30 | $6.46 | | $1,018.15 | $6.77 |
| Class A: | | | | | | | |
| Floating Rate Bond Fund | 1.69% | $1,000.00 | $1,015.70 | $8.42 | | $1,015.91 | $9.02 |
| Monthly Distribution Fund | 1.65% | $1,000.00 | $ 995.60 | $8.19 | | $1,017.70 | $7.22 |
| Corporate/Government Bond Fund | 1.34% | $1,000.00 | $1,016.60 | $6.72 | | $1,018.20 | $6.72 |
| Dynamic Macro Fund | 1.98% | $1,000.00 | $ 961.20 | $9.65 | | $1,015.02 | $9.92 |
| High-Yield Bond Fund | 1.38% | $1,000.00 | $ 995.10 | $6.85 | | $1,018.00 | $6.92 |
| International Opportunity Bond Fund | 1.58% | $1,000.00 | $1,072.40 | $8.14 | | $1,017.01 | $7.92 |
| Appreciation & Income Fund | 1.80% | $1,000.00 | $ 933.00 | $8.65 | | $1,015.91 | $9.02 |
| Alternative Strategy Fund | 1.69% | $1,000.00 | $ 889.90 | $7.96 | | $1,016.44 | $8.49 |
| Large Cap Value Fund | 1.30% | $1,000.00 | $ 989.20 | $6.42 | | $1,018.41 | $5.51 |
| Focused Large Cap Growth Fund | 1.44% | $1,000.00 | $ 909.30 | $6.84 | | $1,017.70 | $7.22 |
| International Stock Fund | 1.93% | $1,000.00 | $ 973.30 | $9.47 | | $1,015.27 | $9.67 |
| Real Estate Stock Fund | 1.49% | $1,000.00 | $1,033.50 | $7.53 | | $1,017.45 | $7.47 |
| Small Cap Value Fund | 1.97% | $1,000.00 | $ 984.80 | $9.72 | | $1,015.07 | $9.87 |
| Emerging Markets Stock Fund | 1.55% | $1,000.00 | $ 994.50 | $7.69 | | $1,017.16 | $7.77 |
| Small Cap Growth Fund | 1.60% | $1,000.00 | $ 923.40 | $7.65 | | $1,016.91 | $8.02 |
| YOUR FUNDS’ EXPENSES (Unaudited) (Continued) |
| | | | | | | Hypothetical |
| | | | Actual | | (5% return before expenses) |
| | Fund’s | Beginning | Ending | Expenses | | Ending | Expenses |
| | Annualized | Account Value | Account Value | Paid During | | Account Value | Paid During |
| | Expense Ratio | 11/1/15 | 4/30/16 | Period* | | 4/30/16 | Period* |
| Class C: | | | | | | | |
| Floating Rate Bond Fund | 2.19% | $1,000.00 | $1,012.10 | $10.90 | | $1,012.08 | $12.86 |
| Monthly Distribution Fund | 2.40% | $1,000.00 | $ 991.40 | $11.88 | | $1,013.72 | $11.22 |
| Corporate/Government Bond Fund | 1.84% | $1,000.00 | $1,014.30 | $ 9.33 | | $1,015.70 | $ 9.23 |
| Dynamic Macro Fund | 2.73% | $1,000.00 | $ 958.20 | $13.29 | | $1,011.29 | $13.65 |
| High-Yield Bond Fund | 1.88% | $1,000.00 | $ 993.70 | $ 9.32 | | $1,015.51 | $ 9.42 |
| International Opportunity Bond Fund | 2.08% | $1,000.00 | $1,069.10 | $10.70 | | $1,014.52 | $10.42 |
| Appreciation & Income Fund | 2.57% | $1,000.00 | $ 929.80 | $12.33 | | $1,012.08 | $12.86 |
| Alternative Strategy Fund | 2.44% | $1,000.00 | $ 886.60 | $11.46 | | $1,012.72 | $12.22 |
| Large Cap Value Fund | 2.05% | $1,000.00 | $ 985.90 | $10.25 | | $1,014.66 | $10.28 |
| Alternative Income Fund | 1.83% | $1,000.00 | $ 995.50 | $ 9.05 | | $1,015.72 | $ 9.15 |
| Focused Large Cap Growth Fund | 2.24% | $1,000.00 | $ 905.40 | $10.61 | | $1,013.72 | $11.22 |
| International Stock Fund | 2.68% | $1,000.00 | $ 970.10 | $13.13 | | $1,011.54 | $13.40 |
| Real Estate Stock Fund | 2.24% | $1,000.00 | $1,029.40 | $11.30 | | $1,013.72 | $11.22 |
| Small Cap Value Fund | 2.72% | $1,000.00 | $ 981.20 | $13.54 | | $1,011.34 | $13.60 |
| Emerging Markets Stock Fund | 2.30% | $1,000.00 | $ 991.00 | $11.39 | | $1,013.43 | $11.51 |
| Small Cap Growth Fund | 2.35% | $1,000.00 | $ 920.10 | $11.20 | | $1,013.18 | $11.76 |
| | | | | | | | |
| * | Expenses Paid During Period are equal to the Fund’s annualized expense ratio, multiplied by the average account value over the period, multiplied by 182 days and divided by 366 (to reflect the number of days in the six month period ending April 30, 2016). |
Privacy Notice
March 2011
| FACTS | WHAT DO THE DUNHAM FUNDS DO WITH YOUR PERSONAL INFORMATION? |
| | |
| Why? | Financial companies choose how they share your personal information. Federal law gives consumers the right to limit some but not all sharing. Federal law also requires us to tell you how we collect, share, and protect your personal information. Please read this notice carefully to understand what we do. |
| | |
| What? | The types of personal information we collect and share depend on the product or service you have with us. This information can include: ■ Social Security number and wire transfer instructions ■ account transactions and transaction history ■ investment experience and purchase history When you are no longer a customer, we continue to share your information as described in this notice. |
| | |
| How? | All financial companies need to share customers’ personal information to run their everyday business. In the section below, we list the reasons financial companies can share their customers’ personal information; the reasons the Dunham Funds chooses to share; and whether you can limit this sharing. |
| Reasons we can share your personal information | Do Dunham Funds share? | Can you limit this sharing? |
| For our everyday business purposes - such as to process your transactions, maintain your account(s), respond to court orders and legal investigations, or report to credit bureaus | Yes | No |
| For our marketing purposes - to offer our products and services to you | Yes | No |
| For joint marketing with other financial companies | No | We don’t share |
| For our affiliates’ everyday business purposes - information about your transactions and experiences | No | We don’t share |
| For our affiliates’ everyday business purposes - information about your creditworthiness | No | We don’t share |
| For nonaffiliates to market to you | No | We don’t share |
| Questions? | Call (800) 442-4358 or go to www.dunham.com |
| What we do |
| How do Dunham Funds protect my personal information? | To protect your personal information from unauthorized access and use, we use security measures that comply with federal law. These measures include computer safeguards and secured files and buildings. We permit only authorized parties and affiliates (as permitted by law) who have signed an agreement (which protects your personal information) with us to have access to customer information. |
| How do Dunham Funds collect my personal information? | We collect your personal information, for example, when you
■ open and account or deposit money ■ direct us to buy securities or direct us to sell your securities ■ seek advice about your investments We also collect your personal information from others, such as credit bureaus, affiliates, or other companies. |
| Why can’t I limit all sharing? | Federal law gives you the right to limit only
■ sharing for affiliates’ everyday business purposes-information about your creditworthiness ■ affiliates from using your information to market to you ■ sharing for nonaffiliates to market to you State laws and individual companies may give you additional rights to limit sharing. |
| Definitions |
| Affiliates | Companies related by common ownership or control. They can be financial and nonfinancial companies. ■ Our affiliates include financial companies, such as Dunham & Associates Investment Counsel, Inc. |
| Nonaffiliates | Companies not related by common ownership or control. They can be financial and nonfinancial companies. ■ Dunham Funds do not share with nonaffiliates so they can market to you. |
| Joint marketing | A formal agreement between nonaffiliated financial companies that together market financial products or services to you. ■ Dunham Funds doesn’t jointly market |
How to Obtain Proxy Voting Information
Information regarding how the Funds voted proxies relating to portfolio securities for the most recent 12-month period ended June 30 as well as a description of the policies and procedures that the Funds use to determine how to vote proxies is available without charge, upon request, by calling (888)-3DUNHAM (338-6426) or by referring to the Securities and Exchange Commission’s (“SEC”) website at http://www.sec.gov.
How to Obtain 1st and 3rd Fiscal Quarter Portfolio Holdings
Each Fund files its complete schedule of portfolio holdings with the SEC for the first and third quarters of each fiscal year on Form N-Q. Form N-Q is available on the SEC’s website at http://www.sec.gov and may be reviewed and copied at the SEC’s Public Reference Room in Washington, DC (800)-SEC-0330. The information on Form N-Q is available without charge, upon request, by calling (888)-3DUNHAM (338-6426).

P.O. Box 910309
San Diego, California 92191
(800) 442-4358
Distributed by Dunham & Associates Investment Counsel, Inc. Member FINRA/SIPC
THIS REPORT AND FINANCIAL STATEMENTS CONTAINED HEREIN ARE NOT INTENDED TO BE A FORECAST OF FUTURE EVENTS, A GUARANTEE OF FUTURE RESULTS, OR INVESTMENT ADVICE. FURTHER, THERE IS NO ASSURANCE THAT CERTAIN SECURITIES WILL REMAIN IN OR OUT OF EACH FUND’S PORTFOLIO.
THE FIGURES IN THIS REPORT REPRESENT PAST PERFORMANCE AND DO NOT GUARANTEE FUTURE RESULTS. THE PRINCIPAL VALUE OF AN INVESTMENT AND INVESTMENT RETURN WILL FLUCTUATE SO THAT AN INVESTOR’S SHARES, WHEN REDEEMED, MAY BE WORTH MORE OR LESS THAN THEIR ORIGINAL COST.
Item 2. Code of Ethics. Not applicable.
Item 3. Audit Committee Financial Expert. Not applicable.
Item 4. Principal Accountant Fees and Services. Not applicable.
Item 5. Audit Committee of Listed Companies. Not applicable to open-end investment companies.
Item 6. Schedule of Investments. Schedule of investments in securities of unaffiliated issuers is included under Item 1.
Item 7. Disclosure of Proxy Voting Policies and Procedures for Closed-End Funds. Not applicable to open-end investment companies.
Item 8. Portfolio Managers of Closed-End Funds. Not applicable to open-end investment companies.
Item 9. Purchases of Equity Securities by Closed-End Funds. Not applicable to open-end investment companies.
Item 10. Submission of Matters to a Vote of Security Holders. None
Item 11. Controls and Procedures.
(a) Based on an evaluation of the registrant’s disclosure controls and procedures as of a date within 90 days of filing date of this Form N-CSR, the disclosure controls and procedures are reasonably designed to ensure that the information required in filings on Forms N-CSR is recorded, processed, summarized, and reported on a timely basis.
(b) There were no significant changes in the registrant’s internal control over financial reporting that occurred during the registrant’s last fiscal half-year that have materially affected, or are reasonably likely to materially affect, the registrant’s internal control over financial reporting.
Item 12. Exhibits.
(a)(1) Not required for semi-annual reports.
(a)(2) Certifications required by Section 302 of the Sarbanes-Oxley Act of 2002 (and Item 11(a)(2) of Form N-CSR) are filed herewith..
(a)(3) Not applicable.
(b) Certifications required by Section 906 of the Sarbanes-Oxley Act of 2002 (and Item 11(b) of Form N-CSR) are filed herewith.
SIGNATURES
Pursuant to the requirements of the Securities Exchange Act of 1934 and the Investment Company Act of 1940, the registrant has duly caused this report to be signed on its behalf by the undersigned, thereunto duly authorized.
(Registrant) Dunham Funds
By (Signature and Title)
/s/ Jeffrey Dunham
Jeffrey Dunham, Principal Executive Officer/President
Date 7/9/2016
Pursuant to the requirements of the Securities Exchange Act of 1934 and the Investment Company Act of 1940, this report has been signed below by the following persons on behalf of the registrant and in the capacities and on the dates indicated.
By (Signature and Title)
/s/ Jeffrey Dunham
Jeffrey Dunham, Principal Executive Officer/President
Date 7/9/2016
By (Signature and Title)
/s/ Denise Iverson
Denise Iverson, Principal Financial Officer/Treasurer
Date 7/9/2016