united states
securities and exchange commission
washington, d.c. 20549
form n-csr
certified shareholder report of registered management
investment companies
Investment Company Act file number 811-22153
Dunham Funds
(Exact name of registrant as specified in charter)
10251 Vista Sorrento Pkwy, Ste. 200, San Diego, CA 92121
(Address of principal executive offices) (Zip code)
Richard Malinowski
Gemini Fund Services, LLC., 80 Arkay Drive, Suite 110, Hauppauge, NY 11788
(Name and address of agent for service)
Registrant's telephone number, including area code: 631-470-2619
Date of fiscal year end: 10/31
Date of reporting period: 4/30/17
Item 1. Reports to Stockholders.
This Semi-annual Report contains “forward-looking statements” within the meaning of the Private Securities Litigation Reform Act Of 1995. Forward-looking statements also include those preceded by, followed by or that include the words “believes”, “expects”, “anticipates” or similar expressions. Such statements should be viewed with caution. actual results or experience could differ materially from the forward-looking statements as a result of many factors. Each Fund makes no commitments to disclose any revisions to forward-looking statements, or any facts, events or circumstances after the date hereof that may bear upon forward-looking statements. In addition, prospective purchasers of the Funds should consider carefully the information set forth herein and the applicable fund’s prospectus. Other factors and assumptions not identified above may also have been involved in the derivation of these forward-looking statements, and the failure of these other assumptions to be realized may also cause actual results to differ materially from those projected.
Dear Fellow Shareholders,
The past six months have been exciting, to say the least. Headlines have bounced from a surprise in U.S. election results, to two increases in the Fed Funds Rate, to a significant rally in equities, to geopolitical uncertainty overseas, and to domestic political excitement, euphoria, and disappointment. While some of these headlines are not uncommon, the convergence of all of these events in such a short period would prompt most financial markets-focused academics to assume that significantly increased volatility would have coincided with this information maelstrom. Instead, volatility subsided to low levels that have not been seen in over a decade, since before the Global Financial Crisis.
While this most recent rally in the equity markets has generally resulted in all-time highs for many broad asset classes, the “per unit of earnings” prices are not at all-time highs. For example, the S&P 500 Index boasted an average Price-to-Earnings ratio of close to 21.3 at the end of the most recent fiscal quarter. This is a far-cry from the 26.5 ratio seen in 2009 or 30.6 ratio in 1999. Therefore, while equity fundamentals and prices do not appear outrageous, we do believe that there are opportunities in both the traditional equity and fixed income markets, as well as in alternative asset classes.
When looking overseas, the increased concerns over geopolitical events, such as the Dutch and French elections, have provided investment opportunities for those who remain calm amidst the panic. Foreign markets, developing markets in particular, have not seen the same rebound and rally over the past decade experienced by U.S. equities. In fact, while U.S. equities have nearly doubled in value from their 2007 highs, emerging markets stocks are still underwater and developed markets stocks are barely positive. As these regions continue to make progress implementing the complex processes needed to revitalize their economies, additional intermediate-term and long-term opportunities may surface.
As the Federal Open Market Committee has acted on their confidence that the U.S. economy is on stronger footing by increasing the Fed Funds Rate an additional 0.5 percent in the December and March meetings, the most interest-rate sensitive fixed income securities have experienced significant declines. Fed Chair, Janet Yellen, has reiterated her commitment to additional increases this year, which are expected to further stress those same securities that have broadly benefitted from close to nine years of record-low interest rates. Similar to the dispersion and uncertainty seen in the equity markets, the disconnect for many investors between what asset classes have historically been strong performers and those that should benefit most in the new environment to come is prevalent in the fixed income markets.
We remain committed to providing you with the highest level of service and an investment experience that is tailored to your specific goals. We thank you for your continued trust and the confidence you have placed in us. We take that trust very seriously and look forward to servicing your investment needs for years to come.
Sincerely,

Jeffrey A. Dunham
President
Dunham & Associates Investment Counsel, Inc.
April 30, 2017
1
Dunham Floating Rate Bond Fund
Message from the Sub-Adviser (Newfleet Asset Management, LLC)
After shocking the world and financial markets with his surprise victory, President-Elect Trump set out to deliver on his campaign promises of economic growth, healthcare and tax reform, and border security. Over the first few months of the fiscal period, U.S. stocks soared while returns on bonds suffered. Investor optimism was gleaming at the prospects for America. The latter half of the fiscal period became more of a reality check for investors. Following the inauguration, the new administration suffered a few setbacks that led investors to reassess the speed, or even the likelihood, at which the new president’s policies would come to fruition. U.S. stocks continued their upward trajectory, albeit at a reduced pace, while bond returns recovered. Over the six-month period ended April 30, 2017, U.S. stocks, as measured by the S&P 500, gained 13.3 percent. Over the same period, interest rates on the 10-year U.S. Treasury fluctuated within an 85 basis point range, hitting their low of 1.78 percent a few days prior to the election, undulating throughout the fiscal period until they reached their high of 2.63 percent in mid-March, before settling at 2.28 percent to end the fiscal period. The Federal Reserve increased the Fed Funds Rate by 25 basis points in December of 2016 and again in March of 2017. As bond prices fall when interest rates rise, returns on U.S. bonds declined. U.S. investment-grade bonds, as measured by the Bloomberg Barclays U.S. Aggregate Total Return Bond Index, lost 0.7 percent over the six-month period ended April 30, 2017. The increase in rates was mimicked by the performance of bank loans, as measured by the S&P / LSTA Leveraged Loan Index. Bank loans gained 3.0 percent over the fiscal period. The London Interbank Offered Rate (“LIBOR”) continued its upward trend during the fiscal period. Three-month LIBOR began the fiscal period at 0.88 percent, generally its lowest point of the six-month period, before beginning a steady climb to its high of 1.17 percent at end of the fiscal period.
U.S. stocks rallied over the six-month period ended April 30, 2017, and bank loan returns were meaningfully positive, as well. At the beginning of the fiscal period, the average bank loan in the Fund had a price of $99.72. By the middle of the fiscal period, the average bank loan price rose to $100.02, before dipping to $99.88 by the end of the fiscal six-month period. The Sub-Adviser remains optimistic about the asset class’ potential as interest rates rise and investor sentiment towards the loan space allows the price to continue to increase. At the beginning of the fiscal six-month period, approximately 22 bank loans in the Fund had a price lower than $95, which represented approximately 7.25 percent of the bank loans in the Fund. By the end of the fiscal six-month period, the Fund held approximately 20 bank loans with a price below $95, which represented approximately 6.25 percent of the bank loans in the Fund.
The yields on bank loans, as measured by the S&P / LSTA Leveraged Loan 100 Index, generally moved in the opposite direction from broader Treasury yield movements over the fiscal period. Bank loans, in general, began the fiscal six-month period with a yield-to-maturity of 5.1 percent, approximately 1.4 percent less than their traditional high-yield bond counterparts, as measured by the BofA Merrill Lynch High-Yield Bond Cash Pay Index. Bank loans underperformed traditional high-yield bonds over the first half of fiscal period by nearly 100 basis points, and trailed by nearly 150 basis points over the second half of the fiscal six-month period. Over the entire period, bank loans underperformed traditional high-yield bonds by nearly 250 basis points. The yield gap between the bank loans and traditional high-yield bonds saw an overall expansion over the fiscal period. At the end of the fiscal six months, the yields on bank loans stood at 4.5 percent and traditional high-yield bonds ended at 6.0 percent. The Fund held approximately 5.8 percent of its assets in traditional high-yield bonds that, from an allocation perspective, enhanced relative performance during the fiscal period.
The Sub-Adviser continued to focus on higher rated first lien loans within the bank loan space, limiting its exposure to bank loans rated CCC and lower. The exposure to lower-rated loans, second lien loans, and traditional bonds has been limited to instances where the Sub-Adviser has determined that the additional reward is expected to significantly outweigh the additional risk. However, with the significant increase in lower-rated securities over the second half of the six-month period, some of the Fund’s bonds also benefitted. For example, the Fund held the CC-rated traditional bonds issued by FTS International, Inc. (30283WAB0) (holding percentage*: 0.03 percent), a provider of oil field services and high-pressure hydraulic fracturing, operating throughout the United States. The company’s bonds increased 53.6 percent on a total return basis over the first half of the six-month period. The second half of the six-month period saw the total return of the bonds lose 2.7 percent. As oil prices rallied from their January 2016 lows and traded in the $45 to $55 range throughout the first half of the fiscal period, many energy-related issuers saw increases in their bank loans over the first half of the fiscal period, such as Fieldwood Energy, LLC (BL1112129) (holding percentage*: 0.07 percent). Another provider of oil and gas services, the company acquires and develops oil and gas opportunity assets throughout the United States. Fieldwood’s bank loan saw a price increase from $60.00 at the beginning of the fiscal period to $79.37 midway through the fiscal period. The second half of the fiscal period saw the price of the bank loans drop from $79.37 to $78.81, as oil prices generally declined from the $55 range to the $49 range. A contributor to the Fund’s performance over the entire six-month period was Drillships Financing Holding, Inc. (BL1037748) (holding percentage*: 0.08 percent), which operates as a financing holding company and a subsidiary of Ocean Rig UDW, Inc. Ocean Rig offers offshore drilling services to the oil and natural gas exploration industry, operating ultra-deepwater semi-submergible offshore drilling rigs, and specializes in drilling in harsh environments. The bank loans saw a 46.0 percent increase in its price from the beginning of the fiscal period through the end.
The Sub-Adviser remains constructive on markets but believes there are still a number of uncertainties to monitor going forward, including the unfolding of Trump’s economic policies, the strength of the U.S. dollar, and commodities prices. The Sub-Adviser expects U.S. growth in the 2 percent to 2.5 percent range for the year and believes the Fed will remain data dependent but will raise rates two more times this year. The Sub-Adviser believes global growth will be driven by emerging markets, and expects an improvement in global growth this year after hitting a bottom last year. The Sub-Adviser believes there will be continued increases in LIBOR and remains encouraged by historically low default rates, both of which should benefit bank loan investors by the floating rate feature offered by bank loans.
| * | Holdings percentage(s) as of 4/30/2017. |
| ** | Holdings percentage(s) as of the date prior to the sale of the security. |
Growth of $100,000 Investment
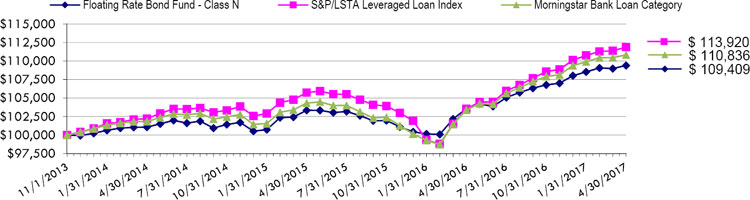
Total Returns as of April 30, 2017
| Annualized | ||||||||
| One | Annualized | Since Inception | ||||||
| Six Months | Year | Three Years | (11/1/13) | |||||
| Class N | 2.47% | 5.65% | 2.68% | 2.61% | ||||
| Class C | 2.25% | 4.94% | 1.97% | 1.86% | ||||
| Class A with load of 4.50% | (2.30)% | 0.56% | 0.86% | 0.99% | ||||
| Class A without load | 2.33% | 5.27% | 2.42% | 2.33% | ||||
| S&P/LSTA Leverage Loan Index | 3.03% | 8.05% | 3.05% | 4.60% | ||||
| Morningstar Bank Loan Category | 2.70% | 7.21% | 2.86% | 2.99% |
The S&P/LSTA U.S. Leveraged Loan 100 Index is designed to reflect the performance of the largest facilities in the leveraged loan market. Investors cannot invest directly in an index or benchmark.
The Morningstar Bank Loan Category is generally representative of mutual funds that primarily invest in floating-rate bank loans instead of bonds. These bank loans generally offer interest payments that typically float above a common short-term benchmark such as the London interbank offered rate, or LIBOR.
As disclosed in the Trust’s latest registration statement, the Fund’s total annual operating expenses, including cost of underlying funds, are 1.20% for Class N, 1.95% for Class C and 1.45% for Class A. Class A shares are subject to a sales load of 4.50% and a deferred sales charge of up to 0.75%. The performance data quoted here represents past performance, which is not indicative of future results. Current performance may be lower or higher than the performance data quoted. The investment return and NAV will fluctuate, so that an investor’s shares, when redeemed, may be worth more or less than their original cost. Total returns are calculated assuming reinvestment of all dividends and capital gains distributions, if any. The returns do not reflect the deductions of taxes a shareholder would pay on the redemption of fund shares or fund distributions. For performance information current to the most recent month-end, please call 1-800-442-4358 or visit our website www.dunham.com
2
| SCHEDULE OF INVESTMENTS (Unaudited) |
| Dunham Floating Rate Bond Fund |
| April 30, 2017 |
| Shares | Value | |||||||||||||||
| COMMON STOCK - 0.1% | ||||||||||||||||
| ELECTRIC - 0.1% | ||||||||||||||||
| Speedstar Holding Corp. | 23,349 | $ | — | |||||||||||||
| Vistra Energy Corp. | 10,588 | 158,291 | ||||||||||||||
| TOTAL COMMON STOCK (Cost - $148,234) | 158,291 | |||||||||||||||
| EXCHANGE TRADED FUND - 1.0% | ||||||||||||||||
| DEBT FUND - 1.0% | ||||||||||||||||
| PowerShares Senior Loan Portfolio | 56,935 | 1,325,447 | ||||||||||||||
| TOTAL EXCHANGE TRADED FUND (Cost - $1,319,832) | ||||||||||||||||
| Principal | Interest | Maturity | ||||||||||||||
| Security | Amount | Rate | Date | |||||||||||||
| BANK LOANS - 88.0% | ||||||||||||||||
| CONSUMER DISCRETIONARY - 24.3% | ||||||||||||||||
| Advantage Sales & Marketing, Inc. | $ | 182,000 | 7.6723 | % | 7/24/2022 | 174,447 | ||||||||||
| Advantage Sales & Marketing, Inc. | 285,000 | 4.4218 | 7/24/2021 | 278,944 | ||||||||||||
| Affinity Gaming LLC | 18,455 | 4.6496 | 6/30/2023 | 18,616 | ||||||||||||
| Altice US Finance I Corp | 334,811 | 3.3712 | 7/28/2025 | 335,194 | ||||||||||||
| AMC Entertainment Holdings, Inc. | 161,595 | 3.9196 | 12/16/2023 | 162,335 | ||||||||||||
| American Axle & Manufacturing Holdings, Inc. | 285,000 | 3.4054 | 4/6/2024 | 283,991 | ||||||||||||
| Aristocrat International Pty L | 600,187 | 3.4032 | 10/20/2021 | 605,940 | ||||||||||||
| Accuride | 369,175 | 8.1496 | 11/16/2023 | 373,328 | ||||||||||||
| Bass Pro Group LLC | 655,000 | 5.8996 | 6/8/2018 | 660,322 | ||||||||||||
| Bass Pro Group LLC | 655,000 | 6.1496 | 12/16/2026 | 639,490 | ||||||||||||
| Boyd Gaming Corp. | 874,475 | 3.6718 | 9/16/2023 | 879,442 | ||||||||||||
| Caesars Entertainment | 129,617 | 1.5000 | — | 159,429 | ||||||||||||
| Caesars Entertainment Operating | 305,000 | 3.6498 | 4/4/2024 | 303,589 | ||||||||||||
| Caesars Entertainment Operating | 526,848 | 10.2500 | 1/28/2018 | 602,911 | ||||||||||||
| Caesars Entertainment Resort | 815,331 | 7.1723 | 10/12/2020 | 819,412 | ||||||||||||
| Caesars Growth Properties Holding | 400,000 | 4.1665 | 5/8/2021 | 402,688 | ||||||||||||
| Caesars Growth Properties Holding | 249,714 | 3.7500 | 5/8/2021 | 251,274 | ||||||||||||
| CBAC Borrower LLC | 98,750 | 8.2500 | 7/2/2020 | 99,244 | ||||||||||||
| CBS Radio, Inc. | 295,333 | 4.6562 | 10/16/2023 | 297,918 | ||||||||||||
| CDS US Intermediate Holdings | 173,360 | 5.1496 | 7/8/2022 | 175,130 | ||||||||||||
| Charter Communications Operating LLC | 136,620 | 3.1723 | 1/16/2022 | 137,332 | ||||||||||||
| Charter Communications Operating LLC | 700,920 | 3.4223 | 1/16/2024 | 705,213 | ||||||||||||
| Charter Communications Operating LLC | 323,451 | 3.1723 | 6/30/2020 | 325,507 | ||||||||||||
| CityCenter Holdings LLC | 565,000 | 3.9062 | 4/18/2024 | 566,554 | ||||||||||||
| Cooper Standard Auto | 189,022 | 3.8996 | 11/2/2023 | 189,760 | ||||||||||||
| CSC Holdings LLC | 1,045,275 | 3.4062 | 7/16/2025 | 1,046,488 | ||||||||||||
| Delta 2 Lux Sarl | 385,000 | 4.2500 | 1/31/2024 | 386,011 | ||||||||||||
| Eldorado Resorts, Inc. | 127,725 | 6.2500 | 7/24/2022 | 127,446 | ||||||||||||
| Eldorado Resorts, Inc. | 590,000 | 5.2500 | 4/16/2024 | 589,817 | ||||||||||||
| Federal-Mogul Holdings Corp. | 983,126 | 4.9062 | 4/16/2021 | 984,001 | ||||||||||||
| Floor & Decor Outlets of America | 261,685 | 4.6723 | 9/30/2023 | 262,666 | ||||||||||||
| Gates Global LLC | 635,952 | 4.4076 | 3/31/2024 | 639,968 | ||||||||||||
| Gateway Casinos & Entertainment | 165,000 | 4.8040 | 2/22/2023 | 167,440 | ||||||||||||
| Graton Economic Development | 117,405 | 4.9601 | 8/31/2022 | 118,139 | ||||||||||||
| Greektown Holdings LLC | 170,000 | 4.1704 | 4/24/2024 | 170,496 | ||||||||||||
| Harbor Freight Tools | 394,515 | 4.4223 | 8/18/2023 | 394,073 | ||||||||||||
| Hilton Worldwide Finance LLC | 1,533,572 | 3.1704 | 10/24/2023 | 1,547,950 | ||||||||||||
| iHeart Communications, Inc. | 910,000 | 7.9223 | 1/30/2019 | 779,998 | ||||||||||||
| Intelsat Jackson Holdings S.A. | 370,000 | 3.9018 | 6/30/2019 | 365,984 | ||||||||||||
| KAR Auction Services, Inc. | 306,184 | 3.3598 | 3/12/2021 | 309,293 | ||||||||||||
| KAR Auction Services, Inc. | 74,250 | 4.6723 | 3/8/2023 | 74,970 | ||||||||||||
| Laureate Education, Inc. | 597,845 | 8.6557 | 3/16/2021 | 598,592 | ||||||||||||
| Laureate Education, Inc. | 449,681 | 5.6562 | 4/26/2024 | 450,151 | ||||||||||||
| Leslie’s Poolmart, Inc. | 318,501 | 4.8996 | 8/16/2023 | 320,624 | ||||||||||||
| Libbey Glass, Inc. | 243,843 | 4.1557 | 4/8/2021 | 236,527 | ||||||||||||
| Lions Gate Entertainment Corp. | 251,200 | 4.1496 | 12/8/2023 | 253,006 | ||||||||||||
| MCC Iowa LLC | 296,655 | 3.6723 | 1/28/2021 | 298,834 | ||||||||||||
| McGraw-Hill Global Education | 263,013 | 5.1723 | 5/4/2022 | 260,999 | ||||||||||||
| Mediacom Illinois LLC | 154,445 | 3.4223 | 2/16/2024 | 155,475 | ||||||||||||
See accompanying notes to financial statements.
3
| SCHEDULE OF INVESTMENTS (Unaudited) |
| Dunham Floating Rate Bond Fund (Continued) |
| April 30, 2017 |
| Principal | Interest | Maturity | ||||||||||||||
| Security | Amount | Rate | Date | Value | ||||||||||||
| CONSUMER DISCRETIONARY (Continued) - 24.3% | ||||||||||||||||
| MGM Growth Properties | $ | 373,230 | 3.672 | % | 4/24/2023 | $ | 374,564 | |||||||||
| Michaels Stores, Inc. | 527,583 | 3.9173 | 1/30/2023 | 527,253 | ||||||||||||
| Mission Broadcasting, Inc. | 19,910 | 4.1562 | 1/16/2024 | 20,114 | ||||||||||||
| Mohegan Tribal Gaming Authority | 249,375 | 5.1723 | 10/12/2023 | 251,531 | ||||||||||||
| Neiman Marcus Group LTD, Inc. | 267,245 | 4.4054 | 10/24/2020 | 213,944 | ||||||||||||
| Nexstar Broadcasting, Inc. | 205,363 | 4.1562 | 1/16/2024 | 207,472 | ||||||||||||
| Numericable US LLC | 650,000 | 3.9062 | 8/1/2025 | 648,102 | ||||||||||||
| Numericable US LLC | 159,600 | 4.4223 | 1/14/2025 | 159,999 | ||||||||||||
| Party City Holdings, Inc. | 531,410 | 4.1708 | 8/20/2022 | 531,853 | ||||||||||||
| Penn National Gaming, Inc. | 125,000 | 3.6496 | 1/20/2024 | 126,016 | ||||||||||||
| PetSmart, Inc. | 536,445 | 4.1518 | 3/12/2022 | 493,715 | ||||||||||||
| Playa Resorts Holdings | 365,000 | 4.1576 | 4/28/2024 | 366,303 | ||||||||||||
| Scientific Games International | 531,267 | 5.1562 | 9/30/2021 | 539,858 | ||||||||||||
| Serta Simmons International | 305,235 | 4.5337 | 11/8/2023 | 306,642 | ||||||||||||
| ServiceMaster Co. LLC | 874,800 | 3.6496 | 11/8/2023 | 885,874 | ||||||||||||
| Sinclair Television | 368,452 | 3.4223 | 1/4/2024 | 369,741 | ||||||||||||
| Six Flags Entertainment Corp. | 343,273 | 3.4232 | 6/30/2022 | 347,063 | ||||||||||||
| Speedstar Holding Corp. | 5,149 | 9.9051 | 4/12/2022 | 3,778 | ||||||||||||
| SRAM Corporation | 261,108 | 4.6850 | 3/16/2024 | 261,108 | ||||||||||||
| St George’s University | 222,252 | 6.3996 | 7/6/2022 | 225,309 | ||||||||||||
| Station Casinos LLC | 877,909 | 3.6562 | 6/8/2023 | 878,607 | ||||||||||||
| TI Group Automotive Systems LLC | 303,384 | 3.9223 | 6/30/2022 | 305,027 | ||||||||||||
| Transtar Holding Co. | 6,701 | 5.5000 | 4/12/2022 | 6,523 | ||||||||||||
| Transtar Holding Co. | 16,970 | 5.5000 | 4/12/2022 | 12,946 | ||||||||||||
| Tribune Co. | 23,631 | 4.1723 | 12/28/2020 | 23,838 | ||||||||||||
| Tribune Co. | 295,270 | 4.1723 | 1/26/2024 | 297,808 | ||||||||||||
| UFC Holdings LLC | 604,973 | 4.4062 | 8/18/2023 | 609,462 | ||||||||||||
| Univision Communications, Inc. | 2,476,298 | 3.9223 | 3/16/2024 | 2,463,334 | ||||||||||||
| US Farathane LLC | 270,685 | 5.1496 | 12/24/2021 | 273,900 | ||||||||||||
| Ziggo BV | 890,000 | 3.6562 | 4/16/2025 | 891,157 | ||||||||||||
| 32,609,799 | ||||||||||||||||
| CONSUMER STAPLES - 5.4% | ||||||||||||||||
| Albertsons LLC | 251,107 | 4.4218 | 12/20/2022 | 252,505 | ||||||||||||
| Albertsons LLC | 460,877 | 4.1723 | 8/24/2021 | 463,013 | ||||||||||||
| Amplify Snack Brands, Inc. | 158,525 | 6.6498 | 9/2/2023 | 156,049 | ||||||||||||
| ARAMARK Corp. | 410,000 | 3.1522 | 3/28/2024 | 414,100 | ||||||||||||
| Chobani LLC | 279,325 | 5.4223 | 10/10/2023 | 284,213 | ||||||||||||
| Coty, Inc. | 390,499 | 3.6498 | 10/28/2022 | 393,550 | ||||||||||||
| Dole Food Co, Inc. | 540,000 | 4.1554 | 4/6/2024 | 542,533 | ||||||||||||
| Galleria Co | 205,952 | 4.1498 | 9/28/2023 | 208,012 | ||||||||||||
| Hostess Brands LLC | 375,569 | 4.1723 | 8/4/2022 | 379,443 | ||||||||||||
| Jacobs Douwe Egberts | 105,001 | 3.6498 | 7/2/2022 | 105,525 | ||||||||||||
| JBS USA Lux | 655,000 | 3.6498 | 10/30/2022 | 658,861 | ||||||||||||
| Kronos, Inc. | 698,250 | 5.0346 | 10/31/2023 | 701,623 | ||||||||||||
| Kronos, Inc. | 120,000 | 9.2846 | 10/31/2024 | 125,385 | ||||||||||||
| Milk Specialties Co. | 341,285 | 5.1496 | 8/16/2023 | 344,913 | ||||||||||||
| Prestige Brands, Inc. | 193,693 | 3.9223 | 1/26/2024 | 195,727 | ||||||||||||
| Reynolds Group Holdings, Inc. | 839,354 | 4.1723 | 2/4/2023 | 844,554 | ||||||||||||
| Rite Aid Corp. | 430,000 | 5.0473 | 6/20/2021 | 431,612 | ||||||||||||
| TKC Holdings, Inc. | 275,000 | 4.8998 | 1/31/2023 | 278,208 | ||||||||||||
| US Foods, Inc. | 465,483 | 3.9223 | 6/28/2023 | 470,284 | ||||||||||||
| 7,250,110 | ||||||||||||||||
| ENERGY - 2.6% | ||||||||||||||||
| Blackhawk Mining LLC | 135,849 | 10.6723 | 2/16/2022 | 132,162 | ||||||||||||
| Chesapeake Energy Corp. | 55,000 | 8.5523 | 8/24/2021 | 59,546 | ||||||||||||
| Chief Exploration & Development | 172,000 | 7.6518 | 5/16/2021 | 166,195 | ||||||||||||
| Contura Energy, Inc. | 370,000 | 6.1518 | 3/18/2024 | 367,342 | ||||||||||||
| Drillships Financing Holding | 140,276 | 8.0000 | 4/1/2021 | 106,084 | ||||||||||||
| Drillships Ocean Ventures, Inc. | 109,200 | 7.5000 | 7/24/2021 | 101,874 | ||||||||||||
| Fieldwood Energy LLC | 134,102 | 8.3750 | 9/30/2020 | 105,689 | ||||||||||||
See accompanying notes to financial statements.
4
| SCHEDULE OF INVESTMENTS (Unaudited) |
| Dunham Floating Rate Bond Fund (Continued) |
| April 30, 2017 |
| Principal | Interest | Maturity | ||||||||||||||
| Security | Amount | Rate | Date | Value | ||||||||||||
| ENERGY - 2.6% (Continued) | ||||||||||||||||
| Fieldwood Energy LLC | $ | 81,748 | 8.3750 | % | 9/30/2020 | $ | 74,663 | |||||||||
| Fieldwood Energy LLC | 180,554 | 8.1723 | 9/1/2020 | 177,244 | ||||||||||||
| Gavilan Resources LLC | 290,000 | 7.1498 | 2/29/2024 | 288,550 | ||||||||||||
| Jonah Energy LLC | 243,000 | 7.6723 | 5/12/2021 | 232,673 | ||||||||||||
| MEG Energy Corp. | 594,194 | 4.5390 | 1/1/2024 | 595,866 | ||||||||||||
| Paragon Offshore Finance Co | 174,258 | 5.7500 | 7/16/2021 | 68,178 | ||||||||||||
| Peabody Energy Corp. | 290,000 | 5.6498 | 4/1/2022 | 291,873 | ||||||||||||
| Seadrill Operating LP | 811,214 | 4.1496 | 2/20/2021 | 552,031 | ||||||||||||
| Ultra Resources, Inc. | 190,000 | 4.1584 | 4/12/2024 | 189,525 | ||||||||||||
| 3,509,495 | ||||||||||||||||
| FINANCIALS - 3.5% | ||||||||||||||||
| Alixpartners LLP | 860,000 | 4.1498 | 4/4/2024 | 868,445 | ||||||||||||
| Asurion LLC | 188,460 | 4.9223 | 11/4/2023 | 190,109 | ||||||||||||
| Asurion LLC | 16,733 | 4.4223 | 7/8/2020 | 16,874 | ||||||||||||
| Asurion LLC | 301,588 | 4.4223 | 8/4/2022 | 303,944 | ||||||||||||
| Asurion LLC | 230,000 | 8.6723 | 3/4/2021 | 233,952 | ||||||||||||
| Avolon | 25,000 | 3.9032 | 3/20/2022 | 25,402 | ||||||||||||
| Delos Finance | 300,000 | 3.3996 | 10/6/2023 | 304,013 | ||||||||||||
| iStar Financial, Inc. | 20,657 | 4.9043 | 6/30/2020 | 20,915 | ||||||||||||
| Lightstone Generation | 127,796 | 5.6723 | 1/30/2024 | 128,654 | ||||||||||||
| Lightstone Generation | 7,884 | 5.6723 | 1/30/2024 | 7,937 | ||||||||||||
| Lonestar Intermediate | 215,000 | 10.1723 | 9/1/2021 | 224,137 | ||||||||||||
| TransUnion LLC | 883,246 | 3.6723 | 4/8/2023 | 891,858 | ||||||||||||
| VF Holdings Corp. | 651,825 | 4.4223 | 6/30/2023 | 655,084 | ||||||||||||
| Walter Investments | 953,918 | 4.9223 | 12/18/2020 | 864,569 | ||||||||||||
| 4,735,893 | ||||||||||||||||
| HEALTHCARE - 11.5% | ||||||||||||||||
| 21st Century Oncology, Inc. | 146,612 | 7.2746 | 4/30/2022 | 133,710 | ||||||||||||
| Acadia Healthcare Co, Inc. | 303,559 | 4.1496 | 2/16/2023 | 304,318 | ||||||||||||
| Akorn, Inc. | 258,135 | 5.4223 | 4/16/2021 | 261,202 | ||||||||||||
| Alere, Inc. | 533,080 | 4.4223 | 6/20/2022 | 536,243 | ||||||||||||
| American Renal Holdings Co, Inc. | 83,338 | 4.7500 | 8/20/2019 | 84,068 | ||||||||||||
| Amneal Pharmaceuticals LLC | 465,924 | 4.6576 | 10/31/2019 | 470,949 | ||||||||||||
| Ardent Legacy Acquisitions, Inc. | 192,075 | 6.6496 | 8/4/2021 | 193,155 | ||||||||||||
| Capsugel Holdings US, Inc. | 401,785 | 4.1723 | 8/1/2021 | 402,707 | ||||||||||||
| Change Healthcare Holdings | 995,000 | 3.9223 | 2/29/2024 | 999,234 | ||||||||||||
| CHG Healthcare Services, Inc. | 144,868 | 4.9223 | 6/8/2023 | 146,905 | ||||||||||||
| CHS/Community Health Systems | 1,099,725 | 4.0767 | 1/28/2021 | 1,094,282 | ||||||||||||
| CHS/Community Health Systems | 271,751 | 3.8268 | 1/1/2020 | 271,099 | ||||||||||||
| Concordia Healthcare Corp. | 147,563 | 5.4165 | 10/20/2021 | 99,732 | ||||||||||||
| ConvaTec, Inc. | 94,000 | 3.4223 | 10/24/2021 | 94,882 | ||||||||||||
| DaVita, Inc. | 740,970 | 3.9223 | 6/24/2021 | 749,676 | ||||||||||||
| DJO Finance LLC | 157,200 | 4.4109 | 6/8/2020 | 153,938 | ||||||||||||
| Endo Luxembourg Finance I Co | 505,000 | 5.4084 | 4/28/2024 | 509,671 | ||||||||||||
| Endo Luxembourg Finance I Co | 614,225 | 4.1496 | 9/26/2022 | 614,437 | ||||||||||||
| Envision Healthcare Corp. | 726,975 | 4.1496 | 11/30/2023 | 735,790 | ||||||||||||
| Greatbatch Ltd | 93,441 | 4.6518 | 10/28/2022 | 94,142 | ||||||||||||
| Grifols Worldwide Operations | 160,000 | 3.4204 | 2/1/2025 | 160,562 | ||||||||||||
| HCA, Inc. | 202,396 | 3.1723 | 3/16/2023 | 203,357 | ||||||||||||
| HLF Financing | 185,000 | 6.6723 | 2/16/2023 | 185,439 | ||||||||||||
| IASIS Healthcare LLC | 296,134 | 4.5000 | 5/3/2018 | 297,578 | ||||||||||||
| IASIS Healthcare LLC | 35,000 | 5.2500 | 4/28/2021 | 34,825 | ||||||||||||
| IMS Health, Inc. | 322,225 | 3.1503 | 3/8/2024 | 325,850 | ||||||||||||
| inVentiv Health, Inc. | 335,160 | 4.8140 | 11/8/2023 | 337,511 | ||||||||||||
| Kindred Healthcare, Inc. | 170,251 | 4.6551 | 4/8/2021 | 171,156 | ||||||||||||
| Mallinckrodt International | 100,000 | 3.8996 | 9/24/2024 | 100,097 | ||||||||||||
| MultiPlan, Inc. | 121,310 | 4.8996 | 6/8/2023 | 123,054 | ||||||||||||
See accompanying notes to financial statements.
5
| SCHEDULE OF INVESTMENTS (Unaudited) |
| Dunham Floating Rate Bond Fund (Continued) |
| April 30, 2017 |
| Principal | Interest | Maturity | ||||||||||||||
| Security | Amount | Rate | Date | Value | ||||||||||||
| HEALTHCARE (Continued) - 11.5% | ||||||||||||||||
| National Mentor Holdings, Inc. | $ | 264,075 | 4.3996 | % | 2/1/2021 | $ | 266,303 | |||||||||
| National Surgical Hospitals Inc. | 115,935 | 4.6723 | 5/31/2022 | 116,370 | ||||||||||||
| NVA Holdings, Inc. | 206,174 | 8.1496 | 8/14/2022 | 209,267 | ||||||||||||
| NVA Holdings, Inc. | 96,612 | 4.6496 | 8/14/2021 | 98,092 | ||||||||||||
| Ortho-Clinical Diag Holding | 655,930 | 4.9223 | 6/30/2021 | 653,624 | ||||||||||||
| Pharmaceutical Product Development | 550,053 | 4.4103 | 8/18/2022 | 553,686 | ||||||||||||
| Quorum Health Corp. | 220,240 | 6.7846 | 4/28/2022 | 220,240 | ||||||||||||
| Sedgwick, Inc. | 125,000 | 6.9223 | 2/28/2022 | 125,729 | ||||||||||||
| Select Medical Corp. | 300,000 | 4.6554 | 3/6/2024 | 304,125 | ||||||||||||
| Sterigenics-Nordion Holdings LLC | 243,200 | 4.1498 | 5/16/2022 | 242,973 | ||||||||||||
| Surgery Center Holding, Inc. | 208,289 | 4.9004 | 11/4/2020 | 209,851 | ||||||||||||
| Team Health, Inc. | 574,194 | 3.9223 | 2/6/2024 | 570,157 | ||||||||||||
| US Renal Care, Inc. | 719,817 | 5.3996 | 12/30/2022 | 684,276 | ||||||||||||
| Valeant Pharmaceuticals International ^ | 1,324,392 | 5.8998 | 3/31/2022 | 1,333,980 | ||||||||||||
| 15,478,242 | ||||||||||||||||
| INDUSTRIALS - 13.7% | ||||||||||||||||
| 84 Lumber Co. | 467,063 | 6.9204 | 10/24/2023 | 472,901 | ||||||||||||
| Accudyne Industries | 740,000 | 4.1496 | 12/12/2019 | 737,532 | ||||||||||||
| ADS Waste Holdings, Inc. | 988,250 | 3.9223 | 11/10/2023 | 997,688 | ||||||||||||
| Air Canada | 144,000 | 3.9054 | 10/6/2023 | 145,103 | ||||||||||||
| American Airlines, Inc. | 499,550 | 3.6562 | 12/14/2023 | 500,839 | ||||||||||||
| American Airlines, Inc. | 89,000 | 3.6723 | 4/28/2023 | 89,243 | ||||||||||||
| American Airlines, Inc. | 431,088 | 3.1723 | 6/28/2020 | 433,013 | ||||||||||||
| APEX Tool Group LLC | 357,744 | 4.5000 | 2/1/2020 | 352,603 | ||||||||||||
| Aspen Merger Sub, Inc. | 137,310 | 5.4223 | 9/28/2023 | 137,933 | ||||||||||||
| Brand Energy | 473,776 | 4.9117 | 11/26/2020 | 475,934 | ||||||||||||
| Brickman Group Holdings, Inc. | 249,000 | 7.6553 | 12/16/2021 | 251,024 | ||||||||||||
| Brickman Group Holdings, Inc. | 684,633 | 4.2959 | 12/18/2020 | 688,484 | ||||||||||||
| Casella Waste Systems, Inc. | 399,000 | 3.9062 | 10/16/2023 | 401,494 | ||||||||||||
| Columbus McKinnon Corp. | 92,331 | 4.1496 | 2/1/2024 | 93,197 | ||||||||||||
| Filtration Group, Inc. | 514,964 | 4.3140 | 11/24/2020 | 518,118 | ||||||||||||
| Fortress Merger Sub, Inc. | 145,635 | 5.1498 | 10/20/2023 | 147,455 | ||||||||||||
| Gardner Denver, Inc. | 730,274 | 4.4002 | 7/30/2020 | 731,150 | ||||||||||||
| Harland Clarke Holdings Corp. | 270,793 | 6.6496 | 2/8/2022 | 272,181 | ||||||||||||
| Harland Clarke Holdings Corp. | 154,995 | 7.1496 | 1/1/2022 | 155,964 | ||||||||||||
| HD Supply, Inc. | 347,305 | 3.8996 | 8/12/2021 | 350,234 | ||||||||||||
| HD Supply, Inc. | 513,420 | 3.8996 | 10/16/2023 | 518,446 | ||||||||||||
| Headwaters, Inc. | 500,347 | 4.1723 | 3/24/2022 | 501,848 | ||||||||||||
| Husky Injection Molding | 717,837 | 4.4223 | 6/30/2021 | 722,854 | ||||||||||||
| McJunkin Red Man Corp. | 433,975 | 5.1723 | 11/8/2019 | 438,656 | ||||||||||||
| Navistar, Inc. | 295,243 | 5.1576 | 8/8/2020 | 299,487 | ||||||||||||
| NN, Inc. | 190,000 | 4.9022 | 4/4/2021 | 190,357 | ||||||||||||
| NN, Inc. | 217,740 | 5.4223 | 10/20/2022 | 217,672 | ||||||||||||
| PAE Holding Corp. | 212,875 | 6.6723 | 10/20/2022 | 215,137 | ||||||||||||
| Piscine US Acquisitions | 324,188 | 5.6496 | 12/20/2023 | 326,958 | ||||||||||||
| Prime Security Service | 471,199 | 4.4223 | 5/2/2022 | 476,757 | ||||||||||||
| Pro Mach Group, Inc. | 621,819 | 4.9223 | 10/22/2021 | 625,706 | ||||||||||||
| Quikrete Co, Inc. | 815,955 | 4.4223 | 11/16/2023 | 819,272 | ||||||||||||
| Rexnord LLC | 368,203 | 3.9091 | 8/20/2023 | 369,946 | ||||||||||||
| Science Applications International | 231,946 | 3.5382 | 5/4/2022 | 233,468 | ||||||||||||
| Sedgwick, Inc. | 195,000 | 6.8140 | 2/28/2022 | 196,219 | ||||||||||||
| Sedgwick, Inc. | 670,193 | 3.9223 | 2/28/2021 | 671,366 | ||||||||||||
| SiteOne Landscape Supply Holding | 208,074 | 5.6665 | 4/28/2022 | 210,416 | ||||||||||||
| Spin Holdcorp | 389,832 | 4.3463 | 11/14/2019 | 390,848 | ||||||||||||
| TransDigm, Inc. | 80,718 | 4.1510 | 6/4/2021 | 80,970 | ||||||||||||
| TransDigm, Inc. | 1,033,584 | 4.1723 | 6/8/2023 | 1,033,584 | ||||||||||||
| TransDigm, Inc. | 392,385 | 4.1648 | 5/14/2022 | 392,583 | ||||||||||||
See accompanying notes to financial statements.
6
| SCHEDULE OF INVESTMENTS (Unaudited) |
| Dunham Floating Rate Bond Fund (Continued) |
| April 30, 2017 |
| Principal | Interest | Maturity | ||||||||||||||
| Security | Amount | Rate | Date | Value | ||||||||||||
| INDUSTRIALS - 13.7% (Continued) | ||||||||||||||||
| United Airlines, Inc. | $ | 495,000 | 3.4019 | % | 3/31/2024 | $ | 497,255 | |||||||||
| Waste Industries USA, Inc. | 539,754 | 3.9223 | 2/28/2020 | 544,701 | ||||||||||||
| WEX, Inc. | 297,750 | 4.6723 | 6/30/2023 | 301,496 | ||||||||||||
| XPO Logistics, Inc. | 205,000 | 3.4057 | 10/31/2021 | 206,552 | ||||||||||||
| 18,434,644 | ||||||||||||||||
| INFORMATION TECHNOLOGY - 9.1% | ||||||||||||||||
| Alorica, Inc. | 56,907 | 5.9223 | 6/30/2022 | 57,832 | ||||||||||||
| Applied Systems, Inc. | 157,482 | 7.6496 | 1/24/2022 | 159,188 | ||||||||||||
| Avaya, Inc. | 183,889 | 6.4218 | 5/28/2020 | 154,269 | ||||||||||||
| Avaya, Inc. | 200,000 | 8.6620 | 1/24/2018 | 205,819 | ||||||||||||
| Blackboard, Inc. | 971,866 | 6.1562 | 6/30/2021 | 975,024 | ||||||||||||
| BMC Software, Inc. | 722,533 | 5.1723 | 9/10/2020 | 727,684 | ||||||||||||
| Cologix, Inc. | 220,000 | 4.1532 | 3/20/2024 | 220,412 | ||||||||||||
| Cologix, Inc. | 110,000 | 4.1518 | 12/16/2021 | 110,550 | ||||||||||||
| Cologix, Inc. | 40,000 | 8.1532 | 3/20/2025 | 40,467 | ||||||||||||
| Cypress Semiconductor Corp. | 288,750 | 4.9054 | 7/4/2021 | 292,120 | ||||||||||||
| Dell International LLC | 1,167,375 | 3.6723 | 9/8/2023 | 1,173,107 | ||||||||||||
| Donnelley Financial Solutions | 68,937 | 5.1498 | 9/28/2023 | 69,640 | ||||||||||||
| First Data Corp. | 184,725 | 4.1665 | 7/8/2022 | 185,995 | ||||||||||||
| First Data Corp. | 1,746,400 | 3.6718 | 4/26/2024 | 1,748,583 | ||||||||||||
| Go Daddy Operating Co. LLC | 385,752 | 3.6723 | 2/16/2024 | 387,706 | ||||||||||||
| Infor US, Inc. | 1,248,760 | 3.8996 | 1/31/2022 | 1,248,079 | ||||||||||||
| Leidos Holdings, Inc. | 211,470 | 3.4223 | 8/16/2023 | 213,717 | ||||||||||||
| Masergy Communications, Inc. | 119,700 | 5.6312 | 12/16/2023 | 120,823 | ||||||||||||
| Mitchell International, Inc. | 156,000 | 8.6723 | 10/12/2021 | 157,950 | ||||||||||||
| Mitchell International, Inc. | 365,641 | 4.5346 | 10/11/2020 | 368,155 | ||||||||||||
| MKS Instruments, Inc. Term | 224,631 | 3.9223 | 4/30/2023 | 227,019 | ||||||||||||
| ON Semiconductor Corp. | 174,743 | 3.4223 | 4/1/2023 | 175,808 | ||||||||||||
| Presidio, Inc. | 179,842 | 4.4001 | 2/2/2022 | 182,231 | ||||||||||||
| Rackspace Hosting, Inc. | 367,080 | 4.5340 | 11/4/2023 | 370,149 | ||||||||||||
| Radiate HoldCo LLC | 289,524 | 4.1723 | 1/31/2024 | 290,954 | ||||||||||||
| Sophia LP | 309,749 | 4.3996 | 9/30/2022 | 309,671 | ||||||||||||
| SS&C Technologies, Inc. | 24,785 | 3.4223 | 7/8/2022 | 24,994 | ||||||||||||
| SS&C Technologies, Inc. | 289,934 | 3.4223 | 7/8/2022 | 292,381 | ||||||||||||
| Tempo Acquisition LLC | 560,000 | 4.1562 | 4/30/2024 | 560,420 | ||||||||||||
| Veritas US, Inc. | 687,397 | 6.7746 | 1/28/2023 | 685,036 | ||||||||||||
| Western Digital Corp. | 407,005 | 3.9223 | 4/28/2023 | 411,329 | ||||||||||||
| 12,147,112 | ||||||||||||||||
| MATERIALS- 7.9% | ||||||||||||||||
| ABC Supply Co, Inc. | 589,311 | 3.9223 | 11/1/2023 | 593,690 | ||||||||||||
| Alpha 3 BV | 150,000 | 4.1496 | 2/1/2024 | 151,054 | ||||||||||||
| Anchor Glass Container Corp. | 244,000 | 8.9076 | 12/8/2024 | 249,338 | ||||||||||||
| Anchor Glass Container Corp. | 185,535 | 4.4121 | 12/8/2024 | 187,321 | ||||||||||||
| Berlin Packaging LLC | 394,576 | 4.6532 | 9/30/2021 | 397,289 | ||||||||||||
| Berry Plastics Group, Inc. | 417,785 | 3.4057 | 1/6/2021 | 420,717 | ||||||||||||
| Berry Plastics Group, Inc. | 371,696 | 3.4057 | 2/8/2020 | 374,340 | ||||||||||||
| Berry Plastics Group, Inc. | 130,000 | 3.6496 | 1/20/2024 | 130,914 | ||||||||||||
| Berry Plastics Group, Inc. | 358,069 | 3.6622 | 9/30/2022 | 360,823 | ||||||||||||
| BWAY Corp. | 490,000 | 4.3998 | 4/4/2024 | 487,680 | ||||||||||||
| CPG International, Inc. | 275,725 | 4.8996 | 9/30/2020 | 277,535 | ||||||||||||
| CPI Acquisition, Inc. | 1,008,336 | 5.6584 | 8/16/2022 | 945,733 | ||||||||||||
| Dubois Chemicals, Inc. | 30,000 | 4.8812 | 3/15/2024 | 30,275 | ||||||||||||
| Dubois Chemicals, Inc. | 125,000 | 4.8812 | 3/16/2024 | 126,146 | ||||||||||||
| Duke Finance LLC | 125,000 | 6.1496 | 2/20/2024 | 126,875 | ||||||||||||
| FMG Resources | 208,172 | 3.9223 | 6/30/2019 | 209,810 | ||||||||||||
| Huntsman International LLC | 591,876 | 4.1723 | 3/31/2023 | 600,387 | ||||||||||||
| Ineos Group Holdings Ltd | 1,209,133 | 3.9223 | 4/1/2022 | 1,221,352 | ||||||||||||
See accompanying notes to financial statements.
7
| SCHEDULE OF INVESTMENTS (Unaudited) |
| Dunham Floating Rate Bond Fund (Continued) |
| April 30, 2017 |
| Principal | Interest | Maturity | ||||||||||||||
| Security | Amount | Rate | Date | Value | ||||||||||||
| MATERIALS- 7.9% (Continued) | ||||||||||||||||
| Ineos US Finance LLC | $ | 104,738 | 3.9223 | % | 3/31/2024 | $ | 105,701 | |||||||||
| Kraton Polymers | 207,981 | 5.1723 | 1/6/2022 | 211,183 | ||||||||||||
| MacDermid, Inc. | 154,689 | 4.6723 | 6/8/2020 | 155,766 | ||||||||||||
| New Arclin US Holdings | 275,000 | 5.3996 | 2/14/2024 | 277,837 | ||||||||||||
| Omnova Solutions, Inc. | 576,105 | 5.4223 | 8/24/2023 | 583,306 | ||||||||||||
| PKC Holding Corp. | 30,000 | 4.6584 | 4/16/2024 | 30,150 | ||||||||||||
| PQ Corp. | 92,304 | 5.4223 | 11/4/2022 | 93,655 | ||||||||||||
| Royal Holdings, Inc. | 257,240 | 4.3996 | 6/20/2022 | 259,892 | ||||||||||||
| Solenis International LP | 346,971 | 4.3142 | 8/1/2021 | 348,742 | ||||||||||||
| Summit Materials | 386,123 | 3.9223 | 7/18/2022 | 390,225 | ||||||||||||
| Tricorbraun, Inc. | 317,386 | 4.8996 | 11/30/2023 | 321,155 | ||||||||||||
| Tricorbraun, Inc. | 31,818 | 4.8040 | 11/30/2023 | 32,196 | ||||||||||||
| Univar, Inc. | 845,099 | 3.9223 | 6/30/2022 | 848,864 | ||||||||||||
| 10,549,951 | ||||||||||||||||
| REAL ESTATE - 2.1% | ||||||||||||||||
| Capital Automotive L.P. | 140,000 | 4.1665 | 3/24/2024 | 141,365 | ||||||||||||
| Capital Automotive L.P. | 390,000 | 7.1665 | 3/24/2025 | 399,506 | ||||||||||||
| Communications Sales & Leasing | 586,836 | 4.1723 | 10/24/2022 | 586,194 | ||||||||||||
| DTZ US Borrower LLC | 589,500 | 4.3500 | 11/4/2021 | 592,899 | ||||||||||||
| ESH Hospitality Inc | 346,374 | 3.6723 | 8/30/2023 | 348,586 | ||||||||||||
| Geo Group, Inc. | 230,000 | 3.4218 | 3/22/2024 | 230,575 | ||||||||||||
| Realogy Group LLC | 453,261 | 3.4196 | 7/20/2022 | 457,510 | ||||||||||||
| 2,756,635 | ||||||||||||||||
| TELECOMMUNICATION SERVICES - 4.9% | ||||||||||||||||
| Aerial Merger Sub, Inc. | 75,000 | 4.3500 | 9/2/2019 | 76,453 | ||||||||||||
| Aerial Merger Sub, Inc. | 235,000 | 4.8500 | 2/29/2024 | 238,624 | ||||||||||||
| Atlice Financinf SA | 420,000 | 3.9062 | 7/16/2025 | 420,420 | ||||||||||||
| Global Tel*Link Corp. | 295,612 | 5.0000 | 5/24/2020 | 296,044 | ||||||||||||
| Level 3 Financing, Inc. | 1,825,000 | 3.4062 | 2/22/2024 | 1,832,820 | ||||||||||||
| Sable International Finance LTD. | 463,000 | 5.9223 | 12/30/2022 | 466,241 | ||||||||||||
| SBA Senior Finance II LLC | 442,512 | 3.4223 | 3/24/2021 | 445,763 | ||||||||||||
| SBA Senior Finance II LLC | 158,183 | 3.4223 | 6/10/2022 | 158,897 | ||||||||||||
| Securus Technologies Holdings | 83,938 | 5.3996 | 4/30/2020 | 84,042 | ||||||||||||
| Securus Technologies Holdings | 139,926 | 4.7500 | 4/30/2020 | 140,101 | ||||||||||||
| Sprint Communications | 460,000 | 3.6723 | 2/2/2024 | 461,079 | ||||||||||||
| UPC Financing Partnership | 1,235,000 | 4.1477 | 4/16/2025 | 1,240,792 | ||||||||||||
| Virgin Media Investment Holdings | 660,000 | 4.1477 | 2/1/2025 | 663,336 | ||||||||||||
| 6,524,612 | ||||||||||||||||
| UTILITIES - 3.0% | ||||||||||||||||
| APLP Holdings LP | 390,883 | 5.3996 | 4/12/2023 | 393,326 | ||||||||||||
| Calpine Construction Finance | 664,321 | 3.4223 | 5/4/2020 | 665,982 | ||||||||||||
| Calpine Corp. | 263,013 | 3.8996 | 6/1/2023 | 264,329 | ||||||||||||
| Dayton Power & Light Co | 93,765 | 4.4223 | 8/24/2022 | 95,113 | ||||||||||||
| Dynergy, Inc. | 671,000 | 4.4076 | 2/8/2024 | 671,631 | ||||||||||||
| Helix Gen Funding LLC | 35,000 | 4.8696 | 3/8/2024 | 35,394 | ||||||||||||
| NRG Energy, Inc. | 960,076 | 3.4223 | 6/30/2023 | 964,978 | ||||||||||||
| Talen Energy Supply LLC | 199,500 | 5.1576 | 7/6/2023 | 198,502 | ||||||||||||
| Talen Energy Supply LLC | 335,000 | 5.0000 | 4/15/2024 | 333,325 | ||||||||||||
| Tex Operations Co. LLC | 53,571 | 3.9223 | 8/4/2023 | 53,520 | ||||||||||||
| Tex Operations Co. LLC | 232,071 | 3.9223 | 8/4/2023 | 231,853 | ||||||||||||
| Texas Comp Elec Hold LLC | 635,000 | 11.5000 | 10/1/2020 | 444 | ||||||||||||
| Vistra Operations Co. | 119,700 | 4.4062 | 12/14/2023 | 120,252 | ||||||||||||
| 4,028,649 | ||||||||||||||||
| TOTAL BANK LOANS (Cost - $117,482,125) | 118,025,142 | |||||||||||||||
| BONDS & NOTES - 6.3% | ||||||||||||||||
| AIRLINES - 0.0% | ||||||||||||||||
| American Airlines Group, Inc. ^ - 144A | 45,000 | 4.6250 | 3/1/2020 | 45,956 | ||||||||||||
| AUTO PARTS & EQUIPMENT - 0.2% | ||||||||||||||||
| Schaeffler Verwaltung Zwei Gmb - 144A | 200,000 | 4.1250 | 9/15/2021 | 203,250 | ||||||||||||
See accompanying notes to financial statements.
8
| SCHEDULE OF INVESTMENTS (Unaudited) |
| Dunham Floating Rate Bond Fund (Continued) |
| April 30, 2017 |
| Principal | Interest | Maturity | ||||||||||||||
| Security | Amount | Rate | Date | Value | ||||||||||||
| BUILDING MATERIALS - 0.1% | ||||||||||||||||
| Standard Industries, Inc. - 144A | $ | 95,000 | 5.5000 | % | 2/15/2023 | $ | 99,038 | |||||||||
| CHEMICALS - 0.2% | ||||||||||||||||
| Hexion US Finance Corp. | 105,000 | 6.6250 | 4/15/2020 | 99,750 | ||||||||||||
| Ineos Group Holdings SA - ^ 144A | 200,000 | 5.6250 | 8/1/2024 | 204,000 | ||||||||||||
| WR Grace & Co-Conn - 144A | 25,000 | 5.1250 | 10/1/2021 | 26,906 | ||||||||||||
| 330,656 | ||||||||||||||||
| COAL - 0.2% | ||||||||||||||||
| Alliance Resource Operating Partners LP - 144A | 257,000 | 7.5000 | 5/1/2025 | 267,601 | ||||||||||||
| Peabody Energy Corp. - 144A | 15,000 | 6.0000 | 3/31/2022 | 15,356 | ||||||||||||
| 282,957 | ||||||||||||||||
| COMPUTERS - 0.5% | ||||||||||||||||
| Diamond 1 Finance Corp. - 144A ^ | 570,000 | 5.4500 | 6/15/2023 | 615,911 | ||||||||||||
| Harland Clarke Holdings Corp. - 144A | 60,000 | 8.3750 | 8/15/2022 | 61,950 | ||||||||||||
| 677,861 | ||||||||||||||||
| DIVERSIFIED FINANANCIAL SERVICES - 0.2% | ||||||||||||||||
| Intl Lease Finance Corp. | 120,000 | 3.8750 | 4/15/2018 | 122,240 | ||||||||||||
| Springleaf Finance Corp. | 170,000 | 5.2500 | 12/15/2019 | 173,011 | ||||||||||||
| 295,251 | ||||||||||||||||
| ELECTRIC - 0.0% | ||||||||||||||||
| Talen Energy Supply LLC - 144A | 18,000 | 5.1250 | 7/15/2019 | 17,775 | ||||||||||||
| ENTERTAINMENT - 0.1% | ||||||||||||||||
| Scientific Games International, Inc. - 144A | 145,000 | 7.0000 | 1/1/2022 | 155,602 | ||||||||||||
| FOOD - 0.1% | ||||||||||||||||
| Dole Food Co., Inc. - 144A | 175,000 | 7.2500 | 6/15/2025 | 182,219 | ||||||||||||
| HEALTHCARE-SERVICES - 0.4% | ||||||||||||||||
| CHS/Community Health Systems, Inc. | 60,000 | 6.2500 | 3/31/2023 | 61,275 | ||||||||||||
| Eagle Holding Co II LLC - 144A | 25,000 | 7.6250 | 5/15/2022 | 25,531 | ||||||||||||
| Surgery Center Holdings, Inc. - 144A | 130,000 | 8.8750 | 4/15/2021 | 138,450 | ||||||||||||
| Tenet Healthcare Corp. | 275,000 | 4.6312 | 6/15/2020 | 277,750 | ||||||||||||
| Tenet Healthcare Corp. | 25,000 | 5.0000 | 3/1/2019 | 25,172 | ||||||||||||
| Tenet Healthcare Corp. | 75,000 | 6.0000 | 10/1/2020 | 79,125 | ||||||||||||
| 607,303 | ||||||||||||||||
| HOLDING COMPANIES - DIVERSIFICATION - 0.1% | ||||||||||||||||
| Argos Merger Sub, Inc. - 144A | 140,000 | 7.1250 | 3/15/2023 | 128,275 | ||||||||||||
| HOME BUILDERS - 0.2% | ||||||||||||||||
| TRI Pointe Holdings, Inc. | 70,000 | 4.3750 | 6/15/2019 | 72,450 | ||||||||||||
| TRI Pointe Group, Inc. | 130,000 | 4.8750 | 7/1/2021 | 135,525 | ||||||||||||
| 207,975 | ||||||||||||||||
| LEISURE TIME - 0.1% | ||||||||||||||||
| NCL Corp. LTD. - 144A | 125,000 | 4.7500 | 12/15/2021 | 128,438 | ||||||||||||
| LODGING - 0.0% | ||||||||||||||||
| Boyd Gaming Corp. | 40,000 | 6.8750 | 5/15/2023 | 43,200 | ||||||||||||
| MACHINERY-DIVERSIFIED - 0.1% | ||||||||||||||||
| CNH Industrial Capital LLC | 95,000 | 4.3750 | 4/5/2022 | 97,095 | ||||||||||||
| MEDIA - 0.7% | ||||||||||||||||
| Cequel Communications Escrow - 144A | 34,000 | 6.3750 | 9/15/2020 | 35,126 | ||||||||||||
| Charter Communications Operating LLC | 225,000 | 4.4640 | 7/23/2022 | 239,226 | ||||||||||||
| iHeartCommunications, Inc. | 95,000 | 9.0000 | 12/15/2019 | 78,731 | ||||||||||||
| SFR Group SA - 144A | 410,000 | 6.0000 | 5/15/2022 | 428,963 | ||||||||||||
| Univision Communications, Inc. - 144A | 200,000 | 5.1250 | 5/15/2023 | 204,000 | ||||||||||||
| 986,046 | ||||||||||||||||
| MINING - 0.1% | ||||||||||||||||
| Vedanta Resources PLC - 144A | 100,000 | 9.5000 | 7/18/2018 | 109,750 | ||||||||||||
See accompanying notes to financial statements.
9
| SCHEDULE OF INVESTMENTS (Unaudited) |
| Dunham Floating Rate Bond Fund (Continued) |
| April 30, 2017 |
| Principal | Interest | Maturity | ||||||||||||||
| Security | Amount | Rate | Date | Value | ||||||||||||
| OIL & GAS - 0.9% | ||||||||||||||||
| Alta Mesa Holdings LP - 144A | $ | 135,000 | 7.8750 | % | 12/15/2024 | $ | 142,425 | |||||||||
| Carrizo Oil & Gas, Inc. ^ | 140,000 | 6.2500 | 4/15/2023 | 141,750 | ||||||||||||
| Chesapeake Energy Corp. ^ | 170,000 | 6.6250 | 8/15/2020 | 172,550 | ||||||||||||
| Denbury Resources, Inc. | 140,000 | 5.5000 | 5/1/2022 | 105,000 | ||||||||||||
| Diamondback Energy, Inc. - 144A | 30,000 | 4.7500 | 11/1/2024 | 30,225 | ||||||||||||
| EP Energy LLC / Everest Acquisition Finance, Inc. - 144A | 160,000 | 8.0000 | 11/29/2024 | 168,200 | ||||||||||||
| FTS International, Inc. | 50,000 | 6.2500 | 5/1/2022 | 43,500 | ||||||||||||
| FTS International, Inc. - 144A | 120,000 | 8.6312 | 6/15/2020 | 121,200 | ||||||||||||
| MEG Energy Corp. - 144A ^ | 115,000 | 6.5000 | 1/15/2025 | 113,994 | ||||||||||||
| Noble Holding International Ltd. | 35,000 | 7.7500 | 1/15/2024 | 32,113 | ||||||||||||
| RSP Permian, Inc. - 144A | 90,000 | 5.2500 | 1/15/2025 | 91,800 | ||||||||||||
| 1,162,757 | ||||||||||||||||
| PACKAGING & CONTAINERS - 0.5% | ||||||||||||||||
| Ardagh Packaging Finance PLC - 144A | 235,000 | 6.0000 | 2/15/2025 | 243,519 | ||||||||||||
| Ardagh Packaging Finance PLC - 144A | 200,000 | 4.2500 | 9/15/2022 | 204,340 | ||||||||||||
| Reynolds Group - 144A | 230,000 | 4.6584 | 7/15/2021 | 235,750 | ||||||||||||
| Reynolds Group | 50,000 | 5.7500 | 10/15/2020 | 51,562 | ||||||||||||
| 735,171 | ||||||||||||||||
| PHARMACEUTICALS - 0.1% | ||||||||||||||||
| Capsugel SA - 144A | 19,000 | 7.0000 | 5/15/2019 | 18,957 | ||||||||||||
| VRX Escrow Corp. - 144A | 70,000 | 5.3750 | 3/15/2020 | 60,287 | ||||||||||||
| 79,244 | ||||||||||||||||
| PRIVATE EQUITY - 0.1% | ||||||||||||||||
| Icahn Enterprises LP - 144A | 60,000 | 6.2500 | 2/1/2022 | 62,550 | ||||||||||||
| REITS - 0.1% | ||||||||||||||||
| IStar Financial, Inc. | 30,000 | 4.8750 | 7/1/2018 | 30,450 | ||||||||||||
| IStar Financial, Inc. | 165,000 | 5.0000 | 7/1/2019 | 167,269 | ||||||||||||
| 197,719 | ||||||||||||||||
| RETAIL - 0.1% | ||||||||||||||||
| Cumberland Farms, Inc. - 144A | 125,000 | 6.7500 | 5/1/2025 | 130,019 | ||||||||||||
| SEMICONDUCTORS - 0.6% | ||||||||||||||||
| Broadcom Corp. - 144A | 355,000 | 2.3750 | 1/15/2020 | 355,455 | ||||||||||||
| Broadcom Corp. - 144A | 160,000 | 3.0000 | 1/15/2022 | 161,438 | ||||||||||||
| NXP Bv - 144A | 200,000 | 4.1250 | 6/1/2021 | 209,750 | ||||||||||||
| 726,643 | ||||||||||||||||
| SOFTWARE - 0.3% | ||||||||||||||||
| First Data Corp. - 144A | 190,000 | 5.3750 | 8/15/2023 | 198,075 | ||||||||||||
| First Data Corp. - 144A | 90,000 | 5.0000 | 1/15/2024 | 92,385 | ||||||||||||
| First Data Corp. - 144A | 25,000 | 5.7500 | 1/15/2024 | 26,031 | ||||||||||||
| 316,491 | ||||||||||||||||
| TELECOMMUNICATIONS - 0.3% | ||||||||||||||||
| Frontier Communications Corp. ^ | 105,000 | 6.2500 | 9/15/2021 | 97,650 | ||||||||||||
| Intelsat Jackson Holdings SA - ^ 144A | 7,000 | 8.0000 | 2/15/2024 | 7,543 | ||||||||||||
| T-Mobile USA, Inc. | 205,000 | 6.0000 | 4/15/2024 | 222,630 | ||||||||||||
| Verizon Communications, Inc. | 78,000 | 3.1250 | 3/16/2022 | 79,248 | ||||||||||||
| 407,071 | ||||||||||||||||
| TOTAL BONDS & NOTES (Cost - $8,317,276) | 8,416,312 | |||||||||||||||
| ASSET BACKED SECURITIES - 1.0% | ||||||||||||||||
| Home Equity Loan Trust 2007-HS | 115,736 | 6.1100 | 6/25/2037 | 116,512 | ||||||||||||
| Morgan Stanley Capital I Trust | 795,775 | 5.8090 | 12/12/2049 | 799,645 | ||||||||||||
| VOLT XXXIII LLC - 144A | 396,150 | 3.5000 | 3/25/2055 | 398,677 | ||||||||||||
| TOTAL ASSET BACKED SECURITIES (Cost - $1,317,514) | 1,314,834 | |||||||||||||||
| PRIVATE PLACEMENTS - 0.2% | ||||||||||||||||
| Wheels Up | 18,704 | 7.5546 | 6/1/2024 | 18,611 | ||||||||||||
| Wheels Up | 251,296 | 5.0000 | 6/1/2024 | 250,039 | ||||||||||||
| TOTAL PRIVATE PLACEMENTS (Cost - 270,970) | 268,650 | |||||||||||||||
See accompanying notes to financial statements.
10
| SCHEDULE OF INVESTMENTS (Unaudited) |
| Dunham Floating Rate Bond Fund (Continued) |
| April 30, 2017 |
| Security | Shares | Value | ||||||||||
| RIGHTS - 0.0% | ||||||||||||
| TRA Rights | 10,588 | $ | 14,294 | |||||||||
| TOTAL RIGHTS (Cost - $17,470) | ||||||||||||
| Interest | ||||||||||||
| SHORT-TERM INVESTMENT - 8.3% | Rate | |||||||||||
| MONEY MARKET FUND - 8.3% | ||||||||||||
| Fidelity Institutional Money Market Funds - Government Portfolio | 11,095,571 | 0.60% | + | 11,095,571 | ||||||||
| TOTAL SHORT-TERM INVESTMENT - (Cost - $11,095,571) | ||||||||||||
| COLLATERAL FOR SECURITIES LOANED - 1.1% | ||||||||||||
| Mount Vernon Prime Portfolio (Cost - $1,493,995) | 1,493,995 | 1.12% | + | 1,493,995 | ||||||||
| TOTAL INVESTMENTS - 106.0% (Cost - $141,434,658) | 142,112,536 | |||||||||||
| LIABILITIES IN EXCESS OF OTHER ASSETS - (6.0)% | (7,939,177 | ) | ||||||||||
| NET ASSETS - 100.0% | $ | 134,173,359 | ||||||||||
REITS - Real Estate Investment Trusts.
144A- Security exempt from registration under Rule 144A of the Securities Act of 1933. These securities may be sold in transactions exempt from registration, normally to qualified institutional buyers.
| ^ | All or a portion of these securities are on loan. Total loaned securities had a value of $957,681 at April 30, 2017. |
| + | Variable rate security. Interest rate is as of April 30, 2017. |
| Portfolio Composition * - (Unaudited) | ||||||||||
| Bank Loans | 83.1 | % | Packaging & Containers | 0.5 | % | |||||
| Short-Term Investment | 7.8 | % | Semiconductors | 0.5 | % | |||||
| Other ** | 1.8 | % | Computers | 0.5 | % | |||||
| Collateral for Securities Loaned | 1.1 | % | Healthcare Services | 0.4 | % | |||||
| Asset Backed Securities | 0.9 | % | Telecommunications | 0.3 | % | |||||
| Exchange Traded Fund | 0.9 | % | Diversified Financial Services | 0.2 | % | |||||
| Oil & Gas | 0.8 | % | Software | 0.2 | % | |||||
| Media | 0.7 | % | Chemicals | 0.2 | % | |||||
| Total | 100.0 | % | ||||||||
| * | Based on total value of investments as of April 30, 2017 |
| ** | Groupings less than 0.20% of holdings. |
Percentage may differ from Schedule of Investments which are based on Fund net assets.
See accompanying notes to financial statements.
11
Dunham Corporate/Government Bond Fund
Message from the Sub-Adviser (Newfleet Asset Management, LLC)
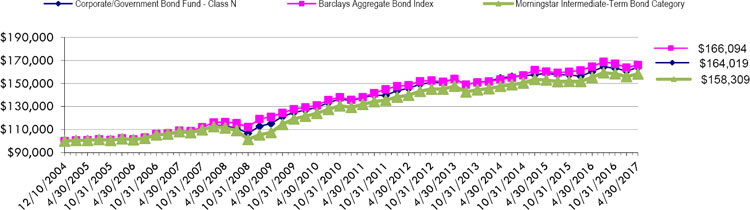
Investment-grade bonds, as measured by the Barclays Aggregate Bond Index, lost 0.7 percent in the six-month period ended April 30, 2017 after a 2.8 percent increase during the previous fiscal six-month period. Treasuries in the middle of the yield curve, as measured by the BofA ML Treasuries 5-7 Years Index, ended the fiscal six-month period down 1.2 percent, while long-term Treasuries, as measured by the BofA ML Treasuries 10+ Years Index, saw a sharp decrease of 4.8 percent over the same six months. Corporate bonds, as measured by the BofA ML U.S. Corporate Bond Master Index, outpaced intermediate-term Treasury bonds, rising 0.3 percent over the fiscal six-month period. High-yield bonds, as measured by the BofA ML High-Yield Bond Cash Pay Index, surged 5.5 percent, outperforming the intermediate-term Treasury bonds by a whopping 6.7 percent during the period.
The Fund continued to balance risk versus reward by choosing to emphasize, relative to the benchmark, lower duration bonds and overweighting lower credit quality securities, in anticipation of rising interest rates. The Fund began the six-month period with an average effective duration of 5.34 years and ended the period with an average effective duration of 5.46 years, while the benchmark index had an average effective duration of 5.59 years and 5.96 years, respectively. This allocation generally benefitted performance of the Fund over the six-month period, as Treasury yields fluctuated in a relatively wide range of 85 basis points. Interest rates on the 10-year U.S. Treasury fluctuated within an 85 basis point range, hitting their low of 1.78 percent a few days prior to the election, undulating throughout the fiscal period until they reached their high of 2.63 percent in mid-March, before settling at 2.28 percent to end the fiscal period. The overweights to corporate high-yield securities and corporate investment-grade securities were the largest contributors to performance over the fiscal quarter. The Sub-Adviser invested roughly 13 percent to the corporate high-yield sector, while the index held less than 1 percent in high-yield securities. The Sub-Adviser invested roughly 30 percent to corporate investment-grade securities, which was nearly 4.5 percent greater than the index’s allocation to that sector.
A contributor to the Fund during the first half of the fiscal six-month period included Scientific Games International, Inc. 6.625% due 5/15/2021 (80874YAQ3) (holding percentage*: 0.11 percent). The company develops and services lottery games and wagering systems. The bonds continued to trade well on solid third calendar quarter 2016 results with revenues up 7.2 percent year-over-year and EBITDA up 2.8 percent year-over-year. The company has deleveraged over 1x over the past year, to 7.5x. The company’s management also continues to note its commitment to reduce debt using cash flow. Most of the strong third calendar quarter 2016 cash flow was used for debt reduction, affirming management’s commitment to deleverage. The bonds gained 14.1 percent over the first half of the fiscal period. The bonds continued to perform well over the second half of the fiscal period, gaining an additional 6.3 percent. A contributor to the Fund during the second half of the fiscal six-month period included Petroleos Mexicanos SA (PEMEX) 6.875% due 8/4/2026 (71654QCB6) (holding percentage*: 0.25 percent). The company provides services for oil and gas exploration and production, offering its services to companies operating throughout Mexico. PEMEX bonds have been lifted by an overall recovery in Mexico sovereign valuations, which reflected the softer trade rhetoric that came from the Trump administration during the fiscal period. In addition, the fourth calendar quarter earnings report was supportive, as the company stated that it is on track with cost reduction efforts in a push to improve efficiency and cash flow. The bonds rose 6.7 percent over the second half of the fiscal period.
A detractor from the Fund during the first half of the fiscal six-month period included Universal Health Services, Inc. 5.000% due 6/1/2026 (913903AT7) (holding percentage**: 0.11 percent), a healthcare management company operating acute care hospitals, behavioral health centers, and surgery centers throughout the United States and Puerto Rico. Buzzfeed published a negative article regarding UHS’s behavioral health practices. The article essentially claimed that the company coded a disproportionately high percentage of patients with suicidal ideation with the implication that they were doing this to enhance admissions. The article also highlighted a handful of cases where patients felt they were wrongly admitted to UHS’s inpatient facilities. Management has strongly denied the claims and defended its positions with a number of metrics. The bonds lost 4.7 percent from the beginning of the fiscal period through December 13, 2016, at which time the Sub-Adviser exited all positions, as it felt the upside/downside was no longer attractive. A detractor from the Fund during the second half of the fiscal six-month period was PetSmart, Inc. 7.125% due 3/15/2023 (04021LAA8) (holding percentage*: 0.16 percent), a specialty retailer of pet services and solutions, operating pet superstores and pet hotels in the United States and Canada, as well as providing pet supplies and products online. The company was caught up in negativity that impacted all retailers in the first calendar quarter. Many investors fear that consumers’ shift to online retail will hurt specialty brick and mortar retailers more than expected. That sentiment resulted in the bonds losing 5.2 percent over the second half of the six-month fiscal period ended April 30, 2017.
The Sub-Adviser remains constructive on markets but believes there are still a number of uncertainties to monitor going forward, including the unfolding of Trump’s economic policies, the strength of the U.S. dollar, and commodities prices. The Sub-Adviser expects U.S. growth in the 2 percent to 2.5 percent range for the year and believes the Fed will remain data dependent but will raise rates two more times this year. The Sub-Adviser believes that housing and consumer fundamentals are still in good shape and feels good about mortgage credit and the Fund’s exposure to ABS. The Sub-Adviser believes global growth will be driven by emerging markets, and expects an improvement in global growth this year after hitting a bottom last year. The Sub-Adviser continues to believe it is important to stay diversified and granular, keeping small positions and maintaining liquidity. The Sub-Adviser has slightly reduced its double-B exposure, opting for a slight increase in single-Bs, and is considering further opportunities in emerging markets debt. The Sub-Adviser believes that the prospect of continued volatility in the bond market will present opportunities and feels they are positioned well to take advantage of those opportunities as they arise.
| * | Holdings percentage(s) as of 4/30/2017. |
Growth of $100,000 Investment
Total Returns as of April 30, 2017
| Annualized | Annualized | Annualized | Annualized Since Inception | |||
| Six Months | One Year | Three Years | Five Years | Ten Years | (12/10/04) | |
| Class N | 0.02% | 2.28% | 1.96% | 2.37% | 4.33% | 4.07% |
| Class C | (0.34)% | 1.47% | 1.19% | 1.60% | 3.55% | 3.30% |
| Class A with load of 4.50% | (4.50)% | (2.50)% | 0.15% | 1.18% | 3.60% | 3.33%* |
| Class A without load | (0.03)% | 2.10% | 1.71% | 2.12% | 4.08% | 3.84%* |
| Barclays Aggregate Bond Index | (0.67)% | 0.83% | 2.66% | 2.27% | 4.30% | 4.18% |
| Morningstar Intermediate-Term Bond Category | (0.13)% | 1.85% | 2.37% | 2.51% | 3.88% | 3.78% |
| * | Class A commenced operations on January 3, 2007. |
The Barclays Aggregate Bond Index is an unmanaged index which represents the U.S. investment-grade fixed-rate bond market (including government and corporate securities, mortgage pass-through securities and asset-backed securities). Investors cannot invest directly in an index or benchmark.
The Morningstar Intermediate-Term Bond Category is generally representative of intermediate-term bond mutual funds that primarily invest in corporate and other investment-grade U.S. fixed-income securities and typically have durations of 3.5 to 6.0 years.
As disclosed in the Trust’s latest registration statement, the Fund’s total annual operating expenses, including underlying funds, are 1.14% for Class N, 1.89% for Class C and 1.39% for Class A. Class A shares are subject to a sales load of 4.50% and a deferred sales charge of up to 0.75%. The performance data quoted here represents past performance, which is not indicative of future results. Current performance may be lower or higher than the performance data quoted. The investment return and NAV will fluctuate, so that an investor’s shares, when redeemed, may be worth more or less than their original cost. Total returns are calculated assuming reinvestment of all dividends and capital gains distributions, if any. The returns do not reflect the deductions of taxes a shareholder would pay on the redemption of fund shares or fund distributions. For performance information current to the most recent month-end, please call 1-800-442-4358 or visit our website www.dunham.com
12
| SCHEDULE OF INVESTMENTS (Unaudited) |
| Dunham Corporate/Government Bond Fund |
| April 30, 2017 |
| Principal | Interest | Maturity | ||||||||||
| Security | Amount | Rate% | Date | Value | ||||||||
| CORPORATE BONDS & NOTES - 56.7% | ||||||||||||
| AEROSPACE / DEFENSE - 0.2% | ||||||||||||
| TransDigm, Inc. | $ | 75,000 | 6.000 | 7/15/2022 | $ | 77,437 | ||||||
| TransDigm, Inc. | 35,000 | 6.500 | 5/15/2025 | 35,875 | ||||||||
| 113,312 | ||||||||||||
| AIRLINES ABS - 0.6% | ||||||||||||
| America West Airlines 2001-1 Pass Through Trust | 68,224 | 7.100 | 4/2/2021 | 74,109 | ||||||||
| United Airlines 2007-1 Pass Through Trust | 229,204 | 6.636 | 7/2/2022 | 247,540 | ||||||||
| 321,649 | ||||||||||||
| AUTO MANUFACTURERS - 1.1% | ||||||||||||
| Daimler Finance LLC - 144A | 165,000 | 2.200 | 10/30/2021 | 162,500 | ||||||||
| Ford Motor Credit Co. LLC. | 270,000 | 5.750 | 2/1/2021 | 297,770 | ||||||||
| General Motors Financial Co., Inc. | 105,000 | 3.500 | 7/10/2019 | 107,640 | ||||||||
| General Motors Financial Co., Inc. | 60,000 | 4.200 | 3/1/2021 | 62,763 | ||||||||
| 630,673 | ||||||||||||
| AUTO PARTS & EQUIPMENT - 0.5% | ||||||||||||
| Cooper Standard Auto - 144A | 110,000 | 5.625 | 11/15/2026 | 111,787 | ||||||||
| Delphi Automotive PLC | 105,000 | 3.150 | 11/19/2020 | 107,264 | ||||||||
| TI Group Automotive Systems, LLC - 144A | 60,000 | 8.750 | 7/15/2023 | 64,500 | ||||||||
| 283,551 | ||||||||||||
| AUTOMOBILE ABS - 5.0% | ||||||||||||
| AmeriCredit Automobile Receivables Trust 2013-5 | 220,000 | 2.860 | 12/9/2019 | 222,401 | ||||||||
| Avis Budget Rental Car Funding AESOP LLC - 144A | 115,000 | 2.970 | 2/20/2020 | 116,720 | ||||||||
| California Republic Auto Receivables Trust 2014-3 A4 | 337,362 | 1.790 | 3/16/2020 | 337,923 | ||||||||
| Centre Point Funding LLC - 144A | 133,103 | 2.610 | 8/20/2021 | 131,258 | ||||||||
| Drive Auto Receivables Trust 2015-A - 144A | 255,000 | 2.560 | 6/15/2020 | 256,481 | ||||||||
| Drive Auto Receivables Trust 2015-D - 144A | 249,913 | 3.060 | 5/17/2021 | 251,405 | ||||||||
| Drive Auto Receivables Trust 2016-B - 144A | 160,000 | 2.980 | 1/18/2022 | 161,320 | ||||||||
| Drive Auto Receivables Trust 2017-A - 144A | 165,000 | 3.380 | 11/15/2021 | 166,768 | ||||||||
| DT Auto Owner Trust 2016-4 - 144A | 195,000 | 2.740 | 10/17/2022 | 195,820 | ||||||||
| Exeter Automobile Recievables Trust 2016-4A C - 144A | 160,000 | 2.82 | 5/16/2022 | 161,300 | ||||||||
| Flagship Credit Auto Trust 2016-1 A - 144A | 97,231 | 2.770 | 12/15/2020 | 97,960 | ||||||||
| Ford Credit Auto Owner Trust 2013-B D | 194,000 | 1.820 | 11/15/2019 | 194,235 | ||||||||
| Santander Drive Auto Receivables Trust 2014-4 | 120,000 | 3.090 | 4/15/2022 | 121,844 | ||||||||
| Santander Drive Auto Receivables Trust 2016-1 | 160,000 | 3.100 | 11/16/2020 | 162,930 | ||||||||
| Westlake Automobile Receivables Trust 2016-3 - 144A | 240,000 | 2.070 | 12/15/2021 | 239,540 | ||||||||
| 2,817,905 | ||||||||||||
| BANKS - 9.0% | ||||||||||||
| Banco de Credito del Peru - 144A | 120,000 | 6.125 | + | 4/24/2027 | 132,600 | |||||||
| Banco de Credito e Inversiones - 144A | 325,000 | 4.000 | 2/11/2023 | 334,786 | ||||||||
| Banco Internacional del Peru SAA -144A | 125,000 | 6.625 | + | 3/19/2029 | 137,187 | |||||||
| Banco Santander Chile - 144A | 150,000 | 3.875 | 9/20/2022 | 156,953 | ||||||||
| Bank of America Corp. | 55,000 | 2.000 | 1/11/2018 | 55,148 | ||||||||
| Bank of America Corp. | 175,000 | 5.625 | 7/1/2020 | 192,342 | ||||||||
| Bank of America Corp. | 286,000 | 4.200 | 8/26/2024 | 294,923 | ||||||||
| Bank of New York Mellon | 135,000 | 2.800 | 5/4/2026 | 131,919 | ||||||||
| Bank of New York Mellon | 110,000 | 4.950 | + | Perpetual | 114,538 | |||||||
| Barclays Bank PLC - 144A | 270,000 | 6.050 | 12/4/2017 | 276,664 | ||||||||
| Capital One Financial Corp. | 135,000 | 4.200 | 10/29/2025 | 136,185 | ||||||||
| Capital One Financial Corp. | 135,000 | 3.750 | 7/28/2026 | 130,527 | ||||||||
| Citigroup, Inc. ^ | 130,000 | 4.050 | 7/30/2022 | 136,277 | ||||||||
| Citigroup, Inc. | 160,000 | 6.250 | + | Perpetual | 174,400 | |||||||
| Goldman Sachs Group, Inc. | 185,000 | 5.750 | 1/24/2022 | 208,939 | ||||||||
| JPMorgan Chase & Co. | 40,000 | 6.125 | 6/27/2017 | 40,274 | ||||||||
| JPMorgan Chase & Co. | 35,000 | 5.300 | + | Perpetual | 36,577 | |||||||
| KeyCorp | 140,000 | 5.000 | + | Perpetual | 140,350 | |||||||
| M&T Bank Corp. | 55,000 | 5.125 | + | Perpetual | 55,688 | |||||||
| Morgan Stanley | 185,000 | 4.100 | 5/22/2023 | 192,291 | ||||||||
| Morgan Stanley | 150,000 | 4.350 | 9/8/2026 | 155,428 | ||||||||
| Morgan Stanley | 225,000 | 6.375 | 7/24/2042 | 292,449 | ||||||||
| PNC Financial Services Group, Inc. | 255,000 | 4.850 | + | Perpetual | 256,147 | |||||||
| PNC Financial Services Group, Inc. | 140,000 | 5.000 | + | Perpetual | 141,740 | |||||||
| Santander Holdings USA, Inc. | 135,000 | 3.700 | 5/24/2019 | 135,985 | ||||||||
| SunTrust Banks, Inc. ^ | 30,000 | 5.625 | + | Perpetual | 31,538 | |||||||
| UBS AG | 650,000 | 7.625 | 8/17/2022 | 760,500 | ||||||||
| Wells Fargo & Co. | 70,000 | 3.069 | 1/24/2023 | 70,849 | ||||||||
See accompanying notes to financial statements.
13
| SCHEDULE OF INVESTMENTS (Unaudited) |
| Dunham Corporate/Government Bond Fund (Continued) |
| April 30, 2017 |
| Principal | Interest | Maturity | ||||||||||
| Security | Amount | Rate% | Date | Value | ||||||||
| BANKS (Continued) - 9.0% | ||||||||||||
| Zions Bancorporation | $ | 115,000 | 4.500 | 6/13/2023 | $ | 121,222 | ||||||
| 5,044,426 | ||||||||||||
| BEVERAGES - 0.4% | ||||||||||||
| Anheuser-Busch InBev Finance, Inc. | 65,000 | 3.3000 | 2/1/2023 | 66,863 | ||||||||
| Anheuser-Busch InBev Finance, Inc. ^ | 135,000 | 3.6500 | 2/1/2026 | 137,820 | ||||||||
| 204,683 | ||||||||||||
| BUILDING MATERIALS - 0.9% | ||||||||||||
| Building Materials Corp. - 144A | 105,000 | 6.000 | 10/15/2025 | 112,613 | ||||||||
| Masco Corp. | 50,000 | 3.500 | 4/1/2021 | 51,500 | ||||||||
| Masco Corp. | 60,000 | 5.950 | 3/15/2022 | 68,120 | ||||||||
| Masco Corp. | 25,000 | 4.450 | 4/1/2025 | 26,709 | ||||||||
| Owens Corning | 135,000 | 3.400 | 8/15/2026 | 131,722 | ||||||||
| Vulcan Materials Co. | 135,000 | 6.000 | 4/1/2027 | 136,625 | ||||||||
| 527,289 | ||||||||||||
| CHEMICALS - 1.0% | ||||||||||||
| Equate Petrochemical BV - 144A | 200,000 | 4.250 | 11/3/2026 | 204,034 | ||||||||
| NewMarket Corp. | 305,000 | 4.100 | 12/15/2022 | 315,600 | ||||||||
| SPCM SA - 144A | 20,000 | 4.875 | 9/15/2025 | 20,275 | ||||||||
| 539,909 | ||||||||||||
| COMMERCIAL MBS - 3.7% | ||||||||||||
| Aventura Mall Trust 2013-AVM A - 144A | 155,000 | 3.743 | + | 12/5/2032 | 164,175 | |||||||
| Aventura Mall Trust 2013-AVM C - 144A | 100,000 | 3.743 | + | 12/5/2032 | 103,403 | |||||||
| BAMLL Commercial Mortgage Securities Trust 2015-200P - 144A | 105,000 | 3.218 | 4/14/2033 | 106,531 | ||||||||
| Citigroup Commercial Mortgage Trust 2008-C7 AM | 95,000 | 6.144 | + | 12/10/2049 | 96,946 | |||||||
| Cold Storage Trust 2017-ICE3 -144A | 160,000 | 1.994 | + | 4/15/2024 | 160,000 | |||||||
| GAHR Commercial Mortgage Trust 2015-NRF CFX - 144A | 105,000 | 3.495 | + | 12/15/2034 | 106,910 | |||||||
| GS Mortgage Securities Corp Trust 2012-ALOHA - 144A | 132,000 | 3.551 | 4/10/2034 | 138,875 | ||||||||
| JP Morgan Chase Commercial Mortgage Securities Trust 2011-C4 A3 - 144A | 100,000 | 4.388 | 7/15/2046 | 107,365 | ||||||||
| JP Morgan Chase Commercial Mortgage Securities Trust 2011-C4 A4 - 144A | 94,155 | 4.106 | 7/15/2046 | 96,338 | ||||||||
| LB Commercial Mortgage Trust 2007- C3 A4 | 73,117 | 6.012 | + | 7/15/2044 | 73,322 | |||||||
| LB-UBS Commercial Mortgage Trust 2007-C7 A3 | 46,563 | 5.866 | + | 9/15/2045 | 47,121 | |||||||
| Morgan Stanley Bank of America Merrill Lynch Trust 2013-C13 AS | 240,000 | 4.266 | 11/15/2046 | 256,533 | ||||||||
| Morgan Stanley Capital Barclays Bank Trust 2016-MART - 144A | 110,000 | 2.200 | 9/13/2031 | 108,741 | ||||||||
| Morgan Stanley Capital I Trust 2007-IQ14 AM | 83,396 | 5.744 | + | 4/15/2049 | 83,302 | |||||||
| Motel 6 Trust CMO 2015-MTL6 Class B - 144A | 170,000 | 3.298 | 2/5/2030 | 170,758 | ||||||||
| One Market Plaza Trust 2017-1MKT - 144A | 105,000 | 3.614 | 2/10/2032 | 109,690 | ||||||||
| Wells Fargo Commercial Mortgage Trust 2015-LC20 B | 165,000 | 3.719 | 4/15/2050 | 166,323 | ||||||||
| 2,096,333 | ||||||||||||
| COMMERCIAL SERVICES - 0.7% | ||||||||||||
| Prime Security Services Borrower LLC - 144A | 55,000 | 9.250 | 5/15/2023 | 60,225 | ||||||||
| S&P Global, Inc. | 140,000 | 4.000 | 6/15/2025 | 147,137 | ||||||||
| Team Health Holdings, Inc. - 144A | 70,000 | 6.375 | 2/1/2025 | 68,513 | ||||||||
| Verisk Analytics, Inc. | 135,000 | 4.000 | 6/15/2025 | 138,330 | ||||||||
| 414,205 | ||||||||||||
| COMPUTERS - 0.9% | ||||||||||||
| Apple, Inc. | 125,000 | 3.250 | 2/23/2026 | 127,794 | ||||||||
| Diamond 1 Finance Corp. - 144A ^ | 30,000 | 5.450 | 6/15/2023 | 32,416 | ||||||||
| Diamond 1 Finance Corp. - 144A | 25,000 | 6.020 | 6/15/2026 | 27,506 | ||||||||
| Diamond 1 Finance Corp. - 144A | 55,000 | 8.100 | 7/15/2036 | 69,205 | ||||||||
| DXC Technology Co. - 144A | 35,000 | 4.250 | 4/15/2024 | 35,914 | ||||||||
| Harland Clarke Holdings Corp. - 144A | 30,000 | 8.375 | 8/15/2022 | 30,975 | ||||||||
| Hewlett Packard Enterprise Co. | 80,000 | 3.600 | 10/15/2020 | 82,758 | ||||||||
| Hewlett Packard Enterprise Co. | 80,000 | 4.900 | 10/15/2025 | 84,202 | ||||||||
| 490,770 | ||||||||||||
| DIVERSIFIED FINANCIAL SERVICES - 1.2% | ||||||||||||
| Air Lease Corp. | 140,000 | 2.625 | 9/4/2018 | 141,090 | ||||||||
| Brookfield Finance LLC | 114,000 | 4.000 | 4/1/2024 | 117,098 | ||||||||
| Jefferies Group LLC | 60,000 | 5.125 | 1/20/2023 | 64,859 | ||||||||
| Macquarie Group Ltd.- 144A | 125,000 | 6.250 | 1/14/2021 | 139,409 | ||||||||
| Navient Corp. | 62,000 | 6.500 | 6/15/2022 | 64,170 | ||||||||
| Navient Corp. | 30,000 | 7.250 | 9/25/2023 | 31,500 | ||||||||
| OM Asset Management Plc | 135,000 | 4.800 | 7/27/2026 | 136,098 | ||||||||
| 694,224 | ||||||||||||
See accompanying notes to financial statements.
14
| SCHEDULE OF INVESTMENTS (Unaudited) |
| Dunham Corporate/Government Bond Fund (Continued) |
| April 30, 2017 |
| Principal | Interest | Maturity | ||||||||||
| Security | Amount | Rate% | Date | Value | ||||||||
| ELECTRIC - 0.6% | ||||||||||||
| Dominion Resources, Inc. | $ | 15,000 | 2.962 | 7/1/2019 | $ | 15,216 | ||||||
| Duke Energy Corp. | 140,000 | 2.650 | 9/1/2026 | 132,551 | ||||||||
| Southern Power Co. | 170,000 | 4.150 | 12/1/2025 | 177,896 | ||||||||
| 325,663 | ||||||||||||
| ELECTRONICS - 0.3% | ||||||||||||
| Flextronics International Ltd. | 135,000 | 4.750 | 6/15/2025 | 143,605 | ||||||||
| ENERGY - ALTERNATE RESOURCES - 0.2% | ||||||||||||
| TerraForm Power Operating LLC. - 144A | 110,000 | 6.375 | 2/1/2023 | 114,263 | ||||||||
| ENTERTAINMENT - 0.3% | ||||||||||||
| Eldorado Resorts, Inc. - 144A | 15,000 | 6.000 | 4/1/2025 | 15,563 | ||||||||
| Gateway Casinos & Entertainment Ltd. - 144A | 45,000 | 8.250 | 3/1/2024 | 46,125 | ||||||||
| Pinnacle Entertainment, Inc. - 144A | 40,000 | 5.625 | 5/1/2024 | 41,400 | ||||||||
| Scientific Games International, Inc. | 65,000 | 6.625 | 5/15/2021 | 62,968 | ||||||||
| Scientific Games International, Inc. - 144A | 10,000 | 7.000 | 1/1/2022 | 10,731 | ||||||||
| 176,787 | ||||||||||||
| FOOD - 0.5% | ||||||||||||
| Post Holdings, Inc. - 144A | 65,000 | 5.750 | 3/1/2027 | 67,844 | ||||||||
| Safeway, Inc. | 85,000 | 7.250 | 2/1/2031 | 82,663 | ||||||||
| Smithfield Foods, Inc. - 144A | 36,000 | 4.250 | 2/1/2027 | 36,807 | ||||||||
| Whole Foods Market, Inc. ^ | 110,000 | 5.200 | 12/3/2025 | 115,455 | ||||||||
| 302,769 | ||||||||||||
| GAS - 0.2% | ||||||||||||
| NGL Energy Partners LP | 105,000 | 5.125 | 7/15/2019 | 105,263 | ||||||||
| HEALTHCARE PRODUCTS - 0.5% | ||||||||||||
| Abbott Laboratories | 30,000 | 3.400 | 11/30/2023 | 30,481 | ||||||||
| Abbott Laboratories | 110,000 | 3.750 | 11/30/2026 | 111,569 | ||||||||
| Fresenius US Finance II, Inc. - 144A | 80,000 | 6.625 | 5/15/2022 | 74,000 | ||||||||
| Fresenius US Finance II, Inc. - 144A | 25,000 | 4.500 | 1/15/2023 | 25,875 | ||||||||
| Hill-Rom Holdings, Inc. - 144A | 63,000 | 5.000 | 2/15/2025 | 63,945 | ||||||||
| 305,870 | ||||||||||||
| HEALTHCARE - SERVICES - 1.2% | ||||||||||||
| CHS/Community Health Systems, Inc. ^ | 30,000 | 5.125 | 8/1/2021 | 29,850 | ||||||||
| CHS/Community Health Systems, Inc. | 25,000 | 6.250 | 3/31/2023 | 25,531 | ||||||||
| Envision Healthcare Corp. - 144A | 25,000 | 6.250 | 12/1/2024 | 26,375 | ||||||||
| HCA, Inc. | 85,000 | 5.375 | 2/1/2025 | 88,719 | ||||||||
| HCA, Inc. | 50,000 | 5.250 | 6/15/2026 | 53,438 | ||||||||
| IASIS Healthcare LLC / IASIS Capital Corp. | 70,000 | 8.375 | 5/15/2019 | 68,600 | ||||||||
| MEDNAX, Inc. - 144A | 65,000 | 5.250 | 12/1/2023 | 66,625 | ||||||||
| Surgery Center Holdings, Inc. - 144A | 80,000 | 8.875 | 4/15/2021 | 85,200 | ||||||||
| Surgical Care Affiliates, Inc. - 144A | 110,000 | 6.000 | 4/1/2023 | 119,251 | ||||||||
| Tenet Healthcare Corp. | 130,000 | 4.631 | + | 6/15/2020 | 131,300 | |||||||
| 694,889 | ||||||||||||
| HOLDING COMPANIES - DIVERSIFIED - 0.5% | ||||||||||||
| Hutchison Whampoa International 12 Ltd. - 144A | 185,000 | 6.000 | + | Perpetual | 185,189 | |||||||
| Leucadia National Corp. | 105,000 | 5.500 | 10/18/2023 | 113,227 | ||||||||
| 298,416 | ||||||||||||
| HOME BUILDERS - 1.2% | ||||||||||||
| CalAtlantic Group, Inc. | 115,000 | 5.250 | 6/1/2026 | 118,594 | ||||||||
| DR Horton, Inc. | 165,000 | 4.750 | 2/15/2023 | 177,912 | ||||||||
| M/I Homes, Inc. | 70,000 | 6.750 | 1/15/2021 | 73,675 | ||||||||
| MDC Holdings, Inc. | 130,000 | 5.500 | 1/15/2024 | 135,811 | ||||||||
| Taylor Morrison Communities, Inc. - 144A | 20,000 | 5.625 | 3/1/2024 | 21,250 | ||||||||
| TRI Pointe Holdings, Inc. | 130,000 | 5.875 | 6/15/2024 | 137,475 | ||||||||
| 664,717 | ||||||||||||
| HOME EQUITY ABS - 1.4% | ||||||||||||
| Bayview Financial Mortgage Pass-Through Trust 2006-A 1A4 (a) | 427,345 | 6.087 | 2/28/2041 | 431,900 | ||||||||
| GSAA Trust 2005-1 AF4 (a) | 209,500 | 5.619 | 11/25/2034 | 215,736 | ||||||||
| NovaStar Mortgage Funding Trust Series 2004-4 | 140,000 | 2.716 | + | 3/25/2035 | 137,463 | |||||||
| 785,099 | ||||||||||||
See accompanying notes to financial statements.
15
| SCHEDULE OF INVESTMENTS (Unaudited) |
| Dunham Corporate/Government Bond Fund (Continued) |
| April 30, 2017 |
| Principal | Interest | Maturity | ||||||||||
| Security | Amount | Rate% | Date | Value | ||||||||
| INSURANCE - 1.3% | ||||||||||||
| Allstate Corp. | $ | 125,000 | 5.750 | + | 8/15/2053 | $ | 136,172 | |||||
| Berkshire Hathaway, Inc. ^ | 30,000 | 3.125 | 3/15/2023 | 30,291 | ||||||||
| Manulife Financial Corp. | 130,000 | 4.150 | 3/4/2026 | 137,962 | ||||||||
| Prudential Financial, Inc. | 245,000 | 5.625 | + | 6/15/2043 | 267,662 | |||||||
| Teachers Insurance & Annuity Association of America - 144A | 110,000 | 4.375 | + | 9/15/2054 | 111,512 | |||||||
| Trinity Acquisition PLC | 10,000 | 3.500 | 9/15/2021 | 10,221 | ||||||||
| Trinity Acquisition PLC | 50,000 | 4.400 | 3/15/2026 | 51,857 | ||||||||
| 745,677 | ||||||||||||
| INTERNET - 0.4% | ||||||||||||
| Priceline Group, Inc. | 140,000 | 3.650 | 3/15/2025 | 143,015 | ||||||||
| Zayo Group LLC | 55,000 | 6.375 | 5/15/2025 | 59,675 | ||||||||
| Zayo Group LLC - 144A | 35,000 | 5.750 | 1/15/2027 | 37,231 | ||||||||
| 239,921 | ||||||||||||
| INVESTMENT COMPANIES - 0.4% | ||||||||||||
| Ares Capital Corp. | 18,000 | 4.875 | 11/30/2018 | 18,618 | ||||||||
| Ares Capital Corp. | 49,000 | 3.875 | 1/15/2020 | 50,127 | ||||||||
| FS Investment Corp. | 110,000 | 4.250 | 1/15/2020 | 112,417 | ||||||||
| FS Investment Corp. | 40,000 | 4.750 | 5/15/2022 | 41,128 | ||||||||
| 222,290 | ||||||||||||
| IRON / STEEL - 0.6% | ||||||||||||
| Carpenter Technology Corp. | 300,000 | 4.450 | 3/1/2023 | 306,754 | ||||||||
| LEISURE TIME - 0.2% | ||||||||||||
| NCL Corp. Ltd. | 80,000 | 4.750 | 12/15/2021 | 82,200 | ||||||||
| LODGING - 0.5% | ||||||||||||
| Caesars Growth Properties Holdings LLC | 45,000 | 9.375 | 5/1/2022 | 48,544 | ||||||||
| Diamond Resorts International, Inc. | 10,000 | 7.750 | 9/1/2023 | 10,700 | ||||||||
| Hilton Worldwide Finance LLC | 30,000 | 4.875 | 4/1/2027 | 30,825 | ||||||||
| Wyndham Worldwide Corp. | 145,000 | 5.100 | 10/1/2025 | 156,205 | ||||||||
| Wyndham Worldwide Corp. | 35,000 | 4.500 | 4/1/2027 | 35,778 | ||||||||
| 282,052 | ||||||||||||
| MEDIA - 0.8% | ||||||||||||
| Cequel Communications Holdings I LLC / Cequel Capital Corp. - 144A | 35,000 | 5.125 | 12/15/2021 | 35,963 | ||||||||
| Cequel Communications Holdings I LLC / Cequel Capital Corp. - 144A | 70,000 | 5.125 | 12/15/2021 | 71,925 | ||||||||
| Clear Channel Worldwide Holdings, Inc. | 135,000 | 7.625 | 3/15/2020 | 137,025 | ||||||||
| Radiate Holdco LLC / Radiate Finance, Inc. - 144A | 70,000 | 6.625 | 2/15/2025 | 70,000 | ||||||||
| Sirius XM Radio, Inc. - 144A | 105,000 | 5.375 | 7/15/2026 | 107,756 | ||||||||
| 422,669 | ||||||||||||
| METAL FABRICATE - 0.2% | ||||||||||||
| Novelis Corp. - 144A | 5,000 | 6.250 | 8/15/2024 | 5,275 | ||||||||
| Novelis Corp. - 144A | 110,000 | 5.875 | 9/30/2026 | 113,300 | ||||||||
| 118,575 | ||||||||||||
| MINING - 0.2% | ||||||||||||
| Glencore Funding LLC | 135,000 | 4.000 | 3/27/2027 | 134,665 | ||||||||
| MISCELLANEOUS MANUFACTURING - 0.6% | ||||||||||||
| General Electric Co. | 341,000 | 5.000 | + | Perpetual | 360,096 | |||||||
| OFFICE / BUSINESS EQUIPMENT - 0.0% | ||||||||||||
| CDW Finance Corp. | 20000 | 5.000 | 9/1/2025 | 20,600 | ||||||||
| OIL & GAS - 1.6% | ||||||||||||
| Alta Mesa Holdings LP / Alta Mesa Finance Services Corp. - 144A | 55,000 | 7.875 | 12/15/2024 | 58,025 | ||||||||
| Antero Resources Corp. | 60,000 | 5.625 | 6/1/2023 | 62,025 | ||||||||
| Covey Park Energy LLC / Covey Park Finance Corp. - 144A | 25,000 | 7.500 | 5/15/2025 | 25,000 | ||||||||
| EP Energy LLC / Everest Acquisition Finance, Inc. | 15,000 | 8.000 | 11/29/2024 | 15,769 | ||||||||
| Helmerich & Payne International Drilling Co. | 80,000 | 4.650 | 3/15/2025 | 84,091 | ||||||||
| Holly Frontier Corp. | 135,000 | 5.875 | 4/1/2026 | 144,188 | ||||||||
| Matador Resources Co. - 144A | 85,000 | 6.875 | 4/15/2023 | 90,100 | ||||||||
| Noble Holding International Ltd. | 65,000 | 7.750 | 1/15/2024 | 59,638 | ||||||||
| Petroleos Mexicanos - 144A | 125,000 | 6.875 | 8/4/2026 | 140,000 | ||||||||
| QEP Resources, Inc. | 40,000 | 5.250 | 5/1/2023 | 39,300 | ||||||||
| Sunoco Finance Corp. ^ | 75,000 | 6.375 | 4/1/2023 | 80,250 | ||||||||
| Transocean, Inc. - 144A | 75,000 | 9.000 | 7/15/2023 | 80,344 | ||||||||
| 878,730 | ||||||||||||
See accompanying notes to financial statements.
16
| SCHEDULE OF INVESTMENTS (Unaudited) |
| Dunham Corporate/Government Bond Fund (Continued) |
| April 30, 2017 |
| Principal | Interest | Maturity | ||||||||||
| Security | Amount | Rate% | Date | Value | ||||||||
| PACKAGING & CONTAINERS - 0.4% | ||||||||||||
| Ardagh Packaging Finance PLC / Ardagh Holdings USA, Inc. - 144A | $ | 200,000 | 6.000 | 2/15/2025 | $ | 207,250 | ||||||
| Silgan Holdings, Inc. - 144A | 25,000 | 4.7500 | 3/15/2025 | 25,281 | ||||||||
| 232,531 | ||||||||||||
| PHARMACEUTICALS - 0.9% | ||||||||||||
| AbbVie, Inc. | 80,000 | 2.850 | 5/14/2023 | 79,428 | ||||||||
| AbbVie, Inc. | 45,000 | 3.600 | 5/14/2025 | 45,460 | ||||||||
| AbbVie, Inc. ^ | 80,000 | 3.200 | 5/14/2026 | 78,115 | ||||||||
| Mylan NV - 144A | 35,000 | 3.000 | 12/15/2018 | 35,500 | ||||||||
| Mylan NV - 144A | 35,000 | 3.150 | 6/15/2021 | 35,362 | ||||||||
| Owens & Minor, Inc. | 25,000 | 3.875 | 9/15/2021 | 25,616 | ||||||||
| Shire Acquisitions Investments Ireland DAC | 60,000 | 2.400 | 9/23/2021 | 59,324 | ||||||||
| Teva Pharmaceutical Finance Netherlands III BV ^ | 80,000 | 3.150 | 10/1/2026 | 74,637 | ||||||||
| Valeant Pharmaceuticals International, Inc. - 144A | 10,000 | 6.500 | 3/15/2022 | 10,263 | ||||||||
| Valeant Pharmaceuticals International, Inc. - 144A | 40,000 | 5.500 | 3/1/2023 | 29,500 | ||||||||
| Valeant Pharmaceuticals International, Inc. - 144A | 15,000 | 7.000 | 3/15/2024 | 15,338 | ||||||||
| Zoetis, Inc. | 35,000 | 3.450 | 11/13/2020 | 35,998 | ||||||||
| 524,541 | ||||||||||||
| PIPELINES - 1.4% | ||||||||||||
| Blue Racer Midstream LLC - 144A | 30,000 | 6.125 | 11/15/2022 | 30,900 | ||||||||
| Crestwood Midstream Partners LP / Crestwood Midstream Finance Corp. - 144A | 95,000 | 5.750 | 4/1/2025 | 98,800 | ||||||||
| Energy Transfer LP | 135,000 | 4.200 | 4/15/2027 | 136,193 | ||||||||
| Holly Energy Partners LP - 144A | 10,000 | 6.000 | 8/1/2024 | 10,625 | ||||||||
| Kinder Morgan, Inc. ^ | 130,000 | 4.300 | 6/1/2025 | 135,638 | ||||||||
| Kinder Morgan, Inc. | 45,000 | 7.750 | 1/15/2032 | 57,442 | ||||||||
| MPLX LP | 110,000 | 4.875 | 12/1/2024 | 117,806 | ||||||||
| NuStar Logistics LP | 45,000 | 5.625 | 4/28/2027 | 46,520 | ||||||||
| Sabine Pass Liquefaction LLC ^ | 100,000 | 6.250 | 3/15/2022 | 112,254 | ||||||||
| Sabine Pass Liquefaction LLC | 25,000 | 4.200 | 3/15/2028 | 25,085 | ||||||||
| Summit Midstream Holdings LLC / Summit Midstream Finance Corp. | 20,000 | 5.750 | 4/15/2025 | 20,350 | ||||||||
| 791,613 | ||||||||||||
| PRIVATE EQUITY - 0.4% | ||||||||||||
| Apollo Management Holdings LP - 144A | 135,000 | 4.000 | 5/30/2024 | 136,309 | ||||||||
| Icahn Enterprises Finance Corp. | 45,000 | 5.875 | 2/1/2022 | 46,519 | ||||||||
| Icahn Enterprises Finance Corp. - 144A | 25,000 | 6.250 | 2/1/2022 | 26,062 | ||||||||
| 208,890 | ||||||||||||
| REAL ESTATE - 1.6% | ||||||||||||
| American Homes 4 Rent 2014-SFR2 C Trust - 144A | 130,000 | 4.705 | 10/17/2036 | 137,772 | ||||||||
| American Homes 4 Rent 2015-SFR2 C Trust - 144A | 120,000 | 4.691 | 10/17/2045 | 127,395 | ||||||||
| Bayview Opportunity Master Fund IVa Trust 2017-SPL1 - 144A | 100,000 | 4.250 | 10/28/2064 | 103,027 | ||||||||
| CWABS Asset-Backed Certificates 2005-1 AF5A (a) | 223,278 | 5.102 | 7/25/2035 | 232,751 | ||||||||
| MVW Owner Trust 2016-1 - 144A | 144,718 | 2.250 | 12/20/2033 | 143,092 | ||||||||
| Sierra Timeshare 2014-2A A Receivables Funding LLC - 144A | 22,137 | 2.050 | 6/20/2031 | 22,025 | ||||||||
| TGIF Funding LLC 2017-1A - 144A | 135,000 | 6.202 | 4/30/2047 | 133,368 | ||||||||
| 899,430 | ||||||||||||
| REITS - 5.2% | ||||||||||||
| Alexandria Real Estate Equities, Inc. | 80,000 | 3.950 | 1/15/2027 | 81,001 | ||||||||
| Brixmor Operating Partnership LP | 35,000 | 3.875 | 8/15/2022 | 35,997 | ||||||||
| Communications Sales & Leasing, Inc. / CSL Capital LLC - 144A | 110,000 | 7.125 | 12/15/2024 | 112,750 | ||||||||
| Corporate Office Properties LP | 90,000 | 3.700 | 6/15/2021 | 92,075 | ||||||||
| Corporate Office Properties LP | 315,000 | 3.600 | 5/15/2023 | 311,164 | ||||||||
| CoreCivic, Inc. | 90,000 | 5.000 | 10/15/2022 | 93,600 | ||||||||
| CyrusOne LP / CyrusOne Finance Corp. - 144A | 30,000 | 5.375 | 3/15/2027 | 30,975 | ||||||||
| Digital Realty Trust LP | 160,000 | 5.250 | 3/15/2021 | 174,110 | ||||||||
| Digital Realty Trust LP | 55,000 | 3.950 | 7/1/2022 | 57,574 | ||||||||
| Education Realty Operating Partnership LP | 135,000 | 4.600 | 12/1/2024 | 137,581 | ||||||||
| EPR Properties | 180,000 | 4.750 | 12/15/2026 | 184,381 | ||||||||
| Healthcare Realty Trust, Inc. | 90,000 | 3.875 | 5/1/2025 | 89,918 | ||||||||
| Healthcare Trust of America Holdings LP | 50,000 | 3.375 | 7/15/2021 | 51,183 | ||||||||
| Highwoods Realty LP | 150,000 | 3.625 | 1/15/2023 | 152,297 | ||||||||
| Hospitality Properties Trust | 165,000 | 4.950 | 2/15/2027 | 172,186 | ||||||||
| iStar Financial, Inc. | 140,000 | 5.000 | 7/1/2019 | 141,925 | ||||||||
| Kilroy Realty LP | 135,000 | 4.375 | 10/1/2025 | 142,170 | ||||||||
See accompanying notes to financial statements.
17
| SCHEDULE OF INVESTMENTS (Unaudited) |
| Dunham Corporate/Government Bond Fund (Continued) |
| April 30, 2017 |
| Principal | Interest | Maturity | ||||||||||
| Security | Amount | Rate% | Date | Value | ||||||||
| REITS (Continued) - 5.2% | ||||||||||||
| Kimco Realty Corp. | $ | 135,000 | 3.400 | 11/1/2022 | $ | 137,606 | ||||||
| LifeStorage LP/CA | 80,000 | 3.500 | 7/1/2026 | 77,105 | ||||||||
| MPT Operating Partnership LP / MPT Finance Corp. | 15,000 | 6.375 | 3/1/2024 | 16,313 | ||||||||
| MPT Operating Partnership LP / MPT Finance Corp. | 60,000 | 5.500 | 5/1/2024 | 63,450 | ||||||||
| National Retail Properties, Inc. | 40,000 | 4.000 | 11/15/2025 | 41,143 | ||||||||
| Retail Opportunity Investments Partnership LP | 105,000 | 4.000 | 12/15/2024 | 101,797 | ||||||||
| Select Income REIT | 140,000 | 4.500 | 2/1/2025 | 141,730 | ||||||||
| Starwood Property Trust, Inc. - 144A | 15,000 | 5.000 | 12/15/2021 | 15,675 | ||||||||
| Welltower, Inc. | 145,000 | 4.000 | 6/1/2025 | 149,037 | ||||||||
| WP Carey, Inc. | 110,000 | 4.600 | 4/1/2024 | 114,888 | ||||||||
| 2,919,631 | ||||||||||||
| RETAIL - 1.5% | ||||||||||||
| CVS Health Corp. ^ | 165,000 | 2.875 | 6/1/2026 | 159,413 | ||||||||
| Landry’s, Inc. - 144A | 35,000 | 6.750 | 10/15/2024 | 36,750 | ||||||||
| PetSmart, Inc. - 144A | 100,000 | 7.125 | 3/15/2023 | 91,625 | ||||||||
| QVC, Inc. | 310,000 | 4.375 | 3/15/2023 | 312,386 | ||||||||
| Signet UK Finance PLC | 135,000 | 4.700 | 6/15/2024 | 133,561 | ||||||||
| Tops Holding LLC / Tops Markets II Corp. - 144A | 110,000 | 8.000 | 6/15/2022 | 96,800 | ||||||||
| 830,535 | ||||||||||||
| SEMICONDUCTORS - 0.6% | ||||||||||||
| Applied Materials, Inc. | 135,000 | 3.300 | 4/1/2027 | 137,371 | ||||||||
| Broadcom Corp. / Broadcom Cayman Finance Ltd. - 144A | 60,000 | 3.000 | 1/15/2022 | 60,539 | ||||||||
| Broadcom Corp. / Broadcom Cayman Finance Ltd. - 144A | 110,000 | 3.625 | 1/15/2024 | 111,761 | ||||||||
| 309,671 | ||||||||||||
| SOFTWARE - 0.5% | ||||||||||||
| First Data Corp. - 144A | 105,000 | 5.000 | 1/15/2024 | 107,783 | ||||||||
| Microsoft Corp. | 160,000 | 3.300 | 2/6/2027 | 164,594 | ||||||||
| Oracle Corp. | 15,000 | 2.400 | 9/15/2023 | 14,802 | ||||||||
| 287,179 | ||||||||||||
| STUDENT LOAN ABS - 0.4% | ||||||||||||
| SoFi Professional Loan Program 2016-C LLC - 144A | 205,000 | 2.360 | 12/27/2032 | 203,514 | ||||||||
| TELECOMMUNICATIONS - 1.5% | ||||||||||||
| AT&T, Inc. | 315,000 | 3.875 | 8/15/2021 | 329,310 | ||||||||
| CommScope Technologies LLC - 144A | 20,000 | 5.000 | 3/15/2027 | 20,225 | ||||||||
| Frontier Communications Corp. | 95,000 | 10.500 | 9/15/2022 | 95,950 | ||||||||
| Telefonica Emisiones SAU | 265,000 | 4.570 | 4/27/2023 | 286,229 | ||||||||
| T-Mobile USA, Inc. | 80,000 | 6.375 | 3/1/2025 | 87,626 | ||||||||
| 819,340 | ||||||||||||
| TRUCKING & LEASING - 0.3% | ||||||||||||
| GATX Corp. | 25,000 | 3.250 | 9/15/2026 | 24,061 | ||||||||
| Park Aerospace Holdings Ltd. - 144A | 65,000 | 5.500 | 2/15/2024 | 68,900 | ||||||||
| Penske Truck Leasing Co. LP - 144A | 55,000 | 3.375 | 2/1/2022 | 56,293 | ||||||||
| 149,254 | ||||||||||||
| WHOLE LOAN COLLATERAL CMO - 3.1% | ||||||||||||
| Agate Bay Mortgage Trust 2013-1 - 144A | 152,488 | 3.500 | + | 7/25/2043 | 154,735 | |||||||
| Banc of America Funding 2005-1 1A1 | 57,023 | 5.500 | 2/25/2035 | 57,180 | ||||||||
| Chase Mortgage Trust 2016-2 - 144A | 104,612 | 3.750 | + | 12/25/2045 | 105,879 | |||||||
| Citigroup Mortgage Loan Trust, Inc. 2004-NCM2 2CB2 | 65,505 | 2.967 | + | 8/25/2034 | 65,838 | |||||||
| Citigroup Mortgage Loan Trust, Inc. 2004-UST1 A3 | 60,121 | 6.750 | 8/25/2034 | 64,890 | ||||||||
| JP Morgan Mortgage Trust 2015-4 1A4 - 144A | 75,387 | 3.500 | + | 6/25/2045 | 76,710 | |||||||
| JP Morgan Mortgage Trust 2016-1 - 144A | 174,288 | 3.500 | 5/25/2046 | 177,347 | ||||||||
| JP Morgan Mortgage Trust - 144A | 205,055 | 2.605 | + | 12/25/2046 | 205,195 | |||||||
| MASTR Alternative Loans Trust 2004-4 6A1 | 73,446 | 5.500 | 4/25/2034 | 76,309 | ||||||||
| Residential Asset Securitization Trust 2005-A1 | 96,242 | 5.500 | 4/25/2035 | 96,944 | ||||||||
| Structured Adjustable Rate Mortgage Loan Trust 2004-4 3A2 | 129,753 | 3.447 | + | 4/25/2034 | 128,991 | |||||||
| Towd Point Mortgage Trust 2015-1 - 144A | 190,000 | 3.250 | + | 11/25/2060 | 189,029 | |||||||
| Towd Point Mortgage Trust 2015-3 - 144A | 114,479 | 3.000 | + | 3/25/2054 | 115,814 | |||||||
| Towd Point Mortgage Trust 2015-6 - 144A | 130,000 | 3.750 | + | 4/25/2055 | 130,016 | |||||||
| Towd Point Mortgage Trust 2016-2 - 144A | 85,404 | 3.000 | + | 8/25/2055 | 86,373 | |||||||
| WaMu Mortgage Pass-Through Certificates Series 2003-S8 A2 Trust | 25,085 | 5.000 | 9/25/2018 | 25,250 | ||||||||
| 1,756,500 | ||||||||||||
| TOTAL CORPORATE BONDS & NOTES (Cost - $31,110,615) | 31,843,128 | |||||||||||
See accompanying notes to financial statements.
18
| SCHEDULE OF INVESTMENTS (Unaudited) |
| Dunham Corporate/Government Bond Fund (Continued) |
| April 30, 2017 |
| Principal | Interest | Maturity | ||||||||||
| Security | Amount | Rate% | Date | Value | ||||||||
| FOREIGN GOVERNMENT BONDS - 0.5% | ||||||||||||
| Argentine Republic Government International Bond - 144A | $ | 130,000 | 6.875 | 1/26/2027 | $ | 160,050 | ||||||
| Argentine Republic Government International Bond - 144A | 150,000 | 7.625 | 4/22/2046 | 137,670 | ||||||||
| TOTAL FOREIGN GOVERNMENT BONDS - (Cost - $272,477) | 297,720 | |||||||||||
| MUNICIPAL - 3.5% | ||||||||||||
| New York City Transitional Finance Authority Future Tax Secured Revenue | 470,000 | 5.000 | 5/1/2040 | 535,274 | ||||||||
| Rockdale County Water & Sewerage Authority | 305,000 | 3.060 | 7/1/2024 | 312,070 | ||||||||
| San Diego County Regional Airport Authority | 325,000 | 5.594 | 7/1/2043 | 360,009 | ||||||||
| State of California | 350,000 | 7.600 | 11/1/2040 | 526,008 | ||||||||
| State of Texas | 245,000 | 3.011 | 10/1/2026 | 249,101 | ||||||||
| TOTAL MUNICIPAL - (Cost - $1,989,749) | 1,982,462 | |||||||||||
| U.S. GOVERNMENT & AGENCY - 31.2% | ||||||||||||
| U.S. GOVERNMENT AGENCY - 11.1% | ||||||||||||
| Fannie Mae Pool 310041 | 98,227 | 6.500 | 5/1/2037 | 113,838 | ||||||||
| Fannie Mae Pool 735061 | 29,945 | 6.000 | 11/1/2034 | 34,148 | ||||||||
| Fannie Mae Pool 866009 | 30,642 | 6.000 | 3/1/2036 | 34,718 | ||||||||
| Fannie Mae Pool 909175 | 43,439 | 5.500 | 4/1/2038 | 50,701 | ||||||||
| Fannie Mae Pool 909220 | 88,045 | 6.000 | 8/1/2038 | 103,416 | ||||||||
| Fannie Mae Pool 938574 | 229,663 | 5.500 | 9/1/2036 | 257,378 | ||||||||
| Fannie Mae Pool 962752 | 35,239 | 5.000 | 4/1/2038 | 39,403 | ||||||||
| Fannie Mae Pool AA7001 | 184,116 | 5.000 | 6/1/2039 | 203,622 | ||||||||
| Fannie Mae Pool AL3166 | 127,555 | 3.000 | 3/1/2043 | 127,810 | ||||||||
| Fannie Mae Pool AS5596 | 351,328 | 3.500 | 8/1/2045 | 361,694 | ||||||||
| Fannie Mae Pool AS5634 | 367,194 | 3.000 | 8/1/2045 | 367,826 | ||||||||
| Fannie Mae Pool AS5696 | 357,635 | 3.500 | 8/1/2045 | 368,187 | ||||||||
| Fannie Mae Pool AS6311 | 219,546 | 3.500 | 12/1/2045 | 226,024 | ||||||||
| Fannie Mae Pool AS6386 | 905,607 | 3.000 | 12/1/2045 | 905,461 | ||||||||
| Fannie Mae Pool AS6522 | 233,239 | 3.500 | 1/1/2046 | 240,121 | ||||||||
| Fannie Mae Pool AS7003 | 361,029 | 3.000 | 4/1/2046 | 360,970 | ||||||||
| Fannie Mae Pool AS7026 | 483,926 | 4.000 | 4/1/2046 | 510,248 | ||||||||
| Fannie Mae Pool AX3195 | 317,469 | 4.000 | 9/1/2044 | 334,736 | ||||||||
| Fannie Mae Pool BC7198 | 417,828 | 3.500 | 6/1/2046 | 430,156 | ||||||||
| Fannie Mae Pool MA2495 | 511,790 | 3.500 | 1/1/2046 | 526,890 | ||||||||
| Freddie Mac Gold Pool G01980 | 243,296 | 5.000 | 12/1/2035 | 271,927 | ||||||||
| Freddie Mac Gold Pool G05888 | 42,107 | 5.500 | 10/1/2039 | 47,124 | ||||||||
| Freddie Mac Gold Pool G08702 | 325,353 | 3.500 | 4/1/2046 | 334,941 | ||||||||
| 6,251,339 | ||||||||||||
| U.S. TREASURY OBLIGATIONS - 20.1% | ||||||||||||
| United States Treasury Bond | 730,000 | 1.125 | 2/28/2019 | 728,574 | ||||||||
| United States Treasury Bond | 180,000 | 1.375 | 4/30/2020 | 179,532 | ||||||||
| United States Treasury Bond | 1,150,000 | 1.125 | 8/31/2021 | 1,120,509 | ||||||||
| United States Treasury Bond | 2,120,000 | 3.125 | 2/15/2043 | 2,191,633 | ||||||||
| United States Treasury Bond | 335,000 | 2.500 | 2/15/2046 | 304,549 | ||||||||
| United States Treasury Note ^ | 7,130,000 | 1.625 | 2/15/2026 | 6,770,994 | ||||||||
| 11,295,791 | ||||||||||||
| TOTAL U.S. GOVERNMENT & AGENCY (Cost - $17,839,634) | 17,547,130 | |||||||||||
| BANK LOANS - 3.9% | ||||||||||||
| AGRICULTURE - 0.1% | ||||||||||||
| NVA Holdings, Inc. | 46,956 | 8.150 | + | 8/14/2022 | 47,660 | |||||||
| AUTO MANUFACTURERS - 0.2% | ||||||||||||
| Navistar, Inc. | 84,572 | 5.158 | + | 8/8/2020 | 85,787 | |||||||
| CHEMICALS - 0.0% | ||||||||||||
| Ineos US Finance LLC | 6,860 | 3.922 | + | 4/1/2022 | 6,930 | |||||||
| COMMERCIAL SERVICES - 0.6% | ||||||||||||
| CHG Healthcare Services, Inc. | 66,330 | 4.922 | + | 6/8/2023 | 67,263 | |||||||
| CPI Card Group | 120,000 | 5.658 | + | 8/16/2022 | 112,550 | |||||||
| Laureate Education, Inc. | 47,195 | 8.515 | + | 3/16/2021 | 47,254 | |||||||
| Sedgwick Claims Management Services, Inc. | 85,000 | 6.814 | + | 2/28/2022 | 85,531 | |||||||
| 312,598 | ||||||||||||
See accompanying notes to financial statements.
19
| SCHEDULE OF INVESTMENTS (Unaudited) |
| Dunham Corporate/Government Bond Fund (Continued) |
| April 30, 2017 |
| Principal | Interest | Maturity | ||||||||||
| Security | Amount | Rate% | Date | Value | ||||||||
| ELECTRIC - 0.4% | ||||||||||||
| Helix Generation | $ | 5,000 | 4.870 | + | 3/8/2024 | $ | 5,056 | |||||
| NRG Energy, Inc. | 157,422 | 3.244 | + | 6/30/2023 | 158,226 | |||||||
| Texas Competitive Electric Holdings Company LLC | 47,330 | 3.922 | + | 8/4/2023 | 47,286 | |||||||
| Texas Competitive Electric Holdings Company LLC | 10,714 | 3.922 | + | 8/4/2023 | 10,704 | |||||||
| 221,272 | ||||||||||||
| ENVIRONMENTAL CONTROL - 0.0% | ||||||||||||
| Advanced Disposal Services, Inc. | 11,810 | 3.922 | + | 11/10/2023 | 11,923 | |||||||
| Avolon Holdings Ltd. | 5,000 | 3.903 | + | 3/20/2022 | 5,080 | |||||||
| 17,003 | ||||||||||||
| FOOD - 0.2% | ||||||||||||
| Albertsons LLC | 74,864 | 4.172 | + | 8/24/2021 | 75,211 | |||||||
| JBS USA | 35,000 | 3.650 | + | 10/30/2022 | 35,206 | |||||||
| 110,417 | ||||||||||||
| HEALTHCARE - 0.3% | ||||||||||||
| American Renal Holdings, Inc. | 24,255 | 4.750 | + | 8/20/2019 | 24,467 | |||||||
| CHG Healthcare Services, Inc. | 53,175 | 4.077 | + | 1/28/2021 | 52,912 | |||||||
| MPH Acquisition Holdings LLC | 29,187 | 4.900 | + | 6/8/2023 | 29,607 | |||||||
| Quorum Health Corp. | 59,445 | 6.785 | + | 4/28/2022 | 59,445 | |||||||
| 166,431 | ||||||||||||
| INVESTMENT COMPANIES - 0.2% | ||||||||||||
| TKC Holdings, Inc. | 30,000 | 4.900 | + | 1/31/2023 | 30,350 | |||||||
| UFC Holdings LLC | 67,724 | 4.406 | + | 8/18/2023 | 68,227 | |||||||
| 98,577 | ||||||||||||
| LODGING - 0.6% | ||||||||||||
| Boyd Gaming | 20,000 | 3.672 | + | 9/16/20/23 | 20,114 | |||||||
| Caesars Entertainment, Inc. | 109,154 | 7.172 | + | 10/12/2020 | 109,700 | |||||||
| Caesars Entertainment, Inc. | 20,000 | 3.672 | + | 9/16/2023 | 19,907 | |||||||
| Caesars Growth Partners | 54,719 | 4.167 | + | 5/8/2021 | 55,061 | |||||||
| City Center | 50,000 | 3.906 | + | 4/18/2024 | 50,137 | |||||||
| Playa Resorts and Hotels | 15,000 | 4.158 | + | 4/28/2024 | 15,054 | |||||||
| Station Casino LLC | 55,920 | 3.656 | + | 6/8/2023 | 55,965 | |||||||
| 325,938 | ||||||||||||
| MACHINERY - DIVERSIFIED - 0.1% | ||||||||||||
| Zodiac Pool Solutions LLC | 79,800 | 5.650 | + | 12/20/2023 | 80,482 | |||||||
| MISCELLANEOUS MANUFACTURING - 0.1% | ||||||||||||
| US Farathane LLC | 76,370 | 5.150 | + | 12/24/2021 | 77,277 | |||||||
| OIL & GAS - 0.2% | ||||||||||||
| Jonah Energy LLC | 62,000 | 7.672 | + | 5/12/2021 | 59,365 | |||||||
| Ultra Petroleum | 75,000 | 4.158 | + | 4/12/2024 | 74,812 | |||||||
| 134,177 | ||||||||||||
| PACKAGING & CONTAINERS - 0.0% | ||||||||||||
| Anchor Glass Container corp. | 24,938 | 4.412 | + | 12/8/2023 | 25,178 | |||||||
| PHARMACEUTICALS - 0.3% | ||||||||||||
| Endo International | 95,000 | 5.408 | + | 4/28/2024 | 95,879 | |||||||
| Grifols Worldwide Operations | 20,000 | 3.420 | + | 2/1/2025 | 20,070 | |||||||
| Herbalife | 30,000 | 6.672 | + | 2/16/2023 | 30,071 | |||||||
| 146,020 | ||||||||||||
| REAL ESTATE - 0.0% | ||||||||||||
| Capital Automotive LP | 15,000 | 4.167 | + | 3/24/2024 | 15,146 | |||||||
| RETAIL - 0.3% | ||||||||||||
| 84 Lumber | 84,469 | 6.920 | + | 10/24/2023 | 85,525 | |||||||
| Floor and Décor Outlets of America | 56,715 | 4.672 | + | 9/30/2023 | 56,928 | |||||||
| 142,453 | ||||||||||||
See accompanying notes to financial statements.
20
| SCHEDULE OF INVESTMENTS (Unaudited) |
| Dunham Corporate/Government Bond Fund (Continued) |
| April 30, 2017 |
| Principal | Interest | Maturity | ||||||||||
| Security | Amount | Rate% | Date | Value | ||||||||
| SOFTWARE - 0.2% | ||||||||||||
| Donnelley Financial Solutions, Inc. | $ | 19,223 | 5.150 | + | 9/28/2023 | $ | 19,419 | |||||
| First Data Corp. | 87,698 | 4.167 | + | 7/8/2022 | 88,300 | |||||||
| Rackspace Hosting | 26,933 | 4.534 | + | 11/4/2023 | 27,158 | |||||||
| 134,877 | ||||||||||||
| TELECOMMUNICATIONS - 0.1% | ||||||||||||
| UPC Financing Partnership | 40,000 | 4.148 | + | 8/31/2024 | 40,188 | |||||||
| TOTAL BANK LOANS - (Cost - $2,166,479) | 2,188,411 | |||||||||||
| PREFERRED STOCK - 0.6% | ||||||||||||
| BANKS - 0.6% | ||||||||||||
| Zions Bancorporation - (Cost - $270,000) | 10,800 | 6.950 | + | 9/15/2028 | 321,570 | |||||||
| Shares | ||||||||||||
| SHORT-TERM INVESTMENT - 2.8% | ||||||||||||
| MONEY MARKET FUND - 2.8% | ||||||||||||
| Fidelity Institutional Money Market Funds - Government Portfolio | ||||||||||||
| (Cost - $1,571,505) | 1,571,505 | 0.320 | + | 1,571,505 | ||||||||
| COLLATERAL FOR SECURITIES LOANED - 13.0% | ||||||||||||
| Mount Vernon Prime Portfolio (Cost - $7,407183) | 7,266,012 | 1.120 | + | 7,407,183 | ||||||||
| TOTAL INVESTMENTS - 112.2% (Cost - $62,627,642) | $ | 63,159,109 | ||||||||||
| LIABILITIES IN EXCESS OF OTHER ASSETS - (12.2)% | (7,014,874 | ) | ||||||||||
| NET ASSETS - 100.0% | $ | 56,144,235 | ||||||||||
LLC - Limited Liability Corporation
ABS - Asset Backed Security
MBS - Mortgage Back Security
CMO - Collateralized Mortgage Obligation
LP - Limited Partnership
REIT - Real Estate Investment Trust
Perpetual - Perpetual bonds are fixed income instruments without defined maturity dates
| ^ | All or a portion of these securities are on loan. Total loaned securities had a value of $7,924,948 at April 30, 2017. |
| + | Variable rate security. Interest rate is as of April 30, 2017. |
144A - Security exempt from registration under Rule 144A of the Securities Act of 1933. These securities may be sold in transactions exempt from registration, normally to qualified institutional buyers. The 144A securities amounted to $11,083,220 or 19.7% of net assets.
| (a) | Step-Up Bond; the interest rate shown is the rate in effect as of April 30, 2017. |
| (b) | Payment - in - Kind. |
| Portfolio Composition - (Unaudited) | ||||||||||
| Corporate Bonds & Notes | 50.4 | % | Municipal | 3.1 | % | |||||
| U.S. Government & Agencies Notes & Bonds | 27.8 | % | Short - Term | 2.5 | % | |||||
| Collateral For Securities Loaned | 11.7 | % | Preferred Stock | 0.5 | % | |||||
| Bank Loans | 3.5 | % | Foreign Government Bonds | 0.5 | % | |||||
| Total | 100.0 | % | ||||||||
| * | Based on total value of investments as of April 30, 2017. |
Percentage may differ from Schedule of Investments which is based on Fund net assets.
See accompanying notes to financial statements.
21
| Dunham Monthly Distribution Fund |
| Message from the Sub-Adviser (Perella Weinberg Partners) |
While “lower” market volatility has been a prominent theme across the past few fiscal quarters, there have been relatively short periods that have experienced significant spikes and drops. For example, market volatility, as measured by the CBOE Volatility Index (“VIX”) ended the previous fiscal quarter 42 percent lower than it began. However, during the previous fiscal quarter, the VIX increased 32 percent, while equity market prices widely tumbled. Generally, large increases in the VIX coincide with sizeable declines in the equity markets. Equity markets rallied during the first two months of the most recent fiscal six-month period as volatility generally remained low. The VIX remained below 13 over this time period. In April, volatility spiked 30 percent mid-month as equity prices fell 1.35 percent, as measured by the S&P 500. In the final weeks of the current fiscal quarter ended April 30, 2017, the VIX once again fell as markets generally recovered. After the higher volatility levels during the fiscal quarter generally continued to result in investors attempting to reduce risk and making indiscriminate sell decisions, the decrease in volatility to close the fiscal period may have increased investor optimism. Event-driven strategies, as measured by the Credit Suisse Event Driven Index, and market neutral strategies, as measured by the IQ Hedge Market Neutral Beta Index, increased 5.7 percent and 3.3 percent, respectively. This came on the heels of these same two strategies increasing 3.4 percent and 0.6 percent, respectively in the previous fiscal six-month period.
The Fund undertook a Sub-Adviser change on April 3, 2017. As of that date, the Fund was Sub-Advised by Perella Weinberg Partners. The Sub-Adviser implements a combination of tactical long/short equity investing and event-driven equity investing within the context of a diversified, low-net portfolio of mid and large cap equites. The Sub-Adviser believes that in the short to medium term the fundamental catalysts of stock returns can often be diluted or even overridden by other influencers of stock prices such as technical, macro/thematic factors and behavioral sentiment. As a result, the Sub-Adviser developed a “multiple lens” approach that takes into account all of these considerations in developing portfolio construction and managing risk. To achieve the Fund’s objective, the Fund invests in both select long and short equity opportunities and event-driven opportunities with a “hard” catalyst. The Fund leverages significant knowledge synergies between the two strategies and maintains a flexible investment mandate across such strategies in order to take advantage of opportunities presented in the market.
In a reversal from the previous fiscal six-month period, merger arbitrage strategies, as measured by the Credit Suisse Merger Arbitrage Index, increased over the most recent fiscal period. Merger arbitrage strategies increased 2.2 percent in the most recent fiscal quarter after climbing 2.6 percent in the previous fiscal quarter, resulting in a 4.9 percent over the fiscal six-month period. Although the broad merger arbitrage space experienced a slight positive return, many merger spreads saw significant widening during the fiscal quarter. For example, the all cash acquisition of Cabela’s Inc. (CAB) (holding percentage**: 1.55) by the private company Bass Pro Outdoor World LLC, saw its deal spread widen during the previous fiscal quarter. Both companies are destination outdoor superstores and they are the only two companies that offer this service and customer experience. The Sub-Adviser believed the spread widened due to the Cabelas branded credit card, issued by an outside institution, is currently under anti-money laundering review. This review put the transaction on hold temporarily. The spread continued to widen in the most recent fiscal quarter and reached a 20 percent gross spread. The position was terminated on 3/31/2017, as the Sub-Adviser believed that the current risk return profile of the position did not currently warrant inclusion into the Fund.
Despite the spikes in volatility, deals continued to close during the fiscal six-month period. The all cash acquisition of WhiteWave Foods Co. (WWAV) (holding percentage**: 1.27 percent) by Danone SA (BN FP) (holding percentage*: not held) closed on 4/12/2017. Danone acquired WhiteWave for $56.25/share, as WhiteWave was trading at $43.34 days before the announcement of the transactions. The deal received Department Of Justice approval by agreeing to sell the Stonyfield Farms brand in order to satisfy antitrust concerns. The cash and stock acquisition of B/E Aerospace Inc. (BEAV) (holding percentage**: 0.18 percent) by Rockwell Collins (COL) (holding percentage**: -0.73 percent) also completed over the most recent fiscal period. B/E Aerospace Inc. will now operate as a newly formed business segment within Rockwell Collins, called Interior Systems. Rockwell Collins had previously stated that it expects the transaction to be a good synergy. These deals successfully closed despite exhibiting substantial spreads in the weeks and months prior to closing. Significant spreads on deals that ultimately proved to successfully close helps to illustrate how this ongoing volatility significantly influences deal spreads within the event driven space.
The Sub-Adviser does not rule out expected seasonal volatility, however, with the current global recovery still indicating expansion. The Sub-Adviser remains positive on the market, albeit with more modest return assumptions. The Sub-Adviser views any constructive policies from Washington as offering the most substantial positive catalyst for the U.S. equity market. While many are hopeful that good news emanates from Washington, the Sub-Adviser remains in “wait and see” mode. The Sub-Adviser is also monitoring weakening auto sales, and weaker-than-expected results and commentary from consumer and auto finance companies, and some auto component suppliers. With the backdrop of constructive earnings results, continued employment and wage growth, and high consumer confidence, the Sub-Adviser thinks that some of these issues are isolated. The Sub-Adviser is optimistic for the coming quarter and will continue to implement its disciplined risk controls while taking advantage of opportunities that the markets present.
| * | Holdings percentage(s) as of 4/30/2017. |
| ** | Holdings percentage(s) as of the date prior to the sale of the security. |
Growth of $10,000 Investment
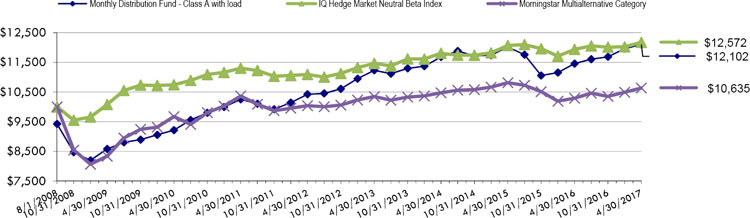
| Total Returns as of April 30, 2017 | |||||
| Annualized | Annualized | Annualized Since | |||
| Six Months | One Year | Three Years | Five Years | Inception (8/1/08)* | |
| Class N | 3.70% | 5.87% | 1.43% | 3.29% | 3.60%** |
| Class C | 3.16% | 4.83% | 0.41% | 2.26% | 2.14% |
| Class A with load of 5.75% | (2.39)% | (0.46)% | (0.80)% | 1.82% | 2.21% |
| Class A without load | 3.57% | 5.63% | 1.18% | 3.03% | 2.90% |
| IQ Hedge Market Neutral Beta Index | 3.28% | 3.92% | 2.22% | 2.60% | 2.65% |
| Morningstar Multialternative Category | 2.71% | 3.33% | 0.51% | 1.16% | 0.71% |
| * | Perella Weinberg Partners was named Sub-Advisor to the Fund on April 1, 2017. Prior to April 1, 2017, Westchester Capital Management, Inc. was named Sub-Adviser to the Fund on August 1, 2008. Prior to August 1, 2008, the Fund was named Kelmoore Strategy Liberty Fund and was managed under a different adviser. |
| ** | Class N commenced operations on September 29, 2008. |
IQ Hedge Market Neutral Beta Index is a benchmark index designed to replicate the risk-adjusted return characteristics of the collective hedge funds using a market neutral investment style. Investors cannot invest directly in an index or benchmark.
The Morningstar Multialternative Category is generally representative of mutual funds with static allocations to alternative strategies and mutual funds that tactically allocate among alternative strategies and asset classes. The gross short exposure in these mutual funds is generally greater than 20%.
As disclosed in the Trust’s latest registration statement, the Fund’s total annual operating expenses before any fee waiver, including the cost of underlying funds, are 1.92% for Class N, 2.92% for Class C and 2.17% for Class A. Class A shares are subject to a sales load of 5.75% and a deferred sales charge of up to 0.75%. The performance data quoted here represents past performance, which is not indicative of future results. Current performance may be lower or higher than the performance data quoted. The investment return and NAV will fluctuate, so that an investor’s shares, when redeemed, may be worth more or less than their original cost. Total returns are calculated assuming reinvestment of all dividends and capital gains distributions, if any. The returns do not reflect the deductions of taxes a shareholder would pay on the redemption of fund shares or fund distributions. For performance information current to the most recent month-end, please call 1-800-442-4358 or visit our website www.dunham.com.
22
| SCHEDULE OF INVESTMENTS (Unaudited) |
| Dunham Monthly Distribution Fund |
| April 30, 2017 |
| Security | Shares | Value | ||||
| COMMON STOCK - 90.0% | ||||||
| AGRICULTURE - 3.9% | ||||||
| Reynolds American, Inc. | 144,253 | $ | 9,304,318 | |||
| AIRLINES - 0.8% | ||||||
| Alaska Air Group, Inc. | 23,181 | 1,972,471 | ||||
| American Airlines Group, Inc. * | 101,283 | 101,283 | ||||
| 2,073,754 | ||||||
| APPAREL - 1.0% | ||||||
| NIKE, Inc. | 42,290 | 2,343,289 | ||||
| AUTO PARTS & EQUIPMENT - 4.7% | ||||||
| Adient PLC | 22,010 | 1,619,056 | ||||
| Delphi Automotive PLC | 49,410 | 3,972,564 | ||||
| Mobileye NV * | 94,530 | 5,853,298 | ||||
| 11,444,918 | ||||||
| BANKS - 2.8% | ||||||
| Citigroup, Inc. | 35,880 | 2,121,226 | ||||
| PrivateBancorp, Inc. | 82,349 | 4,757,302 | ||||
| 6,878,528 | ||||||
| BEVERAGES - 3.1% | ||||||
| Coca-Cola Co. | 130,553 | 5,633,362 | ||||
| Constellation Brands, Inc. | 10,465 | 1,805,631 | ||||
| 7,438,993 | ||||||
| CHEMICALS - 7.1% | ||||||
| Dow Chemical Co. | 54,971 | 3,452,179 | ||||
| Huntsman Corp. | 68,490 | 1,696,497 | ||||
| Monsanto Co. | 22,259 | 2,595,622 | ||||
| Syngenta AG - ADR | 52,759 | 4,908,170 | ||||
| Valspar Corp. | 40,519 | 4,555,956 | ||||
| 17,208,424 | ||||||
| COMMERCIAL SERVICES - 0.8% | ||||||
| PayPal Holdings, Inc. * | 38,532 | 1,838,747 | ||||
| COMPUTERS - 2.4% | ||||||
| Apple, Inc. | 16,685 | 2,396,800 | ||||
| Dell Technologies, Inc. - Vmware, Inc. * | 51,976 | 3,488,109 | ||||
| 5,884,909 | ||||||
| COSMETICS/PERSONAL CARE - 0.9% | ||||||
| Estee Lauder Cos, Inc. | 23,890 | 2,081,775 | ||||
| DIVERSIFIED FINANCIAL SERVICES - 0.9% | ||||||
| Synchrony Financial | 76,733 | 2,133,177 | ||||
| ELECTRICAL COMPONENTS & EQUIPMENT - 1.0% | ||||||
| AMETEK, Inc. | 41,981 | 2,401,313 | ||||
| FOOD - 3.8% | ||||||
| General Mills, Inc. | 47,642 | 2,739,891 | ||||
| Kraft Heinz Co. | 26,423 | 2,388,375 | ||||
| Mondelez International, Inc. | 63,084 | 2,840,672 | ||||
| Whole Foods Market, Inc. | 33,015 | 1,200,756 | ||||
| 9,169,694 | ||||||
See accompanying notes to financial statements.
23
| SCHEDULE OF INVESTMENTS (Unaudited) |
| Dunham Monthly Distribution Fund (Continued) |
| April 30, 2017 |
| Security | Shares | Value | ||||
| FOOD SERVICES - 0.8% | ||||||
| AdvancePierre Foods Holdings, Inc. | 44,890 | $ | 1,823,432 | |||
| HEALTHCARE-PRODUCTS - 4.8% | ||||||
| Alere, Inc. * | 72,965 | 3,587,689 | ||||
| CR Bard, Inc. | 25,675 | 7,894,549 | ||||
| 11,482,238 | ||||||
| HEALTHCARE-SERVICES - 0.9% | ||||||
| Humana, Inc. | 5,047 | 1,120,333 | ||||
| UnitedHealth Group, Inc. | 6,420 | 1,122,730 | ||||
| 2,243,063 | ||||||
| HOLDING COMPANIES-DIVERSIFICATION - 0.5% | ||||||
| Pacific Special Acquisition Corp. * | 105,552 | 1,100,380 | ||||
| HOUSEHOLD PRODUCTS / WARES - 3.7% | ||||||
| Jarden Corp. * | 148,157 | 8,972,521 | ||||
| INSURANCE - 0.7% | ||||||
| Berkshire Hathaway, Inc. * | 10,730 | 1,772,703 | ||||
| INTERNET - 1.4% | ||||||
| Alphabet, Inc. * | 3,515 | 3,249,688 | ||||
| LODGING - 1.4% | ||||||
| MGM Resorts International | 107,506 | 3,301,509 | ||||
| MEDIA - 8.4% | ||||||
| Charter Communications, Inc. * | 11,258 | 3,885,811 | ||||
| Comcast Corp. | 54,357 | 2,130,251 | ||||
| DISH Network Corp. * | 48,835 | 3,146,927 | ||||
| Nexstar Media Group, Inc. | 24,060 | 1,660,140 | ||||
| Time Warner, Inc. | 56,318 | 5,590,688 | ||||
| Walt Disney Co. | 33,256 | 3,844,394 | ||||
| 20,258,211 | ||||||
| OIL & GAS - 4.8% | ||||||
| Chevron Corp. | 13,514 | 1,441,944 | ||||
| Marathon Petroleum Corp. | 33,090 | 1,685,605 | ||||
| Royal Dutch Shell PLC | 59,855 | 3,123,832 | ||||
| VTTI Energy Partners LP | 31,175 | 593,884 | ||||
| Western Refining, Inc. | 135,871 | 4,686,191 | ||||
| 11,531,456 | ||||||
| PACKAGING & CONTAINERS - 1.3% | ||||||
| Berry Global Group, Inc. * | 62,733 | 3,136,650 | ||||
| PHARMACEUTICALS - 5.7% | ||||||
| Akorn, Inc. * | 144,830 | 4,844,562 | ||||
| Bristol-Myers Squibb Co. | 27,921 | 1,564,971 | ||||
| Mead Johnson Nutrition Co. | 55,958 | 4,964,594 | ||||
| Pfizer, Inc. | 70,735 | 2,399,331 | ||||
| 13,773,458 | ||||||
| PIPELINES - 2.2% | ||||||
| Columbia Pipeline Group, Inc. | 84,102 | 2,144,180 | ||||
| ONEOK Partners LP | 60,013 | 3,088,269 | ||||
| 5,232,449 | ||||||
See accompanying notes to financial statements.
24
| SCHEDULE OF INVESTMENTS (Unaudited) |
| Dunham Monthly Distribution Fund (Continued) |
| April 30, 2017 |
| Security | Shares | Value | ||||
| PRIVATE EQUITY - 1.0% | ||||||
| Fortress Investment Group LLC | 294,395 | $ | 2,366,936 | |||
| REITS - 3.0% | ||||||
| American Tower Corp. | 14,621 | 1,841,369 | ||||
| FelCor Lodging Trust, Inc. | 173,714 | 1,346,284 | ||||
| Starwood Property Trust, Inc. | 140,731 | 3,193,186 | ||||
| Winthrop Realty Trust | 102,617 | 854,800 | ||||
| 7,235,639 | ||||||
| RETAIL - 3.3% | ||||||
| CST Brands, Inc. | 57,486 | 2,775,999 | ||||
| Macy’s, Inc. | 76,355 | 2,231,093 | ||||
| Rite Aid Corp. * | 178,038 | 712,152 | ||||
| Wal-Mart Stores, Inc. | 29,601 | 2,225,403 | ||||
| 7,944,647 | ||||||
| SAVINGS & LOANS - 0.9% | ||||||
| EverBank Financial Corp. | 106,607 | 2,078,837 | ||||
| SEMICONDUCTORS - 5.7% | ||||||
| Analog Devices, Inc. | 15,050 | 1,146,810 | ||||
| Broadcom Ltd. | 16,396 | 3,620,401 | ||||
| Cavium, Inc. * | 29,818 | 2,052,969 | ||||
| NXP Semiconductors NV * | 64,376 | 6,807,762 | ||||
| 13,627,942 | ||||||
| SOFTWARE - 2.3% | ||||||
| DH Corp. | 106,472 | 1,980,385 | ||||
| Oracle Corp. | 64,580 | 2,903,517 | ||||
| ServiceNow, Inc. * | 8,030 | 758,674 | ||||
| 5,642,576 | ||||||
| TELECOMMUNICATIONS - 1.6% | ||||||
| Level 3 Communications, Inc. * | 64,038 | 3,890,949 | ||||
| TEXTILES - 1.2% | ||||||
| Mohawk Industries, Inc. * | 12,036 | 2,825,932 | ||||
| TRANSPORTATION - 1.2% | ||||||
| Swift Transportation Co. * | 119,870 | 2,946,405 | ||||
| TOTAL COMMON STOCK (Cost - $215,215,765) | 216,639,460 | |||||
| EXCHANGE TRADED FUNDS - 5.5% | ||||||
| DEBT FUND - 4.5% | ||||||
| iShares iBoxx $ Investment Grade Corporate Bond ETF | 20,250 | 2,409,547 | ||||
| iShares US Credit Bond ETF | 32,665 | 3,616,669 | ||||
| PowerShares Senior Loan Portfolio | 201,235 | 4,684,751 | ||||
| 10,710,967 | ||||||
| EQUITY FUND - 1.0% | ||||||
| SPDR S&P Regional Banking ETF | 44,345 | 2,396,847 | ||||
| TOTAL EXCHANGE TRADED FUNDS - (Cost - $13,075,556) | 13,107,814 | |||||
See accompanying notes to financial statements.
25
| SCHEDULE OF INVESTMENTS (Unaudited) |
| Dunham Monthly Distribution Fund (Continued) |
| April 30, 2017 |
| Security | Shares | Value | |||||||||
| RIGHTS - 0.1% | |||||||||||
| Nexstar Broadcasting Group, Inc. * | 87,600 | $ | 131,400 | ||||||||
| Pacific Special Acquisition Corp. * | 105,552 | 45,388 | |||||||||
| Safeway Casa Ley CVR * | 90,955 | 1,364 | |||||||||
| Safeway PDC, LLC CVR * | 90,955 | 25,922 | |||||||||
| TOTAL RIGHTS (Cost - $142,993) | 204,074 | ||||||||||
| WARRANTS - 0.0% | |||||||||||
| Pacific Special Acquisition Corp. * | 105,552 | 41,165 | |||||||||
| TOTAL WARRANTS (Cost - $8,254) | |||||||||||
| CLOSED-END FUNDS - 0.6% | |||||||||||
| BlackRock Floating Rate Income Strategies Fund, Inc. | 51,151 | 739,132 | |||||||||
| Invesco Senior Income Trust | 152,991 | 719,058 | |||||||||
| TOTAL CLOSED-END FUNDS (Cost - $1,474,242) | 1,458,190 | ||||||||||
| Dividend | |||||||||||
| Shares | Rate | ||||||||||
| PREFERRED STOCK - 0.7% | |||||||||||
| DIVERSIFIED FINANCIAL SERVICES - 0.7% | |||||||||||
| Colony NorthStar, Inc. * | 63,707 | 8.25% | 1,630,262 | ||||||||
| TOTAL PREFERRED STOCK (Cost - $1,604,234) | |||||||||||
| Principal | Interest | Maturity | |||||||||
| Amount | Rate | Date | |||||||||
| BONDS & NOTES - 0.4% | |||||||||||
| RETAIL - 0.4% | |||||||||||
| Rite Aid Corp. | $ | 847,000 | 6.750 | 6/15/2021 | 857,588 | ||||||
| TOTAL BONDS & NOTES (Cost - $877,471) | |||||||||||
| Contracts** | Value | ||||||||||
| PURCHASED PUT OPTIONS - 0.0% | |||||||||||
| S&P 500 Index, Expiration May 2017, Exercise Price $2,330 | 100 | 68,000 | |||||||||
| TOTAL PURCHASED PUT OPTIONS (Cost - $219,704) | |||||||||||
| SHORT-TERM INVESTMENT - 7.8% | Interest | ||||||||||
| MONEY MARKET FUND - 7.8% | Shares | Rate | |||||||||
| First American Government Obligations Fund | 18,744,163 | 0.63 | % + | 18,744,163 | |||||||
| TOTAL SHORT-TERM INVESTMENT (Cost - $18,744,163) | |||||||||||
| TOTAL INVESTMENTS - 105.1% (Cost - $251,362,382) | $ | 252,750,716 | |||||||||
| LIABILITIES IN EXCESS OF OTHER ASSETS - (5.1)% | (12,086,812 | ) | |||||||||
| NET ASSETS - 100.0% | $ | 240,663,904 | |||||||||
| * | Non-Income producing security. |
| ** | Each Purchased Option contract allows the Fund to buy/sell 100 shares of the underlying security at the exercise price. |
ADR- American Depositary Receipt.
REITS - Real Estate Investment Trusts
| + | Variable rate security. Interest rate is as of April 30, 2017. |
| ++ | Each Written Call/Put Option contract allows the holder to purchase/sell 100 shares of the underlying security from/to the Fund at the stated exercise price. |
See accompanying notes to financial statements.
26
| SCHEDULE OF INVESTMENTS (Unaudited) |
| Dunham Monthly Distribution Fund (Continued) |
| April 30, 2017 |
| Security | Contracts ++ | Value | ||||
| WRITTEN CALL OPTIONS - (0.3)% | ||||||
| Alaska Air Group, Inc., Expiration May 2017, Exercise Price $90 | 186 | $ | 7,440 | |||
| Broadcom Ltd., Expiration May 2017 Exercise Price $220 | 160 | 75,840 | ||||
| Delphi Automotive PLC, Expiration May 2017 Exercise Price $75 | 80 | 46,400 | ||||
| DISH Network Corp., Expiration May 2017, Exercise Price $65 | 485 | 118,825 | ||||
| MGM Resorts International, Expiration May 2017, Exercise Price $28 | 540 | 158,760 | ||||
| MGM Resorts International, Expiration May 2017, Exercise Price $29.5 | 535 | 79,982 | ||||
| S&P 500 Index, Expiration May 2017, Exercise Price $2,370 | 100 | 264,000 | ||||
| WRITTEN CALL OPTIONS - (Premiums Received - $512,867) | 751,247 | |||||
| Shares | ||||||
| SECURITIES SOLD SHORT * - (26.0)% | ||||||
| American Airlines Group, Inc. | 5,300 | 225,886 | ||||
| AT&T, Inc. | 50,012 | 1,981,976 | ||||
| Autoliv, Inc. | 11,585 | 1,160,701 | ||||
| Becton Dickinson and Co. | 13,021 | 2,434,536 | ||||
| British American Tobacco PLC | 71,631 | 4,873,773 | ||||
| Canadian Imperial Bank of Commerce | 34,391 | 2,779,825 | ||||
| CenturyLink, Inc. | 91,320 | 2,344,184 | ||||
| Constellation Brands, Inc. | 7,000 | 1,207,780 | ||||
| Darden Restaurants, Inc. | 27,030 | 2,302,686 | ||||
| Emerson Electric Co. | 9,852 | 593,879 | ||||
| Exxon Mobil Corp. | 30,190 | 2,465,013 | ||||
| General Electric Co. | 130,343 | 3,778,644 | ||||
| General Motors Co. | 59,960 | 2,077,014 | ||||
| Genuine Parts Co. | 19,385 | 1,783,808 | ||||
| Intel Corp. | 81,026 | 2,929,090 | ||||
| International Business Machines Corp. | 7,525 | 1,206,182 | ||||
| Knight Transportation, Inc. | 86,305 | 2,960,261 | ||||
| Mosaic Co. | 120,135 | 3,235,236 | ||||
| ONEOK, Inc. | 59,109 | 3,109,724 | ||||
| RLJ Lodging Trust | 62,885 | 1,351,399 | ||||
| Simon Property Group, Inc. | 14,465 | 2,390,486 | ||||
| Starbucks Corp. | 40,175 | 2,412,910 | ||||
| Tesoro Corp. | 19,383 | 1,545,019 | ||||
| Texas Instruments, Inc. | 33,455 | 2,648,967 | ||||
| Verizon Communications, Inc. | 79,680 | 3,658,109 | ||||
| VMware, Inc. * | 32,557 | 3,064,265 | ||||
| Yahoo!, Inc. * | 40,205 | 1,938,283 | ||||
| TOTAL SECURITIES SOLD SHORT - (Proceeds - $62,944,908) | 62,459,636 | |||||
| EXCHANGE TRADED FUND SOLD SHORT - (11.6)% | ||||||
| EQUITY FUND - (11.6)% | ||||||
| Consumer Discretionary Select Sector SPDR Fund | 43,930 | 3,956,335 | ||||
| Consumer Staples Select Sector SPDR Fund | 121,849 | 6,723,628 | ||||
| Energy Select Sector SPDR Fund | 51,440 | 3,489,690 | ||||
| Industrial Select Sector SPDR Fund | 73,230 | 4,858,078 | ||||
| iShares Russell 2000 ETF | 25,521 | 3,548,950 | ||||
| SPDR S&P Homebuilders ETF | 66,769 | 2,524,536 | ||||
| SPDR S&P500 ETF Trust | 12,138 | 2,889,815 | ||||
| TOTAL EXCHANGE TRADED FUND SOLD SHORT (Proceeds - $27,653,691) | 27,991,032 | |||||
See accompanying notes to financial statements.
27
| SCHEDULE OF INVESTMENTS (Unaudited) |
| Dunham Monthly Distribution Fund (Continued) |
| April 30, 2017 |
| Portfolio Composition * - (Unaudited) | ||||||||||
| Consumer, Non-Cyclical | 26.2 | % | Exchange Traded Funds | 5.2 | % | |||||
| Financial | 12.2 | % | Bonds & Notes | 0.3 | % | |||||
| Consumer, Cyclical | 12.6 | % | Closed-end Funds | 0.6 | % | |||||
| Communications | 10.8 | % | Preferred Stock | 0.6 | % | |||||
| Technology | 10.0 | % | Diversified | 0.4 | % | |||||
| Short-Term Investment | 7.4 | % | Rights | 0.1 | % | |||||
| Basic Materials | 6.8 | % | Warrants | 0.0 | % | |||||
| Energy | 6.6 | % | Options | 0.0 | % | |||||
| 100.0 | % | |||||||||
| * | Based on total value of investments as of April 30, 2017 |
Percentage may differ from Schedule of Investments which are based on Fund net assets.
See accompanying notes to financial statements.
28
| Dunham Dynamic Macro Fund |
| Message from the Sub-Adviser (Mellon Capital Management Corporation) |
Political events throughout the first two fiscal quarters of the year were the main catalysts for market movements and investor sentiment. The Trump and republican victory dominated headlines to begin the first fiscal quarter, which prompted a reflation trend that translated across many different asset classes. Equities reacted positively with the MSCI ACWI Index rising 5.7 percent, and the S&P 500 rising 7.8 percent over the first fiscal quarter ended January 31, 2017. The bounce in inflation expectations pushed bond yields up over the three-month period, especially in the non-quantitative easing countries such as the United States, Canada, and Australia. The bond yields in countries currently in quantitative easing programs such as the U.K. and Germany also rose, albeit not as much. Additional optimism has been built into equity markets, as investors may believe that the newly-elected president can push his policies through the republican-dominated congress, specifically in respect to infrastructure spending, tax cuts, deregulation of the finance industry, and repatriation of profits.
Optimism was tempered slightly during the most recent fiscal quarter as President Trump experienced some political disappointments including the failure to successfully bring the healthcare bill to the floor, roadblocks regarding immigration reform, and the perceived slowing in momentum for tax reform. Increasing tensions between the United States and North Korea also weighed on investors. Overseas, Dutch and French elections loomed. As the elections moved against the populist movement, markets rallied. Despite political concerns, economic momentum was positive and there were constructive signs of global growth. Positive growth indicators worked to lift up GDP expectations, and US bonds followed suit. In the euro area, the unemployment rate fell to the lowest level in almost eight years and forward-looking manufacturing PMI neared a six-year high. Over the most recent fiscal six-month period ended April 30, 2017, international equities, as measured by the MSCI ACWI ex US, increased 10.4 percent, underperformed US equities, as measured by the S&P 500, which increased 13.3 percent. Global macro strategies, as measured by the IQ Hedge Global Macro Beta Index, rose 1 percent over the most recent fiscal six-month period ended April 30, 2017.
The Sub-Adviser seeks to construct a balanced growth portfolio that aims to deliver equity-like total returns with less risk and improved downside control. It attempts to achieve this goal by utilizing a multi-asset strategy that allocates dynamically across global equities, bonds, and real assets. The current strategy’s exposure is broken down into three different categories: growth assets, which include developed market equities, emerging market equities, high-yield bonds, and emerging market debt; hedging assets, which include developed and emerging market currency, global cash, investment-grade bonds, and global developed and sovereign bonds; and real assets, which include global commodities, global inflation-linked bonds, and inflation-sensitive derivatives.
The hedging asset exposure detracted from Fund performance over the previous fiscal quarter and was flat during the most recent fiscal quarter ended April 30, 2017. The drastic rise in the yield of the 10-year U.S. Treasury over the first two months of the fiscal year adversely affected bond prices, as the price of the 10-year Treasury, as measured by the Bank of America Merrill Lynch Current 10-Year U.S. Treasury Index, declined 5 percent. The Fund’s large exposure to this asset class detracted from Fund performance over the first two months. The Fund added to the 10-year treasury position, which increased in the final month of the previous fiscal quarter. The Fund’s short position to U.K. Gilts positively contributed to Fund performance in the first fiscal quarter. In contrast to the previous fiscal quarter, the Funds Treasury exposure positively contributed to Fund performance in the most recent fiscal quarter as the price of the 10-year Treasury, as measured by the Bank of America Merrill Lynch Current 10-Year U.S. Treasury Index, increased 1.9 percent. The positive contribution from U.S. Treasuries was offset by losses in short U.K. Gilt positions. This position suffered on political news as Theresa May announced a snap election to “make a success of Brexit.” Additionally as equities rallied, the downside option protection within the hedging asset exposure also detracted over the most recent fiscal period.
The growth asset strategy exposure positively contributed to Fund performance over the most recent fiscal quarter after also positively contributing the previous fiscal quarter. To begin the fiscal six-month period, the Fund was underweight growth assets as the Sub-Adviser saw significant tail risk leading into the election. Once the election results were released and the reflationary trend reverberated throughout markets, the Fund added to growth assets and held the position through the end of the most recent fiscal quarter. The Sub-Adviser saw lower equity risk in the CBOE Volatility Index (“VIX”) as well as their own proprietary measures. Earnings expectations steadily rose in the U.S., which represented the largest equity allocation during the most recent fiscal quarter. The SPDR S&P 500 ETF Trust (SPY) (holding percentage*: 25.7 percent) positively contributed to Fund performance over the six-month period, increasing 13.2 percent. The best performing equity allocation over the previous fiscal quarter was the Fund’s allocation to Japan, which represents the Fund’s largest overweight. iShares Currency Hedged MSCI Japan ETF (HEWJ) (holding percentage*: 8.68 percent) climbed 8.9 percent over the previous fiscal quarter. This position contributed in the most recent fiscal quarter, albeit not as much. HEWJ increased 1.6 percent over the most recent fiscal quarter. The Sub-Adviser believes investors may have become concerned with the strengthening Yen. The Sub-Adviser still believes the fundamentals remain solid and the underperformance is short-term. The Sub-Adviser added approximately 2 percent to the position over the most recent fiscal quarter. The Fund kept its allocation to high-yield bonds consistent throughout both fiscal quarters. This allocation also added to Fund performance as the SPDR Barclays High Yield Bond ETF (JNK) (holding percentage*: 4.97 percent) climbed 5.4 percent. Based on the risk present in emerging markets, the Fund had no exposure to emerging market equities and has not been invested in them since August 2015.
The Sub-Adviser completely divested the position in real assets in mid 2015, as it believes the current risk/reward characteristics of this strategy do not warrant a place in the Fund at this time. Although the Sub-Adviser believes that positions in commodities do not currently warrant an allocation due to its risks, certain attributes that this strategy generally provides are still desired within the Fund. The Sub-Adviser believes that commodities are currently too expensive; therefore, in order to add a hedge against inflation, the Sub-Adviser added Treasury Inflation-Protected Securities to the portfolio. Over the most recent fiscal period ended April 30, 2017, this allocation detracted from Fund performance. For example, the iShares TIPS ETF (TIP) (holding percentage*: 4.62 percent) decreased 0.4 percent over the six-month period. Due to the Fund’s dynamic nature, the Sub-Adviser’s view on real assets can change quickly.
The Sub-Adviser is optimistic for the coming fiscal quarter and the remainder of the fiscal year. The Sub-Adviser believes that this volatility-targeted strategy may provide investors with more consistent returns than traditional asset classes. It believes that through the flexibility of the strategy and the use of alternative investments, the Fund may provide what may be considered to be attractive returns with lower beta and less correlation than traditional equity investments.
| * | Holdings percentage(s) as of 4/30/2017. |
Growth of $100,000 Investment
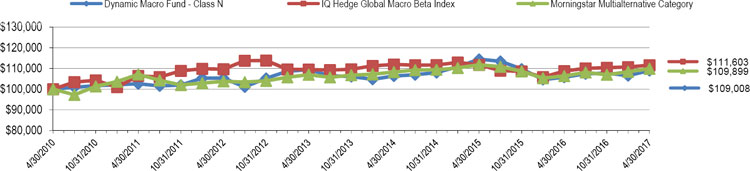
| Total Returns as of April 30, 2017 | |||||
| Annualized | Annualized Since | ||||
| Six | One | Three | Annualized | Inception | |
| Months | Year | Years | Five Years | (4/30/2010) | |
| Class N | 1.88% | 3.07% | 0.83% | 0.69% | 1.24% |
| Class C | 1.41% | 1.96% | (0.19)% | (0.33)% | 0.24% |
| Class A with load of 5.75% | (4.06)% | (3.19)% | (1.45)% | (0.77)% | 0.11% |
| Class A without load | 1.78% | 2.75% | 0.53% | 0.42% | 0.96% |
| IQ Hedge Global Macro Beta Index | 1.09% | 2.65% | (0.11)% | 0.35% | 1.58% |
| Morningstar Multialternative Category | 2.71% | 3.33% | 0.49% | 1.15% | 1.36% |
The IQ Hedge Global Macro Beta Index seeks to replicate the risk-adjusted return characteristics of a combination of hedge funds pursuing a macro strategy and hedge funds pursuing an emerging markets strategy. Investors cannot invest directly in an index or benchmark.
The Morningstar Multialternative Category is generally representative of mutual funds with static allocations to alternative strategies and asset classes. The gross short exposure in these mutual funds is generally greater than 20%.
As disclosed in the Trust’s latest registration statement, the Fund’s total annual operating expenses, including underlying funds, are 1.78% for Class N, 2.78% for Class C and 2.03% for Class A. Class A shares are subject to a sales load of 5.75% and a deferred sales charge of up to 0.75%. The performance data quoted here represents past performance, which is not indicative of future results. Current performance may be lower or higher than the performance data quoted. The investment return and NAV will fluctuate, so that an investor’s shares, when redeemed, may be worth more or less than their original cost. Total returns are calculated assuming reinvestment of all dividends and capital gains distributions, if any. The returns do not reflect the deductions of taxes a shareholder would pay on the redemption of fund shares or fund distributions. For performance information current to the most recent month-end, please call 1-800-442-4358 or visit our website www.dunham.com.
29
| SCHEDULE OF INVESTMENTS (Unaudited) |
| Dunham Dynamic Macro Fund |
| April 30, 2017 |
| Security | Shares | Value | ||||
| EXCHANGE TRADED FUNDS - 49.9% | ||||||
| DEBT FUNDS - 9.6% | ||||||
| iShares TIPS Bond ETF | 15,532 | $ | 1,786,336 | |||
| SPDR Bloomberg Barclays High Yield Bond ETF ^ | 1,921,809 | |||||
| 3,708,145 | ||||||
| EQUITY FUNDS - 40.3% | ||||||
| iShares Currency Hedged MSCI Germany ETF ^ | 78,790 | 2,218,727 | ||||
| iShares Currency Hedged MSCI Japan ETF | 118,751 | 3,355,903 | ||||
| SPDR S&P 500 ETF Trust ^ | 41,679 | 9,922,936 | ||||
| 15,497,566 | ||||||
| TOTAL EXCHANGE TRADED FUNDS (Cost - $16,016,142) | 19,205,711 | |||||
| Contacts + | ||||||
| OPTIONS * - 10.0% | ||||||
| CALL OPTION ON FUTURES PURCHASED - 8.4% | ||||||
| Swiss Market Index, Expiration June 16, 2017 | ||||||
| Exercise Price CHF 8,488.50 | 10 | 3,371 | ||||
| Swiss Market Index, Expiration June 16, 2017 | ||||||
| Exercise Price CHF 8,520 | 10 | 3,112 | ||||
| US 10 Year Future, Expiration June 16, 2017 | ||||||
| Exercise Price $112 | 234 | 3,210,188 | ||||
| 3,216,671 | ||||||
| PUT OPTIONS ON FUTURES PURCHASED - 1.6% | ||||||
| Euro-Bund Option, Expiration June 16, 2017 | ||||||
| Exercise Price $175 | 40 | 575,837 | ||||
| Euro Stoxx, Expiration June 16, 2017 | ||||||
| Exercise Price $2,750 | 201 | 3,393 | ||||
| Nikkei 225 Option, Expiration June 16, 2017 | ||||||
| Exercise Price JPY 16,250 | 85 | 4,575 | ||||
| S&P 500 E-Mini Option, Expiration December 16, 2017 | ||||||
| Exercise Price $1,900 | 117 | 52,650 | ||||
| 636,455 | ||||||
| TOTAL OPTIONS (Cost - $3,622,908) | 3,853,126 | |||||
| Principal | Discount | |||||||||
| Amount ($) | Rate | Maturity | ||||||||
| SHORT-TERM INVESTMENTS - 42.1% | ||||||||||
| U.S. GOVERNMENT SECURITIES - 26.8% | ||||||||||
| US Treasury Bill ++ | 8,798,000 | 0.5300% | 5/18/2017 | 8,795,593 | ||||||
| US Treasury Bill | 1,510,000 | 0.0100% | 6/15/2017 | 1,508,575 | ||||||
| 10,304,168 | ||||||||||
| Shares | Interest Rate | |||||||||
| MONEY MARKET - 15.3% | ||||||||||
| Morgan Stanley Institutional Liquidity Fund | 5,889,298 | 0.4000% | ^^ | 5,889,298 | ||||||
| TOTAL SHORT-TERM INVESTMENTS - (Cost - $16,193,466) | 16,193,466 | |||||||||
| COLLATERAL FOR SECURITIES LOANED - 7.3% | ||||||||||
| Mount Vernon Prime Portfolio (Cost - $2,819,526) | 2,819,526 | 1.1200% | + | 2,819,526 | ||||||
| TOTAL INVESTMENTS - 109.3% (Cost - $38,652,042) (a) | $ | 42,071,829 | ||||||||
| LIABILITIES IN EXCESS OF OTHER ASSETS - (9.3)% | (3,584,421 | ) | ||||||||
| NET ASSETS - 100.0% | $ | 38,487,408 | ||||||||
| Unrealized | ||||||
| Appreciation | ||||||
| Open Futures Contracts | Contracts | (Depreciation) | ||||
| LONG FUTURES CONTRACTS ** - 1.1% | ||||||
| Amsterdam index Future, May 2017 | ||||||
| (Underlying Face Amount at Value $206,660) | 2 | $ | 5,281 | |||
| AUST 10 YR Bond Future, June 2017 | ||||||
| (Underlying Face Amount at Value $9,349,920) | 96 | 250,688 | ||||
| CAC 40 10 Euro Future, May 2017 | ||||||
| (Underlying Face Amount at Value $730,100) | 14 | 38,852 | ||||
| CAN 10 YR Bond Future, June 2017 | ||||||
| (Underlying Face Amount at Value $3,768,120) | 27 | 46,787 | ||||
| Euro-Bund Future, June 2017 | ||||||
| (Underlying Face Amount at Value $161,780) | 1 | 453 | ||||
See accompanying notes to financial statements.
30
| SCHEDULE OF INVESTMENTS (Unaudited) |
| Dunham Dynamic Macro Fund (Continued) |
| April 30, 2017 |
| Unrealized | ||||||
| Appreciation | ||||||
| Open Futures Contracts | Contracts + | (Depreciation) | ||||
| LONG FUTURES CONTRACTS ** - 1.1% (Continued) | ||||||
| Euro Stoxx 50 Future, June 2017 | ||||||
| (Underlying Face Amount at Value $70,160) | 2 | $ | 4,508 | |||
| FTSE 100 Index Future, June 2017 | ||||||
| (Underlying Face Amount at Value $2,292,800) | 32 | (50,520 | ) | |||
| FTSE/MIB Index Future, June 2017 | ||||||
| (Underlying Face Amount at Value $101,435) | 1 | 6,373 | ||||
| IBEX - 35 Index Future, May 2017 | ||||||
| (Underlying Face Amount at Value $643,680) | 6 | 30,247 | ||||
| Nikkei 225 Index Future, June 2017 | ||||||
| (Underlying Face Amount at Value $19,185,000) | 2 | 7,545 | ||||
| S&P 500 EMINI Future, June 2017 | ||||||
| (Underlying Face Amount at Value $1,190,250) | 10 | (3,872 | ) | |||
| S&P/TSX 60 IX Future, June 2017 | ||||||
| (Underlying Face Amount at Value $1,283,520) | 7 | 7,409 | ||||
| SPI 200 Future, June 2017 | ||||||
| (Underlying Face Amount at Value $3,547,800) | 24 | 72,090 | ||||
| TOPIX Index Future, June 2017 | ||||||
| (Underlying Face Amount at Value $214,199,998) | 14 | 5,927 | ||||
| TOTAL FUTURES CONTRACTS PURCHASED | 421,768 | |||||
| SHORT FUTURES CONTRACTS ** - (0.5)% | ||||||
| Dax Index Future, June 2017 | ||||||
| (Underlying Face Amount at Value $311,687) | (1) | (10,513 | ) | |||
| Hang Seng Index Future, May 2017 | ||||||
| (Underlying Face Amount at Value $7,368,300) | (6) | (10,064 | ) | |||
| Long Gilt Future June 2017 | ||||||
| (Underlying Face Amount at Value $7,183,120) | (56) | (106,356 | ) | |||
| 10-Year US Treasury Note Future, June 2017 | ||||||
| (Underlying Face Amount at Value $11,691,844) | (93) | (76,100 | ) | |||
| TOTAL FUTURES CONTRACTS SOLD | (203,033 | ) | ||||
| WRITTEN PUT FUTURE OPTIONS *- (0.2)% | ||||||
| S&P E - Mini, Expiration June 17, 2017 | ||||||
| Exercise Price 2,435 | (117) | (6,435 | ) | |||
| Swiss Market Index, Expiration June 17, 2017 | ||||||
| Exercise Price CHF 8,488 | (10) | (594 | ) | |||
| Swiss Market Index, Expiration June 17, 2017 | ||||||
| Exercise Price CHF 8,520 | (10) | (653 | ) | |||
| TOTAL WRITTEN PUT FUTURE OPTIONS SOLD (Premium - $27,631) | (7,682 | ) | ||||
ETF - Exchange Traded Fund
| * | Non income producing security. |
| + | Each option contract allows holder to purchase/sell 100 shares of the underlying security at the exercise price. |
| ++ | All or part of the security was held as collateral for futures outstanding as of April 30, 2017. |
| ^ | All or a portion of these securities are on loan. Total loaned securities had a value of $4,140,536. |
| ^^ | Variable rate security. Interest rate is as of April 30, 2017. |
| ** | The amounts shown are the underlying reference notional amounts to stock exchange indices, debt securities and equities upon which the fair value of the futures contracts held by the Fund are based. Notional values do not represent the current fair value of, and are not necessarily indicative of the future cash flows futures contracts. Further, the underlying price changes in relation to the variables specified by the notional values affects the fair value of these derivative financial instruments. The notional values as set forth within this schedule do not purport to represent economic value at risk to the Fund. |
| Portfolio Composition * - (Unaudited) | ||||||||||
| Equity Funds | 36.8 | % | Call Options On Futures Purchased | 7.7 | % | |||||
| U.S. Government Securities | 24.5 | % | Collateral for Securities Loaned | 6.7 | % | |||||
| Money Market Fund | 14.0 | % | Put Option On Futures Purchased | 1.5 | % | |||||
| Debt Funds | 8.8 | % | Total | 100.0 | % | |||||
| * | Based on total value of investments as of April 30, 2017. |
Percentage may differ from Schedule of Investments which is based on Fund net assets.
See accompanying notes to financial statements.
31
| Dunham High-Yield Bond Fund |
| Message from the Sub-Adviser (PENN Capital Management Company, Inc.) |
High-yield bonds, as measured by the BofA ML US Cash Pay High Yield Index, outperformed investment-grade corporate bonds, as measured by the BofA ML US Corporate Index, and Treasury bonds, as measured by the BofA ML US Treasury Index over the six-months ended April 30, 2017. The Fed increased the Fed Funds rate another quarter point during the previous fiscal quarter. In the six-month period ended April 30, 2017, high-yield bonds rose 5.5 percent, investment-grade corporate bonds increased 0.3 percent, while Treasury bonds lost 1.4 percent.
Interest rates on 10-year Treasury bonds fluctuated within an 85 basis point range over the six-months ended April 30, 2017. Rates went from a low of 1.78 percent on November 4, 2016 to a high of 2.63 percent on March 13, 2017, before settling at 2.28 percent to end the fiscal six-month period. The Sub-Adviser’s defensive high-yield approach is focused on Single-B and higher-rated debt and has very limited exposure to triple-C rated bonds. The Fund has an emphasis on debt that is senior in the capital structure.
The Fund outperformed due to security selection and Single-B overweight with little impact from duration positioning. The Sub-Adviser had success in security selection within the technology, media & broadcasting and energy within the distribution and services space. The Sub-Adviser outperformed based upon being underweight hospitals in the healthcare sector and being underweight retail including food and drugstores. The detractors came from holding cash in a rallying market and conservative security selection within hotels and transports.
Holdings in the media & broadcasting sector added value on a relative and absolute basis, due to both a slight overweight to the sector and security selection. Cablevision System Corporation (12686CBB4) (holding percentage*: 1.05 percent), one of the largest broadband communications and video services providers in the United States, was one of the better performing bonds in this sector, achieving a 14.4 percent return in the six-month period ended April 30, 2017.
Exposure to the energy sector was generally a positive for the Fund, mainly due to stock selection in certain areas of the sector during the six-month period ended April 30, 2017. A 4.3 percent overweight to the energy distribution sector was of particular benefit. A holding that performed well was DCP Midstream LLC (23311RAE6, 23311RAH9, 23311VAD9) (holding percentage*: 1.35 percent), a full-service midstream logistics provider that, together with its subsidiaries, owns, operates, acquires, and develops a portfolio of midstream energy assets in the United States. It gained 12.5 percent in the six-month period ended April 30, 2017. Most of the move forward was due to an announced merger with its parent company DCP Midstream Partners, LP. Energy services was led by Transocean Inc. (893830AT6, 893830BB4, 893830BE8) (holding percentage*: 0.98 percent), an entity that issues the notes and debentures that have been guaranteed by Transocean Ltd., which is a leader in the offshore drilling industry with the most innovative and sophisticated technology. The bonds gained 15.3 percent over the fiscal six-month period.
The Fund had only a couple detractors during the six-month period. One holding was Argos Merger Sub Inc., (04021LAA8) (holding percentage*: 0.24 percent), a debt issuing vehicle for Argos Holdings Inc., the parent company of Petsmart, the largest specialty pet retailer of services and solutions for the lifetime needs of pets. It lost 9.4 percent in the six-month period ended April 30, 2017 after announcing an acquisition. Another negative holding was Valeant Pharmaceuticals International (91911XAQ7, 91829KAA1) (holding percentage*: 0.42 percent). The company is a multinational specialty pharmaceutical company that develops and markets prescription and non-prescription pharmaceutical products that make a meaningful difference in patients’ lives. The holding lost 0.6 percent in the six-month period ended April 30, 2017 after reporting poor earnings and overall stock market concerns for drug pricing.
The Sub-Adviser believes spread compression reflects an expectation for lower default rates in the next twelve months. The Sub-Adviser is optimistic on the U.S. economy, corporate creditworthiness and stability in oil prices. The Sub-Adviser is optimistic that fundamentals for high yield companies, most of which are U.S.-centric, may remain relatively healthy. The Sub-Adviser says issuance year-to-date has been robust, with minimal low quality issuance and the highest amount of refinancing since 2009. The Sub-Adviser feels that in a low-rate environment, high-yield bonds represent an attractive value relative to most other fixed income asset classes. To the extent that long-term interest rates may rise in a growing economy, the Sub-Adviser believes that larger-cap dividend paying equities and longer duration fixed income asset classes, including investment grade corporates, may underperform as a result.
| * | Holdings percentage(s) as of 4/30/2017. |
Growth of $100,000 Investment
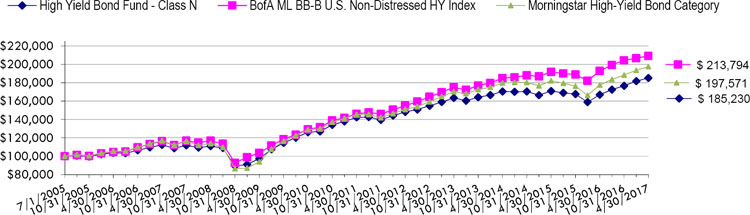
| Total Returns as of April 30, 2017 | ||||||
| Annualized | Annualized | Annualized | Annualized Since | |||
| Six Months | One Year | Three Years | Five Years | Ten Years | Inception(7/1/05) | |
| Class N | 4.83% | 10.91% | 2.80% | 4.56% | 5.12% | 5.35% |
| Class C | 5.40% | 11.01% | 2.36% | 3.99% | 4.44% | 4.64% |
| Class A with load of 4.50% | (0.88)% | 4.88% | 0.74% | 3.20% | 4.29% | 4.30%* |
| Class A without load | 3.85% | 9.80% | 2.29% | 4.14% | 4.77% | 4.77%* |
| BofA ML BB-B U.S. Non-Distressed HY Index | 4.64% | 10.84% | 4.94% | 6.66% | 6.27% | 6.63% |
| Morningstar High-Yield Bond Category | 4.85% | 11.30% | 3.22% | 5.52% | 5.38% | 5.92% |
| * | Class A commenced operations on January 3, 2007. |
BofA ML BB-B U.S. Non-Distressed HY Index is an unmanaged portfolio constructed to mirror the public high-yield corporate debt market and is a subset of the Merrill Lynch High Yield Master II Index. Investors cannot invest directly in an index or benchmark.
The Morningstar High-Yield Bond Category is generally representative of mutual funds that primarily invest in U.S. high-income debt securities where at least 65% or more of bond assets are not rated or are rated by a major agency such as Standard & Poor’s or Moody’s at the level of BB (considered speculative for taxable bonds) and below.
As disclosed in the Trust’s latest registration statement, the Fund’s total annual operating expenses, including the cost of underlying funds, are 1.09% for Class N, 1.84% for Class C and 1.34% for Class A. Class A shares are subject to a sales load of 4.50% and a deferred sales charge of up to 0.75%. The performance data quoted here represents past performance, which is not indicative of future results. Current performance may be lower or higher than the performance data quoted. The investment return and NAV will fluctuate, so that an investor’s shares, when redeemed, may be worth more or less than their original cost. Total returns are calculated assuming reinvestment of all dividends and capital gains distributions, if any. The returns do not reflect the deductions of taxes a shareholder would pay on the redemption of fund shares or fund distributions. For performance information current to the most recent month-end, please call 1-800-442-4358 or visit our website www.dunham.com
32
| SCHEDULE OF INVESTMENTS (Unaudited) |
| Dunham High-Yield Bond Fund |
| April 30, 2017 |
| Principal | Interest | Maturity | ||||||||||
| Security | Amount | Rate | Date | Value | ||||||||
| BONDS & NOTES - 93.4% | ||||||||||||
| AIRLINES - 1.3% | ||||||||||||
| Air Canada - 144A ^ | $ | 485,000 | 7.7500 | % | 4/15/2021 | $ | 550,475 | |||||
| American Airlines Group, Inc. - 144A ^ | 535,000 | 4.6250 | 3/1/2020 | 546,369 | ||||||||
| UAL 2007-1 Pass Through Trust | 172,576 | 6.6360 | 7/2/2022 | 186,383 | ||||||||
| 1,283,227 | ||||||||||||
| AUTO MANUFACTURERS - 0.7% | ||||||||||||
| Fiat Chrysler Automobiles NV ^ | 715,000 | 5.2500 | 4/15/2023 | 738,238 | ||||||||
| BEVERAGES - 0.5% | ||||||||||||
| Cott Beverages, Inc. | 445,000 | 5.3750 | 7/1/2022 | 462,800 | ||||||||
| BUILDING MATERIALS - 2.0% | ||||||||||||
| Griffon Corp. | 585,000 | 5.2500 | 3/1/2022 | 600,356 | ||||||||
| James Hardie International Finance Ltd - 144A | 500,000 | 5.8750 | 2/15/2023 | 526,250 | ||||||||
| Summit Materials LLC / Summit Materials Finance Corp. | 470,000 | 6.1250 | 7/15/2023 | 494,675 | ||||||||
| US Concrete, Inc. - 144A | 320,000 | 6.3750 | 6/1/2024 | 336,000 | ||||||||
| 1,957,281 | ||||||||||||
| CHEMICALS - 2.0% | ||||||||||||
| Blue Cube Spinco, Inc. ^ | 350,000 | 9.7500 | 10/15/2023 | 425,250 | ||||||||
| Blue Cube Spinco, Inc. | 180,000 | 10.0000 | 10/15/2025 | 222,750 | ||||||||
| Olin Corp. | 180,000 | 5.1250 | �� | 9/15/2027 | 187,875 | |||||||
| Platform Specialty Products Corp. - 144A ^ | 485,000 | 6.5000 | 2/1/2022 | 499,550 | ||||||||
| Tronox Finance LLC | 345,000 | 6.3750 | 8/15/2020 | 352,331 | ||||||||
| Tronox Finance LLC - 144A ^ | 280,000 | 7.5000 | 3/15/2022 | 294,000 | ||||||||
| 1,981,756 | ||||||||||||
| COAL - 0.5% | ||||||||||||
| Peabody Energy Corp. - 144A | 495,000 | 6.3750 | 3/31/2025 | 504,281 | ||||||||
| COMMERCIAL SERVICES - 3.0% | ||||||||||||
| ADT Corp. ^ | 160,000 | 3.5000 | 7/15/2022 | 155,600 | ||||||||
| ADT Corp. - 144A | 280,000 | 4.8750 | 7/15/2032 | 245,700 | ||||||||
| ADT Corp. | 275,000 | 6.2500 | 10/15/2021 | 303,031 | ||||||||
| Cardtronics, Inc. | 570,000 | 5.1250 | 8/1/2022 | 584,250 | ||||||||
| Jaguar Holding Co II - 144A | 740,000 | 6.3750 | 8/1/2023 | 773,300 | ||||||||
| Live Nation Entertainment, Inc. - 144A | 555,000 | 5.3750 | 6/15/2022 | 579,975 | ||||||||
| Nielsen Co Luxembourg SARL - 144A | 325,000 | 5.0000 | 2/1/2025 | 326,219 | ||||||||
| 2,968,075 | ||||||||||||
| COMPUTERS - 3.9% | ||||||||||||
| Diamond 1 & 2 Finance Corp. - 144A | 1,105,000 | 8.1000 | 7/15/2036 | 1,390,390 | ||||||||
| Diamond 1 & 2 Finance Corp. - 144A | 110,000 | 7.1250 | 6/15/2024 | 121,647 | ||||||||
| Seagate HDD Cayman | 595,000 | 5.7500 | 12/1/2034 | 555,250 | ||||||||
| Seagate HDD Cayman | 590,000 | 4.8750 | 6/1/2027 | 568,873 | ||||||||
| Western Digital Corp. | 1,035,000 | 10.5000 | 4/1/2024 | 1,221,300 | ||||||||
| 3,857,460 | ||||||||||||
See accompanying notes to financial statements.
33
| SCHEDULE OF INVESTMENTS (Unaudited) |
| Dunham High-Yield Bond Fund (Continued) |
| April 30, 2017 |
| Principal | Interest | Maturity | ||||||||||
| Security | Amount | Rate | Date | Value | ||||||||
| DIVERSIFIED FINANCIAL SERVICES - 4.5% | ||||||||||||
| Ally Financial, Inc. ^ | $ | 1,020,000 | 5.7500 | % | 11/20/2025 | $ | 1,048,050 | |||||
| Ally Financial, Inc. | 790,000 | 8.0000 | 11/1/2031 | 944,050 | ||||||||
| Ally Financial, Inc. | 345,000 | 4.2500 | 4/15/2021 | 353,625 | ||||||||
| Ally Financial, Inc. | 260,000 | 4.6250 | 3/30/2025 | 257,562 | ||||||||
| Fly Leasing Ltd. | 290,000 | 6.3750 | 10/15/2021 | 303,050 | ||||||||
| International Lease Finance Corp. | 760,000 | 8.6250 | 1/15/2022 | 934,263 | ||||||||
| Navient Corp. | 235,000 | 6.6250 | 7/26/2021 | 249,394 | ||||||||
| Navient Corp. | 235,000 | 7.2500 | 9/25/2023 | 246,750 | ||||||||
| Navient Corp. | 100,000 | 7.2500 | 1/25/2022 | 106,875 | ||||||||
| 4,443,619 | ||||||||||||
| ELECTRIC - 3.5% | ||||||||||||
| Calpine Corp. ^ | 350,000 | 5.7500 | 1/15/2025 | 340,375 | ||||||||
| Calpine Corp. ^ | 515,000 | 5.3750 | 1/15/2023 | 509,850 | ||||||||
| Dynegy, Inc. ^ | 585,000 | 6.7500 | 11/1/2019 | 596,700 | ||||||||
| Dynegy, Inc. ^ | 955,000 | 7.3750 | 11/1/2022 | 916,800 | ||||||||
| NRG Energy, Inc. ^ | 360,000 | 7.2500 | 5/15/2026 | 369,900 | ||||||||
| NRG Energy, Inc. | 315,000 | 6.6250 | 3/15/2023 | 321,300 | ||||||||
| NRG Energy, Inc. | 460,000 | 6.6250 | 1/15/2027 | 457,700 | ||||||||
| 3,512,625 | ||||||||||||
| ELECTRICAL COMPONENTS & EQUIPMENT - 0.7% | ||||||||||||
| Belden, Inc. - 144A | 365,000 | 5.5000 | 9/1/2022 | 375,950 | ||||||||
| WESCO Distribution, Inc. | 260,000 | 5.3750 | 12/15/2021 | 268,450 | ||||||||
| 644,400 | ||||||||||||
| ENTERTAINMENT - 3.1% | ||||||||||||
| Eldorado Resorts, Inc. | 230,000 | 7.0000 | 8/1/2023 | 249,262 | ||||||||
| Eldorado Resorts, Inc. - 144A | 145,000 | 6.0000 | 4/1/2025 | 150,438 | ||||||||
| Jacobs Entertainment, Inc. - 144A | 375,000 | 7.8750 | 2/1/2024 | 392,813 | ||||||||
| Lions Gate Entertainment Corp. - 144A ^ | 375,000 | 5.8750 | 11/1/2024 | 390,937 | ||||||||
| Pinnacle Entertainment, Inc. - 144A | 315,000 | 5.6250 | 5/1/2024 | 326,025 | ||||||||
| Regal Entertainment Group | 550,000 | 5.7500 | 6/15/2023 | 581,625 | ||||||||
| Scientific Games International, Inc. - 144A | 230,000 | 7.0000 | 1/1/2022 | 246,818 | ||||||||
| Scientific Games International, Inc. | 690,000 | 10.0000 | 12/1/2022 | 751,238 | ||||||||
| 3,089,156 | ||||||||||||
| FOOD - 1.0% | ||||||||||||
| JBS USA LLC - 144A | 655,000 | 5.8750 | 7/15/2024 | 686,112 | ||||||||
| JBS USA LLC - 144A | 270,000 | 5.7500 | 6/15/2025 | 280,125 | ||||||||
| 966,237 | ||||||||||||
| GAS - 1.4% | ||||||||||||
| AmeriGas Partners LP | 135,000 | 5.6250 | 5/20/2024 | 138,038 | ||||||||
| AmeriGas Partners LP | 640,000 | 5.5000 | 5/20/2025 | 649,600 | ||||||||
| NGL Energy Partners LP / NGL Energy Finance Corp. | 270,000 | 6.8750 | 10/15/2021 | 269,325 | ||||||||
| NGL Energy Partners LP / NGL Energy Finance Corp. - 144A | 260,000 | 7.5000 | 11/1/2023 | 261,300 | ||||||||
| NGL Energy Partners LP / NGL Energy Finance Corp. - 144A | 115,000 | 6.1250 | 3/1/2025 | 107,525 | ||||||||
| 1,425,788 | ||||||||||||
| HEALTHCARE-PRODUCTS - 2.0% | ||||||||||||
| Kinetic Concepts, Inc. / KCI USA, Inc. - 144A | 310,000 | 7.8750 | 2/15/2021 | 331,313 | ||||||||
| Kinetic Concepts, Inc. / KCI USA, Inc. - 144A ^ | 555,000 | 12.5000 | 11/1/2021 | 624,375 | ||||||||
| Mallinckrodt International Finance SA - 144A ^ | 555,000 | 5.7500 | 8/1/2022 | 548,063 | ||||||||
| Mallinckrodt International Finance SA ^ | 560,000 | 4.7500 | 4/15/2023 | 480,200 | ||||||||
| 1,983,951 | ||||||||||||
See accompanying notes to financial statements.
34
| SCHEDULE OF INVESTMENTS (Unaudited) |
| Dunham High-Yield Bond Fund (Continued) |
| April 30, 2017 |
| Principal | Interest | Maturity | ||||||||||
| Security | Amount | Rate | Date | Value | ||||||||
| HEALTHCARE-SERVICES - 6.3% | ||||||||||||
| Centene Corp. | $ | 395,000 | 6.1250 | % | 2/15/2024 | $ | 426,600 | |||||
| CHS/Community Health Systems, Inc. ^ | 535,000 | 5.1250 | 8/1/2021 | 532,325 | ||||||||
| DaVita, Inc. | 250,000 | 5.1250 | 7/15/2024 | 257,501 | ||||||||
| Envision Healthcare Corp. - 144A ^ | 475,000 | 5.1250 | 7/1/2022 | 484,500 | ||||||||
| Envision Healthcare Corp. ^ | 365,000 | 5.6250 | 7/15/2022 | 377,921 | ||||||||
| HCA, Inc. | 455,000 | 7.5000 | 2/15/2022 | 524,569 | ||||||||
| HCA, Inc. | 970,000 | 5.3750 | 2/1/2025 | 1,012,437 | ||||||||
| HealthSouth Corp. | 595,000 | 5.7500 | 11/1/2024 | 609,131 | ||||||||
| MEDNAX, Inc. - 144A | 290,000 | 5.2500 | 12/1/2023 | 297,250 | ||||||||
| Select Medical Corp. ^ | 750,000 | 6.3750 | 6/1/2021 | 770,625 | ||||||||
| Tenet Healthcare Corp. | 400,000 | 6.0000 | 10/1/2020 | 422,000 | ||||||||
| Tenet Healthcare Corp. - 144A | 220,000 | 7.5000 | 1/1/2022 | 235,950 | ||||||||
| WellCare Health Plans, Inc. | 250,000 | 5.2500 | 4/1/2025 | 260,625 | ||||||||
| 6,211,434 | ||||||||||||
| HOME FURNISHINGS - 0.8% | ||||||||||||
| Tempur Sealy International, Inc. | 250,000 | 5.5000 | 6/15/2026 | 249,220 | ||||||||
| Tempur Sealy International, Inc. | 485,000 | 5.6250 | 10/15/2023 | 498,095 | ||||||||
| 747,315 | ||||||||||||
| HOUSEHOLD PRODUCTS - 0.3% | ||||||||||||
| Spectrum Brands, Inc. ^ | 320,000 | 5.7500 | 7/15/2025 | 344,611 | ||||||||
| INDUSTRIALS - 0.7% | ||||||||||||
| Herc Rentals, Inc. - 144A ^ | 517,000 | 7.5000 | 6/1/2022 | 564,823 | ||||||||
| Herc Rentals, Inc. - 144A | 148,000 | 7.7500 | 6/1/2024 | 162,245 | ||||||||
| 727,068 | ||||||||||||
| IRON/STEEL - 0.5% | ||||||||||||
| United States Steel Corp. ^ | 225,000 | 7.3750 | 4/1/2020 | 243,000 | ||||||||
| United States Steel Corp. - 144A | 250,000 | 8.3750 | 7/1/2021 | 275,937 | ||||||||
| 518,937 | ||||||||||||
| LEISURE TIME - 0.4% | ||||||||||||
| NCL Corp. Ltd. - 144A | 400,000 | 4.6250 | 11/15/2020 | 412,000 | ||||||||
| LODGING - 1.9% | ||||||||||||
| Hilton Grand Vacations Borrower LLC - 144A | 157,000 | 6.1250 | 12/1/2024 | 167,794 | ||||||||
| MGM Resorts International ^ | 950,000 | 7.7500 | 3/15/2022 | 1,109,125 | ||||||||
| MGM Resorts International | 645,000 | 4.6250 | 9/1/2026 | 646,613 | ||||||||
| 1,923,532 | ||||||||||||
| MEDIA - 9.8% | ||||||||||||
| Altice Financing SA - 144A | 545,000 | 6.6250 | 2/15/2023 | 578,381 | ||||||||
| Block Communications, Inc. - 144A | 260,000 | 6.8750 | 2/15/2025 | 280,800 | ||||||||
| Cablevision Systems Corp. ^ | 995,000 | 5.8750 | 9/15/2022 | 1,023,606 | ||||||||
| Cequel Communications Holdings I LLC - 144A | 395,000 | 6.3750 | 9/15/2020 | 408,086 | ||||||||
| Clear Channel Worldwide Holdings, Inc. ^ | 740,000 | 6.5000 | 11/15/2022 | 770,525 | ||||||||
| Clear Channel Worldwide Holdings, Inc. | 740,000 | 7.6250 | 3/15/2020 | 751,100 | ||||||||
| CSC Holdings LLC | 245,000 | 6.7500 | 11/15/2021 | 270,112 | ||||||||
| CSC Holdings LLC ^ | 170,000 | 5.2500 | 6/1/2024 | 172,443 | ||||||||
| CSC Holdings LLC - 144A | 325,000 | 10.1250 | 1/15/2023 | 377,813 | ||||||||
| DISH DBS Corp. | 280,000 | 6.7500 | 6/1/2021 | 305,200 | ||||||||
| DISH DBS Corp. | 280,000 | 7.7500 | 7/1/2026 | 328,650 | ||||||||
See accompanying notes to financial statements.
35
| SCHEDULE OF INVESTMENTS (Unaudited) |
| Dunham High-Yield Bond Fund (Continued) |
| April 30, 2017 |
| Principal | Interest | Maturity | ||||||||||
| Security | Amount | Rate | Date | Value | ||||||||
| MEDIA (CONTINUED) - 9.8% | ||||||||||||
| Gray Television, Inc. - 144A | $ | 90,000 | 5.1250 | % | 10/15/2024 | $ | 90,450 | |||||
| Gray Television, Inc. - 144A ^ | 275,000 | 5.8750 | 7/15/2026 | 285,313 | ||||||||
| Nexstar Broadcasting, Inc. - 144A ^ | 325,000 | 6.1250 | 2/15/2022 | 341,452 | ||||||||
| SFR Group SA - 144A | 680,000 | 6.0000 | 5/15/2022 | 711,450 | ||||||||
| SFR Group SA - 144A | 750,000 | 6.2500 | 5/15/2024 | 779,062 | ||||||||
| Sinclair Television Group, Inc. - 144A ^ | 265,000 | 5.6250 | 8/1/2024 | 276,223 | ||||||||
| Townsquare Media, Inc. - 144A ^ | 400,000 | 6.5000 | 4/1/2023 | 406,000 | ||||||||
| Tribune Media Co. ^ | 380,000 | 5.8750 | 7/15/2022 | 401,098 | ||||||||
| Urban One, Inc. - 144A | 650,000 | 7.3750 | 4/15/2022 | 682,500 | ||||||||
| Videotron Ltd. | 425,000 | 5.0000 | 7/15/2022 | 452,136 | ||||||||
| 9,692,400 | ||||||||||||
| MINING - 2.2% | ||||||||||||
| Ferroglobe PLC / Globe Specialty Metals, Inc. - 144A | 350,000 | 9.7500 | 3/1/2022 | 367,500 | ||||||||
| Freeport-McMoRan, Inc. | 600,000 | 5.4500 | 3/15/2043 | 514,500 | ||||||||
| Freeport-McMoRan, Inc. | 260,000 | 3.1000 | 3/15/2020 | 257,725 | ||||||||
| Teck Resources Ltd. | 430,000 | 6.2500 | 7/15/2041 | 457,950 | ||||||||
| Teck Resources Ltd. | 630,000 | 5.2000 | 3/1/2042 | 604,800 | ||||||||
| 2,202,475 | ||||||||||||
| MICELLANEOUS MANUFACTURER - 0.4% | ||||||||||||
| Bombardier, Inc. - 144A | 410,000 | 6.1250 | 1/15/2023 | 410,000 | ||||||||
| Bombardier, Inc. - 144A | 740,000 | 8.7500 | 12/1/2021 | 825,100 | ||||||||
| 1,235,100 | ||||||||||||
| OFFICE/BUSINESS EQUIPMENT - 0.3% | ||||||||||||
| CDW Finance Corp. | 240,000 | 5.5000 | 12/1/2024 | 256,800 | ||||||||
| OIL & GAS - 10.3% | ||||||||||||
| Antero Resources Corp. ^ | 490,000 | 5.3750 | 11/1/2021 | 507,763 | ||||||||
| Antero Resources Corp. | 240,000 | 5.1250 | 12/1/2022 | 244,800 | ||||||||
| Carrizo Oil & Gas, Inc. ^ | 525,000 | 7.5000 | 9/15/2020 | 542,719 | ||||||||
| Comstock Resources, Inc. | 485,000 | 10.0000 | 3/15/2020 | 499,550 | ||||||||
| Continental Resources, Inc. ^ | 285,000 | 4.9000 | 6/1/2044 | 248,663 | ||||||||
| Denbury Resources, Inc. - 144A | 235,000 | 9.0000 | 5/15/2021 | 249,100 | ||||||||
| Ensco PLC | 530,000 | 5.7500 | 10/1/2044 | 388,702 | ||||||||
| Ensco PLC | 140,000 | 4.5000 | 10/1/2024 | 116,200 | ||||||||
| EP Energy LLC - 144A | 455,000 | 8.0000 | 11/29/2024 | 478,319 | ||||||||
| Gulfport Energy Corp. - 144A ^ | 240,000 | 6.0000 | 10/15/2024 | 237,600 | ||||||||
| Halcon Resources Corp. - 144A ^ | 275,000 | 6.7500 | 2/15/2025 | 265,375 | ||||||||
| Hilcorp Energy I LP / Hilcorp Finance Co. - 144A | 430,000 | 5.0000 | 12/1/2024 | 405,275 | ||||||||
| Noble Holding International Ltd. | 405,000 | 7.7500 | 1/15/2024 | 371,587 | ||||||||
| Oasis Petroleum, Inc. ^ | 395,000 | 6.8750 | 3/15/2022 | 401,912 | ||||||||
| PBF Holding Co LLC ^ | 255,000 | 7.0000 | 11/15/2023 | 260,100 | ||||||||
| PDC Energy, Inc. - 144A | 335,000 | 6.1250 | 9/15/2024 | 345,050 | ||||||||
| Sanchez Energy Corp. ^ | 745,000 | 6.1250 | 1/15/2023 | 689,118 | ||||||||
| Southwestern Energy Co. ^ | 570,000 | 4.1000 | 3/15/2022 | 535,800 | ||||||||
| Sunoco LP / Sunoco Finance Corp. | 385,000 | 6.2500 | 4/15/2021 | 407,615 | ||||||||
| Sunoco LP / Sunoco Finance Corp. ^ | 355,000 | 6.3750 | 4/1/2023 | 379,850 | ||||||||
| Transocean, Inc. - 144A ^ | 255,000 | 9.0000 | 7/15/2023 | 273,169 | ||||||||
| Transocean, Inc. | 415,000 | 8.1250 | 12/15/2021 | 433,675 | ||||||||
| Transocean, Inc. ^ | 310,000 | 6.8000 | 3/15/2038 | 249,550 | ||||||||
| Unit Corp | 535,000 | 6.6250 | 5/15/2021 | 535,000 | ||||||||
| Western Refining, Inc. | 570,000 | 6.2500 | 4/1/2021 | 588,881 | ||||||||
| WPX Energy, Inc. ^ | 520,000 | 6.0000 | 1/15/2022 | 530,400 | ||||||||
| 10,185,773 | ||||||||||||
See accompanying notes to financial statements.
36
| SCHEDULE OF INVESTMENTS (Unaudited) |
| Dunham High-Yield Bond Fund (Continued) |
| April 30, 2017 |
| Principal | Interest | Maturity | ||||||||||
| Security | Amount | Rate | Date | Value | ||||||||
| OIL & GAS SERVICES - 1.7% | ||||||||||||
| Exterran Energy Solutions LP / EES Finance Corp. - 144A | $ | 165,000 | 8.1250 | % | 5/1/2025 | $ | 170,672 | |||||
| McDermott International, Inc. - 144A | 835,000 | 8.0000 | 5/1/2021 | 872,993 | ||||||||
| SESI LLC | 300,000 | 6.3750 | 5/1/2019 | 299,625 | ||||||||
| SESI LLC ^ | 380,000 | 7.1250 | 12/15/2021 | 385,700 | ||||||||
| 1,728,990 | ||||||||||||
| PACKAGING & CONTAINERS - 0.5% | ||||||||||||
| Reynolds Group Issuer, Inc. | 480,000 | 5.7500 | 10/15/2020 | 495,000 | ||||||||
| PHARMACEUTICALS - 0.8% | ||||||||||||
| Endo Finance LLC - 144A | 425,000 | 5.7500 | 1/15/2022 | 395,250 | ||||||||
| Valeant Pharmaceuticals International, Inc. - 144A ^ | 205,000 | 6.3750 | 10/15/2020 | 177,069 | ||||||||
| Valeant Pharmaceuticals International, Inc. - 144A | 275,000 | 6.7500 | 8/15/2021 | 228,937 | ||||||||
| 801,256 | ||||||||||||
| PIPELINES - 7.2% | ||||||||||||
| Blue Racer Midstream LLC. - 144A | 400,000 | 6.1250 | 11/15/2022 | 412,000 | ||||||||
| DCP Midstream LLC - 144A | 180,000 | 4.7500 | 9/30/2021 | 184,950 | ||||||||
| DCP Midstream LLC - 144A | 915,000 | 5.8500 | 5/21/2043 | 878,400 | ||||||||
| DCP Midstream Operating LP | 260,000 | 3.8750 | 3/15/2023 | 254,800 | ||||||||
| MPLX LP | 430,000 | 4.5000 | 7/15/2023 | 453,727 | ||||||||
| NGPL PipeCo LLC - 144A | 320,000 | 7.7680 | 12/15/2037 | 369,600 | ||||||||
| Rockies Express Pipeline LLC - 144A | 525,000 | 5.6250 | 4/15/2020 | 563,850 | ||||||||
| Rockies Express Pipeline LLC - 144A | 630,000 | 6.8750 | 4/15/2040 | 676,462 | ||||||||
| Sabine Pass Liquefaction LLC ^ | 735,000 | 6.2500 | 3/15/2022 | 825,066 | ||||||||
| Sabine Pass Liquefaction LLC | 350,000 | 5.6250 | 3/1/2025 | 383,223 | ||||||||
| Sabine Pass Liquefaction LLC - 144A | 560,000 | 5.0000 | 3/15/2027 | 592,191 | ||||||||
| Summit Midstream Holdings LLC / Summit Midstream Finance Corp. | 380,000 | 5.7500 | 4/15/2025 | 386,650 | ||||||||
| Tallgrass Energy Partners LP / Tallgrass Energy Finance Corp. - 144A | 250,000 | 5.5000 | 9/15/2024 | 252,500 | ||||||||
| Targa Resources Partners Finance Corp. | 365,000 | 5.2500 | 5/1/2023 | 377,775 | ||||||||
| Williams Partners LP | 115,000 | 4.8750 | 5/15/2023 | 118,737 | ||||||||
| Williams Partners LP | 360,000 | 4.8750 | 3/15/2024 | 374,400 | ||||||||
| 7,104,331 | ||||||||||||
| PRIVATE EQUITY - 0.8% | ||||||||||||
| Icahn Enterprises LP / Icahn Enterprises Finance Corp. | 500,000 | 5.8750 | 2/1/2022 | 516,875 | ||||||||
| Icahn Enterprises LP / Icahn Enterprises Finance Corp. - 144A | 80,000 | 6.2500 | 2/1/2022 | 83,400 | ||||||||
| Icahn Enterprises LP / Icahn Enterprises Finance Corp. - 144A | 145,000 | 6.7500 | 2/1/2024 | 151,706 | ||||||||
| 751,981 | ||||||||||||
| REAL ESTATE - 0.9% | ||||||||||||
| Realogy Group LLC - 144A | 855,000 | 5.2500 | 12/1/2021 | 904,163 | ||||||||
| REITS - 2.5% | ||||||||||||
| CyrusOne Finance Corp. - 144A | 250,000 | 5.0000 | 3/15/2024 | 257,500 | ||||||||
| ESH Hospitality, Inc. - 144A ^ | 490,000 | 5.2500 | 5/1/2025 | 497,350 | ||||||||
| Equinix, Inc. | 175,000 | 5.3750 | 1/1/2022 | 185,937 | ||||||||
| Equinix, Inc. | 250,000 | 5.8750 | 1/15/2026 | 270,000 | ||||||||
| FelCor Lodging LP | 720,000 | 5.6250 | 3/1/2023 | 761,479 | ||||||||
| RHP Hotel Properties LP | 480,000 | 5.0000 | 4/15/2021 | 491,400 | ||||||||
| 2,463,666 | ||||||||||||
See accompanying notes to financial statements.
37
| SCHEDULE OF INVESTMENTS (Unaudited) |
| Dunham High-Yield Bond Fund (Continued) |
| April 30, 2017 |
| Principal | Interest | Maturity | ||||||||||
| Security | Amount | Rate | Date | Value | ||||||||
| RETAIL - 1.2% | ||||||||||||
| GameStop Corp. - 144A ^ | $ | 425,000 | 6.7500 | % | 3/15/2021 | $ | 436,688 | |||||
| JC Penney Corp, Inc. | 470,000 | 8.1250 | 10/1/2019 | 514,650 | ||||||||
| PetSmart, Inc. - 144A | 260,000 | 7.1250 | 3/15/2023 | 238,225 | ||||||||
| 1,189,563 | ||||||||||||
| SEMICONDUCTORS - 1.3% | ||||||||||||
| Micron Technology, Inc. | 90,000 | 7.5000 | 9/15/2023 | 101,025 | ||||||||
| Micron Technology, Inc. - 144A | 615,000 | 5.2500 | 8/1/2023 | 639,600 | ||||||||
| Micron Technology, Inc. | 135,000 | 5.8750 | 2/15/2022 | 141,581 | ||||||||
| Qorvo, Inc. | 330,000 | 6.7500 | 12/1/2023 | 359,287 | ||||||||
| 1,241,493 | ||||||||||||
| SOFTWARE - 1.5% | ||||||||||||
| First Data Corp. - 144A | 220,000 | 5.0000 | 1/15/2024 | 225,830 | ||||||||
| First Data Corp. - 144A ^ | 930,000 | 7.0000 | 12/1/2023 | 999,471 | ||||||||
| Nuance Communications, Inc. - 144A | 292,000 | 5.3750 | 8/15/2020 | 298,387 | ||||||||
| 1,523,688 | ||||||||||||
| TELECOMMUNICATIONS - 10.2% | ||||||||||||
| Anixter, Inc. | 425,000 | 5.1250 | 10/1/2021 | 452,625 | ||||||||
| Anixter, Inc. | 255,000 | 5.5000 | 3/1/2023 | 271,256 | ||||||||
| CenturyLink, Inc. | 220,000 | 6.4500 | 6/15/2021 | 238,700 | ||||||||
| CenturyLink, Inc. | 370,000 | 5.6250 | 4/1/2020 | 394,050 | ||||||||
| Cincinnati Bell, Inc. - 144A | 520,000 | 7.0000 | 7/15/2024 | 551,720 | ||||||||
| Cogent Communications Finance, Inc. - 144A | 460,000 | 5.6250 | 4/15/2021 | 474,950 | ||||||||
| CommScope, Inc. - 144A | 200,000 | 5.5000 | 6/15/2024 | 210,250 | ||||||||
| CommScope Technologies LLC - 144A | 100,000 | 5.0000 | 3/15/2027 | 101,125 | ||||||||
| Consolidated Communications, Inc. | 350,000 | 6.5000 | 10/1/2022 | 347,375 | ||||||||
| Frontier Communications Corp. | 265,000 | 10.5000 | 9/15/2022 | 267,650 | ||||||||
| Frontier Communications Corp. ^ | 690,000 | 8.5000 | 4/15/2020 | 736,575 | ||||||||
| Frontier Communications Corp. | 260,000 | 8.8750 | 9/15/2020 | 275,436 | ||||||||
| GCI, Inc. | 480,000 | 6.8750 | 4/15/2025 | 518,400 | ||||||||
| Gogo Intermediate Holdings LLC / Gogo Finance Co, Inc. - 144A | 360,000 | 12.5000 | 7/1/2022 | 413,100 | ||||||||
| Intelsat Jackson Holdings SA - 144A ^ | 575,000 | 8.0000 | 2/15/2024 | 619,562 | ||||||||
| Level 3 Financing, Inc. | 245,000 | 5.1250 | 5/1/2023 | 252,044 | ||||||||
| Qwest Corp. | 210,000 | 6.7500 | 12/1/2021 | 233,559 | ||||||||
| Sprint Capital Corp. ^ | 475,000 | 6.8750 | 11/15/2028 | 515,375 | ||||||||
| Sprint Corp. | 495,000 | 7.2500 | 9/15/2021 | 542,644 | ||||||||
| Sprint Corp. ^ | 705,000 | 7.8750 | 9/15/2023 | 793,125 | ||||||||
| Sprint Corp. | 830,000 | 7.1250 | 6/15/2024 | 907,298 | ||||||||
| West Corp. - 144A | 545,000 | 5.3750 | 7/15/2022 | 552,494 | ||||||||
| Windstream Services LLC ^ | 445,000 | 7.7500 | 10/1/2021 | 449,450 | ||||||||
| 10,118,763 | ||||||||||||
See accompanying notes to financial statements.
38
| SCHEDULE OF INVESTMENTS (Unaudited) | ||||||||
| Dunham High-Yield Bond Fund (Continued) | ||||||||
| April 30, 2017 | ||||||||
| Principal | Interest | Maturity | ||||||||||
| Security | Amount | Rate | Date | Value | ||||||||
| TRANSPORTATION - 0.8% | ||||||||||||
| Watco Cos LLC - 144A | $ | 730,000 | 6.3750% | 4/1/2023 | $ | 759,200 | ||||||
| 759,200 | ||||||||||||
| TOTAL BONDS & NOTES (Cost - $88,726,537) | 93,358,433 | |||||||||||
| Interest | ||||||||||||
| Security | Shares | Rate | ||||||||||
| SHORT-TERM INVESTMENT - 4.1% | ||||||||||||
| MONEY MARKET FUND - 4.1% | ||||||||||||
| First American Government Obligations Fund, 0.45% | 4,090,150 | 0.63 | % + | 4,090,150 | ||||||||
| TOTAL SHORT-TERM INVESTMENT (Cost - $4,090,150) | ||||||||||||
| COLLATERAL FOR SECURITIES LOANED - 26.8% | ||||||||||||
| Mount Vernon Prime Portfolio (Cost - $26,541,345) | 26,541,345 | 1.12 | % + | 26,541,345 | ||||||||
| TOTAL INVESTMENTS - 124.3% (Cost - $119,358,032) | $ | 123,989,928 | ||||||||||
| LIABILITIES LESS OTHER ASSETS - (24.3)% | (24,883,174 | ) | ||||||||||
| NET ASSETS - 100.0% | $ | 99,106,754 | ||||||||||
| ^ | All or a portion of these securities are on loan. Total loaned securities had a value of $25,986,950 at April 30, 2017. |
| + | Variable rate security. Interest rate is as of April 30, 2017. |
144A- Security exempt from registration under Rule 144A of the Securities Act of 1933. These securities may be sold in transactions exempt from registration, normally to qualified institutional buyers.
LLC - Limited Liability Corporation
LP - Limited Partnership
REITS - Real Estate Investment Trusts.
| Portfolio Composition ** - (Unaudited) | ||||||||||
| Collateral For Securities Loaned | 21.4 | % | Caa1 | 6.0 | % | |||||
| B1 | 18.7 | % | Ba2 | 4.7 | % | |||||
| B3 | 18.2 | % | Baa3 | 3.5 | % | |||||
| Ba3 | 10.5 | % | Ba1 | 3.5 | % | |||||
| B2 | 10.1 | % | Short-Term Investment | 3.3 | % | |||||
| Baa2 | 0.1 | % | ||||||||
| Total | 100.0 | % | ||||||||
| ** | Based on total value of investments as of April 30, 2017 |
| ** | Bond Ratings provided by Moody’s Ratings. |
Percentage may differ from Schedule of Investments which is based on Fund net assets.
See accompanying notes to financial statements.
39
| Dunham Alternative Dividend Fund |
| Message from the Sub-Adviser (Sungarden Fund Management, LLC) |
After shocking the world and financial markets with his surprise victory, President-Elect Trump set out to deliver on his campaign promises of economic growth, healthcare and tax reform, and border security. Over the first few months of the fiscal period, U.S. stocks soared while returns on bonds suffered. Investor optimism was gleaming at the prospects for America. The latter half of the fiscal period became more of a reality check for investors. Following the inauguration, the new administration suffered a few setbacks that led investors to reassess the speed, or even the likelihood, at which the new president’s policies would come to fruition. U.S. stocks continued their upward trajectory, albeit at a reduced pace, while bond returns recovered. Over the six-month period ended April 30, 2017, U.S. stocks, as measured by the S&P 500, gained 13.3 percent. Over the same period, interest rates on the 10-year U.S. Treasury fluctuated within an 85 basis point range, hitting their low of 1.78 percent a few days prior to the election, undulating throughout the fiscal period until they reached their high of 2.63 percent in mid-March, before settling at 2.28 percent to end the fiscal period. The Federal Reserve increased the Fed Funds Rate by 25 basis points in December of 2016 and again in March of 2017. As bond prices fall when interest rates rise, returns on U.S. bonds declined. U.S. investment-grade bonds, as measured by the Bloomberg Barclays U.S. Aggregate Total Return Bond Index, lost 0.7 percent over the six-month period ended April 30, 2017. Over the same period, moderately conservative strategies, as measured by the Dow Jones Moderately Conservative Portfolio Index, gained 3.6 percent.
The Sub-Adviser implements an income-oriented strategy consisting of long, short, and tactical portions of the portfolio. The long portion is comprised of 25 to 35 stocks rigorously analyzed by the Sub-Adviser’s proprietary approach, applying its Dividend Tiers and SG Stock Score methodology. The short portion is comprised primarily of S&P 500 Index put options, laddered out 1 to 18 months, depending on market conditions. The Sub-Adviser may also use single-inverse exchange traded funds (ETFs), if deemed productive. For the tactical portion, the Sub-Adviser seeks short-term price moves, dividend-capture, and direct hedging of portfolio stock or sector holdings. Using fundamental and technical analysis, along with a proprietary market cycle gauge called the Investment Climate Indicator (ICI), the Sub-Adviser believes it can identify opportunities that offer the risk/ reward characteristics consistent with their aim of producing a competitive income yield with downside protection.
Contributors to the Fund over the fiscal period included CF Industries Holdings, Inc. (CF) (holding percentage*: 0.85 percent), a global manufacturer and distributor of nitrogen and phosphate fertilizer products. The stock had a 12-month dividend yield of 4.28 percent and produced a return of 13.6 percent over the six-month period ended April 30, 2017. Emerson Electric Co. (EMR) (holding percentage*: 2.06 percent), designs and manufactures electronic and electrical equipment, software, systems, and services, offering its products for industrial, commercial, and consumer markets worldwide. The stock had a 12-month dividend yield of 3.28 percent and returned 21.0 percent over the fiscal period. General Motors Company (GM) (holding percentage*: 1.96 percent), designs, builds, and sells cars, trucks, crossovers, and automobile part. The company also offers vehicle protection, parts, accessories, maintenance, satellite radio, and automotive financing. The stock had a 12-month dividend yield of 4.55 percent and returned 12.0 percent for the fiscal quarter.
Detractors from the Fund over the three-month period ended April 30, 2017 included BP plc (BP) (holding percentage*: 0.55 percent), an oil and petrochemicals company. BP explores for and produces oil and natural gas, refines, markets, and supplies petroleum products, generates solar energy, and acrylonitrile, ethylene, and polyethylene. The stock price lost 3.46 percent, but do to its 12-month dividend yield of 6.62 percent the stock was nearly flat on a total return basis, down 0.07 percent over the fiscal period. Another detractor from the Fund was Qualcomm, Inc. (QCOM) (holding percentage*: 2.00 percent), a manufacturer of digital wireless communications equipment. The company licenses its code division multiple access (CDMA) and orthogonal frequency division multiplexing access intellectual property to other companies and produces CDMA-based integrated circuits. The stock had a 4.08 percent 12-month dividend yield, however the stock declined 20.5 percent over the fiscal period. Verizon Communications, Inc. (VZ) (holding percentage*: 3.69 percent), is an integrated telecommunications company that provides wireline voice and data services, wireless services, internet services, and publishing information. The stock’s 12-month dividend yield of 5.10 percent offset some of the price drop of 4.55 percent for a total return decline of 2.21 percent over the fiscal period.
In addition to these core holdings, the Sub-Adviser took advantage of a low-volatility market environment to purchase positions in a variety of put and call options. Most of these were “defensive” in nature, such as the purchase of put options, in which the Fund spends a modest amount of capital to try to protect the portfolio from a large decline in the broad equity market, one of its component sectors, or individual stocks.
In “weather” terms, the Sub-Adviser believes the market environment may be partly sunny now, but the forecast calls for increasing clouds. Per its proprietary ICI, partly sunny means the latter stages of a bull market with periods of increased volatility and corrections. The Sub-Adviser’s caution remains on a long-term basis, with current portfolio positioning in the offensive range, but leaning towards neutral. The Sub-Adviser believes that, based on many of the measures the Sub-Adviser follows closely, the stock market appears overvalued. However, until prices roll over, all of the bearish indicators are viable, but early. The Sub-Adviser continues to see a growing number of warning signs in economic data, including a sub-one percent U.S. GDP figure announced in April and a trend toward declining consumer spending. The Sub-Adviser plans to take advantage of that to the extent it feels it can. The main segment of the strategy continues to follow the familiar drill: fundamental and quantitative factors drive the company research, with technical analysis as a key factor in the bottom-line buy and sell decisions. The Sub-Adviser continues to scout for blue-chip companies whose price declines have made them attractive long-term buy candidates.
| * | Holdings percentage(s) as of 4/30/2017. |
Growth of $100,000 Investment
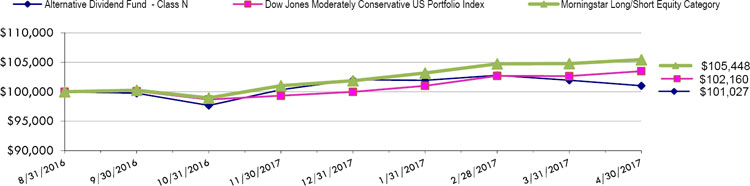
| Total Returns as of April 30, 2017 | ||
| Six | Since Inception | |
| Months | (8/31/2016) | |
| Class N | 3.44% | 1.03% |
| Class C | 2.93% | 0.44% |
| Class A with load of 5.75% | (2.59)% | (7.19)%* |
| Class A without load | 3.39% | 1.48%* |
| Dow Jones Moderately Conservative Index | 3.60% | 2.16% |
| Morningstar Long/Short Equity Category | 6.57% | 5.45% |
| * | Class A commenced operations on August 31, 2016. |
The Dow Jones Moderately Conservative Index measures global stocks, bonds and cash which in turn are represented by multiple subindexes. The index is quoted in USD. This index is officially calculated by Dow Jones and is disseminated by CBOT.
The Morningstar Long/Short Equity Category Index is generally representative of mutual funds that primarily invest in both long and short equity positions and derivatives. Mutual funds in this category will shift their exposures to long and short positions depending on their macro outlook or the opportunities they uncover through bottom-up research.
As disclosed in the Trust’s latest registration statement as supplemented, the Fund’s total annual operating expenses, including the cost of underlying funds, are 1.72% for Class N, 2.72% for Class C and 1.97% for Class A. Class A shares are subject to a sales load of 5.75% and a deferred sales charge of up to 0.75%. The performance data quoted here represents past performance, which is not indicative of future results. Current performance may be lower or higher than the performance data quoted. The investment return and NAV will fluctuate, so that an investor’s shares, when redeemed, may be worth more or less than their original cost. Total returns are calculated assuming reinvestment of all dividends and capital gains distributions, if any. The returns do not reflect the deductions of taxes a shareholder would pay on the redemption of fund shares or fund distributions. For performance information current to the most recent month-end, please call 1-800-442-4358 or visit our website www.dunham.com
40
| SCHEDULE OF INVESTMENTS (Unaudited) |
| Dunham Alternative Dividend Fund |
| April 30, 2017 |
| Security | Shares | Value | ||||
| COMMON STOCK - 74.1% | ||||||
| AEROSPACE & DEFENSE - 0.6% | ||||||
| United Technologies Corp. | 2,000 | $ | 237,980 | |||
| AUTO MANUFACTURERS - 2.0% | ||||||
| General Motors Co. | 21,300 | 737,832 | ||||
| CHEMICALS - 1.9% | ||||||
| CF Industries Holdings, Inc. | 12,000 | 320,880 | ||||
| PPG Industries, Inc. | 3,400 | 373,456 | ||||
| 694,336 | ||||||
| DIVERSIFIED FINANCIAL SERVICES - 0.9% | ||||||
| T Rowe Price Group, Inc. | 5,000 | 354,450 | ||||
| ELECTRIC - 4.2% | ||||||
| Entergy Corp. | 10,600 | 808,356 | ||||
| PPL Corp. | 19,900 | 758,389 | ||||
| 1,566,745 | ||||||
| ELECTRICAL COMPONENTS & EQUIPMENT - 2.1% | ||||||
| Emerson Electric Co. | 12,900 | 777,612 | ||||
| ENTERTAINMENT - 4.0% | ||||||
| Regal Entertainment Group | 67,800 | 1,496,346 | ||||
| INTERNET - 1.0% | ||||||
| Alphabet, Inc. * | 400 | 369,808 | ||||
| LODGING - 4.1% | ||||||
| Las Vegas Sands Corp. | 26,000 | 1,533,740 | ||||
| MISCELLANEOUS MANUFACTURING - 3.9% | ||||||
| General Electric Co. | 50,200 | 1,455,298 | ||||
| OFFICE & BUSINESS EQUIPMENT - 0.5% | ||||||
| Pitney Bowes, Inc. | 15,000 | 199,350 | ||||
| OIL & GAS - 0.5% | ||||||
| BP PLC - ADR | 6,000 | 205,920 | ||||
| PHARMACEUTICALS - 11.6% | ||||||
| AbbVie, Inc. | 22,300 | 1,470,462 | ||||
| GlaxoSmithKline PLC - ADR | 35,000 | 1,431,500 | ||||
| Pfizer, Inc. | 43,000 | 1,458,560 | ||||
| 4,360,522 | ||||||
| REITS - 13.9% | ||||||
| Crown Castle International Corp. | 8,500 | 804,100 | ||||
| EPR Properties | 10,400 | 756,184 | ||||
| Host Hotels & Resorts, Inc. | 81,000 | 1,453,950 | ||||
| National Retail Properties, Inc. | 6,000 | 253,320 | ||||
| Realty Income Corp. | 5,000 | 291,750 | ||||
| RLJ Lodging Trust | 8,000 | 171,920 | ||||
| Ventas, Inc. | 23,200 | 1,485,032 | ||||
| 5,216,256 | ||||||
| RETAIL - 4.7% | ||||||
| Coach, Inc. | 9,500 | 374,205 | ||||
| L Brands, Inc. | 14,000 | 739,340 | ||||
| Target Corp. | 5,000 | 279,250 | ||||
| Wal-Mart Stores, Inc. | 5,000 | 375,900 | ||||
| 1,768,695 | ||||||
See accompanying notes to financial statements.
41
| SCHEDULE OF INVESTMENTS (Unaudited) |
| Dunham Alternative Dividend Fund (Continued) |
| April 30, 2017 |
| Security | Shares | Value | ||||
| SAVINGS & LOANS - 3.0% | ||||||
| New York Community Bancorp, Inc. | 56,000 | $ | 744,240 | |||
| People’s United Financial, Inc. | 21,000 | 366,870 | ||||
| 1,111,110 | ||||||
| SEMICONDUCTORS - 3.3% | ||||||
| Intel Corp. | 13,000 | 469,950 | ||||
| QUALCOMM, Inc. | 14,000 | 752,360 | ||||
| 1,222,310 | ||||||
| SOFTWARE - 0.9% | ||||||
| Paychex, Inc. | 6,000 | 355,680 | ||||
| TELECOMMUNICATIONS - 8.4% | ||||||
| AT&T, Inc. | 35,600 | 1,410,828 | ||||
| Verizon Communications, Inc. | 30,300 | 1,391,073 | ||||
| Vodafone Group PLC - ADR | 14,000 | 366,660 | ||||
| 3,168,561 | ||||||
| TRANSPORTATION - 2.6% | ||||||
| Union Pacific Corp. | 3,400 | 380,664 | ||||
| United Parcel Service, Inc. | 5,500 | 591,030 | ||||
| 971,694 | ||||||
| TOTAL COMMON STOCK (Cost - $27,589,730) | 27,804,245 | |||||
| EXCHANGE TRADED FUNDS - 18.7% | ||||||
| EQUITY FUNDS - 18.7% | ||||||
| Global SuperDividend US ETF | 89,832 | 2,297,004 | ||||
| Global X MLP ETF | 130,000 | 1,501,500 | ||||
| iShares International Select Dividend ETF | 47,000 | 1,495,070 | ||||
| ProShares Short S&P 500 * | 50,000 | 1,708,500 | ||||
| TOTAL EQUITY FUNDS | 7,002,074 | |||||
| TOTAL EXCHANGE TRADED FUNDS (Cost - $6,948,914) | 7,002,074 | |||||
| PURCHASED OPTIONS * - 0.6% | Contracts** | Value | ||||
| PURCHASED CALL OPTIONS * - 0.0% | ||||||
| Chicago Board Options Exchange, Expiration May 2017, Exercise Price $15 | 90 | 3,375 | ||||
| Target Corp., Expiration May 2017, Exercise Price $70 | 75 | 75 | ||||
| TOTAL PURCHASED CALL OPTIONS (Cost - $36,805) | 3,450 | |||||
| Contracts** | Value | |||||
| PURCHASED PUT OPTIONS * - 0.6% | ||||||
| iShares 20+ Year Treasury Bond, Expiration May 2017, Exercise Price $122 | 20 | 2,460 | ||||
| iShares U.S. Real Estate ETF, Expiration July 2017, Exercise Price $78 | 50 | 8,250 | ||||
| iShares U.S. Real Estate ETF, Expiration July 2017, Exercise Price $79 | 50 | 10,750 | ||||
| iShares U.S. Real Estate ETF, Expiration July 2017, Exercise Price $80 | 50 | 12,475 | ||||
| S&P 500 Index, Expiration January 2018, Exercise Price $2,200 | 5 | 12,375 | ||||
| S&P 500 Index, Expiration September 2017 Exercise Price $2,200 | 5 | 25,975 | ||||
| S&P 500 Index, Expiration September 2017 Exercise Price $2,250 | 20 | 64,000 | ||||
| S&P 500 Index, Expiration December 2017, Exercise Price $2,250 | 15 | 82,425 | ||||
| S&P 500 Index, Expiration June 2017, Exercise Price $2,300 | 4 | 5,020 | ||||
| S&P 500 Index, Expiration September 2017, Exercise Price $2,400 | 2 | 14,880 | ||||
| TOTAL PURCHASED PUT OPTIONS (Cost - $452,652) | 238,610 | |||||
| TOTAL OPTIONS PURCHASED (Cost - $489,457) | 242,060 | |||||
See accompanying notes to financial statements.
42
| SCHEDULE OF INVESTMENTS (Unaudited) |
| Dunham Alternative Dividend Fund (Continued) |
| April 30, 2017 |
| Interest | ||||||||||
| Security | Shares | Rate | Value | |||||||
| SHORT-TERM INVESTMENT - 7.0% | ||||||||||
| MONEY MARKET FUND - 7.0% | ||||||||||
| Invesco Short-Term Investments Trust Treasury Portfolio Institutional Class | 2,641,750 | 0.63 | %+ | $ | 2,641,750 | |||||
| TOTAL SHORT-TERM INVESTMENT (Cost - $2,641,750) | ||||||||||
| TOTAL INVESTMENTS - 100.4% (Cost - $37,669,851) | $ | 37,690,129 | ||||||||
| LIABILITIES LESS OTHER ASSETS - (0.4)% | (180,264 | ) | ||||||||
| NET ASSETS - 100.0% | $ | 37,509,865 | ||||||||
| * | Non-Income producing security. |
| ** | Each Purchased Put Option and Call Option contract allows the Fund to sell/buy 100 shares of the underlying security at the exercise price. |
| + | Variable rate security. Interest rate is as of April 30, 2017 |
ADR- American Depositary Receipt.
PLC - Public Limited Company
REITS - Real Estate Investment Trusts
| Portfolio Composition - (Unaudited) | ||||||||||
| Exchange Traded Funds | 18.6 | % | Short-Term Investment | 7.0 | % | |||||
| Financial | 17.7 | % | Technology | 4.7 | % | |||||
| Consumer, Cyclical | 14.7 | % | Utilities | 4.2 | % | |||||
| Consumer, Non-cyclical | 11.6 | % | Basic Materials | 1.8 | % | |||||
| Communications | 9.4 | % | Purchased Options | 0.6 | % | |||||
| Industrial | 9.1 | % | Energy | 0.5 | % | |||||
| Total | 100.0 | % | ||||||||
| * | Based on total value of investments as of April 30, 2017. |
Percentage may differ from Schedule of Investments which is based on Fund net assets.
See accompanying notes to financial statements.
43
Dunham International Opportunity Bond Fund
Message from the Sub-Adviser (Rogge Global Partners LTD)
International bonds, as measured by the Barclays Global Aggregate Ex-U.S. Bond Index, continued to see U.S. dollar movements relative to foreign currencies cause volatility in foreign bond markets. During the six-month period ended April 30, 2017, international bonds decreased 2.5 percent, while the U.S. dollar gained 0.7 percent against a basket of major world currencies. Foreign bond movements matched declines in the U.S. dollar during the first half of the six-month period but, reversed track during the second half of the six-month period as foreign bonds experienced gains while the U.S. dollar continued to decline versus a basket of major world currencies. Major focuses for foreign bond markets during the fiscal period ended April 30, 2017 were a decline in the Japanese yen, policy decisions and potential follow-through of campaign promises by President Trump, and the European Central Bank’s implementation of policies. Currency movements were also a dominant source of changes in spreads and volatility in foreign bond markets.
The Sub-Adviser implements a four-step investment process using four key macroeconomic factors in four major asset classes to achieve returns in five unique areas. The four macroeconomic factors are: global economic outlook, inflation, interest rates, and event risk. The four major asset classes are: developed sovereign (government debt), investment-grade credit (corporate debt), high-yield, and emerging markets. The four-step investment process has the following stages: assess relative value, risk management, micro-level analysis, and implementation. Finally, the five return components are: country, currency, yield curve, duration, and spread/sector. The Sub-Adviser seeks to identify healthy countries by measuring the sustainability of public borrowing in the private sector as well as the effectiveness and credibility of that nation’s authorities.
Emerging markets bonds, as measured by the Barclays Emerging Markets Local Currency Government Index, improved 0.2 percent during the six-month fiscal period. Over the same period, the Sub-Adviser’s active currency selection added to Fund performance. While the Sub-Adviser continues to believe that emerging markets countries are still working through their deleveraging cycle that was brought on during the financial crisis, it overweighted emerging markets currencies, which benefited from gains in the Russian Ruble and Brazilian Real during the first half of the six-month fiscal period. Major themes during the second half of the six-month period were long positions in emerging markets currencies improving versus the U.S. Dollar, long Euro positions gaining versus the U.S. Dollar, as well as shor t positions in the Taiwan Dollar. Negative views on the U.S. Dollar was a dominant force of currency selection, as the Sub-Adviser believes the U.S. Dollar has been stretched too far by recent bandwagons of the “Trump-trade”. This may force the U.S. Dollar to contract during future periods in order for it to become more in-line with what the Sub-Adviser believes is a realistic valuation. The Fund’s emerging markets allocation benefited from a Russian sovereign bond, Russian Federation 3.625% 9/16/2020 (BCRX8B2) (holding percentage*: 1.27 percent). The position gained 1.7 percent over the six-month period ended April 30, 2017.
During the first half of the fiscal year the Sub-Adviser’s country selection detracted from Fund performance. While country selection underperformed, a core theme of the Sub-Adviser’s view on countries benefitted the Fund through its relative exposure to Japan during the first fiscal quarter. The Sub-Adviser’s stance on Japanese debt continued during the second fiscal quarter as the Fund held an underweight, which benefited performance. This continuation in the Sub-Adviser’s macro view was primarily due to the yen’s fluctuations and an increase in yields during the first fiscal quarter. Mexico and Malaysia were sources of negative performance during the six-month period. A Malaysian holding that fell was a Malaysian sovereign bond, Malaysia Government 3.9% 11/30/2026 (BD6RZ22) (holding percentage*: 0.32), which declined 1.6 percent during the six-month fiscal period. Over the second half of the six-month fiscal period the Fund benefitted from a steepening of the German bonds’ yield curve and a long stance on Mexico’s debt, while an underweight to long-term British debt detracted from performance. The Fund continued its underweight to Japan during the second fiscal quarter.
Over the first half of the fiscal year the Sub-Adviser’s spread allocation added to Fund performance. The Sub-Adviser held an overweight in investment-grade credit during the first fiscal quarter and an underweight during the second fiscal quarter. Within the investment-grade credit allocation, the Fund focused on the financials, industrials, and utilities sectors. These sectors contributed positively to relative performance, with financials being the strongest performing sector. In the industrials sector, the Sub-Adviser sought an emphasis on short-dated single-B and double-B issuers. The Fund also held an underweight to long-dated credit, which underperformed during the six-month fiscal period. An example of how the Fund held exposure to European financials credit was through Linde Finance BV 3.125% 12/12/2018 (B64CTX9) (holding percentage*: 1.21). The position gained 0.1 percent during the fiscal six-month period.
The Sub-Adviser is aware of possible changes in global policy surrounding a Trump Presidency and monetary policy decisions by the European Central Bank, as well as China’s balance between growth stability and debt sustainability, and sees these as the greatest risks in the near future. The Sub-Adviser believes that more risk premium has been priced into yield curves as reflation picks up. In addition, the Sub-Adviser sees global inflation pressures beginning as spare capacity in commodities is reduced and possibly pushes prices higher. The Sub-Adviser also anticipates weak fundamentals for emerging market credit creating headwinds in 2017. They believe that the G4 economies have experienced above-trend growth rates and may be approaching full employment levels.
| * | Holdings percentage(s) as of 4/30/2017. |
Growth of $100,000 Investment

Total Returns as of April 30, 2017
| Annualized | Annualized Since | |||
| Six Months | One Year | Three Year | Inception (11/1/13) | |
| Class N | (2.68)% | (4.91)% | (3.54)% | (2.42)% |
| Class C | (3.05)% | (5.71)% | (4.25)% | (3.17)% |
| Class A with load of 4.50% | (7.07)% | (9.30)% | (5.20)% | (3.90)% |
| Class A without load | (2.69)% | (5.03)% | (3.74)% | (2.63)% |
| Barclays Global ex-US Aggregate Bond Index Unhedged | (2.48)% | (4.51)% | (2.66)% | (1.42)% |
| Morningstar World Bond Category | 0.43% | 1.41% | 0.36% | 1.11% |
The Barclays Global ex US Aggregate Bond Index Unhedged is designed to be a broad based measure of the global investment-grade, fixed rate, fixed income corporate markets outside the United States. Investors cannot invest directly in an index or benchmark.
The Morningstar World Bond Category is generally representative of funds that invest at least 40% of bonds in foreign markets. Investors cannot invest directly in an index or benchmark.
As disclosed in the Trust’s latest registration statement, the Fund’s total annual operating expenses, including underlying funds, are 1.28% for Class N, 2.03% for Class C and 1.53% for Class A. Class A shares are subject to a sales load of 4.50% and a deferred sales charge of up to 0.75%. The performance data quoted here represents past performance, which is not indicative of future results. Current performance may be lower or higher than the performance data quoted. The investment return and NAV will fluctuate, so that an investor’s shares, when redeemed, may be worth more or less than their original cost. Total returns are calculated assuming reinvestment of all dividends and capital gains distributions, if any. The returns do not reflect the deductions of taxes a shareholder would pay on the redemption of fund shares or fund distributions. For performance information current to the most recent month-end, please call 1-800-442-4358 or visit our website www.dunham.com.
44
| SCHEDULE OF INVESTMENTS (Unaudited) |
| Dunham International Opportunity Bond Fund |
| April 30, 2017 |
| Interest | ||||||||||||
| Security | Principal Amount | Rate% | Maturity Date | Value | ||||||||
| CORPORATE BONDS & NOTES - 39.6% | ||||||||||||
| AGRICULTURE - 1.5% | ||||||||||||
| BAT International Finance PLC | 200,000 | EUR | 0.8750 | 10/13/2023 | $ | 216,693 | ||||||
| Imperial Brands Finance PLC | 200,000 | EUR | 2.2500 | 2/26/2021 | 232,093 | |||||||
| 448,786 | ||||||||||||
| AUTO MANUFACTURERS - 2.1% | ||||||||||||
| BMW Finance NV | 350,000 | EUR | 0.7500 | 4/15/2024 | 384,447 | |||||||
| FCE Bank PLC | 200,000 | EUR | 1.8750 | 6/24/2021 | 228,535 | |||||||
| 612,982 | ||||||||||||
| BANKS - 14.0% | ||||||||||||
| ABN AMRO Bank NV | 200,000 | EUR | 6.3750 | 4/27/2021 | 266,706 | |||||||
| Banco de Sabadell SA | 200,000 | EUR | 0.6250 | 11/3/2020 | 222,379 | |||||||
| BNP Paribas SA | 200,000 | EUR | 2.8750 | 9/26/2023 | 246,952 | |||||||
| BPCE SA | 100,000 | EUR | 4.6250 | 7/18/2023 | 128,658 | |||||||
| CaixaBank SA | 300,000 | EUR | 0.6250 | 11/12/2020 | 333,819 | |||||||
| Commonwealth Bank of Australia | 200,000 | EUR | 2.0000 | + | 4/22/2027 | 225,735 | ||||||
| Credit Agricole SA/London | 100,000 | EUR | 3.8750 | 2/13/2019 | 116,565 | |||||||
| Danske Bank A/S | 250,000 | EUR | 0.5000 | 5/6/2021 | 275,739 | |||||||
| HSBC Holdings PLC | 200,000 | EUR | 6.0000 | 6/10/2019 | 244,355 | |||||||
| Intesa Sanpaolo SpA | 200,000 | EUR | 4.3750 | 10/15/2019 | 239,328 | |||||||
| KBC Group NV | 200,000 | EUR | 2.3750 | + | 11/25/2024 | 228,164 | ||||||
| Lloyds Bank PLC | 150,000 | EUR | 6.5000 | 3/24/2020 | 191,725 | |||||||
| National Australia Bank Ltd. | 100,000 | GBP | 5.1250 | 12/9/2021 | 153,033 | |||||||
| Nordea Bank AB | 200,000 | EUR | 1.0000 | + | 9/7/2026 | 218,560 | ||||||
| Santander UK PLC | 100,000 | EUR | 2.0000 | 1/14/2019 | 112,598 | |||||||
| Skandinaviska Enskilda Banken AB | 200,000 | EUR | 1.3750 | + | 10/31/2028 | 217,441 | ||||||
| Societe Generale SA | 100,000 | EUR | 0.7500 | 5/26/2023 | 109,789 | |||||||
| UBS Group Funding Switzerland AG | 200,000 | EUR | 1.2500 | 9/1/2026 | 213,884 | |||||||
| Westpac Banking Corp | 250,000 | EUR | 2.1250 | 7/9/2019 | 286,291 | |||||||
| 4,031,721 | ||||||||||||
| BEVERAGES - 1.8% | ||||||||||||
| Anheuser-Busch InBev SA/NV | 250,000 | USD | 0.8750 | 3/17/2022 | 280,519 | |||||||
| Pernod Richard SA | 200,000 | EUR | 1.5000 | 5/18/2026 | 224,188 | |||||||
| 504,707 | ||||||||||||
| CHEMICALS - 2.7% | ||||||||||||
| Air Liquide Finance SA | 400,000 | EUR | 0.7500 | 6/13/2024 | 439,392 | |||||||
| Linde Finance BV | 300,000 | EUR | 3.1250 | 12/12/2018 | 344,099 | |||||||
| 783,491 | ||||||||||||
| DIVERSIFIED FINANCIAL SERVICES - 0.5% | ||||||||||||
| Cabot Financial Luxembourg SA | 100,000 | GBP | 6.5000 | 4/1/2021 | 133,950 | |||||||
| ELECTRIC - 4.0% | ||||||||||||
| Cadent Finance PLC | 400,000 | EUR | 0.6250 | 9/22/2024 | 426,805 | |||||||
| Enel Finance International NV | 200,000 | EUR | 1.9660 | 1/27/2025 | 230,463 | |||||||
| Engie SA | 200,000 | EUR | 2.3750 | 5/19/2026 | 243,099 | |||||||
| Iberdrola Finanzas SAU | 200,000 | EUR | 4.1250 | 3/23/2020 | 243,493 | |||||||
| 1,143,860 | ||||||||||||
| ELECTRONICS - 0.4% | ||||||||||||
| Trionista Holdco GmbH | 100,000 | EUR | 5.0000 | 4/30/2020 | 110,896 | |||||||
| ENGINEERING & CONSTRUCTION - 1.4% | ||||||||||||
| ABB Finance BV | 350,000 | EUR | 2.6250 | 3/26/2019 | 400,548 | |||||||
| ENTERTAINMENT - 0.5% | ||||||||||||
| CPUK Finance Ltd. | 100,000 | GBP | 7.0000 | 8/28/2020 | 136,288 | |||||||
| FOOD - 0.7% | ||||||||||||
| Danone SA | 200,000 | EUR | 0.7090 | 11/3/2024 | 216,020 | |||||||
See accompanying notes to financial statements.
45
| SCHEDULE OF INVESTMENTS (Unaudited) |
| Dunham International Opportunity Bond Fund (Continued) |
| April 30, 2017 |
| Interest | ||||||||||||
| Security | Principal Amount | Rate% | Maturity Date | Value | ||||||||
| INSURANCE - 2.1% | ||||||||||||
| Aviva PLC | 100,000 | EUR | 3.3750 | + | 12/4/2045 | $ | 111,712 | |||||
| Great-West Lifeco, Inc. | 200,000 | EUR | 2.5000 | 4/18/2023 | 239,169 | |||||||
| Willow No 2 Ireland PLC for Zurich Insurance Co. Ltd. | 200,000 | EUR | 3.3750 | 6/27/2022 | 250,534 | |||||||
| 601,415 | ||||||||||||
| IRON / STEEL - 0.2% | ||||||||||||
| BlueScope Steel Finance Ltd. / BlueScope Steel Finance USA LLC - 144A | 50,000 | USD | 6.5000 | 5/15/2021 | 53,125 | |||||||
| MEDIA - 0.8% | ||||||||||||
| Altice Financing SA | 100,000 | EUR | 6.5000 | 1/15/2022 | 114,884 | |||||||
| SFR Group SA - 144A | 100,000 | EUR | 5.3750 | 5/15/2022 | 113,588 | |||||||
| 228,472 | ||||||||||||
| MINING - 0.8% | ||||||||||||
| Anglo American Capital PLC | 100,000 | EUR | 3.2500 | 4/3/2023 | 118,441 | |||||||
| Glencore Finance Europe SA | 100,000 | EUR | 1.6250 | 1/18/2022 | 111,771 | |||||||
| 230,212 | ||||||||||||
| OIL & GAS - 2.4% | ||||||||||||
| BG Energy Capital PLC | 250,000 | EUR | 1.2500 | 11/21/2022 | 284,584 | |||||||
| BP Capital Markets PLC | 250,000 | EUR | 0.8300 | 9/19/2024 | 270,815 | |||||||
| Petrobras Global Finance BV | 100,000 | EUR | 5.8750 | 3/7/2022 | 122,272 | |||||||
| 677,671 | ||||||||||||
| PACKAGING & CONTAINERS - 0.4% | ||||||||||||
| Ardagh Packaging Finance PLC / Ardagh Holdings USA Inc - 144A | 100,000 | EUR | 4.1250 | 5/15/2023 | 115,609 | |||||||
| PHARMACEUTICALS - 0.4% | ||||||||||||
| Grifols SA - 144A | 100,000 | EUR | 3.2000 | 5/1/2025 | 108,408 | |||||||
| SAVINGS & LOANS - 1.5% | ||||||||||||
| Nationwide Building Society | 250,000 | EUR | 1.6250 | 4/3/2019 | 280,745 | |||||||
| Nationwide Building Society | 100,000 | GBP | 5.6250 | 9/9/2019 | 143,859 | |||||||
| 424,604 | ||||||||||||
| TELECOMMUNICATIONS - 1.4% | ||||||||||||
| Deutsche Telekom International Finance BV | 200,000 | EUR | 0.6250 | 4/3/2023 | 218,081 | |||||||
| Inmarsat Finance PLC | 100,000 | USD | 4.8750 | 5/15/2022 | 101,500 | |||||||
| Telecom Italia SpA/Milano | 50,000 | GBP | 6.3750 | 6/24/2019 | 70,737 | |||||||
| 390,318 | ||||||||||||
| TOTAL CORPORATE BONDS & NOTES (Cost - $11,771,015) | 11,353,083 | |||||||||||
| FOREIGN GOVERNMENT BONDS - 57.4% | ||||||||||||
| Bundesrepublik Deutschland | 270,000 | EUR | 2.5000 | 7/4/2044 | 393,397 | |||||||
| Canadian Government Bond | 175,000 | CAD | 4.0000 | 6/1/2041 | 171,692 | |||||||
| Denmark Government Bond | 2,000,000 | DKK | 3.0000 | 11/15/2021 | 336,796 | |||||||
| French Republic Government Bond OAT | 320,000 | EUR | 0.5000 | 5/25/2026 | 342,910 | |||||||
| French Republic Government Bond OAT | 250,000 | EUR | 0.2500 | 11/25/2026 | 259,242 | |||||||
| French Republic Government Bond OAT | 130,000 | EUR | 4.7500 | 4/25/2035 | 217,871 | |||||||
| French Republic Government Bond OAT | 160,000 | EUR | 4.5000 | 4/25/2041 | 273,266 | |||||||
| Hungary Government International Bond | 100,000 | USD | 5.3750 | 3/25/2024 | 112,337 | |||||||
| Indonesia Government International Bond | 100,000 | EUR | 2.8750 | 7/8/2021 | 116,387 | |||||||
| Indonesia Government International Bond - 144A | 150,000 | EUR | 2.8750 | 7/8/2021 | 174,581 | |||||||
| Ireland Government Bond | 110,000 | EUR | 5.4000 | 3/13/2025 | 163,538 | |||||||
| Italy Buoni Poliennali Del Tesoro | 200,000 | EUR | 4.2500 | 9/1/2019 | 238,245 | |||||||
| Italy Buoni Poliennali Del Tesoro | 100,000 | EUR | 5.5000 | 11/1/2022 | 133,795 | |||||||
| Italy Buoni Poliennali Del Tesoro | 340,000 | EUR | 4.5000 | 3/1/2024 | 438,872 | |||||||
| Italy Buoni Poliennali Del Tesoro | 300,000 | EUR | 3.7500 | 9/1/2024 | 371,066 | |||||||
| Italy Buoni Poliennali Del Tesoro | 220,000 | EUR | 5.0000 | 9/1/2040 | 307,906 | |||||||
| Japan Government Ten Year Bond | 133,850,000 | JPY | 0.8000 | 9/20/2022 | 1,262,153 | |||||||
| Japan Government Thirty Year Bond | 122,600,000 | JPY | 2.5000 | 6/20/2036 | 1,494,199 | |||||||
| Japan Government Twenty Year Bond | 185,250,000 | JPY | 1.9000 | 9/20/2023 | 1,877,815 | |||||||
| Japan Government Twenty Year Bond | 101,500,000 | JPY | 2.1000 | 12/20/2027 | 1,109,207 | |||||||
| Japan Government Twenty Year Bond | 85,000,000 | JPY | 1.7000 | 9/20/2033 | 924,121 | |||||||
See accompanying notes to financial statements.
46
| SCHEDULE OF INVESTMENTS (Unaudited) |
| Dunham International Opportunity Bond Fund (Continued) |
| April 30, 2017 |
| Interest | ||||||||||||
| Security | Principal Amount | Rate% | Maturity Date | Value | ||||||||
| FOREIGN GOVERNMENT BONDS - 57.4% (Continued) | ||||||||||||
| Kingdom of Belgium Government | 110,000 | EUR | 4.2500 | 9/28/2022 | $ | 148,604 | ||||||
| Kingdom of Belgium Government - 144A | 110,000 | EUR | 5.0000 | 3/28/2035 | 192,830 | |||||||
| Korea Treasury Bond | 728,590,000 | KRW | 3.0000 | 9/10/2024 | 679,120 | |||||||
| Malaysia Government Bond | 400,000 | MYR | 3.9000 | 11/30/2026 | 91,018 | |||||||
| Mexican Bonos | 11,050,000 | MXN | 5.7500 | 3/5/2026 | 529,479 | |||||||
| Province of British Columbia Canada | 100,000 | CAD | 4.7000 | 6/18/2037 | 92,917 | |||||||
| Province of British Columbia Canada | 100,000 | CAD | 4.9500 | 6/18/2040 | 97,299 | |||||||
| Province of Ontario Canada | 550,000 | CAD | 2.4000 | 6/2/2026 | 409,682 | |||||||
| Republic of Austria Government Bond - 144A | 220,000 | EUR | 1.2000 | 10/20/2025 | 257,041 | |||||||
| Republic of Poland Government Bond | 300,000 | PLN | 5.7500 | 9/23/2022 | 88,163 | |||||||
| Romanian Government International Bond | 100,000 | EUR | 2.8750 | 10/28/2024 | 117,402 | |||||||
| Russian Foreign Bond - Eurobond | 300,000 | EUR | 3.6250 | 9/16/2020 | 361,876 | |||||||
| Spain Government Bond - 144A | 80,000 | EUR | 5.4000 | 1/31/2023 | 110,593 | |||||||
| Spain Government Bond - 144A | 250,000 | EUR | 4.4000 | 10/31/2023 | 333,484 | |||||||
| Spain Government Bond - 144A | 250,000 | EUR | 3.8000 | 4/30/2024 | 323,567 | |||||||
| Spain Government Bond - 144A | 50,000 | EUR | 1.9500 | 4/30/2026 | 56,634 | |||||||
| Spain Government Bond - 144A | 130,000 | EUR | 4.2000 | 1/31/2037 | 178,003 | |||||||
| Sweden Government Bond | 3,890,000 | SEK | 4.2500 | 3/12/2019 | 479,810 | |||||||
| Swiss Confederation Government Bond | 400,000 | CHF | 4.0000 | 2/11/2023 | 508,333 | |||||||
| United Kingdom Gilt | 110,000 | GBP | 4.2500 | 6/7/2032 | 195,927 | |||||||
| United Kingdom Gilt | 155,000 | GBP | 4.5000 | 12/7/2042 | 314,972 | |||||||
| United Kingdom Gilt | 60,000 | GBP | 4.2500 | 12/7/2055 | 136,834 | |||||||
| United Kingdom Gilt | 20,000 | GBP | 4.0000 | 1/22/2060 | 45,438 | |||||||
| TOTAL FOREIGN GOVERNMENT BONDS (Cost - $16,844,695) | 16,468,422 | |||||||||||
| MORTGAGE BACKED SECURITIES - 0.3% | ||||||||||||
| Sunrise Srl 2015-3 A1 (Cost - $82,658) | 73,922 | EUR | 0.5270 | + | 5/27/2035 | 80,873 | ||||||
| WHOLE LOAN COLLATERAL - 0.8% | ||||||||||||
| Bankinter 10 FTA | 112,546 | EUR | 2.7300 | + | 6/21/2043 | 121,094 | ||||||
| Fondo de Titulizacion de Activos Santander Hipotecario 2 | 51,387 | EUR | 4.2500 | + | 1/18/2049 | 55,023 | ||||||
| Silverstone Master Issuer PLC - 144A | 40,001 | GBP | 0.7053 | + | 1/21/2070 | 51,864 | ||||||
| TOTAL WHOLE LOAN COLLATERAL (Cost - $234,595) | 227,981 | |||||||||||
| Shares | ||||||||||||
| SHORT-TERM INVESTMENTS - 0.5% | ||||||||||||
| MONEY MARKET FUND - 0.5% | ||||||||||||
| Fidelity Institutional Money Market | ||||||||||||
| Funds - Government Portfolio (Cost - $154,609) | 154,609 | 0.3740 | + | 154,609 | ||||||||
| TOTAL INVESTMENTS - 98.6% (Cost - $29,087,572) (a) | $ | 28,284,968 | ||||||||||
| OTHER ASSETS LESS LIABILITIES - 1.4% | 396,863 | |||||||||||
| NET ASSETS - 100.0% | $ | 28,681,831 | ||||||||||
| CAD - Canadian Dollar | EUR - Euro | KRW - South Korean Won | PLN - Polish Zloty | ||
| CHF - Swiss Franc | GBP - United Kingdom Pound | MXN - Mexican Peso | SEK - Swedish Krona | ||
| DKK - Danish Krone | JPY - Japanese Yen | MYR - Malaysian Ringgit | USD - US Dollar |
| + | Variable rate security. Interest rate is as of April 30, 2017. |
144A - Security exempt from registration under Rule 144A of the Securities Act of 1933. These securities may be sold in transactions exempt from registration, normally to qualified institutional buyers. The 144A securities amounted to $2,017,463 or 7.0% of net assets.
See accompanying notes to financial statements.
47
| SCHEDULE OF INVESTMENTS (Unaudited) |
| Dunham International Opportunity Bond Fund (Continued) |
| April 30, 2017 |
| Unrealized | ||||||||
| Appreciation | ||||||||
| Futures Contracts | Contracts | (Depreciation) | ||||||
| FUTURES CONTRACTS PURCHASED * | ||||||||
| AUST 10Y BOND Future maturing June, 2017 | ||||||||
| (Underlying Face Amount at Value $485,053) | 5 | $ | 15,101 | |||||
| Canadian 10Y Bond Future maturing June, 2017 | ||||||||
| (Underlying Face Amount at Value $102,070) | 1 | 2,451 | ||||||
| EURO BUXL 30Y BND Future maturing June, 2017 | ||||||||
| (Underlying Face Amount at Value $184,207) | 1 | (1,261 | ) | |||||
| EURO-SCHATZ Future maturing June, 2017 | ||||||||
| (Underlying Face Amount at Value $1,222,238) | 10 | (1,705 | ) | |||||
| Long Gilt Future maturing June, 2017 | ||||||||
| (Underlying Face Amount at Value $995,696) | 6 | 16,892 | ||||||
| NET UNREALIZED GAIN FROM FUTURES CONTRACTS PURCHASED | �� | 31,478 | ||||||
| FUTURES CONTRACTS SOLD * | ||||||||
| EURO-BOBL Future maturing June, 2017 | ||||||||
| (Underlying Face Amount at Value $1,435,890) | (10 | ) | 4,713 | |||||
| EURO-BOND Future maturing June, 2017 | ||||||||
| (Underlying Face Amount at Value $1,937,874) | (11 | ) | (7,486 | ) | ||||
| NET UNREALIZED LOSS FROM FUTURES CONTRACTS SOLD | (2,773 | ) | ||||||
| NET UNREALIZED GAIN FROM FUTURES CONTRACTS | $ | 28,705 | ||||||
| * | Face amounts are the underlying reference notional amounts to stock exchange indices and bonds upon which the fair value of the futures contracts traded by the Fund are based. While face amounts do not represent the current fair value and are not necessarily indicative of the future cash flows of the Fund’s futures contracts, the underlying price changes in relation to the variables specified by the face amounts affect the fair value of these derivative financial instruments. Instrument is non-income producing. |
| Portfolio Composition ** - (Unaudited) | ||||||||||
| Japan | 23.6 | % | Canada | 3.6 | % | |||||
| Britain | 13.1 | % | Sweden | 3.2 | % | |||||
| France | 10.4 | % | Belgium | 3.0 | % | |||||
| Spain | 7.4 | % | Switzerland | 2.6 | % | |||||
| Netherlands | 7.0 | % | Other Countries | 19.4 | % | |||||
| Italy | 6.7 | % | Total | 100.00 | % | |||||
| ** | Based on total value of investments as of April 30, 2017. |
Percentage may differ from Schedule of Investments which are based on Fund net assets.
See accompanying notes to financial statements.
48
| Dunham Appreciation & Income Fund |
| Message from the Sub-Adviser (PENN Capital Management Company, Inc.) |
The first half of the fiscal year was characterized by rising optimism that the US growth rate could accelerate due to potential tax reform that could lower corporate rates from the newly elected administration. The optimism was reflected in strong stock market returns through the six-month period ended April 30, 2017. U.S. large cap stocks, as measured by the Russell 1000 Index, rose 13.4 percent during the six-month, period while U.S. small cap stocks, as measured by the Russell 2000 Index, gained 18.3 percent. Less than one-third of the convertible securities in the Bank of America/Merrill Lynch All Convertibles All Qualities Index are issued by large capitalization companies. Therefore, the majority are more closely related to the movements in small capitalization and mid capitalization stocks. During the six-month period, convertible securities increased 10.5 percent. Most convertible securities are considered to be “equity-sensitive,” meaning significant amounts of a convertible security’s price movements are related to the movements of the underlying common stock rather than the bond itself. However, the bond component may still play a meaningful role in the pricing of the convertible security. Bonds in general, as measured by the Barclays Aggregate Bond Index, lost 0.7 percent during the last six-month period.
The Sub-Adviser continues to focus on identifying credit improvement opportunities in small and mid capitalization companies, and non-investment grade securities. The Sub-Adviser looks to maximize return through both the value of the fixed income features and price changes in the underlying common stock. This is in contrast to convertible securities that trade predominantly on either the underlying stock movements or on the underlying bond characteristics. The Sub-Adviser believes that by focusing on this area of the convertible securities spectrum, it may reduce the volatility experienced from the common stocks while benefitting from the support offered by the bond features.
During the six-month period, the best performing sectors for the fund were technology and telecommunications. However, these within these sectors, there was both winners and losers. For the downside, lower oil prices weighed on the energy sector over the past six months ended April 30, 2017. The Fund also underperformed in the healthcare sector due to company specific events.
Within the technology sector, Teradyne, Inc. (880770AF9) (holding percentage*: 3.43 percent), a leading supplier of automation equipment for test and industrial applications, gained 43.1 percent for the six-month period ended April 30, 2017. The company saw strong bookings in their core semiconductor test market while seeing very strong growth in their Universal Robotics division that aids in manufacturing and warehouse automation. Also, within the same sector, Micron Technology Inc. (595112AY9) (holding percentage*: 2.81 percent), a world leader in memory and semiconductor technology, rose 26.9 percent during the six-month period. The company saw solid price increases in DRAM pricing. In the telecommunications sector, Gogo Inc. (38046CAB5) (holding percentage*: 4.13 percent), a provider of in-flight broadband Internet service and other connectivity services for commercial and business aircraft, increased 16.2 percent during the six-month period ended April 30, 2017.
Within the healthcare sector, Depomed Inc. (249908AA2) (holding percentage*: 2.19 percent), a specialty pharmaceutical company focused on products to treat pain and other central nervous system conditions., was one of the weakest performers in the Fund during the six-month period falling 30.5 percent. The company ended their strategic review without selling the company. The situation was made more complicated when an activist fund invested in the company and replaced management. The Fund sold the position due to these events. Another healthcare holding that detracted from absolute performance was Impax Laboratories, Inc. (45256BAE1) (holding percentage*: 3.43 percent), a technology-based specialty pharmaceutical company utilizing a core competency in drug delivery and formulation expertise, lost 29.6 percent for the six-month period ended April 30, 2017. The company struggled due to a weak generic drug pricing environment and a poorly timed acquisition. The weak spot, in an otherwise positive telecom sector, was Frontier Communications Corp. (35906A207) (holding percentage*: 2.13 percent), a leading provider of data, video and voice services to commercial and consumer customers in 29 states, declined 29.0 percent during the six-month period. The company struggled to integrate the Verizon wireline acquisition during the period and the position was sold by the fund during the six-month period ended April 30, 2017.
The Sub-Adviser expects improving growth in the US market with moderately rising interest rates. The Sub-Adviser feels this should provide a favorable background for convertible securities and convertible issuance. The Sub-Adviser continues to focus on being overweight cyclical areas over defensive sectors of the market in the current environment and avoid rate-sensitive areas like utilities and REITs.
| * | Holdings percentage(s) as of 4/30/2017. |
Growth of $100,000 Investment
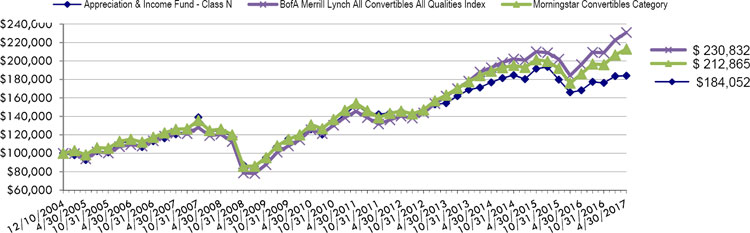
Total Returns as of April 30, 2017
| Six | Annualized | Annualized | Annualized | Annualized Since | ||||||||
| Months | One Year | Three Years | Five Years | Ten Years | Inception (12/10/04) | |||||||
| Class N | 4.42% | 9.45% | 1.34% | 4.80% | 4.32% | 5.05% | ||||||
| Class C | 3.84% | 8.39% | 0.30% | 3.73% | 3.28% | 4.01% | ||||||
| Class A with load of 5.75% | (1.74)% | 2.98% | (0.91)% | 3.29% | 3.44% | 3.77%* | ||||||
| Class A without load | 4.26% | 9.29% | 1.08% | 4.53% | 4.06% | 4.37%* | ||||||
| BofA Merrill Lynch All Convertibles All Qualities Index | 10.52% | 17.70% | 6.19% | 10.48% | 6.60% | 6.98% | ||||||
| Morningstar Convertibles Category | 8.61% | 14.42% | 1.34% | 1.53% | 0.53% | 6.28% |
| * | Class A commenced operations on January 3, 2007. |
The BofA Merrill Lynch All Convertibles All Qualities Index is a widely used index that measures convertible securities’ performance. It measures the performance of U.S. dollar-denominated convertible securities not currently in bankruptcy with a total market value greater than $50 million at issuance.
The Morningstar Convertibles Category is generally representative of convertible bond portfolios that are designed to offer some of the capital-appreciation of stock portfolios, while also supplying some of the safety and yield of bond portfolios.
As disclosed in the Trust’s latest registration statement as supplemented,, the Fund’s total annual operating expenses, including the cost of underlying funds, are 1.38% for Class N, 2.38% for Class C and 1.63% for Class A. Class A shares are subject to a sales load of 5.75% and a deferred sales charge of up to 0.75%. The performance data quoted here represents past performance, which is not indicative of future results. Current performance may be lower or higher than the performance data quoted. The investment return and NAV will fluctuate, so that an investor’s shares, when redeemed, may be worth more or less than their original cost. Total returns are calculated assuming reinvestment of all dividends and capital gains distributions, if any. The returns do not reflect the deductions of taxes a shareholder would pay on the redemption of fund shares or fund distributions. For performance information current to the most recent month-end, please call 1-800-442-4358 or visit our website www.dunham.com.
49
| SCHEDULE OF INVESTMENTS (Unaudited) |
| Dunham Appreciation & Income Fund |
| April 30, 2017 |
| Principal | Interest | Maturity | ||||||||||||
| Security | Amount | Rate | Date | Value | ||||||||||
| CONVERTIBLE BONDS - 75.5% | ||||||||||||||
| BUILDING MATERIALS - 2.7% | ||||||||||||||
| Cemex SAB de CV | $ | 420,000 | 3.7500 | % | 3/15/2018 | $ | 492,188 | |||||||
| COMMERCIAL SERVICES - 5.6% | ||||||||||||||
| Live Nation Entertainment, Inc. | 680,000 | 2.5000 | 5/15/2019 | 760,750 | ||||||||||
| Square, Inc. - 144A | 250,000 | 0.3750 | 3/1/2022 | 265,625 | ||||||||||
| 1,026,375 | ||||||||||||||
| DIVERSIFIED FINANCIAL SERVICES - 2.5% | ||||||||||||||
| Blackhawk Network Holdings, Inc. - 144A | 425,000 | 1.5000 | 1/15/2022 | 462,719 | ||||||||||
| ELECTRONICS - 2.3% | ||||||||||||||
| OSI Systems, Inc. - 144A | 425,000 | 1.2500 | 9/1/2022 | 423,141 | ||||||||||
| HEALTHCARE-PRODUCTS - 8.6% | ||||||||||||||
| Hologic, Inc. | 357,000 | 2.0000 | 3/1/2042 | 521,889 | ||||||||||
| NuVasive, Inc. | 385,000 | 2.2500 | 3/15/2021 | 514,215 | ||||||||||
| Wright Medical Group, Inc. | 462,000 | 2.0000 | 2/15/2020 | 543,427 | ||||||||||
| 1,579,531 | ||||||||||||||
| HOME BUILDERS - 2.4% | ||||||||||||||
| CalAtlantic Group, Inc. | 368,000 | 1.6250 | 5/15/2018 | 450,110 | ||||||||||
| INSURANCE - 3.4% | ||||||||||||||
| AmTrust Financial Services, Inc. | 480,000 | 2.7500 | 12/15/2044 | 345,900 | ||||||||||
| Fidelity National Financial, Inc. | 120,000 | 4.2500 | 8/15/2018 | 275,025 | ||||||||||
| 620,925 | ||||||||||||||
| INTERNET - 8.9% | ||||||||||||||
| FireEye, Inc. | 368,000 | 1.6250 | 6/1/2035 | 332,580 | ||||||||||
| Pandora Media, Inc. | 435,000 | 1.7500 | 12/1/2020 | 426,572 | ||||||||||
| Priceline Group, Inc. | 320,000 | 0.3500 | 6/15/2020 | 468,200 | ||||||||||
| VeriSign, Inc. | 157,000 | 4.4520 | 8/15/2037 | 409,770 | ||||||||||
| 1,637,122 | ||||||||||||||
| MEDIA - 4.4% | ||||||||||||||
| World Wrestling Entertainment, Inc. - 144A | 750,000 | 3.3750 | 12/15/2023 | 816,094 | ||||||||||
| OIL & GAS - 8.5% | ||||||||||||||
| Ensco Jersey Finance Ltd - 144A | 460,000 | 3.0000 | 1/31/2024 | 426,938 | ||||||||||
| Oasis Petroleum, Inc. ^ | 465,000 | 2.6250 | 9/15/2023 | 566,719 | ||||||||||
| PDC Energy, Inc. | 590,000 | 1.1250 | 9/15/2021 | 572,669 | ||||||||||
| 1,566,326 | ||||||||||||||
| PHARMACEUTICALS - 1.8% | ||||||||||||||
| Herbalife Ltd. | 330,000 | 2.0000 | 8/15/2019 | 327,113 | ||||||||||
| SEMICONDUCTORS - 17.5% | ||||||||||||||
| Micron Technology, Inc. | 475,000 | 3.0000 | 11/15/2043 | 515,375 | ||||||||||
| NVIDIA Corp. | 81,000 | 1.0000 | 12/1/2018 | 419,378 | ||||||||||
| ON Semiconductor Corp. | 385 | 1.0000 | 12/1/2020 | 407,859 | ||||||||||
| Rambus, Inc. | 324,000 | 1.1250 | 8/15/2018 | 373,207 | ||||||||||
| Silicon Laboratories, Inc. - 144A | 405,000 | 1.3750 | 3/1/2022 | 427,022 | ||||||||||
| Teradyne, Inc. - 144A ^ | 500,000 | 1.2500 | 12/15/2023 | 628,125 | ||||||||||
| Veeco Instruments, Inc. | 415,000 | 2.7000 | 1/15/2023 | 458,056 | ||||||||||
| 3,229,022 | ||||||||||||||
| SOFTWARE - 2.8% | ||||||||||||||
| Nice Systems, Inc. - 144A | 500,000 | 1.2500 | 1/15/2024 | 519,375 | ||||||||||
See accompanying notes to financial statements.
50
| SCHEDULE OF INVESTMENTS (Unaudited) |
| Dunham Appreciation & Income Fund (Continued) |
| April 30, 2017 |
| Principal | Interest | Maturity | ||||||||||||||
| Security | Amount | Rate | Date | Value | ||||||||||||
| TELECOMMUNICATIONS - 4.1% | ||||||||||||||||
| Gogo, Inc. | $ | 850,000 | 3.7500 | % | 3/1/2020 | $ | 757,562 | |||||||||
| TOTAL CONVERTIBLE BONDS (Cost - $13,363,044) | 13,907,603 | |||||||||||||||
| Dividend | ||||||||||||||||
| Shares | Rate | |||||||||||||||
| PREFERRED STOCK - 21.3% | ||||||||||||||||
| DIVERSIFIED FINANCIAL SERVICES - 2.8% | ||||||||||||||||
| AMG Capital Trust II | 8,900 | 5.1500 | % | 509,525 | ||||||||||||
| HEALTCARE SERVICES - 3.1% | ||||||||||||||||
| Anthem, Inc. | 11,200 | 5.2500 | % | 575,456 | ||||||||||||
| METAL FABRICATION/HARDWARE - 2.8% | ||||||||||||||||
| Rexnord, Corp. | 9,200 | 5.7500 | % | 518,420 | ||||||||||||
| OIL & GAS - 6.0% | ||||||||||||||||
| Resolute Energy Corp. - 144A | 385 | 8.1250 | % | 552,475 | ||||||||||||
| WPX Energy, Inc. | 10,175 | 6.2500 | % | 557,488 | ||||||||||||
| 1,109,963 | ||||||||||||||||
| PHARMACEUTICALS - 3.5% | ||||||||||||||||
| Allergan PLC | 735 | 5.5000 | % | 636,348 | ||||||||||||
| TELECOMUNICATIONS - 3.1% | ||||||||||||||||
| T-Mobile US, Inc. | 5,150 | 5.5000 | % | 565,058 | ||||||||||||
| TOTAL PREFERRED STOCK (Cost - $3,855,918) | 3,914,770 | |||||||||||||||
| Interest | ||||||||||||||||
| Rate | ||||||||||||||||
| SHORT-TERM INVESTMENT - 2.8% | ||||||||||||||||
| MONEY MARKET FUND - 2.8% | ||||||||||||||||
| First American Government Obligations Fund | 508,870 | 0.63 | %+ | 508,870 | ||||||||||||
| TOTAL SHORT-TERM INVESTMENT (Cost - $508,870) | ||||||||||||||||
| COLLATERAL FOR SECURITIES LOANED - 6.7% | ||||||||||||||||
| Mount Vernon Prime Portfolio (Cost - $1,224,363) | 1,224,363 | 1.12 | %+ | 1,224,363 | ||||||||||||
| TOTAL INVESTMENTS - 106.3% (Cost - $18,952,195) | $ | 19,555,606 | ||||||||||||||
| LIABILITIES LESS OTHER ASSETS - (6.3)% | (1,145,034 | ) | ||||||||||||||
| TOTAL NET ASSETS - 100.0% | $ | 18,410,572 | ||||||||||||||
| ^ | All or a portion of these securities are on loan. Total loaned securities had a value of $1,193,992 at April 30, 2017. |
| * | Non-income producing security. |
| + | Variable rate security. Interest rate is as of April 30, 2017. |
144A- Security exempt from registration under Rule 144A of the Securities Act of 1933. These securities may be sold in transactions exempt from registration, normally to qualified institutional buyers.
| Portfolio Composition * - (Unaudited) | ||||
| Convertible Bonds | 71.1 | % | ||
| Preferred Stock | 20.0 | % | ||
| Collateral For Securities Loaned | 6.3 | % | ||
| Short-Term Investment | 2.6 | % | ||
| Total | 100.0 | % | ||
| * | Based on total value of investments as of April 30, 2017. |
Percentage may differ from Schedule of Investments which are based on Fund net assets.
See accompanying notes to financial statements.
51
| Dunham Large Cap Value Fund |
| Message from the Sub-Adviser (Rothschild Asset Management, Inc.) |
U.S. equity markets had strong performances during the six-month period ended April 30, 2017. Although there was some divergence in the amount of returns, all underlying sectors had positive performance. Large cap value stocks, as measured by the Russell 1000 Value Index, increased 11.7 percent over the last six months. However, the gap between the best performing large cap value sector (financials) and the worst performing sector (energy) was more than 20 percent. The primary macro-oriented themes that influenced this polarized performance were that energy prices fell and financials were boosted by a combination of a Fed Fund Rate increase and the belief that the Trump administration would eliminate stricter regulations while creating pro-growth policies. The stock markets have slowed down a little since the initial push of the “Trump Rally” had major indices hitting all-time highs as concerns over the ability of the administration to get the pro-business agenda approved in congress have slowed down the market optimism.
Even though the Fund was slightly underweight financials during the six-month period ended April 30, 2017, it still outperformed the benchmark in the sector. Financials received a nice bump during the period from a couple of factors. With the election of Donald Trump as President, the market viewed business-friendly tax reform and lighter regulations as a much higher possibility. The markets viewed a business man in office as leaning towards a pro-growth environment. The second factor as that the Department of Labor Fiduciary Rule was no longer a certainty and the market seemed to feel that the burdensome regulation for the financial sector would not be implemented or a watered-down version would emerge. The final tailwind for financials was that the Federal Reserve appears to be continuing with slowly raising the Fed Funds Rate. Higher interest rates in general should increase profit margins for banks.
Within the financials sector the top positive holding was Bank of America Corp. (BAC) (holding percentage*: 3.56 percent), a multinational corporation that provides banking and financial products and services for individual consumers, small and middle-market businesses, institutional investors, large corporations, and governments. During the six-month period, BAC increased a strong 42.4 percent. The stock performed well based upon the factors mentioned above with regards to rising interest rates and a business-friendly administration. Another top performer in the financial sector was Ameriprise Financial, Inc. (AMP) (holding percentage*: 1.23 percent), a diversified financial services company that engages in business through its subsidiaries, providing financial planning, products and services, including wealth management, asset management, insurance, annuities and estate planning. The stock gained 46.8 percent during the six-month period ended April 30, 2017. Ameriprise Financial, which has around two-thirds of its business in asset management, may have seen most of its price increase as a direct result of the DOL Fiduciary Rule possibly weakening or going away.
The last of the top three contributing names for the period was VCA Inc. (WOOF) (holding percentage**: 0.49 percent), an animal healthcare company in the United States and Canada that operates in two segments: animal hospital and laboratory. Due to an announcement that VCA Inc. would be acquired, the stock price increased and the Fund sold the position for a gain. The stock returned 48.0 percent for the six-month period ended April 30, 2017.
The drag on the Fund returns came from a mix of sectors. The information technology sector was the biggest laggard for the Fund. Within the sector, QUALCOMM Inc. (QCOM) (holding percentage*: 1.24 percent), a global corporation that develops, designs, manufactures, and markets digital communications products and services, fell 20.4 percent during the six-month period ended April 30, 2017. Another detractor was Antero Resources Corp. (AR) (holding percentage*: 0.59 percent), an independent oil and natural gas company, acquires, explores, produces, and develops natural gas, natural gas liquids, and oil properties in the United States. The stock dropped 20.0 percent during the six-month period ended April 30, 2017. The third worst performer was from the real estate sector. Kimco Realty Corp (KIM) (holding percentage*: 0.71 percent) is an independent real estate investment trust that is primarily engaged in acquisitions, development, and management of neighborhood and community shopping centers. The firm also provides property management services relating to the management, leasing, operation, and maintenance of real estate properties. The stock lost 17.7 percent during the six-month period ended April 30, 2017.
The Sub-Adviser believes that the new administration’s initiatives, when and if formulated and implemented, might offer further headroom. The Sub-Adviser sees tax reform, financial reform, and infrastructure spending as key drivers for the future. Changes in any or all of these areas could improve corporate earnings which can be a driver of stock price. The Sub-Adviser has seen evidence of stronger earnings growth over the last six months after two to three years of flat earnings. For the most part, this growth has been across all sectors. However, much of the revenue growth and margin expansion has been dominated by information technology, financials, and energy. These three sectors are several of the largest weighted sectors for the benchmark index and therefore explain the solid returns for the space over the last six months. The Sub-Adviser sees an improving global economy and pro-growth policies in the U.S. as possible tailwinds for the large cap value space.
| * | Holdings percentage(s) as of 4/30/2017. |
Growth of $100,000 Investment
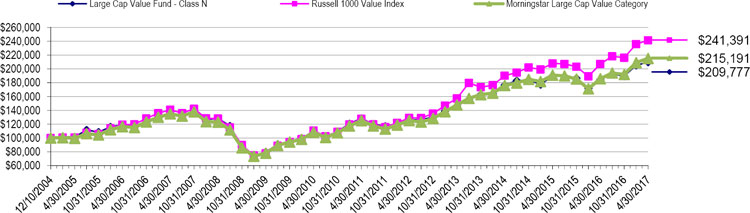
Total Returns as of April 30, 2017
| Annualized | ||||||||||||
| Six | One | Three | Annualized | Annualized | Annualized Since Inception | |||||||
| Months | Year | Years | Five Years | Ten Years | (12/10/04) | |||||||
| Class N | 10.60% | 13.57% | 5.91% | 10.61% | 4.60% | 6.16% | ||||||
| Class C | 10.13% | 12.45% | 4.87% | 9.50% | 3.56% | 5.12% | ||||||
| Class A with load of 5.75% | 4.23% | 6.88% | 3.59% | 9.02% | 3.73% | 4.11%* | ||||||
| Class A without load | 10.57% | 13.37% | 5.66% | 10.32% | 4.34% | 4.71%* | ||||||
| Russell 1000 Value Index | 11.69% | 16.55% | 8.26% | 13.32% | 5.53% | 7.37% | ||||||
| Morningstar Large Cap Value Category | 12.06% | 15.77% | 6.92% | 11.42% | 4.77% | 6.38% |
| * | Class A commenced operations on January 3, 2007. |
The Russell 1000 Value Index measures the performance of the 1,000 largest companies in the Russell 3000 Index with lower price-to-book ratios and lower forecasted growth values. Investors cannot invest directly in an index or benchmark.
The Morningstar Large Cap Value Category is generally representative of mutual funds that primarily invest in big (large capitalization) U.S. companies that are less expensive or growing more slowly than other large-cap stocks.
As disclosed in the Trust’s latest registration statement, the Fund’s total annual operating expenses, including underlying funds, are 0.93% for Class N, 1.93% for Class C and 1.18% for Class A. Class A shares are subject to a sales load of 5.75% and a deferred sales charge of up to 0.75%. The performance data quoted here represents past performance, which is not indicative of future results. Current performance may be lower or higher than the performance data quoted. The investment return and NAV will fluctuate, so that an investor’s shares, when redeemed, may be worth more or less than their original cost. Total returns are calculated assuming reinvestment of all dividends and capital gains distributions, if any. The returns do not reflect the deductions of taxes a shareholder would pay on the redemption of fund shares or fund distributions. For performance information current to the most recent month-end, please call 1-800-442-4358 or visit our website www.dunham.com.
52
| SCHEDULE OF INVESTMENTS (Unaudited) |
| Dunham Large Cap Value Fund |
| April 30, 2017 |
| Security | Shares | Value | ||||||
| COMMON STOCK - 97.3% | ||||||||
| AEROSPACE/DEFENSE - 2.3% | ||||||||
| Northrop Grumman Corp. ^ | 3,866 | $ | 950,881 | |||||
| Raytheon Co. | 3,116 | 483,634 | ||||||
| 1,434,515 | ||||||||
| AIRLINES - 1.2% | ||||||||
| Delta Air Lines, Inc. ^ | 16,351 | 742,989 | ||||||
| BANKS - 14.9% | ||||||||
| Bank of America Corp. | 92,894 | 2,168,146 | ||||||
| Huntington Bancshares, Inc. | 65,036 | 836,363 | ||||||
| JPMorgan Chase & Co. | 27,043 | 2,352,741 | ||||||
| Morgan Stanley | 13,841 | 600,284 | ||||||
| State Street Corp. | 12,305 | 1,032,391 | ||||||
| SunTrust Banks, Inc. | 20,590 | 1,169,718 | ||||||
| Wells Fargo & Co. | 17,549 | 944,838 | ||||||
| 9,104,481 | ||||||||
| BEVERAGES - 1.6% | ||||||||
| PepsiCo, Inc. | 8,539 | 967,298 | ||||||
| BIOTECHNOLOGY - 2.1% | ||||||||
| Amgen, Inc. | 3,122 | 509,885 | ||||||
| Celgene Corp. * | 6,203 | 769,482 | ||||||
| 1,279,367 | ||||||||
| CHEMICALS - 3.1% | ||||||||
| Dow Chemical Co. | 21,120 | 1,326,336 | ||||||
| LyondellBasell Industries NV - Class A | 6,543 | 554,585 | ||||||
| 1,880,921 | ||||||||
| COMMERCIAL SERVICES - 1.9% | ||||||||
| Booz Allen Hamilton Holding Corp. | 13,596 | 488,504 | ||||||
| Quanta Services, Inc. * | 18,550 | 657,412 | ||||||
| 1,145,916 | ||||||||
| COMPUTERS - 1.7% | ||||||||
| Apple, Inc. | 3,621 | 520,157 | ||||||
| Hewlett Packard Enterprise Co. | 29,535 | 550,237 | ||||||
| 1,070,394 | ||||||||
| COSMETICS / PERSONAL CARE - 1.3% | ||||||||
| Procter & Gamble Co. ^ | 9,505 | 830,072 | ||||||
| DIVERSIFIED FINANCIAL SERVICES - 3.7% | ||||||||
| American Express Co. ^ | 8,455 | 670,059 | ||||||
| Ameriprise Financial, Inc. | 5,837 | 746,260 | ||||||
| Discover Financial Services | 13,264 | 830,194 | ||||||
| 2,246,513 | ||||||||
| ELECTRIC - 6.5% | ||||||||
| American Electric Power Co., Inc. | 10,847 | 735,752 | ||||||
| DTE Energy Co. | 7,685 | 803,774 | ||||||
| Edison International | 12,000 | 959,640 | ||||||
| Public Service Enterprise Group, Inc. | 16,087 | 708,632 | ||||||
| Xcel Energy, Inc. | 17,954 | 808,828 | ||||||
| 4,016,626 | ||||||||
| ENGINEERING & CONSTRUCTION - 0.8% | ||||||||
| Fluor Corp. | 9,083 | 466,141 | ||||||
| ENVIRONMENTAL CONTROL - 1.5% | ||||||||
| Waste Management, Inc. | 13,008 | 946,722 | ||||||
| FOOD - 3.2% | ||||||||
| Hershey Co. | 7,006 | 758,049 | ||||||
| Kroger Co. | 16,421 | 486,883 | ||||||
| Tyson Foods, Inc. ^ | 11,064 | 710,973 | ||||||
| 1,955,905 | ||||||||
| HAND / MACHINE TOOLS - 1.4% | ||||||||
| Stanley Black & Decker, Inc. | 6,323 | 860,876 | ||||||
| Security | Shares | Value | ||||||
| HEALTHCARE-PRODUCTS - 2.9% | ||||||||
| Danaher Corp. ^ | 6,836 | $ | 569,644 | |||||
| Hill-Rom Holdings, Inc. | 4,771 | 360,878 | ||||||
| Medtronic PLC | 10,292 | 855,162 | ||||||
| 1,785,684 | ||||||||
| HEALTHCARE-SERVICES - 1.7% | ||||||||
| UnitedHealth Group, Inc. | 5,800 | 1,014,304 | ||||||
| HOME BUILDERS - 1.1% | ||||||||
| PulteGroup, Inc. ^ | 29,011 | 657,679 | ||||||
| INSURANCE - 4.8% | ||||||||
| Allstate Corp. | 10,939 | 889,231 | ||||||
| Berkshire Hathaway, Inc. * | 2,343 | 387,087 | ||||||
| Chubb Ltd. | 9,312 | 1,278,072 | ||||||
| MetLife, Inc. | 8,122 | 420,801 | ||||||
| 2,975,191 | ||||||||
| IRON / STEEL - 1.2% | ||||||||
| Nucor Corp. | 12,117 | 743,136 | ||||||
| MEDIA - 3.6% | ||||||||
| CBS Corp. | 11,124 | 740,413 | ||||||
| Comcast Corp. - Class A | 23,202 | 909,286 | ||||||
| Time Warner, Inc. | 5,527 | 548,665 | ||||||
| 2,198,364 | ||||||||
| MISCELLANEOUS MANUFACTURING - 3.0% | ||||||||
| General Electric Co. | 26,004 | 753,856 | ||||||
| Parker-Hannifin Corp. | 6,822 | 1,096,978 | ||||||
| 1,850,834 | ||||||||
| OIL & GAS - 9.4% | ||||||||
| Antero Resources Corp. * | 17,044 | 361,162 | ||||||
| Chevron Corp. ^ | 13,090 | 1,396,703 | ||||||
| ConocoPhillips ^ | 15,973 | 765,266 | ||||||
| Energen Corp. * | 9,772 | 508,046 | ||||||
| EOG Resources, Inc. | 10,918 | 1,009,915 | ||||||
| Exxon Mobil Corp. ^ | 13,884 | 1,133,629 | ||||||
| Valero Energy Corp. ^ | 9,102 | 588,080 | ||||||
| 5,762,801 | ||||||||
| OIL & GAS SERVICES - 0.9% | ||||||||
| Halliburton Co. ^ | 12,001 | 550,606 | ||||||
| PACKAGING & CONTAINERS - 0.8% | ||||||||
| WestRock Co. | 8,932 | 478,398 | ||||||
| PHARMACEUTICALS - 4.9% | ||||||||
| Eli Lilly & Co. | 11,549 | 947,711 | ||||||
| Johnson & Johnson | 7,046 | 869,970 | ||||||
| Pfizer, Inc. | 34,781 | 1,179,773 | ||||||
| 2,997,454 | ||||||||
| REITS - 2.9% | ||||||||
| Equity LifeStyle Properties, Inc. ^ | 7,462 | 603,750 | ||||||
| Kimco Realty Corp. ^ | 21,232 | 430,797 | ||||||
| Prologis, Inc. | 13,660 | 743,241 | ||||||
| 1,777,788 | ||||||||
| RETAIL - 3.0% | ||||||||
| Foot Locker, Inc. | 9,702 | 750,353 | ||||||
| Home Depot, Inc. ^ | 2,972 | 463,929 | ||||||
| PVH Corp. | 6,068 | 613,050 | ||||||
| 1,827,332 | ||||||||
| SEMICONDUCTORS - 2.3% | ||||||||
| Intel Corp. ^ | 17,542 | 634,143 | ||||||
| Qualcomm, Inc. | 14,074 | 756,337 | ||||||
| 1,390,480 | ||||||||
See accompanying notes to financial statements.
53
| SCHEDULE OF INVESTMENTS (Unaudited)(Continued) |
| Dunham Large Cap Value Fund |
| April 30, 2017 |
| Security | Shares | Value | ||||||
| SOFTWARE - 2.9% | ||||||||
| Microsoft Corp. | 14,757 | $ | 1,010,264 | |||||
| Oracle Corp. | 17,390 | 781,854 | ||||||
| 1,792,118 | ||||||||
| TELECOMMUNICATIONS - 4.7% | ||||||||
| AT&T, Inc. ^ | 46,853 | 1,856,784 | ||||||
| Cisco Systems, Inc. | 30,746 | 1,047,516 | ||||||
| 2,904,300 | ||||||||
| TOTAL COMMON STOCK (Cost - $48,958,242) | 59,655,205 | |||||||
| SHORT - TERM INVESTMENT - 2.0% | ||||||||
| MONEY MARKET FUND - 2.0% | ||||||||
| STIT-STIC Prime Portfolio - 0.52% + | 1,247,333 | 1,247,333 | ||||||
| (Cost - $1,247,333) | ||||||||
| COLLATERAL FOR SECURITIES LOANED - 20.6% | ||||||||
| Mount Vernon Prime Portfolio 1.12% + | 12,593,374 | 12,593,374 | ||||||
| (Cost - $12,593,374) | ||||||||
| Value | ||||
| TOTAL INVESTMENTS - 119.9% (Cost - $62,798,949) (a) | $ | 73,495,912 | ||
| LIABILITIES IN EXCESS OF OTHER ASSETS - (19.9)% | (12,211,601 | ) | ||
| NET ASSETS - 100.0% | $ | 61,284,311 | ||
REIT - Real Estate Investment Trust
| * | Non-income producing security. |
| ^ | All or a portion of these securities are on loan. Total loaned securities had a value of $12,210,667 at April 30, 2017. |
| + | Variable rate security. Interest rate is as of April 30, 2017. |
| Portfolio Composition * - (Unaudited) | ||||||||||
| Financial | 21.9 | % | Technology | 5.8 | % | |||||
| Collateral for Securities Loaned | 17.1 | % | Utilities | 5.5 | % | |||||
| Consumer, Non-Cyclical | 16.3 | % | Consumer, Cyclical | 4.4 | % | |||||
| Energy | 8.6 | % | Basic Materials | 3.6 | % | |||||
| Industrial | 8.2 | % | Funds | 1.7 | % | |||||
| Communications | 6.9 | % | Total | 100.0 | % | |||||
| * | Based on total value of investments as of April 30, 2017. |
Percentage may differ from Schedule of Investments which are based on Fund net assets.
See accompanying notes to financial statements.
54
| Dunham Focused Large Cap Growth Fund |
| Message from the Sub-Adviser (The Ithaka Group, LLC) |
Campaign promises surrounding the new U.S. president occupied investors’ focus in U.S. markets, as they attempted to understand the different implications of President Trump’s policies on the country’s industries. The Sub-Adviser believes growth-style companies moved into favor during the first half of the fiscal year, while large companies in the U.S. also benefitted from talks of a potential tax repatriation. Investors flocked to sectors that were perceived as benefiting under a Trump presidency, such as financials and industrials. The Sub-Adviser believes earnings releases from U.S. companies during the first half of the fiscal year have added strength to the market. Large cap growth stocks, as measured by the Russell 1000 Growth Index, had a strong six-month period with an advance of 15.2 percent for the fiscal period that ended April 30, 2017. The most recent performance outpaced other broad equity indexes, such as the S&P 500 Index, which increased 13.3 percent.
The consumer discretionary sector contained strong holdings over the fiscal six-month period. A strong performer in the consumer discretionary sector was Amazon.com, Inc. (AMZN) (holding percentage*: 5.92 percent), an online retailer that offers a wide range of products, personalized shopping services, Web-based credit card payments and direct shipping to customers. The Sub-Adviser sees the company’s dedication to investments in the business during the period as evidence of potential long-term growth. The Sub-Adviser also believes in continued growth for the company because of the leadership and the overall business plan they have established. The company experienced an increase of 17.1 percent over the fiscal period. A negative performer from the consumer discretionary sector was Under Armour (UA) (holding percentage*: 0.76 percent), which develops, markets, and distributes branded performance products. The company designs and sells a broad offering of apparel and accessories made of synthetic microfibers. The Sub-Adviser believes recent poor performance has stemmed from a slightly tarnished image in a highly concentrated industry. With such high competition, even a small misstep can cause a company to temporarily fall out of favor. The holding saw a drop of 29.9 percent during the fiscal period, before it was fully exited near the end of April.
Another strong sector for the Fund during the fiscal six-month period was the technology sector. A contribution from the technology sector came from Facebook, Inc. (FB) (holding percentage*: 7.20 percent), with a 14.7 percent gain during the fiscal period ending April 30, 2017. The company operates a social networking website and develops technologies that facilitate the sharing of information, photographs, website links, and videos. The Sub-Adviser attributes the fiscal period’s gains to an increase in advertisement sales and the development of augmented reality technology. Another positive performer from the technology sector was Adobe Systems Incorporated (ADBE) (holding percentage*: 4.39 percent), which develops, markets, and supports computer software products and technologies. The company’s products allow users to express and use information across all print and electronic media. The Sub-Adviser believes that the company’s large market share control allows it to continue to outperform as they also explore new business opportunities. ADBE’s recent switch from licensing agreements to subscription payments has also prompted a jump in the company’s revenues. The holding gained 24.4 percent during the six-month period ended April 30, 2017. A detractor from the technology sector came from Palo Alto Networks, Inc. (PANW) (holding percentage*: 1.89 percent), which provides network security solutions. The company focuses on firewalls that identify and control applications, scan content to stop threats, and prevent data leakage. PANW lost 29.5 percent during the fiscal six-month period. The Sub-Adviser attributes poor performance during the fiscal period to the company’s sales numbers not matching expected stock valuations by the market. The Sub-Adviser connects the over-valuation to an increase in security breaches in the last year. Some investors may have expected the breaches would lead to higher sales for security-related companies.
The Sub-Adviser claims no expertise in economic or market predictions, and top-down analysis plays no part in their approach to investing. The Sub-Adviser does not try to “guess” where the market is heading in the next fiscal quarter or fiscal year and therefore chooses to stay fully invested at all times in what it believes are high-quality growth companies. The Sub-Adviser strives to own companies with robust business models and balance sheets that it believes are built to withstand difficult economic environments. With few exceptions, each of the companies in the current portfolio historically exhibited strong fundamentals during the 2008/2009 downturn. Those few that did not have since then significantly strengthened their balance sheets. The Sub-Adviser uses a fundamentals-driven, bottom–up process to identify and own companies that may outperform over the long-term. The Sub-Adviser continues to believe that many of the stocks in the Fund are well-positioned to outperform over the economic cycle due to the strength of the long-term secular trends underpinning them, coupled with the Sub-Adviser’s unique abilities to take advantage of these trends.
| * | Holdings percentage(s) as of 4/30/2017. |
Growth of $100,000 Investment
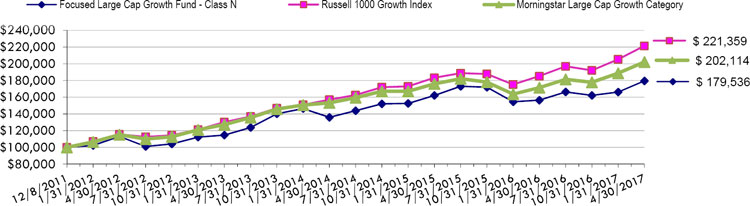
Total Returns as of April 30, 2017
| Annualized | Annualized | Annualized | ||||||||
| Six | One | Three | Five | Since Inception | ||||||
| Months | Year | Years | Years | (12/8/11) | ||||||
| Class N | 10.68% | 14.71% | 9.70% | 9.68% | 11.46% | |||||
| Class C | 10.15% | 13.67% | 8.63% | 8.61% | 10.38% | |||||
| Class A with load of 5.75% | 4.13% | 7.82% | 7.30% | 8.13% | 9.97% | |||||
| Class A without load | 10.49% | 14.42% | 9.42% | 9.42% | 11.18% | |||||
| Russell 1000 Growth Index | 15.23% | 19.50% | 12.11% | 13.87% | 15.88% | |||||
| Morningstar Large Cap Growth Category | 13.60% | 17.87% | 9.66% | 11.90% | 13.93% |
The Russell 1000 Growth Index is a subset of the Russell 1000 Index which measures the performance of the stocks of the 1000 largest companies in the Russell 3000 Index based on market capitalization. The Russell 1000 Growth Index measures the performance of those stocks of the Russell 1000 with higher price-to-book ratios and higher relative forecasted growth rates. Investors cannot invest directly in an index or benchmark.
The Morningstar Large Cap Growth Category Index is generally representative of mutual funds that primarily invest in big (large capitalization) U.S. companies that are projected to grow faster than other large-cap stocks.
As disclosed in the Trust’s latest registration statement, the Fund’s total annual operating expenses, including the cost of underlying funds, are 1.20% for Class N, 2.20% for Class C and 1.45% for Class A. Class A shares are subject to a sales load of 5.75% and a deferred sales charge of up to 0.75%. The performance data quoted here represents past performance, which is not indicative of future results. Current performance may be lower or higher than the performance data quoted. The investment return and NAV will fluctuate, so that an investor’s shares, when redeemed, may be worth more or less than their original cost. Total returns are calculated assuming reinvestment of all dividends and capital gains distributions, if any. The returns do not reflect the deductions of taxes a shareholder would pay on the redemption of fund shares or fund distributions. For performance information current to the most recent month-end, please call 1-800-442-4358 or visit our website www.dunham.com
55
| SCHEDULE OF INVESTMENTS (Unaudited) |
| Dunham Focused Large Cap Growth Fund |
| April 30, 2017 |
| Security | Shares | Value | ||||||
| COMMON STOCK - 99.7% | ||||||||
| AEROSPACE/DEFENSE - 1.4% | ||||||||
| TransDigm Group, Inc. ^ | 3,941 | $ | 972,363 | |||||
| APPAREL - 1.2% | ||||||||
| NIKE, Inc. ^ | 15,482 | 857,858 | ||||||
| BIOTECHNOLOGY - 14.9% | ||||||||
| Alexion Pharmaceuticals, Inc. * | 12,054 | 1,540,260 | ||||||
| BioMarin Pharmaceutical, Inc. * | 8,914 | 854,318 | ||||||
| Celgene Corp. * | 22,496 | 2,790,629 | ||||||
| Illumina, Inc. ^ * | 10,326 | 1,908,864 | ||||||
| Incyte Corp. * | 11,256 | 1,398,896 | ||||||
| Regeneron Pharmaceuticals, Inc. * | 5,742 | 2,230,710 | ||||||
| 10,723,677 | ||||||||
| COMMERCIAL SERVICES - 2.3% | ||||||||
| PayPal Holdings, Inc. * | 35,191 | 1,679,314 | ||||||
| DIVERSIFIED FINANCIAL SERVICES - 12.3% | ||||||||
| Charles Schwab Corp. | 35,729 | 1,388,072 | ||||||
| MasterCard, Inc. | 28,230 | 3,283,714 | ||||||
| Visa, Inc. - Class A ^ | 45,712 | 4,169,849 | ||||||
| 8,841,635 | ||||||||
| HEALTHCARE PRODUCTS - 4.1% | ||||||||
| Align Technology, Inc. ^ * | 7,077 | 952,706 | ||||||
| Edwards Lifesciences Corp. * | 18,215 | 1,997,639 | ||||||
| 2,950,345 | ||||||||
| INTERNET - 25.1% | ||||||||
| Alphabet, Inc. * | 4,139 | 3,749,768 | ||||||
| Amazon.com, Inc. * | 4,597 | 4,252,179 | ||||||
| Facebook, Inc. - Class A * | 34,409 | 5,169,952 | ||||||
| Priceline Group, Inc. * | 1,943 | 3,588,371 | ||||||
| Splunk, Inc. ^ * | 20,462 | 1,315,911 | ||||||
| 18,076,181 | ||||||||
| MACHINERY-DIVERSIFIED - 2.2% | ||||||||
| The Middleby Corp. ^ * | 11,801 | 1,606,470 | ||||||
| MEDIA - 1.6% | ||||||||
| Walt Disney Co. | 9,985 | 1,154,266 | ||||||
| Security | Shares | Value | ||||||
| PHARMACEUTICALS - 1.2% | ||||||||
| DexCom, Inc. ^ * | 11,200 | $ | 873,152 | |||||
| RETAIL - 16.4% | ||||||||
| Domino’s Pizza Inc. ^ | 5,899 | 1,070,020 | ||||||
| Home Depot, Inc. | 9,435 | 1,472,803 | ||||||
| O’Reilly Automotive, Inc. ^ * | 2,289 | 568,015 | ||||||
| Starbucks Corp. ^ | 49,526 | 2,974,532 | ||||||
| TJX Cos. Inc. ^ | 20,776 | 1,633,825 | ||||||
| Ulta Salon, Cosmetics & Fragrances ^ * | 14,640 | 4,120,282 | ||||||
| 11,839,477 | ||||||||
| SEMICONDUCTORS - 0.5% | ||||||||
| NVIDIA Corp. | 3,410 | 355,663 | ||||||
| SOFTWARE - 14.6% | ||||||||
| Adobe Systems, Inc.* | 23,571 | 3,152,385 | ||||||
| Salesforce.com, Inc. * | 46,142 | 3,973,749 | ||||||
| Ultimate Software Group, Inc. ^ * | 6,499 | 1,317,152 | ||||||
| Veeva Systems, Inc. * | 16,731 | 897,116 | ||||||
| Workday, Inc. - Class A * | 13,515 | 1,181,211 | ||||||
| 10,521,613 | ||||||||
| TELECOMMUNICATIONS - 1.9% | ||||||||
| Palo Alto Networks, Inc. * | 12,553 | 1,360,871 | ||||||
| TOTAL COMMON STOCK (Cost - $50,730,186) | 71,812,885 | |||||||
| SHORT-TERM INVESTMENT - 0.1% | ||||||||
| MONEY MARKET FUND - 0.1% | ||||||||
| First American Institutional Prime Obligations Fund 0.87% + (Cost - $46,591) | 46,591 | |||||||
| COLLATERAL FOR SECURITIES LOANED - 22.9% | ||||||||
| Mount Vernon Prime Portfolio, 1.12% + (Cost - $16,495,509) | 16,495,509 | 16,495,509 | ||||||
| TOTAL INVESTMENTS - 122.7% (Cost - $67,272,286) | $ | 88,354,985 | ||||||
| LIABILITIES LESS OTHER ASSETS - (22.7%) | (16,305,029 | ) | ||||||
| NET ASSETS - 100.0% | $ | 72,049,956 | ||||||
| ^ | All or a portion of these securities are on loan. Total loaned securities had a value of $16,081,142 at April 30, 2017. |
| * | Non-Income producing security. |
| + | Variable rate security. Interest rate is as of April 30, 2017 |
| Portfolio Composition * - (Unaudited) | ||||||||||
| Communications | 21.8 | % | Technology | 13.8 | % | |||||
| Collateral for Securities Loaned | 18.7 | % | Financial | 10.0 | % | |||||
| Consumer, Non-Cyclical | 18.4 | % | Industrial | 2.9 | % | |||||
| Consumer, Cyclical | 14.4 | % | Short-Term Investments | 0.1 | % | |||||
| Total | 100.0 | % | ||||||||
| * | Based on total value of investments as of April 30, 2017. |
Percentage may differ from Schedule of Investments which is based on Fund net assets
See accompanying notes to financial statements.
56
| Dunham International Stock Fund |
| Message from the Sub-Adviser (Arrowstreet Capital, L.P.) |
International equity markets, as measured by the MSCI All Country World ex USA Index (Net) (referred to as the “Index”), rose 10.37 percent during the six-month period ending April 30, 2017 (the “six-month period”). For the month of November 2016, the Index was down 2.31 percent while December rebounded up 2.56 percent. The principal story for the markets in November and December were the surprising U.S. election results with the potential for tax cuts and infrastructure spending boosting equity market performance and commodity prices also benefitting from the possibility of increased infrastructure spending. Financials did especially well due to the perceived benefits of higher yields. The start of the year saw positive performance month over month as the Index was up 3.54 percent, 1.59 percent, 2.54 percent, and 2.14 in January, February, March, and April respectively. Despite the political noise in January, the economic data remained robust with the PMI reaching its highest level since February 2014. February had less number of days, but it was just as packed with economic releases and market movers, equity indices across the globe hit record highs, the Fed’s interest rate-hike expectations were notably higher, and the political obstacle courses on both sides of the Atlantic provided a number of headlines for investors to digest. The month of April saw the main event being the first round of the French presidential election with markets rallying in relief as centrist candidate, Emmanuel Macron, making it to the second round. April also saw emerging markets continue their outperformance against their developed market brethren, even though commodity prices weakened.
The Sub-Adviser’s investment process is best characterized as a dynamic process that uses quantitative models to evaluate securities to exploit opportunities across companies, sectors, and countries while seeking to avoid long term systematic biases toward any particular country, sector, style, or market capitalization. These stock selection models are designed to understand what information is likely to impact stock prices with a predictable and measurable lag that allows time to invest and profit. The models obtain the information to forecast individual stock returns by evaluating a stock’s potential on the basis of: (1) direct effects - characteristics of the company itself; and (2) indirect effects - characteristics of other companies that are related by virtue of a common country affiliation and sector affiliation (called country/sector baskets); a common country affiliation; and a common global sector affiliation, and/or other common linkages. Over any time period, the strategy’s performance relative to the Index is driven by allocations to country/sector baskets, stock selection, and the effects of currency exposures differing from those of the Index.
Countries contributing most to the Fund’s returns relative to the Index during the six-month period included France (primarily due to financials and information technology sector overweights), Switzerland (primarily due to health care sector underweights), and South Korea (primarily due to information technology sector overweights). Countries contributing most to the Fund’s underperformance relative to the Index included China (primarily due to energy sector overweights and information technology sector underweights), Japan (primarily due to telecommunication services sector overweights and financials sector underweights), and Russia (primarily due to energy overweights).
Sectors contributing most to the Fund’s returns relative to the Index during the six-month period included materials (primarily due to Netherlands, the United Kingdom, and Mexico overweights), industrials (primarily due to Finland and Germany overweights), and information technology (primarily due to South Korea and France overweights). Sectors contributing most to the Fund’s underperformance relative to the Index included energy (primarily due to China and Russia overweights), and financials (primarily due to Australia, Japan, and China underweights).
The stocks contributing most to the Fund’s returns relative to the Index during the six-month period included Actelion Ltd (holding percentage**: 0.52 percent) (Swiss health care), STMicroelectronics NV (holding percentage*: 0.67 percent) (French information technology), and Turkiye Vakiflar Bankasi Turk Anonim Ortakligi (holding percentage*: 0.68 percent) (Turkish financials). Stocks contributing most to the Fund’s underperformance relative to the Index included Tencent Holdings Ltd. (holding percentage**: 0.20 percent) (Chinese information technology), Cnooc Limited (holding percentage*: 0.77 percent) (Chinese energy), and Oil Company Lukoil PJSC (holding percentage*: 0.76 percent) (Russian energy).
The foregoing Insights from the Sub-Advisor are provided by Arrowstreet Capital, Limited Partnership (“Arrowstreet”) through April 30, 2017 for informational purposes only and solely with respect to the portfolio of assets within the Fund managed by Arrowstreet. References to specific stocks, countries or sectors are shown for informational purposes only and are not intended as investment advice. Arrowstreet is not responsible for, and makes no representation with respect to, any other information or performance data set forth herein.
| * | Holdings percentage(s) as of 4/30/2017. |
| ** | Holdings percentage(s) as of the date prior to the sale of the security. |
Growth of $100,000 Investment
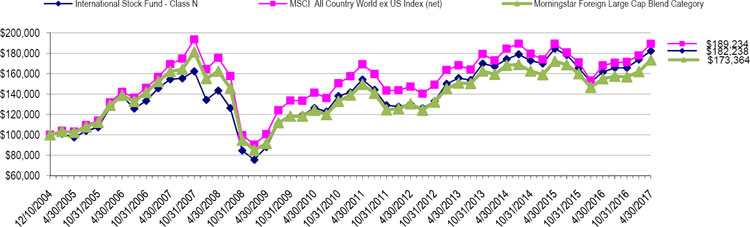
Total Returns as of April 30, 2017
| Annualized | Annualized | Annualized | Annualized Since Inception | |||||||||
| Six Months | One Year | Three Years | Five Years | Ten Years | (12/10/04) | |||||||
| Class N | 9.97% | 12.82% | 1.52% | 6.94% | 1.67% | 4.96% | ||||||
| Class C | 9.41% | 11.71% | 0.50% | 5.87% | 0.65% | 3.93% | ||||||
| Class A with load of 5.75% | 3.52% | 6.20% | (0.70)% | 5.41% | 0.81% | 1.42%* | ||||||
| Class A without load | 9.87% | 12.65% | 1.27% | 6.66% | 1.41% | 2.01%* | ||||||
| MSCI All Country World ex US Index (net) | 10.37% | 12.59% | 0.83% | 5.13% | 1.12% | 5.28% | ||||||
| Morningstar Foreign Large Cap Blend Category | 10.58% | 11.79% | 1.01% | 5.85% | 0.68% | 4.54% |
| * | Class A commenced operations on January 3, 2007. |
The MSCI All Country World ex US Index (net) is a free float-adjusted market capitalization index designed to measure equity market performance in the global developed and emerging markets excluding holdings in the United States and is net of any withholding taxes. Investors cannot invest directly in an index or benchmark.
The Morningstar Foreign Large Cap Blend Category is generally representative of mutual funds that primarily invest in non-U.S. stocks that have market caps in the top 70% of each economically integrated market (such as Europe or Asia ex-Japan). The blend style is generally applicable where neither growth nor value characteristics dominate.
As disclosed in the Trust’s latest registration statement, the Fund’s total annual operating expenses, including underlying funds, are 1.63% for Class N, 2.63% for Class C and 1.88% for Class A. Class A shares are subject to a sales load of 5.75% and a deferred sales charge of up to 0.75%.The performance data quoted here represents past performance, which is not indicative of future results. Current performance may be lower or higher than the performance data quoted. The investment return and NAV will fluctuate, so that an investor’s shares, when redeemed, may be worth more or less than their original cost. Total returns are calculated assuming reinvestment of all dividends and capital gains distributions, if any. The returns do not reflect the deductions of taxes a shareholder would pay on the redemption of fund shares or fund distribution. For performance information current to the most recent month-end, please call 1-800-442-4358 or visit our website www.dunham.com
57
| SCHEDULE OF INVESTMENTS (Unaudited) |
| Dunham International Stock Fund |
| April 30, 2017 |
| Security | Shares | Value | ||||||
| COMMON STOCK - 96.1% | ||||||||
| ADVERTISING - 0.5% | ||||||||
| WPP PLC | 24,372 | $ | 521,306 | |||||
| AEROSPACE / DEFENSE - 1.0% | ||||||||
| BAE Systems PLC - ADR | 12,494 | 408,804 | ||||||
| Kawasaki Heavy Industries Ltd. | 118,000 | 357,274 | ||||||
| Rolls-Royce Holdings PLC - ADR | 17,948 | 189,351 | ||||||
| 955,429 | ||||||||
| AGRICULTURE - 2.9% | ||||||||
| British American Tobacco PLC | 4,850 | 327,316 | ||||||
| British American Tobacco PLC - ADR ^ | 20,770 | 1,413,191 | ||||||
| Imperial Brands PLC | 6,138 | 300,262 | ||||||
| Imperial Brands PLC - ADR ^ | 3,336 | 165,873 | ||||||
| Swedish Match AB | 19,275 | 635,802 | ||||||
| 2,842,444 | ||||||||
| AIRLINES - 0.3% | ||||||||
| Deutsche Lufthansa AG | 16,600 | 286,295 | ||||||
| Turk Hava Yollari * | 1 | 2 | ||||||
| 286,297 | ||||||||
| APPAREL - 0.7% | ||||||||
| Adidas AG | 3064 | 614,100 | ||||||
| Pou Chen Corp. | 61,000 | 85,403 | ||||||
| 699,503 | ||||||||
| AUTO MANUFACTURERS - 2.7% | ||||||||
| Fiat Chrysler Automobile NV * | 23,083 | 262,104 | ||||||
| Hino Motors Ltd. * | 26,700 | 335,028 | ||||||
| Hyundai Motor Co. - GDR | 2,288 | 92,092 | ||||||
| Mazda Motor Corp. | 20,400 | 301,368 | ||||||
| Nissan Motor Co. Ltd. | 51,900 | 494,400 | ||||||
| Peugeot SA * | 18,677 | 391,449 | ||||||
| Porsche Automobil Holding SE - ADR | 2,723 | 15,848 | ||||||
| Renault SA | 2,497 | 232,773 | ||||||
| Volkswagen AG | 3,289 | 530,165 | ||||||
| 2,655,227 | ||||||||
| AUTO PARTS & EQUIPMENT - 2.2% | ||||||||
| Cie Generale Des Establissements | 1,588 | 207,646 | ||||||
| Cie Generale Des Establissements - ADR | 3,500 | 91,245 | ||||||
| Continental AG | 1,281 | 286,849 | ||||||
| Continental AG - ADR ^ | 3,800 | 170,278 | ||||||
| GKN PLC | 95,089 | 441,409 | ||||||
| Linamar Corp. | 1,500 | 63,673 | ||||||
| Magna International, Inc. | 9,600 | 400,346 | ||||||
| Sumitomo Electric Industries Ltd. | 25,000 | 408,317 | ||||||
| Toyoda Gosei Co. Ltd. | 6,100 | 162,122 | ||||||
| 2,231,885 | ||||||||
| BANKS - 9.7% | ||||||||
| Agricultural Bank of China Ltd. | 411,000 | 189,486 | ||||||
| Akbank TAS | 0 | 1 | ||||||
| Banco Bilbao Vizcaya Argentaria SA | 26,396 | 211,407 | ||||||
| Banco Bradesco SA | 6,000 | 61,148 | ||||||
| Banco Bradesco SA - ADR | 41,700 | 439,935 | ||||||
| Banco do Brasil SA | 19,000 | 194,704 | ||||||
| Banco do Brasil SA - ADR | 19,000 | 194,940 | ||||||
| Banco Santander Brasil SA | 31,000 | 264,762 | ||||||
| Banco Santander Brasil SA - ADR | 22,510 | 192,911 | ||||||
| Banco Santander SA | 26,818 | 174,715 | ||||||
| Bangkok Bank PCL | 28,100 | 151,805 | ||||||
| Bank Hapoalim BM | 62,122 | 387,632 | ||||||
| Bank Leumi Le-Israel BM * | 54,789 | 256,375 | ||||||
| Bank of China Ltd. | 386,000 | 186,732 | ||||||
| Bank of Communications Co. Ltd. | 384,000 | 295,295 | ||||||
| Bankinter SA | 7,888 | 69,416 | ||||||
| BNP Paribas SA | 10,321 | 728,194 | ||||||
| China Construction Bank Corp. | 451,000 | 366,098 | ||||||
| Chugoku Bank Ltd. | 1,100 | 16,342 | ||||||
| Concordia Financial Group Ltd. | 23,100 | 106,260 | ||||||
| Credicorp Ltd. | 1,300 | 199,758 | ||||||
| Credit Agricole SA | 44,085 | 655,503 | ||||||
| Security | Shares | Value | ||||||
| BANKS (Continued) - 9.7% | ||||||||
| DNB ASA - ADR ^ | 800 | $ | 125,904 | |||||
| ING Groep NV | 21,834 | 355,770 | ||||||
| Itau Unibanco Holding SA | 26,180 | 279,904 | ||||||
| Itau Unibanco Holding SA - ADR | 30,340 | 373,182 | ||||||
| Mitsubishi UFJ Financial Group, Inc. - ADR ^ | 45,290 | 287,139 | ||||||
| Sberbank of Russia PJSC - ADR | 42,585 | 506,336 | ||||||
| Societe Generale SA | 10,348 | 567,227 | ||||||
| Sumitomo Mitsui Financial Group, Inc. | 8,500 | 315,625 | ||||||
| Turkiye Garanti Bankasi AS | 94,550 | 255,104 | ||||||
| Turkiye Halk Bankasi AS | 13,543 | 44,879 | ||||||
| Turkiye Is Bankasi | 81,167 | 160,104 | ||||||
| Turkiye Vakiflar Bankasi TAO | 393,315 | 671,537 | ||||||
| UniCredit SpA | 11,126 | 181,101 | ||||||
| Yapi ve Kredi Bankasi AS * | 129,421 | 156,916 | ||||||
| 9,624,147 | ||||||||
| BEVERAGES - 0.5% | ||||||||
| Coca-Cola HBC AG | 6,346 | 175,172 | ||||||
| Diageo PLC - ADR | 3,192 | 374,837 | ||||||
| 550,009 | ||||||||
| BUILDING MATERIALS - 2.3% | ||||||||
| Asahi Glass Co. Ltd. | 55,000 | 476,572 | ||||||
| Asia Cement Corp. | 80,000 | 78,986 | ||||||
| Cie de Saint-Gobain | 4,573 | 246,666 | ||||||
| Geberit AG | 829 | 377,445 | ||||||
| HeidelbergCement AG | 4,215 | 390,089 | ||||||
| James Hardie Industries PLC - CDI | 10,581 | 178,807 | ||||||
| Sika AG | 74 | 472,082 | ||||||
| Titan Cement Co SA | 4,082 | 106,503 | ||||||
| 2,327,150 | ||||||||
| CHEMICALS - 4.9% | ||||||||
| Air Water, Inc. | 12,300 | 236,920 | ||||||
| Akzo Nobel NV | 7,114 | 622,006 | ||||||
| BASF SE | 2,300 | 223,758 | ||||||
| Covestro AG - 144A | 7,604 | 592,400 | ||||||
| Croda International PLC | 826 | 40,217 | ||||||
| Daicel Corp. | 7,900 | 90,693 | ||||||
| Hitachi Chemical Co. Ltd. | 5,400 | 154,658 | ||||||
| Johnson Matthey PLC | 1,793 | 69,085 | ||||||
| Kansai Paint Co. Ltd. | 6,700 | 148,320 | ||||||
| Koninklijke DSM NV | 2,885 | 206,379 | ||||||
| Koninklijke DSM NV - ADR | 12,700 | 228,346 | ||||||
| Kuraray Co. Ltd. | 6,600 | 106,523 | ||||||
| LANXESS AG | 5,200 | 375,353 | ||||||
| Linde AG - ADR | 8,900 | 160,200 | ||||||
| Mitsubishi Chemical Holdings Corp. | 43,300 | 338,932 | ||||||
| Mitsui Chemicals, Inc. | 99,000 | 506,576 | ||||||
| Shin-Etsu Chemical Co. Ltd. | 3,500 | 304,225 | ||||||
| Solvay SA | 2,291 | 291,301 | ||||||
| Sumitomo Checmial Co. Ltd. | 14,000 | 79,013 | ||||||
| Toray Industries, Inc. | 9,000 | 79657 | ||||||
| 4,854,562 | ||||||||
| COAL - 0.1% | ||||||||
| China Coal Energy Co. Ltd. * | 262,000 | 127,188 | ||||||
| COMMERCIAL SERVICES - 2.5% | ||||||||
| Abertis Infraestructuras SA | 27,233 | 478,592 | ||||||
| Ashtead Group PLC | 11,360 | 239,382 | ||||||
| Edenred | 6,784 | 173,728 | ||||||
| Experian PLC | 24,300 | 522,175 | ||||||
| RELX NV | 29,210 | 564,266 | ||||||
| RELX PLC | 8,912 | 180486 | ||||||
| RELX PLC - ADR ^ | 14,800 | 303,252 | ||||||
| 2,461,881 | ||||||||
| COMPUTERS - 2.1% | ||||||||
| Capgemini SA | 877 | 87,779 | ||||||
| Compal Electronics, Inc. | 375,000 | 251,035 | ||||||
| Computershare Ltd. | 25,961 | 285,833 | ||||||
| Foxconn Technology Co. Ltd. | 74,740 | 227,728 | ||||||
See accompanying notes to financial statements.
58
| SCHEDULE OF INVESTMENTS (Unaudited) |
| Dunham International Stock Fund (Continued) |
| April 30, 2017 |
| Security | Shares | Value | ||||||
| COMPUTERS (Continued) - 2.1% | ||||||||
| Fujitsu Ltd. | 62,000 | $ | 387,041 | |||||
| Innolux Corp. | 254,000 | 118,552 | ||||||
| Lenovo Group Ltd. | 564,000 | 360,627 | ||||||
| Quanta Computer, Inc. | 83,000 | 171,948 | ||||||
| TDK Corp. | 3,800 | 235,442 | ||||||
| 2,125,985 | ||||||||
| COSMETICS / PERSONAL CARE - 2.5% | ||||||||
| L’Oreal SA | 2,925 | 582,326 | ||||||
| L’Oreal SA - ADR ^ | 2,538 | 101,155 | ||||||
| Svenska Cellulosa AB SCA | 3,200 | 106,208 | ||||||
| Svenska Cellulosa AB SCA - ADR | 145 | 4,802 | ||||||
| Unilever NV - Dutch Cert | 7,574 | 396,640 | ||||||
| Unilever NV - NY Shares | 9,548 | 498,788 | ||||||
| Unilever PLC | 4,648 | 238,864 | ||||||
| Unilever PLC - ADR ^ | 10,271 | 527,313 | ||||||
| 2,456,096 | ||||||||
| DISTRIBUTION / WHOLESALE - 0.5% | ||||||||
| Mitsubishi Corp. | 14,300 | 308,609 | ||||||
| Wolseley PLC - ADR ^ | 33,350 | 213,774 | ||||||
| 522,383 | ||||||||
| DIVERSIFIED FINANANCIAL SERVICES - 3.4% | ||||||||
| BM&FBovespa SA - Bolsa de Valores Mercadorias e Futuros | 28,000 | 165,700 | ||||||
| CITIC Securities Co. Ltd. | 156,000 | 327,020 | ||||||
| Credit Saison Co. Ltd. | 3,700 | 67,423 | ||||||
| Deutsche Boerse AG | 1,409 | 137,868 | ||||||
| DGB Financial Group, Inc. | 9,195 | 93,996 | ||||||
| Hana Financial Group, Inc. | 11,900 | 408,706 | ||||||
| Huatai Securities Co. Ltd. - 144A | 36,400 | 70,494 | ||||||
| IGM Financial, Inc. | 8,300 | 248,945 | ||||||
| Nomura Holdings, Inc. - ADR | 16,069 | 97,057 | ||||||
| ORIX Corp. | 13,800 | 210,911 | ||||||
| ORIX Corp. - ADR ^ | 3,039 | 232,757 | ||||||
| Partners Group Holding AG | 1,055 | 637,466 | ||||||
| Samsung Card Co. Ltd. | 3,576 | 125,386 | ||||||
| Schroders PLC | 5,394 | 161,837 | ||||||
| Worldpay Group PLC - 144A | 43,295 | 167,951 | ||||||
| Yuanta Financial Holding Co. Ltd. | 498,000 | 212,929 | ||||||
| 3,366,446 | ||||||||
| ELECTRIC - 0.8% | ||||||||
| Centrais Eletricas Brasileiras SA - ADR * | 9,100 | 63,245 | ||||||
| CEZ AS | 4,959 | 86,535 | ||||||
| Cia Paranaense de Energia | 5,600 | 40,966 | ||||||
| E.ON SE | 11,987 | 93,413 | ||||||
| Enel SpA | 53,039 | 252,077 | ||||||
| Huaneng Power International, Inc. - ADR ^ | 5,800 | 158,688 | ||||||
| Mercury NZ Ltd. | 33,148 | 73,219 | ||||||
| Uniper SE * | 1,198 | 19,655 | ||||||
| 787,798 | ||||||||
| ELECTRICAL COMPONENTS & EQUIPMENT - 1.4% | ||||||||
| Brother Industries Ltd. | 10,100 | 207,823 | ||||||
| Legrand SA | 2,937 | 190,054 | ||||||
| LG Electronics, Inc. | 2,499 | 151,698 | ||||||
| Osram Licht AG | 3,407 | 228,160 | ||||||
| Schneider Electric SE | 7,618 | 603,196 | ||||||
| 1,380,931 | ||||||||
| ELECTRONICS - 3.3% | ||||||||
| Assa Abloy AB | 4,504 | 97,516 | ||||||
| AU Optronics Corp. | 1,197,000 | 497,482 | ||||||
| Hitachi High-Technologies Corp. | 13,500 | 538,933 | ||||||
| Keyence Corp | 1,900 | 763,861 | ||||||
| Koninklijke Philips NV ^ | 20,522 | 708,448 | ||||||
| LG Display Co. Ltd. | 8,546 | 220,214 | ||||||
| Nippon Electric Glass Co. Ltd. | 43,000 | 266,713 | ||||||
| Pegatron Corp. | 40,000 | 117,803 | ||||||
| Synnex Technology International Corp. | 40,050 | 43,396 | ||||||
| 3,254,366 | ||||||||
| Security | Shares | Value | ||||||
| ENERGY - ALTERNATE SOURCE - 0.1% | ||||||||
| Vestas Wind Systems A/S | 1,323 | $ | 113,814 | |||||
| ENGINEERING & CONSTRUCTION - 0.3% | ||||||||
| Auckland International Airport Ltd. | 17,380 | 82,351 | ||||||
| China Communications Services Corp. Ltd. | 82,000 | 46,669 | ||||||
| Enka Insaat ve Sanayi AS | 14,745 | 22,648 | ||||||
| HOCHTIEF AG | 763 | 137,367 | ||||||
| 289,035 | ||||||||
| ENTERTAINMENT - 0.3% | ||||||||
| Aristocrat Leisure Ltd. | 25,172 | 369,450 | ||||||
| FOOD - 2.7% | ||||||||
| Ajinomoto Co., Inc. | 12,200 | 237,743 | ||||||
| Aryzta AG | 5,400 | 175,236 | ||||||
| CJ CheilJedang Corp. | 362 | 48,816 | ||||||
| Kerry Group PLC | 1,389 | 113,526 | ||||||
| Nestle SA | 12,853 | 989,498 | ||||||
| Orkla ASA | 38,782 | 352,665 | ||||||
| Seven & I Holdings Co. Ltd. - ADR | 4,892 | 103,515 | ||||||
| Tesco PLC - ADR * | 22,150 | 159,812 | ||||||
| Uni-President Enterprises Corp. | 63,000 | 116,298 | ||||||
| WH Group Ltd. - 144A | 380,000 | 339,053 | ||||||
| Wm Morrison Supermarkets PLC | 29,595 | 91,831 | ||||||
| 2,727,993 | ||||||||
| FOOD SERVICE - 0.3% | ||||||||
| Compass Group PLC - ADR | 17,272 | 350,967 | ||||||
| FOREST PRODUCTS & PAPER - 1.5% | ||||||||
| Mondi PLC | 5,864 | 151,540 | ||||||
| Nine Dragons Paper Holdings Ltd. | 129,000 | 139,136 | ||||||
| Oji Holdings Corp. | 125,000 | 605,027 | ||||||
| Stora Enso OYJ | 20,293 | 240,758 | ||||||
| UPM-Kymmene OYJ | 14,043 | 369,868 | ||||||
| 1,506,329 | ||||||||
| GAS - 0.1% | ||||||||
| Gas Natural SDG SA | 6,479 | 146,362 | ||||||
| HAND / MACHINE TOOLS - 0.5% | ||||||||
| Finning International, Inc. | 3,298 | 62,617 | ||||||
| Sandvik AB | 15,928 | 255,431 | ||||||
| Schindler Holding AG | 1,047 | 207,883 | ||||||
| 525,931 | ||||||||
| HEALTHCARE - PRODUCTS - 0.3% | ||||||||
| Smith & Nephew PLC - ADR | 8,738 | 290,451 | ||||||
| HOLDING COMPANIES-DIVERSIFIED - 0.4% | ||||||||
| Haci Omer Sabanci Holdings AS | 1 | 2 | ||||||
| Industrivarden AB | 11,953 | 297,752 | ||||||
| Wharf Holdings Ltd. | 17,000 | 144,958 | ||||||
| 442,712 | ||||||||
| HOME BUILDERS - 0.5% | ||||||||
| Persimmon PLC | 15,531 | 468,094 | ||||||
| HOME FURNISHINGS - 0.9% | ||||||||
| Arcelik AS | 1 | 7 | ||||||
| Electrolux AB - Series B | 9,343 | 277,351 | ||||||
| Sony Corp. - ADR | 19,600 | 672,591 | ||||||
| 949,949 | ||||||||
| HOUSEHOLD PRODUCTS - 0.7% | ||||||||
| Reckitt Benckiser Group PLC | 3,781 | 191,291 | ||||||
| Reckitt Benckiser Group PLC - ADR ^ | 10,200 | 347,982 | ||||||
| Societe BIC SA | 978 | 109,870 | ||||||
| 649,143 | ||||||||
| INSURANCE - 3.4% | ||||||||
| Aegon NV | 18,333 | 93,539 | ||||||
| AXA SA | 15,564 | 415,117 | ||||||
| China Life Insurance Co. Ltd. | 205,000 | 190,878 | ||||||
See accompanying notes to financial statements.
59
| SCHEDULE OF INVESTMENTS (Unaudited) |
| Dunham International Stock Fund (Continued) |
| April 30, 2017 |
| Security | Shares | Value | ||||||
| INSURANCE (Continued) - 3.4% | ||||||||
| CNP Assurances | 14,398 | $ | 300,660 | |||||
| Hannover Rueck SE | 2,506 | 300,534 | ||||||
| Mapfre SA | 104,876 | 365,697 | ||||||
| MS&AD Insurance Group Holdings, Inc. | 10,200 | 332,576 | ||||||
| Muenchener Rueckversicherungs-Gesellschaft AG | 4,886 | 936,440 | ||||||
| Swiss Re AG | 4,592 | 399,229 | ||||||
| Tokio Marine Holdings Inc | 2,400 | 101,197 | ||||||
| 3,435,867 | ||||||||
| INTERNET - 0.6% | ||||||||
| SBI Holdings, Inc. | 24,700 | 342,658 | ||||||
| Start Today Co. Ltd. | 9,600 | 204,857 | ||||||
| 547,515 | ||||||||
| INVESTMENT COMPANIES - 1.0% | ||||||||
| Investor AB | 3,347 | 151,538 | ||||||
| Kinnevik AB | 19,402 | 517,905 | ||||||
| Melker Schorling AB | 595 | 38,113 | ||||||
| Pargesa Holding SA | 3,627 | 271,063 | ||||||
| 978,619 | ||||||||
| IRON / STEEL - 2.5% | ||||||||
| ArcelorMittal * | 46,654 | 366,506 | ||||||
| Eregli Demir ve Celik Fabrikalari TAS | 36,196 | 66,270 | ||||||
| Fortescue Metals Group Ltd. | 57,925 | 229,303 | ||||||
| Hitachi Metals Ltd. | 23,300 | 326,315 | ||||||
| JFE Holdings, Inc. | 17,900 | 305,327 | ||||||
| Nippon Steel & Sumitomo Metal Corp. | 17,900 | 403,135 | ||||||
| POSCO | 1,362 | 321,545 | ||||||
| POSCO - ADR ^ | 4,101 | 242,041 | ||||||
| Vale SA | 21,000 | 178,830 | ||||||
| Voestalpine AG | 1,429 | 59,555 | ||||||
| 2,498,827 | ||||||||
| LEISURE TIME - 0.3% | ||||||||
| Yamaha Motor Co. Ltd. | 12,700 | 301,620 | ||||||
| LODGING - 0.2% | ||||||||
| Crown Resorts Ltd. | 17,942 | 167,551 | ||||||
| MACHINERY CONSTRUCTION & MINING - 3.5% | ||||||||
| ABB Ltd. | 42,279 | 1,035,547 | ||||||
| Atlas Copco AB - A Shares | 9,312 | 347,949 | ||||||
| Atlas Copco AB - ADR | 2,500 | 93,850 | ||||||
| Atlas Copco AB - B Shares | 3,574 | 118,798 | ||||||
| Hitachi Ltd. | 106,000 | 585,609 | ||||||
| Hitachi Ltd. - ADR | 2,293 | 126,906 | ||||||
| Komatsu Ltd. | 22,800 | 609,279 | ||||||
| Mitsubishi Electric Corp. | 43,500 | 607,132 | ||||||
| 3,525,070 | ||||||||
| MACHINERY - DIVERSIFIED - 1.1% | ||||||||
| ANDRITZ AG | 5,092 | 281,279 | ||||||
| Kone OYJ | 12,664 | 579,476 | ||||||
| Metso OYJ | 5,366 | 192,116 | ||||||
| 1,052,871 | ||||||||
| MEDIA - 1.0% | ||||||||
| ITV PLC | 54,584 | 148,282 | ||||||
| Thomson Reuters Corp. | 3,960 | 179,652 | ||||||
| Vivendi SA | 25,444 | 504,525 | ||||||
| Wolters Kluwer NV | 4,038 | 171,294 | ||||||
| 1,003,753 | ||||||||
| METAL FABRICATE / HARDWARE - 0.1% | ||||||||
| SKF AB | 3,695 | 81,110 | ||||||
| MINING - 3.4% | ||||||||
| BHP Billiton Ltd. | 42,447 | 754,766 | ||||||
| BHP Billiton PLC | 10,980 | 167205 | ||||||
| Boliden AB | 12,611 | 360,377 | ||||||
| Glencore PLC * | 230,943 | 906,624 | ||||||
| Industrias Penoles SAB de CV | 5,518 | 133,808 | ||||||
| Security | Shares | Value | ||||||
| MINING (Continued) - 3.4% | ||||||||
| Mitsubishi Materials Corp. | 3,500 | $ | 104,223 | |||||
| Rio Tinto Ltd. | 4,330 | 195,778 | ||||||
| Rio Tinto PLC - ADR ^ | 6,626 | 263,847 | ||||||
| Sumitomo Metal Mining Co. Ltd. | 33,000 | 446,889 | ||||||
| 3,333,517 | ||||||||
| MISCELLANEOUS MANUFACTURING - 1.2% | ||||||||
| Doosan Corp. | 1,200 | 102,449 | ||||||
| FUJIFILM Holdings Corp. | 2,300 | 85,367 | ||||||
| Konica Minolta, Inc. | 30,500 | 270,017 | ||||||
| Nikon Corp. | 20,600 | 294,087 | ||||||
| Wartsila OYJ Abp | 7,961 | 483,989 | ||||||
| 1,235,909 | ||||||||
| OFFICE / BUSINESS - 0.6% | ||||||||
| Ricoh Co. Ltd. | 22,300 | 185,888 | ||||||
| Seiko Epson Corp. | 11,900 | 243,762 | ||||||
| Seiko Epson Corp. - ADR | 15,800 | 160,054 | ||||||
| 589,704 | ||||||||
| OIL & GAS - 4.3% | ||||||||
| China Petroleum & Chemical Corp. | 834,000 | 677,322 | ||||||
| CNOOC Ltd. | 949 | 110,226 | ||||||
| CNOOC Ltd. - ADR | 558,000 | 651,029 | ||||||
| Formosa Petrochemical Corp. | 15,000 | 52,431 | ||||||
| Inpex Corp. | 53,000 | 507,892 | ||||||
| Lukoil PJSC - ADR | 15,187 | 754,262 | ||||||
| Neste OYJ | 5,898 | 240,262 | ||||||
| PTT Exploration & Production PCL | 96,300 | 270,211 | ||||||
| Repsol SA | 35,404 | 558,614 | ||||||
| SK Innovation Co. Ltd. | 2,918 | 437,773 | ||||||
| 4,260,022 | ||||||||
| PACKAGING & CONTAINERS - 0.2% | ||||||||
| Toyo Seikan Group Holdings Ltd. | 11,100 | 186,166 | ||||||
| PHARMACEUTICALS - 3.6% | ||||||||
| Astellas Pharma, Inc. | 30,000 | 395,631 | ||||||
| AstraZeneca PLC - ADR ^ | 17,252 | 521,873 | ||||||
| Daiichi Sankyo Co. Ltd. | 11,700 | 260,031 | ||||||
| GlaxoSmithKline PLC - ADR | 17,995 | 735,996 | ||||||
| Novartis AG - ADR | 2,345 | 180,448 | ||||||
| Otsuka Holdings Co. Ltd. | 7,800 | 359,275 | ||||||
| Roche Holding AG | 350 | 91,541 | ||||||
| Shire PLC | 16,890 | 994,699 | ||||||
| 3,539,494 | ||||||||
| PRIVATE EQUITY - 0.4% | ||||||||
| 3i Group PLC | 10,739 | 110,242 | ||||||
| Eurazeo SA | 4,132 | 279,980 | ||||||
| 390,222 | ||||||||
| REAL ESTATE - 0.6% | ||||||||
| Cheung Kong Property Holdings Ltd. | 61,500 | 440,337 | ||||||
| Wheelock & Co. Ltd. | 14,000 | 109,063 | ||||||
| 549,400 | ||||||||
| RETAIL - 0.4% | ||||||||
| FF Group * | 4,769 | 101,409 | ||||||
| Harvey Norman Holdings Ltd. | 9,276 | 29,059 | ||||||
| Home Product Center PCL | 318,700 | 89,320 | ||||||
| Marks & Spencer Group PLC ^ | 8,500 | 80,835 | ||||||
| Pandora A/S | 592 | 63,939 | ||||||
| 364,562 | ||||||||
| SEMICONDUCTORS - 6.2% | ||||||||
| Advanced Semiconductor Engineering, Inc. | 138,185 | 173,186 | ||||||
| ASML Holding NV | 6,128 | 810,041 | ||||||
| Infineon Technologies AG | 1,064 | 22,004 | ||||||
| Infineon Technologies AG - ADR | 34,445 | 711,735 | ||||||
| Renesas Electronics Corp. | 8,400 | 80,017 | ||||||
| Rohm Co. Ltd. | 2,400 | 168,555 | ||||||
| Samsung Electronics Co. Ltd. | 814 | 1,595,789 | ||||||
| Samsung Electronics Co. Ltd. - GDR - Reg S | 375 | 288,854 | ||||||
See accompanying notes to financial statements.
60
| SCHEDULE OF INVESTMENTS (Unaudited) |
| Dunham International Stock Fund (Continued) |
| April 30, 2017 |
| Security | Shares | Value | ||||||
| SEMICONDUCTORS (Continued) - 6.2% | ||||||||
| SK Hynix, Inc. | 10,874 | $ | 515,138 | |||||
| STMicroelectronics NV | 28,573 | 458,554 | ||||||
| STMicroelectronics NV - NY Shares ^ | 12,884 | 206,015 | ||||||
| Taiwan Semiconductor Manufacturing Co. Ltd. | 35,000 | 225,466 | ||||||
| Taiwan Semiconductor Manufacturing Co. Ltd. - ADR ^ | 12,300 | 406,761 | ||||||
| Tokyo Electron Ltd. | 3,800 | 461,317 | ||||||
| Tokyo Electron Ltd. - ADR | 2,200 | 69,190 | ||||||
| 6,192,622 | ||||||||
| SOFTWARE - 1.8% | ||||||||
| Amadeus IT Holding SA | 10,559 | 569,679 | ||||||
| Constellation Software, Inc. | 300 | 136,985 | ||||||
| Konami Holdings Corp. | 5,800 | 241,449 | ||||||
| NetEase, Inc. - ADR | 2,152 | 571,119 | ||||||
| Open Text Corp. | 5,000 | 173,078 | ||||||
| Sage Group PLC | 6,798 | 58,941 | ||||||
| 1,751,251 | ||||||||
| TELECOMMUNICATIONS - 5.2% | ||||||||
| China Mobile Ltd. | 5,943 | 316,881 | ||||||
| China Telecom Corp Ltd. | 276,000 | 134,642 | ||||||
| KDDI Corp. | 23,300 | 617,806 | ||||||
| KT Corp. - ADR * | 5,497 | 91,195 | ||||||
| Nice Ltd. | 2,420 | 163,562 | ||||||
| Nippon Telegraph & Telephone Corp. | 14,427 | 618,918 | ||||||
| Nippon Telegraph & Telephone Corp. - ADR | 7,800 | 334,289 | ||||||
| NTT DOCOMO, Inc. | 28,500 | 689,648 | ||||||
| Telefonaktiebolaget LM Ericsson - ADR | 28,153 | 182,713 | ||||||
| Telefonica SA | 80,258 | 887,365 | ||||||
| Telekomunikasi Indonesia Persero Tbk PT | 1,285,200 | 423,970 | ||||||
| Telenor ASA | 828 | 13,380 | ||||||
| Vodafone Group PLC | 7,000 | 183,330 | ||||||
| ZTE Corp. | 274,400 | 528,616 | ||||||
| 5,186,315 | ||||||||
| TRANSPORTATION - 1.2% | ||||||||
| AP Moller - Maersk A/S | 125 | 215,580 | ||||||
| Canadian National Railway Co. | 6,600 | 476283 | ||||||
| East Japan Railway Co. | 3500 | 314114 | ||||||
| Sinotrans Ltd. | 341,000 | 153,257 | ||||||
| 1,159,234 | ||||||||
| WATER - 0.4% | ||||||||
| Cia de Saneamento Basico do Estado de Sao Paulo | 40,800 | 371,419 | ||||||
| TOTAL COMMON STOCK (Cost - $83,879,629) | 95,563,903 | |||||||
| Security | Dividend Rate | Shares | Value | |||||||||
| PREFERRED STOCK - 2.1% | ||||||||||||
| AUTO MANUFACTURER - 0.6% | ||||||||||||
| Hyundai Motor Co. | 2.0800 | % | 481 | $ | 41,962 | |||||||
| Porsche Automobil Holding SE | 3.6100 | 9,046 | 529,250 | |||||||||
| 571,212 | ||||||||||||
| AUTO PARTS & EQUIPMENT - 0.1% | ||||||||||||
| Schaeffler AG | 8,042 | 138,660 | ||||||||||
| BANKS - 0.2% | ||||||||||||
| Itau Unibanco Holding SA | 0.4800 | 13,390 | 164,256 | |||||||||
| ELECTRIC - 0.2% | ||||||||||||
| RWE AG | 10.7100 | 16,035 | 194,829 | |||||||||
| HOUSEHOLD PRODUCTS/WARES - 0.7% | ||||||||||||
| Henkel AG & Co KGaA | 5,366 | 729,884 | ||||||||||
| MISCELLANEOUS MANUFACTURING - 0.1% | ||||||||||||
| Doosan Corp. | 5.3400 | 1,070 | 64,098 | |||||||||
| SEMICONDUCTORS - 0.2% | ||||||||||||
| Samsung Electronics Co., Ltd. | 1.3100 | 123 | 189,411 | |||||||||
| TOTAL PREFERRED STOCK (Cost - $1,820,007) | 2,052,350 | |||||||||||
| SHORT-TERM INVESTMENT - 0.8% | ||||||||||||
| MONEY MARKET FUND - 0.8% | ||||||||||||
| Fidelity Institutional Money Market Funds - Government | ||||||||||||
| Portfolio 0.34% +, ^^ (Cost - $851,284) | 851,284 | 851,284 | ||||||||||
| COLLATERAL FOR SECURITIES LOANED - 3.7% | ||||||||||||
| Mount Vernon Prime Portfolio 1.12% + (Cost - $3,719,420) | 3,719,420 | 3,719,420 | ||||||||||
| TOTAL INVESTMENTS - 102.7% (Cost - $90,270,340) (a) | $ | 102,186,957 | ||||||||||
| LIABILITIES IN EXCESS OF OTHER ASSETS - (2.7)% | (2,710,941 | ) | ||||||||||
| NET ASSETS - 100.0% | $ | 99,476,016 | ||||||||||
| ^ | All or a portion of these securities are on loan. Total loaned securities had a value of $5,778,588 at April 30, 2017. |
| * | Non-income producing security. |
ADR - American Depositary Receipt.
GDR - Global Depositary Receipt.
CDI - CHESS Depository Interest
NV - Non-Voting
REIT - Real Estate Investment Trust.
| + | Variable rate security. Interest rate is as of April 30, 2017. |
| ^^ | All or part of the security was held as collateral for forward foreign currency contracts outstanding as of April 30, 2017. |
| Portfolio Composition * - (Unaudited) | ||||||||||
| Japan | 21.2 | % | China | 4.8 | % | |||||
| Britain | 12.2 | % | Sweden | 3.5 | % | |||||
| Germany | 7.7 | % | Spain | 3.4 | % | |||||
| Switzerland | 6.6 | % | Netherlands | 3.1 | % | |||||
| France | 6.3 | % | Other Countries | 26.3 | % | |||||
| South Korea | 4.9 | % | Total | 100.0 | % | |||||
| * | Based on total value of investments as of April 30, 2017. |
Percentage may differ from Schedule of Investments which are based on Fund net assets.
See accompanying notes to financial statements.
61
| Dunham Real Estate Stock Fund |
| Message from the Sub-Adviser (Barings LLC) |
The real estate investment trust (REIT) market had a positive fiscal six-month period ended April 30, 2017. Although the Sub-Adviser believes that data shows evidence that REIT fundamentals have not historically been driven by interest rate shifts, the increase in rates over recent fiscal periods may have slowed growth in REITs. Since 1996, REITs have been up in more rising rate periods than they have been down. REITs, as measured by the FTSE NAREIT All REITs Index, had volatile monthly returns resulting in a 5.0 percent gain for the six-month period ended April 30, 2017. The strongest returns were generated in November when REITs increased 4.5 percent. This strong performance comes on the heels of a 2.6 percent increase in the prior six-month fiscal period. REITs underperformed other broad equity indexes, such as the S&P 500 Index, for the second six-month period in a row as the S&P 500 increased 13.3 percent.
The Sub-Adviser believes that the intrinsic value of a listed real estate company is a function of the quality of its real estate portfolio, management team, and capital plan. Achieving a thorough understanding of the real estate assets owned by an investment candidate is the foundation of establishing the value of that enterprise. Evaluating management’s ability to drive earnings and add value to underlying real estate assets is vital to the Sub-Adviser developing an understanding of the sustainable future success of the company. Assessing a firm’s financial structure within the context of the prevailing financial environment provides the Sub-Adviser a framework to understand the risk and long-term potential of a firm’s business strategy. Over the six-month period ended April 30, 2017, specialty REITs, diversified REITs, self storage REITs, industrial REITs, and single family home REITs were top contributors to the Fund. Sectors that detracted from performance over the six-month period were data center REITs, office REITs, and infrastructure REITs.
The office REIT sector was a large overweight in the Fund during the six-month period ended April 30, 2017. The sector contributed to relative outperformance during the first fiscal quarter and detracted from relative performance during the second fiscal quarter. The Sub-Adviser believes that this sector’s performance has been driven by confidence returning to the U.S. economy, which may have led corporations to increase investments in the office REIT sector. During the first fiscal quarter, a strong performance in financials may have benefited the office REIT sector, as banks gained momentum after having weak demand for office space in previous fiscal quarters. The Sub-Adviser believes that strong performance in the sector is likely to continue if employment numbers maintain their steady growth. One of the largest active overweights within the office REIT sector during the fiscal period was a position in Kilroy Realty Corp. (KRC) (holding percentage*: 3.25 percent). Kilroy Realty Corp. is a real estate trust engaged in the ownership, acquisition, development and operation of Class A office properties located in California and Washington. Kilroy Realty Corp. gained 1.8 percent during the six-month fiscal period.
The specialty REIT sector contributed positively to Fund performance on an absolute basis over the fiscal six-month period, even with an underweight to the allocation. The Fund’s stock selection contributed meaningfully to performance. The specialty REIT sector includes prisons, which had underperformed relative to the market in the previous fiscal quarter, due to negative political positions prior to the U.S. Presidential election. After the culmination of the election, the market invested heavily in prisons, which aided in strong outperformance during the first half of the fiscal year. A position within the sector that added to Fund performance over the fiscal period was The GEO Group, Inc. (GEO) (holding percentage*: 2.27 percent). The GEO Group, Inc. operates private correctional facilities in the United States, Australia, Canada, New Zealand, and South Africa. The company offers educational programs, vocational training, and rehabilitation therapy services. The GEO Group, Inc. increased 111.7 percent over the fiscal period.
Over the fiscal six-month period the industrial REIT sector added strong relative performance. During the first fiscal quarter, a large underweight to the industrial REIT sector benefited relative performance. The atmosphere reversed during the second fiscal quarter as a large overweight to the industrial REIT sector contributed to strong relative outperformance. The Sub-Adviser believes the gains may have been caused by a tailwind effect from growing e-commerce activity in U.S. markets.
A relative underperformance occurred in the data centers REIT sector over the fiscal six-month period ended April 30, 2017, due to an underweight to the allocation and stock selection in the sector. The Sub-Adviser has a strong long-term view on the sector, as companies expand investments for cloud technology operations. The Sub-Adviser believes the sector has been volatile in recent periods as it is a relatively new sector for REITs, and therefore has taken time for companies to adapt to the investment style. A holding that helped reduce the negative relative performance in the sector was Equinix, Inc. (EQIX) (holding percentage*: 1.00 percent), which invests in interconnected data centers. The company focuses on developing network and cloud-neutral data center platforms for cloud and information technology, enterprises, networks, mobile service providers, and financial companies. The holding contributed a 13.2 percent gain before the position was fully exited in late March.
Going forward, the Sub-Adviser is optimistic about REIT performance through 2017, as they see compelling evidence for the valuation of and growth in REITs, specifically concerning the payment of dividends. It also anticipates that equity markets will remain volatile, as uncertainty remains for U.S. Fed policy, global growth, and U.S. dollar strength. The Sub-Adviser believes the sector has the benefit of sufficient supply levels for REITs but faces a headwind of decreasing sentiment levels, possibly from political events. Continued gains after a strong earnings season by U.S. companies may also be a positive sign for the REIT sector. The Sub-Adviser is not concerned with the possibility of rising interest rates having a negative impact on REITs.
| * | Holdings percentage(s) as of 4/30/2017. |
Growth of $100,000 Investment
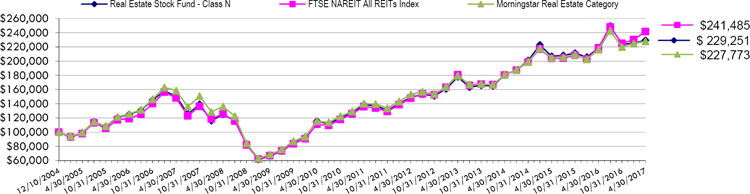
| Total Returns as of April 30, 2017 | ||||||
| Six | One | Annualized | Annualized | Annualized | Annualized Since Inception | |
| Months | Year | Three Years | Five Years | Ten Years | (12/10/04) | |
| Class N | 2.58% | 4.93% | 8.22% | 8.96% | 4.27% | 6.93% |
| Class C | 2.07% | 3.90% | 7.14% | 7.87% | 3.23% | 5.87% |
| Class A with load of 5.75% | (3.42)% | (1.35)% | 5.85% | 7.40% | 3.40% | 3.58%* |
| Class A without load | 2.47% | 4.69% | 7.95% | 8.67% | 4.02% | 4.17%* |
| FTSE NAREIT All REITs Index | 5.68% | 8.68% | 9.67% | 9.97% | 4.82% | 7.37% |
| Morningstar Real Estate Category | 3.71% | 5.43% | 7.94% | 8.26% | 3.69% | 6.87% |
| * | Class A commenced operations on January 3, 2007. |
The FTSE NAREIT All REITs Index is a free float adjusted market capitalization weighted index that includes all tax qualified REITs listed on the NYSE and NASDAQ National Market. Investors cannot invest directly in an index or benchmark.
The Morningstar Real Estate Category is generally representative of mutual funds that primarily invest in REITS of various types. REITs are companies that develop and manage real estate properties.
| As disclosed in the Trust’s latest registration statement, the Fund’s total annual operating expenses, including the cost of underlying funds, are 1.21% for Class N, 2.21% for Class C and 1.46% for Class A. Class A shares are subject to a sales load of 5.75% and a deferred sales charge of up to 0.75% The performance data quoted here represents past performance, which is not indicative of future results. Current performance may be lower or higher than the performance data quoted. The investment return and NAV will fluctuate, so that an investor’s shares, when redeemed, may be worth more or less than their original cost. Total returns are calculated assuming reinvestment of all dividends and capital gains distributions, if any. The returns do not reflect the deductions of taxes a shareholder would pay on the redemption of fund shares or fund distributions. For performance information current to the most recent month-end, please call 1-800-442-4358 or visit our website www.dunham.com |
62
| SCHEDULE OF INVESTMENTS (Unaudited) |
| Dunham Real Estate Stock Fund |
| April 30, 2017 |
| Security | Shares | Value | ||||||
| COMMON STOCK - 1.5% | ||||||||
| LODGING - 1.5% | ||||||||
| Hilton Worldwide Holdings, Inc. | 8,646 | $ | 509,855 | |||||
| TOTAL COMMON STOCK (Cost - $458,510) | ||||||||
| REITS - 97.4% | ||||||||
| APARTMENTS - 14.0% | ||||||||
| AvalonBay Communities, Inc. ^ | 9,880 | 1,875,619 | ||||||
| Equity Residential ^ | 25,180 | 1,626,124 | ||||||
| Mid-America Apartment Communities, Inc. | 11,380 | 1,129,010 | ||||||
| 4,630,753 | ||||||||
| DATA CENTER - 3.4% | ||||||||
| Digital Realty Trust, Inc. ^ | 9,670 | 1,110,503 | ||||||
| FREE STANDING - 5.2% | ||||||||
| National Retail Properties, Inc. ^ | 10,570 | 446,265 | ||||||
| Realty Income Corp. ^ | 5,490 | 320,342 | ||||||
| Spirit Realty Capital, Inc. | 34,910 | 328,852 | ||||||
| STORE Capital Corp. | 26,220 | 629,018 | ||||||
| 1,724,477 | ||||||||
| HEALTHCARE - 12.2% | ||||||||
| Medical Properties Trust | 20,790 | 271,725 | ||||||
| National Health Investors, Inc. ^ | 5,210 | 381,216 | ||||||
| Omega Healthcare Investor ^ | 9,270 | 305,910 | ||||||
| Physicians Realty Trust | 43,620 | 856,697 | ||||||
| Ventas, Inc. | 10,510 | 672,745 | ||||||
| Welltower, Inc. ^ | 21,430 | 1,530,959 | ||||||
| 4,019,252 | ||||||||
| HOTELS - 3.3% | ||||||||
| DiamondRock Hospitality Co. | 34,270 | 377,313 | ||||||
| FelCor Lodging Trust, Inc. ^ | 22,200 | 172,050 | ||||||
| Park Hotels & Resorts, Inc. | 3,472 | 89,126 | ||||||
| Sunstone Hotel Investors, Inc. | 29,730 | 442,680 | ||||||
| 1,081,169 | ||||||||
| INDUSTRIAL 13.0% | ||||||||
| Cousins Properties, Inc. ^ | 40,180 | 341,128 | ||||||
| Duke Realty Corp. | 38,650 | 1,071,765 | ||||||
| Gaming and Leisure Properties, Inc. | 12,260 | 426,648 | ||||||
| Prologis, Inc. | 45,200 | 2,459,332 | ||||||
| 4,298,873 | ||||||||
| OFFICE - 13.7% | ||||||||
| Boston Properties, Inc. | 9,950 | 1,259,670 | ||||||
| Brandywine Realty Trust ^ | 32,170 | 545,925 | ||||||
| Highwoods Properties, Inc. | 8,980 | 456,902 | ||||||
| Hudson Pacific Properties, Inc. | 14,710 | 505,436 | ||||||
| Security | Shares | Value | ||||||
| OFFICE - 13.7% (Continued) | ||||||||
| Kilroy Realty Corp. ^ | 15,243 | $ | 1,075,089 | |||||
| Paramount Group Inc. | 41,240 | 676,336 | ||||||
| 4,519,358 | ||||||||
| REGIONAL MALLS - 9.9% | ||||||||
| Macerich Co. ^ | 14,800 | 923,964 | ||||||
| Simon Property Group, Inc. ^ | 11,711 | 1,935,360 | ||||||
| Taubman Centers, Inc. | 6,650 | 415,957 | ||||||
| 3,275,281 | ||||||||
| SHOPPING CENTERS - 9.1% | ||||||||
| Acadia Realty Trust ^ | 26,968 | 784,229 | ||||||
| Ramco-Gershenson Properties Trust | 27,000 | 359,910 | ||||||
| Regency Centers Corp. | 23,314 | 1,472,979 | ||||||
| Tanger Factory Outlet Centers, Inc. ^ | 12,250 | 382,077 | ||||||
| 2,999,195 | ||||||||
| SINGLE FAMILY - 5.2% | ||||||||
| American Homes 4 Rent ^ | 34,640 | 798,452 | ||||||
| Colony Starwood Homes ^ | 26,920 | 930,624 | ||||||
| 1,729,076 | ||||||||
| SELF STORAGE - 6.1% | ||||||||
| CubeSmart ^ | 21,830 | 553,173 | ||||||
| Extra Space Storage | 19,330 | 1,459,995 | ||||||
| 2,013,168 | ||||||||
| SPECIALTY - 2.3% | ||||||||
| The GEO Group, Inc. ^ | 22,501 | 749,733 | ||||||
| TOTAL REITS (Cost - $27,749,301) | 32,150,838 | |||||||
| SHORT-TERM INVESTMENT - 1.2% | ||||||||
| MONEY MARKET FUND - 1.2% | ||||||||
| Fidelity Institutional Money Market, 0.60% + | 380,469 | 380,469 | ||||||
| TOTAL SHORT-TERM INVESTMENT (Cost - $380,469) | ||||||||
| COLLATERAL FOR SECURITIES LOANED - 30.4% | ||||||||
| Mount Vernon Prime Portfolio, 1.12% + (Cost - $10,034,782) | 10,034,782 | |||||||
| TOTAL INVESTMENTS - 130.5% (Cost - 38,623,062) | $ | 43,075,944 | ||||||
| LIABILITIES LESS OTHER ASSETS - (30.5)% | (10,074,269 | ) | ||||||
| TOTAL NET ASSETS - 100.00% | $ | 33,001,675 | ||||||
| * | Non-Income producing security. |
| ^ | All or a portion of these securities are on loan. Total loaned securities had a value of $9,646,689 at April 30, 2017. |
REITS - Real Estate Investment Trusts.
| + | Variable rate security. Interest rate is as of April 30, 2017 |
| Portfolio Composition * - (Unaudited) | ||||||||||
| Collateral for Securities Loaned | 23.3 | % | Free Standing | 4.0 | % | |||||
| Apartments | 10.7 | % | Single Family | 4.0 | % | |||||
| Office | 10.5 | % | Data Center | 2.6 | % | |||||
| Industrial | 10.0 | % | Hotels | 2.3 | % | |||||
| Healthcare | 9.3 | % | Specialty | 1.7 | % | |||||
| Regional Malls | 7.6 | % | Lodging | 1.4 | % | |||||
| Shopping Centers | 7.0 | % | Short-Term Investment | 0.9 | % | |||||
| Self Storage | 4.7 | % | 100.0 | % | ||||||
| * | Based on total value of investments as of April 30, 2017 |
Percentage may differ from Schedule of Investments which are based on Fund net assets
See accompanying notes to financial statements.
63
| Dunham Small Cap Value Fund |
| Message from the Sub-Adviser (Piermont Capital Management LLC) |
After surging 17.1 percent in the previous fiscal quarter, small cap value stocks, as measured by the Russell 2000 Value Index, rose 1.0 percent in the fiscal quarter ended April 30, 2017. This most recent increase places the six-month performance of small cap value stocks over 18.2 percent. The 4.9 percent relative gain of small cap value stocks over their small cap growth counterparts in the first fiscal quarter was offset during this second fiscal quarter, as small cap growth stocks outpaced small cap value stocks by 4.6 percent. This most recent shift places small cap value stocks 0.2 percent behind small cap growth stocks over the six-month period. On a broader level, just as the value versus growth style saw a shift within the small cap space during this most recent fiscal quarter, small cap stocks, as measured by the Russell 2000 Index, underperformed large cap stocks, as measured by the Russell 1000 Index, during the second fiscal quarter, detracting 1.9 percent on a relative basis. However, during the first fiscal quarter small cap stocks outpaced large cap stocks by 6.7 percent. Therefore, over the six-month period, small cap stocks led large cap stocks by 4.9 percent. The top performing sectors in the Fund during the six-month period included healthcare, industrials, and technology. The energy, telecommunications, and consumer staples sectors generally underperformed the other sectors over the six-month period.
The Sub-Adviser’s proprietary process seeks sector neutrality versus the benchmark index, helping to limit the overall relative underperformance and outperformance to the Sub-Adviser’s stock selection within each sector. The Sub-Adviser implements a combination of five to nine factor groups for each sector model, which measure both fundamental and technical metrics. The Sub-Adviser’s disciplined process requires that stocks rank in the top 20 percent of their peers to be considered for initiation into the Fund. As the Sub-Adviser’s focus is on security selection, there are some sectors where relative performance compared to the benchmark index may be extreme. Similar to the previous fiscal quarter, this included the energy sector. While this sector was one of the worst performing sectors for the Fund on an absolute basis, some holdings experienced extremes in performance between the first fiscal quarter and the second fiscal quarter. For example, Unit Corp. (UNT) (holding percentage*: 0.80 percent), an onshore driller of oil and natural gas wells, declined 17.4 percent during the second fiscal quarter. UNT was one of the strongest performers in the first fiscal quarter, as it increased 51.8 percent, for a total return over the six-month period of 25.5 percent. As the energy sector as a whole was up 6.6 percent for the six-month period, the sector was down 17.3 percent during the second fiscal quarter, the best performing energy holding within the Fund during the same fiscal quarter was still negative. Oceaneering International Inc. (OII) (holding percentage*: 0.70 percent) provides offshore oil companies with underwater drilling support, construction, inspection, and repair services. During the second fiscal quarter, OII decreased 4.7 percent. However, during the six-month period, OII increased 12.1 percent.
Some of the Fund’s highest-performing holdings were in the financial services sector, which increased close to 22 percent over the six-month period. Boasting strong performance in both fiscal quarters was LendingTree Inc. (TREE) (holding percentage*: 1.26 percent), an originator and processor of real estate and business loans. TREE increased 40.1 percent in the first fiscal quarter and surged an additional 25.9 percent in the second fiscal quarter. This back-to-back strong performance placed the six-month return at 76.5 percent. However, as the financial services sector as a whole experienced strong performance during the six-month period, some holdings in the Fund offset some of the strong performance of other holdings like TREE. For example, Greenhill & Co. Inc. (GHL) (holding percentage*: 0.84 percent), a financial advisor for mergers, acquisitions, restructurings, and capital raising for corporate clients and governments, declined 13.1 percent in the second fiscal quarter. The Sub-Adviser did not add this position until close to the end of the most recent fiscal quarter, so the Fund only experienced approximately 7.3 percent of the overall decline.
While the healthcare sector was among the strongest overall sectors during the six-month period, some holdings failed to keep pace with the sector’s surge in performance. These included LifePoint Health Inc. (LPNT) (holding percentage*: 0.82 percent), a provider of acute care facilities, which increased only 3.8 percent over the six-month period. LPNT’s overall performance was hindered in the first fiscal quarter when it declined 0.8 percent amid the majority of the healthcare sector surging in the same time period. Haemonetics Corp. (HAE) (holding percentage*: 1.02 percent), a designer, manufacturer, and marketer of automated blood processing systems, fared quite disparately from LPNT in the first fiscal quarter as HAE rose 19.3 percent. HAE followed the extremely positive first fiscal quarter with a 5.1 percent return in the second fiscal quarter to end the six-month period up 25.4 percent. The top-performing holding in the Fund during the second fiscal quarter was in the healthcare sector. Spectrum Pharmaceuticals Inc. (SPPI) (holding percentage*: 0.75 percent), a biotechnology firm primarily focused on anti-cancer therapies, surged 63.3 percent during the second fiscal quarter. When compounded with its first fiscal quarter return, this placed the overall six-month performance near 115 percent.
Similar to the previous fiscal quarter, the Sub-Adviser is optimistic that its sector-, beta-, and market-capitalization-neutral bottom-up stock picking strategy will benefit from what many view as an improving economic backdrop. Environments where the leading sector is continually changing and where strong fundamentals are rewarded generally benefit the Sub-Adviser’s strategy. Sector leadership continued to shift during the most recent fiscal quarter, and the difference in performance between the best-performing and worst-performing sectors was immense for yet another three-month period.
| * | Holdings percentage(s) as of 4/30/2017. |
| ** | Holdings percentage(s) as of the date prior to the sale of the security. |
Growth of $100,000 Investment
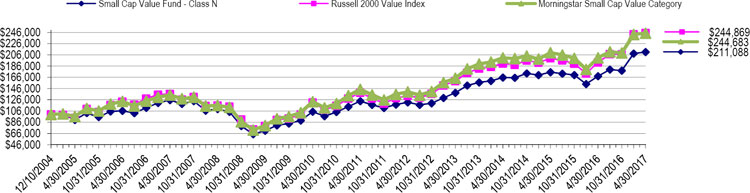
| Total Returns as of April 30, 2017 | ||||||
| Annualized Since | ||||||
| Annualized | Annualized | Annualized | Inception | |||
| Six Months | One Year | Three Years | Five Years | Ten Years | (12/10/04) | |
| Class N | 18.58% | 25.64% | 8.40% | 11.68% | 5.33% | 6.22% |
| Class C | 17.94% | 24.44% | 7.33% | 10.56% | 4.28% | 5.17% |
| Class A with load of 5.75% | 11.59% | 18.22% | 6.01% | 10.14% | 4.47% | 4.95%* |
| Class A without load | 18.38% | 25.41% | 8.13% | 11.45% | 5.09% | 5.55%* |
| Russell 2000 Value Index | 18.26% | 27.18% | 8.71% | 12.96% | 6.02% | 7.50% |
| Morningstar Small Cap Value Category | 16.81% | 21.83% | 6.82% | 11.79% | 6.16% | 7.49% |
| * | Class A commenced operations on January 3, 2007. |
The Russell 2000 Value Index is an unmanaged index that measures the performance of small cap companies in the Russell 2000 Index with lower price-to-book ratios and lower forecasted growth rates. Investors cannot invest directly in an index or benchmark.
The Morningstar Small Cap Value Category is generally representative of mutual funds that primarily invest in small (small capitalization) U.S. companies that are less expensive or growing more slowly than other small-cap stocks.
| As disclosed in the Trust’s latest registration statement, the Fund’s total annual operating expenses, including underlying funds, are 1.48% for Class N, 2.48% for Class C and 1.73% for Class A. Class A shares are subject to a sales load of 5.75% and a deferred sales charge of up to 0.75%. The performance data quoted here represents past performance, which is not indicative of future results. Current performance may be lower or higher than the performance data quoted. The investment return and NAV will fluctuate, so that an investor’s shares, when redeemed, may be worth more or less than their original cost. Total returns are calculated assuming reinvestment of all dividends and capital gains distributions, if any. The returns do not reflect the deductions of taxes a shareholder would pay on the redemption of fund shares or fund distributions. For performance information current to the most recent month-end, please call 1-800-442-4358 or visit our website www.dunham.com. |
64
| SCHEDULE OF INVESTMENTS (Unaudited) |
| Dunham Small Cap Value Fund |
| April 30, 2017 |
| Security | Shares | Value | ||||||
| COMMON STOCK - 99.4% | ||||||||
| AEROSPACE / DEFENSE - 1.1% | ||||||||
| Moog, Inc. * | 4,350 | $ | 298,627 | |||||
| AUTO PARTS & EQUIPMENT - 1.0% | ||||||||
| Cooper Tire & Rubber Co. ^ | 7,537 | 288,667 | ||||||
| BANKS - 18.5% | ||||||||
| Associated Banc-Corp. | 13,000 | 323,700 | ||||||
| BancFirst Corp. ^ | 1,680 | 161,364 | ||||||
| BancorpSouth, Inc. ^ | 8,210 | 249,995 | ||||||
| Banner Corp. ^ | 6,140 | 338,927 | ||||||
| Camden National Corp. | 3,566 | 152,446 | ||||||
| CenterState Banks, Inc. ^ | 11,216 | 282,980 | ||||||
| First Citizens BancShares, Inc. - Class B | 970 | 337,618 | ||||||
| First Financial Corp. | 1,408 | 68,710 | ||||||
| First Interstate BancSystem, Inc. ^ | 7,718 | 291,354 | ||||||
| Heartland Financial USA, Inc. | 4,110 | 197,280 | ||||||
| IBERIABANK Corp. | 4,023 | 319,225 | ||||||
| Peoples Bancorp, Inc. ^ | 3,650 | 122,202 | ||||||
| Seacoast Banking Corp of Florida * ^ | 6,990 | 169,158 | ||||||
| Simmons First National Corp. | 4,800 | 262,320 | ||||||
| State Bank Financial Corp. ^ | 2,792 | 74,993 | ||||||
| TriCo Bancshares | 4,333 | 153,648 | ||||||
| Trustmark Corp. ^ | 8,125 | 269,912 | ||||||
| UMB Financial Corp. ^ | 3,730 | 270,388 | ||||||
| Umpqua Holdings Corp. ^ | 17,490 | 309,048 | ||||||
| United Community Banks, Inc. | 12,599 | 344,583 | ||||||
| WesBanco, Inc. | 4,306 | 171,422 | ||||||
| Wintrust Financial Corp. | 4,600 | 325,956 | ||||||
| 5,197,229 | ||||||||
| BIOTECHNOLOGY - 0.8% | ||||||||
| Spectrum Pharmaceuticals, Inc. * ^ | 27,812 | 211,649 | ||||||
| BUILDING MATERIALS - 0.8% | ||||||||
| Cree, Inc. * ^ | 9,840 | 215,299 | ||||||
| CHEMICALS - 1.9% | ||||||||
| Cabot Corp. ^ | 5,461 | 328,698 | ||||||
| OMNOVA Solutions, Inc. * | 20,780 | 197,410 | ||||||
| 526,108 | ||||||||
| COMMERCIAL SERVICES - 6.8% | ||||||||
| CRA International, Inc. | 4,765 | 180,784 | ||||||
| Ennis, Inc. | 8,190 | 144,144 | ||||||
| Green Dot Corp. * | 6,210 | 212,941 | ||||||
| Huron Consulting Group, Inc. * ^ | 4,719 | 209,995 | ||||||
| K12, Inc. * | 12,000 | 226,200 | ||||||
| LendingTree, Inc. * ^ | 2,510 | 353,659 | ||||||
| McGrath RentCorp | 9,097 | 316,667 | ||||||
| Quad/Graphics, Inc. ^ | 10,542 | 276,833 | ||||||
| 1,921,223 | ||||||||
| COMPUTERS - 2.7% | ||||||||
| DST Systems, Inc. | 2,370 | 291,771 | ||||||
| Insight Enterprises, Inc. * | 10,830 | 455,943 | ||||||
| 747,714 | ||||||||
| DISTRIBUTION/WHOLESALE - 0.4% | ||||||||
| Fossil Group, Inc. * ^ | 5,700 | 98,325 | ||||||
| DIVERSIFIED FINANCIAL SERVICES - 1.9% | ||||||||
| Greenhill & Co., Inc. ^ | 9,314 | 235,644 | ||||||
| LPL Financial Holdings, Inc. | 7,300 | 306,892 | ||||||
| 542,536 | ||||||||
| ELECTRIC - 3.2% | ||||||||
| Avista Corp. | 7,700 | 310,618 | ||||||
| El Paso Electric Co. | 5,600 | 288,960 | ||||||
| Portland General Electric Co. | 6,530 | 296,070 | ||||||
| 895,648 | ||||||||
| Security | Shares | Value | ||||||
| ELECTRICAL COMPONENTS & EQUIPMENT - 0.9% | ||||||||
| EnerSys | 3,210 | $ | 266,783 | |||||
| ELECTRONICS - 0.8% | ||||||||
| FARO Technologies, Inc. * | 6,195 | 227,047 | ||||||
| ENGINEERING & CONSTRUCTION - 1.1% | ||||||||
| Tutor Perini Corp. * ^ | 10,170 | 313,745 | ||||||
| ENTERTAINMENT - 0.7% | ||||||||
| International Speedway Corp. | 5,374 | 199,375 | ||||||
| FOOD - 2.0% | ||||||||
| John B Sanfilippo & Son, Inc. ^ | 4,536 | 333,396 | ||||||
| Lancaster Colony Corp. ^ | 1,750 | 220,325 | ||||||
| 553,721 | ||||||||
| GAS - 2.2% | ||||||||
| Northwest Natural Gas Co. ^ | 5,080 | 302,768 | ||||||
| Spire, Inc. | 4,775 | 327,326 | ||||||
| 630,094 | ||||||||
| HAND / MACHINE TOOLS - 1.1% | ||||||||
| Regal Beloit Corp. | 3,860 | 304,361 | ||||||
| HEALTHCARE - PRODUCTS - 2.0% | ||||||||
| Haemonetics Corp. * ^ | 6,850 | 286,878 | ||||||
| Halyard Health, Inc. | 7,000 | 276,500 | ||||||
| 563,378 | ||||||||
| HEALTHCARE - SERVICES - 0.8% | ||||||||
| LifePoint Health, Inc. * | 3,730 | 231,820 | ||||||
| HOME BUILDERS - 1.5% | ||||||||
| M/I Homes, Inc. * | 7,888 | 214,238 | ||||||
| Taylor Morrison Home Corp. * | 8,910 | 205,821 | ||||||
| 420,059 | ||||||||
| HOUSEHOLD PRODUCTS / WARES - 1.6% | ||||||||
| ACCO Brands Corp. * | 16,869 | 240,383 | ||||||
| Central Garden & Pet Co. * ^ | 5,737 | 216,859 | ||||||
| 457,242 | ||||||||
| INSURANCE - 4.3% | ||||||||
| American Equity Investment Life Holding Co. | 11,476 | 272,211 | ||||||
| Aspen Insurance Holdings Ltd. | 4,840 | 253,374 | ||||||
| First American Financial Corp. | 7,240 | 314,288 | ||||||
| Selective Insurance Group, Inc. | 6,737 | 355,714 | ||||||
| 1,195,587 | ||||||||
| INTERNET - 0.4% | ||||||||
| FTD Cos, Inc. * ^ | 6,080 | 121,600 | ||||||
| IRON / STEEL - 0.9% | ||||||||
| Schnitzer Steel Industries, Inc. | 13,967 | 263,976 | ||||||
| LODGING - 0.5% | ||||||||
| La Quinta Holdings, Inc. * | 10,770 | 151,965 | ||||||
| MEDIA - 0.9% | ||||||||
| Scholastic Corp. ^ | 5,890 | 254,625 | ||||||
| METAL FABRICATE / HARDWARE - 1.3% | ||||||||
| Timken Co. | 7,810 | 376,833 | ||||||
| MISCELLANEOUS MANUFACTURING - 2.3% | ||||||||
| ITT Corp. ^ | 7,750 | 326,508 | ||||||
| Lydall, Inc. * | 6,010 | 314,924 | ||||||
| 641,432 | ||||||||
| OFFICE FURNISHINGS - 1.1% | ||||||||
| Interface, Inc. | 14,820 | 294,918 | ||||||
See accompanying notes to financial statements.
65
| SCHEDULE OF INVESTMENTS (Unaudited) |
| Dunham Small Cap Value Fund (Continued) |
| April 30, 2017 |
| Security | Shares | Value | ||||||
| OIL & GAS - 2.5% | ||||||||
| Laredo Petroleum, Inc. | 16,980 | $ | 218,363 | |||||
| SM Energy Co. | 10,900 | 246,231 | ||||||
| Unit Corp. * ^ | 10,478 | 225,172 | ||||||
| 689,766 | ||||||||
| OIL & GAS SERVICES - 1.7% | ||||||||
| Gulf Island Fabrication, Inc. ^ | 9,720 | 96,714 | ||||||
| Matrix Service Co. * | 8,832 | 103,776 | ||||||
| Oceaneering International, Inc. ^ | 7,430 | 196,078 | ||||||
| TETRA Technologies, Inc. * | 24,980 | 83,183 | ||||||
| 479,751 | ||||||||
| PHARMACEUTICALS - 0.9% | ||||||||
| Anika Therpeutics, Inc. * ^ | 5,433 | 250,624 | ||||||
| REITS - 11.1% | ||||||||
| Chimera Investment Corp. | 14,750 | 300,310 | ||||||
| CyrusOne, Inc. ^ | 6,060 | 331,118 | ||||||
| DCT Industrial Trust, Inc. | 6,024 | 304,573 | ||||||
| Invesco Mortgage Capital, Inc. | 17,450 | 284,610 | ||||||
| LaSalle Hotel Properties ^ | 9,670 | 276,175 | ||||||
| National Storage Affiliates Trust | 7,700 | 188,650 | ||||||
| Outfront Media, Inc. | 10,600 | 277,296 | ||||||
| PS Business Parks, Inc. | 2,100 | 255,234 | ||||||
| Ramco-Gershenson Properties Trust | 12,860 | 171,424 | ||||||
| Sabra Health Care REIT, Inc. ^ | 10,670 | 290,117 | ||||||
| Tier REIT, Inc. ^ | 10,500 | 181,755 | ||||||
| Washington Real Estate Investment Trust | 8,590 | 272,045 | ||||||
| 3,133,307 | ||||||||
| RETAIL - 2.0% | ||||||||
| Big 5 Sporting Goods Corp. ^ | 7,893 | 121,552 | ||||||
| Group 1 Automotive, Inc. ^ | 4,026 | 277,593 | ||||||
| Party City Hold Co., Inc. * ^ | 10,800 | 172,800 | ||||||
| 571,945 | ||||||||
| SAVINGS & LOANS - 3.4% | ||||||||
| First Defiance Financial Corp. | 2,693 | 144,453 | ||||||
| Flagstar Bancorp, Inc. * | 8,612 | 251,815 | ||||||
| HomeStreet, Inc. * ^ | 10,535 | 273,910 | ||||||
| Northwest Bancshares, Inc. ^ | 17,738 | 286,291 | ||||||
| 956,469 | ||||||||
| SEMICONDUCTORS - 4.3% | ||||||||
| Amkor Technology, Inc. * | 32,000 | 376,960 | ||||||
| Nanometrics, Inc. * ^ | 8,412 | 265,441 | ||||||
| Photronics, Inc. * ^ | 22,000 | 253,000 | ||||||
| Rambus, Inc. * ^ | 25,100 | 314,252 | ||||||
| 1,209,653 | ||||||||
| Security | Shares | Value | ||||||
| SOFTWARE - 1.9% | ||||||||
| MicroStrategy, Inc. * | 1,560 | 296,665 | ||||||
| Progress Software Corp. | 8,151 | 242,248 | ||||||
| 538,913 | ||||||||
| TELECOMMUNICATIONS - 1.7% | ||||||||
| Sonus Networks, Inc. * | 14,770 | 113,434 | ||||||
| Spok Holdings, Inc. | 8,460 | 151,857 | ||||||
| West Corp. | 8,020 | 214,054 | ||||||
| 479,345 | ||||||||
| TRANSPORTATION - 0.7% | ||||||||
| Hub Group, Inc. * | 5,350 | 209,453 | ||||||
| TOTAL COMMON STOCK - (Cost - $23,920,983) | 26,930,812 | |||||||
| EXCHANGE TRADED FUND - 3.6% | ||||||||
| EQUITY FUND - 3.6% | ||||||||
| iShares Russell 2000 Value ETF ^ (Cost - 1,014,893) | 8,600 | 1,019,960 | ||||||
| SHORT-TERM INVESTMENT - 0.6% | ||||||||
| MONEY MARKET FUND - 0.6% | ||||||||
| Invesco STIT-Treasury Portfolio Institutional - 0.27% + | 162,015 | 162,015 | ||||||
| (Cost - $162,015) | ||||||||
| COLLATERAL FOR SECURITIES LOANED - 33.7% | ||||||||
| Mount Vernon Prime Portfolio 1.12% + | 9,469,175 | 9,469,175 | ||||||
| (Cost - $9,469,175) | ||||||||
| TOTAL INVESTMENTS - 133.6% (Cost - $34,567,066) | $ | 37,581,962 | ||||||
| LIABILITIES IN EXCESS OF OTHER ASSETS - (33.6)% | (9,440,871 | ) | ||||||
| NET ASSETS - 100.0% | $ | 28,141,091 | ||||||
REIT - Real Estate Investment Trust
| ^ | All or a portion of these securities are on loan. Total loaned securities had a value of $9,020,898 at April 30, 2017. |
| * | Non Income producing security. |
| + | Variable rate security - interest rate is as April 30, 2017. |
| Portfolio Composition * - (Unaudited) | ||||||||||
| Financial | 29.3 | % | Utilities | 4.1 | % | |||||
| Collateral for Securities Loaned | 25.2 | % | Short-Term Investment | 3.2 | % | |||||
| Consumer, Non-Cyclical | 11.1 | % | Energy | 3.1 | % | |||||
| Industrial | 7.6 | % | Communications | 2.3 | % | |||||
| Technology | 6.6 | % | Basic Materials | 2.1 | % | |||||
| Consumer, Cyclical | 5.4 | % | Total | 100.0 | % | |||||
| * | Based on total value of investments as of April 30, 2017. |
Percentage may differ from Schedule of Investments which are based on Fund net assets.
See accompanying notes to financial statements.
66
| Dunham Emerging Markets Stock Fund |
| Message from the Sub-Adviser (Bailard, Inc.) |
The U.S. Presidential election dominated headlines to begin the previous fiscal quarter. The Trump win was a sea change for many market participants who were blindsided by the outcome. This outcome came on the heels of extreme populism in Europe, which was highlighted by the “Brexit” vote in June 2016. Emerging markets stocks, as measured by the MSCI Emerging Markets Index, declined 7.3 percent in the first 14 days of the previous fiscal quarter, as many viewed President Trump’s proposed policies to promote isolationism and protectionism, which could potentially be detrimental to emerging markets stocks. To many investors surprise, the environment has been conducive for emerging markets stocks following the election. Since mid-November, emerging markets stocks rallied. Populism had little impact in the most recent fiscal quarter amid the Austrian, Dutch, and French elections, and combined with the tailwind of a weaker dollar, emerging markets stocks continued to rally in the most recent fiscal quarter. The Sub-Adviser believes that relative earnings in emerging markets countries are strong and profit margins are not yet in extreme ranges with plenty of room to grow. The strong performance in emerging markets has occurred despite political risk in Russia, Hungry, Latin America, and Asia.
The Sub-Adviser believes that across the landscape of investible countries, the great differences in culture, government policies, fiscal and monetary policy, politics and local trading create persistent mispricing opportunities that significantly affect the price of securities. The Sub-Adviser suggests that countries are a powerful contributing factor to stock returns, offer consistent dispersion and set the stage for an investor to profit by emphasizing a country selection strategy. As the Sub-Adviser focuses on individual countries and bottom-up stock selection within those countries, with overweights or underweights to economic sectors being largely incidental. Emerging markets stocks, as measured by the MSCI Emerging Markets Index, increased 8.9 percent over the most recent fiscal six month period ended April 30, 2017. The index underperformed its U.S. counterpart, as measured by the S&P 500 Index, which increased 13.3 percent over the same time period.
The Sub-Adviser’s country selection process is responsive to the current market environment and it results in a ranking of their most and least favorite countries. The largest underweight in the portfolio is the allocation to China. The Sub-Adviser is cognizant of the many changes in China, and the MSCI emerging markets index’s potential inclusion of Chinese mainland stocks in the future. Despite this potential, the Sub-Adviser maintained the underweight. This country allocation detracted from Fund performance over the most recent fiscal six-month period ended April 30, 2017. The Mexican peso has been one of the biggest losers in the post-election Trump era as Mexican stocks declined over 10 percent over the first fiscal quarter of the year, according to the MSCI Mexico Index. The Fund’s underweight position in Mexico positively contributed to Fund performance over the previous fiscal quarter. That underweight detracted from Fund performance in the most recent quarter as Mexican stocks increased 14.5 percent, as measured by the MSCI Mexico Index. The Sub-Adviser attributes the performance to a weakening dollar, as well as President Trump falling short early in his term on some of his perceived protectionist policies. The largest overweight in the portfolio is the allocation to Russia, which was also the largest contributor to Fund performance in the previous fiscal quarter. Over the most recent fiscal quarter, this allocation detracted from Fund performance as Russian equities decreased 4.5 percent, as measured by the MSCI Russia Index. A country allocation that detracted from relative Fund performance was the Fund’s allocation to Egypt. The Fund was overweight Egyptian securities as the Egypt Central Bank devalued its currency, pushing Egyptian equites down over 30 percent in the previous quarter, as measured by the MSCI Egypt index. Over the most recent fiscal quarter, Egyptian equities rebounded slightly, increasing 0.9 percent.
The Sub-Adviser’s security selection process selects from among the model’s highest ranked stocks, while preserving the country characteristics the country model seeks. Despite the Fund’s country allocation to China detracting from performance, stock selection within China positively contributed to Fund performance. A Chinese holding that had a positive impact on Fund performance was Geely Automobile Holdings LTD (175 HK) (holding percentage*: 1.92 percent) a popular car company in China. Geely Automobile Holdings LTD had a strong fiscal six-month period, increasing 30.9. The Sub-Adviser believes that the performance is attributed to strong sales and attractive margins, especially with their focus on high value sport utility vehicles. Additionally, Geely Automobile Holdings LTD acquisition of Volvo cars is paying off. Another Chinese holding that positively contributed to Fund performance was BYD Electronics (285 HK) (holding percentage*: 2.29 percent). BYD Electronics is an information technology company that constructs handset equipment. Over the fiscal six-month period, this position increased 93.6 percent, benefitting from strong Samsung Galaxy sales. A holding that detracted from Fund performance was the National Bank of Pakistan (NBP PA) (holding percentage*: 0.81 percent). The National Bank of Pakistan, a government owned bank which provides a wide range of banking and financial services to corporate, institutional, commercial, agricultural, industrial, and individual customers throughout Pakistan, declined 0.7 percent over the six-month period.
The Sub-Adviser believes Geopolitical risk is also present in Asia, Western Europe, and the United States. These political risks around the world will need to be monitored closely as these changes could potentially contribute to the volatility of many emerging markets countries. China has not been generating a large amount of its GDP growth through value added exports; rather it has been through investment in infrastructure and attempting to increase consumer demand. Investors are becoming accustomed to the slowdown in growth as the country transitions. The Sub-Adviser believes that the true risk is the potential for militarization in China. Despite these risks, the Sub-Adviser is optimistic for emerging markets stocks in the coming quarter and the rest of 2017 as long as investors correctly navigate through the upcoming geopolitical risks. The Sub-Adviser believes that the combination of a weak dollar, strong valuations in emerging markets, and quality earnings could act as a tailwind for emerging markets stocks. The Sub-Adviser believes that this environment is beneficial for the Fund’s “countries matter” investment philosophy. Additionally, favorable prices in commodities may also help boost emerging markets stocks.
* Holdings percentage(s) as of 4/30/2017.
Growth of $100,000 Investment
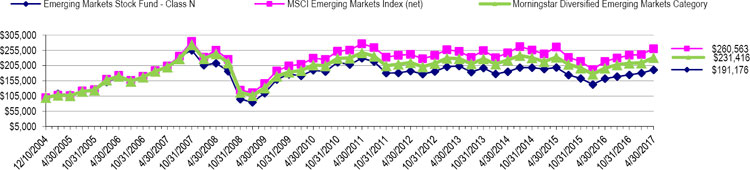
| Total Returns as of April 30, 2017 | ||||||
| Annualized | Annualized | Annualized | Annualized Since Inception | |||
| Six Months | One Year | Three Years | Five Years | Ten Years | (12/10/04) | |
| Class N | 9.43.% | 17.75% | 1.06% | 0.42% | (0.66)% | 5.37% |
| Class C | 8.91% | 16.61% | 0.06% | (0.57)% | (1.65)% | 4.34% |
| Class A with load of 5.75% | 3.00% | 10.62% | (1.14)% | (1.00)% | (1.49)% | (0.49)%* |
| Class A without load | 9.29% | 17.40% | 0.82% | 0.18% | (0.91)% | 0.08%* |
| MSCI Emerging Markets Index (net) | 8.88% | 19.13% | 1.79% | 1.49% | 2.47% | 8.04% |
| Morningstar Diversified Emerging Markets Category | 8.67% | 17.57% | 1.15% | 1.50% | 1.46% | 7.00% |
| * | Class A commenced operations on January 3, 2007. |
The MSCI Emerging Markets Index (net) is a free float-adjusted market capitalization index that is designed to measure equity market performance in the global emerging markets. Investors cannot invest directly in an index or benchmark.
The Morningstar Diversified Emerging Markets Category is generally representative of mutual funds that primarily invest among 20 or more developing nations, with a general focus on the emerging markets of Asia and Latin America rather than on the emerging markets countries in the Middle East, Africa, or Europe.
| As disclosed in the Trust’s latest registration statement, the Fund’s total annual operating expenses, including underlying funds, are 1.30% for Class N, 2.30% for Class C and 1.55% for Class A. Class A shares are subject to a sales load of 5.75% and a deferred sales charge of up to 0.75%. The performance data quoted here represents past performance, which is not indicative of future results. Current performance may be lower or higher than the performance data quoted. The investment return and NAV will fluctuate, so that an investor’s shares, when redeemed, may be worth more or less than their original cost. Total returns are calculated assuming reinvestment of all dividends and capital gains distributions, if any. The returns do not reflect the deductions of taxes a shareholder would pay on the redemption of fund shares or fund distributions. For performance information current to the most recent month-end, please call 1-800-442-4358 or visit our website www.dunham.com. |
67
| SCHEDULE OF INVESTMENTS (Unaudited) |
| Dunham Emerging Markets Stock Fund |
| April 30, 2017 |
| Security | Shares | Value | ||||||
| COMMON STOCK - 95.4% | ||||||||
| ADVERTISING - 0.5% | ||||||||
| Smiles SA | 12,000 | $ | 260,310 | |||||
| AGRICULTURE - 0.6% | ||||||||
| Adecoagro SA * | 30,000 | 332,700 | ||||||
| AUTO MANUFACTURERS - 1.9% | ||||||||
| Geely Automobile Holdings Ltd. | 800,000 | 1,077,995 | ||||||
| AUTO PARTS & EQUIPMENT - 0.9% | ||||||||
| Weichai Power Co. Ltd. | 312,000 | 505,602 | ||||||
| BANKS - 20.0% | ||||||||
| Agricultural Bank of China Ltd. | 1,000,000 | 461,038 | ||||||
| Banco Bradesco SA - ADR | 40,000 | 422,000 | ||||||
| Banco Macro SA -ADR ^ | 7,000 | 600,040 | ||||||
| Bancolombia SA - ADR | 15,000 | 592,350 | ||||||
| China Construction Bank Corp. | 1,250,000 | 1,014,684 | ||||||
| China Merchants Bank Co. Ltd. | 212,000 | 549,351 | ||||||
| Commercial International Bank Egypt SAE - GDR | 274,999 | 1,175,621 | ||||||
| Credicorp Ltd. | 5,000 | 768,300 | ||||||
| FirstRand Ltd. | 150,000 | 558,787 | ||||||
| Industrial & Commercial Bank of China Ltd. | 800,000 | 521,546 | ||||||
| National Bank of Pakistan | 750,000 | 456,274 | ||||||
| OTP Bank PLC | 53,000 | 1,490,855 | ||||||
| Sberbank of Russia - ADR | 120,000 | 1,426,800 | ||||||
| Turkiye Is Bankasi | 300,000 | 591,760 | ||||||
| Woori Bank | 45,000 | 590,081 | ||||||
| 11,219,487 | ||||||||
| CHEMICALS - 6.6% | ||||||||
| Engro Corp Ltd./Pakistan | 300,000 | 1,009,714 | ||||||
| Formosa Chemicals & Fibre Corp. | 100,000 | 553,498 | ||||||
| Kingboard Chemical Holdings Ltd. | 225,000 | 810,434 | ||||||
| Lotte Chemical Corp. | 2,000 | 600,391 | ||||||
| UPL Ltd. | 60,000 | 751,804 | ||||||
| 3,725,841 | ||||||||
| COMMERCIAL SERVICES - 0.9% | ||||||||
| Qualicorp SA | 75,000 | 527,542 | ||||||
| COMPUTERS - 1.2% | ||||||||
| Lite-On Technology Corp. | 400,000 | 697,742 | ||||||
| DISTRIBUTION / WHOLESALE - 1.2% | ||||||||
| Hanwha Corp. | 19,500 | 684,102 | ||||||
| DIVERSIFIED FINANCIAL SERVICES - 2.9% | ||||||||
| BM&FBovespa SA - Bolsa de Valores Mercadorias e Futuros | 100,000 | 591,784 | ||||||
| Fubon Financial Holding Co. Ltd. | 350,000 | 547,898 | ||||||
| Hana Financial Group, Inc. | 15,000 | 515,176 | ||||||
| 1,654,858 | ||||||||
| ELECTRIC - 0.6% | ||||||||
| Transmissora Alianca de Energia Eletrica SA | 48,000 | 352,032 | ||||||
| ELECTRICAL COMPONENTS & EQUIPMENT - 2.1% | ||||||||
| LG Electronics, Inc. | 12,000 | 728,444 | ||||||
| Walsin Lihwa Corp. | 1,000,000 | 448,223 | ||||||
| 1,176,667 | ||||||||
| Security | Shares | Value | ||||||
| ELECTRONICS - 3.9% | ||||||||
| Hon Hai Precision Industry Co. Ltd. | 462,000 | $ | 1,512,201 | |||||
| Micro-Star International Co. Ltd. | 170,000 | 340,501 | ||||||
| WPG Holdings Ltd. | 300,000 | 380,294 | ||||||
| 2,232,996 | ||||||||
| ENGINEERING & CONSTRUCTION - 0.9% | ||||||||
| China Railway Group Ltd. | 600,000 | 507,510 | ||||||
| ENVIRONMENTAL CONTROL - 0.9% | ||||||||
| China Water Affairs Group Ltd. | 750,000 | 501,203 | ||||||
| FOOD - 1.9% | ||||||||
| M Dias Branco SA | 19,500 | 297,182 | ||||||
| Sao Martinho SA | 75,000 | 412,420 | ||||||
| SPAR Group Ltd. | 25,000 | 336,454 | ||||||
| 1,046,056 | ||||||||
| FOREST PRODUCTS & PAPER - 1.6% | ||||||||
| Mondi Ltd. | 15,000 | 388,342 | ||||||
| Nine Dragons Paper Holdings Ltd. | 450,000 | 485,359 | ||||||
| 873,701 | ||||||||
| HOLDING COMPANIES - DIVERSIFIED - 0.9% | ||||||||
| Tekfen Holding AS | 200,000 | 515,222 | ||||||
| HOME BUILDERS - 0.7% | ||||||||
| MRV Engenharia e Participacoes SA | 75,000 | 371,858 | ||||||
| HOME FURNISHINGS - 0.8% | ||||||||
| Arcelik AS | 70,000 | 466,449 | ||||||
| INSURANCE - 1.0% | ||||||||
| China Life Insurance Co. Ltd. | 600,000 | 558,666 | ||||||
| INTERNET- 3.4% | ||||||||
| MercadoLibre, Inc. | 1,500 | 343,365 | ||||||
| Tencent Holdings Ltd. | 50,000 | 1,566,828 | ||||||
| 1,910,193 | ||||||||
| IRON / STEEL- 1.1% | ||||||||
| Severstal PAO - GDR | 25,000 | 342,000 | ||||||
| Vale SA | 30,000 | 257,400 | ||||||
| 599,400 | ||||||||
| LEISURE TIME - 0.6% | ||||||||
| Bajaj Auto Ltd. | 8,000 | 356,143 | ||||||
| MINING - 1.0% | ||||||||
| Cia de Minas Buenaventura SAA - ADR | 45,000 | 540,450 | ||||||
| OIL & GAS - 9.0% | ||||||||
| China Petroleum & Chemical Corp. | 650,000 | 527,889 | ||||||
| Cosan SA Industria e Comercio | 67,500 | 778,018 | ||||||
| Ecopetrol SA - ADR *^ | 35,000 | 319,900 | ||||||
| Gazprom OAO - ADR | 120,000 | 568,800 | ||||||
| Lukoil OAO - ADR | 30,000 | 1,489,950 | ||||||
| MOL Hungarian Oil & Gas PLC | 7,500 | 564,466 | ||||||
| Pakistan Petroleum Ltd. | 200,000 | 302,978 | ||||||
| SK Innovation Co. Ltd. | 3,500 | 525,088 | ||||||
| 5,077,089 | ||||||||
| PHARMACEUTICALS - 1.1% | ||||||||
| Richter Gedeon Nyrt | 25,000 | 605,686 | ||||||
See accompanying notes to financial statements.
68
| SCHEDULE OF INVESTMENTS (Unaudited) |
| Dunham Emerging Markets Stock Fund (Continued) |
| April 30, 2017 |
| Security | Shares | Value | ||||||
| REAL ESTATE - 3.2% | ||||||||
| Country Garden Holdings Co. Ltd. | 950,000 | $ | 903,591 | |||||
| Emlak Konut Gayrimenkul Yatirim Ortakligi AS | 400,000 | 332,044 | ||||||
| Highwealth Construction Corp. | 320,000 | 539,432 | ||||||
| 1,775,067 | ||||||||
| RETAIL - 2.2% | ||||||||
| JUMBO SA | 6,180 | 97,472 | ||||||
| Steinhoff International Holdings NV | 60,000 | 304,770 | ||||||
| Sun Art Retail Group Ltd. | 550,000 | 566,696 | ||||||
| Zhongsheng Group Holdings Ltd. | 200,000 | 282,003 | ||||||
| 1,250,941 | ||||||||
| SEMICONDUCTORS - 10.8% | ||||||||
| Dongbu HiTek Co. Ltd. * | 37,500 | 694,757 | ||||||
| Powertech Technology, Inc. | 180,000 | 564,701 | ||||||
| Samsung Electronics Co. Ltd. | 1,100 | 2,156,472 | ||||||
| Taiwan Semiconductor Manufacturing Co. Ltd. - ADR ^ | 80,000 | 2,645,600 | ||||||
| 6,061,530 | ||||||||
| SOFTWARE - 3.7% | ||||||||
| HCL Technologies Ltd. | 40,000 | 506,051 | ||||||
| NetEase, Inc. - ADR | 6,000 | 1,592,340 | ||||||
| 2,098,391 | ||||||||
| TELECOMMUNICATIONS - 5.3% | ||||||||
| BYD Electronic International Co. Ltd. | 840,000 | 1,282,217 | ||||||
| China Mobile Ltd. | 60,000 | 638,863 | ||||||
| Far EasTone Telecommunications Co. Ltd. | 160,000 | 394,008 | ||||||
| Hellenic Telecommunications Organization SA | 20,000 | 194,178 | ||||||
| Vodacom Group Ltd. | 40,000 | 451,717 | ||||||
| 2,960,983 | ||||||||
| TRANSPORTATION - 1.5% | �� | |||||||
| Rumo Logistica Operadora Multimodal SA * | 200,000 | 547,080 | ||||||
| Super Group Ltd. * | 100,000 | 274,707 | ||||||
| 821,787 | ||||||||
| WATER - 0.5% | ||||||||
| Cia de Saneamento Basico do Estado de Sao Paulo | 30,000 | 273,102 | ||||||
| TOTAL COMMON STOCK (Cost - $43,490,826) | 53,619,301 | |||||||
| Security | Shares | Value | ||||||
| PREFERRED STOCK - 2.9% | ||||||||
| BANKS - 0.9% | ||||||||
| Banco Bradesco SA | 15,000 | $ | 156,527 | |||||
| Itau Unibanco Holding SA | 29,500 | 361,880 | ||||||
| 518,407 | ||||||||
| CHEMICALS - 1.0% | ||||||||
| Braskem SA | 50,000 | 533,169 | ||||||
| HOLDING COMPANIES - DIVERSIFIED - 1.0% | ||||||||
| Itausa - Investimentos Itau SA - Preference | 190,000 | 584,469 | ||||||
| TOTAL PREFERRED STOCK (Cost - $1,390,523) | 1,636,045 | |||||||
| EXCHANGE TRADED FUND - 0.6% | ||||||||
| EQUITY FUNDS - 0.6% | ||||||||
| iShares MSCI All Peru Capped ETF (Cost - $299,207) | 10,000 | 333,600 | ||||||
| SHORT-TERM INVESTMENT - 0.8% | ||||||||
| MONEY MARKET - 0.8% | ||||||||
| First American Government Obligations Fund 0.33% + | ||||||||
| (Cost - $487,270) | 487,270 | 487,270 | ||||||
| COLLATERAL FOR SECURITIES LOANED - 5.0% | ||||||||
| Mount Vernon Prime Portfolio 1.12% + (Cost - $2,814,783) | 2,814,783 | 2,814,783 | ||||||
| TOTAL INVESTMENTS - 104.7% (Cost - $48,482,609) (a) | $ | 58,890,999 | ||||||
| LIABILITIES IN EXCESS OF OTHER ASSETS - (4.7)% | (2,666,242 | ) | ||||||
| NET ASSETS - 100.0% | $ | 56,224,757 | ||||||
| ADR - American Depositary Receipt | ETF - Exchange Traded Fund |
| GDR - Global Depositary Receipt | NVDR - Non-Voting Depositary Receipt |
| * | Non-income producing security |
| ^ | All or a portion of these securities are on loan. Total loaned securities had a value of $3,565,540 at April 30, 2017. |
| + | Variable rate security. Interest rate is as of April 30, 2017. |
| Portfolio Composition * - (Unaudited) | ||||||||||
| China | 18.3 | % | Hong Kong | 5.1 | % | |||||
| Taiwan | 15.6 | % | Hungary | 4.5 | % | |||||
| Brazil | 11.4 | % | South Africa | 3.9 | % | |||||
| South Korea | 11.0 | % | Turkey | 3.2 | % | |||||
| Russia | 6.5 | % | Other Countries | 20.5 | % | |||||
| Total | 100.0 | % | ||||||||
| * | Based on total value of investments as of October 31, 2016. |
Percentage may differ from Schedule of Investments which is based on Fund net assets.
See accompanying notes to financial statements.
69
| Dunham Small Cap Growth Fund |
| Message from the Sub-Adviser (Pier Capital, LLC) |
After boasting strong post-election performance in the first fiscal quarter, small cap growth stocks, as measured by the Russell 2000 Growth Index, experienced a moderately strong second fiscal quarter. During the most recent fiscal quarter, small cap growth stocks increased 5.6 percent. When combined with the 12.2 percent performance in the first fiscal quarter, the total six-month return was near 18.5 percent. The top three performing sectors during the most recent fiscal quarter were telecommunication services, healthcare, and materials. Two of the three strongest performing sectors in the previous fiscal quarter, financial services and energy, were the only two negative performers in the most recent fiscal quarter. While the financial services sector was only down 0.5 percent, the energy sector plummeted 24.5 percent. Similar to the previous fiscal quarter, the dispersion between the top-performing sector and the bottom-performing sector was extreme. However, in the previous fiscal quarter, the dispersion was 25.5 percent, while in the most recent fiscal quarter it was 46.7 percent. Fortunately, the sectors representing the highest and lowest performance in the most recent fiscal quarter only comprise 2 percent of the small cap growth space, and the majority of the other larger-weighted sectors performed with significantly less dispersion.
As the largest sector within the benchmark index, information technology has historically had a meaningful impact on the performance of small cap growth stocks. Similar to the first fiscal quarter, the information technology sector slightly lagged the benchmark, detracting 1.3 percent on a relative basis in the second fiscal quarter. However, this proved to be one of the strongest performing sectors for the Fund in the most recent fiscal quarter. This strong relative performance coupled with the Fund’s large overweight to this sector greatly contributed to the Fund’s performance relative to the benchmark index. Some holdings that performed well in the sector in the first fiscal quarter, such as Wix.com Ltd. (WIX) (holding percentage*: 1.01 percent), a company that offers a low-cost web development platform for small business owners and entrepreneurs to create professional-quality websites, continued to outperform both the sector and the benchmark as a whole during the second fiscal quarter. WIX increased 56.9 percent during the most recent fiscal quarter after increasing 31.4 percent in the previous fiscal quarter, for a combined return of 106.1 percent during the six-month period. Within this same sector, one of the poorer performers in the first fiscal quarter, Gigamon, Inc. (GIMO) (holding percentage**: 0.34 percent), which designs and markets networking products and solutions around the world, was a detractor from performance within the information technology sector in the second fiscal quarter. However, the Sub-Adviser exited the holding early in the second fiscal quarter as holding continued to decline after its 40.1 percent plummet in the first fiscal quarter.
After boasting markedly strong performance in the first fiscal quarter, the financial services sector was one of the only two negative sectors in the second fiscal quarter. The Sub-Adviser reduced the Fund’s exposure to the sector over the second fiscal quarter, exiting holdings such as Bank of the Ozarks (OZRK) (holding percentage**: 0.80 percent), the holding company for the bank of the same name that focuses on individuals and small to mid-sized businesses. After OZRK increased 48.9 percent in the first fiscal quarter, it declined 9.8 percent before the Sub-Adviser sold completely out of the position near the end of the second fiscal quarter. The generally negative performance in the financial services sector during the second fiscal quarter was primarily attributable to intermediate-term and long-term interest rates generally decreasing despite another increase in the Fed Funds Rate in March by the Federal Open Market Committee.
During the most recent fiscal quarter, the second-largest and second-best-performing sector within the benchmark index was the healthcare sector. During both fiscal quarters of the six-month period, the sector boasted a similar return in each fiscal quarter, as it increased 9.9 percent in the first fiscal quarter and then another 10.0 percent in the second fiscal quarter for a total return over the six-month period of almost 21 percent. Within this space, returns continued to be quite disparate within the Fund. For example, Surgery Partners, Inc. (SGRY) (holding percentage*: 0.43 percent), a surgical facility owner and operator of ambulatory surgery centers and surgery hospitals, decreased 7.0 percent during the second fiscal quarter. Conversely, Merit Medical Systems, Inc. (MMSI) (holding percentage*: 1.08 percent), a provider of disposable medical products used during interventional and diagnostic procedures, surged 32.7 percent during the most recent fiscal quarter. Both of these holdings experienced a meaningful difference in performance from the prior fiscal quarter, albeit in different directions, as SGRY and MMSI rose 14.9 percent and 15.7 percent in the previous fiscal quarter, respectively.
The Sub-Adviser remains aware of global concerns and how that may impact the competitive position of U.S. small cap growth companies with their global peers. The Sub-Adviser’s approach generally benefits from investors favoring earnings growth over macro trends. This most recent environment over the recent six-month period was primarily driven by investor sentiment surrounding excitement and concerns over the U.S. President’s comments and views on infrastructure spending in the U.S., to overhauling trade agreements abroad. Therefore, this environment was much more macro-oriented and the Sub-Adviser is hopeful that individual companies’ stories will begin to drive investor decisions going forward.
| * | Holdings percentage(s) as of 4/30/2017. |
| ** | Holdings percentage(s) as of the date prior to the sale of the security. |
Growth of $100,000 Investment
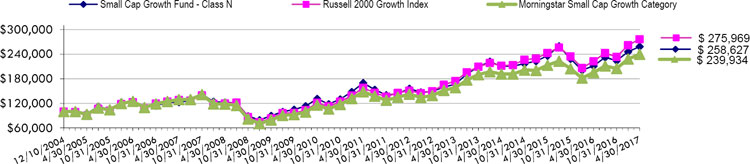
| Total Returns as of April 30, 2017 | ||||||
| Annualized | Annualized Since | |||||
| Six | One | Three | Annualized | Annualized | Inception | |
| Months | Year | Years | Five Years | Ten Years | (12/10/04) | |
| Class N | 15.32% | 22.42% | 7.11% | 10.64% | 7.71% | 7.97% |
| Class C | 14.70% | 21.14% | 6.04% | 9.54% | 6.63% | 6.91% |
| Class A with load of 5.75% | 8.50% | 15.07% | 4.74% | 9.06% | 6.80% | 6.98%* |
| Class A without load | 15.15% | 22.06% | 6.83% | 10.36% | 7.44% | 7.60%* |
| Russell 2000 Growth Index | 18.48% | 24.06% | 9.27% | 12.89% | 7.97% | 8.53% |
| Morningstar Small Cap Growth Category | 16.96% | 22.89% | 7.78% | 11.00% | 6.37% | 7.32% |
| * | Class A commenced operations on January 3, 2007. |
The Russell 2000 Growth Index measures the performance of the Russell 2000 companies with higher price-to-book ratios and higher forecasted growth values. Investors cannot invest directly in an index or benchmark.
The Morningstar Small Cap Growth Category is generally representative of mutual funds that primarily invest in small (small capitalization) U.S. companies that are projected to grow faster than other small-cap stocks.
| As disclosed in the Trust’s latest registration statement, the Fund’s total annual operating expenses, including the cost of underlying funds, are 1.24% for Class N, 2.24% for Class C and 1.49% for Class A. Class A shares are subject to a sales load of 5.75% and a deferred sales charge of up to 0.75%. The performance data quoted here represents past performance, which is not indicative of future results. Current performance may be lower or higher than the performance data quoted. The investment return and NAV will fluctuate, so that an investor’s shares, when redeemed, may be worth more or less than their original cost. Total returns are calculated assuming reinvestment of all dividends and capital gains distributions, if any. The returns do not reflect the deductions of taxes a shareholder would pay on the redemption of fund shares or fund distributions. For performance information current to the most recent month-end, please call 1-800-442-4358 or visit our website www.dunham.com |
70
| SCHEDULE OF INVESTMENTS (Unaudited) |
| Dunham Small Cap Growth Fund |
| April 30, 2017 |
| Security | Shares | Value | ||||||
| COMMON STOCK - 98.6% | ||||||||
| BANKS - 0.9% | ||||||||
| FCB Financial Holdings, Inc. * ^ | 6,613 | $ | 312,464 | |||||
| BIOTECHNOLOGY - 2.5% | ||||||||
| Exact Sciences Corp. * ^ | 16,328 | 490,003 | ||||||
| Foundation Medicine, Inc. * ^ | 4,703 | 166,956 | ||||||
| Momenta Pharmaceuticals, Inc. * | 17,289 | 248,097 | ||||||
| 905,056 | ||||||||
| BUILDING MATERIALS - 2.5% | ||||||||
| Apogee Enterprises, Inc. | 6,048 | 329,616 | ||||||
| Forterra, Inc. * | 14,095 | 271,188 | ||||||
| Summit Materials, Inc. * | 12,469 | 319,955 | ||||||
| 920,759 | ||||||||
| COMMERICAL SERVICES - 4.3% | ||||||||
| Alarm.com Holdings, Inc. * | 7,699 | 251,064 | ||||||
| HealthEquity, Inc. * ^ | 7,621 | 346,908 | ||||||
| Herc Holdings, Inc. * | 6,541 | 297,419 | ||||||
| Paylocity Holding Corp. * ^ | 8,220 | 324,197 | ||||||
| Vantiv, Inc. * | 5,885 | 365,105 | ||||||
| 1,584,693 | ||||||||
| COMPUTERS - 6.8% | ||||||||
| Electronics For Imaging, Inc. * | 7,033 | 321,971 | ||||||
| Globant SA * ^ | 9,172 | 347,527 | ||||||
| KEYW Holding Corp. * ^ | 26,744 | 253,801 | ||||||
| Kornit Digital Ltd. * | 20,020 | 402,402 | ||||||
| Mercury Systems, Inc. * ^ | 13,209 | 493,752 | ||||||
| Virtusa Corp. * | 10,010 | 310,110 | ||||||
| Vocera Communications, Inc. * | 15,206 | 385,624 | ||||||
| 2,515,187 | ||||||||
| COSMETICS - 0.8% | ||||||||
| elf Beauty, Inc. * | 11,344 | 309,124 | ||||||
| DISTRIBUTION/WHOLESALE - 1.4% | ||||||||
| Beacon Roofing Supply, Inc. * | 754 | 37,376 | ||||||
| SiteOne Landscape Supply, Inc. * ^ | 10,311 | 492,969 | ||||||
| 530,345 | ||||||||
| DIVERSIFIED FINANCIAL SERVICES - 1.1% | ||||||||
| WageWorks, Inc. * ^ | 5,476 | 404,129 | ||||||
| ELECTRICAL COMPONENTS & EQUIPMENT - 0.9% | ||||||||
| Universal Display Corp. ^ | 3,755 | 335,509 | ||||||
| ELECTRONICS - 1.9% | ||||||||
| ESCO Technologies, Inc. ^ | 5,900 | 347,215 | ||||||
| Orbotech Ltd. * | 10,410 | 342,801 | ||||||
| 690,016 | ||||||||
| ENGINEERING & CONSTRUCTION - 4.5% | ||||||||
| Dycom Industries, Inc. * ^ | 3,009 | 317,931 | ||||||
| Granite Construction, Inc. | 9,562 | 504,013 | ||||||
| MasTec, Inc. * | 8,175 | 360,926 | ||||||
| NV5 Global, Inc. * | 4,258 | 164,785 | ||||||
| Primoris Services Corp. ^ | 13,558 | 311,427 | ||||||
| 1,659,082 | ||||||||
| ENTERTAINMENT - 2.9% | ||||||||
| IMAX Corp. * | 9,856 | 300,608 | ||||||
| Red Rock Resorts, Inc. | 14,085 | 329,307 | ||||||
| Vail Resorts, Inc. | 2,156 | 426,155 | ||||||
| 1,056,070 | ||||||||
| Security | Shares | Value | ||||||
| FOOD - 1.3% | ||||||||
| Hostess Brands, Inc. * | 27,632 | $ | 473,612 | |||||
| HEALTHCARE-PRODUCTS - 8.7% | ||||||||
| CryoLife, Inc. * | 17,964 | 326,047 | ||||||
| Glaukos Corp. * ^ | 8,876 | 421,876 | ||||||
| Globus Medical, Inc. * ^ | 11,126 | 337,452 | ||||||
| iRhythm Technologies, Inc. * | 9,439 | 333,102 | ||||||
| K2M Group Holdings, Inc. * | 16,570 | 367,025 | ||||||
| Merit Medical Systems, Inc. | 11,822 | 398,401 | ||||||
| Penumbra, Inc. * ^ | 4,164 | 355,814 | ||||||
| Repligen Corp. * | 9,432 | 347,003 | ||||||
| West Pharmaceutical Services, Inc. | 3,710 | 341,431 | ||||||
| 3,228,151 | ||||||||
| HEALTHCARE-SERVICES - 0.4% | ||||||||
| Surgery Partners, Inc. * ^ | 9,220 | 158,584 | ||||||
| HOME BUILDERS - 3.0% | ||||||||
| Installed Building Products, Inc. * | 8,358 | 445,899 | ||||||
| LGI Homes, Inc. * ^ | 9,887 | 314,703 | ||||||
| TRI Pointe Group, Inc. * ^ | 26,969 | 335,764 | ||||||
| 1,096,366 | ||||||||
| INTERNET - 6.4% | ||||||||
| Chegg, Inc. * ^ | 19,695 | 177,452 | ||||||
| Etsy, Inc. * | 30,342 | 326,480 | ||||||
| Ringcentral, Inc. * ^ | 13,061 | 417,299 | ||||||
| Splunk, Inc. * ^ | 5,789 | 372,291 | ||||||
| The Trade Desk, Inc. * | 9,966 | 372,230 | ||||||
| Wix.com Ltd.* | 4,549 | 375,065 | ||||||
| Zendesk, Inc. * | 11,178 | 321,367 | ||||||
| 2,362,184 | ||||||||
| LEISURE TIME - 0.9% | ||||||||
| Planet Fitness, Inc. ^ | 16,251 | 338,021 | ||||||
| MACHINERY-DIVERSIFIED - 0.9% | ||||||||
| Ichor Holdings Ltd. * | 8,103 | 157,198 | ||||||
| Welbilt, Inc. * | 7,867 | 161,273 | ||||||
| 318,471 | ||||||||
| METAL FABRICATE/HARDWARE - 0.7% | ||||||||
| Mueller Water Products, Inc. | 23,772 | 267,435 | ||||||
| MINING - 0.8% | ||||||||
| US Silica Holdings, Inc. | 6,835 | 283,652 | ||||||
| MISCELLANEOUS MANUFACTURING - 1.8% | ||||||||
| Fabrinet * | 9,758 | 338,310 | ||||||
| John Bean Technologies Corp. ^ | 3,619 | 320,824 | ||||||
| 659,134 | ||||||||
| OIL & GAS - 2.8% | ||||||||
| Callon Petroleum Co. * | 25,539 | 302,382 | ||||||
| Matador Resources Co. * ^ | 11,623 | 251,987 | ||||||
| PDC Energy, Inc. * | 3,800 | 209,874 | ||||||
| Resolute Energy Corp. * ^ | 7,513 | 281,362 | ||||||
| 1,045,605 | ||||||||
| OIL & GAS SERVICES - 1.5% | ||||||||
| Keane Group, Inc. * ^ | 18,015 | 248,967 | ||||||
| MRC Global, Inc. * ^ | 17,455 | 318,205 | ||||||
| 567,172 | ||||||||
See accompanying notes to financial statements.
71
| SCHEDULE OF INVESTMENTS (Unaudited) |
| Dunham Small Cap Growth Fund (Continued) |
| April 30, 2017 |
| Security | Shares | Value | ||||||
| PHARMACEUTICALS - 2.8% | ||||||||
| Collegium Pharmaceutical, Inc. * ^ | 23,445 | $ | 229,995 | |||||
| DexCom, Inc. * | 2,131 | 166,133 | ||||||
| Eagle Pharmaceuticals, Inc. * ^ | 4,167 | 377,489 | ||||||
| Patheon NV * | 10,227 | 275,209 | ||||||
| 1,048,826 | ||||||||
| RETAIL - 6.1% | ||||||||
| BMC Stock Holdings, Inc.* | 14,771 | 344,164 | ||||||
| Bojangles’, Inc. * ^ | 12,024 | 263,927 | ||||||
| Five Below, Inc. * ^ | 7,847 | 385,445 | ||||||
| Habit Restaurants, Inc. * ^ | 16,392 | 309,809 | ||||||
| Jack in the Box, Inc. | 3,147 | 320,900 | ||||||
| Ollie’s Bargain Outlet Holdings, Inc. * ^ | 12,430 | 476,069 | ||||||
| Wingstop, Inc. ^ | 5,665 | 166,721 | ||||||
| 2,267,035 | ||||||||
| SAVINGS & LOANS - 0.8% | ||||||||
| Sterling Bancorp. | 12,401 | 288,323 | ||||||
| SEMICONDUCTORS - 8.7% | ||||||||
| Advanced Micro Devices, Inc. * ^ | 31,760 | 422,408 | ||||||
| Cavium, Inc. * ^ | 5,172 | 356,092 | ||||||
| Inphi, Corp. * ^ | 3,798 | 157,313 | ||||||
| Mellanox Technologies Ltd. * ^ | 6,355 | 299,956 | ||||||
| MKS Instruments, Inc. | 4,987 | 390,233 | ||||||
| Monolithic Power Systems, Inc. | 4,428 | 405,162 | ||||||
| Nanometrics, Inc. * ^ | 7,627 | 240,670 | ||||||
| NVIDIA Corp. | 2,986 | 311,440 | ||||||
| Power Integrations, Inc. | 4,760 | 313,922 | ||||||
| Semtech Corp. * | 9,805 | 334,841 | ||||||
| 3,232,037 | ||||||||
| SOFTWARE - 16.2% | ||||||||
| Box, Inc. * ^ | 18,920 | 326,181 | ||||||
| Broadsoft, Inc. * ^ | 9,685 | 371,904 | ||||||
| Callidus Software, Inc. * ^ | 15,714 | 330,780 | ||||||
| Coupa Software, Inc. * | 10,893 | 302,281 | ||||||
| Electronic Arts, Inc. * ^ | 5,271 | 499,796 | ||||||
| Everbridge, Inc. * | 17,034 | 395,359 | ||||||
| HubSpot, Inc. * | 6,137 | 411,486 | ||||||
| Instructure, Inc. * | 10,252 | 245,023 | ||||||
| Medidata Solutions, Inc. * ^ | 4,934 | 322,832 | ||||||
| Security | Shares | Value | ||||||
| SOFTWARE (CONTINUED) - 16.2% | ||||||||
| MINDBODY, Inc. * ^ | 13,518 | $ | 383,235 | |||||
| MuleSoft, Inc. * | 14,144 | 325,878 | ||||||
| New Relic, Inc. * ^ | 8,977 | 358,900 | ||||||
| Red Hat, Inc.* | 2,158 | 190,077 | ||||||
| ServiceNow, Inc.* | 4,295 | 405,792 | ||||||
| Take-Two Interactive Software, Inc.* ^ | 8,247 | 518,324 | ||||||
| Talend SA - ADR * | 13,619 | 406,800 | ||||||
| Tyler Technologies, Inc. * ^ | 1,098 | 179,622 | ||||||
| 5,974,270 | ||||||||
| TELECOMMUNICATIONS - 1.6% | ||||||||
| ORBCOMM, Inc. * | 25,337 | 244,249 | ||||||
| Quantenna Communications, Inc. * ^ | 17,910 | 329,544 | ||||||
| 573,793 | ||||||||
| TRANSPORTATION - 2.7% | ||||||||
| Air Transport Services Group, Inc. * | 18,485 | 339,939 | ||||||
| Old Dominion Freight Line, Inc. | 3,831 | 339,121 | ||||||
| Swift Transportation Co. * ^ | 12,541 | 308,258 | ||||||
| 987,318 | ||||||||
| TOTAL COMMON STOCK (Cost - $31,430,734) | 36,392,423 | |||||||
| SHORT-TERM INVESTMENT - 1.6% | ||||||||
| MONEY MARKET FUND - 1.6% | ||||||||
| Fidelity Institutional Money Market Funds - | ||||||||
| Government Portfolio, 0.60% + | 573,892 | 573,892 | ||||||
| TOTAL SHORT-TERM INVESTMENT (Cost - $573,892) | ||||||||
| COLLATERAL FOR SECURITIES LOANED - 34.0% | ||||||||
| Mount Vernon Prime Portfolio, 1.12% + (Cost - $12,589,867) | 12,589,687 | 12,589,867 | ||||||
| TOTAL INVESTMENTS - 134.2% (Cost - $44,594,493) | $ | 49,556,182 | ||||||
| LIABILITIES LESS OTHER ASSETS - (34.2)% | (12,574,776 | ) | ||||||
| NET ASSETS - 100.0% | $ | 36,981,406 | ||||||
| ^ | All or a portion of these securities are on loan. Total loaned securities had a value of $12,206,112 at April 30, 2017. |
| * | Non-Income producing security. |
| + | Variable rate security. Interest rate is as of April 30, 2017. |
ADR - American Depositary Receipt.
| Portfolio Composition * - (Unaudited) | ||||||||||
| Collateral For Securities Loaned | 25.4 | % | Communication | 5.2 | % | |||||
| Technology | 24.3 | % | Field Energy | 3.3 | % | |||||
| Consumer, Non-Cyclical | 15.6 | % | Financial | 2.0 | % | |||||
| Industrial | 11.7 | % | Short-Term Investment | 1.2 | % | |||||
| Consumer, Cyclical | 10.7 | % | Basic Materials | 0.6 | % | |||||
| Total | 100.0 | % | ||||||||
| * | Based on total value of investments as of April 30,2017. |
Percentage may differ from Schedule of Investments which is based on Fund net assets.
See accompanying notes to financial statements.
72
| STATEMENTS OF ASSETS AND LIABILITIES (Unaudited) |
| April 30, 2017 |
| Dunham | Dunham | Dunham | ||||||||||||||||||||||||||
| Dunham | Corporate / | Monthly | Dunham | Dunham | Dunham | International | ||||||||||||||||||||||
| Floating Rate | Government | Distribution | Dynamic Macro | High-Yield | Alternative | Opportunity | ||||||||||||||||||||||
| Bond Fund | Bond Fund | Fund | Fund | Bond Fund | Dividend Fund | Bond Fund | ||||||||||||||||||||||
| Assets: | ||||||||||||||||||||||||||||
| Investments in securities, at cost | $ | 141,434,658 | $ | 62,627,642 | $ | 251,362,382 | $ | 38,652,042 | $ | 119,358,032 | $ | 37,669,851 | $ | 29,087,572 | ||||||||||||||
| Investments in securities, at value | $ | 142,112,536 | $ | 63,159,109 | $ | 252,750,716 | $ | 42,071,829 | $ | 123,989,928 | $ | 37,690,129 | $ | 28,284,968 | ||||||||||||||
| Foreign currency, at value (Cost $134,168, $745, $8,228 and $35,245 respectively) | — | — | 131,515 | 758 | — | 8,228 | 35,523 | |||||||||||||||||||||
| Deposits with brokers | — | — | 9,530,000 | — | — | — | 155,217 | |||||||||||||||||||||
| Unrealized appreciation on futures | — | — | — | 476,160 | — | — | 39,157 | |||||||||||||||||||||
| Cash | — | 5,888 | 61,488,106 | — | — | — | — | |||||||||||||||||||||
| Receivable for securities sold | 2,258,804 | 149,657 | 29,196,739 | — | 249,900 | 6,050,354 | — | |||||||||||||||||||||
| Interest and dividends receivable | 1,071,905 | 476,661 | 126,276 | 4,507 | 1,486,530 | 119,813 | 228,522 | |||||||||||||||||||||
| Receivable for fund shares sold | 461,402 | 59,535 | 247,047 | 25,521 | 40,827 | — | 32,261 | |||||||||||||||||||||
| Receivable for open forward foreign currency contracts | — | — | 25,130 | — | — | — | 39,087 | |||||||||||||||||||||
| Prepaid expenses and other assets | 7,659 | 35,890 | 99,163 | 37,623 | 34,103 | 59,321 | 19,515 | |||||||||||||||||||||
| Total Assets | 145,912,306 | 63,886,740 | 353,594,692 | 42,616,398 | 125,801,288 | 43,927,845 | 28,834,250 | |||||||||||||||||||||
| Liabilities: | ||||||||||||||||||||||||||||
| Option contracts written (premiums received $512,867 and $27,631, respectively) | — | — | 751,247 | 7,682 | — | — | — | |||||||||||||||||||||
| Payable upon return of securities loaned | 1,493,995 | 7,407,183 | 41 | 2,819,526 | 26,541,345 | — | — | |||||||||||||||||||||
| Securities sold short (proceeds $90,598,599) | — | — | 90,450,668 | — | — | — | — | |||||||||||||||||||||
| Unrealized depreciation on futures | — | — | — | 257,425 | — | — | 10,452 | |||||||||||||||||||||
| Payable for dividends on short sales | — | — | 143,664 | — | — | — | — | |||||||||||||||||||||
| Payable to broker for futures | — | — | — | 838,975 | — | — | — | |||||||||||||||||||||
| Payable for securities purchased | 10,127,444 | 249,249 | 20,725,695 | 131,253 | — | 6,328,231 | — | |||||||||||||||||||||
| Payable for fund shares redeemed | 7,471 | 3,678 | 321,165 | 1,611 | 18,738 | — | 2,111 | |||||||||||||||||||||
| Payable for open forward foreign currency contracts | — | — | — | — | — | — | 95,369 | |||||||||||||||||||||
| Distributions payable | 1,495 | 606 | 56,081 | — | 11,683 | — | — | |||||||||||||||||||||
| Payable to adviser | 65,156 | 22,919 | 126,998 | 20,207 | 48,679 | 20,041 | 14,041 | |||||||||||||||||||||
| Payable to sub-adviser | 14,913 | 20,572 | 93,773 | 26,065 | 32,453 | 9,250 | 8,692 | |||||||||||||||||||||
| Payable for distribution fees | 4,343 | 5,089 | 9,204 | 3,364 | 3,228 | 83 | 1,305 | |||||||||||||||||||||
| Payable for administration fees | 12,233 | 6,727 | 11,651 | 2,215 | 7,758 | 1,814 | 3,590 | |||||||||||||||||||||
| Payable for fund accounting fees | 3,234 | 1,416 | 5,819 | 3,884 | 2,418 | 1,611 | 808 | |||||||||||||||||||||
| Payable for transfer agent fees | 2,234 | 3,283 | 1,819 | 2,352 | 1,120 | 1,560 | 2,350 | |||||||||||||||||||||
| Payable for custody fees | 1,627 | 4,205 | 38,977 | 1,758 | 1,336 | 1,681 | 3,200 | |||||||||||||||||||||
| Payable for non 12b-1 shareholder servicing fees | 1,918 | 2,593 | 16,585 | 2,300 | 5,949 | 300 | 1,268 | |||||||||||||||||||||
| Accrued expenses and other liabilities | 2,884 | 14,985 | 177,401 | 10,373 | 19,827 | 53,409 | 9,233 | |||||||||||||||||||||
| Total Liabilities | 11,738,947 | 7,742,505 | 112,930,788 | 4,128,990 | 26,694,534 | 6,417,980 | 152,419 | |||||||||||||||||||||
| Net Assets | $ | 134,173,359 | $ | 56,144,235 | $ | 240,663,904 | $ | 38,487,408 | $ | 99,106,754 | $ | 37,509,865 | $ | 28,681,831 | ||||||||||||||
| Net Assets: | ||||||||||||||||||||||||||||
| Paid in capital | $ | 136,076,602 | $ | 57,437,057 | $ | 260,579,422 | $ | 38,424,655 | $ | 106,375,229 | $ | 37,893,551 | $ | 31,035,011 | ||||||||||||||
| Accumulated net investment income (loss) | 5,745 | (118,777 | ) | (5,802,473 | ) | (78,295 | ) | 35,252 | 204,210 | (15,212 | ) | |||||||||||||||||
| Accumulated net realized loss on investments, options, securities sold short, futures, swap contracts, and foreign currency transactions | (2,560,226 | ) | (1,705,512 | ) | (15,917,489 | ) | (3,502,023 | ) | (11,935,623 | ) | (608,174 | ) | (1,509,660 | ) | ||||||||||||||
| Net unrealized appreciation (depreciation) on investments, options, securities sold short, futures, swap contracts, and foreign currency translations | 651,238 | 531,467 | 1,804,444 | 3,643,071 | 4,631,896 | 20,278 | (828,308 | ) | ||||||||||||||||||||
| Net Assets | $ | 134,173,359 | $ | 56,144,235 | $ | 240,663,904 | $ | 38,487,408 | $ | 99,106,754 | $ | 37,509,865 | $ | 28,681,831 | ||||||||||||||
| �� | ||||||||||||||||||||||||||||
| Net Asset Value Per Share | ||||||||||||||||||||||||||||
| Class N Shares: | ||||||||||||||||||||||||||||
| Net Assets | $ | 114,385,756 | $ | 47,299,659 | $ | 164,678,911 | $ | 31,724,408 | $ | 80,575,272 | $ | 36,540,996 | $ | 24,852,052 | ||||||||||||||
| Shares of beneficial interest outstanding (no par value; unlimited shares authorized) | 11,729,569 | 3,439,485 | 4,526,419 | 3,251,051 | 8,811,317 | 3,070,722 | 2,756,887 | |||||||||||||||||||||
| Net asset value, offering and redemption price per share | $ | 9.75 | $ | 13.75 | $ | 36.38 | $ | 9.76 | $ | 9.14 | $ | 11.90 | $ | 9.01 | ||||||||||||||
| Class A Shares: | ||||||||||||||||||||||||||||
| Net Assets | $ | 14,041,021 | $ | 5,361,079 | $ | 39,567,827 | $ | 4,865,868 | $ | 10,681,173 | $ | 35,251 | $ | 2,517,108 | ||||||||||||||
| Shares of beneficial interest outstanding (no par value; unlimited shares authorized) | 1,440,845 | 390,278 | 1,115,237 | 500,537 | 1,166,981 | 2,963 | 280,745 | |||||||||||||||||||||
| Net asset value and redemption price per share * | $ | 9.74 | $ | 13.74 | $ | 35.48 | $ | 9.72 | $ | 9.15 | $ | 11.90 | $ | 8.97 | ||||||||||||||
| Front-end sales charge factor | 0.9425 | 0.9550 | 0.9425 | 0.9425 | 0.9550 | 0.9425 | 0.9550 | |||||||||||||||||||||
| Offering price per share (Net asset value per share / front-end sales charge factor) | $ | 10.33 | $ | 14.39 | $ | 37.64 | $ | 10.31 | $ | 9.58 | $ | 12.62 | $ | 9.39 | ||||||||||||||
| Class C Shares: | ||||||||||||||||||||||||||||
| Net Assets | $ | 5,746,582 | $ | 3,483,497 | $ | 36,417,166 | $ | 1,897,132 | $ | 7,850,309 | $ | 933,618 | $ | 1,312,671 | ||||||||||||||
| Shares of beneficial interest outstanding (no par value; unlimited shares authorized) | 589,391 | 255,302 | 1,247,616 | 202,112 | 855,681 | 78,619 | 148,583 | |||||||||||||||||||||
| Net asset value, offering and redemption price per share | $ | 9.75 | $ | 13.64 | $ | 29.19 | $ | 9.39 | $ | 9.17 | $ | 11.88 | $ | 8.83 | ||||||||||||||
| * | For certain purchases of $1 million or more, a 0.75% contingent deferred sales charge may apply to redemptions made within eighteen months of purchase. |
See accompanying notes to financial statements.
73
| STATEMENTS OF ASSETS AND LIABILITIES (Unaudited) (Continued) |
| April 30, 2017 |
| Dunham | Dunham | |||||||||||||||||||||||||||||||
| Dunham | Dunham | Focused | Dunham | Dunham | Dunham | Emerging | Dunham | |||||||||||||||||||||||||
| Appreciation & | Large Cap | Large Cap | International | Real Estate | Small Cap | Markets | Small Cap | |||||||||||||||||||||||||
| Income Fund | Value Fund | Growth Fund | Stock Fund | Stock Fund | Value Fund | Stock Fund | Growth Fund | |||||||||||||||||||||||||
| Assets: | ||||||||||||||||||||||||||||||||
| Investments in securities, at cost | $ | 18,952,195 | $ | 62,798,949 | $ | 67,272,286 | $ | 90,270,340 | $ | 38,623,062 | $ | 34,567,066 | $ | 48,482,609 | $ | 44,594,493 | ||||||||||||||||
| Investments in securities, at value | $ | 19,555,606 | $ | 73,495,912 | $ | 88,354,985 | $ | 102,186,957 | $ | 43,075,944 | $ | 37,581,962 | $ | 58,890,999 | $ | 49,556,182 | ||||||||||||||||
| Foreign currency, at value (Cost $447,632 and $1,814, respectively) | — | — | — | 447,214 | — | — | 1,814 | — | ||||||||||||||||||||||||
| Receivable for securities sold | — | 264,024 | 539,123 | 376,767 | 187,385 | — | — | 784,102 | ||||||||||||||||||||||||
| Interest and dividends receivable | 97,056 | 75,625 | 9,786 | 621,171 | 22,409 | 8,268 | 168,606 | 3,958 | ||||||||||||||||||||||||
| Receivable for fund shares sold | 9,102 | 70,327 | 43,287 | 76,170 | 23,424 | 21,527 | 31,642 | 12,235 | ||||||||||||||||||||||||
| Receivable for open forward foreign currency contracts | — | — | — | 708 | — | — | — | — | ||||||||||||||||||||||||
| Prepaid expenses and other assets | 38,605 | 39,298 | 52,154 | 38,899 | 41,032 | 41,978 | 31,058 | 29,437 | ||||||||||||||||||||||||
| Total Assets | 19,700,369 | 73,945,186 | 88,999,335 | 103,747,886 | 43,350,194 | 37,653,735 | 59,124,119 | 50,385,914 | ||||||||||||||||||||||||
| Liabilities: | ||||||||||||||||||||||||||||||||
| Payable upon return of securities loaned | 1,224,363 | 12,593,374 | 16,495,595 | 3,719,420 | 10,034,923 | 9,469,175 | 2,814,783 | 12,589,867 | ||||||||||||||||||||||||
| Payable for securities purchased and foreign currency transactions | — | — | 357,636 | 383,113 | 278,954 | — | — | 778,607 | ||||||||||||||||||||||||
| Payable for fund shares redeemed | 645 | 2,455 | 4,967 | 5,912 | 1,196 | 1,000 | 1,953 | 1,170 | ||||||||||||||||||||||||
| Distributions Payable | 4,429 | — | — | — | — | — | — | — | ||||||||||||||||||||||||
| Payable to adviser | 9,971 | 32,626 | 37,554 | 52,104 | 18,052 | 14,816 | 29,878 | 19,352 | ||||||||||||||||||||||||
| Payable to sub-adviser | 2,286 | 6,149 | 12,136 | 51,327 | 1,947 | 3,611 | 11,711 | 3,011 | ||||||||||||||||||||||||
| Payable for distribution fees | 1,350 | 6,057 | 3,987 | 16,322 | 1,728 | 3,597 | 6,303 | 1,768 | ||||||||||||||||||||||||
| Payable for administration fees | 1,341 | 3,226 | 3,386 | 9,049 | 1,399 | 1,973 | 3,583 | 1,929 | ||||||||||||||||||||||||
| Payable for fund accounting fees | 457 | 1,644 | 1,721 | 1,677 | 688 | 909 | 2,202 | 787 | ||||||||||||||||||||||||
| Payable for transfer agent fees | 2,641 | 2,420 | 1,641 | 2,634 | 1,461 | 1,997 | 2,098 | 586 | ||||||||||||||||||||||||
| Payable for custody fees | 1,113 | 2,250 | 182 | 23,096 | 2,056 | 1,999 | 4,524 | 2,458 | ||||||||||||||||||||||||
| Payable for non 12b-1 shareholder servicing fees | 428 | 750 | 272 | 697 | 484 | 2,118 | 1,247 | 381 | ||||||||||||||||||||||||
| Payable for line of credit | — | — | 22,000 | — | — | — | — | — | ||||||||||||||||||||||||
| Accrued expenses and other liabilities | 40,773 | 9,924 | 8,302 | 6,519 | 5,631 | 11,449 | 21,080 | 4,592 | ||||||||||||||||||||||||
| Total Liabilities | 1,289,797 | 12,660,875 | 16,949,379 | 4,271,870 | 10,348,519 | 9,512,644 | 2,899,362 | 13,404,508 | ||||||||||||||||||||||||
| Net Assets | $ | 18,410,572 | $ | 61,284,311 | $ | 72,049,956 | $ | 99,476,016 | $ | 33,001,675 | $ | 28,141,091 | $ | 56,224,757 | $ | 36,981,406 | ||||||||||||||||
| Net Assets: | ||||||||||||||||||||||||||||||||
| Paid in capital | $ | 20,465,785 | $ | 50,955,782 | $ | 53,661,381 | $ | 90,566,398 | $ | 28,551,959 | $ | 22,318,427 | $ | 57,477,051 | $ | 30,193,251 | ||||||||||||||||
| Accumulated net investment income (loss) | (133,803 | ) | 163,391 | (634,074 | ) | 1,057,282 | 297,685 | 45,331 | (233,845 | ) | (214,863 | ) | ||||||||||||||||||||
| Accumulated net realized gain (loss) on investments and foreign currency transactions | (2,524,821 | ) | (531,825 | ) | (2,060,050 | ) | (4,056,414 | ) | (300,851 | ) | 2,762,437 | (11,426,999 | ) | 2,041,329 | ||||||||||||||||||
| Net unrealized appreciation on investments and foreign currency translations | 603,411 | 10,696,963 | 21,082,699 | 11,908,750 | 4,452,882 | 3,014,896 | 10,408,550 | 4,961,689 | ||||||||||||||||||||||||
| Net Assets | $ | 18,410,572 | $ | 61,284,311 | $ | 72,049,956 | $ | 99,476,016 | $ | 33,001,675 | $ | 28,141,091 | $ | 56,224,757 | $ | 36,981,406 | ||||||||||||||||
| Net Asset Value Per Share | ||||||||||||||||||||||||||||||||
| Class N Shares: | ||||||||||||||||||||||||||||||||
| Net Assets | $ | 12,640,958 | $ | 48,823,264 | $ | 54,150,175 | $ | 81,526,744 | $ | 26,016,513 | $ | 21,451,566 | $ | 46,499,209 | $ | 27,776,797 | ||||||||||||||||
| Shares of beneficial interest outstanding (no par value; unlimited shares authorized) | 1,550,942 | 3,672,394 | 3,072,997 | 5,205,763 | 1,677,657 | 1,300,004 | 3,397,173 | 1,569,955 | ||||||||||||||||||||||||
| Net asset value, offering and redemption price per share | $ | 8.15 | $ | 13.29 | $ | 17.62 | $ | 15.66 | $ | 15.51 | $ | 16.50 | $ | 13.69 | $ | 17.69 | ||||||||||||||||
| Class A Shares: | ||||||||||||||||||||||||||||||||
| Net Assets | $ | 2,763,319 | $ | 7,406,779 | $ | 11,753,524 | $ | 12,026,561 | $ | 4,131,262 | $ | 3,997,908 | $ | 6,908,612 | $ | 6,526,189 | ||||||||||||||||
| Shares of beneficial interest outstanding (no par value; unlimited shares authorized) | 339,500 | 559,074 | 676,171 | 772,225 | 264,116 | 244,324 | 515,660 | 381,615 | ||||||||||||||||||||||||
| Net asset value, and redemption price per share * | $ | 8.14 | $ | 13.25 | $ | 17.38 | $ | 15.57 | $ | 15.64 | $ | 16.36 | $ | 13.40 | $ | 17.10 | ||||||||||||||||
| Front-end sales charge factor | 0.9425 | 0.9425 | 0.9425 | 0.9425 | 0.9425 | 0.9425 | 0.9425 | 0.9425 | ||||||||||||||||||||||||
| Offering price per share (Net asset value per share / front-end sales charge factor) | $ | 8.64 | $ | 14.06 | $ | 18.44 | $ | 16.52 | $ | 16.59 | $ | 17.36 | $ | 14.21 | $ | 18.14 | ||||||||||||||||
| Class C Shares: | ||||||||||||||||||||||||||||||||
| Net Assets | $ | 3,006,295 | $ | 5,054,268 | $ | 6,146,257 | $ | 5,922,711 | $ | 2,853,900 | $ | 2,691,617 | $ | 2,816,936 | $ | 2,678,420 | ||||||||||||||||
| Shares of beneficial interest outstanding (no par value; unlimited shares authorized) | 376,655 | 397,571 | 367,951 | 397,978 | 192,741 | 180,982 | 221,316 | 182,550 | ||||||||||||||||||||||||
| Net asset value, offering and redemption price per share | $ | 7.98 | $ | 12.71 | $ | 16.70 | $ | 14.88 | $ | 14.81 | $ | 14.87 | $ | 12.73 | $ | 14.67 | ||||||||||||||||
| * | For certain purchases of $1 million or more, a 0.75% contingent deferred sales charge may apply to redemptions made within eighteen months of purchase. |
See accompanying notes to financial statements.
74
| STATEMENTS OF OPERATIONS (Unaudited) |
| For the Six Months Ended April 30, 2017 |
| Dunham | Dunham | Dunham | ||||||||||||||||||||||||||
| Dunham | Corporate / | Monthly | Dunham | Dunham | Dunham | International | ||||||||||||||||||||||
| Floating Rate | Government | Distribution | Dynamic Macro | High-Yield | Alternative | Opportunity | ||||||||||||||||||||||
| Bond Fund | Bond Fund | Fund | Fund | Bond Fund | Dividend Fund | Bond Fund | ||||||||||||||||||||||
| Investment Income: | ||||||||||||||||||||||||||||
| Interest income | $ | 3,046,604 | $ | 972,313 | $ | 469,552 | $ | 27,429 | $ | 2,849,578 | $ | 4,950 | $ | 180,225 | ||||||||||||||
| Dividend income | 44,838 | 8,018 | 2,019,204 | 184,446 | 1,446 | 980,064 | — | |||||||||||||||||||||
| Securities lending income | — | 16,907 | — | 19,113 | 49,530 | — | — | |||||||||||||||||||||
| Less: Foreign withholding taxes | — | — | (2,270 | ) | — | — | (2,976 | ) | — | |||||||||||||||||||
| Total Investment Income | 3,091,442 | 997,238 | 2,486,486 | 230,988 | 2,900,554 | 982,038 | 180,225 | |||||||||||||||||||||
| Operating Expenses: | ||||||||||||||||||||||||||||
| Investment advisory fees | 356,505 | 134,583 | 764,200 | 112,482 | 290,117 | 102,345 | 81,627 | |||||||||||||||||||||
| Sub-advisory fees | 220,997 | 80,750 | 862,231 | 129,787 | 193,410 | 91,579 | 61,220 | |||||||||||||||||||||
| Sub-advisory performance fees | (97,211 | ) | 30,271 | 78,236 | (28,907 | ) | (34,937 | ) | (54,914 | ) | (25,416 | ) | ||||||||||||||||
| Fund accounting fees | 8,617 | 8,447 | 42,996 | 7,919 | 26,552 | 4,606 | 2,683 | |||||||||||||||||||||
| Distribution fees- Class C Shares | 19,684 | 12,191 | 185,953 | 9,211 | 28,529 | 3,453 | 4,450 | |||||||||||||||||||||
| Distribution fees- Class A Shares | 14,697 | 6,034 | 53,792 | 5,088 | 13,074 | 11 | 2,757 | |||||||||||||||||||||
| Administration fees | 65,919 | 49,951 | 76,593 | 11,023 | 34,877 | 10,756 | 27,666 | |||||||||||||||||||||
| Registration fees | 22,315 | 14,874 | 44,054 | 14,079 | 13,389 | 22,315 | 9,378 | |||||||||||||||||||||
| Transfer agent fees | 12,887 | 11,863 | 19,268 | 11,190 | 11,971 | 8,547 | 4,607 | |||||||||||||||||||||
| Custodian fees | 9,494 | 9,417 | 36,010 | 4,672 | 4,479 | 7,289 | 22,550 | |||||||||||||||||||||
| Professional fees | 10,984 | 9,677 | 12,400 | 7,933 | 13,173 | 42,327 | 9,241 | |||||||||||||||||||||
| Chief Compliance Officer fees | 4,333 | 4,401 | 22,093 | 2,635 | 6,471 | 2,306 | 1,087 | |||||||||||||||||||||
| Printing and postage expense | 8,984 | 7,533 | 65,268 | 4,477 | 4,039 | 3,680 | 3,477 | |||||||||||||||||||||
| Trustees’ fees | 13,204 | 1,625 | 11,770 | 1,092 | 4,095 | 1,646 | 954 | |||||||||||||||||||||
| Insurance expense | 433 | 681 | 21,575 | 206 | 1,904 | 308 | 650 | |||||||||||||||||||||
| Non 12b-1 shareholder servicing fees | 58 | 1,475 | 18,483 | 1,475 | 6,273 | 2,480 | 475 | |||||||||||||||||||||
| Dividend expenses on short sales | — | — | 666,689 | — | — | — | — | |||||||||||||||||||||
| Security borrowing fees | — | — | 186,975 | — | — | — | — | |||||||||||||||||||||
| Miscellaneous expenses | 4,948 | 3,600 | 9,695 | 5,729 | 3,058 | 4,834 | 1,789 | |||||||||||||||||||||
| Total Operating Expenses | 676,848 | 387,373 | 3,178,281 | 300,091 | 620,474 | 253,568 | 209,195 | |||||||||||||||||||||
| Less: Expense reduction by commission recapture agreement | — | — | — | — | — | (52,140 | ) | — | ||||||||||||||||||||
| Net Operating Expenses | 676,848 | 387,373 | 3,178,281 | 300,091 | 620,474 | 201,428 | 209,195 | |||||||||||||||||||||
| Net Investment Income (Loss) | 2,414,594 | 609,865 | (691,795 | ) | (69,103 | ) | 2,280,080 | 780,610 | (28,970 | ) | ||||||||||||||||||
| Realized and Unrealized Gain (Loss) on Investments, Futures, Options Purchased, Securities Sold Short, Written Options, Swap Contracts, Foreign Currency Transactions, Capital Gain Distribution from Regulated Investment Companies, and Foreign Currency Exchange Contracts: | ||||||||||||||||||||||||||||
| Net realized gain (loss) from: | ||||||||||||||||||||||||||||
| Investments | (426,569 | ) | 34,902 | 16,739,539 | 350,822 | 775,817 | 454,751 | (57,631 | ) | |||||||||||||||||||
| Futures | — | — | — | (171,109 | ) | — | — | (50,818 | ) | |||||||||||||||||||
| Options purchased | — | — | (4,344,025 | ) | (1,416,076 | ) | — | (912,908 | ) | — | ||||||||||||||||||
| Securities sold short | — | — | (13,792,674 | ) | — | — | — | — | ||||||||||||||||||||
| Written options | — | — | 1,944,044 | — | — | — | — | |||||||||||||||||||||
| Swap contracts | — | — | 3,307,398 | — | — | — | — | |||||||||||||||||||||
| Foreign currency transactions | — | — | — | (63,770 | ) | — | — | (319,480 | ) | |||||||||||||||||||
| Foreign currency exchange contracts | — | — | 205,553 | — | — | — | 16,558 | |||||||||||||||||||||
| Net change in unrealized appreciation (depreciation) on: | ||||||||||||||||||||||||||||
| Investments | 917,680 | (643,322 | ) | (1,361,827 | ) | 1,647,806 | 1,528,883 | 388,095 | (240,165 | ) | ||||||||||||||||||
| Futures | — | — | — | 33,491 | — | — | 64,228 | |||||||||||||||||||||
| Options purchased | — | — | 670,284 | 487,752 | — | — | — | |||||||||||||||||||||
| Securities sold short | — | — | 5,987,857 | — | — | — | — | |||||||||||||||||||||
| Written options | — | — | 91,278 | 28,578 | — | — | — | |||||||||||||||||||||
| Swap contracts | — | — | (422,216 | ) | — | — | — | — | ||||||||||||||||||||
| Foreign currency translations | — | — | (8,293 | ) | (26,487 | ) | — | — | 3,522 | |||||||||||||||||||
| Foreign currency exchange contracts | — | — | (671 | ) | — | — | — | (80,637 | ) | |||||||||||||||||||
| Net Realized and Unrealized Gain (Loss) | 491,111 | (608,420 | ) | 9,016,247 | 871,007 | 2,304,700 | (70,062 | ) | (664,423 | ) | ||||||||||||||||||
| Net Increase (Decrease) in Net Assets Resulting From Operations | $ | 2,905,705 | $ | 1,445 | $ | 8,324,452 | $ | 801,904 | $ | 4,584,780 | $ | 710,548 | $ | (693,393 | ) | |||||||||||||
See accompanying notes to financial statements.
75
| STATEMENTS OF OPERATIONS (Unaudited) (Continued) |
| For the Six Months Ended April 30, 2017 |
| Dunham | Dunham | |||||||||||||||||||||||||||||||
| Dunham | Dunham | Focused | Dunham | Dunham | Dunham | Emerging | Dunham | |||||||||||||||||||||||||
| Appreciation & | Large Cap | Large Cap | International | Real Estate | Small Cap | Markets | Small Cap | |||||||||||||||||||||||||
| Income Fund | Value Fund | Growth Fund | Stock Fund | Stock Fund | Value Fund | Stock Fund | Growth Fund | |||||||||||||||||||||||||
| Investment Income: | ||||||||||||||||||||||||||||||||
| Interest income | $ | 153,644 | $ | 2,162 | $ | 1,437 | $ | 2,815 | $ | 875 | $ | 892 | $ | — | $ | 1,474 | ||||||||||||||||
| Dividend income | 121,976 | 708,190 | 126,234 | 1,393,935 | 633,801 | 265,960 | 618,505 | 68,153 | ||||||||||||||||||||||||
| Securities lending income | 1,537 | 14,828 | 35,013 | 26,601 | 11,221 | 11,210 | 2,525 | 39,259 | ||||||||||||||||||||||||
| Less: Foreign withholding taxes | — | — | — | (151,251 | ) | — | — | (82,656 | ) | (179 | ) | |||||||||||||||||||||
| Total Investment Income | 277,157 | 725,180 | 162,684 | 1,272,100 | 645,897 | 278,062 | 538,374 | 108,707 | ||||||||||||||||||||||||
| Operating Expenses: | ||||||||||||||||||||||||||||||||
| Investment advisory fees | 69,687 | 191,287 | 211,528 | 304,029 | 105,625 | 93,314 | 173,853 | 111,853 | ||||||||||||||||||||||||
| Sub-advisory fees | 54,411 | 88,287 | 113,900 | 302,409 | 65,000 | 64,602 | 133,733 | 86,041 | ||||||||||||||||||||||||
| Sub-advisory performance fees | (24,768 | ) | (54,965 | ) | (48,262 | ) | (51,254 | ) | (58,839 | ) | (47,568 | ) | 23,139 | (83,329 | ) | |||||||||||||||||
| Fund accounting fees | 10,938 | 9,050 | 9,366 | 13,951 | 4,060 | 4,283 | 9,050 | 8,149 | ||||||||||||||||||||||||
| Distribution fees- Class C Shares | 11,566 | 24,499 | 27,089 | 30,709 | 11,029 | 12,339 | 15,909 | 8,982 | ||||||||||||||||||||||||
| Distribution fees- Class A Shares | 4,038 | 8,705 | 13,107 | 13,607 | 5,376 | 5,257 | 7,694 | 7,558 | ||||||||||||||||||||||||
| Administration fees | 12,930 | 18,717 | 16,357 | 37,467 | 8,727 | 10,726 | 22,191 | 9,035 | ||||||||||||||||||||||||
| Registration fees | 12,397 | 14,584 | 2,480 | 22,388 | 19,836 | 14,692 | 21,544 | 14,066 | ||||||||||||||||||||||||
| Transfer agent fees | 9,669 | 12,224 | 9,730 | 14,361 | 9,758 | 9,567 | 11,056 | 8,977 | ||||||||||||||||||||||||
| Custodian fees | 2,795 | 8,900 | 5,885 | 77,634 | 6,571 | 6,333 | 29,067 | 8,129 | ||||||||||||||||||||||||
| Professional fees | 9,896 | 9,053 | 8,756 | 11,551 | 10,342 | 8,715 | 12,977 | 8,563 | ||||||||||||||||||||||||
| Chief Compliance Officer fees | 2,413 | 4,646 | 5,160 | 7,456 | 1,240 | 2,387 | 4,425 | 2,048 | ||||||||||||||||||||||||
| Printing and postage expense | 2,975 | 4,473 | 9,406 | 8,233 | 3,720 | 3,977 | 4,622 | 3,822 | ||||||||||||||||||||||||
| Trustees’ fees | 1,386 | 1,580 | 3,114 | 2,682 | 879 | 822 | — | 1,538 | ||||||||||||||||||||||||
| Insurance expense | 907 | 740 | 5,989 | 934 | 237 | 389 | 545 | 447 | ||||||||||||||||||||||||
| Interest expense | — | — | — | — | — | — | 17,478 | — | ||||||||||||||||||||||||
| Non 12b-1 shareholder servicing fees | 3,960 | 1,475 | 1,855 | 1,475 | 4,422 | 1,475 | 1,475 | 3,960 | ||||||||||||||||||||||||
| Miscellaneous expenses | 2,179 | 4,100 | 5,222 | 2,666 | 3,385 | 2,969 | 3,610 | 1,381 | ||||||||||||||||||||||||
| Total Operating Expenses | 187,379 | 347,355 | 400,682 | 800,298 | 201,368 | 194,279 | 492,368 | 201,220 | ||||||||||||||||||||||||
| Less: Expense reduction by commission recapture agreement | — | (6,796 | ) | — | — | (5,268 | ) | — | (1,520 | ) | ||||||||||||||||||||||
| Net Operating Expenses | 187,379 | 347,355 | 393,886 | 800,298 | 201,368 | 189,011 | 492,368 | 199,700 | ||||||||||||||||||||||||
| Net Investment Income (Loss) | 89,778 | 377,825 | (231,202 | ) | 471,802 | 444,529 | 89,051 | 46,006 | (90,993 | ) | ||||||||||||||||||||||
| Realized and Unrealized Gain (Loss) on Investments, Options Purchased and Foreign Currency Purchased Transactions: | ||||||||||||||||||||||||||||||||
| Net realized gain (loss) from: | ||||||||||||||||||||||||||||||||
| Investments | (363,480 | ) | 1,280,931 | (185,290 | ) | 2,343,954 | 135,740 | 2,810,763 | (126,373 | ) | 2,486,796 | |||||||||||||||||||||
| Foreign currency transactions | — | — | — | 10,098 | — | — | (4,532 | ) | — | |||||||||||||||||||||||
| Foreign currency exchange contracts | — | — | — | (41,908 | ) | — | — | — | — | |||||||||||||||||||||||
| Net change in unrealized appreciation (depreciation) on: | ||||||||||||||||||||||||||||||||
| Investments | 1,219,840 | 4,177,802 | 7,628,168 | 6,132,253 | (34,282 | ) | 2,217,993 | 5,017,830 | 2,492,580 | |||||||||||||||||||||||
| Foreign currency translations | — | — | — | 4,828 | — | — | (2,451 | ) | — | |||||||||||||||||||||||
| Foreign currency exchange contracts | — | — | — | 431 | — | — | — | |||||||||||||||||||||||||
| Net Realized and Unrealized Gain | 856,360 | 5,458,733 | 7,442,878 | 8,449,656 | 101,458 | 5,028,756 | 4,884,474 | 4,979,376 | ||||||||||||||||||||||||
| Net Increase in Net Assets Resulting From Operations | $ | 946,138 | $ | 5,836,558 | $ | 7,211,676 | $ | 8,921,458 | $ | 545,987 | $ | 5,117,807 | $ | 4,930,480 | $ | 4,888,383 | ||||||||||||||||
See accompanying notes to financial statements.
76
| STATEMENTS OF CHANGES IN NET ASSETS |
| Dunham | Dunham | Dunham | Dunham | Dunham | ||||||||||||||||||||||||||||||||||||
| Floating Rate | Corporate/Government | Monthly Distribution | Dynamic Macro | High-Yield | ||||||||||||||||||||||||||||||||||||
| Bond Fund | Bond Fund | Fund | Fund | Bond Fund | ||||||||||||||||||||||||||||||||||||
| Six Months | Six Months | Six Months | Six Months | Six Months | ||||||||||||||||||||||||||||||||||||
| Ended | Year Ended | Ended | Year Ended | Ended | Year Ended | Ended | Year Ended | Ended | Year Ended | |||||||||||||||||||||||||||||||
| April 30, 2017 | Oct. 31, 2016 | April 30, 2017 | Oct. 31, 2016 | April 30, 2017 | Oct. 31, 2016 | April 30, 2017 | Oct. 31, 2016 | April 30, 2017 | Oct. 31, 2016 | |||||||||||||||||||||||||||||||
| (Unaudited) | (Unaudited) | (Unaudited) | (Unaudited) | (Unaudited) | ||||||||||||||||||||||||||||||||||||
| Operations: | ||||||||||||||||||||||||||||||||||||||||
| Net investment income (loss) | $ | 2,414,594 | $ | 3,109,603 | $ | 609,865 | $ | 1,347,329 | $ | (691,795 | ) | $ | 617,646 | $ | (69,103 | ) | $ | (39,696 | ) | $ | 2,280,080 | $ | 4,740,490 | |||||||||||||||||
| Net realized gain (loss) from investments, futures options purchased, securities sold short, written options, swap contracts foreign currency transactions and foreign currency exchange contracts | (426,569 | ) | (1,050,725 | ) | 34,902 | (391,669 | ) | 4,059,835 | (14,494,286 | ) | (1,300,133 | ) | (1,307,984 | ) | 775,817 | (4,616,046 | ) | |||||||||||||||||||||||
| Capital gain distributions from regulated investment | — | — | — | — | — | — | — | 16,065 | — | — | ||||||||||||||||||||||||||||||
| Net change in unrealized appreciation (depreciation) on investments, futures, options purchased, securities sold short, written options foreign currency transactions, and foreign currency translations | 917,680 | 2,127,148 | (643,322 | ) | 1,137,437 | 4,956,412 | 17,075,950 | 2,171,140 | 326,835 | 1,528,883 | 4,880,003 | |||||||||||||||||||||||||||||
| Net Increase (Decrease) in Net Assets Resulting From Operations | 2,905,705 | 4,186,026 | 1,445 | 2,093,097 | 8,324,452 | 3,199,310 | 801,904 | (1,004,780 | ) | 4,584,780 | 5,004,447 | |||||||||||||||||||||||||||||
| Distributions to Shareholders From: | ||||||||||||||||||||||||||||||||||||||||
| Net Realized Gains: | ||||||||||||||||||||||||||||||||||||||||
| Class N | — | — | — | — | (2,977,785 | ) | — | — | — | — | — | |||||||||||||||||||||||||||||
| Class A | — | — | — | — | (826,469 | ) | — | — | — | — | — | |||||||||||||||||||||||||||||
| Class C | — | — | — | — | (872,562 | ) | — | — | — | — | — | |||||||||||||||||||||||||||||
| Net Investment Income: | ||||||||||||||||||||||||||||||||||||||||
| Class N | (2,108,420 | ) | (2,713,303 | ) | (577,039 | ) | (1,222,601 | ) | — | (2,340,282 | ) | — | — | (2,007,271 | ) | (3,843,760 | ) | |||||||||||||||||||||||
| Class A | (228,743 | ) | (304,360 | ) | (55,030 | ) | (133,317 | ) | — | (932,730 | ) | — | — | (248,569 | ) | (486,798 | ) | |||||||||||||||||||||||
| Class C | (84,274 | ) | (106,752 | ) | (29,063 | ) | (75,263 | ) | — | (825,662 | ) | — | — | (156,789 | ) | (351,832 | ) | |||||||||||||||||||||||
| Distributions From Paid In Capital: | ||||||||||||||||||||||||||||||||||||||||
| Class N | — | — | — | — | — | (2,992,066 | ) | — | — | — | — | |||||||||||||||||||||||||||||
| Class A | — | — | — | — | — | (1,107,072 | ) | — | — | — | — | |||||||||||||||||||||||||||||
| Class C | — | — | — | — | — | (1,018,406 | ) | — | — | — | — | |||||||||||||||||||||||||||||
| Total Distributions to Shareholders | (2,421,437 | ) | (3,124,415 | ) | (661,132 | ) | (1,431,181 | ) | (4,676,816 | ) | (9,216,218 | ) | — | — | (2,412,629 | ) | (4,682,390 | ) | ||||||||||||||||||||||
| Share Transactions of Beneficial Interest: | ||||||||||||||||||||||||||||||||||||||||
| Net proceeds from shares sold | ||||||||||||||||||||||||||||||||||||||||
| Class N | 28,300,327 | 31,114,732 | 6,273,933 | 12,243,447 | 25,919,341 | 33,193,976 | 6,158,816 | 9,668,935 | 9,603,970 | 11,238,721 | ||||||||||||||||||||||||||||||
| Class A | 4,810,487 | 4,944,773 | 1,380,755 | 2,890,580 | 7,073,352 | 10,795,276 | 1,497,391 | 2,600,999 | 1,845,772 | 2,527,980 | ||||||||||||||||||||||||||||||
| Class C | 2,825,416 | 1,700,297 | 534,730 | 925,221 | 3,773,275 | 6,193,711 | 241,295 | 1,008,278 | 730,659 | 1,389,655 | ||||||||||||||||||||||||||||||
| Reinvestment of distributions | ||||||||||||||||||||||||||||||||||||||||
| Class N | 2,107,574 | 2,712,469 | 576,180 | 1,221,719 | 2,912,671 | 5,121,998 | — | — | 1,983,198 | 3,778,722 | ||||||||||||||||||||||||||||||
| Class A | 218,597 | 282,009 | 52,227 | 120,244 | 701,188 | 1,739,112 | — | — | 153,491 | 405,699 | ||||||||||||||||||||||||||||||
| Class C | 83,957 | 105,282 | 28,150 | 71,622 | 727,800 | 1,495,861 | — | — | 208,262 | 302,390 | ||||||||||||||||||||||||||||||
| Cost of shares redeemed | ||||||||||||||||||||||||||||||||||||||||
| Class N | (10,652,812 | ) | (13,814,046 | ) | (7,004,545 | ) | (7,944,853 | ) | (19,773,834 | ) | (46,252,134 | ) | (3,759,017 | ) | (8,718,724 | ) | (10,965,804 | ) | (15,743,954 | ) | ||||||||||||||||||||
| Class A | (1,958,478 | ) | (3,023,031 | ) | (853,869 | ) | (3,065,377 | ) | (14,525,219 | ) | (39,725,577 | ) | (626,071 | ) | (1,876,087 | ) | (2,032,722 | ) | (2,742,308 | ) | ||||||||||||||||||||
| Class C | (1,732,165 | ) | (884,861 | ) | (404,786 | ) | (1,378,310 | ) | (7,546,647 | ) | (17,096,041 | ) | (505,088 | ) | (752,842 | ) | (950,590 | ) | (3,228,961 | ) | ||||||||||||||||||||
| Net Increase (Decrease) in Net Assets From Share Transactions of Beneficial Interest | 24,002,903 | 23,137,624 | 582,775 | 5,084,293 | (738,073 | ) | (44,533,818 | ) | 3,007,326 | 1,930,559 | 576,236 | (2,072,056 | ) | |||||||||||||||||||||||||||
| Total Increase (Decrease) in Net Assets | 24,487,171 | 24,199,235 | (76,912 | ) | 5,746,209 | 2,909,563 | (50,550,726 | ) | 3,809,230 | 925,779 | 2,748,387 | (1,749,999 | ) | |||||||||||||||||||||||||||
| Net Assets: | ||||||||||||||||||||||||||||||||||||||||
| Beginning of Period | 109,686,188 | 85,486,953 | 56,221,147 | 50,474,938 | 237,754,341 | 288,305,067 | 34,678,178 | 33,752,399 | 96,358,367 | 98,108,366 | ||||||||||||||||||||||||||||||
| End of Period * | $ | 134,173,359 | $ | 109,686,188 | $ | 56,144,235 | $ | 56,221,147 | $ | 240,663,904 | $ | 237,754,341 | $ | 38,487,408 | $ | 34,678,178 | $ | 99,106,754 | $ | 96,358,367 | ||||||||||||||||||||
| * Includes accumulated net investment income (loss) at end of period | $ | 5,745 | $ | 12,588 | $ | (118,777 | ) | $ | 3,392 | $ | (5,802,473 | ) | $ | (1,211,967 | ) | $ | (78,295 | ) | $ | (9,192 | ) | $ | 35,252 | $ | 167,801 | |||||||||||||||
See accompanying notes to financial statements.
77
| STATEMENTS OF CHANGES IN NET ASSETS (Continued) |
| Dunham | Dunham | Dunham | Dunham | Dunham | ||||||||||||||||||||||||||||||||||||
| Alternative | International Opportunity | Appreciation & | Large Cap | Focused Large Cap | ||||||||||||||||||||||||||||||||||||
| Dividend Fund | Bond Fund | Income Fund | Value Fund | Growth Fund | ||||||||||||||||||||||||||||||||||||
| Six Months | Six Months | Six Months | Six Months | Six Months | ||||||||||||||||||||||||||||||||||||
| Ended | Period Ended | Ended | Year Ended | Ended | Year Ended | Ended | Year Ended | Ended | Year Ended | |||||||||||||||||||||||||||||||
| April 30, 2017 | October 31, 2016^ | April 30, 2017 | Oct. 31, 2016 | April 30, 2017 | Oct. 31, 2016 | April 30, 2017 | Oct. 31, 2016 | April 30, 2017 | Oct. 31, 2016 | |||||||||||||||||||||||||||||||
| (Unaudited) | (Unaudited) | (Unaudited) | (Unaudited) | (Unaudited) | ||||||||||||||||||||||||||||||||||||
| Operations: | ||||||||||||||||||||||||||||||||||||||||
| Net investment income (loss) | $ | 780,610 | $ | 27,264 | $ | (28,970 | ) | $ | 111,654 | $ | 89,778 | $ | 687,222 | $ | 377,825 | $ | 929,784 | $ | (231,202 | ) | $ | (491,313 | ) | |||||||||||||||||
| Net realized gain (loss) from investments and foreign currency transactions | (458,157 | ) | (150,017 | ) | (411,371 | ) | (745,497 | ) | (363,480 | ) | (2,201,104 | ) | 1,280,931 | (1,062,540 | ) | (185,290 | ) | (1,355,084 | ) | |||||||||||||||||||||
| Net change in unrealized appreciation (depreciation) on investments and foreign currency translations | 388,095 | (367,817 | ) | (253,052 | ) | 2,249,812 | 1,219,840 | 851,564 | 4,177,802 | 1,012,440 | 7,628,168 | (1,728,147 | ) | |||||||||||||||||||||||||||
| Net Increase (Decrease) in Net Assets Resulting From Operations | 710,548 | (490,570 | ) | (693,393 | ) | 1,615,969 | 946,138 | (662,318 | ) | 5,836,558 | 879,684 | 7,211,676 | (3,574,544 | ) | ||||||||||||||||||||||||||
| Distributions to Shareholders From: | ||||||||||||||||||||||||||||||||||||||||
| Net Realized Gains: | ||||||||||||||||||||||||||||||||||||||||
| Class N | — | — | — | — | — | (403,190 | ) | — | (11,078,720 | ) | — | (291,262 | ) | |||||||||||||||||||||||||||
| Class A | — | — | — | — | — | (86,592 | ) | — | (1,618,488 | ) | — | (56,919 | ) | |||||||||||||||||||||||||||
| Class C | — | — | — | — | — | (104,911 | ) | — | (1,560,943 | ) | — | (33,681 | ) | |||||||||||||||||||||||||||
| Net Investment Income: | ||||||||||||||||||||||||||||||||||||||||
| Class N | (595,911 | ) | — | (247,203 | ) | (26,161 | ) | (520,043 | ) | (786,055 | ) | (801,099 | ) | (494,656 | ) | — | — | |||||||||||||||||||||||
| Class A | (196 | ) | — | (22,172 | ) | (1,468 | ) | (99,320 | ) | (158,001 | ) | (46,820 | ) | (56,644 | ) | — | — | |||||||||||||||||||||||
| Class C | (10,734 | ) | — | (12,501 | ) | (112 | ) | (70,590 | ) | (157,682 | ) | (105,682 | ) | (12,668 | ) | — | — | |||||||||||||||||||||||
| Total Distributions to Shareholders | (606,841 | ) | — | (281,876 | ) | (27,741 | ) | (689,953 | ) | (1,696,431 | ) | (953,601 | ) | (14,822,119 | ) | — | (381,862 | ) | ||||||||||||||||||||||
| Share Transactions of Beneficial Interest: | ||||||||||||||||||||||||||||||||||||||||
| Net proceeds from shares sold | ||||||||||||||||||||||||||||||||||||||||
| Class N | 13,937,165 | 24,751,166 | 4,342,134 | 5,357,077 | 1,651,748 | 2,852,756 | 4,871,969 | 7,574,814 | 11,526,950 | 12,060,706 | ||||||||||||||||||||||||||||||
| Class A | 35,639 | 12 | 776,451 | 929,673 | 373,499 | 754,836 | 1,600,633 | 1,925,829 | 2,668,021 | 4,522,263 | ||||||||||||||||||||||||||||||
| Class C | 522,677 | 424,059 | 266,313 | 349,149 | 101,110 | 993,090 | 451,511 | 739,554 | 1,419,961 | 1,855,230 | ||||||||||||||||||||||||||||||
| Reinvestment of distributions | ||||||||||||||||||||||||||||||||||||||||
| Class N | 495,047 | — | 247,134 | 26,161 | 508,555 | 1,183,251 | 781,846 | 11,569,073 | — | 289,776 | ||||||||||||||||||||||||||||||
| Class A | 196 | — | 21,649 | 1,390 | 83,738 | 190,060 | 103,998 | 1,655,337 | — | 55,382 | ||||||||||||||||||||||||||||||
| Class C | 10,368 | — | 12,501 | 111 | 64,382 | 230,784 | 46,631 | 1,571,854 | — | 30,681 | ||||||||||||||||||||||||||||||
| Cost of shares redeemed | ||||||||||||||||||||||||||||||||||||||||
| Class N | (1,932,446 | ) | (333,069 | ) | (3,599,094 | ) | (13,978,227 | ) | (6,615,946 | ) | (5,730,350 | ) | (5,748,993 | ) | (7,907,047 | ) | (14,114,471 | ) | (9,460,088 | ) | ||||||||||||||||||||
| Class A | (12 | ) | — | (336,103 | ) | (2,163,714 | ) | (1,373,177 | ) | (1,189,036 | ) | (1,415,206 | ) | (2,032,040 | ) | (1,693,537 | ) | (3,121,382 | ) | |||||||||||||||||||||
| Class C | (14,013 | ) | (61 | ) | (123,492 | ) | (840,513 | ) | (387,601 | ) | (2,555,588 | ) | (710,605 | ) | (1,737,158 | ) | (818,680 | ) | (1,722,420 | ) | ||||||||||||||||||||
| Net Increase (Decrease) in Net Assets From Share Transactions of Beneficial Interest | 13,054,621 | 24,842,107 | 1,607,493 | (10,318,893 | ) | (5,593,692 | ) | (3,270,197 | ) | (18,216 | ) | 13,360,216 | (1,011,756 | ) | 4,510,148 | |||||||||||||||||||||||||
| Total Increase (Decrease) in Net Assets | 13,158,328 | 24,351,537 | 632,224 | (8,730,665 | ) | (5,337,507 | ) | (5,628,946 | ) | 4,864,741 | (582,219 | ) | 6,199,920 | 553,742 | ||||||||||||||||||||||||||
| Net Assets: | ||||||||||||||||||||||||||||||||||||||||
| Beginning of Period | 24,351,537 | — | 28,049,607 | 36,780,272 | 23,748,079 | 29,377,025 | 56,419,570 | 57,001,789 | 65,850,036 | 65,296,294 | ||||||||||||||||||||||||||||||
| End of Period * | $ | 37,509,865 | $ | 24,351,537 | $ | 28,681,831 | $ | 28,049,607 | $ | 18,410,572 | $ | 23,748,079 | $ | 61,284,311 | $ | 56,419,570 | $ | 72,049,956 | $ | 65,850,036 | ||||||||||||||||||||
| * Includes accumulated net investment income (loss) at end of period | $ | 204,210 | $ | 30,441 | $ | (15,212 | ) | $ | (24,355 | ) | $ | (133,803 | ) | $ | 466,372 | $ | 163,391 | $ | 739,093 | $ | (634,074 | ) | $ | (402,872 | ) | |||||||||||||||
| ^ | Dunham Alternative Dividend Fund commenced operations on August 31, 2016. |
See accompanying notes to financial statements.
78
| STATEMENTS OF CHANGES IN NET ASSETS (Continued) |
| Dunham | Dunham | Dunham | Dunham | Dunham | ||||||||||||||||||||||||||||||||||||
| International | Real Estate | Small Cap | Emerging Markets | Small Cap | ||||||||||||||||||||||||||||||||||||
| Stock Fund | Stock Fund | Value Fund | Stock Fund | Growth Fund | ||||||||||||||||||||||||||||||||||||
| Six Months | Six Months | Six Months | Six Months | Six Months | ||||||||||||||||||||||||||||||||||||
| Ended | Year Ended | Ended | Year Ended | Ended | Year Ended | Ended | Year Ended | Ended | Year Ended | |||||||||||||||||||||||||||||||
| April 30, 2017 | Oct. 31, 2016 | April 30, 2017 | Oct. 31, 2016 | April 30, 2017 | Oct. 31, 2016 | April 30, 2017 | Oct. 31, 2016 | April 30, 2017 | Oct. 31, 2016 | |||||||||||||||||||||||||||||||
| (Unaudited) | (Unaudited) | (Unaudited) | (Unaudited) | (Unaudited) | ||||||||||||||||||||||||||||||||||||
| Operations: | ||||||||||||||||||||||||||||||||||||||||
| Net investment income (loss) | $ | 471,802 | $ | 951,682 | $ | 444,529 | $ | 678,696 | $ | 89,051 | $ | 142,836 | $ | 46,006 | $ | 850,585 | $ | (90,993 | ) | $ | (182,879 | ) | ||||||||||||||||||
| Net realized gain (loss) from investments and foreign currency transactions | 2,312,144 | (5,590,409 | ) | 135,740 | 5,144,472 | 2,810,763 | 1,004,619 | (130,905 | ) | (3,164,352 | ) | 2,486,796 | (256,335 | ) | ||||||||||||||||||||||||||
| Net change in unrealized appreciation (depreciation) on investments and foreign currency translations | 6,137,512 | 4,553,684 | (34,282 | ) | (2,930,583 | ) | 2,217,993 | 114,680 | 5,015,379 | 6,286,989 | 2,492,580 | 383,831 | ||||||||||||||||||||||||||||
| Net Increase (Decrease) in Net Assets Resulting From Operations | 8,921,458 | (85,043 | ) | 545,987 | 2,892,585 | 5,117,807 | 1,262,135 | 4,930,480 | 3,973,222 | 4,888,383 | (55,383 | ) | ||||||||||||||||||||||||||||
| Distributions to Shareholders From: | ||||||||||||||||||||||||||||||||||||||||
| Net Realized Gains: | ||||||||||||||||||||||||||||||||||||||||
| Class N | — | — | (3,870,471 | ) | (2,998,341 | ) | (742,732 | ) | (721,628 | ) | — | — | — | (1,889,987 | ) | |||||||||||||||||||||||||
| Class A | — | — | (626,758 | ) | (955,297 | ) | (158,717 | ) | (123,232 | ) | — | — | — | (500,800 | ) | |||||||||||||||||||||||||
| Class C | — | — | (485,899 | ) | (377,983 | ) | (81,547 | ) | (87,966 | ) | — | — | — | (305,357 | ) | |||||||||||||||||||||||||
| Net Investment Income: | ||||||||||||||||||||||||||||||||||||||||
| Class N | — | (43,319 | ) | (494,155 | ) | (353,676 | ) | (150,908 | ) | (13,002 | ) | (796,221 | ) | (286,567 | ) | — | — | |||||||||||||||||||||||
| Class A | — | — | (57,154 | ) | (86,476 | ) | (22,646 | ) | — | (95,754 | ) | (20,580 | ) | — | — | |||||||||||||||||||||||||
| Class C | — | — | (35,575 | ) | (4,842 | ) | — | — | (39,475 | ) | — | — | — | |||||||||||||||||||||||||||
| Distributions From Paid In Capital: | ||||||||||||||||||||||||||||||||||||||||
| Class N | — | — | — | — | — | — | — | — | — | (54,926 | ) | |||||||||||||||||||||||||||||
| Class A | — | — | — | — | — | — | — | — | — | (14,554 | ) | |||||||||||||||||||||||||||||
| Class C | — | — | — | — | — | — | — | — | — | (8,874 | ) | |||||||||||||||||||||||||||||
| Total Distributions to Shareholders | — | (43,319 | ) | (5,570,012 | ) | (4,776,615 | ) | (1,156,550 | ) | (945,828 | ) | (931,450 | ) | (307,147 | ) | — | (2,774,498 | ) | ||||||||||||||||||||||
| Share Transactions of Beneficial Interest: | ||||||||||||||||||||||||||||||||||||||||
| Net proceeds from shares sold | ||||||||||||||||||||||||||||||||||||||||
| Class N | 7,469,832 | 11,593,024 | 3,881,236 | 4,921,239 | 2,830,606 | 3,216,505 | 4,863,147 | 10,467,796 | 4,620,473 | 8,676,971 | ||||||||||||||||||||||||||||||
| Class A | 2,459,118 | 3,460,232 | 943,333 | 1,598,423 | 1,846,941 | 946,333 | 1,842,645 | 2,816,620 | 2,162,706 | 1,105,692 | ||||||||||||||||||||||||||||||
| Class C | 415,314 | 1,189,320 | 221,903 | 836,149 | 577,522 | 367,054 | 264,643 | 929,078 | 482,105 | 438,741 | ||||||||||||||||||||||||||||||
| Reinvestment of distributions | ||||||||||||||||||||||||||||||||||||||||
| Class N | — | 43,140 | 4,259,930 | 3,276,127 | 871,348 | 734,047 | 775,603 | 286,387 | — | 1,940,454 | ||||||||||||||||||||||||||||||
| Class A | — | — | 657,161 | 1,027,941 | 177,734 | 119,701 | 93,730 | 20,108 | — | 363,529 | ||||||||||||||||||||||||||||||
| Class C | — | — | 464,142 | 351,559 | 81,120 | 87,856 | 39,226 | — | 313,976 | |||||||||||||||||||||||||||||||
| Cost of shares redeemed | ||||||||||||||||||||||||||||||||||||||||
| Class N | (11,896,746 | ) | (9,905,060 | ) | (3,894,324 | ) | (14,843,844 | ) | (7,649,844 | ) | (4,020,261 | ) | (8,937,189 | ) | (10,120,339 | ) | (6,557,594 | ) | (5,872,142 | ) | ||||||||||||||||||||
| Class A | (1,800,271 | ) | (2,206,684 | ) | (5,995,072 | ) | (3,203,589 | ) | (2,335,009 | ) | (1,114,590 | ) | (1,818,530 | ) | (1,487,050 | ) | (2,038,817 | ) | (1,667,965 | ) | ||||||||||||||||||||
| Class C | (1,520,800 | ) | (1,909,025 | ) | (578,178 | ) | (1,626,251 | ) | (518,242 | ) | (606,898 | ) | (1,106,586 | ) | (1,010,559 | ) | (280,465 | ) | (1,405,211 | ) | ||||||||||||||||||||
| Net Increase (Decrease) in Net Assets From Share Transactions of Beneficial Interest | (4,873,553 | ) | 2,264,947 | (39,869 | ) | (7,662,246 | ) | (4,117,824 | ) | (270,253 | ) | (3,983,311 | ) | 1,902,041 | (1,611,592 | ) | 3,894,045 | |||||||||||||||||||||||
| Total Increase (Decrease) in Net Assets | 4,047,905 | 2,136,585 | (5,063,894 | ) | (9,546,276 | ) | (156,567 | ) | 46,054 | 15,719 | 5,568,116 | 3,276,791 | 1,064,164 | |||||||||||||||||||||||||||
| Net Assets: | ||||||||||||||||||||||||||||||||||||||||
| Beginning of Period | 95,428,111 | 93,291,526 | 38,065,569 | 47,611,845 | 28,297,658 | 28,251,604 | 56,209,038 | 50,640,922 | 33,704,615 | 32,640,451 | ||||||||||||||||||||||||||||||
| End of Period* | $ | 99,476,016 | $ | 95,428,111 | $ | 33,001,675 | $ | 38,065,569 | $ | 28,141,091 | $ | 28,297,658 | $ | 56,224,757 | $ | 56,209,038 | $ | 36,981,406 | $ | 33,704,615 | ||||||||||||||||||||
| * Includes accumulated net investment income (loss) at end of period | $ | 1,057,282 | $ | (161,564 | ) | $ | 297,685 | $ | 440,040 | $ | 45,331 | $ | 129,834 | $ | (233,845 | ) | $ | 528,087 | $ | (214,863 | ) | $ | (123,870 | ) | ||||||||||||||||
See accompanying notes to financial statements.
79
| FINANCIAL HIGHLIGHTS |
| Dunham Floating Rate Bond Fund |
The table sets forth financial data for one share of beneficial interest outstanding throughout each Period.
| Class N | ||||||||||||||||||||||||||||||||
| Six Months Ended | Year Ended October 31, | |||||||||||||||||||||||||||||||
| April 30, 2017 | 2016 | 2015 | 2014* | |||||||||||||||||||||||||||||
| (Unaudited) | ||||||||||||||||||||||||||||||||
| Net asset value, beginning of period | $ | 9.70 | $ | 9.60 | $ | 9.87 | $ | 10.00 | ||||||||||||||||||||||||
| Income (loss) from investment operations: | ||||||||||||||||||||||||||||||||
| Net investment income** | 0.20 | 0.33 | 0.32 | 0.29 | ||||||||||||||||||||||||||||
| Net realized and unrealized gain (loss) | 0.05 | 0.10 | (0.27 | ) | (0.15 | ) | ||||||||||||||||||||||||||
| Total income from investment operations | 0.25 | 0.43 | 0.05 | 0.14 | ||||||||||||||||||||||||||||
| Less distributions: | ||||||||||||||||||||||||||||||||
| Distributions from net investment income | (0.20 | ) | (0.33 | ) | (0.32 | ) | (0.27 | ) | ||||||||||||||||||||||||
| Total distributions | (0.20 | ) | (0.33 | ) | (0.32 | ) | (0.27 | ) | ||||||||||||||||||||||||
| Net asset value, end of period | $ | 9.75 | $ | 9.70 | $ | 9.60 | $ | 9.87 | ||||||||||||||||||||||||
| Total return + | 2.47 | % | 4.63 | % | 0.51 | % | 1.43 | % | ||||||||||||||||||||||||
| Ratios/Supplemental Data: | ||||||||||||||||||||||||||||||||
| Net assets, end of year (in 000s) | $ | 114,386 | $ | 94,219 | $ | 73,316 | $ | 63,120 | ||||||||||||||||||||||||
| Ratios of expenses to average net assets: ^ | 1.08 | % | 1.34 | % | 1.27 | % | 1.27 | % | ||||||||||||||||||||||||
| Ratios of net investment income to average net assets:^ | 4.10 | % | 3.24 | % | 3.24 | % | 2.87 | % | ||||||||||||||||||||||||
| Portfolio turnover rate | 53 | % (1) | 62 | % | 51 | % | 50 | % | ||||||||||||||||||||||||
| Class A | Class C | |||||||||||||||||||||||||||||||
| Six Months Ended | Year Ended October 31, | Six Months Ended | Year Ended October 31, | |||||||||||||||||||||||||||||
| April 30, 2017 | 2016 | 2015 | 2014* | April 30, 2017 | 2016 | 2015 | 2014* | |||||||||||||||||||||||||
| (Unaudited) | (Unaudited) | |||||||||||||||||||||||||||||||
| Net asset value, beginning of period | $ | 9.70 | $ | 9.59 | $ | 9.87 | $ | 10.00 | $ | 9.69 | $ | 9.59 | $ | 9.86 | $ | 10.00 | ||||||||||||||||
| Income (loss) from investment operations: | ||||||||||||||||||||||||||||||||
| Net investment income** | 0.19 | 0.31 | 0.30 | 0.28 | 0.17 | 0.26 | 0.24 | 0.22 | ||||||||||||||||||||||||
| Net realized and unrealized gain (loss) | 0.03 | 0.11 | (0.28 | ) | (0.16 | ) | 0.05 | 0.10 | (0.26 | ) | (0.16 | ) | ||||||||||||||||||||
| Total income (loss) from investment operations | 0.22 | 0.42 | 0.02 | 0.12 | 0.22 | 0.36 | (0.02 | ) | 0.06 | |||||||||||||||||||||||
| Less distributions: | ||||||||||||||||||||||||||||||||
| Distributions from net investment income | (0.18 | ) | (0.31 | ) | (0.30 | ) | (0.25 | ) | (0.16 | ) | (0.26 | ) | (0.25 | ) | (0.20 | ) | ||||||||||||||||
| Total distributions | (0.18 | ) | (0.31 | ) | (0.30 | ) | (0.25 | ) | (0.16 | ) | (0.26 | ) | (0.25 | ) | (0.20 | ) | ||||||||||||||||
| Net asset value, end of period | $ | 9.74 | $ | 9.70 | $ | 9.59 | $ | 9.87 | $ | 9.75 | $ | 9.69 | $ | 9.59 | $ | 9.86 | ||||||||||||||||
| Total return + | 2.33 | % | 4.49 | % | 0.16 | % | 1.20 | % | 2.25 | % | 3.87 | % | (0.23 | )% | 0.63 | % | ||||||||||||||||
| Ratios/Supplemental Data: | ||||||||||||||||||||||||||||||||
| Net assets, end of period (in 000s) | $ | 14,041 | $ | 10,923 | $ | 8,598 | $ | 13,664 | $ | 5,747 | $ | 4,545 | $ | 3,573 | $ | 3,888 | ||||||||||||||||
| Ratios of expenses to average net assets: ^ | 1.33 | % | 1.59 | % | 1.52 | % | 1.52 | % | 1.83 | % | 2.10 | % | 2.02 | % | 2.02 | % | ||||||||||||||||
| Ratios of net investment income to average net assets:^ | 3.85 | % | 3.49 | % | 2.99 | % | 2.84 | % | 3.35 | % | 2.74 | % | 2.49 | % | 2.24 | % | ||||||||||||||||
| Portfolio turnover rate | 53 | % (1) | 62 | % | 51 | % | 50 | % | 53 | % (1) | 62 | % | 51 | % | 50 | % | ||||||||||||||||
| * | The Fund commenced operations on November 1, 2013. |
| ** | The net investment income per share data was determined using the average shares outstanding throughout each year |
| + | Assumes reinvestment of all dividends and distributions, if any. Aggregate (not annualized) total return is shown for any period shorter than one year. Total return does not reflect the deductions of taxes that a shareholder would pay on distributions or on the redemption of shares. |
| (1) | Not annualized. |
| ^ | Annualized for periods less than one year. |
See accompanying notes to financial statements.
80
| FINANCIAL HIGHLIGHTS |
| Dunham Corporate/Government Bond Fund |
The table sets forth financial data for one share of beneficial interest outstanding throughout each period.
| Class N | ||||||||||||||||||||||||||||||||||||||||||||||||
| Six Months Ended | Year Ended October 31, | |||||||||||||||||||||||||||||||||||||||||||||||
| April 30, 2017 | 2016 | 2015 | 2014 | 2013 | 2012 | |||||||||||||||||||||||||||||||||||||||||||
| (Unaudited) | ||||||||||||||||||||||||||||||||||||||||||||||||
| Net asset value, beginning of period | $ | 13.92 | $ | 13.75 | $ | 14.14 | $ | 14.07 | $ | 14.74 | $ | 14.32 | ||||||||||||||||||||||||||||||||||||
| Income from investment operations: | ||||||||||||||||||||||||||||||||||||||||||||||||
| Net investment income* | 0.16 | 0.36 | 0.42 | 0.38 | 0.37 | 0.36 | ||||||||||||||||||||||||||||||||||||||||||
| Net realized and unrealized gain (loss) | (0.16 | ) | 0.19 | (0.37 | ) | 0.16 | (0.36 | ) | 0.77 | |||||||||||||||||||||||||||||||||||||||
| Total income from investment operations | 0.00 | 0.55 | 0.05 | 0.54 | 0.01 | 1.13 | ||||||||||||||||||||||||||||||||||||||||||
| Less distributions: | ||||||||||||||||||||||||||||||||||||||||||||||||
| Distributions from net investment income | (0.17 | ) | (0.38 | ) | (0.44 | ) | (0.42 | ) | (0.41 | ) | (0.42 | ) | ||||||||||||||||||||||||||||||||||||
| Distributions from net realized gains | — | — | — | (0.05 | ) | (0.27 | ) | (0.29 | ) | |||||||||||||||||||||||||||||||||||||||
| Total distributions | (0.17 | ) | (0.38 | ) | (0.44 | ) | (0.47 | ) | (0.68 | ) | (0.71 | ) | ||||||||||||||||||||||||||||||||||||
| Net asset value, end of period | $ | 13.75 | $ | 13.92 | $ | 13.75 | $ | 14.14 | $ | 14.07 | $ | 14.74 | ||||||||||||||||||||||||||||||||||||
| Total return +# | 0.02 | % | 4.09 | % | 0.36 | % | 3.85 | % | 0.09 | % | 8.10 | % | ||||||||||||||||||||||||||||||||||||
| Ratios/Supplemental Data: | ||||||||||||||||||||||||||||||||||||||||||||||||
| Net assets, end of period (in 000s) | $ | 47,300 | $ | 48,025 | $ | 41,989 | $ | 43,888 | $ | 81,201 | $ | 103,912 | ||||||||||||||||||||||||||||||||||||
| Ratios of expenses to average net assets: | 1.37 | % | 1.13 | % | 1.06 | % | 1.37 | % | 1.21 | % | 1.14 | % | ||||||||||||||||||||||||||||||||||||
| Ratios of net investment income to average net assets: | 2.34 | % | 2.61 | % | 3.00 | % | 2.69 | % | 2.56 | % | 2.50 | % | ||||||||||||||||||||||||||||||||||||
| Portfolio turnover rate | 23 | % | 58 | % | 54 | % | 60 | % | 173 | % | 211 | % | ||||||||||||||||||||||||||||||||||||
| Class A | Class C | |||||||||||||||||||||||||||||||||||||||||||||||
| Six Months Ended | Year Ended October 31, | Six Months Ended | Year Ended October 31, | |||||||||||||||||||||||||||||||||||||||||||||
| April 30, 2017 | 2016 | 2015 | 2014 | 2013 | 2012 | April 30, 2017 | 2016 | 2015 | 2014 | 2013 | 2012 | |||||||||||||||||||||||||||||||||||||
| (Unaudited) | (Unaudited) | |||||||||||||||||||||||||||||||||||||||||||||||
| Net asset value, beginning of period | $ | 13.90 | $ | 13.73 | $ | 14.13 | $ | 14.06 | $ | 14.73 | $ | 14.31 | $ | 13.81 | $ | 13.65 | $ | 14.05 | $ | 13.98 | $ | 14.64 | $ | 14.23 | ||||||||||||||||||||||||
| Income (loss) from investment operations: | ||||||||||||||||||||||||||||||||||||||||||||||||
| Net investment income* | 0.14 | 0.33 | 0.38 | 0.35 | 0.34 | 0.29 | 0.11 | 0.26 | 0.31 | 0.27 | 0.26 | 0.27 | ||||||||||||||||||||||||||||||||||||
| Net realized and unrealized gain (loss) | (0.15 | ) | 0.19 | (0.37 | ) | 0.15 | (0.36 | ) | 0.79 | (0.16 | ) | 0.18 | (0.37 | ) | 0.16 | (0.35 | ) | 0.74 | ||||||||||||||||||||||||||||||
| Total income (loss) from investment operations | (0.01 | ) | 0.52 | 0.01 | 0.50 | (0.02 | ) | 1.08 | (0.05 | ) | 0.44 | (0.06 | ) | 0.43 | (0.09 | ) | 1.01 | |||||||||||||||||||||||||||||||
| Less distributions: | ||||||||||||||||||||||||||||||||||||||||||||||||
| Distributions from net investment income | (0.15 | ) | (0.35 | ) | (0.41 | ) | (0.38 | ) | (0.38 | ) | (0.37 | ) | (0.12 | ) | (0.28 | ) | (0.34 | ) | (0.31 | ) | (0.30 | ) | (0.31 | ) | ||||||||||||||||||||||||
| Distributions from net realized gains | — | — | — | (0.05 | ) | (0.27 | ) | (0.29 | ) | — | — | — | (0.05 | ) | (0.27 | ) | (0.29 | ) | ||||||||||||||||||||||||||||||
| Total distributions | (0.15 | ) | (0.35 | ) | (0.41 | ) | (0.43 | ) | (0.65 | ) | (0.66 | ) | (0.12 | ) | (0.28 | ) | (0.34 | ) | (0.36 | ) | (0.57 | ) | (0.60 | ) | ||||||||||||||||||||||||
| Net asset value, end of period | $ | 13.74 | $ | 13.90 | $ | 13.73 | $ | 14.13 | $ | 14.06 | $ | 14.73 | $ | 13.64 | $ | 13.81 | $ | 13.65 | $ | 14.05 | $ | 13.98 | $ | 14.64 | ||||||||||||||||||||||||
| Total return + # | (0.03 | )% | 3.86 | % | 0.04 | % | 3.59 | % | (0.15 | )% | 7.78 | % | (0.34 | )% | 3.27 | % | (0.45 | )% | 3.08 | % | (0.59 | )% | 7.30 | % | ||||||||||||||||||||||||
| Ratios/Supplemental Data: | ||||||||||||||||||||||||||||||||||||||||||||||||
| Net assets, end of period (in 000s) | $ | 5,361 | $ | 4,832 | $ | 4,788 | $ | 3,684 | $ | 6,888 | $ | 3,598 | $ | 3,483 | $ | 3,364 | $ | 3,698 | $ | 3,690 | $ | 7,733 | $ | 9,007 | ||||||||||||||||||||||||
| Ratios of expenses to average net assets:^ | 1.62 | % | 1.38 | % | 1.31 | % | 1.62 | % | 1.46 | % | 1.39 | % | 2.12 | % | 1.88 | % | 1.81 | % | 2.12 | % | 1.96 | % | 1.89 | % | ||||||||||||||||||||||||
| Ratios of net investment income to average net assets:^ | 2.08 | % | 2.40 | % | 2.74 | % | 2.44 | % | 2.37 | % | 2.25 | % | 1.58 | % | 1.89 | % | 2.27 | % | 1.94 | % | 1.80 | % | 1.75 | % | ||||||||||||||||||||||||
| Portfolio turnover rate (1) | 23 | % | 58 | % | 54 | % | 60 | % | 173 | % | 211 | % | 23 | % | 58 | % | 54 | % | 60 | % | 173 | % | 211 | % | ||||||||||||||||||||||||
| * | The net investment income per share data was determined using the average shares outstanding throughout each year |
| + | Assumes reinvestment of all dividends and distributions, if any. Total return does not reflect the deductions of taxes that a shareholder would pay on distributions or on the redemption of shares. |
| # | Includes adjustments in accordance with accounting principles generally accepted in the United States and, consequently, the net asset value for financial reporting purposes and the returns based upon those net asset values may differ from the net asset values and returns for shareholder transactions. |
See accompanying notes to financial statements.
81
| FINANCIAL HIGHLIGHTS |
| Dunham Monthly Distribution Fund |
The table sets forth financial data for one share of beneficial interest outstanding throughout each period
| Class N | ||||||||||||||||||||||||||||||||||||||||||||||||
| Six Months Ended | Year Ended October 31, | |||||||||||||||||||||||||||||||||||||||||||||||
| April 30, 2017 | 2016 | 2015 | 2014 | 2013 | 2012 | |||||||||||||||||||||||||||||||||||||||||||
| (Unaudited) | ||||||||||||||||||||||||||||||||||||||||||||||||
| Net asset value, beginning of period | $ | 35.74 | $ | 36.36 | $ | 38.16 | $ | 38.47 | $ | 37.22 | $ | 35.87 | ||||||||||||||||||||||||||||||||||||
| Income (loss) from investment operations: | ||||||||||||||||||||||||||||||||||||||||||||||||
| Net investment income (loss)* | (0.18 | ) | 0.14 | (0.18 | ) | 0.17 | 0.36 | 0.14 | ||||||||||||||||||||||||||||||||||||||||
| Net realized and unrealized gain (loss) | 1.51 | 0.49 | (0.39 | ) | 1.35 | 2.13 | 2.41 | |||||||||||||||||||||||||||||||||||||||||
| Total income (loss) from investment operations | 1.33 | 0.63 | (0.57 | ) | 1.52 | 2.49 | 2.55 | |||||||||||||||||||||||||||||||||||||||||
| Less distributions: | ||||||||||||||||||||||||||||||||||||||||||||||||
| Distributions from net investment income | — | (0.55 | ) | — | — | (0.41 | ) | (0.22 | ) | |||||||||||||||||||||||||||||||||||||||
| Distributions from net realized gains | (0.69 | ) | — | (0.80 | ) | (1.59 | ) | (0.83 | ) | (0.32 | ) | |||||||||||||||||||||||||||||||||||||
| Tax return of capital | — | (0.70 | ) | (0.43 | ) | (0.24 | ) | 0.00 | (0.66 | ) | ||||||||||||||||||||||||||||||||||||||
| Total distributions | (0.69 | ) | (1.25 | ) | (1.23 | ) | (1.83 | ) | (1.24 | ) | (1.20 | ) | ||||||||||||||||||||||||||||||||||||
| Net asset value, end of period | $ | 36.38 | $ | 35.74 | $ | 36.36 | $ | 38.16 | $ | 38.47 | $ | 37.22 | ||||||||||||||||||||||||||||||||||||
| Total return + | 3.68 | % | 1.79 | % | (1.53 | )% | 4.01 | % | 6.75 | % | 7.19 | % | ||||||||||||||||||||||||||||||||||||
| Ratios/Supplemental Data: | ||||||||||||||||||||||||||||||||||||||||||||||||
| Net assets, end of period (in 000s) | $ | 164,679 | $ | 153,084 | $ | 163,843 | $ | 156,964 | $ | 161,347 | $ | 127,346 | ||||||||||||||||||||||||||||||||||||
| Ratios of expenses to average net assets: | ||||||||||||||||||||||||||||||||||||||||||||||||
| After waivers ^ | 3.05 | % | 1.85 | % | 2.09 | % | 2.53 | % | 2.23 | % | 2.75 | % | ||||||||||||||||||||||||||||||||||||
| Dividends/borrowings on short sales ^ | 0.57 | % | 0.61 | % | 0.47 | % | 0.59 | % | 0.24 | % | 0.52 | % | ||||||||||||||||||||||||||||||||||||
| Excluding dividends/borrowings on short sales: | ||||||||||||||||||||||||||||||||||||||||||||||||
| Before fee waivers ^ | 2.48 | % | 1.26 | % | 2.17 | % | 2.11 | % | 2.10 | % | 2.23 | % | ||||||||||||||||||||||||||||||||||||
| After fee waivers ^ | 2.48 | % | 1.24 | % | 1.62 | % | 1.94 | % | 1.99 | % | 2.23 | % | ||||||||||||||||||||||||||||||||||||
| Ratios of net investment income (loss) to average net assets: | ||||||||||||||||||||||||||||||||||||||||||||||||
| Before fee waivers ^ | (0.97 | )% | 0.39 | % | (0.56 | )% | 0.26 | % | 0.84 | % | 0.39 | % | ||||||||||||||||||||||||||||||||||||
| After fee waivers ^ | (0.97 | )% | 0.40 | % | (0.48 | )% | 0.43 | % | 0.95 | % | 0.39 | % | ||||||||||||||||||||||||||||||||||||
| Portfolio turnover rate | 126 | % (1) | 208 | % | 155 | % | 229 | % | 227 | % | 205 | % | ||||||||||||||||||||||||||||||||||||
| Class A | Class C | |||||||||||||||||||||||||||||||||||||||||||||||
| Six Months Ended | Year Ended October 31, | Six Months Ended | Year Ended October 31, | |||||||||||||||||||||||||||||||||||||||||||||
| April 30, 2017 | 2016 | 2015 | 2014 | 2013 | 2012 | April 30, 2017 | 2016 | 2015 | 2014 | 2013 | 2012 | |||||||||||||||||||||||||||||||||||||
| (Unaudited) | (Unaudited) | |||||||||||||||||||||||||||||||||||||||||||||||
| Net asset value, beginning of period | $ | 34.90 | $ | 35.63 | $ | 37.52 | $ | 37.95 | $ | 36.82 | $ | 35.58 | $ | 28.94 | $ | 29.99 | $ | 32.01 | $ | 32.87 | $ | 32.29 | $ | 31.55 | ||||||||||||||||||||||||
| Income (loss) from investment operations: | ||||||||||||||||||||||||||||||||||||||||||||||||
| Net investment income (loss)* | (0.20 | ) | 0.13 | (0.27 | ) | 0.07 | 0.24 | 0.03 | (0.28 | ) | (0.14 | ) | (0.46 | ) | (0.20 | ) | (0.07 | ) | (0.18 | ) | ||||||||||||||||||||||||||||
| Net realized and unrealized gain (loss) | 1.47 | 0.39 | (0.39 | ) | 1.33 | 2.13 | 2.40 | 1.22 | 0.34 | (0.33 | ) | 1.17 | 1.89 | 2.09 | ||||||||||||||||||||||||||||||||||
| Total income (loss) from investment operations | 1.27 | 0.52 | (0.66 | ) | 1.40 | 2.37 | 2.43 | 0.94 | 0.20 | (0.79 | ) | 0.97 | 1.82 | 1.91 | ||||||||||||||||||||||||||||||||||
| Less distributions: | ||||||||||||||||||||||||||||||||||||||||||||||||
| Distributions from net investment income | — | (0.55 | ) | — | — | (0.41 | ) | (0.21 | ) | — | (0.55 | ) | — | — | (0.41 | ) | (0.19 | ) | ||||||||||||||||||||||||||||||
| Distributions from net realized gains | (0.69 | ) | — | (0.80 | ) | (1.59 | ) | (0.83 | ) | (0.32 | ) | (0.69 | ) | — | (0.80 | ) | (1.59 | ) | (0.83 | ) | (0.32 | ) | ||||||||||||||||||||||||||
| Tax return of capital | — | (0.70 | ) | (0.43 | ) | (0.24 | ) | 0.00 | (0.66 | ) | — | (0.70 | ) | (0.43 | ) | (0.24 | ) | 0.00 | (0.66 | ) | ||||||||||||||||||||||||||||
| Total distributions | (0.69 | ) | (1.25 | ) | (1.23 | ) | (1.83 | ) | (1.24 | ) | (1.19 | ) | (0.69 | ) | (1.25 | ) | (1.23 | ) | (1.83 | ) | (1.24 | ) | (1.17 | ) | ||||||||||||||||||||||||
| Net asset value, end of period | $ | 35.48 | $ | 34.90 | $ | 35.63 | $ | 37.52 | $ | 37.95 | $ | 36.82 | $ | 29.19 | $ | 28.94 | $ | 29.99 | $ | 32.01 | $ | 32.87 | $ | 32.29 | ||||||||||||||||||||||||
| Total return + | 3.57 | % | 1.54 | % | (1.80 | )% | 3.74 | % | 6.50 | % | 6.92 | % | 3.16 | % | 0.75 | % | (2.53 | )% | 2.99 | % | 5.71 | % | 6.13 | % | ||||||||||||||||||||||||
| Ratios/Supplemental Data: | ||||||||||||||||||||||||||||||||||||||||||||||||
| Net assets, end of period (in 000s) | $ | 39,568 | $ | 45,552 | $ | 74,247 | $ | 79,132 | $ | 68,427 | $ | 51,485 | $ | 36,417 | $ | 39,118 | $ | 50,215 | $ | 48,193 | $ | 37,577 | $ | 30,206 | ||||||||||||||||||||||||
| Ratios of expenses to average net assets: | ||||||||||||||||||||||||||||||||||||||||||||||||
| After waivers ^ | 3.30 | % | 2.06 | % | 2.33 | % | 2.78 | % | 2.48 | % | 3.00 | % | 4.05 | % | 2.83 | % | 3.09 | % | 3.53 | % | 3.23 | % | 3.75 | % | ||||||||||||||||||||||||
| Dividends/borrowings on short sales ^ | 0.57 | % | 0.59 | % | 0.47 | % | 0.59 | % | 0.24 | % | 0.52 | % | 0.57 | % | 0.60 | % | 0.47 | % | 0.59 | % | 0.24 | % | 0.52 | % | ||||||||||||||||||||||||
| Excluding dividends/borrowings on short sales: | ||||||||||||||||||||||||||||||||||||||||||||||||
| Before fee waivers ^ | 2.73 | % | 1.49 | % | 2.42 | % | 2.36 | % | 2.34 | % | 2.48 | % | 3.48 | % | 2.24 | % | 3.16 | % | 3.11 | % | 3.10 | % | 3.23 | % | ||||||||||||||||||||||||
| After fee waivers ^ | 2.73 | % | 1.48 | % | 1.86 | % | 2.19 | % | 2.24 | % | 2.48 | % | 3.48 | % | 2.23 | % | 2.62 | % | 2.94 | % | 2.99 | % | 3.23 | % | ||||||||||||||||||||||||
| Ratios of net investment income (loss) to average net assets: | ||||||||||||||||||||||||||||||||||||||||||||||||
| Before fee waivers ^ | (1.13 | )% | 0.36 | % | (0.79 | )% | 0.01 | % | 0.52 | % | 0.14 | % | (1.94 | )% | (0.50 | )% | (1.54 | )% | (0.74 | )% | (0.32 | )% | (0.61 | )% | ||||||||||||||||||||||||
| After fee waivers ^ | (1.13 | )% | 0.37 | % | (0.71 | )% | 0.18 | % | 0.63 | % | 0.14 | % | (1.94 | )% | (0.48 | )% | (1.46 | )% | (0.57 | )% | (0.21 | )% | (0.61 | )% | ||||||||||||||||||||||||
| Portfolio turnover rate | 126 | % (1) | 208 | % | 155 | % | 229 | % | 227 | % | 205 | % | 126 | % (1) | 208 | % | 155 | % | 229 | % | 227 | % | 205 | % | ||||||||||||||||||||||||
| * | The net investment income (loss) per share data was determined using the average shares outstanding throughout each year. |
| + | Assumes reinvestment of all dividends and distributions, if any. Aggregate (not annualized) total return is shown for any period shorter than one year. Total return does not reflect the deductions of taxes that a shareholder would pay on distributions or on the redemption of shares. |
| (1) | Not annualized. |
| ^ | Annualized for periods less than one year. |
See accompanying notes to financial statements.
82
| FINANCIAL HIGHLIGHTS |
| Dunham Dynamic Macro Fund |
The table sets forth financial data for one share of beneficial interest outstanding throughout each period
| Class N | ||||||||||||||||||||||||||||||||||||||||||||||||
| Six Months Ended | Year Ended October 31, | |||||||||||||||||||||||||||||||||||||||||||||||
| April 30, 2017 | 2016 | 2015 | 2014 | 2013 | 2012 | |||||||||||||||||||||||||||||||||||||||||||
| (Unaudited) | ||||||||||||||||||||||||||||||||||||||||||||||||
| Net asset value, beginning of period | $ | 9.55 | $ | 9.81 | $ | 9.65 | $ | 9.67 | $ | 9.95 | $ | 10.10 | ||||||||||||||||||||||||||||||||||||
| Income from investment operations: | ||||||||||||||||||||||||||||||||||||||||||||||||
| Net investment income (loss) * | (0.05 | ) | (0.00 | ) | (0.14 | ) | 0.19 | 0.33 | 0.30 | |||||||||||||||||||||||||||||||||||||||
| Net realized and unrealized gain (loss) ** | 0.26 | (0.26 | ) | 0.30 | (0.02 | ) | (0.25 | ) | 0.02 | |||||||||||||||||||||||||||||||||||||||
| Total income from investment operations | 0.21 | (0.26 | ) | 0.16 | 0.17 | 0.08 | 0.32 | |||||||||||||||||||||||||||||||||||||||||
| Less distributions: | ||||||||||||||||||||||||||||||||||||||||||||||||
| Distributions from net investment income | — | — | — | (0.19 | ) | (0.33 | ) | (0.35 | ) | |||||||||||||||||||||||||||||||||||||||
| Tax return of capital | — | — | — | — | (0.03 | ) | (0.12 | ) | ||||||||||||||||||||||||||||||||||||||||
| Total distributions | — | — | — | (0.19 | ) | (0.36 | ) | (0.47 | ) | |||||||||||||||||||||||||||||||||||||||
| Net asset value, end of period | $ | 9.76 | $ | 9.55 | $ | 9.81 | $ | 9.65 | $ | 9.67 | $ | 9.95 | ||||||||||||||||||||||||||||||||||||
| Total return + # | 1.88 | % | (2.68 | )% | 1.66 | % | 1.80 | % | 0.80 | % | 3.29 | % | ||||||||||||||||||||||||||||||||||||
| Ratios/Supplemental Data: | ||||||||||||||||||||||||||||||||||||||||||||||||
| Net assets, end of period (in 000s) | $ | 31,724 | $ | 28,650 | $ | 28,518 | $ | 11,758 | $ | 7,185 | $ | 9,002 | ||||||||||||||||||||||||||||||||||||
| Ratios of expenses to average net assets: | 2.29 | % | 1.63 | % | 2.15 | % | 1.90 | % | 1.67 | % | 2.28 | % | ||||||||||||||||||||||||||||||||||||
| Ratios of net investment income (loss) to average net assets: | (0.96 | )% | (0.03 | )% | (1.37 | )% | 1.96 | % | 3.35 | % | 2.94 | % | ||||||||||||||||||||||||||||||||||||
| Portfolio turnover rate | 6 | % | 54 | % | 70 | % | 238 | % | 292 | % | 418 | % | ||||||||||||||||||||||||||||||||||||
| Class A | Class C | |||||||||||||||||||||||||||||||||||||||||||||||
| Six Months Ended | Year Ended October 31, | Six Months Ended | Year Ended October 31, | |||||||||||||||||||||||||||||||||||||||||||||
| April 30, 2017 | 2016 | 2015 | 2014 | 2013 | 2012 | April 30, 2017 | 2016 | 2015 | 2014 | 2013 | 2012 | |||||||||||||||||||||||||||||||||||||
| (Unaudited) | (Unaudited) | |||||||||||||||||||||||||||||||||||||||||||||||
| Net asset value, beginning of period | $ | 9.52 | $ | 9.81 | $ | 9.68 | $ | 9.70 | $ | 9.98 | $ | 10.06 | $ | 9.23 | $ | 9.58 | $ | 9.52 | $ | 9.56 | $ | 9.86 | $ | 9.96 | ||||||||||||||||||||||||
| Income (loss) from investment operations: | ||||||||||||||||||||||||||||||||||||||||||||||||
| Net investment income (loss) * | (0.06 | ) | (0.02 | ) | (0.14 | ) | 0.18 | 0.31 | 0.26 | (0.09 | ) | (0.09 | ) | (0.26 | ) | 0.11 | 0.23 | 0.17 | ||||||||||||||||||||||||||||||
| Net realized and unrealized gain (loss) ** | 0.26 | (0.27 | ) | 0.27 | (0.04 | ) | (0.25 | ) | 0.03 | 0.25 | (0.26 | ) | 0.32 | (0.04 | ) | (0.26 | ) | 0.05 | ||||||||||||||||||||||||||||||
| Total income (loss) from investment operations | 0.20 | (0.29 | ) | 0.13 | 0.14 | 0.06 | 0.29 | 0.16 | (0.35 | ) | 0.06 | 0.07 | (0.03 | ) | 0.22 | |||||||||||||||||||||||||||||||||
| Less distributions: | ||||||||||||||||||||||||||||||||||||||||||||||||
| Distributions from net investment income | — | — | — | (0.16 | ) | (0.31 | ) | (0.25 | ) | — | — | — | (0.11 | ) | (0.24 | ) | (0.20 | ) | ||||||||||||||||||||||||||||||
| Tax return of capital | — | — | — | — | (0.03 | ) | (0.12 | ) | — | — | — | — | (0.03 | ) | (0.12 | ) | ||||||||||||||||||||||||||||||||
| Total distributions | — | — | — | (0.16 | ) | (0.34 | ) | (0.37 | ) | — | — | — | (0.11 | ) | (0.27 | ) | (0.32 | ) | ||||||||||||||||||||||||||||||
| Net asset value, end of period | $ | 9.72 | $ | 9.52 | $ | 9.81 | $ | 9.68 | $ | 9.70 | $ | 9.98 | $ | 9.39 | $ | 9.23 | $ | 9.58 | $ | 9.52 | $ | 9.56 | $ | 9.86 | ||||||||||||||||||||||||
| Total return + # | 1.82 | % | (2.95 | )% | 1.34 | % | 1.52 | % | 0.55 | % | 3.00 | % | 1.40 | % | (3.66 | )% | 0.63 | % | 0.78 | % | (0.29 | )% | 2.27 | % | ||||||||||||||||||||||||
| Ratios/Supplemental Data: | ||||||||||||||||||||||||||||||||||||||||||||||||
| Net assets, end of period (in 000s) | $ | 4,866 | $ | 3,897 | $ | 3,296 | $ | 1,729 | $ | 1,782 | $ | 2,230 | $ | 1,897 | $ | 2,131 | $ | 1,938 | $ | 1,712 | $ | 2,053 | $ | 1,786 | ||||||||||||||||||||||||
| Ratios of expenses to average net assets ^ | 2.54 | % | 1.88 | % | 2.40 | % | 2.15 | % | 1.92 | % | 2.53 | % | 3.29 | % | 2.63 | % | 3.15 | % | 2.90 | % | 2.67 | % | 3.28 | % | ||||||||||||||||||||||||
| Ratios of net investment income (loss) to average net assets:^ | (1.26 | )% | (0.26 | )% | (1.63 | )% | 1.92 | % | 3.13 | % | 2.69 | % | (1.89 | )% | (1.02 | )% | (2.35 | )% | 1.19 | % | 2.38 | % | 1.94 | % | ||||||||||||||||||||||||
| Portfolio turnover rate (1) | 6 | % | 54 | % | 70 | % | 238 | % | 292 | % | 418 | % | 6 | % | 54 | % | 70 | % | 238 | % | 292 | % | 418 | % | ||||||||||||||||||||||||
| * | The net investment income (loss) per share data was determined using the average shares outstanding throughout each year. |
| ** | The amount of net realized and unrealized gain (loss) on investment per share for the years ended October 31, 2015 and 2014 does not accord with the amounts in the Statements of Operations due to the timing of purchases and sales of Fund shares in relation to fluctuating market values. |
| + | Assumes reinvestment of all dividends and distributions, if any. Total return does not reflect the deductions of taxes that a shareholder would pay on distributions or on the redemption of shares. |
| # | Includes adjustments in accordance with accounting principles generally accepted in the United States and, consequently, the net asset value for financial reporting purposes and the returns based upon those net asset values may differ from the net asset values and returns for shareholder transactions. |
| ^ | Annualized for periods less than one year. |
| (1) | Not annualized. |
See accompanying notes to financial statements.
83
| FINANCIAL HIGHLIGHTS |
| Dunham High-Yield Bond Fund |
The table sets forth financial data for one share of beneficial interest outstanding throughout each period
| Class N | ||||||||||||||||||||||||||||||||||||||||||||||||
| Year Ended | ||||||||||||||||||||||||||||||||||||||||||||||||
| Six Months Ended | October 31, | |||||||||||||||||||||||||||||||||||||||||||||||
| April 30, 2017 | 2016 | 2015 | 2014 | 2013 | 2012 | |||||||||||||||||||||||||||||||||||||||||||
| (Unaudited) | ||||||||||||||||||||||||||||||||||||||||||||||||
| Net asset value, beginning of period | $ | 8.94 | $ | 8.92 | $ | 9.51 | $ | 9.61 | $ | 9.52 | $ | 9.08 | ||||||||||||||||||||||||||||||||||||
| Income (loss) from investment operations: | ||||||||||||||||||||||||||||||||||||||||||||||||
| Net investment income* | 0.22 | 0.44 | 0.44 | 0.46 | 0.47 | 0.53 | ||||||||||||||||||||||||||||||||||||||||||
| Net realized and unrealized gain (loss) | 0.21 | 0.02 | (0.59 | ) | (0.10 | ) | 0.09 | 0.44 | ||||||||||||||||||||||||||||||||||||||||
| Total income (loss) from investment operations | 0.43 | 0.46 | (0.15 | ) | 0.36 | 0.56 | 0.97 | |||||||||||||||||||||||||||||||||||||||||
| Less distributions: | ||||||||||||||||||||||||||||||||||||||||||||||||
| Distributions from net investment income | (0.23 | ) | (0.44 | ) | (0.44 | ) | (0.46 | ) | (0.47 | ) | (0.53 | ) | ||||||||||||||||||||||||||||||||||||
| Total distributions | (0.23 | ) | (0.44 | ) | (0.44 | ) | (0.46 | ) | (0.47 | ) | (0.53 | ) | ||||||||||||||||||||||||||||||||||||
| Net asset value, end of period | $ | 9.14 | $ | 8.94 | $ | 8.92 | $ | 9.51 | $ | 9.61 | $ | 9.52 | ||||||||||||||||||||||||||||||||||||
| Total return + | 4.83 | % | 5.39 | % | (1.63 | )% | 3.77 | % | 6.05 | % | 10.96 | % | ||||||||||||||||||||||||||||||||||||
| Ratios/Supplemental Data: | ||||||||||||||||||||||||||||||||||||||||||||||||
| Net assets, end of period (in 000s) | $ | 80,575 | $ | 78,194 | $ | 78,654 | $ | 102,412 | $ | 134,487 | $ | 114,810 | ||||||||||||||||||||||||||||||||||||
| Ratios of expenses to average net assets: ^ | 1.20 | % | 1.08 | % | 1.02 | % | 1.09 | % | 1.11 | % | 1.23 | % | ||||||||||||||||||||||||||||||||||||
| Ratios of net investment income to average net assets: ^ | 4.80 | % | 5.09 | % | 4.77 | % | 4.72 | % | 4.89 | % | 5.70 | % | ||||||||||||||||||||||||||||||||||||
| Portfolio turnover rate | 30 | % (1) | 62 | % | 51 | % | 62 | % | 94 | % | 58 | % | ||||||||||||||||||||||||||||||||||||
| Class A | Class C | |||||||||||||||||||||||||||||||||||||||||||||||
| Year Ended | Year Ended | |||||||||||||||||||||||||||||||||||||||||||||||
| Six Months Ended | October 31, | Six Months Ended | October 31, | |||||||||||||||||||||||||||||||||||||||||||||
| April 30, 2017 | 2016 | 2015 | 2014 | 2013 | 2012 | April 30, 2017 | 2016 | 2015 | 2014 | 2013 | 2012 | |||||||||||||||||||||||||||||||||||||
| (Unaudited) | (Unaudited) | |||||||||||||||||||||||||||||||||||||||||||||||
| Net asset value, beginning of period | $ | 9.02 | $ | 8.99 | $ | 9.58 | $ | 9.68 | $ | 9.59 | $ | 9.15 | $ | 8.88 | $ | 8.86 | $ | 9.46 | $ | 9.55 | $ | 9.47 | $ | 9.04 | ||||||||||||||||||||||||
| Income (loss) from investment operations: | ||||||||||||||||||||||||||||||||||||||||||||||||
| Net investment income* | 0.20 | 0.42 | 0.41 | 0.44 | 0.45 | 0.51 | 0.18 | 0.37 | 0.37 | 0.38 | 0.40 | 0.47 | ||||||||||||||||||||||||||||||||||||
| Net realized and unrealized gain (loss) | 0.14 | 0.03 | (0.59 | ) | (0.10 | ) | 0.09 | 0.44 | 0.30 | 0.02 | (0.60 | ) | (0.08 | ) | 0.08 | 0.43 | ||||||||||||||||||||||||||||||||
| Total income (loss) from investment operations | 0.34 | 0.45 | (0.18 | ) | 0.34 | 0.54 | 0.95 | 0.48 | 0.39 | (0.23 | ) | 0.30 | 0.48 | 0.90 | ||||||||||||||||||||||||||||||||||
| Less distributions: | ||||||||||||||||||||||||||||||||||||||||||||||||
| Distributions from net investment income | (0.21 | ) | (0.42 | ) | (0.41 | ) | (0.44 | ) | (0.45 | ) | (0.51 | ) | (0.19 | ) | (0.37 | ) | (0.37 | ) | (0.39 | ) | (0.40 | ) | (0.47 | ) | ||||||||||||||||||||||||
| Total distributions | (0.21 | ) | (0.42 | ) | (0.41 | ) | (0.44 | ) | (0.45 | ) | (0.51 | ) | (0.19 | ) | (0.37 | ) | (0.37 | ) | (0.39 | ) | (0.40 | ) | (0.47 | ) | ||||||||||||||||||||||||
| Net asset value, end of period | $ | 9.15 | $ | 9.02 | $ | 8.99 | $ | 9.58 | $ | 9.68 | $ | 9.59 | $ | 9.17 | $ | 8.88 | $ | 8.86 | $ | 9.46 | $ | 9.55 | $ | 9.47 | ||||||||||||||||||||||||
| Total return + | 3.85 | % | 5.21 | % | (1.88 | )% | 3.49 | % | 5.74 | % | 10.70 | % | 5.40 | % | 4.65 | % | (2.47 | )% | 3.13 | % | 5.17 | % | 10.19 | % | ||||||||||||||||||||||||
| Ratios/Supplemental Data: | ||||||||||||||||||||||||||||||||||||||||||||||||
| Net assets, end of period (in 000s) | $ | 10,681 | $ | 10,478 | $ | 10,224 | $ | 22,022 | $ | 19,888 | $ | 13,722 | $ | 7,850 | $ | 7,687 | $ | 9,231 | $ | 11,652 | $ | 13,741 | $ | 14,457 | ||||||||||||||||||||||||
| Ratios of expenses to average net assets: ^ | 1.45 | % | 1.33 | % | 1.27 | % | 1.34 | % | 1.36 | % | 1.48 | % | 1.95 | % | 1.83 | % | 1.77 | % | 1.84 | % | 1.86 | % | 1.98 | % | ||||||||||||||||||||||||
| Ratios of net investment income to average net assets: ^ | 4.55 | % | 4.84 | % | 4.52 | % | 4.47 | % | 4.64 | % | 5.45 | % | 4.05 | % | 4.34 | % | 4.02 | % | 3.97 | % | 4.15 | % | 4.95 | % | ||||||||||||||||||||||||
| Portfolio turnover rate | 30 | % (1) | 62 | % | 51 | % | 62 | % | 94 | % | 58 | % | 30 | % (1) | 62 | % | 51 | % | 62 | % | 94 | % | 58 | % | ||||||||||||||||||||||||
| * | The net investment income per share data was determined using the average shares outstanding throughout each year |
| + | Assumes reinvestment of all dividends and distributions, if any. Total return does not reflect the deductions of taxes that a shareholder would pay on distributions or on the redemption of shares. |
| (1) | Not annualized. |
| ^ | Annualized for periods less than one year. |
See accompanying notes to financial statements.
84
| FINANCIAL HIGHLIGHTS |
| Dunham Alternative Dividend Fund |
The table sets forth financial data for one share of beneficial interest outstanding throughout the Period;
| Class N | Class A | Class C | ||||||||||||||||||||||
| Six Months Ended | Period Ended | Six Months Ended | Period Ended | Six Months Ended | Period Ended | |||||||||||||||||||
| April 30, | October 31, | April 30, | October 31, | April 30, | October 31, | |||||||||||||||||||
| 2017 | 2016* | 2017 | 2016* | 2017 | 2016* | |||||||||||||||||||
| (Unaudited) | (Unaudited) | (Unaudited) | ||||||||||||||||||||||
| Net asset value, beginning of period | $ | 11.72 | $ | 12.00 | $ | 11.72 | $ | 12.00 | $ | 11.71 | $ | 12.00 | ||||||||||||
| Income (loss) from investment operations: | ||||||||||||||||||||||||
| Net investment income** | 0.30 | 0.02 | 0.37 | 0.08 | 0.24 | 0.01 | ||||||||||||||||||
| Net realized and unrealized gain (loss) | 0.11 | (0.30 | ) | 0.03 | (0.36 | ) | 0.10 | (0.30 | ) | |||||||||||||||
| Total income (loss) from investment operations | 0.41 | (0.28 | ) | 0.40 | (0.28 | ) | 0.34 | (0.29 | ) | |||||||||||||||
| Less distributions: | ||||||||||||||||||||||||
| Distributions from net investment income | (0.23 | ) | — | (0.22 | ) | — | (0.17 | ) | — | |||||||||||||||
| Total distributions | (0.23 | ) | — | (0.22 | ) | — | (0.17 | ) | — | |||||||||||||||
| Net asset value, end of period | $ | 11.90 | $ | 11.72 | $ | 11.90 | $ | 11.72 | $ | 11.88 | $ | 11.71 | ||||||||||||
| Total return + | 3.44 | % | (2.33 | )% | 3.39 | % | (2.33 | )% | 2.93 | % | (2.42 | )% | ||||||||||||
| Ratios/Supplemental Data: | ||||||||||||||||||||||||
| Net assets, end of period | $ | 36,541 | $ | 23,934 | $ | 35 | $ | 12 | $ | 934 | $ | 418 | ||||||||||||
| Ratios of expenses to average net assets: | ||||||||||||||||||||||||
| Before commission recapture ^ | 1.59 | % | 1.88 | % | 1.84 | % | 2.61 | % | 2.59 | % | 2.74 | % | ||||||||||||
| After commission recapture ^ | 1.26 | % | 1.88 | % | 1.51 | % | 2.61 | % | 2.26 | % | 2.74 | % | ||||||||||||
| Ratios of net investment income to average net assets: | ||||||||||||||||||||||||
| Before commission recapture ^ | 4.64 | % | 0.86 | % | 4.39 | % | 4.18 | % | 3.64 | % | 0.44 | % | ||||||||||||
| After commission recapture ^ | 4.97 | % | 0.86 | % | 4.72 | % | 4.18 | % | 3.97 | % | 0.44 | % | ||||||||||||
| Portfolio turnover rate (1) | 286 | % | 41 | % | �� | 286 | % | 41 | % | 286 | % | 41 | % | |||||||||||
| * | The Fund commenced operations on August 31, 2016 |
| ** | The net investment income per share data was determined using the average shares outstanding throughout the period |
| + | Assumes reinvestment of all dividends and distributions, if any. Aggregate (not annualized) total return is shown for any period shorter than one year. Total return does not reflect the deductions of taxes that a shareholder would pay on distributions or on the redemption of shares. |
| (1) | Not annualized. |
| ^ | Annualized for periods less than one year. |
See accompanying notes to financial statements.
85
| FINANCIAL HIGHLIGHTS |
| Dunham International Opportunity Bond Fund |
The table sets forth financial data for one share of beneficial interest outstanding for each period
| Class N | ||||||||||||||||||||||||||||||||
| Six Months Ended | Year Ended October 31, | |||||||||||||||||||||||||||||||
| April 30, 2017 | 2016 | 2015 | 2014* | |||||||||||||||||||||||||||||
| (Unaudited) | ||||||||||||||||||||||||||||||||
| Net asset value, beginning of period | $ | 9.37 | $ | 8.92 | $ | 9.64 | $ | 10.00 | ||||||||||||||||||||||||
| Income (loss) from investment operations: | ||||||||||||||||||||||||||||||||
| Net investment income (loss)** | (0.01 | ) | 0.04 | 0.05 | 0.07 | |||||||||||||||||||||||||||
| Net realized and unrealized gain (loss) | (0.26 | ) | 0.42 | (0.77 | ) | (0.37 | ) | |||||||||||||||||||||||||
| Total income (loss) from investment operations | (0.27 | ) | 0.46 | (0.72 | ) | (0.30 | ) | |||||||||||||||||||||||||
| Less distributions: | ||||||||||||||||||||||||||||||||
| Distributions from net investment income | — | (0.01 | ) | — | — | |||||||||||||||||||||||||||
| Distributions from net realized gains | (0.09 | ) | 0.00 | 0.00 | ||||||||||||||||||||||||||||
| Tax return of capital | — | — | — | (0.06 | ) | |||||||||||||||||||||||||||
| Total distributions | (0.09 | ) | (0.01 | ) | — | (0.06 | ) | |||||||||||||||||||||||||
| Net asset value, end of period | $ | 9.01 | $ | 9.37 | $ | 8.92 | $ | 9.64 | ||||||||||||||||||||||||
| Total return + # | (2.78 | )% | 5.14 | % | (7.42 | )% | (2.99 | )% | ||||||||||||||||||||||||
| Ratios/Supplemental Data: | ||||||||||||||||||||||||||||||||
| Net assets, end of period (in 000s) | $ | 24,852 | $ | 24,728 | $ | 31,935 | $ | 42,440 | ||||||||||||||||||||||||
| Ratios of expenses to average net assets | 1.49 | % | 1.28 | % | 1.38 | % | 1.38 | % | ||||||||||||||||||||||||
| Ratios of net investment income (loss) to average net assets | (0.17 | )% | 0.41 | % | 0.52 | % | 0.66 | % | ||||||||||||||||||||||||
| Portfolio turnover rate | 21 | % | 64 | % | 52 | % | 60 | % | ||||||||||||||||||||||||
| Class A | Class C | |||||||||||||||||||||||||||||||
| Six Months Ended | Year Ended October 31, | Six Months Ended | Year Ended October 31, | |||||||||||||||||||||||||||||
| April 30, 2017 | 2016 | 2015 | 2014* | April 30, 2017 | 2016 | 2015 | 2014* | |||||||||||||||||||||||||
| (Unaudited) | (Unaudited) | |||||||||||||||||||||||||||||||
| Net asset value, beginning of period | $ | 9.32 | $ | 8.90 | $ | 9.64 | $ | 10.00 | $ | 9.22 | $ | 8.84 | $ | 9.62 | $ | 10.00 | ||||||||||||||||
| Income (loss) from investment operations: | ||||||||||||||||||||||||||||||||
| Net investment income (loss)** | (0.02 | ) | 0.01 | 0.02 | 0.04 | (0.04 | ) | (0.03 | ) | (0.02 | ) | (0.01 | ) | |||||||||||||||||||
| Net realized and unrealized gain (loss) | (0.24 | ) | 0.41 | (0.76 | ) | (0.36 | ) | (0.26 | ) | 0.41 | (0.76 | ) | (0.36 | ) | ||||||||||||||||||
| Total income (loss) from investment operations | (0.26 | ) | 0.42 | (0.74 | ) | (0.32 | ) | (0.30 | ) | 0.38 | (0.78 | ) | (0.37 | ) | ||||||||||||||||||
| Less distributions: | ||||||||||||||||||||||||||||||||
| Distributions from net investment income | — | (0.00 | ) (a) | — | — | — | (0.00 | ) (a) | — | — | ||||||||||||||||||||||
| Distributions from net realized gains | (0.09 | ) | 0.00 | 0.00 | (0.09 | ) | 0.00 | |||||||||||||||||||||||||
| Tax return of capital | — | — | — | (0.04 | ) | — | — | — | (0.01 | ) | ||||||||||||||||||||||
| Total distributions | (0.09 | ) | (0.00 | ) (a) | — | (0.04 | ) | (0.09 | ) | (0.00 | ) (a) | — | (0.01 | ) | ||||||||||||||||||
| Net asset value, end of period | $ | 8.97 | $ | 9.32 | $ | 8.90 | $ | 9.64 | $ | 8.83 | $ | 9.22 | $ | 8.84 | $ | 9.62 | ||||||||||||||||
| Total return + # | (2.69 | )% | 4.77 | % | (7.65 | )% | (3.22 | )% | (3.15 | )% | 4.31 | % | (8.11 | )% | (3.72 | )% | ||||||||||||||||
| Ratios/Supplemental Data: | ||||||||||||||||||||||||||||||||
| Net assets, end of period (in 000s) | $ | 2,517 | $ | 2,118 | $ | 3,208 | $ | 3,513 | $ | 1,313 | $ | 1,204 | $ | 1,638 | $ | 1,879 | ||||||||||||||||
| Ratios of expenses to average net assets ^ | 1.74 | % | 1.53 | % | 1.63 | % | 1.63 | % | 2.24 | % | 2.03 | % | 2.13 | % | 2.13 | % | ||||||||||||||||
| Ratios of net investment income (loss) to average net assets ^ | (0.42 | )% | 0.10 | % | 0.29 | % | 0.41 | % | (0.91 | )% | (0.33 | )% | (0.24 | )% | (0.09 | )% | ||||||||||||||||
| Portfolio turnover rate (1) | 21 | % | 64 | % | 52 | % | 60 | % | 21 | % | 64 | % | 52 | % | 60 | % | ||||||||||||||||
| * | The Fund commenced operations on November 1, 2013. |
| ** | The net investment income (loss) per share data was determined using the average shares outstanding throughout the year |
| (a) | Represents less than $0.01 per share. |
| + | Assumes reinvestment of all dividends and distributions, if any. Total return does not reflect the deductions of taxes that a shareholder would pay on distributions or on the redemption of shares |
| # | Includes adjustments in accordance with accounting principles generally accepted in the United States and, consequently, the net asset value for financial reporting purposes and the returns based upon those net asset values may differ from the net asset values and returns for shareholder transactions |
| ^ | Annualized for periods less than one year. |
| (1) | Not annualized for period less than one year |
See accompanying notes to financial statements.
86
| FINANCIAL HIGHLIGHTS |
| Dunham Appreciation & Income Fund |
The table sets forth financial data for one share of beneficial interest outstanding throughout each period
| Class N | ||||||||||||||||||||||||||||||||||||||||||||||||
| Year Ended | ||||||||||||||||||||||||||||||||||||||||||||||||
| Six Months Ended | October 31, | |||||||||||||||||||||||||||||||||||||||||||||||
| April 30, 2017 | 2016 | 2015 | 2014 | 2013 | 2012 | |||||||||||||||||||||||||||||||||||||||||||
| (Unaudited) | ||||||||||||||||||||||||||||||||||||||||||||||||
| Net asset value, beginning of period | $ | 8.05 | $ | 8.75 | $ | 10.88 | $ | 10.09 | $ | 8.90 | $ | 8.86 | ||||||||||||||||||||||||||||||||||||
| Income (loss) from investment operations: | ||||||||||||||||||||||||||||||||||||||||||||||||
| Net investment income* | 0.04 | 0.23 | 0.27 | 0.11 | 0.16 | 0.10 | ||||||||||||||||||||||||||||||||||||||||||
| Net realized and unrealized gain (loss) | 0.31 | (0.39 | ) | (0.51 | ) | 0.83 | 1.28 | 0.05 | ||||||||||||||||||||||||||||||||||||||||
| Total income (loss) from investment operations | 0.35 | (0.16 | ) | (0.24 | ) | 0.94 | 1.44 | 0.15 | ||||||||||||||||||||||||||||||||||||||||
| Less distributions: | ||||||||||||||||||||||||||||||||||||||||||||||||
| Distributions from net investment income | (0.25 | ) | (0.36 | ) | (0.17 | ) | (0.15 | ) | (0.25 | ) | (0.11 | ) | ||||||||||||||||||||||||||||||||||||
| Distributions from net realized gains | 0.00 | (0.18 | ) | (1.72 | ) | — | — | — | ||||||||||||||||||||||||||||||||||||||||
| Total distributions | (0.25 | ) | (0.54 | ) | (1.89 | ) | (0.15 | ) | (0.25 | ) | (0.11 | ) | ||||||||||||||||||||||||||||||||||||
| Net asset value, end of period | $ | 8.15 | $ | 8.05 | $ | 8.75 | $ | 10.88 | $ | 10.09 | $ | 8.90 | ||||||||||||||||||||||||||||||||||||
| Total return + | 4.42 | % | (1.92 | )% | (2.67 | )% | 9.37 | % | 16.59 | % | 1.83 | % | ||||||||||||||||||||||||||||||||||||
| Ratios/Supplemental Data: | ||||||||||||||||||||||||||||||||||||||||||||||||
| Net assets, end of period (in 000s) | $ | 12,641 | $ | 16,929 | $ | 20,210 | $ | 18,576 | $ | 15,855 | $ | 23,843 | ||||||||||||||||||||||||||||||||||||
| Ratios of expenses to average net assets: ^ | 1.57 | % | 1.42 | % | 1.34 | % | 1.44 | % | 1.39 | % | 1.60 | % | ||||||||||||||||||||||||||||||||||||
| Ratios of net investment income to average net assets: ^ | 1.01 | % | 2.83 | % | 2.83 | % | 1.07 | % | 1.70 | % | 1.13 | % | ||||||||||||||||||||||||||||||||||||
| Portfolio turnover rate | 83 | % (1) | 96 | % | 82 | % | 129 | % | 62 | % | 51 | % | ||||||||||||||||||||||||||||||||||||
| Class A | Class C | |||||||||||||||||||||||||||||||||||||||||||||||
| Year Ended | Year Ended | |||||||||||||||||||||||||||||||||||||||||||||||
| Six Months Ended | October 31, | Six Months Ended | October 31, | |||||||||||||||||||||||||||||||||||||||||||||
| April 30, 2017 | 2016 | 2015 | 2014 | 2013 | 2012 | April 30, 2017 | 2016 | 2015 | 2014 | 2013 | 2012 | |||||||||||||||||||||||||||||||||||||
| (Unaudited) | (Unaudited) | |||||||||||||||||||||||||||||||||||||||||||||||
| Net asset value, beginning of period | $ | 8.03 | $ | 8.73 | $ | 10.85 | $ | 10.06 | $ | 8.88 | $ | 8.83 | $ | 7.86 | $ | 8.56 | $ | 10.66 | $ | 9.90 | $ | 8.74 | $ | 8.70 | ||||||||||||||||||||||||
| Income (loss) from investment operations: | ||||||||||||||||||||||||||||||||||||||||||||||||
| Net investment income (loss)* | 0.03 | 0.20 | 0.24 | 0.09 | 0.13 | 0.08 | 0.00 | 0.14 | 0.18 | 0.01 | 0.06 | 0.01 | ||||||||||||||||||||||||||||||||||||
| Net realized and unrealized gain (loss) | 0.31 | (0.39 | ) | (0.50 | ) | 0.82 | 1.27 | 0.06 | 0.30 | (0.39 | ) | (0.50 | ) | 0.80 | 1.26 | 0.06 | ||||||||||||||||||||||||||||||||
| Total income (loss) from investment operations | 0.34 | (0.19 | ) | (0.26 | ) | 0.91 | 1.40 | 0.14 | 0.30 | (0.25 | ) | (0.32 | ) | 0.81 | 1.32 | 0.07 | ||||||||||||||||||||||||||||||||
| Less distributions: | ||||||||||||||||||||||||||||||||||||||||||||||||
| Distributions from net investment income | (0.23 | ) | (0.33 | ) | (0.14 | ) | (0.12 | ) | (0.22 | ) | (0.09 | ) | (0.18 | ) | (0.27 | ) | (0.06 | ) | (0.05 | ) | (0.16 | ) | (0.03 | ) | ||||||||||||||||||||||||
| Distributions from net realized gains | 0.00 | (0.18 | ) | (1.72 | ) | — | — | — | 0.00 | (0.18 | ) | (1.72 | ) | — | — | — | ||||||||||||||||||||||||||||||||
| Total distributions | (0.23 | ) | (0.51 | ) | (1.86 | ) | (0.12 | ) | (0.22 | ) | (0.09 | ) | (0.18 | ) | (0.45 | ) | (1.78 | ) | (0.05 | ) | (0.16 | ) | (0.03 | ) | ||||||||||||||||||||||||
| Net asset value, end of period | $ | 8.14 | $ | 8.03 | $ | 8.73 | $ | 10.85 | $ | 10.06 | $ | 8.88 | $ | 7.98 | $ | 7.86 | $ | 8.56 | $ | 10.66 | $ | 9.90 | $ | 8.74 | ||||||||||||||||||||||||
| Total return + | 4.26 | % | (2.19 | )% | (2.84 | )% | 9.10 | % | 16.21 | % | 1.63 | % | 3.84 | % | (2.95 | )% | (3.53 | )% | 8.21 | % | 15.35 | % | 0.84 | % | ||||||||||||||||||||||||
| Ratios/Supplemental Data: | ||||||||||||||||||||||||||||||||||||||||||||||||
| Net assets, end of period (in 000s) | $ | 2,763 | $ | 3,638 | $ | 4,211 | $ | 4,509 | $ | 4,368 | $ | 4,470 | $ | 3,006 | $ | 3,181 | $ | 4,956 | $ | 4,046 | $ | 3,765 | $ | 3,867 | ||||||||||||||||||||||||
| Ratios of expenses to average net assets: ^ | 1.82 | % | 1.67 | % | 1.59 | % | 1.69 | % | 1.64 | % | 1.85 | % | 2.57 | % | 2.44 | % | 2.34 | % | 2.44 | % | 2.39 | % | 2.60 | % | ||||||||||||||||||||||||
| Ratios of net investment income (loss) to average net assets: ^ | 0.76 | % | 2.57 | % | 2.56 | % | 0.83 | % | 1.45 | % | 0.88 | % | 0.01 | % | 1.81 | % | 1.91 | % | 0.08 | % | 0.70 | % | 0.13 | % | ||||||||||||||||||||||||
| Portfolio turnover rate | 83 | % (1) | 96 | % | 82 | % | 129 | % | 62 | % | 51 | % | 83 | % (1) | 96 | % | 82 | % | 129 | % | 62 | % | 51 | % | ||||||||||||||||||||||||
| * | The net investment income (loss) per share data was determined using the average shares outstanding throughout each year |
| + | Assumes reinvestment of all dividends and distributions, if any. Total return does not reflect the deductions of taxes that a shareholder would pay on distributions or on the redemption of shares. |
| ^ | Annualized for periods less than one year. |
| (1) | Not annualized. |
See accompanying notes to financial statements.
87
| FINANCIAL HIGHLIGHTS |
| Dunham Large Cap Value Fund |
The table sets forth financial data for one share of beneficial interest outstanding throughout each period.
| Class N | ||||||||||||||||||||||||||||||||||||||||||||||||
| Six Months Ended | Year Ended October 31, | |||||||||||||||||||||||||||||||||||||||||||||||
| April 30, 2017 | 2016 | 2015 | 2014 | 2013 | 2012 | |||||||||||||||||||||||||||||||||||||||||||
| (Unaudited) | ||||||||||||||||||||||||||||||||||||||||||||||||
| Net asset value, beginning of period | $ | 12.22 | $ | 16.32 | $ | 16.21 | $ | 14.55 | $ | 11.74 | $ | 10.60 | ||||||||||||||||||||||||||||||||||||
| Income from investment operations: | ||||||||||||||||||||||||||||||||||||||||||||||||
| Net investment income * | 0.09 | 0.22 | 0.17 | 0.13 | 0.16 | 0.12 | ||||||||||||||||||||||||||||||||||||||||||
| Net realized and unrealized gain (loss) | 1.20 | (0.04 | ) | 0.06 | 1.70 | 2.78 | 1.07 | �� | ||||||||||||||||||||||||||||||||||||||||
| Total income from investment operations | 1.29 | 0.18 | 0.23 | 1.83 | 2.94 | 1.19 | ||||||||||||||||||||||||||||||||||||||||||
| Less distributions: | ||||||||||||||||||||||||||||||||||||||||||||||||
| Distributions from net investment income | (0.22 | ) | (0.18 | ) | (0.12 | ) | (0.17 | ) | (0.13 | ) | (0.05 | ) | ||||||||||||||||||||||||||||||||||||
| Distributions from net realized gains | 0.00 | (4.10 | ) | — | — | — | — | |||||||||||||||||||||||||||||||||||||||||
| Total distributions | (0.22 | ) | (4.28 | ) | (0.12 | ) | (0.17 | ) | (0.13 | ) | (0.05 | ) | ||||||||||||||||||||||||||||||||||||
| Net asset value, end of period | $ | 13.29 | $ | 12.22 | $ | 16.32 | $ | 16.21 | $ | 14.55 | $ | 11.74 | ||||||||||||||||||||||||||||||||||||
| Total return +,# | 10.79 | % | 1.73 | % | 1.41 | % | 12.64 | % | 25.30 | % | 11.29 | % | ||||||||||||||||||||||||||||||||||||
| Ratios/Supplemental Data: | ||||||||||||||||||||||||||||||||||||||||||||||||
| Net assets, end of period (in 000s) | $ | 48,823 | $ | 45,026 | $ | 44,620 | $ | 41,917 | $ | 37,688 | $ | 37,650 | ||||||||||||||||||||||||||||||||||||
| Ratios of expenses to average net assets: | 1.10 | % | 0.93 | % | 1.12 | % | 1.26 | % | 1.00 | % | 1.17 | % | ||||||||||||||||||||||||||||||||||||
| Ratios of net investment income to average net assets: | 1.37 | % | 1.81 | % | 1.03 | % | 0.82 | % | 1.25 | % | 1.04 | % | ||||||||||||||||||||||||||||||||||||
| Portfolio turnover rate | 33 | % | 59 | % | 101 | % | 22 | % | 16 | % | 30 | % | ||||||||||||||||||||||||||||||||||||
| Class A | Class C | |||||||||||||||||||||||||||||||||||||||||||||||
| Six Months Ended | Year Ended October 31, | Six Months Ended | Year Ended October 31, | |||||||||||||||||||||||||||||||||||||||||||||
| April 30, 2017 | 2016 | 2015 | 2014 | 2013 | 2012 | April 30, 2017 | 2016 | 2015 | 2014 | 2013 | 2012 | |||||||||||||||||||||||||||||||||||||
| (Unaudited) | (Unaudited) | |||||||||||||||||||||||||||||||||||||||||||||||
| Net asset value, beginning of period | $ | 12.16 | $ | 16.26 | $ | 16.16 | $ | 14.52 | $ | 11.72 | $ | 10.57 | $ | 11.65 | $ | 15.74 | $ | 15.68 | $ | 14.09 | $ | 11.36 | $ | 10.31 | ||||||||||||||||||||||||
| Income from investment operations: | ||||||||||||||||||||||||||||||||||||||||||||||||
| Net investment income (loss)* | 0.07 | 0.19 | 0.13 | 0.09 | 0.13 | 0.09 | 0.02 | 0.10 | 0.00 | (a) | (0.03 | ) | 0.03 | 0.00 | (a) | |||||||||||||||||||||||||||||||||
| Net realized and unrealized gain (loss) | 1.21 | (0.05 | ) | 0.06 | 1.69 | 2.77 | 1.08 | 1.16 | (0.06 | ) | 0.06 | 1.65 | 2.71 | 1.05 | ||||||||||||||||||||||||||||||||||
| Total income from investment operations | 1.28 | 0.14 | 0.19 | 1.78 | 2.90 | 1.17 | 1.18 | 0.04 | 0.06 | 1.62 | 2.74 | 1.05 | ||||||||||||||||||||||||||||||||||||
| Less distributions: | ||||||||||||||||||||||||||||||||||||||||||||||||
| Distributions from net investment income | (0.19 | ) | (0.14 | ) | (0.09 | ) | (0.14 | ) | (0.10 | ) | (0.02 | ) | (0.12 | ) | (0.03 | ) | — | (0.03 | ) | (0.01 | ) | — | ||||||||||||||||||||||||||
| Distributions from net realized gains | 0.00 | (4.10 | ) | — | — | — | — | — | (4.10 | ) | — | — | — | — | ||||||||||||||||||||||||||||||||||
| Total distributions | (0.19 | ) | (4.24 | ) | (0.09 | ) | (0.14 | ) | (0.10 | ) | (0.02 | ) | (0.12 | ) | (4.13 | ) | — | (0.03 | ) | (0.01 | ) | — | ||||||||||||||||||||||||||
| Net asset value, end of period | $ | 13.25 | $ | 12.16 | $ | 16.26 | $ | 16.16 | $ | 14.52 | $ | 11.72 | $ | 12.71 | $ | 11.65 | $ | 15.74 | $ | 15.68 | $ | 14.09 | $ | 11.36 | ||||||||||||||||||||||||
| Total return +, # | 10.69 | % | 1.43 | % | 1.15 | % | 12.31 | % | 24.99 | % | 11.04 | % | 10.24 | % | 0.66 | % | 0.38 | % | 11.49 | % | 24.09 | % | 10.18 | % | ||||||||||||||||||||||||
| Ratios/Supplemental Data: | ||||||||||||||||||||||||||||||||||||||||||||||||
| Net assets, end of period (in 000s) | $ | 7,407 | $ | 6,544 | $ | 6,577 | $ | 7,685 | $ | 4,980 | $ | 2,969 | $ | 5,054 | $ | 4,850 | $ | 5,805 | $ | 5,639 | $ | 5,029 | $ | 5,431 | ||||||||||||||||||||||||
| Ratios of expenses to average net assets: ^ | 1.35 | % | 1.18 | % | 1.37 | % | 1.51 | % | 1.25 | % | 1.42 | % | 2.10 | % | 1.93 | % | 2.12 | % | 2.26 | % | 2.00 | % | 2.17 | % | ||||||||||||||||||||||||
| Ratios of net investment income (loss) to average net assets:^ | 1.11 | % | 1.57 | % | 0.78 | % | 0.57 | % | 0.99 | % | 0.79 | % | 0.37 | % | 0.83 | % | 0.03 | % | (0.18 | )% | 0.25 | % | 0.04 | % | ||||||||||||||||||||||||
| Portfolio turnover rate (1) | 33 | % | 59 | % | 101 | % | 22 | % | 16 | % | 30 | % | 33 | % | 59 | % | 101 | % | 22 | % | 16 | % | 30 | % | ||||||||||||||||||||||||
| * | The net investment income (loss) per share data was determined using the average shares outstanding throughout each year. |
| + | Assumes reinvestment of all dividends and distributions, if any. Total return does not reflect the deductions of taxes that a shareholder would pay on distributions or on the redemption of shares |
| (a) | Represents less than $0.01 per share. |
| # | Includes adjustments in accordance with accounting principles generally accepted in the United States and, consequently, the net asset value for financial reporting purposes and the returns based upon those net asset values may differ from the net asset values and returns for shareholder transactions. |
| ^ | Annualized for periods less than one year. |
| (1) | Not annualized for period less than one year |
See accompanying notes to financial statements.
88
| FINANCIAL HIGHLIGHTS |
| Dunham Focused Large Cap Growth Fund |
The table sets forth financial data for one share of beneficial interest outstanding throughout each period.
| Class N | ||||||||||||||||||||||||||||||||||||||||||||||||
| Year Ended | Period Ended | |||||||||||||||||||||||||||||||||||||||||||||||
| Six Months Ended | October 31, | October 31, | ||||||||||||||||||||||||||||||||||||||||||||||
| April 30, 2017 | 2016 | 2015 | 2014 | 2013 | 2012* | |||||||||||||||||||||||||||||||||||||||||||
| (Unaudited) | ||||||||||||||||||||||||||||||||||||||||||||||||
| Net asset value, beginning of period | $ | 15.92 | $ | 16.97 | $ | 15.01 | $ | 14.02 | $ | 10.42 | $ | 10.00 | ||||||||||||||||||||||||||||||||||||
| Income (loss) from investment operations: | ||||||||||||||||||||||||||||||||||||||||||||||||
| Net investment loss** | (0.05 | ) | (0.10 | ) | (0.16 | ) | (0.11 | ) | (0.10 | ) | (0.16 | ) | ||||||||||||||||||||||||||||||||||||
| Net realized and unrealized gain (loss) | 1.75 | (0.86 | ) | 2.12 | 1.29 | 3.70 | 0.58 | |||||||||||||||||||||||||||||||||||||||||
| Total income (loss) from investment operations | 1.70 | (0.96 | ) | 1.96 | 1.18 | 3.60 | 0.42 | |||||||||||||||||||||||||||||||||||||||||
| Less distributions: | ||||||||||||||||||||||||||||||||||||||||||||||||
| Distributions from net realized gains | 0.00 | (0.09 | ) | — | (0.19 | ) | — | — | ||||||||||||||||||||||||||||||||||||||||
| Total distributions | 0.00 | (0.09 | ) | — | (0.19 | ) | — | — | ||||||||||||||||||||||||||||||||||||||||
| Net asset value, end of period | $ | 17.62 | $ | 15.92 | $ | 16.97 | $ | 15.01 | $ | 14.02 | $ | 10.42 | ||||||||||||||||||||||||||||||||||||
| Total return + | 10.68 | % | (5.66 | )% | 13.06 | % | 8.48 | % | 34.55 | % | 4.20 | % | ||||||||||||||||||||||||||||||||||||
| Ratios/Supplemental Data: | ||||||||||||||||||||||||||||||||||||||||||||||||
| Net assets, end of period (in 000s) | $ | 54,150 | $ | 51,242 | $ | 51,312 | $ | 37,106 | $ | 814 | $ | 450 | ||||||||||||||||||||||||||||||||||||
| Ratios of expenses to average net assets: | ||||||||||||||||||||||||||||||||||||||||||||||||
| Before fee waivers and commission recapture ^ | 1.10 | % | 1.20 | % | 1.34 | % | 1.16 | % | 1.71 | % | 2.11 | % | ||||||||||||||||||||||||||||||||||||
| After fee waivers and commission recapture ^ | 1.10 | % | 1.20 | % | 1.34 | % | 1.16 | % | 1.69 | % | 1.80 | % | ||||||||||||||||||||||||||||||||||||
| Ratios of net investment loss to average net assets: | ||||||||||||||||||||||||||||||||||||||||||||||||
| Before fee waivers and commission recapture ^ | (0.60 | )% | (0.64 | )% | (1.00 | )% | (0.76 | )% | (0.70 | )% | (1.06 | )% | ||||||||||||||||||||||||||||||||||||
| After fee waivers and commission recapture ^ | (0.60 | )% | (0.64 | )% | (1.00 | )% | (0.76 | )% | (0.67 | )% | (0.75 | )% | ||||||||||||||||||||||||||||||||||||
| Portfolio turnover rate | 23 | % (1) | 29 | % | 45 | % | 29 | % | 91 | % | 27 | % (1) | ||||||||||||||||||||||||||||||||||||
| Class A | Class C | |||||||||||||||||||||||||||||||||||||||||||||||
| Year Ended | Period Ended | Year Ended | Period Ended | |||||||||||||||||||||||||||||||||||||||||||||
| Six Months Ended | October 31, | October 31, | Six Months Ended | October 31, | October 31, | |||||||||||||||||||||||||||||||||||||||||||
| April 30, 2017 | 2016 | 2015 | 2014 | 2013 | 2012* | April 30, 2017 | 2016 | 2015 | 2014 | 2013 | 2012* | |||||||||||||||||||||||||||||||||||||
| (Unaudited) | (Unaudited) | |||||||||||||||||||||||||||||||||||||||||||||||
| Net asset value, beginning of period | $ | 15.73 | $ | 16.80 | $ | 14.91 | $ | 13.96 | $ | 10.39 | $ | 10.00 | $ | 15.17 | $ | 16.33 | $ | 14.59 | $ | 13.76 | $ | 10.33 | $ | 10.00 | ||||||||||||||||||||||||
| Income (loss) from investment operations: | ||||||||||||||||||||||||||||||||||||||||||||||||
| Net investment loss** | (0.07 | ) | (0.14 | ) | (0.19 | ) | (0.21 | ) | (0.11 | ) | (0.09 | ) | (0.11 | ) | (0.25 | ) | (0.31 | ) | (0.26 | ) | (0.26 | ) | (0.30 | ) | ||||||||||||||||||||||||
| Net realized and unrealized gain (loss) | 1.72 | (0.84 | ) | 2.08 | 1.35 | 3.68 | 0.48 | 1.64 | (0.82 | ) | 2.05 | 1.28 | 3.69 | 0.63 | ||||||||||||||||||||||||||||||||||
| Total income (loss) from investment operations | 1.65 | (0.98 | ) | 1.89 | 1.14 | 3.57 | 0.39 | 1.53 | (1.07 | ) | 1.74 | 1.02 | 3.43 | 0.33 | ||||||||||||||||||||||||||||||||||
| Less distributions: | ||||||||||||||||||||||||||||||||||||||||||||||||
| Distributions from net realized gains | 0.00 | (0.09 | ) | — | (0.19 | ) | — | — | 0.00 | (0.09 | ) | — | (0.19 | ) | — | — | ||||||||||||||||||||||||||||||||
| Total distributions | 0.00 | (0.09 | ) | — | (0.19 | ) | 0.00 | 0.00 | 0.00 | (0.09 | ) | — | (0.19 | ) | — | — | ||||||||||||||||||||||||||||||||
| Net asset value, end of period | $ | 17.38 | $ | 15.73 | $ | 16.80 | $ | 14.91 | $ | 13.96 | $ | 10.39 | $ | 16.70 | $ | 15.17 | $ | 16.33 | $ | 14.59 | $ | 13.76 | $ | 10.33 | ||||||||||||||||||||||||
| Total return + | 10.49 | % | (5.84 | )% | 12.68 | % | 8.23 | % | 34.36 | % | 3.90 | % | 10.15 | % | (6.56 | )% | 11.93 | % | 7.47 | % | 33.20 | % | 3.30 | % | ||||||||||||||||||||||||
| Ratios/Supplemental Data: | ||||||||||||||||||||||||||||||||||||||||||||||||
| Net assets, end of period (in 000s) | $ | 11,754 | $ | 9,620 | $ | 8,762 | $ | 19,949 | $ | 11,399 | $ | 10,344 | $ | 6,146 | $ | 4,988 | $ | 5,222 | $ | 4,361 | $ | 510 | $ | 146 | ||||||||||||||||||||||||
| Ratios of expenses to average net assets: | ||||||||||||||||||||||||||||||||||||||||||||||||
| Before fee waivers and commission recapture ^ | 1.35 | % | 1.45 | % | 1.59 | % | 1.41 | % | 1.96 | % | 2.36 | % | 2.10 | % | 2.20 | % | 2.34 | % | 2.16 | % | 2.71 | % | 3.11 | % | ||||||||||||||||||||||||
| After fee waivers and commission recapture ^ | 1.35 | % | 1.45 | % | 1.59 | % | 1.41 | % | 1.94 | % | 2.05 | % | 2.10 | % | 2.20 | % | 2.34 | % | 2.16 | % | 2.69 | % | 2.80 | % | ||||||||||||||||||||||||
| Ratios of net investment loss to average net assets: | ||||||||||||||||||||||||||||||||||||||||||||||||
| Before fee waivers and commission recapture ^ | (0.85 | )% | (0.91 | )% | (1.20 | )% | (1.48 | )% | (0.95 | )% | (1.31 | )% | (1.60 | )% | (1.67 | )% | (2.00 | )% | (1.87 | )% | (1.70 | )% | (2.06 | )% | ||||||||||||||||||||||||
| After fee waivers and commission recapture ^ | (0.85 | )% | (0.91 | )% | (1.20 | )% | (1.48 | )% | (0.92 | )% | (1.00 | )% | (1.60 | )% | (1.67 | )% | (2.00 | )% | (1.87 | )% | (1.67 | )% | (1.75 | )% | ||||||||||||||||||||||||
| Portfolio turnover rate | 23 | % (1) | 29 | % | 45 | % | 29 | % | 91 | % | 27 | % (1) | 23 | % (1) | 29 | % | 45 | % | 29 | % | 91 | % | 27 | % (1) | ||||||||||||||||||||||||
| * | The Fund commenced operations on December 8, 2011. |
| ** | The net investment loss per share data was determined using the average shares outstanding throughout each period. |
| ^ | Annualized for periods less than a year. |
| + | Assumes reinvestment of all dividends and distributions, if any. Aggregate (not annualized) total return is shown for any period shorter than one year. Total return does not reflect the deductions of taxes that a shareholder would pay on distributions or on the redemption of shares. |
| (1) | Not annualized. |
See accompanying notes to financial statements.
89
| FINANCIAL HIGHLIGHTS |
| Dunham International Stock Fund |
The table sets forth financial data for one share of beneficial interest outstanding throughout each period.
| Class N | ||||||||||||||||||||||||||||||||||||||||||||||||
| Six Months Ended | Year Ended October 31, | |||||||||||||||||||||||||||||||||||||||||||||||
| April 30, 2017 | 2016 | 2015 | 2014 | 2013 | 2012 | |||||||||||||||||||||||||||||||||||||||||||
| (Unaudited) | ||||||||||||||||||||||||||||||||||||||||||||||||
| Net asset value, beginning of period | $ | 14.24 | $ | 14.24 | $ | 15.21 | $ | 15.22 | $ | 12.05 | $ | 11.85 | ||||||||||||||||||||||||||||||||||||
| Income (loss) from investment operations: | ||||||||||||||||||||||||||||||||||||||||||||||||
| Net investment income * | 0.08 | 0.16 | 0.00 | 0.15 | 0.07 | 0.14 | ||||||||||||||||||||||||||||||||||||||||||
| Net realized and unrealized gain (loss) | 1.34 | (0.15 | ) | (0.61 | ) | 0.10 | 3.24 | 0.22 | ||||||||||||||||||||||||||||||||||||||||
| Total income (loss) from investment operations | 1.42 | 0.01 | (0.61 | ) | 0.25 | 3.31 | 0.36 | |||||||||||||||||||||||||||||||||||||||||
| Less distributions: | ||||||||||||||||||||||||||||||||||||||||||||||||
| Distributions from net investment income | — | (0.01 | ) | (0.30 | ) | (0.26 | ) | (0.14 | ) | (0.16 | ) | |||||||||||||||||||||||||||||||||||||
| Distributions from net realized gains | — | — | (0.06 | ) | — | — | — | |||||||||||||||||||||||||||||||||||||||||
| Total distributions | 0.00 | (0.01 | ) | (0.36 | ) | (0.26 | ) | (0.14 | ) | (0.16 | ) | |||||||||||||||||||||||||||||||||||||
| Net asset value, end of period | $ | 15.66 | $ | 14.24 | $ | 14.24 | $ | 15.21 | $ | 15.22 | $ | 12.05 | ||||||||||||||||||||||||||||||||||||
| Total return + # | 9.97 | % | 0.06 | % | (4.10 | )% | 1.66 | % | 27.64 | % | 3.16 | % | ||||||||||||||||||||||||||||||||||||
| Ratios/Supplemental Data: | ||||||||||||||||||||||||||||||||||||||||||||||||
| Net assets, end of period (in 000s) | $ | 81,527 | $ | 78,640 | $ | 76,992 | $ | 57,359 | $ | 49,815 | $ | 44,947 | ||||||||||||||||||||||||||||||||||||
| Ratios of expenses to average net assets: | 1.62 | % | 1.63 | % | 2.04 | % | 2.04 | % | 2.11 | % | 1.97 | % | ||||||||||||||||||||||||||||||||||||
| Ratios of net investment income to average net assets: | 1.12 | % | 1.17 | % | 0.03 | % | 0.99 | % | 0.52 | % | 1.24 | % | ||||||||||||||||||||||||||||||||||||
| Portfolio turnover rate | 52 | % | 143 | % | 125 | % | 117 | % | 131 | % | 142 | % | ||||||||||||||||||||||||||||||||||||
| Class A | Class C | |||||||||||||||||||||||||||||||||||||||||||||||
| Six Months Ended | Year Ended October 31, | Six Months Ended | Year Ended October 31, | |||||||||||||||||||||||||||||||||||||||||||||
| April 30, 2017 | 2016 | 2015 | 2014 | 2013 | 2012 | April 30, 2017 | 2016 | 2015 | 2014 | 2013 | 2012 | |||||||||||||||||||||||||||||||||||||
| (Unaudited) | (Unaudited) | |||||||||||||||||||||||||||||||||||||||||||||||
| Net asset value, beginning of period | $ | 14.17 | $ | 14.21 | $ | 15.16 | $ | 15.19 | $ | 12.03 | $ | 11.84 | $ | 13.60 | $ | 13.73 | $ | 14.68 | $ | 14.70 | $ | 11.64 | $ | 11.44 | ||||||||||||||||||||||||
| Income (loss) from investment operations: | ||||||||||||||||||||||||||||||||||||||||||||||||
| Net investment income (loss)* | 0.06 | 0.13 | (0.03 | ) | 0.15 | 0.06 | 0.10 | — | 0.03 | (0.14 | ) | (0.00 | ) (a) | (0.06 | ) | 0.03 | ||||||||||||||||||||||||||||||||
| Net realized and unrealized gain (loss) | 1.34 | (0.17 | ) | (0.60 | ) | 0.06 | 3.22 | 0.22 | 1.28 | (0.16 | ) | (0.59 | ) | 0.10 | 3.13 | 0.21 | ||||||||||||||||||||||||||||||||
| Total income (loss) from investment operations | 1.40 | (0.04 | ) | (0.63 | ) | 0.21 | 3.28 | 0.32 | 1.28 | (0.13 | ) | (0.73 | ) | 0.10 | 3.07 | 0.24 | ||||||||||||||||||||||||||||||||
| Less distributions: | ||||||||||||||||||||||||||||||||||||||||||||||||
| Distributions from net investment income | — | — | (0.26 | ) | (0.24 | ) | (0.12 | ) | (0.13 | ) | — | — | (0.16 | ) | (0.12 | ) | (0.01 | ) | (0.04 | ) | ||||||||||||||||||||||||||||
| Distributions from net realized gains | — | — | (0.06 | ) | — | — | — | — | — | (0.06 | ) | — | — | — | ||||||||||||||||||||||||||||||||||
| Total distributions | — | — | (0.32 | ) | (0.24 | ) | (0.12 | ) | (0.13 | ) | — | — | (0.22 | ) | (0.12 | ) | (0.01 | ) | (0.04 | ) | ||||||||||||||||||||||||||||
| Net asset value, end of period | $ | 15.57 | $ | 14.17 | $ | 14.21 | $ | 15.16 | $ | 15.19 | $ | 12.03 | $ | 14.88 | $ | 13.60 | $ | 13.73 | $ | 14.68 | $ | 14.70 | $ | 11.64 | ||||||||||||||||||||||||
| Total return + # | 9.80 | % | (0.28 | )% | (4.26 | )% | 1.35 | % | 27.40 | % | 2.80 | % | 9.41 | % | (0.95 | )% | (5.06 | )% | 0.67 | % | 26.40 | % | 2.10 | % | ||||||||||||||||||||||||
| Ratios/Supplemental Data: | ||||||||||||||||||||||||||||||||||||||||||||||||
| Net assets, end of period (in 000s) | $ | 12,027 | $ | 10,305 | $ | 9,032 | $ | 7,871 | $ | 4,741 | $ | 1,580 | $ | 5,923 | $ | 6,483 | $ | 7,268 | $ | 6,551 | $ | 5,627 | $ | 5,881 | ||||||||||||||||||||||||
| Ratios of expenses to average net assets:^ | 1.87 | % | 1.88 | % | 2.29 | % | 2.29 | % | 2.36 | % | 2.22 | % | 2.62 | % | 2.63 | % | 3.04 | % | 3.04 | % | 3.11 | % | 2.97 | % | ||||||||||||||||||||||||
| Ratios of net investment income (loss) to average net assets:^ | 0.88 | % | 0.93 | % | (0.19 | )% | 0.97 | % | 0.41 | % | 0.99 | % | 0.06 | % | 0.20 | % | (0.94 | )% | (0.02 | )% | (0.46 | )% | 0.24 | % | ||||||||||||||||||||||||
| Portfolio turnover rate (1) | 52 | % | 143 | % | 125 | % | 117 | % | 131 | % | 142 | % | 52 | % | 143 | % | 125 | % | 117 | % | 131 | % | 142 | % | ||||||||||||||||||||||||
| * | The net investment income (loss) per share data was determined using the average shares outstanding throughout each period. |
| + | Assumes reinvestment of all dividends and distributions, if any. Total return does not reflect the deductions of taxes that a shareholder would pay on distributions or on the redemption of shares. |
| # | Includes adjustments in accordance with accounting principles generally accepted in the United States and, consequently, the net asset value for financial reporting purposes and the returns based upon those net asset values may differ from the net asset values and returns for shareholder transactions. |
| (a) | Represents less than $0.01 per share. |
| ^ | Annualized for periods less than one year. |
| (1) | Not annualized for period less than one year. |
See accompanying notes to financial statements.
90
| FINANCIAL HIGHLIGHTS |
| Dunham Real Estate Stock Fund |
The table sets forth financial data for one share of beneficial interest outstanding throughout each period.
| Class N | ||||||||||||||||||||||||||||||||||||||||||||||||
| Year Ended | ||||||||||||||||||||||||||||||||||||||||||||||||
| Six Months Ended | October 31, | |||||||||||||||||||||||||||||||||||||||||||||||
| April 30, 2017 | 2016 | 2015 | 2014 | 2013 | 2012 | |||||||||||||||||||||||||||||||||||||||||||
| (Unaudited) | ||||||||||||||||||||||||||||||||||||||||||||||||
| Net asset value, beginning of period | $ | 18.31 | $ | 19.23 | $ | 19.27 | $ | 16.53 | $ | 15.79 | $ | 13.80 | ||||||||||||||||||||||||||||||||||||
| Income from investment operations: | ||||||||||||||||||||||||||||||||||||||||||||||||
| Net investment income * | 0.23 | 0.32 | 0.15 | 0.13 | 0.23 | 0.21 | ||||||||||||||||||||||||||||||||||||||||||
| Net realized and unrealized gain | 0.14 | 0.73 | 0.85 | 3.20 | 1.27 | 1.90 | ||||||||||||||||||||||||||||||||||||||||||
| Total income from investment operations | 0.37 | 1.05 | 1.00 | 3.33 | 1.50 | 2.11 | ||||||||||||||||||||||||||||||||||||||||||
| Less distributions: | ||||||||||||||||||||||||||||||||||||||||||||||||
| Distributions from net investment income | (0.36 | ) | (0.21 | ) | (0.11 | ) | (0.20 | ) | (0.23 | ) | (0.12 | ) | ||||||||||||||||||||||||||||||||||||
| Distributions from net realized gains | (2.81 | ) | (1.76 | ) | (0.93 | ) | (0.39 | ) | (0.53 | ) | — | |||||||||||||||||||||||||||||||||||||
| Total distributions | (3.17 | ) | (1.97 | ) | (1.04 | ) | (0.59 | ) | (0.76 | ) | (0.12 | ) | ||||||||||||||||||||||||||||||||||||
| Net asset value, end of period | $ | 15.51 | $ | 18.31 | $ | 19.23 | $ | 19.27 | $ | 16.53 | $ | 15.79 | ||||||||||||||||||||||||||||||||||||
| Total return + | 2.58 | % | 5.77 | % | 5.13 | % | 21.09 | % | 9.85 | % | 15.46 | % | ||||||||||||||||||||||||||||||||||||
| Ratios/Supplemental Data: | ||||||||||||||||||||||||||||||||||||||||||||||||
| Net assets, end of period (in 000s) | $ | 26,017 | $ | 25,479 | $ | 33,379 | $ | 37,143 | $ | 33,545 | $ | 20,424 | ||||||||||||||||||||||||||||||||||||
| Ratios of expenses to average net assets: ^ | 1.12 | % | 1.21 | % | 1.64 | % | 1.59 | % | 1.30 | % | 1.46 | % | ||||||||||||||||||||||||||||||||||||
| Ratios of net investment income to average net assets: ^ | 2.84 | % | 1.74 | % | 0.80 | % | 0.77 | % | 1.40 | % | 1.42 | % | ||||||||||||||||||||||||||||||||||||
| Portfolio turnover rate | 48 | % (1) | 110 | % | 110 | % | 97 | % | 163 | % | 123 | % | ||||||||||||||||||||||||||||||||||||
| Class A | Class C | |||||||||||||||||||||||||||||||||||||||||||||||
| Year Ended | Year Ended | |||||||||||||||||||||||||||||||||||||||||||||||
| Six Months Ended | October 31, | Six Months Ended | October 31, | |||||||||||||||||||||||||||||||||||||||||||||
| April 30, 2017 | 2016 | 2015 | 2014 | 2013 | 2012 | April 30, 2017 | 2016 | 2015 | 2014 | 2013 | 2012 | |||||||||||||||||||||||||||||||||||||
| (Unaudited) | (Unaudited) | |||||||||||||||||||||||||||||||||||||||||||||||
| Net asset value, beginning of period | $ | 18.35 | $ | 19.26 | $ | 19.33 | $ | 16.55 | $ | 15.77 | $ | 13.80 | $ | 17.55 | $ | 18.50 | $ | 18.65 | $ | 16.02 | $ | 15.33 | $ | 13.40 | ||||||||||||||||||||||||
| Income from investment operations: | ||||||||||||||||||||||||||||||||||||||||||||||||
| Net investment income (loss) * | 0.22 | 0.27 | 0.10 | 0.08 | 0.15 | 0.21 | 0.14 | 0.13 | (0.04 | ) | (0.04 | ) | 0.07 | 0.07 | ||||||||||||||||||||||||||||||||||
| Net realized and unrealized gain | 0.14 | 0.74 | 0.85 | 3.22 | 1.31 | 1.87 | 0.14 | 0.70 | 0.82 | 3.11 | 1.23 | 1.86 | ||||||||||||||||||||||||||||||||||||
| Total income from investment operations | 0.36 | 1.01 | 0.95 | 3.30 | 1.46 | 2.08 | 0.28 | 0.83 | 0.78 | 3.07 | 1.30 | 1.93 | ||||||||||||||||||||||||||||||||||||
| Less distributions: | ||||||||||||||||||||||||||||||||||||||||||||||||
| Distributions from net investment income | (0.26 | ) | (0.16 | ) | (0.09 | ) | (0.13 | ) | (0.15 | ) | (0.11 | ) | (0.21 | ) | (0.02 | ) | 0.00 | (0.05 | ) | (0.08 | ) | 0.00 | ||||||||||||||||||||||||||
| Distributions from net realized gains | (2.81 | ) | (1.76 | ) | (0.93 | ) | (0.39 | ) | (0.53 | ) | — | (2.81 | ) | (1.76 | ) | (0.93 | ) | (0.39 | ) | (0.53 | ) | — | ||||||||||||||||||||||||||
| Total distributions | (3.07 | ) | (1.92 | ) | (1.02 | ) | (0.52 | ) | (0.68 | ) | (0.11 | ) | (3.02 | ) | (1.78 | ) | (0.93 | ) | (0.44 | ) | (0.61 | ) | 0.00 | |||||||||||||||||||||||||
| Net asset value, end of period | $ | 15.64 | $ | 18.35 | $ | 19.26 | $ | 19.33 | $ | 16.55 | $ | 15.77 | $ | 14.81 | $ | 17.55 | $ | 18.50 | $ | 18.65 | $ | 16.02 | $ | 15.33 | ||||||||||||||||||||||||
| Total return + | 2.47 | % | 5.54 | % | 4.85 | % | 20.73 | % | 9.60 | % | 15.20 | % | 2.07 | % | 4.73 | % | 4.08 | % | 19.88 | % | 8.73 | % | 14.40 | % | ||||||||||||||||||||||||
| Ratios/Supplemental Data: | ||||||||||||||||||||||||||||||||||||||||||||||||
| Net assets, end of period(in 000s) | $ | 4,131 | $ | 9,376 | $ | 10,386 | $ | 3,913 | $ | 2,539 | $ | 709 | $ | 2,854 | $ | 3,211 | $ | 3,847 | $ | 4,166 | $ | 2,684 | $ | 2,370 | ||||||||||||||||||||||||
| Ratios of expenses to average net assets: ^ | 1.37 | % | 1.45 | % | 1.89 | % | 1.84 | % | 1.55 | % | 1.71 | % | 2.12 | % | 2.21 | % | 2.64 | % | 2.59 | % | 2.30 | % | 2.46 | % | ||||||||||||||||||||||||
| Ratios of net investment income (loss) to average net assets: ^ | 2.59 | % | 1.45 | % | 0.53 | % | 0.48 | % | 1.15 | % | 1.17 | % | 1.84 | % | 0.70 | % | (0.21 | )% | (0.24 | )% | 0.40 | % | 0.42 | % | ||||||||||||||||||||||||
| Portfolio turnover rate | 48 | % (1) | 110 | % | 110 | % | 97 | % | 163 | % | 123 | % | 48 | % (1) | 110 | % | 110 | % | 97 | % | 163 | % | 123 | % | ||||||||||||||||||||||||
| * | The net investment income (loss) per share data was determined using the average shares outstanding throughout each year. |
| + | Assumes reinvestment of all dividends and distributions, if any. Total return does not reflect the deductions of taxes that a shareholder would pay on distributions or on the redemption of shares. |
| (1) | Not annualized. |
| ^ | Annualized for periods less than one year. |
See accompanying notes to financial statements.
91
| FINANCIAL HIGHLIGHTS |
| Dunham Small Cap Value Fund |
The table sets forth financial data for one share of beneficial interest outstanding throughout each period.
| Class N | ||||||||||||||||||||||||||||||||||||||||||||||||
| Six Months Ended | Year Ended October 31, | |||||||||||||||||||||||||||||||||||||||||||||||
| April 30, 2017 | 2016 | 2015 | 2014 | 2013 | 2012 | |||||||||||||||||||||||||||||||||||||||||||
| (Unaudited) | ||||||||||||||||||||||||||||||||||||||||||||||||
| Net asset value, beginning of period | $ | 14.41 | $ | 14.27 | $ | 15.45 | $ | 14.65 | $ | 11.21 | $ | 10.44 | ||||||||||||||||||||||||||||||||||||
| Income (loss) from investment operations: | ||||||||||||||||||||||||||||||||||||||||||||||||
| Net investment income (loss) * | 0.06 | 0.09 | (0.01 | ) | 0.04 | 0.07 | 0.00 | (a) | ||||||||||||||||||||||||||||||||||||||||
| Net realized and unrealized gain (loss) | 2.61 | 0.54 | (0.18 | ) | 1.45 | 3.40 | 0.77 | |||||||||||||||||||||||||||||||||||||||||
| Total income (loss) from investment operations | 2.67 | 0.63 | (0.19 | ) | 1.49 | 3.47 | 0.77 | |||||||||||||||||||||||||||||||||||||||||
| Less distributions: | ||||||||||||||||||||||||||||||||||||||||||||||||
| Distributions from net investment income | (0.10 | ) | (0.01 | ) | (0.04 | ) | (0.02 | ) | (0.03 | ) | — | |||||||||||||||||||||||||||||||||||||
| Distributions from net realized gains | (0.48 | ) | (0.48 | ) | (0.95 | ) | (0.67 | ) | — | — | ||||||||||||||||||||||||||||||||||||||
| Total distributions | (0.58 | ) | (0.49 | ) | (0.99 | ) | (0.69 | ) | (0.03 | ) | — | |||||||||||||||||||||||||||||||||||||
| Net asset value, end of period | $ | 16.50 | $ | 14.41 | $ | 14.27 | $ | 15.45 | $ | 14.65 | $ | 11.21 | ||||||||||||||||||||||||||||||||||||
| Total return + # | 18.59 | % | 4.58 | % | (1.59 | )% | 10.30 | % | 31.05 | % | 7.38 | % | ||||||||||||||||||||||||||||||||||||
| Ratios/Supplemental Data: | ||||||||||||||||||||||||||||||||||||||||||||||||
| Net assets, end of period (in 000s) | $ | 21,452 | $ | 22,254 | $ | 22,068 | $ | 23,783 | $ | 16,640 | $ | 15,764 | ||||||||||||||||||||||||||||||||||||
| Ratios of expenses to average net assets: | 1.19 | % (b) | 1.48 | % | 1.79 | % | 1.45 | % | 1.29 | % | 2.02 | % | ||||||||||||||||||||||||||||||||||||
| Ratios of net investment income (loss) to average net assets: | 0.76 | % | 0.64 | % | (0.10 | )% | 0.27 | % | 0.62 | % | 0.04 | % | ||||||||||||||||||||||||||||||||||||
| Portfolio turnover rate | 57 | % | 129 | % | 122 | % | 106 | % | 147 | % | 62 | % | ||||||||||||||||||||||||||||||||||||
| Class A | Class C | |||||||||||||||||||||||||||||||||||||||||||||||
| Six Months Ended | Year Ended October 31, | Six Months Ended | Year Ended October 31, | |||||||||||||||||||||||||||||||||||||||||||||
| April 30, 2017 | 2016 | 2015 | 2014 | 2013 | 2012 | April 30, 2017 | 2016 | 2015 | 2014 | 2013 | 2012 | |||||||||||||||||||||||||||||||||||||
| (Unaudited) | (Unaudited) | |||||||||||||||||||||||||||||||||||||||||||||||
| Net asset value, beginning of period | $ | 14.29 | $ | 14.18 | $ | 15.36 | $ | 14.59 | $ | 11.16 | $ | 10.40 | $ | 13.02 | $ | 13.06 | $ | 14.32 | $ | 13.74 | $ | 10.59 | $ | 9.96 | ||||||||||||||||||||||||
| Income (loss) from investment operations: | ||||||||||||||||||||||||||||||||||||||||||||||||
| Net investment income (loss)* | 0.04 | 0.05 | (0.05 | ) | (0.00 | ) | 0.01 | 0.00 | (a) | (0.02 | ) | (0.05 | ) | (0.15 | ) | (0.10 | ) | (0.03 | ) | (0.10 | ) | |||||||||||||||||||||||||||
| Net realized and unrealized gain (loss) | 2.58 | 0.54 | (0.18 | ) | 1.44 | 3.42 | 0.76 | 2.35 | 0.49 | (0.16 | ) | 1.35 | 3.18 | 0.73 | ||||||||||||||||||||||||||||||||||
| Total income (loss) from investment operations | 2.62 | 0.59 | (0.23 | ) | 1.44 | 3.43 | 0.76 | 2.33 | 0.44 | (0.31 | ) | 1.25 | 3.15 | 0.63 | ||||||||||||||||||||||||||||||||||
| Less distributions: | ||||||||||||||||||||||||||||||||||||||||||||||||
| Distributions from net investment income | (0.07 | ) | — | — | — | — | — | — | — | — | — | — | — | |||||||||||||||||||||||||||||||||||
| Distributions from net realized gains | (0.48 | ) | (0.48 | ) | (0.95 | ) | (0.67 | ) | — | — | (0.48 | ) | (0.48 | ) | (0.95 | ) | (0.67 | ) | — | — | ||||||||||||||||||||||||||||
| Total distributions | (0.55 | ) | (0.48 | ) | (0.95 | ) | (0.67 | ) | — | — | (0.48 | ) | (0.48 | ) | (0.95 | ) | (0.67 | ) | — | — | ||||||||||||||||||||||||||||
| Net asset value, end of period | $ | 16.36 | $ | 14.29 | $ | 14.18 | $ | 15.36 | $ | 14.59 | $ | 11.16 | $ | 14.87 | $ | 13.02 | $ | 13.06 | $ | 14.32 | $ | 13.74 | $ | 10.59 | ||||||||||||||||||||||||
| Total return + # | 18.41 | % | 4.33 | % | (1.83 | )% | 10.02 | % | 30.74 | % | 7.31 | % | 17.60 | % | 3.52 | % | (2.56 | )% | 9.22 | % | 29.75 | % | 6.33 | % | ||||||||||||||||||||||||
| Ratios/Supplemental Data: | ||||||||||||||||||||||||||||||||||||||||||||||||
| Net assets, end of period (in 000s) | $ | 3,998 | $ | 3,802 | $ | 3,801 | $ | 3,268 | $ | 1,756 | $ | 567 | $ | 2,692 | $ | 2,241 | $ | 2,383 | $ | 2,494 | $ | 2,057 | $ | 2,099 | ||||||||||||||||||||||||
| Ratios of expenses to average net assets:^ | 1.44 | % (b) | 1.73 | % | 2.04 | % | 1.70 | % | 1.54 | % | 2.27 | % | 2.19 | % (b) | 2.48 | % | 2.79 | % | 2.45 | % | 2.29 | % | 3.02 | % | ||||||||||||||||||||||||
| Ratios of net investment income (loss) to average net assets:^ | 0.48 | % | 0.40 | % | (0.36 | )% | (0.06 | )% | 0.15 | % | (0.21 | )% | (0.30 | )% | (0.36 | )% | (1.11 | )% | (0.70 | )% | (0.37 | )% | (0.96 | )% | ||||||||||||||||||||||||
| Portfolio turnover rate (1) | 57 | % | 129 | % | 122 | % | 106 | % | 147 | % | 62 | % | 57 | % | 129 | % | 122 | % | 106 | % | 147 | % | 62 | % | ||||||||||||||||||||||||
| * | The net investment income (loss) per share data was determined using the average shares outstanding throughout each year. |
| + | Assumes reinvestment of all dividends and distributions, if any. Total return does not reflect the deductions of taxes that a shareholder would pay on distributions or on the redemption of shares. |
| (a) | Represents less than $0.01 per share. |
| # | Includes adjustments in accordance with accounting principles generally accepted in the United States and, consequently, the net asset value for financial reporting purposes and the returns based upon those net asset values may differ from the net asset values and returns for shareholder transactions. |
| (b) | Before the application of any fees waived or reimbursed by Dunham & Associates, or reduced by the commission recapture agreement the ratios of the net operating expenses to average daily net assets would have been as follows for the Small Cap Value Fund 1.16% for Class N, 1.41% for Class A and 2.16% for Class C. |
| ^ | Annualized for periods less than one year. |
| (1) | Not annualized. |
See accompanying notes to financial statements.
92
| FINANCIAL HIGHLIGHTS |
| Dunham Emerging Markets Stock Fund |
The table sets forth financial data for one share of beneficial interest outstanding throughout each period
| Class N | ||||||||||||||||||||||||||||||||||||||||||||||||
| Six Months Ended | Year Ended October 31, | |||||||||||||||||||||||||||||||||||||||||||||||
| April 30, 2017 | 2016 | 2015 | 2014 | 2013 | 2012 | |||||||||||||||||||||||||||||||||||||||||||
| (Unaudited) | ||||||||||||||||||||||||||||||||||||||||||||||||
| Net asset value, beginning of period | $ | 12.73 | $ | 11.97 | $ | 14.75 | $ | 14.66 | $ | 13.82 | $ | 13.43 | ||||||||||||||||||||||||||||||||||||
| Income (loss) from investment operations: | ||||||||||||||||||||||||||||||||||||||||||||||||
| Net investment income (loss) * | (0.01 | ) | 0.20 | 0.08 | 0.20 | 0.00 | (a) | 0.04 | ||||||||||||||||||||||||||||||||||||||||
| Net realized and unrealized gain (loss) ** | 1.21 | 0.64 | (2.67 | ) | (0.11 | ) | 0.84 | 0.35 | ||||||||||||||||||||||||||||||||||||||||
| Total income (loss) from investment operations | 1.20 | 0.84 | (2.59 | ) | 0.09 | 0.84 | 0.39 | |||||||||||||||||||||||||||||||||||||||||
| Less distributions: | ||||||||||||||||||||||||||||||||||||||||||||||||
| Distributions from net investment income | (0.24 | ) | (0.08 | ) | (0.19 | ) | — | — | — | |||||||||||||||||||||||||||||||||||||||
| Total distributions | (0.24 | ) | (0.08 | ) | (0.19 | ) | — | — | — | |||||||||||||||||||||||||||||||||||||||
| Net asset value, end of period | $ | 13.69 | $ | 12.73 | $ | 11.97 | $ | 14.75 | $ | 14.66 | $ | 13.82 | ||||||||||||||||||||||||||||||||||||
| Total return + # | 9.43 | % | 7.13 | % | (17.73 | )% | 0.61 | % | 6.08 | % | 2.90 | % | ||||||||||||||||||||||||||||||||||||
| Ratios/Supplemental Data: | ||||||||||||||||||||||||||||||||||||||||||||||||
| Net assets, end of period (in 000s) | $ | 46,499 | $ | 46,481 | $ | 42,831 | $ | 35,872 | $ | 24,736 | $ | 16,017 | ||||||||||||||||||||||||||||||||||||
| Ratios of expenses to average net assets: | 2.11 | % | 1.27 | % | 1.76 | % | 1.29 | % | 2.00 | % | 1.75 | % | ||||||||||||||||||||||||||||||||||||
| Ratios of net investment income (loss) to average net assets: | (0.16 | )% | 1.73 | % | 0.59 | % | 1.39 | % | 0.03 | % | 0.29 | % | ||||||||||||||||||||||||||||||||||||
| Portfolio turnover rate | 20 | % | 97 | % | 137 | % | 108 | % | 166 | % | 104 | % | ||||||||||||||||||||||||||||||||||||
| Class A | Class C | |||||||||||||||||||||||||||||||||||||||||||||||
| Six Months Ended | Year Ended October 31, | Six Months Ended | Year Ended October 31, | |||||||||||||||||||||||||||||||||||||||||||||
| April 30, 2017 | 2016 | 2015 | 2014 | 2013 | 2012 | April 30, 2017 | 2016 | 2015 | 2014 | 2013 | 2012 | |||||||||||||||||||||||||||||||||||||
| (Unaudited) | (Unaudited) | |||||||||||||||||||||||||||||||||||||||||||||||
| Net asset value, beginning of period | $ | 12.45 | $ | 11.71 | $ | 14.44 | $ | 14.39 | $ | 13.59 | $ | 13.23 | $ | 11.82 | $ | 11.14 | $ | 13.76 | $ | 13.82 | $ | 13.16 | $ | 12.90 | ||||||||||||||||||||||||
| Income (loss) from investment operations: | ||||||||||||||||||||||||||||||||||||||||||||||||
| Net investment income (loss)* | (0.03 | ) | 0.17 | 0.05 | 0.16 | (0.07 | ) | 0.05 | (0.06 | ) | 0.08 | (0.06 | ) | 0.04 | (0.14 | ) | (0.09 | ) | ||||||||||||||||||||||||||||||
| Net realized and unrealized gain (loss) ** | 1.19 | 0.62 | (2.62 | ) | (0.11 | ) | 0.87 | 0.31 | 1.11 | 0.60 | (2.49 | ) | (0.10 | ) | 0.80 | 0.35 | ||||||||||||||||||||||||||||||||
| Total income (loss) from investment operations | 1.16 | 0.79 | (2.57 | ) | 0.05 | 0.80 | 0.36 | 1.05 | 0.68 | (2.55 | ) | (0.06 | ) | 0.66 | 0.26 | |||||||||||||||||||||||||||||||||
| Less distributions: | ||||||||||||||||||||||||||||||||||||||||||||||||
| Distributions from net investment income | (0.21 | ) | (0.05 | ) | (0.16 | ) | — | — | — | (0.14 | ) | — | (0.07 | ) | — | — | — | |||||||||||||||||||||||||||||||
| Total distributions | (0.21 | ) | (0.05 | ) | (0.16 | ) | — | — | — | (0.14 | ) | — | (0.07 | ) | — | — | — | |||||||||||||||||||||||||||||||
| Net asset value, end of period | $ | 13.40 | $ | 12.45 | $ | 11.71 | $ | 14.44 | $ | 14.39 | $ | 13.59 | $ | 12.73 | $ | 11.82 | $ | 11.14 | $ | 13.76 | $ | 13.82 | $ | 13.16 | ||||||||||||||||||||||||
| Total return + # | 9.29 | % | 6.84 | % | (17.94 | )% | 0.35 | % | 5.89 | % | 2.72 | % | 8.83 | % | 6.10 | % | (18.60 | )% | (0.43 | )% | 5.02 | % | 2.02 | % | ||||||||||||||||||||||||
| Ratios/Supplemental Data: | ||||||||||||||||||||||||||||||||||||||||||||||||
| Net assets, end of period (in 000s) | $ | 6,909 | $ | 6,348 | $ | 4,594 | $ | 4,036 | $ | 2,475 | $ | 11,364 | $ | 2,817 | $ | 3,380 | $ | 3,216 | $ | 3,593 | $ | 2,735 | $ | 2,497 | ||||||||||||||||||||||||
| Ratios of expenses to average net assets: | 2.36 | % | 1.52 | % | 2.01 | % | 1.54 | % | 2.25 | % | 2.00 | % | 3.11 | % | 2.27 | % | 2.76 | % | 2.29 | % | 3.00 | % | 2.75 | % | ||||||||||||||||||||||||
| Ratios of net investment income (loss) to average net assets: | (0.42 | )% | 1.46 | % | 0.40 | % | 1.14 | % | (0.48 | )% | 0.04 | % | (1.07 | )% | 0.77 | % | (0.48 | )% | 0.34 | % | (1.03 | )% | (0.71 | )% | ||||||||||||||||||||||||
| Portfolio turnover rate | 20 | % | 97 | % | 137 | % | 108 | % | 166 | % | 104 | % | 20 | % | 97 | % | 137 | % | 108 | % | 166 | % | 104 | % | ||||||||||||||||||||||||
| * | The net investment income (loss) per share data was determined using the average shares outstanding throughout each year |
| (a) | Represents less than $0.01 per share. |
| ** | The amount of net realized and unrealized loss on investment per share for the year ended October 31, 2014 does not accord with the amounts in the Statements of Operations due to the timing of purchases and sales of Fund shares in relation to fluctuating market values. |
| + | Assumes reinvestment of all dividends and distributions, if any. Total return does not reflect the deductions of taxes that a shareholder would pay on distributions or on the redemption of shares. |
| # | Includes adjustments in accordance with accounting principles generally accepted in the United States and, consequently, the net asset value for financial reporting purposes and the returns based upon those net asset values may differ from the net asset values and returns for shareholder transactions. |
See accompanying notes to financial statements.
93
| FINANCIAL HIGHLIGHTS |
| Dunham Small Cap Growth Fund |
The table sets forth financial data for one share of beneficial interest outstanding throughout each period.
| Class N | ||||||||||||||||||||||||||||||||||||||||||||||||
| Year Ended | ||||||||||||||||||||||||||||||||||||||||||||||||
| Six Months Ended | October 31, | |||||||||||||||||||||||||||||||||||||||||||||||
| April 30, 2017 | 2016 | 2015 | 2014 | 2013 | 2012 | |||||||||||||||||||||||||||||||||||||||||||
| (Unaudited) | ||||||||||||||||||||||||||||||||||||||||||||||||
| Net asset value, beginning of period | $ | 15.34 | $ | 17.08 | $ | 17.71 | $ | 20.62 | $ | 15.69 | $ | 14.75 | ||||||||||||||||||||||||||||||||||||
| Income from investment operations: | ||||||||||||||||||||||||||||||||||||||||||||||||
| Net investment loss* | (0.03 | ) | (0.06 | ) | (0.24 | ) | (0.29 | ) | (0.19 | ) | (0.17 | ) | ||||||||||||||||||||||||||||||||||||
| Net realized and unrealized gain (loss) (a) | 2.38 | (0.24 | ) | 1.19 | 1.11 | 6.10 | 1.11 | |||||||||||||||||||||||||||||||||||||||||
| Total income (loss) from investment operations | 2.35 | (0.30 | ) | 0.95 | 0.82 | 5.91 | 0.94 | |||||||||||||||||||||||||||||||||||||||||
| Less distributions: | ||||||||||||||||||||||||||||||||||||||||||||||||
| Distributions from net realized gains | 0.00 | (1.40 | ) | (1.58 | ) | (3.73 | ) | (0.98 | ) | — | ||||||||||||||||||||||||||||||||||||||
| Tax return of capital | 0.00 | (0.04 | ) | — | — | — | — | |||||||||||||||||||||||||||||||||||||||||
| Total distributions | 0.00 | (1.44 | ) | (1.58 | ) | (3.73 | ) | (0.98 | ) | — | ||||||||||||||||||||||||||||||||||||||
| Net asset value, end of period | $ | 17.69 | $ | 15.34 | $ | 17.08 | $ | 17.71 | $ | 20.62 | $ | 15.69 | ||||||||||||||||||||||||||||||||||||
| Total return + # | 15.32 | % | (1.88 | )% | 5.36 | % | 3.64 | % | 40.28 | % | 6.37 | % | ||||||||||||||||||||||||||||||||||||
| Ratios/Supplemental Data: | ||||||||||||||||||||||||||||||||||||||||||||||||
| Net assets, end of period (in 000s) | $ | 27,777 | $ | 26,010 | $ | 23,152 | $ | 21,153 | $ | 16,146 | $ | 14,627 | ||||||||||||||||||||||||||||||||||||
| Ratios of expenses to average net assets: | ||||||||||||||||||||||||||||||||||||||||||||||||
| Before commission recapture ^ | 1.06 | % | 1.23 | % | 1.58 | % | 1.84 | % | 1.35 | % | 1.34 | % | ||||||||||||||||||||||||||||||||||||
| After commission recapture ^ | 1.05 | % | 1.23 | % | 1.58 | % | 1.84 | % | 1.35 | % | 1.34 | % | ||||||||||||||||||||||||||||||||||||
| Ratios of net investment loss to average net assets: | ||||||||||||||||||||||||||||||||||||||||||||||||
| Before commission recapture ^ | (0.42 | )% | (0.38 | )% | (1.30 | )% | (1.61 | )% | (1.08 | )% | (1.12 | )% | ||||||||||||||||||||||||||||||||||||
| After commission recapture ^ | (0.41 | )% | (0.38 | )% | (1.30 | )% | (1.61 | )% | (1.08 | )% | (1.12 | )% | ||||||||||||||||||||||||||||||||||||
| Portfolio turnover rate | 87 | % (1) | 181 | % | 138 | % | 192 | % | 231 | % | 211 | % | ||||||||||||||||||||||||||||||||||||
| Class A | Class C | |||||||||||||||||||||||||||||||||||||||||||||||
| Year Ended | Year Ended | |||||||||||||||||||||||||||||||||||||||||||||||
| Six Months Ended | October 31, | Six Months Ended | October 31, | |||||||||||||||||||||||||||||||||||||||||||||
| April 30, 2017 | 2016 | 2015 | 2014 | 2013 | 2012 | April 30, 2017 | 2016 | 2015 | 2014 | 2013 | 2012 | |||||||||||||||||||||||||||||||||||||
| (Unaudited) | (Unaudited) | |||||||||||||||||||||||||||||||||||||||||||||||
| Net asset value, beginning of period | $ | 14.85 | $ | 16.62 | $ | 17.31 | $ | 20.28 | $ | 15.49 | $ | 14.59 | $ | 12.79 | $ | 14.61 | $ | 15.51 | $ | 18.66 | $ | 14.43 | $ | 13.69 | ||||||||||||||||||||||||
| Income from investment operations: | ||||||||||||||||||||||||||||||||||||||||||||||||
| Net investment loss* | (0.05 | ) | (0.10 | ) | (0.27 | ) | (0.34 | ) | (0.24 | ) | (0.21 | ) | (0.10 | ) | (0.18 | ) | (0.36 | ) | (0.42 | ) | (0.32 | ) | (0.30 | ) | ||||||||||||||||||||||||
| Net realized and unrealized gain (loss) (a) | 2.30 | (0.23 | ) | 1.16 | 1.10 | 6.01 | 1.11 | 1.98 | (0.20 | ) | 1.04 | 1.00 | 5.53 | 1.04 | ||||||||||||||||||||||||||||||||||
| Total income (loss) from investment operations | 2.25 | (0.33 | ) | 0.89 | 0.76 | 5.77 | 0.90 | 1.88 | (0.38 | ) | 0.68 | 0.58 | 5.21 | 0.74 | ||||||||||||||||||||||||||||||||||
| Less distributions: | ||||||||||||||||||||||||||||||||||||||||||||||||
| Distributions from net realized gains | 0.00 | (1.40 | ) | (1.58 | ) | (3.73 | ) | (0.98 | ) | — | 0.00 | (1.40 | ) | (1.58 | ) | (3.73 | ) | (0.98 | ) | — | ||||||||||||||||||||||||||||
| Tax return of capital | — | (0.04 | ) | — | — | — | — | 0.00 | (0.04 | ) | — | — | — | — | ||||||||||||||||||||||||||||||||||
| Total distributions | 0.00 | (1.44 | ) | (1.58 | ) | (3.73 | ) | (0.98 | ) | — | 0.00 | (1.44 | ) | (1.58 | ) | (3.73 | ) | (0.98 | ) | — | ||||||||||||||||||||||||||||
| Net asset value, end of period | $ | 17.10 | $ | 14.85 | $ | 16.62 | $ | 17.31 | $ | 20.28 | $ | 15.49 | $ | 14.67 | $ | 12.79 | $ | 14.61 | $ | 15.51 | $ | 18.66 | $ | 14.43 | ||||||||||||||||||||||||
| Total return + # | 15.15 | % | (2.12 | )% | 5.12 | % | 3.36 | % | 39.88 | % | 6.17 | % | 14.70 | % | (2.82 | )% | 4.29 | % | 2.56 | % | 38.87 | % | 5.41 | % | ||||||||||||||||||||||||
| Ratios/Supplemental Data: | ||||||||||||||||||||||||||||||||||||||||||||||||
| Net assets, end of year (in 000s) | $ | 6,526 | $ | 5,540 | $ | 6,326 | $ | 6,443 | $ | 5,890 | $ | 2,418 | $ | 2,678 | $ | 2,155 | $ | 3,163 | $ | 3,165 | $ | 2,685 | $ | 2,694 | ||||||||||||||||||||||||
| Ratios of expenses to average net assets: ^ | ||||||||||||||||||||||||||||||||||||||||||||||||
| Before commission recapture ^ | 1.31 | % | 1.48 | % | 1.83 | % | 2.09 | % | 1.60 | % | 1.59 | % | 2.06 | % | 2.23 | % | 2.58 | % | 2.84 | % | 2.35 | % | 2.34 | % | ||||||||||||||||||||||||
| After commission recapture ^ | 1.30 | % | 1.48 | % | 1.83 | % | 2.09 | % | 1.60 | % | 1.59 | % | 2.05 | % | 2.23 | % | 2.58 | % | 2.84 | % | 2.35 | % | 2.34 | % | ||||||||||||||||||||||||
| Ratios of net investment loss to average net assets: ^ | ||||||||||||||||||||||||||||||||||||||||||||||||
| Before commission recapture ^ | (0.67 | )% | (0.69 | )% | (1.53 | )% | (1.86 | )% | (1.33 | )% | (1.37 | )% | (1.42 | )% | (1.45 | )% | (2.29 | )% | (2.61 | )% | (2.08 | )% | (2.12 | )% | ||||||||||||||||||||||||
| After commission recapture ^ | (0.66 | )% | (0.69 | )% | (1.53 | )% | (1.86 | )% | (1.33 | )% | (1.37 | )% | (1.41 | )% | (1.45 | )% | (2.29 | )% | (2.61 | )% | (2.08 | )% | (2.12 | )% | ||||||||||||||||||||||||
| Portfolio turnover rate | 87 | % (1) | 181 | % | 138 | % | 192 | % | 231 | % | 211 | % | 87 | % (1) | 181 | % | 138 | % | 192 | % | 231 | % | 211 | % | ||||||||||||||||||||||||
| * | The net investment loss per share data was determined using the average shares outstanding throughout each year. |
| + | Assumes reinvestment of all dividends and distributions, if any. Total return does not reflect the deductions of taxes that a shareholder would pay on distributions or on the redemption of shares. |
| # | Includes adjustments in accordance with accounting principles generally accepted in the United States and, consequently, the net asset value for financial reporting purposes and the returns based upon those net asset values may differ from the net asset values and returns for shareholder transactions. |
| (1) | Not annualized. |
| ^ | Annualized for periods less than one year. |
| (a) | The amount of net realized and unrealized gain (loss) on investment per share for the year ended October 31, 2016 does not accord with the amounts in the Statements of Operations due to the timing of purchases and sales of Fund shares in relation to fluctuating market values. |
See accompanying notes to financial statements.
94
| NOTES TO FINANCIAL STATEMENTS (Unaudited) |
| April 30, 2017 |
| 1. | ORGANIZATION |
Each Dunham Fund (each, a “Fund” and collectively the “Funds”) is a series of shares of beneficial interest in the Dunham Funds (the “Trust”), a Delaware Business Trust organized on November 28, 2007 and registered under the Investment Company Act of 1940, as amended, (the “1940 Act”) as an open-end management investment company. Prior to that date, the Dunham Funds were a series of AdvisorOne Funds, also a Delaware Business Trust. The Dunham Funds currently consist of fifteen funds: Floating Rate Bond Fund; Monthly Distribution Fund; Corporate/Government Bond Fund; Dynamic Macro Fund; High-Yield Bond Fund; International Opportunity Bond Fund; Appreciation & Income Fund; Alternative Dividend Fund; Large Cap Value Fund; Focused Large Cap Growth Fund; International Stock Fund; Real Estate Stock Fund; Small Cap Value Fund; Emerging Markets Stock Fund; and Small Cap Growth Fund. With the exception of Focused Large Cap Growth Fund, International Opportunity Bond Fund, and Real Estate Stock Fund, the remaining Funds are diversified funds within the meaning of the 1940 Act.
| Fund | Primary Objective |
| Floating Rate Bond | High level of current income |
| Monthly Distribution | Positive returns in rising and falling market environments |
| Corporate/Government Bond | Current income and capital appreciation |
| Dynamic Macro | Maximize total return from capital appreciation and dividends |
| High-Yield Bond | High level of current income |
| Alternative Dividend | Current income while preserving capital during market downturns |
| International Opportunity Bond | High level of current income |
| Appreciation & Income | Total return under varying market conditions through both current income and capital appreciation |
| Large Cap Value | Maximize total return from capital appreciation and dividends |
| Focused Large Cap Growth | Maximize capital appreciation |
| International Stock | Maximize total return from capital appreciation and dividends |
| Real Estate Stock | Maximize total return from capital appreciation and dividends |
| Small Cap Value | Maximize total return from capital appreciation and income |
| Emerging Markets Stock | Maximize capital appreciation |
| Small Cap Growth | Maximize capital appreciation |
Currently, each Fund offers Class A, Class C and Class N shares. Each class represents an interest in the same assets of the applicable Fund with the only differences being that Class A shares are subject to a front-end sales charge and an annual service fee, Class C shares are subject to an annual service and distribution fee and Class N shares have a higher minimum investment amount. Investors that purchase $1,000,000 or more of Class A shares will not pay any initial sales charge on the purchase. However, purchases of $1,000,000 or more of Class A shares may be subject to a contingent deferred sales charge (“CDSC”) on shares redeemed during the first 18 months after their purchase in the amount of the commissions paid on the shares redeemed. The Class C and Class N shares, with the exception of Monthly Distribution, High-Yield Bond, Dynamic Macro, Focused Large Cap Growth, Floating Rate Bond, International Opportunity Bond, and Alternative Dividend commenced operations on December 10, 2004 and were formed as a result of tax-free conversions from common trusts. The conversions were accomplished through the exchange of the common trust securities, cash, and other assets for equivalent value of the Funds’ shares. High-Yield Bond Class C and Class N shares commenced operations on July 1, 2005. The Class A shares for all Funds except Monthly Distribution, Dynamic Macro, Focused Large Cap Growth, Floating Rate Bond, International Opportunity Bond, and Alternative Dividend commenced operations on January 3, 2007. Monthly Distribution’s Predecessor Fund’s Class A shares and Class C shares commenced operations on December 26, 2000. Monthly Distribution’s Class N shares commenced operations on September 29, 2008. Dynamic Macro commenced operations on April 30, 2010. Focused Large Cap Growth commenced operations on December 8, 2011. Floating Rate Bond and International Opportunity Bond commenced operations on November 1, 2013. Alternative Dividend Fund’s Class A, Class C and Class N shares commenced operations on August 31, 2016.
| 2. | SUMMARY OF SIGNIFICANT ACCOUNTING POLICIES |
The preparation of financial statements in conformity with accounting principles generally accepted in the United States of America (“GAAP”) requires management to make estimates and assumptions that affect the reported amounts of assets and liabilities and disclosure of contingent assets and liabilities at the date of the financial statements and the reported amounts of increases and decreases in net assets from operations during the reporting period. Actual results could differ from those estimates. The Funds are an investment company and accordingly follow the investment company accounting and reporting guidance of the Financial Accounting Standards Board (FASB) Accounting Standard Codification Topic 946 “Financial Services – Investment Companies” including FASB Accounting Standard Update ASU 2013-08.
The following is a summary of significant accounting policies followed by the Funds in preparation of their financial statements.
a. Security Valuation – In determining each Fund’s Net Asset Value (“NAV”) per share, equity securities for which market quotations are readily available are valued at current market value using the last reported sales price. NASDAQ traded securities are
95
| NOTES TO FINANCIAL STATEMENTS (Unaudited) |
| April 30, 2017 (Continued) |
valued using the NASDAQ official closing price (“NOCP”). If no sale price is reported, the mean between the current bid and ask price is used. If market quotations are not readily available, then securities are valued at fair value as determined by the Board of Trustees of the Trust (the “Board”) (or its delegate). U.S. Government and agency securities are valued at the mean between the most recent bid and ask prices. Short-term debt instruments with a remaining maturity of more than 60 days, intermediate and long-term bonds, convertible bonds, bank loans and other debt securities are generally valued on the basis of dealer supplied quotations or by a pricing system selected by Dunham & Associates Investment Counsel, Inc. (“Dunham & Associates” or the “Adviser”) and approved by the Board. Where such prices are not available, valuations will be obtained from brokers who are market makers for such securities. However, in circumstances where the Adviser deems it appropriate to do so, the mean of the bid and ask prices for over-the-counter securities or the last available sale price for exchange-traded debt securities may be used. Where no last sale price for exchange traded debt securities is available, the mean of the bid and ask prices may be used. Short-term debt securities with a remaining maturity of 60 days or less may be valued at amortized cost, provided such valuations represent fair value.
Options are valued at the last reported sale price at the close of the exchange on which the security is primarily traded. If no sales are reported for the exchange-traded options, or the options are not exchange-traded, then they are valued at the mean of their most recent quoted bid and ask price.
Equity swaps are valued at the last reported sale price at the close of the exchange on which the underlying security is primarily traded. If no sale price is reported, then they are valued at the mean of their most recent quoted bid and asked price.
Futures and future options are valued at the final settled price or, in the absence of a settled price, at the mean between the current bid and ask prices on the day of valuation.
Trading in securities on far eastern securities exchanges and over-the-counter markets is normally completed well before the close of business on each business day in New York (i.e., a day on which the New York Stock Exchange (“NYSE”) is open). In addition, far eastern securities trading generally, or in a particular country or countries, may not take place on all business days in New York. Furthermore, trading takes place in Japanese markets on certain Saturdays and in various foreign markets on days, which are not business days in New York, and on which a Fund’s NAV is not calculated. Each Fund calculates NAV per share, and therefore effects sales, redemptions and repurchases of its shares, as of the close of regular trading on the NYSE once on each day on which the NYSE is open. Such calculation may not take place contemporaneously with the determination of the prices of the majority of the portfolio securities used in such calculation. If events that may materially affect the value of such securities occur between the time when their price is determined and the time when the Fund’s NAV is calculated, such securities may be valued at fair value as determined in good faith in accordance with procedures approved by the Board.
Securities in which the Funds invest may be traded in markets that close before 4:00 p.m. Eastern Time (“ET”). Normally, developments that occur between the close of the foreign markets and 4:00 p.m. ET will not be reflected in a Fund’s NAV. However, Funds may determine that such developments are so significant that they will materially affect the value of a Fund’s securities, and the Fund may adjust the previous closing prices to reflect what the Board believes to be the fair value of these securities as of 4:00 p.m. ET. Both International Stock and Emerging Markets Stock utilize fair value prices as provided by an independent pricing vendor on a daily basis for those securities traded on a foreign exchange.
Securities for which current market quotations are not readily available, or for which quotations are not deemed to be representative of market values, are valued at fair value as determined in good faith by or under the direction of the Board in accordance with the Trust’s Portfolio Securities Valuation Procedures (the “Procedures”). The Procedures consider, among others, the following factors to determine a security’s fair value: the nature and pricing history (if any) of the security; whether any dealer quotations for the security are available; and possible valuation methodologies that could be used to determine the fair value of the security.
Valuation of Fund of Funds - The Funds may invest in portfolios of open-end investment companies. Open-end investment companies are valued at their respective net asset values as reported by such investment companies. Open-end investment companies value securities in their portfolios for which market quotations are readily available at their market values (generally the last reported sale price) and all other securities and assets at their fair value based on the methods established by the board of directors of the open-end funds.
The Funds utilize various methods to measure the fair value of most of their investments on a recurring basis. GAAP establishes a hierarchy that prioritizes inputs to valuation methods. The three levels of input are:
Level 1 – Unadjusted quoted prices in active markets for identical assets and liabilities.
Level 2 – Observable inputs other than quoted prices included in Level 1 that are observable for the asset or liability, either directly or indirectly. These inputs may include quoted prices for the identical instrument on an inactive market, prices for similar instruments, interest rates, prepayment speeds, credit risk, yield curves, default rates and similar data.
Level 3 – Unobservable inputs for the asset or liability, to the extent relevant observable inputs are not available, representing the Funds’ own assumptions about the assumptions a market participant would use in valuing the asset or liability, and would be based on the best information available.
96
| NOTES TO FINANCIAL STATEMENTS (Unaudited) |
| April 30, 2017 (Continued) |
The availability of observable inputs can vary from security to security and is affected by a wide variety of factors, including, for example, the type of security, whether the security is new and not yet established in the marketplace, the liquidity of markets, and other characteristics particular to the security. To the extent that valuation is based on models or inputs that are less observable or unobservable in the market, the determination of fair value requires more judgment. Accordingly, the degree of judgment exercised in determining fair value is greatest for instruments categorized in Level 3.
The inputs used to measure fair value may fall into different levels of the fair value hierarchy. In such cases, for disclosure purposes, the level in the fair value hierarchy within which the fair value measurement falls in its entirety, is determined based on the lowest level input that is significant to the fair value measurement in its entirety.
The inputs or methodology used for valuing securities are not necessarily an indication of the risk associated with investing in those securities. The following tables summarize the inputs used as of April 30, 2017 for the Funds’ assets and liabilities measured at fair value:
Floating Rate Bond
| Assets | Level 1 | Level 2 | Level 3 | Total | ||||||||||||
| Common Stock * | $ | 158,291 | $ | — | $ | — | $ | 158,291 | ||||||||
| Exchange Traded Fund * | 1,325,447 | — | — | 1,325,447 | ||||||||||||
| Bank Loans * | — | 118,025,142 | — | 118,025,142 | ||||||||||||
| Bonds & Notes * | — | 8,416,312 | — | 8,416,312 | ||||||||||||
| Asset Backed Securities | — | 1,314,834 | 1,314,834 | |||||||||||||
| Private Placements | 268,650 | 268,650 | ||||||||||||||
| Rights | 14,294 | — | — | 14,294 | ||||||||||||
| Short-Term Investment | 11,095,571 | — | — | 11,095,571 | ||||||||||||
| Collateral for Securities Loaned | 1,493,995 | — | — | 1,493,995 | ||||||||||||
| Total | $ | 14,087,598 | $ | 128,024,938 | $ | — | $ | 142,112,536 | ||||||||
Corporate/Government Bond
| Assets | Level 1 | Level 2 | Level 3 | Total | ||||||||||||
| Corporate Bonds & Notes * | $ | — | $ | 31,843,128 | $ | — | $ | 31,843,128 | ||||||||
| Foreign Government Bonds | — | 297,720 | — | 297,720 | ||||||||||||
| Municipal | — | 1,982,462 | — | 1,982,462 | ||||||||||||
| U.S. Government & Agency | — | 17,547,130 | — | 17,547,130 | ||||||||||||
| Bank Loans * | — | 2,188,411 | — | 2,188,411 | ||||||||||||
| Preferred Stock * | 321,570 | — | — | 321,570 | ||||||||||||
| Short-Term Investment | 1,571,505 | — | — | 1,571,505 | ||||||||||||
| Collateral for Securities Loaned | 7,407,183 | — | — | 7,407,183 | ||||||||||||
| Total | $ | 9,300,258 | $ | 53,858,851 | $ | — | $ | 63,159,109 | ||||||||
Monthly Distribution
| Assets | Level 1 | Level 2 | Level 3 | Total | ||||||||||||
| Common Stock * | $ | 216,639,460 | $ | — | $ | — | $ | 216,639,460 | ||||||||
| Exchange Traded Funds | 13,107,814 | — | — | 13,107,814 | ||||||||||||
| Rights | 204,074 | — | — | 204,074 | ||||||||||||
| Warrants | 41,165 | — | — | 41,165 | ||||||||||||
| Closed End Funds | 1,458,190 | — | — | 1,458,190 | ||||||||||||
| Preferred Stock | 1,630,262 | — | — | 1,630,262 | ||||||||||||
| Bonds & Notes * | — | 857,588 | — | 857,588 | ||||||||||||
| Purchased Put Options | 68,000 | — | — | 68,000 | ||||||||||||
| Short-Term Investment | 18,744,163 | — | — | 18,744,163 | ||||||||||||
| Total Assets | $ | 251,893,128 | $ | 857,588 | $ | — | $ | 252,750,716 | ||||||||
| Liabilities | ||||||||||||||||
| Liabilities-Securities Sold Short | $ | 62,459,636 | $ | — | $ | 62,459,636 | ||||||||||
| Liabilities-Exchange Trade Funds Sold Short | 27,991,033 | — | — | 27,991,033 | ||||||||||||
| Total Liabilities | $ | 90,450,669 | $ | — | $ | — | $ | 90,450,669 | ||||||||
| Liabilities-Derivatives | ||||||||||||||||
| Written Call Options | $ | 751,248 | $ | — | $ | — | $ | 751,248 | ||||||||
| Forward Currency Exchange Contracts | — | 25,130 | — | 25,130 | ||||||||||||
| Total Derivatives | $ | 751,248 | $ | 25,130 | $ | — | $ | 776,378 | ||||||||
97
| NOTES TO FINANCIAL STATEMENTS (Unaudited) |
| April 30, 2017 (Continued) |
| Dynamic Macro | ||||||||||||||||
| Assets | Level 1 | Level 2 | Level 3 | Total | ||||||||||||
| Exchange Traded Funds * | $ | 19,205,711 | $ | — | $ | — | $ | 19,205,711 | ||||||||
| Short-Term Investments | 16,193,466 | — | — | 16,193,466 | ||||||||||||
| Collateral for Securities Loaned | 2,819,526 | — | — | 2,819,526 | ||||||||||||
| Asset - Derivatives | ||||||||||||||||
| Purchased Options | 3,853,126 | — | — | 3,853,126 | ||||||||||||
| Futures | 476,160 | — | — | 476,160 | ||||||||||||
| Total | $ | 42,547,989 | $ | — | $ | — | $ | 42,547,989 | ||||||||
| Liabilities - Derivatives | ||||||||||||||||
| Futures | $ | 257,425 | $ | — | $ | — | $ | 257,425 | ||||||||
| Written Options | 7,682 | — | — | 7,682 | ||||||||||||
| Total | $ | 265,107 | $ | — | $ | — | $ | 265,107 | ||||||||
| High-Yield Bond | ||||||||||||||||
| Assets | Level 1 | Level 2 | Level 3 | Total | ||||||||||||
| Bonds & Notes * | $ | — | $ | 93,358,433 | $ | — | $ | 93,358,433 | ||||||||
| Short-Term Investment | 4,090,150 | — | — | 4,090,150 | ||||||||||||
| Collateral for Securities Loaned | 26,541,345 | — | — | 26,541,345 | ||||||||||||
| Total | $ | 30,631,495 | $ | 93,358,433 | $ | — | $ | 123,989,928 | ||||||||
| Alternative Dividend | ||||||||||||||||
| Assets | Level 1 | Level 2 | Level 3 | Total | ||||||||||||
| Common Stock * | $ | 27,804,245 | $ | — | $ | — | $ | 27,804,245 | ||||||||
| Exchange Traded Funds | 7,002,074 | — | — | 7,002,074 | ||||||||||||
| Asset - Derivatives | ||||||||||||||||
| Purchased Options | 242,060 | — | — | 242,060 | ||||||||||||
| Short-Term Investment | 2,641,750 | — | — | 2,641,750 | ||||||||||||
| Total | $ | 37,690,129 | $ | — | $ | — | $ | 37,690,129 | ||||||||
| International Opportunity Bond | ||||||||||||||||
| Assets | Level 1 | Level 2 | Level 3 | Total | ||||||||||||
| Corporate Bonds & Notes * | $ | — | $ | 11,353,083 | $ | — | $ | 11,353,083 | ||||||||
| Foreign Government Bonds * | — | 16,468,422 | — | 16,468,422 | ||||||||||||
| Mortgage Backed Securities | — | 80,873 | — | 80,873 | ||||||||||||
| Whole Loan Collateral | — | 227,981 | — | 227,981 | ||||||||||||
| Short-Term Investment | 154,609 | — | — | 154,609 | ||||||||||||
| Total Assets | $ | 154,609 | $ | 28,130,359 | $ | — | $ | 28,284,968 | ||||||||
| Asset - Derivatives | ||||||||||||||||
| Futures Contracts | $ | 39,157 | $ | — | $ | — | $ | 39,157 | ||||||||
| Foreign Currency Exchange Contracts | — | 39,087 | — | 39,087 | ||||||||||||
| Total Derivatives | $ | 39,157 | $ | 39,087 | $ | — | $ | 78,244 | ||||||||
| Liabilities-Derivatives | ||||||||||||||||
| Futures Contracts | $ | 10,452 | $ | — | $ | — | $ | 10,452 | ||||||||
| Foreign Currency Exchange Contracts | — | 95,369 | — | 95,369 | ||||||||||||
| Total Derivatives | $ | 10,452 | $ | 95,369 | $ | — | $ | 105,821 | ||||||||
| Appreciation & Income | ||||||||||||||||
| Assets | Level 1 | Level 2 | Level 3 | Total | ||||||||||||
| Convertible Bonds * | $ | — | $ | 13,907,603 | $ | — | $ | 13,907,603 | ||||||||
| Preferred Stock * | 3,914,770 | — | — | 3,914,770 | ||||||||||||
| Short-Term Investment | 508,870 | — | — | 508,870 | ||||||||||||
| Collateral for Securities Loaned | 1,224,363 | — | — | 1,224,363 | ||||||||||||
| Total | $ | 5,648,003 | $ | 13,907,603 | $ | — | $ | 19,555,606 | ||||||||
98
| NOTES TO FINANCIAL STATEMENTS (Unaudited) |
| April 30, 2017 (Continued) |
| Large Cap Value | ||||||||||||||||
| Assets | Level 1 | Level 2 | Level 3 | Total | ||||||||||||
| Common Stock * | $ | 59,655,205 | $ | — | $ | — | $ | 59,655,205 | ||||||||
| Short-Term Investment | 1,247,333 | — | — | 1,247,333 | ||||||||||||
| Collateral for Securities Loaned | 12,593,374 | — | — | 12,593,374 | ||||||||||||
| Total | $ | 73,495,912 | $ | — | $ | — | $ | 73,495,912 | ||||||||
| Focused Large Cap Growth | ||||||||||||||||
| Assets | Level 1 | Level 2 | Level 3 | Total | ||||||||||||
| Common Stock * | $ | 71,812,885 | $ | — | $ | — | $ | 71,812,885 | ||||||||
| Short-Term Investment | 46,591 | — | — | 46,591 | ||||||||||||
| Collateral for Securities Loaned | 16,495,509 | — | — | 16,495,509 | ||||||||||||
| Total | $ | 88,354,985 | $ | — | $ | — | $ | 88,354,985 | ||||||||
| International Stock | ||||||||||||||||
| Assets | Level 1 | Level 2 | Level 3 | Total | ||||||||||||
| Common Stock * | $ | 18,745,269 | $ | 76,818,634 | $ | — | $ | 95,563,903 | ||||||||
| Preferred Stock * | 164,256 | 1,888,094 | — | 2,052,350 | ||||||||||||
| Short-Term Investment | 851,284 | — | — | 851,284 | ||||||||||||
| Collateral for Securities Loaned | 3,719,420 | — | — | 3,719,420 | ||||||||||||
| Total Assets | $ | 23,480,229 | $ | 78,706,728 | $ | — | $ | 102,186,957 | ||||||||
| Assets - Derivatives | ||||||||||||||||
| Forward Currency Exchange Contracts | $ | — | $ | 743 | $ | — | $ | 743 | ||||||||
| Liabilities - Derivatives | ||||||||||||||||
| Forward Currency Exchange Contracts | $ | — | $ | 35 | $ | — | $ | 35 | ||||||||
| Real Estate Stock | ||||||||||||||||
| Assets | Level 1 | Level 2 | Level 3 | Total | ||||||||||||
| Common Stock | $ | 509,855 | $ | — | $ | — | $ | 509,855 | ||||||||
| REITS * | 32,150,838 | — | — | 32,150,838 | ||||||||||||
| Short-Term Investment | 380,469 | — | — | 380,469 | ||||||||||||
| Collateral for Securities Loaned | 10,034,782 | — | — | 10,034,782 | ||||||||||||
| Total | $ | 43,075,944 | $ | — | $ | — | $ | 43,075,944 | ||||||||
| Small Cap Value | ||||||||||||||||
| Assets | Level 1 | Level 2 | Level 3 | Total | ||||||||||||
| Common Stock * | $ | 26,930,812 | $ | — | $ | — | $ | 26,930,812 | ||||||||
| Exchange Traded Fund | 1,019,960 | — | — | 1,019,960 | ||||||||||||
| Short-Term Investment | 162,015 | — | — | 162,015 | ||||||||||||
| Collateral for Securities Loaned | 9,469,175 | — | — | 9,469,175 | ||||||||||||
| Total | $ | 37,581,962 | $ | — | $ | — | $ | 37,581,962 | ||||||||
| Emerging Markets Stock | ||||||||||||||||
| Assets | Level 1 | Level 2 | Level 3 | Total | ||||||||||||
| Common Stock * | $ | 18,160,987 | $ | 35,458,314 | $ | — | $ | 53,619,301 | ||||||||
| Preferred Stock * | 1,636,045 | — | — | 1,636,045 | ||||||||||||
| Exchange Traded Fund | 333,600 | — | — | 333,600 | ||||||||||||
| Short-Term Investment | 487,270 | — | — | 487,270 | ||||||||||||
| Collateral for Securities Loaned | 2,814,783 | — | — | 2,814,783 | ||||||||||||
| Total | $ | 23,432,685 | $ | 35,458,314 | $ | — | $ | 58,890,999 | ||||||||
99
| NOTES TO FINANCIAL STATEMENTS (Unaudited) |
| April 30, 2017 (Continued) |
| Small Cap Growth | ||||||||||||||||
| Assets | Level 1 | Level 2 | Level 3 | Total | ||||||||||||
| Common Stock * | $ | 36,392,423 | $ | — | $ | — | $ | 36,392,423 | ||||||||
| Short-Term Investment | 573,892 | — | — | 573,892 | ||||||||||||
| Collateral for Securities Loaned | 12,589,867 | — | — | 12,589,867 | ||||||||||||
| Total | $ | 49,556,182 | $ | — | $ | — | $ | 49,556,182 | ||||||||
| * | See each Fund’s Schedule of Investments for breakdown by industry. |
The Funds did not hold any Level 3 securities during the period.
There were no transfers into or out of Level 1 or Level 2 during the period. It is the Funds’ policy to recognize transfers into and out of Level 1 and Level 2 at the end of the reporting period.
b. Foreign Currency Translations – The accounting records of the Funds are maintained in U.S. dollars. Investment securities and other assets and liabilities denominated in a foreign currency, and income receipts and expense payments, are translated into U.S. dollars using the prevailing exchange rate at the London market close. Purchases and sales of securities are translated into U.S. dollars at the contractual currency rates established at the approximate time of the trade.
Net realized gains and losses on foreign currency transactions represent net gains and losses from currency realized between the trade and settlement dates on securities transactions and the difference between income accrued versus income received. The effects of changes in foreign currency exchange rates on investments in securities are included with the net realized and unrealized gain or loss on investment securities.
c. Forward Currency Contracts – As foreign securities are purchased, a Fund generally enters into forward currency exchange contracts in order to hedge against foreign currency exchange rate risks. The market value of the contract fluctuates with changes in currency exchange rates. The contract is marked-to-market daily and the change in market value is recorded by a Fund as an unrealized gain or loss. As foreign securities are sold, a portion of the contract is generally closed and the Fund records a realized gain or loss equal to the difference between the value of the contract at the time it was opened and the value at the time it was closed. A Fund may also enter into forward currency contracts as an investment strategy consistent with that Fund’s investment objective. Realized gains and losses from contract transactions are included as a component of net realized gains (losses) from investments and foreign currency in the Statements of Operations.
d. Options – Monthly Distribution, Dynamic Macro, and Alternative Dividend are subject to stock market risk in the normal course of pursuing their investment objectives and may purchase or sell options to help hedge against this risk.
A Fund may write call options only if it (i) owns an offsetting position in the underlying security or (ii) has an absolute or immediate right to acquire that security without additional cash consideration or exchange of other securities held in its portfolio. When a Fund writes an option, there is no taxable event and an amount equal to the premium received is recorded by that Fund as a liability. The liability is thereafter valued to reflect the current value of the option. If the option is not exercised and expires, or if a Fund effects a closing purchase transaction, the Fund realizes a gain (or loss in the case of a closing purchase transaction where the cost to close the transaction exceeds the original premium received), and the liability related to the option is extinguished. Any such gain or loss generally is a short-term capital gain or loss for federal income tax purposes. If a call option that a Fund has written on any equity security is exercised, that Fund will realize a capital gain or loss (long-term or short-term, depending on the holding period of the underlying security) from the sale of the underlying security, and the proceeds from such sale are increased by the premium originally received. If a put option that a Fund has written on an equity security is exercised, the amount of the premium originally received reduces the cost of the security that a Fund purchases upon exercise of the option. When a Fund writes a put option, that Fund must deposit cash or liquid securities into a segregated account equal to the put option’s exercise value (number of shares times strike price).
A Fund may purchase put and call options. Put options are purchased to hedge against a decline in the value of securities held in that Fund’s portfolio. If such a decline occurs, the put options will permit that Fund to sell the securities underlying such options at the exercise price, or to close out the options at a profit. The premium paid for a put or call option plus any transaction costs will reduce the benefit, if any, realized by that Fund upon exercise of the option, and, unless the price of the underlying security rises or declines sufficiently, the option may expire worthless to that Fund. In addition, in the event that the price of the security in connection with which an option was purchased moves in a direction favorable to that Fund, the benefits realized by that Fund as a result of such favorable movement will be reduced by the amount of the premium paid for the option and related transaction costs. Written and purchased options are non-income producing securities.
e. Swap Agreements – Monthly Distribution is subject to stock market risk in the normal course of pursuing its investment objectives. The Fund may enter into various swap transactions for investment purposes to manage equity risk. These are two-party contracts entered into primarily to exchange the returns (or differentials in rates of returns) earned or realized on particular pre-determined investments or instruments. The gross returns to be exchanged or “swapped” between parties are calculated with respect to a notional amount, i.e., the return on or increase in value of a particular dollar amount invested at a particular interest rate, in a particular foreign currency, or in a “basket” of securities representing a particular index or market segment. Changes in the value of swap agreements are recognized as unrealized gains or losses in the Statement of Operations by “marking to market” on a daily basis to reflect the value of the swap agreement at the end of each trading day. Payments received or paid at the beginning of the agreement are reflected as such on the Statements of Assets and Liabilities and may be referred to as upfront payments. The Fund amortizes upfront payments and/or
100
| NOTES TO FINANCIAL STATEMENTS (Unaudited) |
| April 30, 2017 (Continued) |
accrues for the fixed payment stream on swap agreements on a daily basis with the net amount recorded as a component of unrealized gain or loss on the Statement of Operations. A liquidation payment received or made at the termination of the swap agreement is recorded as a realized gain or loss on the Statements of Operations. The Fund segregates liquid securities having a value at least equal to the amount of its current obligation under any swap transaction. Entering into these agreements involves, to varying degrees, lack of liquidity and elements of credit, market, and counterparty risk in excess of amounts recognized on the Statements of Assets and Liabilities. The Fund’s maximum risk of loss from counterparty credit risk is the discounted net value of the cash flows to be received from/paid to the counterparty over the contract’s remaining life, to the extent that that amount is positive.
f. Futures Contracts – International Opportunity Bond and Dynamic Macro are subject to equity interest rate risk and forward currency exchange rate risk in the normal course of pursuing their investment objectives. The Funds may purchase or sell futures contracts to gain exposure to, or hedge against, changes in the value of equities and interest rates. Initial margin deposits required upon entering into futures contracts are satisfied by the segregation of specific securities or cash as collateral for the account of the broker (the Fund’s agent in acquiring the futures position). During the period the futures contracts are open, changes in the value of the contracts are recognized as unrealized gains or losses by “marking to market” on a daily basis to reflect the market value of the contracts at the end of each day’s trading. Variation margin payments are received or made depending upon whether unrealized gains or losses are incurred. When the contracts are closed, the Funds recognize a realized gain or loss equal to the difference between the proceeds from, or cost of, the closing transaction and the Fund’s basis in the contract. If the Funds were unable to liquidate a futures contract and/or enter into an offsetting closing transaction, the Funds would continue to be subject to market risk with respect to the value of the contracts and continue to be required to maintain the margin deposits on the futures contracts. The Funds segregate cash having a value at least equal to the amount of the current obligation under any open futures contract. Risks may exceed amounts recognized in the Statements of Assets and Liabilities. With futures, there is minimal counterparty credit risk to the Funds since futures are exchange traded and the exchange’s clearinghouse, as counterparty to all exchange traded futures, guarantees the futures against default.
The notional value of the derivative instruments outstanding as of April 30, 2017 as disclosed in the Schedule of Investments and the amounts realized and changes in unrealized gains and losses on derivative instruments during the period as disclosed above and within the Statements of Operations serve as indicators of the volume of derivative activity for the Funds.
g. Short Sales – A “short sale” is a transaction in which a Fund sells a security it does not own but has borrowed in anticipation that the market price of that security will decline. The Fund would be obligated to replace the security borrowed by purchasing it on the open market at a later date. If the price of the security sold short increases between the time of the short sale and the time the Fund replaces the borrowed security, the Fund will incur a loss. Conversely, if the price declines, the Fund will realize a gain.
h. Impact of Derivatives on the Statements of Assets and Liabilities and Statements of Operations – The following is a summary of the location of derivative investments of each Fund in the Statement of Assets and Liabilities as of April 30, 2017:
| Location on the Statements of Assets and Liabilities | ||
| Derivatives Investment Type | Asset Derivatives | Liability Derivatives |
| Equity/Currency/Commodity | Investment in securities | Options contracts written |
| Interest rate contracts | Unrealized appreciation on futures | Unrealized depreciation on futures |
| Receivable for open forward foreign currency contracts | Payable for open forward foreign currency contracts | |
The following table sets forth the fair value of each Fund’s derivative contracts by primary risk exposure as of April 30, 2017:
| Asset Derivatives Investment Value | ||||||||||||||||||||
| Equity | Currency | Commodity | Interest Rate | Total value at | ||||||||||||||||
| Contracts | Contracts | Contracts | Contracts | April 30, 2017 | ||||||||||||||||
| Monthly Distribution | ||||||||||||||||||||
| Forward Foreign Currency Contracts | $ | — | $ | 25,130 | $ | — | $ | — | $ | 25,130 | ||||||||||
| Purchased Options | 68,000 | — | — | — | 68,000 | |||||||||||||||
| Dynamic Macro | ||||||||||||||||||||
| Futures | $ | 178,233 | $ | — | $ | — | $ | 297,927 | $ | 476,160 | ||||||||||
| Purchased Options | 67,101 | — | — | 3,786,025 | 3,853,126 | |||||||||||||||
| International Opportunity Bond | ||||||||||||||||||||
| Forward Foreign Currency Contracts | $ | — | $ | 39,087 | $ | — | $ | — | $ | 39,087 | ||||||||||
| Futures | — | — | — | 39,157 | 39,157 | |||||||||||||||
| Alternative Dividend Purchased Options | $ | 242,060 | $ | — | $ | — | $ | — | $ | 242,060 | ||||||||||
| International Stock | ||||||||||||||||||||
| Forward Foreign Currency Contracts | $ | — | $ | 743 | $ | — | $ | — | $ | 743 | ||||||||||
101
| NOTES TO FINANCIAL STATEMENTS (Unaudited) |
| April 30, 2017 (Continued) |
| Liability Derivatives Investment Value | ||||||||||||||||||||
| Equity | Currency | Commodity | Interest Rate | Total value at | ||||||||||||||||
| Contracts | Contracts | Contracts | Contracts | April 30, 2017 | ||||||||||||||||
| Monthly Distribution | ||||||||||||||||||||
| Written Options | $ | 751,247 | $ | — | $ | — | $ | — | $ | 751,247 | ||||||||||
| Dynamic Macro | ||||||||||||||||||||
| Futures | $ | 74,970 | $ | — | $ | — | $ | 182,455 | $ | 257,425 | ||||||||||
| Written Options | 7,682 | — | — | — | 7,682 | |||||||||||||||
| International Opportunity Bond | ||||||||||||||||||||
| Forward Foreign Currency Contracts | $ | — | $ | 95,369 | $ | — | $ | — | $ | 95,369 | ||||||||||
| Futures | — | — | — | 10,452 | 10,452 | |||||||||||||||
| International Stock Forward Foreign Currency Contracts | $ | — | $ | 35 | $ | — | $ | — | $ | 35 | ||||||||||
The following is a summary of the location of derivative investments of each Fund in the Statements of Operations for the six months ended April 30, 2017.
| Derivative Investment Type | Location of Gain (Loss) on Derivatives |
| Equity/Currency/Commodity/ Interest rate contracts | Net Realized gain (loss) from: Futures, Options purchased, Written options, Swap contracts, Foreign currency exchange contracts Net change in unrealized appreciation (depreciation) on: Futures, Options purchased, Written options, Swap contracts, Foreign currency exchange contracts |
The following is a summary of each Fund’s realized gain (loss) and change in unrealized appreciation (depreciation) on derivative investments recognized in the Statements of Operations categorized by primary risk exposure for the six months ended April 30, 2017:
Realized gain/(loss) on derivatives recognized in the Statements of Operations
| Equity | Currency | Commodity | Interest Rate | Total value at | ||||||||||||||||
| Derivative Investment type | Contracts | Contracts | Contracts | Contracts | April 30, 2017 | |||||||||||||||
| Monthly Distribution | ||||||||||||||||||||
| Forward Foreign Currency Contracts | $ | — | $ | 205,553 | $ | — | $ | — | $ | 205,553 | ||||||||||
| Swaps | 3,307,398 | — | — | — | 3,307,398 | |||||||||||||||
| Purchased Options | (4,344,025 | ) | — | — | — | (4,344,025 | ) | |||||||||||||
| Written Options | 1,944,044 | — | — | — | 1,944,044 | |||||||||||||||
| Dynamic Macro | ||||||||||||||||||||
| Futures | $ | (577,652 | ) | $ | — | $ | — | $ | (478,128 | ) | $ | (1,055,780 | ) | |||||||
| Forward Foreign Currency Contracts | — | 1,533 | — | — | 1,533 | |||||||||||||||
| Purchased Options | (527,753 | ) | — | — | 705,177 | 177,424 | ||||||||||||||
| Written Options | 20,592 | — | — | — | 20,592 | |||||||||||||||
| International Opportunity Bond | ||||||||||||||||||||
| Forward Foreign Currency Contracts | $ | — | $ | 16,558 | $ | — | $ | — | $ | 16,558 | ||||||||||
| Futures | — | — | — | (50,818 | ) | (50,818 | ) | |||||||||||||
| Alternative Dividend Purchased Options | $ | (912,908 | ) | $ | — | $ | — | $ | — | $ | (912,908 | ) | ||||||||
| International Stock | ||||||||||||||||||||
| Forward Foreign Currency Contracts | $ | — | $ | (41,908 | ) | $ | — | $ | — | $ | (41,908 | ) | ||||||||
102
| NOTES TO FINANCIAL STATEMENTS (Unaudited) |
| April 30, 2017 (Continued) |
| Changes in unrealized appreciation/(depreciation) on derivatives recognized in the Statements of Operations | ||||||||||||||||||||
| Equity | Currency | Commodity | Interest Rate | Total value at | ||||||||||||||||
| Derivative Investment type | Contracts | Contracts | Contracts | Contracts | April 30, 2017 | |||||||||||||||
| Monthly Distribution | ||||||||||||||||||||
| Forward Foreign Currency Contracts | $ | — | $ | (8,293 | ) | $ | — | $ | — | $ | (8,293 | ) | ||||||||
| Swaps | (422,216 | ) | — | — | — | (422,216 | ) | |||||||||||||
| Purchased Options | 670,284 | — | — | — | 670,284 | |||||||||||||||
| Written Options | 91,278 | — | — | — | 91,278 | |||||||||||||||
| Dynamic Macro | ||||||||||||||||||||
| Futures | (453,717 | ) | — | — | 298,377 | (155,340 | ) | |||||||||||||
| Purchased Options | (9,354 | ) | — | — | (210,708 | ) | (220,062 | ) | ||||||||||||
| Written Options | (20,089 | ) | — | — | — | (20,089 | ) | |||||||||||||
| International Opportunity Bond | ||||||||||||||||||||
| Forward Foreign Currency Contracts | $ | — | $ | (80,637 | ) | $ | — | $ | — | $ | (80,637 | ) | ||||||||
| Futures | — | — | 64,228 | 64,228 | ||||||||||||||||
| Alternative Dividend | ||||||||||||||||||||
| Purchased Options | $ | (202,059 | ) | $ | — | $ | — | $ | — | $ | (202,059 | ) | ||||||||
| International Stock | ||||||||||||||||||||
| Forward Foreign Currency Contracts | $ | — | $ | 431 | $ | — | $ | — | $ | 431 | ||||||||||
i. Offsetting of Financial Assets and Derivative Assets – Monthly Distribution, International Opportunity Bond, Dynamic Macro and International Stock policies are to recognize a net asset or liability equal to the unrealized on futures contracts, forward foreign currency contracts, swaps and written options. During the six months ended April 30, 2017, the Funds are subject to a master netting arrangement for the swaps. The following table shows additional information regarding the offsetting of assets and liabilities at April 30, 2017.
| Monthly Distribution | ||||||||||||||||||||||||
| Gross Amounts Not Offset in the | ||||||||||||||||||||||||
| Assets: | Statement of Assets & Liabilities | |||||||||||||||||||||||
| Gross Amounts | Net Amounts of | |||||||||||||||||||||||
| Gross Amounts | Offset in the | Assets Presented in | Cash | |||||||||||||||||||||
| of Recognized | Statement of Assets | the Statement of | Financial | Collateral | ||||||||||||||||||||
| Description | Assets | & Liabilities | Assets & Liabilities | Instruments | Received | Net Amount | ||||||||||||||||||
| Forward Foreign Currency | ||||||||||||||||||||||||
| Contracts | $ | 25,130 | $ | — | $ | 25,130 | $ | — | $ | — | $ | 25,130 | ||||||||||||
| Total | $ | 25,130 | $ | — | $ | 25,130 | $ | — | $ | — | $ | 25,130 | ||||||||||||
| Gross Amounts Not Offset in the | ||||||||||||||||||||||||
| Liabilities: | Statement of Assets & Liabilities | |||||||||||||||||||||||
| Gross Amounts | Net Amounts of | |||||||||||||||||||||||
| Gross Amounts | Offset in the | Liabilities Presented | Cash | |||||||||||||||||||||
| of Recognized | Statement of Assets | in the Statement of | Financial | Collateral | ||||||||||||||||||||
| Description | Liabilities | & Liabilities | Assets & Liabilities | Instruments | Pledged (1) | Net Amount | ||||||||||||||||||
| Written Options | $ | (751,247 | ) | $ | — | $ | (751,247 | ) | $ | 751,247 | $ | — | $ | — | ||||||||||
| Total | $ | (751,247 | ) | $ | — | $ | (751,247 | ) | $ | 751,247 | $ | — | $ | — | ||||||||||
| (1) | The amount is limited to the derivative liability balance and accordingly, does not include excess collateral pledged. |
103
| NOTES TO FINANCIAL STATEMENTS (Unaudited) |
| April 30, 2017 (Continued) |
| Dynamic Macro | ||||||||||||||||||||||||
| Gross Amounts Not Offset in | ||||||||||||||||||||||||
| the Statement of Assets & | ||||||||||||||||||||||||
| Assets: | Liabilities | |||||||||||||||||||||||
| Gross | Gross Amounts | Net Amounts of | ||||||||||||||||||||||
| Amounts of | Offset in the | Assets Presented in | Cash | |||||||||||||||||||||
| Recognized | Statement of Assets | the Statement of | Financial | Collateral | ||||||||||||||||||||
| Description | Assets | & Liabilities | Assets & Liabilities | Instruments | Pledged | Net Amount | ||||||||||||||||||
| Futures Contracts | $ | 476,160 | $ | — | $ | 476,160 | $ | (257,425 | ) | $ | — | $ | 218,735 | |||||||||||
| Total | $ | 476,160 | $ | — | $ | 476,160 | $ | (257,425 | ) | $ | — | $ | 218,735 | |||||||||||
| Gross Amounts Not Offset in | ||||||||||||||||||||||||
| the Statement of Assets & | ||||||||||||||||||||||||
| Liabilities: | Liabilities | |||||||||||||||||||||||
| Gross | Gross Amounts | Net Amounts of | ||||||||||||||||||||||
| Amounts of | Offset in the | Liabilities Presented | Cash | |||||||||||||||||||||
| Recognized | Statement of Assets | in the Statement of | Financial | Collateral | ||||||||||||||||||||
| Description | Liabilities | & Liabilities | Assets & Liabilities | Instruments | Pledged (1) | Net Amount | ||||||||||||||||||
| Futures Contracts | $ | (257,425 | ) | $ | — | $ | (257,425 | ) | $ | 257,425 | $ | — | $ | — | ||||||||||
| Written Options | (7,682 | ) | — | $ | (7,682 | ) | — | $ | 7,682 | — | ||||||||||||||
| Total | $ | (265,107 | ) | $ | — | $ | (265,107 | ) | $ | 257,425 | $ | 7,682 | $ | — | ||||||||||
| (1) | The amount is limited to the derivative liability balance and accordingly, does not include excess collateral pledged. |
| International Opportunity Bond | ||||||||||||||||||||||||
| Gross Amounts Not Offset in the | ||||||||||||||||||||||||
| Assets: | Statement of Assets & Liabilities | |||||||||||||||||||||||
| Net Amounts of Assets | ||||||||||||||||||||||||
| Gross Amounts | Gross Amounts Offset | Presented in the | ||||||||||||||||||||||
| of Recognized | in the Statement of | Statement of Assets & | Financial | Cash Collateral | ||||||||||||||||||||
| Description | Assets | Assets & Liabilities | Liabilities | Instruments | Pledged | Net Amount | ||||||||||||||||||
| Forward Foreign | ||||||||||||||||||||||||
| Currency Contracts | $ | 39,087 | $ | — | $ | 39,087 | $ | (39,087 | ) | $ | — | $ | — | |||||||||||
| Futures Contracts | 39,157 | — | 39,157 | (10,452 | ) | — | 28,705 | |||||||||||||||||
| Total | $ | 78,244 | $ | — | $ | 78,244 | $ | (49,539 | ) | $ | — | $ | 28,705 | |||||||||||
| Gross Amounts Not Offset in the | ||||||||||||||||||||||||
| Liabilities: | Statement of Assets & Liabilities | |||||||||||||||||||||||
| Net Amounts of | ||||||||||||||||||||||||
| Gross Amounts | Gross Amounts Offset | Liabilities Presented in | ||||||||||||||||||||||
| of Recognized | in the Statement of | the Statement of | Financial | Cash Collateral | ||||||||||||||||||||
| Description | Liabilities | Assets & Liabilities | Assets & Liabilities | Instruments | Pledged (1) | Net Amount | ||||||||||||||||||
| Forward Foreign | ||||||||||||||||||||||||
| Currency Contracts | $ | (95,369 | ) | $ | — | $ | (95,369 | ) | $ | 39,087 | $ | 56,282 | $ | — | ||||||||||
| Futures Contracts | (10,452 | ) | — | (10,452 | ) | 10,452 | — | — | ||||||||||||||||
| Total | $ | (105,821 | ) | $ | — | $ | (105,821 | ) | $ | 49,539 | $ | 56,282 | $ | — | ||||||||||
104
| NOTES TO FINANCIAL STATEMENTS (Unaudited) |
| April 30, 2017 (Continued) |
| International Stock | ||||||||||||||||||||||||
| Gross Amounts Not Offset in | ||||||||||||||||||||||||
| the Statement of Assets & | ||||||||||||||||||||||||
| Assets: | Liabilities | |||||||||||||||||||||||
| Gross | Gross Amounts | Net Amounts of | ||||||||||||||||||||||
| Amounts of | Offset in the | Assets Presented in | Cash | |||||||||||||||||||||
| Recognized | Statement of Assets | the Statement of | Financial | Collateral | ||||||||||||||||||||
| Description | Assets | & Liabilities | Assets & Liabilities | Instruments | Pledged | Net Amount | ||||||||||||||||||
| Forward Foreign | ||||||||||||||||||||||||
| Currency Contracts | $ | 743 | $ | — | $ | 743 | $ | (35 | ) | $ | — | $ | 708 | |||||||||||
| Total | $ | 743 | $ | — | $ | 743 | $ | (35 | ) | $ | — | $ | 708 | |||||||||||
| Gross Amounts Not Offset in | ||||||||||||||||||||||||
| the Statement of Assets & | ||||||||||||||||||||||||
| Liabilities: | Liabilities | |||||||||||||||||||||||
| Gross | Gross Amounts | Net Amounts of | ||||||||||||||||||||||
| Amounts of | Offset in the | Liabilities Presented | Cash | |||||||||||||||||||||
| Recognized | Statement of Assets | in the Statement of | Financial | Collateral | ||||||||||||||||||||
| Description | Liabilities | & Liabilities | Assets & Liabilities | Instruments | Pledged (1) | Net Amount | ||||||||||||||||||
| Forward Foreign | ||||||||||||||||||||||||
| Currency Contracts | $ | (35 | ) | $ | — | $ | (35 | ) | $ | 35 | $ | — | $ | — | ||||||||||
| Total | $ | (35 | ) | $ | — | $ | (35 | ) | $ | 35 | $ | — | $ | — | ||||||||||
| (1) | The amount is limited to the derivative liability balance and accordingly, does not include excess collateral pledged. |
j. Exchange Traded Funds – The Funds may invest in exchange traded funds (“ETFs”). ETFs are a type of index fund bought and sold on a securities exchange. An ETF trades like common stock and represents a fixed portfolio of securities. A Fund may purchase an ETF to temporarily gain exposure to a portion of the U.S. or a foreign market while awaiting purchase of underlying securities. The risks of owning an ETF generally reflect the risks of owning the underlying securities they are designed to track, although the lack of liquidity on an ETF could result in it being more volatile. Additionally, ETFs have fees and expenses that reduce their value.
k. Investment Transactions, Investment Income and Expenses – Investment transactions are recorded on a trade date basis. Realized gains and losses from investment transactions and foreign exchange transactions are calculated using the identified cost method. Dividend income and expense is recorded on the ex-dividend date (“ex-date”) except in the case of certain dividends from foreign securities, which are recorded as soon after the ex-date as the respective Fund, using reasonable diligence, becomes aware of such dividends. Interest income is recorded on an accrual basis. Discounts are accreted and premiums are amortized as adjustments to interest income and the identified cost of investments. Expenses of the Trust that are directly identifiable to a specific fund are charged to that fund. Expenses, which are not readily identifiable to a specific fund, are allocated in such a manner as deemed equitable, taking into consideration the nature and type of expense and the relative sizes of the funds. Each Fund’s income, expenses (other than the class specific distribution fees) and realized and unrealized gains and losses are allocated proportionally each day between the classes based upon the relative net assets of each class.
l. Concentration of Risk – Investing in securities of foreign issuers and currency transactions may involve certain considerations and risks not typically associated with investments in the United States. These risks include revaluation of currencies, adverse fluctuations in foreign currency values and possible adverse political, social and economic developments, including those particular to a specific industry, country or region. These conditions could cause the securities and their markets to be less liquid and prices more volatile than those of comparable U.S. companies and U.S. government securities.
Small capitalization (“small cap”) companies may be more vulnerable than larger capitalization companies to adverse business or economic developments. Small cap companies may also have limited product lines, markets or financial resources, and may be dependent on a relatively small management group. Securities of such companies may be less liquid and more volatile than securities of larger capitalization companies or the market averages in general and therefore may involve greater risk than investing in larger capitalization companies.
The ability of issuers of debt securities held by the Funds to meet their obligations may be affected by economic and political developments particular to a specific industry, country, state or region. Investments in lower grade debt securities are subject to special risks, including greater price volatility and a greater risk of loss of principal and interest.
105
| NOTES TO FINANCIAL STATEMENTS (Unaudited) |
| April 30, 2017 (Continued) |
Certain Funds may invest in collateralized mortgage obligations which are secured by groups of individual mortgages, but are similar to a conventional bond where the investor looks only to the issuer for payment of principal and interest. Although the obligations are recourse obligations to the issuer, the issuer typically has no significant assets, other than assets pledged as collateral for the obligations, and the market value of the collateral, which is sensitive to interest rate movements, may affect the market value of the obligations. A public market for a particular collateralized mortgage obligation may or may not develop and thus, there can be no guarantee of liquidity of an investment in such obligations.
The risk in writing a call option is that a Fund may forgo the opportunity of profit if the market value of the underlying security increases and the option is exercised, although any potential loss is reduced by the amount of option premium received. The risk in writing a put option is that a Fund may be called on to pay the exercise price of the option for a security that has decreased (potentially to zero) in market price, although any potential loss is reduced by the amount of option premium received. Generally, option transactions also involve risks concerning liquidity of the options market. An illiquid market for an option may limit a Fund’s ability to write options or enter closing transactions. As the options written by the Funds are traded on a national exchange, counterparty and credit risk are limited to the failure of the exchange on which the options are traded.
m. Federal Income Taxes – It is each Fund’s policy to continue to comply with all sections of the Internal Revenue Code applicable to regulated investment companies and to distribute all of its taxable income and gains, if any, to its shareholders and therefore, no provision for federal income tax has been made. Each Fund is treated as a separate taxpayer for federal income tax purposes. The Funds recognize the tax benefits of uncertain tax positions only when the position is “more likely than not” to be sustained assuming examination by tax authorities. Management has reviewed the tax positions in the open tax years of 2012 to 2015 and expected to be taken in tax year 2016 and concluded that no liability for unrecognized tax benefits should be recorded related to uncertain tax positions taken in the above open tax years. The Funds identify their major tax jurisdictions as U.S. Federal. The Funds recognize interest and penalties, if any, related to unrecognized tax benefits as income tax expense in the Statements of Operations. During the year, the Funds did not incur any interest or penalties. Generally tax authorities can examine tax returns filed for the last three years.
n. Distributions to Shareholders – It is each Fund’s policy to distribute its respective net investment income and net capital gains, if any, annually except for Monthly Distribution, Corporate/Government Bond, High-Yield Bond, Floating Rate Bond and International Opportunity Bond which will distribute their respective net investment income, if any, monthly. For Dynamic Macro dividends attributable to earned income, if any, will be declared and paid quarterly. Distributions of net investment income and net capital gains are determined in accordance with income tax regulations which may differ from GAAP. Differences in dividends from net investment income per share between the classes are due to service and distribution related expenses. Dividends and distributions to shareholders are recorded on ex-date. Monthly Distribution’s distribution policy is to make twelve monthly distributions to shareholders. The level of monthly distributions (including any return of capital) is not fixed but is expected to be at or near the level of the prime interest rate (“Prime Rate”). Additionally, Monthly Distribution’s distribution policy is not designed to generate, and is not expected to result in distributions that equal a fixed percentage of Monthly Distribution’s current net asset value per share. Shareholders receiving periodic payments from Monthly Distribution may be under the impression that they are receiving net profits. However, all or a portion of a distribution may consist of a return of capital. Shareholders should not assume that the source of a distribution from Monthly Distribution is net profit.
o. Indemnification – The Trust indemnifies its officers and Trustees for certain liabilities that may arise from the performance of their duties to the Trust. Additionally, in the normal course of business, each Fund enters into contracts that contain a variety of representations and warranties and which provide general indemnities. A Fund’s maximum exposure under these arrangements is unknown, as this would involve future claims that may be made against the Fund that have not yet occurred. However, based on experience, the Funds expect the risk of loss due to these warranties and indemnities to be remote.
| 3. | INVESTMENT ADVISORY FEES AND OTHER TRANSACTIONS WITH AFFILIATES |
| a. | Management Fees – Dunham & Associates serves as each Fund’s investment adviser. Pursuant to an investment advisory agreement with the Trust, on behalf of the Funds, Dunham & Associates, subject to the supervision of the Board and in conformity with the stated policies of the Funds, manages the operations of the Funds. The Adviser, subject to the review and approval of the Board, selects Sub-Advisers for each Fund and supervises and monitors the performance of each Sub-Adviser. As compensation for its services, each Fund pays the Adviser a fixed fee, accrued daily and paid monthly, based on each Fund’s respective average daily net assets. The Adviser has entered into a Sub-Advisory Agreement with each Sub-Adviser and the Trust, on behalf of each Fund. Under the Sub-Advisory Agreements, each Fund pays the Sub-Adviser a “Fulcrum Fee.” A Fulcrum Fee is a performance fee whereby the Sub-Adviser is rewarded when out-performing, or is penalized when under-performing, a Fund’s benchmark index. As a result of the Fulcrum Fee arrangement, the total annual management fee for a Fund will have a range as shown in the table below. |
106
| NOTES TO FINANCIAL STATEMENTS (Unaudited) |
| April 30, 2017 (Continued) |
| Adviser’s | Sub-Adviser’s | |||||
| Management Fee | Portion | Portion | ||||
| Floating Rate Bond | 0.70% – 1.10% | 0.60% | 0.10% – 0.50% | |||
| Corporate/Government Bond | 0.65% – 0.95% | 0.50% | 0.15% – 0.45% | |||
| Monthly Distribution | 0.90% – 1.70% | 0.65% | 0.25% – 1.05% | |||
| Dynamic Macro | 1.05% – 1.75% | 0.65% | 0.40% – 1.10% | |||
| High-Yield Bond | 0.80% – 1.20% | 0.60% | 0.20% – 0.60% | |||
| Alternative Dividend | 0.95% – 1.55% | 0.65% | 0.30% - 0.90% | |||
| International Opportunity Bond | 0.80% – 1.30% | 0.60% | 0.20% – 0.70% | |||
| Appreciation & Income | 0.85% – 1.25% | 0.65% | 0.20% – 0.60% | |||
| Large Cap Value | 0.75% – 1.15% | 0.65% | 0.10% – 0.50% | |||
| Focused Large Cap Grow th | 0.85% – 1.15% | 0.65% | 0.20% – 0.50% | |||
| International Stock | 0.95% – 1.65% | 0.65% | 0.30% – 1.00% | |||
| Real Estate Stock | 0.75% – 1.35% | 0.65% | 0.10% – 0.70% | |||
| Small Cap Value | 0.75% – 1.45% | 0.65% | 0.10% – 0.80% | |||
| Emerging Markets Stock | 0.75% – 1.55% | 0.65% | 0.10% – 0.90% | |||
| Small Cap Growth | 0.65% – 1.65% | 0.65% | 0.00% – 1.00% |
Each Fund’s Sub-Advisory Fulcrum Fee is calculated daily using an annual base Sub-Advisory fee of a specified amount of the average daily net assets of the Fund (the “Base Fee”), adjusted by the Fund’s Class N share performance relative to the Fund’s benchmark (the “Performance Fee”). Depending on a Fund’s net performance versus its benchmark, the Sub-Adviser will receive a fee adjustment in accordance with a formula that equates a percentage of out- or under-performance to a percentage of fee increases or decreases, respectively. In addition, most Fulcrum Fees employ a “null zone” around the base fee, whereby small differences in performance versus the benchmark will not trigger a fee increase or decrease. During the first 12 months of the Fulcrum Fee arrangement, the Performance Fee is calculated daily from inception date of the agreement to the calculation date and is applied to the average daily net assets of the Funds during the calculation period. After the initial 12 months, the Performance Fee is calculated on a daily basis based on comparative performance over a rolling 12-month period. All Funds, with the exception of Alternative Dividend which is in its initial year of the Fulcrum Fee arrangement, are calculating Performance Fees on a rolling 12-month basis as of April 30, 2017.
Depending on the particular Sub-Advisory Agreement, the Performance Fee can adjust the Base Fee up or down by as much as 100% of the Base Fee, such that the Sub-Advisory fee can vary anywhere from 0.00% (the “Minimum Fee”) to twice the Base Fee (the “Maximum Fee”). However, because each such Sub-Advisory Agreement requires that the Sub-Adviser only be paid out the monthly Minimum Fee during the first year (in most cases, 0.10%), the Sub-Adviser, in most cases, will receive less compensation until the end of the first year. At the end of the first year of the agreement, the Sub-Adviser will be paid a lump sum that reflects the accrued Fulcrum Fee over the year, less any Minimum Fees paid out during the first year. Therefore, in the first year, the Fulcrum Fee methodology has three elements: 1) daily calculation of the Performance Fee and daily accrual of the Fulcrum Fee; 2) monthly payment of the Minimum Fee only (if any); and 3) a lump sum payment at the end of the initial 12-month period of the accrued Fulcrum Fee less the Minimum Fee.
By virtue of using average daily net assets over a “rolling” 12-month period for purposes of calculating the Performance Fee while using average daily net assets for the most recent month for purposes of calculating the Base Fee, the actual total Fulcrum Fee paid by the Fund to the Sub-Adviser may be higher or lower than the maximum or minimum annual rates described above if the average daily net assets do not remain constant during the rolling 12-month period. If the Fund is significantly underperforming versus the Index and the Fund’s net assets have declined significantly, the monthly total Fulcrum Fee can be a negative number (although the performance fee rate can never be negative, the Performance Fee can be negative). In such instances, if the negative Fulcrum Fee is not earned back or offset the following month, the Sub-Adviser must reimburse the Fund the amount of the negative Fulcrum Fee within an agreed upon time. Likewise, in the case where the Fund has significantly underperformed versus the Index but net assets have increased significantly, the monthly total Fulcrum Fee can be positive although the performance fee rate may be 0.00%. In such instances, the Fund will pay the Sub-Adviser the monthly Fulcrum Fee.
107
| NOTES TO FINANCIAL STATEMENTS (Unaudited) |
| April 30, 2017 (Continued) |
The table below lists the current Sub-Advisers along with their Fulcrum Fee arrangements.
| Null | Minimum | Maximum | ||||
| Fund | Sub-Adviser | Benchmark | Base Fee | Zone | Fee | Fee |
| Floating Rate Bond | New fleet Asset Management, LLC | S&P/LSTA Leveraged Loan Index | 0.30% | +/- 0.00% | 0.10% | 0.50% |
| Corporate/Government Bond | New fleet Asset Management, LLC | Barclays Aggregate Bond Index | 0.30% | +/- 0.10% | 0.15% | 0.45% |
| Monthly Distribution | Perella Weinberg Partners | IQ Hedge Market Neutral Beta Index | 0.65% | +/- 0.40% | 0.25% | 1.05% |
| Dynamic Macro | Mellon Capital Management Corporation | IQ Hedge Global Macro Beta Index | 0.75% | +/- 0.00% | 0.40% | 1.10% |
| High-Yield Bond | PENN Capital Management Co., Inc. | BofA Merrill Lynch U.S. Non-Distressed BB-B High-Yield Index | 0.40% | +/- 0.20% | 0.20% | 0.60% |
| Alternative Dividend | Sungarden Fund Management, LLC | Dow Jones Moderately Conservative Index | 0.60% | +/- 0.00% | 0.30% | 0.90% |
| International Opportunity Bond | Rogge Global Partners Limited | Barclays Global ex US Aggregate Bond Index | 0.45% | +/- 0.00% | 0.20% | 0.70% |
| Appreciation & Income | PENN Capital Management Co., Inc. | Merrill Lynch All Convertibles All Qualities Index | 0.40% | +/- 0.00% | 0.20% | 0.60% |
| Large Cap Value | Rothschild Asset Management, Inc. | Russell 1000 Value Index | 0.30% | +/- 0.00% | 0.10% | 0.50% |
| Focused Large Cap Growth | The Ithaka Group, LLC | Russell 1000 Growth Index | 0.35% | +/- 0.30% | 0.20% | 0.50% |
| International Stock | Arrow street Capital L.P. | MSCI All Country World Index ex USA (Net) | 0.65% | +/- 0.20% | 0.30% | 1.00% |
| Real Estate Stock | Barings Real Estate Advisers LLC | FTSE NAREIT All REITs Index | 0.40% | +/- 0.00% | 0.10% | 0.70% |
| Small Cap Value | Piermont Capital Management, LLC | Russell 2000 Value Index | 0.45% | +/- 0.00% | 0.10% | 0.80% |
| Emerging Markets Stock | Bailard, Inc. | MSCI Emerging Markets Index USD (Net) | 0.50% | +/- 0.00% | 0.10% | 0.90% |
| Small Cap Growth | Pier Capital, LLC | Russell 2000 Growth Index | 0.50% | +/- 0.20% | 0.00% | 1.00% |
b. Administration, Fund Accounting and Transfer Agency Fees – Gemini Fund Services, LLC (“GFS” or the “Administrator”) serves as the administrator, fund accountant and transfer agent for the Funds. GFS receives from each Fund a monthly fee based on the combined average daily net assets at the following annual rates: 0.07% on the first $250 million of average net assets; 0.06% on average net assets between $250 million and $500 million; 0.05% on average net assets over $500 million; 0.3% on average net assets over $1 billion. Such fees are subject to an annual minimum of $400,000 in total for the entire Trust. For providing fund accounting services, the Administrator receives from each Fund a monthly fee based on the combined average daily net assets at the following rates: 0.03% on the first $500 million of average net assets; 0.01% on average net assets over $500 million. Such fees are subject to an annual minimum $300,000 in total for the entire Trust. For providing transfer agent services, the Administrator receives from the Trust a minimum annual fee of $200,000.
Pursuant to the terms of a Custody Administration Agreement, Monthly Distribution pays GFS a monthly fee of $300.
Blu Giant, LLC, (“Blu Giant”), (formerly “Gemcom”), an affiliate of GFS, provides EDGAR conversion and filing services as well as some print management services for the Funds on an ad-hoc basis. For the provision of these services, Blu Giant receives customary fees from the Funds.
An officer of GFS is also an officer of the Trust and is not paid by the Trust.
c. Distributor – The Distributor of the Funds is Dunham & Associates (the “Distributor”). The Funds have adopted a Plan of Distribution (the “Plan”) pursuant to Rule 12b-1 under the 1940 Act, for Class A and Class C shares. The Plan provides for the monthly payment of a distribution fee to the Distributor or other entities at an annualized rate of 0.75% for the equity Funds and 0.50% for the fixed-income Funds, based on the average daily net assets attributable to Class C shares, and 0.25% of the average daily net assets attributable to Class A shares. In addition, the Funds have adopted a Shareholder Servicing Plan which provides for the payment of a shareholder service fee at an annualized rate of up to 0.25% of the average daily net assets attributable to the Class C shares. Class N shares do not pay 12b-1 distribution or shareholder servicing fees.
d. Trustees’ Fees – The Board has approved the following Trustee compensation schedule: Each Trustee who is not an interested person of the Trust will receive $6,250 for each Board meeting attended in-person; $1,000 for all telephonic Board meetings; $1,000 for in-person committee meetings and $500 for telephonic committee meetings, unless the committee meeting is on the same day
108
| NOTES TO FINANCIAL STATEMENTS (Unaudited) |
| April 30, 2017 (Continued) |
as a Board meeting, in which case the Trustee will not be compensated for the committee meeting. The Funds also reimburse each such Trustee for travel and other expenses incurred in attending meetings of the Board.
With the exception of the Trust’s Chief Compliance Officer as discussed below, officers of the Trust and Trustees who are interested persons of the Trust do not receive any compensation from the Trust or any other Funds managed by the Adviser. The Trust has agreed to pay the Adviser a fee in the amount of $150,000 per annum plus an annual discretionary bonus as may be awarded as compensation for providing an officer or employee of the Adviser to serve as Chief Compliance Officer for the Funds (each Fund bearing its pro rata share of the fee), plus the cost of reasonable expenses related to the performance of the Chief Compliance Officer’s duties, including travel expenses, and may compensate the Adviser for the time of other officers or employees of the Adviser who serve in other compliance capacities for the Funds.
e. Commission Recapture – The following funds in the Trust had portfolio trades executed with a certain broker pursuant to a commission recapture agreement under which certain portfolio expenses could be paid by such broker or rebates could be given to each participating Fund. For the six months ended April 30, 2017, the amount received by the participating Funds under this arrangement were: Alternative Dividend - $52,140, Focused Large Cap Growth - $6,796, Small Cap Value - $5,268 and Small Cap Growth - $1,520.
| 4. | INVESTMENT TRANSACTIONS |
The cost of purchases and the proceeds from sales of investments, other than short-term investments, for the six months ended April 30, 2017 were as follows:
| Purchases | Sale Proceeds | Proceeds of | ||||||||||||||
| (excluding U.S. | (excluding U.S. | Purchases of | U.S. | |||||||||||||
| Government | Government | U.S. Government | Government | |||||||||||||
| Fund | Securities) | Securities) | Securities | Securities | ||||||||||||
| Floating Rate Bond | $ | 83,419,985 | $ | 63,098,857 | $ | — | $ | — | ||||||||
| Corporate/Government Bond | 3,347,509 | 3,620,227 | 6,857,398 | 6,505,955 | ||||||||||||
| Monthly Distribution | 310,307,312 | 366,437,927 | — | — | ||||||||||||
| Dynamic Macro | 616,900 | 1,738,097 | — | — | ||||||||||||
| High-Yield Bond | 27,781,631 | 28,227,000 | — | — | ||||||||||||
| Alternative Dividend | 95,834,021 | 81,983,352 | ||||||||||||||
| International Opportunity Bond | 8,031,403 | 17,226 | — | — | ||||||||||||
| Appreciation & Income | 16,948,160 | 21,388,777 | — | — | ||||||||||||
| Large Cap Value | 19,260,612 | 19,549,438 | — | — | ||||||||||||
| Focused Large Cap Growth | 14,967,531 | 16,001,726 | — | — | ||||||||||||
| International Stock | 48,347,731 | 52,766,905 | — | — | ||||||||||||
| Real Estate Stock | 15,835,946 | 20,532,480 | — | — | ||||||||||||
| Small Cap Value | 15,953,155 | 21,058,999 | — | — | ||||||||||||
| Emerging Markets Stock | 10,765,446 | 15,970,952 | — | — | ||||||||||||
| Small Cap Growth | 29,622,026 | 29,977,160 | — | — | ||||||||||||
Transactions in option contracts purchased/written during the six months ended April 30, 2017 were as follows:
Monthly Distribution
| Options Purchased | Options Written | |||||||||||||||
| Contracts | Premium | Contracts | Premium | |||||||||||||
| Outstanding at October 31, 2016 | 29,340 | $ | 1,509,005 | 29,976 | $ | 6,055,973 | ||||||||||
| Options purchased/written during period | 63,387 | 4,528,153 | 87,473 | 18,951,681 | ||||||||||||
| Options exercised during period | — | — | (17,913 | ) | (4,754,870 | ) | ||||||||||
| Options expired during period | (60,669 | ) | (2,774,898 | ) | (11,606 | ) | (2,038,921 | ) | ||||||||
| Options closed during period | (31,958 | ) | (3,042,556 | ) | (85,844 | ) | (17,700,996 | ) | ||||||||
| Outstanding at April 30, 2017 | 100 | $ | 219,704 | 2,086 | $ | 512,867 | ||||||||||
109
| NOTES TO FINANCIAL STATEMENTS (Unaudited) |
| April 30, 2017 (Continued) |
Dynamic Macro
| Options Purchased | Options Written | |||||||||||||||
| Contracts | Premium | Contracts | Premium | |||||||||||||
| Outstanding at October 31, 2016 | 527 | $ | 2,005,687 | 70 | $ | 27,685 | ||||||||||
| Options purchased/written during period | 2,014 | 10,379,496 | 327 | 60,639 | ||||||||||||
| Options exercised during period | — | — | — | — | ||||||||||||
| Options expired during period | (871 | ) | (562,695 | ) | — | — | ||||||||||
| Options closed during period | (973 | ) | (8,399,606 | ) | (260 | ) | (692 | ) | ||||||||
| Outstanding at April 30, 2017 | 697 | $ | 3,422,882 | 137 | $ | 87,632 | ||||||||||
| Alternative Dividend | ||||||||||||||||
| Options Purchased | ||||||||||||||||
| Contracts | Premium | |||||||||||||||
| Outstanding at October 31, 2016 | 1,049 | $ | 782,754 | |||||||||||||
| Options purchased/written during period | 9,696 | 2,276,958 | ||||||||||||||
| Options exercised during period | — | — | ||||||||||||||
| Options expired during period | (2,219 | ) | (303,171 | ) | ||||||||||||
| Options closed during period | (8,140 | ) | (2,267,084 | ) | ||||||||||||
| Outstanding at April 30, 2017 | 386 | $ | 489,457 | |||||||||||||
| 5. | AGGREGATE UNREALIZED APPRECIATION AND DEPRECIATION – TAX BASIS |
The identified cost of investments in securities owned by each Fund for federal income tax purposes, and its respective gross unrealized appreciation and depreciation at April 30, 2017, were as follows:
| Gross | Gross | Net Unrealized | ||||||||||||||
| Tax | Unrealized | Unrealized | Appreciation | |||||||||||||
| Fund | Cost | Appreciation | Depreciation | (Depreciation) | ||||||||||||
| Floating Rate Bond | $ | 141,464,175 | $ | 1,461,713 | $ | (813,352 | ) | $ | 648,361 | |||||||
| Corporate/Government Bond | 62,627,642 | 1,153,899 | (622,432 | ) | 531,467 | |||||||||||
| Monthly Distribution | 161,826,791 | 6,360,405 | (6,638,395 | ) | (277,990 | ) | ||||||||||
| Dynamic Macro | 38,918,205 | 3,249,624 | (96,000 | ) | 3,153,624 | |||||||||||
| High-Yield Bond | 119,359,697 | 4,864,684 | (234,453 | ) | 4,630,231 | |||||||||||
| Alternative Dividend | 37,717,557 | 733,999 | (761,427 | ) | (27,428 | ) | ||||||||||
| International Opportunity Bond | 29,087,572 | 373,269 | (1,175,874 | ) | (802,605 | ) | ||||||||||
| Appreciation & Income | 18,585,826 | 1,386,973 | (417,193 | ) | 969,780 | |||||||||||
| Large Cap Value | 63,667,637 | 10,368,492 | (530,217 | ) | 9,838,275 | |||||||||||
| Focused Large Cap Growth | 67,839,269 | 21,887,397 | (1,371,681 | ) | 20,515,716 | |||||||||||
| International Stock | 90,270,340 | 13,004,216 | (1,087,599 | ) | 11,916,617 | |||||||||||
| Real Estate Stock | 39,206,453 | 5,025,006 | (1,154,516 | ) | 3,870,490 | |||||||||||
| Small Cap Value | 34,579,056 | 2,895,671 | (893,665 | ) | 2,002,006 | |||||||||||
| Emerging Markets Stock | 48,494,598 | 11,185,119 | (788,718 | ) | 10,396,401 | |||||||||||
| Small Cap Growth | 44,737,602 | 5,893,349 | (1,074,770 | ) | 4,818,579 | |||||||||||
| 6. | FORWARD FOREIGN CURRENCY CONTRACTS |
At April 30, 2017, Monthly Distribution, International Opportunity Bond, Dynamic Macro and International Stock had the following open forward foreign currency contracts:
Monthly Distribution:
| Settlement | U.S. Dollar | Unrealized | ||||||||||||||
| Foreign Currency | Date | Counterparty | Local Currency | Value | Appreciation | |||||||||||
| To Sell: | ||||||||||||||||
| Canadian Dollar | 6/4/2017 | JP Morgan | 2,750,000 | 2,015,959 | 25,130 | |||||||||||
| Total | $ | 25,130 | ||||||||||||||
110
| NOTES TO FINANCIAL STATEMENTS (Unaudited) |
| April 30, 2017 (Continued) |
International Opportunity Bond:
| Unrealized | ||||||||||||||||
| Settlement | Local | U.S. Dollar | Appreciation | |||||||||||||
| Foreign Currency | Date | Counterparty | Currency | Value | (Depreciation) | |||||||||||
| To Buy: | ||||||||||||||||
| Australian Dollar | 6/28/2017 | Barclays | 852,728 | $ | 637,038 | $ | (7,385 | ) | ||||||||
| Australian Dollar | 6/28/2017 | Citigroup | 52,626 | 39,314 | (456 | ) | ||||||||||
| Canadian Dollar | 6/28/2017 | Barclays | 231,641 | 169,441 | (3,385 | ) | ||||||||||
| Canadian Dollar | 6/28/2017 | Citigroup | 471,811 | 345,389 | (6,913 | ) | ||||||||||
| Euro | 6/28/2017 | Citigroup | 18,717 | 20,445 | 409 | |||||||||||
| Euro | 6/28/2017 | Credit Suiise First Boston | 50,000 | 54,615 | 1,009 | |||||||||||
| Israeli Shekel | 7/11/2017 | Citigroup | 270,000 | 74,772 | 1,559 | |||||||||||
| Japanese Yen | 6/28/2017 | Barclays | 74,260,130 | 667,825 | (3,871 | ) | ||||||||||
| Japanese Yen | 6/28/2017 | Citigroup | 229,317,875 | 2,062,269 | (11,711 | ) | ||||||||||
| Mexican Peso | 7/11/2017 | Barclays | 664,091 | 34,575 | 1,835 | |||||||||||
| Mexican Peso | 7/11/2017 | Citigroup | 71,220 | 3,708 | 45 | |||||||||||
| New Zealand Dollar | 6/28/2017 | Barclays | 107,497 | 73,685 | (1,053 | ) | ||||||||||
| Russian Ruble | 7/11/2017 | Citigroup | 3,143,000 | 54,250 | 1,648 | |||||||||||
| Singapore Dollar | 7/11/2017 | Barclays | 120,000 | 85,920 | 1,000 | |||||||||||
| South African Rand | 7/11/2017 | Barclays | 70,000 | 5,165 | (60 | ) | ||||||||||
| South African Rand | 7/11/2017 | Citigroup | 1,490,000 | 109,947 | (1,278 | ) | ||||||||||
| $ | 4,438,358 | $ | (28,607 | ) | ||||||||||||
International Opportunity Bond:
| Unrealized | ||||||||||||||||
| Settlement | Local | U.S. Dollar | Appreciation | |||||||||||||
| Foreign Currency | Date | Counterparty | Currency | Value | (Depreciation) | |||||||||||
| To Sell: | ||||||||||||||||
| Euro | 6/28/2017 | Barclays | (660,331 | ) | $ | (721,273 | ) | $ | (14,458 | ) | ||||||
| Euro | 6/28/2017 | Citigroup | (1,762,413 | ) | (1,925,067 | ) | (38,493 | ) | ||||||||
| Japanese Yen | 6/28/2017 | Citigroup | (38,933,898 | ) | (350,135 | ) | 2,351 | |||||||||
| Mexican Peso | 7/11/2017 | Barclays | (664,091 | ) | (34,575 | ) | (446 | ) | ||||||||
| Mexican Peso | 7/11/2017 | Credit Suisse | (71,220 | ) | (3,708 | ) | (48 | ) | ||||||||
| Mexican Peso | 7/11/2017 | Citigroup | (7,045,473 | ) | (366,817 | ) | (4,705 | ) | ||||||||
| South Korean Won | 7/11/2017 | Barclays | (68,125,000 | ) | (59,917 | ) | 37 | |||||||||
| $ | (3,461,492 | ) | $ | (55,762 | ) | |||||||||||
| Local Currency | Local Currency | U.S. Dollar | U.S. Dollar | Unrealized | ||||||||||||||||||||||
| Settlement | Amount Purchased | Amount Purchased | Market Value | Market Value | Appreciation | |||||||||||||||||||||
| Foreign Currency | Date | Counterparty | Buy | Sell | Buy | Sell | (Depreciation) | |||||||||||||||||||
| To Buy: | To Sell: | |||||||||||||||||||||||||
| Czech Koruna | Euro | 7/11/2017 | Barclays | $ | 1,121,861 | $ | (41,759 | ) | $ | 45,752 | $ | (45,644 | ) | $ | 108 | |||||||||||
| Euro | Danish Krone | 6/28/2017 | Barclays | 142,281 | (1,057,871 | ) | 155,412 | (155,389 | ) | 23 | ||||||||||||||||
| Euro | Danish Krone | 6/28/2017 | Citigroup | 50,410 | (374,790 | ) | 55,063 | (55,052 | ) | 11 | ||||||||||||||||
| Euro | Japanese Yen | 6/28/2017 | Credit Suisse First Boston | 72,233 | (8,411,000 | ) | 78,899 | (75,641 | ) | 3,258 | ||||||||||||||||
| Euro | Swedish Krona | 6/28/2017 | Barclays | 225,503 | (2,159,481 | ) | 246,315 | (244,654 | ) | 1,661 | ||||||||||||||||
| Euro | Swedish Krona | 6/28/2017 | Citigroup | 18,320 | (175,437 | ) | 20,011 | (19,876 | ) | 135 | ||||||||||||||||
| Euro | Swiss Franc | 6/28/2017 | Citigroup | 151,685 | (162,076 | ) | 165,684 | (163,425 | ) | 2,259 | ||||||||||||||||
| British Pound | Euro | 6/28/2017 | Citigroup | 1,056,633 | (1,233,995 | ) | 1,369,409 | (1,347,881 | ) | 21,528 | ||||||||||||||||
| Norwegian Krone | Euro | 6/28/2017 | Citigroup | 490,921 | (53,389 | ) | 57,347 | (58,316 | ) | (969 | ) | |||||||||||||||
| Polish Zloty | Euro | 7/11/2017 | Barclays | 36,768 | (8,469 | ) | 9,468 | (9,257 | ) | 211 | ||||||||||||||||
| Swedish Krona | Euro | 6/28/2017 | Citigroup | 179,239 | (18,717 | ) | 20,307 | (20,445 | ) | (138 | ) | |||||||||||||||
| $ | 3,545,854 | $ | (13,696,984 | ) | $ | 2,223,667 | $ | (2,195,580 | ) | $ | 28,087 | |||||||||||||||
111
| NOTES TO FINANCIAL STATEMENTS (Unaudited) |
| April 30, 2017 (Continued) |
International Stock:
| Settlement | Local | U.S. Dollar | Unrealized | |||||||||||||
| Foreign Currency | Date | Counterparty | Currency | Value | Appreciation | |||||||||||
| To Buy: | ||||||||||||||||
| Japanese Yen | 5/2/2017 | JP Morgan Chase | 23,920,511 | $ | 214,591 | $ | 26 | |||||||||
International Stock:
| Unrealized | ||||||||||||||||
| Settlement | Local | U.S. Dollar | Appreciation | |||||||||||||
| Foreign Currency | Date | Counterparty | Currency | Value | (Depreciation) | |||||||||||
| To Sell: | ||||||||||||||||
| Japanese Yen | 5/1/2017 | JP Morgan Chase | (24,611,606 | ) | $ | (220,791 | ) | $ | (35 | ) | ||||||
| Thai Baht | 5/2/2017 | UBS | (2,423,128 | ) | (70,053 | ) | 407 | |||||||||
| Thai Baht | 5/3/2017 | UBS | (2,622,858 | ) | (75,825 | ) | 310 | |||||||||
| $ | (366,669 | ) | $ | 682 | ||||||||||||
| 7. | SHARES OF BENEFICIAL INTEREST |
At April 30, 2017, each Fund had an unlimited number of shares authorized with no par value.
Following is a summary of shareholder transactions for each Fund for the six months ended April 30, 2017 and the year ended October 31, 2016, respectively:
For the six months ended April 30, 2017:
| Class N Shares | Class A Shares | |||||||||||||||||||||||||||||||
| Net Increase | Net Increase | |||||||||||||||||||||||||||||||
| Distributions | (Decrease) in | Distributions | (Decrease) in | |||||||||||||||||||||||||||||
| Fund | Issued | Reinvested | Redeemed | Shares | Issued | Reinvested | Redeemed | Shares | ||||||||||||||||||||||||
| Floating Rate Bond | 2,898,043 | 216,168 | (1,094,210 | ) | 2,020,001 | 492,947 | 22,438 | (201,046 | ) | 314,339 | ||||||||||||||||||||||
| Corporate/Government Bond | 460,535 | 42,275 | (513,537 | ) | (10,727 | ) | 101,482 | 3,835 | (62,574 | ) | 42,743 | |||||||||||||||||||||
| Monthly Distribution | 708,578 | 80,241 | (546,051 | ) | 242,768 | 200,034 | 19,798 | (409,729 | ) | (189,897 | ) | |||||||||||||||||||||
| Dynamic Macro | 643,414 | — | (393,431 | ) | 249,983 | 157,331 | — | (66,143 | ) | 91,188 | ||||||||||||||||||||||
| High-Yield Bond | 1,061,329 | 219,389 | (1,214,006 | ) | 66,712 | 209,569 | 16,887 | (221,423 | ) | 5,033 | ||||||||||||||||||||||
| Alternative Dividend | 1,148,515 | 41,105 | (160,642 | ) | 1,028,978 | 2,947 | 16 | (1 | ) | 2,962 | ||||||||||||||||||||||
| International Opportunity Bond | 495,379 | 28,837 | (407,735 | ) | 116,481 | 88,882 | 2,538 | (37,842 | ) | 53,578 | ||||||||||||||||||||||
| Appreciation & Income | 203,261 | 63,649 | (817,886 | ) | (550,976 | ) | 45,968 | 10,480 | (169,915 | ) | (113,467 | ) | ||||||||||||||||||||
| Large Cap Value | 369,085 | 60,421 | (443,165 | ) | (13,659 | ) | 121,855 | 8,062 | (108,918 | ) | 20,999 | |||||||||||||||||||||
| Focused Large Cap Growth | 724,295 | — | (869,385 | ) | (145,090 | ) | 168,120 | — | (103,662 | ) | 64,458 | |||||||||||||||||||||
| International Stock | 503,147 | — | (821,535 | ) | (318,388 | ) | 167,583 | — | (122,448 | ) | 45,135 | |||||||||||||||||||||
| Real Estate Stock | 247,013 | 283,995 | (244,928 | ) | 286,080 | 57,892 | 43,357 | (348,111 | ) | (246,862 | ) | |||||||||||||||||||||
| Small Cap Value | 171,847 | 53,196 | (469,289 | ) | (244,246 | ) | 112,090 | 10,937 | (144,848 | ) | (21,821 | ) | ||||||||||||||||||||
| Emerging Markets Stock | 377,616 | 64,904 | (696,367 | ) | (253,847 | ) | 144,583 | 8,004 | (146,752 | ) | 5,835 | |||||||||||||||||||||
| Small Cap Growth | 278,434 | — | (404,053 | ) | (125,619 | ) | 134,831 | — | (126,297 | ) | 8,534 | |||||||||||||||||||||
112
| NOTES TO FINANCIAL STATEMENTS (Unaudited) |
| April 30, 2017 (Continued) |
| Class C Shares | ||||||||||||||||
| Net Increase | ||||||||||||||||
| Distributions | (Decrease) | |||||||||||||||
| Fund | Issued | Reinvested | Redeemed | in Shares | ||||||||||||
| Floating Rate Bond | 289,569 | 8,613 | (177,650 | ) | 120,532 | |||||||||||
| Corporate/Government Bond | 39,548 | 2,081 | (29,887 | ) | 11,742 | |||||||||||
| Monthly Distribution | 129,051 | 24,895 | (257,960 | ) | (104,014 | ) | ||||||||||
| Dynamic Macro | 26,224 | — | (393,431 | ) | (367,207 | ) | ||||||||||
| High-Yield Bond | 84,730 | 11,330 | (105,803 | ) | (9,743 | ) | ||||||||||
| Alternative Dividend | 43,224 | 862 | (1,153 | ) | 42,933 | |||||||||||
| International Opportunity Bond | 30,580 | 1,484 | (14,153 | ) | 17,911 | |||||||||||
| Appreciation & Income | 12,689 | 8,202 | (49,015 | ) | (28,124 | ) | ||||||||||
| Large Cap Value | 35,535 | 3,757 | (57,954 | ) | (18,662 | ) | ||||||||||
| Focused Large Cap Growth | 91,802 | — | (52,672 | ) | 39,130 | |||||||||||
| International Stock | 29,290 | — | (108,168 | ) | (78,878 | ) | ||||||||||
| Real Estate Stock | 14,859 | 32,299 | (37,381 | ) | 9,777 | |||||||||||
| Small Cap Value | 38,977 | 5,477 | (35,673 | ) | 8,781 | |||||||||||
| Emerging Markets Stock | 22,035 | 3,518 | (90,244 | ) | (64,691 | ) | ||||||||||
| Small Cap Growth | 34,533 | — | (20,503 | ) | 14,030 | |||||||||||
Year Ended October 31, 2016:
| Class N Shares | Class A Shares | |||||||||||||||||||||||||||||||
| Net Increase | Net Increase | |||||||||||||||||||||||||||||||
| Distributions | (Decrease) in | Distributions | (Decrease) in | |||||||||||||||||||||||||||||
| Fund | Issued | Reinvested | Redeemed | Shares | Issued | Reinvested | Redeemed | Shares | ||||||||||||||||||||||||
| Floating Rate Bond | 3,245,963 | 283,827 | (1,457,613 | ) | 2,072,177 | 518,054 | 29,530 | (317,202 | ) | 230,382 | ||||||||||||||||||||||
| Corporate/Government Bond | 889,311 | 88,721 | (581,522 | ) | 396,510 | 212,107 | 8,751 | (221,945 | ) | (1,087 | ) | |||||||||||||||||||||
| Monthly Distribution | 930,533 | 143,378 | (1,296,398 | ) | (222,487 | ) | 308,917 | 49,761 | (1,137,113 | ) | (778,435 | ) | ||||||||||||||||||||
| Dynamic Macro | 1,014,094 | — | (920,799 | ) | 93,295 | 272,164 | — | (198,785 | ) | 73,379 | ||||||||||||||||||||||
| High-Yield Bond | 1,299,855 | 435,039 | (1,812,374 | ) | (77,480 | ) | 290,157 | 46,309 | (312,037 | ) | 24,429 | |||||||||||||||||||||
| Alternative Dividend | 2,069,758 | — | (28,014 | ) | 2,041,744 | 1 | — | — | 1 | |||||||||||||||||||||||
| International Opportunity Bond | 573,174 | 2,986 | (1,516,131 | ) | (939,971 | ) | 101,064 | 159 | (234,584 | ) | (133,361 | ) | ||||||||||||||||||||
| Appreciation & Income | 363,748 | 145,362 | (715,847 | ) | (206,737 | ) | 95,024 | 23,349 | (147,881 | ) | (29,508 | ) | ||||||||||||||||||||
| Large Cap Value | 616,688 | 968,124 | (632,723 | ) | 952,089 | 155,383 | 138,870 | (160,657 | ) | 133,596 | ||||||||||||||||||||||
| Focused Large Cap Growth | 774,330 | 17,116 | (597,687 | ) | 193,759 | 284,636 | 3,304 | (197,810 | ) | 90,130 | ||||||||||||||||||||||
| International Stock | 841,227 | 3,084 | (726,387 | ) | 117,924 | 251,540 | — | (160,223 | ) | 91,317 | ||||||||||||||||||||||
| Real Estate Stock | 267,773 | 184,156 | (796,210 | ) | (344,281 | ) | 85,202 | 57,555 | (170,890 | ) | (28,133 | ) | ||||||||||||||||||||
| Small Cap Value | 235,460 | 53,816 | (291,167 | ) | (1,891 | ) | 70,193 | 8,834 | (80,919 | ) | (1,892 | ) | ||||||||||||||||||||
| Emerging Markets Stock | 913,954 | 25,824 | (867,084 | ) | 72,694 | 245,332 | 1,850 | (129,758 | ) | 117,424 | ||||||||||||||||||||||
| Small Cap Growth | 602,298 | 124,708 | (387,203 | ) | 339,803 | 77,497 | 24,091 | (109,242 | ) | (7,654 | ) | |||||||||||||||||||||
| Class C Shares | ||||||||||||||||
| Net Increase | ||||||||||||||||
| Distributions | (Decrease) | |||||||||||||||
| Fund | Issued | Reinvested | Redeemed | in Shares | ||||||||||||
| Floating Rate Bond | 177,846 | 11,030 | (92,549 | ) | 96,327 | |||||||||||
| Corporate/Government Bond | 67,852 | 5,244 | (100,458 | ) | (27,362 | ) | ||||||||||
| Monthly Distribution | 211,987 | 51,254 | (585,842 | ) | (322,601 | ) | ||||||||||
| Dynamic Macro | 109,872 | — | (81,233 | ) | 28,639 | |||||||||||
| High-Yield Bond | 160,314 | 35,061 | (371,843 | ) | (176,468 | ) | ||||||||||
| Alternative Dividend | 35,692 | — | (5 | ) | 35,687 | |||||||||||
| International Opportunity Bond | 37,817 | 12 | (92,501 | ) | (54,672 | ) | ||||||||||
| Appreciation & Income | 125,002 | 28,776 | (327,962 | ) | (174,184 | ) | ||||||||||
| Large Cap Value | 59,330 | 136,802 | (148,707 | ) | 47,425 | |||||||||||
| Focused Large Cap Growth | 121,961 | 1,886 | (114,862 | ) | 8,985 | |||||||||||
| International Stock | 90,644 | — | (143,112 | ) | (52,468 | ) | ||||||||||
| Real Estate Stock | 46,146 | 20,451 | (91,576 | ) | (24,979 | ) | ||||||||||
| Small Cap Value | 29,540 | 7,074 | (46,933 | ) | (10,319 | ) | ||||||||||
| Emerging Markets Stock | 87,692 | — | (90,272 | ) | (2,580 | ) | ||||||||||
| Small Cap Growth | 124,968 | 28,776 | (327,919 | ) | (174,175 | ) | ||||||||||
113
| NOTES TO FINANCIAL STATEMENTS (Unaudited) |
| April 30, 2017 (Continued) |
| 8. | DISTRIBUTIONS TO SHAREHOLDERS AND TAX COMPONENTS OF CAPITAL |
The tax character of dividends paid during the year ended October 31, 2016 and October 31, 2015 was as follows:
| For the year or period ended October 31, 2016 | For the year or period ended October 31, 2015 | |||||||||||||||||||||||||||||||
| Ordinary | Long-Term | Return of | Ordinary | Long-Term | Return of | |||||||||||||||||||||||||||
| Fund | Income | Capital Gains | Capital | Total | Income | Capital Gains | Capital | Total | ||||||||||||||||||||||||
| Floating Rate Bond | $ | 3,114,657 | $ | — | $ | — | $ | 3,114,657 | $ | 2,676,918 | $ | — | $ | — | $ | 2,676,918 | ||||||||||||||||
| Corporate/Government Bond | 1,431,865 | — | — | 1,431,865 | 1,657,557 | — | — | 1,657,557 | ||||||||||||||||||||||||
| Monthly Distribution | 4,038,615 | — | 5,117,544 | 9,156,159 | 6,276,573 | — | 3,563,401 | 9,839,974 | ||||||||||||||||||||||||
| Dynamic Macro | — | — | — | — | — | — | — | — | ||||||||||||||||||||||||
| High- Yield Bond | 4,668,522 | — | — | 4,668,522 | 5,267,075 | — | — | 5,267,075 | ||||||||||||||||||||||||
| Alternative Dividend | — | — | — | — | — | — | — | — | ||||||||||||||||||||||||
| International Opportunity Bond | — | 27,741 | — | 27,741 | — | — | 21,370 | 21,370 | ||||||||||||||||||||||||
| Appreciation & Income | 1,690,059 | 6,372 | — | 1,696,431 | 821,516 | 3,916,874 | — | 4,738,390 | ||||||||||||||||||||||||
| Large Cap Value | 564,042 | 14,258,077 | — | 14,822,119 | 365,644 | — | — | 365,644 | ||||||||||||||||||||||||
| Focused Large Cap Growth | — | 381,862 | — | 381,862 | — | — | — | — | ||||||||||||||||||||||||
| International Stock | 43,319 | — | — | 43,319 | 1,350,442 | 267,504 | — | 1,617,946 | ||||||||||||||||||||||||
| Real Estate Stock | 2,119,010 | 2,657,605 | — | 4,776,615 | 1,742,000 | 1,031,723 | — | 2,773,723 | ||||||||||||||||||||||||
| Small Cap Value | 98,604 | 847,224 | — | 945,828 | 1,508,308 | 390,462 | — | 1,898,770 | ||||||||||||||||||||||||
| Emerging Markets Stock | 504,601 | — | — | 504,601 | 537,526 | — | — | 537,526 | ||||||||||||||||||||||||
| Small Cap Growth | 911,397 | 1,784,747 | 78,354 | 2,774,498 | 407,082 | 2,332,537 | — | 2,739,619 | ||||||||||||||||||||||||
Permanent book and tax differences, primarily attributable to the reclass of net operating losses, short-term capital gains, and fund distributions and adjustments for non-deductible expenses, book/tax treatment of foreign currency exchange gains (losses), section 305(c) deemed dividend distributions, paydown gains (losses), C Corp return of capital, swap gains (losses), passive foreign investment companies, reclassifications of gains on contingent payment debt securities, real estate investment trusts, partnerships, grantor trusts, royalty trusts, corporation mergers, and the capitalization of in lieu dividend payments made in connection with short sales of stock that have not been held open for more than 45 days resulted in reclassification for the tax year ended October 31, 2016 as follows:
| Paid | Accumulated | Accumulated | ||||||||||
| In | Net Investment | Net Realized | ||||||||||
| Fund | Capital | Income (Loss) | Gains (Loss) | |||||||||
| Floating Rate Bond | $ | — | $ | — | $ | — | ||||||
| Corporate/Government Bond | — | 70,902 | (70,902 | ) | ||||||||
| Monthly Distribution | — | 3,663,730 | (3,663,730 | ) | ||||||||
| Dynamic Macro | (665,699 | ) | 73,163 | 592,536 | ||||||||
| High-Yield Bond | (706 | ) | 706 | — | ||||||||
| Alternative Dividend | (3,177 | ) | 3,177 | — | ||||||||
| International Opportunity Bond | (1,032,496 | ) | (38,113 | ) | 1,070,609 | |||||||
| Appreciation & Income | — | (75,689 | ) | 75,689 | ||||||||
| Large Cap Value | — | (74 | ) | 74 | ||||||||
| Focused Large Cap Growth | (701,668 | ) | 701,353 | 315 | ||||||||
| International Stock | (141,050 | ) | (747,044 | ) | 888,094 | |||||||
| Real Estate Stock | — | 1 | (1 | ) | ||||||||
| Small Cap Value | — | — | — | |||||||||
| Emerging Markets Stock | — | (123,512 | ) | 123,512 | ||||||||
| Small Cap Growth | (59,009 | ) | 59,009 | — | ||||||||
Net assets were unaffected by the above reclassifications.
114
| NOTES TO FINANCIAL STATEMENTS (Unaudited) |
| April 30, 2017 (Continued) |
As of each of the Fund’s tax year-ended October 31, 2016, the components of distributable earnings on a tax basis were as follows:
| Undistributed | Undistributed | Post October | Capital Loss | Other | Unrealized | Total | ||||||||||||||||||||||
| Ordinary | Long-Term | Loss and | Carry | Book/Tax | Appreciation | Accumulated | ||||||||||||||||||||||
| Fund | Income | Capital Gains | Late Year Loss | Forwards | Differences | (Depreciation) | Earnings(Deficits) | |||||||||||||||||||||
| Floating Rate Bond | $ | 22,346 | $ | — | $ | — | $ | (2,132,469 | ) | $ | (9,758 | ) | $ | (267,630 | ) | $ | (2,387,511 | ) | ||||||||||
| Corporate/Government Bond | 3,634 | — | — | (1,811,316 | ) | (242 | ) | 1,174,789 | (633,135 | ) | ||||||||||||||||||
| Monthly Distribution | — | — | (798,060 | ) | (17,926,947 | ) | (790,114 | ) | (4,048,033 | ) | (23,563,154 | ) | ||||||||||||||||
| Dynamic Macro | — | — | (9,192 | ) | (2,546,135 | ) | — | 1,816,176 | (739,151 | ) | ||||||||||||||||||
| High-Yield Bond | 181,669 | — | — | (12,709,801 | ) | (13,868 | ) | 3,101,374 | (9,440,626 | ) | ||||||||||||||||||
| Alternative Dividend | 30,441 | — | — | (102,311 | ) | — | (415,523 | ) | (487,393 | ) | ||||||||||||||||||
| International Opportunity Bond | — | 254,196 | — | — | — | (599,611 | ) | (345,415 | ) | |||||||||||||||||||
| Appreciation & Income | 499,972 | — | — | (2,161,341 | ) | — | (650,029 | ) | (2,311,398 | ) | ||||||||||||||||||
| Large Cap Value | 739,323 | — | — | (944,869 | ) | — | 5,651,348 | 5,445,802 | ||||||||||||||||||||
| Focused Large Cap Growth | — | — | (402,872 | ) | (1,452,565 | ) | — | 13,032,336 | 11,176,899 | |||||||||||||||||||
| International Stock | — | — | — | (5,480,464 | ) | — | 5,609,674 | 129,210 | ||||||||||||||||||||
| Real Estate Stock | 1,673,832 | 3,748,342 | — | — | — | 4,051,567 | 9,473,741 | |||||||||||||||||||||
| Small Cap Value | 937,880 | 144,514 | — | — | — | 779,013 | 1,861,407 | |||||||||||||||||||||
| Emerging Markets Stock | 801,223 | — | — | (11,160,592 | ) | — | 5,108,035 | (5,251,334 | ) | |||||||||||||||||||
| Small Cap Growth | — | — | (123,870 | ) | (302,357 | ) | — | 2,325,999 | 1,899,772 | |||||||||||||||||||
The difference between book basis and tax basis unrealized appreciation (depreciation), undistributed net investment income/(loss) and accumulated net realized gain (loss) from security transactions are primarily attributable to the tax deferral of losses on wash sales and straddles, adjustments for gains on contingent convertible debt securities, the mark-to-market treatment of open forward foreign currency contracts, options, futures and swap contracts, and adjustments for section 305(c) deemed dividend distributions, real estate investment trusts, partnerships, passive foreign investment companies, royalty trusts, constructive sales of securities held short, straddles and C Corporation return of capital distributions. In addition, the amount listed under other book/tax differences are primarily attributable to the tax deferral of losses on straddles and constructive sales, and tax adjustments for accrued dividend payable.
Late year losses incurred after December 31 within the fiscal year are deemed to arise on the first business day of the following fiscal year for tax purposes. The Funds incurred and elected to defer such late year losses as follows:
| Late Year | ||||
| Fund | Losses | |||
| Floating Rate Bond | — | |||
| Corporate/Government Bond | — | |||
| Monthly Distribution | 798,060 | |||
| Dynamic Macro | 9,192 | |||
| High-Yield Bond | — | |||
| Alternative Dividend | — | |||
| International Opportunity Bond | — | |||
| Appreciation & Income | — | |||
| Large Cap Value | — | |||
| Focused Large Cap Growth | 402,872 | |||
| International Stock | — | |||
| Real Estate Stock | — | |||
| Small Cap Value | — | |||
| Emerging Markets Stock | — | |||
| Small Cap Growth | 123,870 | |||
115
| NOTES TO FINANCIAL STATEMENTS (Unaudited) |
| April 30, 2017 (Continued) |
At October 31, 2016, the following Funds had capital loss carryforwards for federal income tax purposes available to offset future capital gains through the indicated expiration date as follows:
| Non-Expiring | Non-Expiring | |||||||||||||||
| Fund | Expiring | Short-Term | Long-Term | Total | ||||||||||||
| Floating Rate Bond | $ | — | $ | 627,353 | $ | 1,515,997 | $ | 2,143,350 | ||||||||
| Corporate/Government Bond | — | 502,249 | 1,309,067 | 1,811,316 | ||||||||||||
| Monthly Distribution | — | 5,380,806 | 12,546,141 | 17,926,947 | ||||||||||||
| Dynamic Macro | 152,058 | 1,943,448 | 450,629 | 2,546,135 | ||||||||||||
| High-Yield Bond | 3,403,542 | 3,648,764 | 5,657,495 | 12,709,801 | ||||||||||||
| Alternative Dividend | — | 73,481 | 28,830 | 102,311 | ||||||||||||
| International Opportunity Bond | — | — | — | — | ||||||||||||
| Appreciation & Income | — | — | 2,161,341 | 2,161,341 | ||||||||||||
| Large Cap Value | — | 944,869 | — | 944,869 | ||||||||||||
| Focused Large Cap Growth | — | 1,139,981 | 312,584 | 1,452,565 | ||||||||||||
| International Stock | — | 4,996,453 | 484,011 | 5,480,464 | ||||||||||||
| Real Estate Stock | — | — | — | — | ||||||||||||
| Small Cap Value | — | — | — | — | ||||||||||||
| Emerging Markets Stock | 3,737,864 | 6,242,039 | 1,180,689 | 11,160,592 | ||||||||||||
| Small Cap Growth | — | 302,357 | — | 302,357 | ||||||||||||
For Monthly Distribution, $674,128 of capital loss carryforward expired in the current fiscal year.
| 9. | LINE OF CREDIT |
Currently, the Funds have a $40,000,000 uncommitted line of credit provided by U.S. Bank National Association (the “Bank”) under an agreement (the “Uncommitted Line”). Any advance under the Uncommitted Line is contemplated primarily for temporary or emergency purposes, including the meeting of redemption requests that otherwise might require the untimely disposition of securities. Interest on borrowings is payable on an annualized basis. The Uncommitted Line is not a “committed” line of credit, which is to say that the Bank is not obligated to lend money to a Fund. Accordingly, it is possible that a Fund may wish to borrow money for a temporary or emergency purpose but may not be able to do so. During the six months ended April 30, 2017, Focused Large Cap Growth accessed the line of credit, the average amount of borrowing outstanding was $194,192. As of April 30, 2017, the Focused Large Cap Growth had $22,000 of outstanding borrowings under the Credit Agreement.
| 10. | SECURITIES LENDING |
The Funds have entered into a Securities Lending Agreement (“Agreement”) with the Bank. Each participating fund can lend their securities to brokers, dealers and other financial institutions approved by the Board to earn additional income. Loans are collateralized at a value at least equal to 105% of the then current Market Value of any loaned security that are foreign, or 102% of the then current market value of any other loaned security. All interest and dividend payments received on securities which are held as collateral, provided that there is no material default, will be paid to the respective Fund. A portion of the income generated by the investment in the collateral, net of any rebates paid by the Bank to the borrowers is remitted to the Bank as lending agent and the remainder is paid to the Fund(s).
Securities lending income, if any, is disclosed in the Fund’s Statement of Operations. Although risk is mitigated by the collateral, the Fund could experience a delay in recovering its securities and possible loss of income or value if the Borrower fails to return them. Should the borrower of the securities fail financially, each Fund has the right to repurchase the securities using the collateral in the open market.
116
| NOTES TO FINANCIAL STATEMENTS (Unaudited) |
| April 30, 2017 (Continued) |
The following table presents financial instruments that are subject to enforceable netting arrangements as of April 30, 2017.
| Gross Amounts of Assets Presented in the Statements of Assets and Liabilities | ||||||||||||
| Market Value of | Market Value of | Percentage of Total | ||||||||||
| Fund | Loaned Securities | Collateral (1) | Investment Income | |||||||||
| Floating Rate Bond | $ | 1,493,995 | $ | 1,493,995 | 0.00 | % | ||||||
| Corporate/Government Bond | 7,381,247 | 7,381,247 | 0.00 | % | ||||||||
| Monthly Distribution | 7,407,183 | 7,407,183 | 0.00 | % | ||||||||
| Dynamic Macro | 2,819,526 | 2,819,526 | 0.00 | % | ||||||||
| High-Yield Bond | 26,541,345 | 26,541,345 | 0.00 | % | ||||||||
| Alternative Dividend | — | — | 0.00 | % | ||||||||
| International Opportunity Bond | — | — | 0.00 | % | ||||||||
| Appreciation & Income | 1,193,992 | 1,193,992 | 0.00 | % | ||||||||
| Large Cap Value | 12,593,374 | 12,593,374 | 0.00 | % | ||||||||
| Focused Large Cap Growth | 16,495,509 | 16,495,509 | 0.00 | % | ||||||||
| International Stock | 3,719,420 | 3,719,420 | 0.00 | % | ||||||||
| Real Estate Stock | 10,034,782 | 10,034,782 | 0.00 | % | ||||||||
| Small Cap Value | 9,469,175 | 9,469,175 | 0.00 | % | ||||||||
| Emerging Markets Stock | 2,814,783 | 2,814,783 | 0.00 | % | ||||||||
| Small Cap Growth | 12,589,867 | 12,589,867 | 0.00 | % | ||||||||
| (1) | The amount is limited to the loaned securities and accordingly, does not include excess collateral pledged |
| 11. | UNDERLYING INVESTMENT IN OTHER INVESTMENT COMPANIES |
Dynamic Macro currently invests a portion of its assets in the SDPR S&P 500 ETF Trust. The Fund may redeem its investment at any time if the Adviser determines that it is in the best interest of the Fund and its shareholders to do so.
The performance of Dynamic Macro may be directly affected by the performance of the SPDR S&P 500 ETF Trust. The financial statements of the SPDR S&P 500 ETF Trust, including the portfolio of investments, can be found at the Securities and Exchange Commission’s website www.sec.gov and should be read in conjunction with the Fund’s financial statements. As of April 30, 2017 the percentage of Dynamic Macro’s net assets invested in the SPDR S&P 500 ETF Trust was 25.8%.
| 12. | NEW ACCOUNTING PRONOUNCEMENT |
On October 13, 2016 the Securities and Exchange Commission amended existing rules intended to modernize reporting and disclosure of information. These amendments relate to Regulation S-X which sets forth the form and content of financial statements. At this time, management is evaluating the implications of adopting these amendments and their impact on the financial statements and accompanying notes.
| 13. | SUBSEQUENT EVENTS |
Subsequent events after the date of the Statements of Assets and Liabilities have been evaluated through the date the financial statements were issued. Management has concluded that there is no impact requiring adjustment or disclosure in the financial statements relating to the Funds presented in this report.
At a meeting held on June 27, 2017, the Board, including a majority of the Trustees who are not “interested persons” as that term is defined in the Investment Company Act of 1940, as amended, considered and approved the termination of PENN Capital Management Co., Inc. as a sub-adviser to the High-Yield Bond Fund, effective June 30, 2017, and the appointment of PineBridge Investments, LLC to sub-advise the Fund, effective July 1, 2017.
117
FACTORS CONSIDERED BY THE INDEPENDENT TRUSTEES IN APPROVAL OF INVESTMENT ADVISORY AND SUB-ADVISORY AGREEMENTS
Meeting of the Board of Trustees Held on December 20, 2016
At a regular meeting of the Board of Trustees (the “Board”) of the Trust held on December 20, 2016 (the “Meeting”), the Board, including all of the Trustees who are not interested persons of the Trust (the “Independent Trustees”), considered the renewal of an investment advisory agreement between the Trust, on behalf of each series of the Trust, and the Adviser (the “Investment Advisory Agreement”) and continuance of certain Sub-Advisory Agreements (the “Sub-Advisory Agreements”) among the Trust, the Adviser and the following Sub-Advisers for the indicated Funds: 1) Westchester Capital Management, LLC (“Westchester”) with respect to Monthly Distribution; 2) Newfleet Asset Management LLC (“Newfleet”) with respect to Corporate/Government Bond; 3) PENN Capital Management Co., Inc. (“PENN”) with respect to High-Yield Bond; 4) Mellon Capital Management Corporation with respect to Dynamic Macro; 5) PENN with respect to Appreciation & Income; 6) Rothschild Asset Management Inc. (“Rothschild”) with respect to Large Cap Value; 7) Rogge Global Partners PLC (“Rogge”) with respect to International Opportunity Bond; 8) The Ithaka Group, LLC (“Ithaka”) with respect to Focused Large Cap Growth; 9) Arrowstreet Capital, L.P. (“Arrowstreet”) with respect to International Stock; 10) Barings Real Estate Advisers LLC (“Barings”) with respect to Real Estate Stock; 11) 9) Piermont Capital Management, LLC (“Piermont”) with respect to Small Cap Value; 12) Pier Capital, LLC (“Pier”) with respect to Small Cap Growth; 13) Bailard, Inc. (“Bailard”) with respect to Emerging Markets Stock; and 14) Newfleet with respect to Floating Rate Bond.
Continuance of Investment Advisory Agreement for each of Monthly Distribution, Corporate/Government Bond, High-Yield Bond, Dynamic Macro, Appreciation & Income, Large Cap Value, Floating Rate Bond, International Opportunity Bond, Focused Large Cap Growth, International Stock, Real Estate Stock, Small Cap Value, Small Cap Growth, Emerging Markets Stock.
The Trustees reviewed information related to the proposed renewal of the Investment Advisory Agreement with the Trust, including (a) the investment performance of each Fund, a peer group of funds and appropriate indices; (b) the Adviser’s personnel and resources; and (c) comparative fees and expenses of a peer group of funds. The Board relied upon the advice of independent legal counsel and their own business judgment in determining the material factors to be considered in evaluating the Investment Advisory Agreement and the weight to be given to each factor. The conclusions reached by the Board were based on a comprehensive evaluation of all of the information provided and were not the result of any one factor.
Matters considered by the Board, including the Independent Trustees, in connection with its approval of the continuance of the Investment Advisory Agreement included the following:
Nature, Extent and Quality of Services. The Board considered the nature, extent and quality of services provided to the Funds by the Adviser. Among other things, the Board discussed their view that the Adviser’s personnel are focused on delivering high quality services to the Funds as evidenced by its active monitoring of each Sub-Adviser’s performance and compliance with applicable rules and regulations. The Trustees also noted the Adviser’s investment in investor education and technology. The Board agreed that the Adviser provides the Board with thorough and meaningful reports and expressed satisfaction with the level of detail provided in the reports pertaining to advisory agreement renewals. The Board considered the Adviser’s consistent focus on managing expenses and vetting and negotiating with Sub-Advisers and other service providers for the benefit of shareholders. The Board noted that the Adviser continues to demonstrate that it had the skills, experience, quality and depth of personnel, investment analytics, and compliance policies and procedures for performing its duties under the Advisory Agreement, and concluded that the Adviser had the resources to continue to provide quality advisory services in a manner that is consistent with the Board’s expectations.
Performance. The Board reviewed each Fund’s investment performance for various time periods through September 30, 2016 as compared to its benchmark index, Morningstar category average (“MS Category
118
Average”) and the Peer Group Average of a group of funds of comparable size in the MS Category Average (collectively, the “Comparison Group”). In its evaluation of investment performance, the Board gave particular attention to information indicating changes in performance of certain Funds for specific time periods and discussed with the Adviser the reasons for any outperformance or underperformance. The Board also took into consideration the length of time that a Sub-Adviser had been managing a Fund and the performance related to a prior sub-adviser. In some cases when performance was less than satisfactory, the Board agreed that assessing performance over a longer-term would be more meaningful or that careful monitoring of the Sub-Adviser is warranted to determine if further action is required. They noted the Adviser’s consistent and proactive approach to performance issues. As a result of their review, the Independent Trustees concluded that the Adviser, through the Sub-Advisers, had generally provided acceptable returns to shareholders and that the Advisory arrangement with the Adviser should continue.
Monthly Distribution: the Board noted that the Fund had outperformed the Comparison Group across all the time periods since its inception in 2008 and concluded that the Fund’s performance was satisfactory.
Corporate/Government Bond: the Board noted that since the Fund’s inception in 2004, it had outperformed its Comparison Group. The Trustees considered that the Fund has consistently performed well since inception, and concluded that the Fund’s performance was satisfactory.
High-Yield Bond: the Board noted that the Fund had underperformed its Comparison Group across the relevant time periods. The Board noted that the Fund’s short-term performance was impaired by its significant exposure to the energy market’s decline. The Trustees considered the Fund’s strategy is generally more conservative in nature than a majority of the funds in its MS Category Average. The Trustees agreed that the Adviser should continue to monitor performance and they will look for improvement.
Dynamic Macro: the Board noted there was a change in sub-adviser and investment strategy as of October 1, 2014 and that the Fund outperformed its Comparison Group over the past 1-year period. The Board further noted that the Fund’s underperformance in the 3- and 5- year periods was tied to its former sub-adviser. The Board concluded that the Fund’s short-term performance was satisfactory and expressed optimism for continuing improvement.
Appreciation & Income: the Board noted that the Fund had underperformed its Category Average and Peer Group since the Sub-Adviser was hired in October 2014. The Trustees considered the Adviser’s report regarding the challenges presented by the concentrated nature of the portfolio, which while providing opportunities for outperformance over the long-term, was also sensitive to individual security performance and therefore, additional volatility of the portfolio was not unexpected. The Board further noted adjustments made by the Sub-Adviser to try to manage volatility and the Adviser’s belief that the Fund had the ability to outperform over a full market cycle. The Trustees agreed the Adviser should continue to monitor volatility and performance of the Fund.
Large Cap Value: the Board noted that the Fund underperformed the Comparison Group for the all the time periods. The Board further noted that the Fund’s sub-adviser was changed on July 1, 2015 and that most of the Fund’s underperformance over the 3- and 10-year periods were attributable to the previous sub-adviser’s track record. The Trustees expressed optimism for the Fund’s longer-term success under the new Sub-Adviser.
International Opportunity Bond: the Board noted that the Fund performed in-line with its Peer Group Average over the longer-term periods, outperformed its Peer Group Average over the short-term, and underperformed its MS Category Average since the inception of the Fund. The Trustees considered the Adviser’s explanation that the primary reason for the Fund’s underperformance was because it invests strictly in international bonds and, therefore, did not benefit from the performance of U.S. bonds. The Trustees
119
further noted the Adviser’s view that there is currently no Morningstar category that closely aligns with the Fund’s investment strategy. The Trustees agreed performance was satisfactory given the Fund’s mandate.
Focused Large Cap Growth: the Board noted that the Fund underperformed the Comparison Group over the applicable time frames. The Trustees considered the Adviser’s view that the Fund’s concentrated style of investing resulted in a portfolio more volatile than the average peer and benchmark and the Adviser’s report that the Fund did not benefit from the past year’s rally in dividend paying stocks, which it does not hold. The Trustees noted that the Fund benefited from its investment style when it was one of the top performers amongst all large growth mutual funds in 2015 and were hopeful that the Fund’s performance will rebound.
International Stock: the Board noted that the Fund outperformed its Comparison Group across all the time periods. The Board expressed satisfaction with the Fund’s overall performance.
Real Estate Stock: the Board noted that the Fund outperformed or was in-line with its Comparison Groups across all time periods. The Board indicated that they were satisfied with the Fund’s overall performance.
Small Cap Value: the Board noted that the Fund outperformed its Peer Group Average and MS Category Average since the current Sub-Adviser began managing the portfolio in 2013 and outperformed its Peer Group Average for the 10-year period, while trailing the MS Category Average for the same time period. The Trustees further noted that the Fund underperformed its Comparison Group over the 1-year period at 14.26% versus 16.34% and 14.51% for the Peer Group and MS Category Average, respectively and for the 5-year period at 13.26% versus 14.82% and 14.56% for the Peer Group and MS Category Average, respectively. The Trustees were satisfied with the Fund’s performance.
Small Cap Growth: the Board noted that the Fund significantly underperformed the Comparison Group over the 1-year period with a return of 4.91% versus 11.78% and 10.47% for the Peer Group and MS Category Average, respectively, while it outperformed its Comparison Group for the 10-years and since inception time periods and outperformed or was in-line with its Comparison Group for the 5-year period. The Trustees noted the Adviser’s explanation that lack of exposure to the biotechnology sector in the last quarter of 2015 adversely affected the Fund’s return, while the same strategy had previously benefitted the Fund. The Board expressed satisfaction with the Fund’s long-term performance and agreed that the Adviser’s confidence in the Sub-Adviser was reasonable.
Emerging Markets Stock: the Board noted that the Fund significantly underperformed its Comparison Group for the 1-year period. The Board further noted that the current Sub-Adviser began managing the portfolio in July 2013. The Trustees discussed the Adviser’s report that the recent underperformance was mostly attributed to the fourth quarter of 2015; that stock selection, especially in certain markets, and country allocation detracted from performance. The Trustees noted the Adviser’s view that emerging markets is a volatile space where it is possible for investment strategies to temporarily go out of favor and that the Sub-Adviser’s strict adherence to its disciplined strategy and process had not been rewarded. The Board considered the slight modifications to the strategy that the Sub-Adviser had implemented in an effort to capture more value and agreed to monitor the performance of the Fund over the longer-term.
Floating Rate Bond: the Board noted that the Fund’s returns for the 1-year period were in line with the Peer Group Average while trailing the MS Category Average and since inception in 2013, trailed both the Peer Group and MS Category Average. The Trustees considered that the Fund’s recent relative performance was good and the specialized nature of the Fund and concluded that the Fund’s performance was satisfactory.
120
Cost of Services and Profitability. As to the costs of the services provided and profits realized by the Adviser, the Board reviewed the Adviser and Sub-Advisers’ fees and expense data of each Fund compared to the relevant Peer Group and MS Category Average. The Board reviewed for each Fund the fee paid to the Adviser, as well as the total of the advisory fee and sub-advisory fee (the “Management Fees”). They observed that in the case of all the Funds, except for Appreciation & Income, average Management Fees were higher than the Peer Group and MS Category Average. With respect to Appreciation & Income, the Trustees noted that average Management Fees were in-line with the MS Category Average, but lower than the Peer Group.
The Trustees discussed the impact of each Fund’s performance on the fees paid. They considered fees both at the low and higher ranges and observed that the unique performance fee structure is designed to align with the shareholders’ interests. With respect to Focused Large Cap Growth, International Stock, Real Estate Stock, Small Cap Value, Small Cap Growth, Emerging Markets Stock, Dynamic Macro, and Large Cap Value, the Trustees noted that the Sub-Advisers’ mid-fee or higher rate was reflected in the Management Fees because the Fund outperformed, or performed in line with, with benchmark index.
The Trustees discussed the advisory fee relative to the sub-adviser fees, as well as each Fund’s expense ratio. They considered the impact of Fund net assets on total expenses. The Trustees reviewed an analysis of profitability provided by the Adviser. The Trustees took into account possible related benefits derived by the Adviser from its relationship with the Funds including the underwriting and 12b-1 fees paid to DAIC. The Trustees acknowledged that the Adviser, in its capacity as a broker, receives commissions and distribution fees when its customers purchase the Funds, but the Adviser does not execute trades on behalf of the Funds and therefore receives no compensation on portfolio trades. The Trustees reviewed revenue and expense information provided by the Adviser relating to providing advisory service to each Fund. They concluded that profits from the Adviser’s relationship with each Fund was not unreasonable and is at a level to adequately incentivize DAIC to continue to provide high quality services. The Trustees also considered that the Adviser also serves as the sponsor of an Asset Allocation Program (“AAP) that allocates to the Dunham Funds. It was the consensus of the Board that, based on DAIC’s expertise, the fees charged by the Adviser and its Sub-Advisers were reasonable.
Economies of Scale. As to economies of scale, the Trustees noted that the Advisory Agreement does not contain breakpoints that reduce the fee rate on assets above specified levels. The Trustees agreed that breakpoints may be an appropriate way for the Adviser to share its economies of scale with the Funds and the shareholders if the Funds experience a substantial growth in assets, however, the Trustees recognized that no Fund had yet reached an asset level where the Adviser could realize significant economies of scale. The Trustees noted that economies of scale would need to be considered in the future as net asset levels of the Funds grow. The Trustees further noted that at a previous contracts renewal meeting, the Adviser explained that it is prepared to offer concessions to the Funds at appropriate asset levels, and in anticipation of such, had discussed a proposed breakpoint schedule that reflects the economies of scale that the Adviser anticipates realizing. The Trustees concluded that the absence of breakpoints was still acceptable under the current circumstances, and they agreed to continue to evaluate the issue with respect to each Fund as assets increase, and to work with the Adviser to negotiate reasonable breakpoints when appropriate
121
Continuance of Sub-Advisory Agreements for each of Monthly Distribution, Corporate/Government Bond, High-Yield Bond, Dynamic Macro, Appreciation & Income, Large Cap Value, International Opportunity Bond, Focused Large Cap Growth; International Stock; Real Estate Stock, Small Cap Value, Small Cap Growth , Emerging Markets Stock, and Floating Rate Bond.
The Trustees relied upon the advice of legal counsel and their own business judgment in evaluating the Sub-Advisory Agreements and the weight to be given to each factor considered. The conclusions reached by the Board were based on a comprehensive evaluation of all of the information provided and were not the result of any one factor. Moreover, each Trustee may have afforded different weight to the various factors in reaching his conclusions.
Matters considered by the Board, including the Independent Trustees, in connection with its approval of the continuance of each of the Sub-Advisory Agreements included the following:
Nature, Extent and Quality of Services. As to the nature, extent and quality of the services provided by the Sub-Advisers, the Board reviewed and discussed at length each Sub-Adviser’s presentation materials, including information regarding any changes to professional staffing, advisory services, compliance monitoring, regulatory or legal matters, and insurance coverage. In addition, representatives of the Adviser reviewed their working relationship with each Sub-Adviser, including the observation of the Trust’s CCO with respect to compliance matters. The Trustees noted that the Adviser actively and continuously evaluates quality of service delivered by the Sub-Advisers and is generally satisfied with the current line-up of Sub-Advisers. The Trustees concluded that each of the Sub-Advisers provides a level of service that is consistent with the Board’s expectations.
Performance. As to the performance of each Sub-Adviser, the Trustees noted its thorough review and discussion of each Fund’s performance during its earlier evaluation of the Advisory Agreement and their conclusion that the performance was satisfactory or, where less than satisfactory, the Adviser is carefully monitoring the Sub-Adviser and is considering alternatives, including a possible change in sub-adviser.
Cost of Services. As to the cost of the services provided by each Sub-Adviser, the Board considered the Base Fee (as defined in the Sub-Advisory Agreements) paid to each Sub-Adviser when the performance of the Fund is equal to that of the Index plus or minus a “null” zone. Where provided, the Trustees compared advisory (and sub-advisory) fees (both flat fee rates and performance fee rates) charged by each Sub-Adviser to its other accounts.
The Trustees also discussed at length the operation of the Performance Fee and the impact on fees and expenses based on various performance results. They discussed the unique nature of the performance fee, which results in higher fees when the sub-adviser delivers results, and how this fact must be integrated into their analysis of fees. The Board noted its thorough review and discussion of each Fund’s fees and expenses during its earlier evaluation of the Advisory Agreement and their conclusion the fees were within a reasonable range.
Profitability. The Board then considered the potential fee adjustments to be made to each Fund’s Base Fee based on performance. The Trustees affirmed their belief that the 12-month period over which performance is computed is sufficiently long to provide a reasonable basis for indicating performance. The Trust officers confirmed that the performance adjustment to the Base Fee had been calculated daily during the first twelve months, based on the average net assets of each Fund from inception of the contract to date, and the comparative performance of each Fund (based on Class N shares) to the relevant Index. The Trustees confirmed their belief that the method by which the Performance Fee is calculated under the Sub-Advisory Agreements ensures that any significant fee adjustments are attributable to Sub-Adviser’s skill or lack thereof, rather than to random fluctuations, and the performance fee clearly aligns the Sub-Advisers’ interest with those of the shareholders. It was the consensus of the Board that the maximum performance adjustment under each Sub-Advisory Agreement continues to reflect performance differences that could reasonably be considered meaningful and significant taking into account each Fund’s size, volatility, diversification and variability of performance differences. After consideration, the Board was satisfied that in each case, the relationship of the fee adjustments to the Base Fee
122
was not disproportionately large and that each Fund’s sub-advisory fee was acceptable in light of all of the factors discussed. The Board reviewed a profit analysis provided by certain Sub-Advisers and agreed that no Sub-Adviser was excessively profitable. Where profitability information was not provided by the Sub-Adviser, the Board noted the arm’s length negotiations over fees between the Adviser and Sub-Adviser and that the fees actually paid to the Sub-Advisers were not significant.
Economies of Scale. The Trustees discussed the relevance of economies of scale in the context of Sub-Advisers that receive a performance based fee. They agreed that the Adviser had successfully negotiated a favorable Base Fee with each Sub-Adviser, and the Adviser continued to monitor fees and negotiate reductions when warranted.
Conclusion. Having requested and received such information from the Adviser and Sub-Advisers as the Board believed to be reasonably necessary to evaluate the terms of the proposed Advisory Agreements, and as assisted by the advice of counsel, the Board, including all of the Independent Trustees, unanimously concluded that (a) the terms of each of the Advisory Agreements are fair and reasonable; (b) that the Advisory fee and Sub-Advisory fees were for services different than those provided by any underlying Fund’s adviser and are not duplicative; and (c) renewal of the Advisory Agreement and Sub-Advisory Agreements is in the best interests of the Funds, their shareholders and their prospective shareholders.
Meeting of the Board of Trustees Held on March 21, 2017
At a regular meeting (the “Meeting”) of the Board of Trustees (the “Board”) held on March 21, 2017 (the “Meeting’), the Board, including a majority of the Independent Trustees, considered the approval of a new sub-investment advisory agreement among the Trust, Dunham & Associates Investment Counsel, Inc. (the “Adviser”) and Perella Weinberg Partners Capital management LP (“Perella Weinberg” or the “Sub-Adviser”) (the “New Sub-Advisory Agreement”) on behalf of Monthly Distribution.
In connection with its review and approval of the New Sub-Advisory Agreement at the Meeting, the Independent Trustees considered materials furnished by Perella Weinberg, including information about, but not limited to, Rothschild’s personnel and operations and financial condition. At the Meeting, representatives from the Adviser and Perella Weinberg presented to the Board information regarding Perella Weinberg and the Fund and responded to questions from the Trustees. The Board also reviewed the terms of the New Sub-Advisory Agreement and compared its terms to those of the Prior Sub-Advisory Agreement. The Trustees discussed the terms of the New Sub-Advisory Agreement and the performance goals and fulcrum fee arrangements set forth in the New Sub-Advisory Agreement.
Matters considered by the Board, including the Independent Trustees, in connection with its approval of the New Sub-Advisory Agreement included the following:
Performance. With respect to performance, the Board reviewed comparative performance information of other accounts managed by Perella Weinberg with a strategy similar to the Fund’s strategy over various time periods as compared to the Fund’s benchmark index and discussed the same with representatives from Perella Weinberg and the Adviser. The Trustees also noted that the strategy was approaching its 5-year track record and that it outperformed the benchmark since inception. The Trustees concluded that Perella Weinberg’s prior performance is more than reasonable and indicates the potential for favorable results for the Fund.
Nature, Extent and Quality of Services. The Board considered the presentation received with respect to Perella Weinberg’s assets, organizational structure, and investment processes. The Trustees noted the qualifications and experience of Perella Weinberg’s key personal and discussed the investment strategy with Perella Weinberg’s representatives. The Trustees further noted the positive reports from the Adviser regarding Perella Weinberg’s responsiveness to information requests and from the Trust’s CCO concerning Perella Weinberg’s compliance program. The Trustees considered that Perella Weinberg appeared to possess the skills and experience necessary to effectively manage the Fund’s investment strategies, and concluded that Perella Weinberg had sufficient quality
123
and depth of personnel, resources, investment methods and compliance policies and procedures to perform its duties under the proposed Sub-Advisory Agreement in a satisfactory manner.
Cost of Services and Profitability. The Trustees noted that the Fund will pay the sub-adviser a fulcrum fee consisting of a base fee of 0.65% annually, and a performance fee component at a rate that will vary by +/- 0.40% of the average daily net asset value of the Fund depending upon the performance of the Fund’s Class N shares as compared to the benchmark index for a range of 0.25% to 1.05%. The Board also noted that the performance fee rate will increase or decrease by one basis point (0.01%) for each 0.05% of outperformance/underperformance of the benchmark index and they discussed with the Adviser how the performance increments were developed and negotiated. The Board, including the Independent Trustees, took into account that the minimum fee rate of 0.25% is low and that at the maximum level, which the sub-adviser would only earn if the Fund performed very well, of sub-advisory fee to be charged to the Fund was reasonable compared to the fees charged to other accounts managed by Perella Weinberg. The Independent Trustees concluded that the Adviser negotiated a fair sub-advisory agreement with Perella Weinberg and that the fee adjustments under the fulcrum fee arrangement were reasonable and appropriate to reward or penalize outperformance or underperformance, respectively, and that the index and performance adjustments were appropriate and result from meaningful performance differentials. The Independent Trustees also took into account that the Fund pays the Adviser a fixed fee of 0.65% of daily net assets and discussed that the various duties of the Adviser and the Sub-Adviser were not duplicative. The Independent Trustees next considered the anticipated profits to be realized by Perella Weinberg in relation to the operation of the Fund. They reviewed an analysis of profitability provided by Perella Weinberg and noted that the estimated net profit to Perella Weinberg was not unreasonable.
Economies of Scale. As to economies of scale it was the consensus of the Independent Trustees that the Fund had not yet reached an asset level where any material economies of scale could be realized and, consequently, the absence of breakpoints was acceptable at this time.
Conclusion. During the Board’s deliberations, it was noted that the Board did not identify any single piece of information that was all important or controlling with respect to the New Sub-Advisory Agreement. Having requested and received such information from the Adviser and Sub-Adviser as the Board believed to be reasonably necessary to evaluate the terms of the New Sub-Advisory Agreement, and as assisted by the advice of counsel, the Board, including all of the Independent Trustees present, unanimously concluded that the terms of the New Sub-Advisory Agreement were fair and reasonable.
124
| DUNHAM FUNDS’ EXPENSES (Unaudited) |
Example
Shareholders of mutual funds will pay (1) transitional costs, such as sales load, and (2) ongoing expenses, such as advisory fees, distribution and service fees (12b-1), and other fund expenses. The following examples are intended to help you understand the ongoing cost (in dollars) of investing in a fund and to compare these costs with the ongoing costs of investing in other mutual funds. Please note, the expenses shown in the tables are meant to highlight ongoing costs only and do not reflect any transactional costs, such as sales charges (loads), or contingent deferred sales charges on redemptions which may be assessed by mutual funds. This Example is based on an investment of $1,000 invested at the beginning of the period and held for the entire period as indicated below.
Actual Expenses
The columns under the heading entitled “Actual” help you estimate the actual expenses you paid over the period. The “Actual-Ending Account Value” shown is derived from the Fund’s actual return, and the “Actual- Expenses Paid During Period” shows the dollar amount that would have been paid by an investor who started with $1,000 in the Fund. To estimate the expenses you paid on your account during this period, simply divide your account value by $1,000 (for example, an $8,600 account value divided by $1,000 = 8.6), then multiply the result by the number in the column under the heading entitled “Actual-Expenses Paid During Period”.
Hypothetical Examples for Comparison Purposes
The columns under the heading entitled “Hypothetical” provide information about hypothetical account value and hypothetical expenses based on the Fund’s actual expense ratio and an assumed rate of return of 5% per year before expenses, which is not the Fund’s actual return. The hypothetical account values and expenses may not be used to estimate the actual ending account balance or expenses you paid for the period. You may use this information to compare the ongoing costs of investing in the Fund and other funds. To do so, compare this 5% hypothetical example with the 5% hypothetical examples that appear in the shareholder reports of other funds.
Please note that the expenses shown in the table are meant to highlight your ongoing costs only and do not reflect any transactional costs which may be applicable to your account. Therefore, the last column of the table (Hypothetical- Expenses Paid During Period) is useful in comparing ongoing costs only, and will not help you determine the relative total costs of owning different funds. In addition, if these transactional costs were included, your costs would have been higher.
| Hypothetical | ||||||||||||
| Actual | (5% return before expenses) | |||||||||||
| Fund’s | Beginning | Ending | Expenses | Ending | Expenses | |||||||
| Annualized | Account Value | Account Value | Paid During | Account Value | Paid During | |||||||
| Expense Ratio | 11/1/16 | 4/30/17 | Period* | 4/30/17 | Period* | |||||||
| Class N: | ||||||||||||
| Floating Rate Bond Fund | 1.08% | $1,000.00 | $1,024.70 | $ 5.42 | $1,019.44 | $ 5.41 | ||||||
| Corporate/Government Bond Fund | 1.37% | $1,000.00 | $1,000.20 | $ 6.78 | $1,018.02 | $ 6.84 | ||||||
| Monthly Distribution Fund | 3.05% | $1,000.00 | $1,036.80 | $15.40 | $1,009.67 | $15.20 | ||||||
| Dynamic Macro Fund | 2.29% | $1,000.00 | $1,018.80 | $11.46 | $1,012.20 | $11.43 | ||||||
| High-Yield Bond Fund | 1.20% | $1,000.00 | $1,048.30 | $ 6.09 | $1,018.84 | $ 6.32 | ||||||
| Alternative Dividend Fund | 1.26% | $1,000.00 | $1,034.40 | $ 6.36 | $1,018.55 | $ 7.95 | ||||||
| International Opportunity Bond Fund | 1.62% | $1,000.00 | $ 972.20 | $ 7.92 | $1,016.76 | $ 8.10 | ||||||
| Appreciation & Income Fund | 1.57% | $1,000.00 | $1,044.20 | $ 7.96 | $1,017.01 | $ 7.85 | ||||||
| Large Cap Value Fund | 1.10% | $1,000.00 | $1,107.90 | $ 5.73 | $1,019.36 | $ 5.49 | ||||||
| Focused Large Cap Growth Fund | 1.10% | $1,000.00 | $1,106.80 | $ 5.75 | $1,019.34 | $ 5.51 | ||||||
| International Stock Fund | 1.62% | $1,000.00 | $1,099.70 | $ 8.43 | $1,016.76 | $ 8.10 | ||||||
| Real Estate Stock Fund | 1.12% | $1,000.00 | $1,025.80 | $ 5.63 | $1,019.24 | $ 5.61 | ||||||
| Small Cap Value Fund | 1.19% | $1,000.00 | $1,185.90 | $ 6.47 | $1,018.87 | $ 5.98 | ||||||
| Emerging Markets Stock Fund | 2.11% | $1,000.00 | $1,094.30 | $10.95 | $1,014.33 | $10.54 | ||||||
| Small Cap Growth Fund | 1.05% | $1,000.00 | $1,153.20 | $ 5.61 | $1,019.59 | $ 5.26 | ||||||
| Class A: | ||||||||||||
| Floating Rate Bond Fund | 1.33% | $1,000.00 | $1,023.30 | $ 6.67 | $1,018.20 | $ 6.66 | ||||||
| Corporate/Government Bond Fund | 1.62% | $1,000.00 | $ 999.70 | $ 8.05 | $1,016.74 | $ 8.12 | ||||||
| Monthly Distribution Fund | 3.30% | $1,000.00 | $1,035.70 | $16.66 | $1,008.43 | $16.43 | ||||||
| Dynamic Macro Fund | 2.54% | $1,000.00 | $1,018.20 | $12.71 | $1,012.20 | $12.67 | ||||||
| High-Yield Bond Fund | 1.45% | $1,000.00 | $1,038.50 | $ 7.33 | $1,017.60 | $ 7.25 | ||||||
| Alternative Dividend Fund | 1.51% | $1,000.00 | $1,033.90 | $ 7.61 | $1,017.31 | $ 7.55 | ||||||
| International Opportunity Bond Fund | 1.87% | $1,000.00 | $ 973.10 | $ 9.15 | $1,015.52 | $ 9.35 | ||||||
| Appreciation & Income Fund | 1.82% | $1,000.00 | $1,042.60 | $ 9.22 | $1,015.77 | $ 9.10 | ||||||
| Large Cap Value Fund | 1.35% | $1,000.00 | $1,106.90 | $ 7.03 | $1,018.12 | $ 6.74 | ||||||
| Focused Large Cap Growth Fund | 1.35% | $1,000.00 | $1,104.90 | $ 7.05 | $1,018.10 | $ 6.76 | ||||||
| International Stock Fund | 1.87% | $1,000.00 | $1,098.70 | $ 9.73 | $1,015.52 | $ 9.35 | ||||||
| Real Estate Stock Fund | 1.37% | $1,000.00 | $1,024.70 | $ 6.88 | $1,018.00 | $ 6.85 | ||||||
| Small Cap Value Fund | 1.44% | $1,000.00 | $1,184.10 | $ 7.80 | $1,017.65 | $ 7.20 | ||||||
| Emerging Markets Stock Fund | 2.36% | $1,000.00 | $1,092.90 | $12.52 | $1,013.09 | $11.61 | ||||||
| Small Cap Growth Fund | 1.30% | $1,000.00 | $1,151.50 | $ 6.93 | $1,018.35 | $ 6.51 | ||||||
125
| DUNHAM FUNDS’ EXPENSES (Unaudited) (Continued) |
| Hypothetical | ||||||||||||
| Actual | (5% return before expenses) | |||||||||||
| Fund’s | Beginning | Ending | Expenses | Ending | Expenses | |||||||
| Annualized | Account Value | Account Value | Paid During | Account Value | Paid During | |||||||
| Expense Ratio | 11/1/16 | 4/30/17 | Period* | 4/30/17 | Period* | |||||||
| Class C: | ||||||||||||
| Floating Rate Bond Fund | 1.83% | $1,000.00 | $1,022.50 | $ 9.18 | $1,015.72 | $ 9.15 | ||||||
| Corporate/Government Bond Fund | 2.12% | $1,000.00 | $ 996.60 | $10.50 | $1,014.28 | $10.59 | ||||||
| Monthly Distribution Fund | 4.05% | $1,000.00 | $1,031.60 | $20.40 | $1,004.71 | $20.13 | ||||||
| Dynamic Macro Fund | 3.29% | $1,000.00 | $1,014.00 | $16.43 | $1,008.48 | $16.38 | ||||||
| High-Yield Bond Fund | 1.95% | $1,000.00 | $1,054.00 | $ 9.93 | $1,015.12 | $ 9.74 | ||||||
| Alternative Dividend Fund | 2.26% | $1,000.00 | $1,029.30 | $11.37 | $1,013.59 | $11.28 | ||||||
| International Opportunity Bond Fund | 2.24% | $1,000.00 | $ 968.50 | $12.79 | $1,013.69 | $11.18 | ||||||
| Appreciation & Income Fund | 2.57% | $1,000.00 | $1,038.40 | $12.99 | $1,012.10 | $12.82 | ||||||
| Large Cap Value Fund | 2.10% | $1,000.00 | $1,102.40 | $10.94 | $1,014.39 | $10.48 | ||||||
| Focused Large Cap Growth Fund | 2.10% | $1,000.00 | $1,101.50 | $10.94 | $1,014.38 | $10.49 | ||||||
| International Stock Fund | 2.62% | $1,000.00 | $1,099.70 | $ 8.43 | $1,016.76 | $ 8.10 | ||||||
| Real Estate Stock Fund | 2.12% | $1,000.00 | $1,020.70 | $10.62 | $1,014.28 | $10.59 | ||||||
| Small Cap Value Fund | 2.19% | $1,000.00 | $1,176.00 | $11.82 | $1,013.93 | $10.94 | ||||||
| Emerging Markets Stock Fund | 3.11% | $1,000.00 | $1,089.10 | $16.11 | $1,009.37 | $15.49 | ||||||
| Small Cap Growth Fund | 2.05% | $1,000.00 | $1,147.00 | $10.91 | $1,014.63 | $10.24 | ||||||
| * | Expenses Paid During Period are equal to the Fund’s annualized expense ratio, multiplied by the average account value over the period, multiplied by 181 days and divided by 365 (to reflect the number of days in the six month period ending April 30, 2017). |
126
Privacy Notice
October 2016
| FACTS | WHAT DO THE DUNHAM FUNDS DO WITH YOUR PERSONAL INFORMATION? |
| Why? | Financial companies choose how they share your personal information. Federal law gives consumers the right to limit some but not all sharing. Federal law also requires us to tell you how we collect, share, and protect your personal information. Please read this notice carefully to understand what we do. |
| What? | The types of personal information we collect and share depend on the product or service you have with us. This information can include:
■ Social Security number and wire transfer instructions
■ account transactions and transaction history
■ investment experience and purchase history
When you are no longer a customer, we continue to share your information as described in this notice. |
| How? | All financial companies need to share customers’ personal information to run their everyday business. In the section below, we list the reasons financial companies can share their customers’ personal information; the reasons the Dunham Funds chooses to share; and whether you can limit this sharing. |
| Reasons we can share your personal information | Do Dunham Funds share? | Can you limit this sharing? |
| For our everyday business purposes - such as to process your transactions, maintain your account(s), respond to court orders and legal investigations, or report to credit bureaus | Yes | No |
| For our marketing purposes - to offer our products and services to you | Yes | No |
| For joint marketing with other financial companies | No | We don’t share |
| For our affiliates’ everyday business purposes - information about your transactions and experiences | No | We don’t share |
| For our affiliates’ everyday business purposes - information about your creditworthiness | No | We don’t share |
| For nonaffiliates to market to you | No | We don’t share |
| Questions? | Call (800) 442-4358 or go to www.dunham.com |
127
| What we do | |
| How do Dunham Funds protect my personal information? | To protect your personal information from unauthorized access and use, we use security measures that comply with federal law. These measures include computer safeguards and secured files and buildings.
We permit only authorized parties and affiliates (as permitted by law) who have signed an agreement (which protects your personal information) with us to have access to customer information. |
| How do Dunham Funds collect my personal information? | We collect your personal information, for example, when you ■ open and account or deposit money
■ direct us to buy securities or direct us to sell your securities
■ seek advice about your investments
We also collect your personal information from others, such as credit bureaus, affiliates, or other companies. |
| Why can’t I limit all sharing? | Federal law gives you the right to limit only ■ sharing for affiliates’ everyday business purposes-information about your creditworthiness
■ affiliates from using your information to market to you
■ sharing for nonaffiliates to market to you
State laws and individual companies may give you additional rights to limit sharing. |
| Definitions | |
| Affiliates | Companies related by common ownership or control. They can be financial and nonfinancial companies.
■ Our affiliates include financial companies, such as Dunham & Associates Investment Counsel, Inc. |
| Nonaffiliates | Companies not related by common ownership or control. They can be financial and nonfinancial companies.
■ Dunham Funds do not share with nonaffiliates so they can market to you. |
| Joint marketing | A formal agreement between nonaffiliated financial companies that together market financial products or services to you.
■ Dunham Funds doesn’t jointly market |
128
| How to Obtain Proxy Voting Information |
| Information regarding how the Funds voted proxies relating to portfolio securities for the most recent 12-month period ended June 30 as well as a description of the policies and procedures that the Funds use to determine how to vote proxies is available without charge, upon request, by calling (888)-3DUNHAM (338-6426) or by referring to the Securities and Exchange Commission’s (“SEC”) website at http://www.sec.gov. |
| How to Obtain 1st and 3rd Fiscal Quarter Portfolio Holdings |
| Each Fund files its complete schedule of portfolio holdings with the SEC for the first and third quarters of each fiscal year on Form N-Q. Form N-Q is available on the SEC’s website at http://www.sec.gov and may be reviewed and copied at the SEC’s Public Reference Room in Washington, DC (800)-SEC-0330. The information on Form N-Q is available without charge, upon request, by calling (888)-3DUNHAM (338-6426). |
129

P.O. Box 910309
San Diego, California 92191
(800) 442-4358
Distributed by Dunham & Associates Investment Counsel, Inc. Member FINRA/SIPC
THIS REPORT AND FINANCIAL STATEMENTS CONTAINED HEREIN ARE NOT INTENDED TO BE A FORECAST OF FUTURE EVENTS, A GUARANTEE OF FUTURE RESULTS, OR INVESTMENT ADVICE. FURTHER, THERE IS NO ASSURANCE THAT CERTAIN SECURITIES WILL REMAIN IN OR OUT OF EACH FUND’S PORTFOLIO.
THE FIGURES IN THIS REPORT REPRESENT PAST PERFORMANCE AND DO NOT GUARANTEE FUTURE RESULTS. THE PRINCIPAL VALUE OF AN INVESTMENT AND INVESTMENT RETURN WILL FLUCTUATE SO THAT AN INVESTOR’S SHARES, WHEN REDEEMED, MAY BE WORTH MORE OR LESS THAN THEIR ORIGINAL COST.
Item 2. Code of Ethics. Not applicable.
Item 3. Audit Committee Financial Expert. Not applicable.
Item 4. Principal Accountant Fees and Services. Not applicable.
Item 5. Audit Committee of Listed Companies. Not applicable to open-end investment companies.
Item 6. Schedule of Investments. Schedule of investments in securities of unaffiliated issuers is included under Item 1.
Item 7. Disclosure of Proxy Voting Policies and Procedures for Closed-End Funds. Not applicable to open-end investment companies.
Item 8. Portfolio Managers of Closed-End Funds. Not applicable to open-end investment companies.
Item 9. Purchases of Equity Securities by Closed-End Funds. Not applicable to open-end investment companies.
Item 10. Submission of Matters to a Vote of Security Holders. None
Item 11. Controls and Procedures.
(a) Based on an evaluation of the registrant’s disclosure controls and procedures as of a date within 90 days of filing date of this Form N-CSR, the disclosure controls and procedures are reasonably designed to ensure that the information required in filings on Forms N-CSR is recorded, processed, summarized, and reported on a timely basis.
(b) There were no significant changes in the registrant’s internal control over financial reporting that occurred during the registrant’s last fiscal half-year that have materially affected, or are reasonably likely to materially affect, the registrant’s internal control over financial reporting.
Item 12. Exhibits.
(a)(1) Not required for semi-annual reports.
(a)(2) Certifications required by Section 302 of the Sarbanes-Oxley Act of 2002 (and Item 11(a)(2) of Form N-CSR) are filed herewith..
(a)(3) Not applicable.
(b) Certifications required by Section 906 of the Sarbanes-Oxley Act of 2002 (and Item 11(b) of Form N-CSR) are filed herewith.
SIGNATURES
Pursuant to the requirements of the Securities Exchange Act of 1934 and the Investment Company Act of 1940, the registrant has duly caused this report to be signed on its behalf by the undersigned, thereunto duly authorized.
(Registrant) Dunham Funds
By (Signature and Title)
/s/ Jeffrey Dunham
Jeffrey Dunham, Principal Executive Officer/President
Date 7/7/2017
Pursuant to the requirements of the Securities Exchange Act of 1934 and the Investment Company Act of 1940, this report has been signed below by the following persons on behalf of the registrant and in the capacities and on the dates indicated.
By (Signature and Title)
/s/ Jeffrey Dunham
Jeffrey Dunham, Principal Executive Officer/President
Date 7/7/2017
By (Signature and Title)
/s/ Denise Iverson
Denise Iverson, Principal Financial Officer/Treasurer
Date 7/7/2017