united states
securities and exchange commission
washington, d.c. 20549
form n-csr
certified shareholder report of registered management
investment companies
Investment Company Act file number 811-22153
Dunham Funds
(Exact name of registrant as specified in charter)
10251 Vista Sorrento Pkwy, Ste. 200, San Diego, CA 92121
(Address of principal executive offices) (Zip code)
Richard Malinowski
Gemini Fund Services, LLC., 80 Arkay Drive, Suite 110, Hauppauge, NY 11788
(Name and address of agent for service)
Registrant's telephone number, including area code: 631-470-2619
Date of fiscal year end: 10/31
Date of reporting period:4/30/19
Item 1. Reports to Stockholders.
BEGINNING ON JANUARY 1, 2021, AS PERMITTED BY REGULATIONS ADOPTED BY THE SECURITIES AND EXCHANGE COMMISSION, PAPER COPIES OF THE DUNHAM FUNDS’ SHAREHOLDER REPORTS LIKE THIS ONE WILL NO LONGER BE SENT BY MAIL, UNLESS YOU SPECIFICALLY REQUEST PAPER COPIES OF THE REPORTS FROM THE DUNHAM FUNDS OR FROM YOUR FINANCIAL INTERMEDIARY, SUCH AS A BROKER-DEALER OR BANK. INSTEAD, THE REPORTS WILL BE MADE AVAILABLE ON A WEBSITE, AND YOU WILL BE NOTIFIED BY MAIL EACH TIME A REPORT IS POSTED AND PROVIDED WITH A WEBSITE LINK TO ACCESS THE REPORT.
IF YOU ALREADY ELECTED TO RECEIVE SHAREHOLDER REPORTS ELECTRONICALLY, YOU WILL NOT BE AFFECTED BY THIS CHANGE AND YOU NEED NOT TAKE ANY ACTION. YOU MAY ELECT TO RECEIVE SHAREHOLDER REPORTS AND OTHER COMMUNICATIONS FROM THE DUNHAM FUNDS ELECTRONICALLY BY CALLING (888)-3DUNHAM (338-6426) OR CONTACTING YOUR FINANCIAL INTERMEDIARY.
YOU MAY ELECT TO RECEIVE ALL FUTURE REPORTS IN PAPER FREE OF CHARGE. YOU CAN INFORM THE DUNHAM FUNDS OR YOUR FINANCIAL INTERMEDIARY THAT YOU WISH TO CONTINUE RECEIVING PAPER COPIES OF YOUR SHAREHOLDER REPORTS BY CALLING (888)-3DUNHAM (338-6426) OR CONTACTING YOUR FINANCIAL INTERMEDIARY. YOUR ELECTION TO RECEIVE REPORTS IN PAPER WILL APPLY TO ALL DUNHAM FUNDS HELD BY YOU OR THROUGH YOUR FINANCIAL INTERMEDIARY.
THIS SEMI-ANNUAL REPORT CONTAINS “FORWARD-LOOKING STATEMENTS” WITHIN THE MEANING OF THE PRIVATE SECURITIES LITIGATION REFORM ACT OF 1995. FORWARD-LOOKING STATEMENTS ALSO INCLUDE THOSE PRECEDED BY, FOLLOWED BY OR THAT INCLUDE THE WORDS “BELIEVES”, “EXPECTS”, “ANTICIPATES” OR SIMILAR EXPRESSIONS. SUCH STATEMENTS SHOULD BE VIEWED WITH CAUTION. ACTUAL RESULTS OR EXPERIENCE COULD DIFFER MATERIALLY FROM THE FORWARD-LOOKING STATEMENTS AS A RESULT OF MANY FACTORS. EACH FUND MAKES NO COMMITMENTS TO DISCLOSE ANY REVISIONS TO FORWARD-LOOKING STATEMENTS, OR ANY FACTS, EVENTS OR CIRCUMSTANCES AFTER THE DATE HEREOF THAT MAY BEAR UPON FORWARD-LOOKING STATEMENTS. IN ADDITION, PROSPECTIVE PURCHASERS OF THE FUNDS SHOULD CONSIDER CAREFULLY THE INFORMATION SET FORTH HERIN AND THE APPLICABLE FUND’S PROSPECTUS. OTHER FACTORS AND ASSUMPTIONS NOT IDENTIFIED ABOVE MAY ALSO HAVE BEEN INVOLVED IN THE DERIVATION OF THESE FORWARD-LOOKING STATEMENTS, AND THE FAILURE OF THESE OTHER ASSUMPTIONS TO BE REALIZED MAY ALSO CAUSE ACTUAL RESULTS TO DIFFER MATERIALLY FROM THOSE PROJECTED.
Dear Fellow Shareholders,
Volatility rocked global equity and bond markets during the six-month period as the Federal Reserve exhibited a hawkish stance in regards to monetary policy, trade tensions between the U.S and China escalated, China faced trouble in its own economy, and oil prices drastically declined. Nevertheless, global equities and bond markets ended the six-month period with gains, as these same key macro drivers reversed.
In December, the Federal Reserve bumped interest rates up 0.25 percent to a range of 2.25 percent to 2.50 percent. Even though the decision was planned months in advance, the move still unsettled markets. During the same month, the likelihood of a partial U.S government shutdown, deteriorating trade talks between the two largest economies, Brexit negotiations, and oil falling to around $40 a barrel were some events that pushed the S&P 500 Index approximately 16 percent lower within three weeks of December.
By January’s end, the S&P 500 had nearly climbed back to where it had started in December, as first quarter earnings season began to beat expectations and the Federal Reserve announced that it would not raise interest rates in the month of January. In addition, China announced in January that it would provide economic stimulus to its economy and oil prices rose to $54 a barrel.
By April’s end the largest surprise during the six-month period occurred when Chairman Jerome Powell announced the Federal Reserve would halt all interest rate hike plans in 2019 and end quantitative tightening of the balance sheet until further indication of inflation was seen. First quarter earnings season wound down with approximately 80 percent of companies, beating earnings. Furthermore, economic data of unemployment reaching a 50 year low, consumer sentiment reaching decade year highs, and first quarter GDP coming in better than expected at 3.2 percent all pointed to a heathy economy. Fears of a possible recession in 2019 were cast aside and markets roared to finish the six-month period ahead.
The rally in risk assets, lifted high-yield bonds higher as well, while many investors preferred corporate bonds with their fixed coupons over floating rate bonds due to fears of rising interest rates abating in the short term. Floating rates bonds, as measured by S&P / LSTA Leverage Loan Index, rose 2.1 percent, international bonds increased 3.3 percent, as measured by the Bloomberg Barclays Global Aggregate ex-U.S. bond index, corporate and government bonds rose by 5.5 percent, as measured by the Bloomberg Barclays Aggregate Bond Index, and high-yield bonds rose 6.2 percent, as measured by the Bloomberg Barclays High-Yield Ba/B 2% Issuer Cap Index. Dunham’s diversified fixed income stood strong, as the strategy remained balanced to corporate bonds, high yield bonds, and alternatives without overweighting low duration floating rate bonds.
During the six-month period, the Dow Jones Industrial Average rose 7.1 percent, the S&P increased 9.8 percent, and the NASDAQ Composite scaled 11.5 percent. The S&P’s impressive 10-year cumulative returns of 316 percent, a 15.3 percent annualized return, has most likely been on the minds of many investors due to their home-country bias. Much of this recent surge in 10-year performance has been caused by the extensive losses of the Great Financial Crisis rolling off, as March 2009 started the bull market. For perspective, the S&P 500 Index’s cumulative 10-year return as of the end of last year’s April 2018 (including the entire Great Financial Crisis in the 10-year history) was 163 percent – roughly a 10.2 percent annualized return. For these reasons, the concept of diversifying beyond large capitalization U.S. stocks is lost on many investors with the allure of these strong 10-year returns; however, Dunham remains steadfast in diversification beyond large capitalization U.S. stocks with international stocks and emerging markets stocks.
International diversification showed strength during the six-month period as, emerging market stocks, as measured by the MSCI ACWI Emerging Markets Index (Net), outperformed all U.S. markets by rising 13.8 percent, and international stocks, as measured by the MSCI ACWI ex US Index (Net), increased 9.1 percent, in-line with most broad U.S. markets.
We thank you for your continued trust and the confidence you have placed in us. We take that trust very seriously and look forward to servicing your investment needs for years to come.
Sincerely,

Jeffrey A. Dunham
President
Dunham & Associates
April 30, 2019
| Dunham Floating Rate Bond Fund (Unaudited) |
| Message from the Sub-Adviser (Newfleet Asset Management, LLC) |
| |
Asset Class Recap
Retail investor outflows continued throughout the six-month period most likely driven by the Federal Reserve’s decision to not raise interest rates in 2019. Markets even began to price an interest rate cut by the end of 2019, which most likely caused investors to favor fixed-rate corporate bonds. Strong macroeconomic data and an acceptable earnings season all pointed to a lower probability of recession during 2019, which helped risk assets and may explain why equity sensitive high-yield bonds also rallied. However, during the last three months institutional CLO demand, loan repayments via high-yield issuance, and lower primary issuance supply offset retail redemptions and set up the market for loan price increases. By February 21, 2019, bank loans had regained previous losses and from that point on continued to rise through the end of April. During the six-month period, the bank loan space, as measured by the S&P LSTA Leveraged Loan Index, appreciated 2.1 percent. Corporate bonds in general, as measured by the ICE BofA Merrill Lynch Corporate Index, advanced 7.0 percent during the six-month period. High-yield bonds, as measured by the ICE BofA Merrill Lynch Cash Pay High-Yield Index, rose 5.6 percent during the six-month period.
The continued healthy backdrop was also attractive for credit spread portfolios and may have reduced investors’ default expectations. The loan market default rate stood at 1.01 percent in April, which was near a multi-year low. Loan market prices improved to 97.5 in April as investors sought opportunities in the secondary market, while the primary issuance market remained light. Loans rated BB were priced at 99.3, B rated loans were priced at 98.1, and CCC rated loans were priced at 86.6. Loan spreads to maturity closed at London Interbank Offered Rate LIBOR+389 in April, tighter by 78 basis points year-to-date, as investors and risk markets grew more comfortable with U.S. and global fundamental trends, specifically that economies were not entering a recession to start the year.
Allocation Review
During most of the six-month period, the Sub-Adviser was overweight the sector categories consumer non-durables, housing, and gaming, while underweight cyclical industries such as automotive and transportation. The Sub-Adviser was extremely underweight technology and retail companies. Security selection within the manufacturing, broadcasting, diversified media and food industries contributed to Fund performance, while security selection that detracted came from the consumer non-durables and energy industries during the second fiscal quarter.
Holdings Insights
During the six-month period, the top contributor to the Fund was CPI Card Group 8/17/2022 (BL1785619) (holding weight*: 0.54 percent). CPI Card Group manufactures physical debt and credit cards from Mastercard to Visa to dual interface to metal cards. Fourth quarter results marked the company’s third consecutive quarter of earnings stability, as card volumes recovered with cash flow up 55 percent year-over -year. The holding appreciated 18.9 percent during the six-month period. Another contributor to the Fund was IHeartCommunications, Inc. 9.0% 12/15/2019 (184502BL5) (holding weight*: 0.04 percent). IHeartCommunications, Inc. is the largest radio station owner in the U.S. and also has a substantial interest in the second largest outdoor advertising company in the world. A combination of better fourth quarter 2018 results and its pending exit from bankruptcy pushed the value of loans up over the six-month period. Overall, the holding gained 9.5 percent return during the time period. A third contributor to the Fund was PetSmart Inc. 3/11/2022 (BL226478) (holding weight*: 0.37 percent). The company is a retailer of pet animal products and services. The loan rose after the company announced it would seek an Initial Public Offering for its e-commerce website chewy.com. The holding climbed 16.1 percent during the six-month period.
The largest detractor from Fund performance was Ditech Holding 6/30/2022 (BL249813) (holding weight*: 0.35 percent) an independent originator and servicer of mortgage loans and reverse mortgage loans. The loan fell after the company declared Chapter 11 bankruptcy for the second time in 14 months and was considering strategic alternatives, which included selling the company. During the six-month period, the holding lost 28.6 percent. The second largest detractor to the Fund was Isagenix Worldwide LLC 5/26/2025 (BL2682096) (holding weight*: 0.24 percent). The company is a multi-level marketer of weight management products and nutritional supplements. Low unemployment, increasing competition for workers in the gig economy, fiercer competition in the weight loss industry, and a saturated social media ecosystem negatively weighed on the company’s ability to attract employees. In addition, company specific issues—poor marketing message, failed product introduction, and a weak overseas launch—led to two consecutive quarters of mediocre operating performance. During the six-month period, the holding fell 16.8 percent. Another detractor from Fund performance was Gavilan Resources LLC 2/23/2024 (BL2367672) (holding weight*: 0.19 percent), which is a petroleum exploration and production company located in the Texan Eagle Ford basin. The company revealed lower drilling output during the previous fiscal quarter and the holding slid 16.4 percent during the six-month period.
Sub-Adviser Outlook
Relative to the start of the year, the Sub-Adviser believes there are fewer cheap opportunities; however, improved CLO issuance, high yield issuance for loan repayments and lower supply, the Sub-Adviser believes, should lead to price stability in the secondary market. In addition, the Sub-Adviser believes the loan market yield -to-maturity of 6.5 percent compares favorably to the high-yield market of 6.1 percent. Despite the prospect of no further rate hikes and continued retail investors outflows, the Sub-Adviser believes investors may benefit from a higher yield while maintaining a senior position in the issuer’s capital structure and a secured interest in all assets of the issuer, which is important as the credit cycle matures. With a strong start to the year, the Sub-Adviser has de -risked slightly to take advantage of the improvement in loan prices. Moving forward, the Sub-Adviser believes return will be driven by coupon payments rather than price appreciation and default rates should remain low.
| * | Holdings percentage(s) of total investments, excluding collateral for securities loaned, as of 4/30/2019. |
Growth of $100,000 Investment
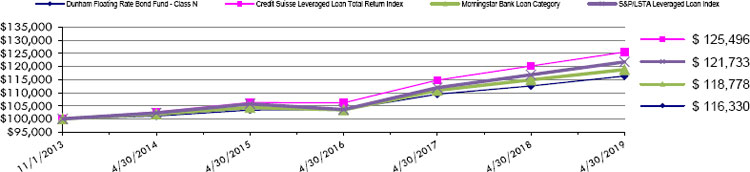
Total Returns as of April 30, 2019
| | | | | Annualized |
| | | | Annualized | Since Inception |
| | Six Months | One Year | Five Years | (11/1/13) |
| Class N | 1.78% | 3.35% | 2.85% | 2.79% |
| Class C | 1.42% | 2.49% | 2.11% | 2.02% |
| Class A with load of 4.50% | (2.89)% | (1.57)% | 1.67% | 1.67% |
| Class A without load | 1.66% | 3.10% | 2.61% | 2.53% |
| Credit Suisse Leveraged Loan Total Return Index | 2.17% | 4.46% | 4.11% | 4.22% |
| S&P/LSTA Leveraged Loan 100 Index ** | 2.09% | 4.20% | 3.55% | 3.64% |
| Morningstar Bank Loan Category | 1.88% | 3.40% | 3.12% | 3.18% |
| | | | | |
| ** | Change in Fund’s benchmark. As a result, the Fund’s performance is compared to both indices in the table above. |
The Credit Suisse Leveraged Loan Total Return Index tracks the investable market of the U.S. dollar denominated leveraged loan market. It consists of issues rated “5B” or lower, meaning that the highest rated issues included in this index are Moody’s/S&P ratings of Baa1/BB+ or Ba1/BBB+. All loans are funded term loans with a tenor of at least one year and are made by issuers domiciled in developed countries.
The S&P/LSTA Leveraged Loan 100 Index is designed to reflect the performance of the largest facilities in the leveraged loan market. Investors cannot invest directly in an index or benchmark.
The Morningstar Bank Loan Category is generally representative of mutual funds that primarily invest in floating-rate bank loans instead of bonds. These bank loans generally offer interest payments that typically float above a common short-term benchmark such as the London interbank offered rate, or LIBOR.
As disclosed in the Trust’s latest registration statement, the Fund’s total annual operating expenses, including cost of underlying funds, are 0.98% for Class N, 1.73% for Class C and 1.23% for Class A. Class A shares are subject to a sales load of 4.50% and a deferred sales charge of up to 0.75%. The performance data quoted here represents past performance, which is not indicative of future results. Current performance may be lower or higher than the performance data quoted. The investment return and NAV will fluctuate, so that an investor’s shares, when redeemed, may be worth more or less than their original cost. Total returns are calculated assuming reinvestment of all dividends and capital gains distributions, if any. The returns do not reflect the deductions of taxes a shareholder would pay on the redemption of Fund shares or Fund distributions. For performance information current to the most recent month-end, please call 1-800-442-4358 or visit our website www.dunham.com
| SCHEDULE OF INVESTMENTS (Unaudited) |
| Dunham Floating Rate Bond Fund |
| April 30, 2019 |
| | | Variable | | Principal | | | Interest | | | Maturity | | | |
| Security | | Rate | | Amount | | | Rate % | | | Date | | Value | |
| BANK LOANS - 92.1% | | | | | | | | | | | | | | | | |
| BASIC MATERIALS - 3.2% | | | | | | | | | | | | | | | | |
| Covia Holdings Corp., Initial Term Loan | | LIBOR + 4.000% | | $ | 565,725 | | | | 6.592 | + | | 5/31/2025 | | $ | 504,604 | |
| Element Solutions, Inc., Initial Term Loan | | LIBOR + 2.250% | | | 733,163 | | | | 4.826 | + | | 1/30/2026 | | | 735,226 | |
| Graftech International Ltd., Initial Term Loan | | LIBOR + 3.500% | | | 744,750 | | | | 6.076 | + | | 2/12/2025 | | | 745,681 | |
| H.B. Fuller Co., Commitment Loan | | LIBOR + 2.000% | | | 678,227 | | | | 4.580 | + | | 10/20/2024 | | | 676,850 | |
| Ineos US Finance LLC, New 2024 Dollar Term Loan | | LIBOR + 2.000% | | | 1,896,000 | | | | 4.576 | + | | 3/31/2024 | | | 1,890,179 | |
| Kraton Polymers LLC, Dollar Replacement Term Loan (2018) | | LIBOR + 2.500% | | | 389,809 | | | | 5.076 | + | | 3/08/2025 | | | 389,727 | |
| New Arclin US Holding Corp., Replacement Term Loan (First Lien) | | LIBOR + 3.500% | | | 262,530 | | | | 6.076 | + | | 2/14/2024 | | | 263,351 | |
| Omnova Solutions, Inc., Term B-2 Loan | | LIBOR + 3.250% | | | 498,354 | | | | 5.826 | + | | 8/24/2023 | | | 499,599 | |
| US Salt LLC, Initial Term Loan | | LIBOR + 4.750% | | | 275,000 | | | | 7.326 | + | | 1/16/2026 | | | 276,375 | |
| | | | | | | | | | | | | | | | 5,981,592 | |
| COMMUNICATIONS - 15.8% | | | | | | | | | | | | | | | | |
| Advantage Sales & Marketing, Inc., Initial Term Loan (First Lien) | | LIBOR + 3.250% | | | 388,286 | | | | 5.826 | + | | 7/24/2021 | | | 341,758 | |
| Altice France SA, USD TLB-13 Incremental Term Loan | | LIBOR + 4.000% | | | 233,825 | | | | 6.588 | + | | 8/14/2026 | | | 229,649 | |
| Centurylink, Inc., Initial Term B Loan | | LIBOR + 2.750% | | | 1,010,060 | | | | 5.326 | + | | 2/01/2025 | | | 1,005,222 | |
| Charter Communications Operating LLC, Term B Loan | | LIBOR + 2.000% | | | 2,256,438 | | | | 4.576 | + | | 4/30/2025 | | | 2,264,549 | |
| Commscope, Inc., Initial Term Loan | | LIBOR + 3.250% | | | 915,000 | | | | 5.826 | + | | 4/06/2026 | | | 924,292 | |
| CSC Holdings, LLC, March 2017 Refinancing Term Loan | | LIBOR + 2.250% | | | 1,756,299 | | | | 4.838 | + | | 7/16/2025 | | | 1,752,883 | |
| CSC Holdings, LLC, October 2018 Incremental Term Loan | | LIBOR + 2.250% | | | 379,050 | | | | 4.838 | + | | 1/16/2026 | | | 378,197 | |
| CSC Holdings, LLC, January 2018 Incremental Term Loan | | LIBOR + 2.500% | | | 128,700 | | | | 5.088 | + | | 1/24/2026 | | | 128,861 | |
| E.W. Scripps Co., Term Loan B | | LIBOR + 2.750% | | | 385,000 | | | | 5.342 | + | | 4/04/2026 | | | 386,444 | |
| Frontier Communications Corp., Term B-1 Loan | | LIBOR + 3.750% | | | 1,140,263 | | | | 6.326 | + | | 6/16/2024 | | | 1,115,081 | |
| Go Daddy Operating Co. LLC, Tranche B-1 Term Loan | | LIBOR + 2.000% | | | 751,686 | | | | 4.576 | + | | 2/16/2024 | | | 753,975 | |
| Hoya Midco LLC., Initial Term Loan (First Lien) | | LIBOR + 3.500% | | | 867,936 | | | | 6.076 | + | | 6/30/2024 | | | 863,058 | |
| iHeart Communications, Inc., Tranche D Term Loan | | LIBOR + 8.750% | | | 1,510,000 | | | | 9.000 | + | | 12/15/2019 | | | 1,125,426 | |
| KSBR Holding Corp., Initial Term Loan | | LIBOR + 4.500% | | | 140,000 | | | | 7.088 | + | | 4/16/2026 | | | 141,487 | |
| Level 3 Financing, Inc., Tranche B 2024 Term Loan | | LIBOR + 2.250% | | | 2,410,000 | | | | 4.826 | + | | 2/22/2024 | | | 2,414,217 | |
| MCC Iowa LLC, Tranche M Term Loan | | LIBOR + 2.000% | | | 783,187 | | | | 4.583 | + | | 1/16/2025 | | | 784,820 | |
| Mcgraw-Hill Global Education Holdings LLC, Term B Loan (First Lien) | | LIBOR + 4.000% | | | 1,475,136 | | | | 6.576 | + | | 5/04/2022 | | | 1,415,998 | |
| Mediacom Illinois LLC, Tranche N Term Loan | | LIBOR + 1.750% | | | 646,754 | | | | 4.333 | + | | 2/15/2024 | | | 645,295 | |
| Meredith Corp., Tranche B-1 Term Loan | | LIBOR + 2.750% | | | 613,750 | | | | 5.326 | + | | 2/01/2025 | | | 616,764 | |
| Numericable US LLC, USD TLB-11 Term Loan | | LIBOR + 2.750% | | | 638,625 | | | | 5.326 | + | | 8/01/2025 | | | 619,070 | |
| Numericable US LLC, USD TLB-12 Term Loan | | LIBOR + 3.688% | | | 323,219 | | | | 6.275 | + | | 2/01/2026 | | | 316,108 | |
| Radiate Holdco LLC, Closing Date Term Loan | | LIBOR + 3.000% | | | 854,604 | | | | 5.576 | + | | 1/31/2024 | | | 853,309 | |
| Red Ventures LLC, Term B-1 Loan (First Lien) | | LIBOR + 3.000% | | | 1,016,343 | | | | 5.576 | + | | 11/08/2024 | | | 1,021,424 | |
| Rodan & Fields LLC, Closing Date Term Loan | | LIBOR + 4.000% | | | 640,163 | | | | 6.588 | + | | 6/16/2025 | | | 569,745 | |
| SBA Senior Finance II LLC, Initial Term Loan | | LIBOR + 2.000% | | | 1,150,838 | | | | 4.576 | + | | 4/12/2025 | | | 1,145,803 | |
| Securus Technologies Holdings, Inc., Initial Term Loan (First Lien) | | LIBOR + 4.500% | | | 370,900 | | | | 7.076 | + | | 10/31/2024 | | | 365,954 | |
| Securus Technologies Holdings, Inc., Initial Loan (Second Lien) | | LIBOR + 8.250% | | | 255,000 | | | | 10.826 | + | | 10/31/2025 | | | 249,517 | |
| Sinclair Television Group, Inc., Tranche B Term Loan | | LIBOR + 2.250% | | | 361,064 | | | | 4.826 | + | | 1/04/2024 | | | 361,741 | |
| Sprint Communications, Inc., Initial Term Loan | | LIBOR + 2.500% | | | 1,043,243 | | | | 5.076 | + | | 2/02/2024 | | | 1,015,597 | |
| Sprint Communications, Inc., 2019 Incremental Term Loan | | LIBOR + 3.000% | | | 369,075 | | | | 5.576 | + | | 2/02/2024 | | | 364,308 | |
| Telenet Financing USD LLC., Term Loan AN Facility | | LIBOR + 2.250% | | | 680,000 | | | | 4.888 | + | | 8/16/2026 | | | 678,980 | |
| Tribune Media Co., Term B Loan | | LIBOR + 3.000% | | | 22,405 | | | | 5.576 | + | | 12/28/2020 | | | 22,475 | |
| Tribune Media Co., Term C Loan | | LIBOR + 3.000% | | | 279,252 | | | | 5.576 | + | | 1/26/2024 | | | 279,907 | |
| Univision Communications, Inc., 2017 Replacement Repriced First-Lien Term Loan | | LIBOR + 2.750% | | | 2,264,710 | | | | 5.326 | + | | 3/16/2024 | | | 2,183,419 | |
| Virgin Media Bristol LLC, K Facility | | LIBOR + 2.500% | | | 690,000 | | | | 5.088 | + | | 1/16/2026 | | | 692,763 | |
| West Corporation, Initial Term B Loan | | LIBOR + 4.000% | | | 445,155 | | | | 6.615 | + | | 10/10/2024 | | | 431,914 | |
| West Corporation, Incremental Term B-1 Loan | | LIBOR + 3.500% | | | 248,125 | | | | 6.115 | + | | 10/10/2024 | | | 239,751 | |
| Ziggo Secured Finance Partnership, Term Loan E Facility | | LIBOR + 2.500% | | | 890,000 | | | | 5.088 | + | | 4/16/2025 | | | 883,418 | |
| | | | | | | | | | | | | | | | 29,583,179 | |
| CONSUMER, CYCLICAL - 19.0% | | | | | | | | | | | | | | | | |
| 84 Lumber Co., Term B-1 Loan | | LIBOR + 5.250% | | | 412,919 | | | | 7.832 | + | | 10/24/2023 | | | 414,467 | |
| Accuride Corp., 2017 Refinancing Term Loan | | LIBOR + 5.250% | | | 450,862 | | | | 7.850 | + | | 11/16/2023 | | | 399,013 | |
| Affinity Gaming, Initial Term Loan | | LIBOR + 3.250% | | | 358,330 | | | | 5.826 | + | | 6/30/2023 | | | 342,804 | |
| American Airlines, Inc., 2017 Class B Term Loan | | LIBOR + 2.000% | | | 87,220 | | | | 4.579 | + | | 4/28/2023 | | | 86,762 | |
| American Airlines, Inc., 2017 Class B Term Loan | | LIBOR + 2.000% | | | 489,559 | | | | 4.588 | + | | 12/14/2023 | | | 487,163 | |
| American Airlines, Inc., 2018 Replacement Term Loan | | LIBOR + 1.750% | | | 426,723 | | | | 4.329 | + | | 6/28/2025 | | | 421,686 | |
| American Axle & Manufacturing, Inc., Tranche B Term Loan | | LIBOR + 2.250% | | | 666,675 | | | | 4.832 | + | | 4/06/2024 | | | 658,342 | |
| American Builders & Contractors Supply Co., Inc., Term B-2 Loan | | LIBOR + 2.000% | | | 1,405,413 | | | | 4.576 | + | | 11/01/2023 | | | 1,396,334 | |
| American Greetings Corp., Initial Term Loan | | LIBOR + 4.500% | | | 342,413 | | | | 7.076 | + | | 4/06/2024 | | | 343,911 | |
| Aramark Intermediate HoldCo Corp., U.S. Term B-2 Loan | | LIBOR + 1.750% | | | 265,455 | | | | 4.326 | + | | 3/28/2024 | | | 265,754 | |
| Aramark Intermediate HoldCo Corp., U.S. Term B-3 Loan | | LIBOR + 1.750% | | | 1,357,024 | | | | 4.326 | + | | 3/12/2025 | | | 1,357,024 | |
| Aristocrat Leisure Ltd., Term B-3 Loan | | LIBOR + 1.750% | | | 1,553,214 | | | | 4.330 | + | | 10/20/2024 | | | 1,552,244 | |
| Bass Pro Group LLC, Initial Term Loan | | LIBOR + 5.000% | | | 933,703 | | | | 7.576 | + | | 9/24/2024 | | | 933,900 | |
| Boyd Gaming Corp., Refinancing Term B Loan | | LIBOR + 2.250% | | | 787,826 | | | | 4.832 | + | | 9/16/2023 | | | 789,303 | |
| | | | | | | | | | | | | | | | | |
See accompanying notes to financial statements.
| SCHEDULE OF INVESTMENTS (Unaudited) |
| Dunham Floating Rate Bond Fund (Continued) |
| April 30, 2019 |
| | | Variable | | Principal | | | Interest | | | Maturity | | | |
| Security | | Rate | | Amount | | | Rate % | | | Date | | Value | |
| BANK LOANS - 92.1% (Continued) | | | | | | | | | | | | | | | | |
| CONSUMER, CYCLICAL - 19.0% (Continued) | | | | | | | | | | | | | | | | |
| Caesars Resort Collection LLC, Term B Loan | | LIBOR + 2.750% | | $ | 1,950,313 | | | | 5.326 | + | | 12/24/2024 | | $ | 1,958,640 | |
| Carlisle FoodService Products, Inc., Initial Term Loan (First Lien) | | LIBOR + 3.000% | | | 452,110 | | | | 5.576 | + | | 3/20/2025 | | | 437,982 | |
| Carlisle FoodService Products, Inc., Delayed Draw Term Loan (First Lien) | | LIBOR + 3.000% | | | 103,067 | | | | — | + | | 3/20/2025 | | | 100,426 | |
| CBAC Borrower LLC, Term B Loan | | LIBOR + 4.000% | | | 231,475 | | | | 6.576 | + | | 7/08/2024 | | | 232,151 | |
| CDS US Intermediate Holdings, Inc., Term B Loan (First Lien) | | LIBOR + 3.750% | | | 622,336 | | | | 6.337 | + | | 7/08/2022 | | | 605,614 | |
| CEOC LLC, Term B Loan | | LIBOR + 2.000% | | | 1,397,313 | | | | 4.576 | + | | 10/08/2024 | | | 1,392,946 | |
| CityCenter Holdings LLC., Term B Loan | | LIBOR + 2.250% | | | 1,173,815 | | | | 4.826 | + | | 4/18/2024 | | | 1,174,825 | |
| Crown Finance US, Inc., Initial Dollar Tranche Term Loan | | LIBOR + 2.250% | | | 571,657 | | | | 4.826 | + | | 2/28/2025 | | | 569,990 | |
| CSC SW Holdco, Inc., Term B-1 Loan (First Lien) | | LIBOR + 3.250% | | | 713,093 | | | | 5.851 | + | | 11/14/2022 | | | 706,112 | |
| DexKo Global, Inc., Replacement U.S. Dollar Term B Loan (First Lien) | | LIBOR + 3.500% | | | 513,514 | | | | 6.076 | + | | 7/24/2024 | | | 513,514 | |
| Eldorado Resorts, Inc., Term Loan | | LIBOR + 2.250% | | | 789,246 | | | | 4.833 | + | | 4/16/2024 | | | 790,067 | |
| Formula One Management Ltd., Facility B3 (USD) | | LIBOR + 2.500% | | | 615,202 | | | | 5.122 | + | | 1/31/2024 | | | 607,896 | |
| Gateway Casinos & Entertainment Ltd., Initial Term Loan | | LIBOR + 3.000% | | | 501,213 | | | | 5.600 | + | | 11/30/2023 | | | 504,345 | |
| Global Appliance, Inc., Tranche B Term Loan | | LIBOR + 4.000% | | | 926,926 | | | | 6.576 | + | | 9/28/2024 | | | 930,402 | |
| Golden Nugget, Inc., Initial B Term Loan | | LIBOR + 2.750% | | | 827,456 | | | | 5.331 | + | | 10/04/2023 | | | 829,615 | |
| GVC Holdings PLC, Facility B2 (USD) | | LIBOR + 2.500% | | | 569,250 | | | | 5.076 | + | | 3/28/2024 | | | 569,748 | |
| HD Supply, Inc., Term B-5 Loan | | LIBOR + 1.750% | | | 845,247 | | | | 4.326 | + | | 10/16/2023 | | | 848,417 | |
| Hilton Worldwide Finance LLC, Series B-2 Term Loan | | LIBOR + 1.750% | | | 1,208,345 | | | | 4.332 | + | | 10/24/2023 | | | 1,213,571 | |
| Isagenix International LLC, Senior Lien Term Loan | | LIBOR + 5.750% | | | 567,875 | | | | 8.350 | + | | 6/14/2025 | | | 457,139 | |
| Libbey Glass, Inc., Initial Loan | | LIBOR + 3.000% | | | 555,242 | | | | 5.581 | + | | 4/08/2021 | | | 508,046 | |
| Michaels Stores, Inc., 2018 New Replacement Term B Loan | | LIBOR + 2.500% | | | 515,943 | | | | 5.077 | + | | 1/30/2023 | | | 513,848 | |
| Navistar, Inc., Tranche B Term Loan | | LIBOR + 3.500% | | | 930,600 | | | | 6.097 | + | | 11/06/2024 | | | 932,810 | |
| Neiman Marcus Group Ltd. LLC, Other Term Loan | | LIBOR + 3.250% | | | 1,242,776 | | | | 5.834 | + | | 10/24/2020 | | | 1,154,228 | |
| Panther BF Aggregator 2 LP, Term Loan B | | LIBOR + 3.500% | | | 850,000 | | | | 6.133 | + | | 3/18/2026 | | | 854,509 | |
| Patriot Container Corp., Closing Date Term Loan (First Lien) | | LIBOR + 3.500% | | | 633,600 | | | | 6.076 | + | | 3/20/2025 | | | 632,412 | |
| PetSmart, Inc., Amended Loan | | LIBOR + 4.250% | | | 722,456 | | | | 6.834 | + | | 3/12/2022 | | | 698,474 | |
| Playa Resorts Holding BV, Initial Term Loan | | LIBOR + 2.750% | | | 839,722 | | | | 5.326 | + | | 4/28/2024 | | | 829,053 | |
| Scientific Games International, Inc., Initial Term B-5 Loan | | LIBOR + 2.750% | | | 799,932 | | | | 5.326 | + | | 8/14/2024 | | | 799,040 | |
| Serta Simmons Bedding LLC, Initial Term Loan (First Lien) | | LIBOR + 3.500% | | | 299,115 | | | | 6.085 | + | | 11/08/2023 | | | 219,208 | |
| Siteone Landscape Supply LLC, Tranche E Term Loan | | LIBOR + 2.750% | | | 692,511 | | | | 5.330 | + | | 10/28/2024 | | | 690,637 | |
| SRAM LLC, New Term Loan (2018) (First Lien) | | LIBOR + 2.750% | | | 501,834 | | | | 5.386 | + | | 3/16/2024 | | | 504,343 | |
| Stars Group Holdings BV, USD Term Loan | | LIBOR + 3.500% | | | 576,417 | | | | 6.100 | + | | 7/10/2025 | | | 579,887 | |
| Station Casinos LLC, Term B Facility Loan | | LIBOR + 2.500% | | | 868,895 | | | | 5.076 | + | | 6/08/2023 | | | 871,367 | |
| Tenneco, Inc., Tranche B Term Loan | | LIBOR + 2.750% | | | 793,013 | | | | 5.326 | + | | 9/30/2025 | | | 776,906 | |
| TI Group Automotive Systems LLC, Initial US Term Loan | | LIBOR + 2.500% | | | 356,576 | | | | 5.076 | + | | 6/30/2022 | | | 354,347 | |
| Univar USA, Inc., Term B-3 Loan | | LIBOR + 2.250% | | | 718,439 | | | | 4.826 | + | | 6/30/2024 | | | 720,236 | |
| | | | | | | | | | | | | | | | 35,531,458 | |
| CONSUMER, NON-CYCLICAL - 20.3% | | | | | | | | | | | | | | | | |
| 21st Century Oncology, Inc., Tranche B Term Loan | | LIBOR + 6.125% | | | 144,779 | | | | 8.726 | + | | 1/16/2023 | | | 120,746 | |
| Accelerated Health Systems LLC, Initial Term Loan | | LIBOR + 3.500% | | | 463,838 | | | | 6.089 | + | | 11/01/2025 | | | 466,013 | |
| Acuity Specialty Products, Inc., Initial Term Loan (First Lien) | | LIBOR + 4.000% | | | 275,800 | | | | 6.600 | + | | 8/12/2024 | | | 230,293 | |
| Agiliti Health, Inc., Initial Term Loan | | LIBOR + 3.000% | | | 435,000 | | | | 5.595 | + | | 1/04/2026 | | | 435,000 | |
| AHP Health Partners, Inc., Term Loan | | LIBOR + 4.500% | | | 580,613 | | | | 7.076 | + | | 6/30/2025 | | | 582,973 | |
| Albertson’s LLC, 2017-1 Term B-5 Loan | | LIBOR + 3.000% | | | 644,688 | | | | 5.601 | + | | 12/20/2022 | | | 646,483 | |
| Albertson’s LLC, 2018 Term B-7 Loan | | LIBOR + 3.000% | | | 1,142,772 | | | | 5.576 | + | | 11/16/2025 | | | 1,145,515 | |
| AlixPartners LLP, 2017 Refinancing Term Loan | | LIBOR + 2.750% | | | 945,247 | | | | 5.326 | + | | 4/04/2024 | | | 947,535 | |
| Allied Universal Holdco LLC, Incremental Term Loan (First Lien) | | LIBOR + 4.250% | | | 448,875 | | | | 6.826 | + | | 7/28/2022 | | | 444,499 | |
| Amneal Pharmaceuticals LLC, Initial Term Loan | | LIBOR + 3.500% | | | 605,284 | | | | 6.076 | + | | 5/04/2025 | | | 608,235 | |
| Atlantic Aviation FBO, Inc., Term Loan | | LIBOR + 3.750% | | | 129,675 | | | | 6.326 | + | | 12/06/2025 | | | 131,458 | |
| Avantor, Inc., Initial B-1 Dollar Term Loan | | LIBOR + 3.750% | | | 624,449 | | | | 6.326 | + | | 11/20/2024 | | | 628,299 | |
| Bausch Health Companies, Inc., Initial Term Loan | | LIBOR + 3.000% | | | 1,163,518 | | | | 5.584 | + | | 6/02/2025 | | | 1,170,126 | |
| Bausch Health Companies, Inc., First Incremental Term Loan | | LIBOR + 2.750% | | | 204,250 | | | | 5.334 | + | | 11/28/2025 | | | 204,679 | |
| Change Healthcare Holdings, Inc., Closing Date Term Loan | | LIBOR + 2.750% | | | 955,200 | | | | 5.326 | + | | 2/29/2024 | | | 956,308 | |
| CHG Healthcare Services, Inc., New Term Loan (2017) (First Lien) | | LIBOR + 3.000% | | | 367,263 | | | | 5.576 | + | | 6/08/2023 | | | 367,915 | |
| CHG PPC Parent LLC, Initial Term Loan (First Lien) | | LIBOR + 2.750% | | | 585,575 | | | | 5.326 | + | | 4/01/2025 | | | 586,676 | |
| Chobani LLC, New Term Loan (First Lien) | | LIBOR + 3.500% | | | 843,429 | | | | 6.076 | + | | 10/10/2023 | | | 833,940 | |
| Concordia International Corp., Initial Dollar Term Loan | | LIBOR + 5.500% | | | 90,090 | | | | 8.097 | + | | 9/06/2024 | | | 84,769 | |
| CPI Acquisition, Inc., Term Loan (First Lien) | | LIBOR + 4.500% | | | 1,368,336 | | | | 7.081 | + | | 8/16/2022 | | | 1,022,831 | |
| Diamond BV, Initial USD Term Loan | | LIBOR + 3.000% | | | 782,120 | | | | 5.576 | + | | 9/06/2024 | | | 755,723 | |
| Dole Food Company, Inc., Tranche B Term Loan | | LIBOR + 2.750% | | | 916,375 | | | | 5.331 | + | | 4/06/2024 | | | 907,976 | |
| Envision Healthcare Corp., Initial Term Loan | | LIBOR + 3.750% | | | 1,560,667 | | | | 6.326 | + | | 10/10/2025 | | | 1,510,655 | |
| Explorer Holdings, Inc., Initial Term Loan | | LIBOR + 3.750% | | | 586,932 | | | | 6.350 | + | | 5/02/2023 | | | 587,759 | |
| Fort Dearborn Holding Company, Inc., Initial Term Loan (First Lien) | | LIBOR + 4.000% | | | 392,602 | | | | 6.589 | + | | 10/20/2023 | | | 390,639 | |
| Greatbatch Ltd., New Term B Loan (2017) | | LIBOR + 3.000% | | | 598,781 | | | | 5.592 | + | | 10/28/2022 | | | 601,916 | |
| Greenrock Finance, Inc., Initial USD Term B Loan (First Lien) | | LIBOR + 3.500% | | | 251,813 | | | | 6.100 | + | | 6/28/2024 | | | 251,499 | |
| GW Honos Security Corp., Term B Loan | | LIBOR + 3.500% | | | 227,198 | | | | 6.108 | + | | 5/24/2024 | | | 227,283 | |
| Heartland Dental, LLC, Initial Term Loan | | LIBOR + 3.750% | | | 606,576 | | | | 6.326 | + | | 4/30/2025 | | | 598,615 | |
| Heartland Dental, LLC, Delayed Term Loan | | LIBOR + 3.750% | | | 13,575 | | | | 6.113 | + | | 4/30/2025 | | | 13,397 | |
| Herbalife Nutrition Ltd., Term Loan B | | LIBOR + 3.250% | | | 243,775 | | | | 5.826 | + | | 8/18/2025 | | | 245,512 | |
See accompanying notes to financial statements.
| SCHEDULE OF INVESTMENTS (Unaudited) |
| Dunham Floating Rate Bond Fund (Continued) |
| April 30, 2019 |
| | | Variable | | Principal | | | Interest | | | Maturity | | | |
| Security | | Rate | | Amount | | | Rate % | | | Date | | Value | |
| BANK LOANS - 92.1% (Continued) | | | | | | | | | | | | | | | | |
| CONSUMER, NON-CYCLICAL - 20.3% (Continued) | | | | | | | | | | | | | | | | |
| H-Food Holdings LLC, Initial Term Loan | | LIBOR + 3.688% | | $ | 471,438 | | | | 6.263 | + | | 5/24/2025 | | $ | 462,989 | |
| Hostess Brands LLC, November 2017 Refinancing Term B Loan | | LIBOR + 2.250% | | | 920,764 | | | | 4.826 | + | | 8/04/2022 | | | 920,764 | |
| Jaguar Holding Company I LLC, 2018 Term Loan | | LIBOR + 2.500% | | | 934,743 | | | | 5.076 | + | | 8/18/2022 | | | 930,831 | |
| JBS USA Lux S.A., Initial Term Loan | | LIBOR + 2.500% | | | 836,900 | | | | 5.081 | + | | 10/30/2022 | | | 838,428 | |
| JBS USA Lux S.A., Term Loan B | | LIBOR + 2.500% | | | 740,000 | | | | 5.082 | + | | 4/24/2026 | | | 742,390 | |
| Kronos Acquisition Intermediate, Inc., Initial Loan | | LIBOR + 4.000% | | | 956,837 | | | | 6.579 | + | | 5/16/2023 | | | 920,788 | |
| Milk Specialties Company, New Term Loan | | LIBOR + 4.000% | | | 334,396 | | | | 6.576 | + | | 8/16/2023 | | | 335,650 | |
| NAB Holdings LLC, 2018 Refinancing Term Loan | | LIBOR + 3.000% | | | 576,254 | | | | 5.600 | + | | 6/30/2024 | | | 565,449 | |
| National Mentor Holdings, Inc., Initial Term Loan (First Lien) | | LIBOR + 4.250% | | | 127,105 | | | | 6.826 | + | | 3/08/2026 | | | 128,138 | |
| National Mentor Holdings, Inc., Initial Term C Loan (First Lien) | | LIBOR + 4.250% | | | 7,895 | | | | 6.826 | + | | 3/08/2026 | | | 7,959 | |
| NVA Holdings, Inc., Term B-3 Loan (First Lien) | | LIBOR + 2.750% | | | 772,220 | | | | 5.326 | + | | 2/02/2025 | | | 761,281 | |
| NVA Holdings, Inc., Incremental Term B-4 Loan | | LIBOR + 3.500% | | | 20,000 | | | | 6.081 | + | | 2/02/2025 | | | 20,075 | |
| Ortho-Clinical Diagnostics, Inc., Second Amendment New Term Loan | | LIBOR + 3.250% | | | 997,786 | | | | 5.833 | + | | 6/30/2025 | | | 999,158 | |
| Parexel International Corp., Initial Term Loan | | LIBOR + 2.750% | | | 615,625 | | | | 5.326 | + | | 9/28/2024 | | | 604,790 | |
| Parfums Holding Co., Inc., Initial Term Loan (First Lien) | | LIBOR + 4.250% | | | 637,041 | | | | 6.865 | + | | 6/30/2024 | | | 634,120 | |
| PetVet Care Centers LLC, Initial Term Loan (First Lien) | | LIBOR + 2.750% | | | 462,825 | | | | 5.332 | + | | 2/14/2025 | | | 447,783 | |
| PetVet Care Centers LLC, Delayed Draw Term Loan (First Lien) | | LIBOR + 2.750% | | | 136,879 | | | | 4.622 | + | | 2/14/2025 | | | 132,430 | |
| Phoenix Guarantor, Inc., Initial Term Loan (First Lien) | | LIBOR + 4.500% | | | 123,750 | | | | 7.092 | + | | 3/04/2026 | | | 124,807 | |
| Phoenix Guarantor, Inc., Delayed Draw Term Loan (First Lien) | | LIBOR + 4.500% | | | 11,250 | | | | 7.107 | + | | 3/05/2026 | | | 11,346 | |
| Prime Security Services Borrower LLC, December 2018 Incremental Term B-1 Loan (First Lien) | | LIBOR + 2.750% | | | 790,010 | | | | 5.326 | + | | 5/02/2022 | | | 792,163 | |
| Prospect Medical Holdings, Inc., Term B-1 Loan | | LIBOR + 5.500% | | | 253,088 | | | | 8.084 | + | | 2/22/2024 | | | 239,484 | |
| Refinitiv US Holdings, Inc., Initial Dollar Term Loan | | LIBOR + 3.750% | | | 937,650 | | | | 6.326 | + | | 9/30/2025 | | | 929,056 | |
| Regionalcare Hospital Partners Holdings, Inc., Term B Loan (First Lien) | | LIBOR + 4.500% | | | 802,988 | | | | 7.080 | + | | 11/16/2025 | | | 808,006 | |
| Revlon Consumer Products Corp., Initial Term B Loan | | LIBOR + 3.500% | | | 650,045 | | | | 6.115 | + | | 9/08/2023 | | | 509,678 | |
| Select Medical Corp., Tranche B Term Loan | | LIBOR + 2.500% | | | 563,789 | | | | 5.080 | + | | 3/06/2025 | | | 565,199 | |
| Sigma Holdco BV, Facility B2 | | LIBOR + 3.000% | | | 550,838 | | | | 5.660 | + | | 7/02/2025 | | | 546,106 | |
| St. George’s University Scholastic Services LLC, Term Loan | | LIBOR + 3.500% | | | 893,796 | | | | 6.076 | + | | 7/16/2025 | | | 896,312 | |
| Sterigenics-Nordion Holdings LLC, Incremental Term Loan | | LIBOR + 3.000% | | | 1,011,502 | | | | 5.576 | + | | 5/16/2022 | | | 1,006,065 | |
| Surgery Center Holdings, Inc., Initial Term Loan | | LIBOR + 3.250% | | | 753,525 | | | | 5.826 | + | | 9/02/2024 | | | 745,914 | |
| Trans Union LLC, 2017 Replacement Term B-3 Loan | | LIBOR + 2.000% | | | 1,489,492 | | | | 4.576 | + | | 4/10/2023 | | | 1,492,866 | |
| U.S. Renal Care Inc., Initial Term Loan (First Lien) | | LIBOR + 4.250% | | | 616,612 | | | | 6.850 | + | | 12/30/2022 | | | 618,027 | |
| Viant Medical Holdings, Inc., Initial Term Loan (First Lien) | | LIBOR + 3.750% | | | 174,125 | | | | 6.350 | + | | 7/02/2025 | | | 174,815 | |
| Vizient, Inc., Term Loan B | | LIBOR + 2.750% | | | 150,000 | | | | 5.341 | + | | 5/16/2026 | | | 151,031 | |
| Wellpath Holdings, Inc., Initial Term Loan (First Lien) | | LIBOR + 5.500% | | | 399,000 | | | | 8.076 | + | | 9/30/2025 | | | 386,531 | |
| WEX, Inc., Term B-2 Loan | | LIBOR + 2.250% | | | 881,257 | | | | 4.826 | + | | 6/30/2023 | | | 884,289 | |
| | | | | | | | | | | | | | | | 38,039,985 | |
| ENERGY - 4.0% | | | | | | | | | | | | | | | | |
| California Resources Corp., Initial Loan | | LIBOR + 4.750% | | | 405,000 | | | | 7.329 | + | | 1/01/2023 | | | 393,964 | |
| CITGO Petroleum Corp., 2019 Incremental Term B Loan | | LIBOR + 5.000% | | | 880,000 | | | | 7.602 | + | | 3/28/2024 | | | 880,365 | |
| Fieldwood Energy LLC, Closing Date Loan (First Lien) | | LIBOR + 5.250% | | | 180,554 | | | | 7.826 | + | | 4/12/2022 | | | 174,724 | |
| Fieldwood Energy LLC, Closing Date Loan 2018 (Second Lien) | | LIBOR + 7.250% | | | 81,748 | | | | 9.826 | + | | 4/12/2023 | | | 71,580 | |
| Gavilan Resources LLC, Initial Term Loan (Second Lien) | | LIBOR + 6.000% | | | 490,000 | | | | 8.582 | + | | 2/29/2024 | | | 369,705 | |
| McDermott International, Inc., Term Loan | | LIBOR + 5.000% | | | 707,850 | | | | 7.576 | + | | 5/12/2025 | | | 702,024 | |
| Medallion Midland Acquisition LLC, Initial Term Loan | | LIBOR + 3.250% | | | 767,813 | | | | 5.826 | + | | 10/30/2024 | | | 764,695 | |
| MRC Global Inc., 2018 Refinancing Term Loan | | LIBOR + 3.000% | | | 754,091 | | | | 5.576 | + | | 9/20/2024 | | | 757,394 | |
| Paragon Offshore Finance Co., Term Loan | | LIBOR + 2.750% | | | 1,153 | | | | — | + | | 7/16/2021 | | | — | |
| Seadrill Operating LP, Initial Term Loan | | LIBOR + 6.000% | | | 1,136,146 | | | | 8.600 | + | | 2/20/2021 | | | 912,166 | |
| TerraForm Power Operating LLC, Specified Refinancing Term Loan | | LIBOR + 2.000% | | | 602,375 | | | | 4.576 | + | | 11/08/2022 | | | 601,622 | |
| Traverse Midstream Partners LLC, Advance | | LIBOR + 4.000% | | | 651,725 | | | | 6.576 | + | | 9/28/2024 | | | 651,083 | |
| Ultra Resources, Inc., Loan | | LIBOR + 4.000% | | | 665,000 | | | | 6.580 | + | | 4/12/2024 | | | 566,361 | |
| Weatherford International Ltd., Loan | | LIBOR + 1.425% | | | 618,032 | | | | 4.001 | + | | 7/12/2020 | | | 607,025 | |
| | | | | | | | | | | | | | | | 7,452,708 | |
| FINANCIAL - 7.1% | | | | | | | | | | | | | | | | |
| Asurion LLC, Amendment No. 14 Replacement B-4 Term Loan | | LIBOR + 3.000% | | | 567,730 | | | | 5.576 | + | | 8/04/2022 | | | 570,660 | |
| Asurion LLC, Replacement B-6 Term Loan | | LIBOR + 3.000% | | | 323,924 | | | | 5.576 | + | | 11/04/2023 | | | 325,417 | |
| Asurion LLC, New B-7 Term Loan | | LIBOR + 3.000% | | | 387,075 | | | | 5.576 | + | | 11/04/2024 | | | 388,768 | |
| Asurion LLC, Second Lien Replacement B-2 Term Loan | | LIBOR + 6.500% | | | 787,456 | | | | 9.076 | + | | 8/04/2025 | | | 805,091 | |
| Blackhawk Network Holdings, Inc., Term Loan (First Lien) | | LIBOR + 3.000% | | | 570,688 | | | | 5.576 | + | | 6/16/2025 | | | 571,284 | |
| Capital Automotive LP, Initial Tranche B-2 Term Loan (First Lien) | | LIBOR + 2.500% | | | 623,998 | | | | 5.076 | + | | 3/24/2024 | | | 623,480 | |
| Capital Automotive LP, Initial Tranche B Term Loan (Second Lien) | | LIBOR + 6.000% | | | 572,573 | | | | 8.576 | + | | 3/24/2025 | | | 576,867 | |
| Ditech Holding Corp., Tranche B Term Loan | | LIBOR + 6.000% | | | 1,048,106 | | | | 10.500 | + | | 6/30/2022 | | | 674,063 | |
| Ellie Mae, Inc., Term Loan (First Lien) | | LIBOR + 4.000% | | | 705,000 | | | | 6.591 | + | | 4/16/2026 | | | 710,178 | |
| FinCo I LLC, 2018 Replacement Loan | | LIBOR + 2.000% | | | 325,100 | | | | 4.576 | + | | 12/28/2022 | | | 326,997 | |
| iStar, Inc., Loan | | LIBOR + 2.750% | | | 850,959 | | | | 5.334 | + | | 6/28/2023 | | | 852,002 | |
| Lightstone Holdco LLC, Refinancing Term B Loan | | LIBOR + 3.750% | | | 470,678 | | | | 6.326 | + | | 1/30/2024 | | | 469,353 | |
| Lightstone Holdco LLC, Refinancing Term C Loan | | LIBOR + 3.750% | | | 26,547 | | | | 6.326 | + | | 1/30/2024 | | | 26,472 | |
| MGM Growth Properties Operating Partnership LP, Term B Loan | | LIBOR + 2.000% | | | 912,869 | | | | 4.576 | + | | 3/20/2025 | | | 913,851 | |
| Pl UK Holdco II Ltd., Facility B1 | | LIBOR + 3.500% | | | 1,460,250 | | | | 6.076 | + | | 1/04/2025 | | | 1,462,995 | |
| | | | | | | | | | | | | | | | | |
See accompanying notes to financial statements.
| SCHEDULE OF INVESTMENTS (Unaudited) |
| Dunham Floating Rate Bond Fund (Continued) |
| April 30, 2019 |
| | | Variable | | Principal | | | Interest | | | Maturity | | | |
| Security | | Rate | | Amount | | | Rate % | | | Date | | Value | |
| BANK LOANS - 92.1% (Continued) | | | | | | | | | | | | | | | | |
| FINANCIAL - 7.1% (Continued) | | | | | | | | | | | | | | | | |
| Sedgwick Claims Management Services, Inc., Initial Term Loan | | LIBOR + 3.250% | | $ | 1,010,000 | | | | 5.826 | + | | 1/01/2026 | | $ | 1,365,208 | |
| TKC Holdings, Inc., Initial Term Loan (First Lien) | | LIBOR + 3.750% | | | 908,237 | | | | 6.326 | + | | 1/31/2023 | | | 894,374 | |
| UFC Holdings LLC, Term Loan (First Lien) | | LIBOR + 3.250% | | | 908,237 | | | | 5.850 | + | | 8/18/2023 | | | 971,606 | |
| UFC Holdings LLC, Term B Loan | | LIBOR + 3.250% | | | 594,333 | | | | 5.832 | + | | 4/30/2026 | | | 95,467 | |
| Uniti Group, Inc., Shortfall Term Loan | | LIBOR + 5.000% | | | 576,541 | | | | 7.576 | + | | 10/24/2022 | | | 567,882 | |
| | | | | | | | | | | | | | | | 13,192,015 | |
| INDUSTRIALS - 13.4% | | | | | | | | | | | | | | | | |
| Accuride Corp., 2017 Refinancing Term Loan | | LIBOR + 5.250% | | | 436,937 | | | | 5.826 | + | | 2/01/2025 | | | 386,689 | |
| Anchor Glass Container Corp., July 2017 Additional Term Loan (First Lien) | | LIBOR + 2.750% | | | 428,075 | | | | 5.332 | + | | 12/08/2023 | | | 363,149 | |
| Anchor Glass Container Corp., Term Loan (Second Lien) | | LIBOR + 7.750% | | | 244,000 | | | | 10.334 | + | | 12/08/2024 | | | 139,486 | |
| Berlin Packaging LLC, Initial Term Loan (First Lien) | | LIBOR + 3.000% | | | 590,538 | | | | 3.000 | + | | 11/08/2025 | | | 584,387 | |
| Berry Global, Inc., Term S Loan | | LIBOR + 1.750% | | | 226,743 | | | | 4.353 | + | | 2/08/2020 | | | 226,938 | |
| Berry Global, Inc., Term T Loan | | LIBOR + 1.750% | | | 417,785 | | | | 4.353 | + | | 1/06/2021 | | | 417,843 | |
| Berry Global, Inc., Term Q Loan | | LIBOR + 2.000% | | | 308,192 | | | | 4.603 | + | | 9/30/2022 | | | 308,176 | |
| Berry Global, Inc., Term R Loan | | LIBOR + 2.000% | | | 521,370 | | | | 4.603 | + | | 1/20/2024 | | | 520,622 | |
| Brand Energy & Infrastructure Services, Inc., Initial Term Loan | | LIBOR + 4.250% | | | 698,067 | | | | 6.838 | + | | 6/20/2024 | | | 686,521 | |
| Brookfield WEC Holdings, Inc., Initial Term Loan (First Lien) | | LIBOR + 3.500% | | | 698,250 | | | | 6.076 | + | | 7/31/2025 | | | 703,487 | |
| Brookfield WEC Holdings, Inc., Initial Term Loan (Second Lien) | | LIBOR + 6.750% | | | 280,000 | | | | 9.326 | + | | 8/04/2026 | | | 285,250 | |
| BWay Holding Co., Initial Term Loan | | LIBOR + 3.250% | | | 481,425 | | | | 5.851 | + | | 4/04/2024 | | | 476,536 | |
| Circor International, Inc., Initial Term Loan | | LIBOR + 3.500% | | | 656,177 | | | | 6.101 | + | | 12/12/2024 | | | 655,974 | |
| CPG International LLC, New Term Loan | | LIBOR + 3.750% | | | 1,722,007 | | | | 6.558 | + | | 5/04/2024 | | | 1,720,578 | |
| Deliver Buyer, Inc., Term Loan | | LIBOR + 5.000% | | | 306,966 | | | | 7.600 | + | | 4/30/2024 | | | 307,063 | |
| Dynasty Acquisition Co., Inc., Initial Term B-1 Loan | | LIBOR + 4.000% | | | 399,965 | | | | 6.589 | + | | 4/06/2026 | | | 402,517 | |
| Dynasty Acquisition Co., Inc., Initial Term B-2 Loan | | LIBOR + 4.000% | | | 215,035 | | | | 6.589 | + | | 4/06/2026 | | | 216,407 | |
| Energizer Holdings, Inc., Term Loan B | | LIBOR + 2.250% | | | 303,600 | | | | 4.826 | + | | 12/16/2025 | | | 304,169 | |
| Filtration Group Corp., Initial Dollar Term Loan | | LIBOR + 3.000% | | | 856,350 | | | | 5.576 | + | | 3/28/2025 | | | 859,831 | |
| Fluidra SA, USD Term Loan | | LIBOR + 2.250% | | | 545,875 | | | | 4.826 | + | | 7/02/2025 | | | 546,102 | |
| Gardner Denver, Inc., Tranche B-1 Dollar Term Loan | | LIBOR + 2.750% | | | 999,411 | | | | 5.326 | + | | 7/30/2024 | | | 1,003,014 | |
| Gates Global LLC, Initial B-2 Dollar Term Loan | | LIBOR + 2.750% | | | 921,766 | | | | 5.326 | + | | 3/31/2024 | | | 924,596 | |
| GFL Environmental, Inc., Effective Date Incremental Term Loan | | LIBOR + 3.000% | | | 611,917 | | | | 5.576 | + | | 5/30/2025 | | | 607,900 | |
| Gopher Resource LLC, Initial Term Loan | | LIBOR + 3.250% | | | 477,038 | | | | 5.826 | + | | 3/06/2025 | | | 472,666 | |
| Hexion, Inc., Initial Term Loan | | LIBOR + 2.750% | | | 210,000 | | | | 5.348 | + | | 9/30/2020 | | | 210,722 | |
| Hillman Group, Inc., Initial Term Loan | | LIBOR + 4.000% | | | 704,675 | | | | 6.576 | + | | 5/30/2025 | | | 697,632 | |
| Klockner Pentaplast Of America, Inc., Dollar Term Loan | | LIBOR + 4.250% | | | 861,875 | | | | 6.826 | + | | 6/30/2022 | | | 767,069 | |
| NN, Inc., 2017 Incremental Term Loan | | LIBOR + 3.250% | | | 174,800 | | | | 5.826 | + | | 4/02/2021 | | | 171,141 | |
| NN, Inc., Tranche B Term Loan | | LIBOR + 3.750% | | | 213,121 | | | | 6.326 | + | | 10/20/2022 | | | 210,457 | |
| Quikrete Holdings, Inc., Initial Loan (First Lien) | | LIBOR + 2.750% | | | 786,538 | | | | 5.326 | + | | 11/16/2023 | | | 784,151 | |
| RBS Global, Inc., Refinancing Term Loan | | LIBOR + 2.000% | | | 800,971 | | | | 4.576 | + | | 8/20/2024 | | | 802,809 | |
| Reynolds Group Holdings, Inc., Incremental U.S. Term Loan | | LIBOR + 2.750% | | | 1,181,607 | | | | 5.326 | + | | 2/04/2023 | | | 1,185,394 | |
| Summit Materials LLC, New Term Loan | | LIBOR + 2.000% | | | 1,147,142 | | | | 4.576 | + | | 11/20/2024 | | | 1,147,503 | |
| Titan Acquisition Ltd., Initial Term Loan | | LIBOR + 3.000% | | | 1,009,800 | | | | 5.600 | + | | 3/28/2025 | | | 973,195 | |
| Transdigm, Inc., New Tranche F Term Loan (2018) | | LIBOR + 2.500% | | | 1,092,105 | | | | 5.076 | + | | 6/08/2023 | | | 1,090,057 | |
| Transdigm, Inc., New Tranche G Term Loan | | LIBOR + 2.500% | | | 737,907 | | | | 5.076 | + | | 8/22/2024 | | | 735,811 | |
| Transdigm, Inc., New Tranche E Term Loan (2018) | | LIBOR + 2.500% | | | 797,143 | | | | 5.076 | + | | 5/30/2025 | | | 794,819 | |
| Tricorbraun Holdings, Inc., Closing Date Term Loan (First Lien) | | LIBOR + 3.750% | | | 637,833 | | | | 6.350 | + | | 11/30/2023 | | | 638,231 | |
| Trident TPI Holdings, Inc., Tranche B-1 Term Loan | | LIBOR + 3.250% | | | 726,394 | | | | 5.826 | + | | 10/16/2024 | | | 710,733 | |
| Tunnel Hill Partners LP, Initial Term Loan | | LIBOR + 3.500% | | | 655,000 | | | | 6.076 | + | | 2/06/2026 | | | 654,181 | |
| US Farathane LLC, Term B-4 Loan | | LIBOR + 3.500% | | | 376,714 | | | | 6.100 | + | | 12/24/2021 | | | 371,063 | |
| | | | | | | | | | | | | | | | 25,064,869 | |
| TECHNOLOGY - 7.8% | | | | | | | | | | | | | | | | |
| Applied Systems, Inc., Closing Date Term Loan (First Lien) | | LIBOR + 3.000% | | | 690,147 | | | | 5.576 | + | | 9/20/2024 | | | 690,488 | |
| Applied Systems, Inc., Initial Term Loan (Second Lien) | | LIBOR + 7.000% | | | 105,000 | | | | 9.576 | + | | 9/20/2025 | | | 107,152 | |
| Blackboard, Inc., Term B-4 Loan (First Lien) | | LIBOR + 5.000% | | | 587,246 | | | | 7.581 | + | | 6/30/2021 | | | 584,751 | |
| Boxer Parent Company, Inc., Initial Dollar Term Loan | | LIBOR + 4.250% | | | 1,436,400 | | | | 6.850 | + | | 10/02/2025 | | | 1,430,116 | |
| Dell International LLC, Refinancing Term B Loan | | LIBOR + 2.000% | | | 1,456,939 | | | | 4.576 | + | | 9/08/2023 | | | 1,459,401 | |
| Dun & Bradstreet Corp., Initial Term Borrowing | | LIBOR + 5.000% | | | 565,000 | | | | 7.579 | + | | 2/06/2026 | | | 569,947 | |
| Everi Payments, Inc., Term B Loan | | LIBOR + 3.000% | | | 739,039 | | | | 5.576 | + | | 5/08/2024 | | | 741,574 | |
| First Data Corporation, 2022D New Dollar Term Loan | | LIBOR + 2.000% | | | 861,265 | | | | 4.586 | + | | 7/08/2022 | | | 862,191 | |
| Iqvia, Inc., Term B-1 Dollar Loan | | LIBOR + 2.000% | | | 144,019 | | | | 4.600 | + | | 3/08/2024 | | | 144,307 | |
| Iqvia, Inc., Incremental Term B-2 Dollar Loan | | LIBOR + 2.000% | | | 73,875 | | | | 4.600 | + | | 1/16/2025 | | | 74,029 | |
| Iqvia, Inc., Term B-3 Dollar Loan | | LIBOR + 1.750% | | | 744,375 | | | | 4.326 | + | | 6/12/2025 | | | 742,749 | |
| Kronos, Inc., Incremental Term Loan (First Lien) | | LIBOR + 3.000% | | | 1,650,628 | | | | 5.733 | + | | 10/31/2023 | | | 1,655,134 | |
| Kronos, Inc., Initial Term Loan (Second Lien) | | LIBOR + 8.250% | | | 120,000 | | | | 10.983 | + | | 10/31/2024 | | | 124,276 | |
| Neustar, Inc., TLB4 (First Lien) | | LIBOR + 3.500% | | | 231,475 | | | | 6.076 | + | | 8/08/2024 | | | 226,942 | |
| Presidio Holdings, Inc., Term B Loan | | LIBOR + 2.750% | | | 528,809 | | | | 5.345 | + | | 2/02/2024 | | | 529,306 | |
| Rackspace Hosting, Inc., Term B Loan (First Lien) | | LIBOR + 3.000% | | | 564,349 | | | | 5.734 | + | | 11/04/2023 | | | 535,895 | |
| | | | | | | | | | | | | | | | | |
See accompanying notes to financial statements.
| SCHEDULE OF INVESTMENTS (Unaudited) |
| Dunham Floating Rate Bond Fund (Continued) |
| April 30, 2019 |
| | | Variable | | Principal | | | Interest | | | Maturity | | | |
| Security | | Rate | | Amount | | | Rate % | | | Date | | Value | |
| BANK LOANS - 92.1% (Continued) | | | | | | | | | | | | | | | | |
| TECHNOLOGY - 7.8% (Continued) | | | | | | | | | | | | | | | | |
| SS&C Technologies Holdings, Inc., Term B-3 Loan | | LIBOR + 2.250% | | $ | 585,057 | | | | 4.826 | + | | 4/16/2025 | | $ | 586,157 | |
| SS&C Technologies Holdings, Inc., Term B-4 Loan | | LIBOR + 2.250% | | | 420,654 | | | | 4.826 | + | | 4/16/2025 | | | 421,445 | |
| SS&C Technologies Holdings, Inc., Term B-5 Loan | | LIBOR + 2.250% | | | 273,603 | | | | 4.826 | + | | 4/16/2025 | | | 274,049 | |
| Tempo Acquisition LLC, Initial Term Loan | | LIBOR + 3.000% | | | 550,200 | | | | 5.576 | + | | 4/30/2024 | | | 551,575 | |
| Ultimate Software Group, Inc., Term Loan B | | LIBOR + 3.750% | | | 410,000 | | | | 6.334 | + | | 4/08/2026 | | | 413,434 | |
| Vertafore, Inc., Initial Term Loan (First Lien) | | LIBOR + 3.250% | | | 1,840,388 | | | | 5.826 | + | | 7/02/2025 | | | 1,828,683 | |
| | | | | | | | | | | | | | | | 14,553,601 | |
| UTILITIES - 1.5% | | | | | | | | | | | | | | | | |
| APLP Holdings LP, Term Loan | | LIBOR + 2.750% | | | 276,536 | | | | 5.326 | + | | 4/12/2023 | | | 278,654 | |
| Calpine Construction Finance Co. LP, Term B Loan | | LIBOR + 2.500% | | | 715,109 | | | | 5.076 | + | | 1/16/2025 | | | 716,261 | |
| Pacific Gas and Electric Company, Term Loan (DIP) | | LIBOR + 2.250% | | | 155,000 | | | | 4.764 | + | | 12/31/2020 | | | 155,969 | |
| Pacific Gas and Electric Company, Delayed Draw Term Loan (DIP) | | LIBOR + 2.250% | | | 50,000 | | | | 4.764 | + | | 12/31/2020 | | | 50,312 | |
| Talen Energy Supply LLC, Term B-1 Loan | | LIBOR + 4.000% | | | 195,510 | | | | 6.576 | + | | 7/16/2023 | | | 196,060 | |
| Talen Energy Supply LLC, Initial Term Loan | | LIBOR + 4.000% | | | 326,290 | | | | 6.576 | + | | 4/16/2024 | | | 327,209 | |
| Texas Competitive Electric Holdings Co. LLC Escrow Bonds | | | | | 635,000 | | | | — | | | 10/01/2020 | | | 445 | |
| Vistra Operations Co. LLC, Initial Term Loan | | LIBOR + 2.000% | | | 227,418 | | | | 4.576 | + | | 8/04/2023 | | | 227,910 | |
| Vistra Operations Co. LLC, 2018 Incremental Term Loan | | LIBOR + 2.000% | | | 868,438 | | | | 4.587 | + | | 1/01/2026 | | | 870,066 | |
| | | | | | | | | | | | | | | | 2,822,886 | |
| TOTAL BANK LOANS (Cost - $174,334,641) | | | | | | | | | | | | | | | 172,222,293 | |
| | | | | | | | | | | | | | | | | |
| BONDS & NOTES - 3.9% | | | | | | | | | | | | | | | | |
| AUTO PARTS & EQUIPMENT - 0.0% | | | | | | | | | | | | | | | | |
| Panther BF Aggregator 2 LP - 144A | | | | | 25,000 | | | | 6.250 | | | 5/15/2026 | | | 26,094 | |
| | | | | | | | | | | | | | | | | |
| CHEMICALS - 0.1% | | | | | | | | | | | | | | | | |
| Hexion, Inc. | | | | | 105,000 | | | | 6.625 | | | 4/15/2020 | | | 83,737 | |
| NOVA Chemicals Corp. - 144A | | | | | 65,000 | | | | 4.875 | | | 6/01/2024 | | | 63,781 | |
| NOVA Chemicals Corp. - 144A | | | | | 40,000 | | | | 5.000 | | | 5/01/2025 | | | 39,050 | |
| | | | | | | | | | | | | | | | 186,568 | |
| COMPUTERS - 0.3% | | | | | | | | | | | | | | | | |
| Exela Intermediate LLC - 144A | | | | | 520,000 | | | | 10.000 | | | 7/15/2023 | | | 526,334 | |
| | | | | | | | | | | | | | | | | |
| DIVERSIFIED FINANCIAL SERVICES - 0.1% | | | | | | | | | | | | | | | | |
| Springleaf Finance Corp. | | | | | 250,000 | | | | 6.125 | | | 5/15/2022 | | | 265,325 | |
| | | | | | | | | | | | | | | | | |
| FOOD - 0.1% | | | | | | | | | | | | | | | | |
| Dole Food Co., Inc. - 144A | | | | | 175,000 | | | | 7.250 | | | 6/15/2025 | | | 162,750 | |
| | | | | | | | | | | | | | | | | |
| HEALTHCARE-SERVICES - 0.6% | | | | | | | | | | | | | | | | |
| Eagle Holding Co. II LLC - 144A | | | | | 175,000 | | | | 7.625 | | | 5/15/2022 | | | 176,312 | |
| One Call Corp. - 144A | | | | | 613,426 | | | | 7.500 | | | 7/01/2024 | | | 531,380 | |
| Tenet Healthcare Corp. | | | | | 405,000 | | | | 4.625 | | | 7/15/2024 | | | 407,660 | |
| | | | | | | | | | | | | | | | 1,115,352 | |
| HOME BUILDERS - 0.3% | | | | | | | | | | | | | | | | |
| Lennar Corp. | | | | | 420,000 | | | | 2.950 | | | 11/29/2020 | | | 416,850 | |
| TRI Pointe Group, Inc. | | | | | 70,000 | | | | 4.375 | | | 6/15/2019 | | | 70,055 | |
| TRI Pointe Group, Inc. | | | | | 130,000 | | | | 4.875 | | | 7/01/2021 | | | 132,275 | |
| | | | | | | | | | | | | | | | 619,180 | |
| INSURANCE - 0.1% | | | | | | | | | | | | | | | | |
| Acrisure LLC - 144A | | | | | 90,000 | | | | 8.125 | | | 2/15/2024 | | | 94,275 | |
| | | | | | | | | | | | | | | | | |
| LODGING - 0.2% | | | | | | | | | | | | | | | | |
| Hilton Domestic Operating Co., Inc. - 144A | | | | | 295,000 | | | | 5.125 | | | 5/01/2026 | | | 302,744 | |
| | | | | | | | | | | | | | | | | |
| MEDIA - 0.2% | | | | | | | | | | | | | | | | |
| CCO Holdings LLC - 144A | | | | | 180,000 | | | | 4.000 | | | 3/01/2023 | | | 180,900 | |
| DISH DBS Corp. | | | | | 175,000 | | | | 5.875 | | | 7/15/2022 | | | 171,404 | |
| iHeartCommunications, Inc. | | | | | 95,000 | | | | 9.000 | | | 12/15/2019 | | | 70,775 | |
| | | | | | | | | | | | | | | | 423,079 | |
| OIL & GAS - 0.1% | | | | | | | | | | | | | | | | |
| Denbury Resources, Inc. - 144A | | | | | 60,000 | | | | 9.250 | | | 3/31/2022 | | | 61,050 | |
| Denbury Resources, Inc. - 144A | | | | | 185,000 | | | | 7.500 | | | 2/15/2024 | | | 171,125 | |
| | | | | | | | | | | | | | | | 232,175 | |
| | | | | | | | | | | | | | | | | |
See accompanying notes to financial statements.
| SCHEDULE OF INVESTMENTS (Unaudited) |
| Dunham Floating Rate Bond Fund (Continued) |
| April 30, 2019 |
| | | Principal | | | Interest | | | Maturity | | | |
| Security | | Amount | | | Rate % | | | Date | | Value | |
| BONDS & NOTES - 3.9% (Continued) | | | | | | | | | | | | | | |
| PACKAGING & CONTAINERS - 0.3% | | | | | | | | | | | | | | |
| Ardagh Packaging Finance PLC - 144A | | $ | 235,000 | | | | 6.000 | | | 2/15/2025 | | $ | 237,350 | |
| BWAY Holding Co. - 144A | | | 265,000 | | | | 5.500 | | | 4/15/2024 | | | 264,178 | |
| | | | | | | | | | | | | | 501,528 | |
| PHARMACEUTICALS - 0.2% | | | | | | | | | | | | | | |
| Bausch Health Companies, Inc. - 144A | | | 445,000 | | | | 5.500 | | | 11/01/2025 | | | 457,100 | |
| | | | | | | | | | | | | | | |
| PIPELINES - 0.1% | | | | | | | | | | | | | | |
| Energy Transfer Operating LP | | | 190,000 | | | | 4.250 | | | 3/15/2023 | | | 194,969 | |
| | | | | | | | | | | | | | | |
| PRIVATE EQUITY - 0.2% | | | | | | | | | | | | | | |
| Icahn Enterprises LP | | | 310,000 | | | | 6.250 | | | 2/01/2022 | | | 320,162 | |
| | | | | | | | | | | | | | | |
| REAL ESTATE INVESTMENT TRUSTS - 0.2% | | | | | | | | | | | | | | |
| iStar Financial, Inc. | | | 60,000 | | | | 6.000 | | | 4/01/2022 | | | 61,575 | |
| iStar Financial, Inc. | | | 335,000 | | | | 5.250 | | | 9/15/2022 | | | 338,350 | |
| | | | | | | | | | | | | | 399,925 | |
| RETAIL - 0.1% | | | | | | | | | | | | | | |
| Cumberland Farms, Inc. - 144A | | | 125,000 | | | | 6.750 | | | 5/01/2025 | | | 132,188 | |
| | | | | | | | | | | | | | | |
| SEMICONDUCTORS - 0.5% | | | | | | | | | | | | | | |
| Broadcom, Inc. - 144A | | | 1,000,000 | | | | 3.125 | | | 10/15/2022 | | | 995,544 | |
| | | | | | | | | | | | | | | |
| SOFTWARE - 0.2% | | | | | | | | | | | | | | |
| First Data Corp. - 144A | | | 190,000 | | | | 5.375 | | | 8/15/2023 | | | 194,731 | |
| First Data Corp. - 144A | | | 90,000 | | | | 5.000 | | | 1/15/2024 | | | 92,316 | |
| First Data Corp. - 144A | | | 25,000 | | | | 5.750 | | | 1/15/2024 | | | 25,859 | |
| | | | | | | | | | | | | | 312,906 | |
| TELECOMMUNICATIONS - 0.0% | | | | | | | | | | | | | | |
| Frontier Communications Corp. | | | 90,000 | | | | 8.500 | | | 4/15/2020 | | | 86,175 | |
| | | | | | | | | | | | | | | |
| TOTAL BONDS & NOTES (Cost - $7,467,472) | | | | | | | | | | | | | 7,354,373 | |
| | | | | | | | | | | | | | | |
| | | Shares | | | | | | | �� | | | | |
| RIGHTS - 0.0% | | | | | | | | | | | | | | |
| TRA Rights | | | 10,588 | | | | | | | | | | 8,142 | |
| TOTAL RIGHTS (Cost - $17,470) | | | | | | | | | | | | | | |
| | | Principal | | | | | | | | | | | |
| | | Amount | | | | | | | | | | | |
| U.S. GOVERNMENT - 1.0% | | | | | | | | | | | | | | |
| Treasury Bill | | $ | 1,885,000 | | | | 2.360 | + | | 9/05/2019 | | | 1,869,290 | |
| TOTAL U.S. GOVERNMENT (Cost - $1,868,641) | | | | | | | | | | | | | | |
| | | | | | | | | | | | | | | |
| | | | | | | | | | | | | | | |
| | | Shares | | | | | | | | | | | |
| SHORT-TERM INVESTMENT - 5.1% | | | | | | | | | | | | | | |
| MONEY MARKET FUND - 5.1% | | | | | | | | | | | | | | |
| Fidelity Investments Money Market Fund - Class I | | | 9,483,324 | | | | 2.310 | + | | | | | 9,483,324 | |
| TOTAL SHORT-TERM INVESTMENT - (Cost - $9,483,324) | | | | | | | | | | | | | | |
| | | | | | | | | | | | | | | |
| TOTAL INVESTMENTS - 102.1% (Cost - $193,171,548) | | | | | | | | | | | | | 190,937,422 | |
| LIABILITIES IN EXCESS OF OTHER ASSETS - (2.1)% | | | | | | | | | | | | | (3,931,807 | ) |
| NET ASSETS - 100.0% | | | | | | | | | | | | $ | 187,005,615 | |
| | | | | | | | | | | | | | | |
LP - Limited Partnership.
LLC - Limited Liability Company.
LLP - Limited Liability Partnership
PLC - Public Limited Company
144A - Security exempt from registration under Rule 144A of the Securities Act of 1933. These securities may be sold in transactions exempt from registration, normally to qualified institutional buyers. As of April 30, 2019 the total market value of 144A securities is $4,735,061 or 2.53% of net assets.
| + | Variable rate security. Interest rate is as of April 30, 2019. |
See accompanying notes to financial statements.
| SCHEDULE OF INVESTMENTS (Unaudited) |
| Dunham Floating Rate Bond Fund (Continued) |
| April 30, 2019 |
| Portfolio Composition*- (Unaudited) |
| Bank Loans | | | 90.2 | % | | Financial | | | 0.6 | % |
| Short-Term Investment | | | 5.0 | % | | Communications | | | 0.3 | % |
| U.S. Government | | | 1.0 | % | | Industrial | | | 0.2 | % |
| Technology | | | 0.9 | % | | Energy | | | 0.2 | % |
| Consumer, Non-Cyclical | | | 0.9 | % | | Basic Materials | | | 0.1 | % |
| Consumer, Cyclical | | | 0.6 | % | | Rights | | | 0.0 | % |
| | | | | | | Total | | | 100.0 | % |
| | | | | | | | | | | |
| * | Based on total value of investments as of April 30, 2019 |
Percentage may differ from Schedule of Investments which are based on Fund net assets.
See accompanying notes to financial statements.
| Dunham Long/Short Credit Fund (Unaudited) |
| Message from the Sub-Adviser (MetLife Investment Management) |
| |
Asset Class Recap
The start to 2019 was by many metrics the strongest start to the year for credit markets since 2003. The sharp selloff at the end of 2018 presented investors with more attractive valuations to begin the new year, while seemingly every macro headwind at year-end became a tailwind. This was primarily bolstered by comments from the Federal Reserve, which orchestrated a dovish pivot that culminated in a “pause” in the rate hiking cycle. While Treasuries and investment grade bonds generally appreciated in the tumultuous final months of 2018, high-yield bonds saw this recent gain as a welcomed swift reversal. Therefore, long/short credit strategies, as measured by the Morningstar MSCI Long/Short Credit Index, were generally tested by the whipsaw. Specifically, as many long/short credit strategies attempt to extract spreads between various bond sectors, credit qualities, and even individual securities, relatively large movements like those seen in the last six months can stress both the long positions and short positions in the strategy. During the primarily negative months of November and December, long/short credit strategies in general declined 0.8 percent. As the new year commenced with a rebound, long/short credit strategies broadly increased close to 5 percent in the first four months of the calendar year.
Allocation Review
As the Sub-Adviser implements multiple strategy types within the Fund, the largest allocations during the six-month period were to the long strategy and the rate hedging strategy. While interest rates generally fell and nearly all bond sectors experienced gains, the rate hedging strategy and other strategies with a short bias generally detracted from performance. However, since the majority of the Fund was investing in long-biased positions, the overall impact was positive. The short-biased strategies had helped to reduce volatility and drawdowns in the volatile end to 2018, where some of 2019’s strongest performers experienced sizeable declines.
The Fund’s exposure to pairs trades and catalyst driven positions generally provided stability during the six-month period and comprised close to 20 percent of the Fund. As the higher octane areas of the fixed income markets advanced during the fiscal quarter, the Sub-Adviser generally added to its short positions in those areas, paring back its long positions.
Holdings Insights
Given the strength and breadth of positive performance in the most recent fiscal quarter, the short positions such as the SWAP on the iBoxx USD Liquid High-Yield Index (IBOXHY) (holding weight*: -7.22 percent) and Commonwealth Bank of Australia credit default SWAP (holding weight*: -0.06 percent) were some of the Fund’s largest detractors. During the most recent fiscal quarter, IBOXHY and Commonwealth Bank of Australia bond each increased, detracting 1.7 percent and 18.4 percent, respectively from the Fund. The Sub-Adviser had been increasing its short position in IBOXHY as the high-yield rally appeared to be pricing in the best outcomes from prevailing macro themes, including a successful trade deal with China. The Sub-Adviser believed that the real estate concerns in Australia would lead its central bank to additional monetary easing, but it simply maintained its historically low interest rates. Further easing was expected to put additional pressure on banks that primarily provide home loans, further compressing their already record-low interest rate spreads. Despite the bleak outlook for spread widening and a lack of additional stimulus for the suffering housing market, the Commonwealth Bank of Australia bonds appreciated during the fiscal quarter. Not all detractors were in short positions, as the Weight Watchers International, Inc. bank loan (BL2563049) (holding weight*: 1.62 percent) suffered a significant drop in subscriptions that many attributed to the material shift in their ad campaign. Since the Weight Watchers bank loan was added to the Fund at the end of January through the end of the second fiscal quarter, the bank loan’s price declined 4.3 percent.
One of the larger detractors in the November and December decline was Freeport-McMoran Inc.’s bond maturing in 2043 (35671DBC8) (holding weight*: 0.95 percent), one of the largest molybdenum and copper producers in the world. After the price of the bonds declined 10.6 percent during the first two months of the fiscal year, primarily due to global growth concerns, the Freeport-McMoran bonds surged 19.4 percent in the proceeding four months, bringing the overall total return for the first half of the fiscal year, including interest, to 10.0 percent. Another holding that experienced a similar decline and recovery was the Reynolds American Inc. bond maturing in 2037 (761713AT3) (holding weight*: 1.70 percent). As a potential ban on menthol cigarettes was weighed, the tobacco sector took a sizeable hit, and the Reynolds American bond’s price declined 8.4 percent in the first fiscal quarter. However, as additional information released showed signs that any ban’s implementation would be years away, the sector broadly rebounded and the Reynolds American bond recovered 9.2 percent in the second fiscal quarter. Since the beginning of the fiscal year through the end of the most recent fiscal quarter, the Reynolds American bond returned 3.1 percent when including the effect of the 7.25 percent coupon.
Sub-Adviser Outlook
The Sub-Adviser continues to believe that fundamentals and economic data may have peaked, using the increased valuations to generally exit long positions and allocate to sub-strategies that are less dependent on the market continuing upward. In addition, while the Sub-Adviser does not see the conditions in place for an impending recession, it believes the widespread bouts of bearishness warrants being cautious and selective - investing in credit situations where the Sub-Adviser can get comfortable that the valuations are not commensurate with the fundamentals. The Sub-Adviser anticipates maintaining a net exposure slightly below average and adding as opportunities arise.
| * | Holdings percentage(s) of total investments, excluding collateral for securities loaned, as of 4/30/2019. |
Growth of $100,000 Investment
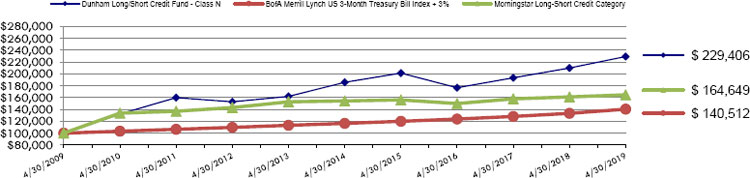
| Total Returns as of April 30, 2019 |
| | | | Annualized | Annualized |
| | Six Months | One Year | Five Years | Ten Years |
| Class N | 2.70% | 9.25% | 4.30% | 8.66% |
| Class C | 2.18% | 8.10% | 3.25% | 7.58% |
| Class A with load of 5.75% | (3.32)% | 2.64% | 2.79% | 7.75% |
| Class A without load | 2.58% | 8.92% | 4.03% | 8.39% |
| BofA Merrill Lynch US 3-Month Treasury Bill Index +3% | 2.64% | 5.24% | 3.81% | 3.46% |
| Morningstar Long-Short Credit Category | 2.56% | 2.21% | 1.29% | 5.11% |
| | | | | |
The BofA Merrill Lynch US 3-Month Treasury Bill Index +3% is comprised of a single issue purchased at the beginning of the month and held for a full month. At the end of the month that issue is sold and rolled in a newly selected issue. The issue selected at each month-end rebalancing is the outstanding Treasury Bill that matures closet to, but not beyond, three months from the rebalancing date. To qualify for selection, an issue must have settled on or before the month-end rebalancing date. Plus an annualized return of 3%.
The Morningstar Long-Short Credit Category is generally representative of funds that purchase or sell bonds, credit default swaps, or other credit derivatives to potentially benefit from changes in the credit markets and/or individual issuers.
As disclosed in the Trust’s latest registration statement as supplemented the Fund’s total annual operating expenses, including the cost of underlying funds, are 1.66% for Class N, 2.66% for Class C and 1.91% for Class A. Class A shares are subject to a sales load of 5.75% and a deferred sales charge of up to 0.75%. The performance data quoted here represents past performance, which is not indicative of future results. Current performance may be lower or higher than the performance data quoted. The investment return and NAV will fluctuate, so that an investor’s shares, when redeemed, may be worth more or less than their original cost. Total returns are calculated assuming reinvestment of all dividends and capital gains distributions, if any. The returns do not reflect the deductions of taxes a shareholder would pay on the redemption of Fund shares or Fund distributions. For performance information current to the most recent month-end, please call 1-800-442-4358 or visit our website www.dunham.com
| SCHEDULE OF INVESTMENTS (Unaudited) |
| Dunham Long/Short Credit Fund |
| April 30, 2019 |
| Security | | | | Shares | | | | | | | | Value | |
| COMMON STOCK - 0.0% | | | | | | | | | | | | | | | | |
| TELECOMMUNICATIONS - 0.0% | | | | | | | | | | | | | | | | |
| NII Holdings, Inc. * | | | | | 10,000 | | | | | | | | | $ | 19,600 | |
| TOTAL COMMON STOCK (Cost - $57,730) | | | | | | | | | | | | | | | | |
| | | Variable | | Principal | | | Interest | | | Maturity | | | | |
| | | Rate | | Amount | | | Rate % | | | Date | | | | |
| BONDS & NOTES - 29.8% | | | | | | | | | | | | | | | | |
| AGRICULTURE - 4.4% | | | | | | | | | | | | | | | | |
| Altria Group, Inc. | | | | $ | 915,000 | | | | 4.800 | | | 2/14/2029 | | | 951,586 | |
| Altria Group, Inc. | | | | | 880,000 | | | | 5.800 | | | 2/14/2039 | | | 942,993 | |
| Reynolds American, Inc. | | | | | 1,000,000 | | | | 7.250 | | | 6/15/2037 | | | 1,199,910 | |
| | | | | | | | | | | | | | | | 3,094,489 | |
| BANKS - 1.3% | | | | | | | | | | | | | | | | |
| Wachovia Capital Trust II | | 3 mo. LIBOR + 0.500% | | | 1,000,000 | | | | 3.097 | + | | 1/15/2027 | | | 923,390 | |
| | | | | | | | | | | | | | | | | |
| COMPUTERS - 1.3% | | | | | | | | | | | | | | | | |
| Harland Clarke Holdings Corp. - 144A | | | | | 1,000,000 | | | | 8.375 | | | 8/15/2022 | | | 892,500 | |
| | | | | | | | | | | | | | | | | |
| DIVERSIFIED FINANCIAL SERVICES - 2.1% | | | | | | | | | | | | | | | | |
| GE Capital International Funding Co. Unlimited Co. | | | | | 325,000 | | | | 2.342 | | | 11/15/2020 | | | 321,588 | |
| GE Capital International Funding Co. Unlimited Co. | | | | | 1,240,000 | | | | 4.418 | | | 11/15/2023 | | | 1,163,550 | |
| | | | | | | | | | | | | | | | 1,485,138 | |
| ENTERTAINMENT - 1.7% | | | | | | | | | | | | | | | | |
| Enterprise Development Authority - 144A | | | | | 1,175,000 | | | | 12.000 | | | 7/15/2024 | | | 1,210,250 | |
| | | | | | | | | | | | | | | | | |
| FOOD - 4.6% | | | | | | | | | | | | | | | | |
| JBS Investments GmbH - 144A | | | | | 1,350,000 | | | | 6.250 | | | 2/5/2023 | | | 1,375,312 | |
| Mars, Inc. - 144A | | | | | 965,000 | | | | 3.600 | | | 4/1/2034 | | | 966,104 | |
| Smithfield Foods, Inc. - 144A | | | | | 835,000 | | | | 5.200 | | | 4/1/2029 | | | 855,089 | |
| | | | | | | | | | | | | | | | 3,196,505 | |
| FOREST PRODUCTS & PAPER - 1.0% | | | | | | | | | | | | | | | | |
| Suzano Austria GmbH- 144A | | | | | 655,000 | | | | 7.000 | | | 3/16/2047 | | | 729,022 | |
| | | | | | | | | | | | | | | | | |
| INSURANCE - 1.4% | | | | | | | | | | | | | | | | |
| United Insurance Holdings Corp. | | | | | 1,000,000 | | | | 6.250 | | | 12/15/2027 | | | 1,017,978 | |
| | | | | | | | | | | | | | | | | |
| IRON/STEEL - 2.0% | | | | | | | | | | | | | | | | |
| CSN Resources | | | | | 1,405,000 | | | | 6.500 | | | 7/21/2020 | | | 1,433,100 | |
| | | | | | | | | | | | | | | | | |
| MEDIA - 2.3% | | | | | | | | | | | | | | | | |
| American Media LLC - 144A | | | | | 100,000 | | | | 10.500 | | | 12/31/2026 | | | 103,750 | |
| Viacom, Inc. | | 3 mo. LIBOR + 3.899% | | | 1,500,000 | | | | 6.250 | + | | 2/28/2057 | | | 1,548,900 | |
| | | | | | | | | | | | | | | | 1,652,650 | |
| MINING - 2.1% | | | | | | | | | | | | | | | | |
| Freeport-McMoRan, Inc. | | | | | 740,000 | | | | 5.450 | | | 3/15/2043 | | | 671,550 | |
| New Gold, Inc. - 144A | | | | | 900,000 | | | | 6.250 | | | 11/15/2022 | | | 821,250 | |
| | | | | | | | | | | | | | | | 1,492,800 | |
| OIL & GAS - 2.4% | | | | | | | | | | | | | | | | |
| Transocean Poseidon Ltd. - 144A | | | | | 1,600,000 | | | | 6.875 | | | 2/1/2027 | | | 1,708,000 | |
| | | | | | | | | | | | | | | | | |
| PIPELINES - 1.0% | | | | | | | | | | | | | | | | |
| Rockies Express Pipeline LLC - 144A | | | | | 725,000 | | | | 4.950 | | | 7/15/2029 | | | 726,428 | |
| | | | | | | | | | | | | | | | | |
See accompanying notes to financial statements.
| SCHEDULE OF INVESTMENTS (Unaudited) |
| Dunham Long/Short Credit Fund (Continued) |
| April 30, 2019 |
| | | Variable | | Principal | | | Interest | | | Maturity | | | |
| Security | | Rate | | Amount | | | Rate % | | | Date | | Value | |
| BONDS & NOTES - 29.8% (Continued) | | | | | | | | | | | | | | | | |
| TELECOMMUNICATIONS - 2.2% | | | | | | | | | | | | | | | | |
| Gogo Intermediate Holdings LLC - 144A | | | | $ | 500,000 | | | | 9.875 | | | 5/1/2024 | | $ | 512,355 | |
| Sprint Spectrum Co. LLC - 144A | | | | | 1,000,000 | | | | 4.738 | | | 3/20/2025 | | | 1,021,250 | |
| | | | | | | | | | | | | | | | 1,533,605 | |
| TOTAL BONDS & NOTES (Cost - $20,178,932) | | | | | | | | | | | | | | | 21,095,855 | |
| | | | | | | | | | | | | | | | | |
| BANK LOANS - 2.9% | | | | | | | | | | | | | | | | |
| HEALTHCARE PRODUCTS - 1.6% | | | | | | | | | | | | | | | | |
| Weight Watchers International, Inc. | | LIBOR + 4.750% | | | 1,184,211 | | | | 0.000 | + | | 11/29/2024 | | | 1,142,023 | |
| | | | | | | | | | | | | | | | | |
| TECHNOLOGY - 1.3% | | | | | | | | | | | | | | | | |
| First Data Corp. | | LIBOR + 2.000% | | | 900,000 | | | | 4.212 | + | | 4/26/2024 | | | 900,846 | |
| SS&C Technologies, Inc. | | LIBOR + 2.250% | | | 2,310 | | | | 4.550 | + | | 4/16/2025 | | | 2,314 | |
| | | | | | | | | | | | | | | | 903,160 | |
| TOTAL BANK LOANS (Cost - $2,075,429) | | | | | | | | | | | | | | | 2,045,183 | |
| | | | | | | | | | | | | | | | | |
| U.S. GOVERNMENT - 53.3% | | | | | | | | | | | | | | | | |
| TREASURY BILLS - 43.2% | | | | | | | | | | | | | | | | |
| Treasury Bill | | | | | 10,150,000 | | | | 2.369 | + | | 5/2/2019 | | | 10,149,332 | |
| Treasury Bill | | | | | 10,155,000 | | | | 2.364 | + | | 5/7/2019 | | | 10,150,842 | |
| Treasury Bill | | | | | 10,275,000 | | | | 2.386 | + | | 5/21/2019 | | | 10,260,864 | |
| | | | | | | | | | | | | | | | 30,561,038 | |
| TREASURY NOTES/BONDS - 10.1% | | | | | | | | | | | | | | | | |
| Treasury Note / Bond | | | | | 1,575,000 | | | | 2.625 | | | 12/31/2023 | | | 1,598,963 | |
| Treasury Note / Bond | | | | | 925,000 | | | | 2.500 | | | 2/28/2026 | | | 931,468 | |
| Treasury Note / Bond | | | | | 790,000 | | | | 2.625 | | | 2/15/2029 | | | 798,147 | |
| Treasury Note / Bond | | | | | 1,910,000 | | | | 3.000 | | | 8/15/2048 | | | 1,931,786 | |
| Treasury Note / Bond | | | | | 1,710,000 | | | | 3.375 | | | 11/15/2048 | | | 1,859,358 | |
| | | | | | | | | | | | | | | | 7,119,722 | |
| TOTAL U.S. GOVERNMENT (Cost - $37,594,441) | | | | | | | | | | | | | | | 37,680,760 | |
| | | | | | | | | | | | | | | | | |
| | | | | Shares | | | | | | | | | | | |
| SHORT-TERM INVESTMENT - 13.3% | | | | | | | | | | | | | | | | |
| MONEY MARKET FUND - 13.3% | | | | | | | | | | | | | | | | |
| First American Government Obligations Fund - Class Z | | | | | 9,422,912 | | | | 2.320 | + | | | | | 9,422,912 | |
| TOTAL SHORT-TERM INVESTMENT (Cost - $9,422,912) | | | | | | | | | | | | | | | | |
| | | | | | | | | | | | | | | | | |
| TOTAL INVESTMENTS - 99.3% (Cost - $69,329,444) | | | | | | | | | | | | | | $ | 70,264,310 | |
| OTHER ASSETS IN EXCESS OF LIABILITIES - 0.7% | | | | | | | | | | | | | | | 481,137 | |
| TOTAL NET ASSETS - 100.0% | | | | | | | | | | | | | | $ | 70,745,447 | |
| | | | | | | | | | | | | | | | | |
LLC - Limited Liability Company
| * | Non-income producing security. |
| + | Variable rate security. Interest rate is as of April 30, 2019. |
144A - Security exempt from registration under Rule 144A of the Securities Act of 1933. These securities may be sold in transactions exempt from registration, normally to qualified institutional buyers. As of April 30, 2019 the total market value of 144A securities is $10,921,310 or 15.5% of net assets.
See accompanying notes to financial statements.
| SCHEDULE OF INVESTMENTS (Unaudited) |
| Dunham Long/Short Credit Fund (Continued) |
| April 30, 2019 |
| | | | | | | | | | Unrealized | |
| | | Short | | | | | Maturity | | Appreciation/ | |
| Security | | Contracts | | Notional | | | Date | | (Depreciation) | |
| OPEN SHORT FUTURES CONTRACTS - (0.2)% | | | | | | | | | | | | |
| U.S. 5 Year Treasury Note | | 14 | | $ | 1,618,969 | | | June-19 | | $ | (13,562 | ) |
| U.S 10 Year Treasury Note | | 46 | | | 5,688,906 | | | June-19 | | | (33,602 | ) |
| U.S. Treasury Long Bond | | 58 | | | 8,553,188 | | | June-19 | | | (116,000 | ) |
| NET UNREALIZED LOSS FROM OPEN SHORT FUTURE CONTRACTS | | $ | (163,164 | ) |
| CREDIT DEFAULT SWAPS |
| |
| | | | | | | | | | | | | Unrealized | |
| | | | | Notional at | | | Premium | | | Maturity | | Appreciation/ | |
| Description (1) | | Counterparty | | April 30, 2019 | | | Paid (Received) | | | Date | | (Depreciation) | |
| To Buy Protection - Commonwealth Bank of Australia | | Goldman Sachs | | $ | 2,000,000 | | | $ | (15,499 | ) | | 12/20/2023 | | $ | (28,595 | ) |
| To Buy Protection - Xerox Corp. | | JPMorgan | | | 3,000,000 | | | | 179,980 | | | 6/20/2024 | | | 2,042 | |
| To Sell Protection - Dell, Inc. | | JPMorgan | | | (3,000,000 | ) | | | (170,136 | ) | | 6/20/2024 | | | 13,581 | |
| NET UNREALIZED LOSS FROM CREDIT DEFAULT SWAPS | | $ | (12,972 | ) |
| TOTAL RETURN SWAPS |
| | | | | | | | | | | | | | | | |
| | | | | | | | | | | | | | | Unrealized | |
| | | | | | | | Notional Value at | | | | | Maturity | | Appreciation/ | |
| Reference Entity | | Shares | | | Counterparty | | April 30, 2019 | | | Interest Rate | | Date | | (Depreciation) | |
| iBoxx USD Liquid High Yield Index | | | (17,621 | ) | | JPMorgan | | | 5,000,000 | | | 3 mo. LIBOR + 0.000% | | 6/20/2019 | | $ | (87,070 | ) |
| NET UNREALIZED LOSS FROM TOTAL RETURN SWAPS | | $ | (87,070 | ) |
| | | | | | | | | | | | | | | | | | | |
| (1) | If the Fund is a seller of protection and a credit event occurs, as defined under the terms of that particular swap agreement, the Fund will either (i) pay the buyer of protection an amount equal to the notional amount of the swap and take delivery of the referenced obligation or underlying securities comprising the referenced index or (ii) pay a net settlement amount in the form of cash or securities equal to the notional amount of the swap less the recovery value of the referenced obligation or underlying securities comprising of the referenced index. |
| Portfolio Composition*- (Unaudited) |
| U.S. Government | | | 53.7 | % |
| Bonds & Notes | | | 30.0 | % |
| Short-Term Investment | | | 13.4 | % |
| Bank Loans | | | 2.9 | % |
| Common Stock | | | 0.0 | % |
| Total | | | 100.0 | % |
| | | | | |
| * | Based on total value of investments as of April 30, 2019. |
Percentage may differ from Schedule of Investments which are based on Fund net assets.
See accompanying notes to financial statements.
| Dunham Corporate/Government Bond Fund (Unaudited) |
| Message from the Sub-Adviser (Newfleet Asset Management, LLC) |
| |
Asset Class Recap
When yields fall, fixed-coupon bonds generally experience capital appreciation. This was the case during the first fiscal quarter when 10-year Treasury yields plummeted 0.5 percent. In the most recent fiscal quarter, the 10-year Treasury’s yield dropped, but by a more muted 0.1 percent. This decline in rates supported bond appreciation, as intermediate- term investment grade bonds, as measured by the Bloomberg Barclays Aggregate Bond Index, rose 1.9 percent during the second fiscal quarter after increasing 3.5 percent in the first fiscal quarter. Despite equity markets rallying, which historically alludes to a difficult backdrop for bonds, the rhetoric coming from the Federal Reserve regarding halts to interest rate increases as well as generally strong corporate fundamentals helped to provide tailwinds for equity and bond investors alike. Therefore, it is not surprising that fixed income instruments that have moderate interest rate sensitivity as well as moderate-to-high potential concerns for corporate health, such as high-yield bonds, saw the largest gains in the fixed income space. During the six-month period, investment grade corporate bonds rose 5.5 percent while high-yield bonds rose a comparable 5.6 percent. As yields dropped between 0.5 percent and 0.8 percent across the credit quality spectrum, yield spreads did not see the same magnitude of tightening due to the sizeable drop in Treasury yields.
Allocation Review
Almost two-thirds of the Bloomberg Barclays Aggregate Bond Index is comprised of U.S. Treasuries and mortgage-backed securities. Conversely, the Fund held less than 20 percent across these same bond sectors. Therefore, the Fund’s allocation is generally quite disparate from the index, with the Fund’s largest overweights in the asset backed securities, residential mortgage-backed securities, and investment grade corporate bond sectors. Historically, the Sub-Adviser has also opportunistically allocated to high-yield bonds and bank loans. However, the Fund’s allocation to these instruments is near an all-time low, with less than 15 percent allocated. These allocation exposures were partially offsetting for Fund performance during the six-month period. Mortgage-backed securities and U.S. Treasuries generally outperformed residential mortgage-backed securities, bank loans, and asset backed securities, but underperformed high-yield bonds and investment grade corporate bonds.
Holdings Insights
Although the sizeable differences in bond sector allocation drove a significant amount of the Fund’s relative performance, holdings such as the Government of Argentina 4.625% bond maturing in 2023 (040114HP8) (holding weight**: 0.48 percent) was one of the greatest detractors. Argentina has been highly volatile, as the country is undergoing an economic reform program to shore up its fiscal position. In addition to tighter fiscal policy, the central bank is tightening monetary policy. This tightening impaired these bonds primarily in the second fiscal quarter, leading to an overall price decline of 13.1 percent from their purchase date in January through when they were sold at the end of April. Another detractor included the Bristow Group Inc. 8.75% bonds maturing in 2023 (110394AG8) (holding weight**: 0.08 percent). Bristow primarily operates helicopters for the offshore oil and gas industry as well as search and rescue in the UK. The Sub-Adviser exited the bonds in early February after the company reported a menagerie of corporate troubles. The bonds had declined 16.6 percent since the beginning of the fiscal year through their sale date.
Contributors to Fund performance during the six-month period included the Springleaf Finance Corporation 6.875% bond maturing in 2025 (85172FAM1) (holding weight*: 0.19 percent), the Pultegroup, Inc. 6.375% bond maturing in 2033 (745867AP6) (holding weight*: 0.26 percent), and the William Lyon Homes 6.0% bond maturing in 2023 (96926DAU4) (holding weight*: 0.26 percent). All of these bonds experienced the majority of their gains in the second fiscal quarter. The Springleaf bonds jumped 10.8 percent in the six-month period as a result of the lender being upgraded by Moody’s and S&P. The Pultegroup’s long-dated bonds benefitted from declining rates, due to the higher duration, as well as market tailwinds arriving for homebuilders. Similar to Pultegroup, the William Lyon Homes bonds were also carried higher by positive homebuilder sentiment. During the six-month period, the Pultegroup and William Lyon Homes bonds rose 12.4 percent and 6.8 percent, respectively.
Sub-Adviser Outlook
The Sub-Adviser believes that sound fundamentals are supportive of stability in the investment grade bond arena. While current conditions have been conducive for appreciation in the high-yield market, the Sub-Adviser is cautious and believes that careful credit selection will be key. The Sub-Adviser also continues to believe that housing will benefit in the near-term from depressed interest rates. The Sub-Adviser believes that the prospect of renewed volatility in the bond market may present opportunities and believes a more cautious stance in the interim may allow for the Fund to take advantage of depressed prices as they arise.
| * | Holdings percentage(s) of total investments, excluding collateral for securities loaned, as of 4/30/2019. |
| ** | Holdings percentage(s) as of the date prior to the sale of the security. |
Growth of $100,000 Investment
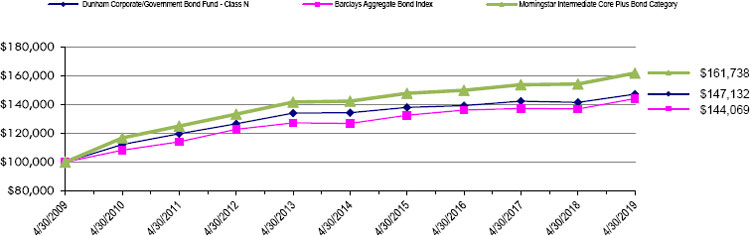
| Total Returns as of April 30, 2019 |
| | | | Annualized | Annualized |
| | Six Months | One Year | Five Years | Ten Years |
| Class N | 4.73% | 4.08% | 1.85% | 3.94% |
| Class C | 4.38% | 3.33% | 1.09% | 3.16% |
| Class A with load of 4.50% | (0.07)% | (0.87)% | 0.65% | 3.19% |
| Class A without load | 4.61% | 3.83% | 1.58% | 3.67% |
| Barclays Aggregate Bond Index | 5.49% | 5.29% | 2.57% | 3.72% |
| Morningstar Intermediate Core Plus Bond Category | 5.12% | 4.94% | 2.60% | 4.92% |
| | | | | |
The Barclays Aggregate Bond Index is an unmanaged index which represents the U.S. investment-grade fixed-rate bond market (including government and corporate securities, mortgage pass-through securities and asset-backed securities). Investors cannot invest directly in an index or benchmark.
The Morningstar Intermediate Core Plus Bond Category is generally representative of intermediate-term bond mutual funds that primarily invest in corporate and other investment-grade U.S. fixed-income securities and typically have durations of 3.5 to 6.0 years.
As disclosed in the Trust’s latest registration statement, the Fund’s total annual operating expenses, including underlying funds, are 1.20% for Class N, 1.95% for Class C and 1.45% for Class A. Class A shares are subject to a sales load of 4.50% and a deferred sales charge of up to 0.75%. The performance data quoted here represents past performance, which is not indicative of future results. Current performance may be lower or higher than the performance data quoted. The investment return and NAV will fluctuate, so that an investor’s shares, when redeemed, may be worth more or less than their original cost. Total returns are calculated assuming reinvestment of all dividends and capital gains distributions, if any. The returns do not reflect the deductions of taxes a shareholder would pay on the redemption of Fund shares or Fund distributions. For performance information current to the most recent month-end, please call 1-800-442-4358 or visit our website www.dunham.com
| SCHEDULE OF INVESTMENTS (Unaudited) |
| Dunham Corporate/Government Bond Fund |
| April 30, 2019 |
| | | Variable | | Principal | | | Interest | | | Maturity | | | |
| Security | | Rate | | Amount | | | Rate % | | | Date | | Value | |
| CORPORATE BONDS & NOTES - 64.6% | | | | | | | | | | | | | | | | |
| AEROSPACE / DEFENSE - 0.3% | | | | | | | | | | | | | | | | |
| Boeing Co. | | | | $ | 100,000 | | | | 3.100 | | | 5/1/2026 | | $ | 99,719 | |
| TransDigm, Inc. | | | | | 50,000 | | | | 6.375 | | | 6/15/2026 | | | 50,313 | |
| | | | | | | | | | | | | | | | 150,032 | |
| AGRICULTURE - 0.2% | | | | | | | | | | | | | | | | |
| Bunge Ltd Finance Corp. | | | | | 110,000 | | | | 4.350 | | | 3/15/2024 | | | 111,908 | |
| | | | | | | | | | | | | | | | | |
| APPAREL - 0.1% | | | | | | | | | | | | | | | | |
| Under Armour, Inc. | | | | | 75,000 | | | | 3.250 | | | 6/15/2026 | | | 69,265 | |
| | | | | | | | | | | | | | | | | |
| AUTO MAUFACTURERS - 0.1% | | | | | | | | | | | | | | | | |
| Navistar International Corp. - 144A | | | | | 55,000 | | | | 6.625 | | | 11/1/2025 | | | 56,306 | |
| | | | | | | | | | | | | | | | | |
| AUTO PARTS & EQUIPMENT - 0.5% | | | | | | | | | | | | | | | | |
| Lear Corp. | | | | | 195,000 | | | | 3.800 | | | 9/15/2027 | | | 190,024 | |
| Panther BF Aggregator 2 LP / Panther Finance Co., Inc. - 144A | | | 5,000 | | | | 6.250 | | | 5/15/2026 | | | 5,219 | |
| Tenneco, Inc. | | | | | 65,000 | | | | 5.000 | | | 7/15/2026 | | | 53,137 | |
| | | | | | | | | | | | | | | | 248,380 | |
| AUTOMOBILE ABS - 8.2% | | | | | | | | | | | | | | | | |
| American Credit Acceptance Receivables Trust 2017-2 - 144A | | | 97,020 | | | | 2.860 | | | 6/12/2023 | | | 96,952 | |
| American Credit Acceptance Receivables Trust 2018-3 - 144A | | | 165,000 | | | | 3.750 | | | 10/15/2024 | | | 166,095 | |
| Americredit Automobile Receivables Trust 2018-1 | | | 135,000 | | | | 3.820 | | | 3/18/2024 | | | 137,691 | |
| Avid Automobile Receivables Trust 2018-1 - 144A | | | 113,795 | | | | 2.840 | | | 8/15/2023 | | | 113,370 | |
| Avis Budget Rental Car Funding AESOP LLC - 144A | | | 150,000 | | | | 3.070 | | | 9/20/2023 | | | 150,553 | |
| Capital Auto Receivables Asset Trust 2017-1 - 144A | | | 160,000 | | | | 2.700 | | | 9/20/2022 | | | 158,411 | |
| Carmax Auto Owner Trust 2019-1 | | | | | 140,000 | | | | 3.740 | | | 1/15/2025 | | | 142,693 | |
| Carnow Auto Receivables Trust - 144A | | | | | 33,731 | | | | 2.920 | | | 9/15/2022 | | | 33,693 | |
| Carvana Auto Receivables Trust 2019-1 - 144A | | | 145,000 | | | | 3.880 | | | 10/15/2024 | | | 146,467 | |
| Centre Point Funding LLC - 144A | | | | | 70,022 | | | | 2.610 | | | 8/20/2020 | | | 69,423 | |
| CPS Auto Receivables Trust 2017-D - 144A | | | | | 100,000 | | | | 2.430 | | | 1/18/2022 | | | 99,760 | |
| Drive Auto Receivables Trust 2017-3 | | | | | 127,645 | | | | 2.800 | | | 7/15/2022 | | | 127,656 | |
| Drive Auto Receivables Trust 2017-A - 144A | | | | | 93,777 | | | | 2.980 | | | 1/18/2022 | | | 93,831 | |
| Drive Auto Receivables Trust 2019-1 | | | | | 165,000 | | | | 3.780 | | | 4/15/2025 | | | 167,607 | |
| DT Auto Owner Trust 2017-3 - 144A | | | | | 160,000 | | | | 3.010 | | | 5/15/2023 | | | 160,048 | |
| DT Auto Owner Trust 2019-1 - 144A | | | | | 120,000 | | | | 3.610 | | | 11/15/2024 | | | 121,112 | |
| Exeter Automobile Receivables Trust 2017-2 - 144A | | | 160,000 | | | | 2.820 | | | 5/16/2022 | | | 159,912 | |
| Exeter Automobile Receivables Trust 2018-1 - 144A | | | 170,000 | | | | 3.030 | | | 1/17/2023 | | | 170,343 | |
| Exeter Automobile Receivables Trust 2019-1 - 144A | | | 165,000 | | | | 3.820 | | | 12/16/2024 | | | 167,661 | |
| First Investors Auto Owner Trust 2017-2 - 144A | | | 135,000 | | | | 2.650 | | | 11/15/2022 | | | 134,800 | |
| First Investors Auto Owner Trust 2019-1 - 144A | | | 150,000 | | | | 3.260 | | | 3/17/2025 | | | 150,250 | |
| Flagship Credit Auto Trust 2016-1 - 144A | | | | | 199 | | | | 2.770 | | | 12/15/2020 | | | 199 | |
| Flagship Credit Auto Trust 2017-3 - 144A | | | | | 160,000 | | | | 2.910 | | | 9/15/2023 | | | 159,655 | |
| GLS Auto Receivables Trust - 144A | | | | | 160,000 | | | | 2.980 | | | 12/15/2021 | | | 159,909 | |
| Hertz Vehicle Financing II LP - 144A | | | | | 135,000 | | | | 2.670 | | | 9/25/2021 | | | 134,198 | |
| Hyundai Auto Lease Securitization Trust 2018-A - 144A | | | 101,506 | | | | 2.550 | | | 8/17/2020 | | | 101,462 | |
| OneMain Direct Auto Receivables Trust 2017-2 - 144A | | | 135,000 | | | | 2.820 | | | 7/15/2024 | | | 134,643 | |
| OneMain Direct Auto Receivables Trust 2018-1 - 144A | | | 125,000 | | | | 3.850 | | | 10/14/2025 | | | 126,904 | |
| Prestige Auto Receivables Trust 2017-1 - 144A | | | 160,000 | | | | 2.810 | | | 1/17/2023 | | | 159,539 | |
| Santander Drive Auto Receivables Trust 2016-1 | | | 66,178 | | | | 3.090 | | | 4/15/2022 | | | 66,232 | |
| Santander Drive Auto Receivables Trust 2017-1 | | | 115,000 | | | | 2.580 | | | 5/16/2022 | | | 114,837 | |
| Tesla Auto Lease Trust 2018-A - 144A | | | | | 75,833 | | | | 2.320 | | | 12/20/2019 | | | 75,770 | |
| Westlake Automobile Receivables Trust 2018-3 - 144A | | | 150,000 | | | | 3.610 | | | 10/16/2023 | | | 151,450 | |
| | | | | | | | | | | | | | | | 4,153,126 | |
| BANKS - 7.3% | | | | | | | | | | | | | | | | |
| Banco de Credito e Inversiones SA - 144A | | | | | 370,000 | | | | 3.500 | | | 10/12/2027 | | | 363,849 | |
| Banco Santander Chile - 144A | | | | | 150,000 | | | | 3.875 | | | 9/20/2022 | | | 153,624 | |
| Bank of America Corp. | | | | | 361,000 | | | | 4.200 | | | 8/26/2024 | | | 374,795 | |
| Bank of Montreal | | 5 Year Swap Rate US + 1.432% | | | 234,000 | | | | 3.803 | + | | 12/15/2032 | | | 227,867 | |
| Bank of New York Mellon Corp. | | 3 Month LIBOR + 3.420% | | | 190,000 | | | | 4.950 | + | | 12/29/2049 | | | 192,653 | |
| BBVA Bancomer SA/Texas - 144A | | 5 Year Treasury Note + 2.650% | | | 200,000 | | | | 5.125 | + | | 1/18/2033 | | | 190,250 | |
| Citigroup, Inc. | | | | | 160,000 | | | | 4.050 | | | 7/30/2022 | | | 165,258 | |
| Citigroup, Inc. | | | | | 222,000 | | | | 3.200 | | | 10/21/2026 | | | 217,591 | |
| Goldman Sachs Group, Inc. | | | | | 230,000 | | | | 4.250 | | | 10/21/2025 | | | 237,033 | |
| JPMorgan Chase & Co. | | 3 Month LIBOR + 3.800% | | | 205,000 | | | | 5.300 | + | | 12/29/2049 | | | 208,968 | |
| M&T Bank Corp. | | 3 Month LIBOR + 3.520% | | | 109,000 | | | | 5.125 | + | | 12/29/2049 | | | 110,732 | |
| Morgan Stanley | | | | | 120,000 | | | | 6.375 | | | 7/24/2042 | | | 157,265 | |
| PNC Financial Services Group, Inc. | | 3 Month LIBOR + 3.300% | | | 170,000 | | | | 5.000 | + | | 12/29/2049 | | | 170,717 | |
| Santander Holdings USA, Inc. | | | | | 65,000 | | | | 4.400 | | | 7/13/2027 | | | 66,087 | |
| | | | | | | | | | | | | | | | | |
See accompanying notes to financial statements.
| SCHEDULE OF INVESTMENTS (Unaudited) |
| Dunham Corporate/Government Bond Fund (Continued) |
| April 30, 2019 |
| | | Variable | | Principal | | | Interest | | | Maturity | | | |
| Security | | Rate | | Amount | | | Rate % | | | Date | | Value | |
| CORPORATE BONDS & NOTES - 64.6% (Continued) | | | | | | | | | | | | | | |
| BANKS - 7.3% (Continued) | | | | | | | | | | | | | | | | |
| Santander Holdings USA, Inc. | | | | $ | 133,000 | | | | 3.700 | | | 3/28/2022 | | $ | 134,407 | |
| Santander Holdings USA, Inc. | | | | | 80,000 | | | | 4.450 | | | 12/3/2021 | | | 82,679 | |
| Synovus Financial Corp. | | 5 Year Swap Rate US + 3.379% | | | 70,000 | | | | 5.900 | + | | 2/7/2029 | | | 71,750 | |
| Toronto-Dominion Bank | | 5 Year Swap Rate US + 2.205% | | | 195,000 | | | | 3.625 | + | | 9/15/2031 | | | 192,644 | |
| UBS AG/Stamford CT | | | | | 250,000 | | | | 7.625 | | | 8/17/2022 | | | 278,269 | |
| Wells Fargo & Co. | | 3 Month LIBOR + 3.110% | | | 115,000 | | | | 5.900 | + | | Perpetual | | | 119,559 | |
| | | | | | | | | | | | | | | | 3,715,997 | |
| BEVERAGES - 0.2% | | | | | | | | | | | | | | | | |
| Anheuser-Busch InBev Worldwide, Inc. | | | | | 50,000 | | | | 4.000 | | | 4/13/2028 | | | 51,039 | |
| Anheuser-Busch InBev Worldwide, Inc. | | | | | 40,000 | | | | 4.750 | | | 1/23/2029 | | | 42,863 | |
| | | | | | | | | | | | | | | | 93,902 | |
| BUILDING MATERIALS - 1.0% | | | | | | | | | | | | | | | | |
| CRH America Finance, Inc. - 144A | | | | | 200,000 | | | | 3.400 | | | 5/9/2027 | | | 192,185 | |
| Owens Corning | | | | | 165,000 | | | | 3.400 | | | 8/15/2026 | | | 157,036 | |
| Vulcan Materials Co. | | | | | 165,000 | | | | 3.900 | | | 4/1/2027 | | | 163,844 | |
| | | | | | | | | | | | | | | | 513,065 | |
| CHEMICALS - 0.5% | | | | | | | | | | | | | | | | |
| NOVA Chemicals Corp. - 144A | | | | | 55,000 | | | | 4.875 | | | 6/1/2024 | | | 53,969 | |
| SABIC Capital II BV - 144A | | | | | 200,000 | | | | 4.500 | | | 10/10/2028 | | | 211,493 | |
| | | | | | | | | | | | | | | | 265,462 | |
| COMMERCIAL MBS - 4.3% | | | | | | | | | | | | | | | | |
| Aventura Mall Trust 2013-AVM - 144A | | | | | 155,000 | | | | 3.867 | ++ | | 12/5/2032 | | | 156,943 | |
| Aventura Mall Trust 2013-AVM - 144A | | | | | 100,000 | | | | 3.867 | ++ | | 12/5/2032 | | | 101,253 | |
| BAMLL Commercial Mortgage Securities Trust 2015-200P - 144A | | | 105,000 | | | | 3.218 | | | 4/14/2033 | | | 106,395 | |
| Caesars Palace Las Vegas Trust 2017-VICI - 144A | | | 100,000 | | | | 4.138 | | | 10/15/2034 | | | 102,733 | |
| Citigroup Commercial Mortgage Trust 2013-375P - 144A | | | 135,000 | | | | 3.635 | ++ | | 5/10/2035 | | | 136,725 | |
| Cold Storage Trust 2017-ICE3 - 144A | | 1 Month LIBOR + 1.000% | | | 260,000 | | | | 3.473 | + | | 4/15/2024 | | | 261,136 | |
| GAHR Commercial Mortgage Trust 2015-NRF - 144A | | | 105,000 | | | | 3.495 | ++ | | 12/15/2019 | | | 104,534 | |
| GS Mortgage Securities Corp. Trust 2012-ALOHA - 144A | | | 252,000 | | | | 3.551 | | | 4/10/2022 | | | 258,351 | |
| Hilton USA Trust 2016-SFP - 144A | | | | | 185,000 | | | | 3.323 | | | 11/5/2035 | | | 184,472 | |
| JP Morgan Chase Commercial Mortgage Securities Trust 2011-C4 - 144A | | | 97,467 | | | | 4.388 | | | 5/15/2021 | | | 100,206 | |
| JPMBB Commercial Mortgage Securities Trust 2015-C31 | | | 125,000 | | | | 4.106 | | | 8/15/2048 | | | 130,586 | |
| Morgan Stanley Capital I Trust 2017-CLS - 144A | | 1 Month LIBOR + 0.700% | | | 85,000 | | | | 3.173 | + | | 11/15/2034 | | | 84,992 | |
| One Market Plaza Trust 2017-1MKT - 144A | | | | | 105,000 | | | | 3.614 | | | 2/10/2024 | | | 107,388 | |
| Sutherland Commercial Mortgage Loans 2018-SBC7 - 144A | | | 84,312 | | | | 4.720 | ++ | | 5/25/2039 | | | 84,734 | |
| Wells Fargo Commercial Mortgage Trust 2015-LC20 | | | 125,000 | | | | 3.184 | | | 4/15/2050 | | | 126,293 | |
| WFRBS Commercial Mortgage Trust 2014-C24 | | | 125,000 | | | | 3.931 | | | 11/15/2047 | | | 128,415 | |
| | | | | | | | | | | | | | | | 2,175,156 | |
| COMMERCIAL SERVICES - 0.1% | | | | | | | | | | | | | | | | |
| Prime Security Services Borrower LLC / Prime Finance, Inc. - 144A | | | 15,000 | | | | 5.250 | | | 4/15/2024 | | | 15,075 | |
| Prime Security Services Borrower LLC / Prime Finance, Inc. - 144A | | | 10,000 | | | | 5.750 | | | 4/15/2026 | | | 10,127 | |
| | | | | | | | | | | | | | | | 25,202 | |
| COMPUTERS - 0.5% | | | | | | | | | | | | | | | | |
| Dell International LLC / EMC Corp. - 144A | | | | | 155,000 | | | | 6.020 | | | 6/15/2026 | | | 168,070 | |
| Hewlett Packard Enterprise Co. | | | | | 100,000 | | | | 4.900 | | | 10/15/2025 | | | 106,780 | |
| | | | | | | | | | | | | | | | 274,850 | |
| DIVERSIFIED FINANCIAL SERVICES - 2.3% | | | | | | | | | | | | | | | | |
| AerCap Ireland Capital DAC / AerCap Global Aviation Trust | | | 150,000 | | | | 3.650 | | | 7/21/2027 | | | 142,808 | |
| Brookfield Finance LLC | | | | | 174,000 | | | | 4.000 | | | 4/1/2024 | | | 178,760 | |
| Capital One Financial Corp. | | | | | 120,000 | | | | 4.200 | | | 10/29/2025 | | | 123,640 | |
| Capital One Financial Corp. | | | | | 165,000 | | | | 3.750 | | | 7/28/2026 | | | 162,563 | |
| E*TRADE Financial Corp. | | | | | 175,000 | | | | 4.500 | | | 6/20/2028 | | | 179,032 | |
| Jefferies Group LLC | | | | | 14,000 | | | | 6.875 | | | 4/15/2021 | | | 14,963 | |
| Navient Corp. | | | | | 135,000 | | | | 6.750 | | | 6/25/2025 | | | 138,038 | |
| Springleaf Finance Corp. | | | | | 90,000 | | | | 6.875 | | | 3/15/2025 | | | 96,750 | |
| Synchrony Financial | | | | | 135,000 | | | | 3.950 | | | 12/1/2027 | | | 129,382 | |
| | | | | | | | | | | | | | | | 1,165,936 | |
| ELECTRIC - 0.9% | | | | | | | | | | | | | | | | |
| DPL, Inc. - 144A | | | | | 75,000 | | | | 4.350 | | | 4/15/2029 | | | 75,598 | |
| Duke Energy Corp. | | | | | 170,000 | | | | 2.650 | | | 9/1/2026 | | | 162,661 | |
| Exelon Corp. | | | | | 230,000 | | | | 3.497 | | | 6/1/2022 | | | 233,329 | |
| | | | | | | | | | | | | | | | 471,588 | |
| ENERGY - ALTERNATE RESOURCES - 0.2% | | | | | | | | | | | | | | | | |
| TerraForm Power Operating LLC - 144A | | | | | 90,000 | | | | 5.000 | | | 1/31/2028 | | | 89,100 | |
| | | | | | | | | | | | | | | | | |
| ENGINEERING & CONSTRUCTION - 0.1% | | | | | | | | | | | | | | | | |
| Frontdoor, Inc. - 144A | | | | | 70,000 | | | | 6.750 | | | 8/15/2026 | | | 73,588 | |
| | | | | | | | | | | | | | | | | |
See accompanying notes to financial statements.
| SCHEDULE OF INVESTMENTS (Unaudited) |
| Dunham Corporate/Government Bond Fund (Continued) |
| April 30, 2019 |
| | | Variable | | Principal | | | Interest | | | Maturity | | | |
| Security | | Rate | | Amount | | | Rate % | | | Date | | Value | |
| CORPORATE BONDS & NOTES - 64.6% (Continued) | | | | | | | | | | | | | | |
| ENTERTAINMENT - 0.3% | | | | | | | | | | | | | | | | |
| Eldorado Resorts, Inc. | | | | $ | 35,000 | | | | 6.000 | | | 9/15/2026 | | $ | 36,488 | |
| Gateway Casinos & Entertainment Ltd. - 144A | | | 45,000 | | | | 8.250 | | | 3/1/2024 | | | 47,250 | |
| Scientific Games International, Inc. - 144A | | | | | 50,000 | | | | 8.250 | | | 3/15/2026 | | | 51,937 | |
| | | | | | | | | | | | | | | | 135,675 | |
| FOOD - 0.3% | | | | | | | | | | | | | | | | |
| Kraft Heinz Foods Co. | | | | | 165,000 | | | | 3.000 | | | 6/1/2026 | | | 155,768 | |
| | | | | | | | | | | | | | | | | |
| HEALTHCARE PRODUCTS - 0.8% | | | | | | | | | | | | | | | | |
| Becton Dickinson and Co. | | | | | 33,000 | | | | 3.363 | | | 6/6/2024 | | | 33,095 | |
| Becton Dickinson and Co. | | | | | 120,000 | | | | 3.700 | | | 6/6/2027 | | | 119,598 | |
| Zimmer Biomet Holdings, Inc. | | | | | 230,000 | | | | 3.550 | | | 4/1/2025 | | | 229,563 | |
| | | | | | | | | | | | | | | | 382,256 | |
| HEALTHCARE - SERVICES - 0.5% | | | | | | | | | | | | | | | | |
| HCA, Inc. | | | | | 120,000 | | | | 5.375 | | | 2/1/2025 | | | 126,600 | |
| Tenet Healthcare Corp. | | | | | 135,000 | | | | 4.625 | | | 7/15/2024 | | | 135,887 | |
| | | | | | | | | | | | | | | | 262,487 | |
| HOME BUILDERS - 0.7% | | | | | | | | | | | | | | | | |
| PulteGroup, Inc. | | | | | 125,000 | | | | 6.375 | | | 5/15/2033 | | | 131,250 | |
| TRI Pointe Group, Inc. | | | | | 85,000 | | | | 5.875 | | | 6/15/2024 | | | 86,346 | |
| William Lyon Homes, Inc. | | | | | 135,000 | | | | 6.000 | | | 9/1/2023 | | | 134,325 | |
| | | | | | | | | | | | | | | | 351,921 | |
| HOME EQUITY ABS - 0.7% | | | | | | | | | | | | | | | | |
| GSAA Trust 2005-1 AF4 (a) | | | | | 69,074 | | | | 5.619 | | | 11/25/2034 | | | 69,815 | |
| NewResidential Mortgage Loan Trust 2018-1 - 144A | | | 205,987 | | | | 4.000 | ++ | | 12/25/2057 | | | 211,308 | |
| NovaStar Mortgage Funding Trust Series 2004-4 | | 1 Month LIBOR + 1.725% | | | 83,469 | | | | 4.202 | + | | 3/25/2035 | | | 84,321 | |
| | | | | | | | | | | | | | | | 365,444 | |
| INSURANCE - 1.5% | | | | | | | | | | | | | | | | |
| Allstate Corp. | | 3 Month LIBOR + 2.938% | | | 150,000 | | | | 5.750 | + | | 8/15/2053 | | | 154,757 | |
| Athene Holding Ltd. | | | | | 135,000 | | | | 4.125 | | | 1/12/2028 | | | 131,231 | |
| MetLife, Inc. | | 3 Month LIBOR + 2.959% | | | 76,000 | | | | 5.875 | + | | Perpetual | | | 79,373 | |
| Prudential Financial, Inc. | | 3 Month LIBOR + 3.920% | | | 230,000 | | | | 5.625 | + | | 6/15/2043 | | | 241,319 | |
| Teachers Insurance & Annuity Association of America - 144A | | 3 Month LIBOR + 2.661% | | | 110,000 | | | | 4.375 | + | | 9/15/2054 | | | 112,870 | |
| Trinity Acquisition PLC | | | | | 60,000 | | | | 4.400 | | | 3/15/2026 | | | 62,113 | |
| | | | | | | | | | | | | | | | 781,663 | |
| INTERNET - 0.4% | | | | | | | | | | | | | | | | |
| Tencent Holdings Ltd. - 144A | | | | | 200,000 | | | | 3.975 | | | 4/11/2029 | | | 201,751 | |
| | | | | | | | | | | | | | | | | |
| INVESTMENT COMPANIES - 0.9% | | | | | | | | | | | | | | | | |
| Ares Capital Corp. | | | | | 80,000 | | | | 3.500 | | | 2/10/2023 | | | 79,204 | |
| Ares Capital Corp. | | | | | 105,000 | | | | 4.250 | | | 3/1/2025 | | | 103,896 | |
| BrightSphere Investment Group PLC | | | | | 165,000 | | | | 4.800 | | | 7/27/2026 | | | 161,125 | |
| FS Investment Corp. | | | | | 64,000 | | | | 4.250 | | | 1/15/2020 | | | 64,148 | |
| FS Investment Corp. | | | | | 50,000 | | | | 4.750 | | | 5/15/2022 | | | 49,959 | |
| | | | | | | | | | | | | | | | 458,332 | |
| IRON/STEEL - 0.4% | | | | | | | | | | | | | | | | |
| ArcelorMittal | | | | | 170,000 | | | | 6.125 | | | 6/1/2025 | | | 190,121 | |
| | | | | | | | | | | | | | | | | |
| LODGING - 0.1% | | | | | | | | | | | | | | | | |
| Wyndham Destinations, Inc. | | | | | 45,000 | | | | 4.500 | | | 4/1/2027 | | | 45,394 | |
| | | | | | | | | | | | | | | | | |
| MACHINERY- CONSTRUCTION & MINING - 0.4% | | | | | | | | | | | | | | |
| Oshkosh Corp. | | | | | 183,000 | | | | 4.600 | | | 5/15/2028 | | | 185,193 | |
| | | | | | | | | | | | | | | | | |
| MACHINERY- DIVERSIFIED - 0.3% | | | | | | | | | | | | | | | | |
| CNH Industrial NV | | | | | 137,000 | | | | 4.500 | | | 8/15/2023 | | | 142,151 | |
| | | | | | | | | | | | | | | | | |
| MEDIA - 1.0% | | | | | | | | | | | | | | | | |
| Charter Communications Operating LLC / Charter Communications Operating Capital | | | 155,000 | | | | 5.050 | | | 3/30/2029 | | | 164,264 | |
| Discovery Communications LLC | | | | | 160,000 | | | | 3.950 | | | 3/20/2028 | | | 157,672 | |
| DISH DBS Corp. | | | | | 80,000 | | | | 5.875 | | | 7/15/2022 | | | 78,356 | |
| Entercom Media Corp. - 144A | | | | | 5,000 | | | | 6.500 | | | 5/1/2027 | | | 5,113 | |
| Meredith Corp. | | | | | 85,000 | | | | 6.875 | | | 2/1/2026 | | | 88,825 | |
| | | | | | | | | | | | | | | | 494,230 | |
| MINING - 0.8% | | | | | | | | | | | | | | | | |
| BHP Billiton Finance USA Ltd. - 144A | | 5 Year Swap Rate USD + 5.093% | | | 200,000 | | | | 6.750 | + | | 10/19/2075 | | | 225,343 | |
| Glencore Funding LLC - 144A | | | | | 165,000 | | | | 4.000 | | | 3/27/2027 | | | 162,003 | |
| | | | | | | | | | | | | | | | 387,346 | |
| | | | | | | | | | | | | | | | | |
See accompanying notes to financial statements.
| SCHEDULE OF INVESTMENTS (Unaudited) |
| Dunham Corporate/Government Bond Fund (Continued) |
| April 30, 2019 |
| | | Variable | | Principal | | | Interest | | | Maturity | | | |
| Security | | Rate | | Amount | | | Rate % | | | Date | | Value | |
| CORPORATE BONDS & NOTES - 64.6% (Continued) | | | | | | | | | | | | | | |
| MISCELLANEOUS MANUFACTURING - 0.2% | | | | | | | | | | | | | | | | |
| General Electric Co. | | 3 Month LIBOR + 3.330% | | $ | 136,000 | | | | 5.000 | + | | 12/29/2049 | | $ | 128,967 | |
| | | | | | | | | | | | | | | | | |
| OIL & GAS - 1.0% | | | | | | | | | | | | | | | | |
| CrownRock LP / CrownRock Finance, Inc. - 144A | | | | | 75,000 | | | | 5.625 | | | 10/15/2025 | | | 74,344 | |
| Helmerich & Payne, Inc. | | | | | 100,000 | | | | 4.650 | | | 3/15/2025 | | | 104,226 | |
| Holly Frontier Corp. | | | | | 165,000 | | | | 5.875 | | | 4/1/2026 | | | 176,827 | |
| Petroleos Mexicanos | | | | | 90,000 | | | | 6.500 | | | 1/23/2029 | | | 90,000 | |
| Transocean Guardian Ltd. - 144A | | | | | 37,800 | | | | 5.875 | | | 1/15/2024 | | | 38,934 | |
| | | | | | | | | | | | | | | | 484,331 | |
| OIL & GAS SERVICES - 0.2% | | | | | | | | | | | | | | | | |
| USA Compression Partners LP / USA Compression Finance Corp. | | | 105,000 | | | | 6.875 | | | 4/1/2026 | | | 110,972 | |
| | | | | | | | | | | | | | | | | |
| OTHER ABS - 9.1% | | | | | | | | | | | | | | | | |
| American Homes 4 Rent 2014-SFR2 Trust - 144A | | | | | 230,000 | | | | 4.705 | | | 10/17/2036 | | | 241,215 | |
| American Homes 4 Rent 2015-SFR2 Trust - 144A | | | | | 220,000 | | | | 4.691 | | | 10/17/2045 | | | 231,998 | |
| AXIS Equipment Finance Receivables VI LLC - 144A | | | | | 140,000 | | | | 3.890 | | | 7/20/2022 | | | 140,543 | |
| Bayview Opportunity Master Fund IVa Trust 2017-RT1 - 144A | | | 77,100 | | | | 3.000 | ++ | | 3/28/2057 | | | 77,021 | |
| Bayview Opportunity Master Fund IVa Trust 2017-SPL5 - 144A | | | 100,000 | | | | 4.000 | ++ | | 6/28/2057 | | | 103,178 | |
| BRE Grand Islander Timeshare Issuer 2019-A LLC - 144A | | | 150,000 | | | | 3.280 | | | 9/26/2033 | | | 150,465 | |
| CoreVest American Finance 2018-1 Trust - 144A | | | | | 108,715 | | | | 3.804 | | | 5/15/2023 | | | 110,822 | |
| CoreVest American Finance 2018-2 Trust - 144A | | | | | 233,355 | | | | 4.026 | | | 11/15/2052 | | | 239,875 | |
| Diamond Resorts Owner Trust - 144A | | | | | 81,786 | | | | 3.270 | | | 10/22/2029 | | | 82,190 | |
| Foundation Finance Trust 2019-1 - 144A | | | | | 145,000 | | | | 3.860 | | | 11/15/2034 | | | 145,159 | |
| Mill City Mortgage Loan Trust 2017-1 - 144A | | | | | 87,601 | | | | 2.750 | ++ | | 11/25/2058 | | | 86,559 | |
| Mill City Mortgage Loan Trust 2018-4 - 144A | | | | | 295,000 | | | | 3.500 | ++ | | 4/25/2066 | | | 297,333 | |
| MVW Owner Trust 2016-1 - 144A | | | | | 62,907 | | | | 2.250 | | | 12/20/2033 | | | 61,894 | |
| MVW Owner Trust 2017-1 - 144A | | | | | 96,493 | | | | 2.420 | | | 12/20/2034 | | | 95,341 | |
| Oak Hill Advisors Residential Loan Trust 2017-NPL2 - 144A (a) | | | 127,540 | | | | 3.000 | | | 7/25/2057 | | | 127,006 | |
| PRPM 2019-2 LLC - 144A (a) | | | | | 200,000 | | | | 3.967 | | | 4/25/2024 | | | 200,000 | |
| Sofi Consumer Loan Program 2017-5 LLC - 144A | | | | | 105,000 | | | | 2.780 | | | 9/25/2026 | | | 104,723 | |
| Sofi Consumer Loan Program 2017-6 LLC - 144A | | | | | 100,000 | | | | 2.820 | | | 11/25/2026 | | | 99,826 | |
| Towd Point Mortgage Trust - 144A | | | | | 172,000 | | | | 3.250 | ++ | | 10/25/2053 | | | 172,579 | |
| Towd Point Mortgage Trust 2015-6 - 144A | | | | | 130,000 | | | | 3.750 | ++ | | 4/25/2055 | | | 132,941 | |
| Towd Point Mortgage Trust 2017-1 - 144A | | | | | 278,079 | | | | 2.750 | ++ | | 10/25/2056 | | | 273,323 | |
| Towd Point Mortgage Trust 2017-1 - 144A | | | | | 115,000 | | | | 3.750 | ++ | | 10/25/2056 | | | 115,717 | |
| Towd Point Mortgage Trust 2018-4 - 144A | | | | | 342,117 | | | | 3.000 | ++ | | 6/25/2058 | | | 338,336 | |
| Towd Point Mortgage Trust 2018-SJ1 - 144A | | | | | 235,561 | | | | 4.000 | ++ | | 10/25/2058 | | | 236,800 | |
| Tricon American Homes 2017-SFR1 Trust - 144A | | | | | 99,755 | | | | 2.716 | | | 9/17/2022 | | | 98,673 | |
| Trinity Rail Leasing 2019 LLC - 144A | | | | | 125,000 | | | | 3.820 | | | 4/17/2049 | | | 125,949 | |
| TRIP Rail Master Funding LLC - 144A | | | | | 127,575 | | | | 2.709 | | | 8/15/2047 | | | 126,887 | |
| VOLT LXXV LLC - 144A (a) | | | | | 154,487 | | | | 4.336 | | | 1/25/2049 | | | 156,101 | |
| VSE 2017-A VOI Mortgage LLC - 144A | | | | | 88,900 | | | | 2.330 | | | 3/20/2035 | | | 87,451 | |
| Wendy’s Funding LLC - 144A | | | | | 139,925 | | | | 4.080 | | | 6/15/2045 | | | 141,322 | |
| | | | | | | | | | | | | | | | 4,601,227 | |
| PACKAGING & CONTAINERS - 0.1% | | | | | | | | | | | | | | | | |
| Greif, Inc. - 144A | | | | | 70,000 | | | | 6.500 | | | 3/1/2027 | | | 72,275 | |
| | | | | | | | | | | | | | | | | |
| PHARMACEUTICALS - 2.3% | | | | | | | | | | | | | | | | |
| AbbVie, Inc. | | | | | 55,000 | | | | 3.600 | | | 5/14/2025 | | | 55,370 | |
| AbbVie, Inc. | | | | | 100,000 | | | | 3.200 | | | 5/14/2026 | | | 97,110 | |
| Allergan Funding SCS | | | | | 200,000 | | | | 3.450 | | | 3/15/2022 | | | 201,096 | |
| Bausch Health Cos, Inc. - 144A | | | | | 70,000 | | | | 5.500 | | | 11/1/2025 | | | 71,903 | |
| Cigna Corp. - 144A | | | | | 5,000 | | | | 4.125 | | | 11/15/2025 | | | 5,172 | |
| Cigna Corp. - 144A | | | | | 138,000 | | | | 4.375 | | | 10/15/2028 | | | 142,465 | |
| CVS Health Corp. | | | | | 199,000 | | | | 4.300 | | | 3/25/2028 | | | 201,377 | |
| Mylan NV | | | | | 145,000 | | | | 3.950 | | | 6/15/2026 | | | 139,759 | |
| Par Pharmaceutical, Inc. - 144A | | | | | 50,000 | | | | 7.500 | | | 4/1/2027 | | | 51,990 | |
| Takeda Pharmaceutical Co., Ltd. - 144A | | | | | 200,000 | | | | 4.000 | | | 11/26/2021 | | | 205,340 | |
| | | | | | | | | | | | | | | | 1,171,582 | |
| PIPELINES - 2.4% | | | | | | | | | | | | | | | | |
| Andeavor Logistics LP | | | | | 135,000 | | | | 4.250 | | | 12/1/2027 | | | 137,562 | |
| Cheniere Energy Partners LP - 144A | | | | | 55,000 | | | | 5.625 | | | 10/1/2026 | | | 56,950 | |
| Energy Transfer Partners LP | | | | | 165,000 | | | | 4.200 | | | 4/15/2027 | | | 166,053 | |
| Kinder Morgan Inc/DE | | | | | 45,000 | | | | 7.750 | | | 1/15/2032 | | | 59,364 | |
| Kinder Morgan Inc/DE | | | | | 160,000 | | | | 4.300 | | | 6/1/2025 | | | 167,873 | |
| MPLX LP | | | | | 135,000 | | | | 4.875 | | | 12/1/2024 | | | 144,226 | |
| NuStar Logistics LP | | | | | 145,000 | | | | 5.625 | | | 4/28/2027 | | | 145,500 | |
| | | | | | | | | | | | | | | | | |
See accompanying notes to financial statements.
| SCHEDULE OF INVESTMENTS (Unaudited) |
| Dunham Corporate/Government Bond Fund (Continued) |
| April 30, 2019 |
| | | Variable | | Principal | | | Interest | | | Maturity | | | |
| Security | | Rate | | Amount | | | Rate % | | | Date | | Value | |
| CORPORATE BONDS & NOTES - 64.6% (Continued) | | | | | | | | | | | | | | |
| PIPELINES - 2.4% (Continued) | | | | | | | | | | | | | | | | |
| Sabine Pass Liquefaction LLC | | | | $ | 100,000 | | | | 6.250 | | | 3/15/2022 | | $ | 107,675 | |
| Sabine Pass Liquefaction LLC | | | | | 85,000 | | | | 4.200 | | | 3/15/2028 | | | 86,170 | |
| Valero Energy Partners LP | | | | | 120,000 | | | | 4.500 | | | 3/15/2028 | | | 125,659 | |
| | | | | | | | | | | | | | | | 1,197,032 | |
| PRIVATE EQUITY - 0.3% | | | | | | | | | | | | | | | | |
| Apollo Management Holdings LP - 144A | | | | | 135,000 | | | | 4.000 | | | 5/30/2024 | | | 136,306 | |
| | | | | | | | | | | | | | | | | |
| REITS - 4.1% | | | | | | | | | | | | | | | | |
| Alexandria Real Estate Equities, Inc. | | | | | 100,000 | | | | 3.950 | | | 1/15/2027 | | | 101,656 | |
| Corporate Office Properties LP | | | | | 196,000 | | | | 3.600 | | | 5/15/2023 | | | 194,042 | |
| EPR Properties | | | | | 220,000 | | | | 4.750 | | | 12/15/2026 | | | 226,889 | |
| GLP Capital LP / GLP Financing II, Inc. | | | | | 155,000 | | | | 5.750 | | | 6/1/2028 | | | 167,020 | |
| Healthcare Realty Trust, Inc. | | | | | 90,000 | | | | 3.875 | | | 5/1/2025 | | | 90,498 | |
| Healthcare Trust of America Holdings LP | | | | | 150,000 | | | | 3.750 | | | 7/1/2027 | | | 148,602 | |
| Hospitality Properties Trust | | | | | 165,000 | | | | 4.950 | | | 2/15/2027 | | | 166,260 | |
| iStar, Inc. | | | | | 55,000 | | | | 5.250 | | | 9/15/2022 | | | 55,550 | |
| Kilroy Realty LP | | | | | 165,000 | | | | 4.375 | | | 10/1/2025 | | | 171,570 | |
| Life Storage LP | | | | | 65,000 | | | | 3.875 | | | 12/15/2027 | | | 63,833 | |
| LifeStorage LP/CA | | | | | 205,000 | | | | 3.500 | | | 7/1/2026 | | | 198,026 | |
| MPT Operating Partnership LP / MPT Finance Corp. | | | | | 85,000 | | | | 5.000 | | | 10/15/2027 | | | 85,425 | |
| Office Properties Income Trust | | | | | 170,000 | | | | 4.500 | | | 2/1/2025 | | | 164,397 | |
| Physicians Realty LP | | | | | 140,000 | | | | 3.950 | | | 1/15/2028 | | | 135,044 | |
| Retail Opportunity Investments Partnership LP | | | | | 105,000 | | | | 4.000 | | | 12/15/2024 | | | 101,940 | |
| | | | | | | | | | | | | | | | 2,070,752 | |
| RETAIL - 0.7% | | | | | | | | | | | | | | | | |
| Dollar Tree, Inc. | | | | | 150,000 | | | | 4.000 | | | 5/15/2025 | | | 153,102 | |
| QVC, Inc. | | | | | 195,000 | | | | 4.375 | | | 3/15/2023 | | | 197,329 | |
| | | | | | | | | | | | | | | | 350,431 | |
| SEMICONDUCTORS - 0.3% | | | | | | | | | | | | | | | | |
| Broadcom Corp. / Broadcom Cayman Finance Ltd. | | | | | 144,000 | | | | 3.625 | | | 1/15/2024 | | | 143,055 | |
| | | | | | | | | | | | | | | | | |
| SOFTWARE - 0.6% | | | | | | | | | | | | | | | | |
| Citrix Systems, Inc. | | | | | 120,000 | | | | 4.500 | | | 12/1/2027 | | | 120,130 | |
| Vmware, Inc. | | | | | 83,000 | | | | 2.950 | | | 8/21/2022 | | | 82,642 | |
| Vmware, Inc. | | | | | 88,000 | | | | 3.900 | | | 8/21/2027 | | | 85,749 | |
| | | | | | | | | | | | | | | | 288,521 | |
| TELECOMMUNICATIONS - 0.7% | | | | | | | | | | | | | | | | |
| AT&T, Inc. | | | | | 71,000 | | | | 4.100 | | | 2/15/2028 | | | 72,712 | |
| CommScope, Inc. - 144A | | | | | 25,000 | | | | 8.250 | | | 3/1/2027 | | | 27,063 | |
| Frontier Communications Corp. - 144A | | | | | 70,000 | | | | 8.500 | | | 4/1/2026 | | | 66,150 | |
| Sprint Spectrum Co. LLC - 144A | | | | | 125,000 | | | | 3.360 | | | 9/20/2021 | | | 125,000 | |
| ViaSat, Inc. - 144A | | | | | 80,000 | | | | 5.625 | | | 4/15/2027 | | | 81,800 | |
| | | | | | | | | | | | | | | | 372,725 | |
| TRUCKING & LEASING - 0.9% | | | | | | | | | | | | | | | | |
| Aviation Capital Group LLC - 144A | | | | | 205,000 | | | | 3.500 | | | 11/1/2027 | | | 196,280 | |
| Avolon Holdings Funding Ltd. - 144A | | | | | 125,000 | | | | 4.375 | | | 5/1/2026 | | | 124,415 | |
| Penske Truck Leasing Co. LP - 144A | | | | | 140,000 | | | | 4.125 | | | 8/1/2023 | | | 144,295 | |
| | | | | | | | | | | | | | | | 464,990 | |
| WHOLE LOAN COLLATERAL CMO - 5.8% | | | | | | | | | | | | | | | | |
| Angel Oak Mortgage Trust I LLC 2018-2 - 144A | | | | | 44,338 | | | | 3.674 | ++ | | 7/27/2048 | | | 44,701 | |
| Angel Oak Mortgage Trust I LLC 2019-1 - 144A | | | | | 205,850 | | | | 3.920 | ++ | | 11/25/2048 | | | 208,436 | |
| Banc of America Funding 2005-1 Trust | | | | | 42,385 | | | | 5.500 | | | 2/25/2035 | | | 42,522 | |
| Bunker Hill Loan Depositary Trust 2019-1 - 144A (a) | | | | | 98,882 | | | | 3.613 | | | 10/26/2048 | | | 100,610 | |
| Chase Home Lending Mortgage Trust 2019-ATR1 - 144A | | | 125,000 | | | | 4.000 | ++ | | 4/25/2049 | | | 127,012 | |
| Chase Mortgage Finance Corp. - 144A | | | | | 129,400 | | | | 3.750 | ++ | | 4/25/2045 | | | 132,379 | |
| Chase Mortgage Finance Corp. - 144A | | | | | 87,964 | | | | 3.750 | ++ | | 2/25/2044 | | | 89,891 | |
| Citigroup Commercial Mortgage Trust - 144A | | 1 Month LIBOR + 0.920% | | | 145,000 | | | | 3.393 | + | | 12/15/2036 | | | 145,367 | |
| Citigroup Mortgage Loan Trust 2019-RP1 - 144A | | | | | 100,000 | | | | 3.500 | ++ | | 1/25/2066 | | | 100,815 | |
| Citigroup Mortgage Loan Trust, Inc. | | | | | 47,364 | | | | 6.750 | | | 8/25/2034 | | | 51,516 | |
| COLT 2018-1 Mortgage Loan Trust - 144A | | | | | 45,544 | | | | 2.930 | ++ | | 2/25/2048 | | | 45,517 | |
| Deephaven Residential Mortgage Trust 2017-2 - 144A | | | 65,747 | | | | 2.453 | ++ | | 6/25/2047 | | | 64,781 | |
| Galton Funding Mortgage Trust 2017-1 - 144A | | | | | 105,800 | | | | 3.500 | ++ | | 11/25/2057 | | | 105,566 | |
| Homeward Opportunities Fund I Trust 2018-2 - 144A | | | 228,354 | | | | 3.985 | ++ | | 11/25/2058 | | | 232,087 | |
| JP Morgan Mortgage Trust 2005-A5 | | | | | 105,409 | | | | 4.244 | ++ | | 8/25/2035 | | | 107,503 | |
| JP Morgan Mortgage Trust 2017-5 - 144A | | | | | 284,040 | | | | 3.175 | ++ | | 12/15/2047 | | | 284,653 | |
| LHOME Mortgage Trust 2019-RTL1 - 144A (a) | | | | | 145,000 | | | | 4.580 | | | 10/25/2023 | | | 146,480 | |
| MASTR Alternative Loan Trust 2004-4 | | | | | 47,976 | | | | 5.500 | | | 4/25/2034 | | | 50,324 | |
| | | | | | | | | | | | | | | | | |
See accompanying notes to financial statements.
| SCHEDULE OF INVESTMENTS (Unaudited) |
| Dunham Corporate/Government Bond Fund (Continued) |
| April 30, 2019 |
| | | Variable | | Principal | | | Interest | | | Maturity | | | |
| Security | | Rate | | Amount | | | Rate % | | | Date | | Value | |
| CORPORATE BONDS & NOTES - 64.6% (Continued) | | | | | | | | | | | | | | |
| WHOLE LOAN COLLATERAL CMO - 5.8% (Continued) | | | | | | | | | | | | | | |
| Metlife Securitization Trust - 144A | | | | $ | 100,000 | | | | 3.717 | ++ | | 4/25/2055 | | $ | 100,193 | |
| Metlife Securitization Trust 2019-1 - 144A | | | | | 150,000 | | | | 3.750 | ++ | | 4/25/2058 | | | 152,724 | |
| OBX 2019-INV1 Trust - 144A | | | | | 153,308 | | | | 4.500 | ++ | | 11/25/2048 | | | 157,175 | |
| Residential Asset Securitization Trust 2005-A1 | | | | | 76,497 | | | | 5.500 | | | 4/25/2035 | | | 77,997 | |
| Structured Adjustable Rate Mortgage Loan Trust Series 2004-4 | | | 65,622 | | | | 4.554 | ++ | | 4/25/2034 | | | 67,924 | |
| Thornburg Mortgage Securities Trust 2004-2 | | 1 Month LIBOR + 0.620% | | | 99,195 | | | | 3.097 | + | | 6/25/2044 | | | 98,581 | |
| Verus Securitization Trust 2018-1 - 144A | | | | | 57,574 | | | | 2.929 | ++ | | 2/25/2048 | | | 57,520 | |
| Verus Securitization Trust 2018-3 - 144A | | | | | 136,396 | | | | 4.108 | ++ | | 10/25/2058 | | | 139,262 | |
| | | | | | | | | | | | | | | | 2,931,536 | |
| | | | | | | | | | | | | | | | | |
| TOTAL CORPORATE BONDS & NOTES (Cost - $32,352,547) | | | | | | | | | | | | | 32,717,297 | |
| | | | | | | | | | | | | | | | | |
| FOREIGN GOVERNMENT BONDS - 2.6% | | | | | | | | | | | | | | | | |
| Dominican Republic International Bond - 144A | | | | | 100,000 | | | | 5.950 | | | 1/25/2027 | | | 105,750 | |
| Dominican Republic International Bond - 144A | | | | | 150,000 | | | | 6.000 | | | 7/19/2028 | | | 158,625 | |
| Indonesia Government International Bond - 144A | | | | | 215,000 | | | | 8.500 | | | 10/12/2035 | | | 310,094 | |
| Oman Government International Bond - 144A | | | | | 200,000 | | | | 5.625 | | | 1/17/2028 | | | 190,653 | |
| Saudi Government International Bond - 144A | | | | | 200,000 | | | | 4.375 | | | 4/16/2029 | | | 210,273 | |
| Turkey Government International Bond | | | | | 115,000 | | | | 7.375 | | | 2/5/2025 | | | 114,011 | |
| State Oil Co of the Azerbaijan Republic | | | | | 200,000 | | | | 6.950 | | | 3/18/2030 | | | 227,382 | |
| TOTAL FOREIGN GOVERNMENT BONDS - (Cost - $1,292,667) | | | | | | | | | | | | | 1,316,788 | |
| | | | | | | | | | | | | | | | | |
| MUNICIPAL BONDS - 5.4% | | | | | | | | | | | | | | | | |
| City of Bristol VA | | | | | 340,000 | | | | 4.210 | | | 1/1/2042 | | | 340,403 | |
| Idaho Health Facilities Authority | | | | | 135,000 | | | | 5.020 | | | 3/1/2048 | | | 147,057 | |
| Rockdale County Water & Sewerage Authority | | | | | 305,000 | | | | 3.060 | | | 7/1/2024 | | | 306,074 | |
| San Diego County Regional Airport Authority | | | | | 325,000 | | | | 5.594 | | | 7/1/2043 | | | 358,111 | |
| State of California | | | | | 765,000 | | | | 7.600 | | | 11/1/2040 | | | 1,194,276 | |
| State of Texas | | | | | 245,000 | | | | 3.011 | | | 10/1/2026 | | | 246,563 | |
| University of California | | | | | 115,000 | | | | 4.428 | | | 5/15/2048 | | | 120,310 | |
| TOTAL MUNICIPAL - (Cost - $2,655,347) | | | | | | | | | | | | | | | 2,712,794 | |
| | | | | | | | | | | | | | | | | |
| U.S. GOVERNMENT & AGENCY - 18.3% | | | | | | | | | | | | | | | | |
| U.S. GOVERNMENT AGENCY - 5.1% | | | | | | | | | | | | | | | | |
| Fannie Mae Pool | | | | | 19,205 | | | | 6.000 | | | 11/1/2034 | | | 21,496 | |
| Fannie Mae Pool | | | | | 16,413 | | | | 6.000 | | | 3/1/2036 | | | 17,967 | |
| Fannie Mae Pool | | | | | 158,789 | | | | 5.500 | | | 9/1/2036 | | | 174,727 | |
| Fannie Mae Pool | | | | | 61,668 | | | | 6.500 | | | 5/1/2037 | | | 71,406 | |
| Fannie Mae Pool | | | | | 25,929 | | | | 5.500 | | | 4/1/2038 | | | 28,535 | |
| Fannie Mae Pool | | | | | 23,966 | | | | 5.000 | | | 4/1/2038 | | | 26,003 | |
| Fannie Mae Pool | | | | | 64,479 | | | | 6.000 | | | 8/1/2038 | | | 71,893 | |
| Fannie Mae Pool | | | | | 139,613 | | | | 5.000 | | | 6/1/2039 | | | 150,141 | |
| Fannie Mae Pool | | | | | 212,306 | | | | 4.000 | | | 9/1/2044 | | | 219,256 | |
| Fannie Mae Pool | | | | | 187,158 | | | | 3.500 | | | 1/1/2046 | | | 189,638 | |
| Fannie Mae Pool | | | | | 339,957 | | | | 4.000 | | | 4/1/2046 | | | 350,871 | |
| Fannie Mae Pool | | | | | 512,161 | | | | 4.000 | | | 4/1/2048 | | | 527,716 | |
| Fannie Mae Pool | | | | | 514,239 | | | | 4.000 | | | 6/1/2048 | | | 529,336 | |
| Freddie Mac Gold Pool | | | | | 175,244 | | | | 5.000 | | | 12/1/2035 | | | 190,384 | |
| Freddie Mac Gold Pool | | | | | 26,570 | | | | 5.500 | | | 10/1/2039 | | | 29,012 | |
| | | | | | | | | | | | | | | | 2,598,381 | |
| U.S. TREASURY OBLIGATIONS - 13.2% | | | | | | | | | | | | | | | | |
| United States Treasury Bond | | | | | 1,170,000 | | | | 2.625 | | | 8/31/2020 | | | 1,174,319 | |
| United States Treasury Bond | | | | | 515,000 | | | | 2.000 | | | 2/15/2025 | | | 505,585 | |
| United States Treasury Bond | | | | | 965,000 | | | | 2.875 | | | 8/15/2028 | | | 995,345 | |
| United States Treasury Bond | | | | | 490,000 | | | | 2.625 | | | 2/15/2029 | | | 495,053 | |
| United States Treasury Bond | | | | | 335,000 | | | | 3.125 | | | 2/15/2043 | | | 348,092 | |
| United States Treasury Bond | | | | | 3,125,000 | | | | 3.000 | | | 8/15/2048 | | | 3,160,645 | |
| | | | | | | | | | | | | | | | 6,679,039 | |
| | | | | | | | | | | | | | | | | |
| TOTAL U.S. GOVERNMENT & AGENCY (Cost - $9,143,370) | | | | | | | | | | | | 9,277,420 | |
| | | | | | | | | | | | | | | | | |
| BANK LOANS - 5.6% | | | | | | | | | | | | | | | | |
| ADVERTISING - 0.2% | | | | | | | | | | | | | | | | |
| Red Ventures LLC Term B-1 Loan | | 1 Month LIBOR + 3.000% | | | 89,618 | | | | 5.315 | + | | 11/8/2024 | | | 90,066 | |
| | | | | | | | | | | | | | | | | |
See accompanying notes to financial statements.
| SCHEDULE OF INVESTMENTS (Unaudited) |
| Dunham Corporate/Government Bond Fund (Continued) |
| April 30, 2019 |
| | | Variable | | Principal | | | Interest | | | Maturity | | | |
| Security | | Rate | | Amount | | | Rate % | | | Date | | Value | |
| BANK LOANS - 5.6% (Continued) | | | | | | | | | | | | | | | | |
| AEROSPACE - 0.1% | | | | | | | | | | | | | | | | |
| Atlantic Aviation FBO, Inc. Term Loan | | 1 Month LIBOR + 3.750% | | $ | 14,963 | | | | — | + | | 11/30/2025 | | $ | 15,168 | |
| TransDigm, Inc. New Tranche E Term Loan | | 1 Month LIBOR + 2.500% | | | 49,749 | | | | 4.742 | + | | 5/14/2025 | | | 49,604 | |
| | | | | | | | | | | | | | | | 64,772 | |
| AUTO MANUFACTURERS - 0.2% | | | | | | | | | | | | | | | | |
| Navistar, Inc. Tranche B Term Loan | | 1 Month LIBOR + 3.500% | | | 89,100 | | | | 5.640 | + | | 11/2/2024 | | | 89,312 | |
| | | | | | | | | | | | | | | | | |
| COMMERCIAL SERVICES - 0.1% | | | | | | | | | | | | | | | | |
| CHG Healthcare Services, Inc. New Term Loan | | 1 Month LIBOR + 3.000% | | | 78,548 | | | | 5.293 | + | | 6/7/2023 | | | 78,687 | |
| | | | | | | | | | | | | | | | | |
| DISTRIBUTION / WHOLESALE - 0.3% | | | | | | | | | | | | | | | | |
| American Builders & Contractors Supply Co, Inc. Term B-2 Loan | | 1 Month LIBOR + 2.000% | | | 133,636 | | | | 4.242 | + | | 10/31/2023 | | | 132,773 | |
| | | | | | | | | | | | | | | | | |
| DIVERSIFIED - FINANCIAL SERVICES - 0.6% | | | | | | | | | | | | | | | | |
| Capital Automotive LP Initial Tranche B-2 Term Loan | | 1 Month LIBOR + 2.500% | | | 152,186 | | | | 4.750 | + | | 3/24/2024 | | | 152,060 | |
| Refinitiv US Holdings, Inc. Initial Dollar Term Loan | | 1 Month LIBOR + 3.750% | | | 134,663 | | | | 6.006 | + | | 10/1/2025 | | | 133,428 | |
| | | | | | | | | | | | | | | | 285,488 | |
| ENERGY - 0.1% | | | | | | | | | | | | | | | | |
| CITGO Petroleum Corporation 2019 Incremental Term B Loan | | 3 Month LIBOR + 5.000% | | | 65,000 | | | | 7.600 | + | | 3/27/2024 | | | 65,027 | |
| | | | | | | | | | | | | | | | | |
| ENTERTAINMENT - 0.3% | | | | | | | | | | | | | | | | |
| Crown Finance US, Inc. Initial Dollar Tranche Term Loan | | 1 Month LIBOR + 2.250% | | | 70,867 | | | | 4.742 | + | | 2/7/2025 | | | 70,660 | |
| Scientific Games International, Inc. Initial Term B-5 Loan | | 1 Month LIBOR + 2.750% | | | 84,150 | | | | 5.019 | + | | 8/14/2024 | | | 84,056 | |
| | | | | | | | | | | | | | | | 154,716 | |
| FOOD - 0.3% | | | | | | | | | | | | | | | | |
| Aramark Intermediate HoldCo Corporation U.S. Term B-3 Loan | | 1 Month LIBOR + 1.750% | | | 65,286 | | | | 4.006 | + | | 3/11/2025 | | | 65,286 | |
| Hearthside Group Holdings LLC Initial Term Loan | | 1 Month LIBOR + 3.688% | | | 14,888 | | | | 5.242 | + | | 5/17/2025 | | | 14,621 | |
| Hearthside Group Holdings LLC 2018 Incremental Term B-2 Loan | | 1 Month LIBOR + 4.000% | | | 59,850 | | | | 6.315 | + | | 5/31/2025 | | | 59,532 | |
| | | | | | | | | | | | | | | | 139,439 | |
| HEALTHCARE - 0.2% | | | | | | | | | | | | | | | | |
| NVA Holdings, Inc. Incremental Term B-4 Loan | | 1 Month LIBOR + 3.500% | | | 10,000 | | | | — | + | | 2/2/2025 | | | 10,038 | |
| Regionalcare Hospital Partners Holdings, Inc. Term B Loan | | 3 Month LIBOR + 4.500% | | | 99,750 | | | | 7.128 | + | | 11/16/2025 | | | 100,373 | |
| | | | | | | | | | | | | | | | 110,411 | |
| HOME FURNISHINGS - 0.1% | | | | | | | | | | | | | | | | |
| SharkNinja Operating LLC Tranche B Term Loan | | 1 Month LIBOR + 4.000% | | | 71,522 | | | | 6.250 | + | | 10/5/2024 | | | 71,790 | |
| | | | | | | | | | | | | | | | | |
| HOUSEHOLD PRODUCTS / WARES - 0.2% | | | | | | | | | | | | | | | | |
| KIK Custom Products, Inc. Initial Loan | | 1 Month LIBOR + 4.000% | | | 108,120 | | | | 6.242 | + | | 5/15/2023 | | | 104,047 | |
| | | | | | | | | | | | | | | | | |
| HOUSING - 0.4% | | | | | | | | | | | | | | | | |
| CPG International LLC New Term Loan | | 3 Month LIBOR + 3.750% | | | 94,758 | | | | 6.251 | + | | 5/4/2024 | | | 94,680 | |
| Summit Materials, LLC New Term Loan | | 1 Month LIBOR + 2.000% | | | 99,496 | | | | 4.345 | + | | 11/10/2024 | | | 99,527 | |
| | | | | | | | | | | | | | | | 194,207 | |
| INSURANCE - 0.0% | | | | | | | | | | | | | | | | |
| Sedgwick Holdings, Inc. Initial Term Loan | | 1 Month LIBOR + 3.250% | | | 4,988 | | | | — | + | | 11/5/2025 | | | 4,983 | |
| | | | | | | | | | | | | | | | | |
| INVESTMENT COMPANIES - 0.2% | | | | | | | | | | | | | | | | |
| TKC Holdings, Inc. Initial Term Loan | | 1 Month LIBOR + 3.750% | | | 82,709 | | | | 6.000 | + | | 2/1/2023 | | | 82,606 | |
| | | | | | | | | | | | | | | | | |
| LODGING - 0.3% | | | | | | | | | | | | | | | | |
| Station Casino LLC Term B Facility Loan | | 1 Month LIBOR + 2.500% | | | 55,346 | | | | 4.750 | + | | 6/8/2023 | | | 55,503 | |
| Wyndham Hotels & Resorts, Inc. Term B Loan | | 1 Month LIBOR + 1.750% | | | 79,600 | | | | 3.992 | + | | 3/29/2025 | | | 79,643 | |
| | | | | | | | | | | | | | | | 135,146 | |
| MACHINERY - DIVERSIFIED - 0.1% | | | | | | | | | | | | | | | | |
| Brookfield WEC Holdings, Inc. Initial Term Loan | | 1 Month LIBOR + 3.500% | | | 79,800 | | | | 5.992 | + | | 7/26/2025 | | | 80,398 | |
| | | | | | | | | | | | | | | | | |
| MEDIA - 0.2% | | | | | | | | | | | | | | | | |
| Commscope, Inc. Initial Term Loan | | 1 Month LIBOR + 3.250% | | | 90,000 | | | | — | + | | 2/7/2026 | | | 90,914 | |
| | | | | | | | | | | | | | | | | |
| PHARMACEUTICALS - 0.1% | | | | | | | | | | | | | | | | |
| Valeant Pharmaceuticals International, Inc. Initial Term Loan | | 1 Month LIBOR + 3.000% | | | 9,250 | | | | 5.092 | + | | 6/1/2025 | | | 9,302 | |
| Valeant Pharmaceuticals International, Inc. First Incremental Term Loan | | 1 Month LIBOR + 2.750% | | | 28,500 | | | | 5.129 | + | | 6/1/2025 | | | 28,560 | |
| | | | | | | | | | | | | | | | 37,862 | |
| REGIONAL - 0.2% | | | | | | | | | | | | | | | | |
| Seminole Indian Tribe of Florida 2018 Replacement Term B Loan | | 1 Month LIBOR + 1.750% | | | 88,650 | | | | 3.456 | + | | 7/6/2024 | | | 89,107 | |
| | | | | | | | | | | | | | | | | |
| RETAIL - 0.1% | | | | | | | | | | | | | | | | |
| 84 Lumber Company Term B-1 Loan | | 1 Month LIBOR + 5.250% | | | 74,677 | | | | 7.466 | + | | 10/25/2023 | | | 74,957 | |
| | | | | | | | | | | | | | | | | |
See accompanying notes to financial statements.
| SCHEDULE OF INVESTMENTS (Unaudited) |
| Dunham Corporate/Government Bond Fund (Continued) |
| April 30, 2019 |
| | | Variable | | Principal | | | Interest | | | Maturity | | | |
| Security | | Rate | | Amount | | | Rate % | | | Date | | Value | |
| BANK LOANS - 5.6% (Continued) | | | | | | | | | | | | |
| SERVICE - 0.2% | | | | | | | | | | | | | | | | |
| Dun & Bradstreet Corporation Initial Term Borrowing | | 1 Month LIBOR + 5.000% | | $ | 95,000 | | | | 7.479 | + | | 2/1/2026 | | $ | 95,832 | |
| | | | | | | | | | | | | | | | | |
| SOFTWARE - 0.6% | | | | | | | | | | | | | | | | |
| Boxer Parent Co., Inc. Initial Dollar Term Loan | | 3 Month LIBOR + 4.250% | | | 109,725 | | | | 6.648 | + | | 6/28/2025 | | | 109,245 | |
| IQVIA, Inc. Term B-3 Dollar Loan | | 1 Month LIBOR + 1.750% | | | 109,175 | | | | 4.136 | + | | 6/8/2025 | | | 108,936 | |
| Kronos, Inc. Incremental Term Loan | | 3 Month LIBOR + 3.000% | | | 78,625 | | | | 5.343 | + | | 11/1/2023 | | | 78,840 | |
| | | | | | | | | | | | | | | | 297,021 | |
| TELECOMMUNICATIONS - 0.2% | | | | | | | | | | | | | |
| CenturyLink, Inc. Initial Term B Loan | | 1 Month LIBOR + 2.750% | | | 113,563 | | | | 4.992 | + | | 1/31/2025 | | | 113,019 | |
| | | | | | | | | | | | | | | | | |
| TRANSPORTATION - AUTOMOTIVE - 0.1% | | | | | | | | | | | | | |
| Panther BF Aggregator 2 L P Term Loan B | | 1 Month LIBOR + 3.500% | | | 65,000 | | | | — | + | | 3/18/2026 | | | 65,345 | |
| | | | | | | | | | | | | | | | | |
| UTILITY - 0.2% | | | | | | | | | | | | | | | | |
| Calpine Corporation Term Loan (2019) | | 3 Month LIBOR + 2.750% | | | 100,000 | | | | 5.340 | + | | 4/1/2026 | | | 100,444 | |
| | | | | | | | | | | | | | | | | |
| TOTAL BANK LOANS - (Cost - $2,839,707) | | | | | | | | | | | 2,848,369 | |
| | | | | | | | | | | | | | | | | |
| | | | | Shares | | | | | | | | | | | |
| SHORT-TERM INVESTMENT - 3.7% | | | | | | | | | | | | | | | |
| MONEY MARKET FUND - 3.7% | | | | | | | | | | | | | | | | |
| Fidelity Institutional Money Market Fund - Government Portfolio (Cost - $1,843,187) | | 1,843,187 | | | | 2.310 | + | | | | | 1,843,187 | |
| | | | | | | | | | | | | | | | | |
| TOTAL INVESTMENTS - 100.2% (Cost - $50,126,825) | | | | | | | | $ | 50,715,855 | |
| LIABILITIES LESS OTHER ASSETS - (0.2)% | | | | | | | | | | (88,609 | ) |
| NET ASSETS - 100.0% | | | | | | | | | | | $ | 50,627,246 | |
| | | | | | | | | | | | | | | | | |
LLC - Limited Liability Corporation
ABS - Asset Backed Security
MBS - Mortgage Backed Security
CMO - Collateralized Mortgage Obligation
LP - Limited Partnership
REITS - Real Estate Investment Trust
Perpetual - Perpetual bonds are fixed income instruments without defined maturity dates
| + | Variable rate security. Interest rate is as of April 30, 2019. |
| ++ | Variable or floating rate security, the interest rate of which adjusts periodically based on changes in current interest rates and prepayments on the underlying pool of assets. |
144A - Security exempt from registration under Rule 144A of the Securities Act of 1933. These securities may be sold in transactions exempt from registration, normally to qualified institutional buyers. The 144A securities amounted to $17,494,776 or 35.56% of net assets.
| (a) | Step-Up Bond; the interest rate shown is the rate in effect as of April 30, 2019. |
| Portfolio Composition*- (Unaudited) |
| Corporate Bonds & Notes | | | 64.6 | % | | Foreign Government Bonds | | | 2.6 | % |
| U.S. Government & Agencies | | | 18.3 | % | | Short - Term | | | 3.5 | % |
| Bank Loans | | | 5.6 | % | | Total | | | 100.0 | % |
| Municipal | | | 5.4 | % | | | | | | |
| | | | | | | | | | | |
Based on total value of investments as of April 30, 2019.
Percentage may differ from Schedule of Investments which is based on Fund net assets.
See accompanying notes to financial statements.
| Dunham Monthly Distribution Fund (Unaudited) |
| Message from the Sub-Adviser (Perella Weinberg Partners Capital Management LP) |
| |
Asset Class Recap
As the fiscal year began with lingering fears and uncertainty surrounding trade deals and interest rates, investors broadly approached each new headline with caution and even some trepidation. During the first fiscal quarter, the volatility reached levels seen only four other times in the last decade. Similar to those time-periods, these sell-offs and corresponding spikes in volatility were generally triggered by “concerns” and headlines rather than deteriorating fundamentals. Regardless of the cause, volatility spikes generally correspond with widening spreads on merger deals and other risk-arbitrage opportunities therefore, the fact that volatility levels subsided before the end of the first fiscal quarter allowed for these risk-arbitrage strategies to recover and rally through the end of the second fiscal quarter. From the beginning of the fiscal year through the most recent fiscal quarter, event driven strategies, as measured by the Credit Suisse Event Driven Liquid Index, rose 5.7 percent. While broader in scope, long/short equity strategies, as measured by the Credit Suisse Long/Short Liquid Index, increased 4.5 percent.
Allocation Review
Within the Fund, the event driven allocation is primarily represented in the form of announced mergers. The event driven holdings began the fiscal year at 60 percent of the Fund and fell to 44 percent at the end of the most recent fiscal quarter. Although the exposure to event driven briefly fell to 38 percent at the end of March, this was not indicative of a less favorable view of the opportunities in the event driven space. The lower than average event exposure was due to prominent positions coming to fruition during the fiscal six-month period.
Holdings Insights
The largest pharmaceutical deal ever, combining two of the world’s largest cancer drug businesses was announced near the beginning of the fiscal year and was a highlight of the event driven allocation over both fiscal quarters. The deal between Celgene Corp. (CELG) (holding weight*: 4.75 percent) and Bristol-Myers Squibb Co. (BMY) (holding weight*: -2.14 percent) faced concerns as BMY was believed to be a takeover target, and also faced concerns that its activist shareholders would block the deal. However, the Sub-Adviser believed that the $74 billion deal was too large for activist shareholders to influence, and BMY is too large to be a target. Ultimately, the deal received the backing from prominent proxy advisory firms. As such, the spread on the deal compressed from $18.54 to $1.40.
Another contributor from the event driven allocation came from Chevron Corp.’s (CVX) (holding weight*: -1.24%) announcement that they intend to acquire Anadarko Petroleum Corp. (APC) (holding weight*: 2.30 percent). Although the spread was not initially attractive, the prospect of another suitor was intriguing enough for the Sub-Adviser to enter the deal. On April 29, 2019, Occidental Petroleum Corp. (OXY) (holding weight*: 1.58 percent) made an offer to acquire all outstanding shares of APC. Additionally, over $16 billion worth of mergers closed within the Fund over the fiscal quarter, as well as a number of new deals announced. The Sub-Adviser believes that the event environment will continue to be robust, but will remain selective about the deals by employing their rigorous fundamental approach.
The contribution from the long / short equity allocation of the Fund was well distributed with no large outliers. Danaher Corp. (DHR) (holding weight*: 1.53 percent), and PepsiCo Inc. (PEP) (holding weight*: 1.51 percent) were among the best performing positions. Conversely, the short positions within the allocation generally detracted during the market rally that commenced at the end of December. Detractors were also well distributed with no large outliers. Boeing Co. (BA) (holding weight*: 1.00 percent) contributed to performance the first fiscal quarter but detracted in the most recent fiscal quarter. BA experienced volatility due to the Ethiopian plane crash and associated safety concerns on the 737 Max 8 jet. However, the negative impact to the Fund was tempered as the Sub-Adviser had purchased put options to hedge the position. The Sub-Adviser believes that moving forward; sector rotation will continue to produce a large opportunity set for the long / short equity allocation.
Sub-Adviser Outlook
Throughout the volatility of the first fiscal quarter and subsequent rally in the second fiscal quarter, the Sub-Adviser continued to reiterate its commitment to its investment approach and philosophy, focusing on capital preservation and opportunistically looking to deploy capital as appropriate. The Sub-Adviser’s multi-lens approach served the Fund during the volatile 2018 period, and the Sub-Adviser is optimistic that its approach is well-suited for additional volatility that may arise in 2019.
| * | Holdings percentage(s) of total investments, excluding collateral for securities loaned, as of 4/30/2019. |
Growth of $100,000 Investment
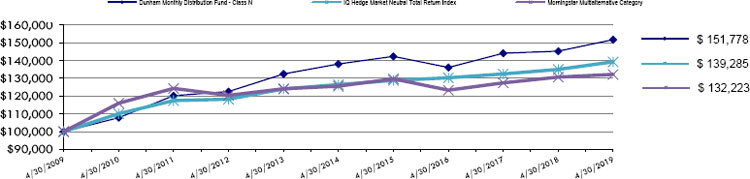
| Total Returns as of April 30, 2019 |
| | | | Annualized | Annualized |
| | Six Months | One Year | Five Years | Ten Years |
| Class N | 2.55% | 4.42% | 1.91% | 4.26% |
| Class C | 2.02% | 3.39% | 0.88% | 3.22% |
| Class A with load of 5.75% | (3.46)% | (1.82)% | 0.45% | 3.37% |
| Class A without load | 2.42% | 4.17% | 1.65% | 3.98% |
| IQ Hedge Market Neutral Total Return Index | 2.94% | 3.17% | 1.94% | 3.37% |
| Morningstar Multialternative Category | 3.06% | 1.19% | 1.02% | 2.83% |
| | | | | |
IQ Hedge Market Neutral Total Return Index seeks to replicate the risk-adjusted return characteristics of the collective hedge funds using a market neutral hedge fund investment style. Market Neutral hedge funds typically invest in both long and short positions in asset classes while minimizing exposure to systematic risk.
The Morningstar Multialternative Category is generally representative of mutual funds with static allocations to alternative strategies and mutual funds that tactically allocate among alternative strategies and asset classes. The gross short exposure in these mutual funds is generally greater than 20%.
As disclosed in the Trust’s latest registration statement, the Fund’s total annual operating expenses before any fee waiver, including the cost of underlying funds, are 2.17% for Class N, 3.17% for Class C and 2.42% for Class A. Class A shares are subject to a sales load of 5.75% and a deferred sales charge of up to 0.75%. The performance data quoted here represents past performance, which is not indicative of future results. Current performance may be lower or higher than the performance data quoted. The investment return and NAV will fluctuate, so that an investor’s shares, when redeemed, may be worth more or less than their original cost. Total returns are calculated assuming reinvestment of all dividends and capital gains distributions, if any. The returns do not reflect the deductions of taxes a shareholder would pay on the redemption of Fund shares or Fund distributions. For performance information current to the most recent month-end, please call 1-800-442-4358 or visit our website www.dunham.com.
| SCHEDULE OF INVESTMENTS (Unaudited) |
| Dunham Monthly Distribution Fund |
| April 30, 2019 |
| Security | | Shares | | | Value | |
| COMMON STOCKS - 75.0% | | | | | | | | |
| AEROSPACE/DEFENSE - 3.6% | | | | | | | | |
| Boeing Co. | | | 7,399 | | | $ | 2,794,528 | |
| Harris Corp. | | | 22,745 | | | | 3,832,532 | |
| United Technologies Corp. | | | 22,077 | | | | 3,148,401 | |
| | | | | | | | 9,775,461 | |
| AIRLINES - 0.1% | | | | | | | | |
| American Airlines Group, Inc. * | | | 101,283 | | | | 126,604 | |
| | | | | | | | | |
| APPAREL - 1.1% | | | | | | | | |
| Nike, Inc. | | | 33,108 | | | | 2,907,876 | |
| | | | | | | | | |
| BANKS - 2.7% | | | | | | | | |
| Bank of America Corp. | | | 136,285 | | | | 4,167,595 | |
| Citigroup, Inc. | | | 41,896 | | | | 2,962,047 | |
| SunTrust Banks, Inc. | | | 3,744 | | | | 245,157 | |
| | | | | | | | 7,374,799 | |
| BEVERAGES - 1.2% | | | | | | | | |
| PepsiCo., Inc. | | | 25,131 | | | | 3,218,025 | |
| | | | | | | | | |
| BIOTECHNOLOGY - 5.1% | | | | | | | | |
| Celgene Corp. * | | | 140,083 | | | | 13,260,257 | |
| Pacific Biosciences of California, Inc. * | | | 127,838 | | | | 944,723 | |
| | | | | | | | 14,204,980 | |
| CHEMICALS - 3.2% | | | | | | | | |
| A. Schulman, Inc. * | | | 44,665 | | | | 33,499 | |
| Dow, Inc. * | | | 20,144 | | | | 1,142,769 | |
| International Flavors & Fragrances, Inc. | | | 7,726 | | | | 1,064,574 | |
| Versum Materials, Inc. | | | 128,492 | | | | 6,704,713 | |
| | | | | | | | 8,945,555 | |
| COAL - 0.3% | | | | | | | | |
| SunCoke Energy Partners LP | | | 60,582 | | | | 759,698 | |
| | | | | | | | | |
| COMMERCIAL SERVICES - 2.9% | | | | | | | | |
| Nielsen Holdings PLC | | | 27,814 | | | | 710,091 | |
| Worldpay, Inc. * | | | 63,443 | | | | 7,436,154 | |
| | | | | | | | 8,146,245 | |
| COMPUTERS - 3.0% | | | | | | | | |
| Apple, Inc. | | | 18,204 | | | | 3,652,997 | |
| Luxoft Holding, Inc. * | | | 80,024 | | | | 4,675,002 | |
| | | | | | | | 8,327,999 | |
| COSMETICS - 0.8% | | | | | | | | |
| Colgate-Palmolive Co. | | | 18,628 | | | | 1,355,932 | |
| Coty, Inc. | | | 83,000 | | | | 898,060 | |
| | | | | | | | 2,253,992 | |
| ELECTRIC - 0.5% | | | | | | | | |
| PG&E Corp. * | | | 64,897 | | | | 1,461,480 | |
| | | | | | | | | |
| ELECTRONICS - 1.4% | | | | | | | | |
| Honeywell International, Inc. | | | 18,087 | | | | 3,140,446 | |
| Resideo Technologies, Inc. * | | | 34,070 | | | | 773,389 | |
| | | | | | | | 3,913,835 | |
| ENGINEERING & CONSTRUCTION - 0.9% | | | | | | | | |
| Jacobs Engineering Group, Inc. | | | 30,263 | | | | 2,358,698 | |
| | | | | | | | | |
| ENTERTAINMENT - 0.7% | | | | | | | | |
| Marriott Vacations Worldwide Corp. | | | 17,234 | | | | 1,820,427 | |
| | | | | | | | | |
| FOOD - 0.9% | | | | | | | | |
| Mondelez International, Inc. | | | 51,088 | | | | 2,597,825 | |
| | | | | | | | | |
See accompanying notes to financial statements.
| SCHEDULE OF INVESTMENTS (Unaudited) |
| Dunham Monthly Distribution Fund (Continued) |
| April 30, 2019 |
| Security | | Shares | | | Value | |
| COMMON STOCKS - 74.9% (Continued) | | | | | | | | |
| GAS - 0.9% | | | | | | | | |
| AmeriGas Partners LP | | | 66,877 | | | $ | 2,424,960 | |
| | | | | | | | | |
| HEALTHCARE - PRODUCTS - 2.0% | | | | | | | | |
| Danaher Corp. | | | 32,192 | | | | 4,263,509 | |
| Thermo Fisher Scientific, Inc. | | | 4,382 | | | | 1,215,786 | |
| | | | | | | | 5,479,295 | |
| HEALTHCARE - SERVICES - 0.9% | | | | | | | | |
| HCA Healthcare, Inc. | | | 11,396 | | | | 1,449,913 | |
| WellCare Health Plans, Inc. * | | | 4,195 | | | | 1,083,778 | |
| | | | | | | | 2,533,691 | |
| HOLDING COMPANIES - DIVERSIFIED - 0.4% | | | | | | | | |
| CM Seven Star Acquisition Corp. * | | | 105,264 | | | | 1,087,377 | |
| | | | | | | | | |
| HOME BUILDERS - 0.7% | | | | | | | | |
| Lennar Corp. | | | 39,168 | | | | 2,037,911 | |
| | | | | | | | | |
| INSURANCE - 0.4% | | | | | | | | |
| Navigators Group, Inc. | | | 14,191 | | | | 992,519 | |
| | | | | | | | | |
| INTERNET - 1.4% | | | | | | | | |
| Amazon.com, Inc. * | | | 2,067 | | | | 3,982,117 | |
| | | | | | | | | |
| INVESTMENT COMPANIES - 0.5% | | | | | | | | |
| Oaktree Capital Group LLC | | | 28,006 | | | | 1,417,664 | |
| | | | | | | | | |
| LEISURE PRODUCTS - 0.5% | | | | | | | | |
| Royal Caribbean Cruises Ltd. | | | 11,300 | | | | 1,366,622 | |
| | | | | | | | | |
| LODGING - 1.3% | | | | | | | | |
| Caesars Entertainment Corp. * | | | 193,932 | | | | 1,815,203 | |
| Wyndham Hotels & Resorts, Inc. | | | 31,072 | | | | 1,731,332 | |
| | | | | | | | 3,546,535 | |
| MEDIA - 4.0% | | | | | | | | |
| CBS Corp. | | | 40,588 | | | | 2,080,947 | |
| Fox Corp. * | | | 1 | | | | 26 | |
| Tribune Media Co. | | | 124,703 | | | | 5,761,279 | |
| Walt Disney Co. | | | 22,722 | | | | 3,112,213 | |
| | | | | | | | 10,954,465 | |
| MINING - 1.7% | | | | | | | | |
| Newmont Goldcorp Corp. | | | 148,807 | | | | 4,621,957 | |
| | | | | | | | | |
| MISCELLANEOUS MANUFACTURING- 0.8% | | | | | | | | |
| Eaton Corp. PLC | | | 10,157 | | | | 841,203 | |
| General Electric Co. | | | 126,749 | | | | 1,289,037 | |
| | | | | | | | 2,130,240 | |
| OIL & GAS - 6.3% | | | | | | | | |
| Anadarko Petroleum Corp. | | | 88,082 | | | | 6,416,774 | |
| Marathon Petroleum Corp. | | | 33,301 | | | | 2,027,032 | |
| Occidental Petroleum Corp. | | | 75,007 | | | | 4,416,412 | |
| Royal Dutch Shell PLC - ADR | | | 30,906 | | | | 1,963,458 | |
| Valero Energy Corp. | | | 27,838 | | | | 2,523,793 | |
| | | | | | | | 17,347,469 | |
| PACKAGING & CONTAINERS - 3.2% | | | | | | | | |
| Bemis Co., Inc. | | | 154,728 | | | | 8,884,482 | |
| | | | | | | | | |
See accompanying notes to financial statements.
| SCHEDULE OF INVESTMENTS (Unaudited) |
| Dunham Monthly Distribution Fund (Continued) |
| April 30, 2019 |
| Security | | Shares | | | Value | |
| COMMON STOCKS - 74.9% (Continued) | | | | | | | | |
| PHARMACEUTICALS - 1.9% | | | | | | | | |
| CVS Health Corp. | | | 19,087 | | | $ | 1,037,951 | |
| Johnson & Johnson | | | 18,622 | | | | 2,629,426 | |
| Zoetis, Inc. | | | 14,729 | | | | 1,500,001 | |
| | | | | | | | 5,167,378 | |
| PIPELINES - 0.0% | | | | | | | | |
| Columbia Pipeline Group, Inc. * | | | 84,102 | | | | — | |
| | | | | | | | | |
| REAL ESTATE INVESTMENT TRUSTS - 2.3% | | | | | | | | |
| Digital Realty Trust, Inc. | | | 8,512 | | | | 1,001,947 | |
| Equinix, Inc. | | | 4,634 | | | | 2,107,080 | |
| InfraREIT, Inc. * | | | 67,384 | | | | 1,418,433 | |
| MedEquities Realty Trust, Inc. | | | 162,884 | | | | 1,744,488 | |
| Winthrop Realty Trust * | | | 102,617 | | | | 80,041 | |
| | | | | | | | 6,351,989 | |
| RETAIL - 2.5% | | | | | | | | |
| Home Depot, Inc. | | | 14,414 | | | | 2,936,132 | |
| O’Reilly Automotive, Inc. * | | | 3,549 | | | | 1,343,545 | |
| Walmart, Inc. | | | 25,004 | | | | 2,571,411 | |
| | | | | | | | 6,851,088 | |
| SEMICONDUCTORS - 3.3% | | | | | | | | |
| Broadcom, Inc. | | | 8,868 | | | | 2,823,571 | |
| Mellanox Technologies, Inc. * | | | 51,971 | | | | 6,252,111 | |
| | | | | | | | 9,075,682 | |
| SOFTWARE - 9.7% | | | | | | | | |
| Borqs Technologies, Inc. * | | | 93,231 | | | | 372,924 | |
| First Data Corp. * | | | 481,139 | | | | 12,442,255 | |
| Microsoft Corp. | | | 36,103 | | | | 4,715,052 | |
| Red Hat, Inc. * | | | 51,133 | | | | 9,333,306 | |
| | | | | | | | 26,863,537 | |
| TELECOMMUNICATIONS - 1.9% | | | | | | | | |
| Quantenna Communications, Inc. * | | | 56,839 | | | | 1,384,030 | |
| T-Mobile US, Inc. * | | | 38,610 | | | | 2,818,144 | |
| Zayo Group Holdings, Inc. * | | | 33,675 | | | | 1,053,691 | |
| | | | | | | | 5,255,865 | |
| | | | | | | | | |
| TOTAL COMMON STOCKS (Cost - $197,459,308) | | | | | | | 206,566,342 | |
| | | | | | | | | |
| CLOSED-END FUND - 0.7% | | | | | | | | |
| Altaba, Inc. * | | | 26,113 | | | | 1,968,659 | |
| TOTAL CLOSED-END FUND (Cost - $1,923,127) | | | | | | | | |
| | | | | | | | | |
| EXCHANGE TRADED FUNDS - 2.5% | | | | | | | | |
| Invesco Senior Loan ETF | | | 56,315 | | | | 1,293,556 | |
| iShares MBS ETF | | | 14,364 | | | | 1,522,440 | |
| SPDR Blackstone / GSO Senior Loan ETF | | | 85,456 | | | | 4,003,614 | |
| TOTAL EXCHANGE TRADED FUNDS - (Cost - $6,859,669) | | | | | | | 6,819,610 | |
| | | | | | | | | |
| RIGHTS - 0.0% | | | | | | | | |
| Nexstar Broadcasting Group, Inc. * | | | 87,600 | | | | 4,380 | |
| TOTAL RIGHTS (Cost - $26,280) | | | | | | | | |
| | | | | | | | | |
| WARRANTS - 0.0% | | | | | | | | |
| Borqs Technologies, Inc. * | | | 105,552 | | | | 6,333 | |
| TOTAL WARRANTS (Cost - $8,254) | | | | | | | | |
See accompanying notes to financial statements.
| SCHEDULE OF INVESTMENTS (Unaudited) |
| Dunham Monthly Distribution Fund (Continued) |
| April 30, 2019 |
| | | | | | | | | | | Exercise | | | | | | |
| Security | | Counterparty | | Contracts** | | | Notional | | | Price | | | Expiration Date | | Value | |
| PURCHASED OPTIONS - 0.2% | | | | | | | | | | | | | | | | | | |
| PURCHASED CALL OPTIONS - 0.0% | | | | | | | | | | | | | | | | | | | | |
| Bristol-Myers Squibb Co. | | JP Morgan | | | 453 | | | $ | 2,378,250 | | | $ | 52.50 | | | 6/21/2019 | | $ | 7,248 | |
| TOTAL PURCHASED CALL OPTIONS (Cost - $165,528) | | | | | | | | | | | | | | |
| | | | | | | | | | | | | | | | | | | | | |
| PURCHASED PUT OPTIONS - 0.2% | | | | | | | | | | | | | | | | |
| Coty, Inc. | | JP Morgan | | | 1,165 | | | | 1,747,500 | | | | 15.00 | | | 5/17/2019 | | | 483,475 | |
| Russel 2000 Index | | JP Morgan | | | 46 | | | | 7,268,000 | | | | 1,580.00 | | | 6/21/2019 | | | 134,320 | |
| TOTAL PURCHASED PUT OPTIONS (Cost - $726,469) | | | | | | | | | | | | | 617,795 | |
| TOTAL PURCHASED OPTIONS (Cost - $891,997) | | | | | | | | | | | | | 625,043 | |
| | | | | | Interest | | | |
| | | Shares | | | Rate | | | |
| SHORT-TERM INVESTMENT - 42.2% | | | | | | | | | | |
| MONEY MARKET FUND - 42.2% | | | | | | | | | | |
| Fidelity Investments Money Market Fund - Class I | | | 116,335,567 | | | 2.28% + | | | 116,335,567 | |
| TOTAL SHORT-TERM INVESTMENT (Cost - $116,335,567) | | | | | | | | | | |
| | | | | | | | | | | |
| TOTAL INVESTMENTS - 120.6% (Cost - $323,504,202) | | | | | | | | $ | 332,325,934 | |
| LIABILITIES IN EXCESS OF OTHER ASSETS - (20.6)% | | | | | | | | | (56,795,280 | ) |
| NET ASSETS - 100.0% | | | | | | | | $ | 275,530,654 | |
| | | | | | | | | | | |
ADR - American Depositary Receipt.
ETF - Exchange Traded Fund
LLC - Limited Liability Company
LP - Limited Partnership
PLC - Public Limited Company
| * | Non-Income producing security. |
| ** | Each Purchased Option contract allows the option holder to buy/sell 100 shares of the underlying security at the exercise price. |
| + | Variable rate security. Interest rate is as of April 30, 2019. |
| | | | | | | | | | | Exercise | | | | | | |
| Security | | Counterparty | | Contracts** | | | Notional | | | Price | | | Expiration Date | | Value | |
| WRITTEN OPTIONS - (0.1)% | | | | | | | | | | | | |
| WRITTEN CALL OPTIONS - (0.1)% | | | | | | | | | | | | | | | | |
| Bristol-Myers Squibb Co. | | JP Morgan | | | 453 | | | $ | 2,831,250 | | | $ | 62.50 | | | 6/21/2019 | | $ | 1,133 | |
| Coty, Inc. | | JP Morgan | | | 2,408 | | | | 2,648,800 | | | | 11.00 | | | 5/17/2019 | | | 142,072 | |
| Russell 2000 Index | | JP Morgan | | | 46 | | | | 7,268,000 | | | | 1,580.00 | | | 6/21/2019 | | | 210,910 | |
| TOTAL WRITTEN CALL OPTIONS - (Premiums Received - $435,882) | | | | | | | | | 354,115 | |
| | | | | | | | | | | | | | | | | | | | | |
| WRITTEN PUT OPTIONS - (0.0)% | | | | | | | | | | | | |
| Bristol-Myers Squibb Co. | | JP Morgan | | | 453 | | | | 2,038,500 | | | | 45.00 | | | 6/21/2019 | | | 39,864 | |
| TOTAL WRITTEN PUT OPTIONS - (Premiums Received - $112,033) | | | | | | | | | | |
| TOTAL WRITTEN OPTIONS (Premiums Received - $547,915) | | | | | | | | | | | 393,979 | |
| | | | | | | | | | | | | | | | | | | | | |
| | | | | | | | | | | | | Shares | | | | | | |
| SECURITIES SOLD SHORT * - (41.5)% | | | | | | | | | | | | | | |
| AEROSPACE/DEFENSE - (0.3)% | | | | | | | | | | | | | | |
| Lockheed Martin Corp. | | | | | | | | | | | | | 2,166 | | | | | | 721,993 | |
| | | | | | | | | | | | | | | | | | | | | |
| AIRLINES - (0.6)% | | | | | | | | | | | | | | | | | | | | |
| American Airlines Group, Inc. | | | | | 1,426 | | | | | | 48,741 | |
| Delta Air Lines, Inc. | | | | | | | | | | | | | 27,729 | | | | | | 1,616,323 | |
| | | | | | | | | | | | | | | | | | | | 1,665,064 | |
| AUTO MANUFACTURERS - (1.0)% | | | | | | | | | | | | | | |
| General Motors Co. | | | | | | | | | 52,014 | | | | | | 2,025,945 | |
| Tesla, Inc. | | | | | | | | | | | | | 3,745 | | | | | | 893,894 | |
| | | | | | | | | | | | | | | | | | | | 2,919,839 | |
| AUTO PARTS & EQUIPMENT - (0.3)% | | | | | | | | | | | | |
| Autoliv, Inc. | | | | | | | | | | | | | 10,759 | | | | | | 844,474 | |
| | | | | | | | | | | | | | | | | | | | | |
See accompanying notes to financial statements.
| SCHEDULE OF INVESTMENTS (Unaudited) |
| Dunham Monthly Distribution Fund (Continued) |
| April 30, 2019 |
| Security | | Shares | | | Value | |
| SECURITIES SOLD SHORT* - (41.5)% (Continued) | | | | | | | | |
| BANKS - (0.1)% | | | | | | | | |
| BB&T Corp. | | | 4,848 | | | $ | 248,218 | |
| | | | | | | | | |
| BUILDING MATERIALS - (0.4)% | | | | | | | | |
| Johnson Controls International PLC | | | 33,078 | | | | 1,240,425 | |
| | | | | | | | | |
| CHEMICALS - (0.4)% | | | | | | | | |
| PPG Industries, Inc. | | | 8,922 | | | | 1,048,335 | |
| | | | | | | | | |
| COAL - (0.3)% | | | | | | | | |
| SunCoke Energy, Inc. | | | 84,815 | | | | 730,257 | |
| | | | | | | | | |
| COMMERCIAL SERVICES - (0.8)% | | | | | | | | |
| PayPal Holdings, Inc. | | | 19,447 | | | | 2,193,038 | |
| | | | | | | | | |
| EQUITY EXCHANGE TRADED FUNDS - (11.9)% | | | | | | | | |
| Communication Services Select Sector SPDR Fund | | | 30,449 | | | | 1,524,581 | |
| Consumer Staples Select Sector SPDR Fund | | | 157,941 | | | | 9,114,775 | |
| Energy Select Sector SPDR Fund | | | 89,654 | | | | 5,927,026 | |
| Health Care Select Sector SPDR Fund | | | 33,128 | | | | 2,957,005 | |
| Industrial Select Sector SPDR Fund | | | 9,312 | | | | 726,429 | |
| iShares Russell 2000 ETF | | | 36,405 | | | | 5,762,548 | |
| iShares U.S. Real Estate ETF | | | 27,839 | | | | 2,421,993 | |
| SPDR S&P 500 ETF Trust | | | 10,036 | | | | 2,950,785 | |
| Utilities Select Sector SPDR Fund | | | 25,616 | | | | 1,503,915 | |
| | | | | | | | 32,889,057 | |
| GAS - (0.7)% | | | | | | | | |
| UGI Corp. | | | 33,439 | | | | 1,822,760 | |
| | | | | | | | | |
| HEALTHCARE - SERVICES - (0.3)% | | | | | | | | |
| Centene Corp. | | | 14,180 | | | | 731,121 | |
| Tivity Health, Inc. | | | 2 | | | | 43 | |
| | | | | | | | 731,164 | |
| INTERNET - (0.3)% | | | | | | | | |
| Netflix, Inc. | | | 1,946 | | | | 721,071 | |
| | | | | | | | | |
| IRON / STEEL - (0.6)% | | | | | | | | |
| Nucor Corp. | | | 27,442 | | | | 1,566,115 | |
| | | | | | | | | |
| MACHINERY - DIVERSIFIED - (0.6)% | | | | | | | | |
| Rockwell Automation, Inc. | | | 9,349 | | | | 1,689,458 | |
| | | | | | | | | |
| MINING - (1.6)% | | | | | | | | |
| Newmont Goldcorp Corp. | | | 147,092 | | | | 4,568,678 | |
| | | | | | | | | |
| MISCELLANEOUS MANUFACTURERS - (0.6)% | | | | | | | | |
| 3M Co. | | | 8,486 | | | | 1,608,182 | |
| | | | | | | | | |
| OIL & GAS - (2.3)% | | | | | | | | |
| Chevron Corp. | | | 28,860 | | | | 3,464,932 | |
| Exxon Mobil Corp. | | | 36,793 | | | | 2,953,742 | |
| | | | | | | | 6,418,674 | |
| PACKAGING & CONTAINERS - (2.9)% | | | | | | | | |
| Amcor Ltd. | | | 704,043 | | | | 7,943,518 | |
| | | | | | | | | |
| PHARMACEUTICALS - (2.2)% | | | | | | | | |
| Bristol-Myers Squibb Co. | | | 128,826 | | | | 5,981,391 | |
| | | | | | | | | |
See accompanying notes to financial statements.
| SCHEDULE OF INVESTMENTS (Unaudited) |
| Dunham Monthly Distribution Fund (Continued) |
| April 30, 2019 |
| Security | | Shares | | | Value | |
| SECURITIES SOLD SHORT* - (41.5)% (Continued) | | | | | | | | |
| PRIVATE EQUITY - (0.3)% | | | | | | | | |
| Brookfield Asset Management, Inc. | | | 15,081 | | | $ | 726,753 | |
| | | | | | | | | |
| REAL ESTATE INVESTMENT TRUSTS - (1.2)% | | | | | | | | |
| Kimco Realty Corp. | | | 77,396 | | | | 1,345,916 | |
| Macerich Co. | | | 16,716 | | | | 670,980 | |
| Omega Healthcare Investors, Inc. | | | 38,290 | | | | 1,355,083 | |
| | | | | | | | 3,371,979 | |
| RETAIL - (0.7)% | | | | | | | | |
| Starbucks Corp. | | | 25,918 | | | | 2,013,310 | |
| | | | | | | | | |
| SEMICONDUCTORS - (1.0)% | | | | | | | | |
| Intel Corp. | | | 12,812 | | | | 653,925 | |
| Texas Instruments, Inc. | | | 18,445 | | | | 2,173,374 | |
| | | | | | | | 2,827,299 | |
| SOFTWARE - (7.9)% | | | | | | | | |
| Fidelity National Information Services, Inc. | | | 58,505 | | | | 6,782,485 | |
| Fiserv, Inc. | | | 139,495 | | | | 12,169,544 | |
| Oracle Corp. | | | 51,742 | | | | 2,862,885 | |
| | | | | | | | 21,814,914 | |
| TELECOMMUNICATIONS - (0.9)% | | | | | | | | |
| AT&T, Inc. | | | 79,114 | | | | 2,449,369 | |
| | | | | | | | | |
| TRANSPORTATION - (1.3)% | | | | | | | | |
| FedEx Corp. | | | 11,165 | | | | 2,115,321 | |
| United Parcel Service, Inc. | | | 15,340 | | | | 1,629,415 | |
| | | | | | | | 3,744,736 | |
| | | | | | | | | |
| TOTAL SECURITIES SOLD SHORT - (Proceeds - $110,884,419) | | | | | | $ | 114,500,071 | |
| | | | | | | | | |
ETF - Exchange Traded Fund
PLC - Public Limited Company
| * | Non-Income producing security. |
| ** | Each Written Option contract allows the option holder to buy/sell 100 shares of the underlying security at the exercise price. |
| Portfolio Composition*- (Unaudited) |
| Short-Term Investment | | | 35.0 | % | | Basic Materials | | | 4.1 | % |
| Technology | | | 13.3 | % | | Exchange Traded Funds | | | 2.1 | % |
| Consumer, Non-Cyclical | | | 13.1 | % | | Utilities | | | 1.2 | % |
| Industrial | | | 8.1 | % | | Closed-End Fund | | | 0.6 | % |
| Communications | | | 6.1 | % | | Diversified | | | 0.3 | % |
| Consumer, Cyclical | | | 5.6 | % | | Options | | | 0.2 | % |
| Energy | | | 5.4 | % | | Warrants | | | 0.0 | % |
| Financial | | | 4.9 | % | | Rights | | | 0.0 | % |
| | | | | | | Total | | | 100.0 | % |
| | | | | | | | | | | |
| * | Based on total value of investments as of April 30, 2019 |
Percentage may differ from Schedule of Investments which are based on Fund net assets.
See accompanying notes to financial statements.
| Dunham Dynamic Macro Fund (Unaudited) |
| Message from the Sub-Adviser (Mellon Investments Corporation) |
| |
Asset Class Recap
It was a volatile beginning to the fiscal year for most asset classes around the globe. Over the first fiscal quarter, investors dealt with rising interest rates, a slowdown in Eurozone business confidence, weaker Chinese growth, and increasing geopolitical tension across the globe. Asset classes rose slightly in November as Fed Chairman Powell changed his tune indicating that rates were just below the range of estimates for neutral. This statement was a much more dovish stance than what was previously conveyed in October. However, once the 10- year U.S. Treasury rose above 3.2 percent for the second time, equity markets began to decline. In December, concerns that the U.S. is late in its economic cycle heightened, and with the Democrats winning the House, the likelihood of further meaningful fiscal stimulus was significantly reduced. Equity markets precipitously declined in December, while government bonds filled their more traditional role as a defensive portion of a balanced portfolio. Equities strongly rebounded through the most recent fiscal quarter ended April 30 as the 10-year U.S Treasury precipitously declined over 80 basis points amid investor optimism. The positive sentiment was also supported by strong economic releases, satisfactory earnings releases from U.S. companies, and progress in the U.S./China trade talks. Global macro strategies, as measured by the IQ Hedge Global Macro Beta Index, increased 3.0 percent during the fiscal six-month period ended April 30, 2019.
Allocation Review
As volatility spiked and equity markets tumbled in the first fiscal quarter, the defensive asset strategy fared well by providing a positive return while most asset classes across the globe precipitously declined. The Sub-Adviser viewed this as an opportunity to reduce the allocation to the defensive asset strategy and increase the exposure to the growth asset strategy. This shift benefitt ed the Fund as equity prices rallied off their lows in late December. As equity markets continued to rally through the end of the most recent fiscal quarter, the Sub-Adviser methodically took profits from the growth strategy and moved back into the defensive asset strategy. At the conclusion of the most recent fiscal quarter, the growth strategy’s allocation reached a low for the fiscal year, while the defensive strategy reached a high.
Holdings Insights
The growth asset and real asset strategies detracted from Fund performance in the first fiscal quarter but strongly contributed in the most recent fiscal quarter. Positions within this strategy included the iShares Currency Hedged MSCI Japan ETF (HEWJ) (holding weight*: 12.62 percent), the iShares Hedged MSCI Germany ETF (HEWG) (holding weight*: 4.16 percent), and the SPDR S&P 500 ETF Trust (SPY) (holding weight*: 11.83 percent). During the six-month period, these positions increased by 1.4 percent, 8.5 percent, and 9.8 percent, respectively. The exposure within the growth asset strategy has shifted through the first half of the fiscal year. To begin the fiscal year, the allocation to U.S. equities was approximately 40 percent of the allocation. Due to the rapid increase in U.S. equities, the Sub-Adviser believes that their prices had outstripped the underlying earnings and more value could be found overseas. As a result of this view, the exposure to use U.S. equities stood at a quarter of its original representation by the end of the most recent fiscal quarter. The exposure to the real asset strategy remained consistent through the first fiscal quarter. However, in the most recent fiscal quarter, the Sub-Adviser eliminated the exposure to TIPS. The Sub-Adviser did not believe that a rapid rise in inflation is an immediate concern. One position within the real asset strategy that detracted from Fund performance was the iShares Commodities Select Strategy ETF (COMT) (holding weight*: 5.88 percent). Over the fiscal six-month period, COMT declined 1.5 percent.
The defensive asset strategy achieved its goal of attempting to provide downside protection for the Fund in the first fiscal quarter. In December alone, equity markets, as measured by the MSCI ACWI Index, declined over 7 percent, while U.S. bonds, as measured by the Bloomberg Barclays U.S. Aggregate Bond Index, increased 1.8 percent. The largest portion of the defensive asset strategy is dedicated to U.S. bonds. In the most recent fiscal quarter, this strategy relatively detracted from Fund performance as risk assets rallied. Throughout the most recent fiscal quarter, the Sub-Adviser reduced the exposure to U.S. bonds and increased the exposure to cash as a strategic hedge to lower the overall risk of the Fund as markets reach all-time highs. The Sub-Adviser also increased the exposure to bonds in the UK and Japan, while also maintaining short positions in Australian bonds and German bunds, as these two countries are experiencing compressed yields and small term premiums.
Sub-Adviser Outlook
The Sub-Adviser is optimistic for opportunities within the asset categories the Fund invests in for the rest of 2019, albeit with continued volatility. The Sub-Adviser remains steadfast in its belief that this volatility-targeted strategy may provide investors with more consistent returns than traditional asset classes. It believes that through the flexibility of the strategy and the use of alternative investments, the Fund may provide what may be considered to be attractive returns with lower systematic risk and lower correlation than traditional equity investments.
| * | Holdings percentage(s) of total investments, excluding collateral for securities loaned, as of 4/30/2019. |
Growth of $100,000 Investment
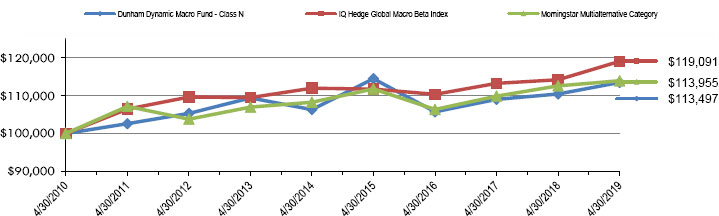
| Total Returns as of April 30, 2019 |
| | | | | Annualized |
| | | | Annualized | Since Inception |
| | Six Months | One Year | Five Years | (4/30/10) |
| Class N | 6.41% | 2.75% | 1.31% | 1.42% |
| Class C | 5.85% | 1.68% | 0.28% | 0.40% |
| Class A with load of 5.75% | 0.07% | (3.49)% | (0.17)% | 0.48% |
| Class A without load | 6.21% | 2.42% | 1.03% | 1.14% |
| IQ Hedge Global Macro Beta Index | 2.97% | 4.24% | 0.94% | 1.79% |
| Morningstar Multialternative Category | 3.06% | 1.19% | 1.02% | 1.46% |
| | | | | |
The IQ Hedge Global Macro Beta Index seeks to replicate the risk-adjusted return characteristics of the collective hedge funds using a global macro investment style. Investors cannot invest directly in an index or benchmark.
The Morningstar Multialternative Category is generally representative of mutual funds with static allocations to alternative strategies and asset classes. The gross short exposure in these mutual funds is generally greater than 20%.
As disclosed in the Trust’s latest registration statement, the Fund’s total annual operating expenses, including underlying funds, are 1.97% for Class N, 2.97% for Class C and 2.22% for Class A. Class A shares are subject to a sales load of 5.75% and a deferred sales charge of up to 0.75%. The performance data quoted here represents past performance, which is not indicative of future results. Current performance may be lower or higher than the performance data quoted. The investment return and NAV will fluctuate, so that an investor’s shares, when redeemed, may be worth more or less than their original cost. Total returns are calculated assuming reinvestment of all dividends and capital gains distributions, if any. The returns do not reflect the deductions of taxes a shareholder would pay on the redemption of Fund shares or Fund distributions. For performance information current to the most recent month-end, please call 1-800-442-4358 or visit our website www.dunham.com
| SCHEDULE OF INVESTMENTS (Unaudited) |
| Dunham Dynamic Macro Fund |
| April 30, 2019 |
| Security | | Shares | | | Value | |
| EXCHANGE TRADED FUNDS - 39.3% | | | | | | | | |
| COMMODITY EXCHANGE TRADED FUNDS - 5.9% | | | | | | | | |
| iShares Commodities Select Strategy ETF | | | 71,252 | | | $ | 2,363,429 | |
| | | | | | | | | |
| DEBT EXCHANGE TRADED FUNDS - 4.8% | | | | | | | | |
| SPDR Bloomberg Barclays High Yield Bond ETF | | | 53,653 | | | | 1,945,994 | |
| | | | | | | | | |
| EQUITY EXCHANGE TRADED FUNDS - 28.6% | | | | | | | | |
| iShares Currency Hedged MSCI Germany ETF | | | 60,045 | | | | 1,672,854 | |
| iShares Currency Hedged MSCI Japan ETF | | | 161,357 | | | | 5,071,451 | |
| SPDR S&P 500 ETF Trust | | | 16,163 | | | | 4,752,245 | |
| | | | | | | | 11,496,550 | |
| TOTAL EXCHANGE TRADED FUNDS (Cost - $13,076,802) | | | | | | | 15,805,973 | |
| | | | | | | | | Exercise | | Expiration | | | |
| | | Counter Party | | Contracts | | Notional | | Price | | Date | | | |
| PURCHASED OPTIONS * + - 3.9% | | | | | |
| CALL OPTION ON FUTURES PURCHASED - 3.8% | | | | | | | | | |
| US 10 Year Future | | Goldman Sachs | | 112 | | 153,125 | | US $110 | | 5/28/2019 | | | 1,531,250 | |
| Swiss Market Index Option | | Morgan Stanley | | 10 | | 140,408 | | CHF $9,675 | | 6/24/2019 | | | 1,404 | |
| | | | | | | | | | | | | | 1,532,654 | |
| PUT OPTIONS ON FUTURES PURCHASED - 0.1% | | | | | | | | | | |
| S&P 500 E-Mini Option | | Goldman Sachs | | 41 | | 16,605 | | US $2,515 | | 6/24/2019 | | | 8,302 | |
| S&P 500 E-Mini Option | | Goldman Sachs | | 41 | | 45,920 | | US $2,600 | | 7/22/2019 | | | 22,960 | |
| | | | | | | | | | | | | | 31,262 | |
| TOTAL PURCHASED OPTIONS (Cost - $1,458,278) | | | | | | | | | 1,563,916 | |
| | | Principal | | Discount | | | | | |
| | | Amount ($) | | Rate (%) | | Maturity | | | |
| SHORT-TERM INVESTMENTS - 56.8% | | | | | | | | |
| U.S. GOVERNMENT SECURITIES - 50.5% | | | | | | | | |
| US Treasury Bill ^^ | | 1,090,000 | | 0.9294 | | 6/6/2019 | | | 1,087,411 | |
| US Treasury Bill | | 19,273,000 | | 1.1271 | | 6/13/2019 | | | 19,218,090 | |
| | | | | | | | | | 20,305,501 | |
| | | | | | | | | | | |
| | | Shares | | Interest
Rate (%) | | | | | | |
| MONEY MARKET - 6.3% | | | | | | | | | | |
| Morgan Stanley Institutional Liquidity Fund | | 2,506,834 | | 2.3400 | ^ | | | | 2,506,834 | |
| | | | | | | | | | | |
| TOTAL SHORT-TERM INVESTMENTS - (Cost - $22,812,432) | | | | | 22,812,335 | |
| | | | | | | |
| TOTAL INVESTMENTS - 100.0% (Cost - $37,347,512) | | $ | 40,182,224 | |
| LIABILITIES LESS OTHER ASSETS - (0.0)% | | | | | (3,111 | ) |
| NET ASSETS - 100.0% | | | | $ | 40,179,113 | |
| | | | | | | | | | | |
See accompanying notes to financial statements.
| SCHEDULE OF INVESTMENTS (Unaudited) |
| Dunham Dynamic Macro Fund (Continued) |
| April 30, 2019 |
| | | | | | | | | | | | | | | Unrealized | |
| | | | | | | | | | | | | Expiration | | Appreciation | |
| Open Futures Contracts | | Counter Party | | Contracts | | | Notional | | | | | Date | | (Depreciation) | |
| LONG FUTURES CONTRACTS ** - 0.7% | | | | | | | | | | | | | | |
| 10 Year Mini JGB Future | | Goldman Sachs | | | 8 | | | $ | 1,096,979 | | | | | 6/12/2019 | | $ | (181 | ) |
| Amsterdam Index Future | | Goldman Sachs | | | 7 | | | | 891,542 | | | | | 5/17/2019 | | | 16,072 | |
| CAC 40 10 Euro Future | | Goldman Sachs | | | 12 | | | | 745,916 | | | | | 5/17/2019 | | | 11,992 | |
| CAN 10 Year Bond Future | | Goldman Sachs | | | 5 | | | | 513,604 | | | | | 6/19/2019 | | | 73 | |
| FTSE 100 Index Future | | Goldman Sachs | | | 44 | | | | 4,228,340 | | | | | 6/21/2019 | | | 147,058 | |
| FTSE/MIB Index Future | | Goldman Sachs | | | 14 | | | | 1,683,281 | | | | | 6/21/2019 | | | 72,978 | |
| IBEX 35 Index Future | | Goldman Sachs | | | 2 | | | | 214,285 | | | | | 5/17/2019 | | | 1,362 | |
| Long Gilt Future | | Goldman Sachs | | | 32 | | | | 5,311,387 | | | | | 6/26/2019 | | | 1,977 | |
| MSCI Emerging Markets Future | | Goldman Sachs | | | 15 | | | | 810,150 | | | | | 6/21/2019 | | | 25,425 | |
| S&P/TSX 60 IX Future | | Goldman Sachs | | | 8 | | | | 1,181,564 | | | | | 6/20/2019 | | | 17,597 | |
| SPI 200 Futures | | Goldman Sachs | | | 1 | | | | 110,927 | | | | | 6/20/2019 | | | 1,263 | |
| TOTAL FUTURES CONTRACTS PURCHASED | | | | | | | | | | | | | | 295,616 | |
| | | | | | | | | | | | | | | | |
| SHORT FUTURES CONTRACTS ** - (0.1)% | | | | | | | | | | | | | | |
| AUST 10 Year Bond Future | | Goldman Sachs | | | (36 | ) | | | (3,503,821 | ) | | | | 6/17/2019 | | | (28,586 | ) |
| DAX Index Future | | Goldman Sachs | | | (1 | ) | | | (346,044 | ) | | | | 6/21/2019 | | | (4,340 | ) |
| Euro-Bond Future | | Goldman Sachs | | | (25 | ) | | | (4,631,575 | ) | | | | 6/6/2019 | | | 7,542 | |
| Hang Seng Index Future | | Goldman Sachs | | | (6 | ) | | | (1,126,826 | ) | | | | 5/30/2019 | | | 3,305 | |
| S&P 500 E-mini Future | | Goldman Sachs | | | (10 | ) | | | (1,474,250 | ) | | | | 6/21/2019 | | | (12,240 | ) |
| Topix Index Future | | Goldman Sachs | | | (6 | ) | | | (870,034 | ) | | | | 6/13/2019 | | | 2,309 | |
| US 10 Year Note (CBT) | | Goldman Sachs | | | (4 | ) | | | (494,688 | ) | | | | 6/19/2019 | | | (375 | ) |
| TOTAL FUTURES CONTRACTS SOLD | | | | | | | | | | | | | (32,385 | ) |
| | | | | | | | | | | | | | | | | | | |
| | | | | | | | | | | | | | | | | | | |
| | | | | | | | | | | | | Exercise Price | | | | Value | |
| OPTIONS WRITTEN *+ - (0.1)% | | | | | | | | | | | | |
| WRITTEN CALL FUTURE OPTIONS - (0.0)% | | | | | | | | | | | | |
| S&P 500 E-Mini Option | | Goldman Sachs | | | (27 | ) | | | (24,300 | ) | | US $2,985 | | 5/20/2019 | | | (12,150 | ) |
| S&P 500 E-Mini Option | | Goldman Sachs | | | (27 | ) | | | (17,280 | ) | | US $3,035 | | 6/10/2019 | | | (8,640 | ) |
| | | | | | | | | | | | | | | | | | (20,790 | ) |
| | | | | | | | | | | | | | | | | | | |
| | | | | | | | | | | | | Exercise Price | | | | Value | |
| WRITTEN PUT FUTURE OPTIONS - (0.1)% | | | | | | | | | | | | | |
| S&P 500 E-Mini Option | | Goldman Sachs | | | (27 | ) | | | (8,235 | ) | | US $2,750 | | 5/20/2019 | | | (4,118 | ) |
| S&P 500 E-Mini Option | | Goldman Sachs | | | (27 | ) | | | (31,860 | ) | | US $2,800 | | 6/10/2019 | | | (15,930 | ) |
| Swiss Market Index Option | | Morgan Stanley | | | (10 | ) | | | (140,408 | ) | | CHF $9,675 | | 6/24/2019 | | | (1,404 | ) |
| | | | | | | | | | | | | | | | | | (21,452 | ) |
| TOTAL WRITTEN FUTURE OPTIONS - (Premiums Received - $44,146) | | | | | (42,242 | ) |
| | | | | | | | | | | | | | | | | | | |
CHF - Swiss Franc
ETF - Exchange Traded Fund
| * | Non income producing security. |
| + | Each option contract allows holder to purchase/sell 100 shares of the underlying security at the exercise price. |
| ^ | Variable rate security. Interest rate is as of April 30, 2019. |
| ^^ | All of this security is segregated as collateral for futures contracts. |
| ** | The amounts shown are the underlying reference notional amounts to stock exchange indices, debt securities and equities upon which the fair value of the futures contracts held by the Fund are based. Notional values do not represent the current fair value of, and are not necessarily indicative of the future cash flows futures contracts. Further, the underlying price changes in relation to the variables specified by the notional values affects the fair value of these derivative financial instruments. The notional values as set forth within this schedule do not purport to represent economic value at risk to the Fund. |
See accompanying notes to financial statements.
| SCHEDULE OF INVESTMENTS (Unaudited) |
| Dunham Dynamic Macro Fund (Continued) |
| April 30, 2019 |
| |
As of April 30, 2019 the following Forward Currency Exchange contracts were open:
| Forward Currency Contracts |
| | | | | | | | | | | | | |
| | | Settlement | | | | Local Currency | | U.S. Dollar | | | Unrealized | |
| Foreign Currency | | Date | | Counterparty | | Amount Purchased | | Market Value | | | Appreciation | |
| To Sell USD and To Buy: | | | | | | | | | | | | | | |
| Swiss Franc | | 5/6/2019 | | Morgan Stanley Smith Barney | | 7,290 | | $ | 7,157 | | | $ | 7 | |
| Net Unrealized Gain on Forward Currency Contracts | | | | $ | 7 | |
| | | | | | | | | | | | | | | |
See accompanying notes to financial statements.
| Dunham High-Yield Bond Fund (Unaudited) |
| Message from the Sub-Adviser (PineBridge Investments LLC) |
| |
Asset Class Recap
High-yield spreads came under pressure at the beginning of the first fiscal quarter amid signs of slowing growth in China and Europe, sharp declines in oil and other commodity prices, the weakest December equity market performance since the Great Depression and a disappointing Fed meeting that offered no flexibility with respect to balance sheet runoff. However, spreads rallied sharply in January, benefitting from progress on U.S. China trade talks, stable or better than expected earnings and, most importantly, a dovish pivot from Jerome Powell and the Fed. Spreads continued to tighten in the most recent fiscal quarter as the Fed continued to reiterate their dovish stance. In the March meeting, they announced that they did not expect to raise rates through 2021. High-yield bonds, as measured by the ICE BofA ML US Cash Pay High-Yield Index, increased 4.1 percent over the most recent fiscal six-month period.
Allocation Review
The Fund’s relative performance was a tale of two halves , specifically, the first two quarters of the fiscal year. The Fund’s sector allocation and security selection detracted in the first fiscal quarter as lower quality bonds rallied. However, in the second fiscal quarter, the majority of the outperformance was attributable to security selection. Sector selection had a small negative contribution during the most recent fiscal quarter because of the small allocation to cash. Positions in the communications and consumer cyclical sectors were the largest contributors, while positions in the industrial and energy sectors detracted slightly. From a sector selection standpoint, an overweight allocation to finance companies and an underweight allocation to insurance were some of the largest contributors. In the first fiscal quarter, the allocation to banking and basic industry companies detracted, while the cash position and an overweight allocation to REITs were the largest detractors in the most recent fiscal quarter. As markets rose strongly since the start of 2019, the Sub-Adviser viewed valuation to be nearing fair value. At that time, the Sub-Adviser lowered the risk of the portfolio by reducing the exposure to single B bonds and increasing the exposure to BB-rated bonds.
Holdings Insights
As previously mentioned, t he best performer within the consumer cyclical sector that has contributed positively to Fund performance over the first two fiscal quarters was a protein company, Pilgrim’s Pride Corp. 5.87% due 09/30/27 (72147KAE8) (holding weight*: 0.85 percent). This credit increased 16.9 percent over the fiscal six-month period on continued solid performance and market consensus that there is a reasonable path to achieve an investment grade rating in the next few years. Another contributor within this sector came from the same parent and is also a protein producer. JBS USA/Food/Finance 6.50% due 04/15/2029 (46590XAA4) (holding weight*: 0.28 percent) increased 4.9 percent since being initiated into the portfolio in early April. Strong contributors from the fiscal six-month period and most recent fiscal quarter came from the communications sector. Altice Luxembourg SA 7.625% 02/15/2025 (02154VAB7) (holding weight*: 1.09 percent) increased 14.8 percent over the most six month period. The Sub-Adviser attributes the positive performance to the company doing a partial refinance on some of their outstanding debt which the Sub-Adviser views as a good sign that they are worthy of doing primary deals. Another contributor was McGraw-Hill Global Education Holdings LLC (580638AC8) (holding weight*: 0.52 percent). The credit increased 5.7 percent as the company announced a deal to merge with a large competitor.
The price of West Texas Intermediate Crude Oil drastically fell over 21 percent during the first fiscal quarter, adversely affecting the energy sector. Although the price of West Texas Intermediate Crude Oil rebounded in the second fiscal quarter, an exploration and production (E&P) company in the Fund displayed weakness. Chaparral Energy Inc. 8.75% 7/15/2023 (15942RAF6) (holding weight*: 0.64 percent). This credit fell 17.6 percent in the first fiscal quarter and another 3 percent in the most recent fiscal quarter ended April 30, 2019.
Sub-Adviser Outlook
The Sub-Adviser continues to monitor four important factors when evaluating what it believes the most attractive risk/reward opportunities: credit fundamentals, future Fed actions, the macroeconomic environment, and corporate earnings. Credit fundamentals generally remained solid, and spreads continue to be attractive versus other fixed income alternatives. Spreads are trading in the 350-400 range, which implies a default rate of 2 percent. The Sub-Adviser believes valuations at the current level are fair, but unlikely to tighten further on a relative basis, as loans remain historically wide at 400 basis points. The Fed’s new dovish tone could be favorable across U.S. fixed income this year, as it is now indicating that it will be patient with further monetary tightening unless warranted by an uptick in growth or inflation. Although the Fed continues to see favorable growth and a strong labor market ahead, it also has acknowledged the risk increase for a less favorable outlook. The Sub-Adviser continues to see relatively low odds for a US recession this year, though a few macro indicators are flashing subtle warnings. Low sovereign rates globally and flat yield curves suggest reasons for caution. However, recent equity-linked weakness and CCC underperformance indicate that the positive technical environment may reverse quickly.
| * | Holdings percentage(s) of total investments, excluding collateral for securities loaned, as of 4/30/2019. |
Growth of $100,000 Investment
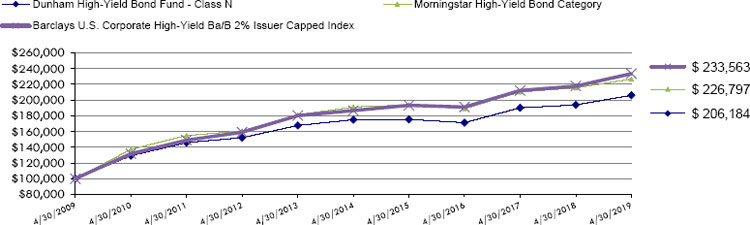
| Total Returns as of April 30, 2019 |
| | | | Annualized | Annualized |
| | Six Months | One Year | Five Years | Ten Years |
| Class N | 5.97% | 6.29% | 3.34% | 7.50% |
| Class C | 5.62% | 5.54% | 2.62% | 6.73% |
| Class A with load of 4.50% | 1.19% | 1.35% | 2.16% | 6.75% |
| Class A without load | 5.90% | 6.09% | 3.10% | 7.24% |
| Barclays U.S. Corporate High-Yield Bond Ba/B 2% Issuer Capped Index | 6.22% | 7.20% | 4.59% | 8.85% |
| Morningstar High-Yield Bond Category | 4.67% | 5.22% | 3.46% | 8.53% |
| | | | | |
Barclays U.S. Corporate High- Yield Bond Ba/B 2% Issuer Capped Index is an issuer-constrained version of the flagship US Corporate High Yield Index, which measures the USD-denominated, high yield, fixed-rate corporate bond market.
The Morningstar High-Yield Bond Category is generally representative of mutual funds that primarily invest in U.S. high-income debt securities where at least 65% or more of bond assets are not rated or are rated by a major agency such as Standard & Poor’s or Moody’s at the level of BB (considered speculative for taxable bonds) and below.
Investors cannot invest directly in an index or benchmark.
As disclosed in the Trust’s latest registration statement, the Fund’s total annual operating expenses, including the cost of underlying funds, are 1.13% for Class N, 1.88% for Class C and 1.38% for Class A. Class A shares are subject to a sales load of 4.50% and a deferred sales charge of up to 0.75%. The performance data quoted here represents past performance, which is not indicative of future results. Current performance may be lower or higher than the performance data quoted. The investment return and NAV will fluctuate, so that an investor’s shares, when redeemed, may be worth more or less than their original cost. Total returns are calculated assuming reinvestment of all dividends and capital gains distributions, if any. The returns do not reflect the deductions of taxes a shareholder would pay on the redemption of Fund shares or Fund distributions. For performance information current to the most recent month-end, please call 1-800-442-4358 or visit our website www.dunham.com
| SCHEDULE OF INVESTMENTS (Unaudited) |
| Dunham High-Yield Bond Fund |
| April 30, 2019 |
| | | Principal | | | Interest | | Maturity | | | |
| Security | | Amount | | | Rate% | | Date | | Value | |
| BONDS & NOTES - 94.0% | | | | | | | | | | | | |
| AEROSPACE/DEFENSE - 0.2% | | | | | | | | | | | | |
| UAL 2007-1 Pass Through Trust | | $ | 229,519 | | | 6.636 | | 7/2/2022 | | $ | 242,303 | |
| | | | | | | | | | | | | |
| AUTO MANUFACTURERS - 1.0% | | | | | | | | | | | | |
| Allison Transmission, Inc. - 144A | | | 551,000 | | | 5.000 | | 10/1/2024 | | | 559,359 | |
| JB Poindexter & Co., Inc. - 144A | | | 528,000 | | | 7.125 | | 4/15/2026 | | | 541,200 | |
| | | | | | | | | | | | 1,100,559 | |
| AUTO PARTS & EQUIPMENT - 0.6% | | | | | | | | | | | | |
| Delphi Technologies PLC - 144A | | | 690,000 | | | 5.000 | | 10/1/2025 | | | 634,800 | |
| | | | | | | | | | | | | |
| BUILDING MATERIALS - 0.7% | | | | | | | | | | | | |
| Standard Industries, Inc. - 144A | | | 750,000 | | | 6.000 | | 10/15/2025 | | | 786,720 | |
| | | | | | | | | | | | | |
| CHEMICALS - 2.9% | | | | | | | | | | | | |
| Consolidated Energy Finance SA - 144A | | | 685,000 | | | 6.875 | | 6/15/2025 | | | 708,975 | |
| Neon Holdings, Inc. - 144A | | | 464,000 | | | 10.125 | | 4/1/2026 | | | 479,080 | |
| NOVA Chemicals Corp. - 144A | | | 750,000 | | | 5.000 | | 5/1/2025 | | | 732,188 | |
| OCI NV -144A | | | 563,000 | | | 6.625 | | 4/15/2023 | | | 589,179 | |
| Rayonier AM Products, Inc. - 144A | | | 700,000 | | | 5.500 | | 6/1/2024 | | | 670,250 | |
| | | | | | | | | | | | 3,179,672 | |
| COAL - 0.7% | | | | | | | | | | | | |
| SunCoke Energy Partners LP - 144A | | | 791,000 | | | 7.500 | | 6/15/2025 | | | 800,888 | |
| | | | | | | | | | | | | |
| COMMERCIAL SERVICES - 2.9% | | | | | | | | | | | | |
| Ahern Rentals, Inc. - 144A | | | 585,000 | | | 7.375 | | 5/15/2023 | | | 523,575 | |
| Garda World Security Corp. - 144A | | | 715,000 | | | 8.750 | | 5/15/2025 | | | 677,606 | |
| Jurassic Holdings III, Inc. - 144A | | | 575,000 | | | 6.875 | | 2/15/2021 | | | 575,000 | |
| Prime Security Services Borrower LLC - 144A | | | 131,000 | | | 5.250 | | 4/15/2024 | | | 131,655 | |
| Prime Security Services Borrower LLC - 144A | | | 447,000 | | | 5.750 | | 4/15/2026 | | | 452,677 | |
| Refinitiv US Holdings, Inc. - 144A | | | 799,000 | | | 8.250 | | 11/15/2026 | | | 811,728 | |
| | | | | | | | | | | | 3,172,241 | |
| COMPUTERS - 2.2% | | | | | | | | | | | | |
| Dell International LLC - 144A | | | 1,215,000 | | | 6.020 | | 6/15/2026 | | | 1,317,455 | |
| Diebold Nixdorf, Inc. | | | 693,000 | | | 8.500 | | 4/15/2024 | | | 582,120 | |
| Seagate HDD Cayman | | | 525,000 | | | 4.875 | | 3/1/2024 | | | 526,766 | |
| | | | | | | | | | | | 2,426,341 | |
| COSMETICS/PERSONAL CARE - 1.1% | | | | | | | | | | | | |
| Coty, Inc. - 144A ^ | | | 575,000 | | | 6.500 | | 4/15/2026 | | | 568,531 | |
| First Quality Finance Co., Inc. - 144A | | | 600,000 | | | 5.000 | | 7/1/2025 | | | 598,500 | |
| | | | | | | | | | | | 1,167,031 | |
| DISTRIBUTION/WHOLESALE - 0.6% | | | | | | | | | | | | |
| H&E Equipment Services, Inc. | | | 655,000 | | | 5.625 | | 9/1/2025 | | | 667,281 | |
| | | | | | | | | | | | | |
| DIVERSIFIED FINANCIAL SERVICES - 5.5% | | | | | | | | | | | | |
| Alliance Data Systems Corp. - 144A | | | 700,000 | | | 5.875 | | 11/1/2021 | | | 716,625 | |
| Credit Acceptance Corp. - 144A | | | 542,000 | | | 6.625 | | 3/15/2026 | | | 571,810 | |
| Enova International, Inc. - 144A | | | 765,000 | | | 8.500 | | 9/1/2024 | | | 738,225 | |
| Enova International, Inc. - 144A | | | 349,000 | | | 8.500 | | 9/15/2025 | | | 342,100 | |
| LPL Holdings, Inc. - 144A | | | 775,000 | | | 5.750 | | 9/15/2025 | | | 790,500 | |
| Navient Corp. | | | 1,075,000 | | | 5.625 | | 8/1/2033 | | | 870,750 | |
| Quicken Loans, Inc. - 144A | | | 875,000 | | | 5.750 | | 5/1/2025 | | | 892,500 | |
| Springleaf Finance Corp. | | | 800,000 | | | 6.875 | | 3/15/2025 | | | 860,000 | |
| Springleaf Finance Corp. | | | 238,000 | | | 7.125 | | 3/15/2026 | | | 255,999 | |
| | | | | | | | | | | | 6,038,509 | |
| | | | | | | | | | | | | |
See accompanying notes to financial statements.
| SCHEDULE OF INVESTMENTS (Unaudited) |
| Dunham High-Yield Bond Fund (Continued) |
| April 30, 2019 |
| | | Principal | | | Interest | | Maturity | | | |
| Security | | Amount | | | Rate% | | Date | | Value | |
| BONDS & NOTES - 94.0% (Continued) | | | | | | | | | | | | |
| ELECTRICAL COMPONENTS & EQUIPMENT - 1.3% | | | | | | | | | | | | |
| Energizer Holdings, Inc. - 144A | | $ | 640,000 | | | 6.375 | | 7/15/2026 | | $ | 662,200 | |
| EnerSys - 144A | | | 794,000 | | | 5.000 | | 4/30/2023 | | | 805,910 | |
| | | | | | | | | | | | 1,468,110 | |
| ELECTRONICS - 1.2% | | | | | | | | | | | | |
| ADT Security Corp. | | | 556,000 | | | 4.125 | | 6/15/2023 | | | 545,225 | |
| Ingram Micro, Inc. | | | 817,000 | | | 5.450 | | 12/15/2024 | | | 814,013 | |
| | | | | | | | | | | | 1,359,238 | |
| ENERGY - 0.8% | | | | | | | | | | | | |
| Pattern Energy Group, Inc. - 144A | | | 839,000 | | | 5.875 | | 2/1/2024 | | | 868,541 | |
| | | | | | | | | | | | | |
| ENGINEERING & CONSTRUCTION - 2.0% | | | | | | | | | | | | |
| Frontdoor, Inc. - 144A | | | 560,000 | | | 6.750 | | 8/15/2026 | | | 588,700 | |
| Great Lakes Dredge & Dock Corp. | | | 535,000 | | | 8.000 | | 5/15/2022 | | | 566,431 | |
| Tutor Perini Corp. - 144A | | | 650,000 | | | 6.875 | | 5/1/2025 | | | 652,438 | |
| Weekley Homes LLC | | | 423,000 | | | 6.000 | | 2/1/2023 | | | 416,655 | |
| | | | | | | | | | | | 2,224,224 | |
| ENTERTAINMENT - 1.5% | | | | | | | | | | | | |
| Cirsa Finance International SARL - 144A | | | 340,000 | | | 7.875 | | 12/20/2023 | | | 353,624 | |
| Eldorado Resorts, Inc. | | | 660,000 | | | 6.000 | | 9/15/2026 | | | 688,050 | |
| Scientific Games International, Inc. - 144A | | | 545,000 | | | 8.250 | | 3/15/2026 | | | 566,119 | |
| | | | | | | | | | | | 1,607,793 | |
| FOOD - 3.5% | | | | | | | | | | | | |
| Albertsons Companies LLC | | | 562,000 | | | 5.750 | | 3/15/2025 | | | 560,595 | |
| JBS USA LLC - 144A | | | 508,000 | | | 5.875 | | 7/15/2024 | | | 524,510 | |
| JBS USA LLC - 144A | | | 525,000 | | | 5.750 | | 6/15/2025 | | | 538,781 | |
| JBS USA LLC - 144A | | | 283,000 | | | 6.500 | | 4/15/2029 | | | 300,688 | |
| Land O’Lakes Capital Trust - 144A | | | 484,000 | | | 7.450 | | 3/15/2028 | | | 525,745 | |
| Pilgrim’s Pride Corp. - 144A | | | 880,000 | | | 5.875 | | 9/30/2027 | | | 910,800 | |
| Post Holdings, Inc. - 144A | | | 430,000 | | | 5.500 | | 3/1/2025 | | | 441,825 | |
| | | | | | | | | | | | 3,802,944 | |
| FOREST PRODUCTS & PAPER - 0.7% | | | | | | | | | | | | |
| Cascades, Inc. - 144A | | | 183,000 | | | 5.500 | | 7/15/2022 | | | 185,288 | |
| Cascades, Inc. - 144A ^ | | | 527,000 | | | 5.750 | | 7/15/2023 | | | 536,222 | |
| | | | | | | | | | | | 721,510 | |
| HEALTHCARE-PRODUCTS - 1.0% | | | | | | | | | | | | |
| Hologic, Inc. - 144A | | | 525,000 | | | 4.375 | | 10/15/2025 | | | 522,703 | |
| Ortho-Clinical Diagnostics, Inc. - 144A | | | 525,000 | | | 6.625 | | 5/15/2022 | | | 515,484 | |
| | | | | | | | | | | | 1,038,187 | |
| HEALTHCARE-SERVICES - 3.8% | | | | | | | | | | | | |
| Centene Corp. | | | 174,000 | | | 4.750 | | 1/15/2025 | | | 176,958 | |
| Centene Corp. - 144A | | | 547,000 | | | 5.375 | | 6/1/2026 | | | 570,373 | |
| DaVita, Inc. | | | 825,000 | | | 5.125 | | 7/15/2024 | | | 827,063 | |
| HCA, Inc. | | | 1,100,000 | | | 5.375 | | 2/1/2025 | | | 1,160,500 | |
| MEDNAX, Inc. - 144A | | | 857,000 | | | 5.250 | | 12/1/2023 | | | 874,140 | |
| MPH Acquisition Holdings LLC - 144A | | | 500,000 | | | 7.125 | | 6/1/2024 | | | 503,850 | |
| | | | | | | | | | | | 4,112,884 | |
| HOUSEHOLD PRODUCTS - 0.5% | | | | | | | | | | | | |
| Central Garden & Pet Co. | | | 600,000 | | | 5.125 | | 2/1/2028 | | | 571,500 | |
| | | | | | | | | | | | | |
| INTERNET - 1.3% | | | | | | | | | | | | |
| Cogent Communications Group, Inc. - 144A | | | 505,000 | | | 5.375 | | 3/1/2022 | | | 523,938 | |
| Netflix, Inc. | | | 655,000 | | | 5.875 | | 2/15/2025 | | | 709,037 | |
| Netflix, Inc. | | | 202,000 | | | 4.375 | | 11/15/2026 | | | 200,232 | |
| | | | | | | | | | | | 1,433,207 | |
| | | | | | | | | | | | | |
See accompanying notes to financial statements.
| SCHEDULE OF INVESTMENTS (Unaudited) |
| Dunham High-Yield Bond Fund (Continued) |
| April 30, 2019 |
| | | Variable | | Principal | | | Interest | | Maturity | | | |
| Security | | Rate | | Amount | | | Rate% | | Date | | Value | |
| BONDS & NOTES - 94.0% (Continued) | | | | | | | | | | | | | | | |
| INVESTMENT COMPANIES - 0.6% | | | | | | | | | | | | | | | |
| FS Energy & Power Fund - 144A | | | | $ | 592,000 | | | | 7.500 | | 8/15/2023 | | $ | 612,850 | |
| | | | | | | | | | | | | | | | |
| IRON/STEEL - 2.0% | | | | | | | | | | | | | | | |
| Cleveland-Cliffs, Inc. - 144A | | | | | 325,000 | | | | 4.875 | | 1/15/2024 | | | 325,813 | |
| Cleveland-Cliffs, Inc. | | | | | 402,000 | | | | 5.750 | | 3/1/2025 | | | 401,075 | |
| Commercial Metals Co. | | | | | 462,000 | | | | 5.750 | | 4/15/2026 | | | 467,775 | |
| Mineral Resources Ltd. - 144A | | | | | 525,000 | | | | 8.125 | | 5/1/2027 | | | 539,805 | |
| United States Steel Corp. | | | | | 445,000 | | | | 6.875 | | 8/15/2025 | | | 419,813 | |
| | | | | | | | | | | | | | | 2,154,281 | |
| LODGING - 0.8% | | | | | | | | | | | | | | | |
| Hilton Grand Vacations Borrower LLC | | | | | 298,000 | | | | 6.125 | | 12/1/2024 | | | 313,645 | |
| Wyndham Destinations, Inc. | | | | | 346,000 | | | | 4.150 | | 4/1/2024 | | | 356,380 | |
| Wyndham Destinations, Inc. | | | | | 175,000 | | | | 4.500 | | 4/1/2027 | | | 176,531 | |
| | | | | | | | | | | | | | | 846,556 | |
| MACHINERY-CONSTRUCTION/MINING - 0.5% | | | | | | | |
| Terex Corp. - 144A | | | | | 559,000 | | | | 5.625 | | 2/1/2025 | | | 566,686 | |
| MEDIA - 9.9% | | | | | | | | | | | | | | | |
| Altice Financing SA - 144A | | | | | 1,090,000 | | | | 7.500 | | 5/15/2026 | | | 1,109,075 | |
| Altice Luxembourg SA - 144A | | | | | 1,235,000 | | | | 7.625 | | 2/15/2025 | | | 1,168,619 | |
| Belo Corp. | | | | | 735,000 | | | | 7.750 | | 6/1/2027 | | | 810,337 | |
| Belo Corp. | | | | | 210,000 | | | | 7.250 | | 9/15/2027 | | | 226,275 | |
| Block Communications, Inc. - 144A | | | | | 778,000 | | | | 6.875 | | 2/15/2025 | | | 811,065 | |
| CCO Holdings LLC - 144A | | | | | 232,000 | | | | 5.875 | | 4/1/2024 | | | 242,953 | |
| CCO Holdings LLC - 144A | | | | | 275,000 | | | | 5.375 | | 5/1/2025 | | | 285,312 | |
| CCO Holdings LLC - 144A | | | | | 478,000 | | | | 5.500 | | 5/1/2026 | | | 494,491 | |
| CCO Holdings LLC - 144A | | | | | 378,000 | | | | 5.000 | | 2/1/2028 | | | 378,472 | |
| Charter Communications Operating LLC | | 3 mo LIBOR + 1.650% | | | 545,000 | | | | 4.386 | + | 2/1/2024 | | | 548,495 | |
| CSC Holdings LLC - 144A | | | | | 225,000 | | | | 5.375 | | 7/15/2023 | | | 230,625 | |
| CSC Holdings LLC - 144A | | | | | 1,800,000 | | | | 5.500 | | 4/15/2027 | | | 1,858,734 | |
| EW Scripps Co. - 144A | | | | | 350,000 | | | | 5.125 | | 5/15/2025 | | | 333,375 | |
| Gray Television, Inc. - 144A | | | | | 428,000 | | | | 5.125 | | 10/15/2024 | | | 436,560 | |
| Gray Television, Inc. - 144A | | | | | 103,000 | | | | 5.875 | | 7/15/2026 | | | 106,412 | |
| McGraw-Hill Global Education Holdings LLC - 144A | | | 643,000 | | | | 7.875 | | 5/15/2024 | | | 552,176 | |
| Sirius XM Radio, Inc. - 144A | | | | | 692,000 | | | | 5.375 | | 7/15/2026 | | | 714,490 | |
| UPCB Finance IV Ltd. - 144A | | 500,000 | | | | 5.375 | | 1/15/2025 | | | 512,350 | |
| | | | | | | | | | | | | | | 10,819,816 | |
| METAL FABRICATE - 0.6% | | | | | | | | | | | | | | | |
| Novelis Corp. - 144A | | | | | 650,000 | | | | 6.250 | | 8/15/2024 | | | 678,438 | |
| | | | | | | | | | | | | | | | |
| MINING - 1.5% | | | | | | | | | | | | | | | |
| First Quantum Minerals Ltd. - 144A | | | | | 473,000 | | | | 7.250 | | 4/1/2023 | | | 470,280 | |
| FMG Resources (August 2006) Pty Ltd. - 144A | | | 600,000 | | | | 5.125 | | 3/15/2023 | | | 612,600 | |
| Freeport-McMoRan, Inc. | | | | | 525,000 | | | | 3.875 | | 3/15/2023 | | | 521,063 | |
| | | | | | | | | | | | | | | 1,603,943 | |
| OIL & GAS - 6.1% | | | | | | | | | | | | | | | |
| Brazos Valley Longhorn LLC | | | | | 639,000 | | | | 6.875 | | 2/1/2025 | | | 644,591 | |
| Callon Petroleum Co. | | | | | 565,000 | | | | 6.375 | | 7/1/2026 | | | 580,537 | |
| Centennial Resource Production LLC - 144A | | | | | 525,000 | | | | 6.875 | | 4/1/2027 | | | 545,344 | |
| Chaparral Energy, Inc. - 144A | | | | | 926,000 | | | | 8.750 | | 7/15/2023 | | | 687,555 | |
| Extraction Oil & Gas, Inc. - 144A | | | | | 725,000 | | | | 5.625 | | 2/1/2026 | | | 598,125 | |
| Hilcorp Energy I LP - 144A | | | | | 842,000 | | | | 5.000 | | 12/1/2024 | | | 839,895 | |
| Lonestar Resources America, Inc. - 144A | | | | | 521,000 | | | | 11.250 | | 1/1/2023 | | | 521,000 | |
| | | | | | | | | | | | | | | | |
See accompanying notes to financial statements.
| SCHEDULE OF INVESTMENTS (Unaudited) |
| Dunham High-Yield Bond Fund (Continued) |
| April 30, 2019 |
| | | Principal | | | Interest | | Maturity | | | |
| Security | | Amount | | | Rate% | | Date | | Value | |
| BONDS & NOTES - 94.0% (Continued) | | | | | | | | | | | | |
| OIL & GAS - 6.1% (Continued) | | | | | | | | | | | | |
| MEG Energy Corp. - 144A | | $ | 725,000 | | | 6.500 | | 1/15/2025 | | $ | 731,344 | |
| Noble Holding International Ltd. - 144A | | | 495,000 | | | 7.875 | | 2/1/2026 | | | 480,769 | |
| Shelf Drilling Holdings Ltd. - 144A | | | 550,000 | | | 8.250 | | 2/15/2025 | | | 541,750 | |
| Southwestern Energy Co. | | | 525,000 | | | 7.500 | | 4/1/2026 | | | 535,500 | |
| | | | | | | | | | | | 6,706,410 | |
| OIL & GAS SERVICES - 3.9% | | | | | | | | | | | | |
| Apergy Corp. | | | 500,000 | | | 6.375 | | 5/1/2026 | | | 518,750 | |
| Calfrac Holdings LP - 144A | | | 565,000 | | | 8.500 | | 6/15/2026 | | | 471,775 | |
| Forum Energy Technologies, Inc. | | | 605,000 | | | 6.250 | | 10/1/2021 | | | 571,725 | |
| Hi-Crush Partners LP - 144A | | | 996,000 | | | 9.500 | | 8/1/2026 | | | 771,900 | |
| KCA Deutag UK Finance PLC - 144A | | | 490,000 | | | 9.875 | | 4/1/2022 | | | 428,750 | |
| Nine Energy Service, Inc. - 144A | | | 265,000 | | | 8.750 | | 11/1/2023 | | | 274,937 | |
| Pioneer Energy Service, Inc. | | | 652,000 | | | 6.125 | | 3/15/2022 | | | 436,840 | |
| SESI LLC | | | 140,000 | | | 7.750 | | 9/15/2024 | | | 103,950 | |
| USA Compression Partners LP | | | 528,000 | | | 6.875 | | 4/1/2026 | | | 558,033 | |
| USA Compression Partners LP - 144A | | | 113,000 | | | 6.875 | | 9/1/2027 | | | 119,497 | |
| | | | | | | | | | | | 4,256,157 | |
| PACKAGING & CONTAINERS - 2.1% | | | | | | | | | | | | |
| Crown Americas LLC | | | 300,000 | | | 4.500 | | 1/15/2023 | | | 307,128 | |
| Crown Cork & Seal Co., Inc. | | | 392,000 | | | 7.375 | | 12/15/2026 | | | 441,000 | |
| Intertape Polymer Group, Inc. - 144A | | | 664,000 | | | 7.000 | | 10/15/2026 | | | 680,600 | |
| Owens-Brockway Glass Container, Inc. - 144A | | | 739,000 | | | 5.375 | | 1/15/2025 | | | 756,551 | |
| Sealed Air Corp. - 144A | | | 106,000 | | | 5.125 | | 12/1/2024 | | | 110,505 | |
| | | | | | | | | | | | 2,295,784 | |
| PHARMACEUTICALS - 1.6% | | | | | | | | | | | | |
| Bausch Health Companies, Inc. - 144A | | | 1,150,000 | | | 5.875 | | 5/15/2023 | | | 1,163,168 | |
| Par Pharmaceutical, Inc. - 144A | | | 529,000 | | | 7.500 | | 4/1/2027 | | | 550,054 | |
| | | | | | | | | | | | 1,713,222 | |
| PIPELINES - 4.6% | | | | | | | | | | | | |
| Antero Midstream Partners LP - 144A | | | 375,000 | | | 5.750 | | 3/1/2027 | | | 383,438 | |
| Cheniere Corpus Christi Holdings LLC | | | 600,000 | | | 7.000 | | 6/30/2024 | | | 674,250 | |
| Cheniere Corpus Christi Holdings LLC | | | 350,000 | | | 5.875 | | 3/31/2025 | | | 378,000 | |
| Cheniere Energy Partners LP | | | 432,000 | | | 5.250 | | 10/1/2025 | | | 442,260 | |
| Genesis Energy LP. | | | 275,000 | | | 6.000 | | 5/15/2023 | | | 278,696 | |
| Genesis Energy LP. | | | 625,000 | | | 5.625 | | 6/15/2024 | | | 623,828 | |
| Holly Energy Partners LP - 144A | | | 525,000 | | | 6.000 | | 8/1/2024 | | | 550,084 | |
| SemGroup Corp. | | | 875,000 | | | 5.625 | | 7/15/2022 | | | 871,719 | |
| SemGroup Corp. | | | 145,000 | | | 5.625 | | 11/15/2023 | | | 138,475 | |
| Summit Midstream Holdings LLC | | | 675,000 | | | 5.500 | | 8/15/2022 | | | 669,937 | |
| | | | | | | | | | | | 5,010,687 | |
| REAL ESTATE - 2.1% | | | | | | | | | | | | |
| Greystar Real Estate Partners LLC - 144A | | | 641,000 | | | 5.750 | | 12/1/2025 | | | 645,807 | |
| Kennedy-Wilson, Inc. | | | 935,000 | | | 5.875 | | 4/1/2024 | | | 949,025 | |
| Newmark Group, Inc. | | | 679,000 | | | 6.125 | | 11/15/2023 | | | 713,037 | |
| | | | | | | | | | | | 2,307,869 | |
| REAL ESTATE INVESTMENT TRUSTS - 6.4% | | | | | | | | | | | | |
| CTR Partnership LP | | | 604,000 | | | 5.250 | | 6/1/2025 | | | 625,249 | |
| ESH Hospitality, Inc. - 144A | | | 865,000 | | | 5.250 | | 5/1/2025 | | | 870,406 | |
| GEO Group, Inc. | | | 275,000 | | | 5.125 | | 4/1/2023 | | | 258,500 | |
| GEO Group, Inc. | | | 310,000 | | | 5.875 | | 10/15/2024 | | | 285,200 | |
| GLP Capital LP | | | 550,000 | | | 5.375 | | 4/15/2026 | | | 582,208 | |
| Iron Mountain, Inc. - 144A | | | 980,000 | | | 4.875 | | 9/15/2027 | | | 953,662 | |
| | | | | | | | | | | | | |
See accompanying notes to financial statements.
| SCHEDULE OF INVESTMENTS (Unaudited) |
| Dunham High-Yield Bond Fund (Continued) |
| April 30, 2019 |
| | | Principal | | | Interest | | Maturity | | | |
| Security | | Amount | | | Rate% | | Date | | Value | |
| BONDS & NOTES - 94.0% (Continued) | | | | | | | | | | | | |
| REAL ESTATE INVESTMENT TRUSTS - 6.4% (Continued) | | | | | | | | | | | | |
| iStar, Inc. | | $ | 250,000 | | | 6.000 | | 4/1/2022 | | $ | 256,562 | |
| iStar, Inc. | | | 733,000 | | | 5.250 | | 9/15/2022 | | | 740,330 | |
| MGM Growth Properties Operating Partnership LP - 144A | | | 261,000 | | | 5.750 | | 2/1/2027 | | | 275,029 | |
| MPT Operating Partnership LP | | | 569,000 | | | 5.000 | | 10/15/2027 | | | 571,845 | |
| Sabra Health Care LP | | | 717,000 | | | 5.125 | | 8/15/2026 | | | 711,819 | |
| Starwood Property Trust, Inc. | | | 794,000 | | | 4.750 | | 3/15/2025 | | | 797,970 | |
| | | | | | | | | | | | 6,928,780 | |
| RETAIL - 2.2% | | | | | | | | | | | | |
| Brinker International, Inc. - 144A | | | 547,000 | | | 5.000 | | 10/1/2024 | | | 548,367 | |
| Conn’s, Inc. | | | 784,000 | | | 7.250 | | 7/15/2022 | | | 787,920 | |
| FirstCash, Inc. - 144A | | | 450,000 | | | 5.375 | | 6/1/2024 | | | 462,375 | |
| Lithia Motors, Inc. - 144A | | | 586,000 | | | 5.250 | | 8/1/2025 | | | 592,593 | |
| | | | | | | | | | | | 2,391,255 | |
| SEMICONDUCTORS - 0.5% | | | | | | | | | | | | |
| Amkor Technology, Inc. - 144A | | | 494,000 | | | 6.625 | | 9/15/2027 | | | 504,343 | |
| | | | | | | | | | | | | |
| SOFTWARE - 2.3% | | | | | | | | | | | | |
| CDK Global, Inc. | | | 539,000 | | | 5.875 | | 6/15/2026 | | | 569,993 | |
| Donnelley Financial Solutions, Inc. | | | 723,000 | | | 8.250 | | 10/15/2024 | | | 737,460 | |
| Rackspace Hosting, Inc. - 144A ^ | | | 625,000 | | | 8.625 | | 11/15/2024 | | | 584,375 | |
| SS&C Technologies, Inc. - 144A | | | 557,000 | | | 5.500 | | 9/30/2027 | | | 572,318 | |
| | | | | | | | | | | | 2,464,146 | |
| TELECOMMUNICATIONS - 9.5% | | | | | | | | | | | | |
| Altice France SA - 144A | | | 875,000 | | | 7.375 | | 5/1/2026 | | | 888,672 | |
| Altice France SA - 144A | | | 213,000 | | | 8.125 | | 2/1/2027 | | | 223,118 | |
| Anixter, Inc. - 144A | | | 319,000 | | | 6.000 | | 12/1/2025 | | | 339,735 | |
| C&W Senior Financing Designated Activity Co. - 144A | | | 633,000 | | | 6.875 | | 9/15/2027 | | | 636,792 | |
| CenturyLink, Inc. | | | 1,435,000 | | | 7.500 | | 4/1/2024 | | | 1,544,419 | |
| CommScope Finance LLC - 144A | | | 577,000 | | | 6.000 | | 3/1/2026 | | | 612,341 | |
| Frontier Communications Corp. | | | 700,000 | | | 7.125 | | 1/15/2023 | | | 439,250 | |
| Frontier Communications Corp. | | | 199,000 | | | 7.625 | | 4/15/2024 | | | 110,942 | |
| Frontier Communications Corp. - 144A | | | 305,000 | | | 8.500 | | 4/1/2026 | | | 288,225 | |
| Hughes Satellite Systems Corp. | | | 553,000 | | | 6.625 | | 8/1/2026 | | | 560,604 | |
| Intelsat Jackson Holdings SA | | | 769,000 | | | 5.500 | | 8/1/2023 | | | 699,790 | |
| Sprint Corp. | | | 3,362,000 | | | 7.875 | | 9/15/2023 | | | 3,510,600 | |
| Telesat LLC - 144A | | | 491,000 | | | 8.875 | | 11/15/2024 | | | 533,349 | |
| | | | | | | | | | | | 10,387,837 | |
| TRUCKING & LEASING - 0.8% | | | | | | | | | | | | |
| Avolon Holdings Funding Ltd. - 144A | | | 725,000 | | | 5.125 | | 10/1/2023 | | | 753,319 | |
| Avolon Holdings Funding Ltd. - 144A | | | 145,000 | | | 5.250 | | 5/15/2024 | | | 151,663 | |
| | | | | | | | | | | | 904,982 | |
| TOTAL BONDS & NOTES (Cost - $101,868,101) | | | | | | | | | | | 102,578,525 | |
| | | | | | | | | | | | | |
| | | Shares | | | | | | | | | |
| EXCHANGE TRADED FUND - 1.0% | | | | | | | | | | | | |
| DEBT FUND - 1.0% | | | | | | | | | | | | |
| iShares iBoxx High Yield Corporate Bond ETF ^ | | | 12,149 | | | | | | | | 1,056,234 | |
| TOTAL EXCHANGE TRADED FUND (Cost - $1,030,477) | | | | | | | | | | | | |
| | | | | | | | | | | | | |
See accompanying notes to financial statements.
| SCHEDULE OF INVESTMENTS (Unaudited) |
| Dunham High-Yield Bond Fund (Continued) |
| April 30, 2019 |
| | | | | | Interest | | | | |
| Security | | Shares | | | Rate% | | | Value | |
| SHORT-TERM INVESTMENT - 3.2% | | | | | | | | |
| MONEY MARKET FUND - 3.2% | | | | | | | | | |
| First American Government Obligations Fund - Class Z | | | 3,495,668 | | | | 2.280 | + | | $ | 3,495,668 | |
| TOTAL SHORT-TERM INVESTMENT (Cost - $3,495,668) | | | | | | | | |
| | | | | | | | | | | | | |
| COLLATERAL FOR SECURITIES LOANED - 2.2% | | | | | | | | | | | | |
| HSBC US Government Money Market Fund - Class Institutional # | | | 360,160 | | | | 2.426 | + | | | 360,160 | |
| Morgan Stanley Institutional Liquidity Fund Prime Portfolio - Class Institutional # | | | 2,000,000 | | | | 2.526 | + | | | 2,000,000 | |
| TOTAL COLLATERAL FOR SECURITIES LOANED (Cost - $2,360,160) | | | | | 2,360,160 | |
| | | | | | | | | | | | | |
| TOTAL INVESTMENTS - 100.4% (Cost - $108,754,406) | | | | | $ | 109,490,587 | |
| OTHER ASSETS IN EXCESS OF LIABILITIES - (0.4)% | | | | | (396,591 | ) |
| NET ASSETS - 100.0% | | | | | | $ | 109,093,996 | |
| | | | | | | | | | | | | |
LLC - Limited Liability Corporation
LP - Limited Partnership
PLC - Public Limited Company
SARL - Société à responsabilité limitée
| ^ | All or a portion of these securities are on loan. Total loaned securities had a value of $2,313,378 at April 30, 2019. |
| + | Variable rate security. Interest rate is as of April 30, 2019. |
| # | The Trust’s securities lending policies and procedures require that the borrower: (i) deliver cash or U.S. Government securities as collateral with respect to each new loan of U.S. securities, equal to at least 102% of the value of the portfolio securities loaned, and (ii) at all times thereafter mark-to-market the collateral on a daily basis so that the market value of such collateral is at least 100% of the value of securities loaned. From time to time the collateral may not be 102% due to end of day market movement. The next business day additional collateral is obtained/received from the borrower to replenish/reestablish 102%. |
144A - Security exempt from registration under Rule 144A of the Securities Act of 1933. These securities may be sold in transactions exempt from registration, normally to qualified institutional buyers. As of April 30, 2019 the total market value of 144A securities is $62,867,716 or 57.63% of net assets.
| Portfolio Composition** - (Unaudited) |
| Ba3 | | | 18.8 | % | | Caa2 | | | 3.9 | % |
| B3 | | | 17.1 | % | | Short-Term Investment | | | 3.2 | % |
| B2 | | | 14.3 | % | | Baa3 | | | 2.2 | % |
| B1 | | | 12.6 | % | | Collateral For Securities Loaned | | | 2.2 | % |
| Ba2 | | | 11.5 | % | | Exchange Traded Fund | | | 1.0 | % |
| Ba1 | | | 6.8 | % | | Other | | | 0.6 | % |
| Caa1 | | | 5.3 | % | | Caa3 | | | 0.5 | % |
| | | | | | | Total | | | 100.0 | % |
| | | | | | | | | | | |
| ** | Based on total value of investments as of April 30, 2019. Bond Ratings provided by Moody’s Ratings. |
Percentage may differ from Schedule of Investments which is based on Fund net assets.
See accompanying notes to financial statements.
| Dunham International Opportunity Bond Fund (Unaudited) |
| Message from the Sub-Adviser (Allianz Global Investors U.S. LLC) |
| |
Asset Class Recap
During the first fiscal quarter, the U.S. Federal Reserve continued to reduce the balance sheet, albeit at a slower pace, and raised interest rates by 0.25 percent. In addition, China faced troubles in their economy. The collapse of oil prices to approximately $40 a barrel also hurt investor sentiment. During the second fiscal quarter, these three key macro drivers stabilized economies, according to the Sub-Adviser. The first key macroeconomic driver was the Unites States Federal Reserve’s decision to end interest rate hikes for the rest of the 2019 year and stop their balance sheet’s quantitative tightening. The second macroeconomic driver involved China responding to its economic slowdown with targeted fiscal and monetary stimulus. The third macroeconomic driver was attributed to oil prices stabilizing.
During the first fiscal quarter, foreign bonds, as measured by the Bloomberg Barclays Global Aggregate ex US Index, increased 4.3 percent. During the second fiscal quarter, foreign bonds decreased 1.0 percent. For the six-month period, foreign bonds rose 3.3 percent. Detracting from overall returns was the strength of the U.S. dollar, which rose 1.4 percent versus a broad basket of foreign currencies, as measured by the Deutsche Bank US Dollar Index.
Allocation Review
During the six-month period, foreign corporate and sovereign debt contributed to Fund performance relative to the benchmark index, while currency selection was flat. For example, country contributions were the result of the Sub-Adviser’s highly selective overweight exposure to emerging markets debt in the Middle East, Middle Asia, and South America. The relative effects of currency was basically flat due to the Sub-Adviser being underweight a strong U.S. Dollar and going long the appreciating emerging market currencies. Spread contributions were due to the Sub-Adviser overweighting corporate bonds in the financials and utilities sectors while underweighting bonds in the industrial sector.
Holdings Insights
Country selection within emerging markets contributed to Fund performance. For example, an emerging market government bond was the Republic of Indonesia Bond 2.15% 7/18/24 (BF41YJ0) (holding weight*: 1.26 percent). The bond returned 5.9 percent in Euros during the six-month period. However, since the bond was issued in Euros, it did not benefit from the appreciation that the Indonesian Rupiah experienced during the six-month period. Another emerging market government bond that contributed to relative and absolute performance was the Republic of Kazakhstan 5.125% 7/21/2025 (Y7276LDE5) (holding weight*: 1.18 percent). This U.S. dollar denominated issue returned 6.9 percent. Another emerging market government bond that contributed to performance was the Saudi International Bond 4.000% 4/17/2025 (BFNF0Z1) (holding weight*: 1.10 percent). This U.S. dollar denominated issue returned 7.6 percent. In addition, corporate bond sector selection had a significant contribution to Fund performance, as well. For example, from the financial sector, Enel Finance International 1.966% 1/27/25 (BVL8RV9) (holding weight*: 0.64 percent) rose 6.4 percent in Euros, but was slightly lower when converted to U.S. Dollars.
Security selection in Japan and a large allocation to Japanese government bonds detracted from Fund performance. For example, the Japan Government Bond 2.100% 12/20/27 (B2B35B7) (holding weight*: 7.31 percent) increased 1.5 percent in Japanese Yen, and when converted to U.S. dollars, performance was only slightly higher. Another detractor was the Japan Government Bond 1.900% 9/20/23 (6708557) (holding weight*: 5.84 percent), which increased 0.3 percent in Japanese Yen but was still relatively flat when measured in U.S dollars. In addition, the Japan Government Bond) 0.1% 11/01/2020 (BGXQKV7 (holding weight*: 0.98 percent) detracted from the Fund, as local currency performance was flat and performance in U.S. dollars was slightly positive.
Sub-Adviser Outlook
Although financial conditions appear to have loosened due to accommodative monetary policy, the Sub-Adviser believes narrow money supply indicators are running below their long-term averages, suggesting weak global growth ahead. The Sub-Adviser remains cautious and has a preference for higher quality bonds. In addition, the Sub-Adviser believes investment grade spreads should remain range bound but may be accompanied by increased dispersion among sectors returns. For example, the Sub-Adviser believes the financial sector has less risky business models, while the outlook for investment grade industrials is deteriorating due to leverage fueled by significant M&A activity. Thus, the Sub-Adviser continues to favor sovereign issuers over corporate issuers due to the near term refinancing risks of corporate issuers. Moving forward, the Sub-Adviser expects the U.S. dollar strength to eventually abate as growth trends lower, with the possibility of emerging market countries benefiting.
| * | Holdings percentage(s) of total investments as of 4/30/2019. |
Growth of $100,000 Investment
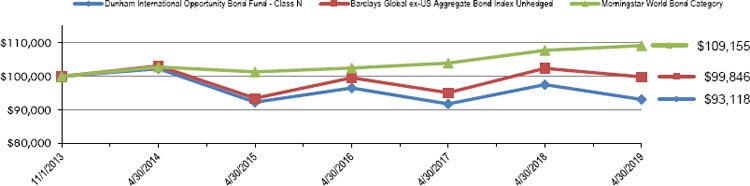
| Total Returns as of April 30, 2019 |
| | | | | Annualized |
| | | | Annualized | Since Inception |
| | Six Months | One Year | Five Years | (11/1/13) |
| Class N | 2.23% | (4.51)% | (1.86)% | (1.29)% |
| Class C | 1.78% | (5.23)% | (2.59)% | (2.04)% |
| Class A with load of 4.50% | (2.61)% | (9.18)% | (3.01)% | (2.36)% |
| Class A without load | 2.01% | (4.87)% | (2.11)% | (1.54)% |
| Barclays Global ex-US Aggregate Bond Index Unhedged | 3.25% | (2.51)% | (0.64)% | (0.03)% |
| Morningstar World Bond Category | 4.13% | 1.31% | 1.21% | 1.61% |
| | | | | |
The Barclays Global ex US Aggregate Bond Index Unhedged is designed to be a broad based measure of the global investment-grade, fixed rate, fixed income corporate markets outside the United States. Investors cannot invest directly in an index or benchmark.
The Morningstar World Bond Category is generally representative of funds that invest at least 40% of bonds in foreign markets.
As disclosed in the Trust’s latest registration statement, the Fund’s total annual operating expenses, including underlying funds, are 1.35% for Class N, 2.10% for Class C and 1.60% for Class A. Class A shares are subject to a sales load of 4.50% and a deferred sales charge of up to 0.75%. The performance data quoted here represents past performance, which is not indicative of future results. Current performance may be lower or higher than the performance data quoted. The investment return and NAV will fluctuate, so that an investor’s shares, when redeemed, may be worth more or less than their original cost. Total returns are calculated assuming reinvestment of all dividends and capital gains distributions, if any. The returns do not reflect the deductions of taxes a shareholder would pay on the redemption of Fund shares or Fund distributions. For performance information current to the most recent month-end, please call 1-800-442-4358 or visit our website www.dunham.com.
| SCHEDULE OF INVESTMENTS (Unaudited) |
| Dunham International Opportunity Bond Fund |
| April 30, 2019 |
| | | | | Principal | | | | Interest | | | Maturity | | | |
| Security | | Variable Rate | | Amount | | | | Rate% | | | Date | | Value | |
| CORPORATE BONDS & NOTES - 36.4% | | | | | | | | | | | | | | | | |
| APPAREL - 1.4% | | | | | | | | | | | | | | | | |
| LVMH Moet Hennessy Louis Vuitton SE | | | | 450,000 | | EUR | | | 0.3750 | | | 5/26/2022 | | $ | 511,402 | |
| | | | | | | | | | | | | | | | | |
| AUTO MANUFACTURERS - 0.6% | | | | | | | | | | | | | | | | |
| BMW Finance NV | | | | 200,000 | | EUR | | | 0.7500 | | | 4/15/2024 | | | 229,143 | |
| | | | | | | | | | | | | | | | | |
| BANKS - 17.2% | | | | | | | | | | | | | | | | |
| ABN AMRO Bank NV | | | | 200,000 | | EUR | | | 6.3750 | | | 4/27/2021 | | | 252,309 | |
| AIB Group PLC | | | | 150,000 | | EUR | | | 2.2500 | | | 7/3/2025 | | | 176,761 | |
| Banco Santander SA | | 3M Euro LIBOR + 0.75% | | 200,000 | | EUR | | | 0.4410 | + | | 3/28/2023 | | | 224,378 | |
| Banque Federative du Credit Mutuel SA | | | | 200,000 | | EUR | | | 2.6250 | | | 3/18/2024 | | | 249,334 | |
| Bayerische Landesbank | | | | 500,000 | | EUR | | | 0.2500 | | | 9/4/2024 | | | 567,147 | |
| BNP Paribas SA | | 3M Euro LIBOR + 0.62% | | 250,000 | | EUR | | | 0.3120 | + | | 5/22/2023 | | | 280,418 | |
| BPCE SA | | | | 200,000 | | EUR | | | 4.6250 | | | 7/18/2023 | | | 261,187 | |
| CaixaBank SA | | | | 400,000 | | EUR | | | 0.6250 | | | 11/12/2020 | | | 454,304 | |
| Cooperatieve Rabobank UA | | | | 200,000 | | EUR | | | 1.3750 | | | 2/3/2027 | | | 240,141 | |
| Credit Agricole SA/London | | | | 200,000 | | EUR | | | 1.8750 | | | 12/20/2026 | | | 239,907 | |
| HSBC Holdings PLC | | | | 200,000 | | EUR | | | 6.0000 | | | 6/10/2019 | | | 225,539 | |
| ING Bank NV | | Euro 5 Year Swap Rate + 2.25% | | 200,000 | | EUR | | | 3.6250 | + | | 2/25/2026 | | | 236,736 | |
| KBC Group NV | | Euro 5 Year Swap Rate + 1.98% | | 200,000 | | EUR | | | 2.3750 | + | | 11/25/2024 | | | 226,580 | |
| Landesbank Hessen-Thueringen Girozentrale | | | | 500,000 | | EUR | | | 0.5000 | | | 9/25/2025 | | | 573,255 | |
| Landesbank Baden-Wuerttemberg | | | | 500,000 | | EUR | | | 0.3750 | | | 2/27/2025 | | | 569,933 | |
| Lloyds Bank PLC | | | | 200,000 | | EUR | | | 6.5000 | | | 3/24/2020 | | | 236,624 | |
| Mitsubishi UFJ Financial Group Inc | | 3 Month LIBOR + 0.86% | | 400,000 | | USD | | | 3.4464 | + | | 7/26/2023 | | | 401,947 | |
| Sumitomo Mitsui Financial Group Inc | | 3 Month LIBOR + 0.74% | | 250,000 | | USD | | | 3.3280 | + | | 1/17/2023 | | | 250,430 | |
| UBS Group Funding Switzerland AG | | | | 200,000 | | EUR | | | 1.2500 | | | 9/1/2026 | | | 231,900 | |
| Westpac Banking Corp | | | | 500,000 | | EUR | | | 0.3750 | | | 3/5/2023 | | | 565,288 | |
| | | | | | | | | | | | | | | | 6,464,118 | |
| BEVERAGES - 2.2% | | | | | | | | | | | | | | | | |
| Anheuser-Busch InBev SA/NV | | | | 300,000 | | EUR | | | 0.8750 | | | 3/17/2022 | | | 345,178 | |
| Heineken NV | | | | 200,000 | | EUR | | | 3.5000 | | | 3/19/2024 | | | 259,981 | |
| Pernod Richard SA | | | | 200,000 | | EUR | | | 1.5000 | | | 5/18/2026 | | | 236,959 | |
| | | | | | | | | | | | | | | | 842,118 | |
| CHEMICALS - 1.5% | | | | | | | | | | | | | | | | |
| Air Liquide Finance SA | | | | 500,000 | | EUR | | | 0.7500 | | | 6/13/2024 | | | 580,467 | |
| | | | | | | | | | | | | | | | | |
| ELECTRIC - 3.0% | | | | | | | | | | | | | | | | |
| Enel Finance International NV | | | | 200,000 | | EUR | | | 1.9660 | | | 1/27/2025 | | | 240,234 | |
| Engie SA | | | | 300,000 | | EUR | | | 2.3750 | | | 5/19/2026 | | | 385,466 | |
| Iberdrola Finanzas SAU | | | | 200,000 | | EUR | | | 1.0000 | | | 3/7/2025 | | | 232,876 | |
| Innogy Finance BV | | | | 250,000 | | EUR | | | 1.0000 | | | 4/13/2025 | | | 289,918 | |
| | | | | | | | | | | | | | | | 1,148,494 | |
| ENGINEERING & CONSTRUCTION - 0.4% | | | | | | | | | | | | | | | | |
| Heathrow Funding Ltd. | | | | 100,000 | | GBP | | | 7.1250 | | | 2/14/2024 | | | 157,698 | |
| | | | | | | | | | | | | | | | | |
| FOOD - 0.6% | | | | | | | | | | | | | | | | |
| Danone SA | | | | 200,000 | | EUR | | | 0.7090 | | | 11/3/2024 | | | 230,382 | |
| | | | | | | | | | | | | | | | | |
See accompanying notes to financial statements.
| SCHEDULE OF INVESTMENTS (Unaudited) |
| Dunham International Opportunity Bond Fund (Continued) |
| April 30, 2019 |
| | | | | Principal | | | | | | | Maturity | | | |
| Security | | Variable Rate | | Amount | | | | Interest Rate% | | | Date | | Value | |
| CORPORATE BONDS & NOTES - 36.4% (Continued) | | | | | | | | | | | | | | |
| INSURANCE - 2.0% | | | | | | | | | | | | | | | | |
| Great-West Lifeco, Inc. | | | | 300,000 | | EUR | | | 2.5000 | | | 4/18/2023 | | $ | 364,956 | |
| Willow No 2 Ireland PLC for Zurich Insurance Co., Ltd. | | 300,000 | | EUR | | | 3.3750 | | | 6/27/2022 | | | 371,822 | |
| | | | | | | | | | | | | | | | 736,778 | |
| MINING - 0.6% | | | | | | | | | | | | | | | | |
| Anglo American Capital PLC | | | | 200,000 | | EUR | | | 3.2500 | | | 4/3/2023 | | | 246,677 | |
| | | | | | | | | | | | | | | | | |
| OIL & GAS - 2.7% | | | | | | | | | | | | | | | | |
| BG Energy Capital PLC | | | | 350,000 | | EUR | | | 0.8300 | | | 9/19/2024 | | | 402,974 | |
| BP Capital Markets PLC | | | | 350,000 | | EUR | | | 1.2500 | | | 11/21/2022 | | | 409,610 | |
| Saudi Arabian Oil Co. - 144A | | | | 200,000 | | USD | | | 3.5000 | | | 4/16/2029 | | | 196,827 | |
| | | | | | | | | | | | | | | | 1,009,411 | |
| PHARMACEUTICALS - 1.4% | | | | | | | | | | | | | | | | |
| GlaxoSmithKline Capital PLC | | | | 350,000 | | EUR | | | 1.2500 | | | 5/21/2026 | | | 411,325 | |
| Teva Pharmaceutical Finance Netherlands II BV | | | | 100,000 | | EUR | | | 3.2500 | | | 4/15/2022 | | | 116,669 | |
| | | | | | | | | | | | | | | | 527,994 | |
| REAL ESTATE - 1.0% | | | | | | | | | | | | | | | | |
| DEMIRE Deutsche Mittelstand Real Estate AG | | 100,000 | | EUR | | | 2.8750 | | | 7/15/2022 | | | 114,031 | |
| Westfield America Management Ltd. | | | | 200,000 | | GBP | | | 2.1250 | | | 3/30/2025 | | | 258,977 | |
| | | | | | | | | | | | | | | | 373,008 | |
| SAVINGS & LOANS - 0.4% | | | | | | | | | | | | | | | | |
| Nationwide Building Society | | | | 100,000 | | EUR | | | 5.6250 | | | 9/9/2019 | | | 132,457 | |
| | | | | | | | | | | | | | | | | |
| TELECOMMUNICATIONS - 0.8% | | | | | | | | | | | | | | | | |
| Deutsche Telekom International Finance BV | | | | 250,000 | | EUR | | | 0.6250 | | | 4/3/2023 | | | 285,694 | |
| | | | | | | | | | | | | | | | | |
| WATER - 0.6% | | | | | | | | | | | | | | | | |
| Veolia Environnement SA | | | | 200,000 | | EUR | | | 1.4960 | | | 11/30/2026 | | | 239,112 | |
| | | | | | | | | | | | | | | | | |
| TOTAL CORPORATE BONDS & NOTES (Cost - $13,787,141) | | | | | | | | | | | 13,714,953 | |
| | | | | | | | | | | | | | | | | |
| FOREIGN GOVERNMENT BONDS - 59.9% | | | | | | | | | | | | | | |
| Bundesrepublik Deutschland Bundesanleihe | | 250,000 | | EUR | | | 2.5000 | | | 8/15/2046 | | | 412,696 | |
| Bundesrepublik Deutschland Bundesanleihe | | 75,000 | | EUR | | | 4.7500 | | | 7/4/2040 | | | 156,827 | |
| Bundesrepublik Deutschland Bundesanleihe | | 370,000 | | EUR | | | 2.5000 | | | 7/4/2044 | | | 600,627 | |
| Bundesrepublik Deutschland Bundesanleihe | | 320,000 | | EUR | | | 0.2500 | | | 8/15/2028 | | | 368,266 | |
| Bundesschatzanweisungen | | 450,000 | | EUR | | | 3.5000 | | | 12/13/2019 | | | 506,076 | |
| Canadian Government Bond | | 160,000 | | CAD | | | 5.0000 | | | 6/1/2037 | | | 173,830 | |
| Canadian Government Bond | | 280,000 | | CAD | | | 3.5000 | | | 12/1/2045 | | | 271,705 | |
| Colombia Government International Bond | | 200,000 | | EUR | | | 3.8750 | | | 3/22/2026 | | | 262,860 | |
| Denmark Government Bond | | 1,420,000 | | DKK | | | 3.0000 | | | 11/15/2021 | | | 232,814 | |
| Dominican Republic International Bond | | 150,000 | | USD | | | 6.0000 | | | 7/19/2028 | | | 158,625 | |
| French Republic Government Bond OAT | | 290,000 | | EUR | | | 4.5000 | | | 4/25/2041 | | | 544,211 | |
| French Republic Government Bond OAT | | 70,000 | | EUR | | | 1.2500 | | | 5/25/2034 | | | 83,736 | |
| Indonesia Government International Bond - 144A | | 400,000 | | EUR | | | 2.1500 | | | 7/18/2024 | | | 472,078 | |
| Indonesia Treasury Bond | | | | 5,400,000,000 | | IDR | | | 7.0000 | | | 5/15/2027 | | | 362,421 | |
| Indonesia Treasury Bond | | | | 2,450,000,000 | | IDR | | | 6.1250 | | | 5/15/2028 | | | 154,737 | |
| Ireland Government Bond | | | | 130,000 | | EUR | | | 5.4000 | | | 3/13/2025 | | | 191,730 | |
| Ireland Government Bond | | | | 50,000 | | EUR | | | 0.9000 | | | 5/15/2028 | | | 58,498 | |
| Ireland Government Bond | | | | 130,000 | | EUR | | | 1.3000 | | | 5/15/2033 | | | 152,810 | |
| Italy Buoni Poliennali Del Tesoro - 144A | | | | 235,000 | | EUR | | | 5.0000 | | | 9/1/2040 | | | 329,359 | |
| Italy Buoni Poliennali Del Tesoro | | | | 240,000 | | EUR | | | 4.5000 | | | 3/1/2024 | | | 305,263 | |
| Italy Buoni Poliennali Del Tesoro | | | | 625,000 | | EUR | | | 2.8000 | | | 12/1/2028 | | | 724,218 | |
| | | | | | | | | | | | | | | | | |
See accompanying notes to financial statements.
| SCHEDULE OF INVESTMENTS (Unaudited) |
| Dunham International Opportunity Bond Fund (Continued) |
| April 30, 2019 |
| | | | | Principal | | | | | | | Maturity | | | |
| Security | | Variable Rate | | Amount | | | | Interest Rate% | | | Date | | Value | |
| FOREIGN GOVERNMENT BONDS - 59.9% (Continued) | | | | | | | | | | | | |
| Italy Buoni Poliennali Del Tesoro | | | | 180,000 | | EUR | | | 3.7500 | | | 9/1/2024 | | $ | 222,445 | |
| Japan Government Forty Year Bond | | 9,850,000 | | JPY | | | 0.8000 | | | 3/20/2058 | | | 94,056 | |
| Japan Government Ten Year Bond | | 77,650,000 | | JPY | | | 0.8000 | | | 9/20/2022 | | | 720,294 | |
| Japan Government Ten Year Bond | | 33,400,000 | | JPY | | | 0.1000 | | | 12/20/2028 | | | 304,799 | |
| Japan Government Ten Year Bond | | 24,000,000 | | JPY | | | 0.1000 | | | 6/20/2026 | | | 219,630 | |
| Japan Government Thirty Year Bond | | 53,800,000 | | JPY | | | 0.5000 | | | 9/20/2046 | | | 482,041 | |
| Japan Government Thirty Year Bond | | 53,450,000 | | JPY | | | 1.5000 | | | 3/20/2045 | | | 598,234 | |
| Japan Government Twenty Year Bond | | 224,150,000 | | JPY | | | 1.9000 | | | 9/20/2023 | | | 2,196,540 | |
| Japan Government Twenty Year Bond | | 256,900,000 | | JPY | | | 2.1000 | | | 12/20/2027 | | | 2,749,071 | |
| Japan Government Twenty Year Bond | | 122,150,000 | | JPY | | | 1.7000 | | | 9/20/2033 | | | 1,339,162 | |
| Japan Government Twenty Year Bond | | 9,800,000 | | JPY | | | 0.7000 | | | 9/20/2038 | | | 93,685 | |
| Japan Government Two Year Bond | | 40,700,000 | | JPY | | | 0.1000 | | | 11/1/2020 | | | 366,877 | |
| Kazakhstan Government International Bond | | 400,000 | | USD | | | 5.1250 | | | 7/21/2025 | | | 441,954 | |
| Kingdom of Belgium Government Bond - 144A | | 130,000 | | EUR | | | 5.0000 | | | 3/28/2035 | | | 233,638 | |
| Kingdom of Belgium Government Bond - 144A | | 130,000 | | EUR | | | 4.2500 | | | 9/28/2022 | | | 169,197 | |
| Mexican Bonos | | | | 3,270,000 | | MXN | | | 5.7500 | | | 3/5/2026 | | | 151,444 | |
| Norway Government Bond - 144A | | 7,400,000 | | NOK | | | 2.0000 | | | 4/26/2028 | | | 878,347 | |
| Paraguay Government International Bond | | 200,000 | | USD | | | 5.0000 | | | 4/15/2026 | | | 212,000 | |
| Portugal Obrigacoes do Tesouro OT - 144A | | 100,000 | | EUR | | | 4.1250 | | | 4/14/2027 | | | 140,797 | |
| Province of Ontario Canada | | 280,000 | | CAD | | | 2.4000 | | | 6/2/2026 | | | 210,160 | |
| Qatar Government International Bond - 144A | | 350,000 | | USD | | | 4.0000 | | | 3/14/2029 | | | 365,067 | |
| Republic of Austria Government Bond - 144A | | 190,000 | | EUR | | | 2.4000 | | | 5/23/2034 | | | 265,638 | |
| Republic of Austria Government Bond - 144A | | 270,000 | | EUR | | | 1.2000 | | | 10/20/2025 | | | 328,687 | |
| Republic of Austria Government Bond - 144A | | 250,000 | | EUR | | | 0.7500 | | | 2/20/2028 | | | 293,849 | |
| Republic of Poland Government Bond | | 360,000 | | PLN | | | 5.7500 | | | 9/23/2022 | | | 105,529 | |
| Saudi Government International Bond | | 400,000 | | USD | | | 4.0000 | | | 4/17/2025 | | | 414,878 | |
| Spain Government Bond - 144A | | 140,000 | | EUR | | | 4.2000 | | | 1/31/2037 | | | 218,946 | |
| Spain Government Bond - 144A | | 600,000 | | EUR | | | 4.0000 | | | 4/30/2020 | | | 701,587 | |
| Swiss Confederation Government Bond | | 480,000 | | CHF | | | 4.0000 | | | 2/11/2023 | | | 556,428 | |
| United Kingdom Gilt | | 185,000 | | GBP | | | 4.5000 | | | 12/7/2042 | | | 374,265 | |
| United Kingdom Gilt | | 20,000 | | GBP | | | 4.0000 | | | 1/22/2060 | | | 44,869 | |
| United Kingdom Gilt | | | | 70,000 | | GBP | | | 4.2500 | | | 12/7/2055 | | | 157,700 | |
| United Kingdom Gilt | | | | 125,000 | | GBP | | | 3.2500 | | | 1/22/2044 | | | 213,967 | |
| United Kingdom Gilt | | | | 70,000 | | GBP | | | 3.5000 | | | 7/22/2068 | | | 151,007 | |
| TOTAL FOREIGN GOVERNMENT BONDS (Cost - $22,535,731) | | | | | | | | | | | 22,540,175 | |
| | | | | | | | | | | | | |
| WHOLE LOAN COLLATERAL - 1.0% | | | | | | | | | | | | |
| Bankinter 10 FTA | | 3M Euro LIBOR + 0.16% | | 86,376 | | EUR | | | 0.0001 | + | | 6/21/2043 | | | 96,107 | |
| Dutch Property Finance 2017-1 BV | | 3M Euro LIBOR + 0.68% | | 223,887 | | EUR | | | 0.3680 | + | | 1/28/2048 | | | 251,933 | |
| Fondo de Titulizacion de Activos Santander Hipotecario 2 | | 3M Euro LIBOR + 0.15% | | 37,824 | | EUR | | | 0.0001 | + | | 1/18/2049 | | | 41,805 | |
| TOTAL WHOLE LOAN COLLATERAL (Cost - $389,890) | | | | | | | | | | | 389,845 | |
| | | | | | | | | | | | | | | | | |
| | | | | Shares | | | | | | | | | | | | |
| SHORT - TERM INVESTMENT - 1.5% | | | | | | | | | | | | |
| MONEY MARKET FUND - 1.5% | | | | | | | | | | | | | | |
| Fidelity Institutional Money Market Fund - Government Portfolio - Institutional Class | | 557,191 | | | | | 2.3100 | + | | | | | 557,191 | |
| TOTAL SHORT-TERM INVESTMENT (Cost - $557,191) | | | | | | | | | | | | |
| | | | | | | | | | | | | | | | | |
| TOTAL INVESTMENTS - 98.8% (Cost - $37,269,953) | | | | | | | | $ | 37,202,164 | |
| OTHER ASSETS LESS LIABILITIES - 1.2% | | | | | | | | | | | 463,161 | |
| NET ASSETS - 100.0% | | | | | | | | | | | | | | $ | 37,665,325 | |
| CAD - Canadian Dollar | GBP - United Kingdom Pound | NOK - Norwegian Krone |
| CHF - Swiss Franc | IDR - Indonesian Rupiah | PLN - Polish Zloty |
| DKK - Danish Krone | JPY - Japanese Yen | USD - US Dollar |
| EUR - Euro | MXN - Mexican Peso | |
| | | |
| + | Variable rate security. Interest rate is as of April 30, 2019. |
144A - Security exempt from registration under Rule 144A of the Securities Act of 1933. These securities may be sold in transactions exempt from registration, normally to qualified institutional buyers. The 144A securities amounted to $4,594,017 or 12.2% of net assets.
See accompanying notes to financial statements.
| SCHEDULE OF INVESTMENTS (Unaudited) |
| Dunham International Opportunity Bond Fund (Continued) |
| April 30, 2019 |
| | | | | | | | | | | | | Unrealized | |
| | | | | | | | | | | | | Appreciation | |
| Futures Contracts * | | Counterparty | | Contracts | | | Notional | | | Expiration | | (Depreciation) | |
| FUTURES CONTRACTS PURCHASED - 0.0% | | | | | | | | | | |
| Australian 10 Year Bond Future | | Credit Suisse | | | 7 | | | $ | 681,299 | | | 6/17/2019 | | $ | 1,123 | |
| Canadian 10 Year Bond Future | | Credit Suisse | | | 1 | | | | 103,177 | | | 6/19/2019 | | | — | |
| EURO-SCHATZ Future | | Credit Suisse | | | 10 | | | | 1,254,288 | | | 6/6/2019 | | | 1,231 | |
| Long Gilt Future | | Credit Suisse | | | 5 | | | | 829,904 | | | 6/26/2019 | | | (657 | ) |
| NET UNREALIZED GAIN FROM FUTURES CONTRACTS PURCHASED | | | | | 1,697 | |
| | | | | | | | | | | | | | | | | |
| FUTURES CONTRACTS SOLD - 0.0% | | | | | | | | | | | | |
| EURO-BOBL Future | | Credit Suisse | | | (5 | ) | | | (744,874 | ) | | 6/6/2019 | | | 554 | |
| NET UNREALIZED GAIN FROM FUTURES CONTRACTS SOLD | | | | | | | 554 | |
| | | | | | | | | | | | | | | | | |
| NET UNREALIZED GAIN FROM FUTURES CONTRACTS | | | | | | | | $ | 2,251 | |
| | | | | | | | | | | | | | | | | |
| * | Face amounts are the underlying reference notional amounts to stock exchange indices and bonds upon which the fair value of the futures contracts traded by the Fund are based. |
While face amounts do not represent the current fair value and are not necessarily indicative of the future cash flows of the Fund’s futures contracts, the underlying price changes in relation to the variables specified by the face amounts affect the fair value of these derivative financial instruments. Instrument is non-income producing.
| Portfolio Composition ** - (Unaudited) |
| Japan | | | 26.4 | % | | Italy | | | 4.3 | % |
| Germany | | | 10.4 | % | | Canada | | | 2.7 | % |
| France | | | 10.3 | % | | Indonesia | | | 2.7 | % |
| Britain | | | 8.1 | % | | Belgium | | | 2.6 | % |
| Netherlands | | | 6.5 | % | | Other Countries | | | 20.7 | % |
| Spain | | | 5.3 | % | | Total | | | 100.00 | % |
| | | | | | | | | | | |
| ** | Based on total value of investments as of April 30, 2019. |
Percentage may differ from Schedule of Investments which are based on Fund net assets.
See accompanying notes to financial statements.
| SCHEDULE OF INVESTMENTS (Unaudited) |
| Dunham International Opportunity Bond Fund (Continued) |
| April 30, 2019 |
| |
As of April 30, 2019 the following Forward Currency Exchange contracts were open:
| Forward Currency Contracts |
| | | | | | | | | | | | | | | | | | | | | Unrealized | |
| | | | | Settlement | | | | Local Currency | | | | | | U.S. Dollar | | | | | | Appreciation | |
| Foreign Currency | | | | Date | | Counterparty | | Amount Purchased | | | | | | Market Value | | | | | | (Depreciation) | |
| To Sell USD and To Buy: | | | | | | | | | | | | | | | | | | | | | | | | |
| Australian Dollar | | 6/12/2019 | | Citigroup | | $ | 1,245,707 | | | | | | | $ | 877,706 | | | | | | | $ | (6,660 | ) |
| British Pound | | 6/12/2019 | | Citigroup | | | 1,188,681 | | | | | | | | 1,553,141 | | | | | | | | (8,020 | ) |
| Canadian Dollar | | 6/12/2019 | | Citigroup | | | 1,513,628 | | | | | | | | 1,126,437 | | | | | | | | (7,996 | ) |
| Euro | | 6/12/2019 | | Citigroup | | | 4,082,757 | | | | | | | | 4,592,228 | | | | | | | | (43,548 | ) |
| Japanese Yen | | 6/12/2019 | | Citigroup | | | 332,740,335 | | | | | | | | 2,997,995 | | | | | | | | (27,260 | ) |
| New Zealand Dollar | | 6/12/2019 | | Citigroup | | | 946,510 | | | | | | | | 631,727 | | | | | | | | (12,078 | ) |
| Swedish Krona | | 6/12/2019 | | Citigroup | | | 1,320,725 | | | | | | | | 139,398 | | | | | | | | (4,331 | ) |
| Brazilian Real | | 7/17/2019 | | Citigroup | | | 4,524,000 | | | | | | | | 1,138,166 | | | | | | | | (25,133 | ) |
| China Yuan Renminbi | | 7/17/2019 | | Citigroup | | | 1,437,000 | | | | | | | | 213,157 | | | | | | | | (1,809 | ) |
| Czech Koruna | | 7/17/2019 | | Citigroup | | | 1,121,861 | | | | | | | | 49,128 | | | | | | | | (373 | ) |
| Hungary Forint | | 7/17/2019 | | Citigroup | | | 14,302,000 | | | | | | | | 49,772 | | | | | | | | (1,099 | ) |
| Indonesian Rupiah | | 7/17/2019 | | Citigroup | | | 11,250,290,000 | | | | | | | | 781,344 | | | | | | | | (12,523 | ) |
| Mexican Peso | | 7/17/2019 | | Citigroup | | | 920,708 | | | | | | | | 47,791 | | | | | | | | (382 | ) |
| Polish Zloty | | 7/17/2019 | | Citigroup | | | 150,000 | | | | | | | | 39,275 | | | | | | | | (483 | ) |
| Russian Ruble | | 7/17/2019 | | Citigroup | | | 5,860,000 | | | | | | | | 89,742 | | | | | | | | (713 | ) |
| Singapore Dollar | | 7/17/2019 | | Citigroup | | | 165,000 | | | | | | | | 121,385 | | | | | | | | (799 | ) |
| South Korean Won | | 7/17/2019 | | Citigroup | | | 992,743,000 | | | | | | | | 852,360 | | | | | | | | (25,427 | ) |
| Thai Baht | | 7/17/2019 | | Citigroup | | | 6,706,000 | | | | | | | | 210,433 | | | | | | | | (598 | ) |
| | | | | | | | | | | | | | | | | | | | | | | | | $ | (179,232 | ) |
| | | | | | | | | | | | | | | | | | | | | | | | | | | |
| | | | | | | | | | | | | | | | | | | | | | | | | Unrealized | |
| | | | | Settlement | | | | Local Currency | | | | | | | U.S. Dollar | | | | | | | Appreciation | |
| Foreign Currency | | | | Date | | Counterparty | | Amount Sold | | | | | | | Market Value | | | | | | | (Depreciation) | |
| To Buy USD and To Sell: | | | | | | | | | | | | | | | | | | �� | | | | | | |
| Australian Dollar | | 6/12/2019 | | Citigroup | | $ | (23,881 | ) | | | | | | $ | (16,826 | ) | | | | | | $ | 135 | |
| British Pound | | 6/12/2019 | | Citigroup | | | (93,354 | ) | | | | | | | (121,977 | ) | | | | | | | 1,329 | |
| Canadian Dollar | | 6/12/2019 | | Citigroup | | | (42,558 | ) | | | | | | | (31,672 | ) | | | | | | | (97 | ) |
| Euro | | 6/12/2019 | | Citigroup | | | (7,359,915 | ) | | | | | | | (8,278,330 | ) | | | | | | | 64,177 | |
| Japanese Yen | | 6/12/2019 | | Citigroup | | | (78,283,191 | ) | | | | | | | (705,333 | ) | | | | | | | 3,765 | |
| New Zealand Dollar | | 6/12/2019 | | Citigroup | | | (782,148 | ) | | | | | | | (522,027 | ) | | | | | | | 15,966 | |
| Norwegian Krone | | 6/12/2019 | | Citigroup | | | (7,768,402 | ) | | | | | | | (899,860 | ) | | | | | | | 14,233 | |
| Indonesian Rupiah Total | | 7/17/2019 | | Citigroup | | | (5,339,238,000 | ) | | | | | | | (370,815 | ) | | | | | | | 94 | |
| | | | | | | | | | | | | | | | | | | | | | | | | $ | 99,602 | |
| | | | | | | | | | | | | | | | | | | | | | | | | | | |
| | | | | | | | | Local Currency | | | Local Currency | | | U.S. Dollar | | | U.S. Dollar | | | Unrealized | |
| | | | | Settlement | | | | Amount Purchased | | | Amount Purchased | | | Market Value | | | Market Value | | | Appreciation | |
| Foreign Currency | | | | Date | | Counterparty | | Buy | | | Sell | | | Buy | | | Sell | | | (Depreciation) | |
| To Buy: | | To Sell: | | | | | | | | | | | | | | | | | | | | | | | | |
| British Pound | | Euro | | 6/12/2019 | | Citigroup | | $ | 265,919 | | | $ | (307,484 | ) | | $ | 347,452 | | | $ | (345,854 | ) | | $ | 1,597 | |
| Danish Krone | | Euro | | 6/12/2019 | | Citigroup | | | 825,984 | | | | (110,746 | ) | | | 124,480 | | | | (124,566 | ) | | | (86 | ) |
| Euro | | Danish Krone | | 6/12/2019 | | Citigroup | | | 187,182 | | | | (1,396,127 | ) | | | 210,540 | | | | (210,403 | ) | | | 137 | |
| Euro | | Norwegian Kron | | 6/12/2019 | | Citigroup | | | 3,936 | | | | (38,138 | ) | | | 4,427 | | | | (4,418 | ) | | | 9 | |
| Euro | | Swiss Franc | | 6/12/2019 | | Citigroup | | | 183,719 | | | | (206,625 | ) | | | 206,644 | | | | (203,602 | ) | | | 3,042 | |
| Norwegian Krone | | Euro | | 6/12/2019 | | Citigroup | | | 651,448 | | | | (67,233 | ) | | | 75,461 | | | | (75,623 | ) | | | (162 | ) |
| Swedish Krona | | Euro | | 6/12/2019 | | Citigroup | | | 1,517,066 | | | | (144,705 | ) | | | 160,122 | | | | (162,762 | ) | | | (2,640 | ) |
| Swiss Franc | | Euro | | 6/12/2019 | | Citigroup | | | 35,000 | | | | (30,794 | ) | | | 34,488 | | | | (34,637 | ) | | | (149 | ) |
| | | | | | | | | | | | | | | | | | | | | | | | | $ | 1,748 | |
| | | | | | | | | | | | | | | | | | | | | | | | | | | |
| Net Unrealized Loss on Forward Currency Contracts | | | | | | | | $ | (77,882 | ) |
| | | | | | | | | | | | | | | | | | | | | | | | | | | |
See accompanying notes to financial statements.
| Dunham Large Cap Value Fund (Unaudited) |
| Message from the Sub-Adviser (Rothschild & Co. Asset Management US Inc.) |
Asset Class Recap
Over long periods of time, value and growth stocks are often compared to one another. In the heat of bull markets, growth historically advances its lead, but as the cool down commences and volatility erodes the markets, value has historically seen a relative recovery. This fiscal year has represented a microcosm of this long- term phenomenon. At the beginning of the fiscal year, volatility, as measured by the CBOE Volatility Index, was relatively high. Volatility oscillated through November and into December, before skyrocketing into Christmas Eve. During these spikes, large cap value stocks, as measured by the Russell 1000 Value Index, generally outperformed large cap growth stocks, as measured by the Russell 1000 Growth Index. However, as volatility subsided to historically low levels, the gains of growth over value rebounded. During the most recent fiscal quarter, amid the lower volatility, large cap value stocks increased 7.5 percent, losing more than 4 percent versus their growth stock peers and bringing overall performance of large cap value stocks to 7.9 percent for the six-month period ended April 30, 2019.
Allocation Review
While the Fund generally maintained a similar weighting in the two largest large cap value sectors, financials and health care, the Sub-Adviser over weighted the industrials, communication services, and information technology sectors. These overweights generally added positive performance during the first half of the fiscal year, as the information technology and industrials sectors proved to be the best performing sectors among large cap value stocks, up 18.8 percent and 14.7 percent, respectively. The communication services sector generally performed in-line with other large cap value stocks, increasing nearly 7.1 percent. While overweights to the highest performing sectors was generally beneficial, the primary underweights were in some of the underperforming sectors, such as consumer staples. During the fiscal quarter, the consumer staples sector increased 5.8 percent.
Holdings Insights
Although the Sub-Adviser’s sector allocation was a meaningful contributor to relative performance, two of the sectors that had relatively neutral exposures contained some of the poorest Fund performers during the six- month fiscal period. The Sub-Adviser’s security selection struggled within the health care and energy sectors. Specifically, holdings such as Biogen Inc. (BIIB) (holding weight*: 0.68 percent), a drug manufacturer focused on neurology, oncology, and immunology, and health insurer Cigna Corp. (CI) (holding weight*: 0.90 percent), each tumbled during the first half of the fiscal year. While the health care sector increased 2.9 percent during the period, BIIB and CI declined 24.7 percent and 25.7 percent, respectively. BIIB experienced the majority of its decline in the second fiscal quarter as an Alzheimer’s disease drug failed and wiped out more than $18 billion in market capitalization. CI experienced its drawdown from increased concerns surrounding the political posturing of the emerging democratic presidential field and the potential ramifications of “health care for all.”
Within the energy sector, oil exploration and drilling company ConocoPhillips (COP) (holding weight*: 1.45 percent), and global oil refiner Marathon Petroleum (MPC) (holding weight*: 1.41 percent), also struggled during the six-month period. As concerns loomed surrounding various energy spreads, potentially disruptive mergers, and geopolitical uncertainty, COP and MPC fell 9.3 percent and 12.3 percent, respectively. One of the companies involved in a merger disrupting the energy space, Chevron Corp. (CVX) (holding weight*: 2.43 percent), was one of the strongest performers for the Fund within the energy sector. CVX has sought to expand its presence in the Permian Basin through a strategic acquisition of Anadarko Petroleum Corp. (APC) (holding weight: not held), which has been entertaining multiple potential suitors. Despite a rapid increase in the bid price for APC, CVX has seen its own value leap 9.7 percent, outpacing the return of the energy sector as a whole.
Within the consumer staples and materials sectors, the Sub-Adviser uncovered some of the Fund’s strongest performers for the fiscal period. Global frozen chicken and beef supplier Tyson Foods Inc. (TSN) (holding weight*: 1.15 percent) soared 26.8 percent during the six-month period as the stock rebounded from a devastating 2018 decline plagued by falling chicken prices. Similarly, in the materials sector, Air Products and Chemicals Inc. (APD) (holding weight*: 1.51 percent), a natural gas and industry chemical supplier, expanded 35.1 percent during the period. APD benefitted from a strong project pipeline and a strong earnings report in the second fiscal quarter.
Sub-Adviser Outlook
As markets continued to head to higher levels, the Sub-Adviser was encouraged by the strong earnings releases and positive economic data. The Sub-Adviser remains focused on identifying companies with what it believes are attractive valuations relative to peers.
| * | Holdings percentage(s) of total investments, excluding collateral for securities loaned, as of 4/30/2019. |
Growth of $100,000 Investment
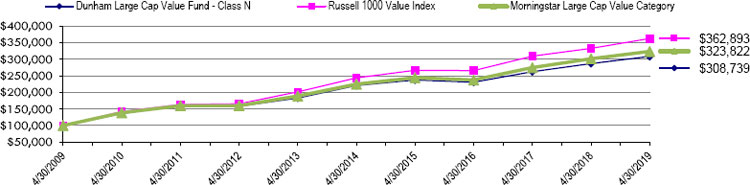
| | Total Returns as of April 30, 2019 | |
| | | | | | | | Annualized | | Annualized | |
| | | | Six Months | | One Year | | Five Years | | Ten Years | |
| | Class N | | 8.25% | | 7.49% | | 6.92% | | 11.93% | |
| | Class C | | 7.68% | | 6.41% | | 5.86% | | 10.83% | |
| | Class A with load of 5.75% | | 1.88% | | 1.07% | | 5.40% | | 11.00% | |
| | Class A without load | | 8.08% | | 7.25% | | 6.65% | | 11.67% | |
| | Russell 1000 Value Index | | 7.90% | | 9.06% | | 8.27% | | 13.76% | |
| | Morningstar Large Cap Value Category | | 6.89% | | 7.41% | | 7.53% | | 12.46% | |
The Russell 1000 Value Index is a subset of the Russell 1000 Index which measures the performance of the stocks of the 1000 largest companies in the Russell 3000 Index based on market capitalization. The Russell 1000 Value Index measures the performance of those Russell 1000 companies with lower price-to-book ratios and lower forecasted growth values.
The Morningstar Large Cap Value Category is generally representative of mutual funds that primarily invest in big (large capitalization) U.S. companies that are less expensive or growing more slowly than other large-cap stocks.
Investors cannot invest directly in an index or benchmark.
As disclosed in the Trust’s latest registration statement, the Fund’s total annual operating expenses, including underlying funds, are 1.30% for Class N, 2.30% for Class C and 1.55% for Class A. Class A shares are subject to a sales load of 5.75% and a deferred sales charge of up to 0.75%. The performance data quoted here represents past performance, which is not indicative of future results. Current performance may be lower or higher than the performance data quoted. The investment return and NAV will fluctuate, so that an investor’s shares, when redeemed, may be worth more or less than their original cost. Total returns are calculated assuming reinvestment of all dividends and capital gains distributions, if any. The returns do not reflect the deductions of taxes a shareholder would pay on the redemption of Fund shares or Fund distributions. For performance information current to the most recent month-end, please call 1-800-442-4358 or visit our website www.dunham.com.
| SCHEDULE OF INVESTMENTS (Unaudited) |
| Dunham Large Cap Value Fund |
| April 30, 2019 |
| Security | | Shares | | | Value | |
| COMMON STOCKS - 97.3% | | | | | | | | |
| AEROSPACE/DEFENSE - 2.5% | | | | | | | | |
| Boeing Co. | | | 2,096 | | | $ | 791,638 | |
| Northrop Grumman Corp. | | | 2,995 | | | | 868,280 | |
| Raytheon Co. | | | 2,164 | | | | 384,305 | |
| | | | | | | | 2,044,223 | |
| AIRLINES - 1.5% | | | | | | | | |
| Delta Air Lines, Inc. | | | 20,355 | | | | 1,186,493 | |
| | | | | | | | | |
| APPAREL - 1.1% | | | | | | | | |
| PVH Corp. | | | 6,674 | | | | 860,879 | |
| | | | | | | | | |
| AUTO PARTS & EQUIPMENT - 0.5% | | | | | | | | |
| BorgWarner, Inc. | | | 9,640 | | | | 402,663 | |
| | | | | | | | | |
| BANKS - 10.4% | | | | | | | | |
| Bank of America Corp. | | | 88,142 | | | | 2,695,383 | |
| JPMorgan Chase & Co. | | | 27,227 | | | | 3,159,693 | |
| State Street Corp. | | | 13,565 | | | | 917,808 | |
| SunTrust Banks, Inc. | | | 15,871 | | | | 1,039,233 | |
| Wells Fargo & Co. | | | 12,234 | | | | 592,248 | |
| | | | | | | | 8,404,365 | |
| BEVERAGES - 1.5% | | | | | | | | |
| PepsiCo, Inc. | | | 9,483 | | | | 1,214,298 | |
| | | | | | | | | |
| BIOTECHNOLOGY - 1.6% | | | | | | | | |
| Biogen, Inc. * | | | 2,408 | | | | 552,010 | |
| Gilead Sciences, Inc. | | | 11,852 | | | | 770,854 | |
| | | | | | | | 1,322,864 | |
| BUILDING MATERIALS - 0.7% | | | | | | | | |
| Owens Corning | | | 10,897 | | | | 558,689 | |
| | | | | | | | | |
| CHEMICALS - 1.5% | | | | | | | | |
| Air Products & Chemicals, Inc. | | | 5,939 | | | | 1,222,187 | |
| | | | | | | | | |
| COSMETICS / PERSONAL CARE - 2.3% | | | | | | | | |
| Procter & Gamble Co. | | | 17,625 | | | | 1,876,710 | |
| | | | | | | | | |
| DIVERSIFIED FINANCIAL SERVICES - 5.9% | | | | | | | | |
| American Express Co. | | | 9,616 | | | | 1,127,284 | |
| Charles Schwab Corp. | | | 12,891 | | | | 590,150 | |
| Discover Financial Services | | | 14,359 | | | | 1,170,115 | |
| E*TRADE Financial Corp. | | | 18,023 | | | | 913,045 | |
| Intercontinental Exchange, Inc. | | | 12,191 | | | | 991,738 | |
| | | | | | | | 4,792,332 | |
| ELECTRIC - 5.0% | | | | | | | | |
| American Electric Power Co., Inc. | | | 14,681 | | | | 1,255,960 | |
| DTE Energy Co. | | | 8,863 | | | | 1,114,168 | |
| Xcel Energy, Inc. | | | 29,125 | | | | 1,645,562 | |
| | | | | | | | 4,015,690 | |
| ELECTRONICS - 1.1% | | | | | | | | |
| Honeywell International, Inc. | | | 5,110 | | | | 887,249 | |
| | | | | | | | | |
| ENVIRONMENTAL CONTROL - 1.8% | | | | | | | | |
| Waste Management, Inc. | | | 13,734 | | | | 1,474,208 | |
| | | | | | | | | |
| FOOD - 1.1% | | | | | | | | |
| Tyson Foods, Inc. | | | 12,324 | | | | 924,423 | |
| | | | | | | | | |
| HEALTHCARE-PRODUCTS - 4.8% | | | | | | | | |
| Danaher Corp. | | | 5,533 | | | | 732,790 | |
| Hill-Rom Holdings, Inc. | | | 5,228 | | | | 530,224 | |
| Medtronic PLC | | | 18,025 | | | | 1,600,800 | |
| Thermo Fisher Scientific, Inc. | | | 3,744 | | | | 1,038,773 | |
| | | | | | | | 3,902,587 | |
| Security | | Shares | | | Value | |
| HEALTHCARE-SERVICES - 0.7% | | | | | | | | |
| UnitedHealth Group, Inc. | | | 2,564 | | | $ | 597,591 | |
| | | | | | | | | |
| INSURANCE - 5.7% | | | | | | | | |
| Allstate Corp. | | | 7,369 | | | | 729,973 | |
| Berkshire Hathaway, Inc. * | �� | | 4,615 | | | | 1,000,117 | |
| Hartford Financial Services Group, Inc. | | | 21,768 | | | | 1,138,684 | |
| Prudential Financial, Inc. | | | 9,846 | | | | 1,040,821 | |
| Travelers Cos., Inc. | | | 5,124 | | | | 736,575 | |
| | | | | | | | 4,646,170 | |
| INTERNET - 1.2% | | | | | | | | |
| Alphabet, Inc. * | | | 823 | | | | 986,744 | |
| | | | | | | | | |
| IRON / STEEL - 0.5% | | | | | | | | |
| Nucor Corp. | | | 7,157 | | | | 408,450 | |
| | | | | | | | | |
| LEISURE TIME - 1.3% | | | | | | | | |
| Royal Caribbean Cruises Ltd. | | | 8,981 | | | | 1,086,162 | |
| | | | | | | | | |
| MACHINERY- DIVERSIFIED - 1.0% | | | | | | | | |
| Caterpillar, Inc. | | | 5,538 | | | | 772,108 | |
| | | | | | | | | |
| MEDIA - 4.2% | | | | | | | | |
| Comcast Corp. | | | 49,331 | | | | 2,147,379 | |
| Walt Disney Co. | | | 9,388 | | | | 1,285,874 | |
| | | | | | | | 3,433,253 | |
| MISCELLANEOUS MANUFACTURING - 2.6% | | | | | | | | |
| Ingersoll-Rand PLC | | | 9,815 | | | | 1,203,417 | |
| Parker-Hannifin Corp. | | | 5,164 | | | | 935,097 | |
| | | | | | | | 2,138,514 | |
| OIL & GAS - 9.5% | | | | | | | | |
| Chevron Corp. | | | 16,334 | | | | 1,961,060 | |
| ConocoPhillips | | | 18,552 | | | | 1,171,002 | |
| Diamondback Energy, Inc. | | | 8,220 | | | | 874,526 | |
| EOG Resources, Inc. | | | 10,075 | | | | 967,704 | |
| Helmerich & Payne, Inc. | | | 11,935 | | | | 698,436 | |
| Marathon Petroleum Corp. | | | 18,653 | | | | 1,135,408 | |
| Phillips 66 | | | 9,013 | | | | 849,656 | |
| | | | | | | | 7,657,792 | |
| PHARMACEUTICALS - 7.8% | | | | | | | | |
| Allergan PLC | | | 3,978 | | | | 584,766 | |
| Cigna Corp. | | | 4,548 | | | | 722,404 | |
| Eli Lilly & Co. | | | 6,639 | | | | 777,029 | |
| Merck & Co., Inc. | | | 25,230 | | | | 1,985,853 | |
| Pfizer, Inc. | | | 55,296 | | | | 2,245,571 | |
| | | | | | | | 6,315,623 | |
| REITS - 4.1% | | | | | | | | |
| Alexandria Real Estate Equities, Inc. | | | 3,264 | | | | 464,761 | |
| AvalonBay Communities, Inc. | | | 3,032 | | | | 609,220 | |
| Equity LifeStyle Properties, Inc. | | | 6,214 | | | | 725,174 | |
| Highwoods Properties, Inc. | | | 9,917 | | | | 442,100 | |
| Prologis, Inc. | | | 13,483 | | | | 1,033,741 | |
| | | | | | | | 3,274,996 | |
| SEMICONDUCTORS - 3.7% | | | | | | | | |
| Broadcom Ltd. | | | 4,554 | | | | 1,449,994 | |
| Intel Corp. | | | 13,914 | | | | 710,170 | |
| NXP Semiconductors NV | | | 8,087 | | | | 854,149 | |
| | | | | | | | 3,014,313 | |
| SOFTWARE - 3.3% | | | | | | | | |
| Microsoft Corp. | | | 11,694 | | | | 1,527,236 | |
| Oracle Corp. | | | 20,156 | | | | 1,115,232 | |
| | | | | | | | 2,642,468 | |
See accompanying notes to financial statements.
| SCHEDULE OF INVESTMENTS (Unaudited) |
| Dunham Large Cap Value Fund (continued) |
| April 30, 2019 |
| Security | | Shares | | | Value | |
| COMMON STOCKS - 97.3% (Continued) | | | | | | | | |
| TELECOMMUNICATIONS - 8.4% | | | | | | | | |
| AT&T, Inc. | | | 51,261 | | | $ | 1,587,041 | |
| Cisco Systems, Inc. | | | 51,469 | | | | 2,879,690 | |
| Verizon Communications, Inc. | | | 40,359 | | | | 2,308,131 | |
| | | | | | | | 6,774,862 | |
| TOTAL COMMON STOCKS (Cost - $61,022,634) | | | | | | | 78,838,906 | |
| | | | | | | | | |
| SHORT - TERM INVESTMENT - 2.3% | | | | | |
| MONEY MARKET FUND - 2.3% | | | | | | | | |
| Invesco STIT-Treasury Portfolio Institutional Class - 2.32% + | | | 1,875,265 | | | | 1,875,265 | |
| (Cost - $1,875,265) | | | | | | | | |
| | | Value | |
| | | | |
| TOTAL INVESTMENTS - 99.6% (Cost - $62,897,899) | | $ | 80,714,171 | |
| OTHER ASSETS LESS LIABILITIES - 0.4% | | | 297,388 | |
| NET ASSETS - 100.0% | | $ | 81,011,559 | |
PLC - Public Limited Company
REITS - Real Estate Investment Trust
| * | Non-income producing security. |
| + | Variable rate security. Interest rate is as of April 30, 2019. |
| Portfolio Composition * - (Unaudited) |
| Financial | | | 26.2 | % | | Technology | | | 7.0 | % |
| Consumer, Non-cyclical | | | 20.0 | % | | Utilities | | | 5.0 | % |
| Communications | | | 13.9 | % | | Consumer, Cyclical | | | 4.4 | % |
| Industrial | | | 9.7 | % | | Basic Materials | | | 2.0 | % |
| Energy | | | 9.5 | % | | Others | | | 2.3 | % |
| | | | | | | Total | | | 100.0 | % |
| * | Based on total value of investments as of April 30, 2019. |
Percentage may differ from Schedule of Investments which are based on Fund net assets.
See accompanying notes to financial statements.
| Dunham Focused Large Cap Growth Fund (Unaudited) |
| Message from the Sub-Adviser (The Ithaka Group, LLC) |
Asset Class Recap
One of the most consistent themes since the end of the Global Financial Crisis has been the tremendous performance of U.S. large cap growth stocks. Large cap growth stocks, as measured by the Russell 1000 Growth Index, have outpaced nearly every other broad asset class over the past 10-plus year period. Since the market low on March 9, 2009 through the end of the most recent fiscal quarter, large cap growth stocks increased more than 500 percent. Since the beginning of the fiscal year, large cap growth stocks have surged 12.1 percent. Nearly all of this positive performance came in the most recent fiscal quarter, as the first fiscal quarter was primarily represented by a drawdown and a subsequent recovery that brought the asset class back to break-even.
Allocation Review
Given the focus on bottom-up stock selection implemented by the Fund’s Sub-Adviser, the sector allocation of the Fund is solely a result of this process. Therefore, the Fund’s ultimate sector exposures are generally indicative of where the Sub-Adviser found the most compelling growth stocks. For example, close to 48 percent of the Fund was allocated to the information technology sector. Similarly, as the Sub-Adviser did not select any stocks within the consumer staples sector, the roughly 6 percent exposure in the benchmark was unrepresented in the Fund. Overall, the Fund’s sector allocation provided a wash in regard to relative performance, as the Fund’s largest sector overweight, information technology, was one of the strongest performers during the fiscal quarter, and the Fund’s largest sector underweight, industrials, slightly outperformed the benchmark as a whole, increasing 12.4 percent.
Holdings Insights
The Fund’s mandate to have no more than 35 stocks generally results in the Fund’s exposure to each stock being higher than that of the benchmark index. However, holdings such as Microsoft Corp. (MSFT) (holding weight*: 5.43 percent) was a relative underweight compared to the benchmark index. As MSFT surged 23.3 percent during the six-month period, it contributed to absolute performance, but the 1.4 percent underweight detracted from relative performance. Conversely, Veeva Systems Inc. (VEEV) (holding weight*: 3.65 percent), a cloud-based service provider for biotech and pharmaceutical companies, was a 3 percent overweight versus the benchmark index. Therefore, as VEEV rose 53.1 percent since the start of the fiscal year, it aided both absolute and relative performance.
Software as a service (SAAS) companies generally provided strong results during the six-month period, as Salesforce.com Inc. (CRM) (holding weight*: 5.98 percent) rose 20.5 percent, outperforming the information technology sector as a whole by close to 5 percent. Another peer in the SAAS space, Workday Inc. (WDAY) (holding weight*: 3.18 percent) also performed strongly, as it increased 54.6 percent during the same six-month period. Following suit, ServiceNow Inc. (NOW) (holding weight*: 4.69 percent), an enterprise information technology management software provider, jumped 50.0 percent as subscriptions surged, including subscriptions from U.S. federal agencies.
The health care sector was home to some of the best and worst performers during the first half of the fiscal year. Vertex Pharmaceuticals Inc. (VRTX) (holding weight*: 1.30 percent), a biotech company dominant in the cystic fibrosis market, fell 0.3 percent as a pricing standoff with UK parliament resulted in negative press. Align Technology Inc. (ALGN) (holding weight*: 2.09 percent), the producer of the Invisalign system, boasted a 46.8 percent return for the same period as orthodontic treatments returned to the spotlight.
Payment processing continues to provide ample growth opportunities, allowing for the adaptive credit card processors Visa Inc. (V) (holding weight*: 6.56 percent) and Mastercard Inc. (MA) (holding weight*: 6.61 percent) to thrive alongside the internet-born Paypal Holdings Inc. (PYPL) (holding weight*: 4.19 percent). As these companies have expanded their digital presence, earnings and growth prospects increased, leading to V, MA, and PYPL increasing 19.7 percent, 29.0 percent, and 34.0 percent, respectively since the start of the fiscal year.
Sub-Adviser Outlook
The Sub-Adviser continues to believe that the stocks in the Fund not only have strong balance sheets, but also garner free cash flow even in a stressed U.S. economic environment. Therefore, the Sub-Adviser is less concerned regarding temporary market displacements, so long as the strong growth characteristics that led them to the concentrated group of stocks in the Fund are unhindered.
| * | Holdings percentage(s) of total investments, excluding collateral for securities loaned, as of 4/30/2019. |
Growth of $100,000 Investment
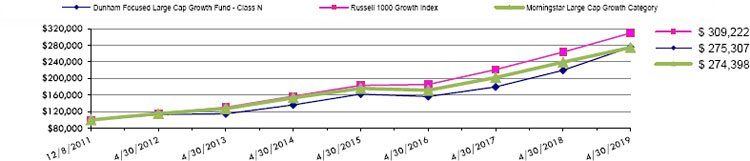
| | Total Returns as of April 30, 2019 | |
| | | | | | | | | | Annualized | |
| | | | | | | | Annualized | | Since Inception | |
| | | | Six Months | | One Year | | Five Years | | (12/8/11) | |
| | Class N | | 18.98% | | 25.39% | | 15.15% | | 14.68% | |
| | Class C | | 18.39% | | 24.19% | | 14.01% | | 13.56% | |
| | Class A with load of 5.75% | | 11.97% | | 17.90% | | 13.51% | | 13.48% | |
| | Class A without load | | 18.81% | | 25.09% | | 14.86% | | 14.39% | |
| | Russell 1000 Growth Index | | 12.09% | | 17.43% | | 14.50% | | 16.50% | |
| | Morningstar Large Cap Growth Category | | 12.17% | | 14.76% | | 12.35% | | 14.62% | |
The Russell 1000 Growth Index is a subset of the Russell 1000 Index which measures the performance of the stocks of the 1000 largest companies in the Russell 3000 Index based on market capitalization. The Russell 1000 Growth Index measures the performance of those stocks of the Russell 1000 with higher price-to-book ratios and higher relative forecasted growth rates. Investors cannot invest directly in an index or benchmark.
The Morningstar Large Cap Growth Category is generally representative of mutual funds that primarily invest in big (large capitalization) U.S. companies that are projected to grow faster than other large-cap stocks.
As disclosed in the Trust’s latest registration statement, the Fund’s total annual operating expenses, including the cost of underlying funds, are 1.30% for Class N, 2.30% for Class C and 1.55% for Class A. Class A shares are subject to a sales load of 5.75% and a deferred sales charge of up to 0.75%. The performance data quoted here represents past performance, which is not indicative of future results. Current performance may be lower or higher than the performance data quoted. The investment return and NAV will fluctuate, so that an investor’s shares, when redeemed, may be worth more or less than their original cost. Total returns are calculated assuming reinvestment of all dividends and capital gains distributions, if any. The returns do not reflect the deductions of taxes a shareholder would pay on the redemption of Fund shares or Fund distributions. For performance information current to the most recent month-end, please call 1-800-442-4358 or visit our website www.dunham.com
| SCHEDULE OF INVESTMENTS (Unaudited) |
| Dunham Focused Large Cap Growth Fund |
| April 30, 2019 |
| Security | | Shares | | | Value | |
| COMMON STOCKS - 98.4% | | | | | | | | |
| BIOTECHNOLOGY - 4.6% | | | | | | | | |
| Illumina, Inc. * | | | 11,317 | | | $ | 3,530,904 | |
| Vertex Pharmaceuticals, Inc. * | | | 8,242 | | | | 1,392,733 | |
| | | | | | | | 4,923,637 | |
| COMMERCIAL SERVICES - 10.2% | | | | | | | | |
| PayPal Holdings, Inc. * | | | 39,885 | | | | 4,497,831 | |
| S&P Global, Inc. | | | 9,911 | | | | 2,186,961 | |
| Square, Inc. * | | | 32,579 | | | | 2,372,403 | |
| TransUnion | | | 26,372 | | | | 1,836,810 | |
| | | | | | | | 10,894,005 | |
| DIVERSIFIED FINANCIAL SERVICES - 13.2% | | | | | | | | |
| Mastercard, Inc. | | | 27,914 | | | | 7,096,855 | |
| Visa, Inc. | | | 42,826 | | | | 7,041,879 | |
| | | | | | | | 14,138,734 | |
| HEALTHCARE-PRODUCTS - 8.0% | | | | | | | | |
| Align Technology, Inc. * | | | 6,922 | | | | 2,247,435 | |
| Edwards Lifesciences Corp. * | | | 17,403 | | | | 3,064,146 | |
| Intuitive Surgical, Inc. * | | | 6,293 | | | | 3,213,395 | |
| | | | | | | | 8,524,976 | |
| INTERNET - 17.5% | | | | | | | | |
| Alibaba Group Holding Ltd. - ADR * | | | 11,884 | | | | 2,205,314 | |
| Alphabet, Inc. * | | | 4,892 | | | | 5,814,044 | |
| Amazon.com, Inc. * | | | 4,055 | | | | 7,812,039 | |
| Facebook, Inc. * | | | 15,244 | | | | 2,948,190 | |
| | | | | | | | 18,779,587 | |
| PHARMACEUTICALS - 1.7% | | | | | | | | |
| DexCom, Inc. * | | | 15,479 | | | | 1,874,043 | |
| | | | | | | | | |
| RETAIL - 6.6% | | | | | | | | |
| Burlington Stores, Inc. * | | | 21,737 | | | | 3,671,597 | |
| Ulta Beauty, Inc. * | | | 9,898 | | | | 3,454,204 | |
| | | | | | | | 7,125,801 | |
| Security | | Shares | | | Value | |
| SEMICONDUCTORS - 2.5% | | | | | | | | |
| NVIDIA Corp. | | | 14,624 | | | $ | 2,646,944 | |
| | | | | | | | | |
| SOFTWARE - 34.1% | | | | | | | | |
| Adobe, Inc. * | | | 15,505 | | | | 4,484,821 | |
| Autodesk, Inc. * | | | 26,812 | | | | 4,778,166 | |
| Microsoft Corp. | | | 44,638 | | | | 5,829,723 | |
| Salesforce.com, Inc. * | | | 38,867 | | | | 6,426,658 | |
| ServiceNow, Inc. * | | | 18,566 | | | | 5,040,855 | |
| Splunk, Inc. * | | | 18,736 | | | | 2,586,317 | |
| Veeva Systems, Inc. * | | | 27,988 | | | | 3,914,682 | |
| Workday, Inc. * | | | 16,588 | | | | 3,410,990 | |
| | | | | | | | 36,472,212 | |
| | | | | | | | | |
| TOTAL COMMON STOCKS (Cost - $56,236,924) | | | | | | | 105,379,939 | |
| | | | | | | | | |
| SHORT-TERM INVESTMENT - 1.9% | | | | | | | | |
| MONEY MARKET FUND - 1.9% | | | | | | | | |
| Treasury Obligations Portfolio - Institutional Class 2.29% + | | | 2,010,454 | | | | 2,010,454 | |
| TOTAL SHORT-TERM INVESTMENT (Cost - $2,010,454) | | | | | | | | |
| | | | | | | | | |
| TOTAL INVESTMENTS - 100.3% (Cost - $58,247,378) | | | | | | $ | 107,390,393 | |
| LIABILITIES IN EXCESS OF OTHER ASSETS - (0.3)% | | | | | | | (292,304 | ) |
| NET ASSETS - 100.0% | | | | | | $ | 107,098,089 | |
ADR - American Depositary Receipt.
| * | Non-Income producing security. |
| + | Variable rate security. Interest rate is as of April 30, 2019. |
| Portfolio Composition*- (Unaudited) |
| Technology | | | 36.4 | % | | Financial | | | 13.2 | % |
| Consumer, Non-Cyclical | | | 24.4 | % | | Consumer, Cyclical | | | 6.6 | % |
| Communications | | | 17.5 | % | | Short-Term Investments | | | 1.9 | % |
| | | | | | | Total | | | 100.0 | % |
| * | Based on total value of investments as of April 30, 2019. |
Percentage may differ from Schedule of Investments which is based on Fund net assets
See accompanying notes to financial statements.
| Dunham International Stock Fund (Unaudited) |
| Message from the Sub-Adviser (Arrowstreet Capital, L.P.) |
Asset Class Recap
International equity markets, as measured by the MSCI All Country World ex USA Index (Net) (referred to as the “Index”), gained 9.12 percent during the six-month period ending April 30, 2019. Across sectors, gains were led by real estate, IT, and communication services.
The best performing developed market countries as measured by the Index during the period were Hong Kong, up 25.61 percent, and New Zealand, up 19.62 percent. The worst performing developed market countries were Norway, down 3.18 percent, and Austria, down 2.27 percent. The best performing emerging market countries over the trailing six-months as measured by the Index were Egypt, up 22.65 percent and South Africa, up 21.82 percent. The worst performing emerging market countries were Pakistan, down 12.87 percent, and Malaysia, up 0.02 percent.
Portfolio Review
The Sub-Adviser’s investment process is best characterized as a dynamic process that uses quantitative models to evaluate securities to exploit opportunities across companies, sectors, and countries while seeking to avoid long-term systematic biases toward any particular country, sector, style, or market capitalization. These stock selection models are designed to understand what information is likely to impact stock prices with a predictable and measurable lag that allows time to invest and profit. The models obtain the information to forecast individual stock returns by evaluating a stock’s potential on the basis of (1) direct effects - characteristics of the company itself; and (2) indirect effects- characteristics of other companies that are related by virtue of a common country and sector affiliation (called country/sector baskets); a common country affiliation; and a common global sector affiliation, and/or other common linkages. Over any time period, the strategy’s performance relative to the Index is driven by allocations to country/sector baskets, stock selection, and the effects of currency exposures differing from those of the Index.
Countries contributing most to returns relative to the Index during the trailing six-month period were: The UK, primarily due to positive selection and an underweight to consumer staples along with strong selection in materials; and Israel, primarily due to an overweight to IT and an underweight to health care. Countries contributing most to underperformance relative to the Index included: China, primarily due to underweights and poor stock selection in both communication services and consumer discretionary sectors; and Australia, primarily due to poor stock selection within the real estate sector along with an underweight to energy.
The sector contributing most to returns relative to the Index during the trailing six-month period were: Utilities, primarily due to an overweight in Italy. The sector contributing the most to underperformance relative to the Index was energy, primarily due to overweights and poor stock selection across both China and Italy.
Holdings Insights
The stocks contributing most to returns relative to the Index during the period included: Enel SPA (ENEL IM) (holding weight*: 1.31 percent), an Italian utilities company; British American Tobacco (BTI) (holding weight*: 0.002 percent), a UK consumer staples company; and Rio Tinto (RIO) (holding weight*: 1.40 percent), a UK materials company. Stocks contributing most to underperformance relative to the Index on a relative basis due to not being held included: Tencent Holdings (700 HK) (holding weight: not held), a Chinese communication services company; Alibaba (BABA) (holding weight: not held), a Chinese consumer discretionary company; and Naspers (NPN SJ) (holding weight: not held), a South African consumer discretionary company.
Sub-Adviser Outlook
The Sub-Adviser generally constructs its portfolios by using proprietary econometric models and a proprietary optimization process that balances the trade-off between a stock’s expected return, its contribution to portfolio level risk, portfolio specific restrictions, and its opportunity costs relative to trading costs. As this is performed quantitatively, the Sub-Adviser’s outlook does not play a role in the disciplined investment process.
| * | Holdings percentage(s) of total investments, excluding collateral for securities loaned, as of 4/30/2019. |
Growth of $100,000 Investment
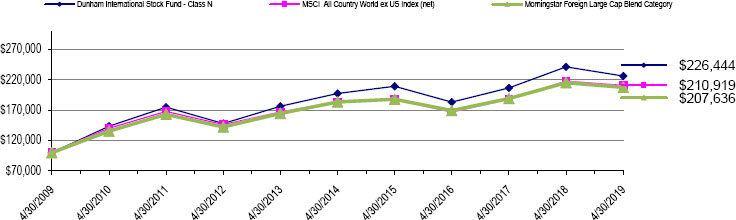
| | Total Returns as of April 30, 2019 | |
| | | | | | | | Annualized | | Annualized | |
| | | | Six Months | | One Year | | Five Years | | Ten Years | |
| | Class N | | 5.15% | | (6.26)% | | 2.75% | | 8.52% | |
| | Class C | | 4.65% | | (7.18)% | | 1.73% | | 7.43% | |
| | Class A with load of 5.75% | | (1.03)% | | (11.86)% | | 1.29% | | 7.60% | |
| | Class A without load | | 5.04% | | (6.49)% | | 2.49% | | 8.24% | |
| | MSCI All Country World ex US Index (net) | | 9.12% | | (3.23)% | | 2.83% | | 7.75% | |
| | Morningstar Foreign Large Cap Blend Category | | 7.78% | | (3.60)% | | 2.48% | | 7.58% | |
| | | | | | | | | | | |
The MSCI All Country World ex US Index (net) is a free float-adjusted market capitalization index designed to measure equity market performance in the global developed and emerging markets excluding holdings in the United States and is net of any withholding taxes. Investors cannot invest directly in an index or benchmark.
The Morningstar Foreign Large Cap Blend Category is generally representative of mutual funds that primarily invest in non-U.S. stocks that have market caps in the top 70% of each economically integrated market (such as Europe or Asia ex-Japan). The blend style is generally applicable where neither growth nor value characteristics dominate.
As disclosed in the Trust’s latest registration statement, the Fund’s total annual operating expenses, including underlying funds, are 1.67% for Class N, 2.67% for Class C and 1.92% for Class A. Class A shares are subject to a sales load of 5.75% and a deferred sales charge of up to 0.75%.The performance data quoted here represents past performance, which is not indicative of future results. Current performance may be lower or higher than the performance data quoted. The investment return and NAV will fluctuate, so that an investor’s shares, when redeemed, may be worth more or less than their original cost. Total returns are calculated assuming reinvestment of all dividends and capital gains distributions, if any. The returns do not reflect the deductions of taxes a shareholder would pay on the redemption of Fund shares or Fund distribution. For performance information current to the most recent month-end, please call 1-800-442-4358 or visit our website www.dunham.com
| SCHEDULE OF INVESTMENTS (Unaudited) |
| Dunham International Stock Fund |
| April 30, 2019 |
| Security | | Shares | | | Value | |
| COMMON STOCKS - 97.7% | | | | | | | | |
| AEROSPACE / DEFENSE - 1.0% | | | | | | | | |
| Airbus SE | | | 3,311 | | | $ | 453,010 | |
| BAE Systems PLC - ADR ^ | | | 10,458 | | | | 268,457 | |
| Bombardier, Inc. * | | | 60,100 | | | | 106,332 | |
| IHI Corp. | | | 4,300 | | | | 102,674 | |
| Leonardo SpA | | | 7,050 | | | | 81,467 | |
| Safran SA | | | 1,991 | | | | 289,978 | |
| | | | | | | | 1,301,918 | |
| AGRICULTURE - 0.3% | | | | | | | | |
| British American Tobacco PLC - ADR | | | 77 | | | | 3,019 | |
| Imperial Brands PLC | | | 6,138 | | | | 195,248 | |
| Japan Tobacco, Inc. | | | 3,500 | | | | 80,891 | |
| Swedish Match AB | | | 2,569 | | | | 125,136 | |
| | | | | | | | 404,294 | |
| AIRLINES - 0.6% | | | | | | | | |
| Deutsche Lufthansa AG | | | 5,684 | | | | 137,407 | |
| International Consolidated Airlines Group SA - ADR | | | 3,800 | | | | 54,074 | |
| International Consolidated Airlines Group SA | | | 19,902 | | | | 140,519 | |
| International Consolidated Airlines Group SA | | | 15,197 | | | | 107,363 | |
| Qantas Airways Ltd. | | | 74,134 | | | | 292,796 | |
| Turk Hava Yollari AO * | | | 1 | | | | 2 | |
| | | | | | | | 732,161 | |
| APPAREL - 1.5% | | | | | | | | |
| adidas AG | | | 3,064 | | | | 788,617 | |
| Gildan Activewear, Inc. | | | 17,100 | | | | 630,477 | |
| Kering SA | | | 454 | | | | 268,441 | |
| Pou Chen Corp. * | | | 92,000 | | | | 111,922 | |
| | | | | | | | 1,799,457 | |
| AUTO MANUFACTURERS - 1.5% | | | | | | | | |
| Bayerische Motoren Werke AG | | | 3,597 | | | | 306,608 | |
| Chongqing Changan Automobile Co Ltd. * | | | 112,500 | | | | 58,985 | |
| Dongfeng Motor Group Co Ltd. | | | 268,000 | | | | 260,347 | |
| Hino Motors Ltd. | | | 21,100 | | | | 200,074 | |
| Kia Motors Corp. | | | 11,634 | | | | 450,980 | |
| Porsche Automobil Holding SE - ADR | | | 21,800 | | | | 150,638 | |
| Porsche Automobil Holding SE | | | 3,193 | | | | 221,792 | |
| Renault SA | | | 3,188 | | | | 217,331 | |
| | | | | | | | 1,866,755 | |
| AUTO PARTS & EQUIPMENT - 2.3% | | | | | | | | |
| Aisin Seiki Co Ltd. | | | 1,200 | | | | 46,430 | |
| Cie Generale des Etablissements Michelin SCA | | | 1,588 | | | | 205,180 | |
| Continental AG | | | 3,829 | | | | 634,686 | |
| Faurecia SA | | | 4,654 | | | | 236,613 | |
| Hankook Tire Co Ltd. * | | | 7,314 | | | | 248,866 | |
| Hyundai Mobis Co Ltd. | | | 553 | | | | 110,310 | |
| Magna International, Inc. | | | 8,385 | | | | 466,541 | |
| NGK Spark Plug Co Ltd. | | | 18,000 | | | | 351,028 | |
| Nokian Renkaat OYJ | | | 10,280 | | | | 344,307 | |
| Schaeffler AG | | | 12,065 | | | | 103,343 | |
| Weichai Power Co Ltd. | | | 61,000 | | | | 99,870 | |
| | | | | | | | 2,847,174 | |
| BANKS - 4.4% | | | | | | | | |
| Agricultural Bank of China Ltd. | | | 369,000 | | | | 170,534 | |
| Akbank T.A.S. * | | | 141,161 | | | | 145,065 | |
| Banco do Brasil SA * | | | 16,900 | | | | 212,068 | |
| Banco Santander Mexico SA | | | 110,300 | | | | 184,559 | |
| Bank CIMB Niaga Tbk PT * | | | 243,700 | | | | 18,226 | |
| Bank of China Ltd. - ADR | | | 1,468 | | | | 17,440 | |
| Bank of China Ltd. | | | 1,784,000 | | | | 851,804 | |
| Bank of Communications Co Ltd. | | | 384,000 | | | | 323,851 | |
| China Construction Bank Corp. - ADR | | | 13,669 | | | | 240,574 | |
| China Everbright Bank Co., Ltd. | | | 475,000 | | | | 234,594 | |
| China Minsheng Banking Corp Ltd. | | | 288,500 | | | | 216,806 | |
| Security | | Shares | | | Value | |
| BANKS - 4.4% (continued) | | | | | | | | |
| Danske Bank A/S | | | 9,033 | | | $ | 160,422 | |
| Erste Group Bank AG - ADR | | | 5,100 | | | | 102,281 | |
| Grupo Financiero Banorte SAB de CV - ADR | | | 1,828 | | | | 57,655 | |
| Grupo Financiero Banorte SAB de CV | | | 7,500 | | | | 47,359 | |
| Industrial & Commercial Bank of China Ltd. - ADR ^ | | | 20,230 | | | | 303,753 | |
| Nordea Bank Abp - ADR | | | 13,200 | | | | 105,534 | |
| Royal Bank of Canada ^ | | | 2,000 | | | | 159,380 | |
| Sberbank of Russia PJSC - ADR * | | | 38,755 | | | | 554,003 | |
| Shinsei Bank Ltd. * | | | 14,100 | | | | 196,650 | |
| Societe Generale SA | | | 9,676 | | | | 306,594 | |
| Turkiye Garanti Bankasi AS | | | 66,475 | | | | 91,230 | |
| Turkiye Is Bankasi AS * | | | 81,167 | | | | 73,059 | |
| UniCredit SpA | | | 26,976 | | | | 373,159 | |
| VTB Bank PJSC - ADR | | | 207,083 | | | | 231,105 | |
| Yapi ve Kredi Bankasi AS * | | | 184,313 | | | | 64,043 | |
| | | | | | | | 5,441,748 | |
| BEVERAGES - 1.3% | | | | | | | | |
| Asahi Group Holdings Ltd. | | | 5,000 | | | | 218,056 | |
| Carlsberg A/S | | | 4,757 | | | | 614,590 | |
| Coca-Cola HBC AG | | | 3,447 | | | | 124,176 | |
| Cia Cervecerias Unidas SA | | | 13,622 | | | | 187,591 | |
| Davide Campari-Milano SpA | | | 13,931 | | | | 140,423 | |
| Tsingtao Brewery Co., Ltd. | | | 60,000 | | | | 382,713 | |
| | | | | | | | 1,667,549 | |
| BUILDING MATERIALS - 1.2% | | | | | | | | |
| AGC, Inc. | | | 20,700 | | | | 706,366 | |
| Asia Cement Corp. | | | 44,000 | | | | 59,555 | |
| Cie de Saint-Gobain | | | 4,573 | | | | 187,342 | |
| HeidelbergCement AG | | | 1,507 | | | | 121,848 | |
| Imerys SA | | | 7,701 | | | | 410,017 | |
| Titan Cement Co SA | | | 958 | | | | 20,754 | |
| | | | | | | | 1,505,882 | |
| CHEMICALS - 2.4% | | | | | | | | |
| Akzo Nobel NV - ADR | | | 1,100 | | | | 31,202 | |
| Braskem SA * | | | 30,100 | | | | 364,678 | |
| Covestro AG | | | 7,604 | | | | 417,486 | |
| Evonik Industries AG | | | 3,187 | | | | 95,064 | |
| Hanwha Chemical Corp. * | | | 6,809 | | | | 120,333 | |
| JSR Corp. | | | 9,700 | | | | 148,034 | |
| KCC Corp. | | | 920 | | | | 279,601 | |
| Kingboard Holdings Ltd. | | | 21,000 | | | | 68,465 | |
| Koninklijke DSM NV | | | 2,643 | | | | 302,042 | |
| Mitsubishi Chemical Holdings Corp. | | | 37,900 | | | | 270,262 | |
| Nitto Denko Corp. | | | 3,200 | | | | 173,046 | |
| Shin-Etsu Chemical Co., Ltd. | | | 6,800 | | | | 644,242 | |
| | | | | | | | 2,914,455 | |
| COAL - 0.3% | | | | | | | | |
| China Shenhua Energy Co., Ltd. - ADR | | | 7,400 | | | | 65,490 | |
| China Shenhua Energy Co., Ltd. | | | 70,500 | | | | 156,037 | |
| Indo Tambangraya Megah Tbk PT | | | 90,900 | | | | 122,756 | |
| | | | | | | | 344,283 | |
| COMMERCIAL SERVICES - 2.8% | | | | | | | | |
| Ashtead Group PLC | | | 11,360 | | | | 315,351 | |
| Brambles Ltd. | | | 25,057 | | | | 212,594 | |
| Cielo SA | | | 48,300 | | | | 94,392 | |
| COSCO SHIPPING Ports Ltd. | | | 70,000 | | | | 69,811 | |
| Experian PLC | | | 20,616 | | | | 599,949 | |
| Guangdong Provincial Expressway Development Co., Ltd. * | | | 185,600 | | | | 170,896 | |
| Randstad NV | | | 10,654 | | | | 607,982 | |
| RELX PLC | | | 8,912 | | | | 204,704 | |
| RELX PLC * | | | 42,562 | | | | 974,423 | |
| Sichuan Expressway Co Ltd. | | | 400,000 | | | | 133,620 | |
| Wirecard AG | | | 613 | | | | 92,530 | |
| | | | | | | | 3,476,252 | |
See accompanying notes to financial statements.
| SCHEDULE OF INVESTMENTS (Unaudited) |
| Dunham International Stock Fund (Continued) |
| April 30, 2019 |
| Security | | Shares | | | Value | |
| COMMON STOCKS - 97.7% (Continued) | | | | | | | | |
| COMPUTERS - 2.2% | | | | | | | | |
| Capgemini SE | | | 1,436 | | | $ | 174,125 | |
| CGI Group, Inc. * | | | 3,300 | | | | 237,039 | |
| Check Point Software Technologies Ltd. * | | | 2,581 | | | | 311,682 | |
| Compal Electronics, Inc. | | | 276,000 | | | | 178,410 | |
| Computershare Ltd. | | | 25,961 | | | | 326,086 | |
| NTT Data Corp. * | | | 49,000 | | | | 571,492 | |
| Otsuka Corp. * | | | 5,300 | | | | 208,502 | |
| Phison Electronics Corp. * | | | 25,000 | | | | 235,450 | |
| Quanta Computer, Inc. | | | 224,000 | | | | 429,557 | |
| | | | | | | | 2,672,343 | |
| COSMETICS / PERSONAL CARE - 2.4% | | | | | | | | |
| Kao Corp. | | | 4,900 | | | | 378,335 | |
| L’Oreal SA | | | 2,925 | | | | 803,884 | |
| Shiseido Co., Ltd. | | | 3,900 | | | | 306,821 | |
| Unilever NV - ADR | | | 20,357 | | | | 1,230,704 | |
| Unilever PLC | | | 4,648 | | | | 281,664 | |
| | | | | | | | 3,001,408 | |
| DISTRIBUTION / WHOLESALE - 1.0% | | | | | | | | |
| Ferguson PLC - ADR | | | 11,100 | | | | 78,255 | |
| Hanwha Corp. * | | | 12,423 | | | | 315,199 | |
| Marubeni Corp. | | | 9,000 | | | | 64,502 | |
| Mitsubishi Corp. | | | 14,700 | | | | 405,024 | |
| Sumitomo Corp. | | | 22,200 | | | | 318,246 | |
| | | | | | | | 1,181,226 | |
| DIVERSIFIED FINANCIAL SERVICES - 3.2% | | | | | | | | |
| ASX Ltd. | | | 9,208 | | | | 483,017 | |
| B3 SA - Brasil Bolsa Balcao | | | 35,500 | | | | 310,489 | |
| BNK Financial Group, Inc. | | | 31,712 | | | | 190,306 | |
| Central China Securities Co., Ltd. | | | 156,000 | | | | 40,220 | |
| China Galaxy Securities Co., Ltd. | | | 120,500 | | | | 78,951 | |
| China International Capital Corp., Ltd. * | | | 144,800 | | | | 311,422 | |
| China Merchants Securities Co., Ltd. | | | 91,200 | | | | 124,831 | |
| CI Financial Corp. | | | 21,600 | | | | 309,420 | |
| CITIC Securities Co., Ltd. | | | 78,500 | | | | 170,138 | |
| Deutsche Boerse AG | | | 3,126 | | | | 417,368 | |
| Everbright Securities Co., Ltd. | | | 86,400 | | | | 82,996 | |
| Hana Financial Group, Inc. | | | 10,225 | | | | 322,504 | |
| Hargreaves Lansdown PLC | | | 7,275 | | | | 214,838 | |
| Huatai Securities Co., Ltd. | | | 52,200 | | | | 98,370 | |
| Investec Ltd. * | | | 7,551 | | | | 48,213 | |
| Japan Exchange Group, Inc. | | | 14,200 | | | | 231,922 | |
| ORIX Corp. | | | 11,800 | | | | 167,187 | |
| Yuanta Financial Holding Co., Ltd. * | | | 498,000 | | | | 288,844 | |
| | | | | | | | 3,891,036 | |
| ELECTRIC - 4.3% | | | | | | | | |
| Centrais Eletricas Brasileiras SA * | | | 37,200 | | | | 308,878 | |
| China Resources Power Holdings Co., Ltd. | | | 42,000 | | | | 58,767 | |
| Chubu Electric Power Co., Inc. | | | 3,500 | | | | 50,783 | |
| Cia Energetica de Minas Gerais - ADR | | | 10,314 | | | | 38,162 | |
| E.ON SE | | | 63,103 | | | | 677,922 | |
| EDP Renovaveis SA | | | 7,350 | | | | 73,028 | |
| Enel Americas SA | | | 2,067,826 | | | | 361,584 | |
| Enel Chile SA | | | 829,780 | | | | 83,322 | |
| Enel SpA * | | | 254,343 | | | | 1,609,250 | |
| Huaneng Power International, Inc. - ADR | | | 249 | | | | 6,332 | |
| Iberdrola SA | | | 49,219 | | | | 446,914 | |
| Interconexion Electrica SA ESP | | | 86,852 | | | | 424,650 | |
| Kansai Electric Power Co., Inc. | | | 2,400 | | | | 29,041 | |
| RWE AG | | | 25,926 | | | | 664,469 | |
| Terna Rete Elettrica Nazionale SpA | | | 31,819 | | | | 190,734 | |
| Tokyo Electric Power Co. Holdings, Inc. * | | | 55,800 | | | | 314,634 | |
| | | | | | | | 5,338,470 | |
| ELECTRICAL COMPONENTS & EQUIPMENT - 0.2% | | | | | | | | |
| Brother Industries Ltd. | | | 10,100 | | | | 199,460 | |
| Dongfang Electric Corp., Ltd. * | | | 125,800 | | | | 96,049 | |
| | | | | | | | 295,509 | |
| ELECTRONICS - 2.2% | | | | | | | | |
| AU Optronics Corp. * | | | 103,000 | | | | 36,837 | |
| Hoya Corp. | | | 10,600 | | | | 748,787 | |
| Kyocera Corp. - ADR | | | 400 | | | | 25,840 | |
| Kyocera Corp. | | | 12,800 | | | | 831,950 | |
| LG Display Co., Ltd. * | | | 11,340 | | | | 192,834 | |
| Security | | Shares | | | Value | |
| ELECTRONICS - 2.2% (Continued) | | | | | | | | |
| Micro-Star International Co., Ltd. * | | | 112,000 | | | $ | 311,100 | |
| Omron Corp. | | | 1,400 | | | | 75,213 | |
| Yokogawa Electric Corp. | | | 21,900 | | | | 458,692 | |
| | | | | | | | 2,681,253 | |
| ENERGY-ALTERNATE SOURCES - 0.1% | | | | | | | | |
| TPI Polene Power PCL | | | 252,500 | | | | 49,037 | |
| Xinyi Solar Holdings Ltd. * | | | 88,000 | | | | 50,178 | |
| | | | | | | | 99,215 | |
| ENGINEERING & CONSTRUCTION - 0.2% | | | | | | | | |
| China Communications Services Corp., Ltd. | | | 80,000 | | | | 64,518 | |
| Enka Insaat ve Sanayi AS | | | 1 | �� | | | 1 | |
| Sydney Airport | | | 26,607 | | | | 142,793 | |
| | | | | | | | 207,312 | |
| ENTERTAINMENT - 0.3% | | | | | | | | |
| Aristocrat Leisure Ltd. | | | 13,075 | | | | 240,317 | |
| OPAP SA | | | 9,772 | | | | 105,366 | |
| | | | | | | | 345,683 | |
| FOOD - 2.4% | | | | | | | | |
| Associated British Foods PLC - ADR | | | 2,400 | | | | 81,012 | |
| Cencosud SA | | | 62,617 | | | | 118,383 | |
| CJ CheilJedang Corp. * | | | 362 | | | | 42,949 | |
| Koninklijke Ahold Delhaize NV | | | 8,613 | | | | 207,421 | |
| Nestle SA | | | 11,762 | | | | 1,132,362 | |
| Orkla ASA | | | 43,983 | | | | 344,402 | |
| Seven & i Holdings Co., Ltd. | | | 15,200 | | | | 526,126 | |
| Uni-President China Holdings Ltd. | | | 137,000 | | | | 125,447 | |
| WH Group Ltd. | | | 167,500 | | | | 198,173 | |
| Wm Morrison Supermarkets PLC | | | 29,595 | | | | 83,395 | |
| Yakult Honsha Co., Ltd. | | | 1,700 | | | | 116,089 | |
| | | | | | | | 2,975,759 | |
| FOOD SERVICE - 0.3% | | | | | | | | |
| Compass Group PLC - ADR | | | 16,490 | | | | 382,403 | |
| | | | | | | | | |
| FOREST PRODUCTS & PAPER- 0.3% | | | | | | | | |
| Shandong Chenming Paper Holdings Ltd. * | | | 191,300 | | | | 97,351 | |
| UPM-Kymmene OYJ | | | 10,279 | | | | 289,993 | |
| | | | | | | | 387,344 | |
| GAS - 0.4% | | | | | | | | |
| National Grid PLC - ADR | | | 4,852 | | | | 265,502 | |
| Tokyo Gas Co., Ltd. | | | 11,200 | | | | 285,003 | |
| | | | | | | | 550,505 | |
| HAND / MACHINE TOOLS - 0.3% | | | | | | | | |
| Fuji Electric Co., Ltd. | | | 4,400 | | | | 156,012 | |
| Techtronic Industries Co., Ltd. - ADR | | | 5,200 | | | | 188,240 | |
| | | | | | | | 344,252 | |
| HEALTHCARE - PRODUCTS - 3.2% | | | | | | | | |
| Alcon, Inc. * | | | 4,276 | | | | 246,237 | |
| EssilorLuxottica SA | | | 2,247 | | | | 273,552 | |
| Getinge AB | | | 12,450 | | | | 175,232 | |
| Hengan International Group Co., Ltd. - ADR | | | 6,759 | | | | 297,017 | |
| Koninklijke Philips NV * | | | 24,762 | | | | 1,062,520 | |
| Lifco AB | | | 4,207 | | | | 200,181 | |
| Olympus Corp. | | | 27,600 | | | | 309,827 | |
| Shimadzu Corp. | | | 3,400 | | | | 91,216 | |
| Smith & Nephew PLC - ADR | | | 8,738 | | | | 341,219 | |
| Smith & Nephew PLC | | | 27,710 | | | | 535,560 | |
| Sonova Holding AG - ADR | | | 5,600 | | | | 226,016 | |
| Terumo Corp. | | | 4,400 | | | | 132,810 | |
| | | | | | | | 3,891,387 | |
| HEALTHCARE - SERVICES - 0.2% | | | | | | | | |
| Fresenius Medical Care AG & Co. KGaA | | | 2,425 | | | | 204,223 | |
| | | | | | | | | |
| HOLDING COMPANIES-DIVERSIFIED - 0.1% | | | | | | | | |
| Financiere de Tubize SA | | | 1,315 | | | | 92,041 | |
| Haci Omer Sabanci Holding AS * | | | 1 | | | | 1 | |
| | | | | | | | 92,042 | |
| HOME BUILDERS - 0.1% | | | | | | | | |
| Taylor Wimpey PLC | | | 36,241 | | | | 85,897 | |
| | | | | | | | | |
| HOME FURNISHINGS - 0.7% | | | | | | | | |
| Arcelik AS * | | | 1 | | | | 3 | |
| Electrolux AB | | | 12,061 | | | | 295,295 | |
| LG Electronics, Inc. | | | 2,286 | | | | 148,526 | |
See accompanying notes to financial statements.
| SCHEDULE OF INVESTMENTS (Unaudited) |
| Dunham International Stock Fund (Continued) |
| April 30, 2019 |
| Security | | Shares | | | Value | |
| COMMON STOCKS - 97.7% (Continued) | | | | | | | | |
| HOME FURNISHINGS - 0.7% (Continued) | | �� | | | | | | |
| Nien Made Enterprise Co., Ltd. | | | 16,000 | | | $ | 125,545 | |
| Panasonic Corp. | | | 30,200 | | | | 278,138 | |
| | | | | | | | 847,507 | |
| HOUSEHOLD PRODUCTS/WARES - 0.3% | | | | | | | | |
| Henkel AG & Co. KGaA | | | 1,172 | | | | 111,671 | |
| Henkel AG & Co. KGaA | | | 2,593 | | | | 262,380 | |
| | | | | | | | 374,051 | |
| INSURANCE - 5.1% | | | | | | | | |
| Aegon NV - ADR ^ | | | 50,350 | | | | 261,820 | |
| Aegon NV | | | 7,354 | | | | 38,358 | |
| Allianz SE | | | 2,859 | | | | 690,507 | |
| Assicurazioni Generali SpA | | | 30,414 | | | | 589,620 | |
| AXA SA | | | 30,706 | | | | 818,166 | |
| China Life Insurance Co., Ltd. * | | | 108,607 | | | | 90,427 | |
| China Reinsurance Group Corp. | | | 221,000 | | | | 45,090 | |
| China Taiping Insurance Holdings Co., Ltd. | | | 57,600 | | | | 175,155 | |
| Dai-ichi Life Holdings, Inc. | | | 17,800 | | | | 256,986 | |
| iA Financial Corp., Inc. | | | 4,725 | | | | 187,356 | |
| Japan Post Holdings Co., Ltd. | | | 27,900 | | | | 312,526 | |
| MS&AD Insurance Group Holdings, Inc. | | | 20,500 | | | | 637,330 | |
| Muenchener Rueckversicherungs-Gesellschaft AG | | | 1,737 | | | | 431,913 | |
| NN Group NV | | | 8,370 | | | | 364,971 | |
| People’s Insurance Co. Group of China Ltd. | | | 206,000 | | | | 84,348 | |
| Porto Seguro SA | | | 5,500 | | | | 75,699 | |
| Shin Kong Financial Holding Co., Ltd. * | | | 642,115 | | | | 181,935 | |
| Sompo Holdings, Inc. | | | 6,000 | | | | 226,500 | |
| Sony Financial Holdings, Inc. | | | 1,300 | | | | 26,734 | |
| Tokio Marine Holdings, Inc. | | | 15,400 | | | | 780,386 | |
| | | | | | | | 6,275,827 | |
| INTERNET - 1.3% | | | | | | | | |
| Auto Trader Group PLC | | | 48,367 | | | | 357,451 | |
| Kakaku.com, Inc. | | | 10,200 | | | | 210,183 | |
| Shopify, Inc. * ^ | | | 1,972 | | | | 480,241 | |
| Trend Micro, Inc. | | | 5,400 | | | | 270,005 | |
| Wix.com Ltd. * ^ | | | 2,000 | | | | 268,320 | |
| | | | | | | | 1,586,200 | |
| INVESTMENT COMPANIES - 0.4% | | | | | | | | |
| Grupo de Inversiones Suramericana SA | | | 6,016 | | | | 64,816 | |
| Grupo de Inversiones Suramericana SA | | | 22,070 | | | | 245,556 | |
| Itausa - Investimentos Itau SA * | | | 50,738 | | | | 153,358 | |
| | | | | | | | 463,730 | |
| IRON / STEEL - 0.2% | | | | | | | | |
| POSCO | | | 1,122 | | | | 245,587 | |
| | | | | | | | | |
| LEISURE TIME - 0.1% | | | | | | | | |
| Giant Manufacturing Co., Ltd. | | | 23,000 | | | | 175,413 | |
| | | | | | | | | |
| LODGING - 0.4% | | | | | | | | |
| InterContinental Hotels Group PLC - ADR | | | 4,862 | | | | 321,427 | |
| NagaCorp., Ltd. | | | 66,000 | | | | 84,748 | |
| Shanghai Jinjiang International Hotels Development Co., Ltd. * | | | 48,300 | | | | 106,646 | |
| | | | | | | | 512,821 | |
| MACHINERY CONSTRUCTION & MINING - 1.5% | | | | | | | | |
| Hitachi Ltd. - ADR | | | 1,793 | | | | 119,459 | |
| Hitachi Ltd. | | | 21,200 | | | | 705,201 | |
| Komatsu Ltd. | | | 12,700 | | | | 328,105 | |
| Mitsubishi Electric Corp. | | | 49,500 | | | | 708,469 | |
| | | | | | | | 1,861,234 | |
| MACHINERY - DIVERSIFIED - 1.4% | | | | | | | | |
| Amada Holdings Co., Ltd. | | | 19,900 | | | | 223,121 | |
| Atlas Copco AB | | | 19,231 | | | | 547,185 | |
| CNH Industrial NV | | | 11,883 | | | | 129,087 | |
| GEA Group AG - ADR | | | 1,000 | | | | 28,230 | |
| Hexagon AB | | | 6,960 | | | | 379,854 | |
| Kone OYJ | | | 3,869 | | | | 212,424 | |
| Shanghai Mechanical and Electrical Industry Co., Ltd. * | | | 25,400 | | | | 47,117 | |
| THK Co., Ltd. | | | 6,600 | | | | 174,561 | |
| | | | | | | | 1,741,579 | |
| MEDIA - 1.4% | | | | | | | | |
| Pearson PLC - ADR ^ | | | 17,000 | | | | 184,280 | |
| ProSiebenSat.1 Media SE - ADR | | | 11,700 | | | | 45,689 | |
| Security | | Shares | | | Value | |
| MEDIA - 1.4% (Continued) | | | | | | | | |
| Vivendi SA | | | 21,438 | | | $ | 621,757 | |
| Wolters Kluwer NV * | | | 12,437 | | | | 867,375 | |
| | | | | | | | 1,719,101 | |
| MINING - 5.7% | | | | | | | | |
| Anglo American PLC | | | 46,438 | | | | 1,204,730 | |
| AngloGold Ashanti Ltd. | | | 7,298 | | | | 86,641 | |
| BHP Group Ltd. | | | 46,457 | | | | 1,227,443 | |
| BHP Group PLC - ADR | | | 8,300 | | | | 391,179 | |
| BHP Group PLC | | | 10,980 | | | | 259,109 | |
| Boliden AB | | | 11,569 | | | | 343,943 | |
| China Molybdenum Co., Ltd. | | | 579,000 | | | | 218,420 | |
| Glencore PLC - ADR ^ | | | 8,716 | | | | 68,769 | |
| Glencore PLC | | | 116,121 | | | | 460,594 | |
| Gold Fields Ltd. - ADR | | | 54,096 | | | | 202,860 | |
| MMC Norilsk Nickel PJSC - ADR | | | 3,591 | | | | 79,720 | |
| Rio Tinto Ltd. ^ | | | 5,811 | | | | 391,064 | |
| Rio Tinto PLC - ADR | | | 29,192 | | | | 1,719,409 | |
| South32 Ltd. | | | 26,158 | | | | 61,684 | |
| Teck Resources Ltd. ^ | | | 13,985 | | | | 329,353 | |
| | | | | | | | 7,044,918 | |
| MISCELLANEOUS MANUFACTURING - 1.0% | | | | | | | | |
| Doosan Corp. | | | 914 | | | | 60,098 | |
| Siemens AG | | | 10,094 | | | | 1,209,322 | |
| | | | | | | | 1,269,420 | |
| OFFICE / BUSINESS EQUIPMENT - 0.2% | | | | | | | | |
| Canon, Inc. | | | 7,300 | | | | 202,597 | |
| Seiko Epson Corp. - ADR | | | 7,800 | | | | 62,712 | |
| | | | | | | | 265,309 | |
| OIL & GAS - 6.5% | | | | | | | | |
| China Petroleum & Chemical Corp. | | | 1,550,000 | | | | 1,191,409 | |
| CNOOC Ltd. - ADR | | | 2,441 | | | | 443,481 | |
| CNOOC Ltd. | | | 371,000 | | | | 673,809 | |
| Cosan SA * | | | 4,200 | | | | 49,663 | |
| Drilling Co of 1972 A/S * | | | 328 | | | | 25,160 | |
| Eni SpA | | | 79,423 | | | | 1,352,373 | |
| Equinor ASA - ADR ^ | | | 10,861 | | | | 241,006 | |
| Galp Energia SGPS SA | | | 10,367 | | | | 173,676 | |
| Gazprom PJSC - ADR | | | 30,800 | | | | 154,616 | |
| Gazprom PJSC - ADR | | | 67,456 | | | | 336,875 | |
| LUKOIL PJSC - ADR | | | 14,183 | | | | 1,202,435 | |
| Petrobras Distribuidora SA | | | 42,700 | | | | 253,802 | |
| PetroChina Co., Ltd. - ADR * | | | 8,450 | | | | 534,800 | |
| PetroChina Co., Ltd. | | | 328,000 | | | | 207,901 | |
| Polski Koncern Naftowy ORLEN SA * | | | 6,490 | | | | 166,338 | |
| Polskie Gornictwo Naftowe i Gazownictwo SA * | | | 48,396 | | | | 73,467 | |
| PTT Exploration & Production PCL | | | 13,200 | | | | 55,075 | |
| Repsol SA | | | 35,758 | | | | 606,280 | |
| Tourmaline Oil Corp. | | | 21,648 | | | | 322,338 | |
| | | | | | | | 8,064,504 | |
| PHARMACEUTICALS - 10.4% | | | | | | | | |
| Astellas Pharma, Inc. | | | 39,200 | | | | 531,015 | |
| AstraZeneca PLC - ADR ^ | | | 21,482 | | | | 809,012 | |
| Bayer AG | | | 13,466 | | | | 895,239 | |
| Eisai Co., Ltd. | | | 1,800 | | | | 104,834 | |
| Eisai Co., Ltd. - ADR | | | 800 | | | | 46,640 | |
| GlaxoSmithKline PLC - ADR | | | 30,000 | | | | 1,233,900 | |
| Grifols SA | | | 12,969 | | | | 249,470 | |
| Kalbe Farma Tbk PT | | | 1,474,300 | | | | 159,954 | |
| Kobayashi Pharmaceutical Co., Ltd. | | | 1,200 | | | | 95,716 | |
| Kyowa Hakko Kirin Co., Ltd. | | | 700 | | | | 13,620 | |
| Merck KGaA | | | 2,996 | | | | 319,089 | |
| Novartis AG | | | 21,381 | | | | 1,751,875 | |
| Novo Nordisk A/S - ADR | | | 3,302 | | | | 161,831 | |
| Novo Nordisk A/S | | | 16,055 | | | | 785,976 | |
| Ono Pharmaceutical Co., Ltd. | | | 11,400 | | | | 214,190 | |
| Orion Oyj | | | 11,009 | | | | 366,795 | |
| Otsuka Holdings Co., Ltd. | | | 4,700 | | | | 168,053 | |
| Roche Holding AG - ADR ^ | | | 13,300 | | | | 439,698 | |
| Roche Holding AG | | | 10,718 | | | | 2,827,949 | |
| Sanofi | | | 7,170 | | | | 625,076 | |
| Shionogi & Co., Ltd. | | | 8,000 | | | | 467,388 | |
| Takeda Pharmaceutical Co., Ltd. - ADR | | | 19,445 | | | | 355,455 | |
| UCB SA | | | 3,051 | | | | 242,296 | |
| | | | | | | | 12,865,071 | |
See accompanying notes to financial statements.
| SCHEDULE OF INVESTMENTS (Unaudited) |
| Dunham International Stock Fund (Continued) |
| April 30, 2019 |
| Security | | Shares | | | Value | |
| COMMON STOCKS - 97.7% (Continued) | | | | | | | | |
| PRIVATE EQUITY - 0.6% | | | | | | | | |
| 3i Group PLC | | | 51,117 | | | $ | 715,059 | |
| | | | | | | | | |
| REAL ESTATE - 0.9% | | | | | | | | |
| CK Asset Holdings Ltd. | | | 32,500 | | | | 261,297 | |
| Guangzhou R&F Properties Co., Ltd. | | | 76,000 | | | | 151,182 | |
| Hang Lung Group Ltd. | | | 37,000 | | | | 110,341 | |
| Hysan Development Co., Ltd. | | | 49,000 | | | | 274,611 | |
| Shanghai Jinqiao Export Processing Zone Development Co., Ltd. * | | | 91,900 | | | | 113,129 | |
| SOHO China Ltd. * | | | 140,500 | | | | 50,958 | |
| Wharf Real Estate Investment Co., Ltd. | | | 17,000 | | | | 130,283 | |
| Wheelock & Co., Ltd. | | | 3,000 | | | | 21,377 | |
| | | | | | | | 1,113,178 | |
| REIT - 0.7% | | | | | | | | |
| H&R REAL ESTATE INV-REIT UTS * | | | 22,400 | | | | 381,160 | |
| Link REIT | | | 38,000 | | | | 443,956 | |
| Scentre Group | | | 34,108 | | | | 91,863 | |
| | | | | | | | 916,979 | |
| RETAIL - 0.9% | | | | | | | | |
| HUGO BOSS AG | | | 7,560 | | | | 527,825 | |
| Kingfisher PLC - ADR | | | 1,800 | | | | 12,456 | |
| Kingfisher PLC | | | 130,026 | | | | 448,234 | |
| Lao Feng Xiang Co., Ltd. | | | 18,100 | | | | 62,517 | |
| | | | | | | | 1,051,032 | |
| SEMICONDUCTORS - 5.4% | | | | | | | | |
| ASML Holding NV | | | 1,930 | | | | 402,681 | |
| Nanya Technology Corp. | | | 126,000 | | | | 267,591 | |
| Renesas Electronics Corp. * | | | 25,800 | | | | 138,202 | |
| Rohm Co., Ltd. | | | 5,400 | | | | 398,269 | |
| Samsung Electronics Co., Ltd. - ADR | | | 126 | | | | 124,236 | |
| Samsung Electronics Co., Ltd. - ADR | | | 375 | | | | 296,250 | |
| Samsung Electronics Co., Ltd. | | | 67,400 | | | | 2,649,981 | |
| Samsung Electronics Co., Ltd. | | | 8,550 | | | | 272,755 | |
| SK Hynix, Inc. * | | | 14,214 | | | | 961,873 | |
| STMicroelectronics NV | | | 12,375 | | | | 227,687 | |
| STMicroelectronics NV - ADR ^ | | | 7,300 | | | | 133,955 | |
| STMicroelectronics NV | | | 21,978 | | | | 403,296 | |
| Taiwan Semiconductor Manufacturing Co., Ltd. * | | | 35,000 | | | | 293,861 | |
| United Microelectronics Corp. * | | | 185,000 | | | | 80,669 | |
| | | | | | | | 6,651,306 | |
| SOFTWARE - 3.3% | | | | | | | | |
| Amadeus IT Group SA | | | 7,687 | | | | 612,137 | |
| Constellation Software, Inc. | | | 300 | | | | 263,620 | |
| Dassault Systemes SE - ADR | | | 1,011 | | | | 160,587 | |
| Micro Focus International PLC | | | 20,549 | | | | 520,763 | |
| Oracle Corp. Japan | | | 2,500 | | | | 171,450 | |
| Sage Group PLC | | | 6,798 | | | | 64,422 | |
| SAP SE | | | 11,373 | | | | 1,464,898 | |
| Ubisoft Entertainment SA * | | | 3,683 | | | | 351,585 | |
| Xero Ltd. * | | | 13,351 | | | | 512,712 | |
| | | | | | | | 4,122,174 | |
| TELECOMMUNICATIONS - 4.2% | | | | | | | | |
| China Mobile Ltd. - ADR | | | 6,600 | | | | 314,622 | |
| China Telecom Corp., Ltd. - ADR | | | 5,000 | | | | 259,200 | |
| China Unicom Hong Kong Ltd. - ADR | | | 22,552 | | | | 267,692 | |
| Deutsche Telekom AG * | | | 54,760 | | | | 916,763 | |
| Elisa OYJ | | | 2,402 | | | | 101,927 | |
| KDDI Corp. | | | 12,300 | | | | 283,536 | |
| Koninklijke KPN NV | | | 19,522 | | | | 59,950 | |
| Nice Ltd. - ADR * ^ | | | 1,319 | | | | 181,837 | |
| Nippon Telegraph & Telephone Corp. | | | 14,800 | | | | 615,915 | |
| Nokia OYJ - ADR ^ | | | 31,100 | | | | 164,208 | |
| Nokia OYJ * | | | 96,562 | | | | 506,989 | |
| Telecom Italia SpA - ADR * | | | 48,078 | | | | 265,391 | |
| Telecom Italia SpA - ADR ^ | | | 7,800 | | | | 40,014 | |
| Telefonaktiebolaget LM Ericsson * | | | 12,773 | | | | 126,919 | |
| Telefonaktiebolaget LM Ericsson | | | 13,184 | | | | 130,286 | |
| Telefonica SA | | | 103,506 | | | | 862,274 | |
| TELUS Corp. | | | 4,100 | | | | 150,352 | |
| | | | | | | | 5,247,875 | |
| Security | | Shares | | | Value | |
| TRANSPORTATION - 1.9% | | | | | | | | |
| AP Moller - Maersk A/S | | | 164 | | | $ | 200,448 | |
| Canadian National Railway Co. | | | 6,832 | | | | 632,006 | |
| Canadian Pacific Railway Ltd. ^ | | | 800 | | | | 179,256 | |
| China Railway Signal & Communication Corp., Ltd. | | | 236,000 | | | | 173,284 | |
| DSV A/S - ADR | | | 2,300 | | | | 107,203 | |
| East Japan Railway Co. | | | 6,100 | | | | 574,979 | |
| Guangshen Railway Co., Ltd. | | | 266,000 | | | | 95,394 | |
| West Japan Railway Co. | | | 5,800 | | | | 431,446 | |
| | | | | | | | 2,394,016 | |
| WATER - 0.2% | | | | | | | | |
| Aguas Andinas SA | | | 456,664 | | | | 262,027 | |
| | | | | | | | | |
| TOTAL COMMON STOCKS (Cost - $112,615,961) | | | | | | | 120,715,113 | |
| | | | | | | | | |
| EXCHANGE TRADED FUND - 0.6% | | | | | | | | |
| EQUITY FUND - 0.6% | | | | | | | | |
| iShares MSCI EAFE ETF | | | 11,048 | | | | 737,565 | |
| TOTAL EXCHANGE TRADED FUND (Cost - $631,015) | | | | | | | | |
| | | | | | | | | |
| WARRANT- 0.0% | | | | | | | | |
| Barito Pacific TBK PT * ++ | | | 35,722 | | | | 3,760 | |
| TOTAL WARRANTS (Cost - $0) | | | | | | | | |
| | | | | | Principal | | | | |
| | | Interest Rate | | | Amount | | | | |
| PREFERRED STOCKS - 0.5% | | | | |
| OIL & GAS - 0.5% | | | | | | | | | | | | |
| PETROLEO BRASILEIRO SA - PETROBRAS | | | 0.000 | | | | 83,800 | | | | 575,312 | |
| TOTAL PREFERRED STOCKS (Cost - $641,656) | | | | | |
| | | | | | | | | | | | | |
| | | | | | | Shares | | | | | |
| SHORT-TERM INVESTMENT - 0.4% | | | | | | | |
| MONEY MARKET FUND - 0.4% | | | | | | | | |
| Fidelity Institutional Money Market Fund - Government Portfolio - Institutional Class | | | 2.310+ | | | | 447,624 | | | | 447,624 | |
| TOTAL SHORT-TERM INVESTMENT (Cost - $447,624) | |
| | | | | | | | | | | | | |
| COLLATERAL FOR SECURITIES LOANED - 3.9% | | | | |
| Mount Vernon Prime Portfolio, 2.61% + # (Cost - $4,874,737) | | | | 4,874,737 | | | | 4,874,737 | |
| | | | | | | | | | | | | |
| TOTAL INVESTMENTS - 103.1% (Cost - $119,210,993) | | | $ | 127,354,111 | |
| LIABILITIES LESS OTHER ASSETS - (3.1)% | | | | (3,822,533 | ) |
| NET ASSETS - 100.0% | | | $ | 123,531,578 | |
| ^ | All or a portion of these securities are on loan. Total loaned securities had a value of $4,782,574 at April 30, 2019. |
| * | Non-income producing security. |
ADR - American Depositary Receipt.
NV - Non-Voting
REIT - Real Estate Investment Trust.
| + | Variable rate security. Interest rate is as of April 30, 2019. |
| ++ | The Advisor or Trustees have determined these securities to be illiquid. On April 30, 2019, these securities amounted to $3,760 or 0.0% of net assets. |
| # | The Trust’s securities lending policies and procedures require that the borrower: (i) deliver cash or U.S. Government securities as collateral with respect to each new loan of U.S. securities, equal to at least 102% of the value of the portfolio securities loaned, and (ii) at all times thereafter mark-to-market the collateral on a daily basis so that the market value of such collateral is at least 100% of the value of securities loaned. From time to time the collateral may not be 102% due to end of day market movement. The next business day additional collateral is obtained/received from the borrower to replenish/reestablish 102%. |
See accompanying notes to financial statements.
| SCHEDULE OF INVESTMENTS (Unaudited) |
| Dunham International Stock Fund (Continued) |
| April 30, 2019 |
| Portfolio Composition*- (Unaudited) |
| Japan | | | 16.4 | % | | France | | | 5.2 | % |
| Britain | | | 11.7 | % | | Canada | | | 3.9 | % |
| Germany | | | 9.7 | % | | Italy | | | 3.8 | % |
| China | | | 7.9 | % | | Netherlands | | | 3.4 | % |
| Switzerland | | | 6.6 | % | | Other Countries ** | | | 25.7 | % |
| South Korea | | | 5.7 | % | | Total | | | 100.0 | % |
| * | Based on total value of investments as of April 30, 2019. |
| ** | Includes collateral for securities loaned as of April 30, 2019. |
Percentage may differ from Schedule of Investments which are based on Fund net assets.
See accompanying notes to financial statements.
| Dunham Real Estate Stock Fund (Unaudited) |
| Message from the Sub-Adviser (Barings LLC) |
Asset Class Recap
In December, the Federal Open Market Committee raised base rates by 25 basis points, moving the Fed Funds rate to 2.50 percent. However, Jerome Powell’s reversal from his hawkish stance was announced in December and sought to reduce the expected interest rate hikes in 2019 from three to two. With inflation remaining stubbornly low and trade war tensions escalating, Fed Chairman Jerome Powell announced to halt the interest rate hike plans in 2019 until further indication of inflation was seen. In addition, the Federal Open Market Committee ended quantitative tightening of the balance sheet, which was a large reversal of its previous stance.
REITs, as measured by the FTSE NAREIT All REITs Index, increased 12.4 percent during the six-month period ending April 30, 2019 and outperformed both broad equity indexes and bonds. Broad equity indexes, as measured by the S&P 500 Index, increased 9.8 percent. Bonds, as measured by the Bloomberg Barclays U.S. Aggregate Total Return Bond Index, rose 5.5 percent during the six-month period.
Portfolio Review
During the first fiscal quarter, concerns about a slowing economy had the defensive REIT sectors such as net lease, healthcare and manufactured housing outperform. However, during the second fiscal quarter concerns about a slowing economy evaporated and cyclical sectors such as data centers, hotels, and offices outperformed. Overall, security selection contributed more than sector allocation during the second fiscal quarter. Security selection and sector allocation within the office sector contributed positively to Fund performance during the second fiscal quarter. Within the data center and hotel sectors, sector allocation detracted while security selection contributed to positive performance during the second fiscal quarter. The Sub-Adviser exited the self-storage sector due to supply concerns.
Holdings Insights
The largest contributor within the Fund was American Tower Corporation (AMT) (holding weight*: 5.63 percent), an owner and operator of wireless and broadcast communications infrastructure. AMT continued to post solid cash flow and the Sub-Adviser believes it is poised to benefit from investment in 5G tower infrastructure. Although the Sub-Adviser sold the holding during the first fiscal quarter, the Fund reinitiated the holding during the second fiscal quarter. The holding rose 26.6 percent during the six-month period. The second top contributor to the Fund was Prologis Inc. (PLD) (holding weight*: 5.09 percent), which operates and invests in industrial properties. The company had better-than-expected earnings during both fiscal quarters; however, it faced weakness from its 2018 merger. Over the six-month period, PLD increased 20.7 percent. Another contributor within the Fund was UDR Inc. (UDR) (holding weight*: 1.96 percent). UDR owns, operates, acquires, renovates, develops, and manages multifamily apartment homes across the U.S. The Sub-Adviser believes that UDR has a strong portfolio of apartment complexes with a diverse exposure to large and small markets. The Sub-Adviser believes these smaller markets are less competitive and are a consistent source of revenue. This is one of the Sub-Adviser’s largest positions due to an easing supply of apartments and the possibility of earnings from rent raises. Over the six-month period, UDR increased 16.5 percent.
The top detractor to the Fund during the six-month period was Acadia Realty Trust (AKR) (holding weight**: 0.34 percent), which owns shopping centers and declined 12.5 percent. The Sub-Adviser sold the holding on December 26, 2018 due to weakness in the shopping center sector. The second largest detractor from Fund performance was the Fund’s allocation to Chesapeake Lodging Trust (CHSP) (holding weight**: 0.09 percent), a position from the hotel sector. CHSP owns hotels in San Francisco and has exhibited solid fundamentals. This position declined drastically amid the selloff of the hotel sector during the first fiscal quarter, as investors became fearful that the end of the real estate cycle was near. CHSP dropped 16.5 percent by the time it was sold at the beginning of January 2019. Another detractor from performance came from the regional mall sector. Macerich Company (MAC) (holding weight**: 0.46 percent) was sold during the first fiscal quarter, near the end of December 2018, after decreasing 18.0 percent. The Sub-Adviser attributes the decline to continued store closures in the regional mall space.
Sub-Adviser Outlook
Going forward, the Sub-Adviser is optimistic about earnings expansion through 2019, as it sees growth opportunity or catalysts in several sectors. The Sub-Adviser believes that demand still outpaces supply; for example, accelerating earnings growth in apartments and single family homes is encouraging to the Sub-Adviser. However, near peak occupancy and completed balance sheet refinancing has made it difficult to find ways to grow. The Sub-Adviser believes lower supply and rising rental rates are how earnings can grow moving forward.
| * | Holdings percentage(s) of total investments, excluding collateral for securities loaned, as of 4/30/2019. |
| ** | Holding percentage(s) as of the date prior to the sale of the security. |
Growth of $100,000 Investment
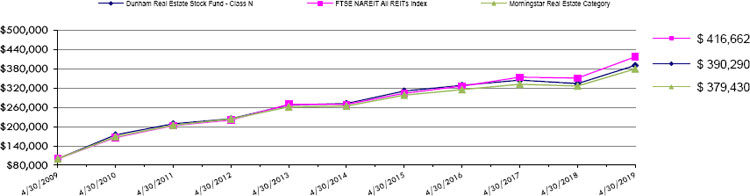
| | Total Returns as of April 30, 2019 | |
| | | | | | | | Annualized | | Annualized | |
| | | | Six Months | | One Year | | Five Years | | Ten Years | |
| | Class N | | 12.73% | | 16.92% | | 7.50% | | 14.59% | |
| | Class C | | 12.20% | | 15.78% | | 6.43% | | 13.46% | |
| | Class A with load of 5.75% | | 6.11% | | 9.93% | | 5.98% | | 13.63% | |
| | Class A without load | | 12.56% | | 16.63% | | 7.24% | | 14.31% | |
| | FTSE NAREIT All REITs Index | | 12.45% | | 18.78% | | 9.15% | | 15.33% | |
| | Morningstar Real Estate Category | | 11.86% | | 16.27% | | 7.53% | | 14.26% | |
The FTSE NAREIT All REITs Index is a free float adjusted market capitalization weighted index that includes all tax qualified REITs listed on the NYSE and NASDAQ National Market. Investors cannot invest directly in an index or benchmark.
The Morningstar Real Estate Category is generally representative of mutual funds that primarily invest in REITS of various types. REITs are companies that develop and manage real estate properties.
As disclosed in the Trust’s latest registration statement, the Fund’s total annual operating expenses, including the cost of underlying funds, are 1.10% for Class N, 2.10% for Class C and 1.35% for Class A. Class A shares are subject to a sales load of 5.75% and a deferred sales charge of up to 0.75% The performance data quoted here represents past performance, which is not indicative of future results. Current performance may be lower or higher than the performance data quoted. The investment return and NAV will fluctuate, so that an investor’s shares, when redeemed, may be worth more or less than their original cost. Total returns are calculated assuming reinvestment of all dividends and capital gains distributions, if any. The returns do not reflect the deductions of taxes a shareholder would pay on the redemption of Fund shares or Fund distributions. For performance information current to the most recent month-end, please call 1-800-442-4358 or visit our website www.dunham.com
| SCHEDULE OF INVESTMENTS (Unaudited) |
| Dunham Real Estate Stock Fund |
| April 30, 2019 |
| Security | | Shares | | | Value | |
| REITS - 98.9% | | | | | | | | |
| APARTMENTS - 23.8% | | | | | | | | |
| American Homes 4 Rent | | | 93,880 | | | $ | 2,251,242 | |
| AvalonBay Communities, Inc. | | | 14,130 | | | | 2,839,141 | |
| Equity Residential | | | 41,100 | | | | 3,140,862 | |
| Invitation Homes, Inc. | | | 59,830 | | | | 1,487,374 | |
| Mid-America Apartment Communities, Inc. | | | 21,610 | | | | 2,364,350 | |
| UDR, Inc. | | | 24,080 | | | | 1,082,396 | |
| | | | | | | | 13,165,365 | |
| DIVERSIFIED - 25.5% | | | | | | | | |
| American Tower Corp. | | | 15,950 | | | | 3,115,035 | |
| Cousins Properties, Inc. | | | 123,160 | | | | 1,178,641 | |
| Crown Castle International Corp. | | | 19,530 | | | | 2,456,483 | |
| Equinix, Inc. | | | 5,340 | | | | 2,428,098 | |
| Gaming and Leisure Properties, Inc. | | | 25,720 | | | | 1,038,573 | |
| New Residential Investment Corp. | | | 92,940 | | | | 1,562,321 | |
| VICI Properties, Inc. | | | 63,250 | | | | 1,442,100 | |
| Weyerhaeuser Co. | | | 33,470 | | | | 896,996 | |
| | | | | | | | 14,118,247 | |
| FINANCE - MORTGAGE LOAN/BANKER - 2.3% | | | | | | | | |
| TPG RE Finance Trust, Inc. | | | 65,460 | | | | 1,290,217 | |
| | | | | | | | | |
| HEALTHCARE - 9.6% | | | | | | | | |
| Medical Properties Trust, Inc. | | | 54,860 | | | | 957,856 | |
| National Health Investors, Inc. | | | 9,200 | | | | 693,956 | |
| Physicians Realty Trust | | | 59,250 | | | | 1,070,055 | |
| Welltower, Inc. | | | 34,730 | | | | 2,588,427 | |
| | | | | | | | 5,310,294 | |
| HOTELS - 4.6% | | | | | | | | |
| Host Hotels & Resorts, Inc. | | | 81,850 | | | | 1,574,794 | |
| Park Hotels & Resorts, Inc. | | | 31,172 | | | | 999,998 | |
| | | | | | | | 2,574,792 | |
| OFFICE - 8.3% | | | | | | | | |
| Boston Properties, Inc. | | | 19,370 | | | | 2,665,699 | |
| Kilroy Realty Corp. | | | 24,993 | | | | 1,922,212 | |
| | | | | | | | 4,587,911 | |
| Security | | Shares | | | Value | |
| REGIONAL MALLS - 2.3% | | | | | | | | |
| Simon Property Group, Inc. | | | 7,541 | | | $ | 1,309,872 | |
| | | | | | | | | |
| SHOPPING CENTERS - 5.9% | | | | | | | | |
| Regency Centers Corp. | | | 31,784 | | | | 2,134,931 | |
| Weingarten Realty Investors | | | 38,600 | | | | 1,117,084 | |
| | | | | | | | 3,252,015 | |
| SINGLE FAMILY - 8.9% | | | | | | | | |
| Agree Realty Corp. | | | 20,570 | | | | 1,346,718 | |
| National Retail Properties, Inc. | | | 36,070 | | | | 1,898,004 | |
| STORE Capital Corp. | | | 50,220 | | | | 1,673,330 | |
| | | | | | | | 4,918,052 | |
| WAREHOUSE/INDUSTRIAL - 7.7% | | | | | | | | |
| First Industrial Realty Trust, Inc. | | | 40,830 | | | | 1,440,074 | |
| Prologis, Inc. | | | 36,720 | | | | 2,815,322 | |
| | | | | | | | 4,255,396 | |
| TOTAL REITS (Cost - $46,139,791) | | | | | | | 54,782,161 | |
| | | | | | | | | |
| SHORT-TERM INVESTMENT - 1.0% | | | | | | | | |
| MONEY MARKET FUND - 1.0% | | | | | | | | |
| Fidelity Investments Money Market - Class I, 2.31% + | | | 565,428 | | | | 565,428 | |
| TOTAL SHORT-TERM INVESTMENT (Cost - $565,428) | | | | | | | | |
| | | | | | | | | |
| TOTAL INVESTMENTS - 99.9% (Cost - $46,705,219) | | | | | | $ | 55,347,589 | |
| OTHER ASSETS IN EXCESS OF LIABILITIES - 0.1% | | | | | | | 56,287 | |
| TOTAL NET ASSETS - 100.00% | | | | | | $ | 55,403,876 | |
REITS - Real Estate Investment Trusts.
| + | Variable rate security. Interest rate is as of April 30, 2019. |
| Portfolio Composition * - (Unaudited) |
| Diversified | | | 25.5 | % | | Shopping Centers | | | 5.9 | % |
| Apartments | | | 23.8 | % | | Hotels | | | 4.6 | % |
| Healthcare | | | 9.6 | % | | Regional Malls | | | 2.4 | % |
| Single Family | | | 8.9 | % | | Finance - Mortgage Loan/Banker | | | 2.3 | % |
| Office | | | 8.3 | % | | Short-Term Investment | | | 1.0 | % |
| Warehouse/Industrial | | | 7.7 | % | | Total | | | 100.0 | % |
| * | Based on total value of investments as of April 30, 2019. |
Percentage may differ from Schedule of Investments which are based on Fund net assets.
See accompanying notes to financial statements.
| Dunham Small Cap Value Fund (Unaudited) |
| Message from the Sub-Adviser (Ziegler Capital Management LLC) |
Asset Class Recap
Small cap value stocks, as measured by the Russell 2000 Value Index, rose 3.7 percent since the start of the fiscal year. Although a roughly 4 percent return in a six-month period is decent by most measures, small cap stocks in general, as measured by the Russell 2000 index, saw an even stronger 6.0 percent return. As investors juggled narratives surrounding trade talks, earnings releases, and potential Fed actions, the underlying theme that prevailed was that of economic optimism. This broadly drove returns and helped assuage, or at least delay fears that his bull market may be out of steam. Small cap stocks are generally represented by companies with limited number of business lines – in some cases a single product. Within the value style, there is generally a tilt toward lower share prices per unit of earnings. However, it is important to delineate that risks are not easily defined and that everything in the small cap value universe is not necessarily trading at a discount. To the contrary, these businesses vie for their market share and margins each day, requiring small cap value active managers to carefully select what they believe to be the best stocks within the broad space.
Allocation Review
As the aforementioned themes of Fed actions and trade talks often broadly impact individual sectors (i.e. a flat yield curve generally adversely affects banks that rely heavily on lending activity), shifts in these themes are difficult to predict, so the Fund’s Sub-Adviser maintains a neutral sector exposure in order to attempt to focused on selecting what it believes are the best stocks. Therefore, the Fund’s exposure to the worst performing sectors, healthcare and energy, was not a meaningful detractor from relative performance. Conversely, the Fund’s allocation to the strongest performing sectors, information technology and utilities, also was not a primary driver of relative performance. Instead, the Sub-Adviser’s quantitatively-driven stock selection within each of these sectors was the primary driver of relative performance.
Holdings Insights
As the second-worst performing sector during the first half of the fiscal year, health care broadly dropped close to 16.8 percent. Due to strong stock selection within the sector, some of these losses were mitigated. For example, the Fund held Integer Holdings Corp. (ITGR) (holding weight*: 0.87 percent), a leading provider of batteries for pacemakers and implantable cardioverter defibrillators. From mid-November when it was initially added to the Fund through the end of the most recent fiscal quarter, ITGR declined 17.9 percent as political concerns in the health care field threatened these primary business lines. However, the Fund also held Providence Service Corp (PRSC) (holding weight*: 0.64 percent), a non-emergency transportation service provider, and Magellan Health Inc. (MGLN) (holding weight*: 0.56 percent), a manager of behavioral health care services. During the same time period, PRSC and MGLN increased 0.4 percent and 7.6 percent, respectively.
When the strongest performing sector, information technology, boasts an overall return over 18 percent, individual stocks within the sector require an even higher return or they result in a detraction from relative performance. For example, Tech Data Corp. (TECD) (holding weight*: 1.63 percent), a global wholesale distributor of technology products, rose 50.9 percent during the six-month period, outperforming the sector as a whole and contributing strongly to the Fund’s relative performance. The Fund also held Electronics for Imaging Inc. (EFII) (holding weight*: 1.70 percent), a systems provider for commercial and enterprise digital printing. During the six-month period, EFII 22.1 percent as private equity firm Siris Capital Group LLC offered $1.7 billion to buyout the company, contributing to relative and absolute performance. Conversely, the Fund held MTS Systems Corp. (MTSC) (holding weight*: 0.68 percent), a company that specializes in running tests and simulations on mechanical systems. Despite producing a 17.5 percent return over the six-month period, it detracted from relative performance due to lagging the sector’s return by more than 1 percent.
Although the financials sector’s overall performance was closer to that of the benchmark index as a whole, it provided an extremely diverse set of underlying stock performance. For example, one of the poorest performers in the Fund during the six-month period was On Deck Capital, Inc. (ONDK) (holding weight*: 0.41 percent), a capital financing service provider. In the same sector, the Fund held Essent Group Ltd. (ESNT) (holding weight*: 1.19 percent), a mortgage insurance and reinsurance services provider. Although ONDK fell 22.8 percent, ESNT’s 20.4 percent increase more than offset the detriment from ONDK due to the Fund having more than double the exposure to ESNT.
Sub-Adviser Outlook
The Sub-Adviser remains optimistic that its quantitatively-driven approach will continue to benefit from the current economic environment. Although volatility has been subdued, the Sub-Adviser believes that the approach it applies to the Fund will be rewarded as volatility moderates. This belief corresponds with what the Sub-Adviser observes as the markets currently underappreciating some of the factors that he Sub-Adviser focuses on in its valuation-oriented signals.
| * | Holdings percentage(s) of total investments, excluding collateral for securities loaned, as of 4/30/2019. |
Growth of $100,000 Investment
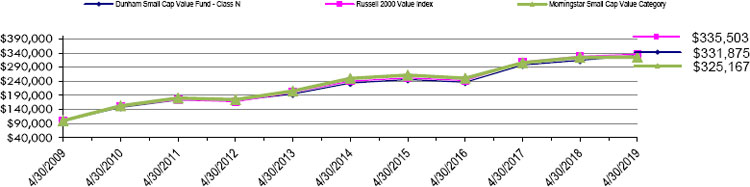
| | Total Returns as of April 30, 2019 | |
| | | | | | | | Annualized | | Annualized | |
| | | | Six Months | | One Year | | Five Years | | Ten Years | |
| | Class N | | 5.06% | | 5.73% | | 7.30% | | 12.75% | |
| | Class C | | 4.48% | | 4.63% | | 6.23% | | 11.63% | |
| | Class A with load of 5.75% | | (1.14)% | | (0.60)% | | 5.77% | | 11.83% | |
| | Class A without load | | 4.90% | | 5.44% | | 7.03% | | 12.49% | |
| | Russell 2000 Value Index | | 3.77% | | 2.19% | | 6.94% | | 12.87% | |
| | Morningstar Small Cap Value Category | | 3.50% | | 0.23% | | 5.37% | | 12.51% | |
The Russell 2000 Value Index is an unmanaged index that measures the performance of small cap companies in the Russell 2000 Index with lower price-to-book ratios and lower forecasted growth rates.
The Morningstar Small Cap Value Category is generally representative of mutual funds that primarily invest in small (small capitalization) U.S. companies that are less expensive or growing more slowly than other small-cap stocks.
Investors cannot invest directly in an index or benchmark.
As disclosed in the Trust’s latest registration statement, the Fund’s total annual operating expenses, including underlying funds, are 1.54% for Class N, 2.54% for Class C and 1.79% for Class A. Class A shares are subject to a sales load of 5.75% and a deferred sales charge of up to 0.75%. The performance data quoted here represents past performance, which is not indicative of future results. Current performance may be lower or higher than the performance data quoted. The investment return and NAV will fluctuate, so that an investor’s shares, when redeemed, may be worth more or less than their original cost. Total returns are calculated assuming reinvestment of all dividends and capital gains distributions, if any. The returns do not reflect the deductions of taxes a shareholder would pay on the redemption of Fund shares or Fund distributions. For performance information current to the most recent month-end, please call 1-800-442-4358 or visit our website www.dunham.com.
| SCHEDULE OF INVESTMENTS (Unaudited) |
| Dunham Small Cap Value Fund |
| April 30, 2019 |
| Security | | Shares | | | Value | |
| COMMON STOCKS - 99.3% | | | | | | | | |
| AUTO PARTS & EQUIPMENT - 0.6% | | | | | | | | |
| Tower International, Inc. | | | 13,138 | | | $ | 306,641 | |
| | | | | | | | | |
| BANKS - 18.5% | | | | | | | | |
| BancFirst Corp. | | | 4,660 | | | | 262,824 | |
| Bancorp, Inc. * | | | 31,318 | | | | 319,757 | |
| BankUnited, Inc. | | | 15,452 | | | | 565,234 | |
| Banner Corp. | | | 9,940 | | | | 527,019 | |
| CenterState Bank Corp. | | | 17,000 | | | | 419,560 | |
| Central Pacific Financial Corp. | | | 13,420 | | | | 402,734 | |
| First Citizens BancShares, Inc. | | | 1,580 | | | | 708,235 | |
| First Interstate BancSystem, Inc. | | | 11,970 | | | | 505,852 | |
| Flagstar Bancorp, Inc. | | | 18,012 | | | | 643,929 | |
| Franklin Financial Network, Inc. | | | 6,360 | | | | 175,854 | |
| Hancock Whitney Corp. | | | 11,500 | | | | 503,010 | |
| Heartland Financial USA, Inc. | | | 10,210 | | | | 458,429 | |
| Independent Bank Corp. | | | 10,280 | | | | 221,328 | |
| International Bancshares Corp. | | | 14,000 | | | | 580,580 | |
| National Bank Holdings Corp. | | | 10,610 | | | | 405,726 | |
| Simmons First National Corp. | | | 21,200 | | | | 538,268 | |
| Texas Capital Bancshares, Inc. * | | | 9,750 | | | | 631,118 | |
| TriCo Bancshares | | | 7,833 | | | | 312,615 | |
| TrustCo Bank Corp. NY | | | 23,000 | | | | 184,000 | |
| United Community Banks, Inc. | | | 23,300 | | | | 654,264 | |
| Wintrust Financial Corp. | | | 6,980 | | | | 531,876 | |
| | | | | | | | 9,552,212 | |
| BIOTECHNOLOGY - 0.4% | | | | | | | | |
| AMAG Pharmaceuticals, Inc. * | | | 17,900 | | | | 199,764 | |
| | | | | | | | | |
| CHEMICALS - 2.1% | | | | | | | | |
| Minerals Technologies, Inc. | | | 8,298 | | | | 520,865 | |
| Stepan Co. | | | 6,025 | | | | 557,554 | |
| | | | | | | | 1,078,419 | |
| COMMERCIAL SERVICES - 5.8% | | | | | | | | |
| Aaron’s, Inc. | | | 14,740 | | | | 820,871 | |
| CBIZ, Inc. * | | | 13,320 | | | | 257,209 | |
| FTI Consulting, Inc. * | | | 7,200 | | | | 611,856 | |
| Graham Holdings Co. | | | 860 | | | | 639,350 | |
| K12, Inc. * | | | 22,120 | | | | 666,254 | |
| | | | | | | | 2,995,540 | |
| COMPUTERS - 2.4% | | | | | | | | |
| Electronics For Imaging, Inc. * | | | 23,552 | | | | 875,899 | |
| MTS Systems Corp. | | | 6,410 | | | | 352,422 | |
| | | | | | | | 1,228,321 | |
| COSMETICS/PERSONAL CARE - 1.0% | | | | | | | | |
| Edgewell Personal Care Co.* | | | 13,268 | | | | 547,040 | |
| | | | | | | | | |
| DISTRIBUTION/WHOLESALE - 1.3% | | | | | | | | |
| WESCO International, Inc.* | | | 11,371 | | | | 650,876 | |
| | | | | | | | | |
| DIVERSIFIED FINANCIAL SERVICES - 2.4% | | | | | | | | |
| Boston Private Financial Holdings, Inc. | | | 33,500 | | | | 383,575 | |
| On Deck Capital, Inc. * | | | 38,800 | | | | 211,848 | |
| Piper Jaffray Cos. | | | 7,740 | | | | 623,844 | |
| | | | | | | | 1,219,267 | |
| ELECTRIC - 2.7% | | | | | | | | |
| PNM Resources, Inc. | | | 14,780 | | | | 686,383 | |
| Portland General Electric Co. | | | 13,980 | | | | 731,294 | |
| | | | | | | | 1,417,677 | |
| Security | | Shares | | | Value | |
| ELECTRONICS - 5.0% | | | | | | | | |
| Coherent, Inc. * | | | 1,400 | | | $ | 207,214 | |
| Comtech Telecommunications Corp. | | | 14,000 | | | | 329,420 | |
| Control4 Corp. * | | | 17,700 | | | | 308,157 | |
| Jabil, Inc. | | | 22,000 | | | | 664,620 | |
| Tech Data Corp. * | | | 7,900 | | | | 842,219 | |
| Vishay Intertechnology, Inc. * | | | 5,574 | | | | 211,087 | |
| | | | | | | | 2,562,717 | |
| FOOD - 0.9% | | | | | | | | |
| Fresh Del Monte Produce, Inc. | | | 16,300 | | | | 481,013 | |
| | | | | | | | | |
| GAS - 2.3% | | | | | | | | |
| Southwest Gas Holdings, Inc. | | | 7,020 | | | | 583,994 | |
| Spire, Inc. | | | 7,450 | | | | 627,216 | |
| | | | | | | | 1,211,210 | |
| HAND / MACHINE TOOLS - 1.0% | | | | | | | | |
| Regal Beloit Corp. | | | 6,400 | | | | 544,512 | |
| | | | | | | | | |
| HEALTHCARE - PRODUCTS - 1.7% | | | | | | | | |
| Integer Holdings Corp.* | | | 6,500 | | | | 449,085 | |
| Lantheus Holdings, Inc.* | | | 18,000 | | | | 434,880 | |
| | | | | | | | 883,965 | |
| HEALTHCARE - SERVICES - 1.2% | | | | | | | | |
| Magellan Health, Inc. * | | | 4,121 | | | | 288,470 | |
| Providence Service Corp. * | | | 5,010 | | | | 332,313 | |
| | | | | | | | 620,783 | |
| HOME BUILDERS- 1.2% | | | | | | | | |
| Taylor Morrison Home Corp. * | | | 31,210 | | | | 604,226 | |
| | | | | | | | | |
| HOME FURNISHINGS - 0.8% | | | | | | | | |
| Ethan Allen Interiors, Inc. | | | 17,790 | | | | 393,159 | |
| | | | | | | | | |
| HOUSEHOLD PRODUCTS/WARES - 0.8% | | | | | | | | |
| ACCO Brands Corp. | | | 46,227 | | | | 422,515 | |
| | | | | | | | | |
| INSURANCE - 4.6% | | | | | | | | |
| Assured Guaranty Ltd. | | | 12,430 | | | | 592,911 | |
| Essent Group Ltd.* | | | 12,920 | | | | 613,054 | |
| Mercury General Corp. | | | 11,033 | | | | 593,355 | |
| Selective Insurance Group, Inc. | | | 7,900 | | | | 563,349 | |
| | | | | | | | 2,362,669 | |
| IRON / STEEL - 0.8% | | | | | | | | |
| Schnitzer Steel Industries, Inc. | | | 16,527 | | | | 392,020 | |
| | | | | | | | | |
| LODGING - 0.8% | | | | | | | | |
| Marcus Corp. | | | 10,620 | | | | 399,524 | |
| | | | | | | | | |
| MEDIA - 2.2% | | | | | | | | |
| Gannett Co., Inc. | | | 39,940 | | | | 372,640 | |
| Gray Television, Inc. * | | | 32,270 | | | | 756,086 | |
| | | | | | | | 1,128,726 | |
| METAL FABRICATE / HARDWARE - 1.8% | | | | | | | | |
| Rexnord Corp. * | | | 21,000 | | | | 600,600 | |
| TriMas Corp. * | | | 10,330 | | | | 319,507 | |
| | | | | | | | 920,107 | |
| MISCELLANEOUS MANUFACTURING - 1.3% | | | | | | | | |
| ITT, Inc. | | | 10,900 | | | | 659,995 | |
See accompanying notes to financial statements.
| SCHEDULE OF INVESTMENTS (Unaudited) |
| Dunham Small Cap Value Fund (Continued) |
| April 30, 2019 |
| Security | | Shares | | | Value | |
| COMMON STOCKS - 99.3% (Continued) | | | | | | | | |
| OIL & GAS - 2.0% | | | | | | | | |
| Bonanza Creek Energy Inc * | | | 14,000 | | | $ | 336,980 | |
| Gulfport Energy Corp * | | | 36,230 | | | | 237,306 | |
| Whiting Petroleum Corp. * | | | 16,900 | | | | 462,891 | |
| | | | | | | | 1,037,177 | |
| OIL & GAS SERVICES - 2.1% | | | | | | | | |
| Exterran Corp. * | | | 16,272 | | | | 231,388 | |
| Helix Energy Solutions Group, Inc. * | | | 56,700 | | | | 443,394 | |
| Newpark Resources, Inc. * | | | 54,207 | | | | 395,711 | |
| | | | | | | | 1,070,493 | |
| PACKAGING & CONTAINERS - 1.1% | | | | | | | | |
| Silgan Holdings, Inc. | | | 18,800 | | | | 562,872 | |
| | | | | | | | | |
| PHARMACEUTICALS - 0.5% | | | | | | | | |
| Anika Therapeutics, Inc. * | | | 8,033 | | | | 255,851 | |
| | | | | | | | | |
| REITS - 14.6% | | | | | | | | |
| Arbor Realty Trust, Inc. | | | 34,000 | | | | 464,440 | |
| Brandywine Realty Trust | | | 45,200 | | | | 695,628 | |
| Columbia Property Trust, Inc. | | | 29,128 | | | | 661,497 | |
| Corporate Office Properties Trust | | | 21,900 | | | | 610,572 | |
| Global Net Lease, Inc. | | | 30,223 | | | | 576,353 | |
| Hersha Hospitality Trust | | | 27,920 | | | | 518,474 | |
| Ladder Capital Corp. | | | 30,520 | | | | 531,048 | |
| Lexington Realty Trust | | | 56,489 | | | | 512,355 | |
| Preferred Apartment Communities, Inc. | | | 26,022 | | | | 406,984 | |
| QTS Realty Trust, Inc. | | | 15,195 | | | | 689,093 | |
| Rexford Industrial Realty, Inc. | | | 19,500 | | | | 738,855 | |
| RLJ Lodging Trust | | | 31,400 | | | | 578,074 | |
| STAG Industrial, Inc. | | | 19,100 | | | | 549,698 | |
| | | | | | | | 7,533,071 | |
| RETAIL - 1.9% | | | | | | | | |
| Conn’s, Inc. * | | | 13,136 | | | | 339,828 | |
| Denny’s Corp. * | | | 22,200 | | | | 413,364 | |
| Habit Restaurants, Inc. * | | | 24,000 | | | | 255,840 | |
| | | | | | | | 1,009,032 | |
| SAVINGS & LOANS - 2.1% | | | | | | | | |
| Washington Federal, Inc. | | | 16,500 | | | | 546,810 | |
| WSFS Financial Corp. | | | 13,023 | | | | 562,333 | |
| | | | | | | | 1,109,143 | |
| SEMICONDUCTORS - 2.4% | | | | | | | | |
| Axcelis Technologies, Inc.* | | | 13,500 | | | | 287,415 | |
| Diodes, Inc. * | | | 14,987 | | | | 545,826 | |
| Rambus, Inc. * | | | 37,480 | | | | 429,521 | |
| | | | | | | | 1,262,762 | |
| Security | | Shares | | | Value | |
| SOFTWARE - 3.1% | | | | | | | | |
| ManTech International Corp. | | | 6,523 | | | $ | 404,361 | |
| MicroStrategy, Inc. * | | | 3,960 | | | | 592,812 | |
| Progress Software Corp. | | | 13,641 | | | | 622,166 | |
| | | | | | | | 1,619,339 | |
| TELECOMMUNICATIONS - 2.9% | | | | | | | | |
| ADTRAN, Inc. | | | 29,032 | | | | 497,608 | |
| Consolidated Communications Holdings, Inc. | | | 18,000 | | | | 92,880 | |
| LogMeIn, Inc. | | | 6,500 | | | | 535,600 | |
| United States Cellular Corp. * | | | 8,040 | | | | 386,724 | |
| | | | | | | | 1,512,812 | |
| TRANSPORTATION - 2.1% | | | | | | | | |
| ArcBest Corp. | | | 12,201 | | | | 372,863 | |
| Covenant Transportation Group, Inc. * | | | 12,120 | | | | 236,704 | |
| Echo Global Logistics, Inc. * | | | 20,195 | | | | 463,273 | |
| | | | | | | | 1,072,840 | |
| WATER - 0.9% | | | | | | | | |
| SJW Group | | | 7,635 | | | | 473,828 | |
| | | | | | | | | |
| TOTAL COMMON STOCKS - (Cost - $49,158,954) | | | | | | | 51,302,118 | |
| | | | | | | | | |
| SHORT-TERM INVESTMENT - 0.7% | | | | | | | | |
| MONEY MARKET FUND - 0.7% | | | | | | | | |
| Invesco STIT-Treasury Portfolio Institutional Class - 2.32% + | | | 366,407 | | | | 366,407 | |
| (Cost - $366,407) | | | | | | | | |
| | | | | | | | | |
| TOTAL INVESTMENTS - 100.0% (Cost - $49,525,361) | | | | | | $ | 51,668,525 | |
| LIABILITIES LESS OTHER ASSETS - (0.0)% | | | | | | | (2,063 | ) |
| NET ASSETS - 100.0% | | | | | | $ | 51,666,462 | |
REITS - Real Estate Investment Trust
| * | Non Income producing security. |
| + | Variable rate security - interest rate is as of April 30, 2019. |
| Portfolio Composition * - (Unaudited) |
| Financial | | | 42.2 | % | | Utilities | | | 6.0 | % |
| Consumer, Non-cyclical | | | 12.4 | % | | Communications | | | 5.1 | % |
| Industrial | | | 12.2 | % | | Energy | | | 4.1 | % |
| Technology | | | 8.0 | % | | Basic Materials | | | 2.8 | % |
| Consumer, Cyclical | | | 6.5 | % | | Other | | | 0.7 | % |
| | | | | | | Total | | | 100.0 | % |
| * | Based on total value of investments as of April 30, 2019. |
Percentage may differ from Schedule of Investments which are based on Fund net assets.
See accompanying notes to financial statements.
| Dunham Small Cap Growth Fund (Unaudited) |
| Message from the Sub-Adviser (Pier Capital, LLC) |
Asset Class Recap
Small cap growth stocks, as measured by the Russell 2000 Growth Index, ended up 0.4 percent in the first fiscal quarter. On the surface, it may seem like an uneventful start to the fiscal year, however, if you dig deeper; it reveals a significant spike and decline of volatility resulting in a “V shaped” trajectory for the asset class. Concerns that the Fed was raising rates too quickly came to a precipice early in the first fiscal quarter as small cap growth stocks fell over 16 percent. To the surprise of many, the Federal Reserve drastically changed its stance by announcing their intention to be patient with future rate rises. Small cap growth stocks reacted positively to the news as they rebounded over 20 percent to finish the first fiscal quarter. The rally continued the most recent fiscal quarter as concerns regarding rates moved to the backburner, trade tensions somewhat dissipated with hints towards progress, and an impressive earnings season highlighted the resilience of American companies in the face of multiple headwinds. Over the most recent fiscal quarter ended April 30, 2019, small cap growth stocks increased 8.2 percent bringing performance over the first six months of the fiscal year to 8.3 percent.
Allocation Review
The sector allocation within the Fund is predominately a result of the bottom-up stock selection. With that being said, both the Sub-Adviser’s stock selection and sector allocation strongly contributed to Fund performance. The Fund’s largest overweight by a significant margin was the information technology sector. This overweight strongly contributed to Fund performance. During the fiscal six-month period, the Sub-Adviser shifted the allocation of the communication services and energy sectors from underweights to slight overweights, which also positively impacted the Fund. Due to the substantial weight in the information technology sector, the Fund was underweight all other sectors. Although the underweight in the health care and financials sectors detracted from Fund performance, the Sub-Adviser’s stock selection more than made up for the adverse allocation effect. In the first fiscal quarter, sector contribution was evenly mixed, while only one sector detracted the second fiscal quarter.
Holdings Insights
Two of the largest positive contributors to Fund performance during the fiscal six-month period came from the information technology sector. Within that sector, Bandwidth Inc. (BAND) (holding weight*: 0.89 percent), a cloud-based software communications platform-as-a-service provider in the U.S. that enables enterprises to create voice or text communication services, was one of the top contributors to Fund performance over the fiscal period. The Sub-Adviser believes that BAND has recently traded at a reduced value relative to their one major competitor, Twilio, Inc. (TWLO) (holding weight*: 1.38 percent), and is just beginning to close the gap. Over the period, BAND increased 41.3 percent. Another contributor from the information technology sector was Roku Inc. (ROKU) (holding weight*: 0.47 percent). ROKU manufactures digital media players that allows customers to access internet streamed video or audio services through television. ROKU increased 14.4 percent over the fiscal period. Despite the strong performance, the Sub-Adviser has lowered the exposure to this position due to increased competition within the industry. Although the Fund was underweight the health care sector, a position within this sector was one of the top performing positions within the Fund. Guardant Health Inc. (GH) (holding weight*: 0.93 percent), a company that is revolutionizing cancer testing with noninvasive liquid biopsy tests, increased 79.5 percent since its initiation into the Fund. GH has won many accolades in the health care industry, leading to it being upgraded by analyst coverage over the most recent fiscal quarter.
One of the worst performing positions over the fiscal period came from the best performing sector, the information technology sector. Benefitfocus Inc. (BNFT) (holding weight*: 0.98 percent), a provider of cloud-based benefits management platforms for consumers, employers, and insurance carriers, was the worst performing position within the Fund over the fiscal six-month period. BNFT declined 26.2 percent since it was added to the Fund. The Sub-Adviser attributes the recent decline to executive turnover, making investors question whether the rally could continue. Other detractors over the fiscal period included Orasure Technologies Inc. (OSUR) (holding weight**: 0.56 percent) and NV5 Global Inc. (NVEE) (holding weight**: 0.99 percent). Granted both positions warranted their own idiosyncratic concerns, but both positons experienced large selloffs due to disappointing earnings releases. Prior to being eliminated from the Fund, OSUR declined 24.0 percent and NVEE fell 33.2 percent.
Sub-Adviser Outlook
The Sub-Adviser does not forecast. The Sub-Adviser’s investment approach involves a thorough understanding of each stock’s value proposition and risk. However, the Sub-Adviser perpetually monitors the effects of these macro themes on each underlying position within the Fund. The Sub-Adviser is keeping a close eye on updates to tariffs, health care policies, and infrastructure spending to evaluate current positions and identify future opportunities.
| * | Holdings percentage(s) of total investments, excluding collateral for securities loaned, as of 4/30/2019. |
| ** | Holdings percentage(s) as of the date prior to the sale of the security. |
Growth of $100,000 Investment
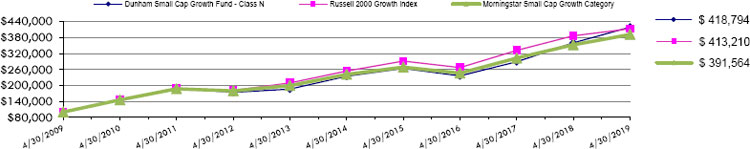
| | Total Returns as of April 30, 2019 | |
| | | | | | | | Annualized | | Annualized | |
| | | | Six Months | | One Year | | Five Years | | Ten Years | |
| | Class N | | 8.90% | | 16.30% | | 12.26% | | 15.40% | |
| | Class C | | 8.36% | | 15.20% | | 11.15% | | 14.25% | |
| | Class A with load of 5.75% | | 2.52% | | 9.31% | | 10.65% | | 14.44% | |
| | Class A without load | | 8.75% | | 15.97% | | 11.97% | | 15.12% | |
| | Russell 2000 Growth Index | | 8.27% | | 6.91% | | 10.22% | | 15.24% | |
| | Morningstar Small Cap Growth Category | | 8.74% | | 11.12% | | 10.14% | | 14.62% | |
The Russell 2000 Growth Index measures the performance of the Russell 2000 companies with higher price- to-book ratios and higher forecasted growth values. Investors cannot invest directly in an index or benchmark.
The Morningstar Small Cap Growth Category is generally representative of mutual funds that primarily invest in small (small capitalization) U.S. companies that are projected to grow faster than other small-cap stocks.
As disclosed in the Trust’s latest registration statement, the Fund’s total annual operating expenses, including the cost of underlying funds, are 1.95% for Class N, 2.95% for Class C and 2.20% for Class A. Class A shares are subject to a sales load of 5.75% and a deferred sales charge of up to 0.75%. The performance data quoted here represents past performance, which is not indicative of future results. Current performance may be lower or higher than the performance data quoted. The investment return and NAV will fluctuate, so that an investor’s shares, when redeemed, may be worth more or less than their original cost. Total returns are calculated assuming reinvestment of all dividends and capital gains distributions, if any. The returns do not reflect the deductions of taxes a shareholder would pay on the redemption of Fund shares or Fund distributions. For performance information current to the most recent month-end, please call 1-800-442-4358 or visit our website www.dunham.com
| SCHEDULE OF INVESTMENTS (Unaudited) |
| Dunham Small Cap Growth Fund |
| April 30, 2019 |
| Security | | Shares | | | Value | |
| COMMON STOCKS - 95.3% | | | | | | | | |
| ADVERTISING - 0.9% | | | | | | | | |
| Trade Desk, Inc. * | | | 2,215 | | | $ | 490,578 | |
| | | | | | | | | |
| AIRLINES - 1.0% | | | | | | | | |
| Spirit Airlines, Inc. * | | | 9,266 | | | | 503,885 | |
| | | | | | | | | |
| APPAREL - 1.7% | | | | | | | | |
| Canada Goose Holdings, Inc. * ^ | | | 8,657 | | | | 462,197 | |
| Farfetch Ltd. * | | | 17,364 | | | | 430,280 | |
| | | | | | | | 892,477 | |
| BANKS - 1.9% | | | | | | | | |
| First Merchants Corp. | | | 12,244 | | | | 448,988 | |
| United Community Banks, Inc. | | | 19,805 | | | | 556,124 | |
| | | | | | | | 1,005,112 | |
| BIOTECHNOLOGY - 5.2% | | | | | | | | |
| Biohaven Pharmaceutical Holding Co. Ltd. * | | | 6,921 | | | | 414,222 | |
| Emergent BioSolutions, Inc. * | | | 7,344 | | | | 379,538 | |
| Exact Sciences Corp. * | | | 6,044 | | | | 596,482 | |
| Guardant Health, Inc. * | | | 7,386 | | | | 483,857 | |
| REGENXBIO, Inc. * | | | 5,132 | | | | 258,653 | |
| Stemline Therapeutics, Inc. * | | | 26,818 | | | | 402,270 | |
| Veracyte, Inc. * | | | 10,374 | | | | 237,253 | |
| | | | | | | | 2,772,275 | |
| BUILDING MATERIALS - 0.8% | | | | | | | | |
| Trex Co., Inc. * | | | 6,378 | | | | 441,804 | |
| | | | | | | | | |
| CHEMICALS - 1.0% | | | | | | | | |
| Rogers Corp. * | | | 3,190 | | | | 534,389 | |
| | | | | | | | | |
| COMMERICAL SERVICES - 2.9% | | | | | | | | |
| Avalara, Inc. * | | | 9,490 | | | | 558,676 | |
| HealthEquity, Inc. * | | | 6,760 | | | | 457,990 | |
| LiveRamp Holdings, Inc. * | | | 8,606 | | | | 501,988 | |
| | | | | | | | 1,518,654 | |
| COMPUTERS - 7.0% | | | | | | | | |
| Cubic Corp. | | | 10,831 | | | | 614,984 | |
| Elastic NV * ^ | | | 6,039 | | | | 516,637 | |
| Globant SA * | | | 7,104 | | | | 596,665 | |
| Mercury Systems, Inc. * | | | 7,278 | | | | 531,440 | |
| Rapid7, Inc. * | | | 7,858 | | | | 427,004 | |
| Virtusa Corp. * | | | 9,079 | | | | 504,338 | |
| WNS Holdings Ltd. - ADR * | | | 9,332 | | | | 533,324 | |
| | | | | | | | 3,724,392 | |
| DISTRIBUTION/WHOLESALE - 0.7% | | | | | | | | |
| SiteOne Landscape Supply, Inc. * ^ | | | 5,409 | | | | 364,026 | |
| | | | | | | | | |
| DIVERSIFIED FINANCIAL SERVICES - 3.9% | | | | | | | | |
| Evercore, Inc. | | | 5,625 | | | | 548,044 | |
| Houlihan Lokey, Inc. | | | 12,593 | | | | 621,087 | |
| LendingTree, Inc. * | | | 1,420 | | | | 546,444 | |
| Moelis & Co. | | | 8,992 | | | | 368,222 | |
| | | | | | | | 2,083,797 | |
| Security | | Shares | | | Value | |
| ELECTRICAL COMPONENTS & EQUIPMENT - 1.2% | | | | | | | | |
| Littelfuse, Inc. | | | 2,838 | | | $ | 570,580 | |
| nLight, Inc. * | | | 2,829 | | | | 73,922 | |
| | | | | | | | 644,502 | |
| ELECTRONICS - 1.1% | | | | | | | | |
| Woodward, Inc. | | | 5,226 | | | | 569,111 | |
| | | | | | | | | |
| ENGINEERING & CONSTRUCTION - 1.9% | | | | | | | | |
| Granite Construction, Inc. | | | 9,213 | | | | 413,572 | |
| Primoris Services Corp. | | | 26,926 | | | | 590,218 | |
| | | | | | | | 1,003,790 | |
| ENTERTAINMENT - 0.6% | | | | | | | | |
| Red Rock Resorts, Inc. | | | 12,464 | | | | 336,279 | |
| | | | | | | | | |
| HEALTHCARE-PRODUCTS - 9.4% | | | | | | | | |
| CareDx, Inc. * | | | 8,203 | | | | 223,204 | |
| Cerus Corp. * | | | 58,473 | | | | 358,439 | |
| Inspire Medical Systems, Inc. * | | | 7,543 | | | | 389,898 | |
| Insulet Corp. * ^ | | | 2,852 | | | | 245,985 | |
| iRhythm Technologies, Inc. * | | | 4,769 | | | | 363,922 | |
| Merit Medical Systems, Inc. * | | | 7,658 | | | | 430,226 | |
| Repligen Corp. * | | | 7,903 | | | | 532,504 | |
| Shockwave Medical, Inc. * ^ | | | 6,265 | | | | 266,952 | |
| Tandem Diabetes Care, Inc. * | | | 9,102 | | | | 558,954 | |
| ViewRay, Inc. * ^ | | | 60,384 | | | | 420,273 | |
| West Pharmaceutical Services, Inc. | | | 4,514 | | | | 558,788 | |
| Wright Medical Group NV * | | | 20,285 | | | | 599,827 | |
| | | | | | | | 4,948,972 | |
| HEALTHCARE-SERVICES - 4.0% | | | | | | | | |
| Addus HomeCare Corp. * | | | 8,059 | | | | 547,206 | |
| Catalent, Inc. * | | | 11,343 | | | | 508,393 | |
| LHC Group, Inc. * | | | 4,615 | | | | 512,773 | |
| Neuronetics, Inc. * | | | 31,499 | | | | 525,088 | |
| | | | | | | | 2,093,460 | |
| HOME BUILDERS - 3.0% | | | | | | | | |
| Century Communities, Inc. * | | | 20,531 | | | | 522,103 | |
| LGI Homes, Inc. * ^ | | | 6,023 | | | | 417,454 | |
| Skyline Corp. | | | 25,234 | | | | 532,690 | |
| | | | | | | | 1,472,247 | |
| INTERNET - 8.5% | | | | | | | | |
| Eventbrite, Inc. * | | | 19,700 | | | | 492,500 | |
| Lyft, Inc. * ^ | | | 4,571 | | | | 273,346 | |
| Mimecast, Inc. * | | | 10,626 | | | | 547,345 | |
| Pinterest, Inc. * ^ | | | 26,055 | | | | 807,184 | |
| Roku, Inc. * | | | 3,878 | | | | 246,602 | |
| Spotify Technology * | | | 3,358 | | | | 455,916 | |
| Wix.com Ltd. * | | | 4,309 | | | | 578,095 | |
| Zendesk, Inc. * | | | 6,330 | | | | 555,647 | |
| Zscaler, Inc. * | | | 7,518 | | | | 513,555 | |
| | | | | | | | 4,470,190 | |
| LODGING - 0.9% | | | | | | | | |
| Boyd Gaming Corp. | | | 17,191 | | | | 494,757 | |
| | | | | | | | | |
| MACHINERY-CONSTRUCTION/MINING - 0.9% | | | | | | | | |
| BWX Technologies, Inc. | | | 9,662 | | | | 493,728 | |
See accompanying notes to financial statements.
| SCHEDULE OF INVESTMENTS (Unaudited) |
| Dunham Small Cap Growth Fund (Continued) |
| April 30, 2019 |
| Security | | Shares | | | Value | |
| COMMON STOCKS - 95.3% (Continued) | | | | | | | | |
| MISCELLANEOUS MANUFACTURING - 0.7% | | | | | | | | |
| ESCO Technologies, Inc. | | | 4,790 | | | $ | 359,250 | |
| | | | | | | | | |
| OIL & GAS - 2.0% | | | | | | | | |
| Matador Resources Co. * ^ | | | 27,686 | | | | 545,137 | |
| PDC Energy, Inc. * | | | 12,183 | | | | 529,839 | |
| | | | | | | | 1,074,976 | |
| PHARMACEUTICALS - 2.1% | | | | | | | | |
| Coherus Biosciences, Inc. * | | | 40,635 | | | | 646,909 | |
| DexCom, Inc . * | | | 1,792 | | | | 216,957 | |
| Heron Therapeutics, Inc. * | | | 11,338 | | | | 245,808 | |
| | | | | | | | 1,109,674 | |
| REAL ESTATE - 2.0% | | | | | | | | |
| Marcus & Millichap, Inc. * | | | 13,284 | | | | 572,540 | |
| Redfin Corp. * ^ | | | 22,973 | | | | 475,082 | |
| | | | | | | | 1,047,622 | |
| RETAIL - 6.4% | | | | | | | | |
| At Home Group, Inc. * ^ | | | 15,373 | | | | 361,112 | |
| Casey’s General Stores, Inc. | | | 4,791 | | | | 634,089 | |
| Floor & Décor Holdings, Inc. * ^ | | | 7,625 | | | | 366,153 | |
| Hudson Ltd. * | | | 27,506 | | | | 421,942 | |
| National Vision Holdings, Inc. * | | | 18,752 | | | | 506,304 | |
| Ollie’s Bargain Outlet Holdings, Inc. * | | | 6,573 | | | | 628,642 | |
| Wingstop, Inc. | | | 6,379 | | | | 480,147 | |
| | | | | | | | 3,398,389 | |
| SEMICONDUCTORS - 1.5% | | | | | | | | |
| Lattice Semiconductor Corp. * | | | 20,852 | | | | 270,033 | |
| Silicon Laboratories, Inc. * | | | 4,884 | | | | 525,811 | |
| | | | | | | | 795,844 | |
| SOFTWARE - 16.8% | | | | | | | | |
| Alteryx, Inc. * | | | 5,925 | | | | 525,192 | |
| Appfolio, Inc. * | | | 3,941 | | | | 382,711 | |
| Atlassian Corp. PLC * | | | 4,504 | | | | 496,116 | |
| Bandwidth, Inc. * | | | 6,172 | | | | 465,492 | |
| Benefitfocus, Inc. * | | | 12,539 | | | | 510,713 | |
| Coupa Software, Inc. * | | | 3,866 | | | | 399,474 | |
| Everbridge, Inc. * | | | 5,454 | | | | 402,996 | |
| Evolent Health, Inc. * | | | 28,442 | | | | 385,389 | |
| Five9, Inc. * | | | 10,853 | | | | 575,969 | |
| Omnicell, Inc. * | | | 7,684 | | | | 617,486 | |
| Pivotal Software, Inc. * | | | 24,794 | | | | 538,030 | |
| Pluralsight, Inc. * | | | 15,709 | | | | 557,512 | |
| ServiceNow, Inc. * | | | 1,101 | | | | 298,933 | |
| Smartsheet, Inc. * | | | 12,706 | | | | 537,845 | |
| Tabula Rasa HealthCare, Inc. * ^ | | | 11,251 | | | | 599,228 | |
| Talend SA - ADR * | | | 6,906 | | | | 342,400 | |
| Security | | Shares | | | Value | |
| SOFTWARE - 16.8% (Continued) | | | | | | | | |
| Twilio, Inc. * | | | 5,255 | | | $ | 720,671 | |
| Yext, Inc. * | | | 22,629 | | | | 495,801 | |
| | | | | | | | 8,851,958 | |
| TELECOMMUNICATIONS - 1.6% | | | | | | | | |
| 8x8, Inc. * ^ | | | 22,392 | | | | 535,617 | |
| Pagerduty, Inc. * | | | 6,464 | | | | 303,162 | |
| | | | | | | | 838,779 | |
| TRANSPORTATION - 3.7% | | | | | | | | |
| Air Transport Services Group, Inc. * | | | 25,144 | | | | 591,638 | |
| Atlas Air Worldwide Holdings, Inc. * | | | 8,210 | | | | 396,461 | |
| CryoPort, Inc. * ^ | | | 33,706 | | | | 474,244 | |
| Saia, Inc. * | | | 7,857 | | | | 505,912 | |
| | | | | | | | 1,968,255 | |
| | | | | | | | | |
| TOTAL COMMON STOCKS (Cost - $41,707,567) | | | | | | | 50,303,172 | |
| | | | | | | | | |
| SHORT-TERM INVESTMENT - 3.4% | | | | | | | | |
| MONEY MARKET FUND - 3.4% | | | | | | | | |
| Fidelity Investment Money Market Fund - Class I 2.31% + | | | 1,812,514 | | | | 1,812,514 | |
| TOTAL SHORT-TERM INVESTMENT(Cost - $1,812,514) | | | | | | | | |
| | | | | | | | | |
| COLLATERAL FOR SECURITIES LOANED - 13.7% | | | | | | | | |
| HSBC US Government Money Market Fund - Class Institutional 2.43% + # | | | 1,334,422 | | | | 1,334,422 | |
| Morgan Stanley Institutional Liquidity Fund Prime Portfolio - Class Institutional 2.53% + # | | | 5,917,350 | | | | 5,917,350 | |
| TOTAL COLLATERAL FOR SECURITIES LOANED (Cost - $7,251,772) | | | | 7,251,772 | |
| | | | | | | | | |
| TOTAL INVESTMENTS - 112.4% (Cost - $50,771,853) | | | $ | 59,367,458 | |
| LIABILITIES IN EXCESS OF OTHER ASSETS - (12.4)% | | | | (6,568,913 | ) |
| NET ASSETS - 100.0% | | | $ | 52,798,545 | |
ADR - American Depositary Receipt
PLC - Public Limited Company
| ^ | All or a portion of these securities are on loan. Total loaned securities had a value of $7,089,805 at April 30, 2019. |
| # | The Trust’s securities lending policies and procedures require that the borrower: (i) deliver cash or U.S. Government securities as collateral with respect to each new loan of U.S. securities, equal to at least 102% of the value of the portfolio securities loaned, and (ii) at all times thereafter mark-to-market the collateral on a daily basis so that the market value of such collateral is at least 100% of the value of securities loaned. From time to time the collateral may not be 102% due to end of day market movement. The next business day additional collateral is obtained/received from the borrower to replenish/reestablish 102%. |
| * | Non-Income producing security. |
| + | Variable rate security. Interest rate is as of April 30, 2019. |
| Portfolio Composition * - (Unaudited) |
| Technology | | | 22.5 | % | | Industrial | | | 9.2 | % |
| Consumer, Non-Cyclical | | | 21.0 | % | | Financial | | | 7.0 | % |
| Consumer, Cyclical | | | 12.6 | % | | Short-Term Investment | | | 3.0 | % |
| Collateral For Securities Loaned | | | 12.2 | % | | Energy | | | 1.8 | % |
| Communications | | | 9.8 | % | | Basic Materials | | | 0.9 | % |
| | | | | | | Total | | | 100.0 | % |
| * | Based on total value of investments as of April 30, 2019. |
Percentage may differ from Schedule of Investments which is based on Fund net assets.
See accompanying notes to financial statements.
| Dunham Emerging Markets Stock Fund (Unaudited) |
| Message from the Sub-Adviser (NS Partners Ltd.) |
Asset Class Recap
Emerging markets stocks, as measured by the MSCI Emerging Markets Index, rose 3.2 percent during the most recent fiscal quarter, after increasing 10.2 percent in the first fiscal quarter. The surge started the fiscal year with most emerging markets countries in positive territory, some up as much as 26 percent. Only Taiwan, United Arab Emirates, Pakistan, and Greece failed to end the most recent fiscal quarter in the black. Three of these four countries comprise only one percent of the index when combined. However, Taiwan is the third largest country weighting in the index, so its detraction from overall performance was much more meaningful, however not impactful enough to outweigh nearly half of the emerging markets countries boasting positive returns in the double- digits. In the most recent fiscal quarter, negative performing countries outnumbered countries in positive territory. Fortunately, two of the three largest constituents, China and Taiwan, helped drive the index higher. These two countries make up over 40 percent of the index and increased 8.3 and 11.4 percent, respectively.
Allocation Review
During the first five months of the fiscal six- month period, the largest country overweights, namely Brazil and Columbia, provided mixed relative results for the Fund as Columbia increased 18.0 percent while Brazil only increased 4.1 percent. The largest country underweights in the Fund during the period were Thailand and South Africa. These relative underweights provided mixed results to relative performance, as Thailand increased 4.0 percent and South Africa increased 12.8 percent. While the largest underweights and overweights broadly detracted from Fund performance, the more moderate underweights and overweights generally detracted, leaving the country selection as a detractor to relative Fund performance. Effective April 1, 2019, the Fund was managed by a new Sub-Adviser. This change was the catalyst for larger than normal turnover, and a shift in country allocation to reflect the Sub-Adviser’s conviction. During the final month of the most recent fiscal quarter, the largest country overweights were India and Mexico, while the largest country underweights were Taiwan and Korea. Over the full three months of the most recent fiscal quarter, country selection was a contributor to relative Fund performance.
Holdings Insights
As the largest country represented in the index, China’s 21.4 percent increase was a large driver of the strong first fiscal quarter’s performance. The Sub-Adviser maintained close to a 30 percent allocation to China, in line with the index’s weighting. Stock selection within China produced strong relative value-adds during the fiscal six-month period, as holdings such as Weichai Power Co., Ltd. (2338 HK) (holding weight**: 1.13 percent), a diesel engine manufacturer, and Shimao Property Holdings Ltd. (813 HK) (holding weight**: 0.86 percent), a real estate developer, increased 81.7 percent and 67.5 percent, respectively. Another strong contributor from China was Li Ning Co. LTD (2331 HK) (holding weight*: 2.50 percent), a leading sports brand company, mainly providing sporting goods including footwear, apparel, and equipment. The Sub-Adviser believes that this is the best local sportswear brand in China. The original founder has regained control of the company, instilled good brand awareness while improving cash flow and inventory controls. Additionally, the average Chinese consumer is becoming wealthier, and they are spending a portion of that income on “athleisure.” 2331 HK increased 65.4 percent over the most recent fiscal quarter.
The allocation to India began the fiscal six-month period slightly overweight but finished the period as the largest country overweight. This country increased 11.7 percent over the fiscal six-month period, but some positions from India detracted from Fund performance. Lemon Tree Hotels Ltd (BF2LSQ7 IN) (holding weight*: 2.54 percent) a mid-priced hotel chain, declined 10.9 percent since it was initiated into the portfolio in early April. The Sub-Adviser believes that this position sold off as investors sold off positions with relatively larger amounts of debt. The Sub-Adviser is optimistic for the position moving forward. In India, mid-priced hotels have been undersupplied for the last 10 years and demand for this segment has been surging due to the increase in business travelers in India. A position from India that relatively detracted from Fund performance in the first fiscal quarter but strongly contributed during the most recent fiscal quarter was Housing Development Finance Corp Ltd (HDFC IN) (holding weight*: 2.01 percent), an Indian banking and financial service company. HDFC IN increased 4.0 percent over the most recent fiscal quarter, after increasing 8.7 percent the first fiscal quarter of the year.
Sub-Adviser Outlook
The Sub-Adviser expects that global economic weakness will extend. The Chinese economy has stabilized but they do not believe it will lead to a rally reminiscent of 2016. The Sub-Adviser believes that U.S. inventories will adjust resulting in a delay in the emerging market exports recovery. The Sub-Adviser finished the most recent fiscal quarter underweight Taiwan and Korea, but will add to the positions if they believe the recovery in exports will come to fruition. The Sub-Adviser will continue to focus on economic profitability rather than accounting profitability and places an emphasis on companies that are beneficiaries of the structural changes occurring in emerging market countries.
| * | Holdings percentage(s) of total investments, excluding collateral for securities loaned, as of 4/30/2019. |
Growth of $100,000 Investment
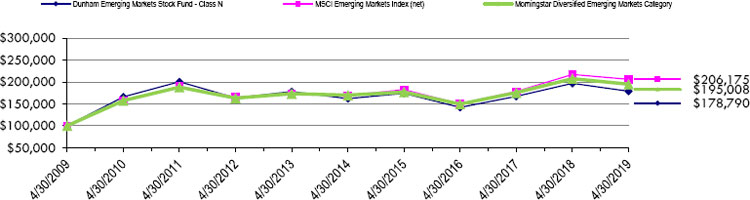
| | Total Returns as of April 30, 2019 | |
| | | | | | | | Annualized | | Annualized | |
| | | | Six Months | | One Year | | Five Years | | Ten Years | |
| | Class N | | 12.65% | | (9.24)% | | 2.02% | | 5.98% | |
| | Class C | | 12.00% | | (10.20)% | | 0.98% | | 4.92% | |
| | Class A with load of 5.75% | | 6.00% | | (14.62)% | | 0.58% | | 5.09% | |
| | Class A without load | | 12.50% | | (9.43)% | | 1.77% | | 5.72% | |
| | MSCI Emerging Markets Index (net) | | 13.76% | | (5.04)% | | 4.04% | | 7.50% | |
| | Morningstar Diversified Emerging Markets Category | | 13.03% | | (6.02)% | | 2.80% | | 6.90% | |
The MSCI Emerging Markets Index (net) is a free float-adjusted market capitalization index that is designed to measure equity market performance in the global emerging markets. Investors cannot invest directly in an index or benchmark.
The Morningstar Diversified Emerging Markets Category is generally representative of mutual funds that primarily invest among 20 or more developing nations, with a general focus on the emerging markets of Asia and Latin America rather than on the emerging markets countries in the Middle East, Africa, or Europe.
As disclosed in the Trust’s latest registration statement, the Fund’s total annual operating expenses, including underlying funds, are 1.21% for Class N,2.21% for Class C and 1.46% for Class A. Class A shares are subject to a sales load of 5.75% and a deferred sales charge of up to 0.75%. The performance data quoted here represents past performance, which is not indicative of future results. Current performance may be lower or higher than the performance data quoted. The investment return and NAV will fluctuate, so that an investor’s shares, when redeemed, may be worth more or less than their original cost. Total returns are calculated assuming reinvestment of all dividends and capital gains distributions, if any. The returns do not reflect the deductions of taxes a shareholder would pay on the redemption of Fund shares or Fund distributions. For performance information current to the most recent month-end, please call 1-800-442-4358 or visit our website www.dunham.com.
| SCHEDULE OF INVESTMENTS (Unaudited) |
| Dunham Emerging Markets Stock Fund |
| April 30, 2019 |
| Security | | Shares | | | Value | |
| COMMON STOCKS - 96.1% | | | | | | | | |
| AGRICULTURE - 0.6% | | | | | | | | |
| Hanjaya Mandala Sampoerna Tbk PT | | | 1,831,500 | | | $ | 450,290 | |
| | | | | | | | | |
| APPAREL - 1.7% | | | | | | | | |
| Makalot Industrial Co. Ltd. * | | | 74,000 | | | | 510,557 | |
| Shenzhou International Group Holdings Ltd. | | | 55,100 | | | | 740,533 | |
| | | | | | | | 1,251,090 | |
| AUTO MANUFACTURERS - 0.9% | | | | | | | | |
| Geely Automobile Holdings Ltd. | | | 338,000 | | | | 680,809 | |
| | | | | | | | | |
| BANKS - 17.0% | | | | | | | | |
| Agricultural Bank of China Ltd. | | | 1,250,000 | | | | 577,688 | |
| Banco Bradesco SA - ADR ^ | | | 75,200 | | | | 681,312 | |
| Banco Santander Brasil SA - ADR ^ | | | 60,000 | | | | 687,000 | |
| Banco Santander Chile - ADR | | | 34,000 | | | | 952,000 | |
| Bank Negara Indonesia Persero Tbk PT * | | | 750,000 | | | | 506,144 | |
| Bank of China Ltd. | | | 700,000 | | | | 334,228 | |
| Bank Rakyat Indonesia Persero Tbk PT | | | 1,886,200 | | | | 579,922 | |
| China Construction Bank Corp. | | | 1,600,000 | | | | 1,410,397 | |
| FirstRand Ltd. | | | 111,732 | | | | 530,578 | |
| Grupo Financiero Banorte SAB de CV | | | 105,600 | | | | 666,811 | |
| ICICI Bank Ltd. - ADR ^ | | | 64,900 | | | | 743,105 | |
| Industrial & Commercial Bank of China Ltd. | | | 1,300,000 | | | | 977,733 | |
| Itau Unibanco Holding SA - ADR | | | 50,000 | | | | 432,500 | |
| Komercni banka as | | | 8,378 | | | | 317,412 | |
| OTP Bank Nyrt | | | 18,000 | | | | 800,045 | |
| Sberbank of Russia PJSC - ADR * | | | 55,000 | | | | 786,225 | |
| Standard Bank Group Ltd. | | | 53,135 | | | | 740,458 | |
| TCS Group Holding PLC | | | 28,344 | | | | 564,046 | |
| | | | | | | | 12,287,604 | |
| BEVERAGES - 2.7% | | | | | | | | |
| Fomento Economico Mexicano SAB de CV - ADR ^ | | | 7,800 | | | | 761,202 | |
| Varun Beverages Ltd. | | | 93,455 | | | | 1,178,110 | |
| | | | | | | | 1,939,312 | |
| BUILDING MATERIALS - 0.6% | | | | | | | | |
| Anhui Conch Cement Co. Ltd. | | | 71,500 | | | | 436,390 | |
| | | | | | | | | |
| CHEMICALS - 1.0% | | | | | | | | |
| LG Chem Ltd. | | | 2,388 | | | | 740,766 | |
| | | | | | | | | |
| COMMERCIAL SERVICES - 2.3% | | | | | | | | |
| China Education Group Holdings Ltd. | | | 709,000 | | | | 1,100,106 | |
| New Oriental Education & Technology Group, Inc. - ADR * ^ | | | 6,000 | | | | 572,760 | |
| | | | | | | | 1,672,866 | |
| DIVERSIFIED FINANCIAL SERVICES - 4.6% | | | | | | | | |
| B3 SA - Brasil Bolsa Balcao | | | 35,000 | | | | 306,116 | |
| Hana Financial Group, Inc. | | | 22,500 | | | | 709,667 | |
| Housing Development Finance Corp. Ltd. | | | 50,826 | | | | 1,458,141 | |
| Investec Ltd. * | | | 50,000 | | | | 319,250 | |
| KB Financial Group, Inc. | | | 13,033 | | | | 514,613 | |
| | | | | | | | 3,307,787 | |
| ENGINEERING & CONSTRUCTION - 0.7% | | | | | | | | |
| Mytilineos Holdings SA | | | 48,863 | | | | 528,690 | |
| | | | | | | | | |
| FOOD - 2.2% | | | | | | | | |
| China Mengniu Dairy Co. Ltd. | | | 301,000 | | | | 1,111,929 | |
| Uni-President Enterprises Corp. * | | | 190,000 | | | | 451,569 | |
| | | | | | | | 1,563,498 | |
| INSURANCE - 8.2% | | | | | | | | |
| AIA Group Ltd. | | | 194,600 | | | | 1,992,442 | |
| China Life Insurance Co Ltd. * | | | 1,162,000 | | | | 967,486 | |
| IRB Brasil Resseguros S/A | | | 30,000 | | | | 717,287 | |
| Odontoprev SA * | | | 86,400 | | | | 368,320 | |
| Ping An Insurance Group Co. of China Ltd. | | | 157,500 | | | | 1,906,339 | |
| | | | | | | | 5,951,874 | |
| Security | | Shares | | | Value | |
| INTERNET- 12.0% | | | | | | | | |
| Alibaba Group Holding Ltd. - ADR * ^ | | | 21,000 | | | $ | 3,896,970 | |
| Naspers Ltd. | | | 3,500 | | | | 898,414 | |
| Tencent Holdings Ltd. | | | 69,200 | | | | 3,410,445 | |
| Yandex NV * | | | 12,000 | | | | 449,160 | |
| | | | | | | | 8,654,989 | |
| IRON/STEEL 1.2% | | | | | | | | |
| Kumba Iron Ore Ltd. | | | 11,000 | | | | 330,092 | |
| POSCO | | | 2,500 | | | | 547,209 | |
| | | | | | | | 877,301 | |
| LODGING - 5.3% | | | | | | | | |
| Lemon Tree Hotels Ltd.- 144A * | | | 1,707,583 | | | | 1,841,690 | |
| Minor International PCL | | | 1,021,700 | | | | 1,201,264 | |
| Wynn Macau Ltd. | | | 286,400 | | | | 823,959 | |
| | | | | | | | 3,866,913 | |
| OIL & GAS - 8.8% | | | | | | | | |
| China Petroleum & Chemical Corp. | | | 620,000 | | | | 476,564 | |
| LUKOIL PJSC - adr | | | 13,000 | | | | 1,102,140 | |
| MOL Hungarian Oil & Gas PLC | | | 35,000 | | | | 402,831 | |
| Oil & Natural Gas Corp. Ltd. | | | 552,260 | | | | 1,343,770 | |
| PetroChina Co. Ltd. - ADR | | | 7,700 | | | | 487,333 | |
| PTT Exploration & Production PCL | | | 217,300 | | | | 906,647 | |
| Reliance Industries Ltd. * | | | 64,663 | | | | 1,295,425 | |
| Rosneft Oil Co. PJSC - ADR * | | | 50,000 | | | | 332,600 | |
| | | | | | | | 6,347,310 | |
| PHARMACEUTICALS - 1.3% | | | | | | | | |
| TCI Co. Ltd. | | | 61,000 | | | | 910,695 | |
| | | | | | | | | |
| REAL ESTATE - 3.3% | | | | | | | | |
| Ayala Corp. | | | 40,780 | | | | 707,364 | |
| China Overseas Land & Investment Ltd. | | | 284,000 | | | | 1,063,969 | |
| Pakuwon Jati Tbk PT | | | 12,770,200 | | | | 640,588 | |
| | | | | | | | 2,411,921 | |
| RETAIL - 6.2% | | | | | | | | |
| Atacadao SA | | | 141,000 | | | | 757,773 | |
| Jollibee Foods Corp. | | | 95,070 | | | | 555,719 | |
| Li Ning Co. Ltd. * | | | 990,000 | | | | 1,798,412 | |
| Lojas Renner SA * | | | 64,700 | | | | 758,652 | |
| Wal-Mart de Mexico SAB de CV | | | 200,000 | | | | 585,610 | |
| | | | | | | | 4,456,166 | |
| SEMICONDUCTORS - 10.1% | | | | | | | | |
| Samsung Electronics Co. Ltd. - ADR - 144A | | | 511 | | | | 503,846 | |
| Samsung Electronics Co. Ltd. | | | 78,000 | | | | 3,066,744 | |
| Taiwan Semiconductor Manufacturing Co. Ltd. - ADR | | | 60,000 | | | | 2,629,200 | |
| Taiwan Semiconductor Manufacturing Co. Ltd. * | | | 136,000 | | | | 1,141,860 | |
| | | | | | | | 7,341,650 | |
| SOFTWARE - 1.9% | | | | | | | | |
| CD Projekt SA * | | | 11,097 | | | | 623,396 | |
| HCL Technologies Ltd. * | | | 45,767 | | | | 778,937 | |
| | | | | | | | 1,402,333 | |
| TELECOMMUNICATIONS - 1.9% | | | | | | | | |
| China Mobile Ltd. | | | 100,000 | | | | 954,067 | |
| Telekomunikasi Indonesia Persero Tbk PT | | | 1,690,000 | | | | 450,026 | |
| | | | | | | | 1,404,093 | |
| WATER - 1.6% | | | | | | | | |
| Guangdong Investment Ltd. | | | 600,000 | | | | 1,122,315 | |
| | | | | | | | | |
| TOTAL COMMON STOCKS (Cost - $65,104,065) | | | | | | | 69,606,662 | |
| | | | | | | | | |
| CLOSED END FUND - 0.8% | | | | | | | | |
| Vietnam Enterprise Investments Limited | | | 96,445 | | | | 560,325 | |
| TOTAL CLOSED END FUND (Cost - $548,616) | | | | | | | | |
| | | | | | | | | |
| WARRANT - 0.0% | | | | | | | | |
| Minor International PCL - NVDR - Warrant ++ | | | 51,085 | | | | — | |
| TOTAL WARRANT (Cost - $0) | | | | | | | | |
See accompanying notes to financial statements.
| SCHEDULE OF INVESTMENTS (Unaudited) |
| Dunham Emerging Markets Stock Fund (Continued) |
| April 30, 2019 |
| Security | | Shares | | | Value | |
| SHORT- TERM INVESTMENT - 0.4% | | | | | | | | |
| MONEY MARKET - 0.4% | | | | | | | | |
| First American Government Obligations Fund 2.36% + | | | 302,569 | | | $ | 302,569 | |
| (Cost - $302,569) | | | | | | | | |
| | | | | | | | | |
| COLLATERAL FOR SECURITIES LOANED - 9.5% | | | 6,891,678 | | | | 6,891,678 | |
| Mount Vernon Prime Portfolio, 2.61% + # (Cost - $6,891,678) | | | | | | | | |
| | | | | | | | | |
| TOTAL INVESTMENTS - 106.8% (Cost - $72,846,928) | | | | 77,361,234 | |
| LIABILITIES IN EXCESS OF OTHER ASSETS - (6.8)% | | | | (4,952,271 | ) |
| NET ASSETS - 100.0% | | | | 72,408,963 | |
ADR - American Depositary Receipt
| * | Non-income producing security |
| ^ | All or a portion of these securities are on loan. Total loaned securities had a value of $6,714,473 at April 30, 2019. |
| + | Variable rate security. Interest rate is as of April 30, 2019. |
| ++ | The value of this security has been determined in good faith under policies of the Board of Trustees. The total of these securities is $0 or 0.0% of net assets. |
144A - Security exempt from registration under Rule 144A of the Securities Act of 1933. These securities may be sold in transactions exempt from registration, normally to qualified institutional buyers. The 144A securities amounted to $2,345,536 or 3.2% of net assets.
| # | The Trust’s securities lending policies and procedures require that the borrower: (i) deliver cash or U.S. Government securities as collateral with respect to each new loan of U.S. securities, equal to at least 102% of the value of the portfolio securities loaned, and (ii) at all times thereafter mark-to-market the collateral on a daily basis so that the market value of such collateral is at least 100% of the value of securities loaned. From time to time the collateral may not be 102% due to end of day market movement. The next business day additional collateral is obtained/received from the borrower to replenish/reestablish 102%. |
| Portfolio Composition * - (Unaudited) |
| China | | | 20.8 | % | | Brazil | | | 7.9 | % |
| India | | | 11.2 | % | | South Africa | | | 3.6 | % |
| Hong Kong | | | 9.5 | % | | Russia | | | 3.5 | % |
| Taiwan | | | 8.5 | % | | Other Countries ** | | | 27.1 | % |
| South Korea | | | 7.9 | % | | Total | | | 100.0 | % |
| * | Based on total value of investments as of April 30, 2019. |
| ** | Includes Collateral for Securities Loaned as of April 30, 2019. |
Percentage may differ from Schedule of Investments which is based on Fund net assets.
See accompanying notes to financial statements.
| STATEMENTS OF ASSETS AND LIABILITIES (Unaudited) |
| April 30, 2019 |
| | | | | | | | | Dunham | | | Dunham | | | | | | | | | Dunham | |
| | | Dunham | | | Dunham | | | Corporate / | | | Monthly | | | Dunham | | | Dunham | | | International | |
| | | Floating Rate | | | Long/Short | | | Government | | | Distribution | | | Dynamic Macro | | | High-Yield | | | Opportunity | |
| | | Bond Fund | | | Credit Fund | | | Bond Fund | | | Fund | | | Fund | | | Bond Fund | | | Bond Fund | |
| Assets: | | | | | | | | | | | | | | | | | | | | | |
| Investments in securities, at cost | | $ | 193,171,548 | | | $ | 69,329,444 | | | $ | 50,126,825 | | | $ | 323,504,202 | | | $ | 37,347,512 | | | $ | 108,754,406 | | | $ | 37,269,953 | |
| Investments in securities, at value | | $ | 190,937,422 | | | $ | 70,264,310 | | | $ | 50,715,855 | | | $ | 332,325,934 | | | $ | 40,182,224 | | | $ | 109,490,587 | | | $ | 37,202,164 | |
| Cash | | | — | | | | 6,689 | | | | — | | | | — | | | | 11,125 | | | | — | | | | — | |
| Foreign currency, at value (cost $9,121,348, $13,270, and $684,947 respectively) | | | — | | | | — | | | | — | | | | 8,851,125 | | | | 13,219 | | | | — | | | | 685,825 | |
| Deposits with brokers for futures | | | — | | | | 413,164 | | | | — | | | | 52,642,553 | | | | — | | | | — | | | | 153,632 | |
| Unrealized appreciation on forward foreign currency exchange contracts | | | — | | | | — | | | | — | | | | — | | | | 7 | | | | — | | | | 104,484 | |
| Unrealized appreciation on futures | | | — | | | | — | | | | — | | | | — | | | | 308,953 | | | | — | | | | 2,908 | |
| Receivable for securities sold | | | — | | | | — | | | | 82,376 | | | | 14,177,875 | | | | 1,404 | | | | 681,339 | | | | 1,995,828 | |
| Interest and dividends receivable | | | 912,694 | | | | 377,669 | | | | 350,497 | | | | 336,706 | | | | 4,366 | | | | 1,575,919 | | | | 223,802 | |
| Receivable for Fund shares sold | | | 8,352 | | | | 76,256 | | | | 35,779 | | | | 123,284 | | | | 35,507 | | | | 3,391 | | | | 23,211 | |
| Prepaid expenses and other assets | | | 33,694 | | | | 49,809 | | | | 37,570 | | | | 64,373 | | | | 31,826 | | | | 41,621 | | | | 31,689 | |
| Total Assets | | | 191,892,162 | | | | 71,187,897 | | | | 51,222,077 | | | | 408,521,850 | | | | 40,588,631 | | | | 111,792,857 | | | | 40,423,543 | |
| | | | | | | | | | | | | | | | | | | | | | | | | | | | | |
| Liabilities: | | | | | | | | | | | | | | | | | | | | | | | | | | | | |
| Option contracts written (premiums received $547,915 and $44,146, respectively) | | | — | | | | — | | | | — | | | | 393,979 | | | | 42,242 | | | | — | | | | — | |
| Payable upon return of securities loaned | | | — | | | | — | | | | — | | | | — | | | | — | | | | 2,360,160 | | | | — | |
| Securities sold short (proceeds $110,884,419) | | | — | | | | — | | | | — | | | | 114,500,071 | | | | — | | | | — | | | | — | |
| Unrealized depreciation on forward foreign currency exchange contracts | | | — | | | | — | | | | — | | | | — | | | | — | | �� | | — | | | | 182,366 | |
| Unrealized depreciation on futures | | | — | | | | 163,164 | | | | — | | | | — | | | | 45,722 | | | | — | | | | 657 | |
| Unrealized depreciation on swaps | | | — | | | | 100,042 | | | | — | | | | — | | | | — | | | | — | | | | — | |
| Payable for dividends on short sales | | | — | | | | — | | | | — | | | | 285,452 | | | | — | | | | — | | | | — | |
| Payable for interest on short sales | | | — | | | | — | | | | — | | | | 175,816 | | | | — | | | | — | | | | — | |
| Payable for securities purchased | | | 4,692,249 | | | | — | | | | 536,096 | | | | 16,920,890 | | | | 8,558 | | | | 170,762 | | | | 2,145,794 | |
| Payable for Fund shares redeemed | | | 19,133 | | | | 1,016 | | | | 728 | | | | 102,634 | | | | — | | | | 38,368 | | | | 460 | |
| Premiums paid on swaps | | | — | | | | 5,655 | | | | — | | | | 24 | | | | — | | | | — | | | | — | |
| Distributions payable | | | 4,345 | | | | 9,913 | | | | 1,212 | | | | 92,228 | | | | — | | | | 6,753 | | | | — | |
| Payable to adviser | | | 90,637 | | | | 36,200 | | | | 20,484 | | | | 145,771 | | | | 21,286 | | | | 52,965 | | | | 18,367 | |
| Payable to sub-adviser | | | 31,439 | | | | 111,191 | | | | 7,264 | | | | 206,328 | | | | 18,561 | | | | 23,618 | | | | 13,162 | |
| Payable for distribution fees | | | 6,534 | | | | 9,138 | | | | 4,668 | | | | 40,624 | | | | 2,058 | | | | 17,879 | | | | 1,680 | |
| Payable for administration fees | | | 15,633 | | | | 1,377 | | | | 11,795 | | | | 9,065 | | | | 2,331 | | | | 9,648 | | | | 5,833 | |
| Payable for fund accounting fees | | | 2,639 | | | | 933 | | | | 886 | | | | 4,178 | | | | 660 | | | | 1,733 | | | | 533 | |
| Payable for transfer agent fees | | | 2,095 | | | | 1,813 | | | | 1,599 | | | | 6,200 | | | | 2,013 | | | | 1,696 | | | | 1,769 | |
| Payable for custody fees | | | 11,282 | | | | 987 | | | | 4,247 | | | | 4,117 | | | | 2,225 | | | | 3,320 | | | | 5,439 | |
| Payable for third party administrative servicing fees | | | 519 | | | | 225 | | | | 82 | | | | 5,411 | | | | 1,935 | | | | 637 | | | | — | |
| Payable to broker | | | — | | | | — | | | | — | | | | 80,814 | | | | 253,123 | | | | — | | | | 376,639 | |
| Payable for line of credit | | | 6,289 | | | | — | | | | — | | | | — | | | | — | | | | — | | | | — | |
| Accrued expenses and other liabilities | | | 3,753 | | | | 796 | | | | 5,770 | | | | 17,594 | | | | 8,804 | | | | 11,322 | | | | 5,519 | |
| Total Liabilities | | | 4,886,547 | | | | 442,450 | | | | 594,831 | | | | 132,991,196 | | | | 409,518 | | | | 2,698,861 | | | | 2,758,218 | |
| | | | | | | | | | | | | | | | | | | | | | | | | | | | | |
| Net Assets | | $ | 187,005,615 | | | $ | 70,745,447 | | | $ | 50,627,246 | | | $ | 275,530,654 | | | $ | 40,179,113 | | | $ | 109,093,996 | | | $ | 37,665,325 | |
| | | | | | | | | | | | | | | | | | | | | | | | | | | | | |
| Net Assets: | | | | | | | | | | | | | | | | | | | | | | | | | | | | |
| Paid in capital | | $ | 192,775,841 | | | $ | 69,908,902 | | | $ | 53,501,506 | | | $ | 280,431,176 | | | $ | 40,133,113 | | | $ | 115,752,277 | | | $ | 38,107,152 | |
| Accumulated earnings (loss) | | | (5,770,226 | ) | | | 836,545 | | | | (2,874,260 | ) | | | (4,900,522 | ) | | | 46,000 | | | | (6,658,281 | ) | | | (441,827 | ) |
| Net Assets | | $ | 187,005,615 | | | $ | 70,745,447 | | | $ | 50,627,246 | | | $ | 275,530,654 | | | $ | 40,179,113 | | | $ | 109,093,996 | | | $ | 37,665,325 | |
| | | | | | | | | | | | | | | | | | | | | | | | | | | | | |
| Net Asset Value Per Share | | | | | | | | | | | | | | | | | | | | | | | | | | | | |
| Class N Shares: | | | | | | | | | | | | | | | | | | | | | | | | | | | | |
| Net Assets | | $ | 158,029,310 | | | $ | 58,195,600 | | | $ | 42,372,010 | | | $ | 196,471,288 | | | $ | 31,167,160 | | | $ | 89,948,298 | | | $ | 32,304,728 | |
| Shares of beneficial interest outstanding (no par value; unlimited shares authorized) | | | 16,529,865 | | | | 6,299,200 | | | | 3,141,627 | | | | 5,649,968 | | | | 3,148,946 | | | | 10,002,260 | | | | 3,562,985 | |
| Net asset value, offering and redemption price per share | | $ | 9.56 | | | $ | 9.24 | | | $ | 13.49 | | | $ | 34.77 | | | $ | 9.90 | | | $ | 8.99 | | | $ | 9.07 | |
| | | | | | | | | | | | | | | | | | | | | | | | | | | | | |
| Class A Shares: | | | | | | | | | | | | | | | | | | | | | | | | | | | | |
| Net Assets | | $ | 21,309,055 | | | $ | 8,979,170 | | | $ | 5,649,380 | | | $ | 44,320,455 | | | $ | 7,243,777 | | | $ | 11,907,458 | | | $ | 4,014,716 | |
| Shares of beneficial interest outstanding (no par value; unlimited shares authorized) | | | 2,231,212 | | | | 973,966 | | | | 419,424 | | | | 1,317,232 | | | | 736,599 | | | | 1,311,174 | | | | 446,421 | |
| Net asset value and redemption price per share * | | $ | 9.55 | | | $ | 9.22 | | | $ | 13.47 | | | $ | 33.65 | | | $ | 9.83 | | | $ | 9.08 | | | $ | 8.99 | |
| Front-end sales charge factor | | | 0.9550 | | | | 0.9425 | | | | 0.9550 | | | | 0.9425 | | | | 0.9425 | | | | 0.9550 | | | | 0.9550 | |
| Offering price per share (Net asset value per share / front-end sales charge factor) | | $ | 10.00 | | | $ | 9.78 | | | $ | 14.10 | | | $ | 35.70 | | | $ | 10.43 | | | $ | 9.52 | | | $ | 9.41 | |
| | | | | | | | | | | | | | | | | | | | | | | | | | | | | |
| Class C Shares: | | | | | | | | | | | | | | | | | | | | | | | | | | | | |
| Net Assets | | $ | 7,667,250 | | | $ | 3,570,677 | | | $ | 2,605,856 | | | $ | 34,738,911 | | | $ | 1,768,176 | | | $ | 7,238,240 | | | $ | 1,345,881 | |
| Shares of beneficial interest outstanding (no par value; unlimited shares authorized) | | | 802,509 | | | | 397,641 | | | | 194,805 | | | | 1,304,448 | | | | 187,705 | | | | 809,072 | | | | 153,015 | |
| Net asset value, offering and redemption price per share | | $ | 9.55 | | | $ | 8.98 | | | $ | 13.38 | | | $ | 26.63 | | | $ | 9.42 | | | $ | 8.95 | | | $ | 8.80 | |
| * | For certain purchases of $1 million or more, a 0.75% contingent deferred sales charge may apply to redemptions made within eighteen months of purchase. |
See accompanying notes to financial statements.
| STATEMENTS OF ASSETS AND LIABILITIES (Unaudited) (Continued) |
| April 30, 2019 |
| | | | | | Dunham | | | | | | | | | | | | | | | Dunham | |
| | | Dunham | | | Focused | | | Dunham | | | Dunham | | | Dunham | | | Dunham | | | Emerging | |
| | | Large Cap | | | Large Cap | | | International | | | Real Estate | | | Small Cap | | | Small Cap | | | Markets | |
| | | Value Fund | | | Growth Fund | | | Stock Fund | | | Stock Fund | | | Value Fund | | | Growth Fund | | | Stock Fund | |
| Assets: | | | | | | | | | | | | | | | | | | | | | |
| Investments in securities, at cost | | $ | 62,897,899 | | | $ | 58,247,378 | | | $ | 119,210,993 | | | $ | 46,705,219 | | | $ | 49,525,361 | | | $ | 50,771,853 | | | $ | 72,846,928 | |
| Investments in securities, at value | | $ | 80,714,171 | | | $ | 107,390,393 | | | $ | 127,354,111 | | | $ | 55,347,589 | | | $ | 51,668,525 | | | $ | 59,367,458 | | | $ | 77,361,234 | |
| Cash | | | — | | | | — | | | | 142,498 | | | | — | | | | — | | | | — | | | | — | |
| Foreign currency, at value (cost $158,138 and 1,989,738 respectively) | | | — | | | | — | | | | 157,592 | | | | — | | | | — | | | | — | | | | 1,984,398 | |
| Receivable for securities sold | | | 195,673 | | | | — | | | | 913,703 | | | | — | | | | — | | | | 755,221 | | | | — | |
| Interest and dividends receivable | | | 90,508 | | | | 12,724 | | | | 891,659 | | | | 29,344 | | | | 12,557 | | | | 9,754 | | | | 113,285 | |
| Receivable for Fund shares sold | | | 61,756 | | | | 80,425 | | | | 117,735 | | | | 31,642 | | | | 28,103 | | | | 26,423 | | | | 65,160 | |
| Prepaid expenses and other assets | | | 45,755 | | | | 41,380 | | | | 73,558 | | | | 38,530 | | | | 35,198 | | | | 50,496 | | | | 46,334 | |
| Total Assets | | | 81,107,863 | | | | 107,524,922 | | | | 129,650,856 | | | | 55,447,105 | | | | 51,744,383 | | | | 60,209,352 | | | | 79,570,411 | |
| | | | | | | | | | | | | | | | | | | | | | | | | | | | | |
| Liabilities: | | | | | | | | | | | | | | | | | | | | | | | | | | | | |
| Payable upon return of securities loaned | | | — | | | | — | | | | 4,874,737 | | | | — | | | | — | | | | 7,251,772 | | | | 6,891,678 | |
| Payable for securities purchased | | | — | | | | 305,033 | | | | 1,069,400 | | | | — | | | | — | | | | 72,516 | | | | 167,953 | |
| Payable for Fund shares redeemed | | | 12,631 | | | | 1,217 | | | | 1,477 | | | | 661 | | | | 537 | | | | 362 | | | | 671 | |
| Payable to adviser | | | 42,582 | | | | 55,368 | | | | 66,147 | | | | 29,580 | | | | 27,445 | | | | 27,698 | | | | 38,815 | |
| Payable to sub-adviser | | | 15,217 | | | | 40,957 | | | | 58,849 | | | | 1,990 | | | | 32,485 | | | | 40,605 | | | | 33,490 | |
| Payable for distribution fees | | | 8,102 | | | | 10,904 | | | | 12,416 | | | | — | | | | 4,663 | | | | 9,853 | | | | 7,834 | |
| Payable for administration fees | | | 3,480 | | | | 3,868 | | | | 2,983 | | | | 1,768 | | | | 2,387 | | | | 1,731 | | | | 3,539 | |
| Payable for fund accounting fees | | | 1,388 | | | | 1,660 | | | | 1,936 | | | | 986 | | | | 728 | | | | 862 | | | | 1,238 | |
| Payable for transfer agent fees | | | 520 | | | | 1,220 | | | | 528 | | | | 1,419 | | | | 1,098 | | | | 1,400 | | | | 673 | |
| Payable for custody fees | | | 3,267 | | | | 384 | | | | 23,560 | | | | 1,123 | | | | 1,870 | | | | 1,552 | | | | 9,379 | |
| Payable for third party administrative servicing fees | | | 121 | | | | 55 | | | | 867 | | | | 80 | | | | 1,158 | | | | — | | | | 839 | |
| Accrued expenses and other liabilities | | | 8,996 | | | | 6,167 | | | | 6,378 | | | | 5,622 | | | | 5,550 | | | | 2,456 | | | | 5,339 | |
| Total Liabilities | | | 96,304 | | | | 426,833 | | | | 6,119,278 | | | | 43,229 | | | | 77,921 | | | | 7,410,807 | | | | 7,161,448 | |
| | | | | | | | | | | | | | | | | | | | | | | | | | | | | |
| Net Assets | | $ | 81,011,559 | | | $ | 107,098,089 | | | $ | 123,531,578 | | | $ | 55,403,876 | | | $ | 51,666,462 | | | $ | 52,798,545 | | | $ | 72,408,963 | |
| | | | | | | | | | | | | | | | | | | | | | | | | | | | | |
| Net Assets: | | | | | | | | | | | | | | | | | | | | | | | | | | | | |
| Paid in capital | | $ | 63,508,572 | | | $ | 57,556,691 | | | $ | 117,266,210 | | | $ | 45,550,642 | | | $ | 50,076,450 | | | $ | 45,423,596 | | | $ | 69,266,961 | |
| Accumulated earnings | | | 17,502,987 | | | | 49,541,398 | | | | 6,265,368 | | | | 9,853,234 | | | | 1,590,012 | | | | 7,374,949 | | | | 3,142,002 | |
| Net Assets | | $ | 81,011,559 | | | $ | 107,098,089 | | | $ | 123,531,578 | | | $ | 55,403,876 | | | $ | 51,666,462 | | | $ | 52,798,545 | | | $ | 72,408,963 | |
| | | | | | | | | | | | | | | | | | | | | | | | | | | | | |
| Net Asset Value Per Share | | | | | | | | | | | | | | | | | | | | | | | | | | | | |
| Class N Shares: | | | | | | | | | | | | | | | | | | | | | | | | | | | | |
| Net Assets | | $ | 60,328,673 | | | $ | 74,674,749 | | | $ | 96,913,354 | | | $ | 43,677,972 | | | $ | 40,170,273 | | | $ | 38,961,785 | | | $ | 56,696,573 | |
| Shares of beneficial interest outstanding (no par value; unlimited shares authorized) | | | 4,148,257 | | | | 3,034,093 | | | | 6,362,471 | | | | 2,575,503 | | | | 2,767,219 | | | | 2,266,867 | | | | 3,995,919 | |
| Net asset value, offering and redemption price per share | | $ | 14.54 | | | $ | 24.61 | | | $ | 15.23 | | | $ | 16.96 | | | $ | 14.52 | | | $ | 17.19 | | | $ | 14.19 | |
| Class A Shares: | | | | | | | | | | | | | | | | | | | | | | | | | | | | |
| Net Assets | | $ | 15,603,917 | | | $ | 24,113,822 | | | $ | 20,604,880 | | | $ | 9,149,268 | | | $ | 8,790,889 | | | $ | 11,195,579 | | | $ | 12,467,776 | |
| Shares of beneficial interest outstanding (no par value; unlimited shares authorized) | | | 1,077,667 | | | | 1,000,030 | | | | 1,361,918 | | | | 535,095 | | | | 613,869 | | | | 689,828 | | | | 898,519 | |
| Net asset value, and redemption price per share * | | $ | 14.48 | | | $ | 24.11 | | | $ | 15.13 | | | $ | 17.10 | | | $ | 14.32 | | | $ | 16.23 | | | $ | 13.88 | |
| Front-end sales charge factor | | | 0.9425 | | | | 0.9425 | | | | 0.9425 | | | | 0.9425 | | | | 0.9425 | | | | 0.9425 | | | | 0.9425 | |
| Offering price per share (Net asset value per share / front-end sales charge factor) | | $ | 15.36 | | | $ | 25.59 | | | $ | 16.05 | | | $ | 18.14 | | | $ | 15.19 | | | $ | 17.22 | | | $ | 14.73 | |
| Class C Shares: | | | | | | | | | | | | | | | | | | | | | | | | | | | | |
| Net Assets | | $ | 5,078,969 | | | $ | 8,309,518 | | | $ | 6,013,344 | | | $ | 2,576,636 | | | $ | 2,705,300 | | | $ | 2,641,181 | | | $ | 3,244,614 | |
| Shares of beneficial interest outstanding (no par value; unlimited shares authorized) | | | 366,883 | | | | 365,916 | | | | 418,799 | | | | 159,678 | | | | 217,455 | | | | 212,181 | | | | 246,864 | |
| Net asset value, offering and redemption price per share | | $ | 13.84 | | | $ | 22.71 | | | $ | 14.36 | | | $ | 16.14 | | | $ | 12.44 | | | $ | 12.45 | | | $ | 13.14 | |
| * | For certain purchases of $1 million or more, a 0.75% contingent deferred sales charge may apply to redemptions made within eighteen months of purchase. |
See accompanying notes to financial statements.
| STATEMENTS OF OPERATIONS (Unaudited) |
| For the Six Months Ended April 30, 2019 |
| | | | | | | | | Dunham | | | Dunham | | | | | | | | | Dunham | |
| | | Dunham | | | Dunham | | | Corporate / | | | Monthly | | | Dunham | | | Dunham | | | International | |
| | | Floating Rate | | | Long/Short | | | Government | | | Distribution | | | Dynamic Macro | | | High-Yield | | | Opportunity | |
| | | Bond Fund | | | Credit Fund | | | Bond Fund | | | Fund | | | Fund | | | Bond Fund | | | Bond Fund | |
| Investment Income: | | | | | | | | | | | | | | | | | | | | | | | | | | | | |
| Interest income | | $ | 5,098,528 | | | $ | 1,192,902 | | | $ | 1,004,964 | | | $ | 1,224,904 | | | $ | 198,933 | | | $ | 3,367,124 | | | $ | 213,686 | |
| Dividend income | | | — | | | | — | | | | — | | | | 1,927,400 | | | | 421,592 | | | | 23,759 | | | | — | |
| Securities lending income | | | 1,065 | | | | 3,996 | | | | 925 | | | | 4,255 | | | | 17,514 | | | | 19,357 | | | | — | |
| Less: Foreign withholding taxes | | | — | | | | — | | | | — | | | | (18,956 | ) | | | — | | | | — | | | | (19,291 | ) |
| Total Investment Income | | | 5,099,593 | | | | 1,196,898 | | | | 1,005,889 | | | | 3,137,603 | | | | 638,039 | | | | 3,410,240 | | | | 194,395 | |
| | | | | | | | | | | | | | | | | | | | | | | | | | | | | |
| Operating Expenses: | | | | | | | | | | | | | | | | | | | | | | | | | | | | |
| Investment advisory fees | | | 548,197 | | | | 189,888 | | | | 125,322 | | | | 856,198 | | | | 130,613 | | | | 319,639 | | | | 107,897 | |
| Sub-advisory fees | | | 272,879 | | | | 175,282 | | | | 75,194 | | | | 790,336 | | | | 150,707 | | | | 170,474 | | | | 80,923 | |
| Sub-advisory performance fees | | | (118,760 | ) | | | (78,666 | ) | | | (40,127 | ) | | | 148,820 | | | | (70,792 | ) | | | 4,058 | | | | (45,203 | ) |
| Fund accounting fees | | | 18,682 | | | | 5,987 | | | | 5,122 | | | | 26,933 | | | | 4,105 | | | | 10,895 | | | | 3,677 | |
| Distribution fees- Class C Shares | | | 27,322 | | | | 16,516 | | | | 9,951 | | | | 170,251 | | | | 8,405 | | | | 27,038 | | | | 5,058 | |
| Distribution fees- Class A Shares | | | 24,655 | | | | 8,842 | | | | 6,532 | | | | 52,302 | | | | 8,771 | | | | 14,737 | | | | 4,678 | |
| Administration fees | | | 79,645 | | | | 22,274 | | | | 52,771 | | | | 69,036 | | | | 17,559 | | | | 50,092 | | | | 30,087 | |
| Registration fees | | | 16,934 | | | | 24,626 | | | | 24,611 | | | | 18,554 | | | | 22,851 | | | | 25,031 | | | | 16,061 | |
| Transfer agent fees | | | 14,251 | | | | 8,547 | | | | 9,152 | | | | 17,772 | | | | 8,810 | | | | 11,545 | | | | 8,588 | |
| Custodian fees | | | 21,170 | | | | 2,989 | | | | 17,644 | | | | 86,500 | | | | 3,932 | | | | 5,869 | | | | 20,828 | |
| Professional fees | | | 10,011 | | | | 7,985 | | | | 8,652 | | | | 15,031 | | | | 8,070 | | | | 10,701 | | | | 7,931 | |
| Chief Compliance Officer fees | | | 12,709 | | | | 2,864 | | | | 3,306 | | | | 18,935 | | | | 3,031 | | | | 7,694 | | | | 2,520 | |
| Printing and postage expense | | | 12,410 | | | | 7,792 | | | | 6,770 | | | | 41,454 | | | | 3,944 | | | | 10,137 | | | | 4,587 | |
| Trustees’ fees | | | 5,653 | | | | 1,035 | | | | 2,004 | | | | 8,665 | | | | 1,515 | | | | 3,708 | | | | 1,289 | |
| Insurance expense | | | 1,045 | | | | 273 | | | | 488 | | | | 1,782 | | | | 367 | | | | 970 | | | | 348 | |
| Security borrowing fees | | | — | | | | — | | | | — | | | | 1,034,394 | | | | — | | | | — | | | | — | |
| Interest expense | | | — | | | | — | | | | 135 | | | | 48,509 | | | | 3,610 | | | | — | | | | — | |
| Third party administrative servicing fees | | | 2,689 | | | | 1,576 | | | | 1,017 | | | | 16,760 | | | | 985 | | | | 2,706 | | | | 461 | |
| Dividend expense on short sales | | | — | | | | — | | | | — | | | | 1,181,584 | | | | — | | | | — | | | | — | |
| Miscellaneous expenses | | | 5,515 | | | | 2,584 | | | | 2,179 | | | | 7,496 | | | | 2,265 | | | | 3,610 | | | | 1,658 | |
| Net Operating Expenses | | | 955,007 | | | | 400,394 | | | | 310,723 | | | | 4,611,312 | | | | 308,748 | | | | 678,904 | | | | 251,388 | |
| | | | | | | | | | | | | | | | | | | | | | | | | | | | | |
| Net Investment Income (Loss) | | | 4,144,586 | | | | 796,504 | | | | 695,166 | | | | (1,473,709 | ) | | | 329,291 | | | | 2,731,336 | | | | (56,993 | ) |
| | | | | | | | | | | | | | | | | | | | | | | | | | | | | |
| Realized and Unrealized Gain (Loss) on Investments, Futures, Purchased Options, Securities Sold Short, Written Options, Swap Contracts, Foreign Currency Transactions, and Foreign Currency Exchange Contracts: | | | | | | | | | | | | | | | 8 | | | | | | | | | | | | | |
| Net realized gain (loss) from: | | | | | | | | | | | | | | | | | | | | | | | | | | | | |
| Investments | | | (642,300 | ) | | | 690,516 | | | | (213,404 | ) | | | (3,414,266 | ) | | | 2,055,819 | | | | (1,763,027 | ) | | | 28,335 | |
| Futures | | | — | | | | (302,525 | ) | | | — | | | | — | | | | (253,936 | ) | | | — | | | | 91,319 | |
| Purchased Options | | | — | | | | — | | | | — | | | | 3,734,023 | | | | 173,644 | | | | — | | | | — | |
| Securities sold short | | | — | | | | — | | | | — | | | | 439,932 | | | | — | | | | — | | | | — | |
| Written options | | | — | | | | — | | | | — | | | | (2,455,940 | ) | | | 21,624 | | | | — | | | | — | |
| Swap contracts | | | — | | | | 19,487 | | | | — | | | | 669,451 | | | | — | | | | — | | | | — | |
| Foreign currency transactions | | | — | | | | — | | | | — | | | | 53,647 | | | | (9,243 | ) | | | — | | | | — | |
| Foreign currency exchange contracts | | | — | | | | — | | | | — | | | | — | | | | — | | | | — | | | | (169,558 | ) |
| Net realized gain (loss) | | | (642,300 | ) | | | 407,478 | | | | (213,404 | ) | | | (973,153 | ) | | | 1,987,908 | | | | (1,763,027 | ) | | | (49,904 | ) |
| Net change in unrealized appreciation (depreciation) on: | | | | | | | | | | | | | | | | | | | | | | | | | | | | |
| Investments | | | (733,568 | ) | | | 1,124,817 | | | | 1,897,646 | | | | 16,866,450 | | | | (1,622,212 | ) | | | 4,814,688 | | | | 1,023,663 | |
| Futures | | | — | | | | (285,321 | ) | | | — | | | | — | | | | 970,210 | | | | — | | | | 7,855 | |
| Purchased Options | | | — | | | | — | | | | — | | | | (1,408,975 | ) | | | 498,906 | | | | — | | | | — | |
| Securities sold short | | | — | | | | — | | | | — | | | | (6,311,647 | ) | | | — | | | | — | | | | — | |
| Written options | | | — | | | | — | | | | — | | | | (466,251 | ) | | | 2,446 | | | | — | | | | — | |
| Swap contracts | | | — | | | | (103,858 | ) | | | — | | | | — | | | | — | | | | — | | | | — | |
| Foreign currency translations | | | — | | | | — | | | | — | | | | (38,726 | ) | | | 2,939 | | | | — | | | | (5,740 | ) |
| Foreign currency exchange contracts | | | — | | | | — | | | | — | | | | — | | | | — | | | | — | | | | (160,077 | ) |
| Net change in unrealized appreciation (depreciation) | | | (733,568 | ) | | | 735,638 | | | | 1,897,646 | | | | 8,640,851 | | | | (147,711 | ) | | | 4,814,688 | | | | 865,701 | |
| Net Realized and Unrealized Gain (Loss) | | | (1,375,868 | ) | | | 1,143,116 | | | | 1,684,242 | | | | 7,667,698 | | | | 1,840,197 | | | | 3,051,661 | | | | 815,797 | |
| | | | | | | | | | | | | | | | | | | | | | | | | | | | | |
| Net Increase in Net Assets Resulting From Operations | | $ | 2,768,718 | | | $ | 1,939,620 | | | $ | 2,379,408 | | | $ | 6,193,989 | | | $ | 2,169,488 | | | $ | 5,782,997 | | | $ | 758,804 | |
See accompanying notes to financial statements.
| STATEMENTS OF OPERATIONS (Unaudited) (Continued) |
| For the Six Months Ended April 30, 2019 |
| | | | | | Dunham | | | | | | | | | | | | | | | Dunham | |
| | | Dunham | | | Focused | | | Dunham | | | Dunham | | | Dunham | | | Dunham | | | Emerging | |
| | | Large Cap | | | Large Cap | | | International | | | Real Estate | | | Small Cap | | | Small Cap | | | Markets | |
| | | Value Fund | | | Growth Fund | | | Stock Fund | | | Stock Fund | | | Value Fund | | | Growth Fund | | | Stock Fund | |
| Investment Income: | | | | | | | | | | | | | | | | | | | | | | | | | | | | |
| Interest income | | $ | 17,136 | | | $ | 7,747 | | | $ | 7,071 | | | $ | 8,253 | | | $ | 6,154 | | | $ | 22,826 | | | $ | 8,099 | |
| Dividend income | | | 911,990 | | | | 130,023 | | | | 2,218,427 | | | | 1,098,175 | | | | 480,468 | | | | 99,506 | | | | 768,221 | |
| Securities lending income | | | 2,022 | | | | 3,152 | | | | 13,572 | | | | 2,448 | | | | 3,703 | | | | 11,141 | | | | 5,275 | |
| Less: Foreign withholding taxes | | | — | | | | — | | | | (269,691 | ) | | | — | | | | — | | | | — | | | | (85,297 | ) |
| Total Investment Income | | | 931,148 | | | | 140,922 | | | | 1,969,379 | | | | 1,108,876 | | | | 490,325 | | | | 133,473 | | | | 696,298 | |
| | | | | | | | | | | | | | | | | | | | | | | | | | | | | |
| Operating Expenses: | | | | | | | | | | | | | | | | | | | | | | | | | | | | |
| Investment advisory fees | | | 241,238 | | | | 297,733 | | | | 376,511 | | | | 175,964 | | | | 156,271 | | | | 156,768 | | | | 220,485 | |
| Sub-advisory fees | | | 111,341 | | | | 160,318 | | | | 376,511 | | | | 108,285 | | | | 108,188 | | | | 120,591 | | | | 166,618 | |
| Sub-advisory performance fees | | | (60,270 | ) | | | 65,083 | | | | (61,405 | ) | | | (80,827 | ) | | | 59,524 | | | | 111,725 | | | | (114,625 | ) |
| Fund accounting fees | | | 7,596 | | | | 9,388 | | | | 11,856 | | | | 5,539 | | | | 4,921 | | | | 4,940 | | | | 6,942 | |
| Distribution fees- Class C Shares | | | 22,024 | | | | 36,460 | | | | 29,353 | | | | 12,180 | | | | 11,665 | | | | 13,130 | | | | 16,017 | |
| Distribution fees- Class A Shares | | | 17,416 | | | | 23,403 | | | | 23,574 | | | | 10,917 | | | | 10,064 | | | | 12,992 | | | | 13,840 | |
| Administration fees | | | 24,207 | | | | 28,031 | | | | 53,862 | | | | 19,680 | | | | 19,155 | | | | 19,051 | | | | 29,016 | |
| Registration fees | | | 24,227 | | | | 20,886 | | | | 26,503 | | | | 24,851 | | | | 22,196 | | | | 37,811 | | | | 25,263 | |
| Transfer agent fees | | | 9,986 | | | | 10,490 | | | | 11,695 | | | | 9,303 | | | | 8,991 | | | | 9,021 | | | | 9,644 | |
| Custodian fees | | | 7,165 | | | | 3,296 | | | | 57,230 | | | | 4,843 | | | | 3,363 | | | | 8,427 | | | | 35,554 | |
| Professional fees | | | 9,372 | | | | 9,620 | | | | 10,612 | | | | 8,931 | | | | 8,270 | | | | 8,325 | | | | 9,875 | |
| Chief Compliance Officer fees | | | 5,269 | | | | 5,524 | | | | 7,793 | | | | 3,751 | | | | 3,186 | | | | 3,147 | | | | 4,653 | |
| Printing and postage expense | | | 5,847 | | | | 6,454 | | | | 9,002 | | | | 4,770 | | | | 4,274 | | | | 6,481 | | | | 5,625 | |
| Trustees’ fees | | | 2,480 | | | | 2,776 | | | | 3,775 | | | | 1,771 | | | | 1,377 | | | | 1,466 | | | | 2,232 | |
| Insurance expense | | | 591 | | | | 453 | | | | 869 | | | | 430 | | | | 277 | | | | 306 | | | | 536 | |
| Third party administrative servicing fees | | | 1,860 | | | | 3,755 | | | | 2,062 | | | | 1,701 | | | | 1,538 | | | | 3,182 | | | | 2,308 | |
| Miscellaneous expenses | | | 2,702 | | | | 2,868 | | | | 4,666 | | | | 2,484 | | | | 2,431 | | | | 2,225 | | | | 4,307 | |
| Total Operating Expenses | | | 433,051 | | | | 686,538 | | | | 944,469 | | | | 314,573 | | | | 425,691 | | | | 519,588 | | | | 438,290 | |
| Less: Fees paid indirectly | | | (2,170 | ) | | | (896 | ) | | | — | | | | — | | | | — | | | | (3,530 | ) | | | — | |
| Net Operating Expenses | | | 430,881 | | | | 685,642 | | | | 944,469 | | | | 314,573 | | | | 425,691 | | | | 516,058 | | | | 438,290 | |
| | | | | | | | | | | | | | | | | | | | | | | | | | | | | |
| Net Investment Income (Loss) | | | 500,267 | | | | (544,720 | ) | | | 1,024,910 | | | | 794,303 | | | | 64,634 | | | | (382,585 | ) | | | 258,008 | |
| | | | | | | | | | | | | | | | | | | | | | | | | | | | | |
| Realized and Unrealized Gain (Loss) on Investments, and Foreign Currency Transactions: | | | | | | | | | | | | | | | | | | | | | | | | | | | | |
| Net realized gain (loss) from: | | | | | | | | | | | | | | | | | | | | | | | | | | | | |
| Investments | | | (62,847 | ) | | | 2,166,542 | | | | (2,666,020 | ) | | | 1,361,666 | | | | (563,424 | ) | | | (188,986 | ) | | | 20,076 | |
| Foreign currency transactions | | | — | | | | — | | | | (51,429 | ) | | | — | | | | — | | | | — | | | | (135,022 | ) |
| Net realized gain (loss) | | | (62,847 | ) | | | 2,166,542 | | | | (2,717,449 | ) | | | 1,361,666 | | | | (563,424 | ) | | | (188,986 | ) | | | (114,946 | ) |
| Net change in unrealized appreciation (depreciation) on: | | | — | | | | | | | | | | | | | | | | | | | | | | | | — | |
| Investments | | | 5,776,833 | | | | 15,795,917 | | | | 7,947,308 | | | | 4,366,593 | | | | 3,158,946 | | | | 5,450,934 | | | | 7,807,025 | |
| Foreign currency translations | | | — | | | | — | | | | (3,573 | ) | | | — | | | | — | | | | — | | | | (6,188 | ) |
| Net change in unrealized appreciation | | | 5,776,833 | | | | 15,795,917 | | | | 7,943,735 | | | | 4,366,593 | | | | 3,158,946 | | | | 5,450,934 | | | | 7,800,837 | |
| Net Realized and Unrealized Gain | | | 5,713,986 | | | | 17,962,459 | | | | 5,226,286 | | | | 5,728,259 | | | | 2,595,522 | | | | 5,261,948 | | | | 7,685,891 | |
| | | | | | | | | | | | | | | | | | | | | | | | | | | | | |
| Net Increase in Net Assets Resulting From Operations | | $ | 6,214,253 | | | $ | 17,417,739 | | | $ | 6,251,196 | | | $ | 6,522,562 | | | $ | 2,660,156 | | | $ | 4,879,363 | | | $ | 7,943,899 | |
See accompanying notes to financial statements.
| STATEMENTS OF CHANGES IN NET ASSETS |
| | | Dunham | | | Dunham | | | Dunham | | | Dunham | | | Dunham | |
| | | Floating Rate | | | Long/Short | | | Corporate/Government | | | Monthly Distribution | | | Dynamic Macro | |
| | | Bond Fund | | | Credit Fund | | | Bond Fund | | | Fund | | | | | | Fund | | | | |
| | | Six Months | | | | | | Six Months | | | | | | Six Months | | | | | | Six Months | | | | | | Six Months | | | | |
| | | Ended | | | Year Ended | | | Ended | | | Year Ended | | | Ended | | | Year Ended | | | Ended | | | Year Ended | | | Ended | | | Year Ended | |
| | | April 30, 2019 | | | Oct. 31, 2018 | | | April 30, 2019 | | | Oct. 31, 2018 | | | April 30, 2019 | | | Oct. 31, 2018 | | | April 30, 2019 | | | Oct. 31, 2018 | | | April 30, 2019 | | | Oct. 31, 2018 | |
| | | (Unaudited) | | | | | | (Unaudited) | | | | | | (Unaudited) | | | | | | (Unaudited) | | | | | | (Unaudited) | | | | |
| Operations: | | | | | | | | | | | | | | | | | | | | | | | | | | | | | | | | | | | | | | | | |
| Net investment income (loss) | | $ | 4,144,586 | | | $ | 7,513,198 | | | $ | 796,504 | | | $ | 590,638 | | | $ | 695,166 | | | $ | 1,551,962 | | | $ | (1,473,709 | ) | | $ | 277,888 | | | $ | 329,291 | | | $ | 56,596 | |
| Net realized gain (loss) from investments, futures, purchased options, securities sold short, written options, swap contracts, foreign currency transactions and foreign currency exchange contracts | | | (642,300 | ) | | | (331,695 | ) | | | 407,478 | | | | 2,210,212 | | | | (213,404 | ) | | | (1,340,800 | ) | | | (973,153 | ) | | | 5,972,173 | | | | 1,987,908 | | | | (1,621,185 | ) |
| Net change in unrealized appreciation (depreciation) on investments, futures, purchased options, securities sold short, written options, foreign currency translations, and foreign currency exchange contracts | | | (733,568 | ) | | | (1,770,479 | ) | | | 735,638 | | | | (1,199,986 | ) | | | 1,897,646 | | | | (2,180,187 | ) | | | 8,640,851 | | | | (8,557,186 | ) | | | (147,711 | ) | | | (1,415,776 | ) |
| Net Increase (Decrease) in Net Assets Resulting From Operations | | | 2,768,718 | | | | 5,411,024 | | | | 1,939,620 | | | | 1,600,864 | | | | 2,379,408 | | | | (1,969,025 | ) | | | 6,193,989 | | | | (2,307,125 | ) | | | 2,169,488 | | | | (2,980,365 | ) |
| | | | | | | | | | | | | | | | | | | | | | | | | | | | | | | | | | | | | | | | | |
| Distributions to Shareholders From: | | | | | | | | | | | | | | | | | | | | | | | | | | | | | | | | | | | | | | | | |
| Distributions From Paid In Capital: | | | | | | | | | | | | | | | | | | | | | | | | | | | | | | | | | | | | | | | | |
| Class N | | | — | | | | — | | | | — | | | | — | | | | — | | | | — | | | | (5,095,328 | ) | | | (7,909,457 | ) | | | — | | | | — | |
| Class A | | | — | | | | — | | | | — | | | | — | | | | — | | | | — | | | | (1,184,779 | ) | | | (1,741,683 | ) | | | — | | | | — | |
| Class C | | | — | | | | — | | | | — | | | | — | | | | — | | | | — | | | | (1,204,883 | ) | | | (1,667,572 | ) | | | — | | | | — | |
| Total Distributions Paid | | | | | | | | | | | | | | | | | | | | | | | | | | | | | | | | | | | | | | | | |
| Class N | | | (3,685,234 | ) | | | (6,592,532 | ) | | | (1,120,765 | ) | | | (364,941 | ) | | | (602,509 | ) | | | (1,401,772 | ) | | | — | | | | (1,898,259 | ) | | | (810,524 | ) | | | — | |
| Class A | | | (451,621 | ) | | | (741,771 | ) | | | (138,167 | ) | | | (72,290 | ) | | | (66,829 | ) | | | (146,528 | ) | | | — | | | | (415,753 | ) | | | (165,669 | ) | | | — | |
| Class C | | | (148,774 | ) | | | (226,608 | ) | | | (59,131 | ) | | | (42,412 | ) | | | (27,167 | ) | | | (59,070 | ) | | | — | | | | (402,623 | ) | | | (24,138 | ) | | | — | |
| Total Distributions to Shareholders | | | (4,285,629 | ) | | | (7,560,911 | ) | | | (1,318,063 | ) | | | (479,643 | ) | | | (696,505 | ) | | | (1,607,370 | ) | | | (7,484,990 | ) | | | (14,035,347 | ) | | | (1,000,331 | ) | | | — | |
| | | | | | | | | | | | | | | | | | | | | | | | | | | | | | | | | | | | | | | | | |
| Share Transactions of Beneficial Interest: | | | | | | | | | | | | | | | | | | | | | | | | | | | | | | | | | | | | | | | | |
| Net proceeds from shares sold | | | | | | | | | | | | | | | | | | | | | | | | | | | | | | | | | | | | | | | | |
| Class N | | | 25,923,295 | | | | 53,805,879 | | | | 37,136,875 | | | | 24,690,679 | | | | 13,857,526 | | | | 26,102,884 | | | | 36,703,397 | | | | 79,596,658 | | | | 2,064,486 | | | | 10,438,482 | |
| Class A | | | 3,144,985 | | | | 9,607,696 | | | | 3,232,930 | | | | 4,941,263 | | | | 914,161 | | | | 2,745,411 | | | | 7,044,370 | | | | 16,902,262 | | | | 1,156,871 | | | | 4,198,213 | |
| Class C | | | 1,374,003 | | | | 2,552,475 | | | | 599,247 | | | | 966,403 | | | | 191,500 | | | | 776,525 | | | | 3,941,812 | | | | 9,988,079 | | | | 209,072 | | | | 534,780 | |
| Reinvestment of distributions | | | | | | | | | | | | | | | | | | | | | | | | | | | | | | | | | | | | | | | | |
| Class N | | | 3,679,136 | | | | 6,585,506 | | | | 1,104,074 | | | | 364,087 | | | | 599,464 | | | | 1,400,755 | | | | 4,918,039 | | | | 9,579,318 | | | | 809,407 | | | | — | |
| Class A | | | 435,698 | | | | 714,614 | | | | 123,425 | | | | 60,330 | | | | 64,262 | | | | 139,151 | | | | 1,037,237 | | | | 1,880,728 | | | | 163,798 | | | | — | |
| Class C | | | 144,829 | | | | 223,666 | | | | 58,134 | | | | 38,665 | | | | 26,106 | | | | 57,080 | | | | 1,030,433 | | | | 1,747,942 | | | | 24,111 | | | | — | |
| Cost of shares redeemed | | | | | | | | | | | | | | | | | | | | | | | | | | | | | | | | | | | | | | | | |
| Class N | | | (35,167,288 | ) | | | (51,103,375 | ) | | | (16,640,013 | ) | | | (2,712,641 | ) | | | (14,666,383 | ) | | | (46,043,475 | ) | | | (45,934,347 | ) | | | (88,657,959 | ) | | | (8,244,477 | ) | | | (8,552,847 | ) |
| Class A | | | (2,344,346 | ) | | | (6,113,143 | ) | | | (706,470 | ) | | | (2,061,767 | ) | | | (806,811 | ) | | | (3,493,266 | ) | | | (6,574,743 | ) | | | (14,526,312 | ) | | | (2,194,735 | ) | | | (2,009,156 | ) |
| Class C | | | (1,044,894 | ) | | | (1,675,351 | ) | | | (249,774 | ) | | | (729,306 | ) | | | (457,033 | ) | | | (1,102,595 | ) | | | (4,392,759 | ) | | | (9,085,236 | ) | | | (230,881 | ) | | | (673,743 | ) |
| Net Increase (Decrease) in Net Assets From Share Transactions of Beneficial Interest | | | (3,854,582 | ) | | | 14,597,967 | | | | 24,658,428 | | | | 25,557,713 | | | | (277,208 | ) | | | (19,417,530 | ) | | | (2,226,561 | ) | | | 7,425,480 | | | | (6,242,348 | ) | | | 3,935,729 | |
| | | | | | | | | | | | | | | | | | | | | | | | | | | | | | | | | | | | | | | | | |
| Total Increase (Decrease) in Net Assets | | | (5,371,493 | ) | | | 12,448,080 | | | | 25,279,985 | | | | 26,678,934 | | | | 1,405,695 | | | | (22,993,925 | ) | | | (3,517,562 | ) | | | (8,916,992 | ) | | | (5,073,191 | ) | | | 955,364 | |
| | | | | | | | | | | | | | | | | | | | | | | | | | | | | | | | | | | | | | | | | |
| Net Assets: | | | | | | | | | | | | | | | | | | | | | | | | | | | | | | | | | | | | | | | | |
| Beginning of Period | | | 192,377,108 | | | | 179,929,028 | | | | 45,465,462 | | | | 18,786,528 | | | | 49,221,551 | | | | 72,215,476 | | | | 279,048,216 | | | | 287,965,208 | | | | 45,252,304 | | | | 44,296,940 | |
| End of Period | | $ | 187,005,615 | | | $ | 192,377,108 | | | $ | 70,745,447 | | | $ | 45,465,462 | | | $ | 50,627,246 | | | $ | 49,221,551 | | | $ | 275,530,654 | | | $ | 279,048,216 | | | $ | 40,179,113 | | | $ | 45,252,304 | |
See accompanying notes to financial statements.
| STATEMENTS OF CHANGES IN NET ASSETS (Continued) |
| | | Dunham | | | Dunham | | | Dunham | | | Dunham | | | Dunham | |
| | | High-Yield | | | International Opportunity | | | Large Cap | | | Focused Large Cap | | | International | |
| | | Bond Fund | | | Bond Fund | | | Value Fund | | | Growth Fund | | | Stock Fund | |
| | | Six Months | | | | | | Six Months | | | | | | Six Months | | | | | | Six Months | | | | | | Six Months | | | | |
| | | Ended | | | Year Ended | | | Ended | | | Year Ended | | | Ended | | | Year Ended | | | Ended | | | Year Ended | | | Ended | | | Year Ended | |
| | | April 30, 2019 | | | Oct. 31, 2018 | | | April 30, 2019 | | | Oct. 31, 2018 | | | April 30, 2019 | | | Oct. 31, 2018 | | | April 30, 2019 | | | Oct. 31, 2018 | | | April 30, 2019 | | | Oct. 31, 2018 | |
| | | (Unaudited) | | | | | | (Unaudited) | | | | | | (Unaudited) | | | | | | (Unaudited) | | | | | | (Unaudited) | | | | |
| Operations: | | | | | | | | | | | | | | | | | | | | | | | | | | | | | | | | | | | | | | | | |
| Net investment income (loss) | | $ | 2,731,336 | | | $ | 5,633,847 | | | $ | (56,993 | ) | | $ | (148,640 | ) | | $ | 500,267 | | | $ | 635,854 | | | $ | (544,720 | ) | | $ | (966,560 | ) | | $ | 1,024,910 | | | $ | 1,350,212 | |
| Net realized gain (loss) from investments, futures, and foreign currency transactions | | | (1,763,027 | ) | | | (321,233 | ) | | | (49,904 | ) | | | 322,454 | | | | (62,847 | ) | | | 2,733,977 | | | | 2,166,542 | | | | 6,846,462 | | | | (2,717,449 | ) | | | 6,533,665 | |
| Net change in unrealized appreciation (depreciation) on investments, swap contracts, futures, foreign currency transactions, and foreign currency exchange contracts | | | 4,814,688 | | | | (6,315,823 | ) | | | 865,701 | | | | (1,574,463 | ) | | | 5,776,833 | | | �� | (1,893,243 | ) | | | 15,795,917 | | | | 7,268,219 | | | | 7,943,735 | | | | (16,664,110 | ) |
| Net Increase (Decrease) in Net Assets Resulting From Operations | | | 5,782,997 | | | | (1,003,209 | ) | | | 758,804 | | | | (1,400,649 | ) | | | 6,214,253 | | | | 1,476,588 | | | | 17,417,739 | | | | 13,148,121 | | | | 6,251,196 | | | | (8,780,233 | ) |
| | | | | | | | | | | | | | | | | | | | | | | | | | | | | | | | | | | | | | | | | |
| Distributions to Shareholders From: | | | | | | | | | | | | | | | | | | | | | | | | | | | | | | | | | | | | | | | | |
| Total Distributions Paid | | | | | | | | | | | | | | | | | | | | | | | | | | | | | | | | | | | | | | | | |
| Class N | | | (2,399,630 | ) | | | (4,663,689 | ) | | | (206,819 | ) | | | (37,115 | ) | | | (2,696,551 | ) | | | (1,037,225 | ) | | | (4,430,347 | ) | | | (529,592 | ) | | | (5,927,318 | ) | | | (3,839,253 | ) |
| Class A | | | (309,298 | ) | | | (548,313 | ) | | | (16,011 | ) | | | (3,597 | ) | | | (634,655 | ) | | | (179,080 | ) | | | (1,226,758 | ) | | | (125,188 | ) | | | (1,198,236 | ) | | | (663,334 | ) |
| Class C | | | (173,311 | ) | | | (308,033 | ) | | | (2,165 | ) | | | (1,630 | ) | | | (174,020 | ) | | | (54,544 | ) | | | (564,922 | ) | | | (67,305 | ) | | | (358,199 | ) | | | (254,735 | ) |
| Total Distributions to Shareholders | | | (2,882,239 | ) | | | (5,520,035 | ) | | | (224,995 | ) | | | (42,342 | ) | | | (3,505,226 | ) | | | (1,270,849 | ) | | | (6,222,027 | ) | | | (722,085 | ) | | | (7,483,753 | ) | | | (4,757,322 | ) |
| | | | | | | | | | | | | | | | | | | | | | | | | | | | | | | | | | | | | | | | | |
| Share Transactions of Beneficial Interest: | | | | | | | | | | | | | | | | | | | | | | | | | | | | | | | | | | | | | | | | |
| Net proceeds from shares sold | | | | | | | | | | | | | | | | | | | | | | | | | | | | | | | | | | | | | | | | |
| Class N | | | 11,978,374 | | | | 25,839,703 | | | | 3,942,816 | | | | 8,552,449 | | | | 5,314,753 | | | | 11,276,861 | | | | 13,032,376 | | | | 14,557,522 | | | | 10,397,526 | | | | 20,225,562 | |
| Class A | | | 1,474,609 | | | | 4,933,144 | | | | 684,363 | | | | 1,815,069 | | | | 3,244,611 | | | | 5,983,202 | | | | 9,139,991 | | | | 6,139,307 | | | | 3,338,286 | | | | 9,177,700 | |
| Class C | | | 372,592 | | | | 1,222,617 | | | | 140,131 | | | | 438,364 | | | | 817,974 | | | | 770,794 | | | | 1,290,904 | | | | 1,148,834 | | | | 630,976 | | | | 1,236,899 | |
| Reinvestment of distributions | | | | | | | | | | | | | | | | | | | | | | | | | | | | | | | | | | | | | | | | |
| Class N | | | 2,387,676 | | | | 4,624,638 | | | | 206,756 | | | | 37,090 | | | | 2,688,416 | | | | 1,034,573 | | | | 4,369,570 | | | | 527,415 | | | | 5,919,259 | | | | 3,736,841 | |
| Class A | | | 291,516 | | | | 500,869 | | | | 15,700 | | | | 3,538 | | | | 612,304 | | | | 174,869 | | | | 1,096,111 | | | | 119,002 | | | | 1,172,202 | | | | 644,219 | |
| Class C | | | 159,009 | | | | 277,641 | | | | 2,165 | | | | 1,630 | | | | 171,204 | | | | 53,746 | | | | 513,630 | | | | 63,642 | | | | 355,855 | | | | 250,970 | |
| Cost of shares redeemed | | | | | | | | | | | | | | | | | | | | | | | | | | | | | | | | | | | | | | | | |
| Class N | | | (21,364,169 | ) | | | (34,003,205 | ) | | | (4,140,441 | ) | | | (7,995,121 | ) | | | (5,118,241 | ) | | | (12,244,072 | ) | | | (10,286,983 | ) | | | (21,393,431 | ) | | | (7,863,142 | ) | | | (14,178,501 | ) |
| Class A | | | (2,585,030 | ) | | | (4,450,345 | ) | | | (542,989 | ) | | | (809,868 | ) | | | (1,284,650 | ) | | | (3,792,405 | ) | | | (3,482,642 | ) | | | (6,326,125 | ) | | | (1,942,994 | ) | | | (4,944,496 | ) |
| Class C | | | (903,129 | ) | | | (1,476,839 | ) | | | (183,002 | ) | | | (333,168 | ) | | | (263,301 | ) | | | (1,312,478 | ) | | | (1,070,727 | ) | | | (2,135,494 | ) | | | (659,230 | ) | | | (1,547,611 | ) |
| Net Increase (Decrease) in Net Assets From Share Transactions of Beneficial Interest | | | (8,188,552 | ) | | | (2,531,777 | ) | | | 125,499 | | | | 1,709,983 | | | | 6,183,070 | | | | 1,945,090 | | | | 14,602,230 | | | | (7,299,328 | ) | | | 11,348,738 | | | | 14,601,583 | |
| | | | | | | | | | | | | | | | | | | | | | | | | | | | | | | | | | | | | | | | | |
| Total Increase (Decrease) in Net Assets | | | (5,287,794 | ) | | | (9,055,021 | ) | | | 659,308 | | | | 266,992 | | | | 8,892,097 | | | | 2,150,829 | | | | 25,797,942 | | | | 5,126,708 | | | | 10,116,181 | | | | 1,064,028 | |
| | | | | | | | | | | | | | | | | | | | | | | | | | | | | | | | | | | | | | | | | |
| Net Assets: | | | | | | | | | | | | | | | | | | | | | | | | | | | | | | | | | | | | | | | | |
| Beginning of Period | | | 114,381,790 | | | | 123,436,811 | | | | 37,006,017 | | | | 36,739,025 | | | | 72,119,462 | | | | 69,968,633 | | | | 81,300,147 | | | | 76,173,439 | | | | 113,415,397 | | | | 112,351,369 | |
| End of Period | | $ | 109,093,996 | | | $ | 114,381,790 | | | $ | 37,665,325 | | | $ | 37,006,017 | | | $ | 81,011,559 | | | $ | 72,119,462 | | | $ | 107,098,089 | | | $ | 81,300,147 | | | $ | 123,531,578 | | | $ | 113,415,397 | |
See accompanying notes to financial statements.
| STATEMENTS OF CHANGES IN NET ASSETS (Continued) |
| | | Dunham | | | Dunham | | | Dunham | | | Dunham | |
| | | Real Estate | | | Small Cap | | | Small Cap | | | Emerging Markets | |
| | | Stock Fund | | | Value Fund | | | Growth Fund | | | Stock Fund | |
| | | Six Months | | | | | | Six Months | | | | | | Six Months | | | | | | Six Months | | | | |
| | | Ended | | | Year Ended | | | Ended | | | Year Ended | | | Ended | | | Year Ended | | | Ended | | | Year Ended | |
| | | April 30, 2019 | | | Oct. 31, 2018 | | | April 30, 2019 | | | Oct. 31, 2018 | | | April 30, 2019 | | | Oct. 31, 2018 | | | April 30, 2019 | | | Oct. 31, 2018 | |
| | | (Unaudited) | | | | | | (Unaudited) | | | | | | (Unaudited) | | | | | | (Unaudited) | | | | |
| Operations: | | | | | | | | | | | | | | | | | | | | | | | | | | | | | | | | |
| Net investment income (loss) | | $ | 794,303 | | | $ | 899,505 | | | $ | 64,634 | | | $ | (45,684 | ) | | $ | (382,585 | ) | | $ | (590,382 | ) | | $ | 258,008 | | | $ | 1,152,940 | |
| Net realized gain (loss) from investments and foreign currency transactions | | | 1,361,666 | | | | (174,994 | ) | | | (563,424 | ) | | | 5,105,140 | | | | (188,986 | ) | | | 9,207,612 | | | | (114,946 | ) | | | 1,431,468 | |
| Net change in unrealized appreciation (depreciation) on investments and foreign currency translations | | | 4,366,593 | | | | (546,360 | ) | | | 3,158,946 | | | | (5,420,545 | ) | | | 5,450,934 | | | | (3,717,938 | ) | | | 7,800,837 | | | | (16,889,852 | ) |
| Net Increase (Decrease) in Net Assets Resulting From Operations | | | 6,522,562 | | | | 178,151 | | | | 2,660,156 | | | | (361,089 | ) | | | 4,879,363 | | | | 4,899,292 | | | | 7,943,899 | | | | (14,305,444 | ) |
| | | | | | | | | | | | | | | | | | | | | | | | | | | | | | | | | |
| Distributions to Shareholders From: | | | | | | | | | | | | | | | | | | | | | | | | | | | | | | | | |
| Total Distributions Paid | | | | | | | | | | | | | | | | | | | | | | | | | | | | | | | | |
| Class N | | | (798,931 | ) | | | (545,647 | ) | | | (3,953,207 | ) | | | (2,382,575 | ) | | | (6,275,235 | ) | | | (3,540,224 | ) | | | (1,006,872 | ) | | | (510,282 | ) |
| Class A | | | (140,920 | ) | | | (80,421 | ) | | | (859,290 | ) | | | (495,340 | ) | | | (2,133,326 | ) | | | (1,070,104 | ) | | | (167,073 | ) | | | (67,957 | ) |
| Class C | | | (23,866 | ) | | | (19,495 | ) | | | (272,184 | ) | | | (301,971 | ) | | | (652,365 | ) | | | (474,106 | ) | | | (29,750 | ) | | | (13,160 | ) |
| Total Distributions to Shareholders | | | (963,717 | ) | | | (645,563 | ) | | | (5,084,681 | ) | | | (3,179,886 | ) | | | (9,060,926 | ) | | | (5,084,434 | ) | | | (1,203,695 | ) | | | (591,399 | ) |
| | | | | | | | | | | | | | | | | | | | | | | | | | | | | | | | | |
| Share Transactions of Beneficial Interest: | | | | | | | | | | | | | | | | | | | | | | | | | | | | | | | | |
| Net proceeds from shares sold | | | | | | | | | | | | | | | | | | | | | | | | | | | | | | | | |
| Class N | | | 1,973,009 | | | | 18,420,383 | | | | 4,480,265 | | | | 17,353,604 | | | | 8,861,441 | | | | 12,088,512 | | | | 4,370,061 | | | | 20,915,714 | |
| Class A | | | 1,168,197 | | | | 4,483,032 | | | | 1,475,433 | | | | 4,612,064 | | | | 2,394,729 | | | | 5,475,767 | | | | 2,757,475 | | | | 6,171,549 | |
| Class C | | | 215,607 | | | | 555,329 | | | | 653,296 | | | | 433,472 | | | | 365,984 | | | | 468,765 | | | | 339,326 | | | | 1,090,420 | |
| Reinvestment of distributions | | | | | | | | | | | | | | | | | | | | | | | | | | | | | | | | |
| Class N | | | 797,852 | | | | 544,150 | | | | 3,947,325 | | | | 2,312,130 | | | | 5,929,101 | | | | 3,415,609 | | | | 997,722 | | | | 494,306 | |
| Class A | | | 138,429 | | | | 78,284 | | | | 796,270 | | | | 445,163 | | | | 1,888,425 | | | | 959,794 | | | | 162,685 | | | | 64,832 | |
| Class C | | | 23,724 | | | | 19,299 | | | | 272,184 | | | | 264,864 | | | | 648,129 | | | | 474,106 | | | | 28,819 | | | | 13,079 | |
| Cost of shares redeemed | | | | | | | | | | | | | | | | | | | | | | | | | | | | | | | | |
| Class N | | | (6,651,299 | ) | | | (9,723,240 | ) | | | (3,640,740 | ) | | | (2,502,809 | ) | | | (7,195,564 | ) | | | (6,253,725 | ) | | | (7,140,126 | ) | | | (7,511,939 | ) |
| Class A | | | (1,504,906 | ) | | | (2,038,975 | ) | | | (929,019 | ) | | | (1,141,557 | ) | | | (2,644,394 | ) | | | (2,475,581 | ) | | | (1,314,237 | ) | | | (2,670,093 | ) |
| Class C | | | (230,814 | ) | | | (661,776 | ) | | | (220,442 | ) | | | (868,985 | ) | | | (669,026 | ) | | | (777,346 | ) | | | (618,774 | ) | | | (659,386 | ) |
| Net Increase (Decrease) in Net Assets From Share Transactions of Beneficial Interest | | | (4,070,201 | ) | | | 11,676,486 | | | | 6,834,572 | | | | 20,907,946 | | | | 9,578,825 | | | | 13,375,901 | | | | (417,049 | ) | | | 17,908,482 | |
| | | | | | | | | | | | | | | | | | | | | | | | | | | | | | | | | |
| Total Increase in Net Assets | | | 1,488,644 | | | | 11,209,074 | | | | 4,410,047 | | | | 17,366,971 | | | | 5,397,262 | | | | 13,190,759 | | | | 6,323,155 | | | | 3,011,639 | |
| | | | | | | | | | | | | | | | | | | | | | | | | | | | | | | | | |
| Net Assets: | | | | | | | | | | | | | | | | | | | | | | | | | | | | | | | | |
| Beginning of Period | | | 53,915,232 | | | | 42,706,158 | | | | 47,256,415 | | | | 29,889,444 | | | | 47,401,283 | | | | 34,210,524 | | | | 66,085,808 | | | | 63,074,169 | |
| End of Period | | $ | 55,403,876 | | | $ | 53,915,232 | | | $ | 51,666,462 | | | $ | 47,256,415 | | | $ | 52,798,545 | | | $ | 47,401,283 | | | $ | 72,408,963 | | | $ | 66,085,808 | |
See accompanying notes to financial statements.
| FINANCIAL HIGHLIGHTS |
| Dunham Floating Rate Bond Fund |
| |
| The table sets forth financial data for one share of beneficial interest outstanding throughout each period/year. |
| | | Class N | | | | | | | | | | | | | | | | | | | | | | | | | |
| | | Six Months Ended | | | Year Ended October 31, | | | | | | | | | | | | | | | | | | | | | | | | | |
| | | April 30, 2019 | | | 2018 | | | 2017 | | | 2016 | | | 2015 | | | 2014* | | | | | | | | | | | | | | | | | | | | | | | | | |
| | | (Unaudited) | | | | | | | | | | | | | | | | | | | | | | | | | | | | | | | | | | | | | | | | |
| Net asset value, beginning of period/year | | $ | 9.62 | | | $ | 9.73 | | | $ | 9.70 | | | $ | 9.60 | | | $ | 9.87 | | | $ | 10.00 | | | | | | | | | | | | | | | | | | | | | | | | | |
| Income from investment operations: | | | | | | | | | | | | | | | | | | | | | | | | | | | | | | | | | | | | | | | | | | | | | | | | |
| Net investment income** | | | 0.22 | | | | 0.40 | | | | 0.35 | | | | 0.33 | | | | 0.32 | | | | 0.29 | | | | | | | | | | | | | | | | | | | | | | | | | |
| Net realized and unrealized gain (loss) | | | (0.06 | ) | | | (0.11 | ) | | | 0.03 | | | | 0.10 | | | | (0.27 | ) | | | (0.15 | ) | | | | | | | | | | | | | | | | | | | | | | | | |
| Total income from investment operations | | | 0.16 | | | | 0.29 | | | | 0.38 | | | | 0.43 | | | | 0.05 | | | | 0.14 | | | | | | | | | | | | | | | | | | | | | | | | | |
| Less distributions: | | | | | | | | | | | | | | | | | | | | | | | | | | | | | | | | | | | | | | | | | | | | | | | | |
| Distributions from net investment income | | | (0.22 | ) | | | (0.40 | ) | | | (0.35 | ) | | | (0.33 | ) | | | (0.32 | ) | | | (0.27 | ) | | | | | | | | | | | | | | | | | | | | | | | | |
| Total distributions | | | (0.22 | ) | | | (0.40 | ) | | | (0.35 | ) | | | (0.33 | ) | | | (0.32 | ) | | | (0.27 | ) | | | | | | | | | | | | | | | | | | | | | | | | |
| Net asset value, end of period/year | | $ | 9.56 | | | $ | 9.62 | | | $ | 9.73 | | | $ | 9.70 | | | $ | 9.60 | | | $ | 9.87 | | | | | | | | | | | | | | | | | | | | | | | | | |
| Total return +# | | | 1.78 | % | | | 3.02 | % | | | 4.01 | % | | | 4.63 | % | | | 0.51 | % | | | 1.43 | % | | | | | | | | | | | | | | | | | | | | | | | | |
| Ratios/Supplemental Data: | | | | | | | | | | | | | | | | | | | | | | | | | | | | | | | | | | | | | | | | | | | | | | | | |
| Net assets, end of period/year (in 000s) | | $ | 158,029 | | | $ | 164,936 | | | $ | 157,485 | | | $ | 94,219 | | | $ | 73,316 | | | $ | 63,120 | | | | | | | | | | | | | | | | | | | | | | | | | |
| Ratios of expenses to average net assets: ^ | | | 0.99 | % | | | 0.97 | % | | | 1.03 | % | | | 1.34 | % | | | 1.27 | % | | | 1.27 | % | | | | | | | | | | | | | | | | | | | | | | | | |
| Ratios of net investment income to average net assets: ^ | | | 4.59 | % | | | 4.08 | % | | | 3.60 | % | | | 3.24 | % | | | 3.24 | % | | | 2.87 | % | | | | | | | | | | | | | | | | | | | | | | | | |
| Portfolio turnover rate (1) | | | 18 | % | | | 79 | % | | | 91 | % | | | 62 | % | | | 51 | % | | | 50 | % | | | | | | | | | | | | | | | | | | | | | | | | |
| | | | | | | | | | | | | | | | | | | | | | | | | | | | | | | | | | | | | | | | | | | | | | | | | |
| | | Class A | | | | | | Class C | |
| | | Six Months Ended | | | Year Ended October 31, | | | Six Months Ended | | | Year Ended October 31, | |
| | | April 30, 2019 | | | 2018 | | | 2017 | | | 2016 | | | 2015 | | | 2014* | | | April 30, 2019 | | | 2018 | | | 2017 | | | 2016 | | | 2015 | | | 2014* | |
| | | (Unaudited) | | | | | | | | | | | | | | | | | | (Unaudited) | | | | | | | | | | | | | | | | |
| Net asset value, beginning of period/year | | $ | 9.61 | | | $ | 9.72 | | | $ | 9.70 | | | $ | 9.59 | | | $ | 9.87 | | | $ | 10.00 | | | $ | 9.62 | | | $ | 9.73 | | | $ | 9.69 | | | $ | 9.59 | | | $ | 9.86 | | | $ | 10.00 | |
| Income (loss) from investment operations: | | | | | | | | | | | | | | | | | | | | | | | | | | | | | | | | | | | | | | | | | | | | | | | | |
| Net investment income** | | | 0.20 | | | | 0.37 | | | | 0.32 | | | | 0.31 | | | | 0.30 | | | | 0.28 | | | | 0.18 | | | | 0.33 | | | | 0.28 | | | | 0.26 | | | | 0.24 | | | | 0.22 | |
| Net realized and unrealized gain (loss) | | | (0.05 | ) | | | (0.11 | ) | | | 0.03 | | | | 0.11 | | | | (0.28 | ) | | | (0.16 | ) | | | (0.06 | ) | | | (0.11 | ) | | | 0.04 | | | | 0.10 | | | | (0.26 | ) | | | (0.16 | ) |
| Total income (loss) from investment operations | | | 0.15 | | | | 0.26 | | | | 0.35 | | | | 0.42 | | | | 0.02 | | | | 0.12 | | | | 0.12 | | | | 0.22 | | | | 0.32 | | | | 0.36 | | | | (0.02 | ) | | | 0.06 | |
| Less distributions: | | | | | | | | | | | | | | | | | | | | | | | | | | | | | | | | | | | | | | | | | | | | | | | | |
| Distributions from net investment income | | | (0.21 | ) | | | (0.37 | ) | | | (0.33 | ) | | | (0.31 | ) | | | (0.30 | ) | | | (0.25 | ) | | | (0.19 | ) | | | (0.33 | ) | | | (0.28 | ) | | | (0.26 | ) | | | (0.25 | ) | | | (0.20 | ) |
| Total distributions | | | (0.21 | ) | | | (0.37 | ) | | | (0.33 | ) | | | (0.31 | ) | | | (0.30 | ) | | | (0.25 | ) | | | (0.19 | ) | | | (0.33 | ) | | | (0.28 | ) | | | (0.26 | ) | | | (0.25 | ) | | | (0.20 | ) |
| Net asset value, end of period/year | | $ | 9.55 | | | $ | 9.61 | | | $ | 9.72 | | | $ | 9.70 | | | $ | 9.59 | | | $ | 9.87 | | | $ | 9.55 | | | $ | 9.62 | | | $ | 9.73 | | | $ | 9.69 | | | $ | 9.59 | | | $ | 9.86 | |
| Total return +# | | | 1.66 | % | | | 2.77 | % | | | 3.64 | % | | | 4.49 | % | | | 0.16 | % | | | 1.20 | % | | | 1.42 | % | | | 2.26 | % | | | 3.31 | % | | | 3.87 | % | | | (0.23 | )% | | | 0.63 | % |
| Ratios/Supplemental Data: | | | | | | | | | | | | | | | | | | | | | | | | | | | | | | | | | | | | | | | | | | | | | | | | |
| Net assets, end of period/year (in 000s) | | $ | 21,309 | | | $ | 20,205 | | | $ | 16,229 | | | $ | 10,923 | | | $ | 8,598 | | | $ | 13,664 | | | $ | 7,667 | | | $ | 7,236 | | | $ | 6,215 | | | $ | 4,545 | | | $ | 3,573 | | | $ | 3,888 | |
| Ratios of expenses to average net assets: ^ | | | 1.24 | % | | | 1.22 | % | | | 1.28 | % | | | 1.59 | % | | | 1.52 | % | | | 1.52 | % | | | 1.74 | % | | | 1.72 | % | | | 1.78 | % | | | 2.10 | % | | | 2.02 | % | | | 2.02 | % |
| Ratios of net investment income to average net assets: ^ | | | 4.35 | % | | | 3.84 | % | | | 3.33 | % | | | 3.49 | % | | | 2.99 | % | | | 2.84 | % | | | 3.85 | % | | | 3.43 | % | | | 2.89 | % | | | 2.74 | % | | | 2.49 | % | | | 2.24 | % |
| Portfolio turnover rate (1) | | | 18 | % | | | 79 | % | | | 91 | % | | | 62 | % | | | 51 | % | | | 50 | % | | | 18 | % | | | 79 | % | | | 91 | % | | | 62 | % | | | 51 | % | | | 50 | % |
| | | | | | | | | | | | | | | | | | | | | | | | | | | | | | | | | | | | | | | | | | | | | | | | | |
| * | The Fund commenced operations on November 1, 2013. |
| ** | The net investment income per share data was determined using the average shares outstanding throughout each period/year. |
| + | Assumes reinvestment of all dividends and distributions, if any. Aggregate (not annualized) total return is shown for any period shorter than one year. Total return does not reflect the deductions of taxes that a shareholder would pay on distributions or on the redemption of shares and does not reflect the impact of any sales charge. |
| ^ | Annualized for periods less than one year. |
| (1) | Not annualized for periods less than one year. |
| # | Includes adjustments in accordance with accounting principles generally accepted in the United States and, consequently, the net asset value for financial reporting purposes and the returns based upon those net asset values may differ from the net asset values and returns for shareholder transactions. Adjustments may apply to some but not all years and classes. |
See accompanying notes to financial statements.
| FINANCIAL HIGHLIGHTS |
| Dunham Long/Short Credit Fund |
| |
| The table sets forth financial data for one share of beneficial interest outstanding throughout each period/year. |
| | | Class N | | | | | | | | | | | | | | | | | | | | | | | | | |
| | | Six Months Ended | | | Year Ended October 31, | | | | | | | | | | | | | | | | | | | | | | | | | |
| | | April 30, 2019 | | | 2018 | | | 2017 | | | 2016 | | | 2015 | | | 2014 | | | | | | | | | | | | | | | | | | | | | | | | | |
| | | (Unaudited) | | | | | | | | | | | | | | | | | | | | | | | | | | | | | | | | | | | | | | | | |
| Net asset value, beginning of period/year | | $ | 9.19 | | | $ | 8.68 | | | $ | 8.05 | | | $ | 8.75 | | | $ | 10.88 | | | $ | 10.09 | | | | | | | | | | | | | | | | | | | | | | | | | |
| Income (loss) from investment operations: | | | | | | | | | | | | | | | | | | | | | | | | | | | | | | | | | | | | | | | | | | | | | | | | |
| Net investment income* | | | 0.13 | | | | 0.23 | | | | 0.16 | | | | 0.23 | | | | 0.27 | | | | 0.11 | | | | | | | | | | | | | | | | | | | | | | | | | |
| Net realized and unrealized gain (loss) | | | 0.11 | | | | 0.49 | | | | 0.72 | | | | (0.39 | ) | | | (0.51 | ) | | | 0.83 | | | | | | | | | | | | | | | | | | | | | | | | | |
| Total income (loss) from investment operations | | | 0.24 | | | | 0.72 | | | | 0.88 | | | | (0.16 | ) | | | (0.24 | ) | | | 0.94 | | | | | | | | | | | | | | | | | | | | | | | | | |
| Less distributions: | | | | | | | | | | | | | | | | | | | | | | | | | | | | | | | | | | | | | | | | | | | | | | | | |
| Distributions from net investment income | | | (0.19 | ) | | | (0.21 | ) | | | (0.25 | ) | | | (0.36 | ) | | | (0.17 | ) | | | (0.15 | ) | | | | | | | | | | | | | | | | | | | | | | | | |
| Distributions from net realized gains | | | — | | | | — | | | | — | | | | (0.18 | ) | | | (1.72 | ) | | | — | | | | | | | | | | | | | | | | | | | | | | | | | |
| Total distributions | | | (0.19 | ) | | | (0.21 | ) | | | (0.25 | ) | | | (0.54 | ) | | | (1.89 | ) | | | (0.15 | ) | | | | | | | | | | | | | | | | | | | | | | | | |
| Net asset value, end of period/year | | $ | 9.24 | | | $ | 9.19 | | | $ | 8.68 | | | $ | 8.05 | | | $ | 8.75 | | | $ | 10.88 | | | | | | | | | | | | | | | | | | | | | | | | | |
| Total return + # | | | 2.70 | % | | | 8.42 | % | | | 11.20 | % | | | (1.92 | )% | | | (2.67 | )% | | | 9.37 | % | | | | | | | | | | | | | | | | | | | | | | | | |
| Ratios/Supplemental Data: | | | | | | | | | | | | | | | | | | | | | | | | | | | | | | | | | | | | | | | | | | | | | | | | |
| Net assets, end of period/year (in 000s) | | $ | 58,196 | | | $ | 36,055 | | | $ | 12,953 | | | $ | 16,929 | | | $ | 20,210 | | | $ | 18,576 | | | | | | | | | | | | | | | | | | | | | | | | | |
| Ratios of expenses to average net assets: ^ | | | 1.29 | % | | | 1.44 | % | | | 1.41 | % | | | 1.42 | % | | | 1.34 | % | | | 1.44 | % | | | | | | | | | | | | | | | | | | | | | | | | |
| Ratios of net investment income to average net assets: ^ | | | 2.80 | % | | | 2.52 | % | | | 1.90 | % | | | 2.83 | % | | | 2.83 | % | | | 1.07 | % | | | | | | | | | | | | | | | | | | | | | | | | |
| Portfolio turnover rate (1) | | | 228 | % | | | 275 | % | | | 106 | % | | | 96 | % | | | 82 | % | | | 129 | % | | | | | | | | | | | | | | | | | | | | | | | | |
| | | | | | | | | | | | | | | | | | | | | | | | | | | | | | | | | | | | | | | | | | | | | | | | | |
| | | Class A | | | | | | Class C | |
| | | Six Months Ended | | | Year Ended October 31, | | | Six Months Ended | | | Year Ended October 31, | |
| | | April 30, 2019 | | | 2018 | | | 2017 | | | 2016 | | | 2015 | | | 2014 | | | April 30, 2019 | | | 2018 | | | 2017 | | | 2016 | | | 2015 | | | 2014 | |
| | | (Unaudited) | | | | | | | | | | | | | | | | | | (Unaudited) | | | | | | | | | | | | | | | | |
| Net asset value, beginning of period/year | | $ | 9.17 | | | $ | 8.66 | | | $ | 8.03 | | | $ | 8.73 | | | $ | 10.85 | | | $ | 10.06 | | | $ | 8.94 | | | $ | 8.46 | | | $ | 7.86 | | | $ | 8.56 | | | $ | 10.66 | | | $ | 9.90 | |
| Income (loss) from investment operations: | | | | | | | | | | | | | | | | | | | | | | | | | | | | | | | | | | | | | | | | | | | | | | | | |
| Net investment income* | | | 0.12 | | | | 0.19 | | | | 0.14 | | | | 0.20 | | | | 0.24 | | | | 0.09 | | | | 0.08 | | | | 0.11 | | | | 0.07 | | | | 0.14 | | | | 0.18 | | | | 0.01 | |
| Net realized and unrealized gain (loss) | | | 0.11 | | | | 0.50 | | | | 0.72 | | | | (0.39 | ) | | | (0.50 | ) | | | 0.82 | | | | 0.12 | | | | 0.49 | | | | 0.71 | | | | (0.39 | ) | | | (0.50 | ) | | | 0.80 | |
| Total income (loss) from investment operations | | | 0.23 | | | | 0.69 | | | | 0.86 | | | | (0.19 | ) | | | (0.26 | ) | | | 0.91 | | | | 0.20 | | | | 0.60 | | | | 0.78 | | | | (0.25 | ) | | | (0.32 | ) | | | 0.81 | |
| Less distributions: | | | | | | | | | | | | | | | | | | | | | | | | | | | | | | | | | | | | | | | | | | | | | | | | |
| Distributions from net investment income | | | (0.18 | ) | | | (0.18 | ) | | | (0.23 | ) | | | (0.33 | ) | | | (0.14 | ) | | | (0.12 | ) | | | (0.16 | ) | | | (0.12 | ) | | | (0.18 | ) | | | (0.27 | ) | | | (0.06 | ) | | | (0.05 | ) |
| Distributions from net realized gains | | | — | | | | — | | | | — | | | | (0.18 | ) | | | (1.72 | ) | | | — | | | | — | | | | — | | | | — | | | | (0.18 | ) | | | (1.72 | ) | | | — | |
| Total distributions | | | (0.18 | ) | | | (0.18 | ) | | | (0.23 | ) | | | (0.51 | ) | | | (1.86 | ) | | | (0.12 | ) | | | (0.16 | ) | | | (0.12 | ) | | | (0.18 | ) | | | (0.45 | ) | | | (1.78 | ) | | | (0.05 | ) |
| Net asset value, end of period/year | | $ | 9.22 | | | $ | 9.17 | | | $ | 8.66 | | | $ | 8.03 | | | $ | 8.73 | | | $ | 10.85 | | | $ | 8.98 | | | $ | 8.94 | | | $ | 8.46 | | | $ | 7.86 | | | $ | 8.56 | | | $ | 10.66 | |
| Total return + # | | | 2.58 | % | | | 8.10 | % | | | 10.92 | % | | | (2.19 | )% | | | (2.84 | )% | | | 9.10 | % | | | 2.18 | % | | | 7.21 | % | | | 10.08 | % | | | (2.95 | )% | | | (3.53 | )% | | | 8.21 | % |
| Ratios/Supplemental Data: | | | | | | | | | | | | | | | | | | | | | | | | | | | | | | | | | | | | | | | | | | | | | | | | |
| Net assets, end of period/year (in 000s) | | $ | 8,979 | | | $ | 6,265 | | | $ | 3,125 | | | $ | 3,638 | | | $ | 4,211 | | | $ | 4,509 | | | $ | 3,571 | | | $ | 3,145 | | | $ | 2,708 | | | $ | 3,181 | | | $ | 4,956 | | | $ | 4,046 | |
| Ratios of expenses to average net assets: ^ | | | 1.50 | % | | | 1.69 | % | | | 1.66 | % | | | 1.67 | % | | | 1.59 | % | | | 1.69 | % | | | 2.24 | % | | | 2.44 | % | | | 2.41 | % | | | 2.44 | % | | | 2.34 | % | | | 2.44 | % |
| Ratios of net investment income to average net assets: ^ | | | 2.59 | % | | | 2.13 | % | | | 1.66 | % | | | 2.57 | % | | | 2.56 | % | | | 0.83 | % | | | 1.86 | % | | | 1.22 | % | | | 0.93 | % | | | 1.81 | % | | | 1.91 | % | | | 0.08 | % |
| Portfolio turnover rate (1) | | | 228 | % | | | 275 | % | | | 106 | % | | | 96 | % | | | 82 | % | | | 129 | % | | | 228 | % | | | 275 | % | | | 106 | % | | | 96 | % | | | 82 | % | | | 129 | % |
| | | | | | | | | | | | | | | | | | | | | | | | | | | | | | | | | | | | | | | | | | | | | | | | | |
| * | The net investment income per share data was determined using the average shares outstanding throughout each period/year. |
| + | Assumes reinvestment of all dividends and distributions, if any. Aggregate (not annualized) total return is shown for any period shorter than one year. Total return does not reflect the deductions of taxes that a shareholder would pay on distributions or on the redemption of shares and does not reflect the impact of any sales charge. |
| # | Includes adjustments in accordance with accounting principles generally accepted in the United States and, consequently, the net asset value for financial reporting purposes and the returns based upon those net asset values may differ from the net asset values and returns for shareholder transactions. Adjustments may apply to some but not all years and classes. |
| ^ | Annualized for periods less than one year. |
| (1) | Not annualized for periods less than one year. |
See accompanying notes to financial statements.
| FINANCIAL HIGHLIGHTS |
| Dunham Corporate/Government Bond Fund |
| |
| The table sets forth financial data for one share of beneficial interest outstanding throughout each period/year. |
| | | Class N | | | | | | | | | | | | | | | | | | | | | | | | | |
| | | Six Months Ended | | | Year Ended October 31, | | | | | | | | | | | | | | | | | | | | | | | | | |
| | | April 30, 2019 | | | 2018 | | | 2017 | | | 2016 | | | 2015 | | | 2014 | | | | | | | | | | | | | | | | | | | | | | | | | |
| | | (Unaudited) | | | | | | | | | | | | | | | | | | | | | | | | | | | | | | | | | | | | | | | | |
| Net asset value, beginning of period/year | | $ | 13.06 | | | $ | 13.82 | | | $ | 13.92 | | | $ | 13.75 | | | $ | 14.14 | | | $ | 14.07 | | | | | | | | | | | | | | | | | | | | | | | | | |
| Income (loss) from investment operations: | | | | | | | | | | | | | | | | | | | | | | | | | | | | | | | | | | | | | | | | | | | | | | | | |
| Net investment income* | | | 0.19 | | | | 0.34 | | | | 0.31 | | | | 0.36 | | | | 0.42 | | | | 0.38 | | | | | | | | | | | | | | | | | | | | | | | | | |
| Net realized and unrealized gain (loss) | | | 0.42 | | | | (0.74 | ) | | | (0.08 | ) | | | 0.19 | | | | (0.37 | ) | | | 0.16 | | | | | | | | | | | | | | | | | | | | | | | | | |
| Total income (loss) from investment operations | | | 0.61 | | | | (0.40 | ) | | | 0.23 | | | | 0.55 | | | | 0.05 | | | | 0.54 | | | | | | | | | | | | | | | | | | | | | | | | | |
| Less distributions: | | | | | | | | | | | | | | | | | | | | | | | | | | | | | | | | | | | | | | | | | | | | | | | | |
| Distributions from net investment income | | | (0.18 | ) | | | (0.36 | ) | | | (0.33 | ) | | | (0.38 | ) | | | (0.44 | ) | | | (0.42 | ) | | | | | | | | | | | | | | | | | | | | | | | | |
| Distributions from net realized gains | | | — | | | | — | | | | — | | | | — | | | | — | | | | (0.05 | ) | | | | | | | | | | | | | | | | | | | | | | | | |
| Total distributions | | | (0.18 | ) | | | (0.36 | ) | | | (0.33 | ) | | | (0.38 | ) | | | (0.44 | ) | | | (0.47 | ) | | | | | | | | | | | | | | | | | | | | | | | | |
| Net asset value, end of period/year | | $ | 13.49 | | | $ | 13.06 | | | $ | 13.82 | | | $ | 13.92 | | | $ | 13.75 | | | $ | 14.14 | | | | | | | | | | | | | | | | | | | | | | | | | |
| Total return +# | | | 4.73 | % | | | (2.93 | )% | | | 1.72 | % | | | 4.09 | % | | | 0.36 | % | | | 3.85 | % | | | | | | | | | | | | | | | | | | | | | | | | |
| Ratios/Supplemental Data: | | | | | | | | | | | | | | | | | | | | | | | | | | | | | | | | | | | | | | | | | | | | | | | | |
| Net assets, end of period/year (in 000s) | | $ | 42,372 | | | $ | 41,151 | | | $ | 62,757 | | | $ | 48,025 | | | $ | 41,989 | | | $ | 43,888 | | | | | | | | | | | | | | | | | | | | | | | | | |
| Ratios of expenses to average net assets: ^ | | | 1.17 | % | | | 1.20 | % | | | 1.35 | % | | | 1.13 | % | | | 1.06 | % | | | 1.37 | % | | | | | | | | | | | | | | | | | | | | | | | | |
| Ratios of net investment income to average net assets: ^ | | | 2.84 | % | | | 2.53 | % | | | 2.27 | % | | | 2.61 | % | | | 3.00 | % | | | 2.69 | % | | | | | | | | | | | | | | | | | | | | | | | | |
| Portfolio turnover rate (1) | | | 49 | % | | | 92 | % | | | 61 | % | | | 58 | % | | | 54 | % | | | 60 | % | | | | | | | | | | | | | | | | | | | | | | | | |
| | | | | | | | | | | | | | | | | | | | | | | | | | | | | | | | | | | | | | | | | | | | | | | | | |
| | | Class A | | | | | | Class C | |
| | | Six Months Ended | | | Year Ended October 31, | | | Six Months Ended | | | Year Ended October 31, | |
| | | April 30, 2019 | | | 2018 | | | 2017 | | | 2016 | | | 2015 | | | 2014 | | | April 30, 2019 | | | 2018 | | | 2017 | | | 2016 | | | 2015 | | | 2014 | |
| | | (Unaudited) | | | | | | | | | | | | | | | | | | (Unaudited) | | | | | | | | | | | | | | | | |
| Net asset value, beginning of period/year | | $ | 13.04 | | | $ | 13.80 | | | $ | 13.90 | | | $ | 13.73 | | | $ | 14.13 | | | $ | 14.06 | | | $ | 12.95 | | | $ | 13.71 | | | $ | 13.81 | | | $ | 13.65 | | | $ | 14.05 | | | $ | 13.98 | |
| Income (loss) from investment operations: | | | | | | | | | | | | | | | | | | | | | | | | | | | | | | | | | | | | | | | | | | | | | | | | |
| Net investment income* | | | 0.17 | | | | 0.31 | | | | 0.28 | | | | 0.33 | | | | 0.38 | | | | 0.35 | | | | 0.14 | | | | 0.24 | | | | 0.21 | | | | 0.26 | | | | 0.31 | | | | 0.27 | |
| Net realized and unrealized gain (loss) | | | 0.43 | | | | (0.74 | ) | | | (0.08 | ) | | | 0.19 | | | | (0.37 | ) | | | 0.15 | | | | 0.42 | | | | (0.74 | ) | | | (0.08 | ) | | | 0.18 | | | | (0.37 | ) | | | 0.16 | |
| Total income (loss) from investment operations | | | 0.60 | | | | (0.43 | ) | | | 0.20 | | | | 0.52 | | | | 0.01 | | | | 0.50 | | | | 0.56 | | | | (0.50 | ) | | | 0.13 | | | | 0.44 | | | | (0.06 | ) | | | 0.43 | |
| Less distributions: | | | | | | | | | | | | | | | | | | | | | | | | | | | | | | | | | | | | | | | | | | | | | | | | |
| Distributions from net investment income | | | (0.17 | ) | | | (0.33 | ) | | | (0.30 | ) | | | (0.35 | ) | | | (0.41 | ) | | | (0.38 | ) | | | (0.13 | ) | | | (0.26 | ) | | | (0.23 | ) | | | (0.28 | ) | | | (0.34 | ) | | | (0.31 | ) |
| Distributions from net realized gains | | | — | | | | — | | | | — | | | | — | | | | — | | | | (0.05 | ) | | | — | | | | — | | | | — | | | | — | | | | — | | | | (0.05 | ) |
| Total distributions | | | (0.17 | ) | | | (0.33 | ) | | | (0.30 | ) | | | (0.35 | ) | | | (0.41 | ) | | | (0.43 | ) | | | (0.13 | ) | | | (0.26 | ) | | | (0.23 | ) | | | (0.28 | ) | | | (0.34 | ) | | | (0.36 | ) |
| Net asset value, end of period/year | | $ | 13.47 | | | $ | 13.04 | | | $ | 13.80 | | | $ | 13.90 | | | $ | 13.73 | | | $ | 14.13 | | | $ | 13.38 | | | $ | 12.95 | | | $ | 13.71 | | | $ | 13.81 | | | $ | 13.65 | | | $ | 14.05 | |
| Total return +# | | | 4.61 | % | | | (3.17 | )% | | | 1.47 | % | | | 3.86 | % | | | 0.04 | % | | | 3.59 | % | | | 4.38 | % | | | (3.67 | )% | | | 0.98 | % | | | 3.27 | % | | | (0.45 | )% | | | 3.08 | % |
| Ratios/Supplemental Data: | | | | | | | | | | | | | | | | | | | | | | | | | | | | | | | | | | | | | | | | | | | | | | | | |
| Net assets, end of period/year (in 000s) | | $ | 5,649 | | | $ | 5,311 | | | $ | 6,260 | | | $ | 4,832 | | | $ | 4,788 | | | $ | 3,684 | | | $ | 2,606 | | | $ | 2,760 | | | $ | 3,199 | | | $ | 3,364 | | | $ | 3,698 | | | $ | 3,690 | |
| Ratios of expenses to average net assets: ^ | | | 1.42 | % | | | 1.45 | % | | | 1.60 | % | | | 1.38 | % | | | 1.31 | % | | | 1.62 | % | | | 1.92 | % | | | 1.95 | % | | | 2.10 | % | | | 1.88 | % | | | 1.81 | % | | | 2.12 | % |
| Ratios of net investment income to average net assets: ^ | | | 2.57 | % | | | 2.31 | % | | | 2.01 | % | | | 2.40 | % | | | 2.74 | % | | | 2.44 | % | | | 2.09 | % | | | 1.81 | % | | | 1.52 | % | | | 1.89 | % | | | 2.27 | % | | | 1.94 | % |
| Portfolio turnover rate (1) | | | 49 | % | | | 92 | % | | | 61 | % | | | 58 | % | | | 54 | % | | | 60 | % | | | 49 | % | | | 92 | % | | | 61 | % | | | 58 | % | | | 54 | % | | | 60 | % |
| | | | | | | | | | | | | | | | | | | | | | | | | | | | | | | | | | | | | | | | | | | | | | | | | |
| * | The net investment income per share data was determined using the average shares outstanding throughout each period/year. |
| + | Assumes reinvestment of all dividends and distributions, if any. Aggregate (not annualized) total return is shown for any period shorter than one year. Total return does not reflect the deductions of taxes that a shareholder would pay on distributions or on the redemption of shares and does not reflect the impact of any sales charge. |
| # | Includes adjustments in accordance with accounting principles generally accepted in the United States and, consequently, the net asset value for financial reporting purposes and the returns based upon those net asset values may differ from the net asset values and returns for shareholder transactions. Adjustments may apply to some but not all years and classes. |
| ^ | Annualized for periods less than one year. |
| (1) | Not annualized for periods less than one year. |
See accompanying notes to financial statements.
| FINANCIAL HIGHLIGHTS |
| Dunham Monthly Distribution Fund |
| |
| The table sets forth financial data for one share of beneficial interest outstanding throughout each period/year. |
| | | Class N | | | | | | | | | | | | | | | | | | | | | | | | | |
| | | Six Months Ended | | | Year Ended October 31, | | | | | | | | | | | | | | | | | | | | | | | | | |
| | | April 30, 2019 | | | 2018 | | | 2017 | | | 2016 | | | 2015 | | | 2014 | | | | | | | | | | | | | | | | | | | | | | | | | |
| | | (Unaudited) | | | | | | | | | | | | | | | | | | | | | | | | | | | | | | | | | | | | | | | | |
| Net asset value, beginning of period/year | | $ | 34.84 | | | $ | 36.71 | | | $ | 35.74 | | | $ | 36.36 | | | $ | 38.16 | | | $ | 38.47 | | | | | | | | | | | | | | | | | | | | | | | | | |
| Income (loss) from investment operations: | | | | | | | | | | | | | | | | | | | | | | | | | | | | | | | | | | | | | | | | | | | | | | | | |
| Net investment income (loss)* | | | (0.16 | ) | | | 0.09 | | | | (0.36 | ) | | | 0.14 | | | | (0.18 | ) | | | 0.17 | | | | | | | | | | | | | | | | | | | | | | | | | |
| Net realized and unrealized gain (loss) | | | 1.01 | | | | (0.25 | ) | | | 2.79 | | | | 0.49 | | | | (0.39 | ) | | | 1.35 | | | | | | | | | | | | | | | | | | | | | | | | | |
| Total income (loss) from investment operations | | | 0.85 | | | | (0.16 | ) | | | 2.43 | | | | 0.63 | | | | (0.57 | ) | | | 1.52 | | | | | | | | | | | | | | | | | | | | | | | | | |
| Less distributions: | | | | | | | | | | | | | | | | | | | | | | | | | | | | | | | | | | | | | | | | | | | | | | | | |
| Distributions from net investment income | | | — | | | | — | | | | — | | | | (0.55 | ) | | | — | | | | — | | | | | | | | | | | | | | | | | | | | | | | | | |
| Distributions from net realized gains | | | — | | | | (0.35 | ) | | | — | | | | — | | | | (0.80 | ) | | | (1.59 | ) | | | | | | | | | | | | | | | | | | | | | | | | |
| Tax return of capital | | | (0.92 | ) | | | (1.36 | ) | | | (1.46 | ) | | | (0.70 | ) | | | (0.43 | ) | | | (0.24 | ) | | | | | | | | | | | | | | | | | | | | | | | | |
| Total distributions | | | (0.92 | ) | | | (1.71 | ) | | | (1.46 | ) | | | (1.25 | ) | | | (1.23 | ) | | | (1.83 | ) | | | | | | | | | | | | | | | | | | | | | | | | |
| Net asset value, end of period/year | | $ | 34.77 | | | $ | 34.84 | | | $ | 36.71 | | | $ | 35.74 | | | $ | 36.36 | | | $ | 38.16 | | | | | | | | | | | | | | | | | | | | | | | | | |
| Total return + # | | | 2.55 | % | | | (0.45 | )% | | | 6.92 | % | | | 1.79 | % | | | (1.53 | )% | | | 4.01 | % | | | | | | | | | | | | | | | | | | | | | | | | |
| Ratios/Supplemental Data: | | | | | | | | | | | | | | | | | | | | | | | | | | | | | | | | | | | | | | | | | | | | | | | | |
| Net assets, end of period/year (in 000s) | | $ | 196,471 | | | $ | 201,405 | | | $ | 212,178 | | | $ | 153,084 | | | $ | 163,843 | | | $ | 156,964 | | | | | | | | | | | | | | | | | | | | | | | | | |
| Ratios of expenses to average net assets: | | | | | | | | | | | | | | | | | | | | | | | | | | | | | | | | | | | | | | | | | | | | | | | | |
| After waivers ^ | | | 3.30 | % | | | 2.16 | % | | | 2.73 | % | | | 1.85 | % | | | 2.09 | % | | | 2.53 | % | | | | | | | | | | | | | | | | | | | | | | | | |
| Dividends/borrowings on short sales ^ | | | 1.68 | % | | | 1.10 | % | | | 1.17 | % | | | 0.61 | % | | | 0.47 | % | | | 0.59 | % | | | | | | | | | | | | | | | | | | | | | | | | |
| Excluding dividends/borrowings on short sales: | | | | | | | | | | | | | | | | | | | | | | | | | | | | | | | | | | | | | | | | | | | | | | | | |
| Before fee waivers ^ | | | 1.62 | % | | | 1.06 | % | | | 1.59 | % | | | 1.26 | % | | | 2.17 | % | | | 2.11 | % | | | | | | | | | | | | | | | | | | | | | | | | |
| After fee waivers ^ | | | 1.62 | % | | | 1.06 | % | | | 1.56 | % | | | 1.24 | % | | | 1.62 | % | | | 1.94 | % | | | | | | | | | | | | | | | | | | | | | | | | |
| Ratios of net investment income (loss) to average net assets: | | | | | | | | | | | | | | | | | | | | | | | | | | | | | | | | | | | | | | | | | | | | | | | | |
| Before fee waivers ^ | | | (0.95 | )% | | | 0.25 | % | | | (1.06 | )% | | | 0.39 | % | | | (0.56 | )% | | | 0.26 | % | | | | | | | | | | | | | | | | | | | | | | | | |
| After fee waivers ^ | | | (0.95 | )% | | | 0.25 | % | | | (1.03 | )% | | | 0.40 | % | | | (0.48 | )% | | | 0.43 | % | | | | | | | | | | | | | | | | | | | | | | | | |
| Portfolio turnover rate (1) | | | 205 | % | | | 453 | % | | | 382 | % | | | 208 | % | | | 155 | % | | | 229 | % | | | | | | | | | | | | | | | | | | | | | | | | |
| | | | | | | | | | | | | | | | | | | | | | | | | | | | | | | | | | | | | | | | | | | | | | | | | |
| | | Class A | | | | | | Class C | |
| | | Six Months Ended | | | Year Ended October 31, | | | Six Months Ended | | | Year Ended October 31, | |
| | | April 30, 2019 | | | 2018 | | | 2017 | | | 2016 | | | 2015 | | | 2014 | | | April 30, 2019 | | | 2018 | | | 2017 | | | 2016 | | | 2015 | | | 2014 | |
| | | (Unaudited) | | | | | | | | | | | | | | | | | | (Unaudited) | | | | | | | | | | | | | | | | |
| Net asset value, beginning of period/year | | $ | 33.77 | | | $ | 35.73 | | | $ | 34.90 | | | $ | 35.63 | | | $ | 37.52 | | | $ | 37.95 | | | $ | 27.02 | | | $ | 29.15 | | | $ | 28.94 | | | $ | 29.99 | | | $ | 32.01 | | | $ | 32.87 | |
| Income (loss) from investment operations: | | | | | | | | | | | | | | | | | | | | | | | | | | | | | | | | | | | | | | | | | | | | | | | | |
| Net investment income (loss)* | | | (0.20 | ) | | | 0.00 | (a) | | | (0.40 | ) | | | 0.13 | | | | (0.27 | ) | | | 0.07 | | | | (0.26 | ) | | | (0.21 | ) | | | (0.55 | ) | | | (0.14 | ) | | | (0.46 | ) | | | (0.20 | ) |
| Net realized and unrealized gain (loss) | | | 1.00 | | | | (0.25 | ) | | | 2.69 | | | | 0.39 | | | | (0.39 | ) | | | 1.33 | | | | 0.79 | | | | (0.21 | ) | | | 2.22 | | | | 0.34 | | | | (0.33 | ) | | | 1.17 | |
| Total income (loss) from investment operations | | | 0.80 | | | | (0.25 | ) | | | 2.29 | | | | 0.52 | | | | (0.66 | ) | | | 1.40 | | | | 0.53 | | | | (0.42 | ) | | | 1.67 | | | | 0.20 | | | | (0.79 | ) | | | 0.97 | |
| Less distributions: | | | | | | | | | | | | | | | | | | | | | | | | | | | | | | | | | | | | | | | | | | | | | | | | |
| Distributions from net investment income | | | — | | | | — | | | | — | | | | (0.55 | ) | | | — | | | | — | | | | — | | | | — | | | | — | | | | (0.55 | ) | | | — | | | | — | |
| Distributions from net realized gains | | | — | | | | (0.35 | ) | | | — | | | | — | | | | (0.80 | ) | | | (1.59 | ) | | | — | | | | (0.35 | ) | | | — | | | | — | | | | (0.80 | ) | | | (1.59 | ) |
| Tax return of capital | | | (0.92 | ) | | | (1.36 | ) | | | (1.46 | ) | | | (0.70 | ) | | | (0.43 | ) | | | (0.24 | ) | | | (0.92 | ) | | | (1.36 | ) | | | (1.46 | ) | | | (0.70 | ) | | | (0.43 | ) | | | (0.24 | ) |
| Total distributions | | | (0.92 | ) | | | (1.71 | ) | | | (1.46 | ) | | | (1.25 | ) | | | (1.23 | ) | | | (1.83 | ) | | | (0.92 | ) | | | (1.71 | ) | | | (1.46 | ) | | | (1.25 | ) | | | (1.23 | ) | | | (1.83 | ) |
| Net asset value, end of period/year | | $ | 33.65 | | | $ | 33.77 | | | $ | 35.73 | | | $ | 34.90 | | | $ | 35.63 | | | $ | 37.52 | | | $ | 26.63 | | | $ | 27.02 | | | $ | 29.15 | | | $ | 28.94 | | | $ | 29.99 | | | $ | 32.01 | |
| Total return + # | | | 2.42 | % | | | (0.72 | )% | | | 6.64 | % | | | 1.54 | % | | | (1.80 | )% | | | 3.74 | % | | | 2.02 | % | | | (1.48 | )% | | | 5.82 | % | | | 0.75 | % | | | (2.53 | )% | | | 2.99 | % |
| Ratios/Supplemental Data: | | | | | | | | | | | | | | | | | | | | | | | | | | | | | | | | | | | | | | | | | | | | | | | | |
| Net assets, end of period/year (in 000s) | | $ | 44,320 | | | $ | 42,980 | | | $ | 41,186 | | | $ | 45,552 | | | $ | 74,247 | | | $ | 79,132 | | | $ | 34,739 | | | $ | 34,664 | | | $ | 34,601 | | | $ | 39,118 | | | $ | 50,215 | | | $ | 48,193 | |
| Ratios of expenses to average net assets: | | | | | | | | | | | | | | | | | | | | | | | | | | | | | | | | | | | | | | | | | | | | | | | | |
| After waivers ^ | | | 3.54 | % | | | 2.41 | % | | | 2.93 | % | | | 2.06 | % | | | 2.33 | % | | | 2.78 | % | | | 4.29 | % | | | 3.16 | % | | | 3.68 | % | | | 2.83 | % | | | 3.09 | % | | | 3.53 | % |
| Dividends/borrowings on short sales ^ | | | 1.68 | % | | | 1.10 | % | | | 1.12 | % | | | 0.59 | % | | | 0.47 | % | | | 0.59 | % | | | 1.68 | % | | | 1.10 | % | | | 1.12 | % | | | 0.60 | % | | | 0.47 | % | | | 0.59 | % |
| Excluding dividends/borrowings on short sales: | | | | | | | | | | | | | | | | | | | | | | | | | | | | | | | | | | | | | | | | | | | | | | | | |
| Before fee waivers ^ | | | 1.86 | % | | | 1.31 | % | | | 1.83 | % | | | 1.49 | % | | | 2.42 | % | | | 2.36 | % | | | 2.61 | % | | | 2.06 | % | | | 2.58 | % | | | 2.24 | % | | | 3.16 | % | | | 3.11 | % |
| After fee waivers ^ | | | 1.86 | % | | | 1.31 | % | | | 1.81 | % | | | 1.48 | % | | | 1.86 | % | | | 2.19 | % | | | 2.61 | % | | | 2.06 | % | | | 2.56 | % | | | 2.23 | % | | | 2.62 | % | | | 2.94 | % |
| Ratios of net investment income (loss) to average net assets: | | | | | | | | | | | | | | | | | | | | | | | | | | | | | | | | | | | | | | | | | | | | | | | | |
| Before fee waivers ^ | | | (1.19 | )% | | | 0.01 | % | | | (1.14 | )% | | | 0.36 | % | | | (0.79 | )% | | | 0.01 | % | | | (1.94 | )% | | | (0.73 | )% | | | (1.89 | )% | | | (0.50 | )% | | | (1.54 | )% | | | (0.74 | )% |
| After fee waivers ^ | | | (1.19 | )% | | | 0.01 | % | | | (1.11 | )% | | | 0.37 | % | | | (0.71 | )% | | | 0.18 | % | | | (1.94 | )% | | | (0.73 | )% | | | (1.86 | )% | | | (0.48 | )% | | | (1.46 | )% | | | (0.57 | )% |
| Portfolio turnover rate (1) | | | 205 | % | | | 453 | % | | | 382 | % | | | 208 | % | | | 155 | % | | | 229 | % | | | 205 | % | | | 453 | % | | | 382 | % | | | 208 | % | | | 155 | % | | | 229 | % |
| | | | | | | | | | | | | | | | | | | | | | | | | | | | | | | | | | | | | | | | | | | | | | | | | |
| * | The net investment income per share data was determined using the average shares outstanding throughout each period/year. |
| + | Assumes reinvestment of all dividends and distributions, if any. Aggregate (not annualized) total return is shown for any period shorter than one year. Total return does not reflect the deductions of taxes that a shareholder would pay on distributions or on the redemption of shares and does not reflect the impact of any sales charge. |
| # | Includes adjustments in accordance with accounting principles generally accepted in the United States and, consequently, the net asset value for financial reporting purposes and the returns based upon those net asset values may differ from the net asset values and returns for shareholder transactions. Adjustments may apply to some but not all years and classes. |
| (a) | Represents less than $0.01 per share. |
| ^ | Annualized for periods less than one year. |
| (1) | Not annualized for periods less than one year. |
See accompanying notes to financial statements.
| FINANCIAL HIGHLIGHTS |
| Dunham Dynamic Macro Fund |
| |
| The table sets forth financial data for one share of beneficial interest outstanding throughout each period/year. |
| | | Class N | | | | | | | | | | | | | | | | | | | | | | | | | |
| | | Six Months Ended | | | Year Ended October 31, | | | | | | | | | | | | | | | | | | | | | | | | | |
| | | April 30, 2019 | | | 2018 | | | 2017 | | | 2016 | | | 2015 | | | 2014 | | | | | | | | | | | | | | | | | | | | | | | | | |
| | | (Unaudited) | | | | | | | | | | | | | | | | | | | | | | | | | | | | | | | | | | | | | | | | |
| Net asset value, beginning of period/year | | $ | 9.53 | | | $ | 10.18 | | | $ | 9.55 | | | $ | 9.81 | | | $ | 9.65 | | | $ | 9.67 | | | | | | | | | | | | | | | | | | | | | | | | | |
| Income (loss) from investment operations: | | | | | | | | | | | | | | | | | | | | | | | | | | | | | | | | | | | | | | | | | | | | | | | | |
| Net investment income (loss) * | | | 0.08 | | | | 0.02 | | | | (0.03 | ) | | | (0.00 | ) (a) | | | (0.14 | ) | | | 0.19 | | | | | | | | | | | | | | | | | | | | | | | | | |
| Net realized and unrealized gain (loss) ** | | | 0.51 | | | | (0.67 | ) | | | 0.66 | | | | (0.26 | ) | | | 0.30 | | | | (0.02 | ) | | | | | | | | | | | | | | | | | | | | | | | | |
| Total income (loss) from investment operations | | | 0.59 | | | | (0.65 | ) | | | 0.63 | | | | (0.26 | ) | | | 0.16 | | | | 0.17 | | | | | | | | | | | | | | | | | | | | | | | | | |
| Less distributions: | | | | | | | | | | | | | | | | | | | | | | | | | | | | | | | | | | | | | | | | | | | | | | | | |
| Distributions from net investment income | | | (0.22 | ) | | | — | | | | — | | | | — | | | | — | | | | (0.19 | ) | | | | | | | | | | | | | | | | | | | | | | | | |
| Net asset value, end of period/year | | $ | 9.90 | | | $ | 9.53 | | | $ | 10.18 | | | $ | 9.55 | | | $ | 9.81 | | | $ | 9.65 | | | | | | | | | | | | | | | | | | | | | | | | | |
| Total return + # | | | 6.41 | % | | | (6.39 | )% | | | 6.60 | % | | | (2.68 | )% | | | 1.66 | % | | | 1.80 | % | | | | | | | | | | | | | | | | | | | | | | | | |
| Ratios/Supplemental Data: | | | | | | | | | | | | | | | | | | | | | | | | | | | | | | | | | | | | | | | | | | | | | | | | |
| Net assets, end of period/year (in 000s) | | $ | 31,167 | | | $ | 35,638 | | | $ | 36,104 | | | $ | 28,650 | | | $ | 28,518 | | | $ | 11,758 | | | | | | | | | | | | | | | | | | | | | | | | | |
| Ratios of expenses to average net assets: ^ | | | 1.44 | % | | | 1.80 | % | | | 1.83 | % | | | 1.63 | % | | | 2.15 | % | | | 1.90 | % | | | | | | | | | | | | | | | | | | | | | | | | |
| Ratios of net investment income (loss) to average net assets: ^ | | | 1.73 | % | | | 0.20 | % | | | (0.32 | )% | | | (0.03 | )% | | | (1.37 | )% | | | 1.96 | % | | | | | | | | | | | | | | | | | | | | | | | | |
| Portfolio turnover rate (1) | | | 23 | % | | | 11 | % | | | 7 | % | | | 54 | % | | | 70 | % | | | 238 | % | | | | | | | | | | | | | | | | | | | | | | | | |
| | | | | | | | | | | | | | | | | | | | | | | | | | | | | | | | | | | | | | | | | | | | | | | | | |
| | | Class A | | | | | | Class C | |
| | | Six Months Ended | | | Year Ended October 31, | | | Six Months Ended | | | Year Ended October 31, | |
| | | April 30, 2019 | | | 2018 | | | 2017 | | | 2016 | | | 2015 | | | 2014 | | | April 30, 2019 | | | 2018 | | | 2017 | | | 2016 | | | 2015 | | | 2014 | |
| | | (Unaudited) | | | | | | | | | | | | | | | | | | (Unaudited) | | | | | | | | | | | | | | | | |
| Net asset value, beginning of period/year | | $ | 9.46 | | | $ | 10.12 | | | $ | 9.52 | | | $ | 9.81 | | | $ | 9.68 | | | $ | 9.70 | | | $ | 9.03 | | | $ | 9.74 | | | $ | 9.23 | | | $ | 9.58 | | | $ | 9.52 | | | $ | 9.56 | |
| Income (loss) from investment operations: | | | | | | | | | | | | | | | | | | | | | | | | | | | | | | | | | | | | | | | | | | | | | | | | |
| Net investment income (loss) * | | | 0.07 | | | | 0.00 | (a) | | | (0.06 | ) | | | (0.02 | ) | | | (0.14 | ) | | | 0.18 | | | | 0.03 | | | | (0.08 | ) | | | (0.12 | ) | | | (0.09 | ) | | | (0.26 | ) | | | 0.11 | |
| Net realized and unrealized gain (loss) ** | | | 0.50 | | | | (0.66 | ) | | | 0.66 | | | | (0.27 | ) | | | 0.27 | | | | (0.04 | ) | | | 0.49 | | | | (0.63 | ) | | | 0.63 | | | | (0.26 | ) | | | 0.32 | | | | (0.04 | ) |
| Total income (loss) from investment operations | | | 0.57 | | | | (0.66 | ) | | | 0.60 | | | | (0.29 | ) | | | 0.13 | | | | 0.14 | | | | 0.52 | | | | (0.71 | ) | | | 0.51 | | | | (0.35 | ) | | | 0.06 | | | | 0.07 | |
| Less distributions: | | | | | | | | | | | | | | | | | | | | | | | | | | | | | | | | | | | | | | | | | | | | | | | | |
| Distributions from net investment income | | | (0.20 | ) | | | — | | | | — | | | | — | | | | — | | | | (0.16 | ) | | | (0.13 | ) | | | — | | | | — | | | | — | | | | — | | | | (0.11 | ) |
| Net asset value, end of period/year | | $ | 9.83 | | | $ | 9.46 | | | $ | 10.12 | | | $ | 9.52 | | | $ | 9.81 | | | $ | 9.68 | | | $ | 9.42 | | | $ | 9.03 | | | $ | 9.74 | | | $ | 9.23 | | | $ | 9.58 | | | $ | 9.52 | |
| Total return + # | | | 6.21 | % | | | (6.52 | )% | | | 6.30 | % | | | (2.95 | )% | | | 1.34 | % | | | 1.52 | % | | | 5.85 | % | | | (7.29 | )% | | | 5.53 | % | | | (3.66 | )% | | | 0.63 | % | | | 0.78 | % |
| Ratios/Supplemental Data: | | | | | | | | | | | | | | | | | | | | | | | | | | | | | | | | | | | | | | | | | | | | | | | | |
| Net assets, end of period/year (in 000s) | | $ | 7,244 | | | $ | 7,918 | | | $ | 6,224 | | | $ | 3,897 | | | $ | 3,296 | | | $ | 1,729 | | | $ | 1,768 | | | $ | 1,696 | | | $ | 1,969 | | | $ | 2,131 | | | $ | 1,938 | | | $ | 1,712 | |
| Ratios of expenses to average net assets: ^ | | | 1.69 | % | | | 2.05 | % | | | 2.08 | % | | | 1.88 | % | | | 2.40 | % | | | 2.15 | % | | | 2.44 | % | | | 2.80 | % | | | 2.83 | % | | | 2.63 | % | | | 3.15 | % | | | 2.90 | % |
| Ratios of net investment income (loss) to average net assets: ^ | | | 1.49 | % | | | 0.00 | %(b) | | | (0.58 | )% | | | (0.26 | )% | | | (1.63 | )% | | | 1.92 | % | | | 0.59 | % | | | (0.84 | )% | | | (1.34 | )% | | | (1.02 | )% | | | (2.35 | )% | | | 1.19 | % |
| Portfolio turnover rate (1) | | | 23 | % | | | 11 | % | | | 7 | % | | | 54 | % | | | 70 | % | | | 238 | % | | | 23 | % | | | 11 | % | | | 7 | % | | | 54 | % | | | 70 | % | | | 238 | % |
| | | | | | | | | | | | | | | | | | | | | | | | | | | | | | | | | | | | | | | | | | | | | | | | | |
| * | The net investment income (loss) per share data was determined using the average shares outstanding throughout each period/year. |
| ** | The amount of net realized and unrealized gain (loss) on investment per share for the years ended October 31, 2015 and 2014 does not accord with the amounts in the Statements of Operations due to the timing of purchases and sales of Fund shares in relation to fluctuating market values. |
| + | Assumes reinvestment of all dividends and distributions, if any. Aggregate (not annualized) total return is shown for any period shorter than one year. Total return does not reflect the deductions of taxes that a shareholder would pay on distributions or on the redemption of shares and does not reflect the impact of any sales charge. |
| # | Includes adjustments in accordance with accounting principles generally accepted in the United States and, consequently, the net asset value for financial reporting purposes and the returns based upon those net asset values may differ from the net asset values and returns for shareholder transactions. Adjustments may apply to some but not all years and classes. |
| (a) | Represents less than $0.01 per share. (b) Represents less than 0.01%. |
| (1) | Not annualized for periods less than one year. |
| ^ | Annualized for periods less than one year. |
See accompanying notes to financial statements.
| FINANCIAL HIGHLIGHTS |
| Dunham High-Yield Bond Fund |
| |
| The table sets forth financial data for one share of beneficial interest outstanding throughout each period/year. |
| | | Class N | | | | | | | | | | | | | | | | | | | | | | | | | |
| | | Six Months Ended | | | Year Ended October 31, | | | | | | | | | | | | | | | | | | | | | | | | | |
| | | April 30, 2019 | | | 2018 | | | 2017 | | | 2016 | | | 2015 | | | 2014 | | | | | | | | | | | | | | | | | | | | | | | | | |
| | | (Unaudited) | | | | | | | | | | | | | | | | | | | | | | | | | | | | | | | | | | | | | | | | |
| Net asset value, beginning of period/year | | $ | 8.72 | | | $ | 9.22 | | | $ | 8.94 | | | $ | 8.92 | | | $ | 9.51 | | | $ | 9.61 | | | | | | | | | | | | | | | | | | | | | | | | | |
| Income (loss) from investment operations: | | | | | | | | | | | | | | | | | | | | | | | | | | | | | | | | | | | | | | | | | | | | | | | | |
| Net investment income* | | | 0.22 | | | | 0.44 | | | | 0.42 | | | | 0.44 | | | | 0.44 | | | | 0.46 | | | | | | | | | | | | | | | | | | | | | | | | | |
| Net realized and unrealized gain (loss) | | | 0.29 | | | | (0.51 | ) | | | 0.30 | | | | 0.02 | | | | (0.59 | ) | | | (0.10 | ) | | | | | | | | | | | | | | | | | | | | | | | | |
| Total income (loss) from investment operations | | | 0.51 | | | | (0.07 | ) | | | 0.72 | | | | 0.46 | | | | (0.15 | ) | | | 0.36 | | | | | | | | | | | | | | | | | | | | | | | | | |
| Less distributions: | | | | | | | | | | | | | | | | | | | | | | | | | | | | | | | | | | | | | | | | | | | | | | | | |
| Distributions from net investment income | | | (0.24 | ) | | | (0.43 | ) | | | (0.44 | ) | | | (0.44 | ) | | | (0.44 | ) | | | (0.46 | ) | | | | | | | | | | | | | | | | | | | | | | | | |
| Total distributions | | | (0.24 | ) | | | (0.43 | ) | | | (0.44 | ) | | | (0.44 | ) | | | (0.44 | ) | | | (0.46 | ) | | | | | | | | | | | | | | | | | | | | | | | | |
| Net asset value, end of period/year | | $ | 8.99 | | | $ | 8.72 | | | $ | 9.22 | | | $ | 8.94 | | | $ | 8.92 | | | $ | 9.51 | | | | | | | | | | | | | | | | | | | | | | | | | |
| Total return +# | | | 5.97 | % | | | (0.80 | )% | | | 8.19 | % | | | 5.39 | % | | | (1.63 | )% | | | 3.77 | % | | | | | | | | | | | | | | | | | | | | | | | | |
| Ratios/Supplemental Data: | | | | | | | | | | | | | | | | | | | | | | | | | | | | | | | | | | | | | | | | | | | | | | | | |
| Net assets, end of period/year (in 000s) | | $ | 89,948 | | | $ | 94,596 | | | $ | 103,567 | | | $ | 78,194 | | | $ | 78,654 | | | $ | 102,412 | | | | | | | | | | | | | | | | | | | | | | | | | |
| Ratios of expenses to average net assets: ^ | | | 1.20 | % | | | 1.12 | % | | | 1.19 | % | | | 1.08 | % | | | 1.02 | % | | | 1.09 | % | | | | | | | | | | | | | | | | | | | | | | | | |
| Ratios of net investment income to average net assets: ^ | | | 5.21 | % | | | 4.84 | % | | | 4.62 | % | | | 5.09 | % | | | 4.77 | % | | | 4.72 | % | | | | | | | | | | | | | | | | | | | | | | | | |
| Portfolio turnover rate (1) | | | 31 | % | | | 101 | % | | | 142 | % | | | 62 | % | | | 51 | % | | | 62 | % | | | | | | | | | | | | | | | | | | | | | | | | |
| | | | | | | | | | | | | | | | | | | | | | | | | | | | | | | | | | | | | | | | | | | | | | | | | |
| | | Class A | | | | | | Class C | |
| | | Six Months Ended | | | Year Ended October 31, | | | Six Months Ended | | | Year Ended October 31, | |
| | | April 30, 2019 | | | 2018 | | | 2017 | | | 2016 | | | 2015 | | | 2014 | | | April 30, 2019 | | | 2018 | | | 2017 | | | 2016 | | | 2015 | | | 2014 | |
| | | (Unaudited) | | | | | | | | | | | | | | | | | | (Unaudited) | | | | | | | | | | | | | | | | |
| Net asset value, beginning of period/year | | $ | 8.81 | | | $ | 9.29 | | | $ | 9.02 | | | $ | 8.99 | | | $ | 9.58 | | | $ | 9.68 | | | $ | 8.68 | | | $ | 9.17 | | | $ | 8.88 | | | $ | 8.86 | | | $ | 9.46 | | | $ | 9.55 | |
| Income (loss) from investment operations: | | | | | | | | | | | | | | | | | | | | | | | | | | | | | | | | | | | | | | | | | | | | | | | | |
| Net investment income* | | | 0.22 | | | | 0.42 | | | | 0.40 | | | | 0.42 | | | | 0.41 | | | | 0.44 | | | | 0.19 | | | | 0.37 | | | | 0.35 | | | | 0.37 | | | | 0.37 | | | | 0.38 | |
| Net realized and unrealized gain (loss) | | | 0.28 | | | | (0.49 | ) | | | 0.28 | | | | 0.03 | | | | (0.59 | ) | | | (0.10 | ) | | | 0.29 | | | | (0.50 | ) | | | 0.30 | | | | 0.02 | | | | (0.60 | ) | | | (0.08 | ) |
| Total income (loss) from investment operations | | | 0.50 | | | | (0.07 | ) | | | 0.68 | | | | 0.45 | | | | (0.18 | ) | | | 0.34 | | | | 0.48 | | | | (0.13 | ) | | | 0.65 | | | | 0.39 | | | | (0.23 | ) | | | 0.30 | |
| Less distributions: | | | | | | | | | | | | | | | | | | | | | | | | | | | | | | | | | | | | | | | | | | | | | | | | |
| Distributions from net investment income | | | (0.23 | ) | | | (0.41 | ) | | | (0.41 | ) | | | (0.42 | ) | | | (0.41 | ) | | | (0.44 | ) | | | (0.21 | ) | | | (0.36 | ) | | | (0.36 | ) | | | (0.37 | ) | | | (0.37 | ) | | | (0.39 | ) |
| Total distributions | | | (0.23 | ) | | | (0.41 | ) | | | (0.41 | ) | | | (0.42 | ) | | | (0.41 | ) | | | (0.44 | ) | | | (0.21 | ) | | | (0.36 | ) | | | (0.36 | ) | | | (0.37 | ) | | | (0.37 | ) | | | (0.39 | ) |
| Net asset value, end of period/year | | $ | 9.08 | | | $ | 8.81 | | | $ | 9.29 | | | $ | 9.02 | | | $ | 8.99 | | | $ | 9.58 | | | $ | 8.95 | | | $ | 8.68 | | | $ | 9.17 | | | $ | 8.88 | | | $ | 8.86 | | | $ | 9.46 | |
| Total return +# | | | 5.90 | % | | | (0.82 | )% | | | 7.70 | % | | | 5.21 | % | | | (1.88 | )% | | | 3.49 | % | | | 5.62 | % | | | (1.43 | )% | | | 7.45 | % | | | 4.65 | % | | | (2.47 | )% | | | 3.13 | % |
| Ratios/Supplemental Data: | | | | | | | | | | | | | | | | | | | | | | | | | | | | | | | | | | | | | | | | | | | | | | | | |
| Net assets, end of period/year (in 000s) | | $ | 11,907 | | | $ | 12,393 | | | $ | 12,085 | | | $ | 10,478 | | | $ | 10,224 | | | $ | 22,022 | | | $ | 7,238 | | | $ | 7,392 | | | $ | 7,785 | | | $ | 7,687 | | | $ | 9,231 | | | $ | 11,652 | |
| Ratios of expenses to average net assets: ^ | | | 1.45 | % | | | 1.37 | % | | | 1.44 | % | | | 1.33 | % | | | 1.27 | % | | | 1.34 | % | | | 1.95 | % | | | 1.87 | % | | | 1.94 | % | | | 1.83 | % | | | 1.77 | % | | | 1.84 | % |
| Ratios of net investment income to average net assets: ^ | | | 4.96 | % | | | 4.60 | % | | | 4.38 | % | | | 4.84 | % | | | 4.52 | % | | | 4.47 | % | | | 4.46 | % | | | 4.09 | % | | | 3.88 | % | | | 4.34 | % | | | 4.02 | % | | | 3.97 | % |
| Portfolio turnover rate (1) | | | 31 | % | | | 101 | % | | | 142 | % | | | 62 | % | | | 51 | % | | | 62 | % | | | 31 | % | | | 101 | % | | | 142 | % | | | 62 | % | | | 51 | % | | | 62 | % |
| | | | | | | | | | | | | | | | | | | | | | | | | | | | | | | | | | | | | | | | | | | | | | | | | |
| * | The net investment income per share data was determined using the average shares outstanding throughout each period/year. |
| + | Assumes reinvestment of all dividends and distributions, if any. Aggregate (not annualized) total return is shown for any period shorter than one year. Total return does not reflect the deductions of taxes that a shareholder would pay on distributions or on the redemption of shares and does not reflect the impact of any sales charge. |
| # | Includes adjustments in accordance with accounting principles generally accepted in the United States and, consequently, the net asset value for financial reporting purposes and the returns based upon those net asset values may differ from the net asset values and returns for shareholder transactions. Adjustments may apply to some but not all years and classes. |
| ^ | Annualized for periods less than one year. |
| (1) | Not annualized for periods less than one year. |
See accompanying notes to financial statements.
| FINANCIAL HIGHLIGHTS |
| Dunham International Opportunity Bond Fund |
| |
| The table sets forth financial data for one share of beneficial interest outstanding throughout each period/year. |
| | | Class N | | | | | | | | | | | | | | | | | | | | | | | | | |
| | | Six Months Ended | | | Year Ended October 31, | | | | | | | | | | | | | | | | | | | | | | | | | |
| | | April 30, 2019 | | | 2018 | | | 2017 | | | 2016 | | | 2015 | | | 2014 | | | | | | | | | | | | | | | | | | | | | | | | | |
| | | (Unaudited) | | | | | | | | | | | | | | | | | | | | | | | | | | | | | | | | | | | | | | | | |
| Net asset value, beginning of period/year | | $ | 8.93 | | | $ | 9.32 | | | $ | 9.37 | | | $ | 8.92 | | | $ | 9.64 | | | $ | 10.00 | | | | | | | | | | | | | | | | | | | | | | | | | |
| Income (loss) from investment operations: | | | | | | | | | | | | | | | | | | | | | | | | | | | | | | | | | | | | | | | | | | | | | | | | |
| Net investment income (loss)* | | | (0.01 | ) | | | (0.03 | ) | | | (0.03 | ) | | | 0.04 | | | | 0.05 | | | | 0.07 | | | | | | | | | | | | | | | | | | | | | | | | | |
| Net realized and unrealized gain (loss) | | | 0.20 | | | | (0.35 | ) | | | 0.07 | | | | 0.42 | | | | (0.77 | ) | | | (0.37 | ) | | | | | | | | | | | | | | | | | | | | | | | | |
| Total income (loss) from investment operations | | | 0.19 | | | | (0.38 | ) | | | 0.04 | | | | 0.46 | | | | (0.72 | ) | | | (0.30 | ) | | | | | | | | | | | | | | | | | | | | | | | | |
| Less distributions: | | | | | | | | | | | | | | | | | | | | | | | | | | | | | | | | | | | | | | | | | | | | | | | | |
| Distributions from net investment income | | | (0.04 | ) | | | — | | | | — | | | | (0.01 | ) | | | — | | | | — | | | | | | | | | | | | | | | | | | | | | | | | | |
| Distributions from net realized gains | | | (0.01 | ) | | | (0.01 | ) | | | (0.09 | ) | | | — | | | | — | | | | — | | | | | | | | | | | | | | | | | | | | | | | | | |
| Tax return of capital | | | — | | | | — | | | | — | | | | — | | | | — | | | | (0.06 | ) | | | | | | | | | | | | | | | | | | | | | | | | |
| Total distributions | | | (0.05 | ) | | | (0.01 | ) | | | (0.09 | ) | | | (0.01 | ) | | | — | | | | (0.06 | ) | | | | | | | | | | | | | | | | | | | | | | | | |
| Net asset value, end of period/year | | $ | 9.07 | | | $ | 8.93 | | | $ | 9.32 | | | $ | 9.37 | | | $ | 8.92 | | | $ | 9.64 | | | | | | | | | | | | | | | | | | | | | | | | | |
| Total return + # | | | 2.23 | % | | | (4.08 | )% | | | 0.57 | % | | | 5.14 | % | | | (7.42 | )% | | | (2.99 | )% | | | | | | | | | | | | | | | | | | | | | | | | |
| Ratios/Supplemental Data: | | | | | | | | | | | | | | | | | | | | | | | | | | | | | | | | | | | | | | | | | | | | | | | | |
| Net assets, end of period/year (in 000s) | | $ | 32,305 | | | $ | 31,838 | | | $ | 32,441 | | | $ | 24,728 | | | $ | 31,935 | | | $ | 42,440 | | | | | | | | | | | | | | | | | | | | | | | | | |
| Ratios of expenses to average net assets: ^ | | | 1.34 | % | | | 1.35 | % | | | 1.54 | % | | | 1.28 | % | | | 1.38 | % | | | 1.38 | % | | | | | | | | | | | | | | | | | | | | | | | | |
| Ratios of net investment income (loss) to average net assets: ^ | | | (0.26 | )% | | | (0.35 | )% | | | (0.37 | )% | | | 0.41 | % | | | 0.52 | % | | | 0.66 | % | | | | | | | | | | | | | | | | | | | | | | | | |
| Portfolio turnover rate (1) | | | 46 | % | | | 45 | % | | | 56 | % | | | 64 | % | | | 52 | % | | | 60 | % | | | | | | | | | | | | | | | | | | | | | | | | |
| | | | | | | | | | | | | | | | | | | | | | | | | | | | | | | | | | | | | | | | | | | | | | | | | |
| | | Class A | | | | | | Class C | |
| | | Six Months Ended | | | Year Ended October 31, | | | Six Months Ended | | | Year Ended October 31, | |
| | | April 30, 2019 | | | 2018 | | | 2017 | | | 2016 | | | 2015 | | | 2014 | | | April 30, 2019 | | | 2018 | | | 2017 | | | 2016 | | | 2015 | | | 2014 | |
| | | (Unaudited) | | | | | | | | | | | | | | | | | | (Unaudited) | | | | | | | | | | | | | | | | |
| Net asset value, beginning of period/year | | $ | 8.85 | | | $ | 9.26 | | | $ | 9.32 | | | $ | 8.90 | | | $ | 9.64 | | | $ | 10.00 | | | $ | 8.66 | | | $ | 9.10 | | | $ | 9.22 | | | $ | 8.84 | | | $ | 9.62 | | | $ | 10.00 | |
| Income (loss) from investment operations: | | | | | | | | | | | | | | | | | | | | | | | | | | | | | | | | | | | | | | | | | | | | | | | | |
| Net investment income (loss)* | | | (0.02 | ) | | | (0.06 | ) | | | (0.06 | ) | | | 0.01 | | | | 0.02 | | | | 0.04 | | | | (0.04 | ) | | | (0.10 | ) | | | (0.10 | ) | | | (0.03 | ) | | | (0.02 | ) | | | (0.01 | ) |
| Net realized and unrealized gain (loss) | | | 0.19 | | | | (0.34 | ) | | | 0.09 | | | | 0.41 | | | | (0.76 | ) | | | (0.36 | ) | | | 0.19 | | | | (0.33 | ) | | | 0.07 | | | | 0.41 | | | | (0.76 | ) | | | (0.36 | ) |
| Total income (loss) from investment operations | | | 0.17 | | | | (0.40 | ) | | | 0.03 | | | | 0.42 | | | | (0.74 | ) | | | (0.32 | ) | | | 0.15 | | | | (0.43 | ) | | | (0.03 | ) | | | 0.38 | | | | (0.78 | ) | | | (0.37 | ) |
| Less distributions: | | | | | | | | | | | | | | | | | | | | | | | | | | | | | | | | | | | | | | | | | | | | | | | | |
| Distributions from net investment income | | | (0.02 | ) | | | — | | | | — | | | | (0.00 | ) (a) | | | — | | | | — | | | | — | | | | — | | | | — | | | | (0.00 | ) (a) | | | — | | | | — | |
| Distributions from net realized gains | | | (0.01 | ) | | | (0.01 | ) | | | (0.09 | ) | | | — | | | | — | | | | — | | | | (0.01 | ) | | | (0.01 | ) | | | (0.09 | ) | | | — | | | | — | | | | — | |
| Tax return of capital | | | — | | | | — | | | | — | | | | — | | | | — | | | | (0.04 | ) | | | — | | | | — | | | | — | | | | — | | | | — | | | | (0.01 | ) |
| Total distributions | | | (0.03 | ) | | | (0.01 | ) | | | (0.09 | ) | | | (0.00 | ) (a) | | | — | | | | (0.04 | ) | | | (0.01 | ) | | | (0.01 | ) | | | (0.09 | ) | | | (0.00 | ) (a) | | | — | | | | (0.01 | ) |
| Net asset value, end of period/year | | $ | 8.99 | | | $ | 8.85 | | | $ | 9.26 | | | $ | 9.32 | | | $ | 8.90 | | | $ | 9.64 | | | $ | 8.80 | | | $ | 8.66 | | | $ | 9.10 | | | $ | 9.22 | | | $ | 8.84 | | | $ | 9.62 | |
| Total return + # | | | 2.01 | % | | | (4.32 | )% | | | 0.46 | % | | | 4.77 | % | | | (7.65 | )% | | | (3.22 | )% | | | 1.78 | % | | | (4.72 | )% | | | (0.19 | )% | | | 4.31 | % | | | (8.11 | )% | | | (3.72 | )% |
| Ratios/Supplemental Data: | | | | | | | | | | | | | | | | | | | | | | | | | | | | | | | | | | | | | | | | | | | | | | | | |
| Net assets, end of period/year (in 000s) | | $ | 4,015 | | | $ | 3,802 | | | $ | 2,968 | | | $ | 2,118 | | | $ | 3,208 | | | $ | 3,513 | | | $ | 1,346 | | | $ | 1,366 | | | $ | 1,330 | | | $ | 1,204 | | | $ | 1,638 | | | $ | 1,879 | |
| Ratios of expenses to average net assets: ^ | | | 1.59 | % | | | 1.60 | % | | | 1.79 | % | | | 1.53 | % | | | 1.63 | % | | | 1.63 | % | | | 2.09 | % | | | 2.10 | % | | | 2.29 | % | | | 2.03 | % | | | 2.13 | % | | | 2.13 | % |
| Ratios of net investment income (loss) to average net assets: ^ | | | (0.51 | )% | | | (0.59 | )% | | | (0.63 | )% | | | 0.10 | % | | | 0.29 | % | | | 0.41 | % | | | (1.01 | )% | | | (1.10 | )% | | | (1.11 | )% | | | (0.33 | )% | | | (0.24 | )% | | | (0.09 | )% |
| Portfolio turnover rate (1) | | | 46 | % | | | 45 | % | | | 56 | % | | | 64 | % | | | 52 | % | | | 60 | % | | | 46 | % | | | 45 | % | | | 56 | % | | | 64 | % | | | 52 | % | | | 60 | % |
| | | | | | | | | | | | | | | | | | | | | | | | | | | | | | | | | | | | | | | | | | | | | | | | | |
| * | The net investment income (loss) per share data was determined using the average shares outstanding throughout the period/year. |
| (a) | Represents less than $0.01 per share. |
| + | Assumes reinvestment of all dividends and distributions, if any. Aggregate (not annualized) total return is shown for any period shorter than one year. Total return does not reflect the deductions of taxes that a shareholder would pay on distributions or on the redemption of shares and does not reflect the impact of any sales charge. |
| # | Includes adjustments in accordance with accounting principles generally accepted in the United States and, consequently, the net asset value for financial reporting purposes and the returns based upon those net asset values may differ from the net asset values and returns for shareholder transactions. Adjustments may apply to some but not all years and classes. |
| ^ | Annualized for periods less than one year. |
| (1) | Not annualized for periods less than one year. |
See accompanying notes to financial statements.
| FINANCIAL HIGHLIGHTS |
| Dunham Large Cap Value Fund |
| |
| The table sets forth financial data for one share of beneficial interest outstanding throughout each period/year. |
| | | Class N | | | | | | | | | | | | | | | | | | | | | | | | | |
| | | Six Months Ended | | | Year Ended October 31, | | | | | | | | | | | | | | | | | | | | | | | | | |
| | | April 30, 2019 | | | 2018 | | | 2017 | | | 2016 | | | 2015 | | | 2014 | | | | | | | | | | | | | | | | | | | | | | | | | |
| | | (Unaudited) | | | | | | | | | | | | | | | | | | | | | | | | | | | | | | | | | | | | | | | | |
| Net asset value, beginning of period/year | | $ | 14.18 | | | $ | 14.16 | | | $ | 12.22 | | | $ | 16.32 | | | $ | 16.21 | | | $ | 14.55 | | | | | | | | | | | | | | | | | | | | | | | | | |
| Income from investment operations: | | | | | | | | | | | | | | | | | | | | | | | | | | | | | | | | | | | | | | | �� | | | | | | | | | |
| Net investment income * | | | 0.10 | | | | 0.14 | | | | 0.15 | | | | 0.22 | | | | 0.17 | | | | 0.13 | | | | | | | | | | | | | | | | | | | | | | | | | |
| Net realized and unrealized gain (loss) | | | 0.95 | | | | 0.15 | | | | 2.01 | | | | (0.04 | ) | | | 0.06 | | | | 1.70 | | | | | | | | | | | | | | | | | | | | | | | | | |
| Total income from investment operations | | | 1.05 | | | | 0.29 | | | | 2.16 | | | | 0.18 | | | | 0.23 | | | | 1.83 | | | | | | | | | | | | | | | | | | | | | | | | | |
| Less distributions: | | | | | | | | | | | | | | | | | | | | | | | | | | | | | | | | | | | | | | | | | | | | | | | | |
| Distributions from net investment income | | | (0.15 | ) | | | (0.13 | ) | | | (0.22 | ) | | | (0.18 | ) | | | (0.12 | ) | | | (0.17 | ) | | | | | | | | | | | | | | | | | | | | | | | | |
| Distributions from net realized gains | | | (0.54 | ) | | | (0.14 | ) | | | — | | | | (4.10 | ) | | | — | | | | — | | | | | | | | | | | | | | | | | | | | | | | | | |
| Total distributions | | | (0.69 | ) | | | (0.27 | ) | | | (0.22 | ) | | | (4.28 | ) | | | (0.12 | ) | | | (0.17 | ) | | | | | | | | | | | | | | | | | | | | | | | | |
| Net asset value, end of period/year | | $ | 14.54 | | | $ | 14.18 | | | $ | 14.16 | | | $ | 12.22 | | | $ | 16.32 | | | $ | 16.21 | | | | | | | | | | | | | | | | | | | | | | | | | |
| Total return + # | | | 8.25 | % | | | 1.98 | % | | | 17.84 | % | | | 1.73 | % | | | 1.41 | % | | | 12.64 | % | | | | | | | | | | | | | | | | | | | | | | | | |
| Ratios/Supplemental Data: | | | | | | | | | | | | | | | | | | | | | | | | | | | | | | | | | | | | | | | | | | | | | | | | |
| Net assets, end of period/year (in 000s) | | $ | 60,329 | | | $ | 55,428 | | | $ | 55,155 | | | $ | 45,026 | | | $ | 44,620 | | | $ | 41,917 | | | | | | | | | | | | | | | | | | | | | | | | | |
| Ratios of expenses to average net assets: | | | | | | | | | | | | | | | | | | | | | | | | | | | | | | | | | | | | | | | | | | | | | | | | |
| After fee Waivers | | | 1.26 | % | | | | | | | | | | | | | | | | | | | | | | | | | | | | | | | | | | | | | | | | | | | | |
| Before fees paid indirectly ^ | | | 1.06 | % | | | 1.30 | % | | | 1.13 | % | | | 0.93 | % | | | 1.12 | % | | | 1.26 | % | | | | | | | | | | | | | | | | | | | | | | | | |
| After fees paid indirectly ^ | | | 1.05 | % | | | 1.30 | % | | | 1.12 | % | | | 0.93 | % | | | 1.12 | % | | | 1.26 | % | | | | | | | | | | | | | | | | | | | | | | | | |
| Ratios of net investment income to average net assets: | | | | | | | | | | | | | | | | | | | | | | | | | | | | | | | | | | | | | | | | | | | | | | | | |
| After fee Waivers | | | 0.82 | % | | | | | | | | | | | | | | | | | | | | | | | | | | | | | | | | | | | | | | | | | | | | |
| Before fees paid indirectly ^ | | | 1.45 | % | | | 0.94 | % | | | 1.12 | % | | | 1.81 | % | | | 1.03 | % | | | 0.82 | % | | | | | | | | | | | | | | | | | | | | | | | | |
| After fees paid indirectly ^ | | | 1.46 | % | | | 0.94 | % | | | 1.13 | % | | | 1.81 | % | | | 1.03 | % | | | 0.82 | % | | | | | | | | | | | | | | | | | | | | | | | | |
| Portfolio turnover rate (1) | | | 23 | % | | | 45 | % | | | 61 | % | | | 59 | % | | | 101 | % | | | 22 | % | | | | | | | | | | | | | | | | | | | | | | | | |
| | | | | | | | | | | | | | | | | | | | | | | | | | | | | | | | | | | | | | | | | | | | | | | | | |
| | | Class A | | | | | | Class C | |
| | | Six Months Ended | | | Year Ended October 31, | | | Six Months Ended | | | Year Ended October 31, | |
| | | April 30, 2019 | | | 2018 | | | 2017 | | | 2016 | | | 2015 | | | 2014 | | | April 30, 2019 | | | 2018 | | | 2017 | | | 2016 | | | 2015 | | | 2014 | |
| | | (Unaudited) | | | | | | | | | | | | | | | | | | (Unaudited) | | | | | | | | | | | | | | | | |
| Net asset value, beginning of period/year | | $ | 14.11 | | | $ | 14.10 | | | $ | 12.16 | | | $ | 16.26 | | | $ | 16.16 | | | $ | 14.52 | | | $ | 13.45 | | | $ | 13.47 | | | $ | 11.65 | | | $ | 15.74 | | | $ | 15.68 | | | $ | 14.09 | |
| Income from investment operations: | | | | | | | | | | | | | | | | | | | | | | | | | | | | | | | | | | | | | | | | | | | | | | | | |
| Net investment income (loss)* | | | 0.08 | | | | 0.10 | | | | 0.11 | | | | 0.19 | | | | 0.13 | | | | 0.09 | | | | 0.03 | | | | (0.01 | ) | | | 0.02 | | | | 0.10 | | | | 0.00 | (a) | | | (0.03 | ) |
| Net realized and unrealized gain (loss) | | | 0.95 | | | | 0.15 | | | | 2.02 | | | | (0.05 | ) | | | 0.06 | | | | 1.69 | | | | 0.91 | | | | 0.15 | | | | 1.92 | | | | (0.06 | ) | | | 0.06 | | | | 1.65 | |
| Total income from investment operations | | | 1.03 | | | | 0.25 | | | | 2.13 | | | | 0.14 | | | | 0.19 | | | | 1.78 | | | | 0.94 | | | | 0.14 | | | | 1.94 | | | | 0.04 | | | | 0.06 | | | | 1.62 | |
| Less distributions: | | | | | | | | | | | | | | | | | | | | | | | | | | | | | | | | | | | | | | | | | | | | | | | | |
| Distributions from net investment income | | | (0.12 | ) | | | (0.10 | ) | | | (0.19 | ) | | | (0.14 | ) | | | (0.09 | ) | | | (0.14 | ) | | | (0.01 | ) | | | (0.02 | ) | | | (0.12 | ) | | | (0.03 | ) | | | — | | | | (0.03 | ) |
| Distributions from net realized gains | | | (0.54 | ) | | | (0.14 | ) | | | 0.00 | | | | (4.10 | ) | | | — | | | | — | | | | (0.54 | ) | | | (0.14 | ) | | | — | | | | (4.10 | ) | | | — | | | | — | |
| Total distributions | | | (0.66 | ) | | | (0.24 | ) | | | (0.19 | ) | | | (4.24 | ) | | | (0.09 | ) | | | (0.14 | ) | | | (0.55 | ) | | | (0.16 | ) | | | (0.12 | ) | | | (4.13 | ) | | | — | | | | (0.03 | ) |
| Net asset value, end of period/year | | $ | 14.48 | | | $ | 14.11 | | | $ | 14.10 | | | $ | 12.16 | | | $ | 16.26 | | | $ | 16.16 | | | $ | 13.84 | | | $ | 13.45 | | | $ | 13.47 | | | $ | 11.65 | | | $ | 15.74 | | | $ | 15.68 | |
| Total return + # | | | 8.08 | % | | | 1.71 | % | | | 17.66 | % | | | 1.43 | % | | | 1.15 | % | | | 12.31 | % | | | 7.68 | % | | | 1.00 | % | | | 16.72 | % | | | 0.66 | % | | | 0.38 | % | | | 11.49 | % |
| Ratios/Supplemental Data: | | | | | | | | | | | | | | | | | | | | | | | | | | | | | | | | | | | | | | | | | | | | | | | | |
| Net assets, end of period/year (in 000s) | | $ | 15,604 | | | $ | 12,525 | | | $ | 10,174 | | | $ | 6,544 | | | $ | 6,577 | | | $ | 7,685 | | | $ | 5,079 | | | $ | 4,167 | | | $ | 4,640 | | | $ | 4,850 | | | $ | 5,805 | | | $ | 5,639 | |
| Ratios of expenses to average net assets: | | | | | | | | | | | | | | | | | | | | | | | | | | | | | | | | | | | | | | | | | | | | | | | | |
| After fee Waivers | | | 1.51 | % | | | 2.26 | % | | | | | | | | | | | | | | | | | | | | | | | | | | | | | | | | | | | | | | | | |
| Before fees paid indirectly ^ | | | 1.31 | % | | | 1.55 | % | | | 1.38 | % | | | 1.18 | % | | | 1.37 | % | | | 1.51 | % | | | 2.06 | % | | | 2.30 | % | | | 2.13 | % | | | 1.93 | % | | | 2.12 | % | | | 2.26 | % |
| After fees paid indirectly ^ | | | 1.30 | % | | | 1.55 | % | | | 1.37 | % | | | 1.18 | % | | | 1.37 | % | | | 1.51 | % | | | 2.05 | % | | | 2.30 | % | | | 2.12 | % | | | 1.93 | % | | | 2.12 | % | | | 2.26 | % |
| Ratios of net investment income (loss) to average net assets: | | | | | | | | | | | | | | | | | | | | | | | | | | | | | | | | | | | | | | | | | | | | | | | | |
| After fee Waivers | | | 0.57 | % | | | (0.18 | )% | | | | | | | | | | | | | | | | | | | | | | | | | | | | | | | | | | | | | | | | |
| Before fees paid indirectly ^ | | | 1.20 | % | | | 0.70 | % | | | 0.84 | % | | | 1.57 | % | | | 0.78 | % | | | 0.57 | % | | | 0.44 | % | | | (0.07 | )% | | | 0.14 | % | | | 0.83 | % | | | 0.03 | % | | | (0.18 | )% |
| After fees paid indirectly ^ | | | 1.21 | % | | | 0.70 | % | | | 0.85 | % | | | 1.57 | % | | | 0.78 | % | | | 0.57 | % | | | 0.45 | % | | | (0.07 | )% | | | 0.15 | % | | | 0.83 | % | | | 0.03 | % | | | (0.18 | )% |
| Portfolio turnover rate (1) | | | 23 | % | | | 45 | % | | | 61 | % | | | 59 | % | | | 101 | % | | | 22 | % | | | 23 | % | | | 45 | % | | | 61 | % | | | 59 | % | | | 101 | % | | | 22 | % |
| | | | | | | | | | | | | | | | | | | | | | | | | | | | | | | | | | | | | | | | | | | | | | | | | |
| * | The net investment income (loss) per share data was determined using the average shares outstanding throughout each period/year. |
| + | Assumes reinvestment of all dividends and distributions, if any. Aggregate (not annualized) total return is shown for any period shorter than one year. Total return does not reflect the deductions of taxes that a shareholder would pay on distributions or on the redemption of shares and does not reflect the impact of any sales charge. |
| (a) | Represents less than $0.01 per share. |
| # | Includes adjustments in accordance with accounting principles generally accepted in the United States and, consequently, the net asset value for financial reporting purposes and the returns based upon those net asset values may differ from the net asset values and returns for shareholder transactions. Adjustments may apply to some but not all years and classes. |
| ^ | Annualized for periods less than one year. |
| (1) | Not annualized for periods less than one year. |
See accompanying notes to financial statements.
| FINANCIAL HIGHLIGHTS |
| Dunham Focused Large Cap Growth Fund |
| |
| The table sets forth financial data for one share of beneficial interest outstanding throughout each period/year. |
| | | Class N | | | | | | | | | | | | | | | | | | | | | | | | | |
| | | Six Months Ended | | | Year Ended October 31, | | | | | | | | | | | | | | | | | | | | | | | | | |
| | | April 30, 2019 | | | 2018 | | | 2017 | | | 2016 | | | 2015 | | | 2014 | | | | | | | | | | | | | | | | | | | | | | | | | |
| | | (Unaudited) | | | | | | | | | | | | | | | | | | | | | | | | | | | | | | | | | | | | | | | | |
| Net asset value, beginning of period/year | | $ | 22.50 | | | $ | 19.37 | | | $ | 15.92 | | | $ | 16.97 | | | $ | 15.01 | | | $ | 14.02 | | | | | | | | | | | | | | | | | | | | | | | | | |
| Income (loss) from investment operations: | | | | | | | | | | | | | | | | | | | | | | | | | | | | | | | | | | | | | | | | | | | | | | | | |
| Net investment loss* | | | (0.12 | ) | | | (0.22 | ) | | | (0.14 | ) | | | (0.10 | ) | | | (0.16 | ) | | | (0.11 | ) | | | | | | | | | | | | | | | | | | | | | | | | |
| Net realized and unrealized gain (loss) | | | 3.93 | | | | 3.53 | | | | 3.59 | | | | (0.86 | ) | | | 2.12 | | | | 1.29 | | | | | | | | | | | | | | | | | | | | | | | | | |
| Total income (loss) from investment operations | | | 3.81 | | | | 3.31 | | | | 3.45 | | | | (0.96 | ) | | | 1.96 | | | | 1.18 | | | | | | | | | | | | | | | | | | | | | | | | | |
| Less distributions: | | | | | | | | | | | | | | | | | | | | | | | | | | | | | | | | | | | | | | | | | | | | | | | | |
| Distributions from net realized gains | | | (1.70 | ) | | | (0.18 | ) | | | — | | | | (0.09 | ) | | | — | | | | (0.19 | ) | | | | | | | | | | | | | | | | | | | | | | | | |
| Total distributions | | | (1.70 | ) | | | (0.18 | ) | | | — | | | | (0.09 | ) | | | — | | | | (0.19 | ) | | | | | | | | | | | | | | | | | | | | | | | | |
| Net asset value, end of period/year | | $ | 24.61 | | | $ | 22.50 | | | $ | 19.37 | | | $ | 15.92 | | | $ | 16.97 | | | $ | 15.01 | | | | | | | | | | | | | | | | | | | | | | | | | |
| Total return +# | | | 18.98 | % | | | 17.24 | % | | | 21.67 | % | | | (5.66 | )% | | | 13.06 | % | | | 8.48 | % | | | | | | | | | | | | | | | | | | | | | | | | |
| Ratios/Supplemental Data: | | | | | | | | | | | | | | | | | | | | | | | | | | | | | | | | | | | | | | | | | | | | | | | | |
| Net assets, end of period/year (in 000s) | | $ | 74,675 | | | $ | 59,424 | | | $ | 56,472 | | | $ | 51,242 | | | $ | 51,312 | | | $ | 37,106 | | | | | | | | | | | | | | | | | | | | | | | | | |
| Ratios of expenses to average net assets: | | | | | | | | | | | | | | | | | | | | | | | | | | | | | | | | | | | | | | | | | | | | | | | | |
| Before fee waivers and fees paid indirectly ^ | | | 1.37 | % | | | 1.30 | % | | | 1.16 | % | | | 1.20 | % | | | 1.34 | % | | | 1.16 | % | | | | | | | | | | | | | | | | | | | | | | | | |
| After fee waivers and fees paid indirectly ^ | | | 1.36 | % | | | 1.29 | % | | | 1.14 | % | | | 1.20 | % | | | 1.34 | % | | | 1.16 | % | | | | | | | | | | | | | | | | | | | | | | | | |
| Ratios of net investment loss to average net assets: | | | | | | | | | | | | | | | | | | | | | | | | | | | | | | | | | | | | | | | | | | | | | | | | |
| Before fee waivers and fees paid indirectly ^ | | | (1.06 | )% | | | (1.01 | )% | | | (0.79 | )% | | | (0.64 | )% | | | (1.00 | )% | | | (0.76 | )% | | | | | | | | | | | | | | | | | | | | | | | | |
| After fee waivers and fees paid indirectly ^ | | | (1.06 | )% | | | (1.01 | )% | | | (0.77 | )% | | | (0.64 | )% | | | (1.00 | )% | | | (0.76 | )% | | | | | | | | | | | | | | | | | | | | | | | | |
| Portfolio turnover rate (1) | | | 18 | % | | | 25 | % | | | 38 | % | | | 29 | % | | | 45 | % | | | 29 | % | | | | | | | | | | | | | | | | | | | | | | | | |
| | | | | | | | | | | | | | | | | | | | | | | | | | | | | | | | | | | | | | | | | | | | | | | | | |
| | | Class A | | | | | | Class C | |
| | | Six Months Ended | | | Year Ended October 31, | | | Six Months Ended | | | Year Ended October 31, | |
| | | April 30, 2019 | | | 2018 | | | 2017 | | | 2016 | | | 2015 | | | 2014 | | | April 30, 2019 | | | 2018 | | | 2017 | | | 2016 | | | 2015 | | | 2014 | |
| | | (Unaudited) | | | | | | | | | | | | | | | | | | (Unaudited) | | | | | | | | | | | | | | | | |
| Net asset value, beginning of period/year | | $ | 22.11 | | | $ | 19.08 | | | $ | 15.73 | | | $ | 16.80 | | | $ | 14.91 | | | $ | 13.96 | | | $ | 21.00 | | | $ | 18.27 | | | $ | 15.17 | | | $ | 16.33 | | | $ | 14.59 | | | $ | 13.76 | |
| Income (loss) from investment operations: | | | | | | | | | | | | | | | | | | | | | | | | | | | | | | | | | | | | | | | | | | | | | | | | |
| Net investment loss* | | | (0.14 | ) | | | (0.28 | ) | | | (0.18 | ) | | | (0.14 | ) | | | (0.19 | ) | | | (0.21 | ) | | | (0.21 | ) | | | (0.42 | ) | | | (0.30 | ) | | | (0.25 | ) | | | (0.31 | ) | | | (0.26 | ) |
| Net realized and unrealized gain (loss) | | | 3.84 | | | | 3.49 | | | | 3.53 | | | | (0.84 | ) | | | 2.08 | | | | 1.35 | | | | 3.62 | | | | 3.33 | | | | 3.40 | | | | (0.82 | ) | | | 2.05 | | | | 1.28 | |
| Total income (loss) from investment operations | | | 3.70 | | | | 3.21 | | | | 3.35 | | | | (0.98 | ) | | | 1.89 | | | | 1.14 | | | | 3.41 | | | | 2.91 | | | | 3.10 | | | | (1.07 | ) | | | 1.74 | | | | 1.02 | |
| Less distributions: | | | | | | | | | | | | | | | | | | | | | | | | | | | | | | | | | | | | | | | | | | | | | | | | |
| Distributions from net realized gains | | | (1.70 | ) | | | (0.18 | ) | | | — | | | | (0.09 | ) | | | — | | | | (0.19 | ) | | | (1.70 | ) | | | (0.18 | ) | | | — | | | | (0.09 | ) | | | — | | | | (0.19 | ) |
| Total distributions | | | (1.70 | ) | | | (0.18 | ) | | | — | | | | (0.09 | ) | | | — | | | | (0.19 | ) | | | (1.70 | ) | | | (0.18 | ) | | | — | | | | (0.09 | ) | | | — | | | | (0.19 | ) |
| Net asset value, end of period/year | | $ | 24.11 | | | $ | 22.11 | | | $ | 19.08 | | | $ | 15.73 | | | $ | 16.80 | | | $ | 14.91 | | | $ | 22.71 | | | $ | 21.00 | | | $ | 18.27 | | | $ | 15.17 | | | $ | 16.33 | | | $ | 14.59 | |
| Total return +# | | | 18.81 | % | | | 16.98 | % | | | 21.30 | % | | | (5.84 | )% | | | 12.68 | % | | | 8.23 | % | | | 18.39 | % | | | 16.08 | % | | | 20.44 | % | | | (6.56 | )% | | | 11.93 | % | | | 7.47 | % |
| Ratios/Supplemental Data: | | | | | | | | | | | | | | | | | | | | | | | | | | | | | | | | | | | | | | | | | | | | | | | | |
| Net assets, end of period/year (in 000s) | | $ | 24,114 | | | $ | 15,031 | | | $ | 12,944 | | | $ | 9,620 | | | $ | 8,762 | | | $ | 19,949 | | | $ | 8,310 | | | $ | 6,844 | | | $ | 6,758 | | | $ | 4,988 | | | $ | 5,222 | | | $ | 4,361 | |
| Ratios of expenses to average net assets: | | | | | | | | | | | | | | | | | | | | | | | | | | | | | | | | | | | | | | | | | | | | | | | | |
| Before fee waivers and fees paid indirectly ^ | | | 1.61 | % | | | 1.55 | % | | | 1.41 | % | | | 1.45 | % | | | 1.59 | % | | | 1.41 | % | | | 2.37 | % | | | 2.30 | % | | | 2.16 | % | | | 2.20 | % | | | 2.34 | % | | | 2.16 | % |
| After fee waivers and fees paid indirectly ^ | | | 1.61 | % | | | 1.54 | % | | | 1.39 | % | | | 1.45 | % | | | 1.59 | % | | | 1.41 | % | | | 2.36 | % | | | 2.29 | % | | | 2.14 | % | | | 2.20 | % | | | 2.34 | % | | | 2.16 | % |
| Ratios of net investment loss to average net assets: | | | | | | | | | | | | | | | | | | | | | | | | | | | | | | | | | | | | | | | | | | | | | | | | |
| Before fee waivers and fees paid indirectly ^ | | | (1.31 | )% | | | (1.26 | )% | | | (1.05 | )% | | | (0.91 | )% | | | (1.20 | )% | | | (1.48 | )% | | | (2.05 | )% | | | (2.01 | )% | | | (1.80 | )% | | | (1.67 | )% | | | (2.00 | )% | | | (1.87 | )% |
| After fee waivers and fees paid indirectly ^ | | | (1.31 | )% | | | (1.26 | )% | | | (1.03 | )% | | | (0.91 | )% | | | (1.20 | )% | | | (1.48 | )% | | | (2.05 | )% | | | (2.01 | )% | | | (1.78 | )% | | | (1.67 | )% | | | (2.00 | )% | | | (1.87 | )% |
| Portfolio turnover rate (1) | | | 18 | % | | | 25 | % | | | 38 | % | | | 29 | % | | | 45 | % | | | 29 | % | | | 18 | % | | | 25 | % | | | 38 | % | | | 29 | % | | | 45 | % | | | 29 | % |
| | | | | | | | | | | | | | | | | | | | | | | | | | | | | | | | | | | | | | | | | | | | | | | | | |
| * | The net investment income per share data was determined using the average shares outstanding throughout each period/year. |
| + | Assumes reinvestment of all dividends and distributions, if any. Aggregate (not annualized) total return is shown for any period shorter than one year. Total return does not reflect the deductions of taxes that a shareholder would pay on distributions or on the redemption of shares and does not reflect the impact of any sales charge. |
| ^ | Annualized for periods less than one year. |
| # | Includes adjustments in accordance with accounting principles generally accepted in the United States and, consequently, the net asset value for financial reporting purposes and the returns based upon those net asset values may differ from the net asset values and returns for shareholder transactions. Adjustments may apply to some but not all years and classes. |
| (1) | Not annualized for periods less than one year. |
See accompanying notes to financial statements.
| FINANCIAL HIGHLIGHTS |
| Dunham International Stock Fund |
| |
| The table sets forth financial data for one share of beneficial interest outstanding throughout each period/year. |
| | | Class N | | | | | | | | | | | | | | | | | | | | | | | | | |
| | | Six Months Ended | | | Year Ended October 31, | | | | | | | | | | | | | | | | | | | | | | | | | |
| | | April 30, 2019 | | | 2018 | | | 2017 | | | 2016 | | | 2015 | | | 2014 | | | | | | | | | | | | | | | | | | | | | | | | | |
| | | (Unaudited) | | | | | | | | | | | | | | | | | | | | | | | | | | | | | | | | | | | | | | | | |
| Net asset value, beginning of period/year | | $ | 15.61 | | | $ | 17.54 | | | $ | 14.24 | | | $ | 14.24 | | | $ | 15.21 | | | $ | 15.22 | | | | | | | | | | | | | | | | | | | | | | | | | |
| Income (loss) from investment operations: | | | | | | | | | | | | | | | | | | | | | | | | | | | | | | | | | | | | | | | | | | | | | | | | |
| Net investment income * | | | 0.14 | | | | 0.21 | | | | 0.21 | | | | 0.16 | | | | 0.00 | (a) | | | 0.15 | | | | | | | | | | | | | | | | | | | | | | | | | |
| Net realized and unrealized gain (loss) | | | 0.54 | | | | (1.39 | ) | | | 3.09 | | | | (0.15 | ) | | | (0.61 | ) | | | 0.10 | | | | | | | | | | | | | | | | | | | | | | | | | |
| Total income (loss) from investment operations | | | 0.68 | | | | (1.18 | ) | | | 3.30 | | | | 0.01 | | | | (0.61 | ) | | | 0.25 | | | | | | | | | | | | | | | | | | | | | | | | | |
| Less distributions: | | | | | | | | | | | | | | | | | | | | | | | | | | | | | | | | | | | | | | | | | | | | | | | | |
| Distributions from net investment income | | | (0.18 | ) | | | (0.26 | ) | | | — | | | | (0.01 | ) | | | (0.30 | ) | | | (0.26 | ) | | | | | | | | | | | | | | | | | | | | | | | | |
| Distributions from net realized gains | | | (0.88 | ) | | | (0.49 | ) | | | — | | | | — | | | | (0.06 | ) | | | — | | | | | | | | | | | | | | | | | | | | | | | | | |
| Total distributions | | | (1.06 | ) | | | (0.75 | ) | | | — | | | | (0.01 | ) | | | (0.36 | ) | | | (0.26 | ) | | | | | | | | | | | | | | | | | | | | | | | | |
| Net asset value, end of period/year | | $ | 15.23 | | | $ | 15.61 | | | $ | 17.54 | | | $ | 14.24 | | | $ | 14.24 | | | $ | 15.21 | | | | | | | | | | | | | | | | | | | | | | | | | |
| Total return + # | | | 5.15 | % | | | (7.08 | )% | | | 23.17 | % | | | 0.06 | % | | | (4.10 | )% | | | 1.66 | % | | | | | | | | | | | | | | | | | | | | | | | | |
| Ratios/Supplemental Data: | | | | | | | | | | | | | | | | | | | | | | | | | | | | | | | | | | | | | | | | | | | | | | | | |
| Net assets, end of period/year (in 000s) | | $ | 96,913 | | | $ | 89,401 | | | $ | 90,257 | | | $ | 78,640 | | | $ | 76,992 | | | $ | 57,359 | | | | | | | | | | | | | | | | | | | | | | | | | |
| Ratios of expenses to average net assets: | | | | | | | | | | | | | | | | | | | | | | | | | | | | | | | | | | | | | | | | | | | | | | | | |
| Before fees paid indirectly ^ | | | 1.52 | % | | | 1.67 | % | | | 1.56 | % | | | 1.63 | % | | | 2.04 | % | | | 2.04 | % | | | | | | | | | | | | | | | | | | | | | | | | |
| After fees paid indirectly ^ | | | 1.52 | % | | | 1.67 | % | | | 1.55 | % | | | 1.63 | % | | | 2.04 | % | | | 2.04 | % | | | | | | | | | | | | | | | | | | | | | | | | |
| Ratios of net investment income to average net assets: | | | | | | | | | | | | | | | | | | | | | | | | | | | | | | | | | | | | | | | | | | | | | | | | |
| Before fees paid indirectly ^ | | | 1.86 | % | | | 1.24 | % | | | 1.34 | % | | | 1.17 | % | | | 0.03 | % | | | 0.99 | % | | | | | | | | | | | | | | | | | | | | | | | | |
| After fees paid indirectly ^ | | | 1.86 | % | | | 1.24 | % | | | 1.35 | % | | | 1.17 | % | | | 0.03 | % | | | 0.99 | % | | | | | | | | | | | | | | | | | | | | | | | | |
| Portfolio turnover rate (1) | | | 55 | % | | | 113 | % | | | 119 | % | | | 143 | % | | | 125 | % | | | 117 | % | | | | | | | | | | | | | | | | | | | | | | | | |
| | | | | | | | | | | | | | | | | | | | | | | | | | | | | | | | | | | | | | | | | | | | | | | | | |
| | | Class A | | | | | | Class C | |
| | | Six Months Ended | | | Year Ended October 31, | | | Six Months Ended | | | Year Ended October 31, | |
| | | April 30, 2019 | | | 2018 | | | 2017 | | | 2016 | | | 2015 | | | 2014 | | | April 30, 2019 | | | 2018 | | | 2017 | | | 2016 | | | 2015 | | | 2014 | |
| | | (Unaudited) | | | | | | | | | | | | | | | | | | (Unaudited) | | | | | | | | | | | | | | | | |
| Net asset value, beginning of period/year | | $ | 15.49 | | | $ | 17.42 | | | $ | 14.17 | | | $ | 14.21 | | | $ | 15.16 | | | $ | 15.19 | | | $ | 14.68 | | | $ | 16.59 | | | $ | 13.60 | | | $ | 13.73 | | | $ | 14.68 | | | $ | 14.70 | |
| Income (loss) from investment operations: | | | | | | | | | | | | | | | | | | | | | | | | | | | | | | | | | | | | | | | | | | | | | | | | |
| Net investment income (loss)* | | | 0.12 | | | | 0.17 | | | | 0.17 | | | | 0.13 | | | | (0.03 | ) | | | 0.15 | | | | 0.06 | | | | 0.04 | | | | 0.04 | | | | 0.03 | | | | (0.14 | ) | | | (0.00 | ) (a) |
| Net realized and unrealized gain (loss) | | | 0.54 | | | | (1.38 | ) | | | 3.08 | | | | (0.17 | ) | | | (0.60 | ) | | | 0.06 | | | | 0.52 | | | | (1.31 | ) | | | 2.95 | | | | (0.16 | ) | | | (0.59 | ) | | | 0.10 | |
| Total income (loss) from investment operations | | | 0.66 | | | | (1.21 | ) | | | 3.25 | | | | (0.04 | ) | | | (0.63 | ) | | | 0.21 | | | | 0.58 | | | | (1.27 | ) | | | 2.99 | | | | (0.13 | ) | | | (0.73 | ) | | | 0.10 | |
| Less distributions: | | | | | | | | | | | | | | | | | | | | | | | | | | | | | | | | | | | | | | | | | | | | | | | | |
| Distributions from net investment income | | | (0.14 | ) | | | (0.23 | ) | | | — | | | | — | | | | (0.26 | ) | | | (0.24 | ) | | | (0.02 | ) | | | (0.15 | ) | | | — | | | | — | | | | (0.16 | ) | | | (0.12 | ) |
| Distributions from net realized gains | | | (0.88 | ) | | | (0.49 | ) | | | — | | | | — | | | | (0.06 | ) | | | — | | | | (0.88 | ) | | | (0.49 | ) | | | — | | | | — | | | | (0.06 | ) | | | — | |
| Total distributions | | | (1.02 | ) | | | (0.72 | ) | | | — | | | | — | | | | (0.32 | ) | | | (0.24 | ) | | | (0.90 | ) | | | (0.64 | ) | | | — | | | | — | | | | (0.22 | ) | | | (0.12 | ) |
| Net asset value, end of period/year | | $ | 15.13 | | | $ | 15.49 | | | $ | 17.42 | | | $ | 14.17 | | | $ | 14.21 | | | $ | 15.16 | | | $ | 14.36 | | | $ | 14.68 | | | $ | 16.59 | | | $ | 13.60 | | | $ | 13.73 | | | $ | 14.68 | |
| Total return + # | | | 5.04 | % | | | (7.30 | )% | | | 22.94 | % | | | (0.28 | )% | | | (4.26 | )% | | | 1.35 | % | | | 4.65 | % | | | (8.03 | )% | | | 21.99 | % | | | (0.95 | )% | | | (5.06 | )% | | | 0.67 | % |
| Ratios/Supplemental Data: | | | | | | | | | | | | | | | | | | | | | | | | | | | | | | | | | | | | | | | | | | | | | | | | |
| Net assets, end of period/year (in 000s) | | $ | 20,605 | | | $ | 18,250 | | | $ | 15,524 | | | $ | 10,305 | | | $ | 9,032 | | | $ | 7,871 | | | $ | 6,013 | | | $ | 5,764 | | | $ | 6,570 | | | $ | 6,483 | | | $ | 7,268 | | | $ | 6,551 | |
| | | | | | | | | | | | | | | | | | | | | | | | | | | | | | | | | | | | | | | | | | | | | | | | | |
| Ratios of expenses to average net assets: | | | | | | | | | | | | | | | | | | | | | | | | | | | | | | | | | | | | | | | | | | | | | | | | |
| Before fees paid indirectly ^ | | | 1.77 | % | | | 1.92 | % | | | 1.81 | % | | | 1.88 | % | | | 2.29 | % | | | 2.29 | % | | | 2.52 | % | | | 2.67 | % | | | 2.56 | % | | | 2.63 | % | | | 3.04 | % | | | 3.04 | % |
| After fees paid indirectly ^ | | | 1.77 | % | | | 1.92 | % | | | 1.80 | % | | | 1.88 | % | | | 2.29 | % | | | 2.29 | % | | | 2.52 | % | | | 2.67 | % | | | 2.55 | % | | | 2.63 | % | | | 3.04 | % | | | 3.04 | % |
| Ratios of net investment income (loss) to average net assets: | | | | | | | | | | | | | | | | | | | | | | | | | | | | | | | | | | | | | | | | | | | | | | | | |
| Before fees paid indirectly ^ | | | 1.63 | % | | | 1.01 | % | | | 1.07 | % | | | 0.93 | % | | | (0.19 | )% | | | 0.97 | % | | | 0.84 | % | | | 0.22 | % | | | 0.30 | % | | | 0.20 | % | | | (0.94 | )% | | | (0.02 | )% |
| After fees paid indirectly ^ | | | 1.63 | % | | | 1.01 | % | | | 1.08 | % | | | 0.93 | % | | | (0.19 | )% | | | 0.97 | % | | | 0.84 | % | | | 0.22 | % | | | 0.31 | % | | | 0.20 | % | | | (0.94 | )% | | | (0.02 | )% |
| Portfolio turnover rate (1) | | | 55 | % | | | 113 | % | | | 119 | % | | | 143 | % | | | 125 | % | | | 117 | % | | | 55 | % | | | 113 | % | | | 119 | % | | | 143 | % | | | 125 | % | | | 117 | % |
| | | | | | | | | | | | | | | | | | | | | | | | | | | | | | | | | | | | | | | | | | | | | | | | | |
| * | The net investment income (loss) per share data was determined using the average shares outstanding throughout each period/year. |
| + | Assumes reinvestment of all dividends and distributions, if any. Aggregate (not annualized) total return is shown for any period shorter than one year. Total return does not reflect the deductions of taxes that a shareholder would pay on distributions or on the redemption of shares and does not reflect the impact of any sales charge. |
| # | Includes adjustments in accordance with accounting principles generally accepted in the United States and, consequently, the net asset value for financial reporting purposes and the returns based upon those net asset values may differ from the net asset values and returns for shareholder transactions. Adjustments may apply to some but not all years and classes. |
| (a) | Represents less than $0.01 per share. |
| ^ | Annualized for periods less than one year. |
| (1) | Not annualized for periods less than one year. |
See accompanying notes to financial statements.
| FINANCIAL HIGHLIGHTS |
| Dunham Real Estate Stock Fund |
| |
| The table sets forth financial data for one share of beneficial interest outstanding throughout each period/year. |
| | | Class N | | | | | | | | | | | | | | | | | | | | | | | | | |
| | | Six Months Ended | | | Year Ended October 31, | | | | | | | | | | | | | | | | | | | | | | | | | |
| | | April 30, 2019 | | | 2018 | | | 2017 | | | 2016 | | | 2015 | | | 2014 | | | | | | | | | | | | | | | | | | | | | | | | | |
| | | (Unaudited) | | | | | | | | | | | | | | | | | | | | | | | | | | | | | | | | | | | | | | | | |
| Net asset value, beginning of period/year | | $ | 15.35 | | | $ | 15.66 | | | $ | 18.31 | | | $ | 19.23 | | | $ | 19.27 | | | $ | 16.53 | | | | | | | | | | | | | | | | | | | | | | | | | |
| Income (loss) from investment operations: | | | | | | | | | | | | | | | | | | | | | | | | | | | | | | | | | | | | | | | | | | | | | | | | |
| Net investment income * | | | 0.24 | | | | 0.28 | | | | 0.13 | | | | 0.32 | | | | 0.15 | | | | 0.13 | | | | | | | | | | | | | | | | | | | | | | | | | |
| Net realized and unrealized gain (loss) | | | 1.66 | | | | (0.35 | ) | | | 0.40 | | | | 0.73 | | | | 0.85 | | | | 3.20 | | | | | | | | | | | | | | | | | | | | | | | | | |
| Total income (loss) from investment operations | | | 1.90 | | | | (0.07 | ) | | | 0.53 | | | | 1.05 | | | | 1.00 | | | | 3.33 | | | | | | | | | | | | | | | | | | | | | | | | | |
| Less distributions: | | | | | | | | | | | | | | | | | | | | | | | | | | | | | | | | | | | | | | | | | | | | | | | | |
| Distributions from net investment income | | | (0.29 | ) | | | (0.12 | ) | | | (0.36 | ) | | | (0.21 | ) | | | (0.11 | ) | | | (0.20 | ) | | | | | | | | | | | | | | | | | | | | | | | | |
| Distributions from net realized gains | | | — | | | | (0.12 | ) | | | (2.82 | ) | | | (1.76 | ) | | | (0.93 | ) | | | (0.39 | ) | | | | | | | | | | | | | | | | | | | | | | | | |
| Total distributions | | | (0.29 | ) | | | (0.24 | ) | | | (3.18 | ) | | | (1.97 | ) | | | (1.04 | ) | | | (0.59 | ) | | | | | | | | | | | | | | | | | | | | | | | | |
| Net asset value, end of period/year | | $ | 16.96 | | | $ | 15.35 | | | $ | 15.66 | | | $ | 18.31 | | | $ | 19.23 | | | $ | 19.27 | | | | | | | | | | | | | | | | | | | | | | | | | |
| Total return +# | | | 12.73 | % | | | (0.48 | )% | | | 3.63 | % | | | 5.77 | % | | | 5.13 | % | | | 21.09 | % | | | | | | | | | | | | | | | | | | | | | | | | |
| Ratios/Supplemental Data: | | | | | | | | | | | | | | | | | | | | | | | | | | | | | | | | | | | | | | | | | | | | | | | | |
| Net assets, end of period/year (in 000s) | | $ | 43,678 | | | $ | 43,163 | | | $ | 34,256 | | | $ | 25,479 | | | $ | 33,379 | | | $ | 37,143 | | | | | | | | | | | | | | | | | | | | | | | | | |
| Ratios of expenses to average net assets: ^ | | | 1.08 | % | | | 1.10 | % | | | 1.17 | % | | | 1.21 | % | | | 1.64 | % | | | 1.59 | % | | | | | | | | | | | | | | | | | | | | | | | | |
| Ratios of net investment income to average net assets: ^ | | | 3.02 | % | | | 1.82 | % | | | 0.79 | % | | | 1.74 | % | | | 0.80 | % | | | 0.77 | % | | | | | | | | | | | | | | | | | | | | | | | | |
| Portfolio turnover rate (1) | | | 40 | % | | | 74 | % | | | 101 | % | | | 110 | % | | | 110 | % | | | 97 | % | | | | | | | | | | | | | | | | | | | | | | | | |
| | | | | | | | | | | | | | | | | | | | | | | | | | | | | | | | | | | | | | | | | | | | | | | | | |
| | | Class A | | | | | | Class C | |
| | | Six Months Ended | | | Year Ended October 31, | | | Six Months Ended | | | Year Ended October 31, | |
| | | April 30, 2019 | | | 2018 | | | 2017 | | | 2016 | | | 2015 | | | 2014 | | | April 30, 2019 | | | 2018 | | | 2017 | | | 2016 | | | 2015 | | | 2014 | |
| | | (Unaudited) | | | | | | | | | | | | | | | | | | (Unaudited) | | | | | | | | | | | | | | | | |
| Net asset value, beginning of period/year | | $ | 15.46 | | | $ | 15.78 | | | $ | 18.35 | | | $ | 19.26 | | | $ | 19.33 | | | $ | 16.55 | | | $ | 14.54 | | | $ | 14.88 | | | $ | 17.55 | | | $ | 18.50 | | | $ | 18.65 | | | $ | 16.02 | |
| Income (loss) from investment operations: | | | | | | | | | | | | | | | | | | | | | | | | | | | | | | | | | | | | | | | | | | | | | | | | |
| Net investment income (loss) * | | | 0.22 | | | | 0.24 | | | | 0.10 | | | | 0.27 | | | | 0.10 | | | | 0.08 | | | | 0.15 | | | | 0.12 | | | | (0.02 | ) | | | 0.13 | | | | (0.04 | ) | | | (0.04 | ) |
| Net realized and unrealized gain (loss) | | | 1.68 | | | | (0.35 | ) | | | 0.41 | | | | 0.74 | | | | 0.85 | | | | 3.22 | | | | 1.60 | | | | (0.34 | ) | | | 0.38 | | | | 0.70 | | | | 0.82 | | | | 3.11 | |
| Total income (loss) from investment operations | | | 1.90 | | | | (0.11 | ) | | | 0.51 | | | | 1.01 | | | | 0.95 | | | | 3.30 | | | | 1.75 | | | | (0.22 | ) | | | 0.36 | | | | 0.83 | | | | 0.78 | | | | 3.07 | |
| Less distributions: | | | | | | | | | | | | | | | | | | | | | | | | | | | | | | | | | | | | | | | | | | | | | | | | |
| Distributions from net investment income | | | (0.26 | ) | | | (0.09 | ) | | | (0.26 | ) | | | (0.16 | ) | | | (0.09 | ) | | | (0.13 | ) | | | (0.15 | ) | | | — | | | | (0.21 | ) | | | (0.02 | ) | | | 0.00 | | | | (0.05 | ) |
| Distributions from net realized gains | | | — | | | | (0.12 | ) | | | (2.82 | ) | | | (1.76 | ) | | | (0.93 | ) | | | (0.39 | ) | | | — | | | | (0.12 | ) | | | (2.82 | ) | | | (1.76 | ) | | | (0.93 | ) | | | (0.39 | ) |
| Total distributions | | | (0.26 | ) | | | (0.21 | ) | | | (3.08 | ) | | | (1.92 | ) | | | (1.02 | ) | | | (0.52 | ) | | | (0.15 | ) | | | (0.12 | ) | | | (3.03 | ) | | | (1.78 | ) | | | (0.93 | ) | | | (0.44 | ) |
| Net asset value, end of period/year | | $ | 17.10 | | | $ | 15.46 | | | $ | 15.78 | | | $ | 18.35 | | | $ | 19.26 | | | $ | 19.33 | | | $ | 16.14 | | | $ | 14.54 | | | $ | 14.88 | | | $ | 17.55 | | | $ | 18.50 | | | $ | 18.65 | |
| Total return +# | | | 12.56 | % | | | (0.74 | )% | | | 3.44 | % | | | 5.54 | % | | | 4.85 | % | | | 20.73 | % | | | 12.20 | % | | | (1.50 | )% | | | 2.61 | % | | | 4.73 | % | | | 4.08 | % | | | 19.88 | % |
| Ratios/Supplemental Data: | | | | | | | | | | | | | | | | | | | | | | | | | | | | | | | | | | | | | | | | | | | | | | | | |
| Net assets, end of period/year (in 000s) | | $ | 9,149 | | | $ | 8,444 | | | $ | 6,002 | | | $ | 9,376 | | | $ | 10,386 | | | $ | 3,913 | | | $ | 2,577 | | | $ | 2,308 | | | $ | 2,448 | | | $ | 3,211 | | | $ | 3,847 | | | $ | 4,166 | |
| Ratios of expenses to average net assets: ^ | | | 1.33 | % | | | 1.35 | % | | | 1.42 | % | | | 1.45 | % | | | 1.89 | % | | | 1.84 | % | | | 2.08 | % | | | 2.10 | % | | | 2.17 | % | | | 2.21 | % | | | 2.64 | % | | | 2.59 | % |
| Ratios of net investment income (loss) to average net assets: ^ | | | 2.78 | % | | | 1.57 | % | | | 0.60 | % | | | 1.45 | % | | | 0.53 | % | | | 0.48 | % | | | 2.02 | % | | | 0.85 | % | | | (0.11 | )% | | | 0.70 | % | | | (0.21 | )% | | | (0.24 | )% |
| Portfolio turnover rate (1) | | | 40 | % | | | 74 | % | | | 101 | % | | | 110 | % | | | 110 | % | | | 97 | % | | | 40 | % | | | 74 | % | | | 101 | % | | | 110 | % | | | 110 | % | | | 97 | % |
| | | | | | | | | | | | | | | | | | | | | | | | | | | | | | | | | | | | | | | | | | | | | | | | | |
| * | The net investment income per share data was determined using the average shares outstanding throughout each period/year. |
| + | Assumes reinvestment of all dividends and distributions, if any. Aggregate (not annualized) total return is shown for any period shorter than one year. Total return does not reflect the deductions of taxes that a shareholder would pay on distributions or on the redemption of shares and does not reflect the impact of any sales charge. |
| ^ | Annualized for periods less than one year. |
| # | Includes adjustments in accordance with accounting principles generally accepted in the United States and, consequently, the net asset value for financial reporting purposes and the returns based upon those net asset values may differ from the net asset values and returns for shareholder transactions. Adjustments may apply to some but not all years and classes. |
| (1) | Not annualized for periods less than one year. |
See accompanying notes to financial statements.
| FINANCIAL HIGHLIGHTS |
| Dunham Small Cap Value Fund |
| |
| The table sets forth financial data for one share of beneficial interest outstanding throughout each period/year. |
| | | Class N | | | | | | | | | | | | | | | | | | | | | | | | | |
| | | Six Months Ended | | | Year Ended October 31, | | | | | | | | | | | | | | | | | | | | | | | | | |
| | | April 30, 2019 | | | 2018 | | | 2017 | | | 2016 | | | 2015 | | | 2014 | | | | | | | | | | | | | | | | | | | | | | | | | |
| | | (Unaudited) | | | | | | | | | | | | | | | | | | | | | | | | | | | | | | | | | | | | | | | | |
| Net asset value, beginning of period/year | | $ | 15.72 | | | $ | 17.47 | | | $ | 14.41 | | | $ | 14.27 | | | $ | 15.45 | | | $ | 14.65 | | | | | | | | | | | | | | | | | | | | | | | | | |
| Income (loss) from investment operations: | | | | | | | | | | | | | | | | | | | | | | | | | | | | | | | | | | | | | | | | | | | | | | | | |
| Net investment income (loss) * | | | 0.03 | | | | 0.00 | (a) | | | 0.07 | | | | 0.09 | | | | (0.01 | ) | | | 0.04 | | | | | | | | | | | | | | | | | | | | | | | | | |
| Net realized and unrealized gain (loss) | | | 0.47 | | | | 0.10 | (b) | | | 3.57 | | | | 0.54 | | | | (0.18 | ) | | | 1.45 | | | | | | | | | | | | | | | | | | | | | | | | | |
| Total income (loss) from investment operations | | | 0.50 | | | | 0.10 | | | | 3.64 | | | | 0.63 | | | | (0.19 | ) | | | 1.49 | | | | | | | | | | | | | | | | | | | | | | | | | |
| Less distributions: | | | | | | | | | | | | | | | | | | | | | | | | | | | | | | | | | | | | | | | | | | | | | | | | |
| Distributions from net investment income | | | — | | | | (0.04 | ) | | | (0.10 | ) | | | (0.01 | ) | | | (0.04 | ) | | | (0.02 | ) | | | | | | | | | | | | | | | | | | | | | | | | |
| Distributions from net realized gains | | | (1.70 | ) | | | (1.81 | ) | | | (0.48 | ) | | | (0.48 | ) | | | (0.95 | ) | | | (0.67 | ) | | | | | | | | | | | | | | | | | | | | | | | | |
| Total distributions | | | (1.70 | ) | | | (1.85 | ) | | | (0.58 | ) | | | (0.49 | ) | | | (0.99 | ) | | | (0.69 | ) | | | | | | | | | | | | | | | | | | | | | | | | |
| Net asset value, end of period/year | | $ | 14.52 | | | $ | 15.72 | | | $ | 17.47 | | | $ | 14.41 | | | $ | 14.27 | | | $ | 15.45 | | | | | | | | | | | | | | | | | | | | | | | | | |
| Total return + # | | | 5.06 | % | | | 0.37 | % | | | 25.55 | % | | | 4.58 | % | | | (1.59 | )% | | | 10.30 | % | | | | | | | | | | | | | | | | | | | | | | | | |
| Ratios/Supplemental Data: | | | | | | | | | | | | | | | | | | | | | | | | | | | | | | | | | | | | | | | | | | | | | | | | |
| Net assets, end of period/year (in 000s) | | $ | 40,170 | | | $ | 37,248 | | | $ | 22,710 | | | $ | 22,254 | | | $ | 22,068 | | | $ | 23,783 | | | | | | | | | | | | | | | | | | | | | | | | | |
| Ratios of expenses to average net assets: ^ | | | 1.68 | % | | | 1.54 | % | | | 1.32 | % | | | 1.48 | % | | | 1.79 | % | | | 1.45 | % | | | | | | | | | | | | | | | | | | | | | | | | |
| Ratios of net investment income (loss) to average net assets: (c) ! ^ | | | 0.36 | % | | | 0.01 | % | | | 0.45 | % | | | 0.64 | % | | | (0.10 | )% | | | 0.27 | % | | | | | | | | | | | | | | | | | | | | | | | | |
| Portfolio turnover rate (1) | | | 48 | % | | | 101 | % | | | 100 | % | | | 129 | % | | | 122 | % | | | 106 | % | | | | | | | | | | | | | | | | | | | | | | | | |
| | | | | | | | | | | | | | | | | | | | | | | | | | | | | | | | | | | | | | | | | | | | | | | | | |
| | | Class A | | | | | | Class C | |
| | | Six Months Ended | | | Year Ended October 31, | | | Six Months Ended | | | Year Ended October 31, | |
| | | April 30, 2019 | | | 2018 | | | 2017 | | | 2016 | | | 2015 | | | 2014 | | | April 30, 2019 | | | 2018 | | | 2017 | | | 2016 | | | 2015 | | | 2014 | |
| | | (Unaudited) | | | | | | | | | | | | | | | | | | (Unaudited) | | | | | | | | | | | | | | | | |
| Net asset value, beginning of period/year | | $ | 15.55 | | | $ | 17.31 | | | $ | 14.29 | | | $ | 14.18 | | | $ | 15.36 | | | $ | 14.59 | | | $ | 13.81 | | | $ | 15.67 | | | $ | 13.02 | | | $ | 13.06 | | | $ | 14.32 | | | $ | 13.74 | |
| Income (loss) from investment operations: | | | | | | | | | | | | | | | | | | | | | | | | | | | | | | | | | | | | | | | | | | | | | | | | |
| Net investment income (loss)* | | | 0.01 | | | | (0.04 | ) | | | 0.03 | | | | 0.05 | | | | (0.05 | ) | | | (0.00 | ) (a) | | | (0.04 | ) | | | (0.15 | ) | | | (0.08 | ) | | | (0.05 | ) | | | (0.15 | ) | | | (0.10 | ) |
| Net realized and unrealized gain (loss) | | | 0.46 | | | | 0.09 | (b) | | | 3.54 | | | | 0.54 | | | | (0.18 | ) | | | 1.44 | | | | 0.37 | | | | 0.10 | (b) | | | 3.21 | | | | 0.49 | | | | (0.16 | ) | | | 1.35 | |
| Total income (loss) from investment operations | | | 0.47 | | | | 0.05 | | | | 3.57 | | | | 0.59 | | | | (0.23 | ) | | | 1.44 | | | | 0.33 | | | | (0.05 | ) | | | 3.13 | | | | 0.44 | | | | (0.31 | ) | | | 1.25 | |
| Less distributions: | | | | | | | | | | | | | | | | | | | | | | | | | | | | | | | | | | | | | | | | | | | | | | | | |
| Distributions from net investment income | | | — | | | | (0.00 | ) (a) | | | (0.07 | ) | | | — | | | | — | | | | — | | | | — | | | | — | | | | — | | | | — | | | | — | | | | — | |
| Distributions from net realized gains | | | (1.70 | ) | | | (1.81 | ) | | | (0.48 | ) | | | (0.48 | ) | | | (0.95 | ) | | | (0.67 | ) | | | (1.70 | ) | | | (1.81 | ) | | | (0.48 | ) | | | (0.48 | ) | | | (0.95 | ) | | | (0.67 | ) |
| Total distributions | | | (1.70 | ) | | | (1.81 | ) | | | (0.55 | ) | | | (0.48 | ) | | | (0.95 | ) | | | (0.67 | ) | | | (1.70 | ) | | | (1.81 | ) | | | (0.48 | ) | | | (0.48 | ) | | | (0.95 | ) | | | (0.67 | ) |
| Net asset value, end of period/year | | $ | 14.32 | | | $ | 15.55 | | | $ | 17.31 | | | $ | 14.29 | | | $ | 14.18 | | | $ | 15.36 | | | $ | 12.44 | | | $ | 13.81 | | | $ | 15.67 | | | $ | 13.02 | | | $ | 13.06 | | | $ | 14.32 | |
| Total return + # | | | 4.90 | % | | | 0.08 | % | | | 25.26 | % | | | 4.33 | % | | | (1.83 | )% | | | 10.02 | % | | | 4.48 | % | | | (0.63 | )% | | | 24.29 | % | | | 3.52 | % | | | (2.56 | )% | | | 9.22 | % |
| Ratios/Supplemental Data: | | | | | | | | | | | | | | | | | | | | | | | | | | | | | | | | | | | | | | | | | | | | | | | | |
| Net assets, end of period/year (in 000s) | | $ | 8,791 | | | $ | 7,869 | | | $ | 4,569 | | | $ | 3,802 | | | $ | 3,801 | | | $ | 3,268 | | | $ | 2,705 | | | $ | 2,139 | | | $ | 2,611 | | | $ | 2,241 | | | $ | 2,383 | | | $ | 2,494 | |
| Ratios of expenses to average net assets: ^ | | | 1.93 | % | | | 1.79 | % | | | 1.57 | % | | | 1.73 | % | | | 2.04 | % | | | 1.70 | % | | | 2.68 | % | | | 2.54 | % | | | 2.32 | % | | | 2.48 | % | | | 2.79 | % | | | 2.45 | % |
| Ratios of net investment income (loss) to average net assets: (c) ! ^ | | | 0.11 | % | | | (0.26 | )% | | | 0.19 | % | | | 0.40 | % | | | (0.36 | )% | | | (0.06 | )% | | | (0.63 | )% | | | (1.04 | )% | | | (0.57 | )% | | | (0.36 | )% | | | (1.11 | )% | | | (0.70 | )% |
| Portfolio turnover rate (1) | | | 48 | % | | | 101 | % | | | 100 | % | | | 129 | % | | | 122 | % | | | 106 | % | | | 48 | % | | | 101 | % | | | 100 | % | | | 129 | % | | | 122 | % | | | 106 | % |
| | | | | | | | | | | | | | | | | | | | | | | | | | | | | | | | | | | | | | | | | | | | | | | | | |
| * | The net investment income (loss) per share data was determined using the average shares outstanding throughout each period/year. |
| + | Assumes reinvestment of all dividends and distributions, if any. Aggregate (not annualized) total return is shown for any period shorter than one year. Total return does not reflect the deductions of taxes that a shareholder would pay on distributions or on the redemption of shares and does not reflect the impact of any sales charge. |
| (a) | Represents less than $0.01 per share. |
| (b) | The amount of net realized and unrealized gain (loss) on investment per share for the year ended October 31, 2018 does not accord with the amounts in the Statements of Operations due to the timing of purchases and sales of Fund shares in relation to fluctuating market values. |
| (c) | Does not Include the expenses of other investment companies in which the Fund invests. |
| # | Includes adjustments in accordance with accounting principles generally accepted in the United States and, consequently, the net asset value for financial reporting purposes and the returns based upon those net asset values may differ from the net asset values and returns for shareholder transactions. Adjustments may apply to some but not all years and classes. |
| ! | Recognition of net investment income (loss) is affected by the timing and declaration of dividends by underlying funds in which the Fund invests. |
| ^ | Annualized for periods less than one year. |
| (1) | Not annualized for periods less than one year. |
See accompanying notes to financial statements.
| FINANCIAL HIGHLIGHTS |
| Dunham Small Cap Growth Fund |
| |
| The table sets forth financial data for one share of beneficial interest outstanding throughout each period/year. |
| | | Class N | | | | | | | | | | | | | | | | | | | | | | | | | |
| | | Six Months Ended | | | Year Ended October 31, | | | | | | | | | | | | | | | | | | | | | | | | | |
| | | April 30, 2019 | | | 2018 | | | 2017 | | | 2016 | | | 2015 | | | 2014 | | | | | | | | | | | | | | | | | | | | | | | | | |
| | | (Unaudited) | | | | | | | | | | | | | | | | | | | | | | | | | | | | | | | | | | | | | | | | |
| Net asset value, beginning of period/year | | $ | 20.28 | | | $ | 20.31 | | | $ | 15.34 | | | $ | 17.08 | | | $ | 17.71 | | | $ | 20.62 | | | | | | | | | | | | | | | | | | | | | | | | | |
| Income (loss) from investment operations: | | | | | | | | | | | | | | | | | | | | | | | | | | | | | | | | | | | | | | | | | | | | | | | | |
| Net investment loss* | | | (0.12 | ) | | | (0.27 | ) | | | (0.15 | ) | | | (0.06 | ) | | | (0.24 | ) | | | (0.29 | ) | | | | | | | | | | | | | | | | | | | | | | | | |
| Net realized and unrealized gain (loss) (a) | | | 0.83 | | | | 3.20 | | | | 5.12 | | | | (0.24 | ) | | | 1.19 | | | | 1.11 | | | | | | | | | | | | | | | | | | | | | | | | | |
| Total income (loss) from investment operations | | | 0.71 | | | | 2.93 | | | | 4.97 | | | | (0.30 | ) | | | 0.95 | | | | 0.82 | | | | | | | | | | | | | | | | | | | | | | | | | |
| Less distributions: | | | | | | | | | | | | | | | | | | | | | | | | | | | | | | | | | | | | | | | | | | | | | | | | |
| Distributions from net investment income | | | | | | | | | | | | | | | | | | | | | | | | | | | | | | | | | | | | | | | | | | | | | | | | |
| Distributions from net realized gains | | | (3.80 | ) | | | (2.96 | ) | | | — | | | | (1.40 | ) | | | (1.58 | ) | | | (3.73 | ) | | | | | | | | | | | | | | | | | | | | | | | | |
| Tax return of capital | | | — | | | | — | | | | — | | | | (0.04 | ) | | | — | | | | — | | | | | | | | | | | | | | | | | | | | | | | | | |
| Total distributions | | | (3.80 | ) | | | (2.96 | ) | | | — | | | | (1.44 | ) | | | (1.58 | ) | | | (3.73 | ) | | | | | | | | | | | | | | | | | | | | | | | | |
| Net asset value, end of period/year | | $ | 17.19 | | | $ | 20.28 | | | $ | 20.31 | | | $ | 15.34 | | | $ | 17.08 | | | $ | 17.71 | | | | | | | | | | | | | | | | | | | | | | | | | |
| Total return + # | | | 8.90 | % | | | 16.02 | % | | | 32.40 | % | | | (1.88 | )% | | | 5.36 | % | | | 3.64 | % | | | | | | | | | | | | | | | | | | | | | | | | |
| Ratios/Supplemental Data: | | | | | | | | | | | | | | | | | | | | | | | | | | | | | | | | | | | | | | | | | | | | | | | | |
| Ratios/Supplemental Data: Net assets, end of period/year (in 000s) | | $ | 38,962 | | | $ | 33,882 | | | $ | 24,641 | | | $ | 26,010 | | | $ | 23,152 | | | $ | 21,153 | | | | | | | | | | | | | | | | | | | | | | | | | |
| Ratios of expenses to average net assets: | | | | | | | | | | | | | | | | | | | | | | | | | | | | | | | | | | | | | | | | | | | | | | | | |
| Before fees paid indirectly ^ | | | 2.04 | % | | | 1.94 | % | | | 1.36 | % | | | 1.23 | % | | | 1.58 | % | | | 1.84 | % | | | | | | | | | | | | | | | | | | | | | | | | |
| After fees paid indirectly ^ | | | 2.03 | % | | | 1.93 | % | | | 1.35 | % | | | 1.23 | % | | | 1.58 | % | | | 1.84 | % | | | | | | | | | | | | | | | | | | | | | | | | |
| Ratios of net investment loss to average net assets: | | | | | | | | | | | | | | | | | | | | | | | | | | | | | | | | | | | | | | | | | | | | | | | | |
| Before fees paid indirectly ^ | | | (1.49 | )% | | | (1.31 | )% | | | (0.86 | )% | | | (0.38 | )% | | | (1.30 | )% | | | (1.61 | )% | | | | | | | | | | | | | | | | | | | | | | | | |
| After fees paid indirectly ^ | | | (1.48 | )% | | | (1.28 | )% | | | (0.85 | )% | | | (0.38 | )% | | | (1.30 | )% | | | (1.61 | )% | | | | | | | | | | | | | | | | | | | | | | | | |
| Portfolio turnover rate (1) | | | 93 | % | | | 190 | % | | | 174 | % | | | 181 | % | | | 138 | % | | | 192 | % | | | | | | | | | | | | | | | | | | | | | | | | |
| | | | | | | | | | | | | | | | | | | | | | | | | | | | | | | | | | | | | | | | | | | | | | | | | |
| | | Class A | | | | | | Class C | |
| | | Six Months Ended | | | Year Ended October 31, | | | Six Months Ended | | | Year Ended October 31, | |
| | | April 30, 2019 | | | 2018 | | | 2017 | | | 2016 | | | 2015 | | | 2014 | | | April 30, 2019 | | | 2018 | | | 2017 | | | 2016 | | | 2015 | | | 2014 | |
| | | (Unaudited) | | | | | | | | | | | | | | | | | | (Unaudited) | | | | | | | | | | | | | | | | |
| Net asset value, beginning of period/year | | $ | 19.42 | | | $ | 19.62 | | | $ | 14.85 | | | $ | 16.62 | | | $ | 17.31 | | | $ | 20.28 | | | $ | 16.00 | | | $ | 16.77 | | | $ | 12.79 | | | $ | 14.61 | | | $ | 15.51 | | | $ | 18.66 | |
| Income (loss) from investment operations: | | | | | | | | | | | | | | | | | | | | | | | | | | | | | | | | | | | | | | | | | | | | | | | | |
| Net investment loss* | | | (0.13 | ) | | | (0.31 | ) | | | (0.19 | ) | | | (0.10 | ) | | | (0.27 | ) | | | (0.34 | ) | | | (0.15 | ) | | | (0.37 | ) | | | (0.28 | ) | | | (0.18 | ) | | | (0.36 | ) | | | (0.42 | ) |
| Net realized and unrealized gain (loss) (a) | | | 0.74 | | | | 3.07 | | | | 4.96 | | | | (0.23 | ) | | | 1.16 | | | | 1.10 | | | | 0.40 | | | | 2.56 | | | | 4.26 | | | | (0.20 | ) | | | 1.04 | | | | 1.00 | |
| Total income (loss) from investment operations | | | 0.61 | | | | 2.76 | | | | 4.77 | | | | (0.33 | ) | | | 0.89 | | | | 0.76 | | | | 0.25 | | | | 2.19 | | | | 3.98 | | | | (0.38 | ) | | | 0.68 | | | | 0.58 | |
| Less distributions: | | | | | | | | | | | | | | | | | | | | | | | | | | | | | | | | | | | | | | | | | | | | | | | | |
| Distributions from net investment income | | | | | | | | | | | | | | | | | | | | | | | | | | | | | | | | | | | | | | | | | | | | | | | | |
| Distributions from net realized gains | | | (3.80 | ) | | | (2.96 | ) | | | — | | | | (1.40 | ) | | | (1.58 | ) | | | (3.73 | ) | | | (3.80 | ) | | | (2.96 | ) | | | — | | | | (1.40 | ) | | | (1.58 | ) | | | (3.73 | ) |
| Tax return of capital | | | — | | | | — | | | | — | | | | (0.04 | ) | | | — | | | | — | | | | — | | | | — | | | | — | | | | (0.04 | ) | | | — | | | | — | |
| Total distributions | | | (3.80 | ) | | | (2.96 | ) | | | — | | | | (1.44 | ) | | | (1.58 | ) | | | (3.73 | ) | | | (3.80 | ) | | | (2.96 | ) | | | — | | | | (1.44 | ) | | | (1.58 | ) | | | (3.73 | ) |
| Net asset value, end of period/year | | $ | 16.23 | | | $ | 19.42 | | | $ | 19.62 | | | $ | 14.85 | | | $ | 16.62 | | | $ | 17.31 | | | $ | 12.45 | | | $ | 16.00 | | | $ | 16.77 | | | $ | 12.79 | | | $ | 14.61 | | | $ | 15.51 | |
| Total return + # | | | 8.75 | % | | | 15.69 | % | | | 32.12 | % | | | (2.12 | )% | | | 5.12 | % | | | 3.36 | % | | | 8.36 | % | | | 14.84 | % | | | 31.12 | % | | | (2.82 | )% | | | 4.29 | % | | | 2.56 | % |
| Ratios/Supplemental Data: | | | | | | | | | | | | | | | | | | | | | | | | | | | | | | | | | | | | | | | | | | | | | | | | |
| Net assets, end of period/year (in 000s) | | $ | 11,196 | | | $ | 10,799 | | | $ | 6,925 | | | $ | 5,540 | | | $ | 6,326 | | | $ | 6,443 | | | $ | 2,641 | | | $ | 2,720 | | | $ | 2,644 | | | $ | 2,155 | | | $ | 3,163 | | | $ | 3,165 | |
| Ratios of expenses to average net assets: | | | | | | | | | | | | | | | | | | | | | | | | | | | | | | | | | | | | | | | | | | | | | | | | |
| Before fees paid indirectly ^ | | | 2.29 | % | | | 2.19 | % | | | 1.61 | % | | | 1.48 | % | | | 1.83 | % | | | 2.09 | % | | | 3.05 | % | | | 2.94 | % | | | 2.36 | % | | | 2.23 | % | | | 2.58 | % | | | 2.84 | % |
| After fees paid indirectly ^ | | | 2.28 | % | | | 2.18 | % | | | 1.60 | % | | | 1.48 | % | | | 1.83 | % | | | 2.09 | % | | | 3.03 | % | | | 2.93 | % | | | 2.35 | % | | | 2.23 | % | | | 2.58 | % | | | 2.84 | % |
| Ratios of net investment loss to average net assets: | | | | | | | | | | | | | | | | | | | | | | | | | | | | | | | | | | | | | | | | | | | | | | | | |
| Before fees paid indirectly ^ | | | (1.73 | )% | | | (1.56 | )% | | | (1.13 | )% | | | (0.69 | )% | | | (1.53 | )% | | | (1.86 | )% | | | (2.48 | )% | | | (2.30 | )% | | | (1.89 | )% | | | (1.45 | )% | | | (2.29 | )% | | | (2.61 | )% |
| After fees paid indirectly ^ | | | (1.72 | )% | | | (1.55 | )% | | | (1.12 | )% | | | (0.69 | )% | | | (1.53 | )% | | | (1.86 | )% | | | (2.47 | )% | | | (2.29 | )% | | | (1.88 | )% | | | (1.45 | )% | | | (2.29 | )% | | | (2.61 | )% |
| Portfolio turnover rate (1) | | | 93 | % | | | 190 | % | | | 174 | % | | | 181 | % | | | 138 | % | | | 192 | % | | | 93 | % | | | 190 | % | | | 174 | % | | | 181 | % | | | 138 | % | | | 192 | % |
| | | | | | | | | | | | | | | | | | | | | | | | | | | | | | | | | | | | | | | | | | | | | | | | | |
| * | The net investment income per share data was determined using the average shares outstanding throughout each period/year. |
| + | Assumes reinvestment of all dividends and distributions, if any. Aggregate (not annualized) total return is shown for any period shorter than one year. Total return does not reflect the deductions of taxes that a shareholder would pay on distributions or on the redemption of shares and does not reflect the impact of any sales charge. |
| # | Includes adjustments in accordance with accounting principles generally accepted in the United States and, consequently, the net asset value for financial reporting purposes and the returns based upon those net asset values may differ from the net asset values and returns for shareholder transactions. Adjustments may apply to some but not all years and classes. |
| (a) | The amount of net realized and unrealized gain (loss) on investment per share for the year ended October 31, 2016 does not accord with the amounts in the Statements of Operations due to the timing of purchases and sales of Fund shares in relation to fluctuating market values. |
| ^ | Annualized for periods less than one year. |
| (1) | Not annualized for periods less than one year. |
See accompanying notes to financial statements.
| FINANCIAL HIGHLIGHTS |
| Dunham Emerging Markets Stock Fund |
| |
| The table sets forth financial data for one share of beneficial interest outstanding throughout each period/year. |
| | | Class N | | | | | | | | | | | | | | | | | | | | | | | | | |
| | | Six Months Ended | | | Year Ended October 31, | | | | | | | | | | | | | | | | | | | | | | | | | |
| | | April 30, 2019 | | | 2018 | | | 2017 | | | 2016 | | | 2015 | | | 2014 | | | | | | | | | | | | | | | | | | | | | | | | | |
| | | (Unaudited) | | | | | | | | | | | | | | | | | | | | | | | | | | | | | | | | | | | | | | | | |
| Net asset value, beginning of period/year | | $ | 12.85 | | | $ | 15.94 | | | $ | 12.73 | | | $ | 11.97 | | | $ | 14.75 | | | $ | 14.66 | | | | | | | | | | | | | | | | | | | | | | | | | |
| Income (loss) from investment operations: | | | | | | | | | | | | | | | | | | | | | | | | | | | | | | | | | | | | | | | | | | | | | | | | |
| Net investment income * | | | 0.06 | | | | 0.27 | | | | 0.17 | | | | 0.20 | | | | 0.08 | | | | 0.20 | | | | | | | | | | | | | | | | | | | | | | | | | |
| Net realized and unrealized gain (loss) ** | | | 1.53 | | | | (3.20 | ) | | | 3.28 | | | | 0.64 | | | | (2.67 | ) | | | (0.11 | ) | | | | | | | | | | | | | | | | | | | | | | | | |
| Total income (loss) from investment operations | | | 1.59 | | | | (2.93 | ) | | | 3.45 | | | | 0.84 | | | | (2.59 | ) | | | 0.09 | | | | | | | | | | | | | | | | | | | | | | | | | |
| Less distributions: | | | | | | | | | | | | | | | | | | | | | | | | | | | | | | | | | | | | | | | | | | | | | | | | |
| Distributions from net investment income | | | (0.25 | ) | | | (0.16 | ) | | | (0.24 | ) | | | (0.08 | ) | | | (0.19 | ) | | | — | | | | | | | | | | | | | | | | | | | | | | | | | |
| Total distributions | | | (0.25 | ) | | | (0.16 | ) | | | (0.24 | ) | | | (0.08 | ) | | | (0.19 | ) | | | — | | | | | | | | | | | | | | | | | | | | | | | | | |
| Net asset value, end of period/year | | $ | 14.19 | | | $ | 12.85 | | | $ | 15.94 | | | $ | 12.73 | | | $ | 11.97 | | | $ | 14.75 | | | | | | | | | | | | | | | | | | | | | | | | | |
| Total return + # | | | 12.62 | % | | | (18.57 | )% | | | 27.69 | % | | | 7.13 | % | | | (17.73 | )% | | | 0.61 | % | | | | | | | | | | | | | | | | | | | | | | | | |
| Ratios/Supplemental Data: | | | | | | | | | | | | | | | | | | | | | | | | | | | | | | | | | | | | | | | | | | | | | | | | |
| Net assets, end of period/year (in 000s) | | $ | 56,697 | | | $ | 53,261 | | | $ | 51,365 | | | $ | 46,481 | | | $ | 42,831 | | | $ | 35,872 | | | | | | | | | | | | | | | | | | | | | | | | | |
| Ratios of expenses to average net assets: ^ | | | 1.20 | % | | | 1.19 | % | | | 1.75 | % | | | 1.27 | % | | | 1.76 | % | | | 1.29 | % | | | | | | | | | | | | | | | | | | | | | | | | |
| Ratios of net investment income to average net assets: ^ | | | 0.85 | % | | | 1.79 | % | | | 1.18 | % | | | 1.73 | % | | | 0.59 | % | | | 1.39 | % | | | | | | | | | | | | | | | | | | | | | | | | |
| Portfolio turnover rate (1) | | | 93 | % | | | 66 | % | | | 74 | % | | | 97 | % | | | 137 | % | | | 108 | % | | | | | | | | | | | | | | | | | | | | | | | | |
| | | | | | | | | | | | | | | | | | | | | | | | | | | | | | | | | | | | | | | | | | | | | | | | | |
| | | Class A | | | | | | Class C | |
| | | Six Months Ended | | | Year Ended October 31, | | | Six Months Ended | | | Year Ended October 31, | |
| | | April 30, 2019 | | | 2018 | | | 2017 | | | 2016 | | | 2015 | | | 2014 | | | April 30, 2019 | | | 2018 | | | 2017 | | | 2016 | | | 2015 | | | 2014 | |
| | | (Unaudited) | | | | | | | | | | | | | | | | | | (Unaudited) | | | | | | | | | | | | | | | | |
| Net asset value, beginning of period/year | | $ | 12.56 | | | $ | 15.58 | | | $ | 12.45 | | | $ | 11.71 | | | $ | 14.44 | | | $ | 14.39 | | | $ | 11.85 | | | $ | 14.74 | | | $ | 11.82 | | | $ | 11.14 | | | $ | 13.76 | | | $ | 13.82 | |
| Income (loss) from investment operations: | | | | | | | | | | | | | | | | | | | | | | | | | | | | | | | | | | | | | | | | | | | | | | | | |
| Net investment income (loss)* | | | 0.04 | | | | 0.23 | | | | 0.14 | | | | 0.17 | | | | 0.05 | | | | 0.16 | | | | (0.01 | ) | | | 0.11 | | | | 0.02 | | | | 0.08 | | | | (0.06 | ) | | | 0.04 | |
| Net realized and unrealized gain (loss) ** | | | 1.50 | | | | (3.13 | ) | | | 3.20 | | | | 0.62 | | | | (2.62 | ) | | | (0.11 | ) | | | 1.42 | | | | (2.94 | ) | | | 3.04 | | | | 0.60 | | | | (2.49 | ) | | | (0.10 | ) |
| Total income (loss) from investment operations | | | 1.54 | | | | (2.90 | ) | | | 3.34 | | | | 0.79 | | | | (2.57 | ) | | | 0.05 | | | | 1.41 | | | | (2.83 | ) | | | 3.06 | | | | 0.68 | | | | (2.55 | ) | | | (0.06 | ) |
| Less distributions: | | | | | | | | | | | | | | | | | | | | | | | | | | | | | | | | | | | | | | | | | | | | | | | | |
| Distributions from net investment income | | | (0.22 | ) | | | (0.12 | ) | | | (0.21 | ) | | | (0.05 | ) | | | (0.16 | ) | | | — | | | | (0.12 | ) | | | (0.06 | ) | | | (0.14 | ) | | | — | | | | (0.07 | ) | | | — | |
| Total distributions | | | (0.22 | ) | | | (0.12 | ) | | | (0.21 | ) | | | (0.05 | ) | | | (0.16 | ) | | | — | | | | (0.12 | ) | | | (0.06 | ) | | | (0.14 | ) | | | — | | | | (0.07 | ) | | | — | |
| Net asset value, end of period/year | | $ | 13.88 | | | $ | 12.56 | | | $ | 15.58 | | | $ | 12.45 | | | $ | 11.71 | | | $ | 14.44 | | | $ | 13.14 | | | $ | 11.85 | | | $ | 14.74 | | | $ | 11.82 | | | $ | 11.14 | | | $ | 13.76 | |
| Total return + # | | | 12.51 | % | | | (18.73 | )% | | | 27.36 | % | | | 6.84 | % | | | (17.94 | )% | | | 0.35 | % | | | 12.03 | % | | | (19.30 | )% | | | 26.31 | % | | | 6.10 | % | | | (18.60 | )% | | | (0.43 | )% |
| Ratios/Supplemental Data: | | | | | | | | | | | | | | | | | | | | | | | | | | | | | | | | | | | | | | | | | | | | | | | | |
| Net assets, end of period/year (in 000s) | | $ | 12,468 | | | $ | 9,662 | | | $ | 8,242 | | | $ | 6,348 | | | $ | 4,594 | | | $ | 4,036 | | | $ | 3,245 | | | $ | 3,163 | | | $ | 3,467 | | | $ | 3,380 | | | $ | 3,216 | | | $ | 3,593 | |
| Ratios of expenses to average net assets: ^ | | | 1.45 | % | | | 1.44 | % | | | 2.00 | % | | | 1.52 | % | | | 2.01 | % | | | 1.54 | % | | | 2.20 | % | | | 2.19 | % | | | 2.75 | % | | | 2.27 | % | | | 2.76 | % | | | 2.29 | % |
| Ratios of net investment income (loss) to average net assets: ^ | | | 0.58 | % | | | 1.54 | % | | | 0.98 | % | | | 1.46 | % | | | 0.40 | % | | | 1.14 | % | | | (0.16 | )% | | | 0.77 | % | | | 0.10 | % | | | 0.77 | % | | | (0.48 | )% | | | 0.34 | % |
| Portfolio turnover rate (1) | | | 93 | % | | | 66 | % | | | 74 | % | | | 97 | % | | | 137 | % | | | 108 | % | | | 93 | % | | | 66 | % | | | 74 | % | | | 97 | % | | | 137 | % | | | 108 | % |
| | | | | | | | | | | | | | | | | | | | | | | | | | | | | | | | | | | | | | | | | | | | | | | | | |
| * | The net investment income (loss) per share data was determined using the average shares outstanding throughout each period/year. |
| ** | The amount of net realized and unrealized loss on investment per share for the year ended October 31, 2014 does not accord with the amounts in the Statements of Operations due to the timing of purchases and sales of Fund shares in relation to fluctuating market values. |
| + | Assumes reinvestment of all dividends and distributions, if any. Aggregate (not annualized) total return is shown for any period shorter than one year. Total return does not reflect the deductions of taxes that a shareholder would pay on distributions or on the redemption of shares and does not reflect the impact of any sales charge. |
| # | Includes adjustments in accordance with accounting principles generally accepted in the United States and, consequently, the net asset value for financial reporting purposes and the returns based upon those net asset values may differ from the net asset values and returns for shareholder transactions. Adjustments may apply to some but not all years and classes. |
| ^ | Annualized for periods less than one year. |
| (1) | Not annualized for periods less than one year. |
See accompanying notes to financial statements.
| NOTES TO FINANCIAL STATEMENTS (Unaudited) |
| April 30, 2019 |
Each Dunham Fund (each, a “Fund” and collectively the “Funds”) is a series of shares of beneficial interest in the Dunham Funds (the “Trust”), a Delaware Business Trust organized on November 28, 2007 and registered under the Investment Company Act of 1940, as amended, (the “1940 Act”) as an open-end management investment company. Prior to that date, the Dunham Funds were a series of AdvisorOne Funds, also a Delaware Business Trust. The Dunham Funds currently consist of fourteen funds: Dunham Floating Rate Bond Fund; Dunham Long/Short Credit Fund; Dunham Corporate/Government Bond Fund; Dunham Monthly Distribution Fund; Dunham Dynamic Macro Fund; Dunham High-Yield Bond Fund ; Dunham International Opportunity Bond Fund; Dunham Large Cap Value Fund; Dunham Focused Large Cap Growth Fund; Dunham International Stock Fund; Dunham Real Estate Stock Fund; Dunham Small Cap Value Fund; Dunham Small Cap Growth Fund; and Dunham Emerging Markets Stock Fund. With the exception of Dunham Focused Large Cap Growth Fund, Dunham International Opportunity Bond Fund, and Dunham Real Estate Stock Fund, the remaining Funds are diversified funds within the meaning of the 1940 Act.
| Fund | Primary Objective |
| Dunham Floating Rate Bond Fund (“Floating Rate Bond”) | High level of current income |
| Dunham Long/Short Credit Fund (“Long/Short Credit”) | Maximize total return under varying market conditions through both current income and capital appreciation |
| Dunham Corporate/Government Bond Fund (“Corporate/Government Bond”) | Current income and capital appreciation |
| Dunham Monthly Distribution Fund (“Monthly Distribution”) | Positive returns in rising and falling market environments |
| Dunham Dynamic Macro Fund (“Dynamic Macro”) | Maximize total return from capital appreciation and dividends |
| Dunham High-Yield Bond Fund (“High-Yield Bond”) | High level of current income |
| Dunham International Opportunity Bond Fund (“International Opportunity Bond”) | High level of current income |
| Dunham Large Cap Value Fund (“Large Cap Value”) | Maximize total return from capital appreciation and dividends |
| Dunham Focused Large Cap Growth Fund (“Focused Large Cap Growth”) | Maximize capital appreciation |
| Dunham International Stock Fund (“International Stock”) | Maximize total return from capital appreciation and dividends |
| Dunham Real Estate Stock Fund (“Real Estate Stock”) | Maximize total return from capital appreciation and dividends |
| Dunham Small Cap Value Fund (“Small Cap Value”) | Maximize total return from capital appreciation and income |
| Dunham Small Cap Growth Fund (“Small Cap Growth”) | Maximize capital appreciation |
| Dunham Emerging Markets Stock Fund (“Emerging Markets Stock”) | Maximize capital appreciation |
Currently, each Fund offers Class A, Class C and Class N shares. Each class represents an interest in the same assets of the applicable Fund with the only differences being that Class A shares are subject to a front-end sales charge and an annual service fee, Class C shares are subject to an annual service and distribution fee and Class N shares have a higher minimum investment amount. Investors that purchase $1,000,000 or more of Class A shares will not pay any initial sales charge on the purchase. However, purchases of $1,000,000 or more of Class A shares may be subject to a contingent deferred sales charge (“CDSC”) on shares redeemed during the first 18 months after their purchase in the amount of the commissions paid on the shares redeemed. The Class C and Class N shares, with the exception of Monthly Distribution, High-Yield Bond , Dynamic Macro, Focused Large Cap Growth, Floating Rate Bond, and International Opportunity Bond commenced operations on December 10, 2004 and were formed as a result of tax-free conversions from common trusts. The conversions were accomplished through the exchange of the common trust securities, cash, and other assets for equivalent value of the Funds’ shares. High-Yield Bond Class C and Class N shares commenced operations on July 1, 2005. The Class A shares for all Funds except Monthly Distribution, Dynamic Macro, Focused Large Cap Growth, Floating Rate Bond, and International Opportunity Bond commenced operations on January 3, 2007. Monthly Distribution’s Predecessor Fund’s Class A shares and Class C shares commenced operations on December 26, 2000. Monthly Distribution’s Class N shares commenced operations on September 29, 2008. Dynamic Macro commenced operations on April 30, 2010. Focused Large Cap Growth commenced operations on December 8, 2011. Floating Rate Bond and International Opportunity Bond commenced operations on November 1, 2013.
| 2. | SUMMARY OF SIGNIFICANT ACCOUNTING POLICIES |
The preparation of financial statements in conformity with accounting principles generally accepted in the United States of America (“GAAP”) requires management to make estimates and assumptions that affect the reported amounts of assets and liabilities and disclosure of contingent assets and liabilities at the date of the financial statements and the reported amounts of increases and decreases in net assets from operations during the reporting period. Actual results could differ from those estimates. The Funds are investment companies and accordingly follow the investment company accounting and reporting guidance of the Financial Accounting Standards Board (FASB) Accounting Standard Codification Topic 946 “Financial Services – Investment Companies” including FASB Accounting Standard Update ASU 2013-08.
| NOTES TO FINANCIAL STATEMENTS (Unaudited) |
| April 30, 2019 (Continued) |
The following is a summary of significant accounting policies followed by the Funds in preparation of their financial statements.
a. Security Valuation – In determining each Fund’s Net Asset Value (“NAV”) per share, equity securities for which market quotations are readily available are valued at current market value using the last reported sales price. NASDAQ traded securities are valued using the NASDAQ official closing price (“NOCP”). If no sale price is reported, the mean between the current bid and ask price is used. If market quotations are not readily available, then securities are valued at fair value as determined by the Board of Trustees of the Trust (the “Board”) (or its delegate). U.S. Government and Agency securities are valued at the mean between the most recent bid and ask prices. Short-term debt instruments with a remaining maturity of more than 60 days, intermediate and long-term bonds, convertible bonds, bank loans and other debt securities are generally valued on the basis of dealer supplied quotations or by a pricing system selected by Dunham & Associates Investment Counsel, Inc. (“Dunham & Associates” or the “Adviser”) and approved by the Board. Where such prices are not available, valuations will be obtained from brokers who are market makers for such securities. However, in circumstances where the Adviser deems it appropriate to do so, the mean of the bid and ask prices for over-the-counter securities or the last available sale price for exchange-traded debt securities may be used. Where no last sale price for exchange traded debt securities is available, the mean of the bid and ask prices may be used. Short-term debt securities with a remaining maturity of 60 days or less may be valued at amortized cost, provided such valuations represent fair value.
Options are valued at the last reported sale price at the close of the exchange on which the security is primarily traded. If no sales are reported for the exchange-traded options, or the options are not exchange-traded, then they are valued at the mean of their most recent quoted bid and ask price.
Futures and future options are valued daily at the final settled price or, in the absence of a settled price, at the mean between the current bid and ask prices on the day of valuation.
Swap transactions are valued through an independent pricing service or at fair value based on daily price reporting from the swap counterparty issuing the swap. Total return swaps on securities listed on an exchange shall be valued at the last quoted sales price or, in the absence of a sale, at the mean between the current bid and ask prices.
Trading in securities on Far East securities exchanges and over-the-counter markets is normally completed well before the close of business on each business day in New York (i.e., a day on which the New York Stock Exchange (“NYSE”) is open). In addition, Far East securities trading generally, or in a particular country or countries, may not take place on all business days in New York. Furthermore, trading takes place in Japanese markets on certain Saturdays and in various foreign markets on days, which are not business days in New York, and on which a Fund’s NAV is not calculated. Each Fund calculates the NAV per share, and therefore effects sales, redemptions and repurchases of its shares, as of the close of regular trading on the NYSE once on each day on which the NYSE is open. Such calculation may not take place contemporaneously with the determination of the prices of the majority of the portfolio securities used in such calculation. If events that may materially affect the value of such securities occur between the time when their price is determined and the time when the Fund’s NAV is calculated, such securities may be valued at fair value as determined in good faith in accordance with procedures approved by the Board.
Securities in which the Funds invest may be traded in markets that close before 4:00 p.m. Eastern Time (“ET”). Normally, developments that occur between the close of the foreign markets and 4:00 p.m. ET will not be reflected in a Fund’s NAV. However, management may determine that such developments are so significant that they will materially affect the value of a Fund’s securities, and the Fund may adjust the previous closing prices to reflect what the Board believes to be the fair value of these securities as of 4:00 p.m. ET. Both International Stock and Emerging Markets Stock utilize fair value prices as provided by an independent pricing vendor on a daily basis for those securities traded on a foreign exchange.
Securities for which current market quotations are not readily available, or for which quotations are not deemed to be representative of market values, are valued at fair value as determined in good faith by or under the direction of the Board in accordance with the Trust’s Portfolio Securities Valuation Procedures (the “Procedures”). The Procedures consider, among others, the following factors to determine a security’s fair value: the nature and pricing history (if any) of the security; whether any dealer quotations for the security are available; and possible valuation methodologies that could be used to determine the fair value of the security.
Valuation of Fund of Funds – The Funds may invest in portfolios of open-end investment companies. Open-end investment companies are valued at their respective net asset values as reported by such investment companies. Open-end investment companies value securities in their portfolios for which market quotations are readily available at their market values (generally the last reported sale price) and all other securities and assets at their fair value based on the methods established by the board of directors of the open-end investment companies.
| NOTES TO FINANCIAL STATEMENTS (Unaudited) |
| April 30, 2019 (Continued) |
The Funds utilize various methods to measure the fair value of their investments on a recurring basis. GAAP establishes a hierarchy that prioritizes inputs to valuation methods. The three levels of input are:
Level 1 –Unadjusted quoted prices in active markets for identical assets and liabilities.
Level 2 – Observable inputs other than quoted prices included in Level 1 that are observable for the asset or liability, either directly or indirectly. These inputs may include quoted prices for the identical instrument on an inactive market, prices for similar instruments, interest rates, prepayment speeds, credit risk, yield curves, default rates and similar data.
Level 3 –Unobservable inputs for the asset or liability, to the extent relevant observable inputs are not available, representing the Funds’ own assumptions about the assumptions a market participant would use in valuing the asset or liability, and would be based on the best information available.
The availability of observable inputs can vary from security to security and is affected by a wide variety of factors, including, for example, the type of security, whether the security is new and not yet established in the marketplace, the liquidity of markets, and other characteristics particular to the security. To the extent that valuation is based on models or inputs that are less observable or unobservable in the market, the determination of fair value requires more judgment. Accordingly, the degree of judgment exercised in determining fair value is greatest for instruments categorized in Level 3.
The inputs used to measure fair value may fall into different levels of the fair value hierarchy. In such cases, for disclosure purposes, the level in the fair value hierarchy within which the fair value measurement falls in its entirety, is determined based on the lowest level input that is significant to the fair value measurement in its entirety.
The inputs or methodology used for valuing securities are not necessarily an indication of the risk associated with investing in those securities. The following tables summarize the inputs used as of April 30, 2019 for the Funds’ assets and liabilities measured at fair value:
| Floating Rate Bond | | | | | | | | | | | | |
| | | | | | | | | | | | | |
| Assets | | Level 1 | | | Level 2 | | | Level 3 | | | Total | |
| Bank Loans * | | $ | — | | | $ | 172,222,293 | | | $ | — | | | $ | 172,222,293 | |
| Bonds & Notes * | | | — | | | | 7,354,373 | | | | — | | | | 7,354,373 | |
| Rights | | | — | | | | 8,142 | | | | — | | | | 8,142 | |
| U.S. Government | | | — | | | | 1,869,290 | | | | — | | | | 1,869,290 | |
| Short-Term Investment | | | 9,483,324 | | | | — | | | | — | | | | 9,483,324 | |
| Total | | $ | 9,483,324 | | | $ | 181,454,098 | | | $ | — | | | $ | 190,937,422 | |
| | | | | | | | | | | | | | | | | |
| Long/Short Credit | | | | | | | | | | | | |
| | | | | | | | | | | | | |
| Assets | | Level 1 | | | Level 2 | | | Level 3 | | | Total | |
| Common Stock * | | $ | 19,600 | | | $ | — | | | $ | — | | | $ | 19,600 | |
| Bonds & Notes * | | | — | | | | 21,095,855 | | | | — | | | | 21,095,855 | |
| Bank Loans | | | — | | | | 2,045,183 | | | | — | | | | 2,045,183 | |
| U.S. Government | | | — | | | | 37,680,760 | | | | — | | | | 37,680,760 | |
| Short-Term Investment | | | 9,422,912 | | | | — | | | | — | | | | 9,422,912 | |
| Total Assets | | $ | 9,442,512 | | | $ | 60,821,798 | | | $ | — | | | $ | 70,264,310 | |
| Assets - Derivatives | | | | | | | | | | | | | | | | |
| Swap Contracts | | $ | — | | | $ | 15,623 | | | $ | — | | | $ | 15,623 | |
| Total Asset Derivatives | | $ | — | | | $ | 15,623 | | | $ | — | | | $ | 15,623 | |
| Liabilities - Derivatives | | | | | | | | | | | | | | | | |
| Futures | | $ | 163,164 | | | $ | — | | | $ | — | | | $ | 163,164 | |
| Swap Contracts | | | — | | | | 115,665 | | | | — | | | | 115,665 | |
| Total Liability Derivatives | | $ | 163,164 | | | $ | 115,665 | | | $ | — | | | $ | 278,829 | |
| | | | | | | | | | | | | | | | | |
| Corporate/Government Bond | | | | | | | | | | | | |
| | | | | | | | | | | | | |
| Assets | | Level 1 | | | Level 2 | | | Level 3 | | | Total | |
| Corporate Bonds & Notes * | | $ | — | | | $ | 32,717,297 | | | $ | — | | | $ | 32,717,297 | |
| Foreign Government Bonds | | | — | | | | 1,316,788 | | | | — | | | | 1,316,788 | |
| Municipal Bonds | | | — | | | | 2,712,794 | | | | — | | | | 2,712,794 | |
| U.S. Government & Agency | | | — | | | | 9,277,420 | | | | — | | | | 9,277,420 | |
| Bank Loans * | | | — | | | | 2,848,369 | | | | — | | | | 2,848,369 | |
| Short-Term Investment | | | 1,843,187 | | | | — | | | | — | | | | 1,843,187 | |
| Total | | $ | 1,843,187 | | | $ | 48,872,668 | | | $ | — | | | $ | 50,715,855 | |
| NOTES TO FINANCIAL STATEMENTS (Unaudited) |
| April 30, 2019 (Continued) |
| Monthly Distribution | | | | | | | | | | | | |
| | | | | | | | | | | | | |
| Assets | | Level 1 | | | Level 2 | | | Level 3 | | | Total | |
| Common Stocks * | | $ | 206,359,697 | | | $ | 206,645 | | | $ | — | | | $ | 206,566,342 | |
| Closed-End Fund | | | 1,968,659 | | | | — | | | | — | | | | 1,968,659 | |
| Exchange Traded Funds | | | 6,819,610 | | | | — | | | | — | | | | 6,819,610 | |
| Rights | | | — | | | | 4,380 | | | | — | | | | 4,380 | |
| Warrants | | | — | | | | 6,333 | | | | — | | | | 6,333 | |
| Options Purchased | | | 625,043 | | | | — | | | | — | | | | 625,043 | |
| Short-Term Investment | | | 116,335,567 | | | | — | | | | — | | | | 116,335,567 | |
| Total Assets | | $ | 332,108,576 | | | $ | 217,358 | | | $ | — | | | $ | 332,325,934 | |
| Liabilities-Derivatives | | | | | | | | | | | | | | | | |
| Written Options | | $ | 181,936 | | | $ | 212,043 | | | $ | — | | | $ | 393,979 | |
| Total Liability Derivatives | | $ | 181,936 | | | $ | 212,043 | | | $ | — | | | $ | 393,979 | |
| Liabilities | | | | | | | | | | | | | | | | |
| Liabilities-Securities Sold Short | | $ | 114,500,071 | | | $ | — | | | $ | — | | | $ | 114,500,071 | |
| Total Liabilities | | $ | 114,500,071 | | | $ | — | | | $ | — | | | $ | 114,500,071 | |
| | | | | | | | | | | | | | | | | |
| Dynamic Macro | | | | | | | | | | | | |
| | | | | | | | | | | | | |
| Assets | | Level 1 | | | Level 2 | | | Level 3 | | | Total | |
| Exchange Traded Funds * | | $ | 15,805,973 | | | $ | — | | | $ | — | | | $ | 15,805,973 | |
| Options Purchased | | | 1,562,512 | | | | 1,404 | | | | — | | | | 1,563,916 | |
| Short-Term Investments | | | 2,506,834 | | | | 20,305,501 | | | | — | | | | 22,812,335 | |
| Total Assets | | $ | 19,875,319 | | | $ | 20,306,905 | | | $ | — | | | $ | 40,182,224 | |
| Assets - Derivatives | | | | | | | | | | | | | | | | |
| Futures | | $ | 308,953 | | | $ | — | | | $ | — | | | $ | 308,953 | |
| Foreign Currency Exchange Contracts | | | — | | | | 7 | | | | — | | | | 7 | |
| Total Asset Derivatives | | $ | 308,953 | | | $ | 7 | | | $ | — | | | $ | 308,960 | |
| Liabilities - Derivatives | | | | | | | | | | | | | | | | |
| Futures | | $ | 45,722 | | | $ | — | | | $ | — | | | $ | 45,722 | |
| Written Options | | | 40,838 | | | | 1,404 | | | | — | | | | 42,242 | |
| Total Liability Derivatives | | $ | 86,560 | | | $ | 1,404 | | | $ | — | | | $ | 87,964 | |
| | | | | | | | | | | | | | | | | |
| High-Yield Bond | | | | | | | | | | | | |
| | | | | | | | | | | | | |
| Assets | | Level 1 | | | Level 2 | | | Level 3 | | | Total | |
| Bonds & Notes * | | $ | — | | | $ | 102,578,525 | | | $ | — | | | $ | 102,578,525 | |
| Exchange Traded Funds | | | 1,056,234 | | | | — | | | | — | | | | 1,056,234 | |
| Short-Term Investment | | | 3,495,668 | | | | — | | | | — | | | | 3,495,668 | |
| Collateral for Securities Loaned | | | 2,360,160 | | | | — | | | | — | | | | 2,360,160 | |
| Total | | $ | 6,912,062 | | | $ | 102,578,525 | | | $ | — | | | $ | 109,490,587 | |
| | | | | | | | | | | | | | | | | |
| International Opportunity Bond | | | | | | | | | | | | |
| | | | | | | | | | | | | |
| Assets | | Level 1 | | | Level 2 | | | Level 3 | | | Total | |
| Corporate Bonds & Notes * | | $ | — | | | $ | 13,714,953 | | | $ | — | | | $ | 13,714,953 | |
| Foreign Government Bonds * | | | — | | | | 22,540,175 | | | | — | | | | 22,540,175 | |
| Whole Loan Collateral | | | — | | | | 389,845 | | | | — | | | | 389,845 | |
| Short-Term Investment | | | 557,191 | | | | — | | | | — | | | | 557,191 | |
| Total Assets | | $ | 557,191 | | | $ | 36,644,973 | | | $ | — | | | $ | 37,202,164 | |
| Assets - Derivatives | | | | | | | | | | | | | | | | |
| Futures Contracts | | $ | 2,908 | | | $ | — | | | $ | — | | | $ | 2,908 | |
| Foreign Currency Exchange Contracts | | | — | | | | 104,484 | | | | — | | | | 104,484 | |
| Total Asset Derivatives | | $ | 2,908 | | | $ | 104,484 | | | $ | — | | | $ | 107,392 | |
| Liabilities - Derivatives | | | | | | | | | | | | | | | | |
| Futures Contracts | | $ | 657 | | | $ | — | | | $ | — | | | $ | 657 | |
| Foreign Currency Exchange Contracts | | | — | | | | 182,366 | | | | — | | | | 182,366 | |
| Total Liability Derivatives | | $ | 657 | | | $ | 182,366 | | | $ | — | | | $ | 183,023 | |
| NOTES TO FINANCIAL STATEMENTS (Unaudited) |
| April 30, 2019 (Continued) |
| Large Cap Value | | | | | | | | | | | | |
| | | | | | | | | | | | | |
| Assets | | Level 1 | | | Level 2 | | | Level 3 | | | Total | |
| Common Stocks * | | $ | 78,838,906 | | | $ | — | | | $ | — | | | $ | 78,838,906 | |
| Short-Term Investment | | | 1,875,265 | | | | — | | | | — | | | | 1,875,265 | |
| Total | | $ | 80,714,171 | | | $ | — | | | $ | — | | | $ | 80,714,171 | |
| | | | | | | | | | | | | | | | | |
| Focused Large Cap Growth | | | | | | | | | | | | |
| | | | | | | | | | | | | |
| Assets | | Level 1 | | | Level 2 | | | Level 3 | | | Total | |
| Common Stocks * | | $ | 105,379,939 | | | $ | — | | | $ | — | | | $ | 105,379,939 | |
| Short-Term Investment | | | 2,010,454 | | | | — | | | | — | | | | 2,010,454 | |
| Total | | $ | 107,390,393 | | | $ | — | | | $ | — | | | $ | 107,390,393 | |
| | | | | | | | | | | | | | | | | |
| International Stock | | | | | | | | | | | | |
| | | | | | | | | | | | | |
| Assets | | Level 1 | | | Level 2 | | | Level 3 | | | Total | |
| Common Stocks * | | $ | 26,825,217 | | | $ | 93,889,896 | | | $ | — | | | $ | 120,715,113 | |
| Exchange Traded Fund | | | 737,565 | | | | — | | | | — | | | | 737,565 | |
| Warrant | | | 3,760 | | | | — | | | | — | | | | 3,760 | |
| Preferred Stocks * | | | 575,312 | | | | — | | | | — | | | | 575,312 | |
| Short-Term Investment | | | 447,624 | | | | — | | | | — | | | | 447,624 | |
| Collateral for Securities Loaned | | | 4,874,737 | | | | — | | | | — | | | | 4,874,737 | |
| Total | | $ | 33,464,215 | | | $ | 93,889,896 | | | $ | — | | | $ | 127,354,111 | |
| | | | | | | | | | | | | | | | | |
| Real Estate Stock | | | | | | | | | | | | |
| | | | | | | | | | | | | |
| Assets | | Level 1 | | | Level 2 | | | Level 3 | | | Total | |
| REITs * | | $ | 54,782,161 | | | $ | — | | | $ | — | | | $ | 54,782,161 | |
| Short-Term Investment | | | 565,428 | | | | — | | | | — | | | | 565,428 | |
| Total | | $ | 55,347,589 | | | $ | — | | | $ | — | | | $ | 55,347,589 | |
| | | | | | | | | | | | | | | | | |
| Small Cap Value | | | | | | | | | | | | |
| | | | | | | | | | | | | |
| Assets | | Level 1 | | | Level 2 | | | Level 3 | | | Total | |
| Common Stocks * | | $ | 51,302,118 | | | $ | — | | | $ | — | | | $ | 51,302,118 | |
| Short-Term Investment | | | 366,407 | | | | — | | | | — | | | | 366,407 | |
| Total | | $ | 51,668,525 | | | $ | — | | | $ | — | | | $ | 51,668,525 | |
| | | | | | | | | | | | | | | | | |
| Small Cap Growth | | | | | | | | | | | | |
| | | | | | | | | | | | | |
| Assets | | Level 1 | | | Level 2 | | | Level 3 | | | Total | |
| Common Stocks * | | $ | 50,303,172 | | | $ | — | | | $ | — | | | $ | 50,303,172 | |
| Short-Term Investment | | | 1,812,514 | | | | — | | | | — | | | | 1,812,514 | |
| Collateral for Securities Loaned | | | 7,251,772 | | | | — | | | | — | | | | 7,251,772 | |
| Total | | $ | 59,367,458 | | | $ | — | | | $ | — | | | $ | 59,367,458 | |
| | | | | | | | | | | | | | | | | |
| Emerging Markets Stock | | | | | | | | | | | | |
| | | | | | | | | | | | | |
| Assets | | Level 1 | | | Level 2 | | | Level 3 | | | Total | |
| Common Stocks * | | $ | 19,741,987 | | | $ | 49,864,675 | | | $ | — | | | $ | 69,606,662 | |
| Closed End Fund | | | — | | | | 560,325 | | | | — | | | | 560,325 | |
| Warrant | | | — | | | | — | | | | — | | | | — | |
| Short-Term Investment | | | 302,569 | | | | — | | | | — | | | | 302,569 | |
| Collateral for Securities Loaned | | | 6,891,678 | | | | — | | | | — | | | | 6,891,678 | |
| Total | | $ | 26,936,234 | | | $ | 50,425,000 | | | $ | — | | | $ | 77,361,234 | |
| * | See each Fund’s Schedule of Investments for breakdown by industry. |
The Funds did not hold any Level 3 securities during the period.
| NOTES TO FINANCIAL STATEMENTS (Unaudited) |
| April 30, 2019 (Continued) |
b. Foreign Currency Translations – The accounting records of the Funds are maintained in U.S. dollars. Investment securities and other assets and liabilities denominated in a foreign currency, and income receipts and expense payments, are translated into U.S. dollars using the prevailing exchange rates at the London market close. Purchases and sales of securities are translated into U.S. dollars at the contractual currency rates established at the approximate time of the trade.
Net realized gains and losses on foreign currency transactions represent net gains and losses from currency realized between the trade and settlement dates on securities transactions and the difference between income accrued versus income received. The effects of changes in foreign currency exchange rates on investments in securities are included with the net realized and unrealized gain or loss on investment securities.
c. Forward Currency Contracts – As foreign securities are purchased, a Fund generally enters into forward currency exchange contracts in order to hedge against foreign currency exchange rate risks. The market value of the contract fluctuates with changes in currency exchange rates. The contract is marked-to-market daily and the change in market value is recorded by a Fund as an unrealized gain or loss. As foreign securities are sold, a portion of the contract is generally closed and the Fund records a realized gain or loss equal to the difference between the value of the contract at the time it was opened and the value at the time it was closed. A Fund may also enter into forward currency contracts as an investment strategy consistent with that Fund’s investment objective. Realized gains and losses from contract transactions are included as a component of net realized gains (losses) from investments and foreign currency in the Statements of Operations.
d. Options –Monthly Distribution and Dynamic Macro are subject to stock market risk in the normal course of pursuing their investment objectives and may purchase or sell options to help hedge against this risk.
A Fund may write call options only if it (i) owns an offsetting position in the underlying security or (ii) has an absolute or immediate right to acquire that security without additional cash consideration or exchange of other securities held in its portfolio. When a Fund writes an option, there is no taxable event and an amount equal to the premium received is recorded by that Fund as a liability. The liability is thereafter valued to reflect the current value of the option. If the option is not exercised and expires, or if a Fund effects a closing purchase transaction, the Fund realizes a gain (or loss in the case of a closing purchase transaction where the cost to close the transaction exceeds the original premium received), and the liability related to the option is extinguished. Any such gain or loss generally is a short-term capital gain or loss for federal income tax purposes. If a call option that a Fund has written on any equity security is exercised, that Fund will realize a capital gain or loss (long-term or short-term, depending on the holding period of the underlying security) from the sale of the underlying security, and the proceeds from such sale are increased by the premium originally received. If a put option that a Fund has written on an equity security is exercised, the amount of the premium originally received reduces the cost of the security that a Fund purchases upon exercise of the option. When a Fund writes a put option, that Fund must deposit cash or liquid securities into a segregated account equal to the put option’s exercise value (number of shares times strike price).
A Fund may purchase put and call options. Put options are purchased to hedge against a decline in the value of securities held in that Fund’s portfolio. If such a decline occurs, the put options will permit that Fund to sell the securities underlying such options at the exercise price, or to close out the options at a profit. The premium paid for a put or call option plus any transaction costs will reduce the benefit, if any, realized by that Fund upon exercise of the option, and, unless the price of the underlying security rises or declines sufficiently, the option may expire worthless to that Fund. In addition, in the event that the price of the security in connection with which an option was purchased moves in a direction favorable to that Fund, the benefits realized by that Fund as a result of such favorable movement will be reduced by the amount of the premium paid for the option and related transaction costs. Written and purchased options are non-income producing securities.
e. Swap Agreements – Long/Short Credit and Monthly Distribution are subject to stock market risk and fixed income risk in the normal course of pursuing its investment objectives. The Funds may enter into various swap transactions for investment purposes to manage equity risk and credit risk. These are two-party contracts entered into primarily to exchange the returns (or differentials in rates of returns) earned or realized on particular pre-determined investments or instruments. The gross returns to be exchanged or “swapped” between parties are calculated with respect to a notional amount, i.e., the return on or increase in value of a particular dollar amount invested at a particular interest rate, in a particular foreign currency, or in a “basket” of securities representing a particular index or market segment. Changes in the value of swap agreements are recognized as unrealized gains or losses in the Statements of Operations by “marking to market” on a daily basis to reflect the value of the swap agreement at the end of each trading day. Payments received or paid at the beginning of the agreement are reflected as such on the Statements of Assets and Liabilities and may be referred to as upfront payments. The Funds amortize upfront payments and/or accrues for the fixed payment stream on swap agreements on a daily basis with the net amount recorded as a component of unrealized gain or loss on the Statements of Operations. A liquidation payment received or made at the termination of the swap agreement is recorded as a realized gain or loss on the Statements of Operations. The Funds segregate liquid securities having a value at least equal to the amount of its current obligation under any swap transaction. Entering into these agreements involves, to varying degrees, lack of liquidity and elements of credit, market, and counterparty risk in excess of amounts recognized on the Statements of Assets and Liabilities. The Funds’ maximum risk of loss from counterparty credit risk is the discounted net value of the cash flows to be received from/paid to the counterparty over the contract’s remaining life, to the extent that that amount is positive.
| NOTES TO FINANCIAL STATEMENTS (Unaudited) |
| April 30, 2019 (Continued) |
| |
f. Futures Contracts– Long/Short Credit, Dynamic Macro, and International Opportunity Bond are subject to equity risk, interest rate risk and forward currency exchange rate risk in the normal course of pursuing their investment objectives. The Funds may purchase or sell futures contracts to gain exposure to, or hedge against, changes in the value of equities, interest rates, and foreign exchange rates. Initial margin deposits required upon entering into futures contracts are satisfied by the segregation of specific securities or cash as collateral for the account of the broker (the Fund’s agent in acquiring the futures position). During the period the futures contracts are open, changes in the value of the contracts are recognized as unrealized gains or losses by “marking to market” on a daily basis to reflect the market value of the contracts at the end of each day’s trading. Variation margin payments are received or made depending upon whether unrealized gains or losses are incurred. When the contracts are closed, the Funds recognize a realized gain or loss equal to the difference between the proceeds from, or cost of, the closing transaction and the Fund’s basis in the contract. If the Funds were unable to liquidate a futures contract and/or enter into an offsetting closing transaction, the Funds would continue to be subject to market risk with respect to the value of the contracts and continue to be required to maintain the margin deposits on the futures contracts. The Funds segregate cash having a value at least equal to the amount of the current obligation under any open futures contract. Risks may exceed amounts recognized in the Statements of Assets and Liabilities. With futures, there is minimal counterparty credit risk to the Funds since futures are exchange traded and the exchange’s clearinghouse, as counterparty to all exchange traded futures, guarantees the futures against default.
The notional value of the derivative instruments outstanding as of April 30, 2019 as disclosed in the Schedules of Investments and the amounts realized and changes in unrealized gains and losses on derivative instruments during the year then ended within the Statements of Operations serve as indicators of the volume of derivative activity for the Funds.
g. Short Sales – A “short sale” is a transaction in which a Fund sells a security it does not own but has borrowed in anticipation that the market price of that security will decline. The Fund would be obligated to replace the security borrowed by purchasing it on the open market at a later date. If the price of the security sold short increases between the time of the short sale and the time the Fund replaces the borrowed security, the Fund will incur a loss. Conversely, if the price declines, the Fund will realize a gain.
h. Impact of Derivatives on the Statements of Assets and Liabilities and Statements of Operations– The following is a summary of the location of derivative investments of each Fund in the Statement of Assets and Liabilities as of April 30, 2019:
| Location on the Statements of Assets and Liabilities |
| Derivatives Investment Type | | Asset Derivatives | | Liability Derivatives |
| Equity/Currency/Commodity Interest rate contracts | | Investments in securities | | Option contracts written |
| | | Unrealized appreciation on futures | | Unrealized depreciation on futures |
| | | Unrealized appreciation on swap contracts | | Unrealized depreciation on forward foreign currency exchange contracts |
| | | Unrealized appreciation on forward foreign currency exchange contracts | | |
| | | | | |
The following table sets forth the fair value of each Fund’s derivative contracts by primary risk exposure as of April 30, 2019:
| Asset Derivatives Investment Value |
| | | | | | | | | | | | | | | | |
| | | Equity | | | Currency | | | Commodity | | | Interest Rate | | | Total value at | |
| | | Contracts | | | Contracts | | | Contracts | | | Contracts | | | April 30, 2019 | |
| Long/Short Credit | | | | | | | | | | | | | | | | | | | | |
| Swap Contracts | | $ | 15,623 | | | $ | — | | | $ | — | | | $ | — | | | $ | 15,623 | |
| Monthly Distribution | | | | | | | | | | | | | | | | | | | | |
| Purchased Options | | $ | 625,043 | | | $ | — | | | $ | — | | | $ | — | | | $ | 625,043 | |
| Dynamic Macro | | | | | | | | | | | | | | | | | | | | |
| Forward Foreign Currency Contracts | | $ | — | | | $ | 7 | | | $ | — | | | $ | — | | | $ | 7 | |
| Futures | | | 299,361 | | | | — | | | | — | | | | 9,592 | | | | 308,953 | |
| Purchased Options | | | 32,666 | | | | — | | | | — | | | | 1,531,250 | | | | 1,563,916 | |
| International Opportunity Bond | | | | | | | | | | | | | | | | | | | | |
| Forward Foreign Currency Contracts | | $ | — | | | $ | 104,484 | | | $ | — | | | $ | — | | | $ | 104,484 | |
| Futures | | | — | | | | — | | | | — | | | | 2,908 | | | | 2,908 | |
| NOTES TO FINANCIAL STATEMENTS (Unaudited) |
| April 30, 2019 (Continued) |
| Liability Derivatives Investment Value |
| | | | | | | | | | | | | | | | |
| | | Equity | | | Currency | | | Commodity | | | Interest Rate | | | Total value at | |
| | | Contracts | | | Contracts | | | Contracts | | | Contracts | | | April 30, 2019 | |
| Long/Short Credit | | | | | | | | | | | | | | | | | | | | |
| Futures | | $ | — | | | $ | — | | | $ | — | | | $ | 163,164 | | | $ | 163,164 | |
| Swap Contracts | | | 28,595 | | | | — | | | | — | | | | 87,070 | | | | 115,665 | |
| Monthly Distribution | | | | | | | | | | | | | | | | | | | | |
| Written Options | | $ | 393,979 | | | $ | — | | | $ | — | | | $ | — | | | $ | 393,979 | |
| Dynamic Macro | | | | | | | | | | | | | | | | | | | | |
| Futures | | $ | 16,580 | | | $ | — | | | $ | — | | | $ | 29,142 | | | $ | 45,722 | |
| Written Options | | | 42,242 | | | | — | | | | — | | | | — | | | | 42,242 | |
| International Opportunity Bond | | | | | | | | | | | | | | | | | | | | |
| Forward Foreign Currency Contracts | | $ | — | | | $ | 182,366 | | | $ | — | | | $ | — | | | $ | 182,366 | |
| Futures | | | — | | | | — | | | | — | | | | 657 | | | | 657 | |
The following is a summary of the location of derivative investments of each Fund in the Statements of Operations for the year ended April 30, 2019.
| Derivative Investment Type | Location of Gain (Loss) on Derivatives |
| Equity/Currency/Commodity/ Interest rate contracts | Net realized gain (loss) from: Futures, Options purchased, Written options, Swap contracts, Foreign currency exchange contracts |
| | Net change in unrealized appreciation (depreciation) on: Futures, Options purchased, Written options, Swap contracts, and Foreign currency exchange contracts |
The following is a summary of each Fund’s realized gain (loss) and change in unrealized appreciation (depreciation) on derivative investments recognized in the Statements of Operations categorized by primary risk exposure for the year ended April 30, 2019:
| Realized gain (loss) on derivatives recognized in the Statements of Operations |
| | | | | | | | | | | | | | | | |
| | | Equity | | | Currency | | | Commodity | | | Interest Rate | | | Total value at | |
| Derivative Investment type | | Contracts | | | Contracts | | | Contracts | | | Contracts | | | April 30, 2019 | |
| Long/Short Credit | | | | | | | | | | | | | | | | | | | | |
| Futures | | $ | — | | | $ | — | | | $ | — | | | $ | (302,525 | ) | | $ | (302,525 | ) |
| Swaps | | | 16,601 | | | | — | | | | — | | | | 2,886 | | | | 19,487 | |
| Monthly Distribution | | | | | | | | | | | | | | | | | | | | |
| Purchased Options | | $ | 3,734,023 | | | $ | — | | | $ | — | | | $ | — | | | $ | 3,734,023 | |
| Written Options | | | (2,455,940 | ) | | | — | | | | — | | | | — | | | | (2,455,940 | ) |
| Swaps | | | 669,451 | | | | — | | | | — | | | | — | | | | 669,451 | |
| Forward Foreign Currency Contracts | | | — | | | | 53,647 | | | | — | | | | — | | | | 53,647 | |
| Dynamic Macro | | | | | | | | | | | | | | | | | | | | |
| Futures | | $ | (456,069 | ) | | $ | — | | | $ | — | | | $ | 202,133 | | | $ | (253,936 | ) |
| Forward Foreign Currency Contracts | | | — | | | | (9,243 | ) | | | — | | | | — | | | | (9,243 | ) |
| Purchased Options | | | (292,551 | ) | | | — | | | | — | | | | 466,195 | | | | 173,644 | |
| Written Options | | | 21,624 | | | | — | | | | — | | | | — | | | | 21,624 | |
| International Opportunity Bond | | | | | | | | | | | | | | | | | | | | |
| Futures | | $ | — | | | $ | — | | | $ | — | | | $ | 91,319 | | | $ | 91,319 | |
| Forward Foreign Currency Contracts | | $ | — | | | $ | (169,558 | ) | | $ | — | | | $ | — | | | $ | (169,558 | ) |
| NOTES TO FINANCIAL STATEMENTS (Unaudited) |
| April 30, 2019 (Continued) |
| Changes in unrealized appreciation (depreciation) on derivatives recognized in the Statements of Operations |
| | | | | | | | | | | | | | | | |
| | | Equity | | | Currency | | | Commodity | | | Interest Rate | | | Total value at | |
| Derivative Investment type | | Contracts | | | Contracts | | | Contracts | | | Contracts | | | April 30, 2019 | |
| Long/Short Credit | | | | | | | | | | | | | | | | | | | | |
| Futures | | $ | — | | | $ | — | | | $ | — | | | $ | (285,321 | ) | | $ | (285,321 | ) |
| Swaps | | | (16,788 | ) | | | — | | | | — | | | | (87,070 | ) | | | (103,858 | ) |
| Monthly Distribution | | | | | | | | | | | | | | | | | | | | |
| Purchased Options | | $ | (1,408,975 | ) | | $ | — | | | $ | — | | | $ | — | | | $ | (1,408,975 | ) |
| Written Options | | | (466,251 | ) | | | — | | | | — | | | | — | | | | (466,251 | ) |
| Dynamic Macro | | | | | | | | | | | | | | | | | | | | |
| Forward Foreign Currency Contracts | | $ | — | | | $ | 2,939 | | | $ | — | | | $ | — | | | $ | 2,939 | |
| Futures | | | 929,213 | | | | — | | | | — | | | | 40,997 | | | | 970,210 | |
| Purchased Options | | | (120,232 | ) | | | — | | | | — | | | | 619,138 | | | | 498,906 | |
| Written Options | | | 2,446 | | | | — | | | | — | | | | — | | | | 2,446 | |
| International Opportunity Bond | | | | | | | | | | | | | | | | | | | | |
| Futures | | $ | — | | | $ | — | | | $ | — | | | $ | 7,855 | | | $ | 7,855 | |
| Forward Foreign Currency Contracts | | | — | | | | (160,077 | ) | | | — | | | | — | | | | (160,077 | ) |
i. Offsetting of Financial Assets & Liabilities and Derivative Assets & Liabilities– Long/Short Credit, Monthly Distribution, International Opportunity Bond, and Dynamic Macro policies are to recognize a gross asset or liability equal to the unrealized on futures contracts, forward foreign currency exchange contracts, swaps and written options. During the six months ended April 30, 2019, Long/Short Credit is subject to a master netting arrangement for swaps. The following table shows additional information regarding the offsetting of assets and liabilities at April 30, 2019.
| | Long/Short Credit | | | | | | | | | | |
| | | | | | | | | | | | |
| | | | | | | | | | | | | | | Gross Amounts Not Offset in the | | | | |
| | Assets: | | | | | | | | | | | | | Statement of Assets & Liabilities | | | | |
| | | | | | | | | | | | | | | | | | | |
| | | | | | | | | Gross Amounts | | | Net Amounts of | | | | | | | | | | |
| | | | | | Gross Amounts of | | | Offset in the | | | Assets Presented in | | | | | | | | | | |
| | | | | | Recognized | | | Statement of Assets | | | the Statement of | | | Financial | | | Cash Collateral | | | | |
| | Description | | Counterparty | | Assets | | | & Liabilities | | | Assets & Liabilities | | | Instruments | | | Received | | | Net Amount | |
| | Credit Default Swaps | | JP Morgan | | $ | 15,623 | | | $ | — | | | $ | 15,623 | | | $ | — | | | $ | — | | | $ | 15,623 | |
| | Total | | | | $ | 15,623 | | | $ | — | | | $ | 15,623 | | | $ | — | | | $ | — | | | $ | 15,623 | |
| | | | | | | | | | | | | | | | | | | | | | | | | | | | |
| | | | | | | | | | | | | | | Gross Amounts Not Offset in the | | | | |
| | Liabilities: | | | | | | | | | | | | | Statement of Assets & Liabilities | | | | |
| | | | | | | | | Gross Amounts | | | Net Amounts of | | | | | | | | | | |
| | | | | | Gross Amounts of | | | Offset in the | | | Liabilities Presented | | | | | | | | | | |
| | | | | | Recognized | | | Statement of Assets | | | in the Statement of | | | Financial | | | Cash Collateral | | | | |
| | Description | | Counterparty | | Liabilities | | | & Liabilities | | | Assets & Liabilities | | | Instruments | | | Pledged (1) | | | Net Amount | |
| | Futures | | HSBC | | $ | (163,164 | ) | | $ | — | | | $ | (163,164 | ) | | $ | — | | | $ | 163,164 | | | $ | — | |
| | Credit Default Swaps | | Goldman Sachs | | | (28,595 | ) | | | — | | | | (28,595 | ) | | | — | | | | — | | | | (28,595 | ) |
| | Total Return Swap | | JP Morgan | | | (87,070 | ) | | | — | | | | (87,070 | ) | | | — | | | | — | | | | (87,070 | ) |
| | Total | | | | $ | (87,070 | ) | | $ | — | | | $ | (87,070 | ) | | $ | — | | | $ | — | | | $ | (115,665 | ) |
| | | | | | | | | | | | | | | | | | | | | | | | | | | | |
| | | | | | | | | | | | | | | | | | | | | | | | | | | | |
| | Monthly Distribution | | | | | | | | | | |
| | | | | | | | | | | | |
| | | | | | | | | | | | | | | Gross Amounts Not Offset in the | | | | |
| | Assets: | | | | | | | | | | | | | Statement of Assets & Liabilities | | | | |
| | | | | | | | | Gross Amounts | | | Net Amounts of | | | | | | | | | | |
| | | | | | Gross Amounts | | | Offset in the | | | Assets Presented in | | | | | | | | | | |
| | | | | | of Recognized | | | Statement of Assets | | | the Statement of | | | Financial | | | Cash Collateral | | | | |
| | Description | | Counterparty | | Assets | | | & Liabilities | | | Assets & Liabilities | | | Instruments | | | Received | | | Net Amount | |
| | Purchased Options | | JP Morgan | | $ | 625,043 | | | $ | — | | | $ | 625,043 | | | $ | — | | | $ | — | | | $ | 625,043 | |
| | Total | | | | $ | 625,043 | | | $ | — | | | $ | 625,043 | | | $ | — | | | $ | — | | | $ | 625,043 | |
| | | | | | | | | | | | | | | | | | | | | | | | | | | | |
| | | | | | | | | | | | | | | Gross Amounts Not Offset in the | | | | |
| | Liabilities: | | | | | | | | | | | | | Statement of Assets & Liabilities | | | | |
| | | | | | | | | Gross Amounts | | | Net Amounts of | | | | | | | | | | |
| | | | | | Gross Amounts | | | Offset in the | | | Liabilities Presented | | | | | | | | | | |
| | | | | | of Recognized | | | Statement of Assets | | | in the Statement of | | | Financial | | | Cash Collateral | | | | |
| | Description | | Counterparty | | Liabilities | | | & Liabilities | | | Assets & Liabilities | | | Instruments | | | Pledged (1) | | | Net Amount | |
| | Written Options | | JP Morgan | | $ | (393,979 | ) | | $ | — | | | $ | (393,979 | ) | | $ | — | | | $ | 393,979 | | | $ | — | |
| | Total | | | | $ | (393,979 | ) | | $ | — | | | $ | (393,979 | ) | | $ | — | | | $ | 393,979 | | | $ | — | |
| | | | | | | | | | | | | | | | | | | | | | | | | | | | |
| (1) | The amount is limited to the derivative liability balance and accordingly, does not include excess collateral pledged. |
| NOTES TO FINANCIAL STATEMENTS (Unaudited) |
| April 30, 2019 (Continued) |
| | Dynamic Macro | | | | | | | | | | |
| | | | | | | | | | | | | | | Gross Amounts Not Offset in | | | | |
| | | | | | | | | | | | | | | the Statement of Assets & | | | | |
| | Assets: | | | | | | | | | | | | | Liabilities | | | | |
| | | | | | Gross | | | Gross Amounts | | | Net Amounts of | | | | | | | | | | |
| | | | | | Amounts of | | | Offset in the | | | Assets Presented in | | | | | | Cash | | | | |
| | | | | | Recognized | | | Statement of Assets | | | the Statement of | | | Financial | | | Collateral | | | | |
| | Description | | Counterparty | | Assets | | | & Liabilities | | | Assets & Liabilities | | | Instruments | | | Received | | | Net Amount | |
| | Futures Contracts | | Goldman Sachs | | $ | 308,953 | | | $ | — | | | $ | 308,953 | | | $ | — | | | $ | — | | | $ | 308,953 | |
| | Purchased Options ^ | | | | | 1,563,916 | | | | — | | | | 1,563,916 | | | | — | | | | — | | | | 1,563,916 | |
| | Forward Foreign | | Morgan | | | | | | | | | | | | | | | | | | | | | | | | |
| | Currency Contracts | | Stanley | | | 7 | | | | — | | | | 7 | | | | — | | | | — | | | | 7 | |
| | Total | | | | $ | 1,872,876 | | | $ | — | | | $ | 1,872,876 | | | $ | — | | | $ | — | | | $ | 1,872,876 | |
| | | | | | | | | | | | | | | | | | | | | | | | | | | | |
| | | | | | | | | | | | | | | Gross Amounts Not Offset in | | | | |
| | | | | | | | | | | | | | | the Statement of Assets & | | | | |
| | Liabilities: | | | | | | | | | | | | | Liabilities | | | | |
| | | | | | Gross | | | Gross Amounts | | | Net Amounts of | | | | | | | | | | |
| | | | | | Amounts of | | | Offset in the | | | Liabilities Presented | | | | | | Cash | | | | |
| | | | | | Recognized | | | Statement of Assets | | | in the Statement of | | | Financial | | | Collateral | | | | |
| | Description | | Counterparty | | Liabilities | | | & Liabilities | | | Assets & Liabilities | | | Instruments | | | Pledged (1) | | | Net Amount | |
| | Futures Contracts | | Goldman Sachs | | $ | (45,722 | ) | | $ | — | | | $ | (45,722 | ) | | $ | 308,953 | | | $ | (263,231 | ) | | $ | — | |
| | Written Options | | Morgan Stanley | | | (42,242 | ) | | | — | | | | (42,242 | ) | | | — | | | | 42,242 | | | | — | |
| | Total | | | | $ | (87,964 | ) | | $ | — | | | $ | (87,964 | ) | | $ | 308,953 | | | $ | (220,989 | ) | | $ | — | |
| | | | | | | | | | | | | | | | | | | | | | | | | | | | |
| | ^ Counterparties used: Goldman Sachs and Morgan Stanley. | |
| | | |
| | High-Yield Bond | | | | | | | |
| | | | | | | | | |
| | | | | | | | | | | | | | | Gross Amounts Not Offset in the | | | | |
| | Liabilities: | | | | | | | | | | | | | Statement of Assets & Liabilities | | | | |
| | | | | | Gross Amounts | | | Net Amounts of | | | | | | | | | | | | | |
| | | | | | Gross Amounts | | | Offset in the | | | Liabilities Presented | | | | | | Cash | | | | |
| | | | | | of Recognized | | | Statement of | | | in the Statement of | | | Financial | | | Collateral | | | | |
| | Description | | Counterparty | | Liabilities | | | Assets & Liabilities | | | Assets & Liabilities | | | Instruments | | | Pledged (1) | | | Net Amount | |
| | Securities Loaned | | HSBC | | $ | (360,160 | ) | | $ | — | | | $ | (360,160 | ) | | $ | 360,160 | | | $ | — | | | $ | — | |
| | Securities Loaned | | Morgan Stanley | | | (2,000,000 | ) | | | — | | | | (2,000,000 | ) | | | 2,000,000 | | | | — | | | | — | |
| | Total | | | | $ | (2,360,160 | ) | | $ | — | | | $ | (2,360,160 | ) | | $ | 2,360,160 | | | $ | — | | | $ | — | |
| | | | | | | | | | | | | | | | | | | | | | | | | | | | |
| | | | | | | | | | | | | | | | | | | | | | | | | | | | |
| | International Opportunity Bond | | | | |
| | | | | | | | | | | | | | | Gross Amounts Not Offset in | | | | |
| | | | | | | | | | | | | | | the Statement of Assets & | | | | |
| | Assets: | | | | | | | | | | | | | Liabilities | | | | |
| | | | | | | | | Gross | | | | | | | | | | | | | |
| | | | | | | | | Amounts | | | | | | | | | | | | | |
| | | | | | Gross | | | Offset in the | | | Net Amounts of | | | | | | | | | | |
| | | | | | Amounts of | | | Statement of | | | Assets Presented in | | | | | | Cash | | | | |
| | | | | | Recognized | | | Assets & | | | the Statement of | | | Financial | | | Collateral | | | | |
| | Description | | Counterparty | | Assets | | | Liabilities | | | Assets & Liabilities | | | Instruments | | | Received | | | Net Amount | |
| | Forward Foreign | | | | | | | | | | | | | | | | | | | | | | | | | | |
| | Currency Contracts | | Citigroup | | $ | 104,484 | | | $ | — | | | $ | 104,484 | | | $ | (182,366 | ) | | $ | — | | | $ | (77,882 | ) |
| | Futures Contracts | | Credit Suisse | | | 2,908 | | | | — | | | | 2,908 | | | | (2,908 | ) | | | — | | | | — | |
| | Total | | | | $ | 107,392 | | | $ | — | | | $ | 107,392 | | | $ | (185,274 | ) | | $ | — | | | $ | (77,882 | ) |
| | | | | | | | | | | | | | | | | | | | | | | | | | | | |
| | | | | | | | | | | | | | | Gross Amounts Not Offset in | | | | |
| | | | | | | | | | | | | | | the Statement of Assets & | | | | |
| | Liabilities: | | | | | | | | | | | | | Liabilities | | | | |
| | | | | | | | | Gross | | | | | | | | | | | | | |
| | | | | | Gross | | | Amounts | | | Net Amounts of | | | | | | | | | | |
| | | | | | Amounts of | | | Offset in the | | | Liabilities Presented | | | | | | Cash | | | | |
| | | | | | Recognized | | | Statement of | | | in the Statement of | | | Financial | | | Collateral | | | | |
| | Description | | Counterparty | | Liabilities | | | Assets & | | | Assets & Liabilities | | | Instruments | | | Pledged (1) | | | Net Amount | |
| | Forward Foreign | | | | | | | | | | | | | | | | | | | | | | | | | | |
| | Currency Contracts | | Citigroup | | $ | (182,366 | ) | | $ | — | | | $ | (182,366 | ) | | $ | 104,484 | | | $ | — | | | $ | (77,882 | ) |
| | Futures Contracts | | Credit Suisse | | | (657 | ) | | | — | | | | (657 | ) | | | 2,908 | | | | (2,251 | ) | | | — | |
| | Total | | | | $ | (183,023 | ) | | $ | — | | | $ | (183,023 | ) | | $ | 107,392 | | | $ | (2,251 | ) | | $ | (77,882 | ) |
| | | | | | | | | | | | | | | | | | | | | | | | | | | | |
| (1) | The amount is limited to the derivative liability balance and accordingly, does not include excess collateral pledged. |
| NOTES TO FINANCIAL STATEMENTS (Unaudited) |
| April 30, 2019 (Continued) |
| | International Stock | | | | | | | |
| | | | | | | | | | | | | | | | | | | | | | |
| | | | | | | | | | | | | | | Gross Amounts Not Offset in the | | | | |
| | Liabilities: | | | | | | | | | | | | | Statement of Assets & Liabilities | | | | |
| | | | | | | | | Gross Amounts | | | Net Amounts of | | | | | | | | | | |
| | | | | | Gross Amounts | | | Offset in the | | | Liabilities Presented | | | | | | | | | | |
| | | | | | of Recognized | | | Statement of Assets | | | in the Statement of | | | Financial | | | Cash Collateral | | | | |
| | Description | | Counterparty | | Liabilities | | | & Liabilities | | | Assets & Liabilities | | | Instruments | | | Pledged (1) | | | Net Amount | |
| | Securities Loaned | | US Bank | | $ | (4,874,737 | ) | | $ | — | | | $ | (4,874,737 | ) | | $ | 4,874,737 | | | $ | — | | | $ | — | |
| | Total | | | | $ | (4,874,737 | ) | | $ | — | | | $ | (4,874,737 | ) | | $ | 4,874,737 | | | $ | — | | | $ | — | |
| | | | | | | | | | | | | | | | | | | | | | | | | | | | |
| | | | | | | | | | | | | | | | | | | | | | | | | | | | |
| | Small Cap Growth | | | | | | | |
| | | | | | | | | | | | | | | | | | | | | | |
| | | | | | | | | | | | | | | Gross Amounts Not Offset in the | | | | |
| | Liabilities: | | | | | | | | | | | | | Statement of Assets & Liabilities | | | | |
| | | | | | | | | Gross Amounts | | | Net Amounts of | | | | | | | | | | |
| | | | | | Gross Amounts | | | Offset in the | | | Liabilities Presented | | | | | | | | | | |
| | | | | | of Recognized | | | Statement of Assets | | | in the Statement of | | | Financial | | | Cash Collateral | | | | |
| | Description | | Counterparty | | Liabilities | | | & Liabilities | | | Assets & Liabilities | | | Instruments | | | Pledged (1) | | | Net Amount | |
| | Securities Loaned | | HSBC | | $ | (1,334,422 | ) | | $ | — | | | $ | (1,334,422 | ) | | $ | 1,334,422 | | | $ | — | | | $ | — | |
| | Securities Loaned | | Morgan Stanley | | | (5,917,350 | ) | | | — | | | | (5,917,350 | ) | | | 5,917,350 | | | | — | | | | — | |
| | Total | | | | $ | (7,251,772 | ) | | $ | — | | | $ | (7,251,772 | ) | | $ | 7,251,772 | | | $ | — | | | $ | — | |
| | | | | | | | | | | | | | | | | | | | | | | | | | | | |
| | | | | | | | | | | | | | | | | | | | | | | | | | | | |
| | Emerging Markets | | | | | | | |
| | | | | | | | | | | | | | | Gross Amounts Not Offset in the | | | | |
| | Liabilities: | | | | | | | | | | | | | Statement of Assets & Liabilities | | | | |
| | | | | | | | | Gross Amounts | | | Net Amounts of | | | | | | | | | | |
| | | | | | Gross Amounts | | | Offset in the | | | Liabilities Presented | | | | | | | | | | |
| | | | | | of Recognized | | | Statement of Assets | | | in the Statement of | | | Financial | | | Cash Collateral | | | | |
| | Description | | Counterparty | | Liabilities | | | & Liabilities | | | Assets & Liabilities | | | Instruments | | | Pledged (1) | | | Net Amount | |
| | Securities Loaned | | US Bank | | $ | (6,891,678 | ) | | $ | — | | | $ | (6,891,678 | ) | | $ | 6,891,678 | | | $ | — | | | $ | — | |
| | Total | | | | $ | (6,891,678 | ) | | $ | — | | | $ | (6,891,678 | ) | | $ | 6,891,678 | | | $ | — | | | $ | — | |
| | | | | | | | | | | | | | | | | | | | | | | | | | | | |
| (1) | The amount is limited to the derivative liability balance and accordingly, does not include excess collateral pledged. |
j. Exchange Traded Funds – The Funds may invest in exchange traded funds (“ETFs”). ETFs are a type of index fund bought and sold on a securities exchange. An ETF trades like common stock and represents a fixed portfolio of securities. A Fund may purchase an ETF to temporarily gain exposure to a portion of the U.S. or a foreign market while awaiting purchase of underlying securities. The risks of owning an ETF generally reflect the risks of owning the underlying securities they are designed to track, although the lack of liquidity on an ETF could result in it being more volatile. Additionally, ETFs have fees and expenses that reduce their value.
k. Investment Transactions, Investment Income and Expenses – Investment transactions are recorded on a trade date basis. Realized gains and losses from investment transactions and foreign exchange transactions are calculated using the identified cost method. Dividend income and expense is recorded on the ex-dividend date (“ex -date”) except in the case of certain dividends from foreign securities, which are recorded as soon after the ex-date that the respective Fund, using reasonable diligence, becomes aware of such dividends. Interest income is recorded on an accrual basis. Discounts are accreted and premiums are amortized as adjustments to interest income and the identified cost of investments. Expenses of the Trust that are directly identifiable to a specific Fund are charged to that Fund. Expenses, which are not readily identifiable to a specific Fund, are allocated in such a manner as deemed equitable, taking into consideration the nature and type of expense and the relative sizes of the Funds. Each Fund’s income, expenses (other than the class specific distribution fees) and realized and unrealized gains and losses are allocated proportionally each day between the classes based upon the relative net assets of each class.
l. Concentration of Risk – Investing in securities of foreign issuers and currency transactions may involve certain considerations and risks not typically associated with investments in the United States. These risks include revaluation of currencies, adverse fluctuations in foreign currency values and possible adverse political, social and economic developments, including those particular to a specific industry, country or region. These conditions could cause the securities and their markets to be less liquid and prices more volatile than those of comparable U.S. companies and U.S. government securities.
| NOTES TO FINANCIAL STATEMENTS (Unaudited) |
| April 30, 2019 (Continued) |
Small capitalization (“small cap”) companies may be more vulnerable than larger capitalization companies to adverse business or economic developments. Small cap companies may also have limited product lines, markets or financial resources, and may be dependent on a relatively small management group. Securities of such companies may be less liquid and more volatile than securities of larger capitalization companies or the market averages in general and therefore may involve greater risk than investing in larger capitalization companies.
The ability of issuers of debt securities held by the Funds to meet their obligations may be affected by economic and political developments particular to a specific industry, country, state or region. Investments in lower grade debt securities are subject to special risks, including greater price volatility and a greater risk of loss of principal and interest.
Certain Funds may invest in collateralized mortgage obligations which are secured by groups of individual mortgages, but are similar to a conventional bond where the investor looks only to the issuer for payment of principal and interest. Although the obligations are recourse obligations to the issuer, the issuer typically has no significant assets, other than assets pledged as collateral for the obligations, and the market value of the collateral, which is sensitive to interest rate movements, may affect the market value of the obligations. A public market for a particular collateralized mortgage obligation may or may not develop and thus, there can be no guarantee of liquidity of an investment in such obligations.
The risk in writing a call option is that a Fund may forgo the opportunity of profit if the market value of the underlying security increases and the option is exercised, although any potential loss is reduced by the amount of option premium received. The risk in writing a put option is that a Fund may be called on to pay the exercise price of the option for a security that has decreased (potentially to zero) in market price, although any potential loss is reduced by the amount of option premium received. Generally, option transactions also involve risks concerning liquidity of the options market. An illiquid market for an option may limit a Fund’s ability to write options or enter closing transactions. As the options written by the Funds are traded on a national exchange, counterparty and credit risk are limited to the failure of the exchange on which the options are traded.
m. Federal Income Taxes – It is each Fund’s policy to continue to comply with all sections of the Internal Revenue Code applicable to regulated investment companies and to distribute all of its taxable income and gains, if any, to its shareholders and therefore, no provision for federal income tax has been made. Each Fund is treated as a separate taxpayer for federal income tax purposes. The Funds recognize the tax benefits of uncertain tax positions only when the position is “more likely than not” to be sustained assuming examination by tax authorities. Management has reviewed the tax positions in the open tax years of 2016 to 2018 and expected to be taken in tax year 2019 and concluded that no liability for unrecognized tax benefits should be recorded related to uncertain tax positions taken in the above open tax years. The Funds identify their major tax jurisdiction as U.S. Federal. The Funds recognize interest and penalties, if any, related to unrecognized tax benefits as income tax expense in the Statements of Operations. During the year, the Funds did not incur any interest or penalties. Generally tax authorities can examine tax returns filed for the last three years.
n. Distributions to Shareholders – It is each Fund’s policy to distribute its respective net investment income and net capital gains, if any, annually except for Long/Short Credit, Monthly Distribution, Corporate/Government Bond, High-Yield Bond , Floating Rate Bond and International Opportunity Bond which will distribute their respective net investment income, if any, monthly. Distributions of net investment income and net capital gains are determined in accordance with income tax regulations which may differ from GAAP. Differences in dividends from net investment income per share between the classes are due to service and distribution related expenses. Dividends and distributions to shareholders are recorded on ex-date. Monthly Distribution’s distribution policy is to make twelve monthly distributions to shareholders. The level of monthly distributions (including any return of capital) is not fixed but is expected to be at or near the level of the prime interest rate (“Prime Rate”). Additionally, Monthly Distribution’s distribution policy is not designed to generate, and is not expected to result in, distributions that equal a fixed percentage of Monthly Distribution’s current net asset value per share. Shareholders receiving periodic payments from Monthly Distribution may be under the impression that they are receiving net income. However, all or a portion of a distribution may consist of a return of capital. Shareholders should not assume that the source of a distribution from Monthly Distribution is net income.
o. Indemnification – The Trust indemnifies its officers and Trustees for certain liabilities that may arise from the performance of their duties to the Trust. Additionally, in the normal course of business, each Fund enters into contracts that contain a variety of representations and warranties and which provide general indemnities. A Fund’s maximum exposure under these arrangements is unknown, as this would involve future claims that may be made against the Fund that have not yet occurred. However, based on experience, the Funds expect the risk of loss due to these warranties and indemnities to be remote.
| NOTES TO FINANCIAL STATEMENTS (Unaudited) |
| April 30, 2019 (Continued) |
| 3. | INVESTMENT ADVISORY FEES AND OTHER TRANSACTIONS WITH AFFILIATES |
| a. | Management Fees –Dunham & Associates serves as each Fund’s investment adviser. Pursuant to an investment advisory agreement with the Trust, on behalf of the Funds, Dunham & Associates, subject to the supervision of the Board and in conformity with the stated policies of the Funds, manages the operations of the Funds. The Adviser, subject to the review and approval of the Board, selects Sub-Advisers for each Fund and supervises and monitors the performance of each Sub-Adviser. As compensation for its services, each Fund pays the Adviser a fixed fee, accrued daily and paid monthly, based on each Fund’s respective average daily net assets. The Adviser has entered into a Sub-Advisory Agreement with each Sub-Adviser and the Trust, on behalf of each Fund. Under the Sub-Advisory Agreements, each Fund pays the Sub-Adviser a “Fulcrum Fee.” A Fulcrum Fee is a performance fee whereby the Sub-Adviser is rewarded when out-performing, or is penalized when under -performing, a Fund’s benchmark index. As a result of the Fulcrum Fee arrangement, the total annual management fee for a Fund will have a range as shown in the table below. |
| | | | | Adviser’s | | Sub-Adviser’s |
| | | Management Fee | | Portion | | Portion |
| Floating Rate Bond* | | 0.70% – 1.06% | | 0.60% | | 0.10% – 0.46% |
| Long/Short Credit | | 0.70% – 1.80% | | 0.65% | | 0.05% – 1.15% |
| Corporate/Government Bond | | 0.65% – 0.95% | | 0.50% | | 0.15% – 0.45% |
| Monthly Distribution | | 0.87% – 1.63% | | 0.65% | | 0.22% – 0.98% |
| Dynamic Macro | | 1.05% – 1.75% | | 0.65% | | 0.40% – 1.10% |
| High-Yield Bond | | 0.82% – 1.02% | | 0.60% | | 0.22% – 0.42% |
| International Opportunity Bond | | 0.80% – 1.30% | | 0.60% | | 0.20% – 0.70% |
| Large Cap Value | | 0.75% – 1.15% | | 0.65% | | 0.10% – 0.50% |
| Focused Large Cap Growth | | 0.85% – 1.15% | | 0.65% | | 0.20% – 0.50% |
| International Stock | | 0.95% – 1.65% | | 0.65% | | 0.30% – 1.00% |
| Real Estate Stock | | 0.75% – 1.35% | | 0.65% | | 0.10% – 0.70% |
| Small Cap Value | | 0.75% – 1.45% | | 0.65% | | 0.10% – 0.80% |
| Small Cap Growth | | 0.65% – 1.65% | | 0.65% | | 0.00% – 1.00% |
| Emerging Markets Stock ** | | 0.70% – 1.50% | | 0.65% | | 0.05% – 0.85% |
| * | Prior to March 1, 2019, the Sub-Adviser’s portion for Floating Rate Bond was 0.10%-0.50% and the Management Fee was 0.70%-1.10%. |
| ** | Prior to April 1, 2019, the Sub-Adviser’s portion for Emerging Markets was 0.10%-0.90% and the Management Fee was 0.75%-1.55%. |
Each Fund’s Sub-Advisory Fulcrum Fee is calculated daily using an annual base Sub-Advisory fee of a specified amount of the average daily net assets of the Fund (the “Base Fee”), adjusted by the Fund’s Class N share performance relative to the Fund’s benchmark (the “Performance Fee”). Depending on a Fund’s net performance versus its benchmark, the Sub-Adviser will receive a fee adjustment in accordance with a formula that equates a percentage of out- or under-performance to a percentage of fee increases or decreases, respectively. In addition, some Fulcrum Fees employ a “null zone” around the base fee, whereby small differences in performance versus the benchmark will not trigger a fee increase or decrease. During the first 12 months of the Fulcrum Fee arrangement, the Performance Fee is calculated daily from inception date of the agreement to the calculation date and is applied to the average daily net assets of the Funds during the calculation period. After the initial 12 months, the Performance Fee is calculated on a daily basis based on comparative performance over a rolling 12-month period. All Funds, with the exception of Long/Short Credit and Emerging Markets which are in their initial year of a new Fulcrum Fee arrangement, are calculating Performance Fees on a rolling 12-month basis as of April 30, 2019.
Depending on the particular Sub-Advisory Agreement, the Performance Fee can adjust the Base Fee up or down by as much as 100% of the Base Fee, such that the Sub-Advisory fee can vary anywhere from 0.00% (the “Minimum Fee”) to twice the Base Fee (the “Maximum Fee”). However, because each such Sub-Advisory Agreement requires that the Sub-Adviser only be paid out the monthly Minimum Fee during the first year (in most cases, 0.10%), the Sub-Adviser, in most cases, will receive less compensation until the end of the first year. At the end of the first year of the agreement, the Sub-Adviser will be paid a lump sum that reflects the accrued Fulcrum Fee over the year, less any Minimum Fees paid out during the first year. Therefore, in the first year, the Fulcrum Fee methodology has three elements: 1) daily calculation of the Performance Fee and daily accrual of the Fulcrum Fee; 2) monthly payment of the Minimum Fee only (if any); and 3) a lump sum payment at the end of the initial 12-month period of the accrued Fulcrum Fee less the Minimum Fee.
By virtue of using average daily net assets over a “rolling” 12-month period for purposes of calculating the Performance Fee while using average daily net assets for the most recent month for purposes of calculating the Base Fee, the actual total Fulcrum Fee paid by the Fund to the Sub-Adviser may be higher or lower than the maximum or minimum annual rates described above if the average daily net assets do not remain constant during the rolling 12-month period. If the Fund is significantly underperforming versus the Index and the Fund’s net assets have declined significantly, the monthly total Fulcrum Fee can be a negative number (although the performance fee rate can never be negative, the Performance Fee can be negative). In such instances, if the negative Fulcrum Fee is not earned back or offset the following month, the Sub-Adviser must reimburse the Fund the amount of the negative Fulcrum Fee within an agreed upon time. Likewise, in the case where the Fund has significantly underperformed versus the Index but net assets have increased significantly, the monthly total Fulcrum Fee can be positive although the performance fee rate may be 0.00%. In such instances, the Fund will pay the Sub-Adviser the monthly Fulcrum Fee.
| NOTES TO FINANCIAL STATEMENTS (Unaudited) |
| April 30, 2019 (Continued) |
The table below lists the current Sub-Advisers along with their Fulcrum Fee arrangements.
| | | | | Null | Minimum | Maximum |
| Fund | Sub-Adviser | Benchmark | Base Fee | Zone | Fee | Fee |
| Floating Rate Bond | Newfleet Asset Management, LLC | Credit Suisse Leveraged Loan Index | 0.28% | +/- 0.00% | 0.10% | 0.46% |
| Long/Short Credit | Metlife Investment Management | BofA Merrill Lynch US 3-month Treasury Bill300 bps (3.00%) Index PLUS | 0.60% | +/- 0.00% | 0.05% | 1.15% |
| Corporate/Government Bond | Newfleet Asset Management, LLC | Barclays Aggregate Bond Index | 0.30% | +/- 0.15% | 0.15% | 0.45% |
| Monthly Distribution | Perella Weinberg Partners Capital Management LP | IQ Hedge Market Neutral Total Return Index | 0.60% | +/- 0.00% | 0.22% | 0.98% |
| Dynamic Macro | Mellon Capital Management Corporation | IQ Hedge Global Macro Beta Index | 0.75% | +/- 0.00% | 0.40% | 1.10% |
| High-Yield Bond | PineBridge Investments LLC | Barclays U.S. Corporate High Yield Ba/B 2% Issuer Capped Index | 0.32% | +/- 0.00% | 0.22% | 0.42% |
| International Opportunity Bond | Allianz Global Investors U.S. LLC | Barclays Global ex US Aggregate Bond Index | 0.45% | +/- 0.00% | 0.20% | 0.70% |
| Large Cap Value | Rothschild & Co. Asset Management US Inc. | Russell 1000 Value Index | 0.30% | +/- 0.00% | 0.10% | 0.50% |
| Focused Large Cap Growth | The Ithaka Group, LLC | Russell 1000 Growth Index | 0.35% | +/- 0.30% | 0.20% | 0.50% |
| International Stock | Arrowstreet Capital L.P. | MSCI All Country World Index ex USA (Net) | 0.65% | +/- 0.20% | 0.30% | 1.00% |
| Real Estate Stock | Barings, LLC | FTSE NAREIT All REITs Index | 0.40% | +/- 0.00% | 0.10% | 0.70% |
| Small Cap Value | Ziegler Capital Management LLC | Russell 2000 Value Index | 0.45% | +/- 0.00% | 0.10% | 0.80% |
| Small Cap Growth | Pier Capital, LLC | Russell 2000 Growth Index | 0.50% | +/- 0.20% | 0.00% | 1.00% |
| Emerging Markets Stock * | NS Partners Ltd. | MSCI Emerging Markets Index (Net) | 0.45% | +/- 0.00% | 0.05% | 0.85% |
| * | Effective April 1, 2019 NS Partners Ltd. replaced Bailard, Inc. as the sub-adviser to Emerging Markets Stock. Bailard, Inc. had a Base fee of 0.50%, a Minimum fee of 0.10% and a Maximum Fee of 0.90%. |
b. Administration, Fund Accounting and Transfer Agency Fees – Gemini Fund Services, LLC (“GFS” or the “Administrator”) serves as the administrator, fund accountant and transfer agent for the Funds. For providing administration services, GFS receives from each Fund a monthly fee based on the combined average daily net assets at the following annual rates; 0.07% on the first $250 million of average net assets; 0.06% on average net assets between $250 million and $500 million; 0.04% on average net assets over $500 million; and 0.02% on average net assets over $1 billion. Such fees are subject to an annual minimum of $403,200 in total for the entire Trust. Effective July 1, 2017, for providing fund accounting services, GFS received from the Trust a minimum annual fee of $262,500. For providing transfer agent services, GFS receives from the Trust a minimum annual fee of $200,000. Pursuant to the terms of a Custody Administration Agreement, Monthly Distribution pays GFS a monthly fee of $300.
Blu Giant, LLC, (“Blu Giant”), an affiliate of GFS, provides EDGAR conversion and filing services as well as some print management services for the Funds on an ad-hoc basis. For the provision of these services, Blu Giant receives customary fees from the Funds. An individual from GFS serves as an officer for the Trust and receives no additional compensation from the Trust for serving in that role.
Effective February 1, 2019, NorthStar Financial Services Group, LLC, the parent company of GFS and its affiliated companies including Blu Giant (collectively, the “Gemini Companies”), sold its interest in the Gemini Companies to a third party private equity firm that contemporaneously acquired Ultimus Fund Solutions, LLC (an independent mutual fund administration firm) and its affiliates (collectively, the “Ultimus Companies”). As a result of these separate transactions, the Gemini Companies and the Ultimus Companies are now indirectly owned through a common parent entity, The Ultimus Group, LLC.
c. Distributor – The Distributor of the Funds is Dunham & Associates (the “Distributor”). The Funds have adopted an Amended and Restated Rule 12b-1 Plan (the “Plan”) in accordance with Rule 12b-1 under the 1940 Act for Class A and Class C shares. The Plan for Class A shares authorizes the Funds to pay distribution fees to the Distributor or other entities on a monthly basis at an annualized rate of up to 0.25% of the average daily net assets attributable to Class A shares. The Plan for Class C shares authorizes the Funds to pay distribution fees at the annualized rate of 0.75% for the equity Funds and 0.50% for the fixed income Funds and shareholder servicing fees at the annualized rate of 0.25% to the Distributor or other entities on a monthly basis based on the average daily net assets attributable to Class C shares. Class N shares do not pay distribution fees or shareholder servicing fees.
| NOTES TO FINANCIAL STATEMENTS (Unaudited) |
| April 30, 2019 (Continued) |
d. Trustees’ Fees – The Board has approved the following Trustee compensation schedule: Each Trustee who is not an interested person of the Trust will receive $6,250 for each Board meeting attended in-person; $1,000 for all telephonic Board meetings; $1,000 for in-person committee meetings and $500 for telephonic committee meetings, unless the committee meeting is on the same day as a Board meeting, in which case the Trustee will not be compensated for the committee meeting. The Funds also reimburse each such Trustee for travel and other expenses incurred in attending meetings of the Board.
With the exception of the Trust’s Chief Compliance Officer as discussed below, officers of the Trust and Trustees who are interested persons of the Trust do not receive any compensation from the Trust or any other Funds managed by the Adviser. The Trust has agreed to pay the Adviser a fee in the amount of $150,000 per annum plus an annual discretionary bonus as may be awarded as compensation for providing an officer or employee of the Adviser to serve as Chief Compliance Officer for the Funds (each Fund bearing its pro rata share of the fee), plus the cost of reasonable expenses related to the performance of the Chief Compliance Officer’s duties, including travel expenses, and may compensate the Adviser for the time of other officers or employees of the Adviser who serve in other compliance capacities for the Funds.
e. Commission Recapture –During the six months ended April 30, 2019, certain Funds had portfolio trades executed with a certain broker pursuant to a commission recapture agreement under which the broker returned a portion of the Fund’s brokerage commissions on the Fund’s behalf. Such amounts, under such commission recapture agreement, are included in fees paid indirectly in the Funds’ Statements of Operations and were paid directly by the broker to the Administrator. For the six months ended April 30, 2019, the amounts received by the Administrator on behalf of certain participating Funds under this arrangement were: Large Cap Value - $2,170, Focused Large Cap Growth - $896, International Stock - $440 and Small Cap Growth - $3,530.
| 4. | INVESTMENT TRANSACTIONS |
The cost of purchases and the proceeds from sales of investments, other than short-term investments, for the six months ended April 30, 2019 were as follows:
| | | Purchases | | | Sale Proceeds | | | | | | Proceeds of | |
| | | (excluding U.S. | | | (excluding U.S. | | | Purchases | | | U.S. | |
| | | Government | | | Government | | | U.S. Government | | | Government | |
| Fund | | Securities) | | | Securities) | | | Securities | | | Securities | |
| Floating Rate Bond | | $ | 32,459,469 | | | $ | 34,679,455 | | | $ | — | | | $ | — | |
| Long/Short Credit | | | 226,281,457 | | | | 70,725,658 | | | | — | | | | — | |
| Corporate/Government Bond | | | 14,947,106 | | | | 16,857,301 | | | | 8,960,365 | | | | 7,392,169 | |
| Monthly Distribution | | | 542,446,605 | | | | 449,753,388 | | | | — | | | | — | |
| Dynamic Macro | | | 4,910,693 | | | | 14,302,040 | | | | — | | | | — | |
| High-Yield Bond | | | 31,854,788 | | | | 41,325,790 | | | | — | | | | — | |
| International Opportunity Bond | | | 16,524,517 | | | | 20,566,986 | | | | — | | | | — | |
| Large Cap Value | | | 19,737,003 | | | | 16,987,480 | | | | — | | | | — | |
| Focused Large Cap Growth | | | 23,212,722 | | | | 16,265,101 | | | | — | | | | — | |
| International Stock | | | 68,580,102 | | | | 64,346,562 | | | | — | | | | — | |
| Real Estate Stock | | | 21,697,185 | | | | 25,562,302 | | | | — | | | | — | |
| Small Cap Value | | | 25,079,374 | | | | 23,222,812 | | | | — | | | | — | |
| Small Cap Growth | | | 43,476,604 | | | | 43,561,324 | | | | — | | | | — | |
| Emerging Markets Stock | | | 62,685,556 | | | | 65,699,746 | | | | — | | | | — | |
| NOTES TO FINANCIAL STATEMENTS (Unaudited) |
| April 30, 2019 (Continued) |
| 5. | AGGREGATE UNREALIZED APPRECIATION AND DEPRECIATION – TAX BASIS |
The identified cost of investments in securities owned by each Fund for federal income tax purposes, and its respective gross unrealized appreciation and depreciation at April 30, 2019, were as follows:
| | | | | | Gross | | | Gross | | | Net Unrealized | |
| | | Tax | | | Unrealized | | | Unrealized | | | Appreciation/ | |
| | | Cost | | | Appreciation | | | Depreciation | | | (Depreciation) | |
| Floating Rate Bond | | $ | 193,172,305 | | | $ | 744,508 | | | $ | (2,979,391 | ) | | $ | (2,234,883 | ) |
| Long/Short Credit | | | 69,446,939 | | | | 1,074,718 | | | | (257,347 | ) | | | 817,371 | |
| Corporate/Government Bond | | | 50,160,527 | | | | 802,039 | | | | (246,711 | ) | | | 555,328 | |
| Monthly Distribution | | | 217,758,976 | | | | 15,553,218 | | | | (15,880,310 | ) | | | (327,092 | ) |
| Dynamic Macro | | | 37,304,481 | | | | 3,470,380 | | | | (371,641 | ) | | | 3,098,739 | |
| High-Yield Bond | | | 108,783,609 | | | | 2,182,280 | | | | (1,475,302 | ) | | | 706,978 | |
| International Opportunity Bond | | | 37,278,027 | | | | 582,225 | | | | (733,719 | ) | | | (151,494 | ) |
| Large Cap Value | | | 63,435,809 | | | | 19,000,775 | | | | (1,722,413 | ) | | | 17,278,362 | |
| Focused Large Cap Growth | | | 58,632,061 | | | | 49,439,307 | | | | (680,975 | ) | | | 48,758,332 | |
| International Stock | | | 119,211,024 | | | | 12,804,473 | | | | (4,661,386 | ) | | | 8,143,087 | |
| Real Estate Stock | | | 47,324,650 | | | | 8,967,452 | | | | (944,513 | ) | | | 8,022,939 | |
| Small Cap Value | | | 49,534,266 | | | | 4,456,769 | | | | (2,322,510 | ) | | | 2,134,259 | |
| Small Cap Growth | | | 51,382,276 | | | | 9,596,374 | | | | (1,611,192 | ) | | | 7,985,182 | |
| Emerging Markets Stock | | | 72,846,928 | | | | 5,786,793 | | | | (1,272,487 | ) | | | 4,514,306 | |
| 6. | SHARES OF BENEFICIAL INTEREST |
Following is a summary of shareholder transactions for each Fund for the year ended October 31, 2018 and the six months ended April 30, 2019, respectively:
For the six months ended April 30, 2019:
| | | Class N Shares | | | Class A Shares | |
| | | | | | | | | | | | Net Increase | | | | | | | | | | | | Net Increase | |
| | | | | | Distributions | | | | | | (Decrease) in | | | | | | Distributions | | | | | | (Decrease) in | |
| Fund | | Issued | | | Reinvested | | | Redeemed | | | Shares | | | Issued | | | Reinvested | | | Redeemed | | | Shares | |
| Floating Rate Bond | | | 2,737,973 | | | | 390,986 | | | | (3,739,637 | ) | | | (610,678 | ) | | | 332,673 | | | | 46,349 | | | | (249,502 | ) | | | 129,520 | |
| Long/Short Credit | | | 4,070,859 | | | | 121,535 | | | | (1,817,708 | ) | | | 2,374,686 | | | | 354,175 | | | | 13,592 | | | | (77,210 | ) | | | 290,557 | |
| Corporate/Government Bond | | | 1,054,836 | | | | 45,254 | | | | (1,109,935 | ) | | | (9,845 | ) | | | 68,848 | | | | 4,855 | | | | (61,496 | ) | | | 12,207 | |
| Monthly Distribution | | | 1,056,861 | | | | 141,849 | | | | (1,329,227 | ) | | | (130,517 | ) | | | 209,627 | | | | 30,899 | | | | (195,996 | ) | | | 44,530 | |
| Dynamic Macro | | | 215,381 | | | | 89,536 | | | | (895,465 | ) | | | (590,548 | ) | | | 121,072 | | | | 18,240 | | | | (239,859 | ) | | | (100,547 | ) |
| High-Yield Bond | | | 1,374,044 | | | | 275,414 | | | | (2,491,293 | ) | | | (841,835 | ) | | | 166,876 | | | | 33,328 | | | | (296,187 | ) | | | (95,983 | ) |
| International Opportunity Bond | | | 434,495 | | | | 22,947 | | | | (457,944 | ) | | | (502 | ) | | | 75,911 | | | | 1,757 | | | | (60,698 | ) | | | 16,970 | |
| Large Cap Value | | | 396,849 | | | | 214,901 | | | | (371,968 | ) | | | 239,782 | | | | 233,817 | | | | 49,142 | | | | (93,284 | ) | | | 189,675 | |
| Focused Large Cap Growth | | | 627,726 | | | | 225,236 | | | | (460,155 | ) | | | 392,807 | | | | 426,246 | | | | 57,629 | | | | (163,821 | ) | | | 320,054 | |
| International Stock | | | 724,151 | | | | 435,240 | | | | (523,119 | ) | | | 636,272 | | | | 228,306 | | | | 86,701 | | | | (131,043 | ) | | | 183,964 | |
| Real Estate Stock | | | 122,910 | | | | 55,368 | | | | (414,904 | ) | | | (236,626 | ) | | | 72,462 | | | | 9,521 | | | | (93,265 | ) | | | (11,282 | ) |
| Small Cap Value | | | 333,246 | | | | 319,621 | | | | (255,152 | ) | | | 397,715 | | | | 108,218 | | | | 65,268 | | | | (65,676 | ) | | | 107,810 | |
| Small Cap Growth | | | 609,000 | | | | 444,127 | | | | (457,305 | ) | | | 595,822 | | | | 172,529 | | | | 149,638 | | | | (188,497 | ) | | | 133,670 | |
| Emerging Markets Stock | | | 319,476 | | | | 80,396 | | | | (547,632 | ) | | | (147,760 | ) | | | 215,740 | | | | 13,390 | | | | (99,964 | ) | | | 129,166 | |
| NOTES TO FINANCIAL STATEMENTS (Unaudited) |
| April 30, 2019 (Continued) |
| | | Class C Shares | |
| | | | | | | | | | | | Net Increase | |
| | | | | | Distributions | | | | | | (Decrease) | |
| Fund | | Issued | | | Reinvested | | | Redeemed | | | in Shares | |
| Floating Rate Bond | | | 145,118 | | | | 15,408 | | | | (110,413 | ) | | | 50,113 | |
| Long/Short Credit | | | 67,306 | | | | 6,581 | | | | (27,918 | ) | | | 45,969 | |
| Corporate/Government Bond | | | 14,627 | | | | 1,987 | | | | (34,905 | ) | | | (18,291 | ) |
| Monthly Distribution | | | 147,407 | | | | 38,609 | | | | (164,290 | ) | | | 21,726 | |
| Dynamic Macro | | | 23,004 | | | | 2,794 | | | | (25,973 | ) | | | (175 | ) |
| High-Yield Bond | | | 43,541 | | | | 18,450 | | | | (104,334 | ) | | | (42,343 | ) |
| International Opportunity Bond | | | 15,951 | | | | 248 | | | | (20,937 | ) | | | (4,738 | ) |
| Large Cap Value | | | 62,565 | | | | 14,327 | | | | (19,849 | ) | | | 57,043 | |
| Focused Large Cap Growth | | | 62,870 | | | | 28,599 | | | | (51,525 | ) | | | 39,944 | |
| International Stock | | | 45,139 | | | | 27,671 | | | | (46,616 | ) | | | 26,194 | |
| Real Estate Stock | | | 14,253 | | | | 1,724 | | | | (15,010 | ) | | | 967 | |
| Small Cap Value | | | 54,389 | | | | 25,629 | | | | (17,506 | ) | | | 62,512 | |
| Small Cap Growth | | | 32,083 | | | | 66,749 | | | | (56,842 | ) | | | 41,990 | |
| Emerging Markets Stock | | | 27,751 | | | | 2,497 | | | | (50,337 | ) | | | (20,089 | ) |
For the year ended October 31, 2018:
| | | Class N Shares | | | Class A Shares | |
| | | | | | | | | | | | Net Increase | | | | | | | | | | | | Net Increase | |
| | | | | | Distributions | | | | | | (Decrease) in | | | | | | Distributions | | | | | | (Decrease) in | |
| Fund | | Issued | | | Reinvested | | | Redeemed | | | Shares | | | Issued | | | Reinvested | | | Redeemed | | | Shares | |
| Floating Rate Bond | | | 5,544,126 | | | | 680,867 | | | | (5,269,356 | ) | | | 955,637 | | | | 990,916 | | | | 73,952 | | | | (632,403 | ) | | | 432,465 | |
| Long/Short Credit | | | 2,695,549 | | | | 41,172 | | | | (304,528 | ) | | | 2,432,193 | | | | 544,088 | | | | 6,854 | | | | (228,544 | ) | | | 322,398 | |
| Corporate/Government Bond | | | 1,912,073 | | | | 104,386 | | | | (3,405,957 | ) | | | (1,389,498 | ) | | | 204,083 | | | | 10,399 | | | | (260,731 | ) | | | (46,249 | ) |
| Monthly Distribution | | | 2,204,120 | | | | 268,595 | | | | (2,471,857 | ) | | | 858 | | | | 484,297 | | | | 54,294 | | | | (418,482 | ) | | | 120,109 | |
| Dynamic Macro | | | 1,045,881 | | | | — | | | | (854,490 | ) | | | 191,391 | | | | 424,021 | | | | — | | | | (201,583 | ) | | | 222,438 | |
| High-Yield Bond | | | 2,859,505 | | | | 516,584 | | | | (3,764,538 | ) | | | (388,449 | ) | | | 541,122 | | | | 55,424 | | | | (489,836 | ) | | | 106,710 | |
| International Opportunity Bond | | | 918,537 | | | | 3,921 | | | | (838,505 | ) | | | 83,953 | | | | 194,919 | | | | 376 | | | | (86,308 | ) | | | 108,987 | |
| Large Cap Value | | | 774,929 | | | | 70,716 | | | | (831,786 | ) | | | 13,859 | | | | 412,732 | | | | 11,986 | | | | (258,513 | ) | | | 166,205 | |
| Focused Large Cap Growth | | | 652,409 | | | | 27,172 | | | | (953,801 | ) | | | (274,220 | ) | | | 281,769 | | | | 6,227 | | | | (286,311 | ) | | | 1,685 | |
| International Stock | | | 1,185,724 | | | | 219,814 | | | | (823,998 | ) | | | 581,540 | | | | 538,029 | | | | 38,097 | | | | (289,098 | ) | | | 287,028 | |
| Real Estate Stock | | | 1,215,646 | | | | 34,637 | | | | (625,212 | ) | | | 625,071 | | | | 292,170 | | | | 4,939 | | | | (131,144 | ) | | | 165,965 | |
| Small Cap Value | | | 1,077,210 | | | | 144,058 | | | | (151,459 | ) | | | 1,069,809 | | | | 284,243 | | | | 27,980 | | | | (70,164 | ) | | | 242,059 | |
| Small Cap Growth | | | 574,078 | | | | 186,952 | | | | (303,103 | ) | | | 457,927 | | | | 273,170 | | | | 54,752 | | | | (124,818 | ) | | | 203,104 | |
| Emerging Markets Stock | | | 1,385,394 | | | | 31,305 | | | | (495,926 | ) | | | 920,773 | | | | 412,227 | | | | 4,193 | | | | (176,092 | ) | | | 240,328 | |
| | | Class C Shares | |
| | | | | | | | | | | | Net Increase | |
| | | | | | Distributions | | | | | | (Decrease) | |
| Fund | | Issued | | | Reinvested | | | Redeemed | | | in Shares | |
| Floating Rate Bond | | | 263,265 | | | | 23,134 | | | | (172,957 | ) | | | 113,442 | |
| Long/Short Credit | | | 110,059 | | | | 4,514 | | | | (83,122 | ) | | | 31,451 | |
| Corporate/Government Bond | | | 58,106 | | | | 4,299 | | | | (82,611 | ) | | | (20,206 | ) |
| Monthly Distribution | | | 355,558 | | | | 62,509 | | | | (322,392 | ) | | | 95,675 | |
| Dynamic Macro | | | 56,142 | | | | — | | | | (70,500 | ) | | | (14,358 | ) |
| High-Yield Bond | | | 135,855 | | | | 31,188 | | | | (164,632 | ) | | | 2,411 | |
| International Opportunity Bond | | | 48,016 | | | | 177 | | | | (36,571 | ) | | | 11,622 | |
| Large Cap Value | | | 55,368 | | | | 3,842 | | | | (93,744 | ) | | | (34,534 | ) |
| Focused Large Cap Growth | | | 54,856 | | | | 3,483 | | | | (102,259 | ) | | | (43,920 | ) |
| International Stock | | | 76,579 | | | | 15,569 | | | | (95,633 | ) | | | (3,485 | ) |
| Real Estate Stock | | | 38,155 | | | | 1,286 | | | | (45,238 | ) | | | (5,797 | ) |
| Small Cap Value | | | 30,003 | | | | 18,626 | | | | (60,317 | ) | | | (11,688 | ) |
| Small Cap Growth | | | 28,475 | | | | 32,629 | | | | (48,775 | ) | | | 12,329 | |
| Emerging Markets Stock | | | 77,471 | | | | 891 | | | | (46,538 | ) | | | 31,824 | |
| NOTES TO FINANCIAL STATEMENTS (Unaudited) |
| April 30, 2019 (Continued) |
| 7. | DISTRIBUTIONS TO SHAREHOLDERS AND TAX COMPONENTS OF CAPITAL |
The tax character of dividends paid during the year or period ended October 31, 2018 and October 31, 2017 was as follows:
| | | For the year or period ended October 31, 2018 | | | For the year or period ended October 31, 2017 | |
| | | Ordinary | | | Long-Term | | | Return of | | | Tax-Exempt | | | | | | Ordinary | | | Long-Term | | | Return of | | | Tax-Exempt | | | | |
| Fund | | Income | | | Capital Gains | | | Capital | | | Income | | | Total | | | Income | | | Capital Gains | | | Capital | | | Income | | | Total | |
| Floating Rate Bond | | $ | 7,558,793 | | | $ | — | | | $ | — | | | $ | — | | | $ | 7,558,793 | | | $ | 4,705,002 | | | $ | — | | | $ | — | | | $ | — | | | $ | 4,705,002 | |
| Long/Short Credit | | | 479,171 | | | | — | | | | — | | | | — | | | | 479,171 | | | | 689,953 | | | | — | | | | — | | | | — | | | | 689,953 | |
| Corporate/Government Bond | | | 1,586,252 | | | | — | | | | 21,031 | | | | — | | | | 1,607,283 | | | | 1,264,680 | | | | — | | | | 24,527 | | | | 59,502 | | | | 1,348,709 | |
| Monthly Distribution | | | 2,716,635 | | | | — | | | | 11,318,712 | | | | — | | | | 14,035,347 | | | | — | | | | — | | | | 10,191,212 | | | | — | | | | 10,191,212 | |
| Dynamic Macro | | | — | | | | — | | | | — | | | | — | | | | — | | | | — | | | | — | | | | — | | | | — | | | | — | |
| High-Yield Bond | | | 5,523,745 | | | | — | | | | — | | | | — | | | | 5,523,725 | | | | 4,756,447 | | | | — | | | | — | | | | — | | | | 4,756,447 | |
| International Opportunity Bond | | | — | | | | 42,342 | | | | — | | | | — | | | | 42,342 | | | | — | | | | 281,876 | | | | — | | | | — | | | | 281,876 | |
| Large Cap Value | | | 557,584 | | | | 713,265 | | | | — | | | | — | | | | 1,270,849 | | | | 953,600 | | | | — | | | | — | | | | — | | | | 953,600 | |
| Focused Large Cap Growth | | | — | | | | 722,085 | | | | — | | | | — | | | | 722,085 | | | | — | | | | — | | | | — | | | | — | | | | — | |
| International Stock | | | 1,605,505 | | | | 3,151,817 | | | | — | | | | — | | | | 4,757,322 | | | | — | | | | — | | | | — | | | | — | | | | — | |
| Real Estate Stock | | | 344,955 | | | | 300,608 | | | | — | | | | — | | | | 645,563 | | | | 1,820,717 | | | | 3,749,295 | | | | — | | | | — | | | | 5,570,012 | |
| Small Cap Value | | | 1,593,661 | | | | 1,586,225 | | | | — | | | | — | | | | 3,179,886 | | | | 1,012,034 | | | | 144,516 | | | | — | | | | — | | | | 1,156,550 | |
| Small Cap Growth | | | 1,842,122 | | | | 3,242,312 | | | | — | | | | — | | | | 5,084,434 | | | | — | | | | — | | | | — | | | | — | | | | — | |
| Emerging Markets Stock * | | | 824,337 | | | | — | | | | — | | | | — | | | | 824,337 | | | | 1,153,950 | | | | — | | | | — | | | | — | | | | 1,153,950 | |
| * | The difference between ordinary distributions paid from book and ordinary distributions paid from tax for the Emerging Markets Fund relates to allowable foreign tax credits of $232,938 for fiscal year ended October 31, 2018, and $222,500 for the fiscal year ended October 31, 2017, which have been passed through to the Fund’s underlying shareholders and are deemed dividends for tax purposes. |
| ** | Differences in distributions between the Statement of Changes paid from book and tax on the income funds relate to the adjustments for dividends payable for tax purposes. |
Permanent book and tax differences, primarily attributable to the reclass of net operating losses and fund distributions, resulted in reclassification for the tax year ended October 31, 2018 as follows:
| | | Paid | | | | |
| | | In | | | Accumulated | |
| Fund | | Capital | | | Earnings (Loss) | |
| Floating Rate Bond | | $ | — | | | $ | — | |
| Long/Short Credit | | | — | | | | — | |
| Corporate/Government Bond | | | (21,031 | ) | | | 21,031 | |
| Monthly Distribution | | | 44,493 | | | | (44,493 | ) |
| Dynamic Macro | | | — | | | | — | |
| High-Yield Bond | | | — | | | | — | |
| International Opportunity Bond | | | — | | | | — | |
| Large Cap Value | | | — | | | | — | |
| Focused Large Cap Growth | | | (176,944 | ) | | | 176,944 | |
| International Stock | | | — | | | | — | |
| Real Estate Stock | | | — | | | | — | |
| Small Cap Value | | | — | | | | — | |
| Small Cap Growth | | | (1 | ) | | | 1 | |
| Emerging Markets Stock | | | — | | | | — | |
| | | | | | | | | |
Net assets were unaffected by the above reclassifications.
| NOTES TO FINANCIAL STATEMENTS (Unaudited) |
| April 30, 2019 (Continued) |
| |
As of each of the Fund’s tax year-ended October 31, 2018, the components of distributable earnings on a tax basis were as follows:
| | | Undistributed | | | Undistributed | | | Post October Loss | | | Capital Loss | | | Other | | | Unrealized | | | Total | |
| | | Ordinary | | | Long-Term | | | and | | | Carry | | | Book/Tax | | | Appreciation/ | | | Accumulated | |
| Fund | | Income | | | Capital Gains | | | Late Year Loss | | | Forwards | | | Differences | | | (Depreciation) | | | Earnings/(Deficits) | |
| Floating Rate Bond | | $ | 203,858 | | | $ | — | | | $ | — | | | $ | (2,952,242 | ) | | $ | (3,616 | ) | | $ | (1,501,315 | ) | | $ | (4,253,315 | ) |
| Long/Short Credit | | | 463,415 | | | | — | | | | — | | | | (66,482 | ) | | | (472 | ) | | | (181,473 | ) | | | 214,988 | |
| Corporate/Government Bond | | | — | | | | — | | | | — | | | | (3,242,763 | ) | | | (930 | ) | | �� | (1,313,470 | ) | | | (4,557,163 | ) |
| Monthly Distribution | | | — | | | | — | | | | — | | | | — | | | | (144,337 | ) | | | (10,950,174 | ) | | | (11,094,511 | ) |
| Dynamic Macro | | | 462,652 | | | | — | | | | — | | | | (5,443,173 | ) | | | — | | | | 3,857,364 | | | | (1,123,157 | ) |
| High-Yield Bond | | | 116,902 | | | | — | | | | — | | | | (5,560,146 | ) | | | (8,085 | ) | | | (4,107,710 | ) | | | (9,559,039 | ) |
| International Opportunity Bond | | | 78,557 | | | | 50,420 | | | | — | | | | — | | | | — | | | | (1,104,613 | ) | | | (975,636 | ) |
| Large Cap Value | | | 817,314 | | | | 2,475,117 | | | | — | | | | — | | | | — | | | | 11,501,529 | | | | 14,793,960 | |
| Focused Large Cap Growth | | | — | | | | 6,221,713 | | | | (838,442 | ) | | | — | | | | — | | | | 32,962,415 | | | | 38,345,686 | |
| International Stock | | | 1,148,335 | | | | 6,332,594 | | | | — | | | | — | | | | — | | | | 16,996 | | | | 7,497,925 | |
| Real Estate Stock | | | 650,188 | | | | — | | | | — | | | | (12,145 | ) | | | — | | | | 3,656,346 | | | | 4,294,389 | |
| Small Cap Value | | | 1,842,665 | | | | 3,196,559 | | | | — | | | | — | | | | — | | | | (1,024,687 | ) | | | 4,014,537 | |
| Small Cap Growth | | | 3,935,267 | | | | 5,086,997 | | | | — | | | | — | | | | — | | | | 2,534,248 | | | | 11,556,512 | |
| Emerging Markets Stock | | | 1,023,407 | | | | — | | | | — | | | | (1,129,268 | ) | | | — | | | | (3,492,341 | ) | | | (3,598,202 | ) |
The difference between book basis and tax basis unrealized appreciation (depreciation), undistributed net investment income (loss) and accumulated net realized gain (loss) from security transactions are primarily attributable to the tax deferral of losses on wash sales and straddles, adjustments for gains on contingent convertible debt securities, the mark-to-market treatment of open forward foreign currency contracts, options, futures, dividend payable and swap contracts, and adjustments for section 305(c) deemed dividend distributions, real estate investment trusts, partnerships, preferred securities, perpetual bonds, passive foreign investment companies, constructive sales of securities held short, straddles and C Corporation return of capital distributions. In addition, the amount listed under other book/tax differences are primarily attributable to the tax deferral of losses on straddles and constructive sales, and tax adjustments for accrued dividend payable.
Late year losses incurred after December 31 within the fiscal year are deemed to arise on the first business day of the following fiscal year for tax purposes. The Funds incurred and elected to defer such late year losses as follows:
| | | Late Year | |
| Fund | | Losses | |
| Floating Rate Bond | | $ | — | |
| Long/Short Credit | | | — | |
| Corporate/Government Bond | | | — | |
| Monthly Distribution | | | — | |
| Dynamic Macro | | | — | |
| High-Yield Bond | | | — | |
| International Opportunity Bond | | | — | |
| Large Cap Value | | | — | |
| Focused Large Cap Growth | | | 838,442 | |
| International Stock | | | — | |
| Real Estate Stock | | | — | |
| Small Cap Value | | | — | |
| Small Cap Growth | | | — | |
| Emerging Markets Stock | | | — | |
| NOTES TO FINANCIAL STATEMENTS (Unaudited) |
| April 30, 2019 (Continued) |
| |
At October 31, 2018, the following Funds had capital loss carryforwards for federal income tax purposes available to offset future capital gains through the indicated expiration date as follows:
| | | | | | Non-Expiring | | | Non-Expiring | | | | | | Capital Loss Carry | |
| Fund | | Expiring 2019 | | | Short-Term | | | Long-Term | | | Total | | | Forward Utilized | |
| Floating Rate Bond | | $ | — | | | $ | 784,995 | | | $ | 2,167,247 | | | $ | 2,952,242 | | | $ | — | |
| Long/Short Credit | | | — | | | | — | | | | 66,482 | | | | 66,482 | | | | 2,170,783 | |
| Corporate/Government Bond | | | — | | | | 1,274,459 | | | | 1,968,304 | | | | 3,242,763 | | | | — | |
| Monthly Distribution | | | — | | | | — | | | | — | | | | — | | | | 6,585,099 | |
| Dynamic Macro | | | 152,059 | | | | 2,371,512 | | | | 2,919,602 | | | | 5,443,173 | | | | — | |
| High-Yield Bond | | | — | | | | 3,224,149 | | | | 2,335,997 | | | | 5,560,146 | | | | — | |
| International Opportunity Bond | | | — | | | | — | | | | — | | | | — | | | | — | |
| Large Cap Value | | | — | | | | — | | | | — | | | | — | | | | — | |
| Focused Large Cap Growth | | | — | | | | — | | | | — | | | | — | | | | — | |
| International Stock | | | — | | | | — | | | | — | | | | — | | | | — | |
| Real Estate Stock | | | — | | | | 12,145 | | | | — | | | | 12,145 | | | | — | |
| Small Cap Value | | | — | | | | — | | | | — | | | | — | | | | — | |
| Small Cap Growth | | | — | | | | — | | | | — | | | | — | | | | — | |
| Emerging Markets Stock | | | 351,019 | | | | 778,249 | | | | — | | | | 1,129,268 | | | | 1,377,534 | |
Currently, the Funds have a $40,000,000 uncommitted line of credit provided by U.S. Bank National Association (the “Bank”) under an agreement (the “Uncommitted Line”). Any advance under the Uncommitted Line is contemplated primarily for temporary or emergency purposes, including the meeting of redemption requests that otherwise might require the untimely disposition of securities. Interest on borrowings is payable on an annualized basis. The Uncommitted Line is not a “committed” line of credit, which is to say that the Bank is not obligated to lend money to a Fund. Accordingly, it is possible that a Fund may wish to borrow money for a temporary or emergency purpose but may not be able to do so. During the six months ended April 30, 2019, Corporate/Government Bond, Monthly Distribution, Dynamic Macro, High-Yield Bond, International Opportunity Bond, Focused Large Cap Growth, International Stock, Small Cap Value, and Emerging Markets Stock accessed the line of credit. Based only on the days borrowed, the average amount of borrowings outstanding were $3,741,667, $9,903,267, $461,000, $2,483,000, $532,000, $2,629,000, $135,500, $81,333, and $989,500, respectively. The interest expense for all of the Funds listed above is immaterial. As of April 30, 2019, all of the Funds listed above had no outstanding borrowings on the Uncommitted Line.
The Funds have entered into a Securities Lending Agreement (“Agreement”) with the two separate lending agents. Each participating Fund can lend their securities to brokers, dealers and other financial institutions approved by the Board to earn additional income. Loans are collateralized at a value at least equal to 105% of the then current market value of any loaned security that are foreign, or 102% of the then current market value of any other loaned security. The following Fund is below the 102% threshold due to market fluctuation, International Stock. All interest and dividend payments received on securities which are held on loan, provided that there is no material default, will be paid to the respective Fund. A portion of the income generated by the investment in the collateral, net of any rebates paid by the Bank to the borrowers is remitted to the Bank as lending agent and the remainder is paid to the Fund(s).
Securities lending income, if any, is disclosed in the Funds’ Statements of Operations. Although risk is mitigated by the collateral, the Funds could experience a delay in recovering their securities and possible loss of income or value if the Borrower fails to return them. Should the borrower of the securities fail financially, each Fund has the right to repurchase the securities using the collateral in the open market. The remaining contractual maturity of all securities lending transactions are overnight and continuous.
| NOTES TO FINANCIAL STATEMENTS (Unaudited) |
| April 30, 2019 (Continued) |
The following table presents financial instruments that are subject to enforceable netting arrangements as of April 30,2019.
| Gross Amounts of Assets Presented in the Statements of Assets and Liabilities |
| | | | | | | | | | |
| | | Market Value of | | | Market Value of | | | Percentage of Total | |
| Fund | | Loaned Securities | | | Collateral (1) | | | Investment Income | |
| Floating Rate Bond | | $ | — | | | $ | — | | | | 0.02 | % |
| Long/Short Credit | | | — | | | | — | | | | 0.34 | % |
| Corporate/Government Bond | | | — | | | | — | | | | 0.09 | % |
| Monthly Distribution | | | — | | | | — | | | | 0.14 | % |
| Dynamic Macro | | | — | | | | — | | | | 2.76 | % |
| High-Yield Bond | | | 2,360,160 | | | | 2,360,160 | | | | 0.57 | % |
| International Opportunity Bond | | | — | | | | — | | | | 0.00 | % |
| Large Cap Value | | | — | | | | — | | | | 0.22 | % |
| Focused Large Cap Growth | | | — | | | | — | | | | 2.24 | % |
| International Stock * | | | 4,782,574 | | | | 4,782,574 | | | | 0.69 | % |
| Real Estate Stock | | | — | | | | — | | | | 0.22 | % |
| Small Cap Value | | | — | | | | — | | | | 0.76 | % |
| Small Cap Growth | | | 7,251,772 | | | | 7,251,772 | | | | 8.35 | % |
| Emerging Markets Stock * | | | 6,714,473 | | | | 6,714,473 | | | | 0.76 | % |
| * | Securities collateralized below 102%. The Trust’s securities lending policies and procedures require that the borrower: (i) deliver cash or U.S. Government securities as collateral with respect to each new loan of U.S. securities, equal to at least 102% of the value of the portfolio securities loaned, and (ii) at all times thereafter mark-to-market the collateral on a daily basis so that the market value of such collateral is at least 100% of the value of securities loaned. From time to time the collateral may not be 102% due to end of day market movement. The next business day additional collateral is obtained/received from the borrower to replenish/reestablish 102%. |
| 10. | UNDERLYING INVESTMENTS IN OTHER INVESTMENT COMPANIES |
The Funds invest in other investment companies. Each underlying fund, including each ETF, is subject to specific risks, depending on the nature of the underlying fund. These risks could include liquidity risk, sector risk, foreign and related currency risk and high yield risk. Investors in the Funds will indirectly bear fees and expenses charged by the underlying investment companies in which the Funds invest in addition to the Funds’ direct fees and expenses. All the Funds may invest in investment companies. Such investments would subject the Funds to similar risks.
The performance of the Monthly Distribution Fund will be directly affected by the performance of the Fidelity Investments Money Market Fund – Class I. The financial statements of this Fund, including the portfolio of investments, can be found at the Securities and Exchange Commission’s (“SEC”) website www.sec.gov and should be read in conjunction with the Monthly Distribution Fund’s financial statements. As of April 30, 2019, the percentage of the Monthly Distribution Fund invested in the Fidelity Investments Money Market Fund- Class I was 42.2%.
| 11. | RECENT ACCOUNTING PRONOUNCEMENTS |
In March 2017, the Financial Accounting Standards Board (FASB) issued Accounting Standards Update (ASU) No. 2017-08, Receivables—Nonrefundable Fees and Other Costs (Subtopic 310-20): Premium Amortization on Purchased Callable Debt Securities. The amendments in the ASU shorten the amortization period for certain callable debt securities, held at a premium, to be amortized to the earliest call date. The ASU does not require an accounting change for securities held at a discount; which continues to be amortized to maturity. The ASU is effective for fiscal years and interim periods within those fiscal years beginning after December 15, 2018. Management is currently evaluating the impact, if any, of applying this provision.
In August 2018, the FASB issued Accounting Standards Update (“ASU”) No. 2018-13, which changes certain fair value measurement disclosure requirements. The new ASU, in addition to other modifications and additions, removes the requirement to disclose the amount and reasons for transfers between Level 1 and Level 2 of the fair value hierarchy, and the policy for the timing of transfers between levels. For investment companies, the amendments are effective for financial statements issued for fiscal years beginning after December 15, 2019, and interim periods within those fiscal years. Early adoption is allowed. These amendments have been adopted with these financial statements.
| NOTES TO FINANCIAL STATEMENTS (Unaudited) |
| April 30, 2019 (Continued) |
In August 2018, the Securities and Exchange Commission adopted amendments to certain disclosure requirements under Regulation S-X to conform to US GAAP, including: (i) an amendment to require presentation of the total, rather than the components, of distributable earnings on the Statement of Assets and Liabilities; and (ii) an amendment to require presentation of the total, rather than the components, of distributions to shareholders, except for tax return of capital distributions, if any, on the Statement of Changes in Net Assets. The amendments also removed the requirement for parenthetical disclosure of undistributed net investment income on the Statement of Changes in Net Assets. These amendments have been adopted with these financial statements.
Subsequent events after the date of the Statements of Assets and Liabilities have been evaluated through the date the financial statements were issued. Management has determined that no events or transactions occurred requiring adjustment or disclosure in the financial statements.
Meeting of the Board of Trustees Held on December 17-18, 2018
On December 17-18, 2018, the Board of Trustees (the “Board”) of Dunham Funds (the “Trust”), a Delaware business trust, met to consider, among other things, (i) the renewal of the investment advisory agreement between the Trust and Dunham & Associates Investment Counsel, Inc. (the “Adviser”) and (ii) the renewal of the sub-advisory agreements with various sub-advisers for certain Trust series (the “Funds”). The investment advisory agreement and the sub-advisory agreements are collectively referred to as the “Advisory Agreements.” The Funds and the relevant sub-advisers with sub-advisory agreements up for renewal include:
| Fund | Sub-Advisory Agreement |
| Dunham Alternative Dividend Fund | Sungarden Fund Management, LLC |
| Dunham Appreciation & Income Fund | [Not up for renewal] |
| Dunham Corporate/Government Bond Fund | Newfleet Asset Management, LLC |
| Dunham Dynamic Macro Fund | Mellon Capital Management |
| Dunham Emerging Markets Stock Fund | Bailard, Inc. |
| Dunham Floating Rate Bond Fund | Newfleet Asset Management, LLC |
| Dunham Focused Large Cap Growth Fund | The Ithaka Group, LLC |
| Dunham High-Yield Bond Fund | PineBridge Investments LLC |
| Dunham International Opportunity Bond Fund | Allianz Global Investors U.S. LLC |
| Dunham International Stock Fund | Arrowstreet Capital, Limited Partnership |
| Dunham Large Cap Value Fund | Rothschild & Co. Asset Management US Inc. |
| Dunham Monthly Distribution Fund | Perella Weinberg Partners Capital Management LP |
| Dunham Real Estate Stock Fund | Barings Asset Management Limited |
| Dunham Small Cap Growth Fund | Pier Capital, LLC |
| Dunham Small Cap Value Fund | Piermont Capital Management, Inc. |
The Independent Trustees had requested and reviewed materials the Adviser and the sub-advisers provided prior to and during the meetings and had reviewed a memorandum from Fund counsel that reviewed their fiduciary duties pertaining to renewal of investment management and sub-advisory agreements and the factors they should consider in evaluating the Advisory agreements.
Among other information, the Adviser and the sub-advisers provided information to assist the Independent Trustees in assessing the nature, extent and quality of services provided, information comparing the investment performance, advisory fees and operating expense ratio of each Fund to other funds, information about estimated profitability and/or financial condition and compliance and regulatory matters. The Board determined that, given the totality of the information provided with respect to each Advisory Agreement, the Board had received sufficient information to approve the Advisory Agreements.
The Independent Trustees and Fund counsel met in executive sessions to consider the renewal of the Advisory Agreements. The Board also received information about the Funds throughout the year in connection with the regular quarterly Board meetings from the Adviser and various Fund sub-advisers.
Based upon its review, the Board concluded that it was in the best interests of each Fund that the Advisory Agreements be renewed. In considering the renewal of the Advisory Agreements, the Board did not identify any single factor or group of factors as all-important or controlling, and considered a variety of factors in its analysis, including those discussed below. The Board did not allot a particular weight to any one factor or group of factors.
Investment Advisory Agreement
Nature, Extent and Quality of Services. In considering the renewal of the investment advisory agreement with the Adviser, the Board considered the nature, extent and quality of services that the Adviser provided to the Funds, including the Adviser’s personnel and resources and the Adviser’s criteria for reviewing a sub-adviser’s performance. The Board reviewed the services the Adviser provided in serving as investment adviser, including the backgrounds of the personnel providing the investment management services and compliance staff. They also reviewed information provided regarding risk management and compliance and regulatory matters. The Board concluded that the services the Adviser provided were satisfactory.
Performance.The Board reviewed performance information the Adviser provided for Class N of each Fund compared to the performance of (a) funds in a peer group (the “Peer Group”) (which is a relevant sub-set of funds in a Fund’s Morningstar category), (b) a Morningstar category average and (c) a benchmark index for the one, three, five and ten year periods or since a Fund’s inception, as applicable, ended September 30, 2018. The Board considered that the Adviser had delegated day-to-day portfolio management of each Fund strategy to a sub-adviser and noted the ongoing oversight activities the Adviser performed, including review of returns on a relative and absolute basis, evaluation of brokerage execution quality and on-site compliance reviews. The Board concluded that the Adviser had appropriately reviewed and monitored each sub-adviser’s investment performance.
Advisory Fee. The Board reviewed each Fund’s advisory fee and expense ratio, taking into account the Fund’s average net assets, and reviewed information comparing the advisory fee and expense ratio to those of the Peer Group and a Morningstar category. The Board discussed that while the advisory fees do not necessarily have to be the lowest compared to the Peer Groups, it is their duty to evaluate whether the advisory fees are reasonable. The Board noted that the Adviser’s fees range from 0.50% to 0.65%, which, when combined with the sub-adviser fees, are generally higher than the Peer Group averages when a Fund is performing well, but in some cases lower than the Peer Group averages when a Fund is underperforming. It noted that the Adviser’s fee ranges are reasonably applied based on the nature of a Fund (i.e., bond vs. equity, or alternative vs. traditional). The Board noted that currently four Funds are considered “alternative” and generally require enhanced oversight compared to more traditional asset classes. The Board discussed the level of work involved in the Adviser’s oversight of the Funds and the Adviser’s ongoing quantitative and qualitative analysis of each sub-adviser.
The Board also noted:
| ● | Dunham Alternative Dividend Fund: The Board noted that the advisory fee was lower than the average of the Peer Group and the Morningstar category, and the overall expense ratio was in a reasonable range. |
| ● | Dunham Appreciation & Income Fund: The Board noted that the advisory fee was in line with the average of the Peer Group and the Morningstar category, and the overall expense ratio was in a reasonable range. |
| ● | Dunham Corporate/Government Bond Fund: The Board noted that the advisory fee was higher than the average of the Peer Group and the Morningstar category; however, the overall expense ratio was in a reasonable range. |
| ● | Dunham Dynamic Macro Fund: The Board noted that the advisory fee was in line with the average of the Peer Group and the Morningstar category, and the overall expense ratio was in a reasonable range. |
| ● | Dunham Emerging Markets Stock Fund: The Board noted that the advisory fee was lower than the average of the Peer Group and the Morningstar category, and the overall expense ratio was in a reasonable range. |
| ● | Dunham Floating Rate Bond Fund: The Board noted that the advisory fee was higher than the average of the Peer Group and the Morningstar category; however, the overall expense ratio was in a reasonable range. |
| ● | Dunham Focused Large Cap Growth Fund: The Board noted that the advisory fee was higher than the average of the Peer Group and the Morningstar category; however, the overall expense ratio was in a reasonable range. |
| ● | Dunham High-Yield Bond Fund: The Board noted that the advisory fee was higher than the average of the Peer Group and the Morningstar category; however, the overall expense ratio was in a reasonable range. |
| ● | Dunham International Opportunity Bond Fund: The Board noted that the advisory fee was higher than the average of the Peer Group and the Morningstar category; however, the overall expense ratio was in a reasonable range. |
| ● | Dunham International Stock Fund: The Board noted that the advisory fee was higher than the average of the Peer Group and the Morningstar category; however, the overall expense ratio was in a reasonable range. |
| ● | Dunham Large Cap Value Fund: The Board noted that the advisory fee was lower than or in line with the average of the Peer Group and the Morningstar category, and the overall expense ratio was in a reasonable range. |
| ● | Dunham Monthly Distribution Fund: The Board noted that the advisory fee was higher than the average of the Peer Group and the Morningstar category; however, the overall expense ratio was in a reasonable range. |
| ● | Dunham Real Estate Stock Fund: The Board noted that the advisory fee was in line with the average of the Peer Group and the Morningstar category, and the overall expense ratio was in a reasonable range. |
| ● | Dunham Small Cap Growth Fund: The Board noted that the advisory fee was lower than the average of the Peer Group and the Morningstar category, and the overall expense ratio was in a reasonable range. |
| ● | Dunham Small Cap Value Fund: The Board noted that the advisory fee was higher than the average of the Peer Group and the Morningstar category; however, the overall expense ratio was in a reasonable range. |
In light of the nature, quality and extent of services the Adviser provided, the Board concluded that each Fund’s advisory fee was reasonable.
Economies of Scale. The Board considered the extent to which economies of scale would be realized as each Fund grows and whether fee levels reflect a reasonable sharing of economies of scale for the benefit of Fund investors. The Board noted that breakpoints may be an appropriate way for the Adviser to share its economies of scale if a Fund experiences substantial asset growth; however, the Board recognized that no Fund had yet reached an asset level where the Adviser could realize significant economies of scale. The Board observed that economies of scale will be considered in the future as Fund asset levels grow.
Profitability.The Board also reviewed the estimated profitability of the Adviser with respect to each Fund. The Board concluded that the estimated profitability of the Adviser in connection with the management of each Fund was reasonable, and at a level to adequately incentivize the Adviser to continue to provide high quality services.
Fallout Benefits. Because of its relationship with the Funds, the Adviser and its affiliates may receive certain benefits. The Board reviewed materials provided by the Adviser as to any such benefits.
Sub-Advisory Agreements
Nature, Extent and Quality of Services. In considering the renewal of the sub-advisory agreement between each Fund and the Fund’s respective sub-adviser, the Board considered the nature, extent and quality of services the sub-adviser provided under the sub-advisory agreement. The Board reviewed the services the sub-adviser provided, the background of the investment professionals servicing the Fund, and the sub-adviser’s reputation, resources and investment approach. The Board also reviewed information provided regarding the structure of portfolio manager compensation, trading and brokerage practices, soft dollar usage, risk management and compliance matters.
Performance.The Board reviewed each Fund’s total return compared to the total returns of the Peer Group and the funds included in the Morningstar category. The Board also noted:
| ● | Dunham Alternative Dividend Fund: The Board noted that Sungarden Fund Management, LLC (“Sungarden”), has served as the Fund’s sub-adviser since August 31, 2016 (the inception date of the Fund). The Board reviewed the Fund’s total return compared to the total returns of the Peer Group and the funds included in the Morningstar category. The Board noted that the Fund underperformed its Peer Group, Morningstar category, and its benchmark index over the one-year period and since the Fund’s inception. The Board considered the Adviser’s observation that the Fund’s strategy of investing in dividend-paying stocks and purchasing put options on the broad equity market generally detracted from performance. While the put options generally provided some support during the sharp market downturns experienced during the past year, the benefit was outweighed by the underperformance during the strong run-up periods. The Board considered that the Adviser would continue to closely monitor performance. The Board concluded that the services Sungarden provided were satisfactory. |
| ● | Dunham Appreciation & Income Fund: The Fund’s sub-advisory agreement is not up for renewal at this time. |
| ● | Dunham Corporate/Government Bond Fund: The Board noted that Newfleet Asset Management, LLC (“Newfleet”), has served as the Fund’s sub-adviser since December 10, 2004 (the inception date of the Fund). The Board reviewed the Fund’s total return compared to the total returns of the Peer Group and the funds included in the Morningstar category. The Board noted that the Fund’s total return was in line with or ahead of the Peer Group, the Morningstar category and the return of the benchmark index for the one-year, five-year and ten-year periods. The Board concluded that the services Newfleet provided were satisfactory. |
| ● | Dunham Dynamic Macro Fund: The Board noted that Mellon Capital Management (“Mellon”), has served as the Fund’s sub-adviser since October 1, 2014 (while the Fund’s inception date was April 30, 2010). The Board reviewed the Fund’s total return compared to the total returns of the Peer Group and the funds included in the Morningstar category. The Board noted that the Fund underperformed the Peer Group and the Morningstar category over the one-year, five-year and ten-year periods. The Fund additionally underperformed the benchmark index over the one-year period and since the Fund’s inception. The Board considered that the underperformance was primarily attributable to the previous sub-adviser and the strategy that was implemented prior to 2014. The Board considered that the Fund has outperformed its Peer Group, the Morningstar category and benchmark index since Mellon began managing the Fund’s investments. The Board concluded that the services Mellon provided were satisfactory. |
| ● | Dunham Emerging Markets Stock Fund: The Board noted that Bailard, Inc. (“Bailard”), has served as the Fund’s sub-adviser since July 1, 2013 (while the Fund’s inception date was December 10, 2004). The Board reviewed the Fund’s total return compared to the total returns of the Peer Group and the funds included in the Morningstar category. The Board noted that the Fund underperformed the Peer Group over the one-year and five-year periods, and since Bailard began managing the |
| | Fund’s investments. The Fund underperformed the Morningstar category and the benchmark index over the one-year and five-year periods. The Board noted that the Fund was currently on the watch-list and management would recommend a replacement at the March 2019 Board meeting. The Board concluded that Bailard would continue to provide services to the Fund until a replacement sub-adviser was approved. |
| ● | Dunham Floating Rate Bond Fund: The Board noted that Newfleet Asset Management, LLC (“Newfleet”), has served as the Fund’s sub-adviser since November 4, 2013 (the inception date of the Fund). The Board reviewed the Fund’s total return compared to the total returns of the Peer Group and the funds included in the Morningstar category. The Board noted that the Fund underperformed its benchmark index over the one-year period and since the Fund’s inception. The Board also considered that the Adviser believes that Newfleet should be able to identify and take advantage of inefficiencies in the bank loan market. The Board considered that the Adviser would continue to closely monitor performance. The Board concluded that the services Newfleet provided were satisfactory. |
| ● | Dunham Focused Large Cap Growth Fund: The Board noted that The Ithaka Group, LLC (“Ithaka”), has served as the Fund’s sub-adviser since December 8, 2011 (the inception date of the Fund), and the Fund may hold a maximum of 35 stocks. The Board reviewed the Fund’s total return compared to the total returns of the Peer Group and the funds included in the Morningstar category. The Board noted that the Fund underperformed the benchmark index over the five-year period and since the Fund’s inception. The Board considered that when the Fund has historically outperformed its Peer Group, Morningstar category average and benchmark index, it has done so by a significant amount. The Board considered that the Adviser continues to believe that Ithaka’s long-term performance should be reasonable. The Board concluded that the services Ithaka provided were satisfactory. |
| ● | Dunham High-Yield Bond Fund: The Board noted that PineBridge Investments LLC (“PineBridge”), has served as the Fund’s sub-adviser since July 1, 2017 (while the Fund’s inception date is July 1, 2005). The Board reviewed the Fund’s total return compared to the total returns of the Peer Group and the funds included in the Morningstar category. The Board noted that the Fund underperformed the Morningstar category and the current benchmark index over the one-year, five-year and ten-year periods. The Board considered that this underperformance was primarily achieved by the previous sub-adviser. Since the commencement of PineBridge, the Fund performed in line with the Morningstar category and the benchmark index. The Board considered that the Adviser is optimistic that PineBridge should achieve reasonable long-term performance. The Board concluded that the services PineBridge provided were satisfactory. |
| ● | Dunham International Opportunity Bond Fund: The Board noted that Allianz Global Investors U.S. LLC (“Allianz”), and, formerly Rogge Global Partners PLC before it was merged into Allianz in June 2017, has served as the Fund’s sub-adviser since November 4, 2013 (the inception date of the Fund). The Board reviewed the Fund’s total return compared to the total returns of the Peer Group and the funds included in the Morningstar category. The Board considered that the Peer Group contained a limited number of funds, and noted that the Fund underperformed its Peer Group, its Morningstar category and benchmark index over the one-year time period and since the Fund’s inception. The Board considered that the Fund’s underperformance relative to its Morningstar category was primarily attributable to the few funds in the category that are foreign bond funds with little exposure to the U.S. bond market. The Fund performed substantially similar to the benchmark index, which does have a similar country and regional exposure compared to the Fund, over each of the time periods measured. The Board concluded that the services Allianz provided were satisfactory. |
| ● | Dunham International Stock Fund: The Board noted that Arrowstreet Capital (“Arrowstreet”), has served as the Fund’s sub-adviser since July 1, 2008 (while the Fund’s inception date is December 10, 2004). The Board reviewed the Fund’s total return compared to the total returns of the Peer Group and the funds included in the Morningstar category. The Board noted that the Fund’s total return was higher than or in line with the Peer Group, the Morningstar category and the return of the benchmark index for the one -year, five-year, and ten-year periods. The Board concluded that the services Arrowstreet provided were satisfactory. |
| ● | Dunham Large Cap Value Fund: The Board noted that Rothschild & Co. Asset Management US Inc. (“Rothschild”), has served as the Fund’s sub-adviser since July 1, 2015 (while the Fund’s inception date is December 10, 2004). The Board reviewed the Fund’s total return compared to the total returns of the Peer Group and the funds included in the Morningstar category. The Board noted that the Fund underperformed its Peer Group and Morningstar category over the one-year and five-year periods and since Rothschild began managing the Fund’s investments, and underperformed the benchmark index over the five-year period and since Rothschild began managing the Fund’s investments. The Board considered that the Adviser believes that Rothschild will provide reasonable performance over the long-term. The Board concluded that the services Rothschild provided were satisfactory. |
| ● | Dunham Monthly Distribution Fund: The Board noted that Perella Weinberg Partners Capital Management LP (“Perella”), has served as the Fund’s sub-adviser since April 4, 2017 (while the Fund’s inception date is September 29, 2008). The Board reviewed the Fund’s total return compared to the total returns of the Peer Group and the funds included in the Morningstar category. The Board noted that the Fund’s total return was in line with the Peer Group, the Morningstar category and the return of the benchmark index for the one-year period since Perella began managing the Fund’s investments. The Board concluded that the services Perella provided were satisfactory. |
| ● | Dunham Real Estate Stock Fund: The Board noted that Barings Asset Management Limited (“Barings”), has served as the Fund’s sub-adviser since May 1, 2012 (while the Fund’s inception date is December 10, 2004). The Board reviewed the Fund’s total return compared to the total returns of the Peer Group and the funds included in the Morningstar category. The Board noted the Fund underperformed its Peer Group and the Morningstar category over the one-year period. The Fund underperformed the benchmark index over the one-year and five-year period and since Barings began managing the Fund’s investments. The Board considered that the Adviser believes that Barings’ strategy has the potential to produce reasonable returns for the Fund. The Board concluded that the services Barings provided were satisfactory. |
| ● | Dunham Small Cap Growth Fund: The Board noted that Pier Capital, LLC (“Pier”), has served as the Fund’s sub-adviser since December 10, 2004 (the inception date of the Fund). The Board reviewed the Fund’s total return compared to the total returns of the Peer Group and the funds included in the Morningstar category. The Board noted that the Fund’s total return was higher than or in line with the Peer Group, the Morningstar category and the return of the benchmark index for the one-year, five-year, and ten-year periods, and since Pier began managing the Fund’s investments. The Board concluded that the services Pier provided were satisfactory. |
| ● | Dunham Small Cap Value Fund: The Board noted that Piermont Capital Management, Inc. (“Piermont”), has served as the Fund’s sub-adviser since July 1, 2013 (while the Fund’s inception date is December 10, 2004). The Board reviewed the Fund’s total return compared to the total returns of the Peer Group and the funds included in the Morningstar category. The Board noted the Fund underperformed the Morningstar average over the ten-year period. However, since Piermont began managing the Fund, the Fund has performed in line with or outperformed its Peer Group, the Morningstar category and the benchmark index. The Board concluded that the services Piermont provided were satisfactory. |
Sub-Advisory Fees and Economies of Scale. The Board considered each Fund’s sub-advisory fee schedule and noted the fees charged to comparable portfolios, if any, that the sub-adviser managed. The Board considered that the fee schedule was negotiated between the Adviser and each sub-adviser, an unaffiliated third party.
The Board considered the base fee paid to each sub-adviser when the performance of a Fund is equal to that of a specific index plus or minus a “null” zone. The Board also reviewed the operation of the
performance fee and the impact on fees and expenses based on various performance results. They discussed the unique nature of the performance fee, which results in higher fees when a sub-adviser delivers results, and how performance fees should be integrated into their analysis.
The Board confirmed its belief that performance fees help ensure that any significant fee adjustments are attributable to a sub-adviser’s skill, rather than to random performance fluctuations, and the performance fee aligns a sub-adviser’s interest with those of Fund shareholders. The Board concluded that each sub-adviser’s fees were in a reasonable range.
The Board reviewed the relevance of economies of scale in the context of a sub-adviser that receives a performance based fee. The Board agreed that the Adviser had successfully negotiated a favorable base fee with each sub-adviser, and that reductions based on asset growth, when coupled with the possibility of fee reductions based on performance, could hinder the Adviser’s ability to attract top sub-advisory talent. The Board agreed that pursuing breakpoints with any of the sub-advisers would not be in the best interests of Fund shareholders at this time.
Profitability and Fallout Benefits. The Board considered information provided regarding each sub-adviser’s estimated profitability from providing sub-advisory services to its respective Fund. The Board noted that the sub-advisory fee schedule was negotiated between the Adviser and each sub-adviser, an unaffiliated third party. The Board reviewed materials provided as to any additional benefits each sub-adviser receives.
All Agreements
Conclusion.Based on all of the information considered and the conclusions reached, the Board determined that the terms of the Advisory Agreements for each Fund are fair and reasonable, and that the continuation of the Advisory Agreements are in the best interests of each Fund.
Meeting of the Board of Trustees Held on March 19, 2019
On March 19, 2019, the Board of Trustees (the “Board”) of Dunham Funds (the “Trust”), a Delaware business trust, met to consider, among other things, new sub-advisory agreements with two sub-advisers for certain Trust series (the “Funds”). The sub-advisory agreements are collectively referred to as the “Sub-Advisory Agreements.” The Funds and the relevant sub-advisers with new sub-advisory agreements include:
| Fund | Sub-Advisory Agreement |
| Dunham Emerging Markets Stock Fund | NS Partners Ltd. (“NS Partners”)1 |
| Dunham Small Cap Value Fund | Ziegler Capital Management LLC2 |
The Independent Trustees had requested and reviewed materials that Dunham & Associates Investment Counsel, Inc. (the “Adviser”) and the sub-advisers provided prior to and during the meeting and had reviewed a memorandum from Fund counsel that reviewed their fiduciary duties pertaining to the new Sub-Advisory Agreements and the factors they should consider in evaluating the Sub-Advisory Agreements.
Among other information, the Adviser and the sub-advisers provided information to assist the Independent Trustees in assessing the nature, extent and quality of services provided, information comparing the investment performance, advisory fees and operating expense ratio of each Fund to other funds, information about estimated profitability and/or financial condition and compliance and regulatory matters.
| 1 | NS Partners’ sub-advisory agreement would take effect on or about April 1, 2019. NS Partners would take over sub-advisory responsibilities from Bailard, Inc. |
| 2 | This sub-advisory agreement would take effect upon the change of control of Piermont Capital Management, Inc., when Piermont Capital merges with Ziegler Capital. |
The Board determined that, given the totality of the information provided with respect to each Sub-Advisory Agreement, the Board had received sufficient information to approve the Sub-Advisory Agreements. The Independent Trustees and Fund counsel also met to consider the Sub-Advisory Agreements.
Based upon its review, the Board concluded that it was in the best interests of each Fund that the Sub-Advisory Agreements be approved. In considering the approval of the Sub-Advisory Agreements, the Board did not identify any single factor or group of factors as all-important or controlling, and considered a variety of factors in its analysis, including those discussed below. The Board did not allot a particular weight to any one factor or group of factors.
I. Sub-Advisory Agreements
Nature, Extent and Quality of Services.In considering the approval of the Sub-Advisory Agreement between each Fund and the Fund’s respective sub-adviser, the Board considered the nature, extent and quality of services the sub-adviser would provide under the Sub-Advisory Agreement. The Board reviewed the background of the investment professionals that would service the Fund, and the sub-adviser’s reputation, resources and investment approach. The Board also reviewed information provided regarding the structure of portfolio manager compensation, trading and brokerage practices, soft dollar usage, risk management and compliance matters.
The Board noted in particular:
| ● | Dunham Emerging Markets Stock Fund: NS Partners Ltd. (“NS Partners”) was founded in 1988 and is an independent investment management firm specializing in actively managed global equity portfolios on behalf of major companies, pension funds, foundations and high net worth individuals. NS Partners is a wholly owned subsidiary of NS Partners UK LLP. CC&L Financial Group is a 50% owner in NS Partners with the NS Partners team of senior managers owning the remaining 50%. While NS Partners does not currently advise or sub-advise a mutual fund, NS Partners and the CC&L Financial Group have considerable experience in managing mutual fund assets in the U.S. and Canada. In total across all affiliates, CC&L Financial Group is sub-adviser to over U.S. $9 billion in mutual fund assets in Canada and the U.S. The Board concluded that the services of NS Partners should be satisfactory. |
| ● | Dunham Small Cap Value Fund: Ziegler Capital Management LLC (“Ziegler Capital”) plans to acquire Piermont on or about April 1, 2019. The entire Piermont investment team, including all team members providing advisory services to the Fund, will remain in place and continue to provide the same investment advisory services to the Fund. The investment discipline, process, tools and models also will remain unchanged. The Board further considered that the business combination will allow Ziegler Capital to provide additional compliance and operations services resources to the Fund. The Board concluded that the services Piermont would provide as part of the Ziegler Capital organization should be satisfactory. |
Performance.The Board reviewed each Fund’s total return compared to the total returns of the Peer Group and the funds included in the Morningstar category. The Board also noted in particular:
| ● | Dunham Emerging Markets Stock Fund: NS Partners Master Global Emerging Market Composite (US-Net) performed as follows relative to its composite benchmark (which is 56.62% MSCI Emerging Markets Net & 43.38% MSCI Emerging Markets): -15.04%, 8.99%, 3.09% and 10.17% for the composite over a 1-, 3-, 5-, and 10-year period respectively, compared to its composite benchmark of -14.44%, 9.57%, 1.98% and 8.36% over the same periods. The Board concluded that the services of NS Partners should be satisfactory. |
| ● | Dunham Small Cap Value Fund: At the December 2018 Board meeting, the Board had noted that Piermont Capital Management, Inc. (“Piermont”), has served as the Fund’s sub-adviser since July 1, 2013 (while the Fund’s inception date is December 10, 2004). The Board noted that since Piermont began managing the Fund, the Fund has performed in line with or outperformed its Peer |
Group, the Morningstar category and the benchmark index. The Board concluded that the services Piermont provided were satisfactory.
At the March meeting, given Ziegler Capital’s planned acquisition of Piermont, the Board considered that the entire Piermont investment team, including all team members providing advisory services to the Fund, will remain in place and continue to provide the same investment advisory services to the Fund. The Board, moreover, considered that the Fund’s investment discipline, process, tools and models will remain unchanged. The Board concluded that the services Piermont would provide as part of the Ziegler Capital organization should be satisfactory.
Sub-Advisory Fees and Economies of Scale.The Board considered each Fund’s sub-advisory fee schedule and noted the fees charged to comparable portfolios, if any, that the sub-adviser managed. The Board considered that the fee schedule was negotiated between the Adviser and each sub-adviser, an unaffiliated third party.
The Board considered the base fee paid to each sub-adviser when the performance of a Fund is equal to that of a specific index plus or minus a “null” zone. The Board also reviewed the operation of the performance fee and the impact on fees and expenses based on various performance results. They discussed the unique nature of the performance fee, which results in higher fees when a sub-adviser delivers results, and how performance fees should be integrated into their analysis.
The Board confirmed its belief that performance fees help ensure that any significant fee adjustments are attributable to a sub-adviser’s skill, rather than to random performance fluctuations, and the performance fee aligns a sub-adviser’s interest with those of Fund shareholders.
The Board also noted in particular:
| ● | Dunham Emerging Markets Stock Fund: The Board considered the new sub-advisory fee schedule with NS Partners. The Board noted that the proposed base fee had been reduced from 50 basis points with the previous sub-adviser to 45 basis points with NS Partners. In addition, the Board noted that the proposed performance fee amount remained the same at plus or minus 40 basis points, resulting in the overall fulcrum fee rate ranging from 5 basis points up to 85 basis points. The Board compared this to the fulcrum fee range with the previous sub-adviser of 10 basis points to 90 basis points. |
| ● | Dunham Small Cap Value Fund: The Board considered that the Fund’s sub-advisory fee schedule will remain the same after Piermont merges with Ziegler Capital on or about April 1, 2019. |
The Board concluded that each sub-adviser’s fees were in a reasonable range.
The Board reviewed the relevance of economies of scale in the context of a sub-adviser that receives a performance based fee. The Board agreed that the Adviser had successfully negotiated a favorable base fee with each sub-adviser, and that reductions based on asset growth, when coupled with the possibility of fee reductions based on performance, could hinder the Adviser’s ability to attract top sub-advisory talent. The Board agreed that pursuing breakpoints with any of the sub-advisers would not be in the best interests of Fund shareholders at this time.
Profitability and Fallout Benefits.The Board considered any information provided regarding each sub-adviser’s estimated profitability from providing sub-advisory services to its respective Fund. The Board noted that the sub-advisory fee schedule was negotiated between the Adviser and each sub-adviser, an unaffiliated third party. The Board reviewed materials provided as to any additional benefits each sub-adviser receives.
II. All Agreements
Conclusion.Based on all of the information considered and the conclusions reached, the Board determined that the terms of the Sub-Advisory Agreements for each Fund are fair and reasonable, and that the approval of the Sub-Advisory Agreements are in the best interests of each Fund.
| DUNHAM FUNDS’ EXPENSES (Unaudited) |
Example
Shareholders of mutual funds will pay (1) transitional costs, such as sales load, and (2) ongoing expenses, such as advisory fees, distribution and service fees (12b-1), and other fund expenses. The following examples are intended to help you understand the ongoing cost (in dollars) of investing in a fund and to compare these costs with the ongoing costs of investing in other mutual funds. Please note, the expenses shown in the tables are meant to highlight ongoing costs only and do not reflect any transactional costs, such as sales charges (loads), or contingent deferred sales charges on redemptions which may be assessed by mutual funds. This Example is based on an investment of $1,000 invested at the beginning of the period and held for the entire period as indicated below.
Actual Expenses
The columns under the heading entitled “Actual” help you estimate the actual expenses you paid over the period. The “Actual-Ending Account Value” shown is derived from the Fund’s actual return, and the “Actual- Expenses Paid During Period” shows the dollar amount that would have been paid by an investor who started with $1,000 in the Fund. To estimate the expenses you paid on your account during this period, simply divide your account value by $1,000 (for example, an $8,600 account value divided by $1,000 = 8.6), then multiply the result by the number in the column under the heading entitled “Actual-Expenses Paid During Period”.
Hypothetical Examples for Comparison Purposes
The columns under the heading entitled “Hypothetical” provide information about hypothetical account value and hypothetical expenses based on the Fund’s actual expense ratio and an assumed rate of return of 5% per year before expenses, which is not the Fund’s actual return. The hypothetical account values and expenses may not be used to estimate the actual ending account balance or expenses you paid for the period. You may use this information to compare the ongoing costs of investing in the Fund and other funds. To do so, compare this 5% hypothetical example with the 5% hypothetical examples that appear in the shareholder reports of other funds.
Please note that the expenses shown in the table are meant to highlight your ongoing costs only and do not reflect any transactional costs which may be applicable to your account. Therefore, the last column of the table (Hypothetical- Expenses Paid During Period) is useful in comparing ongoing costs only, and will not help you determine the relative total costs of owning different funds. In addition, if these transactional costs were included, your costs would have been higher.
| | | | | | | Actual | | Hypothetical |
| | | Fund’s | | Beginning | | Ending | | | | Ending | | |
| | | Annualized | | Account | | Account | | Expenses | | Account | | Expenses |
| | | Expense | | Value | | Value | | Paid During | | Value | | Paid During |
| | | Ratio | | 11/1/18 | | 4/30/19 | | Period* | | 4/30/19 | | Period* |
| Class N: | | | | | | | | | | | | |
| Floating Rate Bond Fund | | 0.99% | | $1,000.00 | | $1,017.80 | | $4.95 | | $1,019.89 | | $4.96 |
| Long/Short Credit Fund | | 1.29% | | $1,000.00 | | $1,027.00 | | $6.48 | | $1,018.40 | | $6.46 |
| Corporate/Government Bond Fund | | 1.17% | | $1,000.00 | | $1,047.30 | | $5.94 | | $1,018.99 | | $5.86 |
| Monthly Distribution Fund | | 1.62% | | $1,000.00 | | $1,025.50 | | $8.14 | | $1,016.76 | | $8.10 |
| Dynamic Macro Fund | | 1.44% | | $1,000.00 | | $1,064.10 | | $7.37 | | $1,017.65 | | $7.20 |
| High-Yield Bond Fund | | 1.20% | | $1,000.00 | | $1,059.70 | | $6.13 | | $1,018.84 | | $6.01 |
| International Opportunity Bond Fund | | 1.34% | | $1,000.00 | | $1,022.30 | | $6.72 | | $1,018.15 | | $6.71 |
| Large Cap Value Fund | | 1.06% | | $1,000.00 | | $1,082.50 | | $5.47 | | $1,019.54 | | $5.31 |
| Focused Large Cap Growth Fund | | 1.36% | | $1,000.00 | | $1,189.80 | | $7.38 | | $1,018.05 | | $6.81 |
| International Stock Fund | | 1.52% | | $1,000.00 | | $1,051.50 | | $7.73 | | $1,017.26 | | $7.60 |
| Real Estate Stock Fund | | 1.08% | | $1,000.00 | | $1,127.30 | | $5.70 | | $1,019.44 | | $5.41 |
| Small Cap Value Fund | | 1.68% | | $1,000.00 | | $1,050.60 | | $8.54 | | $1,016.46 | | $8.40 |
| Small Cap Growth Fund | | 2.03% | | $1,000.00 | | $1,089.00 | | $10.51 | | $1,014.73 | | $10.14 |
| Emerging Markets Stock Fund | | 1.20% | | $1,000.00 | | $1,126.20 | | $6.33 | | $1,018.84 | | $6.01 |
| Class A: | | | | | | | | | | | | |
| Floating Rate Bond Fund | | 1.24% | | $1,000.00 | | $1,016.60 | | $6.20 | | $1,018.65 | | $6.21 |
| Long/Short Credit Fund | | 1.50% | | $1,000.00 | | $1,025.80 | | $7.53 | | $1,017.36 | | $7.50 |
| Corporate/Government Bond Fund | | 1.42% | | $1,000.00 | | $1,046.10 | | $7.20 | | $1,017.75 | | $7.10 |
| Monthly Distribution Fund | | 1.86% | | $1,000.00 | | $1,024.20 | | $9.34 | | $1,015.57 | | $9.30 |
| Dynamic Macro Fund | | 1.69% | | $1,000.00 | | $1,062.10 | | $8.64 | | $1,016.41 | | $8.45 |
| High-Yield Bond Fund | | 1.45% | | $1,000.00 | | $1,059.00 | | $7.40 | | $1,017.60 | | $7.25 |
| International Opportunity Bond Fund | | 1.59% | | $1,000.00 | | $1,020.10 | | $7.96 | | $1,016.91 | | $7.95 |
| Large Cap Value Fund | | 1.31% | | $1,000.00 | | $1,088.00 | | $6.78 | | $1,018.30 | | $6.56 |
| Focused Large Cap Growth Fund | | 1.61% | | $1,000.00 | | $1,188.10 | | $8.73 | | $1,016.81 | | $8.05 |
| International Stock Fund | | 1.77% | | $1,000.00 | | $1,050.40 | | $9.00 | | $1,016.02 | | $8.85 |
| Real Estate Stock Fund | | 1.33% | | $1,000.00 | | $1,125.60 | | $7.01 | | $1,018.20 | | $6.66 |
| Small Cap Value Fund | | 1.93% | | $1,000.00 | | $1,049.00 | | $9.81 | | $1,015.22 | | $9.64 |
| Small Cap Growth Fund | | 2.28% | | $1,000.00 | | $1,087.50 | | $11.80 | | $1,013.49 | | $11.38 |
| Emerging Markets Stock Fund | | 1.45% | | $1,000.00 | | $1,125.10 | | $7.64 | | $1,017.60 | | $7.25 |
| DUNHAM FUNDS’ EXPENSES (Unaudited) |
| | | | | | | Actual | | Hypothetical |
| | | Fund’s | | Beginning | | Ending | | | | Ending | | |
| | | Annualized | | Account | | Account | | Expenses | | Account | | Expenses |
| | | Expense | | Value | | Value | | Paid During | | Value | | Paid During |
| | | Ratio | | 11/1/18 | | 4/30/19 | | Period* | | 4/30/19 | | Period* |
| Class C: | | | | | | | | | | | | |
| Floating Rate Bond Fund | | 1.74% | | $1,000.00 | | $1,014.20 | | $8.69 | | $1,016.17 | | $8.70 |
| Long/Short Credit Fund | | 2.24% | | $1,000.00 | | $1,021.80 | | $11.23 | | $1,013.69 | | $11.18 |
| Corporate/Government Bond Fund | | 1.92% | | $1,000.00 | | $1,043.80 | | $9.73 | | $1,015.27 | | $9.59 |
| Monthly Distribution Fund | | 2.61% | | $1,000.00 | | $1,020.20 | | $13.07 | | $1,011.85 | | $13.02 |
| Dynamic Macro Fund | | 2.44% | | $1,000.00 | | $1,058.50 | | $12.45 | | $1,012.69 | | $12.18 |
| High-Yield Bond Fund | | 1.95% | | $1,000.00 | | $1,056.20 | | $9.94 | | $1,015.12 | | $9.74 |
| International Opportunity Bond Fund | | 2.09% | | $1,000.00 | | $1,017.80 | | $10.46 | | $1,014.43 | | $10.44 |
| Large Cap Value Fund | | 2.06% | | $1,000.00 | | $1,076.80 | | $10.61 | | $1,014.58 | | $10.29 |
| Focused Large Cap Growth Fund | | 2.36% | | $1,000.00 | | $1,183.90 | | $12.78 | | $1,013.09 | | $11.78 |
| International Stock Fund | | 2.52% | | $1,000.00 | | $1,046.50 | | $12.79 | | $1,012.30 | | $12.57 |
| Real Estate Stock Fund | | 2.08% | | $1,000.00 | | $1,122.00 | | $10.94 | | $1,014.48 | | $10.39 |
| Small Cap Value Fund | | 2.68% | | $1,000.00 | | $1,044.80 | | $13.59 | | $1,011.50 | | $13.37 |
| Small Cap Growth Fund | | 3.03% | | $1,000.00 | | $1,083.60 | | $15.65 | | $1,009.77 | | $15.10 |
| Emerging Markets Stock Fund | | 2.20% | | $1,000.00 | | $1,120.30 | | $11.57 | | $1,013.88 | | $10.99 |
| * | Expenses Paid During Period are equal to the Fund’s annualized expense ratio, multiplied by the average account value over the period, multiplied by 181 days and divided by 365 (to reflect the number of days in the six month period ending April 30, 2019). |
NOTICE OF PRIVACY POLICY & PRACTICES
Privacy Notice
| FACTS | WHAT DO THE DUNHAM FUNDS DO WITH YOUR PERSONAL INFORMATION? |
| | |
| Why? | Financial companies choose how they share your personal information. Federal law gives consumers the right to limit some but not all sharing. Federal law also requires us to tell you how we collect, share, and protect your personal information. Please read this notice carefully to understand what we do. |
| | |
| What? | The types of personal information we collect and share depend on the product or service you have with us. This information can include: ■ Social Security number and wire transfer instructions ■ account transactions and transaction history ■ investment experience and purchase history When you areno longera customer, we continue to share your information as described in this notice. |
| | |
| How? | All financial companies need to share customers’ personal information to run their everyday business. In the section below, we list the reasons financial companies can share their customers’ personal information; the reasons the Dunham Funds chooses to share; and whether you can limit this sharing. |
| Reasons we can share your personal information | Do Dunham Funds share? | Can you limit this sharing? |
| For our everyday business purposes -such as to process your transactions, maintain your account(s), respond to court orders and legal investigations, or report to credit bureaus | Yes | No |
| For our marketing purposes -to offer our products and services to you | Yes | No |
| For joint marketing with other financial companies | No | We don’t share |
| For our affiliates’ everyday business purposes -information about your transactions and experiences | No | We don’t share |
| For our affiliates’ everyday business purposes -information about your creditworthiness | No | We don’t share |
| For nonaffiliates to market to you | No | We don’t share |
| Questions? | Call (800) 442-4358 or go towww.dunham.com |
| What we do |
| How do Dunham Funds protect my personal information? | To protect your personal information from unauthorized access and use, we use security measures that comply with federal law. These measures include computer safeguards and secured files and buildings. We permit only authorized parties and affiliates (as permitted by law) who have signed an agreement (which protects your personal information) with us to have access to customer information. |
| How do Dunham Funds collect my personal information? | We collect your personal information, for example, when you
■ open and account or deposit money ■ direct us to buy securities or direct us to sell your securities ■ seek advice about your investments We also collect your personal information from others, such as credit bureaus, affiliates, or other companies. |
| Why can’t I limit all sharing? | Federal law gives you the right to limit only
■ sharing for affiliates’ everyday business purposes-information about your creditworthiness ■ affiliates from using your information to market to you ■ sharing for nonaffiliates to market to you State laws and individual companies may give you additional rights to limit sharing. |
| Definitions |
| Affiliates | Companies related by common ownership or control. They can be financial and nonfinancial companies. ■ Our affiliates include financial companies, such as Dunham & Associates Investment Counsel, Inc. |
| Nonaffiliates | Companies not related by common ownership or control. They can be financial and nonfinancial companies. ■ Dunham Funds do not share with nonaffiliates so they can market to you. |
| Joint marketing | A formal agreement between nonaffiliated financial companies that together market financial products or services to you. ■ Dunham Funds doesn’t jointly market |
How to Obtain Proxy Voting Information
Information regarding how the Funds voted proxies relating to portfolio securities for the most recent 12-month period ended June 30 as well as a description of the policies and procedures that the Funds use to determine how to vote proxies is available without charge, upon request, by calling (888)-3DUNHAM (338-6426) or by referring to the Securities and Exchange Commision’s (“SEC”) website athttp://www.sec.gov.
How to Obtain 1st and 3rd Fiscal Quarter Portfolio Holdings
Each Fund files its complete schedule of portfolio holdings with the SEC for the first and third quarters of each fiscal year on Form N-Q. Form N-Q is available on the SEC’s website at http://www.sec.gov and may be reviewed and copied at the SEC’s Public Reference Room in Washington, DC (800)-SEC-0330. The information on Form N-Q is available without charge, upon request, by calling (888)-3DUNHAM (338-6426).

| P.O. Box 910309 |
| |
| San Diego, California 92191 |
| |
| (800) 442-4358 |
Distributed by Dunham & Associates Investment Counsel, Inc. Member FINRA/SIPC
THIS REPORT AND FINANCIAL STATEMENTS CONTAINED HEREIN ARE NOT INTENDED TO BE A FORECAST OF FUTURE EVENTS, A GUARANTEE OF FUTURE RESULTS, OR INVESTMENT ADVICE. FURTHER, THERE IS NO ASSURANCE THAT CERTAIN SECURITIES WILL REMAIN IN OR OUT OF EACH FUND’S PORTFOLIO.
THE FIGURES IN THIS REPORT REPRESENT PAST PERFORMANCE AND DO NOT GUARANTEE FUTURE RESULTS. THE PRINCIPAL VALUE OF AN INVESTMENT AND INVESTMENT RETURN WILL FLUCTUATE SO THAT AN INVESTOR’S SHARES, WHEN REDEEMED, MAY BE WORTH MORE OR LESS THAN THEIR ORIGINAL COST.
Item 2. Code of Ethics.Not applicable.
Item 3. Audit Committee Financial Expert.Not applicable.
Item 4. Principal Accountant Fees and Services.Not applicable.
Item 5. Audit Committee of Listed Companies.Not applicable to open-end investment companies.
Item 6. Schedule of Investments.Schedule of investments in securities of unaffiliated issuers is included under Item 1.
Item 7. Disclosure of Proxy Voting Policies and Procedures for Closed-End Funds. Not applicable to open-end investment companies.
Item 8. Portfolio Managers of Closed-End Funds. Not applicable to open-end investment companies.
Item 9. Purchases of Equity Securities by Closed-End Funds. Not applicable to open-end investment companies.
Item 10. Submission of Matters to a Vote of Security Holders. None
Item 11. Controls and Procedures.
(a) Based on an evaluation of the registrant’s disclosure controls and procedures as of a date within 90 days of filing date of this Form N-CSR, the disclosure controls and procedures are reasonably designed to ensure that the information required in filings on Forms N-CSR is recorded, processed, summarized, and reported on a timely basis.
(b) There were no significant changes in the registrant’s internal control over financial reporting that occurred during the registrant’s last fiscal half-year that have materially affected, or are reasonably likely to materially affect, the registrant’s internal control over financial reporting.
Item 12. Disclosure of Securities Lending Activities for Closed-End Management Investment Companies.Not Applicable to open-end investment companies.
Item 13. Exhibits.
(a)(1) Not required for semi-annual reports.
(a)(2) Certifications required by Section 302 of the Sarbanes-Oxley Act of 2002 (and Item 11(a)(2) of Form N-CSR) are filed herewith..
(a)(3) Not applicable.
(b) Certifications required by Section 906 of the Sarbanes-Oxley Act of 2002 (and Item 11(b) of Form N-CSR) are filed herewith.
SIGNATURES
Pursuant to the requirements of the Securities Exchange Act of 1934 and the Investment Company Act of 1940, the registrant has duly caused this report to be signed on its behalf by the undersigned, thereunto duly authorized.
(Registrant)Dunham Funds
By (Signature and Title)
/s/ Jeffrey Dunham
Jeffrey Dunham, Principal Executive Officer/President
Date 7/9/2019
Pursuant to the requirements of the Securities Exchange Act of 1934 and the Investment Company Act of 1940, this report has been signed below by the following persons on behalf of the registrant and in the capacities and on the dates indicated.
By (Signature and Title)
/s/ Jeffrey Dunham
Jeffrey Dunham, Principal Executive Officer/President
Date 7/9/2019
By (Signature and Title)
/s/ Denise Iverson
Denise Iverson, Principal Financial Officer/Treasurer
Date 7/9/2019