united states
securities and exchange commission
washington, d.c. 20549
form n-csr
certified shareholder report of registered management
investment companies
Investment Company Act file number 811-22153
Dunham Funds
(Exact name of registrant as specified in charter)
10251 Vista Sorrento Pkwy, Ste. 200, San Diego, CA 92121
(Address of principal executive offices) (Zip code)
Richard Malinowski
Ultimus Fund Solutions LLC., 4221 N 203rd St., Suite 100, Elkhorn, NE 68022
(Name and address of agent for service)
Registrant's telephone number, including area code: 631-470-2619
Date of fiscal year end: 10/31
Date of reporting period: 4/30/22
Item 1. Reports to Stockholders.
| This Semi-Annual Report contains “forward-looking statements” within the meaning of the Private Securities Litigation Reform Act of 1995. Forward-looking statements also include those preceded by, followed by or that include the words “believes”, “expects”, “anticipates” or similar expressions. Such statements should be viewed with caution. Actual results or experience could differ materially from the forward-looking statements as a result of many factors. Each Fund makes no commitments to disclose any revisions to forward-looking statements, or any facts, events or circumstances after the date hereof that may bear upon forward-looking statements. In addition, prospective purchasers of the Funds should consider carefully the information set forth herein and the applicable fund’s prospectus. Other factors and assumptions not identified above may also have been involved in the derivation of these forward-looking statements, and the failure of these other assumptions to be realized may also cause actual results to differ materially from those projected. |
Dear Fellow Shareholders:
The silver lining to volatile markets is that new opportunities may be presented. These are most common when sell-offs are broad and appear to ignore fundamental valuations. The current prominent issues, such as high inflation and Russia’s invasion of Ukraine, have placed additional pressures on both equity and fixed income markets. Although fixed income markets, particularly bonds with high credit quality, have historically served as a buoy in portfolios during larger equity declines, rising interest rates in response to high inflation in the U.S. have driven bond values lower – in some cases representing even greater declines than equities.
At the start of the fiscal year, inflation1 was already running well-above the Fed’s target rate, hitting 6.2 percent year-over-year through October 2021. When excluding food and energy, the number was lower (but still high) at 4.6 percent year-over-year. The reading at the end of April was substantially higher, reaching 8.5 percent and when excluding food and energy it was at 6.2 percent. Raising interest rates generally takes time to have an impact on inflation, which means that these substantial average price increases will continue to impact consumers, companies, etc. and affect spending habits, production, etc. many of which will have long-term repercussions. We anticipate that the Fed’s discussion of how aggressive to increase rates will be balanced with what it believes our economy can withstand.
We have been clear in our concern of how rising interest rates could have significant adverse effects on fixed income securities, as the 10-year U.S. Treasury2 declined 10.3 percent since the start of this fiscal year and the 20-year U.S. Treasury3 plummeted 16.3 percent. While the magnitude of these negative returns may not come as a surprise given their longer maturities, the 7.1 percent decline in the 5-year U.S. Treasury4 over the past six-month period may be a bit more jarring. This intermediate-term maturity is more aligned with the average intermediate-term corporate bond and as this segment of the yield curve lurched upwards (sending prices spiraling downward), the average investment grade corporate bond5 lost 12.4 percent. This decline was even worse than the 11.6 percent decline experienced by global equities6 over the same time period. Therefore, we remain encouraged about the potential prospects of the other Dunham Fund choices we make available to each of you within the fixed income space. We believe that other fixed income asset classes and strategies that have less interest rate sensitivity may be an important consideration, especially since we believe that we are in the early stages of the interest rate hiking cycle and monetary tightening.
We have continued to receive questions from many of you about our views on the various major (and minor) themes present today. In our responses, the core tenet we have not deviated from is that we believe it is crucial to maintain diversification and to remain disciplined and methodical, especially when many other investors are not. I continue to personally invest alongside you, and I remain confident that we at Dunham have the tools and the discipline to succeed as our economy recovers. You can continue to rely on us to apply a rational and unemotional approach. We thank you for your continued trust and the confidence you have placed in us. We take that trust very seriously. We look forward to servicing the investment needs for you and your family for generations to come.
Sincerely,

Jeffrey A. Dunham
President
Dunham & Associates
April 30, 2022
| 1 | As measured by the US Consumer Price Index Urban Consumers NSA |
| 2 | As measured by the ICE BofA Current 10-Year US Treasury Index |
| 3 | As measured by the ICE BofA Current 20-Year US Treasury Index |
| 4 | As measured by the ICE BofA Current 5-Year US Treasury Index |
| 5 | As measured by the ICE BofA U.S. Corporate Index |
| 6 | As measured by the MSCI All Country World Index NR |
| Dunham Corporate/Government Bond Fund (Unaudited) |
| Message from the Sub-Adviser (Newfleet Asset Management, LLC) |
Asset Class Recap
Global bond markets largely sold off over the first half of the fiscal year which ended April 30, 2022, as hawkish tones from the Federal Reserve (Fed) and other central banks rattled markets prices for treasury bonds, corporate bonds, and municipal debt have slumped this year in response to the Fed’s moves to raise interest rates in an effort to rein in inflation. The Bloomberg U.S. Aggregate Bond Index, which is largely U.S. Treasurys, investment grade corporate bonds, and mortgage- backed securities, declined 9.5 percent this fiscal period. Rising yields are often associated with a strengthening economy because faster growth and a tighter labor market can lead central banks to crack down on inflation. In this case, the labor market is particularly tight, and inflation is running at its fastest pace in decades, prompting the Fed to signal a rapid series of interest-rate increases and sparking a steep climb in yields that has sent shock waves through markets. Investors are unlikely to get much relief until inflation concerns abate, a wild card when Covid-19 outbreaks in Asia are pressuring global supply chains and the war in Ukraine is driving up commodity prices. The 10-year U.S. Treasury yield spiked to a high of 2.93 percent in late April 2022, a level not seen in over three years, to close the fiscal half. Following the increase in the 10- year U.S. Treasury yield, longer-dated investment-grade corporate and government bonds sold off. In the U.S., investment-grade corporate bonds and U.S. government bonds, as measured by the Bloomberg U.S. Aggregate Bond Index, fell 9.5 percent over the fiscal half. Overseas, bonds fared worse, with the Bloomberg Global Aggregate ex-US Bond Index, down 10.8 percent. Fixed income asset classes with less interest rate sensitivity, such as high-yield bonds, performed better than their investment-grade counterparts, however, still finished in negative territory. U.S. high-yield bonds, as measured by the ICE BofA U.S. Cash Pay High-Yield Index, dropped 5.4 percent. Leveraged loans, as measured by the Credit Suisse Leveraged Loan Index, outperformed its index counterparts significantly, falling 0.3 percent over the fiscal half.
Allocation Review
Almost half of U.S. investment- grade bonds in the benchmark index are represented by Treasury and government agency bonds. Therefore, much of the performance of the benchmark index is dictated by how those U.S. government-related bonds perform, and far less is dependent on the performance of corporate bonds and non-agency mortgage-backed securities. Over the fiscal half, U.S. government bonds, which make up about 39 percent of the benchmark, fell 8.3 percent and was the worst performing asset class. The higher duration exposure within the U.S. government bonds sector minimized any gains. The next largest weighting in the benchmark index was investment-grade corporate bonds, representing 25.0 percent. The Sub-Adviser’s underweight position to investment-grade corporate bonds at about 22 percent, coupled with superior security selection, contributed to Fund performance. Securitized debt, which is primarily comprised of commercial and residential mortgage-backed securities, was the top contributor to Fund performance. The Fund’s overweight allocation and strong security selection within securitized debt added to relative performance. Leveraged loans, which are not represented in the benchmark index, fell only 0.7 percent over the fiscal half, it was the Fund’s best performing asset class. The Fund’s 10.1 percent allocation to leveraged loans proved beneficial in a rising rate environment. Within the high- yield asset class of the Fund, corporate high-yield bonds fell 10.1 percent, while emerging markets high-yield bonds dropped 10.3 percent. Given, their minimal allocation within the benchmark, the Fund’s overweight allocation was a drag on performance.
Holdings Insights
The largest contributor to Fund performance over the fiscal half was a high-yield bond, Tenneco, Inc. 5.125% Due 4/15/2029 (880349AT2) (holding weight*: 0.19 percent). Tenneco is an American automotive components original equipment manufacturer and an aftermarket ride control and emissions products manufacturer. Tenneco performed well on news it entered into an agreement to be acquired by the Apollo Funds (APO) (not held) at an enterprise value of $7.1 billion. The purchase price of $20 per share was a 100 percent premium over the company’s share price at the time this was announced. The next largest contributor over the fiscal half came from within the investment-grade corporate bond sector, Citrix Systems, Inc. 3.3% Due 3/1/2030 (177376AF7) (holding weight*: 0.37 percent). Citrix Systems, Inc. is an American multinational cloud computing and virtualization technology company that provides server, application, and desktop virtualization, networking, software as a service, and cloud computing technologies. Citrix is being acquired by a strategic investor and therefore the Sub-Adviser could exercise their change of control option which entitles the Sub-Adviser to 101% of par. Despite interest rate volatility, these bonds should remain close to par. Within the emerging markets high-yield bonds, the Government of Oman 7.375% Due 10/28/2032 (68205LAE3) (holding weight*: 0.31 percent), contributed meaningfully to Fund performance. Oman is a country in Western Asia that is dependent on oil exports. Oman bond prices have been supported by the move higher in oil prices, which are now at levels where the fiscal and current account begin to generate material surpluses thus reducing the governments need to borrow and put the sovereign credit outlook on a positive arc.
The largest detractor to Fund performance over the fiscal year was an investment- grade corporate bond, Boeing Company 5.93% Due 5/01/2060 (097023CX) (holding weight*: 0.15 percent) . Boeing Company designs, manufacturers, and sells airplanes, rotorcraft, rockets, satellites, telecommunications equipment, and missiles worldwide. Boeing Company’s price movement has largely been driven by the 2060 maturity and in addition to first half earnings coming in below expectations due to cost overruns and program delays. Another detractor over the fiscal half was Ford Motor Company 4.75% Due 1/15/2043 (345370CQ1) (holding weight*: 0.07 percent). Ford Motor Company is an American automobile manufacturer and seller. The Ford bond sold off as its high duration was impacted by the rise in interest rates. It has been a tough environment for Autos, but recent results have been relatively solid. Another detractor over the fiscal half came from within the high - yield bond sector, Coinbase Global, Inc. 3.63% Due 10/1/2031 (19260QAD9) (holding weight*: 0.17 percent). Coinbase Global is a provider of financial infrastructure and technology for cryptocurrency markets. Competition has increased and same data suggests Coinbase is losing market share and may result in higher future marketing spending. Valuation is dependent on transactions, market share, and commissions, all of which have a wide variation in forecasts. Falling valuations in the technology sector have also weighed on the equity which impacts the bond price.
Sub-Adviser Outlook
The Sub-Adviser believes that the backdrop for fixed income may remain positive as the market continues to acclimate to the ebbs and flows of COVID, while broadening the dissemination and accessibility of vaccines. Developments in COVID variants could be worth monitoring as well, as the numerous COVID variants continue to disrupt multiple industries, including logistics. Persistent COVID cases have led to bottlenecks in the supply chain, resulting in rising input costs and extended delivery times, with some deliveries taking months to complete. Investors will look for clarity regarding the various supply chain bottlenecks from central banks, governments, and other industry leaders. The Sub-Adviser believes issuer selection and allocation will be imperative moving forward, as spreads appear to be tight across most fixed income asset classes.
| * | Holdings percentage(s) of total investments, cash and unsettled trades excluding collateral for securities loaned as of 4/30/2022. |
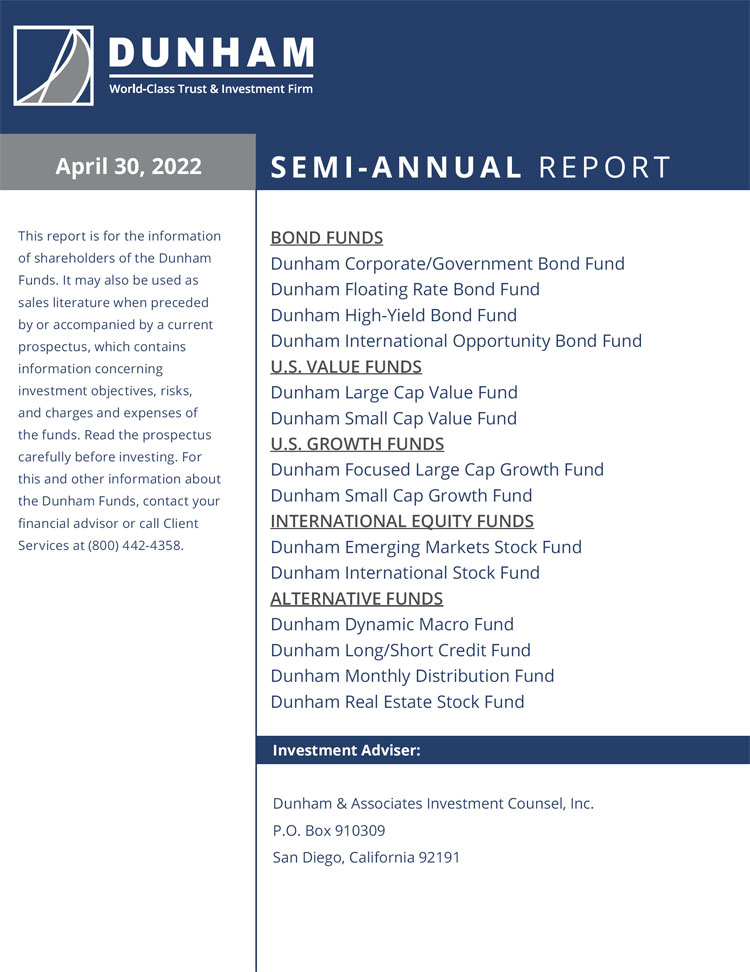
Growth of $100,000 Investment
| Total Returns (a) as of April 30, 2022 |
| | | | Annualized | Annualized |
| | Six Months | One Year | Five Years | Ten Years |
| Class N | (7.87)% | (6.78)% | 1.32% | 1.84% |
| Class A with load of 4.50% | (12.09)% | (11.54)% | 0.14% | 1.13% |
| Class A without load | (7.93)% | (7.02)% | 1.07% | 1.59% |
| Class C | (8.14)% | (7.46)% | 0.58% | 1.08% |
| Bloomberg US Aggregate Bond Index | (9.47)% | (8.51)% | 1.20% | 1.73% |
| Morningstar Intermediate Core Plus Bond Category | (9.12)% | (8.17)% | 1.52% | 2.21% |
| (a) | Total Returns are calculated based on traded NAVs. |
The Bloomberg US Aggregate Bond Index is an unmanaged index which represents the U.S. investment-grade fixed- rate bond market (including government and corporate securities, mortgage pass-through securities and asset-backed securities). Investors cannot invest directly in an index or benchmark.
The Morningstar Intermediate Core Plus Bond Category is generally representative of intermediate-term bond mutual funds that primarily invest in corporate and other investment-grade U.S. fixed-income securities and typically have durations of 3.5 to 6.0 years. Funds in this category also invest in high-yield and foreign bonds.
| As disclosed in the Trust’s latest registration statement, the Fund’s total annual operating expenses, including underlying funds, are 1.25% for Class N, 2.00% for Class C and 1.50% for Class A. Class A shares are subject to a sales load of 4.50% and a deferred sales charge of up to 0.75%. The performance data quoted here represents past performance, which is not indicative of future results. Current performance may be lower or higher than the performance data quoted. The investment return and NAV will fluctuate, so that an investor’s shares, when redeemed, may be worth more or less than their original cost. Total returns are calculated assuming reinvestment of all dividends and capital gains distributions, if any. The returns do not reflect the deductions of taxes a shareholder would pay on the redemption of Fund shares or Fund distributions. For performance information current to the most recent month- end, please call 1-800-442-4358 or visit our website www.dunham.com. |
| DUNHAM CORPORATE/GOVERNMENT BOND FUND |
| SCHEDULE OF INVESTMENTS (Unaudited) |
| April 30, 2022 |
| | | | | | | | Coupon | | | | | |
| Principal Amount ($) | | | | | Spread | | Rate (%) | | Maturity | | Fair Value | |
| | | | | ASSET BACKED SECURITIES — 33.0% | | | | | | | | | | |
| | | | | AUTO LOAN — 6.6% | | | | | | | | | | |
| | 170,000 | | | American Credit Acceptance Receivables Trust (a) | | | | 1.7700 | | 12/14/26 | | $ | 164,657 | |
| | 280,000 | | | American Credit Acceptance Receivables Trust (a) | | | | 0.9700 | | 07/13/27 | | | 272,476 | |
| | 220,000 | | | American Credit Acceptance Receivables Trust (a) | | | | 2.4600 | | 03/13/28 | | | 205,810 | |
| | 230,000 | | | AmeriCredit Automobile Receivables Trust | | | | 1.0600 | | 08/18/26 | | | 220,349 | |
| | 135,000 | | | Americredit Automobile Receivables Trust 2018-1 D | | | | 3.8200 | | 03/18/24 | | | 135,978 | |
| | 125,000 | | | Avis Budget Rental Car Funding AESOP, LLC (a) | | | | 3.0700 | | 09/20/23 | | | 125,257 | |
| | 155,000 | | | Avis Budget Rental Car Funding AESOP, LLC (a) | | | | 2.3600 | | 03/20/26 | | | 149,501 | |
| | 140,000 | | | Carmax Auto Owner Trust 2019-1 | | | | 3.7400 | | 01/15/25 | | | 140,617 | |
| | 160,507 | | | Carvana Auto Receivables Trust 2019-3 (a) | | | | 2.7100 | | 10/15/24 | | | 160,650 | |
| | 175,000 | | | Carvana Auto Receivables Trust 2019-3A Class D (a) | | | | 3.0400 | | 04/15/25 | | | 174,815 | |
| | 241,644 | | | Carvana Auto Receivables Trust 2021-N1 | | | | 1.3000 | | 01/10/28 | | | 236,914 | |
| | 280,000 | | | Carvana Auto Receivables Trust 2021-N2 | | | | 1.0700 | | 03/10/28 | | | 272,238 | |
| | 225,000 | | | Carvana Auto Receivables Trust 2021-P3 | | | | 1.4200 | | 08/10/27 | | | 209,946 | |
| | 225,000 | | | CPS Auto Receivables Trust 2019-D (a) | | | | 3.8600 | | 10/15/25 | | | 222,978 | |
| | 138,524 | | | Credito Real USA Auto Receivables Trust 2021-1 A (a) | | | | 1.3500 | | 02/16/27 | | | 135,841 | |
| | 55,823 | | | Drive Auto Receivables Trust 2019-4 | | | | 2.5100 | | 11/17/25 | | | 55,877 | |
| | 107,418 | | | First Investors Auto Owner Trust 2019-1 (a) | | | | 3.2600 | | 03/17/25 | | | 107,772 | |
| | 180,000 | | | Flagship Credit Auto Trust 2020-4 20-4 C (a) | | | | 1.2800 | | 02/16/27 | | | 174,642 | |
| | 180,000 | | | Foursight Capital Automobile Receivables Trust (a) | | | | 2.1500 | | 05/17/27 | | | 171,065 | |
| | 205,000 | | | Prestige Auto Receivables Trust 2020-1 (a) | | | | 1.3100 | | 11/16/26 | | | 202,866 | |
| | 275,000 | | | Santander Drive Auto Receivables Trust 2021-3 | | | | 0.9500 | | 09/15/27 | | | 268,417 | |
| | 275,000 | | | United Auto Credit Securitization Trust (a) | | | | 0.8400 | | 06/10/26 | | | 270,825 | |
| | 14,857 | | | United Auto Credit Securitization Trust 2020-1 C (a) | | | | 2.1500 | | 02/10/25 | | | 14,859 | |
| | 103,446 | | | Veros Automobile Receivables Trust 2020-1 B (a) | | | | 2.1900 | | 06/16/25 | | | 103,407 | |
| | 170,000 | | | Westlake Automobile Receivables Trust 2020-3 (a) | | | | 1.2400 | | 11/17/25 | | | 166,597 | |
| | 345,000 | | | Westlake Automobile Receivables Trust 2022-1 (a) | | | | 2.7500 | | 03/15/27 | | | 338,490 | |
| | | | | | | | | | | | | | 4,702,844 | |
| | | | | COLLATERALIZED MORTGAGE OBLIGATIONS—9.4% | | | | | | | | | | |
| | 154,793 | | | AJAX Mortgage Loan Trust (a),(b) | | | | 1.0650 | | 09/25/65 | | | 142,631 | |
| | 157,921 | | | Angel Oak Mortgage Trust 2020-R1 (a),(b) | | | | 1.2470 | | 12/26/24 | | | 154,930 | |
| | 80,702 | | | Angel Oak Mortgage Trust 2021-8 (a),(b) | | | | 1.8200 | | 11/25/66 | | | 75,067 | |
| | 142,230 | | | Arroyo Mortgage Trust 2019-1 2019-1 Class A1 (a),(b) | | | | 3.8050 | | 01/25/49 | | | 139,088 | |
| | 56,167 | | | Arroyo Mortgage Trust 2019-2 2019-2 Class A1 (a),(b) | | | | 3.3470 | | 04/25/49 | | | 55,345 | |
| | 18,098 | | | Banc of America Funding 2005-1 Trust | | | | 5.5000 | | 02/25/35 | | | 17,729 | |
See accompanying notes which are an integral part to these financial statements.
| DUNHAM CORPORATE/GOVERNMENT BOND FUND |
| SCHEDULE OF INVESTMENTS (Unaudited) (Continued) |
| April 30, 2022 |
| | | | | | | | Coupon | | | | | |
| Principal Amount ($) | | | | | Spread | | Rate (%) | | Maturity | | Fair Value | |
| | | | | ASSET BACKED SECURITIES — 33.0% (Continued) | | | | | | | | | | |
| | | | | COLLATERALIZED MORTGAGE OBLIGATIONS — 9.4% (Continued) | | | | | | | | | | |
| | 105,942 | | | Bunker Hill Loan Depositary Trust 2019-2 (a),(c) | | | | 2.8790 | | 07/25/49 | | $ | 104,285 | |
| | 135,000 | | | CAFL 2021-RTL1 Issuer, LLC (a),(c) | | | | 2.2390 | | 03/26/29 | | | 126,305 | |
| | 43,123 | | | Chase Mortgage Finance Corporation (a),(b) | | | | 3.7500 | | 02/25/44 | | | 41,937 | |
| | 57,801 | | | Chase Mortgage Finance Corporation (a),(b) | | | | 3.7500 | | 04/25/45 | | | 56,133 | |
| | 148,701 | | | CIM Trust (a),(c) | | | | 2.8160 | | 10/25/61 | | | 141,732 | |
| | 148,971 | | | COLT 2020-RPL1 Trust (a),(b) | | | | 1.3900 | | 01/25/65 | | | 139,230 | |
| | 93,802 | | | COLT Funding, LLC (a),(b) | | | | 1.0510 | | 12/25/64 | | | 91,222 | |
| | 31,482 | | | CSMC 2020-NQM1 Trust (a),(c) | | | | 1.2080 | | 05/25/65 | | | 30,393 | |
| | 169,687 | | | CSMC 2020-RPL4 Trust (a),(b) | | | | 2.0000 | | 01/25/60 | | | 162,265 | |
| | 83,189 | | | CSMC 2021-NQM1 (a),(b) | | | | 0.8090 | | 05/25/65 | | | 80,926 | |
| | 34,328 | | | Deephaven Residential Mortgage Trust 2020-2 (a) | | | | 1.6920 | | 05/25/65 | | | 34,312 | |
| | 26,883 | | | Ellington Financial Mortgage Trust 2019-2 (a),(b) | | | | 3.0460 | | 11/25/59 | | | 26,338 | |
| | 26,991 | | | Flagstar Mortgage Trust 2017-1 (a),(b) | | | | 3.5000 | | 03/25/47 | | | 25,977 | |
| | 13,543 | | | Galton Funding Mortgage Trust 2017-1 (a),(b) | | | | 3.5000 | | 11/25/57 | | | 13,118 | |
| | 92,722 | | | GS Mortgage-Backed Securities Trust 2020-NQM1 (a),(b) | | | | 2.3520 | | 09/27/60 | | | 90,880 | |
| | 57,075 | | | JP Morgan Mortgage Trust 2017-5 (a),(b) | | | | 3.0500 | | 12/15/47 | | | 57,082 | |
| | 220,000 | | | LHOME Mortgage Trust 2021-RTL1 (a),(b) | | | | 2.0900 | | 09/25/26 | | | 212,175 | |
| | 100,000 | | | METLIFE S.E.CURITIZATION TRUST (a),(b) | | | | 3.4500 | | 04/25/55 | | | 95,848 | |
| | 50,100 | | | METLIFE S.E.CURITIZATION TRUST 2019-1 (a),(b) | | | | 3.7500 | | 04/25/58 | | | 50,204 | |
| | 277,084 | | | MFA 2021-NQM1 Trust (a),(b) | | | | 1.1530 | | 04/25/65 | | | 265,520 | |
| | 199,632 | | | Mill City Mortgage Loan Trust 2019-1 (a),(b) | | | | 3.5000 | | 10/25/69 | | | 187,628 | |
| | 170,000 | | | New Residential Mortgage Loan Trust (a) | | | | 4.3360 | | 12/25/26 | | | 169,665 | |
| | 69,099 | | | New Residential Mortgage Loan Trust (a),(b) | | | | 0.9410 | | 09/25/58 | | | 67,322 | |
| | 186,827 | | | New Residential Mortgage Loan Trust 2014-3 (a),(b) | | | | 3.7500 | | 11/25/54 | | | 183,725 | |
| | 173,675 | | | New Residential Mortgage Loan Trust 2016-3 (a),(b) | | | | 4.0000 | | 09/25/56 | | | 169,025 | |
| | 47,438 | | | New Residential Mortgage Loan Trust 2016-4 (a),(b) | | | | 3.7500 | | 11/25/56 | | | 46,382 | |
| | 382,084 | | | New Residential Mortgage Loan Trust 2017-2 (a),(b) | | | | 4.0000 | | 03/25/57 | | | 376,224 | |
| | 101,659 | | | New Residential Mortgage Loan Trust 2018-1 (a),(b) | | | | 4.0000 | | 12/25/57 | | | 99,914 | |
| | 215,000 | | | New Residential Mortgage Loan Trust 2019-RPL2 (a),(b) | | | | 3.7500 | | 02/25/59 | | | 206,106 | |
| | 478,325 | | | New Residential Mortgage Loan Trust 2020-1 (a),(b) | | | | 3.5000 | | 10/25/59 | | | 464,451 | |
| | 20,583 | | | OBX 2019-INV1 Trust (a),(b) | | | | 4.5000 | | 11/25/48 | | | 20,446 | |
| | 102,583 | | | Onslow Bay Mortgage Loan Trust (a) | | | | 1.9570 | | 08/25/61 | | | 94,859 | |
| | 135,000 | | | Palisades Mortgage Loan Trust 2021-RTL1 (a),(c) | | | | 2.8570 | | 06/25/26 | | | 134,241 | |
| | 214,769 | | | PRET 2021-RN3, LLC (a),(c) | | | | 1.8430 | | 09/25/51 | | | 204,386 | |
See accompanying notes which are an integral part to these financial statements.
| DUNHAM CORPORATE/GOVERNMENT BOND FUND |
| SCHEDULE OF INVESTMENTS (Unaudited) (Continued) |
| April 30, 2022 |
| | | | | | | | Coupon | | | | | |
| Principal Amount ($) | | | | | Spread | | Rate (%) | | Maturity | | Fair Value | |
| | | | | ASSET BACKED SECURITIES — 33.0% (Continued) | | | | | | | | | | |
| | | | | COLLATERALIZED MORTGAGE OBLIGATIONS — 9.4% (Continued) | | | | | | | | | | |
| | 35,077 | | | Provident Funding Mortgage Loan Trust 2019-1 A2 (a),(b) | | | | 3.0000 | | 12/25/49 | | $ | 33,559 | |
| | 213,595 | | | PRPM 2021-2, LLC (a),(b) | | | | 2.1150 | | 03/25/26 | | | 206,427 | |
| | 68,277 | | | RCKT Mortgage Trust 2020-1 (a),(b) | | | | 3.0000 | | 02/25/50 | | | 65,381 | |
| | 133,617 | | | RCO VI Mortgage, LLC 2022-1 (a),(c) | | | | 3.0000 | | 01/25/27 | | | 129,017 | |
| | 149,011 | | | RCO VII Mortgage, LLC 2021-2 (a),(c) | | | | 2.1160 | | 09/25/26 | | | 143,758 | |
| | 20,935 | | | Residential Mortgage Loan Trust 2019-2 (a),(b) | | | | 2.9130 | | 05/25/59 | | | 20,895 | |
| | 110,878 | | | Residential Mortgage Loan Trust 2020-1 (a),(b) | | | | 2.3760 | | 02/25/24 | | | 109,407 | |
| | 225,000 | | | ROC Securities Trust 2013-1 (a),(b) | | | | 2.4870 | | 08/25/26 | | | 219,511 | |
| | 188,429 | | | SG Residential Mortgage Trust 2021-1 (a),(b) | | | | 1.5600 | | 07/25/61 | | | 176,960 | |
| | 44,342 | | | Starwood Mortgage Residential Trust 2020-1 (a),(b) | | | | 2.2750 | | 02/25/50 | | | 44,132 | |
| | 4,178 | | | Starwood Mortgage Residential Trust 2020-2 (a),(b) | | | | 2.7180 | | 04/25/60 | | | 4,178 | |
| | 32,642 | | | Starwood Mortgage Residential Trust 2020-3 (a),(b) | | | | 1.4860 | | 04/25/65 | | | 32,117 | |
| | 365,000 | | | Towd Point Mortgage Trust 2021-1 (a),(b) | | | | 2.7500 | | 11/25/61 | | | 328,249 | |
| | 100,000 | | | Verus Securitization Trust 2019-4 (a),(b) | | | | 3.2070 | | 11/25/59 | | | 99,554 | |
| | 73,418 | | | Verus Securitization Trust 2019-INV2 (a),(b) | | | | 2.9130 | | 07/25/59 | | | 73,501 | |
| | 32,732 | | | Verus Securitization Trust 2020-1 (a),(c) | | | | 2.4170 | | 01/25/60 | | | 32,444 | |
| | 57,797 | | | Verus Securitization Trust 2021-2 (a),(b) | | | | 1.0310 | | 02/25/66 | | | 54,666 | |
| | 31,416 | | | Wells Fargo Mortgage Backed Securities 2020-4 (a),(b) | | | | 3.0000 | | 07/25/50 | | | 29,959 | |
| | | | | | | | | | | | | | 6,658,761 | |
| | | | | CREDIT CARD — 0.6% | | | | | | | | | | |
| | 410,000 | | | Genesis Sales Finance Master Trust (a) | | | | 1.6500 | | 09/22/25 | | | 405,252 | |
| | | | | | | | | | | | | | | |
| | | | | NON AGENCY CMBS — 2.2% | | | | | | | | | | |
| | 173,968 | | | Angel Oak SB Commercial Mortgage Trust 2020-SBC1 (a),(b) | | | | 2.0680 | | 05/25/50 | | | 169,136 | |
| | 90,000 | | | BPR Trust (a),(d) | | US0001M + 1.250% | | 1.8040 | | 02/15/29 | | | 89,386 | |
| | 130,000 | | | BX Trust 2019-OC11 2019-OC11 D (a),(b) | | | | 4.0750 | | 12/09/41 | | | 116,772 | |
| | 233,297 | | | CHC Commercial Mortgage Trust 2019 - CHC (a),(d) | | US0001M + 1.120% | | 1.6740 | | 06/15/34 | | | 229,727 | |
| | 119,479 | | | Citigroup Commercial Mortgage Trust 2015-GC27 | | | | 2.8780 | | 02/10/48 | | | 116,634 | |
| | 305,000 | | | GCT Commercial Mortgage Trust 2021-GCT (a),(d) | | US0001M + 0.800% | | 1.3540 | | 02/15/23 | | | 299,754 | |
| | 135,000 | | | GS Mortgage Securities Trust 2020-GC45 (b) | | | | 3.1730 | | 02/13/53 | | | 127,283 | |
| | 185,000 | | | Hilton USA Trust 2016-SFP (a) | | | | 3.3230 | | 11/05/35 | | | 182,026 | |
| | 179,398 | | | Onslow Bay Mortgage Loan Trust (a),(b) | | | | 1.1010 | | 05/25/61 | | | 167,627 | |
| | 62,000 | | | WFRBS Commercial Mortgage Trust 2014-C24 | | | | 3.9310 | | 11/15/47 | | | 61,197 | |
| | | | | | | | | | | | | | 1,559,542 | |
See accompanying notes which are an integral part to these financial statements.
| DUNHAM CORPORATE/GOVERNMENT BOND FUND |
| SCHEDULE OF INVESTMENTS (Unaudited) (Continued) |
| April 30, 2022 |
| | | | | | | | Coupon | | | | | |
| Principal Amount ($) | | | | | Spread | | Rate (%) | | Maturity | | Fair Value | |
| | | | | ASSET BACKED SECURITIES — 33.0% (Continued) | | | | | | | | | | |
| | | | | OTHER ABS — 9.2% | | | | | | | | | | |
| | 230,000 | | | American Homes 4 Rent 2014-SFR2 Trust (a) | | | | 4.7050 | | 10/17/36 | | $ | 231,455 | |
| | 220,000 | | | American Homes 4 Rent 2015-SFR2 Trust (a) | | | | 4.6910 | | 10/17/45 | | | 222,194 | |
| | 175,000 | | | AMSR 2020-SFR1 Trust (a) | | | | 2.1200 | | 04/17/37 | | | 162,976 | |
| | 250,000 | | | AMSR 2020-SFR2 Trust (a) | | | | 2.5330 | | 07/17/37 | | | 233,630 | |
| | 100,000 | | | AMSR 2020-SFR2 Trust (a) | | | | 3.2820 | | 07/17/37 | | | 94,461 | |
| | 136,489 | | | Aqua Finance Trust 2019-A (a) | | | | 3.1400 | | 07/16/40 | | | 134,224 | |
| | 275,000 | | | Aqua Finance Trust 2019-A (a) | | | | 4.0100 | | 07/16/40 | | | 267,237 | |
| | 270,000 | | | Aqua Finance Trust 2020-A (a) | | | | 2.7900 | | 07/17/46 | | | 256,772 | |
| | 100,000 | | | CCG Receivables Trust 2019-2 (a) | | | | 2.5500 | | 03/15/27 | | | 99,620 | |
| | 220,000 | | | CCG Receivables Trust 2021-1 (a) | | | | 0.8400 | | 06/14/27 | | | 207,556 | |
| | 105,858 | | | CF Hippolyta, LLC (a) | | | | 1.6900 | | 07/15/60 | | | 98,345 | |
| | 8,391 | | | Consumer Loan Underlying Bond CLUB Credit Trust (a) | | | | 2.9200 | | 03/15/28 | | | 8,394 | |
| | 118,943 | | | CoreVest American Finance 2018-2 Trust (a) | | | | 4.0260 | | 11/15/52 | | | 118,583 | |
| | 100,000 | | | Corevest American Finance 2019-3 Trust (a) | | | | 3.2650 | | 10/15/52 | | | 88,281 | |
| | 108,693 | | | Corevest American Finance 2020-1 Trust 2020-1 A1 (a) | | | | 1.8320 | | 03/15/50 | | | 102,467 | |
| | 203,761 | | | Corevest American Finance 2020-4 Trust (a) | | | | 1.1740 | | 12/15/52 | | | 185,469 | |
| | 240,000 | | | Dext A.B.S 2020-1, LLC (a) | | | | 1.9200 | | 11/15/27 | | | 233,628 | |
| | 285,000 | | | FirstKey Homes 2020-SFR1 Trust (a) | | | | 2.1890 | | 08/17/28 | | | 252,431 | |
| | 375,000 | | | FirstKey Homes 2020-SFR2 Trust (a) | | | | 1.5670 | | 10/19/37 | | | 342,756 | |
| | 38,054 | | | Foundation Finance Trust 2019-1 (a) | | | | 3.8600 | | 11/15/34 | | | 38,006 | |
| | 121,456 | | | HIN Timeshare Trust 2020-A C 20-A (a) | | | | 3.4200 | | 10/09/39 | | | 117,478 | |
| | 129,675 | | | Jersey Mike’s Funding (a) | | | | 4.4330 | | 02/15/50 | | | 126,126 | |
| | 5,685 | | | LL A.B.S Trust 2020-1 2020-1A A (a) | | | | 2.3300 | | 07/15/22 | | | 5,686 | |
| | 85,006 | | | MVW 2020-1, LLC (a) | | | | 1.7400 | | 10/20/37 | | | 81,302 | |
| | 18,043 | | | MVW Owner Trust 2016-1 (a) | | | | 2.2500 | | 12/20/33 | | | 18,061 | |
| | 157 | | | Octane Receivables Trust 2019-1 2019-1A A (a) | | | | 3.1600 | | 09/20/23 | | | 157 | |
| | 59,939 | | | Octane Receivables Trust 2020-1 2020-1A A (a) | | | | 1.7100 | | 02/20/25 | | | 59,594 | |
| | 255,000 | | | Oportun Funding 2022-1, LLC (a) | | | | 3.2500 | | 06/15/29 | | | 253,824 | |
| | 57,802 | | | Orange Lake Timeshare Trust 2019-A (a) | | | | 3.3600 | | 04/09/38 | | | 56,391 | |
| | 550,000 | | | Progress Residential 2020-SFR2 Trust (a) | | | | 5.1150 | | 06/17/37 | | | 546,991 | |
| | 201,000 | | | Progress Residential 2021-SFR1 (a) | | | | 1.5550 | | 04/17/38 | | | 179,493 | |
| | 265,000 | | | Progress Residential 2021-SFR3 (a) | | | | 2.2880 | | 05/17/26 | | | 235,986 | |
| | 220,000 | | | Progress Residential Trust (a) | | | | 2.1970 | | 04/19/38 | | | 197,795 | |
| | 275,000 | | | Purchasing Power Funding 2021-A, LLC 2021-A A (a) | | | | 1.5700 | | 10/15/25 | | | 265,630 | |
See accompanying notes which are an integral part to these financial statements.
| DUNHAM CORPORATE/GOVERNMENT BOND FUND |
| SCHEDULE OF INVESTMENTS (Unaudited) (Continued) |
| April 30, 2022 |
| | | | | | | | Coupon | | | | | |
| Principal Amount ($) | | | | | Spread | | Rate (%) | | Maturity | | Fair Value | |
| | | | | ASSET BACKED SECURITIES — 33.0% (Continued) | | | | | | | | | | |
| | | | | OTHER ABS — 9.2% | | | | | | | | | | |
| | 265,000 | | | Regional Management Issuance Trust 2021-1 (a) | | | | 1.6800 | | 03/17/31 | | $ | 250,883 | |
| | 77,149 | | | Sierra Timeshare 2020-2 Receivables Funding, LLC (a) | | | | 2.3200 | | 07/20/37 | | | 75,028 | |
| | 85,725 | | | Taco Bell Funding, LLC 2016-1A Class A23 (a) | | | | 4.9700 | | 05/25/46 | | | 87,012 | |
| | 165,000 | | | Tricon American Homes 2019-SFR1 Trust (a) | | | | 3.1490 | | 03/17/38 | | | 156,411 | |
| | 200,000 | | | Tricon American Homes 2020-SFR2 Trust (a) | | | | 2.2810 | | 11/17/27 | | | 170,423 | |
| | 160,000 | | | Tricon Residential 2021-SFR1 Trust (a) | | | | 2.2440 | | 07/17/38 | | | 145,345 | |
| | 122,009 | | | VSE 2016-A VOI Mortgage, LLC (a) | | | | 2.5400 | | 07/20/33 | | | 120,170 | |
| | | | | | | | | | | | | | 6,528,271 | |
| | | | | RESIDENTIAL MORTGAGE — 4.9% | | | | | | | | | | |
| | 98,447 | | | Ajax Mortgage Loan Trust 2019-D (a),(c) | | | | 2.9560 | | 09/25/65 | | | 98,598 | |
| | 100,000 | | | Bayview Opportunity Master Fund IVa Trust (a),(b) | | | | 4.0000 | | 06/28/57 | | | 95,877 | |
| | 22,260 | | | Bayview Opportunity Master Fund IVa Trust 2017-RT1 (a),(b) | | | | 3.0000 | | 03/28/57 | | | 21,935 | |
| | 100,000 | | | Mill City Mortgage Loan Trust 2017-1 2017-1 M2 (a),(b) | | | | 3.2500 | | 11/25/58 | | | 98,496 | |
| | 180,691 | | | Pretium Mortgage Credit Partners, LLC (a),(c) | | | | 2.2390 | | 09/27/60 | | | 173,644 | |
| | 345,000 | | | Towd Point Mortgage Trust 2016-3 (a),(b) | | | | 3.5000 | | 04/25/56 | | | 344,923 | |
| | 135,000 | | | Towd Point Mortgage Trust 2016-4 (a),(b) | | | | 3.8000 | | 07/25/56 | | | 132,202 | |
| | 115,000 | | | Towd Point Mortgage Trust 2017-1 (a),(b) | | | | 3.7500 | | 10/25/56 | | | 112,749 | |
| | 460,000 | | | Towd Point Mortgage Trust 2017-4 (a),(b) | | | | 3.0000 | | 06/25/57 | | | 437,941 | |
| | 111,213 | | | Towd Point Mortgage Trust 2018-4 Class A1 (a),(b) | | | | 3.0000 | | 06/25/58 | | | 108,416 | |
| | 300,000 | | | Towd Point Mortgage Trust 2018-6 (a),(b) | | | | 3.7500 | | 03/25/58 | | | 293,201 | |
| | 140,000 | | | Towd Point Mortgage Trust 2018-6 (a),(b) | | | | 3.7500 | | 03/25/58 | | | 138,544 | |
| | 255,000 | | | Towd Point Mortgage Trust 2019-2 (a),(b) | | | | 3.7500 | | 12/25/58 | | | 246,995 | |
| | 235,000 | | | Towd Point Mortgage Trust 2019-4 (a),(b) | | | | 3.2500 | | 10/25/59 | | | 222,785 | |
| | 100,000 | | | Towd Point Mortgage Trust 2020-1 (a),(b) | | | | 3.5000 | | 01/25/60 | | | 92,597 | |
| | 190,698 | | | VCAT 2021-NPL1, LLC (a),(c) | | | | 2.2890 | | 12/26/50 | | | 185,365 | |
| | 130,000 | | | VCAT 2021-NPL1, LLC (a),(c) | | | | 4.8260 | | 12/26/50 | | | 124,693 | |
| | 68,090 | | | VCAT 2021-NPL2, LLC (a),(c) | | | | 2.1150 | | 03/27/51 | | | 65,830 | |
| | 112,869 | | | VCAT Asset Securitization, LLC (a),(c) | | | | 1.7430 | | 05/25/51 | | | 107,339 | |
| | 80,331 | | | VOLT C, LLC (a),(c) | | | | 1.9920 | | 05/25/51 | | | 76,994 | |
| | 90,667 | | | VOLT CVI, LLC (a),(c) | | | | 2.7340 | | 12/26/51 | | | 86,271 | |
| | 178,251 | | | VOLT XCII, LLC (a),(c) | | | | 1.8920 | | 02/27/51 | | | 172,350 | |
| | | | | | | | | | | | | | 3,437,745 | |
| | | | | STUDENT LOANS — 0.1% | | | | | | | | | | |
| | 83,917 | | | Commonbond Student Loan Trust 2020-1 (a) | | | | 1.6900 | | 10/25/51 | | | 75,779 | |
See accompanying notes which are an integral part to these financial statements.
| DUNHAM CORPORATE/GOVERNMENT BOND FUND |
| SCHEDULE OF INVESTMENTS (Unaudited) (Continued) |
| April 30, 2022 |
| | | | | | | | Coupon | | | | | |
| Principal Amount ($) | | | | | Spread | | Rate (%) | | Maturity | | Fair Value | |
| | | | | ASSET BACKED SECURITIES — 33.0% (Continued) | | | | | | | | | | |
| | | | | TOTAL ASSET BACKED SECURITIES (Cost $24,598,481) | | | | | | | | $ | 23,368,194 | |
| | | | | | | | | | | | | | | |
| | | | | CORPORATE BONDS — 30.7% | | | | | | | | | | |
| | | | | AEROSPACE & DEFENSE — 0.6% | | | | | | | | | | |
| | 108,000 | | | Boeing Company (The) | | | | 5.9300 | | 05/01/60 | | | 107,461 | |
| | 236,000 | | | Huntington Ingalls Industries, Inc. (a) | | | | 2.0430 | | 08/16/28 | | | 206,845 | |
| | 75,000 | | | Spirit AeroSystems, Inc. (a) | | | | 5.5000 | | 01/15/25 | | | 74,887 | |
| | 80,000 | | | TransDigm, Inc. | | | | 5.5000 | | 11/15/27 | | | 73,462 | |
| | | | | | | | | | | | | | 462,655 | |
| | | | | ASSET MANAGEMENT — 1.7% | | | | | | | | | | |
| | 190,000 | | | Ares Finance Co LLC (a) | | | | 4.0000 | | 10/08/24 | | | 189,755 | |
| | 92,000 | | | Blackstone Private Credit Fund (a) | | | | 2.6250 | | 12/15/26 | | | 80,831 | |
| | 125,000 | | | Blue Owl Finance, LLC (a) | | | | 3.1250 | | 06/10/31 | | | 100,423 | |
| | 245,000 | | | Charles Schwab Corporation (The) (b) | | H15T10Y + 3.079% | | 4.0000 | | 03/01/69 | | | 207,973 | |
| | 155,000 | | | Citadel, L.P. (a) | | | | 4.8750 | | 01/15/27 | | | 152,364 | |
| | 250,000 | | | Drawbridge Special Opportunities Fund, L.P. / (a) | | | | 3.8750 | | 02/15/26 | | | 236,402 | |
| | 145,000 | | | Icahn Enterprises, L.P. / Icahn Enterprises | | | | 6.2500 | | 05/15/26 | | | 144,015 | |
| | 180,000 | | | OWL Rock Core Income Corporation (a) | | | | 4.7000 | | 02/08/27 | | | 170,133 | |
| | | | | | | | | | | | | | 1,281,896 | |
| | | | | AUTOMOTIVE — 0.4% | | | | | | | | | | |
| | 96,000 | | | Ford Motor Company | | | | 3.2500 | | 02/12/32 | | | 78,157 | |
| | 65,000 | | | Ford Motor Company | | | | 4.7500 | | 01/15/43 | | | 52,451 | |
| | 140,000 | | | Tenneco, Inc. (a) | | | | 5.1250 | | 04/15/29 | | | 135,687 | |
| | | | | | | | | | | | | | 266,295 | |
| | | | | BANKING — 4.7% | | | | | | | | | | |
| | 200,000 | | | Banco Mercantil del Norte S.A. (a),(b) | | H15T10Y + 5.034% | | 6.6250 | | 01/24/70 | | | 179,300 | |
| | 250,000 | | | Bank of America Corporation (d) | | US0003M + 0.770% | | 1.0850 | | 02/05/26 | | | 249,046 | |
| | 715,000 | | | Bank of America Corporation (b) | | SOFRRATE + 1.320% | | 2.6870 | | 04/22/32 | | | 615,056 | |
| | 230,000 | | | Bank of America Corporation (b) | | H15T5Y + 1.200% | | 2.4820 | | 09/21/36 | | | 184,611 | |
| | 200,000 | | | BBVA Bancomer S.A. (a),(b) | | H15T5Y + 2.650% | | 5.1250 | | 01/18/33 | | | 186,581 | |
| | 325,000 | | | Citigroup, Inc. (d) | | US0003M + 1.250% | | 2.2170 | | 07/01/26 | | | 327,963 | |
| | 113,000 | | | Citigroup, Inc. (d) | | SOFRRATE + 1.280% | | 1.4800 | | 02/24/28 | | | 112,249 | |
| | 175,000 | | | JPMorgan Chase & Company (b),(d) | | SOFRRATE + 1.180% | | 1.3840 | | 02/24/28 | | | 173,099 | |
| | 425,000 | | | JPMorgan Chase & Company | | SOFRRATE + 1.065% | | 1.9530 | | 02/04/32 | | | 347,984 | |
See accompanying notes which are an integral part to these financial statements.
| DUNHAM CORPORATE/GOVERNMENT BOND FUND |
| SCHEDULE OF INVESTMENTS (Unaudited) (Continued) |
| April 30, 2022 |
| | | | | | | | Coupon | | | | | |
| Principal Amount ($) | | | | | Spread | | Rate (%) | | Maturity | | Fair Value | |
| | | | | CORPORATE BONDS — 30.7% (Continued) | | | | | | | | | | |
| | | | | BANKING — 4.7% (Continued) | | | | | | | | | | |
| | 47,000 | | | JPMorgan Chase & Company HH (b) | | SOFRRATE + 3.125% | | 4.6000 | | 08/01/68 | | $ | 43,375 | |
| | 205,000 | | | Santander Holdings USA, Inc. | | | | 4.4000 | | 07/13/27 | | | 202,724 | |
| | 60,000 | | | Synovus Financial Corporation (b) | | USSW5 + 3.379% | | 5.9000 | | 02/07/29 | | | 60,962 | |
| | 200,000 | | | Texas Capital Bancshares, Inc. (b) | | H15T5Y + 3.150% | | 4.0000 | | 05/06/31 | | | 191,916 | |
| | 185,000 | | | Truist Financial Corporation (b) | | H15T10Y + 4.349% | | 5.1000 | | 03/01/69 | | | 185,231 | |
| | 330,000 | | | Wells Fargo & Company (b), (f) | | H15T5Y + 3.453% | | 3.9000 | | 03/15/69 | | | 301,315 | |
| | | | | | | | | | | | | | 3,361,412 | |
| | | | | BEVERAGES — 0.4% | | | | | | | | | | |
| | 200,000 | | | Bacardi Ltd. (a) | | | | 4.7000 | | 05/15/28 | | | 201,098 | |
| | 75,000 | | | Central American Bottling Corp / CBC Bottling (a) | | | | 5.2500 | | 04/27/29 | | | 71,529 | |
| | | | | | | | | | | | | | 272,627 | |
| | | | | BIOTECH & PHARMA — 0.6% | | | | | | | | | | |
| | 40,000 | | | Bausch Health Companies, Inc. (a) | | | | 5.7500 | | 08/15/27 | | | 37,474 | |
| | 160,000 | | | Mylan N.V. | | | | 3.9500 | | 06/15/26 | | | 155,659 | |
| | 40,000 | | | Par Pharmaceutical, Inc. (a) | | | | 7.5000 | | 04/01/27 | | | 36,542 | |
| | 110,000 | | | Teva Pharmaceutical Finance Netherlands III BV (f) | | | | 3.1500 | | 10/01/26 | | | 94,497 | |
| | 681 | | | Viatris, Inc. (a) | | | | 2.3000 | | 06/22/27 | | | 604 | |
| | 150,000 | | | Viatris, Inc. | | | | 2.3000 | | 06/22/27 | | | 133,056 | |
| | | | | | | | | | | | | | 457,832 | |
| | | | | CABLE & SATELLITE — 0.1% | | | | | | | | | | |
| | 35,000 | | | CCO Holdings, LLC / CCO Holdings Capital (a) | | | | 4.7500 | | 03/01/30 | | | 31,216 | |
| | 40,000 | | | CCO Holdings, LLC / CCO Holdings Capital (a), (f) | | | | 4.5000 | | 08/15/30 | | | 34,966 | |
| | | | | | | | | | | | | | 66,182 | |
| | | | | CHEMICALS — 0.6% | | | | | | | | | | |
| | 235,000 | | | Bayport Polymers, LLC (a) | | | | 5.1400 | | 04/14/32 | | | 235,578 | |
| | 245,000 | | | Nutrition & Biosciences, Inc. (a) | | | | 2.3000 | | 11/01/30 | | | 206,062 | |
| | | | | | | | | | | | | | 441,640 | |
| | | | | COMMERCIAL SUPPORT SERVICES — 0.3% | | | | | | | | | | |
| | 45,000 | | | Aramark Services, Inc. (a) | | | | 6.3750 | | 05/01/25 | | | 45,891 | |
| | 115,000 | | | GFL Environmental Inc (a) | | | | 4.0000 | | 08/01/28 | | | 101,355 | |
| | 78,000 | | | Waste Management, Inc. | | | | 4.1500 | | 04/15/32 | | | 77,865 | |
| | | | | | | | | | | | | | 225,111 | |
| | | | | CONSUMER SERVICES — 0.1% | | | | | | | | | | |
| | 55,000 | | | Carriage Services, Inc. (a) | | | | 4.2500 | | 05/15/29 | | | 47,924 | |
See accompanying notes which are an integral part to these financial statements.
| DUNHAM CORPORATE/GOVERNMENT BOND FUND |
| SCHEDULE OF INVESTMENTS (Unaudited) (Continued) |
| April 30, 2022 |
| | | | | | | | Coupon | | | | | |
| Principal Amount ($) | | | | | Spread | | Rate (%) | | Maturity | | Fair Value | |
| | | | | CORPORATE BONDS — 30.7% (Continued) | | | | | | | | | | |
| | | | | DIVERSIFIED INDUSTRIALS — 0.2% | | | | | | | | | | |
| | 181,000 | | | General Electric Company D (b) | | US0003M + 3.330% | | 4.1560 | | 06/15/69 | | $ | 171,700 | |
| | | | | | | | | | | | | | | |
| | | | | ELECTRIC UTILITIES — 1.2% | | | | | | | | | | |
| | 260,000 | | | Alliant Energy Finance, LLC (a) | | | | 3.6000 | | 03/01/32 | | | 241,415 | |
| | 238,000 | | | Puget Energy, Inc. | | | | 2.3790 | | 06/15/28 | | | 212,283 | |
| | 244,000 | | | Southern Company (The) (b) | | H15T5Y + 2.915% | | 3.7500 | | 09/15/51 | | | 220,210 | |
| | 145,000 | | | Vistra Corporation (a),(b) | | H15T5Y + 6.930% | | 8.0000 | | 04/15/70 | | | 146,175 | |
| | | | | | | | | | | | | | 820,083 | |
| | | | | ENGINEERING & CONSTRUCTION — 0.5% | | | | | | | | | | |
| | 130,000 | | | Global Infrastructure Solutions, Inc. (a) | | | | 7.5000 | | 04/15/32 | | | 121,147 | |
| | 238,000 | | | Sempra Infrastructure Partners, L.P. (a) | | | | 3.2500 | | 01/15/32 | | | 206,725 | |
| | | | | | | | | | | | | | 327,872 | |
| | | | | FORESTRY, PAPER & WOOD PRODUCTS — 0.1% | | | | | | | | | | |
| | 90,000 | | | Suzano Austria GmbH | | | | 2.5000 | | 09/15/28 | | | 76,806 | |
| | | | | | | | | | | | | | | |
| | | | | HEALTH CARE FACILITIES & SERVICES — 0.5% | | | | | | | | | | |
| | 125,000 | | | HCA, Inc. (f) | | | | 5.2500 | | 06/15/49 | | | 119,789 | |
| | 145,000 | | | Molina Healthcare, Inc. (a) | | | | 3.8750 | | 05/15/32 | | | 127,524 | |
| | 5,000 | | | Prime Healthcare Services, Inc. (a) | | | | 7.2500 | | 11/01/25 | | | 5,020 | |
| | 150,000 | | | Universal Health Services, Inc. (a) | | | | 2.6500 | | 01/15/32 | | | 123,455 | |
| | | | | | | | | | | | | | 375,788 | |
| | | | | HOME CONSTRUCTION — 0.5% | | | | | | | | | | |
| | 90,000 | | | M/I Homes, Inc. | | | | 4.9500 | | 02/01/28 | | | 82,919 | |
| | 235,000 | | | PulteGroup, Inc. | | | | 6.3750 | | 05/15/33 | | | 254,603 | |
| | | | | | | | | | | | | | 337,522 | |
| | | | | INSTITUTIONAL FINANCIAL SERVICES — 1.9% | | | | | | | | | | |
| | 160,000 | | | Bank of New York Mellon Corporation (The) (b) | | H15T5Y + 4.358% | | 4.7000 | | 09/20/68 | | | 160,000 | |
| | 370,000 | | | Brookfield Finance, Inc. | | | | 2.7240 | | 04/15/31 | | | 325,279 | |
| | 160,000 | | | Coinbase Global, Inc. (a) | | | | 3.6250 | | 10/01/31 | | | 118,898 | |
| | 290,000 | | | Jefferies Group, LLC / Jefferies Group Capital | | | | 2.6250 | | 10/15/31 | | | 238,960 | |
| | 285,000 | | | Morgan Stanley | | | | 3.1250 | | 07/27/26 | | | 273,463 | |
| | 175,000 | | | Morgan Stanley (f) | | | | 6.3750 | | 07/24/42 | | | 211,147 | |
| | | | | | | | | | | | | | 1,327,747 | |
See accompanying notes which are an integral part to these financial statements.
| DUNHAM CORPORATE/GOVERNMENT BOND FUND |
| SCHEDULE OF INVESTMENTS (Unaudited) (Continued) |
| April 30, 2022 |
| | | | | | | | Coupon | | | | | |
| Principal Amount ($) | | | | | Spread | | Rate (%) | | Maturity | | Fair Value | |
| | | | | CORPORATE BONDS — 30.7% (Continued) | | | | | | | | | | |
| | | | | INSURANCE — 2.1% | | | | | | | | | | |
| | 150,000 | | | Allstate Corporation (The) (b) | | US0003M + 2.938% | | 5.7500 | | 08/15/53 | | $ | 145,710 | |
| | 185,000 | | | Ascot Group Ltd. (a) | | | | 4.2500 | | 12/15/30 | | | 179,567 | |
| | 170,000 | | | Brighthouse Financial, Inc. (f) | | | | 5.6250 | | 05/15/30 | | | 177,922 | |
| | 160,000 | | | Liberty Mutual Group, Inc. (a),(b) | | H15T5Y + 3.315% | | 4.1250 | | 12/15/51 | | | 145,447 | |
| | 275,000 | | | Lincoln National Corporation (b),(d) | | US0003M + 2.040% | | 3.1030 | | 04/20/67 | | | 225,390 | |
| | 160,000 | | | MetLife, Inc. (b) | | H15T5Y + 3.576% | | 3.8500 | | 03/15/69 | | | 153,810 | |
| | 76,000 | | | MetLife, Inc. (b) | | US0003M + 2.959% | | 5.8750 | | 09/15/66 | | | 75,284 | |
| | 70,000 | | | Prudential Financial, Inc. (b) | | US0003M + 4.175% | | 5.8750 | | 09/15/42 | | | 69,904 | |
| | 230,000 | | | Prudential Financial, Inc. (b), (f) | | US0003M + 3.920% | | 5.6250 | | 06/15/43 | | | 230,223 | |
| | 59,000 | | | Prudential Financial, Inc. (b), (f) | | H15T5Y + 3.162% | | 5.1250 | | 03/01/52 | | | 57,469 | |
| | | | | | | | | | | | | | 1,460,726 | |
| | | | | INTERNET MEDIA & SERVICES — 0.2% | | | | | | | | | | |
| | 85,000 | | | TripAdvisor, Inc. (a) | | | | 7.0000 | | 07/15/25 | | | 87,239 | |
| | 60,000 | | | Twitter, Inc. (a) | | | | 3.8750 | | 12/15/27 | | | 58,950 | |
| | | | | | | | | | | | | | 146,189 | |
| | | | | LEISURE FACILITIES & SERVICES — 0.1% | | | | | | | | | | |
| | 75,000 | | | Hilton Grand Vacations Borrower Escrow, LLC / (a) | | | | 5.0000 | | 06/01/29 | | | 67,804 | |
| | 15,000 | | | Scientific Games International, Inc. (a) | | | | 7.0000 | | 05/15/28 | | | 15,372 | |
| | | | | | | | | | | | | | 83,176 | |
| | | | | LEISURE PRODUCTS — 0.2% | | | | | | | | | | |
| | 166,000 | | | Brunswick Corporation | | | | 2.4000 | | 08/18/31 | | | 130,913 | |
| | | | | | | | | | | | | | | |
| | | | | MEDICAL EQUIPMENT & DEVICES — 0.8% | | | | | | | | | | |
| | 265,000 | | | Baxter International, Inc. (a) | | | | 2.5390 | | 02/01/32 | | | 226,307 | |
| | 124,000 | | | Bio-Rad Laboratories, Inc. | | | | 3.3000 | | 03/15/27 | | | 118,907 | |
| | 39,000 | | | Bio-Rad Laboratories, Inc. | | | | 3.7000 | | 03/15/32 | | | 36,170 | |
| | 243,000 | | | Illumina, Inc. | | | | 2.5500 | | 03/23/31 | | | 207,552 | |
| | | | | | | | | | | | | | 588,936 | |
| | | | | METALS & MINING — 1.3% | | | | | | | | | | |
| | 125,000 | | | Alliance Resource Operating Partners, L.P. / (a) | | | | 7.5000 | | 05/01/25 | | | 125,496 | |
| | 65,000 | | | Cleveland-Cliffs, Inc. (a) | | | | 6.7500 | | 03/15/26 | | | 68,167 | |
| | 130,000 | | | FMG Resources August 2006 Pty Ltd. (a) | | | | 5.8750 | | 04/15/30 | | | 129,251 | |
| | 205,000 | | | Freeport-McMoRan, Inc. | | | | 5.4500 | | 03/15/43 | | | 205,238 | |
| | 185,000 | | | Glencore Funding, LLC (a) | | | | 2.8500 | | 04/27/31 | | | 158,196 | |
See accompanying notes which are an integral part to these financial statements.
| DUNHAM CORPORATE/GOVERNMENT BOND FUND |
| SCHEDULE OF INVESTMENTS (Unaudited) (Continued) |
| April 30, 2022 |
| | | | | | | | Coupon | | | | | |
| Principal Amount ($) | | | | | Spread | | Rate (%) | | Maturity | | Fair Value | |
| | | | | CORPORATE BONDS — 30.7% (Continued) | | | | | | | | | | |
| | | | | METALS & MINING — 1.3%(Continued) | | | | | | | | | | |
| | 205,000 | | | Teck Resources Ltd. | | | | 6.1250 | | 10/01/35 | | $ | 226,381 | |
| | | | | | | | | | | | | | 912,729 | |
| | | | | OIL & GAS PRODUCERS — 3.6% | | | | | | | | | | |
| | 155,000 | | | Boardwalk Pipelines, L.P. B | | | | 4.9500 | | 12/15/24 | | | 158,599 | |
| | 115,000 | | | Chesapeake Escrow Issuer, LLC B (a) | | | | 5.5000 | | 02/01/26 | | | 114,161 | |
| | 65,000 | | | CrownRock, L.P. / CrownRock Finance, Inc. (a) | | | | 5.6250 | | 10/15/25 | | | 65,080 | |
| | 115,000 | | | DT Midstream, Inc. (a) | | | | 4.1250 | | 06/15/29 | | | 104,801 | |
| | 160,000 | | | Energy Transfer, L.P. (b) | | H15T5Y + 5.694% | | 6.5000 | | 11/15/69 | | | 152,418 | |
| | 245,000 | | | Flex Intermediate Holdco, LLC (a) | | | | 3.3630 | | 06/30/31 | | | 215,647 | |
| | 165,000 | | | HF Sinclair Corporation (a) | | | | 5.8750 | | 04/01/26 | | | 169,726 | |
| | 45,000 | | | Kinder Morgan, Inc. (a) | | | | 7.7500 | | 01/15/32 | | | 54,837 | |
| | 200,000 | | | Lundin Energy Finance BV | | | | 2.0000 | | 07/15/26 | | | 180,807 | |
| | 95,000 | | | Occidental Petroleum Corporation | | | | 6.1250 | | 01/01/31 | | | 99,978 | |
| | 70,000 | | | Parsley Energy, LLC / Parsley Finance Corporation (a) | | | | 4.1250 | | 02/15/28 | | | 66,188 | |
| | 200,000 | | | Pertamina Persero PT (a) | | | | 6.4500 | | 05/30/44 | | | 213,866 | |
| | 185,000 | | | Petroleos Mexicanos | | | | 7.6900 | | 01/23/50 | | | 145,330 | |
| | 200,000 | | | Petronas Capital Ltd. (a) | | | | 3.5000 | | 04/21/30 | | | 192,912 | |
| | 250,000 | | | Reliance Industries Ltd. (a) | | | | 2.8750 | | 01/12/32 | | | 214,463 | |
| | 65,000 | | | Sabine Pass Liquefaction, LLC | | | | 4.2000 | | 03/15/28 | | | 63,923 | |
| | 225,000 | | | Transcanada Trust (b) | | H15T5Y + 3.986% | | 5.6000 | | 03/07/82 | | | 217,968 | |
| | 85,000 | | | Venture Global Calcasieu Pass, LLC (a) | | | | 3.8750 | | 08/15/29 | | | 77,673 | |
| | 80,000 | | | Venture Global Calcasieu Pass, LLC (a) | | | | 3.8750 | | 11/01/33 | | | 69,723 | |
| | | | | | | | | | | | | | 2,578,100 | |
| | | | | OIL & GAS SERVICES & EQUIPMENT — 0.1% | | | | | | | | | | |
| | 30,000 | | | Patterson-UTI Energy, Inc. (f) | | | | 5.1500 | | 11/15/29 | | | 28,594 | |
| | 24,256 | | | Transocean Guardian Ltd. (a) | | | | 5.8750 | | 01/15/24 | | | 23,251 | |
| | | | | | | | | | | | | | 51,845 | |
| | | | | REAL ESTATE INVESTMENT TRUSTS — 1.8% | | | | | | | | | | |
| | 220,000 | | | EPR Properties | | | | 4.7500 | | 12/15/26 | | | 216,283 | |
| | 155,000 | | | GLP Capital, L.P. / GLP Financing II, Inc. | | | | 5.7500 | | 06/01/28 | | | 162,945 | |
| | 23,000 | | | GLP Capital, L.P. / GLP Financing II, Inc. | | | | 3.2500 | | 01/15/32 | | | 19,386 | |
| | 35,000 | | | MPT Operating Partnership, L.P. / MPT Finance | | | | 5.0000 | | 10/15/27 | | | 33,625 | |
| | 20,000 | | | MPT Operating Partnership, L.P. / MPT Finance (f) | | | | 4.6250 | | 08/01/29 | | | 18,408 | |
| | 115,000 | | | MPT Operating Partnership, L.P. / MPT Finance (f) | | | | 3.5000 | | 03/15/31 | | | 98,074 | |
See accompanying notes which are an integral part to these financial statements.
| DUNHAM CORPORATE/GOVERNMENT BOND FUND |
| SCHEDULE OF INVESTMENTS (Unaudited) (Continued) |
| April 30, 2022 |
| | | | | | | | Coupon | | | | | |
| Principal Amount ($) | | | | | Spread | | Rate (%) | | Maturity | | Fair Value | |
| | | | | CORPORATE BONDS — 30.7% (Continued) | | | | | | | | | | |
| | | | | REAL ESTATE INVESTMENT TRUSTS — 1.8% (Continued) | | | | | | | | | | |
| | 170,000 | | | Office Properties Income Trust | | | | 4.5000 | | 02/01/25 | | $ | 168,967 | |
| | 240,000 | | | Phillips Edison Grocery Center Operating | | | | 2.6250 | | 11/15/31 | | | 198,720 | |
| | 105,000 | | | Retail Opportunity Investments Partnership, L.P. | | | | 4.0000 | | 12/15/24 | | | 104,144 | |
| | 225,000 | | | Retail Properties of America, Inc. | | | | 4.7500 | | 09/15/30 | | | 222,933 | |
| | 70,000 | | | Service Properties Trust | | | | 4.9500 | | 02/15/27 | | | 60,756 | |
| | | | | | | | | | | | | | 1,304,241 | |
| | | | | REAL ESTATE OWNERS & DEVELOPERS — 0.3% | | | | | | | | | | |
| | 275,000 | | | Ontario Teachers’ Cadillac Fairview Properties (a) | | | | 2.5000 | | 10/15/31 | | | 238,985 | |
| | | | | | | | | | | | | | | |
| | | | | RETAIL - CONSUMER STAPLES — 0.0%(e) | | | | | | | | | | |
| | 10,000 | | | Albertsons Companies Inc / Safeway Inc / New (a) | | | | 3.5000 | | 03/15/29 | | | 8,437 | |
| | | | | | | | | | | | | | | |
| | | | | RETAIL - DISCRETIONARY — 0.5% | | | | | | | | | | |
| | 160,000 | | | American Builders & Contractors Supply Company, (a) | | | | 4.0000 | | 01/15/28 | | | 149,426 | |
| | 160,000 | | | BlueLinx Holdings, Inc. (a) | | | | 6.0000 | | 11/15/29 | | | 145,000 | |
| | 159,000 | | | Dick’s Sporting Goods, Inc. | | | | 3.1500 | | 01/15/32 | | | 133,059 | |
| | | | | | | | | | | | | | 427,485 | |
| | | | | SEMICONDUCTORS — 0.5% | | | | | | | | | | |
| | 171,000 | | | Broadcom, Inc. | | | | 4.1500 | | 11/15/30 | | | 162,356 | |
| | 9,000 | | | Broadcom, Inc. (a), (f) | | | | 3.1870 | | 11/15/36 | | | 7,128 | |
| | 222,000 | | | Entegris Escrow Corporation (a) | | | | 4.7500 | | 04/15/29 | | | 214,267 | |
| | | | | | | | | | | | | | 383,751 | |
| | | | | SOFTWARE — 0.6% | | | | | | | | | | |
| | 265,000 | | | Citrix Systems, Inc. (f) | | | | 3.3000 | | 03/01/30 | | | 261,911 | |
| | 15,000 | | | Consensus Cloud Solutions, Inc. (a) | | | | 6.0000 | | 10/15/26 | | | 14,271 | |
| | 20,000 | | | Consensus Cloud Solutions, Inc. (a) | | | | 6.5000 | | 10/15/28 | | | 18,825 | |
| | 90,000 | | | Oracle Corporation | | | | 2.8750 | | 03/25/31 | | | 76,132 | |
| | 45,000 | | | Oracle Corporation | | | | 3.8500 | | 04/01/60 | | | 31,986 | |
| | | | | | | | | | | | | | 403,125 | |
| | | | | SPECIALTY FINANCE — 1.0% | | | | | | | | | | |
| | 194,000 | | | Ally Financial, Inc. B (b) | | H15T5Y + 3.868% | | 4.7000 | | 08/15/69 | | | 168,125 | |
| | 145,000 | | | Aviation Capital Group, LLC (a) | | | | 3.5000 | | 11/01/27 | | | 133,757 | |
| | 125,000 | | | Avolon Holdings Funding Ltd. (a) | | | | 4.3750 | | 05/01/26 | | | 120,231 | |
| | 182,000 | | | Capital One Financial Corporation (b) | | SOFRRATE + 1.337% | | 2.3590 | | 07/29/32 | | | 146,851 | |
See accompanying notes which are an integral part to these financial statements.
| DUNHAM CORPORATE/GOVERNMENT BOND FUND |
| SCHEDULE OF INVESTMENTS (Unaudited) (Continued) |
| April 30, 2022 |
| | | | | | | | Coupon | | | | | |
| Principal Amount ($) | | | | | Spread | | Rate (%) | | Maturity | | Fair Value | |
| | | | | CORPORATE BONDS — 30.7% (Continued) | | | | | | | | | | |
| | | | | SPECIALTY FINANCE — 1.0% (Continued) | | | | | | | | | | |
| | 110,000 | | | Ladder Capital Finance Holdings LLLP / Ladder (a) | | | | 4.2500 | | 02/01/27 | | $ | 101,248 | |
| | 60,000 | | | OneMain Finance Corporation | | | | 6.8750 | | 03/15/25 | | | 60,563 | |
| | | | | | | | | | | | | | 730,775 | |
| | | | | TECHNOLOGY HARDWARE — 0.8% | | | | | | | | | | |
| | 224,000 | | | CDW, LLC / CDW Finance Corporation | | | | 3.5690 | | 12/01/31 | | | 196,540 | |
| | 84,000 | | | Dell International, LLC / EMC Corporation | | | | 8.1000 | | 07/15/36 | | | 103,822 | |
| | 50,000 | | | Motorola Solutions, Inc. | | | | 4.6000 | | 05/23/29 | | | 49,365 | |
| | 280,000 | | | TD SYNNEX Corporation (a) | | | | 2.3750 | | 08/09/28 | | | 244,247 | |
| | | | | | | | | | | | | | 593,974 | |
| | | | | TECHNOLOGY SERVICES — 0.6% | | | | | | | | | | |
| | 137,000 | | | Kyndryl Holdings, Inc. (a) | | | | 2.7000 | | 10/15/28 | | | 114,621 | |
| | 245,000 | | | Leidos, Inc. | | | | 2.3000 | | 02/15/31 | | | 202,304 | |
| | 140,000 | | | Science Applications International Corporation (a) | | | | 4.8750 | | 04/01/28 | | | 134,061 | |
| | | | | | | | | | | | | | 450,986 | |
| | | | | TELECOMMUNICATIONS — 0.9% | | | | | | | | | | |
| | 145,000 | | | Level 3 Financing, Inc. (a) | | | | 4.2500 | | 07/01/28 | | | 122,766 | |
| | 150,000 | | | Sprint Spectrum Company, LLC / Sprint Spectrum (a) | | | | 4.7380 | | 03/20/25 | | | 151,284 | |
| | 265,000 | | | T-Mobile USA, Inc. | | | | 3.8750 | | 04/15/30 | | | 251,728 | |
| | 123,000 | | | Verizon Communications, Inc. | | | | 2.5500 | | 03/21/31 | | | 107,059 | |
| | | | | | | | | | | | | | 632,837 | |
| | | | | TOBACCO & CANNABIS — 0.5% | | | | | | | | | | |
| | 195,000 | | | BAT Capital Corporation | | | | 4.9060 | | 04/02/30 | | | 188,583 | |
| | 165,000 | | | Vector Group Ltd. (a) | | | | 5.7500 | | 02/01/29 | | | 145,061 | |
| | | | | | | | | | | | | | 333,644 | |
| | | | | | | | | | | | | | | |
| | | | | TOTAL CORPORATE BONDS (Cost $23,861,135) | | | | | | | | | 21,781,946 | |
| | | | | | | | | | | | | | | |
| | | | | MUNICIPAL BONDS — 5.7% | | | | | | | | | | |
| | | | | CITY — 0.7% | | | | | | | | | | |
| | 340,000 | | | City of Bristol VA | | | | 4.2100 | | 01/01/42 | | | 346,349 | |
| | 145,000 | | | City of San Antonio TX | | | | 1.9630 | | 02/01/33 | | | 121,424 | |
| | | | | | | | | | | | | | 467,773 | |
See accompanying notes which are an integral part to these financial statements.
| DUNHAM CORPORATE/GOVERNMENT BOND FUND |
| SCHEDULE OF INVESTMENTS (Unaudited) (Continued) |
| April 30, 2022 |
| | | | | | Coupon | | | | | |
| Principal Amount ($) | | | | | Rate (%) | | Maturity | | Fair Value | |
| | | | | MUNICIPAL BONDS — 5.7% (Continued) | | | | | | | | |
| | | | | GOVERNMENT LEASE — 0.1% | | | | | | | | |
| | 145,000 | | | Texas Public Finance Authority | | 2.1400 | | 02/01/35 | | $ | 115,457 | |
| | | | | | | | | | | | | |
| | | | | HOSPITALS — 0.2% | | | | | | | | |
| | 135,000 | | | Idaho Health Facilities Authority | | 5.0200 | | 03/01/48 | | | 144,392 | |
| | | | | | | | | | | | | |
| | | | | LOCAL AUTHORITY — 1.3% | | | | | | | | |
| | 325,000 | | | San Diego County Regional Airport Authority | | 5.5940 | | 07/01/43 | | | 343,517 | |
| | 600,000 | | | State of Texas | | 3.2110 | | 04/01/44 | | | 527,842 | |
| | 35,000 | | | Texas Transportation Commission State Highway Fund | | 4.0000 | | 10/01/33 | | | 35,508 | |
| | | | | | | | | | | | 906,867 | |
| | | | | MISCELLANEOUS TAX — 1.2% | | | | | | | | |
| | 765,000 | | | Metropolitan Transportation Authority | | 5.0000 | | 11/15/45 | | | 844,065 | |
| | | | | | | | | | | | | |
| | | | | SALES TAX — 0.0%(e) | | | | | | | | |
| | 20,000 | | | Sales Tax Securitization Corporation | | 3.4110 | | 01/01/43 | | | 17,223 | |
| | | | | | | | | | | | | |
| | | | | WATER AND SEWER — 2.2% | | | | | | | | |
| | 705,000 | | | Broward County FL Water & Sewer Utility Revenue | | 4.0000 | | 10/01/47 | | | 716,568 | |
| | 625,000 | | | New York State Environmental Facilities | | 5.0000 | | 06/15/51 | | | 710,383 | |
| | 160,000 | | | Santa Clara Valley Water District | | 2.9670 | | 06/01/50 | | | 128,708 | |
| | | | | | | | | | | | 1,555,659 | |
| | | | | | | | | | | | | |
| | | | | TOTAL MUNICIPAL BONDS (Cost $4,302,230) | | | | | | | 4,051,436 | |
| | | | | | | | | | | | | |
| | | | | NON U.S. GOVERNMENT & AGENCIES — 1.4% | | | | | | | | |
| | | | | SOVEREIGN — 1.4% | | | | | | | | |
| | 280,000 | | | Dominican Republic International Bond (a) | | 6.0000 | | 02/22/33 | | | 255,290 | |
| | 200,000 | | | Emirate of Dubai Government International Bonds | | 5.2500 | | 01/30/43 | | | 196,779 | |
| | 200,000 | | | Mexico Government International Bond (f) | | 2.6590 | | 05/24/31 | | | 169,500 | |
| | 200,000 | | | Oman Government International Bond (a) | | 7.3750 | | 10/28/32 | | | 220,543 | |
| | 200,000 | | | Panama Government International Bond | | 3.2980 | | 01/19/33 | | | 174,493 | |
| | | | | TOTAL NON U.S. GOVERNMENT & AGENCIES (Cost $1,130,537) | | | | | | | 1,016,605 | |
See accompanying notes which are an integral part to these financial statements.
| DUNHAM CORPORATE/GOVERNMENT BOND FUND |
| SCHEDULE OF INVESTMENTS (Unaudited) (Continued) |
| April 30, 2022 |
| | | | | | | | Coupon | | | | | |
| Principal Amount ($) | | | | | Spread | | Rate (%) | | Maturity | | Fair Value | |
| | | | | TERM LOANS — 8.6% | | | | | | | | | | |
| | | | | AEROSPACE & DEFENSE — 0.2% | | | | | | | | | | |
| | 131,241 | | | TransDigm, Inc. (d) | | US0001M + 2.250% | | 2.7070 | | 05/30/25 | | $ | 128,993 | |
| | | | | | | | | | | | | | | |
| | | | | AUTOMOTIVE — 0.2% | | | | | | | | | | |
| | 142,106 | | | Cooper-Standard Automotive, Inc. (d) | | US0003M + 2.000% | | 2.7500 | | 11/02/23 | | | 131,544 | |
| | | | | | | | | | | | | | | |
| | | | | BIOTECH & PHARMA — 0.0%(e) | | | | | | | | | | |
| | 19,842 | | | Bausch Health Americas, Inc. (d) | | US0003M + 2.750% | | 2.8710 | | 06/01/25 | | | 19,763 | |
| | 5,744 | | | Bausch Health Americas, Inc. (d) | | US0003M + 3.000% | | 3.1210 | | 06/01/25 | | | 5,725 | |
| | | | | | | | | | | | | | 25,488 | |
| | | | | CABLE & SATELLITE — 0.1% | | | | | | | | | | |
| | 83,043 | | | Directv Financing, LLC (d) | | US0001M + 5.000% | | 5.7640 | | 07/22/27 | | | 82,801 | |
| | 20,000 | | | Virgin Media Bristol, LLC (d) | | US0001M + 3.250% | | 3.3530 | | 01/10/29 | | | 19,934 | |
| | | | | | | | | | | | | | 102,735 | |
| | | | | CHEMICALS — 0.4% | | | | | | | | | | |
| | 350 | | | Diamond BC BV | | | | 3.2500 | | 09/15/28 | | | 339 | |
| | 231,697 | | | INEOS US Finance, LLC (d) | | US0001M + 2.000% | | 2.4490 | | 03/31/24 | | | 230,920 | |
| | 338 | | | INEOS US Petrochem, LLC (d) | | US0001M + 2.750% | | 3.2500 | | 01/21/26 | | | 334 | |
| | 78,875 | | | Trinseo Materials Operating SCA (d) | | US0001M + 2.500% | | 2.9570 | | 03/18/28 | | | 78,026 | |
| | | | | | | | | | | | | | 309,619 | |
| | | | | COMMERCIAL SUPPORT SERVICES — 0.0%(e) | | | | | | | | | | |
| | 513 | | | AlixPartners LLP (d) | | US0001M + 2.750% | | 3.2500 | | 01/28/28 | | | 508 | |
| | 23,313 | | | Aramark Services, Inc. (d) | | US0001M + 1.750% | | 1.8710 | | 12/10/26 | | | 22,983 | |
| | | | | | | | | | | | | | 23,491 | |
| | | | | CONSTRUCTION MATERIALS — 0.6% | | | | | | | | | | |
| | 180,087 | | | CPG International, LLC (d) | | US0001M + 2.500% | | 3.2500 | | 05/05/24 | | | 179,861 | |
| | 130,000 | | | CPG International, LLC (d) | | | | 0.000 | | 04/18/29 | | | 128,538 | |
| | 140,000 | | | QUIKRETE HOLDINGS, INC. (d) | | US0001M + 3.000% | | 3.5540 | | 06/11/28 | | | 136,627 | |
| | | | | | | | | | | | | | 445,026 | |
| | | | | CONTAINERS & PACKAGING — 0.1% | | | | | | | | | | |
| | 80,837 | | | Berry Global, Inc. (d) | | US0001M + 1.750% | | 2.2380 | | 07/01/26 | | | 79,718 | |
| | | | | | | | | | | | | | | |
| | | | | ELECTRIC UTILITIES — 0.2% | | | | | | | | | | |
| | 121,209 | | | Astoria Energy, LLC (d) | | US0003M + 3.500% | | 4.5000 | | 12/10/27 | | | 119,745 | |
See accompanying notes which are an integral part to these financial statements.
| DUNHAM CORPORATE/GOVERNMENT BOND FUND |
| SCHEDULE OF INVESTMENTS (Unaudited) (Continued) |
| April 30, 2022 |
| | | | | | | | Coupon | | | | | |
| Principal Amount ($) | | | | | Spread | | Rate (%) | | Maturity | | Fair Value | |
| | | | | TERM LOANS — 8.6% (Continued) | | | | | | | | | | |
| | | | | ELECTRICAL EQUIPMENT — 0.2% | | | | | | | | | | |
| | 115,600 | | | Brookfield WEC Holdings, Inc. (d) | | US0001M + 2.750% | | 3.2500 | | 08/01/25 | | $ | 113,685 | |
| | | | | | | | | | | | | | | |
| | | | | FOOD — 0.2% | | | | | | | | | | |
| | 50,000 | | | CHG PPC Parent, LLC (d) | | US0001M + 3.000% | | 3.5000 | | 11/17/28 | | | 49,250 | |
| | 102,722 | | | Hostess Brands, LLC (d) | | US0001M + 2.250% | | 3.0000 | | 08/03/25 | | | 101,625 | |
| | | | | | | | | | | | | | 150,875 | |
| | | | | HEALTH CARE FACILITIES & SERVICES — 0.3% | | | | | | | | | | |
| | 54,718 | | | Agiliti Health, Inc. (d) | | US0003M + 2.750% | | 3.2500 | | 10/18/25 | | | 54,308 | |
| | 131,596 | | | Legacy LifePoint Health, LLC (d) | | US0001M + 3.750% | | 4.4990 | | 11/16/25 | | | 130,245 | |
| | 30,000 | | | Phoenix Newco, Inc. (d) | | US0001M + 3.500% | | 4.0000 | | 08/11/28 | | | 29,833 | |
| | | | | | | | | | | | | | 214,386 | |
| | | | | HOME CONSTRUCTION — 0.1% | | | | | | | | | | |
| | 54,863 | | | Chariot Buyer, LLC (d) | | US0003M + 3.500% | | 4.0000 | | 10/22/28 | | | 53,911 | |
| | | | | | | | | | | | | | | |
| | | | | INDUSTRIAL INTERMEDIATE PROD — 0.2% | | | | | | | | | | |
| | 177,750 | | | Gates Global, LLC (d) | | US0001M + 2.750% | | 3.2500 | | 03/31/27 | | | 174,676 | |
| | | | | | | | | | | | | | | |
| | | | | INDUSTRIAL SUPPORT SERVICES — 0.2% | | | | | | | | | | |
| | 109,100 | | | Resideo Funding, Inc. (d) | | US0003M + 2.250% | | 2.7500 | | 02/09/28 | | | 108,895 | |
| | | | | | | | | | | | | | | |
| | | | | INSURANCE — 0.2% | | | | | | | | | | |
| | 34,737 | | | Asurion, LLC (d) | | US0001M + 3.250% | | 3.3590 | | 07/28/27 | | | 33,999 | |
| | 95,554 | | | Sedgwick Claims Management Services, Inc. (d) | | US0001M + 3.250% | | 3.3420 | | 11/05/25 | | | 94,768 | |
| | | | | | | | | | | | | | 128,767 | |
| | | | | INTERNET MEDIA & SERVICES — 0.1% | | | | | | | | | | |
| | 68 | | | Pug, LLC (d) | | US0001M + 4.250% | | 4.7500 | | 02/13/27 | | | 67 | |
| | 58,359 | | | Pug, LLC (d) | | US0001M + 3.500% | | 3.9570 | | 12/31/49 | | | 57,119 | |
| | | | | | | | | | | | | | 57,186 | |
| | | | | LEISURE FACILITIES & SERVICES — 1.0% | | | | | | | | | | |
| | 178,242 | | | Caesars Resort Collection, LLC (d) | | US0003M + 2.750% | | 3.2070 | | 10/02/24 | | | 177,628 | |
| | 180,000 | | | Hilton Worldwide Finance, LLC (d) | | US0003M + 1.750% | | 2.4180 | | 06/21/26 | | | 178,169 | |
| | 40,000 | | | Scientific Games Corporation (d) | | SOFRRATE + 3.000% | | 3.5730 | | 04/07/29 | | | 39,869 | |
| | 30,000 | | | Scientific Games Holdings, L.P. (d) | | SOFRRATE + 3.500% | | 4.4670 | | 02/04/29 | | | 29,727 | |
| | 138,937 | | | Station Casinos, LLC (d) | | US0001M + 2.250% | | 2.5000 | | 01/31/27 | | | 137,410 | |
See accompanying notes which are an integral part to these financial statements.
| DUNHAM CORPORATE/GOVERNMENT BOND FUND |
| SCHEDULE OF INVESTMENTS (Unaudited) (Continued) |
| April 30, 2022 |
| | | | | | | | Coupon | | | | | |
| Principal Amount ($) | | | | | Spread | | Rate (%) | | Maturity | | Fair Value | |
| | | | | TERM LOANS — 8.6% (Continued) | | | | | | | | | | |
| | | | | LEISURE FACILITIES & SERVICES — 1.0% (Continued) | | | | | | | | | | |
| | 119,347 | | | UFC Holdings, LLC (d) | | US0001M + 2.750% | | 3.5000 | | 04/29/26 | | $ | 117,809 | |
| | | | | | | | | | | | | | 680,612 | |
| | | | | MACHINERY — 0.3% | | | | | | | | | | |
| | 116,634 | | | Alliance Laundry Systems, LLC (d) | | US0003M + 3.500% | | 4.5210 | | 09/30/27 | | | 116,197 | |
| | 102,654 | | | Standard Industries, Inc. (d) | | US0003M + 2.500% | | 3.7880 | | 08/06/28 | | | 102,501 | |
| | | | | | | | | | | | | | 218,698 | |
| | | | | MEDICAL EQUIPMENT & DEVICES — 0.1% | | | | | | | | | | |
| | 55,000 | | | Mozart Borrower, L.P. (d) | | US0001M + 3.250% | | 3.7500 | | 09/30/28 | | | 54,138 | |
| | | | | | | | | | | | | | | |
| | | | | OIL & GAS PRODUCERS — 0.4% | | | | | | | | | | |
| | 57,477 | | | CITGO Petroleum Corporation (d) | | US0001M + 6.250% | | 7.2500 | | 03/27/24 | | | 57,462 | |
| | 110,000 | | | Freeport LNG Investments LLLP (d) | | US0003M + 3.500% | | 4.5630 | | 11/17/28 | | | 109,509 | |
| | 109,548 | | | Oryx Midstream Services Permian Basin, LLC (d) | | US0003M + 3.250% | | 3.7500 | | 09/30/28 | | | 109,153 | |
| | | | | | | | | | | | | | 276,124 | |
| | | | | PUBLISHING & BROADCASTING — 0.1% | | | | | | | | | | |
| | 78,333 | | | Nexstar Broadcasting, Inc. (d) | | US0001M + 2.500% | | 2.9550 | | 06/20/26 | | | 77,752 | |
| | | | | | | | | | | | | | | |
| | | | | RETAIL - DISCRETIONARY — 0.3% | | | | | | | | | | |
| | 89,550 | | | PetSmart, Inc. (d) | | US0003M + 3.750% | | 4.5000 | | 01/29/28 | | | 88,923 | |
| | 89,550 | | | RH (d) | | US0001M + 2.500% | | 3.0000 | | 10/15/28 | | | 86,328 | |
| | | | | | | | | | | | | | 175,251 | |
| | | | | SOFTWARE — 0.8% | | | | | | | | | | |
| | 113,368 | | | Applied Systems, Inc. (d) | | US0003M + 3.200% | | 3.7500 | | 09/19/24 | | | 113,177 | |
| | 71,765 | | | Boxer Parent Company, Inc. (d) | | US0001M + 3.750% | | 4.5140 | | 10/02/25 | | | 70,985 | |
| | 134,663 | | | CCC Intelligent Solutions, Inc. (d) | | US0003M + 2.500% | | 3.2560 | | 09/17/28 | | | 133,119 | |
| | 123,752 | | | Sophia, L.P. (d) | | US0001M + 3.500% | | 4.2560 | | 10/07/27 | | | 122,515 | |
| | 40,000 | | | Sophia, L.P. (d) | | SOFRRATE + 4.250% | | 4.7720 | | 10/07/27 | | | 39,850 | |
| | 102,245 | | | UKG, Inc. (d) | | US0003M + 3.250% | | 4.2120 | | 05/03/26 | | | 101,327 | |
| | | | | | | | | | | | | | 580,973 | |
| | | | | SPECIALTY FINANCE — 0.1% | | | | | | | | | | |
| | 95,531 | | | Trans Union, LLC (d) | | US0001M + 2.250% | | 2.7500 | | 11/18/28 | | | 94,663 | |
| | | | | | | | | | | | | | | |
| | | | | TECHNOLOGY HARDWARE — 0.1% | | | | | | | | | | |
| | 89,770 | | | NCR Corporation (d) | | US0001M + 2.500% | | 2.7200 | | 08/08/26 | | | 87,526 | |
See accompanying notes which are an integral part to these financial statements.
| DUNHAM CORPORATE/GOVERNMENT BOND FUND |
| SCHEDULE OF INVESTMENTS (Unaudited) (Continued) |
| April 30, 2022 |
| | | | | | | | Coupon | | | | | |
| Principal Amount ($) | | | | | Spread | | Rate (%) | | Maturity | | Fair Value | |
| | | | | TERM LOANS — 8.6% (Continued) | | | | | | | | | | |
| | | | | TECHNOLOGY SERVICES — 1.0% | | | | | | | | | | |
| | 179,070 | | | Blackhawk Network Holdings, Inc. (d) | | US0001M + 3.000% | | 3.4570 | | 05/22/25 | | $ | 176,975 | |
| | 92,931 | | | Dun & Bradstreet Corporation (The) (d) | | US0001M + 3.250% | | 3.6970 | | 02/08/26 | | | 92,361 | |
| | 20,000 | | | Dun & Bradstreet Corporation (The) (d) | | SOFRRATE + 3.250% | | 3.3090 | | 01/07/29 | | | 19,888 | |
| | 129,575 | | | NAB Holdings, LLC (d) | | SOFRRATE + 3.000% | | 3.8010 | | 11/18/28 | | | 127,988 | |
| | 87,490 | | | Peraton Corporation (d) | | US0001M + 3.750% | | 4.5140 | | 02/24/28 | | | 87,019 | |
| | 194,513 | | | Tenable, Inc. (d) | | US0003M + 2.750% | | 3.2500 | | 06/17/28 | | | 194,025 | |
| | 38,050 | | | WEX, Inc. (d) | | US0001M + 2.250% | | 2.7070 | | 03/19/28 | | | 37,760 | |
| | | | | | | | | | | | | | 736,016 | |
| | | | | TELECOMMUNICATIONS — 0.3% | | | | | | | | | | |
| | 39,088 | | | CenturyLink, Inc. (d) | | US0001M + 2.250% | | 2.3370 | | 03/15/27 | | | 37,484 | |
| | 177,957 | | | SBA Senior Finance II, LLC (d) | | US0001M + 1.750% | | 2.2100 | | 04/11/25 | | | 175,308 | |
| | | | | | | | | | | | | | 212,792 | |
| | | | | TRANSPORTATION & LOGISTICS — 0.7% | | | | | | | | | | |
| | 24,706 | | | Air Canada (d) | | US0003M + 3.500% | | 4.2500 | | 07/27/28 | | | 24,515 | |
| | 101,936 | | | Brown Group Holding, LLC (d) | | US0003M + 2.500% | | 3.5060 | | 04/22/28 | | | 100,623 | |
| | 74,538 | | | KKR Apple Bidco, LLC (d) | | US0001M + 3.000% | | 3.5000 | | 07/13/28 | | | 73,862 | |
| | 85,000 | | | Mileage Plus Holdings, LLC (d) | | US0003M + 5.250% | | 6.2500 | | 06/25/27 | | | 88,336 | |
| | 118,878 | | | PODS, LLC (d) | | US0003M + 3.000% | | 3.7500 | | 03/19/28 | | | 117,626 | |
| | 140,000 | | | SkyMiles IP Ltd. (d) | | US0003M + 3.750% | | 4.7500 | | 09/16/27 | | | 144,862 | |
| | | | | | | | | | | | | | 549,824 | |
| | | | | | | | | | | | | | | |
| | | | | TOTAL TERM LOANS (Cost $6,157,952) | | | | | | | | | 6,113,109 | |
| | | | | | | | | | | | | | | |
| | | | | U.S. GOVERNMENT & AGENCIES — 18.7% | | | | | | | | | | |
| | | | | AGENCY FIXED RATE — 0.8% | | | | | | | | | | |
| | 9,389 | | | Fannie Mae Pool 735061 | | | | 6.0000 | | 11/01/34 | | | 10,157 | |
| | 11,504 | | | Fannie Mae Pool 866009 | | | | 6.0000 | | 03/01/36 | | | 12,715 | |
| | 82,462 | | | Fannie Mae Pool 938574 | | | | 5.5000 | | 09/01/36 | | | 87,758 | |
| | 28,008 | | | Fannie Mae Pool 310041 | | | | 6.5000 | | 05/01/37 | | | 31,082 | |
| | 13,992 | | | Fannie Mae Pool 962752 | | | | 5.0000 | | 04/01/38 | | | 14,958 | |
| | 15,506 | | | Fannie Mae Pool 909175 | | | | 5.5000 | | 04/01/38 | | | 16,699 | |
| | 58,178 | | | Fannie Mae Pool 909220 | | | | 6.0000 | | 08/01/38 | | | 63,891 | |
See accompanying notes which are an integral part to these financial statements.
| DUNHAM CORPORATE/GOVERNMENT BOND FUND |
| SCHEDULE OF INVESTMENTS (Unaudited) (Continued) |
| April 30, 2022 |
| | | | | | Coupon | | | | | |
| Principal Amount ($) | | | | | Rate (%) | | Maturity | | Fair Value | |
| | | | | U.S. GOVERNMENT & AGENCIES — 18.7% (Continued) | | | | | | | | |
| | | | | AGENCY FIXED RATE — 0.8% (Continued) | | | | | | | | |
| | 80,125 | | | Fannie Mae Pool AA7001 | | 5.0000 | | 06/01/39 | | $ | 84,836 | |
| | 57,012 | | | Fannie Mae Pool AS7026 | | 4.0000 | | 04/01/46 | | | 57,482 | |
| | 94,296 | | | Fannie Mae Pool BJ9260 | | 4.0000 | | 04/01/48 | | | 94,556 | |
| | 96,202 | | | Freddie Mac Gold Pool G01980 | | 5.0000 | | 12/01/35 | | | 102,747 | |
| | 13,345 | | | Freddie Mac Gold Pool G05888 | | 5.5000 | | 10/01/39 | | | 14,385 | |
| | | | | | | | | | | | 591,266 | |
| | | | | U.S. TREASURY BILLS — 7.2% | | | | | | | | |
| | 915,000 | | | United States Treasury Note | | 0.1250 | | 08/31/23 | | | 887,496 | |
| | 485,000 | | | United States Treasury Note | | 0.8750 | | 11/15/30 | | | 411,549 | |
| | 715,000 | | | United States Treasury Note | | 1.6250 | | 05/15/31 | | | 643,584 | |
| | 715,000 | | | United States Treasury Note | | 2.3750 | | 02/15/42 | | | 633,669 | |
| | 2,045,000 | | | United States Treasury Note | | 1.8750 | | 02/15/51 | | | 1,611,076 | |
| | 1,135,000 | | | United States Treasury Note | | 1.8750 | | 11/15/51 | | | 894,522 | |
| | | | | | | | | | | | 5,081,896 | |
| | | | | U.S. TREASURY BONDS — 5.8% | | | | | | | | |
| | 1,280,000 | | | United States Treasury Bond | | 2.8750 | | 05/15/49 | | | 1,247,200 | |
| | 1,440,000 | | | United States Treasury Bond | | 2.0000 | | 02/15/50 | | | 1,168,144 | |
| | 2,500,000 | | | United States Treasury Bond | | 1.3750 | | 08/15/50 | | | 1,729,883 | |
| | | | | | | | | | | | 4,145,227 | |
| | | | | U.S. TREASURY NOTES — 4.9% | | | | | | | | |
| | 1,010,000 | | | United States Treasury Note | | 0.1250 | | 05/31/22 | | | 1,009,722 | |
| | 2,505,000 | | | United States Treasury Note | | 2.6250 | | 02/15/29 | | | 2,456,955 | |
| | | | | | | | | | | | 3,466,677 | |
| | | | | | | | | | | | | |
| | | | | TOTAL U.S. GOVERNMENT & AGENCIES (Cost $15,677,500) | | | | | | | 13,285,066 | |
| | | | | | | | | | | | | |
| | | | | COLLATERAL FOR SECURITIES LOANED – 2.4% | | | | | | | | |
| | 1,712,005 | | | Mount Vernon Prime Portfolio, 0.45% (Cost $1,712,005) (g), (h) | | | | | | | 1,712,005 | |
| | | | | | | | | | | | | |
| | | | | TOTAL INVESTMENTS – 100.5% (Cost $77,439,840) | | | | | | $ | 71,328,861 | |
| | | | | LIABILITIES IN EXCESS OF OTHER ASSETS – (0.5)% | | | | | | | (393,654 | ) |
| | | | | NET ASSETS - 100.0% | | | | | | $ | 70,935,207 | |
See accompanying notes which are an integral part to these financial statements.
| DUNHAM CORPORATE/GOVERNMENT BOND FUND |
| SCHEDULE OF INVESTMENTS (Unaudited)(Continued) |
| April 30, 2022 |
| LLC | - Limited Liability Company |
| | |
| LP | - Limited Partnership |
| | |
| LTD | - Limited Company |
| | |
| NV | - Naamioze Vennootschap |
| | |
| S/A | - Société Anonyme |
| | |
| H15T10Y | US Treasury Yield Curve Rate T Note Constant Maturity 10 Year |
| | |
| H15T5Y | US Treasury Yield Curve Rate T Note Constant Maturity 5 Year |
| | |
| SOFRRATE | Secured Overnight Financing Rate |
| | |
| TSFR1M | Secured Overnight Financing Rate 1 month |
| | |
| US0001M | ICE LIBOR USD 1 Month |
| | |
| US0003M | ICE LIBOR USD 3 Month |
| | |
| USSW5 | USD SWAP SEMI 30/360 5YR |
| (a) | Security exempt from registration under Rule 144A or Section 4(2) of the Securities Act of 1933. The security may be resold in transactions exempt from registration, normally to qualified institutional buyers. As of April 30, 2022 the total market value of 144A securities is 30,868,363 or 43.5% of net assets. |
| (b) | Variable or floating rate security, the interest rate of which adjusts periodically based on changes in current interest rates and prepayments on the underlying pool of assets. |
| (c) | Step bond. Coupon rate is fixed rate that changes on a specified date. The rate shown is the current rate at April 30, 2022. |
| (d) | Variable rate security; the rate shown represents the rate on April 30, 2022. |
| (e) | Percentage rounds to less than 0.1%. |
| (f) | All or a portion of these securities are on loan. Total loaned securities had a value of $1,666,708 at April 30, 2022. |
| (g) | Rate disclosed is the seven day effective yield as of April 30, 2022. |
| (h) | The Trust’s securities lending policies and procedures require that the borrower: deliver cash or U.S. Government securities as collateral with respect to each new loan of U.S. securities, equal to at least 102% of the value of the portfolio securities loaned, and (ii) at all times thereafter mark-to-market the collateral on a daily basis so that the market value of such collateral is at least 100% of the value of securities loaned. From time to time the collateral may not be 102% due to end of day market movement. The next business day additional collateral is obtained/received from the borrower to replenish/reestablish 102%. |
| Portfolio Composition * - (Unaudited) |
| Asset Backed Securities | | | 32.8 | % | | Municipal Bonds | | | 5.7 | % |
| Corporate Bonds | | | 30.5 | % | | Collateral for Securities Loaned | | | 2.4 | % |
| U.S. Government & Agencies | | | 18.6 | % | | Non U.S. Government & Agencies | | | 1.4 | % |
| Term Loans | | | 8.6 | % | | | | | | |
| | | | | | | Total | | | 100.0 | % |
| * | Based on total value of investments as of April 30, 2022. Does not include derivative holdings. |
| Percentage may differ from Schedule of Investments which are based on Fund net assets. |
See accompanying notes which are an integral part to these financial statements.
Dunham Floating Rate Bond Fund (Unaudited)
Message from the Sub-Adviser (PineBridge Investments, LLC)
Asset Class Recap
As the Federal Open Market Committee moved to increase interest rates in its attempt to quell soaring inflation, fixed income markets experienced substantial declines. As traditional investment grade fixed income bonds, as measured by the Bloomberg U.S. Aggregate Bond Index, plummeted 9.5 percent during the first half of the fiscal year, high-yield bonds, as measured by the ICE BofA U.S. Cash Pay High-Yield Index, decreased 7.2 percent. This corresponded with the 10-year U.S. Treasury Bond yield soaring from 1.56 percent at the end of October 2021 to 2.88 percent at the end of April 2022. The increase of more than 1.3 percent in yield pushed investment grade and high-yield bond interest rates higher, and was responsible for the vast majority of the decline in valuations. Providing some refuge from the rate increases were floating rate securities – with coupons that periodically adjusted to a market reference rate such as the London Interbank Offered Rate (LIBOR) or the Secured Overnight Financing Rate (SOFR). These floating rate securities, as measured by the S&P/LSTA U.S. Leveraged Loan 100 Index, eked out a 0.1 percent increase during the six-month period. Securitized asset pools, known as collateralized loan obligations (CLO), comprised of these floating rate securities, as measured by the Palmer Square CLO Debt Index, declined 0.7 percent over the same time period. Although negative, this represented a significant outperformance versus other leveraged finance securities such as high-yield bonds.
Allocation Review
The Fund was primarily invested in floating rate securities, with approximately 78 percent allocated to bank loans and a bank loan exchange traded fund and 10 percent allocated to CLOs. The remaining allocation included high-yield bonds and cash equivalents. As the high-yield bonds were the largest detractor on a broad level during the fiscal period, the approximate 10 percent allocation to fixed coupon high-yield debt was reduced to approximately 8 percent at the end of the most recent fiscal quarter. The Fund’s bank loans slightly underperformed the benchmark index, primarily due to having a lower overall credit quality exposure. The Fund’s lower exposure to BBB-rated bank loans was the largest underweight versus the benchmark index, as the Fund only had one percent in BBB-rated loans and the benchmark index had nearly 12 percent. The Fund’s largest industry overweights were to oil and gas, which comprised close to 6 percent of the Fund while the benchmark index had near zero direct exposure. The largest industry underweights were to electronics/electrical and health care. These two industries combined comprised close to 28 percent of the benchmark index, but only account for 17 percent of the Fund. The Fund did not have any exposure to derivatives during the six-month period that meaningfully affected performance.
Holdings Insights
The Sub-Adviser’s security selection during the fiscal period provided mixed results, even within its primary category exposures. For example, within the bank loan holdings, the Fund continued to benefit from its exposure to Playa Resorts Holding BV Floating Rate due 4/27/2024 (BL2699181) (holding weight*: 0.89 percent). Playa Resorts is an owner, operator, and developer of all-inclusive resorts in Mexico and the Caribbean. This was one of the strongest bank loan performers during the six-month period, as it increased 3.9 percent. However, the Fund also held Hornblower Sub, LLC due 4/27/2025 (BL3489657) (holding weight*: 1.02 percent), a charter yacht, dining cruise and ferry service company. During the six-month period, the Hornblower bank loan declined 0.7 percent, as lower rated securities generally experienced declines in the most recent fiscal quarter. Within the high-yield bond exposure, the Fund held PBF Finance Corporation 6% due 2/15/2028 (69318FAJ7) (holding weight*: 0.29 percent), an independent petroleum refiner and supplier of unbranded transportation fuels and other petroleum products, and Carvana Company 4.875% due 9/01/2029 (146869AH5) (holding weight*: 0.18 percent), an online used car retailer. While the PBF Finance bond increased 27.2 percent during the fiscal period, the Carvana bond declined 21.4 percent.
The Fund’s exposure to CLOs also saw mixed results, but holdings in the Fund generally contributed positively to relative performance overall. For example, the Fund held Benefit Street Partners CLO III Ltd. due 7/20/2029 (08180GAG4) (holding weight*: 0.93 percent), an investment manager that invests across the credit spectrum and in both liquid and illiquid credit, and Carlyle Global Market Strategies CLO 2015-4 Ltd. due 7/20/2032 (14311PAS8) (holding weight*: 0.90 percent), a global equity and fixed income manager. These two CLOs returned roughly 3.7 percent and 2.4 percent, respectively during the fiscal period. Despite having the same CLO manager, the Benefit Street Partners CLO II Ltd. due 7/15/2029 (08180CAG3) (holding weight*: 1.29 percent) was one of the poorer performers within the CLO allocation along with GoldenTree Loan Management US CLO 2 Ltd. due 11/28/2030 (38136PAA9) (holding weight*: 0.57 percent), a global asset management firm that specializes in opportunities across the credit universe. These two CLOs returned approximately 1.3 percent and -0.1 percent, respectively during the six-month period. Within the CLO space, the potential to receive a principal paydown from the CLO management companies exists, similar to tender offers by corporations to retire outstanding debt. For example, the Fund held the Carlyle Global Market Strategies CLO 2015-3 Ltd. due 7/28/2028 (14311JAL7) (holding weight**: 0.91 percent), which shared the same CLO management team as one of the detractors during the fiscal period. In late February, the CLO was trading in the low-to-mid 90s and effectively redeemed at par, resulting in an overall gain to the Fund of 5.8 percent on that day in isolation.
Sub-Adviser Outlook
The Sub-Adviser is encouraged that trailing twelve-month default rates are at or near all-time lows and that there is a lack of a near-term maturity bulge, which means that there is not a high amount of bank loans maturing all at once. The Sub-Adviser believes that this environment may continue for at least the short-term. The Sub-Adviser observes that while many companies have highlighted inflation concerns in their management discussions, most note that they have been able to raise prices, and at times with incremental margin. Although the Russia/Ukraine War, a hawkish Fed, and Covid lockdowns and stimulus uncertainty in China have led to a markedly higher risk of recession than in the past 18 months; the Sub-Adviser believes that the global economy could revert back on course to moderate mid-cycle growth over the next few years. In terms of relative value, while the year-to-date performance differential would typically lead the Sub-Adviser to favor fixed coupon high-yield bonds over floating rate bank loans, it does not see any obvious catalyst for the current trend to reverse course. The Sub-Adviser believes that as dispersion among issuers has increased, it has led to attractive opportunities from a credit selection standpoint.
| * | Holdings percentage(s) of total investments, cash and unsettled trades excluding collateral for securities loaned as of 4/30/2022. |
| ** | Holdings percentage(s) as of the date prior to the sale of the security. |
Growth of $100,000 Investment
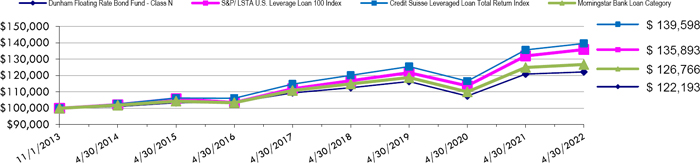
Total Returns (a) as of April 30, 2022
| | | | | Annualized |
| | | | Annualized | Since Inception |
| | Six Months | One Year | Five Years | (11/1/13) |
| Class N | (0.51)% | 1.09% | 2.23% | 2.39% |
| Class A with load of 4.50% | (5.07)% | (3.66)% | 1.05% | 1.58% |
| Class A without load | (0.62)% | 0.85% | 1.99% | 2.13% |
| Class C | (0.87)% | 0.34% | 1.46% | 1.62% |
| S&P/LSTA U.S. Leveraged Loan 100 Index ** | 0.60% | 2.95% | 3.96% | 3.67% |
| Credit Suisse Leveraged Loan Total Return Index | 0.55% | 2.89% | 4.00% | 4.00% |
| Morningstar Bank Loan Category | (0.45)% | 1.44% | 2.72% | 2.83% |
| (a) | Total Returns are calculated based on traded NAVs. |
| ** | Change in Fund’s benchmark due to the implementation of the Sub-Adviser’s investment strategy primarily using the new benchmark index. As a result, the Fund’s performance is compared to both indices in the table above. |
The Credit Suisse Leveraged Loan Total Return Index tracks the investable market of the U.S. dollar denominated leveraged loan market. It consists of issues rated “5B” or lower, meaning that the highest rated issues included in this index are Moody’s/S&P ratings of Baa1/BB+ or Ba1/BBB+. All loans are funded term loans with a tenor of at least one year and are made by issuers domiciled in developed countries. Investors cannot invest directly in an index or benchmark.
The S&P/LSTA U.S. Leveraged Loan 100 Index is designed to reflect the performance of the largest facilities in the leveraged loan market. Investors cannot invest directly in an index or benchmark.
The Morningstar Bank Loan Category is generally representative of mutual funds that primarily invest in floating-rate bank loans instead of bonds. These bank loans generally offer interest payments that typically float above a common short-term benchmark such as the London interbank offered rate (LIBOR), or the Secured Overnight Financing Rate (SOFR).
As disclosed in the Trust’s latest registration statement, the Fund’s total annual operating expenses, including cost of underlying funds, are 1.06% for Class N, 1.81% for Class C and 1.31% for Class A. Class A shares are subject to a sales load of 4.50% and a deferred sales charge of up to 0.75%. The performance data quoted here represents past performance, which is not indicative of future results. Current performance may be lower or higher than the performance data quoted. The investment return and NAV will fluctuate, so that an investor’s shares, when redeemed, may be worth more or less than their original cost. Total returns are calculated assuming reinvestment of all dividends and capital gains distributions, if any. The returns do not reflect the deductions of taxes a shareholder would pay on the redemption of Fund shares or Fund distributions. For performance information current to the most recent month-end, please call 1-800-442-4358 or visit our website www.dunham.com.
| DUNHAM FLOATING RATE BOND FUND |
| SCHEDULE OF INVESTMENTS (Unaudited) |
| April 30, 2022 |
| Shares | | | | | | | | | | | Fair Value | |
| | | | | COMMON STOCKS — 0.3% | | | | | | | | | | |
| | | | | METALS & MINING - 0.1% | | | | | | | | | | |
| | 23,114 | | | Covia Holdings, LLC(a) | | | | | | | | $ | 294,704 | |
| | | | | | | | | | | | | | | |
| | | | | RETAIL - DISCRETIONARY - 0.2% | | | | | | | | | | |
| | 1,963 | | | NMG Parent, LLC(a) | | | | | | | | | 382,785 | |
| | | | | | | | | | | | | | | |
| | | | | TOTAL COMMON STOCKS (Cost $1,110,518) | | | 677,489 | |
| | | | | | | | | | | | | | | |
| | | | | EXCHANGE-TRADED FUNDS — 2.1% | | | | | | | | | | |
| | | | | FIXED INCOME - 2.1% | | | | | | | | | | |
| | 200,000 | | | Invesco Senior Loan ETF | | | | | | | | | 4,312,000 | |
| | | | | | | | | | | | | | | |
| | | | | TOTAL EXCHANGE-TRADED FUNDS (Cost $4,323,160) | | | 4,312,000 | |
| | | | | | | | | | | | | | | |
| Principal | | | | | | | Coupon Rate | | | | | | |
| Amount ($) | | | | | Spread | | (%) | | Maturity | | | | |
| | | | | ASSET BACKED SECURITIES — 9.5% | | | | |
| | | | | CLO — 9.5% | | | | | | | | | | |
| | 1,500,000 | | | Apidos CLO XX 2015-20A DR(b),(c) | | US0003M + 5.700% | | 6.7440 | | 07/16/31 | | | 1,375,806 | |
| | 1,540,000 | | | Atrium IX 9A ER(b),(c) | | US0003M + 6.450% | | 6.9580 | | 05/28/30 | | | 1,465,278 | |
| | 2,900,000 | | | Benefit Street Partners CLO II Ltd. 2013-IIA DR(b),(c) | | US0003M + 6.550% | | 7.5940 | | 07/15/29 | | | 2,647,752 | |
| | 2,000,000 | | | Benefit Street Partners CLO III Ltd. 2013-IIIA DR(b),(c) | | US0003M + 6.600% | | 7.6630 | | 07/20/29 | | | 1,911,964 | |
| | 2,000,000 | | | Benefit Street Partners CLO XII Ltd. 2017-12AD(b),(c) | | US0003M + 6.410% | | 7.4540 | | 10/15/30 | | | 1,924,608 | |
| | 2,000,000 | | | Carlyle Global Market Strategies CLO 2015-4 Ltd. 2015-4A DR(b),(c) | | US0003M + 6.700% | | 7.7630 | | 07/20/32 | | | 1,853,818 | |
| | 250,000 | | | CIFC Funding 2013-II Ltd. 2013-2A B2LR(b),(c) | | US0003M + 6.520% | | 7.5640 | | 10/18/30 | | | 239,824 | |
| | 275,000 | | | CIFC Funding 2017-I Ltd. 2017-1A E(b),(c) | | US0003M + 6.350% | | 7.4480 | | 04/23/29 | | | 268,787 | |
| | 1,250,000 | | | Goldentree Loan Management US CLO 2 Ltd. 2017-2A E (b),(c) | | US0003M + 4.700% | | 5.7630 | | 11/28/30 | | | 1,160,996 | |
| | 3,005,000 | | | THL Credit Wind River 2014-2 CLO Ltd. 2014-2A ER(b),(c) | | US0003M + 5.750% | | 6.7940 | | 01/15/31 | | | 2,741,736 | |
| | 1,750,000 | | | THL Credit Wind River 2019-3 CLO Ltd. 2019-3A E2R(b),(c) | | US0003M + 6.750% | | 7.7940 | | 04/15/31 | | | 1,639,148 | |
| | 700,000 | | | TICP CLO I-2 Ltd. 2018-IA D(b),(c) | | US0003M + 5.770% | | 6.9840 | | 04/26/28 | | | 665,000 | |
| | 1,850,000 | | | Voya CLO 2015-1 Ltd. 2015-1A DR(b),(c) | | US0003M + 5.650% | | 6.6940 | | 01/18/29 | | | 1,705,398 | |
| | | | | | | | | | | | | | 19,600,115 | |
| | | | | TOTAL ASSET BACKED SECURITIES (Cost $20,279,736) | | | 19,600,115 | |
See accompanying notes which are an integral part of these financial statements.
| DUNHAM FLOATING RATE BOND FUND |
| SCHEDULE OF INVESTMENTS (Unaudited) (Continued) |
| April 30, 2022 |
| Principal | | | | | Coupon Rate | | | | | |
| Amount ($) | | | | | (%) | | Maturity | | Fair Value | |
| | | | | CORPORATE BONDS — 7.9% | | | | | | | | |
| | | | | CABLE & SATELLITE — 0.2% | | | | | | | | |
| | 500,000 | | | CSC Holdings, LLC(b),(d) | | 5.7500 | | 01/15/30 | | $ | 412,123 | |
| | | | | | | | | | | | | |
| | | | | CHEMICALS — 0.2% | | | | | | | | |
| | 500,000 | | | Consolidated Energy Finance S.A.(b) | | 5.6250 | | 10/15/28 | | | 463,163 | |
| | | | | | | | | | | | | |
| | | | | COMMERCIAL SUPPORT SERVICES — 0.2% | | | | | | | | |
| | 450,000 | | | Deluxe Corporation(b) | | 8.0000 | | 06/01/29 | | | 427,516 | |
| | | | | | | | | | | | | |
| | | | | CONSUMER SERVICES — 0.2% | | | | | | | | |
| | 437,000 | | | PROG Holdings, Inc.(b) | | 6.0000 | | 11/15/29 | | | 386,734 | |
| | | | | | | | | | | | | |
| | | | | ELECTRIC UTILITIES — 0.2% | | | | | | | | |
| | 500,000 | | | Calpine Corporation(b) | | 5.0000 | | 02/01/31 | | | 427,008 | |
| | | | | | | | | | | | | |
| | | | | FOOD — 0.4% | | | | | | | | |
| | 500,000 | | | HLF Financing Sarl, LLC / Herbalife International,(b) | | 4.8750 | | 06/01/29 | | | 403,105 | |
| | 500,000 | | | Post Holdings, Inc.(b) | | 4.5000 | | 09/15/31 | | | 416,465 | |
| | | | | | | | | | | | 819,570 | |
| | | | | INSTITUTIONAL FINANCIAL SERVICES — 0.2% | | | | | | | | |
| | 475,000 | | | Aretec Escrow Issuer, Inc.(b) | | 7.5000 | | 04/01/29 | | | 442,945 | |
| | | | | | | | | | | | | |
| | | | | INTERNET MEDIA & SERVICES — 0.2% | | | | | | | | |
| | 475,000 | | | GrubHub Holdings, Inc.(b) | | 5.5000 | | 07/01/27 | | | 406,776 | |
| | | | | | | | | | | | | |
| | | | | LEISURE FACILITIES & SERVICES — 1.0% | | | | | | | | |
| | 475,000 | | | CEC Entertainment Company, LLC(b),(d) | | 6.7500 | | 05/01/26 | | | 447,098 | |
| | 199,000 | | | NCL Corporation Ltd.(b),(d) | | 7.7500 | | 02/15/29 | | | 193,301 | |
| | 500,000 | | | Royal Caribbean Cruises Ltd.(b),(d) | | 5.5000 | | 04/01/28 | | | 457,104 | |
| | 525,000 | | | Wynn Macau Ltd.(b) | | 5.6250 | | 08/26/28 | | | 419,336 | |
| | 500,000 | | | Wynn Macau Ltd.(b),(d) | | 5.1250 | | 12/15/29 | | | 394,850 | |
| | | | | | | | | | | | 1,911,689 | |
| | | | | METALS & MINING — 0.6% | | | | | | | | |
| | 450,000 | | | Mineral Resources Ltd.(b) | | 8.1250 | | 05/01/27 | | | 457,735 | |
| | 109,000 | | | Mineral Resources Ltd.(b) | | 8.0000 | | 11/01/27 | | | 108,728 | |
See accompanying notes which are an integral part of these financial statements.
| DUNHAM FLOATING RATE BOND FUND |
| SCHEDULE OF INVESTMENTS (Unaudited) (Continued) |
| April 30, 2022 |
| Principal | | | | | | | Coupon Rate | | | | | |
| Amount ($) | | | | | Spread | | (%) | | Maturity | | Fair Value | |
| | | | | CORPORATE BONDS — 7.9% (Continued) | | | | |
| | | | | METALS & MINING — 0.6% (Continued) | | | | |
| | 127,000 | | | Mineral Resources Ltd.(b) | | | | 8.5000 | | 05/01/30 | | $ | 126,206 | |
| | 510,000 | | | Warrior Met Coal, Inc.(b) | | | | 7.8750 | | 12/01/28 | | | 534,334 | |
| | | | | | | | | | | | | | 1,227,003 | |
| | | | | OIL & GAS PRODUCERS — 1.3% | | | | | | | | | | |
| | 500,000 | | | Genesis Energy, L.P. / Genesis Energy Finance | | | | 8.0000 | | 01/15/27 | | | 491,047 | |
| | 475,000 | | | Hilcorp Energy I, L.P. / Hilcorp Finance Company(b) | | | | 5.7500 | | 02/01/29 | | | 466,103 | |
| | 500,000 | | | ITT Holdings, LLC(b),(d) | | | | 6.5000 | | 08/01/29 | | | 445,350 | |
| | 210,000 | | | PBF Holding Company, LLC / PBF Finance Corporation(b) | | | | 9.2500 | | 05/15/25 | | | 218,006 | |
| | 675,000 | | | PBF Holding Company, LLC / PBF Finance Corporation | | | | 6.0000 | | 02/15/28 | | | 595,300 | |
| | 500,000 | | | Strathcona Resources Ltd.(b) | | | | 6.8750 | | 08/01/26 | | | 484,420 | |
| | | | | | | | | | | | | | 2,700,226 | |
| | | | | REAL ESTATE INVESTMENT TRUSTS — 0.2% | | | | |
| | 525,000 | | | Service Properties Trust(d) | | | | 4.3750 | | 02/15/30 | | | 403,589 | |
| | | | | | | | | | | | | | | |
| | | | | REAL ESTATE OWNERS & DEVELOPERS — 0.2% | | | | |
| | 500,000 | | | Kennedy-Wilson, Inc.(d) | | | | 4.7500 | | 03/01/29 | | | 461,930 | |
| | | | | | | | | | | | | | | |
| | | | | RETAIL - DISCRETIONARY — 0.3% | | | | | | | | | | |
| | 170,000 | | | Carvana Company(b),(d) | | | | 5.8750 | | 10/01/28 | | | 135,449 | |
| | 500,000 | | | Carvana Company(b),(d) | | | | 4.8750 | | 09/01/29 | | | 364,688 | |
| | | | | | | | | | | | | | 500,137 | |
| | | | | SPECIALTY FINANCE — 1.1% | | | | | | | | | | |
| | 450,000 | | | AerCap Global Aviation Trust(b),(d),(e) | | US0001M + 4.300% | | 6.5000 | | 06/15/45 | | | 438,111 | |
| | 533,000 | | | Apollo Commercial Real Estate Finance, Inc.(b) | | | | 4.6250 | | 06/15/29 | | | 464,397 | |
| | 500,000 | | | Cobra AcquisitionCo, LLC(b) | | | | 6.3750 | | 11/01/29 | | | 383,143 | |
| | 475,000 | | | Curo Group Holdings Corporation(b) | | | | 7.5000 | | 08/01/28 | | | 396,076 | |
| | 475,000 | | | FirstCash, Inc.(b) | | | | 5.6250 | | 01/01/30 | | | 442,577 | |
| | | | | | | | | | | | | | 2,124,304 | |
| | | | | STEEL — 0.2% | | | | | | | | | | |
| | 500,000 | | | Allegheny Technologies, Inc.(d) | | | | 4.8750 | | 10/01/29 | | | 455,603 | |
| | | | | | | | | | | | | | | |
| | | | | TECHNOLOGY SERVICES — 0.2% | | | | | | | | | | |
| | 475,000 | | | ION Trading Technologies Sarl(b) | | | | 5.7500 | | 05/15/28 | | | 445,341 | |
See accompanying notes which are an integral part of these financial statements.
| DUNHAM FLOATING RATE BOND FUND |
| SCHEDULE OF INVESTMENTS (Unaudited) (Continued) |
| April 30, 2022 |
| Principal | | | | | | | Coupon Rate | | | | | |
| Amount ($) | | | | | Spread | | (%) | | Maturity | | Fair Value | |
| | | | | CORPORATE BONDS — 7.9% (Continued) | | | | |
| | | | | TELECOMMUNICATIONS — 0.6% | | | | | | | | | | |
| | 500,000 | | | Altice France S.A.(b),(d) | | | | 5.5000 | | 10/15/29 | | $ | 426,817 | |
| | 500,000 | | | Lumen Technologies, Inc.(b) | | | | 5.3750 | | 06/15/29 | | | 408,629 | |
| | 550,000 | | | Telesat Canada / Telesat, LLC(b) | | | | 4.8750 | | 06/01/27 | | | 374,743 | |
| | | | | | | | | | | | | | 1,210,189 | |
| | | | | TRANSPORTATION & LOGISTICS — 0.2% | | | | |
| | 400,000 | | | American Airlines, Inc.(b) | | | | 11.7500 | | 07/15/25 | | | 460,772 | |
| | | | | | | | | | | | | | | |
| | | | | WHOLESALE - CONSUMER STAPLES — 0.2% | | | | |
| | 535,000 | | | C&S Group Enterprises, LLC(b) | | | | 5.0000 | | 12/15/28 | | | 456,106 | |
| | | | | | | | | | | | | | | |
| | | | | TOTAL CORPORATE BONDS (Cost $17,966,477) | | | 16,142,724 | |
| | | | | | | | | | | | | | | |
| | | | | TERM LOANS — 75.8% | | | | | | | | | | |
| | | | | ADVERTISING & MARKETING — 1.1% | | | | | | | | | | |
| | 1,076,480 | | | Dotdash Meredith, Inc.(c) | | SOFRRATE + 4.000% | | 4.5000 | | 12/01/28 | | | 1,068,858 | |
| | 1,193,955 | | | Terrier Media Buyer, Inc.(c) | | US0001M + 3500% | | 3.5900 | | 12/17/26 | | | 1,178,601 | |
| | | | | | | | | | | | | | 2,247,459 | |
| | | | | AEROSPACE & DEFENSE — 1.1% | | | | | | | | | | |
| | 776,438 | | | Dynasty Acquisition Company, Inc.(c) | | US0001M + 3.500% | | 4.5060 | | 04/06/26 | | | 762,567 | |
| | 417,440 | | | Standard Aero Ltd.(c) | | US0001M + 3.500% | | 4.5060 | | 04/06/26 | | | 409,982 | |
| | 1,194,090 | | | WP CPP Holdings, LLC(c) | | US0003M + 3.750% | | 4.7500 | | 04/30/25 | | | 1,131,400 | |
| | | | | | | | | | | | | | 2,303,949 | |
| | | | | APPAREL & TEXTILE PRODUCTS — 0.5% | | | | |
| | 1,133,288 | | | Samsonite IP Holdings Sarl(c) | | US0001M + 3.000% | | 3.7500 | | 04/25/25 | | | 1,125,395 | |
| | | | | | | | | | | | | | | |
| | | | | ASSET MANAGEMENT — 0.6% | | | | | | | | | | |
| | 1,193,893 | | | Nexus Buyer, LLC(c) | | US0001M + 3.750% | | 4.5140 | | 11/09/26 | | | 1,186,246 | |
| | | | | | | | | | | | | | | |
| | | | | AUTOMOTIVE — 0.6% | | | | | | | | | | |
| | 1,008,000 | | | Dexko Global, Inc.(c) | | US0001M + 3.750% | | 4.2500 | | 10/04/28 | | | 984,982 | |
See accompanying notes which are an integral part of these financial statements.
| DUNHAM FLOATING RATE BOND FUND |
| SCHEDULE OF INVESTMENTS (Unaudited) (Continued) |
| April 30, 2022 |
| Principal | | | | | | | Coupon Rate | | | | | |
| Amount ($) | | | | | Spread | | (%) | | Maturity | | Fair Value | |
| | | | | TERM LOANS — 75.8% (Continued) | | | | | | | | | | |
| | | | | AUTOMOTIVE — 0.6% (Continued) | | | | | | | | | | |
| | 192,000 | | | Dexko Global, Inc.(c) | | US0001M + 3.750% | | 4.2500 | | 10/04/28 | | $ | 187,616 | |
| | | | | | | | | | | | | | 1,172,598 | |
| | | | | BIOTECH & PHARMA — 0.8% | | | | | | | | | | |
| | 142,199 | | | Bausch Health Americas, Inc.(c) | | US0001M + 2.750% | | 2.8710 | | 11/27/25 | | | 141,630 | |
| | 722,551 | | | Bausch Health Americas, Inc.(c) | | US0001M + 3.000% | | 3.1210 | | 06/02/25 | | | 720,144 | |
| | 777,071 | | | Curium Bidco Sarl(c) | | US0001M + 4.250% | | 5.0533 | | 12/02/27 | | | 772,219 | |
| | | | | | | | | | | | | | 1,633,993 | |
| | | | | CHEMICALS — 3.1% | | | | | | | | | | |
| | 152,866 | | | Arc Falcon I, Inc., Delayed Draw Term DD(c) | | US0001M + 3.750% | | 4.2500 | | 09/25/28 | | | 148,981 | |
| | 1,044,516 | | | Arc Falcon I, Inc., Initial Term Loan(c) | | US0001M + 3.750% | | 4.2500 | | 09/25/28 | | | 1,017,970 | |
| | 1,412,622 | | | Groupe Solmax, Inc.(c) | | US0001M + 4.750% | | 5.5000 | | 06/26/28 | | | 1,379,954 | |
| | 1,194,852 | | | NIC Acquisition Corporation(c) | | US0001M + 3.750% | | 4.5000 | | 12/29/27 | | | 1,135,109 | |
| | 731,711 | | | Nouryon USA, LLC(c) | | US0001M + 3.000% | | 3.8033 | | 10/01/25 | | | 723,022 | |
| | 1,197,000 | | | Olympus Water US Holding Corporation(c) | | US0001M + 3.750% | | 4.2500 | | 11/09/28 | | | 1,176,352 | |
| | 803,000 | | | Polar US Borrower, LLC(c) | | US0003M + 4.750% | | 4.8310 | | 10/15/25 | | | 785,936 | |
| | | | | | | | | | | | | | 6,367,324 | |
| | | | | COMMERCIAL SUPPORT SERVICES — 5.0% | | | | |
| | 1,011,251 | | | AlixPartners LLP(c) | | US0001M + 2.750% | | 3.2500 | | 02/04/28 | | | 1,002,024 | |
| | 1,184,050 | | | Allied Universal Holdco, LLC(c) | | US0001M + 3.750% | | 4.5140 | | 05/12/28 | | | 1,155,189 | |
| | 258,846 | | | Amentum Government Services Holdings, LLC(c) | | SOFRRATE + 4.000% | | 4.7770 | | 02/16/29 | | | 257,811 | |
| | 1,194,000 | | | APX Group, Inc.(c) | | US0001M + 3.500% | | 4.0000 | | 07/10/28 | | | 1,182,358 | |
| | 1,193,846 | | | Cast & Crew Payroll, LLC(c) | | US0001M + 3.500% | | 3.8970 | | 02/09/26 | | | 1,190,014 | |
| | 1,194,000 | | | CHG Healthcare Services, Inc.(c) | | US0001M + 3.500% | | 4.0000 | | 09/29/28 | | | 1,188,305 | |
| | 1,193,893 | | | Creative Artists Agency, LLC(c) | | US0001M + 3.750% | | 4.2070 | | 11/26/26 | | | 1,191,171 | |
| | 904,462 | | | Garda World Security Corporation(c) | | US0001M + 4.250% | | 4.3600 | | 10/30/26 | | | 897,791 | |
| | 1,193,970 | | | Prime Security Services Borrower, LLC(c) | | US0001M + 2.750% | | 3.5000 | | 09/23/26 | | | 1,181,367 | |
| | 1,193,985 | | | Sotheby’s(c) | | US0001M + 4.500% | | 5.0000 | | 01/15/27 | | | 1,195,292 | |
| | | | | | | | | | | | | | 10,441,322 | |
| | | | | CONSTRUCTION MATERIALS — 1.8% | | | | |
| | 1,140,866 | | | Foley Products Company, LLC(c) | | SOFRRATE + 4.750% | | 5.5270 | | 02/16/29 | | | 1,129,458 | |
| | 1,395,000 | | | Quikrete Holdings, Inc.(c) | | US0001M + 3.000% | | 3.5540 | | 06/12/28 | | | 1,361,387 | |
| | 1,193,596 | | | US Silica Company(c) | | US0003M + 4.000% | | 5.0000 | | 05/01/25 | | | 1,183,278 | |
| | | | | | | | | | | | | | 3,674,123 | |
See accompanying notes which are an integral part of these financial statements.
| DUNHAM FLOATING RATE BOND FUND |
| SCHEDULE OF INVESTMENTS (Unaudited) (Continued) |
| April 30, 2022 |
| Principal | | | | | | | Coupon Rate | | | | | |
| Amount ($) | | | | | Spread | | (%) | | Maturity | | Fair Value | |
| | | | | TERM LOANS — 75.8% (Continued) | | | | | | | | | | |
| | | | | CONSUMER SERVICES — 0.3% | | | | | | | | | | |
| | 664,113 | | | Mckissock Investment Holdings, LLC(c) | | SOFRRATE + 5.000% | | 5.9510 | | 03/12/29 | | $ | 664,113 | |
| | | | | | | | | | | | | | | |
| | | | | CONTAINERS & PACKAGING — 4.4% | | | | | | | | | | |
| | 163,718 | | | Anchor Glass Container Corporation(c) | | US0003M + 2.750% | | 3.7500 | | 12/07/23 | | | 141,462 | |
| | 945,250 | | | Berlin Packaging, LLC(c) | | US0001M + 3.750% | | 4.2500 | | 03/13/28 | | | 935,401 | |
| | 748,232 | | | Clydesdale Acquisition Holdings, Inc.(c) | | TSFR1M + 4.250% | | 4.7830 | | 04/13/29 | | | 739,396 | |
| | 1,284,915 | | | LABL, Inc.(c) | | US0001M + 5.000% | | 5.5000 | | 10/30/28 | | | 1,264,845 | |
| | 1,454,723 | | | Mauser Packaging Solutions Holding Company(c) | | US0003M + 3.250% | | 3.4810 | | 04/03/24 | | | 1,428,903 | |
| | 1,199,748 | | | Patriot Container Corporation(c) | | US0003M + 3.750% | | 4.7500 | | 03/20/25 | | | 1,148,195 | |
| | 1,347,938 | | | Reynolds Group Holdings, Inc.(c) | | US0001M + 3.250% | | 3.3710 | | 02/05/26 | | | 1,313,518 | |
| | 818,150 | | | TricorBraun Holdings, Inc.(c) | | US0001M + 3.250% | | 3.7500 | | 03/03/28 | | | 802,241 | |
| | 861,053 | | | Trident TPI Holdings, Inc.(c) | | US0003M + 3.250% | | 4.0000 | | 10/17/24 | | | 857,733 | |
| | 518,482 | | | Trident TPI Holdings, Inc., Initial Term Loan(c) | | US0001M + 4.000% | | 4.5000 | | 09/15/28 | | | 513,369 | |
| | 46,227 | | | Trident TPI Holdings, Inc., Delayed Draw Term DD(c) | | US0001M + 4.000% | | 4.5000 | | 09/15/28 | | | 45,771 | |
| | | | | | | | | | | | | | 9,190,834 | |
| | | | | E-COMMERCE DISCRETIONARY — 0.3% | | | | | | | | | | |
| | 653,400 | | | CNT Holdings I Corporation(c) | | US0003M + 3.500% | | 4.5000 | | 11/08/27 | | | 647,581 | |
| | | | | | | | | | | | | | | |
| | | | | ELECTRIC UTILITIES — 0.0%(f) | | | | | | | | | | |
| | 635,000 | | | Texas Competitive Electric Holdings Company, LLC(g) | | | | 11.5000 | | 11/22/49 | | | — | |
| | | | | | | | | | | | | | | |
| | | | | ELECTRICAL EQUIPMENT — 0.9% | | | | | | | | | | |
| | 998,145 | | | Brookfield WEC Holdings, Inc.(c) | | US0001M + 2.750% | | 3.2500 | | 08/01/25 | | | 981,611 | |
| | 115,642 | | | Icebox Holdco III, Inc.(c) | | US0001M + 3.750% | | 4.2500 | | 12/22/28 | | | 114,052 | |
| | 558,935 | | | Icebox Holdco III, Inc., Term Loan B(c) | | US0001M + 3.750% | | 4.2500 | | 12/22/28 | | | 551,253 | |
| | 179,825 | | | Icebox Holdco III, Inc., Delayed Draw Term DD(c) | | US0001M + 6.750% | | 7.2500 | | 12/17/29 | | | 175,329 | |
| | | | | | | | | | | | | | 1,822,245 | |
| | | | | ENGINEERING & CONSTRUCTION — 1.7% | | | | | | | | | | |
| | 15,000 | | | Landry’s Finance Acquisition Company(c) | | US0001M + 12.000% | | 13.0000 | | 10/04/23 | | | 16,050 | |
| | 1,194,000 | | | Osmose Utilities Services, Inc.(c) | | US0001M + 3.250% | | 3.7500 | | 06/16/28 | | | 1,179,451 | |
| | 1,194,000 | | | USIC Holdings, Inc.(c) | | US0001M + 3.500% | | 4.3033 | | 05/12/28 | | | 1,182,955 | |
See accompanying notes which are an integral part of these financial statements.
| DUNHAM FLOATING RATE BOND FUND |
| SCHEDULE OF INVESTMENTS (Unaudited) (Continued) |
| April 30, 2022 |
| Principal | | | | | | | Coupon Rate | | | | | |
| Amount ($) | | | | | Spread | | (%) | | Maturity | | Fair Value | |
| | | | | TERM LOANS — 75.8% (Continued) | | | | |
| | | | | ENGINEERING & CONSTRUCTION — 1.7% (Continued) | | | | |
| | 1,067,263 | | | VM Consolidated, Inc.(c) | | US0001M + 3.250% | | 3.6040 | | 03/27/28 | | $ | 1,060,860 | |
| | | | | | | | | | | | | | 3,439,316 | |
| | | | | ENTERTAINMENT CONTENT — 1.2% | | | | |
| | 1,193,830 | | | NEP Group, Inc.(c) | | US0003M + 3.250% | | 3.7500 | | 10/20/25 | | | 1,174,431 | |
| | 1,216,091 | | | Univision Communications, Inc.(c) | | US0003M + 2.750% | | 3.3370 | | 03/15/24 | | | 1,213,178 | |
| | | | | | | | | | | | | | 2,387,609 | |
| | | | | FORESTRY, PAPER & WOOD PRODUCTS — 0.9% | | | | |
| | 819,625 | | | LEB Holdings USA, Inc.(c) | | US0001M + 3.750% | | 4.5000 | | 11/02/27 | | | 811,171 | |
| | 958,273 | | | Sylvamo Corporation(c) | | US0001M + 4.500% | | 5.0000 | | 09/13/28 | | | 942,700 | |
| | | | | | | | | | | | | | 1,753,871 | |
| | | | | HEALTH CARE FACILITIES & SERVICES — 5.5% | | | | |
| | 1,194,000 | | | Bella Holding Company, LLC(c) | | US0001M + 3.750% | | 4.5140 | | 05/10/28 | | | 1,186,836 | |
| | 1,196,985 | | | Cano Health, LLC(c) | | US0001M + 4.000% | | 4.5070 | | 11/23/27 | | | 1,183,818 | |
| | 200,693 | | | Element Materials Technology Group US Holdings,(c) | | TSFR1M + 4.250% | | 4.7830 | | 04/04/29 | | | 200,359 | |
| | 1,252,432 | | | Legacy LifePoint Health, LLC(c) | | US0001M + 3.750% | | 4.4990 | | 11/17/25 | | | 1,239,583 | |
| | 918,759 | | | Milano Acquisition Corporation(c) | | US0001M + 4.000% | | 5.0060 | | 10/01/27 | | | 917,615 | |
| | 588,831 | | | Option Care Health, Inc.(c) | | US0001M + 2.750% | | 3.2500 | | 10/18/28 | | | 587,453 | |
| | 1,193,830 | | | Outcomes Group Holdings, Inc.(c) | | US0003M + 3.250% | | 3.3820 | | 10/24/25 | | | 1,179,278 | |
| | 1,209,524 | | | Packaging Coordinators Midco, Inc.(c) | | US0001M + 3.750% | | 4.2500 | | 12/01/27 | | | 1,204,988 | |
| | 1,185,000 | | | Phoenix Newco, Inc.(c) | | US0001M + 3.500% | | 4.0000 | | 11/15/28 | | | 1,178,429 | |
| | 1,193,985 | | | Radnet Management, Inc.(c) | | US0001M + 3.000% | | 3.7500 | | 04/17/28 | | | 1,184,182 | |
| | 1,233,187 | | | Upstream Newco, Inc.(c) | | US0001M + 4.250% | | 5.0650 | | 11/20/26 | | | 1,224,247 | |
| | | | | | | | | | | | | | 11,286,788 | |
| | | | | HOUSEHOLD PRODUCTS — 0.2% | | | | |
| | 450,450 | | | Sunshine Luxembourg VII Sarl(c) | | US0001M + 3.750% | | 4.5000 | | 10/01/26 | | | 447,153 | |
| | | | | | | | | | | | | | | |
| | | | | INDUSTRIAL INTERMEDIATE PROD — 0.7% | | | | |
| | 1,431,821 | | | Gates Global, LLC(c) | | US0001M + 2.500% | | 3.2500 | | 03/31/27 | | | 1,407,058 | |
| | | | | | | | | | | | | | | |
| | | | | INSTITUTIONAL FINANCIAL SERVICES — 0.5% | | | | |
| | 1,018,074 | | | Deerfield Dakota Holding, LLC(c) | | US0001M + 3.750% | | 4.7500 | | 04/09/27 | | | 1,016,241 | |
See accompanying notes which are an integral part of these financial statements.
| DUNHAM FLOATING RATE BOND FUND |
| SCHEDULE OF INVESTMENTS (Unaudited) (Continued) |
| April 30, 2022 |
| Principal | | | | | | | Coupon Rate | | | | | |
| Amount ($) | | | | | Spread | | (%) | | Maturity | | Fair Value | |
| | | | | TERM LOANS — 75.8% (Continued) | | | | | | | | | | |
| | | | | INSURANCE — 3.0% | | | | | | | | | | |
| | 584,081 | | | Alliant Holdings Intermediate, LLC(c) | | US0001M + 3.500% | | 4.0000 | | 11/08/27 | | $ | 580,907 | |
| | 762,880 | | | Asurion, LLC(c) | | US0001M + 3.250% | | 3.3710 | | 12/23/26 | | | 746,989 | |
| | 668,908 | | | Asurion, LLC(c) | | US0001M + 3.250% | | 3.3590 | | 07/30/27 | | | 654,693 | |
| | 355,000 | | | Asurion, LLC(c) | | US0001M + 5.250% | | 6.0140 | | 01/31/28 | | | 345,016 | |
| | 365,000 | | | Asurion, LLC(c) | | US0001M + 5.250% | | 6.0140 | | 01/19/29 | | | 354,689 | |
| | 1,196,977 | | | Howden Group Holdings Ltd.(c) | | US0001M + 3.250% | | 4.0000 | | 11/12/27 | | | 1,187,252 | |
| | 1,193,955 | | | HUB International Ltd.(c) | | US0001M + 3.250% | | 4.0000 | | 04/25/25 | | | 1,189,316 | |
| | 1,050,556 | | | Sedgwick Claims Management Services, Inc.(c) | | US0003M + 3.250% | | 3.3420 | | 12/31/25 | | | 1,041,916 | |
| | 189,638 | | | Sedgwick Claims Management Services, Inc.(c) | | US0001M + 3.750% | | 3.8590 | | 08/10/26 | | | 188,960 | |
| | | | | | | | | | | | | | 6,289,738 | |
| | | | | LEISURE FACILITIES & SERVICES — 9.6% | | | | | | | | | | |
| | 1,757,000 | | | Aimbridge Acquisition Company, Inc.(c) | | US0003M + 3.750% | | 4.5140 | | 02/02/26 | | | 1,685,622 | |
| | 1,313,000 | | | AMC Entertainment Holdings, Inc.(c) | | US0003M + 3.000% | | 3.4880 | | 04/22/26 | | | 1,175,837 | |
| | 1,197,000 | | | Bally’s Corporation(c) | | US0001M + 3.250% | | 3.7500 | | 10/02/28 | | | 1,187,460 | |
| | 525,700 | | | Carnival Corporation(c) | | US0001M + 3.000% | | 3.7500 | | 06/30/25 | | | 519,318 | |
| | 644,803 | | | Carnival Corporation(c) | | US0001M + 3.250% | | 4.0000 | | 10/09/28 | | | 636,475 | |
| | 700,922 | | | Fertitta Entertainment, LLC/NV(c) | | SOFRRATE + 4.000% | | 4.7000 | | 01/12/29 | | | 698,595 | |
| | 1,200,000 | | | Fogo De Chao, Inc.(c) | | US0003M + 4.250% | | 5.2500 | | 04/07/25 | | | 1,184,100 | |
| | 691,525 | | | Hilton Grand Vacations Borrower, LLC(c) | | US0001M + 3.000% | | 3.5000 | | 08/02/28 | | | 689,364 | |
| | 2,298,865 | | | Hornblower Sub, LLC(c) | | US0001M + 4.500% | | 5.5000 | | 04/25/25 | | | 2,082,772 | |
| | 1,193,782 | | | IRB Holding Corporation(c) | | US0001M + 2.750% | | 3.7500 | | 02/05/25 | | | 1,184,996 | |
| | 138,698 | | | Motion Finco, LLC, Delayed Draw Term Loan B-DD(c) | | US0001M + 3.250% | | 3.5040 | | 11/04/26 | | | 136,141 | |
| | 1,055,310 | | | Motion Finco, LLC, Term Loan B(c) | | US0001M + 3.250% | | 4.2560 | | 11/04/26 | | | 1,035,855 | |
| | 1,855,762 | | | Playa Resorts Holding BV(c) | | US0003M + 2.750% | | 3.7500 | | 04/29/24 | | | 1,831,924 | |
| | 445,643 | | | Scientific Games Corporation(c) | | TSFR1M + 3.000% | | 3.5730 | | 04/16/29 | | | 444,181 | |
| | 408,707 | | | Scientific Games Holdings, L.P.(c) | | SOFRRATE + 3.500% | | 4.4670 | | 04/04/29 | | | 404,985 | |
| | 1,194,000 | | | SeaWorld Parks & Entertainment, Inc.(c) | | US0001M + 3.000% | | 3.5000 | | 08/14/28 | | | 1,178,824 | |
| | 1,197,000 | | | Whatabrands, LLC(c) | | US0001M + 3.250% | | 3.7500 | | 07/21/28 | | | 1,185,640 | |
| | 1,179,367 | | | William Morris Endeavor Entertainment, LLC(c) | | US0003M + 2.750% | | 2.9000 | | 05/16/25 | | | 1,158,729 | |
| | 1,193,846 | | | Wok Holdings, Inc.(c) | | US0003M + 6.250% | | 6.3400 | | 03/02/26 | | | 1,159,672 | |
| | | | | | | | | | | | | | 19,580,490 | |
See accompanying notes which are an integral part of these financial statements.
| DUNHAM FLOATING RATE BOND FUND |
| SCHEDULE OF INVESTMENTS (Unaudited) (Continued) |
| April 30, 2022 |
| Principal | | | | | | | Coupon Rate | | | | | |
| Amount ($) | | | | | Spread | | (%) | | Maturity | | Fair Value | |
| | | | | TERM LOANS — 75.8% (Continued) | | | | | | | | | | |
| | | | | LEISURE PRODUCTS — 0.6% | | | | | | | | | | |
| | 1,193,773 | | | Varsity Brands Holding Company, Inc.(c) | | US0003M + 3.500% | | 5.9830 | | 12/16/24 | | $ | 1,152,492 | |
| | | | | | | | | | | | | | | |
| | | | | MACHINERY — 2.6% | | | | | | | | | | |
| | 830,301 | | | Alliance Laundry Systems, LLC(c) | | US0001M + 3.500% | | 4.5210 | | 10/08/27 | | | 827,188 | |
| | 1,196,893 | | | CIRCOR International, Inc.(c) | | US0001M + 5.500% | | 6.3033 | | 12/18/28 | | | 1,174,451 | |
| | 638,171 | | | Filtration Group Corporation(c) | | US0003M + 3.000% | | 3.1210 | | 03/31/25 | | | 629,929 | |
| | 288,101 | | | Filtration Group Corporation(c) | | US0001M + 3.500% | | 4.0000 | | 10/20/28 | | | 284,860 | |
| | 1,193,985 | | | Madison IAQ, LLC(c) | | US0001M + 3.250% | | 3.7500 | | 06/16/28 | | | 1,160,404 | |
| | 1,196,883 | | | STS Operating, Inc.(c) | | US0003M + 4.250% | | 5.2500 | | 12/11/24 | | | 1,189,403 | |
| | | | | | | | | | | | | | 5,266,235 | |
| | | | | OIL & GAS PRODUCERS — 3.9% | | | | | | | | | | |
| | 264,142 | | | AL GCX Holdings, LLC(c) | | TSFR1M + 3.750% | | 4.2830 | | 04/23/29 | | | 263,895 | |
| | 1,144,236 | | | CQP Holdco, L.P.(c) | | US0001M + 3.750% | | 4.2500 | | 06/05/28 | | | 1,142,359 | |
| | 1,193,786 | | | EG America, LLC(c) | | US0003M + 4.000% | | 5.0060 | | 02/06/25 | | | 1,170,334 | |
| | 1,514,832 | | | Lucid Energy Group II Borrower, LLC(c) | | US0001M + 4.250% | | 5.0000 | | 11/24/28 | | | 1,503,789 | |
| | 1,197,057 | | | Medallion Midland Acquisition, L.P.(c) | | US0001M + 3.750% | | 4.5000 | | 10/18/28 | | | 1,196,123 | |
| | 1,196,987 | | | Oryx Midstream Services Permian Basin, LLC(c) | | US0003M + 3.250% | | 3.7500 | | 10/05/28 | | | 1,192,666 | |
| | 253,747 | | | RelaDyne, Inc.(c) | | SOFRRATE + 4.250% | | 4.7500 | | 12/22/28 | | | 251,950 | |
| | 1,380,666 | | | TransMontaigne Operating Company, L.P.(c) | | US0001M + 3.500% | | 4.0000 | | 11/17/28 | | | 1,377,214 | |
| | | | | | | | | | | | | | 8,098,330 | |
| | | | | OIL & GAS SERVICES & EQUIPMENT — 0.6% | | | | | | | | | | |
| | 1,167,014 | | | ChampionX Holding, Inc.(c) | | US0001M + 5.000% | | 6.0000 | | 06/03/27 | | | 1,172,849 | |
| | 1,153 | | | Paragon Offshore Ltd.(c) | | US0003M + 2.750% | | 4.9180 | | 07/09/21 | | | — | |
| | | | | | | | | | | | | | 1,172,849 | |
| | | | | REAL ESTATE INVESTMENT TRUSTS — 0.6% | | | | | | | | | | |
| | 1,197,000 | | | Claros Mortgage Trust, Inc.(c) | | US0001M + 4.500% | | 6.0000 | | 08/10/26 | | | 1,194,008 | |
| | | | | | | | | | | | | | | |
| | | | | RETAIL - DISCRETIONARY — 4.1% | | | | | | | | | | |
| | 1,268,986 | | | Bass Pro Group, LLC(c) | | US0001M + 3.750% | | 5.0000 | | 03/06/28 | | | 1,259,309 | |
| | 734,953 | | | Hertz Corporation (The), Term Loan B(c) | | US0001M + 3.250% | | 3.7500 | | 06/30/28 | | | 733,164 | |
| | 139,557 | | | Hertz Corporation (The), Term Loan C(c) | | US0001M + 3.250% | | 3.7500 | | 06/30/28 | | | 139,217 | |
| | 1,259,102 | | | JP Intermediate B, LLC(c) | | US0003M + 5.500% | | 6.5000 | | 11/20/25 | | | 1,066,460 | |
| | 909,619 | | | LBM Acquisition, LLC(c) | | US0001M + 3.750% | | 4.5000 | | 12/17/27 | | | 861,295 | |
See accompanying notes which are an integral part of these financial statements.
| DUNHAM FLOATING RATE BOND FUND |
| SCHEDULE OF INVESTMENTS (Unaudited) (Continued) |
| April 30, 2022 |
| Principal | | | | | | | Coupon Rate | | | | | |
| Amount ($) | | | | | Spread | | (%) | | Maturity | | Fair Value | |
| | | | | TERM LOANS — 75.8% (Continued) | | | | | | | | | | |
| | | | | RETAIL - DISCRETIONARY — 4.1% (Continued) | | | | | | | | | | |
| | 1,193,970 | | | Leslie’s Poolmart, Inc.(c) | | US0001M + 2.500% | | 3.2500 | | 03/09/28 | | $ | 1,180,287 | |
| | 941,924 | | | Mavis Tire Express Services TopCo, L.P.(c) | | US0001M + 4.000% | | 4.7500 | | 04/28/28 | | | 938,001 | |
| | 539,550 | | | Petco Health & Wellness Company, Inc.(c) | | US0001M + 3.250% | | 4.0000 | | 03/03/28 | | | 535,166 | |
| | 517,400 | | | PetSmart, Inc.(c) | | US0003M + 3.750% | | 4.5000 | | 02/11/28 | | | 513,778 | |
| | 1,200,063 | | | Specialty Building Products Holdings, LLC(c) | | US0001M + 3.750% | | 4.2500 | | 10/05/28 | | | 1,141,938 | |
| | | | | | | | | | | | | | 8,368,615 | |
| | | | | | | | | | | | | | | |
| | | | | SEMICONDUCTORS — 0.3% | | | | | | | | | | |
| | 576,770 | | | Altar Bidco, Inc.(c) | | SOFRRATE + 3.350% | | 3.8500 | | 02/01/29 | | | 569,992 | |
| | 57,359 | | | Altar Bidco, Inc.(c) | | SOFRRATE + 5.600% | | 6.1000 | | 02/01/30 | | | 56,714 | |
| | | | | | | | | | | | | | 626,706 | |
| | | | | | | | | | | | | | | |
| | | | | SOFTWARE — 7.8% | | | | | | | | | | |
| | 1,106,560 | | | Applied Systems, Inc.(c) | | US0003M + 3.000% | | 3.7500 | | 09/19/24 | | | 1,104,695 | |
| | 192,894 | | | Applied Systems, Inc.(c) | | US0001M + 5.500% | | 6.2500 | | 09/19/25 | | | 193,238 | |
| | 190,624 | | | athenahealth, Inc., Delayed Draw Term DD(c) | | SOFRRATE + 3.500% | | 4.0000 | | 02/15/29 | | | 188,360 | |
| | 1,124,682 | | | athenahealth, Inc., Initial Term Loan(c) | | SOFRRATE + 3.500% | | 4.0000 | | 02/15/29 | | | 1,111,327 | |
| | 600,850 | | | Barracuda Networks, Inc.(c) | | US0003M + 3.750% | | 4.5000 | | 02/12/25 | | | 600,538 | |
| | 1,195,199 | | | Condor Merger Sub, Inc.(c) | | US0001M + 4.000% | | 4.5000 | | 03/01/29 | | | 1,165,319 | |
| | 596,954 | | | Dcert Buyer, Inc.(c) | | US0003M + 4.000% | | 4.1460 | | 10/16/26 | | | 595,202 | |
| | 600,000 | | | Dcert Buyer, Inc.(c) | | US0001M + 7.000% | | 7.0900 | | 02/16/29 | | | 595,251 | |
| | 1,195,830 | | | Epicor Software Corporation(c) | | US0001M + 3.250% | | 4.0000 | | 07/30/27 | | | 1,189,798 | |
| | 564,300 | | | Greeneden US Holdings II, LLC(c) | | US0001M + 4.000% | | 4.7500 | | 12/01/27 | | | 563,242 | |
| | 1,200,000 | | | Helios Software Holdings, Inc.(c) | | US0001M + 3.750% | | 3.9170 | | 03/10/28 | | | 1,195,051 | |
| | 279,561 | | | MedAssets Software Intermediate Holdings, Inc.(c) | | US0001M + 4.000% | | 4.5000 | | 12/18/28 | | | 278,023 | |
| | 121,719 | | | MedAssets Software Intermediate Holdings, Inc.(c) | | US0001M + 6.750% | | 7.2500 | | 12/17/29 | | | 119,939 | |
| | 231,780 | | | Mitnick Corporate Purchaser, Inc.(c) | | TSFR1M + 4.750% | | 5.2830 | | 04/20/29 | | | 231,548 | |
| | 1,193,878 | | | Project Boost Purchaser, LLC(c) | | US0003M + 3.500% | | 3.5900 | | 06/01/26 | | | 1,177,092 | |
| | 1,187,025 | | | Proofpoint, Inc.(c) | | US0001M + 3.250% | | 3.7500 | | 08/31/28 | | | 1,169,718 | |
| | 1,095,124 | | | RealPage, Inc.(c) | | US0001M + 3.250% | | 3.7500 | | 04/24/28 | | | 1,079,556 | |
| | 785,092 | | | Sophia, L.P.(c) | | US0003M + 3.250% | | 4.5000 | | 10/07/27 | | | 777,241 | |
| | 669,346 | | | Sophia, L.P.(c) | | SOFRRATE + 4.250% | | 4.7720 | | 10/07/27 | | | 666,836 | |
| | 99,791 | | | UKG, Inc.(c) | | US0001M + 5.250% | | 6.2120 | | 05/03/27 | | | 99,167 | |
| | 1,193,878 | | | Ultimate Software Group, Inc. (The)(c) | | US0003M + 3.750% | | 4.7560 | | 05/04/26 | | | 1,189,651 | |
See accompanying notes which are an integral part of these financial statements.
| DUNHAM FLOATING RATE BOND FUND |
| SCHEDULE OF INVESTMENTS (Unaudited) (Continued) |
| April 30, 2022 |
| Principal | | | | | | | Coupon Rate | | | | | |
| Amount ($) | | | | | Spread | | (%) | | Maturity | | Fair Value | |
| | | | | TERM LOANS — 75.8% (Continued) | | | | | | | | | | |
| | | | | SOFTWARE — 7.8% (Continued) | | | | | | | | | | |
| | 728,594 | | | Waystar Technologies, Inc.(c) | | US0001M+ 4.000% | | 4.1210 | | 10/22/26 | | $ | 728,823 | |
| | | | | | | | | | | | | | 16,019,615 | |
| | | | | SPECIALTY FINANCE — 0.3% | | | | | | | | | | |
| | 627,364 | | | Apollo Commercial Real Estate Finance, Inc.(c) | | US0001M + 3.500% | | 4.0000 | | 03/10/28 | | | 621,091 | |
| | | | | | | | | | | | | | | |
| | | | | TECHNOLOGY HARDWARE — 1.6% | | | | | | | | | | |
| | 847,157 | | | Everi Payments, Inc.(c) | | US0001M + 2.500% | | 3.0000 | | 08/03/28 | | | 842,392 | |
| | 1,193,830 | | | VeriFone Systems, Inc.(c) | | US0003M + 4.000% | | 4.4980 | | 08/20/25 | | | 1,173,690 | |
| | 1,220,063 | | | Viasat, Inc.(c) | | SOFRRATE + 4.500% | | 5.0000 | | 02/23/29 | | | 1,215,994 | |
| | | | | | | | | | | | | | 3,232,076 | |
| | | | | TECHNOLOGY SERVICES — 2.7% | | | | | | | | | | |
| | 178,650 | | | ION Trading Finance Ltd.(c) | | US0001M + 4.750% | | 4.9520 | | 03/31/28 | | | 177,906 | |
| | 1,149,000 | | | MoneyGram International, Inc.(c) | | US0001M + 4.500% | | 5.0000 | | 07/14/26 | | | 1,145,697 | |
| | 1,194,536 | | | Peraton Corporation(c) | | US0001M + 3.750% | | 4.5140 | | 02/01/28 | | | 1,188,097 | |
| | 674,120 | | | Tempo Acquisition, LLC(c) | | US0001M + 3.000% | | 3.7500 | | 08/31/28 | | | 670,540 | |
| | 1,222,233 | | | Travelport Finance Luxembourg Sarl(c) | | US0001M + 1.500% | | 2.5000 | | 02/28/25 | | | 1,251,262 | |
| | 1,299,128 | | | Travelport Finance Luxembourg Sarl(c) | | US0003M + 5.000% | | 5.1320 | | 05/29/26 | | | 1,101,940 | |
| | | | | | | | | | | | | | 5,535,442 | |
| | | | | TELECOMMUNICATIONS — 2.2% | | | | | | | | | | |
| | 619,125 | | | Altice France S.A.(c) | | US0003M + 2.750% | | 2.8710 | | 07/31/25 | | | 609,129 | |
| | 762,786 | | | Altice France S.A.(c) | | US0003M + 3.690% | | 3.8710 | | 02/02/26 | | | 756,711 | |
| | 226,775 | | | Altice France S.A.(c) | | US0003M + 4.000% | | 4.1980 | | 08/14/26 | | | 225,571 | |
| | 868,665 | | | CCI Buyer, Inc.(c) | | US0001M + 4.000% | | 4.7500 | | 12/17/27 | | | 857,538 | |
| | 1,193,909 | | | Connect Finco S.A.RL(c) | | US0001M + 3.500% | | 4.5000 | | 12/11/26 | | | 1,188,685 | |
| | 2,271 | | | Intelsat Jackson Holdings S.A.(c) | | US0001M + 5.750% | | 8.0000 | | 11/27/23 | | | — | |
| | 1,235 | | | Intelsat Jackson Holdings S.A. | | US0001M + 8.625% | | 8.6250 | | 01/02/24 | | | — | |
| | 1,300,000 | | | Telesat, LLC(c) | | US0001M + 2.750% | | 2.9000 | | 12/07/26 | | | 947,375 | |
| | | | | | | | | | | | | | 4,585,009 | |
| | | | | TRANSPORTATION & LOGISTICS — 4.1% | | | | | | | | | | |
| | 1,005,000 | | | AAdvantage Loyalty IP Ltd.(c) | | US0003M + 4.750% | | 5.8130 | | 04/20/28 | | | 1,024,402 | |
| | 977,529 | | | Air Canada(c) | | US0001M + 3.500% | | 4.2500 | | 08/11/28 | | | 969,954 | |
See accompanying notes which are an integral part of these financial statements.
| DUNHAM FLOATING RATE BOND FUND |
| SCHEDULE OF INVESTMENTS (Unaudited) (Continued) |
| April 30, 2022 |
| Principal | | | | | | | Coupon Rate | | | | | |
| Amount ($) | | | | | Spread | | (%) | | Maturity | | Fair Value | |
| | | | | TERM LOANS — 75.8% (Continued) | | | | |
| | | | | TRANSPORTATION & LOGISTICS — 4.1% (Continued) | | | | |
| | 474,573 | | | American Airlines, Inc.(c) | | US0003M + 2.000% | | 2.1260 | | 12/14/23 | | $ | 470,660 | |
| | 1,193,659 | | | Kenan Advantage Group, Inc. (The)(c) | | US0001M + 3.750% | | 4.5000 | | 03/12/26 | | | 1,184,337 | |
| | 567,103 | | | KKR Apple Bidco, LLC(c) | | US0001M + 3.000% | | 3.5000 | | 09/22/28 | | | 561,962 | |
| | 65,000 | | | KKR Apple Bidco, LLC(c) | | US0001M + 5.750% | | 6.2500 | | 07/13/29 | | | 65,000 | |
| | 995,000 | | | Mileage Plus Holdings, LLC(c) | | US0003M + 5.250% | | 6.2500 | | 06/21/27 | | | 1,034,054 | |
| | 1,230,642 | | | PODS, LLC(c) | | US0001M + 3.000% | | 3.7500 | | 03/20/28 | | | 1,217,682 | |
| | 697,950 | | | United Airlines, Inc.(c) | | US0001M + 3.750% | | 4.5000 | | 04/21/28 | | | 693,905 | |
| | 1,214,458 | | | WestJet Airlines Ltd.(c) | | US0003M + 3.000% | | 4.0000 | | 12/11/26 | | | 1,177,878 | |
| | | | | | | | | | | | | | 8,399,834 | |
| | | | | WHOLESALE - DISCRETIONARY — 0.6% | | | | |
| | 1,193,846 | | | Fastlane Parent Company, Inc.(c) | | US0001M + 4.500% | | 4.5870 | | 02/04/26 | | | 1,191,238 | |
| | | | | | | | | | | | | | | |
| | | | | TOTAL TERM LOANS (Cost $157,217,533) | | | 155,548,986 | |
| | | | | | | | | | | | | | | |
| Shares | | | | | | | | | Expiration Date | | | | |
| | | | | RIGHT — 0.0%(f) | | | | | | | | | | |
| | 10,588 | | | TRA Rights(a) | | | | | | 11/22/24 | | | 14,135 | |
| | | | | TOTAL RIGHT (Cost $17,470) | | | | | | | | | 14,135 | |
| | | | | | | | | | | | | | | |
| | | | | WARRANT — 0.1% | | | | | | | | | | |
| | 14,905 | | | iHeartMedia, Inc.(a) | | | | | | 12/31/49 | | | 283,195 | |
| | | | | TOTAL WARRANT (Cost $287,609) | | | | | | | | | 283,195 | |
| | | | | | | | | | | | | | | |
| | | | | SHORT-TERM INVESTMENTS — 5.7% | | | | |
| | | | | MONEY MARKET FUNDS - 5.7% | | | | | | | | | | |
| | 6,546,342 | | | Fidelity Government Portfolio, Class I, 0.15% (Cost $6,546,342)(h) | | | 6,546,342 | |
| | | | | | | | | | | | | | | |
| | | | | COLLATERAL FOR SECURITIES LOANED — 5.7% | | | | |
| | 5,170,455 | | | Mount Vernon Liquid Assets Portfolio, LLC, 0.45% (Cost $5,170,455)(h),(i) | | | 5,170,455 | |
See accompanying notes which are an integral part of these financial statements.
| DUNHAM FLOATING RATE BOND FUND |
| SCHEDULE OF INVESTMENTS (Unaudited) (Continued) |
| April 30, 2022 |
| | | | | | | Fair Value | |
| | | | | TOTAL INVESTMENTS - 101.4% (Cost $212,919,300) | | $ | 208,295,441 | |
| | | | | LIABILITIES IN EXCESS OF OTHER ASSETS - (1.4)% | | | (2,918,036 | ) |
| | | | | NET ASSETS - 100.0% | | $ | 205,377,405 | |
| ETF | - Exchange-Traded Fund |
| LLC | - Limited Liability Company |
| REIT | - Real Estate Investment Trust |
| SOFRRATE | - United States SOFR Secured Overnight Financing Rate |
| US0001M | - ICE LIBOR USD 1 Month |
| US0003M | - ICE LIBOR USD 3 Month |
| (a) | Non-income producing security. |
| (b) | Security exempt from registration under Rule 144A or Section 4(2) of the Securities Act of 1933. The security may be resold in transactions exempt from registration, normally to qualified institutional buyers. As of April 30, 2022 the total market value of 144A securities is 33,335,370 or 16.2% of net assets. |
| (c) | Variable or floating rate security, the interest rate of which adjusts periodically based on changes in current interest rates and prepayments on the underlying pool of assets. |
| (d) | All or a portion of these securities are on loan. Total loaned securities had a value of $5,020,253 at April 30, 2022. |
| (e) | Variable rate security; the rate shown represents the rate on April 30, 2022. |
| (f) | Percentage rounds to less than 0.1%. |
| (g) | Represents issuer in default on interest payments; non-income producing security. |
| (h) | Rate disclosed is the seven day effective yield as of April 30, 2022. |
| (i) | The Trust’s securities lending policies and procedures require that the borrower: (i) deliver cash or U.S. Government securities as collateral with respect to each new loan of U.S. securities, equal to at least 102% of the value of the portfolio securities loaned, and (ii) at all times thereafter mark-to-market the collateral on a daily basis so that the market value of such collateral is at least 100% of the value of securities loaned. From time to time the collateral may not be 102% due to end of day market movement. The next business day additional collateral is obtained/received from the borrower to replenish/reestablish 102%. |
| Portfolio Composition * - (Unaudited) |
| Term Loans | | | 74.7 | % | | Exchange Traded Funds | | | 2.1 | % |
| Asset Backed Securities | | | 9.4 | % | | Common Stocks | | | 0.3 | % |
| Corporate Bonds | | | 7.8 | % | | Warrants | | | 0.1 | % |
| Short-Term Investment | | | 3.1 | % | | Rights | | | 0.0 | % |
| Collateral for Securities Loaned | | | 2.5 | % | | Total | | | 100.0 | % |
| * | Based on total value of investments as of April 30, 2022. Does not include derivative holdings. |
| Percentage may differ from Schedule of Investments which are based on Fund net assets. |
See accompanying notes which are an integral part of these financial statements.
Dunham High-Yield Bond Fund (Unaudited)
Message from the Sub-Adviser (PineBridge Investments, LLC)
Asset Class Recap
High-yield bonds struggled over the fiscal six-month period ending April 30, 2022, as persistent inflation, rising interest rates, and geopolitical turmoil impacted the higher-risk asset class. Inflation remained elevated over the fiscal quarter, as energy prices reached levels not seen since 2013, with the price per barrel of crude oil hitting a high of $119.50. Geopolitical conflict between Russia and Ukraine squeezed the supply of oil and other key commodities, as western nations enacted sanctions against major Russian corporations and oligarchs. Given the surge in inflation, the Federal Reserve (the Fed) raised the federal funds rate for the first time since 2018. Minutes from the periodical Federal Open Market Committee (FOMC) meeting stressed a more hawkish tone from the Fed, leading many to believe monetary policy would tighten more quickly than anticipated. The 10-year U.S. Treasury yield ended the fiscal quarter at 2.93 percent, nearly 150 basis points higher than the prior fiscal quarter end. As a result, longer-dated investment-grade corporate and government bonds, as measured by the Bloomberg U.S. Aggregate Bond Index, sold off 9.5 percent over the fiscal quarter, as their higher duration dragged down performance. Overseas, foreign bonds, as measured by the Bloomberg Global Aggregate ex-U.S. Bond Index, fared even worse, dropping 13.3 percent. High-yield bonds, as measured by the ICE BofA U.S. Cash Pay High Yield Index, were not as affected by the interest rate hikes given their shorter duration profile, losing 7.2 percent. Leveraged loans, as measured by Credit Suisse Leveraged Loan Index, outperformed the broader bond market, edging 0.6 percent higher, one of the few asset classes realizing a positive absolute return.
Allocation Review
The sector that contributed the most to performance over the fiscal quarter was the energy sector, as stellar credit selection, coupled with an overweight allocation, provided strong relative returns. The conflict between Russia and Ukraine, coupled with ongoing supply chain bottlenecks due to continued COVID cases, limited the supply of oil, further driving up the price per barrel. Also contributing to performance were the financial services and health care sectors, as sector allocation and strong credit selection helped performance. The consumer cyclicals sector detracted the most from performance Fund performance with poor issuer selection being the primary reason. The consumer cyclicals sector felt the affects of supply chain disruptions and inflation, as rising wages and input costs ate into profit margins. The real estate sector also detracted from relative performance, with issuer selection being the primary drag on Fund returns.
Holdings Insights
The largest contributor to Fund performance over the fiscal period was Premier Entertainment Sub, LLC / Premier Entertainment Finance Corporation 5.63% Due 9/1/2029 (7405HAA2) (holding weight*: 0.26 percent). Premier Entertainment is a wholly owned subsidiary of Bally’s Corporation, an operator of casinos, online sports betting, and regional sports networks. While online sports betting surged during the COVID pandemic, casino and sporting event traffic fell substantially. Loosening of COVID restrictions and pent-up demand caused an influx of traffic to Premier Entertainment’s entertainment centers. As COVID restrictions continue to ease and leisure returns to pre-pandemic levels, Premier Entertainment could be poised to benefit. Over the fiscal period, the Premier Entertainment bond rose 29.8 percent. Another contributor to performance over the fiscal period was MoneyGram International, Inc. 5.38% Due 8/1/2026 (60935YAA7) (holding weight*: 0.12 percent). MoneyGram International is a provider of cross-border peer-to-peer payments and money transfer services. Moneygram International benefitted from the ease in travel restrictions over the fiscal period, leading to an increase in cross -border transactions. Similar to the Premier Entertainment bonds, many believe that as COVID restrictions continue to come down, travel and cross-border spending could return to pre-pandemic levels. Over the fiscal period, the Moneygram International bond gained 6.8 percent. Within the materials sector, the Cleveland-Cliffs, Inc. 6.75%, Due 3/15/2026 (185899AG6) (holding weight*: 0.20 percent) bond added to relative Fund performance. Cleveland-Cliffs is one of the largest steel producers in North America. Like other commodities, the price of steel surged, as limited supply, largely attributed to the war between Russia and Ukraine, drove up demand. With inflation likely to remain elevated in the near future, many investors believe Cleveland-Cliffs could be well-positioned to benefit. Over the fiscal period, the Cleveland-Cliffs bond increased 18.0 percent.
The largest detractor to Fund performance over the fiscal period was Ford Motor Company 4.75%, Due 1/15/2043 (345370CQ1) (holding weight*: 1.00 percent). Ford Motor Company is a developer and distributor of automobiles, automobile parts, and accessories across North America, South America, Europe, and China. Given the increase in interest rates, these longer-dated bonds sold off over the fiscal period, as their higher duration weighed on returns. Additionally, rising costs have affected the automobile manufacturer’s bottom line, with negative earnings over the most recent fiscal quarter. The Ford Motor Company bond lost 13.2 percent over the fiscal period. Another detractor from Fund performance over the fiscal period was Altice Financing S.A. 5%, Due 1/15/2028 () (holding weight*: 1.03 percent) .. Altice Financing is a subsidiary of Altice USA, Inc., a provider of television, internet access, and telephone services. Over the fiscal period, Altice USA reported earnings that were in-line with expectations, however, provided weak guidance, as rising input costs would likely detract from future growth. Over the fiscal period, the Altice Financing bond dropped 31.1 percent. Within the materials sector, the Glatfelter Corporation 4.75%, Due 11/15/2029 (377320AA4) (holding weight*: 0.35 percent) bond also detracted from Fund performance. Glatfelter Corporation is a manufacturer and seller of engineered materials worldwide. Glatfelter reported earnings that came in below expectations, causing the credit to fall. Over the fiscal period, the Glatfelter Corporation bond fell 18.0 percent.
Sub-Adviser Outlook
While the current market environment poses many threats to the high-yield asset class, the Sub-Adviser believes there is still opportunity. Inflation remains well-above historical averages, however, has not curtailed spending as much as anticipated, as corporations have been able to pass the rising input costs onto the consumer. In addition, volatility has led to some significant dislocations in the market, with some sectors of the market appearing attractive. While volatility may persist as a result of the ongoing Russia-Ukraine conflict and perceived aggressive monetary tightening, opportunities may arise to benefit of the Sub-Adviser. As always, the Sub-Adviser will remain disciplined in their investment approach, seeking out those sectors and issuers in the market that provide the most attractive risk-adjusted returns.
| * | Holdings percentage(s) of total investments, cash and unsettled trades excluding collateral for securities loaned, as of 4/30/2022. |
Growth of $100,000 Investment
Total Returns (a) as of April 30, 2022
| | | | Annualized | Annualized |
| | Six Months | One Year | Five Years | Ten Years |
| Class N | (6.70)% | (5.07)% | 3.31% | 3.93% |
| Class A with load of 4.50% | (10.90)% | (9.64)% | 2.13% | 3.21% |
| Class A without load | (6.75)% | (5.35)% | 3.07% | 3.68% |
| Class C | (6.98)% | (5.79)% | 2.58% | 3.19% |
Bloomberg U.S. Corporate High-Yield Bond
Ba/B 2% Issuer Capped Index | (7.45)% | (5.35)% | 3.81% | 4.86% |
| Morningstar High-Yield Bond Category | (6.57)% | (4.79)% | 2.77% | 4.14% |
| (a) | Total Returns are calculated based on traded NAVs. |
Bloomberg U.S. Corporate High-Yield Bond Ba/B 2% Issuer Capped Index is an issuer-constrained version of the flagship US Corporate High Yield Index, which measures the USD-denominated, high yield, fixed-rate corporate bond market. Investors cannot invest directly in an index or benchmark.
The Morningstar High-Yield Bond Category is generally representative of mutual funds that primarily invest in U.S. high-income debt securities where at least 65% or more of bond assets are not rated or are rated by a major agency such as Standard & Poor’s or Moody’s at the level of BB (considered speculative for taxable bonds) and below.
As disclosed in the Trust’s latest registration statement, the Fund’s total annual operating expenses, including the cost of underlying funds, are 1.17% for Class N, 1.92% for Class C and 1.42% for Class A. Class A shares are subject to a sales load of 4.50% and a deferred sales charge of up to 0.75%. The performance data quoted here represents past performance, which is not indicative of future results. Current performance may be lower or higher than the performance data quoted. The investment return and NAV will fluctuate, so that an investor’s shares, when redeemed, may be worth more or less than their original cost. Total returns are calculated assuming reinvestment of all dividends and capital gains distributions, if any. The returns do not reflect the deductions of taxes a shareholder would pay on the redemption of Fund shares or Fund distributions. For performance information current to the most recent month-end, please call 1-800-442-4358 or visit our website www.dunham.com.
| DUNHAM HIGH YIELD BOND FUND |
| SCHEDULE OF INVESTMENTS (Unaudited) |
| April 30, 2022 |
| Shares | | | | | | | | | Fair Value | |
| | | | | COMMON STOCKS — 0.7% | | | | | | | | |
| | | | | OIL & GAS SERVICES & EQUIPMENT - 0.7% | | | | | | | | |
| | 2,500,244 | | | Hi-Crush(a),(h) | | | | | | $ | 700,068 | |
| | | | | | | | | | | | | |
| | | | | TOTAL COMMON STOCKS (Cost $1,208,730) | | | | | | | 700,068 | |
| | | | | | | | | | | | | |
| | Principal | | | | | Coupon Rate | | | | | | |
| | Amount ($) | | | | | (%) | | Maturity | | | | |
| | | | | CORPORATE BONDS — 96.9% | | | | | | | | |
| | | | | AEROSPACE & DEFENSE — 1.0% | | | | | | | | |
| | 625,000 | | | Moog, Inc.(b) | | 4.2500 | | 12/15/27 | | | 582,747 | |
| | 451,000 | | | Spirit AeroSystems, Inc.(b) | | 7.5000 | | 04/15/25 | | | 458,259 | |
| | | | | | | | | | | | 1,041,006 | |
| | | | | ASSET MANAGEMENT — 0.6% | | | | | | | | |
| | 241,000 | | | AG Issuer, LLC(b) | | 6.2500 | | 03/01/28 | | | 235,906 | |
| | 441,000 | | | NFP Corporation(b) | | 4.8750 | | 08/15/28 | | | 401,915 | |
| | | | | | | | | | | | 637,821 | |
| | | | | AUTOMOTIVE — 1.5% | | | | | | | | |
| | 292,000 | | | Dornoch Debt Merger Sub, Inc.(b) | | 6.6250 | | 10/15/29 | | | 239,805 | |
| | 185,000 | | | Ford Motor Company | | 3.2500 | | 02/12/32 | | | 150,615 | |
| | 1,304,000 | | | Ford Motor Company | | 4.7500 | | 01/15/43 | | | 1,052,244 | |
| | 205,000 | | | Ford Motor Credit Company, LLC | | 4.9500 | | 05/28/27 | | | 199,891 | |
| | | | | | | | | | | | 1,642,555 | |
| | | | | BIOTECH & PHARMA — 1.2% | | | | | | | | |
| | 587,000 | | | Grifols Escrow Issuer S.A.(b) | | 4.7500 | | 10/15/28 | | | 536,424 | |
| | 200,000 | | | Organon Finance 1, LLC(b),(c) | | 4.1250 | | 04/30/28 | | | 185,546 | |
| | 589,000 | | | Organon Finance 1, LLC(b) | | 5.1250 | | 04/30/31 | | | 533,130 | |
| | | | | | | | | | | | 1,255,100 | |
| | | | | CABLE & SATELLITE — 4.8% | | | | | | | | |
| | 1,290,000 | | | Altice Financing S.A.(b),(c) | | 5.0000 | | 01/15/28 | | | 1,078,658 | |
| | 555,000 | | | Block Communications, Inc.(b) | | 4.8750 | | 03/01/28 | | | 519,727 | |
| | 236,000 | | | CCO Holdings, LLC / CCO Holdings Capital(b) | | 5.5000 | | 05/01/26 | | | 236,898 | |
| | 378,000 | | | CCO Holdings, LLC / CCO Holdings Capital(b) | | 5.0000 | | 02/01/28 | | | 360,548 | |
| | 825,000 | | | CCO Holdings, LLC / CCO Holdings Capital(b),(c) | | 5.3750 | | 06/01/29 | | | 782,777 | |
| | 590,000 | | | CSC Holdings, LLC(b) | | 5.3750 | | 02/01/28 | | | 542,800 | |
| | 535,000 | | | CSC Holdings, LLC(b),(c) | | 5.7500 | | 01/15/30 | | | 440,971 | |
| | 680,000 | | | CSC Holdings, LLC(b) | | 4.6250 | | 12/01/30 | | | 521,404 | |
See accompanying notes which are an integral part of these financial statements.
| DUNHAM HIGH YIELD BOND FUND |
| SCHEDULE OF INVESTMENTS (Unaudited) (Continued) |
| April 30, 2022 |
| Principal | | | | | Coupon Rate | | | | | |
| Amount ($) | | | | | (%) | | Maturity | | Fair Value | |
| | | | | CORPORATE BONDS — 96.9% (Continued) | | | | | | | | |
| | | | | CABLE & SATELLITE — 4.8% (Continued) | | | | | | | | |
| | 610,000 | | | Sirius XM Radio, Inc.(b),(c) | | 4.0000 | | 07/15/28 | | $ | 552,126 | |
| | | | | | | | | | | | 5,035,909 | |
| | | | | CHEMICALS — 1.9% | | | | | | | | |
| | 604,000 | | | Consolidated Energy Finance S.A.(b) | | 5.6250 | | 10/15/28 | | | 559,500 | |
| | 572,000 | | | Methanex Corporation | | 5.1250 | | 10/15/27 | | | 549,818 | |
| | 387,000 | | | Minerals Technologies, Inc.(b) | | 5.0000 | | 07/01/28 | | | 362,064 | |
| | 473,000 | | | Trinseo Materials Operating SCA / Trinseo(b) | | 5.1250 | | 04/01/29 | | | 416,845 | |
| | 90,000 | | | Unifrax Escrow Issuer Corporation(b) | | 5.2500 | | 09/30/28 | | | 79,362 | |
| | | | | | | | | | | | 1,967,589 | |
| | | | | COMMERCIAL SUPPORT SERVICES — 4.5% | | | | | | | | |
| | 400,000 | | | Allied Universal Holdco, LLC / Allied Universal(b) | | 4.6250 | | 06/01/28 | | | 354,464 | |
| | 200,000 | | | Atlas LuxCompany 4 S.A.RL / Allied Universal(b) | | 4.6250 | | 06/01/28 | | | 175,766 | |
| | 585,000 | | | Brink’s Company (The)(b) | | 4.6250 | | 10/15/27 | | | 555,018 | |
| | 344,000 | | | Covanta Holding Corporation | | 5.0000 | | 09/01/30 | | | 311,208 | |
| | 187,000 | | | Covert Mergeco, Inc.(b) | | 4.8750 | | 12/01/29 | | | 170,377 | |
| | 565,000 | | | Deluxe Corporation(b) | | 8.0000 | | 06/01/29 | | | 536,770 | |
| | 228,000 | | | Garda World Security Corporation B(b) | | 4.6250 | | 02/15/27 | | | 207,335 | |
| | 222,000 | | | Garda World Security Corporation(b) | | 6.0000 | | 06/01/29 | | | 184,238 | |
| | 578,000 | | | Harsco Corporation(b) | | 5.7500 | | 07/31/27 | | | 527,457 | |
| | 380,000 | | | Korn Ferry(b) | | 4.6250 | | 12/15/27 | | | 360,500 | |
| | 515,000 | | | Prime Security Services Borrower, LLC / Prime B(b) | | 5.7500 | | 04/15/26 | | | 494,647 | |
| | 505,000 | | | Sotheby’s(b) | | 7.3750 | | 10/15/27 | | | 498,132 | |
| | 580,000 | | | TriNet Group, Inc.(b) | | 3.5000 | | 03/01/29 | | | 526,463 | |
| | | | | | | | | | | | 4,902,375 | |
| | | | | CONSTRUCTION MATERIALS — 0.4% | | | | | | | | |
| | 505,000 | | | Standard Industries, Inc.(b),(c) | | 3.3750 | | 01/15/31 | | | 404,043 | |
| | | | | | | | | | | | | |
| | | | | CONSUMER SERVICES — 1.0% | | | | | | | | |
| | 600,000 | | | PROG Holdings, Inc.(b) | | 6.0000 | | 11/15/29 | | | 530,985 | |
| | 605,000 | | | Rent-A-Center, Inc.(b),(c) | | 6.3750 | | 02/15/29 | | | 527,820 | |
| | | | | | | | | | | | 1,058,805 | |
| | | | | CONTAINERS & PACKAGING — 1.9% | | | | | | | | |
| | 414,000 | | | Ardagh Metal Packaging Finance USA, LLC / Ardagh(b) | | 3.2500 | | 09/01/28 | | | 361,788 | |
| | 580,000 | | | Clydesdale Acquisition Holdings, Inc.(b) | | 6.6250 | | 04/15/29 | | | 584,425 | |
See accompanying notes which are an integral part of these financial statements.
| DUNHAM HIGH YIELD BOND FUND |
| SCHEDULE OF INVESTMENTS (Unaudited) (Continued) |
| April 30, 2022 |
| Principal | | | | | Coupon Rate | | | | | |
| Amount ($) | | | | | (%) | | Maturity | | Fair Value | |
| | | | | CORPORATE BONDS — 96.9% (Continued) | | | | | | | | |
| | | | | CONTAINERS & PACKAGING — 1.9% (Continued) | | | | | | | | |
| | 479,000 | | | Crown Americas, LLC(b) | | 5.2500 | | 04/01/30 | | $ | 477,130 | |
| | 507,000 | | | LABL, Inc.(b),(c) | | 5.8750 | | 11/01/28 | | | 464,507 | |
| | 90,000 | | | Sealed Air Corporation(b) | | 5.0000 | | 04/15/29 | | | 89,445 | |
| | | | | | | | | | | | 1,977,295 | |
| | | | | ELECTRIC UTILITIES — 2.4% | | | | | | | | |
| | 451,000 | | | Calpine Corporation(b) | | 5.0000 | | 02/01/31 | | | 385,161 | |
| | 332,000 | | | Calpine Corporation(b) | | 3.7500 | | 03/01/31 | | | 280,235 | |
| | 165,000 | | | Clearway Energy Operating, LLC(b) | | 3.7500 | | 01/15/32 | | | 140,105 | |
| | 550,000 | | | NextEra Energy Operating Partners, L.P.(b) | | 4.2500 | | 07/15/24 | | | 545,881 | |
| | 510,000 | | | NRG Energy Inc(b) | | 3.6250 | | 02/15/31 | | | 425,388 | |
| | 785,000 | | | Vistra Operations Company, LLC(b) | | 5.0000 | | 07/31/27 | | | 748,654 | |
| | | | | | | | | | | | 2,525,424 | |
| | | | | ENGINEERING & CONSTRUCTION — 0.5% | | | | | | | | |
| | 557,000 | | | VM Consolidated, Inc.(b) | | 5.5000 | | 04/15/29 | | | 499,195 | |
| | | | | | | | | | | | | |
| | | | | ENTERTAINMENT CONTENT — 1.3% | | | | | | | | |
| | 695,000 | | | Banijay Entertainment S.A.SU(b) | | 5.3750 | | 03/01/25 | | | 684,083 | |
| | 735,000 | | | Univision Communications, Inc.(b) | | 6.6250 | | 06/01/27 | | | 737,749 | |
| | | | | | | | | | | | 1,421,832 | |
| | | | | FOOD — 2.6% | | | | | | | | |
| | 208,000 | | | Herbalife Nutrition Ltd. / HLF Financing, Inc.(b) | | 7.8750 | | 09/01/25 | | | 205,001 | |
| | 675,000 | | | HLF Financing Sarl, LLC / Herbalife International,(b) | | 4.8750 | | 06/01/29 | | | 544,192 | |
| | 210,000 | | | Land O’ Lakes, Inc.(b) | | 7.0000 | | 12/29/49 | | | 214,511 | |
| | 484,000 | | | Land O’Lakes Capital Trust I(b) | | 7.4500 | | 03/15/28 | | | 544,569 | |
| | 520,000 | | | Pilgrim’s Pride Corporation(b) | | 5.8750 | | 09/30/27 | | | 524,420 | |
| | 570,000 | | | Post Holdings, Inc.(b) | | 4.5000 | | 09/15/31 | | | 474,770 | |
| | 381,000 | | | Simmons Foods, Inc./Simmons Prepared Foods,(b) | | 4.6250 | | 03/01/29 | | | 344,350 | |
| | | | | | | | | | | | 2,851,813 | |
| | | | | FORESTRY, PAPER & WOOD PRODUCTS — 0.3% | | | | | | | | |
| | 454,000 | | | Glatfelter Corporation(b) | | 4.7500 | | 11/15/29 | | | 363,772 | |
| | | | | | | | | | | | | |
| | | | | GAS & WATER UTILITIES — 0.5% | | | | | | | | |
| | 615,000 | | | Ferrellgas Escrow, LLC / FG Operating Finance(b) | | 5.3750 | | 04/01/26 | | | 557,353 | |
See accompanying notes which are an integral part of these financial statements.
| DUNHAM HIGH YIELD BOND FUND |
| SCHEDULE OF INVESTMENTS (Unaudited) (Continued) |
| April 30, 2022 |
| Principal | | | | | Coupon Rate | | | | | |
| Amount ($) | | | | | (%) | | Maturity | | Fair Value | |
| | | | | CORPORATE BONDS — 96.9% (Continued) | | | | | | | | |
| | | | | HEALTH CARE FACILITIES & SERVICES — 2.7% | | | | | | | | |
| | 357,000 | | | Acadia Healthcare Company, Inc.(b) | | 5.5000 | | 07/01/28 | | $ | 348,182 | |
| | 117,000 | | | Acadia Healthcare Company, Inc.(b) | | 5.0000 | | 04/15/29 | | | 111,022 | |
| | 280,000 | | | Catalent Pharma Solutions, Inc.(b) | | 5.0000 | | 07/15/27 | | | 271,617 | |
| | 342,000 | | | CHS/Community Health Systems, Inc. B(b) | | 5.6250 | | 03/15/27 | | | 326,401 | |
| | 382,000 | | | DaVita, Inc.(b) | | 4.6250 | | 06/01/30 | | | 333,014 | |
| | 597,000 | | | HCA, Inc. | | 3.5000 | | 09/01/30 | | | 536,727 | |
| | 452,000 | | | Legacy LifePoint Health, LLC(b) | | 4.3750 | | 02/15/27 | | | 418,663 | |
| | 360,000 | | | Select Medical Corporation(b) | | 6.2500 | | 08/15/26 | | | 357,887 | |
| | 215,000 | | | Tenet Healthcare Corporation | | 4.6250 | | 07/15/24 | | | 214,686 | |
| | | | | | | | | | | | 2,918,199 | |
| | | | | HOME CONSTRUCTION — 0.9% | | | | | | | | |
| | 361,000 | | | Mattamy Group Corporation(b) | | 5.2500 | | 12/15/27 | | | 338,215 | |
| | 210,000 | | | Mattamy Group Corporation(b) | | 4.6250 | | 03/01/30 | | | 179,024 | |
| | 475,000 | | | PGT Innovations, Inc.(b) | | 4.3750 | | 10/01/29 | | | 417,390 | |
| | | | | | | | | | | | 934,629 | |
| | | | | HOUSEHOLD PRODUCTS — 0.9% | | | | | | | | |
| | 600,000 | | | Edgewell Personal Care Company(b) | | 4.1250 | | 04/01/29 | | | 533,307 | |
| | 479,000 | | | Energizer Holdings, Inc.(b) | | 4.3750 | | 03/31/29 | | | 398,768 | |
| | | | | | | | | | | | 932,075 | |
| | | | | INDUSTRIAL SUPPORT SERVICES — 0.3% | | | | | | | | |
| | 375,000 | | | Ahern Rentals, Inc.(b) | | 7.3750 | | 05/15/23 | | | 354,375 | |
| | | | | | | | | | | | | |
| | | | | INSTITUTIONAL FINANCIAL SERVICES — 0.6% | | | | | | | | |
| | 725,000 | | | Aretec Escrow Issuer, Inc.(b) | | 7.5000 | | 04/01/29 | | | 676,073 | |
| | | | | | | | | | | | | |
| | | | | INSURANCE — 0.6% | | | | | | | | |
| | 274,000 | | | NMI Holdings, Inc.(b) | | 7.3750 | | 06/01/25 | | | 286,016 | |
| | 370,000 | | | Ryan Specialty Group, LLC(b) | | 4.3750 | | 02/01/30 | | | 337,914 | |
| | | | | | | | | | | | 623,930 | |
| | | | | INTERNET MEDIA & SERVICES — 0.3% | | | | | | | | |
| | 375,000 | | | GrubHub Holdings, Inc.(b) | | 5.5000 | | 07/01/27 | | | 321,139 | |
| | | | | | | | | | | | | |
| | | | | LEISURE FACILITIES & SERVICES — 9.1% | | | | | | | | |
| | 600,000 | | | AMC Entertainment Holdings, Inc.(b),(c),(d) | | 10.0000 | | 06/15/26 | | | 503,271 | |
See accompanying notes which are an integral part of these financial statements.
| DUNHAM HIGH YIELD BOND FUND |
| SCHEDULE OF INVESTMENTS (Unaudited) (Continued) |
| April 30, 2022 |
| Principal | | | | | Coupon Rate | | | | | |
| Amount ($) | | | | | (%) | | Maturity | | Fair Value | |
| | | | | CORPORATE BONDS — 96.9% (Continued) | | | | | | | | |
| | | | | LEISURE FACILITIES & SERVICES — 9.1% (Continued) | | | | | | | | |
| | 289,000 | | | Brinker International, Inc.(b) | | 5.0000 | | 10/01/24 | | $ | 288,718 | |
| | 530,000 | | | Caesars Entertainment, Inc.(b) | | 6.2500 | | 07/01/25 | | | 536,440 | |
| | 104,000 | | | Carnival Corporation(b) | | 7.6250 | | 03/01/26 | | | 102,039 | |
| | 835,000 | | | Carnival Corporation(b),(c) | | 5.7500 | | 03/01/27 | | | 757,511 | |
| | 127,000 | | | Carnival Corporation(b) | | 6.0000 | | 05/01/29 | | | 114,172 | |
| | 780,000 | | | Carrols Restaurant Group, Inc.(b) | | 5.8750 | | 07/01/29 | | | 595,674 | |
| | 575,000 | | | CEC Entertainment Company, LLC(b),(c) | | 6.7500 | | 05/01/26 | | | 541,225 | |
| | 442,000 | | | Dave & Buster’s, Inc. B(b) | | 7.6250 | | 11/01/25 | | | 459,136 | |
| | 211,000 | | | Hilton Grand Vacations Borrower Escrow, LLC /(b) | | 5.0000 | | 06/01/29 | | | 190,756 | |
| | 555,000 | | | Hilton Grand Vacations Borrower Escrow, LLC /(b) | | 4.8750 | | 07/01/31 | | | 485,434 | |
| | 629,000 | | | Melco Resorts Finance Ltd.(b) | | 5.3750 | | 12/04/29 | | | 506,477 | |
| | 710,000 | | | NCL Corporation Ltd. B(b),(c) | | 3.6250 | | 12/15/24 | | | 661,350 | |
| | 187,000 | | | NCL Corporation Ltd.(b) | | 5.8750 | | 03/15/26 | | | 172,976 | |
| | 243,000 | | | NCL Corporation Ltd.(b) | | 7.7500 | | 02/15/29 | | | 236,040 | |
| | 335,000 | | | Premier Entertainment Sub, LLC / Premier(b) | | 5.6250 | | 09/01/29 | | | 268,429 | |
| | 335,000 | | | Premier Entertainment Sub, LLC / Premier(b) | | 5.8750 | | 09/01/31 | | | 264,261 | |
| | 603,000 | | | Royal Caribbean Cruises Ltd.(b) | | 4.2500 | | 07/01/26 | | | 545,754 | |
| | 126,000 | | | Royal Caribbean Cruises Ltd.(b) | | 5.5000 | | 04/01/28 | | | 115,190 | |
| | 445,000 | | | SeaWorld Parks & Entertainment, Inc.(b) | | 8.7500 | | 05/01/25 | | | 466,525 | |
| | 630,000 | | | SeaWorld Parks & Entertainment, Inc.(b) | | 5.2500 | | 08/15/29 | | | 574,062 | |
| | 517,000 | | | Wyndham Destinations, Inc. | | 5.7500 | | 04/01/27 | | | 521,519 | |
| | 865,000 | | | Wynn Macau Ltd.(b) | | 5.1250 | | 12/15/29 | | | 683,090 | |
| | | | | | | | | | | | 9,590,049 | |
| | | | | MEDICAL EQUIPMENT & DEVICES — 0.3% | | | | | | | | |
| | 339,000 | | | Embecta Corporation(b) | | 5.0000 | | 02/15/30 | | | 306,527 | |
| | | | | | | | | | | | | |
| | | | | METALS & MINING — 3.2% | | | | | | | | |
| | 200,000 | | | Cleveland-Cliffs, Inc.(b) | | 6.7500 | | 03/15/26 | | | 209,745 | |
| | 301,000 | | | Cleveland-Cliffs, Inc.(b) | | 4.6250 | | 03/01/29 | | | 282,532 | |
| | 511,000 | | | Constellium S.E.(b) | | 5.6250 | | 06/15/28 | | | 489,952 | |
| | 573,000 | | | FMG Resources August 2006 Pty Ltd.(b) | | 4.5000 | | 09/15/27 | | | 543,628 | |
| | 555,000 | | | Hudbay Minerals, Inc.(b) | | 6.1250 | | 04/01/29 | | | 525,868 | |
| | 525,000 | | | Mineral Resources Ltd.(b) | | 8.1250 | | 05/01/27 | | | 534,025 | |
| | 154,000 | | | Mineral Resources Ltd.(b) | | 8.0000 | | 11/01/27 | | | 153,615 | |
See accompanying notes which are an integral part of these financial statements.
| DUNHAM HIGH YIELD BOND FUND |
| SCHEDULE OF INVESTMENTS (Unaudited) (Continued) |
| April 30, 2022 |
| Principal | | | | | Coupon Rate | | | | | |
| Amount ($) | | | | | (%) | | Maturity | | Fair Value | |
| | | | | CORPORATE BONDS — 96.9% (Continued) | | | | | | | | |
| | | | | METALS & MINING — 3.2% (Continued) | | | | | | | | |
| | 180,000 | | | Mineral Resources Ltd.(b) | | 8.5000 | | 05/01/30 | | $ | 178,875 | |
| | 480,000 | | | Warrior Met Coal, Inc.(b) | | 7.8750 | | 12/01/28 | | | 502,903 | |
| | | | | | | | | | | | 3,421,143 | |
| | | | | OIL & GAS PRODUCERS — 18.1% | | | | | | | | |
| | 576,000 | | | Antero Midstream Partners, L.P. / Antero Midstream(b) | | 5.7500 | | 01/15/28 | | | 561,180 | |
| | 680,000 | | | Antero Resources Corporation(b) | | 5.3750 | | 03/01/30 | | | 665,411 | |
| | 405,000 | | | Apache Corporation | | 4.3750 | | 10/15/28 | | | 381,273 | |
| | 434,000 | | | Apache Corporation | | 4.7500 | | 04/15/43 | | | 376,094 | |
| | 854,000 | | | Buckeye Partners, L.P.(b) | | 4.5000 | | 03/01/28 | | | 780,505 | |
| | 800,000 | | | California Resources Corporation(b) | | 7.1250 | | 02/01/26 | | | 815,259 | |
| | 480,000 | | | Civitas Resources, Inc.(b) | | 5.0000 | | 10/15/26 | | | 456,636 | |
| | 296,000 | | | DCP Midstream Operating, L.P. | | 5.6250 | | 07/15/27 | | | 300,674 | |
| | 132,000 | | | DCP Midstream Operating, L.P.(b) | | 6.7500 | | 09/15/37 | | | 148,451 | |
| | 235,000 | | | DCP Midstream Operating, L.P. | | 5.6000 | | 04/01/44 | | | 225,016 | |
| | 331,000 | | | DT Midstream, Inc.(b) | | 4.3750 | | 06/15/31 | | | 297,011 | |
| | 498,000 | | | Earthstone Energy Holdings, LLC(b) | | 8.0000 | | 04/15/27 | | | 496,344 | |
| | 855,000 | | | eG Global Finance plc(b) | | 6.7500 | | 02/07/25 | | | 832,299 | |
| | 87,000 | | | Endeavor Energy Resources, L.P. / EER Finance,(b) | | 5.7500 | | 01/30/28 | | | 87,320 | |
| | 823,000 | | | Genesis Energy, L.P. / Genesis Energy Finance | | 5.6250 | | 06/15/24 | | | 808,119 | |
| | 325,000 | | | Genesis Energy, L.P. / Genesis Energy Finance | | 6.5000 | | 10/01/25 | | | 309,181 | |
| | 307,000 | | | Genesis Energy, L.P. / Genesis Energy Finance | | 8.0000 | | 01/15/27 | | | 301,503 | |
| | 677,000 | | | Harvest Midstream I, L.P.(b) | | 7.5000 | | 09/01/28 | | | 688,360 | |
| | 434,000 | | | Hilcorp Energy I, L.P. / Hilcorp Finance Company(b) | | 5.7500 | | 02/01/29 | | | 425,871 | |
| | 479,000 | | | Hilcorp Energy I, L.P. / Hilcorp Finance Company(b) | | 6.0000 | | 02/01/31 | | | 462,944 | |
| | 814,000 | | | Holly Energy Partners, L.P. / Holly Energy Finance(b),(c) | | 5.0000 | | 02/01/28 | | | 775,372 | |
| | 550,000 | | | Howard Midstream Energy Partners, LLC(b) | | 6.7500 | | 01/15/27 | | | 533,585 | |
| | 579,000 | | | Independence Energy Finance, LLC(b) | | 7.2500 | | 05/01/26 | | | 568,454 | |
| | 695,000 | | | ITT Holdings, LLC(b) | | 6.5000 | | 08/01/29 | | | 619,037 | |
| | 560,000 | | | Murphy Oil Corporation | | 6.3750 | | 07/15/28 | | | 570,360 | |
| | 405,000 | | | Murphy Oil USA, Inc. | | 4.7500 | | 09/15/29 | | | 384,307 | |
| | 650,000 | | | NGL Energy Operating, LLC / NGL Energy Finance(b) | | 7.5000 | | 02/01/26 | | | 612,492 | |
| | 425,000 | | | NGL Energy Partners, L.P. / NGL Energy Finance(c) | | 6.1250 | | 03/01/25 | | | 357,161 | |
| | 152,000 | | | NuStar Logistics, L.P. | | 5.7500 | | 10/01/25 | | | 151,413 | |
| | 379,000 | | | NuStar Logistics, L.P. | | 6.3750 | | 10/01/30 | | | 374,007 | |
See accompanying notes which are an integral part of these financial statements.
| DUNHAM HIGH YIELD BOND FUND |
| SCHEDULE OF INVESTMENTS (Unaudited) (Continued) |
| April 30, 2022 |
| Principal | | | | | Coupon Rate | | | | | |
| Amount ($) | | | | | (%) | | Maturity | | Fair Value | |
| | | | | CORPORATE BONDS — 96.9% (Continued) | | | | | | | | |
| | | | | OIL & GAS PRODUCERS — 18.1% (Continued) | | | | | | | | |
| | 452,000 | | | Oasis Petroleum, Inc.(b) | | 6.3750 | | 06/01/26 | | $ | 454,726 | |
| | 326,000 | | | Occidental Petroleum Corporation | | 5.8750 | | 09/01/25 | | | 335,216 | |
| | 503,000 | | | Occidental Petroleum Corporation | | 6.3750 | | 09/01/28 | | | 528,673 | |
| | 334,000 | | | Occidental Petroleum Corporation(c) | | 3.5000 | | 08/15/29 | | | 312,257 | |
| | 251,000 | | | Occidental Petroleum Corporation | | 6.1250 | | 01/01/31 | | | 264,154 | |
| | 518,000 | | | PBF Holding Company, LLC / PBF Finance Corporation | | 6.0000 | | 02/15/28 | | | 456,837 | |
| | 444,000 | | | Rockcliff Energy II, LLC(b) | | 5.5000 | | 10/15/29 | | | 431,291 | |
| | 514,000 | | | Southwestern Energy Company | | 5.3750 | | 02/01/29 | | | 508,428 | |
| | 344,000 | | | Southwestern Energy Company | | 5.3750 | | 03/15/30 | | | 340,104 | |
| | 60,000 | | | Southwestern Energy Company | | 4.7500 | | 02/01/32 | | | 56,874 | |
| | 600,000 | | | Strathcona Resources Ltd.(b) | | 6.8750 | | 08/01/26 | | | 581,304 | |
| | 701,000 | | | Venture Global Calcasieu Pass, LLC(b) | | 3.8750 | | 08/15/29 | | | 640,577 | |
| | | | | | | | | | | | 19,276,080 | |
| | | | | OIL & GAS SERVICES & EQUIPMENT — 2.1% | | | | | | | | |
| | 663,000 | | | Archrock Partners, L.P. / Archrock Partners(b),(c) | | 6.8750 | | 04/01/27 | | | 664,922 | |
| | 480,000 | | | Nabors Industries Ltd.(b) | | 7.2500 | | 01/15/26 | | | 469,750 | |
| | 434,000 | | | Nabors Industries, Inc.(b) | | 7.3750 | | 05/15/27 | | | 443,333 | |
| | 338,000 | | | USA Compression Partners, L.P. / USA Compression | | 6.8750 | | 04/01/26 | | | 331,688 | |
| | 337,000 | | | Weatherford International Ltd.(b) | | 6.5000 | | 09/15/28 | | | 340,707 | |
| | | | | | | | | | | | 2,250,400 | |
| | | | | PUBLISHING & BROADCASTING — 0.8% | | | | | | | | |
| | 735,000 | | | Belo Corporation | | 7.7500 | | 06/01/27 | | | 829,771 | |
| | | | | | | | | | | | | |
| | | | | REAL ESTATE INVESTMENT TRUSTS — 2.0% | | | | | | | | |
| | 595,000 | | | CTR Partnership, L.P. / CareTrust Capital(b) | | 3.8750 | | 06/30/28 | | | 539,316 | |
| | 600,000 | | | HAT Holdings I, LLC / HAT Holdings II, LLC(b) | | 3.3750 | | 06/15/26 | | | 551,804 | |
| | 302,000 | | | Service Properties Trust | | 5.2500 | | 02/15/26 | | | 269,186 | |
| | 300,000 | | | Service Properties Trust | | 4.7500 | | 10/01/26 | | | 258,404 | |
| | 46,000 | | | Service Properties Trust | | 5.5000 | | 12/15/27 | | | 41,573 | |
| | 57,000 | | | Service Properties Trust | | 3.9500 | | 01/15/28 | | | 45,267 | |
| | 165,000 | | | Service Properties Trust | | 4.9500 | | 10/01/29 | | | 132,097 | |
| | 374,000 | | | Service Properties Trust(c) | | 4.3750 | | 02/15/30 | | | 287,509 | |
| | | | | | | | | | | | 2,125,156 | |
See accompanying notes which are an integral part of these financial statements.
| DUNHAM HIGH YIELD BOND FUND |
| SCHEDULE OF INVESTMENTS (Unaudited) (Continued) |
| April 30, 2022 |
| Principal | | | | | | | Coupon Rate | | | | | |
| Amount ($) | | | | | Spread | | (%) | | Maturity | | Fair Value | |
| | | | | CORPORATE BONDS — 96.9% (Continued) | | | | | | | | | | |
| | | | | REAL ESTATE OWNERS & DEVELOPERS — 0.5% | | | | | | | | | | |
| | 438,000 | | | Kennedy-Wilson, Inc.(c) | | | | 4.7500 | | 03/01/29 | | $ | 404,651 | |
| | 119,000 | | | Kennedy-Wilson, Inc. | | | | 4.7500 | | 02/01/30 | | | 107,851 | |
| | | | | | | | | | | | | | 512,502 | |
| | | | | REAL ESTATE SERVICES — 0.5% | | | | | | | | | | |
| | 541,000 | | | Cushman & Wakefield US Borrower, LLC(b) | | | | 6.7500 | | 05/15/28 | | | 552,429 | |
| | | | | | | | | | | | | | | |
| | | | | RENEWABLE ENERGY — 0.3% | | | | | | | | | | |
| | 300,000 | | | EnerSys(b) | | | | 4.3750 | | 12/15/27 | | | 280,536 | |
| | | | | | | | | | | | | | | |
| | | | | RETAIL - CONSUMER STAPLES — 0.4% | | | | | | | | | | |
| | 440,000 | | | Albertsons Companies Inc / Safeway Inc / New(b) | | | | 4.6250 | | 01/15/27 | | | 412,601 | |
| | | | | | | | | | | | | | | |
| | | | | RETAIL - DISCRETIONARY — 2.8% | | | | | | | | | | |
| | 371,000 | | | Asbury Automotive Group, Inc.(b) | | | | 4.6250 | | 11/15/29 | | | 334,520 | |
| | 462,000 | | | Carvana Company(b),(c) | | | | 5.5000 | | 04/15/27 | | | 370,616 | |
| | 133,000 | | | Carvana Company(b),(c) | | | | 5.8750 | | 10/01/28 | | | 105,969 | |
| | 230,000 | | | Carvana Company(b),(c) | | | | 4.8750 | | 09/01/29 | | | 167,756 | |
| | 460,000 | | | Gap, Inc. (The)(b) | | | | 3.6250 | | 10/01/29 | | | 374,900 | |
| | 145,000 | | | Gap, Inc. (The)(b) | | | | 3.8750 | | 10/01/31 | | | 115,855 | |
| | 598,000 | | | Hertz Corporation (The)(b),(c) | | | | 5.0000 | | 12/01/29 | | | 522,526 | |
| | 600,000 | | | Metis Merger Sub, LLC(b) | | | | 6.5000 | | 05/15/29 | | | 522,784 | |
| | 569,000 | | | Park River Holdings, Inc.(b) | | | | 6.7500 | | 08/01/29 | | | 456,345 | |
| | | | | | | | | | | | | | 2,971,271 | |
| | | | | SOFTWARE — 1.6% | | | | | | | | | | |
| | 765,000 | | | Condor Merger Sub, Inc.(b) | | | | 7.3750 | | 02/15/30 | | | 685,329 | |
| | 585,000 | | | Minerva Merger Sub, Inc.(b),(c) | | | | 6.5000 | | 02/15/30 | | | 539,297 | |
| | 595,000 | | | Rackspace Technology Global, Inc.(b) | | | | 3.5000 | | 02/15/28 | | | 515,380 | |
| | | | | | | | | | | | | | 1,740,006 | |
| | | | | SPECIALTY FINANCE — 8.4% | | | | | | | | | | |
| | 570,000 | | | AerCap Global Aviation Trust(b),(e) | | US0003M + 4.300% | | 6.5000 | | 06/15/45 | | | 554,941 | |
| | 555,000 | | | Alliance Data Systems Corporation(b) | | | | 4.7500 | | 12/15/24 | | | 539,108 | |
| | 625,000 | | | Apollo Commercial Real Estate Finance, Inc.(b) | | | | 4.6250 | | 06/15/29 | | | 544,556 | |
| | 660,000 | | | Burford Capital Global Finance, LLC(b),(c) | | | | 6.2500 | | 04/15/28 | | | 650,771 | |
| | 831,000 | | | Cobra AcquisitionCo, LLC(b) | | | | 6.3750 | | 11/01/29 | | | 636,783 | |
See accompanying notes which are an integral part of these financial statements.
| DUNHAM HIGH YIELD BOND FUND |
| SCHEDULE OF INVESTMENTS (Unaudited) (Continued) |
| April 30, 2022 |
| Principal | | | | | Coupon Rate | | | | | |
| Amount ($) | | | | | (%) | | Maturity | | Fair Value | |
| | | | | CORPORATE BONDS — 96.9% (Continued) | | | | | | | | |
| | | | | SPECIALTY FINANCE — 8.4% (Continued) | | | | | | | | |
| | 559,000 | | | Credit Acceptance Corporation | | 6.6250 | | 03/15/26 | | $ | 565,901 | |
| | 643,000 | | | Curo Group Holdings Corporation(b) | | 7.5000 | | 08/01/28 | | | 536,162 | |
| | 215,000 | | | Enova International, Inc.(b) | | 8.5000 | | 09/01/24 | | | 216,006 | |
| | 430,000 | | | Enova International, Inc. B(b) | | 8.5000 | | 09/15/25 | | | 428,431 | |
| | 512,000 | | | FirstCash, Inc.(b) | | 4.6250 | | 09/01/28 | | | 466,583 | |
| | 211,000 | | | FirstCash, Inc.(b) | | 5.6250 | | 01/01/30 | | | 196,597 | |
| | 418,000 | | | Genworth Mortgage Holdings, Inc.(b) | | 6.5000 | | 08/15/25 | | | 417,808 | |
| | 324,000 | | | goeasy Ltd.(b) | | 4.3750 | | 05/01/26 | | | 301,310 | |
| | 682,000 | | | Ladder Capital Finance Holdings LLLP / Ladder(b) | | 4.2500 | | 02/01/27 | | | 627,740 | |
| | 483,000 | | | LFS Topco, LLC(b) | | 5.8750 | | 10/15/26 | | | 447,669 | |
| | 475,000 | | | Pattern Energy Operations, L.P. / Pattern Energy(b) | | 4.5000 | | 08/15/28 | | | 444,750 | |
| | 342,000 | | | Quicken Loans, LLC / Quicken Loans Co-Issuer, Inc.(b) | | 3.6250 | | 03/01/29 | | | 292,863 | |
| | 567,000 | | | Scientific Games Holdings, L.P./Scientific Games(b) | | 6.6250 | | 03/01/30 | | | 539,421 | |
| | 345,000 | | | Starwood Property Trust, Inc. | | 4.7500 | | 03/15/25 | | | 340,862 | |
| | 125,000 | | | Starwood Property Trust, Inc.(b) | | 3.6250 | | 07/15/26 | | | 114,200 | |
| | 80,000 | | | Starwood Property Trust, Inc.(b) | | 4.3750 | | 01/15/27 | | | 74,716 | |
| | | | | | | | | | | | 8,937,178 | |
| | | | | STEEL — 1.1% | | | | | | | | |
| | 470,000 | | | Allegheny Technologies, Inc.(c) | | 4.8750 | | 10/01/29 | | | 428,266 | |
| | 287,000 | | | Cleveland-Cliffs, Inc. | | 6.2500 | | 10/01/40 | | | 278,186 | |
| | 542,000 | | | Commercial Metals Company(c) | | 3.8750 | | 02/15/31 | | | 478,484 | |
| | | | | | | | | | | | 1,184,936 | |
| | | | | TECHNOLOGY HARDWARE — 1.6% | | | | | | | | |
| | 585,000 | | | Imola Merger Corporation(b) | | 4.7500 | | 05/15/29 | | | 544,796 | |
| | 254,000 | | | NCR Corporation(b) | | 5.1250 | | 04/15/29 | | | 243,943 | |
| | 405,000 | | | Seagate HDD Cayman | | 4.0910 | | 06/01/29 | | | 360,009 | |
| | 605,000 | | | TTM Technologies, Inc.(b),(c) | | 4.0000 | | 03/01/29 | | | 530,152 | |
| | | | | | | | | | | | 1,678,900 | |
| | | | | TECHNOLOGY SERVICES — 3.0% | | | | | | | | |
| | 610,000 | | | Ahead DB Holdings, LLC(b) | | 6.6250 | | 05/01/28 | | | 537,596 | |
| | 680,000 | | | ION Trading Technologies Sarl(b) | | 5.7500 | | 05/15/28 | | | 637,541 | |
| | 120,000 | | | MoneyGram International, Inc.(b) | | 5.3750 | | 08/01/26 | | | 121,946 | |
| | 1,080,000 | | | MPH Acquisition Holdings, LLC(b),(c) | | 5.7500 | | 11/01/28 | | | 940,373 | |
| | 65,000 | | | Nielsen Finance, LLC / Nielsen Finance Company(b) | | 5.6250 | | 10/01/28 | | | 63,080 | |
See accompanying notes which are an integral part of these financial statements.
| DUNHAM HIGH YIELD BOND FUND |
| SCHEDULE OF INVESTMENTS (Unaudited) (Continued) |
| April 30, 2022 |
| Principal | | | | | Coupon Rate | | | | | |
| Amount ($) | | | | | (%) | | Maturity | | Fair Value | |
| | | | | CORPORATE BONDS — 96.9% (Continued) | | | | | | | | |
| | | | | TECHNOLOGY SERVICES — 3.0% (Continued) | | | | | | | | |
| | 402,000 | | | Nielsen Finance, LLC / Nielsen Finance Company(b) | | 5.8750 | | 10/01/30 | | $ | 387,620 | |
| | 520,000 | | | Paysafe Finance plc / Paysafe Holdings US(b) | | 4.0000 | | 06/15/29 | | | 424,492 | |
| | | | | | | | | | | | 3,112,648 | |
| | | | | TELECOMMUNICATIONS — 4.1% | | | | | | | | |
| | 345,000 | | | Altice France S.A.(b) | | 5.1250 | | 07/15/29 | | | 292,632 | |
| | 1,035,000 | | | Altice France S.A.(b) | | 5.5000 | | 10/15/29 | | | 883,513 | |
| | 175,000 | | | CenturyLink, Inc.(b) | | 5.1250 | | 12/15/26 | | | 157,809 | |
| | 680,000 | | | Connect Finco S.A.RL / Connect US Finco, LLC(b) | | 6.7500 | | 10/01/26 | | | 662,093 | |
| | 535,000 | | | Hughes Satellite Systems Corporation | | 6.6250 | | 08/01/26 | | | 533,309 | |
| | 690,000 | | | Iliad Holding S.A.SU(b) | | 7.0000 | | 10/15/28 | | | 653,323 | |
| | 505,000 | | | Lumen Technologies, Inc.(b) | | 5.3750 | | 06/15/29 | | | 412,716 | |
| | 558,000 | | | Telesat Canada / Telesat, LLC(b) | | 4.8750 | | 06/01/27 | | | 380,193 | |
| | 136,000 | | | Telesat Canada / Telesat, LLC(b) | | 6.5000 | | 10/15/27 | | | 58,300 | |
| | 360,000 | | | Zayo Group Holdings, Inc.(b) | | 6.1250 | | 03/01/28 | | | 301,973 | |
| | | | | | | | | | | | 4,335,861 | |
| | | | | TRANSPORTATION & LOGISTICS — 2.9% | | | | | | | | |
| | 435,000 | | | American Airlines Group, Inc.(b),(c) | | 3.7500 | | 03/01/25 | | | 388,879 | |
| | 1,065,000 | | | American Airlines, Inc.(b) | | 11.7500 | | 07/15/25 | | | 1,226,806 | |
| | 650,000 | | | Cargo Aircraft Management, Inc.(b) | | 4.7500 | | 02/01/28 | | | 611,848 | |
| | 110,000 | | | United Airlines Holdings, Inc.(c) | | 4.8750 | | 01/15/25 | | | 106,281 | |
| | 271,000 | | | United Airlines, Inc.(b) | | 4.3750 | | 04/15/26 | | | 261,922 | |
| | 510,000 | | | United Airlines, Inc.(b),(c) | | 4.6250 | | 04/15/29 | | | 468,662 | |
| | | | | | | | | | | | 3,064,398 | |
| | | | | TRANSPORTATION EQUIPMENT — 0.4% | | | | | | | | |
| | 380,000 | | | JB Poindexter & Company, Inc.(b) | | 7.1250 | | 04/15/26 | | | 381,189 | |
| | | | | | | | | | | | | |
| | | | | WHOLESALE - CONSUMER STAPLES — 1.0% | | | | | | | | |
| | 675,000 | | | C&S Group Enterprises, LLC(b) | | 5.0000 | | 12/15/28 | | | 575,461 | |
| | 450,000 | | | Performance Food Group, Inc.(b),(c) | | 5.5000 | | 10/15/27 | | | 436,448 | |
| | | | | | | | | | | | 1,011,909 | |
| | | | | TOTAL CORPORATE BONDS (Cost $110,770,871) | | | | | | | 102,877,797 | |
See accompanying notes which are an integral part of these financial statements.
| DUNHAM HIGH YIELD BOND FUND |
| SCHEDULE OF INVESTMENTS (Unaudited) (Continued) |
| April 30, 2022 |
| Shares | | | | | Fair Value | |
| | | | | COLLATERAL FOR SECURITIES LOANED — 11.9% | | | | |
| | 12,614,458 | | | Mount Vernon Liquid Assets Portfolio, LLC, 0.45% (Cost $12,614,458)(f),(g) | | $ | 12,614,458 | |
| | | | | | | | | |
| | | | | TOTAL INVESTMENTS - 109.5% (Cost $124,594,059) | | $ | 116,192,323 | |
| | | | | LIABILITIES IN EXCESS OF OTHER ASSETS - (9.5)% | | | (10,050,963 | ) |
| | | | | NET ASSETS - 100.0% | | $ | 106,141,360 | |
| LLC | - Limited Liability Company |
| PLC | - Public Limited Company |
| REIT | - Real Estate Investment Trust |
| US0003M | - ICE LIBOR USD 3 Month |
| (a) | Non-income producing security. |
| (b) | Security exempt from registration under Rule 144A or Section 4(2) of the Securities Act of 1933. The security may be resold in transactions exempt from registration, normally to qualified institutional buyers. As of April 30, 2022 the total market value of 144A securities is 86,200,143 or 81.2% of net assets. |
| (c) | All or a portion of these securities are on loan. Total loaned securities had a value of $12,254,114 at April 30, 2022. |
| (e) | Variable rate security; the rate shown represents the rate on April 30, 2022. |
| (f) | Rate disclosed is the seven day effective yield as of April 30, 2022. |
| (g) | The Trust’s securities lending policies and procedures require that the borrower: (i) deliver cash or U.S. Government securities as collateral with respect to each new loan of U.S. securities, equal to at least 102% of the value of the portfolio securities loaned, and (ii) at all times thereafter mark-to-market the collateral on a daily basis so that the market value of such collateral is at least 100% of the value of securities loaned. From time to time the collateral may not be 102% due to end of day market movement. The next business day additional collateral is obtained/received from the borrower to replenish/reestablish 102%. |
| (h) | Level 3 securities fair value under procedures established by the Board of Trustees, represents 0.66% of net assets. The total value of these securities is $700,068. |
| Portfolio Composition * - (Unaudited) |
| B1 | | | 16.9 | % | | Other/Not Rated | | | 7.1 | % |
| B2 | | | 16.1 | % | | Ba1 | | | 6.0 | % |
| Ba3 | | | 15.8 | % | | Caa1 | | | 5.7 | % |
| Collateral for Securities Loaned | | | 10.9 | % | | Caa2 | | | 2.4 | % |
| B3 | | | 9.6 | % | | Baa3 | | | 0.5 | % |
| Ba2 | | | 8.6 | % | | Caa3 | | | 0.4 | % |
| | | | | | | Total | | | 100.0 | % |
| | | | | | | | | | | |
| * | Based on total value of investments as of April 30, 2022. Does not include derivative holdings. Bond Ratings provided by Moody’s Ratings. |
| Percentage may differ from Schedule of Investments which is based on Fund net assets. |
See accompanying notes which are an integral part of these financial statements.
Dunham International Opportunity Bond Fund (Unaudited)
Message from the Sub-Adviser (Stone Harbor Investment Partners LP)
Asset Class Recap
Fixed income markets across the globe declined to begin the fiscal year amid elevated inflation, the emergence of the omicron variant, and hawkish developed markets central banks, prompting interest rates to rise. The persistent theme of rising interest rates continued in the most recent quarter as the conflict between Ukraine and Russia and the uncertain impact on the global economy forced several central banks to shift toward tighter monetary policy than previously anticipated. Although rising interest rates in the U.S. have been top-of-mind for fixed-income investors, it is not the only marketplace seeing adverse effects on bond prices. Foreign fixed income has seen rate increases and adjustments to yields as its local bond markets react to the increasing benchmark rates set by U.S. Treasury bonds. Duration on foreign bonds was approximately 7.7 years, which is higher than U.S. investment-grade bonds, as measured by the Bloomberg U.S. Aggregate Bond Index. Therefore, foreign bonds did not provide a safe haven from the adverse effects of the 138 basis point rise in the 10-year U.S. Treasury bond yield. However, the decline experienced by foreign bonds, as measured by the Bloomberg Global Bond ex U.S. Index, was 5.4 percent during the fiscal six -month period, which was less negative than the 9.5 percent decline experienced by U.S. investment-grade bonds. The sell-off was more pronounced in the historically more volatile foreign high-yield bonds, as measured by the Bloomberg Pan -European High-Yield Total Return Index Unhedged, and emerging market debt, as measured by the Bloomberg Emerging Markets USD Aggregate Total Return Index Unhedged, which tumbled 14.6 percent and 13.3 percent, respectively. During the first six months of the fiscal year, the strength of the U.S. Dollar persisted as it increased 7.3 percent against a broad basket of currencies, as measured by the Bloomberg Dollar Spot Index, exacerbating foreign currency losses.
Allocation Review
To begin the fiscal period, the Fund continued to hold an approximate 55 percent allocation to emerging market debt and 45 percent allocation to developed markets and maintained an approximate 53 percent allocation to high-yield bonds. The Sub-Adviser reduced the allocation to emerging market debt to approximately 52 percent during the fiscal period, with the remaining 48 percent dedicated to developed markets. Additionally, the Sub -Adviser added to the high-yield bond exposure, resulting in an allocation of 55 percent. The allocation to emerging markets debt and high -yield bonds represented the most significant allocation differences between the Fund and the benchmark index. These off -benchmark allocations represented the largest detraction from Fund performance over the six -month period. The Sub -Adviser also maintained an overall duration of more than one year lower than the benchmark index, close to 6.8 years instead of the benchmark index duration of 7.7 years. As rates increased overall during the fiscal period, the lower duration aided the Fund’s relative performance. Still, the positive impact was not enough to offset the declines in emerging markets debt and high yield bonds. During the first six months of the fiscal year, the Fund did not hold any derivatives that materially affected performance.
Holdings Insights
Emerging markets debt was one of the worst-performing sectors over the most recent fiscal six-month period, across both emerging market sovereign bonds as well as emerging market corporate. One of the most meaningful country allocations within this sector was to China. Over the fiscal period, Chinese bonds sold off as the country’s “Covid-Zero” policy weighed on economic growth. The strict mandate possibly caused the Peoples Bank of China to fail to deliver on its promises of supportive government policy and its overhaul of its indebted property sector. Chinese bonds held during the period included China SCE Group Holdings Ltd. 7% 5/2/2025 (G21190AG1) (holding weight*: 0.80 percent), a residential property developer, and Wanda Properties International Company Ltd. 7.25% 1/29/2024 (G9429CAA8) (holding weight*: 2.01 percent), a multinational conglomerate based in China, both of which detracted from performance. China SCE declined 8.9 percent, while Wanda Properties lost 8.5 percent. The Fund’s exposure to Latin America included both sovereign and corporate bonds. Specifically, the Fund held YPF S.A. 17.9%, Due 07/28/2025 (984245AL4) (holding weight*: 1.49 percent), an Argentina state -owned energy company, increased 7.5 percent. The Fund also held Mexican Bonos 7.75% 11/13/2042 (B7V21L1) (holding weight*: 0.40 percent), which is a bond issued by the Mexican government. During the most recent six-month period, the Mexican Bonos declined 8.1 percent.
As Pan-European high-yield bonds also struggled during the six-month period, the sector also had a meaningful impact on the Fund’s absolute and relative performance. The most significant detraction from Fund performance within the sector and accounting for a meaningful percentage of the Fund’s overall decline during the period were credits adversely impacted by Russia’s invasion of Ukraine. This includes VF Ukraine PAT via VFU Funding plc 6.2%, Due 02/11/2025 (984245AL4) (holding weight*: 1.49 percent), a special purpose entity with the purpose of issuing debt securities to repay existing credit facilities, and the Development Bank of the Republic of Belarus JSC 6.75%, Due 05/2/2024 (BK4PGF7) (holding weight*: 0.05 percent), a development bank in Belarus. These credits tumbled 47.4 percent and 91.3 percent over the six -month period. High-yield credits in Western Europe also detracted from performance. Perrigo Finance Unlimited Company 3.15% 6/15/2030 (71429MAC9) (holding weight*: 0.49 percent), an Ireland-based manufacturer of private label over-the-counter pharmaceuticals, declined 9.1 percent.
Outside of Europe, the Fund continued to have a meaningful allocation to Japanese corporate and government bonds. This exposure detracted from Fund performance as surging inflation weighed on the country’s economy. During the six-month period, it was revealed that the country recorded its largest current account deficit in eight years amid a jump in oil import costs, highlighting the country’s dependence on imports of commodities and raw materials. Subsequently, Japanese business confidence worsened for the first time in almost two years in the most recent fiscal quarter. During the period, the Fund held Nomura Holdings, Inc. 1.653%, Due 07/14/2026 (65535HAW9) (holding weight*: 0.37 percent), a Japanese financial holding company, and the Japan Government Thirty Year Bond 0.5%, Due 09/20/2046 (BD8CPW5) (holding weight*: 0.22 percent). These bonds closed the fiscal period 8.1 percent and 6.1 percent lower.
Sub-Adviser Outlook
The Sub -Adviser is cautiously optimistic for the coming quarter and the remainder of the fiscal year. The widespread and indiscriminate sell-off in global markets has created numerous opportunities across fixed-income markets. The Sub -Adviser believes that retaining the flexibility to invest in both emerging and developed markets, as well as both corporate bonds and sovereign debt, will allow the Fund to take advantage of the dispersion. Although the Sub-Adviser sees tremendous value in the market, they are mindful of the lingering risks and will take advantage of the dislocation only when they have clarity in rate markets. As many developed countries’ central banks have begun the process of raising interest rates, the Sub -Adviser continues to evaluate both the sovereign debt as well as the corporate offerings within each country and recognizes that many companies may have the flexibility to navigate their own recovery while their country of domicile struggles. The Sub-adviser also believes that bond markets have nearly priced in the future rate rises announced by major central banks and is prepared to close the duration gap relative to the benchmark if they view them as fully priced in.
| * | Holdings percentage(s) of total investments, cash and unsettled trades excluding collateral for securities loaned as of 4/30/2022. |
Growth of $100,000 Investment
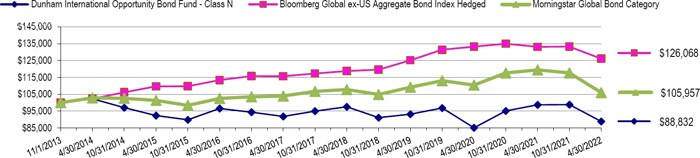
Total Returns (a) as of April 30, 2022
| | | | | Annualized |
| | | | Annualized | Since Inception |
| | Six Month | One Year | Five Years | (11/1/13) |
| Class N | (10.09)% | (10.00)% | (0.65)% | (1.62)% |
| Class A with load of 4.50% | (14.17)% | (14.23)% | (1.81)% | (2.15)% |
| Class A without load | (10.10)% | (10.22)% | (0.91)% | (1.62)% |
| Class C | (10.38)% | (10.72)% | (1.40)% | (2.13)% |
Bloomberg Global Aggregate Bond ex-US
Index Hedged | (5.39)% | (5.29)% | 1.74% | 2.97% |
| Morningstar Global Bond Category | (9.95)% | (11.29)% | 0.39% | 0.76% |
| (a) | Total Returns are calculated based on traded NAVs. |
The Bloomberg Global ex US Aggregate Bond Index Hedged is designed to be a broad-based measure of the global investment-grade, fixed rate, fixed income corporate markets outside the United States. Investors cannot invest directly in an index or benchmark.
The Morningstar Global Bond Category is generally representative of funds that invest at least 40% of bonds in foreign markets.
As disclosed in the Trust’s latest registration statement, the Fund’s total annual operating expenses, including underlying funds, are 1.78% for Class N, 2.53% for Class C and 2.03% for Class A. Class A shares are subject to a sales load of 4.50% and a deferred sales charge of up to 0.75%. The performance data quoted here represents past performance, which is not indicative of future results. Current performance may be lower or higher than the performance data quoted. The investment return and NAV will fluctuate, so that an investor’s shares, when redeemed, may be worth more or less than their original cost. Total returns are calculated assuming reinvestment of all dividends and capital gains distributions, if any. The returns do not reflect the deductions of taxes a shareholder would pay on the redemption of Fund shares or Fund distributions. For performance information current to the most recent month-end, please call 1-800-442-4358 or visit our website www.dunham.com.
| DUNHAM INTERNATIONAL OPPORTUNITY BOND FUND |
| SCHEDULE OF INVESTMENTS (Unaudited) |
| April 30, 2022 |
| | | | | | | | Coupon Rate | | | | | |
| Principal Amount ($) | | | | | Spread | | (%) | | Maturity | | Fair Value | |
| | | | | ASSET BACKED SECURITIES — 0.1% | | | | | | | | | | |
| | | | | RESIDENTIAL MORTGAGE — 0.1% | | | | | | | | | | |
| | 52,376 EUR | | | Bankinter 10 FTA (a) | | EUR003M + 0.160% | | 0.0001 | | 06/21/43 | | $ | 54,762 | |
| | 21,349 EUR | | | Fondo de Titulizacion de Activos Santander (a) | | EUR003M + 0.150% | | 0.0001 | | 01/18/49 | | | 22,270 | |
| | | | | TOTAL ASSET BACKED SECURITIES (Cost $78,349) | | | | | | | | | 77,032 | |
| | | | | | | | | | | | | | | |
| | | | | CORPORATE BONDS — 65.7% | | | | | | | | | | |
| | | | | AEROSPACE & DEFENSE — 0.6% | | | | | | | | | | |
| | 250,000 EUR | | | Airbus S.E. | | | | 2.3750 | | 06/09/40 | | | 236,737 | |
| | 100,000 EUR | | | Rolls-Royce plc | | | | 4.6250 | | 02/16/26 | | | 106,365 | |
| | | | | | | | | | | | | | 343,102 | |
| | | | | ASSET MANAGEMENT — 1.0% | | | | | | | | | | |
| | 300,000 EUR | | | JAB Holdings BV | | | | 1.0000 | | 12/20/27 | | | 291,414 | |
| | 300,000 USD | | | UBS Group A.G. (b),(c), (d) | | H15T1Y + 0.850% | | 1.4940 | | 08/10/27 | | | 266,701 | |
| | | | | | | | | | | | | | 558,115 | |
| | | | | AUTOMOTIVE — 2.3% | | | | | | | | | | |
| | 200,000 EUR | | | Clarios Global, L.P. / Clarios US Finance Company | | | | 4.3750 | | 05/15/26 | | | 202,557 | |
| | 300,000 EUR | | | Daimler A.G. | | | | 0.7500 | | 02/08/30 | | | 288,364 | |
| | 200,000 USD | | | Hyundai Capital America (b) | | | | 1.0000 | | 09/17/24 | | | 186,423 | |
| | 325,000 USD | | | Nissan Motor Acceptance Company, LLC (b) | | | | 1.8500 | | 09/16/26 | | | 282,361 | |
| | 40,000 USD | | | Uzauto Motors AJ (b) | | | | 4.8500 | | 05/04/26 | | | 34,500 | |
| | 200,000 EUR | | | Volkswagen International Finance N.V. | | | | 1.8750 | | 03/30/27 | | | 205,773 | |
| | 100,000 EUR | | | ZF Finance GmbH | | | | 3.7500 | | 09/21/28 | | | 94,008 | |
| | | | | | | | | | | | | | 1,293,986 | |
| | | | | BANKING — 7.4% | | | | | | | | | | |
| | 250,000 EUR | | | AIB Group plc | | | | 2.2500 | | 07/03/25 | | | 265,786 | |
| | 300,000 EUR | | | Banco Bilbao Vizcaya Argentaria S.A. | | | | 3.5000 | | 02/10/27 | | | 325,143 | |
| | 715,000 USD | | | Banco Mercantil del Norte S.A. (b),(c) | | H15T5Y + 4.967% | | 6.7500 | | 09/27/68 | | | 691,298 | |
| | 200,000 USD | | | Banco Santander S.A. (c) | | H15T1Y + 2.000% | | 4.1750 | | 03/24/28 | | | 194,449 | |
| | 300,000 EUR | | | Banque Federative du Credit Mutuel S.A. | | | | 2.6250 | | 03/18/24 | | | 325,276 | |
| | 350,000 USD | | | Barclays plc | | | | 4.8360 | | 05/09/28 | | | 345,161 | |
| | 225,000 EUR | | | Cooperatieve Rabobank UA | | | | 1.3750 | | 02/03/27 | | | 235,698 | |
| | 250,000 USD | | | Danske Bank A/S (b),(c) | | H15T1Y + 1.350% | | 1.6210 | | 09/11/26 | | | 227,528 | |
| | 250,000 USD | | | Deutsche Bank AG/New York NY (c) | | SOFRRATE + 1.870% | | 2.1290 | | 11/24/26 | | | 227,435 | |
| | 175,000 USD | | | HSBC Holdings plc (c), (d) | | SOFRRATE + 1.538% | | 1.6450 | | 04/18/26 | | | 162,437 | |
| | 100,000 USD | | | HSBC Holdings PLC (c) | | SOFRRATE + 1.290% | | 1.5890 | | 05/24/27 | | | 89,060 | |
See accompanying notes which are an integral part of these financial statements.
| DUNHAM INTERNATIONAL OPPORTUNITY BOND FUND |
| SCHEDULE OF INVESTMENTS (Unaudited) (continued) |
| April 30, 2022 |
| | | | | | | | Coupon Rate | | | | | |
| Principal Amount ($) | | | | | Spread | | (%) | | Maturity | | Fair Value | |
| | | | | CORPORATE BONDS — 65.7% (Continued) | | | | | | | | | | |
| | | | | BANKING — 7.4% (Continued) | | | | | | | | | | |
| | 300,000 USD | | | Mizuho Financial Group, Inc. | | | | 2.5640 | | 09/13/31 | | $ | 249,100 | |
| | 250,000 EUR | | | Natwest Group plc (c) | | EUR003M + 1.080% | | 1.7500 | | 03/02/26 | | | 260,395 | |
| | 150,000 USD | | | Standard Chartered plc (b),(c) | | H15T5Y + 2.300% | | 3.2650 | | 02/18/36 | | | 126,623 | |
| | 150,000 USD | | | Standard Chartered plc (b), (d) | | | | 5.7000 | | 03/26/44 | | | 146,392 | |
| | 300,000 USD | | | Sumitomo Mitsui Financial Group, Inc. | | | | 2.1420 | | 09/23/30 | | | 245,808 | |
| | | | | | | | | | | | | | 4,117,589 | |
| | | | | BEVERAGES — 1.3% | | | | | | | | | | |
| | 300,000 EUR | | | Anheuser-Busch InBev S.A./NV | | | | 1.1500 | | 01/22/27 | | | 308,307 | |
| | 200,000 EUR | | | Pernod Ricard S.A. | | | | 1.5000 | | 05/18/26 | | | 210,229 | |
| | 200,000 EUR | | | Primo Water Holdings, Inc. | | | | 3.8750 | | 10/31/28 | | | 193,650 | |
| | | | | | | | | | | | | | 712,186 | |
| | | | | BIOTECH & PHARMA — 3.0% | | | | | | | | | | |
| | 300,000 EUR | | | Bayer A.G. | | | | 1.3750 | | 07/06/32 | | | 276,631 | |
| | 225,000 USD | | | CSL Finance plc (b) | | | | 4.7500 | | 04/27/52 | | | 222,464 | |
| | 250,000 GBP | | | GlaxoSmithKline Capital plc | | | | 1.2500 | | 10/12/28 | | | 287,378 | |
| | 100,000 EUR | | | Grifols S.A. | | | | 2.2500 | | 11/15/27 | | | 95,650 | |
| | 300,000 EUR | | | Mylan N.V. | | | | 3.1250 | | 11/22/28 | | | 312,433 | |
| | 100,000 EUR | | | Nidda BondCompany GmbH | | | | 5.0000 | | 09/30/25 | | | 95,230 | |
| | 100,000 EUR | | | Nidda Healthcare Holding GmbH | | | | 3.5000 | | 09/30/24 | | | 98,041 | |
| | 300,000 USD | | | Perrigo Finance Unlimited Company (d) | | | | 3.1500 | | 06/15/30 | | | 270,005 | |
| | | | | | | | | | | | | | 1,657,832 | |
| | | | | CABLE & SATELLITE — 0.9% | | | | | | | | | | |
| | 200,000 EUR | | | UPCB Finance VII Ltd. | | | | 3.6250 | | 06/15/29 | | | 196,161 | |
| | 100,000 GBP | | | Virgin Media Secured Finance plc | | | | 4.2500 | | 01/15/30 | | | 109,391 | |
| | 100,000 EUR | | | Ziggo Bond Company BV(b) | | | | 3.3750 | | 02/28/30 | | | 88,321 | |
| | 100,000 EUR | | | Ziggo BV | | | | 2.8750 | | 01/15/30 | | | 91,020 | |
| | | | | | | | | | | | | | 484,893 | |
| | | | | CHEMICALS — 1.2% | | | | | | | | | | |
| | 100,000 EUR | | | Chemours Company (The) | | | | 4.0000 | | 05/15/26 | | | 99,043 | |
| | 100,000 EUR | | | INEOS Quattro Finance 1 plc | | | | 3.7500 | | 07/15/26 | | | 96,637 | |
| | 190,000 EUR | | | INEOS Quattro Finance 1 plc (b) | | | | 3.7500 | | 07/15/26 | | | 183,609 | |
| | 200,000 EUR | | | Nobian Finance BV (b) | | | | 3.6250 | | 07/15/26 | | | 187,562 | |
| | 100,000 EUR | | | Solvay Finance S.A.CA (c) | | EUSA5 + 5.223% | | 5.8690 | | 06/03/68 | | | 108,161 | |
| | | | | | | | | | | | | | 675,012 | |
See accompanying notes which are an integral part of these financial statements.
| DUNHAM INTERNATIONAL OPPORTUNITY BOND FUND |
| SCHEDULE OF INVESTMENTS (Unaudited) (Continued) |
| April 30, 2022 |
| | | | | | | | Coupon Rate | | | | | |
| Principal Amount ($) | | | | | Spread | | (%) | | Maturity | | Fair Value | |
| | | | | CORPORATE BONDS — 65.7% (Continued) | | | | | | | | | | |
| | | | | CONSTRUCTION MATERIALS — 0.8% | | | | | | | | | | |
| | 486,000 USD | | | Cemex S.A.B. de C.V. (b),(c) | | H15T5Y + 4.534% | | 5.1250 | | 09/08/69 | | $ | 444,690 | |
| | | | | | | | | | | | | | | |
| | | | | CONTAINERS & PACKAGING — 1.2% | | | | | | | | | | |
| | 200,000 EUR | | | Ardagh Metal Packaging Finance USA, LLC / Ardagh | | | | 3.0000 | | 09/01/29 | | | 172,848 | |
| | 200,000 GBP | | | Ardagh Packaging Finance plc / Ardagh Holdings | | | | 4.7500 | | 07/15/27 | | | 216,436 | |
| | 100,000 EUR | | | Smurfit Kappa Treasury ULC | | | | 1.5000 | | 09/15/27 | | | 101,248 | |
| | 200,000 EUR | | | Trivium Packaging Finance BV | | | | 3.7500 | | 08/15/26 | | | 202,793 | |
| | | | | | | | | | | | | | 693,325 | |
| | | | | ELEC & GAS MARKETING & TRADING — 0.5% | | | | | | | | | | |
| | 250,000 EUR | | | Orsted A/S | | | | 1.5000 | | 11/26/29 | | | 255,093 | |
| | | | | | | | | | | | | | | |
| | | | | ELECTRIC UTILITIES — 4.6% | | | | | | | | | | |
| | 69,000 USD | | | Comision Federal de Electricidad (b), (d) | | | | 4.6880 | | 05/15/29 | | | 64,230 | |
| | 1,000,000 USD | | | Eskom Holdings SOC Ltd. (b) | | | | 6.7500 | | 08/06/23 | | | 976,463 | |
| | 95,000 USD | | | Eskom Holdings SOC Ltd. (b) | | | | 7.1250 | | 02/11/25 | | | 91,024 | |
| | 158,000 USD | | | Eskom Holdings SOC Ltd. (b) | | | | 8.4500 | | 08/10/28 | | | 152,453 | |
| | 64,020 USD | | | Greenko Dutch BV (b) | | | | 3.8500 | | 03/29/26 | | | 58,444 | |
| | 200,000 EUR | | | Iberdrola Finanzas S.A. | | | | 1.0000 | | 03/07/25 | | | 209,764 | |
| | 180,000 USD | | | Inkia Energy Ltd. (b) | | | | 5.8750 | | 11/09/27 | | | 170,663 | |
| | 250,000 EUR | | | innogy Finance BV | | | | 1.0000 | | 04/13/25 | | | 260,808 | |
| | 300,000 EUR | | | Naturgy Finance BV | | | | 1.5000 | | 01/29/28 | | | 309,042 | |
| | 8,000 USD | | | Perusahaan Perseroan Persero PT Perusahaan Listrik | | | | 3.3750 | | 02/05/30 | | | 7,120 | |
| | 233,000 USD | | | Star Energy Geothermal Darajat II / Star Energy (b) | | | | 4.8500 | | 10/14/38 | | | 223,328 | |
| | | | | | | | | | | | | | 2,523,339 | |
| | | | | ELECTRICAL EQUIPMENT — 1.1% | | | | | | | | | | |
| | 300,000 GBP | | | Siemens Financieringsmaatschappij N.V. | | | | 1.0000 | | 02/20/25 | | | 361,930 | |
| | 200,000 EUR | | | Vertical Midco GmbH | | | | 4.3750 | | 07/15/27 | | | 195,638 | |
| | | | | | | | | | | | | | 557,568 | |
| | | | | ENGINEERING & CONSTRUCTION — 1.5% | | | | | | | | | | |
| | 613,000 USD | | | IHS Holding Ltd. (b) | | | | 6.2500 | | 11/29/28 | | | 580,860 | |
| | 248,000 USD | | | IHS Netherlands Holdco BV (b) | | | | 8.0000 | | 09/18/27 | | | 250,703 | |
| | | | | | | | | | | | | | 831,563 | |
| | | | | ENTERTAINMENT CONTENT — 0.3% | | | | | | | | | | |
| | 185,000 EUR | | | Banijay Group S.A.S | | | | 6.5000 | | 03/01/26 | | | 188,949 | |
See accompanying notes which are an integral part of these financial statements.
| DUNHAM INTERNATIONAL OPPORTUNITY BOND FUND |
| SCHEDULE OF INVESTMENTS (Unaudited) (Continued) |
| April 30, 2022 |
| | | | | | | | Coupon Rate | | | | | |
| Principal Amount ($) | | | | | Spread | | (%) | | Maturity | | Fair Value | |
| | | | | CORPORATE BONDS — 65.7% (Continued) | | | | | | | | | | |
| | | | | FOOD — 1.5% | | | | | | | | | | |
| | 338,000 USD | | | Adecoagro S.A. (b) | | | | 6.0000 | | 09/21/27 | | $ | 332,415 | |
| | 495,000 USD | | | Minerva Luxembourg S.A. (b) | | | | 4.3750 | | 03/18/31 | | | 411,458 | |
| | 100,000 EUR | | | Sigma Holdco BV | | | | 5.7500 | | 05/15/26 | | | 77,786 | |
| | | | | | | | | | | | | | 821,659 | |
| | | | | FORESTRY, PAPER & WOOD PRODUCTS — 0.2% | | | | | | | | | | |
| | 100,000 EUR | | | WEPA Hygieneprodukte GmbH | | | | 2.8750 | | 12/15/27 | | | 88,189 | |
| | | | | | | | | | | | | | | |
| | | | | HOUSEHOLD PRODUCTS — 0.3% | | | | | | | | | | |
| | 100,000 EUR | | | Energizer Gamma Acquisition BV (b) | | | | 3.5000 | | 06/30/29 | | | 88,276 | |
| | 110,000 EUR | | | Energizer Gamma Acquisition BV | | | | 3.5000 | | 06/30/29 | | | 97,104 | |
| | | | | | | | | | | | | | 185,380 | |
| | | | | INDUSTRIAL INTERMEDIATE PROD — 0.7% | | | | | | | | | | |
| | 407,000 USD | | | HTA Group Ltd./Mauritius (b) | | | | 7.0000 | | 12/18/25 | | | 403,699 | |
| | | | | | | | | | | | | | | |
| | | | | INDUSTRIAL SUPPORT SERVICES — 0.3% | | | | | | | | | | |
| | 100,000 EUR | | | Loxam S.A.S | | | | 3.7500 | | 07/15/26 | | | 101,674 | |
| | 87,920 EUR | | | Techem Verwaltungsgesellschaft 674 mbH | | | | 6.0000 | | 07/30/26 | | | 91,488 | |
| | | | | | | | | | | | | | 193,162 | |
| | | | | INSTITUTIONAL FINANCIAL SERVICES — 0.5% | | | | | | | | | | |
| | 225,000 USD | | | Nomura Holdings, Inc. | | | | 1.6530 | | 07/14/26 | | | 202,420 | |
| | 75,000 USD | | | Nomura Holdings, Inc. | | | | 2.7100 | | 01/22/29 | | | 66,879 | |
| | | | | | | | | | | | | | 269,299 | |
| | | | | INSURANCE — 0.9% | | | | | | | | | | |
| | 200,000 EUR | | | Allianz S.E. (c) | | EUR003M + 3.350% | | 3.0990 | | 07/06/47 | | | 215,140 | |
| | 250,000 EUR | | | NN Group N.V. | | | | 1.6250 | | 06/01/27 | | | 260,013 | |
| | | | | | | | | | | | | | 475,153 | |
| | | | | INTERNET MEDIA & SERVICES — 0.1% | | | | | | | | | | |
| | 39,000 USD | | | Prosus N.V. (b) | | | | 3.0610 | | 07/13/31 | | | 30,846 | |
| | | | | | | | | | | | | | | |
| | | | | LEISURE FACILITIES & SERVICES — 1.8% | | | | | | | | | | |
| | 215,000 EUR | | | Carnival Corporation | | | | 7.6250 | | 03/01/26 | | | 227,624 | |
| | 100,000 EUR | | | Gamma Bidco SpA (b) | | | | 5.1250 | | 07/15/25 | | | 101,958 | |
| | 100,000 EUR | | | Gamma Bidco SpA | | | | 6.2500 | | 07/15/25 | | | 104,013 | |
| | 200,000 EUR | | | International Game Technology plc | | | | 3.5000 | | 06/15/26 | | | 205,580 | |
See accompanying notes which are an integral part of these financial statements.
| DUNHAM INTERNATIONAL OPPORTUNITY BOND FUND |
| SCHEDULE OF INVESTMENTS (Unaudited) (Continued) |
| April 30, 2022 |
| | | | | | | | Coupon Rate | | | | | |
| Principal Amount ($) | | | | | Spread | | (%) | | Maturity | | Fair Value | |
| | | | | CORPORATE BONDS — 65.7% (Continued) | | | | | | | | | | |
| | | | | LEISURE FACILITIES & SERVICES — 1.8% (Continued) | | | | | | | | | | |
| | 100,000 EUR | | | Motion Finco Sarl | | | | 7.0000 | | 05/15/25 | | $ | 108,885 | |
| | 140,000 GBP | | | Stonegate Pub Company Financing 2019 plc (b) | | | | 8.2500 | | 07/31/25 | | | 178,699 | |
| | 73,000 USD | | | Studio City Finance Ltd. (b) | | | | 6.0000 | | 07/15/25 | | | 61,665 | |
| | | | | | | | | | | | | | 988,424 | |
| | | | | MEDICAL EQUIPMENT & DEVICES — 0.5% | | | | | | | | | | |
| | 300,000 EUR | | | Medtronic Global Holdings SCA | | | | 0.7500 | | 10/15/32 | | | 271,852 | |
| | | | | | | | | | | | | | | |
| | | | | METALS & MINING — 1.6% | | | | | | | | | | |
| | 10,000 USD | | | Corp Nacional del Cobre de Chile | | | | 3.0000 | | 09/30/29 | | | 9,014 | |
| | 106,000 USD | | | Endeavour Mining plc (b) | | | | 5.0000 | | 10/14/26 | | | 97,471 | |
| | 71,000 USD | | | First Quantum Minerals Ltd. B (b) | | | | 6.8750 | | 03/01/26 | | | 71,457 | |
| | 300,000 EUR | | | Glencore Capital Finance DAC | | | | 1.1250 | | 03/10/28 | | | 289,658 | |
| | 40,000 USD | | | Indika Energy Capital IV Pte Ltd. (b) | | | | 8.2500 | | 10/22/25 | | | 40,250 | |
| | 79,000 USD | | | Indonesia Asahan Aluminium Persero PT (b) | | | | 6.7570 | | 11/15/48 | | | 82,715 | |
| | 26,000 USD | | | Indonesia Asahan Aluminium Persero PT (b) | | | | 5.8000 | | 05/15/50 | | | 23,645 | |
| | 63,000 USD | | | Vedanta Resources Finance II plc (b) | | | | 8.9500 | | 03/11/25 | | | 59,965 | |
| | 204,000 USD | | | Vedanta Resources Ltd. (b) | | | | 6.3750 | | 07/30/22 | | | 203,879 | |
| | | | | | | | | | | | | | 878,054 | |
| | | | | OIL & GAS PRODUCERS — 8.7% | | | | | | | | | | |
| | 57,000 USD | | | AI Candelaria Spain SLU (b) | | | | 7.5000 | | 12/15/28 | | | 55,324 | |
| | 250,000 USD | | | Cenovus Energy, Inc. | | | | 3.7500 | | 02/15/52 | | | 201,371 | |
| | 200,000 EUR | | | eG Global Finance plc | | | | 6.2500 | | 10/30/25 | | | 206,875 | |
| | 97,000 USD | | | Geopark Ltd. (b) | | | | 5.5000 | | 01/17/27 | | | 87,191 | |
| | 223,000 USD | | | Gran Tierra Energy International Holdings Ltd. (b) | | | | 6.2500 | | 02/15/25 | | | 206,599 | |
| | 80,000 USD | | | Gran Tierra Energy, Inc. (b) | | | | 7.7500 | | 05/23/27 | | | 74,125 | |
| | 28,000 USD | | | KazMunayGas National Company JSC (b) | | | | 4.7500 | | 04/19/27 | | | 26,950 | |
| | 114,000 USD | | | KazMunayGas National Company JSC (b) | | | | 5.7500 | | 04/19/47 | | | 103,673 | |
| | 92,000 USD | | | MC Brazil Downstream Trading S.A.RL (b) | | | | 7.2500 | | 06/30/31 | | | 80,500 | |
| | 22,000 USD | | | Oil and Gas Holding Company BSCC (The) (b) | | | | 7.6250 | | 11/07/24 | | | 23,071 | |
| | 100,000 USD | | | Pertamina Persero PT (b) | | | | 2.3000 | | 02/09/31 | | | 83,973 | |
| | 80,000 USD | | | Petroleos del Peru S.A. | | | | 5.6250 | | 06/19/47 | | | 58,268 | |
| | 122,000 USD | | | Petroleos Mexicanos (b) | | | | 6.7000 | | 02/16/32 | | | 105,078 | |
| | 120,000 USD | | | Petroleos Mexicanos | | | | 6.7000 | | 02/16/32 | | | 103,636 | |
| | 189,000 USD | | | Petroleos Mexicanos (d) | | | | 6.6250 | | 06/15/35 | | | 153,611 | |
See accompanying notes which are an integral part of these financial statements.
| DUNHAM INTERNATIONAL OPPORTUNITY BOND FUND |
| SCHEDULE OF INVESTMENTS (Unaudited) (Continued) |
| April 30, 2022 |
| | | | | | | | Coupon Rate | | | | | |
| Principal Amount ($) | | | | | Spread | | (%) | | Maturity | | Fair Value | |
| | | | | CORPORATE BONDS — 65.7% (Continued) | | | | | | | | | | |
| | | | | OIL & GAS PRODUCERS — 8.7% (Continued) | | | | | | | | | | |
| | 13,000 USD | | | Petroleos Mexicanos | | | | 6.6250 | | 06/15/38 | | | 10,054 | |
| | 159,000 USD | | | Petroleos Mexicanos | | | | 7.6900 | | 01/23/50 | | | 124,905 | |
| | 571,000 USD | | | SierraCol Energy Andina, LLC (b) | | | | 6.0000 | | 06/15/28 | | | 504,178 | |
| | 166,000 USD | | | Sinopec Group Overseas Development 2018 Ltd. | | | | 2.3000 | | 01/08/31 | | | 143,724 | |
| | 1,623,000 USD | | | Tullow Oil plc (b) | | | | 7.0000 | | 03/01/25 | | | 1,326,031 | |
| | 305,000 USD | | | Tullow Oil plc (b) | | | | 10.2500 | | 05/15/26 | | | 303,204 | |
| | 988,000 USD | | | YPF S.A. (b), (d) | | | | 8.5000 | | 07/28/25 | | | 812,773 | |
| | | | | | | | | | | | | | 4,795,114 | |
| | | | | OIL & GAS SERVICES & EQUIPMENT — 0.6% | | | | | | | | | | |
| | 373,913 USD | | | Poinsettia Finance Ltd. | | | | 6.6250 | | 06/17/31 | | | 339,643 | |
| | | | | | | | | | | | | | | |
| | | | | PUBLISHING & BROADCASTING — 0.5% | | | | | | | | | | |
| | 250,000 EUR | | | Informa plc | | | | 2.1250 | | 10/06/25 | | | 262,773 | |
| | | | | | | | | | | | | | | |
| | | | | REAL ESTATE OWNERS & DEVELOPERS — 5.2% | | | | | | | | | | |
| | 636,000 USD | | | China SCE Group Holdings Ltd. | | | | | | | | | | |
| | 700,000 USD | | | China SCE Group Holdings Ltd. | | | | 7.3750 | | 04/09/24 | | | 438,841 | |
| | 500,000 USD | | | Theta Capital Pte Ltd. | | | | 7.0000 | | 05/02/25 | | | 437,500 | |
| | 250,000 USD | | | Theta Capital Pte Ltd. | | | | 8.1250 | | 01/22/25 | | | 502,500 | |
| | 1,300,000 USD | | | Wanda Properties International Company Ltd. | | | | 6.7500 | | 10/31/26 | | | 236,000 | |
| | 200,000 USD | | | Wanda Properties Overseas Ltd. | | | | 7.2500 | | 01/29/24 | | | 1,098,403 | |
| | | | | | | | | 6.9500 | | 12/05/22 | | | 181,500 | |
| | | | | | | | | | | | | | 2,894,744 | |
| | | | | REIT — 0.7% | | | | | | | | | | |
| | 400,000 USD | | | LMIRT Capital Pte Ltd. | | | | 7.2500 | | 06/19/24 | | | 398,000 | |
| | | | | | | | | | | | | | | |
| | | | | RENEWABLE ENERGY — 0.9% | | | | | | | | | | |
| | 439,000 USD | | | Aydem Yenilenebilir Enerji A/S (b) | | | | 7.7500 | | 02/02/27 | | | 362,790 | |
| | 125,000 USD | | | Investment Energy Resources Ltd. (b) | | | | 6.2500 | | 04/26/29 | | | 123,531 | |
| | | | | | | | | | | | | | 486,321 | |
| | | | | RETAIL - CONSUMER STAPLES — 0.8% | | | | | | | | | | |
| | 100,000 GBP | | | Bellis Acquisition Company plc (b) | | | | 3.2500 | | 02/16/26 | | | 110,665 | |
| | 100,000 GBP | | | Bellis Finco plc (b) | | | | 4.0000 | | 02/16/27 | | | 105,257 | |
| | 200,000 EUR | | | Quatrim S.A.SU | | | | 5.8750 | | 01/15/24 | | | 206,709 | |
| | | | | | | | | | | | | | 422,631 | |
See accompanying notes which are an integral part of these financial statements.
| DUNHAM INTERNATIONAL OPPORTUNITY BOND FUND |
| SCHEDULE OF INVESTMENTS (Unaudited) (Continued) |
| April 30, 2022 |
| | | | | | | | Coupon Rate | | | | | |
| Principal Amount ($) | | | | | Spread | | (%) | | Maturity | | Fair Value | |
| | | | | CORPORATE BONDS — 65.7% (Continued) | | | | | | | | | | |
| | | | | SEMICONDUCTORS — 0.5% | | | | | | | | | | |
| | 150,000 USD | | | TSMC Arizona Corporation | | | | 4.5000 | | 04/22/52 | | $ | 150,729 | |
| | 150,000 USD | | | TSMC Global Ltd. (b) | | | | 1.0000 | | 09/28/27 | | | 129,038 | |
| | | | | | | | | | | | | | 279,767 | |
| | | | | SPECIALTY FINANCE — 0.3% | | | | | | | | | | |
| | 184,000 USD | | | Studio City Finance Ltd. (b) | | | | 6.5000 | | 01/15/28 | | | 144,681 | |
| | | | | | | | | | | | | | | |
| | | | | STEEL — 1.6% | | | | | | | | | | |
| | 132,000 USD | | | CSN Inova Ventures (b) | | | | 6.7500 | | 01/28/28 | | | 131,227 | |
| | 1,374,000 USD | | | Metinvest BV (b) | | | | 7.7500 | | 10/17/29 | | | 769,441 | |
| | | | | | | | | | | | | | 900,668 | |
| | | | | TELECOMMUNICATIONS —4.1% | | | | | | | | | | |
| | 100,000 EUR | | | Altice France Holding S.A. (b) | | | | 8.0000 | | 05/15/27 | | | 107,138 | |
| | 100,000 EUR | | | Altice France S.A. (b) | | | | 2.1250 | | 02/15/25 | | | 97,976 | |
| | 110,000 EUR | | | Altice France S.A. (b) | | | | 4.2500 | | 10/15/29 | | | 100,394 | |
| | 250,000 EUR | | | Deutsche Telekom International Finance BV | | | | 0.8750 | | 01/30/24 | | | 263,581 | |
| | 378,000 USD | | | Digicel International Finance Ltd./Digicel (b) | | | | 8.7500 | | 05/25/24 | | | 373,657 | |
| | 180,000 USD | | | Millicom International Cellular S.A. (b) | | | | 5.1250 | | 01/15/28 | | | 170,993 | |
| | 300,000 EUR | | | Orange S.A. | | | | 2.0000 | | 01/15/29 | | | 319,183 | |
| | 210,000 EUR | | | SoftBank Group Corporation | | | | 2.8750 | | 01/06/27 | | | 189,111 | |
| | 100,000 EUR | | | Telefonica Europe BV (c) | | EUSA6 + 4.107% | | 4.3750 | | 03/14/68 | | | 107,412 | |
| | 300,000 USD | | | TELUS Corporation | | | | 3.4000 | | 05/13/32 | | | 275,471 | |
| | 250,000 USD | | | VF Ukraine PAT via VFU Funding plc (b) | | | | 6.2000 | | 02/11/25 | | | 138,125 | |
| | 100,000 EUR | | | Vodafone Group plc (c) | | EUSA5 + 3.002% | | 2.6250 | | 08/27/80 | | | 98,776 | |
| | | | | | | | | | | | | | 2,241,817 | |
| | | | | TOBACCO & CANNABIS — 0.5% | | | | | | | | | | |
| | 300,000 USD | | | BAT Capital Corporation | | | | 4.7000 | | 04/02/27 | | | 298,073 | |
| | | | | | | | | | | | | | | |
| | | | | TRANSPORTATION & LOGISTICS — 5.3% | | | | | | | | | | |
| | 200,000 EUR | | | Abertis Infraestructuras S.A. | | | | 2.3750 | | 09/27/27 | | | 211,129 | |
| | 64,000 USD | | | DP World plc (b) | | | | 5.6250 | | 09/25/48 | | | 64,328 | |
| | 6,000 USD | | | DP World plc (b) | | | | 4.7000 | | 09/30/49 | | | 5,364 | |
| | 1,245,000 USD | | | DP World Salaam (c) | | H15T5Y + 5.750% | | 6.0000 | | 01/01/70 | | | 1,265,873 | |
| | 662,000 USD | | | Gol Finance S.A. (b) | | | | 7.0000 | | 01/31/25 | | | 567,535 | |
See accompanying notes which are an integral part of these financial statements.
| DUNHAM INTERNATIONAL OPPORTUNITY BOND FUND |
| SCHEDULE OF INVESTMENTS (Unaudited) (Continued) |
| April 30, 2022 |
| | | | | | | | Coupon Rate | | | | | |
| Principal Amount ($) | | | | | Spread | | (%) | | Maturity | | Fair Value | |
| | | | | CORPORATE BONDS — 65.7% (Continued) | | | | | | | | | | |
| | | | | TRANSPORTATION & LOGISTICS — 5.3% (Continued) | | | | | | | | | | |
| | 300,000 USD | | | Gol Finance S.A. (b) | | | | 8.0000 | | 06/30/26 | | $ | 263,373 | |
| | 100,000 GBP | | | Heathrow Finance plc | | | | 6.2500 | | 03/03/25 | | | 125,660 | |
| | 100,000 GBP | | | Heathrow Funding Ltd. | | | | 7.1250 | | 02/14/24 | | | 133,343 | |
| | 100,000 EUR | | | International Consolidated Airlines Group S.A. | | | | 3.7500 | | 03/25/29 | | | 91,174 | |
| | 218,000 USD | | | Simpar Europe S.A. (b) | | | | 5.2000 | | 01/26/31 | | | 179,036 | |
| | | | | | | | | | | | | | 2,906,815 | |
| | | | | TOTAL CORPORATE BONDS (Cost $41,673,082) | | | | | | | | | 36,314,006 | |
| | | | | | | | | | | | | | | |
| | | | | NON U.S. GOVERNMENT & AGENCIES — 27.9% | | | | | | | | | | |
| | | | | GOVERNMENT GUARANTEED — 0.1% | | | | | | | | | | |
| | 33,600 USD | | | Brazil Minas SPE via State of Minas Gerais (b) | | | | 5.3330 | | 02/15/28 | | | 33,971 | |
| | | | | | | | | | | | | | | |
| | | | | GOVERNMENT OWNED, NO GUARANTEE — 0.3% | | | | | | | | | | |
| | 200,000 USD | | | Development Bank of the Republic of Belarus JSC | | | | 6.7500 | | 05/02/24 | | | 25,000 | |
| | 162,000 USD | | | Gabon Government International Bond (b) | | | | 7.0000 | | 11/24/31 | | | 147,504 | |
| | | | | | | | | | | | | | 172,504 | |
| | | | | LOCAL AUTHORITY — 0.4% | | | | | | | | | | |
| | 150,000 CAD | | | Province of British Columbia Canada | | | | 3.2000 | | 06/18/44 | | | 107,649 | |
| | 250,000 CAD | | | Province of Ontario Canada | | | | 2.8000 | | 06/02/48 | | | 164,468 | |
| | | | | | | | | | | | | | 272,117 | |
| | | | | NON U.S. TREASURY — 12.7% | | | | | | | | | | |
| | 860,000 AUD | | | Australia Government Bond | | | | 1.2500 | | 05/21/32 | | | 510,167 | |
| | 105,000,000 CLP | | | Bonos de la Tesoreria de la Republica en pesos | | | | 4.5000 | | 03/01/26 | | | 114,273 | |
| | 1,120,000 BRL | | | Brazilian Government International Bond | | | | 8.5000 | | 01/05/24 | | | 215,015 | |
| | 550,000 CAD | | | Canadian Government Bond | | | | 2.2500 | | 06/01/29 | | | 414,489 | |
| | 516,900,000 COP | | | Colombian TES | | | | 6.0000 | | 04/28/28 | | | 107,169 | |
| | 1,120,000 EGP | | | Egypt Government Bond | | | | 13.7650 | | 01/05/24 | | | 60,292 | |
| | 1,060,000 EGP | | | Egypt Government Bond | | | | 14.4830 | | 04/06/26 | | | 56,958 | |
| | 1,800,000,000 IDR | | | Indonesia Treasury Bond | | | | 9.0000 | | 03/15/29 | | | 138,339 | |
| | 3,088,000,000 IDR | | | Indonesia Treasury Bond | | | | 7.0000 | | 09/15/30 | | | 211,983 | |
| | 930,000,000 IDR | | | Indonesia Treasury Bond | | | | 8.2500 | | 06/15/32 | | | 69,334 | |
| | 755,000,000 IDR | | | Indonesia Treasury Bond | | | | 8.3750 | | 03/15/34 | | | 56,554 | |
| | 76,000 EUR | | | Ireland Government Bond | | | | 5.4000 | | 03/13/25 | | | 91,064 | |
See accompanying notes which are an integral part of these financial statements.
| DUNHAM INTERNATIONAL OPPORTUNITY BOND FUND |
| SCHEDULE OF INVESTMENTS (Unaudited) (Continued) |
| April 30, 2022 |
| | | | | | | | Coupon Rate | | | | | |
| Principal Amount ($) | | | | | Spread | | (%) | | Maturity | | Fair Value | |
| | | | | NON U.S. GOVERNMENT & AGENCIES — 27.9% | | | | | | | | | | |
| | | | | NON U.S. TREASURY — 12.7% (Continued) | | | | | | | | | | |
| | 50,000 EUR | | | Ireland Government Bond | | | | 0.9000 | | 05/15/28 | | | 52,201 | |
| | 130,000 EUR | | | Ireland Government Bond | | | | 1.3000 | | 05/15/33 | | | 132,501 | |
| | 240,000 EUR | | | Italy Buoni Poliennali Del Tesoro | | | | 4.5000 | | 03/01/24 | | | 270,316 | |
| | 750,000 EUR | | | Italy Buoni Poliennali Del Tesoro | | | | 2.8000 | | 12/01/28 | | | 820,621 | |
| | 640,000 EUR | | | Italy Buoni Poliennali Del Tesoro (b) | | | | 2.4500 | | 09/01/33 | | | 654,344 | |
| | 180,000 EUR | | | Italy Buoni Poliennali Del Tesoro | | | | 5.0000 | | 08/01/39 | | | 241,438 | |
| | 235,000 EUR | | | Italy Buoni Poliennali Del Tesoro | | | | 5.0000 | | 09/01/40 | | | 317,601 | |
| | 6,150,000 JPY | | | Japan Government Forty Year Bond | | | | 0.8000 | | 03/20/58 | | | 44,676 | |
| | 17,000,000 JPY | | | Japan Government Thirty Year Bond | | | | 1.5000 | | 03/20/45 | | | 149,520 | |
| | 17,150,000 JPY | | | Japan Government Thirty Year Bond | | | | 0.5000 | | 09/20/46 | | | 121,925 | |
| | 2,909,000 MXN | | | Mexican Bonos | | | | 7.5000 | | 06/03/27 | | | 133,706 | |
| | 4,990,000 MXN | | | Mexican Bonos | | | | 7.7500 | | 11/13/42 | | | 211,771 | |
| | 100,000 EUR | | | Portugal Obrigacoes do Tesouro OT | | | | 4.1250 | | 04/14/27 | | | 120,230 | |
| | 3,730,000 ZAR | | | Republic of South Africa Government Bond | | | | 7.0000 | | 02/28/31 | | | 192,872 | |
| | 995,000 ZAR | | | Republic of South Africa Government Bond | | | | 6.2500 | | 03/31/36 | | | 42,960 | |
| | 10,370,000 RUB | | | Russian Federal Bond - OFZ | | | | 7.4000 | | 12/07/22 | | | 9,629 | |
| | 3,820,000 RUB | | | Russian Federal Bond - OFZ | | | | 6.9000 | | 05/23/29 | | | 3,547 | |
| | 21,770,000 RUB | | | Russian Federal Bond - OFZ | | | | 7.7000 | | 03/23/33 | | | 20,214 | |
| | 350,000 EUR | | | Spain Government Bond | | | | 1.2500 | | 10/31/30 | | | 355,528 | |
| | 170,000 EUR | | | Spain Government Bond | | | | 4.2000 | | 01/31/37 | | | 225,945 | |
| | 250,000 EUR | | | Spain Government Bond | | | | 2.7000 | | 10/31/48 | | | 277,289 | |
| | 300,000 GBP | | | United Kingdom Gilt | | | | 4.5000 | | 09/07/34 | | | 478,982 | |
| | 4,720,000 UYU | | | Uruguay Government International Bond | | | | 9.8750 | | 06/20/22 | | | 114,179 | |
| | | | | | | | | | | | | | 7,037,632 | |
| | | | | SOVEREIGN — 13.8% | | | | | | | | | | |
| | 22,000 USD | | | Abu Dhabi Government International Bond (b) | | | | 3.8750 | | 04/16/50 | | | 20,864 | |
| | 85,000 USD | | | Angolan Government International Bond (b) | | | | 8.7500 | | 04/14/32 | | | 80,655 | |
| | 175,000 USD | | | Angolan Government International Bond (b) | | | | 9.1250 | | 11/26/49 | | | 155,239 | |
| | 1,007,000 USD | | | Argentine Republic Government International Bond (e) | | | | 0.5000 | | 07/09/30 | | | 320,075 | |
| | 478,000 USD | | | Argentine Republic Government International Bond (e) | | | | 1.1250 | | 07/09/35 | | | 136,947 | |
| | 17,000 USD | | | Argentine Republic Government International Bond (e) | | | | 2.0000 | | 01/09/38 | | | 6,147 | |
| | 117,000 USD | | | Argentine Republic Government International Bond (e) | | | | 2.5000 | | 07/09/41 | | | 39,371 | |
| | 63,000 USD | | | Bahrain Government International Bond (b) | | | | 7.0000 | | 01/26/26 | | | 67,275 | |
| | 26,000 USD | | | Bahrain Government International Bond (b) | | | | 7.0000 | | 10/12/28 | | | 27,364 | |
| | | | | | | | | | | | | | | |
See accompanying notes which are an integral part of these financial statements.
| DUNHAM INTERNATIONAL OPPORTUNITY BOND FUND |
| SCHEDULE OF INVESTMENTS (Unaudited) (Continued) |
| April 30, 2022 |
| | | | | | | | Coupon Rate | | | | | |
| Principal Amount ($) | | | | | Spread | | (%) | | Maturity | | Fair Value | |
| | | | | NON U.S. GOVERNMENT & AGENCIES — 27.9% | | | | | | | | | | |
| | | | | SOVEREIGN — 13.8% (Continued) | | | | | | | | | | |
| | 22,000 USD | | | Bahrain Government International Bond (b) | | | | 5.6250 | | 09/30/31 | | $ | 20,372 | |
| | 100,000 EUR | | | Banque Centrale de Tunisie International Bond | | | | 5.6250 | | 02/17/24 | | | 73,438 | |
| | 100,000 EUR | | | Banque Centrale de Tunisie International Bond (b) | | | | 6.3750 | | 07/15/26 | | | 67,140 | |
| | 14,000 USD | | | Bermuda Government International Bond | | | | 2.3750 | | 08/20/30 | | | 12,355 | |
| | 28,000 USD | | | Bermuda Government International Bond | | | | 3.3750 | | 08/20/50 | | | 23,015 | |
| | 68,000 USD | | | Brazilian Government International Bond | | | | 4.6250 | | 01/13/28 | | | 66,428 | |
| | 82,000 USD | | | Brazilian Government International Bond | | | | 4.5000 | | 05/30/29 | | | 77,859 | |
| | 22,000 USD | | | Brazilian Government International Bond (d) | | | | 3.7500 | | 09/12/31 | | | 19,019 | |
| | 10,000 USD | | | Brazilian Government International Bond | | | | 4.7500 | | 01/14/50 | | | 7,593 | |
| | 41,000 USD | | | Chile Government International Bond | | | | 2.4500 | | 01/31/31 | | | 35,900 | |
| | 211,000 USD | | | Chile Government International Bond | | | | 2.5500 | | 07/27/33 | | | 176,648 | |
| | 3,000 USD | | | Chile Government International Bond | | | | 4.3400 | | 03/07/42 | | | 2,743 | |
| | 8,000 USD | | | Chile Government International Bond | | | | 3.2500 | | 09/21/71 | | | 5,479 | |
| | 100,000 EUR | | | Colombia Government International Bond | | | | 3.8750 | | 03/22/26 | | | 106,372 | |
| | 50,000 USD | | | Colombia Government International Bond | | | | 4.5000 | | 03/15/29 | | | 45,495 | |
| | 62,000 USD | | | Colombia Government International Bond | | | | 3.0000 | | 01/30/30 | | | 49,745 | |
| | 76,000 USD | | | Colombia Government International Bond | | | | 3.1250 | | 04/15/31 | | | 59,394 | |
| | 12,000 USD | | | Colombia Government International Bond | | | | 7.3750 | | 09/18/37 | | | 12,405 | |
| | 60,000 USD | | | Colombia Government International Bond | | | | 6.1250 | | 01/18/41 | | | 53,046 | |
| | 14,000 USD | | | Colombia Government International Bond | | | | 5.6250 | | 02/26/44 | | | 11,333 | |
| | 130,000 USD | | | Colombia Government International Bond | | | | 3.8750 | | 02/15/61 | | | 83,189 | |
| | 6,390,000 CZK | | | Czech Republic Government Bond | | | | 1.0000 | | 06/26/26 | | | 235,742 | |
| | 224,000 USD | | | Dominican Republic International Bond (b) | | | | 4.8750 | | 09/23/32 | | | 189,016 | |
| | 45,000 USD | | | Dominican Republic International Bond (b) | | | | 6.0000 | | 02/22/33 | | | 41,029 | |
| | 82,000 USD | | | Dominican Republic International Bond (b) | | | | 7.4500 | | 04/30/44 | | | 79,750 | |
| | 26,000 USD | | | Dominican Republic International Bond | | | | 6.4000 | | 06/05/49 | | | 22,151 | |
| | 101,000 USD | | | Dominican Republic International Bond (b) | | | | 5.8750 | | 01/30/60 | | | 77,175 | |
| | 35,000 USD | | | Dominican Republic International Bond | | | | 5.8750 | | 01/30/60 | | | 26,744 | |
| | 52,074 USD | | | Ecuador Government International Bond(b),(f) | | | | 0.0000 | | 07/31/30 | | | 28,454 | |
| | 59,000 USD | | | Ecuador Government International Bond(b),(e) | | �� | | 5.0000 | | 07/31/30 | | | 48,103 | |
| | 20,000 USD | | | Ecuador Government International Bond(e) | | | | 1.0000 | | 07/31/35 | | | 12,556 | |
| | 387,060 USD | | | Ecuador Government International Bond (b),(e) | | | | 1.0000 | | 07/31/35 | | | 242,990 | |
| | 23,000 USD | | | Ecuador Government International Bond (e) | | | | 0.5000 | | 07/31/40 | | | 12,576 | |
| | 94,000 USD | | | Egypt Government International Bond (b) | | | | 5.2500 | | 10/06/25 | | | 83,568 | |
See accompanying notes which are an integral part of these financial statements.
| DUNHAM INTERNATIONAL OPPORTUNITY BOND FUND |
| SCHEDULE OF INVESTMENTS (Unaudited) (Continued) |
| April 30, 2022 |
| | | | | | | | Coupon Rate | | | | | |
| Principal Amount ($) | | | | | Spread | | (%) | | Maturity | | Fair Value | |
| | | | | NON U.S. GOVERNMENT & AGENCIES — 27.9% | | | | | | | | | | |
| | | | | SOVEREIGN — 13.8% (Continued) | | | | | | | | | | |
| | 102,000 USD | | | Egypt Government International Bond (b) | | | | 7.6000 | | 03/01/29 | | $ | 86,981 | |
| | 29,000 USD | | | Egypt Government International Bond (b) | | | | 7.0530 | | 01/15/32 | | | 22,422 | |
| | 63,000 USD | | | Egypt Government International Bond (b) | | | | 7.3000 | | 09/30/33 | | | 47,347 | |
| | 52,000 USD | | | Egypt Government International Bond (b) | | | | 8.7000 | | 03/01/49 | | | 38,180 | |
| | 128,000 USD | | | Egypt Government International Bond (b) | | | | 8.8750 | | 05/29/50 | | | 94,707 | |
| | 79,000 USD | | | Egypt Government International Bond (b) | | | | 8.1500 | | 11/20/59 | | | 55,081 | |
| | 26,000 USD | | | El Salvador Government International Bond (b) | | | | 5.8750 | | 01/30/25 | | | 12,541 | |
| | 16,000 USD | | | El Salvador Government International Bond | | | | 8.2500 | | 04/10/32 | | | 6,600 | |
| | 140,000 USD | | | Finance Department Government of Sharjah (b) | | | | 3.6250 | | 03/10/33 | | | 123,549 | |
| | 62,000 USD | | | Finance Department Government of Sharjah (b) | | | | 4.0000 | | 07/28/50 | | | 46,465 | |
| | 17,000 USD | | | Ghana Government International Bond (b) | | | | 6.3750 | | 02/11/27 | | | 11,609 | |
| | 49,000 USD | | | Ghana Government International Bond (b) | | | | 7.8750 | | 03/26/27 | | | 34,538 | |
| | 103,000 USD | | | Ghana Government International Bond (b) | | | | 7.7500 | | 04/07/29 | | | 65,841 | |
| | 27,000 USD | | | Ghana Government International Bond (b) | | | | 7.6250 | | 05/16/29 | | | 17,147 | |
| | 63,000 USD | | | Ghana Government International Bond (b) | | | | 8.6270 | | 06/16/49 | | | 36,698 | |
| | 124,000 USD | | | Ghana Government International Bond (b) | | | | 8.9500 | | 03/26/51 | | | 72,118 | |
| | 37,000 USD | | | Guatemala Government Bond (b) | | | | 5.3750 | | 04/24/32 | | | 36,986 | |
| | 31,000 USD | | | Guatemala Government Bond | | | | 5.3750 | | 04/24/32 | | | 30,988 | |
| | 64,000 USD | | | Hungary Government International Bond (b) | | | | 2.1250 | | 09/22/31 | | | 51,415 | |
| | 113,000 EUR | | | Ivory Coast Government International Bond | | | | 5.2500 | | 03/22/30 | | | 107,141 | |
| | 123,000 EUR | | | Ivory Coast Government International Bond (b) | | | | 5.8750 | | 10/17/31 | | | 116,348 | |
| | 189,000 USD | | | Kenya Government International Bond (b) | | | | 8.0000 | | 05/22/32 | | | 163,335 | |
| | 54,000 USD | | | Lebanon Government International Bond (g) | | | | 6.1000 | | 10/04/22 | | | 6,604 | |
| | 66,000 USD | | | Lebanon Government International Bond (g) | | | | 6.3750 | | 03/09/23 | | | 7,920 | |
| | 459,000 USD | | | Lebanon Government International Bond (g) | | | | 8.2500 | | 04/12/23 | | | 56,800 | |
| | 72,000 USD | | | Lebanon Government International Bond (g) | | | | 6.4000 | | 05/26/23 | | | 8,550 | |
| | 317,000 USD | | | Lebanon Government International Bond (g) | | | | 6.1500 | | 06/19/23 | | | 38,832 | |
| | 56,000 USD | | | Lebanon Government International Bond (g) | | | | 6.7500 | | 11/29/27 | | | 6,790 | |
| | 81,000 USD | | | Lebanon Government International Bond (g) | | | | 6.8500 | | 05/25/29 | | | 9,619 | |
| | 175,000 USD | | | Lebanon Government International Bond (g) | | | | 6.6500 | | 02/26/30 | | | 21,046 | |
| | 100,000 EUR | | | Mexico Government International Bond | | | | 1.6250 | | 04/08/26 | | | 102,306 | |
| | 22,000 USD | | | Mexico Government International Bond | | | | 4.7500 | | 04/27/32 | | | 21,595 | |
| | 56,000 USD | | | Mexico Government International Bond | | | | 6.0500 | | 01/11/40 | | | 57,861 | |
| | 33,000 USD | | | Mexico Government International Bond | | | | 5.0000 | | 04/27/51 | | | 29,475 | |
See accompanying notes which are an integral part of these financial statements.
| DUNHAM INTERNATIONAL OPPORTUNITY BOND FUND |
| SCHEDULE OF INVESTMENTS (Unaudited) (Continued) |
| April 30, 2022 |
| | | | | | | | Coupon Rate | | | | | |
| Principal Amount ($) | | | | | Spread | | (%) | | Maturity | | Fair Value | |
| | | | | NON U.S. GOVERNMENT & AGENCIES — 27.9% | | | | | | | | | | |
| | | | | SOVEREIGN — 13.8% (Continued) | | | | | | | | | | |
| | 34,000 USD | | | Mexico Government International Bond | | | | 3.7710 | | 05/24/61 | | $ | 23,904 | |
| | 200,000 USD | | | Mozambique International Bond (b),(e) | | | | 5.0000 | | 09/15/31 | | | 174,730 | |
| | 21,000 USD | | | Nigeria Government International Bond (b) | | | | 8.3750 | | 03/24/29 | | | 19,647 | |
| | 211,000 USD | | | Nigeria Government International Bond (b) | | | | 7.8750 | | 02/16/32 | | | 177,767 | |
| | 21,000 USD | | | Nigeria Government International Bond (b) | | | | 7.3750 | | 09/28/33 | | | 16,857 | |
| | 200,000 USD | | | Nigeria Government International Bond | | | | 7.6250 | | 11/28/47 | | | 143,200 | |
| | 152,000 USD | | | Nigeria Government International Bond (b) | | | | 8.2500 | | 09/28/51 | | | 115,520 | |
| | 139,000 USD | | | Oman Government International Bond (b) | | | | 7.3750 | | 10/28/32 | | | 153,277 | |
| | 91,000 USD | | | Oman Government International Bond (b) | | | | 6.5000 | | 03/08/47 | | | 83,544 | |
| | 40,000 USD | | | Oman Government International Bond (b) | | | | 6.7500 | | 01/17/48 | | | 37,610 | |
| | 133,000 USD | | | Pakistan Government International Bond (b) | | | | 6.0000 | | 04/08/26 | | | 109,113 | |
| | 9,000 USD | | | Panama Government International Bond | | | | 3.1600 | | 01/23/30 | | | 8,193 | |
| | 269,000 USD | | | Panama Government International Bond | | | | 2.2520 | | 09/29/32 | | | 216,082 | |
| | 77,000 USD | | | Papua New Guinea Government International Bond (b) | | | | 8.3750 | | 10/04/28 | | | 66,567 | |
| | 69,000 USD | | | Peruvian Government International Bond | | | | 2.8440 | | 06/20/30 | | | 61,739 | |
| | 86,000 USD | | | Peruvian Government International Bond | | | | 2.7830 | | 01/23/31 | | | 74,806 | |
| | 121,000 USD | | | Philippine Government International Bond | | | | 2.4570 | | 05/05/30 | | | 107,993 | |
| | 26,000 USD | | | Philippine Government International Bond | | | | 7.7500 | | 01/14/31 | | | 32,525 | |
| | 65,000 USD | | | Qatar Government International Bond (b) | | | | 3.7500 | | 04/16/30 | | | 65,807 | |
| | 67,000 USD | | | Qatar Government International Bond (b) | | | | 4.4000 | | 04/16/50 | | | 68,075 | |
| | 21,538 USD | | | Republic of Angola Via Avenir II BV (a) | | US0006M + 7.500% | | 7.8450 | | 07/01/23 | | | 21,754 | |
| | 164,286 USD | | | Republic of Angola Via Avenir Issuer II Ireland | | | | 6.9270 | | 02/19/27 | | | 156,893 | |
| | 156,000 USD | | | Republic of Armenia International Bond (b) | | | | 3.6000 | | 02/02/31 | | | 116,620 | |
| | 4,020,000 ZAR | | | Republic of South Africa Government Bond | | | | 8.5000 | | 01/31/37 | | | 210,593 | |
| | 43,000 USD | | | Republic of South Africa Government International | | | | 7.3000 | | 04/20/52 | | | 40,372 | |
| | 11,000 EUR | | | Romanian Government International Bond | | | | 2.8750 | | 03/11/29 | | | 10,810 | |
| | 105,000 EUR | | | Romanian Government International Bond (b) | | | | 3.3750 | | 02/08/38 | | | 85,802 | |
| | 19,000 EUR | | | Romanian Government International Bond (b) | | | | 2.7500 | | 04/14/41 | | | 13,492 | |
| | 10,000 EUR | | | Romanian Government International Bond (b) | | | | 2.8750 | | 04/13/42 | | | 7,095 | |
| | 25,000 EUR | | | Romanian Government International Bond (b) | | | | 4.6250 | | 04/03/49 | | | 22,036 | |
| | 150,000 USD | | | Saudi Government International Bond (b) | | | | 2.2500 | | 02/02/33 | | | 130,383 | |
| | 111,000 EUR | | | Senegal Government International Bond (b) | | | | 4.7500 | | 03/13/28 | | | 110,386 | |
| | 117,000 EUR | | | Senegal Government International Bond (b) | | | | 5.3750 | | 06/08/37 | | | 95,875 | |
| | 102,000 USD | | | Serbia International Bond (b) | | | | 2.1250 | | 12/01/30 | | | 76,554 | |
See accompanying notes which are an integral part of these financial statements.
| DUNHAM INTERNATIONAL OPPORTUNITY BOND FUND |
| SCHEDULE OF INVESTMENTS (Unaudited) (Continued) |
| April 30, 2022 |
| | | | | | | | Coupon Rate | | | | | |
| Principal Amount ($) | | | | | Spread | | (%) | | Maturity | | Fair Value | |
| | | | | NON U.S. GOVERNMENT & AGENCIES — 27.9% | | | | | | | | | | |
| | | | | SOVEREIGN — 13.8% (Continued) | | | | | | | | | | |
| | 56,000 USD | | | Ukraine Government International Bond (b) | | | | 7.7500 | | 09/01/25 | | $ | 19,040 | |
| | 97,000 USD | | | Ukraine Government International Bond (b) | | | | 7.7500 | | 09/01/26 | | | 33,090 | |
| | 139,000 USD | | | Ukraine Government International Bond (b) | | | | 7.3750 | | 09/25/32 | | | 44,848 | |
| | 14,000 USD | | | Zambia Government International Bond (b) | | | | 5.3750 | | 09/20/22 | | | 10,086 | |
| | 87,000 USD | | | Zambia Government International Bond (b) | | | | 8.9700 | | 07/30/27 | | | 65,203 | |
| | | | | | | | | | | | | | 7,636,082 | |
| | | | | SUPRANATIONAL — 0.6% | | | | | | | | | | |
| | 200,000 EUR | | | European Investment Bank | | | | 1.1250 | | 09/15/36 | | | 192,927 | |
| | 670,000 BRL | | | International Finance Corporation | | | | 4.6000 | | 01/27/23 | | | 130,062 | |
| | | | | | | | | | | | | | 322,989 | |
| | | | | TOTAL NON U.S. GOVERNMENT & AGENCIES (Cost $18,712,622) | | | | | | | | | 15,475,295 | |
| | | | | | | | | | | | | | | |
| Shares | | | | | | | | | | | | | |
| | | | | COLLATERAL FOR SECURITIES ON LOAN — 3.5% | | | | | | | | | | |
| | | | | | | | | | | | | | | |
| | 1,931,628 | | | Mount Vernon Prime Portfolio, 0.45% (Cost $1,931,628)(h) | | | | | | | | | 1,931,628 | |
| | | | | | | | | | | | | | | |
| | | | | TOTAL INVESTMENTS – 97.2% (Cost $62,395,681) | | | | | | | | $ | 53,797,961 | |
| | | | | OTHER ASSETS IN EXCESS OF LIABILITIES - 2.8% | | | | | | | | | 1,545,478 | |
| | | | | NET ASSETS - 100.0% | | | | | | | | $ | 55,343,439 | |
| OPEN FUTURES CONTRACTS |
| | | | | | | | | | | Value and
Unrealized | |
| Number of Contracts | | | Open Long Futures Contracts | | Expiration | | Notional Amount(i) | | | Depreciation | |
| | 9 | | | CBOT 10 Year US Treasury Note | | 06/21/2022 | | $ | 1,072,404 | | | $ | (65,674 | ) |
| | 10 | | | Eurex 30 Year Euro BUXL Future | | 06/08/2022 | | | 1,803,206 | | | | (343,273 | ) |
| | 24 | | | Long Gilt Future | | 06/28/2022 | | | 3,574,198 | | | | (137,253 | ) |
| | 8 | | | TSE Japanese 10 Year Bond Futures | | 06/13/2022 | | | 9,224,486 | | | | (81,262 | ) |
| | | | | TOTAL FUTURES CONTRACTS | | | | | | | | $ | (627,462 | ) |
| OPEN FUTURES CONTRACTS |
| | | | | | | | | | | Value and
Unrealized | |
| Number of Contracts | | | Open Short Futures Contracts | | Expiration | | Notional Amount(i) | | | Appreciation | |
| | 64 | | | CBOT 5 Year US Treasury Note | | 06/30/2022 | | $ | 7,211,008 | | | $ | 318,492 | |
| | 8 | | | Eurex 10 Year Euro BUND Future | | 06/08/2022 | | | 1,295,845 | | | | 114,209 | |
| | | | | TOTAL FUTURES CONTRACTS | | | | | | | | $ | 432,701 | |
See accompanying notes which are an integral part of these financial statements.
| DUNHAM INTERNATIONAL OPPORTUNITY BOND FUND |
| SCHEDULE OF INVESTMENTS (Unaudited) (Continued) |
| April 30, 2022 |
| | | | | | | | | | | | | Unrealized | |
| Foreign Currency | | Settlement Date | | Counterparty | | Local Currency | | | U.S. Dollar Value | | | Appreciation/(Depreciation) | |
| To Buy: | | | | | | | | | | | | | | | | |
| Euro | | 05/06/2022 | | Barclay | | | 224,662 | | | $ | 236,965 | | | $ | (6,119 | ) |
| British Pound | | 05/11/2022 | | JP Morgan Chase | | | 270,000 | | | | 339,493 | | | | (13,793 | ) |
| Euro | | 05/16/2022 | | JP Morgan Chase | | | 970,000 | | | | 1,023,569 | | | | (29,238 | ) |
| Japanese Yen | | 05/18/2022 | | Capstone Global Markets | | | 39,069,999 | | | | 301,245 | | | | (9,190 | ) |
| Euro | | 05/27/2022 | | Capstone Global Markets | | | 460,000 | | | | 485,635 | | | | (7,512 | ) |
| | | | | | | | | | | $ | 2,386,907 | | | $ | (65,852 | ) |
| | | | | | | | | | | | | | | | | |
| To Sell: | | | | | | | | | | | | | | | | |
| Euro | | 05/06/2022 | | Barclay | | | 6,508,819 | | | $ | 6,865,289 | | | $ | 304,711 | |
| Egyptian Pound | | 05/26/2022 | | JP Morgan Chase | | | 2,211,000 | | | | 119,590 | | | | (1,890 | ) |
| Australian Dollar | | 07/21/2022 | | Barclay | | | 726,100 | | | | 513,651 | | | | 6,603 | |
| British Pound | | 07/21/2022 | | Capstone Global Markets | | | 1,056,900 | | | | 1,329,379 | | | | 16,031 | |
| Canadian Dollar | | 07/21/2022 | | Capstone Global Markets | | | 887,600 | | | | 690,694 | | | | 4,149 | |
| Euro | | 07/21/2022 | | JP Morgan Chase | | | 11,236,200 | | | | 11,899,867 | | | | 201,836 | |
| Japanese Yen | | 07/21/2022 | | Barclay | | | 49,694,800 | | | | 384,314 | | | | 5,515 | |
| | | | | | | | | | | $ | 21,802,784 | | | $ | 536,955 | |
| | | | | | | | | | | | | | | | | |
| Total | | | | | | | | | | | | | | $ | 471,103 | |
| | | | | | | | | | Local Currency | | | Local Currency | | | | | | | | | | |
| | | | | Settlement | | | | | Amount | | | Amount Purchased | | | U.S. Dollar Market | | | U.S. Dollar Market | | | Unrealized | |
| Foreign Currency | | | | Date | | | Counterparty | | Purchased Buy | | | Sell | | | Value Buy | | | Value Sell | | | Depreciation | |
| To Buy: | | To Sell: | | | | | | | | | | | | | | | | | | | | | | | | | | |
| Euro | | British Pound | | | 7/21/2022 | | | JP Morgan Chase | | | 836,278 | | | | 707,500 | | | | 885,672 | | | | (889,900 | ) | | $ | (4,228 | ) |
| | | | | | | | | | | | 836,278 | | | | 707,500 | | | $ | 885,672 | | | $ | 889,900 | | | $ | (4,228 | ) |
| | | | | | | | | | | | | | | | | | | | | | | | | | | | | |
| Total | | | | | | | | | | | | | | | | | | | | | | | | | | $ | (4,228 | ) |
| A/S | - Anonim Sirketi |
| | |
| LLC | - Limited Liability Company |
| | |
| LTD | - Limited Company |
| | |
| NV | - Naamioze Vennootschap |
| | |
| PLC | - Public Limited Company |
| | |
| REIT | - Real Estate Investment Trust |
| | |
| S/A | - Societe Anonyme |
| | |
| EUR003M | Euribor 3 Month ACT/360 |
| | |
| EUSA5 | EUR SWAP ANN (VS 6M) 5Y |
See accompanying notes which are an integral part of these financial statements.
| DUNHAM INTERNATIONAL OPPORTUNITY BOND FUND |
| SCHEDULE OF INVESTMENTS (Unaudited) (Continued) |
| April 30, 2022 |
| EUSA6 | EUR SWAP ANN (VS 6M) 6Y |
| | |
| H15T1Y | US Treasury Yield Curve Rate T Note Constant Maturity 1 Year |
| | |
| H15T5Y | US Treasury Yield Curve Rate T Note Constant Maturity 5 Year |
| | |
| SOFRRATE | United States SOFR Secured Overnight Financing Rate |
| | |
| US0006M | ICE LIBOR USD 6 Month |
| | |
| AUD | Australian Dollar |
| | |
| BRL | Brazilian Real |
| | |
| CAD | Canadian Dollar |
| | |
| CLP | Chilean Peso |
| | |
| COP | Columbian Peso |
| | |
| CZK | Czech Koruna |
| | |
| EGP | Egyptian Pound |
| | |
| EUR | Euro |
| | |
| GBP | British Pound |
| | |
| IDR | Indonesia Rupiah |
| | |
| JPY | Japanese Yen |
| | |
| MXN | Mexican Peso |
| | |
| RUB | Russian Ruble |
| | |
| USD | US Dollars |
| | |
| UYU | Uruguayan Peso |
| | |
| ZAR | South African Rand |
| (a) | Variable rate security; the rate shown represents the rate on April 30, 2022. |
| | |
| (b) | Security exempt from registration under Rule 144A or Section 4(2) of the Securities Act of 1933. The security may be resold in transactions exempt from registration, normally to qualified institutional buyers. As of April 30, 2022 the total market value of 144A securities is 20,699,402 or 37.5% of net assets. |
| | |
| (c) | Variable rate security, the rate shown represents the rate on April 30, 2022. |
| | |
| (d) | All or a portion of these securities are on loan. Total loaned securities had a value of $1,872,590 at April 30, 2022. |
| | |
| (e) | Step bond. Coupon rate is fixed rate that changes on a specified date. The rate shown is the current rate at April 30, 2022. |
| | |
| (f) | Zero coupon bond. |
| | |
| (g) | Represents issuer in default on interest payments; non-income producing security. |
| | |
| (h) | Rate disclosed is the seven day effective yield as of April 30, 2022. |
| | |
| (i) | The amounts shown are the underlying reference notional amounts to stock exchange indices and equities upon which the fair value of the futures contracts held by the Fund are based. Notional values do not represent the current fair value of, and are not necessarily indicative of the future cash flows of the Fund’s futures contracts. Further, the underlying price changes in relation to the variables specified by the notional values affects the fair value of these derivative financial instruments. The notional values as set forth within this schedule do not purport to represent economic value at risk to the Fund. |
| Portfolio Composition * - (Unaudited) |
| United States | | | 56.3 | % | | South Africa | | | 0.8 | % |
| Europe | | | 31.1 | % | | Brazil | | | 0.6 | % |
| Great Britain | | | 3.9 | % | | Japan | | | 0.6 | % |
| Canada | | | 1.9 | % | | Mexico | | | 0.6 | % |
| Australia | | | 1.0 | % | | Other Countries** | | | 2.3 | % |
| Indonesia | | | 0.9 | % | | Total | | | 100.0 | % |
| * | Based on total value of investments as of April 30, 2022. Does not include derivative holdings. |
| | |
| ** | Includes Collateral for Securities Loaned as of April 30, 2022. |
| | |
| Percentage may differ from Schedule of Investments which are based on Fund net assets. |
See accompanying notes which are an integral part of these financial statements.
| Dunham Large Cap Value Fund (Unaudited) |
| Message from the Sub-Adviser (Rothschild & Co. Asset Management US Inc.) |
Asset Class Recap
Large cap value stocks rose to begin the fiscal year as investors rotated away from growth stocks and towards value stocks in anticipation of the Federal Reserve hiking interest rates. Not only can many sectors within the large cap value asset class thrive in a rising rate environment, the present value of the stocks within the index declines at a substantially slower pace than their growth counterparts. However, large cap value stocks reversed course as investors grew increasingly concerned with escalating tensions between Russia and Ukraine and a more hawkish than anticipated Federal Reserve. Comments from Federal Reserve Chair reiterated the bank’s commitment to fighting inflation and signaled six potential further rate hikes with the Fed Funds rate forecast to reach 1.9 percent by year-end and that the balance sheet could be scaled back from early summer. These market headwinds increased in intensity during the most recent fiscal quarter in reaction to Russia invading Ukraine. In reaction, the U.S. imposed a myriad of severe sanctions, banned transactions with the Russian central bank, and in collaboration with other major governments, has sought to stop it from deploying foreign reserves. Albeit overlooked, investors digested largely encouraging earnings reports, but unfortunately it was not enough to divert investors’ attention from the war in Europe, broad-based and persistent inflation, and the prominent shift in domestic monetary policy from easing to tightening. For the six-month period ending April 30, 2022, large cap value stocks, as measured by the Russell 1000 Value Index, gave back 4.0 percent, holding up relatively better than large cap growth stocks, as measured by the Russell 1000 Growth Index, which tumbled 17.8 percent
Allocation Review
The Sub-Adviser investment philosophy is centered on the belief that alpha generation is driven by bottom-up stock selection rather than taking large sector bets. With that being said, one of the largest sector contributors during the fiscal period was the manufacturing sector, as strong security selection meaningfully outweighed the slight detraction from the sector allocation. Within the sector, aerospace and defense stocks shined amid escalating geopolitical tensions. The participation of Western countries in providing military aid to Ukraine has provided a tailwind for companies in the industry. Another sector that positively contributed to Fund performance over the period was the health care sector as both security selection and the Fund’s overweight positioning aided positive Fund performance. Although the energy sector was the strongest positive contributor to Fund performance, the Fund’s underweight positioning resulted in it being one of the largest detractors from the Fund’s relative performance to the benchmark. From an absolute perspective, the worst-performing sector over the fiscal period was the financials sector, with security selection and the Fund’s overweight position detracting from Fund performance.
Holding Insights
Some of the most significant contributors to Fund performance came from the aerospace and defense industry within the manufacturing sector. These positions included Lockheed Martin Corporation (LMT) (holding weight**: 0.67 percent), a global security and aerospace company, and Raytheon Technologies Corporation (RTX) (holding weight*: 0.73 percent), a company that engages in the provision of aerospace and defense systems and services for commercial, military, and government customers. These stocks rose during the fiscal period amid escalating tensions in Eastern Europe and multiple countries committing to increase defense spending. In particular, the United States announced a 4 percent increase in defense spending. Additionally, Germany stated that it would almost double its military expenditures, including buying fighter planes made in the U.S. for the first time in decades. During the fiscal quarter, LMT rose 36.3 percent and RTX added 8.0 percent. Strong contributors over the fiscal period also came from pharmaceutical companies within the healthcare sector. Bristol-Myers Squibb Company (BMY) (holding weight*: 1.76 percent), a multinational pharmaceutical company, and AmerisourceBergen Corporation (ABC) (holding weight*: 1.49 percent), an American drug wholesale company, benefited from robust earnings reports thanks to the COVID tailwind that spurred an acceleration of innovation in vaccines. Over the fiscal period, BMY jumped 31.0 percent and ABC added 24.9 percent.
Some of the Fund’s largest detractors from absolute performance over the fiscal period were from the financial sector. The financial sector strongly contributed to Fund performance early in the fiscal year amid expectations that higher interest rates would contribute to the bottom line. However, this sector sold off as recession fears increased, companies lowered guidance, and many investors potentially underestimated the impact of higher interest rates on book values. Within the Fund, JPMorgan Chase & Company (JPM) (holding weight*: 2.34 percent), an American multinational investment bank and financial services holding company, and Wells Fargo & Company (WFC) (holding weight*: 1.49 percent), an American multinational financial services company, detracted from Fund performance as they declined 28.8 percent and 14.0 percent, respectively. Although the energy sector rose sharply during the fiscal period, the Sub-Adviser’s weighting to the sector resulted in one of the largest detractions from relative Fund performance. For example, the Fund held ConocoPhillips (COP) (holding weight*: 2.63 percent), an American multinational corporation engaged in hydrocarbon exploration and production, contributed to Fund performance by rising 29.6 percent, but Chevron Corp. (CVX) (not held), an American multinational energy corporation, contained within the index surged 43.4 percent over the same time period.
Sub-Adviser Outlook
The Sub-Adviser believes that the positions within the Fund exhibit attractive valuations and are resilient enough to navigate the complex environment ahead. However, they may be susceptible to tail risk as the market faces numerous risks, including record levels of inflation, continued supply chain disruptions, an unpredictable war in eastern Europe, and the tightening of monetary policy. Despite these headwinds, the Sub-Adviser will continue to implement its disciplined investment process to identify companies that have the potential to exceed investors’ expectations. The Sub-Adviser recognizes that it cannot add value for clients without taking risk. Its focus is on identifying what the Sub-Adviser considers intelligent risks – the risks that are most likely to contribute to outperforming the benchmark and least likely to cause unnecessary volatility.
| * | Holdings percentage(s) of total investments, cash and unsettled trades excluding collateral for securities loaned as of 4/30/2022. |
| ** | Holdings percentage(s) as of the date prior to the sale of the security. |
Growth of $100,000 Investment

Total Returns (a) as of April 30, 2022
| | | | Annualized | Annualized |
| | Six Month | One Year | Five Years | Ten Years |
| Class N | (5.02)% | 2.80% | 9.46% | 10.03% |
| Class A with load of 5.75% | (10.58)% | (3.33)% | 7.89% | 9.10% |
| Class A without load | (5.11)% | 2.58% | 9.18% | 9.75% |
| Class C | (5.48)% | 1.82% | 8.37% | 8.93% |
| Russell 1000 Value Index | (3.94)% | 1.32% | 9.06% | 11.17% |
| Morningstar Large Cap Value Category | (2.33)% | 3.08% | 9.33% | 10.37% |
| (a) | Total Returns are calculated based on traded NAVs. |
The Russell 1000 Value Index is a subset of the Russell 1000 Index which measures the performance of the stocks of the 1000 largest companies in the Russell 3000 Index based on market capitalization. The Russell 1000 Value Index measures the performance of those Russell 1000 companies with lower price-to-book ratios and lower forecasted growth values. Investors cannot invest directly in an index or benchmark.
The Morningstar Large Cap Value Category is generally representative of mutual funds that primarily invest in big (large capitalization) U.S. companies that are less expensive or growing more slowly than other large-cap stocks.
| As disclosed in the Trust’s latest registration statement, the Fund’s total annual operating expenses, including underlying funds, are 1.10% for Class N, 2.10% for Class C and 1.35% for Class A. Class A shares are subject to a sales load of 5.75% and a deferred sales charge of up to 0.75%. The performance data quoted here represents past performance, which is not indicative of future results. Current performance may be lower or higher than the performance data quoted. The investment return and NAV will fluctuate, so that an investor’s shares, when redeemed, may be worth more or less than their original cost. Total returns are calculated assuming reinvestment of all dividends and capital gains distributions, if any. The returns do not reflect the deductions of taxes a shareholder would pay on the redemption of Fund shares or Fund distributions. For performance information current to the most recent month-end, please call 1-800-442-4358 or visit our website www.dunham.com. |
| DUNHAM LARGE CAP VALUE FUND |
| SCHEDULE OF INVESTMENTS (Unaudited) |
| April 30, 2022 |
| Shares | | | | | Fair Value | |
| | | | | COMMON STOCKS — 97.5% | | | | |
| | | | | AEROSPACE & DEFENSE - 2.1% | | | | |
| | 8,990 | | | L3Harris Technologies, Inc. | | $ | 2,088,017 | |
| | 11,600 | | | Raytheon Technologies Corporation | | | 1,100,956 | |
| | | | | | | | 3,188,973 | |
| | | | | ASSET MANAGEMENT - 2.3% | | | | |
| | 2,530 | | | BlackRock, Inc. | | | 1,580,440 | |
| | 29,778 | | | Charles Schwab Corporation (The) | | | 1,975,175 | |
| | | | | | | | 3,555,615 | |
| | | | | AUTOMOTIVE - 0.9% | | | | |
| | 35,771 | | | General Motors Company(a) | | | 1,356,079 | |
| | | | | | | | | |
| | | | | BANKING - 7.6% | | | | |
| | 108,315 | | | Bank of America Corporation | | | 3,864,680 | |
| | 29,556 | | | JPMorgan Chase & Company | | | 3,527,804 | |
| | 37,403 | | | Truist Financial Corporation | | | 1,808,435 | |
| | 51,343 | | | Wells Fargo & Company | | | 2,240,095 | |
| | | | | | | | 11,441,014 | |
| | | | | BIOTECH & PHARMA - 6.9% | | | | |
| | 10,940 | | | AbbVie, Inc. | | | 1,606,867 | |
| | 35,229 | | | Bristol-Myers Squibb Company | | | 2,651,687 | |
| | 11,763 | | | Horizon Therapeutics plc(a) | | | 1,159,361 | |
| | 18,124 | | | Johnson & Johnson | | | 3,270,657 | |
| | 19,586 | | | Merck & Company, Inc. | | | 1,737,082 | |
| | | | | | | | 10,425,654 | |
| | | | | CHEMICALS - 3.4% | | | | |
| | 5,965 | | | Air Products and Chemicals, Inc. | | | 1,396,228 | |
| | 29,348 | | | Corteva, Inc. | | | 1,693,086 | |
| | 60,468 | | | Huntsman Corporation(b) | | | 2,048,050 | |
| | | | | | | | 5,137,364 | |
| | | | | CONSTRUCTION MATERIALS - 1.5% | | | | |
| | 2,664 | | | Martin Marietta Materials, Inc. | | | 943,642 | |
| | 14,734 | | | Owens Corning | | | 1,339,763 | |
| | | | | | | | 2,283,405 | |
| | | | | CONSUMER SERVICES - 1.2% | | | | |
| | 28,411 | | | Service Corporation International | | | 1,864,045 | |
| | | | | | | | | |
See accompanying notes which are an integral part of these financial statements.
| DUNHAM LARGE CAP VALUE FUND |
| SCHEDULE OF INVESTMENTS (Unaudited) (Continued) |
| April 30, 2022 |
| Shares | | | | | Fair Value | |
| | | | | COMMON STOCKS — 97.5% (Continued) | | | | |
| | | | | CONTAINERS & PACKAGING - 0.5% | | | | |
| | 15,722 | | | Westrock Company | | $ | 778,711 | |
| | | | | | | | | |
| | | | | DIVERSIFIED INDUSTRIALS - 2.9% | | | | |
| | 25,376 | | | Emerson Electric Company | | | 2,288,408 | |
| | 10,758 | | | Honeywell International, Inc. | | | 2,081,781 | |
| | | | | | | | 4,370,189 | |
| | | | | ELECTRIC UTILITIES - 3.8% | | | | |
| | 45,832 | | | NextEra Energy, Inc. | | | 3,254,989 | |
| | 33,413 | | | Xcel Energy, Inc. | | | 2,447,836 | |
| | | | | | | | 5,702,825 | |
| | | | | ELECTRICAL EQUIPMENT - 1.1% | | | | |
| | 28,523 | | | Johnson Controls International plc | | | 1,707,672 | |
| | | | | | | | | |
| | | | | ENGINEERING & CONSTRUCTION - 1.7% | | | | |
| | 21,038 | | | Quanta Services, Inc. (b) | | | 2,439,987 | |
| | | | | | | | | |
| | | | | ENTERTAINMENT CONTENT - 1.7% | | | | |
| | 8,500 | | | Fox Corporation, Class A | | | 304,640 | |
| | 19,569 | | | Walt Disney Company (The)(a) | | | 2,184,487 | |
| | | | | | | | 2,489,127 | |
| | | | | FOOD - 2.6% | | | | |
| | 29,094 | | | Mondelez International, Inc., Class A | | | 1,875,981 | |
| | 21,368 | | | Tyson Foods, Inc., Class A | | | 1,990,643 | |
| | | | | | | | 3,866,624 | |
| | | | | HEALTH CARE FACILITIES & SERVICES - 6.5% | | | | |
| | 14,825 | | | AmerisourceBergen Corporation | | | 2,242,874 | |
| | 28,818 | | | CVS Health Corporation | | | 2,770,274 | |
| | 9,329 | | | UnitedHealth Group, Inc. | | | 4,744,264 | |
| | | | | | | | 9,757,412 | |
| | | | | HOUSEHOLD PRODUCTS - 1.4% | | | | |
| | 12,994 | | | Procter & Gamble Company (The) | | | 2,086,187 | |
| | | | | | | | | |
See accompanying notes which are an integral part of these financial statements.
| DUNHAM LARGE CAP VALUE FUND |
| SCHEDULE OF INVESTMENTS (Unaudited) (Continued) |
| April 30, 2022 |
| Shares | | | | | Fair Value | |
| | | | | COMMON STOCKS — 97.5% (Continued) | | | | |
| | | | | INDUSTRIAL REIT - 1.4% | | | | |
| | 12,691 | | | Prologis, Inc. | | $ | 2,034,240 | |
| | | | | | | | | |
| | | | | INFRASTRUCTURE REIT - 0.8% | | | | |
| | 5,276 | | | American Tower Corporation, A | | | 1,271,622 | |
| | | | | | | | | |
| | | | | INSTITUTIONAL FINANCIAL SERVICES - 2.4% | | | | |
| | 45,576 | | | Bank of New York Mellon Corporation (The) | | | 1,916,927 | |
| | 14,646 | | | Intercontinental Exchange, Inc. | | | 1,696,153 | |
| | | | | | | | 3,613,080 | |
| | | | | INSURANCE - 6.5% | | | | |
| | 17,426 | | | Allstate Corporation (The) | | | 2,205,087 | |
| | 5,716 | | | Berkshire Hathaway, Inc., Class B(a) | | | 1,845,296 | |
| | 30,166 | | | Hartford Financial Services Group, Inc. (The) | | | 2,109,508 | |
| | 16,661 | | | Prudential Financial, Inc. (b) | | | 1,807,885 | |
| | 10,231 | | | Travelers Companies, Inc. (The) | | | 1,750,115 | |
| | | | | | | | 9,717,891 | |
| | | | | INTERNET MEDIA & SERVICES - 2.4% | | | | |
| | 1,562 | | | Alphabet, Inc., Class A(a), (b) | | | 3,564,781 | |
| | | | | | | | | |
| | | | | LEISURE FACILITIES & SERVICES - 1.1% | | | | |
| | 12,728 | | | Darden Restaurants, Inc. (b) | | | 1,676,659 | |
| | | | | | | | | |
| | | | | MACHINERY - 2.2% | | | | |
| | 6,913 | | | Caterpillar, Inc. (b) | | | 1,455,463 | |
| | 6,593 | | | Parker-Hannifin Corporation | | | 1,785,516 | |
| | | | | | | | 3,240,979 | |
| | | | | MEDICAL EQUIPMENT & DEVICES - 6.3% | | | | |
| | 21,323 | | | Abbott Laboratories | | | 2,420,161 | |
| | 27,034 | | | Baxter International, Inc. | | | 1,921,036 | |
| | 5,934 | | | Stryker Corporation | | | 1,431,637 | |
| | 6,614 | | | Thermo Fisher Scientific, Inc. | | | 3,657,012 | |
| | | | | | | | 9,429,846 | |
| | | | | OFFICE REIT - 0.8% | | | | |
| | 10,780 | | | Boston Properties, Inc. | | | 1,267,728 | |
| | | | | | | | | |
See accompanying notes which are an integral part of these financial statements.
| DUNHAM LARGE CAP VALUE FUND |
| SCHEDULE OF INVESTMENTS (Unaudited) (Continued) |
| April 30, 2022 |
| Shares | | | | | Fair Value | |
| | | | | COMMON STOCKS — 97.5% (Continued) | | | | |
| | | | | OIL & GAS PRODUCERS - 5.4% | | | | |
| | 41,469 | | | ConocoPhillips | | $ | 3,961,119 | |
| | 21,873 | | | EOG Resources, Inc. | | | 2,553,891 | |
| | 17,724 | | | Phillips 66(b) | | | 1,537,734 | |
| | | | | | | | 8,052,744 | |
| | | | | OIL & GAS SERVICES & EQUIPMENT - 1.9% | | | | |
| | 74,288 | | | Schlumberger N.V. | | | 2,897,975 | |
| | | | | | | | | |
| | | | | RESIDENTIAL REIT - 1.3% | | | | |
| | 25,028 | | | Equity LifeStyle Properties, Inc. | | | 1,934,164 | |
| | | | | | | | | |
| | | | | RETAIL - CONSUMER STAPLES - 1.7% | | | | |
| | 11,133 | | | Target Corporation | | | 2,545,560 | |
| | | | | | | | | |
| | | | | RETAIL - DISCRETIONARY - 1.1% | | | | |
| | 8,205 | | | Lowe’s Companies, Inc. | | | 1,622,375 | |
| | | | | | | | | |
| | | | | SEMICONDUCTORS - 3.8% | | | | |
| | 3,057 | | | Broadcom, Inc. | | | 1,694,770 | |
| | 16,574 | | | Intel Corporation | | | 722,461 | |
| | 21,254 | | | Micron Technology, Inc. | | | 1,449,310 | |
| | 36,417 | | | ON Semiconductor Corporation(a) | | | 1,897,691 | |
| | | | | | | | 5,764,232 | |
| | | | | SOFTWARE - 1.2% | | | | |
| | 6,572 | | | Microsoft Corporation | | | 1,823,861 | |
| | | | | | | | | |
| | | | | SPECIALTY FINANCE - 1.0% | | | | |
| | 8,689 | | | American Express Company | | | 1,518,055 | |
| | | | | | | | | |
| | | | | TECHNOLOGY HARDWARE - 2.4% | | | | |
| | 33,791 | | | Cisco Systems, Inc. | | | 1,655,083 | |
| | 8,849 | | | Motorola Solutions, Inc. | | | 1,890,943 | |
| | | | | | | | 3,546,026 | |
| | | | | | | | | |
See accompanying notes which are an integral part of these financial statements.
| DUNHAM LARGE CAP VALUE FUND |
| SCHEDULE OF INVESTMENTS (Unaudited) (Continued) |
| April 30, 2022 |
| Shares | | | | | Fair Value | |
| | | | | COMMON STOCKS — 97.5% (Continued) | | | | |
| | | | | TECHNOLOGY SERVICES - 1.0% | | | | |
| | 11,388 | | | Global Payments, Inc. | | $ | 1,559,928 | |
| | | | | | | | | |
| | | | | TELECOMMUNICATIONS - 1.5% | | | | |
| | 49,853 | | | Verizon Communications, Inc. | | | 2,308,194 | |
| | | | | | | | | |
| | | | | TRANSPORTATION & LOGISTICS - 3.2% | | | | |
| | 55,965 | | | CSX Corporation | | | 1,921,839 | |
| | 29,279 | | | Knight-Swift Transportation Holdings, Inc. (b) | | | 1,402,171 | |
| | 32,950 | | | Southwest Airlines Company(a),(b) | | | 1,539,424 | |
| | | | | | | | 4,863,434 | |
| | | | | | | | | |
| | | | | TOTAL COMMON STOCKS (Cost $105,164,541) | | | 146,704,257 | |
| | | | | | | | | |
| | | | | COLLATERAL FOR SECURITIES LOANED — 12.5% | | | | |
| | 18,818,689 | | | Mount Vernon Prime Portfolio , 0.45% (Cost $18,818,689)(c),(d) | | | 18,818,689 | |
| | | | | | | | | |
| | | | | TOTAL INVESTMENTS – 110.0% (Cost $123,983,230) | | $ | 165,522,946 | |
| | | | | LIABILITIES IN EXCESS OF OTHER ASSETS - (10.0)% | | | (15,099,415 | ) |
| | | | | NET ASSETS - 100.0% | | $ | 150,423,531 | |
| NV | - Naamioze Vennootschap |
| | |
| PLC | - Public Limited Company |
| | |
| REIT | - Real Estate Investment Trust |
| | |
| (a) | Non-income producing security. |
| | |
| (b) | All or a portion of these securities are on loan. Total loaned securities had a value of $18,023,491 at April 30, 2022. |
| | |
| (c) | Rate disclosed is the seven day effective yield as of April 30, 2022. |
| | |
| (d) | The Trust’s securities lending policies and procedures require that the borrower: deliver cash or U.S. Government securities as collateral with respect to each new loan of U.S. securities, equal to at least 102% of the value of the portfolio securities loaned, and (ii) at all times thereafter mark-to-market the collateral on a daily basis so that the market value of such collateral is at least 100% of the value of securities loaned. From time to time the collateral may not be 102% due to end of day market movement. The next business day additional collateral is obtained/received from the borrower to replenish/reestablish 102%. |
See accompanying notes which are an integral part of these financial statements.
| DUNHAM LARGE CAP VALUE FUND |
| SCHEDULE OF INVESTMENTS (Unaudited) (Continued) |
| April 30, 2022 |
| Portfolio Composition * - (Unaudited) |
| Financials | | | 18.0 | % | | Consumer Staples | | | 5.1 | % |
| Healthcare | | | 17.9 | % | | Communication | | | 5.0 | % |
| Industrials | | | 12.0 | % | | Materials | | | 5.0 | % |
| Collateral for Securities Loaned | | | 11.4 | % | | Consumer Discretionary | | | 3.9 | % |
| Technology | | | 7.7 | % | | Others | | | 7.4 | % |
| Energy | | | 6.6 | % | | Total | | | 100.0 | % |
| * | Based on total value of investments as of April 30, 2022. Does not include derivatives. |
| Percentage may differ from Schedule of Investments which are based on Fund net assets. |
See accompanying notes which are an integral part of these financial statements.
Dunham Small Cap Value Fund (Unaudited)
Message from the Sub-Adviser (Ziegler Capital Management, LLC)
Asset Class Recap
Small cap value stocks outpaced their small cap growth counterparts over the six-month fiscal period ending April 30, 2022. The fiscal period began with most equity indices trading at all time highs, as it appeared the worst of COVID was behind with vaccinations being disseminated across the globe and cases easing. However, the COVID omicron variant started to spread across the globe, further disrupting supply chains and elevating prices. Inflation reports showed that prices increased at the fastest pace in 40 years, with oil prices up double -digits when compared to a year ago. The Federal Reserve took on a more hawkish tone, stating that it would use its fully capability of tools to combat the historically high inflation, including raising interest rates and unwinding its $8 trillion balance sheet. Markets reacted sharply to the news, with growth stocks selling off as the 10-year U.S. Treasury yield rose above 2 percent, a level not crossed in two years. To make matters worse, geopolitical tensions between Russia and Ukraine further exacerbated already elevated energy and commodity prices. With inflation likely to remain heightened well into 2023, investors believe the Federal Reserve may increase interest rates at a larger magnitude than previously anticipated. Riskier assets, such as growth stocks, sold off on the potential of higher rates, with small cap growth stocks, as measured by the Russell 2000 Growth Index, dropping 26.8 percent over the fiscal period. Small cap value stocks, as measured by the Russell 2000 Value Index, bested their counterparts by over 17 percent, losing 9.5 percent over the fiscal period.
Allocation Review
The Sub-Adviser matches the Fund’s sector allocation to the benchmark index; therefore, any changes to benchmark weights will be quickly reflected within the Fund. With that being said, the Fund is reliant on superior stock selection to generate excess returns. The Sub-Adviser seeks to generate alpha through proprietary sector-specific multi-factor models, combined with qualitative analysis. When looking at the benchmark, as of April 30, 2022, the largest sector by weighting was the financial services sector, at 36.8 percent, or more than one-third of the Fund’s benchmark index. While the financial services sector realized a negative absolute return over the fiscal period, the financial services sector contributed the most to Fund performance. Strong stock selection, coupled with an overweight allocation to the the sector contributed meaningfully to relative performance. The health care sector also contributed to relative outperformance, as stellar stock selection added to returns. The sector that detracted the most from performance was the energy sector. An underweight allocation to the sector, coupled with weak stock selection, dragged on performance. While the energy sector’s performance lagged the energy sector within the benchmark, the sector still provided an absolute return of 8.7 percent.
Holdings Insights
The largest contributor to Fund performance over the fiscal quarter was Amphastar Pharmaceuticals, Inc. (AMPH) (holding weight*: 1.15 percent). AMPH is a bio -pharmaceuticals company that develops and manufactures injectable, inhalation, and intranasal products. AMPH reported revenues and earnings came in higher than anticipated, leading multiple sell- side analysts to raise their target prices on the stock. While most of the biotechnology sector sold off over the fiscal period, as rising interest rates ate into potential future cash flows, AMPH’s fotress balance sheet and steady cash flows helped drive strong returns. Over the fiscal period, AMPH gained 89.9 percent. Another contributor over the fiscal period came from a stock not held in the Fund, AMC Entertainment Holdings, Inc. (AMC) (holding weight*: not held). AMC is one of the largest operators of movie theatres in the U.S. and Europe. AMC, which had been one of the largest beneficiaries of the “meme” stock craze, has seen its share price cut in half, as investors transitioned out of high-risk assets, and into safer, more defensive assets. Additionally, the rapid spread of the COVID omicron variant throughout the United States at the tail-end of 2021 and beginning of 2022 significantly affected sales, with many becoming more comfortable streaming movies from home. Over the fiscal period, AMC lost 56.7 percent. The next largest contributor came from within the consumer discretionary sector, Meritor, Inc. (MTOR) (holding weight**: 1.47 percent), a manufacturer of drivetrain, braking, and powertrain components for the commercial vehicle and industrial markets. In February, a truck engine maker announced plans to acquire MTOR at an acquisition price 45 percent higher than the market value of MTOR stock. The deal could help the acquirer compete in the electric and hybrid vehicle segment of the automobile industry. Over the fiscal period, MTOR increased 46.2 percent.
The largest detractor to Fund performance over the fiscal period came from a stock not held in the Fund, Avis Budget Group, Inc. (CAR) (holding weight: not held). CAR is a provider of car and truck rentals, car sharing, and ancillary products and services to businesses and consumers. CAR reported revenues and earnings that came in higher than anticipated, nearly doubling their levels’ from a year ago. Increased car rental prices and strong growth in the Americas segment contributed to positive earnings beat. Over the fiscal quarter, CAR gained 54.5 percent. The next largest detractor over the fiscal quarter was Laredo Petroleum, Inc. (LPI) (holding weight*: 1.48 percent). LPI is an independent energy company that engages in the acquisition, exploration, and development of oil and natural gas in the Permian Basin of West Texas. In November of 2021, LPI reported earnings that missed on the bottom line, however, showed strong revenue growth as a result of the rise in energy prices. While LPI recently reported earnings that exceeded expectations in the more recent February 2022 results, the stock has nearly tripled over the last year, leading some investors to lock in profits. Over the fiscal period, LPI lost 5.6 percent. Another detractor came from the consumer discretionary sector, Foot Locker, Inc. (FL) (holding weight*: 0.72 percent), an athletic footwear and apparel retailer. FL fell over the fiscal period after it was reported one of FL’s largest third party brands would begin transitioning away from the retailer in efforts to boost their own direct-to- consumer strategy. While the loss of one of their largest clients could affect earnings materially over the next few years, the Sub-Adviser remains bullish on the stock as FL continues to shut down underperforming stores, while adding more alternative brands to its apparel lineup. Over the fiscal period, FL fell 37.3 percent.
Sub-Adviser Outlook
The Sub-Adviser believes the outlook for value stocks remains attractive, despite headwinds, such as persistent inflation, potentially aggressive monetary tightening, and continued geopolitical turmoil. With a possible recession on the horizon, the Sub -Adviser prefers stocks with attractive valuation factors, as these stocks have outperformed the broader market over two of the larger recessions in recent memory (the Great Financia Crisis in 2008 and the technology bubble in 2001) . As always, the Sub-Adviser will select stocks that can be identified through a systematic, risk-controlled, repeatable approach, avoiding sector rotation and market timing.
| * | Holdings percentage(s) of total investments, cash and unsettled trades excluding collateral for securities loaned as of 4/30/2022. |
| ** | Holdings percentage(s) as of the date prior to the sale of the security. |
Growth of $100,000 Investment
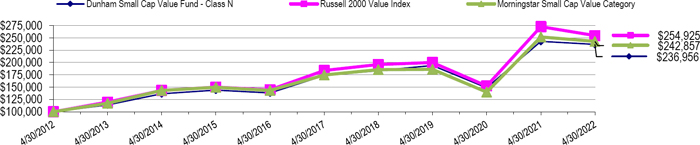
Total Returns (a) as of April 30, 2022
| | | | Annualized | Annualized |
| | Six Month | One Year | Five Years | Ten Years |
| Class N | (5.85)% | (2.50)% | 6.40% | 9.01% |
| Class A with load of 5.75% | (11.37)% | (8.31)% | 4.88% | 8.12% |
| Class A without load | (5.96)% | (2.72)% | 6.14% | 8.76% |
| Class C | (6.29)% | (3.47)% | 5.33% | 7.91% |
| Russell 2000 Value Index | (9.50)% | (6.59)% | 6.75% | 9.81% |
| Morningstar Small Cap Value Category | (6.49)% | (3.61)% | 6.82% | 9.28% |
| (a) | Total Returns are calculated based on traded NAVs. |
The Russell 2000 Value Index is an unmanaged index that measures the performance of small cap companies in the Russell 2000 Index with lower price-to-book ratios and lower forecasted growth rates.
Investors cannot invest directly in an index or benchmark.
The Morningstar Small Cap Value Category is generally representative of mutual funds that primarily invest in small (small capitalization) U.S. companies that are less expensive or growing more slowly than other small-cap stocks.
| As disclosed in the Trust’s latest registration statement, the Fund’s total annual operating expenses, including underlying funds, are 1.05% for Class N, 2.05% for Class C and 1.30% for Class A. Class A shares are subject to a sales load of 5.75% and a deferred sales charge of up to 0.75%. The performance data quoted here represents past performance, which is not indicative of future results. Current performance may be lower or higher than the performance data quoted. The investment return and NAV will fluctuate, so that an investor’s shares, when redeemed, may be worth more or less than their original cost. Total returns are calculated assuming reinvestment of all dividends and capital gains distributions, if any. The returns do not reflect the deductions of taxes a shareholder would pay on the redemption of Fund shares or Fund distributions. For performance information current to the most recent month-end, please call 1-800-442-4358 or visit our website www.dunham.com. |
| DUNHAM SMALL CAP VALUE FUND |
| SCHEDULE OF INVESTMENTS (Unaudited) |
| April 30, 2022 |
| Shares | | | | | Fair Value | |
| | | | | COMMON STOCKS — 99.2% | | | | |
| | | | | AEROSPACE & DEFENSE - 1.4% | | | | |
| | 11,317 | | | Barnes Group, Inc. | | $ | 380,025 | |
| | 15,820 | | | Kaman Corporation | | | 617,138 | |
| | | | | | | | 997,163 | |
| | | | | AUTOMOTIVE - 1.0% | | | | |
| | 117,000 | | | American Axle & Manufacturing Holdings, Inc.(a) | | | 774,540 | |
| | | | | | | | | |
| | | | | BANKING - 15.9% | | | | |
| | 17,126 | | | Banner Corporation | | | 919,666 | |
| | 9,400 | | | BOK Financial Corporation | | | 779,542 | |
| | 30,351 | | | Central Pacific Financial Corporation | | | 733,887 | |
| | 21,250 | | | Customers Bancorp, Inc.(a) | | | 893,988 | |
| | 18,256 | | | First Financial Corporation | | | 778,071 | |
| | 20,800 | | | Hancock Whitney Corporation | | | 972,817 | |
| | 19,881 | | | Heartland Financial USA, Inc. | | | 870,191 | |
| | 38,593 | | | Heritage Financial Corporation(b) | | | 934,722 | |
| | 29,815 | | | Independent Bank Corporation | | | 588,548 | |
| | 18,700 | | | Meta Financial Group, Inc. | | | 816,255 | |
| | 21,444 | | | TriCompany Bancshares | | | 805,222 | |
| | 31,880 | | | Trustmark Corporation(b) | | | 888,814 | |
| | 11,085 | | | UMB Financial Corporation(b) | | | 999,646 | |
| | 18,200 | | | WSFS Financial Corporation | | | 729,274 | |
| | | | | | | | 11,710,643 | |
| | | | | BIOTECH & PHARMA - 4.2% | | | | |
| | 23,900 | | | Amphastar Pharmaceuticals, Inc.(a) | | | 847,732 | |
| | 16,378 | | | AnaptysBio, Inc.(a) | | | 383,245 | |
| | 9,838 | | | Anika Therapeutics, Inc.(a) | | | 211,812 | |
| | 28,542 | | | Coherus Biosciences, Inc.(a) | | | 258,020 | |
| | 8,500 | | | Eagle Pharmaceuticals, Inc.(a) | | | 375,105 | |
| | 36,756 | | | Jounce Therapeutics, Inc.(a) | | | 194,807 | |
| | 18,462 | | | Supernus Pharmaceuticals, Inc.(a) | | | 515,090 | |
| | 27,651 | | | Vanda Pharmaceuticals, Inc.(a),(b) | | | 274,298 | |
| | | | | | | | 3,060,109 | |
| | | | | CHEMICALS - 2.6% | | | | |
| | 18,812 | | | Cabot Corporation | | | 1,238,770 | |
| | | | | | | | | |
See accompanying notes which are an integral part of these financial statements.
| DUNHAM SMALL CAP VALUE FUND |
| SCHEDULE OF INVESTMENTS (Unaudited) (Continued) |
| April 30, 2022 |
| Shares | | | | | Fair Value | |
| | | | | COMMON STOCKS — 99.2% (Continued) | | | | |
| | | | | CHEMICALS - 2.6% (Continued) | | | | |
| | 11,277 | | | Minerals Technologies, Inc. | | $ | 717,330 | |
| | | | | | | | 1,956,100 | |
| | | | | CONSUMER SERVICES - 1.0% | | | | |
| | 1,303 | | | Graham Holdings Company, Class B(b) | | | 771,858 | |
| | | | | | | | | |
| | | | | CONTAINERS & PACKAGING - 1.0% | | | | |
| | 11,554 | | | Greif, Inc., Class A | | | 701,097 | |
| | | | | | | | | |
| | | | | ELECTRIC UTILITIES - 3.0% | | | | |
| | 21,500 | | | Avista Corporation | | | 872,255 | |
| | 15,694 | | | NorthWestern Corporation | | | 889,693 | |
| | 9,337 | | | Unitil Corporation | | | 476,187 | |
| | | | | | | | 2,238,135 | |
| | | | | ENGINEERING & CONSTRUCTION - 1.1% | | | | |
| | 34,719 | | | Primoris Services Corporation | | | 804,786 | |
| | | | | | | | | |
| | | | | FOOD - 0.7% | | | | |
| | 10,130 | | | Seneca Foods Corporation, Class A(a) | | | 549,553 | |
| | | | | | | | | |
| | | | | FORESTRY, PAPER & WOOD PRODUCTS - 1.2% | | | | |
| | 14,200 | | | Louisiana-Pacific Corporation(b) | | | 916,184 | |
| | | | | | | | | |
| | | | | GAS & WATER UTILITIES - 2.2% | | | | |
| | 11,141 | | | SJW Group | | | 657,319 | |
| | 11,257 | | | Southwest Gas Holdings, Inc. | | | 991,854 | |
| | | | | | | | 1,649,173 | |
| | | | | HEALTH CARE FACILITIES & SERVICES - 2.2% | | | | |
| | 14,487 | | | National HealthCare Corporation | | | 985,986 | |
| | 18,119 | | | Owens & Minor, Inc. (b) | | | 643,043 | |
| | | | | | | | 1,629,029 | |
| | | | | HOME CONSTRUCTION - 1.1% | | | | |
| | 9,827 | | | Meritage Homes Corporation(a) | | | 811,219 | |
| | | | | | | | | |
See accompanying notes which are an integral part of these financial statements.
| DUNHAM SMALL CAP VALUE FUND |
| SCHEDULE OF INVESTMENTS (Unaudited) (Continued) |
| April 30, 2022 |
| Shares | | | | | Fair Value | |
| | | | | COMMON STOCKS — 99.2% (Continued) | | | | |
| | | | | HOTEL REIT - 1.0% | | | | |
| | 50,563 | | | Chatham Lodging Trust(a) | | $ | 726,085 | |
| | | | | | | | | |
| | | | | HOTEL REITS - 1.1% | | | | |
| | 46,644 | | | Apple Hospitality REIT, Inc. | | | 825,132 | |
| | | | | | | | | |
| | | | | INDUSTRIAL INTERMEDIATE PROD - 2.5% | | | | |
| | 12,981 | | | AZZ, Inc. | | | 592,453 | |
| | 23,352 | | | Mueller Industries, Inc. (b) | | | 1,264,511 | |
| | | | | | | | 1,856,964 | |
| | | | | INDUSTRIAL REIT - 1.4% | | | | |
| | 5,550 | | | PS Business Parks, Inc. | | | 1,038,960 | |
| | | | | | | | | |
| | | | | INSTITUTIONAL FINANCIAL SERVICES - 1.1% | | | | |
| | 7,042 | | | Piper Sandler Cos(b) | | | 809,689 | |
| | | | | | | | | |
| | | | | INSURANCE - 3.3% | | | | |
| | 15,796 | | | American Equity Investment Life Holding Company | | | 595,825 | |
| | 10,393 | | | Axis Capital Holdings Ltd. | | | 595,831 | |
| | 17,518 | | | Mercury General Corporation | | | 883,432 | |
| | 1,663 | | | National Western Life Group, Inc., Class A | | | 330,538 | |
| | | | | | | | 2,405,626 | |
| | | | | LEISURE FACILITIES & SERVICES - 1.2% | | | | |
| | 16,306 | | | Travel + Leisure Company | | | 904,657 | |
| | | | | | | | | |
| | | | | LEISURE PRODUCTS - 0.9% | | | | |
| | 8,700 | | | Thor Industries, Inc. (b) | | | 665,985 | |
| | | | | | | | | |
| | | | | MACHINERY - 3.1% | | | | |
| | 22,167 | | | Altra Industrial Motion Corporation | | | 864,513 | |
| | 4,196 | | | Curtiss-Wright Corporation | | | 599,650 | |
| | 19,880 | | | Hillenbrand, Inc. | | | 811,502 | |
| | | | | | | | 2,275,665 | |
| | | | | MEDICAL EQUIPMENT & DEVICES - 0.9% | | | | |
| | 6,650 | | | Quidel Corporation(a), (b) | | | 669,123 | |
| | | | | | | | | |
See accompanying notes which are an integral part of these financial statements.
| DUNHAM SMALL CAP VALUE FUND |
| SCHEDULE OF INVESTMENTS (Unaudited) (Continued) |
| April 30, 2022 |
| Shares | | | | | Fair Value | |
| | | | | COMMON STOCKS — 99.2% (Continued) | | | | |
| | | | | MORTGAGE FINANCE - 2.1% | | | | |
| | 55,100 | | | Chimera Investment Corporation | | $ | 552,102 | |
| | 59,236 | | | Dynex Capital, Inc. (b) | | | 961,400 | |
| | | | | | | | 1,513,502 | |
| | | | | MULTI ASSET CLASS REIT - 2.4% | | | | |
| | 69,896 | | | Armada Hoffler Properties, Inc. | | | 947,091 | |
| | 58,409 | | | Global Net Lease, Inc. | | | 819,478 | |
| | | | | | | | 1,766,569 | |
| | | | | OFFICE REIT - 1.0% | | | | |
| | 17,600 | | | Highwoods Properties, Inc. (b) | | | 718,784 | |
| | | | | | | | | |
| | | | | OIL & GAS PRODUCERS - 7.7% | | | | |
| | 90,567 | | | Antero Midstream Corporation | | | 930,123 | |
| | 16,400 | | | Callon Petroleum Company(a) | | | 840,828 | |
| | 24,400 | | | HF Sinclair Corporation(a), (b) | | | 927,688 | |
| | 15,283 | | | Laredo Petroleum, Inc.(a), (b) | | | 1,088,303 | |
| | 20,144 | | | Matador Resources Company(b) | | | 983,430 | |
| | 25,000 | | | SilverBow Resources, Inc.(a) | | | 915,000 | |
| | | | | | | | 5,685,372 | |
| | | | | OIL & GAS SERVICES & EQUIPMENT - 2.0% | | | | |
| | 107,338 | | | Archrock, Inc. | | | 934,914 | |
| | 54,000 | | | RPC, Inc.(a) | | | 558,360 | |
| | | | | | | | 1,493,274 | |
| | | | | RESIDENTIAL REIT - 1.5% | | | | |
| | 46,470 | | | UMH Properties, Inc. | | | 1,092,975 | |
| | | | | | | | | |
| | | | | RETAIL - CONSUMER STAPLES - 2.0% | | | | |
| | 11,602 | | | Big Lots, Inc. | | | 358,502 | |
| | 11,876 | | | Ingles Markets, Inc., Class A(b) | | | 1,105,892 | |
| | | | | | | | 1,464,394 | |
| | | | | RETAIL - DISCRETIONARY – 3.9% | | | | |
| | 28,734 | | | Abercrombie & Fitch Company, Class A(a) | | | 993,622 | |
| | 34,600 | | | Conn’s, Inc.(a) | | | 541,490 | |
| | 34,900 | | | Ethan Allen Interiors, Inc. (b) | | | 828,526 | |
| | 18,090 | | | Foot Locker, Inc. (b) | | | 530,218 | |
| | | | | | | | 2,893,856 | |
| | | | | | | | | |
See accompanying notes which are an integral part of these financial statements.
| DUNHAM SMALL CAP VALUE FUND |
| SCHEDULE OF INVESTMENTS (Unaudited) (Continued) |
| April 30, 2022 |
| Shares | | | | | Fair Value | |
| | | | | COMMON STOCKS — 99.2% (Continued) | | | | |
| | | | | RETAIL REIT - 2.8% | | | | |
| | 44,000 | | | Essential Properties Realty Trust, Inc. | | $ | 1,056,000 | |
| | 65,200 | | | SITE Centers Corporation | | | 1,036,680 | |
| | | | | | | | 2,092,680 | |
| | | | | SEMICONDUCTORS - 2.5% | | | | |
| | 42,861 | | | Amkor Technology, Inc. | | | 806,215 | |
| | 40,447 | | | Rambus, Inc.(a), (b) | | | 1,007,535 | |
| | | | | | | | 1,813,750 | |
| | | | | SOFTWARE - 1.9% | | | | |
| | 26,000 | | | Donnelley Financial Solutions, Inc.(a) | | | 761,020 | |
| | 35,690 | | | NextGen Healthcare, Inc.(a) | | | 672,756 | |
| | | | | | | | 1,433,776 | |
| | | | | SPECIALTY FINANCE - 2.0% | | | | |
| | 18,003 | | | Mr. Cooper Group, Inc.(a) | | | 809,595 | |
| | 13,069 | | | Stewart Information Services Corporation(b) | | | 674,360 | |
| | | | | | | | 1,483,955 | |
| | | | | TECHNOLOGY HARDWARE - 2.1% | | | | |
| | 50,102 | | | Knowles Corporation(a) | | | 927,889 | |
| | 19,400 | | | NetScout Systems, Inc.(a) | | | 597,520 | |
| | | | | | | | 1,525,409 | |
| | | | | TECHNOLOGY SERVICES - 1.7% | | | | |
| | 24,200 | | | Green Dot Corporation, Class A(a) | | | 640,816 | |
| | 7,600 | | | Science Applications International Corporation(b) | | | 632,548 | |
| | | | | | | | 1,273,364 | |
| | | | | TELECOMMUNICATIONS - 1.1% | | | | |
| | 34,900 | | | EchoStar Corporation, Class A(a), (b) | | | 814,915 | |
| | | | | | | | | |
| | | | | TIMBER REIT - 1.4% | | | | |
| | 18,700 | | | PotlatchDeltic Corporation(b) | | | 1,035,793 | |
| | | | | | | | | |
| | | | | TRANSPORTATION & LOGISTICS - 3.6% | | | | |
| | 65,952 | | | Heartland Express, Inc. (b) | | | 910,138 | |
| | 11,522 | | | Matson, Inc. | | | 991,122 | |
| | | | | | | | | |
See accompanying notes which are an integral part of these financial statements.
| DUNHAM SMALL CAP VALUE FUND |
| SCHEDULE OF INVESTMENTS (Unaudited) (Continued) |
| April 30, 2022 |
| Shares | | | | | Fair Value | |
| | | | | COMMON STOCKS — 99.2% (Continued) | | | | |
| | | | | TRANSPORTATION & LOGISTICS - 3.6% (Continued) | | | | |
| | 11,350 | | | Ryder System, Inc. | | $ | 793,365 | |
| | | | | | | | 2,694,625 | |
| | | | | WHOLESALE - CONSUMER STAPLES - 1.1% | | | | |
| | 16,500 | | | Andersons, Inc. (The) | | | 828,795 | |
| | | | | | | | | |
| | | | | WHOLESALE - DISCRETIONARY - 1.1% | | | | |
| | 31,044 | | | G-III Apparel Group Ltd.(a) | | | 822,045 | |
| | | | | | | | | |
| | | | | TOTAL COMMON STOCKS (Cost $65,082,931) | | | 73,195,308 | |
| | | | | | | | | |
| | | | | COLLATERAL FOR SECURITIES LOANED – 32.5 % | | | | |
| | 23,983,526 | | | Mount Vernon Prime Portfolio, 0.45% (Cost $23,983,526) (c),(d) | | | 23,983,526 | |
| | | | | | | | | |
| | | | | TOTAL INVESTMENTS – 131.7% (Cost $89,066,457) | | $ | 97,178,834 | |
| | | | | LIABILITIES IN EXCESS OF OTHER ASSETS – (31.7)% | | | (23,392,811 | ) |
| | | | | NET ASSETS - 100.0% | | $ | 73,786,023 | |
| LTD | - Limited Company |
| | |
| PLC | - Public Limited Company |
| | |
| REIT | - Real Estate Investment Trust |
| (a) | Non-income producing security. |
| | |
| (b) | All or a portion of these securities are on loan. Total loaned securities had a value of $22,713,135 at April 30, 2022. |
| | |
| (c) | Rate disclosed is the seven day effective yield as of April 30, 2022. |
| | |
| (d) | The Trust’s securities lending policies and procedures require that the borrower: deliver cash or U.S. Government securities as collateral with respect to each new loan of U.S. securities, equal to at least 102% of the value of the portfolio securities loaned, and (ii) at all times thereafter mark-to-market the collateral on a daily basis so that the market value of such collateral is at least 100% of the value of securities loaned. From time to time the collateral may not be 102% due to end of day market movement. The next business day additional collateral is obtained/received from the borrower to replenish/reestablish 102%. |
| Portfolio Composition * - (Unaudited) |
| Collateral for Securities Loaned | | | 24.7 | % | | Technology | | | 6.2 | % |
| Financials | | | 18.4 | % | | Healthcare | | | 5.5 | % |
| Real Estate | | | 9.6 | % | | Utilities | | | 4.0 | % |
| Industrials | | | 8.9 | % | | Materials | | | 3.7 | % |
| Consumer Discretionary | | | 7.9 | % | | Others | | | 3.7 | % |
| Energy | | | 7.4 | % | | Total | | | 100.0 | % |
| * | Based on total value of investments as of April 30, 2022. Does not include derivatives. |
| Percentage may differ from Schedule of Investments which are based on Fund net assets. |
See accompanying notes which are an integral part of these financial statements.
Dunham Focused Large Cap Growth Fund (Unaudited)
Message from the Sub-Adviser (The Ithaka Group, LLC)
Asset Class Recap
When comparing the trailing fiscal six-month period ending April 30, 2022, large cap growth stocks, as measured by the Russell 1000 Growth Index, performed worse than large cap value stocks, as measured by the Russell 1000 Value Index. Large cap value stocks beat their growth counterparts by 13.9 percent during the period. Growth stocks have faced a difficult first half of the fiscal year due to rising rates, continued supply chain disruption, and inflation climbing to its highest point in decades. Elevated inflation and rising interest rates hurt the intrinsic value of high-growth stocks as future earnings are discounted at a higher rate. Following Federal Reserve Chairman Jerome Powell’s announcement of raising interest rates, the 10-year U.S. Treasury yield rose above 3 percent, a level not reached since 2018. Growth equities declined in response to the Fed’s announcement as large cap growth stocks fell 17.8 percent during the most recent fiscal period. In addition to Powell’s remarks, the Covid- 19 virus continued to negatively impact global supply chains, further exacerbated by China no-covid policy, effectively shutting down major cities. While large cap growth stocks lagged the broader market, large cap value stocks benefitted from the shift away from riskier assets in into less interest rate sensitive names, dropping only about 4 percent during the fiscal half.
Allocation Review
All sectors within the fund were negative for the first fiscal half of the year due to the aforementioned macroeconomic headwinds so it was mainly the Sub-Adviser’s lack of exposure to specific sector that benefited the fund. The best performing sector over the fiscal half of the year was utilities. The Sub-Adviser’s relative underweight within the sector provided a flat return performance relative to the benchmark. The Sub-Adviser’s underweight exposure within the materials and processing sector was the next best performer relative to the benchmark index. Additionally, the Sub-Adviser’s relative underweight to the producer durables sector and lack of exposure to the consumer staples sector added to relative performance. The sector that detracted the most from performance was the information technology sector. The technology sector is the largest sector by market capitalization within the Russell 1000 Growth Index, but the Sub-Adviser’s relative underweight exposure to technology helped mitigates a portion of the negative return. When looking at the top ten detractors from performance over the fiscal year, seven come from within the information technology sector. It is worth noting that while the Sub-Adviser’ stock selection within the sector detracted from relative performance this period, when looking at longer-dated trailing periods, such as the 3-year and 5-year, the Sub-Adviser’s stock selection within the sector has provided strong relative returns.
Holdings Insights
The largest contributor over the fiscal period was Mastercard, Inc. (MA) (holding weight*: 5.67 percent). MA, a financial service company that focuses on electronic payments, rose 8.6 percent over the first half of the fiscal year. MA, beat estimates in its most recent quarterly earnings report due to substantial recovery in cross -border volume, which resulted from cross-border travel rebounding to pre-pandemic levels. The next largest contributor was Visa, Inc. (V) (holding weight*: 3.95 percent), another financial service company whose focus is on electronic payments systems, rose 1.0 percent during the fiscal half. The global travel recovery is a benefit for Visa as cross -border travel volumes were improved. Travel is a high-margin business for the company. Moreover, while inflation may be dealing a blow to many businesses, Visa may be the beneficiary of the new inflationary environment because it means higher average travel ticket prices. Despite the technology sector detracting from relative performance, Apple Inc. (AAPL) (holding weight*: 3.92 percent), an American multinational technology company that specializes in consumer electronics, software and online services, climbed 5.5 percent during the fiscal period. AAPL beat expectation in its last quarterly report, driven by an increased demand for the new iPhone. Additionally, the services segment, which includes Apple TV+ and Apple Music, has been vital for AAPL because it generates higher profit margins than the product segment.
The worst performing stock during the fiscal half was PayPal Holdings, Inc. (PYPL) (holding weight*: 3.38 percent), a financial technology company that operates online payment systems. PYPL’s most recent revenue missed expectation, marking the fourth straight quarter of falling revenue. Additionally, operating costs have increased as a tight labor market has forced management to increase spending. Another detractor over the fiscal half was Netflix, Inc (NFLX) (holding weight*: 2.59 percent), a media streaming service and production company. NFLX lost subscribers for the first time in over ten years in its most recent quarterly report. Inflation, subscription price increases, more competition, password sharing and the war in Ukraine were factors in the surprise announcement in the company’s first-quarter earnings. NFLX fell 72.4 percent through the first fiscal half of the year.
Sub-Adviser Outlook
The Sub-Adviser seeks to hold what it believes to be the strongest growth stocks, primarily focusing on free-cash-flow and fundamental factors that traditionally support long-term growth. Therefore, the Fund holds an array of stocks ranging from cloud-based technologies to brick -and-mortar retailers. The Sub-Adviser is optimistic that remaining concentrated in the Fund’s number of holdings may prove to be more impactful to the Fund’s outperformance relative to its benchmark index over the long term than the impact of sector weightings.
| * | Holdings percentage(s) of total investments, cash and unsettled trades excluding collateral for securities loaned, as of 4/30/2022. |
Growth of $100,000 Investment
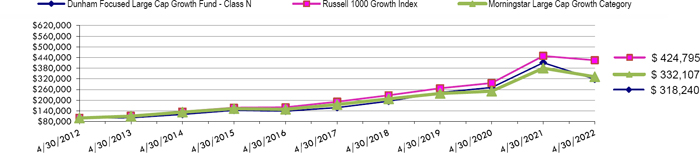
Total Returns (a) as of April 30, 2022
| | | | Annualized | Annualized |
| | Six Months | One Year | Five Years | Ten Years |
| Class N | (30.65)% | (22.56)% | 14.92% | 12.27% |
| Class A with load of 5.75% | (34.72)% | (27.19)% | 13.29% | 11.34% |
| Class A without load | (30.73)% | (22.74)% | 14.64% | 12.00% |
| Class C | (30.98)% | (23.30)% | 13.78% | 11.16% |
| Russell 1000 Growth Index | (17.84)% | (5.35)% | 17.28% | 15.56% |
| Morningstar Large Cap Growth Category | (21.58)% | (12.66)% | 13.60% | 12.75% |
| (a) | Total Returns are calculated based on traded NAVs. |
The Russell 1000 Growth Index is a subset of the Russell 1000 Index which measures the performance of the stocks of the 1000 largest companies in the Russell 3000 Index based on market capitalization. The Russell 1000 Growth Index measures the performance of those stocks of the Russell 1000 with higher price-to-book ratios and higher relative forecasted growth rates. Investors cannot invest directly in an index or benchmark.
The Morningstar Large Cap Growth Category is generally representative of mutual funds that primarily invest in big (large capitalization) U.S. companies that are projected to grow faster than other large-cap stocks.
| As disclosed in the Trust’s latest registration statement, the Fund’s total annual operating expenses, including the cost of underlying funds, are 1.12% for Class N, 2.12% for Class C and 1.37% for Class A. Class A shares are subject to a sales load of 5.75% and a deferred sales charge of up to 0.75%. The performance data quoted here represents past performance, which is not indicative of future results. Current performance may be lower or higher than the performance data quoted. The investment return and NAV will fluctuate, so that an investor’s shares, when redeemed, may be worth more or less than their original cost. Total returns are calculated assuming reinvestment of all dividends and capital gains distributions, if any. The returns do not reflect the deductions of taxes a shareholder would pay on the redemption of Fund shares or Fund distributions. For performance information current to the most recent month-end, please call 1-800-442-4358 or visit our website www.dunham.com. |
| DUNHAM FOCUSED LARGE CAP GROWTH FUND |
| SCHEDULE OF INVESTMENTS (Unaudited) |
| April 30, 2022 |
| Shares | | | | | Fair Value | |
| | | | | COMMON STOCKS — 98.0% | | | | |
| | | | | E-COMMERCE DISCRETIONARY - 8.8% | | | | |
| | 4,611 | | | Amazon.com, Inc.(a) | | $ | 11,461,239 | |
| | 3,459 | | | MercadoLibre, Inc.(a) | | | 3,367,786 | |
| | | | | | | | 14,829,025 | |
| | | | | INTERNET MEDIA & SERVICES - 5.5% | | | | |
| | 34,665 | | | Meta Platforms, Inc., Class A(a) | | | 6,949,293 | |
| | 11,074 | | | Netflix, Inc.(a) | | | 2,108,047 | |
| | | | | | | | 9,057,340 | |
| | | | | LEISURE FACILITIES & SERVICES - 2.7% | | | | |
| | 3,126 | | | Chipotle Mexican Grill, Inc.(a) | | | 4,550,237 | |
| | | | | | | | | |
| | | | | MEDICAL EQUIPMENT & DEVICES - 12.8% | | | | |
| | 10,256 | | | Align Technology, Inc.(a),(b) | | | 2,973,317 | |
| | 12,208 | | | DexCom, Inc.(a) | | | 4,987,945 | |
| | 44,810 | | | Edwards Lifesciences Corporation(a) | | | 4,740,002 | |
| | 15,118 | | | Insulet Corporation(a),(b) | | | 3,613,051 | |
| | 21,721 | | | Intuitive Surgical, Inc.(a) | | | 5,197,835 | |
| | | | | | | | 21,512,150 | |
| | | | | RETAIL - DISCRETIONARY - 6.6% | | | | |
| | 10,267 | | | Burlington Stores, Inc.(a),(b) | | | 2,089,951 | |
| | 12,880 | | | Lululemon Athletica, Inc.(a),(b) | | | 4,567,634 | |
| | 21,604 | | | Tractor Supply Company | | | 4,352,126 | |
| | | | | | | | 11,009,711 | |
| | | | | SEMICONDUCTORS - 13.8% | | | | |
| | 33,701 | | | Advanced Micro Devices, Inc.(a) | | | 2,882,110 | |
| | 5,926 | | | ASML Holding N.V. - ADR | | | 3,340,901 | |
| | 27,010 | | | Marvell Technology, Inc. | | | 1,568,741 | |
| | 53,756 | | | NVIDIA Corporation(b) | | | 9,970,124 | |
| | 37,756 | | | QUALCOMM, Inc. | | | 5,274,136 | |
| | | | | | | | 23,036,012 | |
| | | | | SOFTWARE - 26.7% | | | | |
| | 14,100 | | | Adobe, Inc.(a) | | | 5,582,895 | |
| | 48,138 | | | Microsoft Corporation | | | 13,359,257 | |
| | 34,867 | | | Salesforce, Inc.(a) | | | 6,134,500 | |
| | 22,666 | | | ServiceNow, Inc.(a) | | | 10,836,615 | |
| | | | | | | | | |
See accompanying notes which are an integral part of these financial statements.
| DUNHAM FOCUSED LARGE CAP GROWTH FUND |
| SCHEDULE OF INVESTMENTS (Unaudited) (Continued) |
| April 30, 2022 |
| Shares | | | | | Fair Value | |
| | | | | COMMON STOCKS — 98.0% (Continued) | | | | |
| | | | | SOFTWARE - 26.7% (Continued) | | | | |
| | 1,461 | | | Shopify, Inc., Class A(a) | | $ | 623,584 | |
| | 15,702 | | | Twilio, Inc., Class A(a) | | | 1,755,798 | |
| | 12,619 | | | Unity Software, Inc.(a),(b) | | | 838,028 | |
| | 29,832 | | | Veeva Systems, Inc., Class A(a) | | | 5,427,932 | |
| | | | | | | | 44,558,609 | |
| | | | | TECHNOLOGY HARDWARE - 5.3% | | | | |
| | 56,532 | | | Apple, Inc. | | | 8,912,270 | |
| | | | | | | | | |
| | | | | TECHNOLOGY SERVICES - 15.8% | | | | |
| | 34,653 | | | Block, Inc., Class A(a),(b) | | | 3,449,360 | |
| | 32,918 | | | Mastercard, Inc., Class A | | | 11,961,742 | |
| | 46,165 | | | PayPal Holdings, Inc.(a) | | | 4,059,288 | |
| | 33,081 | | | Visa, Inc., Class A(b) | | | 7,050,554 | |
| | | | | | | | 26,520,944 | |
| | | | | | | | | |
| | | | | TOTAL COMMON STOCKS (Cost $110,926,202) | | | 163,986,298 | |
| | | | | | | | | |
| | | | | COLLATERAL FOR SECURITIES LOANED — 20.9% | | | | |
| | 35,031,728 | | | Mount Vernon Liquid Assets Portfolio, LLC, 0.45% (Cost $35,031,728)(c),(d) | | | 35,031,728 | |
| | | | | | | | | |
| | | | | TOTAL INVESTMENTS - 118.9% (Cost $145,957,930) | | $ | 199,018,026 | |
| | | | | LIABILITIES IN EXCESS OF OTHER ASSETS - (18.9)% | | | (31,569,711 | ) |
| | | | | NET ASSETS - 100.0% | | $ | 167,448,315 | |
| ADR | - American Depositary Receipt |
| | |
| ETF | - Exchange-Traded Fund |
| | |
| LLC | - Limited Liability Company |
| | |
| NV | - Naamioze Vennootschap |
| (a) | Non-income producing security. |
| | |
| (b) | All or a portion of these securities are on loan. Total loaned securities had a value of $32,918,729 at April 30, 2022. |
| | |
| (c) | Rate disclosed is the seven day effective yield as of April 30, 2022. |
| | |
| (d) | The Trust’s securities lending policies and procedures require that the borrower: (i) deliver cash or U.S. Government securities as collateral with respect to each new loan of U.S. securities, equal to at least 102% of the value of the portfolio securities loaned, and (ii) at all times thereafter mark-to-market the collateral on a daily basis so that the market value of such collateral is at least 100% of the value of securities loaned. From time to time the collateral may not be 102% due to end of day market movement. The next business day additional collateral is obtained/received from the borrower to replenish/reestablish 102%. |
See accompanying notes which are an integral part of these financial statements.
| DUNHAM FOCUSED LARGE CAP GROWTH FUND |
| SCHEDULE OF INVESTMENTS (Unaudited) (Continued) |
| April 30, 2022 |
| Portfolio Composition * - (Unaudited) |
| Technology | | | 51.8 | % | | Health Care | | | 10.8 | % |
| Consumer Discretionary | | | 15.3 | % | | Communications | | | 4.5 | % |
| Collateral for Securities Loaned | | | 17.6 | % | | Total | | | 100.0 | % |
| * | Based on total value of investments as of April 30, 2022. Does not include derivative holdings. |
| Percentage may differ from Schedule of Investments which is based on Fund net assets. |
See accompanying notes which are an integral part of these financial statements.
Dunham Small Cap Growth Fund (Unaudited)
Message from the Sub-Adviser (Pier Capital, LLC)
Asset Class Recap
Small cap growth stocks, as measured by the Russell 2000 Growth Index, fell 26.8 percent over the first half of the fiscal year ending April 30, 2022. Small cap value stocks, as measured by the Russell 2000 Value Index, fell 9.5 percent over the same time period and outpaced small cap growth stocks by roughly 17 percent. In recent months, value stocks have outperformed growth names due to multiple negative macroeconomic factors influencing the market. Global markets were still dealing with the impacts of the ongoing pandemic, which have roiled supply chains and sent inflation to its highest point since 1981. The energy sector benefited from rising inflation, along with the war between Russia and Ukraine, which pushed the sector higher. To combat inflation, the Federal Reserve began to increase interest rates and look to accelerate the monetary tightening for the foreseeable future. When looking at the trailing six -month period, large cap stocks, as measured by the Russell 1000 Index, fell 11.3 percent, while small cap stocks, as measured by the Russell 2000 Index, declined 18.4 percent. Large cap stocks have benefited from the volatility throughout the fiscal period as investors move into large cap stocks to mitigate the risk in the current market environment. Small cap growth stocks have been out of favor throughout the first half of the fiscal year lowering valuations across the asset class. The Sub-Adviser believes that this may provide an opportunity for prudent investors to move back into stocks with compelling products and services that have been oversold with the broad market.
Allocation Review
The sector allocation within the Fund is predominantly a result of the Sub-Adviser’s bottom-up stock selection. All sectors that the Fund had exposure to were negative for the first half of the fiscal year. The sector that performed the best during the period was the materials and processing sector which declined 6.5 percent. The material and processing sector within the Fund outperformed the benchmark’s materials sector by approximately 6 percent. The Fund’s relative underweight to the sector, coupled with superior stock selection contributed meaningfully to performance. Additionally, the financial services sector outperformed the benchmark’s equivalent sector by approximately 2.3 percent, as the Fund’s relative underweight to the sector combined with strong stock selection contributed to the result. The sector that detracted the most from performance over the fiscal period was the technology sector. The Fund’s relative overweight, in addition to poor stock selection, detracted from performance. Also, the Fund’s relative overweight to the health care sector hurt relative performance.
Holdings Insights
The largest contributor to performance relative to the benchmark over the first half of the fiscal year was Asana, Inc (ASAN) (not held). The lack of exposure helped the Fund avoid the significant stock decline, relative to the index. ASAN is a digital work management platform that helps companies create strategies to meet deadlines and goals. ASAN declined during the period due to losses expected to grow during the company’s next fiscal year, with profitability not expected for the foreseeable future. Additionally, the technology sector has been under pressure due to rising interest rates and investors moving away from high growth stocks. Over the first half of the fiscal year, ASAN fell 80.3 percent. The second-largest contributor to performance over the fiscal period was Meritor, Inc (MTOR) (holding weight*: 0.45 percent). MTOR manufactures axles for heavy duty electric trucks and buses and climbed 54.5 percent during the fiscal quarter Institutional end customers are using MTOR to help meet their carbon reduction goals. MTOR secured early commitments from some of the largest heavy truck OEMs. On February 22, Cummins (CMI) (not held) announced acquisition plans for MTOR. Over the first half of the fiscal year, MTOR rose 46.2 percent, contributing 47 basis points to the return of the Fund. Another contributor over the fiscal year was Apellis Pharmaceuticals, Inc. (APLS) (holding weight*: 0.90 percent). APLS, a biopharmaceutical company that develops treatments for multiple diseases, rose 41.6 percent over the first fiscal half of the year. The company is being evaluated in two phase III studies for treating patients for geographic atrophy. APLS is looking to submit a marketing authorization application to the European Medicines Agency to treat geographic atrophy in the second half of 2022.
The largest detractor from relative performance over the fiscal year came from Everbridge, Inc. (EVBG) (holding weight*: 0.46 percent), which fell 78.0 during the first half of the fiscal year. EVBG is an enterprise software company that offers applications which provide information about critical events to help with business continuity. Revenue guidance for 2022 came in lower than expected which caused the stock to decline. Another detractor for the period was Vapotherm, Inc. (VAPO) (holding weight*: 0.76 percent). VAPO is a medical device manufacturer that focuses on breathing apparatuses for non-invasive respiratory treatment. The company expected a greater need for their medical devices due to Covid-19 surges, however, there has been less demand for respiratory intervention for the most recent outbreaks so far in 2022. Guidance for the year have been pulled by VAPO, prompting downgrades for the stock and negative revisions for profitability and revenue expected for the year. VAPO fell 80.6 percent during the first fiscal half of the year. The next largest detractor was Bandwidth Inc. (BAND) (holding weight*: 0.99 percent), a cloud communications platform enabling voice, messaging, and emergency services into software and applications. BAND’s network endured the DDoS (denial-of-service) attack in late 2021 which compromised the company’s reputation, however, according to management, BAND did not lose a single client because of it, however new customer growth slowed dramatically in Q4 as a result. BAND lost 74.1 percent during the first half of the fiscal year.
Sub-Adviser Outlook
The Sub-Adviser believes volatility may persist in the near term, as uncertainty surrounding the supply chain, rising input costs, and historically high inflation keep investors on edge. Additionally, developments out of the White House in regard to various economic initiatives and fiscal policy, coupled with the Federal Reserve’s handling of the numerous challenges that remain in today’s economic environment, could be worth monitoring. As always, the Sub-Adviser will continue to seek those companies and industries with what it believes are the most attractive growth prospects, while remaining vigilant on valuations.
| * | Holdings percentage(s) of total investments, cash and unsettled trades excluding collateral for securities loaned, as of 4/30/2022. |
Growth of $100,000 Investment
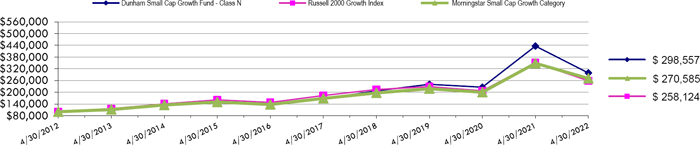
Total Returns (a) as of April 30, 2022
| | | | Annualized | Annualized |
| | Six Months | One Year | Five Years | Ten Years |
| Class N | (35.08)% | (31.58)% | 12.48% | 11.56% |
| Class A with load of 5.75% | (38.89)% | (35.70)% | 10.88% | 10.61% |
| Class A without load | (35.16)% | (31.78)% | 12.20% | 11.27% |
| Class C | (35.42)% | (32.29)% | 11.36% | 10.44% |
| Russell 2000 Growth Index | (26.77)% | (26.44)% | 7.08% | 9.95% |
| Morningstar Small Cap Growth Category | (25.09)% | (22.32)% | 9.92% | 10.46% |
| (a) | Total Returns are calculated based on traded NAVs. |
The Russell 2000 Growth Index measures the performance of the Russell 2000 companies with higher price-to-book ratios and higher forecasted growth values. Investors cannot invest directly in an index or benchmark.
The Morningstar Small Cap Growth Category is generally representative of mutual funds that primarily invest in small (small capitalization) U.S. companies that are projected to grow faster than other small-cap stocks.
| As disclosed in the Trust’s latest registration statement, the Fund’s total annual operating expenses, including the cost of underlying funds, are 1.83% for Class N, 2.83% for Class C and 2.08% for Class A. Class A shares are subject to a sales load of 5.75% and a deferred sales charge of up to 0.75%. The performance data quoted here represents past performance, which is not indicative of future results. Current performance may be lower or higher than the performance data quoted. The investment return and NAV will fluctuate, so that an investor’s shares, when redeemed, may be worth more or less than their original cost. Total returns are calculated assuming reinvestment of all dividends and capital gains distributions, if any. The returns do not reflect the deductions of taxes a shareholder would pay on the redemption of Fund shares or Fund distributions. For performance information current to the most recent month-end, please call 1-800-442-4358 or visit our website www.dunham.com |
| DUNHAM SMALL CAP GROWTH FUND |
| SCHEDULE OF INVESTMENTS (Unaudited) |
| April 30, 2022 |
| Shares | | | | | Fair Value | |
| | | | | COMMON STOCKS — 96.2% | | | | |
| | | | | ADVERTISING & MARKETING - 1.6% | | | | |
| | 15,469 | | | Cardlytics, Inc.(a),(b) | | $ | 527,957 | |
| | 73,967 | | | Magnite, Inc.(a) | | | 713,782 | |
| | | | | | | | 1,241,739 | |
| | | | | AEROSPACE & DEFENSE - 1.4% | | | | |
| | 20,242 | | | Hexcel Corporation(b) | | | 1,100,355 | |
| | | | | | | | | |
| | | | | APPAREL & TEXTILE PRODUCTS - 1.7% | | | | |
| | 10,405 | | | Crocs, Inc.(a) | | | 691,204 | |
| | 2,402 | | | Deckers Outdoor Corporation(a) | | | 638,332 | |
| | | | | | | | 1,329,536 | |
| | | | | BANKING - 3.9% | | | | |
| | 21,630 | | | First Merchants Corporation | | | 847,680 | |
| | 17,036 | | | Glacier Bancorp, Inc.(b) | | | 779,567 | |
| | 24,100 | | | Seacoast Banking Corp of Florida | | | 783,250 | |
| | 4,578 | | | Silvergate Capital Corporation, Class A(a) | | | 535,443 | |
| | | | | | | | 2,945,940 | |
| | | | | BIOTECH & PHARMA - 8.4% | | | | |
| | | | | | | | | |
| | 29,327 | | | Alector, Inc.(a) | | | 281,539 | |
| | 76,343 | | | Allogene Therapeutics, Inc.(a) | | | 637,465 | |
| | 39,844 | | | ALX Oncology Holdings, Inc.(a),(b) | | | 509,206 | |
| | 50,168 | | | Anavex Life Sciences Corporation(a) | | | 430,943 | |
| | 13,190 | | | Apellis Pharmaceuticals, Inc.(a) | | | 574,161 | |
| | 19,585 | | | Avid Bioservices, Inc.(a),(b) | | | 263,614 | |
| | 3,737 | | | Biohaven Pharmaceutical Holding Company Ltd.(a) | | | 333,228 | |
| | 10,910 | | | CRISPR Therapeutics A.G.(a),(b) | | | 541,354 | |
| | 24,077 | | | Immunocore Holdings plc - ADR(a),(b) | | | 785,151 | |
| | 35,587 | | | IVERIC bio, Inc.(a) | | | 492,880 | |
| | 19,178 | | | Maravai LifeSciences Holdings, Inc.(a) | | | 589,340 | |
| | 143,458 | | | MaxCyte, Inc.(a) | | | 794,758 | |
| | 38,007 | | | Seer, Inc.(a) | | | 276,691 | |
| | | | | | | | 6,510,330 | |
| | | | | CHEMICALS - 0.7% | | | | |
| | 44,564 | | | Codexis, Inc.(a) | | | 536,105 | |
| | | | | | | | | |
See accompanying notes which are an integral part of these financial statements.
| DUNHAM SMALL CAP GROWTH FUND |
| SCHEDULE OF INVESTMENTS (Unaudited) (Continued) |
| April 30, 2022 |
| Shares | | | | | Fair Value | |
| | | | | COMMON STOCKS — 96.2% (Continued) | | | | |
| | | | | COMMERCIAL SUPPORT SERVICES - 0.9% | | | | |
| | 8,762 | | | Avalara, Inc.(a) | | $ | 666,525 | |
| | | | | | | | | |
| | | | | ELECTRICAL EQUIPMENT - 1.9% | | | | |
| | 38,232 | | | Bloom Energy Corporation, Class A(a),(b) | | | 709,586 | |
| | 16,208 | | | Itron, Inc.(a) | | | 774,418 | |
| | | | | | | | 1,484,004 | |
| | | | | ENGINEERING & CONSTRUCTION - 3.9% | | | | |
| | 7,632 | | | Exponent, Inc. | | | 731,222 | |
| | 42,614 | | | Latham Group, Inc.(a) | | | 511,368 | |
| | 17,193 | | | Montrose Environmental Group, Inc.(a) | | | 780,046 | |
| | 25,342 | | | WillScot Mobile Mini Holdings Corporation(a),(b) | | | 889,505 | |
| | | | | | | | 2,912,141 | |
| | | | | HEALTH CARE FACILITIES & SERVICES - 5.7% | | | | |
| | 14,016 | | | HealthEquity, Inc.(a),(b) | | | 873,477 | |
| | 16,394 | | | Option Care Health, Inc.(a) | | | 489,853 | |
| | 20,974 | | | Progyny, Inc.(a),(b) | | | 806,450 | |
| | 47,261 | | | RadNet, Inc.(a),(b) | | | 921,590 | |
| | 19,848 | | | Surgery Partners, Inc.(a),(b) | | | 1,015,423 | |
| | 59,243 | | | Vapotherm, Inc.(a) | | | 263,039 | |
| | | | | | | | 4,369,832 | |
| | | | | HOME CONSTRUCTION - 1.8% | | | | |
| | 27,285 | | | AZEK Company, Inc. (The)(a) | | | 579,533 | |
| | 15,430 | | | Skyline Champion Corporation(a) | | | 787,548 | |
| | | | | | | | 1,367,081 | |
| | | | | HOUSEHOLD PRODUCTS - 3.0% | | | | |
| | 37,188 | | | elf Beauty, Inc.(a) | | | 904,784 | |
| | 16,279 | | | Inter Parfums, Inc. | | | 1,330,482 | |
| | | | | | | | 2,235,266 | |
| | | | | INDUSTRIAL INTERMEDIATE PROD - 1.2% | | | | |
| | 5,463 | | | Chart Industries, Inc.(a),(b) | | | 922,264 | |
| | | | | | | | | |
| | | | | INSTITUTIONAL FINANCIAL SERVICES - 1.2% | | | | |
| | 11,047 | | | Houlihan Lokey, Inc. | | | 920,105 | |
| | | | | | | | | |
See accompanying notes which are an integral part of these financial statements.
| DUNHAM SMALL CAP GROWTH FUND |
| SCHEDULE OF INVESTMENTS (Unaudited) (Continued) |
| April 30, 2022 |
| Shares | | | | | Fair Value | |
| | | | | COMMON STOCKS — 96.2% (Continued) | | | | |
| | | | | INTERNET MEDIA & SERVICES - 2.7% | | | | |
| | 59,189 | | | Eventbrite, Inc., Class A(a),(b) | | $ | 626,220 | |
| | 32,702 | | | Pinterest, Inc., Class A(a) | | | 671,045 | |
| | 11,309 | | | TechTarget, Inc.(a) | | | 761,208 | |
| | | | | | | | 2,058,473 | |
| | | | | LEISURE FACILITIES & SERVICES - 6.3% | | | | |
| | 20,391 | | | Dutch Bros, Inc.(a) | | | 974,078 | |
| | 34,334 | | | Lindblad Expeditions Holdings, Inc.(a) | | | 525,654 | |
| | 11,429 | | | Papa John’s International, Inc. | | | 1,040,609 | |
| | 15,923 | | | Shake Shack, Inc., Class A(a),(b) | | | 920,827 | |
| | 9,321 | | | Texas Roadhouse, Inc. | | | 767,398 | |
| | 6,804 | | | Wingstop, Inc.(b) | | | 624,335 | |
| | | | | | | | 4,852,901 | |
| | | | | LEISURE PRODUCTS - 1.1% | | | | |
| | 9,866 | | | Fox Factory Holding Corporation(a),(b) | | | 807,828 | |
| | | | | | | | | |
| | | | | MACHINERY - 2.4% | | | | |
| | 5,646 | | | Lindsay Corporation | | | 763,057 | |
| | 8,634 | | | MSA Safety, Inc. | | | 1,042,037 | |
| | | | | | | | 1,805,094 | |
| | | | | MEDICAL EQUIPMENT & DEVICES - 6.1% | | | | |
| | 34,955 | | | Adaptive Biotechnologies Corporation(a) | | | 288,379 | |
| | 64,775 | | | Alphatec Holdings, Inc.(a) | | | 702,809 | |
| | 22,094 | | | BioLife Solutions, Inc.(a) | | | 279,931 | |
| | 173,765 | | | Cerus Corporation(a),(b) | | | 802,794 | |
| | 10,183 | | | Inari Medical, Inc.(a) | | | 821,768 | |
| | 4,900 | | | Insulet Corporation(a),(b) | | | 1,171,051 | |
| | 3,785 | | | Repligen Corporation(a) | | | 595,153 | |
| | | | | | | | 4,661,885 | |
| | | | | RENEWABLE ENERGY - 1.8% | | | | |
| | 73,703 | | | Fluence Energy, Inc.(a),(b) | | | 675,857 | |
| | 2,717 | | | SolarEdge Technologies, Inc.(a) | | | 680,363 | |
| | | | | | | | 1,356,220 | |
| | | | | | | | | |
See accompanying notes which are an integral part of these financial statements.
| DUNHAM SMALL CAP GROWTH FUND |
| SCHEDULE OF INVESTMENTS (Unaudited) (Continued) |
| April 30, 2022 |
| Shares | | | | | Fair Value | |
| | | | | COMMON STOCKS — 96.2% (Continued) | | | | |
| | | | | RETAIL - CONSUMER STAPLES - 0.9% | | | | |
| | 14,875 | | | Ollie’s Bargain Outlet Holdings, Inc.(a) | | $ | 714,744 | |
| | | | | | | | | |
| | | | | RETAIL - DISCRETIONARY - 3.0% | | | | |
| | 29,647 | | | American Eagle Outfitters, Inc.(b) | | | 447,966 | |
| | 11,320 | | | Freshpet, Inc.(a),(b) | | | 1,056,722 | |
| | 53,697 | | | Mister Car Wash, Inc.(a),(b) | | | 773,237 | |
| | | | | | | | 2,277,925 | |
| | | | | SEMICONDUCTORS - 10.3% | | | | |
| | 36,632 | | | Allegro MicroSystems, Inc.(a),(b) | | | 890,524 | |
| | 16,664 | | | Axcelis Technologies, Inc.(a) | | | 907,355 | |
| | 7,480 | | | Azenta, Inc.(b) | | | 560,701 | |
| | 31,723 | | | FormFactor, Inc.(a) | | | 1,208,963 | |
| | 13,975 | | | Lattice Semiconductor Corporation(a) | | | 671,359 | |
| | 10,127 | | | Onto Innovation, Inc.(a),(b) | | | 720,435 | |
| | 7,040 | | | Power Integrations, Inc.(b) | | | 563,200 | |
| | 9,864 | | | Semtech Corporation(a) | | | 587,894 | |
| | 3,926 | | | Silicon Laboratories, Inc.(a) | | | 529,657 | |
| | 13,805 | | | Wolfspeed, Inc.(a),(b) | | | 1,266,056 | |
| | | | | | | | 7,906,144 | |
| | | | | SOFTWARE - 12.0% | | | | |
| | 26,501 | | | Bandwidth, Inc., Class A(a) | | | 586,202 | |
| | 12,454 | | | Blackline, Inc.(a) | | | 835,041 | |
| | 5,122 | | | Coupa Software, Inc.(a),(b) | | | 442,029 | |
| | 36,880 | | | DoubleVerify Holdings, Inc.(a) | | | 802,140 | |
| | 10,330 | | | Elastic N.V.(a) | | | 786,526 | |
| | 44,514 | | | Expensify, Inc.(a),(b) | | | 669,045 | |
| | 29,251 | | | Jamf Holding Corporation(a) | | | 900,931 | |
| | 36,558 | | | JFrog Ltd.(a),(b) | | | 762,965 | |
| | 23,559 | | | KnowBe4, Inc.(a) | | | 560,704 | |
| | 7,892 | | | Omnicell, Inc.(a),(b) | | | 861,570 | |
| | 7,040 | | | Sprout Social, Inc., Class A(a) | | | 431,411 | |
| | 16,781 | | | Tenable Holdings, Inc.(a) | | | 926,816 | |
| | 6,026 | | | Workiva, Inc.(a),(b) | | | 581,569 | |
| | | | | | | | 9,146,949 | |
| | | | | | | | | |
See accompanying notes which are an integral part of these financial statements.
| DUNHAM SMALL CAP GROWTH FUND |
| SCHEDULE OF INVESTMENTS (Unaudited) (Continued) |
| April 30, 2022 |
| Shares | | | | | Fair Value | |
| | | | | COMMON STOCKS — 96.2% (Continued) | | | | |
| | | | | TECHNOLOGY HARDWARE - 3.6% | | | | |
| | 11,760 | | | Fabrinet(a) | | $ | 1,154,714 | |
| | 11,899 | | | Kornit Digital Ltd.(a) | | | 791,283 | |
| | 29,466 | | | PagerDuty, Inc.(a) | | | 841,844 | |
| | | | | | | | 2,787,841 | |
| | | | | TECHNOLOGY SERVICES - 5.6% | | | | |
| | 7,513 | | | Endava plc - ADR(a) | | | 755,808 | |
| | 17,812 | | | MAXIMUS, Inc. | | | 1,298,138 | |
| | 19,660 | | | Shift4 Payments, Inc.(a),(b) | | | 1,031,364 | |
| | 15,152 | | | WNS Holdings Ltd. - ADR(a) | | | 1,187,462 | |
| | | | | | | | 4,272,772 | |
| | | | | TRANSPORTATION & LOGISTICS - 3.1% | | | | |
| | 30,940 | | | Air Transport Services Group, Inc.(a),(b) | | | 968,421 | |
| | 10,522 | | | Atlas Air Worldwide Holdings, Inc.(a),(b) | | | 725,387 | |
| | 9,051 | | | CryoPort, Inc.(a) | | | 204,191 | |
| | 2,461 | | | Saia, Inc.(a) | | | 506,868 | |
| | | | | | | | 2,404,867 | |
| | | | | | | | | |
| | | | | TOTAL COMMON STOCKS (Cost $80,846,476) | | | 73,594,866 | |
| | | | | | | | | |
| | | | | COLLATERAL FOR SECURITIES LOANED — 20.8% | | | | |
| | 15,894,642 | | | Mount Vernon Liquid Assets Portfolio, LLC, 0.45% (Cost $15,894,642)(c),(d) | | | 15,894,642 | |
| | | | | | | | | |
| | | | | TOTAL INVESTMENTS - 117.0% (Cost $96,741,118) | | $ | 89,489,508 | |
| | | | | LIABILITIES IN EXCESS OF OTHER ASSETS - (17.0)% | | | (13,011,241 | ) |
| | | | | NET ASSETS - 100.0% | | $ | 76,478,267 | |
| ADR | - American Depositary Receipt |
| | |
| LLC | - Limited Liability Company |
| | |
| LTD | - Limited Company |
| | |
| NV | - Naamioze Vennootschap |
| | |
| PLC | - Public Limited Company |
| (a) | Non-income producing security. |
| | |
| (b) | All or a portion of these securities are on loan. Total loaned securities had a value of $15,129,768 at April 30, 2022. |
| | |
| (c) | Rate disclosed is the seven day effective yield as of April 30, 2022. |
See accompanying notes which are an integral part of these financial statements.
| DUNHAM SMALL CAP GROWTH FUND |
| SCHEDULE OF INVESTMENTS (Unaudited) (Continued) |
| April 30, 2022 |
| (d) | The Trust’s securities lending policies and procedures require that the borrower: (i) deliver cash or U.S. Government securities as collateral with respect to each new loan of U.S. securities, equal to at least 102% of the value of the portfolio securities loaned, and (ii) at all times thereafter mark-to-market the collateral on a daily basis so that the market value of such collateral is at least 100% of the value of securities loaned. From time to time the collateral may not be 102% due to end of day market movement. The next business day additional collateral is obtained/received from the borrower to replenish/reestablish 102%. |
| Portfolio Composition * - (Unaudited) |
| Technology | | | 26.9 | % | | Financials | | | 4.3 | % |
| Collateral For Securities Loaned | | | 17.8 | % | | Communications | | | 3.7 | % |
| Health Care | | | 17.4 | % | | Consumer Staples | | | 3.3 | % |
| Industrials | | | 12.6 | % | | Energy | | | 1.5 | % |
| Consumer Discretionary | | | 11.9 | % | | Materials | | | 0.6 | % |
| | | | | | | Total | | | 100.0 | % |
| * | Based on total value of investments as of April 30, 2022. Does not include derivative holdings. |
| Percentage may differ from Schedule of Investments w hich are based on Fund net assets. |
See accompanying notes which are an integral part of these financial statements.
Dunham Emerging Markets Stock Fund (Unaudited)
Message from the Sub-Adviser (NS Partners Ltd.)
Asset Class Recap
Emerging markets stocks faced multiple headwinds during the first fiscal half ending April 30,2022. With central banks increasing interest rates to combat high inflation, emerging markets have fallen as investors reduce their risk exposure. Additionally, the war between Ukraine and Russia has increased oil prices globally. Emerging market countries must determine how their economies will weather the strict sanctions imposed on Russia for starting the war. As western states undermine Russia’ position as a major supplier of oil, gas, precious metals, and agricultural commodities by sourcing them for other suppliers, commodity sensitive countries such as Indonesia and Brazil may stand to benefit. Equity markets in China have seen volatility from the aforementioned challenges with the addition of the Chinese Government continuing to impose its zero covid policy and have locked down major cities. The lockdowns in China have continued to reinforce the global supply chain woes that have persisted since the beginning of the Covid-19 pandemic. China does not face the same problems with inflation as other major economies due to it not relying on the same level of fiscal and monetary stimulus as developed nations. However, consumer confidence in China is low due to the strict Covid protocols along with regulatory overhang from crackdowns in the tech, education, and real estate sectors last year. To calm markets, the Chinese government made a series of announcements indicating that Beijing will pivot to more regulatory predictability and stability and engage with Washington on financial disclosure rules for US-listed Chinese companies. Over the first half of the fiscal year ended April 30, 2021, emerging markets stocks, as measured by the MSCI Emerging Markets Index, fell 14.0 percent. Emerging markets stocks underperformed international developed markets, as measured by the MSCI ACWI ex-U.S. index, as it decreased 11.7 percent over the fiscal period.
Allocation Review
Over the fiscal period, stock selection negatively impacted Fund performance. The Fund experienced positive returns from stock selection within Thailand, Indonesia, and Chile, but stock selection in China, India, and South Korea detracted from Fund performance. The Fund’s country allocation also contributed to performance, albeit to a smaller degree than the Fund’s stock selection. The adverse effects of the overweight exposure to India and Hong Kong and underweight exposure to Gulf Markets were slightly counteracted by the positive impact of the underweight to China and South Korea and overweight to Chile. From a sector perspective, the exposure to the energy, industrials, and financials sectors aided positive performance, while the overweight exposure to the consumer discretionary sector detracted from Fund performance. Over the fiscal period, the Sub-Adviser increased the exposure to China and Indonesia, reduced the exposure to Thailand and India.
Holdings Insights
One of the largest contributors to positive Fund performance over the fiscal period was PTT Exploration & Production Public Company Ltd. “PTTEP” (PTTEP.BK) (holding weight*: 1.59 percent). PTTEP is a petroleum exploration and production company based in Thailand. PTTEP has benefited from the increase of global energy prices with plans to increase output. PTTEP increased 28.0 percent over the fiscal period. The company is the sole operator of Bongkot, having been recently allowed by Emirati government-owned Mubadala Petroleum (Thailand) Holdings, a key shareholder in Erawan gas business, to solely run gas production at Erawan. Varun Beverages, Ltd. (VBL.NS) (holding weight*: 2.00 percent), an Indian company that produces bottles and distributes beverages climbed 25.0 percent during the fiscal half. VBL has see robust sales growth and expansion across geographical regions. On the demand front, the company is seeing a solid uptick in consumption. On the back of an improving demand environment, the management remains confident of delivering healthy volume growth in the medium to longer term. Max Healthcare Institute Ltd. (MAXHEALTH.NS) (holding weight*: 1.08 percent) was another positive contributor to the Fund. NSE is a hospital chain based in new Delhi, India and the second largest operator in the country. NSE saw an increase in revenues and profit after there was a normalization of surgeries once Covid-19 cases declined.
The largest detractor to Fund performance was due to an overweight of Housing Development Finance (HDFC) (holding weight*: 3.17 percent). HDFC is an Indian based financial services company with an emphasis on housing finance. HDFC declined on merger news with HDFC Bank along with subpar back-to- back earnings reports. Another detractor from the fund was China Merchants Bank-H (3968.HK) (holding weight*: 1.61 percent). China Merchants Bank former president and chief executive has been placed under investigation by China’s anticorruption agency. The news drove investors away from the company during the fiscal period. Sungrow Power Supply Co Lt-A (300274.SZ) (holding weight*: 0.46 percent), a Chinese based power inverter supplier to solar and renewable energy equipment industries, posted lower than expected earnings in its most recent release, prompting the stock to plunge.
Sub-Adviser Outlook
The Sub- Adviser is cautiously optimistic for the rest of 2022. The Sub-Adviser believes that global industrial momentum may slow further throughout 2022, but the continued reopening of the global services economy will likely continue to boost global GDP. The Sub-Adviser also believes that inflation fears may be currently overblown and are already priced in the market. However, the market could experience a slight pick-up in core inflation in late 2021 and 2022. The Sub-Adviser views the regulatory risk premium at extreme levels but is ready to adjust the exposure if it begins to subside or China begins to adopt a more accommodative monetary policy. The Sub-Adviser will also continue to focus on high-quality companies with improving return on invested capital.
| * | Holdings percentage(s) of total investments, cash and unsettled trades excluding collateral for securities loaned as of 4/30/2022. |
Growth of $100,000 Investment
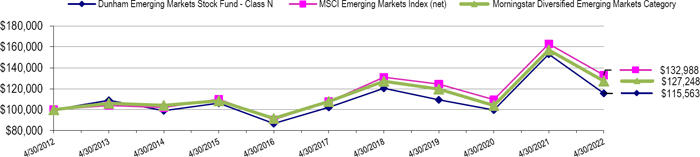
Total Returns (a) as of April 30, 2022
| | | | Annualized | Annualized |
| | Six Month | One Year | Five Years | Ten Years |
| Class N | (20.81)% | (24.47)% | 2.51% | 1.46% |
| Class A with load of 5.75% | (25.47)% | (28.95)% | 1.04% | 0.61% |
| Class A without load | (20.91)% | (24.62)% | 2.25% | 1.21% |
| Class C | (21.19)% | (25.22)% | 1.48% | 0.45% |
| MSCI Emerging Markets Index (net) | (14.15)% | (18.33)% | 4.32% | 2.89% |
| Morningstar Diversified Emerging Markets Category | (16.44)% | (18.97)% | 3.39% | 2.44% |
| (a) | Total Returns are calculated based on traded NAVs. |
The MSCI Emerging Markets Index (net) is a free float-adjusted market capitalization index that is designed to measure equity market performance in the global emerging markets. Investors cannot invest directly in an index or benchmark.
The Morningstar Diversified Emerging Markets Category is generally representative of mutual funds that primarily invest among 20 or more developing nations, with a general focus on the emerging markets of Asia and Latin America rather than on the emerging markets countries in the Middle East, Africa, or Europe.
| As disclosed in the Trust’s latest registration statement, the Fund’s total annual operating expenses, including underlying funds, are 1.69% for Class N, 2.69% for Class C and 1.94% for Class A. Class A shares are subject to a sales load of 5.75% and a deferred sales charge of up to 0.75%. The performance data quoted here represents past performance, which is not indicative of future results. Current performance may be lower or higher than the performance data quoted. The investment return and NAV will fluctuate, so that an investor’s shares, when redeemed, may be worth more or less than their original cost. Total returns are calculated assuming reinvestment of all dividends and capital gains distributions, if any. The returns do not reflect the deductions of taxes a shareholder would pay on the redemption of Fund shares or Fund distributions. For performance information current to the most recent month-end, please call 1-800-442-4358 or visit our website www.dunham.com. |
| DUNHAM EMERGING MARKETS STOCK FUND |
| SCHEDULE OF INVESTMENTS (Unaudited) |
| April 30, 2022 |
| Shares | | | | | Fair Value | |
| | | | | CLOSED END FUNDS — 1.0% | | | | |
| | | | | MIXED ALLOCATION - 1.0% | | | | |
| | 136,545 | | | Vietnam Enterprise Investments Ltd.(a) (Cost $861,698) | | $ | 1,275,960 | |
| | | | | | | | | |
| | | | | COMMON STOCKS — 95.1% | | | | |
| | | | | APPAREL & TEXTILE PRODUCTS - 0.5% | | | | |
| | 41,200 | | | Shenzhou International Group Holdings Ltd.(b) | | | 559,039 | |
| | | | | | | | | |
| | | | | BANKING - 13.8% | | | | |
| | 167,749 | | | Banco Bradesco S.A. – ADR (b) | | | 603,896 | |
| | 64,200 | | | Banco Santander Chile – ADR (b) | | | 1,248,048 | |
| | 2,268,600 | | | Bank Central Asia Tbk P.T. | | | 1,269,504 | |
| | 2,988,800 | | | Bank Negara Indonesia Persero Tbk P.T. | | | 1,883,589 | |
| | 5,593,000 | | | Bank Rakyat Indonesia Persero Tbk P.T. | | | 1,859,283 | |
| | 252,000 | | | China Merchants Bank Company Ltd., H Shares(b) | | | 1,518,861 | |
| | 12,500 | | | HDFC Bank Ltd. - ADR | | | 690,125 | |
| | 59,700 | | | ICICI Bank Ltd. - ADR | | | 1,136,688 | |
| | 160,900 | | | Itau Unibanco Holding S.A. - ADR | | | 770,711 | |
| | 425,300 | | | Kasikornbank PCL - ADR | | | 1,878,730 | |
| | 44,638 | | | KB Financial Group, Inc. | | | 2,064,433 | |
| | 1,907,700 | | | Public Bank Bhd | | | 2,059,095 | |
| | | | | | | | 16,982,963 | |
| | | | | BEVERAGES - 3.9% | | | | |
| | 210,500 | | | Carabao Group PCL(a) | | | 667,840 | |
| | 19,800 | | | Heineken Malaysia Bhd | | | 107,995 | |
| | 203,259 | | | Varun Beverages Ltd. | | | 2,866,138 | |
| | 46,600 | | | Wuliangye Yibin Company Ltd. | | | 1,135,152 | |
| | | | | | | | 4,777,125 | |
| | | | | CHEMICALS - 2.8% | | | | |
| | 7,472,300 | | | AKR Corporindo Tbk P.T. | | | 547,356 | |
| | 4,118 | | | LG Chem Ltd.(b) | | | 1,676,592 | |
| | 16,200 | | | Sociedad Quimica y Minera de Chile S.A. - ADR | | | 1,195,560 | |
| | | | | | | | 3,419,508 | |
| | | | | CONSUMER SERVICES - 1.1% | | | | |
| | 1,635,000 | | | China Education Group Holdings Ltd. | | | 1,393,403 | |
| | | | | | | | | |
See accompanying notes which are an integral part of these financial statements.
| DUNHAM EMERGING MARKETS STOCK FUND |
| SCHEDULE OF INVESTMENTS (Unaudited) (Continued) |
| April 30, 2022 |
| Shares | | | | | Fair Value | |
| | | | | COMMON STOCK – 95.1% (Continued) | | | | |
| | | | | E-COMMERCE DISCRETIONARY - 5.5% | | | | |
| | 461,400 | | | Alibaba Group Holding Ltd.(a),(b) | | $ | 5,627,993 | |
| | 36,504 | | | JD.com, Inc.(a) | | | 1,138,138 | |
| | | | | | | | 6,766,131 | |
| | | | | ELECTRICAL EQUIPMENT - 0.6% | | | | |
| | 83,500 | | | Sungrow Power Supply Company Ltd. | | | 787,297 | |
| | | | | | | | | |
| | | | | ENGINEERING & CONSTRUCTION - 1.3% | | | | |
| | 38,804 | | | Larsen & Toubro Ltd. | | | 851,742 | |
| | 37,809 | | | Mytilineos S.A. | | | 699,930 | |
| | | | | | | | 1,551,672 | |
| | | | | ENTERTAINMENT CONTENT - 1.6% | | | | |
| | 102,800 | | | NetEase, Inc. | | | 1,969,155 | |
| | | | | | | | | |
| | | | | FOOD - 1.5% | | | | |
| | 7,545,300 | | | Monde Nissin Corporation(a) | | | 1,866,366 | |
| | | | | | | | | |
| | | | | GAS & WATER UTILITIES - 1.0% | | | | |
| | 964,000 | | | Guangdong Investment Ltd. | | | 1,234,246 | |
| | | | | | | | | |
| | | | | HEALTH CARE FACILITIES & SERVICES - 1.7% | | | | |
| | 391,275 | | | Max Healthcare Institute Ltd.(a) | | | 2,103,210 | |
| | | | | | | | | |
| | | | | HOME & OFFICE PRODUCTS - 1.9% | | | | |
| | 412,000 | | | Haier Smart Home Company Ltd., H Shares(b) | | | 1,455,506 | |
| | 103,400 | | | Midea Group Company Ltd. | | | 884,587 | |
| | | | | | | | 2,340,093 | |
| | | | | INSURANCE - 4.9% | | | | |
| | 229,400 | | | AIA Group Ltd.(b) | | | 2,253,562 | |
| | 1,079,000 | | | Cathay Financial Holding Company Ltd.(b) | | | 2,269,089 | |
| | 115,492 | | | Prudential plc | | | 1,437,624 | |
| | | | | | | | 5,960,275 | |
| | | | | INTERNET MEDIA & SERVICES - 6.6% | | | | |
| | 4,848 | | | NAVER Corporation(b) | | | 1,073,534 | |
| | 148,300 | | | Tencent Holdings Ltd.(b) | | | 6,988,594 | |
| | | | | | | | 8,062,128 | |
| | | | | | | | | |
See accompanying notes which are an integral part of these financial statements.
| DUNHAM EMERGING MARKETS STOCK FUND |
| SCHEDULE OF INVESTMENTS (Unaudited) (Continued) |
| April 30, 2022 |
| Shares | | | | | Fair Value | |
| | | | | COMMON STOCK – 95.1% (Continued) | | | | |
| | | | | LEISURE FACILITIES & SERVICES - 3.3% | | | | |
| | 155,340 | | | Jollibee Foods Corporation | | $ | 636,607 | |
| | 1,179,387 | | | Lemon Tree Hotels Ltd.(a) | | | 1,010,461 | |
| | 776,900 | | | Minor International PCL - ADR(a) | | | 783,480 | |
| | 108,538 | | | OPAP S.A. | | | 1,608,304 | |
| | | | | | | | 4,038,852 | |
| | | | | MACHINERY - 0.7% | | | | |
| | 339,990 | | | Sany Heavy Industry Company Ltd., Class A | | | 843,226 | |
| | | | | | | | | |
| | | | | METALS & MINING - 2.7% | | | | |
| | 3,993,800 | | | Aneka Tambang Tbk | | | 712,115 | |
| | 2,363,500 | | | Banpu PCL - ADR | | | 840,340 | |
| | 54,500 | | | Ganfeng Lithium Company Ltd. | | | 900,924 | |
| | 128,441 | | | Hindalco Industries Ltd.(b) | | | 798,632 | |
| | | | | | | | 3,252,011 | |
| | | | | OIL & GAS PRODUCERS - 2.2% | | | | |
| | 376,189 | | | Gazprom PJSC | | | 0 | |
| | 445,795 | | | Oil & Natural Gas Corp Ltd.(b) | | | 922,704 | |
| | 50,000 | | | Petroleo Brasileiro S.A. - ADR | | | 678,500 | |
| | 256,200 | | | PTT Exploration & Production PCL | | | 1,118,629 | |
| | | | | | | | 2,719,833 | |
| | | | | REAL ESTATE OWNERS & DEVELOPERS - 1.5% | | | | |
| | 25,680 | | | Ayala Corporation | | | 360,473 | |
| | 667,729 | | | Indiabulls Real Estate Ltd.(a) | | | 770,287 | |
| | 230,490 | | | Vinhomes JSC(b) | | | 651,583 | |
| | | | | | | | 1,782,343 | |
| | | | | REAL ESTATE SERVICES - 0.7% | | | | |
| | 300,000 | | | ESR Cayman Ltd.(a) | | | 910,679 | |
| | | | | | | | | |
| | | | | RENEWABLE ENERGY - 2.6% | | | | |
| | 21,300 | | | Contemporary Amperex Technology Company Ltd. | | | 1,297,919 | |
| | 186,915 | | | LONGi Green Energy Technology Company Ltd., Class A | | | 1,889,707 | |
| | | | | | | | 3,187,626 | |
| | | | | | | | | |
See accompanying notes which are an integral part of these financial statements.
| DUNHAM EMERGING MARKETS STOCK FUND |
| SCHEDULE OF INVESTMENTS (Unaudited) (Continued) |
| April 30, 2022 |
| Shares | | | | | Fair Value | |
| | | | | COMMON STOCK – 95.1% (Continued) | | | | |
| | | | | RETAIL - CONSUMER STAPLES - 1.7% | | | | |
| | 212,700 | | | Atacadao S.A. | | $ | 886,716 | |
| | 8,512 | | | Magnit PJSC | | | 0 | |
| | 331,100 | | | Wal-Mart de Mexico S.A.B. de C.V. | | | 1,173,444 | |
| | | | | | | | 2,060,160 | |
| | | | | RETAIL - DISCRETIONARY - 0.7% | | | | |
| | 1,940,400 | | | Home Product Center PCL | | | 841,847 | |
| | | | | | | | | |
| | | | | SEMICONDUCTORS - 11.5% | | | | |
| | 60,000 | | | MediaTek, Inc.(b) | | | 1,654,389 | |
| | 20,021 | | | SK Hynix, Inc.(b) | | | 1,744,003 | |
| | 457,000 | | | Taiwan Semiconductor Manufacturing Company Ltd. | | | 8,265,317 | |
| | 26,800 | | | Taiwan Semiconductor Manufacturing Company Ltd. – ADR (b) | | | 2,490,524 | |
| | | | | | | | 14,154,233 | |
| | | | | SPECIALTY FINANCE - 2.6% | | | | |
| | 112,121 | | | Housing Development Finance Corp Ltd. | | | 3,230,830 | |
| | | | | | | | | |
| | | | | TECHNOLOGY HARDWARE - 6.6% | | | | |
| | 161,000 | | | Accton Technology Corporation | | | 1,256,014 | |
| | 103,922 | | | Samsung Electronics Company Ltd. | | | 5,505,542 | |
| | 12,575 | | | Samsung Electronics Company Ltd. – Pref. | | | 586,067 | |
| | 113,000 | | | Unimicron Technology Corporation | | | 792,745 | |
| | | | | | | | 8,140,368 | |
| | | | | TECHNOLOGY SERVICES - 4.4% | | | | |
| | 180,511 | | | Infosys Ltd. | | | 3,653,840 | |
| | 249,780 | | | Shanghai Baosight Software Company Ltd. | | | 1,783,838 | |
| | | | | | | | 5,437,678 | |
| | | | | TELECOMMUNICATIONS - 2.8% | | | | |
| | 176,185 | | | Bharti Airtel Ltd.(a) | | | 1,688,772 | |
| | 5,413,600 | | | Telekomunikasi Indonesia Persero Tbk P.T. | | | 1,719,564 | |
| | | | | | | | 3,408,336 | |
| | | | | TRANSPORTATION & LOGISTICS - 1.8% | | | | |
| | 185,376 | | | Spring Airlines Company Ltd.(a) | | | 1,277,414 | |
| | 22,404 | | | Wizz Air Holdings plc(a) | | | 876,344 | |
| | | | | | | | 2,153,758 | |
| | | | | | | | | |
See accompanying notes which are an integral part of these financial statements.
| DUNHAM EMERGING MARKETS STOCK FUND |
| SCHEDULE OF INVESTMENTS (Unaudited) (Continued) |
| April 30, 2022 |
| Shares | | | | | | | | | | Fair Value | |
| | | | | COMMON STOCK – 95.1% (Continued) | | | | | | | | | | |
| | | | | WHOLESALE - CONSUMER STAPLES - 0.6% | | | | | | | | | | |
| | 349,317 | | | Devyani International Ltd.(a) | | | | | | | | $ | 778,106 | |
| | | | | | | | | | | | | | | |
| | | | | TOTAL COMMON STOCKS (Cost $119,959,905) | | | | | | | | | 116,712,497 | |
| | | | | | | | | | | | | | | |
| | | | | | | Expiration Date | | Exercise Price | | | | | |
| | | | | WARRANT — 0.0%(c) | | | | | | | | | | |
| | | | | LEISURE FACILITIES & SERVICES - 0.0% (c) | | | | | | | | | | |
| | 26,977 | | | Minor International PCL (Thailand) | | 07/31/2023 | | $ | 21.60 | | | | 10,366 | |
| | 42,772 | | | Minor International PCL (Thailand) | | 05/08/2023 | | | 28.00 | | | | 8,252 | |
| | 38,762 | | | Minor International PCL (Thailand) | | 02/16/2024 | | | 31.00 | | | | 5,489 | |
| | | | | TOTAL WARRANT (Cost $5,303) | | | | | | | | | 24,107 | |
| | | | | | | | | | | | | | | |
| | | | | | | | | | | | | | | |
| | | | | SHORT-TERM INVESTMENTS – 0.5% | | | | | | | | | | |
| | | | | MONEY MARKET FUNDS – 0.5% | | | | | | | | | | |
| | 606,146 | | | First American Government Obligations, 0.5 % (Cost $606,146)(d) | | | | | 606,146 | |
| | | | | | | | | | | | | | | |
| | | | | COLLATERAL FOR SECURITIES LOANED — 0.5% | | | | | | | | | | |
| | 575,338 | | | Mount Vernon Prime Portfolio, 0.45% (Cost $575,338)(d),(e) | | | | | 575,338 | |
| | | | | | | | | | | | | | | |
| | | | | TOTAL INVESTMENTS – 97.1% (Cost $122,008,390) | | | | $ | 119,194,048 | |
| | | | | OTHER ASSETS LESS LIABILITIES – 2.9% | | | | | 3,539,092 | |
| | | | | NET ASSETS - 100.0% | | | | | | | | $ | 122,733,140 | |
| ADR | - American Depositary Receipt |
| | |
| LTD | - Limited Company |
| | |
| PJSC | - Public Joint-Stock Company |
| | |
| PLC | - Public Limited Company |
| | |
| PT | - Perseroan Terbatas |
| | |
| S/A | - Société Anonyme |
| (a) | Non-income producing security. |
| | |
| (b) | All or a portion of these securities are on loan. Total loaned securities had a value of $553,598 at April 30, 2022. |
| | |
| (c) | Percentage rounds to less than 0.1%. |
| | |
| (d) | Rate disclosed is the seven day effective yield as of April 30, 2022. |
| | |
| (e) | The Trust’s securities lending policies and procedures require that the borrower: deliver cash or U.S. Government securities as collateral with respect to each new loan of U.S. securities, equal to at least 105% of the value of the portfolio securities loaned, and (ii) at all times thereafter mark-to-market the collateral on a daily basis so that the market value of such collateral is at least 100% of the value of securities loaned. From time to time the collateral may not be 105% due to end of day market movement. The next business day additional collateral is obtained/received from the borrower to replenish/reestablish 105%. |
See accompanying notes which are an integral part of these financial statements.
| DUNHAM EMERGING MARKETS STOCK FUND |
| SCHEDULE OF INVESTMENTS (Unaudited) (Continued) |
| April 30, 2022 |
| Portfolio Composition * - (Unaudited) |
| Hong Kong | | | 21.0 | % | | Indonesia | | | 6.7 | % |
| India | | | 15.7 | % | | Thailand | | | 5.9 | % |
| Taiwan | | | 11.9 | % | | Great Britain | | | 3.0 | % |
| United States | | | 10.5 | % | | Philippines | | | 2.4 | % |
| China | | | 9.1 | % | | Others | | | 6.1 | % |
| Sweden | | | 7.7 | % | | Total | | | 100.0 | % |
| * | Based on total value of investments as of April 30, 2022. Does not include derivatives. |
| Percentage may differ from Schedule of Investments which are based on Fund net assets. |
See accompanying notes which are an integral part of these financial statements.
Dunham International Stock Fund (Unaudited)
Message from the Sub-Adviser (Arrowstreet Capital, L.P.)
Asset Class Recap
International equity markets, as measured by the MSCI All Country World ex USA Index (Net) (referred to as the “Index”), lost -11.9 percent during the semi-annual period ending April 30, 2022. Across sectors, gains were led by energy, materials, and utilities. Conversely, consumer discretionary, information technology, and industrials were the most significant underperforming sectors. The best performing developed market countries as measured by the Index in local terms during the semi-annual period were Norway, up 8.9 percent, and the UK, up 8.8 percent. The worst performing developed market countries were the Netherlands, down -21.1 percent, and Ireland, down -16.7 percent. The best performing emerging market countries during the period as measured by the Index were Turkey, up 65.0 percent, and the UAE, up 29.4 percent. The worst performing emerging market countries were Hungary, down -28.1 percent, and China, down -24.2 percent.
Allocation Review
The Sub-Adviser’s investment process is best characterized as a dynamic process that uses quantitative models to evaluate securities to exploit opportunities across companies, sectors, and countries while seeking to avoid long-term systematic biases toward any particular country, sector, style, or market capitalization. These stock selection models are designed to understand what information is likely to impact stock prices with a predictable and measurable lag that allows time to invest and profit. The models obtain the information to forecast individual stock returns by evaluating a stock’s potential on the basis of (1) direct effects - characteristics of the company itself; and (2) indirect effects - characteristics of other companies that are related by virtue of a common country and sector affiliation (called country/sector baskets); a common country affiliation; and a common global sector affiliation, and/or other common linkages. Over any time period, the strategy’s performance relative to the Index is driven by allocations to country/sector baskets, stock selection, and the effects of currency exposures differing from those of the Index.
Countries contributing the most to returns relative to the Index during the semi-annual period were: China, mainly due to the Fund’s underweight positioning to consumer discretionary, and overweight positioning to Chinese energy; and Brazil, primarily due to both positive selection and overweight positioning to energy and materials. Countries contributing the most to underperformance relative to the Index included: Russia, primarily due to the Fund’s overweight positioning to the Russian financials and Russian energy baskets; and Germany, primarily due to both overweights and negative selection within the German consumer discretionary and materials baskets.
Sectors contributing the most to returns relative to the Index during the semi-annual period included: Consumer discretionary, primarily due to underweight positioning to both Chinese consumer discretionary (noted above) and Dutch consumer discretionary; and health care mainly due to underweights to Chinese health care and overweights to UK health care. Sectors contributing the most to underperformance relative to the Index included: financials, primarily due to overweights to Russian financials (noted above), as well as underweights to Canadian and German financials; and information technology, largely due to overweight positioning to Dutch information technology, as well as both overweight positioning and negative stock selection within Australian information technology.
Holdings Insights
Stocks contributing the most to returns relative to the Index during the semi-annual period included: Petrobras – Petroleo Brasileiro S.A. (PETR4 BZ) (holding weight*: 1.53 percent), a Brazilian energy company; BHP Group LTD (BHP LN) (holding weight*: 0.77 percent), an Australian materials company; and Vale S.A. (VALE3 BZ) (holding weight**: 0.07 percent), a Brazilian energy company. PETR4 B and BHP LN rose 55.0 percent and 38.4 percent, respectively over the six-month period. VALE rose 68.3 percent during the fiscal year before it was sold in April. Stocks contributing the most to underperformance relative to the Index included Russian securities that are not currently accessible for trading by foreign investors, including the Fund. These include: Sberbank of Russia PJSC (SBER RX) (holding weight*: 0.00 percent), a Russian financials company, Lukoil PJSC (LKOH RM) (holding weight*: 0.00 percent), a Russian energy company, and Gazprom PJSC (OGZPY) (holding weight*: 0.00 percent), also a Russian energy company. Each of the Fund’s Russian holdings were valued at zero at the end of the most recent fiscal quarter.
Sub-Advisor Outlook
The Sub-Adviser generally constructs its portfolios by using proprietary econometric models and a proprietary optimization process that balances the trade-off between a stock’s expected return, its contribution to portfolio level risk, portfolio specific restrictions, and its opportunity costs relative to trading costs. As this is performed quantitatively, the Sub-Adviser’s outlook does not play a role in the disciplined investment process.
| * | Holdings percentage(s) of total investments, cash and unsettled trades excluding collateral for securities loaned as of 4/30/2022. |
| ** | Holdings percentage(s) as of the date prior to the sale of the security. |
Growth of $100,000 Investment

Total Returns (a) as of April 30, 2022
| | | | Annualized | Annualized |
| | Six Month | One Year | Five Years | Ten Years |
| Class N | (14.85)% | (12.40)% | 5.87% | 6.40% |
| Class A with load of 5.75% | (19.86)% | (17.64)% | 4.35% | 5.50% |
| Class A without load | (14.96)% | (12.62)% | 5.59% | 6.13% |
| Class C | (15.25)% | (13.27)% | 4.82% | 5.34% |
| MSCI All Country World ex US Index (net) | (11.87)% | (10.31)% | 4.94% | 5.04% |
| Morningstar Foreign Large Cap Blend Category | (12.93)% | (10.30)% | 4.16% | 5.00% |
| (a) | Total Returns are calculated based on traded NAVs. |
The MSCI All Country World ex US Index (net) is a free float-adjusted market capitalization index designed to measure equity market performance in the global developed and emerging markets excluding holdings in the United States and is net of any withholding taxes. Investors cannot invest directly in an index or benchmark.
The Morningstar Foreign Large Cap Blend Category is generally representative of mutual funds that primarily invest in non-U.S. stocks that have market caps in the top 70% of each economically integrated market (such as Europe or Asia ex-Japan). The blend style is generally applicable where neither growth nor value characteristics dominate.
As disclosed in the Trust’s latest registration statement, the Fund’s total annual operating expenses, including underlying funds, are 1.92% for Class N, 2.92% for Class C and 2.17% for Class A. Class A shares are subject to a sales load of 5.75% and a deferred sales charge of up to 0.75%.The performance data quoted here represents past performance, which is not indicative of future results. Current performance may be lower or higher than the performance data quoted. The investment return and NAV will fluctuate, so that an investor’s shares, when redeemed, may be worth more or less than their original cost. Total returns are calculated assuming reinvestment of all dividends and capital gains distributions, if any. The returns do not reflect the deductions of taxes a shareholder would pay on the redemption of Fund shares or Fund distribution. For performance information current to the most recent month-end, please call 1-800-442-4358 or visit our website www.dunham.com.
| DUNHAM INTERNATIONAL STOCK FUND |
| SCHEDULE OF INVESTMENTS (Unaudited) |
| April 30, 2022 |
| Shares | | | | | Fair Value | |
| | | | | COMMON STOCKS — 98.1% | | | | |
| | | | | APPAREL & TEXTILE PRODUCTS - 1.2% | | | | |
| | 2,775 | | | adidas A.G. | | $ | 559,434 | |
| | 11,041 | | | Cie Financiere Richemont S.A. | | | 1,283,008 | |
| | | | | | | | 1,842,442 | |
| | | | | ASSET MANAGEMENT - 1.7% | | | | |
| | 37,168 | | | Industrivarden A.B., C Shares | | | 935,998 | |
| | 47,569 | | | Investor A.B. - A | | | 993,685 | |
| | 11,931 | | | Investor A.B. - B | | | 229,618 | |
| | 1,533 | | | Sofina S.A. | | | 469,656 | |
| | | | | | | | 2,628,957 | |
| | | | | AUTOMOTIVE - 2.6% | | | | |
| | 2,100 | | | Ferrari N.V. (d) | | | 440,454 | |
| | 5,604 | | | Hyundai Motor Company | | | 396,854 | |
| | 17,169 | | | Mercedes-Benz Group A.G. | | | 1,198,053 | |
| | 77,900 | | | Nissan Motor Company Ltd.(a) | | | 311,915 | |
| | 65,233 | | | Stellantis N.V. | | | 875,664 | |
| | 5,562 | | | Volkswagen A.G. | | | 861,106 | |
| | | | | | | | 4,084,046 | |
| | | | | BANKING - 9.0% | | | | |
| | 43,009 | | | Bank Leumi Le-Israel BM | | | 450,990 | |
| | 279,200 | | | Bank of Beijing Company Ltd., Class A | | | 192,384 | |
| | 47,790 | | | Bank of China Ltd. - ADR | | | 462,607 | |
| | 3,575,000 | | | Bank of China Ltd., H Shares | | | 1,402,761 | |
| | 2,129,800 | | | Bank of Communications Company Ltd. | | | 1,630,838 | |
| | 1,150,000 | | | Bank of Communications Company Ltd., H Shares | | | 800,269 | |
| | 565,400 | | | Bank of Jiangsu Company Ltd. | | | 622,596 | |
| | 512,200 | | | Bank of Shanghai Company Ltd., Class A | | | 501,251 | |
| | 65,213 | | | Barclays plc - ADR(d) | | | 485,837 | |
| | 31,712 | | | BNK Financial Group, Inc. | | | 195,513 | |
| | 57,900 | | | Chiba Bank Ltd. (The) | | | 333,736 | |
| | 272,000 | | | Chongqing Rural Commercial Bank Company Ltd., H Shares | | | 105,617 | |
| | 190,674 | | | Gulf Bank KSCP | | | 211,915 | |
| | 1 | | | Haci Omer Sabanci Holding A/S | | | 1 | |
| | 10,225 | | | Hana Financial Group, Inc. | | | 377,370 | |
See accompanying notes which are an integral part of these financial statements.
| DUNHAM INTERNATIONAL STOCK FUND |
| SCHEDULE OF INVESTMENTS (Unaudited) (Continued) |
| April 30, 2022 |
| Shares | | | | | Fair Value | |
| | | | | COMMON STOCKS — 98.1% (Continued) | | | | |
| | | | | BANKING - 9.0% (Continued) | | | | |
| | 55,536 | | | Industrial & Commercial Bank of China Ltd. - ADR(d) | | $ | 663,634 | |
| | 1,449,000 | | | Industrial & Commercial Bank of China Ltd., H Shares | | | 873,464 | |
| | 150,400 | | | Industrial Bank Company Ltd. | | | 462,342 | |
| | 12,641 | | | KB Financial Group, Inc. | | | 584,625 | |
| | 449,900 | | | Mebuki Financial Group, Inc. | | | 905,983 | |
| | 218,800 | | | Mitsubishi UFJ Financial Group, Inc. | | | 1,272,124 | |
| | 12,417 | | | Nordea Bank Abp | | | 123,815 | |
| | 74,724 | | | Quinenco S.A. | | | 205,310 | |
| | 775,890 | | | Sberbank of Russia PJSC | | | 0 | |
| | 36,156 | | | Skandinaviska Enskilda Banken A.B. | | | 405,512 | |
| | 12,807 | | | Sumitomo Mitsui Financial Group, Inc. - ADR | | | 76,714 | |
| | 5,600 | | | Sumitomo Mitsui Trust Holdings, Inc. | | | 173,832 | |
| | 58,951 | | | Svenska Handelsbanken A.B., A Shares | | | 594,679 | |
| | 6,000 | | | Swedbank A.B., A Shares | | | 94,928 | |
| | 1 | | | Turkiye Is Bankasi A/S | | | 1 | |
| | 1,284,860,000 | | | VTB Bank PJSC | | | 0 | |
| | | | | | | | 14,210,648 | |
| | | | | BEVERAGES - 0.7% | | | | |
| | 3,702 | | | Carlsberg A/S - Series B | | | 470,249 | |
| | 16,186 | | | Cia Cervecerias Unidas S.A. | | | 108,265 | |
| | 2,961 | | | Diageo plc - ADR(d) | | | 588,291 | |
| | | | | | | | 1,166,805 | |
| | | | | BIOTECH & PHARMA - 8.9% | | | | |
| | 21,748 | | | AstraZeneca plc - ADR(d) | | | 1,444,067 | |
| | 11,613 | | | Bayer A.G. | | | 764,728 | |
| | 106,917 | | | GlaxoSmithKline plc - ADR(d) | | | 4,841,201 | |
| | 10,448 | | | Novartis A.G. - ADR | | | 919,737 | |
| | 6,834 | | | Novartis A.G. | | | 603,984 | |
| | 9,491 | | | Novo Nordisk A/S - ADR(d) | | | 1,081,974 | |
| | 8,202 | | | Novo Nordisk A/S, Class B | | | 936,828 | |
| | 9,103 | | | Roche Holding A.G. | | | 3,375,903 | |
| | | | | | | | 13,968,422 | |
See accompanying notes which are an integral part of these financial statements.
| DUNHAM INTERNATIONAL STOCK FUND |
| SCHEDULE OF INVESTMENTS (Unaudited) (Continued) |
| April 30, 2022 |
| Shares | | | | | Fair Value | |
| | | | | COMMON STOCKS — 98.1% (Continued) | | | | |
| | | | | CHEMICALS - 4.8% | | | | |
| | 17,205 | | | BASF S.E. | | $ | 905,791 | |
| | 15,084 | | | Brenntag S.E. | | | 1,163,580 | |
| | 20,889 | | | Covestro A.G. | | | 899,114 | |
| | 2,300 | | | Daicel Corporation | | | 14,062 | |
| | 16,656 | | | Evonik Industries A.G. | | | 435,529 | |
| | 8,100 | | | Kaneka Corporation | | | 216,763 | |
| | 21,400 | | | Mitsubishi Chemical Holdings Corporation | | | 130,506 | |
| | 8,400 | | | Mitsui Chemicals, Inc. | | | 191,946 | |
| | 145,276 | | | National Industrialization Company(a) | | | 783,021 | |
| | 3,200 | | | Nitto Denko Corporation | | | 214,814 | |
| | 10,128 | | | PhosAgro PJSC | | | 0 | |
| | 14,171 | | | Sasol Ltd.,(a) | | | 347,381 | |
| | 26,739 | | | Saudi Arabian Fertilizer Company | | | 1,151,909 | |
| | 6,800 | | | Shin-Etsu Chemical Company Ltd. | | | 934,670 | |
| | 9,200 | | | Sumitomo Chemical Company Ltd. | | | 39,125 | |
| | 6,700 | | | Tosoh Corporation | | | 92,529 | |
| | 1,096 | | | Yara International ASA | | | 55,723 | |
| | 900 | | | Yara International ASA - ADR | | | 22,905 | |
| | | | | | | | 7,599,368 | |
| | | | | COMMERCIAL SUPPORT SERVICES – 1.0% | | | | |
| | 12,994 | | | Randstad N.V. | | | 686,903 | |
| | 289 | | | SGS S.A. | | | 742,675 | |
| | 2,400 | | | SGS S.A. - ADR | | | 61,344 | |
| | | | | | | | 1,490,922 | |
| | | | | CONSTRUCTION MATERIALS - 0.4% | | | | |
| | 1,100 | | | AGC, Inc. | | | 41,243 | |
| | 10,910 | | | James Hardie Industries plc - ADR(d) | | | 313,008 | |
| | 4,900 | | | James Hardie Industries plc - CDI | | | 141,241 | |
| | 8,762 | | | Titan Cement International S.A. | | | 122,722 | |
| | | | | | | | 618,214 | |
| | | | | DIVERSIFIED INDUSTRIALS - 0.9% | | | | |
| | 16,100 | | | Hitachi Ltd. | | | 763,661 | |
| | 18,900 | | | Mitsubishi Heavy Industries Ltd. | | | 646,273 | |
| | | | | | | | 1,409,934 | |
See accompanying notes which are an integral part of these financial statements.
| DUNHAM INTERNATIONAL STOCK FUND |
| SCHEDULE OF INVESTMENTS (Unaudited) (Continued) |
| April 30, 2022 |
| Shares | | | | | Fair Value | |
| | | | | COMMON STOCKS — 98.1% (Continued) | | | | |
| | | | | ELECTRIC UTILITIES - 0.7% | | | | |
| | 5,943 | | | CEZ A/S | | $ | 254,620 | |
| | 15,700 | | | Chubu Electric Power Company, Inc. | | | 158,512 | |
| | 14,404 | | | E.ON S.E. | | | 149,856 | |
| | 452,000 | | | Huadian Power International Corp Ltd. | | | 156,863 | |
| | 52,622 | | | Origin Energy Ltd. | | | 251,668 | |
| | 24,000 | | | Tenaga Nasional Bhd | | | 50,017 | |
| | 25,700 | | | Tokyo Electric Power Company Holdings, Inc.(a) | | | 88,721 | |
| | | | | | | | 1,110,257 | |
| | | | | ELECTRICAL EQUIPMENT - 2.2% | | | | |
| | 32,548 | | | ABB Ltd. - ADR(d) | | | 972,209 | |
| | 76,728 | | | ABB Ltd. | | | 2,302,250 | |
| | 1,300 | | | Daikin Industries Ltd. | | | 198,688 | |
| | | | | | | | 3,473,147 | |
| | | | | ENGINEERING & CONSTRUCTION - 0.0%(b) | | | | |
| | 1 | | | Enka Insaat ve Sanayi A/S | | | 1 | |
| | | | | | | | | |
| | | | | FOOD - 0.3% | | | | |
| | 741,000 | | | WH Group Ltd. | | | 511,732 | |
| | | | | | | | | |
| | | | | FORESTRY, PAPER & WOOD PRODUCTS - 0.2% | | | | |
| | 8,478 | | | UPM-Kymmene OYJ | | | 293,184 | |
| | | | | | | | | |
| | | | | HEALTH CARE FACILITIES & SERVICES - 0.9% | | | | |
| | 16,464 | | | Fresenius Medical Care A.G. & Company KGaA - ADR(d) | | | 509,232 | |
| | 15,788 | | | Fresenius Medical Care A.G. & Company KGaA | | | 981,508 | |
| | | | | | | | 1,490,740 | |
| | | | | HOME & OFFICE PRODUCTS - 0.0%(b) | | | | |
| | 1 | | | Arcelik A/S | | | 4 | |
| | | | | | | | | |
| | | | | HOUSEHOLD PRODUCTS - 0.8% | | | | |
| | 35 | | | AMOREPACIFIC Group | | | 1,369 | |
| | 28,607 | | | Unilever plc – ADR (d) | | | 1,323,360 | |
| | | | | | | | 1,324,729 | |
| | | | | INSTITUTIONAL FINANCIAL SERVICES - 1.2% | | | | |
| | 62,016 | | | China Development Financial Holding Corporation | | | 37,405 | |
See accompanying notes which are an integral part of these financial statements.
| DUNHAM INTERNATIONAL STOCK FUND |
| SCHEDULE OF INVESTMENTS (Unaudited) (Continued) |
| April 30, 2022 |
| Shares | | | | | Fair Value | |
| | | | | COMMON STOCKS — 98.1% (Continued) | | | | |
| | | | | INSTITUTIONAL FINANCIAL SERVICES - 1.2% (Continued) | | | | |
| | 268,400 | | | Haitong Securities Company Ltd. | | $ | 187,443 | |
| | 110,420 | | | Mirae Asset Daewoo Company Ltd. | | | 385,171 | |
| | 329,400 | | | Nomura Holdings, Inc. | | | 1,268,497 | |
| | | | | | | | 1,878,516 | |
| | | | | INSURANCE - 8.4% | | | | |
| | 90,326 | | | Aegon N.V. | | | 468,170 | |
| | 19,301 | | | Allianz S.E. - ADR | | | 432,342 | |
| | 46,317 | | | China Life Insurance Company Ltd. - ADR(d) | | | 332,093 | |
| | 5,700 | | | COFCO Capital Holdings Company Ltd. | | | 6,192 | |
| | 6,500 | | | Dai-ichi Life Holdings, Inc. | | | 130,172 | |
| | 7,097 | | | Hyundai Marine & Fire Insurance Company Ltd. | | | 181,831 | |
| | 74,000 | | | Japan Post Holdings Company Ltd. | | | 518,942 | |
| | 50,800 | | | MS&AD Insurance Group Holdings, Inc. | | | 1,512,364 | |
| | 4,367 | | | Muenchener Rueckversicherungs-Gesellschaft A.G. in | | | 1,039,645 | |
| | 21,204 | | | NN Group N.V. | | | 1,038,291 | |
| | 1,649,400 | | | People’s Insurance Company Group of China Ltd. | | | 1,086,242 | |
| | 2,312,000 | | | People’s Insurance Company Group of China Ltd., H Shares | | | 736,493 | |
| | 3,712 | | | Samsung Fire & Marine Insurance Company Ltd. | | | 611,647 | |
| | 3,206 | | | Samsung Fire & Marine Insurance Company Ltd.- Pfd. | | | 410,415 | |
| | 36,900 | | | Sompo Holdings, Inc. | | | 1,502,384 | |
| | 25,672 | | | Swiss Re A.G. | | | 2,105,517 | |
| | 3,500 | | | T&D Holdings, Inc. | | | 44,982 | |
| | 1,189 | | | Talanx A.G. | | | 49,423 | |
| | 2,354 | | | Zurich Insurance Group A.G. | | | 1,071,827 | |
| | | | | | | | 13,278,972 | |
| | | | | MACHINERY - 1.7% | | | | |
| | 35,259 | | | CNH Industrial N.V. | | | 499,338 | |
| | 4,000 | | | Keyence Corporation | | | 1,608,216 | |
| | 7,000 | | | Techtronic Industries Company Ltd. | | | 93,436 | |
| | 29,300 | | | Yokogawa Electric Corporation | | | 467,173 | |
| | | | | | | | 2,668,163 | |
| | | | | MEDICAL EQUIPMENT & DEVICES - 0.5% | | | | |
| | 2,800 | | | Hoya Corporation | | | 277,912 | |
| | 6,700 | | | Shimadzu Corporation | | | 219,064 | |
See accompanying notes which are an integral part of these financial statements.
| DUNHAM INTERNATIONAL STOCK FUND |
| SCHEDULE OF INVESTMENTS (Unaudited) (Continued) |
| April 30, 2022 |
| Shares | | | | | Fair Value | |
| | | | | COMMON STOCKS — 98.1% (Continued) | | | | |
| | | | | MEDICAL EQUIPMENT & DEVICES - 0.5% (Continued) | | | | |
| | 13,130 | | | Smith & Nephew plc | | $ | 212,808 | |
| | | | | | | | 709,784 | |
| | | | | METALS & MINING - 6.6% | | | | |
| | 16,642 | | | Anglo American plc - ADR | | | 371,117 | |
| | 33,742 | | | Anglo American PLC | | | 1,494,391 | |
| | 66,716 | | | BHP Group Ltd. | | | 2,232,662 | |
| | 17,472 | | | BHP Group Ltd. – ADR (d) | | | 1,170,275 | |
| | 230,400 | | | China Shenhua Energy Company Ltd. | | | 1,067,815 | |
| | 21,500 | | | China Shenhua Energy Company Ltd., H Shares | | | 68,689 | |
| | 3,785 | | | MMC Norilsk Nickel PJSC | | | 0 | |
| | 8,838 | | | Norsk Hydro ASA | | | 74,209 | |
| | 9,618 | | | Rio Tinto Ltd. | | | 760,729 | |
| | 4,296 | | | Rio Tinto plc | | | 303,524 | |
| | 36,341 | | | Rio Tinto plc - ADR(d) | | | 2,584,571 | |
| | 27,683 | | | South32 Ltd. | | | 92,183 | |
| | 40,200 | | | Yankuang Energy Group Company Ltd., Class A | | | 210,075 | |
| | | | | | | | 10,430,230 | |
| | | | | OIL & GAS PRODUCERS - 15.4% | | | | |
| | 94,242 | | | BP plc - ADR | | | 2,706,631 | |
| | 6,423 | | | Canadian Natural Resources Ltd. | | | 397,391 | |
| | 743,000 | | | China Petroleum & Chemical Corporation | | | 484,938 | |
| | 1,550,000 | | | China Petroleum & Chemical Corporation, H Shares | | | 758,679 | |
| | 17,700 | | | ENEOS Holdings, Inc. | | | 62,287 | |
| | 32,540 | | | Eni SpA - ADR(d) | | | 904,937 | |
| | 13,665 | | | Eni SpA | | | 190,962 | |
| | 2,581 | | | Equinor ASA - ADR | | | 87,960 | |
| | 6,389 | | | Equinor ASA | | | 215,920 | |
| | 247,390 | | | Gazprom PJSC | | | 0 | |
| | 87,530 | | | Gazprom PJSC - ADR | | | 0 | |
| | 1,262,440 | | | Guanghui Energy Company Ltd.(a) | | | 1,688,450 | |
| | 58,300 | | | Idemitsu Kosan Company Ltd. | | | 1,536,690 | |
| | 37,200 | | | Inpex Corporation | | | 442,667 | |
| | 50,467 | | | KOC Holding A/S | | | 136,440 | |
See accompanying notes which are an integral part of these financial statements.
| DUNHAM INTERNATIONAL STOCK FUND |
| SCHEDULE OF INVESTMENTS (Unaudited) (Continued) |
| April 30, 2022 |
| Shares | | | | | Fair Value | |
| | | | | COMMON STOCKS — 98.1% (Continued) | | | | |
| | | | | OIL & GAS PRODUCERS - 15.4% (Continued) | | | | |
| | 24,250 | | | LUKOIL PJSC | | $ | 0 | |
| | 1,320 | | | Lundin Energy A.B. | | | 54,584 | |
| | 94,867 | | | MOL Hungarian Oil & Gas plc | | | 804,358 | |
| | 22,511 | | | Motor Oil Hellas Corinth Refineries S.A. | | | 356,019 | |
| | 9,000 | | | OMV A.G. | | | 459,919 | |
| | 2,085,400 | | | PetroChina Company Ltd. | | | 1,684,719 | |
| | 10,881 | | | PetroChina Company Ltd. – ADR (d) | | | 515,977 | |
| | 96,000 | | | PetroChina Company Ltd., H Shares | | | 45,570 | |
| | 212,700 | | | Petroleo Brasileiro S.A. | | | 1,447,744 | |
| | 388,400 | | | Petroleo Brasileiro S.A.- Pref. | | | 2,395,386 | |
| | 4,496 | | | Petroleo Brasileiro S.A.-A - ADR | | | 55,166 | |
| | 12,584 | | | Petroleo Brasileiro S.A. - ADR | | | 170,765 | |
| | 85,128 | | | Polskie Gornictwo Naftowe i Gazownictwo S.A. | | | 119,300 | |
| | 13,600 | | | PTT Exploration & Production PCL | | | 59,381 | |
| | 9,462 | | | Repsol S.A. | | | 141,110 | |
| | 117,940 | | | Rosneft Oil Company PJSC | | | 0 | |
| | 48,621 | | | Shell plc - ADR | | | 2,597,820 | |
| | 12,575 | | | Suncor Energy, Inc. | | | 451,946 | |
| | 6,830 | | | Tatneft PJSC | | | 0 | |
| | 35,014 | | | TotalEnergies S.E. | | | 1,718,770 | |
| | 30,030 | | | TotalEnergies S.E. - ADR(d) | | | 1,462,761 | |
| | | | | | | | 24,155,247 | |
| | | | | OIL & GAS SERVICES & EQUIPMENT - 0.4% | | | | |
| | 1,256,700 | | | CNOOC Energy Technology & Services Ltd. | | | 449,408 | |
| | 2,292,000 | | | Sinopec Oilfield Service Corporation(a) | | | 170,740 | |
| | | | | | | | 620,148 | |
| | | | | REAL ESTATE OWNERS & DEVELOPERS - 0.0%(b) | | | | |
| | 13,000 | | | Hang Lung Group Ltd. | | | 25,382 | |
| | | | | | | | | |
| | | | | RETAIL - CONSUMER STAPLES - 1.1% | | | | |
| | 108,490 | | | BIM Birlesik Magazalar A/S | | | 609,313 | |
| | 3,867 | | | Carrefour S.A. | | | 82,218 | |
| | 66,193 | | | Cencosud S.A. | | | 106,027 | |
| | 77,648 | | | CK Hutchison Holdings Ltd. - ADR | | | 539,654 | |
See accompanying notes which are an integral part of these financial statements.
| DUNHAM INTERNATIONAL STOCK FUND |
| SCHEDULE OF INVESTMENTS (Unaudited) (Continued) |
| April 30, 2022 |
| Shares | | | | | Fair Value | |
| | | | | COMMON STOCKS — 98.1% (Continued) | | | | |
| | | | | RETAIL - CONSUMER STAPLES - 1.1% (Continued) | | | | |
| | 462 | | | George Weston Ltd. | | $ | 57,474 | |
| | 11,955 | | | Woolworths Group Ltd. | | | 323,380 | |
| | | | | | | | 1,718,066 | |
| | | | | RETAIL - DISCRETIONARY - 0.6% | | | | |
| | 16,800 | | | Jardine Matheson Holdings Ltd. | | | 892,584 | |
| | | | | | | | | |
| | | | | SEMICONDUCTORS - 6.5% | | | | |
| | 4,200 | | | Advantest Corporation | | | 286,677 | |
| | 307 | | | ASM International N.V. | | | 92,223 | |
| | 6,647 | | | ASML Holding N.V. | | | 3,771,284 | |
| | 1,400 | | | ASML Holding N.V. - ADR | | | 789,278 | |
| | 14,214 | | | SK Hynix, Inc. | | | 1,238,163 | |
| | 55,000 | | | Taiwan Semiconductor Manufacturing Company Ltd. | | | 994,732 | |
| | 16,110 | | | Taiwan Semiconductor Manufacturing Company Ltd. - ADR | | | 1,497,103 | |
| | 2,500 | | | Tokyo Electron Ltd. | | | 1,054,997 | |
| | 4,100 | | | Tokyo Electron Ltd. - ADR | | | 435,789 | |
| | | | | | | | 10,160,246 | |
| | | | | SOFTWARE - 1.8% | | | | |
| | 6,223 | | | Check Point Software Technologies Ltd.(a) | | | 785,903 | |
| | 2,116 | | | Nemetschek S.E. | | | 167,863 | |
| | 325 | | | SAP S.E. | | | 32,927 | |
| | 12,248 | | | SAP S.E. - ADR(d) | | | 1,234,598 | |
| | 3,691 | | | Temenos A.G. | | | 372,633 | |
| | 10,300 | | | TIS, Inc. | | | 231,360 | |
| | | | | | | | 2,825,284 | |
| | | | | SPECIALTY FINANCE - 1.2% | | | | |
| | 58,900 | | | ORIX Corporation | | | 1,074,408 | |
| | 2,688 | | | ORIX Corporation - ADR | | | 244,097 | |
| | 20,481 | | | Samsung Card Company Ltd.(a) | | | 539,294 | |
| | | | | | | | 1,857,799 | |
| | | | | STEEL - 2.3% | | | | |
| | 152,000 | | | Angang Steel Company Ltd. | | | 66,489 | |
| | 27,897 | | | BlueScope Steel Ltd. | | | 396,524 | |
| | 100 | | | Hitachi Metals Ltd.(a) | | | 1,561 | |
See accompanying notes which are an integral part of these financial statements.
| DUNHAM INTERNATIONAL STOCK FUND |
| SCHEDULE OF INVESTMENTS (Unaudited) (Continued) |
| April 30, 2022 |
| Shares | | | | | Fair Value | |
| | | | | COMMON STOCKS — 98.1% (Continued) | | | | |
| | | | | STEEL - 2.3% (Continued) | | | | |
| | 8,272 | | | Hyundai Steel Company | | $ | 279,431 | |
| | 81,300 | | | JFE Holdings, Inc. | | | 994,320 | |
| | 268,000 | | | Maanshan Iron & Steel Company Ltd. | | | 104,789 | |
| | 19,000 | | | Mitsui & Company Ltd. | | | 460,157 | |
| | 74,900 | | | Nippon Steel Corporation | | | 1,189,454 | |
| | 383 | | | POSCO Holdings, Inc. | | | 86,931 | |
| | | | | | | | 3,579,656 | |
| | | | | TECHNOLOGY HARDWARE - 5.1% | | | | |
| | 10,100 | | | Brother Industries Ltd. | | | 175,556 | |
| | 7,323 | | | Canon, Inc. - ADR | | | 168,283 | |
| | 12,000 | | | Canon, Inc. | | | 276,144 | |
| | 103,000 | | | Chicony Electronics Company Ltd. | | | 286,560 | |
| | 1,005 | | | FUJIFILM Holdings Corporation - ADR | | | 55,697 | |
| | 5,400 | | | FUJIFILM Holdings Corporation | | | 296,881 | |
| | 2,200 | | | Kyocera Corporation | | | 115,530 | |
| | 7,571 | | | LG Electronics, Inc. | | | 344,900 | |
| | 20,218 | | | Nokia OYJ | | | 102,476 | |
| | 113,676 | | | Nokia OYJ - ADR | | | 572,927 | |
| | 8,400 | | | Ricoh Company Ltd. | | | 61,344 | |
| | 352 | | | Samsung Electronics Company Ltd. - ADR | | | 465,872 | |
| | 78,420 | | | Samsung Electronics Company Ltd. | | | 4,154,507 | |
| | 19,632 | | | Samsung Electronics Company Ltd.-Pref. | | | 914,963 | |
| | 22 | | | Samsung Electronics Company Ltd. 144A - ADR(c) | | | 25,828 | |
| | | | | | | | 8,017,468 | |
| | | | | TECHNOLOGY SERVICES - 2.8% | | | | |
| | 30,600 | | | Adyen N.V. - ADR(a), (d) | | | 510,102 | |
| | 7,000 | | | Fujitsu Ltd. | | | 1,058,174 | |
| | 11,600 | | | Nomura Research Institute Ltd. | | | 328,047 | |
| | 35,100 | | | NTT Data Corporation | | | 647,251 | |
| | 13,825 | | | RELX plc - ADR(d) | | | 407,146 | |
| | 6,978 | | | Thomson Reuters Corporation | | | 697,521 | |
| | 5,551 | | | Wolters Kluwer N.V. | | | 560,385 | |
| | 2,435 | | | Wolters Kluwer N.V. - ADR | | | 245,375 | |
| | | | | | | | 4,454,001 | |
See accompanying notes which are an integral part of these financial statements.
| DUNHAM INTERNATIONAL STOCK FUND |
| SCHEDULE OF INVESTMENTS (Unaudited) (Continued) |
| April 30, 2022 |
| Shares | | | | | Fair Value | |
| | | | | COMMON STOCKS — 98.1% (Continued) | | | | |
| | | | | TELECOMMUNICATIONS - 3.1% | | | | |
| | 36,619 | | | Deutsche Telekom A.G. | | $ | 674,360 | |
| | 29,600 | | | Nippon Telegraph & Telephone Corporation | | | 872,401 | |
| | 15,625 | | | Proximus S.A.DP | | | 273,016 | |
| | 590,627 | | | Telecom Italia SpA, Savings Shares | | | 164,355 | |
| | 165,419 | | | Telefonica S.A.,(a) | | | 804,460 | |
| | 23,519 | | | Telekomunikasi Indonesia Persero Tbk P.T. - ADR | | | 748,375 | |
| | 20,879 | | | Telenor ASA | | | 294,431 | |
| | 127,392 | | | Telia Company A.B. | | | 528,827 | |
| | 699,290 | | | Turk Telekomunikasyon A/S | | | 473,693 | |
| | | | | | | | 4,833,918 | |
| | | | | TOBACCO & CANNABIS - 1.4% | | | | |
| | 46,310 | | | British American Tobacco plc - ADR | | | 1,934,832 | |
| | 39,939 | | | Swedish Match A.B. | | | 318,148 | |
| | | | | | | | 2,252,980 | |
| | | | | TRANSPORTATION & LOGISTICS – 1.0% | | | | |
| | 4,173 | | | AP Moller - Maersk A/S - ADR | | | 60,300 | |
| | 34 | | | AP Moller - Maersk A/S - Series B | | | 98,398 | |
| | 211 | | | AP Moller - Maersk A/S - Series A | | | 597,229 | |
| | 92,000 | | | COSCO SHIPPING Ports Ltd. | | | 65,599 | |
| | 3,536 | | | Deutsche Post A.G. | | | 151,021 | |
| | 39,000 | | | Evergreen Marine Corp Taiwan Ltd. | | | 187,506 | |
| | 4,000 | | | Nippon Yusen KK | | | 288,611 | |
| | 60,100 | | | Shanghai International Port Group Company Ltd. | | | 53,637 | |
| | 1 | | | Turk Hava Yollari AO(a) | | | 3 | |
| | 11,000 | | | Yang Ming Marine Transport Corporation,(a) | | | 45,900 | |
| | | | | | | | 1,548,204 | |
| | | | | TRANSPORTATION EQUIPMENT - 0.0%(b) | | | | |
| | 10,800 | | | Hino Motors Ltd. | | | 55,756 | |
| | | | | | | | | |
| | | | | WHOLESALE - CONSUMER STAPLES - 0.2% | | | | |
| | 29,500 | | | Marubeni Corporation | | | 322,051 | |
| | | | | | | | | |
| | | | | WHOLESALE - DISCRETIONARY - 0.5% | | | | |
| | 21,700 | | | Toyota Tsusho Corporation | | | 779,717 | |
See accompanying notes which are an integral part of these financial statements.
| DUNHAM INTERNATIONAL STOCK FUND |
| SCHEDULE OF INVESTMENTS (Unaudited) (Continued) |
| April 30, 2022 |
| Shares | | | | | Fair Value | |
| | | | | COMMON STOCKS — 98.1% (Continued) | | | | |
| | | | | TOTAL COMMON STOCKS (Cost $157,564,345) | | $ | 154,287,724 | |
| | | | | | | | | |
| | | | | EXCHANGE-TRADED FUNDS — 1.1% | | | | |
| | | | | EQUITY - 1.1% | | | | |
| | 25,635 | | | Global X MSCI Argentina ETF | | | 813,142 | |
| | 2,022 | | | iShares MSCI EAFE ETF | | | 138,790 | |
| | 20,127 | | | iShares MSCI Eurozone ETF(d) | | | 807,294 | |
| | | | | | | | | |
| | | | | TOTAL EXCHANGE-TRADED FUNDS (Cost $1,655,602) | | | 1,759,226 | |
| | | | | | | | | |
| | | | | | | | | |
| | | | | COLLATERAL FOR SECURTIES LOANED – 12.7 % | | | | |
| | 20,016,338 | | | Mount Vernon Prime Portfolio, 0.45% (Cost $20,016,338) (e),(f) | | | 20,016,338 | |
| | | | | | | | | |
| | | | | TOTAL INVESTMENTS – 111.9% (Cost $179,236,285) | | $ | 176,063,288 | |
| | | | | LIABILITIES IN EXCESS OF OTHER ASSETS- (11.9)% | | | (18,772,279 | ) |
| | | | | NET ASSETS - 100.0% | | $ | 157,291,009 | |
| ADR | - American Depositary Receipt |
| | |
| A/S | - Anonim Sirketi |
| | |
| EAFE | - Europe, Australasia and Far East |
| | |
| ETF | - Exchange-Traded Fund |
| | |
| LTD | - Limited Company |
| | |
| MSCI | - Morgan Stanley Capital International |
| | |
| NV | - Naamioze Vennootschap |
| | |
| OYJ | - Julkinen osakeyhtio |
| | |
| PJSC | - Public Joint-Stock Company |
| | |
| PLC | - Public Limited Company |
| | |
| PT | - Perseroan Terbatas |
| | |
| S/A | - Société Anonyme |
| | |
| TAS | - Turkish Accounting Standards |
| (a) | Non-income producing security. |
| | |
| (b) | Percentage rounds to less than 0.1%. |
| | |
| (c) | Security exempt from registration under Rule 144A or Section 4(2) of the Securities Act of 1933. The security may be resold in transactions exempt from registration, normally to qualified institutional buyers. As of April 30, 2022 the total market value of 144A securities is 25,828 or 0.0% of net assets. |
| | |
| (d) | All or a portion of these securities are on loan. Total loaned securities had a value of $19,380,217 at April 30, 2022. |
| | |
| (e) | Rate disclosed is the seven day effective yield as of April 30, 2022. |
| | |
| (f) | The Trust’s securities lending policies and procedures require that the borrower: (i) deliver cash or U.S. Government securities as collateral with respect to each new loan of U.S. securities, equal to at least 102% (105% for non US Shares) of the value of the portfolio securities loaned, and (ii) at all times thereafter mark-to-market the collateral on a daily basis so that the market value of such collateral is at least 100% of the value of securities loaned. From time to time the collateral may not be 105% due to end of day market movement. The next business day additional collateral is obtained/received from the borrower to replenish/reestablish 105%. |
See accompanying notes which are an integral part of these financial statements.
| DUNHAM INTERNATIONAL STOCK FUND |
| SCHEDULE OF INVESTMENTS (Unaudited) (Continued) |
| April 30, 2022 |
| Portfolio Composition * - (Unaudited) |
| United States | | | 28.3 | % | | Norway | | | 4.9 | % |
| Japan | | | 14.7 | % | | Netherlands | | | 3.8 | % |
| Collateral for securities loaned | | | 11.4 | % | | Hong Kong | | | 3.5 | % |
| Switzerland | | | 6.3 | % | | Brazil | | | 2.2 | % |
| China | | | 5.8 | % | | Other Countries | | | 14.0 | % |
| Denmark | | | 5.1 | % | | Total | | | 100.0 | % |
| * | Based on total value of investments as of April 30, 2022. Does not include derivatives. |
| | |
| Percentage may differ from Schedule of Investments which are based on Fund net assets. |
See accompanying notes which are an integral part of these financial statements.
Dunham Dynamic Macro Fund (Unaudited)
Message from the Sub-Adviser (Newton Investment Management North America, LLC)
Asset Class Recap
Global markets fell substantially over the six-month fiscal period ending April 30, 2022, as persistent inflation, rising COVID cases, and fear of aggressive monetary tightening dented investor sentiment. A new sub-variant of COVID began to spread throughout Asia and Europe, which led China to introduce a ‘zero-covid’ policy, in effect requiring citizens to quarantine for weeks on end. The restrictive lockdown measures further disrupted the supply chain, which continued to push commodity and goods prices higher. Russia’s invasion of Ukraine exacerbated the already elevated inflation, with prices of key commodities, such as oil and grains, surging. European markets tumbled following the invasion, with countries heavily dependent on the two nations impacted more severely than others. In addition to the geopolitical turmoil, the Federal Reserve (the Fed) increased interest rates for the first time since 2018. Investors were spooked by the Fed’s more hawkish tone, leading some to believe that monetary tightening may be more aggressive than previously anticipated. The 10-year U.S. Treasury yield continued to climb higher, ending the fiscal period at 2.93 percent, the highest level since December 2018. Over the fiscal period, global equities, as measured by the MSCI ACWI Index, lost 11.4 percent, while global fixed income markets, as measured by the Bloomberg Global Aggregate Bond Index, declined 11.7 percent. The global macro asset class, which has historically had a lower correlation to traditional stock and bond asset classes, significantly outperformed the broader market. Over the fiscal period, the global macro asset class, as measured by the IQ Hedge Global Macro Beta Index, edged 1.1 percent lower.
Allocation Review
The Sub-Adviser utilizes a combination of strategies to best achieve its investment objective; maximizing total return from capital appreciation and dividends, while also preserving capital in market downturns. The growth strategy, which is primarily utilized for the capital appreciation objective, is made up of global equities. Given the sell -off in equities over the fiscal period, coupled with the Sub-Adviser’s significant allocation to this strategy (63.2 percent), the growth strategy detracted the most from Fund performance. When compared to the prior fiscal period end, the growth strategy allocation increased 11.3 percent, from 51.9 percent. The defensive strategy, which is primarily utilized for the capital preservation objective, is made up of global bonds and cash equivalents. Like global equities, global bonds fell over the fiscal period, as central banks across the globe took a more dovish stance given the rapid rise in inflation. As mentioned earlier, the Fed raised interest rates for the first time since 2018, leading to a spike in the 10- year U.S. Treasury yield, causing prices of longer-dated investment grade corporate and government bonds to plummet. The defensive strategy fluctuated from a low of 27.8 percent over the fiscal period, to a high of 51.8 percent, before settling at 44.2 percent at the end of the fiscal period. Another strategy the Sub-Adviser utilizes to best achieve its investment objective is an allocation to real assets, primarily comprised of physical asset exchange-traded futures and exchanged-traded funds (ETFs). Historically, real assets, such as commodities, real estate, and infrastructure, have outperformed in periods of heightened inflation. With inflation reaching levels not seen in 40 years, the real asset strategy contributed meaningfully to Fund performance this fiscal quarter. The real asset strategy increased from 4.9 percent at the prior fiscal period end to 16.3 percent at the most recent fiscal period end, primarily due to price appreciation. Lastly, the Fund has a minimal allocation to diversifying strategies, which utilizes option writing strategies designed to protect downside risk. The diversifying strategy contributed marginally to Fund performance.
Holdings Insights
As mentioned earlier, the growth strategy detracted the most from Fund performance, primarily attributed to the sell-off in global equities. Domestic and foreign equities spanning developed and emerging markets all fell, as rising inflation, geopolitical conflict between Russia and Ukraine, and potentially aggressive monetary policy negatively impacted stocks. The largest individual detractor from Fund performance over the fiscal period was the SPDR S&P 500 ETF Trust (SPY) (holding weight*: 21.26 percent). Over the fiscal period, SPY fell 9.7 percent. Additionally, the Sub-Adviser’s exposure to emerging markets equities, through the iShares MSCI Emerging Markets ETF (EEM) (holding weight*: 2.17 percent), and German stocks, through the iShares Currency Hedged MSCI Germany ETF (HEWG) (holding weight*: 1.43 percent) detracted from performance, highlighting that the sell-off in equities was felt across the globe. Over the fiscal period, EEM lost 15.5 percent, while HEWG decreased 14.0 percent.
Within the defensive strategy, the allocation to U.S. government bonds detracted from Fund performance. Given the rise in interest rates, government bonds, as well as other investment-grade corporate bonds, sold off more than the other fixed income asset classes, such as high-yield corporate bonds and leveraged loans. The higher duration of this asset class was negatively impacted by the Fed’s decision to raise interest rates. The Sub-Adviser’s long position in the 10-year U.S. Treasury Futures Option due June 2022 (TYM2C 110.00 COMDTY) (holding weight*: 2.42 percent) future contract detracted the most from Fund performance. Over the fiscal period, this position decreased 41.8 percent.
Within the real asset strategy, the Sub-Adviser’s allocation to commodities contributed to Fund performance. The third largest holding in the Fund is the allocation to the iShares GSCI Commodity Dynamic Roll Strategy ETF (COMT) (holding weight*: 16.36 percent), which was the largest contributor to Fund performance over the fiscal period. The price of major commodities, such as oil, gas, precious metals, and grains, all saw their prices rise substantially over the fiscal period, as supply chain disruptions, coupled with political turmoil in Russia and Ukraine, strained the supply of these key resources. Over the fiscal quarter, COMT increased 31.2 percent.
Sub-Adviser Outlook
The Sub-Adviser believes that while there are numerous headwinds in today’s market, there are still opportunities. Given the flexibility of the strategy, the Sub-Adviser has the ability to tactically shift from segments of the market that appear unattractive, and selectively allocate to other areas that could potentially provide more upside, making this strategy one of the few that could navigate various market environments. With rising prices, global geopolitical conflict, and potentially aggressive monetary policy, this Fund could provide attractive returns with lower systematic risk and lower correlation to traditional asset classes, such as equity and fixed income.
| * | Holdings percentage(s) of total investments, cash and unsettled trades excluding collateral for securities loaned as of 4/30/2022. |
Growth of $100,000 Investment
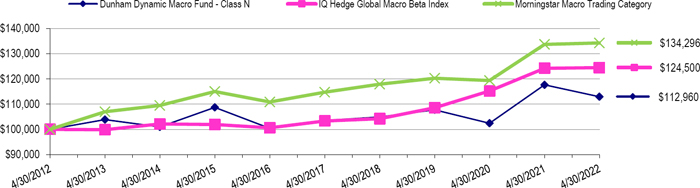
Total Returns (a) as of April 30, 2022
| | | | Annualized | Annualized |
| | Six Month | One Year | Five Years | Ten Years |
| Class N | (8.12)% | (4.01)% | 1.76% | 1.23% |
| Class A with load of 5.75% | (13.57)% | (9.82)% | 0.31% | 0.36% |
| Class A without load | (8.28)% | (4.32)% | 1.50% | 0.96% |
| Class C | (8.59)% | (5.05)% | 0.74% | 0.20% |
| IQ Hedge Global Macro Beta Index | (1.12)% | 0.19% | 3.80% | 2.06% |
| Morningstar Macro Trading Category | (1.11)% | 0.41% | 3.20% | 2.99% |
| (a) | Total Returns are calculated based on traded NAVs. |
The IQ Hedge Global Macro Beta Index seeks to replicate the risk-adjusted return characteristics of the collective hedge funds using a global macro investment style. Investors cannot invest directly in an index or benchmark.
The Morningstar Macro Trading Category is generally representative of mutual funds that use systematic or discretionary methods to examine broad factors such as the global economy, government policies, interest rates, inflation, and market trends. These mutual funds are not restricted by asset class and may invest across such disparate assets as global equities, bonds, currencies, and commodities, and make extensive use of derivatives. These strategies can take significant directional long or short positions on any asset class over short periods and may have relatively high portfolio turnover.
As disclosed in the Trust’s latest registration statement, the Fund’s total annual operating expenses, including underlying funds, are 2.16% for Class N, 3.16% for Class C and 2.41% for Class A. Class A shares are subject to a sales load of 5.75% and a deferred sales charge of up to 0.75%. The performance data quoted here represents past performance, which is not indicative of future results. Current performance may be lower or higher than the performance data quoted. The investment return and NAV will fluctuate, so that an investor’s shares, when redeemed, may be worth more or less than their original cost. Total returns are calculated assuming reinvestment of all dividends and capital gains distributions, if any. The returns do not reflect the deductions of taxes a shareholder would pay on the redemption of Fund shares or Fund distributions. For performance information current to the most recent month-end, please call 1-800-442-4358 or visit our website www.dunham.com.
| DUNHAM DYNAMIC MACRO FUND |
| SCHEDULE OF INVESTMENTS (Unaudited) |
| April 30, 2022 |
| Shares | | | | | | | | | | | Fair Value | |
| | | | | EXCHANGE-TRADED FUNDS — 41.1% | | | | | | | | | | | | |
| | | | | COMMODITY - 16.4% | | | | | | | | | | | | |
| | 92,497 | | | iShares GSCI Commodity Dynamic | | | | | | | | | | $ | 3,843,250 | |
| | | | | | | | | | | | | | | | | |
| | | | | EQUITY - 24.8% | | | | | | | | | | | | |
| | 11,990 | | | iShares Currency Hedged MSCI Germany ETF | | | | | | | | | | | 337,159 | |
| | 12,017 | | | iShares MSCI Emerging Markets ETF | | | | | | | | | | | 509,280 | |
| | 12,124 | | | SPDR S&P 500 ETF Trust (a) | | | | | | | | | | | 4,995,089 | |
| | | | | | | | | | | | | | | | 5,841,528 | |
| | | | | | | | | | | | | | | | | |
| | | | | TOTAL EXCHANGE-TRADED FUNDS (Cost $6,425,736) | | | | | | | | | | | 9,684,778 | |
| | | | | | | | | | | | | | | | | |
| | | | | | | Coupon Rate | | | | | | | | |
| Principal Amount ($) | | | | | (%) | | | Maturity | | | | | |
| | | | | U.S. GOVERNMENT & AGENCIES — 45.8% | | | | | | | | | | | | |
| | | | | U.S. TREASURY BILLS — 45.8% | | | | | | | | | | | | |
| | 541,000 | | | United States Treasury Bill (b) | | | 0.1900 | | | | 05/19/22 | | | | 540,946 | |
| | 10,239,000 | | | United States Treasury Bill | | | 0.4300 | | | | 06/16/22 | | | | 10,233,365 | |
| | | | | | | | | | | | | | | | | |
| | | | | | | | | | | | | | | | | |
| | | | | TOTAL U.S. GOVERNMENT & AGENCIES (Cost $10,773,912) | | | | | | | | | | | 10,774,311 | |
| | | | | | | | | | | | | | | | | |
| Shares | | | | | | | | | | | | | | | |
| | | | | SHORT-TERM INVESTMENTS — 7.3% | | | | | | | | | | | | |
| | | | | MONEY MARKET FUNDS - 7.3% | | | | | | | | | | | | |
| | 1,539,480 | | | Morgan Stanley Institutional Liquidity Funds -, Institutional Class, 0.30% (Cost $1,539,480)(c) | | | | | | | | | | | 1,539,480 | |
| | | | | | | | | | | | | | | | | |
| | | | | COLLATERAL FOR SECURITIES LOANED – 22.3% | | | | | | | | | | | | |
| | 5,238,873 | | | Mount Vernon Prime Portfolio, 0.45% (Cost $5,238,873) (c),(d) | | | | | | | | | | | 5,238,873 | |
| Contracts(c) | | | | | Broker/Counterparty | | | Expiration Date | | Exercise Price | | | Notional Value | | | Fair Value | |
| | | | | FUTURE OPTIONS PURCHASED - 2.4% | | | | | | | | | | | | | | | | | |
| | | | | CALL OPTIONS PURCHASED - 2.4% | | | | | | | | | | | | | | | | | |
| | 9 | | | S&P 500 Emini Future | | GS | | | 07/15/2022 | | $ | 4,950 | | | $ | 2,227,500 | | | $ | 720 | |
| | 24 | | | S&P 500 Emini Future | | GS | | | 07/15/2022 | | | 5,080 | | | | 6,096,000 | | | | 840 | |
| | 9 | | | S&P 500 Emini Future | | GS | | | 06/17/2022 | | | 4,725 | | | | 2,126,250 | | | | 1,125 | |
| | 24 | | | S&P 500 Emini Future | | GS | | | 06/17/2022 | | | 4,900 | | | | 5,880,000 | | | | 660 | |
| | 62 | | | US 10YR Treasury Note Future | | GS | | | 05/20/2022 | | | 110 | | | | 6,820,000 | | | | 567,688 | |
| | | | | TOTAL CALL OPTIONS PURCHASED (Cost - $1,029,165) | | | | | | | | | | 571,033 | |
See accompanying notes which are an integral part of these financial statements.
| DUNHAM DYNAMIC MACRO FUND |
| SCHEDULE OF INVESTMENTS (Unaudited) (Continued) |
| April 30, 2022 |
| | TOTAL INVESTMENTS – 118.1% (Cost $25,007,166) | | $ | 27,808,475 | |
| | LIABILITIES IN EXCESS OF OTHER ASSETS – (18.1)% | | | (4,268,238 | ) |
| | NET ASSETS - 100.0% | | $ | 23,540,237 | |
| Contracts(e) | | | | | Counterparty | | | Expiration Date | | Exercise Price | | | Notional Value | | | Fair Value | |
| | | | | WRITTEN FUTURE OPTIONS - (0.4)% | | | | | | | | | | | | | | | | | | |
| | | | | PUT OPTIONS WRITTEN - (0.4)% | | | | | | | | | | | | | | | | | | |
| | 6 | | | S&P 500 Emini Future | | | GS | | | 05/20/2022 | | $ | 4,080 | | | $ | 1,224,000 | | | $ | 30,075 | |
| | 12 | | | S&P 500 Emini Future | | | GS | | | 05/31/2022 | | | 4,000 | | | | 2,400,000 | | | | 54,450 | |
| | | | | TOTAL PUT OPTIONS WRITTEN (Proceeds - $54,244) | | | | | | | | | | | | | | | | | 84,525 | |
| OPEN FUTURES CONTRACTS |
| Number of Contracts | | | Open Long Futures Contracts | | | Expiration | | | Notional Amount(f) | | | Value and Unrealized
Appreciation
(Depreciation) | |
| | 21 | | | CBOT 10 Year US Treasury Note | | | 06/21/2022 | | | $ | 2,502,276 | | | $ | (47,289 | ) |
| | 10 | | | CME E-mini Russell 2000 Index Futures | | | 06/17/2022 | | | | 930,650 | | | | (55,966 | ) |
| | 21 | | | CME E-Mini Standard & Poor’s 500 Index Future | | | 06/17/2022 | | | | 4,333,874 | | | | (69,004 | ) |
| | 16 | | | Eurex 10 Year Euro BUND Future | | | 06/08/2022 | | | | 2,591,688 | | | | (81,666 | ) |
| | 3 | | | Euronext Amsterdam Index Future | | | 05/20/2022 | | | | 447,039 | | | | 839 | |
| | 11 | | | Euronext CAC 40 Index Future | | | 05/20/2022 | | | | 751,334 | | | | (1,615 | ) |
| | 12 | | | FTSE 100 Index Future | | | 06/17/2022 | | | | 1,133,610 | | | | 43,858 | |
| | 1 | | | HKG Hang Seng Index Future | | | 05/30/2022 | | | | 133,828 | | | | 8,124 | |
| | 1 | | | MEFF Madrid IBEX 35 Index Future | | | 05/20/2022 | | | | 90,377 | | | | 707 | |
| | 7 | | | Montreal Exchange 10 Year Canadian Bond Future | | | 06/21/2022 | | | | 688,509 | | | | (8,603 | ) |
| | 3 | | | Montreal Exchange S&P/TSX 60 Index Future | | | 06/16/2022 | | | | 584,732 | | | | (22,430 | ) |
| | 29 | | | SFE 10 Year Australian Bond Future | | | 06/15/2022 | | | | 2,543,309 | | | | (68,290 | ) |
| | 2 | | | SFE S&P ASX Share Price Index 200 Future | | | 06/16/2022 | | | | 261,710 | | | | 2,797 | |
| | 5 | | | TSE TOPIX (Tokyo Price Index) Future | | | 06/09/2022 | | | | 733,282 | | | | 26,426 | |
| | | | | TOTAL FUTURES CONTRACTS | | | | | | | | | | $ | (272,112 | ) |
| | | | | | | | | | | | | | | | | |
| | | | | Open Short Futures Contracts | | | | | | | | | | | | |
| | 4 | | | Eurex Swiss Market New Index Future | | | 06/17/2022 | | | $ | 497,203 | | | $ | (12,024 | ) |
| | 12 | | | Long Gilt Future | | | 06/28/2022 | | | | 1,787,099 | | | | 49,740 | |
| | | | | TOTAL FUTURES CONTRACTS | | | | | | | | | | $ | 37,716 | |
| ETF | - Exchange-Traded Fund |
| MSCI | - Morgan Stanley Capital International |
| SPDR | - Standard & Poor’s Depositary Receipt |
See accompanying notes which are an integral part of these financial statements.
| DUNHAM DYNAMIC MACRO FUND |
| SCHEDULE OF INVESTMENTS (Unaudited) (Continued) |
| April 30, 2022 |
| (a) | All or a portion of these securities are on loan. Total loaned securities had a value of $4,944,824 at April 30, 2021. |
| | |
| (b) | All of this security is segregated as collateral for futures contracts. |
| | |
| (c) | Rate disclosed is the seven day effective yield as of October 31, 2021. |
| | |
| (d) | The Trust’s securities lending policies and procedures require that the borrower: deliver cash or U.S. Government securities as collateral with respect to each new loan of U.S. securities, equal to at least 102% of the value of the portfolio securities loaned, and (ii) at all times thereafter mark-to-market the collateral on a daily basis so that the market value of such collateral is at least 100% of the value of securities loaned. From time to time the collateral may not be 102% due to end of day market movement. The next business day additional collateral is obtained/received from the borrower to replenish/reestablish 102%. |
| | |
| (e) | Each option contract allows the holder of the option to purchase or sell 100 shares of the underlying security. |
| | |
| (f) | The amounts shown are the underlying reference notional amounts to stock exchange indices and equities upon which the fair value of the futures contracts held by the Fund are based. Notional values do not represent the current fair value of, and are not necessarily indicative of the future cash flows of the Fund’s futures contracts. Further, the underlying price changes in relation to the variables specified by the notional values affects the fair value of these derivative financial instruments. The notional values as set forth within this schedule do not purport to represent economic value at risk to the Fund. |
| Portfolio Composition* (Unaudited) |
| U.S. Treasury Obligations | | | 39.6 | % |
| Equity | | | 21.5 | % |
| Collateral for Securities Loaned | | | 19.2 | % |
| Commodity | | | 14.1 | % |
| Money Market | | | 5.6 | % |
| Total | | | 100.0 | % |
| * | Based on total value of investments as of April 30, 2022. Does not include derivative holdings. |
| | |
| Percentage may differ from Schedule of Investments which are based on Fund net assets. |
See accompanying notes which are an integral part of these financial statements.
Dunham Long/Short Credit Fund (Unaudited)
Message from the Sub-Adviser (MetLife Investment Advisors, LLC)
Asset Class Recap
The fiscal year began with heightened volatility in both the equity and fixed income markets. The increased volatility had multiple underlying drivers, including supply chain issues, the Fed’s plans and pace to potentially control inflation, sanctions, and additional global disruptions as Russia attacked Ukraine. This collection of factors led to substantial and broad declines in the fixed income markets, as the Bloomberg U.S. Aggregate Bond Index declined 9.5 percent. These historically poor total returns were primarily driven by the sharp increase in U.S. Treasury yields which saw 2-year yields rise more than 220 basis points and briefly invert to 10-year yields, which rose more than 130 basis points. This aggressive rise in yields was precipitated not only by the start of the Fed hiking cycle, which saw the Fed Funds rate rise for the first time in over 3 years, but also by a recognition from many members of the Fed that the pace of this hiking cycle may have to be faster than expected to stem the spike in inflation. Although high-yield bonds generally exhibit a lower interest rate sensitivity than investment-grade bonds, all else equal, the sell-off in the fixed income markets covered all credit qualities. Within the high-yield bond sector, CCC-rated bonds dropped 7.3 percent, faring worse than single-B rated bonds, which declined 5.8 percent, while BB-rated bonds decreased 8.1 percent. High-yield bonds in general, as measured by the ICE BofA U.S. Cash Pay High-Yield Index, declined 7.2 percent.
Allocation Review
As the Sub-Adviser continued to limit the overall interest rate sensitivity of the Fund, the Fed’s interest rate increases, along with concerns of additional larger raises, had a substantially muted impact on the Fund as a whole. The Sub-Adviser implemented its rate hedging strategy by utilizing Treasury Bond futures of various maturities to maintain an overall duration exposure for the Fund of close to one year. In addition, as the Sub-Adviser reduced the Fund’s exposure to emerging market debt and other holdings that it perceived as higher risk. The reduction in these long-duration securities resulted in the overall duration exposure of the Fund dropping significantly below one year. Similarly, the net notional exposure of the Fund decreased below 10 percent as Sub-Adviser maintained a cautious view on the credit markets. The Fund continued to primarily hold high-yield bonds, although it also held some investment-grade bonds, and the Sub-Adviser continued to utilize derivatives such as credit default swaps to take short positions in baskets of high-yield and investment-grade securities. At the end of the most recent fiscal quarter, the notional value of these credit hedges comprised close to 28 percent of the Fund. This does not include the additional 9 percent in single-name credit default swaps, which are generally part of a pairs trade strategy – therefore, the total allocation to pairs trading was close to 18 percent. The Fund had approximately 8 percent allocated to catalyst-driven prospects and close to 10 percent in opportunistic trading. The core long holdings, which included preferred stocks, accounted for approximately 24 percent of the Fund, while the rate hedging strategy accounted for 28 percent of the Fund’s holdings.
Holdings Insights
As nearly all sectors and credit qualities within the bond universe experienced losses, the strongest contributors to positive returns in the Fund were the holdings that provided short exposure to CDX high-yield and investment grade indices. This included the Fund’s holdings in the Markit CDX North America High-Yield Index (CDXNAHY38) (holding notional weight*: 11.94 percent), which is composed of one hundred liquid North American entities with high-yield credit ratings that trade in the CDS market, and holdings in the Markit North American Investment Grade CDX Index (CDXNAIG38) (holding notional weight*: 15.80 percent), which is composed of one hundred twenty five of the most liquid North American entities with investment grade credit ratings that trade in the CDS market. The CDXNAHY and CDXNAIG are tradable indices that allow market participants to take a view on the overall credit quality and direction of the underlying basket in one tradable instrument. The long positions in these credit default swap indices, which generally represent a short position in the direction of the credit risk of the index constituents, appreciated 2.8 percent and 0.5 percent, respectively since their addition to the Fund in the final two months of the most recent fiscal quarter. Other short positions in the Fund during the fiscal period included credit default swaps in DR Horton Inc. (DRINC1718) (holding notional weight*: 1.16 percent), a U.S. homebuilder. During the six-month period, the DR Horton credit default swap appreciated 1.4 percent, as credit spreads widened, particularly in the second fiscal quarter.
Although the pairs trading strategy does not generally result in a net short position, the effective netting out of the systematic risk between the two bonds in each pairs trade helped to reduce the adverse impact from the overall decline in bond values. During the fiscal period, the Fund had exposure to pairs trades between long Gap Inc. (GAPCD1718) (holding notional weight*: -1.93 percent) and short Bath & Body Works, Inc. (BBWCD1718) (holding notional weight*: 1.93 percent). This pairs trade was performed using credit default swaps on both the long and the short, by taking a long exposure to the credit risk of Gap Inc. via a short position in credit default swap and taking a short exposure to the credit risk of Bath & Body Works, Inc. with a long position in a credit default swap. Therefore, the notional holdings weights appear reversed compared to the exposure to the credit risk of the underlying. Although the first fiscal quarter generally saw the net effect of the pairs trade work favorably for the Fund, the second fiscal quarter generally detracted from performance overall as both spreads widened out and Gap Inc.’s spread appeared to widen even more than Bath & Body Work, Inc.’s.
Most long positions within the Fund performed poorly during the fiscal period. As the Sub-Adviser implemented its stop-loss parameters, some more volatile holdings were stopped out during the fiscal period. This included two emerging market positions, Alfa Desarrollo SpA 4.55% Due 9/27/2051 (01538TAA3) (holding notional weight**: 0.88 percent), a Chilean energy and infrastructure company, and Aeropuerto Internacional de Tocumen S.A. 5.125% Due 8/11/2061 (00787CAE2) (holding notional weight**: 1.26 percent), the international airport in Panama City. From the beginning of the fiscal period through mid-February when they were sold, the Alfa Desarrollo and Aeropuerto Internacional de Tocumen bonds declined 8.3 percent and 6.3 percent, respectively. Although the Sub-Adviser believes that both bonds’ declines were driven by technical pressure on emerging market credit rather than any deteriorating fundamental factors, it followed its discipline of using the stop loss for an exit. The result was that the triggering of these stops stemmed the extent of the Fund’s losses in these holdings which each continued to decline approximately 10 percent after being sold.
Sub-Adviser Outlook
The Sub-Adviser continues to take a cautious approach to the current market environment. This includes maintaining some cash and what the Sub-Adviser considers to be short-term high quality holdings in order to have the ability to move into attractive opportunities as may be uncovered by its selection process. The Sub-Adviser believes that managing the interest rate overlay is important to maintain a low overall duration for the Fund, so that changes in the yield curve, particularly upward movements, may be mitigated.
| * | Holdings percentage(s) of total investments, cash and unsettled trades excluding collateral for securities loaned as of 4/30/2022. |
| ** | Holdings percentage(s) as of the date prior to the sale of the security. |
Growth of $100,000 Investment
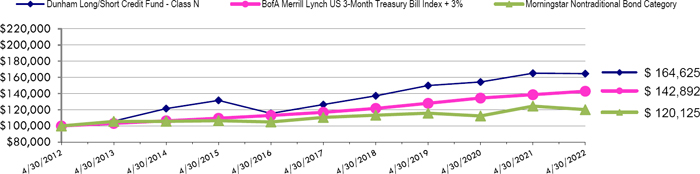
Total Returns (a) as of April 30, 2022
| | | | Annualized | Annualized |
| | Six Months | One Year | Five Years | Ten Years |
| Class N | (1.19)% | (0.31)% | 5.43% | 5.11% |
| Class A with load of 5.75% | (6.99)% | (6.30)% | 3.92% | 4.22% |
| Class A without load | (1.32)% | (0.56)% | 5.17% | 4.85% |
| Class C | (1.76)% | (1.38)% | 4.38% | 4.05% |
| BofA Merrill Lynch US 3-Month Treasury Bill Index +3% | 3.07% | 3.08% | 4.12% | 3.63% |
| Morningstar Nontraditional Bond Category | (4.02)% | (3.50)% | 1.68% | 1.85% |
| (a) | Total Returns are calculated based on traded NAVs. |
The BofA Merrill Lynch US 3 -Month Treasury Bill Index + 3% is comprised of a single issue purchased at the beginning of the month and held for a full month. At the end of the month that issue is sold and rolled in a newly selected issue. The issue selected at each month-end rebalancing is the outstanding Treasury Bill that matures closest to, but not beyond, three months from the rebalancing date. To qualify for selection, an issue must have settled on or before the month-end rebalancing date. Plus an annualized return of 3%. Investors cannot invest directly in an index or benchmark.
The Morningstar Nontraditional Bond Category is generally representative of mutual funds that deploy absolute return strategies, strategies that are low-correlated to the overall bond market, and strategies that take long and short market and security-level positions.
As disclosed in the Trust’s latest registration statement as supplemented the Fund’s total annual operating expenses, including the cost of underlying funds, are 1.83% for Class N, 2.83% for Class C and 2.08% for Class A. Class A shares are subject to a sales load of 5.75% and a deferred sales charge of up to 0.75%. The performance data quoted here represents past performance, which is not indicative of future results. Current performance may be lower or higher than the performance data quoted. The investment return and NAV will fluctuate, so that an investor’s shares, when redeemed, may be worth more or less than their original cost. Total returns are calculated assuming reinvestment of all dividends and capital gains distributions, if any. The returns do not reflect the deductions of taxes a shareholder would pay on the redemption of Fund shares or Fund distributions. For performance information current to the most recent month-end, please call 1-800-442-4358 or visit our website www.dunham.com.
| DUNHAM LONG/SHORT CREDIT FUND |
| SCHEDULE OF INVESTMENTS (Unaudited) |
| April 30, 2022 |
| Shares | | | | | | | | | | | | | | Fair Value | |
| | | | | COMMON STOCKS — 0.0%(a) | | | | | | | | | | | | | | | | |
| | | | | TELECOMMUNICATIONS - 0.0%(a) | | | | | | | | | | | | | | | | |
| | 10,000 | | | NII Holdings, Inc. 144A(b),(c),(k) | | | | | | | | | | | | | | $ | 5,700 | |
| | | | | | | | | | | | | | | | | | | | | |
| | | | | TOTAL COMMON STOCKS (Cost $57,730) | | | | | | | | | | | | | | | 5,700 | |
| | | | | | | | | | | | | | | | | | | | | |
| | | | | | | | | | | Interest Rate | | | | | | | | | |
| | | | | | | | | | | (%) | | | | | | | | | |
| | | | | PREFERRED STOCKS — 2.7% | | | | | | | | | | | | | | | |
| | | | | REAL ESTATE INVESTMENT TRUSTS — 1.2% | | | | | | | | | | | | | | | |
| | 121,684 | | | Inpoint Commercial Real Estate Income, Inc. | | | | | | | 6.7500 | | | | | | | | 2,739,837 | |
| | | | | | | | | | | | | | | | | | | | | |
| | | | | REAL ESTATE SERVICES — 0.8% | | | | | | | | | | | | | | | | |
| | 2,000 | | | UIRC-GSA International, LLC 144A(c),(k) | | | | | | | 6.0000 | | | | | | | | 2,030,000 | |
| | | | | | | | | | | | | | | | | | | | | |
| | | | | SPECIALTY FINANCE — 0.7% | | | | | | | | | | | | | | | | |
| | 83,214 | | | TPG RE Finance Trust, Inc. | | | | | | | 6.2500 | | | | | | | | 1,737,092 | |
| | | | | | | | | | | | | | | | | | | | | |
| | | | | TOTAL PREFERRED STOCKS (Cost $7,122,450) | | | | | | | | | | | | | | | 6,506,929 | |
| | | | | | | | | | | | | | | | | | | | | |
| Principal | | | | | | | | | Coupon Rate | | | | | | | | | |
| Amount ($) | | | | | Spread | | | (%) | | | Maturity | | | | | |
| | | | | CORPORATE BONDS — 37.6% | | | | | | | | | | | | | | | | |
| | | | | ASSET MANAGEMENT — 2.9% | | | | | | | | | | | | | | | | |
| | 1,255,000 | | | Blackstone Secured Lending Fund | | | | | | | 3.6250 | | | | 01/15/26 | | | | 1,202,969 | |
| | 2,265,000 | | | FS KKR Capital Corporation | | | | | | | 1.6500 | | | | 10/12/24 | | | | 2,123,836 | |
| | 1,040,000 | | | Main Street Capital Corporation (d) | | | | | | | 4.5000 | | | | 12/01/22 | | | | 1,051,138 | |
| | 2,780,000 | | | PennantPark Investment Corporation | | | | | | | 4.0000 | | | | 11/01/26 | | | | 2,578,097 | |
| | | | | | | | | | | | | | | | | | | | 6,956,040 | |
| | | | | AUTOMOTIVE — 0.8% | | | | | | | | | | | | | | | | |
| | 2,065,000 | | | Hyundai Capital America (c) | | | | | | | 1.0000 | | | | 09/17/24 | | | | 1,924,819 | |
| | | | | | | | | | | | | | | | | | | | | |
| | | | | BANKING — 6.2% | | | | | | | | | | | | | | | | |
| | 3,545,000 | | | HSBC Holdings plc (e) | | | SOFRRATE + 1.430% | | | | 1.6560 | | | | 03/10/26 | | | | 3,554,477 | |
| | 2,450,000 | | | HSBC Holdings plc | | | | | | | 6.5000 | | | | 09/15/37 | | | | 2,760,879 | |
See accompanying notes which are an integral part of these financial statements.
| DUNHAM LONG/SHORT CREDIT FUND |
| SCHEDULE OF INVESTMENTS (Unaudited) (Continued) |
| April 30, 2022 |
| Principal | | | | | | | | Coupon Rate | | | | | | | |
| Amount ($) | | | | | Spread | | | (%) | | | Maturity | | | Fair Value | |
| | | | | CORPORATE BONDS — 37.6% (Continued) | | | | | | | | | | | | | | | | |
| | | | | BANKING — 6.2% (Continued) | | | | | | | | | | | | | | | | |
| | 2,005,000 | | | JPMorgan Chase & Company (e) | | | US0003M + 0.550% | | | | 0.8700 | | | | 02/01/27 | | | $ | 1,909,082 | |
| | 3,505,000 | | | KeyCorp Capital II (d) | | | | | | | 6.8750 | | | | 03/17/29 | | | | 3,752,803 | |
| | 1,645,000 | | | SVB Financial Group (f) | | | H15T10Y + 3.064% | | | | 4.7000 | | | | 02/15/70 | | | | 1,354,065 | |
| | 1,000,000 | | | Wells Fargo & Company (e),(f) | | | US0003M + 0.500% | | | | 1.5440 | | | | 01/15/27 | | | | 952,678 | |
| | 795,000 | | | Wells Fargo & Company | | | | | | | 5.9500 | | | | 12/01/86 | | | | 868,824 | |
| | | | | | | | | | | | | | | | | | | | 15,152,808 | |
| | | | | | | | | | | | | | | | | | | | | |
| | | | | CONSTRUCTION MATERIALS — 0.3% | | | | | | | | | | | | | | | | |
| | 830,000 | | | Oscar AcquisitionCo, LLC / Oscar Finance, Inc. (c) | | | | | | | 9.5000 | | | | 04/15/30 | | | | 757,134 | |
| | | | | | | | | | | | | | | | | | | | | |
| | | | | CONSUMER SERVICES — 1.8% | | | | | | | | | | | | | | | | |
| | 2,300,000 | | | Grand Canyon University | | | | | | | 4.1250 | | | | 10/01/24 | | | | 2,244,754 | |
| | 2,300,000 | | | Grand Canyon University (d) | | | | | | | 5.1250 | | | | 10/01/28 | | | | 2,219,500 | |
| | | | | | | | | | | | | | | | | | | | 4,464,254 | |
| | | | | | | | | | | | | | | | | | | | | |
| | | | | ELECTRIC UTILITIES — 2.5% | | | | | | | | | | | | | | | | |
| | 3,310,000 | | | American Electric Power Company, Inc. | | | | | | | 2.0310 | | | | 03/15/24 | | | | 3,215,420 | |
| | 2,785,000 | | | Pacific Gas and Electric Company | | | | | | | 1.7000 | | | | 11/15/23 | | | | 2,707,297 | |
| | | | | | | | | | | | | | | | | | | | 5,922,717 | |
| | | | | | | | | | | | | | | | | | | | | |
| | | | | ENTERTAINMENT CONTENT — 1.5% | | | | | | | | | | | | | | | | |
| | 3,545,000 | | | Magallanes, Inc. (c),(e) | | | SOFRRATE + 1.780% | | | | 2.0380 | | | | 03/15/24 | | | | 3,578,351 | |
| | | | | | | | | | | | | | | | | | | | | |
| | | | | FOOD — 1.6% | | | | | | | | | | | | | | | | |
| | 2,875,000 | | | Del Monte Foods, Inc. (c) | | | | | | | 11.8750 | | | | 05/15/25 | | | | 3,143,548 | |
| | 700,000 | | | Kraft Heinz Foods Company | | | | | | | 5.0000 | | | | 06/04/42 | | | | 676,387 | |
| | | | | | | | | | | | | | | | | | | | 3,819,935 | |
| | | | | INDUSTRIAL SUPPORT SERVICES — 1.0% | | | | | | | | | | | | | | | | |
| | 2,615,000 | | | Resideo Funding, Inc. (c) | | | | | | | 4.0000 | | | | 09/01/29 | | | | 2,331,050 | |
| | | | | | | | | | | | | | | | | | | | | |
| | | | | INSTITUTIONAL FINANCIAL SERVICES — 3.1% | | | | | | | | | | | | | | | | |
| | 2,880,000 | | | Credit Suisse Group A.G. (c),(f) | | | USSW5 + 4.598% | | | | 7.5000 | | | | 06/11/70 | | | | 2,891,793 | |
| | 2,250,000 | | | Goldman Sachs Capital I | | | | | | | 6.3450 | | | | 02/15/34 | | | | 2,490,038 | |
| | 2,050,000 | | | Goldman Sachs Group, Inc. (The) (e) | | | SOFRRATE + 0.490% | | | | 0.7620 | | | | 10/21/24 | | | | 2,022,046 | |
| | | | | | | | | | | | | | | | | | | | 7,403,877 | |
See accompanying notes which are an integral part of these financial statements.
| DUNHAM LONG/SHORT CREDIT FUND |
| SCHEDULE OF INVESTMENTS (Unaudited) (Continued) |
| April 30, 2022 |
| Principal | | | | | | | | Coupon Rate | | | | | | | |
| Amount ($) | | | | | Spread | | | (%) | | | Maturity | | | Fair Value | |
| | | | | CORPORATE BONDS — 37.6% (Continued) | | | | | | | | | | | | | | | | |
| | | | | INSURANCE — 2.4% | | | | | | | | | | | | | | | | |
| | 2,155,000 | | | Mutual of Omaha Insurance Company (c),(f) | | | US0003M + 2.640% | | | | 4.2970 | | | | 07/15/54 | | | $ | 2,116,091 | |
| | 2,285,000 | | | Ohio National Financial Services, Inc. (c) | | | | | | | 5.5500 | | | | 01/24/30 | | | | 2,285,440 | |
| | 1,000,000 | | | Pacific Life Insurance Company (c) | | | | | | | 9.2500 | | | | 06/15/39 | | | | 1,452,524 | |
| | | | | | | | | | | | | | | | | | | | 5,854,055 | |
| | | | | LEISURE FACILITIES & SERVICES — 0.8% | | | | | | | | | | | | | | | | |
| | 2,050,000 | | | Mohegan Gaming & Entertainment (c) | | | | | | | 8.0000 | | | | 02/01/26 | | | | 1,810,919 | |
| | | | | | | | | | | | | | | | | | | | | |
| | | | | METALS & MINING — 0.5% | | | | | | | | | | | | | | | | |
| | 1,110,000 | | | Freeport-McMoRan, Inc. | | | | | | | 4.1250 | | | | 03/01/28 | | | | 1,074,286 | |
| | | | | | | | | | | | | | | | | | | | | |
| | | | | OIL & GAS PRODUCERS — 6.3% | | | | | | | | | | | | | | | | |
| | 1,845,000 | | | Comstock Resources, Inc. (c),(d) | | | | | | | 5.8750 | | | | 01/15/30 | | | | 1,777,943 | |
| | 2,135,000 | | | Earthstone Energy Holdings, LLC (c),(d) | | | | | | | 8.0000 | | | | 04/15/27 | | | | 2,127,901 | |
| | 2,525,000 | | | Energean Israel Finance Ltd. | | | | | | | 5.8750 | | | | 03/30/31 | | | | 2,279,444 | |
| | 1,000,000 | | | Hilcorp Energy I, L.P. / Hilcorp Finance Company (c) | | | | | | | 6.0000 | | | | 04/15/30 | | | | 993,695 | |
| | 2,485,000 | | | Hilcorp Energy I, L.P. / Hilcorp Finance Company (c) | | | | | | | 6.2500 | | | | 04/15/32 | | | | 2,452,062 | |
| | 1,045,000 | | | Northern Oil and Gas, Inc. (c),(d) | | | | | | | 8.1250 | | | | 03/01/28 | | | | 1,041,076 | |
| | 845,000 | | | Rockcliff Energy II, LLC (c) | | | | | | | 5.5000 | | | | 10/15/29 | | | | 820,812 | |
| | 2,230,000 | | | Saudi Arabian Oil Company (c) | | | | | | | 1.2500 | | | | 11/24/23 | | | | 2,170,394 | |
| | 1,725,000 | | | Tullow Oil plc (c) | | | | | | | 10.2500 | | | | 05/15/26 | | | | 1,714,840 | |
| | | | | | | | | | | | | | | | | | | | 15,378,167 | |
| | | | | SPECIALTY FINANCE — 4.6% | | | | | | | | | | | | | | | | |
| | 3,700,000 | | | AerCap Ireland Capital DAC / AerCap Global | | | | | | | 1.1500 | | | | 10/29/23 | | | | 3,534,658 | |
| | 1,335,000 | | | Finance of America Funding, LLC (c),(d) | | | | | | | 7.8750 | | | | 11/15/25 | | | | 1,199,758 | |
| | 424,000 | | | GE Capital International Funding Company Unlimited | | | | | | | 4.4180 | | | | 11/15/35 | | | | 415,834 | |
| | 3,300,000 | | | PRA Group, Inc. (c),(d) | | | | | | | 5.0000 | | | | 10/01/29 | | | | 3,057,995 | |
| | 3,500,000 | | | World Acceptance Corporation (c) | | | | | | | 7.0000 | | | | 11/01/26 | | | | 3,040,923 | |
| | | | | | | | | | | | | | | | | | | | 11,249,168 | |
| | | | | TELECOMMUNICATIONS — 1.3% | | | | | | | | | | | | | | | | |
| | 2,250,000 | | | HC2 Holdings, Inc. (c) | | | | | | | 8.5000 | | | | 02/01/26 | | | | 2,172,499 | |
| | 930,000 | | | Sprint Spectrum Company, LLC / Sprint Spectrum (c) | | | | | | | 5.1520 | | | | 03/20/28 | | | | 958,132 | |
| | | | | | | | | | | | | | | | | | | | 3,130,631 | |
See accompanying notes which are an integral part of these financial statements.
| DUNHAM LONG/SHORT CREDIT FUND |
| SCHEDULE OF INVESTMENTS (Unaudited) (Continued) |
| April 30, 2022 |
| | | | | | | | | | | | | | | Fair Value | |
| | | | | CORPORATE BONDS — 37.6% (Continued) | | | | | | | | | | | | | | | | |
| | | | | TOTAL CORPORATE BONDS (Cost $95,514,643) | | | | | | | | | | | | | | $ | 90,808,211 | |
| | | | | | | | | | | | | | | | | | | | | |
| Principal | | | | | | | | | Coupon Rate | | | | | | | | | |
| Amount ($) | | | | | Spread | | | (%) | | | Maturity | | | | | |
| | | | | | | | | | | | | | | | | | | | | |
| | | | | TERM LOANS — 2.3% | | | | | | | | | | | | | | | | |
| | | | | | | | | | | | | | | | | | | | | |
| | | | | FOOD — 0.8% | | | | | | | | | | | | | | | | |
| | 1,975,000 | | | Del Monte Foods, Inc. (e) | | | SOFRRATE + 4.250% | | | | 4.5300 | | | | 02/15/29 | | | | 1,960,197 | |
| | | | | | | | | | | | | | | | | | | | | |
| | | | | LEISURE FACILITIES & SERVICES — 1.5% | | | | | | | | | | | | | | | | |
| | 1,567,500 | | | Enterprise Development Authority (The) (e) | | | US0001M + 4.250% | | | | 5.0000 | | | | 02/19/28 | | | | 1,563,581 | |
| | 1,975,000 | | | Lucky Bucks, LLC (e) | | | US0001M + 5.500% | | | | 6.2500 | | | | 07/20/27 | | | | 1,947,844 | |
| | | | | | | | | | | | | | | | | | | | 3,511,425 | |
| | | | | TOTAL TERM LOANS (Cost $5,447,334) | | | | | | | | | | | | | | | 5,471,622 | |
| | | | | | | | | | | | | | | | | | | | | |
| | | | | U.S. GOVERNMENT & AGENCIES — 47.0% | | | | | | | | | | | | | | | | |
| | | | | U.S. TREASURY BILLS — 47.0% | | | | | | | | | | | | | | | | |
| | 21,265,000 | | | United States Cash Management Bill (g) | | | | | | | — | | | | 05/24/22 | | | | 21,261,248 | |
| | 28,465,000 | | | United States Treasury Bill (g) | | | | | | | — | | | | 05/19/22 | | | | 28,462,177 | |
| | 19,190,000 | | | United States Treasury Bill (g) | | | | | | | — | | | | 07/21/22 | | | | 19,155,128 | |
| | 21,330,000 | | | United States Treasury Bill (g) | | | | | | | — | | | | 08/11/22 | | | | 21,272,611 | |
| | 3,705,000 | | | United States Treasury Note | | | | | | | 2.5000 | | | | 03/31/27 | | | | 3,634,663 | |
| | 3,080,000 | | | United States Treasury Note | | | | | | | 2.3750 | | | | 03/31/29 | | | | 2,972,681 | |
| | 5,510,000 | | | United States Treasury Note | | | | | | | 1.8750 | | | | 02/15/32 | | | | 5,039,067 | |
| | 5,855,000 | | | United States Treasury Note | | | | | | | 2.3750 | | | | 02/15/42 | | | | 5,188,994 | |
| | 8,195,000 | | | United States Treasury Note | | | | | | | 1.8750 | | | | 11/15/51 | | | | 6,458,684 | |
| | | | | | | | | | | | | | | | | | | | 113,445,253 | |
| | | | | TOTAL U.S. GOVERNMENT & AGENCIES (Cost $115,095,689) | | | | | | | | | | | | | | | 113,445,253 | |
| | | | | | | | | | | | | | | | | | | | | |
| Shares | | | | | | | | | | | | | | | | | | | |
| | | | | SHORT-TERM INVESTMENTS — 14.5% | | | | | | | | | | | | | | | | |
| | | | | MONEY MARKET FUNDS - 14.5% | | | | | | | | | | | | | | | | |
| | 29,077,685 | | | First American Government Obligations Fund, Class X, 0.22% (Cost - $29,077,685)(h) | | | | | | | | | | | | | | | 29,077,685 | |
See accompanying notes which are an integral part of these financial statements.
| DUNHAM LONG/SHORT CREDIT FUND |
| SCHEDULE OF INVESTMENTS (Unaudited) (Continued) |
| April 30, 2022 |
| Shares | | | | | Fair Value | |
| | | | | COLLATERAL FOR SECURITIES LOANED — 2.5% | | | | |
| | 6,001,785 | | | Mount Vernon Liquid Assets Portfolio, LLC, 0.45% (Cost - $6,001,785)(h),(j) | | $ | 6,001,785 | |
| | | | | | | | | |
| | | | | TOTAL INVESTMENTS - 104.1% (Cost $258,317,316) | | $ | 251,317,185 | |
| | | | | LIABILITIES IN EXCESS OF OTHER ASSETS - (4.1)% | | | (10,005,370 | ) |
| | | | | NET ASSETS - 100.0% | | $ | 241,311,815 | |
| OPEN FUTURES CONTRACTS | |
| Number of | | | | | | | | | | | Value and Unrealized | |
| Contracts | | | Open Short Futures Contracts | | Expiration | | | Notional Amount(i) | | | Appreciation | |
| | 71 | | | CBOT 10 Year US Treasury Note | | | 06/21/2022 | | | $ | 8,460,076 | | | $ | 501,290 | |
| | 48 | | | CBOT 5 Year US Treasury Note | | | 06/30/2022 | | | | 5,408,256 | | | | 228,369 | |
| | 31 | | | CBOT US Long Bond Future | | | 06/21/2022 | | | | 4,361,328 | | | | 418,568 | |
| | 71 | | | CME Ultra Long Term US Treasury Bond Future | | | 06/21/2022 | | | | 11,391,098 | | | | 1,578,154 | |
| | 97 | | | Ultra 10-Year US Treasury Note Futures | | | 06/21/2022 | | | | 12,513,000 | | | | 751,861 | |
| | | | | TOTAL FUTURES CONTRACTS | | | | | | | | | | $ | 3,478,242 | |
| CREDIT DEFAULT SWAP AGREEMENTS |
| Description and Payment | | | | Fixed Deal | | | | | | | | | | Amortized Upfront | | | Unrealized
Appreciation/ | |
| Frequency | | Counterparty | | (Pay)Rate | | Maturity Date | | Notional Value | | | Fair Value(m) | | | Payments Paid | | | (Depreciation) | |
| To Buy Monthly - BATH & BODY WORKS, INC. | | JP Morgan | | 1.00% | | 12/20/2026 | | $ | 5,000,000 | | | $ | 305,404 | | | $ | 136,023 | | | $ | 169,381 | |
| To Buy Monthly - CDX.NA.HY SERIES 38 | | HSBC | | 5.00% | | 6/20/2027 | | | 31,000,000 | | | | (470,394 | ) | | | (1,343,395 | ) | | | 873,002 | |
| To Buy Monthly - CDX.NA.IG | | Securities HSBC | | 1.00% | | 6/20/2027 | | | 41,000,000 | | | | (307,041 | ) | | | (520,467 | ) | | | 213,426 | |
| SERIES 38 | | Securities | | | | | | | | | | | | | | | | | | | | |
| To Buy Monthly - D.R. HORTON, INC. | | US Bank | | 1.00% | | 3/20/2025 | | | 3,000,000 | | | | (17,135 | ) | | | (58,676 | ) | | | 41,541 | |
| To Buy Monthly - DARDEN RESTAURANTS, INC. | | Barclays | | 1.00% | | 6/20/2027 | | | 7,000,000 | | | | (20,349 | ) | | | (23,946 | ) | | | 3,597 | |
| To Buy Monthly - GAP, INC. (l) | | JP Morgan | | 1.00% | | 12/20/2026 | | | (5,000,000 | ) | | | (596,631 | ) | | | (261,713 | ) | | | (334,918 | ) |
| To Buy Monthly - MARATHON PETROLEUM CORPORATION | | Barclays | | 5.00% | | 12/20/2026 | | | 3,000,000 | | | | (553,460 | ) | | | (584,442 | ) | | | 30,982 | |
| To Buy Monthly - NETFLIX, INC. (l) | | HSBC Securities | | 5.00% | | 6/20/2027 | | | (3,000,000 | ) | | | 455,710 | | | | 534,862 | | | | (79,152 | ) |
| To Buy Monthly - PARAMOUNT GLOBAL | | Barclays | | 1.00% | | 6/20/2027 | | | 3,000,000 | | | | 68,307 | | | | 33,927 | | | | 34,380 | |
| To Buy Monthly - UNITED RENTALS | | JP Morgan | | 1.00% | | 6/20/2022 | | | 3,000,000 | | | | (20,000 | ) | | | (18,998 | ) | | | (1,002 | ) |
| To Buy Monthly - VALERO ENERGY CORPORATION (l) | | Barclays | | 1.00% | | 12/20/2026 | | | (3,000,000 | ) | | | 17,767 | | | | 24,589 | | | | (6,822 | ) |
| To Buy Monthly - VERIZON COMMUNICATIONS, INC. (l) | | Barclays | | 1.00% | | 7/20/2022 | | | (3,000,000 | ) | | | 2,821 | | | | 2,685 | | | | 136 | |
| To Buy Monthly – VERIZON COMMUNICATIONS, INC. (l) | | Barclays | | 1.00% | | 6/20/2027 | | | (7,000,000 | ) | | | (11,184 | ) | | | 4,309 | | | | (15,493 | ) |
See accompanying notes which are an integral part of these financial statements.
| DUNHAM LONG/SHORT CREDIT FUND |
| SCHEDULE OF INVESTMENTS (Unaudited) (Continued) |
| April 30, 2022 |
| CREDIT DEFAULT SWAP AGREEMENTS (Continued) |
| Description and Payment | | | | Fixed Deal | | | | | | | | | | Amortized Upfront | | | Unrealized
Appreciation/ | |
| Frequency | | Counterparty | | (Pay)Rate | | Maturity Date | | Notional Value | | | Fair Value(m) | | | Payments Paid | | | (Depreciation) | |
| At Maturity - KRAFT HEINZ FOOD | | JP Morgan | | 1.00% | | 6/20/2023 | | $ | 2,000,000 | | | $ | (32,839 | ) | | $ | (31,954 | ) | | $ | (885 | ) |
| At Maturity - KRAFT HEINZ | | Goldman | | 1.00% | | 6/20/2023 | | | (2,000,000 | ) | | | 34,676 | | | | 14,987 | | | | 19,689 | |
| FOOD (l) | | Sachs | | | | | | | | | | | | | | | | | | | | |
| At Maturity - NEWELL BRANDS | | JP Morgan | | 1.00% | | 6/20/2023 | | | 2,000,000 | | | | 34,057 | | | | 22,030 | | | | 12,027 | |
| At Maturity - NEWELL BRANDS (l) | | Goldman Sachs | | 1.00% | | 6/20/2023 | | | (2,000,000 | ) | | | (32,614 | ) | | | (32,614 | ) | | | (3,280 | ) |
| TOTAL | | | | | | | | | | | | | | | | | | | | $ | 956,609 | |
| LLC | - Limited Liability Company |
| | |
| LTD | - Limited Company |
| | |
| PLC | - Public Limited Company |
| | |
| REIT | - Real Estate Investment Trust |
| | |
| H15T10Y | - US Treasury Yield Curve Rate T Note Constant Maturity 10 Year |
| | |
| SOFRRATE | - United States SOFR Secured Overnight Financing Rate |
| | |
| US0001M | - ICE LIBOR USD 1 Month |
| | |
| US0003M | - ICE LIBOR USD 3 Month |
| | |
| USSW5 | - USD SWAP SEMI 30/360 5YR |
| (a) | Percentage rounds to less than 0.1%. |
| | |
| (b) | Non-income producing security. |
| | |
| (c) | Security exempt from registration under Rule 144A or Section 4(2) of the Securities Act of 1933. The security may be resold in transactions exempt from registration, normally to qualified institutional buyers. As of April 30, 2022 the total market value of 144A securities is 47,855,399 or 19.8% of net assets. |
| | |
| (d) | All or a portion of these securities are on loan. Total loaned securities had a value of $5,851,506 at April 30, 2022. |
| | |
| (e) | Variable or floating rate security, the interest rate of which adjusts periodically based on changes in current interest rates and prepayments on the underlying pool of assets. |
| | |
| (f) | Variable rate security; the rate shown represents the rate on April 30, 2022. |
| | |
| (g) | Zero coupon bond. |
| | |
| (h) | Rate disclosed is the seven day effective yield as of April 30, 2022. |
| | |
| (i) | The amounts shown are the underlying reference notional amounts to stock exchange indices and equities upon which the fair value of the futures contracts held by the Fund are based. Notional values do not represent the current fair value of, and are not necessarily indicative of the future cash flows of the Fund’s futures contracts. Further, the underlying price changes in relation to the variables specified by the notional values affects the fair value of these derivative financial instruments. The notional values as set forth within this schedule do not purport to represent economic value at risk to the Fund. |
| | |
| (j) | The Trust’s securities lending policies and procedures require that the borrower: (i) deliver cash or U.S. Government securities as collateral with respect to each new loan of U.S. securities, equal to at least 102% of the value of the portfolio securities loaned, and (ii) at all times thereafter mark-to-market the collateral on a daily basis so that the market value of such collateral is at least 100% of the value of securities loaned. From time to time the collateral may not be 102% due to end of day market movement. The next business day additional collateral is obtained/received from the borrower to replenish/reestablish 102%. |
| | |
| (k) | Level 3 securities fair value under procedures established by the Board of Trustees, represents 0.84% of net assets. The total value of these securities is $2,035,700. |
See accompanying notes which are an integral part of these financial statements.
| DUNHAM LONG/SHORT CREDIT FUND |
| SCHEDULE OF INVESTMENTS (Unaudited) (Continued) |
| April 30, 2022 |
| (l) | If the Fund is a seller of protection and if a credit event occurs, as defined under the terms of that particular swap agreement, the Fund will either (i) pay the buyer of protection an amount equal to the notional amount of the swap and take delivery of the referenced obligation or underlying securities comprising the referenced index or (ii) pay a net settlement amount in the form of cash or securities equal to the notional amount of the swap less the recovery value of the referenced obligation or underlying securities comprising of the referenced index. |
| | |
| (m) | The prices and resulting values for credit default swap agreements serve as indicators of the current status of the payment/performance risk and represent the likelihood of an expected liability (or profit) for the credit derivative should the notional amount of the swap agreement be closed/sold as of the period end. Increasing values, in absolute terms when compared to the notional amount of the swap, represent a deterioration of the underlying referenced instrument’s credit soundness and a greater likelihood or risk of default or other credit event occurring as defined under the terms of the agreement. |
| Portfolio Composition * - (Unaudited) |
| U.S. Government & Agencies | | | 45.1 | % |
| Corporate Bonds | | | 36.1 | % |
| Short-Term Investment | | | 11.6 | % |
| Preferred Stocks | | | 2.6 | % |
| Collateral for Securities Loaned | | | 2.4 | % |
| Term Loans | | | 2.2 | % |
| Common Stocks | | | 0.0 | % |
| Total | | | 100.0 | % |
| * | Based on total value of investments as of April 30, 2022. Does not include derivative holdings. |
| Percentage may differ from Schedule of Investments which are based on Fund net assets. |
See accompanying notes which are an integral part of these financial statements.
Dunham Monthly Distribution Fund (Unaudited)
Message from the Sub-Adviser (Grantham, Mayo, Van Otterloo & Co., LLC)
Asset Class Recap
The event-driven asset class continued to grapple with market volatility over the fiscal period, as the COVID outbreak persisted overseas, inflation reached levels not seen in 40 years, and hawkish comments from the Federal Reserve (the Fed) led to a significant sell-off in global equities. The 10-year U.S. Treasury yield rose to pre-pandemic levels as investors started pricing in an aggressive interest rate hiking cycle to curb inflation. Fed Chairman Jerome Powell announced the first interest rate increase since 2018, stating that the Fed would use its full array of tools to combat rising prices. While the rise in the 10-year U.S. Treasury yield drove equity markets lower, spreads on deals widened, leading to some attractive opportunities in the event-driven asset class. Rising interest rates have historically been a boon for the asset class, as the baseline for deal spreads typically rise in tandem with the risk-free rate. Volatility, as measured by the CBOE Volatility index, which measures the stock market’s expectation of volatility based on S&P index options, rose to 33.4 by the end of the fiscal period, further widening spreads on outstanding and newly announced deals. During the most recent fiscal period, the Barclays Merger Arbitrage U.S. Index edged 0.3 percent lower, while broad U.S. equities, as measured by the S&P 500 Index, decreased 9.6 percent and broad U.S. fixed income, as measured by the Bloomberg U.S. Aggregated Bond Index, lost 9.5 percent.
Allocation Review
The Sub-Adviser did not deviate from its investment strategy of investing in a relatively small amount of deals where it believes that the risk-reward profile is most attractive. The Sub-Adviser’s approach to risk focuses on the adverse effect of a particular deal breaking and then uses that to adjust the allocation to the deal within the Fund. This strategy is intended to help balance having a more concentrated allocation to merger deals with the adverse effect on the Fund for a single deal terminating and potentially reverting to pre-announcement valuations. In regard to cash-only merger deals and those that include acquirer stock, the Fund held approximately half of each. In greater sell-offs, the cash deals may represent a larger adverse effect to Fund performance, as there is not a short position in the acquirer that can offset the effect of the target company’s falling price. This is because the Sub-adviser primarily hedges the exposures in a deal by shorting shares of the acquiring company if its shares are part of the deal terms. The use of derivatives in the Sub-Adviser’s strategy is generally rare and generally employed in small amounts when there may be some aspect of a deal that shorting acquirer shares may not fully address. Therefore, the Fund did not have any derivatives exposure that had a meaningful impact on the Fund’s performance during the fiscal period.
Holdings Insights
One deal that contributed to performance over the fiscal period was the $34.1 billion stock-for-stock acquisition of Xilinx, Inc. (XLNX) (holding weight**: 2.44 percent) by Advanced Micro Devices, Inc. (AMD) (holding weight**: -2.42 percent). AMD announced in October 2020 that they would acquire XLNX in order to increase its breadth in key industries, such as data centers, 5G communications, and automotive markets. This deal has experienced a lot of volatility as antitrust concerns from Chinese regulatory authorities delayed the deal, which was initially expected to close on December 31, 2021. Significant progress was made on the regulatory concerns in January of 2022, leading to an eventual completion on February 15, 2022. Given the wide deal spread at the beginning of the fiscal period, the closing in February 2022 contributed meaningfully to performance. Over the fiscal period, XLNX gained 8.7 percent, while AMD lost 5.9 percent.
One deal that detracted from Fund performance over the fiscal period was the $3.6 billion failed cash acquisition of Aerojet Rocketdyne Holdings, Inc. (AJRD) (holding weight**: 0.11 percent) by Lockheed Martin Corp. (LMT) (holding weight: not held). The merger, which was announced in late 2020, fell through after the U.S. Federal Trade Commission (FTC) voted unanimously to sue to block the deal over antitrust concerns. Criticisms stemmed from the potential dominant position LMT would hold over solid fuel rocket motors, a vital piece of the U.S. missile industry. Over the fiscal period, LMT increased 32.0 percent, while AJRD lost 9.2 percent, leading to a significant widening in the deal spread.
The largest exposure to a merger at the end of the most recent fiscal period was the $6.1 billion cash and stock acquisition of Terminix Global Holdings, Inc. (TMX) (holding weight*: 4.39 percent) by Rentokil Initial Plc (RTO LN) (holding weight*: -3.51 percent). The deal, announced on December 14, 2021, would combine two of the larger pest control and hygiene companies in the U.S., forming what would be the largest pest control company in North America. On March 14, 2022, the pending merger cleared a necessary antitrust process, satisfying a primary condition for the completion of the deal. Over the fiscal period, TMX increased 13.4 percent, while RTO LN decreased 13.3 percent.
Sub-Adviser Outlook
While various headwinds pose a threat to the event driven asset class, the Sub-Adviser believes recent dislocations in the market could lead to merger arbitrage opportunities. Market volatility has spiked activism, with corporations looking to pursue potential divestitures and acquisitions. With valuations depressed and interest rates up, the landscape for the asset class could reward investors over the long term. Short-term volatility may persist, however, the Sub-Adviser believes the merger arbitrage environment still presents attractive opportunities. As always, the Sub-Adviser will continue its rigorous, bottom-up research process when selecting, monitoring, and potentially eliminating certain deals from the Fund.
| * | Holdings percentage(s) of total investments, cash and unsettled trades excluding collateral for securities loaned as of 4/30/2022. |
| ** | Holdings percentage(s) as of the date prior to the sale of the security. |
Growth of $100,000 Investment
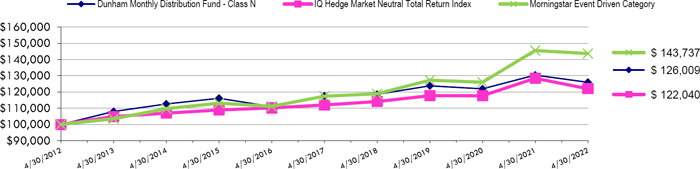
Total Returns (a) as of April 30, 2022
| | | | Annualized | Annualized |
| | Six Months | One Year | Five Years | Ten Years |
| Class N | (0.11)% | (3.39)% | 1.39% | 2.34% |
| Class A with load of 5.75% | (5.95)% | (9.19)% | (0.05)% | 1.48% |
| Class A without load | (0.22)% | (3.65)% | 1.14% | 2.08% |
| Class C | (0.59)% | (4.33)% | 0.38% | 1.32% |
| IQ Hedge Market Neutral Total Return Index | (4.66)% | (5.03)% | 1.73% | 2.01% |
| Morningstar Event Driven Category | (1.27)% | (1.27)% | 4.12% | 3.69% |
| (a) | Total Returns are calculated based on traded NAVs. |
IQ Hedge Market Neutral Total Return Index seeks to replicate the risk-adjusted return characteristics of the collective hedge funds using a market neutral hedge fund investment style. Market Neutral hedge funds typically invest in both long and short positions in asset classes while minimizing exposure to systematic risk. Investors cannot invest directly in an index or benchmark.
The Morningstar Event Driven Category is generally representative of mutual funds that primarily employ strategies that seek to profit from corporate actions, such as mergers and acquisitions. Mutual funds in this category typically focus on equity securities but can invest across the capital structure. However, they typically have low to moderate equity market sensitivity since company-specific developments tend to drive security prices.
| As disclosed in the Trust’s latest registration statement, the Fund’s total annual operating expenses before any fee waiver, including the cost of underlying funds, are 2.29% for Class N, 3.29% for Class C and 2.54% for Class A. Class A shares are subject to a sales load of 5.75% and a deferred sales charge of up to 0.75%. The performance data quoted here represents past performance, which is not indicative of future results. Current performance may be lower or higher than the performance data quoted. The investment return and NAV will fluctuate, so that an investor’s shares, when redeemed, may be worth more or less than their original cost. Total returns are calculated assuming reinvestment of all dividends and capital gains distributions, if any. The returns do not reflect the deductions of taxes a shareholder would pay on the redemption of Fund shares or Fund distributions. For performance information current to the most recent month-end, please call 1-800-442-4358 or visit our website www.dunham.com. |
| DUNHAM MONTHLY DISTRIBUTION FUND |
| SCHEDULE OF INVESTMENTS (Unaudited) |
| April 30, 2022 |
| Shares | | | | | Fair Value | |
| | | | | CLOSED END FUNDS — 5.6% | | | | |
| | | | | EQUITY - 5.6% | | | | |
| | 2,468,782 | | | Altaba, Inc.(i) | | $ | 14,072,057 | |
| | | | | | | | | |
| | | | | TOTAL CLOSED END FUNDS (Cost $22,837,384) | | | 14,072,057 | |
| | | | | | | | | |
| | | | | COMMON STOCKS — 79.9% | | | | |
| | | | | AEROSPACE & DEFENSE - 3.2% | | | | |
| | 20,343 | | | HEICO Corporation, Class A | | | 2,372,807 | |
| | 588,517 | | | Meggitt plc(a) | | | 5,734,951 | |
| | | | | | | | 8,107,758 | |
| | | | | ASSET MANAGEMENT - 4.6% | | | | |
| | 589,316 | | | Pershing Square Tontine Holdings Ltd.(a) | | | 11,721,495 | |
| | | | | | | | | |
| | | | | BANKING - 6.9% | | | | |
| | 8 | | | Citizens Financial Group, Inc. | | | 315 | |
| | 446,728 | | | First Horizon Corporation | | | 9,997,773 | |
| | 433,478 | | | Umpqua Holdings Corporation | | | 7,169,726 | |
| | | | | | | | 17,167,814 | |
| | | | | | | | | |
| | | | | CABLE & SATELLITE - 3.0% | | | | |
| | 251,432 | | | Shaw Communications, Inc., Class B | | | 7,488,023 | |
| | | | | | | | | |
| | | | | CHEMICALS - 2.6% | | | | |
| | 180,399 | | | Atotech Ltd.(a) | | | 3,842,499 | |
| | 9,579 | | | Rogers Corporation(a) | | | 2,593,227 | |
| | | | | | | | 6,435,726 | |
| | | | | COMMERCIAL SUPPORT SERVICES - 4.4% | | | | |
| | 239,028 | | | Terminix Global Holdings, Inc.(a),(b) | | | 10,968,995 | |
| | | | | | | | | |
| | | | | ENTERTAINMENT CONTENT - 10.4% | | | | |
| | 130,363 | | | Activision Blizzard, Inc. | | | 9,855,442 | |
| | 199,119 | | | Fox Corporation, Class B | | | 6,618,716 | |
| | 1,155,813 | | | Zynga, Inc., Class A(a) | | | 9,558,573 | |
| | | | | | | | 26,032,731 | |
| | | | | | | | | |
See accompanying notes which are an integral part of these financial statements.
| DUNHAM MONTHLY DISTRIBUTION FUND |
| SCHEDULE OF INVESTMENTS (Unaudited) (Continued) |
| April 30, 2022 |
| Shares | | | | | Fair Value | |
| | | | | COMMON STOCKS — 79.9% (Continued) | | | | |
| | | | | GAS & WATER UTILITIES - 4.1% | | | | |
| | 302,304 | | | South Jersey Industries, Inc.(b) | | $ | 10,335,774 | |
| | | | | | | | | |
| | | | | HEALTH CARE REIT - 5.1% | | | | |
| | 411,428 | | | Healthcare Trust of America, Inc., Class A | | | 12,532,097 | |
| | | | | | | | | |
| | | | | HOME CONSTRUCTION - 1.6% | | | | |
| | 164,492 | | | Cornerstone Building Brands, Inc.(a) | | | 4,011,960 | |
| | | | | | | | | |
| | | | | INSURANCE - 4.9% | | | | |
| | 6,158 | | | Alleghany Corporation(a) | | | 5,151,167 | |
| | 32,845 | | | Willis Towers Watson plc | | | 7,057,077 | |
| | | | | | | | 12,208,244 | |
| | | | | LEISURE FACILITIES & SERVICES - 1.1% | | | | |
| | 296,742 | | | Crown Resorts Ltd.(a) | | | 2,704,325 | |
| | | | | | | | | |
| | | | | PUBLISHING & BROADCASTING - 1.8% | | | | |
| | 202,976 | | | TEGNA, Inc. | | | 4,475,621 | |
| | | | | | | | | |
| | | | | RETAIL - DISCRETIONARY - 0.5% | | | | |
| | 124,253 | | | Sportsman’s Warehouse Holdings, Inc.(a),(b) | | | 1,194,071 | |
| | | | | | | | | |
| | | | | SEMICONDUCTORS - 6.9% | | | | |
| | 36,863 | | | CMC Materials, Inc. | | | 6,595,159 | |
| | 14,552 | | | Coherent, Inc.(a) | | | 3,898,481 | |
| | 11,331 | | | Siltronic A.G. | | | 1,071,916 | |
| | 123,445 | | | Tower Semiconductor Ltd.(a) | | | 5,962,394 | |
| | | | | | | | 17,527,950 | |
| | | | | SOFTWARE - 16.2% | | | | |
| | 1,366,119 | | | Avast plc | | | 9,688,056 | |
| | 69,970 | | | Cerner Corporation | | | 6,551,991 | |
| | 493,175 | | | Change Healthcare, Inc.(a) | | | 11,619,204 | |
| | | | | | | | | |
See accompanying notes which are an integral part of these financial statements.
| DUNHAM MONTHLY DISTRIBUTION FUND |
| SCHEDULE OF INVESTMENTS (Unaudited) (Continued) |
| April 30, 2022 |
| Shares | | | | | | | | | | Fair Value | |
| | | | | COMMON STOCKS — 79.9% (Continued) | | | | | | | | |
| | | | | SOFTWARE - 16.2% (Continued) | | | | | | | | |
| | 57,953 | | | Citrix Systems, Inc.(b) | | | | | | | | $ | 5,801,095 | |
| | 320,531 | | | Mandiant, Inc.(a) | | | | | | | | | 7,045,271 | |
| | | | | | | | | | | | | | 40,705,617 | |
| | | | | TECHNOLOGY SERVICES - 2.6% | | | | | | | | |
| | 240,273 | | | Nielsen Holdings plc | | | | | | | | | 6,441,719 | |
| | | | | | | | | | | | | | | |
| | | | | TELECOMMUNICATIONS - 0.0%(c) | | | | | | | | |
| | 205,893 | | | NII Holdings, Inc. 144A(a),(d),(i) | | | | | | | 61,768 | |
| | | | | | | | | | | | | | | |
| | | | | TRANSPORTATION & LOGISTICS - 0.0%(c) | | | | | | | | |
| | 1,025 | | | American Airlines Group, Inc.(a) | | | | | | | | | 19,239 | |
| | | | | | | | | | | | | | | |
| | | | | TOTAL COMMON STOCKS (Cost $206,560,935) | | | | | | | | | 200,140,927 | |
| | | | | | | | | | | | | | | |
| | | | | | | Expiration Date | | Exercise Price | | | | | |
| | | | | RIGHT — 0.0%(c) | | | | | | | | | | |
| | 51,066 | | | Zogenix, Inc. CVR | | 12/31/2023 | | $ | 2 | | | | 38,300 | |
| | | | | | | | | | | | | | | |
| | | | | TOTAL RIGHT (Cost $28,086) | | | | | | | | | 38,300 | |
| | | | | | | | | | | | | | | |
| | | | | COLLATERAL FOR SECURITIES LOANED — 5.0% | | | | | | | | |
| | 12,395,269 | | | Mount Vernon Liquid Assets Portfolio, LLC, 0.45% (Cost $12,395,269)(e),(h) | | | | 12,395,269 | |
| Contracts(f) | | | | | Broker/Counterparty | | Expiration Date | | Exercise Price | | | Notional Value | | | | |
| | | | | EQUITY OPTIONS PURCHASED - 0.0% (c) | | | | | | | | | | | | | | | | |
| | | | | PUT OPTIONS PURCHASED - 0.0%(c) | | | | | | | | | | | | | | | | |
| | 86 | | | Take-Two Interactive Software, Inc. | | USB | | 06/17/2022 | | $ | 120 | | | $ | 1,027,786 | | | | 69,660 | |
| | | | | TOTAL PUT OPTIONS PURCHASED (Cost - $25,413) | | | | | | |
| | | | | | | | | | | | | | | | | | | | | |
| | | | | TOTAL EQUITY OPTIONS PURCHASED (Cost - $25,413) | | | | | | 69,660 | |
| | | | | | | | | | | | | | | | | | | | | |
See accompanying notes which are an integral part of these financial statements.
| DUNHAM MONTHLY DISTRIBUTION FUND |
| SCHEDULE OF INVESTMENTS (Unaudited) (Continued) |
| April 30, 2022 |
| | | | | | Fair Value | |
| | | | | TOTAL INVESTMENTS - 90.5% (Cost $241,847,087) | | $ | 226,716,213 | |
| | | | | CALL OPTIONS WRITTEN – (0.0)%(g) (Proceeds - $269,947) | | | (60,325 | ) |
| | | | | OTHER ASSETS IN EXCESS OF LIABILITIES - 9.5% | | | 23,478,029 | |
| | | | | NET ASSETS - 100.0% | | $ | 250,133,917 | |
| Contracts(f) | | | | | Counterparty | | Expiration Date | | Exercise Price | | | Notional Value | | | Fair Value | |
| | | | | WRITTEN EQUITY OPTIONS – (0.0)% (g) | | | | | | | | | | | | | | | | |
| | | | | CALL OPTIONS WRITTEN – (0.0)%(g) | | | | | | | | | | | | | | | | |
| | 3,715 | | | Zynga, Inc. | | USB | | 05/20/2022 | | $ | 9 | | | $ | 3,072,305 | | | $ | 26,005 | |
| | 2,145 | | | Zynga, Inc. | | USB | | 06/17/2022 | | | 9 | | | | 1,773,915 | | | | 34,320 | |
| | | | | TOTAL CALL OPTIONS WRITTEN (Proceeds - $269,947) | | | | | 60,325 | |
| | | | | | | | | | | | | | | | | | | | | |
| | | | | TOTAL EQUITY OPTIONS WRITTEN (Proceeds - $269,947) | | | | $ | 60,325 | |
| LLC | - Limited Liability |
| | |
| LTD | - Limited |
| | |
| PLC | - Public Limited Company |
| | |
| REIT | - Real Estate Investment Trust |
| | |
| USB | - US Bank |
| (a) | Non-income producing security. |
| | |
| (b) | All or a portion of these securities are on loan. Total loaned securities had a value of $12,028,895 at April 30, 2022. |
| | |
| (c) | Percentage rounds to less than 0.1%. |
| | |
| (d) | Security exempt from registration under Rule 144A or Section 4(2) of the Securities Act of 1933. The security may be resold in transactions exempt from registration, normally to qualified institutional buyers. As of April 30, 2022 the total market value of 144A securities is 61,768 or 0.0% of net assets. |
| | |
| (e) | Rate disclosed is the seven day effective yield as of April 30, 2022. |
| | |
| (f) | Each option contract allows the holder of the option to purchase or sell 100 shares of the underlying security. |
| | |
| (g) | Percentage rounds to greater than (0.1%). |
| | |
| (h) | The Trust’s securities lending policies and procedures require that the borrower: (i) deliver cash or U.S. Government securities as collateral with respect to each new loan of U.S. securities, equal to at least 102% of the value of the portfolio securities loaned, and (ii) at all times thereafter mark-to-market the collateral on a daily basis so that the market value of such collateral is at least 100% of the value of securities loaned. From time to time the collateral may not be 102% due to end of day market movement. The next business day additional collateral is obtained/received from the borrower to replenish/reestablish 102%. |
| | |
| (i) | Level 3 securities fair value under procedures established by the Board of Trustees, represents 5.7% of net assets. The total value of these securities is $14,133,825. |
See accompanying notes which are an integral part of these financial statements.
| DUNHAM MONTHLY DISTRIBUTION FUND |
| SCHEDULE OF INVESTMENTS (Unaudited) (Continued) |
| April 30, 2022 |
| Shares | | | | | Fair Value | |
| | | | | COMMON STOCKS — (20.0)% | | | | |
| | | | | AEROSPACE & DEFENSE - (0.9)% | | | | |
| | (16,677 | ) | | HEICO Corporation | | $ | (2,355,293 | ) |
| | | | | | | | | |
| | | | | BANKING - (2.9)% | | | | |
| | (258,268 | ) | | Columbia Banking System, Inc. | | | (7,252,165 | ) |
| | (3 | ) | | M&T Bank Corporation | | | (500 | ) |
| | | | | | | | (7,252,665 | ) |
| | | | | COMMERCIAL SUPPORT SERVICES - (3.5)% | | | | |
| | (1,270,214 | ) | | Rentokil Initial plc | | | (8,784,329 | ) |
| | | | | | | | | |
| | | | | ENTERTAINMENT CONTENT - (3.4)% | | | | |
| | (183,262 | ) | | Fox Corporation, Class A | | | (6,568,110 | ) |
| | (16,704 | ) | | Take-Two Interactive Software, Inc. | | | (1,996,295 | ) |
| | | | | | | | (8,564,405 | ) |
| | | | | HEALTH CARE REIT - (4.5)% | | | | |
| | (411,428 | ) | | Healthcare Realty Trust, Inc. | | | (11,141,470 | ) |
| | | | | | | | | |
| | | | | INSTITUTIONAL FINANCIAL SERVICES - 0.0% (a) | | | | |
| | (1 | ) | | Goldman Sachs Group, Inc. (The) | | | (305 | ) |
| | | | | | | | | |
| | | | | INSURANCE - (3.1)% | | | | |
| | (26,764 | ) | | Aon plc, CLASS A | | | (7,707,765 | ) |
| | | | | | | | | |
| | | | | SEMICONDUCTORS - (1.3)% | | | | |
| | (16,612 | ) | | Entegris, Inc. | | | (1,850,411 | ) |
| | (13,252 | ) | | II-VI, Inc. | | | (811,155 | ) |
| | (7,553 | ) | | MKS Instruments, Inc. | | | (860,891 | ) |
| | | | | | | | (3,522,457 | ) |
| | | | | SOFTWARE - (0.4)% | | | | |
| | (41,338 | ) | | NortonLifeLock, Inc. | | | (1,035,103 | ) |
| | | | | | | | | |
| | | | | TOTAL SECURITIES SOLD SHORT - (Proceeds - $52,267,224) | | $ | (50,363,792 | ) |
| | | | | | | | | |
See accompanying notes which are an integral part of these financial statements.
| DUNHAM MONTHLY DISTRIBUTION FUND |
| SCHEDULE OF INVESTMENTS (Unaudited) (Continued) |
| April 30, 2022 |
| | | | | | | | | | | | | Unrealized | |
| Foreign Currency | | Settlement Date | | Counterparty | | Local Currency | | | U.S. Dollar Value | | | Appreciation/(Depreciation) | |
| To Buy: | | | | | | | | | | | | | | | | |
| British Pound | | 06/21/2022 | | US Bank | | | 2,061,592 | | | $ | 2,592,458 | | | $ | 6,644 | |
| Euro | | 06/21/2022 | | US Bank | | | 1,061,835 | | | | 1,122,562 | | | | (30,281 | ) |
| | | | | | | | | | | $ | 3,715,020 | | | $ | (23,637 | ) |
| | | | | | | | | | | | | | | | | |
| To Sell: | | | | | | | | | | | | | | | | |
| British Pound | | 05/03/2022 | | US Bank | | | 144,148 | | | $ | 181,250 | | | $ | (1,860 | ) |
| British Pound | | 05/04/2022 | | US Bank | | | 424,604 | | | | 533,892 | | | | (432 | ) |
| Canadian Dollar | | 05/11/2022 | | US Bank | | | 10,182,999 | | | | 7,926,355 | | | | 157,061 | |
| Australian Dollar | | 06/21/2022 | | US Bank | | | 7,156,740 | | | | 5,060,468 | | | | 273,107 | |
| British Pound | | 06/21/2022 | | US Bank | | | 6,769,728 | | | | 8,512,951 | | | | 342,139 | |
| Euro | | 06/21/2022 | | US Bank | | | 4,073,254 | | | | 4,306,203 | | | | 113,382 | |
| | | | | | | | | | | $ | 26,521,119 | | | $ | 883,397 | |
| | | | | | | | | | | | | | | | | |
| Total | | | | | | | | | | | | | | $ | 859,760 | |
| Portfolio Composition * - (Unaudited) |
| Technology | | | 28.5 | % | | Collateral for Securities Loaned | | | 5.5 | % |
| Financials | | | 18.1 | % | | Utilities | | | 4.6 | % |
| Communications | | | 16.8 | % | | Consumer Discretionary | | | 3.5 | % |
| Industrials | | | 8.4 | % | | Materials | | | 2.9 | % |
| Closed-End Fund | | | 6.2 | % | | Right | | | 0.0 | % |
| Real Estate | | | 5.5 | % | | Total | | | 100.0 | % |
| * | Based on total value of investments as of April 30, 2022. Does not include derivative holdings. |
| Percentage may differ from Schedule of Investments which are based on Fund net assets. |
See accompanying notes which are an integral part of these financial statements.
Dunham Real Estate Stock Fund (Unaudited)
Message from the Sub-Adviser (American Assets Capital Advisers, LLC)
Asset Class Recap
Real estate stocks began the fiscal year on a strong note as robust economic data offset concerns regarding high inflation and wariness on the transition to tighter monetary policy. However, real estate stocks sold off in January as the Omicron variant of the pandemic persisted, and the Federal Reserve indicated its readiness to raise interest rates and reduce the balance sheet. In the most recent fiscal quarter, real estate stocks declined alongside nearly all asset classes as political tension in eastern Europe spiked, and the Federal Reserve raised the Fed Funds rate for the first time since 2018 in March. Additionally, the Federal Reserve laid out plans to increase rates at every Federal Reserve meeting in 2022. Real estate stocks continued to fall in April as economic data showed signs of weakening, and inflationary pressures prompted the Federal Reserve into an even more aggressive path of interest rate hikes to cap off the most recent fiscal quarter. Over the first six months of the fiscal year, real estate stocks, as measured by the Dow Jones U.S. Real Estate Total Return Index, declined 4.0 percent, outperforming the broad U.S. stock market, as measured by the S&P 500 Index, which ended the quarter down 9.7 percent. Meanwhile, the yield on the 10-year U.S. Treasury yield jumped 116 basis points in the most recent fiscal quarter and 138 basis points since the start of the fiscal year, to end the fiscal year at 2.93 percent
Allocation Review
The Sub-Adviser is very selective in its approach to real estate stocks, focusing on what it perceives to be real estate companies that have pricing power over their tenants. The Sub-Adviser seeks to identify stocks with oligopolistic traits that may be inherent in the type of real estate it owns or that are unique to its business structure. One of the largest examples of this in the Fund is the exposure to real estate stocks in the telecommunications industry, primarily related to cell towers. The Sub-Adviser generally avoids stocks of companies with little pricing power, such as retail real estate stocks. In areas such as office or residential real estate stocks, the Sub-Adviser generally seeks individual stocks that it believes exhibit qualities that may allow it to better retain tenants and have more control over pricing than its industry peers.
Holdings Insights
The Fund’s exposure to industrial and infrastructure sectors provided some of the strongest contributors to positive Fund performance over the fiscal period. Industrial REITs, such as Prologis, Inc. (PLD) (holding weight*: 4.78 percent), a global logistics leader that focuses on business-to-business and retail/online fulfillment, continued to thrive over the fiscal period as the stock rose 11.6 percent. The Sub-Adviser believes that the need for resilience in the supply chain will continue to drive record demand for the company despite ongoing market volatility. Another position within the industrial sector that positively contributed to Fund performance was Rexford Industrial Realty, Inc. (REXR) (holding weight*: 4.38 percent), a company that engages in owning, operating, and acquiring industrial properties. REXR rose 17.0 percent over the fiscal period as the company announced successful acquisitions of multiple high-quality properties that the Sub-Adviser believes would help drive revenue growth. Positions within the infrastructure sector also positively contributed to Fund over the fiscal period, with particular strength coming from companies that provide infrastructure to wireless carriers. Crown Castle International Corporation (CCI) (holding weight*: 4.81 percent), the nation’s largest provider of infrastructure for wireless carriers, and SBA Communications Corporation (SBAC) (holding weight*: 2.01 percent), a multinational provider of a various infrastructure needs to wireless service providers, positively contributed to Fund performance by increasing 4.4 percent and 0.9 percent, respectively.
The largest detractor from Fund performance over the fiscal period was the exposure to Chinese data centers. These positions fell as the country’s “COVID-zero” policy took a heavy toll on economic growth. According to estimates, 46 cities were in full or partial lockdown during the fiscal period, affecting more than 343 million people, accounting for approximately 35 percent of the country’s economic output. Within the Fund, positions included GDS Holdings Ltd. (GDS) (Holding weight*: 1.10 percent) and Vnet Group, Inc. (VNET) (holding weight*: 1.12 percent). These Chinese data centers declined 47.1 percent and 61.9 percent, respectively. The Fund was also adversely impacted by the exposure to casino properties. Caesars Entertainment, Inc. (CZR) (holding weight*: 3.13 percent), a domestic manager of casinos and resorts, and MGM Resorts International (MGM) (holding weight*: 3.12 percent), an international manager of casinos and resorts, both detracted from Fund performance as CZR declined 39.5 percent and MGM gave back 13.0 percent. During the fiscal period, these positions were under pressure as the sector experienced multiple headwinds. Investors may have been concerned that inflationary pressures could weigh on consumers’ capacity for discretionary spending. Additionally, U.S. listed companies exposed to Macau, the world’s largest gaming region, faced additional pressure amid surging Covid cases in Guangdong, China, and Hong Kong.
Sub-Adviser Outlook
The Sub-Adviser believes that real estate performs better over time when it is more difficult to supply, the demand is less cyclical, and tenants are reluctant to leave. Therefore, the Fund generally has higher weightings in real estate sectors that share these four characteristics: oligopoly or duopoly sector structure; high barriers to entry for new owners/developers; high barriers to exit for tenants; and secular demand drivers underlying the user side of the business. The Sub-Adviser is confident that it will continue to find combinations of these four characteristics (or some subset), which creates a competitive landscape where tenants have fewer options to move or play one building owner against another. The Sub-Adviser believes that over the long-term, the properties with these characteristics can command higher occupancy rates and better rents.
| * | Holdings percentage(s) of total investments, cash and unsettled trades excluding collateral for securities loaned, as of 4/30/2022. |
Growth of $100,000 Investment
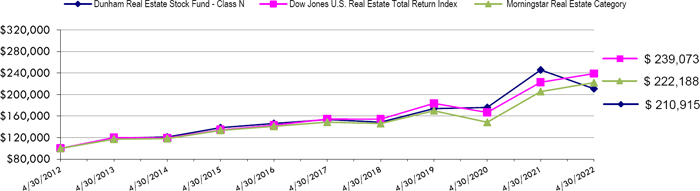
Total Returns (a) as of April 30, 2022
| | | | Annualized | Annualized |
| | Six Months | One Year | Five Years | Ten Years |
| Class N | (17.09)% | (14.20)% | 6.55% | 7.75% |
| Class A with load of 5.75% | (21.94)% | (19.32)% | 5.04% | 6.84% |
| Class A without load | (17.18)% | (14.39)% | 6.29% | 7.47% |
| Class C | (17.51)% | (15.06)% | 5.48% | 6.67% |
| Dow Jones U.S. Real Estate Total Return Index | (3.96)% | 7.22% | 9.11% | 9.10% |
| Morningstar Real Estate Category | (2.90)% | 8.06% | 8.36% | 8.31% |
| (a) | Total Returns are calculated based on traded NAVs. |
The Dow Jones U.S. Real Estate Total Return Index is designed to track the performance of real estate investment trusts (REITs) and other companies that invest directly or indirectly in real estate through development, management, or ownership, including property agencies. Investors cannot invest directly in an index or benchmark.
The Morningstar Real Estate Category is generally representative of mutual funds that primarily invest in REITs of various types. REITs are companies that develop and manage real estate properties.
| As disclosed in the Trust’s latest registration statement, the Fund’s total annual operating expenses, including the cost of underlying funds, are 1.37% for Class N, 2.37% for Class C and 1.62% for Class A. Class A shares are subject to a sales load of 5.75% and a deferred sales charge of up to 0.75% The performance data quoted here represents past performance, which is not indicative of future results. Current performance may be lower or higher than the performance data quoted. The investment return and NAV will fluctuate, so that an investor’s shares, when redeemed, may be worth more or less than their original cost. Total returns are calculated assuming reinvestment of all dividends and capital gains distributions, if any. The returns do not reflect the deductions of taxes a shareholder would pay on the redemption of Fund shares or Fund distributions. For performance information current to the most recent month-end, please call 1-800-442-4358 or visit our website www.dunham.com |
| DUNHAM REAL ESTATE STOCK FUND |
| SCHEDULE OF INVESTMENTS (Unaudited) |
| April 30, 2022 |
| Shares | | | | | Fair Value | |
| | | | | COMMON STOCKS — 99.4% | | | | |
| | | | | DATA CENTER REIT - 3.8% | | | | |
| | 4,981 | | | Equinix, Inc.(a) | | $ | 3,581,737 | |
| | | | | | | | | |
| | | | | HEALTH CARE REIT - 1.0% | | | | |
| | 28,146 | | | Healthpeak Properties, Inc.(a) | | | 923,470 | |
| | | | | | | | | |
| | | | | INDUSTRIAL REIT - 14.6% | | | | |
| | 11,599 | | | Duke Realty Corporation | | | 635,045 | |
| | 17,982 | | | Innovative Industrial Properties, Inc.(a) | | | 2,600,017 | |
| | 28,228 | | | Prologis, Inc. | | | 4,524,666 | |
| | 53,163 | | | Rexford Industrial Realty, Inc. | | | 4,148,841 | |
| | 26,215 | | | Terreno Realty Corporation | | | 1,907,141 | |
| | | | | | | | 13,815,710 | |
| | | | | INFRASTRUCTURE REIT - 10.7% | | | | |
| | 15,334 | | | American Tower Corporation, A | | | 3,695,801 | |
| | 24,589 | | | Crown Castle International Corporation | | | 4,554,129 | |
| | 5,498 | | | SBA Communications Corporation | | | 1,908,411 | |
| | | | | | | | 10,158,341 | |
| | | | | INTERNET MEDIA & SERVICES - 2.3% | | | | |
| | 14,451 | | | Airbnb, Inc., CLASS A(b) | | | 2,214,038 | |
| | | | | | | | | |
| | | | | LEISURE FACILITIES & SERVICES - 8.4% | | | | |
| | 44,721 | | | Caesars Entertainment, Inc.(b) | | | 2,964,108 | |
| | 1,640,419 | | | Drive Shack, Inc.(b) | | | 2,017,715 | |
| | 71,937 | | | MGM Resorts International | | | 2,952,294 | |
| | | | | | | | 7,934,117 | |
| | | | | MULTI ASSET CLASS REIT - 5.8% | | | | |
| | 777,019 | | | DigitalBridge Group, Inc.(b) | | | 5,408,052 | |
| | | | | | | | | |
| | | | | OFFICE REIT - 4.3% | | | | |
| | 20,000 | | | Alexandria Real Estate Equities, Inc.(a) | | | 3,643,200 | |
| | 6,622 | | | Kilroy Realty Corporation(a) | | | 463,540 | |
| | | | | | | | 4,106,740 | |
| | | | | | | | | |
See accompanying notes which are an integral part of these financial statements.
| DUNHAM REAL ESTATE STOCK FUND |
| SCHEDULE OF INVESTMENTS (Unaudited) (Continued) |
| April 30, 2022 |
| Shares | | | | | Fair Value | |
| | | | | COMMON STOCKS — 99.4% (Continued) | | | | |
| | | | | REAL ESTATE OWNERS & DEVELOPERS - 4.4% | | | | |
| | 589,394 | | | WeWork, Inc.(a),(b) | | $ | 4,131,652 | |
| | | | | | | | | |
| | | | | RESIDENTIAL REIT - 19.8% | | | | |
| | 69,203 | | | American Homes 4 Rent, Class A | | | 2,741,131 | |
| | 8,524 | | | AvalonBay Communities, Inc. | | | 1,939,040 | |
| | 16,825 | | | Camden Property Trust | | | 2,639,674 | |
| | 31,629 | | | Equity LifeStyle Properties, Inc. | | | 2,444,289 | |
| | 2,964 | | | Essex Property Trust, Inc. | | | 975,956 | |
| | 94,071 | | | Invitation Homes, Inc.(a) | | | 3,745,907 | |
| | 8,891 | | | Mid-America Apartment Communities, Inc. | | | 1,748,682 | |
| | 15,288 | | | Sun Communities, Inc.(a) | | | 2,684,114 | |
| | | | | | | | 18,918,793 | |
| | | | | SELF-STORAGE REIT - 9.1% | | | | |
| | 17,993 | | | Extra Space Storage, Inc. | | | 3,418,670 | |
| | 19,344 | | | Life Storage, Inc. | | | 2,562,887 | |
| | 47,221 | | | National Storage Affiliates Trust | | | 2,672,709 | |
| | | | | | | | 8,654,266 | |
| | | | | SPECIALTY FINANCE - 3.9% | | | | |
| | 173,971 | | | Fortress Transportation and Infrastructure Investors, LLC | | | 3,738,637 | |
| | | | | | | | | |
| | | | | SPECIALTY REITS - 2.6% | | | | |
| | 111,922 | | | NewLake Capital Partners, Inc. | | | 2,462,284 | |
| | | | | | | | | |
| | | | | TELECOMMUNICATIONS - 8.7% | | | | |
| | 264,575 | | | Chindata Group Holdings Ltd. - ADR(a),(b) | | | 1,650,949 | |
| | 33,058 | | | GDS Holdings Ltd. - ADR(a),(b) | | | 1,038,682 | |
| | 152,814 | | | Switch, Inc., Class A | | | 4,563,026 | |
| | 177,192 | | | Vnet Group, Inc. - ADR(a),(b) | | | 1,057,836 | |
| | | | | | | | 8,310,493 | |
| | | | | | | | | |
| | | | | TOTAL COMMON STOCKS (Cost $82,101,309) | | | 94,358,330 | |
| | | | | | | | | |
See accompanying notes which are an integral part of these financial statements.
| DUNHAM REAL ESTATE STOCK FUND |
| SCHEDULE OF INVESTMENTS (Unaudited) (Continued) |
| April 30, 2022 |
| Shares | | | | | Fair Value | |
| | | | | | | |
| | | | | COLLATERAL FOR SECURITIES LOANED — 18.8% | | | | |
| | 17,803,436 | | | Mount Vernon Liquid Assets Portfolio, LLC, 0.45% (Cost $17,803,436)(c),(d) | | $ | 17,803,436 | |
| | | | | | | | | |
| | | | | TOTAL INVESTMENTS - 118.2% (Cost $99,904,745) | | $ | 112,161,766 | |
| | | | | LIABILITIES IN EXCESS OF OTHER ASSETS - (18.2)% | | | (17,237,388 | ) |
| | | | | NET ASSETS - 100.0% | | $ | 94,924,378 | |
| ADR | - American Depositary Receipt |
| | |
| LLC | - Limited Liability Company |
| | |
| LTD | - Limited Company |
| | |
| REIT | - Real Estate Investment Trust |
| (a) | Non-income producing security. |
| | |
| (b) | All or a portion of these securities are on loan. Total loaned securities had a value of $16,852,200 at April 30, 2022. |
| | |
| (c) | Rate disclosed is the seven day effective yield as of April 30, 2022. |
| | |
| (d) | The Trust’s securities lending policies and procedures require that the borrower: (i) deliver cash or U.S. Government securities as collateral with respect to each new loan of U.S. securities, equal to at least 102% of the value of the portfolio securities loaned, and (ii) at all times thereafter mark-to-market the collateral on a daily basis so that the market value of such collateral is at least 100% of the value of securities loaned. From time to time the collateral may not be 102% due to end of day market movement. The next business day additional collateral is obtained/received from the borrower to replenish/reestablish 102%. |
| Portfolio Composition * - (Unaudited) |
| Real Estate | | | 64.3 | % | | Consumer Discretionary | | | 7.1 | % |
| Collateral for Securities Loaned | | | 15.9 | % | | Financials | | | 3.3 | % |
| Communications | | | 9.4 | % | | Total | | | 100.0 | % |
| * | Based on total value of investments as of April 30, 2022. Does not include derivative holdings. |
| Percentage may differ from Schedule of Investments which are based on Fund net assets. |
See accompanying notes which are an integral part of these financial statements.
| STATEMENTS OF ASSETS AND LIABILITIES (Unaudited) |
| April 30, 2022 |
| | | Dunham | | | | | | | | | Dunham | | | | | | | | | Dunham | |
| | | Corporate / | | | Dunham | | | Dunham | | | International | | | Dunham | | | Dunham | | | Focused | |
| | | Government | | | Floating Rate | | | High-Yield | | | Opportunity | | | Large Cap | | | Small Cap | | | Large Cap | |
| | | Bond Fund | | | Bond Fund | | | Bond Fund | | | Bond Fund | | | Value Fund | | | Value Fund | | | Growth Fund | |
| Assets: | | | | | | | | | | | | | | | | | | | | | | | | | | | | |
| Investments in securities, at cost | | $ | 77,439,840 | | | $ | 212,919,300 | | | $ | 124,594,059 | | | $ | 62,395,681 | | | $ | 123,983,230 | | | $ | 89,066,457 | | | $ | 145,957,930 | |
| Investments in securities, at value | | $ | 71,328,361 | | | $ | 208,295,441 | | | $ | 116,192,323 | | | $ | 53,797,961 | | | $ | 165,522,946 | | | $ | 97,178,834 | | | $ | 199,018,026 | |
| Cash | | | 437 | | | | 1,751,384 | | | | 1,469,425 | | | | 1,831,536 | | | | 3,790,970 | | | | 509,985 | | | | 3,454,776 | |
| Foreign currency, at value (cost $723,874) | | | — | | | | — | | | | — | | | | 728,465 | | | | — | | | | — | | | | — | |
| Deposits with brokers (a) | | | — | | | | — | | | | — | | | | 404,261 | | | | — | | | | — | | | | — | |
| Unrealized appreciation on forward foreign currency exchange contracts | | | — | | | | — | | | | — | | | | 538,845 | | | | — | | | | — | | | | — | |
| Unrealized appreciation on futures | | | — | | | | — | | | | — | | | | 114,209 | | | | — | | | | — | | | | — | |
| Receivable for securities sold | | | 2,008,155 | | | | 7,257,129 | | | | 54,875 | | | | 613,438 | | | | — | | | | — | | | | — | |
| Interest and dividends receivable | | | 426,951 | | | | 1,133,366 | | | | 1,575,243 | | | | 795,336 | | | | 165,858 | | | | 42,296 | | | | 18,675 | |
| Receivable for Fund shares sold | | | 4,554 | | | | 521,232 | | | | 46,192 | | | | 207,157 | | | | 222,938 | | | | 105,291 | | | | 315,912 | |
| Prepaid expenses and other assets | | | 35,559 | | | | 40,957 | | | | 34,883 | | | | 34,862 | | | | 51,428 | | | | 87,544 | | | | 49,987 | |
| Total Assets | | | 73,804,017 | | | | 218,999,509 | | | | 119,372,941 | | | | 59,066,070 | | | | 169,754,140 | | | | 97,923,950 | | | | 202,857,376 | |
| | | | | | | | | | | | | | | | | | | | | | | | | | | | | |
| Liabilities: | | | | | | | | | | | | | | | | | | | | | | | | | | | | |
| Payable for securities purchased | | | 271,446 | | | | 8,210,365 | | | | 404,800 | | | | 8,302 | | | | 306,647 | | | | — | | | | — | |
| Payable for Fund shares redeemed | | | 630,543 | | | | 14,089 | | | | 66,634 | | | | 31,490 | | | | 3,958 | | | | 1,925 | | | | 163,578 | |
| Payable to broker | | | — | | | | — | | | | — | | | | 1,120,000 | | | | — | | | | — | | | | — | |
| Distributions payable | | | 928 | | | | 5,627 | | | | 4,422 | | | | 166,605 | | | | — | | | | — | | | | — | |
| Payable upon return of securities loaned (Market value of securities on loan $1,666,708, $5,020,253, $12,254,114, $1,872,590, $18,023,491, $22,713,135, and $32,918,729 respectively) | | | 1,712,005 | | | | 5,170,455 | | | | 12,614,458 | | | | 1,931,628 | | | | 18,818,689 | | | | 23,983,526 | | | | 35,031,728 | |
| Unrealized depreciation on forward foreign currency exchange contracts | | | — | | | | — | | | | — | | | | 71,970 | | | | — | | | | — | | | | — | |
| Unrealized depreciation on futures | | | — | | | | — | | | | — | | | | 308,970 | | | | — | | | | — | | | | — | |
| Payable to adviser | | | 30,260 | | | | 121,146 | | | | 54,106 | | | | 28,347 | | | | 84,419 | | | | 41,082 | | | | 98,695 | |
| Payable to sub-adviser | | | 29,431 | | | | 52,685 | | | | 24,287 | | | | 7,490 | | | | 69,751 | | | | 52,582 | | | | 27,772 | |
| Payable for distribution fees | | | 9,426 | | | | 17,845 | | | | 24,808 | | | | 2,574 | | | | 24,125 | | | | 11,220 | | | | 54,621 | |
| Payable for administration fees | | | 22,841 | | | | 21,847 | | | | 22,637 | | | | 16,266 | | | | 4,475 | | | | 18,098 | | | | 9,387 | |
| Payable for fund accounting fees | | | 111 | | | | 2,236 | | | | — | | | | 3,753 | | | | 1,500 | | | | 43 | | | | 416 | |
| Payable for transfer agent fees | | | 5,965 | | | | 1,174 | | | | — | | | | 1,427 | | | | 4,675 | | | | 7,299 | | | | 4,408 | |
| Payable for custody fees | | | 2,094 | | | | 4,635 | | | | 4,378 | | | | 17,916 | | | | 2,136 | | | | 7,245 | | | | 806 | |
| Payable for third party administrative servicing fees | | | 578 | | | | — | | | | 511 | | | | 841 | | | | 800 | | | | 4,640 | | | | 4,622 | |
| Payable for line of credit | | | 148,000 | | | | — | | | | — | | | | — | | | | — | | | | — | | | | — | |
| Accrued expenses and other liabilities | | | 5,182 | | | | — | | | | 10,540 | | | | 5,052 | | | | 9,434 | | | | 10,267 | | | | 13,028 | |
| Total Liabilities | | | 2,868,810 | | | | 13,622,104 | | | | 13,231,581 | | | | 3,722,631 | | | | 19,330,609 | | | | 24,137,927 | | | | 35,409,061 | |
| | | | | | | | | | | | | | | | | | | | | | | | | | | | | |
| Net Assets | | $ | 70,935,207 | | | $ | 205,377,405 | | | $ | 106,141,360 | | | $ | 55,343,439 | | | $ | 150,423,531 | | | $ | 73,786,023 | | | $ | 167,448,315 | |
| | | | | | | | | | | | | | | | | | | | | | | | | | | | | |
| Net Assets: | | | | | | | | | | | | | | | | | | | | | | | | | | | | |
| Paid in capital | | $ | 78,747,559 | | | $ | 224,119,734 | | | $ | 120,232,726 | | | $ | 64,262,521 | | | $ | 107,448,742 | | | $ | 62,589,246 | | | $ | 114,721,459 | |
| Accumulated earnings (loss) | | | (7,812,352 | ) | | | (18,742,329 | ) | | | (14,091,366 | ) | | | (8,919,082 | ) | | | 42,974,789 | | | | 11,196,777 | | | | 52,726,856 | |
| Net Assets | | $ | 70,935,207 | | | $ | 205,377,405 | | | $ | 106,141,360 | | | $ | 55,343,439 | | | $ | 150,423,531 | | | $ | 73,786,023 | | | $ | 167,448,315 | |
| | | | | | | | | | | | | | | | | | | | | | | | | | | | | |
| Net Asset Value Per Share | | | | | | | | | | | | | | | | | | | | | | | | | | | | |
| Class N Shares: | | | | | | | | | | | | | | | | | | | | | | | | | | | | |
| Net Assets | | $ | 60,868,722 | | | $ | 175,752,822 | | | $ | 89,169,431 | | | $ | 47,228,463 | | | $ | 122,596,617 | | | $ | 61,841,844 | | | $ | 133,538,727 | |
| Shares of beneficial interest outstanding (no par value; unlimited shares authorized) | | | 4,620,013 | | | | 19,616,738 | | | | 10,461,891 | | | | 5,858,273 | | | | 7,030,567 | | | | 3,943,600 | | | | 4,743,545 | |
| Net asset value, offering and redemption price per share | | $ | 13.18 | | | $ | 8.96 | | | $ | 8.52 | | | $ | 8.06 | | | $ | 17.44 | | | $ | 15.68 | | | $ | 28.15 | |
| | | | | | | | | | | | | | | | | | | | | | | | | | | | | |
| Class A Shares: | | | | | | | | | | | | | | | | | | | | | | | | | | | | |
| Net Assets | | $ | 7,188,740 | | | $ | 22,904,164 | | | $ | 12,683,780 | | | $ | 7,004,363 | | | $ | 23,502,933 | | | $ | 9,379,341 | | | $ | 25,062,836 | |
| Shares of beneficial interest outstanding (no par value; unlimited shares authorized) | | | 546,296 | | | | 2,559,561 | | | | 1,471,590 | | | | 877,842 | | | | 1,355,914 | | | | 609,529 | | | | 918,988 | |
| Net asset value and redemption price per share * | | $ | 13.16 | | | $ | 8.95 | | | $ | 8.62 | | | $ | 7.98 | | | $ | 17.33 | | | $ | 15.39 | | | $ | 27.27 | |
| Front-end sales charge factor | | | 0.9550 | | | | 0.9550 | | | | 0.9550 | | | | 0.9550 | | | | 0.9425 | | | | 0.9425 | | | | 0.9425 | |
| Offering price per share (Net asset value per share / front-end sales charge factor) | | $ | 13.78 | | | $ | 9.37 | | | $ | 9.03 | | | $ | 8.36 | | | $ | 18.39 | | | $ | 16.33 | | | $ | 28.93 | |
| | | | | | | | | | | | | | | | | | | | | | | | | | | | | |
| Class C Shares: | | | | | | | | | | | | | | | | | | | | | | | | | | | | |
| Net Assets | | $ | 2,877,745 | | | $ | 6,720,419 | | | $ | 4,288,149 | | | $ | 1,110,613 | | | $ | 4,323,981 | | | $ | 2,564,838 | | | $ | 8,846,752 | |
| Shares of beneficial interest outstanding (no par value; unlimited shares authorized) | | | 220,356 | | | | 750,506 | | | | 505,869 | | | | 143,043 | | | | 264,830 | | | | 198,500 | | | | 356,377 | |
| Net asset value, offering and redemption price per share | | $ | 13.06 | | | $ | 8.95 | | | $ | 8.48 | | | $ | 7.76 | | | $ | 16.33 | | | $ | 12.92 | | | $ | 24.82 | |
| * | For certain purchases of $1 million or more, a 0.75% contingent deferred sales charge may apply to redemptions made within eighteen months of purchase. |
| (a) | See Section 2.k. in the notes for the breakout by counterparty. |
See accompanying notes which are an integral part to these financial statements.
| STATEMENTS OF ASSETS AND LIABILITIES (Unaudited) (Continued) |
| April 30, 2022 |
| | | | | | Dunham | | | | | | | | | | | | Dunham | | | | |
| | | Dunham | | | Emerging | | | Dunham | | | Dunham | | | Dunham | | | Monthly | | | Dunham | |
| | | Small Cap | | | Markets | | | International | | | Dynamic Macro | | | Long/Short | | | Distribution | | | Real Estate | |
| | | Growth Fund | | | Stock Fund | | | Stock Fund | | | Fund | | | Credit Fund | | | Fund | | | Stock Fund | |
| Assets: | | | | | | | | | | | | | | | | | | | | | | | | | | | | |
| Investments in securities, at cost | | $ | 96,741,118 | | | $ | 122,008,390 | | | $ | 179,236,285 | | | $ | 25,007,166 | | | $ | 258,317,316 | | | $ | 241,847,087 | | | $ | 99,904,745 | |
| Investments in securities, at value | | $ | 89,489,508 | | | $ | 119,194,048 | | | $ | 176,063,288 | | | $ | 27,808,475 | | | $ | 251,317,185 | | | $ | 226,716,213 | | | $ | 112,161,766 | |
| Cash | | | 2,766,347 | | | | 5,088,034 | | | | 807 | | | | 1,048,633 | | | | 8,274,728 | | | | 72,568,752 | | | | 390,900 | |
| Foreign currency, at value (cost $0, $0, $536,954, $831, $28,826, $36,113 and $0 respectively) | | | — | | | | — | | | | 502,665 | | | | 734 | | | | 26,722 | | | | 34,009 | | | | — | |
| Deposits with brokers (a) | | | — | | | | — | | | | — | | | | 195,680 | | | | 3,590,654 | | | | 12,556,243 | | | | — | |
| Unrealized appreciation on futures | | | — | | | | — | | | | — | | | | 132,491 | | | | 3,478,242 | | | | — | | | | — | |
| Unrealized appreciation on swap contracts | | | — | | | | — | | | | — | | | | — | | | | 1,392,857 | | | | — | | | | — | |
| Premiums paid on swap contracts | | | — | | | | — | | | | — | | | | — | | | | 341,749 | | | | — | | | | — | |
| Unrealized appreciation on forward foreign currency exchange contracts | | | — | | | | — | | | | — | | | | — | | | | — | | | | 859,760 | | | | — | |
| Receivable for securities sold | | | 322,689 | | | | 214,637 | | | | 522,392 | | | | 20,419 | | | | 1,519,972 | | | | 6,202,199 | | | | 284,791 | |
| Interest and dividends receivable | | | 9,600 | | | | 245,305 | | | | 1,439,971 | | | | 1,041 | | | | 1,088,850 | | | | 102,069 | | | | 3,922 | |
| Receivable for Fund shares sold | | | 112,487 | | | | — | | | | 345,102 | | | | 49,382 | | | | 601,107 | | | | 79,618 | | | | 168,332 | |
| Prepaid expenses and other assets | | | 68,179 | | | | 46,657 | | | | 44,153 | | | | 39,128 | | | | 56,942 | | | | 41,324 | | | | 37,209 | |
| Total Assets | | | 92,768,810 | | | | 124,788,681 | | | | 178,918,378 | | | | 29,295,983 | | | | 271,689,008 | | | | 319,160,187 | | | | 113,046,920 | |
| | | | | | | | | | | | | | | | | | | | | | | | | | | | | |
| Liabilities: | | | | | | | | | | | | | | | | | | | | | | | | | | | | |
| Option contracts written (premiums received $54,244 and $269,947 respectively) | | | — | | | | — | | | | — | | | | 84,525 | | | | — | | | | 60,325 | | | | — | |
| Securities sold short (proceeds $52,267,224) | | | — | | | | — | | | | — | | | | — | | | | — | | | | 50,363,792 | | | | — | |
| Payable upon return of securities loaned (Market value of securities on loan $15,129,768, $0, $19,380,214, $4,994,824, $5,851,506, $12,028,895, and $16,852,200 respectively) | | | 15,894,642 | | | | 575,338 | | | | 20,016,338 | | | | 5,238,873 | | | | 6,001,785 | | | | 12,395,269 | | | | 17,803,436 | |
| Accrued foreign capital gains tax on appreciated securities | | | — | | | | 375,343 | | | | — | | | | — | | | | — | | | | — | | | | — | |
| Payable for securities purchased | | | 267,406 | | | | 933,241 | | | | 1,061,897 | | | | — | | | | 21,119,899 | | | | 5,277,878 | | | | 149,049 | |
| Payable for Fund shares redeemed | | | 29,252 | | | | 3,954 | | | | 109,375 | | | | 14,108 | | | | 165,104 | | | | 285,584 | | | | 64,585 | |
| Distributions Payable | | | — | | | | — | | | | — | | | | — | | | | 13,211 | | | | 28,134 | | | | — | |
| Premiums received on swap contracts | | | — | | | | — | | | | — | | | | — | | | | 2,444,542 | | | | — | | | | — | |
| Unrealized depreciation on swap contracts | | | — | | | | — | | | | — | | | | — | | | | 436,248 | | | | — | | | | — | |
| Unrealized depreciation on futures | | | — | | | | — | | | | — | | | | 366,887 | | | | — | | | | — | | | | — | |
| Payable for dividend on short sales | | | — | | | | — | | | | — | | | | — | | | | — | | | | 80,261 | | | | — | |
| Payable to adviser | | | 44,732 | | | | 67,951 | | | | 88,708 | | | | 13,116 | | | | 130,013 | | | | 137,080 | | | | 54,086 | |
| Payable to sub-adviser | | | — | | | | 6,607 | | | | 34,440 | | | | 9,499 | | | | 14,701 | | | | 209,265 | | | | 9,641 | |
| Payable for distribution fees | | | 23,387 | | | | 15,283 | | | | 24,667 | | | | 5,435 | | | | 29,710 | | | | 70,548 | | | | 11,808 | |
| Payable for administration fees | | | — | | | | 1,814 | | | | 19,948 | | | | 2,713 | | | | 9,968 | | | | 9,724 | | | | 18,915 | |
| Payable for fund accounting fees | | | — | | | | 994 | | | | 3,486 | | | | 874 | | | | — | | | | 2,681 | | | | — | |
| Payable for transfer agent fees | | | 5,465 | | | | 9,551 | | | | 6,149 | | | | 4,103 | | | | 6,072 | | | | 13,669 | | | | — | |
| Payable for custody fees | | | 16,404 | | | | 61,236 | | | | 108,293 | | | | 2,561 | | | | 2,897 | | | | 4,775 | | | | 2,383 | |
| Payable for third party administrative servicing fees | | | 7,107 | | | | 1,335 | | | | 4,817 | | | | 1,459 | | | | 3,043 | | | | 8,960 | | | | — | |
| Payable for line of credit | | | — | | | | — | | | | 13,000 | | | | — | | | | — | | | | — | | | | — | |
| Accrued expenses and other liabilities | | | 2,148 | | | | 2,894 | | | | 136,251 | | | | 11,593 | | | | — | | | | 78,325 | | | | 8,639 | |
| Total Liabilities | | | 16,290,543 | | | | 2,055,541 | | | | 21,627,369 | | | | 5,755,746 | | | | 30,377,193 | | | | 69,026,270 | | | | 18,122,542 | |
| | | | | | | | | | | | | | | | | | | | | | | | | | | | | |
| Net Assets | | $ | 76,478,267 | | | $ | 122,733,140 | | | $ | 157,291,009 | | | $ | 23,540,237 | | | $ | 241,311,815 | | | $ | 250,133,917 | | | $ | 94,924,378 | |
| | | | | | | | | | | | | | | | | | | | | | | | | | | | | |
| Net Assets: | | | | | | | | | | | | | | | | | | | | | | | | | | | | |
| Paid in capital | | $ | 88,733,281 | | | $ | 133,617,731 | | | $ | 156,110,297 | | | $ | 22,925,922 | | | $ | 244,887,495 | | | $ | 266,359,169 | | | $ | 90,808,130 | |
| Accumulated earnings (loss) | | | (12,255,014 | ) | | | (10,884,591 | ) | | | 1,180,712 | | | | 614,315 | | | | (3,575,680 | ) | | | (16,225,252 | ) | | | 4,116,248 | |
| Net Assets | | $ | 76,478,267 | | | $ | 122,733,140 | | | $ | 157,291,009 | | | $ | 23,540,237 | | | $ | 241,311,815 | | | $ | 250,133,917 | | | $ | 94,924,378 | |
| | | | | | | | | | | | | | | | | | | | | | | | | | | | | |
| Net Asset Value Per Share | | | | | | | | | | | | | | | | | | | | | | | | | | | | |
| Class N Shares: | | | | | | | | | | | | | | | | | | | | | | | | | | | | |
| Net Assets | | $ | 61,950,353 | | | $ | 101,692,274 | | | $ | 130,002,253 | | | $ | 18,929,492 | | | $ | 203,231,911 | | | $ | 200,178,400 | | | $ | 78,828,842 | |
| Shares of beneficial interest outstanding (no par value; unlimited shares authorized) | | | 4,054,792 | | | | 7,515,779 | | | | 8,348,825 | | | | 1,839,057 | | | | 21,810,937 | | | | 6,330,820 | | | | 4,747,045 | |
| Net asset value, offering and redemption price per share | | $ | 15.28 | | | $ | 13.53 | | | $ | 15.57 | | | $ | 10.29 | | | $ | 9.32 | | | $ | 31.62 | | | $ | 16.61 | |
| | | | | | | | | | | | | | | | | | | | | | | | | | | | | |
| Class A Shares: | | | | | | | | | | | | | | | | | | | | | | | | | | | | |
| Net Assets | | $ | 12,075,423 | | | $ | 18,389,787 | | | $ | 22,456,041 | | | $ | 3,612,213 | | | $ | 33,804,764 | | | $ | 32,600,769 | | | $ | 12,366,297 | |
| Shares of beneficial interest outstanding (no par value; unlimited shares authorized) | | | 858,225 | | | | 1,395,501 | | | | 1,454,799 | | | | 354,565 | | | | 3,636,786 | | | | 1,078,415 | | | | 741,139 | |
| Net asset value, and redemption price per share * | | $ | 14.07 | | | $ | 13.18 | | | $ | 15.44 | | | $ | 10.19 | | | $ | 9.30 | | | $ | 30.23 | | | $ | 16.69 | |
| Front-end sales charge factor | | | 0.9425 | | | | 0.9425 | | | | 0.9425 | | | | 0.9425 | | | | 0.9425 | | | | 0.9425 | | | | 0.9425 | |
| Offering price per share (Net asset value per share / front-end sales charge factor) | | $ | 14.93 | | | $ | 13.98 | | | $ | 16.38 | | | $ | 10.81 | | | $ | 9.87 | | | $ | 32.07 | | | $ | 17.71 | |
| | | | | | | | | | | | | | | | | | | | | | | | | | | | | |
| Class C Shares: | | | | | | | | | | | | | | | | | | | | | | | | | | | | |
| Net Assets | | $ | 2,452,491 | | | $ | 2,651,079 | | | $ | 4,832,715 | | | $ | 998,532 | | | $ | 4,275,140 | | | $ | 17,354,748 | | | $ | 3,729,239 | |
| Shares of beneficial interest outstanding (no par value; unlimited shares authorized) | | | 263,644 | | | | 215,901 | | | | 334,691 | | | | 104,286 | | | | 477,202 | | | | 768,392 | | | | 245,035 | |
| Net asset value, offering and redemption price per share | | $ | 9.30 | | | $ | 12.28 | | | $ | 14.44 | | | $ | 9.57 | | | $ | 8.96 | | | $ | 22.59 | | | $ | 15.22 | |
| * | For certain purchases of $1 million or more, a 0.75% contingent deferred sales charge may apply to redemptions made within eighteen months of purchase. |
| (a) | See Section 2.k. in the notes for the breakout by counterparty. |
See accompanying notes which are an integral part to these financial statements.
| STATEMENTS OF OPERATIONS (Unaudited) |
| For the Six Months Ended April 30, 2022 |
| | | Dunham | | | | | | | | | Dunham | | | | | | | | | Dunham | |
| | | Corporate / | | | Dunham | | | Dunham | | | International | | | Dunham | | | Dunham | | | Focused | |
| | | Government | | | Floating Rate | | | High-Yield | | | Opportunity | | | Large Cap | | | Small Cap | | | Large Cap | |
| | | Bond Fund | | | Bond Fund | | | Bond Fund | | | Bond Fund | | | Value Fund | | | Value Fund | | | Growth Fund | |
| Investment Income: | | | | | | | | | | | | | | | | | | | | | | | | | | | | |
| Interest income | | $ | 1,175,769 | | | $ | 4,876,584 | | | $ | 3,112,376 | | | $ | 1,587,262 | | | $ | 61 | | | $ | 8 | | | $ | 128 | |
| Dividend income | | | 2,686 | | | | 15,835 | | | | 350,034 | | | | — | | | | 1,505,418 | | | | 1,067,371 | | | | 193,191 | |
| Securities lending income - net | | | 3,428 | | | | 3,341 | | | | 15,043 | | | | 4,440 | | | | 5,015 | | | | 9,830 | | | | 9,351 | |
| Less: Foreign withholding taxes | | | — | | | | — | | | | — | | | | (10,468 | ) | | | — | | | | — | | | | (1,209 | ) |
| Total Investment Income | | | 1,181,883 | | | | 4,895,760 | | | | 3,477,453 | | | | 1,581,234 | | | | 1,510,494 | | | | 1,077,209 | | | | 201,461 | |
| | | | | | | | | | | | | | | | | | | | | | | | | | | | | |
| Operating Expenses: | | | | | | | | | | | | | | | | | | | | | | | | | | | | |
| Investment advisory fees | | | 214,741 | | | | 605,360 | | | | 348,442 | | | | 204,889 | | | | 525,205 | | | | 282,281 | | | | 611,849 | |
| Sub-advisory fees | | | 128,845 | | | | 282,501 | | | | 185,836 | | | | 153,666 | | | | 242,402 | | | | 195,425 | | | | 329,457 | |
| Sub-advisory performance fees | | | 51,027 | | | | (80,906 | ) | | | 6,932 | | | | (60,770 | ) | | | 147,753 | | | | 117,010 | | | | (144,476 | ) |
| Fund accounting fees | | | 3,814 | | | | 9,720 | | | | 4,364 | | | | 6,691 | | | | 6,805 | | | | 3,504 | | | | 8,419 | |
| Distribution fees- Class C Shares | | | 10,445 | | | | 24,834 | | | | 17,230 | | | | 4,777 | | | | 23,548 | | | | 14,239 | | | | 58,596 | |
| Distribution fees- Class A Shares | | | 11,089 | | | | 27,630 | | | | 16,426 | | | | 10,592 | | | | 32,019 | | | | 14,949 | | | | 39,351 | |
| Administration fees | | | 73,088 | | | | 65,452 | | | | 58,895 | | | | 51,877 | | | | 25,546 | | | | 28,624 | | | | 32,654 | |
| Registration fees | | | 26,680 | | | | 19,119 | | | | 28,931 | | | | 18,241 | | | | 27,101 | | | | 27,577 | | | | 24,299 | |
| Transfer agent fees | | | 15,067 | | | | 16,992 | | | | 8,879 | | | | 8,315 | | | | 18,595 | | | | 12,846 | | | | 19,631 | |
| Custodian fees | | | 16,830 | | | | 31,870 | | | | 6,237 | | | | 27,290 | | | | 5,056 | | | | 2,016 | | | | 3,570 | |
| Professional fees | | | 9,460 | | | | 13,241 | | | | 9,007 | | | | 9,034 | | | | 10,414 | | | | 9,892 | | | | 11,586 | |
| Chief Compliance Officer fees | | | 3,044 | | | | 6,393 | | | | 6,243 | | | | 1,385 | | | | 4,791 | | | | 2,953 | | | | 5,602 | |
| Printing and postage expense | | | 4,584 | | | | 9,342 | | | | 6,935 | | | | 7,052 | | | | 9,795 | | | | 5,954 | | | | 10,304 | |
| Trustees’ fees | | | 1,684 | | | | 4,630 | | | | 2,650 | | | | 684 | | | | 2,630 | | | | 1,624 | | | | 3,671 | |
| Insurance expense | | | 517 | | | | 1,657 | | | | 961 | | | | 385 | | | | 868 | | | | 534 | | | | 1,141 | |
| Interest expense | | | — | | | | — | | | | — | | | | 271 | | | | — | | | | — | | | | — | |
| Third party administrative servicing fees | | | 1,092 | | | | 2,012 | | | | 2,196 | | | | 875 | | | | 3,339 | | | | 1,865 | | | | 13,422 | |
| Miscellaneous expenses | | | 2,840 | | | | 7,434 | | | | 5,617 | | | | 2,998 | | | | 2,932 | | | | 2,592 | | | | 5,722 | |
| Total Operating Expenses | | | 574,847 | | | | 1,047,281 | | | | 715,781 | | | | 448,252 | | | | 1,088,799 | | | | 723,885 | | | | 1,034,798 | |
| Net Operating Expenses | | | 574,847 | | | | 1,047,281 | | | | 715,781 | | | | 448,252 | | | | 1,088,799 | | | | 723,885 | | | | 1,034,798 | |
| | | | | | | | | | | | | | | | | | | | | | | | | | | | | |
| Net Investment Income (Loss) | | | 607,036 | | | | 3,848,479 | | | | 2,761,672 | | | | 1,132,982 | | | | 421,695 | | | | 353,324 | | | | (833,337 | ) |
| | | | | | | | | | | | | | | | | | | | | | | | | | | | | |
| Realized and Unrealized Gain (Loss) on Investments, Futures, Foreign Currency Translations, and Forward Foreign Currency Exchange Contracts: | | | | | | | | | | | | | | | | | | | | | | | | | | | | |
| Net realized gain (loss) from: | | | | | | | | | | | | | | | | | | | | | | | | | | | | |
| Investments | | | (708,159 | ) | | | (1,102,326 | ) | | | (464,421 | ) | | | (1,549,299 | ) | | | 1,617,586 | | | | 3,597,157 | | | | 2,419,966 | |
| Futures | | | — | | | | — | | | | — | | | | (71,346 | ) | | | — | | | | — | | | | — | |
| Forward foreign currency exchange contracts | | | — | | | | — | | | | — | | | | 1,619,259 | | | | — | | | | — | | | | — | |
| Net realized gain (loss) | | | (708,159 | ) | | | (1,102,326 | ) | | | (464,421 | ) | | | (1,386 | ) | | | 1,617,586 | | | | 3,597,157 | | | | 2,419,966 | |
| Net change in unrealized appreciation (depreciation) on: | | | | | | | | | | | | | | | | | | | | | | | | | | | | |
| Investments | | | (6,763,871 | ) | | | (3,623,388 | ) | | | (10,190,148 | ) | | | (8,518,571 | ) | | | (9,803,014 | ) | | | (8,111,436 | ) | | | (69,768,335 | ) |
| Futures | | | — | | | | — | | | | — | | | | (116,578 | ) | | | — | | | | — | | | | — | |
| Forward foreign currency exchange contracts | | | — | | | | — | | | | — | | | | 259,599 | | | | — | | | | — | | | | — | |
| Net change in unrealized depreciation | | | (6,763,871 | ) | | | (3,623,388 | ) | | | (10,190,148 | ) | | | (8,375,550 | ) | | | (9,803,014 | ) | | | (8,111,436 | ) | | | (69,768,335 | ) |
| Net Realized and Unrealized Loss | | | (7,472,030 | ) | | | (4,725,714 | ) | | | (10,654,569 | ) | | | (8,376,936 | ) | | | (8,185,428 | ) | | | (4,514,279 | ) | | | (67,348,369 | ) |
| | | | | | | | | | | | | | | | | | | | | | | | | | | | | |
| Net Decrease in Net Assets Resulting From Operations | | $ | (6,864,994 | ) | | $ | (877,235 | ) | | $ | (7,892,897 | ) | | $ | (7,243,954 | ) | | $ | (7,763,733 | ) | | $ | (4,160,955 | ) | | $ | (68,181,706 | ) |
See accompanying notes which are an integral part to these financial statements.
| STATEMENTS OF OPERATIONS (Unaudited) (Continued) |
| For the Six Months Ended April 30, 2022 |
| | | | | | Dunham | | | | | | | | | | | | Dunham | | | | |
| | | Dunham | | | Emerging | | | Dunham | | | Dunham | | | Dunham | | | Monthly | | | Dunham | |
| | | Small Cap | | | Markets | | | International | | | Dynamic Macro | | | Long/Short | | | Distribution | | | Real Estate | |
| | | Growth Fund | | | Stock Fund | | | Stock Fund | | | Fund | | | Credit Fund | | | Fund | | | Stock Fund | |
| Investment Income: | | | | | | | | | | | | | | | | | | | | | | | | | | | | |
| Interest income | | $ | 139 | | | $ | 240 | | | $ | 14 | | | $ | 9,090 | | | $ | 3,171,605 | | | $ | (85,689 | ) | | $ | 12 | |
| Dividend income | | | 131,607 | | | | 1,074,391 | | | | 4,283,687 | | | | 359,255 | | | | 306,821 | | | | 8,776,209 | | | | 914,457 | |
| Securities lending income - net | | | 38,258 | | | | 740 | | | | 24,062 | | | | 3,542 | | | | 14,325 | | | | 12,116 | | | | 26,270 | |
| Less: Foreign withholding taxes | | | (375 | ) | | | (155,345 | ) | | | (528,245 | ) | | | — | | | | — | | | | 234,510 | | | | (1,218 | ) |
| Total Investment Income | | | 169,629 | | | | 920,026 | | | | 3,779,518 | | | | 371,887 | | | | 3,492,751 | | | | 8,937,146 | | | | 939,521 | |
| | | | | | | | | | | | | | | | | | | | | | | | | | | | | |
| Operating Expenses: | | | | | | | | | | | | | | | | | | | | | | | | | | | | |
| Investment advisory fees | | | 254,583 | | | | 417,733 | | | | 565,206 | | | | 82,452 | | | | 765,269 | | | | 857,013 | | | | 327,006 | |
| Sub-advisory fees | | | 195,833 | | | | 289,909 | | | | 565,206 | | | | 95,136 | | | | 706,402 | | | | 791,089 | | | | 226,389 | |
| Sub-advisory performance fees | | | 8,903 | | | | (251,951 | ) | | | 1,241 | | | | 28,781 | | | | (430,469 | ) | | | 1,346,681 | | | | (151,533 | ) |
| Fund accounting fees | | | 1,655 | | | | 4,571 | | | | 11,016 | | | | 981 | | | | 6,010 | | | | 5,790 | | | | 2,837 | |
| Distribution fees- Class C Shares | | | 15,429 | | | | 15,368 | | | | 27,663 | | | | 5,531 | | | | 22,181 | | | | 91,048 | | | | 20,812 | |
| Distribution fees- Class A Shares | | | 19,168 | | | | 24,750 | | | | 32,125 | | | | 4,900 | | | | 38,901 | | | | 40,544 | | | | 16,327 | |
| Administration fees | | | 6,795 | | | | 20,509 | | | | 58,190 | | | | 7,197 | | | | 44,043 | | | | 27,977 | | | | 32,165 | |
| Registration fees | | | 26,739 | | | | 25,908 | | | | 28,893 | | | | 22,264 | | | | 28,334 | | | | 31,818 | | | | 29,172 | |
| Transfer agent fees | | | 12,925 | | | | 21,805 | | | | 20,322 | | | | 11,249 | | | | 22,053 | | | | 31,180 | | | | 9,405 | |
| Custodian fees | | | 10,396 | | | | 105,036 | | | | 132,560 | | | | 4,273 | | | | 5,610 | | | | 14,165 | | | | 3,359 | |
| Professional fees | | | 9,151 | | | | 12,338 | | | | 12,094 | | | | 8,076 | | | | 11,046 | | | | 15,322 | | | | 9,723 | |
| Chief Compliance Officer fees | | | 2,933 | | | | 4,370 | | | | 5,616 | | | | 745 | | | | 7,171 | | | | 14,365 | | | | 3,619 | |
| Printing and postage expense | | | 6,082 | | | | 5,722 | | | | 11,688 | | | | 4,817 | | | | 8,563 | | | | 38,371 | | | | 13,977 | |
| Trustees’ fees | | | 1,580 | | | | 2,142 | | | | 3,799 | | | | 514 | | | | 3,116 | | | | 6,368 | | | | 1,813 | |
| Insurance expense | | | 465 | | | | 780 | | | | 1,274 | | | | 381 | | | | 848 | | | | 2,231 | | | | 558 | |
| Interest expense | | | — | | | | — | | | | — | | | | 916 | | | | — | | | | — | | | | — | |
| Third party administrative servicing fees | | | 10,378 | | | | 2,778 | | | | 8,169 | | | | 1,287 | | | | 13,174 | | | | 10,981 | | | | 2,646 | |
| Dividend expense on short sales | | | — | | | | — | | | | — | | | | — | | | | — | | | | 296,374 | | | | — | |
| Broker Fees | | | — | | | | — | | | | — | | | | — | | | | — | | | | 273,187 | | | | — | |
| Miscellaneous expenses | | | 2,706 | | | | 4,106 | | | | 8,324 | | | | 2,754 | | | | 3,460 | | | | 9,869 | | | | 2,873 | |
| Total Operating Expenses | | | 585,721 | | | | 705,874 | | | | 1,493,386 | | | | 282,254 | | | | 1,255,712 | | | | 3,904,373 | | | | 551,148 | |
| Net Operating Expenses | | | 585,721 | | | | 705,874 | | | | 1,493,386 | | | | 282,254 | | | | 1,255,712 | | | | 3,904,373 | | | | 551,148 | |
| | | | | | | | | | | | | | | | | | | | | | | | | | | | | |
| Net Investment Income (Loss) | | | (416,092 | ) | | | 214,152 | | | | 2,286,132 | | | | 89,633 | | | | 2,237,039 | | | | 5,032,773 | | | | 388,373 | |
| | | | | | | | | | | | | | | | | | | | | | | | | | | | | |
| Realized and Unrealized Gain (Loss) on Investments, Futures, Purchased Options, Securities Sold Short, Written Options, Swap Contracts, Foreign Currency Transactions and Foreign Currency Translations: | | | | | | | | | | | | | | | | | | | | | | | | | | | | |
| Net realized gain (loss) from: | | | | | | | | | | | | | | | | | | | | | | | | | | | | |
| Investments | | | (2,860,676 | ) | | | (5,705,707 | ) | | | 3,089,792 | | | | 652,630 | | | | (2,530,191 | ) | | | 4,098,438 | | | | (8,714,490 | ) |
| Futures | | | — | | | | — | | | | — | | | | (1,229,169 | ) | | | 2,341,229 | | | | — | | | | — | |
| Purchased options | | | — | | | | — | | | | — | | | | (512,121 | ) | | | — | | | | 32,850 | | | | — | |
| Securities sold short | | | — | | | | — | | | | — | | | | — | | | | — | | | | (5,467,443 | ) | | | — | |
| Written options | | | — | | | | — | | | | — | | | | 194,161 | | | | — | | | | 276,211 | | | | — | |
| Swap contracts | | | — | | | | — | | | | — | | | | — | | | | (99,771 | ) | | | — | | | | — | |
| Foreign currency exchange contracts | | | — | | | | (82,778 | ) | | | (56,031 | ) | | | 5,328 | | | | 5,384 | | | | 412,897 | | | | — | |
| Net realized gain (loss) | | | (2,860,676 | ) | | | (5,788,485 | ) | | | 3,033,761 | | | | (889,171 | ) | | | (283,349 | ) | | | (647,047 | ) | | | (8,714,490 | ) |
| Net change in unrealized appreciation (depreciation) on: | | | | | | | | | | | | | | | | | | | | | | | | | | | | |
| Investments | | | (31,185,732 | ) | | | (24,279,556 | ) | | | (32,084,451 | ) | | | (883,373 | ) | | | (8,831,743 | ) | | | (30,813,468 | ) | | | (10,424,240 | ) |
| Futures | | | — | | | | — | | | | — | | | | (72,890 | ) | | | 3,086,022 | | | | — | | | | — | |
| Purchased options | | | — | | | | — | | | | — | | | | (321,327 | ) | | | — | | | | 44,247 | | | | — | |
| Securities sold short | | | — | | | | — | | | | — | | | | — | | | | — | | | | 23,312,635 | | | | — | |
| Written options | | | — | | | | — | | | | — | | | | (33,801 | ) | | | — | | | | 209,622 | | | | — | |
| Swap contracts | | | — | | | | — | | | | — | | | | — | | | | 794,086 | | | | — | | | | — | |
| Foreign currency transactions | | | — | | | | — | | | | — | | | | 5,210 | | | | (2,035 | ) | | | (1,657 | ) | | | — | |
| Foreign currency exchange contracts | | | — | | | | — | | | | — | | | | — | | | | — | | | | 932,549 | | | | — | |
| Net change in foreign capital gains tax on appreciated securities | | | — | | | | 252,853 | | | | — | | | | — | | | | — | | | | — | | | | — | |
| Net change in unrealized depreciation | | | (31,185,732 | ) | | | (24,026,703 | ) | | | (32,084,451 | ) | | | (1,306,181 | ) | | | (4,953,670 | ) | | | (6,316,072 | ) | | | (10,424,240 | ) |
| Net Realized and Unrealized Loss | | | (34,046,408 | ) | | | (29,815,188 | ) | | | (29,050,690 | ) | | | (2,195,352 | ) | | | (5,237,019 | ) | | | (6,963,119 | ) | | | (19,138,730 | ) |
| | | | | | | | | | | | | | | | | | | | | | | | | | | | | |
| Net Decrease in Net Assets Resulting From Operations | | $ | (34,462,500 | ) | | $ | (29,601,036 | ) | | $ | (26,764,558 | ) | | $ | (2,105,719 | ) | | $ | (2,999,980 | ) | | $ | (1,930,346 | ) | | $ | (18,750,357 | ) |
See accompanying notes which are an integral part to these financial statements.
| STATEMENTS OF CHANGES IN NET ASSETS |
| | | Dunham | | | Dunham | | | Dunham | | | Dunham | | | Dunham | |
| | | Corporate/Government | | | Floating Rate | | | High-Yield | | | International Opportunity | | | Large Cap | |
| | | Bond Fund | | | Bond Fund | | | Bond Fund | | | Bond Fund | | | Value Fund | |
| | | | | | | | | | | | | | | | |
| | | Six Months
Ended | | | Year Ended | | | Six Months
Ended | | | Year Ended | | | Six Months
Ended | | | Year Ended | | | Six Months
Ended | | | Year Ended | | | Six Months
Ended | | | Year Ended | |
| | | April 30, 2022 | | | October 31, 2021 | | | April 30, 2022 | | | October 31, 2021 | | | April 30, 2022 | | | October 31, 2021 | | | April 30, 2022 | | | October 31, 2021 | | | April 30, 2022 | | | October 31, 2021 | |
| | | (Unaudited) | | | | | | (Unaudited) | | | | | | (Unaudited) | | | | | | (Unaudited) | | | | | | (Unaudited) | | | | |
| Operations: | | | | | | | | | | | | | | | | | | | | | | | | | | | | | | |
| Net investment income | | $ | 607,036 | | | $ | 1,115,758 | | | $ | 3,848,479 | | | $ | 5,395,499 | | | $ | 2,761,672 | | | $ | 4,590,219 | | | $ | 1,132,982 | | | $ | 1,441,432 | | | $ | 421,695 | | | $ | 867,245 | |
| Net realized gain (loss) from investments, futures, and forward foreign currency exchange contracts | | | (708,159 | ) | | | 663,320 | | | | (1,102,326 | ) | | | (704,426 | ) | | | (464,421 | ) | | | 3,485,153 | | | | (1,386 | ) | | | 911,495 | | | | 1,617,586 | | | | 10,381,354 | |
| Net change in unrealized appreciation (depreciation) on investments, futures, foreign currency translations, and forward foreign currency exchange contracts | | | (6,763,871 | ) | | | (862,438 | ) | | | (3,623,388 | ) | | | 6,505,769 | | | | (10,190,148 | ) | | | 1,712,224 | | | | (8,375,550 | ) | | | (522,678 | ) | | | (9,803,014 | ) | | | 34,943,028 | |
| Net Increase (Decrease) in Net Assets Resulting From Operations | | | (6,864,994 | ) | | | 916,640 | | | | (877,235 | ) | | | 11,196,842 | | | | (7,892,897 | ) | | | 9,787,596 | | | | (7,243,954 | ) | | | 1,830,249 | | | | (7,763,733 | ) | | | 46,191,627 | |
| | | | | | | | | | | | | | | | | | | | | | | | | | | | | | | | | | | | | | | | | |
| Distributions to Shareholders From: | | | | | | | | | | | | | | | | | | | | | | | | | | | | | | | | | | | | | | | | |
| Total Distributions Paid | | | | | | | | | | | | | | | | | | | | | | | | | | | | | | | | | | | | | | | | |
| Class N | | | (578,015 | ) | | | (1,111,747 | ) | | | (3,540,223 | ) | | | (5,232,288 | ) | | | (2,196,674 | ) | | | (3,923,046 | ) | | | (1,372,331 | ) | | | (1,404,947 | ) | | | (8,440,624 | ) | | | (885,281 | ) |
| Class A | | | (57,280 | ) | | | (113,506 | ) | | | (428,174 | ) | | | (661,563 | ) | | | (276,128 | ) | | | (508,571 | ) | | | (190,429 | ) | | | (196,625 | ) | | | (1,657,189 | ) | | | (159,962 | ) |
| Class C | | | (12,673 | ) | | | (19,976 | ) | | | (110,923 | ) | | | (178,039 | ) | | | (86,430 | ) | | | (162,670 | ) | | | (26,522 | ) | | | (24,098 | ) | | | (296,620 | ) | | | (13,236 | ) |
| Total Distributions to Shareholders | | | (647,968 | ) | | | (1,245,229 | ) | | | (4,079,320 | ) | | | (6,071,890 | ) | | | (2,559,232 | ) | | | (4,594,287 | ) | | | (1,589,282 | ) | | | (1,625,670 | ) | | | (10,394,433 | ) | | | (1,058,479 | ) |
| | | | | | | | | | | | | | | | | | | | | | | | | | | | | | | | | | | | | | | | | |
| Share Transactions of Beneficial Interest: | | | | | | | | | | | | | | | | | | | | | | | | | | | | | | | | | | | | | | | | |
| Net proceeds from shares sold | | | | | | | | | | | | | | | | | | | | | | | | | | | | | | | | | | | | | | | | |
| Class N | | | 8,502,920 | | | | 37,363,091 | | | | 24,661,739 | | | | 49,250,845 | | | | 7,917,858 | | | | 30,047,934 | | | | 6,309,556 | | | | 29,428,075 | | | | 18,515,498 | | | | 35,671,210 | |
| Class A | | | 860,011 | | | | 4,362,738 | | | | 3,863,169 | | | | 6,045,587 | | | | 1,372,841 | | | | 4,608,305 | | | | 831,082 | | | | 4,565,559 | | | | 5,023,411 | | | | 8,236,476 | |
| Class C | | | 820,351 | | | | 730,362 | | | | 756,695 | | | | 854,266 | | | | 194,888 | | | | 609,761 | | | | 105,648 | | | | 395,013 | | | | 379,413 | | | | 660,022 | |
| Reinvestment of distributions | | | | | | | | | | | | | | | | | | | | | | | | | | | | | | | | | | | | | | | | |
| Class N | | | 577,033 | | | | 1,108,792 | | | | 3,525,799 | | | | 5,216,097 | | | | 2,190,372 | | | | 3,902,928 | | | | 1,371,844 | | | | 1,403,554 | | | | 8,418,440 | | | | 882,505 | |
| Class A | | | 56,269 | | | | 110,697 | | | | 418,992 | | | | 644,688 | | | | 264,137 | | | | 485,370 | | | | 187,789 | | | | 193,529 | | | | 1,510,269 | | | | 147,796 | |
| Class C | | | 11,237 | | | | 19,637 | | | | 105,402 | | | | 168,317 | | | | 78,506 | | | | 147,452 | | | | 26,217 | | | | 23,805 | | | | 295,033 | | | | 13,125 | |
| Cost of shares redeemed | | | | | | | | | | | | | | | | | | | | | | | | | | | | | | | | | | | | | | | | |
| Class N | | | (20,071,088 | ) | | | (20,862,705 | ) | | | (21,310,906 | ) | | | (21,169,647 | ) | | | (14,036,680 | ) | | | (19,327,337 | ) | | | (15,306,949 | ) | | | (9,894,782 | ) | | | (19,369,470 | ) | | | (16,306,551 | ) |
| Class A | | | (2,549,634 | ) | | | (3,338,641 | ) | | | (3,045,685 | ) | | | (4,799,310 | ) | | | (1,361,480 | ) | | | (4,261,225 | ) | | | (2,094,291 | ) | | | (2,353,597 | ) | | | (7,056,671 | ) | | | (5,925,541 | ) |
| Class C | | | (375,203 | ) | | | (954,395 | ) | | | (710,129 | ) | | | (1,307,869 | ) | | | (316,387 | ) | | | (915,443 | ) | | | (175,407 | ) | | | (292,489 | ) | | | (480,549 | ) | | | (1,474,929 | ) |
| Net Increase (Decrease) in Net Assets From Share Transactions of Beneficial Interest | | | (12,168,104 | ) | | | 18,539,576 | | | | 8,265,076 | | | | 34,902,974 | | | | (3,695,945 | ) | | | 15,297,745 | | | | (8,744,511 | ) | | | 23,468,667 | | | | 7,235,374 | | | | 21,904,113 | |
| | | | | | | | | | | | | | | | | | | | | | | | | | | | | | | | | | | | | | | | | |
| Total Increase (Decrease) in Net Assets | | | (19,681,066 | ) | | | 18,210,987 | | | | 3,308,521 | | | | 40,027,926 | | | | (14,148,074 | ) | | | 20,491,054 | | | | (17,577,747 | ) | | | 23,673,246 | | | | (10,922,792 | ) | | | 67,037,261 | |
| | | | | | | | | | | | | | | | | | | | | | | | | | | | | | | | | | | | | | | | | |
| Net Assets: | | | | | | | | | | | | | | | | | | | | | | | | | | | | | | | | | | | | | | | | |
| Beginning of Year/Period | | | 90,616,273 | | | | 72,405,286 | | | | 202,068,884 | | | | 162,040,958 | | | | 120,289,434 | | | | 99,798,380 | | | | 72,921,186 | | | | 49,247,940 | | | | 161,346,323 | | | | 94,309,062 | |
| End of Year/Period | | $ | 70,935,207 | | | $ | 90,616,273 | | | $ | 205,377,405 | | | $ | 202,068,884 | | | $ | 106,141,360 | | | $ | 120,289,434 | | | $ | 55,343,439 | | | $ | 72,921,186 | | | $ | 150,423,531 | | | $ | 161,346,323 | |
See accompanying notes which are an integral part to these financial statements.
| STATEMENTS OF CHANGES IN NET ASSETS (Continued) |
| | | Dunham | | | Dunham | | | Dunham | | | Dunham | | | Dunham | |
| | | Small Cap | | | Focused Large Cap | | | Small Cap | | | Emerging Markets | | | International | |
| | | Value Fund | | | Growth Fund | | | Growth Fund | | | Stock Fund | | | Stock Fund | |
| | | | | | | | | | | | | | | | |
| | | Six Months
Ended | | | Year Ended | | | Six Months
Ended | | | Year Ended | | | Six Months
Ended | | | Year Ended | | | Six Months
Ended | | | Year Ended | | | Six Months
Ended | | | Year Ended | |
| | | April 30, 2022 | | | October 31, 2021 | | | April 30, 2022 | | | October 31, 2021 | | | April 30, 2022 | | | October 31, 2021 | | | April 30, 2022 | | | October 31, 2021 | | | April 30, 2022 | | | October 31, 2021 | |
| | | (Unaudited) | | | | | | (Unaudited) | | | | | | (Unaudited) | | | | | | (Unaudited) | | | | | | (Unaudited) | | | | |
| Operations: | | | | | | | | | | | | | | | | | | | | | | | | | | | | | | |
| Net investment income (loss) | | $ | 353,324 | | | $ | 454,624 | | | $ | (833,337 | ) | | $ | (1,930,598 | ) | | $ | (416,092 | ) | | $ | (1,231,538 | ) | | $ | 214,152 | | | $ | 135,110 | | | $ | 2,286,132 | | | $ | 2,287,121 | |
| Net realized gain (loss) from investments, and foreign currency transactions | | | 3,597,157 | | | | 15,659,426 | | | | 2,419,966 | | | | 19,114,247 | | | | (2,860,676 | ) | | | 18,441,711 | | | | (5,788,485 | ) | | | 11,204,195 | | | | 3,033,761 | | | | 23,917,595 | |
| Net change in unrealized appreciation (depreciation) on investments, foreign currency transactions and capital gains on appreciated securities | | | (8,111,436 | ) | | | 14,013,471 | | | | (69,768,335 | ) | | | 35,550,794 | | | | (31,185,732 | ) | | | 10,669,060 | | | | (24,026,703 | ) | | | 5,322,207 | | | | (32,084,451 | ) | | | 21,600,892 | |
| Net Increase (Decrease) in Net Assets Resulting From Operations | | | (4,160,955 | ) | | | 30,127,521 | | | | (68,181,706 | ) | | | 52,734,443 | | | | (34,462,500 | ) | | | 27,879,233 | | | | (29,601,036 | ) | | | 16,661,512 | | | | (26,764,558 | ) | | | 47,805,608 | |
| | | | | | | | | | | | | | | | | | | | | | | | | | | | | | | | | | | | | | | | | |
| Distributions to Shareholders From: | | | | | | | | | | | | | | | | | | | | | | | | | | | | | | | | | | | | | | | | |
| Total Distributions Paid | | | | | | | | | | | | | | | | | | | | | | | | | | | | | | | | | | | | | | | | |
| Class N | | | (8,082,160 | ) | | | (485,740 | ) | | | (12,138,317 | ) | | | (2,769,774 | ) | | | (10,232,676 | ) | | | (6,664,517 | ) | | | (9,680,432 | ) | | | (125,901 | ) | | | (20,424,436 | ) | | | (981,773 | ) |
| Class A | | | (1,369,856 | ) | | | (77,307 | ) | | | (2,937,408 | ) | | | (811,011 | ) | | | (3,441,219 | ) | | | (2,433,036 | ) | | | (1,850,179 | ) | | | — | | | | (3,680,446 | ) | | | (161,146 | ) |
| Class C | | | (363,568 | ) | | | (4,934 | ) | | | (1,174,480 | ) | | | (289,087 | ) | | | (791,503 | ) | | | (608,456 | ) | | | (279,057 | ) | | | — | | | | (794,025 | ) | | | (3,018 | ) |
| Total Distributions to Shareholders | | | (9,815,584 | ) | | | (567,981 | ) | | | (16,250,205 | ) | | | (3,869,872 | ) | | | (14,465,398 | ) | | | (9,706,009 | ) | | | (11,809,668 | ) | | | (125,901 | ) | | | (24,898,907 | ) | | | (1,145,937 | ) |
| | | | | | | | | | | | | | | | | | | | | | | | | | | | | | | | | | | | | | | | | |
| Share Transactions of Beneficial Interest: | | | | | | | | | | | | | | | | | | | | | | | | | | | | | | | | | | | | | | | | |
| Net proceeds from shares sold | | | | | | | | | | | | | | | | | | | | | | | | | | | | | | | | | | | | | | | | |
| Class N | | | 9,951,970 | | | | 20,986,577 | | | | 39,423,532 | | | | 43,139,698 | | | | 31,107,823 | | | | 20,800,330 | | | | 23,685,231 | | | | 40,234,684 | | | | 20,393,317 | | | | 45,256,461 | |
| Class A | | | 1,054,311 | | | | 3,566,512 | | | | 6,374,781 | | | | 9,273,680 | | | | 4,993,363 | | | | 10,277,892 | | | | 3,408,070 | | | | 7,142,063 | | | | 3,127,075 | | | | 5,877,586 | |
| Class C | | | 249,464 | | | | 536,803 | | | | 1,000,740 | | | | 2,176,190 | | | | 379,579 | | | | 709,162 | | | | 280,540 | | | | 614,699 | | | | 390,771 | | | | 664,270 | |
| Reinvestment of distributions | | | | | | | | | | | | | | | | | | | | | | | | | | | | | | | | | | | | | | | | |
| Class N | | | 8,067,916 | | | | 483,618 | | | | 11,836,240 | | | | 2,685,861 | | | | 10,127,549 | | | | 6,476,423 | | | | 9,673,626 | | | | 125,588 | | | | 20,345,234 | | | | 977,525 | |
| Class A | | | 1,353,929 | | | | 76,511 | | | | 2,791,471 | | | | 774,617 | | | | 3,122,559 | | | | 2,209,269 | | | | 1,837,164 | | | | — | | | | 3,636,079 | | | | 158,869 | |
| Class C | | | 361,649 | | | | 4,890 | | | | 1,057,574 | | | | 260,537 | | | | 785,687 | | | | 602,421 | | | | 272,598 | | | | — | | | | 781,476 | | | | 2,970 | |
| Redemption fee proceeds | | | | | | | | | | | | | | | | | | | | | | | | | | | | | | | | | | | | | | | | |
| Class A | | | — | | | | — | | | | — | | | | (36 | ) | | | — | | | | — | | | | — | | | | — | | | | — | | | | — | |
| Cost of shares redeemed | | | | | | | | | | | | | | | | | | | | | | | | | | | | | | | | | | | | | | | | |
| Class N | | | (17,284,881 | ) | | | (15,001,394 | ) | | | (9,900,908 | ) | | | (34,080,183 | ) | | | (5,979,194 | ) | | | (20,755,973 | ) | | | (9,979,223 | ) | | | (12,057,092 | ) | | | (19,372,543 | ) | | | (28,595,820 | ) |
| Class A | | | (3,930,829 | ) | | | (4,523,056 | ) | | | (7,102,417 | ) | | | (13,354,769 | ) | | | (6,205,728 | ) | | | (8,444,911 | ) | | | (1,598,321 | ) | | | (3,677,490 | ) | | | (3,286,120 | ) | | | (8,121,107 | ) |
| Class C | | | (301,441 | ) | | | (912,325 | ) | | | (1,719,612 | ) | | | (2,056,571 | ) | | | (299,662 | ) | | | (834,899 | ) | | | (249,094 | ) | | | (841,166 | ) | | | (484,043 | ) | | | (1,387,921 | ) |
| Net Increase in Net Assets From Share Transactions of Beneficial Interest | | | (477,912 | ) | | | 5,218,136 | | | | 43,761,401 | | | | 8,819,024 | | | | 38,031,976 | | | | 11,039,714 | | | | 27,330,591 | | | | 31,541,286 | | | | 25,531,246 | | | | 14,832,833 | |
| | | | | | | | | | | | | | | | | | | | | | | | | | | | | | | | | | | | | | | | | |
| Total Increase (Decrease) in Net Assets | | | (14,454,451 | ) | | | 34,777,676 | | | | (40,670,510 | ) | | | 57,683,595 | | | | (10,895,922 | ) | | | 29,212,938 | | | | (14,080,113 | ) | | | 48,076,897 | | | | (26,132,219 | ) | | | 61,492,504 | |
| | | | | | | | | | | | | | | | | | | | | | | | | | | | | | | | | | | | | | | | | |
| Net Assets: | | | | | | | | | | | | | | | | | | | | | | | | | | | | | | | | | | | | | | | | |
| Beginning of Year/Period | | | 88,240,474 | | | | 53,462,798 | | | | 208,118,825 | | | | 150,435,230 | | | | 87,374,189 | | | | 58,161,251 | | | | 136,813,253 | | | | 88,736,356 | | | | 183,423,228 | | | | 121,930,724 | |
| End of Year/Period | | $ | 73,786,023 | | | $ | 88,240,474 | | | $ | 167,448,315 | | | $ | 208,118,825 | | | $ | 76,478,267 | | | $ | 87,374,189 | | | $ | 122,733,140 | | | $ | 136,813,253 | | | $ | 157,291,009 | | | $ | 183,423,228 | |
See accompanying notes which are an integral part to these financial statements.
| STATEMENTS OF CHANGES IN NET ASSETS (Continued) |
| | | Dunham | | | Dunham | | | Dunham | | | Dunham | |
| | | Dynamic Macro | | | Long/Short | | | Monthly Distribution | | | Real Estate | |
| | | Fund | | | Credit Fund | | | Fund | | | Stock Fund | |
| | | | | | | | | | | | | |
| | | Six Months
Ended | | | Year Ended | | | Six Months
Ended | | | Year Ended | | | Six Months
Ended | | | Year Ended | | | Six Months
Ended | | | Year Ended | |
| | | April 30, 2022 | | | October 31, 2021 | | | April 30, 2022 | | | October 31, 2021 | | | April 30, 2022 | | | October 31, 2021 | | | April 30, 2022 | | | October 31, 2021 | |
| | | (Unaudited) | | | | | | (Unaudited) | | | | | | (Unaudited) | | | | | | (Unaudited) | | | | |
| Operations: | | | | | | | | | | | | | | | | | | | | | | | | |
| Net investment income (loss) | | $ | 89,633 | | | $ | (341,257 | ) | | $ | 2,237,039 | | | $ | 1,139,166 | | | $ | 5,032,773 | | | $ | (2,474,048 | ) | | $ | 388,373 | | | $ | (149,488 | ) |
| Net realized gain (loss) from investments, futures, purchased options, securities sold short, written options, swap contracts and foreign currency transactions | | | (889,171 | ) | | | 1,703,292 | | | | (283,349 | ) | | | 4,617,731 | | | | (647,047 | ) | | | 10,690,910 | | | | (8,714,490 | ) | | | 7,630,466 | |
| Net change in unrealized appreciation (depreciation) on investments, futures, purchased options, securities sold short, written options, and foreign currency translations | | | (1,306,181 | ) | | | 1,907,511 | | | | (4,953,670 | ) | | | 576,984 | | | | (6,316,072 | ) | | | (5,547,460 | ) | | | (10,424,240 | ) | | | 16,332,614 | |
| Net Increase (Decrease) in Net Assets Resulting From Operations | | | (2,105,719 | ) | | | 3,269,546 | | | | (2,999,980 | ) | | | 6,333,881 | | | | (1,930,346 | ) | | | 2,669,402 | | | | (18,750,357 | ) | | | 23,813,592 | |
| | | | | | | | | | | | | | | | | | | | | | | | | | | | | | | | | |
| Distributions to Shareholders From: | | | | | | | | | | | | | | | | | | | | | | | | | | | | | | | | |
| Distributions From Paid In Capital: | | | | | | | | | | | | | | | | | | | | | | | | | | | | | | | | |
| Class N | | | — | | | | — | | | | — | | | | — | | | | — | | | | (2,379,879 | ) | | | — | | | | — | |
| Class A | | | — | | | | — | | | | — | | | | — | | | | — | | | | (387,771 | ) | | | — | | | | — | |
| Class C | | | — | | | | — | | | | — | | | | — | | | | — | | | | (312,062 | ) | | | — | | | | — | |
| Total Distributions Paid | | | | | | | | | | | | | | | | | | | | | | | | | | | | | | | | |
| Class N | | | — | | | | (135,675 | ) | | | (5,568,338 | ) | | | (3,356,255 | ) | | | (3,552,644 | ) | | | (3,665,355 | ) | | | (5,499,204 | ) | | | (4,866,699 | ) |
| Class A | | | — | | | | (12,837 | ) | | | (787,639 | ) | | | (447,166 | ) | | | (569,348 | ) | | | (707,769 | ) | | | (850,102 | ) | | | (967,474 | ) |
| Class C | | | — | | | | — | | | | (112,163 | ) | | | (72,450 | ) | | | (421,739 | ) | | | (631,174 | ) | | | (307,750 | ) | | | (282,450 | ) |
| Total Distributions to Shareholders | | | — | | | | (148,512 | ) | | | (6,468,140 | ) | | | (3,875,871 | ) | | | (4,543,731 | ) | | | (8,084,010 | ) | | | (6,657,056 | ) | | | (6,116,623 | ) |
| | | | | | | | | | | | | | | | | | | | | | | | | | | | | | | | | |
| Share Transactions of Beneficial Interest: | | | | | | | | | | | | | | | | | | | | | | | | | | | | | | | | |
| Net proceeds from shares sold | | | | | | | | | | | | | | | | | | | | | | | | | | | | | | | | |
| Class N | | | 2,217,812 | | | | 4,773,495 | | | | 40,006,735 | | | | 105,287,518 | | | | 24,699,146 | | | | 86,626,522 | | | | 14,519,709 | | | | 29,537,589 | |
| Class A | | | 371,019 | | | | 1,027,623 | | | | 11,216,629 | | | | 15,532,775 | | | | 2,514,985 | | | | 8,503,404 | | | | 1,919,840 | | | | 4,330,490 | |
| Class C | | | 40,882 | | | | 122,726 | | | | 412,375 | | | | 1,750,991 | | | | 517,706 | | | | 1,900,124 | | | | 266,181 | | | | 1,508,116 | |
| Reinvestment of distributions | | | | | | | | | | | | | | | | | | | | | | | | | | | | | | | | |
| Class N | | | — | | | | 134,970 | | | | 5,352,677 | | | | 3,229,140 | | | | 3,504,305 | | | | 5,924,043 | | | | 5,403,784 | | | | 4,827,354 | |
| Class A | | | — | | | | 12,761 | | | | 751,468 | | | | 419,491 | | | | 520,674 | | | | 980,344 | | | | 842,420 | | | | 957,510 | |
| Class C | | | — | | | | — | | | | 98,626 | | | | 67,601 | | | | 353,142 | | | | 784,135 | | | | 306,360 | | | | 280,569 | |
| Cost of shares redeemed | | | | | | | | | | | | | | | | | | | | | | | | | | | | | | | | |
| Class N | | | (2,651,833 | ) | | | (10,012,675 | ) | | | (29,947,813 | ) | | | (24,965,410 | ) | | | (42,422,140 | ) | | | (29,160,238 | ) | | | (11,714,748 | ) | | | (10,723,310 | ) |
| Class A | | | (460,540 | ) | | | (2,602,857 | ) | | | (5,977,564 | ) | | | (4,343,613 | ) | | | (2,949,313 | ) | | | (8,774,650 | ) | | | (2,160,065 | ) | | | (4,086,037 | ) |
| Class C | | | (90,641 | ) | | | (400,312 | ) | | | (565,379 | ) | | | (1,194,718 | ) | | | (2,300,108 | ) | | | (5,777,804 | ) | | | (452,508 | ) | | | (769,703 | ) |
| Net Increase (Decrease) in Net Assets From Share Transactions of Beneficial Interest | | | (573,301 | ) | | | (6,944,269 | ) | | | 21,347,754 | | | | 95,783,775 | | | | (15,561,603 | ) | | | 61,005,880 | | | | 8,930,973 | | | | 25,862,578 | |
| | | | | | | | | | | | | | | | | | | | | | | | | | | | | | | | | |
| Total Increase (Decrease) in Net Assets | | | (2,679,020 | ) | | | (3,823,235 | ) | | | 11,879,634 | | | | 98,241,785 | | | | (22,035,680 | ) | | | 55,591,272 | | | | (16,476,440 | ) | | | 43,559,547 | |
| | | | | | | | | | | | | | | | | | | | | | | | | | | | | | | | | |
| Net Assets: | | | | | | | | | | | | | | | | | | | | | | | | | | | | | | | | |
| Beginning of Year/Period | | | 26,219,257 | | | | 30,042,492 | | | | 229,432,181 | | | | 131,190,396 | | | | 272,169,597 | | | | 216,578,325 | | | | 111,400,818 | | | | 67,841,271 | |
| End of Year/Period | | $ | 23,540,237 | | | $ | 26,219,257 | | | $ | 241,311,815 | | | $ | 229,432,181 | | | $ | 250,133,917 | | | $ | 272,169,597 | | | $ | 94,924,378 | | | $ | 111,400,818 | |
See accompanying notes which are an integral part to these financial statements.
| FINANCIAL HIGHLIGHTS |
| Dunham Corporate/Government Bond Fund |
The table sets forth financial data for one share of beneficial interest outstanding throughout each year/period.
| | | Class N | | | | | | | | | | | | | | | | | | | | | | | | | |
| | | Six Months Ended | | | Year Ended October 31, | | | | | | | | | | | | | | | | | | | | | | | | | |
| | | April 30, 2022 | | | 2021 | | | 2020 | | | 2019 | | | 2018 | | | 2017 | | | | | | | | | | | | | | | | | | | | | | | | | |
| | | (Unaudited) | | | | | | | | | | | | | | | | | | | | | | | | | | | | | | | | | | | | | | | | |
| Net asset value, beginning of year/period | | $ | 14.41 | | | $ | 14.44 | | | $ | 14.02 | | | $ | 13.06 | | | $ | 13.82 | | | $ | 13.92 | | | | | | | | | | | | | | | | | | | | | | | | | |
| Income (loss) from investment operations: | | | | | | | | | | | | | | | | | | | | | | | | | | | | | | | | | | | | | | | | | | | | | | | | |
| Net investment income* | | | 0.10 | | | | 0.19 | | | | 0.28 | | | | 0.36 | | | | 0.34 | | | | 0.31 | | | | | | | | | | | | | | | | | | | | | | | | | |
| Net realized and unrealized gain (loss) | | | (1.22 | ) | | | (0.01 | ) | | | 0.44 | | | | 0.96 | | | | (0.74 | ) | | | (0.08 | ) | | | | | | | | | | | | | | | | | | | | | | | | |
| Total income (loss) from investment operations | | | (1.12 | ) | | | 0.18 | | | | 0.72 | | | | 1.32 | | | | (0.40 | ) | | | 0.23 | | | | | | | | | | | | | | | | | | | | | | | | | |
| Less distributions: | | | | | | | | | | | | | | | | | | | | | | | | | | | | | | | | | | | | | | | | | | | | | | | | |
| Distributions from net investment income | | | (0.11 | ) | | | (0.21 | ) | | | (0.30 | ) | | | (0.36 | ) | | | (0.36 | ) | | | (0.33 | ) | | | | | | | | | | | | | | | | | | | | | | | | |
| Total distributions | | | (0.11 | ) | | | (0.21 | ) | | | (0.30 | ) | | | (0.36 | ) | | | (0.36 | ) | | | (0.33 | ) | | | | | | | | | | | | | | | | | | | | | | | | |
| Net asset value, end of year/period | | $ | 13.18 | | | $ | 14.41 | | | $ | 14.44 | | | $ | 14.02 | | | $ | 13.06 | | | $ | 13.82 | | | | | | | | | | | | | | | | | | | | | | | | | |
| Total return + # | | | (7.87 | )% | | | 1.23 | % | | | 5.17 | % | | | 10.27 | % | | | (2.93 | )% | | | 1.72 | % | | | | | | | | | | | | | | | | | | | | | | | | |
| Ratios/Supplemental Data: | | | | | | | | | | | | | | | | | | | | | | | | | | | | | | | | | | | | | | | | | | | | | | | | |
| Net assets, end of year/period (in 000s) | | $ | 60,869 | | | $ | 78,345 | | | $ | 61,209 | | | $ | 42,730 | | | $ | 41,151 | | | $ | 62,757 | | | | | | | | | | | | | | | | | | | | | | | | | |
| Ratios of expenses to average net assets: | | | 1.28 | % | | | 1.25 | % | | | 1.24 | % | | | 1.20 | % | | | 1.20 | % | | | 1.35 | % | | | | | | | | | | | | | | | | | | | | | | | | |
| Ratios of net investment income to average net assets: | | | 1.47 | % | | | 1.30 | % | | | 1.99 | % | | | 2.68 | % | | | 2.53 | % | | | 2.27 | % | | | | | | | | | | | | | | | | | | | | | | | | |
| Portfolio turnover rate (1) | | | 29 | % | | | 59 | % | | | 75 | % | | | 76 | % | | | 92 | % | | | 61 | % | | | | | | | | | | | | | | | | | | | | | | | | |
| | | | | | | | | | | | | | | | | | | | | | | | | | | | | | | | | | | | | | | | | | | | | | | | | |
| | | Class A | | | Class C | |
| | | Six Months Ended | | | Year Ended October 31, | | | Six Months Ended | | | Year Ended October 31, | |
| | | April 30, 2022 | | | 2021 | | | 2020 | | | 2019 | | | 2018 | | | 2017 | | | April 30, 2022 | | | 2021 | | | 2020 | | | 2019 | | | 2018 | | | 2017 | |
| | | (Unaudited) | | | | | | | | | | | | | | | | | | (Unaudited) | | | | | | | | | | | | | | | | |
| Net asset value, beginning of year/period | | $ | 14.39 | | | $ | 14.42 | | | $ | 14.01 | | | $ | 13.04 | | | $ | 13.80 | | | $ | 13.90 | | | $ | 14.28 | | | $ | 14.31 | | | $ | 13.91 | | | $ | 12.95 | | | $ | 13.71 | | | $ | 13.81 | |
| Income (loss) from investment operations: | | | | | | | | | | | | | | | | | | | | | | | | | | | | | | | | | | | | | | | | | | | | | | | | |
| Net investment income* | | | 0.08 | | | | 0.15 | | | | 0.25 | | | | 0.33 | | | | 0.31 | | | | 0.28 | | | | 0.05 | | | | 0.08 | | | | 0.18 | | | | 0.26 | | | | 0.24 | | | | 0.21 | |
| Net realized and unrealized gain (loss) | | | (1.22 | ) | | | (0.01 | ) | | | 0.42 | | | | 0.97 | | | | (0.74 | ) | | | (0.08 | ) | | | (1.21 | ) | | | (0.01 | ) | | | 0.41 | | | | 0.96 | | | | (0.74 | ) | | | (0.08 | ) |
| Total income (loss) from investment operations | | | (1.14 | ) | | | 0.14 | | | | 0.67 | | | | 1.30 | | | | (0.43 | ) | | | 0.20 | | | | (1.16 | ) | | | 0.07 | | | | 0.59 | | | | 1.22 | | | | (0.50 | ) | | | 0.13 | |
| Less distributions: | | | | | | | | | | | | | | | | | | | | | | | | | | | | | | | | | | | | | | | | | | | | | | | | |
| Distributions from net investment income | | | (0.09 | ) | | | (0.17 | ) | | | (0.26 | ) | | | (0.33 | ) | | | (0.33 | ) | | | (0.30 | ) | | | (0.06 | ) | | | (0.10 | ) | | | (0.19 | ) | | | (0.26 | ) | | | (0.26 | ) | | | (0.23 | ) |
| Total distributions | | | (0.09 | ) | | | (0.17 | ) | | | (0.26 | ) | | | (0.33 | ) | | | (0.33 | ) | | | (0.30 | ) | | | (0.06 | ) | | | (0.10 | ) | | | (0.19 | ) | | | (0.26 | ) | | | (0.26 | ) | | | (0.23 | ) |
| Net asset value, end of year/period | | $ | 13.16 | | | $ | 14.39 | | | $ | 14.42 | | | $ | 14.01 | | | $ | 13.04 | | | $ | 13.80 | | | $ | 13.06 | | | $ | 14.28 | | | $ | 14.31 | | | $ | 13.91 | | | $ | 12.95 | | | $ | 13.71 | |
| Total return + # | | | (7.93 | )% | | | 0.98 | % | | | 4.84 | % | | | 10.09 | % | | | (3.17 | )% | | | 1.47 | % | | | (8.14 | )% | | | 0.49 | % | | | 4.29 | % | | | 9.53 | % | | | (3.67 | )% | | | 0.98 | % |
| Ratios/Supplemental Data: | | | | | | | | | | | | | | | | | | | | | | | | | | | | | | | | | | | | | | | | | | | | | | | | |
| Net assets, end of year/period (in 000s) | | $ | 7,189 | | | $ | 9,593 | | | $ | 8,490 | | | $ | 7,510 | | | $ | 5,311 | | | $ | 6,260 | | | $ | 2,878 | | | $ | 2,878 | | | $ | 2,886 | | | $ | 2,672 | | | $ | 2,760 | | | $ | 3,199 | |
| Ratios of expenses to average net assets: | | | 1.53 | % | | | 1.50 | % | | | 1.49 | % | | | 1.45 | % | | | 1.45 | % | | | 1.60 | % | | | 2.03 | % | | | 2.00 | % | | | 1.99 | % | | | 1.95 | % | | | 1.95 | % | | | 2.10 | % |
| Ratios of net investment income to average net assets: | | | 1.22 | % | | | 1.05 | % | | | 1.75 | % | | | 2.41 | % | | | 2.31 | % | | | 2.01 | % | | | 0.74 | % | | | 0.56 | % | | | 1.31 | % | | | 1.92 | % | | | 1.81 | % | | | 1.52 | % |
| Portfolio turnover rate (1) | | | 29 | % | | | 59 | % | | | 75 | % | | | 76 | % | | | 92 | % | | | 61 | % | | | 29 | % | | | 59 | % | | | 75 | % | | | 76 | % | | | 92 | % | | | 61 | % |
| * | The net investment income per share data was determined using the average shares outstanding throughout each year/period. |
| + | Assumes reinvestment of all dividends and distributions, if any. Total return does not reflect the deductions of taxes that a shareholder would pay on distributions or on the redemption of shares and does not reflect the impact of any sales charge. |
| # | Includes adjustments in accordance with accounting principles generally accepted in the United States and, consequently, the net asset values for financial reporting purposes and the returns based upon those net asset values may differ from the net asset values and returns for shareholder transactions. Adjustments may apply to some but not all years and classes. |
| (1) | Not annualized for periods less than one year. |
See accompanying notes which are an integral part to these financial statements.
| FINANCIAL HIGHLIGHTS |
| Dunham Floating Rate Bond Fund |
| |
| The table sets forth financial data for one share of beneficial interest outstanding throughout each year/period. |
| | | Class N | | | | | | | | | | | | | | | | | | | | | | | | | |
| | | Six Months Ended | | | Year Ended October 31, | | | | | | | | | | | | | | | | | | | | | | | | | |
| | | April 30, 2022 | | | 2021 | | | 2020 | | | 2019 | | | 2018 | | | 2017 | | | | | | | | | | | | | | | | | | | | | | | | | |
| | | (Unaudited) | | | | | | | | | | | | | | | | | | | | | | | | | | | | | | | | | | | | | | | | |
| Net asset value, beginning of year/period | | $ | 9.18 | | | $ | 8.90 | | | $ | 9.36 | | | $ | 9.62 | | | $ | 9.73 | | | $ | 9.70 | | | | | | | | | | | | | | | | | | | | | | | | | |
| Income (loss) from investment operations: | | | | | | | | | | | | | | | | | | | | | | | | | | | | | | | | | | | | | | | | | | | | | | | | |
| Net investment income* | | | 0.17 | | | | 0.27 | | | | 0.34 | | | | 0.44 | | | | 0.40 | | | | 0.35 | | | | | | | | | | | | | | | | | | | | | | | | | |
| Net realized and unrealized gain (loss) | | | (0.21 | ) | | | 0.32 | | | | (0.47 | ) | | | (0.26 | ) | | | (0.11 | ) | | | 0.03 | | | | | | | | | | | | | | | | | | | | | | | | | |
| Total income (loss) from investment operations | | | (0.04 | ) | | | 0.59 | | | | (0.13 | ) | | | 0.18 | | | | 0.29 | | | | 0.38 | | | | | | | | | | | | | | | | | | | | | | | | | |
| Less distributions: | | | | | | | | | | | | | | | | | | | | | | | | | | | | | | | | | | | | | | | | | | | | | | | | |
| Distributions from net investment income | | | (0.18 | ) | | | (0.31 | ) | | | (0.33 | ) | | | (0.44 | ) | | | (0.40 | ) | | | (0.35 | ) | | | | | | | | | | | | | | | | | | | | | | | | |
| Total distributions | | | (0.18 | ) | | | (0.31 | ) | | | (0.33 | ) | | | (0.44 | ) | | | (0.40 | ) | | | (0.35 | ) | | | | | | | | | | | | | | | | | | | | | | | | |
| Net asset value, end of year/period | | $ | 8.96 | | | $ | 9.18 | | | $ | 8.90 | | | $ | 9.36 | | | $ | 9.62 | | | $ | 9.73 | | | | | | | | | | | | | | | | | | | | | | | | | |
| Total return + # | | | (0.51 | )% | | | 6.63 | % | | | (1.30 | )% | | | 1.99 | % | | | 3.02 | % | | | 4.01 | % | | | | | | | | | | | | | | | | | | | | | | | | |
| Ratios/Supplemental Data: | | | | | | | | | | | | | | | | | | | | | | | | | | | | | | | | | | | | | | | | | | | | | | | | |
| Net assets, end of year/period (in 000s) | | $ | 175,753 | | | $ | 173,112 | | | $ | 135,536 | | | $ | 157,757 | | | $ | 164,936 | | | $ | 157,485 | | | | | | | | | | | | | | | | | | | | | | | | | |
| Ratios of expenses to average net assets: ^ | | | 0.99 | % | | | 0.90 | % | | | 1.00 | % | | | 1.01 | % | | | 0.97 | % | | | 1.03 | % | | | | | | | | | | | | | | | | | | | | | | | | |
| Ratios of net investment income to average net assets: ^ | | | 3.87 | % | | | 2.97 | % | | | 3.81 | % | | | 4.60 | % | | | 4.08 | % | | | 3.60 | % | | | | | | | | | | | | | | | | | | | | | | | | |
| Portfolio turnover rate (1) | | | 25 | % | | | 135 | % | | | 76 | % | | | 44 | % | | | 79 | % | | | 91 | % | | | | | | | | | | | | | | | | | | | | | | | | |
| | | | | | | | | | | | | | | | | | | | | | | | | | | | | | | | | | | | | | | | | | | | | | | | | |
| | | Class A | | | Class C | |
| | | Six Months Ended | | | Year Ended October 31, | | | Six Months Ended | | | Year Ended October 31, | |
| | | April 30, 2022 | | | 2021 | | | 2020 | | | 2019 | | | 2018 | | | 2017 | | | April 30, 2022 | | | 2021 | | | 2020 | | | 2019 | | | 2018 | | | 2017 | |
| | | (Unaudited) | | | | | | | | | | | | | | | | | | (Unaudited) | | | | | | | | | | | | | | | | |
| Net asset value, beginning of year/period | | $ | 9.17 | | | $ | 8.89 | | | $ | 9.35 | | | $ | 9.61 | | | $ | 9.72 | | | $ | 9.70 | | | $ | 9.18 | | | $ | 8.89 | | | $ | 9.35 | | | $ | 9.62 | | | $ | 9.73 | | | $ | 9.69 | |
| Income (loss) from investment operations: | | | | | | | | | | | | | | | | | | | | | | | | | | | | | | | | | | | | | | | | | | | | | | | | |
| Net investment income* | | | 0.16 | | | | 0.25 | | | | 0.32 | | | | 0.41 | | | | 0.37 | | | | 0.32 | | | | 0.14 | | | | 0.21 | | | | 0.27 | | | | 0.37 | | | | 0.33 | | | | 0.28 | |
| Net realized and unrealized gain (loss) | | | (0.21 | ) | | | 0.32 | | | | (0.47 | ) | | | (0.25 | ) | | | (0.11 | ) | | | 0.03 | | | | (0.22 | ) | | | 0.32 | | | | (0.46 | ) | | | (0.27 | ) | | | (0.11 | ) | | | 0.04 | |
| Total income (loss) from investment operations | | | (0.05 | ) | | | 0.57 | | | | (0.15 | ) | | | 0.16 | | | | 0.26 | | | | 0.35 | | | | (0.08 | ) | | | 0.53 | | | | (0.19 | ) | | | 0.10 | | | | 0.22 | | | | 0.32 | |
| Less distributions: | | | | | | | | | | | | | | | | | | | | | | | | | | | | | | | | | | | | | | | | | | | | | | �� | | |
| Distributions from net investment income | | | (0.17 | ) | | | (0.29 | ) | | | (0.31 | ) | | | (0.42 | ) | | | (0.37 | ) | | | (0.33 | ) | | | (0.15 | ) | | | (0.24 | ) | | | (0.27 | ) | | | (0.37 | ) | | | (0.33 | ) | | | (0.28 | ) |
| Total distributions | | | (0.17 | ) | | | (0.29 | ) | | | (0.31 | ) | | | (0.42 | ) | | | (0.37 | ) | | | (0.33 | ) | | | (0.15 | ) | | | (0.24 | ) | | | (0.27 | ) | | | (0.37 | ) | | | (0.33 | ) | | | (0.28 | ) |
| Net asset value, end of year/period | | $ | 8.95 | | | $ | 9.17 | | | $ | 8.89 | | | $ | 9.35 | | | $ | 9.61 | | | $ | 9.72 | | | $ | 8.95 | | | $ | 9.18 | | | $ | 8.89 | | | $ | 9.35 | | | $ | 9.62 | | | $ | 9.73 | |
| Total return + # | | | (0.62 | )% | | | 6.39 | % | | | (1.56 | )% | | | 1.74 | % | | | 2.77 | % | | | 3.64 | % | | | (0.87 | )% | | | 5.98 | % | | | (2.06 | )% | | | 1.13 | % | | | 2.26 | % | | | 3.31 | % |
| Ratios/Supplemental Data: | | | | | | | | | | | | | | | | | | | | | | | | | | | | | | | | | | | | | | | | | | | | | | | | |
| Net assets, end of year/period (in 000s) | | $ | 22,904 | | | $ | 22,225 | | | $ | 19,705 | | | $ | 21,997 | | | $ | 20,205 | | | $ | 16,229 | | | $ | 6,720 | | | $ | 6,732 | | | $ | 6,800 | | | $ | 8,654 | | | $ | 7,236 | | | $ | 6,215 | |
| Ratios of expenses to average net assets: ^ | | | 1.24 | % | | | 1.15 | % | | | 1.25 | % | | | 1.26 | % | | | 1.22 | % | | | 1.28 | % | | | 1.74 | % | | | 1.65 | % | | | 1.75 | % | | | 1.76 | % | | | 1.72 | % | | | 1.78 | % |
| Ratios of net investment income to average net assets: ^ | | | 3.61 | % | | | 2.73 | % | | | 3.56 | % | | | 4.36 | % | | | 3.84 | % | | | 3.33 | % | | | 3.11 | % | | | 2.24 | % | | | 3.07 | % | | | 3.86 | % | | | 3.43 | % | | | 2.89 | % |
| Portfolio turnover rate (1) | | | 25 | % | | | 135 | % | | | 76 | % | | | 44 | % | | | 79 | % | | | 91 | % | | | 25 | % | | | 135 | % | | | 76 | % | | | 44 | % | | | 79 | % | | | 91 | % |
| * | The net investment income per share data was determined using the average shares outstanding throughout each year/period. |
| + | Assumes reinvestment of all dividends and distributions, if any. Total return does not reflect the deductions of taxes that a shareholder would pay on distributions or on the redemption of shares and does not reflect the impact of any sales charge. |
| # | Includes adjustments in accordance with accounting principles generally accepted in the United States and, consequently, the net asset values for financial reporting purposes and the returns based upon those net asset values may differ from the net asset values and returns for shareholder transactions. Adjustments may apply to some but not all years and classes. |
| ^ | Annualized for periods less than one year. |
| (1) | Not annualized for periods less than one year. |
See accompanying notes which are an integral part to these financial statements.
| FINANCIAL HIGHLIGHTS |
| Dunham High-Yield Bond Fund |
| |
| The table sets forth financial data for one share of beneficial interest outstanding throughout each year/period. |
| | | Class N | | | | | | | | | | | | | | | | | | | | | | | | | |
| | | Six Months Ended | | | Year Ended October 31, | | | | | | | | | | | | | | | | | | | | | | | | | |
| | | April 30, 2022 | | | 2021 | | | 2020 | | | 2019 | | | 2018 | | | 2017 | | | | | | | | | | | | | | | | | | | | | | | | | |
| | | (Unaudited) | | | | | | | | | | | | | | | | | | | | | | | | | | | | | | | | | | | | | | | | |
| Net asset value, beginning of year/period | | $ | 9.34 | | | $ | 8.88 | | | $ | 8.97 | | | $ | 8.72 | | | $ | 9.22 | | | $ | 8.94 | | | | | | | | | | | | | | | | | | | | | | | | | |
| Income (loss) from investment operations: | | | | | | | | | | | | | | | | | | | | | | | | | | | | | | | | | | | | | | | | | | | | | | | | |
| Net investment income* | | | 0.22 | | | | 0.38 | | | | 0.41 | | | | 0.45 | | | | 0.44 | | | | 0.42 | | | | | | | | | | | | | | | | | | | | | | | | | |
| Net realized and unrealized gain (loss) | | | (0.84 | ) | | | 0.46 | | | | (0.09 | ) | | | 0.26 | | | | (0.51 | ) | | | 0.30 | | | | | | | | | | | | | | | | | | | | | | | | | |
| Total income (loss) from investment operations | | | (0.62 | ) | | | 0.84 | | | | 0.32 | | | | 0.71 | | | | (0.07 | ) | | | 0.72 | | | | | | | | | | | | | | | | | | | | | | | | | |
| Less distributions: | | | | | | | | | | | | | | | | | | | | | | | | | | | | | | | | | | | | | | | | | | | | | | | | |
| Distributions from net investment income | | | (0.20 | ) | | | (0.38 | ) | | | (0.41 | ) | | | (0.46 | ) | | | (0.43 | ) | | | (0.44 | ) | | | | | | | | | | | | | | | | | | | | | | | | |
| Total distributions | | | (0.20 | ) | | | (0.38 | ) | | | (0.41 | ) | | | (0.46 | ) | | | (0.43 | ) | | | (0.44 | ) | | | | | | | | | | | | | | | | | | | | | | | | |
| Net asset value, end of year/period | | $ | 8.52 | | | $ | 9.34 | | | $ | 8.88 | | | $ | 8.97 | | | $ | 8.72 | | | $ | 9.22 | | | | | | | | | | | | | | | | | | | | | | | | | |
| Total return + # | | | (6.70 | )% | | | 9.54 | % | | | 3.74 | % | | | 8.42 | % | | | (0.80 | )% | | | 8.19 | % | | | | | | | | | | | | | | | | | | | | | | | | |
| Ratios/Supplemental Data: | | | | | | | | | | | | | | | | | | | | | | | | | | | | | | | | | | | | | | | | | | | | | | | | |
| Net assets, end of year/period (in 000s) | | $ | 89,169 | | | $ | 101,951 | | | $ | 83,009 | | | $ | 90,262 | | | $ | 94,596 | | | $ | 103,567 | | | | | | | | | | | | | | | | | | | | | | | | | |
| Ratios of expenses to average net assets: ^ | | | 1.18 | % | | | 1.17 | % | | | 1.14 | % | | | 1.12 | % | | | 1.12 | % | | | 1.19 | % | | | | | | | | | | | | | | | | | | | | | | | | |
| Ratios of net investment income to average net assets: ^ | | | 4.82 | % | | | 4.07 | % | | | 4.69 | % | | | 5.12 | % | | | 4.84 | % | | | 4.62 | % | | | | | | | | | | | | | | | | | | | | | | | | |
| Portfolio turnover rate (1) | | | 20 | % | | | 69 | % | | | 75 | % | | | 70 | % | | | 101 | % | | | 142 | % | | | | | | | | | | | | | | | | | | | | | | | | |
| | | | | | | | | | | | | | | | | | | | | | | | | | | | | | | | | | | | | | | | | | | | | | | | | |
| | | Class A | | | Class C | |
| | | Six Months Ended | | | Year Ended October 31, | | | Six Months Ended | | | Year Ended October 31, | |
| | | April 30, 2022 | | | 2021 | | | 2020 | | | 2019 | | | 2018 | | | 2017 | | | April 30, 2022 | | | 2021 | | | 2020 | | | 2019 | | | 2018 | | | 2017 | |
| | | (Unaudited) | | | | | | | | | | | | | | | | | | (Unaudited) | | | | | | | | | | | | | | | | |
| Net asset value, beginning of year/period | | $ | 9.44 | | | $ | 8.97 | | | $ | 9.06 | | | $ | 8.81 | | | $ | 9.29 | | | $ | 9.02 | | | $ | 9.29 | | | $ | 8.83 | | | $ | 8.92 | | | $ | 8.68 | | | $ | 9.17 | | | $ | 8.88 | |
| Income (loss) from investment operations: | | | | | | | | | | | | | | | | | | | | | | | | | | | | | | | | | | | | | | | | | | | | | | | | |
| Net investment income* | | | 0.21 | | | | 0.36 | | | | 0.39 | | | | 0.44 | | | | 0.42 | | | | 0.40 | | | | 0.18 | | | | 0.31 | | | | 0.34 | | | | 0.39 | | | | 0.37 | | | | 0.35 | |
| Net realized and unrealized gain (loss) | | | (0.84 | ) | | | 0.47 | | | | (0.09 | ) | | | 0.25 | | | | (0.49 | ) | | | 0.28 | | | | (0.82 | ) | | | 0.46 | | | | (0.09 | ) | | | 0.25 | | | | (0.50 | ) | | | 0.30 | |
| Total income (loss) from investment operations | | | (0.63 | ) | | | 0.83 | | | | 0.30 | | | | 0.69 | | | | (0.07 | ) | | | 0.68 | | | | (0.64 | ) | | | 0.77 | | | | 0.25 | | | | 0.64 | | | | (0.13 | ) | | | 0.65 | |
| Less distributions: | | | | | | | | | | | | | | | | | | | | | | | | | | | | | | | | | | | | | | | | | | | | | | | | |
| Distributions from net investment income | | | (0.19 | ) | | | (0.36 | ) | | | (0.39 | ) | | | (0.44 | ) | | | (0.41 | ) | | | (0.41 | ) | | | (0.17 | ) | | | (0.31 | ) | | | (0.34 | ) | | | (0.40 | ) | | | (0.36 | ) | | | (0.36 | ) |
| Total distributions | | | (0.19 | ) | | | (0.36 | ) | | | (0.39 | ) | | | (0.44 | ) | | | (0.41 | ) | | | (0.41 | ) | | | (0.17 | ) | | | (0.31 | ) | | | (0.34 | ) | | | (0.40 | ) | | | (0.36 | ) | | | (0.36 | ) |
| Net asset value, end of year/period | | $ | 8.62 | | | $ | 9.44 | | | $ | 8.97 | | | $ | 9.06 | | | $ | 8.81 | | | $ | 9.29 | | | $ | 8.48 | | | $ | 9.29 | | | $ | 8.83 | | | $ | 8.92 | | | $ | 8.68 | | | $ | 9.17 | |
| Total return + # | | | (6.75 | )% | | | 9.29 | % | | | 3.44 | % | | | 8.07 | % | | | (0.82 | )% | | | 7.70 | % | | | (6.98 | )% | | | 8.79 | % | | | 2.95 | % | | | 7.55 | % | | | (1.43 | )% | | | 7.45 | % |
| Ratios/Supplemental Data: | | | | | | | | | | | | | | | | | | | | | | | | | | | | | | | | | | | | | | | | | | | | | | | | |
| Net assets, end of year/period (in 000s) | | $ | 12,684 | | | $ | 13,592 | | | $ | 12,127 | | | $ | 12,336 | | | $ | 12,393 | | | $ | 12,085 | | | $ | 4,288 | | | $ | 4,746 | | | $ | 4,663 | | | $ | 7,497 | | | $ | 7,392 | | | $ | 7,785 | |
| Ratios of expenses to average net assets: ^ | | | 1.43 | % | | | 1.42 | % | | | 1.39 | % | | | 1.37 | % | | | 1.37 | % | | | 1.44 | % | | | 1.93 | % | | | 1.92 | % | | | 1.89 | % | | | 1.87 | % | | | 1.87 | % | | | 1.94 | % |
| Ratios of net investment income to average net assets: ^ | | | 4.56 | % | | | 3.82 | % | | | 4.44 | % | | | 4.87 | % | | | 4.60 | % | | | 4.38 | % | | | 4.07 | % | | | 3.32 | % | | | 3.93 | % | | | 4.37 | % | | | 4.09 | % | | | 3.88 | % |
| Portfolio turnover rate (1) | | | 20 | % | | | 69 | % | | | 75 | % | | | 70 | % | | | 101 | % | | | 142 | % | | | 20 | % | | | 69 | % | | | 75 | % | | | 70 | % | | | 101 | % | | | 142 | % |
| * | The net investment income (loss) per share data was determined using the average shares outstanding throughout each year/period. |
| + | Assumes reinvestment of all dividends and distributions, if any. Total return does not reflect the deductions of taxes that a shareholder would pay on distributions or on the redemption of shares and does not reflect the impact of any sales charge. |
| # | Includes adjustments in accordance with accounting principles generally accepted in the United States and, consequently, the net asset values for financial reporting purposes and the returns based upon those net asset values may differ from the net asset values and returns for shareholder transactions. Adjustments may apply to some but not all years and classes. |
| ^ | Annualized for periods less than one year. |
| (1) | Not annualized for periods less than one year. |
See accompanying notes which are an integral part to these financial statements.
| FINANCIAL HIGHLIGHTS |
| Dunham International Opportunity Bond Fund |
| |
| The table sets forth financial data for one share of beneficial interest outstanding throughout each year/period. |
| | | | | | Class N | | | | | | | | | | | | | | | | | | | | | | | | | |
| | | Six Months Ended | | | Year Ended October 31, | | | | | | | | | | | | | | | | | | | | | | | | | |
| | | April 30, 2022 | | | 2021 | | | 2020 | | | 2019 | | | 2018 | | | 2017 | | | | | | | | | | | | | | | | | | | | | | | | | |
| | | (Unaudited) | | | | | | | | | | | | | | | | | | | | | | | | | | | | | | | | | | | | | | | | |
| Net asset value, beginning of year/period | | $ | 9.18 | | | $ | 9.05 | | | $ | 9.43 | | | $ | 8.93 | | | $ | 9.32 | | | $ | 9.37 | | | | | | | | | | | | | | | | | | | | | | | | | |
| Income (loss) from investment operations: | | | | | | | | | | | | | | | | | | | | | | | | | | | | | | | | | | | | | | | | | | | | | | | | |
| Net investment income (loss)* | | | 0.15 | | | | 0.21 | | | | 0.19 | | | | (0.03 | ) | | | (0.03 | ) | | | (0.03 | ) | | | | | | | | | | | | | | | | | | | | | | | | |
| Net realized and unrealized gain (loss) | | | (1.10 | ) | | | 0.15 | | | | (0.37 | ) | | | 0.58 | | | | (0.35 | ) | | | 0.07 | | | | | | | | | | | | | | | | | | | | | | | | | |
| Total income (loss) from investment operations | | | (0.95 | ) | | | 0.36 | | | | (0.18 | ) | | | 0.55 | | | | (0.38 | ) | | | 0.04 | | | | | | | | | | | | | | | | | | | | | | | | | |
| Less distributions: | | | | | | | | | | | | | | | | | | | | | | | | | | | | | | | | | | | | | | | | | | | | | | | | |
| Distributions from net investment income | | | (0.17 | ) | | | (0.23 | ) | | | (0.11 | ) | | | (0.04 | ) | | | — | | | | — | | | | | | | | | | | | | | | | | | | | | | | | | |
| Distributions from net realized gains | | | (0.00 | ) | | | — | | | | (0.02 | ) | | | (0.01 | ) | | | (0.01 | ) | | | (0.09 | ) | | | | | | | | | | | | | | | | | | | | | | | | |
| Tax return of capital | | | — | | | | — | | | | (0.07 | ) | | | — | | | | — | | | | — | | | | | | | | | | | | | | | | | | | | | | | | | |
| Total distributions | | | (0.17 | ) | | | (0.23 | ) | | | (0.20 | ) | | | (0.05 | ) | | | (0.01 | ) | | | (0.09 | ) | | | | | | | | | | | | | | | | | | | | | | | | |
| Net asset value, end of year/period | | $ | 8.06 | | | $ | 9.18 | | | $ | 9.05 | | | $ | 9.43 | | | $ | 8.93 | | | $ | 9.32 | | | | | | | | | | | | | | | | | | | | | | | | | |
| Total return + # | | | (10.09 | )% | | | 3.93 | % | | | (1.81 | )% | | | 6.29 | % | | | (4.08 | )% | | | 0.57 | % | | | | | | | | | | | | | | | | | | | | | | | | |
| Ratios/Supplemental Data: | | | | | | | | | | | | | | | | | | | | | | | | | | | | | | | | | | | | | | | | | | | | | | | | |
| Net assets, end of year/period (in 000s) | | $ | 47,228 | | | $ | 47,228 | | | $ | 41,346 | | | $ | 32,927 | | | $ | 31,838 | | | $ | 32,441 | | | | | | | | | | | | | | | | | | | | | | | | | |
| Ratios of expenses to average net assets: | | | 1.28 | % | | | 1.78 | % | | | 1.36 | % | | | 1.36 | % | | | 1.35 | % | | | 1.54 | % | | | | | | | | | | | | | | | | | | | | | | | | |
| Ratios of net investment income (loss) to average net assets: | | | 3.36 | % | | | 2.21 | % | | | 2.08 | % | | | (0.30 | )% | | | (0.35 | )% | | | (0.37 | )% | | | | | | | | | | | | | | | | | | | | | | | | |
| Portfolio turnover rate (1) | | | 28 | % | | | 40 | % | | | 138 | % | | | 109 | % | | | 45 | % | | | 56 | % | | | | | | | | | | | | | | | | | | | | | | | | |
| | | | | | | | | | | | | | | | | | | | | | | | | | | | | | | | | | | | | | | | | | | | | | | | | |
| | | | | | Class A | | | | | | Class C | |
| | | Six Months Ended | | | Year Ended October 31, | | | Six Months Ended | | | Year Ended October 31, | |
| | | April 30, 2022 | | | 2021 | | | 2020 | | | 2019 | | | 2018 | | | 2017 | | | April 30, 2022 | | | 2021 | | | 2020 | | | 2019 | | | 2018 | | | 2017 | |
| | | (Unaudited) | | | | | | | | | | | | | | | | | | (Unaudited) | | | | | | | | | | | | | | | | |
| Net asset value, beginning of year/period | | $ | 9.08 | | | $ | 8.96 | | | $ | 9.34 | | | $ | 8.85 | | | $ | 9.26 | | | $ | 9.32 | | | $ | 8.84 | | | $ | 8.73 | | | $ | 9.11 | | | $ | 8.66 | | | $ | 9.10 | | | $ | 9.22 | |
| Income (loss) from investment operations: | | | | | | | | | | | | | | | | | | | | | | | | | | | | | | | | | | | | | | | | | | | | | | | | |
| Net investment income (loss)* | | | 0.13 | | | | 0.18 | | | | 0.17 | | | | (0.05 | ) | | | (0.06 | ) | | | (0.06 | ) | | | 0.11 | | | | 0.13 | | | | 0.10 | | | | (0.09 | ) | | | (0.10 | ) | | | (0.10 | ) |
| Net realized and unrealized gain (loss) | | | (1.04 | ) | | | 0.14 | | | | (0.37 | ) | | | 0.57 | | | | (0.34 | ) | | | 0.09 | | | | (0.99 | ) | | | 0.14 | | | | (0.33 | ) | | | 0.55 | | | | (0.33 | ) | | | 0.07 | |
| Total income (loss) from investment operations | | | (0.91 | ) | | | 0.32 | | | | (0.20 | ) | | | 0.52 | | | | (0.40 | ) | | | 0.03 | | | | (0.88 | ) | | | 0.27 | | | | (0.23 | ) | | | 0.46 | | | | (0.43 | ) | | | (0.03 | ) |
| Less distributions: | | | | | | | | | | | | | | | | | | | | | | | | | | | | | | | | | | | | | | | | | | | | | | | | |
| Distributions from net investment income | | | (0.19 | ) | | | (0.20 | ) | | | (0.09 | ) | | | (0.02 | ) | | | — | | | | — | | | | (0.20 | ) | | | (0.16 | ) | | | (0.06 | ) | | | — | | | | — | | | | — | |
| Distributions from net realized gains | | | — | | | | — | | | | (0.02 | ) | | | (0.01 | ) | | | (0.01 | ) | | | (0.09 | ) | | | (0.00 | ) | | | — | | | | (0.02 | ) | | | (0.01 | ) | | | (0.01 | ) | | | (0.09 | ) |
| Tax return of capital | | | — | | | | — | | | | (0.07 | ) | | | — | | | | — | | | | — | | | | — | | | | — | | | | (0.07 | ) | | | — | | | | — | | | | — | |
| Total distributions | | | (0.19 | ) | | | (0.20 | ) | | | (0.18 | ) | | | (0.03 | ) | | | (0.01 | ) | | | (0.09 | ) | | | (0.21 | ) | | | (0.16 | ) | | | (0.15 | ) | | | (0.01 | ) | | | (0.01 | ) | | | (0.09 | ) |
| Net asset value, end of year/period | | $ | 7.98 | | | $ | 9.08 | | | $ | 8.96 | | | $ | 9.34 | | | $ | 8.85 | | | $ | 9.26 | | | $ | 7.76 | | | $ | 8.84 | | | $ | 8.73 | | | $ | 9.11 | | | $ | 8.66 | | | $ | 9.10 | |
| Total return + # | | | (10.10 | )% | | | 3.60 | % | | | (2.03 | )% | | | 5.98 | % | | | (4.32 | )% | | | 0.46 | % | | | (10.38 | )% | | | 3.07 | % | | | (2.48 | )% | | | 5.36 | % | | | (4.72 | )% | | | (0.19 | )% |
| Ratios/Supplemental Data: | | | | | | | | | | | | | | | | | | | | | | | | | | | | | | | | | | | | | | | | | | | | | | | | |
| Net assets, end of year/period (in 000s) | | $ | 7,004 | | | $ | 7,004 | | | $ | 6,722 | | | $ | 4,357 | | | $ | 3,802 | | | $ | 2,968 | | | $ | 1,111 | | | $ | 1,111 | | | $ | 1,180 | | | $ | 1,442 | | | $ | 1,366 | | | $ | 1,330 | |
| Ratios of expenses to average net assets: | | | 1.53 | % | | | 2.03 | % | | | 1.61 | % | | | 1.61 | % | | | 1.60 | % | | | 1.79 | % | | | 2.03 | % | | | 2.53 | % | | | 2.11 | % | | | 2.11 | % | | | 2.10 | % | | | 2.29 | % |
| Ratios of net investment income (loss) to average net assets: | | | 3.11 | % | | | 1.96 | % | | | 1.91 | % | | | (0.55 | )% | | | (0.59 | )% | | | (0.63 | )% | | | 2.62 | % | | | 1.44 | % | | | 1.21 | % | | | (1.05 | )% | | | (1.10 | )% | | | (1.11 | )% |
| Portfolio turnover rate (1) | | | 28 | % | | | 40 | % | | | 138 | % | | | 109 | % | | | 45 | % | | | 56 | % | | | 28 | % | | | 40 | % | | | 138 | % | | | 109 | % | | | 45 | % | | | 56 | % |
| * | The net investment income (loss) per share data was determined using the average shares outstanding throughout the year/period. |
| + | Assumes reinvestment of all dividends and distributions, if any. Total return does not reflect the deductions of taxes that a shareholder would pay on distributions or on the redemption of shares and does not reflect the impact of any sales charge. |
| # | Includes adjustments in accordance with accounting principles generally accepted in the United States and, consequently, the net asset values for financial reporting purposes and the returns based upon those net asset values may differ from the net asset values and returns for shareholder transactions. Adjustments may apply to some but not all years and classes. |
| (1) | Not annualized for periods less than one year. |
See accompanying notes which are an integral part to these financial statements.
| FINANCIAL HIGHLIGHTS |
| Dunham Large Cap Value Fund |
| |
| The table sets forth financial data for one share of beneficial interest outstanding throughout each year/period. |
| | | Class N | | | | | | | | | | | | | | | | | | | | | | | | | |
| | | Six Months Ended | | | Year Ended October 31, | | | | | | | | | | | | | | | | | | | | | | | | | |
| | | April 30, 2022 | | | 2021 | | | 2020 | | | 2019 | | | 2018 | | | 2017 | | | | | | | | | | | | | | | | | | | | | | | | | |
| | | (Unaudited) | | | | | | | | | | | | | | | | | | | | | | | | | | | | | | | | | | | | | | | | |
| Net asset value, beginning of year/period | | $ | 19.59 | | | $ | 13.58 | | | $ | 14.96 | | | $ | 14.18 | | | $ | 14.16 | | | $ | 12.22 | | | | | | | | | | | | | | | | | | | | | | | | | |
| Income (loss) from investment operations: | | | | | | | | | | | | | | | | | | | | | | | | | | | | | | | | | | | | | | | | | | | | | | | | |
| Net investment income * | | | 0.06 | | | | 0.13 | | | | 0.17 | | | | 0.18 | | | | 0.14 | | | | 0.15 | | | | | | | | | | | | | | | | | | | | | | | | | |
| Net realized and unrealized gain (loss) | | | (0.95 | ) | | | 6.03 | | | | (1.03 | ) | | | 1.29 | | | | 0.15 | | | | 2.01 | | | | | | | | | | | | | | | | | | | | | | | | | |
| Total income (loss) from investment operations | | | (0.89 | ) | | | 6.16 | | | | (0.86 | ) | | | 1.47 | | | | 0.29 | | | | 2.16 | | | | | | | | | | | | | | | | | | | | | | | | | |
| Less distributions: | | | | | | | | | | | | | | | | | | | | | | | | | | | | | | | | | | | | | | | | | | | | | | | | |
| Distributions from net investment income | | | (0.11 | ) | | | (0.15 | ) | | | (0.18 | ) | | | (0.15 | ) | | | (0.13 | ) | | | (0.22 | ) | | | | | | | | | | | | | | | | | | | | | | | | |
| Distributions from net realized gains | | | (1.15 | ) | | | — | | | | (0.34 | ) | | | (0.54 | ) | | | (0.14 | ) | | | — | | | | | | | | | | | | | | | | | | | | | | | | | |
| Total distributions | | | (1.26 | ) | | | (0.15 | ) | | | (0.52 | ) | | | (0.69 | ) | | | (0.27 | ) | | | (0.22 | ) | | | | | | | | | | | | | | | | | | | | | | | | |
| Net asset value, end of year/period | | $ | 17.44 | | | $ | 19.59 | | | $ | 13.58 | | | $ | 14.96 | | | $ | 14.18 | | | $ | 14.16 | | | | | | | | | | | | | | | | | | | | | | | | | |
| Total return + # | | | (5.02 | )% | | | 45.69 | % | | | (6.15 | )% | | | 11.37 | % | | | 1.98 | % | | | 17.84 | % | | | | | | | | | | | | | | | | | | | | | | | | |
| Ratios/Supplemental Data: | | | | | | | | | | | | | | | | | | | | | | | | | | | | | | | | | | | | | | | | | | | | | | | | |
| Net assets, end of year/period (in 000s) | | $ | 122,597 | | | $ | 129,641 | | | $ | 73,557 | | | $ | 61,791 | | | $ | 55,428 | | | $ | 55,155 | | | | | | | | | | | | | | | | | | | | | | | | | |
| Ratios of expenses to average net assets: | | | | | | | | | | | | | | | | | | | | | | | | | | | | | | | | | | | | | | | | | | | | | | | | |
| Before fees paid indirectly | | | 1.28 | % | | | 1.10 | % | | | 1.24 | % | | | 1.14 | % | | | 1.30 | % | | | 1.13 | % | | | | | | | | | | | | | | | | | | | | | | | | |
| After fees paid indirectly | | | 1.28 | % | | | 1.10 | % | | | 1.24 | % | | | 1.14 | % | | | 1.30 | % | | | 1.12 | % | | | | | | | | | | | | | | | | | | | | | | | | |
| Ratios of net investment income to average net assets: | | | | | | | | | | | | | | | | | | | | | | | | | | | | | | | | | | | | | | | | | | | | | | | | |
| Before fees paid indirectly | | | 0.59 | % | | | 0.72 | % | | | 1.25 | % | | | 1.30 | % | | | 0.94 | % | | | 1.12 | % | | | | | | | | | | | | | | | | | | | | | | | | |
| After fees paid indirectly | | | 0.59 | % | | | 0.72 | % | | | 1.25 | % | | | 1.30 | % | | | 0.94 | % | | | 1.13 | % | | | | | | | | | | | | | | | | | | | | | | | | |
| Portfolio turnover rate (1) | | | 5 | % | | | 33 | % | | | 43 | % | | | 44 | % | | | 45 | % | | | 61 | % | | | | | | | | | | | | | | | | | | | | | | | | |
| | | | | | | | | | | | | | | | | | | | | | | | | | | | | | | | | | | | | | | | | | | | | | | | | |
| | | Class A | | | Class C | |
| | | Six Months Ended | | | Year Ended October 31, | | | Six Months Ended | | | Year Ended October 31, | |
| | | April 30, 2022 | | | 2021 | | | 2020 | | | 2019 | | | 2018 | | | 2017 | | | April 30, 2022 | | | 2021 | | | 2020 | | | 2019 | | | 2018 | | | 2017 | |
| | | (Unaudited) | | | | | | | | | | | | | | | | | | (Unaudited) | | | | | | | | | | | | | | | | |
| Net asset value, beginning of year/period | | $ | 19.46 | | | $ | 13.50 | | | $ | 14.87 | | | $ | 14.11 | | | $ | 14.10 | | | $ | 12.16 | | | $ | 18.40 | | | $ | 12.80 | | | $ | 14.17 | | | $ | 13.45 | | | $ | 13.47 | | | $ | 11.65 | |
| Income (loss) from investment operations: | | | | | | | | | | | | | | | | | | | | | | | | | | | | | | | | | | | | | | | | | | | | | | | | |
| Net investment income (loss)* | | | 0.03 | | | | 0.08 | | | | 0.14 | | | | 0.15 | | | | 0.10 | | | | 0.11 | | | | (0.04 | ) | | | (0.04 | ) | | | 0.03 | | | | 0.04 | | | | (0.01 | ) | | | 0.02 | |
| Net realized and unrealized gain (loss) | | | (0.94 | ) | | | 6.00 | | | | (1.03 | ) | | | 1.27 | | | | 0.15 | | | | 2.02 | | | | (0.88 | ) | | | 5.69 | | | | (0.98 | ) | | | 1.23 | | | | 0.15 | | | | 1.92 | |
| Total income (loss) from investment operations | | | (0.91 | ) | | | 6.08 | | | | (0.89 | ) | | | 1.42 | | | | 0.25 | | | | 2.13 | | | | (0.92 | ) | | | 5.65 | | | | (0.95 | ) | | | 1.27 | | | | 0.14 | | | | 1.94 | |
| Less distributions: | | | | | | | | | | | | | | | | | | | | | | | | | | | | | | | | | | | | | | | | | | | | | | | | |
| Distributions from net investment income | | | (0.07 | ) | | | (0.12 | ) | | | (0.14 | ) | | | (0.12 | ) | | | (0.10 | ) | | | (0.19 | ) | | | 0.00 | | | | (0.05 | ) | | | (0.08 | ) | | | (0.01 | ) | | | (0.02 | ) | | | (0.12 | ) |
| Distributions from net realized gains | | | (1.15 | ) | | | — | | | | (0.34 | ) | | | (0.54 | ) | | | (0.14 | ) | | | — | | | | (1.15 | ) | | | — | | | | (0.34 | ) | | | (0.54 | ) | | | (0.14 | ) | | | — | |
| Total distributions | | | (1.22 | ) | | | (0.12 | ) | | | (0.48 | ) | | | (0.66 | ) | | | (0.24 | ) | | | (0.19 | ) | | | (1.15 | ) | | | (0.05 | ) | | | (0.42 | ) | | | (0.55 | ) | | | (0.16 | ) | | | (0.12 | ) |
| Net asset value, end of year/period | | $ | 17.33 | | | $ | 19.46 | | | $ | 13.50 | | | $ | 14.87 | | | $ | 14.11 | | | $ | 14.10 | | | $ | 16.33 | | | $ | 18.40 | | | $ | 12.80 | | | $ | 14.17 | | | $ | 13.45 | | | $ | 13.47 | |
| Total return + # | | | (5.11 | )% | | | 45.28 | % | | | (6.33 | )% | | | 11.00 | % | | | 1.71 | % | | | 17.66 | % | | | (5.48 | )% | | | 44.20 | % | | | (7.05 | )% | | | 10.24 | % | | | 1.00 | % | | | 16.72 | % |
| Ratios/Supplemental Data: | | | | | | | | | | | | | | | | | | | | | | | | | | | | | | | | | | | | | | | | | | | | | | | | |
| Net assets, end of year/period (in 000s) | | $ | 23,503 | | | $ | 27,023 | | | $ | 16,855 | | | $ | 16,363 | | | $ | 12,525 | | | $ | 10,174 | | | $ | 4,324 | | | $ | 4,683 | | | $ | 3,897 | | | $ | 5,319 | | | $ | 4,167 | | | $ | 4,640 | |
| Ratios of expenses to average net assets: | | | | | | | | | | | | | | | | | | | | | | | | | | | | | | | | | | | | | | | | | | | | | | | | |
| Before fees paid indirectly | | | 1.53 | % | | | 1.35 | % | | | 1.49 | % | | | 1.39 | % | | | 1.55 | % | | | 1.38 | % | | | 2.28 | % | | | 2.10 | % | | | 2.24 | % | | | 2.14 | % | | | 2.30 | % | | | 2.13 | % |
| After fees paid indirectly | | | 1.53 | % | | | 1.35 | % | | | 1.49 | % | | | 1.39 | % | | | 1.55 | % | | | 1.37 | % | | | 2.28 | % | | | 2.10 | % | | | 2.24 | % | | | 2.14 | % | | | 2.30 | % | | | 2.12 | % |
| Ratios of net investment income (loss) to average net assets: | | | | | | | | | | | | | | | | | | | | | | | | | | | | | | | | | | | | | | | | | | | | | | | | |
| Before fees paid indirectly | | | 0.34 | % | | | 0.47 | % | | | 1.00 | % | | | 1.05 | % | | | 0.70 | % | | | 0.84 | % | | | (0.41 | )% | | | (0.27 | )% | | | 0.23 | % | | | 0.30 | % | | | (0.07 | )% | | | 0.14 | % |
| After fees paid indirectly | | | 0.34 | % | | | 0.47 | % | | | 1.00 | % | | | 1.05 | % | | | 0.70 | % | | | 0.85 | % | | | (0.41 | )% | | | (0.27 | )% | | | 0.23 | % | | | 0.30 | % | | | (0.07 | )% | | | 0.15 | % |
| Portfolio turnover rate (1) | | | 5 | % | | | 33 | % | | | 43 | % | | | 44 | % | | | 45 | % | | | 61 | % | | | 5 | % | | | 33 | % | | | 43 | % | | | 44 | % | | | 45 | % | | | 61 | % |
| * | The net investment income (loss) per share data was determined using the average shares outstanding throughout each year/period. |
| + | Assumes reinvestment of all dividends and distributions, if any. Total return does not reflect the deductions of taxes that a shareholder would pay on distributions or on the redemption of shares and does not reflect the impact of any sales charge. |
| # | Includes adjustments in accordance with accounting principles generally accepted in the United States and, consequently, the net asset values for financial reporting purposes and the returns based upon those net asset values may differ from the net asset values and returns for shareholder transactions. Adjustments may apply to some but not all years and classes. |
| (1) | Not annualized for periods less than one year. |
See accompanying notes which are an integral part to these financial statements.
| FINANCIAL HIGHLIGHTS |
| Dunham Small Cap Value Fund |
| |
| The table sets forth financial data for one share of beneficial interest outstanding throughout each year/period. |
| | | Class N | | | | | | | | | | | | | | | | | | | | | | | | | |
| | | Six Months Ended | | | Year Ended October 31, | | | | | | | | | | | | | | | | | | | | | | | | | |
| | | April 30, 2022 | | | 2021 | | | 2020 | | | 2019 | | | 2018 | | | 2017 | | | | | | | | | | | | | | | | | | | | | | | | | |
| | | (Unaudited) | | | | | | | | | | | | | | | | | | | | | | | | | | | | | | | | | | | | | | | | |
| Net asset value, beginning of year/period | | $ | 18.65 | | | $ | 11.91 | | | $ | 14.67 | | | $ | 15.72 | | | $ | 17.47 | | | $ | 14.41 | | | | | | | | | | | | | | | | | | | | | | | | | |
| Income (loss) from investment operations: | | | | | | | | | | | | | | | | | | | | | | | | | | | | | | | | | | | | | | | | | | | | | | | | |
| Net investment income (loss) * | | | 0.08 | | | | 0.11 | | | | 0.10 | | | | (0.00 | ) (a) | | | 0.00 | (a) | | | 0.07 | | | | | | | | | | | | | | | | | | | | | | | | | |
| Net realized and unrealized gain (loss) | | | (0.98 | ) | | | 6.78 | | | | (2.86 | ) | | | 0.65 | | | | 0.10 | (b) | | | 3.57 | | | | | | | | | | | | | | | | | | | | | | | | | |
| Total income (loss) from investment operations | | | (0.90 | ) | | | 6.89 | | | | (2.76 | ) | | | 0.65 | | | | 0.10 | | | | 3.64 | | | | | | | | | | | | | | | | | | | | | | | | | |
| Less distributions: | | | | | | | | | | | | | | | | | | | | | | | | | | | | | | | | | | | | | | | | | | | | | | | | |
| Distributions from net investment income | | | (0.09 | ) | | | (0.14 | ) | | | — | | | | — | | | | (0.04 | ) | | | (0.10 | ) | | | | | | | | | | | | | | | | | | | | | | | | |
| Distributions from net realized gains | | | (1.98 | ) | | | (0.01 | ) | | | — | | | | (1.70 | ) | | | (1.81 | ) | | | (0.48 | ) | | | | | | | | | | | | | | | | | | | | | | | | |
| Total distributions | | | (2.07 | ) | | | (0.15 | ) | | | — | | | | (1.70 | ) | | | (1.85 | ) | | | (0.58 | ) | | | | | | | | | | | | | | | | | | | | | | | | |
| Net asset value, end of year/period | | $ | 15.68 | | | $ | 18.65 | | | $ | 11.91 | | | $ | 14.67 | | | $ | 15.72 | | | $ | 17.47 | | | | | | | | | | | | | | | | | | | | | | | | | |
| Total return + # | | | (5.85 | )% | | | 58.16 | % | | | (18.81 | )% | | | 6.15 | % | | | 0.37 | % | | | 25.55 | % | | | | | | | | | | | | | | | | | | | | | | | | |
| Ratios/Supplemental Data: | | | | | | | | | | | | | | | | | | | | | | | | | | | | | | | | | | | | | | | | | | | | | | | | |
| Net assets, end of year/period (in 000s) | | $ | 61,842 | | | $ | 72,651 | | | $ | 42,444 | | | $ | 43,564 | | | $ | 37,248 | | | $ | 22,710 | | | | | | | | | | | | | | | | | | | | | | | | | |
| Ratios of expenses to average net assets: | | | | | | | | | | | | | | | | | | | | | | | | | | | | | | | | | | | | | | | | | | | | | | | | |
| Before fees paid indirectly | | | 1.60 | % | | | 1.05 | % | | | 1.26 | % | | | 1.72 | % | | | 1.54 | % | | | 1.32 | % | | | | | | | | | | | | | | | | | | | | | | | | |
| After fees paid indirectly | | | 1.60 | % | | | 1.05 | % | | | 1.17 | % | | | 1.72 | % | | | 1.54 | % | | | 1.32 | % | | | | | | | | | | | | | | | | | | | | | | | | |
| Ratios of net investment income (loss) to average net assets: (c) ! | | | | | | | | | | | | | | | | | | | | | | | | | | | | | | | | | | | | | | | | | | | | | | | | |
| Before fees paid indirectly | | | 0.88 | % | | | 0.67 | % | | | 0.72 | % | | | (0.01 | )% | | | 0.01 | % | | | 0.45 | % | | | | | | | | | | | | | | | | | | | | | | | | |
| After fees paid indirectly | | | 0.88 | % | | | 0.67 | % | | | 0.81 | % | | | (0.01 | )% | | | 0.01 | % | | | 0.45 | % | | | | | | | | | | | | | | | | | | | | | | | | |
| Portfolio turnover rate (1) | | | 44 | % | | | 87 | % | | | 135 | % | | | 85 | % | | | 101 | % | | | 100 | % | | | | | | | | | | | | | | | | | | | | | | | | |
| | | | | | | | | | | | | | | | | | | | | | | | | | | | | | | | | | | | | | | | | | | | | | | | | |
| | | Class A | | | Class C | |
| | | Six Months Ended | | | Year Ended October 31, | | | Six Months Ended | | | Year Ended October 31, | |
| | | April 30, 2022 | | | 2021 | | | 2020 | | | 2019 | | | 2018 | | | 2017 | | | April 30, 2022 | | | 2021 | | | 2020 | | | 2019 | | | 2018 | | | 2017 | |
| | | (Unaudited) | | | | | | | | | | | | | | | | | | (Unaudited) | | | | | | | | | | | | | | | | |
| Net asset value, beginning of year/period | | $ | 18.31 | | | $ | 11.70 | | | $ | 14.45 | | | $ | 15.55 | | | $ | 17.31 | | | $ | 14.29 | | | $ | 15.70 | | | $ | 10.05 | | | $ | 12.51 | | | $ | 13.81 | | | $ | 15.67 | | | $ | 13.02 | |
| Income (loss) from investment operations: | | | | | | | | | | | | | | | | | | | | | | | | | | | | | | | | | | | | | | | | | | | | | | | | |
| Net investment income (loss) * | | | 0.06 | | | | 0.08 | | | | 0.07 | | | | (0.04 | ) | | | (0.04 | ) | | | 0.03 | | | | (0.01 | ) | | | (0.04 | ) | | | (0.02 | ) | | | (0.12 | ) | | | (0.15 | ) | | | (0.08 | ) |
| Net realized and unrealized gain (loss) | | | (0.95 | ) | | | 6.65 | | | | (2.82 | ) | | | 0.64 | | | | 0.09 | (b) | | | 3.54 | | | | (0.79 | ) | | | 5.72 | | | | (2.44 | ) | | | 0.52 | | | | 0.10 | (b) | | | 3.21 | |
| Total income (loss) from investment operations | | | (0.89 | ) | | | 6.73 | | | | (2.75 | ) | | | 0.60 | | | | 0.05 | | | | 3.57 | | | | (0.80 | ) | | | 5.68 | | | | (2.46 | ) | | | 0.40 | | | | (0.05 | ) | | | 3.13 | |
| Less distributions: | | | | | | | | | | | | | | | | | | | | | | | | | | | | | | | | | | | | | | | | | | | | | | | | |
| Distributions from net investment income | | | (0.05 | ) | | | (0.11 | ) | | | — | | | | — | | | | (0.00 | )(a) | | | (0.07 | ) | | | — | | | | (0.02 | ) | | | — | | | | — | | | | — | | | | — | |
| Distributions from net realized gains | | | (1.98 | ) | | | (0.01 | ) | | | — | | | | (1.70 | ) | | | (1.81 | ) | | | (0.48 | ) | | | (1.98 | ) | | | (0.01 | ) | | | — | | | | (1.70 | ) | | | (1.81 | ) | | | (0.48 | ) |
| Total distributions | | | (2.03 | ) | | | (0.12 | ) | | | — | | | | (1.70 | ) | | | (1.81 | ) | | | (0.55 | ) | | | (1.98 | ) | | | (0.03 | ) | | | — | | | | (1.70 | ) | | | (1.81 | ) | | | (0.48 | ) |
| Net asset value, end of year/period | | $ | 15.39 | | | $ | 18.31 | | | $ | 11.70 | | | $ | 14.45 | | | $ | 15.55 | | | $ | 17.31 | | | $ | 12.92 | | | $ | 15.70 | | | $ | 10.05 | | | $ | 12.51 | | | $ | 13.81 | | | $ | 15.67 | |
| Total return + # | | | (5.90 | )% | | | 57.71 | % | | | (19.03 | )% | | | 5.85 | % | | | 0.08 | % | | | 25.26 | % | | | (6.29 | )% | | | 56.55 | % | | | (19.66 | )% | | | 5.06 | % | | | (0.63 | )% | | | 24.29 | % |
| Ratios/Supplemental Data: | | | | | | | | | | | | | | | | | | | | | | | | | | | | | | | | | | | | | | | | | | | | | | | | |
| Net assets, end of year/period (in 000s) | | $ | 9,379 | | | $ | 12,795 | | | $ | 8,955 | | | $ | 9,848 | | | $ | 7,869 | | | $ | 4,569 | | | $ | 2,565 | | | $ | 2,794 | | | $ | 2,064 | | | $ | 2,835 | | | $ | 2,139 | | | $ | 2,611 | |
| Ratios of expenses to average net assets: | | | | | | | | | | | | | | | | | | | | | | | | | | | | | | | | | | | | | | | | | | | | | | | | |
| Before fees paid indirectly | | | 1.85 | % | | | 1.30 | % | | | 1.51 | % | | | 1.97 | % | | | 1.79 | % | | | 1.57 | % | | | 2.60 | % | | | 2.05 | % | | | 2.26 | % | | | 2.72 | % | | | 2.54 | % | | | 2.32 | % |
| After fees paid indirectly | | | 1.85 | % | | | 1.30 | % | | | 1.42 | % | | | 1.97 | % | | | 1.79 | % | | | 1.57 | % | | | 2.60 | % | | | 2.05 | % | | | 2.17 | % | | | 2.72 | % | | | 2.54 | % | | | 2.32 | % |
| Ratios of net investment income (loss) to average net assets: (c) ! | | | | | | | | | | | | | | | | | | | | | | | | | | | | | | | | | | | | | | | | | | | | | | | | |
| Before fees paid indirectly | | | 0.65 | % | | | 0.46 | % | | | 0.46 | % | | | (0.26 | )% | | | (0.26 | )% | | | 0.19 | % | | | (0.14 | )% | | | (0.31 | )% | | | (0.29 | )% | | | (1.01 | )% | | | (1.04 | )% | | | (0.57 | )% |
| After fees paid indirectly | | | 0.65 | % | | | 0.46 | % | | | 0.55 | % | | | (0.26 | )% | | | (0.26 | )% | | | 0.19 | % | | | (0.14 | )% | | | (0.31 | )% | | | (0.20 | )% | | | (1.01 | )% | | | (1.04 | )% | | | (0.57 | )% |
| Portfolio turnover rate (1) | | | 44 | % | | | 87 | % | | | 135 | % | | | 85 | % | | | 101 | % | | | 100 | % | | | 44 | % | | | 87 | % | | | 135 | % | | | 85 | % | | | 101 | % | | | 100 | % |
| * | The net investment income (loss) per share data was determined using the average shares outstanding throughout each year/period. |
| + | Assumes reinvestment of all dividends and distributions, if any. Total return does not reflect the deductions of taxes that a shareholder would pay on distributions or on the redemption of shares and does not reflect the impact of any sales charge. |
| # | Includes adjustments in accordance with accounting principles generally accepted in the United States and, consequently, the net asset values for financial reporting purposes and the returns based upom those net assets may differ from the net asset values and returns for shareholder transactions. Adjustments may apply to some but not all years and classes. |
| ! | Recognition of net investment income (loss) is affected by the timing and declaration of dividends by underlying funds in which the Fund invests. |
| (a) | Represents less than $0.01 per share. |
| (b) | The amount of net realized and unrealized gain (loss) on investment per share for the year ended October 31, 2018 does not accord with the amounts in the Statements of Operations due to the timing of purchases and sales of Fund shares in relation to fluctuating market values. |
| (c) | Does not Include the expenses of other investment companies in which the Fund invests. |
| (1) | Not annualized for periods less than one year. |
See accompanying notes which are an integral part to these financial statements.
| FINANCIAL HIGHLIGHTS |
| Dunham Focused Large Cap Growth Fund |
| |
| The table sets forth financial data for one share of beneficial interest outstanding throughout each year/period. |
| | | Class N | | | | | | | | | | | | | | | | | | | | | | | | | |
| | | Six Months Ended | | | Year Ended October 31, | | | | | | | | | | | | | | | | | | | | | | | | | |
| | | April 30, 2022 | | | 2021 | | | 2020 | | | 2019 | | | 2018 | | | 2017 | | | | | | | | | | | | | | | | | | | | | | | | | |
| | | (Unaudited) | | | | | | | | | | | | | | | | | | | | | | | | | | | | | | | | | | | | | | | | |
| Net asset value, beginning of year/period | | $ | 43.94 | | | $ | 33.67 | | | $ | 24.24 | | | $ | 22.50 | | | $ | 19.37 | | | $ | 15.92 | | | | | | | | | | | | | | | | | | | | | | | | | |
| Income (loss) from investment operations: | | | | | | | | | | | | | | | | | | | | | | | | | | | | | | | | | | | | | | | | | | | | | | | | |
| Net investment loss* | | | (0.14 | ) | | | (0.36 | ) | | | (0.32 | ) | | | (0.25 | ) | | | (0.22 | ) | | | (0.14 | ) | | | | | | | | | | | | | | | | | | | | | | | | |
| Net realized and unrealized gain (loss) | | | (12.37 | ) | | | 11.47 | | | | 10.58 | | | | 3.69 | | | | 3.53 | | | | 3.59 | | | | | | | | | | | | | | | | | | | | | | | | | |
| Total income (loss) from investment operations | | | (12.51 | ) | | | 11.11 | | | | 10.26 | | | | 3.44 | | | | 3.31 | | | | 3.45 | | | | | | | | | | | | | | | | | | | | | | | | | |
| Less distributions: | | | | | | | | | | | | | | | | | | | | | | | | | | | | | | | | | | | | | | | | | | | | | | | | |
| Distributions from net realized gains | | | (3.28 | ) | | | (0.84 | ) | | | (0.83 | ) | | | (1.70 | ) | | | (0.18 | ) | | | — | | | | | | | | | | | | | | | | | | | | | | | | | |
| Total distributions | | | (3.28 | ) | | | (0.84 | ) | | | (0.83 | ) | | | (1.70 | ) | | | (0.18 | ) | | | — | | | | | | | | | | | | | | | | | | | | | | | | | |
| Net asset value, end of year/period | | $ | 28.15 | | | $ | 43.94 | | | $ | 33.67 | | | $ | 24.24 | | | $ | 22.50 | | | $ | 19.37 | | | | | | | | | | | | | | | | | | | | | | | | | |
| Total return + # | | | (30.65 | )% | | | 33.44 | % | | | 43.39 | % | | | 17.19 | % | | | 17.24 | % | | | 21.67 | % | | | | | | | | | | | | | | | | | | | | | | | | |
| Ratios/Supplemental Data: | | | | | | | | | | | | | | | | | | | | | | | | | | | | | | | | | | | | | | | | | | | | | | | | |
| Net assets, end of year/period (in 000s) | | $ | 133,539 | | | $ | 156,938 | | | $ | 108,816 | | | $ | 74,714 | | | $ | 59,424 | | | $ | 56,472 | | | | | | | | | | | | | | | | | | | | | | | | | |
| Ratios of expenses to average net assets: ^ | | | | | | | | | | | | | | | | | | | | | | | | | | | | | | | | | | | | | | | | | | | | | | | | |
| Before fee waivers and fees paid indirectly | | | 1.00 | % | | | 1.12 | % | | | 1.30 | % | | | 1.33 | % | | | 1.30 | % | | | 1.16 | % | | | | | | | | | | | | | | | | | | | | | | | | |
| After fee waivers and fees paid indirectly | | | 1.00 | % | | | 1.12 | % | | | 1.30 | % | | | 1.33 | % | | | 1.29 | % | | | 1.14 | % | | | | | | | | | | | | | | | | | | | | | | | | |
| Ratios of net investment loss to average net assets: ^ | | | | | | | | | | | | | | | | | | | | | | | | | | | | | | | | | | | | | | | | | | | | | | | | |
| Before fee waivers and fees paid indirectly | | | (0.78 | )% | | | (0.92 | )% | | | (1.08 | )% | | | (1.06 | )% | | | (1.01 | )% | | | (0.79 | )% | | | | | | | | | | | | | | | | | | | | | | | | |
| After fee waivers and fees paid indirectly | | | (0.78 | )% | | | (0.92 | )% | | | (1.08 | )% | | | (1.06 | )% | | | (1.01 | )% | | | (0.77 | )% | | | | | | | | | | | | | | | | | | | | | | | | |
| Portfolio turnover rate (1) | | | 3 | % | | | 27 | % | | | 17 | % | | | 28 | % | | | 25 | % | | | 38 | % | | | | | | | | | | | | | | | | | | | | | | | | |
| | | | | | | | | | | | | | | | | | | | | | | | | | | | | | | | | | | | | | | | | | | | | | | | | |
| | | Class A | | | Class C | |
| | | Six Months Ended | | | Year Ended October 31, | | | Six Months Ended | | | Year Ended October 31, | |
| | | April 30, 2022 | | | 2021 | | | 2020 | | | 2019 | | | 2018 | | | 2017 | | | April 30, 2022 | | | 2021 | | | 2020 | | | 2019 | | | 2018 | | | 2017 | |
| | | (Unaudited) | | | | | | | | | | | | | | | | | | (Unaudited) | | | | | | | | | | | | | | | | |
| Net asset value, beginning of year/period | | $ | 42.73 | | | $ | 32.84 | | | $ | 23.71 | | | $ | 22.11 | | | $ | 19.08 | | | $ | 15.73 | | | $ | 39.33 | | | $ | 30.51 | | | $ | 22.25 | | | $ | 21.00 | | | $ | 18.27 | | | $ | 15.17 | |
| Income (loss) from investment operations: | | | | | | | | | | | | | | | | | | | | | | | | | | | | | | | | | | | | | | | | | | | | | | | | |
| Net investment loss* | | | (0.18 | ) | | | (0.45 | ) | | | (0.38 | ) | | | (0.30 | ) | | | (0.28 | ) | | | (0.18 | ) | | | (0.28 | ) | | | (0.68 | ) | | | (0.55 | ) | | | (0.44 | ) | | | (0.42 | ) | | | (0.30 | ) |
| Net realized and unrealized gain (loss) | | | (12.00 | ) | | | 11.18 | | | | 10.34 | | | | 3.60 | | | | 3.49 | | | | 3.53 | | | | (10.95 | ) | | | 10.34 | | | | 9.64 | | | | 3.39 | | | | 3.33 | | | | 3.40 | |
| Total income (loss) from investment operations | | | (12.18 | ) | | | 10.73 | | | | 9.96 | | | | 3.30 | | | | 3.21 | | | | 3.35 | | | | (11.23 | ) | | | 9.66 | | | | 9.09 | | | | 2.95 | | | | 2.91 | | | | 3.10 | |
| Less distributions: | | | | | | | | | | | | | | | | | | | | | | | | | | | | | | | | | | | | | | | | | | | | | | | | |
| Distributions from net realized gains | | | (3.28 | ) | | | (0.84 | ) | | | (0.83 | ) | | | (1.70 | ) | | | (0.18 | ) | | | — | | | | (3.28 | ) | | | (0.84 | ) | | | (0.83 | ) | | | (1.70 | ) | | | (0.18 | ) | | | — | |
| Total distributions | | | (3.28 | ) | | | (0.84 | ) | | | (0.83 | ) | | | (1.70 | ) | | | (0.18 | ) | | | — | | | | (3.28 | ) | | | (0.84 | ) | | | (0.83 | ) | | | (1.70 | ) | | | (0.18 | ) | | | — | |
| Net asset value, end of year/period | | $ | 27.27 | | | $ | 42.73 | | | $ | 32.84 | | | $ | 23.71 | | | $ | 22.11 | | | $ | 19.08 | | | $ | 24.82 | | | $ | 39.33 | | | $ | 30.51 | | | $ | 22.25 | | | $ | 21.00 | | | $ | 18.27 | |
| Total return + # | | | (30.73 | )% | | | 33.13 | % | | | 43.09 | % | | | 16.84 | % | | | 16.98 | % | | | 21.30 | % | | | (30.98 | )% | | | 32.13 | % | | | 41.97 | % | | | 16.00 | % | | | 16.08 | % | | | 20.44 | % |
| Ratios/Supplemental Data: | | | | | | | | | | | | | | | | | | | | | | | | | | | | | | | | | | | | | | | | | | | | | | | | |
| Net assets, end of year/period (in 000s) | | $ | 25,063 | | | $ | 37,270 | | | $ | 31,205 | | | $ | 24,131 | | | $ | 15,031 | | | $ | 12,944 | | | $ | 8,847 | | | $ | 13,911 | | | $ | 10,414 | | | $ | 8,314 | | | $ | 6,844 | | | $ | 6,758 | |
| Ratios of expenses to average net assets: ^ | | | | | | | | | | | | | | | | | | | | | | | | | | | | | | | | | | | | | | | | | | | | | | | | |
| Before fee waivers and fees paid indirectly | | | 1.25 | % | | | 1.37 | % | | | 1.55 | % | | | 1.58 | % | | | 1.55 | % | | | 1.41 | % | | | 2.00 | % | | | 2.12 | % | | | 2.30 | % | | | 2.33 | % | | | 2.30 | % | | | 2.16 | % |
| After fee waivers and fees paid indirectly | | | 1.25 | % | | | 1.37 | % | | | 1.55 | % | | | 1.58 | % | | | 1.54 | % | | | 1.39 | % | | | 2.00 | % | | | 2.12 | % | | | 2.30 | % | | | 2.33 | % | | | 2.29 | % | | | 2.14 | % |
| Ratios of net investment loss to average net assets: ^ | | | | | | | | | | | | | | | | | | | | | | | | | | | | | | | | | | | | | | | | | | | | | | | | |
| Before fee waivers and fees paid indirectly | | | (1.03 | )% | | | (1.17 | )% | | | (1.34 | )% | | | (1.32 | )% | | | (1.26 | )% | | | (1.05 | )% | | | (1.78 | )% | | | (1.92 | )% | | | (2.08 | )% | | | (2.06 | )% | | | (2.01 | )% | | | (1.80 | )% |
| After fee waivers and fees paid indirectly | | | (1.03 | )% | | | (1.17 | )% | | | (1.34 | )% | | | (1.32 | )% | | | (1.26 | )% | | | (1.03 | )% | | | (1.78 | )% | | | (1.92 | )% | | | (2.08 | )% | | | (2.06 | )% | | | (2.01 | )% | | | (1.78 | )% |
| Portfolio turnover rate (1) | | | 3 | % | | | 27 | % | | | 17 | % | | | 28 | % | | | 25 | % | | | 38 | % | | | 3 | % | | | 27 | % | | | 17 | % | | | 28 | % | | | 25 | % | | | 38 | % |
| * | The net investment loss per share data was determined using the average shares outstanding throughout each year/period. |
| + | Assumes reinvestment of all dividends and distributions, if any. Total return does not reflect the deductions of taxes that a shareholder would pay on distributions or on the redemption of shares and does not reflect the impact of any sales charge. |
| # | Includes adjustments in accordance with accounting principles generally accepted in the United States and, consequently, the net asset values for financial reporting purposes and the returns based upon those net asset values may differ from the net asset values and returns for shareholder transactions. Adjustments may apply to some but not all years and classes. |
| ^ | Annualized for periods less than one year. |
| (1) | Not annualized for periods less than one year. |
See accompanying notes which are an integral part to these financial statements.
| FINANCIAL HIGHLIGHTS |
| Dunham Small Cap Growth Fund |
| |
| The table sets forth financial data for one share of beneficial interest outstanding throughout each year/period. |
| | | Class N | | | | | | | | | | | | | | | | | | | | | | | | | |
| | | Six Months Ended | | | Year Ended October 31, | | | | | | | | | | | | | | | | | | | | | | | | | |
| | | April 30, 2022 | | | 2021 | | | 2020 | | | 2019 | | | 2018 | | | 2017 | | | | | | | | | | | | | | | | | | | | | | | | | |
| | | (Unaudited) | | | | | | | | | | | | | | | | | | | | | | | | | | | | | | | | | | | | | | | | |
| Net asset value, beginning of year/period | | $ | 27.93 | | | $ | 21.62 | | | $ | 16.00 | | | $ | 20.28 | | | $ | 20.31 | | | $ | 15.34 | | | | | | | | | | | | | | | | | | | | | | | | | |
| Income (loss) from investment operations: | | | | | | | | | | | | | | | | | | | | | | | | | | | | | | | | | | | | | | | | | | | | | | | | |
| Net investment loss* | | | (0.09 | ) | | | (0.38 | ) | | | (0.23 | ) | | | (0.23 | ) | | | (0.27 | ) | | | (0.15 | ) | | | | | | | | | | | | | | | | | | | | | | | | |
| Net realized and unrealized gain (loss) (a) | | | (8.53 | ) | | | 10.50 | | | | 6.15 | | | | (0.25 | ) | | | 3.20 | | | | 5.12 | | | | | | | | | | | | | | | | | | | | | | | | | |
| Total income (loss) from investment operations | | | (8.62 | ) | | | 10.12 | | | | 5.92 | | | | (0.48 | ) | | | 2.93 | | | | 4.97 | | | | | | | | | | | | | | | | | | | | | | | | | |
| Less distributions: | | | | | | | | | | | | | | | | | | | | | | | | | | | | | | | | | | | | | | | | | | | | | | | | |
| Distributions from net investment income | | | (0.18 | ) | | | (0.28 | ) | | | (0.05 | ) | | | — | | | | — | | | | — | | | | | | | | | | | | | | | | | | | | | | | | | |
| Distributions from net realized gains | | | (3.85 | ) | | | (3.53 | ) | | | (0.25 | ) | | | (3.80 | ) | | | (2.96 | ) | | | — | | | | | | | | | | | | | | | | | | | | | | | | | |
| Total distributions | | | (4.03 | ) | | | (3.81 | ) | | | (0.30 | ) | | | (3.80 | ) | | | (2.96 | ) | | | — | | | | | | | | | | | | | | | | | | | | | | | | | |
| Net asset value, end of year/period | | $ | 15.28 | | | $ | 27.93 | | | $ | 21.62 | | | $ | 16.00 | | | $ | 20.28 | | | $ | 20.31 | | | | | | | | | | | | | | | | | | | | | | | | | |
| Total return + # | | | (35.08 | )% | | | 49.28 | % | | | 37.55 | % | | | 1.36 | % | | | 16.02 | % | | | 32.40 | % | | | | | | | | | | | | | | | | | | | | | | | | |
| Ratios/Supplemental Data: | | | | | | | | | | | | | | | | | | | | | | | | | | | | | | | | | | | | | | | | | | | | | | | | |
| Net assets, end of year/period (in 000s) | | $ | 61,950 | | | $ | 63,287 | | | $ | 42,792 | | | $ | 37,340 | | | $ | 33,882 | | | $ | 24,641 | | | | | | | | | | | | | | | | | | | | | | | | | |
| Ratios of expenses to average net assets: ^ | | | | | | | | | | | | | | | | | | | | | | | | | | | | | | | | | | | | | | | | | | | | | | | | |
| Before fees paid indirectly | | | 1.39 | % | | | 1.83 | % | | | 1.78 | % | | | 1.90 | % | | | 1.94 | % | | | 1.36 | % | | | | | | | | | | | | | | | | | | | | | | | | |
| After fees paid indirectly | | | 1.39 | % | | | 1.83 | % | | | 1.75 | % | | | 1.88 | % | | | 1.93 | % | | | 1.35 | % | | | | | | | | | | | | | | | | | | | | | | | | |
| Ratios of net investment loss to average net assets: ^ | | | | | | | | | | | | | | | | | | | | | | | | | | | | | | | | | | | | | | | | | | | | | | | | |
| Before fees paid indirectly | | | (0.95 | )% | | | (1.47 | )% | | | (1.34 | )% | | | (1.36 | )% | | | (1.31 | )% | | | (0.86 | )% | | | | | | | | | | | | | | | | | | | | | | | | |
| After fees paid indirectly | | | (0.95 | )% | | | (1.47 | )% | | | (1.31 | )% | | | (1.34 | )% | | | (1.29 | )% | | | (0.85 | )% | | | | | | | | | | | | | | | | | | | | | | | | |
| Portfolio turnover rate (1) | | | 44 | % | | | 111 | % | | | 178 | % | | | 169 | % | | | 190 | % | | | 174 | % | | | | | | | | | | | | | | | | | | | | | | | | |
| | | | | | | | | | | | | | | | | | | | | | | | | | | | | | | | | | | | | | | | | | | | | | | | | |
| | | Class A | | | Class C | |
| | | Six Months Ended | | | Year Ended October 31, | | | Six Months Ended | | | Year Ended October 31, | |
| | | April 30, 2022 | | | 2021 | | | 2020 | | | 2019 | | | 2018 | | | 2017 | | | April 30, 2022 | | | 2021 | | | 2020 | | | 2019 | | | 2018 | | | 2017 | |
| | | (Unaudited) | | | | | | | | | | | | | | | | | | (Unaudited) | | | | | | | | | | | | | | | | |
| Net asset value, beginning of year/period | | $ | 26.04 | | | $ | 20.36 | | | $ | 15.09 | | | $ | 19.42 | | | $ | 19.62 | | | $ | 14.85 | | | $ | 18.62 | | | $ | 15.39 | | | $ | 11.54 | | | $ | 16.00 | | | $ | 16.77 | | | $ | 12.79 | |
| Income (loss) from investment operations: | | | | | | | | | | | | | | | | | | | | | | | | | | | | | | | | | | | | | | | | | | | | | | | | |
| Net investment loss* | | | (0.12 | ) | | | (0.42 | ) | | | (0.26 | ) | | | (0.25 | ) | | | (0.31 | ) | | | (0.19 | ) | | | (0.13 | ) | | | (0.44 | ) | | | (0.29 | ) | | | (0.29 | ) | | | (0.37 | ) | | | (0.28 | ) |
| Net realized and unrealized gain (loss) (a) | | | (7.87 | ) | | | 9.86 | | | | 5.80 | | | | (0.28 | ) | | | 3.07 | | | | 4.96 | | | | (5.33 | ) | | | 7.33 | | | | 4.39 | | | | (0.37 | ) | | | 2.56 | | | | 4.26 | |
| Total income (loss) from investment operations | | | (7.99 | ) | | | 9.44 | | | | 5.54 | | | | (0.53 | ) | | | 2.76 | | | | 4.77 | | | | (5.46 | ) | | | 6.89 | | | | 4.10 | | | | (0.66 | ) | | | 2.19 | | | | 3.98 | |
| Less distributions: | | | | | | | | | | | | | | | | | | | | | | | | | | | | | | | | | | | | | | | | | | | | | | | | |
| Distributions from net investment income | | | (0.13 | ) | | | (0.23 | ) | | | (0.02 | ) | | | — | | | | — | | | | — | | | | (0.01 | ) | | | (0.13 | ) | | | — | | | | — | | | | — | | | | — | |
| Distributions from net realized gains | | | (3.85 | ) | | | (3.53 | ) | | | (0.25 | ) | | | (3.80 | ) | | | (2.96 | ) | | | — | | | | (3.85 | ) | | | (3.53 | ) | | | (0.25 | ) | | | (3.80 | ) | | | (2.96 | ) | | | — | |
| Total distributions | | | (3.98 | ) | | | (3.76 | ) | | | (0.27 | ) | | | (3.80 | ) | | | (2.96 | ) | | | — | | | | (3.86 | ) | | | (3.66 | ) | | | (0.25 | ) | | | (3.80 | ) | | | (2.96 | ) | | | — | |
| Net asset value, end of year/period | | $ | 14.07 | | | $ | 26.04 | | | $ | 20.36 | | | $ | 15.09 | | | $ | 19.42 | | | $ | 19.62 | | | $ | 9.30 | | | $ | 18.62 | | | $ | 15.39 | | | $ | 11.54 | | | $ | 16.00 | | | $ | 16.77 | |
| Total return + # | | | (35.16 | )% | | | 48.93 | % | | | 37.18 | % | | | 1.11 | % | | | 15.69 | % | | | 32.12 | % | | | (35.42 | )% | | | 47.87 | % | | | 36.10 | % | | | 0.36 | % | | | 14.84 | % | | | 31.12 | % |
| Ratios/Supplemental Data: | | | | | | | | | | | | | | | | | | | | | | | | | | | | | | | | | | | | | | | | | | | | | | | | |
| Net assets, end of year/period (in 000s) | | $ | 12,075 | | | $ | 20,357 | | | $ | 12,750 | | | $ | 10,797 | | | $ | 10,799 | | | $ | 6,925 | | | $ | 2,452 | | | $ | 3,730 | | | $ | 2,619 | | | $ | 2,440 | | | $ | 2,720 | | | $ | 2,644 | |
| Ratios of expenses to average net assets: ^ | | | | | | | | | | | | | | | | | | | | | | | | | | | | | | | | | | | | | | | | | | | | | | | | |
| Before fees paid indirectly | | | 1.73 | % | | | 2.08 | % | | | 2.03 | % | | | 2.15 | % | | | 2.19 | % | | | 1.61 | % | | | 2.45 | % | | | 2.83 | % | | | 2.78 | % | | | 2.90 | % | | | 2.94 | % | | | 2.36 | % |
| After fees paid indirectly | | | 1.73 | % | | | 2.08 | % | | | 2.00 | % | | | 2.13 | % | | | 2.18 | % | | | 1.60 | % | | | 2.45 | % | | | 2.83 | % | | | 2.75 | % | | | 2.88 | % | | | 2.93 | % | | | 2.35 | % |
| Ratios of net investment loss to average net assets: ^ | | | | | | | | | | | | | | | | | | | | | | | | | | | | | | | | | | | | | | | | | | | | | | | | |
| Before fees paid indirectly | | | (1.30 | )% | | | (1.72 | )% | | | (1.57 | )% | | | (1.61 | )% | | | (1.56 | )% | | | (1.13 | )% | | | (2.01 | )% | | | (2.47 | )% | | | (2.32 | )% | | | (2.37 | )% | | | (2.30 | )% | | | (1.89 | )% |
| After fees paid indirectly | | | (1.30 | )% | | | (1.72 | )% | | | (1.54 | )% | | | (1.59 | )% | | | (1.55 | )% | | | (1.12 | )% | | | (2.01 | )% | | | (2.47 | )% | | | (2.29 | )% | | | (2.35 | )% | | | (2.29 | )% | | | (1.88 | )% |
| Portfolio turnover rate (1) | | | 44 | % | | | 111 | % | | | 178 | % | | | 169 | % | | | 190 | % | | | 174 | % | | | 44 | % | | | 111 | % | | | 178 | % | | | 169 | % | | | 190 | % | | | 174 | % |
| * | The net investment loss per share data was determined using the average shares outstanding throughout each year/period. |
| + | Assumes reinvestment of all dividends and distributions, if any. Total return does not reflect the deductions of taxes that a shareholder would pay on distributions or on the redemption of shares and does not reflect the impact of any sales charge. |
| # | Includes adjustments in accordance with accounting principles generally accepted in the United States and, consequently, the net asset values for financial reporting purposes and the returns based upon those net asset values may differ from the net asset values and returns for shareholder transactions. Adjustments may apply to some but not all years and classes. |
| (a) | The amount of net realized and unrealized gain (loss) on investment per share for the years ended October 31, 2019 and October 31, 2016 does not accord with the amounts in the Statements of Operations due to the timing of purchases and sales of Fund shares in relation to fluctuating market values. |
| ^ | Annualized for periods less than one year. |
| (1) | Not annualized for periods less than one year. |
See accompanying notes which are an integral part to these financial statements.
| FINANCIAL HIGHLIGHTS |
| Dunham Emerging Markets Stock Fund |
| |
| The table sets forth financial data for one share of beneficial interest outstanding throughout each year/period. |
| | | Class N | | | | | | | | | | | | | | | | | | | | | | | | | |
| | | Six Months Ended | | | Year Ended October 31, | | | | | | | | | | | | | | | | | | | | | | | | | |
| | | April 30, 2022 | | | 2021 | | | 2020 | | | 2019 | | | 2018 | | | 2017 | | | | | | | | | | | | | | | | | | | | | | | | | |
| | | (Unaudited) | | | | | | | | | | | | | | | | | | | | | | | | | | | | | | | | | | | | | | | | |
| Net asset value, beginning of year/period | | $ | 18.76 | | | $ | 15.70 | | | $ | 14.27 | | | $ | 12.85 | | | $ | 15.94 | | | $ | 12.73 | | | | | | | | | | | | | | | | | | | | | | | | | |
| Income (loss) from investment operations: | | | | | | | | | | | | | | | | | | | | | | | | | | | | | | | | | | | | | | | | | | | | | | | | |
| Net investment income (loss) * | | | 0.03 | | | | 0.04 | | | | (0.03 | ) | | | 0.19 | | | | 0.27 | | | | 0.17 | | | | | | | | | | | | | | | | | | | | | | | | | |
| Net realized and unrealized gain (loss) | | | (3.67 | ) | | | 3.05 | | | | 1.59 | | | | 1.48 | | | | (3.20 | ) | | | 3.28 | | | | | | | | | | | | | | | | | | | | | | | | | |
| Total income (loss) from investment operations | | | (3.64 | ) | | | 3.09 | | | | 1.56 | | | | 1.67 | | | | (2.93 | ) | | | 3.45 | | | | | | | | | | | | | | | | | | | | | | | | | |
| Less distributions: | | | | | | | | | | | | | | | | | | | | | | | | | | | | | | | | | | | | | | | | | | | | | | | | |
| Distributions from net investment income | | | (0.25 | ) | | | (0.03 | ) | | | (0.13 | ) | | | (0.25 | ) | | | (0.16 | ) | | | (0.24 | ) | | | | | | | | | | | | | | | | | | | | | | | | |
| Total distributions | | | (1.59 | ) | | | (0.03 | ) | | | (0.13 | ) | | | (0.25 | ) | | | (0.16 | ) | | | (0.24 | ) | | | | | | | | | | | | | | | | | | | | | | | | |
| Net asset value, end of year/period | | $ | 13.53 | | | $ | 18.76 | | | $ | 15.70 | | | $ | 14.27 | | | $ | 12.85 | | | $ | 15.94 | | | | | | | | | | | | | | | | | | | | | | | | | |
| Total return + # | | | (20.81 | )% | | | 19.67 | % | | | 10.94 | % | | | 13.29 | % | | | (18.57 | )% | | | 27.69 | % | | | | | | | | | | | | | | | | | | | | | | | | |
| Ratios/Supplemental Data: | | | | | | | | | | | | | | | | | | | | | | | | | | | | | | | | | | | | | | | | | | | | | | | | |
| Net assets, end of year/period (in 000s) | | $ | 101,692 | | | $ | 112,290 | | | $ | 70,868 | | | $ | 59,931 | | | $ | 53,261 | | | $ | 51,365 | | | | | | | | | | | | | | | | | | | | | | | | | |
| Ratios of expenses to average net assets: | | | 1.04 | % | | | 1.67 | % | | | 1.86 | % | | | 1.61 | % | | | 1.19 | % | | | 1.75 | % | | | | | | | | | | | | | | | | | | | | | | | | |
| Ratios of net investment income (loss) to average net assets: | | | 0.40 | % | | | 0.19 | % | | | (0.19 | )% | | | 1.42 | % | | | 1.79 | % | | | 1.18 | % | | | | | | | | | | | | | | | | | | | | | | | | |
| Portfolio turnover rate (1) | | | 26 | % | | | 77 | % | | | 113 | % | | | 129 | % | | | 66 | % | | | 74 | % | | | | | | | | | | | | | | | | | | | | | | | | |
| | | | | | | | | | | | | | | | | | | | | | | | | | | | | | | | | | | | | | | | | | | | | | | | | |
| | | Class A | | | Class C | |
| | | Six Months Ended | | | Year Ended October 31, | | | Six Months Ended | | | Year Ended October 31, | |
| | | April 30, 2022 | | | 2021 | | | 2020 | | | 2019 | | | 2018 | | | 2017 | | | April 30, 2022 | | | 2021 | | | 2020 | | | 2019 | | | 2018 | | | 2017 | |
| | | (Unaudited) | | | | | | | | | | | | | | | | | | (Unaudited) | | | | | | | | | | | | | | | | |
| Net asset value, beginning of year/period | | $ | 18.29 | | | $ | 15.32 | | | $ | 13.94 | | | $ | 12.56 | | | $ | 15.58 | | | $ | 12.45 | | | $ | 17.07 | | | $ | 14.41 | | | $ | 13.16 | | | $ | 11.85 | | | $ | 14.74 | | | $ | 11.82 | |
| Income (loss) from investment operations: | | | | | | | | | | | | | | | | | | | | | | | | | | | | | | | | | | | | | | | | | | | | | | | | |
| Net investment income (loss)* | | | 0.01 | | | | (0.02 | ) | | | (0.06 | ) | | | 0.16 | | | | 0.23 | | | | 0.14 | | | | (0.04 | ) | | | (0.15 | ) | | | (0.16 | ) | | | 0.05 | | | | 0.11 | | | | 0.02 | |
| Net realized and unrealized gain (loss) | | | (3.57 | ) | | | 2.99 | | | | 1.54 | | | | 1.44 | | | | (3.13 | ) | | | 3.20 | | | | (3.34 | ) | | | 2.81 | | | | 1.45 | | | | 1.38 | | | | (2.94 | ) | | | 3.04 | |
| Total income (loss) from investment operations | | | (3.56 | ) | | | 2.97 | | | | 1.48 | | | | 1.60 | | | | (2.90 | ) | | | 3.34 | | | | (3.38 | ) | | | 2.66 | | | | 1.29 | | | | 1.43 | | | | (2.83 | ) | | | 3.06 | |
| Less distributions: | | | | | | | | | | | | | | | | | | | | | | | | | | | | | | | | | | | | | | | | | | | | | | | | |
| Distributions from net investment income | | | (0.21 | ) | | | — | | | | (0.10 | ) | | | (0.22 | ) | | | (0.12 | ) | | | (0.21 | ) | | | (0.07 | ) | | | — | | | | (0.04 | ) | | | (0.12 | ) | | | (0.06 | ) | | | (0.14 | ) |
| Total distributions | | | (1.55 | ) | | | — | | | | (0.10 | ) | | | (0.22 | ) | | | (0.12 | ) | | | (0.21 | ) | | | (1.41 | ) | | | — | | | | (0.04 | ) | | | (0.12 | ) | | | (0.06 | ) | | | (0.14 | ) |
| Net asset value, end of year/period | | $ | 13.18 | | | $ | 18.29 | | | $ | 15.32 | | | $ | 13.94 | | | $ | 12.56 | | | $ | 15.58 | | | $ | 12.28 | | | $ | 17.07 | | | $ | 14.41 | | | $ | 13.16 | | | $ | 11.85 | | | $ | 14.74 | |
| Total return + # | | | (20.87 | )% | | | 19.39 | % | | | 10.58 | % | | | 12.98 | % | | | (18.73 | )% | | | 27.36 | % | | | (21.19 | )% | | | 18.46 | % | | | 9.78 | % | | | 12.18 | % | | | (19.30 | )% | | | 26.31 | % |
| Ratios/Supplemental Data: | | | | | | | | | | | | | | | | | | | | | | | | | | | | | | | | | | | | | | | | | | | | | | | | |
| Net assets, end of year/period (in 000s) | | $ | 18,390 | | | $ | 21,174 | | | $ | 14,864 | | | $ | 12,106 | | | $ | 9,662 | | | $ | 8,242 | | | $ | 2,651 | | | $ | 3,349 | | | $ | 3,005 | | | $ | 3,463 | | | $ | 3,163 | | | $ | 3,467 | |
| Ratios of expenses to average net assets: | | | 1.29 | % | | | 1.92 | % | | | 2.11 | % | | | 1.86 | % | | | 1.44 | % | | | 2.00 | % | | | 2.04 | % | | | 2.67 | % | | | 2.86 | % | | | 2.61 | % | | | 2.19 | % | | | 2.75 | % |
| Ratios of net investment income (loss) to average net assets: | | | 0.15 | % | | | (0.08 | )% | | | (0.43 | )% | | | 1.17 | % | | | 1.54 | % | | | 0.98 | % | | | (0.62 | )% | | | (0.87 | )% | | | (1.22 | )% | | | 0.41 | % | | | 0.77 | % | | | 0.10 | % |
| Portfolio turnover rate (1) | | | 26 | % | | | 77 | % | | | 113 | % | | | 129 | % | | | 66 | % | | | 74 | % | | | 26 | % | | | 77 | % | | | 113 | % | | | 129 | % | | | 66 | % | | | 74 | % |
| * | The net investment income (loss) per share data was determined using the average shares outstanding throughout each year/period. |
| + | Assumes reinvestment of all dividends and distributions, if any. Total return does not reflect the deductions of taxes that a shareholder would pay on distributions or on the redemption of shares and does not reflect the impact of any sales charge. |
| # | Includes adjustments in accordance with accounting principles generally accepted in the United States and, consequently, the net asset values for financial reporting purposes and the returns based upon those net asset values may differ from the net asset values and returns for shareholder transactions. Adjustments may apply to some but not all years and classes. |
| (1) | Not annualized for periods less than one year. |
See accompanying notes which are an integral part to these financial statements.
| FINANCIAL HIGHLIGHTS |
| Dunham International Stock Fund |
| |
| The table sets forth financial data for one share of beneficial interest outstanding throughout each year/period. |
| | | Class N | | | | | | | | | | | | | | | | | | | | | | | | | |
| | | Six Months Ended | | | Year Ended October 31, | | | | | | | | | | | | | | | | | | | | | | | | | |
| | | April 30, 2022 | | | 2021 | | | 2020 | | | 2019 | | | 2018 | | | 2017 | | | | | | | | | | | | | | | | | | | | | | | | | |
| | | (Unaudited) | | | | | | | | | | | | | | | | | | | | | | | | | | | | | | | | | | | | | | | | |
| Net asset value, beginning of year/period | | $ | 21.10 | | | $ | 15.26 | | | $ | 15.51 | | | $ | 15.61 | | | $ | 17.54 | | | $ | 14.24 | | | | | | | | | | | | | | | | | | | | | | | | | |
| Income (loss) from investment operations: | | | | | | | | | | | | | | | | | | | | | | | | | | | | | | | | | | | | | | | | | | | | | | | | |
| Net investment income * | | | 0.24 | | | | 0.30 | | | | 0.15 | | | | 0.34 | | | | 0.21 | | | | 0.21 | | | | | | | | | | | | | | | | | | | | | | | | | |
| Net realized and unrealized gain (loss) ! | | | (2.95 | ) | | | 5.70 | | | | (0.06 | ) | | | 0.62 | | | | (1.39 | ) | | | 3.09 | | | | | | | | | | | | | | | | | | | | | | | | | |
| Total income (loss) from investment operations | | | (2.71 | ) | | | 6.00 | | | | 0.09 | | | | 0.96 | | | | (1.18 | ) | | | 3.30 | | | | | | | | | | | | | | | | | | | | | | | | | |
| Less distributions: | | | | | | | | | | | | | | | | | | | | | | | | | | | | | | | | | | | | | | | | | | | | | | | | |
| Distributions from net investment income | | | (0.40 | ) | | | (0.15 | ) | | | (0.34 | ) | | | (0.18 | ) | | | (0.26 | ) | | | — | | | | | | | | | | | | | | | | | | | | | | | | | |
| Distributions from net realized gains | | | (2.42 | ) | | | (0.01 | ) | | | — | | | | (0.88 | ) | | | (0.49 | ) | | | — | | | | | | | | | | | | | | | | | | | | | | | | | |
| Total distributions | | | (2.82 | ) | | | (0.16 | ) | | | (0.34 | ) | | | (1.06 | ) | | | (0.75 | ) | | | — | | | | | | | | | | | | | | | | | | | | | | | | | |
| Net asset value, end of year/period | | $ | 15.57 | | | $ | 21.10 | | | $ | 15.26 | | | $ | 15.51 | | | $ | 15.61 | | | $ | 17.54 | | | | | | | | | | | | | | | | | | | | | | | | | |
| Total return + # | | | (14.81 | )% | | | 39.45 | % | | | 0.45 | % | | | 7.08 | % | | | (7.08 | )% | | | 23.17 | % | | | | | | | | | | | | | | | | | | | | | | | | |
| Ratios/Supplemental Data: | | | | | | | | | | | | | | | | | | | | | | | | | | | | | | | | | | | | | | | | | | | | | | | | |
| Net assets, end of year/period (in 000s) | | $ | 130,002 | | | $ | 150,922 | | | $ | 96,239 | | | $ | 101,505 | | | $ | 89,401 | | | $ | 90,257 | | | | | | | | | | | | | | | | | | | | | | | | | |
| Ratios of expenses to average net assets: | | | | | | | | | | | | | | | | | | | | | | | | | | | | | | | | | | | | | | | | | | | | | | | | |
| Before fees paid indirectly | | �� | 1.65 | % | | | 1.92 | % | | | 1.71 | % | | | 1.43 | % | | | 1.67 | % | | | 1.56 | % | | | | | | | | | | | | | | | | | | | | | | | | |
| After fees paid indirectly | | | 1.65 | % | | | 1.92 | % | | | 1.71 | % | | | 1.43 | % | | | 1.67 | % | | | 1.55 | % | | | | | | | | | | | | | | | | | | | | | | | | |
| Ratios of net investment income to average net assets: | | | | | | | | | | | | | | | | | | | | | | | | | | | | | | | | | | | | | | | | | | | | | | | | |
| Before fees paid indirectly | | | 2.71 | % | | | 1.47 | % | | | 0.98 | % | | | 2.28 | % | | | 1.24 | % | | | 1.34 | % | | | | | | | | | | | | | | | | | | | | | | | | |
| After fees paid indirectly | | | 2.71 | % | | | 1.47 | % | | | 0.98 | % | | | 2.28 | % | | | 1.24 | % | | | 1.35 | % | | | | | | | | | | | | | | | | | | | | | | | | |
| Portfolio turnover rate (1) | | | 42 | % | | | 131 | % | | | 156 | % | | | 100 | % | | | 113 | % | | | 119 | % | | | | | | | | | | | | | | | | | | | | | | | | |
| | | | | | | | | | | | | | | | | | | | | | | | | | | | | | | | | | | | | | | | | | | | | | | | | |
| | | Class A | | | Class C | |
| | | Six Months Ended | | | Year Ended October 31, | | | Six Months Ended | | | Year Ended October 31, | |
| | | April 30, 2022 | | | 2021 | | | 2020 | | | 2019 | | | 2018 | | | 2017 | | | April 30, 2022 | | | 2021 | | | 2020 | | | 2019 | | | 2018 | | | 2017 | |
| | | (Unaudited) | | | | | | | | | | | | | | | | | | (Unaudited) | | | | | | | | | | | | | | | | |
| Net asset value, beginning of year/period | | $ | 20.92 | | | $ | 15.13 | | | $ | 15.38 | | | $ | 15.49 | | | $ | 17.42 | | | $ | 14.17 | | | $ | 19.66 | | | $ | 14.25 | | | $ | 14.55 | | | $ | 14.68 | | | $ | 16.59 | | | $ | 13.60 | |
| Income (loss) from investment operations: | | | | | | | | | | | | | | | | | | | | | | | | | | | | | | | | | | | | | | | | | | | | | | | | |
| Net investment income (loss)* | | | 0.22 | | | | 0.23 | | | | 0.11 | | | | 0.30 | | | | 0.17 | | | | 0.17 | | | | 0.14 | | | | 0.08 | | | | (0.02 | ) | | | 0.18 | | | | 0.04 | | | | 0.04 | |
| Net realized and unrealized gain (loss) ! | | | (2.93 | ) | | | 5.68 | | | | (0.06 | ) | | | 0.61 | | | | (1.38 | ) | | | 3.08 | | | | (2.74 | ) | | | 5.34 | | | | (0.05 | ) | | | 0.59 | | | | (1.31 | ) | | | 2.95 | |
| Total income (loss) from investment operations | | | (2.71 | ) | | | 5.91 | | | | 0.05 | | | | 0.91 | | | | (1.21 | ) | | | 3.25 | | | | (2.60 | ) | | | 5.42 | | | | (0.07 | ) | | | 0.77 | | | | (1.27 | ) | | | 2.99 | |
| Less distributions: | | | | | | | | | | | | | | | | | | | | | | | | | | | | | | | | | | | | | | | | | | | | | | | | |
| Distributions from net investment income | | | (0.35 | ) | | | (0.11 | ) | | | (0.30 | ) | | | (0.14 | ) | | | (0.23 | ) | | | — | | | | (0.20 | ) | | | — | | | | (0.23 | ) | | | (0.02 | ) | | | (0.15 | ) | | | — | |
| Distributions from net realized gains | | | (2.42 | ) | | | (0.01 | ) | | | — | | | | (0.88 | ) | | | (0.49 | ) | | | — | | | | (2.42 | ) | | | (0.01 | ) | | | — | | | | (0.88 | ) | | | (0.49 | ) | | | — | |
| Total distributions | | | (2.77 | ) | | | (0.12 | ) | | | (0.30 | ) | | | (1.02 | ) | | | (0.72 | ) | | | — | | | | (2.62 | ) | | | (0.01 | ) | | | (0.23 | ) | | | (0.90 | ) | | | (0.64 | ) | | | — | |
| Net asset value, end of year/period | | $ | 15.44 | | | $ | 20.92 | | | $ | 15.13 | | | $ | 15.38 | | | $ | 15.49 | | | $ | 17.42 | | | $ | 14.44 | | | $ | 19.66 | | | $ | 14.25 | | | $ | 14.55 | | | $ | 14.68 | | | $ | 16.59 | |
| Total return + # | | | (14.90 | )% | | | 39.15 | % | | | 0.24 | % | | | 6.78 | % | | | (7.30 | )% | | | 22.94 | % | | | (15.21 | )% | | | 38.04 | % | | | (0.55 | )% | | | 6.03 | % | | | (8.03 | )% | | | 21.99 | % |
| Ratios/Supplemental Data: | | | | | | | | | | | | | | | | | | | | | | | | | | | | | | | | | | | | | | | | | | | | | | | | |
| Net assets, end of year/period (in 000s) | | $ | 22,456 | | | $ | 26,672 | | | $ | 20,938 | | | $ | 22,499 | | | $ | 18,250 | | | $ | 15,524 | | | $ | 4,833 | | | $ | 5,830 | | | $ | 4,754 | | | $ | 6,409 | | | $ | 5,764 | | | $ | 6,570 | |
| Ratios of expenses to average net assets: | | | | | | | | | | | | | | | | | | | | | | | | | | | | | | | | | | | | | | | | | | | | | | | | |
| Before fees paid indirectly | | | 1.90 | % | | | 2.17 | % | | | 1.96 | % | | | 1.68 | % | | | 1.92 | % | | | 1.81 | % | | | 2.65 | % | | | 2.92 | % | | | 2.71 | % | | | 2.43 | % | | | 2.67 | % | | | 2.56 | % |
| After fees paid indirectly | | | 1.90 | % | | | 2.17 | % | | | 1.96 | % | | | 1.68 | % | | | 1.92 | % | | | 1.80 | % | | | 2.65 | % | | | 2.92 | % | | | 2.71 | % | | | 2.43 | % | | | 2.67 | % | | | 2.55 | % |
| Ratios of net investment income (loss) to average net assets: | | | | | | | | | | | | | | | | | | | | | | | | | | | | | | | | | | | | | | | | | | | | | | | | |
| Before fees paid indirectly | | | 2.41 | % | | | 1.17 | % | | | 0.71 | % | | | 2.04 | % | | | 1.01 | % | | | 1.07 | % | | | 1.64 | % | | | 0.43 | % | | | (0.11 | )% | | | 1.26 | % | | | 0.22 | % | | | 0.30 | % |
| After fees paid indirectly | | | 2.41 | % | | | 1.17 | % | | | 0.71 | % | | | 2.04 | % | | | 1.01 | % | | | 1.08 | % | | | 1.64 | % | | | 0.43 | % | | | (0.11 | )% | | | 1.26 | % | | | 0.22 | % | | | 0.31 | % |
| Portfolio turnover rate (1) | | | 42 | % | | | 131 | % | | | 156 | % | | | 100 | % | | | 113 | % | | | 119 | % | | | 42 | % | | | 131 | % | | | 156 | % | | | 100 | % | | | 113 | % | | | 119 | % |
| * | The net investment income (loss) per share data was determined using the average shares outstanding throughout each year/period. |
| + | Assumes reinvestment of all dividends and distributions, if any. Total return does not reflect the deductions of taxes that a shareholder would pay on distributions or on the redemption of shares and does not reflect the impact of any sales charge. |
| # | Includes adjustments in accordance with accounting principles generally accepted in the United States and, consequently, the net asset values for financial reporting purposes and the returns based upon those net asset values may differ from the net asset values and returns for shareholder transactions. Adjustments may apply to some but not all years and classes. |
| ! | The amount of net realized and unrealized gain (loss) on investment per share for the year ended October 31, 2020 does not accord with the amounts in the Statements of Operations due to the timing of purchases and sales of Fund shares in relation to fluctuating market values. |
| (1) | Not annualized for periods less than one year. |
See accompanying notes which are an integral part to these financial statements.
| FINANCIAL HIGHLIGHTS |
| Dunham Dynamic Macro Fund |
| |
| The table sets forth financial data for one share of beneficial interest outstanding throughout each year/period. |
| | | Class N | | | | | | | | | | | | | | | | | | | | | | | | | |
| | | Six Months Ended | | | Year Ended October 31, | | | | | | | | | | | | | | | | | | | | | | | | | |
| | | April 30, 2022 | | | 2021 | | | 2020 | | | 2019 | | | 2018 | | | 2017 | | | | | | | | | | | | | | | | | | | | | | | | | |
| | | (Unaudited) | | | | | | | | | | | | | | | | | | | | | | | | | | | | | | | | | | | | | | | | |
| Net asset value, beginning of year/period | | $ | 11.22 | | | $ | 10.00 | | | $ | 10.08 | | | $ | 9.53 | | | $ | 10.18 | | | $ | 9.55 | | | | | | | | | | | | | | | | | | | | | | | | | |
| Income (loss) from investment operations: | | | | | | | | | | | | | | | | | | | | | | | | | | | | | | | | | | | | | | | | | | | | | | | | |
| Net investment income (loss) * | | | 0.04 | | | | (0.14 | ) | | | (0.00 | )(a) | | | 0.12 | | | | 0.02 | | | | (0.03 | ) | | | | | | | | | | | | | | | | | | | | | | | | |
| Net realized and unrealized gain (loss) | | | (0.97 | ) | | | 1.44 | | | | (0.08 | ) | | | 0.65 | | | | (0.67 | ) | | | 0.66 | | | | | | | | | | | | | | | | | | | | | | | | | |
| Total income (loss) from investment operations | | | (0.93 | ) | | | 1.30 | | | | (0.08 | ) | | | 0.77 | | | | (0.65 | ) | | | 0.63 | | | | | | | | | | | | | | | | | | | | | | | | | |
| Less distributions: | | | | | | | | | | | | | | | | | | | | | | | | | | | | | | | | | | | | | | | | | | | | | | | | |
| Distributions from net investment income | | | — | | | | (0.08 | ) | | | — | | | | (0.17 | ) | | | — | | | | — | | | | | | | | | | | | | | | | | | | | | | | | | |
| Tax return of capital | | | — | | | | — | | | | — | | | | (0.05 | ) | | | — | | | | — | | | | | | | | | | | | | | | | | | | | | | | | | |
| Total distributions | | | — | | | | (0.08 | ) | | | — | | | | (0.22 | ) | | | — | | | | — | | | | | | | | | | | | | | | | | | | | | | | | | |
| Net asset value, end of year/period | | $ | 10.29 | | | $ | 11.22 | | | $ | 10.00 | | | $ | 10.08 | | | $ | 9.53 | | | $ | 10.18 | | | | | | | | | | | | | | | | | | | | | | | | | |
| Total return + # | | | (8.29 | )% | | | 13.05 | % | | | (0.79 | )% | | | 8.35 | % | | | (6.39 | )% | | | 6.60 | % | | | | | | | | | | | | | | | | | | | | | | | | |
| Ratios/Supplemental Data: | | | | | | | | | | | | | | | | | | | | | | | | | | | | | | | | | | | | | | | | | | | | | | | | |
| Net assets, end of year/period (in 000s) | | $ | 18,929 | | | $ | 21,043 | | | $ | 23,680 | | | $ | 32,074 | | | $ | 35,638 | | | $ | 36,104 | | | | | | | | | | | | | | | | | | | | | | | | | |
| Ratios of expenses to average net assets: | | | 2.14 | % | | | 2.06 | % | | | 1.69 | % | | | 1.54 | % | | | 1.80 | % | | | 1.83 | % | | | | | | | | | | | | | | | | | | | | | | | | |
| Ratios of net investment income (loss) to average net assets: | | | 0.79 | % | | | (1.26 | )% | | | (0.02 | )% | | | 1.29 | % | | | 0.20 | % | | | (0.32 | )% | | | | | | | | | | | | | | | | | | | | | | | | |
| Portfolio turnover rate (1) | | | 25 | % | | | 12 | % | | | 187 | % | | | 28 | % | | | 11 | % | | | 7 | % | | | | | | | | | | | | | | | | | | | | | | | | |
| | | | | | | | | | | | | | | | | | | | | | | | | | | | | | | | | | | | | | | | | | | | | | | | | |
| | | Class A | | | Class C | |
| | | Six Months Ended | | | Year Ended October 31, | | | Six Months Ended | | | Year Ended October 31, | |
| | | April 30, 2022 | | | 2021 | | | 2020 | | | 2019 | | | 2018 | | | 2017 | | | April 30, 2022 | | | 2021 | | | 2020 | | | 2019 | | | 2018 | | | 2017 | |
| | | (Unaudited) | | | | | | | | | | | | | | | | | | (Unaudited) | | | | | | | | | | | | | | | | |
| Net asset value, beginning of year/period | | $ | 11.11 | | | $ | 9.90 | | | $ | 10.00 | | | $ | 9.46 | | | $ | 10.12 | | | $ | 9.52 | | | $ | 10.49 | | | $ | 9.37 | | | $ | 9.55 | | | $ | 9.03 | | | $ | 9.74 | | | $ | 9.23 | |
| Income (loss) from investment operations: | | | | | | | | | | | | | | | | | | | | | | | | | | | | | | | | | | | | | | | | | | | | | | | | |
| Net investment income (loss) * | | | 0.03 | | | | (0.16 | ) | | | (0.03 | ) | | | 0.10 | | | | 0.00 | (a) | | | (0.06 | ) | | | (0.01 | ) | | | (0.23 | ) | | | (0.10 | ) | | | 0.02 | | | | (0.08 | ) | | | (0.12 | ) |
| Net realized and unrealized gain (loss) | | | (0.95 | ) | | | 1.41 | | | | (0.07 | ) | | | 0.64 | | | | (0.66 | ) | | | 0.66 | | | | (0.91 | ) | | | 1.35 | | | | (0.08 | ) | | | 0.63 | | | | (0.63 | ) | | | 0.63 | |
| Total income (loss) from investment operations | | | (0.92 | ) | | | 1.25 | | | | (0.10 | ) | | | 0.74 | | | | (0.66 | ) | | | 0.60 | | | | (0.92 | ) | | | 1.12 | | | | (0.18 | ) | | | 0.65 | | | | (0.71 | ) | | | 0.51 | |
| Less distributions: | | | | | | | | | | | | | | | | | | | | | | | | | | | | | | | | | | | | | | | | | | | | | | | | |
| Distributions from net investment income | | | — | | | | (0.04 | ) | | | — | | | | (0.15 | ) | | | — | | | | — | | | | — | | | | — | | | | — | | | | (0.08 | ) | | | — | | | | — | |
| Tax return of capital | | | — | | | | — | | | | — | | | | (0.05 | ) | | | — | | | | — | | | | — | | | | — | | | | — | | | | (0.05 | ) | | | — | | | | — | |
| Total distributions | | | — | | | | (0.04 | ) | | | — | | | | (0.20 | ) | | | — | | | | — | | | | — | | | | — | | | | — | | | | (0.13 | ) | | | — | | | | — | |
| Net asset value, end of year/period | | $ | 10.19 | | | $ | 11.11 | | | $ | 9.90 | | | $ | 10.00 | | | $ | 9.46 | | | $ | 10.12 | | | $ | 9.57 | | | $ | 10.49 | | | $ | 9.37 | | | $ | 9.55 | | | $ | 9.03 | | | $ | 9.74 | |
| Total return + # | | | (8.28 | )% | | | 12.62 | % | | | (1.00 | )% | | | 8.04 | % | | | (6.52 | )% | | | 6.30 | % | | | (8.77 | )% | | | 11.95 | % | | | (1.88 | )% | | | 7.31 | % | | | (7.29 | )% | | | 5.53 | % |
| Ratios/Supplemental Data: | | | | | | | | | | | | | | | | | | | | | | | | | | | | | | | | | | | | | | | | | | | | | | | | |
| Net assets, end of year/period (in 000s) | | $ | 3,612 | | | $ | 4,030 | | | $ | 5,078 | | | $ | 7,713 | | | $ | 7,918 | | | $ | 6,224 | | | $ | 999 | | | $ | 1,146 | | | $ | 1,284 | | | $ | 1,927 | | | $ | 1,696 | | | $ | 1,969 | |
| Ratios of expenses to average net assets: | | | 2.39 | % | | | 2.31 | % | | | 1.94 | % | | | 1.79 | % | | | 2.05 | % | | | 2.08 | % | | | 3.14 | % | | | 3.06 | % | | | 2.69 | % | | | 2.54 | % | | | 2.80 | % | | | 2.83 | % |
| Ratios of net investment income (loss) to average net assets: | | | 0.55 | % | | | (1.48 | )% | | | (0.26 | )% | | | 1.03 | % | | | 0.00 | %(b) | | | (0.58 | )% | | | (0.19 | )% | | | (2.29 | )% | | | (1.04 | )% | | | 0.20 | % | | | (0.84 | )% | | | (1.34 | )% |
| Portfolio turnover rate (1) | | | 25 | % | | | 12 | % | | | 187 | % | | | 28 | % | | | 11 | % | | | 7 | % | | | 25 | % | | | 12 | % | | | 187 | % | | | 28 | % | | | 11 | % | | | 7 | % |
| * | The net investment income (loss) per share data was determined using the average shares outstanding throughout each year/period. |
| + | Assumes reinvestment of all dividends and distributions, if any. Total return does not reflect the deductions of taxes that a shareholder would pay on distributions or on the redemption of shares and does not reflect the impact of any sales charge. |
| # | Includes adjustments in accordance with accounting principles generally accepted in the United States and, consequently, the net asset values for financial reporting purposes and the returns based upon those net asset values may differ from the net asset values and returns for shareholder transactions. Adjustments may apply to some but not all years and classes. |
| (a) | Represents less than $0.01 per share. |
| (b) | Represents less than 0.01%. |
| (1) | Annualized for periods less than one year. |
See accompanying notes which are an integral part to these financial statements.
| FINANCIAL HIGHLIGHTS |
| Dunham Long/Short Credit Fund |
| |
| The table sets forth financial data for one share of beneficial interest outstanding throughout each year/period. |
| | | Class N | | | | | | | | | | | | | | | | | | | | | | | | | |
| | | Six Months Ended | | | Year Ended October 31, | | | | | | | | | | | | | | | | | | | | | | | | | |
| | | April 30, 2022 | | | 2021 | | | 2020 | | | 2019 | | | 2018 | | | 2017 | | | | | | | | | | | | | | | | | | | | | | | | | |
| | | (Unaudited) | | | | | | | | | | | | | | | | | | | | | | | | | | | | | | | | | | | | | | | | |
| Net asset value, beginning of year/period | | $ | 9.70 | | | $ | 9.55 | | | $ | 9.36 | | | $ | 9.19 | | | $ | 8.68 | | | $ | 8.05 | | | | | | | | | | | | | | | | | | | | | | | | | |
| Income (loss) from investment operations: | | | | | | | | | | | | | | | | | | | | | | | | | | | | | | | | | | | | | | | | | | | | | | | | |
| Net investment income* | | | 0.09 | | | | 0.06 | | | | 0.13 | | | | 0.24 | | | | 0.23 | | | | 0.16 | | | | | | | | | | | | | | | | | | | | | | | | | |
| Net realized and unrealized gain (loss) | | | (0.20 | ) | | | 0.32 | | | | 0.26 | | | | 0.24 | | | | 0.49 | | | | 0.72 | | | | | | | | | | | | | | | | | | | | | | | | | |
| Total income (loss) from investment operations | | | (0.11 | ) | | | 0.38 | | | | 0.39 | | | | 0.48 | | | | 0.72 | | | | 0.88 | | | | | | | | | | | | | | | | | | | | | | | | | |
| Less distributions: | | | | | | | | | | | | | | | | | | | | | | | | | | | | | | | | | | | | | | | | | | | | | | | | |
| Distributions from net investment income | | | (0.09 | ) | | | (0.07 | ) | | | (0.15 | ) | | | (0.31 | ) | | | (0.21 | ) | | | (0.25 | ) | | | | | | | | | | | | | | | | | | | | | | | | |
| Distributions from net realized gains | | | (0.18 | ) | | | (0.16 | ) | | | (0.05 | ) | | | — | | | | — | | | | — | | | | | | | | | | | | | | | | | | | | | | | | | |
| Total distributions | | | (0.27 | ) | | | (0.23 | ) | | | (0.20 | ) | | | (0.31 | ) | | | (0.21 | ) | | | (0.25 | ) | | | | | | | | | | | | | | | | | | | | | | | | |
| Net asset value, end of year/period | | $ | 9.32 | | | $ | 9.70 | | | $ | 9.55 | | | $ | 9.36 | | | $ | 9.19 | | | $ | 8.68 | | | | | | | | | | | | | | | | | | | | | | | | | |
| Total return + # | | | (1.19 | )% | | | 4.00 | % | | | 4.23 | % | | | 5.31 | % | | | 8.42 | % | | | 11.20 | % | | | | | | | | | | | | | | | | | | | | | | | | |
| Ratios/Supplemental Data: | | | | | | | | | | | | | | | | | | | | | | | | | | | | | | | | | | | | | | | | | | | | | | | | |
| Net assets, end of year/period (in 000s) | | $ | 203,232 | | | $ | 195,874 | | | $ | 110,215 | | | $ | 67,276 | | | $ | 36,055 | | | $ | 12,953 | | | | | | | | | | | | | | | | | | | | | | | | | |
| Ratios of expenses to average net assets: ^ | | | 1.02 | % | | | 1.82 | % | | | 1.43 | % | | | 1.24 | % | | | 1.44 | % | | | 1.41 | % | | | | | | | | | | | | | | | | | | | | | | | | |
| Ratios of net investment income (loss) to average net assets: ^ | | | 1.95 | % | | | 0.67 | % | | | 1.41 | % | | | 2.60 | % | | | 2.52 | % | | | 1.90 | % | | | | | | | | | | | | | | | | | | | | | | | | |
| Portfolio turnover rate (1) | | | 48 | % | | | 343 | % | | | 519 | % | | | 426 | % | | | 275 | % | | | 106 | % | | | | | | | | | | | | | | | | | | | | | | | | |
| | | | | | | | | | | | | | | | | | | | | | | | | | | | | | | | | | | | | | | | | | | | | | | | | |
| | | Class A | | | Class C | |
| | | Six Months Ended | | | Year Ended October 31, | | | Six Months Ended | | | Year Ended October 31, | |
| | | April 30, 2022 | | | 2021 | | | 2020 | | | 2019 | | | 2018 | | | 2017 | | | April 30, 2022 | | | 2021 | | | 2020 | | | 2019 | | | 2018 | | | 2017 | |
| | | (Unaudited) | | | | | | | | | | | | | | | | | | (Unaudited) | | | | | | | | | | | | | | | | |
| Net asset value, beginning of year/period | | $ | 9.68 | | | $ | 9.53 | | | $ | 9.33 | | | $ | 9.17 | | | $ | 8.66 | | | $ | 8.03 | | | $ | 9.34 | | | $ | 9.24 | | | $ | 9.08 | | | $ | 8.94 | | | $ | 8.46 | | | $ | 7.86 | |
| Income (loss) from investment operations: | | | | | | | | | | | | | | | | | | | | | | | | | | | | | | | | | | | | | | | | | | | | | | | | |
| Net investment income (loss)* | | | 0.08 | | | | 0.04 | | | | 0.11 | | | | 0.22 | | | | 0.19 | | | | 0.14 | | | | 0.04 | | | | (0.03 | ) | | | 0.05 | | | | 0.15 | | | | 0.11 | | | | 0.07 | |
| Net realized and unrealized gain (loss) | | | (0.20 | ) | | | 0.32 | | | | 0.26 | | | | 0.22 | | | | 0.50 | | | | 0.72 | | | | (0.19 | ) | | | 0.30 | | | | 0.24 | | | | 0.23 | | | | 0.49 | | | | 0.71 | |
| Total income (loss) from investment operations | | | (0.12 | ) | | | 0.36 | | | | 0.37 | | | | 0.44 | | | | 0.69 | | | | 0.86 | | | | (0.15 | ) | | | 0.27 | | | | 0.29 | | | | 0.38 | | | | 0.60 | | | | 0.78 | |
| Less distributions: | | | | | | | | | | | | | | | | | | | | | | | | | | | | | | | | | | | | | | | | | | | | | | | | |
| Distributions from net investment income | | | (0.08 | ) | | | (0.05 | ) | | | (0.12 | ) | | | (0.28 | ) | | | (0.18 | ) | | | (0.23 | ) | | | (0.05 | ) | | | (0.01 | ) | | | (0.08 | ) | | | (0.24 | ) | | | (0.12 | ) | | | (0.18 | ) |
| Distributions from net realized gains | | | (0.18 | ) | | | (0.16 | ) | | | (0.05 | ) | | | — | | | | — | | | | — | | | | (0.18 | ) | | | (0.16 | ) | | | (0.05 | ) | | | — | | | | — | | | | — | |
| Total distributions | | | (0.26 | ) | | | (0.21 | ) | | | (0.17 | ) | | | (0.28 | ) | | | (0.18 | ) | | | (0.23 | ) | | | (0.23 | ) | | | (0.17 | ) | | | (0.13 | ) | | | (0.24 | ) | | | (0.12 | ) | | | (0.18 | ) |
| Net asset value, end of year/period | | $ | 9.30 | | | $ | 9.68 | | | $ | 9.53 | | | $ | 9.33 | | | $ | 9.17 | | | $ | 8.66 | | | $ | 8.96 | | | $ | 9.34 | | | $ | 9.24 | | | $ | 9.08 | | | $ | 8.94 | | | $ | 8.46 | |
| Total return + # | | | (1.32 | )% | | | 3.77 | % | | | 4.09 | % | | | 4.95 | % | | | 8.10 | % | | | 10.92 | % | | | (1.76 | )% | | | 2.89 | % | | | 3.24 | % | | | 4.34 | % | | | 7.21 | % | | | 10.08 | % |
| Ratios/Supplemental Data: | | | | | | | | | | | | | | | | | | | | | | | | | | | | | | | | | | | | | | | | | | | | | | | | |
| Net assets, end of year/period (in 000s) | | $ | 33,805 | | | $ | 29,040 | | | $ | 17,123 | | | $ | 11,087 | | | $ | 6,265 | | | $ | 3,125 | | | $ | 4,275 | | | $ | 4,518 | | | $ | 3,852 | | | $ | 4,077 | | | $ | 3,145 | | | $ | 2,708 | |
| Ratios of expenses to average net assets: ^ | | | 1.25 | % | | | 2.07 | % | | | 1.68 | % | | | 1.48 | % | | | 1.69 | % | | | 1.66 | % | | | 2.02 | % | | | 2.82 | % | | | 2.43 | % | | | 2.22 | % | | | 2.44 | % | | | 2.41 | % |
| Ratios of net investment income (loss) to average net assets: ^ | | | 1.70 | % | | | 0.41 | % | | | 1.21 | % | | | 2.36 | % | | | 2.13 | % | | | 1.66 | % | | | 0.96 | % | | | (0.37 | )% | | | 0.53 | % | | | 1.63 | % | | | 1.22 | % | | | 0.93 | % |
| Portfolio turnover rate (1) | | | 48 | % | | | 343 | % | | | 519 | % | | | 426 | % | | | 275 | % | | | 106 | % | | | 48 | % | | | 343 | % | | | 519 | % | | | 426 | % | | | 275 | % | | | 106 | % |
| * | The net investment income (loss) per share data was determined using the average shares outstanding throughout each year/period. |
| + | Assumes reinvestment of all dividends and distributions, if any. Total return does not reflect the deductions of taxes that a shareholder would pay on distributions or on the redemption of shares and does not reflect the impact of any sales charge. |
| # | Includes adjustments in accordance with accounting principles generally accepted in the United States and, consequently, the net asset values for financial reporting purposes and the returns based upon those net asset values may differ from the net asset values and returns for shareholder transactions. Adjustments may apply to some but not all years and classes. |
| ^ | Annualized for periods less than one year. |
| (1) | Not annualized for periods less than one year. |
See accompanying notes which are an integral part to these financial statements.
| FINANCIAL HIGHLIGHTS |
| Dunham Monthly Distribution Fund |
| |
| The table sets forth financial data for one share of beneficial interest outstanding throughout each year/period. |
| | | Class N | | | | | | | | | | | | | | | | | | | | | | | | | |
| | | Six Months Ended | | | Year Ended October 31, | | | | | | | | | | | | | | | | | | | | | | | | | |
| | | April 30, 2022 | | | 2021 | | | 2020 | | | 2019 | | | 2018 | | | 2017 | | | | | | | | | | | | | | | | | | | | | | | | | |
| | | (Unaudited) | | | | | | | | | | | | | | | | | | | | | | | | | | | | | | | | | | | | | | | | |
| Net asset value, beginning of year/period | | $ | 32.18 | | | $ | 32.75 | | | $ | 33.88 | | | $ | 34.84 | | | $ | 36.71 | | | $ | 35.74 | | | | | | | | | | | | | | | | | | | | | | | | | |
| Income (loss) from investment operations: | | | | | | | | | | | | | | | | | | | | | | | | | | | | | | | | | | | | | | | | | | | | | | | | |
| Net investment income (loss)* | | | 0.62 | | | | (0.28 | ) | | | (0.21 | ) | | | (0.13 | ) | | | 0.09 | | | | (0.36 | ) | | | | | | | | | | | | | | | | | | | | | | | | |
| Net realized and unrealized gain (loss) | | | (0.65 | ) | | | 0.79 | | | | 0.33 | | | | 1.02 | | | | (0.25 | ) | | | 2.79 | | | | | | | | | | | | | | | | | | | | | | | | | |
| Total income (loss) from investment operations | | | (0.03 | ) | | | 0.51 | | | | 0.12 | | | | 0.89 | | | | (0.16 | ) | | | 2.43 | | | | | | | | | | | | | | | | | | | | | | | | | |
| Less distributions: | | | | | | | | | | | | | | | | | | | | | | | | | | | | | | | | | | | | | | | | | | | | | | | | |
| Distributions from net investment income | | | (0.53 | ) | | | (0.71 | ) | | | (0.30 | ) | | | — | | | | — | | | | — | | | | | | | | | | | | | | | | | | | | | | | | | |
| Distributions from net realized gains | | | — | | | | — | | | | — | | | | — | | | | (0.35 | ) | | | — | | | | | | | | | | | | | | | | | | | | | | | | | |
| Tax return of capital | | | — | | | | (0.37 | ) | | | (0.95 | ) | | | (1.85 | ) | | | (1.36 | ) | | | (1.46 | ) | | | | | | | | | | | | | | | | | | | | | | | | |
| Total distributions | | | (0.53 | ) | | | (1.08 | ) | | | (1.25 | ) | | | (1.85 | ) | | | (1.71 | ) | | | (1.46 | ) | | | | | | | | | | | | | | | | | | | | | | | | |
| Net asset value, end of year/period | | $ | 31.62 | | | $ | 32.18 | | | $ | 32.75 | | | $ | 33.88 | | | $ | 34.84 | | | $ | 36.71 | | | | | | | | | | | | | | | | | | | | | | | | | |
| Total return + # | | | (0.11 | )% | | | 1.54 | % | | | 0.37 | % | | | 2.61 | % | | | (0.45 | )% | | | 6.92 | % | | | | | | | | | | | | | | | | | | | | | | | | |
| Ratios/Supplemental Data: | | | | | | | | | | | | | | | | | | | | | | | | | | | | | | | | | | | | | | | | | | | | | | | | |
| Net assets, end of year/period (in 000s) | | $ | 200,178 | | | $ | 219,703 | | | $ | 160,250 | | | $ | 183,319 | | | $ | 201,405 | | | $ | 212,178 | | | | | | | | | | | | | | | | | | | | | | | | | |
| Ratios of expenses to average net assets: | | | | | | | | | | | | | | | | | | | | | | | | | | | | | | | | | | | | | | | | | | | | | | | | |
| After waivers | | | 2.86 | % | | | 1.90 | % | | | 1.81 | % | | | 2.62 | % | | | 2.16 | % | | | 2.73 | % | | | | | | | | | | | | | | | | | | | | | | | | |
| Dividends/borrowings on short sales | | | 0.43 | % | | | 0.81 | % | | | 0.69 | % | | | 1.24 | % | | | 1.10 | % | | | 1.17 | % | | | | | | | | | | | | | | | | | | | | | | | | |
| Excluding dividends/borrowings on short sales: ^ | | | | | | | | | | | | | | | | | | | | | | | | | | | | | | | | | | | | | | | | | | | | | | | | |
| Before fee waivers | | | 2.43 | % | | | 1.09 | % | | | 1.13 | % | | | 1.38 | % | | | 1.06 | % | | | 1.59 | % | | | | | | | | | | | | | | | | | | | | | | | | |
| After fee waivers | | | 2.43 | % | | | 1.09 | % | | | 1.13 | % | | | 1.38 | % | | | 1.06 | % | | | 1.56 | % | | | | | | | | | | | | | | | | | | | | | | | | |
| Ratios of net investment income (loss) to average net assets: ^ | | | | | | | | | | | | | | | | | | | | | | | | | | | | | | | | | | | | | | | | | | | | | | | | |
| Before fee waivers | | | 3.92 | % | | | (0.84 | )% | | | (0.62 | )% | | | (0.39 | )% | | | 0.25 | % | | | (1.06 | )% | | | | | | | | | | | | | | | | | | | | | | | | |
| After fee waivers | | | 3.92 | % | | | (0.84 | )% | | | (0.62 | )% | | | (0.39 | )% | | | 0.25 | % | | | (1.03 | )% | | | | | | | | | | | | | | | | | | | | | | | | |
| Portfolio turnover rate (1) | | | 95 | % | | | 339 | % | | | 605 | % | | | 496 | % | | | 453 | % | | | 382 | % | | | | | | | | | | | | | | | | | | | | | | | | |
| | | | | | | | | | | | | | | | | | | | | | | | | | | | | | | | | | | | | | | | | | | | | | | | | |
| | | Class A | | | Class C | |
| | | Six Months Ended | | | Year Ended October 31, | | | Six Months Ended | | | Year Ended October 31, | |
| | | April 30, 2022 | | | 2021 | | | 2020 | | | 2019 | | | 2018 | | | 2017 | | | April 30, 2022 | | | 2021 | | | 2020 | | | 2019 | | | 2018 | | | 2017 | |
| | | (Unaudited) | | | | | | | | | | | | | | | | | | (Unaudited) | | | | | | | | | | | | | | | | |
| Net asset value, beginning of year/period | | $ | 30.83 | | | $ | 31.49 | | | $ | 32.71 | | | $ | 33.77 | | | $ | 35.73 | | | $ | 34.90 | | | $ | 23.26 | | | $ | 24.19 | | | $ | 25.60 | | | $ | 27.02 | | | $ | 29.15 | | | $ | 28.94 | |
| Income (loss) from investment operations: | | | | | | | | | | | | | | | | | | | | | | | | | | | | | | | | | | | | | | | | | | | | | | | | |
| Net investment income (loss)* | | | 0.56 | | | | (0.44 | ) | | | (0.30 | ) | | | (0.21 | ) | | | 0.00 | (a) | | | (0.40 | ) | | | 0.33 | | | | (0.55 | ) | | | (0.43 | ) | | | (0.36 | ) | | | (0.21 | ) | | | (0.55 | ) |
| Net realized and unrealized gain (loss) | | | (0.63 | ) | | | 0.86 | | | | 0.33 | | | | 1.00 | | | | (0.25 | ) | | | 2.69 | | | | (0.47 | ) | | | 0.70 | | | | 0.27 | | | | 0.79 | | | | (0.21 | ) | | | 2.22 | |
| Total income (loss) from investment operations | | | (0.07 | ) | | | 0.42 | | | | 0.03 | | | | 0.79 | | | | (0.25 | ) | | | 2.29 | | | | (0.14 | ) | | | 0.15 | | | | (0.16 | ) | | | 0.43 | | | | (0.42 | ) | | | 1.67 | |
| Less distributions: | | | | | | | | | | | | | | | | | | | | | | | | | | | | | | | | | | | | | | | | | | | | | | | | |
| Distributions from net investment income | | | (0.53 | ) | | | (0.71 | ) | | | (0.30 | ) | | | — | | | | — | | | | — | | | | (0.53 | ) | | | (0.71 | ) | | | (0.30 | ) | | | — | | | | — | | | | — | |
| Distributions from net realized gains | | | — | | | | — | | | | — | | | | — | | | | (0.35 | ) | | | — | | | | — | | | | — | | | | — | | | | — | | | | (0.35 | ) | | | — | |
| Tax return of capital | | | — | | | | (0.37 | ) | | | (0.95 | ) | | | (1.85 | ) | | | (1.36 | ) | | | (1.46 | ) | | | — | | | | (0.37 | ) | | | (0.95 | ) | | | (1.85 | ) | | | (1.36 | ) | | | (1.46 | ) |
| Total distributions | | | (0.53 | ) | | | (1.08 | ) | | | (1.25 | ) | | | (1.85 | ) | | | (1.71 | ) | | | (1.46 | ) | | | (0.53 | ) | | | (1.08 | ) | | | (1.25 | ) | | | (1.85 | ) | | | (1.71 | ) | | | (1.46 | ) |
| Net asset value, end of year/period | | $ | 30.23 | | | $ | 30.83 | | | $ | 31.49 | | | $ | 32.71 | | | $ | 33.77 | | | $ | 35.73 | | | $ | 22.59 | | | $ | 23.26 | | | $ | 24.19 | | | $ | 25.60 | | | $ | 27.02 | | | $ | 29.15 | |
| Total return + # | | | (0.22 | )% | | | 1.25 | % | | | 0.10 | % | | | 2.39 | % | | | (0.72 | )% | | | 6.64 | % | | | (0.59 | )% | | | 0.54 | % | | | (0.63 | )% | | | 1.63 | % | | | (1.48 | )% | | | 5.82 | % |
| Ratios/Supplemental Data: | | | | | | | | | | | | | | | | | | | | | | | | | | | | | | | | | | | | | | | | | | | | | | | | |
| Net assets, end of year/period (in 000s) | | $ | 32,601 | | | $ | 33,155 | | | $ | 33,157 | | | $ | 42,052 | | | $ | 42,980 | | | $ | 41,186 | | | $ | 17,355 | | | $ | 19,311 | | | $ | 23,171 | | | $ | 33,913 | | | $ | 34,664 | | | $ | 34,601 | |
| Ratios of expenses to average net assets: | | | | | | | | | | | | | | | | | | | | | | | | | | | | | | | | | | | | | | | | | | | | | | | | |
| After waivers | | | 3.11 | % | | | 2.16 | % | | | 2.06 | % | | | 2.87 | % | | | 2.41 | % | | | 2.93 | % | | | 3.85 | % | | | 2.93 | % | | | 2.81 | % | | | 3.62 | % | | | 3.16 | % | | | 3.68 | % |
| Dividends/borrowings on short sales | | | 0.43 | % | | | 0.81 | % | | | 0.68 | % | | | 1.24 | % | | | 1.10 | % | | | 1.12 | % | | | 0.43 | % | | | 0.81 | % | | | 0.68 | % | | | 1.23 | % | | | 1.10 | % | | | 1.12 | % |
| Excluding dividends/borrowings on short sales: ^ | | | | | | | | | | | | | | | | | | | | | | | | | | | | | | | | | | | | | | | | | | | | | | | | |
| Before fee waivers | | | 2.68 | % | | | 1.35 | % | | | 1.38 | % | | | 1.63 | % | | | 1.31 | % | | | 1.83 | % | | | 3.42 | % | | | 2.12 | % | | | 2.12 | % | | | 2.39 | % | | | 2.06 | % | | | 2.58 | % |
| After fee waivers | | | 2.68 | % | | | 1.35 | % | | | 1.38 | % | | | 1.63 | % | | | 1.31 | % | | | 1.81 | % | | | 3.42 | % | | | 2.12 | % | | | 2.12 | % | | | 2.39 | % | | | 2.06 | % | | | 2.56 | % |
| Ratios of net investment income (loss) to average net assets: ^ | | | | | | | | | | | | | | | | | | | | | | | | | | | | | | | | | | | | | | | | | | | | | | | | |
| Before fee waivers | | | 3.67 | % | | | (1.39 | )% | | | (0.94 | )% | | | (0.63 | )% | | | 0.01 | % | | | (1.14 | )% | | | 2.92 | % | | | (2.28 | )% | | | (1.74 | )% | | | (1.38 | )% | | | (0.73 | )% | | | (1.89 | )% |
| After fee waivers | | | 3.67 | % | | | (1.39 | )% | | | (0.94 | )% | | | (0.63 | )% | | | 0.01 | % | | | (1.11 | )% | | | 2.92 | % | | | (2.28 | )% | | | (1.74 | )% | | | (1.38 | )% | | | (0.73 | )% | | | (1.86 | )% |
| Portfolio turnover rate (1) | | | 95 | % | | | 339 | % | | | 605 | % | | | 496 | % | | | 453 | % | | | 382 | % | | | 95 | % | | | 339 | % | | | 605 | % | | | 496 | % | | | 453 | % | | | 382 | % |
| * | The net investment income (loss) per share data was determined using the average shares outstanding throughout each year/period. |
| + | Assumes reinvestment of all dividends and distributions, if any. Total return does not reflect the deductions of taxes that a shareholder would pay on distributions or on the redemption of shares and does not reflect the impact of any sales charge. |
| # | Includes adjustments in accordance with accounting principles generally accepted in the United States and, consequently, the net asset values for financial reporting purposes and the returns based upon those net asset values may differ from the net asset values and returns for shareholder transactions. Adjustments may apply to some but not all years and classes. |
| (a) | Represents less than $0.01 per share. |
| ^ | Annualized for periods less than one year. |
| (1) | Not annualized for periods less than one year. |
See accompanying notes which are an integral part to these financial statements.
| FINANCIAL HIGHLIGHTS |
| Dunham Real Estate Stock Fund |
| |
| The table sets forth financial data for one share of beneficial interest outstanding throughout each year/period. |
| | | Class N | | | | | | | | | | | | | | | | | | | | | | | | | |
| | | Six Months Ended | | | Year Ended October 31, | | | | | | | | | | | | | | | | | | | | | | | | | |
| | | April 30, 2022 | | | 2021 | | | 2020 | | | 2019 | | | 2018 | | | 2017 | | | | | | | | | | | | | | | | | | | | | | | | | |
| | | (Unaudited) | | | | | | | | | | | | | | | | | | | | | | | | | | | | | | | | | | | | | | | | |
| Net asset value, beginning of year/period | | $ | 21.36 | | | $ | 17.34 | | | $ | 18.68 | | | $ | 15.35 | | | $ | 15.66 | | | $ | 18.31 | | | | | | | | | | | | | | | | | | | | | | | | | |
| Income (loss) from investment operations: | | | | | | | | | | | | | | | | | | | | | | | | | | | | | | | | | | | | | | | | �� | | | | | | | | |
| Net investment income (loss) * | | | 0.08 | | | | (0.02 | ) | | | 0.11 | | | | 0.30 | | | | 0.28 | | | | 0.13 | | | | | | | | | | | | | | | | | | | | | | | | | |
| Net realized and unrealized gain (loss) ! | | | (3.54 | ) | | | 5.52 | | | | (0.14 | ) | | | 3.32 | | | | (0.35 | ) | | | 0.40 | | | | | | | | | | | | | | | | | | | | | | | | | |
| Total income (loss) from investment operations | | | (3.46 | ) | | | 5.50 | | | | (0.03 | ) | | | 3.62 | | | | (0.07 | ) | | | 0.53 | | | | | | | | | | | | | | | | | | | | | | | | | |
| Less distributions: | | | | | | | | | | | | | | | | | | | | | | | | | | | | | | | | | | | | | | | | | | | | | | | | |
| Distributions from net investment income | | | — | | | | — | | | | (0.31 | ) | | | (0.29 | ) | | | (0.12 | ) | | | (0.36 | ) | | | | | | | | | | | | | | | | | | | | | | | | |
| Distributions from net realized gains | | | (1.29 | ) | | | (1.48 | ) | | | (1.00 | ) | | | — | | | | (0.12 | ) | | | (2.82 | ) | | | | | | | | | | | | | | | | | | | | | | | | |
| Total distributions | | | (1.29 | ) | | | (1.48 | ) | | | (1.31 | ) | | | (0.29 | ) | | | (0.24 | ) | | | (3.18 | ) | | | | | | | | | | | | | | | | | | | | | | | | |
| Net asset value, end of year/period | | $ | 16.61 | | | $ | 21.36 | | | $ | 17.34 | | | $ | 18.68 | | | $ | 15.35 | | | $ | 15.66 | | | | | | | | | | | | | | | | | | | | | | | | | |
| Total return + # | | | (17.09 | )% | | | 32.81 | % | | | (0.02 | )% | | | 24.16 | % | | | (0.48 | )% | | | 3.63 | % | | | | | | | | | | | | | | | | | | | | | | | | |
| Ratios/Supplemental Data: | | | | | | | | | | | | | | | | | | | | | | | | | | | | | | | | | | | | | | | | | | | | | | | | |
| Net assets, end of year/period (in 000s) | | $ | 78,829 | | | $ | 91,553 | | | $ | 53,647 | | | $ | 42,865 | | | $ | 43,163 | | | $ | 34,256 | | | | | | | | | | | | | | | | | | | | | | | | | |
| Ratios of expenses to average net assets: ^ | | | 1.02 | % | | | 1.37 | % | | | 1.66 | % | | | 1.15 | % | | | 1.10 | % | | | 1.17 | % | | | | | | | | | | | | | | | | | | | | | | | | |
| Ratios of net investment income (loss) to average net assets: ^ | | | 0.85 | % | | | (0.08 | )% | | | 0.63 | % | | | 1.81 | % | | | 1.82 | % | | | 0.79 | % | | | | | | | | | | | | | | | | | | | | | | | | |
| Portfolio turnover rate (1) | | | 35 | % | | | 59 | % | | | 125 | % | | | 63 | % | | | 74 | % | | | 101 | % | | | | | | | | | | | | | | | | | | | | | | | | |
| | | | | | | | | | | | | | | | | | | | | | | | | | | | | | | | | | | | | | | | | | | | | | | | | |
| | | Class A | | | Class C | |
| | | Six Months Ended | | | Year Ended October 31, | | | Six Months Ended | | | Year Ended October 31, | |
| | | April 30, 2022 | | | 2021 | | | 2020 | | | 2019 | | | 2018 | | | 2017 | | | April 30, 2022 | | | 2021 | | | 2020 | | | 2019 | | | 2018 | | | 2017 | |
| | | (Unaudited) | | | | | | | | | | | | | | | | | | (Unaudited) | | | | | | | | | | | | | | | | |
| Net asset value, beginning of year/period | | $ | 21.48 | | | $ | 17.47 | | | $ | 18.81 | | | $ | 15.46 | | | $ | 15.78 | | | $ | 18.35 | | | $ | 19.78 | | | $ | 16.30 | | | $ | 17.69 | | | $ | 14.54 | | | $ | 14.88 | | | $ | 17.55 | |
| Income (loss) from investment operations: | | | | | | | | | | | | | | | | | | | | | | | | | | | | | | | | | | | | | | | | | | | | | | | | |
| Net investment income (loss) * | | | 0.05 | | | | (0.07 | ) | | | 0.06 | | | | 0.26 | | | | 0.24 | | | | 0.10 | | | | (0.01 | ) | | | (0.20 | ) | | | (0.06 | ) | | | 0.13 | | | | 0.12 | | | | (0.02 | ) |
| Net realized and unrealized gain (loss) ! | | | (3.55 | ) | | | 5.56 | | | | (0.13 | ) | | | 3.35 | | | | (0.35 | ) | | | 0.41 | | | | (3.26 | ) | | | 5.16 | | | | (0.14 | ) | | | 3.17 | | | | (0.34 | ) | | | 0.38 | |
| Total income (loss) from investment operations | | | (3.50 | ) | | | 5.49 | | | | (0.07 | ) | | | 3.61 | | | | (0.11 | ) | | | 0.51 | | | | (3.27 | ) | | | 4.96 | | | | (0.20 | ) | | | 3.30 | | | | (0.22 | ) | | | 0.36 | |
| Less distributions: | | | | | | | | | | | | | | | | | | | | | | | | | | | | | | | | | | | | | | | | | | | | | | | | |
| Distributions from net investment income | | | — | | | | — | | | | (0.27 | ) | | | (0.26 | ) | | | (0.09 | ) | | | (0.26 | ) | | | — | | | | — | | | | (0.19 | ) | | | (0.15 | ) | | | — | | | | (0.21 | ) |
| Distributions from net realized gains | | | (1.29 | ) | | | (1.48 | ) | | | (1.00 | ) | | | — | | | | (0.12 | ) | | | (2.82 | ) | | | (1.29 | ) | | | (1.48 | ) | | | (1.00 | ) | | | — | | | | (0.12 | ) | | | (2.82 | ) |
| Total distributions | | | (1.29 | ) | | | (1.48 | ) | | | (1.27 | ) | | | (0.26 | ) | | | (0.21 | ) | | | (3.08 | ) | | | (1.29 | ) | | | (1.48 | ) | | | (1.19 | ) | | | (0.15 | ) | | | (0.12 | ) | | | (3.03 | ) |
| Net asset value, end of year/period | | $ | 16.69 | | | $ | 21.48 | | | $ | 17.47 | | | $ | 18.81 | | | $ | 15.46 | | | $ | 15.78 | | | $ | 15.22 | | | $ | 19.78 | | | $ | 16.30 | | | $ | 17.69 | | | $ | 14.54 | | | $ | 14.88 | |
| Total return + # | | | (17.18 | )% | | | 32.48 | % | | | (0.28 | )% | | | 23.81 | % | | | (0.74 | )% | | | 3.44 | % | | | (17.51 | )% | | | 31.50 | % | | | (1.08 | )% | | | 22.97 | % | | | (1.50 | )% | | | 2.61 | % |
| Ratios/Supplemental Data: | | | | | | | | | | | | | | | | | | | | | | | | | | | | | | | | | | | | | | | | | | | | | | | | |
| Net assets, end of year/period (in 000s) | | $ | 12,366 | | | $ | 15,112 | | | $ | 11,196 | | | $ | 9,161 | | | $ | 8,444 | | | $ | 6,002 | | | $ | 3,729 | | | $ | 4,736 | | | $ | 2,998 | | | $ | 2,812 | | | $ | 2,308 | | | $ | 2,448 | |
| Ratios of expenses to average net assets: ^ | | | 1.27 | % | | | 1.62 | % | | | 1.91 | % | | | 1.40 | % | | | 1.35 | % | | | 1.42 | % | | | 2.03 | % | | | 2.37 | % | | | 2.66 | % | | | 2.15 | % | | | 2.10 | % | | | 2.17 | % |
| Ratios of net investment income (loss) to average net assets: ^ | | | 0.59 | % | | | (0.33 | )% | | | 0.36 | % | | | 1.56 | % | | | 1.57 | % | | | 0.60 | % | | | (0.17 | )% | | | (1.07 | )% | | | (0.36 | )% | | | 0.79 | % | | | 0.85 | % | | | (0.11 | )% |
| Portfolio turnover rate (1) | | | 35 | % | | | 59 | % | | | 125 | % | | | 63 | % | | | 74 | % | | | 101 | % | | | 35 | % | | | 59 | % | | | 125 | % | | | 63 | % | | | 74 | % | | | 101 | % |
| * | The net investment income (loss) per share data was determined using the average shares outstanding throughout each year/period. |
| + | Assumes reinvestment of all dividends and distributions, if any. Total return does not reflect the deductions of taxes that a shareholder would pay on distributions or on the redemption of shares and does not reflect the impact of any sales charge. |
| # | Includes adjustments in accordance with accounting principles generally accepted in the United States and, consequently, the net asset values for financial reporting purposes and the returns based upon those net asset values may differ from the net asset values and returns for shareholder transactions. Adjustments may apply to some but not all years and classes. |
| ! | The amount of net realized and unrealized gain (loss) on investment per share for the year ended October 31, 2020 does not accord with the amounts in the Statements of Operations due to the timing of purchases and sales of Fund shares in relation to fluctuating market values. |
| ^ | Annualized for periods less than one year. |
| (1) | Not annualized for periods less than one year. |
See accompanying notes which are an integral part to these financial statements.
NOTES TO FINANCIAL STATEMENTS (Unaudited)
April 30, 2022
Each Dunham Fund (each, a “Fund” and collectively the “Funds”) is a series of shares of beneficial interest in the Dunham Funds (the “Trust”), a Delaware Business Trust organized on November 28, 2007 and registered under the Investment Company Act of 1940, as amended, (the “1940 Act”) as an open -end management investment company. The Dunham Funds currently consist of fourteen funds: Dunham Corporate/Government Bond Fund; Dunham Floating Rate Bond Fund; Dunham High-Yield Bond Fund; Dunham International Opportunity Bond Fund; Dunham Large Cap Value Fund; Dunham Small Cap Value Fund; Dunham Focused Large Cap Growth Fund; Dunham Small Cap Growth Fund; Dunham Emerging Markets Stock Fund; Dunham International Stock Fund; Dunham Dynamic Macro Fund; Dunham Long/Short Credit Fund; Dunham Monthly Distribution Fund; and Dunham Real Estate Stock Fund. With the exception of Dunham International Opportunity Bond Fund, Dunham Focused Large Cap Growth Fund, and Dunham Real Estate Stock Fund, the remaining Funds are diversified funds within the meaning of the 1940 Act.
| Fund | | Primary Objective |
| Dunham Corporate/Government Bond Fund (“Corporate/Government Bond”) | | Current income and capital appreciation |
| Dunham Floating Rate Bond Fund (“Floating Rate Bond”) | | High level of current income |
| Dunham High-Yield Bond Fund (“High-Yield Bond”) | | High level of current income |
| Dunham International Opportunity Bond Fund (“International Opportunity Bond”) | | High level of current income |
| Dunham Large Cap Value Fund (“Large Cap Value”) | | Maximize total return from capital appreciation and dividends |
| Dunham Small Cap Value Fund (“Small Cap Value”) | | Maximize total return from capital appreciation and income |
| Dunham Focused Large Cap Growth Fund (“Focused Large Cap Growth”) | | Maximize capital appreciation |
| Dunham Small Cap Growth Fund (“Small Cap Growth”) | | Maximize capital appreciation |
| Dunham Emerging Markets Stock Fund (“Emerging Markets Stock”) | | Maximize capital appreciation |
| Dunham International Stock Fund (“International Stock”) | | Maximize total return from capital appreciation and dividends |
| Dunham Dynamic Macro Fund (“Dynamic Macro”) | | Maximize total return from capital appreciation and dividends |
| Dunham Long/Short Credit Fund (“Long/Short Credit”) | | Maximize total return under varying market conditions through both current income and capital appreciation |
| Dunham Monthly Distribution Fund (“Monthly Distribution”) | | Positive returns in rising and falling market environments |
| Dunham Real Estate Stock Fund (“Real Estate Stock”) | | Maximize total return from capital appreciation and dividends |
Currently, each Fund offers Class A, Class C and Class N shares. Each class represents an interest in the same assets of the applicable Fund with the only differences being that Class A shares are subject to a front-end sales charge and an annual distribution fee, Class C shares are subject to an annual service and distribution fee and Class N shares have a higher minimum investment amount. Investors that purchase $1,000,000 or more of Class A shares will not pay any initial sales charge on the purchase. However, purchases of $1,000,000 or more of Class A shares may be subject to a contingent deferred sales charge (“CDSC”) on shares redeemed during the first 18 months after their purchase in the amount of the commissions paid on the shares redeemed. The Class C and Class N shares, with the exception of Floating Rate Bond, High-Yield Bond, International Opportunity Bond, Focused Large Cap Growth, Dynamic Macro, and Monthly Distribution commenced operations on December 10, 2004 and were formed as a result of tax -free conversions from common trusts. The conversions were accomplished through the exchange of the common trust securities, cash, and other assets for equivalent value of the Funds’ shares. High-Yield Bond Class C and Class N shares commenced operations on July 1, 2005. The Class A shares for all Funds except Floating Rate Bond, International Opportunity Bond, Focused Large Cap Growth, Dynamic Macro, and Monthly Distribution commenced operations on January 3, 2007. Monthly Distribution’s Predecessor Fund’s Class A shares and Class C shares commenced operations on December 26, 2000. Monthly Distribution’s Class N shares commenced operations on September 29, 2008. Dynamic Macro commenced operations on April 30, 2010. Focused Large Cap Growth commenced operations on December 8, 2011. Floating Rate Bond and International Opportunity Bond commenced operations on November 1, 2013.
| 2. | SUMMARY OF SIGNIFICANT ACCOUNTING POLICIES |
The preparation of financial statements in conformity with accounting principles generally accepted in the United States of America (“GAAP”) requires management to make estimates and assumptions that affect the reported amounts of assets and liabilities and disclosure of contingent assets and liabilities at the date of the financial statements and the reported amounts of increases and decreases in net assets from operations during the reporting period. Actual results could differ from those estimates. The Funds are investment companies and accordingly follow the investment company accounting and reporting guidance of the Financial Accounting Standards Board (FASB) Accounting Standard Codification Topic 946 “Financial Services – Investment Companies.”
NOTES TO FINANCIAL STATEMENTS (Unaudited)
April 30, 2022 (Continued)
The following is a summary of significant accounting policies followed by the Funds in preparation of their financial statements.
a. Security Valuation – In determining each Fund’s Net Asset Value (“NAV”) per share, equity securities for which market quotations are readily available are valued at current market value using the last reported sales price. NASDAQ traded securities are valued using the NASDAQ official closing price (“NOCP”). If no sale price is reported, the mean between the current bid and ask price is used. If market quotations are not readily available, then securities are valued at fair value as determined by the Board of Trustees of the Trust (the “Board”) (or its delegate). U.S. Government and Agency securities are valued at the mean between the most recent bid and ask prices. Short-term debt instruments with a remaining maturity of more than 60 days, Debt securities including Bank Loans (other than short-term obligations) are valued each day by an independent pricing service elected by Dunham & Associates Investment Counsel, Inc. (“Dunham & Associates” or the “Adviser”) and approved by the Board using methods which include current market quotations from a major market maker in the securities and based on methods which include the consideration of yields or prices of securities of comparable quality, coupon, maturity and type. Where such prices are not available, valuations will be obtained from brokers who are market makers for such securities. However, in circumstances where the Adviser deems it appropriate to do so, the mean of the bid and ask prices for over-the-counter securities or the last available sale price for exchange-traded debt securities may be used. Where no last sale price for exchange traded debt securities is available, the mean of the bid and ask prices may be used. Short-term debt securities with a remaining maturity of 60 days or less may be valued at amortized cost, provided such valuations represent fair value.
The Funds may invest in portfolios of open-end, closed-end investment companies and Exchange Traded Funds (“ETFs”) (the “underlying funds”). Underlying open-end investment companies are valued at their respective net asset values as reported by such investment companies. The underlying funds value securities in their portfolios for which market quotations are readily available at their market values (generally the last reported sale price) and all other securities and assets at their fair value by the methods established by the boards of the underlying funds. The shares of many closed-end investment companies and ETFs, after their initial public offering, frequently trade at a price per share, which is different than the net asset value per share. The difference represents a market premium or market discount of such shares. There can be no assurances that the market discount or market premium on shares of any closed-end investment company or ETF purchased by a Fund will not change.
Options are valued at the last reported sale price at the close of the exchange on which the security is primarily traded. If no sales are reported for the exchange-traded options, or the options are not exchange-traded, then they are valued at the mean of their most recent quoted bid and ask price.
Futures and future options are valued daily at the final settled price or, in the absence of a settled price, at the mean between the current bid and ask prices on the day of valuation.
Swap transactions are valued through an independent pricing service or at fair value based on daily price reporting from the swap counterparty issuing the swap. Total return swaps on securities listed on an exchange shall be valued at the last quoted sales price or, in the absence of a sale, at the mean between the current bid and ask prices.
Trading in securities on Far East securities exchanges and over-the-counter markets is normally completed well before the close of business on each business day in New York (i.e., a day on which the New York Stock Exchange (“NYSE”) is open). In addition, Far East securities trading generally, or in a particular country or countries, may not take place on all business days in New York. Furthermore, trading takes place in Japanese markets on certain Saturdays and in various foreign markets on days, which are not business days in New York, and on which a Fund’s NAV is not calculated. Each Fund calculates the NAV per share, and therefore effects sales, redemptions and repurchases of its shares, as of the close of regular trading on the NYSE once on each day on which the NYSE is open. Such calculation may not take place contemporaneously with the determination of the prices of the majority of the portfolio securities used in such calculation. If events that may materially affect the value of such securities occur between the time when their price is determined and the time when the Fund’s NAV is calculated, such securities may be valued at fair value as determined in good faith in accordance with procedures approved by the Board. Foreign currency and forward currency exchange contracts are valued daily at the London Stock Exchange close each day.
Securities in which the Funds invest may be traded in markets that close before 4:00 p.m. Eastern Time (“ET”). Normally, developments that occur between the close of the foreign markets and 4:00 p.m. ET will not be reflected in a Fund’s NAV. However, management may determine that such developments are so significant that they will materially affect the value of a Fund’s securities, and the Fund may adjust the previous closing prices to reflect what the Board believes to be the fair value of these securities as of 4:00 p.m. ET. Both Emerging Markets Stock and International Stock utilize fair value prices as provided by an independent pricing vendor on a daily basis for those securities traded on a foreign exchange.
Securities for which current market quotations are not readily available, or for which quotations are not deemed to be representative of market values, are valued at fair value as determined in good faith by or under the direction of the Board in accordance with the Trust’s Portfolio Securities Valuation Procedures (the “Procedures”). The Procedures consider, among others, the following factors to determine a security’s fair value: the nature and pricing history (if any) of the security; whether any dealer quotations for the security are available; and possible valuation methodologies that could be used to determine the fair value of the security.
NOTES TO FINANCIAL STATEMENTS (Unaudited)
April 30, 2022 (Continued)
The Funds utilize various methods to measure the fair value of their investments on a recurring basis. GAAP establishes a hierarchy that prioritizes inputs to valuation methods. The three levels of input are:
Level 1 – Unadjusted quoted prices in active markets for identical assets and liabilities.
Level 2 – Observable inputs other than quoted prices included in Level 1 that are observable for the asset or liability, either directly or indirectly. These inputs may include quoted prices for the identical instrument on an inactive market, prices for similar instruments, interest rates, prepayment speeds, credit risk, yield curves, default rates and similar data.
Level 3 – Unobservable inputs for the asset or liability, to the extent relevant observable inputs are not available, representing the Funds’ own assumptions about the assumptions a market participant would use in valuing the asset or liability, and would be based on the best information available.
The availability of observable inputs can vary from security to security and is affected by a wide variety of factors, including, for example, the type of security, whether the security is new and not yet established in the marketplace, the liquidity of markets, and other characteristics particular to the security. To the extent that valuation is based on models or inputs that are less observable or unobservable in the market, the determination of fair value requires more judgment. Accordingly, the degree of judgment exercised in determining fair value is greatest for instruments categorized in Level 3.
The inputs used to measure fair value may fall into different levels of the fair value hierarchy. In such cases, for disclosure purposes, the level in the fair value hierarchy within which the fair value measurement falls in its entirety, is determined based on the lowest level input that is significant to the fair value measurement in its entirety.
The inputs or methodology used for valuing securities are not necessarily an indication of the risk associated with investing in those securities. The following tables summarize the inputs used as of April 30, 2022 for the Funds’ assets and liabilities measured at fair value:
| Corporate/Government Bond | | | | | | | | | | | | |
| | | | | | | | | | | | | |
| Assets | | Level 1 | | | Level 2 | | | Level 3 | | | Total | |
| Asset Backed Securities * | | $ | — | | | $ | 23,368,194 | | | $ | — | | | $ | 23,368,194 | |
| Corporate Bonds * | | | — | | | | 21,781,946 | | | | — | | | | 21,781,946 | |
| Municipal Bonds | | | — | | | | 4,051,436 | | | | — | | | | 4,051,436 | |
| Non U.S. Government & Agencies | | | — | | | | 1,016,605 | | | | — | | | | 1,016,605 | |
| Term Loans * | | | — | | | | 6,113,109 | | | | — | | | | 6,113,109 | |
| U.S. Government & Agencies | | | — | | | | 13,285,066 | | | | — | | | | 13,285,066 | |
| Collateral for Securities Loaned | | | — | | | | 1,712,005 | | | | — | | | | 1,712,005 | |
| Total | | $ | — | | | $ | 71,328,361 | | | $ | — | | | $ | 71,328,361 | |
| Floating Rate Bond | | | | | | | | | | | | |
| | | | | | | | | | | | | |
| Assets | | Level 1 | | | Level 2 | | | Level 3 | | | Total | |
| Common Stocks * | | $ | 382,785 | | | $ | 294,704 | | | $ | — | | | $ | 677,489 | |
| Exchange Traded Funds | | | 4,312,000 | | | | — | | | | — | | | | 4,312,000 | |
| Asset Backed Securities | | | — | | | | 19,600,115 | | | | — | | | | 19,600,115 | |
| Corporate Bonds * | | | — | | | | 16,142,724 | | | | — | | | | 16,142,724 | |
| Term Loans * | | | — | | | | 155,548,986 | | | | — | | | | 155,548,986 | |
| Rights | | | — | | | | 14,135 | | | | — | | | | 14,135 | |
| Warrants | | | — | | | | 283,195 | | | | — | | | | 283,195 | |
| Short-Term Investment | | | 6,546,342 | | | | — | | | | — | | | | 6,546,342 | |
| Collateral for Securities Loaned | | | — | | | | 5,170,455 | | | | — | | | | 5,170,455 | |
| Total | | $ | 11,241,127 | | | $ | 197,054,314 | | | $ | — | | | $ | 208,295,441 | |
| | | | | | | | | | | | | | | | | |
| High-Yield Bond | | | | | | | | | | | | | | | | |
| | | | | | | | | | | | | | | | | |
| Assets | | Level 1 | | | Level 2 | | | Level 3 | | | Total | |
| Common Stocks * | | $ | — | | | $ | — | | | $ | 700,068 | | | $ | 700,068 | |
| Corporate Bonds * | | | — | | | | 102,877,797 | | | | — | | | | 102,877,797 | |
| Collateral for Securities Loaned | | | — | | | | 12,614,458 | | | | — | | | | 12,614,458 | |
| Total | | $ | — | | | $ | 115,492,255 | | | $ | 700,068 | | | $ | 116,192,323 | |
NOTES TO FINANCIAL STATEMENTS (Unaudited)
April 30, 2022 (Continued)
| International Opportunity Bond | | | | | | | | | | | | |
| | | | | | | | | | | | | |
| Assets | | Level 1 | | | Level 2 | | | Level 3 | | | Total | |
| Asset Backed Securities | | $ | — | | | $ | 77,032 | | | $ | — | | | $ | 77,032 | |
| Corporate Bonds * | | | — | | | | 36,314,006 | | | | — | | | | 36,314,006 | |
| Non U.S. Government & Agencies | | | — | | | | 15,475,295 | | | | — | | | | 15,475,295 | |
| Collateral for Securities Loaned | | | — | | | | 1,931,628 | | | | — | | | | 1,931,628 | |
| Total Assets | | $ | — | | | $ | 53,797,961 | | | $ | — | | | $ | 53,797,961 | |
| Assets - Derivatives | | | | | | | | | | | | | | | | |
| Futures Contracts | | $ | 432,701 | | | $ | — | | | $ | — | | | $ | 432,701 | |
| Forward Foreign Currency Exchange Contracts | | | — | | | | 538,845 | | | | — | | | | 538,845 | |
| Total Asset Derivatives | | $ | 432,701 | | | $ | 538,845 | | | $ | — | | | $ | 971,546 | |
| Liabilities - Derivatives | | | | | | | | | | | | | | | | |
| Futures Contracts | | $ | 627,462 | | | $ | — | | | $ | — | | | $ | 627,462 | |
| Forward Foreign Currency Exchange Contracts | | | — | | | | 71,970 | | | | — | | | | 71,970 | |
| Total Liability Derivatives | | $ | 627,462 | | | $ | 71,970 | | | $ | — | | | $ | 699,432 | |
| | | | | | | | | | | | | | | | | |
| Large Cap Value | | | | | | | | | | | | | | | | |
| | | | | | | | | | | | | | | | | |
| Assets | | | Level 1 | | | | Level 2 | | | | Level 3 | | | | Total | |
| Common Stocks * | | $ | 146,704,257 | | | $ | — | | | $ | — | | | $ | 146,704,257 | |
| Collateral for Securities Loaned | | | — | | | | 18,818,689 | | | | — | | | | 18,818,689 | |
| Total | | $ | 146,704,257 | | | $ | 18,818,689 | | | $ | — | | | $ | 165,522,946 | |
| | | | | | | | | | | | | | | | | |
| Small Cap Value | | | | | | | | | | | | | | | | |
| | | | | | | | | | | | | | | | | |
| Assets | | Level 1 | | | Level 2 | | | Level 3 | | | Total | |
| Common Stocks * | | $ | 73,195,308 | | | $ | — | | | $ | — | | | $ | 73,195,308 | |
| Collateral for Securities Loaned | | | — | | | | 23,983,526 | | | | — | | | | 23,983,526 | |
| Total | | $ | 73,195,308 | | | $ | 23,983,526 | | | $ | — | | | $ | 97,178,834 | |
| | | | | | | | | | | | | | | | | |
| Focused Large Cap Growth | | | | | | | | | | | | | | | | |
| | | | | | | | | | | | | | | | | |
| Assets | | Level 1 | | | Level 2 | | | Level 3 | | | Total | |
| Common Stocks * | | $ | 163,986,298 | | | $ | — | | | $ | — | | | $ | 163,986,298 | |
| Collateral for Securities Loaned | | | — | | | | 35,031,728 | | | | — | | | | 35,031,728 | |
| Total | | $ | 163,986,298 | | | $ | 35,031,728 | | | $ | — | | | $ | 199,018,026 | |
| | | | | | | | | | | | | | | | | |
| Small Cap Growth | | | | | | | | | | | | | | | | |
| | | | | | | | | | | | | | | | | |
| Assets | | Level 1 | | | Level 2 | | | Level 3 | | | Total | |
| Common Stocks * | | $ | 73,594,866 | | | $ | — | | | $ | — | | | $ | 73,594,866 | |
| Collateral for Securities Loaned | | | — | | | | 15,894,642 | | | | — | | | | 15,894,642 | |
| Total | | $ | 73,594,866 | | | $ | 15,894,642 | | | $ | — | | | $ | 89,489,508 | |
NOTES TO FINANCIAL STATEMENTS (Unaudited)
April 30, 2022 (Continued)
Emerging Markets Stock
| Assets | | Level 1 | | | Level 2 | | | Level 3 | | | Total | |
| Closed End Fund | | | | | | | | | | | | |
| Mixed Allocation | | $ | — | | | $ | 1,275,960 | | | $ | — | | | $ | 1,275,960 | |
| Total Closed End Fund | | | — | | | | 1,275,960 | | | | — | | | | 1,275,960 | |
| Common Stocks | | | | | | | | | | | | | | | | |
| Apparel & Textile Products | | | — | | | | 559,039 | | | | — | | | | 559,039 | |
| Banking | | | 4,449,467 | | | | 12,533,496 | | | | — | | | | 16,982,963 | |
| Beverages | | | — | | | | 4,777,125 | | | | — | | | | 4,777,125 | |
| Chemicals | | | 1,195,560 | | | | 2,223,948 | | | | — | | | | 3,419,508 | |
| Consumer Services | | | — | | | | 1,393,403 | | | | — | | | | 1,393,403 | |
| E-Commerce Discretionary | | | — | | | | 6,766,131 | | | | — | | | | 6,766,131 | |
| Electrical Equipment | | | — | | | | 787,297 | | | | — | | | | 787,297 | |
| Engineering & Construction | | | — | | | | 1,551,672 | | | | — | | | | 1,551,672 | |
| Entertainment Content | | | — | | | | 1,969,155 | | | | — | | | | 1,969,155 | |
| Food | | | — | | | | 1,866,366 | | | | — | | | | 1,866,366 | |
| Gas & Water Utilities | | | — | | | | 1,234,246 | | | | — | | | | 1,234,246 | |
| Health Care Facilities & Services | | | — | | | | 2,103,210 | | | | — | | | | 2,103,210 | |
| Home & Office Products | | | — | | | | 2,340,093 | | | | — | | | | 2,340,093 | |
| Insurance | | | — | | | | 5,960,275 | | | | — | | | | 5,960,275 | |
| Internet Media & Services | | | — | | | | 8,062,128 | | | | — | | | | 8,062,128 | |
| Leisure Facilities & Services | | | — | | | | 4,038,852 | | | | — | | | | 4,038,852 | |
| Machinery | | | — | | | | 843,226 | | | | — | | | | 843,226 | |
| Metals & Mining | | | — | | | | 3,252,011 | | | | — | | | | 3,252,011 | |
| Oil & Gas Producers | | | 678,500 | | | | 2,041,333 | | | | — | | | | 2,719,833 | |
| Real Estate Owners & Developers | | | 651,583 | | | | 1,130,760 | | | | — | | | | 1,782,343 | |
| Real Estate Services | | | — | | | | 910,679 | | | | — | | | | 910,679 | |
| Renewable Energy | | | — | | | | 3,187,626 | | | | — | | | | 3,187,626 | |
| Retail - Consumer Staples | | | 2,060,160 | | | | — | | | | — | | | | 2,060,160 | |
| Retail - Discretionary | | | — | | | | 841,847 | | | | — | | | | 841,847 | |
| Semiconductors | | | 2,490,525 | | | | 11,663,708 | | | | — | | | | 14,154,233 | |
| Specialty Finance | | | — | | | | 3,230,830 | | | | — | | | | 3,230,830 | |
| Technology Hardware | | | — | | | | 8,140,368 | | | | — | | | | 8,140,368 | |
| Technology Services | | | — | | | | 5,437,678 | | | | — | | | | 5,437,678 | |
| Telecommunications | | | — | | | | 3,408,336 | | | | — | | | | 3,408,336 | |
| Transportation & Logistics | | | — | | | | 2,153,758 | | | | — | | | | 2,153,758 | |
| Wholesale - Consumer Staples | | | — | | | | 778,106 | | | | — | | | | 778,106 | |
| Total Common Stocks | | | 11,525,795 | | | | 105,186,702 | | | | — | | | | 116,712,497 | |
| Warrants | | | | | | | | | | | | | | | | |
| Leisure Facilities & Services | | | — | | | | 24,107 | | | | — | | | | 24,107 | |
| Total Warrants | | | — | | | | 24,107 | | | | — | | | | 24,107 | |
| Short-Term Investments | | | 606,146 | | | | — | | | | — | | | | 606,146 | |
| Collateral for Securities Loaned | | | — | | | | 575,338 | | | | — | | | | 575,338 | |
| Total | | $ | 11,525,795 | | | $ | 107,062,107 | | | $ | — | | | $ | 119,194,048 | |
NOTES TO FINANCIAL STATEMENTS (Unaudited)
April 30, 2022 (Continued)
International Stock
| Assets | | Level 1 | | | Level 2 | | | Level 3 | | | Total | |
| Common Stocks | | | | | | | | | | | | |
| Apparel & Textile Products | | $ | — | | | $ | 1,842,442 | | | $ | — | | | $ | 1,842,442 | |
| Asset Management | | | — | | | | 2,628,957 | | | | — | | | | 2,628,957 | |
| Automotive | | | 440,455 | | | | 3,643,591 | | | | — | | | | 4,084,046 | |
| Banking | | | 2,106,017 | | | | 12,104,631 | | | | — | | | | 14,210,648 | |
| Beverages | | | 696,556 | | | | 470,249 | | | | — | | | | 1,166,805 | |
| Biotech & Pharma | | | 8,286,979 | | | | 5,681,443 | | | | — | | | | 13,968,422 | |
| Chemicals | | | 22,905 | | | | 7,576,463 | | | | — | | | | 7,599,368 | |
| Commercial Support Services | | | 61,344 | | | | 1,429,578 | | | | — | | | | 1,490,922 | |
| Construction Materials | | | 313,007 | | | | 305,207 | | | | — | | | | 618,214 | |
| Diversified Industrials | | | — | | | | 1,409,934 | | | | — | | | | 1,409,934 | |
| Electric Utilities | | | — | | | | 1,110,257 | | | | — | | | | 1,110,257 | |
| Electrical Equipment | | | 972,209 | | | | 2,500,938 | | | | — | | | | 3,473,147 | |
| Engineering & Construction | | | — | | | | 1 | | | | — | | | | 1 | |
| Food | | | — | | | | 511,732 | | | | — | | | | 511,732 | |
| Forestry, Paper & Wood Products | | | — | | | | 293,184 | | | | — | | | | 293,184 | |
| Health Care Facilities & Services | | | 509,232 | | | | 981,508 | | | | — | | | | 1,490,740 | |
| Home & Office Products | | | — | | | | 4 | | | | — | | | | 4 | |
| Household Products | | | 1,323,360 | | | | 1,369 | | | | — | | | | 1,324,729 | |
| Institutional Financial Services | | | — | | | | 1,878,516 | | | | — | | | | 1,878,516 | |
| Insurance | | | 764,435 | | | | 12,514,537 | | | | — | | | | 13,278,972 | |
| Machinery | | | — | | | | 2,668,163 | | | | — | | | | 2,668,163 | |
| Medical Equipment & Devices | | | — | | | | 709,784 | | | | — | | | | 709,784 | |
| Metals & Mining | | | 4,125,963 | | | | 6,304,267 | | | | — | | | | 10,430,230 | |
| Oil & Gas Producers | | | 13,194,484 | | | | 10,960,763 | | | | — | | | | 24,155,247 | |
| Oil & Gas Services & Equipment | | | — | | | | 620,148 | | | | — | | | | 620,148 | |
| Real Estate Owners & Developers | | | — | | | | 25,382 | | | | — | | | | 25,382 | |
| Retail - Consumer Staples | | | 785,374 | | | | 932,692 | | | | — | | | | 1,718,066 | |
| Retail - Discretionary | | | 892,584 | | | | — | | | | — | | | | 892,584 | |
| Semiconductors | | | 2,722,171 | | | | 7,438,075 | | | | — | | | | 10,160,246 | |
| Software | | | 2,020,501 | | | | 804,783 | | | | — | | | | 2,825,284 | |
| Specialty Finance | | | 244,097 | | | | 1,613,702 | | | | — | | | | 1,857,799 | |
| Steel | | | — | | | | 3,579,656 | | | | — | | | | 3,579,656 | |
| Technology Hardware | | | 1,288,607 | | | | 6,728,861 | | | | — | | | | 8,017,468 | |
| Technology Services | | | 1,860,143 | | | | 2,593,858 | | | | — | | | | 4,454,001 | |
| Telecommunications | | | 748,375 | | | | 4,085,543 | | | | — | | | | 4,833,918 | |
| Tobacco & Cannabis | | | 1,934,832 | | | | 318,148 | | | | — | | | | 2,252,980 | |
| Transportation & Logistics | | | 60,302 | | | | 1,487,902 | | | | — | | | | 1,548,204 | |
| Transportation Equipment | | | — | | | | 55,756 | | | | — | | | | 55,756 | |
| Wholesale - Consumer Staples | | | — | | | | 322,051 | | | | — | | | | 322,051 | |
| Wholesale - Discretionary | | | — | | | | 779,717 | | | | — | | | | 779,717 | |
| Total Common Stocks | | | 45,373,932 | | | | 108,913,792 | | | | — | | | | 154,287,724 | |
| Exchange-Traded Funds | | | 1,759,226 | | | | — | | | | — | | | | 1,759,226 | |
| Collateral for Securities Loaned | | | — | | | | 20,016,338 | | | | — | | | | 20,016,338 | |
| Total | | $ | 47,133,158 | | | $ | 128,930,130 | | | $ | — | | | $ | 176,063,288 | |
NOTES TO FINANCIAL STATEMENTS (Unaudited)
April 30, 2022 (Continued)
Dynamic Macro
| Assets | | Level 1 | | | Level 2 | | | Level 3 | | | Total | |
| Exchange Traded Funds * | | $ | 9,684,778 | | | $ | — | | | $ | — | | | $ | 9,684,778 | |
| U.S. Government & Agencies | | | — | | | | 10,774,311 | | | | — | | | | 10,774,311 | |
| Short-Term Investments | | | 1,539,480 | | | | — | | | | — | | | | 1,539,480 | |
| Collateral for Securities Loaned | | | — | | | | 5,238,873 | | | | — | | | | 5,238,873 | |
| Purchased Options | | | 571,033 | | | | — | | | | — | | | | 571,033 | |
| Total Assets | | $ | 11,795,291 | | | $ | 16,013,184 | | | $ | — | | | $ | 27,808,475 | |
| Assets - Derivatives | | | | | | | | | | | | | | | | |
| Futures Contracts | | $ | 132,491 | | | $ | — | | | $ | — | | | $ | 132,491 | |
| Total Asset Derivatives | | $ | 132,491 | | | $ | — | | | $ | — | | | $ | 132,491 | |
| Liabilities - Derivatives | | | | | | | | | | | | | | | | |
| Futures Contracts | | $ | 366,887 | | | $ | — | | | $ | — | | | $ | 366,887 | |
| Written Options | | | 84,525 | | | | — | | | | — | | | | 84,525 | |
| Total Liability Derivatives | | $ | 451,412 | | | $ | — | | | $ | — | | | $ | 451,412 | |
| | | | | | | | | | | | | | | | | |
| Long/Short Credit | | | | | | | | | | | | | | | | |
| | | | | | | | | | | | | | | | | |
| Assets | | Level 1 | | | Level 2 | | | Level 3 | | | Total | |
| Common Stocks * | | $ | — | | | $ | — | | | $ | 5,700 | | | $ | 5,700 | |
| Preferred Stocks * | | | — | | | | 4,476,929 | | | | 2,030,000 | | | | 6,506,929 | |
| Corporate Bonds * | | | — | | | | 90,808,211 | | | | — | | | | 90,808,211 | |
| Term Loans * | | | — | | | | 5,471,622 | | | | — | | | | 5,471,622 | |
| U.S. Government & Agencies | | | — | | | | 113,445,253 | | | | — | | | | 113,445,253 | |
| Short-Term Investment | | | 29,077,685 | | | | — | | | | — | | | | 29,077,685 | |
| Collateral for Securities Loaned | | | — | | | | 6,001,785 | | | | — | | | | 6,001,785 | |
| Total Assets | | $ | 29,077,685 | | | $ | 220,203,800 | | | $ | 2,035,700 | | | $ | 251,317,185 | |
| Assets - Derivatives | | | | | | | | | | | | | | | | |
| Futures Contracts | | $ | 3,478,242 | | | $ | — | | | $ | — | | | $ | 3,478,242 | |
| Swap Contracts | | | — | | | | 1,398,161 | | | | — | | | | 1,398,161 | |
| Total Asset Derivatives | | $ | 3,478,242 | | | $ | 1,398,161 | | | $ | — | | | $ | 4,876,403 | |
| Liabilities - Derivatives | | | | | | | | | | | | | | | | |
| Swap Contracts | | $ | — | | | $ | 441,552 | | | $ | — | | | $ | 441,552 | |
| Total Liability Derivatives | | $ | — | | | $ | 441,552 | | | $ | — | | | $ | 441,552 | |
NOTES TO FINANCIAL STATEMENTS (Unaudited)
April 30, 2022 (Continued)
Monthly Distribution
| Assets | | Level 1 | | | Level 2 | | | Level 3 | | | Total | |
| Closed-End Fund | | $ | — | | | $ | — | | | $ | 14,072,057 | | | $ | 14,072,057 | |
| Common Stocks * | | | 200,079,159 | | | | — | | | | 61,768 | | | | 200,140,927 | |
| Rights | | | — | | | | — | | | | 38,300 | | | | 38,300 | |
| Purchased Put Options | | | 69,660 | | | | — | | | | — | | | | 69,660 | |
| Collateral for Securities Loaned | | | — | | | | 12,395,269 | | | | — | | | | 12,395,269 | |
| Total Assets | | $ | 200,148,819 | | | $ | 12,395,269 | | | $ | 14,172,125 | | | $ | 226,716,213 | |
| Liabilities-Derivatives | | | | | | | | | | | | | | | | |
| Written Options | | $ | — | | | $ | 60,325 | | | $ | — | | | $ | 60,325 | |
| Total Liability Derivatives | | $ | — | | | $ | 60,325 | | | $ | — | | | $ | 60,325 | |
| Liabilities | | | | | | | | | | | | | | | | |
| Securities Sold Short | | $ | 50,363,792 | | | $ | — | | | $ | — | | | $ | 50,363,792 | |
| Total Liabilities | | $ | 50,363,792 | | | $ | — | | | $ | — | | | $ | 50,363,792 | |
| Assets - Derivatives | | | | | | | | | | | | | | | | |
| Forward Foreign Currency Exchange Contracts | | $ | — | | | $ | 892,333 | | | $ | — | | | $ | 892,333 | |
| Total Asset Derivatives | | $ | — | | | $ | 892,333 | | | $ | — | | | $ | 892,333 | |
| Liabilities - Derivatives | | | | | | | | | | | | | | | | |
| Forward Foreign Currency Exchange Contracts | | $ | — | | | $ | 32,573 | | | $ | — | | | $ | 32,573 | |
| Written Options | | | — | | | | 60,325 | | | | — | | | | 60,325 | |
| Total Asset Derivatives | | $ | — | | | $ | 92,898 | | | $ | — | | | $ | 92,898 | |
Real Estate Stock
| Assets | | Level 1 | | | Level 2 | | | Level 3 | | | Total | |
| Common Stocks * | | $ | 26,328,937 | | | $ | — | | | $ | — | | | $ | 26,328,937 | |
| REITs * | | | 68,029,393 | | | | — | | | | — | | | | 68,029,393 | |
| Collateral for Securities Loaned | | | — | | | | 17,803,436 | | | | — | | | | 17,803,436 | |
| Total | | $ | 94,358,330 | | | $ | 17,803,436 | | | $ | — | | | $ | 112,161,766 | |
| * | See each Fund’s Schedule of Investments for breakdown by industry. |
The following is a reconciliation for the Funds for which Level 3 inputs were used in determining value:
| | | | | Beginning | | | | | | | | | | | | | | | | | | Net | | | Ending | |
| | | | | balance | | | Total | | | Change in | | | | | | | | | | | | transfers | | | balance | |
| | | | | October 31, | | | realized | | | unrealized | | | | | | Net | | | | | | (out) of | | | April 30, | |
| | | | | 2021 | | | gain/(loss) | | | appreciation | | | Conversion | | | Purchases | | | Net Sales | | | Level 3 | | | 2022 | |
| High-Yield Bond | | Common Stock | | $ | 4,809 | | | $ | — | | | $ | 375,027 | | | $ | 320,232 | | | $ | — | | | $ | — | | | $ | — | | | $ | 700,068 | |
| | | Convertible Bond | | | 402,273 | | | | — | | | | — | | | | (402,273 | ) | | | — | | | | — | | | | — | | | | — | |
| Long/Short Credit | | Common Stock | | | 5,700 | | | | — | | | | — | | | | — | | | | — | | | | — | | | | — | | | | 5,700 | |
| | | Preferred Stock | | | 2,060,000 | | | | — | | | | (30,000 | ) | | | — | | | | — | | | | — | | | | — | | | | 2,030,000 | |
| Monthly Distribution | | Closed End Fund | | | 7,199,576 | | | | — | | | | (1,563,067 | ) | | | — | | | | 8,435,548 | | | | — | | | | — | | | | 14,072,057 | |
| | | Common Stock | | | 61,768 | | | | — | | | | — | | | | — | | | | — | | | | — | | | | — | | | | 61,768 | |
| NOTES TO FINANCIAL STATEMENTS (Unaudited) |
| April 30, 2022 (Continued) |
Quantitative disclosures of unobservable inputs and assumptions used by High-Yield Bond, Long/Short Credit, and Monthly Distribution are below:
| | | | | | | | | | | | | | | |
| Investments in Securities: | | | | | | | | | | |
| High-Yield Bond | | | | | | | | | | |
| | | | | | | | | | | |
| | | | | | | | | | (Weighted | |
| Common Stock | | | Fair Value | | | Valuation Techniques | | Unobservable Input | | Average) | |
| | Hi-Crush | | $ | 2,500,244 | | | Prior Transaction Analysis | | Value Per Share | | $0.26 | |
| | Total Fair Value Securities | | $ | 2,500,244 | | | | | | | | |
| Long/Short Credit | | | | | | | | | | | | |
| Common Stock | | | | | | | | | | | | |
| | NII Holdings, Inc. | | $ | 5,700 | | | Broker Quote | | Indicative Value | | $0.57 | |
| Preferred Stock | | | | | | | | | | | | |
| | UIRC-GSA International, LLC | | | 2,030,000 | | | Broker Quote | | Indicative Value | | $1,023 | |
| | Total Fair Value Securities | | $ | 2,035,700 | | | | | | | | |
| | | | | | | | | | | | | |
| Monthly Distribution | | | | | | | | | | | | |
| Closed End Fund | | | | | | | | | | | | |
| | Altaba, Inc. | | $ | 14,072,057 | | | Broker Quote | | Indicative Value | | $5.70 - $6.50 | |
| Common Stock | | | | | | | | | | | | |
| | NII Holdings, Inc. | | | 61,768 | | | Broker Quote | | Indicative Value | | $0.30 | |
| Rights | | | | | | | | | | | | |
| | Zogenix, Inc. CVR | | | 38,300 | | | Broker Quote | | Indicative Value | | $0.75 | |
| | Total Fair Value Securities | | $ | 14,172,125 | | | | | | | | |
b. Foreign Currency Translations – The accounting records of the Funds are maintained in U.S. dollars. Investment securities and other assets and liabilities denominated in a foreign currency, and income receipts and expense payments, are translated into U.S. dollars using the prevailing exchange rates at the London market close. Purchases and sales of securities are translated into U.S. dollars at the contractual currency rates established at the approximate time of the trade.
Net realized gains and losses on foreign currency transactions represent net gains and losses from currency realized between the trade and settlement dates on securities transactions and the difference between income accrued versus income received and are included with the net realized and unrealized gain or loss on investment securities. The effects of changes in foreign currency exchange rates on investments in securities are included with the net realized and unrealized gain or loss on investment securities.
c. Forward Foreign Currency Exchange Contracts – As foreign securities are purchased, a Fund generally enters into forward foreign currency exchange contracts in order to hedge against foreign currency exchange rate risks. The market value of the contract fluctuates with changes in currency exchange rates. The contract is marked-to-market daily and the change in market value is recorded by a Fund as an unrealized gain or loss. As foreign securities are sold, a portion of the contract is generally closed and the Fund records a realized gain or loss equal to the difference between the value of the contract at the time it was opened and the value at the time it was closed. A Fund may also enter into forward foreign currency exchange contracts as an investment strategy consistent with that Fund’s investment objective. Realized gains and losses from contract transactions are included as a component of net realized gains (losses) from investments and forward foreign currency exchange contracts in the Statements of Operations.
d. Options – Dynamic Macro and Monthly Distribution are subject to stock market risk in the normal course of pursuing their investment objectives and may purchase or sell options to help hedge against this risk.
A Fund may write call options only if it (i) owns an offsetting position in the underlying security or (ii) has an absolute or immediate right to acquire that security without additional cash consideration or exchange of other securities held in its portfolio. When a Fund writes an option, there is no taxable event and an amount equal to the premium received is recorded by that Fund as a liability. The liability is thereafter valued to reflect the current value of the option. If the option is not exercised and expires, or if a Fund effects a closing purchase transaction, the Fund realizes a gain (or loss in the case of a closing purchase transaction where the cost to close the transaction exceeds the original premium received), and the liability related to the option is extinguished. Any such gain or loss generally is a short -term capital gain or loss for federal income tax purposes. If a call option that a Fund has written on any equity security is exercised, that Fund will realize a capital gain or loss (long-term or short-term, depending on the holding period of the underlying security) from the sale of the underlying security, and the proceeds from such sale are increased by the premium originally received. If a put option that a Fund has written on an equity security is exercised, the amount of the premium originally received reduces the cost of the security that a Fund purchases upon exercise of the option. When a Fund writes a put option, that Fund must deposit cash or liquid securities into a segregated account equal to the put option’s exercise value (number of shares times strike price).
| NOTES TO FINANCIAL STATEMENTS (Unaudited) |
| April 30, 2022 (Continued) |
A Fund may purchase put and call options. Put options are purchased to hedge against a decline in the value of securities held in that Fund’s portfolio. If such a decline occurs, the put options will permit that Fund to sell the securities underlying such options at the exercise price, or to close out the options at a profit. The premium paid for a put or call option plus any transaction costs will reduce the benefit, if any, realized by that Fund upon exercise of the option, and, unless the price of the underlying security rises or declines sufficiently, the option may expire worthless to that Fund. In addition, in the event that the price of the security in connection with which an option was purchased moves in a direction favorable to that Fund, the benefits realized by that Fund as a result of such favorable movement will be reduced by the amount of the premium paid for the option and related transaction costs. Written and purchased options are non-income producing securities.
e. Cash – The Funds consider their investments in an FDIC insured interest bearing savings account to be cash. The Funds maintain cash balances, which, at times, may exceed federally insured limits. The Funds maintain these balances with a high quality financial institution.
f. Swap Agreements – International Opportunity Bond, Long/Short Credit and Monthly Distribution may enter into interest rate, index, total return, and currency exchange rate swap agreements in attempts to obtain a particular desired return at a lower cost to the Fund than if the Fund has invested directly in an instrument that yielded that desired return. These are two-party contracts entered into primarily to exchange the returns (or differentials in rates of returns) earned or realized on particular pre-determined investments or instruments. The gross returns to be exchanged or “swapped” between parties are calculated with respect to a notional amount, i.e., the return on or increase in value of a particular dollar amount invested at a particular interest rate, in a particular foreign currency, or in a “basket” of securities representing a particular index or market segment. Changes in the value of swap agreements are recognized as unrealized gains or losses in the Statements of Operations by “marking to market” on a daily basis to reflect the value of the swap agreement at the end of each trading day. Payments received or paid at the beginning of the agreement are reflected as such on the Statements of Assets and Liabilities and may be referred to as upfront payments. The Funds amortize upfront payments and/or accrue for the fixed payment stream on swap agreements on a daily basis with the net amount recorded as a component of unrealized gain or loss on the Statements of Operations. A liquidation payment received or made at the termination of the swap agreement is recorded as a realized gain or loss on the Statements of Operations. The Funds segregate liquid securities having a value at least equal to the amount of its current obligation under any swap transaction.
g. Swaps Risk. The Fund may use swaps to enhance returns and manage risk. The Fund’s use of swaps involves risks different from, or possibly greater than, the risks associated with investing directly in securities and other traditional investments. These risks include (i) the risk that the counterparty to a derivative transaction may not fulfill its contractual obligations; (ii) risk of mispricing or improper valuation; and (iii) the risk that changes in the value of the derivative may not correlate perfectly with the underlying asset, rate or index. Derivative prices are highly volatile and may fluctuate substantially during a short period of time. Such prices are influenced by numerous factors that affect the markets, including, but not limited to: changing supply and demand relationships; government programs and policies; national and international political and economic events, changes in interest rates, inflation and deflation and changes in supply and demand relationships. Trading derivative instruments involves risks different from, or possibly greater than, the risks associated with investing directly in securities. Derivative contracts ordinarily have leverage inherent in their terms. The low margin deposits normally required in trading derivatives, including futures contracts, permit a high degree of leverage. Accordingly, a relatively small price movement may result in an immediate and substantial loss to the Fund. The use of leverage may also cause the Fund to liquidate portfolio positions when it would not be advantageous to do so in order to satisfy its obligations or to meet collateral segregation requirements. The use of leveraged derivatives can magnify the Fund’s potential for loss and, therefore, amplify the effects of market volatility on the Fund’s share price.
h. Futures Contracts – International Opportunity Bond, Dynamic Macro, and Long/Short Credit are subject to equity risk, interest rate risk and forward currency exchange rate risk in the normal course of pursuing their investment objectives. The Funds may purchase or sell futures contracts to gain exposure to, or hedge against, changes in the value of equities, interest rates, and foreign exchange rates. Initial margin deposits required upon entering into futures contracts are satisfied by the segregation of specific securities or cash as collateral for the account of the broker (the Fund’s agent in acquiring the futures position). During the period the futures contracts are open, changes in the value of the contracts are recognized as unrealized gains or losses by “marking to market” on a daily basis to reflect the market value of the contracts at the end of each day’s trading. Variation margin payments are received or made depending upon whether unrealized gains or losses are incurred. When the contracts are closed, the Funds recognize a realized gain or loss equal to the difference between the proceeds from, or cost of, the closing transaction and the Fund’s basis in the contract. If the Funds were unable to liquidate a futures contract and/or enter into an offsetting closing transaction, the Funds would continue to be subject to market risk with respect to the value of the contracts and continue to be required to maintain the margin deposits on the futures contracts. The Funds segregate cash having a value at least equal to the amount of the current obligation under any open futures contract. Risks may exceed amounts recognized in the Statements of Assets and Liabilities. With futures, there is minimal counterparty credit risk to the Funds since futures are exchange traded and the exchange’s clearinghouse, as counterparty to all exchange traded futures, guarantees the futures against default.
i. Short Sales – The Funds may sell a security that it does not own in anticipation of a decline in the fair value of that security. When the Company sells a security short, it must borrow the security sold short and deliver it to the broker-dealer through which it made the short sale. A gain, limited to the price at which the Company sold the security short, or a loss, unlimited in size, will be recognized upon the termination of a short sale. The Company is also subject to the risk that it may be unable to reacquire a security to terminate a
| NOTES TO FINANCIAL STATEMENTS (Unaudited) |
| April 30, 2022 (Continued) |
short position except at a price substantially in excess of the last quoted price. The Company’s borrowing agreements with broker-dealers are not subject to master netting or similar agreements or collateral agreements.
j. Impact of Derivatives on the Statements of Assets and Liabilities and Statements of Operations – The following is a summary of the location of derivative investments of each Fund in the Statement of Assets and Liabilities as of April 30, 2022:
| | | Location on the Statements of Assets and Liabilities |
| Derivatives Investment Type | | Asset Derivatives | | Liability Derivatives |
| Equity/Currency/Commodity | | Investments in securities | | Option contracts written |
| Interest rate contracts | | Unrealized appreciation on futures | | Unrealized depreciation on futures |
| | | Unrealized appreciation on swap contracts | | Unrealized depreciation on swap contracts |
| | | Unrealized appreciation on forward foreign currency exchange contracts | | Unrealized depreciation on forward foreign currency exchange contracts |
The following table sets forth the fair value of each Fund’s derivative contracts by primary risk exposure as of April 30, 2022:
| Asset Derivatives Investment Value |
| | | Equity | | | Currency | | | Interest Rate | | | Total at | |
| | | Contracts | | | Contracts | | | Contracts | | | April 30, 2022 | |
| International Opportunity Bond | | | | | | | | | | | | | | | | |
| Forward Foreign Currency Exchange Contracts | | $ | — | | | $ | 538,845 | | | $ | — | | | $ | 538,845 | |
| Futures Contracts | | | — | | | | — | | | | 432,701 | | | | 432,701 | |
| Dynamic Macro | | | | | | | | | | | | | | | | |
| Futures Contracts | | $ | 82,751 | | | $ | — | | | $ | 49,741 | | | $ | 132,492 | |
| Purchased Options | | | 3,345 | | | | — | | | | 567,688 | | | | 571,033 | |
| Long/Short Credit | | | | | | | | | | | | | | | | |
| Credit Default Swap Contracts | | $ | 1,398,161 | | | $ | — | | | $ | — | | | $ | 1,398,161 | |
| Futures Contracts | | | — | | | | — | | | | 3,478,242 | | | | 3,478,242 | |
| Monthly Distribution | | | | | | | | | | | | | | | | |
| Forward Foreign Currency Exchange Contracts | | $ | — | | | $ | 892,333 | | | $ | — | | | $ | 892,333 | |
| Purchased Options | | | 69,660 | | | | — | | | | — | | | | — | |
| | | | | | | | | | | | | | | | | |
| Liability Derivatives Investment Value |
| | | Equity | | | Currency | | | Interest Rate | | | Total at | |
| | | Contracts | | | Contracts | | | Contracts | | | April 30, 2022 | |
| International Opportunity Bond | | | | | | | | | | | | | | | | |
| Forward Foreign Currency Exchange Contracts | | $ | — | | | $ | 71,970 | | | $ | — | | | $ | 71,970 | |
| Futures Contracts | | | — | | | | — | | | | 627,462 | | | | 627,462 | |
| Dynamic Macro | | | | | | | | | | | | | | | | |
| Futures Contracts | | $ | 161,041 | | | $ | — | | | $ | 205,847 | | | $ | 366,888 | |
| Written Options | | | 84,525 | | | | — | | | | — | | | | 84,525 | |
| Long/Short Credit | | | | | | | | | | | | | | | | |
| Credit Default Swap Contracts | | $ | 441,552 | | | $ | — | | | $ | — | | | $ | 441,552 | |
| Monthly Distribution | | | | | | | | | | | | | | | | |
| Forward Foreign Currency Exchange Contracts | | $ | — | | | $ | 32,573 | | | $ | — | | | $ | 32,573 | |
| Written Options | | | 60,325 | | | | — | | | | — | | | | 60,325 | |
| NOTES TO FINANCIAL STATEMENTS (Unaudited) |
| April 30, 2022 (Continued) |
The following is a summary of the location of derivative investments of each Fund in the Statements of Operations for the six months ended April 30, 2022.
| Derivative Investment Type | Location of Gain (Loss) on Derivatives |
| Equity/Currency/Commodity/ Interest rate contracts | Net realized gain (loss) from: Futures, Purchased options, Written options, Swap contracts, Forward foreign currency exchange contracts |
| | |
| | Net change in unrealized appreciation (depreciation) on: Futures , Purchased options, Written options, Swap contracts, and Forward foreign currency exchange contracts |
The following is a summary of each Fund’s realized gain (loss) and change in unrealized appreciation (depreciation) on derivative investments recognized in the Statements of Operations categorized by primary risk exposure for the six months ended April 30, 2022:
| Realized gain (loss) on derivatives recognized in the Statements of Operations |
| | | Equity | | | Currency | | | Interest Rate | | | Total at April | |
| Derivative Investment type | | | Contracts | | | | Contracts | | | | Contracts | | | | 30,2022 | |
| International Opportunity Bond | | | | | | | | | | | | | | | | |
| Futures Contracts | | $ | — | | | $ | — | | | $ | (71,346 | ) | | $ | (71,346 | ) |
| Swap Contracts | | | — | | | | — | | | | — | | | | — | |
| Forward Foreign Currency Exchange Contracts | | | — | | | | 1,619,259 | | | | — | | | | 1,619,259 | |
| Dynamic Macro | | | | | | | | | | | | | | | | |
| Futures Contracts | | $ | (728,356 | ) | | $ | — | | | $ | (500,813 | ) | | $ | (1,229,169 | ) |
| Purchased Options | | | (142,819 | ) | | | — | | | | (369,302 | ) | | | (512,121 | ) |
| Written Options | | | 194,161 | | | | — | | | | — | | | | 194,161 | |
| Long/Short Credit | | | | | | | | | | | | | | | | |
| Futures Contracts | | $ | — | | | $ | — | | | $ | 2,341,229 | | | $ | 2,341,229 | |
| Swaps Contracts | | | — | | | | — | | | | (238,522 | ) | | | (238,522 | ) |
| Monthly Distribution | | | | | | | | | | | | | | | | |
| Forward Foreign Currency Exchange Contracts | | $ | — | | | $ | 412,897 | | | $ | — | | | $ | 412,897 | |
| Purchased Options | | | 32,850 | | | | — | | | | — | | | | 32,850 | |
| Written Options | | | 276,211 | | | | — | | | | — | | | | 276,211 | |
| | | | | | | | | | | | | | | | | |
| Changes in unrealized appreciation (depreciation) on derivatives recognized in the Statements of Operations |
| | | Equity | | | Currency | | | Interest Rate | | | Total at April | |
| Derivative Investment type | | Contracts | | | Contracts | | | Contracts | | | 30, 2022 | |
| International Opportunity Bond | | | | | | | | | | | | | | | | |
| Futures Contracts | | $ | — | | | $ | — | | | $ | (116,578 | ) | | $ | (116,578 | ) |
| Forward Foreign Currency Exchange Contracts | | | — | | | | 259,599 | | | | — | | | | 259,599 | |
| Dynamic Macro | | | | | | | | | | | | | | | | |
| Futures Contracts | | $ | (128,608 | ) | | $ | — | | | $ | 55,718 | | | $ | (72,890 | ) |
| Purchased Options | | | 12,079 | | | | — | | | | (333,406 | ) | | | (321,327 | ) |
| Written Options | | | (33,801 | ) | | | — | | | | — | | | | (33,801 | ) |
| Long/Short Credit | | | | | | | | | | | | | | | | |
| Futures Contracts | | $ | — | | | $ | — | | | $ | 3,086,022 | | | $ | 3,086,022 | |
| Swaps Contracts | | | — | | | | — | | | | 932,837 | | | | 932,837 | |
| Monthly Distribution | | | | | | | | | | | | | | | | |
| Forward Foreign Currency Exchange Contracts | | $ | — | | | $ | 932,549 | | | $ | — | | | $ | 932,549 | |
| Purchased Options | | | 44,247 | | | | — | | | | — | | | | 44,247 | |
| Written Options | | | 209,622 | | | | — | | | | — | | | | 209,622 | |
| NOTES TO FINANCIAL STATEMENTS (Unaudited) |
| April 30, 2022 (Continued) |
The average notional value of the derivative instruments for the six months ended April 30, 2022 is disclosed below:
| | | Average Notional Value | |
| | | Long | | | Short | | | Purchased | | | Written | | | Long | | | Short | |
| | | Futures | | | Futures | | | Options | | | Options | | | Swaps | | | Swaps | |
| International Opportunity Bond | | $ | 17,154,363 | | | $ | 5,583,014 | | | $ | — | | | $ | — | | | $ | — | | | $ | — | |
| Dynamic Macro | | | 18,717,375 | | | | 3,070,500 | | | | 15,232,264 | | | | 2,191,670 | | | | — | | | | — | |
| Long/Short Credit | | | — | | | | 42,084,258 | | | | — | | | | — | | | | 96,000,000 | | | | 23,500,000 | |
| Monthly Distribution | | | — | | | | — | | | | 1,027,786 | * | | | 6,683,589 | | | | — | | | | — | |
| * | Averaged over Quarter 2 when the Fund had derivative exposure. |
k. Offsetting of Financial Assets & Liabilities and Derivative Assets & Liabilities – International Opportunity Bond, Dynamic Macro, Long/Short Credit, and Monthly Distribution policies are to recognize a gross asset or liability equal to the unrealized amounts on futures contracts, forward foreign currency exchange contracts, swaps and written options. The following table shows additional information regarding the offsetting of assets and liabilities at April 30, 2022.
| International Opportunity Bond | |
| | | | | | | | | | | | | | Gross Amounts Not Offset in the | | | | |
| Assets: | | | | | | | | | | | | | Statements of Assets & Liabilities | | | | |
| | | | | | | | Gross Amounts | | | | | | | | | | | | | |
| | | | | Gross | | | Offset in the | | | Net Amounts of Assets | | | | | | | | | | |
| | | | | Amounts of | | | Statements of | | | Presented in the | | | | | | | | | | |
| | | | | Recognized | | | Assets & | | | Statements of Assets | | | Financial | | | Cash Collateral | | | | |
| Description | | Counterparty | | Assets | | | Liabilities | | | & Liabilities | | | Instruments | | | Received | | | Net Amount | |
| Forward Foreign Currency Exchange Contracts | | Barclays | | $ | 316,829 | | | $ | — | | | $ | 316,829 | | | $ | (6,119 | ) | | $ | — | | | $ | 310,710 | |
| | | Capston Global Markets | | | 20,180 | | | | — | | | | 20,180 | | | | (16,702 | ) | | | — | | | | 3,478 | |
| | | JP Morgan Chase | | | 201,836 | | | | — | | | | 201,836 | | | | (49,149 | ) | | | — | | | | 152,687 | |
| Total | | | | $ | 538,845 | | | $ | — | | | $ | 538,845 | | | $ | (71,970 | ) | | $ | — | | | $ | 466,875 | |
| | | | | | | | | | | | | | | | | | | | | | | | | | | |
| | | | | | | | | | | | | | Gross Amounts Not Offset in the | | | | |
| Liabilities: | | | | | | | | | | | | | Statements of Assets & Liabilities | | | | |
| | | | | | | | Gross Amounts | | | | | | | | | | | | | |
| | | | | Gross | | | Offset in the | | | Net Amounts of | | | | | | | | | | |
| | | | | Amounts of | | | Statements of | | | Liabilities Presented in | | | | | | | | | | |
| | | | | Recognized | | | Assets & | | | the Statements of | | | Financial | | | Cash Collateral | | | | |
| Description | | Counterparty | | Liabilities | | | Liabilities | | | Assets & Liabilities | | | Instruments (1) | | | Pledged | | | Net Amount | |
| Forward Foreign Currency Exchange Contracts | | Barclays | | $ | (6,119 | ) | | $ | — | | | $ | (6,119 | ) | | $ | 6,119 | | | $ | — | | | $ | — | |
| | | Capston Global Markets | | $ | (16,702 | ) | | | — | | | | (16,702 | ) | | | 16,702 | | | | — | | | | — | |
| | | JP Morgan Chase | | | (49,149 | ) | | | — | | | | (49,149 | ) | | | 49,149 | | | | — | | | | — | |
| Total | | | | $ | (71,970 | ) | | $ | — | | | $ | (71,970 | ) | | $ | 71,970 | | | $ | — | | | $ | — | |
| | | | | | | | | | | | | | | | | | | | | | | | | | | |
| (1) | The amount is limited to the derivative liability balance and accordingly, does not include excess collateral pledged. |
| NOTES TO FINANCIAL STATEMENTS (Unaudited) |
| April 30, 2022 (Continued) |
| Dynamic Macro | |
| | | | | | | | | | | | | | Gross Amounts Not Offset in the | | | | |
| Assets: | | | | | | | | | | | | | Statements of Assets & Liabilities | | | | |
| | | | | | | | | | | Net Amounts of Assets | | | | | | | | | | |
| | | | | Gross Amounts | | | Gross Amounts Offset | | | Presented in the | | | | | | | | | | |
| | | | | of Recognized | | | in the Statements of | | | Statements of Assets & | | | Financial | | | Cash Collateral | | | | |
| Description | | Counterparty | | Assets | | | Assets & Liabilities | | | Liabilities | | | Instruments | | | Received | | | Net Amount | |
| Purchased Options | | Goldman Sachs | | | 571,033 | | | | — | | | | 571,033 | | | | (84,525 | ) | | | — | | | | 486,508 | |
| Total | | | | $ | 571,033 | | | $ | — | | | $ | 571,033 | | | $ | (84,525 | ) | | $ | — | | | $ | 486,508 | |
| | | | | | | | | | | | | | | | | | | | | | | | | | | |
| | | | | | | | | | | | | | Gross Amounts Not Offset in the | | | | |
| Liabilities: | | | | | | | | | | | | | Statements of Assets & Liabilities | | | | |
| | | | | | | | | | | Net Amounts of | | | | | | | | | | |
| | | | | Gross Amounts | | | Gross Amounts Offset | | | Liabilities Presented in | | | | | | | | | | |
| | | | | of Recognized | | | in the Statements of | | | the Statements of | | | Financial | | | Cash Collateral | | | | |
| Description | | Counterparty | | Liabilities | | | Assets & Liabilities | | | Assets & Liabilities | | | Instruments (1) | | | Pledged | | | Net Amount | |
| Written Options | | Goldman Sachs | | | (84,525 | ) | | | — | | | | (84,525 | ) | | | 84,525 | | | | — | | | | — | |
| Total | | | | $ | (84,525 | ) | | $ | — | | | $ | (84,525 | ) | | $ | 84,525 | | | $ | — | | | $ | — | |
| | | | | | | | | | | | | | | | | | | | | | | | | | | |
| | | | | | | | | | | | | | | | | | | | | | | | | | | |
| Long/Short Credit | |
| | | | | | | | | | | | | | | | | | | | | |
| | | | | | | | | | | | | | Gross Amounts Not Offset in the | | | | |
| Assets: | | | | | | | | | | | | | Statements of Assets & Liabilities | | | | |
| | | | | | | | Gross Amounts | | | Net Amounts of | | | | | | | | | | |
| | | | | Gross Amounts of | | | Offset in the | | | Assets Presented in | | | | | | | | | | |
| | | | | Recognized | | | Statements of | | | the Statements of | | | Financial | | | Cash Collateral | | | | |
| Description | | Counterparty | | Assets | | | Assets & Liabilities | | | Assets & Liabilities | | | Instruments | | | Received | | | Net Amount | |
| Futures Contracts | | HSBC | | $ | 3,478,242 | | | $ | — | | | $ | 3,478,242 | | | $ | — | | | $ | — | | | $ | 3,478,242 | |
| Credit Default Swaps | | Barclays | | | 69,095 | | | | — | | | | 69,095 | | | | (22,315 | ) | | | — | | | | 46,780 | |
| Credit Default Swaps | | HSBC | | | 1,086,428 | | | | — | | | | 1,086,428 | | | | (79,152 | ) | | | — | | | | 1,007,276 | |
| Credit Default Swaps | | US Bank | | | 41,541 | | | | — | | | | 41,541 | | | | — | | | | — | | | | 41,541 | |
| Credit Default Swaps | | Goldman Sachs | | | 19,689 | | | | — | | | | 19,689 | | | | (3,280 | ) | | | — | | | | 16,409 | |
| Credit Default Swaps | | JP Morgan | | | 181,408 | | | | — | | | | 181,408 | | | | (181,408 | ) | | | — | | | | — | |
| Total | | | | $ | 4,876,403 | | | $ | — | | | $ | 4,876,403 | | | $ | (286,155 | ) | | $ | — | | | $ | 4,590,248 | |
| | | | | | | | | | | | | | | | | | | | | | | | | | | |
| | | | | | | | | | | | | | Gross Amounts Not Offset in the | | | | |
| Liabilities: | | | | | | | | | | | | | Statements of Assets & Liabilities | | | | |
| | | | | | | | Gross Amounts | | | Net Amounts of | | | | | | | | | | |
| | | | | Gross Amounts of | | | Offset in the | | | Liabilities Presented | | | | | | | | | | |
| | | | | Recognized | | | Statements of | | | in the Statements of | | | Financial | | | Cash Collateral | | | | |
| Description | | Counterparty | | Liabilities | | | Assets & Liabilities | | | Assets & Liabilities | | | Instruments (1) | | | Pledged | | | Net Amount | |
| Credit Default Swaps | | Barclays | | $ | (22,315 | ) | | $ | — | | | $ | (22,315 | ) | | $ | 22,315 | | | $ | — | | | $ | — | |
| Credit Default Swaps | | HSBC | | | (79,152 | ) | | | — | | | | (79,152 | ) | | | 79,152 | | | | — | | | | — | |
| Credit Default Swaps | | Goldman Sachs | | | (3,280 | ) | | | — | | | | (3,280 | ) | | | 3,280 | | | | — | | | | — | |
| Credit Default Swaps | | JP Morgan | | | (336,805 | ) | | | — | | | | (336,805 | ) | | | 181,408 | | | | — | | | | (155,397 | ) |
| Total | | | | $ | (441,552 | ) | | $ | — | | | $ | (441,552 | ) | | $ | 286,155 | | | $ | — | | | $ | (155,397 | ) |
| | | | | | | | | | | | | | | | | | | | | | | | | | | |
| (1) | The amount is limited to the derivative liability balance and accordingly, does not include excess collateral pledged. |
| NOTES TO FINANCIAL STATEMENTS (Unaudited) |
| April 30, 2022 (Continued) |
| Monthly Distribution Fund | |
| | | | | | | | | | | | | | Gross Amounts Not Offset in the | | | | |
| | | | | | | | | | | | | | Statements of Assets & | | | | |
| Assets: | | | | | | | | | | | | | Liabilities | | | | |
| | | | | | | | Gross | | | | | | | | | | | | | |
| | | | | | | | Amounts | | | | | | | | | | | | | |
| | | | | Gross | | | Offset in the | | | Net Amounts of | | | | | | | | | | |
| | | | | Amounts of | | | Statements of | | | Assets Presented in | | | | | | Cash | | | | |
| | | | | Recognized | | | Assets & | | | the Statements of | | | Financial | | | Collateral | | | | |
| Description | | Counterparty | | Assets | | | Liabilities | | | Assets & Liabilities | | | Instruments | | | Received | | | Net Amount | |
| Forward Foreign Currency Exchange Contracts | | US Bank | | $ | 892,333 | | | $ | — | | | $ | 892,333 | | | $ | (32,573 | ) | | $ | — | | | $ | 859,760 | |
| Purchased Options | | US Bank | | | 69,660 | | | | — | | | | 69,660 | | | | — | | | | — | | | | 69,660 | |
| Total | | | | $ | 961,993 | | | $ | — | | | $ | 961,993 | | | $ | (32,573 | ) | | $ | — | | | $ | 929,420 | |
| | | | | | | | | | | | | | | | | | | | | | | | | | | |
| | | | | | | | | | | | | | Gross Amounts Not Offset in the | | | | |
| | | | | | | | | | | | | | Statements of Assets & | | | | |
| Liabilities: | | | | | | | | | | | | | Liabilities | | | | |
| | | | | | | | Gross | | | | | | | | | | | | | |
| | | | | Gross | | | Amounts | | | Net Amounts of | | | | | | | | | | |
| | | | �� | Amounts of | | | Offset in the | | | Liabilities Presented | | | | | | Cash | | | | |
| | | | | Recognized | | | Statements of | | | in the Statements of | | | Financial | | | Collateral | | | | |
| Description | | Counterparty | | Liabilities | | | Assets & Liabilities | | | Assets & Liabilities | | | Instruments (1) | | | Pledged | | | Net Amount | |
| Forward Foreign Currency Exchange Contracts | | US Bank | | $ | (32,573 | ) | | $ | — | | | $ | (32,573 | ) | | $ | 32,573 | | | $ | — | | | $ | — | |
| Written Options | | US Bank | | | (60,325 | ) | | | — | | | | (60,325 | ) | | | — | | | | — | | | | (60,325 | ) |
| Total | | | | $ | (92,898 | ) | | $ | — | | | $ | (92,898 | ) | | $ | 32,573 | | | $ | — | | | $ | (60,325 | ) |
| | | | | | | | | | | | | | | | | | | | | | | | | | | |
| (1) | The amount is limited to the derivative liability balance and accordingly, does not include excess collateral pledged. |
l. Deposits with Broker for Futures, Options and Swaps
| Fund | | Derivative Type | | Broker | | Deposit with Broker | |
| International Opportunity Bond | | Futures | | Barclays | | $ | 404,261 | |
| Dynamic Macro | | Futures | | Goldman Sachs | | | 195,680 | |
| Long/Short Credit | | Swaps | | HSBC | | | 1,530,654 | |
| | | Swaps | | JP Morgan | | | 270,000 | |
| | | Swaps | | Barclays | | | 750,000 | |
| | | Futures | | HSBC | | | 1,040,000 | |
| Monthly Distribution | | Securities Sold Short | | JP Morgan | | | 12,556,243 | |
m. Exchange Traded Funds – The Funds may invest in exchange traded funds (“ETFs”). ETFs are a type of index fund bought and sold on a securities exchange. An ETF trades like common stock and represents a fixed portfolio of securities. A Fund may purchase an ETF to temporarily gain exposure to a portion of the U.S. or a foreign market while awaiting purchase of underlying securities. The risks of owning an ETF generally reflect the risks of owning the underlying securities they are designed to track, although the lack of liquidity on an ETF could result in it being more volatile. Additionally, ETFs have fees and expenses that reduce their value.
n. Investment Transactions, Investment Income and Expenses – Investment transactions are recorded on a trade date basis. Realized gains and losses from investment transactions and foreign exchange transactions are calculated using the identified cost method. Dividend income and expense is recorded on the ex-dividend date (“ex-date”) except in the case of certain dividends from foreign securities, which are recorded as soon after the ex-date that the respective Fund, using reasonable diligence, becomes aware of such dividends. Interest income is recorded on an accrual basis. Discounts are accreted and premiums are amortized as adjustments to interest income and the identified cost of investments. Expenses of the Trust that are directly identifiable to a specific Fund are charged to that Fund. Expenses, which are not readily identifiable to a specific Fund, are allocated in such a manner as deemed equitable, taking into consideration the nature and type of expense and the relative sizes of the Funds. Each Fund’s income, expenses (other than the class specific distribution fees) and realized and unrealized gains and losses are allocated proportionally each day between the classes based upon the relative net assets of each class. The Fund recharacterizes distributions received from REIT investments based on
| NOTES TO FINANCIAL STATEMENTS (Unaudited) |
| April 30, 2022 (Continued) |
| |
information provided by the REIT into the following categories: ordinary income, long-term capital gains, and return of capital. If information is not available on a timely basis from the REIT, the recharacterization will be estimated based on available information which may include the previous year’s allocation. If new or additional information becomes available from the REIT at a later date, a recharacterization will be made in the following year. Dividends, less foreign tax withholding (if any), are recorded on the ex-dividend date.
o. Foreign Capital Gains Taxes – Foreign Capital Gains taxes are generally based on either income or gains earned or repatriated cash. Foreign Capital Gains tax is provided in accordance with the Funds’ understanding of applicable country’s tax using a tax service in that country. Each Fund accrues and applies such taxes to net investment income, net realized gains and net unrealized gains as income and/or capital gains earned. The Trust is monitoring and recording accrued foreign capital gains tax on appreciated securities of $375,343 as of April 30, 2022, on International Stock as shown on the Statement of Assets and Liabilities. For the six months ended April 30, 2022, International Stock recorded net change in unrealized depreciation on Accrued Foreign Capital Gains Tax on Appreciated Securities of $252,853 as shown on the Statement of Operations.
p. Foreign Tax Reclaims – The Funds are subject to foreign withholding tax imposed by certain foreign countries in which the Funds may invest. Withholding taxes are incurred on certain foreign dividends and are accrued at the time the dividend is recognized based on applicable foreign tax laws. The Funds may file withholding tax refunds in certain jurisdictions to recover a portion of amounts previously withheld. The Funds will record a receivable for such tax refunds based on several factors including; an assessment of a jurisdiction’s legal obligation to pay reclaims, administrative practices and payment history.
q. Concentration of Risk – Investing in securities of foreign issuers and currency transactions may involve certain considerations and risks not typically associated with investments in the United States. These risks include revaluation of currencies, adverse fluctuations in foreign currency values and possible adverse political, social and economic developments, including those particular to a specific industry, country or region. These conditions could cause the securities and their markets to be less liquid and prices more volatile than those of comparable U.S. companies and U.S. government securities.
Small capitalization (“small cap”) companies may be more vulnerable than larger capitalization companies to adverse business or economic developments. Small cap companies may also have limited product lines, markets or financial resources, and may be dependent on a relatively small management group. Securities of such companies may be less liquid and more volatile than securities of larger capitalization companies or the market averages in general and therefore may involve greater risk than investing in larger capitalization companies.
The ability of issuers of debt securities held by the Funds to meet their obligations may be affected by economic and political developments particular to a specific industry, country, state or region. Investments in lower grade debt securities are subject to special risks, including greater price volatility and a greater risk of loss of principal and interest.
Certain Funds may invest in collateralized mortgage obligations which are secured by groups of individual mortgages, but are similar to a conventional bond where the investor looks only to the issuer for payment of principal and interest. Although the obligations are recourse obligations to the issuer, the issuer typically has no significant assets, other than assets pledged as collateral for the obligations, and the market value of the collateral, which is sensitive to interest rate movements, may affect the market value of the obligations. A public market for a particular collateralized mortgage obligation may or may not develop and thus, there can be no guarantee of liquidity of an investment in such obligations.
The risk in writing a call option is that a Fund may forgo the opportunity of profit if the market value of the underlying security increases and the option is exercised, although any potential loss is reduced by the amount of option premium received. The risk in writing a put option is that a Fund may be called on to pay the exercise price of the option for a security that has decreased (potentially to zero) in market price, although any potential loss is reduced by the amount of option premium received. Generally, option transactions also involve risks concerning liquidity of the options market. An illiquid market for an option may limit a Fund’s ability to write options or enter closing transactions. As the options written by the Funds are traded on a national exchange, counterparty and credit risk are limited to the failure of the exchange on which the options are traded.
r. LIBOR Risk – The Funds may invest in securities and other instruments whose interest payments are determined by references to a market reference rate such as the London Interbank Offered Rate (“LIBOR”) or the Secured Overnight Financing Rate (“SOFR”).
The United Kingdom Financial Conduct Authority, which regulates LIBOR, announced that after 2021 it will cease its active encouragement of banks to provide the quotations needed to sustain LIBOR. On March 5, 2021, ICE Benchmark Administration Limited, the administrator of LIBOR, announced its intention to cease publishing a majority of the USD LIBOR rates after publication on June 30, 2023, with the one week and two months USD LIBOR rates to cease after publication on December 31, 2021. The U.S. Federal Reserve, based on the recommendations of the Alternative Reference Rates Committee (comprised of major derivative market participants and their regulators), has begun publishing SOFR, a broad measure of secured overnight U.S. Treasury repo rates, that is intended to replace USD LIBOR. Proposals for alternative reference rates for other currencies have also been announced or have already begun publication. The unavailability of LIBOR presents risks to the Fund, including the risk that any pricing or adjustments to the Fund’s investments resulting from a substitute or alternate reference rate may adversely affect the Fund’s performance and/or NAV. It remains uncertain how
| NOTES TO FINANCIAL STATEMENTS (Unaudited) |
| April 30, 2022 (Continued) |
| |
such changes would be implemented and the effects such changes would have on the Fund, including any negative effects on the Fund’s liquidity and valuation of the Fund’s investments, issuers of instruments in which the Fund invests and financial markets generally.
s. Natural Disaster/Epidemic Risk – Natural or environmental disasters, such as earthquakes, fires, floods, hurricanes, tsunamis, and other severe weather-related phenomena generally, and widespread disease and illness, including pandemics and epidemics, have been and can be highly disruptive to economies and markets. They may adversely impact individual companies, sectors, industries, markets, currencies, interest and inflation rates, credit ratings, investor sentiment, and other factors affecting the value of the Funds’ investments. For example, the novel coronavirus (COVID-19), which was first detected in 2019, has resulted in, among other things, stressors to healthcare service infrastructure, country border closings, business and school closings, and disruptions to supply chains and customer activity. Natural disaster/epidemic risk could have a significant adverse impact on the Funds’ portfolio investments.
t. Emerging Markets Risk – Emerging market countries may have relatively unstable governments, weaker economies, and less -developed legal systems which do not protect securities holders. Emerging market economies may be based on only a few industries and security issuers may be more susceptible to economic weakness and more likely to default. Emerging market securities also tend to be less liquid.
u. Foreign Investing Risk – Investments in foreign countries are subject to currency risk and country-specific risks such as political, diplomatic, regional conflicts, terrorism, war, social and economic instability, and policies that have the effect of decreasing the value of foreign securities. Foreign countries may be subject to different trading settlement practices, less government supervision, less publicly available information, limited trading markets and greater volatility than U.S. investments.
v. Federal Income Taxes – It is each Fund’s policy to continue to comply with all sections of the Internal Revenue Code applicable to regulated investment companies and to distribute all of its taxable income and gains, if any, to its shareholders and therefore, no provision for federal income tax has been made. Each Fund is treated as a separate taxpayer for federal income tax purposes. The Funds recognize the tax benefits of uncertain tax positions only when the position is “more likely than not” to be sustained assuming examination by tax authorities. Management has reviewed the tax positions in the open tax years of 2019 to 2021 and expected to be taken in tax year 2022 and concluded that no liability for unrecognized tax benefits should be recorded related to uncertain tax positions taken in the above open tax years. The Funds identify their major tax jurisdiction as U.S. Federal and California. The Funds recognize interest and penalties, if any, related to unrecognized tax benefits as income tax expense in the Statements of Operations. During the year, the Funds did not incur any interest or penalties. Generally tax authorities can examine tax returns filed for the last three years.
w. Distributions to Shareholders – It is each Fund’s policy to distribute its respective net investment income and net capital gains, if any, annually except for Corporate/Government Bond, Floating Rate Bond, High-Yield Bond, International Opportunity Bond, Long/Short Credit, and Monthly Distribution which will distribute their respective net investment income, if any, monthly. Distributions of net investment income and net capital gains are determined in accordance with income tax regulations which may differ from GAAP. Differences in dividends from net investment income per share between the classes are due to service and distribution related expenses. Dividends and distributions to shareholders are recorded on ex-date. Monthly Distribution’s distribution policy is to make twelve monthly distributions to shareholders. The level of monthly distributions (including any return of capital) is not fixed but is expected to be at or near the level of the prime interest rate (“Prime Rate”). Additionally, Monthly Distribution’s distribution policy is not designed to generate, and is not expected to result in, distributions that equal a fixed percentage of Monthly Distribution’s current net asset value per share. Shareholders receiving periodic payments from Monthly Distribution may be under the impression that they are receiving net income. However, all or a portion of a distribution may consist of a return of capital. Shareholders should not assume that the source of a distribution from Monthly Distribution is net income.
x. Real Estate Investment Trusts – Real Estate Stock invests primarily in Real Estate Investment Trusts (REITs). Distributions from REITs may be characterized as dividends, capital gains, and/or return of capital.
y. Indemnification – The Trust indemnifies its officers and Trustees for certain liabilities that may arise from the performance of their duties to the Trust. Additionally, in the normal course of business, each Fund enters into contracts that contain a variety of representations and warranties and which provide general indemnities. A Fund’s maximum exposure under these arrangements is unknown, as this would involve future claims that may be made against the Fund that have not yet occurred. However, based on experience, the Funds expect the risk of loss due to these warranties and indemnities to be remote.
| NOTES TO FINANCIAL STATEMENTS (Unaudited) |
| April 30, 2022 (Continued) |
| |
| 3. | INVESTMENT ADVISORY FEES AND OTHER TRANSACTIONS WITH AFFILIATES |
| a. | Management Fees – Dunham & Associates serves as each Fund’s investment adviser. Pursuant to an investment advisory agreement with the Trust, on behalf of the Funds, Dunham & Associates, subject to the supervision of the Board and in conformity with the stated policies of the Funds, manages the operations of the Funds. The Adviser, subject to the review and approval of the Board, selects Sub-Advisers for each Fund and supervises and monitors the performance of each Sub-Adviser. As compensation for its services, each Fund pays the Adviser a fixed fee, accrued daily and paid monthly, based on each Fund’s respective average daily net assets. The Adviser has entered into a Sub-Advisory Agreement with each Sub-Adviser and the Trust, on behalf of each Fund. Under the Sub-Advisory Agreements, each Fund pays the Sub-Adviser a “Fulcrum Fee.” A Fulcrum Fee is a performance fee whereby the Sub-Adviser is rewarded when out-performing, or is penalized when under-performing, a Fund’s benchmark index. As a result of the Fulcrum Fee arrangement, the total annual management fee for a Fund will have a range as shown in the table below. |
| | | | | | | Sub-Adviser’s |
| | | Management Fee | | Adviser’s Portion | | Portion |
| Corporate/Government Bond | | 0.65% – 0.95% | | 0.50% | | 0.15% – 0.45% |
| Floating Rate Bond | | 0.78% – 0.98% | | 0.60% | | 0.18% – 0.38% |
| High-Yield Bond | | 0.82% – 1.02% | | 0.60% | | 0.22% – 0.42% |
| International Opportunity Bond | | 0.80% – 1.30% | | 0.60% | | 0.20% – 0.70% |
| Large Cap Value | | 0.75% – 1.15% | | 0.65% | | 0.10% – 0.50% |
| Small Cap Value | | 0.75% – 1.45% | | 0.65% | | 0.10% – 0.80% |
| Focused Large Cap Growth | | 0.85% – 1.15% | | 0.65% | | 0.20% – 0.50% |
| Small Cap Growth | | 0.65% – 1.65% | | 0.65% | | 0.00% – 1.00% |
| Emerging Markets Stock | | 0.70% – 1.50% | | 0.65% | | 0.05% – 0.85% |
| International Stock | | 0.95% – 1.65% | | 0.65% | | 0.30% – 1.00% |
| Dynamic Macro | | 1.05% – 1.75% | | 0.65% | | 0.40% – 1.10% |
| Long/Short Credit | | 0.70% – 1.80% | | 0.65% | | 0.05% – 1.15% |
| Monthly Distribution | | 0.87% – 1.63% | | 0.65% | | 0.22% – 0.98% |
| Real Estate Stock | | 0.80% – 1.40% | | 0.65% | | 0.15% – 0.75% |
| | | | | | | |
Each Fund’s Sub-Advisory Fulcrum Fee is calculated daily using an annual base Sub-Advisory fee of a specified amount of the average daily net assets of the Fund (the “Base Fee”), adjusted by the Fund’s Class N share performance relative to the Fund’s benchmark (the “Performance Fee”). Depending on a Fund’s net performance versus its benchmark, the Sub-Adviser will receive a fee adjustment in accordance with a formula that equates a percentage of out- or under-performance to a percentage of fee increases or decreases, respectively. In addition, some Fulcrum Fees employ a “null zone” around the base fee, whereby small differences in performance versus the benchmark will not trigger a fee increase or decrease. During the first 12 months of the Fulcrum Fee arrangement, the Performance Fee is calculated daily from inception date of the agreement to the calculation date and is applied to the average daily net assets of the Funds during the calculation period. After the initial 12 months, the Performance Fee is calculated on a daily basis based on comparative performance over a rolling 12-month period. Floating Rate Bond and Monthly Distribution, which are in the initial year of new Fulcrum Fee arrangements, are calculating Performance Fees based on the inception dates as of October 1, 2021 and April 1, 2021, respectively.
Depending on the particular Sub-Advisory Agreement, the Performance Fee can adjust the Base Fee up or down by as much as 100% of the Base Fee, such that the Sub-Advisory fee can vary anywhere from 0.00% (the “Minimum Fee”) to twice the Base Fee (the “Maximum Fee”). However, because each such Sub-Advisory Agreement requires that the Sub -Adviser only be paid out the monthly Minimum Fee during the first year, the Sub-Adviser, in most cases, will receive less compensation until the end of the first year. At the end of the first year of the agreement, the Sub-Adviser will be paid a lump sum that reflects the accrued Fulcrum Fee over the year, less any Minimum Fees paid out during the first year. Therefore, in the first year, the Fulcrum Fee methodology has three elements: 1) daily calculation of the Performance Fee and daily accrual of the Fulcrum Fee; 2) monthly payment of the Minimum Fee only (if any); and 3) a lump sum payment at the end of the initial 12-month period of the accrued Fulcrum Fee less the Minimum Fee.
By virtue of using average daily net assets over a “rolling” 12-month period for purposes of calculating the Performance Fee while using average daily net assets for the most recent month for purposes of calculating the Base Fee, the actual total Fulcrum Fee paid by the Fund to the Sub-Adviser may be higher or lower than the maximum or minimum annual rates described above if the average daily net assets do not remain constant during the rolling 12-month period. If the Fund is significantly underperforming versus the Index and the Fund’s net assets have declined significantly, the monthly total Fulcrum Fee can be a negative number (although the performance fee rate can never be negative, the Performance Fee can be negative). In such instances, if the negative Fulcrum Fee is not earned back or offset the following month, the Sub-Adviser must reimburse the Fund the amount of the negative Fulcrum Fee within an agreed upon time. Likewise, in the case where the Fund has significantly underperformed versus the Index but net assets have increased significantly, the monthly total Fulcrum Fee can be positive although the performance fee rate may be 0.00%. In such instances, the Fund will pay the Sub-Adviser the monthly Fulcrum Fee.
| NOTES TO FINANCIAL STATEMENTS (Unaudited) |
| April 30, 2022 (Continued) |
| |
The table below lists the current Sub-Advisers along with their Fulcrum Fee arrangements.
| | | | | Null | Minimum | Maximum |
| Fund | Sub-Adviser | Benchmark | Base Fee | Zone | Fee | Fee |
| Corporate/Government Bond | Newfleet Asset Management, LLC | Bloomberg Aggregate Bond Index | 0.30% | +/- 0.15% | 0.15% | 0.45% |
| Floating Rate Bond * | PineBridge Investments LLC | S&P/LSTA U.S. Leveraged Loan 100 Index | 0.28% | +/- 0.00% | 0.18% | 0.38% |
| High-Yield Bond | PineBridge Investments LLC | Bloomberg U.S. Corporate High Yield Bond Ba/B 2% Issuer Capped Index | 0.32% | +/- 0.00% | 0.22% | 0.42% |
| International Opportunity Bond | Stone Harbor Investment Partners LP | Bloomberg Global ex US Aggregate Bond Index (Hedged) | 0.45% | +/- 0.00% | 0.20% | 0.70% |
| Large Cap Value | Rothschild & Co. Asset Management US Inc. | Russell 1000 Value Index | 0.30% | +/- 0.00% | 0.10% | 0.50% |
| Small Cap Value | Ziegler Capital Management, LLC | Russell 2000 Value Index | 0.45% | +/- 0.00% | 0.10% | 0.80% |
| Focused Large Cap Growth | The Ithaka Group, LLC | Russell 1000 Growth Index | 0.35% | +/- 0.30% | 0.20% | 0.50% |
| Small Cap Growth | Pier Capital, LLC | Russell 2000 Growth Index | 0.50% | +/- 0.20% | 0.00% | 1.00% |
| Emerging Markets Stock | NS Partners Ltd. | MSCI Emerging Markets Index (Net) | 0.45% | +/- 0.00% | 0.05% | 0.85% |
| International Stock | Arrowstreet Capital L.P. | MSCI All Country World Index ex USA (Net) | 0.65% | +/- 0.20% | 0.30% | 1.00% |
| Dynamic Macro | Newton Investment Management North America, LLC | IQ Hedge Global Macro Beta Index | 0.75% | +/- 0.00% | 0.40% | 1.10% |
| Long/Short Credit | Metlife Investment Advisors, LLC | BofA Merrill Lynch US 3-month Treasury Bill Index PLUS 300 bps (3.00%) | 0.60% | +/- 0.00% | 0.05% | 1.15% |
| Monthly Distribution ** | Grantham, Mayo, Van Otterloo & Co., LLC | IQ Hedge Market Neutral Total Return Index | 0.60% | +/- 0.00% | 0.22% | 0.98% |
| Real Estate Stock | American Assets Capital Advisers, LLC | Dow Jones U.S. Real Estate Total Return Index | 0.45% | +/- 0.00% | 0.15% | 0.75% |
| * | Effective October 1, 2021 PineBridge Investments, LLC replaced Newfleet Asset Management, LLC as the Sub-Adviser to Floating Rate Bond. Newfleet Asset Management, LLC had a Base Fee of 0.28%, a Minimum Fee of 0.10%, and a Maximum Fee of 0.46%. |
| ** | Effective April 1, 2021 Grantham, Mayo, Van Otterloo & Co., LLC replaced Weiss Multi-Strategy Advisers, LLC as the Sub-Adviser to Monthly Distribution. Weiss Multi-Strategy Advisers, LLC had a Base Fee of 0.60%, a Minimum Fee of 0.22% and a Maximum Fee of 0.98%. |
b. Administration, Fund Accounting and Transfer Agency Fees – Gemini Fund Services, LLC (“GFS” or the “Administrator”) serves as the administrator, fund accountant and transfer agent for the Funds. For providing administration services, GFS receives from each Fund a monthly fee based on the combined average daily net assets at the following annual rates; 0.07% on the first $250 million of average net assets; 0.05% on average net assets between $250 million and $500 million; 0.03% on average net assets over $500 million; and 0.01% on average net assets over $1 billion. Such fees are subject to an annual minimum of $400,000 in total for the entire Trust. For providing fund accounting services, GFS receives from the Trust a minimum annual fee of $245,000. For providing transfer agent services, GFS receives from the Trust a minimum annual fee of $201,600.
Blu Giant, LLC, (“Blu Giant”), an affiliate of GFS, provides EDGAR conversion and filing services as well as some print management services for the Funds on an ad-hoc basis. For the provision of these services, Blu Giant receives customary fees from the Funds. An individual from GFS serves as an officer for the Trust and receives no additional compensation from the Trust for serving in that role.
c. Distributor – The Distributor of the Funds is Dunham & Associates (the “Distributor”). The Funds have adopted an Amended and Restated Rule 12b-1 Plan (the “Plan”) in accordance with Rule 12b-1 under the 1940 Act for Class A and Class C shares. The Plan for Class A shares authorizes the Funds to pay distribution fees to the Distributor or other entities on a monthly basis at an annualized rate of up to 0.25% of the average daily net assets attributable to Class A shares. The Plan for Class C shares authorizes the Funds to pay distribution fees at the annualized rate of 0.75% for the equity Funds and 0.50% for the fixed income Funds and shareholder servicing fees at the annualized rate of 0.25% to the Distributor or other entities on a monthly basis based on the average daily net assets attributable to Class C shares. Class N shares do not pay distribution fees or shareholder servicing fees.
| NOTES TO FINANCIAL STATEMENTS (Unaudited) |
| April 30, 2022 (Continued) |
| | | | | | 12b-1 and Shareholder Service Fees | |
| | | Distributor Sales Charges | | | Paid to the Distributor | |
| Fund | | Class A | | | Class A | | | Class C | |
| Corporate/Government Bond | | $ | 506 | | | $ | 9,542 | | | $ | 4,039 | |
| Floating Rate Bond | | | 325 | | | | 23,766 | | | | 6,260 | |
| High-Yield Bond | | | 5,219 | | | | 12,856 | | | | 4,695 | |
| International Opportunity Bond | | | 2 | | | | 9,396 | | | | 2,363 | |
| Large Cap Value | | | 46,634 | | | | 25,534 | | | | 6,978 | |
| Small Cap Value | | | 7,024 | | | | 12,120 | | | | 4,386 | |
| Focused Large Cap Growth | | | 43,150 | | | | 27,190 | | | | 9,313 | |
| Small Cap Growth | | | 23,680 | | | | 11,167 | | | | 3,799 | |
| Emerging Markets Stock | | | 2,245 | | | | 22,150 | | | | 5,646 | |
| International Stock | | | 2,173 | | | | 27,060 | | | | 8,854 | |
| Dynamic Macro | | | 86 | | | | 3,963 | | | | 921 | |
| Long/Short Credit | | | 5,057 | | | | 23,959 | | | | 7,422 | |
| Monthly Distribution | | | 5,749 | | | | 27,490 | | | | 17,552 | |
| Real Estate Stock | | | 9,767 | | | | 13,190 | | | | 4,026 | |
| | | | | | | | | | | | | |
d. Trustees’ Fees – The Board has approved the following Trustee compensation schedule: Each Trustee who is not an interested person of the Trust will receive $ 6,250 for each Board meeting attended in-person; $2,500 for all electronically-attended Board meetings; $1,000 for in-person committee meetings and $500 for telephonic committee meetings, unless the committee meeting is on the same day as a Board meeting, in which case the Trustee will not be compensated for the committee meeting. The Funds also reimburse each such Trustee for travel and other expenses incurred in attending meetings of the Board.
With the exception of the Trust’s Chief Compliance Officer as discussed below, officers of the Trust and Trustees who are interested persons of the Trust do not receive any compensation from the Trust or any other Funds managed by the Adviser. The Trust has agreed to pay the Adviser a fee in the amount of $107,500 per annum plus an annual discretionary bonus as may be awarded as compensation for providing an officer or employee of the Adviser to serve as Chief Compliance Officer for the Funds (each Fund bearing its pro rata share of the fee), plus the cost of reasonable expenses related to the performance of the Chief Compliance Officer’s duties, including travel expenses, and may compensate the Adviser for the time of other officers or employees of the Adviser who serve in other compliance capacities for the Funds.
e. Commission Recapture – During the six months ended April 30, 2022, certain Funds had portfolio trades executed with a certain brokers pursuant to a commission recapture agreement under which the brokers returned a portion of the Fund’s brokerage commissions on the Fund’s behalf. Such amounts, under such commission recapture agreement, are included in fees paid indirectly in the Funds’ Statements of Operations and will be paid directly by the brokers for the expenses of the Fund. For the six months ended April 30, 2022, the amounts received by the Administrator on behalf of certain participating Funds under this arrangement were: Large Cap Value - $0, and Small Cap Value - $0.
| 4. | INVESTMENT TRANSACTIONS |
The cost of purchases and the proceeds from sales of investments, other than short-term investments, for the six months ended April 30, 2022 were as follows:
| | | | | | Sale Proceeds | | | | | | | |
| | | Purchases (excluding | | | (excluding U.S. | | | Purchases of U.S. | | | Proceeds of U.S. | |
| | | U.S. Government | | | Government | | | Government | | | Government | |
| Fund | | Securities) | | | Securities) | | | Securities | | | Securities | |
| Corporate/Government Bond | | $ | 15,553,027 | | | $ | 16,406,184 | | | $ | 1,706,610 | | | $ | 4,675,531 | |
| Floating Rate Bond | | | 58,050,442 | | | | 50,456,389 | | | | — | | | | — | |
| High-Yield Bond | | | 22,843,006 | | | | 23,625,808 | | | | — | | | | — | |
| International Opportunity Bond | | | 17,577,805 | | | | 23,163,363 | | | | — | | | | — | |
| Large Cap Value | | | 18,608,461 | | | | 7,507,809 | | | | — | | | | — | |
| Small Cap Value | | | 26,685,726 | | | | 36,940,949 | | | | — | | | | — | |
| Focused Large Cap Growth | | | 31,841,809 | | | | 4,969,707 | | | | — | | | | — | |
| Small Cap Growth | | | 56,537,958 | | | | 35,070,690 | | | | — | | | | — | |
| Emerging Markets Stock | | | 51,286,152 | | | | 33,085,682 | | | | — | | | | — | |
| International Stock | | | 88,269,497 | | | | 70,732,964 | | | | — | | | | — | |
| Dynamic Macro | | | 3,485,590 | | | | 2,343,629 | | | | — | | | | — | |
| Long/Short Credit | | | 65,226,484 | | | | 62,100,657 | | | | 89,087,926 | | | | 82,528,576 | |
| Monthly Distribution | | | 312,191,180 | | | | 211,330,078 | | | | — | | | | — | |
| Real Estate Stock | | | 37,921,647 | | | | 35,531,092 | | | | — | | | | — | |
| NOTES TO FINANCIAL STATEMENTS (Unaudited) |
| April 30, 2022 (Continued) |
| |
| 5. | AGGREGATE UNREALIZED APPRECIATION AND DEPRECIATION – TAX BASIS |
The identified cost of investments in securities owned by each Fund for federal income tax purposes, and its respective gross unrealized appreciation and depreciation at April 30, 2022, were as follows:
| | | | | | Gross | | | Gross | | | Net Unrealized | |
| | | Tax | | | Unrealized | | | Unrealized | | | Appreciation/ | |
| | | Cost | | | Appreciation | | | Depreciation | | | (Depreciation) | |
| Corporate/Government Bond | | $ | 77,446,190 | | | $ | 127,665 | | | $ | (6,245,495 | ) | | $ | (6,117,830 | ) |
| Floating Rate Bond | | | 211,932,892 | | | | 515,007 | | | | (4,152,458 | ) | | | (3,637,451 | ) |
| High-Yield Bond | | | 123,717,145 | | | | 758,279 | | | | (8,283,101 | ) | | | (7,524,822 | ) |
| International Opportunity Bond | | | 62,462,012 | | | | 1,068,933 | | | | (9,460,869 | ) | | | (8,391,936 | ) |
| Large Cap Value | | | 124,409,684 | | | | 43,813,372 | | | | (2,700,110 | ) | | | 41,113,262 | |
| Small Cap Value | | | 89,728,202 | | | | 12,265,196 | | | | (4,814,564 | ) | | | 7,450,632 | |
| Focused Large Cap Growth | | | 146,147,266 | | | | 64,913,306 | | | | (12,042,546 | ) | | | 52,870,760 | |
| Small Cap Growth | | | 97,885,169 | | | | 8,542,534 | | | | (16,938,195 | ) | | | (8,395,661 | ) |
| Emerging Markets Stock | | | 121,724,274 | | | | 12,654,603 | | | | (15,790,975 | ) | | | (3,136,372 | ) |
| International Stock | | | 179,253,836 | | | | 16,664,740 | | | | (19,855,288 | ) | | | (3,190,548 | ) |
| Dynamic Macro | | | 25,508,279 | | | | 3,259,454 | | | | (1,089,363 | ) | | | 2,170,091 | |
| Long/Short Credit | | | 258,530,398 | | | | 152,237 | | | | (7,365,450 | ) | | | (7,213,213 | ) |
| Monthly Distribution | | | 191,293,586 | | | | 6,111,678 | | | | (21,052,843 | ) | | | (14,941,165 | ) |
| Real Estate Stock | | | 99,609,249 | | | | 18,870,507 | | | | (6,317,990 | ) | | | 12,552,517 | |
| | | | | | | | | | | | | | | | | |
| 6. | SHARES OF BENEFICIAL INTEREST |
Following is a summary of shareholder transactions for each Fund for the six months ended April 30, 2022 and the year ended October 31, 2021, respectively:
For the six months ended April 30, 2022:
| | Class N Shares | | | Class A Shares |
| Fund | Issued | | | Distributions
Reinvested | | | Redeemed | | | Net Increase
(Decrease) in
Shares | | | Issued | | | Distributions
Reinvested | | | Redeemed | | | Net Increase
(Decrease) in
Shares | |
| Corporate/Government Bond | | 603,938 | | | 41,406 | | | (1,461,993 | ) | | (816,649 | ) | | 61,645 | | | 4,043 | | | (186,006 | ) | | (120,318 | ) |
| Floating Rate Bond | | 2,715,278 | | | 388,394 | | | (2,339,509 | ) | | 764,163 | | | 425,421 | | | 46,209 | | | (335,069 | ) | | 136,561 | |
| High-Yield Bond | | 855,375 | | | 242,966 | | | (1,551,337 | ) | | (452,996 | ) | | 150,486 | | | 28,997 | | | (147,297 | ) | | 32,186 | |
| International Opportunity Bond | | 712,222 | | | 157,360 | | | (1,813,521 | ) | | (943,939 | ) | | 97,071 | | | 21,745 | | | (251,459 | ) | | (132,643 | ) |
| Large Cap Value | | 988,057 | | | 446,602 | | | (1,021,523 | ) | | 413,136 | | | 266,819 | | | 80,548 | | | (380,025 | ) | | (32,658 | ) |
| Small Cap Value | | 570,040 | | | 466,893 | | | 989,453 | | | 2,026,386 | | | 61,526 | | | 79,784 | | | (230,418 | ) | | (89,108 | ) |
| Focused Large Cap Growth | | 1,150,932 | | | 298,895 | | | (277,543 | ) | | 1,172,284 | | | 186,140 | | | 72,695 | | | (212,119 | ) | | 46,716 | |
| Small Cap Growth | | 1,622,274 | | | 469,520 | | | (302,644 | ) | | 1,789,150 | | | 261,308 | | | 157,070 | | | (342,008 | ) | | 76,370 | |
| Emerging Markets Stock | | 1,533,909 | | | 598,986 | | | (602,697 | ) | | 1,530,198 | | | 223,718 | | | 116,719 | | | (102,387 | ) | | 238,050 | |
| International Stock | | 1,132,350 | | | 1,112,978 | | | (1,048,693 | ) | | 1,196,635 | | | 169,216 | | | 200,446 | | | (190,027 | ) | | 179,635 | |
| Dynamic Macro | | 202,576 | | | — | | | (239,719 | ) | | (37,143 | ) | | 34,001 | | | — | | | (42,049 | ) | | (8,048 | ) |
| Long/Short Credit | | 4,222,487 | | | 565,326 | | | (3,167,717 | ) | | 1,620,096 | | | 1,190,683 | | | 79,546 | | | (634,145 | ) | | 636,084 | |
| Monthly Distribution | | 720,858 | | | 109,866 | | | (1,326,209 | ) | | (495,485 | ) | | 82,204 | | | 17,063 | | | (96,217 | ) | | 3,050 | |
| Real Estate Stock | | 805,827 | | | 276,975 | | | (622,847 | ) | | 459,955 | | | 106,647 | | | 42,937 | | | (112,097 | ) | | 37,487 | |
| NOTES TO FINANCIAL STATEMENTS (Unaudited) |
| April 30, 2022 (Continued) |
| | | Class C Shares | | | | | | | | | | | | | | | | | |
| | | | | | | | | | | | Net Increase | | | | | | | | | | | | | | | | | |
| | | | | | Distributions | | | | | | (Decrease) in | | | | | | | | | | | | | | | | | |
| Fund | | Issued | | | Reinvested | | | Redeemed | | | Shares | | | | | | | | | | | | | | | | | |
| Corporate/Government Bond | | | 59,381 | | | | 816 | | | | (27,347 | ) | | | 32,850 | | | | | | | | | | | | | | | | | |
| Floating Rate Bond | | | 83,287 | | | | 11,618 | | | | (77,915 | ) | | | 16,990 | | | | | | | | | | | | | | | | | |
| High-Yield Bond | | | 21,274 | | | | 8,760 | | | | (35,007 | ) | | | (4,973 | ) | | | | | | | | | | | | | | | | |
| International Opportunity Bond | | | 12,178 | | | | 3,118 | | | | (21,476 | ) | | | (6,180 | ) | | | | | | | | | | | | | | | | |
| Large Cap Value | | | 21,212 | | | | 16,659 | | | | (27,523 | ) | | | 10,348 | | | | | | | | | | | | | | | | | |
| Small Cap Value | | | 16,622 | | | | 25,308 | | | | 21,420 | | | | 63,350 | | | | | | | | | | | | | | | | | |
| Focused Large Cap Growth | | | 29,839 | | | | 30,182 | | | | (57,311 | ) | | | 2,710 | | | | | | | | | | | | | | | | | |
| Small Cap Growth | | | 28,458 | | | | 59,612 | | | | (24,774 | ) | | | 63,296 | | | | | | | | | | | | | | | | | |
| Emerging Markets Stock | | | 19,026 | | | | 18,531 | | | | (17,855 | ) | | | 19,702 | | | | | | | | | | | | | | | | | |
| International Stock | | | 21,814 | | | | 45,942 | | | | 29,544 | | | | 97,300 | | | | | | | | | | | | | | | | | |
| Dynamic Macro | | | 3,937 | | | | — | | | | (8,896 | ) | | | (4,959 | ) | | | | | | | | | | | | | | | | |
| Long/Short Credit | | | 44,628 | | | | 10,818 | | | | (61,790 | ) | | | (6,344 | ) | | | | | | | | | | | | | | | | |
| Monthly Distribution | | | 22,447 | | | | 15,423 | | | | 99,881 | | | | 137,751 | | | | | | | | | | | | | | | | | |
| Real Estate Stock | | | 15,411 | | | | 17,077 | | | | (26,905 | ) | | | 5,583 | | | | | | | | | | | | | | | | | |
| | | | | | | | | | | | | | | | | | | | | | | | | | | | | | | | | |
| For the year ended October 31, 2021: |
| | | | | | | | | | | | | | | | |
| | | Class N Shares | | | Class A Shares | |
| Fund | | Issued | | | Distributions
Reinvested | | | Redeemed | | | Net Increase
(Decrease) in
Shares | | | Issued | | | Distributions
Reinvested | | | Redeemed | | | Net Increase
(Decrease) in
Shares | |
| Corporate/Government Bond | | | 2,571,070 | | | | 76,601 | | | | (1,438,091 | ) | | | 1,209,580 | | | | 300,737 | | | | 7,657 | | | | (230,635 | ) | | | 77,759 | |
| Floating Rate Bond | | | 5,351,926 | | | | 568,208 | | | | (2,302,539 | ) | | | 3,617,595 | | | | 658,582 | | | | 70,313 | | | | (522,843 | ) | | | 206,052 | |
| High-Yield Bond | | | 3,209,083 | | | | 417,822 | | | | (2,063,754 | ) | | | 1,563,151 | | | | 486,892 | | | | 51,404 | | | | (450,739 | ) | | | 87,557 | |
| International Opportunity Bond | | | 3,137,730 | | | | 150,297 | | | | (1,054,346 | ) | | | 2,233,681 | | | | 493,131 | | | | 20,931 | | | | (253,857 | ) | | | 260,205 | |
| Large Cap Value | | | 2,073,516 | | | | 57,194 | | | | (929,585 | ) | | | 1,201,125 | | | | 474,985 | | | | 9,622 | | | | (344,911 | ) | | | 139,696 | |
| Small Cap Value | | | 1,219,879 | | | | 33,238 | | | | (921,729 | ) | | | 331,388 | | | | 207,777 | | | | 5,343 | | | | (279,909 | ) | | | (66,789 | ) |
| Focused Large Cap Growth | | | 1,121,718 | | | | 71,719 | | | | (854,301 | ) | | | 339,136 | | | | 247,268 | | | | 21,228 | | | | (346,540 | ) | | | (78,044 | ) |
| Small Cap Growth | | | 802,528 | | | | 264,776 | | | | (781,005 | ) | | | 286,299 | | | | 412,070 | | | | 96,686 | | | | (353,188 | ) | | | 155,568 | |
| Emerging Markets Stock | | | 2,092,748 | | | | 6,610 | | | | (627,775 | ) | | | 1,471,583 | | | | 382,656 | | | | — | | | | (195,128 | ) | | | 187,528 | |
| International Stock | | | 2,221,567 | | | | 51,395 | | | | (1,426,685 | ) | | | 846,277 | | | | 292,871 | | | | 8,406 | | | | (409,741 | ) | | | (108,464 | ) |
| Dynamic Macro | | | 444,180 | | | | 12,928 | | | | (948,346 | ) | | | (491,238 | ) | | | 96,728 | | | | 1,231 | | | | (248,391 | ) | | | (150,432 | ) |
| Long/Short Credit | | | 10,900,459 | | | | 337,097 | | | | (2,587,285 | ) | | | 8,650,271 | | | | 1,611,447 | | | | 43,938 | | | | (451,389 | ) | | | 1,203,996 | |
| Monthly Distribution | | | 2,632,603 | | | | 179,526 | | | | (879,031 | ) | | | 1,933,098 | | | | 267,118 | | | | 30,920 | | | | (275,516 | ) | | | 22,522 | |
| Real Estate Stock | | | 1,461,477 | | | | 254,742 | | | | (523,737 | ) | | | 1,192,482 | | | | 212,275 | | | | 50,131 | | | | (199,730 | ) | | | 62,676 | |
| | | | | | | | | | | | | | | | | | | | | | | | | | | | | | | | | |
| | | Class C Shares | | | | | | | | | | | | | | | | | |
| | | | | | | | | | | | Net Increase | | | | | | | | | | | | | | | | | |
| | | | | | Distributions | | | | | | (Decrease) in | | | | | | | | | | | | | | | | | |
| Fund | | Issued | | | Reinvested | | | Redeemed | | | Shares | | | | | | | | | | | | | | | | | |
| Corporate/Government Bond | | | 50,783 | | | | 1,367 | | | | (66,271 | ) | | | (14,121 | ) | | | | | | | | | | | | | | | | |
| Floating Rate Bond | | | 93,059 | | | | 18,350 | | | | (142,503 | ) | | | (31,094 | ) | | | | | | | | | | | | | | | | |
| High-Yield Bond | | | 65,582 | | | | 15,875 | | | | (98,540 | ) | | | (17,083 | ) | | | | | | | | | | | | | | | | |
| International Opportunity Bond | | | 43,835 | | | | 2,642 | | | | (32,355 | ) | | | 14,122 | | | | | | | | | | | | | | | | | |
| Large Cap Value | | | 40,306 | | | | 898 | | | | (91,267 | ) | | | (50,063 | ) | | | | | | | | | | | | | | | | |
| Small Cap Value | | | 37,233 | | | | 396 | | | | (65,054 | ) | | | (27,425 | ) | | | | | | | | | | | | | | | | |
| Focused Large Cap Growth | | | 62,773 | | | | 7,708 | | | | (58,166 | ) | | | 12,315 | | | | | | | | | | | | | | | | | |
| Small Cap Growth | | | 40,462 | | | | 36,644 | | | | (46,900 | ) | | | 30,206 | | | | | | | | | | | | | | | | | |
| Emerging Markets Stock | | | 35,011 | | | | — | | | | (47,386 | ) | | | (12,375 | ) | | | | | | | | | | | | | | | | |
| International Stock | | | 35,002 | | | | 166 | | | | (72,293 | ) | | | (37,125 | ) | | | | | | | | | | | | | | | | |
| Dynamic Macro | | | 12,245 | | | | — | | | | (39,975 | ) | | | (27,730 | ) | | | | | | | | | | | | | | | | |
| Long/Short Credit | | | 187,707 | | | | 7,336 | | | | (128,490 | ) | | | 66,553 | | | | | | | | | | | | | | | | | |
| Monthly Distribution | | | 77,973 | | | | 32,470 | | | | (237,893 | ) | | | (127,450 | ) | | | | | | | | | | | | | | | | |
| Real Estate Stock | | | 80,019 | | | | 15,851 | | | | (40,378 | ) | | | 55,492 | | | | | | | | | | | | | | | | | |
| NOTES TO FINANCIAL STATEMENTS (Unaudited) |
| April 30, 2022 (Continued) |
| |
| 7. | DISTRIBUTIONS TO SHAREHOLDERS AND TAX COMPONENTS OF CAPITAL |
The tax character of dividends paid during the year ended October 31, 2021 and October 31, 2020 was as follows:
| For fiscal year ended | | Ordinary | | | Long-Term | | | Return of | | | | |
| 10/31/2021 | | Income | | | Capital Gains | | | Capital | | | Total | |
| Corporate/Government Bond ** | | $ | 1,245,650 | | | $ | — | | | $ | — | | | $ | 1,245,650 | |
| Floating Rate Bond ** | | | 6,071,064 | | | | — | | | | — | | | | 6,071,064 | |
| High-Yield Bond ** | | | 4,596,419 | | | | — | | | | — | | | | 4,596,419 | |
| International Opportunity Bond | | | 1,625,612 | | | | — | | | | — | | | | 1,625,612 | |
| Large Cap Value | | | 1,058,479 | | | | — | | | | — | | | | 1,058,479 | |
| Small Cap Value | | | 567,981 | | | | — | | | | — | | | | 567,981 | |
| Focused Large Cap Growth | | | — | | | | 3,869,872 | | | | — | | | | 3,869,872 | |
| Small Cap Growth | | | 4,242,651 | | | | 5,463,358 | | | | — | | | | 9,706,009 | |
| Emerging Markets Stock * | | | 451,197 | | | | — | | | | — | | | | 451,197 | |
| International Stock * | | | 1,683,689 | | | | 70,762 | | | | — | | | | 1,754,451 | |
| Dynamic Macro | | | 148,493 | | | | — | | | | 19 | | | | 148,512 | |
| Long/Short Credit ** | | | 3,870,741 | | | | — | | | | — | | | | 3,870,741 | |
| Monthly Distribution ** | | | 5,009,573 | | | | — | | | | 3,079,712 | | | | 8,089,285 | |
| Real Estate Stock | | | — | | | | 6,116,623 | | | | — | | | | 6,116,623 | |
| | | | | | | | | | | | | | | | | |
| For fiscal year ended | | Ordinary | | | Long-Term | | | Return of | | | | |
| 10/31/2020 | | Income | | | Capital Gains | | | Capital | | | Total | |
| Corporate/Government Bond ** | | $ | 1,137,278 | | | $ | — | | | $ | — | | | $ | 1,137,278 | |
| Floating Rate Bond ** | | | 6,315,171 | | | | — | | | | — | | | | 6,315,171 | |
| High-Yield Bond ** | | | 4,586,673 | | | | — | | | | — | | | | 4,586,673 | |
| International Opportunity Bond | | | 598,123 | | | | — | | | | 329,450 | | | | 927,573 | |
| Large Cap Value | | | 933,518 | | | | 1,931,134 | | | | — | | | | 2,864,652 | |
| Small Cap Value | | | — | | | | — | | | | — | | | | — | |
| Focused Large Cap Growth | | | — | | | | 3,668,052 | | | | — | | | | 3,668,052 | |
| Small Cap Growth | | | 116,998 | | | | 825,002 | | | | — | | | | 942,000 | |
| Emerging Markets Stock * | | | 834,088 | | | | — | | | | — | | | | 834,088 | |
| International Stock * | | | 3,234,865 | | | | — | | | | — | | | | 3,234,865 | |
| Dynamic Macro | | | — | | | | — | | | | — | | | | — | |
| Long/Short Credit ** | | | 1,890,160 | | | | — | | | | — | | | | 1,890,160 | |
| Monthly Distribution ** | | | 2,397,356 | | | | — | | | | 6,523,968 | | | | 8,921,324 | |
| Real Estate Stock | | | 1,519,797 | | | | 2,213,358 | | | | — | | | | 3,733,155 | |
| | | | | | | | | | | | | | | | | |
| * | The difference between ordinary distributions paid from book and ordinary distributions paid from tax relates to allowable foreign tax credits of $608,514 and $325,296 for fiscal year ended October 31, 2021 for the International Stock Fund and Emerging Markets Fund respectively, and $449,736 and $203,526 for fiscal year ended October 31, 2020 for the International Stock Fund and Emerging Markets Fund respectively, which have been passed through to the Funds’ underlying shareholders and are deemed dividends for tax purposes. |
| ** | Differences in distributions between the Statement of Changes paid from book and tax on the income funds relate to the adjustments for dividends payable for tax purposes. |
| NOTES TO FINANCIAL STATEMENTS (Unaudited) |
| April 30, 2022 (Continued) |
| |
As of each of the Fund’s tax year-ended October 31, 2021, the components of distributable earnings on a tax basis were as follows:
| | | Undistributed | | | Undistributed | | | Post October Loss | | | Capital Loss | | | Other | | | Unrealized | | | Total | |
| | | Ordinary | | | Long-Term | | | and | | | Carry | | | Book/Tax | | | Appreciation/ | | | Accumulated | |
| Fund | | Income | | | Capital Gains | | | Late Year Loss | | | Forwards | | | Differences | | | (Depreciation) | | | Earnings/(Deficits) | |
| Corporate/Government Bond | | $ | 22,284 | | | $ | — | | | $ | — | | | $ | (980,886 | ) | | $ | (326 | ) | | $ | 659,538 | | | $ | (299,390 | ) |
| Floating Rate Bond | | | 194,389 | | | | — | | | | — | | | | (13,962,610 | ) | | | (3,490 | ) | | | (14,063 | ) | | | (13,785,774 | ) |
| High-Yield Bond | | | 59,457 | | | | — | | | | — | | | | (6,360,309 | ) | | | (3,711 | ) | | | 2,665,326 | | | | (3,639,237 | ) |
| International Opportunity Bond | | | 203,439 | | | | 22,444 | | | | — | | | | — | | | | (292 | ) | | | (311,437 | ) | | | (85,846 | ) |
| Large Cap Value | | | 3,738,840 | | | | 6,477,839 | | | | — | | | | — | | | | — | | | | 50,916,276 | | | | 61,132,955 | |
| Small Cap Value | | | 8,171,394 | | | | 1,402,043 | | | | — | | | | — | | | | — | | | | 15,599,879 | | | | 25,173,316 | |
| Focused Large Cap Growth | | | — | | | | 16,249,986 | | | | (1,647,968 | ) | | | — | | | | — | | | | 122,639,095 | | | | 137,241,113 | |
| Small Cap Growth | | | 7,210,683 | | | | 6,672,130 | | | | — | | | | — | | | | — | | | | 22,790,071 | | | | 36,672,884 | |
| Emerging Markets Stock | | | 10,107,233 | | | | 1,730,171 | | | | — | | | | — | | | | — | | | | 18,688,707 | | | | 30,526,111 | |
| International Stock | | | 15,655,728 | | | | 9,039,564 | | | | — | | | | — | | | | — | | | | 28,148,885 | | | | 52,844,177 | |
| Dynamic Macro | | | — | | | | — | | | | (356,095 | ) | | | (718,468 | ) | | | — | | | | 3,794,597 | | | | 2,720,034 | |
| Long/Short Credit | | | 3,189,931 | | | | 1,068,737 | | | | — | | | | — | | | | (8,461 | ) | | | 1,642,233 | | | | 5,892,440 | |
| Monthly Distribution | | | — | | | | — | | | | (2,233,086 | ) | | | — | | | | (30,038 | ) | | | (7,488,051 | ) | | | (9,751,175 | ) |
| Real Estate Stock | | | 4,783,677 | | | | 1,780,450 | | | | — | | | | — | | | | — | | | | 22,976,757 | | | | 29,540,884 | |
| | | | | | | | | | | | | | | | | | | | | | | | | | | | | |
The difference between book basis and tax basis unrealized appreciation (depreciation), undistributed net investment income and accumulated net realized gain from security transactions are primarily attributable to the tax deferral of losses on wash sales, the mark-to-market treatment of open forward foreign currency, swap and 1256 futures contracts, and adjustments for partnerships, perpetual bonds, debt modification, defaulted income bonds, passive foreign investment companies, C Corporation return of capital distributions and dividend payable. The unrealized appreciation (depreciation) in the table above includes unrealized foreign currency gains (losses) for the Funds. In addition, the amount listed under other book/tax differences are primarily attributable to tax adjustments for accrued dividend payable.
Late year losses incurred after December 31 within the fiscal year are deemed to arise on the first business day of the following fiscal year for tax purposes. The Funds incurred and elected to defer such late year losses as follows:
| | | Late Year | |
| Fund | | Losses | |
| Corporate/Government Bond | | $ | — | |
| Floating Rate Bond | | | — | |
| High-Yield Bond | | | — | |
| International Opportunity Bond | | | — | |
| Large Cap Value | | | — | |
| Small Cap Value | | | — | |
| Focused Large Cap Growth | | | 1,647,968 | |
| Small Cap Growth | | | — | |
| Emerging Markets Stock | | | — | |
| International Stock | | | — | |
| Dynamic Macro | | | 356,095 | |
| Long/Short Credit | | | — | |
| Monthly Distribution | | | 2,233,086 | |
| Real Estate Stock | | | — | |
| NOTES TO FINANCIAL STATEMENTS (Unaudited) |
| April 30, 2022 (Continued) |
| |
At October 31, 2021, the following Funds had capital loss carryforwards for federal income tax purposes available to offset future capital gains as follows:
| | | | | | | | | | | | Capital Loss Carry | |
| Fund | | Short-Term | | | Long-Term | | | Total | | | Forward Utilized | |
| Corporate/Government Bond | | $ | 879,180 | | | $ | 101,706 | | | $ | 980,886 | | | $ | 542,713 | |
| Floating Rate Bond | | | 1,334,043 | | | | 12,628,567 | | | | 13,962,610 | | | | — | |
| High-Yield Bond | | | 2,089,999 | | | | 4,270,310 | | | | 6,360,309 | | | | 2,581,608 | |
| International Opportunity Bond | | | — | | | | — | | | | — | | | | 442,099 | |
| Large Cap Value | | | — | | | | — | | | | — | | | | 35,068 | |
| Small Cap Value | | | — | | | | — | | | | — | | | | 5,861,913 | |
| Focused Large Cap Growth | | | — | | | | — | | | | — | | | | — | |
| Small Cap Growth | | | — | | | | — | | | | — | | | | — | |
| Emerging Markets Stock | | | — | | | | — | | | | — | | | | 243,844 | |
| International Stock | | | — | | | | — | | | | — | | | | — | |
| Dynamic Macro | | | 718,468 | | | | — | | | | 718,468 | | | | 1,814,183 | |
| Long/Short Credit | | | — | | | | — | | | | — | | | | — | |
| Monthly Distribution | | | — | | | | — | | | | — | | | | — | |
| Real Estate Stock | | | — | | | | — | | | | — | | | | — | |
| | | | | | | | | | | | | | | | | |
During the fiscal year ended October 31, 2021, the Funds utilized tax equalization which is the use of earnings and profits distributions to shareholders on redemption of shares as part of the dividends paid deduction for income tax purposes. Permanent book and tax differences, primarily attributable to the reclassification of net operating losses, fund distributions, the use of tax equalization credits and adjustments for prior year tax returns resulted in reclassification for the tax year ended October 31, 2021 as follows:
| | | Paid | | | | |
| | | In | | | Accumulated | |
| Fund | | Capital | | | Earnings (Loss) | |
| Corporate/Government Bond | | $ | — | | | $ | — | |
| Floating Rate Bond | | | — | | | | — | |
| High-Yield Bond | | | — | | | | — | |
| International Opportunity Bond | | | — | | | | — | |
| Large Cap Value | | | 763,668 | | | | (763,668 | ) |
| Small Cap Value | | | 279,408 | | | | (279,408 | ) |
| Focused Large Cap Growth | | | 918,433 | | | | (918,433 | ) |
| Small Cap Growth | | | 2,278,035 | | | | (2,278,035 | ) |
| Emerging Markets Stock | | | 440,108 | | | | (440,108 | ) |
| International Stock | | | 2,126,067 | | | | (2,126,067 | ) |
| Dynamic Macro | | | (40,134 | ) | | | 40,134 | |
| Long/Short Credit | | | 201,340 | | | | (201,340 | ) |
| Monthly Distribution | | | — | | | | — | |
| Real Estate Stock | | | 584,684 | | | | (584,684 | ) |
| | | | | | | | | |
Net assets were unaffected by the above reclassifications.
| NOTES TO FINANCIAL STATEMENTS (Unaudited) |
| April 30, 2022 (Continued) |
Currently, the Funds have a $50,000,000 uncommitted line of credit provided by U.S. Bank National Association (the “Bank”) under an agreement (the “Uncommitted Line”). Any advance under the Uncommitted Line is contemplated primarily for temporary or emergency purposes, including the meeting of redemption requests that otherwise might require the untimely disposition of securities. Interest on borrowings is payable on an annualized basis at rate of Prime less .5%. The Uncommitted Line is not a “committed” line of credit, which is to say that the Bank is not obligated to lend money to a Fund. Accordingly, it is possible that a Fund may wish to borrow money for a temporary or emergency purpose but may not be able to do so. Based only on the days borrowed, the average amount of borrowings outstanding were as follows:
| | | Average borrowings | | | Average | |
| Fund | | outstanding | | | borrowings rate | |
| Corporate/Government Bond | | $ | 839,912 | | | | 3.00 | % |
| Floating Rate Bond | | | 3,257,050 | | | | 2.75 | % |
| International Opportunity Bond | | | 3,138,000 | | | | 3.00 | % |
| Large Cap Value | | | 6,710,500 | | | | 3.00 | % |
| Small Cap Value | | | 1,461,273 | | | | 2.77 | % |
| Small Cap Growth | | | 1,188,667 | | | | 2.75 | % |
| Emerging Markets Stock | | | 743,429 | | | | 2.75 | % |
| International Stock | | | 485,739 | | | | 2.80 | % |
| Monthly Distribution | | | 1,971,750 | | | | 2.75 | % |
| Real Estate Stock | | | 816,792 | | | | 2.84 | % |
| | | | | | | | | |
The interest expense for all the Funds listed above is immaterial.
As of April 30, 2022, Corporate/Government and International Stock had outstanding borrowings of $148,000 and $13,000, respectively, on the Uncommitted Line. Funds not listed above did not access the line of credit during the six months ended April 30, 2022.
The Funds have entered into a Securities Lending Agreement (“Agreement”) with the Bank. Each participating Fund can lend their securities to brokers, dealers and other financial institutions approved by the Board to earn additional income. Loans are collateralized at a value at least equal to 105% of the then current market value of any loaned security that are foreign, or 102% of the then current market value of any other loaned security. International Stock is below the 105% threshold due to market fluctuation. All interest and dividend payments received on securities which are held on loan, provided that there is no material default, will be paid to the respective Fund. A portion of the income generated by the investment in the Funds collateral, net of any rebates paid by the Bank to the borrowers is remitted to the Bank as lending agent and the remainder is paid to the Fund(s).
Securities lending income is disclosed in the Funds’ Statements of Operations and is net of fees retained by the counterparty. Although risk is mitigated by the collateral, the Funds could experience a delay in recovering their securities and possible loss of income or value if the Borrower fails to return them. Should the borrower of the securities fail financially, each Fund has the right to repurchase the securities using the collateral in the open market. The remaining contractual maturity of all securities lending transactions are overnight and continuous.
As of April 30, 2022 the below table shows the securities loan and collateral for the loan both of which are presented gross on the Statement of Assets and Liabilities. All individual open security loan transactions were overcollateralized. This cash is invested in the Mount Vernon Liquid Assets Portfolio.
| | | Market Value of Loaned | | | Market Value of | |
| Fund | | Securities | | | Collateral | |
| Corporate/Government Bond | | $ | 1,666,708 | | | $ | 1,712,005 | |
| Floating Rate Bond | | | 5,020,253 | | | | 5,170,455 | |
| High-Yield Bond | | | 12,254,114 | | | | 12,614,458 | |
| International Opportunity Bond (1) | | | 1,872,590 | | | | 1,931,673 | |
| Large Cap Value | | | 18,023,491 | | | | 18,818,689 | |
| Small Cap Value | | | 22,713,135 | | | | 23,983,526 | |
| Focused Large Cap Growth | | | 32,918,729 | | | | 35,031,728 | |
| Small Cap Growth | | | 15,129,768 | | | | 15,894,642 | |
| Emerging Markets Stock (1) | | | 553,598 | | | | 575,338 | |
| International Stock (1) | | | 19,380,217 | | | | 20,016,338 | |
| Dynamic Macro | | | 4,944,824 | | | | 5,238,873 | |
| Long/Short Credit | | | 5,851,506 | | | | 6,001,785 | |
| Monthly Distribution | | | 12,028,895 | | | | 12,395,269 | |
| Real Estate Stock | | | 16,852,200 | | | | 17,803,436 | |
| | | | | | | | | |
| (1) | Securities collateralized below 102% or 105% for foreign securities. The Trust’s securities lending policies and procedures require that the borrower: (i) deliver cash or U.S. Government securities as collateral with respect to each new loan of U.S. securities, equal to at least 102% or 105% of the value of the portfolio securities loaned, and (ii) at all times thereafter mark-to-market the collateral on a daily basis so that the market value of such collateral is at least 100% of the value of securities loaned. From time to time the collateral may not be 102% or 105% due to end of day market movement. The next business day, additional collateral is obtained/received from the borrower to replenish/reestablish 102% or 105%. |
| NOTES TO FINANCIAL STATEMENTS (Unaudited) |
| April 30, 2022 (Continued) |
| |
| 10. | NEW ACCOUNTING PRONOUNCEMENTS |
In March 2020, FASB issued ASU 2020-04, Reference Rate Reform (Topic 848): Facilitation of the Effects of Reference Rate Reform on Financial Reporting (’‘ASU 2020 -04’’). The amendments in ASU 2020-04 provide optional temporary financial reporting relief from the effect of certain types of contract modifications due to the planned discontinuation of LIBOR and other interbank-offered based reference rates as of the end of 2021. ASU 2020-04 is effective for certain reference rate-related contract modifications that occur during the period March 12, 2020 through December 31, 2022. Management is currently evaluating the impact, if any of applying this ASU.
In October 2020, the SEC adopted new regulations governing the use of derivative by registered investment companies (“Rule 18f-4”). Rule 18f-4 will impose limits on the amount of derivatives a Fund can enter into, eliminate the asset segregation framework currently used by funds to comply with Section 18 of the 1940 Act, and require funds whose use of derivatives is greater than a limited specified amount to establish and maintain a comprehensive derivatives risk management program and appoint a derivatives risk manager. Funds will be required to comply with Rule 18f-4 by August 19,2022. It is not currently clear what impact, if any, Rule 18f-4 will have on the availability, liquidity or performance of derivatives. Management is currently evaluating the potential impact of Rule 18f-4 on the Funds. When fully implemented, Rule 18f-4 may require changes in how a Fund uses derivatives, adversely affect the Fund’s performance and increase costs related to the Funds’ use of derivatives.
Subsequent events after the date of the Statements of Assets and Liabilities have been evaluated through the date the financial statements were issued. Management has determined that no events or transactions occurred requiring adjustment or disclosure in the financial statements.
| ADDITIONAL INFORMATION (Unaudited) |
| |
Dunham Funds
15(c) BOARD CONSIDERATIONS
December 13–14, 2021
On December 13–14, 2021, the Board of Trustees (the “Board”) of Dunham Funds (the “Trust”), a Delaware business trust, met to consider, among other things, (i) the renewal of the investment advisory agreement between the Trust and Dunham & Associates Investment Counsel, Inc. (the “Adviser”) and (ii) the approval and/or renewal of the sub-advisory agreements with various sub -advisers for certain series (the “Funds”). The investment advisory agreement and the sub-advisory agreements collectively are referred to as the “Advisory Agreements.” The Funds and the relevant sub-advisers with sub-advisory agreements up for approval and/or renewal include:
| Fund | | Sub-Advisory Agreement |
| Dunham Corporate/Government Bond Fund | | Newfleet Asset Management LLC |
| Dunham Dynamic Macro Fund | | [Newton Investment Management North America, LLC not up for renewal at this time; sub-advisory contract recently approved in June 2021] |
| Dunham Emerging Markets Stock Fund | | NS Partners Ltd. |
| Dunham Floating Rate Bond Fund | | [PineBridge Investments LLC not up for renewal at this time; sub-advisory contract recently approved in September 2021] |
| Dunham Focused Large Cap Growth Fund | | The Ithaka Group LLC |
| Dunham High Yield Bond Fund | | PineBridge Investments LLC |
| Dunham International Opportunity Bond Fund | | Stone Harbor Investment Partners LP |
| Dunham International Stock Fund | | Arrowstreet Capital, Limited Partnership |
| Dunham Large Cap Value Fund | | Rothschild & Co. Asset Management U.S. Inc. |
Dunham Long/Short Credit Fund
(formerly Dunham Appreciation & Income Fund) | | MetLife Investment Advisors LLC |
| Dunham Monthly Distribution Fund | | [Grantham Mayo Van Otterloo & Co. LLC not up for renewal at this time; sub-advisory contract recently approved in March 2021] |
| Dunham Real Estate Stock Fund | | American Assets Capital Advisers LLC |
| Dunham Small Cap Growth Fund | | Pier Capital, LLC |
| Dunham Small Cap Value Fund | | Ziegler Capital Management LLC |
| | | |
The Independent Trustees had requested and reviewed materials the Adviser and the sub-advisers provided prior to and during the meetings and had reviewed a memorandum from Fund counsel that reviewed their fiduciary duties pertaining to renewal of investment management and sub-advisory agreements and the factors they should consider in evaluating the Advisory Agreements.
Among other information, the Adviser and the sub-advisers provided information to assist the Independent Trustees in assessing the nature, extent and quality of services provided, information comparing the investment performance, advisory fees and operating expense ratio of each Fund to other funds, information about estimated profitability and/or financial condition and compliance and regulatory matters. The Board determined that, given the totality of the information provided with respect to each Advisory Agreement, the Board had received sufficient information to approve the Advisory Agreements.
The Independent Trustees and Fund counsel met in executive sessions to consider the renewal of the Advisory Agreements. The Board also received information about the Funds throughout the year in connection with the regular quarterly Board meetings from the Adviser and various Fund sub-advisers.
Based upon its review, the Board concluded that it was in the best interests of each Fund that the Advisory Agreements be renewed. In considering the renewal of the Advisory Agreements, the Board did not identify any single factor or group of factors as all-important or controlling, and considered a variety of factors in its analysis, including those discussed below. The Board did not allot a particular weight to any one factor or group of factors.
| ADDITIONAL INFORMATION (Unaudited) (Continued) |
| |
| II. | Investment Advisory Agreement |
Nature, Extent and Quality of Services. In considering the renewal of the investment advisory agreement with the Adviser, the Board considered the nature, extent and quality of services that the Adviser provided to the Funds, including the Adviser’s personnel and resources and the Adviser’s criteria for reviewing a sub-adviser’s performance. The Board reviewed the services the Adviser provided in serving as investment adviser, including the backgrounds of the personnel providing the investment management services and compliance staff. They also reviewed information provided regarding risk management and compliance and regulatory matters. The Board concluded that the services the Adviser provided were satisfactory.
Performance. The Board reviewed performance information the Adviser provided for Class N of each Fund compared to the performance of (a) funds in a peer group (the “Peer Group”) (which is a relevant sub -set of funds in a Fund’s Morningstar category), (b) a Morningstar category average and (c) a benchmark index for the one, five and ten year periods or since a Fund’s inception, as applicable, ended September 30, 2021. The Board considered that the Adviser had delegated day-to-day portfolio management of each Fund’s strategy to a sub-adviser and noted the ongoing oversight activities the Adviser performed, including review of returns on a relative and absolute basis, evaluation of brokerage execution quality and yearly compliance reviews. The Board concluded that the Adviser appropriately had reviewed and monitored each sub-adviser’s investment performance.
Advisory Fee. The Board reviewed each Fund’s advisory fee and expense ratio, taking into account the Fund’s average net assets, and reviewed information comparing the advisory fee and expense ratio to those of the Peer Group and a Morningstar category. The Board discussed that, while the advisory fees do not necessarily have to be the lowest compared to the Peer Groups, it is their duty to evaluate whether the advisory fees are reasonable. The Board noted that the Adviser’s fees range from 0.50% to 0.65%, which, when combined with the sub-adviser fees, are generally higher than the Peer Group averages when a Fund is performing well, but in some cases lower than the Peer Group averages when a Fund is underperforming. The Board concluded that the Adviser’s fee ranges are applied reasonably based on the nature of a Fund (i.e., bond vs. equity, or alternative vs. traditional). The Board observed that currently four Funds are considered “alternative” and generally require enhanced oversight compared to more traditional asset classes. The Board discussed the level of work involved in the Adviser’s oversight of the Funds, the Adviser’s ongoing quantitative and qualitative analysis of each sub-adviser, and the other services that the Adviser provides to the Funds.
The Board also noted:
| ● | Dunham Corporate/Government Bond Fund: The Board noted that the advisory fee was higher than the average of the Peer Group and the Morningstar category; however, the overall expense ratio was in a reasonable range. |
| ● | Dunham Dynamic Macro Fund: The Board noted that the advisory fee was in line with the average of the Peer Group and the Morningstar category, and the overall expense ratio was in a reasonable range. |
| ● | Dunham Emerging Markets Stock Fund: The Board noted that the advisory fee was higher than the average of the Peer Group and the Morningstar category; however, the overall expense ratio was in a reasonable range. |
| ● | Dunham Floating Rate Bond Fund: The Board noted that the advisory fee was higher than the average of the Peer Group and the Morningstar category; however, the overall expense ratio was in a reasonable range. |
| ● | Dunham Focused Large Cap Growth Fund: The Board noted that the advisory fee was higher than the average of the Peer Group and the Morningstar category; however, the overall expense ratio was in a reasonable range. |
| ● | Dunham High-Yield Bond Fund: The Board noted that the advisory fee was higher than the average of the Peer Group and the Morningstar category; however, the overall expense ratio was in a reasonable range. |
| ● | Dunham International Opportunity Bond Fund: The Board noted that the advisory fee was higher than the average of the Peer Group and the Morningstar category; however, the overall expense ratio was in a reasonable range in light of the Fund’s atypical other expenses. |
| ● | Dunham International Stock Fund: The Board noted that the advisory fee was higher than the average of the Peer Group and the Morningstar category; however, the overall expense ratio was in a reasonable range. |
| ADDITIONAL INFORMATION (Unaudited) (Continued) |
| |
| ● | Dunham Large Cap Value Fund: The Board noted that the advisory fee was higher than the average of the Peer Group and the Morningstar category, however, the overall expense ratio was in a reasonable range. |
| ● | Dunham Long/Short Credit Fund (formerly Dunham Appreciation & Income Fund): The Board noted that the advisory fee was higher than the average of the Peer Group and the Morningstar category, however, the overall expense ratio was in a reasonable range. |
| ● | Dunham Monthly Distribution Fund: The Board noted that the advisory fee was in line with the average of the Peer Group and the Morningstar category, and the overall expense ratio was in a reasonable range. |
| ● | Dunham Real Estate Stock Fund: The Board noted that the advisory fee was higher than the average of the Peer Group and the Morningstar category; however, the overall expense ratio was in a reasonable range. |
| ● | Dunham Small Cap Growth Fund: The Board noted that the advisory fee was higher than the average of the Peer Group and the Morningstar category; however, the overall expense ratio was in a reasonable range. |
| ● | Dunham Small Cap Value Fund: The Board noted that the advisory fee was in line with the average of the Peer Group and the Morningstar category; however, the overall expense ratio was in a reasonable range. |
In light of the nature, quality and extent of services the Adviser provided, the Board concluded that each Fund’s advisory fee was reasonable.
Economies of Scale. The Board considered the extent to which economies of scale would be realized as each Fund grows and whether fee levels reflect a reasonable sharing of economies of scale for the benefit of Fund investors. The Board noted that breakpoints may be an appropriate way for the Adviser to share its economies of scale if a Fund experiences substantial asset growth; however, the Board recognized that no Fund had yet reached an asset level where the Adviser could realize significant economies of scale. The Board observed that economies of scale will be considered in the future as Fund asset levels grow.
Profitability. The Board also reviewed the estimated profitability of the Adviser with respect to each Fund. The Board concluded that the estimated profitability of the Adviser in connection with the management of each Fund was reasonable, and at a level to adequately incentivize the Adviser to continue to provide high quality services.
Fallout Benefits. Because of its relationship with the Funds, the Adviser and its affiliates may receive certain benefits. The Board reviewed materials provided by the Adviser as to any such benefits.
| III. | Sub-Advisory Agreements |
Nature, Extent and Quality of Services. In considering the approval and/or renewal of the sub-advisory agreement, as applicable, between each Fund and the Fund’s respective sub-adviser, the Board considered the nature, extent and quality of services the sub-adviser provided under the sub-advisory agreement. The Board reviewed the services the sub-adviser provided, the background of the investment professionals servicing the Fund, and the sub-adviser’s reputation, resources and investment approach. The Board also reviewed information provided regarding the structure of portfolio manager compensation, trading and brokerage practices, soft dollar usage, risk management and compliance matters.
Performance. The Board reviewed each Fund’s total return compared to the average total returns of the Fund’s Peer Group and Morningstar category averages and benchmark index. The Board also noted:
| ● | Dunham Corporate/Government Bond Fund: The Board noted that Newfleet Asset Management, LLC (“Newfleet”) has served as the Fund’s sub-adviser since December 10, 2004 (the inception date of the Fund). The Board noted that the Fund underperformed its Peer Group average and Morningstar category average over the one- and five- -year periods. However, the Fund performed in line with or outperformed the assigned Benchmark Index over the one- and five-year periods, and performed in line with or outperformed the Peer Group average, Morningstar category average, and Benchmark Index over the ten-year period. The Board observed that the Fund’s underperformance could be attributed largely to the higher than average expense ratio of the Fund. The Board concluded that the services Newfleet provided were satisfactory. |
| ● | Dunham Emerging Markets Stock Fund: The Board noted that NS Partners Ltd. (“NS Partners”) has served as the Fund’s sub-adviser since April 1, 2019 (while the Fund’s inception date is December 10, |
| ADDITIONAL INFORMATION (Unaudited) (Continued) |
| |
2004). The Board noted that the Fund underperformed its Peer Group average and Morningstar category average over the one- and ten -year time periods. The Board observed that the Fund’s underperformance for the one-year period could be attributed largely to region, sector, and individual security allocation. However, the Board considered that the Fund has outperformed its Peer Group average, Morningstar category average, and benchmark index for the period since NS Partners began to manage the Fund. The Board concluded that the services NS Partners provided were satisfactory.
| ● | Dunham Focused Large Cap Growth Fund: The Board noted that The Ithaka Group, LLC (“Ithaka”) has served as the Fund’s sub-adviser since December 8, 2011 (the inception date of the Fund), and the Fund may hold a maximum of 35 stocks. The Board noted that the Fund underperformed its Peer Group average, Morningstar category average, and benchmark index over the one-year period. However, the Board considered that the Fund has outperformed its Peer Group average, Morningstar category average, and benchmark index for the longer-term time periods. The Board further noted that when the Fund historically has outperformed its Peer Group average, Morningstar category average, and benchmark index, it has done so by a significant amount. The Board concluded that the services Ithaka provided were satisfactory. |
| ● | Dunham High Yield Bond Fund: The Board noted that PineBridge Investments LLC (“PineBridge”) has served as the Fund’s sub-adviser since July 1, 2017 (while the Fund’s inception date is July 1, 2005). The Board noted that the Fund underperformed its benchmark index over the five-year and ten-year periods and since PineBridge began to manage the Fund and underperformed its Peer Group average and Morningstar category average for the ten-year period. The Board observed that the Fund’s underperformance could be attributed largely to the higher than average expense ratio of the Fund. However, the Board considered the Fund’s performance since PineBridge began to manage the Fund, outperforming its Peer Group average and Morningstar category average during the period. The Board also noted that the Fund performed in line with its Peer Group average, Morningstar category average, and benchmark index for the one-year period. The Board concluded that the services PineBridge provided were satisfactory. |
| ● | Dunham International Opportunity Bond Fund: The Board noted that Stone Harbor Investment Partners LP (“Stone Harbor”) has served as the Fund’s sub-adviser since January 1, 2020 (while the Fund’s inception date is November 4, 2013). The Board noted that the Fund underperformed its Peer Group average, Morningstar category average, and benchmark index over the five-year, and since inception periods. The Board observed that the Fund’s underperformance relative to its Morningstar category could be attributed largely to the category including funds with exposure to the U.S. bond market, while the Fund invests solely in foreign bonds. However, the Board considered the Fund’s performance since Stone Harbor began to manage the Fund, noting that the Fund outperformed its Peer Group average, Morningstar category average, and Benchmark Index over the one-year period and underperformed the Peer Group average and Morningstar category average since Stone Harbor began to manage the Fund. The Board concluded that the services Stone Harbor provided were satisfactory. |
| ● | Dunham International Stock Fund: The Board noted that Arrowstreet Capital, Limited Partnership (“Arrowstreet”) has served as the Fund’s sub-adviser since July 1, 2008 (while the Fund’s inception date is December 10, 2004). The Board noted that the Fund outperformed its Peer Group average, Morningstar category average, and benchmark index over the relevant periods. The Board concluded that the services Arrowstreet provided were satisfactory. |
| ● | Dunham Large Cap Value Fund: The Board noted that Rothschild & Co. Asset Management U.S. Inc. (“Rothschild”) has served as the Fund’s sub-adviser since July 1, 2015 (while the Fund’s inception date is December 10, 2004). The Board noted that the Fund underperformed its benchmark index over the ten-year period. However, since Rothschild began to manage the Fund, the Fund has performed in line with its benchmark index. Also, the Fund has outperformed its benchmark index and the Morningstar category average over the past year. The Board concluded that the services Rothschild provided were satisfactory. |
| ● | Dunham Long/Short Credit Fund (formerly Dunham Appreciation & Income Fund): The Board noted that MetLife Investment Management, LLC (“MetLife”) has served as the Fund’s sub-adviser since July 1, 2018 (while the Fund’s inception date is December 10, 2004). The Board noted that the Fund outperformed or was in line with its Peer Group average, the Morningstar category average, and its benchmark index over all time periods, except for underperforming its Morningstar category average over the one-year period. The Board concluded that the services MetLife provided were satisfactory. |
| ● | Dunham Real Estate Stock Fund: The Board noted that American Assets Capital Advisers LLC (“AACA”) has served as the Fund’s sub-adviser since January 1, 2020 (while the Fund’s inception date is December 10, 2004). The Board noted that the Fund outperformed its Peer Group average, the Morningstar category |
| ADDITIONAL INFORMATION (Unaudited) (Continued) |
| |
average, and its benchmark index over all time periods, aside from the one-year period, during which it underperformed. The Board concluded that the services AACA provided were satisfactory.
| ● | Dunham Small Cap Growth Fund: The Board noted that Pier Capital, LLC (“Pier”) has served as the Fund’s sub-adviser since December 10, 2004 (the inception date of the Fund). The Board noted that the Fund outperformed or performed in line with its Peer Group average, the Morningstar category average, and its benchmark index over the relevant time periods. The Board concluded that the services Pier provided were satisfactory. |
| ● | Dunham Small Cap Value Fund: The Board noted that Ziegler Capital Management LLC (“ZCM”), or a predecessor firm, has served as the Fund’s sub-adviser since July 1, 2013 (while the Fund’s inception date is December 10, 2004). The Board noted that the Fund underperformed its Morningstar category average and benchmark index over the one-year period. However, the Board considered that the Fund outperformed or performed in line with the Peer Group average and Morningstar Category average over all other relevant time periods. The Board concluded that the services ZCM provided were satisfactory. |
Sub-Advisory Fees and Economies of Scale. The Board considered each Fund’s sub-advisory fee schedule and noted the fees charged to comparable portfolios, if any, that the sub -adviser managed. The Board noted that the fee schedule was negotiated between the Adviser and each sub-adviser, an unaffiliated third party.
The Board considered the base fee paid to each sub-adviser when the performance of a Fund is equal to that of a specific index plus or minus a “null” zone. The Board also reviewed the operation of the performance fee and the impact on fees and expenses based on various performance results. The Board recognized the unique nature of a performance fee, which results in higher fees when a sub-adviser delivers positive results, and how performance fees should be integrated into their analysis. The Board noted information that the Adviser provided regarding the specific benchmark index used to compute each sub-adviser’s performance fee, how performance adjustments are calculated, and why each Fund’s N-share class (as the class with the most assets) is used for performance calculations.
The Board confirmed its belief that performance fees help ensure that any significant fee adjustments are attributable to a sub-adviser’s skill, rather than to random performance fluctuations, and the performance fee aligns a sub-adviser’s interest with those of Fund shareholders. The Board concluded that each sub-adviser’s fees were in a reasonable range.
The Board reviewed the relevance of economies of scale in the context of a sub-adviser that receives a performance based fee. The Board agreed that the Adviser successfully had negotiated a favorable base fee with each sub-adviser, and that reductions based on asset growth, when coupled with the possibility of fee reductions based on performance, could hinder the Adviser’s ability to attract top sub-advisory talent. The Board agreed that pursuing breakpoints with any of the sub-advisers would not be in the best interests of Fund shareholders at this time.
Profitability and Fallout Benefits. The Board considered information provided regarding each sub-adviser’s estimated profitability from providing sub-advisory services to its respective Fund. The Board noted that the sub-advisory fee schedule was negotiated between the Adviser and each sub-adviser, an unaffiliated third party. The Board reviewed materials provided as to any additional benefits each sub-adviser receives.
Conclusion. Based on all of the information considered and the conclusions reached, the Board determined that the terms of the Advisory Agreements for each Fund are fair and reasonable, and that the approval and/or continuation of the Advisory Agreements, as applicable, are in the best interests of each Fund.
| DUNHAM FUNDS’ EXPENSES (Unaudited) |
| |
Example
Shareholders of mutual funds will pay (1) transitional costs, such as sales load, and (2) ongoing expenses, such as advisory fees, distribution and service fees (12b-1), and other fund expenses. The following examples are intended to help you understand the ongoing cost (in dollars) of investing in a fund and to compare these costs with the ongoing costs of investing in other mutual funds. Please note, the expenses shown in the tables are meant to highlight ongoing costs only and do not reflect any transactional costs, such as sales charges (loads), or contingent deferred sales charges on redemptions which may be assessed by mutual funds. This Example is based on an investment of $1,000 invested at the beginning of the period and held for the entire period as indicated below.
Actual Expenses
The columns under the heading entitled “Actual” help you estimate the actual expenses you paid over the period. The “Actual-Ending Account Value” shown is derived from the Fund’s actual return, and the “Actual- Expenses Paid During Period” shows the dollar amount that would have been paid by an investor who started with $1,000 in the Fund. To estimate the expenses you paid on your account during this period, simply divide your account value by $1,000 (for example, an $8,600 account value divided by $1,000 = 8.6), then multiply the result by the number in the column under the heading entitled “Actual-Expenses Paid During Period”.
Hypothetical Examples for Comparison Purposes
The columns under the heading entitled “Hypothetical” provide information about hypothetical account value and hypothetical expenses based on the Fund’s actual expense ratio and an assumed rate of return of 5% per year before expenses, which is not the Fund’s actual return. The hypothetical account values and expenses may not be used to estimate the actual ending account balance or expenses you paid for the period. You may use this information to compare the ongoing costs of investing in the Fund and other funds. To do so, compare this 5% hypothetical example with the 5% hypothetical examples that appear in the shareholder reports of other funds.
Please note that the expenses shown in the table are meant to highlight your ongoing costs only and do not reflect any transactional costs which may be applicable to your account. Therefore, the last column of the table (Hypothetical- Expenses Paid During Period) is useful in comparing ongoing costs only, and will not help you determine the relative total costs of owning different funds. In addition, if these transactional costs were included, your costs would have been higher.
| | | | | | | Actual | | Hypothetical |
| | | Fund’s | | | | | | | | | | |
| | | Annualized | | Beginning | | Ending | | Expenses | | Ending | | Expenses |
| | | Expense | | Account | | Account | | Paid During | | Account | | Paid During |
| | | Ratio | | Value 11/1/21 | | Value 4/30/22 | | Period* | | Value 4/30/22 | | Period* |
| Class N: | | | | | | | | | | | | |
| Corporate/Government Bond Fund | | 1.28% | | $1,000.00 | | $921.30 | | $6.09 | $1,018.45 | | $6.40 |
| Floating Rate Bond Fund | | 0.99% | | $1,000.00 | | $994.90 | | $4.88 | $1,019.90 | | $4.94 |
| High-Yield Bond Fund | | 1.18% | | $1,000.00 | | $933.00 | | $5.63 | $1,018.97 | | $5.88 |
| International Opportunity Bond Fund | | 1.28% | | $1,000.00 | | $899.10 | | $6.00 | $1,018.47 | | $6.38 |
| Large Cap Value Fund | | 1.28% | | $1,000.00 | | $949.80 | | $6.18 | $1,018.45 | | $6.40 |
| Small Cap Value Fund | | 1.60% | | $1,000.00 | | $941.50 | | $7.71 | $1,016.85 | | $8.01 |
| Focused Large Cap Growth Fund | | 1.00% | | $1,000.00 | | $693.50 | | $4.18 | $1,019.86 | | $4.99 |
| Small Cap Growth Fund | | 1.39% | | $1,000.00 | | $649.20 | | $5.67 | $1,017.91 | | $6.94 |
| Emerging Markets Stock Fund | | 1.04% | | $1,000.00 | | $791.90 | | $4.61 | $1,019.65 | | $5.19 |
| International Stock Fund | | 1.65% | | $1,000.00 | | $851.50 | | $7.57 | $1,016.61 | | $8.25 |
| Dynamic Macro Fund | | 2.14% | | $1,000.00 | | $918.80 | | $10.20 | $1,014.17 | | $10.70 |
| Long/Short Credit Fund | | 1.02% | | $1,000.00 | | $988.10 | | $5.01 | $1,019.76 | | $5.09 |
| Monthly Distribution Fund | | 2.86% | | $1,000.00 | | $998.90 | | $14.20 | $1,010.59 | | $14.28 |
| Real Estate Stock Fund | | 1.02% | | $1,000.00 | | $829.10 | | $4.64 | $1,019.73 | | $5.12 |
| Class A: | | | | | | | | | | | | |
| Corporate/Government Bond Fund | | 1.53% | | $1,000.00 | | $920.70 | | $7.30 | $1,017.19 | | $7.67 |
| Floating Rate Bond Fund | | 1.23% | | $1,000.00 | | $993.80 | | $6.10 | $1,018.67 | | $6.18 |
| High-Yield Bond Fund | | 1.42% | | $1,000.00 | | $932.50 | | $6.83 | $1,017.73 | | $7.13 |
| International Opportunity Bond Fund | | 1.53% | | $1,000.00 | | $899.00 | | $7.18 | $1,017.23 | | $7.63 |
| Large Cap Value Fund | | 1.53% | | $1,000.00 | | $948.90 | | $7.39 | $1,017.21 | | $7.65 |
| Small Cap Value Fund | | 1.85% | | $1,000.00 | | $940.40 | | $8.88 | $1,015.64 | | $9.23 |
| Focused Large Cap Growth Fund | | 1.25% | | $1,000.00 | | $692.70 | | $5.24 | $1,018.60 | | $6.25 |
| Small Cap Growth Fund | | 1.73% | | $1,000.00 | | $648.40 | | $7.07 | $1,016.21 | | $8.65 |
| Emerging Markets Stock Fund | | 1.29% | | $1,000.00 | | $790.90 | | $5.71 | $1,018.42 | | $6.43 |
| International Stock Fund | | 1.90% | | $1,000.00 | | $850.40 | | $8.72 | $1,015.37 | | $9.50 |
| Dynamic Macro Fund | | 2.39% | | $1,000.00 | | $917.20 | | $11.34 | $1,012.96 | | $11.91 |
| Long/Short Credit Fund | | 1.25% | | $1,000.00 | | $986.80 | | $6.18 | $1,018.58 | | $6.28 |
| Monthly Distribution Fund | | 3.11% | | $1,000.00 | | $997.80 | | $15.39 | $1,009.38 | | $15.48 |
| Real Estate Stock Fund | | 1.27% | | $1,000.00 | | $828.20 | | $5.78 | $1,018.47 | | $6.38 |
| DUNHAM FUNDS’ EXPENSES (Unaudited) (Continued) |
| | | | | | | Actual | | Hypothetical |
| | | Fund’s | | | | | | | | | | |
| | | Annualized | | Beginning | | Ending | | Expenses | | Ending | | Expenses |
| | | Expense | | Account | | Account | | Paid During | | Account | | Paid During |
| | | Ratio | | Value 11/1/21 | | Value 4/30/22 | | Period* | | Value 4/30/22 | | Period* |
| Class C: | | | | | | | | | | | | |
| Corporate/Government Bond Fund | | 2.03% | | $1,000.00 | | $918.60 | | $9.67 | $1,014.72 | | $10.15 |
| Floating Rate Bond Fund | | 1.74% | | $1,000.00 | | $991.30 | | $8.58 | $1,016.18 | | $8.69 |
| High-Yield Bond Fund | | 1.93% | | $1,000.00 | | $930.20 | | $9.22 | $1,015.25 | | $9.62 |
| International Opportunity Bond Fund | | 2.03% | | $1,000.00 | | $896.20 | | $9.52 | $1,014.75 | | $10.12 |
| Large Cap Value Fund | | 2.28% | | $1,000.00 | | $945.20 | | $11.00 | $1,013.49 | | $11.38 |
| Small Cap Value Fund | | 2.60% | | $1,000.00 | | $937.10 | | $12.51 | $1,011.88 | | $12.99 |
| Focused Large Cap Growth Fund | | 2.00% | | $1,000.00 | | $690.20 | | $8.39 | $1,014.87 | | $10.00 |
| Small Cap Growth Fund | | 2.45% | | $1,000.00 | | $645.80 | | $10.00 | $1,012.65 | | $12.22 |
| Emerging Markets Stock Fund | | 2.04% | | $1,000.00 | | $788.10 | | $9.06 | $1,014.66 | | $10.21 |
| International Stock Fund | | 2.65% | | $1,000.00 | | $847.50 | | $12.13 | $1,011.67 | | $13.20 |
| Dynamic Macro Fund | | 3.14% | | $1,000.00 | | $914.10 | | $14.88 | $1,009.25 | | $15.62 |
| Long/Short Credit Fund | | 2.02% | | $1,000.00 | | $982.40 | | $9.95 | $1,014.76 | | $10.11 |
| Monthly Distribution Fund | | 3.85% | | $1,000.00 | | $994.10 | | $19.05 | $1,005.69 | | $19.16 |
| Real Estate Stock Fund | | 2.03% | | $1,000.00 | | $824.90 | | $9.16 | $1,014.75 | | $10.12 |
| | | | | | | | | | | | |
| * | Expenses Paid During Period are equal to the Fund’s annualized expense ratio, multiplied by the average account value over the period, multiplied by 181 days and divided by 365 (to reflect the number of days in the six month period ending April 30, 2022). |
| ADDITIONAL INFORMATION (Unaudited) (Continued) |
| |
LIQUIDITY RISK MANAGEMENT PROGRAM
In October 2016, the Securities and Exchange Commission (“SEC”) adopted Rule 22e-4, or the “Liquidity Rule,” under the Investment Company Act of 1940. The Liquidity Rule requires a mutual fund to adopt a liquidity risk management program (“Program”). In June 2018, the SEC adopted a requirement that a mutual fund disclose information about the operation and effectiveness of its Program in its reports to shareholders.
The Funds have adopted and implemented a Program pursuant to the Liquidity Rule, effective December 1, 2018. The Program is intended to provide a framework for: (1) assessing and managing a Fund’s liquidity risk (i.e., the risk that a Fund could not meet requests to redeem shares without significantly diluting remaining investors’ interests) based on a variety of factors, including the Fund’s investment strategy and liquidity of its portfolio investments, (2) classifying the liquidity of a Fund’s investments, (3) determining a Fund’s highly liquid investment minimum (“HLIM”), if applicable, (4) complying with a Fund’s illiquid investment limit, and (5) reporting to the Funds’ Board of Trustees. The Board of Trustees designated the Funds’ investment adviser, Dunham & Associates Investment Counsel, Inc. (the “Program Administrator”), to administer the Program. The Program Administrator established a liquidity risk management group to assist the Program Administrator in implementing the Program.
Under the Program, each of the Fund’s portfolio investments is classified into one of four liquidity categories defined by the SEC: highly liquid, moderately liquid, less liquid, and illiquid. Liquidity classifications take into account a variety of market, trading, and investment factors, including the Fund’s reasonably anticipated trade size, and the Program Administrator has engaged a third-party vendor to assist with the classification of portfolio investments.
The Liquidity Rule prohibits mutual funds from acquiring investments that would cause their illiquid investments to exceed 15% of net assets. The Liquidity Rule also requires funds that do not primarily hold assets that are highly liquid investments to determine a minimum percentage of net assets to be invested in highly liquid investments (the HLIM). The Program includes provisions designed to comply with the 15% limit on illiquid investments and for determining and complying with the HLIM requirement, as applicable.
In accordance with the Liquidity Rule, the Program Administrator prepared, and the Funds’ Board of Trustees reviewed, a report regarding the operation and effectiveness of the Program for the period from January 1, 2021 through December 31, 2021. The report concluded that the Program remains reasonably designed to assess and manage a Fund’s liquidity risk, and that during the period the Program was implemented effectively.
NOTICE OF PRIVACY POLICY & PRACTICES
Privacy Notice
| FACTS | WHAT DO DUNHAM FUNDS DO WITH YOUR PERSONAL INFORMATION? |
| | |
| Why? | Financial companies choose how they share your personal information. Federal law gives consumers the right to limit some but not all sharing. Federal law also requires us to tell you how we collect, share, and protect your personal information. Please read this notice carefully to understand what we do. |
| | |
| What? | The types of personal information we collect and share depend on the product or service you have with us. This information can include: ■ Social Security number and wire transfer instructions ■ account transactions and transaction history ■ investment experience and purchase history When you are no longer a customer, we continue to share your information as described in this notice. |
| | |
| How? | All financial companies need to share customers’ personal information to run their everyday business. In the section below, we list the reasons financial companies can share their customers’ personal information; the reasons Dunham Funds chooses to share; and whether you can limit this sharing. |
Reasons we can share your personal
information | Do Dunham
Funds share? | Can you limit
this sharing? |
| For our everyday business purposes – such as to process your transactions, maintain your account(s), respond to court orders and legal investigations, or report to credit bureaus | Yes | No |
| For our marketing purposes – to offer our products and services to you | Yes | No |
| For joint marketing with other financial companies | No | We don’t share |
| For our affiliates’ everyday business purposes – information about your transactions and experiences | No | We don’t share |
| For our affiliates’ everyday business purposes – information about your creditworthiness | No | We don’t share |
| For non-affiliates to market to you | No | We don’t share |
| Questions? | Call (800) 442-4358 or go to www.dunham.com |
| What we do |
| How do Dunham Funds protect my personal information? | To protect your personal information from unauthorized access and use, we use security measures that comply with federal law. These measures include computer safeguards and secured files and buildings. We permit only authorized parties and affiliates (as permitted by law) who have signed an agreement (which protects your personal information) with us to have access to customer information. |
| How do Dunham Funds collect my personal information? | We collect your personal information, for example, when you
■ open and account or deposit money ■ direct us to buy securities or direct us to sell your securities ■ seek advice about your investments We also collect your personal information from others, such as credit bureaus, affiliates, or other companies. |
| | Federal law gives you the right to limit only
■ sharing for affiliates’ everyday business purposes-information about your creditworthiness ■ affiliates from using your information to market to you ■ sharing for non-affiliates to market to you State laws and individual companies may give you additional rights to limit sharing. |
| Definitions |
| Affiliates | Companies related by common ownership or control. They can be financial and nonfinancial companies. ■ Our affiliates include financial companies, such as Dunham & Associates Investment Counsel, Inc., Dunham Trust Company. |
| Non-affiliates | Companies not related by common ownership or control. They can be financial and nonfinancial companies. ■ Dunham Funds do not share with non-affiliates so they can market to you. |
| Joint marketing | A formal agreement between nonaffiliated financial companies that together market financial products or services to you. ■ Dunham Funds do not jointly market. |
How to Obtain Proxy Voting Information
Information regarding how the Funds voted proxies relating to portfolio securities for the most recent 12-month period ended June 30 as well as a description of the policies and procedures that the Funds use to determine how to vote proxies is available without charge, upon request, by calling (888)-3DUNHAM (338-6426) or by referring to the Securities and Exchange Commission’s (“SEC”) website at http://www.sec.gov.
How to Obtain 1st and 3rd Fiscal Quarter Portfolio Holdings
Each Fund files its complete schedule of portfolio holdings with the SEC for the first and third quarters of each fiscal year on Form N-PORT. Form N-PORT is available on the SEC’s website at http://www.sec.gov and may be reviewed and copied at the SEC’s Public Reference Room in Washington, DC (800)-SEC-0330. The information on Form N-PORT is available without charge, upon request, by calling (888)-3DUNHAM (338-6426).

P.O. Box 910309
San Diego, California 92191
(800) 442-4358
Distributed by Dunham & Associates Investment Counsel, Inc. Member FINRA/SIPC
THIS REPORT AND FINANCIAL STATEMENTS CONTAINED HEREIN ARE NOT INTENDED TO BE A FORECAST OF FUTURE EVENTS, A GUARANTEE OF FUTURE RESULTS, OR INVESTMENT ADVICE. FURTHER, THERE IS NO ASSURANCE THAT CERTAIN SECURITIES WILL REMAIN IN OR OUT OF EACH FUND’S PORTFOLIO.
THE FIGURES IN THIS REPORT REPRESENT PAST PERFORMANCE AND DO NOT GUARANTEE FUTURE RESULTS. THE PRINCIPAL VALUE OF AN INVESTMENT AND INVESTMENT RETURN WILL FLUCTUATE SO THAT AN INVESTOR’S SHARES, WHEN REDEEMED, MAY BE WORTH MORE OR LESS THAN THEIR ORIGINAL COST.
DUNHAM-SA22
Item 2. Code of Ethics. Not applicable.
Item 3. Audit Committee Financial Expert. Not applicable.
Item 4. Principal Accountant Fees and Services. Not applicable.
Item 5. Audit Committee of Listed Companies. Not applicable to open-end investment companies.
Item 6. Schedule of Investments. Schedule of investments in securities of unaffiliated issuers is included under Item 1.
Item 7. Disclosure of Proxy Voting Policies and Procedures for Closed-End Funds. Not applicable to open-end investment companies.
Item 8. Portfolio Managers of Closed-End Funds. Not applicable to open-end investment companies.
Item 9. Purchases of Equity Securities by Closed-End Funds. Not applicable to open-end investment companies.
Item 10. Submission of Matters to a Vote of Security Holders. None
Item 11. Controls and Procedures.
(a) Based on an evaluation of the registrant’s disclosure controls and procedures as of a date within 90 days of filing date of this Form N-CSR, the disclosure controls and procedures are reasonably designed to ensure that the information required in filings on Forms N-CSR is recorded, processed, summarized, and reported on a timely basis.
(b) There were no significant changes in the registrant’s internal control over financial reporting that occurred during the registrant’s last fiscal half-year that have materially affected, or are reasonably likely to materially affect, the registrant’s internal control over financial reporting.
Item 12. Disclosure of Securities Lending Activities for Closed-End Management Investment Companies. Not Applicable to open-end investment companies.
Item 13. Exhibits.
(a)(1) Not required for semi-annual reports.
(a)(2) Certifications required by Section 302 of the Sarbanes-Oxley Act of 2002 (and Item 11(a)(2) of Form N-CSR) are filed herewith..
(a)(3) Not applicable.
(b) Certifications required by Section 906 of the Sarbanes-Oxley Act of 2002 (and Item 11(b) of Form N-CSR) are filed herewith.
SIGNATURES
Pursuant to the requirements of the Securities Exchange Act of 1934 and the Investment Company Act of 1940, the registrant has duly caused this report to be signed on its behalf by the undersigned, thereunto duly authorized.
(Registrant) Dunham Funds
By (Signature and Title)
/s/ Jeffrey Dunham
Jeffrey Dunham, Principal Executive Officer/President
Date 7/7/2022
Pursuant to the requirements of the Securities Exchange Act of 1934 and the Investment Company Act of 1940, this report has been signed below by the following persons on behalf of the registrant and in the capacities and on the dates indicated.
By (Signature and Title)
/s/ Jeffrey Dunham
Jeffrey Dunham, Principal Executive Officer/President
Date 7/7/2022
By (Signature and Title)
/s/ Denise Iverson
Denise Iverson, Principal Financial Officer/Treasurer
Date 7/7/2022