united states
securities and exchange commission
washington, d.c. 20549
form n-csr
certified shareholder report of registered management
investment companies
Investment Company Act file number 811-22153
Dunham Funds
(Exact name of registrant as specified in charter)
6256 Greenwich Dr. Ste. 550, San Diego, CA 92122
(Address of principal executive offices) (Zip code)
Timothy Burdick
Ultimus Fund Solutions LLC., 4221 N 203rd St., Suite 100, Elkhorn, NE 68022
(Name and address of agent for service)
Registrant's telephone number, including area code: 631-470-2619
Date of fiscal year end: 10/31
Date of reporting period: 4/30/23
Item 1. Reports to Stockholders.
| This Semi-Annual Report contains “forward-looking statements” within the meaning of the Private Securities Litigation Reform Act of 1995. Forward-looking statements also include those preceded by, followed by or that include the words “believes”, “expects”, “anticipates” or similar expressions. Such statements should be viewed with caution. Actual results or experience could differ materially from the forward-looking statements as a result of many factors. Each Fund makes no commitments to disclose any revisions to forward-looking statements, or any facts, events or circumstances after the date hereof that may bear upon forward-looking statements. In addition, prospective purchasers of the Funds should consider carefully the information set forth herein and the applicable fund’s prospectus. Other factors and assumptions not identified above may also have been involved in the derivation of these forward-looking statements, and the failure of these other assumptions to be realized may also cause actual results to differ materially from those projected. |
Dear Fellow Shareholders:
Volatile markets that were predicated on uncertainty and fear have historically provided opportunities to seek out potentially oversold asset classes and securities. The previous fiscal year exhibited these characteristics as U.S. investment-grade bonds fell substantially along with stocks and investors had little refuge to protect their portfolios from substantial declines. The significant negative returns in bonds were primarily explained by the aggressive interest rate increases implemented by the Federal Open Market Committee as they sought to battle rampant inflation. However, these significantly higher short-term interest rates corresponded with a sharply inverted yield curve and increasing odds of a recession, causing securities associated with higher risk, such as equities, to experience substantial declines, as well. At the commencement of the current fiscal year, some equity valuations appeared attractive and bond yields were broadly adjusted to reflect the new interest rate regime. This meant that short-term real yields (adjusted for inflation) were still negative, but were at least less negative than in the middle of 2022. Although earnings reports have broadly corresponded with company management providing tepid outlooks, more recent disruptions in the banking sector resulted in a short-term resurgence of fear. Much of that fear was quickly stifled by a Fed that has prioritized the perception of liquidity in the banking system since the start of the COVID pandemic, as it quickly announced that deposits over the FDIC limit would be covered for those particular banks. Similarly, when one of the largest global banks faltered, the Swiss government quickly arranged for a union with its largest bank to quell a run on the banks. This has evolved into a period of heightened government intervention where the end goal for each country’s central bank is to control inflation but to also avoid a deep recession.
The remainder of this fiscal year is expected to provide additional clarity on the depth of the impending recession. However, factors that provide some uncertainty for the investment markets also include the potential for rising default rates, deterioration in certain real estate property markets, and the perseverance of an exhausted consumer that has borne the brunt of massively inflated goods and services. We are cautious that a worsening or deterioration of any of these may serve to conflagrate another spike in market volatility. Therefore, with a diverse array of Dunham Funds, each representing a unique asset class and investment strategy, we are confident that the tools are available to our investors that are seeking to maintain diversification across asset classes and manage impending risks. We continue to believe that it is important to remain disciplined and methodical, especially when many other investors are not.
I continue to personally invest alongside you, and I remain confident that you can continue to rely on us to apply a rational and unemotional approach. We thank you for your continued trust and the confidence you have placed in us. We take that trust very seriously. We look forward to servicing the investment needs for you and your family for generations to come.
Sincerely,

Jeffrey A. Dunham
President
Dunham & Associates
April 30, 2023
| Dunham Corporate/Government Bond Fund (Unaudited) |
| Message from the Sub-Adviser (Virtus Fixed Income Advisers, LLC) |
| |
Asset Class Recap
Investment-grade bonds, as measured by the Bloomberg U.S. Aggregate Bond Index, sold off in tandem with equity markets the previous fiscal year as the asset classes duration adversely impacted performance. The Federal Open Market Committee became increasingly hawkish the previous fiscal year as persistent inflation, coupled with data illustrating a strong consumer and resilient job market, helped justify a series of rate hikes in the Federal Funds Rate. The aggressive actions continued to begin the current fiscal year as the Federal Reserve raised the Federal Funds Rate another 75 basis points in early November. However, sentiment meaningfully turned toward the end of the fiscal six-month period amid hopes of a Federal Reserve pivot on the horizon, due to economic data indicating that inflation was slowing, and rising concerns of recession following the collapse of Silicon Valley Bank (SVB) (not held). Although all credit sectors finished in positive territory, it was a volatile six -month period ended April 30, 2023. The 10-year U.S. Treasury yield spiked to its highest level during the six-month period at 4.2 percent in early November 2022, but sank to its lowest level during the fiscal period at 3.3 percent in early April 2023. Investment-grade corporate bonds and U.S. government bonds, as measured by the Bloomberg U.S. Aggregate Bond Index, gained 6.9 percent over the six-month period. Fixed income asset classes with less interest rate sensitivity, such as high-yield bonds, underperformed their investment-grade counterparts, however, still finished in positive territory. U.S. high-yield bonds, as measured by the ICE BofA U.S. Cash Pay High-Yield Index, gained 5.8 percent. Similarly, leveraged loans, as measured by the Credit Suisse Leveraged Loan Index, increased 5.6 percent over the fiscal period.
Allocation Review
Nearly half of U.S. investment-grade bonds in the benchmark index are represented by Treasury and government agency bonds; therefore, much of the performance of the benchmark index is dictated by how those U.S. government-related bonds perform, and far less is dependent on the performance of corporate bonds and non-agency mortgage-backed securities. Over the fiscal period, U.S. Treasury bonds, as measured by the ICE BofA U.S. Treasury & Agency Index, increased 6.0 percent. As the Fund had approximately 25 percent allocated to Treasury and government agency bonds, this is far less than what is represented by the benchmark index, and this significant underweight generally contributed to relative Fund performance over the most recent fiscal period. The Fund’s largest exposure was to investment-grade corporate bonds, comprising roughly 27 percent of the Fund. Investment-grade corporate bonds, as measured by the ICE BofA U.S. Corporate Index, increased 9.2 percent during the fiscal period, contributing to relative and absolute outperformance. The Fund’s significant overweight to non-agency residential mortgage-backed securities, was one of the largest detractors from performance. Although commercial mortgage-backed securities still benefited from robust demand, higher interest rates and challenging valuations were a headwind in the credit sector. Over the fiscal period, non-agency RMBS, as measured by the Markit iBoxx Broad U.S. Non-Agency RMBS Index, increased 4.0 percent.
Holdings Insights
Credit selection within corporate bonds provided one of the largest contributions to relative and absolute performance over the fiscal period. The PulteGroup, Inc. 6.375%, due 05/15/2033 (745867AP6) (holding weight*: 0.34 percent), the third largest residential home construction company in the U.S. based on total homes closed, increased 17.5 percent over the fiscal period. The Pulte bond benefitted from greater-than expected housing market resilience, potentially leading to a strong earnings report highlighting record home closings. Also, Pulte has tightened their financial discipline recently, reducing their outstanding debt by more than one third since 2018. Furthermore, the allocation to and composition within U.S. Treasury holdings contributed positively to Fund performance. An outperforming position within this sector was the U.S. Treasury Bond 1.375% due 8/15/2050 (912810SP4) (holding weight*: 1.22 percent), increasing 14.7 percent over the fiscal period. This gain was primarily attributable to the long duration of this bond. Exposure to municipal bonds was another meaningful contributor to performance, as the relative overweight coupled with strong security selection provided a significant tailwind in the sector. An example of strong security selection was the Broward County, Florida Water & Sewer Utility Revenue 4.0% due 10/01/2047 (115117NJ8) (holding weight*: 0.56 percent), which increased 13.4 percent over the fiscal period. The Sub-Adviser attributes the outperformance to the longer duration of this bond, coupled with a relatively low new issue supply.
Although the high yield corporate bond sector held positions that contributed to Fund performance, some of the worst performing credits within the Fund came from this sector. Two such positions were high-yield bonds from the same issuer, the Level 3 Financing, Inc. 3.625%, due 1/15/2029 (527298BS1) (holding weight*: 0.12 percent) and the 4.25% due 7/1/2028 (527298BR3) (holding weight*: 0.08 percent) which declined 25.9 percent and 27.0 percent, respectively over the fiscal period; the bottom performing credits in the Fund. The Sub-Adviser attributes this performance to parent company Lumen Technologies’ (LUMN) (not held) senior management giving very poor guidance for 2023 which they expected will result in far less deleveraging and free cash flow than investors anticipated. Given the complexity of their structure, the market quickly concluded that Level 3 would become a funding vehicle for Lumen, entailing substantial leverage increases. The third largest detractor from Fund performance was an investment-grade corporate bond, Lincoln National Corporation floating rate due 4/20/2067 (534187BP3) (holding weight*: 0.09 percent), which declined 9.2 percent over the six -month period. The Sub-Adviser noted that the underperformance of Lincoln bonds followed a weak fourth quarter earnings release in which Lincoln took additional large reserve charges and announced a change in their Chief Financial Officer. The Sub-Adviser also noted that Lincoln’s leverage is elevated resulting from several successive quarters of increased reserve provisions, potentially driving negative sentiment around the recent changes.
Sub-Adviser Outlook
Following the volatile 2022 calendar year, where bond markets experienced their worst selloff since 1949, the Sub-Adviser views fixed-income markets as transitioning to a more range-bound environment moving forward. The Sub-Adviser is optimistic that the economy is building for a soft landing, and if it enters a recession, it anticipates that it will be mild. As a result, it believes the worst-case scenarios for the economy are already priced in. The Sub-Adviser believes that spread valuations are currently at fair levels; therefore, it remains neutral on the direction of risk markets but are ready to add risk exposure if the opportunity arises.
| * | Holdings percentage(s) of total investments, cash and unsettled trades excluding collateral for securities loaned as of 4/30/2023. |
| Dunham Corporate/Government Bond Fund |
| PORTFOLIO REVIEW (Unaudited) |
| April 30, 2023 |
| |
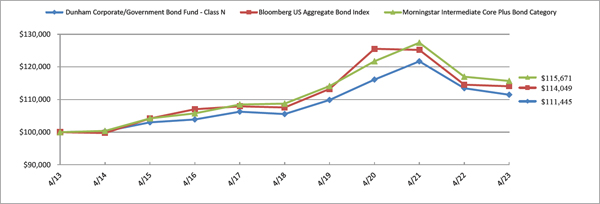
The Fund’s performance figures* for each of the periods ended April 30, 2023, compared to its benchmarks:
| | | | Annualized | Annualized |
| | 6 Month | 1 Year Return | 5 Year Return | 10 Year Return |
| Class N | 6.63% | (1.76)% | 1.09% | 1.09% |
| Class A with Load 4.50% | 1.60% | (6.48)% | (0.08)% | 0.37% |
| Class A without load | 6.43% | (2.07)% | 0.85% | 0.83% |
| Class C | 6.21% | (2.50)% | 0.35% | 0.34% |
| Bloomberg US Aggregate Bond Index (a) | 6.91% | (0.43)% | 1.18% | 1.32% |
| Morningstar Intermediate Core Plus Bond Category (b) | 6.88% | (1.11)% | 1.24% | 1.47% |
| | | | | |
| * | Total Returns are calculated based on traded NAVs. As disclosed in the Trust’s latest registration statement, the Fund’s total annual operating expenses, including underlying funds, are 1.34% for Class N, 2.09% for Class C and 1.59% for Class A. Class A shares are subject to a sales load of 4.50% and a deferred sales charge of up to 0.75%. The performance data quoted here represents past performance, which is not indicative of future results. Current performance may be lower or higher than the performance data quoted. The investment return and NAV will fluctuate, so that an investor’s shares, when redeemed, may be worth more or less than their original cost. Total returns are calculated assuming reinvestment of all dividends and capital gains distributions, if any. The returns do not reflect the deductions of taxes a shareholder would pay on the redemption of Fund shares or Fund distributions. For performance information current to the most recent month-end, please call 1-800-442-4358 or visit our website www.dunham.com. |
| (a) | The Bloomberg US Aggregate Bond Index is an unmanaged index which represents the U.S. investment-grade fixed-rate bond market (including government and corporate securities, mortgage pass-through securities and asset-backed securities). Investors cannot invest directly in an index or benchmark. |
| (b) | The Morningstar Intermediate Core Plus Bond Category is generally representative of intermediate-term bond mutual funds that primarily invest in corporate and other investment-grade U.S. fixed-income securities and typically have durations of 3.5 to 6.0 years. Funds in this category also invest in high-yield and foreign bonds. |
Comparison of the Change in Value of a $100,000 Investment
| Portfolio Composition * (Unaudited) |
| Corporate Bonds | | | 33.1 | % |
| Asset Backed Securities | | | 30.9 | % |
| U.S. Government & Agencies | | | 22.8 | % |
| Term Loans | | | 5.2 | % |
| Municipal Bonds | | | 3.1 | % |
| Short-Term Investments | | | 2.0 | % |
| Non U.S. Government & Agencies | | | 1.6 | % |
| Collateral for Securities Loaned | | | 1.3 | % |
| Total | | | 100.0 | % |
| | | | | |
* Based on total value of investments as of April 30, 2022. Does not include derivative holdings.
Percentage may differ from Schedule of Investments which are based on Fund net assets.
| DUNHAM CORPORATE/GOVERNMENT BOND FUND |
| SCHEDULE OF INVESTMENTS (Unaudited) |
| April 30, 2023 |
| Principal | | | | | | | Coupon Rate | | | | | |
| Amount ($) | | | | | Spread | | (%) | | Maturity | | Fair Value | |
| | | | | ASSET BACKED SECURITIES — 31.2% | | | | | | | | | | |
| | | | | AUTO LOAN — 6.5% | | | | | | | | | | |
| | 158,509 | | | American Credit Acceptance Receivables Trust Series 2021-2 C(a) | | | | 0.9700 | | 07/13/27 | | $ | 156,235 | |
| | 220,000 | | | American Credit Acceptance Receivables Trust Series 2022-1 D(a) | | | | 2.4600 | | 03/13/28 | | | 206,466 | |
| | 230,000 | | | AmeriCredit Automobile Receivables Trust Series 2020-3 C | | | | 1.0600 | | 08/18/26 | | | 216,828 | |
| | 155,000 | | | Avis Budget Rental Car Funding AESOP, LLC Series 2019-3A A(a) | | | | 2.3600 | | 03/20/26 | | | 147,171 | |
| | 611,000 | | | Avis Budget Rental Car Funding AESOP, LLC Series 2023-3A A(a) | | | | 5.4400 | | 02/22/28 | | | 615,990 | |
| | 317,000 | | | CarNow Auto Receivables Trust Series 2023-1A C(a) | | | | 7.2400 | | 09/15/26 | | | 316,987 | |
| | 86,345 | | | Carvana Auto Receivables Trust Series 2019-3A D(a) | | | | 3.0400 | | 04/15/25 | | | 85,648 | |
| | 225,000 | | | Carvana Auto Receivables Trust Series 2021-P3 B | | | | 1.4200 | | 08/10/27 | | | 192,239 | |
| | 87,189 | | | Carvana Auto Receivables Trust Series 2021-N1 C | | | | 1.3000 | | 01/10/28 | | | 81,462 | |
| | 105,708 | | | Carvana Auto Receivables Trust Series 2021-N2 C | | | | 1.0700 | | 03/10/28 | | | 97,601 | |
| | 225,000 | | | CPS Auto Receivables Trust Series 2019-D E(a) | | | | 3.8600 | | 10/15/25 | | | 219,917 | |
| | 47,581 | | | Credito Real USA Auto Receivables Trust Series 2021-1A A(a) | | | | 1.3500 | | 02/16/27 | | | 46,815 | |
| | 529,000 | | | DT Auto Owner Trust Series 2023-1A B(a) | | | | 5.1900 | | 10/16/28 | | | 525,718 | |
| | 310,000 | | | FHF Trust Series 2023-1A A2(a) | | | | 6.5700 | | 06/15/28 | | | 310,363 | |
| | 180,000 | | | Flagship Credit Auto Trust Series 2020-4 C(a) | | | | 1.2800 | | 02/16/27 | | | 172,578 | |
| | 180,000 | | | Foursight Capital Automobile Receivables Trust Series 2022-1 B(a) | | | | 2.1500 | | 05/17/27 | | | 170,103 | |
| | 315,000 | | | Foursight Capital Automobile Receivables Trust Series 2023-1 A3(a) | | | | 5.3900 | | 12/15/27 | | | 314,668 | |
| | 432,000 | | | GLS Auto Receivables Issuer Trust Series 2019-4A D(a) | | | | 4.0900 | | 08/17/26 | | | 421,139 | |
| | 345,000 | | | Hertz Vehicle Financing III, LLC Series 2022-1A C(a) | | | | 2.6300 | | 06/25/26 | | | 317,465 | |
| | 373,824 | | | LAD Auto Receivables Trust Series 2022-1A A(a) | | | | 5.2100 | | 06/15/27 | | | 371,196 | |
| | 149,508 | | | Lendbuzz Securitization Trust Series 2022-1A A(a) | | | | 4.2200 | | 05/17/27 | | | 144,319 | |
| | 140,000 | | | OneMain Direct Auto Receivables Trust Series 2021-1A B(a) | | | | 1.2600 | | 07/14/28 | | | 126,061 | |
| | 921,010 | | | Santander Drive Auto Receivables Trust Series 2020-2 D | | | | 2.2200 | | 09/15/26 | | | 904,561 | |
| | 275,000 | | | Santander Drive Auto Receivables Trust Series 2021-3 C | | | | 0.9500 | | 09/15/27 | | | 268,286 | |
| | 195,000 | | | Santander Drive Auto Receivables Trust Series 2022-5 C | | | | 4.7400 | | 10/15/28 | | | 191,704 | |
| | 422,000 | | | United Auto Credit Securitization Trust Series 2023-1 B(a) | | | | 5.9100 | | 07/10/28 | | | 418,601 | |
| | 146,000 | | | Veros Auto Receivables Trust Series 2022-1 B(a) | | | | 4.3900 | | 08/16/27 | | | 141,648 | |
| | 151,957 | | | Westlake Automobile Receivables Trust Series 2020-3A C(a) | | | | 1.2400 | | 11/17/25 | | | 149,567 | |
| | 345,000 | | | Westlake Automobile Receivables Trust Series 2022-1A B(a) | | | | 2.7500 | | 03/15/27 | | | 334,940 | |
| | 415,000 | | | Westlake Automobile Receivables Trust Series 2023-1A C(a) | | | | 5.7400 | | 08/15/28 | | | 416,365 | |
| | | | | | | | | | | | | | 8,082,641 | |
| | | | | CLO — 0.3% | | | | | | | | | | |
| | 350,000 | | | GoldentTree Loan Management US CLO 1 Ltd. Series 2021-9A A(a),(b) | | US0003M + 1.070% | | 6.3200 | | 01/20/33 | | | 345,609 | |
| | | | | | | | | | | | | | | |
See accompanying notes which are an integral part of these financial statements.
| DUNHAM CORPORATE/GOVERNMENT BOND FUND |
| SCHEDULE OF INVESTMENTS (Unaudited) (Continued) |
| April 30, 2023 |
| Principal | | | | | | | Coupon Rate | | | | | |
| Amount ($) | | | | | Spread | | (%) | | Maturity | | Fair Value | |
| | | | | ASSET BACKED SECURITIES — 31.2% (Continued) | | | | | | |
| | | | | COLLATERALIZED MORTGAGE OBLIGATIONS — 11.1% | | | | | | |
| | 813,533 | | | AJAX Mortgage Loan Trust Series 2021-A A1(a),(c) | | | | 1.0650 | | 09/25/65 | | $ | 706,930 | |
| | 102,890 | | | Angel Oak Mortgage Trust Series 2020-R1 A2(a),(c) | | | | 1.2470 | | 12/26/24 | | | 93,466 | |
| | 68,412 | | | Angel Oak Mortgage Trust Series 2021-8 A1(a),(c) | | | | 1.8200 | | 11/25/66 | | | 58,616 | |
| | 300,000 | | | Arm Master Trust, LLC Series 2023-T1 A(a) | | | | 6.5620 | | 02/17/25 | | | 299,998 | |
| | 93,054 | | | Arroyo Mortgage Trust Series 2019-1 A1(a),(c) | | | | 3.8050 | | 01/25/49 | | | 88,069 | |
| | 100,158 | | | Arroyo Mortgage Trust Series 2019-2 A1(a),(c) | | | | 3.3470 | | 04/25/49 | | | 94,706 | |
| | 303,111 | | | Bunker Hill Loan Depositary Trust Series 2019-2 A1(a),(d) | | | | 2.8790 | | 07/25/49 | | | 285,927 | |
| | 35,966 | | | Chase Mortgage Finance Corporation Series 2016-SH2 M2(a),(c) | | | | 3.7500 | | 02/25/44 | | | 32,034 | |
| | 47,145 | | | Chase Mortgage Finance Corporation Series 2016-SH1 M2(a),(c) | | | | 3.7500 | | 04/25/45 | | | 40,410 | |
| | 393,960 | | | CIM TRUST Series 2022-R2 A1(a),(c) | | | | 3.7500 | | 12/25/61 | | | 372,070 | |
| | 69,615 | | | COLT Funding, LLC Series 2021-3R A1(a),(c) | | | | 1.0510 | | 12/25/64 | | | 60,163 | |
| | 1,533,694 | | | COLT Mortgage Loan Trust Series 2022-4 A1(a),(c) | | | | 4.3010 | | 03/25/67 | | | 1,493,146 | |
| | 309,774 | | | COLT Mortgage Loan Trust Series 2022-5 A1(a),(c) | | | | 4.5500 | | 04/25/67 | | | 303,848 | |
| | 64,162 | | | CSMC Series 2021-NQM1 A1(a),(c) | | | | 0.8090 | | 05/25/65 | | | 54,753 | |
| | 144,695 | | | CSMC Trust Series 2020-RPL4 A1(a),(c) | | | | 2.0000 | | 01/25/60 | | | 127,881 | |
| | 23,542 | | | CSMC Trust Series 2020-NQM1 A1(a),(d) | | | | 1.2080 | | 05/25/65 | | | 21,419 | |
| | 370,696 | | | Ellington Financial Mortgage Trust Series 2019-2 A3(a),(c) | | | | 3.0460 | | 11/25/59 | | | 344,953 | |
| | 22,733 | | | Flagstar Mortgage Trust Series 2017-1 1A3(a),(c) | | | | 3.5000 | | 03/25/47 | | | 20,850 | |
| | 10,396 | | | Galton Funding Mortgage Trust Series 2018-1 A23(a),(c) | | | | 3.5000 | | 11/25/57 | | | 9,514 | |
| | 30,633 | | | JP Morgan Mortgage Trust Series 2017-5 A1(a),(c) | | | | 3.3000 | | 12/15/47 | | | 29,803 | |
| | 1,010,015 | | | JP Morgan Mortgage Trust Series 2017-4 A3(a),(c) | | | | 3.5000 | | 11/25/48 | | | 940,850 | |
| | 186,919 | | | LHOME Mortgage Trust Series 2021-RTL1 A1(a),(c) | | | | 2.0900 | | 09/25/26 | | | 183,377 | |
| | 100,000 | | | METLIFE S.E.CURITIZATION TRUST Series 2017-1A M1(a),(c) | | | | 3.4390 | | 04/25/55 | | | 90,792 | |
| | 36,803 | | | METLIFE S.E.CURITIZATION TRUST Series 2019-1A A1A(a),(c) | | | | 3.7500 | | 04/25/58 | | | 35,801 | |
| | 1,345,370 | | | MFA Trust Series 2022-INV1 A1(a),(d) | | | | 3.9070 | | 04/25/66 | | | 1,287,572 | |
| | 756,591 | | | MFA Trust Series 2022-NQM2 A1(a),(d) | | | | 4.0000 | | 05/25/67 | | | 727,332 | |
| | 199,632 | | | Mill City Mortgage Loan Trust Series 2019-1 M2(a),(c) | | | | 3.5000 | | 10/25/69 | | | 177,395 | |
| | 170,000 | | | New Residential Mortgage Loan Trust Series 2022-RTL1 A1F(a) | | | | 4.3360 | | 12/25/26 | | | 164,260 | |
| | 155,420 | | | New Residential Mortgage Loan Trust Series 2014-3A AFX3(a),(c) | | | | 3.7500 | | 11/25/54 | | | 143,577 | |
| | 155,550 | | | New Residential Mortgage Loan Trust Series 2016-3A B1(a),(c) | | | | 4.0000 | | 09/25/56 | | | 143,982 | |
| | 39,532 | | | New Residential Mortgage Loan Trust Series 2016-4A A1(a),(c) | | | | 3.7500 | | 11/25/56 | | | 36,878 | |
| | 307,142 | | | New Residential Mortgage Loan Trust Series 2017-2A A3(a),(c) | | | | 4.0000 | | 03/25/57 | | | 292,853 | |
| | 82,289 | | | New Residential Mortgage Loan Trust Series 2018-1A A1A(a),(c) | | | | 4.0000 | | 12/25/57 | | | 78,589 | |
| | 48,391 | | | New Residential Mortgage Loan Trust Series 2021-NQ2R A1(a),(c) | | | | 0.9410 | | 09/25/58 | | | 43,761 | |
| | | | | | | | | | | | | | | |
See accompanying notes which are an integral part of these financial statements.
| DUNHAM CORPORATE/GOVERNMENT BOND FUND |
| SCHEDULE OF INVESTMENTS (Unaudited) (Continued) |
| April 30, 2023 |
| Principal | | | | | | | Coupon Rate | | | | | |
| Amount ($) | | | | | Spread | | (%) | | Maturity | | Fair Value | |
| | | | | ASSET BACKED SECURITIES — 31.2% (Continued) | | | | | | |
| | | | | COLLATERALIZED MORTGAGE OBLIGATIONS — 11.1% (Continued) | | | | | | |
| | 215,000 | | | New Residential Mortgage Loan Trust Series 2019-RPL2 M2(a),(c) | | | | 3.7500 | | 02/25/59 | | $ | 188,767 | |
| | 388,885 | | | New Residential Mortgage Loan Trust Series 2020-1A A1B(a),(c) | | | | 3.5000 | | 10/25/59 | | | 361,809 | |
| | 13,000 | | | OBX Trust Series 2019-INV1 A3(a),(c) | | | | 4.5000 | | 11/25/48 | | | 12,637 | |
| | 135,000 | | | Palisades Mortgage Loan Trust Series 2021-RTL1 A1(a),(d) | | | | 2.8570 | | 06/25/26 | | | 129,513 | |
| | 177,325 | | | PRET, LLC Series 2021-RN3 A1(a),(d) | | | | 1.8430 | | 09/25/51 | | | 162,827 | |
| | 31,216 | | | Provident Funding Mortgage Loan Trust Series 2019-1 A2(a),(c) | | | | 3.0000 | | 12/25/49 | | | 27,276 | |
| | 159,990 | | | PRPM, LLC Series 2021-2 A1(a),(c) | | | | 2.1150 | | 03/25/26 | | | 152,387 | |
| | 57,444 | | | RCKT Mortgage Trust Series 2020-1 A1(a),(c) | | | | 3.0000 | | 02/25/50 | | | 50,084 | |
| | 60,341 | | | Residential Mortgage Loan Trust Series 2020-1 A1(a),(c) | | | | 2.3760 | | 02/25/24 | | | 57,614 | |
| | 8,788 | | | Residential Mortgage Loan Trust Series 2019-2 A1(a),(c) | | | | 2.9130 | | 05/25/59 | | | 8,642 | |
| | 162,248 | | | SG Residential Mortgage Trust Series 2021-1 A3(a),(c) | | | | 1.5600 | | 07/25/61 | | | 129,105 | |
| | 71,963 | | | Starwood Mortgage Residential Trust Series 2020-1 A1(a),(c) | | | | 2.2750 | | 02/25/50 | | | 68,599 | |
| | 22,613 | | | Starwood Mortgage Residential Trust Series 2020-3 A1(a),(c) | | | | 1.4860 | | 04/25/65 | | | 21,296 | |
| | 725,000 | | | Towd Point Mortgage Trust Series 2017-1 A2(a),(c) | | | | 3.5000 | | 10/25/56 | | | 699,066 | |
| | 265,000 | | | Towd Point Mortgage Trust Series 2019-HY2 M1(a),(b) | | US0001M + 1.600% | | 6.6200 | | 05/25/58 | | | 259,047 | |
| | 365,000 | | | Towd Point Mortgage Trust Series 2021-1 A2(a),(c) | | | | 2.7500 | | 11/25/61 | | | 299,449 | |
| | 134,499 | | | Verus Securitization Trust Series 2019-INV2 A1(a),(c) | | | | 2.9130 | | 07/25/59 | | | 130,420 | |
| | 100,000 | | | Verus Securitization Trust Series 2019-4 M1(a),(c) | | | | 3.2070 | | 11/25/59 | | | 89,968 | |
| | 23,885 | | | Verus Securitization Trust Series 2020-1 A1(a),(d) | | | | 2.4170 | | 01/25/60 | | | 22,622 | |
| | 44,337 | | | Verus Securitization Trust Series 2021-2 A1(a),(c) | | | | 1.0310 | | 02/25/66 | | | 38,261 | |
| | 1,820,000 | | | Verus Securitization Trust Series 2023-1 A1(a),(d) | | | | 5.8500 | | 12/25/67 | | | 1,821,090 | |
| | 162,711 | | | Wells Fargo Mortgage Backed Securities Series 2020-4 A1(a),(c) | | | | 3.0000 | | 07/25/50 | | | 142,049 | |
| | | | | | | | | | | | | | 13,758,103 | |
| | | | | CREDIT CARD — 0.3% | | | | | | | | | | |
| | 316,000 | | | Mercury Financial Credit Card Master Trust Series 2023-1A A(a) | | | | 8.0400 | | 09/20/27 | | | 317,308 | |
| | | | | | | | | | | | | | | |
| | | | | NON AGENCY CMBS — 2.6% | | | | | | | | | | |
| | 134,767 | | | Angel Oak SB Commercial Mortgage Trust Series 2020-SBC1 A1(a),(c) | | | | 2.0680 | | 05/25/50 | | | 128,599 | |
| | 310,000 | | | Benchmark Mortgage Trust Series 2023-B38 A2 | | | | 5.6260 | | 04/15/56 | | | 314,110 | |
| | 90,000 | | | BPR Trust Series 2021-KEN A(a),(b) | | TSFR1M + 1.364% | | 6.2540 | | 02/15/29 | | | 87,903 | |
| | 385,000 | | | BPR Trust Series 2022-OANA A(a),(b) | | TSFR1M + 1.898% | | 6.7880 | | 04/15/37 | | | 375,697 | |
| | 160,000 | | | BX Trust Series 2019-OC11 B(a) | | | | 3.6050 | | 12/09/41 | | | 139,619 | |
| | 130,000 | | | BX Trust Series 2019-OC11 D(a),(c) | | | | 4.0750 | | 12/09/41 | | | 110,401 | |
| | 233,239 | | | CHC Commercial Mortgage Trust Series 2019-CHC A(a),(b) | | US0001M + 1.120% | | 6.0680 | | 06/15/34 | | | 230,430 | |
| | | | | | | | | | | | | | | |
See accompanying notes which are an integral part of these financial statements.
| DUNHAM CORPORATE/GOVERNMENT BOND FUND |
| SCHEDULE OF INVESTMENTS (Unaudited) (Continued) |
| April 30, 2023 |
| Principal | | | | | | | Coupon Rate | | | | | |
| Amount ($) | | | | | Spread | | (%) | | Maturity | | Fair Value | |
| | | | | ASSET BACKED SECURITIES — 31.2% (Continued) | | | | | | |
| | | | | NON AGENCY CMBS — 2.6% (Continued) | | | | | | |
| | 150,000 | | | COMM Mortgage Trust Series 2020-CBM B(a) | | | | 3.0990 | | 02/10/37 | | $ | 139,424 | |
| | 548,635 | | | CSMC Series 2019-ICE4 A(a),(b) | | US0001M + 0.980% | | 5.9280 | | 05/15/36 | | | 544,652 | |
| | 305,000 | | | GCT Commercial Mortgage Trust Series 2021-GCT A(a),(b) | | US0001M + 0.800% | | 5.7480 | | 02/15/38 | | | 265,593 | |
| | 185,000 | | | Hilton USA Trust Series 2016-SFP B(a) | | | | 3.3230 | | 11/05/35 | | | 170,333 | |
| | 382,500 | | | KKR Industrial Portfolio Trust Series 2021-KDIP C(a),(b) | | TSFR1M + 1.114% | | 6.0040 | | 12/15/37 | | | 367,726 | |
| | 261,000 | | | UBS-Barclays Commercial Mortgage Trust Series 2013-C6 B(a),(c) | | | | 3.8750 | | 04/10/46 | | | 259,828 | |
| | 62,000 | | | WFRBS Commercial Mortgage Trust Series 2014-C24 AS | | | | 3.9310 | | 11/15/47 | | | 59,271 | |
| | | | | | | | | | | | | | 3,193,586 | |
| | | | | OTHER ABS — 8.7% | | | | | | | | | | |
| | 218,130 | | | ACHV A.B.S TRUST Series 2023-1PL A(a) | | | | 6.4200 | | 03/18/30 | | | 218,334 | |
| | 1,568,591 | | | American Homes 4 Rent 2015-SFR1 Series 2015-SFR1 A(a) | | | | 3.4670 | | 04/17/52 | | | 1,517,234 | |
| | 230,000 | | | American Homes 4 Rent Trust Series 2014-SFR2 C(a) | | | | 4.7050 | | 10/17/36 | | | 226,191 | |
| | 220,000 | | | American Homes 4 Rent Trust Series 2015-SFR2 C(a) | | | | 4.6910 | | 10/17/45 | | | 215,365 | |
| | 175,000 | | | AMSR Trust Series 2020-SFR1 B(a) | | | | 2.1200 | | 04/17/37 | | | 163,115 | |
| | 250,000 | | | AMSR Trust Series 2020-SFR2 C(a) | | | | 2.5330 | | 07/17/37 | | | 233,926 | |
| | 100,000 | | | AMSR Trust Series 2020-SFR2 D(a) | | | | 3.2820 | | 07/17/37 | | | 93,394 | |
| | 384,303 | | | Aqua Finance Trust Series 2017-A A(a) | | | | 3.7200 | | 11/15/35 | | | 379,657 | |
| | 65,897 | | | Aqua Finance Trust Series 2019-A A(a) | | | | 3.1400 | | 07/16/40 | | | 62,347 | |
| | 255,080 | | | Aqua Finance Trust Series 2019-A C(a) | | | | 4.0100 | | 07/16/40 | | | 226,622 | |
| | 270,000 | | | Aqua Finance Trust Series 2020-AA B(a) | | | | 2.7900 | | 07/17/46 | | | 237,596 | |
| | 193,653 | | | BHG Securitization Trust Series 2021-1A A(a) | | | | 1.4200 | | 11/17/33 | | | 181,250 | |
| | 70,669 | | | CCG Receivables Trust Series 2019-2 B(a) | | | | 2.5500 | | 03/15/27 | | | 70,586 | |
| | 220,000 | | | CCG Receivables Trust Series 2021-1 C(a) | | | | 0.8400 | | 06/14/27 | | | 206,318 | |
| | 103,437 | | | CF Hippolyta, LLC Series 2020-1 A1(a) | | | | 1.6900 | | 07/15/60 | | | 93,895 | |
| | 329,963 | | | CLI Funding VI, LLC Series 2020-1A A(a) | | | | 2.0800 | | 09/18/45 | | | 292,727 | |
| | 73,972 | | | Conn’s Receivables Funding, LLC Series 2021-A B(a) | | | | 2.8700 | | 05/15/26 | | | 73,343 | |
| | 57,885 | | | Corevest American Finance Trust Series 2020-1 A1(a) | | | | 1.8320 | | 03/15/50 | | | 54,935 | |
| | 100,000 | | | Corevest American Finance Trust Series 2019-3 C(a) | | | | 3.2650 | | 10/15/52 | | | 84,790 | |
| | 177,949 | | | Corevest American Finance Trust Series 2020-4 A(a) | | | | 1.1740 | | 12/15/52 | | | 161,159 | |
| | 240,000 | | | Dext A.B.S, LLC Series 2020-1 B(a) | | | | 1.9200 | | 11/15/27 | | | 233,324 | |
| | 429,000 | | | Dext A.B.S, LLC Series 2023-1 A2(a) | | | | 5.9900 | | 03/15/32 | | | 429,140 | |
| | 285,000 | | | FirstKey Homes Trust Series 2021-SFR1 D(a) | | | | 2.1890 | | 08/17/28 | | | 247,296 | |
| | 375,000 | | | FirstKey Homes Trust Series 2020-SFR2 B(a) | | | | 1.5670 | | 10/19/37 | | | 340,079 | |
| | 228,448 | | | Foundation Finance Trust Series 2019-1A A(a) | | | | 3.8600 | | 11/15/34 | | | 224,467 | |
| | | | | | | | | | | | | | | |
See accompanying notes which are an integral part of these financial statements.
| DUNHAM CORPORATE/GOVERNMENT BOND FUND |
| SCHEDULE OF INVESTMENTS (Unaudited) (Continued) |
| April 30, 2023 |
| Principal | | | | | | | Coupon Rate | | | | | |
| Amount ($) | | | | | Spread | | (%) | | Maturity | | Fair Value | |
| | | | | ASSET BACKED SECURITIES — 31.2% (Continued) | | | | | | |
| | | | | OTHER ABS — 8.7% (Continued) | | | | | | |
| | 85,633 | | | HIN Timeshare Trust Series 2020-A C(a) | | | | 3.4200 | | 10/09/39 | | $ | 79,402 | |
| | 129,025 | | | Jersey Mike’s Funding Series 2019-1A A2(a) | | | | 4.4330 | | 02/15/50 | | | 121,069 | |
| | 1,080,000 | | | Kubota Credit Owner Trust Series 2023-1A A2(a) | | | | 5.4000 | | 02/17/26 | | | 1,079,511 | |
| | 57,994 | | | MVW, LLC Series 2020-1A A(a) | | | | 1.7400 | | 10/20/37 | | | 53,365 | |
| | 370,000 | | | MVW, LLC Series 2023-1A B(a) | | | | 5.4200 | | 10/20/40 | | | 368,676 | |
| | 12,037 | | | Octane Receivables Trust Series 2020-1A A(a) | | | | 1.7100 | | 02/20/25 | | | 11,962 | |
| | 265,000 | | | Octane Receivables Trust Series 2023-1A C(a) | | | | 6.3700 | | 09/20/29 | | | 267,141 | |
| | 81,485 | | | Oportun Funding, LLC Series 2022-1 A(a) | | | | 3.2500 | | 06/15/29 | | | 79,936 | |
| | 38,352 | | | Orange Lake Timeshare Trust Series 2019-A B(a) | | | | 3.3600 | | 04/09/38 | | | 36,495 | |
| | 265,000 | | | Progress Residential Series 2021-SFR3 D(a) | | | | 2.2880 | | 05/17/26 | | | 234,456 | |
| | 201,000 | | | Progress Residential Series 2021-SFR1 C(a) | | | | 1.5550 | | 04/17/38 | | | 177,334 | |
| | 577,415 | | | Progress Residential Trust Series 2020-SFR1 A(a) | | | | 1.7320 | | 04/17/37 | | | 538,884 | |
| | 550,000 | | | Progress Residential Trust Series 2020-SFR2 E(a) | | | | 5.1150 | | 06/17/37 | | | 522,752 | |
| | 275,000 | | | Purchasing Power Funding, LLC Series 2021-A A(a) | | | | 1.5700 | | 10/15/25 | | | 269,958 | |
| | 265,000 | | | Regional Management Issuance Trust Series 2021-1 A(a) | | | | 1.6800 | | 03/17/31 | | | 247,062 | |
| | 47,758 | | | Sierra Timeshare Receivables Funding, LLC Series 2020-2A B(a) | | | | 2.3200 | | 07/20/37 | | | 44,944 | |
| | 84,825 | | | Taco Bell Funding, LLC Series 2016-1A A23(a) | | | | 4.9700 | | 05/25/46 | | | 83,434 | |
| | 200,000 | | | Tricon American Homes Trust Series 2020-SFR2 D(a) | | | | 2.2810 | | 11/17/27 | | | 169,164 | |
| | 165,000 | | | Tricon American Homes Trust Series 2019-SFR1 C(a) | | | | 3.1490 | | 03/17/38 | | | 154,016 | |
| | 160,000 | | | Tricon Residential Trust Series 2021-SFR1 B(a) | | | | 2.2440 | | 07/17/38 | | | 144,442 | |
| | | | | | | | | | | | | | 10,951,093 | |
| | | | | RESIDENTIAL MORTGAGE — 1.7% | | | | | | | | | | |
| | 83,607 | | | Ajax Mortgage Loan Trust Series 2019-D A1(a),(d) | | | | 2.9560 | | 09/25/65 | | | 78,912 | |
| | 138,127 | | | Pretium Mortgage Credit Partners, LLC Series 2021-NPL1 A1(a),(d) | | | | 2.2390 | | 09/27/60 | | | 132,125 | |
| | 135,000 | | | Towd Point Mortgage Trust Series 2016-4 B1(a),(c) | | | | 3.9310 | | 07/25/56 | | | 126,650 | |
| | 115,000 | | | Towd Point Mortgage Trust Series 2017-1 M1(a),(c) | | | | 3.7500 | | 10/25/56 | | | 109,184 | |
| | 460,000 | | | Towd Point Mortgage Trust Series 2017-4 A2(a),(c) | | | | 3.0000 | | 06/25/57 | | | 417,727 | |
| | 160,000 | | | Towd Point Mortgage Trust Series 2017-6 A2(a),(c) | | | | 3.0000 | | 10/25/57 | | | 148,007 | |
| | 140,000 | | | Towd Point Mortgage Trust Series 2018-6 A1B(a),(c) | | | | 3.7500 | | 03/25/58 | | | 131,126 | |
| | 300,000 | | | Towd Point Mortgage Trust Series 2018-6 A2(a),(c) | | | | 3.7500 | | 03/25/58 | | | 269,072 | |
| | 255,000 | | | Towd Point Mortgage Trust Series 2019-2 A2(a),(c) | | | | 3.7500 | | 12/25/58 | | | 231,742 | |
| | 235,000 | | | Towd Point Mortgage Trust Series 2019-4 A2(a),(c) | | | | 3.2500 | | 10/25/59 | | | 211,038 | |
| | 100,000 | | | Towd Point Mortgage Trust Series 2020-1 M1(a),(c) | | | | 3.5000 | | 01/25/60 | | | 83,391 | |
| | 88,932 | | | VCAT Asset Securitization, LLC Series 2021-NPL3 A1(a),(d) | | | | 1.7430 | | 05/25/51 | | | 83,318 | |
| | | | | | | | | | | | | | | |
See accompanying notes which are an integral part of these financial statements.
| DUNHAM CORPORATE/GOVERNMENT BOND FUND |
| SCHEDULE OF INVESTMENTS (Unaudited) (Continued) |
| April 30, 2023 |
| Principal | | | | | | | Coupon Rate | | | | | |
| Amount ($) | | | | | Spread | | (%) | | Maturity | | Fair Value | |
| | | | | ASSET BACKED SECURITIES — 31.2% (Continued) | | | | | | |
| | | | | RESIDENTIAL MORTGAGE — 1.7% (Continued) | | | | | | |
| | 51,474 | | | VCAT,LLC Series 2021-NPL2A1 (a),(d) | | | | 2.1150 | | 03/27/51 | | $ | 49,140 | |
| | | | | | | | | | | | | | 2,071,432 | |
| | | | | STUDENT LOANS — 0.0% (e) | | | | | | | | | | |
| | 63,950 | | | Common bond Student Loan Trust Series 2020-1 A(a) | | | | 1.6900 | | 10/25/51 | | | 57,261 | |
| | | | | | | | | | | | | | | |
| | | | | TOTAL ASSET BACKED SECURITIES (Cost $40,223,248) | | | | | 38,777,033 | |
| | | | | | | | | | | | | | | |
| | | | | CORPORATE BONDS — 33.3% | | | | | | | | | | |
| | | | | AEROSPACE & DEFENSE — 0.6% | | | | | | | | | | |
| | 303,000 | | | Boeing Company (The) | | | | 5.9300 | | 05/01/60 | | | 299,273 | |
| | 456,000 | | | Huntington Ingalls Industries, Inc. | | | | 2.0430 | | 08/16/28 | | | 389,022 | |
| | 85,000 | | | TransDigm, Inc. | | | | 5.5000 | | 11/15/27 | | | 81,714 | |
| | | | | | | | | | | | | | 770,009 | |
| | | | | ASSET MANAGEMENT — 1.1% | | | | | | | | | | |
| | 157,000 | | | Blackstone Private Credit Fund | | | | 2.6250 | | 12/15/26 | | | 133,749 | |
| | 200,000 | | | Blue Owl Finance, LLC(a) | | | | 3.1250 | | 06/10/31 | | | 150,777 | |
| | 305,000 | | | Charles Schwab Corporation (The)(b) | | H15T10Y + 3.079% | | 4.0000 | | 03/01/69 | | | 234,850 | |
| | 320,000 | | | Citadel, L.P.(a) | | | | 4.8750 | | 01/15/27 | | | 306,726 | |
| | 250,000 | | | Drawbridge Special Opportunities Fund, L.P. /(a) | | | | 3.8750 | | 02/15/26 | | | 222,633 | |
| | 220,000 | | | Icahn Enterprises, L.P. / Icahn Enterprises | | | | 5.2500 | | 05/15/27 | | | 207,664 | |
| | 128,000 | | | OWL Rock Core Income Corporation | | | | 4.7000 | | 02/08/27 | | | 116,919 | |
| | | | | | | | | | | | | | 1,373,318 | |
| | | | | AUTOMOTIVE — 0.3% | | | | | | | | | | |
| | 25,000 | | | Clarios Global, L.P. / Clarios US Finance Company(a) | | | | 6.7500 | | 05/15/28 | | | 25,126 | |
| | 106,000 | | | Ford Motor Company | | | | 3.2500 | | 02/12/32 | | | 82,032 | |
| | 70,000 | | | Ford Motor Company | | | | 4.7500 | | 01/15/43 | | | 52,670 | |
| | 200,000 | | | Ford Motor Credit Company, LLC | | | | 6.8000 | | 05/12/28 | | | 200,370 | |
| | 13,000 | | | General Motors Financial Company, Inc. | | | | 5.8500 | | 04/06/30 | | | 12,985 | |
| | | | | | | | | | | | | | 373,183 | |
| | | | | BANKING — 5.0% | | | | | | | | | | |
| | 200,000 | | | Banco Mercantil del Norte S.A.(a),(b) | | H15T10Y + 5.034% | | 6.6250 | | Perpetual | | | 162,200 | |
| | 1,200,000 | | | Bank of America Corporation(b) | | SOFRRATE + 1.320% | | 2.6870 | | 04/22/32 | | | 1,002,751 | |
| | | | | | | | | | | | | | | |
See accompanying notes which are an integral part of these financial statements.
| DUNHAM CORPORATE/GOVERNMENT BOND FUND |
| SCHEDULE OF INVESTMENTS (Unaudited) (Continued) |
| April 30, 2023 |
| Principal | | | | | | | Coupon Rate | | | | | |
| Amount ($) | | | | | Spread | | (%) | | Maturity | | Fair Value | |
| | | | | CORPORATE BONDS — 33.3% (Continued) | | | | | | |
| | | | | BANKING — 5.0% (Continued) | | | | | | |
| | 390,000 | | | Bank of America Corporation(b) | | H15T5Y + 1.200% | | 2.4820 | | 09/21/36 | | $ | 297,797 | |
| | 400,000 | | | Barclays plc(b),(f) | | H15T1Y + 3.500% | | 7.4370 | | 11/02/33 | | | 440,298 | |
| | 200,000 | | | BBVA Bancomer S.A.(a),(b) | | H15T5Y + 2.650% | | 5.1250 | | 01/18/33 | | | 176,670 | |
| | 113,000 | | | Citigroup, Inc.(b) | | SOFRRATE + 1.280% | | 6.0070 | | 02/24/28 | | | 112,846 | |
| | 325,000 | | | Citigroup, Inc.(b) | | US0003M + 1.338% | | 3.9800 | | 03/20/30 | | | 304,491 | |
| | 460,000 | | | Citigroup, Inc.(b) | | SOFRRATE + 2.338% | | 6.2700 | | 11/17/33 | | | 497,521 | |
| | 250,000 | | | Citizens Bank NA | | | | 2.2500 | | 04/28/25 | | | 228,449 | |
| | 250,000 | | | Fifth Third Bancorp(b) | | SOFRRATE + 1.660% | | 4.3370 | | 04/25/33 | | | 225,305 | |
| | 280,000 | | | Huntington Bancshares, Inc. | | | | 2.5500 | | 02/04/30 | | | 227,803 | |
| | 175,000 | | | JPMorgan Chase & Company(b),(f) | | SOFRRATE + 1.180% | | 5.8960 | | 02/24/28 | | | 175,286 | |
| | 710,000 | | | JPMorgan Chase & Company(b) | | SOFRRATE + 1.065% | | 1.9530 | | 02/04/32 | | | 571,741 | |
| | 420,000 | | | JPMorgan Chase & Company(b) | | SOFRRATE + 2.580% | | 5.7170 | | 09/14/33 | | | 433,228 | |
| | 82,000 | | | JPMorgan Chase & Company Series HH(b) | | SOFRRATE + 3.125% | | 4.6000 | | Perpetual | | | 76,260 | |
| | 200,000 | | | Texas Capital Bancshares, Inc.(b) | | H15T5Y + 3.150% | | 4.0000 | | 05/06/31 | | | 161,578 | |
| | 285,000 | | | Toronto-Dominion Bank (The)(b) | | H15T5Y + 4.075% | | 8.1250 | | 10/31/82 | | | 290,994 | |
| | 285,000 | | | Truist Financial Corporation(b) | | H15T10Y + 4.349% | | 5.1000 | | 03/01/69 | | | 252,813 | |
| | 280,000 | | | Wells Fargo & Company(b) | | SOFRRATE + 2.100% | | 4.8970 | | 07/25/33 | | | 273,557 | |
| | 545,000 | | | Wells Fargo & Company(b) | | H15T5Y + 3.453% | | 3.9000 | | Perpetual | | | 474,596 | |
| | | | | | | | | | | | | | 6,386,184 | |
| | | | | BEVERAGES — 0.7% | | | | | | | | | | |
| | 445,000 | | | Anheuser-Busch Companies, LLC / Anheuser-Busch | | | | 4.9000 | | 02/01/46 | | | 438,667 | |
| | 335,000 | | | Bacardi Ltd.(a) | | | | 4.7000 | | 05/15/28 | | | 330,291 | |
| | 75,000 | | | Central American Bottling Corp / CBC Bottling(a) | | | | 5.2500 | | 04/27/29 | | | 70,007 | |
| | | | | | | | | | | | | | 838,965 | |
| | | | | BIOTECH & PHARMA — 0.8% | | | | | | | | | | |
| | 123,000 | | | Amgen, Inc.(f) | | | | 5.2500 | | 03/02/33 | | | 126,394 | |
| | 93,000 | | | Amgen, Inc. | | | | 5.6500 | | 03/02/53 | | | 96,348 | |
| | 40,000 | | | Bausch Health Companies, Inc.(a) | | | | 5.7500 | | 08/15/27 | | | 27,649 | |
| | 200,000 | | | Cheplapharm Arzneimittel GmbH(a) | | | | 5.5000 | | 01/15/28 | | | 182,951 | |
| | 265,000 | | | Mylan N.V. | | | | 3.9500 | | 06/15/26 | | | 253,359 | |
| | | | | | | | | | | | | | | |
See accompanying notes which are an integral part of these financial statements.
| DUNHAM CORPORATE/GOVERNMENT BOND FUND |
| SCHEDULE OF INVESTMENTS (Unaudited) (Continued) |
| April 30, 2023 |
| Principal | | | | | | | Coupon Rate | | | | | |
| Amount ($) | | | | | Spread | | (%) | | Maturity | | Fair Value | |
| | | | | CORPORATE BONDS — 33.3% (Continued) | | | | | | | | | | |
| | | | | BIOTECH & PHARMA — 0.8% (Continued) | | | | | | | | | | |
| | 45,000 | | | Par Pharmaceutical, Inc.(a) | | | | 7.5000 | | 04/01/27 | | $ | 32,020 | |
| | 120,000 | | | Teva Pharmaceutical Finance Netherlands III BV(f) | | | | 3.1500 | | 10/01/26 | | | 108,642 | |
| | 681 | | | Viatris, Inc.(a) | | | | 2.3000 | | 06/22/27 | | | 600 | |
| | 150,000 | | | Viatris, Inc. | | | | 2.3000 | | 06/22/27 | | | 132,122 | |
| | | | | | | | | | | | | | 960,085 | |
| | | | | CABLE & SATELLITE — 0.2% | | | | | | | | | | |
| | 14,000 | | | CCO Holdings, LLC / CCO Holdings Capital(a),(f) | | | | 6.3750 | | 09/01/29 | | | 13,319 | |
| | 180,000 | | | CCO Holdings, LLC / CCO Holdings Capital(a) | | | | 4.7500 | | 03/01/30 | | | 155,479 | |
| | 45,000 | | | CCO Holdings, LLC / CCO Holdings Capital(a),(f) | | | | 4.5000 | | 08/15/30 | | | 37,833 | |
| | | | | | | | | | | | | | 206,631 | |
| | | | | CHEMICALS — 0.4% | | | | | | | | | | |
| | 80,000 | | | Avient Corporation(a) | | | | 7.1250 | | 08/01/30 | | | 81,859 | |
| | 235,000 | | | Bayport Polymers, LLC(a) | | | | 5.1400 | | 04/14/32 | | | 220,361 | |
| | 70,000 | | | International Flavors & Fragrances, Inc.(a) | | | | 3.4680 | | 12/01/50 | | | 48,082 | |
| | 190,000 | | | Nutrition & Biosciences, Inc.(a) | | | | 2.3000 | | 11/01/30 | | | 154,309 | |
| | | | | | | | | | | | | | 504,611 | |
| | | | | COMMERCIAL SUPPORT SERVICES — 0.0%(e) | | | | | | | | | | |
| | 50,000 | | | Aramark Services, Inc.(a) | | | | 6.3750 | | 05/01/25 | | | 50,065 | |
| | | | | | | | | | | | | | | |
| | | | | CONSTRUCTION MATERIALS — 0.0%(e) | | | | | | | | | | |
| | 30,000 | | | Knife River Holding Company(a) | | | | 7.7500 | | 05/01/31 | | | 30,449 | |
| | | | | | | | | | | | | | | |
| | | | | CONSUMER SERVICES — 0.0%(e) | | | | | | | | | | |
| | 60,000 | | | Carriage Services, Inc.(a) | | | | 4.2500 | | 05/15/29 | | | 49,869 | |
| | | | | | | | | | | | | | | |
| | | | | DIVERSIFIED INDUSTRIALS — 0.2% | | | | | | | | | | |
| | 248,000 | | | General Electric Company(b) | | US0003M + 3.330% | | 8.1960 | | Perpetual | | | 248,496 | |
| | | | | | | | | | | | | | | |
| | | | | ELECTRIC UTILITIES — 2.0% | | | | | | | | | | |
| | 280,000 | | | CMS Energy Corporation(b) | | H15T5Y + 4.116% | | 4.7500 | | 06/01/50 | | | 245,700 | |
| | 235,000 | | | Enel Finance International N.V.(a) | | | | 7.5000 | | 10/14/32 | | | 262,878 | |
| | 410,000 | | | Exelon Corporation | | | | 5.6000 | | 03/15/53 | | | 422,149 | |
| | 250,000 | | | National Rural Utilities Cooperative Finance(b) | | US0003M + 2.910% | | 4.7500 | | 04/30/43 | | | 243,750 | |
| | 384,000 | | | NRG Energy, Inc.(a) | | | | 7.0000 | | 03/15/33 | | | 398,820 | |
| | | | | | | | | | | | | | | |
See accompanying notes which are an integral part of these financial statements.
| DUNHAM CORPORATE/GOVERNMENT BOND FUND |
| SCHEDULE OF INVESTMENTS (Unaudited) (Continued) |
| April 30, 2023 |
| Principal | | | | | | | Coupon Rate | | | | | |
| Amount ($) | | | | | Spread | | (%) | | Maturity | | Fair Value | |
| | | | | CORPORATE BONDS — 33.3% (Continued) | | | | | | |
| | | | | ELECTRIC UTILITIES — 2.0% (Continued) | | | | | | |
| | 403,000 | | | Puget Energy, Inc. | | | | 2.3790 | | 06/15/28 | | $ | 358,329 | |
| | 404,000 | | | Southern Company (The)(b) | | H15T5Y + 2.915% | | 3.7500 | | 09/15/51 | | | 344,805 | |
| | 245,000 | | | Vistra Corporation(a),(b) | | H15T5Y + 6.930% | | 8.0000 | | Perpetual | | | 231,312 | |
| | | | | | | | | | | | | | 2,507,743 | |
| | | | | ENGINEERING & CONSTRUCTION — 0.4% | | | | | | | | | | |
| | 140,000 | | | Global Infrastructure Solutions, Inc.(a) | | | | 7.5000 | | 04/15/32 | | | 120,840 | |
| | 398,000 | | | Sempra Infrastructure Partners, L.P.(a) | | | | 3.2500 | | 01/15/32 | | | 330,282 | |
| | | | | | | | | | | | | | 451,122 | |
| | | | | FOOD — 0.2% | | | | | | | | | | |
| | 300,000 | | | Pilgrim’s Pride Corporation | | | | 6.2500 | | 07/01/33 | | | 296,343 | |
| | | | | | | | | | | | | | | |
| | | | | GAS & WATER UTILITIES — 0.4% | | | | | | | | | | |
| | 260,000 | | | Brooklyn Union Gas Company (The)(a) | | | | 4.8660 | | 08/05/32 | | | 250,799 | |
| | 255,000 | | | KeySpan Gas East Corporation(a) | | | | 5.9940 | | 03/06/33 | | | 264,120 | |
| | | | | | | | | | | | | | 514,919 | |
| | | | | HEALTH CARE FACILITIES & SERVICES — 1.0% | | | | | | |
| | 225,000 | | | AdaptHealth, LLC(a) | | | | 5.1250 | | 03/01/30 | | | 185,985 | |
| | 360,000 | | | CVS Health Corporation | | | | 5.1250 | | 02/21/30 | | | 365,620 | |
| | 345,000 | | | HCA, Inc. | | | | 5.2500 | | 06/15/49 | | | 313,455 | |
| | 540,000 | | | Universal Health Services, Inc. | | | | 2.6500 | | 01/15/32 | | | 437,112 | |
| | | | | | | | | | | | | | 1,302,172 | |
| | | | | HOME CONSTRUCTION — 0.6% | | | | | | | | | | |
| | 260,000 | | | MDC Holdings, Inc. | | | | 3.9660 | | 08/06/61 | | | 158,379 | |
| | 395,000 | | | PulteGroup, Inc. | | | | 6.3750 | | 05/15/33 | | | 421,212 | |
| | | | | | | | | | | | | | 579,591 | |
| | | | | HOUSEHOLD PRODUCTS — 0.3% | | | | | | | | | | |
| | 370,000 | | | Church & Dwight Company, Inc. | | | | 5.0000 | | 06/15/52 | | | 371,188 | |
| | | | | | | | | | | | | | | |
| | | | | INDUSTRIAL INTERMEDIATE PROD — 0.0%(e) | | | | | | | | | | |
| | 5,000 | | | Chart Industries, Inc.(a) | | | | 7.5000 | | 01/01/30 | | | 5,156 | |
| | | | | | | | | | | | | | | |
| | | | | INDUSTRIAL SUPPORT SERVICES — 0.6% | | | | | | | | | | |
| | 405,000 | | | Ashtead Capital, Inc.(a) | | | | 5.5000 | | 08/11/32 | | | 400,049 | |
| | 440,000 | | | Ferguson Finance plc(a) | | | | 4.6500 | | 04/20/32 | | | 420,346 | |
| | | | | | | | | | | | | | | |
See accompanying notes which are an integral part of these financial statements.
| DUNHAM CORPORATE/GOVERNMENT BOND FUND |
| SCHEDULE OF INVESTMENTS (Unaudited) (Continued) |
| April 30, 2023 |
| Principal | | | | | | | Coupon Rate | | | | | |
| Amount ($) | | | | | Spread | | (%) | | Maturity | | Fair Value | |
| | | | | CORPORATE BONDS — 33.3% (Continued) | | | | | | | | | | |
| | | | | INDUSTRIAL SUPPORT SERVICES — 0.6% (Continued) | | | | $ | 820,395 | |
| | | | | INSTITUTIONAL FINANCIAL SERVICES — 2.6% | | | | | | | | | | |
| | 210,000 | | | Bank of New York Mellon Corporation (The)(b) | | SOFRINDX + 2.074% | | 5.8340 | | 10/25/33 | | | 224,493 | |
| | 265,000 | | | Bank of New York Mellon Corporation (The)(b) | | H15T5Y + 4.358% | | 4.7000 | | Perpetual | | | 258,706 | |
| | 620,000 | | | Brookfield Finance, Inc. | | | | 2.7240 | | 04/15/31 | | | 520,421 | |
| | 550,000 | | | Goldman Sachs Group, Inc. (The)(b) | | SOFRRATE + 1.090% | | 1.9920 | | 01/27/32 | | | 439,969 | |
| | 310,000 | | | Goldman Sachs Group, Inc. (The) | | | | 6.4500 | | 05/01/36 | | | 334,457 | |
| | 475,000 | | | Morgan Stanley | | | | 3.1250 | | 07/27/26 | | | 451,369 | |
| | 395,000 | | | Morgan Stanley | | | | 6.3750 | | 07/24/42 | | | 447,499 | |
| | 435,000 | | | State Street Corporation(b) | | SOFRRATE + 1.726% | | 4.1640 | | 08/04/33 | | | 411,816 | |
| | 216,000 | | | State Street Corporation(b),(f) | | SOFRRATE + 1.567% | | 4.8210 | | 01/26/34 | | | 214,918 | |
| | | | | | | | | | | | | | 3,303,648 | |
| | | | | INSURANCE — 1.9% | | | | | | | | | | |
| | 300,000 | | | Allstate Corporation (The)(b) | | US0003M + 2.938% | | 5.7500 | | 08/15/53 | | | 292,414 | |
| | 185,000 | | | Ascot Group Ltd.(a) | | | | 4.2500 | | 12/15/30 | | | 147,930 | |
| | 170,000 | | | Brighthouse Financial, Inc. | | | | 5.6250 | | 05/15/30 | | | 165,874 | |
| | 391,000 | | | Corebridge Financial, Inc.(a),(b) | | H15T5Y + 3.846% | | 6.8750 | | 12/15/52 | | | 355,091 | |
| | 175,000 | | | Liberty Mutual Group, Inc.(a),(b) | | H15T5Y + 3.315% | | 4.1250 | | 12/15/51 | | | 141,350 | |
| | 168,000 | | | Lincoln National Corporation(b) | | US0003M + 2.040% | | 7.2900 | | 04/20/67 | | | 109,620 | |
| | 265,000 | | | MetLife, Inc.(b) | | H15T5Y + 3.576% | | 3.8500 | | 03/15/69 | | | 244,154 | |
| | 126,000 | | | MetLife, Inc.(b) | | US0003M + 2.959% | | 5.8750 | | Perpetual | | | 117,529 | |
| | 385,000 | | | Prudential Financial, Inc.(b) | | US0003M + 3.920% | | 5.6250 | | 06/15/43 | | | 384,895 | |
| | 104,000 | | | Prudential Financial, Inc.(b) | | H15T5Y + 3.162% | | 5.1250 | | 03/01/52 | | | 94,308 | |
| | 53,000 | | | Prudential Financial, Inc.(b) | | H15T5Y + 3.234% | | 6.0000 | | 09/01/52 | | | 51,014 | |
| | 210,000 | | | Prudential Financial, Inc.(b) | | H15T5Y + 2.848% | | 6.7500 | | 03/01/53 | | | 210,965 | |
| | | | | | | | | | | | | | 2,315,144 | |
| | | | | LEISURE FACILITIES & SERVICES — 0.3% | | | | | | | | | | |
| | 150,000 | | | Churchill Downs, Inc.(a) | | | | 6.7500 | | 05/01/31 | | | 150,996 | |
| | 145,000 | | | Hilton Domestic Operating Company, Inc.(a) | | | | 3.6250 | | 02/15/32 | | | 123,883 | |
| | 160,000 | | | Station Casinos, LLC(a) | | | | 4.5000 | | 02/15/28 | | | 147,230 | |
| | | | | | | | | | | | | | 422,109 | |
| | | | | | | | | | | | | | | |
See accompanying notes which are an integral part of these financial statements.
| DUNHAM CORPORATE/GOVERNMENT BOND FUND |
| SCHEDULE OF INVESTMENTS (Unaudited) (Continued) |
| April 30, 2023 |
| Principal | | | | | | | Coupon Rate | | | | | |
| Amount ($) | | | | | Spread | | (%) | | Maturity | | Fair Value | |
| | | | | CORPORATE BONDS — 33.3% (Continued) | | | | | | | | | | |
| | | | | MACHINERY — 0.4% | | | | | | | | | | |
| | 430,000 | | | Regal Rexnord Corporation(a) | | | | 6.4000 | | 04/15/33 | | $ | 438,253 | |
| | | | | | | | | | | | | | | |
| | | | | MEDICAL EQUIPMENT & DEVICES — 1.2% | | | | | | | | | | |
| | 209,000 | | | Bio-Rad Laboratories, Inc. | | | | 3.3000 | | 03/15/27 | | | 198,066 | |
| | 179,000 | | | Bio-Rad Laboratories, Inc. | | | | 3.7000 | | 03/15/32 | | | 161,264 | |
| | 415,000 | | | DENTSPLY SIRONA, Inc. | | | | 3.2500 | | 06/01/30 | | | 368,080 | |
| | 295,000 | | | GE Healthcare Holding, LLC(a) | | | | 5.8570 | | 03/15/30 | | | 310,213 | |
| | 468,000 | | | Illumina, Inc. | | | | 2.5500 | | 03/23/31 | | | 391,915 | |
| | | | | | | | | | | | | | 1,429,538 | |
| | | | | METALS & MINING — 0.8% | | | | | | | | | | |
| | 135,000 | | | Alliance Resource Operating Partners, L.P. /(a) | | | | 7.5000 | | 05/01/25 | | | 134,307 | |
| | 70,000 | | | Cleveland-Cliffs, Inc.(a) | | | | 6.7500 | | 03/15/26 | | | 71,166 | |
| | 140,000 | | | FMG Resources August 2006 Pty Ltd.(a) | | | | 5.8750 | | 04/15/30 | | | 136,025 | |
| | 295,000 | | | Glencore Funding, LLC(a) | | | | 2.8500 | | 04/27/31 | | | 248,787 | |
| | 345,000 | | | Teck Resources Ltd. | | | | 6.1250 | | 10/01/35 | | | 360,200 | |
| | | | | | | | | | | | | | 950,485 | |
| | | | | OIL & GAS PRODUCERS — 2.8% | | | | | | | | | | |
| | 385,000 | | | BP Capital Markets plc(b) | | H15T5Y + 4.398% | | 4.8750 | | Perpetual | | | 354,933 | |
| | 70,000 | | | Chesapeake Escrow Issuer, LLC B(a) | | | | 5.5000 | | 02/01/26 | | | 69,322 | |
| | 160,000 | | | CITGO Petroleum Corporation(a) | | | | 7.0000 | | 06/15/25 | | | 159,440 | |
| | 95,000 | | | CrownRock, L.P. / CrownRock Finance, Inc.(a) | | | | 5.0000 | | 05/01/29 | | | 89,837 | |
| | 125,000 | | | DT Midstream, Inc.(a) | | | | 4.1250 | | 06/15/29 | | | 110,929 | |
| | 205,000 | | | Ecopetrol S.A. | | | | 8.8750 | | 01/13/33 | | | 198,892 | |
| | 275,000 | | | Enbridge, Inc.(b) | | H15T5Y + 4.418% | | 7.6250 | | 01/15/83 | | | 280,797 | |
| | 175,000 | | | Energy Transfer, L.P.(b) | | H15T5Y + 5.694% | | 6.5000 | | Perpetual | | | 155,313 | |
| | 125,000 | | | EQM Midstream Partners, L.P.(a) | | | | 7.5000 | | 06/01/30 | | | 121,524 | |
| | 425,000 | | | Flex Intermediate Holdco, LLC(a) | | | | 3.3630 | | 06/30/31 | | | 349,858 | |
| | 35,000 | | | Genesis Energy, L.P. / Genesis Energy Finance | | | | 8.8750 | | 04/15/30 | | | 35,091 | |
| | 320,000 | | | Kinder Morgan, Inc. | | | | 7.7500 | | 01/15/32 | | | 371,853 | |
| | 425,000 | | | Lundin Energy Finance BV(a) | | | | 2.0000 | | 07/15/26 | | | 387,123 | |
| | 105,000 | | | Occidental Petroleum Corporation(f) | | | | 6.1250 | | 01/01/31 | | | 109,891 | |
| | 70,000 | | | Parsley Energy, LLC / Parsley Finance Corporation(a) | | | | 4.1250 | | 02/15/28 | | | 66,430 | |
| | 200,000 | | | Pertamina Persero PT(a) | | | | 6.4500 | | 05/30/44 | | | 208,479 | |
| | 185,000 | | | Petroleos Mexicanos | | | | 7.6900 | | 01/23/50 | | | 123,975 | |
| | | | | | | | | | | | | | | |
See accompanying notes which are an integral part of these financial statements.
| DUNHAM CORPORATE/GOVERNMENT BOND FUND |
| SCHEDULE OF INVESTMENTS (Unaudited) (Continued) |
| April 30, 2023 |
| Principal | | | | | | | Coupon Rate | | | | | |
| Amount ($) | | | | | Spread | | (%) | | Maturity | | Fair Value | |
| | | | | CORPORATE BONDS — 33.3% (Continued) | | | | | | |
| | | | | OIL & GAS PRODUCERS — 2.8% (Continued) | | | | | | |
| | 250,000 | | | Reliance Industries Ltd.(a) | | | | 2.8750 | | 01/12/32 | | $ | 209,225 | |
| | 95,000 | | | Venture Global Calcasieu Pass, LLC(a) | | | | 3.8750 | | 08/15/29 | | | 85,547 | |
| | | | | | | | | | | | | | 3,488,459 | |
| | | | | OIL & GAS SERVICES & EQUIPMENT — 0.2% | | | | | | | | | | |
| | 102,000 | | | Enerflex Ltd.(a) | | | | 9.0000 | | 10/15/27 | | | 101,761 | |
| | 90,000 | | | USA Compression Partners, L.P. / USA Compression | | | | 6.8750 | | 04/01/26 | | | 89,187 | |
| | | | | | | | | | | | | | 190,948 | |
| | | | | REAL ESTATE INVESTMENT TRUSTS — 1.6% | | | | | | | | | | |
| | 310,000 | | | EPR Properties | | | | 4.7500 | | 12/15/26 | | | 282,083 | |
| | 255,000 | | | GLP Capital, L.P. / GLP Financing II, Inc. | | | | 5.7500 | | 06/01/28 | | | 251,282 | |
| | 108,000 | | | GLP Capital, L.P. / GLP Financing II, Inc. | | | | 3.2500 | | 01/15/32 | | | 88,730 | |
| | 240,000 | | | Iron Mountain, Inc.(a),(f) | | | | 4.5000 | | 02/15/31 | | | 208,965 | |
| | 25,000 | | | MPT Operating Partnership, L.P. / MPT Finance | | | | 4.6250 | | 08/01/29 | | | 18,954 | |
| | 125,000 | | | MPT Operating Partnership, L.P. / MPT Finance | | | | 3.5000 | | 03/15/31 | | | 85,768 | |
| | 170,000 | | | Office Properties Income Trust | | | | 4.5000 | | 02/01/25 | | | 145,277 | |
| | 240,000 | | | Phillips Edison Grocery Center Operating | | | | 2.6250 | | 11/15/31 | | | 182,492 | |
| | 105,000 | | | Retail Opportunity Investments Partnership, L.P. | | | | 4.0000 | | 12/15/24 | | | 102,706 | |
| | 225,000 | | | Retail Properties of America, Inc. | | | | 4.7500 | | 09/15/30 | | | 205,506 | |
| | 75,000 | | | Service Properties Trust | | | | 4.9500 | | 02/15/27 | | | 63,664 | |
| | 205,000 | | | VICI Properties, L.P. | | | | 4.9500 | | 02/15/30 | | | 196,181 | |
| | 165,000 | | | VICI Properties, L.P. | | | | 5.1250 | | 05/15/32 | | | 157,060 | |
| | | | | | | | | | | | | | 1,988,668 | |
| | | | | REAL ESTATE OWNERS & DEVELOPERS — 0.2% | | | | | | |
| | 275,000 | | | Ontario Teachers’ Cadillac Fairview Properties(a) | | | | 2.5000 | | 10/15/31 | | | 223,407 | |
| | | | | | | | | | | | | | | |
| | | | | RETAIL - CONSUMER STAPLES — 0.1% | | | | | | | | | | |
| | 110,000 | | | Albertsons Companies, Inc. / Safeway, Inc. / New(a) | | | | 6.5000 | | 02/15/28 | | | 111,249 | |
| | | | | | | | | | | | | | | |
| | | | | RETAIL - DISCRETIONARY — 0.1% | | | | | | | | | | |
| | 175,000 | | | BlueLinx Holdings, Inc.(a) | | | | 6.0000 | | 11/15/29 | | | 146,283 | |
| | | | | | | | | | | | | | | |
| | | | | SEMICONDUCTORS — 0.4% | | | | | | | | | | |
| | 336,000 | | | Broadcom, Inc. | | | | 4.1500 | | 11/15/30 | | | 312,203 | |
| | 262,000 | | | Entegris Escrow Corporation(a) | | | | 4.7500 | | 04/15/29 | | | 244,567 | |
| | | | | | | | | | | | | | | |
See accompanying notes which are an integral part of these financial statements.
| DUNHAM CORPORATE/GOVERNMENT BOND FUND |
| SCHEDULE OF INVESTMENTS (Unaudited) (Continued) |
| April 30, 2023 |
| Principal | | | | | | | Coupon Rate | | | | | |
| Amount ($) | | | | | Spread | | (%) | | Maturity | | Fair Value | |
| | | | | CORPORATE BONDS — 33.3% (Continued) | | | | | | |
| | | | | SEMICONDUCTORS — 0.4% (Continued) | | | | $ | 556,770 | |
| | | | | | | | | | | | | | | |
| | | | | SOFTWARE — 0.3% | | | | | | | | | | |
| | 90,000 | | | Consensus Cloud Solutions, Inc.(a) | | | | 6.5000 | | 10/15/28 | | | 78,849 | |
| | 155,000 | | | Oracle Corporation | | | | 6.2500 | | 11/09/32 | | | 167,131 | |
| | 123,000 | | | Oracle Corporation | | | | 5.5500 | | 02/06/53 | | | 118,164 | |
| | 75,000 | | | Oracle Corporation | | | | 3.8500 | | 04/01/60 | | | 52,654 | |
| | | | | | | | | | | | | | 416,798 | |
| | | | | SPECIALTY FINANCE — 1.2% | | | | | | | | | | |
| | 235,000 | | | Aviation Capital Group, LLC(a) | | | | 3.5000 | | 11/01/27 | | | 212,559 | |
| | 210,000 | | | Avolon Holdings Funding Ltd.(a) | | | | 4.3750 | | 05/01/26 | | | 198,269 | |
| | 382,000 | | | Capital One Financial Corporation(b) | | SOFRRATE + 1.337% | | 2.3590 | | 07/29/32 | | | 276,465 | |
| | 324,000 | | | Discover Financial Services | | | | 6.7000 | | 11/29/32 | | | 342,613 | |
| | 120,000 | | | Ladder Capital Finance Holdings LLLP / Ladder(a) | | | | 4.2500 | | 02/01/27 | | | 102,472 | |
| | 235,000 | | | OneMain Finance Corporation | | | | 6.8750 | | 03/15/25 | | | 230,239 | |
| | 65,000 | | | Synchrony Financial | | | | 4.8750 | | 06/13/25 | | | 61,414 | |
| | 67,000 | | | Synchrony Financial | | | | 3.7000 | | 08/04/26 | | | 59,954 | |
| | | | | | | | | | | | | | 1,483,985 | |
| | | | | STEEL — 0.2% | | | | | | | | | | |
| | 245,000 | | | ArcelorMittal S.A. | | | | 6.8000 | | 11/29/32 | | | 256,426 | |
| | | | | | | | | | | | | | | |
| | | | | TECHNOLOGY HARDWARE — 1.2% | | | | | | | | | | |
| | 349,000 | | | CDW, LLC / CDW Finance Corporation | | | | 3.5690 | | 12/01/31 | | | 292,307 | |
| | 304,000 | | | Dell International, LLC / EMC Corporation | | | | 8.1000 | | 07/15/36 | | | 357,124 | |
| | 335,000 | | | HP, Inc. | | | | 5.5000 | | 01/15/33 | | | 332,000 | |
| | 300,000 | | | Motorola Solutions, Inc. | | | | 4.6000 | | 05/23/29 | | | 294,615 | |
| | 210,000 | | | TD SYNNEX Corporation | | | | 2.3750 | | 08/09/28 | | | 174,630 | |
| | | | | | | | | | | | | | 1,450,676 | |
| | | | | TECHNOLOGY SERVICES — 1.2% | | | | | | | | | | |
| | 140,000 | | | Booz Allen Hamilton, Inc.(a) | | | | 3.8750 | | 09/01/28 | | | 128,699 | |
| | 275,000 | | | Booz Allen Hamilton, Inc.(a) | | | | 4.0000 | | 07/01/29 | | | 249,710 | |
| | 485,000 | | | CoStar Group, Inc.(a) | | | | 2.8000 | | 07/15/30 | | | 405,626 | |
| | 137,000 | | | Kyndryl Holdings, Inc. | | | | 2.7000 | | 10/15/28 | | | 115,566 | |
| | 545,000 | | | Leidos, Inc. | | | | 2.3000 | | 02/15/31 | | | 441,815 | |
| | | | | | | | | | | | | | | |
See accompanying notes which are an integral part of these financial statements.
| DUNHAM CORPORATE/GOVERNMENT BOND FUND |
| SCHEDULE OF INVESTMENTS (Unaudited) (Continued) |
| April 30, 2023 |
| Principal | | | | | | | Coupon Rate | | | | | |
| Amount ($) | | | | | Spread | | (%) | | Maturity | | Fair Value | |
| | | | | CORPORATE BONDS — 33.3% (Continued) | | | | | | |
| | | | | TECHNOLOGY SERVICES — 1.2% (Continued) | | | | | | |
| | 245,000 | | | Science Applications International Corporation(a) | | | | 4.8750 | | 04/01/28 | | $ | 231,486 | |
| | | | | | | | | | | | | | 1,572,902 | |
| | | | | TELECOMMUNICATIONS — 0.8% | | | | | | | | | | |
| | 160,000 | | | Level 3 Financing, Inc.(a) | | | | 4.2500 | | 07/01/28 | | | 93,435 | |
| | 270,000 | | | Level 3 Financing, Inc.(a) | | | | 3.6250 | | 01/15/29 | | | 151,290 | |
| | 85,000 | | | Sprint Capital Corporation | | | | 8.7500 | | 03/15/32 | | | 103,950 | |
| | 100,000 | | | Sprint Spectrum Company, LLC / Sprint Spectrum(a) | | | | 4.7380 | | 03/20/25 | | | 99,314 | |
| | 184,000 | | | T-Mobile USA, Inc. | | | | 5.0500 | | 07/15/33 | | | 185,006 | |
| | 360,000 | | | Vodafone Group plc | | | | 5.6250 | | 02/10/53 | | | 355,911 | |
| | | | | | | | | | | | | | 988,906 | |
| | | | | TOBACCO & CANNABIS — 0.4% | | | | | | | | | | |
| | 415,000 | | | BAT Capital Corporation | | | | 7.7500 | | 10/19/32 | | | 461,808 | |
| | | | | | | | | | | | | | | |
| | | | | TRANSPORTATION & LOGISTICS — 0.6% | | | | | | | | | | |
| | 410,859 | | | Alaska Airlines Class A Pass Through Trust Series 2021-1(a) | | | | 4.8000 | | 08/15/27 | | | 400,011 | |
| | 330,627 | | | Delta Air Lines Class AA Pass Through Trust Series 2015-1 | | | | 3.6250 | | 07/30/27 | | | 305,476 | |
| | | | | | | | | | | | | | 705,487 | |
| | | | | TOTAL CORPORATE BONDS (Cost $43,429,519) | | | | | | | | | 41,542,443 | |
| | | | | | | | | | | | | | | |
| | | | | MUNICIPAL BONDS — 3.1% | | | | | | | | | | |
| | | | | CITY — 0.3% | | | | | | | | | | |
| | 340,000 | | | City of Bristol VA | | | | 4.2100 | | 01/01/42 | | | 307,936 | |
| | 145,000 | | | City of San Antonio TX | | | | 1.9630 | | 02/01/33 | | | 119,143 | |
| | | | | | | | | | | | | | 427,079 | |
| | | | | GOVERNMENT LEASE — 0.1% | | | | | | | | | | |
| | 145,000 | | | Texas Public Finance Authority | | | | 2.1400 | | 02/01/35 | | | 113,927 | |
| | | | | | | | | | | | | | | |
| | | | | HOSPITALS — 0.1% | | | | | | | | | | |
| | 135,000 | | | Idaho Health Facilities Authority | | | | 5.0200 | | 03/01/48 | | | 130,131 | |
| | | | | | | | | | | | | | | |
| | | | | LOCAL AUTHORITY — 0.7% | | | | | | | | | | |
| | 320,000 | | | San Diego County Regional Airport Authority | | | | 5.5940 | | 07/01/43 | | | 314,534 | |
| | | | | | | | | | | | | | | |
See accompanying notes which are an integral part of these financial statements.
| DUNHAM CORPORATE/GOVERNMENT BOND FUND |
| SCHEDULE OF INVESTMENTS (Unaudited) (Continued) |
| April 30, 2023 |
| Principal | | | | | Coupon Rate | | | | | |
| Amount ($) | | | | | (%) | | Maturity | | Fair Value | |
| | | | | MUNICIPAL BONDS — 3.1% (Continued) | | | | | | | | |
| | | | | LOCAL AUTHORITY — 0.7% (Continued) | | | | | | | | |
| | 600,000 | | | State of Texas | | 3.2110 | | 04/01/44 | | $ | 498,029 | |
| | 35,000 | | | Texas Transportation Commission State Highway Fund | | 4.0000 | | 10/01/33 | | | 34,018 | |
| | | | | | | | | | | | 846,581 | |
| | | | | MISCELLANEOUS TAX — 0.7% | | | | | | | | |
| | 765,000 | | | Metropolitan Transportation Authority | | 5.0000 | | 11/15/45 | | | 842,012 | |
| | | | | | | | | | | | | |
| | | | | SALES TAX — 0.0%(e) | | | | | | | | |
| | 20,000 | | | Sales Tax Securitization Corporation | | 3.4110 | | 01/01/43 | | | 15,942 | |
| | | | | | | | | | | | | |
| | | | | WATER AND SEWER — 1.2% | | | | | | | | |
| | 705,000 | | | Broward County FL Water & Sewer Utility Revenue | | 4.0000 | | 10/01/47 | | | 696,945 | |
| | 625,000 | | | New York State Environmental Facilities | | 5.0000 | | 06/15/51 | | | 691,811 | |
| | 160,000 | | | Santa Clara Valley Water District | | 2.9670 | | 06/01/50 | | | 115,512 | |
| | | | | | | | | | | | 1,504,268 | |
| | | | | TOTAL MUNICIPAL BONDS (Cost $4,270,719) | | | 3,879,940 | |
| | | | | | | | | | | | | |
| | | | | NON U.S. GOVERNMENT & AGENCIES — 1.6% | | | | |
| | | | | SOVEREIGN — 1.6% | | | | | | | | |
| | 200,000 | | | Brazilian Government International Bond | | 6.0000 | | 10/20/33 | | | 196,591 | |
| | 515,000 | | | Dominican Republic International Bond(a) | | 4.8750 | | 09/23/32 | | | 445,091 | |
| | 200,000 | | | Emirate of Dubai Government International Bonds | | 5.2500 | | 01/30/43 | | | 190,677 | |
| | 250,000 | | | Hungary Government International Bond(a) | | 6.2500 | | 09/22/32 | | | 259,783 | |
| | 200,000 | | | Mexico Government International Bond | | 2.6590 | | 05/24/31 | | | 168,992 | |
| | 450,000 | | | Mexico Government International Bond | | 6.3500 | | 02/09/35 | | | 482,819 | |
| | 200,000 | | | Serbia International Bond(a) | | 6.5000 | | 09/26/33 | | | 203,350 | |
| | | | | | | | | | | | 1,947,303 | |
| | | | | TOTAL NON U.S. GOVERNMENT & AGENCIES (Cost $1,960,622) | | | 1,947,303 | |
| | | | | | Spread | | | | | | | |
| | | | | TERM LOANS — 5.3% | | | | | | | | | | |
| | | | | AEROSPACE & DEFENSE — 0.2% | | | | | | | | | | |
| | 195,612 | | | TransDigm, Inc.(b) | | TSFR1M – 3.250% | | 8.1480 | | 08/10/28 | | | 195,677 | |
| | | | | | | | | | | | | | | |
| | | | | AUTOMOTIVE — 0.2% | | | | | | | | | | |
| | 215,000 | | | Clarios Global, L.P.(b) | | TSFR1M – 3.750% | | 8.6680 | | 04/20/30 | | | 213,925 | |
| | | | | | | | | | | | | | | |
See accompanying notes which are an integral part of these financial statements.
| DUNHAM CORPORATE/GOVERNMENT BOND FUND |
| SCHEDULE OF INVESTMENTS (Unaudited) (Continued) |
| April 30, 2023 |
| Principal | | | | | | | Coupon Rate | | | | | |
| Amount ($) | | | | | Spread | | (%) | | Maturity | | Fair Value | |
| | | | | TERM LOANS — 5.3% (Continued) | | | | | | | | | | |
| | | | | BIOTECH & PHARMA — 0.1% | | | | | | | | | | |
| | 64,513 | | | Perrigo Investments, LLC(b) | | TSFR1M + 2.500% | | 7.1570 | | 04/07/29 | | $ | 64,298 | |
| | | | | | | | | | | | | | | |
| | | | | CABLE & SATELLITE — 0.3% | | | | | | | | | | |
| | 172,682 | | | Directv Financing, LLC(b) | | US0001M + 5.000% | | 9.8400 | | 07/22/27 | | | 166,207 | |
| | 205,000 | | | Virgin Media Bristol, LLC(b) | | US0001M – 2.500% | | 7.4480 | | 01/04/28 | | | 201,988 | |
| | | | | | | | | | | | | | 368,195 | |
| | | | | CHEMICALS — 0.3% | | | | | | | | | | |
| | 230,487 | | | INEOS US Finance, LLC(b) | | TSFR1M – 3.750% | | 8.6570 | | 11/08/27 | | | 230,486 | |
| | 120,000 | | | Trinseo Materials Operating SCA(b) | | US0003M – 2.000% | | 6.9280 | | 09/06/24 | | | 118,600 | |
| | | | | | | | | | | | | | 349,086 | |
| | | | | COMMERCIAL SUPPORT SERVICES — 0.4% | | | | | | | | | | |
| | 149,618 | | | AlixPartners LLP(b) | | US0001M + 2.750% | | 7.6090 | | 01/28/28 | | | 149,567 | |
| | 209,472 | | | Brightview Landscapes, LLC(b) | | TSFR1M – 3.250% | | 7.9260 | | 04/22/29 | | | 206,331 | |
| | 204,481 | | | CHG Healthcare Services, Inc.(b) | | US0003M + 3.500% | | 8.0900 | | 09/30/28 | | | 203,535 | |
| | | | | | | | | | | | | | 559,433 | |
| | | | | CONTAINERS & PACKAGING — 0.2% | | | | | | | | | | |
| | 254,807 | | | Berry Global, Inc.(b) | | US0001M + 1.750% | | 6.6400 | | 07/01/26 | | | 254,540 | |
| | | | | | | | | | | | | | | |
| | | | | ELECTRIC UTILITIES — 0.2% | | | | | | | | | | |
| | 209,533 | | | Astoria Energy, LLC(b) | | US0001M + 3.500% | | 8.3500 | | 12/10/27 | | | 208,990 | |
| | | | | | | | | | | | | | | |
| | | | | ELECTRICAL EQUIPMENT — 0.2% | | | | | | | | | | |
| | 269,374 | | | Brookfield WEC Holdings, Inc.(b) | | US0001M + 2.750% | | 7.5900 | | 08/01/25 | | | 268,908 | |
| | | | | | | | | | | | | | | |
| | | | | FOOD — 0.4% | | | | | | | | | | |
| | 175,000 | | | Del Monte Foods, Inc.(b) | | TSFR1M – 4.250% | | 9.3140 | | 05/16/29 | | | 172,157 | |
| | 204,474 | | | Froneri US, Inc.(b) | | US0001M – 2.250% | | 7.4090 | | 01/30/27 | | | 202,350 | |
| | 79,215 | | | Hostess Brands, LLC(b) | | US0001M + 2.250% | | 7.0750 | | 08/03/25 | | | 79,271 | |
| | | | | | | | | | | | | | 453,778 | |
| | | | | HEALTH CARE FACILITIES & SERVICES — 0.3% | | | | | | | | | | |
| | 114,154 | | | Agiliti Health, Inc.(b) | | US0001M + 2.750% | | 7.6250 | | 10/18/25 | | | 113,568 | |
| | 71,596 | | | Legacy LifePoint Health, LLC(b) | | US0001M + 3.750% | | 8.5750 | | 11/16/25 | | | 67,529 | |
| | | | | | | | | | | | | | | |
See accompanying notes which are an integral part of these financial statements.
| DUNHAM CORPORATE/GOVERNMENT BOND FUND |
| SCHEDULE OF INVESTMENTS (Unaudited) (Continued) |
| April 30, 2023 |
| Principal | | | | | | | Coupon Rate | | | | | |
| Amount ($) | | | | | Spread | | (%) | | Maturity | | Fair Value | |
| | | | | TERM LOANS — 5.3% (Continued) | | | | | | | | | | |
| | | | | HEALTH CARE FACILITIES & SERVICES — 0.3% (Continued) | | | | | | |
| | 159,592 | | | Milano Acquisition Corporation(b) | | US0003M + 4.000% | | 8.9980 | | 08/17/27 | | $ | 154,206 | |
| | | | | | | | | | | | | | 335,303 | |
| | | | | INDUSTRIAL SUPPORT SERVICES — 0.0%(e) | | | | | | | | | | |
| | 68,265 | | | Resideo Funding, Inc.(b) | | US0001M + 2.250% | | 7.1200 | | 02/09/28 | | | 68,190 | |
| | | | | | | | | | | | | | | |
| | | | | INTERNET MEDIA & SERVICES — 0.2% | | | | | | | | | | |
| | 254,363 | | | Uber Technologies, Inc.(b) | | TSFR1M – 2.750% | | 7.6560 | | 03/03/30 | | | 253,872 | |
| | | | | | | | | | | | | | | |
| | | | | LEISURE FACILITIES & SERVICES — 0.5% | | | | | | | | | | |
| | 60,000 | | | Caesars Entertainment, Inc.(b) | | TSFR1M – 3.250% | | 8.1570 | | 01/26/30 | | | 59,871 | |
| | 70,000 | | | Hilton Worldwide Finance, LLC(b) | | US0001M + 1.750% | | 6.8210 | | 06/21/26 | | | 69,971 | |
| | 39,700 | | | Scientific Games Corporation(b) | | SOFRRATE + 3.000% | | 7.9810 | | 04/07/29 | | | 39,657 | |
| | 154,612 | | | Scientific Games Holdings, L.P.(b) | | SOFRRATE + 3.500% | | 8.4210 | | 02/04/29 | | | 152,582 | |
| | 68,225 | | | Station Casinos, LLC(b) | | US0001M + 2.250% | | 7.1000 | | 01/31/27 | | | 67,640 | |
| | 251,845 | | | UFC Holdings, LLC(b) | | US0006M + 2.750% | | 7.5700 | | 04/29/26 | | | 251,599 | |
| | | | | | | | | | | | | | 641,320 | |
| | | | | MACHINERY — 0.1% | | | | | | | | | | |
| | 70,901 | | | Alliance Laundry Systems, LLC(b) | | US0003M + 3.500% | | 8.5590 | | 09/30/27 | | | 70,591 | |
| | 70,985 | | | Standard Industries, Inc.(b) | | US0006M + 2.500% | | 7.3290 | | 08/06/28 | | | 70,916 | |
| | | | | | | | | | | | | | 141,507 | |
| | | | | MEDICAL EQUIPMENT & DEVICES — 0.2% | | | | | | | | | | |
| | 214,458 | | | Mozart Borrower, L.P.(b) | | US0001M + 3.250% | | 8.0900 | | 09/30/28 | | | 208,457 | |
| | | | | | | | | | | | | | | |
| | | | | OIL & GAS PRODUCERS — 0.2% | | | | | | | | | | |
| | 68,931 | | | Freeport LNG Investments LLLP(b) | | US0003M + 3.500% | | 8.7500 | | 11/17/28 | | | 67,132 | |
| | 98,113 | | | Oryx Midstream Services Permian Basin, LLC(b) | | US0001M + 3.250% | | 8.1930 | | 09/30/28 | | | 97,210 | |
| | 30,000 | | | Whitewater Whistler Holdings, LLC(b) | | TSFR1M – 3.250% | | 8.1480 | | 01/25/30 | | | 30,008 | |
| | | | | | | | | | | | | | 194,350 | |
| | | | | PUBLISHING & BROADCASTING — 0.0%(e) | | | | | | | | | | |
| | 37,394 | | | Nexstar Broadcasting, Inc.(b) | | US0001M + 2.500% | | 7.3400 | | 06/20/26 | | | 37,367 | |
| | | | | | | | | | | | | | | |
| | | | | RETAIL - DISCRETIONARY — 0.1% | | | | | | | | | | |
| | 154,608 | | | PetSmart, Inc.(b) | | US0006M + 3.750% | | 8.6570 | | 01/29/28 | | | 154,124 | |
| | | | | | | | | | | | | | | |
See accompanying notes which are an integral part of these financial statements.
| DUNHAM CORPORATE/GOVERNMENT BOND FUND |
| SCHEDULE OF INVESTMENTS (Unaudited) (Continued) |
| April 30, 2023 |
| Principal | | | | | | | Coupon Rate | | | | | |
| Amount ($) | | | | | Spread | | (%) | | Maturity | | Fair Value | |
| | | | | TERM LOANS — 5.3% (Continued) | | | | | | | | | | |
| | | | | SOFTWARE — 0.4% | | | | | | | | | | |
| | 221,830 | | | Applied Systems, Inc.(b) | | TSFR1M – 4.500% | | 9.3980 | | 09/19/26 | | $ | 222,541 | |
| | 68,964 | | | CCC Intelligent Solutions, Inc.(b) | | US0003M + 2.500% | | 7.0900 | | 09/17/28 | | | 68,766 | |
| | 54,863 | | | Open Text Corporation(c) | | | | 8.4070 | | 11/16/29 | | | 54,897 | |
| | 67,754 | | | Sophia, L.P.(b) | | US0003M + 3.250% | | 8.6590 | | 10/07/27 | | | 66,992 | |
| | 66,571 | | | UKG, Inc.(b) | | US0001M + 3.250% | | 8.2710 | | 05/03/26 | | | 64,930 | |
| | | | | | | | | | | | | | 478,126 | |
| | | | | TECHNOLOGY HARDWARE — 0.1% | | | | | | | | | | |
| | 68,638 | | | NCR Corporation(b) | | US0001M + 2.500% | | 7.3300 | | 08/08/26 | | | 67,780 | |
| | | | | | | | | | | | | | | |
| | | | | TECHNOLOGY SERVICES — 0.3% | | | | | | | | | | |
| | 58,379 | | | Blackhawk Network Holdings, Inc.(b) | | US0001M + 3.000% | | 7.8900 | | 05/22/25 | | | 57,839 | |
| | 64,593 | | | Dun & Bradstreet Corporation (The)(b) | | US0001M + 3.250% | | 8.0950 | | 02/08/26 | | | 64,583 | |
| | 68,878 | | | NAB Holdings, LLC(b) | | SOFRRATE + 3.000% | | 8.0480 | | 11/18/28 | | | 68,131 | |
| | 246,253 | | | Peraton Corporation(b) | | US0001M + 3.750% | | 8.5900 | | 02/24/28 | | | 241,712 | |
| | | | | | | | | | | | | | 432,265 | |
| | | | | TELECOMMUNICATIONS — 0.2% | | | | | | | | | | |
| | 204,482 | | | Cincinnati Bell, Inc.(b) | | SOFRRATE – 3.250% | | 8.1570 | | 11/17/28 | | | 200,101 | |
| | 96,029 | | | SBA Senior Finance II, LLC(b) | | US0001M + 1.750% | | 6.6000 | | 04/11/25 | | | 96,057 | |
| | | | | | | | | | | | | | 296,158 | |
| | | | | TRANSPORTATION & LOGISTICS — 0.2% | | | | | | | | | | |
| | 100,839 | | | Brown Group Holding, LLC(b) | | US0003M + 2.500% | | 7.4070 | | 04/22/28 | | | 98,859 | |
| | 59,500 | | | Mileage Plus Holdings, LLC(b) | | US0003M + 5.250% | | 10.2130 | | 06/25/27 | | | 62,008 | |
| | 73,135 | | | PODS, LLC(b) | | US0001M + 3.000% | | 7.9220 | | 03/19/28 | | | 71,796 | |
| | 63,000 | | | SkyMiles IP Ltd.(b) | | US0003M + 3.750% | | 8.7980 | | 09/16/27 | | | 65,367 | |
| | | | | | | | | | | | | | 298,030 | |
| | | | | TOTAL TERM LOANS (Cost $6,551,399) | | | | | 6,543,679 | |
| | | | | | | | | | | | | | | |
| | | | | U.S. GOVERNMENT & AGENCIES — 23.0% | | | | | | |
| | | | | AGENCY FIXED RATE — 2.9% | | | | | | | | | | |
| | 7,857 | | | Fannie Mae Pool 735061 | | | | 6.0000 | | 11/01/34 | | | 8,159 | |
| | | | | | | | | | | | | | | |
See accompanying notes which are an integral part of these financial statements.
| DUNHAM CORPORATE/GOVERNMENT BOND FUND |
| SCHEDULE OF INVESTMENTS (Unaudited) (Continued) |
| April 30, 2023 |
| Principal | | | | | Coupon Rate | | | | | |
| Amount ($) | | | | | (%) | | Maturity | | Fair Value | |
| | | | | U.S. GOVERNMENT & AGENCIES — 23.0% (Continued) | | | | |
| | | | | AGENCY FIXED RATE — 2.9% (Continued) | | | | | | | | |
| | 10,510 | | | Fannie Mae Pool 866009 | | 6.0000 | | 03/01/36 | | $ | 10,966 | |
| | 68,310 | | | Fannie Mae Pool 938574 | | 5.5000 | | 09/01/36 | | | 70,738 | |
| | 26,010 | | | Fannie Mae Pool 310041 | | 6.5000 | | 05/01/37 | | | 28,104 | |
| | 11,412 | | | Fannie Mae Pool 962752 | | 5.0000 | | 04/01/38 | | | 11,666 | |
| | 14,795 | | | Fannie Mae Pool 909175 | | 5.5000 | | 04/01/38 | | | 15,324 | |
| | 55,642 | | | Fannie Mae Pool 909220 | | 6.0000 | | 08/01/38 | | | 57,761 | |
| | 47,693 | | | Fannie Mae Pool AS7026 | | 4.0000 | | 04/01/46 | | | 46,451 | |
| | 82,442 | | | Fannie Mae Pool BJ9260 | | 4.0000 | | 04/01/48 | | | 80,015 | |
| | 925,000 | | | Fannie Mae Pool FS4438 | | 5.0000 | | 11/01/52 | | | 918,822 | |
| | 76,904 | | | Freddie Mac Gold Pool G01980 | | 5.0000 | | 12/01/35 | | | 78,472 | |
| | 10,897 | | | Freddie Mac Gold Pool G05888 | | 5.5000 | | 10/01/39 | | | 11,298 | |
| | 2,343,214 | | | Freddie Mac Pool SD2026 | | 5.0000 | | 11/01/52 | | | 2,327,209 | |
| | | | | | | | | | | | 3,664,985 | |
| | | | | U.S. TREASURY BONDS — 2.7% | | | | | | | | |
| | 1,040,000 | | | United States Treasury Bond | | 2.8750 | | 05/15/49 | | | 890,541 | |
| | 1,440,000 | | | United States Treasury Bond | | 2.0000 | | 02/15/50 | | | 1,021,275 | |
| | 2,500,000 | | | United States Treasury Bond | | 1.3750 | | 08/15/50 | | | 1,503,222 | |
| | | | | | | | | | | | 3,415,038 | |
| | | | | U.S. TREASURY NOTES — 17.4% | | | | | | | | |
| | 1,525,000 | | | United States Treasury Note | | 3.8750 | | 11/30/27 | | | 1,544,569 | |
| | 2,505,000 | | | United States Treasury Note | | 2.6250 | | 02/15/29 | | | 2,383,273 | |
| | 485,000 | | | United States Treasury Note | | 0.8750 | | 11/15/30 | | | 404,018 | |
| | 715,000 | | | United States Treasury Note | | 1.6250 | | 05/15/31 | | | 625,653 | |
| | 540,000 | | | United States Treasury Note | | 2.8750 | | 05/15/32 | | | 515,953 | |
| | 3,720,000 | | | United States Treasury Note | | 4.1250 | | 11/15/32 | | | 3,919,369 | |
| | 2,045,000 | | | United States Treasury Note | | 1.8750 | | 02/15/51 | | | 1,398,588 | |
| | 1,135,000 | | | United States Treasury Note | | 1.8750 | | 11/15/51 | | | 772,820 | |
| | 310,000 | | | United States Treasury Note | | 2.8750 | | 05/15/52 | | | 265,086 | |
| | 5,925,000 | | | United States Treasury Note | | 4.0000 | | 11/15/52 | | | 6,286,056 | |
| | 3,405,000 | | | United States Treasury Note | | 3.6250 | | 02/15/53 | | | 3,373,610 | |
| | | | | | | | | | | | 21,488,995 | |
| | | | | TOTAL U.S. GOVERNMENT & AGENCIES (Cost $31,523,205) | | | 28,569,018 | |
| | | | | | | | | | | | | |
See accompanying notes which are an integral part of these financial statements.
| DUNHAM CORPORATE/GOVERNMENT BOND FUND |
| SCHEDULE OF INVESTMENTS (Unaudited) (Continued) |
| April 30, 2023 |
| Shares | | | | | Fair Value | |
| | | | | SHORT-TERM INVESTMENTS — 3.4% | | | | |
| | | | | COLLATERAL FOR SECURITIES LOANED - 1.3% | | | | |
| | 1,642,388 | | | Mount Vernon Liquid Assets Portfolio, LLC, 4.96% (Cost $1,642,388)(g),(h) | | $ | 1,642,388 | |
| | | | | | | | | |
| | | | | MONEY MARKET FUNDS - 2.1% | | | | |
| | 2,594,194 | | | Fidelity Government Portfolio, CLASS I, 4.73% (Cost $2,594,194)(g) | | | 2,594,194 | |
| | | | | | | | | |
| | | | | TOTAL SHORT-TERM INVESTMENTS (Cost $4,215,544) | | | 4,215,544 | |
| | | | | | | | | |
| | | | | TOTAL INVESTMENTS - 100.9% (Cost $132,195,294) | | $ | 125,495,998 | |
| | | | | LIABILITIES IN EXCESS OF OTHER ASSETS - (0.9)% | | | (1,050,607 | ) |
| | | | | NET ASSETS - 100.0% | | $ | 124,445,391 | |
| LLC | - Limited Liability Company |
| | |
| LP | - Limited Partnership |
| | |
| LTD | - Limited Company |
| | |
| NV | - Naamioze Vennootschap |
| | |
| PLC | - Public Limited Company |
| | |
| REIT | - Real Estate Investment Trust |
| | |
| S/A | - Societe Anonyme |
| | |
| H15T10Y | US Treasury Yield Curve Rate T Note Constant Maturity 10 Year |
| | |
| H15T1Y | US Treasury Yield Curve Rate T Note Constant Maturity 1 Year |
| | |
| H15T5Y | US Treasury Yield Curve Rate T Note Constant Maturity 5 Year |
| | |
| SOFRINDX | Secured Overnight Financing Rate Compounded |
| | |
| SOFRRATE | Secured Overnight Financing Rate |
| | |
| TSFR1M | Secured Overnight Financing Rate 1 month |
| | |
| US0001M | ICE LIBOR USD 1 Month |
| | |
| US0003M | ICE LIBOR USD 3 Month |
| | |
| US0006M | ICE LIBOR USD 6 Month |
| | |
| (a) | Security exempt from registration under Rule 144A or Section 4(2) of the Securities Act of 1933. The security may be resold in transactions exempt from registration, normally to qualified institutional buyers. As of April 30, 2023 the total market value of 144A securities is 50,409,954 or 40.5% of net assets. |
| (b) | Variable rate security; the rate shown represents the rate on April 30, 2023 |
| (c) | Variable or floating rate security, the interest rate of which adjusts periodically based on changes in current interest rates and prepayments on the underlying pool of assets. |
| (d) | Step bond. Coupon rate is fixed rate that changes on a specified date. The rate shown is the current rate at April 30, 2023. |
| (e) | Percentage rounds to less than 0.1%. |
| (f) | All or a portion of these securities are on loan. Total loaned securities had a value of $1,619,708 at April 30, 2023. |
| (g) | Rate disclosed is the seven day effective yield as of April 30, 2023. |
| (h) | The Trust’s securities lending policies and procedures require that the borrower: deliver cash or U.S. Government securities as collateral with respect to each new loan of U.S. securities, equal to at least 102% of the value of the portfolio securities loaned, and (ii) at all times thereafter mark-to-market the collateral on a daily basis so that the market value of such collateral is at least 100% of the value of securities loaned. From time to time the collateral may not be 102% due to end of day market movement. The next business day additional collateral is obtained/received from the borrower to replenish/reestablish 102%. |
See accompanying notes which are an integral part of these financial statements.
| Dunham Floating Rate Bond Fund (Unaudited) |
| Message from the Sub-Adviser (PineBridge Investments, LLC) |
| |
Asset Class Recap
After one of the worst years for bond markets in decades, fixed coupon bonds meaningfully rebounded in the first fiscal quarter of the fiscal year as investment-grade corporate bonds, as measured by the Bloomberg US Credit Index, rose 8.9 percent, and high-yield bonds, as measured by the ICE BofA U.S. Cash Pay High-Yield Index, rose 5.1 percent. Although bonds with low -interest rate sensitivity, such as floating rate securities, generally sustained more minor losses in the 2022 fiscal year, the Morningstar LSTA US Leveraged Loan 100 Index, which is comprised of bank loans with coupons tied to a market reference rate such as LIBOR or SOFR, and Securitized asset pools, known as collateralized loan obligations (CLO), as measured by the Palmer Square CLO Debt Index, continued their resilient performance by increasing 5.1 percent and 6.7 percent, respectively, over the same time period. In the most recent fiscal quarter inflation appeared to ebb and the US economy showed signs of resilience. The strong performance carried into March until volatility spiked mid-month amid the turmoil in the banking sector. However, bank loans continued their ascent higher in April to close the most recent fiscal quarter, with spreads tightening as markets recovered from an indiscriminate sell-off following the events surrounding the banking turmoil. Technical factors acted as a tailwind for the asset class over the first half of the fiscal year as limited M&A (mergers and acquisitions) brought little net-new supply to the markets. Fundamentals also remained supportive during the period despite volatility as the percentage of market trading at distressed levels declined, and the default rate remained less than half of the market’s long-term average. Over the most recent fiscal quarter, bank loans and CLOs increased 1.2 percent and 1.7 percent, respectively, outpacing their fixed coupon high-yield bond counterparts, which added 0.3 percent and 0.8 percent, respectively.
Allocation Review
The Fund continued to primarily hold floating rate securities, which was predominately comprised of bank loans and CLOs. In aggregate, the Fund held approximately 91 percent in these two categories, with close to 9 percent allocated to CLOs and 82 percent allocated to bank loans. Contrary to the previous fiscal year, the Fund’s allocation to CLOs generally detracted from overall performance, as CLO issuance declined, and retail outflows continued to mount. The Fund also had approximately 8 percent allocated to fixed coupon high- yield corporate bonds, which slightly detracted from Fund performance. The Fund maintained a higher allocation to single-B and CCC rated securities versus the Morningstar LSTA US Leveraged Loan 100 Index. Similar to previous periods, the Fund’s lower exposure to BBB-rated bank loans was the largest underweight versus the benchmark index, as the Fund had no exposure to BBB-rated loans and the benchmark index had nearly 9 percent. The Fund’s largest credit quality overweight was in the single-B space, as the Fund had close to 71 percent exposure versus 63 percent in the benchmark index. The largest sector overweights were to the diversified financial services and consumer services sectors, while the largest underweights were to the software & services and telecommunications sectors. The Fund did not have any exposure to derivatives during the six-month period that meaningfully affected performance.
Holdings Insights
The largest exposure within the Fund was the allocation to variable rate securities, and despite a decline in interest rates, some of the best performing positions over the six-month period were variable rate securities. For example, the position in Wok Holdings, Inc. Floating Rate, due 03/01/2026 (BL2922831) (holding weight*: 1.00 percent), the operator of the P.F. Chang’s restaurant chain, was one of the strongest performing credits within the Fund. Over the six-month period, the price of the Wok Holdings, Inc. bank loan rose 5.5 percent. The allocation to the LBM Acquisition, LLC Floating Rate, Due 12/18/2027, a building material distributor, also contributed to positive Fund performance. The price of this credit increased 8.2 percent after it was announced that the company reached a definitive agreement to sell three of the company’s operating divisions. Within the exposure to CLOs, the positions in the THL Credit Wind River 2019-3 Ltd. (97314GAC5) (holding weight*: 1.09 percent), a manager that specializes in tradable credit and direct lending to middle-market companies, and Goldentree Loan Management US 2 Ltd. (38136PAA9) (holding weight*: 0.84 percent), a global asset manager, positively contributed to Fund performance. Over the six-month period, these positions rose in price by 7.2 percent and 9.2 percent, respectively.
Although many of the bank loans within the Fund rose during the period, some of the positions within the asset class meaningfully detracted from Fund performance. This included the Hornblower Sub, LLC Floating Rate, Due 04/27/2025 (BL3489657) (holding weight*: 1.05 percent), a charter yacht, dining cruise, and ferry service company, which saw its price decline 25.0 percent over the fiscal six-month period. Although the broader cruise market industry has begun to recover, the company’s exposure to the river cruise industry has adversely affected profitability for the company. The Sub-Adviser believes that the Hornblower Sub, LLC added too much capacity within this industry and failed to capture market share from the dominant players in this space. Another poor performing variable rate credit within the Fund was Team Health Holdings, Inc. Floating Rate, Due 02/17/2027 (BL3859172) (holding weight*: 0.67 percent), a US physician practice. Over the same period, the price of this loan fell 21.6 percent. In spite of the poor recent performance, the Sub-Adviser remains confident in the position as it believes the company is better positioned than its peers, and the headwinds for the industry are overblown.
Sub-Adviser Outlook
The Sub-Adviser believes that the economy appears on track for flat to modestly negative growth in the next few quarters; however, risk is increasingly skewed to the downside. The U.S. economy grew 1.1 percent on an annualized basis in the first calendar quarter, below forecasts of 1.9 percent and also negative when adjusting for inflation. Business surveys in April mirrored the slowdown in activity, and declining job openings reflect a normalizing labor market. Headline inflation also continued to decline for the March reporting period, according to the Consumer Price Index, but the core component excluding food & energy, remained steady and contributed to concerns that price pressures would take longer to abate. Despite stubborn inflation readings, investors largely expect a 25-basis point rate hike in May and anticipate it to be the last for the year, with over 100 basis points of cuts priced into Fed Fund futures through January 2024. In contrast to market expectations, the Sub-Adviser expects an extended pause for interest rates near current levels into the second half of 2023. Adding to the uncertainty for investors, the prolonged negotiations over the debt ceiling are contributing to dislocation within the Treasury Bill market, while the final collapse and acquisition of First Republic Bank (FRCB) (not held) just after month end has fueled fresh turmoil among regional banks. Within the loan market, the Sub-Adviser is confident that performance will likely remain bifurcated between higher and lower-quality bank loans as default activity continues to rise; however, issuer fundamentals remain healthy on the balance and limited net supply should keep any pressure on prices in check.
| * | Holdings percentage(s) of total investments, cash and unsettled trades excluding collateral for securities loaned as of 4/30/2023. |
| Dunham Floating Rate Bond Fund |
| PORTFOLIO REVIEW (Unaudited) |
| April 30, 2023 |
| |
The Fund’s performance figures* for each of the periods ended April 30, 2023, compared to its benchmarks:
| | | | Annualized | Annualized |
| | 6 Month Return | 1 Year Return | 5 Year Return | Since Inception (11/1/13) |
| Class N | 5.84% | 2.58% | 2.18% | 2.41% |
| Class A with Load 4.50% | 0.92% | (2.27)% | 0.98% | 1.66% |
| Class A without load | 5.71% | 2.32% | 1.92% | 2.15% |
| Class C | 5.45% | 1.93% | 1.42% | 1.65% |
| Morningstar LSTA U.S. Leveraged Loan 100 Index (a) | 6.35% | 3.25% | 3.47% | 3.34% |
| Morningstar Bank Loan Category (b) | 5.43% | 1.89% | 2.37% | 2.73% |
| | | | | |
| * | Total Returns are calculated based on traded NAVs. As disclosed in the Trust’s latest registration statement, the Fund’s total annual operating expenses, including cost of underlying funds, are 1.05% for Class N, 1.80% for Class C and 1.30% for Class A. Class A shares are subject to a sales load of 4.50% and a deferred sales charge of up to 0.75%. The performance data quoted here represents past performance, which is not indicative of future results. Current performance may be lower or higher than the performance data quoted. The investment return and NAV will fluctuate, so that an investor’s shares, when redeemed, may be worth more or less than their original cost. Total returns are calculated assuming reinvestment of all dividends and capital gains distributions, if any. The returns do not reflect the deductions of taxes a shareholder would pay on the redemption of Fund shares or Fund distributions. For performance information current to the most recent month-end, please call 1-800-442-4358 or visit our website www.dunham.com. |
| (a) | The Morningstar LSTA U.S. Leveraged Loan 100 Index is designed to reflect the performance of the largest facilities in the leveraged loan market. Investors cannot invest directly in an index or benchmark. |
| (a) | The Morningstar LSTA US Leveraged Loan 100 Index is designed to measure the performance of the 100 largest facilities in the US leveraged loan market. Underpinned by PitchBook | LCD data, the index brings transparency to the performance, activity, and key characteristics of the most tradeable loans in the market |
| (b) | The Morningstar Bank Loan Category is generally representative of mutual funds that primarily invest in floating-rate bank loans instead of bonds. These bank loans generally offer interest payments that typically float above a common short-term benchmark such as the London interbank offered rate (LIBOR), or the Secured Overnight Financing Rate (SOFR). |
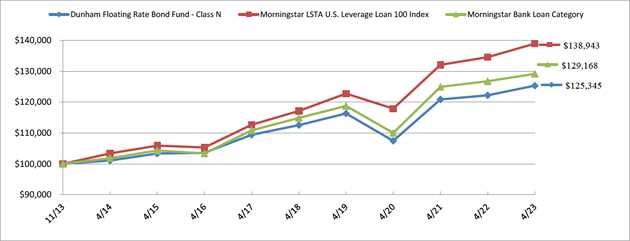
| Portfolio Composition * (Unaudited) |
| Term Loans | | | 78.8 | % |
| Asset Backed Securities | | | 9.5 | % |
| Corporate Bonds | | | 8.4 | % |
| Collateral for Securities Loaned | | | 2.3 | % |
| Short-Term Investment | | | 0.8 | % |
| Common Stock | | | 0.2 | % |
| Warrant | | | 0.0 | % |
| Right | | | 0.0 | % |
| Total | | | 100.0 | % |
| | | | | |
* Based on total value of investments as of April 30, 2023. Does not include derivative holdings.
Percentage may differ from Schedule of Investments which are based on Fund net assets.
| DUNHAM FLOATING RATE BOND FUND |
| SCHEDULE OF INVESTMENTS (Unaudited) |
| April 30, 2023 |
| Shares | | | | | Fair Value | |
| | | | | COMMON STOCK — 0.2% | | | | |
| | | | | METALS & MINING - 0.2% | | | | |
| | 23,114 | | | Covia Holdings, LLC(a) | | $ | 308,191 | |
| | | | | | | | | |
| | | | | TOTAL COMMON STOCK (Cost $183,467) | | | 308,191 | |
| Principal | | | | | | | Coupon Rate | | | | | |
| Amount ($) | | | | | Spread | | (%) | | Maturity | | Fair Value | |
| | | | | ASSET BACKED SECURITIES — 9.6% | | | | | | | | | | |
| | | | | CLO — 9.6% | | | | | | | | | | |
| | 1,500,000 | | | Apidos CLO XX Series 2015-20A DR(b),(c) | | US0003M + 5.700% | | 10.9600 | | 07/16/31 | | | 1,278,456 | |
| | 1,540,000 | | | Atrium IX Series 9A ER(b),(c) | | US0003M + 6.450% | | 11.4030 | | 05/28/30 | | | 1,366,775 | |
| | 2,900,000 | | | Benefit Street Partners CLO II Ltd. Series 2013-IIA DR(b),(c) | | US0003M + 6.550% | | 11.8100 | | 07/15/29 | | | 2,586,228 | |
| | 2,000,000 | | | Benefit Street Partners CLO III Ltd. Series 2013-IIIA DR(b),(c) | | US0003M + 6.600% | | 11.8500 | | 07/20/29 | | | 1,848,893 | |
| | 2,000,000 | | | Benefit Street Partners Clo XII Ltd. Series 2017-12A D(b),(c) | | US0003M + 6.410% | | 11.6700 | | 10/15/30 | | | 1,841,348 | |
| | 250,000 | | | CIFC Funding 2013-II Ltd. Series 2013-2A B2LR(b),(c) | | US0003M + 6.520% | | 11.7820 | | 10/18/30 | | | 212,060 | |
| | 275,000 | | | CIFC Funding 2017-I Ltd. Series 2017-1A E(b),(c) | | US0003M + 6.350% | | 11.6110 | | 04/23/29 | | | 256,847 | |
| | 1,250,000 | | | Goldentree Loan Management US Clo 2 Ltd. Series 2017-2A E(b),(c) | | US0003M + 4.700% | | 9.9500 | | 11/28/30 | | | 1,119,148 | |
| | 1,505,000 | | | THL Credit Wind River 2014-2 CLO Ltd. Series 2014-2A ER(b),(c) | | US0003M + 5.750% | | 11.0100 | | 01/15/31 | | | 1,059,278 | |
| | 1,750,000 | | | THL Credit Wind River 2019-3 Clo Ltd. Series 2019-3A E2R(b),(c) | | US0003M + 6.750% | | 12.0100 | | 04/15/31 | | | 1,463,508 | |
| | | | | | | | | | | | | | 13,032,541 | |
| | | | | TOTAL ASSET BACKED SECURITIES (Cost $14,571,436) | | 13,032,541 | |
| | | | | | | | | | | | | | | |
| Principal | | | | | | | Coupon Rate | | | | | |
| Amount ($) | | | | | Spread | | (%) | | Maturity | | Fair Value | |
| | | | | CORPORATE BONDS — 8.5% | | | | | | | | | | |
| | | | | CABLE & SATELLITE — 0.2% | | | | | | | | | | |
| | 500,000 | | | CSC Holdings, LLC(b) | | | | 5.7500 | | 01/15/30 | | | 255,451 | |
| | | | | | | | | | | | | | | |
| | | | | CHEMICALS — 0.3% | | | | | | | | | | |
| | 500,000 | | | Consolidated Energy Finance S.A.(b) | | | | 5.6250 | | 10/15/28 | | | 439,993 | |
| | | | | | | | | | | | | | | |
| | | | | COMMERCIAL SUPPORT SERVICES — 0.3% | | | | | | | | | | |
| | 450,000 | | | Deluxe Corporation(b) | | | | 8.0000 | | 06/01/29 | | | 348,121 | |
| | | | | | | | | | | | | | | |
| | | | | CONSUMER SERVICES — 0.3% | | | | | | | | | | |
| | 437,000 | | | PROG Holdings, Inc.(b),(d) | | | | 6.0000 | | 11/15/29 | | | 393,722 | |
| | | | | | | | | | | | | | | |
See accompanying notes which are an integral part of these financial statements.
| DUNHAM FLOATING RATE BOND FUND |
| SCHEDULE OF INVESTMENTS (Unaudited) (Continued) |
| April 30, 2023 |
| Principal | | | | | | | Coupon Rate | | | | | |
| Amount ($) | | | | | Spread | | (%) | | Maturity | | Fair Value | |
| | | | | CORPORATE BONDS — 8.5% (Continued) | | | | | | | | | | |
| | | | | ELECTRIC UTILITIES — 0.3% | | | | | | | | | | |
| | 471,000 | | | Calpine Corporation(b) | | | | 5.0000 | | 02/01/31 | | $ | 397,373 | |
| | | | | | | | | | | | | | | |
| | | | | ENTERTAINMENT CONTENT — 0.3% | | | | | | | | | | |
| | 424,000 | | | Paramount Global(e) | | H15T5Y + 3.999% | | 6.3750 | | 03/30/62 | | | 360,875 | |
| | | | | | | | | | | | | | | |
| | | | | FOOD — 0.3% | | | | | | | | | | |
| | 524,000 | | | HLF Financing Sarl, LLC / Herbalife International,(b) | | | | 4.8750 | | 06/01/29 | | | 401,651 | |
| | | | | | | | | | | | | | | |
| | | | | HEALTH CARE FACILITIES & SERVICES — 0.3% | | | | | | | | | | |
| | 459,000 | | | CHS/Community Health Systems, Inc.(b) | | | | 5.6250 | | 03/15/27 | | | 424,194 | |
| | | | | | | | | | | | | | | |
| | | | | LEISURE FACILITIES & SERVICES — 1.2% | | | | | | | | | | |
| | 440,000 | | | Carnival Corporation(b),(d) | | | | 10.5000 | | 06/01/30 | | | 417,931 | |
| | 439,000 | | | CEC Entertainment Company, LLC(b) | | | | 6.7500 | | 05/01/26 | | | 417,707 | |
| | 502,000 | | | NCL Corporation Ltd.(b),(d) | | | | 7.7500 | | 02/15/29 | | | 425,663 | |
| | 523,000 | | | Royal Caribbean Cruises Ltd.(b),(d) | | | | 5.5000 | | 04/01/28 | | | 461,962 | |
| | | | | | | | | | | | | | 1,723,263 | |
| | | | | OIL & GAS PRODUCERS — 1.5% | | | | | | | | | | |
| | 422,000 | | | Genesis Energy, L.P. / Genesis Energy Finance(d) | | | | 8.0000 | | 01/15/27 | | | 421,550 | |
| | 416,000 | | | Howard Midstream Energy Partners, LLC(b) | | | | 6.7500 | | 01/15/27 | | | 388,620 | |
| | 424,000 | | | Independence Energy Finance, LLC(b) | | | | 7.2500 | | 05/01/26 | | | 406,703 | |
| | 494,000 | | | ITT Holdings, LLC(b) | | | | 6.5000 | | 08/01/29 | | | 410,655 | |
| | 450,000 | | | Strathcona Resources Ltd.(b),(d) | | | | 6.8750 | | 08/01/26 | | | 381,063 | |
| | | | | | | | | | | | | | 2,008,591 | |
| | | | | REAL ESTATE INVESTMENT TRUSTS — 0.2% | | | | | | | | | | |
| | 514,000 | | | Service Properties Trust | | | | 4.3750 | | 02/15/30 | | | 382,948 | |
| | | | | | | | | | | | | | | |
| | | | | REAL ESTATE OWNERS & DEVELOPERS — 0.3% | | | | | | | | | | |
| | 458,000 | | | Kennedy-Wilson, Inc. | | | | 4.7500 | | 03/01/29 | | | 365,944 | |
| | | | | | | | | | | | | | | |
| | | | | RETAIL - DISCRETIONARY — 0.6% | | | | | | | | | | |
| | 474,000 | | | Ken Garff Automotive, LLC(b) | | | | 4.8750 | | 09/15/28 | | | 414,319 | |
| | | | | | | | | | | | | | | |
See accompanying notes which are an integral part of these financial statements.
| DUNHAM FLOATING RATE BOND FUND |
| SCHEDULE OF INVESTMENTS (Unaudited) (Continued) |
| April 30, 2023 |
| Principal | | | | | | | Coupon Rate | | | | | |
| Amount ($) | | | | | Spread | | (%) | | Maturity | | Fair Value | |
| | | | | CORPORATE BONDS — 8.5% (Continued) | | | | | | | | | | |
| | | | | RETAIL - DISCRETIONARY — 0.6% (Continued) | | | | | | |
| | 370,000 | | | Specialty Building Products Holdings, LLC / SBP(b) | | | | 6.3750 | | 09/30/26 | | $ | 336,217 | |
| | | | | | | | | | | | | | 750,536 | |
| | | | | SOFTWARE — 0.2% | | | | | | | | | | |
| | 380,000 | | | Helios Software Holdings, Inc. / ION Corporate(b) | | | | 4.6250 | | 05/01/28 | | | 319,746 | |
| | | | | | | | | | | | | | | |
| | | | | SPECIALTY FINANCE — 0.8% | | | | | | | | | | |
| | 505,000 | | | Apollo Commercial Real Estate Finance, Inc.(b),(d) | | | | 4.6250 | | 06/15/29 | | | 382,474 | |
| | 216,000 | | | Burford Capital Global Finance, LLC(b) | | | | 6.2500 | | 04/15/28 | | | 203,306 | |
| | 236,000 | | | Burford Capital Global Finance, LLC(b) | | | | 6.8750 | | 04/15/30 | | | 219,708 | |
| | 500,000 | | | Cobra AcquisitionCo, LLC(b) | | | | 6.3750 | | 11/01/29 | | | 290,163 | |
| | | | | | | | | | | | | | 1,095,651 | |
| | | | | TECHNOLOGY SERVICES — 0.3% | | | | | | | | | | |
| | 475,000 | | | ION Trading Technologies Sarl(b) | | | | 5.7500 | | 05/15/28 | | | 397,960 | |
| | | | | | | | | | | | | | | |
| | | | | TELECOMMUNICATIONS — 0.8% | | | | | | | | | | |
| | 500,000 | | | Altice France S.A.(b) | | | | 5.5000 | | 10/15/29 | | | 374,751 | |
| | 464,000 | | | Sable International Finance Ltd.(b) | | | | 5.7500 | | 09/07/27 | | | 437,946 | |
| | 550,000 | | | Telesat Canada / Telesat, LLC(b),(d) | | | | 4.8750 | | 06/01/27 | | | 294,914 | |
| | | | | | | | | | | | | | 1,107,611 | |
| | | | | WHOLESALE - CONSUMER STAPLES — 0.3% | | | | | | | | | | |
| | 571,000 | | | C&S Group Enterprises, LLC(b) | | | | 5.0000 | | 12/15/28 | | | 447,089 | |
| | | | | | | | | | | | | | | |
| | | | | TOTAL CORPORATE BONDS (Cost $13,558,818) | | | | | 11,620,719 | |
| | | | | | | | | | | | | | | |
| Principal | | | | | | | Coupon Rate | | | | | |
| Amount ($) | | | | | Spread | | (%) | | Maturity | | Fair Value | |
| | | | | TERM LOANS — 79.5% | | | | | | | | | | |
| | | | | AEROSPACE & DEFENSE — 1.4% | | | | | | | | | | |
| | 768,474 | | | Dynasty Acquisition Company, Inc.(c) | | US0001M + 3.500% | | 8.4070 | | 04/08/26 | | | 756,144 | |
| | 735,620 | | | Spirit AeroSystems, Inc.(c) | | TSFR1M + 4.157% | | 9.1760 | | 11/23/27 | | | 734,127 | |
| | 413,158 | | | Standard Aero Ltd.(c) | | US0001M + 3.500% | | 8.4070 | | 04/08/26 | | | 406,529 | |
| | | | | | | | | | | | | | 1,896,800 | |
| | | | | APPAREL & TEXTILE PRODUCTS — 0.5% | | | | | | | | | | |
| | 728,951 | | | Birkenstock US BidCo, Inc.(c) | | US0001M + 3.001% | | 8.0640 | | 04/28/28 | | | 724,322 | |
| | | | | | | | | | | | | | | |
See accompanying notes which are an integral part of these financial statements.
| DUNHAM FLOATING RATE BOND FUND |
| SCHEDULE OF INVESTMENTS (Unaudited) (Continued) |
| April 30, 2023 |
| Principal | | | | | | | Coupon Rate | | | | | |
| Amount ($) | | | | | Spread | | (%) | | Maturity | | Fair Value | |
| | | | | TERM LOANS — 79.5% (Continued) | | | | | | | | | | |
| | | | | ASSET MANAGEMENT — 3.3% | | | | | | | | | | |
| | 1,180,846 | | | Advisor Group Holdings, Inc.(c) | | US0001M + 4.500% | | 9.3400 | | 07/31/26 | | $ | 1,175,480 | |
| | 1,183,985 | | | Hightower Holding, LLC(c) | | US0001M + 3.948% | | 9.0100 | | 04/21/28 | | | 1,139,958 | |
| | 1,096,220 | | | Nexus Buyer, LLC(c) | | US0001M + 3.750% | | 8.5900 | | 11/08/26 | | | 1,038,076 | |
| | 1,190,835 | | | NFP Corporation(c) | | US0001M + 3.028% | | 8.0900 | | 02/04/27 | | | 1,167,679 | |
| | | | | | | | | | | | | | 4,521,193 | |
| | | | | AUTOMOTIVE — 0.8% | | | | | | | | | | |
| | 1,188,000 | | | Dexko Global, Inc.(c) | | US0001M + 3.750% | | 8.9090 | | 09/24/28 | | | 1,133,209 | |
| | | | | | | | | | | | | | | |
| | | | | BEVERAGES — 1.0% | | | | | | | | | | |
| | 1,346,120 | | | Pegasus Bidco BV(c) | | TSFR1M + 3.992% | | 9.0110 | | 05/05/29 | | | 1,338,549 | |
| | | | | | | | | | | | | | | |
| | | | | BIOTECH & PHARMA — 0.6% | | | | | | | | | | |
| | 769,301 | | | Curium Bidco Sarl(c) | | US0001M + 4.250% | | 9.4090 | | 09/10/27 | | | 761,608 | |
| | | | | | | | | | | | | | | |
| | | | | CABLE & SATELLITE — 1.3% | | | | | | | | | | |
| | 1,191,852 | | | CSC Holdings, LLC(c) | | US0003M + 4.087% | | 9.3900 | | 07/17/25 | | | 1,098,989 | |
| | 650,000 | | | UPC Financing Partnership(c) | | US0001M + 3.000% | | 7.8730 | | 01/31/29 | | | 642,821 | |
| | | | | | | | | | | | | | 1,741,810 | |
| | | | | CHEMICALS — 2.8% | | | | | | | | | | |
| | 698,177 | | | ASP Unifrax Holdings, Inc.(c) | | US0003M + 3.607% | | 8.9090 | | 11/05/25 | | | 645,936 | |
| | 1,398,389 | | | Groupe Solmax, Inc.(c) | | US0001M + 4.750% | | 9.9090 | | 07/23/28 | | | 1,260,592 | |
| | 1,274,062 | | | Iris Holding, Inc.(c) | | TSFR1M + 4.507% | | 9.5260 | | 06/15/28 | | | 1,146,496 | |
| | 1,049,246 | | | NIC Acquisition Corporation(c) | | US0001M + 3.750% | | 8.9100 | | 01/14/28 | | | 805,296 | |
| | | | | | | | | | | | | | 3,858,320 | |
| | | | | COMMERCIAL SUPPORT SERVICES — 3.8% | | | | | | | | | | |
| | 775,982 | | | Amentum Government Services Holdings, LLC(c) | | SOFRRATE + 4.000% | | 8.7640 | | 02/07/29 | | | 746,883 | |
| | 1,182,000 | | | APX Group, Inc.(c) | | US0001M + 2.500% | | 8.2480 | | 07/01/28 | | | 1,182,963 | |
| | 989,752 | | | Creative Artists Agency, LLC(c) | | TSFR1M + 3.607% | | 8.3070 | | 11/16/28 | | | 988,930 | |
| | 1,121,462 | | | Garda World Security Corporation(c) | | US0001M + 4.250% | | 9.1090 | | 10/30/26 | | | 1,120,996 | |
| | 1,181,955 | | | Sotheby’s(c) | | US0001M + 4.500% | | 9.7600 | | 01/15/27 | | | 1,182,694 | |
| | | | | | | | | | | | | | 5,222,466 | |
| | | | | | | | | | | | | | | |
See accompanying notes which are an integral part of these financial statements.
| DUNHAM FLOATING RATE BOND FUND |
| SCHEDULE OF INVESTMENTS (Unaudited) (Continued) |
| April 30, 2023 |
| Principal | | | | | | | Coupon Rate | | | | | |
| Amount ($) | | | | | Spread | | (%) | | Maturity | | Fair Value | |
| | | | | TERM LOANS — 79.5% (Continued) | | | | | | | | | | |
| | | | | CONSTRUCTION MATERIALS — 2.0% | | | | | | | | | | |
| | 1,096,897 | | | Foley Products Company, LLC(c) | | SOFRRATE + 4.750% | | 9.7980 | | 02/10/29 | | $ | 1,090,042 | |
| | 883,563 | | | Quikrete Holdings, Inc.(c) | | US0001M + 3.000% | | 7.8400 | | 06/11/28 | | | 881,150 | |
| | 772,306 | | | US Silica Company(c) | | TSFR1M + 4.613% | | 9.6320 | | 03/17/30 | | | 762,652 | |
| | | | | | | | | | | | | | 2,733,844 | |
| | | | | CONSUMER SERVICES — 0.9% | | | | | | | | | | |
| | 1,180,509 | | | Mckissock Investment Holdings, LLC(c) | | SOFRRATE + 5.000% | | 10.0540 | | 03/04/29 | | | 1,160,588 | |
| | | | | | | | | | | | | | | |
| | | | | CONTAINERS & PACKAGING — 3.0% | | | | | | | | | | �� |
| | 1,181,306 | | | Clydesdale Acquisition Holdings, Inc.(c) | | TSFR1M + 4.250% | | 9.0820 | | 03/30/29 | | | 1,156,203 | |
| | 1,272,034 | | | LABL, Inc.(c) | | US0001M + 5.000% | | 9.8400 | | 10/22/28 | | | 1,256,203 | |
| | 1,187,251 | | | Patriot Container Corporation(c) | | US0003M + 3.750% | | 8.6570 | | 03/16/25 | | | 1,097,097 | |
| | 586,412 | | | Trident TPI Holdings, Inc.(c) | | US0001M + 4.000% | | 9.1590 | | 09/17/28 | | | 571,661 | |
| | | | | | | | | | | | | | 4,081,164 | |
| | | | | E-COMMERCE DISCRETIONARY — 1.1% | | | | | | | | | | |
| | 1,040,785 | | | CNT Holdings I Corporation(c) | | US0001M + 3.500% | | 8.4590 | | 10/16/27 | | | 1,032,250 | |
| | 524,000 | | | CNT Holdings I Corporation(c) | | US0001M + 6.647% | | 11.7090 | | 11/06/28 | | | 499,110 | |
| | | | | | | | | | | | | | 1,531,360 | |
| | | | | ELECTRIC UTILITIES — 0.0%(f) | | | | | | | | | | |
| | 635,000 | | | Texas Competitive Electric Holdings Company, LLC /(g) | | | | — | | 11/22/49 | | | — | |
| | | | | | | | | | | | | | | |
| | | | | ELECTRICAL EQUIPMENT — 0.6% | | | | | | | | | | |
| | 668,410 | | | Icebox Holdco III, Inc.(c) | | US0001M + 3.750% | | 8.6590 | | 12/22/28 | | | 643,414 | |
| | 179,825 | | | Icebox Holdco III, Inc.(c) | | US0001M + 6.750% | | 11.9090 | | 12/15/29 | | | 160,044 | |
| | | | | | | | | | | | | | 803,458 | |
| | | | | ENGINEERING & CONSTRUCTION — 0.9% | | | | | | | | | | |
| | 1,182,000 | | | USIC Holdings, Inc.(c) | | US0001M + 3.500% | | 8.3400 | | 05/14/28 | | | 1,161,936 | |
| | | | | | | | | | | | | | | |
| | | | | ENTERTAINMENT CONTENT — 1.6% | | | | | | | | | | |
| | 1,181,491 | | | NEP Group, Inc.(c) | | US0003M + 3.250% | | 8.0900 | | 10/20/25 | | | 1,111,051 | |
| | 1,117,539 | | | Univision Communications, Inc.(c) | | TSFR1M + 4.130% | | 9.1480 | | 06/10/29 | | | 1,110,554 | |
| | | | | | | | | | | | | | 2,221,605 | |
| | | | | | | | | | | | | | | |
See accompanying notes which are an integral part of these financial statements.
| DUNHAM FLOATING RATE BOND FUND |
| SCHEDULE OF INVESTMENTS (Unaudited) (Continued) |
| April 30, 2023 |
| Principal | | | | | | | Coupon Rate | | | | | |
| Amount ($) | | | | | Spread | | (%) | | Maturity | | Fair Value | |
| | | | | TERM LOANS — 79.5% (Continued) | | | | | | | | | | |
| | | | | HEALTH CARE FACILITIES & SERVICES — 4.0% | | | | | | | | | | |
| | 1,182,000 | | | Bella Holding Company, LLC(c) | | US0001M + 3.750% | | 8.6570 | | 04/01/28 | | $ | 1,149,330 | |
| | 1,180,644 | | | Corgi BidCo, Inc.(c) | | TSFR1M + 4.880 | | 9.8980 | | 09/20/29 | | | 1,114,233 | |
| | 1,191,292 | | | Milano Acquisition Corporation(c) | | US0001M + 4.000% | | 8.9980 | | 08/17/27 | | | 1,151,091 | |
| | 997,022 | | | Phoenix Newco, Inc.(c) | | US0001M + 3.250% | | 8.0900 | | 08/11/28 | | | 981,384 | |
| | 325,000 | | | Team Health Holdings, Inc.(c) | | US0003M + 2.288% | | 7.5900 | | 01/12/24 | | | 275,527 | |
| | 1,363,436 | | | Team Health Holdings, Inc.(c) | | SOFRRATE + 5.250% | | 10.0570 | | 02/17/27 | | | 895,777 | |
| | | | | | | | | | | | | | 5,567,342 | |
| | | | | INDUSTRIAL INTERMEDIATE PROD — 0.5% | | | | | | | | | | |
| | 644,037 | | | Crosby US Acquisition Corporation(c) | | TSFR1M + 5.052% | | 10.0710 | | 06/27/26 | | | 632,767 | |
| | | | | | | | | | | | | | | |
| | | | | INSTITUTIONAL FINANCIAL SERVICES — 0.9% | | | | | | | | | | |
| | 1,177,775 | | | Aretec Group, Inc.(c) | | US0003M + 4.250% | | 9.1570 | | 10/01/25 | | | 1,174,412 | |
| | | | | | | | | | | | | | | |
| | | | | INSURANCE — 3.3% | | | | | | | | | | |
| | 1,177,647 | | | Alliant Holdings Intermediate, LLC(c) | | US0001M + 3.448% | | 8.5100 | | 11/06/27 | | | 1,169,209 | |
| | 455,920 | | | Asurion, LLC(c) | | US0001M + 3.250% | | 8.0900 | | 12/18/26 | | | 427,140 | |
| | 662,151 | | | Asurion, LLC(c) | | US0001M + 3.250% | | 8.0900 | | 07/28/27 | | | 613,595 | |
| | 355,000 | | | Asurion, LLC(c) | | US0001M + 5.250% | | 10.0900 | | 01/29/28 | | | 298,349 | |
| | 365,000 | | | Asurion, LLC(c) | | US0001M + 5.250% | | 10.0900 | | 01/14/29 | | | 304,129 | |
| | 550,435 | | | BroadStreet Partners, Inc.(c) | | TSFR1M + 3.952% | | 8.9710 | | 01/26/29 | | | 546,651 | |
| | 1,230,588 | | | Sedgwick Claims Management Services, Inc.(c) | | TSFR1M + 3.538% | | 8.5570 | | 02/17/28 | | | 1,218,965 | |
| | | | | | | | | | | | | | 4,578,038 | |
| | | | | LEISURE FACILITIES & SERVICES — 6.6% | | | | | | | | | | |
| | 1,738,979 | | | Aimbridge Acquisition Company, Inc.(c) | | US0003M + 3.750% | | 8.5900 | | 02/01/26 | | | 1,644,430 | |
| | 520,349 | | | Carnival Corporation(c) | | US0001M + 3.000% | | 8.0250 | | 06/30/25 | | | 518,398 | |
| | 638,339 | | | Carnival Corporation(c) | | US0001M + 3.250% | | 8.0900 | | 10/08/28 | | | 628,499 | |
| | 1,337,443 | | | Dave & Buster’s, Inc.(c) | | TSFR1M + 4.919% | | 9.9380 | | 06/23/29 | | | 1,339,951 | |
| | 1,194,857 | | | Fogo De Chao, Inc.(c) | | US0003M + 4.250% | | 9.0900 | | 04/05/25 | | | 1,172,609 | |
| | 2,541,343 | | | Hornblower Sub, LLC(c) | | US0001M + 4.500% | | 9.7100 | | 04/27/25 | | | 1,412,834 | |
| | 865,646 | | | Playa Resorts Holding BV(c) | | TSFR1M + 4.121% | | 9.1400 | | 11/22/28 | | | 865,525 | |
| | | | | | | | | | | | | | | |
See accompanying notes which are an integral part of these financial statements.
| DUNHAM FLOATING RATE BOND FUND |
| SCHEDULE OF INVESTMENTS (Unaudited) (Continued) |
| April 30, 2023 |
| Principal | | | | | | | Coupon Rate | | | | | |
| Amount ($) | | | | | Spread | | (%) | | Maturity | | Fair Value | |
| | | | | TERM LOANS — 79.5% (Continued) | | | | | | | | | | |
| | | | | LEISURE FACILITIES & SERVICES — 6.6% (Continued) | | | | | | |
| | 1,448,453 | | | Wok Holdings, Inc.(c) | | US0003M + 6.250% | | 11.3400 | | 03/01/26 | | $ | 1,341,637 | |
| | | | | | | | | | | | | | 8,923,883 | |
| | | | | LEISURE PRODUCTS — 1.1% | | | | | | | | | | |
| | 1,574,414 | | | Varsity Brands Holding Company, Inc.(c) | | US0003M + 3.500% | | 9.8740 | | 12/15/24 | | | 1,479,950 | |
| | | | | | | | | | | | | | | |
| | | | | MACHINERY — 1.5% | | | | | | | | | | |
| | 821,767 | | | Alliance Laundry Systems, LLC(c) | | US0001M + 3.500% | | 8.5590 | | 09/30/27 | | | 818,172 | |
| | 1,181,299 | | | STS Operating, Inc.(c) | | US0003M + 4.250% | | 9.0900 | | 12/07/24 | | | 1,178,346 | |
| | | | | | | | | | | | | | 1,996,518 | |
| | | | | MEDICAL EQUIPMENT & DEVICES — 1.5% | | | | | | | | | | |
| | 1,566,135 | | | Mozart Borrower, L.P.(c) | | US0001M + 3.250% | | 8.0900 | | 09/30/28 | | | 1,522,307 | |
| | 504,384 | | | Sotera Health Holdings, LLC(c) | | TSFR1M + 3.797% | | 8.8160 | | 12/11/26 | | | 502,493 | |
| | | | | | | | | | | | | | 2,024,800 | |
| | | | | OIL & GAS PRODUCERS — 3.4% | | | | | | | | | | |
| | 1,547,291 | | | CQP Holdco, L.P.(c) | | US0001M + 3.750% | | 8.6590 | | 06/04/28 | | | 1,546,038 | |
| | 783,498 | | | EG America, LLC(c) | | US0003M + 4.000% | | 8.8400 | | 02/05/25 | | | 759,601 | |
| | 1,169,840 | | | M6 ETX Holdings II Midco, LLC(c) | | TSFR1M + 4.527% | | 9.5460 | | 08/11/29 | | | 1,162,774 | |
| | 1,185,056 | | | Medallion Midland Acquisition, L.P.(c) | | US0001M + 3.750% | | 8.9100 | | 10/14/28 | | | 1,175,132 | |
| | | | | | | | | | | | | | 4,643,545 | |
| | | | | OIL & GAS SERVICES & EQUIPMENT — 0.0%(f) | | | | | | | | | | |
| | 1,140 | | | Paragon Offshore Finance Company(c) | | US0003M + 0.000% | | 5.0000 | | 07/15/22 | | | — | |
| | | | | | | | | | | | | | | |
| | | | | PUBLISHING & BROADCASTING — 0.6% | | | | | | | | | | |
| | 1,004,739 | | | Sinclair Television Group, Inc.(c) | | TSFR1M + 3.750% | | 8.6570 | | 04/13/29 | | | 843,981 | |
| | | | | | | | | | | | | | | |
| | | | | REAL ESTATE INVESTMENT TRUSTS — 0.8% | | | | | | | | | | |
| | 1,185,000 | | | Claros Mortgage Trust, Inc.(c) | | US0001M + 4.500% | | 9.4900 | | 08/09/26 | | | 1,028,977 | |
| | | | | | | | | | | | | | | |
| | | | | RETAIL - DISCRETIONARY — 3.4% | | | | | | | | | | |
| | 867,105 | | | Hertz Corporation (The)(c) | | US0001M + 3.250% | | 8.0900 | | 06/14/28 | | | 865,588 | |
| | 1,177,307 | | | JP Intermediate B, LLC(c) | | US0003M + 5.500% | | 10.3250 | | 11/20/25 | | | 630,836 | |
| | 1,275,850 | | | LBM Acquisition, LLC(c) | | US0001M + 3.750% | | 8.5900 | | 12/18/27 | | | 1,188,997 | |
| | | | | | | | | | | | | | | |
See accompanying notes which are an integral part of these financial statements.
| DUNHAM FLOATING RATE BOND FUND |
| SCHEDULE OF INVESTMENTS (Unaudited) (Continued) |
| April 30, 2023 |
| Principal | | | | | | | Coupon Rate | | | | | |
| Amount ($) | | | | | Spread | | (%) | | Maturity | | Fair Value | |
| | | | | TERM LOANS — 79.5% (Continued) | | | | | | | | | | |
| | | | | RETAIL - DISCRETIONARY — 3.4% (Continued) | | | | | | |
| | 1,020,904 | | | Park River Holdings, Inc.(c) | | US0001M + 3.460% | | 8.5220 | | 01/22/28 | | $ | 956,914 | |
| | 524,242 | | | Petco Health & Wellness Company, Inc.(c) | | US0001M + 3.250% | | 8.4100 | | 02/25/28 | | | 517,657 | |
| | 512,200 | | | PetSmart, Inc.(c) | | US0003M + 3.750% | | 8.6570 | | 01/29/28 | | | 510,599 | |
| | | | | | | | | | | | | | 4,670,591 | |
| | | | | SOFTWARE — 12.5% | | | | | | | | | | |
| | 706,560 | | | Applied Systems, Inc.(c) | | US0003M + 2.000% | | 9.3980 | | 09/19/24 | | | 708,824 | |
| | 190,250 | | | Applied Systems, Inc.(c) | | US0001M + 5.500% | | 11.6480 | | 09/19/25 | | | 191,044 | |
| | 139,606 | | | athenahealth, Inc.(c) | | SOFRRATE + 0.000% | | 3.5000 | | 01/27/29 | | | 131,280 | |
| | 1,136,418 | | | athenahealth, Inc.(c) | | SOFRRATE + 3.500% | | 8.4640 | | 01/27/29 | | | 1,068,637 | |
| | 1,182,201 | | | Barracuda Networks, Inc.(c) | | TSFR1M + 4.157% | | 9.1760 | | 08/15/29 | | | 1,149,874 | |
| | 1,155,223 | | | Central Parent, Inc.(c) | | TSFR1M + 4.130% | | 9.1480 | | 06/09/29 | | | 1,155,530 | |
| | 1,805,555 | | | Condor Merger Sub, Inc.(c) | | SOFRRATE + 4.000% | | 8.6530 | | 02/03/29 | | | 1,706,899 | |
| | 590,863 | | | Dcert Buyer, Inc.(c) | | US0003M + 4.000% | | 8.6960 | | 08/08/26 | | | 586,402 | |
| | 600,000 | | | Dcert Buyer, Inc.(c) | | US0001M + 7.000% | | 11.6960 | | 02/16/29 | | | 557,061 | |
| | 1,183,689 | | | Epicor Software Corporation(c) | | US0001M + 3.250% | | 8.0900 | | 07/31/27 | | | 1,170,657 | |
| | 1,776,238 | | | Greeneden US Holdings II, LLC(c) | | US0001M + 4.000% | | 8.8400 | | 10/08/27 | | | 1,762,551 | |
| | 300,000 | | | Helios Software Holdings, Inc.(c) | | US0001M + 3.750% | | 8.6570 | | 03/11/28 | | | 294,321 | |
| | 1,089,607 | | | MedAssets Software Intermediate Holdings, Inc.(c) | | US0001M + 4.000% | | 8.8400 | | 11/19/28 | | | 941,835 | |
| | 121,719 | | | MedAssets Software Intermediate Holdings, Inc.(c) | | US0001M + 6.750% | | 11.5900 | | 11/19/29 | | | 87,105 | |
| | 1,181,633 | | | Project Boost Purchaser, LLC(c) | | US0003M + 3.500% | | 8.3400 | | 05/30/26 | | | 1,175,169 | |
| | 1,175,125 | | | Proofpoint, Inc.(c) | | US0001M + 3.250% | | 8.0900 | | 06/10/28 | | | 1,151,376 | |
| | 1,084,117 | | | RealPage, Inc.(c) | | US0001M + 3.250% | | 7.8400 | | 02/18/28 | | | 1,054,646 | |
| | 777,202 | | | Sophia, L.P.(c) | | US0003M + 3.250% | | 8.6590 | | 09/23/27 | | | 768,458 | |
| | 266,331 | | | Sophia, L.P.(c) | | SOFRRATE + 4.250% | | 9.0570 | | 10/07/27 | | | 264,584 | |
| | 1,181,633 | | | Ultimate Software Group, Inc. (The)(c) | | US0003M + 3.750% | | 8.5750 | | 04/08/26 | | | 1,164,310 | |
| | | | | | | | | | | | | | 17,090,563 | |
| | | | | SPECIALTY FINANCE — 0.4% | | | | | | | | | | |
| | 621,027 | | | Apollo Commercial Real Estate Finance, Inc.(c) | | US0001M + 3.500% | | 8.3400 | | 03/11/28 | | | 555,819 | |
| | | | | | | | | | | | | | | |
| | | | | TECHNOLOGY HARDWARE — 1.6% | | | | | | | | | | |
| | 1,181,491 | | | VeriFone Systems, Inc.(c) | | US0003M + 4.000% | | 8.9580 | | 08/20/25 | | | 1,024,536 | |
| | | | | | | | | | | | | | | |
See accompanying notes which are an integral part of these financial statements.
| DUNHAM FLOATING RATE BOND FUND |
| SCHEDULE OF INVESTMENTS (Unaudited) (Continued) |
| April 30, 2023 |
| Principal | | | | | | | Coupon Rate | | | | | |
| Amount ($) | | | | | Spread | | (%) | | Maturity | | Fair Value | |
| | | | | TERM LOANS — 79.5% (Continued) | | | | | | | | | | |
| | | | | TECHNOLOGY HARDWARE — 1.6% (Continued) | | | | | | |
| | 1,210,913 | | | Viasat, Inc.(c) | | SOFRRATE + 4.500% | | 9.4210 | | 02/24/29 | | $ | 1,178,672 | |
| | | | | | | | | | | | | | 2,203,208 | |
| | | | | TECHNOLOGY SERVICES — 4.5% | | | | | | | | | | |
| | 176,850 | | | ION Trading Finance Ltd.(c) | | US0001M + 4.750% | | 9.9090 | | 03/26/28 | | | 171,165 | |
| | 1,137,000 | | | MoneyGram International, Inc.(c) | | US0001M + 4.500% | | 9.3400 | | 07/21/26 | | | 1,131,787 | |
| | 1,212,560 | | | MPH Acquisition Holdings, LLC(c) | | US0001M + 4.250% | | 9.2030 | | 08/17/28 | | | 1,044,826 | |
| | 1,182,248 | | | Peraton Corporation(c) | | US0001M + 3.750% | | 8.5900 | | 02/24/28 | | | 1,160,447 | |
| | 1,166,121 | | | Sitel Worldwide Corporation(c) | | US0001M + 3.750% | | 8.6000 | | 07/29/28 | | | 1,163,818 | |
| | 1,308,866 | | | Travelport Finance Luxembourg Sarl(c) | | US0003M + 5.000% | | 9.7300 | | 05/29/26 | | | 826,457 | |
| | 585,611 | | | Verscend Holding Corporation(c) | | US0001M + 4.000% | | 8.8400 | | 08/27/25 | | | 585,795 | |
| | | | | | | | | | | | | | 6,084,295 | |
| | | | | TELECOMMUNICATIONS — 2.9% | | | | | | | | | | |
| | 1,594,433 | | | Altice France S.A.(c) | | US0003M + 3.688% | | 10.4860 | | 01/09/26 | | | 1,504,085 | |
| | 889,885 | | | CCI Buyer, Inc.(c) | | US0001M + 4.000% | | 8.8980 | | 12/12/27 | | | 876,260 | |
| | 883,239 | | | Connect Finco S.A.RL(c) | | US0001M + 3.500% | | 8.3500 | | 12/12/26 | | | 879,847 | |
| | 1,201,429 | | | Telesat, LLC(c) | | US0001M + 2.750% | | 7.5800 | | 12/06/26 | | | 667,165 | |
| | | | | | | | | | | | | | 3,927,357 | |
| | | | | TRANSPORTATION & LOGISTICS — 3.5% | | | | | | | | | | |
| | 680,000 | | | AAdvantage Loyalty IP Ltd.(c) | | US0003M + 4.750% | | 10.0000 | | 03/10/28 | | | 685,569 | |
| | 970,198 | | | Air Canada(c) | | US0001M + 3.500% | | 8.3690 | | 07/27/28 | | | 969,747 | |
| | 1,181,571 | | | Kenan Advantage Group, Inc. (The)(c) | | US0001M + 3.750% | | 8.5900 | | 03/24/26 | | | 1,179,356 | |
| | 690,900 | | | United Airlines, Inc.(c) | | US0001M + 3.750% | | 8.7700 | | 04/14/28 | | | 689,819 | |
| | 1,470,735 | | | WestJet Airlines Ltd.(c) | | US0003M + 2.762% | | 8.0640 | | 10/08/26 | | | 1,395,771 | |
| | | | | | | | | | | | | | 4,920,262 | |
| | | | | WHOLESALE - DISCRETIONARY — 0.9% | | | | | | | | | | |
| | 1,181,538 | | | Fastlane Parent Company, Inc.(c) | | US0001M + 4.500% | | 9.3400 | | 02/04/26 | | | 1,179,812 | |
| | | | | | | | | | | | | | �� | |
| | | | | TOTAL TERM LOANS (Cost $113,372,705) | | | | | | | | | 108,418,352 | |
| | | | | | | | | | | | | | | |
See accompanying notes which are an integral part of these financial statements.
| DUNHAM FLOATING RATE BOND FUND |
| SCHEDULE OF INVESTMENTS (Unaudited) (Continued) |
| April 30, 2023 |
| Shares | | | | | Expiration Date | | Exercise Price | | | Fair Value | |
| | | | | RIGHT — 0.0%(f) | | | | | | | | | | |
| | | | | NON-LISTED RIGHT - 0.0% (f) (Continued) | | | | | | | | | | |
| | 10,588 | | | TRA Rights | | 11/22/2024 | | | — | | | $ | 12,176 | |
| | | | | | | | | | | | | | | |
| | | | | TOTAL RIGHT (Cost $17,470) | | | | | | | | | 12,176 | |
| | | | | | | | | | | | | | | |
| Shares | | | | | Expiration Date | | Exercise Price | | | Fair Value | |
| | | | | WARRANT — 0.0%(f) | | | | | | | | | | |
| | | | | PUBLISHING & BROADCASTING - 0.0% (f) | | | | | | | | | | |
| | 14,905 | | | iHeartMedia, Inc. | | 05/02/2039 | | $ | 0.00 | | | $ | 52,168 | |
| | | | | | | | | | | | | | | |
| | | | | TOTAL WARRANT (Cost $287,609) | | | | | | | | | 52,168 | |
| Shares | | | | | Fair Value | |
| | | | | SHORT-TERM INVESTMENTS — 3.2% | | | | |
| | | | | COLLATERAL FOR SECURITIES LOANED - 2.4% | | | | |
| | 3,171,340 | | | Mount Vernon Liquid Assets Portfolio, LLC, 4.96% (Cost $3,171,340)(h) (i) | | | 3,171,340 | |
| | | | | | | | | |
| | | | | MONEY MARKET FUND - 0.8% | | | | |
| | 1,157,653 | | | Fidelity Government Portfolio, CLASS I, 4.73% (Cost $1,157,653)(h) | | | 1,157,653 | |
| | | | | | | | | |
| | | | | TOTAL SHORT-TERM INVESTMENTS (Cost $4,328,993) | | | 4,328,993 | |
| | | | | | | | | |
| | | | | TOTAL INVESTMENTS - 101.0% (Cost $146,320,498) | | $ | 137,773,140 | |
| | | | | LIABILITIES IN EXCESS OF OTHER ASSETS - (1.0)% | | | (1,361,212 | ) |
| | | | | NET ASSETS - 100.0% | | $ | 136,411,928 | |
| LLC | - Limited Liability Company |
| | |
| LP | - Limited Partnership |
| | |
| LTD | - Limited Company |
| | |
| REIT | - Real Estate Investment Trust |
| | |
| S/A | - Société Anonyme |
| | |
| H15T5Y | US Treasury Yield Curve Rate T Note Constant Maturity 5 Year |
| | |
| SOFRRATE | United States SOFR Secured Overnight Financing Rate |
| | |
| TSFR1M | TSFR1M |
| | |
| US0001M | ICE LIBOR USD 1 Month |
| | |
| US0003M | ICE LIBOR USD 3 Month |
| | |
| (a) | Non-income producing security. |
| (b) | Security exempt from registration under Rule 144A or Section 4(2) of the Securities Act of 1933. The security may be resold in transactions exempt from registration, normally to qualified institutional buyers. As of April 30, 2023 the total market value of 144A securities is 23,121,943 or 17.0% of net assets. |
| (c) | Variable or floating rate security, the interest rate of which adjusts periodically based on changes in current interest rates and prepayments on the underlying pool of assets. |
| (d) | All or a portion of these securities are on loan. Total loaned securities had a value of $3,119,318 at April 30, 2023. |
| (e) | Variable rate security; the rate shown represents the rate on April 30, 2023. |
| (f) | Percentage rounds to less than 0.1%. |
| (g) | Represents issuer in default on interest payments; non-income producing security. |
| (h) | Rate disclosed is the seven day effective yield as of April 30, 2023. |
| (i) | The Trust’s securities lending policies and procedures require that the borrower: (i) deliver cash or U.S. Government securities as collateral with respect to each new loan of U.S. securities, equal to at least 102% of the value of the portfolio securities loaned, and (ii) at all times thereafter mark-to-market the collateral on a daily basis so that the market value of such collateral is at least 100% of the value of securities loaned. From time to time the collateral may not be 102% due to end of day market movement. The next business day additional collateral is obtained/received from the borrower to replenish/reestablish 102%. |
See accompanying notes which are an integral part of these financial statements.
| Dunham High-Yield Bond Fund (Unaudited) |
| Message from the Sub-Adviser (PineBridge Investments, LLC) |
Asset Class Recap
High-Yield bonds, as measured by the Bloomberg U.S. High-Yield Ba/B 2% Issuer Cap Index, rallied to begin the fiscal year amid easing inflation concerns and a string of positive retail fund flows despite restrictive central bank policies, as positive market sentiment quickly returned following weaker than expected inflation data. However, the narrative began to shift to close the 2022 calendar year due to a surprisingly hawkish tone from central banks and weaker-than-anticipated global economic data. To begin 2023, the asset class resumed its rally thanks to constructive data on inflation, China’s reopening from its strict covid-zero policy, and warmer weather leading to a rising growth outlook in Europe. Heading into February, investors had been optimistic that inflation was moderating at a pace that would allow the Federal Reserve (the Fed) to think about pausing the interest rate increases that roiled markets in 2022. However, jobs data released early in February pointed to an unexpected surge in employment in January which, coupled with stronger-than-expected core PCE figures, pushed out expectations for a Fed pause or cut. This remained the market narrative until March, when turmoil in the US regional and European banking sectors led to an increase in volatility in both Treasury rates and risk asset classes. In the face of these challenges, the Fed increased rates 25 basis points at both their February and March meetings amid still elevated inflation and a robust labor market, bringing the Federal Funds rate to 4.75 percent to 5.00 percent. High-yield bonds continued to generate positive total returns in April amid easing fears of regional banking failures having broad contagion effects, better-than-expected earnings, and mixed economic data. Over the six-month period ended April 30, 2023, high-yield bonds increased 6.2 percent.
Allocation Review
Sector allocation detracted from performance for the fiscal six-month period, while security selection contributed. From a sector allocation standpoint, an underweight allocation to consumer cyclicals and an overweight allocation to the energy sector detracted from performance, while an underweight allocation to the communications sector contributed. From a security selection standpoint, holdings among the communications, capital goods, and consumer cyclical sectors contributed to performance for the period. These contributions more than offset the detraction from selection within the technology and finance sectors. The Fund continued to have an approximate 8 percent allocation to CCC-rated bonds, which contributed to positive Fund performance as the ICE BofA CCC and Lower U.S. Cash Pay High-Yield Index increased 6.4 percent. Additionally, the Fund’s significant 15 percent relative underweight to BB-rated bonds generally aided relative performance, as the ICE BofA BB U.S. Cash Pay High-Yield Index increased 5.8 percent during the six-month period.
Holdings Insights
One of the most significant contributors to positive Fund performance over the fiscal period was the exposure to AMC Entertainment Holdings, Inc. 7.5%, due 02/15/2029 (00165CBA1) (holding weight*: 0.42 percent), an American movie theater chain. This credit surged 22.8 percent since being added to the Fund after better-than-anticipated box office sales prompted many analysts to raise growth estimates for the first quarter of 2023. The company reported that Easter weekend was its busiest weekend of the year and its third busiest since 2019, giving investors further hope of a box office resurgence. The Fund also received positive contributions from credits from the cruise line industry due to companies in the industry reporting smaller-than-anticipated losses and stating that bookings were near record highs at elevated prices. This included the global cruise operators Carnival Corporation 5.75% due 3/1/2027 (143658BN1) (holding weight*: 0.92 percent), and Royal Caribbean Cruises Ltd. 5.5%, Due 04/1/2028 (780153BG6) (holding weight*: 0.11 percent). Over the six-month period, these credits increased 23.7 percent and 17.8 percent, respectively. Outside of the consumer cyclical industry, Telesat, LLC 4.875%, due 06/01/2027 (87952VAP1) (holding weight*: 0.39 percent), one of the largest and most innovative global satellite operators, positively contributed to Fund performance by rising 17.9 percent.
Rackspace Technology Global, Inc. 3.5%, due 02/15/2028 (750098AB1) (holding weight*: 0.24 percent), an end-to-end multi-cloud technology services company meaningfully detracted from Fund performance. In the first fiscal quarter, this credit faced numerous headwinds, including a disappointing earnings report as the company shifted business models to focus on cloud-based services. Additionally, the company was hit with a ransomware attack, causing significant disruptions for thousands of the company’s customers. Not only did this adversely impact the company’s credibility, but many customers also switched providers in order to regain access to their emails and other functions left inaccessible by the disruptions. Although the most recent earnings report released in the most recent fiscal quarter showed some promise, investor concerns were not fully resolved, weighing on the credit. Over the six-month period, this credit declined 34.7 percent. Other meaningful detractors during the period were CSC Holdings, LLC 5.75%, due 1/15/2030 (126307BA4) (holding weight*: 0.38 percent), a cable and telecommunications services provider, and Curo Group Holdings Corporation 7.5%, due 8/1/2028 (23131LAC1) (holding weight*: 0.57 percent), a provider of unsecured and secured installment, open-end, and single-pay loan services. Over the six-month period the CSC Holdings, LLC credit tumbled 30.1 percent, while Curo Group Holdings credit fell 26.8 percent.
Sub-Adviser Outlook
With fears of a widespread banking crisis having subsided, the Sub-Adviser expects credit spreads to remain largely rangebound as we approach the end of the Fed’s rate hike cycle. The Sub-Adviser remains of the view that a more forward-looking Fed and tightening lending conditions will result in slowing economic growth, a more uncertain consumer, and a corporate earnings slowdown in developed market economies, which should further reveal itself in the second half of the year as the lagged effect of rate increases takes hold. The Sub-Adviser is also beginning to see some weakness in the underlying US economic data, with both jobless claims and JOLTS (Job Openings and Labor Turnover Survey) missing consensus expectations. While nonfarm payrolls remained robust, this may prove temporary as the backdrop weakens. As a result, the Sub-Adviser maintains a marginally defensive bias in the Fund while looking for select opportunities to take advantage of attractive valuations at the issuer level.
| * | Holdings percentage(s) of total investments, cash and unsettled trades excluding collateral for securities loaned as of 4/30/2023. |
| Dunham High-Yield Bond Fund |
| PORTFOLIO REVIEW (Unaudited) |
| April 30, 2023 |
The Fund’s performance figures* for each of the periods ended April 30, 2023, compared to its benchmarks:
| | | | Annualized | Annualized |
| | 6 Month Return | 1 Year Return | 5 Year Return | 10 Year Return |
| Class N | 6.86% | 2.08% | 3.31% | 3.13% |
| Class A with Load 4.50% | 1.82% | (2.82)% | 2.13% | 2.40% |
| Class A without load | 6.64% | 1.80% | 3.07% | 2.88% |
| Class C | 6.37% | 1.21% | 2.53% | 2.37% |
| Bloomberg US Corp. High-Yield Bond Ba/B 2% Issuer Capped Index (a) | 6.16% | 8.32% | 3.61% | 3.74% |
| Morningstar High-Yield Bond Category | 5.54% | 0.41% | 2.36% | 2.94% |
| * | Total Returns are calculated based on traded NAVs. As disclosed in the Trust’s latest registration statement, the Fund’s total annual operating expenses, including the cost of underlying funds, are 1.19% for Class N, 1.94% for Class C and 1.44% for Class A. Class A shares are subject to a sales load of 4.50% and a deferred sales charge of up to 0.75%. The performance data quoted here represents past performance, which is not indicative of future results. Current performance may be lower or higher than the performance data quoted. The investment return and NAV will fluctuate, so that an investor’s shares, when redeemed, may be worth more or less than their original cost. Total returns are calculated assuming reinvestment of all dividends and capital gains distributions, if any. The returns do not reflect the deductions of taxes a shareholder would pay on the redemption of Fund shares or Fund distributions. For performance information current to the most recent month-end, please call 1-800-442-4358 or visit our website www.dunham.com. |
| (a) | Bloomberg U.S. Corporate High-Yield Bond Ba/B 2% Issuer Capped Index is an issuer-constrained version of the flagship US Corporate High Yield Index, which measures the USD-denominated, high yield, fixed-rate corporate bond market. Investors cannot invest directly in an index or benchmark. |
| (b) | The Morningstar High-Yield Bond Category is generally representative of mutual funds that primarily invest in U.S. high-income debt securities where at least 65% or more of bond assets are not rated or are rated by a major agency such as Standard & Poor’s or Moody’s at the level of BB (considered speculative for taxable bonds) and below. |
Comparison of the Change in Value of a $100,000 Investment
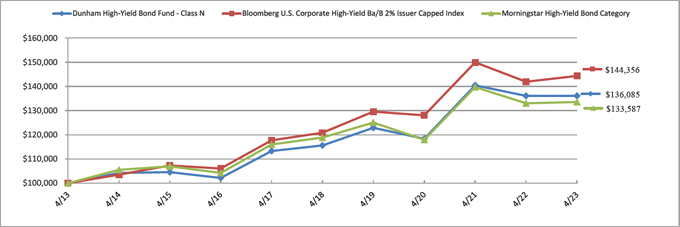
| Portfolio Composition * (Unaudited) |
| B2 | | | 16.9 | % |
| B1 | | | 16.5 | % |
| Ba3 | | | 14.6 | % |
| Collateral for Securities Loaned | | | 11.5 | % |
| Ba2 | | | 11.4 | % |
| B3 | | | 9.0 | % |
| Other/Not Rated | | | 7.6 | % |
| Ba1 | | | 4.7 | % |
| Caa1 | | | 4.6 | % |
| Caa2 | | | 2.3 | % |
| Baa3 | | | 0.9 | % |
| Total | | | 100.0 | % |
* Based on total value of investments as of April 30, 2023. Does not include derivative holdings.
Percentage may differ from Schedule of Investments which are based on Fund net assets.
| DUNHAM HIGH YIELD BOND FUND |
| SCHEDULE OF INVESTMENTS (Unaudited) |
| April 30, 2023 |
| Shares | | | | | Fair Value | |
| | | | | COMMON STOCKS — 1.7% | | | | |
| | | | | OIL & GAS SERVICES & EQUIPMENT- 1.7% | | | | |
| | 50 | | | Hi-Crush(a) (g) | | $ | 1,813,750 | |
| | | | | | | | | |
| | | | | TOTAL COMMON STOCKS (Cost $1,196,933) | | | 1,813,750 | |
| Principal | | | | | | | Coupon Rate | | | | | |
| Amount ($) | | | | | Spread | | (%) | | Maturity | | Fair Value | |
| | | | | CORPORATE BONDS — 93.0% | | | | | | | | | | |
| | | | | AEROSPACE & DEFENSE — 0.9% | | | | | | | | | | |
| | 493,000 | | | Rolls-Royce plc(b) | | | | 5.7500 | | 10/15/27 | | | 492,562 | |
| | 457,000 | | | Spirit AeroSystems, Inc.(b) | | | | 7.5000 | | 04/15/25 | | | 454,633 | |
| | | | | | | | | | | | | | 947,195 | |
| | | | | ASSET MANAGEMENT — 1.0% | | | | | | | | | | |
| | 415,000 | | | AG Issuer, LLC(b) | | | | 6.2500 | | 03/01/28 | | | 386,176 | |
| | 683,000 | | | NFP Corporation(b) | | | | 4.8750 | | 08/15/28 | | | 622,623 | |
| | | | | | | | | | | | | | 1,008,799 | |
| | | | | AUTOMOTIVE — 2.0% | | | | | | | | | | |
| | 185,000 | | | Ford Motor Company | | | | 3.2500 | | 02/12/32 | | | 143,168 | |
| | 404,000 | | | Ford Motor Company | | | | 4.7500 | | 01/15/43 | | | 303,982 | |
| | 461,000 | | | Ford Motor Credit Co LLC | | | | 4.0000 | | 11/13/30 | | | 395,590 | |
| | 205,000 | | | Ford Motor Credit Company, LLC | | | | 4.9500 | | 05/28/27 | | | 194,075 | |
| | 728,000 | | | Ford Motor Credit Company, LLC | | | | 7.3500 | | 11/04/27 | | | 750,614 | |
| | 152,000 | | | ZF North America Capital, Inc.(b) | | | | 6.8750 | | 04/14/28 | | | 156,700 | |
| | 152,000 | | | ZF North America Capital, Inc.(b) | | | | 7.1250 | | 04/14/30 | | | 157,086 | |
| | | | | | | | | | | | | | 2,101,215 | |
| | | | | BIOTECH & PHARMA — 1.3% | | | | | | | | | | |
| | 200,000 | | | Organon Finance 1, LLC(b) | | | | 4.1250 | | 04/30/28 | | | 184,321 | |
| | 589,000 | | | Organon Finance 1, LLC(b) | | | | 5.1250 | | 04/30/31 | | | 525,317 | |
| | 200,000 | | | Teva Pharmaceutical Finance Netherlands III BV | | | | 5.1250 | | 05/09/29 | | | 186,282 | |
| | 405,000 | | | Teva Pharmaceutical Finance Netherlands III BV | | | | 7.8750 | | 09/15/29 | | | 425,557 | |
| | | | | | | | | | | | | | 1,321,477 | |
| | | | | CABLE & SATELLITE — 4.7% | | | | | | | | | | |
| | 1,290,000 | | | Altice Financing S.A.(b),(c) | | | | 5.0000 | | 01/15/28 | | | 1,046,347 | |
| | 555,000 | | | Block Communications, Inc.(b) | | | | 4.8750 | | 03/01/28 | | | 480,016 | |
| | 378,000 | | | CCO Holdings, LLC / CCO Holdings Capital(b) | | | | 5.0000 | | 02/01/28 | | | 350,156 | |
| | | | | | | | | | | | | | | |
See accompanying notes which are an integral part of these financial statements.
| DUNHAM HIGH YIELD BOND FUND |
| SCHEDULE OF INVESTMENTS (Unaudited) (Continued) |
| April 30, 2023 |
| Principal | | | | | | | Coupon Rate | | | | | |
| Amount ($) | | | | | Spread | | (%) | | Maturity | | Fair Value | |
| | | | | CORPORATE BONDS — 93.0% (Continued) | | | | | | | | | | |
| | | | | CABLE & SATELLITE — 4.7% (Continued) | | | | | | | | | | |
| | 825,000 | | | CCO Holdings, LLC / CCO Holdings Capital(b) | | | | 5.3750 | | 06/01/29 | | $ | 757,646 | |
| | 800,000 | | | CCO Holdings, LLC / CCO Holdings Capital(b),(c) | | | | 6.3750 | | 09/01/29 | | | 761,090 | |
| | 775,000 | | | CSC Holdings, LLC(b) | | | | 5.7500 | | 01/15/30 | | | 395,949 | |
| | 680,000 | | | CSC Holdings, LLC(b),(c) | | | | 4.6250 | | 12/01/30 | | | 332,879 | |
| | 610,000 | | | Sirius XM Radio, Inc.(b) | | | | 4.0000 | | 07/15/28 | | | 515,665 | |
| | 435,000 | | | UPC Broadband Finco BV(b) | | | | 4.8750 | | 07/15/31 | | | 375,827 | |
| | | | | | | | | | | | | | 5,015,575 | |
| | | | | CHEMICALS — 2.0% | | | | | | | | | | |
| | 854,000 | | | Consolidated Energy Finance S.A.(b) | | | | 5.6250 | | 10/15/28 | | | 751,506 | |
| | 480,000 | | | Methanex Corporation | | | | 5.1250 | | 10/15/27 | | | 459,029 | |
| | 531,000 | | | Minerals Technologies, Inc.(b) | | | | 5.0000 | | 07/01/28 | | | 485,674 | |
| | 614,000 | | | Trinseo Materials Operating SCA / Trinseo(b) | | | | 5.1250 | | 04/01/29 | | | 381,273 | |
| | | | | | | | | | | | | | 2,077,482 | |
| | | | | COMMERCIAL SUPPORT SERVICES — 5.1% | | | | | | | | | | |
| | 400,000 | | | Allied Universal Holdco, LLC / Allied Universal(b) | | | | 4.6250 | | 06/01/28 | | | 347,927 | |
| | 585,000 | | | Brink’s Company (The)(b) | | | | 4.6250 | | 10/15/27 | | | 553,729 | |
| | 312,000 | | | Covanta Holding Corporation | | | | 5.0000 | | 09/01/30 | | | 273,337 | |
| | 456,000 | | | Covert Mergeco, Inc.(b) | | | | 4.8750 | | 12/01/29 | | | 406,250 | |
| | 630,000 | | | Deluxe Corporation(b) | | | | 8.0000 | | 06/01/29 | | | 487,369 | |
| | 505,000 | | | Garda World Security Corporation(b) | | | | 9.5000 | | 11/01/27 | | | 484,603 | |
| | 222,000 | | | Garda World Security Corporation(b) | | | | 6.0000 | | 06/01/29 | | | 182,795 | |
| | 612,000 | | | Harsco Corporation(b) | | | | 5.7500 | | 07/31/27 | | | 505,790 | |
| | 380,000 | | | Korn Ferry(b) | | | | 4.6250 | | 12/15/27 | | | 361,428 | |
| | 515,000 | | | Prime Security Services Borrower, LLC / Prime(b) | | | | 5.7500 | | 04/15/26 | | | 511,778 | |
| | 505,000 | | | Sotheby’s(b) | | | | 7.3750 | | 10/15/27 | | | 474,035 | |
| | 350,000 | | | Sotheby’s/Bidfair Holdings, Inc.(b) | | | | 5.8750 | | 06/01/29 | | | 288,435 | |
| | 580,000 | | | TriNet Group, Inc.(b) | | | | 3.5000 | | 03/01/29 | | | 507,781 | |
| | | | | | | | | | | | | | 5,385,257 | |
| | | | | CONSTRUCTION MATERIALS — 0.7% | | | | | | | | | | |
| | 328,000 | | | Standard Industries, Inc.(b) | | | | 4.7500 | | 01/15/28 | | | 306,375 | |
| | 524,000 | | | Standard Industries, Inc.(b) | | | | 3.3750 | | 01/15/31 | | | 415,216 | |
| | | | | | | | | | | | | | 721,591 | |
| | | | | CONSUMER SERVICES — 1.0% | | | | | | | | | | |
| | 600,000 | | | PROG Holdings, Inc.(b),(c) | | | | 6.0000 | | 11/15/29 | | | 540,579 | |
See accompanying notes which are an integral part of these financial statements.
| DUNHAM HIGH YIELD BOND FUND |
| SCHEDULE OF INVESTMENTS (Unaudited) (Continued) |
| April 30, 2023 |
| Principal | | | | | | | Coupon Rate | | | | | |
| Amount ($) | | | | | Spread | | (%) | | Maturity | | Fair Value | |
| | | | | CORPORATE BONDS — 93.0% (Continued) | | | | | | | | | | |
| | | | | CONSUMER SERVICES — 1.0% (Continued) | | | | | | | | | | |
| | 561,000 | | | Rent-A-Center, Inc.(b) | | | | 6.3750 | | 02/15/29 | | $ | 493,141 | |
| | | | | | | | | | | | | | 1,033,720 | |
| | | | | CONTAINERS & PACKAGING — 3.1% | | | | | | | | | | |
| | 764,000 | | | Ardagh Metal Packaging Finance USA, LLC / Ardagh(b) | | | | 3.2500 | | 09/01/28 | | | 669,797 | |
| | 139,000 | | | Ball Corporation | | | | 5.2500 | | 07/01/25 | | | 138,789 | |
| | 199,000 | | | Ball Corporation | | | | 2.8750 | | 08/15/30 | | | 167,040 | |
| | 600,000 | | | Clydesdale Acquisition Holdings, Inc.(b) | | | | 6.6250 | | 04/15/29 | | | 589,513 | |
| | 479,000 | | | Crown Americas, LLC | | | | 5.2500 | | 04/01/30 | | | 466,376 | |
| | 507,000 | | | LABL, Inc.(b) | | | | 5.8750 | | 11/01/28 | | | 468,658 | |
| | 33,000 | | | LABL, Inc.(b) | | | | 9.5000 | | 11/01/28 | | | 33,949 | |
| | 382,000 | | | Mauser Packaging Solutions Holding Company(b) | | | | 7.8750 | | 08/15/26 | | | 386,517 | |
| | 465,000 | | | Silgan Holdings, Inc. | | | | 4.1250 | | 02/01/28 | | | 435,270 | |
| | | | | | | | | | | | | | 3,355,909 | |
| | | | | ELECTRIC UTILITIES — 2.4% | | | | | | | | | | |
| | 703,000 | | | Calpine Corporation(b) | | | | 5.0000 | | 02/01/31 | | | 593,107 | |
| | 332,000 | | | Calpine Corporation(b) | | | | 3.7500 | | 03/01/31 | | | 283,614 | |
| | 165,000 | | | Clearway Energy Operating, LLC(b) | | | | 3.7500 | | 01/15/32 | | | 138,546 | |
| | 510,000 | | | NRG Energy Inc(b),(c) | | | | 3.6250 | | 02/15/31 | | | 413,536 | |
| | 555,000 | | | NRG Energy, Inc.(b) | | | | 5.2500 | | 06/15/29 | | | 512,572 | |
| | 685,000 | | | Vistra Operations Company, LLC(b) | | | | 5.0000 | | 07/31/27 | | | 651,806 | |
| | | | | | | | | | | | | | 2,593,181 | |
| | | | | ENGINEERING & CONSTRUCTION — 0.5% | | | | | | | | | | |
| | 557,000 | | | VM Consolidated, Inc.(b) | | | | 5.5000 | | 04/15/29 | | | 517,378 | |
| | | | | | | | | | | | | | | |
| | | | | ENTERTAINMENT CONTENT — 1.7% | | | | | | | | | | |
| | 445,000 | | | Banijay Entertainment S.A.SU(b) | | | | 5.3750 | | 03/01/25 | | | 434,106 | |
| | 604,000 | | | Paramount Global(d) | | H15T5Y + 3.999% | | 6.3750 | | 03/30/62 | | | 514,076 | |
| | 735,000 | | | Univision Communications, Inc.(b) | | | | 6.6250 | | 06/01/27 | | | 711,022 | |
| | 131,000 | | | Univision Communications, Inc.(b) | | | | 7.3750 | | 06/30/30 | | | 125,829 | |
| | | | | | | | | | | | | | 1,785,033 | |
| | | | | FOOD — 1.6% | | | | | | | | | | |
| | 208,000 | | | Herbalife Nutrition Ltd. / HLF Financing, Inc.(b) | | | | 7.8750 | | 09/01/25 | | | 199,368 | |
| | 925,000 | | | HLF Financing Sarl, LLC / Herbalife International,(b),(c) | | | | 4.8750 | | 06/01/29 | | | 709,021 | |
| | 209,000 | | | Land O’Lakes Capital Trust I(b) | | | | 7.4500 | | 03/15/28 | | | 198,028 | |
See accompanying notes which are an integral part of these financial statements.
| DUNHAM HIGH YIELD BOND FUND |
| SCHEDULE OF INVESTMENTS (Unaudited) (Continued) |
| April 30, 2023 |
| Principal | | | | | | | Coupon Rate | | | | | |
| Amount ($) | | | | | Spread | | (%) | | Maturity | | Fair Value | |
| | | | | CORPORATE BONDS — 93.0% (Continued) | | | | | | | | | | |
| | | | | FOOD — 1.6% (Continued) | | | | | | | | | | |
| | 321,000 | | | Post Holdings, Inc.(b) | | | | 4.5000 | | 09/15/31 | | $ | 281,616 | |
| | 381,000 | | | Simmons Foods, Inc./Simmons Prepared Foods,(b) | | | | 4.6250 | | 03/01/29 | | | 315,186 | |
| | | | | | | | | | | | | | 1,703,219 | |
| | | | | FORESTRY, PAPER & WOOD PRODUCTS — 0.3% | | | | | | | | | | |
| | 456,000 | | | Glatfelter Corporation(b) | | | | 4.7500 | | 11/15/29 | | | 321,184 | |
| | | | | | | | | | | | | | | |
| | | | | GAS & WATER UTILITIES — 0.6% | | | | | | | | | | |
| | 615,000 | | | Ferrellgas Escrow, LLC / FG Operating Finance(b) | | | | 5.3750 | | 04/01/26 | | | 573,978 | |
| | 30,000 | | | Ferrellgas Escrow, LLC / FG Operating Finance(b) | | | | 5.8750 | | 04/01/29 | | | 25,379 | |
| | | | | | | | | | | | | | 599,357 | |
| | | | | HEALTH CARE FACILITIES & SERVICES — 3.4% | | | | | | | | | | |
| | 750,000 | | | CHS/Community Health Systems, Inc.(b) | | | | 5.6250 | | 03/15/27 | | | 693,127 | |
| | 678,000 | | | DaVita, Inc.(b) | | | | 4.6250 | | 06/01/30 | | | 591,423 | |
| | 597,000 | | | HCA, Inc. | | | | 3.5000 | | 09/01/30 | | | 537,070 | |
| | 530,000 | | | Legacy LifePoint Health, LLC(b) | | | | 4.3750 | | 02/15/27 | | �� | 451,690 | |
| | 575,000 | | | Molina Healthcare Inc 3.875% 11/15/2030(b) | | | | 3.8750 | | 11/15/30 | | | 507,734 | |
| | 695,000 | | | Select Medical Corporation(b),(c) | | | | 6.2500 | | 08/15/26 | | | 682,129 | |
| | 215,000 | | | Tenet Healthcare Corporation | | | | 4.6250 | | 07/15/24 | | | 213,449 | |
| | | | | | | | | | | | | | 3,676,622 | |
| | | | | HOME CONSTRUCTION — 0.9% | | | | | | | | | | |
| | 361,000 | | | Mattamy Group Corporation(b) | | | | 5.2500 | | 12/15/27 | | | 336,386 | |
| | 210,000 | | | Mattamy Group Corporation(b) | | | | 4.6250 | | 03/01/30 | | | 184,329 | |
| | 475,000 | | | PGT Innovations, Inc.(b) | | | | 4.3750 | | 10/01/29 | | | 429,350 | |
| | | | | | | | | | | | | | 950,065 | |
| | | | | HOUSEHOLD PRODUCTS — 0.9% | | | | | | | | | | |
| | 456,000 | | | Coty, Inc.(b) | | | | 5.0000 | | 04/15/26 | | | 445,571 | |
| | 600,000 | | | Edgewell Personal Care Company(b),(c) | | | | 4.1250 | | 04/01/29 | | | 532,119 | |
| | | | | | | | | | | | | | 977,690 | |
| | | | | INSTITUTIONAL FINANCIAL SERVICES — 1.0% | | | | | | | | | | |
| | 550,000 | | | Aretec Escrow Issuer, Inc.(b) | | | | 7.5000 | | 04/01/29 | | | 461,151 | |
| | 689,000 | | | LPL Holdings, Inc.(b) | | | | 4.0000 | | 03/15/29 | | | 619,157 | |
| | | | | | | | | | | | | | 1,080,308 | |
| | | | | INSURANCE — 1.1% | | | | | | | | | | |
| | 313,000 | | | Jones Deslauriers Insurance Management, Inc.(b) | | | | 8.5000 | | 03/15/30 | | | 317,010 | |
See accompanying notes which are an integral part of these financial statements.
| DUNHAM HIGH YIELD BOND FUND |
| SCHEDULE OF INVESTMENTS (Unaudited) (Continued) |
| April 30, 2023 |
| Principal | | | | | | | Coupon Rate | | | | | |
| Amount ($) | | | | | Spread | | (%) | | Maturity | | Fair Value | |
| | | | | CORPORATE BONDS — 93.0% (Continued) | | | | | | | | | | |
| | | | | INSURANCE — 1.1% (Continued) | | | | | | | | | | |
| | 345,000 | | | NMI Holdings, Inc.(b) | | | | 7.3750 | | 06/01/25 | | $ | 351,153 | |
| | 575,000 | | | Ryan Specialty Group, LLC(b) | | | | 4.3750 | | 02/01/30 | | | 513,102 | |
| | | | | | | | | | | | | | 1,181,265 | |
| | | | | INTERNET MEDIA & SERVICES — 0.5% | | | | | | | | | | |
| | 659,000 | | | GrubHub Holdings, Inc.(b),(c) | | | | 5.5000 | | 07/01/27 | | | 481,930 | |
| | | | | | | | | | | | | | | |
| | | | | LEISURE FACILITIES & SERVICES — 7.4% | | | | | | | | | | |
| | 609,000 | | | AMC Entertainment Holdings, Inc.(b),(c) | | | | 7.5000 | | 02/15/29 | | | 442,097 | |
| | 506,000 | | | Brinker International, Inc.(b) | | | | 5.0000 | | 10/01/24 | | | 495,928 | |
| | 643,000 | | | Caesars Entertainment, Inc.(b) | | | | 6.2500 | | 07/01/25 | | | 644,617 | |
| | 122,000 | | | Carnival Corporation(b),(c) | | | | 7.6250 | | 03/01/26 | | | 111,397 | |
| | 1,163,000 | | | Carnival Corporation(b),(c) | | | | 5.7500 | | 03/01/27 | | | 954,710 | |
| | 322,000 | | | Carnival Corporation(b) | | | | 6.0000 | | 05/01/29 | | | 253,059 | |
| | 470,000 | | | Carnival Corporation(b),(c) | | | | 10.5000 | | 06/01/30 | | | 446,426 | |
| | 715,000 | | | CEC Entertainment Company, LLC(b) | | | | 6.7500 | | 05/01/26 | | | 680,322 | |
| | 295,000 | | | Dave & Buster’s, Inc. B(b) | | | | 7.6250 | | 11/01/25 | | | 299,693 | |
| | 211,000 | | | Hilton Grand Vacations Borrower Escrow, LLC /(b) | | | | 5.0000 | | 06/01/29 | | | 191,476 | |
| | 555,000 | | | Hilton Grand Vacations Borrower Escrow, LLC /(b) | | | | 4.8750 | | 07/01/31 | | | 484,827 | |
| | 710,000 | | | NCL Corporation Ltd.(b),(c) | | | | 3.6250 | | 12/15/24 | | | 666,940 | |
| | 187,000 | | | NCL Corporation Ltd.(b) | | | | 5.8750 | | 03/15/26 | | | 160,940 | |
| | 243,000 | | | NCL Corporation Ltd.(b),(c) | | | | 7.7500 | | 02/15/29 | | | 206,048 | |
| | 603,000 | | | Royal Caribbean Cruises Ltd.(b),(c) | | | | 4.2500 | | 07/01/26 | | | 540,603 | |
| | 126,000 | | | Royal Caribbean Cruises Ltd.(b),(c) | | | | 5.5000 | | 04/01/28 | | | 111,295 | |
| | 445,000 | | | SeaWorld Parks & Entertainment, Inc.(b),(c) | | | | 8.7500 | | 05/01/25 | | | 455,529 | |
| | 556,000 | | | Wyndham Destinations, Inc. | | | | 6.0000 | | 04/01/27 | | | 547,629 | |
| | | | | | | | | | | | | | 7,693,536 | |
| | | | | MEDICAL EQUIPMENT & DEVICES — 0.8% | | | | | | | | | | |
| | 482,000 | | | Mozart Debt Merger Sub, Inc.(b) | | | | 3.8750 | | 04/01/29 | | | 422,008 | |
| | 505,000 | | | Mozart Debt Merger Sub, Inc.(b),(c) | | | | 5.2500 | | 10/01/29 | | | 436,974 | |
| | | | | | | | | | | | | | 858,982 | |
| | | | | METALS & MINING — 2.0% | | | | | | | | | | |
| | 697,000 | | | FMG Resources August 2006 Pty Ltd.(b) | | | | 4.5000 | | 09/15/27 | | | 663,147 | |
| | 555,000 | | | Hudbay Minerals, Inc.(b) | | | | 6.1250 | | 04/01/29 | | | 519,605 | |
| | 305,000 | | | Mineral Resources Ltd.(b) | | | | 8.1250 | | 05/01/27 | | | 307,969 | |
See accompanying notes which are an integral part of these financial statements.
| DUNHAM HIGH YIELD BOND FUND |
| SCHEDULE OF INVESTMENTS (Unaudited) (Continued) |
| April 30, 2023 |
| Principal | | | | | | | Coupon Rate | | | | | |
| Amount ($) | | | | | Spread | | (%) | | Maturity | | Fair Value | |
| | | | | CORPORATE BONDS — 93.0% (Continued) | | | | | | | | | | |
| | | | | METALS & MINING — 2.0% (Continued) | | | | | | | | | | |
| | 135,000 | | | Mineral Resources Ltd.(b) | | | | 8.5000 | | 05/01/30 | | $ | 137,508 | |
| | 480,000 | | | Warrior Met Coal, Inc.(b) | | | | 7.8750 | | 12/01/28 | | | 485,730 | |
| | | | | | | | | | | | | | 2,113,959 | |
| | | | | OIL & GAS PRODUCERS — 14.8% | | | | | | | | | | |
| | 576,000 | | | Antero Midstream Partners, L.P. / Antero Midstream(b) | | | | 5.7500 | | 01/15/28 | | | 558,476 | |
| | 487,000 | | | Antero Resources Corporation(b),(c) | | | | 5.3750 | | 03/01/30 | | | 456,913 | |
| | 148,000 | | | Apache Corporation | | | | 4.3750 | | 10/15/28 | | | 138,819 | |
| | 652,000 | | | Apache Corporation | | | | 4.7500 | | 04/15/43 | | | 509,176 | |
| | 554,000 | | | Buckeye Partners, L.P.(b) | | | | 4.5000 | | 03/01/28 | | | 504,195 | |
| | 494,000 | | | California Resources Corporation(b) | | | | 7.1250 | | 02/01/26 | | | 497,848 | |
| | 480,000 | | | Civitas Resources, Inc.(b) | | | | 5.0000 | | 10/15/26 | | | 451,726 | |
| | 132,000 | | | DCP Midstream Operating, L.P.(b) | | | | 6.7500 | | 09/15/37 | | | 143,674 | |
| | 235,000 | | | DCP Midstream Operating, L.P. | | | | 5.6000 | | 04/01/44 | | | 226,691 | |
| | 498,000 | | | Earthstone Energy Holdings, LLC(b) | | | | 8.0000 | | 04/15/27 | | | 486,558 | |
| | 605,000 | | | eG Global Finance plc(b) | | | | 6.7500 | | 02/07/25 | | | 573,960 | |
| | 70,000 | | | EQM Midstream Partners, L.P.(b) | | | | 7.5000 | | 06/01/27 | | | 69,823 | |
| | 233,000 | | | EQM Midstream Partners, L.P. | | | | 5.5000 | | 07/15/28 | | | 212,582 | |
| | 264,000 | | | EQM Midstream Partners, L.P.(b) | | | | 7.5000 | | 06/01/30 | | | 256,659 | |
| | 54,000 | | | Genesis Energy, L.P. / Genesis Energy Finance | | | | 6.2500 | | 05/15/26 | | | 52,091 | |
| | 507,000 | | | Genesis Energy, L.P. / Genesis Energy Finance | | | | 8.0000 | | 01/15/27 | | | 506,460 | |
| | 674,000 | | | Genesis Energy, L.P. / Genesis Energy Finance | | | | 8.8750 | | 04/15/30 | | | 675,754 | |
| | 677,000 | | | Harvest Midstream I, L.P.(b) | | | | 7.5000 | | 09/01/28 | | | 663,154 | |
| | 659,000 | | | Hilcorp Energy I, L.P. / Hilcorp Finance Company(b) | | | | 5.7500 | | 02/01/29 | | | 616,329 | |
| | 279,000 | | | Hilcorp Energy I, L.P. / Hilcorp Finance Company(b) | | | | 6.0000 | | 02/01/31 | | | 258,181 | |
| | 865,000 | | | Holly Energy Partners, L.P. / Holly Energy Finance(b) | | | | 5.0000 | | 02/01/28 | | | 807,909 | |
| | 550,000 | | | Howard Midstream Energy Partners, LLC(b) | | | | 6.7500 | | 01/15/27 | | | 513,801 | |
| | 509,000 | | | Independence Energy Finance, LLC(b) | | | | 7.2500 | | 05/01/26 | | | 488,235 | |
| | 695,000 | | | ITT Holdings, LLC(b) | | | | 6.5000 | | 08/01/29 | | | 577,743 | |
| | 405,000 | | | Murphy Oil USA, Inc. | | | | 4.7500 | | 09/15/29 | | | 376,192 | |
| | 650,000 | | | NGL Energy Operating, LLC / NGL Energy Finance(b) | | | | 7.5000 | | 02/01/26 | | | 623,868 | |
| | 425,000 | | | NGL Energy Partners, L.P. / NGL Energy Finance | | | | 6.1250 | | 03/01/25 | | | 392,545 | |
| | 152,000 | | | NuStar Logistics, L.P. | | | | 5.7500 | | 10/01/25 | | | 149,226 | |
| | 379,000 | | | NuStar Logistics, L.P.(c) | | | | 6.3750 | | 10/01/30 | | | 365,381 | |
| | 452,000 | | | Oasis Petroleum, Inc.(b),(c) | | | | 6.3750 | | 06/01/26 | | | 450,940 | |
See accompanying notes which are an integral part of these financial statements.
| DUNHAM HIGH YIELD BOND FUND |
| SCHEDULE OF INVESTMENTS (Unaudited) (Continued) |
| April 30, 2023 |
| Principal | | | | | | | Coupon Rate | | | | | |
| Amount ($) | | | | | Spread | | (%) | | Maturity | | Fair Value | |
| | | | | CORPORATE BONDS — 93.0% (Continued) | | | | | | | | | | |
| | | | | OIL & GAS PRODUCERS — 14.8% (Continued) | | | | | | | | | | |
| | 503,000 | | | Occidental Petroleum Corporation | | | | 6.3750 | | 09/01/28 | | $ | 525,110 | |
| | 476,000 | | | Occidental Petroleum Corporation | | | | 6.1250 | | 01/01/31 | | | 498,174 | |
| | 192,000 | | | Rockcliff Energy II, LLC(b) | | | | 5.5000 | | 10/15/29 | | | 173,945 | |
| | 145,000 | | | Southwestern Energy Company | | | | 5.3750 | | 02/01/29 | | | 136,841 | |
| | 669,000 | | | Southwestern Energy Company | | | | 5.3750 | | 03/15/30 | | | 623,220 | |
| | 600,000 | | | Strathcona Resources Ltd.(b) | | | | 6.8750 | | 08/01/26 | | | 508,084 | |
| | 526,000 | | | Venture Global Calcasieu Pass, LLC(b) | | | | 3.8750 | | 08/15/29 | | | 473,660 | |
| | | | | | | | | | | | | | 15,543,943 | |
| | | | | OIL & GAS SERVICES & EQUIPMENT — 2.1% | | | | | | | | | | |
| | 491,000 | | | Archrock Partners, L.P. / Archrock Partners(b) | | | | 6.8750 | | 04/01/27 | | | 483,012 | |
| | 434,000 | | | Nabors Industries, Inc.(b) | | | | 7.3750 | | 05/15/27 | | | 423,693 | |
| | 510,000 | | | USA Compression Partners, L.P. / USA Compression | | | | 6.8750 | | 04/01/26 | | | 505,393 | |
| | 415,000 | | | Valaris Ltd.(b) | | | | 8.3750 | | 04/30/30 | | | 415,828 | |
| | 337,000 | | | Weatherford International Ltd.(b) | | | | 6.5000 | | 09/15/28 | | | 337,359 | |
| | | | | | | | | | | | | | 2,165,285 | |
| | | | | PUBLISHING & BROADCASTING — 0.3% | | | | | | | | | | |
| | 332,000 | | | Belo Corporation | | | | 7.7500 | | 06/01/27 | | | 319,303 | |
| | | | | | | | | | | | | | | |
| | | | | REAL ESTATE INVESTMENT TRUSTS — 1.3% | | | | | | | | | | |
| | 650,000 | | | HAT Holdings I, LLC / HAT Holdings II, LLC(b) | | | | 3.3750 | | 06/15/26 | | | 576,249 | |
| | 141,000 | | | Service Properties Trust | | | | 5.2500 | | 02/15/26 | | | 125,398 | |
| | 461,000 | | | Service Properties Trust | | | | 4.7500 | | 10/01/26 | | | 399,169 | |
| | 46,000 | | | Service Properties Trust | | | | 5.5000 | | 12/15/27 | | | 40,240 | |
| | 57,000 | | | Service Properties Trust | | | | 3.9500 | | 01/15/28 | | | 44,723 | |
| | 165,000 | | | Service Properties Trust | | | | 4.9500 | | 10/01/29 | | | 125,229 | |
| | | | | | | | | | | | | | 1,311,008 | |
| | | | | REAL ESTATE OWNERS & DEVELOPERS — 0.4% | | | | | | | | | | |
| | 438,000 | | | Kennedy-Wilson, Inc. | | | | 4.7500 | | 03/01/29 | | | 349,965 | |
| | 119,000 | | | Kennedy-Wilson, Inc. | | | | 4.7500 | | 02/01/30 | | | 92,227 | |
| | | | | | | | | | | | | | 442,192 | |
| | | | | REAL ESTATE SERVICES — 0.7% | | | | | | | | | | |
| | 844,000 | | | Cushman & Wakefield US Borrower, LLC(b) | | | | 6.7500 | | 05/15/28 | | | 791,415 | |
See accompanying notes which are an integral part of these financial statements.
| DUNHAM HIGH YIELD BOND FUND |
| SCHEDULE OF INVESTMENTS (Unaudited) (Continued) |
| April 30, 2023 |
| Principal | | | | | | | Coupon Rate | | | | | |
| Amount ($) | | | | | Spread | | (%) | | Maturity | | Fair Value | |
| | | | | CORPORATE BONDS — 93.0% (Continued) | | | | | | | | | | |
| | | | | RENEWABLE ENERGY — 1.0% | | | | | | | | | | |
| | 558,000 | | | Atlantica Sustainable Infrastructure plc(b),(c) | | | | 4.1250 | | 06/15/28 | | $ | 509,677 | |
| | 554,000 | | | EnerSys(b) | | | | 4.3750 | | 12/15/27 | | | 519,724 | |
| | | | | | | | | | | | | | 1,029,401 | |
| | | | | RETAIL - CONSUMER STAPLES — 0.9% | | | | | | | | | | |
| | 440,000 | | | Albertsons Companies Inc / Safeway Inc / New(b) | | | | 4.6250 | | 01/15/27 | | | 425,992 | |
| | 506,000 | | | Albertsons Companies Inc / Safeway Inc / New(b) | | | | 5.8750 | | 02/15/28 | | | 501,557 | |
| | | | | | | | | | | | | | 927,549 | |
| | | | | RETAIL - DISCRETIONARY — 2.4% | | | | | | | | | | |
| | 575,000 | | | Ken Garff Automotive, LLC(b) | | | | 4.8750 | | 09/15/28 | | | 502,602 | |
| | 975,000 | | | LBM Acquisition, LLC(b) | | | | 6.2500 | | 01/15/29 | | | 774,104 | |
| | 598,000 | | | Metis Merger Sub, LLC(b) | | | | 6.5000 | | 05/15/29 | | | 507,438 | |
| | 569,000 | | | Park River Holdings, Inc.(b) | | | | 6.7500 | | 08/01/29 | | | 416,407 | |
| | 405,000 | | | Specialty Building Products Holdings, LLC / SBP(b) | | | | 6.3750 | | 09/30/26 | | | 368,021 | |
| | | | | | | | | | | | | | 2,568,572 | |
| | | | | SEMICONDUCTORS — 0.8% | | | | | | | | | | |
| | 520,000 | | | Entegris Escrow Corporation(b),(c) | | | | 5.9500 | | 06/15/30 | | | 496,006 | |
| | 354,000 | | | ON Semiconductor Corporation(b) | | | | 3.8750 | | 09/01/28 | | | 319,054 | |
| | | | | | | | | | | | | | 815,060 | |
| | | | | SOFTWARE — 2.1% | | | | | | | | | | |
| | 335,000 | | | Central Parent, Inc. / Central Merger Sub, Inc.(b) | | | | 7.2500 | | 06/15/29 | | | 332,086 | |
| | 800,000 | | | Condor Merger Sub, Inc.(b) | | | | 7.3750 | | 02/15/30 | | | 665,094 | |
| | 600,000 | | | Helios Software Holdings, Inc. / ION Corporate(b) | | | | 4.6250 | | 05/01/28 | | | 504,863 | |
| | 164,000 | | | NortonLifeLock, Inc.(b) | | | | 6.7500 | | 09/30/27 | | | 164,773 | |
| | 321,000 | | | NortonLifeLock, Inc.(b),(c) | | | | 7.1250 | | 09/30/30 | | | 322,778 | |
| | 595,000 | | | Rackspace Technology Global, Inc.(b) | | | | 3.5000 | | 02/15/28 | | | 247,559 | |
| | | | | | | | | | | | | | 2,237,153 | |
| | | | | SPECIALTY FINANCE — 7.2% | | | | | | | | | | |
| | 570,000 | | | AerCap Global Aviation Trust(b),(d) | | US0003M + 4.300% | | 6.5000 | | 06/15/45 | | | 536,183 | |
| | 555,000 | | | Alliance Data Systems Corporation(b) | | | | 4.7500 | | 12/15/24 | | | 490,780 | |
| | 625,000 | | | Apollo Commercial Real Estate Finance, Inc.(b),(c) | | | | 4.6250 | | 06/15/29 | | | 473,360 | |
| | 660,000 | | | Burford Capital Global Finance, LLC(b) | | | | 6.2500 | | 04/15/28 | | | 621,212 | |
| | 831,000 | | | Cobra AcquisitionCo, LLC(b) | | | | 6.3750 | | 11/01/29 | | | 482,250 | |
| | 505,000 | | | Curo Group Holdings Corporation(b) | | | | 7.5000 | | 08/01/28 | | | 199,334 | |
| | 215,000 | | | Enova International, Inc.(b) | | | | 8.5000 | | 09/01/24 | | | 214,363 | |
See accompanying notes which are an integral part of these financial statements.
| DUNHAM HIGH YIELD BOND FUND |
| SCHEDULE OF INVESTMENTS (Unaudited) (Continued) |
| April 30, 2023 |
| Principal | | | | | | | Coupon Rate | | | | | |
| Amount ($) | | | | | Spread | | (%) | | Maturity | | Fair Value | |
| | | | | CORPORATE BONDS — 93.0% (Continued) | | | | | | | | | | |
| | | | | SPECIALTY FINANCE — 7.2% (Continued) | | | | | | | | | | |
| | 430,000 | | | Enova International, Inc.(b),(c) | | | | 8.5000 | | 09/15/25 | | $ | 412,936 | |
| | 512,000 | | | FirstCash, Inc.(b) | | | | 4.6250 | | 09/01/28 | | | 467,512 | |
| | 202,000 | | | FirstCash, Inc.(b) | | | | 5.6250 | | 01/01/30 | | | 187,860 | |
| | 668,000 | | | Genworth Mortgage Holdings, Inc.(b) | | | | 6.5000 | | 08/15/25 | | | 662,232 | |
| | 324,000 | | | goeasy Ltd.(b) | | | | 4.3750 | | 05/01/26 | | | 284,640 | |
| | 682,000 | | | Ladder Capital Finance Holdings LLLP / Ladder(b) | | | | 4.2500 | | 02/01/27 | | | 582,380 | |
| | 483,000 | | | LFS Topco, LLC(b) | | | | 5.8750 | | 10/15/26 | | | 424,328 | |
| | 475,000 | | | Pattern Energy Operations, L.P. / Pattern Energy(b) | | | | 4.5000 | | 08/15/28 | | | 442,180 | |
| | 342,000 | | | Quicken Loans, LLC / Quicken Loans Co-Issuer, Inc.(b) | | | | 3.6250 | | 03/01/29 | | | 289,506 | |
| | 400,000 | | | Scientific Games Holdings, L.P./Scientific Games(b) | | | | 6.6250 | | 03/01/30 | | | 355,252 | |
| | 345,000 | | | Starwood Property Trust, Inc. | | | | 4.7500 | | 03/15/25 | | | 326,529 | |
| | 125,000 | | | Starwood Property Trust, Inc.(b) | | | | 3.6250 | | 07/15/26 | | | 107,684 | |
| | 80,000 | | | Starwood Property Trust, Inc.(b) | | | | 4.3750 | | 01/15/27 | | | 69,012 | |
| | | | | | | | | | | | | | 7,629,533 | |
| | | | | STEEL — 1.0% | | | | | | | | | | |
| | 433,000 | | | Allegheny Technologies, Inc. | | | | 4.8750 | | 10/01/29 | | | 397,142 | |
| | 287,000 | | | Cleveland-Cliffs, Inc. | | | | 6.2500 | | 10/01/40 | | | 242,363 | |
| | 477,000 | | | Commercial Metals Company | | | | 3.8750 | | 02/15/31 | | | 414,399 | |
| | | | | | | | | | | | | | 1,053,904 | |
| | | | | TECHNOLOGY HARDWARE — 1.5% | | | | | | | | | | |
| | 585,000 | | | Imola Merger Corporation(b) | | | | 4.7500 | | 05/15/29 | | | 507,236 | |
| | 295,000 | | | NCR Corporation(b) | | | | 5.1250 | | 04/15/29 | | | 255,492 | |
| | 405,000 | | | Seagate HDD Cayman | | | | 4.0910 | | 06/01/29 | | | 351,751 | |
| | 605,000 | | | TTM Technologies, Inc.(b),(c) | | | | 4.0000 | | 03/01/29 | | | 511,514 | |
| | | | | | | | | | | | | | 1,625,993 | |
| | | | | TECHNOLOGY SERVICES — 1.6% | | | | | | | | | | |
| | 650,000 | | | Ahead DB Holdings, LLC(b) | | | | 6.6250 | | 05/01/28 | | | 543,423 | |
| | 880,000 | | | ION Trading Technologies Sarl(b) | | | | 5.7500 | | 05/15/28 | | | 737,273 | |
| | 520,000 | | | Paysafe Finance plc / Paysafe Holdings US(b),(c) | | | | 4.0000 | | 06/15/29 | | | 406,991 | |
| | | | | | | | | | | | | | 1,687,687 | |
| | | | | TELECOMMUNICATIONS — 4.0% | | | | | | | | | | |
| | 1,585,000 | | | Altice France S.A.(b) | | | | 5.5000 | | 10/15/29 | | | 1,187,962 | |
| | 625,000 | | | Cogent Communications Group, Inc.(b) | | | | 7.0000 | | 06/15/27 | | | 619,309 | |
| | 880,000 | | | Connect Finco S.A.RL / Connect US Finco, LLC(b) | | | | 6.7500 | | 10/01/26 | | | 839,930 | |
See accompanying notes which are an integral part of these financial statements.
| DUNHAM HIGH YIELD BOND FUND |
| SCHEDULE OF INVESTMENTS (Unaudited) (Continued) |
| April 30, 2023 |
| Principal | | | | | | | Coupon Rate | | | | | |
| Amount ($) | | | | | Spread | | (%) | | Maturity | | Fair Value | |
| | | | | CORPORATE BONDS — 93.0% (Continued) | | | | | | | | | | |
| | | | | TELECOMMUNICATIONS — 4.0% (Continued) | | | | | | | | | | |
| | 535,000 | | | Hughes Satellite Systems Corporation | | | | 6.6250 | | 08/01/26 | | $ | 506,107 | |
| | 690,000 | | | Iliad Holding S.A.SU(b) | | | | 7.0000 | | 10/15/28 | | | 653,524 | |
| | 760,000 | | | Telesat Canada / Telesat, LLC(b) | | | | 4.8750 | | 06/01/27 | | | 407,517 | |
| | | | | | | | | | | | | | 4,214,349 | |
| | | | | TRANSPORTATION & LOGISTICS — 3.0% | | | | | | | | | | |
| | 550,000 | | | Air Canada(b) | | | | 3.8750 | | 08/15/26 | | | 509,763 | |
| | 1,081,000 | | | American Airlines, Inc.(b),(c) | | | | 11.7500 | | 07/15/25 | | | 1,187,821 | |
| | 150,000 | | | American Airlines, Inc.(b) | | | | 7.2500 | | 02/15/28 | | | 146,011 | |
| | 725,000 | | | Cargo Aircraft Management, Inc.(b),(c) | | | | 4.7500 | | 02/01/28 | | | 651,550 | |
| | 271,000 | | | United Airlines, Inc.(b) | | | | 4.3750 | | 04/15/26 | | | 259,136 | |
| | 510,000 | | | United Airlines, Inc.(b) | | | | 4.6250 | | 04/15/29 | | | 462,317 | |
| | | | | | | | | | | | | | 3,216,598 | |
| | | | | WHOLESALE - CONSUMER STAPLES — 1.0% | | | | | | | | | | |
| | 963,000 | | | C&S Group Enterprises, LLC(b) | | | | 5.0000 | | 12/15/28 | | | 754,021 | |
| | 285,000 | | | Performance Food Group, Inc.(b) | | | | 5.5000 | | 10/15/27 | | | 279,608 | |
| | | | | | | | | | | | | | 1,033,629 | |
| | | | | TOTAL CORPORATE BONDS (Cost $106,048,753) | | | | | | | | | 98,114,503 | |
| Shares | | | | | Fair Value | |
| | | | | SHORT-TERM INVESTMENTS — 16.7% | | | | |
| | | | | COLLATERAL FOR SECURITIES LOANED - 12.8% | | | | |
| | 13,508,510 | | | Mount Vernon Liquid Assets Portfolio, LLC, 4.96% (Cost $13,508,510)(e) (f) | | | 13,508,510 | |
| | | | | | | | | |
| | | | | MONEY MARKET FUND – 3.9% | | | | |
| | 4,085,664 | | | First American Government Obligations Fund, Class Z, 4.69% (Cost $4,085,664)(e) | | | 4,085,664 | |
| | | | | | | | | |
| | | | | TOTAL SHORT-TERM INVESTMENTS (Cost $17,594,174) | | | 17,594,174 | |
| | | | | | | | | |
| | | | | TOTAL INVESTMENTS - 111.4% (Cost $124,839,860) | | $ | 117,522,427 | |
| | | | | LIABILITIES IN EXCESS OF OTHER ASSETS - (11.4)% | | | (11,968,317 | ) |
| | | | | NET ASSETS - 100.0% | | $ | 105,554,110 | |
| LLC | - Limited Liability Company |
| | |
| LP | - Limited Partnership |
| | |
| LTD | - Limited Company |
| | |
| PLC | - Public Limited Company |
| | |
| REIT | - Real Estate Investment Trust |
| | |
| S/A | - Société Anonyme |
| | |
| H15T5Y | US Treasury Yield Curve Rate T Note Constant Maturity 5 Year |
| | |
| US0003M | ICE LIBOR USD 3 Month |
| | |
| (a) | Non-income producing security. |
| | |
| (b) | Security exempt from registration under Rule 144A or Section 4(2) of the Securities Act of 1933. The security may be resold in transactions exempt from registration, normally to qualified institutional buyers. As of April 30, 2023 the total market value of 144A securities is 82,334,970 or 78.0% of net assets. |
| | |
| (c) | All or a portion of these securities are on loan. Total loaned securities had a value of $13,279,201 at April 30, 2023. |
| | |
| (d) | Variable rate security; the rate shown represents the rate on April 30, 2023. |
| | |
| (e) | Rate disclosed is the seven day effective yield as of April 30, 2023. |
| | |
| (f) | The Trust’s securities lending policies and procedures require that the borrower: deliver cash or U.S. Government securities as collateral with respect to each new loan of U.S. securities, equal to at least 102% of the value of the portfolio securities loaned, and (ii) at all times thereafter mark-to-market the collateral on a daily basis so that the market value of such collateral is at least 100% of the value of securities loaned. From time to time the collateral may not be 102% due to end of day market movement. The next business day additional collateral is obtained/received from the borrower to replenish/reestablish 102%. |
| | |
| (g) | Level 3 securities fair value under procedures established by the Board of Trustees, represents 1.7% of net assets. The total value of these securities is $1,813,750. |
See accompanying notes which are an integral part of these financial statements.
| Dunham International Opportunity Bond Fund (Unaudited) |
| Message from the Sub-Adviser (Virtus Fixed Income Advisers, LLC) |
Asset Class Recap
Interest rate increases and related volatility has been a meaningful theme during the first half of the fiscal year. This volatility was evident on a global level, as central banks around the world attempted to navigate inflationary pressures and as bonds benchmarked to the US Treasury market adjusted to fluctuating US interest rates. Encouraging economic data indicated that inflation is falling and the global economy is slowing. It also appears that an energy crisis in Europe was alleviated by a warmer-than-anticipated fall and winter, despite a lack of resolution to the conflict between Ukraine and Russia. For the six-month period ended April 30, 2023, foreign bonds, as measured by the Bloomberg Global Aggregate Bond ex US Index, surged 10.6 percent, outperforming US investment-grade bonds, as measured by the Bloomberg US Aggregate Bond Index, which increased 6.9 percent. The historically more volatile foreign high-yield bonds, as measured by the Bloomberg Pan-European High-Yield Total Return Index Unhedged, and emerging market debt, as measured by the Bloomberg Emerging Markets USD Aggregate Total Return Index Unhedged, also finished the fiscal six-month period in positive territory by increasing 6.1 percent and fell 10.3 percent, respectively.
Allocation Review
The Fund maintained a similar exposure to emerging market debt since the start of the fiscal year, as the allocation remained just shy of 46 percent. This was commensurate with the allocation to developed market debt ending close to 54 percent. Within the developed market allocation, there was a meaningful shift in the exposure to high-yield debt during the second fiscal quarter, as the weighting increased from 8 percent to 12 percent, which was primarily sourced from reducing the exposure to developed market government bonds. This increase in developed market high-yield debt contributed to the increase in total high-yield allocation for the Fund from 54 percent to over 57 percent at the end of the semi-annual period. As the developed market government debt is predominantly rated AAA, the allocation to AAA-rated bonds was reduced from 12 percent to less than 9 percent. The allocation to emerging markets debt and high-yield bonds continued to represent the most significant allocation differences between the Fund and the benchmark index. However, the overall allocation to emerging market debt shifted from significantly contributing to relative performance in the first fiscal quarter to detracting from performance during the second fiscal quarter. Despite the higher volatility, the exposure to emerging markets was the greatest contributor to positive performance for the Fund during the six-month period. The Sub-Adviser maintained the Fund’s duration around 5.7 years, which continued to be less than the benchmark by approximately 1.5 years. The derivative exposures within the Fund, which was primarily comprised of bond futures to manage duration and broad government bond exposure, provided mixed results over the fiscal period, but none were material to overall performance.
Holdings Insights
Within the allocation to Pan-European high-yield bonds, the Fund held Techem Verwaltungsgesellschaft 6%, Due 07/30/2026 (BG1TGX2) (holding weight*: 0.19 percent), a German global energy service provider. During the six -month period ended April 30, 2023, the Techem Verwaltungsgesellschaft bond increased 3.8 percent. Another Pan-European high-yield bond that contributed to Fund performance since the start of the fiscal year was VF Ukraine PAT via VFU Funding plc 6.2%, Due 02/11/2025 (918212AA9) (holding weight*: 0.32 percent). This credit surged 13.6 percent in the first fiscal quarter and 7.8 percent in the second fiscal quarter, bringing overall performance close to 22 percent for the six-month period. Some European investment-grade bonds comprised the worst performing positions within the Fund in the first fiscal quarter, such as the Spain Government Bond 4.2%, Due 01/31/2037 (B05L4R2) (holding weight*: 0.42 percent) and the Ireland Government Bond 5.4%, Due 03/13/2025 (B4TV0D4) (holding weight*: 0.19 percent). In the initial three months of the fiscal year, the Spanish government bond gave back 0.2 percent, and the Irish government bond declined 0.6 percent. These detractions were not completely reversed in the second fiscal quarter, as both bonds ended the six-month period down 0.2 percent.
As the largest overall contributor in the first fiscal quarter and largest detractor in the second fiscal quarter, the Fund’s holdings in emerging markets corporate debt contained some of the largest gains and declines. For example, the Fund had exposure to China, which had just benefitted in the first fiscal quarter from a rebound in the country’s housing sector thanks to supportive regulatory measures from Chinese authorities. The Fund held China SCE Group Holdings Ltd. 7.375%, Due 04/09/2024 (G21190AB2) (holding weight*: 0.28 percent), a residential property developer, and Wanda Properties International Company Ltd. 7.25%, Due 01/29/2024 (G9429CAA8) (holding weight*: 0.75 percent) a multinational conglomerate based in China. After surging more than 300 percent in the first fiscal quarter, China SCE decreased 7.6 percent in the second fiscal quarter, while Wanda Properties tumbled 24.2 percent in the second fiscal quarter after rising more than 100 percent in the first fiscal quarter. The Fund also continued to hold corporate and government bonds in Argentina. This included the Argentine Republic Government International Bond 0.125%, Due 07/09/2035 (040114HT0) (holding weight*: 0.16 percent), which decreased 26.4 percent in the second fiscal quarter after surging 56.1 percent in the first fiscal quarter, and the YPF S.A. 8.5%, Due 07/28/2025 (984245AL4) (holding weight*: 0.60 percent), a state-owned Argentine energy company, which dropped 7.1 percent after it added 29 percent in the first fiscal quarter.
Sub-Adviser Outlook
The Sub-Adviser remains cautious but optimistic for the remainder of the fiscal year. With interest rates potentially peaking, and many central banks moving to halt tightening policies or even ease, there is some light at the end of the tunnel. However, recessions in developed markets could spill over into significant problems for high-yield bonds and risk-appetite for bonds from emerging markets. While opportunities across fixed-income markets may continue to be abundant, the potential for meaningful volatility still exists. Therefore, the Sub-Adviser believes that retaining the flexibility to invest in both emerging and developed markets, as well as both corporate bonds and sovereign debt, will allow the Fund to take advantage of the dispersion.
| * | Holdings percentage(s) of total investments, cash and unsettled trades excluding collateral for securities loaned as of 4/30/2023. |
| Dunham International Opportunity Bond Fund |
| PORTFOLIO REVIEW (Unaudited) |
| April 30, 2023 |
The Fund’s performance figures* for each of the periods ended April 30, 2023, compared to its benchmarks:
| | | | | Annualized |
| | 6 Month Return | 1 Year Return | Annualized
5 Year Return | Since Inception
(11/1/13) |
| Class N | 11.35% | (1.56)% | (2.16)% | (1.40)% |
| Class A with Load 4.50% | 6.26% | (6.28)% | (3.30)% | (2.12)% |
| Class A without load | 11.19% | (1.82)% | (2.40)% | (1.64)% |
| Class C | 10.94% | (2.23)% | (2.88)% | (2.14)% |
| Bloomberg Global Aggregate Bond ex -US Index Hedged (a) | 10.55% | (3.90)% | (2.67)% | (1.17)% |
| Morningstar Global Bond Category (b) | 8.57% | (1.75)% | (0.68)% | 0.10% |
| * | Total Returns are calculated based on traded NAVs. As disclosed in the Trust’s latest registration statement, the Fund’s total annual operating expenses, including underlying funds, are 1.33% for Class N, 2.08% for Class C and 1.58% for Class A. Class A shares are subject to a sales load of 4.50% and a deferred sales charge of up to 0.75%. The performance data quoted here represents past performance, which is not indicative of future results. Current performance may be lower or higher than the performance data quoted. The investment return and NAV will fluctuate, so that an investor’s shares, when redeemed, may be worth more or less than their original cost. Total returns are calculated assuming reinvestment of all dividends and capital gains distributions, if any. The returns do not reflect the deductions of taxes a shareholder would pay on the redemption of Fund shares or Fund distributions. For performance information current to the most recent month-end, please call 1-800-442-4358 or visit our website www.dunham.com. |
| (a) | The Bloomberg Global ex US Aggregate Bond Index Hedged is designed to be a broad-based measure of the global investment-grade, fixed rate, fixed income corporate markets outside the United States. Investors cannot invest directly in an index or benchmark. |
| (b) | The Morningstar Global Bond Category is generally representative of funds that invest at least 40% of bonds in foreign markets. |
Comparison of the Change in Value of a $100,000 Investment
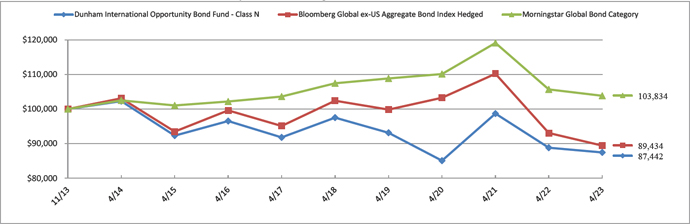
| Portfolio Composition * (Unaudited) |
| Netherlands | | | 11.7 | % |
| Great Britain | | | 9.4 | % |
| United States | | | 8.4 | % |
| Cayman Islands | | | 5.3 | % |
| Mexico | | | 5.2 | % |
| Spain | | | 5.2 | % |
| Italy | | | 4.9 | % |
| Germany | | | 3.6 | % |
| France | | | 3.2 | % |
| Turkey | | | 2.7 | % |
| Other Countries | | | 40.4 | % |
| Total | | | 100.0 | % |
* Based on total value of investments as of April 30, 2023. Does not include derivative holdings.
** Includes Collateral for Securities Loaned as of April 30, 2023.
Percentage may differ from Schedule of Investments which are based on Fund net assets.
| DUNHAM INTERNATIONAL OPPORTUNITY BOND FUND |
| SCHEDULE OF INVESTMENTS (Unaudited) |
| April 30, 2023 |
| Principal | | | | | | | Coupon Rate | | | | | |
| Amount ($) | | | | | Spread | | (%) | | Maturity | | Fair Value | |
| | | | | ASSET BACKED SECURITIES — 0.1% | | | | | | | | | | |
| | | | | RESIDENTIAL MORTGAGE — 0.1% | | | | | | | | | | |
| | 41,371 EUR | | | Bankinter FTA Series 10 A2(b) | | EUR003M + 0.160% | | 2.8060 | | 06/21/43 | | $ | 45,314 | |
| | 15,548 EUR | | | Fondo de Titulizacion de Activos Santander Series 2 A(b) | | EUR003M + 0.150% | | 3.3250 | | 01/18/49 | | | 16,829 | |
| | | | | TOTAL ASSET BACKED SECURITIES (Cost $60,557) | | | | | 62,143 | |
| | | | | | | | | | | | | | | |
| | | | | CORPORATE BONDS — 67.5% | | | | | | | | | | |
| | | | | ASSET MANAGEMENT — 1.5% | | | | | | | | | | |
| | 200,000 USD | | | Huarong Finance II Company Ltd. | | | | 4.8750 | | 11/22/26 | | | 177,250 | |
| | 300,000 EUR | | | JAB Holdings BV | | | | 1.0000 | | 12/20/27 | | | 291,611 | |
| | 250,000 USD | | | UBS Group A.G.(a),(b) | | H15T1Y + 1.750% | | 4.7510 | | 05/12/28 | | | 240,906 | |
| | | | | | | | | | | | | | 709,767 | |
| | | | | AUTOMOTIVE — 4.0% | | | | | | | | | | |
| | 150,000 EUR | | | Clarios Global, L.P. / Clarios US Finance Company | | | | 4.3750 | | 05/15/26 | | | 158,549 | |
| | 300,000 EUR | | | Daimler A.G. | | | | 0.7500 | | 02/08/30 | | | 279,589 | |
| | 150,000 EUR | | | Ford Motor Credit Company, LLC | | | | 2.3300 | | 11/25/25 | | | 154,167 | |
| | 110,000 EUR | | | Grupo Antolin-Irausa S.A. | | | | 3.3750 | | 04/30/26 | | | 99,716 | |
| | 120,000 EUR | | | Grupo Antolin-Irausa S.A. | | | | 3.5000 | | 04/30/28 | | | 91,448 | |
| | 200,000 USD | | | Hyundai Capital America(a) | | | | 3.0000 | | 02/10/27 | | | 184,542 | |
| | 210,000 EUR | | | Jaguar Land Rover Automotive plc | | | | 5.8750 | | 11/15/24 | | | 231,075 | |
| | 325,000 USD | | | Nissan Motor Acceptance Company, LLC(a) | | | | 1.8500 | | 09/16/26 | | | 277,173 | |
| | 142,000 USD | | | Uzauto Motors AJ(a) | | | | 4.8500 | | 05/04/26 | | | 122,475 | |
| | 200,000 EUR | | | Volkswagen International Finance N.V. | | | | 1.8750 | | 03/30/27 | | | 203,368 | |
| | 100,000 EUR | | | ZF Finance GmbH | | | | 3.7500 | | 09/21/28 | | | 98,726 | |
| | | | | | | | | | | | | | 1,900,828 | |
| | | | | BANKING — 7.3% | | | | | | | | | | |
| | 250,000 EUR | | | AIB Group plc | | | | 2.2500 | | 07/03/25 | | | 266,683 | |
| | 300,000 EUR | | | Banco Bilbao Vizcaya Argentaria S.A. | | | | 3.5000 | | 02/10/27 | | | 321,072 | |
| | 622,000 USD | | | Banco Mercantil del Norte S.A.(a),(b) | | H15T5Y + 4.967% | | 6.7500 | | 09/27/68 | | | 596,095 | |
| | 200,000 USD | | | Banco Santander S.A.(b) | | H15T1Y + 2.000% | | 4.1750 | | 03/24/28 | | | 189,984 | |
| | 350,000 USD | | | Barclays plc | | | | 4.8360 | | 05/09/28 | | | 331,895 | |
| | 50,000 USD | | | BBVA Bancomer S.A.(a),(b) | | H15T5Y + 2.650% | | 5.1250 | | 01/18/33 | | | 44,167 | |
| | 50,000 USD | | | BPCE S.A.(a),(b) | | SOFRRATE + 2.100% | | 5.9750 | | 01/18/27 | | | 50,379 | |
See accompanying notes which are an integral part of these financial statements.
| DUNHAM INTERNATIONAL OPPORTUNITY BOND FUND |
| SCHEDULE OF INVESTMENTS (Unaudited) (Continued) |
| April 30, 2023 |
| Principal | | | | | | | Coupon Rate | | | | | |
| Amount ($) | | | | | Spread | | (%) | | Maturity | | Fair Value | |
| | | | | CORPORATE BONDS — 67.5% (Continued) | | | | | | | | | | |
| | | | | BANKING — 7.3% (Continued) | | | | | | | | | | |
| | 225,000 EUR | | | Cooperatieve Rabobank UA | | | | 1.3750 | | 02/03/27 | | $ | 230,719 | |
| | 250,000 USD | | | Danske Bank A/S(a),(b) | | H15T1Y + 1.350% | | 1.6210 | | 09/11/26 | | | 224,682 | |
| | 250,000 USD | | | Deutsche Bank AG/New York NY(b) | | SOFRRATE + 1.870% | | 2.1290 | | 11/24/26 | | | 222,382 | |
| | 200,000 USD | | | HSBC Holdings plc(b)(c) | | SOFRRATE + 2.390% | | 6.2540 | | 03/09/34 | | | 208,266 | |
| | 100,000 USD | | | HSBC Holdings PLC(b) | | SOFRRATE + 1.290% | | 1.5890 | | 05/24/27 | | | 89,052 | |
| | 250,000 EUR | | | Natwest Group plc(b) | | EUR003M + 1.080% | | 1.7500 | | 03/02/26 | | | 263,252 | |
| | 300,000 USD | | | Societe Generale S.A.(a),(b) | | H15T1Y + 1.300% | | 2.8890 | | 06/09/32 | | | 238,074 | |
| | 150,000 USD | | | Standard Chartered plc(a),(b) | | H15T5Y + 2.300% | | 3.2650 | | 02/18/36 | | | 119,283 | |
| | | | | | | | | | | | | | 3,395,985 | |
| | | | | BEVERAGES — 0.7% | | | | | | | | | | |
| | 250,000 EUR | | | Diageo Capital BV | | | | 1.5000 | | 06/08/29 | | | 247,773 | |
| | 110,000 EUR | | | Primo Water Holdings, Inc. | | | | 3.8750 | | 10/31/28 | | | 106,507 | |
| | | | | | | | | | | | | | 354,280 | |
| | | | | BIOTECH & PHARMA — 2.6% | | | | | | | | | | |
| | 300,000 EUR | | | Bayer A.G. | | | | 1.3750 | | 07/06/32 | | | 265,855 | |
| | 200,000 USD | | | CSL Finance plc(a) | | | | 4.0500 | | 04/27/29 | | | 194,201 | |
| | 250,000 GBP | | | GlaxoSmithKline Capital plc | | | | 1.2500 | | 10/12/28 | | | 266,342 | |
| | 110,000 EUR | | | Grifols S.A. | | | | 3.2000 | | 05/01/25 | | | 112,699 | |
| | 100,000 EUR | | | Grifols S.A. | | | | 2.2500 | | 11/15/27 | | | 95,050 | |
| | 300,000 EUR | | | Mylan N.V. | | | | 3.1250 | | 11/22/28 | | | 306,975 | |
| | | | | | | | | | | | | | 1,241,122 | |
| | | | | CABLE & SATELLITE — 0.4% | | | | | | | | | | |
| | 200,000 EUR | | | United Group BV | | | | 3.1250 | | 02/15/26 | | | 192,569 | |
| | | | | | | | | | | | | | | |
| | | | | CHEMICALS — 2.3% | | | | | | | | | | |
| | 469,000 USD | | | Braskem Idesa S.A.PI(a) | | | | 6.9900 | | 02/20/32 | | | 334,420 | |
| | 100,000 EUR | | | INEOS Quattro Finance 1 plc | | | | 3.7500 | | 07/15/26 | | | 97,113 | |
| | 190,000 EUR | | | INEOS Quattro Finance 1 plc(a) | | | | 3.7500 | | 07/15/26 | | | 184,513 | |
| | 200,000 EUR | | | Nobian Finance BV(a) | | | | 3.6250 | | 07/15/26 | | | 190,640 | |
| | 132,000 USD | | | Sasol Financing USA, LLC(a) | | | | 8.7500 | | 05/03/29 | | | 132,530 | |
| | 150,000 EUR | | | Synthomer plc | | | | 3.8750 | | 07/01/25 | | | 153,414 | |
| | | | | | | | | | | | | | 1,092,630 | |
See accompanying notes which are an integral part of these financial statements.
| DUNHAM INTERNATIONAL OPPORTUNITY BOND FUND |
| SCHEDULE OF INVESTMENTS (Unaudited) (Continued) |
| April 30, 2023 |
| Principal | | | | | | | Coupon Rate | | | | | |
| Amount ($) | | | | | Spread | | (%) | | Maturity | | Fair Value | |
| | | | | CORPORATE BONDS — 67.5% (Continued) | | | | | | | | | | |
| | | | | CONSTRUCTION MATERIALS — 0.9% | | | | | | | | | | |
| | 123,000 USD | | | Cemex S.A.B. de C.V.(a),(b) | | H15T5Y + 4.907% | | 9.1250 | | 03/14/28 | | $ | 122,969 | |
| | 363,000 USD | | | Cemex S.A.B. de C.V.(a),(b) | | H15T5Y + 4.534% | | 5.1250 | | 09/08/69 | | | 321,872 | |
| | | | | | | | | | | | | | 444,841 | |
| | | | | CONTAINERS & PACKAGING — 1.5% | | | | | | | | | | |
| | 200,000 EUR | | | Ardagh Metal Packaging Finance USA, LLC / Ardagh | | | | 3.0000 | | 09/01/29 | | | 162,510 | |
| | 200,000 GBP | | | Ardagh Packaging Finance plc / Ardagh Holdings | | | | 4.7500 | | 07/15/27 | | | 201,319 | |
| | 150,000 EUR | | | Canpack S.A. / Canpack US, LLC | | | | 2.3750 | | 11/01/27 | | | 132,888 | |
| | 200,000 EUR | | | Trivium Packaging Finance BV | | | | 3.7500 | | 08/15/26 | | | 203,585 | |
| | | | | | | | | | | | | | 700,302 | |
| | | | | ELEC & GAS MARKETING & TRADING — 0.5% | | | | | | | | | | |
| | 250,000 EUR | | | Orsted A/S | | | | 1.5000 | | 11/26/29 | | | 243,761 | |
| | | | | | | | | | | | | | | |
| | | | | ELECTRIC UTILITIES — 8.4% | | | | | | | | | | |
| | 200,000 USD | | | Adani Electricity Mumbai Ltd. | | | | 3.9490 | | 02/12/30 | | | 146,443 | |
| | 200,000 USD | | | Adani Green Energy Ltd. | | | | 4.3750 | | 09/08/24 | | | 179,803 | |
| | 160,200 USD | | | Adani Renewable Energy RJ Ltd./Kodangal Solar(a) | | | | 4.6250 | | 10/15/39 | | | 114,929 | |
| | 144,000 USD | | | Adani Transmission Step-One Ltd.(a) | | | | 4.0000 | | 08/03/26 | | | 123,314 | |
| | 23,000 USD | | | Comision Federal de Electricidad(a) | | | | 4.6880 | | 05/15/29 | | | 20,846 | |
| | 250,000 USD | | | Electricite de France S.A.(a) | | | | 4.5000 | | 09/21/28 | | | 244,935 | |
| | 250,000 USD | | | Enel Finance International N.V.(a) | | | | 5.5000 | | 06/15/52 | | | 227,105 | |
| | 387,000 USD | | | Eskom Holdings SOC Ltd.(a) | | | | 7.1250 | | 02/11/25 | | | 378,583 | |
| | 226,000 USD | | | Eskom Holdings SOC Ltd.(a) | | | | 8.4500 | | 08/10/28 | | | 217,210 | |
| | 297,040 USD | | | Greenko Dutch BV(a) | | | | 3.8500 | | 03/29/26 | | | 268,821 | |
| | 200,000 EUR | | | Iberdrola Finanzas S.A. | | | | 1.0000 | | 03/07/25 | | | 211,881 | |
| | 180,000 USD | | | Inkia Energy Ltd.(a),(c) | | | | 5.8750 | | 11/09/27 | | | 167,654 | |
| | 250,000 EUR | | | innogy Finance BV | | | | 1.0000 | | 04/13/25 | | | 263,606 | |
| | 300,000 USD | | | Minejesa Capital BV(a) | | | | 4.6250 | | 08/10/30 | | | 264,750 | |
| | 7,000 USD | | | Minejesa Capital BV(a) | | | | 5.6250 | | 08/10/37 | | | 5,574 | |
| | 300,000 USD | | | Mong Duong Finance Holdings BV(a) | | | | 5.1250 | | 05/07/29 | | | 261,192 | |
| | 238,000 USD | | | MSU Energy S.A. / UGEN S.A. / UENSA S.A.(a) | | | | 6.8750 | | 02/01/25 | | | 166,842 | |
| | 500,000 EUR | | | National Grid plc | | | | 0.1630 | | 01/20/28 | | | 469,765 | |
| | 300,000 EUR | | | Naturgy Finance BV | | | | 1.5000 | | 01/29/28 | | | 302,238 | |
| | 8,000 USD | | | Perusahaan Perseroan Persero PT Perusahaan Listrik | | | | 3.3750 | | 02/05/30 | | | 7,124 | |
| | 33,000 USD | | | Star Energy Geothermal Darajat II / Star Energy(a) | | | | 4.8500 | | 10/14/38 | | | 28,569 | |
| | | | | | | | | | | | | | 4,071,184 | |
See accompanying notes which are an integral part of these financial statements.
| DUNHAM INTERNATIONAL OPPORTUNITY BOND FUND |
| SCHEDULE OF INVESTMENTS (Unaudited) (Continued) |
| April 30, 2023 |
| Principal | | | | | | | Coupon Rate | | | | | |
| Amount ($) | | | | | Spread | | (%) | | Maturity | | Fair Value | |
| | | | | CORPORATE BONDS — 67.5% (Continued) | | | | | | | | | | |
| | | | | ELECTRICAL EQUIPMENT — 1.3% | | | | | | | | | | |
| | 300,000 GBP | | | Siemens Financieringsmaatschappij N.V. | | | | 1.0000 | | 02/20/25 | | $ | 353,026 | |
| | 108,900 EUR | | | TK Elevator Holdco GmbH | | | | 6.6250 | | 07/15/28 | | | 100,728 | |
| | 200,000 EUR | | | Vertical Midco GmbH | | | | 4.3750 | | 07/15/27 | | | 197,407 | |
| | | | | | | | | | | | | | 651,161 | |
| | | | | ENGINEERING & CONSTRUCTION — 0.8% | | | | | | | | | | |
| | 363,000 USD | | | IHS Holding Ltd.(a) | | | | 6.2500 | | 11/29/28 | | | 289,493 | |
| | 98,000 USD | | | IHS Netherlands Holdco BV(a) | | | | 8.0000 | | 09/18/27 | | | 86,421 | |
| | | | | | | | | | | | | | 375,914 | |
| | | | | ENTERTAINMENT CONTENT — 0.7% | | | | | | | | | | |
| | 185,000 EUR | | | Banijay Group S.A.S | | | | 6.5000 | | 03/01/26 | | | 199,495 | |
| | 120,000 GBP | | | Pinewood Finance Company Ltd. | | | | 3.2500 | | 09/30/25 | | | 141,779 | |
| | | | | | | | | | | | | | 341,274 | |
| | | | | FOOD — 0.2% | | | | | | | | | | |
| | 96,000 USD | | | Minerva Luxembourg S.A.(a) | | | | 4.3750 | | 03/18/31 | | | 75,476 | |
| | | | | | | | | | | | | | | |
| | | | | HEALTH CARE FACILITIES & SERVICES — 0.5% | | | | | | | | | | |
| | 250,000 EUR | | | Catalent Pharma Solutions, Inc. | | | | 2.3750 | | 03/01/28 | | | 232,234 | |
| | | | | | | | | | | | | | | |
| | | | | HOUSEHOLD PRODUCTS — 0.4% | | | | | | | | | | |
| | 100,000 EUR | | | Energizer Gamma Acquisition BV(a) | | | | 3.5000 | | 06/30/29 | | | 87,508 | |
| | 110,000 EUR | | | Energizer Gamma Acquisition BV | | | | 3.5000 | | 06/30/29 | | | 96,258 | |
| | | | | | | | | | | | | | 183,766 | |
| | | | | INDUSTRIAL INTERMEDIATE PROD — 1.1% | | | | | | | | | | |
| | 551,000 USD | | | HTA Group Ltd./Mauritius(a) | | | | 7.0000 | | 12/18/25 | | | 520,296 | |
| | | | | | | | | | | | | | | |
| | | | | INDUSTRIAL SUPPORT SERVICES — 0.9% | | | | | | | | | | |
| | 97,323 EUR | | | Loxam S.A.S | | | | 6.0000 | | 04/15/25 | | | 105,250 | |
| | 210,000 EUR | | | Loxam S.A.S | | | | 3.7500 | | 07/15/26 | | | 218,606 | |
| | 87,920 EUR | | | Techem Verwaltungsgesellschaft 674 mbH | | | | 6.0000 | | 07/30/26 | | | 91,597 | |
| | | | | | | | | | | | | | 415,453 | |
See accompanying notes which are an integral part of these financial statements.
| DUNHAM INTERNATIONAL OPPORTUNITY BOND FUND |
| SCHEDULE OF INVESTMENTS (Unaudited) (Continued) |
| April 30, 2023 |
| Principal | | | | | | | Coupon Rate | | | | | |
| Amount ($) | | | | | Spread | | (%) | | Maturity | | Fair Value | |
| | | | | CORPORATE BONDS — 67.5% (Continued) | | | | | | | | | | |
| | | | | INSTITUTIONAL FINANCIAL SERVICES — 0.6% | | | | | | | | | | |
| | 150,000 USD | | | Nomura Holdings, Inc. | | | | 1.6530 | | 07/14/26 | | $ | 132,897 | |
| | 175,000 USD | | | Nomura Holdings, Inc. | | | | 2.1720 | | 07/14/28 | | | 147,221 | |
| | | | | | | | | | | | | | 280,118 | |
| | | | | INSURANCE — 0.9% | | | | | | | | | | |
| | 200,000 EUR | | | Allianz S.E.(b) | | EUR003M + 3.350% | | 3.0990 | | 07/06/47 | | | 206,753 | |
| | 250,000 EUR | | | NN Group N.V. | | | | 1.6250 | | 06/01/27 | | | 254,761 | |
| | | | | | | | | | | | | | 461,514 | |
| | | | | INTERNET MEDIA & SERVICES — 0.5% | | | | | | | | | | |
| | 10,000 USD | | | Prosus N.V.(a) | | | | 3.0610 | | 07/13/31 | | | 7,875 | |
| | 273,000 USD | | | Prosus N.V. | | | | 3.0610 | | 07/13/31 | | | 214,975 | |
| | | | | | | | | | | | | | 222,850 | |
| | | | | LEISURE FACILITIES & SERVICES — 1.8% | | | | | | | | | | |
| | 215,000 EUR | | | Carnival Corporation | | | | 7.6250 | | 03/01/26 | | | 212,532 | |
| | 100,000 EUR | | | Gamma Bidco SpA | | | | 6.2500 | | 07/15/25 | | | 111,631 | |
| | 133,000 USD | | | Melco Resorts Finance Ltd. | | | | 5.7500 | | 07/21/28 | | | 116,042 | |
| | 80,000 USD | | | Sands China Ltd. | | | | 3.7500 | | 08/08/31 | | | 66,177 | |
| | 140,000 GBP | | | Stonegate Pub Company Financing 2019 plc(a) | | | | 8.2500 | | 07/31/25 | | | 162,102 | |
| | 200,000 USD | | | Studio City Company Ltd. | | | | 7.0000 | | 02/15/27 | | | 189,961 | |
| | 73,000 USD | | | Studio City Finance Ltd.(a) | | | | 6.0000 | | 07/15/25 | | | 67,226 | |
| | | | | | | | | | | | | | 925,671 | |
| | | | | MACHINERY — 0.4% | | | | | | | | | | |
| | 180,000 EUR | | | Renk A.G./Frankfurt am Main | | | | 5.7500 | | 07/15/25 | | | 194,802 | |
| | | | | | | | | | | | | | | |
| | | | | MEDICAL EQUIPMENT & DEVICES — 0.6% | | | | | | | | | | |
| | 300,000 EUR | | | Medtronic Global Holdings SCA | | | | 0.7500 | | 10/15/32 | | | 259,197 | |
| | | | | | | | | | | | | | | |
| | | | | METALS & MINING — 1.2% | | | | | | | | | | |
| | 10,000 USD | | | Corp Nacional del Cobre de Chile | | | | 3.0000 | | 09/30/29 | | | 8,979 | |
| | 71,000 USD | | | First Quantum Minerals Ltd.(a) | | | | 6.8750 | | 03/01/26 | | | 69,647 | |
| | 7,000 USD | | | Freeport Indonesia PT(a) | | | | 6.2000 | | 04/14/52 | | | 6,462 | |
| | 300,000 EUR | | | Glencore Capital Finance DAC | | | | 1.1250 | | 03/10/28 | | | 285,268 | |
| | 20,000 USD | | | Indika Energy Capital IV Pte Ltd.(a) | | | | 8.2500 | | 10/22/25 | | | 19,860 | |
| | 88,000 USD | | | Indika Energy Capital IV Pte Ltd. | | | | 8.2500 | | 10/22/25 | | | 87,383 | |
| | 26,000 USD | | | Indonesia Asahan Aluminium Persero PT(a) | | | | 5.8000 | | 05/15/50 | | | 23,629 | |
See accompanying notes which are an integral part of these financial statements.
| DUNHAM INTERNATIONAL OPPORTUNITY BOND FUND |
| SCHEDULE OF INVESTMENTS (Unaudited) (Continued) |
| April 30, 2023 |
| Principal | | | | | | | Coupon Rate | | | | | |
| Amount ($) | | | | | Spread | | (%) | | Maturity | | Fair Value | |
| | | | | CORPORATE BONDS — 67.5% (Continued) | | | | | | | | | | |
| | | | | METALS & MINING — 1.2% (Continued) | | | | | | | | | | |
| | 158,000 USD | | | Vedanta Resources Finance II plc(a) | | | | 8.9500 | | 03/11/25 | | $ | 113,128 | |
| | | | | | | | | | | | | | 614,356 | |
| | | | | OIL & GAS PRODUCERS — 11.4% | | | | | | | | | | |
| | 59,000 USD | | | Abu Dhabi Crude Oil Pipeline, LLC(a) | | | | 3.6500 | | 11/02/29 | | | 55,950 | |
| | 78,000 USD | | | AI Candelaria Spain S.A.(a) | | | | 5.7500 | | 06/15/33 | | | 55,439 | |
| | 652,000 USD | | | AI Candelaria Spain S.A. | | | | 5.7500 | | 06/15/33 | | | 463,408 | |
| | 43,317 USD | | | AI Candelaria Spain SLU(a) | | | | 7.5000 | | 12/15/28 | | | 40,198 | |
| | 175,000 USD | | | Cenovus Energy, Inc. | | | | 6.7500 | | 11/15/39 | | | 190,112 | |
| | 350,000 USD | | | Ecopetrol S.A. | | | | 5.8750 | | 05/28/45 | | | 229,607 | |
| | 200,000 EUR | | | eG Global Finance plc | | | | 6.2500 | | 10/30/25 | | | 208,240 | |
| | 250,000 USD | | | Enbridge, Inc. | | | | 2.5000 | | 02/14/25 | | | 239,302 | |
| | 250,000 EUR | | | Exxon Mobil Corporation | | | | 0.5240 | | 06/26/28 | | | 238,387 | |
| | 97,000 USD | | | Geopark Ltd.(a) | | | | 5.5000 | | 01/17/27 | | | 80,579 | |
| | 543,000 USD | | | Gran Tierra Energy International Holdings Ltd.(a) | | | | 6.2500 | | 02/15/25 | | | 464,870 | |
| | 87,000 USD | | | Gran Tierra Energy, Inc.(a) | | | | 7.7500 | | 05/23/27 | | | 65,879 | |
| | 46,000 USD | | | Gran Tierra Energy, Inc. | | | | 7.7500 | | 05/23/27 | | | 34,832 | |
| | 400,000 USD | | | KazMunayGas National Company JSC | | | | 3.5000 | | 04/14/33 | | | 308,965 | |
| | 54,000 USD | | | KazMunayGas National Company JSC(a) | | | | 5.7500 | | 04/19/47 | | | 42,879 | |
| | 2,000 USD | | | KazMunayGas National Company JSC(a) | | | | 6.3750 | | 10/24/48 | | | 1,691 | |
| | 486,000 USD | | | Kosmos Energy Ltd. | | | | 7.7500 | | 05/01/27 | | | 420,544 | |
| | 318,863 USD | | | MC Brazil Downstream Trading S.A.RL | | | | 7.2500 | | 06/30/31 | | | 245,283 | |
| | 98,000 USD | | | Petroleos del Peru S.A. | | | | 5.6250 | | 06/19/47 | | | 62,238 | |
| | 185,000 USD | | | Petroleos Mexicanos(c) | | | | 6.5000 | | 03/13/27 | | | 166,212 | |
| | 53,000 USD | | | Petroleos Mexicanos | | | | 6.8400 | | 01/23/30 | | | 42,869 | |
| | 361,000 USD | | | Petroleos Mexicanos | | | | 6.7000 | | 02/16/32 | | | 277,890 | |
| | 27,000 USD | | | Petroleos Mexicanos(a) | | | | 10.0000 | | 02/07/33 | | | 25,097 | |
| | 13,000 USD | | | Petroleos Mexicanos | | | | 6.6250 | | 06/15/38 | | | 8,683 | |
| | 58,000 USD | | | Petroleos Mexicanos | | | | 7.6900 | | 01/23/50 | | | 38,868 | |
| | 600,000 USD | | | SierraCol Energy Andina, LLC(a) | | | | 6.0000 | | 06/15/28 | | | 444,840 | |
| | 673,000 USD | | | Tullow Oil plc(a) | | | | 7.0000 | | 03/01/25 | | | 410,331 | |
| | 305,000 USD | | | Tullow Oil plc(a) | | | | 10.2500 | | 05/15/26 | | | 238,490 | |
| | 339,000 USD | | | YPF S.A.(a) | | | | 8.5000 | | 07/28/25 | | | 282,070 | |
| | | | | | | | | | | | | | 5,383,753 | |
See accompanying notes which are an integral part of these financial statements.
| DUNHAM INTERNATIONAL OPPORTUNITY BOND FUND |
| SCHEDULE OF INVESTMENTS (Unaudited) (Continued) |
| April 30, 2023 |
| Principal | | | | | | | Coupon Rate | | | | | |
| Amount ($) | | | | | Spread | | (%) | | Maturity | | Fair Value | |
| | | | | CORPORATE BONDS — 67.5% (Continued) | | | | | | | | | | |
| | | | | OIL & GAS SERVICES & EQUIPMENT — 2.1% | | | | | | | | | | |
| | 171,187 USD | | | Guara Norte Sarl(a) | | | | 5.1980 | | 06/15/34 | | $ | 145,977 | |
| | 368,295 USD | | | MV24 Capital BV(a) | | | | 6.7480 | | 06/01/34 | | | 329,066 | |
| | 623,700 USD | | | Poinsettia Finance Ltd. | | | | 6.6250 | | 06/17/31 | | | 517,499 | |
| | | | | | | | | | | | | | 992,542 | |
| | | | | PUBLISHING & BROADCASTING — 0.5% | | | | | | | | | | |
| | 250,000 EUR | | | Informa plc | | | | 2.1250 | | 10/06/25 | | | 262,903 | |
| | | | | | | | | | | | | | | |
| | | | | REAL ESTATE OWNERS & DEVELOPERS — 3.6% | | | | | | | | | | |
| | 236,000 USD | | | China SCE Group Holdings Ltd. | | | | 7.3750 | | 04/09/24 | | | 133,267 | |
| | 700,000 USD | | | China SCE Group Holdings Ltd. | | | | 7.0000 | | 05/02/25 | | | 252,000 | |
| | 200,000 USD | | | Country Garden Holdings Company Ltd. | | | | 4.8000 | | 08/06/30 | | | 81,834 | |
| | 200,000 USD | | | Longfor Group Holdings Ltd. | | | | 3.9500 | | 09/16/29 | | | 150,444 | |
| | 330,000 USD | | | MAF Global Securities Ltd.(b) | | H15T5Y + 3.539% | | 6.3750 | | 09/20/70 | | | 323,667 | |
| | 300,000 USD | | | Theta Capital Pte Ltd. | | | | 8.1250 | | 01/22/25 | | | 252,375 | |
| | 250,000 USD | | | Theta Capital Pte Ltd. | | | | 6.7500 | | 10/31/26 | | | 181,125 | |
| | 500,000 USD | | | Wanda Properties International Company Ltd. | | | | 7.2500 | | 01/29/24 | | | 357,312 | |
| | | | | | | | | | | | | | 1,732,024 | |
| | | | | REIT — 0.6% | | | | | | | | | | |
| | 400,000 USD | | | LMIRT Capital Pte Ltd. | | | | 7.2500 | | 06/19/24 | | | 271,000 | |
| | | | | | | | | | | | | | | |
| | | | | RENEWABLE ENERGY — 1.0% | | | | | | | | | | |
| | 439,000 USD | | | Aydem Yenilenebilir Enerji A/S(a) | | | | 7.7500 | | 02/02/27 | | | 369,462 | |
| | 102,000 USD | | | Investment Energy Resources Ltd.(a) | | | | 6.2500 | | 04/26/29 | | | 94,460 | |
| | | | | | | | | | | | | | 463,922 | |
| | | | | RETAIL - CONSUMER STAPLES — 0.4% | | | | | | | | | | |
| | 100,000 GBP | | | Bellis Acquisition Company plc(a) | | | | 3.2500 | | 02/16/26 | | | 103,526 | |
| | 100,000 GBP | | | Bellis Finco plc(a) | | | | 4.0000 | | 02/16/27 | | | 86,257 | |
| | | | | | | | | | | | | | 189,783 | |
| | | | | RETAIL - DISCRETIONARY — 0.2% | | | | | | | | | | |
| | 120,000 EUR | | | Avis Budget Finance plc | | | | 4.7500 | | 01/30/26 | | | 129,295 | |
| | | | | | | | | | | | | | | |
| | | | | SEMICONDUCTORS — 0.3% | | | | | | | | | | |
| | 175,000 USD | | | TSMC Arizona Corporation | | | | 3.1250 | | 10/25/41 | | | 142,271 | |
See accompanying notes which are an integral part of these financial statements.
| DUNHAM INTERNATIONAL OPPORTUNITY BOND FUND |
| SCHEDULE OF INVESTMENTS (Unaudited) (Continued) |
| April 30, 2023 |
| Principal | | | | | | | Coupon Rate | | | | | |
| Amount ($) | | | | | Spread | | (%) | | Maturity | | Fair Value | |
| | | | | CORPORATE BONDS — 67.5% (Continued) | | | | | | | | | | |
| | | | | SPECIALTY FINANCE — 0.3% | | | | | | | | | | |
| | 184,000 USD | | | Studio City Finance Ltd.(a) | | | | 6.5000 | | 01/15/28 | | $ | 158,692 | |
| | | | | | | | | | | | | | | |
| | | | | STEEL — 1.1% | | | | | | | | | | |
| | 870,000 USD | | | Metinvest BV(a) | | | | 7.7500 | | 10/17/29 | | | 504,599 | |
| | | | | | | | | | | | | | | |
| | | | | TECHNOLOGY SERVICES — 0.5% | | | | | | | | | | |
| | 256,000 USD | | | Sixsigma Networks Mexico S.A. de CV(a) | | | | 7.5000 | | 05/02/25 | | | 218,289 | |
| | | | | | | | | | | | | | | |
| | | | | TELECOMMUNICATIONS — 2.8% | | | | | | | | | | |
| | 100,000 EUR | | | Altice France Holding S.A.(a) | | | | 8.0000 | | 05/15/27 | | | 79,211 | |
| | 100,000 EUR | | | Altice France S.A.(a) | | | | 2.1250 | | 02/15/25 | | | 101,325 | |
| | 262,000 USD | | | Digicel International Finance Ltd./Digicel(a) | | | | 8.7500 | | 05/25/24 | | | 237,519 | |
| | 40,500 USD | | | Millicom International Cellular S.A.(a) | | | | 5.1250 | | 01/15/28 | | | 35,695 | |
| | 270,000 USD | | | Network i2i Ltd.(b) | | H15T5Y + 4.274% | | 5.6500 | | 04/15/71 | | | 259,200 | |
| | 300,000 EUR | | | Orange S.A. | | | | 2.0000 | | 01/15/29 | | | 309,607 | |
| | 210,000 EUR | | | SoftBank Group Corporation | | | | 2.8750 | | 01/06/27 | | | 197,562 | |
| | 250,000 USD | | | VF Ukraine PAT via VFU Funding plc(a) | | | | 6.2000 | | 02/11/25 | | | 153,053 | |
| | | | | | | | | | | | | | 1,373,172 | |
| | | | | TRANSPORTATION & LOGISTICS — 0.7% | | | | | | | | | | |
| | 200,000 EUR | | | Abertis Infraestructuras S.A. | | | | 2.3750 | | 09/27/27 | | | 207,780 | |
| | 6,000 USD | | | DP World plc(a) | | | | 4.7000 | | 09/30/49 | | | 5,254 | |
| | 100,000 GBP | | | Heathrow Funding Ltd. | | | | 7.1250 | | 02/14/24 | | | 126,823 | |
| | | | | | | | | | | | | | 339,857 | |
| | | | | TOTAL CORPORATE BONDS (Cost $36,407,642) | | | | | 32,263,453 | |
| | | | | | | | | | | | | | | |
| | | | | NON U.S. GOVERNMENT & AGENCIES — 25.8% | | | | | | | | | | |
| | | | | GOVERNMENT GUARANTEED — 0.1% | | | | | | | | | | |
| | 28,000 USD | | | Brazil Minas SPE via State of Minas Gerais(a) | | | | 5.3330 | | 02/15/28 | | | 27,669 | |
| | | | | | | | | | | | | | | |
| | | | | GOVERNMENT OWNED, NO GUARANTEE — 0.3% | | | | | | | | | | |
| | 176,000 USD | | | Gabon Government International Bond(a) | | | | 7.0000 | | 11/24/31 | | | 130,697 | |
See accompanying notes which are an integral part of these financial statements.
| DUNHAM INTERNATIONAL OPPORTUNITY BOND FUND |
| SCHEDULE OF INVESTMENTS (Unaudited) (Continued) |
| April 30, 2023 |
| Principal | | | | | | | Coupon Rate | | | | | |
| Amount ($) | | | | | Spread | | (%) | | Maturity | | Fair Value | |
| | | | | NON U.S. GOVERNMENT & AGENCIES — 25.8% (Continued) | | | | | | | | | | |
| | | | | LOCAL AUTHORITY — 0.6% | | | | | | | | | | |
| | 150,000 CAD | | | Province of British Columbia Canada | | | | 3.2000 | | 06/18/44 | | $ | 97,641 | |
| | 250,000 CAD | | | Province of Ontario Canada | | | | 2.8000 | | 06/02/48 | | | 149,597 | |
| | 181,000 USD | | | Provincia de Buenos Aires/Government Bonds(d) | | | | 5.2500 | | 09/01/37 | | | 56,666 | |
| | | | | | | | | | | | | | 303,904 | |
| | | | | NON U.S. TREASURY — 9.0% | | | | | | | | | | |
| | 860,000 AUD | | | Australia Government Bond | | | | 1.2500 | | 05/21/32 | | | 477,437 | |
| | 550,000 CAD | | | Canadian Government Bond | | | | 2.2500 | | 06/01/29 | | | 393,171 | |
| | 88,200,000 COP | | | Colombian TES | | | | 7.5000 | | 08/26/26 | | | 16,847 | |
| | 382,300,000 COP | | | Colombian TES | | | | 6.0000 | | 04/28/28 | | | 65,253 | |
| | 2,150,000 CZK | | | Czech Republic Government Bond | | | | 2.4000 | | 09/17/25 | | | 94,158 | |
| | 1,981,000,000 IDR | | | Indonesia Treasury Bond | | | | 7.0000 | | 09/15/30 | | | 138,829 | |
| | 710,000,000 IDR | | | Indonesia Treasury Bond | | | | 8.2500 | | 06/15/32 | | | 53,421 | |
| | 76,000 EUR | | | Ireland Government Bond | | | | 5.4000 | | 03/13/25 | | | 87,770 | |
| | 50,000 EUR | | | Ireland Government Bond | | | | 0.9000 | | 05/15/28 | | | 50,799 | |
| | 130,000 EUR | | | Ireland Government Bond | | | | 1.3000 | | 05/15/33 | | | 125,193 | |
| | 240,000 EUR | | | Italy Buoni Poliennali Del Tesoro | | | | 4.5000 | | 03/01/24 | | | 266,749 | |
| | 750,000 EUR | | | Italy Buoni Poliennali Del Tesoro | | | | 2.8000 | | 12/01/28 | | | 791,179 | |
| | 640,000 EUR | | | Italy Buoni Poliennali Del Tesoro(a) | | | | 2.4500 | | 09/01/33 | | | 603,953 | |
| | 180,000 EUR | | | Italy Buoni Poliennali Del Tesoro | | | | 5.0000 | | 08/01/39 | | | 211,123 | |
| | 235,000 EUR | | | Italy Buoni Poliennali Del Tesoro | | | | 5.0000 | | 09/01/40 | | | 276,031 | |
| | 2,980,000 MXN | | | Mexican Bonos | | | | 7.7500 | | 11/13/42 | | | 144,853 | |
| | 170,000 EUR | | | Spain Government Bond | | | | 4.2000 | | 01/31/37 | | | 199,488 | |
| | 250,000 EUR | | | Spain Government Bond | | | | 2.7000 | | 10/31/48 | | | 225,180 | |
| | | | | | | | | | | | | | 4,221,434 | |
| | | | | SOVEREIGN — 15.4% | | | | | | | | | | |
| | 10,000 USD | | | Angolan Government International Bond(a) | | | | 8.2500 | | 05/09/28 | | | 8,792 | |
| | 268,000 USD | | | Angolan Government International Bond(a) | | | | 8.7500 | | 04/14/32 | | | 222,804 | |
| | 51,000 USD | | | Angolan Government International Bond(a) | | | | 9.1250 | | 11/26/49 | | | 38,197 | |
| | 378,000 USD | | | Argentine Republic Government International Bond(d) | | | | 0.5000 | | 07/09/30 | | | 92,349 | |
| | 337,000 USD | | | Argentine Republic Government International Bond(d) | | | | 1.5000 | | 07/09/35 | | | 75,347 | |
| | 200,000 EUR | | | Banque Centrale de Tunisie International Bond | | | | 5.6250 | | 02/17/24 | | | 150,491 | |
| | 3,000 USD | | | Bermuda Government International Bond(a) | | | | 4.7500 | | 02/15/29 | | | 3,001 | |
| | 35,000 USD | | | Bolivian Government International Bond | | | | 4.5000 | | 03/20/28 | | | 20,081 | |
See accompanying notes which are an integral part of these financial statements.
| DUNHAM INTERNATIONAL OPPORTUNITY BOND FUND |
| SCHEDULE OF INVESTMENTS (Unaudited) (Continued) |
| April 30, 2023 |
| Principal | | | | | | | Coupon Rate | | | | | |
| Amount ($) | | | | | Spread | | (%) | | Maturity | | Fair Value | |
| | | | | NON U.S. GOVERNMENT & AGENCIES — 25.8% (Continued) | | | | | | | | | | |
| | | | | SOVEREIGN — 15.4% (Continued) | | | | | | | | | | |
| | 140,000 BRL | | | Brazilian Government International Bond | | | | 8.5000 | | 01/05/24 | | $ | 27,286 | |
| | 550,000 BRL | | | Brazilian Government International Bond | | | | 10.2500 | | 01/10/28 | | | 105,216 | |
| | 82,000 USD | | | Brazilian Government International Bond | | | | 4.5000 | | 05/30/29 | | | 77,951 | |
| | 231,000 USD | | | Brazilian Government International Bond | | | | 4.7500 | | 01/14/50 | | | 170,783 | |
| | 11,000 USD | | | Chile Government International Bond | | | | 2.4500 | | 01/31/31 | | | 9,684 | |
| | 3,000 USD | | | Chile Government International Bond | | | | 2.5500 | | 07/27/33 | | | 2,519 | |
| | 4,000 USD | | | Chile Government International Bond | | | | 3.1000 | | 05/07/41 | | | 3,095 | |
| | 3,000 USD | | | Chile Government International Bond | | | | 4.3400 | | 03/07/42 | | | 2,731 | |
| | 100,000 EUR | | | Colombia Government International Bond | | | | 3.8750 | | 03/22/26 | | | 105,296 | |
| | 39,000 USD | | | Colombia Government International Bond | | | | 4.5000 | | 03/15/29 | | | 33,949 | |
| | 66,000 USD | | | Colombia Government International Bond | | | | 3.0000 | | 01/30/30 | | | 50,674 | |
| | 32,000 USD | | | Colombia Government International Bond | | | | 6.1250 | | 01/18/41 | | | 25,280 | |
| | 173,000 USD | | | Colombia Government International Bond | | | | 4.1250 | | 02/22/42 | | | 107,168 | |
| | 66,000 USD | | | Colombia Government International Bond | | | | 5.6250 | | 02/26/44 | | | 48,105 | |
| | 161,000 USD | | | Colombia Government International Bond | | | | 5.0000 | | 06/15/45 | | | 107,682 | |
| | 33,000 USD | | | Colombia Government International Bond | | | | 5.2000 | | 05/15/49 | | | 22,234 | |
| | 37,000 USD | | | Colombia Government International Bond | | | | 4.1250 | | 05/15/51 | | | 21,833 | |
| | 42,000 USD | | | Colombia Government International Bond | | | | 3.8750 | | 02/15/61 | | | 22,852 | |
| | 163,000 USD | | | Costa Rica Government International Bond(a) | | | | 6.5500 | | 04/03/34 | | | 166,111 | |
| | 228,000 USD | | | Dominican Republic International Bond(a) | | | | 4.8750 | | 09/23/32 | | | 197,050 | |
| | 133,000 USD | | | Dominican Republic International Bond(a) | | | | 6.0000 | | 02/22/33 | | | 124,521 | |
| | 35,000 USD | | | Dominican Republic International Bond | | | | 5.3000 | | 01/21/41 | | | 27,688 | |
| | 82,000 USD | | | Dominican Republic International Bond(a) | | | | 7.4500 | | 04/30/44 | | | 79,690 | |
| | 95,000 USD | | | Dominican Republic International Bond | | | | 6.4000 | | 06/05/49 | | | 79,902 | |
| | 35,000 USD | | | Dominican Republic International Bond | | | | 5.8750 | | 01/30/60 | | | 26,842 | |
| | 45,000 USD | | | Dominican Republic International Bond(a) | | | | 5.8750 | | 01/30/60 | | | 34,512 | |
| | 83,000 USD | | | Ecuador Government International Bond(a),(d) | | | | 5.5000 | | 07/31/30 | | | 44,202 | |
| | 16,000 USD | | | Ecuador Government International Bond(d) | | | | 5.5000 | | 07/31/30 | | | 8,521 | |
| | 501,060 USD | | | Ecuador Government International Bond(a),(d) | | | | 2.5000 | | 07/31/35 | | | 185,733 | |
| | 251,000 USD | | | Ecuador Government International Bond(d) | | | | 2.5000 | | 07/31/35 | | | 93,041 | |
| | 21,000 USD | | | Ecuador Government International Bond(a),(d) | | | | 1.5000 | | 07/31/40 | | | 6,930 | |
| | 70,000 USD | | | Ecuador Government International Bond(d) | | | | 1.5000 | | 07/31/40 | | | 23,100 | |
| | 94,000 USD | | | Egypt Government International Bond(a) | | | | 5.2500 | | 10/06/25 | | | 64,949 | |
| | 164,000 USD | | | Egypt Government International Bond(a) | | | | 5.8000 | | 09/30/27 | | | 101,063 | |
See accompanying notes which are an integral part of these financial statements.
| DUNHAM INTERNATIONAL OPPORTUNITY BOND FUND |
| SCHEDULE OF INVESTMENTS (Unaudited) (Continued) |
| April 30, 2023 |
| Principal | | | | | | | Coupon Rate | | | | | |
| Amount ($) | | | | | Spread | | (%) | | Maturity | | Fair Value | |
| | | | | NON U.S. GOVERNMENT & AGENCIES — 25.8% (Continued) | | | | | | | | | | |
| | | | | SOVEREIGN — 15.4% (Continued) | | | | | | | | | | |
| | 200,000 EUR | | | Egypt Government International Bond(a) | | | | 6.3750 | | 04/11/31 | | $ | 115,828 | |
| | 236,000 USD | | | Egypt Government International Bond(a) | | | | 7.0530 | | 01/15/32 | | | 130,978 | |
| | 17,000 USD | | | Egypt Government International Bond(a) | | | | 8.8750 | | 05/29/50 | | | 9,097 | |
| | 239,000 USD | | | El Salvador Government International Bond | | | | 6.3750 | | 01/18/27 | | | 150,733 | |
| | 45,000 USD | | | El Salvador Government International Bond | | | | 8.6250 | | 02/28/29 | | | 26,595 | |
| | 51,000 USD | | | El Salvador Government International Bond | | | | 9.5000 | | 07/15/52 | | | 28,116 | |
| | 136,000 USD | | | Ethiopia International Bond(a) | | | | 6.6250 | | 12/11/24 | | | 95,494 | |
| | 24,667 USD | | | Gabon Government International Bond(a) | | | | 6.3750 | | 12/12/24 | | | 23,648 | |
| | 51,000 USD | | | Gabon Government International Bond(a) | | | | 6.9500 | | 06/16/25 | | | 47,254 | |
| | 225,000 USD | | | Ghana Government International Bond(a) | | | | 10.7500 | | 10/14/30 | | | 154,688 | |
| | 30,000 USD | | | Hungary Government International Bond(a) | | | | 6.2500 | | 09/22/32 | | | 31,174 | |
| | 16,000 USD | | | Indonesia Government International Bond | | | | 4.5500 | | 01/11/28 | | | 16,074 | |
| | 9,000 USD | | | Indonesia Government International Bond | | | | 4.8500 | | 01/11/33 | | | 9,176 | |
| | 6,000 USD | | | Indonesia Government International Bond | | | | 4.2000 | | 10/15/50 | | | 5,262 | |
| | 223,000 EUR | | | Ivory Coast Government International Bond(a) | | | | 5.8750 | | 10/17/31 | | | 200,603 | |
| | 260,000 EUR | | | Ivory Coast Government International Bond | | | | 5.8750 | | 10/17/31 | | | 233,888 | |
| | 100,000 EUR | | | Ivory Coast Government International Bond | | | | 4.8750 | | 01/30/32 | | | 83,788 | |
| | 99,000 USD | | | Jordan Government International Bond(a) | | | | 7.5000 | | 01/13/29 | | | 99,972 | |
| | 2,000 USD | | | Kazakhstan Government International Bond(a) | | | | 4.8750 | | 10/14/44 | | | 1,840 | |
| | 20,000 USD | | | Kazakhstan Government International Bond(a) | | | | 6.5000 | | 07/21/45 | | | 21,336 | |
| | 166,000 USD | | | Kenya Government International Bond(a) | | | | 8.0000 | | 05/22/32 | | | 125,169 | |
| | 509,000 USD | | | Lebanon Government International Bond(e) | | | | 6.1000 | | 10/04/22 | | | 31,558 | |
| | 66,000 USD | | | Lebanon Government International Bond(e) | | | | 6.3750 | | 03/09/23 | | | 4,092 | |
| | 395,000 USD | | | Lebanon Government International Bond(e) | | | | 8.2500 | | 04/12/23 | | | 25,675 | |
| | 72,000 USD | | | Lebanon Government International Bond(e) | | | | 6.4000 | | 05/26/23 | | | 4,559 | |
| | 156,000 USD | | | Lebanon Government International Bond(e) | | | | 6.1500 | | 06/19/23 | | | 9,672 | |
| | 56,000 USD | | | Lebanon Government International Bond(e) | | | | 6.7500 | | 11/29/27 | | | 3,384 | |
| | 81,000 USD | | | Lebanon Government International Bond(e) | | | | 6.8500 | | 05/25/29 | | | 5,032 | |
| | 175,000 USD | | | Lebanon Government International Bond(e) | | | | 6.6500 | | 02/26/30 | | | 10,890 | |
| | 11,000 USD | | | Magyar Export-Import Bank Zrt | | | | 6.1250 | | 12/04/27 | | | 11,076 | |
| | 24,000 USD | | | Mexico Government International Bond | | | | 4.7500 | | 04/27/32 | | | 23,398 | |
| | 32,000 USD | | | Mexico Government International Bond | | | | 4.8750 | | 05/19/33 | | | 31,069 | |
| | 1,000 USD | | | Mexico Government International Bond | | | | 6.3380 | | 05/04/53 | | | 1,033 | |
| | 25,000 USD | | | Mongolia Government International Bond(a) | | | | 8.6500 | | 01/19/28 | | | 25,339 | |
See accompanying notes which are an integral part of these financial statements.
| DUNHAM INTERNATIONAL OPPORTUNITY BOND FUND |
| SCHEDULE OF INVESTMENTS (Unaudited) (Continued) |
| April 30, 2023 |
| Principal | | | | | | | Coupon Rate | | | | | |
| Amount ($) | | | | | Spread | | (%) | | Maturity | | Fair Value | |
| | | | | NON U.S. GOVERNMENT & AGENCIES — 25.8% (Continued) | | | | | | | | | | |
| | | | | SOVEREIGN — 15.4% (Continued) | | | | | | | | | | |
| | 400,000 USD | | | Mozambique International Bond(a),(d) | | | | 5.0000 | | 09/15/31 | | $ | 281,360 | |
| | 51,000 USD | | | Nigeria Government International Bond(a) | | | | 6.1250 | | 09/28/28 | | | 39,020 | |
| | 124,000 USD | | | Nigeria Government International Bond(a) | | | | 7.8750 | | 02/16/32 | | | 92,162 | |
| | 206,000 USD | | | Nigeria Government International Bond(a) | | | | 7.3750 | | 09/28/33 | | | 142,809 | |
| | 200,000 USD | | | Nigeria Government International Bond | | | | 7.6250 | | 11/28/47 | | | 125,280 | |
| | 8,000 USD | | | Oman Government International Bond(a) | | | | 6.0000 | | 08/01/29 | | | 8,194 | |
| | 277,000 USD | | | Pakistan Government International Bond(a) | | | | 6.0000 | | 04/08/26 | | | 100,684 | |
| | 41,000 USD | | | Panama Government International Bond | | | | 2.2520 | | 09/29/32 | | | 31,807 | |
| | 48,000 USD | | | Papua New Guinea Government International Bond(a) | | | | 8.3750 | | 10/04/28 | | | 42,984 | |
| | 2,000 USD | | | Peruvian Government International Bond | | | | 2.3920 | | 01/23/26 | | | 1,891 | |
| | 6,000 USD | | | Peruvian Government International Bond | | | | 2.7830 | | 01/23/31 | | | 5,211 | |
| | 28,000 USD | | | Philippine Government International Bond | | | | 2.4570 | | 05/05/30 | | | 24,730 | |
| | 12,000 USD | | | Philippine Government International Bond | | | | 5.0000 | | 07/17/33 | | | 12,407 | |
| | 4,000 USD | | | Philippine Government International Bond | | | | 2.9500 | | 05/05/45 | | | 2,947 | |
| | 1,000 USD | | | Philippine Government International Bond | | | | 4.2000 | | 03/29/47 | | | 879 | |
| | 31,000 USD | | | Qatar Government International Bond(a) | | | | 3.7500 | | 04/16/30 | | | 30,712 | |
| | 10,000 USD | | | Qatar Government International Bond(a) | | | | 4.4000 | | 04/16/50 | | | 9,399 | |
| | 9,846 USD | | | Republic of Angola Via Avenir II BV(b) | | US0006M + 7.500% | | 12.7720 | | 07/01/23 | | | 9,871 | |
| | 165,714 USD | | | Republic of Angola Via Avenir Issuer II Ireland | | | | 6.9270 | | 02/19/27 | | | 153,700 | |
| | 118,000 USD | | | Republic of Kenya Government International Bond(a) | | | | 6.8750 | | 06/24/24 | | | 102,760 | |
| | 6,000 USD | | | Republic of Poland Government International Bond | | | | 5.7500 | | 11/16/32 | | | 6,514 | |
| | 3,317,000 ZAR | | | Republic of South Africa Government Bond | | | | 8.5000 | | 01/31/37 | | | 142,657 | |
| | 46,000 USD | | | Republic of South Africa Government International | | | | 4.3000 | | 10/12/28 | | | 41,406 | |
| | 21,000 USD | | | Republic of South Africa Government International | | | | 5.7500 | | 09/30/49 | | | 15,122 | |
| | 64,000 USD | | | Republic of South Africa Government International | | | | 7.3000 | | 04/20/52 | | | 54,762 | |
| | 20,000 EUR | | | Romanian Government International Bond | | | | 2.3750 | | 04/19/27 | | | 19,915 | |
| | 2,000 USD | | | Romanian Government International Bond(a) | | | | 6.6250 | | 02/17/28 | | | 2,083 | |
| | 7,000 EUR | | | Romanian Government International Bond | | | | 3.6240 | | 05/26/30 | | | 6,624 | |
| | 29,000 EUR | | | Romanian Government International Bond(a) | | | | 2.1240 | | 07/16/31 | | | 23,737 | |
| | 2,000 EUR | | | Romanian Government International Bond | | | | 4.1250 | | 03/11/39 | | | 1,654 | |
| | 2,000 EUR | | | Romanian Government International Bond | | | | 2.8750 | | 04/13/42 | | | 1,307 | |
| | 10,000 EUR | | | Romanian Government International Bond(a) | | | | 2.8750 | | 04/13/42 | | | 6,536 | |
| | 12,000 USD | | | Saudi Government International Bond(a) | | | | 5.5000 | | 10/25/32 | | | 13,003 | |
| | 35,000 USD | | | Saudi Government International Bond(a) | | | | 2.2500 | | 02/02/33 | | | 29,181 | |
See accompanying notes which are an integral part of these financial statements.
| DUNHAM INTERNATIONAL OPPORTUNITY BOND FUND |
| SCHEDULE OF INVESTMENTS (Unaudited) (Continued) |
| April 30, 2023 |
| Principal | | | | | | | Coupon Rate | | | | | |
| Amount ($) | | | | | Spread | | (%) | | Maturity | | Fair Value | |
| | | | | NON U.S. GOVERNMENT & AGENCIES — 25.8% (Continued) | | | | | | | | | | |
| | | | | SOVEREIGN — 15.4% (Continued) | | | | | | | | | | |
| | 2,000 USD | | | Saudi Government International Bond(a) | | | | 4.6250 | | 10/04/47 | | $ | 1,822 | |
| | 100,000 EUR | | | Senegal Government International Bond(a) | | | | 5.3750 | | 06/08/37 | | | 70,292 | |
| | 1,403,000 THB | | | Thailand Government Bond | | | | 2.1250 | | 12/17/26 | | | 41,197 | |
| | 100,000 EUR | | | Tunisian Republic(a) | | | | 6.7500 | | 10/31/23 | | | 94,371 | |
| | 564,000 USD | | | Turkey Government International Bond | | | | 9.8750 | | 01/15/28 | | | 584,250 | |
| | 100,000 USD | | | Turkey Government International Bond | | | | 9.3750 | | 03/14/29 | | | 101,133 | |
| | 107,000 USD | | | Turkey Government International Bond | | | | 9.1250 | | 07/13/30 | | | 107,065 | |
| | 118,000 USD | | | Turkey Government International Bond | | | | 5.7500 | | 05/11/47 | | | 84,096 | |
| | 56,000 USD | | | Ukraine Government International Bond(a) | | | | 7.7500 | | 09/01/25 | | | 9,853 | |
| | 272,000 USD | | | Ukraine Government International Bond(a) | | | | 7.7500 | | 09/01/26 | | | 48,087 | |
| | 136,000 USD | | | Ukraine Government International Bond | | | | — | | 09/01/27 | | | 23,928 | |
| | 139,000 USD | | | Ukraine Government International Bond(a) | | | | 7.3750 | | 09/25/32 | | | 22,935 | |
| | 2,000 USD | | | Uruguay Government International Bond | | | | 4.3750 | | 01/23/31 | | | 2,021 | |
| | 1,900,000 UYU | | | Uruguay Government International Bond | | | | 8.2500 | | 05/21/31 | | | 44,422 | |
| | 14,000 USD | | | Zambia Government International Bond(a) | | | | 5.3750 | | 01/20/23 | | | 6,140 | |
| | 87,000 USD | | | Zambia Government International Bond(a) | | | | 8.9700 | | 07/30/27 | | | 40,768 | |
| | | | | | | | | | | | | | 7,471,357 | |
| | | | | SUPRANATIONAL — 0.4% | | | | | | | | | | |
| | 200,000 EUR | | | European Investment Bank | | | | 1.1250 | | 09/15/36 | | | 171,723 | |
| | | | | | | | | | | | | | | |
| | | | | TOTAL NON U.S. GOVERNMENT & AGENCIES (Cost $14,313,050) | | | | | 12,337,860 | |
See accompanying notes which are an integral part of these financial statements.
| DUNHAM INTERNATIONAL OPPORTUNITY BOND FUND |
| SCHEDULE OF INVESTMENTS (Unaudited) (Continued) |
| April 30, 2023 |
| Shares | | | | | Fair Value | |
| | | | | SHORT-TERM INVESTMENTS — 3.1% | | | | |
| | | | | COLLATERAL FOR SECURITIES LOANED - 0.9% | | | | |
| | 451,588 | | | Mount Vernon Liquid Assets Portfolio, LLC, 4.96% (Cost $451,588)(f)(h) | | $ | 451,588 | |
| | | | | | | | | |
| | | | | MONEY MARKET FUNDS - 2.2% | | | | |
| | 1,006,617 | | | Fidelity Government Portfolio, CLASS I, 4.73% (Cost $1,006,616)(f) | | | 1,006,616 | |
| | | | | | | | | |
| | | | | TOTAL SHORT-TERM INVESTMENTS (Cost $1,458,204) | | | 1,458,204 | |
| | | | | | | | | |
| | | | | TOTAL INVESTMENTS - 96.5% (Cost $52,239,453) | | $ | 46,121,660 | |
| | | | | OTHER ASSETS IN EXCESS OF LIABILITIES- 3.5% | | | 1,682,348 | |
| | | | | NET ASSETS - 100.0% | | $ | 47,804,008 | |
| OPEN FUTURES CONTRACTS |
| | | | | | | | | | | Value and | |
Number of
Contracts | | | Open Long Futures Contracts | | Expiration | | Notional
Amount(g) | | | Unrealized
Appreciation | |
| | 23 | | | Eurex 10 Year Euro BUND Future | | 06/08/2023 | | $ | 3,435,680 | | | $ | 99,849 | |
| | 6 | | | Eurex 30 Year Euro BUXL Future | | 06/08/2023 | | | 922,314 | | | | 47,366 | |
| | 25 | | | Long Gilt Future | | 06/28/2023 | | | 3,187,799 | | | | 14,507 | |
| | 7 | | | TSE Japanese 10 Year Bond Future | | 06/13/2023 | | | 7,635,001 | | | | 161,775 | |
| | | | | TOTAL FUTURES CONTRACTS | | | | | | | | $ | 323,497 | |
| | | | | | | | | | | | | | | |
| OPEN FUTURES CONTRACTS | |
| | | | | | | | | | | Value and | |
Number of
Contracts | | | Open Short Futures Contracts | | Expiration | | Notional
Amount(g) | | | Unrealized
Depreciation | |
| | 60 | | | CBOT 10 Year US Treasury Note Future | | 06/21/2023 | | $ | 6,912,180 | | | $ | (149,296 | ) |
| | 16 | | | CBOT 5 Year US Treasury Note Future | | 06/30/2023 | | | 1,755,872 | | | | (37,622 | ) |
| | 4 | | | CBOT US Treasure Bond Futures | | 06/21/2023 | | | 526,624 | | | | (23,093 | ) |
| | 8 | | | Euro-BTP Italian Bond Future | | 06/08/2023 | | | 1,012,452 | | | | (32,302 | ) |
| | | | | TOTAL FUTURES CONTRACTS | | | | | | | | $ | (242,313 | ) |
| CREDIT DEFAULT SWAP AGREEMENTS |
| | | | | | | | | | | | | | | | | | | | | | Amortized | | | | |
Description and
Payment Frequency | | Payment
Frequency | | Counterparty | | | Fixed Deal
(Pay)Rate | | | Implied
Credit Spread | | | Maturity Date | | Notional Value | | | Fair Value | | | Upfront Payments Paid/ (Received) | | | Unrealized
Appreciation/
(Depreciation) | |
| CDX.EM SERIES 38 | | To Buy Monthly | | Citibank | | | 1.00% | | | 238 | | | 6/20/2028 | | $ | 2,775,000.00 | | | | 164,401 | | | | 171,955 | | | | (7,544 | ) |
| TOTAL | | | | | | | | | | | | | | | | | | | $ | 164,401 | | | $ | 171,955 | | | $ | (7,544 | ) |
See accompanying notes which are an integral part of these financial statements.
| DUNHAM INTERNATIONAL OPPORTUNITY BOND FUND |
| SCHEDULE OF INVESTMENTS (Unaudited) (Continued) |
| April 30, 2023 |
| | | | | | | | | | | | | Unrealized
Appreciation/ | |
| Foreign Currency | | Settlement Date | | Counterparty | | Local Currency | | | U.S. Dollar Value | | | (Depreciation) | |
| To Buy: | | | | | | | | | | | | | | | | |
| Canadian Dollar | | 05/01/2023 | | Capstone Global Markets | | | 660,000 | | | $ | 487,215 | | | $ | 1,522 | |
| Australian Dollar | | 05/03/2023 | | Capstone Global Markets | | | 420,000 | | | | 277,919 | | | | (2,882 | ) |
| Brazilian Real | | 05/03/2023 | | JP Morgan Chase | | | 64,000 | | | | 12,826 | | | | 669 | |
| Euro | | 05/05/2023 | | Barclay | | | 86,008 | | | | 94,792 | | | | 415 | |
| Mexican Peso | | 05/10/2023 | | JP Morgan Chase | | | 790,000 | | | | 43,858 | | | | 1,472 | |
| Canadian Dollar | | 05/12/2023 | | Capstone Global Markets | | | 160,000 | | | | 118,136 | | | | 763 | |
| Japanese Yen | | 05/12/2023 | | JP Morgan Chase | | | 16,060,000 | | | | 118,062 | | | | (1,760 | ) |
| Swiss Franc | | 05/12/2023 | | Capstone Global Markets | | | 230,000 | | | | 257,655 | | | | 1,157 | |
| Japanese Yen | | 05/15/2023 | | Capstone Global Markets | | | 32,250,000 | | | | 237,190 | | | | (342 | ) |
| Columbian Peso | | 05/18/2023 | | JP Morgan Chase | | | 84,999,999 | | | | 18,016 | | | | 333 | |
| Australian Dollar | | 06/05/2023 | | JP Morgan Chase | | | 420,000 | | | | 278,321 | | | | 872 | |
| Brazilian Real | | 07/05/2023 | | JP Morgan Chase | | | 64,000 | | | | 12,672 | | | | 191 | |
| | | | | | | | | | | $ | 1,956,662 | | | $ | 2,410 | |
| To Sell: | | | | | | | | | | | | | | | | |
| Canadian Dollar | | 05/01/2023 | | Capstone Global Markets | | | 660,000 | | | $ | 487,215 | | | $ | 1,177 | |
| Australian Dollar | | 05/03/2023 | | JP Morgan Chase | | | 420,000 | | | | 277,919 | | | | (860 | ) |
| Brazilian Real | | 05/03/2023 | | JP Morgan Chase | | | 64,000 | | | | 12,826 | | | | (195 | ) |
| Euro | | 05/05/2023 | | Barclay | | | 5,087,784 | | | | 5,607,432 | | | | (57,433 | ) |
| Mexican Peso | | 05/10/2023 | | JP Morgan Chase | | | 120,000 | | | | 6,662 | | | | (51 | ) |
| Canadian Dollar | | 05/12/2023 | | Capstone Global Markets | | | 160,000 | | | | 118,136 | | | | 2,064 | |
| Japanese Yen | | 05/12/2023 | | Capstone Global Markets | | | 16,060,000 | | | | 118,062 | | | | 2,486 | |
| Swiss Franc | | 05/12/2023 | | Capstone Global Markets | | | 230,000 | | | | 257,654 | | | | 2,016 | |
| Japanese Yen | | 05/15/2023 | | Capstone Global Markets | | | 71,950,000 | | | | 529,173 | | | | 21,309 | |
| Columbian Peso | | 05/18/2023 | | JP Morgan Chase | | | 84,999,999 | | | | 18,016 | | | | 769 | |
| Mexican Peso | | 05/19/2023 | | Capstone Global Markets | | | 4,340,000 | | | | 240,445 | | | | (2,781 | ) |
| Euro | | 05/30/2023 | | Capstone Global Markets | | | 220,000 | | | | 242,852 | | | | (914 | ) |
| Mexican Peso | | 05/30/2023 | | Capstone Global Markets | | | 4,300,000 | | | | 237,630 | | | | (2,060 | ) |
| Brazilian Real | | 07/05/2023 | | JP Morgan Chase | | | 34,000 | | | | 6,732 | | | | (36 | ) |
| Australian Dollar | | 07/21/2023 | | Capstone Global Markets | | | 719,400 | | | | 477,669 | | | | 1,077 | |
| British Pound | | 07/21/2023 | | Barclay | | | 807,600 | | | | 1,016,565 | | | | (12,876 | ) |
| Canadian Dollar | | 07/21/2023 | | Barclay | | | 883,600 | | | | 653,334 | | | | (3,263 | ) |
| Euro | | 07/21/2023 | | Barclay | | | 9,317,500 | | | | 10,313,702 | | | | (32,420 | ) |
| Euro | | 07/21/2023 | | JP Morgan Chase | | | 429,333 | | | | 475,236 | | | | 1,000 | |
| Japanese Yen | | 07/21/2023 | | Barclay | | | 48,621,200 | | | | 361,344 | | | | 6,137 | |
| | | | | | | | | | | $ | 21,458,604 | | | $ | (74,854 | ) |
| | | | | | | | | | | | | | | | | |
| Total | | | | | | | | | | | | | | $ | (72,444 | ) |
See accompanying notes which are an integral part of these financial statements.
| |
| DUNHAM INTERNATIONAL OPPORTUNITY BOND FUND |
| SCHEDULE OF INVESTMENTS (Unaudited) (Continued) |
| April 30, 2023 |
| | | | | | | | | | | Local Currency | | | | | | | | | | |
| | | | | Settlement | | | | Local Currency
Amount | | Amount
Purchased | | | U.S. Dollar
Market | | | U.S. Dollar
Market | | | Unrealized
Appreciation/ | |
| Foreign Currency | | | | Date | | Counterparty | | Purchased Buy | | Sell | | | Value Buy | | | Value Sell | | | (Depreciation) | |
| To Buy: | | To Sell: | | | | | | | | | | | | | | | | | | | | | | |
| British Pound | | Euro | | 5/18/2023 | | Capstone Global Markets | | 388,128 | | | 440,000 | | | | 487,976 | | | | (485,336 | ) | | $ | 2,640 | |
| Euro | | British Pound | | 7/21/2023 | | JP Morgan Chase | | 641,250 | | | 569,400 | | | | 709,811 | | | | (716,731 | ) | | | (6,920 | ) |
| | | | | | | | | 1,029,378 | | | 1,009,400 | | | $ | 1,197,787 | | | $ | 1,202,067 | | | $ | (4,280 | ) |
| | | | | | | | | | | | | | | | | | | | | | | | | |
| Total | | | | | | | | | | | | | | | | | | | | | | $ | (4,280 | ) |
| A/S | - Anonim Sirketi |
| | |
| LLC | - Limited Liability Company |
| | |
| LTD | - Limited Company |
| | |
| NV | - Naamioze Vennootschap |
| | |
| PLC | - Public Limited Company |
| | |
| REIT | - Real Estate Investment Trust |
| | |
| S/A | - Societe Anonyme |
| | |
| SA de CV | - Sociedad Anonima de Capital Variable |
| | |
| EUR003M | Euribor 3 Month ACT/360 |
| | |
| H15T1Y | US Treasury Yield Curve Rate T Note Constant Maturity 1 Year |
| | |
| H15T5Y | US Treasury Yield Curve Rate T Note Constant Maturity 5 Year |
| | |
| SOFRRATE | United States SOFR Secured Overnight Financing Rate |
| | |
| US0006M | ICE LIBOR USD 6 Month |
| | |
| AUD | Australian Dollar |
| | |
| BRL | Brazilian Real |
| | |
| CAD | Canadian Dollar |
| | |
| CHF | US Dollars |
| | |
| COP | Columbian Peso |
| | |
| CZK | Czech Koruna |
| | |
| EUR | Euro |
| | |
| GBP | British Pound |
| | |
| IDR | Indonesia Rupiah |
| | |
| JPY | Japanese Yen |
| | |
| MXN | Mexican Peso |
| | |
| THB | Thailand Baht |
| | |
| USD | US Dollars |
| | |
| UYU | Uruguayan Peso |
| | |
| ZAR | South African Rand |
| (a) | Security exempt from registration under Rule 144A or Section 4(2) of the Securities Act of 1933. The security may be resold in transactions exempt from registration, normally to qualified institutional buyers. As of April 30, 2023 the total market value of 144A securities is 16,770,252 or 35.1% of net assets. |
| | |
| (b) | Variable rate security; the rate shown represents the rate on April 30, 2023. |
| | |
| (c) | All or a portion of these securities are on loan. Total loaned securities had a value of $444,950 at April 30, 2023. |
| | |
| (d) | Step bond. Coupon rate is fixed rate that changes on a specified date. The rate shown is the current rate at April 30, 2023. |
| | |
| (e) | Represents issuer in default on interest payments; non-income producing security. |
| | |
| (f) | Rate disclosed is the seven day effective yield as of April 30, 2023. |
| | |
| (g) | The amounts shown are the underlying reference notional amounts to stock exchange indices and equities upon which the fair value of the futures contracts held by the Fund are based. Notional values do not represent the current fair value of, and are not necessarily indicative of the future cash flows of the Fund’s futures contracts. Further, the underlying price changes in relation to the variables specified by the notional values affects the fair value of these derivative financial instruments. The notional values as set forth within this schedule do not purport to represent economic value at risk to the Fund. |
| | |
| (h) | The Trust’s securities lending policies and procedures require that the borrower: deliver cash or U.S. Government securities as collateral with respect to each new loan of U.S. securities, equal to at least 102% of the value of the portfolio securities loaned, and (ii) at all times thereafter mark-to-market the collateral on a daily basis so that the market value of such collateral is at least 100% of the value of securities loaned. From time to time the collateral may not be 102% due to end of day market movement. The next business day additional collateral is obtained/received from the borrower to replenish/reestablish 102%. |
See accompanying notes which are an integral part of these financial statements.
| Dunham Large Cap Value Fund (Unaudited) |
| Message from the Sub-Adviser (Great Lakes Advisors. LLC) |
| |
Asset Class Recap
Large cap value stocks, as measured by the Russel 1000 Value Index, increased 4.5 percent for the six-month period ended April 30, 2023, underperforming their large cap growth counterparts, as measured by the Russel 1000 Growth Index, which increased 11.5 percent. This dispersion narrows the overall chasm of performance between the two asset classes developed in the previous two years. The six-month fiscal period began with most equity indices trading at discounts from one year prior as investors rotated away from growth stocks and towards value in anticipation of the Federal Reserve increasing the Federal Funds Rate further. Market participants continued to speculate as to whether the Federal Reserve would be able to control inflation without tipping the economy into a recession, and these concerns seemed to materialize following the collapse of Silicon Valley Bank (SVB) (not held). Concerns then mounted as investors questioned whether the pressures on the financial sector would spread and have negative implications on the economy overall. However, toward the end of the period, sentiment meaningfully turned as renewed expectations of rate cuts outweighed continued turmoil in the banking sector, following economic data that showed inflation cooling, coupled with commentary from the Federal Reserve indicating that they considered a pause in rate increases following the collapse of SVB.
Allocation Review
The Sub- Adviser’s investment philosophy is centered on the belief that alpha generation is driven by bottom-up stock selection rather than taking large sector bets. With that being said, the largest contributor to Fund performance was the technology sector, as a 2.7 percent relative overweight coupled with superior stock selection became a meaningful driver of performance. Conversely, the largest detractor from Fund performance was the consumer discretionary sector as a 2.1 percent underweight, combined with poor stock selection in the space acted as a headwind to performance. The health care sector was another meaningful contributor as a slight overweight was eclipsed by superior stock selection in the space. Furthermore, the second largest detractor was the financial services sector, as a slight underweight could not surmount inferior stock selection in the space.
Holding Insights
The most significant contributor to absolute Fund performance was the exposure to the technology sector. Some investors anticipate a near-term end to the Federal Reserve’s hiking cycle due to cooling inflation data and the velocity of rate increases slowed, significantly when compared to early in the cycle. Higher interest rates result in a higher cost for companies to borrow money to finance projects, posing a significant headwind for the research heavy technology sector. It can also result in consumers having less disposable income because they are paying more for mortgages, car loans, and credit cards. As the Federal Reserve approaches the peak of its hiking cycle, these headwinds are expected to show some signs of easing, and many companies should have adjusted for the higher cost of capital. One such position was Meta Platforms, Inc. (META) (holding weight*: 2.99 percent), an American multinational technology company. Over the fiscal period, META surged 158.0 percent, the best-performing position within the Fund on an absolute basis. To begin the fiscal period, a slight underweight to META detracted from relative Fund performance; however, to end the fiscal period, META was a relative overweight. Investors’ confidence in META may have been regained thanks to increasing financial discipline by the company, cutting expenses, and announcing a $40 billion share repurchase program. Also, META may have been helped by congressional testimony from ByteDance CEO Shou Zi Chew regarding national security concerns about the user data collected by the popular video sharing app TikTok, which directly competes with META. The second largest contributor to Fund performance was Horizon Therapeutics Public Ltd. Co. (HZNP) (holding weight**: 0.30 percent), an Ireland based biopharmaceutical company that focuses on the research, development, and commercialization of medicine for people impacted by rare and rheumatic diseases. During the period held, HZNP increased 81.2 percent, attributable to the announced acquisition by Pillartree, Ltd. wholly owned subsidiary of Amgen, Inc. (AMGN) (not held). The all-cash acquisition announced on December 12, 2023, came at an 86.9 percent premium to the closing price of HZNP on October 31, 2022. Another meaningful contributor to Fund performance was Broadcom, Inc. (AVGO) (holding weight*: 1.26 percent), an American company involved in the design, development, and manufacturing of semiconductor and infrastructure software products. Over the fiscal period, AVGO increased 35.4 percent, aided by a strong first quarter earnings report, highlighting a 16 percent increase in cash flows. Also, AVGO may have been helped by positive investor sentiment regarding the proposed acquisition of VMware, Inc. (VMW) (not held).
Exposure to the financial services sector detracted from Fund performance as institutions and investors digested the shock of the first domestic banking failure since 2020. Investors’ concerns surrounding whether other banks were facing similar pressures in terms of deposit flight forcing banks to realize losses on their long-term investment portfolios. The largest detractor from performance was The Charles Schwab Corporation (SCHW) (holding weight**: 1.07), an American multinational financial services company offering banking, wealth management advising, and related services. Over the period held, SCHW decreased 34.5 percent, attributable to its net interest margin, which generates roughly half of its revenue, coming under significant pressure as clients rotate their cash positions into money market funds and Treasury bills given the attractive yields now available. This ‘cash sorting’ has the appearance and effects of deposit outflow even if Schwab still retains the assets. Also, Schwab may have been hurt further by sentiment around the large unrealized losses in its long-dated securities portfolio. Another position in the financial services sector that detracted from performance was Truist Financial Corporation (TFC) (holding weight*: 0.40 percent), an American bank holding company headquartered in Charlotte, North Carolina. Over the fiscal period, TFC declined 25.6 percent, attributable to a surprise slowdown in earnings, outflows of deposits, and rising concerns about high exposure to Treasury bonds with large unrealized losses. Exposure to consumer staples generally detracted from performance as a slight underweight and inferior stock selection detracted from performance in the space. One such detractor was CVS Health Corporation (CVS) (holding weight*: 1.39 percent), the largest pharmacy chain in America by number of locations. CVS declined 21.4 percent over the fiscal period, as its fourth quarter earnings report, although better than expected, showed declining profits. Also, CVS may have been hurt by investor sentiment regarding the announced acquisition of Oak Street Health (OSH) (not held).
Sub-Adviser Outlook
The Sub-Adviser is cautiously optimistic about the opportunity set for the remainder of 2023. The Sub- Adviser believes that monetary tightening has affected equity markets, leading to economic weakness and depressed sentiment among market participants. However, the Sub-Adviser believes the outlook for value stocks remains attractive and may realize more value if market participants continue to move into higher quality assets. Moving forward, the Sub- Adviser is confident that avoiding landmines is key to positive relative performance. Therefore, ignoring the noise and focusing on corporate fundamentals is critical in identifying companies that exhibit attractive valuations and are resilient enough to navigate the complex environment. The Sub-Adviser will continue to implement its disciplined investment process but understands that it may be susceptible to systematic tail risk. The Sub-Adviser recognizes that it cannot add value without taking risks, therefore its focus is on identifying what the Sub-Adviser considers intelligent risks – the risks that it believes are most likely to contribute to outperforming the benchmark and least likely to cause unnecessary relative volatility.
| * | Holdings percentage(s) of total investments, cash and unsettled trades excluding collateral for securities loaned as of 4/30/2023. |
| ** | Holdings percentage(s) as of the date prior to the sale of the security. |
| Dunham Large Cap Value Fund |
| PORTFOLIO REVIEW (Unaudited) |
| April 30, 2023 |
| |
The Fund’s performance figures* for each of the periods ended April 30, 2023, compared to its benchmarks:
| | | | Annualized | Annualized |
| | 6 Month Return | 1 Year Return | 5 Year Return | 10 Year Return |
| Class N | 4.10% | 0.87% | 7.69% | 8.57% |
| Class A with Load 5.75% | (1.98)% | (5.18)% | 6.16% | 7.66% |
| Class A without load | 3.98% | 0.62% | 7.43% | 8.29% |
| Class C | 3.63% | (0.12)% | 6.63% | 7.48% |
| Russell 1000 Value Index (a) | 4.54% | 1.21% | 7.75% | 9.13% |
| Morningstar Large Cap Value Category (b) | 3.94% | 1.52% | 7.68% | 8.72% |
| | | | | |
| * | Total Returns are calculated based on traded NAVs. As disclosed in the Trust’s latest registration statement, the Fund’s total annual operating expenses, including underlying funds, are 1.26% for Class N, 2.26% for Class C and 1.51% for Class A. Class A shares are subject to a sales load of 5.75% and a deferred sales charge of up to 0.75%. The performance data quoted here represents past performance, which is not indicative of future results. Current performance may be lower or higher than the performance data quoted. The investment return and NAV will fluctuate, so that an investor’s shares, when redeemed, may be worth more or less than their original cost. Total returns are calculated assuming reinvestment of all dividends and capital gains distributions, if any. The returns do not reflect the deductions of taxes a shareholder would pay on the redemption of Fund shares or Fund distributions. For performance information current to the most recent month-end, please call 1-800-442-4358 or visit our website |
| (a) | The Russell 1000 Value Index is a subset of the Russell 1000 Index which measures the performance of the stocks of the 1000 largest companies in the Russell 3000 Index based on market capitalization. The Russell 1000 Value Index measures the performance of those Russell 1000 companies with lower price-to-book ratios and lower forecasted growth values. Investors cannot invest directly in an index or benchmark. |
| (b) | The Morningstar Large Cap Value Category is generally representative of mutual funds that primarily invest in big (large capitalization) U.S. companies that are less expensive or growing more slowly than other large-cap stocks. |
Comparison of the Change in Value of a $100,000 Investment
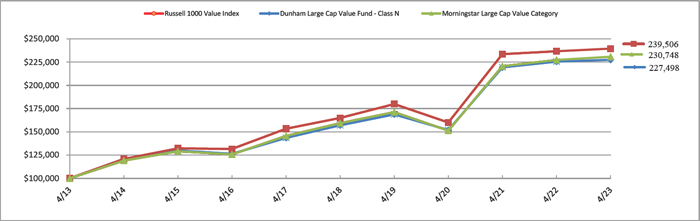
| Portfolio Composition * (Unaudited) |
| Collateral for Securities Loaned | | | 8.8 | % |
| Oil & Gas Producers | | | 6.7 | % |
| Medical Equipment & Devices | | | 6.3 | % |
| Biotech & Pharma | | | 5.7 | % |
| Banking | | | 5.6 | % |
| Insurance | | | 5.2 | % |
| Internet Media & Services | | | 4.7 | % |
| Health Care Facilities & Services | | | 3.9 | % |
| Electric Utilities | | | 3.7 | % |
| Others | | | 49.4 | % |
| Total | | | 100.0 | % |
| | | | | |
* Based on total value of investments as of April 30, 2023. Does not include derivative holdings.
Percentage may differ from Schedule of Investments which are based on Fund net assets.
| DUNHAM LARGE CAP VALUE FUND |
| SCHEDULE OF INVESTMENTS (Unaudited) |
| April 30, 2023 |
| Shares | | | | | Fair Value | |
| | | | | COMMON STOCKS — 98.1% | | | | |
| | | | | AEROSPACE & DEFENSE - 3.1% | | | | |
| | 9,910 | | | L3Harris Technologies, Inc. | | $ | 1,933,937 | |
| | 33,181 | | | Raytheon Technologies Corporation | | | 3,314,782 | |
| | | | | | | | 5,248,719 | |
| | | | | ASSET MANAGEMENT - 1.6% | | | | |
| | 3,922 | | | BlackRock, Inc. | | | 2,632,446 | |
| | | | | | | | | |
| | | | | AUTOMOTIVE - 0.8% | | | | |
| | 39,420 | | | General Motors Company | | | 1,302,437 | |
| | | | | | | | | |
| | | | | BANKING - 6.1% | | | | |
| | 100,832 | | | Bank of America Corporation | | | 2,952,361 | |
| | 32,568 | | | JPMorgan Chase & Company | | | 4,502,199 | |
| | 20,827 | | | Truist Financial Corporation | | | 678,544 | |
| | 56,581 | | | Wells Fargo & Company | | | 2,249,095 | |
| | | | | | | | 10,382,199 | |
| | | | | BIOTECH & PHARMA - 6.3% | | | | |
| | 12,054 | | | AbbVie, Inc. | | | 1,821,600 | |
| | 38,821 | | | Bristol-Myers Squibb Company | | | 2,592,078 | |
| | 14,569 | | | Johnson & Johnson | | | 2,384,945 | |
| | 32,196 | | | Merck & Company, Inc. | | | 3,717,673 | |
| | | | | | | | 10,516,296 | |
| | | | | CHEMICALS - 3.0% | | | | |
| | 6,576 | | | Air Products and Chemicals, Inc. | | | 1,935,711 | |
| | 32,341 | | | Corteva, Inc. | | | 1,976,682 | |
| | 44,608 | | | Huntsman Corporation | | | 1,195,048 | |
| | | | | | | | 5,107,441 | |
| | | | | CONSTRUCTION MATERIALS - 2.2% | | | | |
| | 5,925 | | | Martin Marietta Materials, Inc. | | | 2,151,960 | |
| | 14,234 | | | Owens Corning(a) | | | 1,520,334 | |
| | | | | | | | 3,672,294 | |
| | | | | CONSUMER SERVICES - 1.3% | | | | |
| | 31,312 | | | Service Corp International(a) | | | 2,197,789 | |
| | | | | | | | | |
See accompanying notes which are an integral part of these financial statements.
| DUNHAM LARGE CAP VALUE FUND |
| SCHEDULE OF INVESTMENTS (Unaudited) (Continued) |
| April 30, 2023 |
| Shares | | | | | Fair Value | |
| | | | | COMMON STOCKS — 98.1% (Continued) | | | | |
| | | | | DIVERSIFIED INDUSTRIALS - 1.4% | | | | |
| | 11,856 | | | Honeywell International, Inc. | | $ | 2,369,303 | |
| | | | | | | | | |
| | | | | ELECTRIC UTILITIES - 4.1% | | | | |
| | 12,500 | | | Duke Energy Corporation | | | 1,236,000 | |
| | 53,773 | | | NextEra Energy, Inc.(a) | | | 4,120,625 | |
| | 21,487 | | | Xcel Energy, Inc. | | | 1,502,156 | |
| | | | | | | | 6,858,781 | |
| | | | | ELECTRICAL EQUIPMENT - 1.3% | | | | |
| | 35,793 | | | Johnson Controls International plc | | | 2,141,853 | |
| | | | | | | | | |
| | | | | ENGINEERING & CONSTRUCTION - 1.5% | | | | |
| | 15,103 | | | Quanta Services, Inc.(a) | | | 2,562,073 | |
| | | | | | | | | |
| | | | | ENTERTAINMENT CONTENT - 2.6% | | | | |
| | 48,230 | | | Fox Corporation, Class A(a) | | | 1,604,130 | |
| | 26,451 | | | Walt Disney Company (The)(b) | | | 2,711,228 | |
| | | | | | | | 4,315,358 | |
| | | | | FOOD - 2.7% | | | | |
| | 42,700 | | | Mondelez International, Inc., Class A | | | 3,275,944 | |
| | 23,545 | | | Tyson Foods, Inc., Class A | | | 1,471,327 | |
| | | | | | | | 4,747,271 | |
| | | | | HEALTH CARE FACILITIES & SERVICES - 4.3% | | | | |
| | 14,255 | | | AmerisourceBergen Corporation | | | 2,378,447 | |
| | 31,757 | | | CVS Health Corporation | | | 2,328,106 | |
| | 5,046 | | | UnitedHealth Group, Inc. | | | 2,483,086 | |
| | | | | | | | 7,189,639 | |
| | | | | HOUSEHOLD PRODUCTS - 1.8% | | | | |
| | 18,852 | | | Procter & Gamble Company (The) | | | 2,948,076 | |
| | | | | | | | | |
| | | | | INDUSTRIAL REIT - 1.0% | | | | |
| | 13,983 | | | Prologis, Inc. | | | 1,751,371 | |
| | | | | | | | | |
See accompanying notes which are an integral part of these financial statements.
| DUNHAM LARGE CAP VALUE FUND |
| SCHEDULE OF INVESTMENTS (Unaudited) (Continued) |
| April 30, 2023 |
| Shares | | | | | Fair Value | |
| | | | | COMMON STOCKS — 98.1% (Continued) | | | | |
| | | | | INFRASTRUCTURE REIT - 1.3% | | | | |
| | 10,487 | | | American Tower Corporation, A | | $ | 2,143,438 | |
| | | | | | | | | |
| | | | | INSTITUTIONAL FINANCIAL SERVICES - 2.6% | | | | |
| | 50,224 | | | Bank of New York Mellon Corporation (The) | | | 2,139,040 | |
| | 19,947 | | | Intercontinental Exchange, Inc. | | | 2,172,827 | |
| | | | | | | | 4,311,867 | |
| | | | | INSURANCE - 5.7% | | | | |
| | 19,203 | | | Allstate Corporation (The) | | | 2,222,939 | |
| | 6,301 | | | Berkshire Hathaway, Inc., Class B(b) | | | 2,070,194 | |
| | 33,241 | | | Hartford Financial Services Group, Inc. (The) | | | 2,359,778 | |
| | 10,549 | | | Prudential Financial, Inc. | | | 917,763 | |
| | 11,275 | | | Travelers Companies, Inc. (The) | | | 2,042,354 | |
| | | | | | | | 9,613,028 | |
| | | | | INTERNET MEDIA & SERVICES - 5.2% | | | | |
| | 34,412 | | | Alphabet, Inc., Class A(b) | | | 3,693,784 | |
| | 20,907 | | | Meta Platforms, Inc., Class A(b) | | | 5,024,370 | |
| | | | | | | | 8,718,154 | |
| | | | | LEISURE FACILITIES & SERVICES - 1.1% | | | | |
| | 12,396 | | | Darden Restaurants, Inc.(a) | | | 1,883,324 | |
| | | | | | | | | |
| | | | | MACHINERY - 2.1% | | | | |
| | 6,437 | | | Caterpillar, Inc. | | | 1,408,416 | |
| | 6,351 | | | Parker-Hannifin Corporation | | | 2,063,312 | |
| | | | | | | | 3,471,728 | |
| | | | | MEDICAL EQUIPMENT & DEVICES - 7.0% | | | | |
| | 39,240 | | | Abbott Laboratories | | | 4,334,843 | |
| | 67,088 | | | Avantor, Inc.(a),(b) | | | 1,306,874 | |
| | 6,544 | | | Stryker Corporation | | | 1,960,910 | |
| | 7,291 | | | Thermo Fisher Scientific, Inc. | | | 4,045,776 | |
| | | | | | | | 11,648,403 | |
| | | | | OIL & GAS PRODUCERS - 7.4% | | | | |
| | 27,098 | | | ConocoPhillips | | | 2,788,113 | |
| | 15,665 | | | EOG Resources, Inc. | | | 1,871,498 | |
| | 52,776 | | | Exxon Mobil Corporation | | | 6,245,511 | |
| | | | | | | | | |
See accompanying notes which are an integral part of these financial statements.
| DUNHAM LARGE CAP VALUE FUND |
| SCHEDULE OF INVESTMENTS (Unaudited) (Continued) |
| April 30, 2023 |
| Shares | | | | | Fair Value | |
| | | | | COMMON STOCKS — 98.1% (Continued) | | | | |
| | | | | OIL & GAS PRODUCERS - 7.4% (Continued) | | | | |
| | 15,085 | | | Phillips 66 | | $ | 1,493,415 | |
| | | | | | | | 12,398,537 | |
| | | | | OIL & GAS SERVICES & EQUIPMENT - 1.5% | | | | |
| | 52,190 | | | Schlumberger Ltd | | | 2,575,577 | |
| | | | | | | | | |
| | | | | RESIDENTIAL REIT - 1.1% | | | | |
| | 27,581 | | | Equity LifeStyle Properties, Inc. | | | 1,900,331 | |
| | | | | | | | | |
| | | | | RETAIL - CONSUMER STAPLES - 1.2% | | | | |
| | 12,267 | | | Target Corporation | | | 1,935,119 | |
| | | | | | | | | |
| | | | | RETAIL - DISCRETIONARY - 1.3% | | | | |
| | 10,565 | | | Lowe’s Companies, Inc. | | | 2,195,724 | |
| | | | | | | | | |
| | | | | SEMICONDUCTORS - 3.3% | | | | |
| | 3,371 | | | Broadcom, Inc. | | | 2,111,931 | |
| | 23,422 | | | Micron Technology, Inc. | | | 1,507,440 | |
| | 27,832 | | | ON Semiconductor Corporation(a),(b) | | | 2,002,791 | |
| | | | | | | | 5,622,162 | |
| | | | | SOFTWARE - 3.0% | | | | |
| | 8,697 | | | Microsoft Corporation | | | 2,672,241 | |
| | 25,063 | | | Oracle Corporation | | | 2,373,967 | |
| | | | | | | | 5,046,208 | |
| | | | | SPECIALTY FINANCE - 0.9% | | | | |
| | 9,575 | | | American Express Company | | | 1,544,831 | |
| | | | | | | | | |
| | | | | TECHNOLOGY HARDWARE - 1.7% | | | | |
| | 9,757 | | | Motorola Solutions, Inc. | | | 2,843,190 | |
| | | | | | | | | |
| | | | | TECHNOLOGY SERVICES - 2.6% | | | | |
| | 29,610 | | | PayPal Holdings, Inc.(b) | | | 2,250,360 | |
| | 5,764 | | | S&P Global, Inc. | | | 2,089,911 | |
| | | | | | | | 4,340,271 | |
| | | | | | | | | |
See accompanying notes which are an integral part of these financial statements.
| DUNHAM LARGE CAP VALUE FUND |
| SCHEDULE OF INVESTMENTS (Unaudited) (Continued) |
| April 30, 2023 |
| Shares | | | | | Fair Value | |
| | | | | COMMON STOCKS — 98.1% (Continued) | | | | |
| | | | | TELECOMMUNICATIONS - 1.3% | | | | |
| | 55,681 | | | Verizon Communications, Inc. | | $ | 2,162,093 | |
| | | | | | | | | |
| | | | | TRANSPORTATION & LOGISTICS - 2.7% | | | | |
| | 70,604 | | | CSX Corporation | | | 2,163,307 | |
| | 23,094 | | | Knight-Swift Transportation Holdings, Inc.(a) | | | 1,300,654 | |
| | 36,312 | | | Southwest Airlines Company | | | 1,099,890 | |
| | | | | | | | 4,563,851 | |
| | | | | | | | | |
| | | | | | | | | |
| | | | | TOTAL COMMON STOCKS (Cost $123,782,437) | | | 164,861,182 | |
| | | | | | | | | |
| | | | | SHORT-TERM INVESTMENTS — 11.4% | | | | |
| | | | | COLLATERAL FOR SECURITIES LOANED - 9.6% | | | | |
| | 16,175,261 | | | Mount Vernon Liquid Assets Portfolio, LLC, 4.96% (Cost $16,175,261)(c) | | | 16,175,261 | |
| | | | | | | | | |
| | | | | MONEY MARKET FUNDS - 1.8% | | | | |
| | 3,047,748 | | | STIT - Treasury Portfolio, Institutional Class, 4.77% (Cost $3,047,748)(c) | | | 3,047,748 | |
| | | | | | | | | |
| | | | | TOTAL SHORT-TERM INVESTMENTS (Cost $19,223,009) | | | 19,223,009 | |
| | | | | | | | | |
| | | | | TOTAL INVESTMENTS - 109.5% (Cost $143,005,446) | | $ | 184,084,191 | |
| | | | | LIABILITIES IN EXCESS OF OTHER ASSETS - (9.5)% | | | (16,029,390 | ) |
| | | | | NET ASSETS - 100.0% | | $ | 168,054,801 | |
| LLC | - Limited Liability Company |
| | |
| LTD | - Limited Company |
| | |
| PLC | - Public Limited Company |
| | |
| REIT | - Real Estate Investment Trust |
| | |
| (a) | All or a portion of these securities are on loan. Total loaned securities had a value of $15,974,227 at April 30, 2023. |
| (b) | Non-income producing security. |
| (c) | Rate disclosed is the seven day effective yield as of April 30, 2023. |
| (d) | The Trust’s securities lending policies and procedures require that the borrower: deliver cash or U.S. Government securities as collateral with respect to each new loan of U.S. securities, equal to at least 102% of the value of the portfolio securities loaned, and (ii) at all times thereafter mark-to-market the collateral on a daily basis so that the market value of such collateral is at least 100% of the value of securities loaned. From time to time the collateral may not be 102% due to end of day market movement. The next business day additional collateral is obtained/received from the borrower to replenish/reestablish 102%. |
See accompanying notes which are an integral part of these financial statements.
| Dunham Small Cap Value Fund (Unaudited) |
| Message from the Sub-Adviser (Ziegler Capital Management, LLC) |
| |
Asset Class Recap
Small cap value stocks fell behind their small cap growth counterparts over the six-month period ended April 30, 2023. However, this dispersion narrows the overall chasm of performance between the two asset classes developed in the last three fiscal years. The fiscal period began with most equity indices trading at discounts from one year earlier, as the historically fast pace of Federal Funds Rate increases shocked markets. The Federal Reserve continued with aggressive actions, raising the Federal Funds Rate by 75 basis points in November and 50 basis points in December. Throughout the action, market participants continued to speculate as to whether the Federal Reserve would be able to control inflation without tipping the economy into a recession. These concerns materialized following the second- largest bank failure in United States history in early-March. Amidst the height of this trepidation, the Federal Reserve remained steadfast with their monetary tightening, raising the Federal Funds Rate 25 basis points in mid-March. However, softer-than-expected Consumer & Producer Price Index reports, in combination with lower Purchasing Manager’s Index reports, helped to quell investors’ concerns as a slowdown in price growth and tightening business conditions supported the depiction of peak inflation. Over the fiscal period, small cap value stocks, as measured by the Russel 2000 Value Index, declined 6.7 percent, while large cap growth stocks, as measured by the Russel 2000 Growth Index, declined 0.6 percent.
Allocation Review
The Sub-Adviser matches the Fund’s sector allocation to the benchmark index; therefore, any changes to benchmark weights will be quickly reflected within the Fund. The Sub- Adviser seeks to generate alpha through proprietary sector-specific multi-factor models combined with qualitative analysis. With that being said, the Fund is reliant on superior stock selection to generate excess returns. The largest boost to performance came from the financial services sector, where superior stock selection helped drive relative outperformance in the sector, overshadowing a 0.7 percent overweight. In addition, the adverse impact from the slight overweight to the consumer staples sector was outshined by strong stock selection in the space, which contributed to Fund performance. Conversely, the largest detractor from performance was exposure to the energy sector, where a slight overweight coupled with inferior security selection in space acted as a significant headwind to performance.
Holdings Insights
The best performing position within the Fund was Meritage Homes Corporation (MTH) (holding weight*: 2.04 percent), an American real estate development company that constructs a variety of single- family detached homes across the United States. Over the fiscal period, MTH increased 68.6 percent, aided by earnings that exceeded expectations, highlighting record home closing revenue and record first quarter closing units. Also, MTH may have been helped by a short supply of existing homes, potentially driven by the unwillingness of some homeowners to forgo their lower interest rate mortgages locked in previous to the Federal Reserve’s hiking cycle, for higher interest rates mortgages found on the market now. The second- largest contributor to Fund performance came from the producer durables sector, where security selection significantly outshined a small overweight to the sector. One example of superior security selection was SkyWest Inc. (SKY) (holding weight*: 1.68 percent), an American regional airline headquartered in St. George, Utah. Over the fiscal period, SKYW increased 60.1 percent, aided by a stronger than expected earnings report highlighting decreasing debt and costs. Also, SKYW may have been helped by competitor Southwest Airlines (LUV) (not held) facing a scheduling crisis over the most recent holiday season. Another position that contributed positively to Fund performance was Academy Sports + Outdoors (ASO) (holding weight*: 1.40 percent) an American sporting goods store chain headquartered in Katy, TX. Over the fiscal period, ASO increased 44.7 percent, aided by a strong 2022 earnings report highlighting the opening of 9 new stores, record earnings per share, and announcement of a 20 percent increase to its quarterly dividend.
Some of the largest detractors from Fund performance came from the financial services sector as investors’ concerns of contagion and deposit flight mounted following the collapse of Silicon Valley Bank (SVB) (not held). The largest overall detractor from Fund performance was Heritage Financial Corporation (HFWA) (holding weight*: 0.96 percent) the holding company of Heritage Bank, a full-service commercial bank providing financial solutions to small and medium- sized enterprises in Washington, Oregon, and Idaho. Over the fiscal period, HFWA declined 47.0 percent, attributable to a disappointing first quarter earnings report that showed declining deposits, complementing mounting concerns regarding the unrealized losses on its balance sheet. An additional position in the sector that detracted from Fund performance was PacWest Bancorp (PACW) (holding weight **: 0.49 percent), a bank holding company with one wholly owned banking subsidiary, Pacific Western Bank. Over the period held, PACW declined 18.5 percent. However, following the sale of PACW from the Fund in early March, PACW fell an additional 49.0 percent as concerns mounted around deposit flight. Another detractor from Fund performance was Adicet Bio (ACET) (holding weight**: 0.40 percent), a biotechnology company engaged in the development of allogenic gamma delta T-cell therapies for cancer and other diseases, headquartered in Boston, MA. Over the period held, Adicet declined 49.7 percent, due to negative sentiment around a study of its allogenic treatments showing relapses becoming a problem. Specifically, the study reported an initial 75 percent response rate falling to 18 percent after six months.
Sub-Adviser Outlook
The Sub-Adviser believes the outlook for value stocks remains attractive despite headwinds such as persistent inflation, tightening credit conditions and continued geopolitical turmoil. The Sub-Adviser will continue to implement its quantitatively driven approach, focusing on what its industry specific factors have identified as attractive opportunities. The Sub-Adviser remains disciplined in its application of its models and factors, as it is aware that subjective tampering during periods of large dislocations such as the environment in 2022, erodes the effectiveness of its quantitatively driven process. The Sub-Adviser believes that historically, environments where low quality thrives are short lived and difficult to predict, therefore the Sub-Adviser does not reposition its industry specific factors based on market expectations or macroeconomic outlook. The Sub-Adviser believes that the current market continues to over appreciate growth-oriented factors, while maintaining the expectation that valuation-oriented, high quality seeking signals may succeed as a positive contributor to the Fund going forward.
| * | Holdings percentage(s) of total investments, cash and unsettled trades excluding collateral for securities loaned as of 4/30/23. |
| ** | Holdings percentage(s) as of the date prior to the sale of the security. |
| Dunham Small Cap Value Fund |
| PORTFOLIO REVIEW (Unaudited) |
| April 30, 2023 |
| |
The Fund’s performance figures* for each of the periods ended April 30, 2023, compared to its benchmarks:
| | | | Annualized | Annualized |
| | 6 Month Return | 1 Year Return | 5 Year Return | 10 Year Return |
| Class N | (3.99)% | (5.83)% | 3.99% | 6.95% |
| Class A with Load 5.75% | (9.60)% | (11.48)% | 2.51% | 6.05% |
| Class A without load | (4.08)% | (6.08)% | 3.73% | 6.68% |
| Class C | (4.51)% | (6.80)% | 2.93% | 5.88% |
| Russell 2000 Value Index (a) | (6.72)% | (7.99)% | 3.66% | 6.96% |
| Morningstar Small Cap Value Category (b) | (1.78)% | (2.82)% | 4.91% | 7.22% |
| | | | | |
| * | Total Returns are calculated based on traded NAVs. As disclosed in the Trust’s latest registration statement, the Fund’s total annual operating expenses, including underlying funds, are 1.61% for Class N, 2.61% for Class C and 1.86% for Class A. Class A shares are subject to a sales load of 5.75% and a deferred sales charge of up to 0.75%. The performance data quoted here represents past performance, which is not indicative of future results. Current performance may be lower or higher than the performance data quoted. The investment return and NAV will fluctuate, so that an investor’s shares, when redeemed, may be worth more or less than their original cost. Total returns are calculated assuming reinvestment of all dividends and capital gains distributions, if any. The returns do not reflect the deductions of taxes a shareholder would pay on the redemption of Fund shares or Fund distributions. For performance information current to the most recent month-end, please call 1-800-442-4358 or visit our website www.dunham.com. |
| (a) | The Russell 2000 Value Index is an unmanaged index that measures the performance of small cap companies in the Russell 2000 Index with lower price-to-book ratios and lower forecasted growth rates. Investors cannot invest directly in an index or benchmark. |
| (b) | The Morningstar Small Cap Value Category is generally representative of mutual funds that primarily invest in small (small capitalization) U.S. companies that are less expensive or growing more slowly than other small-cap stocks. |
Comparison of the Change in Value of a $100,000 Investment
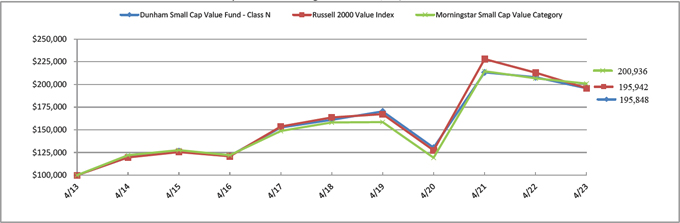
| Portfolio Composition * (Unaudited) |
| Collateral for Securities Loaned | | | 23.2 | % |
| Banking | | | 11.7 | % |
| REIT | | | 8.7 | % |
| Biotech & Pharma | | | 4.5 | % |
| Transportation & Logistics | | | 4.4 | % |
| Retail - Discretionary | | | 3.8 | % |
| Specialty Finance | | | 3.1 | % |
| Insurance | | | 2.9 | % |
| Technology Services | | | 2.9 | % |
| Other | | | 34.8 | % |
| Total | | | 100.0 | % |
| | | | | |
* Based on total value of investments as of April 30, 2023. Does not include derivative holdings.
Percentage may differ from Schedule of Investments which are based on Fund net assets.
| DUNHAM SMALL CAP VALUE FUND |
| SCHEDULE OF INVESTMENTS (Unaudited) |
| April 30, 2023 |
| Shares | | | | | Fair Value | |
| | | | | COMMON STOCKS — 98.9% | | | | |
| | | | | AUTOMOTIVE - 1.2% | | | | |
| | 103,655 | | | American Axle & Manufacturing Holdings, Inc.(a) | | $ | 741,133 | |
| | | | | | | | | |
| | | | | BANKING - 15.2% | | | | |
| | 23,694 | | | Amalgamated Financial Corporation | | | 385,738 | |
| | 15,124 | | | Banner Corporation | | | 754,990 | |
| | 28,907 | | | Berkshire Hills Bancorp, Inc.(b) | | | 614,852 | |
| | 26,670 | | | Central Pacific Financial Corporation | | | 423,520 | |
| | 24,687 | | | First Bancorp(b) | | | 759,866 | |
| | 16,080 | | | First Financial Corporation | | | 555,564 | |
| | 21,166 | | | Hancock Whitney Corporation(b) | | | 772,982 | |
| | 34,710 | | | Hanmi Financial Corporation | | | 560,914 | |
| | 21,141 | | | Heartland Financial USA, Inc. | | | 688,351 | |
| | 34,021 | | | Heritage Financial Corporation | | | 599,110 | |
| | 26,298 | | | Independent Bank Corporation | | | 468,630 | |
| | 51,745 | | | Old Second Bancorp, Inc. | | | 635,946 | |
| | 25,963 | | | Pathward Financial, Inc. | | | 1,156,133 | |
| | 22,205 | | | Peoples Bancorp, Inc.(b) | | | 578,662 | |
| | 17,287 | | | TrustCompany Bank Corp NY | | | 515,844 | |
| | | | | | | | 9,471,102 | |
| | | | | BIOTECH & PHARMA - 5.9% | | | | |
| | 20,871 | | | Amphastar Pharmaceuticals, Inc.(a),(b) | | | 746,556 | |
| | 14,156 | | | Anika Therapeutics, Inc.(a) | | | 363,243 | |
| | 20,200 | | | Chinook Therapeutics, Inc.(a) | | | 404,202 | |
| | 16,680 | | | Eagle Pharmaceuticals, Inc.(a) | | | 468,374 | |
| | 29,221 | | | Ideaya Biosciences, Inc.(a) | | | 533,575 | |
| | 16,229 | | | Supernus Pharmaceuticals, Inc.(a),(b) | | | 598,201 | |
| | 22,293 | | | Vir Biotechnology, Inc.(a),(b) | | | 560,669 | |
| | | | | | | | 3,674,820 | |
| | | | | CHEMICALS - 2.6% | | | | |
| | 22,736 | | | AdvanSix, Inc. | | | 856,693 | |
| | 13,017 | | | Minerals Technologies, Inc. | | | 771,387 | |
| | | | | | | | 1,628,080 | |
| | | | | | | | | |
See accompanying notes which are an integral part of these financial statements.
| DUNHAM SMALL CAP VALUE FUND |
| SCHEDULE OF INVESTMENTS (Unaudited) (Continued) |
| April 30, 2023 |
| Shares | | | | | Fair Value | |
| | | | | COMMON STOCKS — 98.9% (Continued) | | | | |
| | | | | COMMERCIAL SUPPORT SERVICES - 1.6% | | | | |
| | 12,073 | | | Huron Consulting Group, Inc.(a) | | $ | 1,023,670 | |
| | | | | | | | | |
| | | | | CONTAINERS & PACKAGING - 1.4% | | | | |
| | 39,793 | | | O-I Glass, Inc.(a) | | | 894,149 | |
| | | | | | | | | |
| | | | | ELECTRIC UTILITIES - 3.0% | | | | |
| | 23,020 | | | Avista Corporation(b) | | | 1,014,492 | |
| | 16,241 | | | Portland General Electric Company | | | 822,119 | |
| | | | | | | | 1,836,611 | |
| | | | | ELECTRICAL EQUIPMENT - 0.8% | | | | |
| | 5,942 | | | Belden, Inc. | | | 468,764 | |
| | | | | | | | | |
| | | | | FORESTRY, PAPER & WOOD PRODUCTS - 1.2% | | | | |
| | 12,468 | | | Louisiana-Pacific Corporation(b) | | | 744,838 | |
| | | | | | | | | |
| | | | | GAS & WATER UTILITIES - 2.4% | | | | |
| | 10,162 | | | ONE Gas, Inc.(b) | | | 781,966 | |
| | 9,774 | | | SJW Group(b) | | | 742,042 | |
| | | | | | | | 1,524,008 | |
| | | | | HEALTH CARE FACILITIES & SERVICES - 1.4% | | | | |
| | 6,642 | | | Addus HomeCare Corporation(a) | | | 542,917 | |
| | 5,781 | | | National HealthCare Corporation | | | 334,778 | |
| | | | | | | | 877,695 | |
| | | | | HEALTH CARE REIT - 1.2% | | | | |
| | 65,436 | | | Sabra Health Care REIT, Inc.(b) | | | 745,970 | |
| | | | | | | | | |
| | | | | HOME CONSTRUCTION - 2.0% | | | | |
| | 9,926 | | | Meritage Homes Corporation | | | 1,271,024 | |
| | | | | | | | | |
| | | | | HOTEL REIT - 1.6% | | | | |
| | 124,504 | | | DiamondRock Hospitality Company(b) | | | 1,009,727 | |
| | | | | | | | | |
| | | | | INDUSTRIAL INTERMEDIATE PROD - 2.9% | | | | |
| | 7,968 | | | EnPro Industries, Inc. | | | 751,143 | |
| | | | | | | | | |
See accompanying notes which are an integral part of these financial statements.
| DUNHAM SMALL CAP VALUE FUND |
| SCHEDULE OF INVESTMENTS (Unaudited) (Continued) |
| April 30, 2023 |
| Shares | | | | | Fair Value | |
| | | | | COMMON STOCKS — 98.9% (Continued) | | | | |
| | | | | INDUSTRIAL INTERMEDIATE PROD - 2.9% (Continued) | | | | |
| | 14,643 | | | Mueller Industries, Inc.(b) | | $ | 1,052,100 | |
| | | | | | | | 1,803,243 | |
| | | | | INSTITUTIONAL FINANCIAL SERVICES - 1.3% | | | | |
| | 6,194 | | | Piper Sandler Cos | | | 838,915 | |
| | | | | | | | | |
| | | | | INSURANCE - 3.8% | | | | |
| | 13,932 | | | American Equity Investment Life Holding Company | | | 536,939 | |
| | 14,252 | | | Axis Capital Holdings Ltd. | | | 805,809 | |
| | 5,297 | | | Hanover Insurance Group, Inc. (The) | | | 633,309 | |
| | 1,458 | | | National Western Life Group, Inc., Class A | | | 371,761 | |
| | | | | | | | 2,347,818 | |
| | | | | INTERNET MEDIA & SERVICES - 1.5% | | | | |
| | 16,341 | | | HealthStream, Inc.(a) | | | 402,642 | |
| | 31,272 | | | TripAdvisor, Inc.(a) | | | 554,453 | |
| | | | | | | | 957,095 | |
| | | | | LEISURE FACILITIES & SERVICES - 2.0% | | | | |
| | 28,264 | | | Bloomin’ Brands, Inc.(b) | | | 700,099 | |
| | 14,381 | | | Travel + Leisure Company | | | 550,361 | |
| | | | | | | | 1,250,460 | |
| | | | | LEISURE PRODUCTS - 1.0% | | | | |
| | 7,723 | | | Thor Industries, Inc.(b) | | | 610,271 | |
| | | | | | | | | |
| | | | | MACHINERY - 2.8% | | | | |
| | 5,688 | | | Curtiss-Wright Corporation | | | 965,993 | |
| | 17,488 | | | Hillenbrand, Inc. | | | 797,803 | |
| | | | | | | | 1,763,796 | |
| | | | | MEDICAL EQUIPMENT & DEVICES - 1.3% | | | | |
| | 26,574 | | | Avanos Medical, Inc.(a) | | | 784,996 | |
| | | | | | | | | |
| | | | | METALS & MINING - 0.8% | | | | |
| | 2,998 | | | Encore Wire Corporation(b) | | | 468,677 | |
| | | | | | | | | |
| | | | | MORTGAGE FINANCE - 1.9% | | | | |
| | 65,574 | | | Ladder Capital Corporation | | | 613,117 | |
| | | | | | | | | |
See accompanying notes which are an integral part of these financial statements.
| DUNHAM SMALL CAP VALUE FUND |
| SCHEDULE OF INVESTMENTS (Unaudited) (Continued) |
| April 30, 2023 |
| Shares | | | | | Fair Value | |
| | | | | COMMON STOCKS — 98.9% (Continued) | | | | |
| | | | | MORTGAGE FINANCE - 1.9% (Continued) | | | | |
| | 54,569 | | | Ready Capital Corporation(b) | | $ | 585,525 | |
| | | | | | | | 1,198,642 | |
| | | | | MULTI ASSET CLASS REIT - 1.2% | | | | |
| | 61,405 | | | Armada Hoffler Properties, Inc. | | | 719,667 | |
| | | | | | | | | |
| | | | | OIL & GAS PRODUCERS - 3.3% | | | | |
| | 15,040 | | | Callon Petroleum Company(a),(b) | | | 498,426 | |
| | 22,435 | | | PBF Energy, Inc., Class A | | | 782,084 | |
| | 20,331 | | | SilverBow Resources, Inc.(a),(b) | | | 484,894 | |
| | 11,800 | | | World Fuel Services Corporation | | | 278,952 | |
| | | | | | | | 2,044,356 | |
| | | | | OIL & GAS SERVICES & EQUIPMENT - 2.2% | | | | |
| | 47,643 | | | Liberty Oilfield Services, Inc., Class A | | | 610,307 | |
| | 101,314 | | | RPC, Inc.(b) | | | 748,710 | |
| | | | | | | | 1,359,017 | |
| | | | | PUBLISHING & BROADCASTING - 1.3% | | | | |
| | 40,148 | | | Sinclair Broadcast Group, Inc., Class A(b) | | | 798,544 | |
| | | | | | | | | |
| | | | | RESIDENTIAL REIT - 0.8% | | | | |
| | 8,840 | | | Centerspace | | | 498,399 | |
| | | | | | | | | |
| | | | | RETAIL - CONSUMER STAPLES - 1.6% | | | | |
| | 10,519 | | | Ingles Markets, Inc., Class A | | | 968,168 | |
| | | | | | | | | |
| | | | | RETAIL - DISCRETIONARY - 4.9% | | | | |
| | 13,721 | | | Academy Sports & Outdoors, Inc.(b) | | | 871,559 | |
| | 30,737 | | | Ethan Allen Interiors, Inc.(b) | | | 858,484 | |
| | 45,900 | | | Sally Beauty Holdings, Inc.(a),(b) | | | 653,157 | |
| | 9,010 | | | Signet Jewelers Ltd.(b) | | | 662,956 | |
| | | | | | | | 3,046,156 | |
| | | | | RETAIL REIT - 4.3% | | | | |
| | 52,325 | | | Acadia Realty Trust | | | 706,911 | |
| | 45,422 | | | Essential Properties Realty Trust, Inc.(b) | | | 1,124,195 | |
| | | | | | | | | |
See accompanying notes which are an integral part of these financial statements.
| DUNHAM SMALL CAP VALUE FUND |
| SCHEDULE OF INVESTMENTS (Unaudited) (Continued) |
| April 30, 2023 |
| Shares | | | | | Fair Value | |
| | | | | COMMON STOCKS — 98.9% (Continued) | | | | |
| | | | | RETAIL REIT - 4.3% (Continued) | | | | |
| | 22,062 | | | Spirit Realty Capital, Inc.(b) | | $ | 848,505 | |
| | | | | | | | 2,679,611 | |
| | | | | SEMICONDUCTORS - 1.4% | | | | |
| | 10,789 | | | Diodes, Inc.(a),(b) | | | 859,883 | |
| | | | | | | | | |
| | | | | SPECIALTY FINANCE - 2.1% | | | | |
| | 14,215 | | | Essent Group Ltd. | | | 603,711 | |
| | 15,856 | | | Mr Cooper Group, Inc.(a) | | | 734,133 | |
| | | | | | | | 1,337,844 | |
| | | | | SPECIALTY REIT - 0.8% | | | | |
| | 11,160 | | | EPR Properties(b) | | | 468,274 | |
| | | | | | | | | |
| | | | | TECHNOLOGY HARDWARE - 0.9% | | | | |
| | 21,048 | | | NetScout Systems, Inc.(a) | | | 572,716 | |
| | | | | | | | | |
| | | | | TECHNOLOGY SERVICES - 3.8% | | | | |
| | 39,662 | | | Green Dot Corporation, Class A(a),(b) | | | 681,790 | |
| | 40,624 | | | LiveRamp Holdings, Inc.(a) | | | 978,632 | |
| | 6,665 | | | Science Applications International Corporation | | | 680,030 | |
| | | | | | | | 2,340,452 | |
| | | | | TELECOMMUNICATIONS - 1.0% | | | | |
| | 36,348 | | | EchoStar Corporation, Class A(a) | | | 620,460 | |
| | | | | | | | | |
| | | | | TIMBER REIT - 1.4% | | | | |
| | 19,523 | | | PotlatchDeltic Corporation(b) | | | 902,548 | |
| | | | | | | | | |
| | | | | TRANSPORTATION & LOGISTICS - 5.7% | | | | |
| | 9,172 | | | ArcBest Corporation(b) | | | 865,837 | |
| | 12,547 | | | Matson, Inc.(b) | | | 853,572 | |
| | 9,954 | | | Ryder System, Inc. | | | 787,959 | |
| | 36,974 | | | SkyWest, Inc.(a) | | | 1,046,364 | |
| | | | | | | | 3,553,732 | |
| | | | | | | | | |
See accompanying notes which are an integral part of these financial statements.
| DUNHAM SMALL CAP VALUE FUND |
| SCHEDULE OF INVESTMENTS (Unaudited) (Continued) |
| April 30, 2023 |
| Shares | | | | | Fair Value | |
| | | | | COMMON STOCKS — 98.9% (Continued) | | | | |
| | | | | WHOLESALE - CONSUMER STAPLES - 1.4% | | | | |
| | 19,828 | | | Andersons, Inc. (The) | | $ | 886,312 | |
| | | | | | | | | |
| | | | | TOTAL COMMON STOCKS (Cost $59,198,702) | | | 61,591,643 | |
| | | | | | | | | |
| | | | | SHORT-TERM INVESTMENTS — 31.2% | | | | |
| | | | | COLLATERAL FOR SECURITIES LOANED - 30.1% | | | | |
| | 18,755,560 | | | Mount Vernon Liquid Assets Portfolio, LLC, 4.96% (Cost $18,755,560)(c),(d) | | | 18,755,560 | |
| | | | | | | | | |
| | | | | MONEY MARKET FUNDS - 1.1% | | | | |
| | 666,168 | | | STIT - Treasury Portfolio, Institutional Class, 4.77% (Cost $666,168)(c) | | | 666,168 | |
| | | | | | | | | |
| | | | | TOTAL SHORT-TERM INVESTMENTS (Cost $19,421,728) | | | 19,421,728 | |
| | | | | | | | | |
| | | | | TOTAL INVESTMENTS - 130.1% (Cost $78,620,430) | | $ | 81,013,371 | |
| | | | | LIABILITIES IN EXCESS OF OTHER ASSETS - (30.1)% | | | (18,724,317 | ) |
| | | | | NET ASSETS - 100.0% | | $ | 62,289,054 | |
| LLC | - Limited Liability Company |
| | |
| LTD | - Limited Company |
| | |
| PLC | - Public Limited Company |
| | |
| REIT | - Real Estate Investment Trust |
| | |
| (a) | Non-income producing security. |
| (b) | All or a portion of these securities are on loan. Total loaned securities had a value of $18,524,253 at April 30, 2023. |
| (c) | Rate disclosed is the seven day effective yield as of April 30, 2023. |
| (d) | The Trust’s securities lending policies and procedures require that the borrower: deliver cash or U.S. Government securities as collateral with respect to each new loan of U.S. securities, equal to at least 102% of the value of the portfolio securities loaned, and (ii) at all times thereafter mark-to-market the collateral on a daily basis so that the market value of such collateral is at least 100% of the value of securities loaned. From time to time the collateral may not be 102% due to end of day market movement. The next business day additional collateral is obtained/received from the borrower to replenish/reestablish 102%. |
See accompanying notes which are an integral part of these financial statements.
| Dunham Focused Large Cap Growth Fund (Unaudited) |
| Message from the Sub-Adviser (The Ithaka Group, LLC) |
| |
Asset Class Recap
When comparing the trailing fiscal six-month period ended April 30, 2023, large cap growth stocks, as measured by the Russell 1000 Growth Index, outperformed large cap value stocks, as measured by the Russell 1000 Value Index, as they returned 11.5 percent and 4.5 percent, respectively. Large cap growth stocks beat their value counterparts by 7.0 percent during the fiscal period. Growth stocks appeared to have gained upward momentum despite a volatile first half of the fiscal year. Concerns of the U.S. banking industry, softer U.S. corporate earnings, severity of a U.S. recession, continued interest rate hikes by the Federal Reserve to potentially stem inflation, and lack of resolution to the Russia/Ukraine war remained persistent headwinds during the fiscal period. Much of the positive performance for the period coincided with U.S. corporate earnings not being as weak as expected, perception of short-term oversold market conditions, and optimism that the Federal Reserve may be near the end of its tightening schedule. The Federal Reserve continued to reaffirm its conviction for higher-for-longer rates and clarified that more time was needed to gain “substantially more evidence to give confidence that inflation is on a sustained downward path.” The Federal Reserve also cautioned against a premature loosening of policy. Fundamentally, elevated inflation and rising interest rates repress intrinsic values of high-growth stocks as future earnings are discounted at a greater rate. On the data front, producer and consumer prices eased more than expected at the end of the fiscal period while U.S. weekly jobless claims unexpectedly rose to the highest levels since October 2021, raising investor expectations that the Federal Reserve may soon pause its policy tightening. Meanwhile, markets continued to follow the U.S. banking industry crisis and the U.S. debt ceiling impasse.
Allocation Review
Excluding the sectors with weightings of less than 2.0 percent in the benchmark index (energy, materials and processing and utilities), the remaining sectors generated positive returns over the fiscal period including technology up 22.0 percent, consumer staples up 9.7 percent, financial services up 7.4 percent, healthcare up 4.8 percent, producer durables up 3.9 percent, and consumer discretionary up 2.8 percent. The dispersion of returns among these sectors was not as wide as in previous fiscal periods, as the difference between the best performing sector and worst performing sector was approximately 19.2 percent. The largest sector in the benchmark, technology, outperformed the benchmark index by 10.6 percent. Regarding allocation attribution, technology was the largest contributor to the benchmark’s total return and therefore the Fund’s 5.5 percent underweight to technology, which comprises 43.2 percent of the benchmark index, detracted from Fund performance. Conversely, the largest detractor to the benchmark’s performance was its 9.1 percent weight to producer durables, which the Fund had no exposure to over the period as the Sub-Adviser did not identify any opportunities within the sector. The Fund’s high concentration of holdings, approximately 10 stocks comprising 60 percent of the market value of the Fund’s portfolio, generated materially different performance within each of the sectors as compared to the benchmark index. The Fund’s largest outperformance occurred within the technology sector, where it outperformed the benchmark index return in the same sector by 9.4 percent. In contrast, the Fund’s greatest underperformance occurred within the producer durables sector, where it underperformed the benchmark by 3.9 percent.
Holdings Insights
Within the technology sector, much of the Fund’s outperformance over the fiscal period was attributed to strong performers such as Nvidia Corp. (NVDA) (holding weight*: 8.31 percent), a designer of graphics processing units and application programming interfaces. NVDA returned 105.7 percent over the fiscal period, as it benefited from the signing of a 10-year agreement with Microsoft’s Activision Blizzard and favorable market sentiment around artificial intelligence-oriented companies. Fund performance was also supported by solid absolute performers such as Microsoft Corp. (MSFT) (holding weight*: 8.22 percent), the multinational technology company, that returned 33.1 percent for the six-month period. Conversely, Qualcomm Inc. (QCOM) (holding weight**: 2.98 percent), a designer and licensor of wireless communication technologies, was the poorest performer among the Fund’s technology names. The Sub-Advisers’ decision to completely liquidate the Fund’s holdings in QCOM in late February, due to slower smartphone market growth, proved to be beneficial as it returned 5.6 percent versus the benchmark’s decline of 5.2 percent for the fiscal period.
The healthcare sector was the second largest contributor to the Fund’s total return over the fiscal period with attribution from names such as Align Technology, Inc. (ALGN) (holding weight*: 1.98 percent), a company engaged in the design, manufacture and marketing of Invisalign clear aligners for the treatment of malocclusions, or the misalignment of teeth, by orthodontists and general dental practitioners. The Sub-Adviser points to ALGN’s 67.4 percent gain as a result of delayed market demand for the Invisalign clear aligner product. The greatest healthcare detractor to relative and absolute Fund performance was, Dexcom Inc. (DXCM) (holding weight*: 3.56 percent), a company that develops, manufactures, produces, and distributes continuous glucose monitoring systems for diabetes management, as it returned 0.5 percent for the fiscal period. DXCM’s poor performance was due to lowered revenue guidance and investor skepticism of expanded Medicare coverage for its G7 device.
Despite being the largest sector overweight in the Fund, the financial services sector, had only four holdings represented. All holdings were affiliated with payment processing, including Mastercard, Inc. (MA) (holding weight*: 7.17 percent) and Visa Inc. (V) (holding weight*: 4.42 percent), two global payment-processors, primarily between banks, merchants, and card-carrying customers of those merchants, representing approximately 82.7 percent of the Fund’s exposure in the sector. In the fiscal period, MA and V increased 16.6 percent and 12.8 percent, respectively. The other two holdings were Block Inc. (SQ) (holding weight*: 1.21 percent), known for its payments platform aimed at small and medium businesses that allows them to accept credit card payments via smartphones and tablet computers, and PayPal Holdings Inc. (PYPL) (holding weight*: 1.22 percent), an online payments system facilitating money transfers. Over the same six-month period SQ and PYPL increased 1.2 percent and decreased 9.1 percent, respectively.
Sub-Adviser Outlook
The Sub-Adviser seeks to hold what it believes to be the strongest growth stocks, primarily focusing on free-cash-flow and fundamental factors that traditionally support long-term growth. Therefore, the Fund holds an array of stocks ranging from cloud-based technologies to brick-and-mortar retailers. The Sub-Adviser is optimistic that remaining concentrated in the Fund’s number of holdings may prove to be more impactful to the Fund’s outperformance relative to its benchmark index over the long term than the impact of sector weightings.
| * | Holdings percentage(s) of total investments, cash and unsettled trades excluding collateral for securities loaned as of 4/30/2023. |
| ** | Holdings percentage(s) as of the date prior to the sale of the security. |
| Dunham Focused Large Cap Growth Fund |
| PORTFOLIO REVIEW (Unaudited) |
| April 30, 2023 |
| |
The Fund’s performance figures* for each of the periods ended April 30, 2023, compared to its benchmarks:
| | | | Annualized | Annualized |
| | 6 Month Return | 1 Year Return | 5 Year Return | 10 Year Return |
| Class N | 20.80% | 5.44% | 11.56% | 12.71% |
| Class A with Load 5.75% | 13.72% | (0.86)% | 9.98% | 12.42% |
| Class A without load | 20.66% | 5.17% | 11.29% | 11.75% |
| Class C | 20.18% | 4.35% | 10.46% | 11.59% |
| Russell 1000 Growth Index (a) | 11.51% | 2.34% | 13.80% | 15.22% |
| Morningstar Large Cap Growth Category (b) | 9.55% | (0.22)% | 9.80% | 11.61% |
| | | | | |
| * | Total Returns are calculated based on traded NAVs. As disclosed in the Trust’s latest registration statement, the Fund’s total annual operating expenses, including the cost of underlying funds, are 1.01% for Class N, 2.01% for Class C and 1.26% for Class A. Class A shares are subject to a sales load of 5.75% and a deferred sales charge of up to 0.75%. The performance data quoted here represents past performance, which is not indicative of future results. Current performance may be lower or higher than the performance data quoted. The investment return and NAV will fluctuate, so that an investor’s shares, when redeemed, may be worth more or less than their original cost. Total returns are calculated assuming reinvestment of all dividends and capital gains distributions, if any. The returns do not reflect the deductions of taxes a shareholder would pay on the redemption of Fund shares or Fund distributions. For performance information current to the most recent month-end, please call 1-800-442-4358 or visit our website www.dunham.com. |
| (a) | The Russell 1000 Growth Index is a subset of the Russell 1000 Index which measures the performance of the stocks of the 1000 largest companies in the Russell 3000 Index based on market capitalization. The Russell 1000 Growth Index measures the performance of those stocks of the Russell 1000 with higher price-to-book ratios and higher relative forecasted growth rates. Investors cannot invest directly in an index or benchmark. |
| (b) | The Morningstar Large Cap Growth Category is generally representative of mutual funds that primarily invest in big (large capitalization) U.S. companies that are projected to grow faster than other large-cap stocks. |
Comparison of the Change in Value of a $100,000 Investment
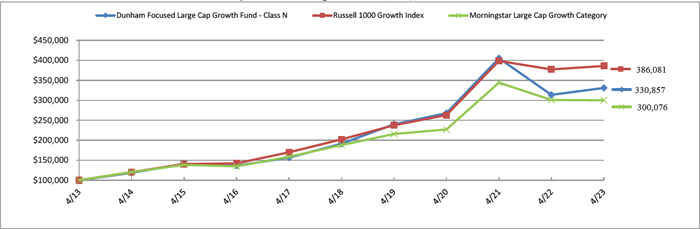
| Portfolio Composition * (Unaudited) |
| Technology | | | 54.4 | % |
| Collateral for Securities Loaned | | | 12.5 | % |
| Consumer Discretionary | | | 15.6 | % |
| Health Care | | | 12.5 | % |
| Short-Term Investment | | | 0.9 | % |
| Communications | | | 2.0 | % |
| Financials | | | 2.1 | % |
| Total | | | 100.0 | % |
| | | | | |
* Based on total value of investments as of April 30, 2023. Does not include derivative holdings.
Percentage may differ from Schedule of Investments which are based on Fund net assets.
| DUNHAM FOCUSED LARGE CAP GROWTH FUND |
| SCHEDULE OF INVESTMENTS (Unaudited) |
| April 30, 2023 |
| Shares | | | | | Fair Value | |
| | | | | COMMON STOCKS — 99.0% | | | | |
| | | | | ASSET MANAGEMENT - 2.4% | | | | |
| | 47,746 | | | Blackstone, Inc.(a) | | $ | 4,265,150 | |
| | | | | | | | | |
| | | | | E-COMMERCE DISCRETIONARY - 8.3% | | | | |
| | 96,292 | | | Amazon.com, Inc.(b) | | | 10,153,991 | |
| | 3,795 | | | MercadoLibre, Inc.(b) | | | 4,848,075 | |
| | | | | | | | 15,002,066 | |
| | | | | INTERNET MEDIA & SERVICES - 2.3% | | | | |
| | 12,635 | | | Netflix, Inc.(b) | | | 4,168,666 | |
| | | | | | | | | |
| | | | | LEISURE FACILITIES & SERVICES - 3.8% | | | | |
| | 3,281 | | | Chipotle Mexican Grill, Inc.(b) | | | 6,783,861 | |
| | | | | | | | | |
| | | | | MEDICAL EQUIPMENT & DEVICES - 14.3% | | | | |
| | 10,950 | | | Align Technology, Inc.(b) | | | 3,562,035 | |
| | 52,728 | | | DexCom, Inc.(b) | | | 6,398,016 | |
| | 45,991 | | | Edwards Lifesciences Corporation(b) | | | 4,046,288 | |
| | 15,593 | | | Insulet Corporation(a),(b) | | | 4,959,198 | |
| | 22,393 | | | Intuitive Surgical, Inc.(b) | | | 6,745,219 | |
| | | | | | | | 25,710,756 | |
| | | | | RETAIL - DISCRETIONARY - 5.8% | | | | |
| | 13,310 | | | Lululemon Athletica, Inc.(b) | | | 5,056,868 | |
| | 22,307 | | | Tractor Supply Company(a) | | | 5,317,989 | |
| | | | | | | | 10,374,857 | |
| | | | | SEMICONDUCTORS - 14.8% | | | | |
| | 42,453 | | | Advanced Micro Devices, Inc.(b) | | | 3,794,025 | |
| | 9,129 | | | ASML Holding N.V. - ADR | | | 5,813,895 | |
| | 54,924 | | | Marvell Technology, Inc. | | | 2,168,400 | |
| | 53,863 | | | NVIDIA Corporation | | | 14,946,443 | |
| | | | | | | | 26,722,763 | |
| | | | | SOFTWARE - 27.7% | | | | |
| | 15,356 | | | Adobe, Inc.(b) | | | 5,797,811 | |
| | 6,155 | | | Intuit, Inc. | | | 2,732,512 | |
| | 48,138 | | | Microsoft Corporation | | | 14,790,881 | |
| | 10,689 | | | Palo Alto Networks, Inc.(b) | | | 1,950,315 | |
| | | | | | | | | |
See accompanying notes which are an integral part of these financial statements.
| DUNHAM FOCUSED LARGE CAP GROWTH FUND |
| SCHEDULE OF INVESTMENTS (Unaudited) (Continued) |
| April 30, 2023 |
| Shares | | | | | Fair Value | |
| | | | | COMMON STOCKS — 99.0% (Continued) | | | | |
| | | | | SOFTWARE - 27.7% (Continued) | | | | |
| | 32,985 | | | Salesforce, Inc.(b) | | $ | 6,543,234 | |
| | 23,166 | | | ServiceNow, Inc.(b) | | | 10,642,924 | |
| | 11,000 | | | Snowflake, Inc.(a),(b) | | | 1,628,880 | |
| | 30,807 | | | Veeva Systems, Inc., Class A(b) | | | 5,516,918 | |
| | | | | | | | 49,603,475 | |
| | | | | TECHNOLOGY HARDWARE - 5.6% | | | | |
| | 59,210 | | | Apple, Inc. | | | 10,046,753 | |
| | | | | | | | | |
| | | | | TECHNOLOGY SERVICES - 14.0% | | | | |
| | 35,798 | | | Block, Inc., Class A(b) | | | 2,176,160 | |
| | 33,948 | | | Mastercard, Inc., Class A | | | 12,901,259 | |
| | 28,934 | | | PayPal Holdings, Inc.(b) | | | 2,198,984 | |
| | 34,160 | | | Visa, Inc., Class A(a) | | | 7,950,058 | |
| | | | | | | | 25,226,461 | |
| | | | | | | | | |
| | | | | TOTAL COMMON STOCKS (Cost $97,848,361) | | | 177,904,808 | |
| | | | | | | | | |
| | | | | SHORT-TERM INVESTMENTS — 15.4% | | | | |
| | | | | COLLATERAL FOR SECURITIES LOANED - 14.3% | | | | |
| | 25,751,011 | | | Mount Vernon Liquid Assets Portfolio, LLC, 4.96% (Cost $25,751,011)(c) (d) | | | 25,751,011 | |
| | | | | | | | | |
| | | | | MONEY MARKET FUND - 1.1% | | | | |
| | 1,942,417 | | | STIT - Treasury Obligations Portfolio, 4.65% (Cost $1,942,417)(c) | | | 1,942,417 | |
| | | | | | | | | |
| | | | | TOTAL SHORT-TERM INVESTMENTS (Cost $27,693,428) | | | 27,693,428 | |
| | | | | | | | | |
| | | | | TOTAL INVESTMENTS - 114.4% (Cost $125,541,789) | | $ | 205,598,236 | |
| | | | | LIABILITIES IN EXCESS OF OTHER ASSETS - (14.4)% | | | (25,911,409 | ) |
| | | | | NET ASSETS - 100.0% | | $ | 179,686,827 | |
| ADR | - American Depositary Receipt |
| | |
| ETF | - Exchange-Traded Fund |
| | |
| LLC | - Limited Liability Company |
| | |
| (a) | All or a portion of these securities are on loan. Total loaned securities had a value of $24,465,317 at April 30, 2023. |
| (b) | Non-income producing security. |
| (c) | Rate disclosed is the seven day effective yield as of April 30, 2023. |
| (d) | The Trust’s securities lending policies and procedures require that the borrower: (i) deliver cash or U.S. Government securities as collateral with respect to each new loan of U.S. securities, equal to at least 102% of the value of the portfolio securities loaned, and (ii) at all times thereafter mark-to-market the collateral on a daily basis so that the market value of such collateral is at least 100% of the value of securities loaned. From time to time the collateral may not be 102% due to end of day market movement. The next business day additional collateral is obtained/received from the borrower to replenish/reestablish 102%. |
See accompanying notes which are an integral part of these financial statements.
| Dunham Small Cap Growth Fund (Unaudited) |
| Message from the Sub-Adviser (Pier Capital, LLC) |
| |
Asset Class Recap
Small cap growth stocks, as measured by the Russell 2000 Growth Index, fell 0.5 percent over the first half of the fiscal year ended April 30, 2023. Small cap value stocks, as measured by the Russell 2000 Value Index, fell 7.0 percent over the same time period and underperformed small cap growth stocks by 6.5 percent. In recent months, growth stocks have outperformed value names despite concerns about the U.S. banking industry, softer U.S. corporate earnings, the severity of a potential U.S. recession, continued interest rate hikes by the Federal Reserve to potentially stem inflation, and lack of resolution to the Russia/Ukraine war. Much of the performance for the period coincided with U.S. corporate earnings not being as weak as expected, perception of short-term oversold market conditions, and optimism that the Federal Reserve may be near the end of its tightening schedule. When looking at the trailing six-month period, large cap stocks, as measured by the Russell 1000 Index, rose 11.5 percent, while small cap stocks, as measured by the Russell 2000 Index, declined 3.6 percent. Large cap stocks have benefited from the volatility throughout the fiscal period as investors flocked into quality large cap names to mitigate risk in the current market environment. Small cap growth stocks have been out of favor throughout the first half of the fiscal year lowering valuations across the asset class. The Sub- Adviser believes that this may provide an opportunity for prudent investors to move back into stocks with compelling products and services that have been oversold in the broad market.
Allocation Review
Sector allocation within the Fund is predominantly a result of the Sub-Adviser’s bottom-up stock selection method. Excluding sectors with weightings of less than 4.0 percent in the benchmark index (consumer staples and utilities), the consumer discretionary, materials and processing, producer durables, and healthcare sectors all positively contributed to benchmark performance. The sectors that detracted from benchmark performance over the fiscal period included technology, financial services, and energy. The dispersion of returns among these sectors was not as wide as in previous fiscal periods, as the difference between the best performing sector and the worst performing sector was approximately 12.0 percent. The largest sector in the benchmark, healthcare, outperformed the benchmark index by 3.3 percent. Therefore, the Fund’s 1.0 percent healthcare underweight, which healthcare comprises 19.1 percent of the benchmark index, detracted from Fund performance. Regarding allocation attribution, the largest contributor to the benchmark’s performance was the consumer discretionary sector with a weight of 10.4 percent. Conversely, the largest detractor to the benchmark’s performance was the energy sector with a weight of 7.1 percent. The Fund’s greatest outperformance occurred within the materials and processing sector, where it outperformed the benchmark by 31.3 percent. In contrast, the Fund’s poorest performance was in the technology sector, where the Fund beat the benchmark by 2.4 percent.
Holdings Insights
Contributors to Fund performance over the fiscal quarter came from many sectors within the Fund. The greatest contributor was in the consumer discretionary sector, Inter Parfums, Inc. (IPAR) (holding weight*: 0.92 percent), a company that manufactures, markets, and distributes a range of fragrance and fragrance-related products. IPAR rose 89.5 percent over the period as the company reported record net sales for the calendar quarter ended and raised forward guidance expectations. The largest contributor in the healthcare sector, RadNet, Inc. (RDNT) (holding weight*: 1.44 percent), a company that operates outpatient diagnostic imaging centers, increased 44.7 percent. Over the fiscal period, investor sentiment was boosted by RDNT’s ongoing implementation of artificial intelligence to aid medical professionals with outpatient imaging services. Within the producer durables sector exists the largest holding in the Fund for the fiscal quarter, Maximus, Inc. (MMS) (holding weight*: 1.89 percent), an operator of government health and human services programs and provider of technology solutions to governments. MMS increased 36.7 percent during the period despite a mixed earnings report due to an operating loss in the outside the U.S. segment and lower-than-expected U.S. Federal Services segment profitability.
In contrast, detractors to Fund performance over the fiscal quarter came from all sectors within the Fund. In the technology sector, Wolfspeed, Inc. (WOLF) (holding weight*: 0.75 percent), a developer and manufacturer of wide-bandgap semiconductors, dropped 41.0 percent for the period after missing earnings forecasts and lowering forward expectations citing delays at the Mohawk Valley production facility. In the producer durables sector, Lindsay Corporation (LNN) (holding weight*: 0.62 percent), a Nebraska based manufacturer of Zimmatic brand center pivot irrigation systems, farm and construction machinery, as well as road and railroad infrastructure equipment, missed irrigation revenue estimates and declined 28.4 percent for the fiscal period. In the financial services sector, Signature Bank (SBNY) (holding weights**: 1.00 percent), a full-service commercial and specialty finance bank, declined 27.3 percent over the period as the Sub-Adviser prudently exited most of Fund’s position in the company. SBNY ’s mismanagement, lack of corporate governance, and failure to listen to and respond quickly to the FDIC’s recommendations drove a high influx of depositors to make massive withdrawals and forced the bank into receivership. In the energy sector, Bloom Energy Corporation (BE) (holding weight*: 0.45 percent), a manufacturer and marketer of solid oxide fuel cells that produce electricity on-site, missed earnings estimates and fell 11.0 percent by the end of the fiscal quarter.
Sub-Adviser Outlook
The Sub-Adviser believes volatility may persist in the near term, as uncertainty surrounding the supply chain, rising input costs, and high inflation keep investors on edge. Additionally, developments out of the White House regarding various economic initiatives and fiscal policy, coupled with the Federal Reserve’s handling of the numerous challenges that remain in today’s economic environment, are worth monitoring. As always, the Sub-Adviser will continue to seek those companies and industries with what it believes are the most attractive growth prospects, while remaining vigilant on valuations.
| * | Holdings percentage(s) of total investments, cash and unsettled trades excluding collateral for securities loaned as of 4/30/2022. |
| ** | Holdings percentage(s) as of the date prior to the sale of the security. |
| Dunham Small Cap Growth Fund |
| PORTFOLIO REVIEW (Unaudited) |
| April 30, 2023 |
| |
The Fund’s performance figures* for each of the periods ended April 30, 2023, compared to its benchmarks:
| | | | Annualized | Annualized |
| | 6 Month Return | 1 Year Return | 5 Year Return | 10 Year Return |
| Class N | 5.84% | 2.03% | 8.05% | 11.02% |
| Class A with Load 5.75% | (0.42)% | (4.09)% | 6.50% | 10.09% |
| Class A without load | 5.68% | 1.78% | 7.77% | 10.74% |
| Class C | 5.26% | 1.08% | 6.99% | 9.92% |
| Russell 2000 Growth Index (a) | (0.29)% | 0.72% | 4.00% | 8.44% |
| Morningstar Small Cap Growth Category (b) | 0.16% | (3.51)% | 5.86% | 10.32% |
| | | | | |
| * | Total Returns are calculated based on traded NAVs. As disclosed in the Trust’s latest registration statement, the Fund’s total annual operating expenses, including the cost of underlying funds, are 1.17% for Class N, 2.17% for Class C and 1.42% for Class A. Class A shares are subject to a sales load of 5.75% and a deferred sales charge of up to 0.75%. The performance data quoted here represents past performance, which is not indicative of future results. Current performance may be lower or higher than the performance data quoted. The investment return and NAV will fluctuate, so that an investor’s shares, when redeemed, may be worth more or less than their original cost. Total returns are calculated assuming reinvestment of all dividends and capital gains distributions, if any. The returns do not reflect the deductions of taxes a shareholder would pay on the redemption of Fund shares or Fund distributions. For performance information current to the most recent month-end, please call 1-800-442-4358 or visit our website www.dunham.com |
| (a) | The Russell 2000 Growth Index measures the performance of the Russell 2000 companies with higher price-to-book ratios and higher forecasted growth values. Investors cannot invest directly in an index or benchmark. |
| (b) | The Morningstar Small Cap Growth Category is generally representative of mutual funds that primarily invest in small (small capitalization) U.S. companies that are projected to grow faster than other small-cap stocks. |
Comparison of the Change in Value of a $100,000 Investment
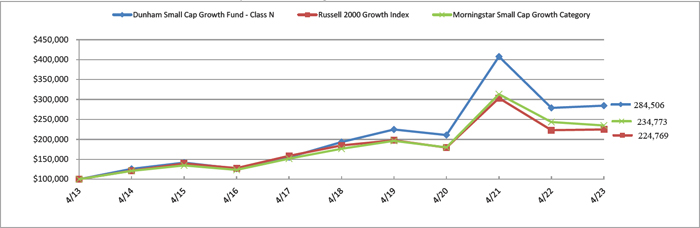
| Portfolio Composition * (Unaudited) |
| Technology | | | 23.1 | % |
| Health Care | | | 18.5 | % |
| Collateral For Securities Loaned | | | 17.2 | % |
| Industrials | | | 12.9 | % |
| Consumer Discretionary | | | 8.8 | % |
| Consumer Staples | | | 6.8 | % |
| Financials | | | 3.5 | % |
| Communications | | | 3.2 | % |
| Energy | | | 3.1 | % |
| Short-Term Investment | | | 2.9 | % |
| Total | | | 100.0 | % |
| | | | | |
* Based on total value of investments as of April 30, 2023. Does not include derivative holdings.
Percentage may differ from Schedule of Investments which are based on Fund net assets.
| DUNHAM SMALL CAP GROWTH FUND |
| SCHEDULE OF INVESTMENTS (Unaudited) |
| April 30, 2023 |
| Shares | | | | | Fair Value | |
| | | | | COMMON STOCKS — 96.9% | | | | |
| | | | | ADVERTISING & MARKETING - 1.3% | | | | |
| | 13,722 | | | Trade Desk, Inc. (The), Class A(a),(b) | | $ | 882,873 | |
| | | | | | | | | |
| | | | | AEROSPACE & DEFENSE - 1.8% | | | | |
| | 17,048 | | | Hexcel Corporation(b) | | | 1,228,820 | |
| | | | | | | | | |
| | | | | APPAREL & TEXTILE PRODUCTS - 1.0% | | | | |
| | 2,004 | | | Crocs, Inc.(a) | | | 247,835 | |
| | 12,548 | | | On Holding A.G.(a) | | | 407,182 | |
| | | | | | | | 655,017 | |
| | | | | BANKING - 1.0% | | | | |
| | 30,040 | | | Seacoast Banking Corp of Florida | | | 666,588 | |
| | | | | | | | | |
| | | | | BEVERAGES - 0.7% | | | | |
| | 21,844 | | | Vita Coco Company, Inc. (The)(a) | | | 472,923 | |
| | | | | | | | | |
| | | | | BIOTECH & PHARMA - 9.1% | | | | |
| | 11,725 | | | Akero Therapeutics, Inc.(a) | | | 524,577 | |
| | 37,553 | | | Alector, Inc.(a) | | | 247,850 | |
| | 6,780 | | | Apellis Pharmaceuticals, Inc.(a) | | | 565,655 | |
| | 8,115 | | | Halozyme Therapeutics, Inc.(a) | | | 260,735 | |
| | 6,048 | | | Immunocore Holdings plc - ADR(a),(b) | | | 351,086 | |
| | 12,589 | | | Intra-Cellular Therapies, Inc.(a) | | | 782,406 | |
| | 20,194 | | | IVERIC bio, Inc.(a) | | | 664,181 | |
| | 27,988 | | | Maravai LifeSciences Holdings, Inc.(a),(b) | | | 385,955 | |
| | 77,396 | | | Point Biopharma Global, Inc.(a) | | | 599,045 | |
| | 57,656 | | | Roivant Sciences Ltd.(a),(b) | | | 492,959 | |
| | 21,538 | | | TG Therapeutics, Inc.(a) | | | 534,789 | |
| | 18,364 | | | Vaxcyte, Inc.(a),(b) | | | 786,529 | |
| | | | | | | | 6,195,767 | |
| | | | | COMMERCIAL SUPPORT SERVICES - 1.9% | | | | |
| | 4,508 | | | AMN Healthcare Services, Inc.(a) | | | 389,266 | |
| | 5,129 | | | FTI Consulting, Inc.(a) | | | 925,784 | |
| | | | | | | | 1,315,050 | |
| | | | | | | | | |
See accompanying notes which are an integral part of these financial statements.
| DUNHAM SMALL CAP GROWTH FUND |
| SCHEDULE OF INVESTMENTS (Unaudited) (Continued) |
| April 30, 2023 |
| Shares | | | | | Fair Value | |
| | | | | COMMON STOCKS — 96.9% (Continued) | | | | |
| | | | | E-COMMERCE DISCRETIONARY - 0.9% | | | | |
| | 22,735 | | | Global-e Online Ltd.(a) | | $ | 633,852 | |
| | | | | | | | | |
| | | | | ELECTRICAL EQUIPMENT - 3.2% | | | | |
| | 18,586 | | | Bloom Energy Corporation, Class A(a),(b) | | | 309,457 | |
| | 16,625 | | | BWX Technologies, Inc. | | | 1,073,642 | |
| | 14,592 | | | Itron, Inc.(a) | | | 779,213 | |
| | | | | | | | 2,162,312 | |
| | | | | ENGINEERING & CONSTRUCTION - 4.0% | | | | |
| | 7,745 | | | Exponent, Inc. | | | 712,927 | |
| | 4,141 | | | Installed Building Products, Inc. | | | 514,602 | |
| | 8,177 | | | MasTec, Inc.(a) | | | 726,199 | |
| | 16,239 | | | WillScot Mobile Mini Holdings Corporation(a) | | | 737,251 | |
| | | | | | | | 2,690,979 | |
| | | | | ENTERTAINMENT CONTENT - 1.1% | | | | |
| | 34,756 | | | IMAX Corporation(a) | | | 728,138 | |
| | | | | | | | | |
| | | | | FOOD - 1.3% | | | | |
| | 57,413 | | | Krispy Kreme, Inc.(b) | | | 883,012 | |
| | | | | | | | | |
| | | | | HEALTH CARE FACILITIES & SERVICES - 7.1% | | | | |
| | 9,013 | | | Amedisys, Inc.(a) | | | 723,744 | |
| | 29,843 | | | Option Care Health, Inc.(a) | | | 959,452 | |
| | 12,088 | | | Progyny, Inc.(a) | | | 401,805 | |
| | 35,549 | | | RadNet, Inc.(a) | | | 983,285 | |
| | 34,891 | | | SI-BONE, Inc.(a) | | | 771,091 | |
| | 25,229 | | | Surgery Partners, Inc.(a),(b) | | | 1,000,583 | |
| | | | | | | | 4,839,960 | |
| | | | | HOME CONSTRUCTION - 0.9% | | | | |
| | 22,764 | | | AZEK Company, Inc. (The)(a) | | | 617,815 | |
| | | | | | | | | |
| | | | | HOUSEHOLD PRODUCTS - 3.2% | | | | |
| | 74,840 | | | Coty, Inc., Class A(a) | | | 888,350 | |
| | 6,638 | | | elf Beauty, Inc.(a) | | | 615,741 | |
| | | | | | | | | |
See accompanying notes which are an integral part of these financial statements.
| DUNHAM SMALL CAP GROWTH FUND |
| SCHEDULE OF INVESTMENTS (Unaudited) (Continued) |
| April 30, 2023 |
| Shares | | | | | Fair Value | |
| | | | | COMMON STOCKS — 96.9% (Continued) | | | | |
| | | | | HOUSEHOLD PRODUCTS - 3.2% (Continued) | | | | |
| | 4,135 | | | Inter Parfums, Inc. | | $ | 627,652 | |
| | | | | | | | 2,131,743 | |
| | | | | INDUSTRIAL SUPPORT SERVICES - 2.0% | | | | |
| | 4,940 | | | Applied Industrial Technologies, Inc. | | | 670,160 | |
| | 4,645 | | | SiteOne Landscape Supply, Inc.(a),(b) | | | 686,253 | |
| | | | | | | | 1,356,413 | |
| | | | | INSTITUTIONAL FINANCIAL SERVICES - 3.2% | | | | |
| | 5,758 | | | Evercore, Inc., Class A | | | 656,815 | |
| | 8,770 | | | Houlihan Lokey, Inc.(b) | | | 801,402 | |
| | 10,455 | | | Tradeweb Markets, Inc., Class A | | | 736,137 | |
| | | | | | | | 2,194,354 | |
| | | | | INTERNET MEDIA & SERVICES - 1.5% | | | | |
| | 83,047 | | | Eventbrite, Inc., Class A(a) | | | 603,752 | |
| | 18,695 | | | Pinterest, Inc., Class A(a) | | | 429,985 | |
| | | | | | | | 1,033,737 | |
| | | | | LEISURE FACILITIES & SERVICES - 5.6% | | | | |
| | 17,807 | | | Dave & Buster’s Entertainment, Inc.(a),(b) | | | 631,436 | |
| | 58,044 | | | OneSpaWorld Holdings Ltd.(a) | | | 696,528 | |
| | 4,663 | | | Papa John’s International, Inc. | | | 348,746 | |
| | 8,308 | | | Planet Fitness, Inc., Class A(a),(b) | | | 690,727 | |
| | 6,408 | | | Texas Roadhouse, Inc.(b) | | | 708,853 | |
| | 3,714 | | | Wingstop, Inc.(b) | | | 743,209 | |
| | | | | | | | 3,819,499 | |
| | | | | LEISURE PRODUCTS - 1.5% | | | | |
| | 2,543 | | | Axon Enterprise, Inc.(a) | | | 535,835 | |
| | 4,533 | | | Fox Factory Holding Corporation(a),(b) | | | 502,574 | |
| | | | | | | | 1,038,409 | |
| | | | | MACHINERY - 2.8% | | | | |
| | 24,011 | | | Flowserve Corporation | | | 801,728 | |
| | 3,502 | | | Lindsay Corporation | | | 422,831 | |
| | 5,383 | | | MSA Safety, Inc. | | | 698,444 | |
| | | | | | | | 1,923,003 | |
| | | | | MEDICAL EQUIPMENT & DEVICES - 6.2% | | | | |
| | 45,692 | | | Adaptive Biotechnologies Corporation(a) | | | 326,241 | |
| | | | | | | | | |
See accompanying notes which are an integral part of these financial statements.
| DUNHAM SMALL CAP GROWTH FUND |
| SCHEDULE OF INVESTMENTS (Unaudited) (Continued) |
| April 30, 2023 |
| Shares | | | | | Fair Value | |
| | | | | COMMON STOCKS — 96.9% (Continued) | | | | |
| | | | | MEDICAL EQUIPMENT & DEVICES - 6.2% (Continued) | | | | |
| | 46,416 | | | Alphatec Holdings, Inc.(a) | | $ | 670,247 | |
| | 16,292 | | | BioLife Solutions, Inc.(a) | | | 286,088 | |
| | 5,148 | | | DexCom, Inc.(a) | | | 624,658 | |
| | 5,920 | | | Inari Medical, Inc.(a),(b) | | | 393,206 | |
| | 2,014 | | | Insulet Corporation(a),(b) | | | 640,533 | |
| | 4,521 | | | Repligen Corporation(a) | | | 685,519 | |
| | 14,042 | | | Silk Road Medical, Inc.(a),(b) | | | 618,129 | |
| | | | | | | | 4,244,621 | |
| | | | | OIL & GAS PRODUCERS - 0.9% | | | | |
| | 4,030 | | | Cheniere Energy, Inc. | | | 616,590 | |
| | | | | | | | | |
| | | | | OIL & GAS SERVICES & EQUIPMENT - 1.0% | | | | |
| | 51,193 | | | TechnipFMC plc(a) | | | 700,832 | |
| | | | | | | | | |
| | | | | RENEWABLE ENERGY - 1.8% | | | | |
| | 27,336 | | | Shoals Technologies Group, Inc., Class A(a) | | | 571,049 | |
| | 2,280 | | | SolarEdge Technologies, Inc.(a),(b) | | | 651,237 | |
| | | | | | | | 1,222,286 | |
| | | | | RETAIL - CONSUMER STAPLES - 2.4% | | | | |
| | 4,093 | | | Five Below, Inc.(a) | | | 807,794 | |
| | 13,130 | | | Ollie’s Bargain Outlet Holdings, Inc.(a),(b) | | | 856,733 | |
| | | | | | | | 1,664,527 | |
| | | | | RETAIL - DISCRETIONARY - 1.7% | | | | |
| | 4,085 | | | Floor & Decor Holdings, Inc., Class A(a),(b) | | | 405,804 | |
| | 10,748 | | | Freshpet, Inc.(a),(b) | | | 741,289 | |
| | | | | | | | 1,147,093 | |
| | | | | SEMICONDUCTORS - 6.8% | | | | |
| | 10,219 | | | Aehr Test Systems(a),(b) | | | 252,920 | |
| | 8,306 | | | Allegro MicroSystems, Inc.(a) | | | 297,106 | |
| | 5,104 | | | Axcelis Technologies, Inc.(a) | | | 603,803 | |
| | 7,844 | | | Lattice Semiconductor Corporation(a) | | | 625,167 | |
| | 9,190 | | | Onto Innovation, Inc.(a) | | | 744,206 | |
| | 8,071 | | | Power Integrations, Inc.(b) | | | 587,407 | |
| | 3,955 | | | Silicon Laboratories, Inc.(a),(b) | | | 550,932 | |
| | | | | | | | | |
See accompanying notes which are an integral part of these financial statements.
| DUNHAM SMALL CAP GROWTH FUND |
| SCHEDULE OF INVESTMENTS (Unaudited) (Continued) |
| April 30, 2023 |
| Shares | | | | | Fair Value | |
| | | | | COMMON STOCKS — 96.9% (Continued) | | | | |
| | | | | SEMICONDUCTORS - 6.8% (Continued) | | | | |
| | 3,858 | | | SiTime Corporation(a),(b) | | $ | 418,477 | |
| | 10,951 | | | Wolfspeed, Inc.(a),(b) | | | 509,769 | |
| | | | | | | | 4,589,787 | |
| | | | | SOFTWARE - 13.5% | | | | |
| | 7,772 | | | Alteryx, Inc., Class A(a) | | | 319,662 | |
| | 5,347 | | | Appfolio, Inc., Class A(a) | | | 746,548 | |
| | 6,690 | | | BigCommerce Holdings, Inc.(a) | | | 49,439 | |
| | 6,021 | | | Blackline, Inc.(a) | | | 335,430 | |
| | 18,725 | | | Calix, Inc.(a) | | | 855,733 | |
| | 5,305 | | | Crowdstrike Holdings, Inc., Class A(a) | | | 636,865 | |
| | 29,319 | | | DoubleVerify Holdings, Inc.(a) | | | 862,564 | |
| | 12,900 | | | Doximity, Inc.(a),(b) | | | 474,075 | |
| | 5,149 | | | Duolingo, Inc.(a) | | | 701,088 | |
| | 10,752 | | | Dynatrace, Inc.(a) | | | 454,595 | |
| | 11,458 | | | Five9, Inc.(a) | | | 742,937 | |
| | 20,101 | | | Gitlab, Inc.(a),(b) | | | 610,266 | |
| | 29,548 | | | Privia Health Group, Inc.(a) | | | 816,411 | |
| | 18,421 | | | Smartsheet, Inc., Class A(a) | | | 752,866 | |
| | 27,072 | | | Sprinklr, Inc., Class A(a),(b) | | | 323,781 | |
| | 22,063 | | | Vertex, Inc., CLASS A(a) | | | 455,601 | |
| | | | | | | | 9,137,861 | |
| | | | | TECHNOLOGY HARDWARE - 0.5% | | | | |
| | 3,724 | | | Fabrinet(a) | | | 353,594 | |
| | | | | | | | | |
| | | | | TECHNOLOGY SERVICES - 6.4% | | | | |
| | 1,246 | | | ExlService Holdings, Inc.(a) | | | 222,261 | |
| | 5,257 | | | Globant S.A.(a) | | | 824,666 | |
| | 15,403 | | | MAXIMUS, Inc.(b) | | | 1,288,461 | |
| | 1,504 | | | MSCI, Inc. | | | 725,605 | |
| | 6,084 | | | Shift4 Payments, Inc.(a),(b) | | | 412,313 | |
| | 9,738 | | | WNS Holdings Ltd. - ADR(a) | | | 878,076 | |
| | | | | | | | 4,351,382 | |
| | | | | | | | | |
See accompanying notes which are an integral part of these financial statements.
| DUNHAM SMALL CAP GROWTH FUND |
| SCHEDULE OF INVESTMENTS (Unaudited) (Continued) |
| April 30, 2023 |
| Shares | | | | | Fair Value | |
| | | | | COMMON STOCKS — 96.9% (Continued) | | | | |
| | | | | WHOLESALE - CONSUMER STAPLES - 0.6% | | | | |
| | 14,297 | | | Grocery Outlet Holding Corporation(a),(b) | | $ | 425,765 | |
| | | | | | | | | |
| | | | | | | | | |
| | | | | TOTAL COMMON STOCKS (Cost $55,841,726) | | | 65,924,602 | |
| | | | | | | | | |
| | | | | SHORT-TERM INVESTMENTS — 31.3% | | | | |
| | | | | COLLATERAL FOR SECURITIES LOANED - 27.8% | | | | |
| | 18,870,462 | | | Mount Vernon Liquid Assets Portfolio, LLC, 4.96% (Cost $18,870,462)(c) (d) | | | 18,870,462 | |
| | | | | | | | | |
| | | | | MONEY MARKET FUND - 3.5% | | | | |
| | 2,400,870 | | | Fidelity Government Portfolio, CLASS I, 4.73% (Cost $2,400,870)(c) | | | 2,400,870 | |
| | | | | | | | | |
| | | | | TOTAL SHORT-TERM INVESTMENTS (Cost $21,271,332) | | | 21,271,332 | |
| | | | | | | | | |
| | | | | TOTAL INVESTMENTS - 128.2% (Cost $77,113,058) | | $ | 87,195,934 | |
| | | | | LIABILITIES IN EXCESS OF OTHER ASSETS - (28.2)% | | | (19,163,425 | ) |
| | | | | NET ASSETS - 100.0% | | $ | 68,032,509 | |
| ADR | - American Depositary Receipt |
| | |
| LLC | - Limited Liability Company |
| | |
| LTD | - Limited Company |
| | |
| MSCI | - Morgan Stanley Capital International |
| | |
| PLC | - Public Limited Company |
| | |
| S/A | - Société Anonyme |
| | |
| (a) | Non-income producing security. |
| (b) | All or a portion of these securities are on loan. Total loaned securities had a value of $18,560,332 at April 30, 2023. |
| (c) | Rate disclosed is the seven day effective yield as of April 30, 2023. |
| (d) | The Trust’s securities lending policies and procedures require that the borrower: (i) deliver cash or U.S. Government securities as collateral with respect to each new loan of U.S. securities, equal to at least 102% of the value of the portfolio securities loaned, and (ii) at all times thereafter mark-to-market the collateral on a daily basis so that the market value of such collateral is at least 100% of the value of securities loaned. From time to time the collateral may not be 102% due to end of day market movement. The next business day additional collateral is obtained/received from the borrower to replenish/reestablish 102%. |
See accompanying notes which are an integral part of these financial statements.
| Dunham Emerging Markets Stock Fund (Unaudited) |
| Message from the Sub-Adviser (NS Partners Ltd.) |
| |
Asset Class Recap
Over the first half of the fiscal year ended April 30, 2023, emerging markets stocks, as measured by the MSCI Emerging Markets Index, rose 16.2 percent. Emerging markets stocks underperformed international developed markets, as measured by the MSCI ACWI ex-U.S. index, as it increased 20.9 percent over the fiscal period. Volatility increased due to rising trade tensions between the U.S. and China, despite positive economic data indicating that inflation potentially peaked. China’s gross domestic product grew by 4.5 percent in the most recent calendar quarter, albeit shy of its 5.0 percent target, which marked the highest growth since the first calendar quarter of last year. The Caixin China General Composite Purchasing Managers Index (PMI), an economic indicator of the manufacturing and services sectors, declined to a three-month low in April from March’s nine-month high. It was the fourth straight period of growth in the private sector as services activity maintained momentum following the reversal of China’s strict COVID-zero measures. New orders advanced at the weakest rate for three months, albeit solidly overall, while new export business rose slightly. Similarly, Taiwan appeared to struggle on the back of waning global electronics demand; compounded by increasing tensions and weak trade with China. Taiwan’s manufacturing PMI declined to a three-month low, pointing to the eleventh consecutive decrease in the health of the sector, which represents roughly a third of Taiwan’s economy. More positively, India’s composite PMI jumped in April, pointing to the highest reading since July 2010 amid quicker expansions for goods producers and services providers. In South Korea, the Manufacturing PMI rose modestly in April, pointing to a softer deterioration in the sector’s health but remaining contractionary for the tenth-consecutive month. The manufacturing sector comprises, roughly a quarter of South Korea’s economy.
Allocation Review
Over the fiscal period, security selection and country specific overweight allocations generally detracted from Fund performance. Among stocks selected in the Fund’s positive overweight China allocation, consumer and financial related names weighed on Fund performance. Consumer stocks surrendered prior gains due to unrealized demand expectations following the COVID-zero policy reversal while financial stocks surged as lenders were able to cut deposit rates and progress on state-owned enterprise reform boosted sentiments. Meanwhile, consumer securities selected in the Fund’s overweight Philippines allocation also dragged on performance as companies in the region suffered intense cost pressures and higher borrowing rates. In addition, Fund performance was also negatively impacted by country specific overweight allocations in Indonesia and Chile, as Indonesia’s economy contracted in the first quarter of 2023 and Chile’s president announced efforts to nationalize Chile’s lithium industry. Positively, the Fund experienced beneficial performance from stocks selected in India and Greece, of which the Fund was overweight both countries. Fund performance was also supported by its underweight allocation to Saudi Arabia and its overweight allocation to Brazil. Throughout the first half of the fiscal year, the Sub-Adviser trimmed allocations to China and to a lesser extent Taiwan, added to cyclical semiconductors holdings in Korea, and increased exposure in Thailand.
Holdings Insights
Many of the strongest performing positions within the Fund over the period were attributed to exposure in China. Positions such as Alibaba Group Holding Ltd. (9988 HK) (holding weight*: 4.33 percent), a China-based provider of technology infrastructure and marketing platforms, Tencent Holdings Ltd. (700 HK) (holding weight*: 4.68 percent), a China-based provider of value-added services, online advertising, as well as FinTech and business services, and Shanghai Baosight Software Co., Ltd (600845 CH) (holding weight*: 2.65 percent), a China-based software solutions provider for iron and steel manufacturers, returned 33.5 percent, 76.4 percent, and 34.8 percent, respectively. On the other hand, the largest underperformers over the period quarter also came from exposure in China. The largest underperformer was Meituan (3690 HK) (holding weight*: 2.31 percent), a China-based e-commerce platform that connects consumers and businesses to provide services satisfying people’s daily eating needs, declined, 19.2 percent. In addition, positions such as Longi Green Energy Technology (601012 CH) (holding weight*: 0.87 percent), a China-based end-to-end solutions provider of solar energy projects, and Li Ning Company Ltd. (2331 HK) (holding weight*: 1.47 percent), a China-based brand developer, designer, manufacturer and seller of sport-related footwear, apparel, equipment and accessories, declined 23.3 percent and 9.4 percent, respectively.
The greatest contributor to Fund performance was Varun Beverages Ltd. (VBL IN) (holding weight*: 2.97 percent), an India-based beverage company, that returned 39.4 percent during the fiscal period. In addition, the Greek Organization of Football Prognostics SA (OPAP GA) (holding weight*: 1.68), a Greece-based company that conducts, manages, organizes and operates numerical lottery games as well as sports and other betting games also contributed to Fund performance as it rose 39.2 percent. The second largest underperformer Naspers Ltd. (NPN SJ) (holding weight*: 1.13 percent), a South African- based global internet group and technology investor, declined 7.3 percent. In efforts to reposition the portfolio, the Sub-Adviser sold the Fund’s position in Shenzhou International Group Holdings Ltd. (2313 HK) (holding weight**: 1.00 percent), a China-based manufacturer of knitwear products and acquired a position in SCB X PCL (SCB-R TB) (holding weight*: 1.07 percent), a Thailand-based financial company. The Sub-Adviser also liquidated the Fund’s position in CTBC Financial Holding Co. Ltd. (2891 TW) (holding weight**: 1.86 percent), a Taiwan-based financial company, to purchase a position in Yageo Corporation (2327 TW) (holding weight*: 0.97 percent), a Taiwan-based computer chip design and manufacturing company.
Sub-Adviser Outlook
The Sub-Adviser believes that the global economic downswing and equity market volatility will continue to extend into the immediate future but remains optimistic for a recovery by the end of 2023. Although the Sub-Adviser believes monetary authorities have overdone monetary policymaking, thus making a global recession likely, the Sub-Adviser believes that the worst has already passed and as inflation may return to pre-pandemic levels in 2023 or early 2024. The Sub-Adviser views excess money measures as negative but should turn mixed shortly, favoring quality growth stocks. Given this backdrop, the Sub-Adviser believes that security and country selection will be critical for the rest of 2023. The Sub-Adviser will continue to focus on what it considers to be high-quality stocks with stable returns on invested capital.
| * | Holdings percentage(s) of total investments, cash and unsettled trades excluding collateral for securities loaned as of 4/30/2022. |
| ** | Holdings percentage(s) as of the date prior to the sale of the security. |
| Dunham Emerging Markets Stock Fund |
| PORTFOLIO REVIEW (Unaudited) |
| April 30, 2023 |
| |
The Fund’s performance figures* for each of the periods ended April 30, 2023, compared to its benchmarks:
| | | | Annualized | Annualized |
| | 6 Month Return | 1 Year Return | 5 Year Return | 10 Year Return |
| Class N | 14.74% | (7.39)% | (2.33)% | (0.17)% |
| Class A with Load 5.75% | 7.99% | (12.95)% | (3.72)% | (1.00)% |
| Class A without load | 14.60% | (7.66)% | (2.58)% | (0.41)% |
| Class C | 14.20% | (8.31)% | (3.31)% | (1.17)% |
| MSCI Emerging Markets Index (net) (a) | 16.36% | (6.51)% | (1.05)% | 1.80% |
| Morningstar Diversified Emerging Markets Category (b) | 16.16% | (3.51)% | (0.70)% | 1.47% |
| | | | | |
| * | Total Returns are calculated based on traded NAVs. As disclosed in the Trust’s latest registration statement, the Fund’s total annual operating expenses, including underlying funds, are 1.03% for Class N, 2.03% for Class C and 1.28% for Class A. Class A shares are subject to a sales load of 5.75% and a deferred sales charge of up to 0.75%. The performance data quoted here represents past performance, which is not indicative of future results. Current performance may be lower or higher than the performance data quoted. The investment return and NAV will fluctuate, so that an investor’s shares, when redeemed, may be worth more or less than their original cost. Total returns are calculated assuming reinvestment of all dividends and capital gains distributions, if any. The returns do not reflect the deductions of taxes a shareholder would pay on the redemption of Fund shares or Fund distributions. For performance information current to the most recent month-end, please call 1-800-442-4358 or visit our website www.dunham.com. |
| (a) | The MSCI Emerging Markets Index (net) is a free float-adjusted market capitalization index that is designed to measure equity market performance in the global emerging markets. Investors |
| (b) | The Morningstar Diversified Emerging Markets Category is generally representative of mutual funds that primarily invest among 20 or more developing nations, with a general focus on the |
Comparison of the Change in Value of a $100,000 Investment
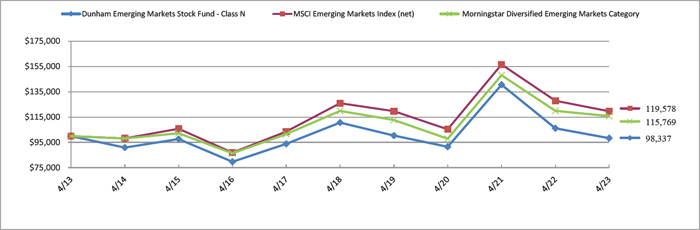
| Portfolio Composition * (Unaudited) |
| Hong Kong | | | 20.0 | % |
| India | | | 15.4 | % |
| China | | | 12.7 | % |
| Taiwan | | | 12.0 | % |
| United States | | | 11.8 | % |
| Korea | | | 8.1 | % |
| Thailand | | | 4.7 | % |
| Indonesia | | | 3.2 | % |
| Great Britain | | | 2.4 | % |
| Greece | | | 2.3 | % |
| Others | | | 7.4 | % |
| Total | | | 100.0 | % |
| | | | | |
* Based on total value of investments as of April 30, 2023. Does not include derivative holdings.
Percentage may differ from Schedule of Investments which are based on Fund net assets.
| DUNHAM EMERGING MARKETS STOCK FUND |
| SCHEDULE OF INVESTMENTS (Unaudited) |
| April 30, 2023 |
| Shares | | | | | Fair Value | |
| | | | | CLOSED END FUNDS — 0.8% | | | | |
| | | | | MIXED ALLOCATION - 0.8% | | | | |
| | 136,545 | | | Vietnam Enterprise Investments Ltd.(a) TOTAL CLOSED END FUNDS (Cost $861,698) | | $ | 914,871 | |
| | | | | | | | | |
| | | | | COMMON STOCKS — 97.1% | | | | |
| | | | | ASSET MANAGEMENT - 0.5% | | | | |
| | 238,080 | | | East Money Information Company Ltd. | | | 556,024 | |
| | | | | | | | | |
| | | | | AUTOMOTIVE - 0.6% | | | | |
| | 1,518 | | | LG Energy Solution Ltd.(a) | | | 662,083 | |
| | | | | | | | | |
| | | | | BANKING - 7.1% | | | | |
| | 167,748 | | | Banco Bradesco S.A. - ADR(b) | | | 469,694 | |
| | 2,100,500 | | | Bank Central Asia Tbk P.T. | | | 1,300,252 | |
| | 265,895 | | | FirstRand Ltd. | | | 936,989 | |
| | 11,900 | | | HDFC Bank Ltd. - ADR | | | 830,620 | |
| | 210,148 | | | Itau Unibanco Holding S.A. - ADR | | | 1,082,262 | |
| | 3,210 | | | KB Financial Group, Inc. | | | 119,230 | |
| | 1,620,700 | | | Public Bank Bhd | | | 1,416,102 | |
| | 152,825 | | | Qatar National Bank QPSC | | | 647,026 | |
| | 388,400 | | | SCB X PCL | | | 1,181,518 | |
| | | | | | | | 7,983,693 | |
| | | | | BEVERAGES - 4.1% | | | | |
| | 19,800 | | | Heineken Malaysia Bhd | | | 124,985 | |
| | 4,300 | | | Kweichow Moutai Company Ltd. | | | 1,096,990 | |
| | 184,836 | | | Varun Beverages Ltd. | | | 3,280,117 | |
| | | | | | | | 4,502,092 | |
| | | | | BIOTECH & PHARMA - 0.2% | | | | |
| | 226,000 | | | CSPC Pharmaceutical Group Ltd. | | | 229,751 | |
| | | | | | | | | |
| | | | | CHEMICALS - 2.5% | | | | |
| | 3,906 | | | LG Chem Ltd. | | | 2,171,308 | |
| | | | | | | | | |
See accompanying notes which are an integral part of these financial statements.
| DUNHAM EMERGING MARKETS STOCK FUND |
| SCHEDULE OF INVESTMENTS (Unaudited) (Continued) |
| April 30, 2023 |
| Shares | | | | | Fair Value | |
| | | | | COMMON STOCKS — 97.1% (Continued) | | | | |
| | | | | CHEMICALS - 2.5% (Continued) | | | | |
| | 7,577 | | | Sociedad Quimica y Minera de Chile S.A. - ADR | | $ | 511,296 | |
| | | | | | | | 2,682,604 | |
| | | | | | | | | |
| | | | | CONSTRUCTION MATERIALS - 0.4% | | | | |
| | 596,000 | | | China National Building Material Company Ltd., H Shares | | | 447,181 | |
| | | | | | | | | |
| | | | | CONSUMER SERVICES - 1.0% | | | | |
| | 1,200,000 | | | China Education Group Holdings Ltd. | | | 1,068,389 | |
| | | | | | | | | |
| | | | | E-COMMERCE DISCRETIONARY - 7.4% | | | | |
| | 451,941 | | | Alibaba Group Holding Ltd.(a), | | | 4,778,613 | |
| | 50,046 | | | JD.com, Inc. | | | 893,205 | |
| | 149,040 | | | Meituan(a), | | | 2,547,139 | |
| | | | | | | | 8,218,957 | |
| | | | | ELECTRIC UTILITIES - 0.0%(d) | | | | |
| | 77,040 | | | ACEN Corporation | | | 8,388 | |
| | | | | | | | | |
| | | | | ELECTRICAL EQUIPMENT - 1.6% | | | | |
| | 207,024 | | | NARI Technology Company Ltd. | | | 784,250 | |
| | 74,442 | | | Zhejiang Supcon Technology Company Ltd. | | | 1,040,678 | |
| | | | | | | | 1,824,928 | |
| | | | | ENGINEERING & CONSTRUCTION - 2.5% | | | | |
| | 69,518 | | | Larsen & Toubro Ltd. | | | 2,018,039 | |
| | 25,748 | | | Mytilineos S.A. | | | 747,040 | |
| | | | | | | | 2,765,079 | |
| | | | | ENTERTAINMENT CONTENT - 2.2% | | | | |
| | 136,990 | | | NetEase, Inc. | | | 2,438,729 | |
| | | | | | | | | |
| | | | | FOOD - 0.7% | | | | |
| | 4,480,700 | | | Monde Nissin Corporation | | | 757,644 | |
| | | | | | | | | |
| | | | | HEALTH CARE FACILITIES & SERVICES - 3.2% | | | | |
| | 113,400 | | | Hangzhou Tigermed Consulting Company Ltd. | | | 944,636 | |
| | 452,096 | | | Max Healthcare Institute Ltd.(a) | | | 2,550,584 | |
| | | | | | | | 3,495,220 | |
| | | | | | | | | |
See accompanying notes which are an integral part of these financial statements.
| DUNHAM EMERGING MARKETS STOCK FUND |
| SCHEDULE OF INVESTMENTS (Unaudited) (Continued) |
| April 30, 2023 |
| Shares | | | | | Fair Value | |
| | | | | COMMON STOCKS — 97.1% (Continued) | | | | |
| | | | | HOME & OFFICE PRODUCTS - 0.8% | | | | |
| | 283,400 | | | Haier Smart Home Company Ltd., H Shares | | $ | 923,758 | |
| | | | | | | | | |
| | | | | INSTITUTIONAL FINANCIAL SERVICES - 1.5% | | | | |
| | 39,400 | | | Hong Kong Exchanges & Clearing Ltd. | | | 1,635,751 | |
| | | | | | | | | |
| | | | | INSURANCE - 3.5% | | | | |
| | 194,600 | | | AIA Group Ltd. | | | 2,118,606 | |
| | 113,170 | | | Prudential PLC | | | 1,731,648 | |
| | | | | | | | 3,850,254 | |
| | | | | INTERNET MEDIA & SERVICES - 5.8% | | | | |
| | 6,993 | | | Naspers Ltd., N Shares | | | 1,246,454 | |
| | 116,400 | | | Tencent Holdings Ltd. | | | 5,169,990 | |
| | | | | | | | 6,416,444 | |
| | | | | LEISURE FACILITIES & SERVICES - 4.2% | | | | |
| | 182,930 | | | Jollibee Foods Corporation | | | 743,982 | |
| | 1,016,335 | | | Lemon Tree Hotels Ltd.(a) | | | 1,100,122 | |
| | 1,052,400 | | | Minor International PCL(a) | | | 974,820 | |
| | 108,538 | | | OPAP S.A. | | | 1,850,915 | |
| | | | | | | | 4,669,839 | |
| | | | | MACHINERY - 2.1% | | | | |
| | 127,500 | | | Jiangsu Hengli Hydraulic Company Ltd. | | | 1,137,468 | |
| | 485,326 | | | Sany Heavy Industry Company Ltd., Class A | | | 1,160,353 | |
| | | | | | | | 2,297,821 | |
| | | | | MEDICAL EQUIPMENT & DEVICES - 1.4% | | | | |
| | 35,200 | | | Shenzhen Mindray Bio-Medical Electronics Company | | | 1,591,129 | |
| | | | | | | | | |
| | | | | OIL & GAS PRODUCERS - 1.9% | | | | |
| | 376,189 | | | Gazprom PJSC (c) | | | — | |
| | 89,100 | | | Petroleo Brasileiro S.A. - ADR | | | 946,242 | |
| | 259,210 | | | PTT Exploration & Production PCL | | | 1,127,902 | |
| | | | | | | | 2,074,144 | |
| | | | | REAL ESTATE OWNERS & DEVELOPERS - 1.0% | | | | |
| | 667,729 | | | Indiabulls Real Estate Ltd.(a) | | | 597,721 | |
| | | | | | | | | |
See accompanying notes which are an integral part of these financial statements.
| DUNHAM EMERGING MARKETS STOCK FUND |
| SCHEDULE OF INVESTMENTS (Unaudited) (Continued) |
| April 30, 2023 |
| Shares | | | | | Fair Value | |
| | | | | COMMON STOCKS — 97.1% (Continued) | | | | |
| | | | | REAL ESTATE OWNERS & DEVELOPERS - 1.0% (Continued) | | | | |
| | 230,490 | | | Vinhomes JSC | | $ | 486,369 | |
| | | | | | | | 1,084,090 | |
| | | | | RENEWABLE ENERGY - 1.9% | | | | |
| | 34,920 | | | Contemporary Amperex Technology Company Ltd. | | | 1,171,049 | |
| | 189,450 | | | LONGi Green Energy Technology Company Ltd., Class A | | | 959,067 | |
| | | | | | | | 2,130,116 | |
| | | | | RETAIL - CONSUMER STAPLES - 2.9% | | | | |
| | 8,512 | | | Magnit PJSC(a)(c) | | | — | |
| | 156,000 | | | President Chain Store Corporation | | | 1,372,849 | |
| | 472,337 | | | Wal-Mart de Mexico S.A.B. de C.V. | | | 1,903,807 | |
| | | | | | | | 3,276,656 | |
| | | | | RETAIL - DISCRETIONARY - 2.1% | | | | |
| | 1,828,200 | | | Home Product Center PCL | | | 752,274 | |
| | 226,500 | | | Li Ning Company Ltd. | | | 1,619,827 | |
| | | | | | | | 2,372,101 | |
| | | | | SEMICONDUCTORS - 11.3% | | | | |
| | 9,000 | | | eMemory Technology, Inc. | | | 537,540 | |
| | 40,196 | | | MediaTek, Inc. | | | 873,064 | |
| | 28,406 | | | SK Hynix, Inc. | | | 1,912,655 | |
| | 478,608 | | | Taiwan Semiconductor Manufacturing Company Ltd. | | | 7,828,960 | |
| | 5,300 | | | Taiwan Semiconductor Manufacturing Company Ltd. - ADR | | | 446,790 | |
| | 66,000 | | | Yageo Corporation | | | 1,068,758 | |
| | | | | | | | 12,667,767 | |
| | | | | SPECIALTY FINANCE - 3.5% | | | | |
| | 115,498 | | | Housing Development Finance Corp Ltd. | | | 3,940,188 | |
| | | | | | | | | |
| | | | | TECHNOLOGY HARDWARE - 9.8% | | | | |
| | 112,099 | | | Accton Technology Corporation | | | 1,093,893 | |
| | 202,000 | | | E Ink Holdings, Inc. | | | 1,257,114 | |
| | 25,000 | | | Parade Technologies Ltd. | | | 764,855 | |
| | 157,418 | | | Samsung Electronics Company Ltd. | | | 7,751,285 | |
| | | | | | | | 10,867,147 | |
| | | | | | | | | |
See accompanying notes which are an integral part of these financial statements.
| DUNHAM EMERGING MARKETS STOCK FUND |
| SCHEDULE OF INVESTMENTS (Unaudited) (Continued) |
| April 30, 2023 |
| Shares | | | | | Fair Value | |
| | | | | COMMON STOCKS — 97.1% (Continued) | | | | |
| | | | | TECHNOLOGY SERVICES - 2.6% | | | | |
| | 374,328 | | | Shanghai Baosight Software Company Ltd. | | $ | 2,926,936 | |
| | | | | | | | | |
| | | | | TELECOMMUNICATIONS - 3.3% | | | | |
| | 148,450 | | | Bharti Airtel Ltd. | | | 1,455,059 | |
| | 7,762,700 | | | Telekomunikasi Indonesia Persero Tbk P.T. | | | 2,249,070 | |
| | | | | | | | 3,704,129 | |
| | | | | TRANSPORTATION & LOGISTICS - 2.8% | | | | |
| | 185,172 | | | Container Corp Of India Ltd. | | | 1,390,152 | |
| | 185,376 | | | Spring Airlines Company Ltd.(a) | | | 1,675,446 | |
| | | | | | | | 3,065,598 | |
| | | | | WHOLESALE - CONSUMER STAPLES - 0.7% | | | | |
| | 407,136 | | | Devyani International Ltd.(a) | | | 807,677 | |
| | | | | | | | | |
| | | | | TOTAL COMMON STOCKS (Cost $106,414,564) | | | 107,942,307 | |
| | | | | | | | | |
| | | | | PREFERRED STOCKS — 0.5% | | | | |
| | | | | TECHNOLOGY HARDWARE — 0.5% | | | | |
| | 12,575 | | | Samsung Electronics Company Ltd. TOTAL PREFERRED STOCKS (Cost $664,237) | | | 526,082 | |
| | | | | | Expiration Date | | Exercise Price | | | | |
| | | | | WARRANT — 0.0%(d) | | | | | | | | | | |
| | | | | LEISURE FACILITIES & SERVICES - 0.0% (d) | | | | | | | | | | |
| | 26,977 | | | Minor International PCL (Thailand) | | 07/31/2023 | | $ | 21.60 | | | | 7,519 | |
| | 42,772 | | | Minor International PCL (Thailand) | | 05/08/2023 | | | 28.00 | | | | 2,856 | |
| | 38,762 | | | Minor International PCL (Thailand) | | 02/16/2024 | | | 31.00 | | | | 3,511 | |
| | | | | TOTAL WARRANT (Cost $5,303) | | | | | | | | | 13,886 | |
| | | | | | | | | | | | | | | |
See accompanying notes which are an integral part of these financial statements.
| DUNHAM EMERGING MARKETS STOCK FUND |
| SCHEDULE OF INVESTMENTS (Unaudited) (Continued) |
| April 30, 2023 |
| Shares | | | | | Fair Value | |
| | | | | SHORT-TERM INVESTMENTS — 1.8% | | | | |
| | | | | COLLATERAL FOR SECURITIES LOANED - 1.0% | | | | |
| | 1,171,930 | | | Mount Vernon Liquid Assets Portfolio, LLC, 4.96% (Cost $1,171,930)(e),(f) | | $ | 1,171,930 | |
| | | | | | | | | |
| | | | | MONEY MARKET FUNDS - 0.8% | | | | |
| | 840,779 | | | First American Government Obligations Fund, Class X, 4.73% (Cost $840,779)(e) | | | 840,779 | |
| | | | | | | | | |
| | | | | TOTAL SHORT-TERM INVESTMENTS (Cost $2,012,709) | | | 2,012,709 | |
| | | | | | | | | |
| | | | | TOTAL INVESTMENTS - 100.2% (Cost $109,958,511) | | $ | 111,409,855 | |
| | | | | LIABILITIES IN EXCESS OF OTHER ASSETS - (0.2)% | | | (212,954 | ) |
| | | | | NET ASSETS - 100.0% | | $ | 111,196,901 | |
| ADR | - American Depositary Receipt |
| | |
| LLC | - Limited Liability Company |
| | |
| LTD | - Limited Company |
| | |
| PJSC | - Public Joint-Stock Company |
| | |
| PLC | - Public Limited Company |
| | |
| PT | - Perseroan Terbatas |
| | |
| S/A | - Societe Anonyme |
| | |
| (a) | Non-income producing security. |
| (b) | All or a portion of these securities are on loan. Total loaned securities had a value of $1,107,684 at April 30, 2023. |
| (c) | The value of this security has been determined in good faith under policies of the Board of Trustees. |
| (d) | Percentage rounds to less than 0.1%. |
| (e) | Rate disclosed is the seven day effective yield as of April 30, 2023. |
| (f) | The Trust’s securities lending policies and procedures require that the borrower: deliver cash or U.S. Government securities as collateral with respect to each new loan of U.S. securities, equal to at least 102% of the value of the portfolio securities loaned, and (ii) at all times thereafter mark-to-market the collateral on a daily basis so that the market value of such collateral is at least 100% of the value of securities loaned. From time to time the collateral may not be 102% due to end of day market movement. The next business day additional collateral is obtained/received from the borrower to replenish/reestablish 102%. |
See accompanying notes which are an integral part of these financial statements.
| Dunham International Stock Fund (Unaudited) |
| Message from the Sub-Adviser (Arrowstreet Capital, L.P.) |
| |
Asset Class Recap
International equity markets, as measured by the MSCI All Country World ex USA Index (Net) (referred to as the “Index”), gained 20.7 percent during the semi-annual period ended April 30, 2023. Across sectors, gains were led by consumer discretionary, communication services, and industrials. Conversely, energy, health care, and utilities were the most significant underperforming sectors. The best performing developed market countries as measured by the Index in local terms during the semi-annual period were Hong Kong, up 32.1 percent, and Denmark, up 25.8 percent. The worst performing developed market countries were Israel, down -6.4 percent, and Finland, down -0.2 percent. The best performing emerging market countries during the period as measured by the Index were Egypt, up 63.22 percent, and China, up 34.4 percent. The worst performing emerging market countries were Qatar, down -16.1 percent, and Brazil, down -10.0 percent.
Allocation Review
The Sub-Adviser’s investment process is best characterized as a dynamic process that uses quantitative models to evaluate securities to exploit opportunities across companies, sectors, and countries while seeking to avoid long-term systematic biases toward any particular country, sector, style, or market capitalization. These stock selection models are designed to understand what information is likely to impact stock prices with a predictable and measurable lag that allows time to invest and profit. The models obtain the information to forecast individual stock returns by evaluating a stock’s potential on the basis of (1) direct effects - characteristics of the company itself; and (2) indirect effects - characteristics of other companies that are related by virtue of a common country and sector affiliation (called country/sector baskets); a common country affiliation; and a common global sector affiliation, and/or other common linkages. Over any time period, the strategy’s performance relative to the Index is driven by allocations to country/sector baskets, stock selection, and the effects of currency exposures differing from those of the Index.
Countries contributing the most to returns relative to the Index during the semi-annual period were: China, mainly due to the Fund’s overweight positioning to energy and financials, and positive selection and overweight positioning within Chinese industrials; and India, primarily due to underweight positioning to financials and information technology. Countries contributing the most to underperformance relative to the Index included: the UK, primarily due to the Fund’s overweight positioning to the UK energy basket and underweights to the UK financials basket; and Switzerland, primarily due to both overweights and negative selection within the Swiss health care basket.
Sectors contributing the most to returns relative to the Index during the semi-annual period included: Industrials, primarily due to both positive selection and overweight positioning to the Chinese industrials and Turkish industrials baskets; and financials, mainly due to overweights to Chinese financials, as noted above, and underweight positioning to Canadian financials. Sectors contributing the most to underperformance relative to the Index included: health care, primarily due to overweights and negative selection within Swiss health care, as noted above; and IT largely due to underweight positioning and negative selection within Taiwanese IT, as well as both overweight positioning and negative stock selection within Japanese IT.
Holdings Insights
Stocks contributing the most to returns relative to the Index during the fiscal quarter included: Petrochina Co. LTD (BP3R206) (holding weight*: 1.88 percent), a Chinese energy company; China Petroleum & Chemical (BP3R240) (holding weight*: 0.76 percent), a Chinese energy company; and TangShan Port Group Co. LTD (BP3R9F0) (holding weight*: 1.07 percent), a Chinese industrials company. Petrochina Co. LTD, China Petroleum & Chemical, and TangShan Port Group Co. LTD increased 74.1 percent, 74.2 percent, and 66.3 percent respectively during the most recent fiscal quarter. Stocks contributing the most to underperformance relative to the Index included: NN Group N.V. (NN NA) (holding weight*: 0.66 percent), a Dutch financial services company, Roche Holdings AG-Genusschein (ROG SW) (holding weight*: 3.48 percent), a Swiss health care company, and Tencent Holdings Ltd. (700 HK) (not held), a Chinese communication services company. NN NA and ROG SW declined 12.1 percent and 2.0 percent, respectively during the six-month period. 700 HK surged 76.4 percent during the same period, but was not held in the Fund, so it detracted from the Fund’s performance relative to the benchmark index.
Sub-Adviser Outlook
The Sub-Adviser generally constructs its portfolios by using proprietary econometric models and a proprietary optimization process that balances the trade-off between a stock’s expected return, its contribution to portfolio level risk, portfolio specific restrictions, and its opportunity costs relative to trading costs. As this is performed quantitatively, the Sub-Adviser’s outlook does not play a role in the disciplined investment process.
| * | Holdings percentage(s) of total investments, cash and unsettled trades excluding collateral for securities loaned as of 4/30/2023. |
| Dunham International Stock Fund |
| PORTFOLIO REVIEW (Unaudited) |
| April 30, 2023 |
| |
The Fund’s performance figures* for each of the periods ended April 30, 2023, compared to its benchmarks:
| | | | Annualized | Annualized |
| | 6 Month Return | 1 Year Return | 5 Year Return | 10 Year Return |
| Class N | 20.11% | 8.39% | 4.31% | 5.38% |
| Class A with Load 5.75% | 13.02% | 1.91% | 2.82% | 4.49% |
| Class A without load | 19.93% | 8.11% | 4.04% | 5.11% |
| Class C | 19.44% | 7.28% | 3.27% | 4.33% |
| MSCI All Country World ex US Index (net) (a) | 20.65% | 3.05% | 2.50% | 3.97% |
| Morningstar Foreign Large Cap Blend Category (b) | 21.97% | 6.40% | 2.77% | 4.14% |
| | | | | |
| * | Total Returns are calculated based on traded NAVs. As disclosed in the Trust’s latest registration statement, the Fund’s total annual operating expenses, including underlying funds, are 1.54% for Class N, 2.54% for Class C and 1.79% for Class A. Class A shares are subject to a sales load of 5.75% and a deferred sales charge of up to 0.75%.The performance data quoted here represents past performance, which is not indicative of future results. Current performance may be lower or higher than the performance data quoted. The investment return and NAV will fluctuate, so that an investor’s shares, when redeemed, may be worth more or less than their original cost. Total returns are calculated assuming reinvestment of all dividends and capital gains distributions, if any. The returns do not reflect the deductions of taxes a shareholder would pay on the redemption of Fund shares or Fund distribution. For performance information current to the most recent month-end, please call 1-800-442-4358 or visit our website www.dunham.com. |
| (a) | The MSCI All Country World ex US Index (net) is a free float-adjusted market capitalization index designed to measure equity market performance in the global developed and emerging markets excluding holdings in the United States and is net of any withholding taxes. Investors cannot invest directly in an index or benchmark. |
| (b) | The Morningstar Foreign Large Cap Blend Category is generally representative of mutual funds that primarily invest in non-U.S. stocks that have market caps in the top 70% of each economically integrated market (such as Europe or Asia ex-Japan). The blend style is generally applicable where neither growth nor value characteristics dominate. |
Comparison of the Change in Value of a $100,000 Investment
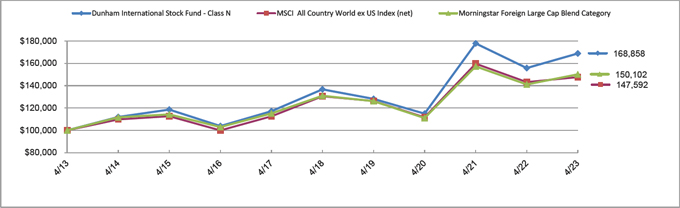
| Portfolio Composition * (Unaudited) |
| United States | | | 26.1 | % |
| Japan | | | 14.6 | % |
| China | | | 10.2 | % |
| Germany | | | 8.2 | % |
| Netherlands | | | 6.4 | % |
| Hong Kong | | | 6.0 | % |
| Turkey | | | 5.5 | % |
| Korea | | | 4.3 | % |
| Switzerland | | | 4.0 | % |
| Other Countries | | | 14.7 | % |
| Total | | | 100.0 | % |
| | | | | |
* Based on total value of investments as of April 30, 2023. Does not include derivative holdings.
Percentage may differ from Schedule of Investments which are based on Fund net assets.
| DUNHAM INTERNATIONAL STOCK FUND |
| SCHEDULE OF INVESTMENTS (Unaudited) |
| April 30, 2023 |
| Shares | | | | | Fair Value | |
| | | | | COMMON STOCKS — 91.6% | | | | |
| | | | | AUTOMOTIVE - 7.2% | | | | |
| | 5,000 | | | Aisin Corporation | | $ | 146,762 | |
| | 23,857 | | | Bayerische Motoren Werke A.G. | | | 2,674,066 | |
| | 10,835 | | | Continental A.G. | | | 760,281 | |
| | 9,100 | | | Honda Motor Company Ltd. | | | 241,367 | |
| | 4,244 | | | Hyundai Mobis Company Ltd. | | | 691,686 | |
| | 753 | | | Hyundai Motor Company | | | 111,623 | |
| | 1,761 | | | Kia Motors Corporation | | | 111,612 | |
| | 17,169 | | | Mercedes-Benz Group A.G. | | | 1,338,977 | |
| | 77,900 | | | Nissan Motor Company Ltd. | | | 284,066 | |
| | 99,253 | | | Stellantis N.V. | | | 1,646,225 | |
| | 26,400 | | | Subaru Corporation | | | 430,909 | |
| | 37,700 | | | Sumitomo Electric Industries Ltd. | | | 481,151 | |
| | 6,600 | | | Suzuki Motor Corporation | | | 230,139 | |
| | | | | | | | 9,148,864 | |
| | | | | BANKING - 11.9% | | | | |
| | 167,000 | | | Agricultural Bank of China Ltd., H Shares | | | 64,567 | |
| | 1,559,658 | | | Akbank T.A.S. | | | 1,289,490 | |
| | 30,481 | | | Banco Bilbao Vizcaya Argentaria S.A. | | | 223,157 | |
| | 85,730 | | | Banco Santander S.A. | | | 301,184 | |
| | 7,597 | | | Bancolombia S.A. (a)(b) | | | — | |
| | 43,009 | | | Bank Leumi Le-Israel BM | | | 340,924 | |
| | 279,200 | | | Bank of Beijing Company Ltd., Class A | | | 191,633 | |
| | 14,968 | | | Bank of China Ltd. - ADR | | | 148,782 | |
| | 3,575,000 | | | Bank of China Ltd., H Shares | | | 1,427,694 | |
| | 503,500 | | | Bank of Communications Company Ltd. | | | 405,979 | |
| | 1,150,000 | | | Bank of Communications Company Ltd., H Shares | | | 742,779 | |
| | 6,913 | | | Barclays plc - ADR | | | 55,788 | |
| | 31,712 | | | BNK Financial Group, Inc. | | | 157,880 | |
| | 5,821 | | | BNP Paribas S.A. | | | 376,124 | |
| | 1,240,000 | | | China Construction Bank Corporation, H Shares | | | 828,965 | |
| | 350,500 | | | China Minsheng Banking Corp Ltd., H Shares | | | 128,753 | |
| | 272,000 | | | Chongqing Rural Commercial Bank Company Ltd., H Shares | | | 105,135 | |
| | 27,662 | | | Commercial International Bank Egypt S.A.E | | | 33,471 | |
| | | | | | | | | |
See accompanying notes which are an integral part of these financial statements.
| DUNHAM INTERNATIONAL STOCK FUND |
| SCHEDULE OF INVESTMENTS (Unaudited) (Continued) |
| April 30, 2023 |
| Shares | | | | | Fair Value | |
| | | | | COMMON STOCKS — 91.6% (Continued) | | | | |
| | | | | BANKING - 11.9% (Continued) | | | | |
| | 1,861 | | | Erste Group Bank A.G. | | $ | 67,666 | |
| | 694,354 | | | Haci Omer Sabanci Holding A/S | | | 1,364,883 | |
| | 10,225 | | | Hana Financial Group, Inc. | | | 321,542 | |
| | 69,333 | | | Industrial & Commercial Bank of China Ltd. - ADR | | | 740,476 | |
| | 1,449,000 | | | Industrial & Commercial Bank of China Ltd., H Shares | | | 779,561 | |
| | 26,400 | | | Industrial Bank Company Ltd. | | | 65,905 | |
| | 12,641 | | | KB Financial Group, Inc. | | | 469,530 | |
| | 357,800 | | | Mebuki Financial Group, Inc. | | | 916,587 | |
| | 121,567 | | | Quinenco S.A. | | | 499,219 | |
| | 775,890 | | | Sberbank of Russia PJSC(a)(b) | | | — | |
| | 2,831 | | | Shinhan Financial Group Company Ltd. | | | 74,171 | |
| | 36,156 | | | Skandinaviska Enskilda Banken A.B. | | | 411,044 | |
| | 6,000 | | | Swedbank A.B., A Shares | | | 104,239 | |
| | 529,219 | | | Turkiye Garanti Bankasi A/S | | | 746,148 | |
| | 119,320 | | | Turkiye Is Bankasi A/S | | | 66,509 | |
| | 21,414 | | | UniCredit SpA | | | 424,340 | |
| | 1,284,860,000 | | | VTB Bank PJSC(a)(b) | | | — | |
| | 2,410,939 | | | Yapi ve Kredi Bankasi A/S | | | 1,176,255 | |
| | | | | | | | 15,050,380 | |
| | | | | BEVERAGES - 0.1% | | | | |
| | 1,857 | | | Anheuser-Busch InBev S.A./NV - ADR(c) | | | 120,649 | |
| | | | | | | | | |
| | | | | BIOTECH & PHARMA - 6.1% | | | | |
| | 12,451 | | | Bayer A.G. | | | 821,741 | |
| | 58,236 | | | GSK plc - ADR(c) | | | 2,098,243 | |
| | 8,740 | | | Orion OYJ, Class B | | | 410,555 | |
| | 2,500 | | | Otsuka Holdings Company Ltd. | | | 85,054 | |
| | 14,093 | | | Roche Holding A.G. | | | 4,413,382 | |
| | | | | | | | 7,828,975 | |
| | | | | CHEMICALS - 2.1% | | | | |
| | 16,656 | | | Evonik Industries A.G. | | | 363,551 | |
| | 8,100 | | | Kaneka Corporation | | | 215,496 | |
| | 79,416 | | | Lianhe Chemical Technology Company Ltd. | | | 138,158 | |
| | 3,200 | | | Nitto Denko Corporation | | | 206,880 | |
| | | | | | | | | |
See accompanying notes which are an integral part of these financial statements.
| DUNHAM INTERNATIONAL STOCK FUND |
| SCHEDULE OF INVESTMENTS (Unaudited) (Continued) |
| April 30, 2023 |
| Shares | | | | | Fair Value | |
| | | | | COMMON STOCKS — 91.6% (Continued) | | | | |
| | | | | CHEMICALS - 2.1% (Continued) | | | | |
| | 10,128 | | | PhosAgro PJSC(a)(b) | | $ | — | |
| | 34,000 | | | Shin-Etsu Chemical Company Ltd. | | | 970,247 | |
| | 72,200 | | | Toray Industries, Inc. | | | 409,191 | |
| | 21,489 | | | Yara International ASA - ADR | | | 432,724 | |
| | | | | | | | 2,736,247 | |
| | | | | COMMERCIAL SUPPORT SERVICES - 0.6% | | | | |
| | 12,994 | | | Randstad N.V. | | | 706,057 | |
| | | | | | | | | |
| | | | | CONSTRUCTION MATERIALS - 0.0%(d) | | | | |
| | 1,100 | | | AGC, Inc. | | | 41,014 | |
| | 0 | | | Turkiye Sise ve Cam Fabrikalari A/S | | | 1 | |
| | | | | | | | 41,015 | |
| | | | | DIVERSIFIED INDUSTRIALS - 0.9% | | | | |
| | 13,515 | | | Alfa Laval A.B. | | | 495,735 | |
| | 18,900 | | | Mitsubishi Heavy Industries Ltd. | | | 716,714 | |
| | | | | | | | 1,212,449 | |
| | | | | ELECTRIC UTILITIES - 0.5% | | | | |
| | 1,200 | | | Chubu Electric Power Company, Inc. | | | 13,383 | |
| | 19,994 | | | Engie S.A.(c) | | | 319,998 | |
| | 52,622 | | | Origin Energy Ltd. | | | 291,756 | |
| | | | | | | | 625,137 | |
| | | | | ELECTRICAL EQUIPMENT - 0.5% | | | | |
| | 6,400 | | | ABB Ltd. - ADR | | | 230,976 | |
| | 7,240 | | | ABB Ltd. | | | 261,191 | |
| | 7,654 | | | Hexagon A.B. | | | 87,619 | |
| | 7,600 | | | Mitsubishi Electric Corporation | | | 94,234 | |
| | | | | | | | 674,020 | |
| | | | | ENGINEERING & CONSTRUCTION - 1.7% | | | | |
| | 1,198,200 | | | China State Construction Engineering Corp Ltd. | | | 1,140,602 | |
| | 1 | | | Enka Insaat ve Sanayi A/S | | | 1 | |
| | 1,666,800 | | | Metallurgical Corp of China Ltd., Class A | | | 1,082,273 | |
| | | | | | | | 2,222,876 | |
| | | | | | | | | |
See accompanying notes which are an integral part of these financial statements.
| DUNHAM INTERNATIONAL STOCK FUND |
| SCHEDULE OF INVESTMENTS (Unaudited) (Continued) |
| April 30, 2023 |
| Shares | | | | | Fair Value | |
| | | | | COMMON STOCKS — 91.6% (Continued) | | | | |
| | | | | ENTERTAINMENT CONTENT - 0.4% | | | | |
| | 21,900 | | | Bandai Namco Holdings, Inc. | | $ | 497,482 | |
| | | | | | | | | |
| | | | | FOOD - 0.3% | | | | |
| | 741,000 | | | WH Group Ltd. | | | 412,540 | |
| | | | | | | | | |
| | | | | HOME & OFFICE PRODUCTS - 0.0%(d) | | | | |
| | 1 | | | Arcelik A/S | | | 5 | |
| | | | | | | | | |
| | | | | INDUSTRIAL INTERMEDIATE PROD - 0.0%(d) | | | | |
| | 1,134 | | | China International Marine Containers Group | | | 1,151 | |
| | | | | | | | | |
| | | | | INDUSTRIAL SUPPORT SERVICES - 0.2% | | | | |
| | 13,200 | | | Sumitomo Corporation | | | 236,589 | |
| | | | | | | | | |
| | | | | INSTITUTIONAL FINANCIAL SERVICES - 1.5% | | | | |
| | 3,396 | | | Deutsche Boerse A.G. | | | 647,663 | |
| | 88,400 | | | Haitong Securities Company Ltd. | | | 58,715 | |
| | 329,400 | | | Nomura Holdings, Inc. | | | 1,180,902 | |
| | | | | | | | 1,887,280 | |
| | | | | INSURANCE - 7.1% | | | | |
| | 231,585 | | | China Life Insurance Company Ltd., H Shares | | | 444,907 | |
| | 6,500 | | | Dai-ichi Life Holdings, Inc. | | | 120,909 | |
| | 7,097 | | | Hyundai Marine & Fire Insurance Company Ltd. | | | 199,529 | |
| | 74,000 | | | Japan Post Holdings Company Ltd. | | | 609,180 | |
| | 28,900 | | | MS&AD Insurance Group Holdings, Inc. | | | 948,593 | |
| | 4,367 | | | Muenchener Rueckversicherungs-Gesellschaft A.G. in | | | 1,641,281 | |
| | 22,464 | | | NN Group N.V. | | | 837,712 | |
| | 1,133,100 | | | People’s Insurance Company Group of China Ltd. | | | 1,021,280 | |
| | 2,312,000 | | | People’s Insurance Company Group of China Ltd., H Shares | | | 909,302 | |
| | 3,712 | | | Samsung Fire & Marine Insurance Company Ltd. | | | 624,913 | |
| | 28,200 | | | Sompo Holdings, Inc. | | | 1,176,809 | |
| | 5,130 | | | Swiss Re A.G. | | | 516,646 | |
| | | | | | | | 9,051,061 | |
| | | | | | | | | |
See accompanying notes which are an integral part of these financial statements.
| DUNHAM INTERNATIONAL STOCK FUND |
| SCHEDULE OF INVESTMENTS (Unaudited) (Continued) |
| April 30, 2023 |
| Shares | | | | | Fair Value | |
| | | | | COMMON STOCKS — 91.6% (Continued) | | | | |
| | | | | LEISURE FACILITIES & SERVICES - 0.2% | | | | |
| | 20,500 | | | Fosun International Ltd. | | $ | 14,377 | |
| | 3,940 | | | Restaurant Brands International, Inc. | | | 276,312 | |
| | | | | | | | 290,689 | |
| | | | | MACHINERY - 1.8% | | | | |
| | 1,374 | | | Accelleron Industries A.G.(b) | | | 33,892 | |
| | 4,000 | | | Keyence Corporation | | | 1,803,878 | |
| | 29,300 | | | Yokogawa Electric Corporation | | | 475,869 | |
| | | | | | | | 2,313,639 | |
| | | | | MEDICAL EQUIPMENT & DEVICES - 0.7% | | | | |
| | 2,390 | | | Alcon, Inc. | | | 173,227 | |
| | 2,800 | | | Hoya Corporation | | | 293,602 | |
| | 6,700 | | | Shimadzu Corporation | | | 209,561 | |
| | 13,130 | | | Smith & Nephew plc | | | 216,252 | |
| | | | | | | | 892,642 | |
| | | | | METALS & MINING - 3.0% | | | | |
| | 67,500 | | | China Shenhua Energy Company Ltd. | | | 284,469 | |
| | 5,500 | | | China Shenhua Energy Company Ltd., H Shares | | | 18,268 | |
| | 3,785 | | | MMC Norilsk Nickel PJSC(a)(b) | | | — | |
| | 7,491 | | | Norsk Hydro ASA | | | 55,132 | |
| | 16,735 | | | Rio Tinto Ltd.(c) | | | 1,255,169 | |
| | 25,263 | | | Rio Tinto plc - ADR(c) | | | 1,616,579 | |
| | 1,994 | | | Rio Tinto PLC(c) | | | 126,765 | |
| | 151,000 | | | Shanxi Coal International Energy Group Company | | | 379,226 | |
| | | | | | | | 3,735,608 | |
| | | | | OIL & GAS PRODUCERS - 15.3% | | | | |
| | 1,615 | | | Aker BP ASA | | | 38,611 | |
| | 73,743 | | | BP plc - ADR | | | 2,970,369 | |
| | 105,666 | | | BP PLC | | | 708,924 | |
| | 991,900 | | | China Petroleum & Chemical Corporation | | | 964,844 | |
| | 1,294,000 | | | China Petroleum & Chemical Corporation, H Shares | | | 848,100 | |
| | 17,700 | | | ENEOS Holdings, Inc. | | | 62,970 | |
| | 25,103 | | | Eni SpA - ADR(c) | | | 760,119 | |
| | 13,665 | | | Eni SpA | | | 206,448 | |
| | 2,334 | | | Equinor ASA - ADR | | | 67,079 | |
| | | | | | | | | |
See accompanying notes which are an integral part of these financial statements.
| DUNHAM INTERNATIONAL STOCK FUND |
| SCHEDULE OF INVESTMENTS (Unaudited) (Continued) |
| April 30, 2023 |
| Shares | | | | | Fair Value | |
| | | | | COMMON STOCKS — 91.6% (Continued) | | | | |
| | | | | OIL & GAS PRODUCERS - 15.3% (Continued) | | | | |
| | 6,389 | | | Equinor ASA | | $ | 183,962 | |
| | 247,390 | | | Gazprom PJSC(a)(b) | | | — | |
| | 87,530 | | | Gazprom PJSC - ADR(a)(b) | | | — | |
| | 30,300 | | | Idemitsu Kosan Company Ltd. | | | 645,198 | |
| | 37,200 | | | Inpex Corporation | | | 407,094 | |
| | 486,725 | | | KOC Holding A/S | | | 1,894,868 | |
| | 24,250 | | | LUKOIL PJSC(a)(b) | | | — | |
| | 22,511 | | | Motor Oil Hellas Corinth Refineries S.A. | | | 536,531 | |
| | 9,000 | | | OMV A.G. | | | 425,915 | |
| | 2,085,400 | | | PetroChina Company Ltd. | | | 2,387,778 | |
| | 1,184,100 | | | PetroChina Company Ltd., H Shares | | | 822,510 | |
| | 126,800 | | | Petroleo Brasileiro S.A. | | | 674,325 | |
| | 21,279 | | | Petroleo Brasileiro S.A. - ADR | | | 225,983 | |
| | 3,417 | | | Petroleo Brasileiro S.A.-A - ADR | | | 32,427 | |
| | 60,434 | | | Polski Koncern Naftowy ORLEN S.A. | | | 922,001 | |
| | 13,600 | | | PTT Exploration & Production PCL | | | 59,178 | |
| | 9,462 | | | Repsol S.A. | | | 138,998 | |
| | 117,940 | | | Rosneft Oil Company PJSC(a)(b) | | | — | |
| | 12,791 | | | Shell plc - ADR | | | 792,787 | |
| | 76,652 | | | Shell plc | | | 2,369,739 | |
| | 6,830 | | | Tatneft PJSC(a)(b) | | | — | |
| | 8,363 | | | TotalEnergies S.E. | | | 534,409 | |
| | | | | | | | 19,681,167 | |
| | | | | OIL & GAS SERVICES & EQUIPMENT - 1.0% | | | | |
| | 1,256,700 | | | CNOOC Energy Technology & Services Ltd. | | | 672,728 | |
| | 1,240,200 | | | Sinopec Oilfield Service Corporation - A (b) | | | 404,532 | |
| | 2,676,000 | | | Sinopec Oilfield Service Corporation- H(b) | | | 225,365 | |
| | | | | | | | 1,302,625 | |
| | | | | RETAIL - CONSUMER STAPLES - 1.5% | | | | |
| | 9,055 | | | Carrefour S.A. | | | 188,354 | |
| | 7,372 | | | Dollarama, Inc. | | | 456,696 | |
| | 47,593 | | | Woolworths Group Ltd. | | | 1,227,716 | |
| | | | | | | | 1,872,766 | |
| | | | | | | | | |
See accompanying notes which are an integral part of these financial statements.
| DUNHAM INTERNATIONAL STOCK FUND |
| SCHEDULE OF INVESTMENTS (Unaudited) (Continued) |
| April 30, 2023 |
| Shares | | | | | Fair Value | |
| | | | | COMMON STOCKS — 91.6% (Continued) | | | | |
| | | | | RETAIL - DISCRETIONARY - 0.0%(d) | | | | |
| | 3,842 | | | Hennes & Mauritz A.B., Class B | | $ | 56,316 | |
| | | | | | | | | |
| | | | | SEMICONDUCTORS - 6.7% | | | | |
| | 400 | | | Advantest Corporation | | | 31,174 | |
| | 17,000 | | | ASE Technology Holding Company Ltd. | | | 55,828 | |
| | 5,391 | | | ASML Holding N.V. | | | 3,421,285 | |
| | 1,400 | | | ASML Holding N.V. - ADR(c) | | | 891,604 | |
| | 49,000 | | | MediaTek, Inc. | | | 1,064,289 | |
| | 63,000 | | | Novatek Microelectronics Corporation | | | 860,343 | |
| | 3,541 | | | SK Hynix, Inc. | | | 238,425 | |
| | 55,000 | | | Taiwan Semiconductor Manufacturing Company Ltd. | | | 899,677 | |
| | 13,644 | | | Taiwan Semiconductor Manufacturing Company Ltd. - ADR | | | 1,150,189 | |
| | | | | | | | 8,612,814 | |
| | | | | SOFTWARE - 0.9% | | | | |
| | 108 | | | Constellation Software, Inc. | | | 211,419 | |
| | 1,442 | | | Open Text Corporation(c) | | | 54,637 | |
| | 6,857 | | | SAP S.E. | | | 927,887 | |
| | | | | | | | 1,193,943 | |
| | | | | SPECIALTY FINANCE - 1.0% | | | | |
| | 49,600 | | | ORIX Corporation | | | 843,845 | |
| | 20,481 | | | Samsung Card Company Ltd. | | | 456,597 | |
| | | | | | | | 1,300,442 | |
| | | | | STEEL - 0.2% | | | | |
| | 8,790 | | | ArcelorMittal S.A. | | | 249,727 | |
| | 96,000 | | | Maanshan Iron & Steel Company Ltd. | | | 20,493 | |
| | | | | | | | 270,220 | |
| | | | | TECHNOLOGY HARDWARE - 2.3% | | | | |
| | 10,100 | | | Brother Industries Ltd. | | | 158,628 | |
| | 12,000 | | | Canon, Inc. | | | 285,817 | |
| | 103,000 | | | Chicony Electronics Company Ltd. | | | 325,082 | |
| | 5,400 | | | FUJIFILM Holdings Corporation | | | 281,456 | |
| | 2,200 | | | Kyocera Corporation | | | 115,476 | |
| | 84,000 | | | Lenovo Group Ltd. | | | 85,938 | |
| | 27,000 | | | Micro-Star International Company Ltd. | | | 128,192 | |
| | | | | | | | | |
See accompanying notes which are an integral part of these financial statements.
| DUNHAM INTERNATIONAL STOCK FUND |
| SCHEDULE OF INVESTMENTS (Unaudited) (Continued) |
| April 30, 2023 |
| Shares | | | | | Fair Value | |
| | | | | COMMON STOCKS — 91.6% (Continued) | | | | |
| | | | | TECHNOLOGY HARDWARE - 2.3% (Continued) | | | | |
| | 32,015 | | | Nokia OYJ | | $ | 135,464 | |
| | 35,476 | | | Nokia OYJ - ADR(c) | | | 148,644 | |
| | 25,050 | | | Samsung Electronics Company Ltd. | | | 1,233,465 | |
| | | | | | | | 2,898,162 | |
| | | | | TECHNOLOGY SERVICES - 2.6% | | | | |
| | 11,851 | | | Experian PLC | | | 419,590 | |
| | 7,000 | | | Fujitsu Ltd. | | | 932,969 | |
| | 2,800 | | | Nomura Research Institute Ltd. | | | 70,449 | |
| | 27,000 | | | NTT Data Corporation | | | 366,756 | |
| | 13,825 | | | RELX plc - ADR | | | 457,746 | |
| | 7,689 | | | Wolters Kluwer N.V. | | | 1,018,769 | |
| | | | | | | | 3,266,279 | |
| | | | | TELECOMMUNICATIONS - 6.0% | | | | |
| | 2,583,200 | | | China United Network Communications Ltd. | | | 2,035,196 | |
| | 137,923 | | | Deutsche Telekom A.G. | | | 3,325,653 | |
| | 15,625 | | | Proximus S.A.DP | | | 133,200 | |
| | 42,446 | | | Tele2 A.B., B Shares | | | 450,952 | |
| | 154,974 | | | Telefonica S.A. | | | 703,939 | |
| | 57,706 | | | Telenor ASA | | | 720,129 | |
| | 91,244 | | | Telia Company A.B. | | | 253,991 | |
| | | | | | | | 7,623,060 | |
| | | | | TOBACCO & CANNABIS - 0.1% | | | | |
| | 2,681 | | | British American Tobacco plc - ADR | | | 99,331 | |
| | | | | | | | | |
| | | | | TRANSPORTATION & LOGISTICS - 6.1% | | | | |
| | 34 | | | AP Moller - Maersk A/S - Series B | | | 61,454 | |
| | 211 | | | AP Moller - Maersk A/S - Series A | | | 377,079 | |
| | 575,460 | | | COSCO SHIPPING Holdings Company Ltd., Class A | | | 927,584 | |
| | 2,888 | | | Deutsche Post A.G. | | | 138,915 | |
| | 56,800 | | | Evergreen Marine Corp Taiwan Ltd. | | | 299,664 | |
| | 20,000 | | | Mitsui OSK Lines Ltd. | | | 495,827 | |
| | 8,500 | | | Nippon Express Holdings Company Ltd. | | | 498,811 | |
| | 21,300 | | | Nippon Yusen KK | | | 503,524 | |
| | 2,374,600 | | | TangShan Port Group Company Ltd. | | | 1,358,117 | |
| | | | | | | | | |
See accompanying notes which are an integral part of these financial statements.
| DUNHAM INTERNATIONAL STOCK FUND |
| SCHEDULE OF INVESTMENTS (Unaudited) (Continued) |
| April 30, 2023 |
| Shares | | | | | Fair Value | |
| | | | | COMMON STOCKS — 91.6% (Continued) | | | | |
| | | | | TRANSPORTATION & LOGISTICS - 6.1% (Continued) | | | | |
| | 417,526 | | | Turk Hava Yollari AO(b) | | $ | 2,745,763 | |
| | 13,597 | | | ZIM Integrated Shipping Services Ltd.(c) | | | 232,101 | |
| | | | | | | | 7,638,840 | |
| | | | | WHOLESALE - CONSUMER STAPLES - 0.4% | | | | |
| | 38,800 | | | Marubeni Corporation | | | 550,712 | |
| | | | | | | | | |
| | | | | WHOLESALE - DISCRETIONARY - 0.7% | | | | |
| | 21,700 | | | Toyota Tsusho Corporation | | | 902,036 | |
| | | | | | | | | |
| | | | | TOTAL COMMON STOCKS (Cost $113,178,495) | | | 116,954,068 | |
| | | | | | | | | |
| | | | | EXCHANGE-TRADED FUNDS — 0.9% | | | | |
| | | | | EQUITY - 0.9% | | | | |
| | 13,599 | | | Global X MSCI Argentina ETF | | | 534,305 | |
| | 8,915 | | | iShares MSCI EAFE ETF(c) | | | 656,322 | |
| | | | | | | | 1,190,627 | |
| | | | | | | | | |
| | | | | TOTAL EXCHANGE-TRADED FUNDS (Cost $944,508) | | | 1,190,627 | |
| | | | | | | | | |
| | | | | PREFERRED STOCKS — 4.0% | | | | |
| | | | | AUTOMOTIVE — 1.6% | | | | |
| | 5,604 | | | Hyundai Motor Company | | | 439,572 | |
| | 11,130 | | | Volkswagen A.G. | | | 1,519,838 | |
| | | | | | | | 1,959,410 | |
| | | | | INSTITUTIONAL FINANCIAL SERVICES — 0.2% | | | | |
| | 110,420 | | | Mirae Asset Securities Company Ltd. | | | 304,200 | |
| | | | | | | | | |
| | | | | INSURANCE — 0.4% | | | | |
| | 3,206 | | | Samsung Fire & Marine Insurance Company Ltd. | | | 400,578 | |
| | | | | | | | | |
See accompanying notes which are an integral part of these financial statements.
| DUNHAM INTERNATIONAL STOCK FUND |
| SCHEDULE OF INVESTMENTS (Unaudited) (Continued) |
| April 30, 2023 |
| Shares | | | | | Fair Value | |
| | | | | OIL & GAS PRODUCERS — 1.2% | | | | |
| | 334,600 | | | Petroleo Brasileiro S.A. | | $ | 1,586,243 | |
| | | | | | | | | |
| | | | | TECHNOLOGY HARDWARE — 0.6% | | | | |
| | 19,632 | | | Samsung Electronics Company Ltd. | | | 821,315 | |
| | | | | | | | | |
| | | | | TOTAL PREFERRED STOCKS (Cost $6,013,295) | | | 5,071,746 | |
| | | | | | | | | |
| | | | | SHORT-TERM INVESTMENTS — 6.5% | | | | |
| | | | | COLLATERAL FOR SECURITIES LOANED - 3.8% | | | | |
| | 4,908,591 | | | Mount Vernon Liquid Assets Portfolio, LLC, 4.96% (Cost $4,908,591)(e)(f) | | | 4,908,591 | |
| | | | | | | | | |
| | | | | MONEY MARKET FUNDS - 2.7% | | | | |
| | 3,415,517 | | | Fidelity Government Portfolio, CLASS I, 4.73% (Cost $3,415,517)(e) | | | 3,415,517 | |
| | | | | | | | | |
| | | | | TOTAL SHORT-TERM INVESTMENTS (Cost $8,324,108) | | | 8,324,108 | |
| | | | | | | | | |
| | | | | TOTAL INVESTMENTS - 103.0% (Cost $128,460,406) | | $ | 131,540,549 | |
| | | | | LIABILITIES IN EXCESS OF OTHER ASSETS - (3.0)% | | | (3,860,883 | ) |
| | | | | NET ASSETS - 100.0% | | $ | 127,679,666 | |
| ADR | - American Depositary Receipt |
| | |
| A/S | - Anonim Sirketi |
| | |
| EAFE | - Europe, Australasia and Far East |
| | |
| ETF | - Exchange-Traded Fund |
| | |
| LLC | - Limited Liability Company |
| | |
| LTD | - Limited Company |
| | |
| MSCI | - Morgan Stanley Capital International |
| | |
| NV | - Naamioze Vennootschap |
| | |
| OYJ | - Julkinen osakeyhtio |
| | |
| PJSC | - Public Joint-Stock Company |
| | |
| PLC | - Public Limited Company |
| | |
| S/A | - Societe Anonyme |
| | |
| TAS | - Turkish Accounting Standards |
| | |
| (a) | Level 3 securities fair value under procedures established by the Board of Trustees, represents 0.00% of net assets. The total value of these securities are $0. |
| (b) | Non-income producing security. |
| (c) | All or a portion of these securities are on loan. Total loaned securities had a value of $4,804,499 at April 30, 2023. |
| (d) | Percentage rounds to less than 0.1%. |
| (e) | Rate disclosed is the seven day effective yield as of April 30, 2023. |
| (f) | The Trust’s securities lending policies and procedures require that the borrower: deliver cash or U.S. Government securities as collateral with respect to each new loan of U.S. securities, equal to at least 102% of the value of the portfolio securities loaned, and (ii) at all times thereafter mark-to-market the collateral on a daily basis so that the market value of such collateral is at least 100% of the value of securities loaned. From time to time the collateral may not be 102% due to end of day market movement. The next business day additional collateral is obtained/received from the borrower to replenish/reestablish 102%. |
See accompanying notes which are an integral part of these financial statements.
| Dunham Dynamic Macro Fund (Unaudited) |
| Message from the Sub-Adviser (Vontobel Asset Management, Inc) |
| |
Asset Class Recap
Since the start of the fiscal year, markets have been strongly data-dependent - watching every central bank move closely and anticipating when a pivot may occur. Headline and core inflation data remained mixed, US and EU economic data took a turn for the worse, and central banks appeared once again as lender of last resort in response to already wobbly lenders caving under the pressure of rising rates. Recession risks linger on, but equity volatility appears to have subsided as investors considered more recent comments from the Federal Reserve Chairman Jerome Powell and the state of inflation and the economy. During the six -month period ended April 30, 2023, the Federal Reserve raised interest rates four times, totaling 150 basis points, and the latest statements from the Fed signaled that there may be a pause in future increases if inflation eases. Global equities, as measured by the MSCI All Country World Index (net), increased 12.7 percent during the first half of the fiscal year. US equities, as measured by the S&P 500 Index, increased 8.6 percent while foreign equities, as measured by the MSCI All Country World Index ex US (net), surged 20.7 percent. Bond markets, as measured by the Bloomberg Global Aggregate Bond Unhedged Index, increased 8.9 percent during the same time period. Broad commodities on the other hand, as measured by the S&P GSCI Commodity Dynamic Roll index, fell 8.3 percent. The dispersion in returns across these broad asset classes was significant during the six-month period, meaning that the penalty for an outsized allocation to the wrong asset class at the wrong time could result in a strategy landing in negative territory overall.
Allocation Review
During the fiscal period, the Fund’s Sub-Adviser was changed, effective February 1, 2023. The current Sub-Adviser utilizes a highly active allocation strategy, which involves large shifts in exposures across three broad asset classes: equities, bonds, and commodities. Since the current Sub- Adviser began managing the Fund, the allocation to equities ranged between 69 percent at the beginning of the period and 97 percent at the end of April. The main driver for the Sub-Adviser’s positioning in equities is the term spread that continually signaled slowing economic momentum which encourages expectations on central banks becoming more accommodative soon. In general, the banking issues and corresponding market volatility only briefly affected positioning for the equity basket. In fact, the Sub- Adviser was optimistic that these emerging cracks in the financial sector have made a central bank pivot, or pause at least, more likely, fueling its positive overall sentiment on stocks. This higher exposure to equities broadly benefitted the Fund, as stocks generally experienced a small rally over the most recent three-month period. The bond allocation generally ranged from a modest positive exposure, reaching 10 percent, to a meaningfully negative exposure of more than negative 20 percent. The lowest interest rate sensitivity level was reached in mid-March, then increased to a slightly positive level in mid- April before subsiding to near zero at the end of the fiscal quarter. One of the most prevalent drivers in the Sub-Adviser’s bond model during the second fiscal quarter was momentum which reacted to elevated volatility in bonds as rates kept repricing in response to markets oscillating between sticky inflation concerns and easing hopes. With flat and inverted yield curves, the carry has generally been unattractive. Similarly, mean reversion has not signaled higher bond exposures as a dovish central-bank pivot that could take rates back closer to their historical mean, is not yet imminent. Overall, bonds detracted from performance since the current Sub-Adviser took over, despite having a larger exposure to foreign bonds. Commodities were consistently close to a zero allocation during the entire period, as the asset class failed to reach attractive levels within the Sub-Adviser’s metrics. Many of these exposures were accessed via futures contracts and exchange-traded funds, each of which will be expanded upon in the Holdings Insights section below.
Holdings Insights
Within the equity allocation, Fund holdings related to the tech-heavy Nasdaq 100 Index generally experienced the strongest performance. For example, the Fund held the Invesco Nasdaq 100 ETF (QQQM) (holding weight*: 9.47 percent) and the CME E-Mini NASDAQ 100 Index Future 06/16/2023 (NQM3 IND) (holding notional weight*: 7.02 percent). Since the current Sub-Adviser began managing the Fund at the beginning of February, the Nasdaq 100 Index surged 9.7 percent, greatly outperforming the 2.7 percent return of the S&P 500 Index. The Fund had an even higher exposure to the S&P 500 Index through its holdings in the SPDR S&P 500 ETF Trust (SPY) (holding weight*: 12.80 percent) and the CME E-Mini Standard & Poor’s 500 Index Future 06/16/2023 (ESM3 IND) (holding notional weight*: 3.51 percent). This higher exposure to the lower-performing S&P 500 Index resulted in the weighted average return from the Fund’s allocation to US equities to be strong, but not as high as the high- soaring Nasdaq 100 Index. Foreign equities generally contributed positively, and were closer in performance to the S&P 500 Index. For example, the Fund held the Franklin FTSE United Kingdom ETF (FLGB) (holding weight*: 6.57 percent) and the Franklin FTSE Japan ETF (FLJP) (holding weight*: 6.43 percent). During the second fiscal quarter, FLGB and FLJP increased 4.5 percent and 0.7 percent, respectively. Through futures contracts, the Fund also had exposure to the United Kingdom and Japan through its holdings in the FTSE 100 Index Future 06/16/2023 (Z M3 IND) (holding notional weight*: 9.47 percent) and the TSE TOPIX (Tokyo Price Index) Future 06/08/2023 (TPM3 IND) (holding notional weight*: 2.57 percent). As these underlying indices increased 3.5 percent and 0.8 percent, respectively, during the final three months of the fiscal period, the Fund generally benefitted from the modest positive performance.
The Fund’s allocation to bonds had the widest variance during the second fiscal quarter, shifting from an approximate negative 20 percent exposure to a positive 10 percent exposure. The Fund primarily used bond futures to express these exposures. For example, at the end of the six-month period, the Fund held the Long Gilt Future 06/28/2023 (G M3 COM) (holding notional weight*: 0.31 percent), the Euro-BTP Italian Bond Futures 06/08/2023 (IKM3 COM) (holding notional weight*: 0.61 percent), the French Government Bond Futures 06/08/2023 (OATM3 COM) (holding notional weight*: -0.82 percent), and the CBOT 10 Year US Treasury Note 06/21/2023 (TYM3 COM) (holding notional weight*: 0.55 percent). As the total exposure to bonds varied widely, so did the exposures to each of these futures, which included expressing short exposures by writing contracts as opposed to solely taking a long position. This produced mixed results, as the bond indices underlying these futures contracts returned between negative 0.5 percent and positive 1.4 percent during the second fiscal quarter and the Sub-Adviser was dramatically adjusting the exposure throughout the second fiscal quarter. The end- result was that these aggregate moves slightly detracted from Fund performance.
Sub-Adviser Outlook
The Sub-Adviser is concerned that recession risks continue to loom large, which could lead to a reckoning in the near-term. The Sub-Adviser is monitoring whether the crisis that has engulfed regional banks in the US worsens or if banks themselves unleash a recession by causing a credit crunch as the rate hiking cycle starts to bite. Even if there is no recession, the question is to what extent central banks can cut rates at all, especially if inflation refuses to revert back to the ambitious 2 percent target. A lack of outright rate cuts could confound expectations for ample quantitative easing, which the Sub-Adviser believes could lead to renewed volatility in the market. Therefore, for equities, the economic outlook combined with market expectations on central-bank policies is likely to remain the dominant variable in the Sub-Adviser’s models, while momentum may continue to be the main driver for the position in the bond asset class, closely followed by mean reversion which reflects the chances of interest rates changing direction again.
| * | Holdings percentage(s) of total investments, cash and unsettled trades excluding collateral for securities loaned as of 4/30/2023. |
| Dunham Dynamic Macro Fund |
| PORTFOLIO REVIEW (Unaudited) |
| April 30, 2023 |
| |
The Fund’s performance figures* for each of the periods ended April 30, 2023, compared to its benchmarks:
| | | | Annualized | Annualized |
| | 6 Month Return | 1 Year Return | 5 Year Return | 10 Year Return |
| Class N | 5.76% | (0.10)% | 1.48% | 0.83% |
| Class A with Load 4.50% | (0.39)% | (6.01)% | 0.02% | (0.03)% |
| Class A without load | 5.72% | (0.29)% | 1.22% | 0.57% |
| Class C | 5.33% | (1.04)% | 0.46% | (0.18)% |
| Dow Jones Moderately Aggressive Portfolio Index (a) | 8.89% | 0.44% | 5.67% | 7.06% |
| IQ Hedge Global Macro Beta Index (b) | 3.31% | 1.46% | 3.93% | 2.23% |
| Morningstar Macro Trading Category (b) | (0.15)% | (1.70)% | 2.29% | 2.12% |
| | | | | |
| * | Total Returns are calculated based on traded NAVs. As disclosed in the Trust’s latest registration statement, the Fund’s total annual operating expenses, including underlying funds, are 1.86% for Class N, 2.86% for Class C and 2.11% for Class A. Class A shares are subject to a sales load of 5.75% and a deferred sales charge of up to 0.75%. The performance data quoted here represents past performance, which is not indicative of future results. Current performance may be lower or higher than the performance data quoted. The investment return and NAV will fluctuate, so that an investor’s shares, when redeemed, may be worth more or less than their original cost. Total returns are calculated assuming reinvestment of all dividends and capital gains distributions, if any. The returns do not reflect the deductions of taxes a shareholder would pay on the redemption of Fund shares or Fund distributions. For performance information current to the most recent month-end, please call 1-800-442-4358 or visit our website www.dunham.com. |
| (a) | The Dow Jones Moderately Aggressive Portfolio Index is designed to measure a total portfolio of stocks, bonds, and cash, allocated to represent an investor’s desired risk profile. The Dow Jones Moderately Aggressive Portfolio Index risk level is set to 80% of the Dow Jones Global Stock CMAC Index’s downside risk (past 36 months). |
| (b) | The IQ Hedge Global Macro Beta Index seeks to replicate the risk-adjusted return characteristics of the collective hedge funds using a global macro investment style. Investors cannot invest directly in an index or benchmark. |
| (c) | The Morningstar Macro Trading Category is generally representative of mutual funds that use systematic or discretionary methods to examine broad factors such as the global economy, government policies, interest rates, inflation, and |
Comparison of the Change in Value of a $100,000 Investment
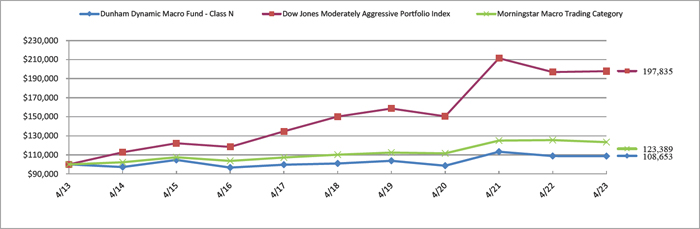
| Portfolio Composition * (Unaudited) |
| Exchange-Traded Funds | | | 43.2 | % |
| US Government | | | 41.7 | % |
| Short-Term Investments | | | 15.1 | % |
| Total | | | 100.0 | % |
| | | | | |
* Based on total value of investments as of April 30, 2023. Does not include derivative holdings.
Percentage may differ from Schedule of Investments which are based on Fund net assets.
| DUNHAM DYNAMIC MACRO FUND |
| SCHEDULE OF INVESTMENTS (Unaudited) |
| April 30, 2023 |
| Shares | | | | | Fair Value | |
| | | | | EXCHANGE-TRADED FUNDS — 41.8% | | | | |
| | | | | COMMODITY - 0.1% | | | | |
| | 1,267 | | | iShares GSCI Commodity Dynamic Roll Strategy ETF | | $ | 33,740 | |
| | | | | | | | | |
| | | | | EQUITY - 41.7% | | | | |
| | 103,300 | | | Franklin FTSE Japan ETF | | | 2,684,251 | |
| | 107,700 | | | Franklin FTSE United Kingdom ETF | | | 2,744,735 | |
| | 29,800 | | | Invesco Nasdaq 100 ETF | | | 3,953,864 | |
| | 57,600 | | | SPDR EURO STOXX 50 ETF | | | 2,668,032 | |
| | 12,843 | | | SPDR S&P 500 ETF Trust | | | 5,341,788 | |
| | | | | | | | 17,392,670 | |
| | | | | | | | | |
| | | | | TOTAL EXCHANGE-TRADED FUNDS (Cost $14,705,011) | | | 17,426,410 | |
| Principal | | | | | Coupon Rate | | | | | |
| Amount ($) | | | | | (%) | | Maturity | | | |
| | | | | U.S. GOVERNMENT & AGENCIES — 40.2% | | | | | | | | |
| | | | | U.S. TREASURY BILLS — 28.8% | | | | | | | | |
| | 3,219,000 | | | United States Treasury Bill(a) | | 4.0942 | | 05/18/23 | | | 3,212,410 | |
| | 4,528,000 | | | United States Treasury Bill(a) | | 4.6418 | | 06/15/23 | | | 4,501,144 | |
| | 4,500,000 | | | United States Treasury Bill(a) | | 4.5065 | | 02/22/24 | | | 4,332,133 | |
| | | | | | | | | | | | 12,045,687 | |
| | | | | U.S. TREASURY NOTES — 11.4% | | | | | | | | |
| | 5,000,000 | | | United States Treasury Note | | 1.0000 | | 12/15/24 | | | 4,742,383 | |
| | | | | | | | | | | | | |
| | | | | TOTAL U.S. GOVERNMENT & AGENCIES (Cost $16,714,590) | | | | | | | 16,788,070 | |
| Shares | | | | | | |
| | | | | SHORT-TERM INVESTMENTS — 14.6% | | | | |
| | | | | MONEY MARKET FUNDS - 14.6% | | | | |
| | 6,075,433 | | | Morgan Stanley Institutional Liquidity Fund, Institutional Class, 4.78% (Cost $6,075,433)(b) | | | 6,075,433 | |
| | | | | | | | | |
| | | | | TOTAL INVESTMENTS - 96.6% (Cost $37,495,034) | | $ | 40,289,913 | |
| | | | | OTHER ASSETS IN EXCESS OF LIABILITIES - 3.4% | | | 1,430,013 | |
| | | | | NET ASSETS - 100.0% | | $ | 41,719,926 | |
| | | | | | | | | |
See accompanying notes which are an integral part of these financial statements.
| DUNHAM DYNAMIC MACRO FUND |
| SCHEDULE OF INVESTMENTS (Unaudited) (Continued) |
| April 30, 2023 |
| OPEN FUTURES CONTRACTS | |
Number of
Contracts | | | Open Long Futures Contracts | | Expiration | | Notional
Amount(c) | | | Value and
Unrealized
Appreciation
(Depreciation) | |
| | 2 | | | CBOT 10 Year US Treasury Note Future | | 06/21/2023 | | $ | 230,406 | | | $ | (438 | ) |
| | 11 | | | CME E-Mini NASDAQ 100 Index Future | | 06/16/2023 | | | 2,930,466 | | | | 162,436 | |
| | 7 | | | CME E-Mini Standard & Poor’s 500 Index Future | | 06/16/2023 | | | 1,465,975 | | | | 24,325 | |
| | 84 | | | Eurex EURO STOXX 50 Future | | 06/16/2023 | | | 3,998,678 | | | | 148,500 | |
| | 2 | | | Euro-BTP Italian Bond Future | | 06/08/2023 | | | 253,113 | | | | (515 | ) |
| | 40 | | | FTSE 100 Index Future | | 06/16/2023 | | | 3,952,544 | | | | 107,172 | |
| | 1 | | | Long Gilt Future | | 06/28/2023 | | | 127,512 | | | | (2,226 | ) |
| | 71 | | | TSE TOPIX (Tokyo Price Index) Future | | 06/08/2023 | | | 10,724,966 | | | | 262,319 | |
| | | | | TOTAL FUTURES CONTRACTS | | | | | | | | $ | 701,573 | |
| | | | | | | | | | | | | | | |
| OPEN FUTURES CONTRACTS | |
Number of
Contracts | | | Open Short Futures Contracts | | Expiration | | Notional
Amount(c) | | | Value and
Unrealized
Depreciation | |
| | 4 | | | French Government Bond Future | | 06/08/2023 | | $ | 572,959 | | | $ | (4,947 | ) |
| | | | | TOTAL FUTURES CONTRACTS | | | | | | | | | | |
| Foreign Currency | | Settlement Date | | Counterparty | | Local Currency | | | U.S. Dollar Value | | | Unrealized
Appreciation/
(Depreciation) | |
| To Sell: | | | | | | | | | | | | | | | | |
| British Pound | | 05/19/2023 | | US Bank | | | 1,980,000 | | | $ | 2,489,417 | | | $ | (119,445 | ) |
| Euro | | 05/19/2023 | | US Bank | | | 2,200,000 | | | | 2,426,837 | | | | (77,592 | ) |
| Japanese Yen | | 05/19/2023 | | US Bank | | | 322,000,000 | | | | 2,369,691 | | | | 17,491 | |
| | | | | | | | | | | $ | 7,285,945 | | | $ | (179,546 | ) |
| | | | | | | | | | | | | | | | | |
| Total | | | | | | | | | | | | | | $ | (179,546 | ) |
| ETF | - Exchange-Traded Fund |
| | |
| SPDR | - Standard & Poor’s Depositary Receipt |
| | |
| USB | - US Bank |
| (b) | Rate disclosed is the seven day effective yield as of April 30, 2023. |
| (c) | The amounts shown are the underlying reference notional amounts to stock exchange indices and equities upon which the fair value of the futures contracts held by the Fund are based. Notional values do not represent the current fair value of, and are not necessarily indicative of the future cash flows of the Fund’s futures contracts. Further, the underlying price changes in relation to the variables specified by the notional values affects the fair value of these derivative financial instruments. The notional values as set forth within this schedule do not purport to represent economic value at risk to the Fund. |
See accompanying notes which are an integral part of these financial statements.
| Dunham Long/Short Credit Fund (Unaudited) |
| Message from the Sub-Adviser (MetLife Investment Advisors, LLC) |
| |
Asset Class Recap
The 2022 fiscal year took its toll on fixed income investors as rising interest rates prompted one of the worst years in the asset class’s history. The Bloomberg U.S. Aggregate Bond Index and the Bloomberg U.S. Corporate Bond Index both recorded abysmal total returns of 15.7 percent and 19.6 percent, respectively, while the ICE BofA U.S. Cash Pay High Yield Index declined 11.3 percent. As rising Interest rates were the primary driver for the poor performance in the 2022 fiscal year, falling interest rates helped the fixed income asset class rebound in the first two quarters of the 2023 fiscal year. Despite the Federal Funds Rate continuing to rise through the period, yields eased lower amid investor expectations that the Federal Reserve is nearing the end of it tightening cycle. In the first fiscal quarter, the yield on the 5-year US Treasury, 10- year US Treasury, and 30-year US Treasury all declined over 50 basis points, prompting duration- sensitive assets to rally. Fixed income markets were also boosted in the first fiscal quarter as strong demand for credit was met with underwhelming supply. Although fixed income markets continued to experience a duration tailwind as rates continued to ease lower in the most recent fiscal quarter, the technical environment reversed course, with the largest February on record for high grade primary issuance pushing spreads wider. Spread volatility was further exacerbated to close the fiscal quarter due to weakening economic data and turmoil in the regional banking sector. Over the six- month period ended April 30, 2023, short and intermediate- term corporates underperformed their longer-dated counterparts, as the Bloomberg US Corporate 3-5 years Index increased 6.1 percent while the Bloomberg US Corporate 7-10 years Index rose 9.7 percent. When considering the credit quality spectrum, the higher duration associated with higher credit quality resulted in the ICE BofA AAA US Corporate Index outpacing the ICE BofA Single-B US Cash Pay High-Yield Index by 4.1percent.
Allocation Review
The Fund’s core long positions generally contributed to performance during the six-month period, and the exposure to core long positions increased from 29 percent to 34 percent. However, the net notional exposure of the Fund decreased from approximately 16 percent to 15 percent. The Sub-Adviser continued to implement its interest rate hedging strategy, which resulted in an overall duration of approximately 0.3 years. This interest rate hedging strategy primarily utilizes Treasury bond futures of various maturities to maintain an overall duration exposure for the Fund. While this meaningfully helped the Fund avoid some of the most significant losses in fiscal year 2022, it was a detractor from gains in the most recent fiscal period. Although the Fed continued its interest rate increases, the market began to price in an end to the tightening as the Fed exhibited a slowing pace and many anticipate that the upcoming Fed meeting in May could possibly be the last 25 basis point hike before a pause. The Sub-Adviser also continued to manage credit risk exposure with credit default swaps on broad baskets of high-yield and investment grade debt, as well as with total return swaps on the IBOXX High-Yield Bond Index. At the end of the most recent fiscal quarter, the aggregate gross notional value of these credit default swaps and total return swaps was close to 25 percent of the Fund. The Fund also had exposure to strategies that are generally less reliant on the market’s trajectory, such as pairs trades, catalyst-driven investments, and opportunistic trading. During the fiscal six-month period, these strategies in aggregate comprised close to 22 percent of the Fund, with an allocation of approximately 11 percent to opportunistic trading, 6 percent to pairs trades, and 5 percent catalyst driven trades.
Holdings Insights
The biggest driver of underperformance over the six-month period was the Fund’s position in the Credit Suisse Group A.G. 7.5% Until 12/11/2023 Due 6/11/2170 (22546DAB2) (holding weight*: 0.07 percent). This was one of the Sub- Adviser’s highest conviction ideas in the Fund, and it was written down to $0 as part of the conditions imposed by the Swiss regulator FINMA related to the forced marriage of Credit Suisse and UBS. The Sub-Adviser believes this type of loss is unlike any it has encountered, and the velocity was such that it evaded one of the Fund’s risk mitigation tools, the stop loss. The Sub-Adviser held the view that the debt was not generic subordinated risk, but rather a unique security that contained language that strongly suggested the bank would call the security at its first call date of December 2023. The Sub- Adviser did not anticipate the tremors in the US banking system that would quickly lead to knock -on effects across Europe that coincided with an off-the-cuff remark from the Saudi Finance minister that suggested they would provide no further support for the beleaguered bank. Although the exposure to credit defaults contributed to Fund performance during periods of volatility, this exposure contributed to Fund performance over the fiscal quarter amid the heightened volatility. However, this exposure detracted over the six-month period given the meaningful rally to begin the fiscal year. For example, the Fund held the CDX NA HY Series 39 12/20/2027 (CDXNAHY39) (holding notional weight**: 7.63 percent), a credit default swap on baskets of high-yield bonds, which increased 2.5 percent over the most recent quarter but fell 1 percent over the six-month period.
Although the exposure to the Credit Suisse debt overshadowed all other positions within the Fund, many credits contributed to positive Fund performance. This includes, the floating rate debt HSBC Holdings plc, Due 03/10/2026 (404280DB2) (holding weight*: 1.58 percent), a British multinational bank, and the Mohegan Tribal Gaming Authority 13.25%, Due 12/15/2027 (608328BJ8) (holding weight*: 0.77 percent), operator of Mohegan Sun properties throughout the United States and developer of the Inspire Integrated Resort in South Korea. Over the six-month period, the HSBC floating rate credit rose 5.2 percent, and the Mohegan Tribal Gaming Authority added 11.1 percent since being added to the Fund in early December, helping to offset some of the losses that the Fund experienced during the fiscal quarter. The fund was also positively impacted by the exposure to Finance of America Funding LLC 7.875% Due 11/15/2025 (317386AA8) (holding weight**: 0.38 percent), a mortgage loan company. During the period, Finance of America agreed to sell its title insurance business for $100 million, in reaction this credit rose 25.6 percent prior to being sold in early March.
Sub-Adviser Outlook
The Sub-Adviser believes that the banking turmoil over the most recent fiscal quarter has presented a complex headwind to the macroeconomic backdrop, nevertheless it believes tensions in the sector seem to be cooling. With that being said, positioning in the sector will remain paramount focus, as increasing bifurcation in the sector is creating significant opportunities. Outside the financial sector, the Sub-Adviser views valuation as being too rich for an economy on the brink of recession amidst a likely steady deterioration in credit fundamentals. However, the Sub-Adviser is still finding value in the front end of the credit curve. Inverted Treasury curves and flat credit curves (depending on tenor) are still offering a historically attractive opportunity to shorten spread duration without sacrificing yield. Additionally, the elevated volatility should continue to present opportunities for pair trades and single name shorts depending on the potential timing of a catalyst. As difficult as the most recent fiscal quarter was, the Sub-Adviser has great conviction that the strategy is positioned to do well in what we believe will continue to be a challenging period for credit.
| * | Holdings percentage(s) of total investments, cash and unsettled trades excluding collateral for securities loaned as of 04/30/2023. |
| ** | Holdings percentage(s) as of the date prior to the sale of the security. |
| Dunham Long/Short Credit Fund |
| PORTFOLIO REVIEW (Unaudited) |
| April 30, 2023 |
| |
The Fund’s performance figures* for each of the periods ended April 30, 2023, compared to its benchmarks:
| | | | Annualized | Annualized |
| | 6 Month Return | 1 Year Return | 5 Year Return | 10 Year Return |
| Class N | (0.72)% | (2.10)% | 3.27% | 4.28% |
| Class A with Load 5.75% | (6.51)% | (7.99)% | 1.79% | 3.41% |
| Class A without load | (0.84)% | (2.35)% | 3.01% | 4.02% |
| Class C | (1.25)% | (3.06)% | 2.23% | 3.23% |
| BofA Merrill Lynch US 3-Month Treasury Bill Index + 3% (a) | 5.10% | 5.84% | 4.45% | 3.90% |
| Morningstar Nontraditional Bond Category (b) | 3.59% | (0.66)% | 1.05% | 1.23% |
| | | | | |
| * | Total Returns are calculated based on traded NAVs. As disclosed in the Trust’s latest registration statement as supplemented the Fund’s total annual operating expenses, including the cost of underlying funds, are 0.99% for Class N, 1.99% for Class C and 1.24% for Class A. Class A shares are subject to a sales load of 5.75% and a deferred sales charge of up to 0.75%. The performance data quoted here represents past performance, which is not indicative of future results. Current performance may be lower or higher than the performance data quoted. The investment return and NAV will fluctuate, so that an investor’s shares, when redeemed, may be worth more or less than their original cost. Total returns are calculated assuming reinvestment of all dividends and capital gains distributions, if any. The returns do not reflect the deductions of taxes a shareholder would pay on the redemption of Fund shares or Fund distributions. For performance information current to the most recent month-end, please call 1-800-442-4358 or visit our website www.dunham.com. |
| (a) | The BofA Merrill Lynch US 3-Month Treasury Bill Index + 3% is comprised of a single issue purchased at the beginning of the month and held for a full month. At the end of the month that issue is sold and rolled in a newly selected issue. The issue selected at each month-end rebalancing is the outstanding Treasury Bill that matures closest to, but not beyond, three months from the rebalancing date. To qualify for selection, an issue must have settled on or before the month-end rebalancing date. Plus an annualized return of 3%. Investors cannot invest directly in an index or benchmark. |
| (b) | The Morningstar Nontraditional Bond Category is generally representative of mutual funds that deploy absolute return strategies, strategies that are low-correlated to the overall bond market, and strategies that take long and short market and security-level positions. |
Comparison of the Change in Value of a $100,000 Investment
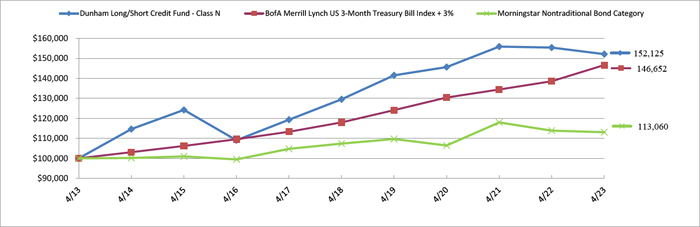
| Portfolio Composition * (Unaudited) |
| Corporate Bonds | | | 48.5 | % |
| U.S. Government & Agencies | | | 41.1 | % |
| Short-Term Investment | | | 5.2 | % |
| Collateral for Securities Loaned | | | 4.3 | % |
| Term Loans | | | 0.9 | % |
| Common Stocks | | | 0.0 | % |
| Total | | | 100.0 | % |
| | | | | |
* Based on total value of investments as of April 30, 2023. Does not include derivative holdings.
Percentage may differ from Schedule of Investments which are based on Fund net assets.
| DUNHAM LONG/SHORT CREDIT FUND |
| SCHEDULE OF INVESTMENTS (Unaudited) |
| April 30, 2023 |
| Shares | | | | | Fair Value | |
| | | | | COMMON STOCKS — 0.0%(a) | | | | |
| | | | | TELECOMMUNICATIONS - 0.0%(a) | | | | |
| | 10,000 | | | NII Holdings, Inc. 144A(b),(c) | | $ | 5,700 | |
| | | | | | | | | |
| | | | | TOTAL COMMON STOCKS (Cost $57,730) | | | 5,700 | |
| Principal | | | | | | | Coupon Rate | | | | | |
| Amount ($) | | | | | Spread | | (%) | | Maturity | | Fair Value | |
| | | | | CORPORATE BONDS — 48.0% | | | | | | | | | | |
| | | | | ASSET MANAGEMENT — 1.4% | | | | | | | | | | |
| | 830,000 | | | Blackstone Secured Lending Fund | | | | 3.6250 | | 01/15/26 | | | 762,785 | |
| | 2,780,000 | | | PennantPark Investment Corporation | | | | 4.0000 | | 11/01/26 | | | 2,487,242 | |
| | | | | | | | | | | | | | 3,250,027 | |
| | | | | AUTOMOTIVE — 1.7% | | | | | | | | | | |
| | 1,885,000 | | | Ford Motor Credit Company, LLC | | | | 3.3700 | | 11/17/23 | | | 1,855,442 | |
| | 2,065,000 | | | Hyundai Capital America(c) | | | | 1.0000 | | 09/17/24 | | | 1,941,844 | |
| | | | | | | | | | | | | | 3,797,286 | |
| | | | | BANKING — 17.1% | | | | | | | | | | |
| | 2,510,000 | | | Bank of America Corporation(d) | | SOFRRATE + 0.670% | | 1.8430 | | 02/04/25 | | | 2,436,386 | |
| | 7,265,000 | | | BPCE S.A.(c),(d),(e) | | SOFRRATE + 2.100% | | 5.9750 | | 01/18/27 | | | 7,320,125 | |
| | 1,210,000 | | | Danske Bank A/S(c),(d) | | H15T1Y + 2.100% | | 6.4660 | | 01/09/26 | | | 1,218,606 | |
| | 3,545,000 | | | HSBC Holdings plc(f) | | SOFRRATE + 1.430% | | 6.1610 | | 03/10/26 | | | 3,545,914 | |
| | 2,005,000 | | | JPMorgan Chase & Company(f) | | US0003M + 0.550% | | 5.3640 | | 02/01/27 | | | 1,849,445 | |
| | 3,505,000 | | | KeyCorp Capital II(e) | | | | 6.8750 | | 03/17/29 | | | 3,402,176 | |
| | 950,000 | | | Mitsubishi UFJ Financial Group, Inc.(d) | | H15T1Y + 1.080% | | 5.7190 | | 02/20/26 | | | 954,899 | |
| | 3,550,000 | | | NatWest Group plc(d),(e) | | H15T1Y + 2.850% | | 7.4720 | | 11/10/26 | | | 3,706,792 | |
| | 4,110,000 | | | Societe Generale S.A.(c) | | | | 7.3670 | | 01/10/53 | | | 4,040,524 | |
| | 4,735,000 | | | Synchrony Bank | | | | 5.4000 | | 08/22/25 | | | 4,516,153 | |
| | 5,145,000 | | | Wells Fargo & Company(f) | | US0003M + 0.500% | | 5.7600 | | 01/15/27 | | | 4,735,301 | |
| | 795,000 | | | Wells Fargo & Company | | | | 5.9500 | | 12/01/86 | | | 811,458 | |
| | | | | | | | | | | | | | 38,537,779 | |
| | | | | CHEMICALS — 2.2% | | | | | | | | | | |
| | 4,970,000 | | | Celanese US Holdings, LLC | | | | 5.9000 | | 07/05/24 | | | 4,974,587 | |
| | | | | | | | | | | | | | | |
See accompanying notes which are an integral part of these financial statements.
| DUNHAM LONG/SHORT CREDIT FUND |
| SCHEDULE OF INVESTMENTS (Unaudited) (Continued) |
| April 30, 2023 |
| Principal | | | | | | | Coupon Rate | | | | | |
| Amount ($) | | | | | Spread | | (%) | | Maturity | | Fair Value | |
| | | | | CORPORATE BONDS — 48.0% (Continued) | | | | | | | | | | |
| | | | | CONSUMER SERVICES — 1.8% | | | | | | | | | | |
| | 2,300,000 | | | Grand Canyon University | | | | 4.1250 | | 10/01/24 | | $ | 2,191,670 | |
| | 2,300,000 | | | Grand Canyon University | | | | 5.1250 | | 10/01/28 | | | 2,080,879 | |
| | | | | | | | | | | | | | 4,272,549 | |
| | | | | ELECTRIC UTILITIES — 4.6% | | | | | | | | | | |
| | 3,310,000 | | | American Electric Power Company, Inc. | | | | 2.0310 | | 03/15/24 | | | 3,206,535 | |
| | 2,785,000 | | | Pacific Gas and Electric Company | | | | 1.7000 | | 11/15/23 | | | 2,720,219 | |
| | 4,397,000 | | | Vistra Operations Company, LLC(c) | | | | 4.8750 | | 05/13/24 | | | 4,351,013 | |
| | | | | | | | | | | | | | 10,277,767 | |
| | | | | ENTERTAINMENT CONTENT — 1.6% | | | | | | | | | | |
| | 3,545,000 | | | Magallanes, Inc.(c),(f) | | SOFRINDX + 1.780% | | 6.5500 | | 03/15/24 | | | 3,565,471 | |
| | | | | | | | | | | | | | | |
| | | | | FOOD — 3.0% | | | | | | | | | | |
| | 7,250,000 | | | JBS USA LUX S.A. / JBS USA Food Company / JBS USA(c),(e) | | | | 6.5000 | | 12/01/52 | | | 6,874,516 | |
| | | | | | | | | | | | | | | |
| | | | | INSTITUTIONAL FINANCIAL SERVICES — 3.0% | | | | | | | | | | |
| | 3,515,000 | | | Credit Suisse Group A.G.(c),(d) | | SOFRRATE + 3.340% | | 6.3730 | | 07/15/26 | | | 3,428,891 | |
| | 4,185,000 | | | Credit Suisse Group A.G.(c),(d) | | USSW5 + 4.598% | | 7.5000 | | 06/11/70 | | | 167,400 | |
| | 1,155,000 | | | Goldman Sachs Capital I | | | | 6.3450 | | 02/15/34 | | | 1,198,699 | |
| | 2,050,000 | | | Goldman Sachs Group, Inc. (The)(f) | | SOFRRATE + 0.490% | | 5.2930 | | 10/21/24 | | | 2,030,890 | |
| | | | | | | | | | | | | | 6,825,880 | |
| | | | | INSURANCE — 2.5% | | | | | | | | | | |
| | 2,155,000 | | | Mutual of Omaha Insurance Company(c),(d) | | US0003M + 2.640% | | 4.2970 | | 07/15/54 | | | 2,081,166 | |
| | 2,285,000 | | | Ohio National Financial Services, Inc.(c) | | | | 5.8000 | | 01/24/30 | | | 2,169,205 | |
| | 1,000,000 | | | Pacific Life Insurance Company(c) | | | | 9.2500 | | 06/15/39 | | | 1,351,958 | |
| | | | | | | | | | | | | | 5,602,329 | |
| | | | | LEISURE FACILITIES & SERVICES — 0.8% | | | | | | | | | | |
| | 1,600,000 | | | Mohegan Tribal Gaming Authority(c) | | | | 13.2500 | | 12/15/27 | | | 1,716,704 | |
| | | | | | | | | | | | | | | |
| | | | | METALS & MINING — 0.5% | | | | | | | | | | |
| | 1,110,000 | | | Freeport-McMoRan, Inc.(e) | | | | 4.1250 | | 03/01/28 | | | 1,049,333 | |
| | | | | | | | | | | | | | | |
See accompanying notes which are an integral part of these financial statements.
| DUNHAM LONG/SHORT CREDIT FUND |
| SCHEDULE OF INVESTMENTS (Unaudited) (Continued) |
| April 30, 2023 |
| Principal | | | | | | | Coupon Rate | | | | | |
| Amount ($) | | | | | Spread | | (%) | | Maturity | | Fair Value | |
| | | | | CORPORATE BONDS — 48.0% (Continued) | | | | | | | | | | |
| | | | | OIL & GAS PRODUCERS — 3.8% | | | | | | | | | | |
| | 2,135,000 | | | Earthstone Energy Holdings, LLC(c),(e) | | | | 8.0000 | | 04/15/27 | | $ | 2,085,948 | |
| | 2,525,000 | | | Energean Israel Finance Ltd. | | | | 5.8750 | | 03/30/31 | | | 2,206,219 | |
| | 845,000 | | | Rockcliff Energy II, LLC(c) | | | | 5.5000 | | 10/15/29 | | | 765,540 | |
| | 2,230,000 | | | Saudi Arabian Oil Company(c) | | | | 1.2500 | | 11/24/23 | | | 2,181,471 | |
| | 1,725,000 | | | Tullow Oil plc(c) | | | | 10.2500 | | 05/15/26 | | | 1,348,838 | |
| | | | | | | | | | | | | | 8,588,016 | |
| | | | | SPECIALTY FINANCE — 2.8% | | | | | | | | | | |
| | 5,150,000 | | | AerCap Ireland Capital DAC / AerCap Global | | | | 1.1500 | | 10/29/23 | | | 5,029,883 | |
| | 1,195,000 | | | Antares Holdings, L.P.(c) | | | | 6.0000 | | 08/15/23 | | | 1,188,425 | |
| | | | | | | | | | | | | | 6,218,308 | |
| | | | | TELECOMMUNICATIONS — 1.2% | | | | | | | | | | |
| | 2,250,000 | | | HC2 Holdings, Inc.(c) | | | | 8.5000 | | 02/01/26 | | | 1,755,099 | |
| | 930,000 | | | Sprint Spectrum Company, LLC / Sprint Spectrum(c) | | | | 5.1520 | | 03/20/28 | | | 924,258 | |
| | | | | | | | | | | | | | 2,679,357 | |
| | | | | TOTAL CORPORATE BONDS (Cost $116,576,238) | | | | | | | | | 108,229,909 | |
| | | | | | | | | | | | | | | |
| Principal | | | | | | | Coupon Rate | | | | | |
| Amount ($) | | | | | Spread | | (%) | | Maturity | | Fair Value | |
| | | | | TERM LOANS — 0.9% | | | | | | | | | | |
| | | | | FOOD — 0.9% | | | | | | | | | | |
| | 1,970,063 | | | Del Monte Foods, Inc.(f) | | SOFRRATE - —% | | 9.3140 | | 05/16/29 | | | 1,938,059 | |
| | | | | | | | | | | | | | | |
| | | | | TOTAL TERM LOANS (Cost $1,949,968) | | | | | | | | | 1,938,059 | |
| Principal | | | | | Coupon Rate | | | | | |
| Amount ($) | | | | | (%) | | Maturity | | Fair Value | |
| | | | | U.S. GOVERNMENT & AGENCIES — 45.2% | | | | | | | | |
| | | | | U.S. TREASURY BILLS — 45.2% | | | | | | | | |
| | 28,855,000 | | | United States Treasury Bill(g) | | — | | 05/18/23 | | | 28,795,932 | |
| | 29,000,000 | | | United States Treasury Bill(g) | | — | | 06/22/23 | | | 28,797,625 | |
| | 26,720,000 | | | United States Treasury Bill(g) | | — | | 07/20/23 | | | 26,427,713 | |
| | 2,460,000 | | | United States Treasury Note | | 3.6250 | | 03/31/28 | | | 2,468,745 | |
| | 3,500,000 | | | United States Treasury Note | | 3.6250 | | 03/31/30 | | | 3,525,977 | |
| | 7,725,000 | | | United States Treasury Note | | 3.5000 | | 02/15/33 | | | 7,756,986 | |
| | | | | | | | | | | | | |
See accompanying notes which are an integral part of these financial statements.
| DUNHAM LONG/SHORT CREDIT FUND |
| SCHEDULE OF INVESTMENTS (Unaudited) (Continued) |
| April 30, 2023 |
| Principal | | | | | Coupon Rate | | | | | |
| Amount ($) | | | | | (%) | | Maturity | | Fair Value | |
| | | | | U.S. GOVERNMENT & AGENCIES — 45.2% (Continued) | | | | | | | | |
| | | | | U.S. TREASURY BILLS — 45.2% (Continued) | | | | | | | | |
| | 3,990,000 | | | United States Treasury Note | | 4.0000 | | 11/15/52 | | $ | 4,233,141 | |
| | | | | | | | | | | $ | 102,006,119 | |
| | | | | TOTAL U.S. GOVERNMENT & AGENCIES (Cost $101,766,379) | | | | | | | 102,006,119 | |
| Shares | | | | | Fair Value | |
| | | | | SHORT-TERM INVESTMENTS — 9.4% | | | | |
| | | | | COLLATERAL FOR SECURITIES LOANED - 4.3% | | | | |
| | 9,585,508 | | | Mount Vernon Liquid Assets Portfolio, LLC, 4.96% (Cost $9,585,508)(h),(j) | | | 9,585,508 | |
| | | | | | | | | |
| | | | | MONEY MARKET FUND - 5.1% | | | | |
| | 11,591,388 | | | First American Government Obligations Fund Class X, 4.73% (Cost $11,591,388)(h) | | | 11,591,388 | |
| | | | | | | | | |
| | | | | | | | | |
| | | | | TOTAL SHORT-TERM INVESTMENTS (Cost $21,176,896) | | | 21,176,896 | |
| | | | | | | | | |
| | | | | TOTAL INVESTMENTS - 103.5% (Cost $241,527,211) | | $ | 233,356,683 | |
| | | | | LIABILITIES IN EXCESS OF OTHER ASSETS - (3.5)% | | | (7,865,202 | ) |
| | | | | NET ASSETS - 100.0% | | $ | 225,491,481 | |
| OPEN FUTURES CONTRACTS | |
Number of
Contracts | | | Open Short Futures Contracts | | Expiration | | Notional
Amount(i) | | | Value and
Unrealized
Depreciation | |
| | 75 | | | CBOT 10 Year US Treasury Note Future | | 06/21/2023 | | $ | 8,640,225 | | | $ | (257,478 | ) |
| | 34 | | | CBOT 5 Year US Treasury Note Future | | 06/30/2023 | | | 3,731,228 | | | | (80,169 | ) |
| | 22 | | | CBOT US Treasure Bond Futures | | 06/21/2023 | | | 2,896,432 | | | | (129,152 | ) |
| | 100 | | | Ultra 10-Year US Treasury Note Future | | 06/21/2023 | | | 12,145,300 | | | | (408,580 | ) |
| | 79 | | | Ultra U.S. Treasury Bond Futures | | 06/21/2023 | | | 11,171,074 | | | | (453,966 | ) |
| | | | | TOTAL FUTURES CONTRACTS | | | | | | | | $ | (1,329,345 | ) |
| | | | | | | | | | | | | | | |
See accompanying notes which are an integral part of these financial statements.
| DUNHAM LONG/SHORT CREDIT FUND |
| SCHEDULE OF INVESTMENTS (Unaudited) (Continued) |
| April 30, 2023 (Unaudited) |
| CREDIT DEFAULT SWAP AGREEMENTS |
Description and Payment
Frequency | | Payment
Frequency | | Counterparty | | Fixed Deal
(Pay)Rate | | Implied
Credit
Spread | | Maturity
Date | | Notional
Value | | | Fair Value(m) | | | Amortized
Upfront
Payments
Paid/ | | | Unrealized
Appreciation/
(Depreciation) | |
| CDX.NA.HYSERIES 40 | | To Buy Monthly | | HSBC Securities | | 5.00% | | (39.10) | | 12/20/2027 | | $ | 17,000,000 | | | | (243,075 | ) | | | 46,198 | | | $ | (291,321 | ) |
| CDX.NA.IG SERIES 40 | | To Buy Monthly | | HSBC Securities | | 1.00% | | 81.69 | | 12/20/2027 | | | 41,000,000 | | | | (461,965 | ) | | | (353,997 | ) | | | (153,524 | ) |
| DARDEN RESTAURANTS INC | | To Buy Monthly | | Barclays | | 1.00% | | — | | 6/20/2027 | | | 7,000,000 | | | | (134,195 | ) | | | (19,287 | ) | | | (122,686 | ) |
| DR HORTON INC | | To Buy Monthly | | Barclays | | 1.00% | | — | | 12/20/2027 | | | 3,500,000 | | | | (56,920 | ) | | | 63,012 | | | | (123,820 | ) |
| UNITED STATES STEEL CORP | | To Buy | | Barclays | | 1.00% | | — | | 12/20/2027 | | | 2,800,000 | | | | (95,345 | ) | | | (73,112 | ) | | | (37,789 | ) |
| VERIZON COMMUNICATIONS INC(k) | | To Buy Monthly | | Barclays | | 1.00% | | — | | 6/20/2027 | | | (7,000,000 | ) | | | 23,037 | | | | 3,471 | | | | 27,344 | |
| KRAFT HEINZ FOOD | | At Maturity | | JPMorgan | | 1.00% | | — | | 6/20/2023 | | | 2,000,000 | | | | (32,839 | ) | | | (31,954 | ) | | | (885 | ) |
| KRAFT HEINZ FOOD(k) | | At Maturity | | Goldman Sachs | | 1.00% | | — | | 6/20/2023 | | | (2,000,000 | ) | | | 34,676 | | | | 14,987 | | | | 19,689 | |
| NEWELL BRANDS | | At Maturity | | Goldman Sachs | | 1.00% | | — | | 6/20/2023 | | | 2,000,000 | | | | 34,057 | | | | 22,030 | | | | 12,027 | |
| NEWELL BRANDS(k) | | At Maturity | | JPMorgan | | 1.00% | | — | | 6/20/2023 | | | (2,000,000 | ) | | | (35,894 | ) | | | (32,614 | ) | | | (3,280 | ) |
| TOTAL | | | | | | | | | | | | | | | | $ | (968,463 | ) | | $ | (361,266 | ) | | $ | (674,245 | ) |
| TOTAL RETURN SWAPS |
| Description | | Frequency | | Counterparty | | Notional
Value | | | Variable Rate
Premium Paid | | Premium Paid | | | Maturity Date | | Unrealized
Depreciation | |
| | | | | | | | | | | | | | | | | | | | | |
Markit IBoxx US Dollar
Liquid High Yield Index | | At Maturity | | Barclays | | $ | 14,000,000 | | | 1D SOFRRATE | | $ | 150,251 | | | 6/20/2023 | | $ | (558,565.00 | ) |
| A/S | - Anonim Sirketi |
| | |
| LLC | - Limited Liability Company |
| | |
| LP | - Limited Partnership |
| | |
| LTD | - Limited Company |
| | |
| PLC | - Public Limited Company |
| | |
| S/A | - Societe Anonyme |
| | |
| H15T1Y | US Treasury Yield Curve Rate T Note Constant Maturity 1 Year |
| | |
| SOFRINDX | SOFRINDX |
| | |
| SOFRRATE | United States SOFR Secured Overnight Financing Rate |
| | |
| US0003M | ICE LIBOR USD 3 Month |
| | |
| USSW5 | USD SWAP SEMI 30/360 5YR |
| | |
| (a) | Percentage rounds to less than 0.1%. |
| (b) | Non-income producing security. |
| (c) | Security exempt from registration under Rule 144A or Section 4(2) of the Securities Act of 1933. The security may be resold in transactions exempt from registration, normally to qualified institutional buyers. As of April 30, 2023 the total market value of 144A securities is 50,482,702 or 22.4% of net assets. |
| (d) | Variable rate security; the rate shown represents the rate on April 30, 2023. |
| (e) | All or a portion of these securities are on loan. Total loaned securities had a value of $9,423,697 at April 30, 2023. |
| (f) | Variable or floating rate security, the interest rate of which adjusts periodically based on changes in current interest rates and prepayments on the underlying pool of assets. |
| (h) | Rate disclosed is the seven day effective yield as of April 30, 2023. |
| (i) | The amounts shown are the underlying reference notional amounts to stock exchange indices and equities upon which the fair value of the futures contracts held by the Fund are based. Notional values do not represent the current fair value of, and are not necessarily indicative of the future cash flows of the Fund’s futures contracts. Further, the underlying price changes in relation to the variables specified by the notional values affects the fair value of these derivative financial instruments. The notional values as set forth within this schedule do not purport to represent economic value at risk to the Fund. |
| (j) | The Trust’s securities lending policies and procedures require that the borrower: (i) deliver cash or U.S. Government securities as collateral with respect to each new loan of U.S. securities, equal to at least 102% of the value of the portfolio securities loaned, and (ii) at all times thereafter mark-to-market the collateral on a daily basis so that the market value of such collateral is at least 100% of the value of securities loaned. From time to time the collateral may not be 102% due to end of day market movement. The next business day additional collateral is obtained/received from the borrower to replenish/reestablish 102%. |
See accompanying notes which are an integral part of these financial statements.
| Dunham Monthly Distribution Fund (Unaudited) |
| Message from the Sub-Adviser (Grantham, Mayo, Van Otterloo & Co., LLC) |
| |
Asset Class Recap
Domestic equity markets experienced a strong showing in the six -month period ended April 30, 2023, with the S&P 500 Index increasing 8.6 percent. The appreciation in equities coincided with volatility broadly subsiding, as the Chicago Board Options Exchange’s CBOE Volatility Index (VIX) ended the first half of the fiscal year slightly below 16. The VIX is generally referred to as the “fear gauge” and a higher reading generally signifies more investor uncertainty and it began the fiscal year near 26, then declined until mid-March when it revisited the 26 level once again before falling below 16 at the end of April. The 20-year average for the index is over 19, which means that a reading of 16 is indicative of below-average uncertainty while 26 was substantially higher than average. Bonds broadly experienced meaningful gains, as the Bloomberg Global Aggregate Bond Unhedged Index rose 8.9 percent. However, the merger-arbitrage asset class, as measured by the Credit Suisse Merger Arbitrage Liquid Index, increased a lackluster 2.6 percent over the fiscal six-month period, as risk-arbitrage rose 1.8 percent in the first fiscal quarter and then only managed another 0.7 percent gain in the final three months.
Allocation Review
The Fund continued to primarily hold exposures to a small amount of merger deals. The Sub-Adviser believes that each deal should be considered based upon its risk-reward profile and often pursues announced mergers where the upside from a completed deal on a probability-weighted basis is substantial relative to the potential downside from the deal breaking. The allocation of the Fund to each of these deals is primarily based on the Sub-Adviser’s assessment of the adverse effect of a particular deal breaking and then in turn using that to adjust the allocation to the deal within the Fund. This potentially creates a balance of having a more concentrated allocation to merger deals with the adverse effect on the Fund of a single deal terminating and potentially reverting to pre-announcement valuations. The Fund continued to hold more cash- only mergers than mergers where the acquirer’s stock was also a consideration in the deal. The use of derivatives in the Sub-Adviser’s strategy is generally rare and represented in small amounts when there may be some aspect of a deal that shorting acquirer shares may not fully address. Therefore, the Fund did not have any derivatives exposure that had a meaningful impact on the Fund’s performance during the fiscal quarter.
Holdings Insights
Larger merger deals may take more than a year to complete after they are announced. For example, deals that have remained in the Fund since before the commencement of the fiscal year include the Microsoft Corporation’s (MSFT) (holding weight: not held) $68.7 billion cash acquisition of Activision Blizzard, Inc. (ATVI) (holding weight*: 5.92 percent). The anticipated close for the deal is near the end of June 2023, so the approximate 22.3 percent spread between the cash offer price and the price of ATVI at the end of April is significant. This substantial spread reflects the higher uncertainty regarding the successful closing of this deal with its current terms and anticipated closing date. During the fiscal six-month period, ATVI increased 6.7 percent, contracting a portion of the spread. One of the widest deal spreads in the Fund was the all-cash acquisition of TEGNA, Inc. (TGNA) (holding weight*: 2.88 percent), a broadcast television group, by Standard General LP (holding weight: not held), a hedge fund. The spread had widened to 20 percent by the end of the first fiscal quarter, but TGNA’s 13.7 percent decline in the second fiscal quarter brought the spread to more than 40 percent. This deal had an expected closing date of mid-May, but there is fear that the Federal Communications Commission may move to block the deal, greatly increasing the uncertainty of the deal closing. While the Sub-Adviser did not exit the holding, it did adjust the size of the position in the Fund in order to manage its overall risk contribution to the Fund.
Merger deals may near the final weeks before a closing deadline with substantial spreads and still reach a successful close. For example, one of the detractors from Fund performance in the first fiscal quarter was the cash acquisition of 1Life Healthcare, Inc. (ONEM) (holding weight**: 1.79 percent), a company that facilitates online primary care appointments, by Amazon.com Inc. (AMZN) (holding weight: not held). During the first fiscal quarter, ONEM fell 6.5 percent, resulting in a deal spread at the end of 12.6 percent with only three weeks left until the deal was expected to close. However, as the FTC did not pursue actions to stop the deal, the deal successfully closed and the 12.6 percent spread was the bounty awarded to the Fund as it held it to completion and received the cash proceeds in mid-February.
Another deal that closed during the six -month period was the cash and stock acquisition of IAA, Inc. (IAA) (holding weight*: 1.70 percent) by Ritchie Bros. Auctioneers, Inc. (RBA) (holding weight*: 0.00 percent). The deal was announced near the beginning of the fiscal year and the Sub-Adviser entered when the spread was approximately 10 percent. The spread contracted modestly in the first fiscal quarter and then the remaining amount was realized in the final two months as the deal closed near the end of March.
Sub-Adviser Outlook
The Sub-Adviser continues to believe that the deal opportunity set remains plentiful and that spreads are generally providing adequate compensation for the risks presented with each deal, although each situation is unique. Therefore, the Sub-Adviser believes that the reward for identifying successful deals will be ample and that deals experiencing higher uncertainty may provide opportunities for short-term participation until the spread narrows to what the Sub-Adviser believes is a more realistic level provided the risks. Some deals are priced with what the Sub-Adviser views as particularly wide spreads, especially when considered on an annualized basis. As always, the Sub-Adviser will continue its rigorous, bottom-up research process when selecting, monitoring, and potentially eliminating certain deals from the Fund.
| * | Holdings percentage(s) of total investments, cash and unsettled trades excluding collateral for securities loaned as of 4/30/2023. |
| ** | Holdings percentage(s) as of the date prior to the sale of the security. |
| Dunham Monthly Distribution Fund |
| PORTFOLIO REVIEW (Unaudited) |
| April 30, 2023 |
| |
The Fund’s performance figures* ^ for each of the periods ended April 30, 2023, compared to its benchmarks:
| | | | Annualized | Annualized |
| | 6 Month Return | 1 Year Return | 5 Year Return | 10 Year Return |
| Class N | 1.19% | 2.40% | 1.71% | 1.79% |
| Class A with Load 5.75% | 1.04% | 2.14% | 1.45% | 1.54% |
| Class A without load | (4.76)% | (3.72)% | 0.26% | 0.94% |
| Class C | 0.68% | 1.38% | 0.70% | 0.78% |
| Credit Suisse Merger Arbitrage Liquid Index (a) | 2.57% | 3.17% | 4.14% | 2.41% |
| Morningstar Event Driven Category (b) | 1.19% | 0.92% | 4.05% | 3.43% |
| | | | | |
| * | Total Returns are calculated based on traded NAVs. As disclosed in the Trust’s latest registration statement, the Fund’s total annual operating expenses before any fee waiver, including the cost of underlying funds, are 2.53% for Class N, 3.53% for Class C and 2.78% for Class A. Class A shares are subject to a sales load of 5.75% and a deferred sales charge of up to 0.75%. The performance data quoted here represents past performance, which is not indicative of future results. Current performance may be lower or higher than the performance data quoted. The investment return and NAV will fluctuate, so that an investor’s shares, when redeemed, may be worth more or less than their original cost. Total returns are calculated assuming reinvestment of all dividends and capital gains distributions, if any. The returns do not reflect the deductions of taxes a shareholder would pay on the redemption of Fund shares or Fund distributions. For performance information current to the most recent month-end, please call 1-800-442-4358 or visit our website www.dunham.com. |
| ^ | The Dunham Monthly Distribution Fund’s distribution policy is to make twelve monthly distributions to shareholders. The level of monthly distributions (including any return of capital) is not fixed but is expected to be at or near the level of the prime interest rate (“Prime Rate”). Additionally, the Fund’s distribution policy is not designed to generate, and is not expected to result in, distributions that equal a fixed percentage of the Fund’s current net asset value per share. Shareholders receiving periodic payments from the Fund may be under the impression that they are receiving net profits. All or a portion of a distribution may consist of a return of capital, which would be a return of original shareholder investments in the Fund and not an income or capital gains distribution. Shareholders should not assume that the source of a distribution from the Fund is net profit. For more information about the Fund’s distribution policy, please turn to the “Distribution Policy and Goals” section in the Fund’s Prospectus. For disclosure regarding the extent to which the Fund’s distribution policy resulted in distributions of capital (i.e., a return of capital), please refer to Form 19a-1 Notice available at https://www.dunham.com/FA/FundInfo/MonthlyDistribution#distribution |
| (a) | Effective March 1, 2023, the Benchmark Index of the Dunham Monthly Distribution Fund is the Credit Suisse Merger Arbitrage Liquid Index. Due to the discontinuation of the IQ Hedge Market Neutral Total Return Index in March 2023, the performance through April 30, 2023 is not available. The Credit Suisse Merger Arbitrage Liquid Index aims to gain broad exposure to the merger arbitrage strategy using pre-defined quantitative methodology to invest in a liquid, diversified and broadly representative set of announced merger deals. |
| (b) | The Morningstar Event Driven Category is generally representative of mutual funds that primarily employ strategies that seek to profit from corporate actions, such as mergers and acquisitions. Mutual funds in this category typically focus on equity securities but can invest across the capital structure. However, they typically have low to moderate equity market sensitivity since company-specific developments tend to drive security prices. |
Comparison of the Change in Value of a $100,000 Investment
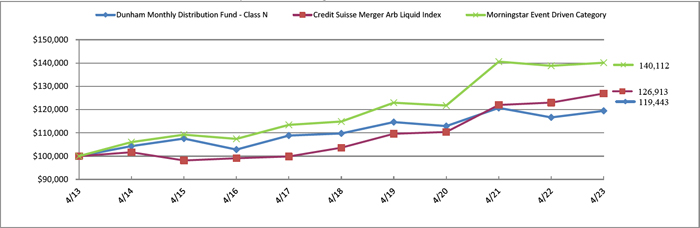
| Portfolio Composition * (Unaudited) |
| Communications | | | 21.5 | % |
| Industrials | | | 17.2 | % |
| Technology | | | 16.2 | % |
| Utilities | | | 8.2 | % |
| Healthcare | | | 7.7 | % |
| Collateral for Securities Loaned | | | 7.1 | % |
| Financials | | | 6.0 | % |
| Consumer Staples | | | 5.0 | % |
| Equity | | | 2.9 | % |
| Short-Term Investment | | | 2.9 | % |
| Materials | | | 2.5 | % |
| Real Estate | | | 2.0 | % |
| Right | | | 0.6 | % |
| Consumer Discretionary | | | 0.2 | % |
| Total | | | 100.0 | % |
| | | | | |
* Based on total value of investments as of April 30, 2023. Does not include derivative holdings.
Percentage may differ from Schedule of Investments which are based on Fund net assets.
| DUNHAM MONTHLY DISTRIBUTION FUND |
| SCHEDULE OF INVESTMENTS (Unaudited) |
| April 30, 2023 |
| Shares | | | | | Fair Value | |
| | | | | CLOSED END FUNDS — 2.9% | | | | |
| | | | | EQUITY - 2.9% | | | | |
| | 2,468,782 | | | Altaba, Inc. (i) | | $ | 5,752,262 | |
| | | | | | | | | |
| | | | | TOTAL CLOSED END FUNDS (Cost $22,837,384) | | | 5,752,262 | |
| Shares | | | | | Fair Value | |
| | | | | COMMON STOCKS — 86.9% | | | | |
| | | | | AEROSPACE & DEFENSE - 6.3% | | | | |
| | 115,083 | | | Aerojet Rocketdyne Holdings, Inc.(a),(b) | | | 6,491,832 | |
| | 43,432 | | | HEICO Corporation, Class A | | | 5,829,877 | |
| | | | | | | | 12,321,709 | |
| | | | | ASSET MANAGEMENT - 2.3% | | | | |
| | 549,718 | | | Canaccord Genuity Group, Inc. | | | 4,386,740 | |
| | 469,792 | | | Pershing Square Tontine Holdings Ltd.(a) | | | 46,979 | |
| | | | | | | | 4,433,719 | |
| | | | | BANKING – 3.8% | | | | |
| | 169,493 | | | Columbia Banking System, Inc. | | | 3,620,328 | |
| | 214,784 | | | First Horizon Corporation(b) | | | 3,769,459 | |
| | | | | | | | 7,389,787 | |
| | | | | BIOTECH & PHARMA - 3.0% | | | | |
| | 53,750 | | | Horizon Therapeutics plc(a) | | | 5,974,850 | |
| | | | | | | | | |
| | | | | CABLE & SATELLITE - 9.8% | | | | |
| | 124,540 | | | Liberty Broadband Corporation - Series C(a) | | | 10,558,501 | |
| | 450,785 | | | Liberty Global plc, Class A(a) | | | 8,794,815 | |
| | | | | | | | 19,353,316 | |
| | | | | CHEMICALS - 2.5% | | | | |
| | 139,351 | | | Univar Solutions, Inc.(a) | | | 4,946,961 | |
| | | | | | | | | |
| | | | | ELECTRIC UTILITIES - 8.3% | | | | |
| | 878,756 | | | Origin Energy Ltd.(c) | | | 4,849,352 | |
| | 237,084 | | | PNM Resources, Inc. | | | 11,410,853 | |
| | | | | | | | 16,260,205 | |
| | | | | ELECTRICAL EQUIPMENT - 4.4% | | | | |
| | 67,757 | | | National Instruments Corporation(b) | | | 3,945,490 | |
| | | | | | | | | |
See accompanying notes which are an integral part of these financial statements.
| DUNHAM MONTHLY DISTRIBUTION FUND |
| SCHEDULE OF INVESTMENTS (Unaudited) (Continued) |
| April 30, 2023 |
| Shares | | | | | Fair Value | |
| | | | | COMMON STOCKS — 86.9% (Continued) | | | | |
| | | | | ELECTRICAL EQUIPMENT - 4.4% (Continued) | | | | |
| | 146,878 | | | Toshiba Corporation(a) | | $ | 4,743,529 | |
| | | | | | | | 8,689,019 | |
| | | | | ENTERTAINMENT CONTENT - 7.4% | | | | |
| | 149,811 | | | Activision Blizzard, Inc. | | | 11,641,812 | |
| | 97,620 | | | Fox Corporation - Class B, CLASS B | | | 2,981,315 | |
| | | | | | | | 14,623,127 | |
| | | | | INDUSTRIAL SUPPORT SERVICES – 3.4% | | | | |
| | 48,040 | | | Ritchie Bros Auctioneers, Inc. | | | 2,747,408 | |
| | 47,478 | | | Triton International Ltd. | | | 3,925,006 | |
| | | | | | | | 6,672,414 | |
| | | | | MACHINERY - 2.2% | | | | |
| | 86,968 | | | Evoqua Water Technologies Corporation(a) | | | 4,300,568 | |
| | | | | | | | | |
| | | | | MEDICAL EQUIPMENT & DEVICES - 4.7% | | | | |
| | 158,194 | | | Globus Medical, Inc., Class A(a),(b) | | | 9,197,399 | |
| | | | | | | | | |
| | | | | OIL & GAS PRODUCERS - 0.0%(d) | | | | |
| | 84,102 | | | Columbia Pipeline Group, Inc.(a) | | | — | |
| | | | | | | | | |
| | | | | PUBLISHING & BROADCASTING - 4.3% | | | | |
| | 42,533 | | | Liberty Media Corp-Liberty Formula One - Series A(a) | | | 2,755,288 | |
| | 331,326 | | | TEGNA, Inc. | | | 5,665,674 | |
| | | | | | | | 8,420,962 | |
| | | | | REAL ESTATE OWNERS & DEVELOPERS - 2.0% | | | | |
| | 267,674 | | | Radius Global Infrastructure, Inc., Class A(a),(b) | | | 3,932,131 | |
| | | | | | | | | |
| | | | | RETAIL - CONSUMER STAPLES - 5.0% | | | | |
| | 474,636 | | | Albertsons Companies, Inc., Class A | | | 9,919,892 | |
| | | | | | | | | |
| | | | | RETAIL - DISCRETIONARY - 0.2% | | | | |
| | 71,634 | | | Sportsman’s Warehouse Holdings, Inc.(a) | | | 445,563 | |
| | | | | | | | | |
| | | | | SEMICONDUCTORS - 7.7% | | | | |
| | 134,001 | | | Silicon Motion Technology Corporation - ADR | | | 8,527,824 | |
| | | | | | | | | |
See accompanying notes which are an integral part of these financial statements.
| DUNHAM MONTHLY DISTRIBUTION FUND |
| SCHEDULE OF INVESTMENTS (Unaudited) (Continued) |
| April 30, 2023 |
| Shares | | | | | Fair Value | |
| | | | | COMMON STOCKS — 86.9% (Continued) | | | | |
| | | | | SEMICONDUCTORS - 7.7% (Continued) | | | | |
| | 145,689 | | | Tower Semiconductor Ltd.(a) | | $ | 6,556,734 | |
| | | | | | | | 15,084,558 | |
| | | | | SOFTWARE - 8.6% | | | | |
| | 105,854 | | | Black Knight, Inc.(a) | | | 5,783,863 | |
| | 58,311 | | | Oak Street Health, Inc.(a) | | | 2,272,380 | |
| | 70,373 | | | VMware, Inc., Class A(a) | | | 8,798,736 | |
| | | | | | | | 16,854,979 | |
| | | | | TELECOMMUNICATIONS - 0.0%(d) | | | | |
| | 205,893 | | | NII Holdings, Inc. 144A(a),(e), (i) | | | 72,063 | |
| | | | | | | | | |
| | | | | TRANSPORTATION & LOGISTICS - 1.0% | | | | |
| | 1,025 | | | American Airlines Group, Inc.(a),(b) | | | 13,981 | |
| | 114,600 | | | Spirit Airlines, Inc. | | | 1,959,660 | |
| | | | | | | | 1,973,641 | |
| | | | | | | | | |
| | | | | TOTAL COMMON STOCKS (Cost $174,214,537) | | | 170,866,863 | |
| Shares | | | | | Expiration
Date | | Exercise
Price | | | Fair Value | |
| | | | | RIGHTS — 0.5% | | | | | | | | | | |
| | | | | FORESTRY, PAPER & WOOD PRODUCTS - 0.5% | | | | | | | | | | |
| | 532,221 | | | Resolute Forest Products, Inc. – CVR (i) | | 12/20/2023 | | $ | 20.50 | | | | 1,064,442 | |
| | | | | | | | | | | | | | | |
| | | | | MEDICAL EQUIPMENT & DEVICES - 0.0% | | | | | | | | | | |
| | 34,956 | | | ABIOMED, Inc. - CVR(a) | | 12/20/2023 | | $ | 35.00 | | | | 61,173 | |
| | | | | TOTAL RIGHTS (Cost $833,388) | | | | | | | | | 1,125,615 | |
| Shares | | | | | Fair Value | |
| | | | | SHORT-TERM INVESTMENTS — 10.0% | | | | |
| | | | | COLLATERAL FOR SECURITIES LOANED - 7.1% | | | | |
| | 13,960,747 | | | Mount Vernon Liquid Assets Portfolio, LLC, 4.96% (Cost $13,960,747) (f) (h) | | | 13,960,747 | |
| | | | | | | | | |
See accompanying notes which are an integral part of these financial statements.
| DUNHAM MONTHLY DISTRIBUTION FUND |
| SCHEDULE OF INVESTMENTS (Unaudited) (Continued) |
| April 30, 2023 |
| Shares | | | | | Fair Value | |
| | | | | MONEY MARKET FUND - 2.9% | | | | |
| | 5,781,858 | | | Fidelity Government Portfolio, CLASS I, 4.73% (Cost $5,781,858)(f) | | $ | 5,781,858 | |
| | | | | TOTAL SHORT-TERM INVESTMENTS (Cost $19,742,605) | | | 19,742,605 | |
| | | | | | | | | |
| | | | | TOTAL INVESTMENTS – 100.4% (Cost $217,628,914) | | $ | 197,487,345 | |
| | | | | CALL OPTIONS WRITTEN - (0.8)% (Proceeds - $2,088,976) | | | (1,657,291 | ) |
| | | | | OTHER ASSETS IN EXCESS OF LIABILITIES - 0.4% | | | 788,989 | |
| | | | | NET ASSETS - 100.0% | | $ | 196,619,043 | |
| Contracts(g) | | | | | Counterparty | | Expiration
Date | | Exercise
Price | | | Notional
Value | | | Fair Value | |
| | | | | WRITTEN EQUITY OPTIONS - (0.8)% | | | | | | | | | | | | | | | | |
| | | | | CALL OPTIONS WRITTEN - (0.8)% | | | | | | | | | | | | | | | | |
| | 560 | | | Activision Blizzard, Inc. | | MS | | 01/19/2024 | | $ | 78 | | | $ | 4,351,760 | | | $ | 484,400 | |
| | 304 | | | Activision Blizzard, Inc. | | MS | | 01/19/2024 | | | 80 | | | | 2,362,384 | | | | 218,880 | |
| | 3,982 | | | Albertsons Companies, Inc. | | MS | | 07/21/2023 | | | 21 | | | | 8,322,380 | | | | 219,010 | |
| | 395 | | | Globus Medical, Inc. | | MS | | 09/15/2023 | | | 60 | | | | 2,296,530 | | | | 132,325 | |
| | 345 | | | Globus Medical, Inc. | | MS | | 09/15/2023 | | | 63 | | | | 2,005,830 | | | | 82,800 | |
| | 1,146 | | | Spirit Airlines, Inc. | | MS | | 09/15/2023 | | | 18 | | | | 1,959,660 | | | | 138,666 | |
| | 262 | | | VMware, Inc. | | MS | | 01/19/2024 | | | 120 | | | | 3,275,786 | | | | 381,210 | |
| | | | | TOTAL CALL OPTIONS WRITTEN (Proceeds - $2,088,976) | | | | | | | | | | | 1,657,291 | |
| | | | | | | | | | | | | | | | | | | | | |
| | | | | TOTAL EQUITY OPTIONS WRITTEN (Proceeds - $2,088,976) | | | | | | | | | | $ | 1,657,291 | |
| ADR | - American Depositary Receipt |
| | |
| LLC | - Limited Liability Company |
| | |
| LTD | - Limited Company |
| | |
| PLC | - Public Limited Company |
| | |
| MS | Morgan Stanley |
| | |
| USB | US Bank |
| | |
| (a) | Non-income producing security. |
| (b) | All or a portion of these securities are on loan. Total loaned securities had a value of $13,681,201 at April 30, 2023. |
| (c) | The value of this security has been determined in good faith under policies of the Board of Trustees. |
| (d) | Percentage rounds to less than 0.1%. |
| (e) | Security exempt from registration under Rule 144A or Section 4(2) of the Securities Act of 1933. The security may be resold in transactions exempt from registration, normally to qualified institutional buyers. As of April 30, 2023 the total market value of 144A securities is 72,063 or 0.0% of net assets. |
| (f) | Rate disclosed is the seven day effective yield as of April 30, 2023. |
| (g) | Each option contract allows the holder of the option to purchase or sell 100 shares of the underlying security. |
| (h) | The Trust’s securities lending policies and procedures require that the borrower: (i) deliver cash or U.S. Government securities as collateral with respect to each new loan of U.S. securities, equal to at least 102% of the value of the portfolio securities loaned, and (ii) at all times thereafter mark-to-market the collateral on a daily basis so that the market value of such collateral is at least 100% of the value of securities loaned. From time to time the collateral may not be 102% due to end of day market movement. The next business day additional collateral is obtained/received from the borrower to replenish/reestablish 102%. |
| (i) | Level 3 securities fair value under procedures established by the Board of Trustees, represents 3.53% of net assets. The total value of these securities is $6,949,940. |
See accompanying notes which are an integral part of these financial statements.
| DUNHAM MONTHLY DISTRIBUTION FUND |
| SCHEDULE OF SECURITIES SOLD SHORT (Unaudited) |
| April 30, 2023 |
| Shares | | | | | Fair Value | |
| | | | | COMMON STOCKS — (27.9)% | | | | |
| | | | | AEROSPACE & DEFENSE - (3.0)% | | | | |
| | (35,017 | ) | | HEICO Corporation | | $ | (5,905,267 | ) |
| | | | | | | | | |
| | | | | ASSET MANAGEMENT - (0.2)% | | | | |
| | (9,496 | ) | | Brookfield Infrastructure Corporation, Class A | | | (404,530 | ) |
| | | | | | | | | |
| | | | | BANKING – (1.8)% | | | | |
| | (169,493 | ) | | Columbia Banking System, Inc. | | | (3,620,370 | ) |
| | | | | | | | | |
| | | | | BIOTECH & PHARMA - (1.6)% | | | | |
| | (15,561 | ) | | Seagen, Inc. | | | (3,112,200 | ) |
| | | | | | | | | |
| | | | | CABLE & SATELLITE - (10.1)% | | | | |
| | (30,016 | ) | | Charter Communications, Inc., Class A | | | (11,066,899 | ) |
| | (426,272 | ) | | Liberty Global plc - Series C | | | (8,670,372 | ) |
| | | | | | | | (19,737,271 | ) |
| | | | | ENTERTAINMENT CONTENT - (1.6)% | | | | |
| | (92,200 | ) | | Fox Corporation, Class A | | | (3,066,572 | ) |
| | | | | | | | | |
| | | | | INDUSTRIAL SUPPORT SERVICES – (1.4)% (a) | | | | |
| | (48,041 | ) | | Ritchie Bros Auctioneers, Inc. | | | (2,747,465 | ) |
| | | | | | | | | |
| | | | | MACHINERY - (2.2)% | | | | |
| | (41,746 | ) | | Xylem, Inc. | | | (4,334,905 | ) |
| | | | | | | | | |
| | | | | MEDICAL EQUIPMENT & DEVICES - (2.5)% | | | | |
| | (112,259 | ) | | NuVasive, Inc. | | | (4,831,627 | ) |
| | | | | | | | | |
| | | | | PUBLISHING & BROADCASTING - (1.4)% | | | | |
| | (38,018 | ) | | Liberty Media Corp-Liberty Formula One - Series C | | | (2,744,519 | ) |
| | | | | | | | | |
| | | | | SEMICONDUCTORS - (2.1)% | | | | |
| | (5,505 | ) | | Broadcom, Inc. | | | (3,448,883 | ) |
| | | | | | | | | |
See accompanying notes which are an integral part of these financial statements.
| DUNHAM MONTHLY DISTRIBUTION FUND |
| SCHEDULE OF SECURITIES SOLD SHORT (Unaudited) (Continued) |
| April 30, 2023 |
| Shares | | | | | Fair Value | |
| | | | | COMMON STOCKS — (27.9)% (Continued) | | | | |
| | | | | SEMICONDUCTORS - (2.1)% (Continued) | | | | |
| | (27,882 | ) | | MaxLinear, Inc. | | $ | (672,793 | ) |
| | | | | | | | (4,121,676 | ) |
| | | | | | | | | |
| | | | | TOTAL SECURITIES SOLD SHORT - (Proceeds - $56,738,832) | | $ | (54,626,402 | ) |
| | | | | | | | | |
See accompanying notes which are an integral part of these financial statements.
| DUNHAM MONTHLY DISTRIBUTION FUND |
| SCHEDULE OF INVESTMENTS (Unaudited) |
| April 30, 2023 (Unaudited) |
| Foreign Currency | | Settlement Date | | Counterparty | | Local Currency | | | U.S. Dollar Value | | | Unrealized
Appreciation/
(Depreciation) | |
| To Buy: | | | | | | | | | | | | | | | | |
| Canadian Dollar | | 05/08/2023 | | US Bank | | | 13,062,349 | | | $ | 9,643,828 | | | $ | (88,469 | ) |
| | | | | | | | | | | $ | 9,643,828 | | | $ | (88,469 | ) |
| | | | | | | | | | | | | | | | | |
| To Sell: | | | | | | | | | | | | | | | | |
| Australian Dollar | | 05/08/2023 | | US Bank | | | 11,204,581 | | | $ | 7,415,816 | | | $ | 31,599 | |
| Canadian Dollar | | 05/08/2023 | | US Bank | | | 19,356,116 | | | | 14,290,466 | | | | 27,503 | |
| Japanese Yen | | 06/07/2023 | | US Bank | | | 678,576,360 | | | | 5,008,661 | | | | 162,797 | |
| | | | | | | | | | | $ | 26,714,943 | | | $ | 221,899 | |
| | | | | | | | | | | | | | | | | |
| Total | | | | | | | | | | | | | | $ | 133,430 | |
| | | | | | | | | | | | | | | | | |
See accompanying notes which are an integral part of these financial statements.
| Dunham Real Estate Stock Fund (Unaudited) |
| Message from the Sub-Adviser (American Assets Capital Advisers, LLC) |
| |
Asset Class Recap
Real estate stocks rallied to begin the fiscal year as the asset class, as measured by the Dow Jones U.S. Real Estate Total Return Index, put in its strongest fiscal quarter since early 2021 amid increasing optimism that the Federal Reserve’s aggressive monetary policy is having its intended impact on the economy. Data revealed that inflation, as measured by the Consumer Price Index and the Personal Consumption Expenditures Price Index, fell for the sixth-straight month, retail sales declined, and the outlook for corporate earnings fell. However, a resilient job market and inflation that still has room to fall to reach the Fed’s target prompted Federal Reserve officials to remain hawkish. The optimism in the first fiscal quarter gave way to pessimism in the second fiscal quarter as investors may have come to terms with the possibility that the Federal Reserve may keep interest rates higher than previously anticipated. The Federal Reserve continued to reiterate its commitment to getting inflation under control and weakening economic data weighed on confidence that the Federal Reserve is capable of slowing inflation without pushing the economy into a deep recession. During the fiscal period, the Federal Reserve raised interest rates 75 basis points in November, 50 basis point increase in early December, and slowed to a 25 basis point rise in both February and March. In response, the 10- year US Treasury yield reached a high of 4.2 percent early in the period but reversed course, falling 78 basis points to close at 3.42 percent. Over the fiscal six-month period ended April 30, 2023, real estate stocks increased 3.8 percent, underperforming the broad U.S. stock market, as measured by the S&P 500 Index, which ended up 8.6 percent over the same time period.
Allocation Review
The Sub-Adviser focuses on companies with competitive advantages that it believes can increase net operating income, independent of what is happening in the economy. Given this bias, the Fund gravitates away from cyclical sectors, which contributed to Fund performance over the fiscal six-month period. Specifically, the Fund has no exposure to traditional office REITs, which was the worst performing REIT sector over the fiscal six- month period. Office REITs were simultaneously combatting a cyclical slowdown as well as secular changes in the way people work and shop. The rise of remote work and e-commerce has reduced demand for office space, while the rise in interest rates has caused many of these property values to fall. The Fund also received positive contributions from the exposure to data center REITs, industrial REITs, and the off-benchmark exposure to casino and gaming. However, these positive contributions could not overcome the adverse effect from the exposure to industrial REITs, tower REITs and self-storage REITs.
Holdings Insights
After being one of the most meaningful detractors from positive Fund performance over the previous fiscal year, casino and gaming stocks rebounded over the first two quarters of the fiscal year. Positions such as Wynn Resorts Ltd. (WYNN) (holding weight*: 3.68 percent), a domestic manager of casinos and resorts, and MGM Resorts International (MGM) (holding weight*: 3.56 percent), a global manager of casino properties, increased 10.3 percent and 26.3 percent, respectively, over the six-month period. These positions benefited from surging year-over-year revenues thanks to an increase in conventions business and elevated casino spending due to pent-up demand following coronavirus lockdowns. Casino and gaming stocks also received a boost from the resurgence of gaming revenue in Macau. In early January, Macau loosened its travel restrictions after China rolled back its COVID-zero policy. Subsequently, Macau experienced its highest monthly gaming revenue figures in three years, according to the region’s Gaming Inspection and Coordination Bureau. To further capitalize on this opportunity, the Sub-Adviser added Las Vegas Sands Corporation (LVS) (holding weight*: 1.93 percent), a Macau-exposed casino stock, towards the end of the most recent fiscal quarter. LVS jumped 7.6 percent since being added to the Fund after the company’s earnings and revenue beat expectations, while company executives indicated positive trends in travel and tourism in Macau.
Cadiz, Inc. (CDZI) (holding weight*: 1.94 percent), a land and water resource development company, also meaningfully contributed to positive Fund performance. The Cadiz wellfields capture groundwater that would otherwise be lost to evaporation. CDZI surged 109.2 percent over the six-month period as the company completed construction of three new groundwater wells in California. Also adding to optimism in late March was news that CDZI secured a government contract to supply 5,000 acre-feet per year of water to support the restoration of the Salton Sea and health, safety, and economic development of tribal lands and in disadvantaged communities in the eastern Coachella Valley. Conversely, not all off-benchmark exposures contributed to Fund performance over the fiscal quarter. WeWork, Inc. (WE) (holding weight*: 0.77 percent), a company that engages in flexible workspace solutions, declined 83.6 percent. WE came under pressure during the six-month period as the company combatted liquidity issues.
The Fund was also adversely impacted by the exposure to tower REITs. This includes Crown Castle, Inc. (CCI) (holding weight*: 4.51 percent), American Tower Corporation (AMT) (holding weight*: 7.87 percent), and SBA Communications Corporation (SBAC) (holding weight*: 2.94 percent). CCI declined 5.5 percent, SBAC gave back 2.8 percent, while AMT rose just 0.1 percent, detracting from relative Fund performance, as earnings from companies within this industry implied slowing growth in the coming year. Elsewhere within the traditional REIT allocation, the exposure to self-storage REITs contributed to positive Fund performance. Self-storage REITs put in a constructive quarter largely due to optimism surrounding merger and acquisition activity in the space. Since being added to the Fund, the self-storage REITs CubeSmart (CUBE) (holding weight*: 0.85 percent) and Public Storage (PSA) (holding weight*: 3.79 percent) increased 16.7 and 7.6 percent, respectively, since being added to the Fund in early January.
Sub-Adviser Outlook
The Sub-Adviser believes that real estate performs better over time when it is more difficult to supply, the demand is less cyclical, and tenants are reluctant to leave. Therefore, the Fund generally has higher weightings in real estate sectors that share these characteristics: oligopoly or duopoly sector structure; high barriers to entry for new owners/developers; high barriers to exit for tenants; and secular demand drivers underlying the user side of the business. The Sub-Adviser is confident that it will continue to find combinations of these four characteristics (or some subset), which creates a competitive landscape where tenants have fewer options to move or play one building owner against another. The Sub-Adviser believes that over the long-term, the properties with these characteristics can command higher occupancy rates and better rents.
| * | Holdings percentage(s) of total investments, cash and unsettled trades excluding collateral for securities loaned as of 4/30/2023. |
| Dunham Real Estate Stock Fund |
| PORTFOLIO REVIEW (Unaudited) |
| April 30, 2023 |
| |
The Fund’s performance figures* for each of the periods ended April 30, 2023, compared to its benchmarks:
| | | | Annualized | Annualized |
| | 6 Month Return | 1 Year Return | 5 Year Return | 10 Year Return |
| Class N | 0.06% | (24.88)% | 1.27% | 2.90% |
| Class A with Load 5.75% | (5.80)% | (29.36)% | (0.17)% | 2.04% |
| Class A without load | (0.08)% | (25.05)% | 1.02% | 2.64% |
| Class C | (0.44)% | (25.62)% | 0.25% | 1.87% |
| Dow Jones U.S. Real Estate Total Return Index (a) | 3.76% | (14.60)% | 5.76% | 5.46% |
| Morningstar Real Estate Category (b) | 3.42% | (4.41)% | 5.04% | 4.79% |
| | | | | |
| * | Total Returns are calculated based on traded NAVs. As disclosed in the Trust’s latest registration statement, the Fund’s total annual operating expenses, including the cost of underlying funds, are 1.01% for Class N, 2.01% for Class C and 1.26% for Class A. Class A shares are subject to a sales load of 5.75% and a deferred sales charge of up to 0.75% The performance data quoted here represents past performance, which is not indicative of future results. Current performance may be lower or higher than the performance data quoted. The investment return and NAV will fluctuate, so that an investor’s shares, when redeemed, may be worth more or less than their original cost. Total returns are calculated assuming reinvestment of all dividends and capital gains distributions, if any. The returns do not reflect the deductions of taxes a shareholder would pay on the redemption of Fund shares or Fund distributions. For performance information current to the most recent month-end, please call 1-800-442-4358 or visit our website www.dunham.com |
| (a) | The Dow Jones U.S. Real Estate Total Return Index is designed to track the performance of real estate investment trusts (REITs) and other companies that invest directly or indirectly in real estate through development, management, or ownership, including property agencies. Investors cannot invest directly in an index or benchmark. |
| (b) | The Morningstar Real Estate Category is generally representative of mutual funds that primarily invest in REITs of various types. REITs are companies that develop and manage real estate properties. |
Comparison of the Change in Value of a $100,000 Investment
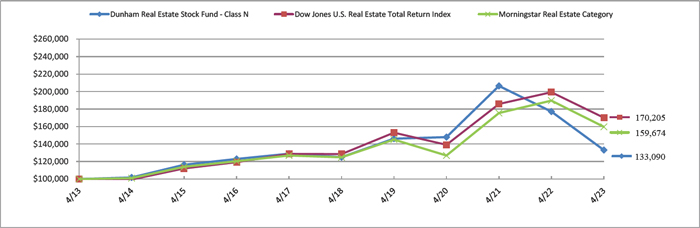
| Portfolio Composition * (Unaudited) |
| Real Estate | | | 55.4 | % |
| Collateral for Securities Loaned | | | 21.8 | % |
| Consumer Discretionary | | | 9.8 | % |
| Communications | | | 5.0 | % |
| Financials | | | 4.3 | % |
| Technology | | | 2.0 | % |
| Consumer Staples | | | 1.5 | % |
| Short-Term Investment | | | 0.2 | % |
| Total | | | 100.0 | % |
| | | | | |
* Based on total value of investments as of April 30, 2023. Does not include derivative holdings.
Percentage may differ from Schedule of Investments which are based on Fund net assets.
| DUNHAM REAL ESTATE STOCK FUND |
| SCHEDULE OF INVESTMENTS (Unaudited) |
| April 30, 2023 |
| Shares | | | | | Fair Value | |
| | | | | COMMON STOCKS — 99.8% | | | | |
| | | | | ASSET MANAGEMENT - 2.2% | | | | |
| | 517,282 | | | FTAI Infrastructure, LLC | | $ | 1,603,574 | |
| | | | | | | | | |
| | | | | DATA CENTER REIT - 7.8% | | | | |
| | 16,873 | | | Digital Realty Trust, Inc.(a) | | | 1,672,958 | |
| | 5,607 | | | Equinix, Inc. | | | 4,059,917 | |
| | | | | | | | 5,732,875 | |
| | | | | FOOD - 1.9% | | | | |
| | 352,601 | | | Cadiz, Inc.(a),(b) | | | 1,438,612 | |
| | | | | | | | | |
| | | | | GAMING REIT - 3.6% | | | | |
| | 79,805 | | | VICI Properties, Inc. | | | 2,708,582 | |
| | | | | | | | | |
| | | | | GAMING REITS - 1.0% | | | | |
| | 14,600 | | | Gaming and Leisure Properties, Inc.(a) | | | 759,200 | |
| | | | | | | | | |
| | | | | HEALTH CARE REIT - 1.0% | | | | |
| | 33,073 | | | Healthpeak Properties, Inc. | | | 726,614 | |
| | | | | | | | | |
| | | | | INDUSTRIAL REIT - 14.4% | | | | |
| | 57,147 | | | Prologis, Inc.(a) | | | 7,157,661 | |
| | 63,689 | | | Rexford Industrial Realty, Inc. | | | 3,551,936 | |
| | | | | | | | 10,709,597 | |
| | | | | INFRASTRUCTURE REIT - 15.3% | | | | |
| | 28,611 | | | American Tower Corporation, A | | | 5,847,802 | |
| | 27,210 | | | Crown Castle, Inc. | | | 3,349,279 | |
| | 8,371 | | | SBA Communications Corporation, A | | | 2,183,910 | |
| | | | | | | | 11,380,991 | |
| | | | | INTERNET MEDIA & SERVICES - 2.5% | | | | |
| | 15,443 | | | Airbnb, Inc., CLASS A(a),(b) | | | 1,848,064 | |
| | | | | | | | | |
| | | | | LEISURE FACILITIES & SERVICES - 12.5% | | | | |
| | 54,377 | | | Caesars Entertainment, Inc.(b) | | | 2,462,734 | |
| | 22,475 | | | Las Vegas Sands Corporation(a),(b) | | | 1,435,029 | |
| | 58,825 | | | MGM Resorts International | | | 2,642,419 | |
| | | | | | | | | |
See accompanying notes which are an integral part of these financial statements.
| DUNHAM REAL ESTATE STOCK FUND |
| SCHEDULE OF INVESTMENTS (Unaudited) (Continued) |
| April 30, 2023 |
| Shares | | | | | Fair Value | |
| | | | | COMMON STOCKS — 99.8% (Continued) | | | | |
| | | | | LEISURE FACILITIES & SERVICES - 12.5% (Continued) | | | | |
| | 23,959 | | | Wynn Resorts Ltd.(a),(b) | | $ | 2,738,034 | |
| | | | | | | | 9,278,216 | |
| | | | | OFFICE REIT - 3.7% | | | | |
| | 22,380 | | | Alexandria Real Estate Equities, Inc. | | | 2,779,148 | |
| | | | | | | | | |
| | | | | REAL ESTATE OWNERS & DEVELOPERS - 0.8% | | | | |
| | 1,352,955 | | | WeWork, Inc.(a),(b) | | | 570,271 | |
| | | | | | | | | |
| | | | | REAL ESTATE SERVICES - 2.0% | | | | |
| | 19,500 | | | CBRE Group, Inc., Class A(a),(b) | | | 1,494,870 | |
| | | | | | | | | |
| | | | | RESIDENTIAL REIT - 7.4% | | | | |
| | 33,316 | | | American Homes 4 Rent, Class A(a) | | | 1,108,090 | |
| | 16,325 | | | Equity LifeStyle Properties, Inc. | | | 1,124,793 | |
| | 44,408 | | | Invitation Homes, Inc.(a) | | | 1,481,895 | |
| | 12,871 | | | Sun Communities, Inc. | | | 1,788,168 | |
| | | | | | | | 5,502,946 | |
| | | | | SELF-STORAGE REIT - 6.7% | | | | |
| | 8,104 | | | Extra Space Storage, Inc.(a) | | | 1,232,132 | |
| | 23,158 | | | National Storage Affiliates Trust(a) | | | 892,741 | |
| | 9,560 | | | Public Storage | | | 2,818,575 | |
| | | | | | | | 4,943,448 | |
| | | | | SELF-STORAGE REITS - 0.8% | | | | |
| | 13,855 | | | CubeSmart(a) | | | 630,264 | |
| | | | | | | | | |
| | | | | SPECIALTY FINANCE - 3.3% | | | | |
| | 88,440 | | | FTAI Aviation Ltd. | | | 2,516,118 | |
| | | | | | | | | |
| | | | | SPECIALTY REITS - 6.3% | | | | |
| | 79,797 | | | Americold Realty Trust, Inc. | | | 2,361,193 | |
| | 18,300 | | | Iron Mountain, Inc. | | | 1,010,892 | |
| | 100,821 | | | NewLake Capital Partners, Inc. | | | 1,270,345 | |
| | | | | | | | 4,642,430 | |
| | | | | | | | | |
See accompanying notes which are an integral part of these financial statements.
| DUNHAM REAL ESTATE STOCK FUND |
| SCHEDULE OF INVESTMENTS (Unaudited) (Continued) |
| April 30, 2023 |
| Shares | | | | | Fair Value | |
| | | | | COMMON STOCKS — 99.8% (Continued) | | | | |
| | | | | TECHNOLOGY SERVICES - 2.6% | | | | |
| | 25,250 | | | CoStar Group, Inc.(b) | | $ | 1,942,988 | |
| | | | | | | | | |
| | | | | TELECOMMUNICATIONS - 4.0% | | | | |
| | 237,264 | | | DigitalBridge Group, Inc.(a) | | | 2,949,191 | |
| | | | | | | | | |
| | | | | TOTAL COMMON STOCKS (Cost $74,003,344) | | | 74,157,999 | |
| | | | | | | | | |
| Shares | | | | | Fair Value | |
| | | | | SHORT-TERM INVESTMENTS — 28.1% | | | | |
| | | | | COLLATERAL FOR SECURITIES LOANED - 27.9% | | | | |
| | 20,722,245 | | | Mount Vernon Liquid Assets Portfolio, LLC, 4.96% (Cost $20,722,245)(c)(d) | | | 20,722,245 | |
| | | | | | | | | |
| | | | | MONEY MARKET FUND - 0.2% | | | | |
| | 157,761 | | | Fidelity Government Portfolio, CLASS I, 4.73% (Cost $157,761)(c) | | | 157,761 | |
| | | | | | | | | |
| | | | | TOTAL SHORT-TERM INVESTMENTS (Cost $20,880,006) | | | 20,880,006 | |
| | | | | | | | | |
| | | | | TOTAL INVESTMENTS - 127.9% (Cost $94,883,350) | | $ | 95,038,005 | |
| | | | | LIABILITIES IN EXCESS OF OTHER ASSETS - (27.9)% | | | (20,754,670 | ) |
| | | | | NET ASSETS - 100.0% | | $ | 74,283,335 | |
| LLC | - Limited Liability Company |
| | |
| LTD | - Limited Company |
| | |
| REIT | - Real Estate Investment Trust |
| | |
| (a) | Non-income producing security. |
| (b) | All or a portion of these securities are on loan. Total loaned securities had a value of $19,772,684 at April 30, 2023. |
| (c) | Rate disclosed is the seven day effective yield as of April 30, 2023. |
| (d) | The Trust’s securities lending policies and procedures require that the borrower: deliver cash or U.S. Government securities as collateral with respect to each new loan of U.S. securities, equal to at least 102% of the value of the portfolio securities loaned, and (ii) at all times thereafter mark-to-market the collateral on a daily basis so that the market value of such collateral is at least 100% of the value of securities loaned. From time to time the collateral may not be 102% due to end of day market movement. The next business day additional collateral is obtained/received from the borrower to replenish/reestablish 102%. |
See accompanying notes which are an integral part of these financial statements.
| STATEMENTS OF ASSETS AND LIABILITIES (Unaudited) |
| April 30, 2023 |
| | | Dunham | | | | | | | | | Dunham | | | | | | | | | Dunham | |
| | | Corporate / | | | Dunham | | | Dunham | | | International | | | Dunham | | | Dunham | | | Focused | |
| | | Government | | | Floating Rate | | | High-Yield | | | Opportunity | | | Large Cap | | | Small Cap | | | Large Cap | |
| | | Bond Fund | | | Bond Fund | | | Bond Fund | | | Bond Fund | | | Value Fund | | | Value Fund | | | Growth Fund | |
| Assets: | | | | | | | | | | | | | | | | | | | | | | | | | | | | |
| Investments in securities, at cost | | $ | 131,195,294 | | | $ | 146,320,498 | | | $ | 124,839,860 | | | $ | 52,239,453 | | | $ | 143,005,446 | | | $ | 78,620,430 | | | $ | 125,541,789 | |
| Investments in securities, at value | | $ | 125,495,998 | | | $ | 137,773,140 | | | $ | 117,522,427 | | | $ | 46,121,660 | | | $ | 184,084,191 | | | $ | 81,013,371 | | | $ | 205,598,236 | |
| Cash | | | 5,789 | | | | — | | | | 19,218 | | | | 11,492 | | | | 32,568 | | | | — | | | | — | |
| Foreign currency, at value (cost $0, $0, $0, $1,347,991, $0, $0 and $0 respectively) | | | — | | | | — | | | | — | | | | 1,344,796 | | | | — | | | | — | | | | — | |
| Deposits with brokers (a) | | | — | | | | — | | | | — | | | | 179,782 | | | | — | | | | — | | | | — | |
| Unrealized appreciation on forward foreign currency exchange contracts | | | — | | | | — | | | | — | | | | 48,069 | | | | — | | | | — | | | | — | |
| Unrealized appreciation on futures | | | — | | | | — | | | | — | | | | 323,497 | | | | — | | | | — | | | | — | |
| Receivable for securities sold | | | 277,390 | | | | 2,311,348 | | | | — | | | | 588,517 | | | | — | | | | — | | | | — | |
| Receivable for swap contracts | | | — | | | | — | | | | — | | | | 164,401 | | | | | | | | | | | | | |
| Interest and dividends receivable | | | 1,052,271 | | | | 962,944 | | | | 1,849,911 | | | | 766,072 | | | | 215,575 | | | | 15,377 | | | | 70,053 | |
| Receivable for Fund shares sold | | | 40,133 | | | | 2,346 | | | | 2,136 | | | | 1,142 | | | | 77,336 | | | | 31,959 | | | | 63,229 | |
| Prepaid expenses and other assets | | | 34,961 | | | | 32,031 | | | | 33,334 | | | | 24,554 | | | | 38,280 | | | | 89,504 | | | | 38,393 | |
| Total Assets | | | 126,906,542 | | | | 141,081,809 | | | | 119,427,026 | | | | 49,573,982 | | | | 184,447,950 | | | | 81,150,211 | | | | 205,769,911 | |
| | | | | | | | | | | | | | | | | | | | | | | | | | | | | |
| Liabilities: | | | | | | | | | | | | | | | | | | | | | | | | | | | | |
| Payable for securities purchased | | | 688,075 | | | | 963,358 | | | | 60,600 | | | | 819,515 | | | | — | | | | — | | | | — | |
| Payable for Fund shares redeemed | | | 2,904 | | | | 194,449 | | | | 158,401 | | | | 34,815 | | | | 42,302 | | | | 411 | | | | 100,091 | |
| Distributions payable | | | 2,737 | | | | 11,206 | | | | 8,020 | | | | 626 | | | | — | | | | — | | | | — | |
| Payable upon return of securities loaned (Market value of securities on loan $1,619,708, $3,119,318, $13,279,201, $444,950, $15,974,227, $18,524,253, and $24,465,317 respectively) | | | 1,642,388 | | | | 3,341,340 | | | | 13,508,510 | | | | 451,588 | | | | 16,175,261 | | | | 18,755,560 | | | | 25,751,011 | |
| Unrealized depreciation on forward foreign currency exchange contracts | | | — | | | | — | | | | — | | | | 124,794 | | | | — | | | | — | | | | — | |
| Unrealized depreciation on futures | | | — | | | | — | | | | — | | | | 242,313 | | | | — | | | | — | | | | — | |
| Payable to adviser | | | 50,886 | | | | 85,455 | | | | 51,503 | | | | 23,648 | | | | 89,082 | | | | 33,546 | | | | 94,448 | |
| Payable to sub-adviser | | | 22,297 | | | | 9,429 | | | | 22,536 | | | | 15,986 | | | | 39,772 | | | | 42,800 | | | | 70,598 | |
| Payable for distribution fees | | | 8,005 | | | | 8,055 | | | | 19,049 | | | | 1,116 | | | | 15,436 | | | | 5,960 | | | | 30,520 | |
| Payable to related parties | | | 36,483 | | | | 32,375 | | | | 24,810 | | | | 30,648 | | | | 21,168 | | | | 11,919 | | | | 7,298 | |
| Accrued expenses and other liabilities | | | 7,376 | | | | 24,214 | | | | 19,487 | | | | 24,925 | | | | 10,128 | | | | 10,961 | | | | 29,118 | |
| Total Liabilities | | | 2,461,151 | | | | 4,669,881 | | | | 13,872,916 | | | | 1,769,974 | | | | 16,393,149 | | | | 18,861,157 | | | | 26,083,084 | |
| | | | | | | | | | | | | | | | | | | | | | | | | | | | | |
| Net Assets | | $ | 124,445,391 | | | $ | 136,411,928 | | | $ | 105,554,110 | | | $ | 47,804,008 | | | $ | 168,054,801 | | | $ | 62,289,054 | | | $ | 179,686,827 | |
| | | | | | | | | | | | | | | | | | | | | | | | | | | | | |
| Net Assets: | | | | | | | | | | | | | | | | | | | | | | | | | | | | |
| Paid in capital | | $ | 134,432,875 | | | $ | 164,511,405 | | | $ | 123,676,424 | | | $ | 61,949,536 | | | $ | 126,179,894 | | | $ | 61,068,349 | | | $ | 111,535,283 | |
| Accumulated earnings (loss) | | | (9,987,484 | ) | | | (28,099,477 | ) | | | (18,122,314 | ) | | | (14,145,528 | ) | | | 41,874,907 | | | | 1,220,705 | | | | 68,151,544 | |
| Net Assets | | $ | 124,445,391 | | | $ | 136,411,928 | | | $ | 105,554,110 | | | $ | 47,804,008 | | | $ | 168,054,801 | | | $ | 62,289,054 | | | $ | 179,686,827 | |
| | | | | | | | | | | | | | | | | | | | | | | | | | | | | |
| Net Asset Value Per Share | | | | | | | | | | | | | | | | | | | | | | | | | | | | |
| Class N Shares: | | | | | | | | | | | | | | | | | | | | | | | | | | | | |
| Net Assets | | $ | 106,678,538 | | | $ | 115,709,977 | | | $ | 87,917,880 | | | $ | 40,310,043 | | | $ | 140,561,303 | | | $ | 52,997,528 | | | $ | 146,060,781 | |
| Shares of beneficial interest outstanding (no par value; unlimited shares authorized) | | | 8,444,003 | | | | 13,519,892 | | | | 10,756,219 | | | | 5,461,143 | | | | 8,222,843 | | | | 3,895,597 | | | | 4,921,682 | |
| Net asset value, offering and redemption price per share | | $ | 12.63 | | | $ | 8.56 | | | $ | 8.17 | | | $ | 7.38 | | | $ | 17.09 | | | $ | 13.60 | | | $ | 29.68 | |
| | | | | | | | | | | | | | | | | | | | | | | | | | | | | |
| Class A Shares: | | | | | | | | | | | | | | | | | | | | | | | | | | | | |
| Net Assets | | $ | 15,049,623 | | | $ | 14,789,760 | | | $ | 13,809,029 | | | $ | 6,538,388 | | | $ | 23,834,102 | | | $ | 7,413,917 | | | $ | 26,090,072 | |
| Shares of beneficial interest outstanding (no par value; unlimited shares authorized) | | | 1,193,030 | | | | 1,730,082 | | | | 1,669,542 | | | | 895,527 | | | | 1,402,873 | | | | 557,296 | | | | 909,731 | |
| Net asset value and redemption price per share * | | $ | 12.61 | | | $ | 8.55 | | | $ | 8.27 | | | $ | 7.30 | | | $ | 16.99 | | | $ | 13.30 | | | $ | 28.68 | |
| Front-end sales charge factor | | | 0.9550 | | | | 0.9550 | | | | 0.9550 | | | | 0.9550 | | | | 0.9425 | | | | 0.9425 | | | | 0.9425 | |
| Offering price per share (Net asset value per share / front-end sales charge factor) | | $ | 13.20 | | | $ | 8.95 | | | $ | 8.66 | | | $ | 7.64 | | | $ | 18.03 | | | $ | 14.11 | | | $ | 30.43 | |
| | | | | | | | | | | | | | | | | | | | | | | | | | | | | |
| Class C Shares: | | | | | | | | | | | | | | | | | | | | | | | | | | | | |
| Net Assets | | $ | 2,717,230 | | | $ | 5,912,191 | | | $ | 3,827,201 | | | $ | 955,577 | | | $ | 3,659,396 | | | $ | 1,877,609 | | | $ | 7,535,974 | |
| Shares of beneficial interest outstanding (no par value; unlimited shares authorized) | | | 217,044 | | | | 691,217 | | | | 470,966 | | | | 134,781 | | | | 229,551 | | | | 172,250 | | | | 290,871 | |
| Net asset value, offering and redemption price per share | | $ | 12.52 | | | $ | 8.55 | | | $ | 8.13 | | | $ | 7.09 | | | $ | 15.94 | | | $ | 10.90 | | | $ | 25.91 | |
| * | For certain purchases of $1 million or more, a 0.75% contingent deferred sales charge may apply to redemptions made within eighteen months of purchase. |
| (a) | See Section 2.k. in the notes for the breakout by counterparty. |
See accompanying notes which are an integral part to these financial statements.
| STATEMENTS OF ASSETS AND LIABILITIES (Unaudited) (Continued) |
| April 30, 2023 |
| | | | | | Dunham | | | | | | | | | | | | Dunham | | | | |
| | | Dunham | | | Emerging | | | Dunham | | | Dunham | | | Dunham | | | Monthly | | | Dunham | |
| | | Small Cap | | | Markets | | | International | | | Dynamic Macro | | | Long/Short | | | Distribution | | | Real Estate | |
| | | Growth Fund | | | Stock Fund | | | Stock Fund | | | Fund | | | Credit Fund | | | Fund | | | Stock Fund | |
| Assets: | | | | | | | | | | | | | | | | | | | | | |
| Investments in securities, at cost | | $ | 77,113,058 | | | $ | 109,958,511 | | | $ | 128,460,406 | | | $ | 37,495,034 | | | $ | 241,527,211 | | | $ | 217,628,914 | | | $ | 94,883,350 | |
| Investments in securities, at value | | $ | 87,195,934 | | | $ | 111,409,855 | | | $ | 131,540,549 | | | $ | 40,289,913 | | | $ | 233,356,683 | | | $ | 197,487,345 | | | $ | 95,038,005 | |
| Cash | | | — | | | | — | | | | 72,034 | | | | — | | | | 697,113 | | | | — | | | | — | |
| Foreign currency, at value (cost $0, $850,112, $286,410, $831, $28,826, $4,881,023 and $0 respectively) | | | — | | | | 852,194 | | | | 286,740 | | | | — | | | | 27,920 | | | | 4,870,748 | | | | — | |
| Deposits with brokers (a) | | | — | | | | — | | | | — | | | | 940,282 | | | | 1,984,162 | | | | 64,407,628 | | | | — | |
| Unrealized appreciation on futures | | | — | | | | — | | | | — | | | | 704,752 | | | | — | | | | — | | | | — | |
| Unrealized appreciation on swap contracts | | | — | | | | — | | | | — | | | | — | | | | 59,060 | | | | — | | | | — | |
| Premiums paid on swap contracts | | | — | | | | — | | | | — | | | | — | | | | 299,949 | | | | — | | | | — | |
| Unrealized appreciation on forward foreign currency exchange contracts | | | — | | | | — | | | | — | | | | 17,491 | | | | — | | | | 221,899 | | | | — | |
| Receivable for securities sold | | | 536,198 | | | | 913,996 | | | | 225,619 | | | | — | | | | 600,919 | | | | — | | | | — | |
| Interest and dividends receivable | | | 11,987 | | | | 180,737 | | | | 1,443,212 | | | | 41,932 | | | | 1,781,234 | | | | 520,331 | | | | 16,404 | |
| Receivable for Fund shares sold | | | 31,335 | | | | 53,079 | | | | 43,406 | | | | 12,851 | | | | 118,005 | | | | 2,939 | | | | 21,978 | |
| Prepaid expenses and other assets | | | 37,748 | | | | 35,526 | | | | 34,868 | | | | 35,636 | | | | 40,558 | | | | 31,350 | | | | 34,101 | |
| Total Assets | | | 87,813,202 | | | | 113,445,387 | | | | 133,646,428 | | | | 42,042,857 | | | | 238,965,603 | | | | 267,542,240 | | | | 95,110,488 | |
| | | | | | | | | | | | | | | | | | | | | | | | | | | | | |
| Liabilities: | | | | | | | | | | | | | | | | | | | | | | | | | | | | |
| Option contracts written (premiums received $0, $0, $0, $0, $0, $2,088,976, $0) | | | — | | | | — | | | | — | | | | — | | | | — | | | | 1,657,291 | | | | — | |
| Securities sold short (proceeds $0, $0, $0, $0, $0, $56,738,832, $0) | | | — | | | | — | | | | — | | | | — | | | | — | | | | 54,626,402 | | | | — | |
| Cash overdraft | | | — | | | | 9,215 | | | | — | | | | — | | | | — | | | | — | | | | — | |
| Payable for securities purchased | | | 775,593 | | | | 230,757 | | | | 738,388 | | | | — | | | | — | | | | — | | | | — | |
| Payable for Fund shares redeemed | | | 320 | | | | 14,402 | | | | 74,250 | | | | 300 | | | | 545,647 | | | | 211,307 | | | | 23,190 | |
| Payable upon return of securities loaned (Market value of securities on loan $18,560,332, $1,107,684, $4,804,499, $0, $9,423,697, $13,681,201, and $19,772,684 respectively) | | | 18,870,462 | | | | 1,171,930 | | | | 4,908,591 | | | | — | | | | 9,585,508 | | | | 13,960,747 | | | | 20,722,245 | |
| Unrealized depreciation on forward foreign currency exchange contracts | | | — | | | | — | | | | — | | | | 197,037 | | | | — | | | | 88,469 | | | | — | |
| Accrued foreign capital gains tax on appreciated securities | | | — | | | | 666,583 | | | | — | | | | — | | | | — | | | | — | | | | — | |
| Distributions payable | | | — | | | | — | | | | — | | | | — | | | | 34,072 | | | | 54,613 | | | | — | |
| Premiums received on swap contracts | | | — | | | | — | | | | — | | | | — | | | | 510,964 | | | | — | | | | — | |
| Unrealized depreciation on swap contracts | | | — | | | | — | | | | — | | | | — | | | | 1,291,870 | | | | — | | | | — | |
| Unrealized depreciation on futures | | | — | | | | — | | | | 92 | | | | 8,126 | | | | 1,329,345 | | | | — | | | | — | |
| Payable to adviser | | | 37,877 | | | | 60,209 | | | | 68,059 | | | | 21,984 | | | | 119,762 | | | | 105,004 | | | | 39,471 | |
| Payable to sub-adviser | | | 57,636 | | | | 27,018 | | | | 105,359 | | | | 74,179 | | | | (1,416 | ) | | | 162,056 | | | | 6,291 | |
| Payable for distribution fees | | | 14,760 | | | | 9,899 | | | | 14,383 | | | | 3,931 | | | | 18,026 | | | | 34,678 | | | | 2,971 | |
| Payable to related parties | | | 9,035 | | | | 15,703 | | | | 7,419 | | | | 6,634 | | | | 20,053 | | | | 22,239 | | | | 12,844 | |
| Accrued expenses and other liabilities | | | 15,010 | | | | 42,770 | | | | 50,221 | | | | 10,740 | | | | 20,291 | | | | 391 | | | | 20,141 | |
| Total Liabilities | | | 19,780,693 | | | | 2,248,486 | | | | 5,966,762 | | | | 322,931 | | | | 13,474,122 | | | | 70,923,197 | | | | 20,827,153 | |
| | | | | | | | | | | | | | | | | | | | | | | | | | | | | |
| Net Assets | | $ | 68,032,509 | | | $ | 111,196,901 | | | $ | 127,679,666 | | | $ | 41,719,926 | | | $ | 225,491,481 | | | $ | 196,619,043 | | | $ | 74,283,335 | |
| Net Assets: | | | | | | | | | | | | | | | | | | | | | | | | | | | | |
| Paid in capital | | $ | 77,712,490 | | | $ | 130,661,729 | | | $ | 124,029,014 | | | $ | 39,673,316 | | | $ | 243,739,828 | | | $ | 212,259,599 | | | $ | 94,179,752 | |
| Accumulated earnings (loss) | | | (9,679,981 | ) | | | (19,464,828 | ) | | | 3,650,652 | | | | 2,046,610 | | | | (18,248,347 | ) | | | (15,640,556 | ) | | | (19,896,417 | ) |
| Net Assets | | $ | 68,032,509 | | | $ | 111,196,901 | | | $ | 127,679,666 | | | $ | 41,719,926 | | | $ | 225,491,481 | | | $ | 196,619,043 | | | $ | 74,283,335 | |
| Net Asset Value Per Share | | | | | | | | | | | | | | | | | | | | | | | | | | | | |
| Class N Shares: | | | | | | | | | | | | | | | | | | | | | | | | | | | | |
| Net Assets | | $ | 56,452,221 | | | $ | 93,096,659 | | | $ | 106,871,171 | | | $ | 34,448,587 | | | $ | 194,234,262 | | | $ | 156,486,926 | | | $ | 62,214,248 | |
| Shares of beneficial interest outstanding (no par value; unlimited shares authorized) | | | 3,622,403 | | | | 7,448,874 | | | | 6,596,955 | | | | 3,347,310 | | | | 22,161,682 | | | | 5,158,124 | | | | 5,021,295 | |
| Net asset value, offering and redemption price per share | | $ | 15.58 | | | $ | 12.50 | | | $ | 16.20 | | | $ | 10.29 | | | $ | 8.76 | | | $ | 30.34 | | | $ | 12.39 | |
| | | | | | | | | | | | | | | | | | | | | | | | | | | | | |
| Class A Shares: | | | | | | | | | | | | | | | | | | | | | | | | | | | | |
| Net Assets | | $ | 9,669,941 | | | $ | 16,139,815 | | | $ | 16,821,399 | | | $ | 6,347,091 | | | $ | 27,868,989 | | | $ | 25,817,373 | | | $ | 9,739,347 | |
| Shares of beneficial interest outstanding (no par value; unlimited shares authorized) | | | 675,451 | | | | 1,326,175 | | | | 1,047,162 | | | | 624,565 | | | | 3,187,865 | | | | 895,171 | | | | 781,730 | |
| Net asset value, and redemption price per share * | | $ | 14.32 | | | $ | 12.17 | | | $ | 16.06 | | | $ | 10.16 | | | $ | 8.74 | | | $ | 28.84 | | | $ | 12.46 | |
| Front-end sales charge factor | | | 0.9425 | | | | 0.9425 | | | | 0.9425 | | | | 0.9425 | | | | 0.9425 | | | | 0.9425 | | | | 0.9425 | |
| Offering price per share (Net asset value per share / front-end sales charge factor) | | $ | 15.19 | | | $ | 12.91 | | | $ | 17.04 | | | $ | 10.78 | | | $ | 9.27 | | | $ | 30.60 | | | $ | 13.22 | |
| | | | | | | | | | | | | | | | | | | | | | | | | | | | | |
| Class C Shares: | | | | | | | | | | | | | | | | | | | | | | | | | | | | |
| Net Assets | | $ | 1,910,347 | | | $ | 1,960,427 | | | $ | 3,987,096 | | | $ | 924,248 | | | $ | 3,388,230 | | | $ | 14,314,744 | | | $ | 2,329,740 | |
| Shares of beneficial interest outstanding (no par value; unlimited shares authorized) | | | 203,349 | | | | 174,168 | | | | 266,636 | | | | 97,497 | | | | 403,672 | | | | 686,015 | | | | 205,775 | |
| Net asset value, offering and redemption price per share | | $ | 9.39 | | | $ | 11.26 | | | $ | 14.95 | | | $ | 9.48 | | | $ | 8.39 | | | $ | 20.87 | | | $ | 11.32 | |
| * | For certain purchases of $1 million or more, a 0.75% contingent deferred sales charge may apply to redemptions made within eighteen months of purchase. |
| (a) | See Section 2.k. in the notes for the breakout by counterparty. |
See accompanying notes which are an integral part to these financial statements.
| STATEMENTS OF OPERATIONS (Unaudited) |
| For the Six Months Ended April 30, 2023 |
| | | Dunham | | | | | | | | | Dunham | | | | | | | | | Dunham | |
| | | Corporate / | | | Dunham | | | Dunham | | | International | | | Dunham | | | Dunham | | | Focused | |
| | | Government | | | Floating Rate | | | High-Yield | | | Opportunity | | | Large Cap | | | Small Cap | | | Large Cap | |
| | | Bond Fund | | | Bond Fund | | | Bond Fund | | | Bond Fund | | | Value Fund | | | Value Fund | | | Growth Fund | |
| Investment Income: | | | | | | | | | | | | | | | | | | | | | | | | | | | | |
| Interest income | | $ | 2,001,912 | | | $ | 7,379,212 | | | $ | 3,127,401 | | | $ | 1,319,058 | | | $ | 62,021 | | | $ | 8,404 | | | $ | 52,533 | |
| Dividend income | | | — | | | | 30,782 | | | | 704,606 | | | | — | | | | 1,759,670 | | | | 707,380 | | | | 401,165 | |
| Securities lending income - net | | | 1,812 | | | | 4,301 | | | | 29,666 | | | | 1,424 | | | | 15,006 | | | | 15,244 | | | | 22,553 | |
| Less: Foreign withholding taxes | | | — | | | | — | | | | — | | | | (336 | ) | | | — | | | | — | | | | (4,528 | ) |
| Total Investment Income | | | 2,003,724 | | | | 7,414,295 | | | | 3,861,673 | | | | 1,320,146 | | | | 1,836,697 | | | | 731,028 | | | | 471,723 | |
| | | | | | | | | | | | | | | | | | | | | | | | | | | | | |
| Operating Expenses: | | | | | | | | | | | | | | | | | | | | | | | | | | | | |
| Investment advisory fees | | | 233,985 | | | | 472,709 | | | | 286,549 | | | | 124,258 | | | | 525,674 | | | | 202,656 | | | | 572,325 | |
| Sub-advisory fees | | | 140,391 | | | | 220,598 | | | | 152,826 | | | | 93,193 | | | | 242,619 | | | | 140,300 | | | | 308,175 | |
| Sub-advisory performance fees | | | (8,391 | ) | | | (175,142 | ) | | | 6,360 | | | | (33,863 | ) | | | (101,701 | ) | | | 84,121 | | | | (83,953 | ) |
| Distribution fees- Class A Shares | | | 13,838 | | | | 22,328 | | | | 15,703 | | | | 7,181 | | | | 28,457 | | | | 9,337 | | | | 31,915 | |
| Distribution fees- Class C Shares | | | 9,690 | | | | 23,407 | | | | 14,137 | | | | 3,491 | | | | 19,183 | | | | 10,553 | | | | 36,225 | |
| Administration fees | | | 72,468 | | | | 64,548 | | | | 50,672 | | | | 54,831 | | | | 33,487 | | | | 19,352 | | | | 36,528 | |
| Registration fees | | | 27,769 | | | | 27,273 | | | | 28,761 | | | | 24,051 | | | | 30,497 | | | | 28,017 | | | | 28,365 | |
| Transfer agent fees | | | 12,397 | | | | 18,844 | | | | 14,380 | | | | 11,405 | | | | 16,364 | | | | 11,405 | | | | 17,852 | |
| Custodian fees | | | 18,844 | | | | 20,332 | | | | 4,215 | | | | 22,315 | | | | 3,967 | | | | 2,976 | | | | 3,968 | |
| Printing and postage expense | | | 8,431 | | | | 15,571 | | | | 8,927 | | | | 9,173 | | | | 8,679 | | | | 5,082 | | | | 10,413 | |
| Professional fees | | | 8,827 | | | | 12,096 | | | | 9,843 | | | | 8,178 | | | | 11,727 | | | | 9,202 | | | | 11,609 | |
| Fund accounting fees | | | 7,019 | | | | 11,818 | | | | 7,164 | | | | 3,107 | | | | 12,131 | | | | 4,677 | | | | 13,207 | |
| Chief Compliance Officer fees | | | 1,897 | | | | 5,799 | | | | 3,110 | | | | 1,120 | | | | 5,359 | | | | 2,344 | | | | 5,218 | |
| Trustees’ fees | | | 1,499 | | | | 4,587 | | | | 2,458 | | | | 887 | | | | 4,237 | | | | 1,854 | | | | 4,127 | |
| Insurance expense | | | 644 | | | | 1,439 | | | | 843 | | | | 509 | | | | 1,140 | | | | 619 | | | | 1,388 | |
| Interest expense | | | 125 | | | | 76,895 | | | | 1,317 | | | | 2,695 | | | | 1,198 | | | | 4,777 | | | | 8,810 | |
| Third party administrative servicing fees | | | 1,736 | | | | 4,116 | | | | 2,628 | | | | 1,339 | | | | 5,951 | | | | 3,223 | | | | 8,927 | |
| Miscellaneous expenses | | | 3,520 | | | | 9,172 | | | | 4,090 | | | | 3,472 | | | | 5,356 | | | | 2,976 | | | | 5,306 | |
| Total Operating Expenses | | | 554,689 | | | | 836,390 | | | | 613,983 | | | | 337,342 | | | | 854,325 | | | | 543,471 | | | | 1,020,405 | |
| Less: Fees paid indirectly | | | — | | | | — | | | | — | | | | — | | | | (2,404 | ) | | | (35,420 | ) | | | (3,025 | ) |
| Net Operating Expenses | | | 554,689 | | | | 836,390 | | | | 613,983 | | | | 337,342 | | | | 851,921 | | | | 508,051 | | | | 1,017,380 | |
| | | | | | | | | | | | | | | | | | | | | | | | | | | | | |
| Net Investment Income (Loss) | | | 1,449,035 | | | | 6,577,905 | | | | 3,247,690 | | | | 982,804 | | | | 984,776 | | | | 222,977 | | | | (545,657 | ) |
| | | | | | | | | | | | | | | | | | | | | | | | | | | | | |
| Realized and Unrealized Gain (Loss) on Investments, Futures and Forward Foreign Currency Exchange Contracts: | | | | | | | | | | | | | | | | | | | | | | | | | | | | |
| Net realized gain (loss) from: | | | | | | | | | | | | | | | | | | | | | | | | | | | | |
| Investments | | | (603,759 | ) | | | (1,984,425 | ) | | | (2,385,375 | ) | | | (1,172,271 | ) | | | 1,687,797 | | | | (484,356 | ) | | | (4,722,992 | ) |
| Futures | | | — | | | | — | | | | — | | | | (183,700 | ) | | | — | | | | — | | | | — | |
| Swap contracts | | | — | | | | — | | | | — | | | | 1,398 | | | | — | | | | — | | | | — | |
| Forward foreign currency exchange contracts | | | — | | | | — | | | | — | | | | (1,109,096 | ) | | | — | | | | — | | | | — | |
| Net realized gain (loss) | | | (603,759 | ) | | | (1,984,425 | ) | | | (2,385,375 | ) | | | (2,463,669 | ) | | | 1,687,797 | | | | (484,356 | ) | | | (4,722,992 | ) |
| Net change in unrealized appreciation (depreciation) on: | | | | | | | | | | | | | | | | | | | | | | | | | | | | |
| Investments | | | 4,280,168 | | | | 4,410,113 | | | | 4,890,278 | | | | 5,498,865 | | | | 4,830,353 | | | | (1,772,668 | ) | | | 38,975,010 | |
| Futures | | | — | | | | — | | | | — | | | | 138,480 | | | | — | | | | — | | | | — | |
| Swap contracts | | | — | | | | — | | | | — | | | | (7,554 | ) | | | — | | | | — | | | | — | |
| Forward foreign currency exchange contracts | | | — | | | | — | | | | — | | | | (125,019 | ) | | | — | | | | — | | | | — | |
| Net change in unrealized appreciation (depreciation) | | | 4,280,168 | | | | 4,410,113 | | | | 4,890,278 | | | | 5,504,772 | | | | 4,830,353 | | | | (1,772,668 | ) | | | 38,975,010 | |
| Net Realized and Unrealized Gain (Loss) | | | 3,676,409 | | | | 2,425,688 | | | | 2,504,903 | | | | 3,041,103 | | | | 6,518,150 | | | | (2,257,024 | ) | | | 34,252,018 | |
| | | | | | | | | | | | | | | | | | | | | | | | | | | | | |
| Net Increase (Decrease) in Net Assets Resulting From Operations | | $ | 5,125,444 | | | $ | 9,003,593 | | | $ | 5,752,593 | | | $ | 4,023,907 | | | $ | 7,502,926 | | | $ | (2,034,047 | ) | | $ | 33,706,361 | |
See accompanying notes which are an integral part to these financial statements.
| STATEMENTS OF OPERATIONS (Unaudited) (Continued) |
| For the Six Months Ended April 30, 2023 |
| | | | | | Dunham | | | | | | | | | | | | Dunham | | | | |
| | | Dunham | | | Emerging | | | Dunham | | | Dunham | | | Dunham | | | Monthly | | | Dunham | |
| | | Small Cap | | | Markets | | | International | | | Dynamic Macro | | | Long/Short | | | Distribution | | | Real Estate | |
| | | Growth Fund | | | Stock Fund | | | Stock Fund | | | Fund | | | Credit Fund | | | Fund | | | Stock Fund | |
| Investment Income: | | | | | | | | | | | | | | | | | | | | | | | | | | | | |
| Interest income | | $ | 52,469 | | | $ | 17,831 | | | $ | 40,480 | | | $ | 397,112 | | | $ | 5,519,698 | | | $ | 386,427 | | | $ | 10,383 | |
| Dividend income | | | 139,216 | | | | 1,359,871 | | | | 3,827,339 | | | | 430,137 | | | | 79,520 | | | | 12,558,349 | | | | 1,057,956 | |
| Securities lending income - net | | | 22,622 | | | | 2,034 | | | | 18,888 | | | | 3,168 | | | | 12,885 | | | | 11,264 | | | | 48,889 | |
| Less: Foreign withholding taxes | | | (143 | ) | | | (122,814 | ) | | | (486,093 | ) | | | — | | | | — | | | | (140,801 | ) | | | — | |
| Total Investment Income | | | 214,164 | | | | 1,256,922 | | | | 3,400,614 | | | | 830,417 | | | | 5,612,103 | | | | 12,815,239 | | | | 1,117,228 | |
| | | | | | | | | | | | | | | | | | | | | | | | | | | | | |
| Operating Expenses: | | | | | | | | | | | | | | | | | | | | | | | | | | | | |
| Investment advisory fees | | | 246,378 | | | | 369,028 | | | | 434,982 | | | | 117,063 | | | | 763,190 | | | | 681,089 | | | | 245,174 | |
| Sub-advisory fees | | | 189,522 | | | | 255,481 | | | | 434,982 | | | | 120,299 | | | | 704,483 | | | | 628,698 | | | | 169,736 | |
| Sub-advisory performance fees | | | (111,633 | ) | | | (173,820 | ) | | | 215,506 | | | | 6,599 | | | | (654,384 | ) | | | 440,113 | | | | (125,975 | ) |
| Distribution fees- Class A Shares | | | 13,946 | | | | 21,205 | | | | 23,212 | | | | 7,001 | | | | 35,534 | | | | 34,410 | | | | 12,193 | |
| Distribution fees- Class C Shares | | | 10,377 | | | | 10,710 | | | | 20,371 | | | | 4,617 | | | | 17,980 | | | | 74,849 | | | | 12,280 | |
| Administration fees | | | 20,277 | | | | 33,135 | | | | 48,916 | | | | 18,392 | | | | 56,063 | | | | 48,727 | | | | 22,507 | |
| Registration fees | | | 27,769 | | | | 29,356 | | | | 29,852 | | | | 29,009 | | | | 35,456 | | | | 42,151 | | | | 28,761 | |
| Transfer agent fees | | | 12,397 | | | | 14,876 | | | | 17,356 | | | | 9,421 | | | | 20,828 | | | | 21,820 | | | | 13,389 | |
| Custodian fees | | | 4,463 | | | | 72,400 | | | | 61,987 | | | | 3,719 | | | | 7,935 | | | | 21,820 | | | | 2,728 | |
| Printing and postage expense | | | 6,695 | | | | 7,439 | | | | 8,927 | | | | 5,951 | | | | 16,464 | | | | 27,769 | | | | 7,562 | |
| Professional fees | | | 9,256 | | | | 10,132 | | | | 10,864 | | | | 8,011 | | | | 13,794 | | | | 13,249 | | | | 9,198 | |
| Fund accounting fees | | | 5,686 | | | | 8,516 | | | | 10,038 | | | | 2,701 | | | | 17,612 | | | | 15,717 | | | | 5,658 | |
| Chief Compliance Officer fees | | | 2,409 | | | | 3,455 | | | | 4,330 | | | | 921 | | | | 7,828 | | | | 7,178 | | | | 2,339 | |
| Trustees’ fees | | | 1,904 | | | | 2,731 | | | | 3,422 | | | | 728 | | | | 6,190 | | | | 5,676 | | | | 1,850 | |
| Insurance expense | | | 545 | | | | 906 | | | | 1,252 | | | | 181 | | | | 1,636 | | | | 1,884 | | | | 744 | |
| Interest expense | | | 172 | | | | 4,111 | | | | 9,233 | | | | 60 | | | | 709 | | | | 1,275 | | | | 2,449 | |
| Third party administrative servicing fees | | | 5,455 | | | | 2,331 | | | | 4,315 | | | | 1,488 | | | | 25,440 | | | | 9,173 | | | | 6,943 | |
| Dividend expense on short sales | | | — | | | | — | | | | — | | | | — | | | | — | | | | 300,173 | | | | — | |
| Broker Fees | | | — | | | | — | | | | — | | | | — | | | | — | | | | (1,009,209 | ) | | | — | |
| Miscellaneous expenses | | | 3,473 | | | | 6,545 | | | | 6,496 | | | | 1,736 | | | | 10,412 | | | | 9,174 | | | | 4,463 | |
| Total Operating Expenses | | | 449,091 | | | | 678,537 | | | | 1,346,041 | | | | 337,897 | | | | 1,087,170 | | | | 1,375,736 | | | | 421,999 | |
| Less: Fees paid indirectly | | | (7,016 | ) | | | — | | | | — | | | | — | | | | — | | | | — | | | | — | |
| Net Operating Expenses | | | 442,075 | | | | 678,537 | | | | 1,346,041 | | | | 337,897 | | | | 1,087,170 | | | | 1,375,736 | | | | 421,999 | |
| | | | | | | | | | | | | | | | | | | | | | | | | | | | | |
| Net Investment Income (Loss) | | | (227,911 | ) | | | 578,385 | | | | 2,054,573 | | | | 492,520 | | | | 4,524,933 | | | | 11,439,503 | | | | 695,229 | |
| | | | | | | | | | | | | | | | | | | | | | | | | | | | | |
| Realized and Unrealized Gain (Loss) on Investments, Futures, Purchased Options, Securities Sold Short, Written Options, Swap Contracts, Foreign Currency Transactions and Forward Foreign Currency Exchange Contracts | | | | | | | | | | | | | | | | | | | | | | | | | | | | |
| Net realized gain (loss) from: | | | | | | | | | | | | | | | | | | | | | | | | | | | | |
| Investments | | | (3,165,944 | ) | | | (4,515,939 | ) | | | 1,760,929 | | | | (2,054 | ) | | | (6,162,289 | ) | | | (3,646,830 | ) | | | (10,355,595 | ) |
| Foreign capital gains tax | | | — | | | | (72,898 | ) | | | — | | | | — | | | | — | | | | — | | | | — | |
| Futures | | | — | | | | — | | | | — | | | | 39,842 | | | | 3,027,939 | | | | — | | | | — | |
| Purchased options | | | — | | | | — | | | | — | | | | (185,267 | ) | | | — | | | | — | | | | — | |
| Securities sold short | | | — | | | | — | | | | — | | | | — | | | | — | | | | (337,232 | ) | | | — | |
| Written options | | | — | | | | — | | | | — | | | | — | | | | — | | | | 694,251 | | | | — | |
| Swap contracts | | | — | | | | — | | | | — | | | | — | | | | (1,366,050 | ) | | | — | | | | — | |
| Forward foreign currency exchange contracts | | | — | | | | (30,454 | ) | | | 24,036 | | | | 4,725 | | | | — | | | | 431,066 | | | | — | |
| Options purchased | | | — | | | | — | | | | — | | | | — | | | | — | | | | (22,856 | ) | | | — | |
| Net realized gain (loss) | | | (3,165,944 | ) | | | (4,619,291 | ) | | | 1,784,965 | | | | (142,754 | ) | | | (4,500,400 | ) | | | (2,881,601 | ) | | | (10,355,595 | ) |
| Net change in unrealized appreciation (depreciation) on: | | | | | | | | | | | | | | | | | | | | | | | | | | | | |
| Investments | | | 7,678,871 | | | | 19,292,924 | | | | 20,546,065 | | | | 892,819 | | | | 3,855,703 | | | | (12,262,225 | ) | | | 9,922,816 | |
| Futures | | | — | | | | — | | | | — | | | | 754,703 | | | | (5,111,598 | ) | | | — | | | | — | |
| Purchased options | | | — | | | | — | | | | — | | | | 354,466 | | | | — | | | | 6,356 | | | | — | |
| Securities sold short | | | — | | | | — | | | | — | | | | — | | | | — | | | | (136,910 | ) | | | — | |
| Written options | | | — | | | | — | | | | — | | | | — | | | | — | | | | 446,119 | | | | — | |
| Swap contracts | | | — | | | | — | | | | — | | | | — | | | | (264,971 | ) | | | — | | | | — | |
| Forward foreign currency exchange contracts | | | — | | | | — | | | | — | | | | (179,546 | ) | | | — | | | | (463,666 | ) | | | — | |
| Foreign currency transactions | | | — | | | | 3,883 | | | | 49,239 | | | | (4,554 | ) | | | 2,888 | | | | (7,088 | ) | | | — | |
| Net change in foreign capital gains tax on appreciated securities | | | — | | | | (148,980 | ) | | | — | | | | — | | | | — | | | | — | | | | — | |
| Net change in unrealized appreciation (depreciation) | | | 7,678,871 | | | | 19,147,827 | | | | 20,595,304 | | | | 1,817,888 | | | | (1,517,978 | ) | | | (12,417,414 | ) | | | 9,922,816 | |
| Net Realized and Unrealized Gain (Loss) | | | 4,512,927 | | | | 14,528,536 | | | | 22,380,269 | | | | 1,675,134 | | | | (6,018,378 | ) | | | (15,299,015 | ) | | | (432,779 | ) |
| | | | | | | | | | | | | | | | | | | | | | | | | | | | | |
| Net Increase (Decrease) in Net Assets Resulting From Operations | | $ | 4,285,016 | | | $ | 15,106,921 | | | $ | 24,434,842 | | | $ | 2,167,654 | | | $ | (1,493,445 | ) | | $ | (3,859,512 | ) | | $ | 262,450 | |
See accompanying notes which are an integral part to these financial statements.
| STATEMENTS OF CHANGES IN NET ASSETS |
| | | Dunham | | | Dunham | | | Dunham | | | Dunham | | | Dunham | |
| | | Corporate/Government | | | Floating Rate | | | High-Yield | | | International Opportunity | | | Large Cap | |
| | | Bond Fund | | | Bond Fund | | | Bond Fund | | | Bond Fund | | | Value Fund | |
| | | Six Months Ended | | | Year Ended | | | Six Months Ended | | | Year Ended | | | Six Months Ended | | | Year Ended | | | Six Months Ended | | | Year Ended | | | Six Months Ended | | | Year Ended | |
| | | April 30, 2023 | | | October 31, 2022 | | | April 30, 2023 | | | October 31, 2022 | | | April 30, 2023 | | | October 31, 2022 | | | April 30, 2023 | | | October 31, 2022 | | | April 30, 2023 | | | October 31, 2022 | |
| | | (Unaudited) | | | | | | (Unaudited) | | | | | | (Unaudited) | | | | | | (Unaudited) | | | | | | (Unaudited) | | | | |
| Operations: | | | | | | | | | | | | | | | | | | | | | | | | | | | | | | |
| Net investment income | | $ | 1,449,035 | | | $ | 1,217,781 | | | $ | 6,577,905 | | | $ | 9,072,838 | | | $ | 3,247,690 | | | $ | 5,257,988 | | | $ | 982,804 | | | $ | 2,192,290 | | | $ | 984,776 | | | $ | 1,135,691 | |
| Net realized gain (loss) from investments, futures, swaps and forward foreign currency exchange contracts | | | (603,759 | ) | | | (1,660,818 | ) | | | (1,984,425 | ) | | | (4,559,655 | ) | | | (2,385,375 | ) | | | (2,996,730 | ) | | | (2,463,669 | ) | | | (3,927,814 | ) | | | 1,687,797 | | | | 2,566,661 | |
| Net change in unrealized appreciation (depreciation) on investments, futures, swaps and forward foreign currency exchange contracts | | | 4,280,168 | | | | (11,631,856 | ) | | | 4,410,113 | | | | (11,957,000 | ) | | | 4,890,278 | | | | (13,996,123 | ) | | | 5,504,772 | | | | (11,665,905 | ) | | | 4,830,353 | | | | (15,094,338 | ) |
| Net Increase (Decrease) in Net Assets Resulting From Operations | | | 5,125,444 | | | | (12,074,893 | ) | | | 9,003,593 | | | | (7,443,817 | ) | | | 5,752,593 | | | | (11,734,865 | ) | | | 4,023,907 | | | | (13,401,429 | ) | | | 7,502,926 | | | | (11,391,986 | ) |
| | | | | | | | | | | | | | | | | | | | | | | | | | | | | | | | | | | | | | | | | |
| Distributions to Shareholders From: | | | | | | | | | | | | | | | | | | | | | | | | | | | | | | | | | | | | | | | | |
| Total Distributions Paid | | | | | | | | | | | | | | | | | | | | | | | | | | | | | | | | | | | | | | | | |
| Class N | | | (1,262,968 | ) | | | (1,135,544 | ) | | | (5,588,385 | ) | | | (8,046,721 | ) | | | (2,904,324 | ) | | | (4,285,168 | ) | | | (1,707,057 | ) | | | (2,274,698 | ) | | | (3,794,693 | ) | | | (8,440,624 | ) |
| Class A | | | (164,487 | ) | | | (118,468 | ) | | | (716,725 | ) | | | (1,005,888 | ) | | | (440,271 | ) | | | (574,395 | ) | | | (281,120 | ) | | | (328,443 | ) | | | (581,798 | ) | | | (1,657,189 | ) |
| Class C | | | (27,589 | ) | | | (29,589 | ) | | | (247,432 | ) | | | (268,328 | ) | | | (124,728 | ) | | | (171,919 | ) | | | (44,756 | ) | | | (46,086 | ) | | | (90,311 | ) | | | (296,620 | ) |
| Total Distributions to Shareholders | | | (1,455,044 | ) | | | (1,283,601 | ) | | | (6,552,542 | ) | | | (9,320,937 | ) | | | (3,469,323 | ) | | | (5,031,482 | ) | | | (2,032,933 | ) | | | (2,649,227 | ) | | | (4,466,802 | ) | | | (10,394,433 | ) |
| | | | | | | | | | | | | | | | | | | | | | | | | | | | | | | | | | | | | | | | | |
| Share Transactions of Beneficial Interest: | | | | | | | | | | | | | | | | | | | | | | | | | | | | | | | | | | | | | | | | |
| Net proceeds from shares sold | | | | | | | | | | | | | | | | | | | | | | | | | | | | | | | | | | | | | | | | |
| Class N | | | 62,619,275 | | | | 11,238,241 | | | | 8,188,400 | | | | 32,982,082 | | | | 15,328,883 | | | | 14,033,946 | | | | 11,776,466 | | | | 8,090,496 | | | | 18,258,217 | | | | 50,046,025 | |
| Class A | | | 9,178,713 | | | | 1,470,664 | | | | 1,325,767 | | | | 5,686,586 | | | | 2,512,850 | | | | 2,942,020 | | | | 1,750,828 | | | | 1,423,245 | | | | 3,322,757 | | | | 8,410,001 | |
| Class C | | | 535,872 | | | | 873,684 | | | | 117,042 | | | | 1,290,413 | | | | 212,497 | | | | 351,868 | | | | 131,099 | | | | 146,032 | | | | 191,056 | | | | 613,073 | |
| Reinvestment of distributions | | | | | | | | | | | | | | | | | | | | | | | | | | | | | | | | | | | | | | | | |
| Class N | | | 1,259,498 | | | | 1,132,986 | | | | 5,561,755 | | | | 8,013,242 | | | | 2,893,332 | | | | 4,272,521 | | | | 1,703,926 | | | | 2,273,622 | | | | 3,775,688 | | | | 8,418,440 | |
| Class A | | | 162,133 | | | | 116,316 | | | | 702,108 | | | | 983,618 | | | | 424,863 | | | | 549,551 | | | | 277,574 | | | | 323,705 | | | | 519,222 | | | | 1,510,268 | |
| Class C | | | 21,632 | | | | 24,043 | | | | 230,819 | | | | 255,155 | | | | 110,482 | | | | 155,235 | | | | 44,163 | | | | 45,503 | | | | 88,830 | | | | 295,033 | |
| Cost of shares redeemed | | | | | | | | | | | | | | | | | | | | | | | | | | | | | | | | | | | | | | | | |
| Class N | | | (9,053,863 | ) | | | (30,502,217 | ) | | | (52,250,687 | ) | | | (47,660,452 | ) | | | (13,435,604 | ) | | | (24,862,675 | ) | | | (4,043,790 | ) | | | (29,901,796 | ) | | | (25,474,954 | ) | | | (29,083,278 | ) |
| Class A | | | (1,100,116 | ) | | | (3,408,740 | ) | | | (8,087,880 | ) | | | (6,431,427 | ) | | | (2,090,936 | ) | | | (2,487,049 | ) | | | (553,190 | ) | | | (4,076,825 | ) | | | (3,200,836 | ) | | | (10,652,729 | ) |
| Class C | | | (385,771 | ) | | | (665,138 | ) | | | (1,024,700 | ) | | | (1,225,094 | ) | | | (409,396 | ) | | | (754,635 | ) | | | (124,134 | ) | | | (344,420 | ) | | | (639,205 | ) | | | (938,835 | ) |
| Net Increase (Decrease) in Net Assets From Share Transactions of Beneficial Interest | | | 63,237,373 | | | | (19,720,161 | ) | | | (45,237,376 | ) | | | (6,105,877 | ) | | | 5,546,971 | | | | (5,799,218 | ) | | | 10,962,942 | | | | (22,020,438 | ) | | | (3,159,225 | ) | | | 28,617,998 | |
| | | | | | | | | | | | | | | | | | | | | | | | | | | | | | | | | | | | | | | | | |
| Total Increase (Decrease) in Net Assets | | | 66,907,773 | | | | (33,078,655 | ) | | | (42,786,325 | ) | | | (22,870,631 | ) | | | 7,830,241 | | | | (22,565,565 | ) | | | 12,953,916 | | | | (38,071,094 | ) | | | (123,101 | ) | | | 6,831,579 | |
| | | | | | | | | | | | | | | | | | | | | | | | | | | | | | | | | | | | | | | | | |
| Net Assets: | | | | | | | | | | | | | | | | | | | | | | | | | | | | | | | | | | | | | | | | |
| Beginning of Year/Period | | | 57,537,618 | | | | 90,616,273 | | | | 179,198,253 | | | | 202,068,884 | | | | 97,723,869 | | | | 120,289,434 | | | | 34,850,092 | | | | 72,921,186 | | | | 168,177,902 | | | | 161,346,323 | |
| End of Year/Period | | $ | 124,445,391 | | | $ | 57,537,618 | | | $ | 136,411,928 | | | $ | 179,198,253 | | | $ | 105,554,110 | | | $ | 97,723,869 | | | $ | 47,804,008 | | | $ | 34,850,092 | | | $ | 168,054,801 | | | $ | 168,177,902 | |
See accompanying notes which are an integral part to these financial statements.
| STATEMENTS OF CHANGES IN NET ASSETS (Continued) |
| | | Dunham | | | Dunham | | | Dunham | | | Dunham | | | Dunham | |
| | | Small Cap | | | Focused Large Cap | | | Small Cap | | | Emerging Markets | | | International | |
| | | Value Fund | | | Growth Fund | | | Growth Fund | | | Stock Fund | | | Stock Fund | |
| | | Six Months Ended | | | Year Ended | | | Six Months Ended | | | Year Ended | | | Six Months Ended | | | Year Ended | | | Six Months Ended | | | Year Ended | | | Six Months Ended | | | Year Ended | |
| | | April 30, 2023 | | | October 31, 2022 | | | April 30, 2023 | | | October 31, 2022 | | | April 30, 2023 | | | October 31, 2022 | | | April 30, 2023 | | | October 31, 2022 | | | April 30, 2023 | | | October 31, 2022 | |
| | | (Unaudited) | | | | | | (Unaudited) | | | | | | (Unaudited) | | | | | | (Unaudited) | | | | | | (Unaudited) | | | | |
| Operations: | | | | | | | | | | | | | | | | | | | | | | | | | | | | | | |
| Net investment income (loss) | | $ | 222,977 | | | $ | 280,929 | | | $ | (545,657 | ) | | $ | (1,355,776 | ) | | $ | (227,911 | ) | | $ | (613,330 | ) | | $ | 578,385 | | | $ | 1,422,810 | | | $ | 2,054,573 | | | $ | 6,408,389 | |
| Net realized gain (loss) from investments, foreign capital gain tax and forward foreign currency exchange contracts | | | (484,356 | ) | | | 5,333,249 | | | | (4,722,992 | ) | | | (5,401,687 | ) | | | (3,165,944 | ) | | | (14,831,085 | ) | | | (4,619,291 | ) | | | (15,320,034 | ) | | | 1,784,965 | | | | (2,390,288 | ) |
| Net change in unrealized appreciation (depreciation) on investments, foreign currency transactions and capital gains on appreciated securities | | | (1,772,668 | ) | | | (12,058,203 | ) | | | 38,975,010 | | | | (81,746,994 | ) | | | 7,678,871 | | | | (21,530,117 | ) | | | 19,147,827 | | | | (39,195,209 | ) | | | 20,595,304 | | | | (46,362,309 | ) |
| Net Increase (Decrease) in Net Assets Resulting From Operations | | | (2,034,047 | ) | | | (6,444,025 | ) | | | 33,706,361 | | | | (88,504,457 | ) | | | 4,285,016 | | | | (36,974,532 | ) | | | 15,106,921 | | | | (53,092,433 | ) | | | 24,434,842 | | | | (42,344,208 | ) |
| | | | | | | | | | | | | | | | | | | | | | | | | | | | | | | | | | | | | | | | | |
| Distributions to Shareholders From: | | | | | | | | | | | | | | | | | | | | | | | | | | | | | | | | | | | | | | | | |
| Total Distributions Paid | | | | | | | | | | | | | | | | | | | | | | | | | | | | | | | | | | | | | | | | |
| Class N | | | (3,813,890 | ) | | | (8,082,160 | ) | | | — | | | | (12,138,317 | ) | | | — | | | | (10,232,676 | ) | | | (219,990 | ) | | | (9,680,432 | ) | | | (4,237,875 | ) | | | (20,424,436 | ) |
| Class A | | | (540,756 | ) | | | (1,369,856 | ) | | | — | | | | (2,937,408 | ) | | | — | | | | (3,441,219 | ) | | | — | | | | (1,850,179 | ) | | | (644,994 | ) | | | (3,680,446 | ) |
| Class C | | | (200,590 | ) | | | (363,568 | ) | | | — | | | | (1,174,480 | ) | | | — | | | | (791,503 | ) | | | — | | | | (279,057 | ) | | | (140,909 | ) | | | (794,025 | ) |
| Total Distributions to Shareholders | | | (4,555,236 | ) | | | (9,815,584 | ) | | | — | | | | (16,250,205 | ) | | | — | | | | (14,465,398 | ) | | | (219,990 | ) | | | (11,809,668 | ) | | | (5,023,778 | ) | | | (24,898,907 | ) |
| | | | | | | | | | | | | | | | | | | | | | | | | | | | | | | | | | | | | | | | | |
| Share Transactions of Beneficial Interest: | | | | | | | | | | | | | | | | | | | | | | | | | | | | | | | | | | | | | | | | |
| Net proceeds from shares sold | | | | | | | | | | | | | | | | | | | | | | | | | | | | | | | | | | | | | | | | |
| Class N | | | 10,549,242 | | | | 22,822,893 | | | | 9,078,070 | | | | 79,275,818 | | | | 4,689,140 | | | | 43,544,756 | | | | 6,953,965 | | | | 37,156,820 | | | | 6,128,713 | | | | 33,424,663 | |
| Class A | | | 1,746,039 | | | | 1,827,469 | | | | 1,475,012 | | | | 11,424,283 | | | | 817,452 | | | | 6,245,266 | | | | 763,433 | | | | 5,529,970 | | | | 2,835,933 | | | | 4,607,895 | |
| Class C | | | 83,166 | | | | 523,011 | | | | 171,481 | | | | 1,366,792 | | | | 45,974 | | | | 443,328 | | | | 72,541 | | | | 373,439 | | | | 65,760 | | | | 458,875 | |
| Reinvestment of distributions | | | | | | | | | | | | | | | | | | | | | | | | | | | | | | | | | | | | | | | | |
| Class N | | | 3,791,875 | | | | 8,067,916 | | | | — | | | | 11,836,217 | | | | — | | | | 10,127,549 | | | | 219,293 | | | | 9,673,626 | | | | 4,202,687 | | | | 20,345,234 | |
| Class A | | | 527,970 | | | | 1,353,929 | | | | — | | | | 2,791,471 | | | | — | | | | 3,122,559 | | | | — | | | | 1,837,164 | | | | 640,037 | | | | 3,636,079 | |
| Class C | | | 199,470 | | | | 361,649 | | | | — | | | | 1,057,574 | | | | — | | | | 785,687 | | | | — | | | | 272,597 | | | | 138,359 | | | | 781,476 | |
| Redemption fee proceeds | | | | | | | | | | | | | | | | | | | | | | | | | | | | | | | | | | | | | | | | |
| Class A | | | — | | | | — | | | | — | | | | — | | | | — | | | | — | | | | — | | | | — | | | | — | | | | — | |
| Cost of shares redeemed | | | | | | | | | | | | | | | | | | | | | | | | | | | | | | | | | | | | | | | | |
| Class N | | | (15,770,941 | ) | | | (30,122,239 | ) | | | (33,960,002 | ) | | | (23,825,971 | ) | | | (16,831,289 | ) | | | (13,353,325 | ) | | | (12,262,562 | ) | | | (19,820,390 | ) | | | (31,223,824 | ) | | | (37,984,597 | ) |
| Class A | | | (2,402,399 | ) | | | (5,447,387 | ) | | | (4,931,974 | ) | | | (9,366,435 | ) | | | (3,579,208 | ) | | | (7,277,905 | ) | | | (2,217,733 | ) | | | (3,239,190 | ) | | | (7,924,443 | ) | | | (6,319,472 | ) |
| Class C | | | (446,067 | ) | | | (768,124 | ) | | | (1,471,007 | ) | | | (2,305,026 | ) | | | (463,179 | ) | | | (503,571 | ) | | | (410,076 | ) | | | (504,079 | ) | | | (738,517 | ) | | | (986,369 | ) |
| Net Increase/(Decrease) in Net Assets From Share Transactions of Beneficial Interest | | | (1,721,645 | ) | | | (1,380,883 | ) | | | (29,638,420 | ) | | | 72,254,723 | | | | (15,321,110 | ) | | | 43,134,344 | | | | (6,881,139 | ) | | | 31,279,957 | | | | (25,875,295 | ) | | | 17,963,784 | |
| | | | | | | | | | | | | | | | | | | | | | | | | | | | | | | | | | | | | | | | | |
| Total Increase (Decrease) in Net Assets | | | (8,310,928 | ) | | | (17,640,492 | ) | | | 4,067,941 | | | | (32,499,939 | ) | | | (11,036,094 | ) | | | (8,305,586 | ) | | | 8,005,792 | | | | (33,622,144 | ) | | | (6,464,231 | ) | | | (49,279,331 | ) |
| | | | | | | | | | | | | | | | | | | | | | | | | | | | | | | | | | | | | | | | | |
| Net Assets: | | | | | | | | | | | | | | | | | | | | | | | | | | | | | | | | | | | | | | | | |
| Beginning of Year/Period | | | 70,599,982 | | | | 88,240,474 | | | | 175,618,886 | | | | 208,118,825 | | | | 79,068,603 | | | | 87,374,189 | | | | 103,191,109 | | | | 136,813,253 | | | | 134,143,897 | | | | 183,423,228 | |
| End of Year/Period | | $ | 62,289,054 | | | $ | 70,599,982 | | | $ | 179,686,827 | | | $ | 175,618,886 | | | $ | 68,032,509 | | | $ | 79,068,603 | | | $ | 111,196,901 | | | $ | 103,191,109 | | | $ | 127,679,666 | | | $ | 134,143,897 | |
| | | | | | | | | | | | | | | | | | | | | | | | | | | | | | | | | | | | | | | | | |
See accompanying notes which are an integral part to these financial statements.
| STATEMENTS OF CHANGES IN NET ASSETS (Continued) |
| | | Dunham | | | Dunham | | | Dunham | | | Dunham | |
| | | Dynamic Macro | | | Long/Short | | | Monthly Distribution | | | Real Estate | |
| | | Fund | | | Credit Fund | | | Fund | | | Stock Fund | |
| | | Six Months Ended | | | Year Ended | | | Six Months Ended | | | Year Ended | | | Six Months Ended | | | Year Ended | | | Six Months Ended | | | Year Ended | |
| | | April 30, 2023 | | | October 31, 2022 | | | April 30, 2023 | | | October 31, 2022 | | | April 30, 2023 | | | October 31, 2022 | | | April 30, 2023 | | | October 31, 2022 | |
| | | (Unaudited) | | | | | | (Unaudited) | | | | | | (Unaudited) | | | | | | (Unaudited) | | | | |
| Operations: | | | | | | | | | | | | | | | | | | | | | | | | |
| Net investment income (loss) | | $ | 492,520 | | | $ | 47,985 | | | $ | 4,524,933 | | | $ | 4,703,901 | | | $ | 11,439,503 | | | $ | (3,703,291 | ) | | $ | 695,229 | | | $ | 716,843 | |
| Net realized gain (loss) from investments, futures, purchased options, securities sold short, written options, swap contracts and forward foreign currency exchange contracts | | | (142,754 | ) | | | (1,110,821 | ) | | | (4,500,400 | ) | | | 287,776 | | | | (2,881,601 | ) | | | 4,818,782 | | | | (10,355,595 | ) | | | (10,844,324 | ) |
| Net change in unrealized appreciation (depreciation) on investments, futures, purchased options, securities sold short, written options, swap contracts, and foreign currency translations and forward foreign currency exchange contracts | | | 1,817,888 | | | | (2,356,465 | ) | | | (1,517,978 | ) | | | (11,463,146 | ) | | | (12,417,414 | ) | | | 787,207 | | | | 9,922,816 | | | | (32,449,422 | ) |
| Net Increase (Decrease) in Net Assets Resulting From Operations | | | 2,167,654 | | | | (3,419,301 | ) | | | (1,493,445 | ) | | | (6,471,469 | ) | | | (3,859,512 | ) | | | 1,902,698 | | | | 262,450 | | | | (42,576,903 | ) |
| | | | | | | | | | | | | | | | | | | | | | | | | | | | | | | | | |
| Distributions to Shareholders From: | | | | | | | | | | | | | | | | | | | | | | | | | | | | | | | | |
| Distributions From Paid In Capital: | | | | | | | | | | | | | | | | | | | | | | | | | | | | | | | | |
| Class N | | | — | | | | — | | | | — | | | | — | | | | (1,629,563 | ) | | | (6,847,683 | ) | | | — | | | | — | |
| Class A | | | — | | | | — | | | | — | | | | — | | | | (255,806 | ) | | | (1,166,961 | ) | | | — | | | | — | |
| Class C | | | — | | | | — | | | | — | | | | — | | | | (195,022 | ) | | | (849,813 | ) | | | — | | | | — | |
| Total Distributions Paid | | | | | | | | | | | | | | | | | | | | | | | | | | | | | | | | |
| Class N | | | — | | | | — | | | | (5,897,948 | ) | | | (8,052,024 | ) | | | (8,881 | ) | | | (1,638,444 | ) | | | (424,646 | ) | | | (5,499,204 | ) |
| Class A | | | — | | | | — | | | | (789,137 | ) | | | (1,100,569 | ) | | | (1,396 | ) | | | (257,202 | ) | | | (37,364 | ) | | | (850,102 | ) |
| Class C | | | — | | | | — | | | | (94,387 | ) | | | (147,146 | ) | | | (1,076 | ) | | | (196,098 | ) | | | — | | | | (307,750 | ) |
| Total Distributions to Shareholders | | | — | | | | — | | | | (6,781,472 | ) | | | (9,299,739 | ) | | | (2,091,744 | ) | | | (10,956,201 | ) | | | (462,010 | ) | | | (6,657,056 | ) |
| | | | | | | | | | | | | | | | | | | | | | | | | | | | | | | | | |
| Share Transactions of Beneficial Interest: | | | | | | | | | | | | | | | | | | | | | | | | | | | | | | | | |
| Net proceeds from shares sold | | | | | | | | | | | | | | | | | | | | | | | | | | | | | | | | |
| Class N | | | 12,420,402 | | | | 9,503,028 | | | | 26,323,151 | | | | 87,383,682 | | | | 13,222,757 | | | | 38,741,266 | | | | 8,507,540 | | | | 26,981,312 | |
| Class A | | | 2,496,415 | | | | 1,422,232 | | | | 3,363,871 | | | | 15,236,101 | | | | 1,572,018 | | | | 4,501,409 | | | | 1,420,588 | | | | 3,069,951 | |
| Class C | | | 102,250 | | | | 118,628 | | | | 142,041 | | | | 708,042 | | | | 338,267 | | | | 1,321,111 | | | | 153,976 | | | | 374,346 | |
| Reinvestment of distributions | | | | | | | | | | | | | | | | | | | | | | | | | | | | | | | | |
| Class N | | | — | | | | — | | | | 5,643,202 | | | | 7,724,291 | | | | 6,228,944 | | | | 8,373,239 | | | | 417,757 | | | | 5,403,784 | |
| Class A | | | — | | | | — | | | | 762,753 | | | | 1,051,996 | | | | 991,230 | | | | 1,302,583 | | | | 37,172 | | | | 842,420 | |
| Class C | | | — | | | | — | | | | 84,151 | | | | 128,693 | | | | 697,273 | | | | 882,463 | | | | — | | | | 306,360 | |
| Cost of shares redeemed | | | | | | | | | | | | | | | | | | | | | | | | | | | | | | | | |
| Class N | | | (2,091,765 | ) | | | (5,459,115 | ) | | | (37,494,226 | ) | | | (70,667,342 | ) | | | (34,266,248 | ) | | | (84,307,867 | ) | | | (10,938,798 | ) | | | (18,789,259 | ) |
| Class A | | | (642,725 | ) | | | (777,634 | ) | | | (3,133,467 | ) | | | (15,392,435 | ) | | | (4,921,988 | ) | | | (8,760,862 | ) | | | (1,152,142 | ) | | | (3,107,857 | ) |
| Class C | | | (140,203 | ) | | | (199,197 | ) | | | (563,343 | ) | | | (1,195,736 | ) | | | (2,168,815 | ) | | | (4,292,575 | ) | | | (369,868 | ) | | | (841,246 | ) |
| Net Increase (Decrease) in Net Assets From Share Transactions of Beneficial Interest | | | 12,144,374 | | | | 4,607,942 | | | | (4,871,867 | ) | | | 24,977,292 | | | | (18,306,562 | ) | | | (42,239,233 | ) | | | (1,923,775 | ) | | | 14,239,811 | |
| | | | | | | | | | | | | | | | | | | | | | | | | | | | | | | | | |
| Total Increase (Decrease) in Net Assets | | | 14,312,028 | | | | 1,188,641 | | | | (13,146,784 | ) | | | 9,206,084 | | | | (24,257,818 | ) | | | (51,292,736 | ) | | | (2,123,335 | ) | | | (34,994,148 | ) |
| | | | | | | | | | | | | | | | | | | | | | | | | | | | | | | | | |
| Net Assets: | | | | | | | | | | | | | | | | | | | | | | | | | | | | | | | | |
| Beginning of Year/Period | | | 27,407,898 | | | | 26,219,257 | | | | 238,638,265 | | | | 229,432,181 | | | | 220,876,861 | | | | 272,169,597 | | | | 76,406,670 | | | | 111,400,818 | |
| End of Year/Period | | $ | 41,719,926 | | | $ | 27,407,898 | | | $ | 225,491,481 | | | $ | 238,638,265 | | | $ | 196,619,043 | | | $ | 220,876,861 | | | $ | 74,283,335 | | | $ | 76,406,670 | |
See accompanying notes which are an integral part to these financial statements.
| FINANCIAL HIGHLIGHTS |
| Dunham Corporate/Government Bond Fund |
| |
| The table sets forth financial data for one share of beneficial interest outstanding throughout each year/period. |
| | | Class N | | | | | | | | | | | | | | | | | | | | | | | | | |
| | | Six Months Ended | | | Year Ended October 31, | | | | | | | | | | | | | | | | | | | | | | | | | |
| | | April 30, 2023 | | | 2022 | | | 2021 | | | 2020 | | | 2019 | | | 2018 | | | | | | | | | | | | | | | | | | | | | | | | | |
| | | (Unaudited) | | | | | | | | | | | | | | | | | | | | | | | | | | | | | | | | | | | | | | | | |
| Net asset value, beginning of year/period | | $ | 12.01 | | | $ | 14.41 | | | $ | 14.44 | | | $ | 14.02 | | | $ | 13.06 | | | $ | 13.82 | | | | | | | | | | | | | | | | | | | | | | | | | |
| Income (loss) from investment operations: | | | | | | | | | | | | | | | | | | | | | | | | | | | | | | | | | | | | | | | | | | | | | | | | |
| Net investment income* | | | 0.19 | | | | 0.22 | | | | 0.19 | | | | 0.28 | | | | 0.36 | | | | 0.34 | | | | | | | | | | | | | | | | | | | | | | | | | |
| Net realized and unrealized gain (loss) | | | 0.60 | | | | (2.38 | ) | | | (0.01 | ) | | | 0.44 | | | | 0.96 | | | | (0.74 | ) | | | | | | | | | | | | | | | | | | | | | | | | |
| Total income (loss) from investment operations | | | 0.79 | | | | (2.16 | ) | | | 0.18 | | | | 0.72 | | | | 1.32 | | | | (0.40 | ) | | | | | | | | | | | | | | | | | | | | | | | | |
| Less distributions: | | | | | | | | | | | | | | | | | | | | | | | | | | | | | | | | | | | | | | | | | | | | | | | | |
| Distributions from net investment income | | | (0.17 | ) | | | (0.24 | ) | | | (0.21 | ) | | | (0.30 | ) | | | (0.36 | ) | | | (0.36 | ) | | | | | | | | | | | | | | | | | | | | | | | | |
| Total distributions | | | (0.17 | ) | | | (0.24 | ) | | | (0.21 | ) | | | (0.30 | ) | | | (0.36 | ) | | | (0.36 | ) | | | | | | | | | | | | | | | | | | | | | | | | |
| Net asset value, end of year/period | | $ | 12.63 | | | $ | 12.01 | | | $ | 14.41 | | | $ | 14.44 | | | $ | 14.02 | | | $ | 13.06 | | | | | | | | | | | | | | | | | | | | | | | | | |
| Total return + # | | | 6.63 | % | | | (15.12 | )% | | | 1.23 | % | | | 5.17 | % | | | 10.27 | % | | | (2.93 | )% | | | | | | | | | | | | | | | | | | | | | | | | |
| Ratios/Supplemental Data: | | | | | | | | | | | | | | | | | | | | | | | | | | | | | | | | | | | | | | | | | | | | | | | | |
| Net assets, end of year/period (in 000s) | | $ | 106,679 | | | $ | 48,744 | | | $ | 78,345 | | | $ | 61,209 | | | $ | 42,730 | | | $ | 41,151 | | | | | | | | | | | | | | | | | | | | | | | | | |
| Ratios of expenses to average net assets: | | | 1.13 | % | | | 1.34 | % | | | 1.25 | % | | | 1.24 | % | | | 1.20 | % | | | 1.20 | % | | | | | | | | | | | | | | | | | | | | | | | | |
| Ratios of net investment income to average net assets: | | | 3.14 | % | | | 1.67 | % | | | 1.30 | % | | | 1.99 | % | | | 2.68 | % | | | 2.53 | % | | | | | | | | | | | | | | | | | | | | | | | | |
| Portfolio turnover rate (1) | | | 15 | % | | | 35 | % | | | 59 | % | | | 75 | % | | | 76 | % | | | 92 | % | | | | | | | | | | | | | | | | | | | | | | | | |
| | | | | | | | | | | | | | | | | | | | | | | | | | | | | | | | | | | | | | | | | | | | | | | | | |
| | | Class A | | | Class C | |
| | | Six Months Ended | | | Year Ended October 31, | | | Six Months Ended | | | Year Ended October 31, | |
| | | April 30, 2023 | | | 2022 | | | 2021 | | | 2020 | | | 2019 | | | 2018 | | | April 30, 2023 | | | 2022 | | | 2021 | | | 2020 | | | 2019 | | | 2018 | |
| | | (Unaudited) | | | | | | | | | | | | | | | | | | (Unaudited) | | | | | | | | | | | | | | | | |
| | | | | | | | | | | | | | | | | | | | | | | | | | | | | | | | | | | | | |
| Net asset value, beginning of year/period | | $ | 12.00 | | | $ | 14.39 | | | $ | 14.42 | | | $ | 14.01 | | | $ | 13.04 | | | $ | 13.80 | | | $ | 11.91 | | | $ | 14.28 | | | $ | 14.31 | | | $ | 13.91 | | | $ | 12.95 | | | $ | 13.71 | |
| Income (loss) from investment operations: | | | | | | | | | | | | | | | | | | | | | | | | | | | | | | | | | | | | | | | | | | | | | | | | |
| Net investment income* | | | 0.18 | | | | 0.19 | | | | 0.15 | | | | 0.25 | | | | 0.33 | | | | 0.31 | | | | 0.14 | | | | 0.13 | | | | 0.08 | | | | 0.18 | | | | 0.26 | | | | 0.24 | |
| Net realized and unrealized gain (loss) | | | 0.59 | | | | (2.37 | ) | | | (0.01 | ) | | | 0.42 | | | | 0.97 | | | | (0.74 | ) | | | 0.60 | | | | (2.36 | ) | | | (0.01 | ) | | | 0.41 | | | | 0.96 | | | | (0.74 | ) |
| Total income (loss) from investment operations | | | 0.77 | | | | (2.18 | ) | | | 0.14 | | | | 0.67 | | | | 1.30 | | | | (0.43 | ) | | | 0.74 | | | | (2.23 | ) | | | 0.07 | | | | 0.59 | | | | 1.22 | | | | (0.50 | ) |
| Less distributions: | | | | | | | | | | | | | | | | | | | | | | | | | | | | | | | | | | | | | | | | | | | | | | | | |
| Distributions from net investment income | | | (0.16 | ) | | | (0.21 | ) | | | (0.17 | ) | | | (0.26 | ) | | | (0.33 | ) | | | (0.33 | ) | | | (0.13 | ) | | | (0.14 | ) | | | (0.10 | ) | | | (0.19 | ) | | | (0.26 | ) | | | (0.26 | ) |
| Total distributions | | | (0.16 | ) | | | (0.21 | ) | | | (0.17 | ) | | | (0.26 | ) | | | (0.33 | ) | | | (0.33 | ) | | | (0.13 | ) | | | (0.14 | ) | | | (0.10 | ) | | | (0.19 | ) | | | (0.26 | ) | | | (0.26 | ) |
| Net asset value, end of year/period | | $ | 12.61 | | | $ | 12.00 | | | $ | 14.39 | | | $ | 14.42 | | | $ | 14.01 | | | $ | 13.04 | | | $ | 12.52 | | | $ | 11.91 | | | $ | 14.28 | | | $ | 14.31 | | | $ | 13.91 | | | $ | 12.95 | |
| Total return + # | | | 6.43 | % | | | (15.29 | )% | | | 0.98 | % | | | 4.84 | % | | | 10.09 | % | | | (3.17 | )% | | | 6.21 | % | | | (15.68 | )% | | | 0.49 | % | | | 4.29 | % | | | 9.53 | % | | | (3.67 | )% |
| Ratios/Supplemental Data: | | | | | | | | | | | | | | | | | | | | | | | | | | | | | | | | | | | | | | | | | | | | | | | | |
| Net assets, end of year/period (in 000s) | | $ | 15,050 | | | $ | 6,376 | | | $ | 9,593 | | | $ | 8,490 | | | $ | 7,510 | | | $ | 5,311 | | | $ | 2,717 | | | $ | 2,418 | | | $ | 2,717 | | | $ | 2,886 | | | $ | 2,672 | | | $ | 2,760 | |
| Ratios of expenses to average net assets: | | | 1.38 | % | | | 1.59 | % | | | 1.50 | % | | | 1.49 | % | | | 1.45 | % | | | 1.45 | % | | | 1.88 | % | | | 2.09 | % | | | 2.00 | % | | | 1.99 | % | | | 1.95 | % | | | 1.95 | % |
| Ratios of net investment income to average net assets: | | | 2.90 | % | | | 1.42 | % | | | 1.05 | % | | | 1.75 | % | | | 2.41 | % | | | 2.31 | % | | | 2.28 | % | | | 0.96 | % | | | 0.56 | % | | | 1.31 | % | | | 1.92 | % | | | 1.81 | % |
| Portfolio turnover rate (1) | | | 15 | % | | | 35 | % | | | 59 | % | | | 75 | % | | | 76 | % | | | 92 | % | | | 15 | % | | | 35 | % | | | 59 | % | | | 75 | % | | | 76 | % | | | 92 | % |
| | | | | | | | | | | | | | | | | | | | | | | | | | | | | | | | | | | | | | | | | | | | | | | | | |
| * | The net investment income per share data was determined using the average shares outstanding throughout each year/period. |
| + | Assumes reinvestment of all dividends and distributions, if any. Total return does not reflect the deductions of taxes that a shareholder would pay on distributions or on the redemption of shares and does not reflect the impact of any sales charge. |
| # | Includes adjustments in accordance with accounting principles generally accepted in the United States and, consequently, the net asset values for financial reporting purposes and the returns based upon those net asset values may differ from the net asset values and returns for shareholder transactions. Adjustments may apply to some but not all years and classes. |
| (1) | Not annualized for periods less than one year. |
See accompanying notes which are an integral part to these financial statements.
| FINANCIAL HIGHLIGHTS |
| Dunham Floating Rate Bond Fund |
| |
| The table sets forth financial data for one share of beneficial interest outstanding throughout each year/period. |
| | | Class N | | | | | | | | | | | | | | | | | | | | | | | | | |
| | | Six Months Ended | | | Year Ended October 31, | | | | | | | | | | | | | | | | | | | | | | | | | |
| | | April 30, 2023 | | | 2022 | | | 2021 | | | 2020 | | | 2019 | | | 2018 | | | | | | | | | | | | | | | | | | | | | | | | | |
| | | (Unaudited) | | | | | | | | | | | | | | | | | | | | | | | | | | | | | | | | | | | | | | | | |
| Net asset value, beginning of year/period | | $ | 8.44 | | | $ | 9.18 | | | $ | 8.90 | | | $ | 9.36 | | | $ | 9.62 | | | $ | 9.73 | | | | | | | | | | | | | | | | | | | | | | | | | |
| Income (loss) from investment operations: | | | | | | | | | | | | | | | | | | | | | | | | | | | | | | | | | | | | | | | | | | | | | | | | |
| Net investment income* | | | 0.30 | | | | 0.41 | | | | 0.27 | | | | 0.34 | | | | 0.44 | | | | 0.40 | | | | | | | | | | | | | | | | | | | | | | | | | |
| Net realized and unrealized gain (loss) | | | 0.19 | | | | (0.72 | ) | | | 0.32 | | | | (0.47 | ) | | | (0.26 | ) | | | (0.11 | ) | | | | | | | | | | | | | | | | | | | | | | | | |
| Total income (loss) from investment operations | | | 0.49 | | | | (0.31 | ) | | | 0.59 | | | | (0.13 | ) | | | 0.18 | | | | 0.29 | | | | | | | | | | | | | | | | | | | | | | | | | |
| Less distributions: | | | | | | | | | | | | | | | | | | | | | | | | | | | | | | | | | | | | | | | | | | | | | | | | |
| Distributions from net investment income | | | (0.37 | ) | | | (0.43 | ) | | | (0.31 | ) | | | (0.33 | ) | | | (0.44 | ) | | | (0.40 | ) | | | | | | | | | | | | | | | | | | | | | | | | |
| Total distributions | | | (0.37 | ) | | | (0.43 | ) | | | (0.31 | ) | | | (0.33 | ) | | | (0.44 | ) | | | (0.40 | ) | | | | | | | | | | | | | | | | | | | | | | | | |
| Net asset value, end of year/period | | $ | 8.56 | | | $ | 8.44 | | | $ | 9.18 | | | $ | 8.90 | | | $ | 9.36 | | | $ | 9.62 | | | | | | | | | | | | | | | | | | | | | | | | | |
| Total return + # | | | 5.84 | % | | | (3.46 | )% | | | 6.63 | % | | | (1.30 | )% | | | 1.99 | % | | | 3.02 | % | | | | | | | | | | | | | | | | | | | | | | | | |
| Ratios/Supplemental Data: | | | | | | | | | | | | | | | | | | | | | | | | | | | | | | | | | | | | | | | | | | | | | | | | |
| Net assets, end of year/period (in 000s) | | $ | 115,710 | | | $ | 152,134 | | | $ | 173,112 | | | $ | 135,536 | | | $ | 157,757 | | | $ | 164,936 | | | | | | | | | | | | | | | | | | | | | | | | | |
| Ratios of expenses to average net assets: | | | 1.00 | % | | | 1.04 | % | | | 0.90 | % | | | 1.00 | % | | | 1.01 | % | | | 0.97 | % | | | | | | | | | | | | | | | | | | | | | | | | |
| Ratios of net investment income to average net assets: | | | 8.42 | % | | | 4.67 | % | | | 2.97 | % | | | 3.81 | % | | | 4.60 | % | | | 4.08 | % | | | | | | | | | | | | | | | | | | | | | | | | |
| Portfolio turnover rate (1) | | | 6 | % | | | 56 | % | | | 135 | % | | | 76 | % | | | 44 | % | | | 79 | % | | | | | | | | | | | | | | | | | | | | | | | | |
| | | | | | | | | | | | | | | | | | | | | | | | | | | | | | | | | | | | | | | | | | | | | | | | | |
| | | Class A | | | Class C | |
| | | Six Months Ended | | | Year Ended October 31, | | | Six Months Ended | | | Year Ended October 31, | |
| | | April 30, 2023 | | | 2022 | | | 2021 | | | 2020 | | | 2019 | | | 2018 | | | April 30, 2023 | | | 2022 | | | 2021 | | | 2020 | | | 2019 | | | 2018 | |
| | | (Unaudited) | | | | | | | | | | | | | | | | | | (Unaudited) | | | | | | | | | | | | | | | | |
| Net asset value, beginning of year/period | | $ | 8.43 | | | $ | 9.17 | | | $ | 8.89 | | | $ | 9.35 | | | $ | 9.61 | | | $ | 9.72 | | | $ | 8.43 | | | $ | 9.18 | | | $ | 8.89 | | | $ | 9.35 | | | $ | 9.62 | | | $ | 9.73 | |
| Income (loss) from investment operations: | | | | | | | | | | | | | | | | | | | | | | | | | | | | | | | | | | | | | | | | | | | | | | | | |
| Net investment income* | | | 0.29 | | | | 0.39 | | | | 0.25 | | | | 0.32 | | | | 0.41 | | | | 0.37 | | | | 0.33 | | | | 0.35 | | | | 0.21 | | | | 0.27 | | | | 0.37 | | | | 0.33 | |
| Net realized and unrealized gain (loss) | | | 0.19 | | | | (0.72 | ) | | | 0.32 | | | | (0.47 | ) | | | (0.25 | ) | | | (0.11 | ) | | | 0.13 | | | | (0.74 | ) | | | 0.32 | | | | (0.46 | ) | | | (0.27 | ) | | | (0.11 | ) |
| Total income (loss) from investment operations | | | 0.48 | | | | (0.33 | ) | | | 0.57 | | | | (0.15 | ) | | | 0.16 | | | | 0.26 | | | | 0.46 | | | | (0.39 | ) | | | 0.53 | | | | (0.19 | ) | | | 0.10 | | | | 0.22 | |
| Less distributions: | | | | | | | | | | | | | | | | | | | | | | | | | | | | | | | | | | | | | | | | | | | | | | | | |
| Distributions from net investment income | | | (0.36 | ) | | | (0.41 | ) | | | (0.29 | ) | | | (0.31 | ) | | | (0.42 | ) | | | (0.37 | ) | | | (0.34 | ) | | | (0.36 | ) | | | (0.24 | ) | | | (0.27 | ) | | | (0.37 | ) | | | (0.33 | ) |
| Total distributions | | | (0.36 | ) | | | (0.41 | ) | | | (0.29 | ) | | | (0.31 | ) | | | (0.42 | ) | | | (0.37 | ) | | | (0.34 | ) | | | (0.36 | ) | | | (0.24 | ) | | | (0.27 | ) | | | (0.37 | ) | | | (0.33 | ) |
| Net asset value, end of year/period | | $ | 8.55 | | | $ | 8.43 | | | $ | 9.17 | | | $ | 8.89 | | | $ | 9.35 | | | $ | 9.61 | | | $ | 8.55 | | | $ | 8.43 | | | $ | 9.18 | | | $ | 8.89 | | | $ | 9.35 | | | $ | 9.62 | |
| Total return + # | | | 5.71 | % | | | (3.70 | )% | | | 6.39 | % | | | (1.56 | )% | | | 1.74 | % | | | 2.77 | % | | | 5.45 | % | | | (4.30 | )% | | | 5.98 | % | | | (2.06 | )% | | | 1.13 | % | | | 2.26 | % |
| Ratios/Supplemental Data: | | | | | | | | | | | | | | | | | | | | | | | | | | | | | | | | | | | | | | | | | | | | | | | | |
| Net assets, end of year/period (in 000s) | | $ | 14,790 | | | $ | 20,569 | | | $ | 22,225 | | | $ | 19,705 | | | $ | 21,997 | | | $ | 20,205 | | | $ | 5,912 | | | $ | 6,495 | | | $ | 6,732 | | | $ | 6,800 | | | $ | 8,654 | | | $ | 7,236 | |
| Ratios of expenses to average net assets: ^ | | | 1.25 | % | | | 1.29 | % | | | 1.15 | % | | | 1.25 | % | | | 1.26 | % | | | 1.22 | % | | | 1.77 | % | | | 1.80 | % | | | 1.65 | % | | | 1.75 | % | | | 1.76 | % | | | 1.72 | % |
| Ratios of net investment income to average net assets: ^ | | | 8.16 | % | | | 4.44 | % | | | 2.73 | % | | | 3.56 | % | | | 4.36 | % | | | 3.84 | % | | | 7.70 | % | | | 3.95 | % | | | 2.24 | % | | | 3.07 | % | | | 3.86 | % | | | 3.43 | % |
| Portfolio turnover rate (1) | | | 6 | % | | | 56 | % | | | 135 | % | | | 76 | % | | | 44 | % | | | 79 | % | | | 6 | % | | | 56 | % | | | 135 | % | | | 76 | % | | | 44 | % | | | 79 | % |
| | | | | | | | | | | | | | | | | | | | | | | | | | | | | | | | | | | | | | | | | | | | | | | | | |
| * | The net investment income per share data was determined using the average shares outstanding throughout each year. |
| + | Assumes reinvestment of all dividends and distributions, if any. Total return does not reflect the deductions of taxes that a shareholder would pay on distributions or on the redemption of shares and does not reflect the impact of any sales charge. |
| # | Includes adjustments in accordance with accounting principles generally accepted in the United States and, consequently, the net asset values for financial reporting purposes and the returns based upon those net asset values may differ from the net asset values and returns for shareholder transactions. Adjustments may apply to some but not all years and classes. |
| ^ | Annualized for periods less than one year. |
| (1) | Not annualized for periods less than one year. |
See accompanying notes which are an integral part to these financial statements.
| FINANCIAL HIGHLIGHTS |
| Dunham High-Yield Bond Fund |
| |
| The table sets forth financial data for one share of beneficial interest outstanding throughout each year/period. |
| | | Class N | | | | | | | | | | | | | | | | | | | | | | | | | |
| | | Six Months Ended | | | Year Ended October 31, | | | | | | | | | | | | | | | | | | | | | | | | | |
| | | April 30, 2023 | | | 2022 | | | 2021 | | | 2020 | | | 2019 | | | 2018 | | | | | | | | | | | | | | | | | | | | | | | | | |
| | | (Unaudited) | | | | | | | | | | | | | | | | | | | | | | | | | | | | | | | | | | | | | | | | |
| Net asset value, beginning of year/period | | $ | 8.00 | | | $ | 9.34 | | | $ | 8.88 | | | $ | 8.97 | | | $ | 8.72 | | | $ | 9.22 | | | | | | | | | | | | | | | | | | | | | | | | | |
| Income (loss) from investment operations: | | | | | | | | | | | | | | | | | | | | | | | | | | | | | | | | | | | | | | | | | | | | | | | | |
| Net investment income* | | | 0.26 | | | | 0.43 | | | | 0.38 | | | | 0.41 | | | | 0.45 | | | | 0.44 | | | | | | | | | | | | | | | | | | | | | | | | | |
| Net realized and unrealized gain (loss) | | | 0.21 | | | | (1.36 | ) | | | 0.46 | | | | (0.09 | ) | | | 0.26 | | | | (0.51 | ) | | | | | | | | | | | | | | | | | | | | | | | | |
| Total income (loss) from investment operations | | | 0.47 | | | | (0.93 | ) | | | 0.84 | | | | 0.32 | | | | 0.71 | | | | (0.07 | ) | | | | | | | | | | | | | | | | | | | | | | | | |
| Less distributions: | | | | | | | | | | | | | | | | | | | | | | | | | | | | | | | | | | | | | | | | | | | | | | | | |
| Distributions from net investment income | | | (0.30 | ) | | | (0.41 | ) | | | (0.38 | ) | | | (0.41 | ) | | | (0.46 | ) | | | (0.43 | ) | | | | | | | | | | | | | | | | | | | | | | | | |
| Total distributions | | | (0.30 | ) | | | (0.41 | ) | | | (0.38 | ) | | | (0.41 | ) | | | (0.46 | ) | | | (0.43 | ) | | | | | | | | | | | | | | | | | | | | | | | | |
| Net asset value, end of year/period | | $ | 8.17 | | | $ | 8.00 | | | $ | 9.34 | | | $ | 8.88 | | | $ | 8.97 | | | $ | 8.72 | | | | | | | | | | | | | | | | | | | | | | | | | |
| Total return + # | | | 5.92 | % | | | (10.09 | )% | | | 9.54 | % | | | 3.74 | % | | | 8.42 | % | | | (0.80 | )% | | | | | | | | | | | | | | | | | | | | | | | | |
| Ratios/Supplemental Data: | | | | | | | | | | | | | | | | | | | | | | | | | | | | | | | | | | | | | | | | | | | | | | | | |
| Net assets, end of year/period (in 000s) | | $ | 87,918 | | | $ | 81,243 | | | $ | 101,951 | | | $ | 83,009 | | | $ | 90,262 | | | $ | 94,596 | | | | | | | | | | | | | | | | | | | | | | | | | |
| Ratios of expenses to average net assets: ^ | | | 1.22 | % | | | 1.19 | % | | | 1.17 | % | | | 1.14 | % | | | 1.12 | % | | | 1.12 | % | | | | | | | | | | | | | | | | | | | | | | | | |
| Ratios of net investment income to average net assets: ^ | | | 6.86 | % | | | 4.96 | % | | | 4.07 | % | | | 4.69 | % | | | 5.12 | % | | | 4.84 | % | | | | | | | | | | | | | | | | | | | | | | | | |
| Portfolio turnover rate (1) | | | 15 | % | | | 36 | % | | | 69 | % | | | 75 | % | | | 70 | % | | | 101 | % | | | | | | | | | | | | | | | | | | | | | | | | |
| | | | | | | | | | | | | | | | | | | | | | | | | | | | | | | | | | | | | | | | | | | | | | | | | |
| | | Class A | | | Class C | |
| | | Six Months Ended | | | Year Ended October 31, | | | Six Months Ended | | | Year Ended October 31, | |
| | | April 30, 2023 | | | 2022 | | | 2021 | | | 2020 | | | 2019 | | | 2018 | | | April 30, 2023 | | | 2022 | | | 2021 | | | 2020 | | | 2019 | | | 2018 | |
| | | (Unaudited) | | | | | | | | | | | | | | | | | | (Unaudited) | | | | | | | | | | | | | | | | |
| | | | | | | | | | | | | | | | | | | | | | | | | | | | | | | | | | | | | |
| Net asset value, beginning of year/period | | $ | 8.09 | | | $ | 9.44 | | | $ | 8.97 | | | $ | 9.06 | | | $ | 8.81 | | | $ | 9.29 | | | $ | 7.96 | | | $ | 9.29 | | | $ | 8.83 | | | $ | 8.92 | | | $ | 8.68 | | | $ | 9.17 | |
| Income (loss) from investment operations: | | | | | | | | | | | | | | | | | | | | | | | | | | | | | | | | | | | | | | | | | | | | | | | | |
| Net investment income* | | | 0.28 | | | | 0.41 | | | | 0.36 | | | | 0.39 | | | | 0.44 | | | | 0.42 | | | | 0.23 | | | | 0.36 | | | | 0.31 | | | | 0.34 | | | | 0.39 | | | | 0.37 | |
| Net realized and unrealized gain (loss) | | | 0.19 | | | | (1.37 | ) | | | 0.47 | | | | (0.09 | ) | | | 0.25 | | | | (0.49 | ) | | | 0.21 | | | | (1.34 | ) | | | 0.46 | | | | (0.09 | ) | | | 0.25 | | | | (0.50 | ) |
| Total income (loss) from investment operations | | | 0.47 | | | | (0.96 | ) | | | 0.83 | | | | 0.30 | | | | 0.69 | | | | (0.07 | ) | | | 0.44 | | | | (0.98 | ) | | | 0.77 | | | | 0.25 | | | | 0.64 | | | | (0.13 | ) |
| Less distributions: | | | | | | | | | | | | | | | | | | | | | | | | | | | | | | | | | | | | | | | | | | | | | | | | |
| Distributions from net investment income | | | (0.29 | ) | | | (0.39 | ) | | | (0.36 | ) | | | (0.39 | ) | | | (0.44 | ) | | | (0.41 | ) | | | (0.27 | ) | | | (0.35 | ) | | | (0.31 | ) | | | (0.34 | ) | | | (0.40 | ) | | | (0.36 | ) |
| Total distributions | | | (0.29 | ) | | | (0.39 | ) | | | (0.36 | ) | | | (0.39 | ) | | | (0.44 | ) | | | (0.41 | ) | | | (0.27 | ) | | | (0.35 | ) | | | (0.31 | ) | | | (0.34 | ) | | | (0.40 | ) | | | (0.36 | ) |
| Net asset value, end of year/period | | $ | 8.27 | | | $ | 8.09 | | | $ | 9.44 | | | $ | 8.97 | | | $ | 9.06 | | | $ | 8.81 | | | $ | 8.13 | | | $ | 7.96 | | | $ | 9.29 | | | $ | 8.83 | | | $ | 8.92 | | | $ | 8.68 | |
| Total return + # | | | 5.85 | % | | | (10.32 | )% | | | 9.29 | % | | | 3.44 | % | | | 8.07 | % | | | (0.82 | )% | | | 5.43 | % | | | (10.71 | )% | | | 8.79 | % | | | 2.95 | % | | | 7.55 | % | | | (1.43 | )% |
| Ratios/Supplemental Data: | | | | | | | | | | | | | | | | | | | | | | | | | | | | | | | | | | | | | | | | | | | | | | | | |
| Net assets, end of year/period (in 000s) | | $ | 13,809 | | | $ | 12,650 | | | $ | 13,592 | | | $ | 12,127 | | | $ | 12,336 | | | $ | 12,393 | | | $ | 3,827 | | | $ | 3,830 | | | $ | 4,746 | | | $ | 4,663 | | | $ | 7,497 | | | $ | 7,392 | |
| Ratios of expenses to average net assets: ^ | | | 1.47 | % | | | 1.44 | % | | | 1.42 | % | | | 1.39 | % | | | 1.37 | % | | | 1.37 | % | | | 1.97 | % | | | 1.94 | % | | | 1.92 | % | | | 1.89 | % | | | 1.87 | % | | | 1.87 | % |
| Ratios of net investment income to average net assets: ^ | | | 6.62 | % | | | 4.72 | % | | | 3.82 | % | | | 4.44 | % | | | 4.87 | % | | | 4.60 | % | | | 6.07 | % | | | 4.21 | % | | | 3.32 | % | | | 3.93 | % | | | 4.37 | % | | | 4.09 | % |
| Portfolio turnover rate (1) | | | 15 | % | | | 36 | % | | | 69 | % | | | 75 | % | | | 70 | % | | | 101 | % | | | 15 | % | | | 36 | % | | | 69 | % | | | 75 | % | | | 70 | % | | | 101 | % |
| | | | | | | | | | | | | | | | | | | | | | | | | | | | | | | | | | | | | | | | | | | | | | | | | |
| * | The net investment income per share data was determined using the average shares outstanding throughout each year. |
| + | Assumes reinvestment of all dividends and distributions, if any. Total return does not reflect the deductions of taxes that a shareholder would pay on distributions or on the redemption of shares and does not reflect the impact of any sales charge. |
| # | Includes adjustments in accordance with accounting principles generally accepted in the United States and, consequently, the net asset values for financial reporting purposes and the returns based upon those net asset values may differ from the net asset values and returns for shareholder transactions. Adjustments may apply to some but not all years and classes. |
| ^ | Annualized for periods less than one year. |
| (1) | Not annualized for periods less than one year. |
See accompanying notes which are an integral part to these financial statements.
| FINANCIAL HIGHLIGHTS |
| Dunham International Opportunity Bond Fund |
| |
| The table sets forth financial data for one share of beneficial interest outstanding throughout each year/period. |
| | | Class N | | | | | | | | | | | | | | | | | | | | | | | | | |
| | | Six Months Ended | | | Year Ended October 31, | | | | | | | | | | | | | | | | | | | | | | | | | |
| | | April 30, 2023 | | | 2022 | | | 2021 | | | 2020 | | | 2019 | | | 2018 | | | | | | | | | | | | | | | | | | | | | | | | | |
| | | (Unaudited) | | | | | | | | | | | | | | | | | | | | | | | | | | | | | | | | | | | | | | | | |
| Net asset value, beginning of year/period | | $ | 6.96 | | | $ | 9.18 | | | $ | 9.05 | | | $ | 9.43 | | | $ | 8.93 | | | $ | 9.32 | | | | | | | | | | | | | | | | | | | | | | | | | |
| Income (loss) from investment operations: | | | | | | | | | | | | | | | | | | | | | | | | | | | | | | | | | | | | | | | | | | | | | | | | |
| Net investment income (loss)* | | | 0.16 | | | | 0.31 | | | | 0.21 | | | | 0.19 | | | | (0.03 | ) | | | (0.03 | ) | | | | | | | | | | | | | | | | | | | | | | | | |
| Net realized and unrealized gain (loss) | | | 0.62 | | | | (2.15 | ) | | | 0.15 | | | | (0.37 | ) | | | 0.58 | | | | (0.35 | ) | | | | | | | | | | | | | | | | | | | | | | | | |
| Total income (loss) from investment operations | | | 0.78 | | | | (1.84 | ) | | | 0.36 | | | | (0.18 | ) | | | 0.55 | | | | (0.38 | ) | �� | | | | | | | | | | | | | | | | | | | | | | | |
| Less distributions: | | | | | | | | | | | | | | | | | | | | | | | | | | | | | | | | | | | | | | | | | | | | | | | | |
| Distributions from net investment income | | | (0.36 | ) | | | (0.38 | ) | | | (0.23 | ) | | | (0.11 | ) | | | (0.04 | ) | | | — | | | | | | | | | | | | | | | | | | | | | | | | | |
| Distributions from net realized gains | | | — | | | | (0.00 | ) | | | — | | | | (0.02 | ) | | | (0.01 | ) | | | (0.01 | ) | | | | | | | | | | | | | | | | | | | | | | | | |
| Tax return of capital | | | — | | | | — | | | | — | | | | (0.07 | ) | | | — | | | | — | | | | | | | | | | | | | | | | | | | | | | | | | |
| Total distributions | | | (0.36 | ) | | | (0.38 | ) | | | (0.23 | ) | | | (0.20 | ) | | | (0.05 | ) | | | (0.01 | ) | | | | | | | | | | | | | | | | | | | | | | | | |
| Net asset value, end of year/period | | $ | 7.38 | | | $ | 6.96 | | | $ | 9.18 | | | $ | 9.05 | | | $ | 9.43 | | | $ | 8.93 | | | | | | | | | | | | | | | | | | | | | | | | | |
| Total return + # | | | 11.35 | % | | | (20.52 | )% | | | 3.93 | % | | | (1.81 | )% | | | 6.29 | % | | | (4.08 | )% | | | | | | | | | | | | | | | | | | | | | | | | |
| Ratios/Supplemental Data: | | | | | | | | | | | | | | | | | | | | | | | | | | | | | | | | | | | | | | | | | | | | | | | | |
| Net assets, end of year/period (in 000s) | | $ | 40,310 | | | $ | 29,209 | | | $ | 62,423 | | | $ | 41,346 | | | $ | 32,927 | | | $ | 31,838 | | | | | | | | | | | | | | | | | | | | | | | | | |
| Ratios of expenses to average net assets (including interest expense) (1) | | | 1.56 | % | | | 1.33 | % | | | 1.78 | % | | | 1.36 | % | | | 1.36 | % | | | 1.35 | % | | | | | | | | | | | | | | | | | | | | | | | | |
| Ratios of net investment income (loss) to average net assets: | | | 4.41 | % | | | 3.83 | % | | | 2.21 | % | | | 2.08 | % | | | (0.30 | )% | | | (0.35 | )% | | | | | | | | | | | | | | | | | | | | | | | | |
| Portfolio turnover rate (2) | | | 24 | % | | | 58 | % | | | 40 | % | | | 138 | % | | | 109 | % | | | 45 | % | | | | | | | | | | | | | | | | | | | | | | | | |
| | | | | | | | | | | | | | | | | | | | | | | | | | | | | | | | | | | | | | | | | | | | | | | | | |
| | | Class A | | | Class C | |
| | | Six Months Ended | | | Year Ended October 31, | | | Six Months Ended | | | Year Ended October 31, | |
| | | April 30, 2023 | | | 2022 | | | 2021 | | | 2020 | | | 2019 | | | 2018 | | | April 30, 2023 | | | 2022 | | | 2021 | | | 2020 | | | 2019 | | | 2018 | |
| | | (Unaudited) | | | | | | | | | | | | | | | | | | (Unaudited) | | | | | | | | | | | | | | | | |
| Net asset value, beginning of year/period | | $ | 6.89 | | | $ | 9.08 | | | $ | 8.96 | | | $ | 9.34 | | | $ | 8.85 | | | $ | 9.26 | | | $ | 6.70 | | | $ | 8.84 | | | $ | 8.73 | | | $ | 9.11 | | | $ | 8.66 | | | $ | 9.10 | |
| Income (loss) from investment operations: | | | | | | | | | | | | | | | | | | | | | | | | | | | | | | | | | | | | | | | | | | | | | | | | |
| Net investment income (loss)* | | | 0.15 | | | | 0.29 | | | | 0.18 | | | | 0.17 | | | | (0.05 | ) | | | (0.06 | ) | | | 0.13 | | | | 0.25 | | | | 0.13 | | | | 0.10 | | | | (0.09 | ) | | | (0.10 | ) |
| Net realized and unrealized gain (loss) | | | 0.61 | | | | (2.12 | ) | | | 0.14 | | | | (0.37 | ) | | | 0.57 | | | | (0.34 | ) | | | 0.60 | | | | (2.07 | ) | | | 0.14 | | | | (0.33 | ) | | | 0.55 | | | | (0.33 | ) |
| Total income (loss) from investment operations | | | 0.76 | | | | (1.83 | ) | | | 0.32 | | | | (0.20 | ) | | | 0.52 | | | | (0.40 | ) | | | 0.73 | | | | (1.82 | ) | | | 0.27 | | | | (0.23 | ) | | | 0.46 | | | | (0.43 | ) |
| Less distributions: | | | | | | | | | | | | | | | | | | | | | | | | | | | | | | | | | | | | | | | | | | | | | | | | |
| Distributions from net investment income | | | (0.35 | ) | | | (0.36 | ) | | | (0.20 | ) | | | (0.09 | ) | | | (0.02 | ) | | | — | | | | (0.34 | ) | | | (0.32 | ) | | | (0.16 | ) | | | (0.06 | ) | | | — | | | | — | |
| Distributions from net realized gains | | | — | | | | (0.00 | ) | | | — | | | | (0.02 | ) | | | (0.01 | ) | | | (0.01 | ) | | | — | | | | (0.00 | ) | | | — | | | | (0.02 | ) | | | (0.01 | ) | | | (0.01 | ) |
| Tax return of capital | | | — | | | | — | | | | — | | | | (0.07 | ) | | | — | | | | — | | | | — | | | | — | | | | — | | | | (0.07 | ) | | | — | | | | — | |
| Total distributions | | | (0.35 | ) | | | (0.36 | ) | | | (0.20 | ) | | | (0.18 | ) | | | (0.03 | ) | | | (0.01 | ) | | | (0.34 | ) | | | (0.32 | ) | | | (0.16 | ) | | | (0.15 | ) | | | (0.01 | ) | | | (0.01 | ) |
| Net asset value, end of year/period | | $ | 7.30 | | | $ | 6.89 | | | $ | 9.08 | | | $ | 8.96 | | | $ | 9.34 | | | $ | 8.85 | | | $ | 7.09 | | | $ | 6.70 | | | $ | 8.84 | | | $ | 8.73 | | | $ | 9.11 | | | $ | 8.66 | |
| Total return + # | | | 11.19 | % | | | (20.62 | )% | | | 3.60 | % | | | (2.03 | )% | | | 5.98 | % | | | (4.32 | )% | | | 10.94 | % | | | (21.01 | )% | | | 3.07 | % | | | (2.48 | )% | | | 5.36 | % | | | (4.72 | )% |
| Ratios/Supplemental Data: | | | | | | | | | | | | | | | | | | | | | | | | | | | | | | | | | | | | | | | | | | | | | | | | |
| Net assets, end of year/period (in 000s) | | $ | 6,538 | | | $ | 4,787 | | | $ | 9,179 | | | $ | 6,722 | | | $ | 4,357 | | | $ | 3,802 | | | $ | 956 | | | $ | 854 | | | $ | 1,320 | | | $ | 1,180 | | | $ | 1,442 | | | $ | 1,366 | |
| Ratios of expenses to average net assets (including interest expense) (3) | | | 1.81 | % | | | 1.58 | % | | | 2.03 | % | | | 1.61 | % | | | 1.61 | % | | | 1.60 | % | | | 2.31 | % | | | 2.08 | % | | | 2.53 | % | | | 2.11 | % | | | 2.11 | % | | | 2.10 | % |
| Ratios of net investment income (loss) to average net assets: | | | 4.18 | % | | | 3.61 | % | | | 1.96 | % | | | 1.91 | % | | | (0.55 | )% | | | (0.59 | )% | | | 3.64 | % | | | 3.13 | % | | | 1.44 | % | | | 1.21 | % | | | (1.05 | )% | | | (1.10 | )% |
| Portfolio turnover rate (2) | | | 24 | % | | | 58 | % | | | 40 | % | | | 138 | % | | | 109 | % | | | 45 | % | | | 24 | % | | | 58 | % | | | 40 | % | | | 138 | % | | | 109 | % | | | 45 | % |
| | | | | | | | | | | | | | | | | | | | | | | | | | | | | | | | | | | | | | | | | | | | | | | | | |
| * The net investment income (loss) per share data was determined using the average shares outstanding throughout the year/period. |
| | | | | | | | | | | | | | | | | | | | | | | | | | | | | | | | | | | | | | | | | | | | | | | | | |
| + Assumes reinvestment of all dividends and distributions, if any. Total return does not reflect the deductions of taxes that a shareholder would pay on distributions or on the redemption of shares and does not reflect the impact of any sales charge. |
| | | | | | | | | | | | | | | | | | | | | | | | | | | | | | | | | | | | | | | | | | | | | | | | | |
| # Includes adjustments in accordance with accounting principles generally accepted in the United States and, consequently, the net asset values for financial reporting purposes and the returns based upon those net asset values may differ from the net asset values and returns for shareholder transactions. Adjustments may apply to some but not all years and classes. |
| | | | | | | | | | | | | | | | | | | | | | | | | | | | | | | | | | | | | | | | | | | | | | | | | |
| (1) Ratios of expenses to average net assets (excluding interest expense): | | | 1.56 | % | | | 1.32 | % | | | | | | | | | | | | | | | | | | | | | | | | | | | | | | | | | | | | | | | | |
| | | | | | | | | | | | | | | | | | | | | | | | | | | | | | | | | | | | | | | | | | | | | | | | | |
| | | | | | | | | | | | | | | | | | | | | | | | | | | | | | | | | | | | | | | | | | | | | | | | | |
| (2) Not annualized for periods less than one year. | | | | | | | | | | | | | | | | | | | | | | | | | | | | | | | | | | | | | | | | | | | | | | | | |
| | | | | | | | | | | | | | | | | | | | | | | | | | | | | | | | | |
| | | | | | | | | | | | | | | | | | | | | | | | | | | | | | | | | | | | | | | | | | | | | | | | | |
| (3) Ratios of expenses to average net assets (excluding interest expense): | | | 1.81 | % | | | 1.57 | % | | | | | | | | | | | | | | | | | | | 2.31 | % | | | 2.07 | % | | | | | | | | | | | | | | | | |
See accompanying notes which are an integral part to these financial statements.
| FINANCIAL HIGHLIGHTS |
| Dunham Large Cap Value Fund |
| |
| The table sets forth financial data for one share of beneficial interest outstanding throughout each year/period. |
| | | Class N | | | | | | | | | | | | | | | | | | | | | | | | | |
| | | Six Months Ended | | | Year Ended October 31, | | | | | | | | | | | | | | | | | | | | | | | | | |
| | | April 30, 2023 | | | 2022 | | | 2021 | | | 2020 | | | 2019 | | | 2018 | | | | | | | | | | | | | | | | | | | | | | | | | |
| | | (Unaudited) | | | | | | | | | | | | | | | | | | | | | | | | | | | | | | | | | | | | | | | | |
| Net asset value, beginning of year/period | | $ | 16.90 | | | $ | 19.59 | | | $ | 13.58 | | | $ | 14.96 | | | $ | 14.18 | | | $ | 14.16 | | | | | | | | | | | | | | | | | | | | | | | | | |
| Income (loss) from investment operations: | | | | | | | | | | | | | | | | | | | | | | | | | | | | | | | | | | | | | | | | | | | | | | | | |
| Net investment income * | | | 0.11 | | | | 0.14 | | | | 0.13 | | | | 0.17 | | | | 0.18 | | | | 0.14 | | | | | | | | | | | | | | | | | | | | | | | | | |
| Net realized and unrealized gain (loss) | | | 0.57 | | | | (1.57 | ) | | | 6.03 | | | | (1.03 | ) | | | 1.29 | | | | 0.15 | | | | | | | | | | | | | | | | | | | | | | | | | |
| Total income (loss) from investment operations | | | 0.68 | | | | (1.43 | ) | | | 6.16 | | | | (0.86 | ) | | | 1.47 | | | | 0.29 | | | | | | | | | | | | | | | | | | | | | | | | | |
| Less distributions: | | | | | | | | | | | | | | | | | | | | | | | | | | | | | | | | | | | | | | | | | | | | | | | | |
| Distributions from net investment income | | | (0.16 | ) | | | (0.11 | ) | | | (0.15 | ) | | | (0.18 | ) | | | (0.15 | ) | | | (0.13 | ) | | | | | | | | | | | | | | | | | | | | | | | | |
| Distributions from net realized gains | | | (0.33 | ) | | | (1.15 | ) | | | — | | | | (0.34 | ) | | | (0.54 | ) | | | (0.14 | ) | | | | | | | | | | | | | | | | | | | | | | | | |
| Total distributions | | | (0.49 | ) | | | (1.26 | ) | | | (0.15 | ) | | | (0.52 | ) | | | (0.69 | ) | | | (0.27 | ) | | | | | | | | | | | | | | | | | | | | | | | | |
| Net asset value, end of year/period | | $ | 17.09 | | | $ | 16.90 | | | $ | 19.59 | | | $ | 13.58 | | | $ | 14.96 | | | $ | 14.18 | | | | | | | | | | | | | | | | | | | | | | | | | |
| Total return + # | | | 4.10 | % | | | (7.96 | )% | | | 45.69 | % | | | (6.15 | )% | | | 11.37 | % | | | 1.98 | % | | | | | | | | | | | | | | | | | | | | | | | | |
| Ratios/Supplemental Data: | | | | | | | | | | | | | | | | | | | | | | | | | | | | | | | | | | | | | | | | | | | | | | | | |
| Net assets, end of year/period (in 000s) | | $ | 140,561 | | | $ | 141,436 | | | $ | 129,641 | | | $ | 73,557 | | | $ | 61,791 | | | $ | 55,428 | | | | | | | | | | | | | | | | | | | | | | | | | |
| Ratios of expenses to average net assets: | | | | | | | | | | | | | | | | | | | | | | | | | | | | | | | | | | | | | | | | | | | | | | | | |
| Before fees paid indirectly | | | 0.99 | % | | | 1.26 | % | | | 1.10 | % | | | 1.24 | % | | | 1.14 | % | | | 1.30 | % | | | | | | | | | | | | | | | | | | | | | | | | |
| After fees paid indirectly | | | 0.99 | % | | | 1.26 | % | | | 1.10 | % | | | 1.24 | % | | | 1.14 | % | | | 1.30 | % | | | | | | | | | | | | | | | | | | | | | | | | |
| Ratios of net investment income to average net assets: | | | | | | | | | | | | | | | | | | | | | | | | | | | | | | | | | | | | | | | | | | | | | | | | |
| Before fees paid indirectly | | | 1.28 | % | | | 0.79 | % | | | 0.72 | % | | | 1.25 | % | | | 1.30 | % | | | 0.94 | % | | | | | | | | | | | | | | | | | | | | | | | | |
| After fees paid indirectly | | | 1.28 | % | | | 0.79 | % | | | 0.72 | % | | | 1.25 | % | | | 1.30 | % | | | 0.94 | % | | | | | | | | | | | | | | | | | | | | | | | | |
| Portfolio turnover rate (1) | | | 16 | % | | | 23 | % | | | 33 | % | | | 43 | % | | | 44 | % | | | 45 | % | | | | | | | | | | | | | | | | | | | | | | | | |
| | | | | | | | | | | | | | | | | | | | | | | | | | | | | | | | | | | | | | | | | | | | | | | | | |
| | | Class A | | | Class C | |
| | | Six Months Ended | | | Year Ended October 31, | | | Six Months Ended | | | Year Ended October 31, | |
| | | April 30, 2023 | | | 2022 | | | 2021 | | | 2020 | | | 2019 | | | 2018 | | | April 30, 2023 | | | 2022 | | | 2021 | | | 2020 | | | 2019 | | | 2018 | |
| | | (Unaudited) | | | | | | | | | | | | | | | | | | (Unaudited) | | | | | | | | | | | | | | | | |
| Net asset value, beginning of year/period | | $ | 16.78 | | | $ | 19.46 | | | $ | 13.50 | | | $ | 14.87 | | | $ | 14.11 | | | $ | 14.10 | | | $ | 15.74 | | | $ | 18.40 | | | $ | 12.80 | | | $ | 14.17 | | | $ | 13.45 | | | $ | 13.47 | |
| Income (loss) from investment operations: | | | | | | | | | | | | | | | | | | | | | | | | | | | | | | | | | | | | | | | | | | | | | | | | |
| Net investment income (loss)* | | | 0.09 | | | | 0.09 | | | | 0.08 | | | | 0.14 | | | | 0.15 | | | | 0.10 | | | | 0.02 | | | | (0.04 | ) | | | (0.04 | ) | | | 0.03 | | | | 0.04 | | | | (0.01 | ) |
| Net realized and unrealized gain (loss) | | | 0.56 | | | | (1.55 | ) | | | 6.00 | | | | (1.03 | ) | | | 1.27 | | | | 0.15 | | | | 0.54 | | | | (1.47 | ) | | | 5.69 | | | | (0.98 | ) | | | 1.23 | | | | 0.15 | |
| Total income (loss) from investment operations | | | 0.65 | | | | (1.46 | ) | | | 6.08 | | | | (0.89 | ) | | | 1.42 | | | | 0.25 | | | | 0.56 | | | | (1.51 | ) | | | 5.65 | | | | (0.95 | ) | | | 1.27 | | | | 0.14 | |
| Less distributions: | | | | | | | | | | | | | | | | | | | | | | | | | | | | | | | | | | | | | | | | | | | | | | | | |
| Distributions from net investment income | | | (0.11 | ) | | | (0.07 | ) | | | (0.12 | ) | | | (0.14 | ) | | | (0.12 | ) | | | (0.10 | ) | | | (0.03 | ) | | | 0.00 | | | | (0.05 | ) | | | (0.08 | ) | | | (0.01 | ) | | | (0.02 | ) |
| Distributions from net realized gains | | | (0.33 | ) | | | (1.15 | ) | | | — | | | | (0.34 | ) | | | (0.54 | ) | | | (0.14 | ) | | | (0.33 | ) | | | (1.15 | ) | | | — | | | | (0.34 | ) | | | (0.54 | ) | | | (0.14 | ) |
| Total distributions | | | (0.44 | ) | | | (1.22 | ) | | | (0.12 | ) | | | (0.48 | ) | | | (0.66 | ) | | | (0.24 | ) | | | (0.36 | ) | | | (1.15 | ) | | | (0.05 | ) | | | (0.42 | ) | | | (0.55 | ) | | | (0.16 | ) |
| Net asset value, end of year/period | | $ | 16.99 | | | $ | 16.78 | | | $ | 19.46 | | | $ | 13.50 | | | $ | 14.87 | | | $ | 14.11 | | | $ | 15.94 | | | $ | 15.74 | | | $ | 18.40 | | | $ | 12.80 | | | $ | 14.17 | | | $ | 13.45 | |
| Total return + # | | | 3.98 | % | | | (8.18 | )% | | | 45.28 | % | | | (6.33 | )% | | | 11.00 | % | | | 1.71 | % | | | 3.63 | % | | | (8.90 | )% | | | 44.20 | % | | | (7.05 | )% | | | 10.24 | % | | | 1.00 | % |
| Ratios/Supplemental Data: | | | | | | | | | | | | | | | | | | | | | | | | | | | | | | | | | | | | | | | | | | | | | | | | |
| Net assets, end of year/period (in 000s) | | $ | 23,834 | | | $ | 22,784 | | | $ | 27,023 | | | $ | 16,855 | | | $ | 16,363 | | | $ | 12,525 | | | $ | 3,659 | | | $ | 3,958 | | | $ | 4,683 | | | $ | 3,897 | | | $ | 5,319 | | | $ | 4,167 | |
| Ratios of expenses to average net assets: | | | | | | | | | | | | | | | | | | | | | | | | | | | | | | | | | | | | | | | | | | | | | | | | |
| Before fees paid indirectly | | | 1.24 | % | | | 1.51 | % | | | 1.35 | % | | | 1.49 | % | | | 1.39 | % | | | 1.55 | % | | | 1.99 | % | | | 2.26 | % | | | 2.10 | % | | | 2.24 | % | | | 2.14 | % | | | 2.30 | % |
| After fees paid indirectly | | | 1.24 | % | | | 1.51 | % | | | 1.35 | % | | | 1.49 | % | | | 1.39 | % | | | 1.55 | % | | | 1.99 | % | | | 2.26 | % | | | 2.10 | % | | | 2.24 | % | | | 2.14 | % | | | 2.30 | % |
| Ratios of net investment income (loss) to average net assets: | | | | | | | | | | | | | | | | | | | | | | | | | | | | | | | | | | | | | | | | | | | | | | | | |
| Before fees paid indirectly | | | 1.03 | % | | | 0.52 | % | | | 0.47 | % | | | 1.00 | % | | | 1.05 | % | | | 0.70 | % | | | 0.27 | % | | | (0.23 | )% | | | (0.27 | )% | | | 0.23 | % | | | 0.30 | % | | | (0.07 | )% |
| After fees paid indirectly | | | 1.03 | % | | | 0.52 | % | | | 0.47 | % | | | 1.00 | % | | | 1.05 | % | | | 0.70 | % | | | 0.27 | % | | | (0.23 | )% | | | (0.27 | )% | | | 0.23 | % | | | 0.30 | % | | | (0.07 | )% |
| Portfolio turnover rate (1) | | | 16 | % | | | 23 | % | | | 33 | % | | | 43 | % | | | 44 | % | | | 45 | % | | | 16 | % | | | 23 | % | | | 33 | % | | | 43 | % | | | 44 | % | | | 45 | % |
| | | | | | | | | | | | | | | | | | | | | | | | | | | | | | | | | | | | | | | | | | | | | | | | | |
| * | The net investment income (loss) per share data was determined using the average shares outstanding throughout each year/period. |
| + | Assumes reinvestment of all dividends and distributions, if any. Total return does not reflect the deductions of taxes that a shareholder would pay on distributions or on the redemption of shares and does not reflect the impact of any sales charge. |
| # | Includes adjustments in accordance with accounting principles generally accepted in the United States and, consequently, the net asset values for financial reporting purposes and the returns based upon those net asset values may differ from the net asset values and returns for shareholder transactions. Adjustments may apply to some but not all years and classes. |
| (1) | Not annualized for periods less than one year. |
See accompanying notes which are an integral part to these financial statements.
| FINANCIAL HIGHLIGHTS |
| Dunham Small Cap Value Fund |
| |
| The table sets forth financial data for one share of beneficial interest outstanding throughout each year/period. |
| | | Class N | | | | | | | | | | | | | | | | | | | | | | | | | |
| | | Six Months Ended | | | Year Ended October 31, | | | | | | | | | | | | | | | | | | | | | | | | | |
| | | April 30, 2023 | | | 2022 | | | 2021 | | | 2020 | | | 2019 | | | 2018 | | | | | | | | | | | | | | | | | | | | | | | | | |
| | | (Unaudited) | | | | | | | | | | | | | | | | | | | | | | | | | | | | | | | | | | | | | | | | |
| Net asset value, beginning of year/period | | $ | 15.38 | | | $ | 18.65 | | | $ | 11.91 | | | $ | 14.67 | | | $ | 15.72 | | | $ | 17.47 | | | | | | | | | | | | | | | | | | | | | | | | | |
| Income (loss) from investment operations: | | | | | | | | | | | | | | | | | | | | | | | | | | | | | | | | | | | | | | | | | | | | | | | | |
| Net investment income (loss) * | | | 0.07 | | | | 0.07 | | | | 0.11 | | | | 0.10 | | | | (0.00 | ) (a) | | | 0.00 | (a) | | | | | | | | | | | | | | | | | | | | | | | | |
| Net realized and unrealized gain (loss) | | | (0.68 | ) | | | (1.27 | ) | | | 6.78 | | | | (2.86 | ) | | | 0.65 | | | | 0.10 | (b) | | | | | | | | | | | | | | | | | | | | | | | | |
| Total income (loss) from investment operations | | | (0.61 | ) | | | (1.20 | ) | | | 6.89 | | | | (2.76 | ) | | | 0.65 | | | | 0.10 | | | | | | | | | | | | | | | | | | | | | | | | | |
| Less distributions: | | | | | | | | | | | | | | | | | | | | | | | | | | | | | | | | | | | | | | | | | | | | | | | | |
| Distributions from net investment income | | | (0.01 | ) | | | (0.09 | ) | | | (0.14 | ) | | | — | | | | — | | | | (0.04 | ) | | | | | | | | | | | | | | | | | | | | | | | | |
| Distributions from net realized gains | | | (1.16 | ) | | | (1.98 | ) | | | (0.01 | ) | | | — | | | | (1.70 | ) | | | (1.81 | ) | | | | | | | | | | | | | | | | | | | | | | | | |
| Total distributions | | | (1.17 | ) | | | (2.07 | ) | | | (0.15 | ) | | | — | | | | (1.70 | ) | | | (1.85 | ) | | | | | | | | | | | | | | | | | | | | | | | | |
| Net asset value, end of year/period | | $ | 13.60 | | | $ | 15.38 | | | $ | 18.65 | | | $ | 11.91 | | | $ | 14.67 | | | $ | 15.72 | | | | | | | | | | | | | | | | | | | | | | | | | |
| Total return + # | | | (4.06 | )% | | | (7.65 | )% | | | 58.16 | % | | | (18.81 | )% | | | 6.15 | % | | | 0.37 | % | | | | | | | | | | | | | | | | | | | | | | | | |
| Ratios/Supplemental Data: | | | | | | | | | | | | | | | | | | | | | | | | | | | | | | | | | | | | | | | | | | | | | | | | |
| Net assets, end of year/period (in 000s) | | $ | 52,998 | | | $ | 59,955 | | | $ | 72,651 | | | $ | 42,444 | | | $ | 43,564 | | | $ | 37,248 | | | | | | | | | | | | | | | | | | | | | | | | | |
| Ratios of expenses to average net assets: | | | | | | | | | | | | | | | | | | | | | | | | | | | | | | | | | | | | | | | | | | | | | | | | |
| Before fees paid indirectly | | | 1.57 | % | | | 1.67 | % | | | 1.05 | % | | | 1.26 | % | | | 1.72 | % | | | 1.54 | % | | | | | | | | | | | | | | | | | | | | | | | | |
| After fees paid indirectly | | | 1.46 | % | | | 1.61 | % | | | 1.05 | % | | | 1.17 | % | | | 1.72 | % | | | 1.54 | % | | | | | | | | | | | | | | | | | | | | | | | | |
| Ratios of net investment income (loss) to average net assets: (c) ! | | | | | | | | | | | | | | | | | | | | | | | | | | | | | | | | | | | | | | | | | | | | | | | | |
| Before fees paid indirectly | | | 0.78 | % | | | 0.34 | % | | | 0.67 | % | | | 0.72 | % | | | (0.01 | )% | | | 0.01 | % | | | | | | | | | | | | | | | | | | | | | | | | |
| After fees paid indirectly | | | 0.89 | % | | | 0.41 | % | | | 0.67 | % | | | 0.81 | % | | | (0.01 | )% | | | 0.01 | % | | | | | | | | | | | | | | | | | | | | | | | | |
| Portfolio turnover rate (1) | | | 45 | % | | | 83 | % | | | 87 | % | | | 135 | % | | | 85 | % | | | 101 | % | | | | | | | | | | | | | | | | | | | | | | | | |
| | | | | | | | | | | | | | | | | | | | | | | | | | | | | | | | | | | | | | | | | | | | | | | | | |
| | | Class A | | | Class C | |
| | | Six Months Ended | | | Year Ended October 31, | | | Six Months Ended | | | Year Ended October 31, | |
| | | April 30, 2023 | | | 2022 | | | 2021 | | | 2020 | | | 2019 | | | 2018 | | | April 30, 2023 | | | 2022 | | | 2021 | | | 2020 | | | 2019 | | | 2018 | |
| | | (Unaudited) | | | | | | | | | | | | | | | | | | (Unaudited) | | | | | | | | | | | | | | | | |
| | | | | | | | | | | | | | | | | | | | | | | | | | | | | | | | | | | | | |
| Net asset value, beginning of year/period | | $ | 15.07 | | | $ | 18.31 | | | $ | 11.70 | | | $ | 14.45 | | | $ | 15.55 | | | $ | 17.31 | | | $ | 12.60 | | | $ | 15.70 | | | $ | 10.05 | | | $ | 12.51 | | | $ | 13.81 | | | $ | 15.67 | |
| Income (loss) from investment operations: | | | | | | | | | | | | | | | | | | | | | | | | | | | | | | | | | | | | | | | | | | | | | | | | |
| Net investment income (loss) * | | | 0.05 | | | | 0.03 | | | | 0.08 | | | | 0.07 | | | | (0.04 | ) | | | (0.04 | ) | | | (0.01 | ) | | | (0.08 | ) | | | (0.04 | ) | | | (0.02 | ) | | | (0.12 | ) | | | (0.15 | ) |
| Net realized and unrealized gain (loss) | | | (0.66 | ) | | | (1.24 | ) | | | 6.65 | | | | (2.82 | ) | | | 0.64 | | | | 0.09 | (b) | | | (0.53 | ) | | | (1.04 | ) | | | 5.72 | | | | (2.44 | ) | | | 0.52 | | | | 0.10 | (b) |
| Total income (loss) from investment operations | | | (0.61 | ) | | | (1.21 | ) | | | 6.73 | | | | (2.75 | ) | | | 0.60 | | | | 0.05 | | | | (0.54 | ) | | | (1.12 | ) | | | 5.68 | | | | (2.46 | ) | | | 0.40 | | | | (0.05 | ) |
| Less distributions: | | | | | | | | | | | | | | | | | | | | | | | | | | | | | | | | | | | | | | | | | | | | | | | | |
| Distributions from net investment income | | | — | | | | (0.05 | ) | | | (0.11 | ) | | | — | | | | — | | | | (0.00 | ) (a) | | | — | | | | — | | | | (0.02 | ) | | | — | | | | — | | | | — | |
| Distributions from net realized gains | | | (1.16 | ) | | | (1.98 | ) | | | (0.01 | ) | | | — | | | | (1.70 | ) | | | (1.81 | ) | | | (1.16 | ) | | | (1.98 | ) | | | (0.01 | ) | | | — | | | | (1.70 | ) | | | (1.81 | ) |
| Total distributions | | | (1.16 | ) | | | (2.03 | ) | | | (0.12 | ) | | | — | | | | (1.70 | ) | | | (1.81 | ) | | | (1.16 | ) | | | (1.98 | ) | | | (0.03 | ) | | | — | | | | (1.70 | ) | | | (1.81 | ) |
| Net asset value, end of year/period | | $ | 13.30 | | | $ | 15.07 | | | $ | 18.31 | | | $ | 11.70 | | | $ | 14.45 | | | $ | 15.55 | | | $ | 10.90 | | | $ | 12.60 | | | $ | 15.70 | | | $ | 10.05 | | | $ | 12.51 | | | $ | 13.81 | |
| Total return + # | | | (4.16 | )% | | | (7.86 | )% | | | 57.71 | % | | | (19.03 | )% | | | 5.85 | % | | | 0.08 | % | | | (4.51 | )% | | | (8.62 | )% | | | 56.55 | % | | | (19.66 | )% | | | 5.06 | % | | | (0.63 | )% |
| Ratios/Supplemental Data: | | | | | | | | | | | | | | | | | | | | | | | | | | | | | | | | | | | | | | | | | | | | | | | | |
| Net assets, end of year/period (in 000s) | | $ | 7,414 | | | $ | 8,331 | | | $ | 12,795 | | | $ | 8,955 | | | $ | 9,848 | | | $ | 7,869 | | | $ | 1,878 | | | $ | 2,314 | | | $ | 2,794 | | | $ | 2,064 | | | $ | 2,835 | | | $ | 2,139 | |
| Ratios of expenses to average net assets: | | | | | | | | | | | | | | | | | | | | | | | | | | | | | | | | | | | | | | | | | | | | | | | | |
| Before fees paid indirectly | | | 1.82 | % | | | 1.92 | % | | | 1.30 | % | | | 1.51 | % | | | 1.97 | % | | | 1.79 | % | | | 2.57 | % | | | 2.67 | % | | | 2.05 | % | | | 2.26 | % | | | 2.72 | % | | | 2.54 | % |
| After fees paid indirectly | | | 1.71 | % | | | 1.86 | % | | | 1.30 | % | | | 1.42 | % | | | 1.97 | % | | | 1.79 | % | | | 2.46 | % | | | 2.61 | % | | | 2.05 | % | | | 2.17 | % | | | 2.72 | % | | | 2.54 | % |
| Ratios of net investment income (loss) to average net assets: (c) ! | | | | | | | | | | | | | | | | | | | | | | | | | | | | | | | | | | | | | | | | | | | | | | | | |
| Before fees paid indirectly | | | 0.52 | % | | | 0.12 | % | | | 0.46 | % | | | 0.46 | % | | | (0.26 | )% | | | (0.26 | )% | | | (0.21 | )% | | | (0.67 | )% | | | (0.31 | )% | | | (0.29 | )% | | | (1.01 | )% | | | (1.04 | )% |
| After fees paid indirectly | | | 0.63 | % | | | 0.17 | % | | | 0.46 | % | | | 0.55 | % | | | (0.26 | )% | | | (0.26 | )% | | | (0.10 | )% | | | (0.61 | )% | | | (0.31 | )% | | | (0.20 | )% | | | (1.01 | )% | | | (1.04 | )% |
| Portfolio turnover rate (1) | | | 45 | % | | | 83 | % | | | 87 | % | | | 135 | % | | | 85 | % | | | 101 | % | | | 45 | % | | | 83 | % | | | 87 | % | | | 135 | % | | | 85 | % | | | 101 | % |
| | | | | | | | | | | | | | | | | | | | | | | | | | | | | | | | | | | | | | | | | | | | | | | | | |
| * | The net investment income (loss) per share data was determined using the average shares outstanding throughout each year/period. |
| + | Assumes reinvestment of all dividends and distributions, if any. Total return does not reflect the deductions of taxes that a shareholder would pay on distributions or on the redemption of shares and does not reflect the impact of any sales charge. |
| # | Includes adjustments in accordance with accounting principles generally accepted in the United States and, consequently, the net asset values for financial reporting purposes and the returns based upon those net assets may differ from the net asset values and returns for shareholder transactions. Adjustments may apply to some but not all years and classes. |
| ! | Recognition of net investment income (loss) is affected by the timing and declaration of dividends by underlying funds in which the Fund invests. |
| (a) | Represents less than $0.01 per share. |
| (b) | The amount of net realized and unrealized gain (loss) on investment per share for the year ended October 31, 2018 does not accord with the amounts in the Statements of Operations due to the timing of purchases and sales of Fund shares in relation to fluctuating market values. |
| (c) | Does not Include the expenses of other investment companies in which the Fund invests. |
| (1) | Not annualized for periods less than one year. |
See accompanying notes which are an integral part to these financial statements.
| FINANCIAL HIGHLIGHTS |
| Dunham Focused Large Cap Growth Fund |
| |
| The table sets forth financial data for one share of beneficial interest outstanding throughout each year/period. |
| | | Class N | | | | | | | | | | | | | | | | | | | | | | | | | |
| | | Six Months Ended | | | Year Ended October 31, | | | | | | | | | | | | | | | | | | | | | | | | | |
| | | April 30, 2023 | | | 2022 | | | 2021 | | | 2020 | | | 2019 | | | 2018 | | | | | | | | | | | | | | | | | | | | | | | | | |
| | | (Unaudited) | | | | | | | | | | | | | | | | | | | | | | | | | | | | | | | | | | | | | | | | |
| Net asset value, beginning of year/period | | $ | 24.57 | | | $ | 43.94 | | | $ | 33.67 | | | $ | 24.24 | | | $ | 22.50 | | | $ | 19.37 | | | | | | | | | | | | | | | | | | | | | | | | | |
| Income (loss) from investment operations: | | | | | | | | | | | | | | | | | | | | | | | | | | | | | | | | | | | | | | | | | | | | | | | | |
| Net investment loss* | | | (0.08 | ) | | | (0.20 | ) | | | (0.36 | ) | | | (0.32 | ) | | | (0.25 | ) | | | (0.22 | ) | | | | | | | | | | | | | | | | | | | | | | | | |
| Net realized and unrealized gain (loss) | | | 5.19 | | | | (15.89 | ) | | | 11.47 | | | | 10.58 | | | | 3.69 | | | | 3.53 | | | | | | | | | | | | | | | | | | | | | | | | | |
| Total income (loss) from investment operations | | | 5.11 | | | | (16.09 | ) | | | 11.11 | | | | 10.26 | | | | 3.44 | | | | 3.31 | | | | | | | | | | | | | | | | | | | | | | | | | |
| Less distributions: | | | | | | | | | | | | | | | | | | | | | | | | | | | | | | | | | | | | | | | | | | | | | | | | |
| Distributions from net realized gains | | | — | | | | (3.28 | ) | | | (0.84 | ) | | | (0.83 | ) | | | (1.70 | ) | | | (0.18 | ) | | | | | | | | | | | | | | | | | | | | | | | | |
| Total distributions | | | — | | | | (3.28 | ) | | | (0.84 | ) | | | (0.83 | ) | | | (1.70 | ) | | | (0.18 | ) | | | | | | | | | | | | | | | | | | | | | | | | |
| Net asset value, end of year/period | | $ | 29.68 | | | $ | 24.57 | | | $ | 43.94 | | | $ | 33.67 | | | $ | 24.24 | | | $ | 22.50 | | | | | | | | | | | | | | | | | | | | | | | | | |
| Total return + # | | | 20.80 | % | | | (39.47 | )% | | | 33.44 | % | | | 43.39 | % | | | 17.19 | % | | | 17.24 | % | | | | | | | | | | | | | | | | | | | | | | | | |
| Ratios/Supplemental Data: | | | | | | | | | | | | | | | | | | | | | | | | | | | | | | | | | | | | | | | | | | | | | | | | |
| Net assets, end of year/period (in 000s) | | $ | 146,061 | | | $ | 143,425 | | | $ | 156,938 | | | $ | 108,816 | | | $ | 74,714 | | | $ | 59,424 | | | | | | | | | | | | | | | | | | | | | | | | | |
| Ratios of expenses to average net assets: | | | | | | | | | | | | | | | | | | | | | | | | | | | | | | | | | | | | | | | | | | | | | | | | |
| Before fee waivers and fees paid indirectly | | | 1.08 | % | | | 1.01 | % | | | 1.12 | % | | | 1.30 | % | | | 1.33 | % | | | 1.30 | % | | | | | | | | | | | | | | | | | | | | | | | | |
| After fee waivers and fees paid indirectly | | | 1.08 | % | | | 1.01 | % | | | 1.12 | % | | | 1.30 | % | | | 1.33 | % | | | 1.29 | % | | | | | | | | | | | | | | | | | | | | | | | | |
| Ratios of net investment loss to average net assets: | | | | | | | | | | | | | | | | | | | | | | | | | | | | | | | | | | | | | | | | | | | | | | | | |
| Before fee waivers and fees paid indirectly | | | (0.54 | )% | | | (0.67 | )% | | | (0.92 | )% | | | (1.08 | )% | | | (1.06 | )% | | | (1.01 | )% | | | | | | | | | | | | | | | | | | | | | | | | |
| After fee waivers and fees paid indirectly | | | (0.54 | )% | | | (0.67 | )% | | | (0.92 | )% | | | (1.08 | )% | | | (1.06 | )% | | | (1.01 | )% | | | | | | | | | | | | | | | | | | | | | | | | |
| Portfolio turnover rate (1) | | | 8 | % | | | 9 | % | | | 27 | % | | | 17 | % | | | 28 | % | | | 25 | % | | | | | | | | | | | | | | | | | | | | | | | | |
| | | | | | | | | | | | | | | | | | | | | | | | | | | | | | | | | | | | | | | | | | | | | | | | | |
| | | Class A | | | Class C | |
| | | Six Months Ended | | | Year Ended October 31, | | | Six Months Ended | | | Year Ended October 31, | |
| | | April 30, 2023 | | | 2022 | | | 2021 | | | 2020 | | | 2019 | | | 2018 | | | April 30, 2023 | | | 2022 | | | 2021 | | | 2020 | | | 2019 | | | 2018 | |
| | | (Unaudited) | | | | | | | | | | | | | | | | | | (Unaudited) | | | | | | | | | | | | | | | | |
| Net asset value, beginning of year/period | | $ | 23.77 | | | $ | 42.73 | | | $ | 32.84 | | | $ | 23.71 | | | $ | 22.11 | | | $ | 19.08 | | | $ | 21.56 | | | $ | 39.33 | | | $ | 30.51 | | | $ | 22.25 | | | $ | 21.00 | | | $ | 18.27 | |
| Income (loss) from investment operations: | | | | | | | | | | | | | | | | | | | | | | | | | | | | | | | | | | | | | | | | | | | | | | | | |
| Net investment loss* | | | (0.11 | ) | | | (0.28 | ) | | | (0.45 | ) | | | (0.38 | ) | | | (0.30 | ) | | | (0.28 | ) | | | (0.16 | ) | | | (0.46 | ) | | | (0.68 | ) | | | (0.55 | ) | | | (0.44 | ) | | | (0.42 | ) |
| Net realized and unrealized gain (loss) | | | 5.02 | | | | (15.40 | ) | | | 11.18 | | | | 10.34 | | | | 3.60 | | | | 3.49 | | | | 4.51 | | | | (14.03 | ) | | | 10.34 | | | | 9.64 | | | | 3.39 | | | | 3.33 | |
| Total income (loss) from investment operations | | | 4.91 | �� | | | (15.68 | ) | | | 10.73 | | | | 9.96 | | | | 3.30 | | | | 3.21 | | | | 4.35 | | | | (14.49 | ) | | | 9.66 | | | | 9.09 | | | | 2.95 | | | | 2.91 | |
| Less distributions: | | | | | | | | | | | | | | | | | | | | | | | | | | | | | | | | | | | | | | | | | | | | | | | | |
| Distributions from net realized gains | | | — | | | | (3.28 | ) | | | (0.84 | ) | | | (0.83 | ) | | | (1.70 | ) | | | (0.18 | ) | | | — | | | | (3.28 | ) | | | (0.84 | ) | | | (0.83 | ) | | | (1.70 | ) | | | (0.18 | ) |
| Total distributions | | | — | | | | (3.28 | ) | | | (0.84 | ) | | | (0.83 | ) | | | (1.70 | ) | | | (0.18 | ) | | | — | | | | (3.28 | ) | | | (0.84 | ) | | | (0.83 | ) | | | (1.70 | ) | | | (0.18 | ) |
| Net asset value, end of year/period | | $ | 28.68 | | | $ | 23.77 | | | $ | 42.73 | | | $ | 32.84 | | | $ | 23.71 | | | $ | 22.11 | | | $ | 25.91 | | | $ | 21.56 | | | $ | 39.33 | | | $ | 30.51 | | | $ | 22.25 | | | $ | 21.00 | |
| Total return + # | | | 20.66 | % | | | (39.62 | )% | | | 33.13 | % | | | 43.09 | % | | | 16.84 | % | | | 16.98 | % | | | 20.18 | % | | | (40.07 | )% | | | 32.13 | % | | | 41.97 | % | | | 16.00 | % | | | 16.08 | % |
| Ratios/Supplemental Data: | | | | | | | | | | | | | | | | | | | | | | | | | | | | | | | | | | | | | | | | | | | | | | | | |
| Net assets, end of year/period (in 000s) | | $ | 26,090 | | | $ | 24,711 | | | $ | 37,270 | | | $ | 31,205 | | | $ | 24,131 | | | $ | 15,031 | | | $ | 7,536 | | | $ | 7,483 | | | $ | 13,911 | | | $ | 10,414 | | | $ | 8,314 | | | $ | 6,844 | |
| Ratios of expenses to average net assets: | | | | | | | | | | | | | | | | | | | | | | | | | | | | | | | | | | | | | | | | | | | | | | | | |
| Before fee waivers and fees paid indirectly | | | 1.33 | % | | | 1.26 | % | | | 1.37 | % | | | 1.55 | % | | | 1.58 | % | | | 1.55 | % | | | 2.08 | % | | | 2.01 | % | | | 2.12 | % | | | 2.30 | % | | | 2.33 | % | | | 2.30 | % |
| After fee waivers and fees paid indirectly | | | 1.33 | % | | | 1.26 | % | | | 1.37 | % | | | 1.55 | % | | | 1.58 | % | | | 1.54 | % | | | 2.08 | % | | | 2.01 | % | | | 2.12 | % | | | 2.30 | % | | | 2.33 | % | | | 2.29 | % |
| Ratios of net investment loss to average net assets: | | | | | | | | | | | | | | | | | | | | | | | | | | | | | | | | | | | | | | | | | | | | | | | | |
| Before fee waivers and fees paid indirectly | | | (0.79 | )% | | | (0.93 | )% | | | (1.17 | )% | | | (1.34 | )% | | | (1.32 | )% | | | (1.26 | )% | | | (1.54 | )% | | | (1.69 | )% | | | (1.92 | )% | | | (2.08 | )% | | | (2.06 | )% | | | (2.01 | )% |
| After fee waivers and fees paid indirectly | | | (0.79 | )% | | | (0.93 | )% | | | (1.17 | )% | | | (1.34 | )% | | | (1.32 | )% | | | (1.26 | )% | | | (1.54 | )% | | | (1.69 | )% | | | (1.92 | )% | | | (2.08 | )% | | | (2.06 | )% | | | (2.01 | )% |
| Portfolio turnover rate (1) | | | 8 | % | | | 9 | % | | | 27 | % | | | 17 | % | | | 28 | % | | | 25 | % | | | 8 | % | | | 9 | % | | | 27 | % | | | 17 | % | | | 28 | % | | | 25 | % |
| | | | | | | | | | | | | | | | | | | | | | | | | | | | | | | | | | | | | | | | | | | | | | | | | |
| * | The net investment loss per share data was determined using the average shares outstanding throughout each year. |
| + | Assumes reinvestment of all dividends and distributions, if any. Total return does not reflect the deductions of taxes that a shareholder would pay on distributions or on the redemption of shares and does not reflect the impact of any sales charge. |
| # | Includes adjustments in accordance with accounting principles generally accepted in the United States and, consequently, the net asset values for financial reporting purposes and the returns based upon those net asset values may differ from the net asset values and returns for shareholder transactions. Adjustments may apply to some but not all years and classes. |
| ^ | Annualized for periods less than one year. |
| (1) | Not annualized for periods less than one year. |
See accompanying notes which are an integral part to these financial statements.
| FINANCIAL HIGHLIGHTS |
| Dunham Small Cap Growth Fund |
| |
| The table sets forth financial data for one share of beneficial interest outstanding throughout each year/period. |
| | | Class N | | | | | | | | | | | | | | | | | | | | | | | | | |
| | | Six Months Ended | | | Year Ended October 31, | | | | | | | | | | | | | | | | | | | | | | | | | |
| | | April 30, 2023 | | | 2022 | | | 2021 | | | 2020 | | | 2019 | | | 2018 | | | | | | | | | | | | | | | | | | | | | | | | | |
| Net asset value, beginning of year/period | | $ | 14.73 | | | $ | 27.93 | | | $ | 21.62 | | | $ | 16.00 | | | $ | 20.28 | | | $ | 20.31 | | | | | | | | | | | | | | | | | | | | | | | | | |
| Income (loss) from investment operations: | | | | | | | | | | | | | | | | | | | | | | | | | | | | | | | | | | | | | | | | | | | | | | | | |
| Net investment loss* | | | (0.05 | ) | | | (0.12 | ) | | | (0.38 | ) | | | (0.23 | ) | | | (0.23 | ) | | | (0.27 | ) | | | | | | | | | | | | | | | | | | | | | | | | |
| Net realized and unrealized gain (loss) (a) | | | 0.90 | | | | (9.04 | ) | | | 10.50 | | | | 6.15 | | | | (0.25 | ) | | | 3.20 | | | | | | | | | | | | | | | | | | | | | | | | | |
| Total income (loss) from investment operations | | | 0.85 | | | | (9.16 | ) | | | 10.12 | | | | 5.92 | | | | (0.48 | ) | | | 2.93 | | | | | | | | | | | | | | | | | | | | | | | | | |
| Less distributions: | | | | | | | | | | | | | | | | | | | | | | | | | | | | | | | | | | | | | | | | | | | | | | | | |
| Distributions from net investment income | | | — | | | | (0.19 | ) | | | (0.28 | ) | | | (0.05 | ) | | | — | | | | — | | | | | | | | | | | | | | | | | | | | | | | | | |
| Distributions from net realized gains | | | — | | | | (3.85 | ) | | | (3.53 | ) | | | (0.25 | ) | | | (3.80 | ) | | | (2.96 | ) | | | | | | | | | | | | | | | | | | | | | | | | |
| Total distributions | | | — | | | | (4.04 | ) | | | (3.81 | ) | | | (0.30 | ) | | | (3.80 | ) | | | (2.96 | ) | | | | | | | | | | | | | | | | | | | | | | | | |
| Net asset value, end of year/period | | $ | 15.58 | | | $ | 14.73 | | | $ | 27.93 | | | $ | 21.62 | | | $ | 16.00 | | | $ | 20.28 | | | | | | | | | | | | | | | | | | | | | | | | | |
| Total return + # | | | 5.84 | % | | | (37.42 | )% | | | 49.28 | % | | | 37.55 | % | | | 1.36 | % | | | 16.02 | % | | | | | | | | | | | | | | | | | | | | | | | | |
| Ratios/Supplemental Data: | | | | | | | | | | | | | | | | | | | | | | | | | | | | | | | | | | | | | | | | | | | | | | | | |
| Net assets, end of year/period (in 000s) | | $ | 56,452 | | | $ | 65,064 | | | $ | 63,287 | | | $ | 42,792 | | | $ | 37,340 | | | $ | 33,882 | | | | | | | | | | | | | | | | | | | | | | | | | |
| Ratios of expenses to average net assets: | | | | | | | | | | | | | | | | | | | | | | | | | | | | | | | | | | | | | | | | | | | | | | | | |
| Before fees paid indirectly | | | 1.12 | % | | | 1.17 | % | | | 1.83 | % | | | 1.78 | % | | | 1.90 | % | | | 1.94 | % | | | | | | | | | | | | | | | | | | | | | | | | |
| After fees paid indirectly | | | 1.10 | % | | | 1.14 | % | | | 1.83 | % | | | 1.75 | % | | | 1.88 | % | | | 1.93 | % | | | | | | | | | | | | | | | | | | | | | | | | |
| Ratios of net investment loss to average net assets: | | | | | | | | | | | | | | | | | | | | | | | | | | | | | | | | | | | | | | | | | | | | | | | | |
| Before fees paid indirectly | | | (0.56 | )% | | | (0.72 | )% | | | (1.47 | )% | | | (1.34 | )% | | | (1.36 | )% | | | (1.31 | )% | | | | | | | | | | | | | | | | | | | | | | | | |
| After fees paid indirectly | | | (0.54 | )% | | | (0.70 | )% | | | (1.47 | )% | | | (1.31 | )% | | | (1.34 | )% | | | (1.29 | )% | | | | | | | | | | | | | | | | | | | | | | | | |
| Portfolio turnover rate (1) | | | 54 | % | | | 92 | % | | | 111 | % | | | 178 | % | | | 169 | % | | | 190 | % | | | | | | | | | | | | | | | | | | | | | | | | |
| | | | | | | | | | | | | | | | | | | | | | | | | | | | | | | | | | | | | | | | | | | | | | | | | |
| | | Class A | | | Class C | |
| | | Six Months Ended | | | Year Ended October 31, | | | Six Months Ended | | | Year Ended October 31, | |
| | | April 30, 2023 | | | 2022 | | | 2021 | | | 2020 | | | 2019 | | | 2018 | | | April 30, 2023 | | | 2022 | | | 2021 | | | 2020 | | | 2019 | | | 2018 | |
| | | (Unaudited) | | | | | | | | | | | | | | | | | | (Unaudited) | | | | | | | | | | | | | | | | |
| | | | | | | | | | | | | | | | | | | | | | | | | | | | | | | | | | | | | |
| Net asset value, beginning of year/period | | $ | 13.55 | | | $ | 26.04 | | | $ | 20.36 | | | $ | 15.09 | | | $ | 19.42 | | | $ | 19.62 | | | $ | 8.93 | | | $ | 18.62 | | | $ | 15.39 | | | $ | 11.54 | | | $ | 16.00 | | | $ | 16.77 | |
| Income (loss) from investment operations: | | | | | | | | | | | | | | | | | | | | | | | | | | | | | | | | | | | | | | | | | | | | | | | | |
| Net investment loss* | | | (0.05 | ) | | | (0.17 | ) | | | (0.42 | ) | | | (0.26 | ) | | | (0.25 | ) | | | (0.31 | ) | | | (0.06 | ) | | | (0.19 | ) | | | (0.44 | ) | | | (0.29 | ) | | | (0.29 | ) | | | (0.37 | ) |
| Net realized and unrealized gain (loss) (a) | | | 0.82 | | | | (8.34 | ) | | | 9.86 | | | | 5.80 | | | | (0.28 | ) | | | 3.07 | | | | 0.52 | | | | (5.64 | ) | | | 7.33 | | | | 4.39 | | | | (0.37 | ) | | | 2.56 | |
| Total income (loss) from investment operations | | | 0.77 | | | | (8.51 | ) | | | 9.44 | | | | 5.54 | | | | (0.53 | ) | | | 2.76 | | | | 0.46 | | | | (5.83 | ) | | | 6.89 | | | | 4.10 | | | | (0.66 | ) | | | 2.19 | |
| Less distributions: | | | | | | | | | | | | | | | | | | | | | | | | | | | | | | | | | | | | | | | | | | | | | | | | |
| Distributions from net investment income | | | — | | | | (0.13 | ) | | | (0.23 | ) | | | (0.02 | ) | | | — | | | | — | | | | — | | | | (0.01 | ) | | | (0.13 | ) | | | — | | | | — | | | | — | |
| Distributions from net realized gains | | | — | | | | (3.85 | ) | | | (3.53 | ) | | | (0.25 | ) | | | (3.80 | ) | | | (2.96 | ) | | | — | | | | (3.85 | ) | | | (3.53 | ) | | | (0.25 | ) | | | (3.80 | ) | | | (2.96 | ) |
| Total distributions | | | — | | | | (3.98 | ) | | | (3.76 | ) | | | (0.27 | ) | | | (3.80 | ) | | | (2.96 | ) | | | — | | | | (3.86 | ) | | | (3.66 | ) | | | (0.25 | ) | | | (3.80 | ) | | | (2.96 | ) |
| Net asset value, end of year/period | | $ | 14.32 | | | $ | 13.55 | | | $ | 26.04 | | | $ | 20.36 | | | $ | 15.09 | | | $ | 19.42 | | | $ | 9.39 | | | $ | 8.93 | | | $ | 18.62 | | | $ | 15.39 | | | $ | 11.54 | | | $ | 16.00 | |
| Total return + # | | | 5.68 | % | | | (37.55 | )% | | | 48.93 | % | | | 37.18 | % | | | 1.11 | % | | | 15.69 | % | | | 5.26 | % | | | (37.99 | )% | | | 47.87 | % | | | 36.10 | % | | | 0.36 | % | | | 14.84 | % |
| Ratios/Supplemental Data: | | | | | | | | | | | | | | | | | | | | | | | | | | | | | | | | | | | | | | | | | | | | | | | | |
| Net assets, end of year/period (in 000s) | | $ | 9,670 | | | $ | 11,795 | | | $ | 20,357 | | | $ | 12,750 | | | $ | 10,797 | | | $ | 10,799 | | | $ | 1,910 | | | $ | 2,210 | | | $ | 3,730 | | | $ | 2,619 | | | $ | 2,440 | | | $ | 2,720 | |
| Ratios of expenses to average net assets: | | | | | | | | | | | | | | | | | | | | | | | | | | | | | | | | | | | | | | | | | | | | | | | | |
| Before fees paid indirectly | | | 1.37 | % | | | 1.42 | % | | | 2.08 | % | | | 2.03 | % | | | 2.15 | % | | | 2.19 | % | | | 2.12 | % | | | 2.17 | % | | | 2.83 | % | | | 2.78 | % | | | 2.90 | % | | | 2.94 | % |
| After fees paid indirectly | | | 1.35 | % | | | 1.39 | % | | | 2.08 | % | | | 2.00 | % | | | 2.13 | % | | | 2.18 | % | | | 2.10 | % | | | 2.14 | % | | | 2.83 | % | | | 2.75 | % | | | 2.88 | % | | | 2.93 | % |
| Ratios of net investment loss to average net assets: | | | | | | | | | | | | | | | | | | | | | | | | | | | | | | | | | | | | | | | | | | | | | | | | |
| Before fees paid indirectly | | | (0.80 | )% | | | (0.97 | )% | | | (1.72 | )% | | | (1.57 | )% | | | (1.61 | )% | | | (1.56 | )% | | | (1.56 | )% | | | (1.72 | )% | | | (2.47 | )% | | | (2.32 | )% | | | (2.37 | )% | | | (2.30 | )% |
| After fees paid indirectly | | | (0.78 | )% | | | (0.95 | )% | | | (1.72 | )% | | | (1.54 | )% | | | (1.59 | )% | | | (1.55 | )% | | | (1.54 | )% | | | (1.70 | )% | | | (2.47 | )% | | | (2.29 | )% | | | (2.35 | )% | | | (2.29 | )% |
| Portfolio turnover rate (1) | | | 54 | % | | | 92 | % | | | 111 | % | | | 178 | % | | | 169 | % | | | 190 | % | | | 54 | % | | | 92 | % | | | 111 | % | | | 178 | % | | | 169 | % | | | 190 | % |
| | | | | | | | | | | | | | | | | | | | | | | | | | | | | | | | | | | | | | | | | | | | | | | | | |
| * | The net investment loss per share data was determined using the average shares outstanding throughout each year. |
| + | Assumes reinvestment of all dividends and distributions, if any. Total return does not reflect the deductions of taxes that a shareholder would pay on distributions or on the redemption of shares and does not reflect the impact of any sales charge. |
| # | Includes adjustments in accordance with accounting principles generally accepted in the United States and, consequently, the net asset values for financial reporting purposes and the returns based upon those net asset values may differ from the net asset values and returns for shareholder transactions. Adjustments may apply to some but not all years and classes. |
| (a) | The amount of net realized and unrealized gain (loss) on investment per share for the year ended October 31, 2019 does not accord with the amounts in the Statements of Operations due to the timing of purchases and sales of Fund shares in relation to fluctuating market values. |
| ^ | Annualized for periods less than one year. |
| (1) | Not annualized for periods less than one year. |
See accompanying notes which are an integral part to these financial statements.
| FINANCIAL HIGHLIGHTS |
| Dunham Emerging Markets Stock Fund |
| |
| The table sets forth financial data for one share of beneficial interest outstanding throughout each year/period. |
| | | Class N | | | | | | | | | | | | | | | | | | | | | | | | | |
| | | Six Months Ended | | | Year Ended October 31, | | | | | | | | | | | | | | | | | | | | | | | | | |
| | | April 30, 2023 | | | 2022 | | | 2021 | | | 2020 | | | 2019 | | | 2018 | | | | | | | | | | | | | | | | | | | | | | | | | |
| | | (Unaudited) | | | | | | | | | | | | | | | | | | | | | | | | | | | | | | | | | | | | | | | | |
| | | | | | | | | | | | | | | | | | | | | | | | | | | | | | | | | | | | | | | | | | | |
| Net asset value, beginning of year/period | | $ | 10.93 | | | $ | 18.76 | | | $ | 15.70 | | | $ | 14.27 | | | $ | 12.85 | | | $ | 15.94 | | | | | | | | | | | | | | | | | | | | | | | | | |
| Income (loss) from investment operations: | | | | | | | | | | | | | | | | | | | | | | | | | | | | | | | | | | | | | | | | | | | | | | | | |
| Net investment income (loss) * | | | 0.07 | | | | 0.17 | | | | 0.04 | | | | (0.03 | ) | | | 0.19 | | | | 0.27 | | | | | | | | | | | | | | | | | | | | | | | | | |
| Net realized and unrealized gain (loss) | | | 1.53 | | | | (6.41 | ) | | | 3.05 | | | | 1.59 | | | | 1.48 | | | | (3.20 | ) | | | | | | | | | | | | | | | | | | | | | | | | |
| Total income (loss) from investment operations | | | 1.60 | | | | (6.24 | ) | | | 3.09 | | | | 1.56 | | | | 1.67 | | | | (2.93 | ) | | | | | | | | | | | | | | | | | | | | | | | | |
| Less distributions: | | | | | | | | | | | | | | | | | | | | | | | | | | | | | | | | | | | | | | | | | | | | | | | | |
| Distributions from net investment income | | | — | | | | (0.25 | ) | | | (0.03 | ) | | | (0.13 | ) | | | (0.25 | ) | | | (0.16 | ) | | | | | | | | | | | | | | | | | | | | | | | | |
| Distributions from net realized gains | | | (0.03 | ) | | | (1.34 | ) | | | — | | | | — | | | | — | | | | — | | | | | | | | | | | | | | | | | | | | | | | | | |
| Total distributions | | | (0.03 | ) | | | (1.59 | ) | | | (0.03 | ) | | | (0.13 | ) | | | (0.25 | ) | | | (0.16 | ) | | | | | | | | | | | | | | | | | | | | | | | | |
| Net asset value, end of year/period | | $ | 12.50 | | | $ | 10.93 | | | $ | 18.76 | | | $ | 15.70 | | | $ | 14.27 | | | $ | 12.85 | | | | | | | | | | | | | | | | | | | | | | | | | |
| Total return + # | | | 14.74 | % | | | (36.02 | )% | | | 19.67 | % | | | 10.94 | % | | | 13.29 | % | | | (18.57 | )% | | | | | | | | | | | | | | | | | | | | | | | | |
| Ratios/Supplemental Data: | | | | | | | | | | | | | | | | | | | | | | | | | | | | | | | | | | | | | | | | | | | | | | | | |
| Net assets, end of year/period (in 000s) | | $ | 93,097 | | | $ | 85,825 | | | $ | 112,290 | | | $ | 70,868 | | | $ | 59,931 | | | $ | 53,261 | | | | | | | | | | | | | | | | | | | | | | | | | |
| Ratios of expenses to average net assets: | | | 1.14 | % | | | 1.03 | % | | | 1.67 | % | | | 1.86 | % | | | 1.61 | % | | | 1.19 | % | | | | | | | | | | | | | | | | | | | | | | | | |
| Ratios of net investment income (loss) to average net assets: | | | 1.08 | % | | | 1.23 | % | | | 0.19 | % | | | (0.19 | )% | | | 1.42 | % | | | 1.79 | % | | | | | | | | | | | | | | | | | | | | | | | | |
| Portfolio turnover rate (1) | | | 28 | % | | | 64 | % | | | 77 | % | | | 113 | % | | | 129 | % | | | 66 | % | | | | | | | | | | | | | | | | | | | | | | | | |
| | | | | | | | | | | | | | | | | | | | | | | | | | | | | | | | | | | | | | | | | | | | | | | | | |
| | | Class A | | | Class C | |
| | | Six Months Ended | | | Year Ended October 31, | | | Six Months Ended | | | Year Ended October 31, | |
| | | April 30, 2023 | | | 2022 | | | 2021 | | | 2020 | | | 2019 | | | 2018 | | | April 30, 2023 | | | 2022 | | | 2021 | | | 2020 | | | 2019 | | | 2018 | |
| | | (Unaudited) | | | | | | | | | | | | | | | | | | (Unaudited) | | | | | | | | | | | | | | | | |
| | | | | | | | | | | | | | | | | | | | | | | | | | | | | | | | | | | | | |
| Net asset value, beginning of year/period | | $ | 10.63 | | | $ | 18.29 | | | $ | 15.32 | | | $ | 13.94 | | | $ | 12.56 | | | $ | 15.58 | | | $ | 9.87 | | | $ | 17.07 | | | $ | 14.41 | | | $ | 13.16 | | | $ | 11.85 | | | $ | 14.74 | |
| Income (loss) from investment operations: | | | | | | | | | | | | | | | | | | | | | | | | | | | | | | | | | | | | | | | | | | | | | | | | |
| Net investment income (loss)* | | | 0.05 | | | | 0.13 | | | | (0.02 | ) | | | (0.06 | ) | | | 0.16 | | | | 0.23 | | | | 0.01 | | | | 0.02 | | | | (0.15 | ) | | | (0.16 | ) | | | 0.05 | | | | 0.11 | |
| Net realized and unrealized gain (loss) | | | 1.49 | | | | (6.24 | ) | | | 2.99 | | | | 1.54 | | | | 1.44 | | | | (3.13 | ) | | | 1.38 | | | | (5.81 | ) | | | 2.81 | | | | 1.45 | | | | 1.38 | | | | (2.94 | ) |
| Total income (loss) from investment operations | | | 1.54 | | | | (6.11 | ) | | | 2.97 | | | | 1.48 | | | | 1.60 | | | | (2.90 | ) | | | 1.39 | | | | (5.79 | ) | | | 2.66 | | | | 1.29 | | | | 1.43 | | | | (2.83 | ) |
| Less distributions: | | | | | | | | | | | | | | | | | | | | | | | | | | | | | | | | | | | | | | | | | | | | | | | | |
| Distributions from net investment income | | | — | | | | (0.21 | ) | | | — | | | | (0.10 | ) | | | (0.22 | ) | | | (0.12 | ) | | | — | | | | (0.07 | ) | | | — | | | | (0.04 | ) | | | (0.12 | ) | | | (0.06 | ) |
| Distributions from net realized gains | | | — | | | | (1.34 | ) | | | — | | | | — | | | | — | | | | — | | | | — | | | | (1.34 | ) | | | — | | | | — | | | | — | | | | — | |
| Total distributions | | | — | | | | (1.55 | ) | | | — | | | | (0.10 | ) | | | (0.22 | ) | | | (0.12 | ) | | | — | | | | (1.41 | ) | | | — | | | | (0.04 | ) | | | (0.12 | ) | | | (0.06 | ) |
| Net asset value, end of year/period | | $ | 12.17 | | | $ | 10.63 | | | $ | 18.29 | | | $ | 15.32 | | | $ | 13.94 | | | $ | 12.56 | | | $ | 11.26 | | | $ | 9.87 | | | $ | 17.07 | | | $ | 14.41 | | | $ | 13.16 | | | $ | 11.85 | |
| Total return + # | | | 14.60 | % | | | (36.18 | )% | | | 19.39 | % | | | 10.58 | % | | | 12.98 | % | | | (18.73 | )% | | | 14.20 | % | | | (36.66 | )% | | | 18.46 | % | | | 9.78 | % | | | 12.18 | % | | | (19.30 | )% |
| Ratios/Supplemental Data: | | | | | | | | | | | | | | | | | | | | | | | | | | | | | | | | | | | | | | | | | | | | | | | | |
| Net assets, end of year/period (in 000s) | | $ | 16,140 | | | $ | 15,367 | | | $ | 21,174 | | | $ | 14,864 | | | $ | 12,106 | | | $ | 9,662 | | | $ | 1,960 | | | $ | 1,999 | | | $ | 3,349 | | | $ | 3,005 | | | $ | 3,463 | | | $ | 3,163 | |
| Ratios of expenses to average net assets: | | | 1.39 | % | | | 1.28 | % | | | 1.92 | % | | | 2.11 | % | | | 1.86 | % | | | 1.44 | % | | | 2.14 | % | | | 2.03 | % | | | 2.67 | % | | | 2.86 | % | | | 2.61 | % | | | 2.19 | % |
| Ratios of net investment income (loss) to average net assets: | | | 0.82 | % | | | 0.96 | % | | | (0.08 | )% | | | (0.43 | )% | | | 1.17 | % | | | 1.54 | % | | | 0.09 | % | | | 0.15 | % | | | (0.87 | )% | | | (1.22 | )% | | | 0.41 | % | | | 0.77 | % |
| Portfolio turnover rate (1) | | | 28 | % | | | 64 | % | | | 77 | % | | | 113 | % | | | 129 | % | | | 66 | % | | | 28 | % | | | 64 | % | | | 77 | % | | | 113 | % | | | 129 | % | | | 66 | % |
| | | | | | | | | | | | | | | | | | | | | | | | | | | | | | | | | | | | | | | | | | | | | | | | | |
| * | The net investment income (loss) per share data was determined using the average shares outstanding throughout each year/period. |
| + | Assumes reinvestment of all dividends and distributions, if any. Total return does not reflect the deductions of taxes that a shareholder would pay on distributions or on the redemption of shares and does not reflect the impact of any sales charge. |
| # | Includes adjustments in accordance with accounting principles generally accepted in the United States and, consequently, the net asset values for financial reporting purposes and the returns based upon those net asset values may differ from the net asset values and returns for shareholder transactions. Adjustments may apply to some but not all years and classes. |
| (1) | Not annualized for periods less than one year. |
See accompanying notes which are an integral part to these financial statements.
| FINANCIAL HIGHLIGHTS |
| Dunham International Stock Fund |
| |
| The table sets forth financial data for one share of beneficial interest outstanding throughout each year/period. |
| | | Class N | | | | | | | | | | | | | | | | | | | | | | | | | |
| | | Six Months Ended | | | Year Ended October 31, | | | | | | | | | | | | | | | | | | | | | | | | | |
| | | April 30, 2023 | | | 2022 | | | 2021 | | | 2020 | | | 2019 | | | 2018 | | | | | | | | | | | | | | | | | | | | | | | | | |
| | | (Unaudited) | | | | | | | | | | | | | | | | | | | | | | | | | | | | | | | | | | | | | | | | |
| Net asset value, beginning of year/period | | $ | 14.07 | | | $ | 21.10 | | | $ | 15.26 | | | $ | 15.51 | | | $ | 15.61 | | | $ | 17.54 | | | | | | | | | | | | | | | | | | | | | | | | | |
| Income (loss) from investment operations: | | | | | | | | | | | | | | | | | | | | | | | | | | | | | | | | | | | | | | | | | | | | | | | | |
| Net investment income * | | | 0.25 | | | | 0.66 | | | | 0.30 | | | | 0.15 | | | | 0.34 | | | | 0.21 | | | | | | | | | | | | | | | | | | | | | | | | | |
| Net realized and unrealized gain (loss) ! | | | 2.49 | | | | (4.87 | ) | | | 5.70 | | | | (0.06 | ) | | | 0.62 | | | | (1.39 | ) | | | | | | | | | | | | | | | | | | | | | | | | |
| Total income (loss) from investment operations | | | 2.74 | | | | (4.21 | ) | | | 6.00 | | | | 0.09 | | | | 0.96 | | | | (1.18 | ) | | | | | | | | | | | | | | | | | | | | | | | | |
| Less distributions: | | | | | | | | | | | | | | | | | | | | | | | | | | | | | | | | | | | | | | | | | | | | | | | | |
| Distributions from net investment income | | | (0.61 | ) | | | (0.40 | ) | | | (0.15 | ) | | | (0.34 | ) | | | (0.18 | ) | | | (0.26 | ) | | | | | | | | | | | | | | | | | | | | | | | | |
| Distributions from net realized gains | | | — | | | | (2.42 | ) | | | (0.01 | ) | | | — | | | | (0.88 | ) | | | (0.49 | ) | | | | | | | | | | | | | | | | | | | | | | | | |
| Total distributions | | | (0.61 | ) | | | (2.82 | ) | | | (0.16 | ) | | | (0.34 | ) | | | (1.06 | ) | | | (0.75 | ) | | | | | | | | | | | | | | | | | | | | | | | | |
| Net asset value, end of year/period | | $ | 16.20 | | | $ | 14.07 | | | $ | 21.10 | | | $ | 15.26 | | | $ | 15.51 | | | $ | 15.61 | | | | | | | | | | | | | | | | | | | | | | | | | |
| Total return + # | | | 20.04 | % | | | (23.01 | )% | | | 39.45 | % | | | 0.45 | % | | | 7.08 | % | | | (7.08 | )% | | | | | | | | | | | | | | | | | | | | | | | | |
| Ratios/Supplemental Data: | | | | | | | | | | | | | | | | | | | | | | | | | | | | | | | | | | | | | | | | | | | | | | | | |
| Net assets, end of year/period (in 000s) | | $ | 106,871 | | | $ | 106,871 | | | $ | 150,922 | | | $ | 96,239 | | | $ | 101,505 | | | $ | 89,401 | | | | | | | | | | | | | | | | | | | | | | | | | |
| Ratios of expenses to average net assets: | | | | | | | | | | | | | | | | | | | | | | | | | | | | | | | | | | | | | | | | | | | | | | | | |
| Before fees paid indirectly | | | 1.95 | % | | | 1.53 | % | | | 1.92 | % | | | 1.71 | % | | | 1.43 | % | | | 1.67 | % | | | | | | | | | | | | | | | | | | | | | | | | |
| After fees paid indirectly | | | 1.95 | % | | | 1.53 | % | | | 1.92 | % | | | 1.71 | % | | | 1.43 | % | | | 1.67 | % | | | | | | | | | | | | | | | | | | | | | | | | |
| Ratios of net investment income to average net assets: | | | | | | | | | | | | | | | | | | | | | | | | | | | | | | | | | | | | | | | | | | | | | | | | |
| Before fees paid indirectly | | | 3.19 | % | | | 4.03 | % | | | 1.47 | % | | | 0.98 | % | | | 2.28 | % | | | 1.24 | % | | | | | | | | | | | | | | | | | | | | | | | | |
| After fees paid indirectly | | | 3.19 | % | | | 4.03 | % | | | 1.47 | % | | | 0.98 | % | | | 2.28 | % | | | 1.24 | % | | | | | | | | | | | | | | | | | | | | | | | | |
| Portfolio turnover rate (1) | | | 29 | % | | | 91 | % | | | 131 | % | | | 156 | % | | | 100 | % | | | 113 | % | | | | | | | | | | | | | | | | | | | | | | | | |
| | | | | | | | | | | | | | | | | | | | | | | | | | | | | | | | | | | | | | | | | | | | | | | | | |
| | | Class A | | | Class C | |
| | | Six Months Ended | | | Year Ended October 31, | | | Six Months Ended | | | Year Ended October 31, | |
| | | April 30, 2023 | | | 2022 | | | 2021 | | | 2020 | | | 2019 | | | 2018 | | | April 30, 2023 | | | 2022 | | | 2021 | | | 2020 | | | 2019 | | | 2018 | |
| | | (Unaudited) | | | | | | | | | | | | | | | | | | (Unaudited) | | | | | | | | | | | | | | | | |
| | | | | | | | | | | | | | | | | | | | | | | | | | | | | | | | | | | | | |
| Net asset value, beginning of year/period | | $ | 13.93 | | | $ | 20.92 | | | $ | 15.13 | | | $ | 15.38 | | | $ | 15.49 | | | $ | 17.42 | | | $ | 12.98 | | | $ | 19.66 | | | $ | 14.25 | | | $ | 14.55 | | | $ | 14.68 | | | $ | 16.59 | |
| Income (loss) from investment operations: | | | | | | | | | | | | | | | | | | | | | | | | | | | | | | | | | | | | | | | | | | | | | | | | |
| Net investment income (loss)* | | | 0.22 | | | | 0.60 | | | | 0.23 | | | | 0.11 | | | | 0.30 | | | | 0.17 | | | | 0.16 | | | | 0.44 | | | | 0.08 | | | | (0.02 | ) | | | 0.18 | | | | 0.04 | |
| Net realized and unrealized gain (loss) ! | | | 2.48 | | | | (4.82 | ) | | | 5.68 | | | | (0.06 | ) | | | 0.61 | | | | (1.38 | ) | | | 2.30 | | | | (4.50 | ) | | | 5.34 | | | | (0.05 | ) | | | 0.59 | | | | (1.31 | ) |
| Total income (loss) from investment operations | | | 2.70 | | | | (4.22 | ) | | | 5.91 | | | | 0.05 | | | | 0.91 | | | | (1.21 | ) | | | 2.46 | | | | (4.06 | ) | | | 5.42 | | | | (0.07 | ) | | | 0.77 | | | | (1.27 | ) |
| Less distributions: | | | | | | | | | | | | | | | | | | | | | | | | | | | | | | | | | | | | | | | | | | | | | | | | |
| Distributions from net investment income | | | (0.57 | ) | | | (0.35 | ) | | | (0.11 | ) | | | (0.30 | ) | | | (0.14 | ) | | | (0.23 | ) | | | (0.49 | ) | | | (0.20 | ) | | | — | | | | (0.23 | ) | | | (0.02 | ) | | | (0.15 | ) |
| Distributions from net realized gains | | | — | | | | (2.42 | ) | | | (0.01 | ) | | | — | | | | (0.88 | ) | | | (0.49 | ) | | | — | | | | (2.42 | ) | | | (0.01 | ) | | | — | | | | (0.88 | ) | | | (0.49 | ) |
| Total distributions | | | (0.57 | ) | | | (2.77 | ) | | | (0.12 | ) | | | (0.30 | ) | | | (1.02 | ) | | | (0.72 | ) | | | (0.49 | ) | | | (2.62 | ) | | | (0.01 | ) | | | (0.23 | ) | | | (0.90 | ) | | | (0.64 | ) |
| Net asset value, end of year/period | | $ | 16.06 | | | $ | 13.93 | | | $ | 20.92 | | | $ | 15.13 | | | $ | 15.38 | | | $ | 15.49 | | | $ | 14.95 | | | $ | 12.98 | | | $ | 19.66 | | | $ | 14.25 | | | $ | 14.55 | | | $ | 14.68 | |
| Total return + # | | | 19.85 | % | | | (23.23 | )% | | | 39.15 | % | | | 0.24 | % | | | 6.78 | % | | | (7.30 | )% | | | 19.36 | % | | | (23.78 | )% | | | 38.04 | % | | | (0.55 | )% | | | 6.03 | % | | | (8.03 | )% |
| Ratios/Supplemental Data: | | | | | | | | | | | | | | | | | | | | | | | | | | | | | | | | | | | | | | | | | | | | | | | | |
| Net assets, end of year/period (in 000s) | | $ | 16,821 | | | $ | 18,638 | | | $ | 26,672 | | | $ | 20,938 | | | $ | 22,499 | | | $ | 18,250 | | | $ | 3,987 | | | $ | 3,936 | | | $ | 5,830 | | | $ | 4,754 | | | $ | 6,409 | | | $ | 5,764 | |
| Ratios of expenses to average net assets: | | | | | | | | | | | | | | | | | | | | | | | | | | | | | | | | | | | | | | | | | | | | | | | | |
| Before fees paid indirectly | | | 2.20 | % | | | 1.78 | % | | | 2.17 | % | | | 1.96 | % | | | 1.68 | % | | | 1.92 | % | | | 2.95 | % | | | 2.53 | % | | | 2.92 | % | | | 2.71 | % | | | 2.43 | % | | | 2.67 | % |
| After fees paid indirectly | | | 2.20 | % | | | 1.78 | % | | | 2.17 | % | | | 1.96 | % | | | 1.68 | % | | | 1.92 | % | | | 2.95 | % | | | 2.53 | % | | | 2.92 | % | | | 2.71 | % | | | 2.43 | % | | | 2.67 | % |
| Ratios of net investment income (loss) to average net assets: | | | | | | | | | | | | | | | | | | | | | | | | | | | | | | | | | | | | | | | | | | | | | | | | |
| Before fees paid indirectly | | | 2.81 | % | | | 3.70 | % | | | 1.17 | % | | | 0.71 | % | | | 2.04 | % | | | 1.01 | % | | | 2.19 | % | | | 2.89 | % | | | 0.43 | % | | | (0.11 | )% | | | 1.26 | % | | | 0.22 | % |
| After fees paid indirectly | | | 2.81 | % | | | 3.70 | % | | | 1.17 | % | | | 0.71 | % | | | 2.04 | % | | | 1.01 | % | | | 2.19 | % | | | 2.89 | % | | | 0.43 | % | | | (0.11 | )% | | | 1.26 | % | | | 0.22 | % |
| Portfolio turnover rate (1) | | | 29 | % | | | 91 | % | | | 131 | % | | | 156 | % | | | 100 | % | | | 113 | % | | | 29 | % | | | 91 | % | | | 131 | % | | | 156 | % | | | 100 | % | | | 113 | % |
| | | | | | | | | | | | | | | | | | | | | | | | | | | | | | | | | | | | | | | | | | | | | | | | | |
| * | The net investment income (loss) per share data was determined using the average shares outstanding throughout each year/period. |
| + | Assumes reinvestment of all dividends and distributions, if any. Total return does not reflect the deductions of taxes that a shareholder would pay on distributions or on the redemption of shares and does not reflect the impact of any sales charge. |
| # | Includes adjustments in accordance with accounting principles generally accepted in the United States and, consequently, the net asset values for financial reporting purposes and the returns based upon those net asset values may differ from the net asset values and returns for shareholder transactions. Adjustments may apply to some but not all years and classes. |
| ! | The amount of net realized and unrealized gain (loss) on investment per share for the year ended October 31, 2020 does not accord with the amounts in the Statements of Operations due to the timing of purchases and sales of Fund shares in relation to fluctuating market values. |
| (1) | Not annualized for periods less than one year. |
See accompanying notes which are an integral part to these financial statements.
| FINANCIAL HIGHLIGHTS |
| Dunham Dynamic Macro Fund |
| |
| The table sets forth financial data for one share of beneficial interest outstanding throughout each year/period. |
| | | Class N | | | | | | | | | | | | | | | | | | | | | | | | | |
| | | Six Months Ended | | | Year Ended October 31, | | | | | | | | | | | | | | | | | | | | | | | | | |
| | | April 30, 2023 | | | 2022 | | | 2021 | | | 2020 | | | 2019 | | | 2018 | | | | | | | | | | | | | | | | | | | | | | | | | |
| | | | | | | | | | | | | | | | | | | | | | | | | | | | | | | | | | | | | | | | | | | |
| Net asset value, beginning of year/period | | $ | 9.73 | | | $ | 11.22 | | | $ | 10.00 | | | $ | 10.08 | | | $ | 9.53 | | | $ | 10.18 | | | | | | | | | | | | | | | | | | | | | | | | | |
| Income (loss) from investment operations: | | | | | | | | | | | | | | | | | | | | | | | | | | | | | | | | | | | | | | | | | | | | | | | | |
| Net investment income (loss) * | | | 0.14 | | | | 0.03 | | | | (0.14 | ) | | | (0.00 | ) (a) | | | 0.12 | | | | 0.02 | | | | | | | | | | | | | | | | | | | | | | | | | |
| Net realized and unrealized gain (loss) | | | 0.42 | | | | (1.52 | ) | | | 1.44 | | | | (0.08 | ) | | | 0.65 | | | | (0.67 | ) | | | | | | | | | | | | | | | | | | | | | | | | |
| Total income (loss) from investment operations | | | 0.56 | | | | (1.49 | ) | | | 1.30 | | | | (0.08 | ) | | | 0.77 | | | | (0.65 | ) | | | | | | | | | | | | | | | | | | | | | | | | |
| Less distributions: | | | | | | | | | | | | | | | | | | | | | | | | | | | | | | | | | | | | | | | | | | | | | | | | |
| Distributions from net investment income | | | — | | | | — | | | | (0.08 | ) | | | — | | | | (0.17 | ) | | | — | | | | | | | | | | | | | | | | | | | | | | | | | |
| Tax return of capital | | | — | | | | — | | | | — | | | | — | | | | (0.05 | ) | | | — | | | | | | | | | | | | | | | | | | | | | | | | | |
| Total distributions | | | — | | | | — | | | | (0.08 | ) | | | — | | | | (0.22 | ) | | | — | | | | | | | | | | | | | | | | | | | | | | | | | |
| Net asset value, end of year/period | | $ | 10.29 | | | $ | 9.73 | | | $ | 11.22 | | | $ | 10.00 | | | $ | 10.08 | | | $ | 9.53 | | | | | | | | | | | | | | | | | | | | | | | | | |
| Total return + # | | | 5.76 | % | | | (13.28 | )% | | | 13.05 | % | | | (0.79 | )% | | | 8.35 | % | | | (6.39 | )% | | | | | | | | | | | | | | | | | | | | | | | | |
| Ratios/Supplemental Data: | | | | | | | | | | | | | | | | | | | | | | | | | | | | | | | | | | | | | | | | | | | | | | | | |
| Net assets, end of year/period (in 000s) | | $ | 34,449 | | | $ | 22,330 | | | $ | 21,043 | | | $ | 23,680 | | | $ | 32,074 | | | $ | 35,638 | | | | | | | | | | | | | | | | | | | | | | | | | |
| Ratios of expenses to average net assets: | | | 1.80 | % | | | 1.88 | % | | | 2.06 | % | | | 1.69 | % | | | 1.54 | % | | | 1.80 | % | | | | | | | | | | | | | | | | | | | | | | | | |
| Ratios of net investment income (loss) to average net assets: | | | 2.79 | % | | | 0.26 | % | | | (1.26 | )% | | | (0.02 | )% | | | 1.29 | % | | | 0.20 | % | | | | | | | | | | | | | | | | | | | | | | | | |
| Portfolio turnover rate (1) | | | 159 | % | | | 76 | % | | | 12 | % | | | 187 | % | | | 28 | % | | | 11 | % | | | | | | | | | | | | | | | | | | | | | | | | |
| | | | | | | | | | | | | | | | | | | | | | | | | | | | | | | | | | | | | | | | | | | | | | | | | |
| | | Class A | | | Class C | |
| | | Six Months Ended | | | Year Ended October 31, | | | Six Months Ended | | | Year Ended October 31, | |
| | | April 30, 2023 | | | 2022 | | | 2021 | | | 2020 | | | 2019 | | | 2018 | | | April 30, 2023 | | | 2022 | | | 2021 | | | 2020 | | | 2019 | | | 2018 | |
| | | (Unaudited) | | | | | | | | | | | | | | | | | | (Unaudited) | | | | | | | | | | | | | | | | |
| Net asset value, beginning of year/period | | $ | 9.61 | | | $ | 11.11 | | | $ | 9.90 | | | $ | 10.00 | | | $ | 9.46 | | | $ | 10.12 | | | $ | 9.00 | | | $ | 10.49 | | | $ | 9.37 | | | $ | 9.55 | | | $ | 9.03 | | | $ | 9.74 | |
| Income (loss) from investment operations: | | | | | | | | | | | | | | | | | | | | | | | | | | | | | | | | | | | | | | | | | | | | | | | | |
| Net investment income (loss) * | | | 0.12 | | | | 0.00 | (a) | | | (0.16 | ) | | | (0.03 | ) | | | 0.10 | | | | 0.00 | (a) | | | 0.11 | | | | (0.07 | ) | | | (0.23 | ) | | | (0.10 | ) | | | 0.02 | | | | (0.08 | ) |
| Net realized and unrealized gain (loss) | | | 0.43 | | | | (1.50 | ) | | | 1.41 | | | | (0.07 | ) | | | 0.64 | | | | (0.66 | ) | | | 0.37 | | | | (1.42 | ) | | | 1.35 | | | | (0.08 | ) | | | 0.63 | | | | (0.63 | ) |
| Total income (loss) from investment operations | | | 0.55 | | | | (1.50 | ) | | | 1.25 | | | | (0.10 | ) | | | 0.74 | | | | (0.66 | ) | | | 0.48 | | | | (1.49 | ) | | | 1.12 | | | | (0.18 | ) | | | 0.65 | | | | (0.71 | ) |
| Less distributions: | | | | | | | | | | | | | | | | | | | | | | | | | | | | | | | | | | | | | | | | | | | | | | | | |
| Distributions from net investment income | | | — | | | | — | | | | (0.04 | ) | | | — | | | | (0.15 | ) | | | — | | | | — | | | | — | | | | — | | | | — | | | | (0.08 | ) | | | — | |
| Tax return of capital | | | — | | | | — | | | | — | | | | — | | | | (0.05 | ) | | | — | | | | — | | | | — | | | | — | | | | — | | | | (0.05 | ) | | | — | |
| Total distributions | | | — | | | | — | | | | (0.04 | ) | | | — | | | | (0.20 | ) | | | — | | | | — | | | | — | | | | — | | | | — | | | | (0.13 | ) | | | — | |
| Net asset value, end of year/period | | $ | 10.16 | | | $ | 9.61 | | | $ | 11.11 | | | $ | 9.90 | | | $ | 10.00 | | | $ | 9.46 | | | $ | 9.48 | | | $ | 9.00 | | | $ | 10.49 | | | $ | 9.37 | | | $ | 9.55 | | | $ | 9.03 | |
| Total return + # | | | 5.72 | % | | | (13.50 | )% | | | 12.62 | % | | | (1.00 | )% | | | 8.04 | % | | | (6.52 | )% | | | 5.33 | % | | | (14.20 | )% | | | 11.95 | % | | | (1.88 | )% | | | 7.31 | % | | | (7.29 | )% |
| Ratios/Supplemental Data: | | | | | | | | | | | | | | | | | | | | | | | | | | | | | | | | | | | | | | | | | | | | | | | | |
| Net assets, end of year/period (in 000s) | | $ | 6,347 | | | $ | 4,166 | | | $ | 4,030 | | | $ | 5,078 | | | $ | 7,713 | | | $ | 7,918 | | | $ | 924 | | | $ | 912 | | | $ | 1,146 | | | $ | 1,284 | | | $ | 1,927 | | | $ | 1,696 | |
| Ratios of expenses to average net assets: | | | 2.05 | % | | | 2.13 | % | | | 2.31 | % | | | 1.94 | % | | | 1.79 | % | | | 2.05 | % | | | 2.80 | % | | | 2.88 | % | | | 3.06 | % | | | 2.69 | % | | | 2.54 | % | | | 2.80 | % |
| Ratios of net investment income (loss) to average net assets: | | | 2.53 | % | | | 0.04 | % | | | (1.48 | )% | | | (0.26 | )% | | | 1.03 | % | | | 0.00 | % (b) | | | 2.38 | % | | | (0.68 | )% | | | (2.29 | )% | | | (1.04 | )% | | | 0.20 | % | | | (0.84 | )% |
| Portfolio turnover rate (1) | | | 159 | % | | | 76 | % | | | 12 | % | | | 187 | % | | | 28 | % | | | 11 | % | | | 159 | % | | | 76 | % | | | 12 | % | | | 187 | % | | | 28 | % | | | 11 | % |
| | | | | | | | | | | | | | | | | | | | | | | | | | | | | | | | | | | | | | | | | | | | | | | | | |
| * | The net investment income (loss) per share data was determined using the average shares outstanding throughout each year/period. |
| + | Assumes reinvestment of all dividends and distributions, if any. Total return does not reflect the deductions of taxes that a shareholder would pay on distributions or on the redemption of shares and does not reflect the impact of any sales charge. |
| # | Includes adjustments in accordance with accounting principles generally accepted in the United States and, consequently, the net asset values for financial reporting purposes and the returns based upon those net asset values may differ from the net asset values and returns for shareholder transactions. Adjustments may apply to some but not all years and classes. |
| (a) | Represents less than $0.01 per share. |
| (b) | Represents less than 0.01%. |
| (1) | Annualized for periods less than one year. |
See accompanying notes which are an integral part to these financial statements.
| FINANCIAL HIGHLIGHTS |
| Dunham Long/Short Credit Fund |
| |
| The table sets forth financial data for one share of beneficial interest outstanding throughout each year/period. |
| | | Class N | | | | | | | | | | | | | | | | | | | | | | | | | |
| | | Six Months Ended | | | Year Ended October 31, | | | | | | | | | | | | | | | | | | | | | | | | | |
| | | April 30, 2023 | | | 2022 | | | 2021 | | | 2020 | | | 2019 | | | 2018 | | | | | | | | | | | | | | | | | | | | | | | | | |
| | | (Unaudited) | | | | | | | | | | | | | | | | | | | | | | | | | | | | | | | | | | | | | | | | |
| Net asset value, beginning of year/period | | $ | 9.08 | | | $ | 9.70 | | | $ | 9.55 | | | $ | 9.36 | | | $ | 9.19 | | | $ | 8.68 | | | | | | | | | | | | | | | | | | | | | | | | | |
| Income (loss) from investment operations: | | | | | | | | | | | | | | | | | | | | | | | | | | | | | | | | | | | | | | | | | | | | | | | | |
| Net investment income* | | | 0.18 | | | | 0.19 | | | | 0.06 | | | | 0.13 | | | | 0.24 | | | | 0.23 | | | | | | | | | | | | | | | | | | | | | | | | | |
| Net realized and unrealized gain (loss) | | | (0.24 | ) | | | (0.43 | ) | | | 0.32 | | | | 0.26 | | | | 0.24 | | | | 0.49 | | | | | | | | | | | | | | | | | | | | | | | | | |
| Total income (loss) from investment operations | | | (0.06 | ) | | | (0.24 | ) | | | 0.38 | | | | 0.39 | | | | 0.48 | | | | 0.72 | | | | | | | | | | | | | | | | | | | | | | | | | |
| Less distributions: | | | | | | | | | | | | | | | | | | | | | | | | | | | | | | | | | | | | | | | | | | | | | | | | |
| Distributions from net investment income | | | (0.17 | ) | | | (0.20 | ) | | | (0.07 | ) | | | (0.15 | ) | | | (0.31 | ) | | | (0.21 | ) | | | | | | | | | | | | | | | | | | | | | | | | |
| Distributions from net realized gains | | | (0.09 | ) | | | (0.18 | ) | | | (0.16 | ) | | | (0.05 | ) | | | — | | | | — | | | | | | | | | | | | | | | | | | | | | | | | | |
| Total distributions | | | (0.26 | ) | | | (0.38 | ) | | | (0.23 | ) | | | (0.20 | ) | | | (0.31 | ) | | | (0.21 | ) | | | | | | | | | | | | | | | | | | | | | | | | |
| Net asset value, end of year/period | | $ | 8.76 | | | $ | 9.08 | | | $ | 9.70 | | | $ | 9.55 | | | $ | 9.36 | | | | 9.19 | | | | | | | | | | | | | | | | | | | | | | | | | |
| Total return + # | | | (0.72 | )% | | | (2.57 | )% | | | 4.00 | % | | | 4.23 | % | | | 5.31 | % | | | 8.42 | % | | | | | | | | | | | | | | | | | | | | | | | | |
| Ratios/Supplemental Data: | | | | | | | | | | | | | | | | | | | | | | | | | | | | | | | | | | | | | | | | | | | | | | | | |
| Net assets, end of year/period (in 000s) | | $ | 194,234 | | | $ | 206,875 | | | $ | 195,874 | | | $ | 110,215 | | | $ | 67,276 | | | $ | 36,055 | | | | | | | | | | | | | | | | | | | | | | | | | |
| Ratios of expenses to average net assets: ^ | | | 0.89 | % | | | 0.97 | % | | | 1.82 | % | | | 1.43 | % | | | 1.24 | % | | | 1.44 | % | | | | | | | | | | | | | | | | | | | | | | | | |
| Ratios of net investment income to average net assets: ^ | | | 3.89 | % | | | 2.02 | % | | | 0.67 | % | | | 1.41 | % | | | 2.60 | % | | | 2.52 | % | | | | | | | | | | | | | | | | | | | | | | | | |
| Portfolio turnover rate (1) | | | 48 | % | | | 216 | % | | | 343 | % | | | 519 | % | | | 426 | % | | | 275 | % | | | | | | | | | | | | | | | | | | | | | | | | |
| | | | | | | | | | | | | | | | | | | | | | | | | | | | | | | | | | | | | | | | | | | | | | | | | |
| | | Class A | | | Class C | |
| | | Six Months Ended | | | Year Ended October 31, | | | Six Months Ended | | | Year Ended October 31, | |
| | | April 30, 2023 | | | 2022 | | | 2021 | | | 2020 | | | 2019 | | | 2018 | | | April 30, 2023 | | | 2022 | | | 2021 | | | 2020 | | | 2019 | | | 2018 | |
| | | (Unaudited) | | | | | | | | | | | | | | | | | | (Unaudited) | | | | | | | | | | | | | | | | |
| | | | | | | | | | | | | | | | | | | | | | | | | | | | | | | | | | | | | |
| Net asset value, beginning of year/period | | $ | 9.06 | | | $ | 9.68 | | | $ | 9.53 | | | $ | 9.33 | | | $ | 9.17 | | | $ | 8.66 | | | $ | 8.72 | | | $ | 9.34 | | | $ | 9.24 | | | $ | 9.08 | | | $ | 8.94 | | | $ | 8.46 | |
| Income (loss) from investment operations: | | | | | | | | | | | | | | | | | | | | | | | | | | | | | | | | | | | | | | | | | | | | | | | | |
| Net investment income (loss)* | | | 0.16 | | | | 0.16 | | | | 0.04 | | | | 0.11 | | | | 0.22 | | | | 0.19 | | | | 0.11 | | | | 0.09 | | | | (0.03 | ) | | | 0.05 | | | | 0.15 | | | | 0.11 | |
| Net realized and unrealized gain (loss) | | | (0.23 | ) | | | (0.43 | ) | | | 0.32 | | | | 0.26 | | | | 0.22 | | | | 0.50 | | | | (0.22 | ) | | | (0.41 | ) | | | 0.30 | | | | 0.24 | | | | 0.23 | | | | 0.49 | |
| Total income (loss) from investment operations | | | (0.07 | ) | | | (0.27 | ) | | | 0.36 | | | | 0.37 | | | | 0.44 | | | | 0.69 | | | | (0.11 | ) | | | (0.32 | ) | | | 0.27 | | | | 0.29 | | | | 0.38 | | | | 0.60 | |
| Less distributions: | | | | | | | | | | | | | | | | | | | | | | | | | | | | | | | | | | | | | | | | | | | | | | | | |
| Distributions from net investment income | | | (0.16 | ) | | | (0.17 | ) | | | (0.05 | ) | | | (0.12 | ) | | | (0.28 | ) | | | (0.18 | ) | | | (0.13 | ) | | | (0.12 | ) | | | (0.01 | ) | | | (0.08 | ) | | | (0.24 | ) | | | (0.12 | ) |
| Distributions from net realized gains | | | (0.09 | ) | | | (0.18 | ) | | | (0.16 | ) | | | (0.05 | ) | | | — | | | | — | | | | (0.09 | ) | | | (0.18 | ) | | | (0.16 | ) | | | (0.05 | ) | | | — | | | | — | |
| Total distributions | | | (0.25 | ) | | | (0.35 | ) | | | (0.21 | ) | | | (0.17 | ) | | | (0.28 | ) | | | (0.18 | ) | | | (0.22 | ) | | | (0.30 | ) | | | (0.17 | ) | | | (0.13 | ) | | | (0.24 | ) | | | (0.12 | ) |
| Net asset value, end of year/period | | $ | 8.74 | | | $ | 9.06 | | | $ | 9.68 | | | $ | 9.53 | | | $ | 9.33 | | | $ | 9.17 | | | $ | 8.39 | | | $ | 8.72 | | | $ | 9.34 | | | $ | 9.24 | | | $ | 9.08 | | | $ | 8.94 | |
| Total return + # | | | (0.84 | )% | | | (2.82 | )% | | | 3.77 | % | | | 4.09 | % | | | 4.95 | % | | | 8.10 | % | | | (1.25 | )% | | | (3.45 | )% | | | 2.89 | % | | | 3.24 | % | | | 4.34 | % | | | 7.21 | % |
| Ratios/Supplemental Data: | | | | | | | | | | | | | | | | | | | | | | | | | | | | | | | | | | | | | | | | | | | | | | | | |
| Net assets, end of year/period (in 000s) | | $ | 27,869 | | | $ | 27,906 | | | $ | 29,040 | | | $ | 17,123 | | | $ | 11,087 | | | $ | 6,265 | | | $ | 3,388 | | | $ | 3,858 | | | $ | 4,518 | | | $ | 3,852 | | | $ | 4,077 | | | $ | 3,145 | |
| Ratios of expenses to average net assets: ^ | | | 1.06 | % | | | 1.22 | % | | | 2.07 | % | | | 1.68 | % | | | 1.48 | % | | | 1.69 | % | | | 1.89 | % | | | 1.98 | % | | | 2.82 | % | | | 2.43 | % | | | 2.22 | % | | | 2.44 | % |
| Ratios of net investment income (loss) to average net assets: ^ | | | 3.73 | % | | | 1.75 | % | | | 0.41 | % | | | 1.21 | % | | | 2.36 | % | | | 2.13 | % | | | 2.88 | % | | | 1.01 | % | | | (0.37 | )% | | | 0.53 | % | | | 1.63 | % | | | 1.22 | % |
| Portfolio turnover rate (1) | | | 48 | % | | | 216 | % | | | 343 | % | | | 519 | % | | | 426 | % | | | 275 | % | | | 216 | % | | | 216 | % | | | 343 | % | | | 519 | % | | | 426 | % | | | 275 | % |
| | | | | | | | | | | | | | | | | | | | | | | | | | | | | | | | | | | | | | | | | | | | | | | | | |
| * | The net investment income (loss) per share data was determined using the average shares outstanding throughout each year. |
| + | Assumes reinvestment of all dividends and distributions, if any. Total return does not reflect the deductions of taxes that a shareholder would pay on distributions or on the redemption of shares and does not reflect the impact of any sales charge. |
| # | Includes adjustments in accordance with accounting principles generally accepted in the United States and, consequently, the net asset values for financial reporting purposes and the returns based upon those net asset values may differ from the net asset values and returns for shareholder transactions. Adjustments may apply to some but not all years and classes. |
| ^ | Annualized for periods less than one year. |
| (1) | Not annualized for periods less than one year. |
See accompanying notes which are an integral part to these financial statements.
| FINANCIAL HIGHLIGHTS |
| Dunham Monthly Distribution Fund |
| |
| The table sets forth financial data for one share of beneficial interest outstanding throughout each year/period. |
| | | Class N | | | | | | | | | | | | | | | | | | | | | | | | | |
| | | Six Months Ended | | | Year Ended October 31, | | | | | | | | | | | | | | | | | | | | | | | | | |
| | | April 30, 2023 | | | 2022 | | | 2021 | | | 2020 | | | 2019 | | | 2018 | | | | | | | | | | | | | | | | | | | | | | | | | |
| | | (Unaudited) | | | | | | | | | | | | | | | | | | | | | | | | | | | | | | | | | | | | | | | | |
| Net asset value, beginning of year/period | | $ | 31.15 | | | $ | 32.18 | | | $ | 32.75 | | | $ | 33.88 | | | $ | 34.84 | | | $ | 36.71 | | | | | | | | | | | | | | | | | | | | | | | | | |
| Income (loss) from investment operations: | | | | | | | | | | | | | | | | | | | | | | | | | | | | | | | | | | | | | | | | | | | | | | | | |
| Net investment income (loss)* | | | 1.46 | | | | (0.45 | ) | | | (0.28 | ) | | | (0.21 | ) | | | (0.13 | ) | | | 0.09 | | | | | | | | | | | | | | | | | | | | | | | | | |
| Net realized and unrealized gain (loss) | | | (1.10 | ) | | | 0.80 | | | | 0.79 | | | | 0.33 | | | | 1.02 | | | | (0.25 | ) | | | | | | | | | | | | | | | | | | | | | | | | |
| Total income (loss) from investment operations | | | 0.36 | | | | 0.35 | | | | 0.51 | | | | 0.12 | | | | 0.89 | | | | (0.16 | ) | | | | | | | | | | | | | | | | | | | | | | | | |
| Less distributions: | | | | | | | | | | | | | | | | | | | | | | | | | | | | | | | | | | | | | | | | | | | | | | | | |
| Distributions from net investment income | | | (0.04 | ) | | | — | | | | (0.71 | ) | | | (0.30 | ) | | | — | | | | — | | | | | | | | | | | | | | | | | | | | | | | | | |
| Distributions from net realized gains | | | — | | | | (0.25 | ) | | | — | | | | — | | | | — | | | | (0.35 | ) | | | | | | | | | | | | | | | | | | | | | | | | |
| Tax return of capital | | | (1.13 | ) | | | (1.13 | ) | | | (0.37 | ) | | | (0.95 | ) | | | (1.85 | ) | | | (1.36 | ) | | | | | | | | | | | | | | | | | | | | | | | | |
| Total distributions | | | (1.17 | ) | | | (1.38 | ) | | | (1.08 | ) | | | (1.25 | ) | | | (1.85 | ) | | | (1.71 | ) | | | | | | | | | | | | | | | | | | | | | | | | |
| Net asset value, end of year/period | | $ | 30.34 | | | $ | 31.15 | | | $ | 32.18 | | | $ | 32.75 | | | $ | 33.88 | | | $ | 34.84 | | | | | | | | | | | | | | | | | | | | | | | | | |
| Total return + # | | | 1.19 | % | | | 1.11 | % | | | 1.54 | % | | | 0.37 | % | | | 2.61 | % | | | (0.45 | )% | | | | | | | | | | | | | | | | | | | | | | | | |
| Ratios/Supplemental Data: | | | | | | | | | | | | | | | | | | | | | | | | | | | | | | | | | | | | | | | | | | | | | | | | |
| Net assets, end of year/period (in 000s) | | $ | 156,487 | | | $ | 175,703 | | | $ | 219,703 | | | $ | 160,250 | | | $ | 183,319 | | | $ | 201,405 | | | | | | | | | | | | | | | | | | | | | | | | | |
| Ratios of expenses to average net assets: | | | | | | | | | | | | | | | | | | | | | | | | | | | | | | | | | | | | | | | | | | | | | | | | |
| After waivers | | | 1.90 | % | | | 2.52 | % | | | 1.90 | % | | | 1.81 | % | | | 2.62 | % | | | 2.16 | % | | | | | | | | | | | | | | | | | | | | | | | | |
| Dividends/borrowings on short sales | | | 0.68 | % | | | 0.39 | % | | | 0.81 | % | | | 0.69 | % | | | 1.24 | % | | | 1.10 | % | | | | | | | | | | | | | | | | | | | | | | | | |
| Excluding dividends/borrowings on short sales: | | | | | | | | | | | | | | | | | | | | | | | | | | | | | | | | | | | | | | | | | | | | | | | | |
| Before fee waivers | | | 1.22 | % | | | 2.13 | % | | | 1.09 | % | | | 1.13 | % | | | 1.38 | % | | | 1.06 | % | | | | | | | | | | | | | | | | | | | | | | | | |
| After fee waivers | | | 1.22 | % | | | 2.13 | % | | | 1.09 | % | | | 1.13 | % | | | 1.38 | % | | | 1.06 | % | | | | | | | | | | | | | | | | | | | | | | | | |
| Ratios of net investment income (loss) to average net assets: | | | | | | | | | | | | | | | | | | | | | | | | | | | | | | | | | | | | | | | | | | | | | | | | |
| Before fee waivers | | | 11.03 | % | | | (1.41 | )% | | | (0.84 | )% | | | (0.62 | )% | | | (0.39 | )% | | | 0.25 | % | | | | | | | | | | | | | | | | | | | | | | | | |
| After fee waivers | | | 11.03 | % | | | (1.41 | )% | | | (0.84 | )% | | | (0.62 | )% | | | (0.39 | )% | | | 0.25 | % | | | | | | | | | | | | | | | | | | | | | | | | |
| Portfolio turnover rate (1) | | | 83 | % | | | 221 | % | | | 339 | % | | | 605 | % | | | 496 | % | | | 453 | % | | | | | | | | | | | | | | | | | | | | | | | | |
| | | | | | | | | | | | | | | | | | | | | | | | | | | | | | | | | | | | | | | | | | | | | | | | | |
| | | Class A | | | Class C | |
| | | Six Months Ended | | | Year Ended October 31, | | | Six Months Ended | | | Year Ended October 31, | |
| | | April 30, 2023 | | | 2022 | | | 2021 | | | 2020 | | | 2019 | | | 2018 | | | April 30, 2023 | | | 2022 | | | 2021 | | | 2020 | | | 2019 | | | 2018 | |
| | | (Unaudited) | | | | | | | | | | | | | | | | | | (Unaudited) | | | | | | | | | | | | | | | | |
| | | | | | | | | | | | | | | | | | | | | | | | | | | | | | | | | | | | | |
| Net asset value, beginning of year/period | | $ | 29.70 | | | $ | 30.83 | | | $ | 31.49 | | | $ | 32.71 | | | $ | 33.77 | | | $ | 35.73 | | | $ | 21.89 | | | $ | 23.26 | | | $ | 24.19 | | | $ | 25.60 | | | $ | 27.02 | | | $ | 29.15 | |
| Income (loss) from investment operations: | | | | | | | | | | | | | | | | | | | | | | | | | | | | | | | | | | | | | | | | | | | | | | | | |
| Net investment income (loss)* | | | 1.42 | | | | (0.46 | ) | | | (0.44 | ) | | | (0.30 | ) | | | (0.21 | ) | | | 0.00 | (a) | | | 0.97 | | | | (0.52 | ) | | | (0.55 | ) | | | (0.43 | ) | | | (0.36 | ) | | | (0.21 | ) |
| Net realized and unrealized gain (loss) | | | (1.11 | ) | | | 0.71 | | | | 0.86 | | | | 0.33 | | | | 1.00 | | | | (0.25 | ) | | | (0.82 | ) | | | 0.53 | | | | 0.70 | | | | 0.27 | | | | 0.79 | | | | (0.21 | ) |
| Total income (loss) from investment operations | | | 0.31 | | | | 0.25 | | | | 0.42 | | | | 0.03 | | | | 0.79 | | | | (0.25 | ) | | | 0.15 | | | | 0.01 | | | | 0.15 | | | | (0.16 | ) | | | 0.43 | | | | (0.42 | ) |
| Less distributions: | | | | | | | | | | | | | | | | | | | | | | | | | | | | | | | | | | | | | | | | | | | | | | | | |
| Distributions from net investment income | | | (0.04 | ) | | | — | | | | (0.71 | ) | | | (0.30 | ) | | | — | | | | — | | | | (0.04 | ) | | | — | | | | (0.71 | ) | | | (0.30 | ) | | | — | | | | — | |
| Distributions from net realized gains | | | — | | | | (0.25 | ) | | | — | | | | — | | | | — | | | | (0.35 | ) | | | — | | | | (0.25 | ) | | | — | | | | — | | | | — | | | | (0.35 | ) |
| Tax return of capital | | | (1.13 | ) | | | (1.13 | ) | | | (0.37 | ) | | | (0.95 | ) | | | (1.85 | ) | | | (1.36 | ) | | | (1.13 | ) | | | (1.13 | ) | | | (0.37 | ) | | | (0.95 | ) | | | (1.85 | ) | | | (1.36 | ) |
| Total distributions | | | (1.17 | ) | | | (1.38 | ) | | | (1.08 | ) | | | (1.25 | ) | | | (1.85 | ) | | | (1.71 | ) | | | (1.17 | ) | | | (1.38 | ) | | | (1.08 | ) | | | (1.25 | ) | | | (1.85 | ) | | | (1.71 | ) |
| Net asset value, end of year/period | | $ | 28.84 | | | $ | 29.70 | | | $ | 30.83 | | | $ | 31.49 | | | $ | 32.71 | | | $ | 33.77 | | | $ | 20.87 | | | $ | 21.89 | | | $ | 23.26 | | | $ | 24.19 | | | $ | 25.60 | | | $ | 27.02 | |
| Total return + # | | | 1.08 | % | | | 0.83 | % | | | 1.25 | % | | | 0.10 | % | | | 2.39 | % | | | (0.72 | )% | | | 0.73 | % | | | 0.05 | % | | | 0.54 | % | | | (0.63 | )% | | | 1.63 | % | | | (1.48 | )% |
| Ratios/Supplemental Data: | | | | | | | | | | | | | | | | | | | | | | | | | | | | | | | | | | | | | | | | | | | | | | | | |
| Net assets, end of year/period (in 000s) | | $ | 25,817 | | | $ | 28,997 | | | $ | 33,155 | | | $ | 33,157 | | | $ | 42,052 | | | $ | 42,980 | | | $ | 14,315 | | | $ | 16,177 | | | $ | 19,311 | | | $ | 23,171 | | | $ | 33,913 | | | $ | 34,664 | |
| Ratios of expenses to average net assets: | | | | | | | | | | | | | | | | | | | | | | | | | | | | | | | | | | | | | | | | | | | | | | | | |
| After waivers | | | 2.15 | % | | | 2.77 | % | | | 2.16 | % | | | 2.06 | % | | | 2.87 | % | | | 2.41 | % | | | 2.90 | % | | | 3.52 | % | | | 2.93 | % | | | 2.81 | % | | | 3.62 | % | | | 3.16 | % |
| Dividends/borrowings on short sales | | | 0.68 | % | | | 0.39 | % | | | 0.81 | % | | | 0.68 | % | | | 1.24 | % | | | 1.10 | % | | | 0.68 | % | | | 0.39 | % | | | 0.81 | % | | | 0.68 | % | | | 1.23 | % | | | 1.10 | % |
| Excluding dividends/borrowings on short sales: | | | | | | | | | | | | | | | | | | | | | | | | | | | | | | | | | | | | | | | | | | | | | | | | |
| Before fee waivers | | | 1.47 | % | | | 2.38 | % | | | 1.35 | % | | | 1.38 | % | | | 1.63 | % | | | 1.31 | % | | | 2.22 | % | | | 3.13 | % | | | 2.12 | % | | | 2.12 | % | | | 2.39 | % | | | 2.06 | % |
| After fee waivers | | | 1.47 | % | | | 2.38 | % | | | 1.35 | % | | | 1.38 | % | | | 1.63 | % | | | 1.31 | % | | | 2.22 | % | | | 3.13 | % | | | 2.12 | % | | | 2.12 | % | | | 2.39 | % | | | 2.06 | % |
| Ratios of net investment income (loss) to average net assets: | | | | | | | | | | | | | | | | | | | | | | | | | | | | | | | | | | | | | | | | | | | | | | | | |
| Before fee waivers | | | 10.78 | % | | | (1.53 | )% | | | (1.39 | )% | | | (0.94 | )% | | | (0.63 | )% | | | 0.01 | % | | | 10.03 | % | | | (2.32 | )% | | | (2.28 | )% | | | (1.74 | )% | | | (1.38 | )% | | | (0.73 | )% |
| After fee waivers | | | 10.78 | % | | | (1.53 | )% | | | (1.39 | )% | | | (0.94 | )% | | | (0.63 | )% | | | 0.01 | % | | | 10.03 | % | | | (2.32 | )% | | | (2.28 | )% | | | (1.74 | )% | | | (1.38 | )% | | | (0.73 | )% |
| Portfolio turnover rate (1) | | | 83 | % | | | 221 | % | | | 339 | % | | | 605 | % | | | 496 | % | | | 453 | % | | | 83 | % | | | 221 | % | | | 339 | % | | | 605 | % | | | 496 | % | | | 453 | % |
| | | | | | | | | | | | | | | | | | | | | | | | | | | | | | | | | | | | | | | | | | | | | | | | | |
| * | The net investment income (loss) per share data was determined using the average shares outstanding throughout each year. |
| + | Assumes reinvestment of all dividends and distributions, if any. Total return does not reflect the deductions of taxes that a shareholder would pay on distributions or on the redemption of shares and does not reflect the impact of any sales charge. |
| # | Includes adjustments in accordance with accounting principles generally accepted in the United States and, consequently, the net asset values for financial reporting purposes and the returns based upon those net asset values may differ from the net asset values and returns for shareholder transactions. Adjustments may apply to some but not all years and classes. |
| (a) | Represents less than $0.01 per share. |
| ^ | Annualized for periods less than one year. |
| (1) | Not annualized for periods less than one year. |
See accompanying notes which are an integral part to these financial statements.
| FINANCIAL HIGHLIGHTS |
| Dunham Real Estate Stock Fund |
| |
| The table sets forth financial data for one share of beneficial interest outstanding throughout each year/period. |
| | | Class N | | | | | | | | | | | | | | | | | | | | | | | | | |
| | | Six Months Ended | | | Year Ended October 31, | | | | | | | | | | | | | | | | | | | | | | | | | |
| | | April 30, 2023 | | | 2022 | | | 2021 | | | 2020 | | | 2019 | | | 2018 | | | | | | | | | | | | | | | | | | | | | | | | | |
| Net asset value, beginning of year/period | | $ | 12.47 | | | $ | 21.36 | | | $ | 17.34 | | | $ | 18.68 | | | $ | 15.35 | | | $ | 15.66 | | | | | | | | | | | | | | | | | | | | | | | | | |
| Income (loss) from investment operations: | | | | | | | | | | | | | | | | | | | | | | | | | | | | | | | | | | | | | | | | | | | | | | | | |
| Net investment income (loss) * | | | 0.13 | | | | 0.14 | | | | (0.02 | ) | | | 0.11 | | | | 0.30 | | | | 0.28 | | | | | | | | | | | | | | | | | | | | | | | | | |
| Net realized and unrealized gain (loss) ! | | | (0.13 | ) | | | (7.74 | ) | | | 5.52 | | | | (0.14 | ) | | | 3.32 | | | | (0.35 | ) | | | | | | | | | | | | | | | | | | | | | | | | |
| Total income (loss) from investment operations | | | 0.00 | | | | (7.60 | ) | | | 5.50 | | | | (0.03 | ) | | | 3.62 | | | | (0.07 | ) | | | | | | | | | | | | | | | | | | | | | | | | |
| Less distributions: | | | | | | | | | | | | | | | | | | | | | | | | | | | | | | | | | | | | | | | | | | | | | | | | |
| Distributions from net investment income | | | — | | | | — | | | | — | | | | (0.31 | ) | | | (0.29 | ) | | | (0.12 | ) | | | | | | | | | | | | | | | | | | | | | | | | |
| Distributions from net realized gains | | | (0.08 | ) | | | (1.29 | ) | | | (1.48 | ) | | | (1.00 | ) | | | — | | | | (0.12 | ) | | | | | | | | | | | | | | | | | | | | | | | | |
| Total distributions | | | (0.08 | ) | | | (1.29 | ) | | | (1.48 | ) | | | (1.31 | ) | | | (0.29 | ) | | | (0.24 | ) | | | | | | | | | | | | | | | | | | | | | | | | |
| Net asset value, end of year/period | | $ | 12.39 | | | $ | 12.47 | | | $ | 21.36 | | | $ | 17.34 | | | $ | 18.68 | | | $ | 15.35 | | | | | | | | | | | | | | | | | | | | | | | | | |
| Total return + # | | | 0.06 | % | | | (37.75 | )% | | | 32.81 | % | | | (0.02 | )% | | | 24.16 | % | | | (0.48 | )% | | | | | | | | | | | | | | | | | | | | | | | | |
| Ratios/Supplemental Data: | | | | | | | | | | | | | | | | | | | | | | | | | | | | | | | | | | | | | | | | | | | | | | | | |
| Net assets, end of year/period (in 000s) | | $ | 62,214 | | | $ | 64,414 | | | $ | 91,553 | | | $ | 53,647 | | | $ | 42,865 | | | $ | 43,163 | | | | | | | | | | | | | | | | | | | | | | | | | |
| Ratios of expenses to average net assets: ^ | | | 1.05 | % | | | 1.01 | % | | | 1.37 | % | | | 1.66 | % | | | 1.15 | % | | | 1.10 | % | | | | | | | | | | | | | | | | | | | | | | | | |
| Ratios of net investment income (loss) to average net assets: ^ | | | 1.91 | % | | | 0.85 | % | | | (0.08 | )% | | | 0.63 | % | | | 1.81 | % | | | 1.82 | % | | | | | | | | | | | | | | | | | | | | | | | | |
| Portfolio turnover rate (1) | | | 35 | % | | | 58 | % | | | 59 | % | | | 125 | % | | | 63 | % | | | 74 | % | | | | | | | | | | | | | | | | | | | | | | | | |
| | | | | | | | | | | | | | | | | | | | | | | | | | | | | | | | | | | | | | | | | | | | | | | | | |
| | | Class A | | | Class C | |
| | | Six Months Ended | | | Year Ended October 31, | | | Six Months Ended | | | Year Ended October 31, | |
| | | April 30, 2023 | | | 2022 | | | 2021 | | | 2020 | | | 2019 | | | 2018 | | | April 30, 2023 | | | 2022 | | | 2021 | | | 2020 | | | 2019 | | | 2018 | |
| | | (Unaudited) | | | | | | | | | | | | | | | | | | (Unaudited) | | | | | | | | | | | | | | | | |
| | | | | | | | | | | | | | | | | | | | | | | | | | | | | | | | | | | | | |
| Net asset value, beginning of year/period | | $ | 12.52 | | | $ | 21.48 | | | $ | 17.47 | | | $ | 18.81 | | | $ | 15.46 | | | $ | 15.78 | | | $ | 11.37 | | | $ | 19.78 | | | $ | 16.30 | | | $ | 17.69 | | | $ | 14.54 | | | $ | 14.88 | |
| Income (loss) from investment operations: | | | | | | | | | | | | | | | | | | | | | | | | | | | | | | | | | | | | | | | | | | | | | | | | |
| Net investment income (loss) * | | | 0.11 | | | | 0.10 | | | | (0.07 | ) | | | 0.06 | | | | 0.26 | | | | 0.24 | | | | 0.05 | | | | (0.03 | ) | | | (0.20 | ) | | | (0.06 | ) | | | 0.13 | | | | 0.12 | |
| Net realized and unrealized gain (loss) ! | | | (0.12 | ) | | | (7.77 | ) | | | 5.56 | | | | (0.13 | ) | | | 3.35 | | | | (0.35 | ) | | | (0.10 | ) | | | (7.09 | ) | | | 5.16 | | | | (0.14 | ) | | | 3.17 | | | | (0.34 | ) |
| Total income (loss) from investment operations | | | (0.01 | ) | | | (7.67 | ) | | | 5.49 | | | | (0.07 | ) | | | 3.61 | | | | (0.11 | ) | | | (0.05 | ) | | | (7.12 | ) | | | 4.96 | | | | (0.20 | ) | | | 3.30 | | | | (0.22 | ) |
| Less distributions: | | | | | | | | | | | | | | | | | | | | | | | | | | | | | | | | | | | | | | | | | | | | | | | | |
| Distributions from net investment income | | | — | | | | — | | | | — | | | | (0.27 | ) | | | (0.26 | ) | | | (0.09 | ) | | | — | | | | — | | | | — | | | | (0.19 | ) | | | (0.15 | ) | | | — | |
| Distributions from net realized gains | | | (0.05 | ) | | | (1.29 | ) | | | (1.48 | ) | | | (1.00 | ) | | | — | | | | (0.12 | ) | | | — | | | | (1.29 | ) | | | (1.48 | ) | | | (1.00 | ) | | | — | | | | (0.12 | ) |
| Total distributions | | | (0.05 | ) | | | (1.29 | ) | | | (1.48 | ) | | | (1.27 | ) | | | (0.26 | ) | | | (0.21 | ) | | | 0.00 | | | | (1.29 | ) | | | (1.48 | ) | | | (1.19 | ) | | | (0.15 | ) | | | (0.12 | ) |
| Net asset value, end of year/period | | $ | 12.46 | | | $ | 12.52 | | | $ | 21.48 | | | $ | 17.47 | | | $ | 18.81 | | | $ | 15.46 | | | $ | 11.32 | | | $ | 11.37 | | | $ | 19.78 | | | $ | 16.30 | | | $ | 17.69 | | | $ | 14.54 | |
| Total return + # | | | (0.08 | )% | | | (37.87 | )% | | | 32.48 | % | | | (0.28 | )% | | | 23.81 | % | | | (0.74 | )% | | | (0.44 | )% | | | (38.38 | )% | | | 31.50 | % | | | (1.08 | )% | | | 22.97 | % | | | (1.50 | )% |
| Ratios/Supplemental Data: | | | | | | | | | | | | | | | | | | | | | | | | | | | | | | | | | | | | | | | | | | | | | | | | |
| Net assets, end of year/period (in 000s) | | $ | 9,739 | | | $ | 9,449 | | | $ | 15,112 | | | $ | 11,196 | | | $ | 9,161 | | | $ | 8,444 | | | $ | 2,330 | | | $ | 2,544 | | | $ | 4,736 | | | $ | 2,998 | | | $ | 2,812 | | | $ | 2,308 | |
| Ratios of expenses to average net assets: ^ | | | 1.30 | % | | | 1.27 | % | | | 1.62 | % | | | 1.91 | % | | | 1.40 | % | | | 1.35 | % | | | 2.05 | % | | | 2.02 | % | | | 2.37 | % | | | 2.66 | % | | | 2.15 | % | | | 2.10 | % |
| Ratios of net investment income (loss) to average net assets: ^ | | | 1.67 | % | | | 0.60 | % | | | (0.33 | )% | | | 0.36 | % | | | 1.56 | % | | | 1.57 | % | | | 0.89 | % | | | (0.19 | )% | | | (1.07 | )% | | | (0.36 | )% | | | 0.79 | % | | | 0.85 | % |
| Portfolio turnover rate (1) | | | 35 | % | | | 58 | % | | | 59 | % | | | 125 | % | | | 63 | % | | | 74 | % | | | 35 | % | | | 58 | % | | | 59 | % | | | 125 | % | | | 63 | % | | | 74 | % |
| | | | | | | | | | | | | | | | | | | | | | | | | | | | | | | | | | | | | | | | | | | | | | | | | |
| * | The net investment income (loss) per share data was determined using the average shares outstanding throughout each year. |
| + | Assumes reinvestment of all dividends and distributions, if any. Total return does not reflect the deductions of taxes that a shareholder would pay on distributions or on the redemption of shares and does not reflect the impact of any sales charge. |
| # | Includes adjustments in accordance with accounting principles generally accepted in the United States and, consequently, the net asset values for financial reporting purposes and the returns based upon those net asset values may differ from the net asset values and returns for shareholder transactions. Adjustments may apply to some but not all years and classes. |
| ! | The amount of net realized and unrealized gain (loss) on investment per share for the year ended October 31, 2020 does not accord with the amounts in the Statements of Operations due to the timing of purchases and sales of Fund shares in relation to fluctuating market values. |
| ^ | Annualized for periods less than one year. |
| (1) | Not annualized for periods less than one year. |
See accompanying notes which are an integral part to these financial statements.
| NOTES TO FINANCIAL STATEMENTS (Unaudited) |
| April 30, 2023 |
Each Dunham Fund (each, a “Fund” and collectively the “Funds”) is a series of shares of beneficial interest in the Dunham Funds (the “Trust”), a Delaware Business Trust organized on November 28, 2007 and registered under the Investment Company Act of 1940, as amended, (the “1940 Act”) as an open -end management investment company. The Dunham Funds currently consist of fourteen funds: Dunham Corporate/Government Bond Fund; Dunham Floating Rate Bond Fund; Dunham High-Yield Bond Fund; Dunham International Opportunity Bond Fund; Dunham Large Cap Value Fund; Dunham Small Cap Value Fund; Dunham Focused Large Cap Growth Fund; Dunham Small Cap Growth Fund; Dunham Emerging Markets Stock Fund; Dunham International Stock Fund; Dunham Dynamic Macro Fund; Dunham Long/Short Credit Fund; Dunham Monthly Distribution Fund; and Dunham Real Estate Stock Fund. With the exception of Dunham Focused Large Cap Growth Fund and Dunham Real Estate Stock Fund, the remaining Funds are diversified funds within the meaning of the 1940 Act.
| Fund | Primary Objective |
| Dunham Corporate/Government Bond Fund (“Corporate/Government Bond”) | Current income and capital appreciation |
| Dunham Floating Rate Bond Fund (“Floating Rate Bond”) | High level of current income |
| Dunham High-Yield Bond Fund (“High-Yield Bond”) | High level of current income |
| Dunham International Opportunity Bond Fund (“International Opportunity Bond”) | High level of current income |
| Dunham Large Cap Value Fund (“Large Cap Value”) | Maximize total return from capital appreciation and dividends |
| Dunham Small Cap Value Fund (“Small Cap Value”) | Maximize total return from capital appreciation and income |
| Dunham Focused Large Cap Growth Fund (“Focused Large Cap Growth”) | Maximize capital appreciation |
| Dunham Small Cap Growth Fund (“Small Cap Growth”) | Maximize capital appreciation |
| Dunham Emerging Markets Stock Fund (“Emerging Markets Stock”) | Maximize capital appreciation |
| Dunham International Stock Fund (“International Stock”) | Maximize total return from capital appreciation and dividends |
| Dunham Dynamic Macro Fund (“Dynamic Macro”) | Maximize total return from capital appreciation and dividends |
| Dunham Long/Short Credit Fund (“Long/Short Credit”) | Maximize total return under varying market conditions through both current income and capital appreciation |
| Dunham Monthly Distribution Fund (“Monthly Distribution”) | Positive returns in rising and falling market environments |
| Dunham Real Estate Stock Fund (“Real Estate Stock”) | Maximize total return from capital appreciation and dividends |
Currently, each Fund offers Class A, Class C and Class N shares. Each class represents an interest in the same assets of the applicable Fund with the only differences being that Class A shares are subject to a front-end sales charge and an annual distribution fee, Class C shares are subject to an annual service and distribution fee and Class N shares have a higher minimum investment amount. Investors that purchase $1,000,000 or more of Class A shares will not pay any initial sales charge on the purchase. However, purchases of $1,000,000 or more of Class A shares may be subject to a contingent deferred sales charge (“CDSC”) on shares redeemed during the first 18 months after their purchase in the amount of the commissions paid on the shares redeemed. The Class C and Class N shares, with the exception of Floating Rate Bond, High-Yield Bond, International Opportunity Bond, Focused Large Cap Growth, Dynamic Macro, and Monthly Distribution commenced operations on December 10, 2004 and were formed as a result of tax -free conversions from common trusts. The conversions were accomplished through the exchange of the common trust securities, cash, and other assets for equivalent value of the Funds’ shares. High-Yield Bond Class C and Class N shares commenced operations on July 1, 2005. The Class A shares for all Funds except Floating Rate Bond, International Opportunity Bond, Focused Large Cap Growth, Dynamic Macro, and Monthly Distribution commenced operations on January 3, 2007. Monthly Distribution’s Predecessor Fund’s Class A shares and Class C shares commenced operations on December 26, 2000. Monthly Distribution’s Class N shares commenced operations on September 29, 2008. Dynamic Macro commenced operations on April 30, 2010. Focused Large Cap Growth commenced operations on December 8, 2011. Floating Rate Bond and International Opportunity Bond commenced operations on November 1, 2013.
| 2. | SUMMARY OF SIGNIFICANT ACCOUNTING POLICIES |
The preparation of financial statements in conformity with accounting principles generally accepted in the United States of America (“GAAP”) requires management to make estimates and assumptions that affect the reported amounts of assets and liabilities and disclosure of contingent assets and liabilities at the date of the financial statements and the reported amounts of increases and decreases in net assets from operations during the reporting period. Actual results could differ from those estimates. The Funds are investment companies and accordingly follow the investment company accounting and reporting guidance of the Financial Accounting Standards Board (FASB) Accounting Standard Codification Topic 946 “Financial Services – Investment Companies.”
| NOTES TO FINANCIAL STATEMENTS (Unaudited) |
| April 30, 2023 (Continued) |
The following is a summary of significant accounting policies followed by the Funds in preparation of their financial statements.
a. Security Valuation – In determining each Fund’s Net Asset Value (“NAV”) per share, equity securities for which market quotations are readily available are valued at current market value using the last reported sales price. NASDAQ traded securities are valued using the NASDAQ official closing price (“NOCP”). If no sale price is reported, the mean between the current bid and ask price is used. If market quotations are not readily available, then securities will be valued using the “fair value” procedures approved by the Board of Trustees (the “Board”). The Board has delegated execution of these procedures to the Adviser as its valuation designee (the “Valuation Designee”) based on the Trust’s Portfolio Securities Valuation Procedures (the “Procedures”). U.S. Government and Agency securities are valued at the mean between the most recent bid and ask prices. Short-term debt instruments with a remaining maturity of more than 60 days, Debt securities including Bank Loans (other than short-term obligations) are valued each day by an independent pricing service elected by Dunham & Associates Investment Counsel, Inc. (“Dunham & Associates” or the “Adviser”) and approved by the Board using methods which include current market quotations from a major market maker in the securities and based on methods which include the consideration of yields or prices of securities of comparable quality, coupon, maturity and type. Where such prices are not available, valuations will be obtained from brokers who are market makers for such securities. However, in circumstances where the Adviser deems it appropriate to do so, the mean of the bid and ask prices for over-the-counter securities or the last available sale price for exchange-traded debt securities may be used. Where no last sale price for exchange traded debt securities is available, the mean of the bid and ask prices may be used. Short-term debt securities with a remaining maturity of 60 days or less may be valued at amortized cost, provided such valuations represent fair value.
The Funds may invest in portfolios of open-end, closed-end investment companies and Exchange Traded Funds (“ETFs”) (the “underlying funds”). Underlying open-end investment companies are valued at their respective net asset values as reported by such investment companies. The underlying funds value securities in their portfolios for which market quotations are readily available at their market values (generally the last reported sale price) and all other securities and assets at their fair value by the methods established by the boards of the underlying funds. The shares of many closed-end investment companies and ETFs, after their initial public offering, frequently trade at a price per share, which is different than the net asset value per share. The difference represents a market premium or market discount of such shares. There can be no assurances that the market discount or market premium on shares of any closed-end investment company or ETF purchased by a Fund will not change.
Options are valued at the last reported sale price at the close of the exchange on which the security is primarily traded. If no sales are reported for the exchange-traded options, or the options are not exchange-traded, then they are valued at the mean of their most recent quoted bid and ask price.
Futures and future options are valued daily at the final settled price or, in the absence of a settled price, at the mean between the current bid and ask prices on the day of valuation.
Swap transactions are valued through an independent pricing service or at fair value based on daily price reporting from the swap counterparty issuing the swap. Total return swaps on securities listed on an exchange shall be valued at the last quoted sales price or, in the absence of a sale, at the mean between the current bid and ask prices.
Trading in securities on Far East securities exchanges and over-the-counter markets is normally completed well before the close of business on each business day in New York (i.e., a day on which the New York Stock Exchange (“NYSE”) is open). In addition, Far East securities trading generally, or in a particular country or countries, may not take place on all business days in New York. Furthermore, trading takes place in Japanese markets on certain Saturdays and in various foreign markets on days, which are not business days in New York, and on which a Fund’s NAV is not calculated. Each Fund calculates the NAV per share, and therefore effects sales, redemptions and repurchases of its shares, as of the close of regular trading on the NYSE once on each day on which the NYSE is open. Such calculation may not take place contemporaneously with the determination of the prices of the majority of the portfolio securities used in such calculation. If events that may materially affect the value of such securities occur between the time when their price is determined and the time when the Fund’s NAV is calculated, such securities may be valued at fair value as determined in good faith in accordance with procedures approved by the Board. Foreign currency and forward currency exchange contracts are valued daily at the London Stock Exchange close each day.
Securities in which the Funds invest may be traded in markets that close before 4:00 p.m. Eastern Time (“ET”). Normally, developments that occur between the close of the foreign markets and 4:00 p.m. ET will not be reflected in a Fund’s NAV. However, management may determine that such developments are so significant that they will materially affect the value of a Fund’s securities, and the Fund may adjust the previous closing prices to reflect what the Board believes to be the fair value of these securities as of 4:00 p.m. ET. Both Emerging Markets Stock and International Stock utilize fair value prices as provided by an independent pricing vendor on a daily basis for those securities traded on a foreign exchange.
Securities for which current market quotations are not readily available, or for which quotations are not deemed to be representative of market values, will be valued using the “fair value” procedures approved by the Board. The Board has delegated execution of these procedures to the Adviser as its Valuation Designee based on the Trust’s Procedures. The Procedures consider, among others, the following factors to determine a security’s fair value: the nature and pricing history (if any) of the security; whether any dealer quotations for the security are available; and possible valuation methodologies that could be used to determine the fair value of the security.
| NOTES TO FINANCIAL STATEMENTS (Unaudited) |
| April 30, 2023 (Continued) |
The Funds utilize various methods to measure the fair value of their investments on a recurring basis. GAAP establishes a hierarchy that prioritizes inputs to valuation methods. The three levels of input are:
Level 1 – Unadjusted quoted prices in active markets for identical assets and liabilities.
Level 2 – Observable inputs other than quoted prices included in Level 1 that are observable for the asset or liability, either directly or indirectly. These inputs may include quoted prices for the identical instrument on an inactive market, prices for similar instruments, interest rates, prepayment speeds, credit risk, yield curves, default rates and similar data.
Level 3 – Unobservable inputs for the asset or liability, to the extent relevant observable inputs are not available, representing the Funds’ own assumptions about the assumptions a market participant would use in valuing the asset or liability, and would be based on the best information available.
The availability of observable inputs can vary from security to security and is affected by a wide variety of factors, including, for example, the type of security, whether the security is new and not yet established in the marketplace, the liquidity of markets, and other characteristics particular to the security. To the extent that valuation is based on models or inputs that are less observable or unobservable in the market, the determination of fair value requires more judgment. Accordingly, the degree of judgment exercised in determining fair value is greatest for instruments categorized in Level 3.
The inputs used to measure fair value may fall into different levels of the fair value hierarchy. In such cases, for disclosure purposes, the level in the fair value hierarchy within which the fair value measurement falls in its entirety, is determined based on the lowest level input that is significant to the fair value measurement in its entirety.
The inputs or methodology used for valuing securities are not necessarily an indication of the risk associated with investing in those securities. The following tables summarize the inputs used as of April 30, 2023 for the Funds’ assets and liabilities measured at fair value:
| Corporate/Government Bond | |
| | | | | | | | | | | | | |
| Assets | | Level 1 | | | Level 2 | | | Level 3 | | | Total | |
| Asset Backed Securities * | | $ | — | | | $ | 38,777,033 | | | $ | — | | | $ | 38,777,033 | |
| Corporate Bonds * | | | — | | | | 41,542,443 | | | | — | | | | 41,542,443 | |
| Municipal Bonds | | | — | | | | 3,879,940 | | | | — | | | | 3,879,940 | |
| Non U.S. Government & Agencies | | | — | | | | 1,947,303 | | | | — | | | | 1,947,303 | |
| Term Loans * | | | — | | | | 6,543,679 | | | | — | | | | 6,543,679 | |
| U.S. Government & Agencies | | | — | | | | 28,569,018 | | | | — | | | | 28,569,018 | |
| Short-Term Investment | | | 2,594,194 | | | | — | | | | — | | | | 2,594,194 | |
| Collateral for Securities Loaned | | | — | | | | 1,642,388 | | | | — | | | | 1,642,388 | |
| Total | | $ | 2,594,194 | | | $ | 122,901,804 | | | $ | — | | | $ | 125,495,998 | |
| | | | | | | | | | | | | | | | | |
| Floating Rate Bond | |
| | | | | | | | | | | | | |
| Assets | | Level 1 | | | Level 2 | | | Level 3 | | | Total | |
| Common Stock * | | $ | — | | | $ | 308,191 | | | $ | — | | | $ | 308,191 | |
| Asset Backed Securities | | | — | | | | 13,032,541 | | | | — | | | | 13,032,541 | |
| Corporate Bonds * | | | — | | | | 11,620,719 | | | | — | | | | 11,620,719 | |
| Term Loans * | | | — | | | | 108,418,352 | | | | — | | | | 108,418,352 | |
| Rights | | | — | | | | 12,176 | | | | — | | | | 12,176 | |
| Warrants | | | — | | | | 52,168 | | | | — | | | | 52,168 | |
| Short-Term Investment | | | 1,157,653 | | | | — | | | | — | | | | 1,157,653 | |
| Collateral for Securities Loaned | | | — | | | | 3,171,340 | | | | — | | | | 3,171,340 | |
| Total | | $ | 1,157,653 | | | $ | 136,615,487 | | | $ | — | | | $ | 137,773,140 | |
| | | | | | | | | | | | | | | | | |
| High-Yield Bond | |
| | | | | | | | | | | | | |
| Assets | | Level 1 | | | Level 2 | | | Level 3 | | | Total | |
| Common Stock * | | $ | — | | | $ | — | | | $ | 1,813,750 | | | $ | 1,813,750 | |
| Corporate Bonds * | | | — | | | | 98,114,503 | | | | — | | | | 98,114,503 | |
| Short-Term Investment | | | 4,085,664 | | | | — | | | | — | | | | 4,085,664 | |
| Collateral for Securities Loaned | | | — | | | | 13,508,510 | | | | — | | | | 13,508,510 | |
| Total | | $ | 4,085,664 | | | $ | 111,623,013 | | | $ | 1,813,750 | | | $ | 117,522,427 | |
| NOTES TO FINANCIAL STATEMENTS (Unaudited) |
| April 30, 2023 (Continued) |
| International Opportunity Bond | |
| | | | | | | | | | | | | |
| Assets | | Level 1 | | | Level 2 | | | Level 3 | | | Total | |
| Asset Backed Securities | | $ | — | | | $ | 62,143 | | | $ | — | | | $ | 62,143 | |
| Corporate Bonds * | | | — | | | | 32,263,453 | | | | — | | | | 32,263,453 | |
| Non U.S. Government & Agencies | | | — | | | | 12,337,860 | | | | — | | | | 12,337,860 | |
| Short-Term Investment | | | 451,588 | | | | — | | | | — | | | | 451,588 | |
| Collateral for Securities Loaned | | | — | | | | 1,006,616 | | | | — | | | | 1,006,616 | |
| Total Assets | | $ | 451,588 | | | $ | 45,670,072 | | | $ | — | | | $ | 46,121,660 | |
| Assets - Derivatives | | | | | | | | | | | | | | | | |
| Futures Contracts | | $ | 323,497 | | | $ | — | | | $ | — | | | $ | 323,497 | |
| Forward Foreign Currency Exchange | | | | | | | | | | | | | | | | |
| Contracts | | | — | | | | 53,626 | | | | — | | | | 53,626 | |
| Total Asset Derivatives | | $ | 323,497 | | | $ | 53,626 | | | $ | — | | | $ | 377,123 | |
| Liabilities - Derivatives | | | | | | | | | | | | | | | | |
| Futures Contracts | | $ | 242,313 | | | $ | — | | | $ | — | | | $ | 242,313 | |
| Forward Foreign Currency Exchange | | | | | | | | | | | | | | | | |
| Contracts | | | — | | | | 130,351 | | | | — | | | | 130,351 | |
| Swap Contract | | | — | | | | 164,401 | | | | — | | | | 164,401 | |
| Total Liability Derivatives | | $ | 242,313 | | | $ | 294,752 | | | $ | — | | | $ | 537,065 | |
| | | | | | | | | | | | | | | | | |
| Large Cap Value | |
| | | | | | | | | | | | | |
| Assets | | Level 1 | | | Level 2 | | | Level 3 | | | Total | |
| Common Stocks * | | $ | 164,861,182 | | | $ | — | | | $ | — | | | $ | 164,861,182 | |
| Short-Term Investments | | | 3,047,748 | | | | — | | | | — | | | | 3,047,748 | |
| Collateral for Securities Loaned | | | — | | | | 16,175,261 | | | | — | | | | 16,175,261 | |
| Total | | $ | 167,908,930 | | | $ | 16,175,261 | | | $ | — | | | $ | 184,084,191 | |
| | | | | | | | | | | | | | | | | |
| Small Cap Value | |
| | | | | | | | | | | | | |
| Assets | | Level 1 | | | Level 2 | | | Level 3 | | | Total | |
| Common Stocks * | | $ | 61,591,643 | | | $ | — | | | $ | — | | | $ | 61,591,643 | |
| Short-Term Investments | | | 666,168 | | | | — | | | | — | | | | 666,168 | |
| Collateral for Securities Loaned | | | — | | | | 18,755,560 | | | | — | | | | 18,755,560 | |
| Total | | $ | 62,257,811 | | | $ | 18,755,560 | | | $ | — | | | $ | 81,013,371 | |
| | | | | | | | | | | | | | | | | |
| Focused Large Cap Growth | |
| | | | | | | | | | | | | |
| Assets | | Level 1 | | | Level 2 | | | Level 3 | | | Total | |
| Common Stocks * | | $ | 177,904,808 | | | $ | — | | | $ | — | | | $ | 177,904,808 | |
| Short-Term Investment | | | 1,942,417 | | | | — | | | | — | | | | 1,942,417 | |
| Collateral for Securities Loaned | | | — | | | | 25,751,011 | | | | — | | | | 25,751,011 | |
| Total | | $ | 179,847,225 | | | $ | 25,751,011 | | | $ | — | | | $ | 205,598,236 | |
| | | | | | | | | | | | | | | | | |
| Small Cap Growth | |
| | | | | | | | | | | | | |
| Assets | | Level 1 | | | Level 2 | | | Level 3 | | | Total | |
| Common Stocks * | | $ | 65,924,602 | | | $ | — | | | $ | — | | | $ | 65,924,602 | |
| Short-Term Investment | | | 2,400,870 | | | | — | | | | — | | | | 2,400,870 | |
| Collateral for Securities Loaned | | | — | | | | 18,870,462 | | | | — | | | | 18,870,462 | |
| Total | | $ | 68,325,472 | | | $ | 18,870,462 | | | $ | — | | | $ | 87,195,934 | |
| NOTES TO FINANCIAL STATEMENTS (Unaudited) |
| April 30, 2023 (Continued) |
| Emerging Markets | |
| | | | | | | | | | | | | |
| Assets | | Level 1 | | | Level 2 | | | Level 3 | | | Total | |
| Common Stocks | | | | | | | | | | | | | | | | |
| Asset Management | | $ | — | | | $ | 556,024 | | | $ | — | | | $ | 556,024 | |
| Automotive | | | — | | | | 662,083 | | | | — | | | | 662,083 | |
| Banking | | | 2,382,576 | | | | 5,601,117 | | | | — | | | | 7,983,693 | |
| Beverages | | | 124,985 | | | | 4,377,107 | | | | — | | | | 4,502,092 | |
| Biotech & Pharma | | | 229,751 | | | | — | | | | — | | | | 229,751 | |
| Chemicals | | | 511,296 | | | | 2,171,308 | | | | — | | | | 2,682,604 | |
| Construction Materials | | | — | | | | 447,181 | | | | — | | | | 447,181 | |
| Consumer Services | | | — | | | | 1,068,389 | | | | — | | | | 1,068,389 | |
| E-Commerce Discretionary | | | — | | | | 8,218,957 | | | | — | | | | 8,218,957 | |
| Electric Utilities | | | — | | | | 8,388 | | | | — | | | | 8,388 | |
| Electrical Equipment | | | — | | | | 1,824,928 | | | | — | | | | 1,824,928 | |
| Engineering & Construction | | | — | | | | 2,765,079 | | | | — | | | | 2,765,079 | |
| Entertainment Content | | | — | | | | 2,438,729 | | | | — | | | | 2,438,729 | |
| Food | | | — | | | | 757,644 | | | | — | | | | 757,644 | |
| Health Care Facilities & Services | | | — | | | | 3,495,220 | | | | — | | | | 3,495,220 | |
| Home & Office Products | | | — | | | | 923,758 | | | | — | | | | 923,758 | |
| Institutional Financial Services | | | — | | | | 1,635,751 | | | | — | | | | 1,635,751 | |
| Insurance | | | — | | | | 3,850,254 | | | | — | | | | 3,850,254 | |
| Internet Media & Services | | | — | | | | 6,416,444 | | | | — | | | | 6,416,444 | |
| Leisure Facilities & Services | | | — | | | | 4,669,839 | | | | — | | | | 4,669,839 | |
| Machinery | | | — | | | | 2,297,821 | | | | — | | | | 2,297,821 | |
| Medical Equipment & Devices | | | — | | | | 1,591,129 | | | | — | | | | 1,591,129 | |
| Oil & Gas Producers | | | 946,242 | | | | 1,127,902 | | | | 0 | | | | 2,074,144 | |
| Real Estate Owners & Developers | | | 486,369 | | | | 597,721 | | | | — | | | | 1,084,090 | |
| Renewable Energy | | | — | | | | 2,130,116 | | | | — | | | | 2,130,116 | |
| Retail - Consumer Staples | | | 1,903,807 | | | | 1,372,849 | | | | 0 | | | | 3,276,656 | |
| Retail - Discretionary | | | — | | | | 2,372,101 | | | | — | | | | 2,372,101 | |
| Semiconductors | | | 446,790 | | | | 12,220,977 | | | | — | | | | 12,667,767 | |
| Specialty Finance | | | — | | | | 3,940,188 | | | | — | | | | 3,940,188 | |
| Technology Hardware | | | — | | | | 10,867,147 | | | | — | | | | 10,867,147 | |
| Technology Services | | | — | | | | 2,926,936 | | | | — | | | | 2,926,936 | |
| Telecommunications | | | — | | | | 3,704,129 | | | | — | | | | 3,704,129 | |
| Transportation & Logistics | | | — | | | | 3,065,598 | | | | — | | | | 3,065,598 | |
| Wholesale - Consumer Staples | | | — | | | | 807,677 | | | | — | | | | 807,677 | |
| Total Common Stocks | | | 7,031,816 | | | | 100,910,491 | | | | — | | | | 107,942,307 | |
| Preferred Stocks | | | | | | | | | | | | | | | | |
| Technology Hardware | | | — | | | | 526,082 | | | | — | | | | 526,082 | |
| Total Preferred Stock | | | — | | | | 526,082 | | | | — | | | | 526,082 | |
| Warrants | | | — | | | | | | | | | | | | | |
| Lodging | | | 2,856 | | | | 11,030 | | | | — | | | | 13,886 | |
| Total Warrants | | | 2,856 | | | | 11,030 | | | | — | | | | 13,886 | |
| Exchange-Traded Funds | | | 914,871 | | | | — | | | | — | | | | 914,871 | |
| Short-Term Investments | | | 840,779 | | | | — | | | | — | | | | 840,779 | |
| Collateral for Securities Loaned | | | — | | | | 1,171,930 | | | | — | | | | 1,171,930 | |
| Total | | $ | 8,790,322 | | | $ | 102,619,533 | | | $ | — | | | $ | 111,409,855 | |
| NOTES TO FINANCIAL STATEMENTS (Unaudited) |
| April 30, 2023 (Continued) |
| International Stock | |
| | | | | | | | | | | | | |
| Assets | | Level 1 | | | Level 2 | | | Level 3 | | | Total | |
| Closed End Fund | | | | | | | | | | | | |
| Equity | | $ | 1,190,627 | | | $ | — | | | $ | — | | | $ | 1,190,627 | |
| Total Closed End Fund | | | 1,190,627 | | | | — | | | | — | | | | 1,190,627 | |
| Common Stocks | | | | | | | | | | | | | | | | |
| Automotive | | | — | | | | 9,148,864 | | | | — | | | | 9,148,864 | |
| Banking | | | 1,477,736 | | | | 13,572,644 | | | | 0 | | | | 15,050,380 | |
| Beverages | | | 120,649 | | | | — | | | | — | | | | 120,649 | |
| Biotech & Pharma | | | 2,098,243 | | | | 5,730,732 | | | | — | | | | 7,828,975 | |
| Chemicals | | | 432,724 | | | | 2,303,523 | | | | — | | | | 2,736,247 | |
| Commercial Support Services | | | — | | | | 706,057 | | | | — | | | | 706,057 | |
| Construction Material | | | — | | | | 41,015 | | | | — | | | | 41,015 | |
| Diversifier Industrials | | | — | | | | 1,212,449 | | | | — | | | | 1,212,449 | |
| Electric Utilities | | | — | | | | 625,137 | | | | — | | | | 625,137 | |
| Electrical Equipment | | | 230,976 | | | | 443,044 | | | | — | | | | 674,020 | |
| Engineering & Construction | | | — | | | | 2,222,876 | | | | — | | | | 2,222,876 | |
| Entertainment Content | | | — | | | | 497,482 | | | | — | | | | 497,482 | |
| Food | | | — | | | | 412,540 | | | | — | | | | 412,540 | |
| Home & Office Products | | | — | | | | 5 | | | | — | | | | 5 | |
| Industrial Intermediate Products | | | — | | | | 1,151 | | | | — | | | | 1,151 | |
| Industrial Support Services | | | — | | | | 236,589 | | | | — | | | | 236,589 | |
| Institutional Financial Services | | | — | | | | 1,887,280 | | | | — | | | | 1,887,280 | |
| Insurance | | | — | | | | 9,051,061 | | | | — | | | | 9,051,061 | |
| Leisure Facilities & Services | | | 276,312 | | | | 14,377 | | | | — | | | | 290,689 | |
| Machinery | | | — | | | | 2,313,639 | | | | — | | | | 2,313,639 | |
| Medical Equipment & Devices | | | 173,227 | | | | 719,415 | | | | — | | | | 892,642 | |
| Metal & Mining | | | 1,616,579 | | | | 2,119,029 | | | | 0 | | | | 3,735,608 | |
| Oil & Gas Producers | | | 5,523,087 | | | | 14,158,080 | | | | 0 | | | | 19,681,167 | |
| Oil & Gas Service & Equipment | | | — | | | | 1,302,625 | | | | — | | | | 1,302,625 | |
| Retail - Consumer Staples | | | 456,696 | | | | 1,416,070 | | | | — | | | | 1,872,766 | |
| Retail - Discretionary | | | — | | | | 56,316 | | | | — | | | | 56,316 | |
| Semiconductors | | | 2,041,793 | | | | 6,571,021 | | | | — | | | | 8,612,814 | |
| Software | | | 266,056 | | | | 927,887 | | | | — | | | | 1,193,943 | |
| Specialty Finance | | | — | | | | 1,300,442 | | | | — | | | | 1,300,442 | |
| Steel | | | — | | | | 270,220 | | | | — | | | | 270,220 | |
| Technology Hardware | | | 148,644 | | | | 2,749,518 | | | | — | | | | 2,898,162 | |
| Technology Services | | | 457,746 | | | | 2,808,533 | | | | — | | | | 3,266,279 | |
| Telecommunications | | | — | | | | 7,623,060 | | | | — | | | | 7,623,060 | |
| Tobacco & Cannabis | | | 99,331 | | | | — | | | | — | | | | 99,331 | |
| Transportation & Logistics | | | 232,101 | | | | 7,406,739 | | | | — | | | | 7,638,840 | |
| Wholesale - Consumer Staples | | | — | | | | 550,712 | | | | — | | | | 550,712 | |
| Wholesale Discretionary | | | — | | | | 902,036 | | | | — | | | | 902,036 | |
| Total Common Stocks | | | 15,651,900 | | | | 101,302,168 | | | | — | | | | 116,954,068 | |
| Preferred Stocks | | | | | | | | | | | | | | | | |
| Automotive | | | — | | | | 1,959,410 | | | | — | | | | 1,959,410 | |
| Institutional Financial Services | | | — | | | | 304,200 | | | | — | | | | 304,200 | |
| Insurance | | | — | | | | 400,578 | | | | — | | | | 400,578 | |
| Oil & Gas Producers | | | 1,586,243 | | | | — | | | | — | | | | 1,586,243 | |
| Technology Hardware | | | — | | | | 821,315 | | | | — | | | | 821,315 | |
| Total Preferred Stocks | | | — | | | | — | | | | — | | | | 5,071,746 | |
| Short-Term Investments | | | 3,415,517 | | | | — | | | | — | | | | 3,415,517 | |
| Collateral for Securities Loaned | | | — | | | | 4,908,591 | | | | — | | | | 4,908,591 | |
| Total | | $ | 20,258,044 | | | $ | 106,210,759 | | | $ | — | | | $ | 131,540,549 | |
| NOTES TO FINANCIAL STATEMENTS (Unaudited) |
| April 30, 2023 (Continued) |
| Dynamic Macro | |
| | | | | | | | | | | | | |
| Assets | | Level 1 | | | Level 2 | | | Level 3 | | | Total | |
| Exchange Traded Funds * | | $ | 17,426,410 | | | $ | — | | | $ | — | | | $ | 17,426,410 | |
| U.S. Government & Agencies | | | — | | | | 16,788,070 | | | | — | | | | 16,788,070 | |
| Short-Term Investments | | | 6,075,433 | | | | — | | | | — | | | | 6,075,433 | |
| Total Assets | | $ | 23,501,843 | | | $ | 16,788,070 | | | $ | — | | | $ | 40,289,913 | |
| Assets - Derivatives | | | | | | | | | | | | | | | | |
| Futures Contracts | | $ | 704,752 | | | $ | — | | | $ | — | | | $ | 704,752 | |
| Foreign Currency Exchange Contracts | | | — | | | | 17,491 | | | | — | | | | 17,491 | |
| Total Asset Derivatives | | $ | 704,752 | | | $ | 17,491 | | | $ | — | | | $ | 722,243 | |
| Liabilities - Derivatives | | | | | | | | | | | | | | | | |
| Futures Contracts | | $ | 8,126 | | | $ | — | | | $ | — | | | $ | 8,126 | |
| Foreign Currency Exchange Contracts | | | — | | | | 197,037 | | | | — | | | | 197,037 | |
| Total Liability Derivatives | | $ | 8,126 | | | $ | 197,037 | | | $ | — | | | $ | 205,163 | |
| | | | | | | | | | | | | | | | | |
| Long/Short Credit | |
| | | | | | | | | | | | | |
| Assets | | Level 1 | | | Level 2 | | | Level 3 | | | Total | |
| Common Stocks * | | $ | — | | | $ | — | | | $ | 5,700 | | | $ | 5,700 | |
| Corporate Bonds * | | | — | | | | 108,229,909 | | | | — | | | | 108,229,909 | |
| Term Loans * | | | — | | | | 1,938,059 | | | | — | | | | 1,938,059 | |
| U.S. Government & Agencies | | | — | | | | 102,006,119 | | | | — | | | | 102,006,119 | |
| Short-Term Investment | | | 11,591,388 | | | | — | | | | — | | | | 11,591,388 | |
| Collateral for Securities Loaned | | | — | | | | 9,585,508 | | | | — | | | | 9,585,508 | |
| Total Assets | | $ | 11,591,388 | | | $ | 221,759,595 | | | $ | 5,700 | | | $ | 233,356,683 | |
| Assets - Derivatives | | | | | | | | | | | | | | | | |
| Credit Default Swap Contracts | | $ | — | | | $ | 59,060 | | | $ | — | | | $ | 59,060 | |
| Total Asset Derivatives | | $ | — | | | $ | 59,060 | | | $ | — | | | $ | 59,060 | |
| Liabilities - Derivatives | | | | | | | | | | | | | | | | |
| Futures Contracts | | $ | 1,329,345 | | | $ | — | | | $ | — | | | $ | 1,329,345 | |
| Credit Default Swap Contracts | | | — | | | | 615,185 | | | | — | | | | 615,185 | |
| Total Return Swap Contracts | | | — | | | | 558,565 | | | | — | | | | 558,565 | |
| Total Liability Derivatives | | $ | 1,329,345 | | | $ | 1,173,750 | | | $ | — | | | $ | 2,503,095 | |
| NOTES TO FINANCIAL STATEMENTS (Unaudited) |
| April 30, 2023 (Continued) |
| Monthly Distribution | |
| | |
| Assets | | Level 1 | | | Level 2 | | | Level 3 | | | Total | |
| Closed-End Fund | | $ | — | | | $ | — | | | $ | 5,752,262 | | | $ | 5,752,262 | |
| Common Stocks * | | | 164,488,237 | | | | — | | | | 72,063 | | | | 164,560,300 | |
| Rights | | | — | | | | — | | | | 1,064,442 | | | | 1,064,442 | |
| Purchased Put Options | | | — | | | | — | | | | — | | | | — | |
| Short-Term Investment | | | 5,781,858 | | | | — | | | | — | | | | 5,781,858 | |
| Collateral for Securities Loaned | | | — | | | | 13,960,747 | | | | — | | | | 13,960,747 | |
| Total Assets | | $ | 170,270,095 | | | $ | 13,960,747 | | | $ | 6,888,767 | | | $ | 191,119,609 | |
| Assets-Derivatives | | | | | | | | | | | | | | | | |
| Written Options | | $ | 1,657,291 | | | $ | — | | | $ | — | | | $ | 1,657,291 | |
| Total Asset Derivatives | | $ | 1,657,291 | | | $ | — | | | $ | — | | | $ | 1,657,291 | |
| Liabilities | | | | | | | | | | | | | | | | |
| Securities Sold Short | | $ | 48,258,667 | | | $ | — | | | $ | — | | | $ | 48,258,667 | |
| Total Liabilities | | $ | 48,258,667 | | | $ | — | | | $ | — | | | $ | 48,258,667 | |
| Assets - Derivatives | | | | | | | | | | | | | | | | |
| Forward Foreign Currency Exchange Contracts | | $ | — | | | $ | 221,899 | | | $ | — | | | $ | 221,899 | |
| Total Asset Derivatives | | $ | — | | | $ | 221,899 | | | $ | — | | | $ | 221,899 | |
| Liabilities - Derivatives | | | | | | | | | | | | | | | | |
| Forward Foreign Currency Exchange Contracts | | $ | — | | | $ | 88,469 | | | $ | — | | | $ | 88,469 | |
| Total Liability Derivatives | | $ | — | | | $ | 88,469 | | | $ | — | | | $ | 88,469 | |
| | | | | | | | | | | | | | | | | |
| Real Estate Stock | |
| | | | | | | | | | | | | |
| Assets | | Level 1 | | | Level 2 | | | Level 3 | | | Total | |
| Common Stocks * | | $ | 26,350,489 | | | $ | — | | | $ | — | | | $ | 26,350,489 | |
| REITs * | | | 47,807,510 | | | | — | | | | — | | | | 47,807,510 | |
| Short-Term Investment | | | 157,761 | | | | — | | | | — | | | | 157,761 | |
| Collateral for Securities Loaned | | | — | | | | 20,722,245 | | | | — | | | | 20,722,245 | |
| Total | | $ | 74,315,760 | | | $ | 20,722,245 | | | $ | — | | | $ | 95,038,005 | |
| * | See each Fund’s Schedule of Investments for breakdown by industry. |
| NOTES TO FINANCIAL STATEMENTS (Unaudited) |
| April 30, 2023 (Continued) |
The following is a reconciliation for the Funds for which Level 3 inputs were used in determining value:
| | | Beginning | | | | | | Change in | | | | | | | | | | | | | | | Net | | | | |
| | | balance | | | Total | | | unrealized | | | | | | | | | | | | Net | | | transfers | | | Ending | |
| | | October 31, | | | realized | | | appreciation/ | | | | | | Net | | | | | | transfers | | | (out) of | | | balance April | |
| | | 2022 | | | gain/(loss) | | | (depreciation) | | | Conversion | | | Purchases | | | Net Sales | | | into Level 3 | | | Level 3 | | | 30, 2023 | |
| High-Yield Bond | | | | | | | | | | | | | | | | | | | | | | | | | | | | | | | | | | | | |
| Common Stock | | $ | 2,317,450 | | | $ | — | | | $ | (503,700 | ) | | $ | — | | | $ | — | | | $ | — | | | $ | — | | | $ | — | | | $ | 1,813,750 | |
| | | | | | | | | | | | | | | | | | | | | | | | | | | | | | | | | | | | | |
| Emerging Markets | | | | | | | | | | | | | | | | | | | | | | | | | | | | | | | | | | | | |
| Magnit PJSC | | | — | | | | — | | | | — | | | | — | | | | — | | | | — | | | | — | | | | — | | | | — | |
| Gazprom PJSC | | | — | | | | — | | | | — | | | | — | | | | — | | | | — | | | | — | | | | — | | | | — | |
| | | | | | | | | | | | | | | | | | | | | | | | | | | | | | | | | | | | | |
| International Stock | | | | | | | | | | | | | | | | | | | | | | | | | | | | | | | | | | | | |
| Sberbank of Russia PJSC | | | — | | | | — | | | | — | | | | — | | | | — | | | | — | | | | — | | | | — | | | | — | |
| PhosAgro PJSC | | | — | | | | — | | | | — | | | | — | | | | — | | | | — | | | | — | | | | — | | | | — | |
| Tatneft PJSC | | | — | | | | — | | | | — | | | | — | | | | — | | | | — | | | | — | | | | — | | | | — | |
| Gazprom PJSC | | | — | | | | — | | | | — | | | | — | | | | — | | | | — | | | | — | | | | — | | | | — | |
| LUKOIL PJSC | | | — | | | | — | | | | — | | | | — | | | | — | | | | — | | | | — | | | | — | | | | — | |
| Rosneft Oil Company PJSC | | | — | | | | — | | | | — | | | | — | | | | — | | | | — | | | | — | | | | — | | | | — | |
| VTB Bank PJSC | | | — | | | | — | | | | — | | | | — | | | | — | | | | — | | | | — | | | | — | | | | — | |
| MMC Norilsk Nickel PJSC | | | — | | | | — | | | | — | | | | — | | | | — | | | | — | | | | — | | | | — | | | | — | |
| Gazprom PJSC - ADR | | | — | | | | — | | | | — | | | | — | | | | — | | | | — | | | | — | | | | — | | | | — | |
| | | | | | | | | | | | | | | | | | | | | | | | | | | | | | | | | | | | | |
| Long/Short Credit | | | | | | | | | | | | | | | | | | | | | | | | | | | | | | | | | | | | |
| Common Stock | | | 5,700 | | | | — | | | | — | | | | — | | | | — | | | | — | | | | — | | | | — | | | | 5,700 | |
| Preferred Stock | | | 1,950,000 | | | | (60,000 | ) | | | — | | | | — | | | | — | | | | (1,890,000 | ) | | | — | | | | — | | | | — | |
| | | | | | | | | | | | | | | | | | | | | | | | | | | | | | | | | | | | | |
| Monthly Distribution | | | | | | | | | | | | | | | | | | | | | | | | | | | | | | | | | | | | |
| Closed End Fund | | | 9,257,933 | | | | — | | | | (3,505,671 | ) | | | — | | | | — | | | | — | | | | — | | | | — | | | | 5,752,262 | |
| Common Stock | | | 72,063 | | | | — | | | | — | | | | — | | | | — | | | | — | | | | 46,979 | | | | — | | | | 119,042 | |
| Rights | | | 38,300 | | | | 74,045 | | | | — | | | | — | | | | — | | | | (112,345 | ) | | | 1,125,615 | | | | — | | | | 1,125,615 | |
| NOTES TO FINANCIAL STATEMENTS (Unaudited) |
| April 30, 2023 (Continued) |
Quantitative disclosures of unobservable inputs and assumptions used by High-Yield Bond, Long/Short Credit, Monthly Distribution, Emerging Markets Stock and International Stock are below:
| Investments in Securities: | | | | | | | | | | | Impact to valuation |
| | | | | | | | | | | | | | Input | | from an increase |
| | | Fair Value | | | Valuation Techniques | | Unobservable Input | | Range | | in input |
| High-Yield Bond | | | | | | | | | | | | |
| | | Common Stock | | | | | | | | | | | | |
| | | | | | | | | | | | | | | | | |
| | | | | Hi-Crush* | | $ | 1,813,750 | | | Market comparable | | Enterprise value/EBITDA | | 4.2x | | Increase |
| | | | | | | | | | | companies | | Market Discount | | 30% | | Decrease |
| | | | | Total Fair Value Securities | | $ | 1,813,750 | | | | | | | | | |
| Emerging Markets | | | | | | | | | | | | |
| | | Common Stock | | | | | | | | | | | | |
| | | Magnit PJSC | | $ | — | | | Market Approach | | Discount for lack of marketability (DLOM) | | 100% | | |
| | | Gazprom PJSC | | | — | | | Market Approach | | Discount for lack of marketability (DLOM) | | 100% | | |
| | | | | Total Fair Value Securities | | $ | — | | | | | | | | | |
| | | | | | | | | | | | | | | | | |
| International Stock | | | | | | | | | | | | |
| | | Common Stock | | | | | | | | | | | | |
| | | Sberbank of Russia PJSC | | $ | — | | | Market Approach | | Discount for lack of marketability (DLOM) | | 100% | | |
| | | PhosAgro PJSC | | | — | | | Market Approach | | Discount for lack of marketability (DLOM) | | 100% | | |
| | | Tatneft PJSC | | | — | | | Market Approach | | Discount for lack of marketability (DLOM) | | 100% | | |
| | | Gazprom PJSC | | | — | | | Market Approach | | Discount for lack of marketability (DLOM) | | 100% | | |
| | | LUKOIL PJSC | | | — | | | Market Approach | | Discount for lack of marketability (DLOM) | | 100% | | |
| | | Rosneft Oil Company PJSC | | | — | | | Market Approach | | Discount for lack of marketability (DLOM) | | 100% | | |
| | | VTB Bank PJSC | | | — | | | Market Approach | | Discount for lack of marketability (DLOM) | | 100% | | |
| | | MMC Norilsk Nickel PJSC | | | — | | | Market Approach | | Discount for lack of marketability (DLOM) | | 100% | | |
| | | Gazprom PJSC | | | — | | | Market Approach | | Discount for lack of marketability (DLOM) | | 100% | | |
| | | | | Total Fair Value Securities | | $ | — | | | | | | | | | |
| | | | | | | | | | | | | | | | | |
| Long/Short Credit | | | | | | | | | | | | |
| | | Common Stock | | | | | | | | | | | | |
| | | NII Holdings, Inc. | | $ | 5,700 | | | Broker Quote | | Indicative Value | | $0.57 | | |
| | | | | Total Fair Value Securities | | $ | 5,700 | | | | | | | | | |
| Monthly Distribution | | | | | | | | | | | | |
| | | Closed End Fund | | | | | | | | | | | | |
| | | Altaba, Inc. | | $ | 5,752,262 | | | Broker Quote | | Indicative Value | | $2.33 - $3.75 | | |
| | | Common Stock | | | | | | | | | | | | |
| | | NII Holdings, Inc. | | | 72,063 | | | Broker Quote | | Indicative Value | | $0.30 | | |
| | | Pershing Tontine Holdings, Ltd. | | | 46,979 | | | Broker Quote | | Indicative Value | | $0.10 | | |
| | | Rights | | | | | | | | | | | | |
| | | ABIOMED, Inc. - CVR | | | 38,300 | | | Broker Quote | | Indicative Value | | $1.75 | | |
| | | Resolute Forest Products, Inc. - CVR | | | 38,300 | | | Broker Quote | | Indicative Value | | $2.00 | | |
| | | | | Total Fair Value Securities | | $ | 5,947,904 | | | | | | | | | |
b. Foreign Currency Translations – The accounting records of the Funds are maintained in U.S. dollars. Investment securities and other assets and liabilities denominated in a foreign currency, and income receipts and expense payments, are translated into U.S. dollars using the prevailing exchange rates at the London market close. Purchases and sales of securities are translated into U.S. dollars at the contractual currency rates established at the approximate time of the trade.
Net realized gains and losses on foreign currency transactions represent net gains and losses from currency realized between the trade and settlement dates on securities transactions and the difference between income accrued versus income received and are included with the net realized and unrealized gain or loss on investment securities. The effects of changes in foreign currency exchange rates on investments in securities are included with the net realized and unrealized gain or loss on investment securities.
c. Forward Foreign Currency Exchange Contracts – As foreign securities are purchased, a Fund generally enters into forward foreign currency exchange contracts in order to hedge against foreign currency exchange rate risks. The market value of the contract fluctuates with changes in currency exchange rates. The contract is marked-to-market daily and the change in market value is recorded by a Fund as an unrealized gain or loss. As foreign securities are sold, a portion of the contract is generally closed and the Fund records a realized gain or loss equal to the difference between the value of the contract at the time it was opened and the value at the time it was closed. A Fund may also enter into forward foreign currency exchange contracts as an investment strategy consistent with that Fund’s investment objective. Realized gains and losses from contract transactions are included as a component of net realized gains (losses) from investments and forward foreign currency exchange contracts in the Statements of Operations.
| NOTES TO FINANCIAL STATEMENTS (Unaudited) |
| April 30, 2023 (Continued) |
d. Options – Dynamic Macro and Monthly Distribution are subject to stock market risk in the normal course of pursuing their investment objectives and may purchase or sell options to help hedge against this risk.
A Fund may write call options only if it (i) owns an offsetting position in the underlying security or (ii) has an absolute or immediate right to acquire that security without additional cash consideration or exchange of other securities held in its portfolio. When a Fund writes an option, there is no taxable event and an amount equal to the premium received is recorded by that Fund as a liability. The liability is thereafter valued to reflect the current value of the option. If the option is not exercised and expires, or if a Fund effects a closing purchase transaction, the Fund realizes a gain (or loss in the case of a closing purchase transaction where the cost to close the transaction exceeds the original premium received), and the liability related to the option is extinguished. Any such gain or loss generally is a short -term capital gain or loss for federal income tax purposes. If a call option that a Fund has written on any equity security is exercised, that Fund will realize a capital gain or loss (long-term or short-term, depending on the holding period of the underlying security) from the sale of the underlying security, and the proceeds from such sale are increased by the premium originally received. If a put option that a Fund has written on an equity security is exercised, the amount of the premium originally received reduces the cost of the security that a Fund purchases upon exercise of the option. When a Fund writes a put option, that Fund must deposit cash or liquid securities into a segregated account equal to the put option’s exercise value (number of shares times strike price).
A Fund may purchase put and call options. Put options are purchased to hedge against a decline in the value of securities held in that Fund’s portfolio. If such a decline occurs, the put options will permit that Fund to sell the securities underlying such options at the exercise price, or to close out the options at a profit. The premium paid for a put or call option plus any transaction costs will reduce the benefit, if any, realized by that Fund upon exercise of the option, and, unless the price of the underlying security rises or declines sufficiently, the option may expire worthless to that Fund. In addition, in the event that the price of the security in connection with which an option was purchased moves in a direction favorable to that Fund, the benefits realized by that Fund as a result of such favorable movement will be reduced by the amount of the premium paid for the option and related transaction costs. Written and purchased options are non-income producing securities.
e. Cash – The Funds consider their investments in an FDIC insured interest bearing savings account to be cash. The Funds may maintain cash balances, which, at times, may exceed federally insured limits. The Funds maintain these balances with a high quality financial institution.
f. Swap Agreements – International Opportunity Bond, Long/Short Credit and Monthly Distribution may enter into interest rate, index, total return, credit default and currency exchange rate swap agreements in attempts to obtain a particular desired return at a lower cost to the Fund than if the Fund has invested directly in an instrument that yielded that desired return. These are two-party contracts entered into primarily to exchange the returns (or differentials in rates of returns) earned or realized on particular pre-determined investments or instruments. The gross returns to be exchanged or “swapped” between parties are calculated with respect to a notional amount, i.e., the return on or increase in value of a particular dollar amount invested at a particular interest rate, in a particular foreign currency, or in a “basket” of securities representing a particular index or market segment. Changes in the value of swap agreements are recognized as unrealized gains or losses in the Statements of Operations by “marking to market” on a daily basis to reflect the value of the swap agreement at the end of each trading day. Payments received or paid at the beginning of the agreement are reflected as such on the Statements of Assets and Liabilities and may be referred to as upfront payments. The Funds amortize upfront payments and/or accrue for the fixed payment stream on swap agreements on a daily basis with the net amount recorded as a component of unrealized gain or loss on the Statements of Operations. A liquidation payment received or made at the termination of the swap agreement is recorded as a realized gain or loss on the Statements of Operations. The Funds segregate liquid securities having a value at least equal to the amount of its current obligation under any swap transaction.
g. Swaps Risk. The Fund may use swaps to enhance returns and manage risk. The Fund’s use of swaps involves risks different from, or possibly greater than, the risks associated with investing directly in securities and other traditional investments. These risks include (i) the risk that the counterparty to a derivative transaction may not fulfill its contractual obligations; (ii) risk of mispricing or improper valuation; and (iii) the risk that changes in the value of the derivative may not correlate perfectly with the underlying asset, rate or index. Derivative prices are highly volatile and may fluctuate substantially during a short period of time. Such prices are influenced by numerous factors that affect the markets, including, but not limited to: changing supply and demand relationships; government programs and policies; national and international political and economic events, changes in interest rates, inflation and deflation and changes in supply and demand relationships. Trading derivative instruments involves risks different from, or possibly greater than, the risks associated with investing directly in securities. Derivative contracts ordinarily have leverage inherent in their terms. The low margin deposits normally required in trading derivatives, including futures contracts, permit a high degree of leverage. Accordingly, a relatively small price movement may result in an immediate and substantial loss to the Fund. The use of leverage may also cause the Fund to liquidate portfolio positions when it would not be advantageous to do so in order to satisfy its obligations or to meet collateral segregation requirements. The use of leveraged derivatives can magnify the Fund’s potential for loss and, therefore, amplify the effects of market volatility on the Fund’s share price.
h. Futures Contracts – International Opportunity Bond, Dynamic Macro, and Long/Short Credit are subject to equity risk, interest rate risk and forward currency exchange rate risk in the normal course of pursuing their investment objectives. The Funds may purchase or sell futures contracts to gain exposure to, or hedge against, changes in the value of equities, interest rates, and foreign exchange rates. Initial margin deposits required upon entering into futures contracts are satisfied by the segregation of specific securities
| NOTES TO FINANCIAL STATEMENTS (Unaudited) |
| April 30, 2023 (Continued) |
or cash as collateral for the account of the broker (the Fund’s agent in acquiring the futures position). During the period the futures contracts are open, changes in the value of the contracts are recognized as unrealized gains or losses by “marking to market” on a daily basis to reflect the market value of the contracts at the end of each day’s trading. Variation margin payments are received or made depending upon whether unrealized gains or losses are incurred. When the contracts are closed, the Funds recognize a realized gain or loss equal to the difference between the proceeds from, or cost of, the closing transaction and the Fund’s basis in the contract. If the Funds were unable to liquidate a futures contract and/or enter into an offsetting closing transaction, the Funds would continue to be subject to market risk with respect to the value of the contracts and continue to be required to maintain the margin deposits on the futures contracts. The Funds segregate cash having a value at least equal to the amount of the current obligation under any open futures contract. Risks may exceed amounts recognized in the Statements of Assets and Liabilities. With futures, there is minimal counterparty credit risk to the Funds since futures are exchange traded and the exchange’s clearinghouse, as counterparty to all exchange traded futures, guarantees the futures against default.
i. Short Sales – The Funds may sell a security that it does not own in anticipation of a decline in the fair value of that security. When the Company sells a security short, it must borrow the security sold short and deliver it to the broker-dealer through which it made the short sale. A gain, limited to the price at which the Company sold the security short, or a loss, unlimited in size, will be recognized upon the termination of a short sale. The Company is also subject to the risk that it may be unable to reacquire a security to terminate a short position except at a price substantially in excess of the last quoted price. The Company’s borrowing agreements with broker-dealers are not subject to master netting or similar agreements or collateral agreements.
j. Impact of Derivatives on the Statements of Assets and Liabilities and Statements of Operations – The following is a summary of the location of derivative investments of each Fund in the Statement of Assets and Liabilities as of April 30, 2023:
| Location on the Statements of Assets and Liabilities |
| Derivatives Investment Type | | Asset Derivatives | | Liability Derivatives |
| Equity/Currency/Commodity | | Investments in securities | | Option contracts written |
| Interest rate contracts | | Unrealized appreciation on futures | | Unrealized depreciation on futures |
| | | Unrealized appreciation on swap contracts | | Unrealized depreciation on swap contracts |
| | | Unrealized appreciation on forward foreign currency exchange contracts | | Unrealized depreciation on forward foreign currency exchange contracts |
The following table sets forth the fair value of each Fund’s derivative contracts by primary risk exposure as of April 30, 2023:
| Asset Derivatives Investment Value |
| | | Equity | | | Currency | | | Interest Rate | | | Total at | |
| | | Contracts | | | Contracts | | | Contracts | | | April 30, 2023 | |
| International Opportunity Bond | | | | | | | | | | | | | | | | |
| Forward Foreign Currency Exchange Contracts | | $ | — | | | $ | 53,626 | | | $ | — | | | $ | 53,626 | |
| Futures Contracts | | | — | | | | — | | | | 323,497 | | | | 323,497 | |
| Swap Contracts | | | — | | | | — | | | | 164,401 | | | | 164,401 | |
| Dynamic Macro | | | | | | | | | | | | | | | | |
| Futures Contracts | | $ | 704,752 | | | $ | — | | | $ | — | | | $ | 704,752 | |
| Forward Foreign Currency Exchange Contracts | | | — | | | | 17,491 | | | | — | | | | 17,491 | |
| Long/Short Credit | | | | | | | | | | | | | | | | |
| Credit Default Swap Contracts | | $ | — | | | $ | — | | | $ | 59,060 | | | $ | 59,060 | |
| Monthly Distribution | | | | | | | | | | | | | | | | |
| Forward Foreign Currency Exchange Contracts | | $ | — | | | $ | 221,899 | | | $ | — | | | $ | 221,899 | |
| NOTES TO FINANCIAL STATEMENTS (Unaudited) |
| April 30, 2023 (Continued) |
| Liability Derivatives Investment Value |
| | | Equity | | | Currency | | | Interest Rate | | | Total at | |
| | | Contracts | | | Contracts | | | Contracts | | | April 30, 2023 | |
| International Opportunity Bond | | | | | | | | | | | | | | | | |
| Forward Foreign Currency Exchange Contracts | | $ | — | | | $ | 130,351 | | | $ | — | | | $ | 130,351 | |
| Futures Contracts | | | — | | | | — | | | | 242,313 | | | | 242,313 | |
| Dynamic Macro | | | | | | | | | | | | | | | | |
| Forward Foreign Currency Contracts | | $ | — | | | $ | 197,037 | | | $ | — | | | $ | 197,037 | |
| Futures Contracts | | | — | | | | — | | | | 8,126 | | | | 8,126 | |
| Long/Short Credit | | | | | | | | | | | | | | | | |
| Total Return Swap Contracts | | $ | 558,565 | | | $ | — | | | $ | — | | | $ | 558,565 | |
| Futures Contracts | | | — | | | | — | | | | 1,329,345 | | | | 1,329,345 | |
| Credit Default Swap Contracts | | | — | | | | — | | | | 733,305 | | | | 733,305 | |
| Monthly Distribution | | | | | | | | | | | | | | | | |
| Forward Foreign Currency Exchange Contracts | | $ | — | | | $ | 88,469 | | | $ | — | | | $ | 88,469 | |
| Written Options | | | 1,657,291 | | | | — | | | | — | | | | 1,657,291 | |
The following is a summary of the location of derivative investments of each Fund in the Statements of Operations for the six months ended April 30, 2023.
| Derivative Investment Type | | Location of Gain (Loss) on Derivatives |
| Equity/Currency/Commodity/Interest rate contracts | | Net realized gain (loss) from: Futures, Purchased options, Written options, Swap contracts, Forward foreign currency exchange contracts |
| | | |
| | | Net change in unrealized appreciation (depreciation) on: Futures, Purchased options, Written options, Swap contracts, and Forward foreign currency exchange contracts |
The following is a summary of each Fund’s realized gain (loss) and change in unrealized appreciation (depreciation) on derivative investments recognized in the Statements of Operations categorized by primary risk exposure for the six months ended April 30, 2023:
| Realized gain (loss) on derivatives recognized in the Statements of Operations |
| | | Equity | | | Currency | | | Interest Rate | | | Total at | |
| Derivative Investment type | | Contracts | | | Contracts | | | Contracts | | | April 30, 2023 | |
| International Opportunity Bond | | | | | | | | | | | | | | | | |
| Futures Contracts | | $ | — | | | $ | — | | | $ | (183,700 | ) | | $ | (183,700 | ) |
| Forward Foreign Currency Exchange Contracts | | | — | | | | (1,109,096 | ) | | | — | | | | (1,109,096 | ) |
| Swap Contracts | | | — | | | | — | | | | 1,398 | | | | 1,398 | |
| Dynamic Macro | | | | | | | | | | | | | | | | |
| Forward Foreign Currency Contracts | | $ | — | | | $ | 4,725 | | | $ | — | | | $ | 4,725 | | |
| Futures Contracts | | | 266,597 | | | | — | | | | (226,755 | ) | | | 39,842 | |
| Purchased Options | | | (7,611 | ) | | | — | | | | (177,656 | ) | | | (185,267 | ) |
| Long/Short Credit | | | | | | | | | | | | | | | | |
| Futures Contracts | | $ | — | | | $ | — | | | $ | 3,027,939 | | | $ | 3,027,939 | |
| Credit Default Swap Contracts | | | — | | | | — | | | | (1,524,884 | ) | | | (1,524,884 | ) |
| Total Return Swap Contracts | | | 158,834 | | | | — | | | | — | | | | 158,834 | |
| Monthly Distribution | | | | | | | | | | | | | | | | |
| Forward Foreign Currency Exchange Contracts | | $ | — | | | $ | 431,066 | | | $ | — | | | $ | 431,066 | |
| Purchased Options | | | (22,856 | ) | | | — | | | | — | | | | (22,856 | ) |
| Written Options | | | 694,251 | | | | — | | | | — | | | | 694,251 | |
| NOTES TO FINANCIAL STATEMENTS (Unaudited) |
| April 30, 2023 (Continued) |
| Changes in unrealized appreciation (depreciation) on derivatives recognized in the Statements of Operations |
| | | Equity | | | Currency | | | Interest Rate | | | Total at April | |
| Derivative Investment type | | Contracts | | | Contracts | | | Contracts | | | 30, 2023 | |
| International Opportunity Bond | | | | | | | | | | | | | | | | |
| Futures Contracts | | $ | — | | | $ | — | | | $ | 138,480 | | | $ | 138,480 | |
| Swap Contracts | | | — | | | | — | | | | (7,544 | ) | | | (7,544 | ) |
| Forward Foreign Currency Exchange Contracts | | | — | | | | (125,019 | ) | | | — | | | | (125,019 | ) |
| Dynamic Macro | | | | | | | | | | | | | | | | |
| Forward Foreign Currency Contracts | | $ | — | | | $ | (179,546 | ) | | $ | — | | | $ | (179,546 | ) |
| Futures Contracts | | | 749,432 | | | | — | | | | 5,271 | | | | 754,703 | |
| Purchased Options | | | (64,987 | ) | | | — | | | | 419,453 | | | | 354,466 | |
| Long/Short Credit | | | | | | | | | | | | | | | | |
| Futures Contracts | | $ | — | | | $ | — | | | $ | (511,598 | ) | | $ | (511,598 | ) |
| Credit Default Swap Contracts | | | — | | | | — | | | | 243,361 | | | | 243,361 | |
| Total Return Swap Contracts | | | (508,332 | ) | | | — | | | | — | | | | (508,332 | ) |
| Monthly Distribution | | | | | | | | | | | | | | | | |
| Forward Foreign Currency Exchange Contracts | | $ | — | | | $ | (463,666 | ) | | $ | — | | | $ | (463,666 | ) |
| Purchased Options | | | 6,356 | | | | — | | | | — | | | | 6,356 | |
| Written Options | | | 446,119 | | | | — | | | | — | | | | 446,119 | |
The average notional value of the derivative instruments for the six months ended April 30, 2023 is disclosed below:
| | | Average Notional Value | |
| | | Long | | | Short | | | Written | | | Total Return | | | Credit Default | | | Credit Default | |
| | | Futures | | | Futures | | | Options | | | Swaps - Long | | | Swaps - Long | | | Swaps - Short | |
| International Opportunity Bond | | $ | 14,246,899 | | | $ | 10,168,958 | | | $ | — | | | $ | — | | | $ | 3,475,000 | | | $ | — | |
| Dynamic Macro | | | 11,841,830 | | | | 286,489 | | | | — | | | | — | | | | — | | | | — | |
| Long/Short Credit | | | — | | | | 41,232,237 | | | | — | | | | 14,000,000 | | | | 71,300,000 | | | | 7,000,000 | |
| Monthly Distribution | | | — | | | | — | | | | 21,638,242 | | | | — | | | | — | | | | — | |
| NOTES TO FINANCIAL STATEMENTS (Unaudited) |
| April 30, 2023 (Continued) |
k. Offsetting of Financial Assets & Liabilities and Derivative Assets & Liabilities – International Opportunity Bond, Dynamic Macro, Long/Short Credit, and Monthly Distribution policies are to recognize a gross asset or liability equal to the unrealized amounts on futures contracts, forward foreign currency exchange contracts, swaps and written options. The following table shows additional information regarding the offsetting of assets and liabilities at April 30, 2023.
| International Opportunity Bond | |
| | | | | | | | | | | | | | Gross Amounts Not Offset in the | | | | |
| | | | | | | | | | | | | | Statements of Assets & | | | | |
| Assets: | | | | | | | | | | | | | Liabilities | | | | |
| | | | | | | | Amounts | | | | | | | | | | | | | |
| | | | | Gross | | | Offset in the | | | Net Amounts of | | | | | | | | | | |
| | | | | Amounts of | | | Statements of | | | Assets Presented in | | | | | | Cash | | | | |
| | | | | Recognized | | | Assets & | | | the Statements of | | | Financial | | | Collateral | | | | |
| Description | | Counterparty | | Assets | | | Liabilities | | | Assets & Liabilities | | | Instruments | | | Received | | | Net Amount | |
| Futures | | Barclays | | $ | 323,497 | | | $ | — | | | $ | 323,497 | | | $ | (323,497 | ) | | $ | — | | | $ | — | |
| Forward Foreign Currency Exchange Contracts | | Barclays | | | 6,552 | | | | — | | | | 6,552 | | | | (6,552 | ) | | | — | | | | — | |
| | | Capstone Global Markets | | | 36,211 | | | | — | | | | 36,211 | | | | (36,211 | ) | | | — | | | | — | |
| | | JP Morgan Chase | | | 5,306 | | | | — | | | | 5,306 | | | | (5,306 | ) | | | — | | | | — | |
| Total | | | | $ | 371,566 | | | $ | — | | | $ | 371,566 | | | $ | (371,566 | ) | | $ | — | | | $ | — | |
| | | | | | | | | | | | | | | | | | | | | | | | | | | |
| | | | | | | | | | | | | | Gross Amounts Not Offset in the | | | | |
| | | | | | | | | | | | | | Statements of Assets & | | | | |
| Liabilities: | | | | | | | | | | | | | Liabilities | | | | |
| | | | | | | | Gross | | | | | | | | | | | | | |
| | | | | | | | Amounts | | | | | | | | | | | | | |
| | | | | Gross | | | Offset in the | | | Net Amounts of | | | | | | | | | | |
| | | | | Amounts of | | | Statements of | | | Liabilities Presented | | | | | | Cash | | | | |
| | | | | Recognized | | | Assets & | | | in the Statements of | | | Financial | | | Collateral | | | | |
| Description | | Counterparty | | Liabilities | | | Liabilities | | | Assets & Liabilities | | | Instruments (1) | | | Pledged | | | Net Amount | |
| Futures | | Barclays | | $ | (242,313 | ) | | $ | — | | | $ | (242,313 | ) | | $ | 242,313 | | | $ | — | | | $ | — | |
| Forward Foreign Currency Exchange Contracts | | Barclays | | | (105,993 | ) | | | — | | | | (105,993 | ) | | | 105,993 | | | | — | | | | — | |
| | | Citigroup Capital Markets | | | (8,979 | ) | | | — | | | | (8,979 | ) | | | 8,979 | | | | — | | | | — | |
| | | JP Morgan Chase | | | (9,822 | ) | | | — | | | | (9,822 | ) | | | 9,822 | | | | — | | | | — | |
| Total | | | | $ | (367,107 | ) | | $ | — | | | $ | (367,107 | ) | | $ | 367,107 | | | $ | — | | | $ | — | |
| | | | | | | | | | | | | | | | | | | | | | | | | | | |
| (1) | The amount is limited to the derivative liability balance and accordingly, does not include excess collateral pledged. |
| Dynamic Macro |
| | | | | | | | | | | | | | Gross Amounts Not Offset in the | | | | |
| | | | | | | | | | | | | | Statements of Assets & | | | | |
| Assets: | | | | | | | | | | | | | Liabilities | | | | |
| | | | | Gross | | | Gross Amounts | | | Net Amounts of | | | | | | | | | | |
| | | | | Amounts of | | | Offset in the | | | Assets Presented in | | | | | | Cash | | | | |
| | | | | Recognized | | | Statements of | | | the Statements of | | | Financial | | | Collateral | | | | |
| Description | | Counterparty | | Assets | | | Assets & Liabilities | | | Assets & Liabilities | | | Instruments | | | Received | | | Net Amount | |
| Futures | | Goldman Sachs | | $ | 704,752 | | | $ | — | | | $ | 704,752 | | | $ | (704,752 | ) | | $ | — | | | $ | — | |
| Forward Foreign Exchange contracts | | US Bank | | $ | 17,491 | | | $ | — | | | $ | 17,491 | | | $ | (17,491 | ) | | | | | | | | |
| Total | | | | $ | 704,752 | | | $ | — | | | $ | 704,752 | | | $ | (704,752 | ) | | $ | — | | | $ | — | |
| | | | | | | | | | | | | | | | | | | | | | | | | | | |
| | | | | | | | | | | | | | Gross Amounts Not Offset in the | | | | |
| Liabilities: | | | | | | | | | | | | | Statements of Assets & Liabilities | | | | |
| | | | | Gross | | | Gross Amounts | | | Net Amounts of | | | | | | | | | | |
| | | | | Amounts of | | | Offset in the | | | Liabilities Presented | | | | | | Cash | | | | |
| | | | | Recognized | | | Statements of | | | in the Statements of | | | Financial | | | Collateral | | | | |
| Description | | Counterparty | | Liabilities | | | Assets & Liabilities | | | Assets & Liabilities | | | Instruments (1) | | | Pledged | | | Net Amount | |
| Futures | | Goldman Sachs | | $ | (8,126 | ) | | $ | — | | | $ | (8,126 | ) | | $ | 8,126 | | | $ | — | | | $ | — | |
| Forward Foreign Exchange Contracts | | US Bank | | | (197,037 | ) | | | — | | | | (197,037 | ) | | | 197,037 | | | | — | | | | — | |
| Total | | | | $ | (205,163 | ) | | $ | — | | | $ | (205,163 | ) | | $ | 205,163 | | | $ | — | | | $ | — | |
| | | | | | | | | | | | | | | | | | | | | | | | | | | |
| (1) | The amount is limited to the derivative liability balance and accordingly, does not include excess collateral pledged. |
| NOTES TO FINANCIAL STATEMENTS (Unaudited) |
| April 30, 2023 (Continued) |
| Long/Short Credit |
| | | | | | | | | | | | | | | | | | | | | |
| | | | | | | | | | | | | | Gross Amounts Not Offset in the | | | | |
| Assets: | | | | | | | | | | | | | Statements of Assets & Liabilities | | | | |
| | | | | | | | Gross Amounts | | | Net Amounts of | | | | | | | | | | |
| | | | | Gross Amounts of | | | Offset in the | | | Assets Presented in | | | | | | | | | | |
| | | | | Recognized | | | Statements of | | | the Statements of | | | Financial | | | Cash Collateral | | | | |
| Description | | Counterparty | | Assets | | | Assets & Liabilities | | | Assets & Liabilities | | | Instruments | | | Received | | | Net Amount | |
| Credit Default Swaps | | Barclays | | $ | 27,344 | | | $ | — | | | $ | 27,344 | | | $ | — | | | $ | — | | | $ | 27,344 | |
| Credit Default Swaps | | Goldman Sachs | | | 31,716 | | | | — | | | | 31,716 | | | | — | | | | — | | | | 31,716 | |
| Total | | | | $ | 59,060 | | | $ | — | | | $ | 59,060 | | | $ | — | | | $ | — | | | $ | 59,060 | |
| | | | | | | | | | | | | | | | | | | | | | | | | | | |
| | | | | | | | | | | | | | Gross Amounts Not Offset in the | | | | |
| Liabilities: | | | | | | | | | | | | | Statements of Assets & Liabilities | | | | |
| | | | | | | | Gross Amounts | | | Net Amounts of | | | | | | | | | | |
| | | | | Gross Amounts of | | | Offset in the | | | Liabilities Presented | | | | | | | | | | |
| | | | | Recognized | | | Statements of | | | in the Statements of | | | Financial | | | Cash Collateral | | | | |
| Description | | Counterparty | | Liabilities | | | Assets & Liabilities | | | Assets & Liabilities | | | Instruments (1) | | | Pledged(1) | | | Net Amount | |
| Futures Contracts | | HSBC | | $ | 1,329,345 | | | $ | — | | | $ | 1,329,345 | | | $ | — | | | $ | — | | | $ | 1,329,345 | |
| Credit Default Swaps | | Barclays | | | (284,295 | ) | | | — | | | | (284,295 | ) | | | — | | | | — | | | | (284,295 | ) |
| Credit Default Swaps | | HSBC | | | (444,845 | ) | | | — | | | | (444,845 | ) | | | — | | | | 444,845 | | | | — | |
| Credit Default Swaps | | JP Morgan | | | (4,165 | ) | | | — | | | | (4,165 | ) | | | — | | | | 4,165 | | | | — | |
| Total Return Swap | | Barclays | | | (558,565 | ) | | | — | | | | (558,565 | ) | | | — | | | | — | | | | (558,565 | ) |
| Total | | | | $ | 37,475 | | | $ | — | | | $ | 37,475 | | | $ | — | | | $ | 449,010 | | | $ | 486,485 | |
| | | | | | | | | | | | | | | | | | | | | | | | | | | |
| (1) | The amount is limited to the derivative liability balance and accordingly, does not include excess collateral pledged. |
| Monthly Distribution Fund |
| | | | | | | | | | | | | | Gross Amounts Not Offset in the | | | | |
| Assets: | | | | | | | | | | | | | Statements of Assets & Liabilities | | | | |
| | | | | | | | Gross | | | | | | | | | | | | | |
| | | | | | | | Amounts | | | | | | | | | | | | | |
| | | | | Gross | | | Offset in the | | | Net Amounts of | | | | | | | | | | |
| | | | | Amounts of | | | Statements of | | | Assets Presented in | | | | | | Cash | | | | |
| | | | | Recognized | | | Assets & | | | the Statements of | | | Financial | | | Collateral | | | | |
| Description | | Counterparty | | Assets | | | Liabilities | | | Assets & Liabilities | | | Instruments | | | Received | | | Net Amount | |
| Forward Foreign Currency Exchange Contracts | | US Bank | | $ | 221,899 | | | $ | — | | | $ | 221,899 | | | $ | (88,469 | ) | | $ | — | | | $ | 133,430 | |
| Total | | | | $ | 221,899 | | | $ | — | | | $ | 221,899 | | | $ | (88,469 | ) | | $ | — | | | $ | 133,430 | |
| | | | | | | | | | | | | | | | | | | | | | | | | | | |
| | | | | | | | | | | | | | Gross Amounts Not Offset in the | | | | |
| Liabilities: | | | | | | | | | | | | | Statements of Assets & Liabilities | | | | |
| | | | | | | | Gross | | | | | | | | | | | | | |
| | | | | Gross | | | Amounts | | | Net Amounts of | | | | | | | | | | |
| | | | | Amounts of | | | Offset in the | | | Liabilities Presented | | | | | | Cash | | | | |
| | | | | Recognized | | | Statements of | | | in the Statements of | | | Financial | | | Collateral | | | | |
| Description | | Counterparty | | Liabilities | | | Assets & | | | Assets & Liabilities | | | Instruments (1) | | | Pledged | | | Net Amount | |
| Forward Foreign Currency Exchange Contracts | | US Bank | | $ | (88,469 | ) | | $ | — | | | $ | (88,469 | ) | | $ | 88,469 | | | $ | — | | | $ | — | |
| Written Options | | US Bank | | | (1,657,291 | ) | | | — | | | | (1,657,291 | ) | | | 1,657,291 | | | | — | | | | — | |
| Total | | | | $ | (1,745,760 | ) | | $ | — | | | $ | (1,745,760 | ) | | $ | 1,745,760 | | | $ | — | | | $ | — | |
| | | | | | | | | | | | | | | | | | | | | | | | | | | |
| (1) | The amount is limited to the derivative liability balance and accordingly, does not include excess collateral pledged. |
| NOTES TO FINANCIAL STATEMENTS (Unaudited) |
| April 30, 2023 (Continued) |
l. Deposits with Broker for Futures, Options and Swaps
| Fund | | Derivative Type | | Broker | | Deposit with Broker | |
| International Opportunity Bond | | Futures | | Barclays | | $ | 179,782 | |
| Dynamic Macro | | Future Options Purchased | | Goldman Sachs | | | 940,282 | |
| Long/Short Credit | | Futures | | HSBC | | | 1,032,118 | |
| | | Swaps | | HSBC | | | 788,210 | |
| | | Swaps | | JP Morgan | | | 163,834 | |
| Monthly Distribution | | Written Options | | Morgan Stanley | | | 3,200,000 | |
| Monthly Distribution | | Securities Sold Short | | JP Morgan | | | 3,207,628 | |
m. Exchanged Traded Funds – The Funds may invest in ETFs. ETFs are a type of index fund bought and sold on a securities exchange. An ETF trades like common stock and represents a fixed portfolio of securities. A Fund may purchase an ETF to temporarily gain exposure to a portion of the U.S. or a foreign market while awaiting purchase of underlying securities. The risks of owning an ETF generally reflect the risks of owning the underlying securities they are designed to track, although the lack of liquidity on an ETF could result in it being more volatile. Additionally, ETFs have fees and expenses that reduce their value.
n. Investment Transactions, Investment Income and Expenses – Investment transactions are recorded on a trade date basis. Realized gains and losses from investment transactions and foreign exchange transactions are calculated using the identified cost method. Dividend income less foreign tax withholding (if any), and expense is recorded on the ex-dividend date (“ex-date”) except in the case of certain dividends from foreign securities, which are recorded as soon after the ex-date that the respective Fund, using reasonable diligence, becomes aware of such dividends and foreign tax withholding (If any). Interest income is recorded on an accrual basis. Discounts are accreted and premiums are amortized as adjustments to interest income and the identified cost of investments. Expenses of the Trust that are directly identifiable to a specific Fund are charged to that Fund. Expenses, which are not readily identifiable to a specific Fund, are allocated in such a manner as deemed equitable, taking into consideration the nature and type of expense and the relative sizes of the Funds. Each Fund’s income, expenses (other than the class specific distribution fees) and realized and unrealized gains and losses are allocated proportionally each day between the classes based upon the relative net assets of each class. The Fund recharacterizes distributions received from REIT investments based on information provided by the REIT into the following categories: ordinary income, long -term capital gains, and return of capital. If information is not available on a timely basis from the REIT, the recharacterization will be estimated based on available information which may include the previous year’s allocation. If new or additional information becomes available from the REIT at a later date, a recharacterization will be made in the following year. Dividends, less foreign tax withholding (if any), are recorded on the ex-dividend date.
o. Foreign Capital Gains Taxes — Foreign Capital Gains taxes are generally based on either income or gains earned or repatriated cash. Foreign Capital Gains tax is provided in accordance with the Funds’ understanding of applicable country’s tax using a tax service in that country. Each Fund accrues and applies such taxes to net investment income, net realized gains and net unrealized gains as income and/or capital gains earned. The Trust is monitoring and recording accrued foreign capital gains tax on appreciated securities of $666,583 as of April 30, 2023, on Emerging Markets as shown on the Statement of Assets and Liabilities. For the six months ended April 30, 2023, Emerging Markets recorded net change in unrealized depreciation on Accrued Foreign Capital Gains Tax on Appreciated Securities of $148,980 as shown on the Statement of Operations.
p. Foreign Tax Reclaims —The Funds are subject to foreign withholding tax imposed by certain foreign countries in which the Funds may invest. Withholding taxes are incurred on certain foreign dividends and are accrued at the time the dividend is recognized based on applicable foreign tax laws. The Funds may file withholding tax refunds in certain jurisdictions to recover a portion of amounts previously withheld. The Funds will record a receivable for such tax refunds based on several factors including; an assessment of a jurisdiction’s legal obligation to pay reclaims, administrative practices and payment history.
q. Concentration of Risk – Investing in securities of foreign issuers and currency transactions may involve certain considerations and risks not typically associated with investments in the United States. These risks include revaluation of currencies, adverse fluctuations in foreign currency values and possible adverse political, social and economic developments, including those particular to a specific industry, country or region. These conditions could cause the securities and their markets to be less liquid and prices more volatile than those of comparable U.S. companies and U.S. government securities.
Small capitalization (“small cap”) companies may be more vulnerable than larger capitalization companies to adverse business or economic developments. Small cap companies may also have limited product lines, markets or financial resources, and may be dependent on a relatively small management group. Securities of such companies may be less liquid and more volatile than securities of larger capitalization companies or the market averages in general and therefore may involve greater risk than investing in larger capitalization companies.
| NOTES TO FINANCIAL STATEMENTS (Unaudited) |
| April 30, 2023 (Continued) |
The ability of issuers of debt securities held by the Funds to meet their obligations may be affected by economic and political developments particular to a specific industry, country, state or region. Investments in lower grade debt securities are subject to special risks, including greater price volatility and a greater risk of loss of principal and interest.
Certain Funds may invest in collateralized mortgage obligations which are secured by groups of individual mortgages, but are similar to a conventional bond where the investor looks only to the issuer for payment of principal and interest. Although the obligations are recourse obligations to the issuer, the issuer typically has no significant assets, other than assets pledged as collateral for the obligations, and the market value of the collateral, which is sensitive to interest rate movements, may affect the market value of the obligations. A public market for a particular collateralized mortgage obligation may or may not develop and thus, there can be no guarantee of liquidity of an investment in such obligations.
The risk in writing a call option is that a Fund may forgo the opportunity of profit if the market value of the underlying security increases and the option is exercised, although any potential loss is reduced by the amount of option premium received. The risk in writing a put option is that a Fund may be called on to pay the exercise price of the option for a security that has decreased (potentially to zero) in market price, although any potential loss is reduced by the amount of option premium received. Generally, option transactions also involve risks concerning liquidity of the options market. An illiquid market for an option may limit a Fund’s ability to write options or enter closing transactions. As the options written by the Funds are traded on a national exchange, counterparty and credit risk are limited to the failure of the exchange on which the options are traded.
r. LIBOR Risk – The Funds may invest in securities and other instruments whose interest payments are determined by references to a market reference rate such as the London Interbank Offered Rate (“LIBOR”) or the Secured Overnight Financing Rate (“SOFR”). The United Kingdom Financial Conduct Authority, which regulates LIBOR, announced that after 2021 it will cease its active encouragement of banks to provide the quotations needed to sustain LIBOR. On March 5, 2021, ICE Benchmark Administration Limited, the administrator of LIBOR, announced its intention to cease publishing a majority of the USD LIBOR rates after publication on June 30, 2023, with the one week and two months USD LIBOR rates to cease after publication on December 31, 2021. The U.S. Federal Reserve, based on the recommendations of the Alternative Reference Rates Committee (comprised of major derivative market participants and their regulators), has begun publishing SOFR, a broad measure of secured overnight U.S. Treasury repo rates, that is intended to replace USD LIBOR. Proposals for alternative reference rates for other currencies have also been announced or have already begun publication. The unavailability of LIBOR presents risks to the Fund, including the risk that any pricing or adjustments to the Fund’s investments resulting from a substitute or alternate reference rate may adversely affect the Fund’s performance and/or NAV. It remains uncertain how such changes would be implemented and the effects such changes would have on the Fund, including any negative effects on the Fund’s liquidity and valuation of the Fund’s investments, issuers of instruments in which the Fund invests and financial markets generally.
s. Natural Disaster/Epidemic Risk – Natural or environmental disasters, such as earthquakes, fires, floods, hurricanes, tsunamis, and other severe weather-related phenomena generally, and widespread disease and illness, including pandemics and epidemics, have been and can be highly disruptive to economies and markets. They may adversely impact individual companies, sectors, industries, markets, currencies, interest and inflation rates, credit ratings, investor sentiment, and other factors affecting the value of the Funds’ investments. For example, the novel coronavirus (COVID -19), which was first detected in 2019, has resulted in, among other things, stressors to healthcare service infrastructure, country border closings, business and school closings, and disruptions to supply chains and customer activity. Natural disaster/epidemic risk could have a significant adverse impact on the Funds’ portfolio investments.
t. Emerging Markets Risk – Emerging market countries may have relatively unstable governments, weaker economies, and less -developed legal systems which do not protect securities holders. Emerging market economies may be based on only a few industries and security issuers may be more susceptible to economic weakness and more likely to default. Emerging market securities also tend to be less liquid.
u. Foreign Investing Risk – Investments in foreign countries are subject to currency risk and country-specific risks such as political, diplomatic, regional conflicts, terrorism, war, social and economic instability, and policies that have the effect of decreasing the value of foreign securities. Foreign countries may be subject to different trading settlement practices, less government supervision, less publicly available information, limited trading markets and greater volatility than U.S. investments.
v. Federal Income Taxes – It is each Fund’s policy to continue to comply with all sections of the Internal Revenue Code applicable to regulated investment companies and to distribute all of its taxable income and gains, if any, to its shareholders and therefore, no provision for federal income tax has been made. Each Fund is treated as a separate taxpayer for federal income tax purposes. The Funds recognize the tax benefits of uncertain tax positions only when the position is “more likely than not” to be sustained assuming examination by tax authorities. Management has reviewed the tax positions in the open tax years of 2020 to 2022 and expected to be taken in tax year 2023 and concluded that no liability for unrecognized tax benefits should be recorded related to uncertain tax positions taken in the above open tax years. The Funds identify their major tax jurisdiction as U.S. Federal and California. The Funds recognize interest and penalties, if any, related to unrecognized tax benefits as income tax expense in the Statements of Operations. During the year, the Funds did not incur any interest or penalties. Generally tax authorities can examine tax returns filed for the last three years.
| NOTES TO FINANCIAL STATEMENTS (Unaudited) |
| April 30, 2023 (Continued) |
w. Distributions to Shareholders – It is each Fund’s policy to distribute its respective net investment income and net capital gains, if any, annually except for Corporate/Government Bond, Floating Rate Bond, High-Yield Bond, International Opportunity Bond, Long/Short Credit, and Monthly Distribution which will distribute their respective net investment income, if any, monthly. Distributions of net investment income and net capital gains are determined in accordance with income tax regulations which may differ from GAAP. Differences in dividends from net investment income per share between the classes are due to service and distribution related expenses. Dividends and distributions to shareholders are recorded on ex-date. Monthly Distribution’s distribution policy is to make twelve monthly distributions to shareholders. The level of monthly distributions (including any return of capital) is not fixed but is expected to be at or near the level of the prime interest rate (“Prime Rate”). Additionally, Monthly Distribution’s distribution policy is not designed to generate, and is not expected to result in, distributions that equal a fixed percentage of Monthly Distribution’s current net asset value per share. Shareholders receiving periodic payments from Monthly Distribution may be under the impression that they are receiving net income. However, all or a portion of a distribution may consist of a return of capital. Shareholders should not assume that the source of a distribution from Monthly Distribution is net income.
x. Real Estate Investment Trusts – Real Estate Stock invests primarily in REITs. Distributions from REITs may be characterized as dividends, capital gains, and/or return of capital.
y. Indemnification – The Trust indemnifies its officers and Trustees for certain liabilities that may arise from the performance of their duties to the Trust. Additionally, in the normal course of business, each Fund enters into contracts that contain a variety of representations and warranties and which provide general indemnities. A Fund’s maximum exposure under these arrangements is unknown, as this would involve future claims that may be made against the Fund that have not yet occurred. However, based on experience, the Funds expect the risk of loss due to these warranties and indemnities to be remote.
| 3. | INVESTMENT ADVISORY FEES AND OTHER TRANSACTIONS WITH AFFILIATES |
| a. | Management Fees – Dunham & Associates serves as each Fund’s investment adviser. Pursuant to an investment advisory agreement with the Trust, on behalf of the Funds, Dunham & Associates, subject to the supervision of the Board and in conformity with the stated policies of the Funds, manages the operations of the Funds. The Adviser, subject to the review and approval of the Board, selects Sub-Advisers for each Fund and supervises and monitors the performance of each Sub-Adviser. As compensation for its services, each Fund pays the Adviser a fixed fee, accrued daily and paid monthly, based on each Fund’s respective average daily net assets. The Adviser has entered into a Sub-Advisory Agreement with each Sub-Adviser and the Trust, on behalf of each Fund. Under the Sub-Advisory Agreements, each Fund pays the Sub-Adviser a “Fulcrum Fee.” A Fulcrum Fee is a performance fee whereby the Sub-Adviser is rewarded when out-performing, or is penalized when under-performing, a Fund’s benchmark index. As a result of the Fulcrum Fee arrangement, the total annual management fee for a Fund will have a range as shown in the table below. |
| | | | | Adviser’s | | Sub-Adviser’s |
| | | Management Fee | | Portion | | Portion |
| Corporate/Government Bond | | 0.65% – 0.95% | | 0.50% | | 0.15% – 0.45% |
| Floating Rate Bond | | 0.78% – 0.98% | | 0.60% | | 0.18% – 0.38% |
| High-Yield Bond | | 0.82% – 1.02% | | 0.60% | | 0.22% – 0.42% |
| International Opportunity Bond | | 0.80% – 1.30% | | 0.60% | | 0.20% – 0.70% |
| Large Cap Value | | 0.75% – 1.15% | | 0.65% | | 0.10% – 0.50% |
| Small Cap Value | | 0.75% – 1.45% | | 0.65% | | 0.10% – 0.80% |
| Focused Large Cap Growth | | 0.85% – 1.15% | | 0.65% | | 0.20% – 0.50% |
| Small Cap Growth | | 0.65% – 1.65% | | 0.65% | | 0.00% – 1.00% |
| Emerging Markets Stock | | 0.70% – 1.50% | | 0.65% | | 0.05% – 0.85% |
| International Stock | | 0.95% – 1.65% | | 0.65% | | 0.30% – 1.00% |
| Dynamic Macro * | | 0.80% – 1.60% | | 0.65% | | 0.25% – 0.95% |
| Long/Short Credit | | 0.70% – 1.80% | | 0.65% | | 0.05% – 1.15% |
| Monthly Distribution | | 0.87% – 1.63% | | 0.65% | | 0.22% – 0.98% |
| Real Estate Stock | | 0.80% – 1.40% | | 0.65% | | 0.15% – 0.75% |
| * | Prior to January 31, 2023, the Sub-Adviser’s portion for Dynamic Macro was 0.40% – 1.10% and the Management fee range w as 1.05% to 1.75% |
Each Fund’s Sub-Advisory Fulcrum Fee is calculated daily using an annual base Sub-Advisory fee of a specified amount of the average daily net assets of the Fund (the “Base Fee”), adjusted by the Fund’s Class N share performance relative to the Fund’s benchmark (the “Performance Fee”). Depending on a Fund’s net performance versus its benchmark, the Sub-Adviser will receive a fee adjustment in accordance with a formula that equates a percentage of out- or under-performance to a percentage of fee increases or decreases, respectively. In addition, some Fulcrum Fees employ a “null zone” around the base fee, whereby small differences in performance versus the benchmark will not trigger a fee increase or decrease. During the first 12 months of the Fulcrum Fee arrangement, the Performance Fee is calculated daily from inception date of the agreement to the calculation date and is applied to the average daily net assets of the
| NOTES TO FINANCIAL STATEMENTS (Unaudited) |
| April 30, 2023 (Continued) |
Funds during the calculation period. After the initial 12 months, the Performance Fee is calculated on a daily basis based on comparative performance over a rolling 12-month period.
Depending on the particular Sub-Advisory Agreement, the Performance Fee can adjust the Base Fee up or down by as much as 100% of the Base Fee, such that the Sub-Advisory fee can vary anywhere from 0.00% (the “Minimum Fee”) to twice the Base Fee (the “Maximum Fee”). However, because each such Sub-Advisory Agreement requires that the Sub -Adviser only be paid out the monthly Minimum Fee during the first year, the Sub-Adviser, in most cases, will receive less compensation until the end of the first year. At the end of the first year of the agreement, the Sub-Adviser will be paid a lump sum that reflects the accrued Fulcrum Fee over the year, less any Minimum Fees paid out during the first year. Therefore, in the first year, the Fulcrum Fee methodology has three elements: 1) daily calculation of the Performance Fee and daily accrual of the Fulcrum Fee; 2) monthly payment of the Minimum Fee only (if any); and 3) a lump sum payment at the end of the initial 12-month period of the accrued Fulcrum Fee less the Minimum Fee.
By virtue of using average daily net assets over a “rolling” 12-month period for purposes of calculating the Performance Fee while using average daily net assets for the most recent month for purposes of calculating the Base Fee, the actual total Fulcrum Fee paid by the Fund to the Sub-Adviser may be higher or lower than the maximum or minimum annual rates described above if the average daily net assets do not remain constant during the rolling 12-month period. If the Fund is significantly underperforming versus the Index and the Fund’s net assets have declined significantly, the monthly total Fulcrum Fee can be a negative number (although the performance fee rate can never be negative, the Performance Fee can be negative). In such instances, if the negative Fulcrum Fee is not earned back or offset the following month, the Sub-Adviser must reimburse the Fund the amount of the negative Fulcrum Fee within an agreed upon time. Likewise, in the case where the Fund has significantly underperformed versus the Index but net assets have increased significantly, the monthly total Fulcrum Fee can be positive although the performance fee rate may be 0.00%. In such instances, the Fund will pay the Sub-Adviser the monthly Fulcrum Fee.
The table below lists the current Sub-Advisers along with their Fulcrum Fee arrangements.
| | | | | Null | Minimum | Maximum |
| Fund | Sub-Adviser | Benchmark | Base Fee | Zone | Fee | Fee |
| Corporate/Government Bond | Virtus Fixed Income Advisers, LLC | Bloomberg US Aggregate Bond Index | 0.30% | +/-0.15% | 0.15% | 0.45% |
| Floating Rate Bond | PineBridge Investments LLC | Morningstar/LSTA U.S. Leveraged Loan 100 Index | 0.28% | +/- 0.00% | 0.18% | 0.38% |
| High-Yield Bond | PineBridge Investments LLC | Bloomberg U.S. Corporate High Yield Bond Ba/B 2% Issuer Capped Index | 0.32% | +/- 0.00% | 0.22% | 0.42% |
| International Opportunity Bond | Virtus Fixed Income Advisers, LLC | Bloomberg Global ex US Aggregate Bond Index (Hedged) | 0.45% | +/- 0.00% | 0.20% | 0.70% |
| Large Cap Value * | Great Lakes Advisors, LLC. | Russell 1000 Value Index | 0.30% | +/- 0.00% | 0.10% | 0.50% |
| Small Cap Value | Ziegler Capital Management, LLC | Russell 2000 Value Index | 0.45% | +/- 0.00% | 0.10% | 0.80% |
| Focused Large Cap Growth | The Ithaka Group, LLC | Russell 1000 Growth Index | 0.35% | +/- 0.30% | 0.20% | 0.50% |
| Small Cap Growth | Pier Capital, LLC | Russell 2000 Growth Index | 0.50% | +/- 0.20% | 0.00% | 1.00% |
| Emerging Markets Stock | NS Partners Ltd. | MSCI Emerging Markets Index (Net) | 0.45% | +/- 0.00% | 0.05% | 0.85% |
| International Stock | Arrow street Capital L.P. | MSCI All Country World Index ex USA (Net) | 0.65% | +/- 0.20% | 0.30% | 1.00% |
| Dynamic Macro ** | Vontobel Asset Management, Inc. | Dow Jones Moderately Aggressive Portfolio Index | 0.60% | +/- 0.00% | 0.25% | 0.95% |
| Long/Short Credit | Metlife Investment Advisors, LLC | BofA Merrill Lynch US 3-month Treasury Bill Index PLUS 300 bps (3.00%) | 0.60% | +/- 0.00% | 0.05% | 1.15% |
| Monthly Distribution | Grantham, Mayo, Van Otterloo & Co., LLC | Credit Suisse Merger Arbitrage Liquid Index*** | 0.60% | +/- 0.00% | 0.22% | 0.98% |
| Real Estate Stock | American Assets Capital Advisers, LLC | Dow Jones U.S. Real Estate Total Return Index | 0.45% | +/- 0.00% | 0.15% | 0.75% |
| * | Effective April 3, 2023 Rothschild & Co. Asset Management US, Inc. was acquired by Great Lakes Advisors, LLC, a subsidiary of Wintrust Financial Corp. |
| ** | Effective February 1, 2023, Vontobel Asset Management, Inc. replaced Newton Investment Management North America, LLC as sub-adviser and the Funds Benchmark was changed to Dow Jones Moderately Aggressive Portfolio Index from IQ Hedge Global Macro Beta Index. Prior to January 31, 2023, Newton Investment Management North American, LLC had a Base Fee of 0.75%, a Minimum Fee of 0.40%, and a Maximum Fee of 1.10%. |
| *** | Effective March 1, 2023, the Benchmark Index of the Dunham Monthly Distribution Fund is the Credit Suisse Merger Arbitrage Liquid Index due to the discontinuation of the IQ Hedge Market Neutral Total Return Index in March 2023. |
| NOTES TO FINANCIAL STATEMENTS (Unaudited) |
| April 30, 2023 (Continued) |
b. Administration, Fund Accounting and Transfer Agency Fees – Gemini Fund Services, LLC (“GFS” or the “Administrator”) serves as the administrator, fund accountant and transfer agent for the Funds. For providing administration services, GFS receives from each Fund a monthly fee based on the combined average daily net assets at the following annual rates; 0.07% on the first $250 million of average net assets; 0.05% on average net assets between $250 million and $500 million; 0.03% on average net assets over $500 million; and 0.01% on average net assets over $1 billion. Such fees are subject to an annual minimum of $400,000 in total for the entire Trust. For providing fund accounting services, GFS receives from the Trust a minimum annual fee of $245,000. For providing transfer agent services, GFS receives from the Trust a minimum annual fee of $214,000 plus a per account charge for 75,000 or more accounts.
Blu Giant, LLC, (“Blu Giant”), an affiliate of GFS, provides EDGAR conversion and filing services as well as some print management services for the Funds on an ad-hoc basis. For the provision of these services, Blu Giant receives customary fees from the Funds. An individual from GFS serves as an officer for the Trust and receives no additional compensation from the Trust for serving in that role.
c. Distributor – The Distributor of the Funds is Dunham & Associates (the “Distributor”). The Funds have adopted an Amended and Restated Rule 12b-1 Plan (the “Plan”) in accordance with Rule 12b -1 under the 1940 Act for Class A and Class C shares. The Plan for Class A shares authorizes the Funds to pay distribution fees to the Distributor or other entities on a monthly basis at an annualized rate of up to 0.25% of the average daily net assets attributable to Class A shares. The Plan for Class C shares authorizes the Funds to pay distribution fees at the annualized rate of 0.75% for the equity Funds and 0.50% for the fixed income Funds and shareholder servicing fees at the annualized rate of 0.25% to the Distributor or other entities on a monthly basis based on the average daily net assets attributable to Class C shares. Class N shares do not pay distribution fees or shareholder servicing fees.
| | | Distributor Sales Charges | | | 12b-1 and Shareholder Service | |
| Fund | | Class A | | | Class A | | | Class C | |
| Corporate/Government Bond | | $ | 136 | | | $ | 13,838 | | | $ | 9,960 | |
| Floating Rate Bond | | | 446 | | | | 22,328 | | | | 23,407 | |
| High-Yield Bond | | | 6,490 | | | | 15,703 | | | | 14,137 | |
| International Opportunity Bond | | | 7 | | | | 7,181 | | | | 3,491 | |
| Large Cap Value | | | 21,049 | | | | 28,457 | | | | 19,183 | |
| Small Cap Value | | | 5,157 | | | | 9,337 | | | | 10,533 | |
| Focused Large Cap Growth | | | 49,538 | | | | 31,915 | | | | 36,225 | |
| Small Cap Growth | | | 25,559 | | | | 13,946 | | | | 10,377 | |
| Emerging Markets Stock | | | 137 | | | | 21,205 | | | | 10,710 | |
| International Stock | | | 234 | | | | 23,212 | | | | 20,371 | |
| Dynamic Macro | | | 71 | | | | 7,001 | | | | 4,617 | |
| Long/Short Credit | | | 8,421 | | | | 35,534 | | | | 17,980 | |
| Monthly Distribution | | | 5,938 | | | | 34,410 | | | | 74,849 | |
| Real Estate Stock | | | 9,818 | | | | 12,193 | | | | 12,280 | |
d. Trustees’ Fees – The Board has approved the following Trustee compensation schedule: Each Trustee who is not an interested person of the Trust will receive $ 6,250 for each Board meeting attended in-person; $2,500 for all electronically-attended Board meetings; $1,000 for in-person committee meetings and $500 for telephonic committee meetings, unless the committee meeting is on the same day as a Board meeting, in which case the Trustee will not be compensated for the committee meeting. The Funds also reimburse each such Trustee for travel and other expenses incurred in attending meetings of the Board.
With the exception of the Trust’s Chief Compliance Officer as discussed below, officers of the Trust and Trustees who are interested persons of the Trust do not receive any compensation from the Trust or any other Funds managed by the Adviser. The Trust has agreed to pay the Adviser a fee in the amount of $125,750 per annum including an annual discretionary bonus as may be awarded as compensation for providing an officer or employee of the Adviser to serve as Chief Compliance Officer for the Funds (each Fund bearing its pro rata share of the fee), plus the cost of reasonable expenses related to the performance of the Chief Compliance Officer’s duties, including travel expenses, and may compensate the Adviser for the time of other officers or employees of the Adviser who serve in other compliance capacities for the Funds.
e. Commission Recapture – During the six months ended April 30, 2023, certain Funds had portfolio trades executed with a certain brokers pursuant to a commission recapture agreement under which the brokers returned a portion of the Fund’s brokerage commissions on the Fund’s behalf. Such amounts, under such commission recapture agreement, are included in Commission Recapture in the Funds’ Statements of Operations and will be paid directly by the brokers for the expenses of the Fund. For the six months ended April 30, 2023, the amounts received by the Administrator on behalf of certain participating Funds under this arrangement were: Large Cap Value - $2,404, Small Cap Value - $35,420, Focused Large Cap Growth - $3,025 and Small Cap Growth - $7,106.
| NOTES TO FINANCIAL STATEMENTS (Unaudited) |
| April 30, 2023 (Continued) |
| 4. | INVESTMENT TRANSACTIONS |
The cost of purchases and the proceeds from sales of investments, other than short-term investments, for the six months ended April 30, 2023 were as follows:
| | | Purchases | | | Sale Proceeds | | | | | | Proceeds of | |
| | | (excluding U.S. | | | (excluding U.S. | | | Purchases of | | | U.S. | |
| | | Government | | | Government | | | U.S. Government | | | Government | |
| Fund | | Securities) | | | Securities) | | | Securities | | | Securities | |
| Corporate/Government Bond | | $ | 59,742,661 | | | $ | 8,406,981 | | | $ | 18,626,403 | | | $ | 4,876,194 | |
| Floating Rate Bond | | | 9,262,835 | | | | 53,973,240 | | | | — | | | | — | |
| High-Yield Bond | | | 18,924,625 | | | | 14,310,374 | | | | — | | | | — | |
| International Opportunity Bond | | | 18,362,857 | | | | 10,065,445 | | | | — | | | | — | |
| Large Cap Value | | | 26,030,077 | | | | 32,540,202 | | | | — | | | | — | |
| Small Cap Value | | | 28,288,655 | | | | 34,720,865 | | | | — | | | | — | |
| Focused Large Cap Growth | | | 13,783,231 | | | | 38,548,493 | | | | — | | | | — | |
| Small Cap Growth | | | 39,666,582 | | | | 53,541,672 | | | | — | | | | — | |
| Emerging Markets Stock | | | 30,842,392 | | | | 34,944,923 | | | | — | | | | — | |
| International Stock | | | 38,083,819 | | | | 63,582,556 | | | | — | | | | — | |
| Dynamic Macro | | | 65,157,062 | | | | 26,751,467 | | | | — | | | | — | |
| Long/Short Credit | | | 126,330,943 | | | | 111,517,456 | | | | 154,667,995 | | | | 168,184,662 | |
| Monthly Distribution | | | 183,537,695 | | | | 108,193,484 | | | | — | | | | — | |
| Real Estate Stock | | | 32,074,797 | | | | 33,626,983 | | | | — | | | | — | |
| 5. | AGGREGATE UNREALIZED APPRECIATION AND DEPRECIATION – TAX BASIS |
The identified cost of investments in securities owned by each Fund for federal income tax purposes, and its respective gross unrealized appreciation and depreciation at April 30, 2023, were as follows:
| | | | | | Gross | | | Gross | | | Net Unrealized | |
| | | Tax | | | Unrealized | | | Unrealized | | | Appreciation/ | |
| | | Cost | | | Appreciation | | | Depreciation | | | (Depreciation) | |
| Corporate/Government Bond | | $ | 132,184,307 | | | $ | 819,900 | | | $ | (7,508,209 | ) | | $ | (6,688,309 | ) |
| Floating Rate Bond | | | 146,336,219 | | | | 621,509 | | | | (9,184,588 | ) | | | (8,563,079 | ) |
| High-Yield Bond | | | 124,000,288 | | | | 2,175,250 | | | | (8,653,111 | ) | | | (6,477,861 | ) |
| International Opportunity Bond | | | 52,508,241 | | | | 524,392 | | | | (6,910,973 | ) | | | (6,386,581 | ) |
| Large Cap Value | | | 144,454,632 | | | | 42,831,378 | | | | (3,201,819 | ) | | | 39,629,559 | |
| Small Cap Value | | | 79,463,406 | | | | 6,010,552 | | | | (4,460,587 | ) | | | 1,549,965 | |
| Focused Large Cap Growth | | | 125,776,388 | | | | 82,420,467 | | | | (2,598,619 | ) | | | 79,821,848 | |
| Small Cap Growth | | | 79,802,734 | | | | 9,956,226 | | | | (2,563,026 | ) | | | 7,393,200 | |
| Emerging Markets Stock | | | 112,104,987 | | | | 11,173,130 | | | | (11,868,262 | ) | | | (695,132 | ) |
| International Stock | | | 128,590,460 | | | | 17,698,015 | | | | (14,747,926 | ) | | | 2,950,089 | |
| Dynamic Macro | | | 37,180,829 | | | | 3,319,595 | | | | (210,511 | ) | | | 3,109,084 | |
| Long/Short Credit | | | 241,840,986 | | | | 16,915,369 | | | | (25,399,672 | ) | | | (8,484,303 | ) |
| Monthly Distribution | | | 216,618,225 | | | | 9,018,470 | | | | (29,806,641 | ) | | | (20,788,171 | ) |
| Real Estate Stock | | | 94,318,929 | | | | 9,653,334 | | | | (8,934,258 | ) | | | 719,076 | |
| NOTES TO FINANCIAL STATEMENTS (Unaudited) |
| April 30, 2023 (Continued) |
| 6. | SHARES OF BENEFICIAL INTEREST |
Following is a summary of shareholder transactions for each Fund for the six months ended April 30, 2023 and the year ended October 31, 2022, respectively:
For the six months ended April 30, 2023:
| | | Class N Shares | | | Class A Shares | |
| | | | | | | | | | | | Net Increase | | | | | | | | | | | | Net Increase | |
| | | | | | Distributions | | | | | | (Decrease) in | | | | | | Distributions | | | | | | (Decrease) in | |
| Fund | | Issued | | | Reinvested | | | Redeemed | | | Shares | | | Issued | | | Reinvested | | | Redeemed | | | Shares | |
| Corporate/Government Bond | | | 5,009,676 | | | | 100,496 | | | | (723,996 | ) | | | 4,386,176 | | | | 736,718 | | | | 12,954 | | | | (88,057 | ) | | | 661,615 | |
| Floating Rate Bond | | | 954,513 | | | | 652,054 | | | | (6,114,342 | ) | | | (4,507,775 | ) | | | 155,329 | | | | 82,424 | | | | (948,148 | ) | | | (710,395 | ) |
| High-Yield Bond | | | 1,897,345 | | | | 357,914 | | | | (1,653,403 | ) | | | 601,856 | | | | 308,676 | | | | 51,943 | | | | (254,171 | ) | | | 106,448 | |
| International Opportunity Bond | | | 1,578,359 | | | | 232,660 | | | | (545,126 | ) | | | 1,265,893 | | | | 238,148 | | | | 38,335 | | | | (75,552 | ) | | | 200,931 | |
| Large Cap Value | | | 1,107,366 | | | | 227,314 | | | | (1,481,054 | ) | | | (146,374 | ) | | | 202,321 | | | | 31,430 | | | | (188,915 | ) | | | 44,836 | |
| Small Cap Value | | | 767,735 | | | | 275,973 | | | | (1,047,607 | ) | | | (3,899 | ) | | | 129,250 | | | | 39,254 | | | | (164,139 | ) | | | 4,365 | |
| Focused Large Cap Growth | | | 355,032 | | | | — | | | | (1,270,376 | ) | | | (915,344 | ) | | | 59,024 | | | | — | | | | (188,701 | ) | | | (129,677 | ) |
| Small Cap Growth | | | 309,691 | | | | — | | | | (1,102,888 | ) | | | (793,197 | ) | | | 59,561 | | | | — | | | | (254,398 | ) | | | (194,837 | ) |
| Emerging Markets Stock | | | 544,002 | | | | 17,990 | | | | (968,023 | ) | | | (406,031 | ) | | | 62,915 | | | | — | | | | (182,642 | ) | | | (119,727 | ) |
| International Stock | | | 389,914 | | | | 280,741 | | | | (2,001,461 | ) | | | (1,330,806 | ) | | | 180,206 | | | | 43,071 | | | | (513,806 | ) | | | (290,529 | ) |
| Dynamic Macro | | | 1,260,958 | | | | — | | | | (209,791 | ) | | | 1,051,167 | | | | 256,700 | | | | — | | | | (65,482 | ) | | | 191,218 | |
| Long/Short Credit | | | 2,915,474 | | | | 628,009 | | | | (4,162,347 | ) | | | (618,864 | ) | | | 372,871 | | | | 85,159 | | | | (350,518 | ) | | | 107,512 | |
| Monthly Distribution | | | 432,300 | | | | 203,656 | | | | (1,118,727 | ) | | | (482,771 | ) | | | 53,768 | | | | 34,042 | | | | (168,841 | ) | | | (81,031 | ) |
| Real Estate Stock | | | 700,406 | | | | 35,859 | | | | (879,816 | ) | | | (143,551 | ) | | | 116,661 | | | | 3,169 | | | | (92,887 | ) | | | 26,943 | |
| | | | | | | | | | | | | | | | | | | | | | | | | | | | | | | | | |
| | | Class C Shares | | | | | | | | | | | | | | | | | |
| | | | | | | | | | | | Net Increase | | | | | | | | | | | | | | | | | |
| | | | | | Distributions | | | | | | (Decrease) in | | | | | | | | | | | | | | | | | |
| Fund | | Issued | | | Reinvested | | | Redeemed | | | Shares | | | | | | | | | | | | | | | | | |
| Corporate/Government Bond | | | 43,400 | | | | 1,742 | | | | (31,170 | ) | | | 13,972 | | | | | | | | | | | | | | | | | |
| Floating Rate Bond | | | 13,661 | | | | 27,074 | | | | (119,613 | ) | | | (78,878 | ) | | | | | | | | | | | | | | | | |
| High-Yield Bond | | | 26,536 | | | | 13,758 | | | | (50,725 | ) | | | (10,431 | ) | | | | | | | | | | | | | | | | |
| International Opportunity Bond | | | 18,406 | | | | 6,280 | | | | (17,384 | ) | | | 7,302 | | | | | | | | | | | | | | | | | |
| Large Cap Value | | | 12,145 | | | | 5,716 | | | | (39,732 | ) | | | (21,871 | ) | | | | | | | | | | | | | | | | |
| Small Cap Value | | | 7,235 | | | | 18,052 | | | | (36,584 | ) | | | (11,297 | ) | | | | | | | | | | | | | | | | |
| Focused Large Cap Growth | | | 7,399 | | | | — | | | | (63,615 | ) | | | (56,216 | ) | | | | | | | | | | | | | | | | |
| Small Cap Growth | | | 5,034 | | | | — | | | | (49,269 | ) | | | (44,235 | ) | | | | | | | | | | | | | | | | |
| Emerging Markets Stock | | | 6,452 | | | | — | | | | (34,938 | ) | | | (28,486 | ) | | | | | | | | | | | | | | | | |
| International Stock | | | 4,612 | | | | 9,975 | | | | (51,107 | ) | | | (36,520 | ) | | | | | | | | | | | | | | | | |
| Dynamic Macro | | | 11,235 | | | | — | | | | (15,026 | ) | | | (3,791 | ) | | | | | | | | | | | | | | | | |
| Long/Short Credit | | | 16,278 | | | | 9,764 | | | | (64,933 | ) | | | (38,891 | ) | | | | | | | | | | | | | | | | |
| Monthly Distribution | | | 15,776 | | | | 32,842 | | | | (101,471 | ) | | | (52,853 | ) | | | | | | | | | | | | | | | | |
| Real Estate Stock | | | 13,759 | | | | — | | | | (31,637 | ) | | | (17,878 | ) | | | | | | | | | | | | | | | | |
| NOTES TO FINANCIAL STATEMENTS (Unaudited) |
| April 30, 2023 (Continued) |
For the year ended October 31, 2022:
| | | Class N Shares | | | Class A Shares | |
| | | | | | | | | | | | Net Increase | | | | | | | | | | | | Net Increase | |
| | | | | | Distributions | | | | | | (Decrease) in | | | | | | Distributions | | | | | | (Decrease) in | |
| Fund | | Issued | | | Reinvested | | | Redeemed | | | Shares | | | Issued | | | Reinvested | | | Redeemed | | | Shares | |
| Corporate/Government Bond | | | 817,831 | | | | 85,209 | | | | (2,281,875 | ) | | | (1,378,835 | ) | | | 109,812 | | | | 8,781 | | | | (253,792 | ) | | | (135,199 | ) |
| Floating Rate Bond | | | 3,679,891 | | | | 915,144 | | | | (5,419,943 | ) | | | (824,908 | ) | | | 637,236 | | | | 112,571 | | | | (732,330 | ) | | | 17,477 | |
| High-Yield Bond | | | 1,624,016 | | | | 501,164 | | | | (2,885,704 | ) | | | (760,524 | ) | | | 344,626 | | | | 64,006 | | | | (284,942 | ) | | | 123,690 | |
| International Opportunity Bond | | | 951,013 | | | | 279,890 | | | | (3,837,865 | ) | | | (2,606,962 | ) | | | 177,128 | | | | 40,431 | | | | (533,448 | ) | | | (315,889 | ) |
| Large Cap Value | | | 2,912,920 | | | | 446,602 | | | | (1,607,735 | ) | | | 1,751,787 | | | | 479,304 | | | | 80,548 | | | | (590,387 | ) | | | (30,535 | ) |
| Small Cap Value | | | 1,408,422 | | | | 466,893 | | | | (1,871,938 | ) | | | 3,377 | | | | 114,363 | | | | 79,784 | | | | (339,853 | ) | | | (145,706 | ) |
| Focused Large Cap Growth | | | 2,781,652 | | | | 298,894 | | | | (814,781 | ) | | | 2,265,765 | | | | 399,032 | | | | 72,695 | | | | (304,591 | ) | | | 167,136 | |
| Small Cap Growth | | | 2,492,192 | | | | 469,520 | | | | (811,754 | ) | | | 2,149,958 | | | | 354,910 | | | | 157,070 | | | | (423,547 | ) | | | 88,433 | |
| Emerging Markets Stock | | | 2,635,295 | | | | 598,986 | | | | (1,364,956 | ) | | | 1,869,325 | | | | 407,407 | | | | 116,720 | | | | (235,676 | ) | | | 288,451 | |
| International Stock | | | 2,020,121 | | | | 1,112,978 | | | | (2,357,528 | ) | | | 775,571 | | | | 271,053 | | | | 200,445 | | | | (408,971 | ) | | | 62,527 | |
| Dynamic Macro | | | 946,512 | | | | — | | | | (526,569 | ) | | | 419,943 | | | | 145,154 | | | | — | | | | (74,420 | ) | | | 70,734 | |
| Long/Short Credit | | | 9,358,178 | | | | 824,061 | | | | (7,592,535 | ) | | | 2,589,704 | | | | 1,628,749 | | | | 112,406 | | | | (1,661,504 | ) | | | 79,651 | |
| Monthly Distribution | | | 1,218,712 | | | | 265,639 | | | | (2,669,761 | ) | | | (1,185,410 | ) | | | 148,530 | | | | 43,269 | | | | (290,962 | ) | | | (99,163 | ) |
| Real Estate Stock | | | 1,704,276 | | | | 276,975 | | | | (1,103,495 | ) | | | 877,756 | | | | 187,864 | | | | 42,937 | | | | (179,666 | ) | | | 51,135 | |
| | | | | | | | | | | | | | | | | | | | | | | | | | | | | | | | | |
| | | Class C Shares | | | | | | | | | | | | | | | | | |
| | | | | | | | | | | | Net Increase | | | | | | | | | | | | | | | | | |
| | | | | | Distributions | | | | | | (Decrease) in | | | | | | | | | | | | | | | | | |
| Fund | | Issued | | | Reinvested | | | Redeemed | | | Shares | | | | | | | | | | | | | | | | | |
| Corporate/Government Bond | | | 63,722 | | | | 1,834 | | | | (49,990 | ) | | | 15,566 | | | | | | | | | | | | | | | | | |
| Floating Rate Bond | | | 145,267 | | | | 29,211 | | | | (137,899 | ) | | | 36,579 | | | | | | | | | | | | | | | | | |
| High-Yield Bond | | | 41,266 | | | | 18,328 | | | | (89,039 | ) | | | (29,445 | ) | | | | | | | | | | | | | | | | |
| International Opportunity Bond | | | 18,020 | | | | 5,847 | | | | (45,612 | ) | | | (21,745 | ) | | | | | | | | | | | | | | | | |
| Large Cap Value | | | 36,731 | | | | 16,659 | | | | (56,451 | ) | | | (3,061 | ) | | | | | | | | | | | | | | | | |
| Small Cap Value | | | 39,043 | | | | 25,308 | | | | (58,794 | ) | | | 5,557 | | | | | | | | | | | | | | | | | |
| Focused Large Cap Growth | | | 46,527 | | | | 30,182 | | | | (83,289 | ) | | | (6,580 | ) | | | | | | | | | | | | | | | | |
| Small Cap Growth | | | 35,698 | | | | 59,612 | | | | (48,074 | ) | | | 47,236 | | | | | | | | | | | | | | | | | |
| Emerging Markets Stock | | | 27,725 | | | | 18,531 | | | | (39,801 | ) | | | 6,455 | | | | | | | | | | | | | | | | | |
| International Stock | | | 26,877 | | | | 45,942 | | | | (66,142 | ) | | | 6,677 | | | | | | | | | | | | | | | | | |
| Dynamic Macro | | | 12,639 | | | | — | | | | (20,596 | ) | | | (7,957 | ) | | | | | | | | | | | | | | | | |
| Long/Short Credit | | | 78,007 | | | | 14,234 | | | | (133,224 | ) | | | (40,983 | ) | | | | | | | | | | | | | | | | |
| Monthly Distribution | | | 58,752 | | | | 39,360 | | | | (189,647 | ) | | | (91,535 | ) | | | | | | | | | | | | | | | | |
| Real Estate Stock | | | 24,383 | | | | 17,077 | | | | (57,259 | ) | | | (15,799 | ) | | | | | | | | | | | | | | | | |
| NOTES TO FINANCIAL STATEMENTS (Unaudited) |
| April 30, 2023 (Continued) |
| 7. | DISTRIBUTIONS TO SHAREHOLDERS AND TAX COMPONENTS OF CAPITAL |
The tax character of dividends paid during the year ended October 31, 2022 and October 31, 2021 was as follows:
| For fiscal year ended | | Ordinary | | | Long-Term | | | Return of | | | | |
| 10/31/2022 | | Income | | | Capital Gains | | | Capital | | | Total | |
| Corporate/Government Bond ** | | $ | 1,283,066 | | | $ | — | | | $ | — | | | $ | 1,283,066 | |
| Floating Rate Bond ** | | | 9,317,486 | | | | — | | | | — | | | | 9,317,486 | |
| High-Yield Bond ** | | | 5,031,200 | | | | — | | | | — | | | | 5,031,200 | |
| International Opportunity Bond ** | | | 2,626,747 | | | | 22,444 | | | | — | | | | 2,649,191 | |
| Large Cap Value | | | 3,915,866 | | | | 6,478,567 | | | | — | | | | 10,394,433 | |
| Small Cap Value | | | 8,413,359 | | | | 1,402,225 | | | | — | | | | 9,815,584 | |
| Focused Large Cap Growth | | | — | | | | 16,249,986 | | | | 219 | | | | 16,250,205 | |
| Small Cap Growth | | | 7,792,974 | | | | 6,672,424 | | | | — | | | | 14,465,398 | |
| Emerging Markets Stock | | | 10,055,268 | | | | 1,701,647 | | | | 52,753 | | | | 11,809,668 | |
| International Stock | | | 15,859,343 | | | | 9,039,564 | | | | — | | | | 24,898,907 | |
| Dynamic Macro | | | — | | | | — | | | | — | | | | — | |
| Long/Short Credit ** | | | 4,824,117 | | | | 4,459,491 | | | | — | | | | 9,283,608 | |
| Monthly Distribution ** | | | — | | | | 2,080,414 | | | | 8,864,457 | | | | 10,944,871 | |
| Real Estate Stock | | | 4,858,847 | | | | 1,798,209 | | | | — | | | | 6,657,056 | |
| | | | | | | | | | | | | | | | | |
| For fiscal year ended | | Ordinary | | | Long-Term | | | Return of | | | | |
| 10/31/2021 | | Income | | | Capital Gains | | | Capital | | | Total | |
| Corporate/Government Bond ** | | $ | 1,245,650 | | | $ | — | | | $ | — | | | $ | 1,245,650 | |
| Floating Rate Bond ** | | | 6,071,064 | | | | — | | | | — | | | | 6,071,064 | |
| High-Yield Bond ** | | | 4,596,419 | | | | — | | | | — | | | | 4,596,419 | |
| International Opportunity Bond | | | 1,625,612 | | | | — | | | | — | | | | 1,625,612 | |
| Large Cap Value | | | 1,058,479 | | | | — | | | | — | | | | 1,058,479 | |
| Small Cap Value | | | 567,981 | | | | — | | | | — | | | | 567,981 | |
| Focused Large Cap Growth | | | — | | | | 3,869,872 | | | | — | | | | 3,869,872 | |
| Small Cap Growth | | | 4,242,651 | | | | 5,463,358 | | | | — | | | | 9,706,009 | |
| Emerging Markets Stock * | | | 451,197 | | | | — | | | | — | | | | 451,197 | |
| International Stock * | | | 1,683,689 | | | | 70,762 | | | | — | | | | 1,754,451 | |
| Dynamic Macro | | | 148,493 | | | | — | | | | 19 | | | | 148,512 | |
| Long/Short Credit ** | | | 3,870,741 | | | | — | | | | — | | | | 3,870,741 | |
| Monthly Distribution ** | | | 5,009,573 | | | | — | | | | 3,079,712 | | | | 8,089,285 | |
| Real Estate Stock | | | — | | | | 6,116,623 | | | | — | | | | 6,116,623 | |
| * | The difference between ordinary distributions paid from book and ordinary distributions paid from tax relates to allowable foreign tax credits of $608,514 and $325,296 for fiscal year ended October 31, 2021 for the International Stock Fund and Emerging Markets Fund respectively, which have been passed through to the Funds’ underlying shareholders and are deemed dividends for tax purposes. |
| ** | Differences in distributions between the Statement of Changes paid from book and tax on the income funds relate to the adjustments for dividends payable for tax purposes. |
| NOTES TO FINANCIAL STATEMENTS (Unaudited) |
| April 30, 2023 (Continued) |
As of each of the Fund’s tax year-ended October 31, 2022, the components of distributable earnings on a tax basis were as follows:
| | | Undistributed | | | Undistributed | | | Post October Loss | | | Capital Loss | | | Other | | | Unrealized | | | Total | |
| | | Ordinary | | | Long-Term | | | and | | | Carry | | | Book/Tax | | | Appreciation/ | | | Accumulated | |
| Fund | | Income | | | Capital Gains | | | Late Year Loss | | | Forwards | | | Differences | | | (Depreciation) | | | Earnings/(Deficits) | |
| Corporate/Government Bond | | $ | 24,329 | | | $ | — | | | $ | — | | | $ | (2,712,875 | ) | | $ | (861 | ) | | $ | (10,968,477 | ) | | $ | (13,657,884 | ) |
| Floating Rate Bond | | | 38,141 | | | | — | | | | — | | | | (17,608,536 | ) | | | (6,941 | ) | | | (12,973,192 | ) | | | (30,550,528 | ) |
| High-Yield Bond | | | 286,052 | | | | — | | | | — | | | | (9,319,504 | ) | | | (3,993 | ) | | | (11,368,139 | ) | | | (20,405,584 | ) |
| International Opportunity Bond | | | 920,661 | | | | — | | | | — | | | | (4,926,378 | ) | | | (328 | ) | | | (12,130,457 | ) | | | (16,136,502 | ) |
| Large Cap Value | | | 2,218,350 | | | | 1,821,227 | | | | — | | | | — | | | | — | | | | 34,799,206 | | | | 38,838,783 | |
| Small Cap Value | | | 229,345 | | | | 4,258,010 | | | | — | | | | — | | | | — | | | | 3,322,633 | | | | 7,809,988 | |
| Focused Large Cap Growth | | | — | | | | — | | | | (1,060,493 | ) | | | (5,341,162 | ) | | | — | | | | 40,846,838 | | | | 34,445,183 | |
| Small Cap Growth | | | — | | | | — | | | | (351,639 | ) | | | (13,327,687 | ) | | | — | | | | (285,671 | ) | | | (13,964,997 | ) |
| Emerging Markets Stock | | | — | | | | — | | | | — | | | | (13,842,922 | ) | | | — | | | | (20,508,839 | ) | | | (34,351,761 | ) |
| International Stock | | | 4,374,807 | | | | — | | | | — | | | | (2,486,969 | ) | | | — | | | | (17,648,250 | ) | | | (15,760,412 | ) |
| Dynamic Macro | | | — | | | | — | | | | (189,104 | ) | | | (1,866,721 | ) | | | — | | | | 1,934,781 | | | | (121,044 | ) |
| Long/Short Credit | | | 250,513 | | | | 2,144,449 | | | | — | | | | — | | | | (24,592 | ) | | | (12,343,800 | ) | | | (9,973,430 | ) |
| Monthly Distribution | | | — | | | | — | | | | (2,909,987 | ) | | | — | | | | (46,343 | ) | | | (6,732,970 | ) | | | (9,689,300 | ) |
| Real Estate Stock | | | 163,478 | | | | — | | | | — | | | | (10,656,594 | ) | | | — | | | | (9,203,740 | ) | | | (19,696,856 | ) |
The difference between book basis and tax basis unrealized appreciation (depreciation), undistributed net investment income and accumulated net realized gain from security transactions are primarily attributable to the tax deferral of losses on wash sales, the mark-to-market treatment of open forward foreign currency, swap and 1256 futures and options contracts, and adjustments for partnerships, perpetual bonds, debt modification, defaulted income bonds, passive foreign investment companies, C Corporation return of capital distributions and dividend payable. The unrealized appreciation (depreciation) in the table above includes unrealized foreign currency gains (losses) for the Funds. In addition, the amount listed under other book/tax differences are primarily attributable to the tax deferral of losses on straddles and tax adjustments for accrued dividend payable.
Late year losses incurred after December 31 within the fiscal year are deemed to arise on the first business day of the following fiscal year for tax purposes. The Funds incurred and elected to defer such late year losses as follows:
| | | Late Year | |
| Fund | | Losses | |
| Corporate/Government Bond | | $ | — | |
| Floating Rate Bond | | | — | |
| High-Yield Bond | | | — | |
| International Opportunity Bond | | | — | |
| Large Cap Value | | | — | |
| Small Cap Value | | | — | |
| Focused Large Cap Growth | | | 1,060,493 | |
| Small Cap Growth | | | 351,639 | |
| Emerging Markets Stock | | | — | |
| International Stock | | | — | |
| Dynamic Macro | | | 189,104 | |
| Long/Short Credit | | | — | |
| Monthly Distribution | | | 2,909,987 | |
| Real Estate Stock | | | — | |
| NOTES TO FINANCIAL STATEMENTS (Unaudited) |
| April 30, 2023 (Continued) |
At October 31, 2022, the following Funds had capital loss carryforwards for federal income tax purposes available to offset future capital gains as follows:
| | | | | | | | | | | | Capital Loss Carry | |
| Fund | | Short-Term | | | Long-Term | | | Total | | | Forward Utilized | |
| Corporate/Government Bond | | $ | 1,842,909 | | | $ | 869,966 | | | $ | 2,712,875 | | | $ | — | |
| Floating Rate Bond | | | 3,989,496 | | | | 13,619,040 | | | | 17,608,536 | | | | — | |
| High-Yield Bond | | | 3,573,016 | | | | 5,746,488 | | | | 9,319,504 | | | | — | |
| International Opportunity Bond | | | 1,875,030 | | | | 3,051,348 | | | | 4,926,378 | | | | — | |
| Large Cap Value | | | — | | | | — | | | | — | | | | — | |
| Small Cap Value | | | — | | | | — | | | | — | | | | — | |
| Focused Large Cap Growth | | | 3,387,897 | | | | 1,953,265 | | | | 5,341,162 | | | | — | |
| Small Cap Growth | | | 13,126,776 | | | | 200,911 | | | | 13,327,687 | | | | — | |
| Emerging Markets Stock | | | 11,512,090 | | | | 2,330,832 | | | | 13,842,922 | | | | — | |
| International Stock | | | 2,486,969 | | | | — | | | | 2,486,969 | | | | — | |
| Dynamic Macro | | | 1,600,090 | | | | 266,631 | | | | 1,866,721 | | | | — | |
| Long/Short Credit | | | — | | | | — | | | | — | | | | — | |
| Monthly Distribution | | | — | | | | — | | | | — | | | | — | |
| Real Estate Stock | | | 10,656,594 | | | | — | | | | 10,656,594 | | | | — | |
During the fiscal year ended October 31, 2022, the Funds utilized tax equalization which is the use of earnings and profits distributions to shareholders on redemption of shares as part of the dividends paid deduction for income tax purposes. Permanent book and tax differences, primarily attributable to the reclassification of net operating losses, fund distributions, the use of tax equalization credits and adjustments for prior year tax returns resulted in reclassification for the tax year ended October 31, 2022, as follows:
| | | Paid | | | | |
| | | In | | | Accumulated | |
| Fund | | Capital | | | Earnings (Loss) | |
| Corporate/Government Bond | | $ | — | | | $ | — | |
| Floating Rate Bond | | | — | | | | — | |
| High-Yield Bond | | | — | | | | — | |
| International Opportunity Bond | | | — | | | | — | |
| Large Cap Value | | | 507,753 | | | | (507,753 | ) |
| Small Cap Value | | | 1,103,718 | | | | (1,103,718 | ) |
| Focused Large Cap Growth | | | (1,958,732 | ) | | | 1,958,732 | |
| Small Cap Growth | | | (802,049 | ) | | | 802,049 | |
| Emerging Markets Stock | | | (24,229 | ) | | | 24,229 | |
| International Stock | | | 1,361,474 | | | | (1,361,474 | ) |
| Dynamic Macro | | | (578,223 | ) | | | 578,223 | |
| Long/Short Credit | | | 94,662 | | | | (94,662 | ) |
| Monthly Distribution | | | (250,921 | ) | | | 250,921 | |
| Real Estate Stock | | | 3,781 | | | | (3,781 | ) |
Net assets were unaffected by the above reclassifications.
Currently, the Funds have a $50,000,000 uncommitted line of credit provided by U.S. Bank National Association (the “Bank”) under an agreement (the “Uncommitted Line”). Any advance under the Uncommitted Line is contemplated primarily for temporary or emergency purposes, including the meeting of redemption requests that otherwise might require the untimely disposition of securities. Interest on borrowings is payable on an annualized basis at rate of Prime less .5%. The Uncommitted Line is not a “committed” line of credit, which is to say that the Bank is not obligated to lend money to a Fund. Accordingly, it is possible that a Fund may wish to borrow money for a temporary or emergency purpose but may not be able to do so. Based only on the days borrowed, the average amount of borrowings outstanding were as follows:
| NOTES TO FINANCIAL STATEMENTS (Unaudited) |
| April 30, 2023 (Continued) |
| | | Average borrowing | | | Largest Outstanding | | | | | | Average | |
| Fund | | outstanding | | | Balance | | | Loan Outstanding | | | borrowing rate | |
| Corporate/Government Bond | | $ | — | | | $ | — | | | $ | — | | | | 0.00 | % |
| Floating Rate Bond | | | 7,645,667 | | | | 24,624,000 | | | | — | | | | 7.18 | % |
| High-Yield Bond | | | 630,111 | | | | 1,561,000 | | | | — | | | | 7.00 | % |
| International Opportunity Bond | | | 272,700 | | | | 372,000 | | | | — | | | | 6.75 | % |
| Large Cap Value | | | 621,667 | | | | 2,315,000 | | | | — | | | | 6.81 | % |
| Small Cap Value | | | 889,737 | | | | 7,593,000 | | | | — | | | | 6.76 | % |
| Focused Large Cap Growth | | | 2,942,500 | | | | 11,656,000 | | | | — | | | | 7.36 | % |
| Small Cap Growth | | | — | | | | — | | | | — | | | | 0.00 | % |
| Emerging Markets Stock | | | 529,184 | | | | 1,944,000 | | | | — | | | | 7.10 | % |
| International Stock | | | 1,317,536 | | | | 10,466,000 | | | | — | | | | 7.11 | % |
| Dynamic Macro | | | — | | | | — | | | | — | | | | 0.00 | % |
| Long/Short Credit | | | 320,667 | | | | 661,000 | | | | — | | | | 7.25 | % |
| Monthly Distribution | | | 1,789,000 | | | | 1,994,000 | | | | — | | | | 7.50 | % |
| Real Estate Stock | | | 244,958 | | | | 560,000 | | | | — | | | | 6.98 | % |
The interest expense for all the Funds listed is included in interest expense on the statement of operations.
The Funds have entered into a Securities Lending Agreement (“Agreement”) with the Bank. Each participating Fund can lend their securities to brokers, dealers and other financial institutions approved by the Board to earn additional income. Loans are collateralized at a value at least equal to 105% of the then current market value of any loaned security that are foreign, or 102% of the then current market value of any other loaned security. International Stock is below the 105% threshold due to market fluctuation. All interest and dividend payments received on securities which are held on loan, provided that there is no material default, will be paid to the respective Fund. A portion of the income generated by the investment in the Funds collateral, net of any rebates paid by the Bank to the borrowers is remitted to the Bank as lending agent and the remainder is paid to the Fund(s).
Securities lending income is disclosed in the Funds’ Statements of Operations and is net of fees retained by the counterparty. Although risk is mitigated by the collateral, the Funds could experience a delay in recovering their securities and possible loss of income or value if the Borrower fails to return them. Should the borrower of the securities fail financially, each Fund has the right to repurchase the securities using the collateral in the open market. The remaining contractual maturity of those transactions are overnight and continuous.
As of April 30, 2023 the below table shows the securities loan and collateral for the loan both of which are presented gross on the Statement of Assets and Liabilities. All individual open security loan transactions were overcollateralized. This cash is invested in the Mount Vernon Liquid Assets Portfolio.
| | | Market Value of | | | Market Value of | |
| Fund | | Loaned Securities | | | Collateral | |
| Corporate/Government Bond | | $ | 1,619,708 | | | $ | 1,642,388 | |
| Floating Rate Bond | | | 3,119,318 | | | | 3,341,340 | |
| High-Yield Bond | | | 13,279,201 | | | | 13,508,510 | |
| International Opportunity Bond (1) | | | 444,950 | | | | 451,588 | |
| Large Cap Value | | | 15,974,227 | | | | 16,175,261 | |
| Small Cap Value | | | 18,524,253 | | | | 18,755,560 | |
| Focused Large Cap Growth | | | 24,465,317 | | | | 25,751,011 | |
| Small Cap Growth | | | 18,560,332 | | | | 18,870,462 | |
| Emerging Markets Stock (1) | | | 1,107,684 | | | | 1,171,930 | |
| International Stock (1) | | | 4,804,499 | | | | 4,908,591 | |
| Dynamic Macro | | | — | | | | — | |
| Long/Short Credit | | | 9,423,697 | | | | 9,585,508 | |
| Monthly Distribution | | | 13,681,201 | | | | 13,960,747 | |
| Real Estate Stock | | | 19,772,684 | | | | 20,722,245 | |
| (1) | Securities collateralized below 102% or 105% for foreign securities. The Trust’s securities lending policies and procedures require that the borrower: (i) deliver cash or U.S. Government securities as collateral with respect to each new loan of U.S. securities, equal to at least 102% or 105% of the value of the portfolio securities loaned, and (ii) at all times thereafter mark-to-market the collateral on a daily basis so that the market value of such collateral is at least 100% of the value of securities loaned. From time to time the collateral may not be 102% or 105% due to end of day market movement. The next business day, additional collateral is obtained/received from the borrower to replenish/reestablish 102% or 105%. |
| NOTES TO FINANCIAL STATEMENTS (Unaudited) |
| April 30, 2023 (Continued) |
| 10. | NEW ACCOUNTING PRONOUNCEMENTS |
In March 2020, FASB issued ASU 2020-04, Reference Rate Reform (Topic 848): Facilitation of the Effects of Reference Rate Reform on Financial Reporting (’‘ASU 2020 -04’’). The amendments in ASU 2020-04 provide optional temporary financial reporting relief from the effect of certain types of contract modifications due to the planned discontinuation of LIBOR and other interbank-offered based reference rates as of the end of 2021. ASU 2020-04 is effective for certain reference rate-related contract modifications that occur during the period March 12, 2020 through December 31, 2022. Management is currently evaluating the impact if any, of applying this ASU.
Subsequent events after the date of the Statements of Assets and Liabilities have been evaluated through the date the financial statements were issued. Management has determined that no events or transactions occurred requiring adjustment or disclosure in the financial statements.
| Change in Independent Registered Public Accounting Firm (Unaudited) |
| April 30, 2023 |
On March 6, 2023, BBD LLP (“BBD”) ceased to serve as the independent registered public accounting firm of Dunham Corporate/Government Bond Fund; Dunham Floating Rate Bond Fund; Dunham High-Yield Bond Fund; Dunham International Opportunity Bond Fund; Dunham Large Cap Value Fund; Dunham Small Cap Value Fund; Dunham Focused Large Cap Growth Fund; Dunham Small Cap Growth Fund; Dunham Emerging Markets Stock Fund; Dunham International Stock Fund; Dunham Dynamic Macro Fund; Dunham Long/Short Credit Fund; Dunham Monthly Distribution Fund; and Dunham Real Estate Stock Fund. each a “Fund” and collectively, the “Funds”. The Audit Committee of the Board of Trustees approved the replacement of BBD as a result of Cohen & Company, Ltd.’s (“Cohen”) acquisition of BBD’s investment management group.
The report of BBD on the financial statements of the Funds did not contain an adverse opinion or a disclaimer of opinion, and were not qualified or modified as to uncertainties, audit scope or accounting principles. During the interim period ended March 6, 2023: (i) there were no disagreements between the registrant and BBD on any matter of accounting principles or practices, financial statement disclosure, or auditing scope or procedure, which disagreements, if not resolved to the satisfaction of BBD, would have caused it to make reference to the subject matter of the disagreements in its report on the financial statements of the Fund/Funds for such years or interim period; and (ii) there were no “reportable events,” as defined in Item 304(a)(1)(v) of Regulation S-K under the Securities Exchange Act of 1934, as amended.
The registrant requested that BBD furnish it with a letter addressed to the U.S. Securities and Exchange Commission stating that it agrees with the above statements. A copy of such letter is filed as an exhibit hereto.
On March 21, 2023, the Audit Committee of the Board of Trustees also recommended and approved the appointment of Cohen as the Fund’s independent registered public accounting firm for the fiscal period ending October 31, 2023.
During the interim period ending March 6, 2023, neither the registrant, nor anyone acting on its behalf, consulted with Cohen on behalf of the Funds regarding the application of accounting principles to a specified transaction (either completed or proposed), the type of audit opinion that might be rendered on the Fund’s financial statements, or any matter that was either: (i) the subject of a “disagreement,” as defined in Item 304(a)(1)(iv) of Regulation S-K and the instructions thereto; or (ii) “reportable events,” as defined in Item 304(a)(1)(v) of Regulation S-K.
| ADDITIONAL INFORMATION (Unaudited) |
| April 30, 2023 |
Dunham Funds
15(c) Board Considerations
December 19–20, 2022
On December 19–20, 2022, the Board of Trustees (the “Board”) of Dunham Funds (the “Trust”), a Delaware business trust, met to consider, among other things, (i) the renewal of the investment advisory agreement between the Trust and Dunham & Associates Investment Counsel, Inc. (the “Adviser”) and (ii) the approval and/or renewal of the sub-advisory agreements with various sub -advisers for certain series (the “Funds”). The investment advisory agreement and the sub-advisory agreements collectively are referred to as the “Advisory Agreements.” The Funds and the relevant sub-advisers with sub-advisory agreements up for approval and/or renewal include:
| Funds | Sub-Advisory Agreement |
| Dunham Corporate/Government Bond Fund | [Virtus Fixed Income Advisers, LLC is not up for renewal at this time] |
| Dunham Dynamic Macro Fund | [Consideration of new sub-advisory agreement with Vontobel Asset Management, Inc. included below] |
| Dunham Emerging Markets Stock Fund | NS Partners Ltd. |
| Dunham Floating Rate Bond Fund | PineBridge Investments LLC |
| Dunham Focused Large Cap Growth Fund | [Consideration of new sub-advisory agreement with The Ithaka Group, LLC included separately] |
| Dunham High Yield Bond Fund | PineBridge Investments LLC |
| Dunham International Opportunity Bond Fund | [Virtus Fixed Income Advisers, LLC is not up for renewal at this time] |
| Dunham International Stock Fund | Arrowstreet Capital, Limited Partnership |
| Dunham Large Cap Value Fund | Rothschild & Co. Management US, Inc. |
| Dunham Long/Short Credit Fund (formerly Dunham Appreciation & Income Fund) | MetLife Investment Advisors, LLC |
| Dunham Monthly Distribution Fund [Consideration of renewal of advisory agreement to be addressed at a future meeting] | Grantham, Mayo, Van Otterloo & Co. LLC |
| Dunham Real Estate Stock Fund | American Assets Capital Advisers LLC |
| Dunham Small Cap Growth Fund | Pier Capital, LLC |
| Dunham Small Cap Value Fund | Ziegler Capital Management, LLC |
The Independent Trustees had requested and reviewed materials the Adviser and the sub-advisers provided prior to and during the meetings and had reviewed a memorandum from Fund counsel that reviewed their fiduciary duties pertaining to renewal of investment management and sub-advisory agreements and the factors they should consider in evaluating the Advisory Agreements.
Among other information, the Adviser and the sub-advisers provided information to assist the Independent Trustees in assessing the nature, extent and quality of services provided, information comparing the investment performance, advisory fees and operating expense ratio of each Fund to other funds, information about estimated profitability and/or financial condition and compliance and regulatory matters. The Board determined that, given the totality of the information provided with respect to each Advisory Agreement, the Board had received sufficient information to approve the Advisory Agreements.
| ADDITIONAL INFORMATION (Unaudited) (Continued) |
| April 30, 2023 |
The Independent Trustees and Fund counsel met in executive sessions to consider the renewal of the Advisory Agreements. The Board also received information about the Funds throughout the year in connection with the regular quarterly Board meetings from the Adviser and various Fund sub-advisers.
Based upon its review, the Board concluded that it was in the best interests of each Fund that the Advisory Agreements be renewed. In considering the renewal of the Advisory Agreements, the Board did not identify any single factor or group of factors as all-important or controlling, and considered a variety of factors in its analysis, including those discussed below. The Board did not allot a particular weight to any one factor or group of factors.
| II. | Investment Advisory Agreement |
Nature, Extent and Quality of Services. In considering the renewal of the Advisory Agreement with the Adviser, the Board considered the nature, extent and quality of services that the Adviser provided to the Funds, including the Adviser’s personnel and resources and the Adviser’s criteria for reviewing a sub-adviser’s performance. The Board reviewed the services the Adviser provided in serving as investment adviser, including the backgrounds of the personnel providing the investment management services and compliance staff. They also reviewed information provided regarding risk management and compliance and regulatory matters. The Board concluded that the services the Adviser provided were satisfactory.
Performance. The Board reviewed performance information the Adviser provided for Class N of each Fund compared to the performance of (a) funds in a peer group (the “Peer Group”) (which is a relevant sub -set of funds in a Fund’s Morningstar category), (b) a Morningstar category average and (c) a benchmark index for the one, five and ten year periods or since a Fund’s inception, as applicable, ended September 30, 2022. The Board considered that the Adviser had delegated day-to-day portfolio management of each Fund’s strategy to a sub-adviser and noted the ongoing oversight activities the Adviser performed, including review of returns on a relative and absolute basis, evaluation of brokerage execution quality and yearly compliance reviews. The Board concluded that the Adviser appropriately had reviewed and monitored each sub-adviser’s investment performance.
Advisory Fee. The Board reviewed each Fund��s advisory fee and expense ratio, taking into account the Fund’s average net assets, and reviewed information comparing the advisory fee and expense ratio to those of the Peer Group and a Morningstar category. The Board discussed that, while the advisory fees do not necessarily have to be the lowest compared to the Peer Groups, it is their duty to evaluate whether the advisory fees are reasonable. The Board noted that the Adviser’s fees range from 0.50% to 0.65%, which, when combined with the sub-adviser fees, are generally higher than the Peer Group averages when a Fund is performing well, but in some cases lower than the Peer Group averages when a Fund is underperforming. The Board concluded that the Adviser’s fee ranges are applied reasonably based on the nature of a Fund (i.e., bond vs. equity, or alternative vs. traditional). The Board observed that currently four Funds are considered “alternative” and generally require enhanced oversight compared to more traditional asset classes. The Board discussed the level of work involved in the Adviser’s oversight of the Funds, the Adviser’s ongoing quantitative and qualitative analysis of each sub-adviser, and the other services that the Adviser provides to the Funds.
The Board also noted:
| ● | Dunham Corporate/Government Bond Fund: The Board noted that the advisory fee was higher than the average of the Peer Group and the Morningstar category; however, the overall expense ratio was in a reasonable range. |
| ● | Dunham Dynamic Macro Fund: The Board noted that the advisory fee was higher than the average of the Peer Group and the Morningstar category; however, the overall expense ratio was in a reasonable range. |
| ● | Dunham Emerging Markets Stock Fund: The Board noted that the advisory fee was higher than the average of the Peer Group and the Morningstar category; however, the overall expense ratio was in a reasonable range. |
| ● | Dunham Floating Rate Bond Fund: The Board noted that the advisory fee was higher than the average of the Peer Group and the Morningstar category; however, the overall expense ratio was in a reasonable range. |
| ● | Dunham Focused Large Cap Growth Fund: The Board noted that the advisory fee was higher than the average of the Peer Group and the Morningstar category; however, the overall expense ratio was in a reasonable range. |
| ADDITIONAL INFORMATION (Unaudited) (Continued) |
| April 30, 2023 |
| ● | Dunham High-Yield Bond Fund: The Board noted that the advisory fee was higher than the average of the Peer Group and the Morningstar category; however, the overall expense ratio was in a reasonable range. |
| ● | Dunham International Opportunity Bond Fund: The Board noted that the advisory fee was higher than the average of the Peer Group and the Morningstar category; however, the overall expense ratio was in a reasonable range in light of the Fund’s atypical other expenses. |
| ● | Dunham International Stock Fund: The Board noted that the advisory fee was higher than the average of the Peer Group and the Morningstar category; however, the overall expense ratio was in a reasonable range. |
| ● | Dunham Large Cap Value Fund: The Board noted that the advisory fee was higher than the average of the Peer Group and the Morningstar category, however, the overall expense ratio was in a reasonable range. |
| ● | Dunham Long/Short Credit Fund (formerly Dunham Appreciation & Income Fund): The Board noted that the advisory fee was higher than the average of the Peer Group and the Morningstar category, however, the overall expense ratio was in a reasonable range. |
| ● | Dunham Real Estate Stock Fund: The Board noted that the advisory fee was higher than the average of the Peer Group and the Morningstar category; however, the overall expense ratio was in a reasonable range. |
| ● | Dunham Small Cap Growth Fund: The Board noted that the advisory fee was higher than the average of the Peer Group and the Morningstar category; however, the overall expense ratio was in a reasonable range. |
| ● | Dunham Small Cap Value Fund: The Board noted that the advisory fee was lower than the average of the Peer Group and the Morningstar category and that the overall expense ratio was in a reasonable range. |
In light of the nature, quality and extent of services the Adviser provided, the Board concluded that each Fund’s advisory fee was reasonable.
Economies of Scale. The Board considered the extent to which economies of scale would be realized as each Fund grows and whether fee levels reflect a reasonable sharing of economies of scale for the benefit of Fund investors. The Board noted that breakpoints may be an appropriate way for the Adviser to share its economies of scale if a Fund experiences substantial asset growth; however, the Board recognized that no Fund had yet reached an asset level where the Adviser could realize significant economies of scale. The Board observed that economies of scale will be considered in the future as Fund asset levels grow.
Profitability. The Board also reviewed the estimated profitability of the Adviser with respect to each Fund. The Board concluded that the estimated profitability of the Adviser in connection with the management of each Fund was reasonable, and at a level to adequately incentivize the Adviser to continue to provide high quality services.
Fallout Benefits. Because of its relationship with the Funds, the Adviser and its affiliates may receive certain benefits. The Board reviewed materials provided by the Adviser as to any such benefits.
| III. | Sub-Advisory Agreements |
Nature, Extent and Quality of Services. In considering the approval and/or renewal of the sub-advisory agreement, as applicable, between each Fund and the Fund’s respective sub-adviser, the Board considered the nature, extent and quality of services the sub-adviser provided under the sub-advisory agreement. The Board reviewed the services the sub-adviser provided, the background of the investment professionals servicing the Fund, and the sub-adviser’s reputation, resources and investment approach. The Board also reviewed information provided regarding the structure of portfolio manager compensation, trading and brokerage practices, soft dollar usage, risk management and compliance matters.
Performance. The Board reviewed each Fund’s total return compared to the average total returns of the Fund’s Peer Group and Morningstar category averages and benchmark index. The Board also noted:
● Dunham Emerging Markets Stock Fund: The Board noted that NS Partners Ltd. (“NS Partners”) has served as the Fund’s sub-adviser since April 1, 2019 (while the Fund’s inception date is December 10, 2004). The Board observed that the Fund underperformed its Peer Group average, Morningstar category average, and benchmark index over the one-, five-, and ten-year periods. However, the Board considered that the Fund has performed in line with its
| ADDITIONAL INFORMATION (Unaudited) (Continued) |
| April 30, 2023 |
Peer Group average, Morningstar category average, and benchmark index for the period since NS Partners began to manage the Fund. The Board concluded that the services NS Partners provided were satisfactory.
● Dunham Floating Rate Bond Fund: The Board noted that PineBridge Investments LLC (“PineBridge”) has served as the Fund’s sub-adviser since October 1, 2021 (while the Fund’s inception date is November 4, 2013). The Board observed that Fund underperformed its Peer Group average, Morningstar category average, and benchmark index for the one- and five-year and since inception periods, as well as since PineBridge began to manage the Fund. The Board concluded that the service PineBridge provided were satisfactory.
● Dunham High Yield Bond Fund: The Board noted that PineBridge has served as the Fund’s sub-adviser since July 1, 2017 (while the Fund’s inception date is July 1, 2005). The Board observed that Fund underperformed its benchmark for the five- and ten-year periods, but had outperformed or performed in line with its benchmark since PineBridge began to manage the Fund. The Board concluded that the service PineBridge provided were satisfactory.
● Dunham International Stock Fund: The Board noted that Arrowstreet Capital, Limited Partnership (“Arrowstreet”) has served as the Fund’s sub-adviser since July 1, 2008 (while the Fund’s inception date is December 10, 2004). The Board observed that the Fund had underperformed its Peer Group average, Morningstar Category average, and benchmark index for the one-year period, but had outperformed its Peer Group average, Morningstar Category average, and benchmark index for the five- and ten-year and since inception periods. The Board concluded that the services Arrowstreet provided were satisfactory.
● Dunham Large Cap Value Fund: The Board noted that Rothschild & Co. Asset Management U.S. Inc. (“Rothschild”) has served as the Fund’s sub-adviser since July 1, 2015 (while the Fund’s inception date is December 10, 2004). The Board observed the Fund had performed in line with its Peer Group average for the one-year period and with its Morningstar Category average and benchmark index for the five- and ten-year and since inception periods. The Board concluded that the services Rothschild provided were satisfactory.
● Dunham Long/Short Credit Fund: The Board noted that MetLife Investment Management, LLC (“MetLife”) has served as the Fund’s sub-adviser since July 1, 2018 (while the Fund’s inception date is December 10, 2004). The Board noted that the Fund outperformed its Peer Group average, the Morningstar Category average over all relevant periods, but underperformed its benchmark index for the one-year period and since MetLife began to manage the Fund. The Board concluded that the services MetLife provided were satisfactory.
● Dunham Monthly Distribution Fund: The Board noted Grantham, Mayo, Van Otterloo & Co. LLC (“GMO”) has served as the Fund’s sub-adviser since April 1, 2021 (while the Fund’s inception date is September 29, 2008). The Board observed that the Fund underperformed its Peer Group average and Morningstar Category average for the five-and ten-year periods, but had outperformed its Peer Group average, Morningstar Category average, and benchmark index for the one-year period and since GMO began to manage the Fund. The Board concluded that the services GMO provided were satisfactory.
● Dunham Real Estate Stock Fund: The Board noted that American Assets Capital Advisers LLC (“AACA”) has served as the Fund’s sub-adviser since January 1, 2020 (while the Fund’s inception date is December 10, 2004). The Board observed that the Fund underperformed its Peer Group average, Morningstar Category average, and benchmark index over all time periods, but noted that this underperformance was primarily due to the Fund’s one-year performance. The Board concluded that the services AACA provided were satisfactory.
● Dunham Small Cap Growth Fund: The Board noted that Pier Capital, LLC (“Pier”) has served as the Fund’s sub-adviser since December 10, 2004 (the inception date of the Fund). The Board observed that the Fund outperformed its Peer Group average, the Morningstar category average, and its benchmark index over all time periods, aside from the one-year period, during which it underperformed. The Board concluded that the services Pier provided were satisfactory.
● Dunham Small Cap Value Fund: The Board noted that Ziegler Capital Management LLC (“ZCM”), or a predecessor firm, has served as the Fund’s sub-adviser since July 1, 2013 (while the Fund’s inception date is December 10, 2004). The Board noted that the Fund had outperformed or performed in line with its Peer Group average, Morningstar Category average, and benchmark over the one- and ten-year period and since ZCM began to manage the Fund but had underperformed its Peer Group average and Morningstar Category average for the five-year period. The Board concluded that the services ZCM provided were satisfactory.
Sub-Advisory Fees and Economies of Scale. The Board considered each Fund’s sub-advisory fee schedule and noted the fees charged to comparable portfolios, if any, that the sub -adviser managed. The Board noted that the fee schedule was negotiated between the Adviser and each sub-adviser, an unaffiliated third party.
The Board considered the base fee paid to each sub-adviser when the performance of a Fund is equal to that of a specific index plus or minus a “null” zone. The Board also reviewed the operation of the performance fee and the impact on fees and expenses based on various performance results. The Board recognized the unique nature of a
| ADDITIONAL INFORMATION (Unaudited) (Continued) |
| April 30, 2023 |
performance fee, which results in higher fees when a sub -adviser delivers positive results, and how performance fees should be integrated into their analysis. The Board noted information that the Adviser provided regarding the specific benchmark index used to compute each sub-adviser’s performance fee, how performance adjustments are calculated, and why each Fund’s N-share class (as the class with the most assets) is used for performance calculations.
The Board confirmed its belief that performance fees help ensure that any significant fee adjustments are attributable to a sub-adviser’s skill, rather than to random performance fluctuations, and the performance fee aligns a sub-adviser’s interest with those of Fund shareholders. The Board concluded that each sub-adviser’s fees were in a reasonable range.
The Board reviewed the relevance of economies of scale in the context of a sub-adviser that receives a performance -based fee. The Board agreed that the Adviser successfully had negotiated a favorable base fee with each sub-adviser, and that reductions based on asset growth, when coupled with the possibility of fee reductions based on performance, could hinder the Adviser’s ability to attract top sub-advisory talent. The Board agreed that pursuing breakpoints with any of the sub-advisers would not be in the best interests of Fund shareholders at this time.
Profitability and Fallout Benefits. The Board considered information provided regarding each sub-adviser’s estimated profitability from providing sub-advisory services to its respective Fund. The Board noted that the sub-advisory fee schedule was negotiated between the Adviser and each sub-adviser, an unaffiliated third party. The Board reviewed materials provided as to any additional benefits each sub-adviser receives.
Conclusion. Based on all of the information considered and the conclusions reached, the Board determined that the terms of the Advisory Agreements for each Fund are fair and reasonable, and that the approval and/or continuation of the Advisory Agreements, as applicable, are in the best interests of each Fund.
| ADDITIONAL INFORMATION (Unaudited) (Continued) |
| April 30, 2023 |
Dunham Large Cap Value Fund
15(c) Board Considerations
December 20, 2022
On December 20, 2022, the Board of Trustees (the “Board”) of Dunham Funds (the “Trust”), a Delaware business trust, met to consider, among other things, a new sub-advisory agreement (the “New Sub-Advisory Agreement”) with Great Lakes Advisors, LLC (“Great Lakes”) on behalf of the Dunham Large Cap Value Fund (the “Fund”). The New Sub-Advisory Agreement would take effect upon the change of control of Rothschild & Co. Asset Management US Inc. (“Rothschild”) when Wintrust Financial Corporation (“Wintrust”), the parent company of Great Lakes, acquires Rothschild (the “Acquisition”). The Acquisition is expected to close in the first quarter of 2023.
In considering the New Sub-Advisory Agreement, the Independent Trustees had requested and reviewed materials that Dunham & Associates Investment Counsel, Inc. (the “Adviser”) and Great Lakes provided prior to and during the meeting and had reviewed a memorandum from Fund counsel that reviewed their fiduciary duties pertaining to the New Sub-Advisory Agreement and the factors they should consider in evaluating the New Sub-Advisory Agreement.
Among other information, the Adviser and Great Lakes provided information to assist the Independent Trustees in assessing the nature, extent and quality of services provided, information comparing the investment performance, advisory fees and operating expense ratio of the Fund to other funds, information about estimated profitability and/or financial condition and compliance and regulatory matters. The Board determined that, given the totality of the information provided with respect to the New Sub-Advisory Agreement, the Board had received sufficient information to approve the New Sub-Advisory Agreement. The Independent Trustees and Fund counsel also met to consider the Sub-Advisory Agreement.
Based upon its review, the Board concluded that it was in the best interests of the Fund that the New Sub-Advisory Agreement be approved. In considering the approval of the New Sub-Advisory Agreement, the Board did not identify any single factor or group of factors as all-important or controlling, and considered a variety of factors in its analysis, including those discussed below. The Board did not allot a particular weight to any one factor or group of factors.
| II. | Sub-Advisory Agreement |
Nature, Extent and Quality of Services. In considering the approval of the New Sub-Advisory Agreement between the Fund and Great Lakes, the Board considered the nature, extent and quality of services Great Lakes would provide under the New Sub-Advisory Agreement. The Board reviewed the background of the investment professionals that would service the Fund, and the sub-adviser’s reputation, resources and investment approach. The Board also reviewed information provided regarding the structure of portfolio manager compensation, trading and brokerage practices, soft dollar usage, risk management and compliance matters.
The Board noted in particular that, after the Acquisition, the entire Rothschild investment team, including all team members providing advisory services to the Fund, will remain in place and continue to provide the same investment advisory services to the Fund. The investment discipline, process, tools and models also will remain unchanged. The Board further considered the changes that would be made to the compliance team as a result of the Acquisition. The Board concluded that the services Great Lakes would provide should be satisfactory.
Performance. The Board reviewed the Fund’s total return compared to the average total returns of the Fund’s Peer Group, Morningstar category averages, and benchmark index. The Board noted that Rothschild has served as the Fund’s sub-adviser since July 1, 2015 (while the Fund’s inception date is December 10, 2004). The Board observed the Fund had performed in line with its Peer Group average for the one-year period and with its Morningstar Category average and benchmark index for the five- and ten-year and since inception periods. The Board concluded that the services that Great Lakes would provide should be satisfactory.
Sub-Advisory Fees and Economies of Scale. The Board considered the Fund’s sub -advisory fee schedule and noted the fees charged to comparable portfolios, if any, that the sub-adviser managed. The Board considered that the fee schedule was negotiated between the Adviser and Great Lakes, an unaffiliated third party.
The Board reviewed the operation of the performance fee and the impact on fees and expenses based on various performance results. They discussed the unique nature of the performance fee, which results in higher fees when the Sub-Adviser delivers results, and how performance fees should be integrated into their analysis.
| ADDITIONAL INFORMATION (Unaudited) (Continued) |
| April 30, 2023 |
The Board confirmed its belief that performance fees help ensure that any significant fee adjustments are attributable to the Sub-Adviser’s skill, rather than to random performance fluctuations, and the performance fee aligns the Sub-Adviser’s interest with those of Fund shareholders.
The Board also noted in particular that the Fund’s sub-advisory fee schedule will remain the same after the Sub-Adviser takes over from the current sub-adviser, Rothschild. The Fund will pay a “fulcrum fee” consisting of: a “base fee” of 30 basis points (0.30%) annually; and a “performance fee” at a rate that will vary by up to +/- 20 bps (0.20%). The Board concluded that the Sub-Adviser’s fees were in a reasonable range.
The Board reviewed the relevance of economies of scale in the context of the Sub-Adviser that receives a performance-based fee. The Board agreed that the Adviser had successfully negotiated a favorable base fee with the Sub-Adviser, and that reductions based on asset growth, when coupled with the possibility of fee reductions based on performance, could hinder the Adviser’s ability to attract top sub-advisory talent. The Board agreed that pursuing breakpoints with the Sub-Adviser would not be in the best interests of Fund shareholders at this time.
Profitability and Fallout Benefits. The Board considered any information provided regarding Great Lakes’ estimated profitability from providing sub-advisory services to the Fund. The Board noted that the sub-advisory fee schedule was negotiated between the Adviser and Great Lakes, an unaffiliated third party. The Board reviewed materials provided as to any additional benefits Great Lakes receives.
Conclusion. Based on all of the information considered and the conclusions reached, the Board determined that the terms of the New Sub-Advisory Agreement for the Fund are fair and reasonable, and that the approval of the New Sub-Advisory Agreement is in the best interests of the Fund.
| ADDITIONAL INFORMATION (Unaudited) (Continued) |
| April 30, 2023 |
Dunham Focused Large Cap Growth Fund
15(c) Board Considerations
December 20, 2022
On December 20, 2022, the Board of Trustees (the “Board”) of Dunham Funds (the “Trust”), a Delaware business trust, met to consider, among other things, a new sub-advisory agreement (the “New Sub-Advisory Agreement”) with The Ithaka Group, LLC (“Ithaka”) on behalf of the Dunham Focused Large Cap Growth Fund (the “Fund”). The New Sub-Advisory Agreement would take effect upon the change of control of Ithaka following a change to its ownership group effective December 31, 2022.
In considering the New Sub-Advisory Agreement, the Independent Trustees had requested and reviewed materials that Dunham & Associates Investment Counsel, Inc. (the “Adviser”) and Ithaka provided prior to and during the meeting and had reviewed a memorandum from Fund counsel that reviewed their fiduciary duties pertaining to the New Sub-Advisory Agreement and the factors they should consider in evaluating the New Sub-Advisory Agreement.
Among other information, the Adviser and Ithaka provided information to assist the Independent Trustees in assessing the nature, extent and quality of services provided, information comparing the investment performance, advisory fees and operating expense ratio of the Fund to other funds, information about estimated profitability and/or financial condition and compliance and regulatory matters. The Board determined that, given the totality of the information provided with respect to the New Sub-Advisory Agreement, the Board had received sufficient information to approve the New Sub-Advisory Agreement. The Independent Trustees and Fund counsel also met to consider the Sub-Advisory Agreement.
Based upon its review, the Board concluded that it was in the best interests of the Fund that the New Sub-Advisory Agreement be approved. In considering the approval of the New Sub-Advisory Agreement, the Board did not identify any single factor or group of factors as all-important or controlling, and considered a variety of factors in its analysis, including those discussed below. The Board did not allot a particular weight to any one factor or group of factors.
| II. | Sub-Advisory Agreement |
Nature, Extent and Quality of Services. In considering the approval of the New Sub-Advisory Agreement between the Fund and Ithaka, the Board considered the nature, extent and quality of services Ithaka would provide under the New Sub-Advisory Agreement. The Board reviewed the background of the investment professionals that would service the Fund, and the sub-adviser’s reputation, resources and investment approach. The Board also reviewed information provided regarding the structure of portfolio manager compensation, trading and brokerage practices, soft dollar usage, risk management and compliance matters.
The Board discussed the changes to the portfolio management team of the Fund due to the change of firm ownership, noting Mr. Scott O’Gorman would continue to serve as portfolio manager of the Fund and that Ithaka will continue to provide the same investment advisory services to the Fund and that its investment discipline, process, tools and models also will remain unchanged. The Board concluded that the services Ithaka would provide should be satisfactory.
Performance. The Board reviewed the Fund’s total return compared to the average total returns of the Fund’s Peer Group, Morningstar category averages, and benchmark index. The Board noted that Ithaka has served as the Fund’s sub-adviser since December 8, 2011 (the inception date of the Fund). The Board observed the Fund had underperformed its Peer Group, Morningstar category averages, and benchmark index over all relevant time period, but noted Ithaka’s belief in the long-term potential performance of its investment strategy. The Board concluded that the services that Ithaka would provide should be satisfactory.
Sub-Advisory Fees and Economies of Scale. The Board considered the Fund’s sub -advisory fee schedule and noted the fees charged to comparable portfolios, if any, that the sub-adviser managed. The Board considered that the fee schedule was negotiated between the Adviser and Ithaka, an unaffiliated third party.
The Board reviewed the operation of the performance fee and the impact on fees and expenses based on various performance results. They discussed the unique nature of the performance fee, which results in higher fees when the Sub-Adviser delivers results, and how performance fees should be integrated into their analysis.
| ADDITIONAL INFORMATION (Unaudited) (Continued) |
| April 30, 2023 |
The Board confirmed its belief that performance fees help ensure that any significant fee adjustments are attributable to the Sub-Adviser’s skill, rather than to random performance fluctuations, and the performance fee aligns the Sub-Adviser’s interest with those of Fund shareholders.
The Board also noted in particular that the Fund’s sub -advisory fee schedule will remain the same. The Fund will pay a “fulcrum fee” consisting of: a “base fee” of 35 basis points (0.35%) annually; and a “performance fee” at a rate that will vary by up to +/- 15 bps (0.15%). The Board concluded that the Sub-Adviser’s fees were in a reasonable range.
The Board reviewed the relevance of economies of scale in the context of the Sub-Adviser that receives a performance-based fee. The Board agreed that the Adviser had successfully negotiated a favorable base fee with the Sub-Adviser, and that reductions based on asset growth, when coupled with the possibility of fee reductions based on performance, could hinder the Adviser’s ability to attract top sub-advisory talent. The Board agreed that pursuing breakpoints with the Sub-Adviser would not be in the best interests of Fund shareholders at this time.
Profitability and Fallout Benefits. The Board considered any information provided regarding Ithaka’s estimated profitability from providing sub-advisory services to the Fund. The Board noted that the sub-advisory fee schedule was negotiated between the Adviser and Ithaka, an unaffiliated third party. The Board reviewed materials provided as to any additional benefits Ithaka receives.
Conclusion. Based on all of the information considered and the conclusions reached, the Board determined that the terms of the New Sub-Advisory Agreement for the Fund are fair and reasonable, and that the approval of the New Sub-Advisory Agreement is in the best interests of the Fund.
| ADDITIONAL INFORMATION (Unaudited) (Continued) |
| April 30, 2023 |
Dunham Dynamic Macro Fund
15(c) Board Considerations
December 20, 2022
On December 20, 2022, the Board of Trustees (the “Board”) of Dunham Funds (the “Trust”), a Delaware business trust, met to consider, among other things, a new sub -advisory agreement (the “Sub-Advisory Agreement”) with Vontobel Asset Management, Inc. (“Vontobel”) on behalf of the Dunham Dynamic Macro Fund (the “Fund”). The Sub-Advisory Agreement would take effect on or about February 1, 2023.
In considering the Sub-Advisory Agreement, the Independent Trustees had requested and reviewed materials that Dunham & Associates Investment Counsel, Inc. (the “Adviser”) and Vontobel provided prior to and during the meeting. The Independent Trustees also had reviewed a memorandum from Fund counsel that addressed their fiduciary duties pertaining to the new Sub-Advisory Agreement and the factors they should consider in evaluating the Sub-Advisory Agreement.
Among other information, the Adviser and Vontobel provided information to assist the Independent Trustees in assessing the nature, extent and quality of services provided, information comparing the investment performance, sub-advisory fees and operating expense ratio of the Fund to other funds, information about estimated profitability and/or financial condition and compliance and regulatory matters. The Board determined that, given the totality of the information provided with respect to the Sub-Advisory Agreement, the Board had received sufficient information to approve the Sub-Advisory Agreement.
Based upon its review, the Board concluded that it was in the best interests of the Fund that the Sub-Advisory Agreement be approved. In considering the approval of the Sub-Advisory Agreement, the Board did not identify any single factor or group of factors as all-important or controlling, and considered a variety of factors in its analysis, including those discussed below. The Board did not allot a particular weight to any one factor or group of factors.
| II. | Sub-Advisory Agreement |
Nature, Extent and Quality of Services. In considering the approval of the Sub-Advisory Agreement between the Fund and Vontobel, the Board considered the nature, extent and quality of services Vontobel would provide under the Sub-Advisory Agreement. The Board reviewed the background of the investment professionals that would service the Fund, and Vontobel’s reputation, resources and investment approach. The Board also reviewed information provided regarding the structure of portfolio manager compensation, trading and brokerage practices, soft dollar usage, risk management and compliance matters.
The Board noted in particular that Vontobel has been an SEC-registered investment adviser since 1984 and has managed mutual fund assets since 1992.
The Board concluded that the services that Vontobel would provide should be satisfactory.
Performance. The Board considered the performance of other investment strategies managed by Vontobel.
The Board concluded that the services that Vontobel would provide should be satisfactory.
Sub-Advisory Fees and Economies of Scale. The Board considered the Fund’s sub-advisory fee schedule and noted the fees charged to comparable portfolios, if any, that Vontobel managed. The Board considered that the fee schedule was negotiated between the Adviser and Vontobel, an unaffiliated third party.
The Board reviewed the operation of the performance fee and the impact on fees and expenses based on various performance results. They discussed the unique nature of the performance fee, which results in higher fees when Vontobel delivers results, and how performance fees should be integrated into their analysis.
The Board confirmed its belief that performance fees help ensure that any significant fee adjustments are attributable to Vontobel’s skill, rather than to random performance fluctuations, and the performance fee aligns Vontobel’s interest with those of Fund shareholders.
The Board also noted the Fund will pay a “fulcrum fee” consisting of: a “base fee” of 60 basis points (“bps”) (0. 60%) annually; and a “performance fee” at a rate that will vary by up to +/-35 bps (0.35%). The performance fee will be added to or subtracted from the base fee to arrive at the total fulcrum fee. The comparative index will be the Dow
| ADDITIONAL INFORMATION (Unaudited) (Continued) |
| April 30, 2023 |
Jones Moderately Aggressive Portfolio Index over the applicable measurement period. The Board concluded that Vontobel’s fees were in a reasonable range.
The Board reviewed the relevance of economies of scale in the context of a sub -adviser that receives a performance-based fee. The Board agreed that the Adviser had successfully negotiated a favorable base fee with Vontobel, and that reductions based on asset growth, when coupled with the possibility of fee reductions based on performance, could hinder the Adviser’s ability to attract top sub-advisory talent. The Board agreed that pursuing breakpoints with Vontobel would not be in the best interests of Fund shareholders at this time.
Profitability and Fallout Benefits. The Board considered any information provided regarding Vontobel’s estimated profitability from providing sub-advisory services to the Fund. The Board noted that the sub-advisory fee schedule was negotiated between the Adviser and Vontobel, an unaffiliated third party. The Board reviewed materials provided regarding any additional benefits that Vontobel would receive.
Conclusion. Based on all the information considered and the conclusions reached, the Board determined that the terms of the Sub-Advisory Agreement for the Fund are fair and reasonable, and that the approval of the Sub-Advisory Agreement is in the best interests of the Fund.
| ADDITIONAL INFORMATION (Unaudited) (Continued) |
| April 30, 2023 |
Dunham Monthly Distribution Fund
15(c) Board Considerations
December 22, 2022
On December 22, 2022, the Board of Trustees (the “Board”) of Dunham Funds (the “Trust”), a Delaware business trust, met to consider, among other things, the renewal of the investment advisory agreement between the Trust and Dunham & Associates Investment Counsel, Inc. (the “Adviser”) on behalf of the Dunham Monthly Distribution Fund (the “Fund”) (the “Advisory Agreement”).
The Independent Trustees had requested and reviewed materials the Adviser and the sub-advisers provided prior to and during the meetings and had reviewed a memorandum from Fund counsel that reviewed their fiduciary duties pertaining to renewal of the investment advisory agreement and the factors they should consider in evaluating the Advisory Agreement.
Among other information, the Adviser provided information to assist the Independent Trustees in assessing the nature, extent and quality of services provided, information comparing the investment performance, advisory fees and operating expense ratio of the Fund to other funds, information about estimated profitability and/or financial condition and compliance and regulatory matters. The Board determined that, given the totality of the information provided with respect to the Advisory Agreement, the Board had received sufficient information to approve the Advisory Agreement.
The Independent Trustees and Fund counsel met in executive sessions to consider the renewal of the Advisory Agreement. The Board also received information about the Fund throughout the year in connection with the regular quarterly Board meetings from the Adviser.
Based upon its review, the Board concluded that it was in the best interests of the Fund that the Advisory Agreement be renewed. In considering the renewal of the Advisory Agreement, the Board did not identify any single factor or group of factors as all-important or controlling, and considered a variety of factors in its analysis, including those discussed below. The Board did not allot a particular weight to any one factor or group of factors.
| II. | Investment Advisory Agreement |
Nature, Extent and Quality of Services. In considering the renewal of the Advisory Agreement with the Adviser, the Board considered the nature, extent and quality of services that the Adviser provided to the Fund, including the Adviser’s personnel and resources and the Adviser’s criteria for reviewing a sub-adviser’s performance. The Board reviewed the services the Adviser provided in serving as investment adviser, including the backgrounds of the personnel providing the investment management services and compliance staff. They also reviewed information provided regarding risk management and compliance and regulatory matters. The Board concluded that the services the Adviser provided were satisfactory.
Performance. The Board reviewed performance information the Adviser provided for Class N of the Fund compared to the performance of (a) funds in a peer group (the “Peer Group”) (which is a relevant sub-set of funds in the Fund’s Morningstar category), (b) a Morningstar category average and (c) a benchmark index for the one, five and ten year periods, ended September 30, 2022. The Board considered that the Adviser had delegated day-to-day portfolio management of the Fund’s strategy to a sub-adviser and noted the ongoing oversight activities the Adviser performed, including review of returns on a relative and absolute basis, evaluation of brokerage execution quality and yearly compliance reviews. The Board concluded that the Adviser appropriately had reviewed and monitored the sub-adviser’s investment performance.
Advisory Fee. The Board reviewed the Fund’s advisory fee and expense ratio, taking into account the Fund’s average net assets, and reviewed information comparing the advisory fee and expense ratio to those of the Peer Group and a Morningstar category. The Board discussed that, while the advisory fees do not necessarily have to be the lowest compared to the Peer Groups, it is their duty to evaluate whether the advisory fees are reasonable. The Board noted that the Adviser’s fees range from 0.50% to 0.65% for the Dunham Funds in general, which, when combined with the sub-adviser fees, are generally higher than the Peer Group averages when a Fund is performing well, but in some cases lower than the Peer Group averages when a Fund is underperforming. The Board concluded that the Adviser’s fee ranges are applied reasonably based on the nature of a Fund (i.e., bond vs. equity, or alternative vs. traditional).
| ADDITIONAL INFORMATION (Unaudited) (Continued) |
| April 30, 2023 |
The Board observed that currently four Funds are considered “alternative” and generally require enhanced oversight compared to more traditional asset classes. The Board discussed the level of work involved in the Adviser’s oversight of the Fund, the Adviser’s ongoing quantitative and qualitative analysis of each sub-adviser, and the other services that the Adviser provides to the Fund.
The Board also noted that the Fund’s advisory fee was higher than the average of the Peer Group and the Morningstar category; however, the overall expense ratio was in a reasonable range.
In light of the nature, quality and extent of services the Adviser provided, the Board concluded that the Fund’s advisory fee was reasonable.
Economies of Scale. The Board considered the extent to which economies of scale would be realized as the Fund grows and whether fee levels reflect a reasonable sharing of economies of scale for the benefit of Fund investors. The Board noted that breakpoints may be an appropriate way for the Adviser to share its economies of scale if the Fund experiences substantial asset growth; however, the Board recognized that the Fund had not yet reached an asset level where the Adviser could realize significant economies of scale. The Board observed that economies of scale will be considered in the future as Fund asset levels grow.
Profitability. The Board also reviewed the estimated profitability of the Adviser with respect to the Fund. The Board concluded that the estimated profitability of the Adviser in connection with the management of the Fund was reasonable, and at a level to adequately incentivize the Adviser to continue to provide high quality services.
Fallout Benefits. Because of its relationship with the Fund, the Adviser and its affiliates may receive certain benefits. The Board reviewed materials provided by the Adviser as to any such benefits.
Conclusion. Based on all of the information considered and the conclusions reached, the Board determined that the terms of the Advisory Agreement for the Fund are fair and reasonable, and that the continuation of the Advisory Agreement is in the best interests of the Fund.
| ADDITIONAL INFORMATION (Unaudited) (Continued) |
LIQUIDITY RISK MANAGEMENT PROGRAM
In October 2016, the Securities and Exchange Commission (“SEC”) adopted Rule 22e-4, or the “Liquidity Rule,” under the Investment Company Act of 1940. The Liquidity Rule requires a mutual fund to adopt a liquidity risk management program (“Program”). In June 2018, the SEC adopted a requirement that a mutual fund disclose information about the operation and effectiveness of its Program in its reports to shareholders.
The Funds have adopted and implemented a Program pursuant to the Liquidity Rule, effective December 1, 2018. The Program is intended to provide a framework for: (1) assessing and managing a Fund’s liquidity risk (i.e., the risk that a Fund could not meet requests to redeem shares without significantly diluting remaining investors’ interests) based on a variety of factors, including the Fund’s investment strategy and liquidity of its portfolio investments, (2) classifying the liquidity of a Fund’s investments, (3) determining a Fund’s highly liquid investment minimum (“HLIM”), if applicable, (4) complying with a Fund’s illiquid investment limit, and (5) reporting to the Funds’ Board of Trustees. The Board of Trustees designated the Funds’ investment adviser, Dunham & Associates Investment Counsel, Inc. (the “Program Administrator”), to administer the Program. The Program Administrator established a liquidity risk management group to assist the Program Administrator in implementing the Program.
Under the Program, each of the Fund’s portfolio investments is classified into one of four liquidity categories defined by the SEC: highly liquid, moderately liquid, less liquid, and illiquid. Liquidity classifications take into account a variety of market, trading, and investment factors, including the Fund’s reasonably anticipated trade size, and the Program Administrator has engaged a third-party vendor to assist with the classification of portfolio investments.
The Liquidity Rule prohibits mutual funds from acquiring investments that would cause their illiquid investments to exceed 15% of net assets. The Liquidity Rule also requires funds that do not primarily hold assets that are highly liquid investments to determine a minimum percentage of net assets to be invested in highly liquid investments (the HLIM). The Program includes provisions designed to comply with the 15% limit on illiquid investments and for determining and complying with the HLIM requirement, as applicable.
In accordance with the Liquidity Rule, the Program Administrator prepared, and the Funds’ Board of Trustees reviewed, a report regarding the operation and effectiveness of the Program for the period from January 1, 2022 through December 31, 2022. The report concluded that the Program remains reasonably designed to assess and manage a Fund’s liquidity risk, and that during the period the Program was implemented effectively.
| DUNHAM FUNDS’ EXPENSES (Unaudited) |
Example
Shareholders of mutual funds will pay (1) transitional costs, such as sales load, and (2) ongoing expenses, such as advisory fees, distribution and service fees (12b-1), and other fund expenses. The following examples are intended to help you understand the ongoing cost (in dollars) of investing in a fund and to compare these costs with the ongoing costs of investing in other mutual funds. Please note, the expenses shown in the tables are meant to highlight ongoing costs only and do not reflect any transactional costs, such as sales charges (loads), or contingent deferred sales charges on redemptions which may be assessed by mutual funds. This Example is based on an investment of $1,000 invested at the beginning of the period and held for the entire period as indicated below.
Actual Expenses
The columns under the heading entitled “Actual” help you estimate the actual expenses you paid over the period. The “Actual-Ending Account Value” shown is derived from the Fund’s actual return, and the “Actual- Expenses Paid During Period” shows the dollar amount that would have been paid by an investor who started with $1,000 in the Fund. To estimate the expenses you paid on your account during this period, simply divide your account value by $1,000 (for example, an $8,600 account value divided by $1,000 = 8.6), then multiply the result by the number in the column under the heading entitled “Actual-Expenses Paid During Period”.
Hypothetical Examples for Comparison Purposes
The columns under the heading entitled “Hypothetical” provide information about hypothetical account value and hypothetical expenses based on the Fund’s actual expense ratio and an assumed rate of return of 5% per year before expenses, which is not the Fund’s actual return. The hypothetical account values and expenses may not be used to estimate the actual ending account balance or expenses you paid for the period. You may use this information to compare the ongoing costs of investing in the Fund and other funds. To do so, compare this 5% hypothetical example with the 5% hypothetical examples that appear in the shareholder reports of other funds.
Please note that the expenses shown in the table are meant to highlight your ongoing costs only and do not reflect any transactional costs which may be applicable to your account. Therefore, the last column of the table (Hypothetical- Expenses Paid During Period) is useful in comparing ongoing costs only, and will not help you determine the relative total costs of owning different funds. In addition, if these transactional costs were included, your costs would have been higher.
| | | | | | | Actual | | Hypothetical |
| | | Fund’s | | Beginning | | Ending | | | | Ending | | |
| | | Annualized | | Account | | Account | | Expenses | | Account | | Expenses |
| | | Expense | | Value | | Value | | Paid During | | Value | | Paid During |
| | | Ratio | | 11/01/22 | | 4/30/23 | | Period* | | 4/30/23 | | Period* |
| Class N: | | | | | | | | | | | | |
| Corporate/Government Bond Fund | | 1.13% | | $1,000.00 | | $1,066.30 | | $5.79 | | $1,019.19 | | $5.66 |
| Floating Rate Bond Fund | | 1.00% | | $1,000.00 | | $1,058.40 | | $5.13 | | $1,019.81 | | $5.03 |
| High-Yield Bond Fund | | 1.22% | | $1,000.00 | | $1,059.20 | | $6.24 | | $1,018.73 | | $6.12 |
| International Opportunity Bond Fund | | 1.56% | | $1,000.00 | | $1,113.50 | | $8.20 | | $1,017.04 | | $7.82 |
| Large Cap Value Fund | | 0.99% | | $1,000.00 | | $1,041.00 | | $5.03 | | $1,019.87 | | $4.98 |
| Small Cap Value Fund | | 1.57% | | $1,000.00 | | $959.40 | | $7.62 | | $1,017.02 | | $7.84 |
| Focused Large Cap Growth Fund | | 1.08% | | $1,000.00 | | $1,208.00 | | $5.90 | | $1,019.45 | | $5.40 |
| Small Cap Growth Fund | | 1.10% | | $1,000.00 | | $1,058.40 | | $5.63 | | $1,019.32 | | $5.53 |
| Emerging Markets Stock Fund | | 1.14% | | $1,000.00 | | $1,147.40 | | $6.06 | | $1,019.16 | | $5.69 |
| International Stock Fund | | 1.95% | | $1,000.00 | | $1,200.40 | | $10.62 | | $1,015.14 | | $9.73 |
| Dynamic Macro Fund | | 1.80% | | $1,000.00 | | $1,057.60 | | $9.18 | | $1,015.87 | | $8.99 |
| Long/Short Credit Fund | | 0.89% | | $1,000.00 | | $992.80 | | $4.40 | | $1,020.38 | | $4.46 |
| Monthly Distribution Fund | | 1.21% | | $1,000.00 | | $1,011.90 | | $6.03 | | $1,018.80 | | $6.05 |
| Real Estate Stock Fund | | 1.05% | | $1,000.00 | | $1,000.60 | | $5.23 | | $1,019.57 | | $5.28 |
| Class A: | | | | | | | | | | | | |
| Corporate/Government Bond Fund | | 1.38% | | $1,000.00 | | $1,064.30 | | $7.04 | | $1,017.97 | | $6.89 |
| Floating Rate Bond Fund | | 1.25% | | $1,000.00 | | $1,057.10 | | $6.40 | | $1,018.57 | | $6.28 |
| High-Yield Bond Fund | | 1.47% | | $1,000.00 | | $1,058.50 | | $7.51 | | $1,017.49 | | $7.37 |
| International Opportunity Bond Fund | | 1.81% | | $1,000.00 | | $1,111.90 | | $9.49 | | $1,015.80 | | $9.06 |
| Large Cap Value Fund | | 1.24% | | $1,000.00 | | $1,039.80 | | $6.29 | | $1,018.63 | | $6.22 |
| Small Cap Value Fund | | 1.82% | | $1,000.00 | | $958.40 | | $8.83 | | $1,015.77 | | $9.09 |
| Focused Large Cap Growth Fund | | 1.33% | | $1,000.00 | | $1,206.60 | | $7.26 | | $1,018.21 | | $6.64 |
| Small Cap Growth Fund | | 1.35% | | $1,000.00 | | $1,056.80 | | $6.87 | | $1,018.11 | | $6.74 |
| Emerging Markets Stock Fund | | 1.39% | | $1,000.00 | | $1,146.00 | | $7.38 | | $1,017.92 | | $6.94 |
| International Stock Fund | | 2.20% | | $1,000.00 | | $1,198.50 | | $11.97 | | $1,013.90 | | $10.97 |
| Dynamic Macro Fund | | 2.05% | | $1,000.00 | | $1,057.20 | | $10.43 | | $1,014.65 | | $10.22 |
| Long/Short Credit Fund | | 1.06% | | $1,000.00 | | $991.60 | | $5.26 | | $1,019.52 | | $5.33 |
| Monthly Distribution Fund | | 1.46% | | $1,000.00 | | $1,010.80 | | $7.27 | | $1,017.56 | | $7.30 |
| Real Estate Stock Fund | | 1.30% | | $1,000.00 | | $999.20 | | $6.47 | | $1,018.33 | | $6.53 |
| DUNHAM FUNDS’ EXPENSES (Unaudited) (Continued) |
| | | | | | | Actual | | Hypothetical |
| | | Fund’s | | Beginning | | Ending | | | | Ending | | |
| | | Annualized | | Account | | Account | | Expenses | | Account | | Expenses |
| | | Expense | | Value | | Value | | Paid During | | Value | | Paid During |
| | | Ratio | | 11/01/22 | | 4/30/23 | | Period* | | 4/30/23 | | Period* |
| Class C: | | | | | | | | | | | | |
| Corporate/Government Bond Fund | | 1.91% | | $1,000.00 | | $1,062.10 | | $9.77 | | $1,015.32 | | $9.55 |
| Floating Rate Bond Fund | | 1.77% | | $1,000.00 | | $1,054.50 | | $9.03 | | $1,016.00 | | $8.86 |
| High-Yield Bond Fund | | 1.97% | | $1,000.00 | | $1,054.30 | | $10.05 | | $1,015.01 | | $9.86 |
| International Opportunity Bond Fund | | 2.31% | | $1,000.00 | | $1,109.40 | | $12.07 | | $1,013.35 | | $11.52 |
| Large Cap Value Fund | | 1.99% | | $1,000.00 | | $1,036.30 | | $10.06 | | $1,014.91 | | $9.96 |
| Small Cap Value Fund | | 2.56% | | $1,000.00 | | $954.90 | | $12.42 | | $1,012.09 | | $12.78 |
| Focused Large Cap Growth Fund | | 2.08% | | $1,000.00 | | $1,201.80 | | $11.34 | | $1,014.49 | | $10.38 |
| Small Cap Growth Fund | | 2.10% | | $1,000.00 | | $1,052.60 | | $10.69 | | $1,014.37 | | $10.50 |
| Emerging Markets Stock Fund | | 2.13% | | $1,000.00 | | $1,142.00 | | $11.31 | | $1,014.23 | | $10.64 |
| International Stock Fund | | 2.95% | | $1,000.00 | | $1,193.60 | | $16.02 | | $1,010.19 | | $14.68 |
| Dynamic Macro Fund | | 2.78% | | $1,000.00 | | $1,053.30 | | $14.15 | | $1,011.01 | | $13.86 |
| Long/Short Credit Fund | | 1.89% | | $1,000.00 | | $987.50 | | $9.32 | | $1,015.42 | | $9.45 |
| Monthly Distribution Fund | | 2.21% | | $1,000.00 | | $1,007.30 | | $10.99 | | $1,013.85 | | $11.02 |
| Real Estate Stock Fund | | 2.05% | | $1,000.00 | | $995.60 | | $10.16 | | $1,014.61 | | $10.26 |
| * | Expenses Paid During Period are equal to the Fund’s annualized expense ratio, multiplied by the average account value over the period, multiplied by 184 days and divided by 365 (to reflect the number of days in the six month period ending October 31, 2022). |
NOTICE OF PRIVACY POLICY & PRACTICES
Privacy Notice
| FACTS | WHAT DO DUNHAM FUNDS DO WITH YOUR PERSONAL INFORMATION? |
| Why? | Financial companies choose how they share your personal information. Federal law gives consumers the right to limit some but not all sharing. Federal law also requires us to tell you how we collect, share, and protect your personal information. Please read this notice carefully to understand what we do. |
| What? | The types of personal information we collect and share depend on the product or service you have with us. This information can include: ■ Social Security number and wire transfer instructions ■ account transactions and transaction history ■ investment experience and purchase history When you are no longer a customer, we continue to share your information as described in this notice. |
| How? | All financial companies need to share customers’ personal information to run their everyday business. In the section below, we list the reasons financial companies can share their customers’ personal information; the reasons Dunham Funds chooses to share; and whether you can limit this sharing. |
Reasons we can share your personal
information | Do Dunham
Funds share? | Can you limit
this sharing? |
| For our everyday business purposes – such as to process your transactions, maintain your account(s), respond to court orders and legal investigations, or report to credit bureaus | Yes | No |
| For our marketing purposes – to offer our products and services to you | Yes | No |
| For joint marketing with other financial companies | No | We don’t share |
| For our affiliates’ everyday business purposes – information about your transactions and experiences | No | We don’t share |
| For our affiliates’ everyday business purposes – information about your creditworthiness | No | We don’t share |
| For non-affiliates to market to you | No | We don’t share |
| Questions? | Call (800) 442-4358 or go to www.dunham.com |
| Definitions What we do |
| How do Dunham Funds protect my personal information? | To protect your personal information from unauthorized access and use, we use security measures that comply with federal law. These measures include computer safeguards and secured files and buildings. We permit only authorized parties and affiliates (as permitted by law) who have signed an agreement (which protects your personal information) with us to have access to customer information. |
| How do Dunham Funds collect my personal information? | We collect your personal information, for example, when you
■ open and account or deposit money ■ direct us to buy securities or direct us to sell your securities ■ seek advice about your investments We also collect your personal information from others, such as credit bureaus, affiliates, or other companies. |
| | Federal law gives you the right to limit only
■ sharing for affiliates’ everyday business purposes-information about your creditworthiness ■ affiliates from using your information to market to you ■ sharing for non-affiliates to market to you State laws and individual companies may give you additional rights to limit sharing. |
| Definitions |
| Affiliates | Companies related by common ownership or control. They can be financial and nonfinancial companies. ■ Our affiliates include financial companies, such as Dunham & Associates Investment Counsel, Inc., Dunham Trust Company. |
| Non-affiliates | Companies not related by common ownership or control. They can be financial and nonfinancial companies. ■ Dunham Funds do not share with non-affiliates so they can market to you. |
| Joint marketing | A formal agreement between nonaffiliated financial companies that together market financial products or services to you. ■ Dunham Funds do not jointly market. |
How to Obtain Proxy Voting Information
Information regarding how the Funds voted proxies relating to portfolio securities for the most recent 12-month period ended June 30 as well as a description of the policies and procedures that the Funds use to determine how to vote proxies is available without charge, upon request, by calling (888)-3DUNHAM (338-6426) or by referring to the Securities and Exchange Commission’s (“SEC”) website at http://www.sec.gov.
How to Obtain 1st and 3rd Fiscal Quarter Portfolio Holdings
Each Fund files its complete schedule of portfolio holdings with the SEC for the first and third quarters of each fiscal year on Form N-PORT. Form N-PORT is available on the SEC’s website at http://www.sec.gov and may be reviewed and copied at the SEC’s Public Reference Room in Washington, DC (800)-SEC-0330. The information on Form N-PORT is available without charge, upon request, by calling (888)-3DUNHAM (338-6426).

P.O. Box 910309
San Diego, California 92191
(800) 442-4358
Distributed by Dunham & Associates Investment Counsel, Inc. Member FINRA/SIPC
THIS REPORT AND FINANCIAL STATEMENTS CONTAINED HEREIN ARE NOT INTENDED TO BE A FORECAST OF FUTURE EVENTS, A GUARANTEE OF FUTURE RESULTS, OR INVESTMENT ADVICE. FURTHER, THERE IS NO ASSURANCE THAT CERTAIN SECURITIES WILL REMAIN IN OR OUT OF EACH FUND’S PORTFOLIO.
THE FIGURES IN THIS REPORT REPRESENT PAST PERFORMANCE AND DO NOT GUARANTEE FUTURE RESULTS. THE PRINCIPAL VALUE OF AN INVESTMENT AND INVESTMENT RETURN WILL FLUCTUATE SO THAT AN INVESTOR’S SHARES, WHEN REDEEMED, MAY BE WORTH MORE OR LESS THAN THEIR ORIGINAL COST.
DUNHAM-SA23
Item 2. Code of Ethics. Not applicable.
Item 3. Audit Committee Financial Expert. Not applicable.
Item 4. Principal Accountant Fees and Services. Not applicable.
Item 5. Audit Committee of Listed Companies. Not applicable to open-end investment companies.
Item 6. Schedule of Investments. Schedule of investments in securities of unaffiliated issuers is included under Item 1.
Item 7. Disclosure of Proxy Voting Policies and Procedures for Closed-End Funds. Not applicable to open-end investment companies.
Item 8. Portfolio Managers of Closed-End Funds. Not applicable to open-end investment companies.
Item 9. Purchases of Equity Securities by Closed-End Funds. Not applicable to open-end investment companies.
Item 10. Submission of Matters to a Vote of Security Holders. None
Item 11. Controls and Procedures.
(a) Based on an evaluation of the Registrant’s disclosure controls and procedures as of a date within 90 days of filing date of this Form N-CSR, the principal executive officer and principal financial officer of the Registrant have concluded that the disclosure controls and procedures of the Registrant are reasonably designed to ensure that the information required in filings on Form N-CSR is recorded, processed, summarized, and reported by the filing date, including that information required to be disclosed is accumulated and communicated to the Registrant’s management, including the Registrant’s principal executive officer and principal financial officer, as appropriate to allow timely decisions regarding required disclosure.
(b) There were no significant changes in the registrant’s internal control over financial reporting that occurred during the registrant’s last fiscal half-year that have materially affected, or are reasonably likely to materially affect, the registrant’s internal control over financial reporting.
Item 12. Disclosure of Securities Lending Activities for Closed-End Management Investment Companies. Not Applicable to open-end investment companies.
Item 13. Exhibits.
(a)(1) Not required for semi-annual reports.
(a)(2) Certifications required by Section 302 of the Sarbanes-Oxley Act of 2002 (and Item 11(a)(2) of Form N-CSR) are filed herewith..
(a)(3) Not applicable.
(b) Certifications required by Section 906 of the Sarbanes-Oxley Act of 2002 (and Item 11(b) of Form N-CSR) are filed herewith.
SIGNATURES
Pursuant to the requirements of the Securities Exchange Act of 1934 and the Investment Company Act of 1940, the registrant has duly caused this report to be signed on its behalf by the undersigned, thereunto duly authorized.
(Registrant) Dunham Funds
By (Signature and Title)
/s/ Jeffrey Dunham
Jeffrey Dunham, Principal Executive Officer/President
Date 7/7/2023
Pursuant to the requirements of the Securities Exchange Act of 1934 and the Investment Company Act of 1940, this report has been signed below by the following persons on behalf of the registrant and in the capacities and on the dates indicated.
By (Signature and Title)
/s/ Jeffrey Dunham
Jeffrey Dunham, Principal Executive Officer/President
Date 7/7/2023
By (Signature and Title)
/s/ Denise Iverson
Denise Iverson, Principal Financial Officer/Treasurer
Date 7/7/2023