united states
securities and exchange commission
washington, d.c. 20549
form n-csr
certified shareholder report of registered management
investment companies
Investment Company Act file number 811-22153
Dunham Funds
(Exact name of registrant as specified in charter)
10251 Vista Sorrento Pkwy, Ste. 200, San Diego, CA 92121
(Address of principal executive offices) (Zip code)
Emile Molineaux
Gemini Fund Services, LLC., 80 Arkay Drive Hauppauge, NY 11788
(Name and address of agent for service)
Registrant's telephone number, including area code: 631-470-2616
Date of fiscal year end: 10/31
Date of reporting period:10/31/16
Item 1. Reports to Stockholders.
This Annual Report contains “forward-looking statements” within the meaning of the Private Securities Litigation Reform Act of 1995. Forward-looking statements also include those preceded by, followed by or that include the words “believes”, “expects”, “anticipates” or similar expressions. Such statements should be viewed with caution. Actual results or experience could differ materially from the forward-looking statements as a result of many factors. Each Fund makes no commitments to disclose any revisions to forward-looking statements, or any facts, events or circumstances after the date hereof that may bear upon forward-looking statements. In addition, prospective purchasers of the Funds should consider carefully the information set forth herein and the applicable fund’s prospectus. Other factors and assumptions not identified above may also have been involved in the derivation of these forward-looking statements, and the failure of these other assumptions to be realized may also cause actual results to differ materially from those projected.
Dear Fellow Shareholders,
Over the past fiscal year, the markets have had some ups and downs. In the first fiscal quarter, investors reacted negatively to a rise in short-term interest rates of a quarter point agreed to at the December 2015 Federal Open Market Committee (FOMC) meeting. After gaining back the losses from the interest rate movement, the stock market was given another shock when the UK voted to leave the European Union (EU) at the end of June. However, after the initial fall, the markets roared back in July to end up with a second consecutive strong positive quarter. As interest rates stayed the same, all eyes turned towards the U.S. Presidential election. As the election drew nearer and the polls started to show a closer race, market uncertainty rose and the markets were down slightly for the final fiscal quarter.
Stocks, even though they started off poorly, overall were decent for the fiscal year. While U.S. stock returns were in the mid-single digits, they were ahead of Chinese stocks, but lagged Japanese stocks. They outpaced foreign equities in developed markets but trailed emerging markets, who were the top performers for the 12-month period. Major U.S. indexes were held back by rising interest rates and election uncertainty.
In Europe, the “Brexit” vote dragged the markets down. The UK was down over 11 percent for the 12-month period. Other members of the EU were also hurt by the vote and most developed markets in the EU were negative for the fiscal year. It will be interesting to see how the European Central Bank’s (ECB) continues with its stimulus program with the UK exit from the EU looming.
Initial fears about a potential shortfall in China’s foreign exchange reserves dropped the world markets in January and February. However, all losses were recouped by the end of March. Other central banks continued their accommodating policies as the ECB started buying corporate bonds and the Bank of England resumed quantitative easing.
The oil market has seen heavy volatility as the Organization of Petroleum Exporting Countries (OPEC) continues to try and agree on a production freeze. However , an agreement is yet to be made. Certain members, such as Iran, continue to want to pump as much as possible and do not see the advantage of freezing output. Each announcement from OPEC conversations and meetings continues to drive the price of oil up or down. Even if an agreement is finalized, it remains to be seen how levels will be monitored, penalties enforced, and how countries will treat the standards. Supply and demand should be the driving force until OPEC members find a settlement for their constituents.
Domestic bonds continued to do relatively well for the year, even with the interest rate increase in December 2015. After ending under 1.5 percent at the end of the third fiscal quarter, the yield on the 10-year U.S. Treasury finished up about 35 basis points from that point to settle at 1.83 percent to end the 12-month period ended October 31, 2016. Global bonds, on the other hand, were up and down. They were up over 9 percent in the second fiscal quarter but fell over 4 percent in final fiscal quarter to close out the fiscal year. Overall, foreign bonds had higher returns for the 12-month period ended October 31, 2016, compared to the broad US bond market.
On the fund side, we have added the Dunham Alternative Dividend Fund. We believe this new fund will offer a strong source of income while still seeking to preserve capital during market downturns.
As we continue to move towards more clarity with the U.S. Presidential election and hopefully a better understanding on the future direction and timing of interest rate increases or decreases, we are optimistic that our diverse line-up of mutual funds will enable our shareholders to capitalize on opportunities the markets may present. We thank you for your continued trust and the confidence you have placed in us. We take that trust very seriously and look forward to servicing your investment needs for years to come.
Sincerely,
Jeffrey A. Dunham
President
Dunham & Associates Investment Counsel, Inc.
October 31, 2016
1
Dunham Floating Rate Bond Fund
Message from the Sub-Adviser (Newfleet Asset Management, LLC)
Interest rates fell over the fiscal year, but the path was anything but direct. The yield on the 10-year Treasury began the fiscal year at 2.14 percent and hit its high for the fiscal year of 2.34 percent a few days in, trading within a relatively tight range through the end of December. From that point, the yield began a decline which reversed at the beginning of February, corresponding to the 2016 bottom of the U.S. stock market and oil prices. The subsequent uptrend lasted until early May, at which point the yield began a steady decline, hitting its low point for the fiscal year of 1.36 percent in early July, before trending steadily upward to finish the fiscal year at 1.83 percent. The overall decline in rates generally did not hinder the performance for bank loans, as measured by the S&P / LSTA Leveraged Loan Index. Bank loans managed a positive return for the fiscal year despite rates falling, rising 6.5 percent during the fiscal year. Although interest rates fell, the London Interbank Offered Rate (“LIBOR”) increased significantly during the fiscal year. Three-month LIBOR began the fiscal year at 0.33 percent and ended the fiscal year at 0.88 percent.
The dip in interest rates over the fiscal year coincided with an equity market increase over the same time period. At the beginning of the fiscal year, the average bank loan in the Fund had a price of $96.79. By the end of the fiscal year, the average price rose to $98.57. The Sub-Adviser remains optimistic about the asset class’ potential as interest rates rise and investor sentiment towards the loan space allows the prices to continue to increase. At the beginning of the fiscal year, approximately 36 bank loans in the Fund had a price below $95, which represented approximately 13.0 percent of the bank loans in the Fund. By the end of the fiscal year, the Fund held approximately 22 bank loans with a price below $95, which represented approximately 7.0 percent of the bank loans in the Fund.
The yields on bank loans, as measured by the S&P / LSTA Leveraged Loan 100 Index, moved in similar fashion to broader Treasury yield movements during the fiscal year. Bank loans in general began the fiscal year with a yield-to-maturity of 5.9 percent, approximately 1.8 percent less than their traditional high-yield bond counterparts, as measured by the Bank of America Merrill Lynch High-Yield Bond Cash Pay Index. Bank loans underperformed traditional high-yield bonds during the fiscal year by 3.6 percent. As bank loans underperformed traditional high-yield bonds, the yield gap between the bank loans and traditional high-yield bonds saw a contraction. At the end of the fiscal year, the yields on bank loans stood at 5.1 percent and traditional high-yield bonds ended at 6.5 percent. The Fund held approximately 5.3 percent of its assets in traditional high-yield bonds, which from an allocation perspective enhanced relative performance during the fiscal year.
The Sub-Adviser continued to focus on higher-rated first lien loans within the bank loan space, limiting its exposure to bank loans rated CCC and lower. The exposure to lower-rated loans, second lien loans, and traditional bonds has been limited to instances where the Sub-Adviser has determined that the additional reward is expected to significantly outweigh the additional risk. However, with the significant increase in lower-rated securities, some of the Fund’s bonds also benefitted. For example, over the second half of the fiscal year, the Fund held the CCC-rated traditional bonds issued by Beverage Packaging Holdings Luxembourg I SA (08783AAC7) (holding percentage**: 0.14 percent), a joint issuer of debt that operates as a dual issuer of senior notes. The company is a subsidiary of Reynolds Group Holdings Limited, which is a leading global manufacturer and supplier of consumer beverage and foodservice packaging products, based in Auckland, New Zealand. The Beverage Packaging Holdings bonds increased 3.4 percent over the fiscal year through late June, when the Sub-Adviser sold the bonds just prior to them being called by the issuer. An example of a CCC-rated bond that had a challenging fiscal year was the that of iHeartCommunications, Inc. (184502BL5) (holding percentage*: 0.06 percent), a mobile and on-demand entertainment and information services provider. The bonds struggled over the first fiscal quarter but rebounded to start the second fiscal quarter. Crossing the break-even threshold near the end of the third fiscal quarter the bonds gained momentum the first part of the fourth fiscal quarter, at which time they began to fall again. Over the entire fiscal period, the bonds gained 0.93 percent in total return.
As oil prices rallied from their January lows, many energy-related issuers saw increases in their bank loans. One such issuer that benefitted the Fund over the first part of the second half of the fiscal year was MEG Energy Corporation (BL0932949) (holding percentage*: 0.43 percent), an oil and gas company that is primarily involved in oil sands developments and leases. Despite oil prices falling from their mid-year high of $51.23 a barrel, the MEG Energy bank loans saw a price increase of 1.2 percent through July 31, 2016. From that day until the end of the fiscal year, the MEG Energy bank loans delivered an additional 3.7 percent price increase. A bank loan that detracted from Fund performance was from issuer Quorum Health Corporation (BL1974247) (holding percentage*: 0.18 percent), a group of hospitals that were spun off from Community Health Systems, Inc. The Quorum bank loans suffered a price decrease of 7.7 percent over the second half of the fiscal year.
The Sub-Adviser remains optimistic that interest rates, on the short- and long-end of the yield curve, will continue to rise and that bank loan investors may benefit from a highly-correlated increase in LIBOR. The Sub-Adviser believes we are still in the later innings of the credit cycle and anticipates the Fed will increase the federal funds rate by year-end. The Sub-Adviser is incrementally dialing up risk in the Fund, albeit cautiously, and remains encouraged by the historically low default rates combined with the floating rate feature offered by bank loans.
| * | Holdings percentage(s) as of 10/31/2016. |
| ** | Holdings percentage(s) as of the date prior to the sale of the security. |
Growth of $100,000 Investment
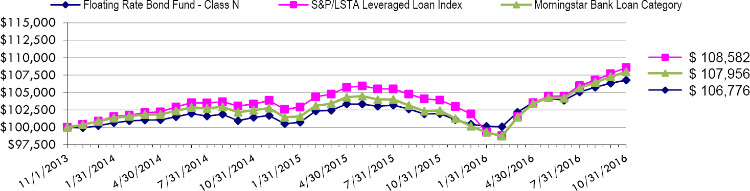
Total Returns as of October 31, 2016
| Annualized | ||
| One | Since Inception | |
| Year | (11/1/13) | |
| Class N | 4.74% | 2.21% |
| Class C | 3.87% | 1.41% |
| Class A with load of 4.50% | (0.20)% | 0.38% |
| Class A without load | 4.49% | 1.93% |
| S&P/LSTA Leverage Loan Index | 6.51% | 3.40% |
| Morningstar Bank Loan Category | 5.42% | 2.58% |
The S&P/LSTA U.S. Leveraged Loan 100 Index is designed to reflect the performance of the largest facilities in the leveraged loan market. Investors cannot invest directly in an index or benchmark.
The Morningstar Bank Loan Category is generally representative of mutual funds that primarily invest in floating-rate bank loans instead of bonds. These bank loans generally offer interest payments that typically float above a common short-term benchmark such as the London interbank offered rate, or LIBOR.
As disclosed in the Trust’s latest registration statement, the Fund’s total annual operating expenses, including cost of underlying funds, are 1.27% for Class N, 2.02% for Class C and 1.52% for Class A. Class A shares are subject to a sales load of 4.50% and a deferred sales charge of up to 0.75%. The performance data quoted here represents past performance, which is not indicative of future results. Current performance may be lower or higher than the performance data quoted. The investment return and NAV will fluctuate, so that an investor’s shares, when redeemed, may be worth more or less than their original cost. Total returns are calculated assuming reinvestment of all dividends and capital gains distributions, if any. The returns do not reflect the deductions of taxes a shareholder would pay on the redemption of fund shares or fund distributions. For performance information current to the most recent month-end, please call 1-800-442-4358 or visit our website www.dunham.com
2
| SCHEDULE OF INVESTMENTS |
| Dunham Floating Rate Bond Fund |
| October 31, 2016 |
| Shares | Value | |||||||||||||||
| EXCHANGE TRADED FUND - 1.0% | ||||||||||||||||
| DEBT FUND - 1.0% | ||||||||||||||||
| PowerShares Senior Loan Portfolio | 46,935 | $ | 1,087,953 | |||||||||||||
| TOTAL EXCHANGE TRADED FUND (Cost - $1,086,819) | ||||||||||||||||
| Principal | Interest | Maturity | ||||||||||||||
| Security | Amount | Rate | Date | |||||||||||||
| BANK LOANS - 91.7% | ||||||||||||||||
| CONSUMER DISCRETIONARY - 23.1% | ||||||||||||||||
| Advantage Sales & Marketing Inc | $ | 97,000 | 7.5000 | % | 7/24/2022 | 91,969 | ||||||||||
| Affinity Gaming LLC | 19,000 | 5.0000 | 6/30/2023 | 19,104 | ||||||||||||
| Altice US Finance I Corp | 325,625 | 3.8837 | 1/16/2025 | 327,253 | ||||||||||||
| AMC Entertainment Holdings, Inc. | 162,000 | 2.7500 | 12/15/2023 | 161,595 | ||||||||||||
| AOT Bedding Super Holdings LLC | 306,000 | 4.5000 | 10/20/2023 | 306,436 | ||||||||||||
| Aristocrat International Pty L | 631,776 | 3.6307 | 10/20/2021 | 635,396 | ||||||||||||
| Boyd Gaming Corp. | 176,302 | 4.0000 | 8/14/2020 | 177,928 | ||||||||||||
| Boyd Gaming Corp. | 112,000 | 3.8456 | 9/16/2023 | 113,019 | ||||||||||||
| Caesars Entertainment Operating | 129,617 | 12.7500 | 2/28/2017 | 151,793 | ||||||||||||
| Caesars Entertainment Operating | 441,848 | 10.2500 | 2/28/2017 | 480,509 | ||||||||||||
| Caesars Entertainment Resort | 819,544 | 7.0000 | 10/12/2020 | 825,691 | ||||||||||||
| Caesars Growth Properties Holding | 250,998 | 6.2500 | 5/8/2021 | 251,232 | ||||||||||||
| CBAC Borrower LLC | 99,250 | 8.2500 | 7/2/2020 | 98,009 | ||||||||||||
| CBS Radio, Inc. | 327,000 | 4.5000 | 10/16/2023 | 329,179 | ||||||||||||
| CCO Safari III LLC | 704,460 | 3.6359 | 1/24/2023 | 709,645 | ||||||||||||
| CCO Safari III LLC | 137,310 | 3.3859 | 8/24/2021 | 138,048 | ||||||||||||
| CDS US Intermediate Holdings | 174,240 | 5.0000 | 7/8/2022 | 174,785 | ||||||||||||
| Cengage Learning, Inc. | 220,448 | 5.2500 | 6/8/2023 | 216,131 | ||||||||||||
| Charter Communications Operating | 325,132 | 3.1359 | 6/30/2020 | 326,209 | ||||||||||||
| CityCenter Holdings LLC | 301,249 | 4.2500 | 10/16/2020 | 303,477 | ||||||||||||
| Clear Channel Communications | 730,000 | 7.6359 | 1/30/2019 | 555,129 | ||||||||||||
| CS Intermediate Holdco 2 LLC | 408,599 | 4.0000 | 4/4/2021 | 409,979 | ||||||||||||
| CSC Holdings LLC | 1,047,895 | 3.8739 | 10/12/2024 | 1,053,627 | ||||||||||||
| Delta 2 Lux Sarl | 310,000 | 4.7500 | 7/30/2021 | 311,077 | ||||||||||||
| Eldorado Resorts, Inc. | 128,375 | 4.2500 | 7/24/2022 | 129,338 | ||||||||||||
| Federal-Mogul Holdings Corp. | 561,769 | 4.7500 | 4/16/2021 | 546,219 | ||||||||||||
| Floor & Decor Outlets of America | 263,000 | 5.2500 | 9/30/2023 | 263,986 | ||||||||||||
| Gates Global LLC | 525,783 | 4.2500 | 7/6/2021 | 519,347 | ||||||||||||
| Graton Economic Development | 129,865 | 4.7500 | 8/31/2022 | 130,677 | ||||||||||||
| Harbor Freight Tools | 497,000 | 4.1359 | 8/18/2023 | 501,115 | ||||||||||||
| Hilton Worldwide Finance LLC | 1,432,105 | 3.3837 | 10/24/2023 | 1,441,385 | ||||||||||||
| Hilton Worldwide Finance LLC | 140,090 | 3.5000 | 10/26/2020 | 140,845 | ||||||||||||
| Hudson’s Bay Co | 250,000 | 4.2500 | 9/30/2022 | 252,395 | ||||||||||||
| Intelsat Jackson Holdings S.A. | 370,000 | 3.7500 | 6/30/2019 | 354,863 | ||||||||||||
| KAR Auction Services, Inc. | 308,343 | 4.0331 | 3/12/2021 | 310,463 | ||||||||||||
| KAR Auction Services, Inc. | 74,625 | 4.3456 | 3/8/2023 | 75,558 | ||||||||||||
| Laureate Education, Inc. | 485,577 | 8.8716 | 3/16/2021 | 482,724 | ||||||||||||
| Leslie’s Poolmart, Inc. | 189,776 | 5.2500 | 8/16/2023 | 191,397 | ||||||||||||
| Libbey Glass, Inc. | 251,226 | 3.8739 | 4/8/2021 | 252,482 | ||||||||||||
| Lions Gate Entertainment Corp. | 314,000 | 3.8811 | 10/12/2023 | 314,327 | ||||||||||||
| MCC Georgia LLC | 298,197 | 3.3456 | 1/28/2021 | 301,180 | ||||||||||||
| MCC Georgia LLC | 154,840 | 3.5956 | 6/30/2021 | 156,292 | ||||||||||||
| MGM Growth Properties Operating | 375,115 | 3.5956 | 4/24/2023 | 376,552 | ||||||||||||
| Michaels Stores, Inc. | 585,796 | 3.7500 | 1/30/2023 | 590,922 | ||||||||||||
| Mohegan Tribal Gaming Authority | 250,000 | 5.5000 | 10/12/2023 | 249,728 | ||||||||||||
| MPG Holdco I, Inc. | 285,376 | 3.7500 | 10/20/2021 | 286,674 | ||||||||||||
| Neiman Marcus Group LTD, Inc. | 267,934 | 4.2500 | 10/24/2020 | 247,182 | ||||||||||||
| Nexstar Broadcasting, Inc. | 19,309 | 3.8538 | 9/26/2023 | 19,412 | ||||||||||||
| Nexstar Broadcasting, Inc. | 216,691 | 3.0000 | 9/26/2023 | 217,843 | ||||||||||||
See accompanying notes to financial statements.
3
| SCHEDULE OF INVESTMENTS |
| Dunham Floating Rate Bond Fund (Continued) |
| October 31, 2016 |
| Principal | Interest | Maturity | ||||||||||||||
| Security | Amount | Rate | Date | Value | ||||||||||||
| CONSUMER DISCRETIONARY (Continued) - 23.1% | ||||||||||||||||
| Numericable US LLC | $ | 324,188 | 5.136 | % | 1/16/2024 | $ | 327,672 | |||||||||
| Numericable US LLC | 142,643 | 4.8859 | 2/10/2023 | 142,704 | ||||||||||||
| Party City Holdings, Inc. | 614,482 | 3.8811 | 8/20/2022 | 617,127 | ||||||||||||
| Penn National Gaming, Inc. | 453,457 | 3.3859 | 10/30/2020 | 455,158 | ||||||||||||
| PetSmart, Inc. | 539,175 | 4.000 | 3/11/2022 | 541,051 | ||||||||||||
| Scientific Games International | 678,281 | 6.0000 | 9/30/2021 | 682,096 | ||||||||||||
| ServiceMaster Co LLC | 892,679 | 4.2500 | 6/16/2021 | 895,843 | ||||||||||||
| SFR Group SA | 160,000 | 4.1300 | 1/14/2025 | 159,567 | ||||||||||||
| Sinclair Television Group, Inc. | 370,313 | 3.6359 | 7/30/2021 | 372,858 | ||||||||||||
| Six Flags Theme Parks, Inc. | 343,273 | 3.3464 | 6/30/2022 | 346,438 | ||||||||||||
| SRAM Corporation | 271,719 | 4.0146 | 4/10/2020 | 265,605 | ||||||||||||
| St George’s University | 192,000 | 6.2500 | 7/6/2022 | 193,680 | ||||||||||||
| Station Casinos LLC | 503,738 | 3.8739 | 6/8/2023 | 506,843 | ||||||||||||
| TI Group Automotive Systems LLC | 304,924 | 4.5000 | 6/30/2022 | 305,749 | ||||||||||||
| Transtar Holding Co | 34,125 | 7.7500 | 10/9/2018 | 26,106 | ||||||||||||
| Tribune Co | 367,093 | 3.8859 | 12/28/2020 | 369,846 | ||||||||||||
| UFC Holdings LLC | 333,000 | 5.0000 | 8/18/2023 | 336,357 | ||||||||||||
| Univision Communications, Inc. | 261,261 | 4.0000 | 2/29/2020 | 261,956 | ||||||||||||
| Univision Communications, Inc. | 1,324,117 | 4.0000 | 2/29/2020 | 1,328,050 | ||||||||||||
| US Farathane LLC | 277,671 | 5.7500 | 12/24/2021 | 279,059 | ||||||||||||
| Ziggo BV | 419,000 | 3.8817 | 9/1/2024 | 419,668 | ||||||||||||
| 25,353,559 | ||||||||||||||||
| CONSUMER STAPLES - 9.3% | ||||||||||||||||
| Albertsons LLC | 251,737 | 4.7500 | 12/20/2022 | 254,640 | ||||||||||||
| Albertsons LLC | 462,032 | 4.5000 | 8/24/2021 | 466,042 | ||||||||||||
| Amplify Snack Brands, Inc. | 295,000 | 6.5000 | 9/2/2023 | 294,816 | ||||||||||||
| ARAMARK Corp. | 796,597 | 3.3456 | 2/24/2021 | 802,217 | ||||||||||||
| ASP MSG Acquisition Co. Inc. | 343,000 | 6.0000 | 8/16/2023 | 346,430 | ||||||||||||
| Charger Opco | 126,901 | 4.3537 | 7/2/2022 | 127,416 | ||||||||||||
| Chobani LLC | 270,000 | 5.2500 | 10/8/2023 | 273,208 | ||||||||||||
| Coty, Inc. | 102,461 | 3.8537 | 10/28/2022 | 102,792 | ||||||||||||
| Coty, Inc. | 290,000 | 3.3904 | 10/28/2022 | 290,937 | ||||||||||||
| Dell International LLC | 1,050,000 | 4.1359 | 9/8/2023 | 1,058,926 | ||||||||||||
| Dole Food Co, Inc. | 554,680 | 4.5012 | 10/31/2018 | 557,256 | ||||||||||||
| Galleria Co | 205,952 | 3.8857 | 1/26/2023 | 207,753 | ||||||||||||
| Hostess Brands LLC | 317,790 | 4.5000 | 8/4/2023 | 320,471 | ||||||||||||
| Hostess Brands LLC | 235,000 | 8.5000 | 8/4/2022 | 237,277 | ||||||||||||
| Kronos, Inc. | 80,442 | 9.7500 | 4/30/2020 | 81,649 | ||||||||||||
| Kronos, Inc. | 820,590 | 4.5000 | 10/30/2019 | 825,103 | ||||||||||||
| Kronos, Inc. | 700,000 | 5.0000 | 10/31/2023 | 703,938 | ||||||||||||
| Kronos, Inc. | 120,000 | 9.2500 | 10/31/2024 | 124,025 | ||||||||||||
| Pinnacle Foods Finance LLC | 22,828 | 3.6357 | 1/12/2023 | 23,053 | ||||||||||||
| Pinnacle Foods Finance LLC | 798,163 | 3.3859 | 4/28/2020 | 803,802 | ||||||||||||
| Prestige Brands, Inc. | 518,194 | 3.6359 | 9/4/2021 | 522,161 | ||||||||||||
| Reynolds Group Holdings, Inc. | 843,567 | 4.2500 | 2/4/2023 | 846,916 | ||||||||||||
| Rite Aid Corp. | 430,000 | 4.8750 | 6/20/2021 | 432,062 | ||||||||||||
| US Foods, Inc. | 467,828 | 4.1359 | 6/28/2023 | 471,336 | ||||||||||||
| 10,174,226 | ||||||||||||||||
| ENERGY - 1.7% | ||||||||||||||||
| Chesapeake Energy Corp. | 55,000 | 8.5000 | 8/24/2021 | 59,011 | ||||||||||||
| Chief Exploration & Development | 172,000 | 7.5000 | 5/16/2021 | 165,389 | ||||||||||||
| Drillships Financing Holding | 140,639 | 6.0000 | 4/1/2021 | 72,781 | ||||||||||||
| Drillships Ocean Ventures, Inc. | 109,480 | 5.5000 | 7/24/2021 | 78,493 | ||||||||||||
| EP Energy LLC | 200,000 | 9.7500 | 6/30/2021 | 205,500 | ||||||||||||
| Fieldwood Energy LLC | 134,102 | 8.3750 | 9/30/2020 | 80,461 | ||||||||||||
See accompanying notes to financial statements.
4
| SCHEDULE OF INVESTMENTS |
| Dunham Floating Rate Bond Fund (Continued) |
| October 31, 2016 |
| Principal | Interest | Maturity | ||||||||||||||
| Security | Amount | Rate | Date | Value | ||||||||||||
| ENERGY - 1.7% (Continued) | ||||||||||||||||
| Fieldwood Energy LLC | $ | 81,748 | 8.3750 | % | 9/30/2020 | $ | 66,420 | |||||||||
| Fieldwood Energy LLC | 60,554 | 8.0000 | 9/1/2020 | 53,015 | ||||||||||||
| Jonah Energy LLC | 243,000 | 7.5000 | 5/12/2021 | 230,850 | ||||||||||||
| MEG Energy Corp. | 539,257 | 3.7500 | 4/1/2020 | 510,356 | ||||||||||||
| Paragon Offshore Finance Co | 174,258 | 5.2500 | 7/16/2021 | 63,604 | ||||||||||||
| Seadrill Operating LP | 489,569 | 4.0000 | 2/20/2021 | 275,385 | ||||||||||||
| 1,861,265 | ||||||||||||||||
| FINANCIALS - 4.2% | ||||||||||||||||
| Asurion LLC | 187,440 | 5.0000 | 8/4/2022 | 188,612 | ||||||||||||
| Asurion LLC | 77,010 | 5.0000 | 5/24/2019 | 77,175 | ||||||||||||
| Asurion LLC | 19,767 | 4.7500 | 11/4/2023 | 19,668 | ||||||||||||
| Alixpartners LLP | 512,820 | 4.0000 | 7/28/2022 | 515,438 | ||||||||||||
| Delos Finance | 300,000 | 3.5956 | 3/6/2021 | 302,298 | ||||||||||||
| iStar Financial, Inc. | 20,762 | 5.5000 | 6/30/2020 | 21,013 | ||||||||||||
| Lonestar Intermediate Super | 215,000 | 10.0000 | 9/1/2021 | 217,330 | ||||||||||||
| Prime Security Services Borrower, LLC | 247,380 | 4.7500 | 5/2/2022 | 249,588 | ||||||||||||
| RPI Finance Trust | 242,077 | 3.3800 | 10/14/2022 | 244,583 | ||||||||||||
| Starwood Property Trust, Inc. | 474,060 | 3.6359 | 4/16/2020 | 475,067 | ||||||||||||
| TCEH | 53,571 | 5.0000 | 8/4/2023 | 54,081 | ||||||||||||
| TCEH | 232,653 | 5.0000 | 8/4/2023 | 234,870 | ||||||||||||
| TransUnion LLC | 887,793 | 3.6359 | 4/8/2021 | 891,676 | ||||||||||||
| VF Holdings Corp. | 635,000 | 4.7500 | 6/30/2023 | 638,324 | ||||||||||||
| Walter Investments | 538,471 | 4.7500 | 12/18/2020 | 505,602 | ||||||||||||
| 4,635,325 | ||||||||||||||||
| HEALTHCARE - 12.2% | ||||||||||||||||
| 21st Century Oncology, Inc. | 207,375 | 7.1250 | 4/30/2022 | 191,822 | ||||||||||||
| Acadia Healthcare Co, Inc. | 305,096 | 3.8818 | 2/16/2023 | 307,003 | ||||||||||||
| Akorn, Inc. | 258,134 | 5.2500 | 4/16/2021 | 260,394 | ||||||||||||
| Alere, Inc. | 320,793 | 4.2500 | 6/20/2022 | 320,257 | ||||||||||||
| American Renal Holdings Co, Inc. | 83,784 | 4.7500 | 8/20/2019 | 83,017 | ||||||||||||
| Amneal Pharmaceuticals LLC | 342,663 | 4.5008 | 10/31/2019 | 345,288 | ||||||||||||
| Amsurg Corp. | 100,682 | 3.6359 | 7/16/2021 | 100,818 | ||||||||||||
| Ardent Legacy Acquisitions, Inc. | 193,050 | 6.5000 | 8/4/2021 | 192,085 | ||||||||||||
| Capsugel Holdings US, Inc. | 408,755 | 4.0000 | 8/1/2021 | 411,201 | ||||||||||||
| CHG Healthcare Services, Inc. | 79,600 | 4.7500 | 6/8/2023 | 80,326 | ||||||||||||
| CHS/Community Health Systems | 281,081 | 3.7500 | 1/1/2020 | 266,720 | ||||||||||||
| CHS/Community Health Systems | 727,181 | 4.0000 | 1/28/2021 | 689,095 | ||||||||||||
| CHS/Community Health Systems | 193,980 | 4.0921 | 1/1/2019 | 189,912 | ||||||||||||
| Concordia Healthcare Corp. | 148,875 | 5.2500 | 10/20/2021 | 133,748 | ||||||||||||
| ConvaTec, Inc. | 94,000 | 3.2500 | 10/14/2021 | 93,941 | ||||||||||||
| DaVita, Inc. | 744,780 | 3.6359 | 6/24/2021 | 746,176 | ||||||||||||
| DJO Finance LLC | 158,000 | 4.2500 | 6/8/2020 | 156,486 | ||||||||||||
| Emdeon, Inc. | 43,222 | 3.7500 | 11/2/2018 | 43,371 | ||||||||||||
| Emdeon, Inc. | 490,000 | 3.7500 | 11/2/2018 | 491,227 | ||||||||||||
| Emergency Medical Svcs Corp. | 189,012 | 4.2500 | 5/24/2018 | 189,535 | ||||||||||||
| Endo Luxembourg Finance I Co | 617,335 | 3.8859 | 9/26/2022 | 617,452 | ||||||||||||
| Envision Healthcare Corp. | 160,785 | 4.5000 | 10/28/2022 | 161,627 | ||||||||||||
| Greatbatch Ltd | 100,243 | 5.2500 | 10/28/2022 | 99,065 | ||||||||||||
| HCA, Inc. | 202,905 | 4.1359 | 3/16/2023 | 205,265 | ||||||||||||
| IASIS Healthcare LLC | 297,680 | 4.5000 | 5/4/2018 | 296,490 | ||||||||||||
| IMS Health, Inc. | 448,013 | 3.5000 | 3/16/2021 | 451,235 | ||||||||||||
| inVentiv Health, Inc. | 233,269 | 8.7500 | 5/15/2018 | 233,473 | ||||||||||||
| inVentiv Health, Inc. | 336,000 | 4.7500 | 11/8/2023 | 336,420 | ||||||||||||
| Kindred Healthcare, Inc. | 171,125 | 4.2500 | 4/8/2021 | 171,553 | ||||||||||||
| Lanai Holdings III, Inc. | 233,000 | 5.7500 | 8/28/2022 | 229,505 | ||||||||||||
| MultiPlan, Inc. | 127,251 | 5.0000 | 6/8/2023 | 128,811 | ||||||||||||
See accompanying notes to financial statements.
5
| SCHEDULE OF INVESTMENTS |
| Dunham Floating Rate Bond Fund (Continued) |
| October 31, 2016 |
| Principal | Interest | Maturity | ||||||||||||||
| Security | Amount | Rate | Date | Value | ||||||||||||
| HEALTHCARE (Continued) - 12.2% | ||||||||||||||||
| National Mentor Holdings, Inc. | $ | 265,436 | 4.2500 | % | 2/1/2021 | $ | 266,099 | |||||||||
| National Surgical Hospitals Inc. | 116,525 | 4.5000 | 5/31/2022 | 115,651 | ||||||||||||
| NVA Holdings, Inc. | 173,000 | 8.0000 | 8/14/2022 | 173,649 | ||||||||||||
| NVA Holdings, Inc. | 78,920 | 5.5000 | 8/14/2021 | 79,118 | ||||||||||||
| Ortho-Clinical Diag Holding | 533,659 | 4.7500 | 6/30/2021 | 522,818 | ||||||||||||
| Pharmaceutical Product Development | 552,852 | 4.2500 | 8/18/2022 | 552,949 | ||||||||||||
| PRA Holdings, Inc. | 367,438 | 4.5000 | 9/24/2020 | 369,734 | ||||||||||||
| Quorum Health Corp. | 224,870 | 6.7500 | 4/28/2022 | 210,029 | ||||||||||||
| Sedgwick, Inc. | 125,000 | 6.7500 | 2/28/2022 | 124,375 | ||||||||||||
| Select Medical Corp. | 253,725 | 6.0045 | 3/4/2021 | 255,735 | ||||||||||||
| Sterigenics-Nordion Holdings LLC | 118,800 | 4.2500 | 5/16/2022 | 118,503 | ||||||||||||
| Surgery Center Holdings, Inc. | 209,352 | 4.7500 | 11/4/2020 | 210,530 | ||||||||||||
| Surgical Care Affiliates LLC | 368,409 | 3.7500 | 3/16/2022 | 370,251 | ||||||||||||
| Team Health, Inc. | 242,173 | 3.8456 | 11/24/2022 | 243,157 | ||||||||||||
| US Renal Care, Inc. | 207,702 | 5.2500 | 12/30/2022 | 199,458 | ||||||||||||
| Valeant Pharmaceuticals International | 395,848 | 5.6037 | 3/31/2022 | 395,533 | ||||||||||||
| Valeant Pharmaceuticals International | 290,941 | 5.3739 | 8/4/2020 | 290,296 | ||||||||||||
| Valeant Pharmaceuticals International | 642,029 | 5.1300 | 2/12/2019 | 641,172 | ||||||||||||
| 13,362,375 | ||||||||||||||||
| INDUSTRIALS - 14.5% | ||||||||||||||||
| 84 Lumber Co. | 350,000 | 6.7500 | 10/12/2023 | 347,375 | ||||||||||||
| ADS Waste Holdings, Inc. | 508,149 | 3.8860 | 10/8/2019 | 509,173 | ||||||||||||
| Advanced Disposal Services, Inc. | 496,000 | 3.6373 | 11/10/2023 | 497,550 | ||||||||||||
| Air Canada | 144,000 | 3.6179 | 10/6/2023 | 144,558 | ||||||||||||
| American Airlines, Inc. | 89,000 | 3.6360 | 4/28/2023 | 89,173 | ||||||||||||
| American Airlines, Inc. | 431,088 | 3.3904 | 6/28/2020 | 432,216 | ||||||||||||
| Aspen Merger Sub, Inc. | 138,000 | 5.2500 | 9/28/2023 | 139,438 | ||||||||||||
| Brickman Group Holdings, Inc. | 249,000 | 7.5000 | 12/16/2021 | 249,233 | ||||||||||||
| Brickman Group Holdings, Inc. | 688,162 | 4.0000 | 12/18/2020 | 688,021 | ||||||||||||
| Casella Waste Systems, Inc. | 400,000 | 4.0000 | 10/16/2023 | 402,000 | ||||||||||||
| Coinstar, Inc. | 100,000 | 9.7500 | 9/28/2024 | 99,688 | ||||||||||||
| Cortes NP Acquisition Corp. | 183,000 | 6.0000 | 9/28/2023 | 182,199 | ||||||||||||
| Filtration Group, Inc. | 339,247 | 4.2500 | 11/20/2020 | 340,043 | ||||||||||||
| Filtration Group, Inc. | 177,924 | 4.2500 | 11/20/2020 | 178,146 | ||||||||||||
| Fortress Merger Sub, Inc. | 146,000 | 5.0000 | 10/20/2023 | 147,004 | ||||||||||||
| Gardner Denver, Inc. | 363,384 | 4.2500 | 7/30/2020 | 353,576 | ||||||||||||
| Harland Clarke Holdings Corp. | 92,820 | 7.0000 | 5/22/2018 | 92,588 | ||||||||||||
| Harland Clarke Holdings Corp. | 64,256 | 6.9930 | 8/4/2019 | 63,955 | ||||||||||||
| Harland Clarke Holdings Corp. | 274,993 | 7.0000 | 1/1/2020 | 273,790 | ||||||||||||
| HD Supply, Inc. | 543,944 | 3.6317 | 8/12/2021 | 544,967 | ||||||||||||
| HD Supply, Inc. | 516,000 | 3.6317 | 10/16/2023 | 516,970 | ||||||||||||
| Headwaters, Inc. | 510,304 | 4.0000 | 3/24/2022 | 513,733 | ||||||||||||
| Husky Injection Molding | 764,652 | 4.2500 | 6/30/2021 | 765,371 | ||||||||||||
| McGraw-Hill Global Education | 264,338 | 5.0000 | 5/4/2022 | 264,337 | ||||||||||||
| McJunkin Red Man Corp. | 542,506 | 5.0000 | 11/8/2019 | 539,116 | ||||||||||||
| Navistar, Inc. | 256,535 | 6.5000 | 8/8/2020 | 258,459 | ||||||||||||
| NN, Inc. | 218,894 | 5.1359 | 10/20/2022 | 219,487 | ||||||||||||
| PAE Holding Corp. | 170,000 | 6.5000 | 10/20/2022 | 170,000 | ||||||||||||
| Pro Mach Group, Inc. | 1,125,000 | 4.7500 | 10/22/2021 | 1,126,407 | ||||||||||||
| Quikrete Co, Inc. | 384,342 | 4.0000 | 9/28/2020 | 385,505 | ||||||||||||
| Rexnord LLC | 413,933 | 4.0000 | 8/20/2020 | 415,642 | ||||||||||||
| Science Applications International | 231,946 | 3.3254 | 5/4/2022 | 233,830 | ||||||||||||
| Sedgwick, Inc. | 195,000 | 6.7500 | 2/28/2022 | 194,025 | ||||||||||||
| Sedgwick, Inc. | 673,648 | 3.7500 | 2/28/2021 | 670,071 | ||||||||||||
| Silver II Borrower | 300,000 | 4.0000 | 12/12/2019 | 276,750 | ||||||||||||
See accompanying notes to financial statements.
6
| SCHEDULE OF INVESTMENTS |
| Dunham Floating Rate Bond Fund (Continued) |
| October 31, 2016 |
| Principal | Interest | Maturity | ||||||||||||||
| Security | Amount | Rate | Date | Value | ||||||||||||
| INDUSTRIALS - 14.5% (Continued) | ||||||||||||||||
| SiteOne Landscape Supply Holding | $ | 175,120 | 6.2500 | % | 4/28/2022 | $ | 176,324 | |||||||||
| Spin Holdcorp | 283,261 | 4.2500 | 11/14/2019 | 282,269 | ||||||||||||
| TransDigm, Inc. | 813,791 | 3.7500 | 6/9/2023 | 812,359 | ||||||||||||
| TransDigm, Inc. | 394,288 | 3.8859 | 5/14/2022 | 393,529 | ||||||||||||
| TransDigm, Inc. | 81,132 | 3.8484 | 6/4/2021 | 81,102 | ||||||||||||
| United Airlines, Inc. | 515,778 | 3.6317 | 9/16/2021 | 519,215 | ||||||||||||
| US Airways, Inc. | 499,550 | 3.6318 | 5/24/2019 | 501,111 | ||||||||||||
| Waste Industries USA, Inc. | 542,508 | 3.6359 | 2/28/2020 | 544,287 | ||||||||||||
| WEX, Inc. | 299,250 | 4.3859 | 6/30/2023 | 303,155 | ||||||||||||
| 15,937,747 | ||||||||||||||||
| INFORMATION TECHNOLOGY - 8.9% | ||||||||||||||||
| Abacus Innovations Corp. | 212,000 | 3.6359 | 8/16/2023 | 213,912 | ||||||||||||
| Allflex Holdings III, Inc. | 281,300 | 4.2500 | 7/16/2020 | 282,882 | ||||||||||||
| Alorica, Inc. | 61,845 | 5.6359 | 6/30/2022 | 62,695 | ||||||||||||
| Applied Systems, Inc. | 158,197 | 7.5000 | 1/24/2022 | 159,829 | ||||||||||||
| Avago Technologies Cayman Finance | 475,677 | 3.8817 | 1/31/2023 | 481,159 | ||||||||||||
| Blackboard, Inc. | 790,000 | 6.0000 | 6/30/2021 | 784,668 | ||||||||||||
| BMC Software, Inc. | 520,000 | 5.0000 | 9/10/2020 | 513,378 | ||||||||||||
| CCC Holdings, Inc. | 333,676 | 4.0000 | 12/20/2019 | 334,405 | ||||||||||||
| CDW LLC | 1,056,755 | 3.1359 | 8/16/2023 | 1,063,175 | ||||||||||||
| Cypress Semiconductor Corp. | 296,250 | 6.5000 | 7/4/2021 | 300,695 | ||||||||||||
| Deltek, Inc. | 94,000 | 9.5000 | 6/26/2023 | 95,488 | ||||||||||||
| Deltek, Inc. | 126,852 | 5.0000 | 6/24/2022 | 127,784 | ||||||||||||
| Donnelley Financial Solutions | 104,000 | 5.0000 | 9/28/2023 | 105,040 | ||||||||||||
| Ensemble S Merger Sub, Inc. | 314,544 | 4.7500 | 9/30/2022 | 315,429 | ||||||||||||
| First Data Corp. | 198,000 | 4.6318 | 7/8/2022 | 199,655 | ||||||||||||
| First Data Corp. | 1,094,444 | 3.8818 | 3/24/2021 | 1,100,600 | ||||||||||||
| Inception Merger Sub, Inc. | 348,000 | 5.0000 | 11/4/2023 | 350,393 | ||||||||||||
| Infor US, Inc. | 237,930 | 3.7500 | 6/4/2020 | 237,980 | ||||||||||||
| Infor US, Inc. | 595,666 | 3.7500 | 6/4/2020 | 595,243 | ||||||||||||
| Mitchell International, Inc. | 221,000 | 8.5000 | 10/12/2021 | 219,619 | ||||||||||||
| Mitchell International, Inc. | 367,478 | 4.5000 | 10/12/2020 | 367,249 | ||||||||||||
| MKS Instruments, Inc. Term | 259,581 | 4.3859 | 4/30/2023 | 262,122 | ||||||||||||
| NXP BV | 126,902 | 3.3633 | 12/8/2020 | 127,554 | ||||||||||||
| ON Semiconductor Corp. | 231,000 | 4.1179 | 4/1/2023 | 232,761 | ||||||||||||
| Presidio, Inc. | 201,531 | 5.2500 | 2/2/2022 | 202,129 | ||||||||||||
| SS&C European Holdings | 24,578 | 3.6359 | 7/8/2020 | 24,640 | ||||||||||||
| SS&C European Holdings | 38,122 | 3.6359 | 7/8/2020 | 38,217 | ||||||||||||
| SS&C Technologies, Inc. | 248,842 | 4.1329 | 7/8/2022 | 251,195 | ||||||||||||
| SS&C Technologies, Inc. | 30,924 | 4.1259 | 7/8/2022 | 31,216 | ||||||||||||
| Veritas US, Inc. | 345,000 | 4.6373 | 4/28/2023 | 322,199 | ||||||||||||
| Western Digital Corp. | 394,013 | 4.6373 | 4/28/2023 | 398,971 | ||||||||||||
| 9,802,282 | ||||||||||||||||
| MATERIALS - 8.4% | ||||||||||||||||
| ABC Supply Co, Inc. | 510,889 | 3.6359 | 4/16/2020 | 513,457 | ||||||||||||
| American Builders & Contractor | 78,422 | 3.6067 | 11/1/2023 | 78,842 | ||||||||||||
| Anchor Glass Container Corp. | 561,531 | 4.7500 | 6/30/2022 | 568,022 | ||||||||||||
| Ardagh Holdings USA, Inc. | 259,149 | 4.0000 | 12/16/2019 | 262,104 | ||||||||||||
| Berlin Packaging LLC | 396,587 | 4.5000 | 9/30/2021 | 399,102 | ||||||||||||
| Berry Plastics Corp. | 378,020 | 3.7500 | 9/30/2022 | 379,697 | ||||||||||||
| Berry Plastics Corp. | 417,784 | 3.5000 | 1/6/2021 | 418,656 | ||||||||||||
| Berry Plastics Group, Inc. | 237,612 | 3.5000 | 2/8/2020 | 238,228 | ||||||||||||
| CPG International, Inc. | 276,438 | 4.7500 | 9/30/2020 | 278,080 | ||||||||||||
| CPI Acquisition, Inc. | 445,310 | 5.5000 | 8/16/2022 | 438,443 | ||||||||||||
| Fortescue Metals Group Ltd | 634,646 | 3.7500 | 6/30/2019 | 635,042 | ||||||||||||
| Huntsman International LLC | 111,440 | 4.3456 | 3/31/2023 | 112,439 | ||||||||||||
| Huntsman International LLC | 483,410 | 3.8859 | 9/30/2021 | 486,509 | ||||||||||||
| Ineos Group Holdings Ltd | 821,550 | 3.7500 | 12/16/2020 | 825,144 | ||||||||||||
See accompanying notes to financial statements.
7
| SCHEDULE OF INVESTMENTS |
| Dunham Floating Rate Bond Fund (Continued) |
| October 31, 2016 |
| Principal | Interest | Maturity | ||||||||||||||
| Security | Amount | Rate | Date | Value | ||||||||||||
| MATERIALS - 8.4% (Continued) | ||||||||||||||||
| Ineos US Finance LLC | $ | 393,703 | 4.2500 | % | 4/1/2022 | $ | 396,582 | |||||||||
| Kraton Polymers LLC | 300,000 | 6.0000 | 1/6/2022 | 302,175 | ||||||||||||
| MacDermid, Inc. | 263,668 | 5.5000 | 6/8/2020 | 266,211 | ||||||||||||
| Omnova Solutions, Inc. | 579,000 | 5.2500 | 8/24/2023 | 579,724 | ||||||||||||
| Owens-Brockway Glass Container | 286,870 | 3.6216 | 8/31/2022 | 287,468 | ||||||||||||
| PolyOne Corp. | 65,834 | 3.6040 | 11/12/2022 | 66,479 | ||||||||||||
| PQ Corp. | 92,768 | 5.7500 | 11/4/2022 | 92,883 | ||||||||||||
| Royal Holdings, Inc. | 235,025 | 4.5000 | 6/20/2022 | 236,530 | ||||||||||||
| Solenis International LP | 351,865 | 4.2500 | 8/1/2021 | 352,178 | ||||||||||||
| Summit Materials | 388,088 | 4.0000 | 7/18/2022 | 391,144 | ||||||||||||
| Univar, Inc. | 498,476 | 4.2500 | 6/30/2022 | 499,929 | ||||||||||||
| WR Grace & Co | 111,773 | 2.7676 | 2/4/2021 | 112,080 | ||||||||||||
| 9,217,148 | ||||||||||||||||
| REAL ESTATE - 1.7% | ||||||||||||||||
| Capital Automotive L.P. | 83,350 | 4.0000 | 4/10/2019 | 84,144 | ||||||||||||
| Capital Automotive L.P. | 197,005 | 6.0000 | 4/30/2020 | 198,991 | ||||||||||||
| Communications Sales & Leasing | 223,867 | 4.5000 | 10/24/2022 | 225,041 | ||||||||||||
| DTZ US Borrower LLC | 592,499 | 4.2500 | 11/4/2021 | 592,192 | ||||||||||||
| ESH Hospitality Inc | 303,000 | 3.8859 | 8/30/2023 | 305,179 | ||||||||||||
| Realogy Group LLC | 455,539 | 3.8818 | 7/20/2022 | 460,238 | ||||||||||||
| 1,865,785 | ||||||||||||||||
| TELECOMMUNICATION SERVICES - 4.3% | ||||||||||||||||
| Coral-US Co-Borrower LLC | 135,450 | 5.6067 | 1/4/2023 | 137,143 | ||||||||||||
| Coral-US Co-Borrower LLC | 165,550 | 5.5956 | 1/4/2023 | 167,619 | ||||||||||||
| Global Tel*Link Corp. | 297,290 | 5.0000 | 5/24/2020 | 289,746 | ||||||||||||
| Level 3 Financing, Inc. | 355,000 | 4.0000 | 1/16/2020 | 357,529 | ||||||||||||
| Level 3 Financing, Inc. | 986,000 | 3.6239 | 6/1/2022 | 991,635 | ||||||||||||
| SBA Senior Finance II LLC | 158,988 | 3.3456 | 6/10/2022 | 159,253 | ||||||||||||
| SBA Senior Finance II LLC | 209,185 | 3.3456 | 3/24/2021 | 209,734 | ||||||||||||
| Securus Technologies Holdings | 84,363 | 5.2500 | 4/30/2020 | 83,097 | ||||||||||||
| Securus Technologies Holdings | 140,651 | 4.7500 | 4/30/2020 | 138,541 | ||||||||||||
| T-Mobile USA, Inc. | 198,500 | 3.6359 | 11/8/2022 | 200,327 | ||||||||||||
| UPC Financing Partnership | 1,042,564 | 4.2290 | 9/1/2024 | 1,049,008 | ||||||||||||
| Virgin Media Investment Holdings | 445,962 | 4.0123 | 6/30/2023 | 448,388 | ||||||||||||
| West Corporation | 225,129 | 3.8859 | 6/16/2023 | 226,677 | ||||||||||||
| XO Communications LLC | 258,375 | 4.2500 | 3/20/2021 | 259,129 | ||||||||||||
| 4,717,826 | ||||||||||||||||
| UTILITIES - 3.4% | ||||||||||||||||
| APLP Holdings LP | 416,312 | 6.0000 | 4/12/2023 | 423,857 | ||||||||||||
| Calpine Construction Finance | 257,509 | 3.3456 | 2/1/2022 | 256,866 | ||||||||||||
| Calpine Construction Finance | 667,772 | 3.0956 | 5/4/2020 | 664,991 | ||||||||||||
| Calpine Corp. | 264,338 | 3.8456 | 6/1/2023 | 266,452 | ||||||||||||
| Dayton Power & Light Co | 94,000 | 4.1357 | 8/24/2022 | 94,979 | ||||||||||||
| Dynergy, Inc. | 596,000 | 5.0000 | 6/28/2023 | 598,661 | ||||||||||||
| NRG Energy, Inc. | 964,913 | 3.6359 | 6/30/2023 | 967,929 | ||||||||||||
| Talen Energy Supply LLC | 200,000 | 6.0000 | 10/18/2023 | 200,333 | ||||||||||||
| Texas Comp Elec Hold LLC | 635,000 | 5.3393 | 10/10/2017 | 187,805 | ||||||||||||
| 3,661,873 | ||||||||||||||||
| TOTAL BANK LOANS (Cost - $100,897,049) | 100,589,411 | |||||||||||||||
| BONDS & NOTES - 5.2% | ||||||||||||||||
| AIRLINES - 0.0% | ||||||||||||||||
| American Airlines Group, Inc. ^ - 144A | 45,000 | 4.6250 | 3/1/2020 | 45,450 | ||||||||||||
| AUTO PARTS & EQUIPMENT - 0.2% | ||||||||||||||||
| Schaeffler Verwaltung Zwei Gmb - 144A | 200,000 | 4.1250 | 9/15/2021 | 205,250 | ||||||||||||
See accompanying notes to financial statements.
8
| SCHEDULE OF INVESTMENTS |
| Dunham Floating Rate Bond Fund (Continued) |
| October 31, 2016 |
| Principal | Interest | Maturity | ||||||||||||||
| Security | Amount | Rate | Date | Value | ||||||||||||
| BUILDING MATERIALS - 0.1% | ||||||||||||||||
| Standard Pacific Corp. - 144A | $ | 95,000 | 5.5000 | % | 2/15/2023 | $ | 99,275 | |||||||||
| CHEMICALS - 0.2% | ||||||||||||||||
| Hexion US Finance Corp. | 105,000 | 6.6250 | 4/15/2020 | 92,400 | ||||||||||||
| INEOS GROUP HOLDINGS SA - 144A | 200,000 | 5.6250 | 8/1/2024 | 198,750 | ||||||||||||
| 291,150 | ||||||||||||||||
| COMPUTERS - 0.1% | ||||||||||||||||
| Diamond 1 Finance Corp. - 144A | 95,000 | 5.8750 | 6/15/2021 | 100,164 | ||||||||||||
| DIVERSIFIED FINANCIAL SERVICES - 0.3% | ||||||||||||||||
| Ally Financial, Inc. | 50,000 | 4.1250 | 2/13/2022 | 50,141 | ||||||||||||
| Intl Lease Finance Corp. | 120,000 | 3.8750 | 4/15/2018 | 123,000 | ||||||||||||
| Springleaf Finance Corp. | 170,000 | 5.2500 | 12/15/2019 | 171,063 | ||||||||||||
| 344,204 | ||||||||||||||||
| ELECTRIC - 0.1% | ||||||||||||||||
| Talen Energy Supply LLC - 144A | 100,000 | 4.6250 | 7/15/2019 | 95,500 | ||||||||||||
| ENTERTAINMENT - 0.0% | ||||||||||||||||
| GLP Capital LP | 50,000 | 4.8750 | 11/1/2020 | 53,563 | ||||||||||||
| FOOD - 0.1% | ||||||||||||||||
| Dole Food Co., Inc. - 144A | 70,000 | 7.2500 | 5/1/2019 | 71,138 | ||||||||||||
| HEALTHCARE-SERVICES - 0.5% | ||||||||||||||||
| Centene Corp. | 75,000 | 5.6250 | 2/15/2021 | 78,863 | ||||||||||||
| Surgery Center Holdings, Inc. - 144A | 130,000 | 8.8750 | 4/15/2021 | 138,775 | ||||||||||||
| Tenet Healthcare Corp. ^ | 275,000 | 4.3503 | 6/15/2020 | 278,438 | ||||||||||||
| Tenet Healthcare Corp. | 25,000 | 5.0000 | 3/1/2019 | 24,367 | ||||||||||||
| Tenet Healthcare Corp. | 75,000 | 6.0000 | 10/1/2020 | 79,191 | ||||||||||||
| 599,634 | ||||||||||||||||
| HOLDING COMPANIES - DIVERSIFICATION - 0.1% | ||||||||||||||||
| Argos Merger Sub, Inc. ^ - 144A | 140,000 | 7.1250 | 3/15/2023 | 146,825 | ||||||||||||
| HOME BUILDERS - 0.2% | ||||||||||||||||
| TRI Pointe Holdings, Inc. | 70,000 | 4.3750 | 6/15/2019 | 71,925 | ||||||||||||
| TRI Pointe Group, Inc. | 130,000 | 4.8750 | 7/1/2021 | 134,225 | ||||||||||||
| 206,150 | ||||||||||||||||
| LODGING - 0.0% | ||||||||||||||||
| Boyd Gaming Corp. | 40,000 | 6.8750 | 5/15/2023 | 43,000 | ||||||||||||
| MEDIA - 0.8% | ||||||||||||||||
| Cequel Communications Escrow - 144A | 50,000 | 6.3750 | 9/15/2020 | 51,688 | ||||||||||||
| Clear Channel Communications | 95,000 | 9.0000 | 12/15/2019 | 72,438 | ||||||||||||
| Numericable Group SA - 144A | 410,000 | 6.0000 | 5/15/2022 | 421,919 | ||||||||||||
| RCN Telecom Services LLC - 144A | 110,000 | 8.5000 | 8/15/2020 | 117,356 | ||||||||||||
| Univision Communications, Inc. - 144A | 200,000 | 5.1250 | 5/15/2023 | 204,000 | ||||||||||||
| 867,401 | ||||||||||||||||
| MINING - 0.1% | ||||||||||||||||
| Vedanta Resources PLC - 144A | 100,000 | 9.5000 | 7/18/2018 | 106,255 | ||||||||||||
| OIL & GAS - 0.6% | ||||||||||||||||
| Carrizo Oil & Gas, Inc. | 140,000 | 6.2500 | 4/15/2023 | 144,550 | ||||||||||||
| Diamondback Energy, Inc. - 144A | 30,000 | 4.7500 | 11/1/2024 | 30,038 | ||||||||||||
| FTS International, Inc. | 50,000 | 6.2500 | 5/1/2022 | 28,500 | ||||||||||||
See accompanying notes to financial statements.
9
| SCHEDULE OF INVESTMENTS |
| Dunham Floating Rate Bond Fund (Continued) |
| October 31, 2016 |
| Principal | Interest | Maturity | ||||||||||||||
| Security | Amount | Rate | Date | Value | ||||||||||||
| OIL & GAS - 0.6% (Continued) | ||||||||||||||||
| FTS International, Inc. - 144A | $ | 120,000 | 8.3041 | % | 6/15/2020 | $ | 116,156 | |||||||||
| Laredo Petroleum, Inc. | 90,000 | 5.6250 | 1/15/2022 | 88,200 | ||||||||||||
| Newfield Exploration Co | 90,000 | 5.7500 | 1/30/2022 | 94,275 | ||||||||||||
| Range Resources Corp. - 144A | 90,000 | 5.0000 | 8/15/2022 | 88,200 | ||||||||||||
| Whiting Petroleum Corp. | 50,000 | 5.7500 | 3/15/2021 | 46,625 | ||||||||||||
| 636,544 | ||||||||||||||||
| PACKAGING & CONTAINERS - 0.5% | ||||||||||||||||
| Ardagh Packaging Finance PLC - 144A | 200,000 | 6.2500 | 1/31/2019 | 204,500 | ||||||||||||
| Reynolds Group ^ - 144A | 230,000 | 3.5000 | 7/15/2021 | 235,175 | ||||||||||||
| Reynolds Group | 50,000 | 5.7500 | 10/15/2020 | 51,377 | ||||||||||||
| 491,052 | ||||||||||||||||
| PHARMACEUTICALS - 0.1% | ||||||||||||||||
| Capsugel SA - 144A | 19,000 | 7.0000 | 5/15/2019 | 19,010 | ||||||||||||
| Quintiles Transnational Corp. - 144A | 40,000 | 4.8750 | 5/15/2023 | 41,450 | ||||||||||||
| VRX Escrow Corp. - 144A | 70,000 | 5.3750 | 3/15/2020 | 61,250 | ||||||||||||
| 121,710 | ||||||||||||||||
| PIPELINES - 0.1% | ||||||||||||||||
| Antero Midstream Partners LP - 144A | 75,000 | 5.3750 | 9/15/2024 | 75,750 | ||||||||||||
| REITS - 0.2% | ||||||||||||||||
| IStar Financial, Inc. | 30,000 | 4.8750 | 7/1/2018 | 30,113 | ||||||||||||
| IStar Financial, Inc. | 165,000 | 5.0000 | 7/1/2019 | 165,022 | ||||||||||||
| 195,135 | ||||||||||||||||
| SEMICONDUCTORS - 0.2% | ||||||||||||||||
| NXP Bv - 144A | 200,000 | 4.1250 | 6/1/2021 | 214,000 | ||||||||||||
| SOFTWARE - 0.3% | ||||||||||||||||
| First Data Corp. - 144A | 190,000 | 5.3750 | 8/15/2023 | 197,126 | ||||||||||||
| First Data Corp. - 144A | 90,000 | 5.0000 | 1/15/2024 | 91,688 | ||||||||||||
| First Data Corp. - 144A | 25,000 | 5.7500 | 1/15/2024 | 25,469 | ||||||||||||
| 314,283 | ||||||||||||||||
| TELECOMMUNICATIONS - 0.4% | ||||||||||||||||
| Frontier Communications Corp. | 105,000 | 6.2500 | 9/15/2021 | 100,275 | ||||||||||||
| Intelsat Jackson Holdings SA - 144A | 7,000 | 8.0000 | 2/15/2024 | 7,070 | ||||||||||||
| T-Mobile USA, Inc. | 205,000 | 6.0000 | 4/15/2024 | 218,581 | ||||||||||||
| West Corp. - 144A | 105,000 | 4.7500 | 7/15/2021 | 108,413 | ||||||||||||
| 434,339 | ||||||||||||||||
| TOTAL BONDS & NOTES (Cost - $5,890,108) | 5,757,772 | |||||||||||||||
| ASSET BACKED SECURITIES - 1.9% | ||||||||||||||||
| Home Equity Loan Trust 2007-HS | 125,083 | 6.1100 | 6/25/2037 | 126,112 | ||||||||||||
| Morgan Stanley Capital I Trust | 1,433,442 | 5.8090 | 12/12/2049 | 1,467,938 | ||||||||||||
| VOLT XXXIII LLC - 144A | 500,160 | 0.0000 | 3/25/2055 | 503,142 | ||||||||||||
| TOTAL ASSET BACKED SECURITIES (Cost - $2,096,552) | 2,097,192 | |||||||||||||||
| PRIVATE PLACEMENTS - 0.2% | ||||||||||||||||
| Wheels Up | 46,957 | 7.5000 | 6/1/2024 | 46,487 | ||||||||||||
| Wheels Up | 223,043 | 5.0000 | 6/1/2024 | 220,813 | ||||||||||||
| TOTAL PRIVATE PLACEMENTS (Cost - $95,542) | 267,300 | |||||||||||||||
See accompanying notes to financial statements.
10
| SCHEDULE OF INVESTMENTS |
| Dunham Floating Rate Bond Fund (Continued) |
| October 31, 2016 |
| Interest | ||||||||||||||||
| Security | Shares | Rate | Value | |||||||||||||
| SHORT-TERM INVESTMENT - 9.0% | ||||||||||||||||
| MONEY MARKET FUND - 9.0% | ||||||||||||||||
| Fidelity Institutional Money Market Funds - Government Portfolio | 9,844,573 | 0.27 | % + | $ | 9,844,573 | |||||||||||
| TOTAL SHORT-TERM INVESTMENT - (Cost - $9,844,573) | ||||||||||||||||
| COLLATERAL FOR SECURITIES LOANED - 0.5% | ||||||||||||||||
| Mount Vernon Prime Portfolio (Cost - $506,125) | 506,125 | 0.67 | % + | 506,125 | ||||||||||||
| TOTAL INVESTMENTS - 109.5% (Cost - $120,416,768) | 120,150,326 | |||||||||||||||
| LIABILITIES IN EXCESS OF OTHER ASSETS - (9.5)% | (10,464,138 | ) | ||||||||||||||
| NET ASSETS - 100.0% | $ | 109,686,188 | ||||||||||||||
REITS - Real Estate Investment Trusts.
| ^ | All or a portion of these securities are on loan. Total loaned securities had a value of $493,658 at October 31, 2016. Securities loaned with a value of $88,758 have been sold and are pending settlement. |
| + | Variable rate security. Interest rate is as of October 31, 2016. |
144A - Security exempt from registration under Rule 144A of the Securities Act of 1933. These securities may be sold in transactions exempt from registration, normally to qualified institutional buyers.
| Portfolio Composition * - (Unaudited) | ||||||||||
| Bank Loans | 83.7 | % | Telecommunications | 0.4 | % | |||||
| Asset Backed Securities | 1.9 | % | Diversified Financial Services | 0.3 | % | |||||
| Exchange Traded Fund | 0.9 | % | Software | 0.3 | % | |||||
| Media | 0.8 | % | Other ** | 3.0 | % | |||||
| Oil & Gas | 0.6 | % | Short-Term Investment | 7.7 | % | |||||
| Packaging & Containers | 0.4 | % | Total | 100.0 | % | |||||
| * | Based on total value of investments as of October 31, 2016. |
| ** | Groupings less than 0.20% of holdings. |
Percentage may differ from Schedule of Investments which are based on Fund net assets.
See accompanying notes to financial statements.
11
Dunham Monthly Distribution Fund
Message from the Sub-Adviser (Westchester Capital Management, LLC)
While “higher” market volatility has been a prominent theme across the fiscal year, there have been relatively short periods that have experienced significant spikes and drops. Market volatility, as measured by the CBOE Volatility Index (“VIX”) ended the fiscal year 13.2 percent higher than it began. However, during the first fiscal quarter through January and into February, the VIX significantly spiked four different times with at least an increase of 33 percent and as much as 77 percent. These spikes generally coincided with declines in the equity markets. Equity markets rallied from mid-February through May as volatility generally subsided. In June, volatility once again spiked 96 percent amid the Brexit referendum and once more to close the year amid the U.S. presidential election. These points of higher volatility levels during the fiscal year generally resulted in investors attempting to reduce risk and making indiscriminate sell decisions. However, as volatility subsided between these spikes, equity markets generally recovered. Event driven strategies, as measured by the Credit Suisse Event Driven Index, fell 8.1 percent in the first fiscal quarter but increased 10.3 percent in the final three fiscal quarters, resulting in a positive 1.4 percent for the fiscal year. Market neutral strategies, as measured by the IQ Hedge Market Neutral Beta Index, had a less significant downturn in the first fiscal quarter falling just 2.1 percent. The final three quarters were also positive for market neutral strategies increasing 4.3 percent, resulting in a 2.1 percent increase for the fiscal year ended October 31, 2016.
Merger arbitrage strategies, as measured by the Credit Suisse Merger Arbitrage Index, declined 3.0 percent over the fiscal year ended October 31, 2016. When broken down, merger arbitrage strategies increased 1.0 percent for the first six months of the fiscal year, and declined 4.0 percent in the final six months of the fiscal year. As volatility spiked over the fiscal year, many merger spreads saw significant widening during the period. However, deals continued to close during these volatile times. For example, the acquisition of Starwood Hotels and Resorts (STWD) (holding percentage*: 2.16 percent) by Marriott International Inc. (MAR) (holding percentage*: 0.66 percent) closed on September 23, 2016. These significant spreads on deals that ultimately proved to successfully close helps to illustrate how this ongoing volatility significantly impacted deal spreads within the event driven space.
As volatility peaked during the first three months of the period, many deal spreads widened substantially. For example, the cash and stock acquisition of Baker Hughes Inc. (BHI) (holding percentage**: 0.06 percent) by Halliburton Co. (HAL) (holding percentage**: -0.03 percent) continued to experience its deal spread widen. At the start of the period, the spread stood at 17.7 percent and by the end of the first three months, it had widened further to a spread of 25.5 percent. Even though volatility generally subsided, the spread did not improve during the final three months. The deal completion date was pushed back to midsummer due regulatory request from the U.S. government and European Commission. The Sub-Adviser believed the risk present in the position no longer warranted a place in the Fund and sold out of the position on March 3, 2016. The Justice Department denied the approval of this acquisition on April 6, 2016. Another deal that saw its spread widen over the fiscal year was the cash and stock acquisition of St. Jude Medical Inc. (STJ) (holding percentage*: 2.97 percent) by Abbott Laboratories (ABT) (holding percentage*: -1.30 percent). Over the final fiscal quarter this deal’s spread widened by approximately 14 percent.
The Sub-Adviser generally implements risk-reversals, a risk management technique using call and put options, on event driven opportunities outside of the merger arbitrage strategy. The Sub-Adviser does this in order to help keep the risk within what it believes are acceptable bounds. A special situation event example that has spanned multiple fiscal quarters included Hertz Global Holdings, Inc.’s (HTZ) (holding percentage*: 2.75 percent) spin-off of its equipment rental business. In this particular example, HTZ experienced substantial declines in the first fiscal quarter, primarily due to concerns over the company’s leverage and its growing competition from smart-phone oriented ride-hailing companies. However, the Sub-Adviser’s implementation of the risk reversals served well to offset a meaningful amount of the downturn. The risk reversal detracted in the previous fiscal quarter and until the position was liquidated on September 16, 2016 as HTZ increased. Over the fiscal year, buy/write strategies, as measured by the CBOE S&P 500 Buy/Write Index, increased 4.3 percent, although they declined 4.5 percent in the first quarter. The difference in utilizing a risk-reversal instead of a buy/write strategy is that it uses the majority of the proceeds of the written call to purchase protective put options. Therefore, in the declining periods such as the first fiscal quarter, the risk-reversal strategy generally helped to reduce the downside (leaving less to be recovered).
The Sub-Adviser continued to maintain a small position in credit opportunities during the fiscal year. During the fiscal year, corporate bonds in general, as measured by the Bank of America Merrill Lynch Corporate Bond Index, increased 7.0 percent. The strategy as a whole generally contributed positively to Fund performance during the fiscal year. Fund holdings such as the defaulted debt of Energy Future 3/1/2022 (29269QAD9) (holding percentage*: 2.55 percent) aided positive performance during the fiscal year. The Energy Future bond price increased 25.9 percent over the fiscal year. Another holding that positively contributed to Fund performance was the WhiteWave Foods Co 10/1/2022 (966244AA3) (holding percentage*: 0.80 percent). Since the position was initiated in the Fund on September 7, 2016 through the end of the fiscal year, this holding increased 0.3 percent.
The Sub-Adviser believes that the shifting volatility across the markets has generally increased the potential rewards for many of these event driven opportunities. However, while the core tenets for many of these events have not substantially changed, the Sub-Adviser is optimistic that the overall risk-reward profile has improved. The Sub-Adviser continues to implement its disciplined risk controls while taking advantage of these perceived opportunities.
| * | Holdings percentage(s) as of 10/31/2016. |
| ** | Holdings percentage(s) as of the date prior to the sale of the security. |
Growth of $10,000 Investment
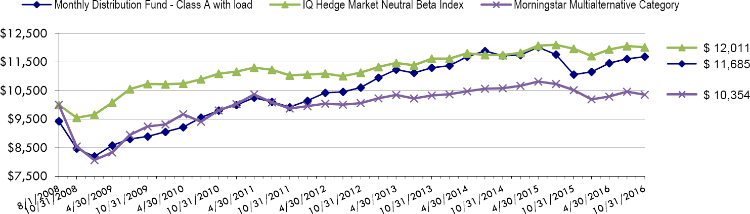
Total Returns as of October 31, 2016
| Annualized | Annualized | Annualized Since | ||
| One Year | Three Years | Five Years | Inception (8/1/08)* | |
| Class N | 1.79% | 1.39% | 3.59% | 3.36%** |
| Class C | 0.75% | 0.38% | 2.56% | 1.88% |
| Class A with load of 5.75% | (4.29)% | (0.85)% | 2.11% | 1.91% |
| Class A without load | 1.54% | 1.13% | 3.33% | 2.64% |
| IQ Hedge Market Neutral Beta Index | 0.42% | 1.12% | 1.72% | 2.24% |
| Morningstar Multialternative Category | (1.53)% | 0.08% | 0.96% | 0.42% |
| * | Westchester Capital Management, Inc. was named Sub-Adviser to the Fund on August 1, 2008. Prior to August 1, 2008, the Fund was named Kelmoore Strategy Liberty Fund and was managed under a different adviser. |
| ** | Class N commenced operations on September 29, 2008. IQ Hedge Market Neutral Beta Index is a benchmark index designed to replicate the risk-adjusted return characteristics of the collective hedge funds using a market neutral investment style. Investors cannot invest directly in an index or benchmark. |
The Morningstar Multialternative Category is generally representative of mutual funds with static allocations to alternative strategies and mutual funds that tactically allocate among alternative strategies and asset classes. The gross short exposure in these mutual funds is generally greater than 20%.
As disclosed in the Trust’s latest registration statement, the Fund’s total annual operating expenses before any fee waiver, including the cost of underlying funds, are 2.11% for Class N, 3.11% for Class C and 2.36% for Class A. Class A shares are subject to a sales load of 5.75% and a deferred sales charge of up to 0.75%. The performance data quoted here represents past performance, which is not indicative of future results. Current performance may be lower or higher than the performance data quoted. The investment return and NAV will fluctuate, so that an investor’s shares, when redeemed, may be worth more or less than their original cost. Total returns are calculated assuming reinvestment of all dividends and capital gains distributions, if any. The returns do not reflect the deductions of taxes a shareholder would pay on the redemption of fund shares or fund distributions. For performance information current to the most recent month-end, please call 1-800-442-4358 or visit our website www.dunham.com.
12
| SCHEDULE OF INVESTMENTS |
| Dunham Monthly Distribution Fund |
| October 31, 2016 |
| Security | Shares | Value | ||||||||||||||
| COMMON STOCK - 87.1% | ||||||||||||||||
| AEROSPACE & DEFENSE - 0.9% | ||||||||||||||||
| Arconic, Inc. # | 49,000 | $ | 1,407,284 | |||||||||||||
| B/E Aerospace, Inc. | 13,383 | 796,556 | ||||||||||||||
| 2,203,840 | ||||||||||||||||
| AGRICULTURE - 0.9% | ||||||||||||||||
| Reynolds American, Inc. ^ | 38,130 | 2,100,200 | ||||||||||||||
| AIRLINES - 0.0% | ||||||||||||||||
| American Airlines Group, Inc. * | 101,283 | 114,450 | ||||||||||||||
| AUTO MANUFACTURERS - 1.0% | ||||||||||||||||
| General Motors Co. | 72,000 | 2,275,200 | ||||||||||||||
| AUTO PARTS & EQUIPMENT - 0.2% | ||||||||||||||||
| Adient Plc * | 13,270 | 603,920 | ||||||||||||||
| BANKS - 1.3% | ||||||||||||||||
| PrivateBancorp, Inc. # | 66,955 | 3,029,044 | ||||||||||||||
| CHEMICALS - 9.8% | ||||||||||||||||
| Ashland Global Holdings, Inc. # | 21,100 | 2,357,503 | ||||||||||||||
| Dow Chemical Co. # | 88,400 | 4,756,804 | ||||||||||||||
| Monsanto Co. | 35,500 | 3,577,335 | ||||||||||||||
| Syngenta AG - ADR | 78,362 | 6,301,872 | ||||||||||||||
| Valspar Corp. # | 62,341 | 6,209,164 | ||||||||||||||
| Valvoline, Inc. * ^ | 7,253 | 147,961 | ||||||||||||||
| 23,350,639 | ||||||||||||||||
| COMMERCIAL SERVICES - 0.0% | ||||||||||||||||
| SFX Entertainment, Inc. * | 414,496 | 3,231 | ||||||||||||||
| COMPUTERS - 5.5% | ||||||||||||||||
| Dell Technologies, Inc. - Vmware, Inc. * # | 57,945 | 2,844,512 | ||||||||||||||
| Hewlett Packard Enterprise Co. # | 441,000 | 9,909,270 | ||||||||||||||
| Lexmark International, Inc. | 6,063 | 240,640 | ||||||||||||||
| 12,994,422 | ||||||||||||||||
| COSMETICS/PERSONAL CARE - 1.7% | ||||||||||||||||
| Coty, Inc. ^ | 172,071 | 3,955,912 | ||||||||||||||
| The Procter & Gamble Co. | 36 | 3,125 | ||||||||||||||
| 3,959,037 | ||||||||||||||||
| DISTRIBUTION / WHOLESALE - 3.6% | ||||||||||||||||
| Ingram Micro, Inc. # | 233,589 | 8,689,511 | ||||||||||||||
| �� | ||||||||||||||||
| DIVERSIFIED FINANCIAL SERVICES - 2.6% | ||||||||||||||||
| Bats Global Markets, Inc. | 28,949 | 851,390 | ||||||||||||||
| CIT Group, Inc. # | 148,500 | 5,395,005 | ||||||||||||||
| 6,246,395 | ||||||||||||||||
| ELECTRIC - 0.0% | ||||||||||||||||
| Fortis, Inc. | 7 | 241 | ||||||||||||||
| ELECTRONICS - 2.2% | ||||||||||||||||
| Johnson Controls International PLC | 132,700 | 5,350,483 | ||||||||||||||
| ENTERTAINMENT - 0.8% | ||||||||||||||||
| Isle of Capri Casinos, Inc. * # | 56,623 | 1,189,083 | ||||||||||||||
| Vail Resorts, Inc. | 5,055 | 806,001 | ||||||||||||||
| 1,995,084 | ||||||||||||||||
| FOOD - 4.0% | ||||||||||||||||
| ConAgra Foods, Inc. # | 172,900 | 8,330,322 | ||||||||||||||
| The WhiteWave Foods Co. *# | 21,154 | 1,152,681 | ||||||||||||||
| 9,483,003 | ||||||||||||||||
See accompanying notes to Financial Statements.
13
| SCHEDULE OF INVESTMENTS |
| Dunham Monthly Distribution Fund (Continued) |
| October 31, 2016 |
| Security | Shares | Value | ||||||||||||||
| HEALTHCARE-PRODUCTS - 3.1% | ||||||||||||||||
| St Jude Medical, Inc. # | 93,491 | $ | 7,277,339 | |||||||||||||
| HOLDING COMPANIES-DIVERSIFICATION - 0.9% | ||||||||||||||||
| Hennessy Capital Acquisition Corp. II * | 104,074 | 1,027,210 | ||||||||||||||
| Pacific Special Acquisition Corp. * | 105,552 | 1,081,908 | ||||||||||||||
| 2,109,118 | ||||||||||||||||
| HOUSEHOLD PRODUCTS / WARES - 3.9% | ||||||||||||||||
| Jarden Corp. * | 148,157 | 9,321,031 | ||||||||||||||
| INSURANCE - 5.2% | ||||||||||||||||
| Endurance Specialty Holdings Ltd. | 62,279 | 5,726,554 | ||||||||||||||
| Metlife, Inc. | 139,500 | 6,550,920 | ||||||||||||||
| 12,277,474 | ||||||||||||||||
| INTERNET - 5.4% | ||||||||||||||||
| Yahoo!, Inc. * # | 308,067 | 12,800,184 | ||||||||||||||
| INVESTMENT COMPANIES - 2.3% | ||||||||||||||||
| American Capital Ltd. * # | 319,103 | 5,421,560 | ||||||||||||||
| Northstar Asset Management Group | 1,875 | 25,718 | ||||||||||||||
| 5,447,278 | ||||||||||||||||
| LODGING - 7.3% | ||||||||||||||||
| Hilton Worldwide Holdings, Inc. # | 406,600 | 9,189,160 | ||||||||||||||
| MGM Resorts International * | 250,000 | 6,542,500 | ||||||||||||||
| Marriott International, Inc. ^ | 23,600 | 1,621,320 | ||||||||||||||
| 17,352,980 | ||||||||||||||||
| MEDIA - 8.8% | ||||||||||||||||
| CBS Corp. # | 118,200 | 6,692,484 | ||||||||||||||
| Liberty SiriusXM Group * # | 212,403 | 7,066,648 | ||||||||||||||
| Media General, Inc. * ^ | 57,588 | 970,358 | ||||||||||||||
| Time Warner, Inc. | 69,200 | 6,158,108 | ||||||||||||||
| 20,887,598 | ||||||||||||||||
| MISCELLANEOUS MANUFACTURING - 1.5% | ||||||||||||||||
| General Electric Co. ^ | 120,700 | 3,512,370 | ||||||||||||||
| OIL & GAS - 0.6% | ||||||||||||||||
| Showa Shell Sekiyu KK | 155,280 | 1,452,557 | ||||||||||||||
| OIL & GAS SERVICES - 2.1% | ||||||||||||||||
| FMC Technologies Inc | 154,003 | 4,969,677 | ||||||||||||||
| PIPELINES - 0.9% | ||||||||||||||||
| Columbia Pipeline Group, Inc. | 84,102 | 2,168,392 | ||||||||||||||
| PRIVATE EQUITY - 0.8% | ||||||||||||||||
| The Blackstone Group LP ^ # | 74,000 | 1,852,220 | ||||||||||||||
| REITS - 3.5% | ||||||||||||||||
| NorthStar Realty Finance Corp. # | 51,505 | 723,066 | ||||||||||||||
| Starwood Property Trust, Inc. # | 237,766 | 5,287,916 | ||||||||||||||
| Wheeler Real Estate Investment Trust, Inc. # | 841,527 | 1,447,426 | ||||||||||||||
| Winthrop Realty Trust # | 102,617 | 846,590 | ||||||||||||||
| 8,304,998 | ||||||||||||||||
| RETAIL - 4.1% | ||||||||||||||||
| Cabela’s, Inc. * # | 119,003 | 7,331,775 | ||||||||||||||
| Yum! Brands, Inc. | 28,100 | 2,424,468 | ||||||||||||||
| 9,756,243 | ||||||||||||||||
| SEMICONDUCTORS - 2.2% | ||||||||||||||||
| KLA-Tencor Corp.# | 26,000 | 1,952,860 | ||||||||||||||
| NXP Semiconductors NV * | 32,053 | 3,205,300 | ||||||||||||||
| 5,158,160 | ||||||||||||||||
| TOTAL COMMON STOCK (Cost - $204,524,216) | 207,046,319 | |||||||||||||||
See accompanying notes to Financial Statements.
14
| SCHEDULE OF INVESTMENTS |
| Dunham Monthly Distribution Fund (Continued) |
| October 31, 2016 |
| Security | Shares | Value | ||||||||||||||
| RIGHTS - 0.0% | ||||||||||||||||
| Leap Wireless International, Inc. * | 4,071 | $ | 12,009 | |||||||||||||
| Pacific Special Acquisition Corp. * | 105,552 | 23,860 | ||||||||||||||
| Safeway Casa Ley CVR * | 90,955 | 4,548 | ||||||||||||||
| Safeway PDC, LLC CVR * | 90,955 | 31,834 | ||||||||||||||
| TOTAL RIGHTS (Cost - $126,880) | 72,251 | |||||||||||||||
| WARRANTS - 0.0% | ||||||||||||||||
| Pacific Special Acquisition Corp. * | 105,552 | 11,611 | ||||||||||||||
| TOTAL WARRANTS (Cost - $8,254) | ||||||||||||||||
| CLOSED-END FUNDS - 2.7% | ||||||||||||||||
| BlackRock Floating Rate Income Strategies Fund, Inc. | 103,341 | 1,424,039 | ||||||||||||||
| Eaton Vance Floating-Rate Income Trust | 48,842 | 704,302 | ||||||||||||||
| Invesco Senior Income Trust # | 586,649 | 2,575,389 | ||||||||||||||
| Voya Prime Rate Trust # | 203,862 | 1,082,507 | ||||||||||||||
| Western Asset High Income Opportunity Fund, Inc. | 106,644 | 528,954 | ||||||||||||||
| TOTAL CLOSED-END FUNDS (Cost - $6,287,617) | 6,315,191 | |||||||||||||||
| Dividend | ||||||||||||||||
| Shares | Rate | |||||||||||||||
| PREFERRED STOCK - 1.7% | ||||||||||||||||
| DIVERSIFIED FINANCIAL SERVICES - 1.7% | ||||||||||||||||
| Kinder Morgan GP, Inc. - 144A * | 2,000 | 4.80 | % | 1,825,000 | ||||||||||||
| NorthStar Realty Finance Corp | 34,828 | 8.25 | % | 921,413 | ||||||||||||
| NorthStar Realty Finance Corp # | 45,545 | 8.75 | % | 1,208,309 | ||||||||||||
| TOTAL PREFERRED STOCK (Cost - $3,955,187) | 3,954,722 | |||||||||||||||
| Principal | Interest | Maturity | ||||||||||||||
| Amount | Rate | Date | ||||||||||||||
| BONDS & NOTES - 7.7% | ||||||||||||||||
| ELECTRIC - 2.7% | ||||||||||||||||
| Energy Future Intermediate Holding Co. LLC / EFIH Finance, Inc. - 144A | $ | 4,903,373 | 11.75 | % | 3/1/2022 | 6,325,351 | ||||||||||
| ENGINEERING & CONSTRUCTION - 0.1% | ||||||||||||||||
| Aeropuertos Dominicanos Siglo XXI SA - 144A | 192,000 | 9.750 | 11/13/2019 | 202,080 | ||||||||||||
| FOOD - 1.4% | ||||||||||||||||
| WhiteWave Foods Co. # | 2,950,000 | 5.3750 | 10/1/2022 | 3,329,812 | ||||||||||||
| HEALTHCARE - 0.5% | ||||||||||||||||
| Change Healthcare Holdings, Inc. | 1,224,000 | 11.0000 | 12/31/2019 | 1,286,096 | ||||||||||||
| LODGING - 1.4% | ||||||||||||||||
| Caesars Growth Properties Holdings LLC / Caesars Growth Properties Finance, Inc. | 3,180,000 | 9.3750 | 5/1/2022 | 3,394,650 | ||||||||||||
| MEDIA - 0.9% | ||||||||||||||||
| LIN Television Corp. | 2,000,000 | 5.875 | 11/15/2022 | 2,102,500 | ||||||||||||
| RETAIL - 0.7% | ||||||||||||||||
| Rite Aid Corp. | 1,694,000 | 6.750 | 6/15/2021 | 1,781,393 | ||||||||||||
| TOTAL BONDS & NOTES (Cost - $17,551,771) | 18,421,882 | |||||||||||||||
| Contracts** | ||||||||||||||||
| PURCHASED CALL OPTIONS - 0.0% | ||||||||||||||||
| SPDR S&P 500 ETF Trust, Expiration November 2016, Exercise Price $221 | 130 | 2,340 | ||||||||||||||
| TOTAL PURCHASED CALL OPTIONS (Cost - $29,213) | 2,340 | |||||||||||||||
| Contracts** | ||||||||||||||||
| PURCHASED PUT OPTIONS - 0.3% | ||||||||||||||||
| Allergan Public, Expiration November 2016, Exercise Price $215 | 55 | 54,340 | ||||||||||||||
| American International Group, Inc., Expiration November 2016, Exercise Price $50 | 256 | 512 | ||||||||||||||
| American International Group, Inc., Expiration December 2016, Exercise Price $52.5 | 356 | 9,078 | ||||||||||||||
| Arconic, Inc., Expiration December 2016, Exercise Price $22 | 490 | 2,450 | ||||||||||||||
See accompanying notes to Financial Statements.
15
| SCHEDULE OF INVESTMENTS |
| Dunham Monthly Distribution Fund (Continued) |
| October 31, 2016 |
| Security | Contracts** | Value | ||||||||||||||
| PURCHASED PUT OPTIONS - 0.3% (Continued) | ||||||||||||||||
| Blackstone Group LP., Expiration November 2016, Exercise Price $22 | 240 | $ | 1,200 | |||||||||||||
| Blackstone Group LP., Expiration December 2016, Exercise Price $22 | 740 | 11,470 | ||||||||||||||
| ConAgra Foods, Inc., Expiration December 2016, Exercise Price $40 | 197 | 3,447 | ||||||||||||||
| ConAgra Foods, Inc., Expiration November 2016, Exercise Price $42 | 102 | 1,020 | ||||||||||||||
| ConAgra Foods, Inc., Expiration December 2016, Exercise Price $42 | 1,287 | 25,740 | ||||||||||||||
| CBS Corp., Expiration December 2016, Exercise Price $47 | 1,182 | 34,278 | ||||||||||||||
| CIT Group, Inc., Expiration November 2016, Exercise Price $32 | 1,094 | 24,615 | ||||||||||||||
| CIT Group, Inc., Expiration November 2016, Exercise Price $33 | 391 | 5,865 | ||||||||||||||
| Dow Chemical Company, Expiration December 2016, Exercise Price $45 | 1,507 | 24,112 | ||||||||||||||
| Vivendi SA, Expiration November 2016, Exercise Price $14 | 545 | 598 | ||||||||||||||
| Vivendi SA, Expiration December 2016, Exercise Price $16 | 2,011 | 15,453 | ||||||||||||||
| General Electric Co., Expiration December 2016, Exercise Price $26 | 1,207 | 18,709 | ||||||||||||||
| General Motors Co., Expiration December 2016, Exercise Price $28 | 2,379 | 52,338 | ||||||||||||||
| Hilton Worldwide Holdings, Inc., Expiration November 2016, Exercise Price $19 | 203 | 2,030 | ||||||||||||||
| Hilton Worldwide Holdings, Inc., Expiration November 2016, Exercise Price $20 | 419 | 4,190 | ||||||||||||||
| Hilton Worldwide Holdings, Inc., Expiration November 2016, Exercise Price $21 | 3,444 | 43,050 | ||||||||||||||
| Hewlett Packard Enterprise Company, Expiration November 2016, Exercise Price $17 | 3,281 | 8,203 | ||||||||||||||
| Hewlett Packard Enterprise Company, Expiration November 2016, Exercise Price $18 | 1,129 | 2,823 | ||||||||||||||
| Johnson Controls International PLC, Expiration November 2016, Exercise Price $38 | 224 | 5,152 | ||||||||||||||
| Johnson Controls International PLC, Expiration November 2016, Exercise Price $40 | 267 | 6,808 | ||||||||||||||
| Johnson Controls International PLC, Expiration January 2017, Exercise Price $40 | 306 | 15,912 | ||||||||||||||
| MetLife, Inc., Expiration November 2016, Exercise Price $37.5 | 1,277 | 5,108 | ||||||||||||||
| MetLife, Inc., Expiration January 2017, Exercise Price $40 | 1,395 | 78,120 | ||||||||||||||
| MGM Resorts International, Expiration December 2016, Exercise Price $21 | 2,500 | 32,500 | ||||||||||||||
| SPDR S&P 500 ETF Trust, Expiration November 2016, Exercise Price $214 | 110 | 41,800 | ||||||||||||||
| SPDR S&P 500 ETF Trust, Expiration November 2016, Exercise Price $215 | 335 | 138,020 | ||||||||||||||
| Yum! Brands, Inc., Expiration January 2017, Exercise Price $72.5 | 281 | 15,736 | ||||||||||||||
| TOTAL PURCHASED PUT OPTIONS (Cost - $1,479,792) | 684,677 | |||||||||||||||
| TOTAL PURCHASED OPTIONS (Cost - $1,509,005) | 687,017 | |||||||||||||||
| Interest | ||||||||||||||||
| Shares | Rate | |||||||||||||||
| SHORT-TERM INVESTMENT - 16.3% | ||||||||||||||||
| MONEY MARKET FUND - 16.3% | ||||||||||||||||
| First American Government Obligations Fund | 38,645,259 | 0.24%+ | 38,645,259 | |||||||||||||
| TOTAL SHORT-TERM INVESTMENT (Cost - $38,645,259) | ||||||||||||||||
| COLLATERAL FOR SECURITIES LOANED - 3.7% | ||||||||||||||||
| Mount Vernon Prime Portfolio (Cost - $8,851,794) | 8,851,794 | 0.67%+ | 8,851,794 | |||||||||||||
| TOTAL INVESTMENTS - 119.5% (Cost - $281,459,983) | $ | 284,006,046 | ||||||||||||||
| LIABILITIES IN EXCESS OF OTHER ASSETS - (19.5)% | (46,251,705 | ) | ||||||||||||||
| NET ASSETS - 100.0% | $ | 237,754,341 | ||||||||||||||
| * | Non-Income producing security. |
| ** | Each Purchased Option contract allows the Fund to buy/sell 100 shares of the underlying security at the exercise price. |
| *** | Issuer in default on interest payments, non-interest producing security. |
ADR- American Depositary Receipt.
REITS - Real Estate Investment Trusts
| + | Variable rate security. Interest rate is as of October 31, 2016. |
| ++ | Each Written Call/Put Option contract allows the holder to purchase/sell 100 shares of the underlying security from/to the Fund at the stated exercise price. |
| +++ | Less than one share |
| ^ | All or a portion of these securities are on loan. Total loaned securities had a value of $8,642,699 at October 31, 2016. |
| # | All or a portion of the security is segregated as collateral for securities sold short and/or options purchased/written at October 31, 2016. Total collateral had a value of $50,441,347 at October 31, 2016. |
144A - Security exempt from registration under Rule 144A of the Securities Act of 1933. These securities may be sold in transactions exempt from registration, normally to qualified institutional buyers.
See accompanying notes to Financial Statements.
16
| SCHEDULE OF INVESTMENTS |
| Dunham Monthly Distribution Fund (Continued) |
| October 31, 2016 |
| Security | Contracts ++ | Value | ||||||
| WRITTEN CALL OPTIONS - (2.7)% | ||||||||
| Allergan Public, Expiration November 2016, Exercise Price $235 | 52 | $ | 5,720 | |||||
| American International Group, Expiration November 2016, Exercise Price $57.50 | 256 | 112,640 | ||||||
| American International Group, Expiration December 2016, Exercise Price $57.50 | 535 | 256,800 | ||||||
| Arconic, Inc., Expiration December 2016, Exercise Price $25 | 490 | 195,020 | ||||||
| Ashland Global Holdings, Expiration November 2016, Exercise Price $125 | 21 | 525 | ||||||
| Blackstone Group LP, Expiration December 2016, Exercise Price $25 | 740 | 50,320 | ||||||
| ConAgra Foods, Inc., Expiration December 2016, Exercise Price $44 | 241 | 109,655 | ||||||
| ConAgra Foods, Inc., Expiration December 2016 Exercise Price $45 | 1,386 | 512,820 | ||||||
| ConAgra Foods, Inc., Expiration December 2016 Exercise Price $47 | 102 | 24,480 | ||||||
| CBS Corp, Expiration December 2016, Exercise Price $52.5 | 1,182 | 582,135 | ||||||
| CIT Group ,Inc., Expiration November 2016, Exercise Price $35 | 1,094 | 188,715 | ||||||
| CIT Group ,Inc., Expiration November 2016, Exercise Price $36 | 391 | 41,055 | ||||||
| Coty, Inc., Expiration December 2016, Exercise Price $23 | 430 | 47,730 | ||||||
| Dow Chemical Company, Expiration December 2016, Exercise Price $52.5 | 1,507 | 361,680 | ||||||
| Vivendi SA, Expiration November 2016, Exercise Price $16.5 | 545 | 116,664 | ||||||
| Vivendi SA, Expiration December 2016, Exercise Price $18 | 2,011 | 176,606 | ||||||
| General Electric Co., Expiration December 2016, Exercise Price $29 | 1,207 | 90,525 | ||||||
| General Motors Co., Expiration December 2016, Exercise Price $31 | 2,379 | 309,270 | ||||||
| General Motors Co., Expiration November 2016, Exercise Price $32 | 115 | 5,405 | ||||||
| Hilton Worldwide Holdings, Inc., Expiration November 2016, Exercise Price $22 | 193 | 15,826 | ||||||
| Hilton Worldwide Holdings, Inc., Expiration November 2016, Exercise Price $23 | 3,476 | 121,660 | ||||||
| Hewlett Packard Enterprise Co., Expiration November 2016, Exercise Price $20 | 3,281 | 803,845 | ||||||
| Hewlett Packard Enterprise Co., Expiration November 2016, Exercise Price $21 | 1,129 | 176,124 | ||||||
| Johnson Controls, Inc., Expiration November 2016, Exercise Price $42 | 224 | 61,600 | ||||||
| Johnson Controls, Inc., Expiration January 2017, Exercise Price $44 | 136 | 29,716 | ||||||
| Johnson Controls, Inc., Expiration November 2016, Exercise Price $44 | 267 | 45,123 | ||||||
| Johnson Controls, Inc., Expiration January 2017, Exercise Price $45 | 170 | 28,050 | ||||||
| KLA-Tencor Corp., Expiration November 2016, Exercise Price $70 | 260 | 135,200 | ||||||
| Marriott International, Inc., Expiration December 2016, Exercise Price $67.5 | 162 | 47,385 | ||||||
| Marriott International, Inc., Expiration November 2016, Exercise Price $70 | 74 | 8,510 | ||||||
| MetLife, Inc., Expiration January 2017, Exercise Price $45 | 1,395 | 467,325 | ||||||
| MGM Resorts International, Expiration December 2016, Exercise Price $24 | 2,500 | 673,750 | ||||||
| NXP Semiconductors NV, Expiration December 2016, Exercise Price $100 | 122 | 14,640 | ||||||
| Reynolds American, Inc., Expiration November 2016, Exercise Price $52.5 | 111 | 37,740 | ||||||
| SPDR S&P 500 ETF Trust, Expiration November 2016, Exercise Price $210 | 130 | 66,040 | ||||||
| Time Warner, Inc., Expiration December 2016, Exercise Price $85 | 692 | 290,640 | ||||||
| Yum! Brands, Inc., Expiration January 2017, Exercise Price $85 | 253 | 104,995 | ||||||
| WRITTEN CALL OPTIONS - (Premiums Received - $5,986,849) | 6,315,934 | |||||||
| WRITTEN PUT OPTIONS - (0.0)% | ||||||||
| Alibaba Group Holding Ltd., November 2016, Exercise Price $90 | 16 | 704 | ||||||
| Alibaba Group Holding Ltd., November 2016, Exercise Price $95 | 18 | 2,286 | ||||||
| Blackstone Group LP., Expiration November 2016, Exercise Price $24 | 240 | 7,200 | ||||||
| SPDR S&P 500 ETF Trust, Expiration November 2016, Exercise Price $200 | 108 | 6,912 | ||||||
| SPDR S&P 500 ETF Trust, Expiration November 2016, Exercise Price $207 | 335 | 52,595 | ||||||
| TOTAL WRITTEN PUT OPTIONS - (Premiums Received - $69,124) | 69,697 | |||||||
| Shares | ||||||||
| SECURITIES SOLD SHORT * - (17.0)% | ||||||||
| Allergan PLC | 703 | 146,885 | ||||||
| Abbott Laboratories | 81,206 | 3,186,523 | ||||||
| Alibaba Group Holding Ltd. - ADR | 122,529 | 12,459,974 | ||||||
| American Airlines Group, Inc. | 5,300 | 215,180 | ||||||
| American International Group, Inc. | 8,889 | 548,451 | ||||||
| Ares Capital Corp. | 157,637 | 2,411,846 | ||||||
| British American Tobacco PLC - ADR | 7,437 | 854,437 | ||||||
See accompanying notes to Financial Statements.
17
| SCHEDULE OF INVESTMENTS |
| Dunham Monthly Distribution Fund (Continued) |
| October 31, 2016 |
| Shares | Value | |||||||
| SECURITIES SOLD SHORT * - (17.0)% (Continued) | ||||||||
| Canadian Imperial Bank of Commerce | 24,485 | $ | 1,835,396 | |||||
| CBOE Holdings, Inc. | 9,261 | 585,388 | ||||||
| Colony Capital, Inc. | 38,623 | 734,223 | ||||||
| Eldorado Resorts, Inc. | 38,956 | 471,368 | ||||||
| Idemitsu Kosan Co. Ltd. | 77,504 | 1,789,236 | ||||||
| Joy Global, Inc. | 23,473 | 653,254 | ||||||
| Nexstar Broadcasting Group, Inc. | 7,200 | 351,360 | ||||||
| Quintiles IMS Holdings, Inc. | 1 | 66 | ||||||
| Rockwell Collins, Inc. | 2,810 | 236,939 | ||||||
| Sirius XM Holdings, Inc. | 1,999,882 | 8,339,508 | ||||||
| Vail Resorts, Inc. | 9,216 | 1,469,399 | ||||||
| Vmware, Inc. | 51,941 | 4,082,563 | ||||||
| TOTAL SECURITIES SOLD SHORT - (Proceeds - $34,548,796) | 40,371,996 | |||||||
| Unrealized | ||||
| Appreciation/ | ||||
| (Depreciation) | ||||
| LONG EQUITY SWAP CONTRACTS - 0.5% | ||||
| Allergan PLC Equity Swap, Bank of America - January 22, 2018 | $ | (516,673 | ) | |
| to receive total return of Allergan PLC less USD- 3 Month LIBOR plus 0.72% | ||||
| (NOTIONAL AMOUNT $1,810,500) | ||||
| American International Group Equity Swap, JP Morgan - April 12, 2017 | 721,482 | |||
| to receive total return of American International Group less USD- 3 Month LIBOR plus 01.20% | ||||
| (NOTIONAL AMOUNT $4,699,492) | ||||
| Dow Chemical Co. Equity Swap, JP Morgan - February 03, 2017 | 436,935 | |||
| to receive total return of Dow Chemical Co. less USD- 3 Month LIBOR plus 1.15% | ||||
| (NOTIONAL AMOUNT $2,911,902) | ||||
| Eaton Vance Floating Rate, Inc. Equity Swap, JP Morgan - December 21, 2016 | 442,748 | |||
| to receive total return of Eaton Vance Floating Rate, Inc. less USD- 3 Month LIBOR plus 1.65% | ||||
| (NOTIONAL AMOUNT $2,820,261) | ||||
| Eaton Vance Floating Rate, Inc. Equity Swap, JP Morgan - January 04, 2017 | 31,399 | |||
| to receive total return of Eaton Vance Floating Rate, Inc. less USD- 3 Month LIBOR plus 1.65% | ||||
| (NOTIONAL AMOUNT $195,346) | ||||
| First Trust Four Corners Senior Floating Rate Equity Swap, JP Morgan - December 30, 2016 | 45,289 | |||
| to receive total return of First Trust Four Corners Senior Floating Rate less USD- 3 Month LIBOR plus 1.65% | ||||
| (NOTIONAL AMOUNT $409,037) | ||||
| First Trust Four Corners Senior Floating Rate Equity Swap, JP Morgan - January 04, 2017 | 35,714 | |||
| to receive total return of First Trust Four Corners Senior Floating Rate less USD- 3 Month LIBOR plus 1.65% | ||||
| (NOTIONAL AMOUNT $312,869) | ||||
| FMC Technologies, Inc. Equity Swap, Bank of America - August 10, 2017 | 108,909 | |||
| to receive total return of FMC Technologies, Inc. less USD- 3 Month LIBOR plus 0.79% | ||||
| (NOTIONAL AMOUNT $444,288) | ||||
| General Motors Co. Equity Swap, JP Morgan - December 14, 2016 | (705,647 | ) | ||
| to receive total return of General Motors Co. less USD- 3 Month LIBOR plus 1.65% | ||||
| (NOTIONAL AMOUNT $6,423,540) | ||||
| Linkedin Corp. Equity Swap, Bank of America - June 29, 2017 | (57,705 | ) | ||
| to receive total return of Linkedin Corp. less USD- 3 Month LIBOR plus 0.87% | ||||
| (NOTIONAL AMOUNT $14,212,788) | ||||
See accompanying notes to Financial Statements.
18
| SCHEDULE OF INVESTMENTS |
| Dunham Monthly Distribution Fund (Continued) |
| October 31, 2016 |
| Unrealized | ||||
| Appreciation/ | ||||
| (Depreciation) | ||||
| LONG EQUITY SWAP CONTRACTS (Continued) - 0.5% | ||||
| Syngenta AG, Bank of America - February 15, 2017 | $ | (16,443 | ) | |
| to receive total return of Syngenta AG less USD- 3 Month LIBOR plus 0.74% | ||||
| (NOTIONAL AMOUNT $1,720,145) | ||||
| Vail Resorts, Inc. Equity Swap, Bank of America - October 24, 2017 | 34,826 | |||
| to receive total return of Vail Resorts, Inc. less USD- 3 Month LIBOR plus .88% | ||||
| (NOTIONAL AMOUNT $628,445) | ||||
| Voya Prime Rate Equity Swap, JP Morgan - December 21, 2016 | 18,576 | |||
| to receive total return of Voya Prime Rate less USD- 3 Month LIBOR plus 1.40% | ||||
| (NOTIONAL AMOUNT $259,875) | ||||
| Voya Prime Rate Equity Swap, JP Morgan - December 28, 2016 | 45,385 | |||
| to receive total return of Voya Prime Rate less USD- 3 Month LIBOR plus 1.40% | ||||
| (NOTIONAL AMOUNT $804,134) | ||||
| Vivendi Equity Swap, JP Morgan - June 06, 2017 | 596,976 | |||
| to receive total return of Vivendi less USD- 3 Month LIBOR plus 1.25% | ||||
| (NOTIONAL AMOUNT $4,567,516) | ||||
| TOTAL LONG EQUITY SWAP CONTRACTS | $ | 1,221,771 | ||
| SHORT EQUITY SWAP CONTRACTS - (0.3)% | ||||
| Technip SA, Bank of America - August 09, 2017 | (799,555 | ) | ||
| to receive total return of Technip SA less USD- 3 Month LIBOR plus 0.86% | ||||
| (NOTIONAL AMOUNT $85,586) | ||||
| TOTAL SHOT EQUITY SWAP CONTRACTS | $ | (799,555 | ) | |
| Portfolio Composition * - (Unaudited) | ||||||||||
| Financial | 16.6 | % | Industrial | 4.0 | % | |||||
| Consumer, Cyclical | 16.2 | % | Collateral For Securities Loaned | 3.1 | % | |||||
| Communications | 12.6 | % | Energy | 3.0 | % | |||||
| Consumer, Non-Cyclical | 12.5 | % | Utilities | 2.2 | % | |||||
| Basic Materials | 8.2 | % | Diversified | 0.8 | % | |||||
| Technology | 7.0 | % | Short-Term Investment | 13.8 | % | |||||
| 100.0 | % | |||||||||
| * | Based on total value of investments as of October 31, 2016 |
Percentage may differ from Schedule of Investments which are based on Fund net assets.
See accompanying notes to Financial Statements.
19
| Dunham Corporate/Government Bond Fund |
| Message from the Sub-Adviser (Newfleet Asset Management, LLC) |
Investment-grade bonds, as measured by the Barclays Aggregate Bond Index, rose 4.4 percent in the fiscal year ended October 31, 2016 after a 2.0 percent increase over the previous fiscal year. Treasuries in the middle of the yield curve, as measured by the BofA ML Treasuries 5-7 Years Index, ended the fiscal year up 3.6 percent, while long-term Treasuries, as measured by the BofA ML Treasuries 10+ Years Index, saw an increase of 8.8 percent over the fiscal year. Corporate bonds, as measured by the BofA ML U.S. Corporate Bond Index, increased nearly doubled the return of intermediate-term Treasury bonds, rising 7.0 percent over the fiscal year. High-yield bonds, as measured by the BofA ML High-Yield Bond Cash Pay Index, increased 10.1 percent, outperforming the intermediate-term Treasury bonds by 6.5 percent during the fiscal year ended October 31, 2016.
The Fund continued to balance risk versus reward by choosing to emphasize lower duration bonds and overweighting lower credit quality securities, which outperformed over the previous fiscal year in anticipation of rising interest rates, and continued to outperform over the current fiscal year, after a hiccup over the first fiscal quarter and into the second. The effective duration of the Fund increased throughout the fiscal year and was roughly 4.98 years, on average, while the benchmark index had an approximate effective duration of 5.50 years, on average. This allocation generally dragged on performance for the Fund as Treasury yields experienced a general down trend over the fiscal year, trading in a relatively broad range of 99 basis points. Long-term Treasury yields began the fiscal year at 2.14 percent, hit a high of 2.34 percent in early November and reversed course, undulating through mid-fiscal year before hitting a low in early July of 1.36 percent. Long-term Treasury yields then began a steady rise to end the fiscal year at 1.83 percent.
A holding in the Fund that performed very well for the fiscal year, which is in the high-yield sector, was Scientific Games International, Inc. 6.625% due 5/15/2021 (80874YAQ3) (holdings percentage*: 0.09 percent). The company develops and services lottery games and wagering systems, operating worldwide. The holding ended the first fiscal quarter as a detractor to Fund performance but reversed course throughout the fiscal year. During the last fiscal quarter of the year, the bonds returned 15.5 percent on solid quarterly results that exceeded estimates on both the revenue and EBITDA lines. The company also produced positive cash flow and repurchased a portion of its subordinated bonds at a discount in a deleveraging transaction. The bonds produced a total return of 30.5 percent for the fiscal year. Another contributor to Fund performance included Kinder Morgan, Inc. 4.300% due 6/1/2025 (49456BAF8) (holdings percentage*: 0.24 percent), a pipeline transportation and energy storage company. The company owns and operates pipelines that transport natural gas; gasoline; crude oil; carbon dioxide; and other products; and terminals that store petroleum products and chemicals, and handle bulk materials like coal and petroleum coke. The total return for these bonds over the fiscal year was 20.1 percent.
One detractor from Fund performance over the fiscal year was Tops Holding, LLC 8.000% due 6/15/2022 (89078YAA3) (holdings percentage*: 0.17 percent), which owns and operates full-service supermarkets, gas stations, and pharmacies in New York, Pennsylvania, and Vermont. The bonds detracted from Fund performance over the second and third fiscal quarters, which amounted to an overall detraction from Fund performance for the entire fiscal year. The bonds suffered a total return loss of 6.2 percent for the 12-month period ended October 31, 2016. Another holding that performed poorly over the fiscal year was Corrections Corporation of America (CXW) 5.000% due 10/15/2022 (22025YAQ3) (holdings percentage*: 0.14 percent). The company provides detention and corrections services to government agencies in the United States and United Kingdom. The holding did relatively well until, on August 18th, the U.S. Department of Justice sent a memo to the Federal Bureau of Prisons that it should either decline to renew contracts with private prisons or substantially lower its capacity. The memo stated that private prisons do not maintain the same level of security and safety that the Bureau provides. The Bureau of Prisons is one of CXW’s largest customers, at 7 percent of revenue. The Bureau of Prisons has reduced the total inmate population by 26,000 over the past 3 years and CXW’s revenue from the Bureau of Prisons has declined by 47 percent since 2010. The bonds lost 5.9 percent over the fiscal year.
The Sub-Adviser believes macro concerns, such as the effectiveness of widespread unconventional central bank policies and low global interest rates, will continue to weigh on investors, despite the belief that the Fed is likely to push one rate hike by year-end. The Sub-Adviser expects the 10-year U.S. Treasury to end the year in the 1.5 percent to 1.9 percent range, and believes the U.S. is in the late innings of the credit cycle. The Sub-Adviser believes the lead-up to and outcome of the U.S. Presidential election could introduce some volatility to the markets. Overseas, Brexit could create more uncertainty going forward, as the plan to detach from the European Union rolls out, and the fragile economic conditions across Europe will remain a concern. The Sub-Adviser is constructive on bonds, in general, and believes yields in the U.S. are still attractive compared to other parts of the world, providing nice demand for U.S. bonds. The Sub-Adviser continues to believe it is important to stay diversified and granular, keeping small positions and maintaining liquidity. The Sub-Adviser has reduced its below-investment-grade and energy exposure and upgraded to more conservative industries, although it does not expect default levels, ex-energy, to increase too much. The Sub-Adviser believes that the prospect of continued volatility in the bond market will present opportunities and feels that the Fund is positioned well to take advantage of those opportunities as they arise.
| * | Holdings percentage(s) as of 10/31/2016. |
Growth of $100,000 Investment
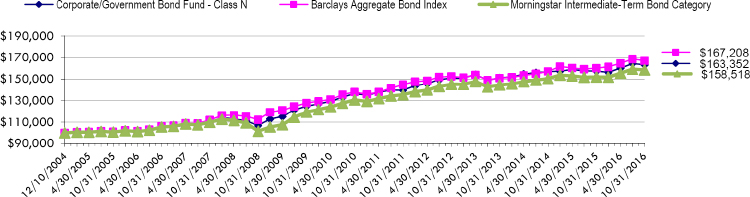
Total Returns as of October 31, 2016
| Annualized | Annualized | Annualized | Annualized Since Inception | ||||||||
| One Year | Three Years | Five Years | Ten Years | (12/10/04) | |||||||
| Class N | 4.09% | 2.61% | 3.19% | 4.54% | 4.21% | ||||||
| Class C | 3.27% | 1.95% | 2.48% | 3.79% | 3.47% | ||||||
| Class A with load of 4.50% | (0.86)% | 0.92% | 2.04% | N/A | 3.67%* | ||||||
| Class A without load | 3.86% | 2.48% | 2.98% | N/A | 4.15%* | ||||||
| Barclays Aggregate Bond Index | 4.37% | 3.48% | 2.90% | 4.64% | 4.42% | ||||||
| Morningstar Intermediate-Term Bond Category | 4.36% | 3.11% | 3.18% | 4.16% | 3.95% |
| * | Class A commenced operations on January 3, 2007. |
The Barclays Aggregate Bond Index is an unmanaged index which represents the U.S. investment-grade fixed-rate bond market (including government and corporate securities, mortgage pass-through securities and asset-backed securities). Investors cannot invest directly in an index or benchmark.
The Morningstar Intermediate-Term Bond Category is generally representative of intermediate-term bond mutual funds that primarily invest in corporate and other investment-grade U.S. fixed-income securities and typically have durations of 3.5 to 6.0 years.
As disclosed in the Trust’s latest registration statement, the Fund’s total annual operating expenses, including underlying funds, are 1.06% for Class N, 1.81% for Class C and 1.31% for Class A. Class A shares are subject to a sales load of 4.50% and a deferred sales charge of up to 0.75%. The performance data quoted here represents past performance, which is not indicative of future results. Current performance may be lower or higher than the performance data quoted. The investment return and NAV will fluctuate, so that an investor’s shares, when redeemed, may be worth more or less than their original cost. Total returns are calculated assuming reinvestment of all dividends and capital gains distributions, if any. The returns do not reflect the deductions of taxes a shareholder would pay on the redemption of fund shares or fund distributions. For performance information current to the most recent month-end, please call 1-800-442-4358 or visit our website www.dunham.com
20
| SCHEDULE OF INVESTMENTS |
| Dunham Corporate/Government Bond Fund |
| October 31, 2016 |
| Principal | Interest | Maturity | ||||||||||||
| Security | Amount | Rate | Date | Value | ||||||||||
| CORPORATE BONDS & NOTES - 56.4% | ||||||||||||||
| AEROSPACE / DEFENSE - 0.2% | ||||||||||||||
| TransDigm, Inc. | $ | 75,000 | 6.000 | % | 7/15/2022 | $ | 78,562 | |||||||
| TransDigm, Inc. | 35,000 | 6.500 | 5/15/2025 | 36,619 | ||||||||||
| 115,181 | ||||||||||||||
| AIRLINES ABS - 0.6% | ||||||||||||||
| Air Canada 2013-1 Class B Pass Through Trust - 144A | 92,509 | 5.375 | 5/15/2021 | 97,019 | ||||||||||
| United Airlines 2007-1 Pass Through Trust | 240,596 | 6.636 | 7/2/2022 | 257,137 | ||||||||||
| 354,156 | ||||||||||||||
| APPAREL - 0.1% | ||||||||||||||
| Hanesbrands, Inc. - 144A | 15,000 | 4.625 | 5/15/2024 | 15,328 | ||||||||||
| Hanesbrands, Inc. - 144A | 45,000 | 4.875 | 5/15/2026 | 46,013 | ||||||||||
| 61,341 | ||||||||||||||
| AUTO MANUFACTURERS - 1.1% | ||||||||||||||
| Daimler Finance LLC - 144A | 165,000 | 2.200 | 10/30/2021 | 165,337 | ||||||||||
| Ford Motor Credit Co. LLC. | 270,000 | 5.750 | 2/1/2021 | 302,854 | ||||||||||
| General Motors Financial Co., Inc. | 105,000 | 3.500 | 7/10/2019 | 108,107 | ||||||||||
| General Motors Financial Co., Inc. | 60,000 | 4.200 | 3/1/2021 | 63,184 | ||||||||||
| 639,482 | ||||||||||||||
| AUTO PARTS & EQUIPMENT - 0.6% | ||||||||||||||
| Cooper Standard Auto - 144A | 65,000 | 5.625 | 11/15/2026 | 65,488 | ||||||||||
| Delphi Automotive PLC | 105,000 | 3.150 | 11/19/2020 | 108,300 | ||||||||||
| MPG Holdco I, Inc. | 105,000 | 7.375 | 10/15/2022 | 107,494 | ||||||||||
| TI Group Automotive Systems, LLC - 144A | 60,000 | 8.750 | 7/15/2023 | 64,050 | ||||||||||
| 345,332 | ||||||||||||||
| AUTOMOBILE ABS - 5.2% | ||||||||||||||
| AmeriCredit Automobile Receivables Trust 2013-5 | 220,000 | 2.860 | 12/9/2019 | 223,787 | ||||||||||
| California Republic Auto Receivables Trust 2014-3 A4 | 390,000 | 1.790 | 3/16/2020 | 392,447 | ||||||||||
| Capital Auto Receivables Asset Trust / Ally 2013-1 C | 389,617 | 1.740 | 10/22/2018 | 389,956 | ||||||||||
| Centre Point Funding LLC - 144A | 156,847 | 2.610 | 8/20/2020 | 155,562 | ||||||||||
| Drive Auto Receivables Trust 2015-A - 144A | 260,000 | 3.060 | 5/17/2021 | 263,155 | ||||||||||
| Drive Auto Receivables Trust 2015-D - 144A | 165,000 | 3.380 | 11/15/2021 | 168,486 | ||||||||||
| Drive Auto Receivables Trust 2016-B - 144A | 255,000 | 2.560 | 6/15/2020 | 257,378 | ||||||||||
| DT Auto Owner Trust 2016-4 - 144A | 195,000 | 2.740 | 10/17/2022 | 194,651 | ||||||||||
| Flagship Credit Auto Trust 2016-1 A - 144A | 130,139 | 2.770 | 12/15/2020 | 131,524 | ||||||||||
| Ford Credit Auto Owner Trust 2013-B D | 194,000 | 1.820 | 11/15/2019 | 194,771 | ||||||||||
| Santander Drive Auto Receivables Trust 2014-4 | 160,000 | 3.100 | 11/16/2020 | 163,817 | ||||||||||
| Santander Drive Auto Receivables Trust 2016-1 | 120,000 | 3.090 | 4/15/2022 | 123,027 | ||||||||||
| Westlake Automobile Receivables Trust 2016-3 - 144A | 240,000 | 2.070 | 12/15/2021 | 240,092 | ||||||||||
| 2,898,653 | ||||||||||||||
| BANKS - 8.9% | ||||||||||||||
| Banco de Credito del Peru - 144A | 120,000 | 6.125 | + | 4/24/2027 | 133,800 | |||||||||
| Banco de Credito e Inversiones - 144A | 325,000 | 4.000 | 2/11/2023 | 344,005 | ||||||||||
| Banco Internacional del Peru SAA -144A | 125,000 | 6.625 | + | 3/19/2029 | 137,775 | |||||||||
| Banco Santander Chile - 144A | 150,000 | 3.875 | 9/20/2022 | 159,558 | ||||||||||
| Bank of America Corp. | 55,000 | 2.000 | 1/11/2018 | 55,259 | ||||||||||
| Bank of America Corp. | 175,000 | 5.625 | 7/1/2020 | 196,030 | ||||||||||
| Bank of America Corp. | 285,000 | 4.450 | 3/3/2026 | 304,812 | ||||||||||
| Bank of New York Mellon | 135,000 | 2.800 | 5/4/2026 | 136,351 | ||||||||||
| Bank of New York Mellon | 110,000 | 4.950 | + | Perpetual | 112,750 | |||||||||
| Barclays Bank PLC - 144A | 270,000 | 6.050 | 12/4/2017 | 281,386 | ||||||||||
| Capital One Financial Corp. | 135,000 | 4.200 | 10/29/2025 | 140,442 | ||||||||||
| Capital One Financial Corp. | 135,000 | 3.750 | 7/28/2026 | 135,110 | ||||||||||
| Citigroup, Inc. | 130,000 | 4.050 | 7/30/2022 | 137,575 | ||||||||||
| Citigroup, Inc. | 160,000 | 6.250 | + | Perpetual | 172,464 | |||||||||
| Goldman Sachs Group, Inc. | 185,000 | 5.750 | 1/24/2022 | 214,136 | ||||||||||
| JPMorgan Chase & Co. | 40,000 | 6.125 | 6/27/2017 | 41,249 | ||||||||||
| JPMorgan Chase & Co. | 35,000 | 5.300 | + | Perpetual | 35,612 | |||||||||
| KeyCorp | 140,000 | 5.000 | + | Perpetual | 137,795 | |||||||||
| M&T Bank Corp. | 55,000 | 5.125 | + | Perpetual | 55,481 | |||||||||
| Morgan Stanley | 185,000 | 4.100 | 5/22/2023 | 195,202 | ||||||||||
| Morgan Stanley | 150,000 | 4.350 | 9/8/2026 | 159,575 | ||||||||||
| Morgan Stanley | 225,000 | 6.375 | 7/24/2042 | 301,679 | ||||||||||
| PNC Financial Services Group, Inc. | 140,000 | 5.000 | + | Perpetual | 140,143 | |||||||||
| PNC Financial Services Group, Inc. | 255,000 | 4.850 | + | Perpetual | 252,450 | |||||||||
| Santander Holdings USA, Inc. | 130,000 | 2.700 | 5/24/2019 | 131,344 | ||||||||||
| SunTrust Banks, Inc. ^ | 30,000 | 5.625 | + | Perpetual | 30,975 | |||||||||
| UBS AG | 650,000 | 7.625 | 8/17/2022 | 754,813 | ||||||||||
| Zions Bancorporation | 115,000 | 4.500 | 6/13/2023 | 119,689 | ||||||||||
| 5,017,460 | ||||||||||||||
See accompanying notes to financial statements.
21
| SCHEDULE OF INVESTMENTS |
| Dunham Corporate/Government Bond Fund (Continued) |
| October 31, 2016 |
| Principal | Interest | Maturity | ||||||||||||
| Security | Amount | Rate | Date | Value | ||||||||||
| BEVERAGES - 0.4% | ||||||||||||||
| Anheuser-Busch InBev Finance, Inc. | $ | 65,000 | 3.3000 | % | 2/1/2023 | $ | 67,933 | |||||||
| Anheuser-Busch InBev Finance, Inc. ^ | 135,000 | 3.6500 | 2/1/2026 | 142,219 | ||||||||||
| 210,152 | ||||||||||||||
| BUILDING MATERIALS - 0.7% | ||||||||||||||
| Masco Corp. | 50,000 | 3.500 | 4/1/2021 | 51,450 | ||||||||||
| Masco Corp. | 60,000 | 5.950 | 3/15/2022 | 68,438 | ||||||||||
| Masco Corp. | 25,000 | 4.450 | 4/1/2025 | 26,219 | ||||||||||
| Owens Corning | 135,000 | 3.400 | 8/15/2026 | 133,852 | ||||||||||
| Standard Industries, Inc. - 144A | 105,000 | 6.000 | 10/15/2025 | 112,607 | ||||||||||
| 392,566 | ||||||||||||||
| CHEMICALS - 0.9% | ||||||||||||||
| Equate Petrochemical BV - 144A | 200,000 | 4.250 | 11/3/2026 | 198,618 | ||||||||||
| NewMarket Corp. | 305,000 | 4.100 | 12/15/2022 | 314,110 | ||||||||||
| 512,728 | ||||||||||||||
| COMMERCIAL MBS - 5.5% | ||||||||||||||
| Aventura Mall Trust 2013-AVM A - 144A | 155,000 | 3.743 | + | 12/5/2032 | 165,931 | |||||||||
| Aventura Mall Trust 2013-AVM C - 144A | 100,000 | 3.867 | + | 12/5/2032 | 104,625 | |||||||||
| CD 2007-CD4 Commercial Mortgage Trust | 42,956 | 5.322 | 12/11/2049 | 43,101 | ||||||||||
| Citigroup Commercial Mortgage Trust 2007-C6 A4 | 290,000 | 5.711 | + | 12/10/2049 | 293,940 | |||||||||
| Citigroup Commercial Mortgage Trust 2008-C7 AM | 95,000 | 6.129 | + | 12/10/2049 | 97,988 | |||||||||
| DBUBS 2011-LC3 Mortgage Trust -LC3A Class D - 144A | 105,000 | 5.345 | + | 8/10/2044 | 109,700 | |||||||||
| GAHR Commercial Mortgage Trust 2015-NRF CFX - 144A | 105,000 | 3.382 | + | 12/15/2034 | 107,017 | |||||||||
| JP Morgan Chase Commercial Mortgage Securities Trust 2007-CIBC19 | 195,277 | 5.715 | + | 2/12/2049 | 197,534 | |||||||||
| JP Morgan Chase Commercial Mortgage Securities Trust 2007-LDP12 A4 | 410,425 | 5.882 | + | 2/15/2051 | 418,531 | |||||||||
| JP Morgan Chase Commercial Mortgage Securities Trust 2011-C4 A3 - 144A | 94,155 | 4.106 | 7/15/2046 | 97,488 | ||||||||||
| JP Morgan Chase Commercial Mortgage Securities Trust 2011-C4 A4 - 144A | 100,000 | 4.388 | 7/15/2046 | 108,449 | ||||||||||
| LB Commercial Mortgage Trust 2007- C3 A4 | 98,794 | 5.916 | + | 7/15/2044 | 100,905 | |||||||||
| LB-UBS Commercial Mortgage Trust 2007-C7 A3 | 61,028 | 5.866 | + | 9/15/2045 | 62,871 | |||||||||
| Morgan Stanley Bank of America Merrill Lynch Trust 2013-C13 AS | 240,000 | 4.266 | 11/15/2046 | 263,410 | ||||||||||
| Morgan Stanley Bank of America Merrill Lynch Trust 2015-C26 C | 135,000 | 4.411 | + | 10/15/2048 | 138,723 | |||||||||
| Morgan Stanley Capital Barclays Bank Trust 2016-MART - 144A | 110,000 | 2.200 | 9/13/2031 | 109,962 | ||||||||||
| Morgan Stanley Capital I Trust 2007-IQ14 AM | 224,000 | 5.678 | + | 4/15/2049 | 218,057 | |||||||||
| Motel 6 Trust CMO 2015-MTL6 Class B - 144A | 170,000 | 3.298 | 2/5/2030 | 170,444 | ||||||||||
| Wells Fargo Commercial Mortgage Trust 2015-LC20 B | 165,000 | 3.719 | 4/15/2050 | 171,919 | ||||||||||
| WFRBS Commercial Mortgage Trust 2011-C5 - 144A | 100,000 | 5.678 | + | 11/15/2044 | 109,723 | |||||||||
| 3,090,318 | ||||||||||||||
| COMMERCIAL SERVICES - 0.8% | ||||||||||||||
| Live Nation Entertainment, Inc. - 144A | 45,000 | 4.875 | 11/1/2024 | 45,000 | ||||||||||
| New York University | 55,000 | 4.142 | 7/1/2048 | 54,400 | ||||||||||
| Prime Security Services Borrower LLC - 144A | 55,000 | 9.250 | 5/15/2023 | 58,575 | ||||||||||
| S&P Global, Inc. | 140,000 | 4.000 | 6/15/2025 | 150,418 | ||||||||||
| Team Health, Inc. - 144A ^ | 5,000 | 7.250 | 12/15/2023 | 5,669 | ||||||||||
| Verisk Analytics, Inc. | 135,000 | 4.000 | 6/15/2025 | 141,234 | ||||||||||
| 455,296 | ||||||||||||||
| COMPUTERS - 0.7% | ||||||||||||||
| Apple, Inc. | 45,000 | 2.850 | 2/23/2023 | 46,710 | ||||||||||
| Apple, Inc. | 125,000 | 3.250 | 2/23/2026 | 130,537 | ||||||||||
| Diamond 1 Finance Corp. - 144A | 30,000 | 5.450 | 6/15/2023 | 32,170 | ||||||||||
| Diamond 1 Finance Corp. - 144A | 20,000 | 7.125 | 6/15/2024 | 21,927 | ||||||||||
| Diamond 1 Finance Corp. - 144A | 25,000 | 6.020 | 6/15/2026 | 27,301 | ||||||||||
| Diamond 1 Finance Corp. - 144A ^ | 25,000 | 8.100 | 7/15/2036 | 29,922 | ||||||||||
| Diamond 1 Finance Corp. - 144A | 30,000 | 8.350 | 7/15/2046 | 36,463 | ||||||||||
| Hewlett Packard Enterprise Co. - 144A ^ | 80,000 | 4.900 | 10/15/2025 | 85,579 | ||||||||||
| 410,609 | ||||||||||||||
| DIVERSIFIED FINANCIAL SERVICES - 0.9% | ||||||||||||||
| Air Lease Corp. | 140,000 | 2.625 | 9/4/2018 | 141,780 | ||||||||||
| Jefferies Group LLC | 60,000 | 6.875 | 4/15/2021 | 69,744 | ||||||||||
| Macquarie Group Ltd.- 144A | 125,000 | 6.250 | 1/14/2021 | 141,496 | ||||||||||
| Navient Corp. | 30,000 | 7.250 | 9/25/2023 | 29,963 | ||||||||||
| OM Asset Management Plc | 135,000 | 4.800 | 7/27/2026 | 133,344 | ||||||||||
| 516,327 | ||||||||||||||
| ELECTRIC - 0.7% | ||||||||||||||
| Dominion Resources, Inc. | 15,000 | 2.962 | 7/1/2019 | 15,353 | ||||||||||
| Duke Energy Corp. | 140,000 | 2.650 | 9/1/2026 | 136,516 | ||||||||||
| NRG Yield Operating LLC | 40,000 | 5.375 | 8/15/2024 | 41,000 | ||||||||||
| Southern Power Co. | 170,000 | 4.150 | 12/1/2025 | 182,210 | ||||||||||
| 375,079 | ||||||||||||||
| ELECTRONICS - 0.3% | ||||||||||||||
| Flextronics International Ltd. | 135,000 | 4.750 | 6/15/2025 | 145,346 | ||||||||||
See accompanying notes to financial statements.
22
| SCHEDULE OF INVESTMENTS |
| Dunham Corporate/Government Bond Fund (Continued) |
| October 31, 2016 |
| Principal | Interest | Maturity | ||||||||||||
| Security | Amount | Rate | Date | Value | ||||||||||
| ENERGY - ALTERNATE RESOURCES - 0.2% | ||||||||||||||
| TerraForm Power Operating LLC. - 144A | $ | 110,000 | 9.375 | % | 2/1/2023 | $ | 110,825 | |||||||
| ENTERTAINMENT - 0.3% | ||||||||||||||
| AMC Entertainment Holdings, Inc. - 144A | 15,000 | 5.875 | 11/15/2026 | 15,094 | ||||||||||
| Pinnacle Entertainment, Inc. - 144A | 40,000 | 5.625 | 5/1/2024 | 40,400 | ||||||||||
| Scientific Games International, Inc. | 65,000 | 6.625 | 5/15/2021 | 53,787 | ||||||||||
| Six Flags Entertainment Corp. - 144A | 85,000 | 4.875 | 7/31/2024 | 85,425 | ||||||||||
| 194,706 | ||||||||||||||
| FOOD - 0.4% | ||||||||||||||
| Safeway, Inc. | 85,000 | 7.250 | 2/1/2031 | 85,213 | ||||||||||
| Whole Foods Market, Inc. - 144A | 110,000 | 5.200 | 12/3/2025 | 118,644 | ||||||||||
| 203,857 | ||||||||||||||
| FOOD SERVICE - 0.1% | ||||||||||||||
| Aramark Services, Inc. - 144A | 60,000 | 4.750 | 6/1/2026 | 60,150 | ||||||||||
| GAS - 0.2% | ||||||||||||||
| NGL Energy Partners LP | 105,000 | 5.125 | 7/15/2019 | 104,475 | ||||||||||
| HEALTHCARE PRODUCTS - 0.3% | ||||||||||||||
| Fresenius US Finance II, Inc. - 144A | 25,000 | 4.500 | 1/15/2023 | 26,188 | ||||||||||
| Ortho-Clinical Diagnostics, Inc. - 144A | 80,000 | 6.625 | 5/15/2022 | 68,800 | ||||||||||
| Teleflex, Inc. | 55,000 | 4.875 | 6/1/2026 | 56,512 | ||||||||||
| 151,500 | ||||||||||||||
| HEALTHCARE - SERVICES - 1.6% | ||||||||||||||
| Centene Corp. | 140,000 | 4.750 | 1/15/2025 | 139,737 | ||||||||||
| CHS/Community Health Systems, Inc. | 30,000 | 5.125 | 8/1/2021 | 28,050 | ||||||||||
| HCA, Inc. | 120,000 | 5.375 | 2/1/2025 | 122,634 | ||||||||||
| HCA, Inc. | 50,000 | 5.250 | 6/15/2026 | 52,375 | ||||||||||
| IASIS Healthcare LLC / IASIS Capital Corp. | 70,000 | 8.375 | 5/15/2019 | 67,025 | ||||||||||
| MEDNAX, Inc. - 144A | 65,000 | 5.250 | 12/1/2023 | 68,088 | ||||||||||
| Surgery Center Holdings, Inc. - 144A | 80,000 | 8.875 | 4/15/2021 | 85,400 | ||||||||||
| Surgical Care Affiliates, Inc. - 144A | 110,000 | 6.000 | 4/1/2023 | 114,950 | ||||||||||
| Tenet Healthcare Corp. | 130,000 | 4.350 | + | 6/15/2020 | 131,625 | |||||||||
| Universal Health Services, Inc. - 144A | 60,000 | 5.000 | 6/1/2026 | 62,400 | ||||||||||
| 872,284 | ||||||||||||||
| HOLDING COMPANIES - DIVERSIFIED - 0.5% | ||||||||||||||
| Hutchison Whampoa International 12 Ltd. - 144A | 185,000 | 6.000 | + | Perpetual | 189,301 | |||||||||
| Leucadia National Corp. | 105,000 | 5.500 | 10/18/2023 | 110,398 | ||||||||||
| 299,699 | ||||||||||||||
| HOME BUILDERS - 0.9% | ||||||||||||||
| M/I Homes, Inc. | 70,000 | 6.750 | 1/15/2021 | 74,025 | ||||||||||
| MDC Holdings, Inc. | 130,000 | 5.500 | 1/15/2024 | 137,475 | ||||||||||
| Toll Brothers Finance Corp. ^ | 155,000 | 4.875 | 11/15/2025 | 158,488 | ||||||||||
| TRI Pointe Holdings, Inc. | 110,000 | 5.875 | 6/15/2024 | 114,538 | ||||||||||
| 484,526 | ||||||||||||||
| HOME EQUITY ABS - 1.8% | ||||||||||||||
| Bayview Financial Mortgage Pass-Through Trust 2006-A 1A4 (a) | 560,000 | 6.087 | 2/28/2041 | 578,604 | ||||||||||
| GSAA Trust 2005-1 AF4 (a) | 262,680 | 5.619 | 11/25/2034 | 272,000 | ||||||||||
| NovaStar Mortgage Funding Trust Series 2004-4 | 140,000 | 2.259 | + | 3/25/2035 | 137,272 | |||||||||
| 987,876 | ||||||||||||||
| HOUSEWARES - 0.1% | ||||||||||||||
| Newell Brands, Inc. ^ | 15,000 | 5.000 | 11/15/2023 | 16,113 | ||||||||||
| Newell Brands, Inc. | 15,000 | 4.200 | 4/1/2026 | 16,226 | ||||||||||
| 32,339 | ||||||||||||||
| INSURANCE - 1.4% | ||||||||||||||
| Allstate Corp. | 125,000 | 5.750 | + | 8/15/2053 | 134,322 | |||||||||
| Berkshire Hathaway, Inc. | 15,000 | 2.750 | 3/15/2023 | 15,459 | ||||||||||
| Berkshire Hathaway, Inc. | 30,000 | 3.125 | 3/15/2026 | 31,171 | ||||||||||
| Manulife Financial Corp. | 130,000 | 4.150 | 3/4/2026 | 141,801 | ||||||||||
| Prudential Financial, Inc. | 245,000 | 5.625 | + | 6/15/2043 | 263,681 | |||||||||
| Teachers Insurance & Annuity Association of America - 144A | 110,000 | 4.375 | + | 9/15/2054 | 112,063 | |||||||||
| Trinity Acquisition PLC | 10,000 | 3.500 | 9/15/2021 | 10,338 | ||||||||||
| Trinity Acquisition PLC | 50,000 | 4.400 | 3/15/2026 | 52,271 | ||||||||||
| 761,106 | ||||||||||||||
| INTERNET - 0.4% | ||||||||||||||
| Priceline Group, Inc. | 140,000 | 3.650 | 3/15/2025 | 145,764 | ||||||||||
| Zayo Group LLC | 55,000 | 6.375 | 5/15/2025 | 58,111 | ||||||||||
| 203,875 | ||||||||||||||
See accompanying notes to financial statements.
23
| SCHEDULE OF INVESTMENTS |
| Dunham Corporate/Government Bond Fund (Continued) |
| October 31, 2016 |
| Principal | Interest | Maturity | ||||||||||||
| Security | Amount | Rate | Date | Value | ||||||||||
| INVESTMENT COMPANIES - 0.4% | ||||||||||||||
| Ares Capital Corp. | $ | 18,000 | 4.875 | % | 11/30/2018 | $ | 18,756 | |||||||
| Ares Capital Corp. | 49,000 | 3.875 | 1/15/2020 | 50,419 | ||||||||||
| FS Investment Corp. | 110,000 | 4.250 | 1/15/2020 | 112,278 | ||||||||||
| FS Investment Corp. | 40,000 | 4.750 | 5/15/2022 | 40,874 | ||||||||||
| 222,327 | ||||||||||||||
| IRON / STEEL - 0.5% | ||||||||||||||
| Carpenter Technology Corp. | 300,000 | 4.450 | 3/1/2023 | 295,285 | ||||||||||
| LODGING - 0.8% | ||||||||||||||
| Boyd Gaming Corp. | 55,000 | 6.875 | 5/15/2023 | 59,125 | ||||||||||
| Caesars Growth Properties Holdings LLC | 45,000 | 9.375 | 5/1/2022 | 48,038 | ||||||||||
| Diamond Resorts International, Inc. - 144A | 10,000 | 7.750 | 9/1/2023 | 9,850 | ||||||||||
| Station Casinos LLC | 170,000 | 7.500 | 3/1/2021 | 178,990 | ||||||||||
| Wyndham Worldwide Corp. | 145,000 | 5.100 | 10/1/2025 | 156,800 | ||||||||||
| 452,803 | ||||||||||||||
| MEDIA - 0.7% | ||||||||||||||
| CCO Holdings LLC - 144A | 85,000 | 5.500 | 5/1/2026 | 87,285 | ||||||||||
| Cequel Communications Holdings I LLC / Cequel Capital Corp. - 144A | 35,000 | 5.125 | 12/15/2021 | 34,650 | ||||||||||
| Cequel Communications Holdings I LLC / Cequel Capital Corp. - 144A | 70,000 | 5.125 | 12/15/2021 | 68,425 | ||||||||||
| Clear Channel Worldwide Holdings, Inc. | 115,000 | 7.625 | 3/15/2020 | 111,837 | ||||||||||
| Sirius XM Radio, Inc. - 144A | 105,000 | 5.375 | 7/15/2026 | 106,904 | ||||||||||
| 409,101 | ||||||||||||||
| METAL FABRICATE - 0.2% | ||||||||||||||
| Novelis Corp. - 144A | 110,000 | 5.875 | 9/30/2026 | 111,650 | ||||||||||
| Novelis Corp. - 144A | 5,000 | 6.250 | 8/15/2024 | 5,212 | ||||||||||
| 116,862 | ||||||||||||||
| MISCELLANEOUS MANUFACTURING - 0.8% | ||||||||||||||
| Bombardier, Inc. - 144A | 105,000 | 4.750 | 4/15/2019 | 105,000 | ||||||||||
| General Electric Co. | 341,000 | 5.000 | + | Perpetual | 361,682 | |||||||||
| 466,682 | ||||||||||||||
| OIL & GAS - 1.7% | ||||||||||||||
| Antero Resources Corp. - 144A | 60,000 | 5.625 | 6/1/2023 | 61,500 | ||||||||||
| Callon Petroleum Co. | 25,000 | 6.125 | 10/1/2024 | 25,812 | ||||||||||
| Cimarex Energy Co. | 80,000 | 4.375 | 6/1/2024 | 84,446 | ||||||||||
| Continental Resources, Inc. | 45,000 | 4.500 | 4/15/2023 | 43,087 | ||||||||||
| Continental Resources, Inc. ^ | 75,000 | 5.000 | 9/15/2022 | 73,687 | ||||||||||
| Diamondback Energy, Inc. - 144A | 15,000 | 4.750 | 11/1/2024 | 15,019 | ||||||||||
| Helmerich & Payne International Drilling Co. | 80,000 | 4.650 | 3/15/2025 | 83,239 | ||||||||||
| Parsley Energy LLC - 144A | 145,000 | 6.250 | 6/1/2024 | 152,975 | ||||||||||
| Petroleos Mexicanos - 144A | 125,000 | 6.875 | 8/4/2026 | 140,063 | ||||||||||
| Range Resources Corp. - 144A | 90,000 | 5.000 | 3/15/2023 | 87,525 | ||||||||||
| Sunoco Finance Corp. | 155,000 | 6.375 | 4/1/2023 | 159,263 | ||||||||||
| Woodside Finance Ltd. - 144A | 35,000 | 3.700 | 9/15/2026 | 34,966 | ||||||||||
| 961,582 | ||||||||||||||
| PACKAGING & CONTAINERS - 0.2% | ||||||||||||||
| Berry Plastics Corp. | 105,000 | 5.125 | 7/15/2023 | 107,362 | ||||||||||
| PHARMACEUTICALS - 0.9% | ||||||||||||||
| AbbVie, Inc. | 80,000 | 2.850 | 5/14/2023 | 80,485 | ||||||||||
| AbbVie, Inc. | 45,000 | 3.600 | 5/14/2025 | 45,970 | ||||||||||
| AbbVie, Inc. | 80,000 | 3.200 | 5/14/2026 | 78,831 | ||||||||||
| Capsugel SA - 144A (b) | 15,000 | 7.000 | 5/15/2019 | 15,007 | ||||||||||
| Mylan NV - 144A | 35,000 | 3.150 | 6/15/2021 | 35,600 | ||||||||||
| Mylan NV - 144A | 35,000 | 3.000 | 12/15/2018 | 35,764 | ||||||||||
| Owens & Minor, Inc. | 25,000 | 3.875 | 9/15/2021 | 25,719 | ||||||||||
| Shire Acquisitions Investments Ireland DAC | 60,000 | 2.400 | 9/23/2021 | 59,603 | ||||||||||
| Teva Pharmaceutical Finance Netherlands III BV ^ | 80,000 | 3.150 | 10/1/2026 | 77,967 | ||||||||||
| Valeant Pharmaceuticals International, Inc. - 144A | 40,000 | 5.500 | 3/1/2023 | 31,600 | ||||||||||
| Zoetis, Inc. | 35,000 | 3.450 | 11/13/2020 | 36,367 | ||||||||||
| 522,913 | ||||||||||||||
| PIPELINES - 0.8% | ||||||||||||||
| Antero Midstream Partners LP - 144A | 40,000 | 5.375 | 9/15/2024 | 40,400 | ||||||||||
| Blue Racer Midstream LLC - 144A | 30,000 | 6.125 | 11/15/2022 | 29,475 | ||||||||||
| EnLink Midstream Partners LP | 10,000 | 4.850 | 7/15/2026 | 10,206 | ||||||||||
| Holly Energy Partners LP - 144A | 10,000 | 6.000 | 8/1/2024 | 10,450 | ||||||||||
| Kinder Morgan, Inc. ^ | 130,000 | 4.300 | 6/1/2025 | 135,347 | ||||||||||
| MPLX LP - 144A | 110,000 | 4.875 | 12/1/2024 | 115,231 | ||||||||||
| Sabine Pass Liquefaction LLC ^ | 100,000 | 6.250 | 3/15/2022 | 110,000 | ||||||||||
| 451,109 | ||||||||||||||
See accompanying notes to financial statements.
24
| SCHEDULE OF INVESTMENTS |
| Dunham Corporate/Government Bond Fund (Continued) |
| October 31, 2016 |
| Principal | Interest | Maturity | ||||||||||||
| Security | Amount | Rate | Date | Value | ||||||||||
| PRIVATE EQUITY - 0.3% | ||||||||||||||
| Apollo Management Holdings LP - 144A | $ | 135,000 | 4.000 | % | 5/30/2024 | $ | 138,555 | |||||||
| Icahn Enterprises Finance Corp. | 45,000 | 5.875 | 2/1/2022 | 43,031 | ||||||||||
| 181,586 | ||||||||||||||
| REAL ESTATE - 1.3% | ||||||||||||||
| American Homes 4 Rent 2014-SFR2 C Trust - 144A | 130,000 | 4.705 | 10/17/2036 | 140,976 | ||||||||||
| American Homes 4 Rent 2015-SFR2 C Trust - 144A | 120,000 | 4.691 | 10/17/2045 | 130,538 | ||||||||||
| CWABS Asset-Backed Certificates 2005-1 AF5A (a) | 241,646 | 5.141 | 7/25/2035 | 240,064 | ||||||||||
| MVW Owner Trust 2016-1 - 144A | 160,427 | 2.250 | 12/20/2033 | 159,691 | ||||||||||
| Sierra Timeshare 2014-2A A Receivables Funding LLC - 144A | 28,812 | 2.050 | 6/20/2031 | 28,825 | ||||||||||
| 700,094 | ||||||||||||||
| REITS - 4.4% | ||||||||||||||
| Alexandria Real Estate Equities, Inc. - 144A | 80,000 | 3.950 | 1/15/2027 | 83,638 | ||||||||||
| Brixmor Operating Partnership LP | 35,000 | 3.875 | 8/15/2022 | 36,643 | ||||||||||
| Corporate Office Properties LP | 90,000 | 3.700 | 6/15/2021 | 94,127 | ||||||||||
| Corporate Office Properties LP | 315,000 | 3.600 | 5/15/2023 | 312,437 | ||||||||||
| Corrections Corp of America | 90,000 | 5.000 | 10/15/2022 | 81,675 | ||||||||||
| Crown Castel International Corp. | 15,000 | 3.700 | 6/15/2026 | 15,394 | ||||||||||
| Digital Realty Trust LP | 160,000 | 5.250 | 3/15/2021 | 178,939 | ||||||||||
| Digital Realty Trust LP | 55,000 | 3.950 | 7/1/2022 | 58,191 | ||||||||||
| Education Realty Operating Partnership LP | 135,000 | 4.600 | 12/1/2024 | 139,718 | ||||||||||
| Healthcare Realty Trust, Inc. | 90,000 | 3.875 | 5/1/2025 | 91,759 | ||||||||||
| Healthcare Trust of America Holdings LP | 50,000 | 3.375 | 7/15/2021 | 51,557 | ||||||||||
| Highwoods Realty LP | 150,000 | 3.625 | 1/15/2023 | 153,011 | ||||||||||
| iStar Financial, Inc. | 140,000 | 5.000 | 7/1/2019 | 140,018 | ||||||||||
| Kilroy Realty LP | 135,000 | 4.375 | 10/1/2025 | 144,296 | ||||||||||
| Kimco Realty Corp. | 135,000 | 3.400 | 11/1/2022 | 141,342 | ||||||||||
| MGM Growth Properties Operating Partnerships LP - 144A | 15,000 | 5.625 | 5/1/2024 | 16,004 | ||||||||||
| MGM Growth Properties Operating Partnerships LP - 144A | 30,000 | 4.500 | 9/1/2026 | 29,625 | ||||||||||
| MPT Operating Partnership LP / MPT Finance Corp. | 15,000 | 6.375 | 3/1/2024 | 16,238 | ||||||||||
| MPT Operating Partnership LP / MPT Finance Corp. | 60,000 | 5.500 | 5/1/2024 | 62,100 | ||||||||||
| MPT Operating Partnership LP / MPT Finance Corp. | 5,000 | 5.250 | 8/1/2026 | 5,112 | ||||||||||
| National Retail Properties, Inc. | 40,000 | 4.000 | 11/15/2025 | 42,472 | ||||||||||
| Retail Opportunity Investments Partnership LP | 105,000 | 4.000 | 12/15/2024 | 104,939 | ||||||||||
| Select Income REIT | 140,000 | 4.500 | 2/1/2025 | 141,034 | ||||||||||
| Sovran Acquisition LP | 80,000 | 3.500 | 7/1/2026 | 80,386 | ||||||||||
| Welltower, Inc. | 145,000 | 4.000 | 6/1/2025 | 152,088 | ||||||||||
| WP Carey, Inc. | 110,000 | 4.600 | 4/1/2024 | 114,756 | ||||||||||
| 2,487,499 | ||||||||||||||
| RETAIL - 1.6% | ||||||||||||||
| CVS Health Corp. | 165,000 | 2.875 | 6/1/2026 | 164,122 | ||||||||||
| Landry’s, Inc. - 144A | 35,000 | 6.750 | 10/15/2024 | 35,788 | ||||||||||
| PetSmart, Inc. - 144A | 100,000 | 7.125 | 3/15/2023 | 104,875 | ||||||||||
| QVC, Inc. | 310,000 | 4.375 | 3/15/2023 | 311,657 | ||||||||||
| Rite Aid Corp. - 144A | 30,000 | 6.125 | 4/1/2023 | 31,762 | ||||||||||
| Signet UK Finance PLC | 135,000 | 4.700 | 6/15/2024 | 131,269 | ||||||||||
| Tops Holding LLC / Tops Markets II Corp. - 144A | 110,000 | 8.000 | 6/15/2022 | 97,350 | ||||||||||
| 876,823 | ||||||||||||||
| SOFTWARE - 0.7% | ||||||||||||||
| First Data Corp. - 144A | 155,000 | 5.000 | 1/15/2024 | 157,906 | ||||||||||
| Microsoft Corp. ^ | 80,000 | 2.400 | 8/8/2026 | 78,565 | ||||||||||
| Oracle Corp. | 15,000 | 2.400 | 9/15/2023 | 14,976 | ||||||||||
| Oracle Corp. | 110,000 | 2.650 | 7/15/2026 | 108,645 | ||||||||||
| Quintiles IMS, Inc. - 144A | 55,000 | 4.875 | 5/15/2023 | 56,994 | ||||||||||
| 417,086 | ||||||||||||||
| STUDENT LOAN ABS - 0.4% | ||||||||||||||
| SoFi Professional Loan Program 2016-C LLC - 144A | 205,000 | 2.360 | 12/27/2032 | 206,091 | ||||||||||
| TELECOMMUNICATIONS - 1.6% | ||||||||||||||
| AT&T, Inc. | 315,000 | 3.875 | 8/15/2021 | 334,313 | ||||||||||
| Frontier Communications Corp. | 95,000 | 10.500 | 9/15/2022 | 99,156 | ||||||||||
| Sprint Corp. | 105,000 | 7.250 | 9/15/2021 | 107,756 | ||||||||||
| Telefonica Emisiones SAU | 265,000 | 4.570 | 4/27/2023 | 290,508 | ||||||||||
| T-Mobile USA, Inc. | 80,000 | 6.375 | 3/1/2025 | 85,950 | ||||||||||
| 917,683 | ||||||||||||||
| TRUCKING & LEASING - 0.1% | ||||||||||||||
| GATX Corp. | 25,000 | 3.250 | 9/15/2026 | 24,546 | ||||||||||
| Penske Truck Leasing Co. LP - 144A | 55,000 | 3.375 | 2/1/2022 | 56,914 | ||||||||||
| 81,460 | ||||||||||||||
See accompanying notes to financial statements.
25
| SCHEDULE OF INVESTMENTS |
| Dunham Corporate/Government Bond Fund (Continued) |
| October 31, 2016 |
| Principal | Interest | Maturity | ||||||||||||
| Security | Amount | Rate | Date | Value | ||||||||||
| WHOLE LOAN COLLATERAL CMO - 3.2% | ||||||||||||||
| Agate Bay Mortgage Trust 2013-1 - 144A | $ | 162,737 | 3.500 | %,+ | 7/25/2043 | $ | 166,923 | |||||||
| Banc of America Funding 2005-1 1A1 | 57,939 | 5.500 | 2/25/2035 | 58,406 | ||||||||||
| Chase Mortgage Trust 2016-2 - 144A | 111,699 | 3.750 | + | 12/25/2045 | 115,192 | |||||||||
| Citigroup Mortgage Loan Trust, Inc. 2004-NCM2 2CB2 | 80,219 | 2.824 | + | 8/25/2034 | 80,466 | |||||||||
| Citigroup Mortgage Loan Trust, Inc. 2004-UST1 A3 | 65,325 | 6.750 | 8/25/2034 | 68,471 | ||||||||||
| JP Morgan Mortgage Trust 2015-4 1A4 - 144A | 83,581 | 3.500 | + | 6/25/2045 | 86,492 | |||||||||
| JP Morgan Mortgage Trust 2016-1 - 144A | 197,752 | 3.500 | 5/25/2046 | 204,360 | ||||||||||
| MASTR Alternative Loans Trust 2004-4 6A1 | 80,021 | 5.500 | 4/25/2034 | 83,187 | ||||||||||
| Residential Asset Securitization Trust 2005-A1 | 104,518 | 5.500 | 4/25/2035 | 104,544 | ||||||||||
| Sequoia Mortgage Trust 2014-4 -144A | 117,523 | 3.500 | + | 11/25/2044 | 121,020 | |||||||||
| Sequoia Mortgage Trust 2015-1 A1 - 144A | 107,951 | 3.500 | + | 1/25/2045 | 111,919 | |||||||||
| Structured Adjustable Rate Mortgage Loan Trust 2004-4 3A2 | 141,322 | 3.087 | + | 4/25/2034 | 140,603 | |||||||||
| Towd Point Mortgage Trust 2015-1 - 144A | 190,000 | 3.250 | + | 11/25/2060 | 183,231 | |||||||||
| Towd Point Mortgage Trust 2015-3 A1B - 144A | 135,280 | 3.000 | + | 3/25/2054 | 138,004 | |||||||||
| Towd Point Mortgage Trust 2016-2 - 144A | 95,085 | 3.000 | + | 8/25/2055 | 97,599 | |||||||||
| WaMu Mortgage Pass-Through Certificates Series 2003-S8 A2 Trust | 45,074 | 5.000 | 9/25/2018 | 45,489 | ||||||||||
| 1,805,906 | ||||||||||||||
| TOTAL CORPORATE BONDS & NOTES (Cost - $30,915,504) | 31,687,498 | |||||||||||||
| FOREIGN GOVERNMENT BONDS - 0.3% | ||||||||||||||
| Argentine Republic Government International Bond - 144A ^ (Cost - $ 143,665) | 150,000 | 7.625 | 4/22/2046 | 164,175 | ||||||||||
| MUNICIPAL - 3.6% | ||||||||||||||
| State of California | 350,000 | 7.600 | 11/1/2040 | 550,274 | ||||||||||
| New York City Transitional Finance Authority Future Tax Secured Revenue | 470,000 | 5.000 | 5/1/2040 | 554,396 | ||||||||||
| Rockdale County Water & Sewerage Authority | 305,000 | 3.060 | 7/1/2024 | 319,658 | ||||||||||
| San Diego County Regional Airport Authority | 325,000 | 5.594 | 7/1/2043 | 367,474 | ||||||||||
| State of Texas | 245,000 | 3.011 | 10/1/2026 | 254,731 | ||||||||||
| TOTAL MUNICIPAL - (Cost - $1,996,505) | 2,046,533 | |||||||||||||
| U.S. GOVERNMENT & AGENCY - 31.9% | ||||||||||||||
| U.S. GOVERNMENT AGENCY - 11.7% | ||||||||||||||
| Fannie Mae Pool 310041 | 108,771 | 6.500 | 5/1/2037 | 125,192 | ||||||||||
| Fannie Mae Pool 735061 | 33,555 | 6.000 | 11/1/2034 | 38,716 | ||||||||||
| Fannie Mae Pool 866009 | 37,933 | 6.000 | 3/1/2036 | 43,592 | ||||||||||
| Fannie Mae Pool 909175 | 48,620 | 5.500 | 4/1/2038 | 57,641 | ||||||||||
| Fannie Mae Pool 909220 | 89,228 | 6.000 | 8/1/2038 | 102,199 | ||||||||||
| Fannie Mae Pool 938574 | 258,829 | 5.500 | 9/1/2036 | 294,967 | ||||||||||
| Fannie Mae Pool 962752 | 38,927 | 5.000 | 4/1/2038 | 44,029 | ||||||||||
| Fannie Mae Pool AA7001 | 222,652 | 5.000 | 6/1/2039 | 250,782 | ||||||||||
| Fannie Mae Pool AL3166 | 248,069 | 3.000 | 3/1/2043 | 256,343 | ||||||||||
| Fannie Mae Pool AS 5596 | 387,154 | 3.500 | 8/1/2045 | 406,548 | ||||||||||
| Fannie Mae Pool AS5634 | 385,555 | 3.000 | 8/1/2045 | 398,523 | ||||||||||
| Fannie Mae Pool AS5696 | 392,319 | 3.500 | 8/1/2045 | 411,896 | ||||||||||
| Fannie Mae Pool AS 6311 | 234,092 | 3.500 | 12/1/2045 | 245,786 | ||||||||||
| Fannie Mae Pool AS6386 | 956,591 | 3.000 | 12/1/2045 | 985,988 | ||||||||||
| Fannie Mae Pool AS6522 | 248,683 | 3.500 | 1/1/2046 | 261,101 | ||||||||||
| Fannie Mae Pool AX3195 | 356,735 | 4.000 | 9/1/2044 | 381,966 | ||||||||||
| Fannie Mae Pool BC7198 | 446,418 | 3.500 | 6/1/2046 | 468,919 | ||||||||||
| Fannie Mae Pool AS7003 | 487,709 | 3.000 | 4/1/2046 | 502,696 | ||||||||||
| Fannie Mae Pool MA2495 | 550,791 | 3.500 | 1/1/2046 | 578,277 | ||||||||||
| Freddie Mac Gold Pool G01980 | 267,280 | 5.000 | 12/1/2035 | 302,525 | ||||||||||
| Freddie Mac Gold Pool G05888 | 50,014 | 5.500 | 10/1/2039 | 56,217 | ||||||||||
| Freddie Mac Gold Pool G08702 | 351,106 | 3.500 | 4/1/2046 | 368,606 | ||||||||||
| 6,582,509 | ||||||||||||||
| U.S. TREASURY OBLIGATIONS - 20.2% | ||||||||||||||
| United States Treasury Bond | 1,315,000 | 3.125 | 2/15/2043 | 1,462,757 | ||||||||||
| United States Treasury Bond | 335,000 | 2.500 | 2/15/2046 | 328,771 | ||||||||||
| United States Treasury Note | 2,885,000 | 2.375 | 8/15/2024 | 3,028,686 | ||||||||||
| United States Treasury Note ^ | 6,650,000 | 1.625 | 2/15/2026 | 6,541,030 | ||||||||||
| 11,361,244 | ||||||||||||||
| TOTAL U.S. GOVERNMENT & AGENCY (Cost - $17,683,606) | 17,943,753 | |||||||||||||
See accompanying notes to financial statements.
26
| SCHEDULE OF INVESTMENTS |
| Dunham Corporate/Government Bond Fund (Continued) |
| October 31, 2016 |
| Principal | Interest | Maturity | ||||||||||||
| Security | Amount | Rate | Date | Value | ||||||||||
| BANK LOANS - 3.8% | ||||||||||||||
| AGRICULTURE - 0.1% | ||||||||||||||
| NVA Holdings, Inc. | $ | 40,000 | 4.250 | % | 8/8/2022 | $ | 40,150 | |||||||
| BIOTECHNOLOGY - 0.1% | ||||||||||||||
| Concordia Healthcare Corp. | 45,655 | 4.250 | + | 10/21/2021 | 41,016 | |||||||||
| CHEMICALS - 0.0% | ||||||||||||||
| Ineos US Finance LLC | 6,895 | 3.250 | + | 3/11/2022 | 6,945 | |||||||||
| COMMERCIAL SERVICES - 0.4% | ||||||||||||||
| Laureate Education, Inc. | 47,434 | 0.750 | + | 6/16/2018 | 47,155 | |||||||||
| McGraw-Hill Global Education Holdings, LLC | 63,840 | 4.000 | + | 5/4/2022 | 63,840 | |||||||||
| Sedgwick Claims Management Services, Inc. | 85,000 | 5.750 | + | 2/11/2022 | 84,575 | |||||||||
| 195,570 | ||||||||||||||
| COMPUTERS - 0.0% | ||||||||||||||
| Western Digital | 9,975 | 0.750 | + | 4/29/2023 | 10,100 | |||||||||
| DIVERSIFIED FINANCIAL SERVICES - 0.1% | ||||||||||||||
| Donally Financial Solutions, Inc. | 29,000 | 1.000 | + | 9/23/2023 | 29,290 | |||||||||
| ELECTRIC - 0.4% | ||||||||||||||
| NRG Energy, Inc. | 158,215 | 2.750 | + | 7/1/2018 | 158,710 | |||||||||
| Texas Competitive Electric Holdings Company LLC | 47,449 | 4.000 | + | 8/4/2023 | 47,940 | |||||||||
| Texas Competitive Electric Holdings Company LLC | 10,714 | 4.000 | + | 8/4/2023 | 10,825 | |||||||||
| 217,475 | ||||||||||||||
| ENTERTAINMENT - 0.2% | ||||||||||||||
| CDS US Intermediate Holdings, Inc. | 28,710 | 4.000 | + | 7/8/2022 | 28,800 | |||||||||
| Zuffa LLC | 64,000 | 5.000 | + | 8/3/2023 | 64,645 | |||||||||
| 93,445 | ||||||||||||||
| FOOD - 0.3% | ||||||||||||||
| Albertsons LLC | 75,052 | 3.500 | + | 8/25/2021 | 75,703 | |||||||||
| Hostess Brands LLC | 110,000 | 7.500 | + | 8/3/2023 | 111,066 | |||||||||
| 186,769 | ||||||||||||||
| HEALTHCARE - 0.9% | ||||||||||||||
| American Renal Holdings, Inc. | 24,385 | 3.500 | + | 8/20/2019 | 24,162 | |||||||||
| Ardent Legacy Acquisitions, Inc. | 55,440 | 5.500 | + | 8/4/2021 | 55,163 | |||||||||
| CHG Healthcare Services, Inc. | 67,000 | 3.750 | + | 6/7/2023 | 67,611 | |||||||||
| Community Health Systems, Inc. | 55,000 | 1/6/2021 | 52,119 | |||||||||||
| Inventive Health, Inc. | 119,990 | 6.250 | + | 5/15/2018 | 120,095 | |||||||||
| Multiplan, Inc. | 30,617 | 5.000 | + | 5/25/2023 | 30,992 | |||||||||
| Quorum Health Corp. | 60,695 | 5.750 | + | 4/29/2022 | 56,689 | |||||||||
| Surgery Center | 67,928 | 4.250 | + | 11/3/2020 | 68,310 | |||||||||
| 475,141 | ||||||||||||||
| HOLDINGS COMPANY- 0.1% | ||||||||||||||
| Navistar, Inc. | 85,000 | 1.000 | + | 6/7/2023 | 85,638 | |||||||||
| HOME IMPROVEMENT - 0.1% | ||||||||||||||
| Floor and Decor Outlets of America | 57,000 | 1.000 | + | 9/29/2023 | 57,214 | |||||||||
| LODGING - 0.4% | ||||||||||||||
| Boyd Gaming | 32,000 | 1.000 | + | 8/17/2023 | 32,291 | |||||||||
| Caesers Entertainment, Inc. | 109,718 | 3.250 | + | 10/9/2020 | 110,541 | |||||||||
| Caesars Growth Partners | 55,000 | 1.000 | + | 4/9/2021 | 55,051 | |||||||||
| Station Casino LLC | 47,880 | 3.000 | + | 5/25/2023 | 48,175 | |||||||||
| 246,058 | ||||||||||||||
| MEDIA - 0.1% | ||||||||||||||
| UPC Financing Partnership | 43,013 | 4.000 | + | 8/31/2024 | 43,279 | |||||||||
| MISCELLANEOUS MANUFACTURING - 0.1% | ||||||||||||||
| US Farathane LLC | 78,341 | 5.750 | + | 6/28/2018 | 78,733 | |||||||||
| OIL & GAS - 0.1% | ||||||||||||||
| Jonah Energy LLC | 62,000 | 6.500 | + | 5/12/2021 | 58,900 | |||||||||
| REAL ESTATE - 0.1% | ||||||||||||||
| Capital Automotive LP | 31,564 | 5.000 | + | 4/30/2020 | 31,883 | |||||||||
| RETAIL - 0.1% | ||||||||||||||
| 84 Lumber | 85,000 | 1.000 | + | 10/12/2023 | 84,362 | |||||||||
See accompanying notes to financial statements.
27
| SCHEDULE OF INVESTMENTS |
| Dunham Corporate/Government Bond Fund (Continued) |
| October 31, 2016 |
| Principal | Interest | Maturity | ||||||||||||
| Security | Amount | Rate | Date | Value | ||||||||||
| SEMICONDUCTORS - 0.1% | ||||||||||||||
| ON Semiconductor Corp. | $ | 34,000 | 4.500 | %,+ | 3/31/2023 | $ | 34,259 | |||||||
| SOFTWARE - 0.2% | ||||||||||||||
| First Data Corp. | 94,000 | 3.750 | + | 7/10/2022 | 94,786 | |||||||||
| Rackspace Hosting | 17,000 | 1.000 | + | 10/26/2023 | 17,117 | |||||||||
| 111,903 | ||||||||||||||
| WASTE MANAGEMENT - 0.0% | ||||||||||||||
| Ads Waste Holdings | 12,000 | 0.750 | + | 10/28/2023 | 12,038 | |||||||||
| TOTAL BANK LOANS - (Cost - $2,132,898) | 2,140,168 | |||||||||||||
| PREFERRED STOCK - 1.4% | ||||||||||||||
| BANKS - 1.4% | ||||||||||||||
| GMAC Capital Trust I | 17,600 | 6.667 | + | 2/15/2040 | 449,328 | |||||||||
| Zions Bancorporation | 10,800 | 6.950 | + | 9/15/2028 | 325,512 | |||||||||
| TOTAL PREFERRED STOCK - (Cost - $710,000) | 774,840 | |||||||||||||
| Shares | ||||||||||||||
| SHORT-TERM INVESTMENT - 4.1% | ||||||||||||||
| MONEY MARKET FUND - 4.1% | ||||||||||||||
| Fidelity Institutional Money Market Funds - Government Portfolio | ||||||||||||||
| (Cost - $2,315,271) | 2,315,271 | 0.270 | + | 2,315,271 | ||||||||||
| COLLATERAL FOR SECURITIES LOANED - 13.5% | ||||||||||||||
| Mount Vernon Prime Portfolio (Cost - $7,559,736) | 7,559,736 | 0.670 | + | 7,559,736 | ||||||||||
| TOTAL INVESTMENTS - 115.0% (Cost - $63,457,185) | $ | 64,631,974 | ||||||||||||
| LIABILITIES IN EXCESS OF OTHER ASSETS - (15.0)% | (8,410,827 | ) | ||||||||||||
| NET ASSETS - 100.0% | $ | 56,221,147 | ||||||||||||
LLC - Limited Liability Corporation
ABS - Asset Backed Security
MBS - Mortgage Back Security
CMO - Collateralized Mortgage Obligation
LP - Limited Partnership
REIT - Real Estate Investment Trust
Perpetual - Perpetual bonds are fixed income instruments without defined maturity dates
| ^ | All or a portion of these securities are on loan. Total loaned securities had a value of $7,381,247 at October 31, 2016. Securities loaned with a value of $36,547 have been sold and are pending settlement. |
| + | Variable rate security. Interest rate is as of October 31, 2016. |
144A - Security exempt from registration under Rule 144A of the Securities Act of 1933. These securities may be sold in transactions exempt from registration, normally to qualified institutional buyers. The 144A securities amounted to $9,921,438 or 17.6% of net assets.
| (a) | Step-Up Bond; the interest rate shown is the rate in effect as of October 31, 2016. |
| (b) | Payment - in - Kind. |
Portfolio Composition * - (Unaudited)
| Corporate Bonds & Notes | 49.0 | % | Bank Loans | 3.3 | % | |||||
| U.S. Government & Agencies Notes & Bonds | 27.8 | % | Municipal | 3.1 | % | |||||
| Collateral For Securities Loaned | 11.7 | % | Preferred Stock | 1.2 | % | |||||
| Short - Term Investments | 3.6 | % | Foreign Government Bonds | 0.3 | % | |||||
| Total | 100.0 | % |
| * | Based on total value of investments as of October 31, 2016. |
Percentage may differ from Schedule of Investments which is based on Fund net assets.
See accompanying notes to financial statements.
28
| Dunham Dynamic Macro Fund |
| Message from the Sub-Adviser (Mellon Capital Management Corporation) |
Equity markets were up for the fiscal year ended October 31, 2016 but taking a more introspective look would identify a V-shaped trajectory to stocks. The downward leg of this path initially began in December 2015 after the Federal Reserve raised interest rates and started normalizing its policy, the European Central Bank (ECB) came to the market and disappointed with the delivery of its stimulus package, and the Chinese economy continued to show signs of weakness. This trend lingered through mid-February until the world’s major central banks took additional action to support markets worldwide which in turn equities rallied through the rest of May and into June. Leading up to the UK vote to leave the European Union, momentum was building for the “remain” camp as investors may have written off the vote as a non-material event for investors. Investors were blindsided when the vote to leave the European Union was passed. Equities declined following the vote, with the worst of it hitting Japan and the Euro zone. In July and through the final three months of the fiscal year, the thesis continued as central bank actions remained supportive. Japanese equities had a strong final fiscal quarter, on a currency hedged basis, as Shinzo Abe won a sweeping victory in the house election. The Bank of Japan also recognized the difficulties created by negative interest rates, and in an attempt to help the banks, announced a “yield curve targeting” plan. Despite lackluster growth and low inflation, European stocks outperformed as Draghi reassured investors that the quantitative easing program will not end abruptly despite it being scheduled to end March 2017. U.S. equities on the other hand underperformed international markets in the final three months of the fiscal year. Third quarter earnings disappointed and expectations have steadily risen for a rate rise in December. Presidential uncertainty also plagued U.S. equities. Global macro strategies, as measured by the IQ Hedge Global Macro Beta Index, increased 1.6 percent over the fiscal year ended October 31, 2016.
The Sub-Adviser seeks to construct a balanced growth portfolio that aims to deliver equity-like total returns with less risk and improved downside control. It attempts to achieve this goal by utilizing a multi-asset strategy that allocates dynamically across global equities, bonds, and real assets. The current strategy’s exposure is broken down into three different categories: growth assets which include developed market equities, emerging market equities, high-yield bonds, and emerging market debt; hedging assets which include developed and emerging market currency, global cash, investment-grade bonds, and global developed and sovereign bonds; and real assets which include global commodities, global inflation-linked bonds, and inflation-sensitive derivatives.
For the first three quarters of the fiscal year, the hedging assets positively contributed to Fund performance. The hedging assets exposure helped shield some of the volatility during the first three months of the fiscal year, most notably the position in U.S. Treasuries. As global bond yields fell, the Sub-Adviser decreased the allocation to global bonds. The allocation reached a low of approximately 6 percent during the end of the second fiscal quarter. Bonds retreated and the Sub-Adviser slowly increased the position, reaching an overall exposure of 32 percent by the end of April. In the third fiscal quarter, the Sub-Adviser cut risk in the Fund by reducing equity exposure and purchasing options. Historically, the Fund has held positions in U.S. equity options to protect the Fund, but when the U.S. equity market strongly outperformed other markets earlier in the year, the Sub-Adviser believed U.S. equity options may not be the most efficient hedge. As a result, the Sub-Adviser initiated positions in Euro Stoxx and Nikkei options, which benefitted the Fund. The hedging assets detracted from Fund performance in the final three months of the fiscal year. After contributing positively to performance for the first three quarters of the fiscal year, U.S. Treasuries detracted from Fund performance as the yield on the U.S. Treasury increased from 1.5 to 1.9 percent over the fiscal quarter. However, the Fund’s short positions to German Bunds and UK Gilts positively contributed to Fund performance.
The volatility over the first six months of the fiscal year significantly affected the growth asset strategy exposure. However, going into December the Sub-Adviser saw an increase in risk on the horizon, especially considering the fact that the ECB has historically exhibited its propensity to disappoint. On the first day of December the Sub-Adviser worked towards cutting risk in half over the entire Fund due to this concern, which somewhat shielded the Fund. With the uncertainty and volatility in growth assets rising over the second fiscal quarter, the Sub-Adviser reduced and diversified the positions within its allocation to growth assets. The Sub-Adviser increased the allocation to high-yield bonds over the second fiscal quarter as high-yield bonds have traditionally had a lower beta to the broad U.S. equity markets. Despite volatility present in the third fiscal quarter amid the “Brexit” event, equities were a major contributor to positive performance. One of the top performers over the third fiscal quarter was the Funds allocation to U.S. equities. On average, the Fund held a 25 percent allocation to U.S. equities during the third fiscal quarter. In the final quarter of the fiscal year, the growth assets once again contributed to Fund performance. Unlike the third fiscal quarter, the allocation to U.S. equities detracted from Fund performance. The SPDR S&P 500 ETF Trust (SPY) (holding percentage*: 25.00 percent) declined 1.6 percent over the final three months, however it increased 4.4 percent over the full fiscal year. The Fund’s exposure to international equities and high-yield bonds made up for a portion of the underperformance of U.S. stocks in the final fiscal quarter of the year. Over this time period, the iShares Currency Hedged MSCI Japan ETF (HEWJ) (holding percentage*: 9.03 percent) increased 7.9 percent and the SPDR Barclays High Yield Bond ETF (JNK) (holding percentage*: 4.73 percent) climbed 2.1 percent. The Exposure to high-yield bonds also contributed to Fund performance for the full fiscal year as JNK increased 5.9 percent. Based on the risk present in emerging markets, the Fund had no exposure to emerging market equities and has not been invested in them since August 2015.
The Sub-Adviser completely divested the position in real assets in mid-2015, as it believes the current risk/reward characteristics of this strategy do not warrant a place in the Fund at this time. Although the Sub-Adviser believes that positions in commodities do not warrant an allocation due to its risks, certain attributes that this strategy generally provides are still desired within the Fund. The Sub-Adviser believes that commodities are currently too expensive; therefore, in order to add a hedge against inflation, the Sub-Adviser added Treasury Inflation-Protected Securities to the portfolio. Over the fiscal year ended October 31, 2016, this allocation contributed positively to Fund performance. For example, the iShares TIPS ETF (TIP) (holding percentage*: 4.82 percent) increased 5.8 percent over the fiscal year. Due to the Fund’s dynamic nature, the Sub-Adviser’s view on real assets can change quickly.
The Sub-Adviser is optimistic for the coming fiscal quarter and the next fiscal year. The Sub-Adviser believes that this volatility-targeted strategy may provide investors with more consistent returns than traditional asset classes. It believes that through the flexibility of the strategy and the use of alternative investments, the Fund may provide what may be considered to be attractive returns with lower beta and less correlation than traditional equity investments.
| * | Holdings percentage(s) as of 10/31/2016. |
Growth of $100,000 Investment
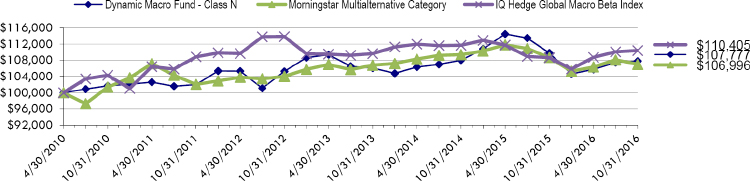
Total Returns as of October 31, 2016
| Annualized | Annualized Since | ||||||||
| One | Three | Annualized | Inception | ||||||
| Year | Years | Five Years | (4/30/2010) | ||||||
| Class N | (1.83)% | 0.53% | 1.11% | 1.16% | |||||
| Class C | (2.82)% | (0.48)% | 0.10% | 0.15% | |||||
| Class A with load of 5.75% | (7.78)% | (1.73)% | (0.34)% | (0.04)% | |||||
| Class A without load | (2.14)% | 0.23% | 0.84% | 0.88% | |||||
| IQ Hedge Global Macro Beta Index | 1.64% | 0.23% | 0.28% | 1.54% | |||||
| Morningstar Multialternative Category | (1.53)% | 0.06% | 0.95% | 1.05% |
The IQ Hedge Global Macro Beta Index seeks to replicate the risk-adjusted return characteristics of a combination of hedge funds pursuing a macro strategy and hedge funds pursuing an emerging markets strategy. Investors cannot invest directly in an index or benchmark.
The Morningstar Multialternative Category is generally representative of mutual funds with static allocations to alternative strategies and asset classes. The gross short exposure in these mutual funds is generally greater than 20%.
As disclosed in the Trust’s latest registration statement, the Fund’s total annual operating expenses, including underlying funds, are 2.26% for Class N, 3.26% for Class C and 2.51% for Class A. Class A shares are subject to a sales load of 5.75% and a deferred sales charge of up to 0.75%. The performance data quoted here represents past performance, which is not indicative of future results. Current performance may be lower or higher than the performance data quoted. The investment return and NAV will fluctuate, so that an investor’s shares, when redeemed, may be worth more or less than their original cost. Total returns are calculated assuming reinvestment of all dividends and capital gains distributions, if any. The returns do not reflect the deductions of taxes a shareholder would pay on the redemption of fund shares or fund distributions. For performance information current to the most recent month-end, please call 1-800-442-4358 or visit our website www.dunham.com.
29
| SCHEDULE OF INVESTMENTS |
| Dunham Dynamic Macro Fund |
| October 31, 2016 |
| Security | Shares | Value | ||||||||||||||
| EXCHANGE TRADED FUNDS - 53.9% | ||||||||||||||||
| DEBT FUNDS - 9.6% | ||||||||||||||||
| iShares TIPS Bond ETF | 14,538 | $ | 1,684,373 | |||||||||||||
| SPDR Barclays High Yield Bond ETF ^ | 45,534 | 1,651,063 | ||||||||||||||
| 3,335,436 | ||||||||||||||||
| EQUITY FUNDS - 44.3% | ||||||||||||||||
| iShares Currency Hedged MSCI Germany ETF | 143,118 | 3,462,024 | ||||||||||||||
| iShares Currency Hedged MSCI Japan ETF ^ | 122,220 | 3,153,276 | ||||||||||||||
| SPDR S&P 500 ETF Trust ^ | 41,065 | 8,728,366 | ||||||||||||||
| 15,343,666 | ||||||||||||||||
| TOTAL EXCHANGE TRADED FUNDS (Cost - $17,137,338) | 18,679,102 | |||||||||||||||
| OPTIONS * - 5.8% | ||||||||||||||||
| CALL OPTION ON FUTURES PURCHASED - 5.2% | Contacts + | |||||||||||||||
| Swiss Market Index, Expiration December 16, 2016 | ||||||||||||||||
| Exercise Price CHF 8,172 | 70 | 2,521 | ||||||||||||||
| US 10 Year Future, Expiration December 16, 2016 | ||||||||||||||||
| Exercise Price $117 | 143 | 1,805,375 | ||||||||||||||
| 1,807,896 | ||||||||||||||||
| PUT OPTIONS ON FUTURES PURCHASED - 0.6% | ||||||||||||||||
| Euro-Bund Option, Expiration December 16, 2016 | ||||||||||||||||
| Exercise Price $177 | 49 | 119,767 | ||||||||||||||
| Euro Stoxx, Expiration December 16, 2016 | ||||||||||||||||
| Exercise Price $2,750 | 144 | 28,887 | ||||||||||||||
| Nikkei 225 Option, Expiration December 16, 2016 | ||||||||||||||||
| Exercise Price JPY 15,000 | 72 | 8,222 | ||||||||||||||
| S&P 500 E-Mini Option, Expiration December 16, 2016 | ||||||||||||||||
| Exercise Price $2,000 | 49 | 40,915 | ||||||||||||||
| 197,791 | ||||||||||||||||
| TOTAL OPTIONS (Cost - $2,263,221) | 2,005,687 | |||||||||||||||
| Principal | Discount | |||||||||||||||
| Amount ($) | Rate | Maturity | ||||||||||||||
| SHORT-TERM INVESTMENTS - 40.5% | ||||||||||||||||
| U.S. GOVERNMENT SECURITIES - 27.6% | ||||||||||||||||
| US Treasury Bill ++ | 8,175,000 | 0.0548 | % | 11/17/2016 | 8,173,955 | |||||||||||
| US Treasury Bill | 1,400,000 | 0.1656 | % | 12/15/2016 | 1,399,401 | |||||||||||
| 9,573,356 | ||||||||||||||||
| Shares | Interest Rate | |||||||||||||||
| MONEY MARKET - 12.9% | ||||||||||||||||
| STIT- Liquid Assets - Institutional Class | 4,473,673 | 0.5000 | % ^^ | 4,473,673 | ||||||||||||
| TOTAL SHORT-TERM INVESTMENTS - (Cost - $14,047,029) | 14,047,029 | |||||||||||||||
| COLLATERAL FOR SECURITIES LOANED - 31.7% | ||||||||||||||||
| Mount Vernon Prime Portfolio (Cost - $11,005,156) | 0.6700 | % + | 11,005,156 | |||||||||||||
| TOTAL INVESTMENTS - 131.9% (Cost - $44,452,745) | $ | 45,736,974 | ||||||||||||||
| LIABILITIES IN EXCESS OF OTHER ASSETS - (31.9)% | (11,058,796 | ) | ||||||||||||||
| NET ASSETS - 100.0% | $ | 34,678,178 | ||||||||||||||
| Unrealized | ||||||||||||||||
| Appreciation | ||||||||||||||||
| Open Futures Contracts | Contracts | (Depreciation) | ||||||||||||||
| LONG FUTURES CONTRACTS ** - (0.3)% | ||||||||||||||||
| AUST 10 YR Bond Future, December 2016 | ||||||||||||||||
| (Underlying Face Amount at Value $8,073,527) | 80 | $ | (101,512 | ) | ||||||||||||
| CAC 40 10 Euro Future, November 2016 | ||||||||||||||||
| (Underlying Face Amount at Value $691,604) | 14 | 3,629 | ||||||||||||||
| Euro Stoxx 50 Future, December 2016 | ||||||||||||||||
| (Underlying Face Amount at Value $435,071) | 13 | 14,193 | ||||||||||||||
| FTSE 100 Index Future, December 2016 | ||||||||||||||||
| (Underlying Face Amount at Value $2,368,694) | 28 | (4,835 | ) | |||||||||||||
| FTSE/MIB Index Future, December 2016 | ||||||||||||||||
| (Underlying Face Amount at Value $468,845) | 5 | 15,931 | ||||||||||||||
See accompanying notes to financial statements.
30
| SCHEDULE OF INVESTMENTS |
| Dunham Dynamic Macro Fund (Continued) |
| October 31, 2016 |
| Unrealized | ||||||||
| Appreciation | ||||||||
| Open Futures Contracts | Contracts | (Depreciation) | ||||||
| LONG FUTURES CONTRACTS ** - (0.3)% (Continued) | ||||||||
| IBEX - 35 Index Future, November 2016 | ||||||||
| (Underlying Face Amount at Value $100,049) | 1 | $ | 3,471 | |||||
| Nikkei 225 Index Future, December 2016 | ||||||||
| (Underlying Face Amount at Value $414,664) | 5 | 11,467 | ||||||
| S&P/TSX 60 IX Future, December 2016 | ||||||||
| (Underlying Face Amount at Value $129,304) | 1 | 3,564 | ||||||
| S&P 500 EMINI Future, December 2016 | ||||||||
| (Underlying Face Amount at Value $742,000) | 7 | 237 | ||||||
| SPI 200 Future, December 2016 | ||||||||
| (Underlying Face Amount at Value $603,814) | 6 | (4,168 | ) | |||||
| TOPIX Index Future, December 2016 | ||||||||
| (Underlying Face Amount at Value $796,498) | 6 | 20,579 | ||||||
| 10-Year US Treasury Note Future, September 2016 | ||||||||
| (Underlying Face Amount at Value $9,721,875) | 75 | (58,509 | ) | |||||
| TOTAL FUTURES CONTRACTS PURCHASED | (95,953 | ) | ||||||
| SHORT FUTURES CONTRACTS ** - 0.8% | ||||||||
| CAN 10 YR Bond Future, December 2016 | ||||||||
| (Underlying Face Amount at Value $3,237,157) | (30 | ) | 16,380 | |||||
| DAX Index Future, December 2016 | ||||||||
| (Underlying Face Amount at Value $1,463,016) | (5 | ) | (33,252 | ) | ||||
| Euro-Bund Future, December 2016 | ||||||||
| (Underlying Face Amount at Value $4,444,270) | (25 | ) | 52,235 | |||||
| Hang Seng Index Future, November 2016 | ||||||||
| (Underlying Face Amount at Value $295,364) | (2 | ) | 6,358 | |||||
| Long Gilt Future December 2016 | ||||||||
| (Underlying Face Amount at Value $5,049,913) | (33 | ) | 235,393 | |||||
| S&P 500 EMINI Future, December 2016 | ||||||||
| (Underlying Face Amount at Value $424,000) | (4 | ) | 4,083 | |||||
| TOTAL FUTURES CONTRACTS SOLD | 281,197 | |||||||
| WRITTEN PUT FUTURE OPTIONS *- 0.1% | ||||||||
| Swiss Market Index, Expiration December 16, 2016 | ||||||||
| Exercise Price CHF 8,172 ( Premium - $19,056) | (70 | ) | (27,685 | ) | ||||
ETF - Exchange Traded Fund
| * | Non income producing security. |
| + | Each option contract allows holder to purchase/sell 100 shares of the underlying security at the exercise price. |
| ++ | All or part of the security was held as collateral for futures outstanding as of October 31, 2016. |
| ^ | All or a portion of these securities are on loan. Total loaned securities had a value of $10,775,310. |
| ^^ | Variable rate security. Interest rate is as of October 31, 2016. |
| ** | The amounts shown are the underlying reference notional amounts to stock exchange indices, debt securities and equities upon which the fair value of the futures contracts held by the Fund are based. Notional values do not represent the current fair value of, and are not necessarily indicative of the future cash flows futures contracts. Further, the underlying price changes in relation to the variables specified by the notional values affects the fair value of these derivative financial instruments. The notional values as set forth within this schedule do not purport to represent economic value at risk to the Fund. |
Portfolio Composition * - (Unaudited)
| Equity Funds | 33.6 | % | Debt Funds | 7.3 | % | |||||
| Collateral for securities loaned | 24.1 | % | Call Options On Futures Purchased | 3.9 | % | |||||
| U.S. Government Securities | 20.9 | % | Put Option On Futures Purchased | 1.9 | % | |||||
| Money Market Fund | 8.3 | % | Total | 100.0 | % |
| * | Based on total value of investments as of October 31, 2016. |
Percentage may differ from Schedule of Investments which is based on Fund net assets.
See accompanying notes to financial statements.
31
Dunham High-Yield Bond Fund
Message from the Sub-Adviser (PENN Capital Management Company, Inc.)
High-yield bonds, as measured by the BofA ML US Cash Pay High Yield Index, outperformed investment-grade corporate bonds, as measured by the BofA ML Corporate Index, for the fiscal year ended October 31, 2016. Although high-yield bonds underperformed Treasury bonds, as measured by the BofA ML US Treasury Index, last fiscal year, this time around they fared better, outperforming for the fiscal year. Interest rates on 10-year Treasury bonds generally increased at the beginning of the fiscal year, hitting a high on November 9, 2015. They subsequently reversed course and went on a general down-trend, hitting a low for the fiscal year on July 8, 2016, before trending up again, to finish the fiscal year lower than they began. During this fiscal year, Treasury bonds rose 3.5 percent, investment-grade corporate bonds gained 7.0 percent, while high-yield bonds increased 10.1 percent.
Interest rates on 10-year Treasury bonds expanded their range during the fiscal year, fluctuating by 99 basis points. Rates went from a high of 2.34 percent on November 9, 2016 to a low of 1.35 percent on July 8, 2016, before settling in and ending the fiscal year at 1.82 percent. The Fund’s double-B focus and longer duration bias detracted from performance over the fiscal year ended October 31, 2016, as single-B rated bonds and shorter duration credit generally outperformed. During the fiscal year, bonds rated single-B were up 9.1 percent, bonds rated double-B increased 8.9 percent, while those rated triple-C and below performed the best, gaining 18.3 percent. Currently, the Fund has over 50 percent invested in double-B rated credit and about 40 percent in single-B rated debt. As of October 31, 2016, the Sub-Adviser holds no triple-C rated bonds as default rates on below investment-grade bonds are near historic lows and if they rise, bonds rated triple-C and lower could be adversely affected.
Despite the Fund historically maintaining a shorter duration exposure relative to the benchmark index, the average duration crept up during the fiscal quarter. The Fund kept a bias toward the intermediate segment of the credit curve that matures in three to seven years and historically has exhibited less volatility. The average duration of positions held by the Fund was 4.4 years for the fiscal quarter versus 4.2 years for bonds contained in the benchmark index. Bonds that have a maturity of more than 10 years have generally been avoided unless purchased at a significant discount to par. The Sub-Adviser has also targeted higher coupons in an attempt to mitigate the effects of having an overall lower duration, should interest rates continue to fall.
The Sub-Adviser continued to heavily underweight the metals and mining sector relative to the benchmark, which detracted from the Fund during a surge in steel and gold commodities over the fiscal year. Security selection benefited the Fund over the same time period. One of the contributors from this sector that the Fund held exposure to during the fiscal year was Freeport-McMoRan, Inc. (35671DBG9) (holdings percentage*: 0.54 percent), an international natural resources company that operates large, geographically diverse assets with significant reserves of copper, gold, molybdenum, cobalt, oil, and gas. A specific bond (35671DBG9) from the issuer held from the beginning of May through the end of the fiscal year gained 12.6 percent.
The technology sector held an overweight relative to the benchmark throughout the fiscal year. Combined with strong security selection, the sector overweight benefited the Fund over the fiscal year. One of the outperformers from this sector that the Fund held exposure to through multiple bonds during the fiscal year was Western Digital Corp. (958102AK1) (holdings percentage*: 2.52 percent). The company offers telecommunications services, including local telephone, high-speed internet, long distance, network access, and video services to residential and business customers in rural communities throughout the United States. A specific bond (958102AK1) the Fund purchased near the beginning of April gained 21.7 percent through the fiscal year ended October 31, 2016.
The financial services sector was a consistent contributor to the Fund throughout the fiscal year, while the media & broadcasting and energy - distribution sectors also positively aided over the course of the fiscal year. The chemicals and services sectors were some of the largest detractors of the Fund’s performance, while the leisure & entertainment sector was a benefit.
Going forward, the Sub-Adviser believes high-yield bonds may see tepid activity due to the market pricing in the possibility of the Federal Reserve raising interest rates by the end of the year, as well as upward movements in the 3-Month Libor. The Sub-Adviser believes that the quality of issuance for double-B rated debt has remained high, while new issuance levels have been modest. The Sub-Adviser has also seen a lack of activity in the number of mergers and acquisitions occurring, which may cause a decline in supply for bond markets. The Sub-Adviser expects to see the level of issuance used for refinancing to keep its current trend, due to geopolitical and international economic uncertainty that forces companies to take on less risk. The Sub-Adviser believes that the largest current risk for a pull-back in high-yield bonds comes from volatility in the oil market.
| * | Holdings percentage(s) as of 10/31/2016. |
Growth of $100,000 Investment
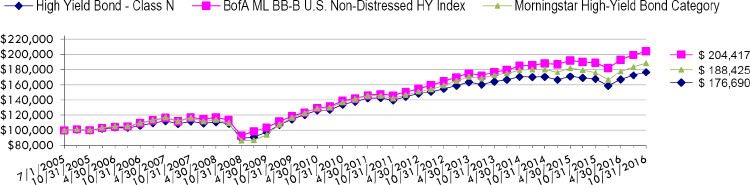
Total Returns as of October 31, 2016
| Annualized | Annualized | Annualized | Annualized Since | |||||||
| One Year | Three Years | Five Years | Ten Years | Inception(7/1/05) | ||||||
| Class N | 5.39% | 2.47% | 4.83% | 5.20% | 5.15% | |||||
| Class C | 4.65% | 1.72% | 4.05% | 4.42% | 4.36% | |||||
| Class A with load of 4.50% | 0.52% | 0.66% | 3.62% | N/A | 4.13%* | |||||
| Class A without load | 5.21% | 2.23% | 4.57% | N/A | 4.61%* | |||||
| BofA ML BB-B U.S. Non-Distressed HY Index | 8.10% | 4.91% | 6.96% | 6.42% | 6.51% | |||||
| Morningstar High-Yield Bond Category | 6.89% | 2.97% | 5.82% | 5.56% | 5.74% |
| * | Class A commenced operations on January 3, 2007. |
BofA ML BB-B U.S. Non-Distressed HY Index is an unmanaged portfolio constructed to mirror the public high-yield corporate debt market and is a subset of the Merrill Lynch High Yield Master II Index. Investors cannot invest directly in an index or benchmark.
The Morningstar High-Yield Bond Category is generally representative of mutual funds that primarily invest in U.S. high-income debt securities where at least 65% or more of bond assets are not rated or are rated by a major agency such as Standard & Poor’s or Moody’s at the level of BB (considered speculative for taxable bonds) and below.
As disclosed in the Trust’s latest registration statement, the Fund’s total annual operating expenses, including the cost of underlying funds, are 1.02% for Class N, 1.77% for Class C and 1.27% for Class A. Class A shares are subject to a sales load of 4.50% and a deferred sales charge of up to 0.75%. The performance data quoted here represents past performance, which is not indicative of future results. Current performance may be lower or higher than the performance data quoted. The investment return and NAV will fluctuate, so that an investor’s shares, when redeemed, may be worth more or less than their original cost. Total returns are calculated assuming reinvestment of all dividends and capital gains distributions, if any. The returns do not reflect the deductions of taxes a shareholder would pay on the redemption of fund shares or fund distributions. For performance information current to the most recent month-end, please call 1-800-442-4358 or visit our website www.dunham.com
32
| SCHEDULE OF INVESTMENTS |
| Dunham High-Yield Bond Fund |
| October 31, 2016 |
| Principal | Interest | Maturity | ||||||||||||
| Security | Amount | Rate | Date | Value | ||||||||||
| BONDS & NOTES - 95.9% | ||||||||||||||
| AIRLINES - 1.2% | ||||||||||||||
| Air Canada - 144A ^ | $ | 360,000 | 7.7500 | % | 4/15/2021 | $ | 396,900 | |||||||
| American Airlines Group, Inc. - 144A ^ | 535,000 | 4.6250 | 3/1/2020 | 540,350 | ||||||||||
| UAL 2007-1 Pass Through Trust | 181,154 | 6.6360 | 7/2/2022 | 193,608 | ||||||||||
| 1,130,858 | ||||||||||||||
| AUTO MANUFACTURERS - 0.8% | ||||||||||||||
| Fiat Chrysler Automobiles NV ^ | 715,000 | 5.2500 | 4/15/2023 | 731,981 | ||||||||||
| AUTO PARTS & EQUIPMENT - 0.3% | ||||||||||||||
| TI Group Automotive Systems LLC - 144A | 250,000 | 8.7500 | 7/15/2023 | 266,875 | ||||||||||
| BEVERAGES - 0.5% | ||||||||||||||
| Cott Beverages, Inc. ^ | 445,000 | 5.3750 | 7/1/2022 | 453,344 | ||||||||||
| BUILDING MATERIALS - 1.7% | ||||||||||||||
| Griffon Corp. | 480,000 | 5.2500 | 3/1/2022 | 487,800 | ||||||||||
| James Hardie International Finance Ltd - 144A | 500,000 | 5.8750 | 2/15/2023 | 530,000 | ||||||||||
| Masonite International Corp. - 144A | 265,000 | 5.6250 | 3/15/2023 | 275,600 | ||||||||||
| Summit Materials LLC / Summit Materials Finance Corp. | 300,000 | 6.1250 | 7/15/2023 | 309,000 | ||||||||||
| 1,602,400 | ||||||||||||||
| CHEMICALS - 1.0% | ||||||||||||||
| Blue Cube Spinco, Inc. ^ | 350,000 | 9.7500 | 10/15/2023 | 413,000 | ||||||||||
| Blue Cube Spinco, Inc. | 180,000 | 10.0000 | 10/15/2025 | 216,900 | ||||||||||
| Platform Specialty Products Corp. - 144A ^ | 295,000 | 6.5000 | 2/1/2022 | 287,625 | ||||||||||
| 917,525 | ||||||||||||||
| COMMERCIAL SERVICES - 3.7% | ||||||||||||||
| ADT Corp. ^ | 160,000 | 3.5000 | 7/15/2022 | 152,400 | ||||||||||
| ADT Corp. - 144A | 280,000 | 4.8750 | 7/15/2032 | 240,800 | ||||||||||
| ADT Corp. ^ | 275,000 | 6.2500 | 10/15/2021 | 302,156 | ||||||||||
| Avis Budget Car Rental LLC - 144A | 495,000 | 5.1250 | 6/1/2022 | 486,956 | ||||||||||
| Cardtronics, Inc. | 570,000 | 5.1250 | 8/1/2022 | 585,675 | ||||||||||
| Jaguar Holding Co II - 144A | 505,000 | 6.3750 | 8/1/2023 | 509,040 | ||||||||||
| Live Nation Entertainment, Inc. - 144A | 555,000 | 5.3750 | 6/15/2022 | 577,200 | ||||||||||
| United Rentals North America, Inc. | 710,000 | 6.1250 | 6/15/2023 | 745,500 | ||||||||||
| 3,599,727 | ||||||||||||||
| COMPUTERS - 6.7% | ||||||||||||||
| Diamond 1 & 2 Finance Corp. - 144A | 140,000 | 6.0200 | 6/15/2026 | 152,884 | ||||||||||
| Diamond 1 & 2 Finance Corp. - 144A ^ | 1,495,000 | 8.1000 | 7/15/2036 | 1,789,368 | ||||||||||
| Diamond 1 & 2 Finance Corp. - 144A | 175,000 | 8.3500 | 7/15/2046 | 212,701 | ||||||||||
| Diamond 1 & 2 Finance Corp. - 144A | 85,000 | 5.8750 | 6/15/2021 | 89,621 | ||||||||||
| Diamond 1 & 2 Finance Corp. - 144A | 110,000 | 7.1250 | 6/15/2024 | 120,596 | ||||||||||
| Seagate HDD Cayman | 865,000 | 4.8750 | 6/1/2027 | 783,101 | ||||||||||
| Seagate HDD Cayman | 595,000 | 5.7500 | 12/1/2034 | 518,542 | ||||||||||
| Western Digital Corp. - 144A | 345,000 | 7.3750 | 4/1/2023 | 378,206 | ||||||||||
| Western Digital Corp. - 144A ^ | 2,050,000 | 10.5000 | 4/1/2024 | 2,372,875 | ||||||||||
| 6,417,894 | ||||||||||||||
See accompanying notes to financial statements.
33
| SCHEDULE OF INVESTMENTS |
| Dunham High-Yield Bond Fund (Continued) |
| October 31, 2016 |
| Principal | Interest | Maturity | ||||||||||||
| Security | Amount | Rate | Date | Value | ||||||||||
| DIVERSIFIED FINANCIAL SERVICES - 3.8% | ||||||||||||||
| Ally Financial, Inc. | $ | 1,020,000 | 5.7500 | % | 11/20/2025 | $ | 1,048,050 | |||||||
| Ally Financial, Inc. | 790,000 | 8.0000 | 11/1/2031 | 948,000 | ||||||||||
| Ally Financial, Inc. | 345,000 | 4.2500 | 4/15/2021 | 349,312 | ||||||||||
| Fly Leasing Ltd. | 410,000 | 6.3750 | 10/15/2021 | 421,275 | ||||||||||
| International Lease Finance Corp. | 760,000 | 8.6250 | 1/15/2022 | 933,850 | ||||||||||
| 3,700,487 | ||||||||||||||
| ELECTRIC - 3.4% | ||||||||||||||
| Calpine Corp. | 350,000 | 5.7500 | 1/15/2025 | 341,687 | ||||||||||
| Calpine Corp. | 515,000 | 5.3750 | 1/15/2023 | 512,425 | ||||||||||
| Dynegy, Inc. | 305,000 | 6.7500 | 11/1/2019 | 310,212 | ||||||||||
| Dynegy, Inc. ^ | 955,000 | 7.3750 | 11/1/2022 | 925,753 | ||||||||||
| NRG Energy, Inc. | 270,000 | 6.2500 | 7/15/2022 | 272,025 | ||||||||||
| NRG Energy, Inc. | 168,000 | 7.8750 | 5/15/2021 | 176,400 | ||||||||||
| NRG Energy, Inc. | 315,000 | 6.6250 | 3/15/2023 | 315,788 | ||||||||||
| NRG Energy, Inc. - 144A | 460,000 | 6.6250 | 1/15/2027 | 431,393 | ||||||||||
| 3,285,683 | ||||||||||||||
| ELECTRICAL COMPONENTS & EQUIPMENT - 1.6% | ||||||||||||||
| Anixter, Inc. | 425,000 | 5.1250 | 10/1/2021 | 445,825 | ||||||||||
| Anixter, Inc. | 255,000 | 5.5000 | 3/1/2023 | 269,344 | ||||||||||
| Belden, Inc. - 144A | 365,000 | 5.5000 | 9/1/2022 | 375,037 | ||||||||||
| WESCO Distribution, Inc. | 435,000 | 5.3750 | 12/15/2021 | 446,419 | ||||||||||
| 1,536,625 | ||||||||||||||
| ENTERTAINMENT - 2.3% | ||||||||||||||
| Eldorado Resorts, Inc. | 230,000 | 7.0000 | 8/1/2023 | 245,525 | ||||||||||
| LG FinanceCo Corp. - 144A | 375,000 | 5.8750 | 11/1/2024 | 380,391 | ||||||||||
| Penn National Gaming, Inc. ^ | 370,000 | 5.8750 | 11/1/2021 | 384,800 | ||||||||||
| Pinnacle Entertainment, Inc. - 144A | 160,000 | 5.6250 | 5/1/2024 | 161,600 | ||||||||||
| Regal Entertainment Group | 550,000 | 5.7500 | 6/15/2023 | 567,875 | ||||||||||
| Scientific Games International, Inc. - 144A ^ | 480,000 | 7.0000 | 1/1/2022 | 512,928 | ||||||||||
| 2,253,119 | ||||||||||||||
| FOOD - 1.0% | ||||||||||||||
| JBS USA LLC - 144A | 265,000 | 7.2500 | 6/1/2021 | 272,950 | ||||||||||
| JBS USA LLC - 144A | 90,000 | 7.2500 | 6/1/2021 | 92,700 | ||||||||||
| JBS USA LLC - 144A | 565,000 | 5.8750 | 7/15/2024 | 570,650 | ||||||||||
| 936,300 | ||||||||||||||
| GAS - 0.5% | ||||||||||||||
| NGL Energy Partners LP / NGL Energy Finance Corp. | 270,000 | 6.8750 | 10/15/2021 | 267,300 | ||||||||||
| NGL Energy Partners LP / NGL Energy Finance Corp. - 144A | 260,000 | 7.5000 | 11/1/2023 | 261,950 | ||||||||||
| 529,250 | ||||||||||||||
| HEALTHCARE-PRODUCTS - 1.0% | ||||||||||||||
| Kinetic Concepts, Inc. / KCI USA, Inc. | 345,000 | 10.5000 | 11/1/2018 | 363,112 | ||||||||||
| Kinetic Concepts, Inc. / KCI USA, Inc. - 144A | 255,000 | 9.6250 | 1/1/2021 | 247,350 | ||||||||||
| Mallinckrodt International Finance SA | 395,000 | 4.7500 | 4/15/2023 | 346,119 | ||||||||||
| 956,581 | ||||||||||||||
See accompanying notes to financial statements.
34
| SCHEDULE OF INVESTMENTS |
| Dunham High-Yield Bond Fund (Continued) |
| October 31, 2016 |
| Principal | Interest | Maturity | ||||||||||||
| Security | Amount | Rate | Date | Value | ||||||||||
| HEALTHCARE-SERVICES - 4.1% | ||||||||||||||
| Amsurg Corp. | $ | 365,000 | 5.6250 | % | 7/15/2022 | $ | 373,669 | |||||||
| Centene Corp. | 395,000 | 6.1250 | 2/15/2024 | 421,662 | ||||||||||
| Envision Healthcare Corp. - 144A | 475,000 | 5.1250 | 7/1/2022 | 477,375 | ||||||||||
| HCA, Inc. | 455,000 | 7.5000 | 2/15/2022 | 518,927 | ||||||||||
| HCA, Inc. | 370,000 | 5.3750 | 2/1/2025 | 378,122 | ||||||||||
| HealthSouth Corp. | 350,000 | 5.7500 | 11/1/2024 | 362,687 | ||||||||||
| MEDNAX, Inc. - 144A | 290,000 | 5.2500 | 12/1/2023 | 303,775 | ||||||||||
| Select Medical Corp. ^ | 750,000 | 6.3750 | 6/1/2021 | 744,375 | ||||||||||
| Tenet Healthcare Corp. | 400,000 | 6.0000 | 10/1/2020 | 422,352 | ||||||||||
| 4,002,944 | ||||||||||||||
| HOME BUILDERS - 1.1% | ||||||||||||||
| Taylor Morrison Communities, Inc. - 144A | 385,000 | 5.2500 | 4/15/2021 | 396,550 | ||||||||||
| William Lyon Homes, Inc. | 655,000 | 8.5000 | 11/15/2020 | 689,387 | ||||||||||
| 1,085,937 | ||||||||||||||
| HOME FURNISHINGS - 0.7% | ||||||||||||||
| Tempur Sealy International, Inc. | 250,000 | 5.5000 | 6/15/2026 | 258,125 | ||||||||||
| Tempur Sealy International, Inc. | 390,000 | 5.6250 | 10/15/2023 | 405,600 | ||||||||||
| 663,725 | ||||||||||||||
| HOUSEHOLD PRODUCTS - 0.4% | ||||||||||||||
| Spectrum Brands, Inc. | 320,000 | 5.7500 | 7/15/2025 | 348,000 | ||||||||||
| INDUSTRIALS - 0.5% | ||||||||||||||
| Herc Rentals, Inc. - 144A ^ | 60,000 | 7.7500 | 6/1/2024 | 60,450 | ||||||||||
| Herc Rentals, Inc. - 144A | 455,000 | 7.5000 | 6/1/2022 | 456,138 | ||||||||||
| 516,588 | ||||||||||||||
| IRON/STEEL - 0.4% | ||||||||||||||
| United States Steel Corp. ^ | 375,000 | 7.3750 | 4/1/2020 | 375,000 | ||||||||||
| LEISURE TIME - 0.4% | ||||||||||||||
| NCL Corp. Ltd. - 144A ^ | 400,000 | 4.6250 | 11/15/2020 | 407,000 | ||||||||||
| LODGING - 1.5% | ||||||||||||||
| MGM Resorts International | 325,000 | 4.6250 | 9/1/2026 | 314,437 | ||||||||||
| MGM Resorts International ^ | 950,000 | 7.7500 | 3/15/2022 | 1,102,000 | ||||||||||
| 1,416,437 | ||||||||||||||
| MEDIA - 13.1% | ||||||||||||||
| Altice Financing SA - 144A | 545,000 | 6.6250 | 2/15/2023 | 562,713 | ||||||||||
| Cablevision Systems Corp. ^ | 995,000 | 5.8750 | 9/15/2022 | 920,375 | ||||||||||
| CBS Radio, Inc. -144A | 150,000 | 7.2500 | 11/1/2024 | 156,188 | ||||||||||
| Cequel Communications Holdings I LLC - 144A | 565,000 | 6.3750 | 9/15/2020 | 584,069 | ||||||||||
| Clear Channel Worldwide Holdings, Inc. ^ | 740,000 | 6.5000 | 11/15/2022 | 757,390 | ||||||||||
| Clear Channel Worldwide Holdings, Inc. | 740,000 | 7.6250 | 3/15/2020 | 719,650 | ||||||||||
| CSC Holdings LLC | 245,000 | 6.7500 | 11/15/2021 | 258,475 | ||||||||||
| CSC Holdings LLC | 170,000 | 5.2500 | 6/1/2024 | 159,375 | ||||||||||
| CSC Holdings LLC - 144A ^ | 325,000 | 10.1250 | 1/15/2023 | 367,250 | ||||||||||
| DISH DBS Corp. | 340,000 | 7.8750 | 9/1/2019 | 379,950 | ||||||||||
| DISH DBS Corp. | 370,000 | 7.7500 | 7/1/2026 | 407,233 | ||||||||||
See accompanying notes to financial statements.
35
| SCHEDULE OF INVESTMENTS |
| Dunham High-Yield Bond Fund (Continued) |
| October 31, 2016 |
| Principal | Interest | Maturity | ||||||||||||
| Security | Amount | Rate | Date | Value | ||||||||||
| MEDIA (CONTINUED) - 13.1% | ||||||||||||||
| DISH DBS Corp. | $ | 280,000 | 6.7500 | % | 6/1/2021 | $ | 301,526 | |||||||
| Gray Television, Inc. - 144A | 90,000 | 5.1250 | 10/15/2024 | 87,525 | ||||||||||
| Gray Television, Inc. - 144A | 275,000 | 5.8750 | 7/15/2026 | 274,313 | ||||||||||
| LIN Television Corp. | 390,000 | 6.3750 | 1/15/2021 | 403,650 | ||||||||||
| Mediacom LLC. | 660,000 | 7.2500 | 2/15/2022 | 688,875 | ||||||||||
| Nexstar Broadcasting, Inc. - 144A ^ | 325,000 | 6.1250 | 2/15/2022 | 334,750 | ||||||||||
| Nexstar Broadcasting, Inc. ^ | 1,140,000 | 6.8750 | 11/15/2020 | 1,184,175 | ||||||||||
| Radio One, Inc. - 144A | 650,000 | 7.3750 | 4/15/2022 | 656,500 | ||||||||||
| SFR Group SA - 144A | 680,000 | 6.0000 | 5/15/2022 | 699,768 | ||||||||||
| SFR Group SA - 144A | 750,000 | 6.2500 | 5/15/2024 | 752,340 | ||||||||||
| Sinclair Television Group, Inc. - 144A | 265,000 | 5.6250 | 8/1/2024 | 268,975 | ||||||||||
| TEGNA, Inc. - 144A | 85,000 | 5.5000 | 9/15/2024 | 87,444 | ||||||||||
| Time, Inc. - 144A | 350,000 | 5.7500 | 4/15/2022 | 338,625 | ||||||||||
| Townsquare Media, Inc. - 144A ^ | 400,000 | 6.5000 | 4/1/2023 | 398,500 | ||||||||||
| Tribune Media Co. ^ | 380,000 | 5.8750 | 7/15/2022 | 381,900 | ||||||||||
| Videotron Ltd | 425,000 | 5.0000 | 7/15/2022 | 445,188 | ||||||||||
| 12,576,722 | ||||||||||||||
| MINING - 2.7% | ||||||||||||||
| FMG Resources August 2006 Pty Ltd. - 144A | 310,000 | 9.7500 | 3/1/2022 | 361,150 | ||||||||||
| Freeport-McMoRan, Inc. ^ | 600,000 | 5.4500 | 3/15/2043 | 501,000 | ||||||||||
| Freeport-McMoRan, Inc. ^ | 530,000 | 3.1000 | 3/15/2020 | 512,775 | ||||||||||
| Teck Resources Ltd | 275,000 | 4.5000 | 1/15/2021 | 277,750 | ||||||||||
| Teck Resources Ltd | 430,000 | 6.2500 | 7/15/2041 | 427,850 | ||||||||||
| Teck Resources Ltd | 630,000 | 5.2000 | 3/1/2042 | 571,725 | ||||||||||
| 2,652,250 | ||||||||||||||
| OFFICE/BUSINESS EQUIPMENT - 0.3% | ||||||||||||||
| CDW Finance Corp. | 240,000 | 5.5000 | 12/1/2024 | 253,274 | ||||||||||
| OIL & GAS - 7.2% | ||||||||||||||
| Antero Resources Corp. ^ | 580,000 | 5.3750 | 11/1/2021 | 591,600 | ||||||||||
| Antero Resources Corp. | 240,000 | 5.1250 | 12/1/2022 | 243,000 | ||||||||||
| Callon Petroleum Co. - 144A | 370,000 | 6.1250 | 10/1/2024 | 382,025 | ||||||||||
| Carrizo Oil & Gas, Inc. ^ | 525,000 | 7.5000 | 9/15/2020 | 546,656 | ||||||||||
| Continental Resources, Inc. | 240,000 | 7.1250 | 4/1/2021 | 248,772 | ||||||||||
| Continental Resources, Inc. ^ | 845,000 | 4.9000 | 6/1/2044 | 723,531 | ||||||||||
| Ensco PLC | 530,000 | 5.7500 | 10/1/2044 | 356,425 | ||||||||||
| Gulfport Energy Corp. - 144A | 240,000 | 6.0000 | 10/15/2024 | 244,800 | ||||||||||
| Noble Holding International Ltd. | 465,000 | 3.9500 | 3/15/2022 | 358,050 | ||||||||||
| Oasis Petroleum, Inc. ^ | 360,000 | 6.8750 | 3/15/2022 | 358,200 | ||||||||||
| PDC Energy, Inc. - 144A | 335,000 | 6.1250 | 9/15/2024 | 349,237 | ||||||||||
| Sunoco LP / Sunoco Finance Corp. | 95,000 | 6.2500 | 4/15/2021 | 97,613 | ||||||||||
| Transocean, Inc. - 144A | 255,000 | 9.0000 | 7/15/2023 | 250,378 | ||||||||||
| Transocean, Inc. ^ | 415,000 | 8.1250 | 12/15/2021 | 402,633 | ||||||||||
| Transocean, Inc. | 355,000 | 6.8000 | 3/15/2038 | 235,188 | ||||||||||
| Unit Corp | 535,000 | 6.6250 | 5/15/2021 | 494,875 | ||||||||||
| Western Refining, Inc. | 570,000 | 6.2500 | 4/1/2021 | 577,125 | ||||||||||
| WPX Energy, Inc. ^ | 520,000 | 6.0000 | 1/15/2022 | 521,300 | ||||||||||
| 6,981,408 | ||||||||||||||
See accompanying notes to financial statements.
36
| SCHEDULE OF INVESTMENTS |
| Dunham High-Yield Bond Fund (Continued) |
| October 31, 2016 |
| Principal | Interest | Maturity | ||||||||||||
| Security | Amount | Rate | Date | Value | ||||||||||
| OIL & GAS SERVICES - 1.1% | ||||||||||||||
| McDermott International, Inc. - 144A | $ | 515,000 | 8.0000 | % | 5/1/2021 | $ | 502,125 | |||||||
| SESI LLC | 300,000 | 6.3750 | 5/1/2019 | 297,750 | ||||||||||
| SESI LLC | 245,000 | 7.1250 | 12/15/2021 | 240,100 | ||||||||||
| 1,039,975 | ||||||||||||||
| PACKAGING & CONTAINERS - 0.7% | ||||||||||||||
| Reynolds Group Issuer, Inc. | 670,000 | 5.7500 | 10/15/2020 | 688,445 | ||||||||||
| PHARMACEUTICALS - 2.7% | ||||||||||||||
| Endo Finance LLC - 144A | 805,000 | 5.7500 | 1/15/2022 | 728,525 | ||||||||||
| Valeant Pharmaceuticals International, Inc. - 144A ^ | 800,000 | 6.3750 | 10/15/2020 | 694,000 | ||||||||||
| Valeant Pharmaceuticals International, Inc. - 144A | 725,000 | 5.3750 | 3/15/2020 | 634,375 | ||||||||||
| Valeant Pharmaceuticals International, Inc. - 144A | 655,000 | 6.7500 | 8/15/2021 | 569,850 | ||||||||||
| 2,626,750 | ||||||||||||||
| PIPELINES - 8.4% | ||||||||||||||
| Blue Racer Midstream LLC. - 144A | 400,000 | 6.1250 | 11/15/2022 | 393,000 | ||||||||||
| DCP Midstream LLC - 144A | 180,000 | 4.7500 | 9/30/2021 | 184,950 | ||||||||||
| DCP Midstream LLC - 144A | 240,000 | 5.3500 | 3/15/2020 | 248,400 | ||||||||||
| DCP Midstream LLC - 144A | 855,000 | 5.8500 | 5/21/2043 | 731,025 | ||||||||||
| DCP Midstream Operating LP | 260,000 | 3.8750 | 3/15/2023 | 254,150 | ||||||||||
| MPLX LP | 600,000 | 4.5000 | 7/15/2023 | 618,087 | ||||||||||
| MPLX LP | 240,000 | 5.5000 | 2/15/2023 | 250,096 | ||||||||||
| NGPL PipeCo LLC - 144A ^ | 320,000 | 7.7680 | 12/15/2037 | 352,000 | ||||||||||
| Rockies Express Pipeline LLC - 144A | 525,000 | 5.6250 | 4/15/2020 | 553,219 | ||||||||||
| Rockies Express Pipeline LLC - 144A | 985,000 | 6.8750 | 4/15/2040 | 1,031,788 | ||||||||||
| Sabine Pass Liquefaction LLC | 370,000 | 5.6250 | 2/1/2021 | 391,275 | ||||||||||
| Sabine Pass Liquefaction LLC | 860,000 | 6.2500 | 3/15/2022 | 946,000 | ||||||||||
| Sabine Pass Liquefaction LLC - 144A | 560,000 | 5.0000 | 3/15/2027 | 571,200 | ||||||||||
| Tallgrass Energy Partners LP / Tallgrass Energy Finance Corp. - 144A | 250,000 | 5.5000 | 9/15/2024 | 249,375 | ||||||||||
| Targa Resources Partners Finance Corp. | 365,000 | 5.2500 | 5/1/2023 | 364,124 | ||||||||||
| Williams Partners LP | 255,000 | 4.8750 | 5/15/2023 | 258,494 | ||||||||||
| Williams Partners LP | 360,000 | 4.8750 | 3/15/2024 | 369,500 | ||||||||||
| Williams Partners LP | 170,000 | 5.1000 | 9/15/2045 | 163,969 | ||||||||||
| Williams Partners LP | 170,000 | 6.3000 | 4/15/2040 | 182,849 | ||||||||||
| 8,113,501 | ||||||||||||||
| PRIVATE EQUITY - 0.5% | ||||||||||||||
| Icahn Enterprises LP / Icahn Enterprises Finance Corp. | 500,000 | 5.8750 | 2/1/2022 | 478,125 | ||||||||||
| REAL ESTATE - 0.9% | ||||||||||||||
| Realogy Group LLC - 144A ^ | 855,000 | 5.2500 | 12/1/2021 | 903,094 | ||||||||||
| REITS - 2.7% | ||||||||||||||
| CyrusOne Finance Corp. | 840,000 | 6.3750 | 11/15/2022 | 894,600 | ||||||||||
| Equinix, Inc. | 175,000 | 5.3750 | 1/1/2022 | 186,375 | ||||||||||
| Equinix, Inc. | 250,000 | 5.8750 | 1/15/2026 | 267,855 | ||||||||||
| FelCor Lodging LP | 720,000 | 5.6250 | 3/1/2023 | 746,633 | ||||||||||
| RHP Hotel Properties LP | 480,000 | 5.0000 | 4/15/2021 | 496,800 | ||||||||||
| 2,592,263 | ||||||||||||||
See accompanying notes to financial statements.
37
| SCHEDULE OF INVESTMENTS |
| Dunham High-Yield Bond Fund (Continued) |
| October 31, 2016 |
| Principal | Interest | Maturity | ||||||||||||
| Security | Amount | Rate | Date | Value | ||||||||||
| RETAIL - 1.5% | ||||||||||||||
| Dollar Tree, Inc. ^ | $ | 420,000 | 5.7500 | % | 3/1/2023 | $ | 449,400 | |||||||
| GameStop Corp. - 144A ^ | 225,000 | 5.5000 | 10/1/2019 | 232,031 | ||||||||||
| JC Penney Corp, Inc. | 345,000 | 8.1250 | 10/1/2019 | 377,344 | ||||||||||
| PetSmart, Inc. - 144A ^ | 400,000 | 7.1250 | 3/15/2023 | 419,500 | ||||||||||
| 1,478,275 | ||||||||||||||
| SEMICONDUCTORS - 1.6% | ||||||||||||||
| Micron Technology, Inc. - 144A | 90,000 | 7.5000 | 9/15/2023 | 99,563 | ||||||||||
| Micron Technology, Inc. - 144A | 300,000 | 5.6250 | 1/15/2026 | 292,500 | ||||||||||
| Micron Technology, Inc. - 144A | 615,000 | 5.2500 | 8/1/2023 | 605,775 | ||||||||||
| Micron Technology, Inc. ^ | 135,000 | 5.8750 | 2/15/2022 | 139,948 | ||||||||||
| Qorvo, Inc. | 330,000 | 6.7500 | 12/1/2023 | 362,588 | ||||||||||
| 1,500,374 | ||||||||||||||
| SOFTWARE - 2.0% | ||||||||||||||
| First Data Corp. - 144A | 220,000 | 5.0000 | 1/15/2024 | 224,125 | ||||||||||
| First Data Corp. - 144A | 930,000 | 7.0000 | 12/1/2023 | 976,500 | ||||||||||
| Nuance Communications, Inc. - 144A | 685,000 | 5.3750 | 8/15/2020 | 704,266 | ||||||||||
| 1,904,891 | ||||||||||||||
| TELECOMMUNICATIONS - 11.1% | ||||||||||||||
| CenturyLink, Inc. | 80,000 | 7.5000 | 4/1/2024 | 83,500 | ||||||||||
| CenturyLink, Inc. | 220,000 | 6.4500 | 6/15/2021 | 235,950 | ||||||||||
| CenturyLink, Inc. ^ | 370,000 | 5.6250 | 4/1/2020 | 396,362 | ||||||||||
| CenturyLink, Inc. | 280,000 | 7.6000 | 9/15/2039 | 250,600 | ||||||||||
| Cincinnati Bell, Inc. - 144A | 220,000 | 7.0000 | 7/15/2024 | 231,000 | ||||||||||
| Cogent Communications Finance, Inc. - 144A | 460,000 | 5.6250 | 4/15/2021 | 463,450 | ||||||||||
| CommScope, Inc. - 144A | 200,000 | 5.5000 | 6/15/2024 | 210,250 | ||||||||||
| EarthLink Holdings Corp. | 960,000 | 7.3750 | 6/1/2020 | 1,012,800 | ||||||||||
| FairPoint Communications, Inc. - 144A | 825,000 | 8.7500 | 8/15/2019 | 842,531 | ||||||||||
| Frontier Communications Corp. | 265,000 | 10.5000 | 9/15/2022 | 276,594 | ||||||||||
| Frontier Communications Corp. | 115,000 | 6.2500 | 9/15/2021 | 109,825 | ||||||||||
| Frontier Communications Corp. | 465,000 | 6.8750 | 1/15/2025 | 391,181 | ||||||||||
| Frontier Communications Corp. | 480,000 | 8.5000 | 4/15/2020 | 514,200 | ||||||||||
| Frontier Communications Corp. | 855,000 | 9.2500 | 7/1/2021 | 905,231 | ||||||||||
| GCI, Inc. | 335,000 | 6.8750 | 4/15/2025 | 341,700 | ||||||||||
| Intelsat Jackson Holdings SA - 144A | 240,000 | 8.0000 | 2/15/2024 | 242,400 | ||||||||||
| Level 3 Financing, Inc. | 330,000 | 5.1250 | 5/1/2023 | 334,125 | ||||||||||
| Qwest Corp. | 210,000 | 6.7500 | 12/1/2021 | 233,362 | ||||||||||
| Sprint Capital Corp. | 285,000 | 6.8750 | 11/15/2028 | 262,912 | ||||||||||
| Sprint Communications, Inc. | 615,000 | 7.0000 | 8/15/2020 | 641,138 | ||||||||||
| Sprint Communications, Inc. - 144A | 200,000 | 7.0000 | 3/1/2020 | 218,000 | ||||||||||
| Sprint Corp. | 495,000 | 7.2500 | 9/15/2021 | 507,994 | ||||||||||
| Sprint Corp. | 705,000 | 7.8750 | 9/15/2023 | 699,713 | ||||||||||
| West Corp. - 144A ^ | 410,000 | 5.3750 | 7/15/2022 | 396,163 | ||||||||||
| Windstream Services LLC ^ | 555,000 | 7.7500 | 10/1/2021 | 552,919 | ||||||||||
| Windstream Services LLC | 350,000 | 7.7500 | 10/15/2020 | 357,875 | ||||||||||
| 10,711,775 | ||||||||||||||
See accompanying notes to financial statements.
38
| SCHEDULE OF INVESTMENTS |
| Dunham High-Yield Bond Fund (Continued) |
| October 31, 2016 |
| Principal | Interest | Maturity | ||||||||||||
| Security | Amount | Rate | Date | Value | ||||||||||
| TRANSPORTATION - 0.8% | ||||||||||||||
| Watco Cos LLC - 144A | $ | 730,000 | 6.3750 | % | 4/1/2023 | $ | 744,600 | |||||||
| 744,600 | ||||||||||||||
| TOTAL BONDS & NOTES (Cost - $89,276,989) | 92,380,002 | |||||||||||||
| Interest | ||||||||||||||
| Security | Shares | Rate | ||||||||||||
| SHORT-TERM INVESTMENT - 1.9% | ||||||||||||||
| MONEY MARKET FUND - 1.9% | ||||||||||||||
| First American Government Obligations Fund, 0.24% | 1,891,803 | 0.24 | % + | 1,891,803 | ||||||||||
| TOTAL SHORT-TERM INVESTMENT (Cost - $1,891,803) | ||||||||||||||
| COLLATERAL FOR SECURITIES LOANED - 23.0% | ||||||||||||||
| Mount Vernon Prime Portfolio (Cost - $22,131,280) | 22,131,280 | 0.67 | % + | 22,131,280 | ||||||||||
| TOTAL INVESTMENTS - 120.8% (Cost - $113,300,072) | $ | 116,403,085 | ||||||||||||
| LIABILITIES IN EXCESS OF OTHER ASSETS - (20.8)% | (20,044,718 | ) | ||||||||||||
| NET ASSETS - 100.0% | $ | 96,358,367 | ||||||||||||
| ^ | All or a portion of these securities are on loan. Total loaned securities had a value of $21,332,052 at October 31, 2016. Securities loaned with a value of $666,513 have been sold and are pending settlement. |
| + | Variable rate security. Interest rate is as of October 31, 2016. |
144A- Security exempt from registration under Rule 144A of the Securities Act of 1933. These securities may be sold in transactions exempt from registration, normally to qualified institutional buyers.
LLC - Limited Liability Corporation
LP - Limited Partnership
REITS - Real Estate Investment Trusts.
Portfolio Composition ** - (Unaudited)
| Collateral For Securities Loaned | 19.0% | Ba2 | 8.0% | |||
| B1 | 17.5% | Caa1 | 7.8% | |||
| B3 | 15.9% | Baa3 | 4.6% | |||
| B2 | 11.3% | Ba1 | 3.6% | |||
| Ba3 | 10.7% | Short-Term Investment | 1.6% | |||
| Total | 100.0% |
| ** | Based on total value of investments as of October 31, 2016. |
| ** | Bond Ratings provided by Fitch Ratings. |
Percentage may differ from Schedule of Investments which is based on Fund net assets.
See accompanying notes to financial statements.
39
Dunham International Opportunity Bond Fund
Message from the Sub-Adviser (Rogge Global Partners Limited)
International bonds, as measured by the Barclays Global ex US Aggregate Bond Index Unhedged, continued to see U.S. dollar movements relative to foreign currencies causing volatility in the foreign bond markets. During the most recent fiscal quarter, international bonds decreased 4.2 percent after increasing 11.1 percent across the previous three fiscal quarters. This most recent decrease brought performance for the fiscal year to 6.5 percent. The most recent fiscal quarter’s meaningful decline coincided with the U.S. dollar appreciating more than 3.0 percent against a basket of major world currencies. Over the fiscal year, the U.S. dollar appreciated 1.3 percent against the same basket of world currencies. In contrast to the previous fiscal quarter, the rise in the U.S. dollar was somewhat consistent across foreign markets, as its 1.8 percent gain versus the euro was matched with a 3.4 percent rise versus the Japanese yen. The British pound’s significant 9.5 percent decline versus the U.S. dollar in the previous fiscal quarter was almost repeated in the most recent fiscal quarter, as the British pound declined 8.1 percent versus the U.S. dollar. Britain’s vote to leave the European Union during the third fiscal quarter was the primary catalyst behind the large fluctuations in the British pound, and over the course of the fiscal year the pound lost 20.7 percent relative to the U.S. dollar.
The Sub-Adviser primarily focuses on developed markets, which underperformed developing country debt during the fiscal year. Emerging markets bonds, as measured by the Barclays Emerging Markets Local Currency Government Index, decreased 0.4 percent during the most recent fiscal quarter, after surging 9.6 percent across the previous three fiscal quarters. As emerging markets bonds experienced only a slight decline in the most recent fiscal quarter, those bonds in general outperformed their developed markets counterparts when measured across the entire fiscal year, ending up 9.2 percent. While the Sub-Adviser continues to believe that emerging markets countries are still working through their deleveraging cycle that was brought on during the financial crisis, it is concerned about fundamental headwinds that may adversely affect emerging markets-based corporations. Therefore, the Sub-Adviser has been cautious and selective in its approach to emerging markets debt. The Fund’s emerging markets allocation included the Mexico sovereign bond, Mex Bonos Desrr Fix Rate 5.75% 3/5/2026 (BYNMJL4) (holding percentage*: 0.47 percent). This holding has experienced increased volatility, primarily attributable to the swings in peso-to-U.S. dollar valuations. During the fiscal year, the peso declined 12.5 percent versus the U.S. dollar. The total return for the bond during the fiscal year was 5.5 percent when measured in local terms, but when converting back to the U.S. dollar, the decline was 7.6 percent for the same 12-month period.
The Sub-Adviser’s stance on Japanese debt shifted meaningfully during the fiscal year, from an overweight near the beginning of the period, to an underweight at the end of the period. This change in the Sub-Adviser’s macro view was primarily due to the yen’s fluctuations and the promise and implementation of policies by the densely populated country’s central bank. These policies translated to significant swings in the valuation of the Japanese yen, leading to a 13.3 percent surge versus the U.S. dollar in the first half of the fiscal year. In the second half of the fiscal year, the yen continued to gain versus the U.S. dollar, adding 1.6 percent. The Fund continued to benefit from its exposure to Japanese debt, primarily from the currency effect and less from any coupon (many of which are negligible or even offer a negative yield). For example, the Fund held the Japan 0.1% 6/20/2026 (BYT3PS0) (holding percentage*: 2.88 percent), which declined 1.3 percent in local currency terms during the most recent fiscal quarter. Converting to U.S. dollars, the bond was down closer to 5 percent, as the yen’s value depreciated relative to the U.S. dollar during the most recent three-month period. However, over the fiscal year, the yen’s 15.1 percent increase versus the U.S. dollar significantly aided the returns of these intermediate-to-long-term Japanese bonds.
In the second half of the fiscal year, Britain voted to leave the European Union, and speculation and discussions regarding its impact on the European Union persisted through the end of the fiscal year. The Sub-Adviser maintained positions in Spain and Italy, such as the Italian bond Buoni Poliennali Del Tesoro 4.5% 3/1/2024 (BCRYKK8) (holding percentage*: 1.45 percent), and the Spanish bond Bonos Y Oblig Del Estado 4.2% Due 01/21/2037 (B05L4R2) (holding percentage*: 0.67 percent). During the fiscal year, the Italian bond increased 2.2 percent and the Spanish bond surged 12.2 percent in local currency terms. As both of these countries are members of the euro-zone the slight depreciation of the euro versus the U.S. dollar detracted 0.2 percent from the performance for each of these two bonds. The Fund also held British bonds, such as the UK Treasury 4.25% 12/7/2055 (B7W4LN8) (holding percentage*: 0.39 percent). The long-dated British bond rose 22.4 percent during the fiscal year, while the British pound’s decline versus the U.S. dollar erased the majority of the return, detracting 20.7 percent from the bond’s performance.
The Sub-Adviser is optimistic that some of the divergence across the various sectors and countries within the foreign bond markets provides opportunities for its investment strategy. The Sub-Adviser believes that some of the global central banks’ stimulus programs are unclear and will provide increased volatility within the credit markets. In addition, the global disinflationary pressures appear less intense than earlier in the year and long-term inflation expectations are subdued across the most prominent developed countries.
| * | Holdings percentage(s) as of 10/31/2016. |
Growth of $100,000 Investment
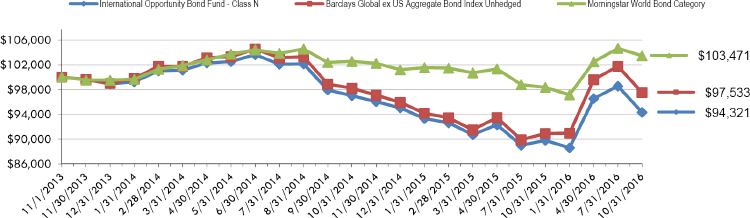
Total Returns as of October 31, 2016
| Annualized Since | ||||||
| One Year | Inception (11/1/13) | |||||
| Class N | 5.03% | (1.93)% | ||||
| Class C | 4.19% | (2.68)% | ||||
| Class A with load of 4.50% | 0.05% | (3.66)% | ||||
| Class A without load | 4.77% | (2.17)% | ||||
| Barclays Global ex-US Aggregate Bond Index Unhedged | 6.47% | (0.83)% | ||||
| Morningstar World Bond Category | 5.20% | 1.38% |
The Barclays Global ex US Aggregate Bond Index Unhedged is designed to be a broad based measure of the global investment-grade, fixed rate, fixed income corporate markets outside the United States. Investors cannot invest directly in an index or benchmark.
The Morningstar World Bond Category is generally representative of funds that invest at least 40% of bonds in foreign markets. Investors cannot invest directly in an index or benchmark.
As disclosed in the Trust’s latest registration statement, the Fund’s total annual operating expenses, including underlying funds, are 1.38% for Class N, 2.13% for Class C and 1.63% for Class A. Class A shares are subject to a sales load of 4.50% and a deferred sales charge of up to 0.75%. The performance data quoted here represents past performance, which is not indicative of future results. Current performance may be lower or higher than the performance data quoted. The investment return and NAV will fluctuate, so that an investor’s shares, when redeemed, may be worth more or less than their original cost. Total returns are calculated assuming reinvestment of all dividends and capital gains distributions, if any. The returns do not reflect the deductions of taxes a shareholder would pay on the redemption of fund shares or fund distributions. For performance information current to the most recent month-end, please call 1-800-442-4358 or visit our website www.dunham.com.
40
| SCHEDULE OF INVESTMENTS |
| Dunham International Opportunity Bond Fund |
| October 31, 2016 |
| Principal | Interest | ||||||||||||||
| Security | Amount | Rate% | Maturity Date | Value | |||||||||||
| CORPORATE BONDS & NOTES - 38.6% | |||||||||||||||
| AGRICULTURE - 2.4% | |||||||||||||||
| BAT International Finance PLC | 400,000 | EUR | 0.8750 | 10/13/2023 | $ | 444,454 | |||||||||
| Imperial Brands Finance PLC | 200,000 | EUR | 2.2500 | 2/26/2021 | 235,620 | ||||||||||
| 680,074 | |||||||||||||||
| AUTO MANUFACTURERS - 2.2% | |||||||||||||||
| BMW Finance NV | 350,000 | EUR | 0.7500 | 4/15/2024 | 391,493 | ||||||||||
| FCE Bank PLC | 200,000 | EUR | 1.8750 | 6/24/2021 | 231,857 | ||||||||||
| 623,350 | |||||||||||||||
| BANKS - 12.7% | |||||||||||||||
| ABN AMRO Bank NV | 200,000 | EUR | 6.3750 | 4/27/2021 | 271,217 | ||||||||||
| Banco de Sabadell SA | 200,000 | EUR | 0.6250 | 11/3/2020 | 224,874 | ||||||||||
| BNP Paribas SA | 200,000 | EUR | 2.8750 | 9/26/2023 | 254,170 | ||||||||||
| BPCE SA | 200,000 | EUR | 4.6250 | 7/18/2023 | 261,474 | ||||||||||
| CaixaBank SA | 300,000 | EUR | 0.6250 | 11/12/2020 | 337,668 | ||||||||||
| Credit Agricole SA/London | 100,000 | EUR | 3.8750 | 2/13/2019 | 119,326 | ||||||||||
| HSBC Holdings PLC | 200,000 | EUR | 6.0000 | 6/10/2019 | 252,252 | ||||||||||
| Intesa Sanpaolo SpA | 200,000 | EUR | 4.3750 | 10/15/2019 | 243,562 | ||||||||||
| KBC Group NV | 200,000 | EUR | 2.3750 | + | 11/25/2024 | 227,674 | |||||||||
| Lloyds Bank PLC | 150,000 | EUR | 6.5000 | 3/24/2020 | 193,527 | ||||||||||
| National Australia Bank Ltd. | 100,000 | GBP | 5.1250 | 12/9/2021 | 143,342 | ||||||||||
| Santander UK PLC | 100,000 | EUR | 2.0000 | 1/14/2019 | 114,115 | ||||||||||
| Societe Generale SA | 100,000 | EUR | 0.7500 | 5/26/2023 | 111,232 | ||||||||||
| Societe Generale SA | 200,000 | EUR | 4.0000 | 6/7/2023 | 251,189 | ||||||||||
| UBS AG/London | 200,000 | GBP | 6.6250 | 4/11/2018 | 264,178 | ||||||||||
| Westpac Banking Corp | 250,000 | EUR | 2.1250 | 7/9/2019 | 291,102 | ||||||||||
| 3,560,902 | |||||||||||||||
| BEVERAGES - 1.8% | |||||||||||||||
| Anheuser-Busch InBev SA/NV | 250,000 | USD | 0.8750 | 3/17/2022 | 282,157 | ||||||||||
| Pernod Richard SA | 200,000 | EUR | 1.5000 | 5/18/2026 | 229,556 | ||||||||||
| 511,713 | |||||||||||||||
| CHEMICALS - 3.1% | |||||||||||||||
| Air Liquide Finance SA | 400,000 | EUR | 0.7500 | 6/13/2024 | 445,912 | ||||||||||
| Linde Finance BV | 350,000 | EUR | 3.1250 | 12/12/2018 | 410,002 | ||||||||||
| 855,914 | |||||||||||||||
| ELECTRIC - 3.6% | |||||||||||||||
| Enel Finance International NV | 200,000 | EUR | 1.9660 | 1/27/2025 | 238,516 | ||||||||||
| Engie SA | 200,000 | EUR | 2.3750 | 5/19/2026 | 253,704 | ||||||||||
| Engie SA | 150,000 | GBP | 7.0000 | 10/30/2028 | 276,334 | ||||||||||
| Iberdrola Finanzas SAU | 200,000 | EUR | 4.1250 | 3/23/2020 | 249,058 | ||||||||||
| 1,017,612 | |||||||||||||||
| ELECTRONICS - 0.4% | |||||||||||||||
| Trionista Holdco GmbH | 100,000 | EUR | 5.0000 | 4/30/2020 | 113,041 | ||||||||||
| ENGINEERING & CONSTRUCTION - 1.5% | |||||||||||||||
| ABB Finance BV | 350,000 | EUR | 2.6250 | 3/26/2019 | 407,900 | ||||||||||
| ENTERTAINMENT - 0.5% | |||||||||||||||
| CPUK Finance Ltd. | 100,000 | GBP | 7.0000 | 8/28/2020 | 129,622 | ||||||||||
| INSURANCE - 2.0% | |||||||||||||||
| Aviva PLC | 100,000 | EUR | 3.3750 | + | 12/12/2045 | 107,364 | |||||||||
| AXA SA | 150,000 | EUR | 5.2500 | + | 4/16/2040 | 183,452 | |||||||||
| Willow No 2 Ireland PLC for Zurich Insurance Co. Ltd. | 200,000 | EUR | 3.3750 | 6/27/2022 | 255,192 | ||||||||||
| 546,008 | |||||||||||||||
| MEDIA - 0.8% | |||||||||||||||
| Altice Financing SA | 100,000 | EUR | 6.5000 | 1/15/2022 | 115,959 | ||||||||||
| SFR Group SA - 144A | 100,000 | EUR | 5.3750 | 5/15/2022 | 114,706 | ||||||||||
| 230,665 | |||||||||||||||
| MINING - 0.8% | |||||||||||||||
| Anglo American Capital PLC | 100,000 | EUR | 2.7500 | 6/7/2019 | 114,774 | ||||||||||
| Glencore Finance Canada Ltd | 100,000 | USD | 2.7000 | 10/25/2017 | 100,384 | ||||||||||
| 215,158 | |||||||||||||||
| OIL & GAS - 1.4% | |||||||||||||||
| BG Energy Capital PLC | 100,000 | EUR | 3.0000 | 11/16/2018 | 116,373 | ||||||||||
| BG Energy Capital PLC | 250,000 | EUR | 1.2500 | 11/21/2022 | 288,100 | ||||||||||
| 404,473 | |||||||||||||||
See accompanying notes to financial statements.
41
| SCHEDULE OF INVESTMENTS |
| Dunham International Opportunity Bond Fund (Continued) |
| October 31, 2016 |
| Security | Principal Amount | Interest Rate% | Maturity Date | Value | |||||||||||
| PACKAGING & CONTAINERS - 0.4% | |||||||||||||||
| Ardagh Packaging Finance PLC / Ardagh Holdings USA Inc - 144A | 100,000 | EUR | 4.1250 | 5/15/2023 | $ | 115,238 | |||||||||
| REAL ESTATE - 0.4% | |||||||||||||||
| Deutsche Raststaetten Gruppe IV GmbH | 100,000 | EUR | 6.7500 | 12/30/2020 | 114,725 | ||||||||||
| SAVINGS & LOANS - 1.5% | |||||||||||||||
| Nationwide Building Society | 250,000 | EUR | 1.6250 | 4/3/2019 | 283,471 | ||||||||||
| Nationwide Building Society | 100,000 | GBP | 5.6250 | 9/9/2019 | 136,990 | ||||||||||
| 420,461 | |||||||||||||||
| TELECOMMUNICATIONS - 3.1% | |||||||||||||||
| America Movil SAB de CV | 200,000 | EUR | 3.0000 | 7/12/2021 | 245,360 | ||||||||||
| Deutsche Telekom International Finance BV | 200,000 | EUR | 0.6250 | 4/3/2023 | 222,478 | ||||||||||
| Play Finance 2 SA | 100,000 | EUR | 5.2500 | 2/1/2019 | 112,689 | ||||||||||
| Telecom Italia SpA/Milano | 50,000 | GBP | 6.3750 | 6/24/2019 | 67,032 | ||||||||||
| Telefonica Emisiones SAU | 200,000 | EUR | 1.4770 | 9/14/2021 | 229,342 | ||||||||||
| 876,901 | |||||||||||||||
| TOTAL CORPORATE BONDS & NOTES(Cost - $11,507,962) | 10,823,757 | ||||||||||||||
| FOREIGN GOVERNMENT BONDS - 55.8% | |||||||||||||||
| Bundesobligation | 200,000 | EUR | 1.0000 | 10/12/2018 | 226,236 | ||||||||||
| Bundesrepublik Deutschland | 250,000 | EUR | 2.5000 | 7/4/2044 | 393,097 | ||||||||||
| Canadian Government Bond | 145,000 | CAD | 4.0000 | 6/1/2041 | 153,527 | ||||||||||
| Denmark Government Bond | 1,850,000 | DKK | 3.0000 | 11/15/2021 | 317,328 | ||||||||||
| France Government Bond OAT | 120,000 | EUR | 4.7500 | 4/25/2035 | 216,833 | ||||||||||
| France Government Bond OAT | 150,000 | EUR | 4.5000 | 4/25/2041 | 281,549 | ||||||||||
| Hungary Government International Bond | 100,000 | USD | 5.3750 | 3/25/2024 | 115,080 | ||||||||||
| Indonesia Government International Bond - 144A | 150,000 | EUR | 2.8750 | 7/8/2021 | 175,307 | ||||||||||
| Ireland Government Bond | 100,000 | EUR | 5.4000 | 3/13/2025 | 153,549 | ||||||||||
| Italy Buoni Poliennali Del Tesoro | 100,000 | EUR | 5.5000 | 11/1/2022 | 139,086 | ||||||||||
| Italy Buoni Poliennali Del Tesoro | 290,000 | EUR | 4.5000 | 3/1/2024 | 391,044 | ||||||||||
| Italy Buoni Poliennali Del Tesoro | 240,000 | EUR | 3.7500 | 9/1/2024 | 310,638 | ||||||||||
| Italy Buoni Poliennali Del Tesoro | 200,000 | EUR | 5.0000 | 9/1/2040 | 312,649 | ||||||||||
| Japan Government Ten Year Bond | 73,900,000 | JPY | 1.4000 | 9/20/2019 | 736,524 | ||||||||||
| Japan Government Ten Year Bond | 80,450,000 | JPY | 0.1000 | 6/20/2026 | 778,201 | ||||||||||
| Japan Government Thirty Year Bond | 106,800,000 | JPY | 2.5000 | 6/20/2036 | 1,425,273 | ||||||||||
| Japan Government Twenty Year Bond | 185,250,000 | JPY | 1.9000 | 9/20/2023 | 2,017,156 | ||||||||||
| Japan Government Twenty Year Bond | 133,800,000 | JPY | 2.1000 | 12/20/2027 | 1,572,668 | ||||||||||
| Kingdom of Belgium Government | 150,000 | EUR | 4.2500 | 9/28/2022 | 208,214 | ||||||||||
| Kingdom of Belgium Government - 144A | 100,000 | EUR | 5.0000 | 3/28/2035 | 187,021 | ||||||||||
| Korea Treasury Bond | 674,150,000 | KRW | 3.0000 | 9/10/2024 | 647,509 | ||||||||||
| Malaysia Government Bond | 2,700,000 | MYR | 3.8000 | 8/17/2023 | 654,015 | ||||||||||
| Malaysia Government Bond | 400,000 | MYR | 3.9000 | 11/3/2026 | 97,669 | ||||||||||
| Mexican Bonos | 2,450,000 | MXN | 5.7500 | 3/5/2026 | 125,874 | ||||||||||
| Province of British Columbia Canada | 100,000 | CAD | 4.7000 | 6/18/2037 | 97,758 | ||||||||||
| Province of British Columbia Canada | 100,000 | CAD | 4.9500 | 6/18/2040 | 102,796 | ||||||||||
| Province of Ontario Canada | 550,000 | CAD | 2.4000 | 6/2/2026 | 422,692 | ||||||||||
| Republic of Austria Government Bond - 144A | 200,000 | EUR | 1.2000 | 10/20/2025 | 239,108 | ||||||||||
| Republic of Poland Government Bond | 300,000 | PLN | 5.7500 | 9/23/2022 | 88,677 | ||||||||||
| Romanian Government International Bond | 100,000 | EUR | 2.8750 | 10/28/2024 | 119,995 | ||||||||||
| Russian Foreign Bond - Eurobond | 200,000 | EUR | 3.6250 | 9/16/2020 | 242,746 | ||||||||||
| Spain Government Bond - 144A | 80,000 | EUR | 5.4000 | 1/31/2023 | 114,393 | ||||||||||
| Spain Government Bond - 144A | 200,000 | EUR | 4.4000 | 10/31/2023 | 275,668 | ||||||||||
| Spain Government Bond - 144A | 250,000 | EUR | 3.8000 | 4/30/2024 | 333,859 | ||||||||||
| Spain Government Bond - 144A | 50,000 | EUR | 1.9500 | 4/30/2026 | 58,773 | ||||||||||
| Spain Government Bond - 144A | 120,000 | EUR | 4.2000 | 1/31/2037 | 180,682 | ||||||||||
| Sweden Government Bond | 3,600,000 | SEK | 4.2500 | 3/12/2019 | 446,653 | ||||||||||
| Switzerland Government Bond | 400,000 | CHF | 4.0000 | 2/11/2023 | 524,848 | ||||||||||
| United Kingdom Gilt | 100,000 | GBP | 4.2500 | 6/7/2032 | 166,544 | ||||||||||
| United Kingdom Gilt | 235,000 | GBP | 4.5000 | 12/7/2042 | 444,143 | ||||||||||
| United Kingdom Gilt | 50,000 | GBP | 4.2500 | 12/7/2055 | 105,038 | ||||||||||
| United Kingdom Gilt | 20,000 | GBP | 4.0000 | 1/22/2060 | 41,667 | ||||||||||
| TOTAL FOREIGN GOVERNMENT BONDS (Cost - $15,504,445) | 15,642,087 | ||||||||||||||
See accompanying notes to financial statements.
42
| SCHEDULE OF INVESTMENTS |
| Dunham International Opportunity Bond Fund (Continued) |
| October 31, 2016 |
| Principal | Interest | ||||||||||||||
| Security | Amount | Rate% | Maturity Date | Value | |||||||||||
| MORTGAGE BACKED SECURITIES - 0.8% | |||||||||||||||
| Sunrise Srl 2015-3 A1 | 100,000 | EUR | 0.5290 | + | 5/27/2035 | $ | 110,210 | ||||||||
| Taurus 2013 GMF1 PLC | 95,244 | EUR | 0.7510 | + | 5/21/2024 | 104,855 | |||||||||
| TOTAL MORTGAGE BACKED SECURITIES (Cost - $219,458) | 215,065 | ||||||||||||||
| WHOLE LOAN COLLATERAL - 0.9% | |||||||||||||||
| Bankinter 10 FTA | 119,623 | EUR | 2.7300 | + | 6/21/2043 | 129,170 | |||||||||
| Fondo de Titulizacion de Activos Santander Hipotecario 2 | 54,805 | EUR | 4.2500 | + | 1/18/2049 | 59,142 | |||||||||
| Silverstone Master Issuer PLC - 144A | 50,000 | GBP | 0.7718 | + | 1/21/2070 | 61,147 | |||||||||
| TOTAL WHOLE LOAN COLLATERAL (Cost - $260,942) | 249,459 | ||||||||||||||
| Shares | |||||||||||||||
| SHORT-TERM INVESTMENTS - 0.5% | |||||||||||||||
| MONEY MARKET FUND - 0.5% | |||||||||||||||
| Fidelity Institutional Money Market | |||||||||||||||
| Funds - Government Portfolio (Cost - $144,356) | 144,356 | 0.2800 | + | $ | 144,356 | ||||||||||
| TOTAL INVESTMENTS - 96.6% (Cost - $27,637,163) | $ | 27,074,724 | |||||||||||||
| OTHER ASSETS LESS LIABILITIES - 3.4% | 974,883 | ||||||||||||||
| NET ASSETS - 100.0% | $ | 28,049,607 | |||||||||||||
| CAD - Canadian Dollar | EUR - Euro | KRW - South Korean Won | PLN - Polish Zloty |
| CHF - Swiss Franc | GBP - United Kingdom Pound | MXN - Mexican Peso | SEK - Swedish Krona |
| DKK - Danish Krone | JPY - Japanese Yen | MYR - Malaysian Ringgit | USD - US Dollar |
| + | Variable rate security. Interest rate is as of October 31, 2016. |
144A - Security exempt from registration under Rule 144A of the Securities Act of 1933. These securities may be sold in transactions exempt from registration, normally to qualified institutional buyers.
| Unrealized | ||||||||
| Appreciation | ||||||||
| Futures Contracts | Contracts | (Depreciation) | ||||||
| FUTURES CONTRACTS PURCHASED * | ||||||||
| AUST 10Y BOND Future maturing December, 2016 | ||||||||
| (Underlying Face Amount at Value $403,676) | 4 | $ | (8,836 | ) | ||||
| EURO-BOND Future maturing December, 2016 | ||||||||
| (Underlying Face Amount at Value $533,312) | 3 | (4,839 | ) | |||||
| EURO BUXL 30Y BND Future maturing December, 2016 | ||||||||
| (Underlying Face Amount at Value $197,184) | 1 | (10,691 | ) | |||||
| EURO-SCHATZ Future maturing December, 2016 | ||||||||
| (Underlying Face Amount at Value $1,595,783) | 13 | (975 | ) | |||||
| Long Gilt Future maturing December, 2016 | ||||||||
| (Underlying Face Amount at Value $459,083) | 3 | (20,744 | ) | |||||
| NET UNREALIZED LOSS FROM FUTURES CONTRACTS PURCHASED | (46,085 | ) | ||||||
| FUTURES CONTRACTS SOLD * | ||||||||
| EURO-BOBL Future maturing December, 2016 | ||||||||
| (Underlying Face Amount at Value $2,587,011) | (18 | ) | 10,562 | |||||
| NET UNREALIZED LOSS FROM FUTURES CONTRACTS | $ | (35,523 | ) | |||||
| * | Face amounts are the underlying reference notional amounts to stock exchange indices and bonds upon which the fair value of the futures contracts traded by the Fund are based. While face amounts do not represent the current fair value and are not necessarily indicative of the future cash flows of the Fund’s futures contracts, the underlying price changes in relation to the variables specified by the face amounts affect the fair value of these derivative financial instruments. |
Portfolio Composition ** - (Unaudited)
| Japan | 24.1% | Belgium | 3.3% | |||
| Britain | 12.7% | Canada | 3.2% | |||
| France | 11.1% | Germany | 3.1% | |||
| Spain | 8.1% | Switzerland | 2.9% | |||
| Netherlands | 7.2% | Other Countries | 18.5% | |||
| Italy | 5.8% | Total | 100.00% |
| ** | Based on total value of investments as of October 31, 2016. |
Percentage may differ from Schedule of Investments which are based on Fund net assets.
See accompanying notes to financial statements.
43
Dunham Appreciation & Income Fund
Message from the Sub-Adviser (PENN Capital Management Company, Inc.)
Historically, less than one-third of the convertible securities in the Bank of America/Merrill Lynch All Convertibles Index are issued by large capitalization companies, leaving the majority more closely related to the movements in small capitalization and mid capitalization stocks. U.S. large cap stocks, as measured by the Russell 1000 Index, declined 1.7 percent after rising 13.8 percent across the previous two fiscal quarters. This brought the return for U.S. large cap stocks to 4.3 percent for the fiscal year. U.S. small cap stocks, as measured by the Russell 2000 Index, declined 2.0 percent after surging 18.7 percent across the previous two fiscal quarters. Across the fiscal year, U.S. small cap stocks were up 4.1 percent. During the most recent fiscal quarter, convertible securities fell 0.2 percent, which was less negative than both large cap stocks and small cap stocks during the same period. This decrease followed a 13.7 percent increase across the previous two fiscal quarters. Convertible securities returned 3.5 percent over the fiscal year.
Most convertible securities are considered to be “equity-sensitive,” meaning significant amounts of a convertible security’s price movements are related to the movements of the underlying common stock rather than the bond itself. However, the bond component may still play a meaningful role in the pricing of the convertible security. Bonds in general, as measured by the Barclays Aggregate Bond Index, declined 0.9 percent during the fiscal quarter, after rising 4.5 percent across the previous two fiscal quarters. Bond performance over the fiscal year was 4.4 percent.
The Sub-Adviser has consistently focused on small and mid capitalization companies, and primarily on convertible securities that were considered to be trading based upon both the value of their fixed income features (i.e., coupon rate, default risk, etc.) and the price changes of the underlying common stock. This is in contrast to convertible securities that trade predominantly on either the underlying stock movements or on the underlying bond characteristics. The Sub-Adviser believes that by focusing on this area of the convertible securities spectrum, it can reduce the volatility experienced from the common stocks while benefitting from the support offered by the bond features.
During the fiscal year, results were mixed across and within sectors. For example, some of the best performers within the Fund were within the technology and health care sectors, but some of the worst performers were in those same sectors. The best performing sector in the benchmark index during the fiscal year was information technology, and it was the second-best performing sector during the most recent fiscal quarter. Within the technology sector, one of the best performing securities in the previous fiscal quarter was the convertible bond of internet radio company Pandora Media Inc. (698354AA5) (holding percentage*: 2.79 percent). During the previous fiscal quarter, the common stock of Pandora Media Inc. (P) (holding percentage*: not held) surged 37.0 percent and the convertible bond rose 16.7 percent. However, in the most recent fiscal quarter, the common stock of Pandora Media Inc. declined 16.7 percent and the convertible bond fell with it, but to a far lesser extent, down 7.2 percent. This brought the overall performance of the Pandora Media Inc.’s common stock to 14.1 percent across the most recent two fiscal quarters, while the convertible bond was up 8.3 percent across the same six-month time period. When observed since its issuance in December 2015, Pandora Media Inc.’s common stock decreased 7.5 percent, while the convertible only fell slightly, down 1.3 percent.
Healthcare continued to be a significant sector weighting in the Fund, but was one of the worst performing sectors during the fiscal year. Within the healthcare sector, Depomed, Inc. (249908AA2) (holding percentage*: 4.69 percent), a developer of oral drug delivery technologies, and Allergan PLC (EP0481507), (holding percentage*: 2.38 percent), a global pharmaceutical developer and distributor, produced performance at opposite ends of the spectrum. The Allergan PLC convertible preferred stock decreased 12.7 percent after increasing 16.8 percent in the previous fiscal quarter. This most recent fiscal quarter’s decline was less than the common stock’s decline of 17.4 percent in the same fiscal quarter. Conversely, the Depomed, Inc. convertible bond rose 11.7 percent during the fiscal quarter, after rising 10.4 percent in the previous fiscal quarter. This increase in the Depomed, Inc. convertible bond in the most recent fiscal quarter coincided with a 17.9 percent increase in the company’s common stock. Allergan’s common stock fell 32.3 percent, while Depomed’s common stock surged 27.8 percent over the fiscal year. However, their convertible securities decreased 21.3 percent and rose 19.5 percent, respectively over the same time period.
The Sub-Adviser remains optimistic that its fairly concentrated and selective approach to the convertible securities market will identify attractive risk-adjusted opportunities for the Fund. The large dispersion across sector performance, as well as significant dislocations of convertible bonds within the sectors has provided opportunities for the Sub-Adviser to consider within its disciplined selection process.
| * | Holdings percentage(s) as of 10/31/2016. |
Growth of $100,000 Investment
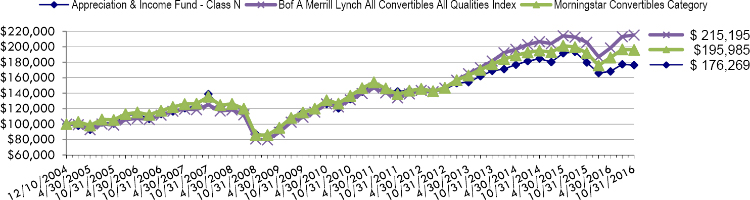
Total Returns as of October 31, 2016
| Annualized | Annualized | Annualized | Annualized Since | ||||||||
| One Year | Three Years | Five Years | Ten Years | Inception (12/10/04) | |||||||
| Class N | (1.92)% | 1.45% | 4.39% | 4.54% | 4.88% | ||||||
| Class C | (2.95)% | 0.44% | 3.34% | 3.50% | 3.85% | ||||||
| Class A with load of 5.75% | (7.79)% | 0.75% | 2.90% | N/A | 3.53%* | ||||||
| Class A without load | (2.19)% | 1.21% | 4.13% | N/A | 4.15%* | ||||||
| Bof A Merrill Lynch All Convertibles All Qualities Index | 4.51% | 5.81% | 9.92% | 7.00% | 6.65% | ||||||
| Morningstar Convertibles Category | 2.10% | 3.36% | 7.18% | 5.26% | 5.82% |
| * | Class A commenced operations on January 3, 2007. |
The Bof A Merrill Lynch All Convertibles All Qualities Index is a widely used index that measures convertible securities’ performance. It measures the performance of U.S. dollar-denominated convertible securities not currently in bankruptcy with a total market value greater than $50 million at issuance.
The Morningstar Convertibles Category is generally representative of convertible bond portfolios that are designed to offer some of the capital-appreciation of stock portfolios, while also supplying some of the safety and yield of bond portfolios.
As disclosed in the Trust’s latest registration statement as supplemented,, the Fund’s total annual operating expenses, including the cost of underlying funds, are 1.29% for Class N, 2.29% for Class C and 1.29% for Class A. Class A shares are subject to a sales load of 5.75% and a deferred sales charge of up to 0.75%. The performance data quoted here represents past performance, which is not indicative of future results. Current performance may be lower or higher than the performance data quoted. The investment return and NAV will fluctuate, so that an investor’s shares, when redeemed, may be worth more or less than their original cost. Total returns are calculated assuming reinvestment of all dividends and capital gains distributions, if any. The returns do not reflect the deductions of taxes a shareholder would pay on the redemption of fund shares or fund distributions. For performance information current to the most recent month-end, please call 1-800-442-4358 or visit our website www.dunham.com.
44
| SCHEDULE OF INVESTMENTS |
| Dunham Appreciation & Income Fund |
| October 31, 2016 |
| Security | Shares | Value | ||||||||||||||
| COMMON STOCK - 0.0% | ||||||||||||||||
| Southwestern Energy Co * | 10 | $ | 108 | |||||||||||||
| TOTAL COMMON STOCK (Cost - $136) | 108 | |||||||||||||||
| Principal | Interest | Maturity | ||||||||||||||
| Security | Amount | Rate | Date | Value | ||||||||||||
| CONVERTIBLE BONDS - 79.2% | ||||||||||||||||
| DIVERSIFIED FINANCIAL SERVICES - 3.6% | ||||||||||||||||
| PRA Group, Inc. ^ | $ | 960,000 | 3.0000 | % | 8/1/2020 | 865,800 | ||||||||||
| HEALTHCARE-PRODUCTS - 10.8% | ||||||||||||||||
| Hologic, Inc. | 565,000 | 2.0000 | 3/1/2042 | 722,494 | ||||||||||||
| NuVasive, Inc. - 144A | 585,000 | 2.2500 | 3/15/2021 | 696,150 | ||||||||||||
| Wright Medical Group, Inc. | 1,115,000 | 2.0000 | 2/15/2020 | 1,146,359 | ||||||||||||
| 2,565,003 | ||||||||||||||||
| HEALTHCARE-SERVICES - 4.0% | ||||||||||||||||
| Molina Healthcare, Inc. | 820,000 | 1.6250 | 8/15/2044 | 953,250 | ||||||||||||
| INSURANCE - 4.7% | ||||||||||||||||
| AmTrust Financial Services, Inc. | 745,000 | 2.7500 | 12/15/2044 | 641,631 | ||||||||||||
| Fidelity National Financial, Inc. | 235,000 | 4.2500 | 8/15/2018 | 470,294 | ||||||||||||
| 1,111,925 | ||||||||||||||||
| INTERNET - 4.9% | ||||||||||||||||
| FireEye, Inc. | 558,000 | 1.6250 | 6/1/2035 | 503,944 | ||||||||||||
| Pandora Media, Inc. - 144A | 670,000 | 1.7500 | 12/1/2020 | 661,206 | ||||||||||||
| 1,165,150 | ||||||||||||||||
| MEDIA - 3.1% | ||||||||||||||||
| DISH Network Corp. - 144A | 630,000 | 3.3750 | 8/15/2026 | 724,894 | ||||||||||||
| OIL & GAS - 8.8% | ||||||||||||||||
| Chesapeake Energy Corp. - 144A | 360,000 | 5.5000 | 9/15/2026 | 339,750 | ||||||||||||
| Oasis Petroleum, Inc. | 635,000 | 2.6250 | 9/15/2023 | 709,216 | ||||||||||||
| PDC Energy, Inc. | 590,000 | 1.1250 | 9/15/2021 | 602,536 | ||||||||||||
| SM Energy Co. | 400,000 | 1.5000 | 7/1/2021 | 447,500 | ||||||||||||
| 2,099,002 | ||||||||||||||||
| OIL & GAS SERVICES - 2.4% | ||||||||||||||||
| Helix Energy Solutions Group, Inc. ^ | 565,000 | 3.2500 | 3/15/2032 | 560,409 | ||||||||||||
| PHARMACEUTICALS - 12.0% | ||||||||||||||||
| Depomed, Inc. | 837,000 | 2.5000 | 9/1/2021 | 1,112,687 | ||||||||||||
| Impax Laboratories, Inc. | 1,020,000 | 2.0000 | 6/15/2022 | 889,950 | ||||||||||||
| Jazz Investments I Ltd. ^ | 850,000 | 1.8750 | 8/15/2021 | 846,813 | ||||||||||||
| 2,849,450 | ||||||||||||||||
| SEMICONDUCTORS - 10.6% | ||||||||||||||||
| Micron Technology, Inc. ^ | 690,000 | 3.0000 | 11/15/2043 | 611,944 | ||||||||||||
| ON Semiconductor Corp. ^ | 1,205,000 | 1.0000 | 12/1/2020 | 1,208,766 | ||||||||||||
| Rambus, Inc. | 609,000 | 1.1250 | 8/15/2018 | 706,440 | ||||||||||||
| 2,527,150 | ||||||||||||||||
See accompanying notes to financial statements.
45
| SCHEDULE OF INVESTMENTS |
| Dunham Appreciation & Income Fund (Continued) |
| October 31, 2016 |
| Principal | Interest | Maturity | ||||||||||||||
| Security | Amount | Rate | Date | Value | ||||||||||||
| SOFTWARE - 6.1% | ||||||||||||||||
| Medidata Solutions, Inc. | $ | 760,000 | 1.0000 | % | 8/1/2018 | $ | 837,900 | |||||||||
| ServiceNow, Inc. | 470,000 | 0.0000 | 11/1/2018 | 615,406 | ||||||||||||
| 1,453,306 | ||||||||||||||||
| TELECOMMUNICATIONS - 3.3% | ||||||||||||||||
| Gogo, Inc. | 1,010,000 | 3.7500 | 3/1/2020 | 773,281 | ||||||||||||
| TRANSPORTATION - 4.9% | ||||||||||||||||
| Echo Global Logistics, Inc. ^ | 850,000 | 2.5000 | 5/1/2020 | 780,937 | ||||||||||||
| Hornbeck Offshore Services, Inc. | 610,000 | 1.5000 | 9/1/2019 | 386,206 | ||||||||||||
| 1,167,143 | ||||||||||||||||
| TOTAL CONVERTIBLE BONDS (Cost - $19,105,807) | 18,815,763 | |||||||||||||||
| Dividend | ||||||||||||||||
| Shares | Rate | |||||||||||||||
| PREFERRED STOCK - 11.0% | ||||||||||||||||
| OIL & GAS - 3.6% | ||||||||||||||||
| Resolute Energy Corp. - 144A | 150 | 8.1250 | 162,225 | |||||||||||||
| Southwestern Energy Co. | 5,750 | 6.2500 | 144,152 | |||||||||||||
| WPX Energy, Inc. | 10,175 | 6.2500 | 557,692 | |||||||||||||
| 864,069 | ||||||||||||||||
| PHARMACEUTICALS - 2.4% | ||||||||||||||||
| Allergan PLC | 735 | 5.5000 | 563,837 | |||||||||||||
| REITS - 2.6% | ||||||||||||||||
| Crown Castle International Corp. | 5,750 | 4.5000 | 619,562 | |||||||||||||
| TELECOMUNICATIONS - 2.4% | ||||||||||||||||
| Frontier Communications Corp. | 6,825 | 11.1250 | 569,956 | |||||||||||||
| TOTAL PREFERRED STOCK (Cost - $2,943,781) | 2,617,424 | |||||||||||||||
| Interest | ||||||||||||||||
| Rate | ||||||||||||||||
| SHORT-TERM INVESTMENT - 9.6% | ||||||||||||||||
| MONEY MARKET FUND - 9.6% | ||||||||||||||||
| First American Government Obligations Fund | 2,284,184 | 0.24 | % + | 2,284,184 | ||||||||||||
| TOTAL SHORT-TERM INVESTMENT (Cost - $2,284,184) | ||||||||||||||||
| COLLATERAL FOR SECURITIES LOANED - 17.7% | ||||||||||||||||
| Mount Vernon Prime Portfolio (Cost - $4,189,895) | 4,189,895 | 0.67 | % + | 4,189,895 | ||||||||||||
| TOTAL INVESTMENTS - 117.5% (Cost - $28,523,803) | $ | 27,907,374 | ||||||||||||||
| LIABILITIES IN EXCESS OF OTHER ASSETS - (17.5)% | (4,159,295 | ) | ||||||||||||||
| TOTAL NET ASSETS - 100.0% | $ | 23,748,079 | ||||||||||||||
| ^ | All or a portion of these securities are on loan. Total loaned securities had a value of $4,096,292 at October 31, 2016. Securities loaned with a value of $82,758 have been sold and are pending settlement. |
| * | Non-income producing security. |
| + | Variable rate security. Interest rate is as of October 31, 2016. |
REITS - Real Estate Investment Trusts.
144A- Security exempt from registration under Rule 144A of the Securities Act of 1933. These securities may be sold in transactions exempt from registration, normally to qualified institutional buyers.
| Portfolio Composition * - (Unaudited) | ||||
| Convertible Bonds | 67.4 | % | ||
| Collateral For Securities Loaned | 15.0 | % | ||
| Preferred Stock | 9.4 | % | ||
| Common Stock | 0.0 | % | ||
| Short-Term Investment | 8.2 | % | ||
| Total | 100.0 | % | ||
| * | Based on total value of investments as of October 31, 2016. |
Percentage may differ from Schedule of Investments which are based on Fund net assets.
See accompanying notes to financial statements.
46
Dunham Alternative Dividend Fund
Message from the Sub-Adviser (Sungarden Investment Research)
With the U.S. Presidential election concluded, many changes have been firmly set into motion. It is the Sub-Adviser’s belief that the bond bull market of over 35 years appears to be finally ending, with interest rates poised to move higher across many parts of the fixed income spectrum, from Treasuries to Corporates, Municipals to High Yield. Meanwhile, the stock market is trying to predict winners and losers from expected future isolationist policies in the U.S. and other parts of the world. The Sub-Adviser feels that this noticeably spells out more volatility, as market participants sort out their suspicions and later, the reality of what is to come. Conservative strategies, as measured by the Dow Jones Moderately Conservative Portfolio Index, gained 1.6 percent over the two-month period ended October 31, 2016.
The Fund is an income-oriented portfolio, driven primarily by equity dividends but without “reaching” for yield. A secondary goal of the strategy is to exhibit lower volatility than the broad stock market. The Sub-Adviser’s investment process consists of investing in large capitalization common stocks and American Depositary Receipts (ADRs) that offer above-average dividend yields, while hedging the portfolio using securities such as inverse exchange traded funds (ETFs), which aim to deliver performance opposite a major stock index (e.g., S&P 500); put options on indexes and ETFs; and cash.
The Sub-Adviser notes that the Fund was negatively impacted by the return of the REIT sector and by price weakness in two of the fund’s core telecommunications holdings, Verizon Communications, Inc. (VZ) (holding percentage*: 3.43 percent) and AT&T, Inc. (T) (holding percentage*: 3.53 percent), which declined 7.45% and 9.61% respectively. REITs and Telecoms are a core holding for many dividend-oriented managers, and while the Fund’s allocation to these sectors was moderate during the period, they did detract from performance.
During a two-month period in which many core dividend stocks did not help performance, the Fund’s ability to identify and invest in stocks outside of those sectors (e.g. “non-traditional” dividend stocks) contributed strongly to the upside. Top contributors during the quarter included a pair of technology stocks, Qualcomm, Inc. (Q) (holding percentage*: 3.87) percent and Western Digital (WDC) (holding percentage*: 2.66 percent); two casino gaming businesses, Las Vegas Sands (LVS) (holding percentage*: 2.83 percent and International Game Technology PLC (IGT) (holding percentage*: 0.05 percent); and a theme park operator, Six Flags Entertainment (SIX) (holding percentage*: 2.07 percent).
The Sub-Adviser spent the first two months of its existence gradually building positions in its “core” holdings, while using most of the remaining Fund assets to position for the environment described above. Core holdings are the stocks that the Fund expects to hold for the longest period of time, hopefully for years. They are businesses the Sub-Adviser believes have sustainable competitive advantages and whose financial condition will support their above-average dividend payments well into the future.
In addition to these core holdings, the Sub-Adviser took advantage of a low-volatility market environment to purchase positions in a variety of put and call options. Most of these are “defensive” in nature, such as the purchase of put options, in which the Fund spends a modest amount of capital to try to protect the portfolio from a large decline in the broad equity market, one of its component sectors, or individual stocks. A key theme in this early positioning is the focus the Sub-Adviser has taken on attempting to benefit from a rise in interest rates. There are many ways to accomplish this, including put purchases on ETFs representing the various segments of the bond market, as well as equity sectors that are considered interest rate sensitive. These include REITs, Utilities, Telecommunications and Energy stocks.
The Sub-Adviser has also made modest use of call options to minimize capital outlay to pursue profits in certain market segments or individual companies. This is a strategy that is employed when the Sub-Adviser believes that reward potential in a specific security is high, but risk is as well. The purchase of a call or put option limits loss to the amount of money invested in that option, which is a small fraction of the value of securities that option controls. This is one of many risk-management measures the Sub-Adviser employs.
The bottom-line for investors in the Fund is that the Sub-Adviser believes that current market conditions play right into the hands of flexible, market-agnostic investors. Furthermore, they believe that 2017 will usher in an era in which long-short, dividend-focused investing will be increasingly recognized for its value.
| * | Holdings percentage(s) as of 10/31/2016. |
47
| SCHEDULE OF INVESTMENTS |
| Dunham Alternative Dividend Fund |
| October 31, 2016 |
| Security | Shares | Value | ||||||||||
| COMMON STOCK - 73.3% | ||||||||||||
| AUTO MANUFACTURERS - 1.8% | ||||||||||||
| General Motors Co. | 14,100 | $ | 445,560 | |||||||||
| CHEMICALS - 6.5% | ||||||||||||
| Agrium, Inc. | 10,100 | 927,382 | ||||||||||
| CF Industries Holdings, Inc. | 26,800 | 643,468 | ||||||||||
| 1,570,850 | ||||||||||||
| COMMERCIAL SERVICES - 1.6% | ||||||||||||
| Macquarie Infrastructure Corp. | 4,700 | 384,507 | ||||||||||
| COMPUTERS - 4.9% | ||||||||||||
| Apple, Inc. | 4,900 | 556,346 | ||||||||||
| Western Digital Corp. | 10,900 | 636,996 | ||||||||||
| 1,193,342 | ||||||||||||
| ELECTRIC - 3.6% | ||||||||||||
| Entergy Corp. | 12,000 | 884,160 | ||||||||||
| ELECTRICAL COMPONENTS & EQUIPMENT - 3.8% | ||||||||||||
| Emerson Electric Co. | 18,300 | 927,444 | ||||||||||
| ELECTRONICS - 1.7% | ||||||||||||
| Garmin Ltd | 8,800 | 425,568 | ||||||||||
| ENTERTAINMENT - 5.6% | ||||||||||||
| Regal Entertainment Group | 40,200 | 864,702 | ||||||||||
| Six Flags Entertainment Corp. | 8,900 | 495,285 | ||||||||||
| 1,359,987 | ||||||||||||
| LEISURE - 1.6% | ||||||||||||
| Royal Caribbean Cruises Ltd. | 5,000 | 384,350 | ||||||||||
| LODGING - 2.8% | ||||||||||||
| Las Vegas Sands Corp. | 11,700 | 677,196 | ||||||||||
| MINING - 1.7% | ||||||||||||
| BHP Billiton Ltd. - ADR | 12,000 | 420,240 | ||||||||||
| MISCELLANEOUS MANUFACTURING - 3.7% | ||||||||||||
| General Electric Co. | 30,700 | 893,370 | ||||||||||
| OIL & GAS - 6.1% | ||||||||||||
| BP PLC - ADR | 11,600 | 412,380 | ||||||||||
| Royal Dutch Shell PLC - ADR | 8,000 | 418,480 | ||||||||||
| Phillips 66 | 2,000 | 162,300 | ||||||||||
| Valero Energy Corp. | 8,300 | 491,692 | ||||||||||
| 1,484,852 | ||||||||||||
| PHARMACEUTICALS - 3.9% | ||||||||||||
| GlaxoSmithKline PLC | 23,700 | 948,237 | ||||||||||
| REITS - 7.6% | ||||||||||||
| EPR Properties | 6,000 | 436,320 | ||||||||||
| Host Hotels & Resorts, Inc. | 58,800 | 910,224 | ||||||||||
| Omega Healthcare Investors, Inc. | 15,500 | 493,365 | ||||||||||
| 1,839,909 | ||||||||||||
| SAVINGS & LOANS - 3.9% | ||||||||||||
| People’s United Financial, Inc. | 59,000 | 958,160 | ||||||||||
See accompanying notes to financial statements.
48
| SCHEDULE OF INVESTMENTS |
| Dunham Alternative Dividend Fund (Continued) |
| October 31, 2016 |
| Security | Shares | Value | ||||||||||
| SEMICONDUCTORS - 3.8% | ||||||||||||
| QUALCOMM, Inc. | 13,500 | $ | 927,720 | |||||||||
| TELECOMMUNICATIONS - 8.7% | ||||||||||||
| AT&T, Inc. | 23,000 | 846,170 | ||||||||||
| CenturyLink, Inc. | 17,000 | 451,860 | ||||||||||
| Verizon Communications, Inc. | 17,100 | 822,510 | ||||||||||
| 2,120,540 | ||||||||||||
| TOTAL COMMON STOCK (Cost - $18,119,008) | 17,845,992 | |||||||||||
| EXCHANGE TRADED FUNDS - 8.4% | ||||||||||||
| EQUITY FUNDS - 8.4% | ||||||||||||
| Global SuperDividend US ETF | 39,232 | 941,568 | ||||||||||
| JPMorgan Alerian MLP Index ETN | 29,400 | 886,116 | ||||||||||
| VanEck Vectors Steel ETF | 7,000 | 232,680 | ||||||||||
| TOTAL EQUITY FUNDS | 2,060,364 | |||||||||||
| TOTAL EXCHANGE TRADED FUNDS (Cost - $2,109,829) | 2,060,364 | |||||||||||
| Contracts** | Value | |||||||||||
| PURCHASED CALL OPTIONS * - 0.2% | ||||||||||||
| American Tower Corp., Expiration November 2016, Exercise Price $116 | 35 | 9,275 | ||||||||||
| Bristol-Myers Squibb Co., Expiration January 2017, Exercise Price $52.50 | 40 | 6,960 | ||||||||||
| Bristol-Myers Squibb Co., Expiration March 2017, Exercise Price $52.50 | 40 | 11,000 | ||||||||||
| Bristol-Myers Squibb Co., Expiration January 2017, Exercise Price $55 | 40 | 3,800 | ||||||||||
| Bristol-Myers Squibb Co., Expiration March 2017, Exercise Price $55 | 40 | 7,120 | ||||||||||
| iShares Gold Trust, Expiration January 2017, Exercise Price $30 | 40 | 3,600 | ||||||||||
| iShares Gold Trust, Expiration April 2017, Exercise Price $30 | 40 | 6,300 | ||||||||||
| Johnson Controls International, Expiration January 2017, Exercise Price $48 | 50 | 2,900 | ||||||||||
| Medifirst Solutions, Inc., Expiration February 2017, Exercise Price $62.50 | 75 | 10,800 | ||||||||||
| TOTAL PURCHASED CALL OPTIONS (Cost - $76,896) | 61,755 | |||||||||||
| Contracts** | Value | |||||||||||
| PURCHASED PUT OPTIONS * - 2.8% | ||||||||||||
| iShares Dow Jones US Real Estate, Expiration January 2017, Exercise Price $75 | 35 | 9,240 | ||||||||||
| iShares Dow Jones US Real Estate, Expiration March 2017, Exercise Price $75 | 60 | 18,600 | ||||||||||
| iShares Dow Jones US Real Estate, Expiration January 2017, Exercise Price $77 | 35 | 12,040 | ||||||||||
| iShares Dow Jones US Real Estate, Expiration January 2017, Exercise Price $81 | 36 | 22,500 | ||||||||||
| iShares IBoxx Invest Grade Corp Bond Fund, Expiration March 2017, Exercise Price $120 | 75 | 15,563 | ||||||||||
| iShares IBoxx Invest Grade Corp Bond Fund, Expiration December 2016, Exercise Price $121 | 30 | 3,975 | ||||||||||
| S&P 500 Index, Expiration December 2017, Exercise Price $1,900 | 11 | 99,275 | ||||||||||
| S&P 500 Index, Expiration December 2016, Exercise Price $2,100 | 15 | 57,375 | ||||||||||
| S&P 500 Index, Expiration January 2017, Exercise Price $2,100 | 18 | 92,790 | ||||||||||
| S&P 500 Index, Expiration March 2017, Exercise Price $2,100 | 4 | 29,800 | ||||||||||
| S&P 500 Index, Expiration November 2016, Exercise Price $2,150 | 7 | 30,555 | ||||||||||
| S&P 500 Index, Expiration June 2017, Exercise Price $2,150 | 7 | 73,395 | ||||||||||
| S&P 500 Index, Expiration January 2017, Exercise Price $2,175 | 4 | 33,200 | ||||||||||
| S&P 500 Index, Expiration March 2017, Exercise Price $2,175 | 10 | 105,450 | ||||||||||
| AT&T, Inc., Expiration December 2016, Exercise Price $38 | 30 | 4,560 | ||||||||||
| AT&T, Inc., Expiration January 2017, Exercise Price $38 | 30 | 6,600 | ||||||||||
| iShares Barclays 20+ Year Treasury Bond Fund, Expiration March 2017, Exercise Price $130 | 75 | 32,700 | ||||||||||
| iShares Barclays 20+ Year Treasury Bond Fund, Expiration January 2017, Exercise Price $135 | 7 | 4,165 | ||||||||||
| Verizon Communications, Inc., Expiration January 2017, Exercise Price $49 | 25 | 5,475 | ||||||||||
| Verizon Communications, Inc., Expiration December 2016, Exercise Price $50 | 25 | 5,475 | ||||||||||
| SPDR Utilities ETF, Expiration January 2017, Exercise Price $47 | 50 | 4,050 | ||||||||||
| SPDR Utilities ETF, Expiration January 2017, Exercise Price $49 | 60 | 8,880 | ||||||||||
| TOTAL PURCHASED PUT OPTIONS (Cost - $705,858) | 675,663 | |||||||||||
| TOTAL OPTIONS PURCHASED (Cost - $782,754) | 737,418 | |||||||||||
See accompanying notes to financial statements.
49
| SCHEDULE OF INVESTMENTS | |||||
| Dunham Alternative Dividend Fund (Continued) | |||||
| October 31, 2016 | |||||
| Interest | ||||||||||||
| Security | Shares | Rate | Value | |||||||||
| SHORT-TERM INVESTMENT - 13.7% | ||||||||||||
| MONEY MARKET FUND - 13.7% | ||||||||||||
| STIT-Treasury Portfolio | 3,326,409 | 0.23%+ | $ | 3,326,409 | ||||||||
| TOTAL SHORT-TERM INVESTMENT (Cost - $3,326,409) | ||||||||||||
| TOTAL INVESTMENTS - 98.4% (Cost - $24,338,000) | $ | 23,970,183 | ||||||||||
| OTHER ASSETS LESS LIABILITIES - 1.6% | 381,354 | |||||||||||
| NET ASSETS - 100.0% | $ | 24,351,537 | ||||||||||
| * | Non-Income producing security. |
| ** | Each Purchased Put Option and Call Option contract allows the Fund to sell/buy 100 shares of the underlying security at the exercise price. |
| + | Variable rate security. Interest rate is as of October 31, 2016. |
ADR- American Depositary Receipt.
PLC - Public Limited Company
REITS - Real Estate Investment Trusts
ETF - Exchange Traded Fund
ETN - Exchange Traded Notes
| Portfolio Composition * - (Unaudited) | ||||||||||
| Consumer, Cyclical | 12.0 | % | Basic Materials | 8.3 | % | |||||
| Financial | 11.7 | % | Energy | 6.2 | % | |||||
| Industrial | 9.4 | % | Consumer, Non-cyclical | 5.6 | % | |||||
| Communications | 8.8 | % | Utilities | 3.7 | % | |||||
| Technology | 8.8 | % | Purchased Options | 3.1 | % | |||||
| Exchange Traded Funds | 8.6 | % | Short-Term Investment | 13.8 | % | |||||
| Total | 100.0 | % | ||||||||
| * | Based on total value of investments as of October 31, 2016. |
Percentage may differ from Schedule of Investments which is based on Fund net assets.
See accompanying notes to financial statements.
50
| Dunham Large Cap Value Fund |
| Message from the Sub-Adviser (Rothschild Asset Management, Inc.) |
After two consecutive fiscal quarters of significant positive returns, large cap value stocks, as measured by the Russell 1000 Value Index, slumped 1.0 percent in the most recent fiscal quarter, to end the fiscal year up 6.3 percent. Many themes that prevailed earlier in the fiscal year appeared to reverse, while some persisted. This was most noticeable in the sector performance, as energy was one of the few positive performing sectors in the most recent fiscal quarter, after lagging most other sectors in the previous fiscal quarter. Energy prices and concerns were consistently making headlines, and the Fed’s view on “when” to raise interest rates led to sizeable moves in valuations for both fixed income securities as well as dividend-paying stocks. The latter included not only the financial services sector, but also impacted dividend-paying stocks in the utilities and telecommunications sectors.
Energy was the second largest sector in the large value space, but was also one of the worst performing sectors during the fiscal year. The Sub-Adviser reduced its relative underweight to the sector towards the end of the fiscal year, as the diverging performance of the sector produced some opportunities. The Fund continued to hold energy-related stocks such as ConocoPhillips (COP) (holding percentage*: 2.20 percent), Exxon Mobil Corp. (XOM) (holding percentage*: 4.33 percent), and EOG Resources Inc. (EOG) (holding percentage*: 2.18 percent). All three of these companies are engaged in the exploration, development, production and marketing of crude oil and natural gas. After COP declined 13.6 percent in the previous fiscal quarter, it responded as one of the strongest performers in the most recent fiscal quarter, increasing 7.1 percent. This most recent fiscal quarter’s increase was not enough to bring its performance for the fiscal year into positive territory, as it ended the 12-month period down 16.5 percent. EOG also experienced a significant increase during the most recent fiscal quarter, increasing 10.9 percent, which was enough to push the stock’s performance into the black for the fiscal year, ending up 6.2 percent. Conversely, XOM declined 5.5 percent during the most recent fiscal quarter, but its strong performance earlier in the fiscal year was enough to offset the poor recent performance and XOM finished the most recent 12-month period up 4.3 percent.
For most of the fiscal year, the utilities sector’s fluctuations coincided with speculation on the timing of interest rates increases. The Sub-Adviser maintained the underweight to the sector that it had established in the first half of the fiscal year. Many utilities stocks faced headwinds as interest rates precipitously rose from the recent lows achieved in July. The Fund continued to hold Edison International (EIX) (holding percentage*: 1.70 percent), a global electrical power developer and operator. During the most recent fiscal quarter, EIX fell 4.4 percent, after surging 21.2 percent in the previous two fiscal quarters. The most recent fiscal quarter’s decline brought EIX’s performance for the fiscal year to 24.8 percent. The Sub-Adviser continued to favor media and telecommunications stocks, maintaining a substantial overweight to the sector. Within the telecommunications sector, AT&T Inc (T) (holding percentage*: 3.21 percent), plummeted 13.9 percent. This most recent fiscal quarter’s decline followed a massive increase of 34.0 percent across the previous three fiscal quarters, resulting in a 15.4 percent return for the fiscal year. Within the media industry, CBS Corp (CBS) (holding percentage*: 1.15 percent) offset its previous fiscal quarter’s decline of 6.3 percent when it increased 8.8 percent in the most recent fiscal quarter, ending the 12-month period up 23.2 percent.
The financial services sector shifted from being a top-performing sector to a bottom-performing sector throughout the fiscal year. It was the leading performer during the most recent fiscal quarter. The Sub-Adviser has generally sought to underweight the Fund’s exposure to the sector, as the low interest rate environment has provided a bleak backdrop for improvement in the short-term. Given that financial services is the largest sector within the large cap value space, the Sub-Adviser has focused on holdings such as The Allstate Corp. (ALL) (holding percentage*: 1.35 percent), a property and casualty insurer. During the fiscal year, ALL increased 11.9 percent, outperforming the sector as a whole. Other financial services holdings included the global credit card companies American Express Co. (AXP) (holding percentage*: 1.02 percent) and Discover Financial Services (DFS) (holding percentage*: 1.36 percent). During the fiscal year, AXP decreased 7.6 percent, while DFS rose 2.3 percent.
The Sub-Adviser continues to emphasize that it is cautious to avoid overreacting to short-term divergences in the markets, especially when speculation may result in significant price changes. The Sub-Adviser’s combination of fundamental analysis with quantitative tools that drive its stock selection to potentially identify stocks that it believes will prevail in a prolonged low-to-moderate growth environment.
| * | Holdings percentage(s) as of 10/31/2016. |
Growth of $100,000 Investment

Total Returns as of October 31, 2016
| Annualized | Annualized | Annualized | Annualized Since Inception | ||||||||
| One | Three | Five Years | Ten Years | (12/10/04) | |||||||
| Year | Years | ||||||||||
| Class N | 1.73% | 5.14% | 10.14% | 4.49% | 5.53% | ||||||
| Class C | 0.66% | 4.08% | 9.02% | 3.44% | 4.48% | ||||||
| Class A with load of 5.75% | (4.39)% | 2.78% | 8.56% | N/A | 3.26%* | ||||||
| Class A without load | 1.43% | 4.84% | 9.85% | N/A | 3.88%* | ||||||
| Russell 1000 Value Index | 6.37% | 7.59% | 13.31% | 5.35% | 6.70% | ||||||
| Morningstar Large Cap Value Category | 3.61% | 5.65% | 11.17% | 4.52% | 5.64% |
| * | Class A commenced operations on January 3, 2007. |
The Russell 1000 Value Index measures the performance of the 1,000 largest companies in the Russell 3000 Index with lower price-to-book ratios and lower forecasted growth values. Investors cannot invest directly in an index or benchmark.
The Morningstar Large Cap Value Category is generally representative of mutual funds that primarily invest in big (large capitalization) U.S. companies that are less expensive or growing more slowly than other large-cap stocks.
As disclosed in the Trust’s latest registration statement, the Fund’s total annual operating expenses, including underlying funds, are 1.25% for Class N, 2.25% for Class C and 1.50% for Class A. Class A shares are subject to a sales load of 5.75% and a deferred sales charge of up to 0.75%. The performance data quoted here represents past performance, which is not indicative of future results. Current performance may be lower or higher than the performance data quoted. The investment return and NAV will fluctuate, so that an investor’s shares, when redeemed, may be worth more or less than their original cost. Total returns are calculated assuming reinvestment of all dividends and capital gains distributions, if any. The returns do not reflect the deductions of taxes a shareholder would pay on the redemption of fund shares or fund distributions. For performance information current to the most recent month-end, please call 1-800-442-4358 or visit our website www.dunham.com.
51
| SCHEDULE OF INVESTMENTS |
| Dunham Large Cap Value Fund |
| October 31, 2016 |
| Security | Shares | Value | ||||||
| COMMON STOCK -99.3% | ||||||||
| AEROSPACE/DEFENSE - 2.8% | ||||||||
| Northrop Grumman Corp. | 4,915 | $ | 1,125,535 | |||||
| Raytheon Co. | 3,196 | 436,606 | ||||||
| 1,562,141 | ||||||||
| AIRLINES - 1.2% | ||||||||
| Delta Air Lines, Inc. | 16,759 | 700,023 | ||||||
| APPAREL - 0.8% | ||||||||
| Sketchers U.S.A., Inc. * ^ | 21,919 | 460,957 | ||||||
| AUTO PARTS & EQUIPMENT - 0.6% | ||||||||
| Lear Corp. | 2,809 | 344,889 | ||||||
| BANKS - 11.8% | ||||||||
| Bank of America Corp. | 95,214 | 1,571,031 | ||||||
| JPMorgan Chase & Co. ^ | 27,614 | 1,912,546 | ||||||
| M&T Bank Corp. ^ | 5,454 | 669,369 | ||||||
| State Street Corp. | 9,945 | 698,238 | ||||||
| SunTrust Banks, Inc. | 21,102 | 954,443 | ||||||
| Wells Fargo & Co. | 17,986 | 827,536 | ||||||
| 6,633,163 | ||||||||
| BEVERAGES - 1.7% | ||||||||
| PepsiCo, Inc. | 8,750 | 938,000 | ||||||
| BIOTECHNOLOGY - 1.7% | ||||||||
| Amgen, Inc. | 3,201 | 451,853 | ||||||
| Gilead Sciences, Inc. | 7,064 | 520,122 | ||||||
| 971,975 | ||||||||
| CHEMICALS - 2.9% | ||||||||
| Dow Chemical Co. | 17,633 | 948,832 | ||||||
| LyondellBasell Industries NV - Class A | 8,291 | 659,549 | ||||||
| 1,608,381 | ||||||||
| COMPUTERS - 3.0% | ||||||||
| Amdocs Ltd. | 9,586 | 560,302 | ||||||
| Apple, Inc. | 3,708 | 421,006 | ||||||
| Hewlett Packard Enterprise Co. | 30,873 | 693,716 | ||||||
| 1,675,024 | ||||||||
| COSMETICS / PERSONAL CARE - 2.1% | ||||||||
| Procter & Gamble Co. | 13,540 | 1,175,272 | ||||||
| DIVERSIFIED FINANCIAL SERVICES - 3.3% | ||||||||
| American Express Co. | 8,666 | 575,596 | ||||||
| Ameriprise Financial, Inc. | 5,982 | 528,749 | ||||||
| Discover Financial Services | 13,594 | 765,750 | ||||||
| 1,870,095 | ||||||||
| ELECTRIC - 6.2% | ||||||||
| American Electric Power Co., Inc. | 16,662 | 1,080,364 | ||||||
| DTE Energy Co. | 7,877 | 756,271 | ||||||
| Edison International | 13,019 | 956,636 | ||||||
| Public Service Enterprise Group, Inc. ^ | 17,254 | 726,048 | ||||||
| 3,519,319 | ||||||||
| ENGINEERING & CONSTRUCTION - 1.3% | ||||||||
| Fluor Corp. ^ | 14,330 | 745,017 | ||||||
| ENVIRONMENTAL CONTROL - 1.7% | ||||||||
| Waste Management, Inc. ^ | 14,297 | 938,741 | ||||||
| FOOD - 2.4% | ||||||||
| Kroger Co. ^ | 16,831 | 521,424 | ||||||
| Tyson Foods, Inc. | 11,952 | 846,799 | ||||||
| 1,368,223 | ||||||||
| FOREST PRODUCTS & PAPER - 1.2% | ||||||||
| International Paper Co. ^ | 14,968 | 674,009 | ||||||
| Security | Shares | Value | ||||||
| HAND / MACHINE TOOLS - 1.3% | ||||||||
| Stanley Black & Decker, Inc. | 6,481 | $ | 737,797 | |||||
| HEALTHCARE-PRODUCTS - 3.9% | ||||||||
| Becton Dickinson and Co. ^ | 3,303 | 554,607 | ||||||
| Danaher Corp. ^ | 7,007 | 550,400 | ||||||
| Medtronic PLC | 13,579 | 1,113,750 | ||||||
| 2,218,757 | ||||||||
| HEALTHCARE-SERVICES - 1.4% | ||||||||
| UnitedHealth Group, Inc. | 5,671 | 801,482 | ||||||
| HOME BUILDERS - 1.2% | ||||||||
| PulteGroup, Inc. ^ | 37,654 | 700,364 | ||||||
| INSURANCE - 6.3% | ||||||||
| Allstate Corp. | 11,209 | 761,091 | ||||||
| American International Group, Inc. ^ | 11,936 | 736,451 | ||||||
| Berkshire Hathaway, Inc. * | 2,404 | 346,897 | ||||||
| Chubb Ltd. | 8,072 | 1,025,144 | ||||||
| MetLife, Inc. | 13,995 | 657,205 | ||||||
| 3,526,788 | ||||||||
| MEDIA - 3.4% | ||||||||
| CBS Corp. | 11,401 | 645,525 | ||||||
| Comcast Corp. - Class A | 11,912 | 736,400 | ||||||
| Time Warner, Inc. | 5,682 | 505,641 | ||||||
| 1,887,566 | ||||||||
| MISCELLANEOUS MANUFACTURING - 1.4% | ||||||||
| General Electric Co. | 26,641 | 775,253 | ||||||
| OIL & GAS - 13.1% | ||||||||
| Antero Resources Corp. ^* | 24,972 | 661,009 | ||||||
| Chevron Corp. ^ | 13,416 | 1,405,326 | ||||||
| ConocoPhillips ^ | 28,501 | 1,238,368 | ||||||
| EOG Resources, Inc. ^ | 13,541 | 1,224,377 | ||||||
| Exxon Mobil Corp. ^ | 29,263 | 2,438,193 | ||||||
| Valero Energy Corp. | 7,124 | 422,026 | ||||||
| 7,389,299 | ||||||||
| PHARMACEUTICALS - 6.6% | ||||||||
| Johnson & Johnson | 7,220 | 837,448 | ||||||
| Merck & Co., Inc. ^ | 10,036 | 589,314 | ||||||
| Pfizer, Inc. | 56,581 | 1,794,184 | ||||||
| VCA, Inc. * | 8,514 | 523,270 | ||||||
| 3,744,216 | ||||||||
| REITS - 2.0% | ||||||||
| Boston Properties, Inc. ^ | 4,533 | 546,136 | ||||||
| Equity LifeStyle Properties, Inc. | 7,646 | 579,873 | ||||||
| 1,126,009 | ||||||||
| RETAIL - 2.1% | ||||||||
| Home Depot, Inc. | 5,119 | 624,569 | ||||||
| PVH Corp. | 5,121 | 547,845 | ||||||
| 1,172,414 | ||||||||
| SEMICONDUCTORS - 3.6% | ||||||||
| Intel Corp. ^ | 37,131 | 1,294,758 | ||||||
| Qualcomm, Inc. | 11,134 | 765,129 | ||||||
| 2,059,887 | ||||||||
| SOFTWARE - 1.1% | ||||||||
| Microsoft Corp. | 10,354 | 620,412 | ||||||
| TELECOMMUNICATIONS - 7.2% | ||||||||
| AT&T, Inc. ^ | 49,060 | 1,804,917 | ||||||
| Cisco Systems, Inc. | 39,439 | 1,209,989 | ||||||
| Verizon Communications | 22,067 | 1,061,423 | ||||||
| 4,076,329 | ||||||||
| TOTAL COMMON STOCK (Cost - $49,502,641) | 56,021,802 | |||||||
See accompanying notes to Financial Statements.
52
| SCHEDULE OF INVESTMENTS |
| Dunham Large Cap Value Fund (Continued) |
| October 31, 2016 |
| Security | Shares | Value | ||||||
| SHORT - TERM INVESTMENT - 0.9% | ||||||||
| MONEY MARKET FUND - 0.9% | ||||||||
| STIT-STIC Prime Portfolio - 0.25% + | 503,004 | 503,004 | ||||||
| (Cost - $503,004) | ||||||||
| COLLATERAL FOR SECURITIES LOANED - 33.6% | ||||||||
| Mount Vernon Prime Portfolio 0.67% + | 18,963,231 | 18,963,231 | ||||||
| (Cost - 18,963,231) | ||||||||
| Security | Value | |||||||
| TOTAL INVESTMENTS - 133.8% (Cost - $68,968,876) | $ | 75,488,037 | ||||||
| LIABILITIES IN EXCESS OF OTHER ASSETS - (33.8)% | (19,068,467 | ) | ||||||
| NET ASSETS - 100.0% | $ | 56,419,570 | ||||||
| ^ | All or a portion of these securities are on loan. Total loaned securities had a value of $18,573,447 at October 31, 2016. |
| * | Non-income producing security. |
| + | Variable rate security. Interest rate is as of October 31, 2016. |
Portfolio Composition * - (Unaudited)
| Collateral for Securities Loaned | 25.1 | % | Technology | 5.8 | % | |||||
| Financial | 17.4 | % | Utilities | 4.7 | % | |||||
| Consumer, Non-Cyclical | 14.8 | % | Consumer, Cyclical | 4.5 | % | |||||
| Energy | 9.8 | % | Basic Materials | 3.0 | % | |||||
| Communications | 7.9 | % | Funds | 0.7 | % | |||||
| Industrial | 6.3 | % | Total | 100.0 | % |
| * | Based on total value of investments as of October 31, 2016. |
Percentage may differ from Schedule of Investments which are based on Fund net assets.
See accompanying notes to Financial Statements.
53
| Dunham Focused Large Cap Growth Fund |
| Message from the Sub-Adviser (The Ithaka Group, LLC) |
Over the most recent fiscal year, the backdrop for the financial markets was highlighted by the possibility of rising interest rates in the U.S., attempts to reign in global oil production levels, uncertainty over the U.S. presidential election, and possible consequences from the Brexit. Large cap growth stocks, as measured by the Russell 1000 Growth Index, had a moderate fiscal year with a return of 2.3 percent. The most recent performance lagged behind other broader equity indexes, such as the S&P 500 Index, which returned 4.5 percent.
The Sub-Adviser strives to own companies with robust business models and balance sheets that it believes are built to withstand difficult economic environments. With few expectations, each of the companies in the current portfolio historically exhibited strong fundamentals during the 2008/2009 downturn. Those few that did not have since then significantly strengthened their balance sheets. The Sub-Adviser believes that the companies in the Fund have a low risk of poor fundamental performance in an economic downturn, and a low risk of underperforming the market over the course of a business cycle.
The most damaging quarter to absolute value for the Fund was the first quarter of the most recent fiscal year. The Sub-Adviser attributes this difficult quarter to certain macroeconomic factors, such as data concerning China’s market health and the U.S. Federal Reserve voting to raise interest rates. The Sub-Adviser also believes that low oil prices and members of the Organization of Petroleum Exporting Countries (OPEC) refusal to reduce oil production also added to market turbulence during the first fiscal quarter of the year. One holding that detracted from performance during this period of volatility was Amazon.com (AMZN) (Holding Percentage*: 5.61 percent), an online retailer that offers a wide range of products, personalized shopping services, web-based credit card payment and direct shipping to customers. From the beginning of the fiscal year through January 31, 2016 AMZN declined 6.2 percent. The Sub-Adviser believed that this decline was not reflective of the fundamentals of the company. The Fund was rewarded for its conviction as AMZN increased 26.2 percent over the fiscal year.
A weak performer in the Fund was Starbucks Corp. (SBUX) (Holding Percentage*: 3.73 percent), which is a premier roaster, marketer, and retailer of specialty coffee in the world. The Sub-Adviser thinks the recent underperformance can be attributed to not meeting investors’ unrealistic expectations during a slowdown in growth, after a year of massive buildup. Over the fiscal year Starbucks Corp declined 14.0 percent. Another weak performer in the Fund was Illumina, Inc. (ILMN) (Holding Percentage*: 2.18 percent), which declined by 5.0 percent over the fiscal year. The company develops, manufactures, and sells systems for the analysis of genetic variation and biological function. The Sub-Adviser attributes part of the decline to a transitioning of the company’s business model. The sales focus changed from being an equipment provider to centering on consumables products, and the it has taken time for the adjustment to get up to full speed. The Sub-Adviser also attributes the fiscal year’s decrease to missing sales numbers and giving weak guidance, but sees the holding as a long-term positive contributor.
Another positive contributor to the Fund was Paypal Holdings Inc. (PYPL) (Holding Percentage*: 2.27 percent), which operates as a technology platform company that enables digital and mobile payments on behalf of customers and merchants worldwide. Over the fiscal year, Paypal Holdings Inc. increased 15.7 percent. A large detractor from the Fund was Walt Disney Co. (DIS) (Holding Percentage*: 2.30 percent), an entertainment company that conducts operations in media networks, studio entertainment, theme parks and resorts, consumer products, and interactive media. The company produces motion pictures, television programs, and musical recordings, as well as books and magazines. The Sub-Adviser believes a reduction in viewers of the company’s ESPN business due to competitors new offerings has caused the holding to decline in price. Walt Disney Co. declined 17.4 percent over the fiscal year.
During the most recent fiscal year, two strong holdings within the Fund were Splunk Inc.(SPLK) (Holding Percentage*: 1.91 percent), which develops web based application software that collects and analyzes machine data generated by websites, applications, servers, networks and mobile devices, and Facebook, Inc. (FB) (Holding percentage*: 8.12 percent), which operates a social networking website. Splunk Inc. increased 7.2 percent during the fiscal year. Facebook, Inc. gained 28.5 percent over the same time period. The Sub-Adviser believes that Facebook, Inc.’s strong performance came from increased members and revenue from the company’s website, larger monetization of their Instagram application, and a heightened focus on the development of the Oculus Rift product.
The Sub-Adviser claims no expertise in economic or market predictions, and top-down analysis plays no part in their approach to investing. The Sub-Adviser does not try to “guess” where the market is heading in the next quarter or year and therefore chooses to stay fully invested at all times in what it believes are high-quality growth companies. The Sub-Adviser uses a fundamentals-driven, bottom –up process to identify and own companies that may outperform over the long-term. The Sub-Adviser continues to believe that all of the companies in the Fund are well-positioned to outperform over the economic cycle due to the strength of the long-term secular trends underpinning them, coupled with the Sub-Advisers unique abilities to take advantage of these trends.
| * | Holdings percentage(s) as of 10/31/2016. |
Growth of $100,000 Investment
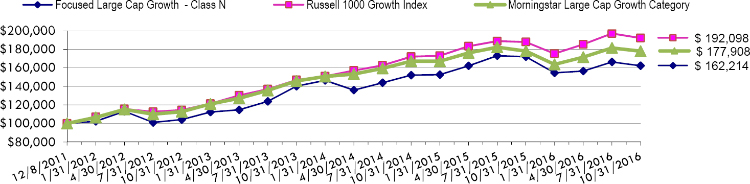
Total Returns as of October 31, 2016
| Annualized | Annualized Since | ||||||
| One | Three | Inception | |||||
| Year | Years | (12/8/11) | |||||
| Class N | (5.66)% | 4.98% | 10.38% | ||||
| Class C | (6.56)% | 3.97% | 9.31% | ||||
| Class A with load of 5.75% | (11.23)% | 2.67% | 8.79% | ||||
| Class A without load | (5.84)% | 4.72% | 10.12% | ||||
| Russell 1000 Growth Index | 2.28% | 9.35% | 14.25% | ||||
| Morningstar Large Cap Growth Category | (0.08)% | 6.86% | 12.47% |
The Russell 1000 Growth Index is a subset of the Russell 1000 Index which measures the performance of the stocks of the 1000 largest companies in the Russell 3000 Index based on market capitalization. The Russell 1000 Growth Index measures the performance of those stocks of the Russell 1000 with higher price-to-book ratios and higher relative forecasted growth rates. Investors cannot invest directly in an index or benchmark.
The Morningstar Large Cap Growth Category Index is generally representative of mutual funds that primarily invest in big (large capitalization) U.S. companies that are projected to grow faster than other large-cap stocks.
As disclosed in the Trust’s latest registration statement, the Fund’s total annual operating expenses, including the cost of underlying funds, are 1.34% for Class N, 2.34% for Class C and 1.59% for Class A. Class A shares are subject to a sales load of 5.75% and a deferred sales charge of up to 0.75%. The performance data quoted here represents past performance, which is not indicative of future results. Current performance may be lower or higher than the performance data quoted. The investment return and NAV will fluctuate, so that an investor’s shares, when redeemed, may be worth more or less than their original cost. Total returns are calculated assuming reinvestment of all dividends and capital gains distributions, if any. The returns do not reflect the deductions of taxes a shareholder would pay on the redemption of fund shares or fund distributions. For performance information current to the most recent month-end, please call 1-800-442-4358 or visit our websitewww.dunham.com
54
| SCHEDULE OF INVESTMENTS |
| Dunham Focused Large Cap Growth Fund |
| October 31, 2016 |
| Security | Shares | Value | ||||||
| COMMON STOCK - 99.3% | ||||||||
| AEROSPACE/DEFENSE - 3.0% | ||||||||
| TransDigm Group, Inc. * ^ | 7,300 | $ | 1,988,958 | |||||
| APPAREL - 3.7% | ||||||||
| NIKE, Inc. ^ | 15,781 | 791,891 | ||||||
| Under Armour, Inc. - Class A * ^ | 28,269 | 879,166 | ||||||
| Under Armour, Inc. - Class C * | 28,468 | 736,182 | ||||||
| 2,407,239 | ||||||||
| BIOTECHNOLOGY - 14.9% | ||||||||
| Alexion Pharmaceuticals, Inc. * | 12,131 | 1,583,096 | ||||||
| Biogen Idec, Inc. * | 2,389 | 669,350 | ||||||
| BioMarin Pharmaceutical, Inc. * | 9,189 | 739,898 | ||||||
| Celgene Corp. * | 22,918 | 2,341,761 | ||||||
| Illumina, Inc. * | 10,555 | 1,436,957 | ||||||
| Incyte Corp. * | 11,463 | 996,937 | ||||||
| Regeneron Pharmaceuticals, Inc. * | 5,846 | 2,016,987 | ||||||
| 9,784,986 | ||||||||
| COMMERCIAL SERVICES - 2.3% | ||||||||
| PayPal Holdings, Inc. * | 35,850 | 1,493,511 | ||||||
| DIVERSIFIED FINANCIAL SERVICES - 10.5% | ||||||||
| MasterCard, Inc. | 28,727 | 3,074,364 | ||||||
| Visa, Inc. - Class A ^ | 46,641 | 3,848,349 | ||||||
| 6,922,713 | ||||||||
| HEALTHCARE PRODUCTS - 2.7% | ||||||||
| Edwards Lifesciences Corp. * | 18,541 | 1,765,474 | ||||||
| INTERNET - 25.0% | ||||||||
| Alphabet, Inc. * | 4,178 | 3,277,808 | ||||||
| Amazon.com, Inc. * | 4,672 | 3,690,039 | ||||||
| Facebook, Inc. - Class A * | 40,802 | 5,344,654 | ||||||
| Priceline Group, Inc. * ^ | 1,971 | 2,905,707 | ||||||
| Splunk, Inc. * ^ | 20,888 | 1,257,249 | ||||||
| 16,475,457 | ||||||||
| MACHINERY-DIVERSIFIED - 2.0% | ||||||||
| The Middleby Corp. * ^ | 12,053 | 1,351,262 | ||||||
| MEDIA - 2.3% | ||||||||
| Walt Disney Co. | 16,334 | 1,513,998 | ||||||
| Security | Shares | Value | ||||||
| PHARMACEUTICALS - 1.3% | ||||||||
| DexCom, Inc. | 11,396 | $ | 891,623 | |||||
| RETAIL - 15.9% | ||||||||
| Domino’s Pizza Inc. ^ | 6,023 | 1,019,333 | ||||||
| Home Depot, Inc. | 9,625 | 1,174,346 | ||||||
| O’Reilly Automotive, Inc. * ^ | 2,303 | 609,005 | ||||||
| Starbucks Corp. | 46,286 | 2,456,398 | ||||||
| TJX Cos. Inc. ^ | 21,206 | 1,563,943 | ||||||
| Ulta Salon, Cosmetics & Fragrances * | 14,939 | 3,635,256 | ||||||
| 10,458,281 | ||||||||
| SOFTWARE - 12.7% | ||||||||
| Adobe Systems, Inc.* | 20,785 | 2,234,595 | ||||||
| Salesforce.com, Inc. * | 47,054 | 3,536,579 | ||||||
| Ultimate Software Group, Inc. * | 6,613 | 1,395,277 | ||||||
| Workday, Inc. - Class A * ^ | 13,729 | 1,190,030 | ||||||
| 8,356,481 | ||||||||
| TELECOMMUNICATIONS - 3.0% | ||||||||
| Palo Alto Networks, Inc. * | 12,784 | 1,966,563 | ||||||
| TOTAL COMMON STOCK (Cost - $51,922,015) | 65,376,546 | |||||||
| SHORT-TERM INVESTMENT - 0.6% | ||||||||
| MONEY MARKET FUND - 0.6% | ||||||||
| First American Institutional Prime Obligations Fund 0.27% + (Cost - $419,879) | 419,879 | |||||||
| COLLATERAL FOR SECURITIES LOANED - 23.0% | ||||||||
| Mount Vernon Prime Portfolio 0.67% + (Cost - $15,156,286) | 15,156,286 | |||||||
| TOTAL INVESTMENTS - 122.9% (Cost - $67,498,180) | $ | 80,952,711 | ||||||
| LIABILITIES LESS OTHER ASSETS - (22.9%) | (15,102,675 | ) | ||||||
| NET ASSETS - 100.0% | $ | 65,850,036 | ||||||
| ^ | All or a portion of these securities are on loan. Total loaned securities had a value of $14,852,759 at October 31, 2016. |
| * | Non-Income producing security. |
ADR - American Depositary Receipt.
| + | Variable rate security. Interest rate is as of October 31, 2016. |
Portfolio Composition * - (Unaudited)
| Communications | 23.1 | % | Technology | 11.9 | % | |||||
| Collateral For Securities Loaned | 18.7 | % | Financial | 8.6 | % | |||||
| Consumer, Non-Cyclical | 17.2 | % | Industrial | 4.1 | % | |||||
| Consumer, Cyclical | 15.9 | % | Short-Term Investments | 0.5 | % | |||||
| Total | 100.0 | % |
| * | Based on total value of investments as of October 31, 2016. |
Percentage may differ from Schedule of Investments which is based on Fund net assets.
See accompanying notes to financial statements.
55
Dunham International Stock Fund
Message from the Sub-Adviser (Arrowstreet Capital, L.P.)
International equity markets, as measured by the MSCI All Country World ex USA Index (Net) (referred to as the “Index”), added 0.22 percent during the year ending October 31, 2016 (the “fiscal year”).
The best performing developed market countries as measured by the Index during the fiscal year were New Zealand, up 28.53 percent, and Australia, up 12.55 percent. The worst performing developed market countries were Italy, down 23.15 percent, and Israel, down 19.81 percent. The best performing emerging market countries during the fiscal year as measured by the Index were Brazil, up 70.69 percent and Hungary, up 42.88 percent. The worst performing emerging market countries were Greece, down 42.06 percent, and Poland, down 11.82 percent.
The Sub-Adviser’s investment process is best characterized as a dynamic process that uses quantitative models to evaluate securities to exploit opportunities across companies, sectors, and countries while seeking to avoid long-term systematic biases toward any particular country, sector, style, or market capitalization. These stock selection models are designed to understand what information is likely to impact stock prices with a predictable and measurable lag that allows time to invest and profit. The models obtain the information to forecast individual stock returns by evaluating a stock’s potential on the basis of (1) direct effects - characteristics of the company itself; and (2) indirect effects - characteristics of other companies that are related by virtue of a common country and sector affiliation (called country/sector baskets); a common country affiliation; and a common global sector affiliation, and/or other common linkages. Over any time period, the strategy’s performance relative to the Index is driven by allocations to country/sector baskets, stock selection, and the effects of currency exposures differing from those of the Index.
Countries contributing most to returns relative to the Index during the fiscal year were: Brazil, primarily due to overweights to the energy and utilities sectors; and France, primarily due to underweights to the financials and health care sectors. Countries contributing most to underperformance relative to the Index included: Australia, primarily due to underweights to the financials and materials sectors; and the United Kingdom, primarily due to underweights to the energy and health care sectors.
Sectors contributing most to returns relative to the Index during the fiscal year included: the health care sector, primarily due to overweights in Canada and underweights in Switzerland, Germany, and France; the energy sector, primarily due to overweights in Russia and Brazil; and the consumer staples sector, primarily due to overweights in Belgium, Sweden, and Portugal. The sectors contributing the most to underperformance relative to the Index was the materials sector, primarily due to underweights in Australia and overweights in South Korea and Denmark; and the utilities sector, primarily due to overweights in Italy and South Korea.
The stocks contributing most to returns relative to the Index during the fiscal year included: Oil Company Lukoil Pjsc (holding percentage*: 0.99 percent), a Russian energy company; Teck Resources Limited Class B (holding percentage*: 0.70 percent), a Canadian materials company; and Swedish Match Ab (holding percentage*: 0.70 percent), a Swedish consumer staples company. Stocks contributing most to underperformance relative to the Index included: Royal Dutch Shell Plc Class A (holding percentage*: 0.58 percent), a United Kingdom energy company; HSBC Holdings Plc (holding percentage*: not held), a United Kingdom financials company; and Dai-Ichi Life Holdings, Inc. (holding percentage**: 0.03 percent), a Japanese financials company.
The foregoing Sub-Adviser Background and Insights from the Sub-Adviser are provided by Arrowstreet as of October 31, 2016 for informational purposes only and solely with respect to the portfolio of assets in the Fund managed by Arrowstreet. References to specific stocks, countries or sectors are shown for informational purposes only and are not intended as investment advice. Arrowstreet is not responsible for, and makes no representation with respect to, any other information or performance data set forth herein.
| * | Holdings percentage(s) as of 10/31/2016. |
| ** | Holdings percentage(s) as of the date prior to the sale of the security. |
Growth of $100,000 Investment
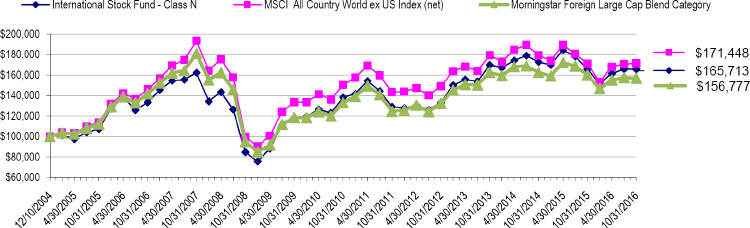
Total Returns as of October 31, 2016
| Annualized | Annualized | Annualized | Annualized Since Inception | ||||||||
| One Year | Three Years | Five Years | Ten Years | (12/10/04) | |||||||
| Class N | 0.06% | (0.82)% | 5.14% | 2.20% | 4.34% | ||||||
| Class C | (0.95)% | (1.81)% | 4.09% | 1.18% | 3.31% | ||||||
| Class A with load of 5.75% | (5.97)% | (3.01)% | 3.64% | N/A | 0.53%* | ||||||
| Class A without load | (0.28)% | (1.07)% | 4.87% | N/A | 1.13%* | ||||||
| MSCI All Country World ex US Index (net) | 0.22% | (1.49)% | 3.64% | 1.61% | 4.64% | ||||||
| Morningstar Foreign Large Cap Blend Category | (2.00)% | (1.19)% | 4.71% | 1.02% | 3.85% |
| * | Class A commenced operations on January 3, 2007. |
The MSCI All Country World ex US Index (net) is a free float-adjusted market capitalization index designed to measure equity market performance in the global developed and emerging markets excluding holdings in the United States and is net of any withholding taxes. Investors cannot invest directly in an index or benchmark.
The Morningstar Foreign Large Cap Blend Category is generally representative of mutual funds that primarily invest in non-U.S. stocks that have market caps in the top 70% of each economically integrated market (such as Europe or Asia ex-Japan). The blend style is generally applicable where neither growth nor value characteristics dominate.
As disclosed in the Trust’s latest registration statement, the Fund’s total annual operating expenses, including underlying funds, are 2.04% for Class N, 3.04% for Class C and 2.29% for Class A. Class A shares are subject to a sales load of 5.75% and a deferred sales charge of up to 0.75%.The performance data quoted here represents past performance, which is not indicative of future results. Current performance may be lower or higher than the performance data quoted. The investment return and NAV will fluctuate, so that an investor’s shares, when redeemed, may be worth more or less than their original cost. Total returns are calculated assuming reinvestment of all dividends and capital gains distributions, if any. The returns do not reflect the deductions of taxes a shareholder would pay on the redemption of fund shares or fund distribution. For performance information current to the most recent month-end, please call 1-800-442-4358 or visit our website www.dunham.com
56
| SCHEDULE OF INVESTMENTS |
| Dunham International Stock Fund |
| October 31, 2016 |
| Security | Shares | Value | ||||||
| COMMON STOCK - 96.5% | ||||||||
| ADVERTISING - 0.9% | ||||||||
| WPP PLC - ADR ^ | 2,900 | $ | 314,563 | |||||
| WPP PLC | 24,372 | 527,850 | ||||||
| 842,413 | ||||||||
| AEROSPACE / DEFENSE - 1.5% | ||||||||
| Airbus Group SE - ADR | 220 | 3,263 | ||||||
| Airbus Group SE | 6,970 | 413,294 | ||||||
| BAE Systems PLC - ADR ^ | 12,494 | 331,091 | ||||||
| Kawasaki Heavy Industries Ltd. | 191,000 | 556,749 | ||||||
| Rolls-Royce Holdings PLC - ADR ^ | 17,948 | 158,840 | ||||||
| 1,463,237 | ||||||||
| AGRICULTURE - 2.4% | ||||||||
| British American Tobacco PLC | 4,850 | 277,264 | ||||||
| British American Tobacco PLC - ADR ^ | 7,485 | 859,952 | ||||||
| Imperial Brands PLC | 6,138 | 296,155 | ||||||
| Imperial Brands PLC - ADR | 3,336 | 161,296 | ||||||
| KT&G Corp. | 502 | 49,512 | ||||||
| Swedish Match AB | 19,275 | 671,564 | ||||||
| 2,315,743 | ||||||||
| AIRLINES - 0.2% | ||||||||
| Deutsche Lufthansa AG | 16,600 | 212,165 | ||||||
| Turk Hava Yollari * | 1 | 2 | ||||||
| 212,167 | ||||||||
| APPAREL - 0.1% | ||||||||
| Pou Chen Corp. | 61,000 | 82,306 | ||||||
| AUTO MANUFACTURERS - 1.0% | ||||||||
| Hyundai Motor Co. - GDR | 2,288 | 95,524 | ||||||
| Mazda Motor Corp. | 20,400 | 337,617 | ||||||
| Porsche Automobil Holding SE - ADR | 2,723 | 14,527 | ||||||
| Renault SA | 2,497 | 216,837 | ||||||
| Volkswagen AG | 2,234 | 333,477 | ||||||
| 997,982 | ||||||||
| AUTO PARTS & EQUIPMENT - 0.5% | ||||||||
| Continental AG | 3,800 | 145,958 | ||||||
| GKN PLC | 95,089 | 369,891 | ||||||
| 515,849 | ||||||||
| BANKS - 6.6% | ||||||||
| Agricultural Bank of China Ltd. | 411,000 | 172,911 | ||||||
| Akbank TAS | 1 | 1 | ||||||
| Banco Bradesco SA - ADR | 19,700 | 205,077 | ||||||
| Banco do Brasil SA - ADR | 19,000 | 174,990 | ||||||
| Banco do Brasil SA | 19,000 | 176,085 | ||||||
| Banco Santander Brasil SA - ADR ^ | 36,010 | 294,562 | ||||||
| Banco Santander Brasil SA | 31,000 | 258,019 | ||||||
| Bangkok Bank PCL | 28,100 | 127,589 | ||||||
| Bank Hapoalim BM | 62,122 | 357,892 | ||||||
| Bank Leumi Le-Israel BM * | 54,789 | 206,485 | ||||||
| Bank of China Ltd. | 236,000 | 105,766 | ||||||
| Bank of Communications Co. Ltd. | 384,000 | 291,895 | ||||||
| Barclays PLC - ADR | 21,322 | 196,589 | ||||||
| BNP Paribas SA | 10,321 | 597,601 | ||||||
| Commerzbank AG | 19,043 | 129,504 | ||||||
| Credicorp Ltd. | 1,300 | 193,284 | ||||||
| Credit Agricole SA | 44,085 | 474,961 | ||||||
| DNB ASA - ADR ^ | 800 | 116,400 | ||||||
| Gentera SAB de CV | 157,400 | 311,996 | ||||||
| Itau Unibanco Holding SA - ADR | 10,340 | 123,356 | ||||||
| Itau Unibanco Holding SA | 16,480 | 171,783 | ||||||
| KBC Group NV * | 7,729 | 470,503 | ||||||
| Sberbank of Russia PJSC - ADR | 42,585 | 404,558 | ||||||
| Societe Generale SA | 10,348 | 403,080 | ||||||
| Turkiye Is Bankasi | 81,167 | 131,698 | ||||||
| Yapi ve Kredi Bankasi AS | 129,421 | 154,825 | ||||||
| 6,251,410 | ||||||||
| Security | Shares | Value | ||||||
| BEVERAGES - 2.7% | ||||||||
| Anheuser-Busch InBev NV - ADR | 3,759 | $ | 434,127 | |||||
| Anheuser-Busch InBev NV | 2,817 | 322,850 | ||||||
| Carlsberg A/S | 2,072 | 186,391 | ||||||
| Coca-Cola HBC AG | 6,346 | 137,921 | ||||||
| Diageo PLC - ADR ^ | 8,943 | 961,641 | ||||||
| Heineken NV | 6,541 | 538,010 | ||||||
| 2,580,940 | ||||||||
| BUILDING MATERIALS - 2.6% | ||||||||
| Asahi Glass Co. Ltd. | 55,000 | 383,872 | ||||||
| Cemex SAB de CV - ADR * | 1 | 7 | ||||||
| China Resources Cement Holdings Ltd. | 272,000 | 109,843 | ||||||
| Cie de Saint-Gobain | 4,573 | 202,769 | ||||||
| CRH PLC - ADR | 7,700 | 248,710 | ||||||
| Geberit AG | 829 | 350,707 | ||||||
| HeidelbergCement AG | 3,171 | 299,547 | ||||||
| James Hardie Industries PLC | 10,581 | 157,537 | ||||||
| LafargeHolcim Ltd. | 5,477 | 292,339 | ||||||
| Sika AG | 74 | 355,912 | ||||||
| Titan Cement Co SA | 4,082 | 94,678 | ||||||
| 2,495,921 | ||||||||
| CHEMICALS - 2.6% | ||||||||
| Akzo Nobel NV | 7,070 | 456,155 | ||||||
| Covestro AG | 7,604 | 449,653 | ||||||
| Croda International PLC | 826 | 35,234 | ||||||
| Hitachi Chemical Co. Ltd. | 5,400 | 125,977 | ||||||
| IRPC PCL | 1,816,300 | 247,915 | ||||||
| Johnson Matthey PLC | 1,793 | 74,549 | ||||||
| K+S AG | 5,344 | 108,062 | ||||||
| LG Chem Ltd. | 529 | 113,619 | ||||||
| Mexichem SAB de CV | 45,447 | 109,150 | ||||||
| Mitsui Chemicals, Inc. | 110,000 | 540,603 | ||||||
| Novozymes A/S - ADR | 6,260 | 231,401 | ||||||
| 2,492,318 | ||||||||
| COAL - 0.8% | ||||||||
| China Coal Energy Co. Ltd. * | 767,000 | 434,260 | ||||||
| Semirara Mining & Power Corp. | 7,810 | 20,316 | ||||||
| Yanzhou Coal Mining Co. Ltd. | 364,000 | 269,601 | ||||||
| 724,177 | ||||||||
| COMMERCIAL SERVICES - 2.6% | ||||||||
| AerCap Holdings NV | 7,709 | 316,917 | ||||||
| Ashtead Group PLC | 11,360 | 176,558 | ||||||
| Edenred | 6,784 | 156,784 | ||||||
| Experian PLC | 55,436 | 1,063,033 | ||||||
| RELX NV | 29,210 | 491,859 | ||||||
| RELX PLC - ADR | 14,800 | 268,472 | ||||||
| 2,473,623 | ||||||||
| COMPUTERS - 2.6% | ||||||||
| BlackBerry Ltd. * ^ | 52,600 | 370,830 | ||||||
| Capgemini SA | 877 | 72,528 | ||||||
| Compal Electronics, Inc. | 375,000 | 222,981 | ||||||
| Computershare Ltd. | 38,711 | 310,189 | ||||||
| Foxconn Technology Co. Ltd. | 74,740 | 216,657 | ||||||
| Fujitsu Ltd. | 62,000 | 366,978 | ||||||
| Lenovo Group Ltd. - ADR | 7,411 | 94,638 | ||||||
| Lenovo Group Ltd. | 646,000 | 413,854 | ||||||
| Quanta Computer, Inc. | 83,000 | 167,906 | ||||||
| TDK Corp. | 3,800 | 261,836 | ||||||
| 2,498,397 | ||||||||
| COSMETICS / PERSONAL CARE - 2.7% | ||||||||
| Kao Corp. | 2,200 | 112,973 | ||||||
| L’Oreal SA | 2,925 | 523,301 | ||||||
| L’Oreal SA - ADR | 2,000 | 71,640 | ||||||
| Svenska Cellulosa AB SCA | 3,916 | 111,043 | ||||||
| Svenska Cellulosa AB SCA - ADR | 3,200 | 90,624 | ||||||
| Unilever NV - Dutch Certificates | 19,430 | 811,531 | ||||||
| Unilever NV - NY Reg. Shares ^ | 4,609 | 192,748 | ||||||
See accompanying notes to financial statements.
57
| SCHEDULE OF INVESTMENTS |
| Dunham International Stock Fund (Continued) |
| October 31, 2016 |
| Security | Shares | Value | ||||||
| COSMETICS / PERSONAL CARE (Continued)- 2.7% | ||||||||
| Unilever PLC | 4,648 | $ | 193,559 | |||||
| Unilever PLC - ADR | 11,600 | 483,372 | ||||||
| 2,590,791 | ||||||||
| DISTRIBUTION / WHOLESALE - 0.2% | ||||||||
| Wolseley PLC - ADR | 33,350 | 171,919 | ||||||
| DIVERSIFIED FINANANCIAL SERVICES - 2.2% | ||||||||
| BM&FBovespa SA - Bolsa de Valores Mercadorias e Futuros | 28,000 | 165,832 | ||||||
| CITIC Securities Co. Ltd. | 260,000 | 575,061 | ||||||
| DGB Financial Group, Inc. | 9,195 | 77,023 | ||||||
| Hana Financial Group, Inc. | 11,900 | 340,366 | ||||||
| Huatai Securities Co. Ltd. | 36,400 | 76,849 | ||||||
| IGM Financial, Inc. | 8,300 | 222,944 | ||||||
| KB Financial Group, Inc. - ADR | 2,900 | 107,242 | ||||||
| Samsung Card Co. Ltd. | 8,552 | 360,036 | ||||||
| Worldpay Group PLC | 51,103 | 177,155 | ||||||
| 2,102,508 | ||||||||
| ELECTRIC - 2.0% | ||||||||
| Centrais Eletricas Brasileiras SA - ADR * | 9,100 | 78,897 | ||||||
| CEZ AS | 4,959 | 93,404 | ||||||
| Cia Paranaense de Energia | 3,000 | 22,364 | ||||||
| E.ON SE | 11,987 | 87,727 | ||||||
| E.ON SE - ADR | 21,400 | 157,611 | ||||||
| Electricite de France SA | 10,081 | 112,851 | ||||||
| Enel SpA | 106,437 | 456,963 | ||||||
| Iberdrola SA | 43,865 | 298,100 | ||||||
| Iberdrola SA - ADR | 1,777 | 48,370 | ||||||
| Korea Electric Power Corp. - ADR | 3,799 | 164,347 | ||||||
| Korea Electric Power Corp. - ADR | 12,167 | 265,362 | ||||||
| Mercury NZ Ltd. | 33,148 | 72,394 | ||||||
| Uniper SE | 1,198 | 15,923 | ||||||
| 1,874,313 | ||||||||
| ELECTRICAL COMPONENTS & EQUIPMENT - 1.2% | ||||||||
| Brother Industries Ltd. | 10,100 | 184,948 | ||||||
| Legrand A | 2,937 | 165,697 | ||||||
| LG Electronics, Inc. | 2,499 | 104,177 | ||||||
| Osram Licht AG | 3,407 | 193,234 | ||||||
| Schneider Electric SE | 7,618 | 511,588 | ||||||
| 1,159,644 | ||||||||
| ELECTRONICS - 2.8% | ||||||||
| Alps Electric Co. Ltd. | 2,400 | 57,453 | ||||||
| Assa Abloy AB | 4,504 | 81,950 | ||||||
| Assa Abloy AB - ADR | 15,300 | 138,312 | ||||||
| AU Optronics Corp. | 1,197,000 | 454,643 | ||||||
| Hitachi High-Technologies Corp. | 13,500 | 561,879 | ||||||
| Hoya Corp. | 8,400 | 349,765 | ||||||
| Koninklijke Philips NV | 2,529 | 76,097 | ||||||
| LG Display Co. Ltd. | 8,546 | 204,332 | ||||||
| Murata Manufacturing Co. Ltd. | 2,200 | 306,583 | ||||||
| Nippon Electric Glass Co. Ltd. | 43,000 | 233,441 | ||||||
| Pegatron Corp. | 40,000 | 107,711 | ||||||
| Synnex Technology International Corp. | 85,050 | 90,617 | ||||||
| 2,662,783 | ||||||||
| ENGINEERING & CONSTRUCTION - 1.4% | ||||||||
| ACS Actividades de Construccion y Servicios SA | 5,020 | 153,338 | ||||||
| Auckland International Airport Ltd. | 42,795 | 201,631 | ||||||
| Enka Insaat ve Sanayi AS | 13,463 | 20,548 | ||||||
| Grupo Aeroportuario del Pacifico SAB de CV | 13,000 | 126,216 | ||||||
| HOCHTIEF AG | 3,125 | 426,107 | ||||||
| LendLease Group | 30,287 | 310,359 | ||||||
| Promotora y Operadora de Infraestructura SAB de CV | 5,639 | 63,219 | ||||||
| 1,301,418 | ||||||||
| ENTERTAINMENT - 0.3% | ||||||||
| Aristocrat Leisure Ltd. | 25,172 | 293,170 | ||||||
| Security | Shares | Value | ||||||
| FOOD - 6.1% | ||||||||
| Ajinomoto Co., Inc. | 3,300 | $ | 73,233 | |||||
| Associated British Foods PLC | 2,400 | 73,416 | ||||||
| Barry Callebaut AG | 45 | 56,076 | ||||||
| Carrefour SA | 5,076 | 132,849 | ||||||
| Chocoladefabriken Lindt & Sprungli AG | 39 | 202,652 | ||||||
| Cosan Ltd. | 43,300 | 385,370 | ||||||
| Jeronimo Martins SGPS SA | 3,382 | 58,031 | ||||||
| Kerry Group PLC | 1,389 | 100,666 | ||||||
| Koninklijke Ahold NV | 4,266 | 97,188 | ||||||
| Koninklijke Ahold NV - ADR | 16,861 | 384,094 | ||||||
| Marine Harvest ASA | 13,519 | 245,644 | ||||||
| MEIJI Holdings Co. Ltd. | 2,000 | 199,072 | ||||||
| METRO AG | 2,522 | 75,438 | ||||||
| Nestle SA | 8,704 | 631,576 | ||||||
| Nestle SA - ADR | 16,865 | 1,225,158 | ||||||
| Nisshin Seifun Group, Inc. | 12,600 | 185,221 | ||||||
| Nissin Foods Holdings Co. Ltd. | 1,200 | 69,313 | ||||||
| Orkla ASA | 38,782 | 366,680 | ||||||
| Pioneer Foods Group Ltd. | 5,873 | 70,763 | ||||||
| Seven & I Holdings Co. Ltd. - ADR | 4,892 | 101,998 | ||||||
| Tesco PLC - ADR | 22,150 | 170,001 | ||||||
| Toyo Suisan Kaisha Ltd. | 4,800 | 194,068 | ||||||
| Uni-President Enterprises Corp. | 180,000 | 347,769 | ||||||
| WH Group Ltd. | 380,000 | 307,788 | ||||||
| Wm Morrison Supermarkets PLC | 29,595 | 81,719 | ||||||
| 5,835,783 | ||||||||
| FOOD SERVICE - 0.3% | ||||||||
| Compass Group PLC - ADR | 17,272 | 313,660 | ||||||
| FOREST PRODUCTS & PAPER - 1.1% | ||||||||
| Mondi PLC | 5,864 | 114,149 | ||||||
| Nine Dragons Paper Holdings Ltd. | 129,000 | 104,888 | ||||||
| Sappi Ltd. * | 30,854 | 171,696 | ||||||
| Stora Enso OYJ | 20,293 | 191,501 | ||||||
| UPM-Kymmene OYJ | 14,043 | 326,200 | ||||||
| West Fraser Timber Co. Ltd. | 2,800 | 95,934 | ||||||
| 1,004,368 | ||||||||
| GAS - 1.0% | ||||||||
| Gas Natural SDG SA | 14,555 | 286,101 | ||||||
| National Grid PLC - ADR | 9,443 | 617,761 | ||||||
| 903,862 | ||||||||
| HAND / MACHINE TOOLS - 0.7% | ||||||||
| Finning International, Inc. | 13,514 | 251,677 | ||||||
| Sandvik AB | 15,928 | 181,178 | ||||||
| Schindler Holding AG | 1,047 | 193,935 | ||||||
| 626,790 | ||||||||
| HEALTHCARE - PRODUCTS - 0.4% | ||||||||
| Smith & Nephew PLC - ADR | 8,738 | 255,587 | ||||||
| Terumo Corp. | 2,100 | 81,045 | ||||||
| 336,632 | ||||||||
| HEALTHCARE - SERVICES - 0.1% | ||||||||
| Ramsay Health Care Ltd. | 2,335 | 130,067 | ||||||
| HOLDING COMPANIES-DIVERSIFIED - 0.0% | ||||||||
| Haci Omer Sabanci Holdings AS | 1 | 2 | ||||||
| HOME FURNISHINGS - 0.6% | ||||||||
| Arcelik AS | 1 | 7 | ||||||
| Electrolux AB - Series B | 9,343 | 221,394 | ||||||
| Panasonic Corp. | 35,500 | 365,464 | ||||||
| 586,865 | ||||||||
| HOUSEHOLD PRODUCTS - 0.7% | ||||||||
| Reckitt Benckiser Group PLC | 3,781 | 337,394 | ||||||
| Reckitt Benckiser Group PLC - ADR | 10,200 | 186,048 | ||||||
| Societe BIC SA | 978 | 135,371 | ||||||
| 658,813 | ||||||||
See accompanying notes to financial statements.
58
| SCHEDULE OF INVESTMENTS |
| Dunham International Stock Fund (Continued) |
| October 31, 2016 |
| Security | Shares | Value | ||||||
| INSURANCE - 2.3% | ||||||||
| Allianz SE | 2,686 | $ | 418,704 | |||||
| AXA SA | 15,564 | 350,664 | ||||||
| Hannover Rueck SE | 2,506 | 279,178 | ||||||
| Industrial Alliance Insurance & Financial Services, Inc. | 4,500 | 174,393 | ||||||
| Manulife Financial Corp. | 7,400 | 107,280 | ||||||
| Manulife Financial Corp. | 24,935 | 361,059 | ||||||
| Muenchener Rueckversicherungs-Gesellschaft AG | 1,340 | 259,806 | ||||||
| Power Corp of Canada | 12,900 | 276,913 | ||||||
| 2,227,997 | ||||||||
| INTERNET - 1.3% | ||||||||
| SEEK Ltd. | 11,538 | 128,187 | ||||||
| Tencent Holdings Ltd. | 33,000 | 874,656 | ||||||
| United Internet AG | 5,428 | 222,855 | ||||||
| 1,225,698 | ||||||||
| INVESTMENT COMPANIES - 0.1% | ||||||||
| Melker Schorling AB | 2,212 | 128,001 | ||||||
| IRON / STEEL - 2.7% | ||||||||
| ArcelorMittal | 38,915 | 262,576 | ||||||
| ArcelorMittal - NY Reg Shares ^ | 30,900 | 207,957 | ||||||
| Eregli Demir ve Celik Fabrikalari TAS | 36,196 | 49,179 | ||||||
| Fortescue Metals Group Ltd. | 57,925 | 243,170 | ||||||
| JFE Holdings, Inc. | 17,900 | 256,028 | ||||||
| Kobe Steel Ltd. | 92,700 | 763,424 | ||||||
| POSCO | 1,362 | 283,395 | ||||||
| POSCO - ADR | 4,101 | 213,047 | ||||||
| Thyssenkrupp AG | 11,589 | 268,521 | ||||||
| Voestalpine AG | 1,429 | 50,552 | ||||||
| 2,597,849 | ||||||||
| LEISURE TIME - 0.7% | ||||||||
| Carnival PLC - ADR ^ | 4,013 | 196,115 | ||||||
| Flight Centre Travel Group Ltd. | 8,510 | 218,723 | ||||||
| TUI AG * | 18,534 | 235,489 | ||||||
| 650,327 | ||||||||
| LODGING - 0.2% | ||||||||
| Crown Resorts Ltd. | 17,942 | 148,379 | ||||||
| MACHINERY CONSTRUCTION & MINING - 2.3% | ||||||||
| ABB Ltd. | 42,279 | 872,807 | ||||||
| ABB Ltd. - ADR | 9,160 | 189,154 | ||||||
| Atlas Copco AB - A Shares | 9,312 | 273,118 | ||||||
| Atlas Copco AB - B Shares | 3,574 | 93,465 | ||||||
| Hitachi Ltd. | 106,000 | 563,919 | ||||||
| Hitachi Ltd. - ADR | 2,293 | 122,515 | ||||||
| Mitsubishi Electric Corp. | 8,200 | 110,712 | ||||||
| 2,225,690 | ||||||||
| MACHINERY - DIVERSIFIED - 0.5% | ||||||||
| ANDRITZ AG | 5,092 | 265,861 | ||||||
| Kone OYJ | 2,252 | 103,472 | ||||||
| Metso OYJ | 5,366 | 140,497 | ||||||
| 509,830 | ||||||||
| MEDIA - 0.4% | ||||||||
| ITV PLC | 54,584 | 113,506 | ||||||
| Thomson Reuters Corp. | 2,300 | 90,713 | ||||||
| Wolters Kluwer NV | 4,038 | 155,930 | ||||||
| 360,149 | ||||||||
| METAL FABRICATE / HARDWARE - 0.2% | ||||||||
| SKF AB | 3,695 | 62,660 | ||||||
| Tenaris SA | 193 | 2,726 | ||||||
| Tenaris SA - ADR ^ | 5,623 | 158,569 | ||||||
| 223,955 | ||||||||
| MINING - 5.7% | ||||||||
| AngloGold Ashanti Ltd. * | 4,434 | 60,378 | ||||||
| Barrick Gold Corp. | 13,479 | 237,096 | ||||||
| Barrick Gold Corp. | 21,884 | 385,348 | ||||||
| BHP Billiton PLC | 10,980 | 164,689 | ||||||
| Security | Shares | Value | ||||||
| MINING (Continued) - 5.7% | ||||||||
| Boliden AB | 12,611 | $ | 292,623 | |||||
| First Quantum Minerals Ltd. | 32,494 | 308,878 | ||||||
| Glencore PLC * | 230,943 | 705,151 | ||||||
| Gold Fields Ltd. | 17,264 | 71,208 | ||||||
| Goldcorp, Inc. | 10,016 | 152,230 | ||||||
| Grupo Mexico SAB de CV | 139,200 | 343,420 | ||||||
| Industrias Penoles SAB de CV | 8,333 | 202,593 | ||||||
| Kinross Gold Corp. * | 46,000 | 178,818 | ||||||
| Mitsubishi Materials Corp. | 3,500 | 100,073 | ||||||
| MMC Norilsk Nickel PJSC - ADR | 6,586 | 99,317 | ||||||
| Rio Tinto Ltd. | 1,889 | 78,182 | ||||||
| Rio Tinto PLC - ADR | 10,426 | 363,346 | ||||||
| Silver Wheaton Corp. | 6,100 | 147,101 | ||||||
| Sumitomo Metal Mining Co. Ltd. | 8,000 | 103,745 | ||||||
| Teck Resources Ltd. | 31,000 | 669,845 | ||||||
| Turquoise Hill Resources Ltd. * | 210,700 | 653,991 | ||||||
| Yamana Gold, Inc. | 38,500 | 137,597 | ||||||
| 5,455,629 | ||||||||
| MISCELLANEOUS MANUFACTURING - 1.3% | ||||||||
| Doosan Corp. | 1,200 | 107,374 | ||||||
| Konica Minolta Holdings, Inc. | 24,000 | 214,529 | ||||||
| Siemens AG - ADR | 4,800 | 545,520 | ||||||
| Wartsila OYJ Abp | 7,961 | 343,543 | ||||||
| 1,210,966 | ||||||||
| OFFICE / BUSINESS - 0.1% | ||||||||
| Seiko Epson Corp. - ADR | 7,700 | 77,693 | ||||||
| OIL & GAS - 6.9% | ||||||||
| BP PLC | 176,266 | 1,039,394 | ||||||
| BP PLC - ADR ^ | 17,789 | 632,399 | ||||||
| CNOOC Ltd. | 226,000 | 284,396 | ||||||
| CNOOC Ltd. - ADR | 949 | 119,081 | ||||||
| Crescent Point Energy Corp. | 6,600 | 78,645 | ||||||
| Formosa Petrochemical Corp. | 15,000 | 50,083 | ||||||
| Gazprom OAO - ADR | 135,365 | 586,130 | ||||||
| Lukoil OAO - ADR | 19,435 | 947,456 | ||||||
| Neste Oil OYJ | 5,898 | 254,093 | ||||||
| Novatek OJSC - GDR | 2,344 | 250,574 | ||||||
| Petroleo Brasileiro SA * | 107,300 | 632,442 | ||||||
| Petroleo Brasileiro SA - ADR * ^ | 25,958 | 302,930 | ||||||
| Rosneft OAO - GDR | 26,472 | 144,272 | ||||||
| Royal Dutch Shell PLC | 22,287 | 554,550 | ||||||
| Seven Generations Energy Ltd. * | 11,368 | 242,585 | ||||||
| SK Innovation Co. Ltd. | 2,918 | 384,109 | ||||||
| Surgutneftegas OAO - ADR | 8,288 | 38,415 | ||||||
| 6,541,554 | ||||||||
| PACKAGING & CONTAINERS - 0.2% | ||||||||
| CCL Industries, Inc. | 1,200 | 213,578 | ||||||
| PHARMACEUTICALS - 2.5% | ||||||||
| Actelion Ltd. | 2,866 | 414,397 | ||||||
| Astellas Pharma, Inc. | 30,000 | 444,345 | ||||||
| Daiichi Sankyo Co. Ltd. | 11,700 | 280,567 | ||||||
| GlaxoSmithKline PLC - ADR ^ | 7,636 | 305,516 | ||||||
| Otsuka Holdings Co. Ltd. | 4,900 | 214,014 | ||||||
| Roche Holding AG - Genusschein | 848 | 197,218 | ||||||
| Shire PLC | 4,534 | 255,354 | ||||||
| Shire PLC - ADR | 1,384 | 233,398 | ||||||
| 2,344,809 | ||||||||
| PIPELINES - 0.2% | ||||||||
| Petronas Gas Bhd | 40,800 | 213,644 | ||||||
| REAL ESTATE - 0.2% | ||||||||
| REA Group Ltd. | 6,015 | 233,353 | ||||||
See accompanying notes to financial statements.
59
| SCHEDULE OF INVESTMENTS |
| Dunham International Stock Fund (Continued) |
| October 31, 2016 |
| Security | Shares | Value | ||||||
| REIT - 0.6% | ||||||||
| Scentre Group | 188,699 | $ | 604,137 | |||||
| RETAIL - 1.1% | ||||||||
| Domino’s Pizza Enterprises Ltd. | 2,499 | 121,781 | ||||||
| FF Group * | 4,769 | 114,055 | ||||||
| Harvey Norman Holdings Ltd. | 9,276 | 35,535 | ||||||
| Home Product Center PCL | 2,072,100 | 596,674 | ||||||
| Lojas Americanas SA | 12,000 | 59,700 | ||||||
| Marks & Spencer Group PLC | 8,500 | 70,720 | ||||||
| Pandora A/S | 592 | 76,875 | ||||||
| 1,075,340 | ||||||||
| SEMICONDUCTORS - 7.5% | ||||||||
| Advanced Semiconductor Engineering, Inc. | 303,000 | 356,019 | ||||||
| ASML Holding NV | 9,325 | 985,136 | ||||||
| Infineon Technologies AG | 34,445 | 618,629 | ||||||
| Infineon Technologies AG - ADR | 18,864 | 339,175 | ||||||
| MediaTek, Inc. | 21,000 | 159,178 | ||||||
| Rohm Co. Ltd. | 2,400 | 125,897 | ||||||
| Samsung Electronics Co. Ltd. | 691 | 988,357 | ||||||
| Samsung Electronics Co. Ltd. - GDR - Reg S | 375 | 215,807 | ||||||
| Silicon Motion Technology Corp. - ADR | 6,763 | 274,645 | ||||||
| SK Hynix, Inc. | 10,874 | 388,926 | ||||||
| STMicroelectronics NV | 28,573 | 270,804 | ||||||
| STMicroelectronics NV - NY Shares ^ | 12,884 | 121,754 | ||||||
| Taiwan Semiconductor Manufacturing Co. Ltd. | 35,000 | 210,047 | ||||||
| Taiwan Semiconductor Manufacturing Co. Ltd. - ADR ^ | 55,388 | 1,722,567 | ||||||
| Tokyo Electron Ltd. - ADR | 2,200 | 49,456 | ||||||
| Tokyo Electron Ltd. | 3,800 | 342,078 | ||||||
| 7,168,475 | ||||||||
| SOFTWARE - 2.8% | ||||||||
| Amadeus IT Holding SA | 10,559 | 496,245 | ||||||
| NetEase, Inc. - ADR | 3,795 | 975,277 | ||||||
| Open Text Corp. | 2,500 | 155,344 | ||||||
| Sage Group PLC | 6,798 | 59,827 | ||||||
| SAP SE | 9,557 | 840,778 | ||||||
| SAP SE - ADR ^ | 1,238 | 108,746 | ||||||
| 2,636,217 | ||||||||
| TELECOMMUNICATIONS - 4.0% | ||||||||
| KDDI Corp. | 23,300 | 706,712 | ||||||
| KT Corp. - ADR | 5,497 | 87,897 | ||||||
| Nice Ltd. | 2,420 | 160,451 | ||||||
| Nice Ltd. - ADR | 1,240 | 82,423 | ||||||
| Nippon Telegraph & Telephone Corp. - ADR | 14,427 | 640,415 | ||||||
| Nippon Telegraph & Telephone Corp. | 7,800 | 345,120 | ||||||
| NTT DOCOMO, Inc. | 32,500 | 814,535 | ||||||
| NTT DOCOMO, Inc. - ADR | 1,558 | 39,168 | ||||||
| Telefonaktiebolaget LM Ericsson - ADR | 28,153 | 137,105 | ||||||
| Telekomunikasi Indonesia Persero Tbk PT | 1,285,200 | 414,957 | ||||||
| ZTE Corp. | 274,400 | 377,049 | ||||||
| 3,805,832 | ||||||||
| TEXTILES - 0.2% | ||||||||
| Formosa Taffeta Co. Ltd. | 203,000 | 184,947 | ||||||
| TRANSPORTATION - 0.8% | ||||||||
| Airports of Thailand PLC | 30,700 | 333,996 | ||||||
| Aurizon Holdings Ltd. | 27,572 | 102,186 | ||||||
| Rumo Logistica Operadora Multimodal SA * | 179,100 | 404,493 | ||||||
| Sinotrans Ltd. | 341,000 | 160,586 | ||||||
| 1,001,261 | ||||||||
| WATER - 0.6% | ||||||||
| Cia de Saneamento Basico do Estado de Sao Paulo | 52,200 | 555,661 | ||||||
| TOTAL COMMON STOCK (Cost - $86,526,655) | 92,120,842 | |||||||
| Security | Dividend Rate | Shares | Value | |||||||||
| PREFERRED STOCK - 1.5% | ||||||||||||
| AUTO MANUFACTURER - 0.5% | ||||||||||||
| Porsche Automobil Holding SE | 2.2000 | % | 9,046 | 488,141 | ||||||||
| BANKS - 0.2% | ||||||||||||
| Itau Unibanco Holding SA | 0.5200 | 13,390 | 162,752 | |||||||||
| ELECTRIC - 0.1% | ||||||||||||
| COMPANHIA ENERGETICA DE MINAS GERAIS | 3.6800 | 36,000 | 110,871 | |||||||||
| FOOD - 0.1% | ||||||||||||
| CJ CheilJedang Corp | 2.5500 | 362 | 55,603 | |||||||||
| HOUSEHOLD PRODUCTS - 0.2% | ||||||||||||
| Henkel AG & Co KGaA | 1.3600 | 1,434 | 184,053 | |||||||||
| MISCELLANEOUS MANUFACTURING - 0.1% | ||||||||||||
| Doosan Corp. | 4.6000 | 1,070 | 61,969 | |||||||||
| OIL & GAS - 0.2% | ||||||||||||
| PETROBRAS- PETROLEO BRAS | 0.0000 | 41,800 | 233,568 | |||||||||
| SEMICONDUCTORS - 0.1% | ||||||||||||
| Samsung Electronics Co., Ltd. | 1.6400 | 123 | 141,422 | |||||||||
| TOTAL PREFERRED STOCK (Cost - $1,248,202) | 1,438,379 | |||||||||||
| SHORT-TERM INVESTMENT - 1.7% | ||||||||||||
| MONEY MARKET FUND - 1.7% | ||||||||||||
| Fidelity Institutional Money Market Funds - Government | ||||||||||||
| Portfolio 0.27% +, ^^ (Cost - $1,628,390) | 1,628,390 | 1,628,390 | ||||||||||
| COLLATERAL FOR SECURITIES LOANED - 6.1% | ||||||||||||
| Mount Vernon Prime Portfolio 0.67% + (Cost - $5,780,012) | 5,780,012 | 5,780,012 | ||||||||||
| TOTAL INVESTMENTS - 105.8% (Cost - $95,183,259) | $ | 100,967,623 | ||||||||||
| LIABILITIES IN EXCESS OF OTHER ASSETS - (5.8)% | (5,539,512 | ) | ||||||||||
| NET ASSETS - 100.0% | $ | 95,428,111 | ||||||||||
| ^ | All or a portion of these securities are on loan. Total loaned securities had a value of $5,684,575 at October 31, 2016. |
| * | Non-income producing security. |
ADR - American Depositary Receipt.
GDR - Global Depositary Receipt.
NV - Non-Voting
REIT - Real Estate Investment Trust.
| + | Variable rate security. Interest rate is as of October 31, 2016. |
| ^^ | All or part of the security was held as collateral for forward foreign currency contracts outstanding as of October 31, 2016. |
See accompanying notes to financial statements.
60
| SCHEDULE OF INVESTMENTS |
| Dunham International Stock Fund (Continued) |
| October 31, 2016 |
| Portfolio Composition * - (Unaudited) | ||||||||||
| Britain | 11.9 | % | China | 5.2 | % | |||||
| Japan | 11.8 | % | South Korea | 5.1 | % | |||||
| United States | 8.1 | % | Taiwan | 4.6 | % | |||||
| Germany | 7.4 | % | France | 4.5 | % | |||||
| Switzerland | 6.3 | % | Other Countries | 29.7 | % | |||||
| Canada | 5.4 | % | Total | 100.0 | % | |||||
| * | Based on total value of investments as of October 31, 2016. |
Percentage may differ from Schedule of Investments which are based on Fund net assets.
See accompanying notes to financial statements.
61
Dunham Real Estate Stock Fund
Message from the Sub-Adviser (Barings Real Estate Advisers LLC)
The real estate investment trust (REIT) market had a positive fiscal year ended October 31, 2016, however a negative final three months pared some of the gains. Although the Sub-Adviser believes that historical data shows evidence that REIT fundamentals have not historically been driven by interest rates shifts, the sudden increase in rates over the most recent fiscal period may have pushed investors to dump REITs. Since 1996, REITs have been up in more rising rate periods than down. Over the final three months of the fiscal year, the 10-year Treasury rose 40 basis points to end at 1.83 percent. REITs, as measured by the FTSE NAREIT All REIT Index, increased 19.2 percent through the first three quarters of the fiscal year, but fell 9.3 percent in the final fiscal quarter. For the year, REITs increased 8.2 percent while other broad equity indexes, such as the S&P 500 Index increased 4.9 percent. In contrast to the previous fiscal year when the S&P 500 Index outperformed REITs by 0.4 percent.
The Sub-Adviser believes that the intrinsic value of a listed real estate company is a function of the quality of its real estate portfolio, management team, and capital plan. Achieving a thorough understanding of the real estate assets owned by an investment candidate is the foundation of establishing the value of that enterprise. Evaluating management’s ability to drive earnings and add value to underlying real estate assets is vital to the Sub-Adviser developing an understanding of the potential sustainable future success of the company. Assessing a firm’s financial structure within the context of the prevailing financial environment provides the Sub-Adviser with a framework to understand the risk and long-term potential of a firm’s business strategy. Over the three-month period ended October 31, 2016, industrial REITs, hotel REITs and apartment REITs contributed positively to the Fund. Sectors that detracted from performance over the three-month period were infrastructure REITs, and data center REITs.
The Fund’s largest sector overweight is dedicated to the industrial REIT sector. The industrial REIT sector contributed to Fund performance over the most recent fiscal year ended October 31, 2016. The contribution to performance was primarily attributed to the Fund’s allocation to this sector, as security selection slightly detracted. The Sub-Adviser believes that this sector’s performance has been driven by ecommerce companies attempting to take market share from brick and mortar stores. In order to accomplish this, it believes ecommerce companies must develop additional fulfillment centers. From 2013 to 2014, less than 10 fulfillment centers were active for ecommerce companies and the market is attempting to catch up. In this year alone, a single ecommerce company is on pace to add 20 new one million square foot fulfillment centers. One of the largest active overweights within the Fund is the position in Prologis, Inc. (PLD) (holding percentage*:6.63 percent). Prologis is the largest public and private operator of industrial properties in the world. Over the most recent fiscal quarter, Prologis released, what the Sub-Adviser believes is, a strong earnings report. This reports showed that rents are growing at a double digit pace as supply continues to be tame. Over the fiscal year ended October 31, 2016, Prologis, Inc. contributed to the Fund’s relative performance increasing 26.4 percent. The Sub-Adviser believes that the demand within the industrials sector will remain strong through the end of 2016 and 2017.
Although the manufactured homes REIT sector contributed positively to Fund performance on an absolute basis over the fiscal year, the allocation to this sector detracted from relative performance. The Fund’s underweight to this sector detracted from performance in the fiscal year ended October 31, 2016, however, the Fund’s stock selection slightly contributed. A position within this sector that detracted from Fund performance over the fiscal quarter was Sun Communities, Inc. (SUI) (holding percentage**:1.34 percent). Sun Communities, Inc. is a self-administered and self-managed REIT. The company operates in two segments: real property operations, and home sales and rentals. Before being eliminated from the Fund Sun Communities, Inc. (SUI) declined 3.3 percent, however over the fiscal year this position increased 17.3 percent. The Sub-Adviser believes that this sector has had a strong year as a result of very little new supply hitting the market while occupancy continued to increase. Manufactured homes also have attracted a large percentage of baby boomers as rent is reasonable relative to other options.
The apartment REIT sector outperformed most other REIT sectors for the second consecutive fiscal year. Both the Fund’s security selection and allocation within the apartment REIT sector contributed positively to Fund performance. Overall, exposure to the sector added approximately 0.5 percent. Apartment Investment and Management Company (ACC) (holding percentage*: 4.61 percent), a REIT that engages in on and off-campus housing properties within close proximity to colleges and universities, contributed positively with a 33.2 percent increase in the fiscal year ended October 31, 2016. After five consecutive quarters of an overweight to this sector, the Sub-Adviser began the second half of the fiscal year with an underweight to the apartment REIT sector. The Sub-Adviser believed that landlords were losing pricing power due to an increase in supply. The increase in supply was most evident in the New York and San Francisco markets. The Sub-Adviser added back to the allocation over the most recent fiscal quarter, resulting in a 2 percent overweight by July 31, 2016. The Sub-Adviser kept the overweight in place over the most recent fiscal quarter as it believes this sector will continue to do well.
Going forward, the Sub-Adviser is optimistic about REIT performance through the end of 2016 and into 2017. It also anticipates that equity markets will remain volatile as uncertainty remains for U.S. Fed policy, global growth uncertainty, volatility in commodities, and a stronger U.S. dollar. Economic growth, rising interest rates, and inflation may support real estate fundamentals, rent growth, and in turn help REITs. The Sub-Adviser believes that real estate fundamentals remain positive in the U.S. and in Europe, and that global valuations are currently attractive.
| * | Holdings percentage(s) as of 10/31/2016. |
Growth of $100,000 Investment
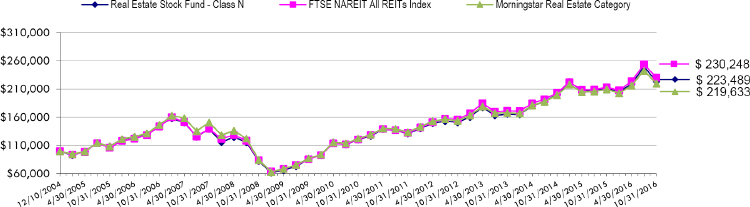
Total Returns as of October 31 2016
| One | Annualized | Annualized | Annualized | Annualized Since Inception | |||||||
| Year | Three Years | Five Years | Ten Years | (12/10/04) | |||||||
| Class N | 5.83% | 10.45% | 11.31% | 4.39% | 7.00% | ||||||
| Class C | 4.79% | 9.35% | 10.22% | 3.35% | 5.94% | ||||||
| Class A with load of 5.75% | (0.50)% | 8.00% | 9.73% | N/A | 3.50%* | ||||||
| Class A without load | 5.60% | 10.16% | 11.03% | N/A | 4.13%* | ||||||
| FTSE NAREIT All REITs Index | 8.06% | 10.31% | 11.73% | 4.81% | 7.26% | ||||||
| Morningstar Real Estate Category | 4.97% | 9.37% | 10.42% | 4.12% | 6.84% |
| * | Class A commenced operations on January 3, 2007. |
The FTSE NAREIT All REITs Index is a free float adjusted market capitalization weighted index that includes all tax qualified REITs listed on the NYSE and NASDAQ National Market. Investors cannot invest directly in an index or benchmark.
The Morningstar Real Estate Category is generally representative of mutual funds that primarily invest in REITS of various types. REITs are companies that develop and manage real estate properties.
As disclosed in the Trust’s latest registration statement, the Fund’s total annual operating expenses, including the cost of underlying funds, are 1.64% for Class N, 2.64% for Class C and 1.89% for Class A. Class A shares are subject to a sales load of 5.75% and a deferred sales charge of up to 0.75% The performance data quoted here represents past performance, which is not indicative of future results. Current performance may be lower or higher than the performance data quoted. The investment return and NAV will fluctuate, so that an investor’s shares, when redeemed, may be worth more or less than their original cost. Total returns are calculated assuming reinvestment of all dividends and capital gains distributions, if any. The returns do not reflect the deductions of taxes a shareholder would pay on the redemption of fund shares or fund distributions. For performance information current to the most recent month-end, please call 1-800-442-4358 or visit our website www.dunham.com
62
| SCHEDULE OF INVESTMENTS |
| Dunham Real Estate Stock Fund |
| October 31, 2016 |
| Security | Shares | Value | ||||||
| COMMON STOCK - 0.8% | ||||||||
| LODGING - 0.8% | ||||||||
| Hilton Worldwide Holdings, Inc. | 12,940 | $ | 292,444 | |||||
| TOTAL COMMON STOCK (Cost - $290,738) | ||||||||
| REITS - 97.5% | ||||||||
| APARTMENTS - 14.5% | ||||||||
| American Campus Communities, Inc. | 33,480 | 1,744,643 | ||||||
| AvalonBay Communities, Inc. ^ | 11,300 | 1,934,334 | ||||||
| Mid-America Apartment Communities, Inc. ^ | 12,250 | 1,136,188 | ||||||
| Post Properties, Inc. | 10,860 | 714,480 | ||||||
| 5,529,645 | ||||||||
| DATA CENTER - 7.3% | ||||||||
| CyrusOne, Inc. | 22,430 | 1,000,603 | ||||||
| Equinix, Inc. ^ | 4,190 | 1,497,003 | ||||||
| QTS Realty Trust, Inc. | 6,430 | 295,523 | ||||||
| 2,793,129 | ||||||||
| FREE STANDING - 3.8% | ||||||||
| Spirit Realty Capital, Inc. ^ | 83,200 | 990,912 | ||||||
| STORE Capital Corp. | 17,130 | 467,478 | ||||||
| 1,458,390 | ||||||||
| HEALTHCARE - 13.2% | ||||||||
| National Health Investors, Inc. | 6,170 | 467,438 | ||||||
| Physicians Realty Trust ^ | 41,850 | 827,374 | ||||||
| Ventas, Inc. ^ | 27,650 | 1,873,287 | ||||||
| Welltower, Inc. ^ | 26,950 | 1,846,883 | ||||||
| 5,014,982 | ||||||||
| HOTELS - 2.6% | ||||||||
| DiamondRock Hospitality Co. | 32,790 | 300,029 | ||||||
| FelCor Lodging Trust, Inc. ^ | 49,600 | 316,944 | ||||||
| Sunstone Hotel Investors, Inc. ^ | 28,890 | 362,858 | ||||||
| 979,831 | ||||||||
| INDUSTRIAL 11.6% | ||||||||
| Duke Realty Corp. | 37,010 | 967,811 | ||||||
| First Industrial Realty Trust, Inc. | 35,840 | 946,534 | ||||||
| Prologis, Inc. ^ | 48,100 | 2,508,896 | ||||||
| 4,423,241 | ||||||||
| OFFICE - 13.7% | ||||||||
| Boston Properties, Inc. ^ | 13,340 | 1,607,203 | ||||||
| Brandywine Realty Trust | 37,190 | 576,445 | ||||||
| Highwoods Properties, Inc. ^ | 13,600 | 674,968 | ||||||
| Hudson Pacific Properties, Inc. | 11,280 | 379,234 | ||||||
| Kilroy Realty Corp. ^ | 16,663 | 1,196,903 | ||||||
| Paramount Group Inc. | 49,260 | 765,993 | ||||||
| 5,200,746 | ||||||||
| Security | Shares | Value | ||||||
| REGIONAL MALLS - 12.9% | ||||||||
| Macerich Co. ^ | 20,580 | $ | 1,456,652 | |||||
| Simon Property Group, Inc. | 15,451 | 2,873,268 | ||||||
| Taubman Centers, Inc. | 7,990 | 578,955 | ||||||
| 4,908,875 | ||||||||
| SHOPPING CENTERS - 10.4% | ||||||||
| Acadia Realty Trust | 32,758 | 1,103,617 | ||||||
| Equity One, Inc. | 33,850 | 964,725 | ||||||
| Ramco-Gershenson Properties Trust ^ | 29,480 | 511,183 | ||||||
| Regency Centers Corp. | 12,530 | 903,037 | ||||||
| Tanger Factory Outlet Centers, Inc. ^ | 13,630 | 474,324 | ||||||
| 3,956,886 | ||||||||
| SINGLE FAMILY - 1.2% | ||||||||
| Colony Starwood Homes | 16,130 | 467,931 | ||||||
| SELF STORAGE - 3.6% | ||||||||
| Public Storage | 4,530 | 968,152 | ||||||
| Extra Space Storage | 5,220 | 381,843 | ||||||
| 1,349,995 | ||||||||
| SPECIALTY - 0.8% | ||||||||
| The GEO Group, Inc. | 12,640 | 302,855 | ||||||
| TIMBER - 1.9% | ||||||||
| Weyerhaeuser Co. ^ | 24,630 | 737,176 | ||||||
| TOTAL REITS (Cost - $32,638,224) | 37,123,682 | |||||||
| SHORT-TERM INVESTMENT - 1.4% | ||||||||
| MONEY MARKET FUND - 1.4% | ||||||||
| Fidelity Institutional Money Market, 0.27% + | 545,597 | 545,597 | ||||||
| TOTAL SHORT-TERM INVESTMENT (Cost - $545,597) | ||||||||
| COLLATERAL FOR SECURITIES LOANED -33.4% | ||||||||
| Mount Vernon Prime Portfolio 0.67% + (Cost - $12,692,392) | 12,692,392 | 12,692,392 | ||||||
| TOTAL INVESTMENTS - 133.1% (Cost - 46,166,951) | $ | 50,654,115 | ||||||
| LIABILITIES LESS OTHER ASSETS - (33.1)% | (12,588,546 | ) | ||||||
| TOTAL NET ASSETS - 100.00% | $ | 38,065,569 | ||||||
| ^ | All or a portion of these securities are on loan. Total loaned securities had a value of $12,573,071 at October 31, 2016. |
REITS - Real Estate Investment Trusts.
| + | Variable rate security. Interest rate is as of October 31, 2016. |
| Portfolio Composition * - (Unaudited) | ||||||||||
| Collateral for Securities Loaned | 25.3 | % | Free Standing | 2.9 | % | |||||
| Apartments | 11.0 | % | Hotels | 1.9 | % | |||||
| Office | 10.4 | % | Self Storage | 1.7 | % | |||||
| Healthcare | 10.0 | % | Timber | 1.5 | % | |||||
| Regional Malls | 9.8 | % | Single Family | 0.9 | % | |||||
| Industrial | 8.8 | % | Specialty | 0.6 | % | |||||
| Shopping Centers | 7.9 | % | Lodging | 0.6 | % | |||||
| Data Center | 5.6 | % | Short-Term Investment | 1.1 | % | |||||
| 100.0 | % | |||||||||
| * | Based on total value of investments as of October 31, 2016. |
Percentage may differ from Schedule of Investments which are based on Fund net assets.
See accompanying notes to financial statements.
63
| Dunham Small Cap Value Fund |
| Message from the Sub-Adviser (Piermont Capital Management LLC) |
Small cap value stocks, as measured by the Russell 2000 Value Index, rose by 8.8 percent in the 12-month period ended October 31, 2016. Small cap value and small cap growth stocks followed the same pattern over the fiscal year, showing negative returns in the first and fourth fiscal quarters, while producing nice gains in the second and third fiscal quarters. Comparatively, small cap growth stocks in the Russell 2000 Growth Index significantly underperformed small value stocks, returning a negative 0.5 percent over the fiscal year. On a broader level, small cap stocks, as measured by the Russell 2000 Index, underperformed large cap stocks, as measured by the S&P 500 Index. During the fiscal period, the Russell 2000 Index increased by 4.1 percent, while the S&P 500 Index rose 4.5 percent. Top performing sectors in the Fund included technology - services and utilities while the services – consumer and healthcare sectors lagged somewhat.
The Sub-Adviser’s strategy continued to focus on, what it believes to be, high quality firms, using 14 sector-specific models consisting of a combination of five to nine factors for each sector model, which measure both fundamental and technical metrics. Stocks must rank in the top 20 percent to be considered for purchase and also undergo a qualitative red flag review. The red flag review may include reviewing news stories that could adversely affect a stock, high turnover in senior management, and an accelerating debt ratio, among other factors. Another core premise of the strategy is that the Fund should remain sector and industry neutral, so as to avoid large risks by overweighting or underweighting a particular sector. This allows the Sub-Adviser to focus solely on picking the best stocks in each sector and industry rather than trying to predict macroeconomic trends. It is this complete bottom-up selection approach that makes the Sub-Adviser’s investment process somewhat unique.
Exposure to the technology – services sector had a decidedly positive impact on the Fund, as technology – services stocks held by the Sub-Adviser outperformed those within the benchmark by an astounding 33.3 percent. Tech stocks in the Fund increased 36.1 percent, the highest of any sector, while those contained in the index rose only 27.1 percent. With a weighting of more than 5 percent, this sector was a very important driver of performance. The stock that had the highest contribution to Fund performance over the entire fiscal year was TiVo Corporation (fka Rovi Corp.) (TIVO) (Holding Percentage**: 0.42 percent), a firm that specializes in entertainment technology and audience insights, offering services that allow viewers to record and control live television, customize viewing preferences, and access television shows. From the time the Sub-Adviser bought the stock on November 11, 2015, to the time the Sub-Adviser sold the stock on January 11, 2016, the stock gained 64.8 percent, adding 79 basis points to Fund performance.
Although stocks in the technology – hardware sector in the Fund underperformed the benchmark by 12.6 percent, the second highest contributing stock to Fund performance came from this sector. II-VI Incorporated (IIVI) (holding percentage*: 1.46 percent), designs, manufactures, and markets optical and optoelectronic devices used in laser processing, fiber-optic telecommunication, infrared missile guidance, advanced x-ray systems, and nuclear radiation detection, manufacturing its products in the United States, Singapore, China, Mexico, and Belgium. IIVI gained 53.4 percent over the fiscal year and contributed 57 basis points to the Fund’s performance. Not surprisingly, the worst performing stock over the fiscal year also came from the technology – hardware sector. OSI Systems, Inc. (OSIS) (holding percentage**: 0.33 percent) produces medical monitoring and anesthesia systems; security and inspection systems; and lasers, optics, and optoelectronic components. The stock was down 41.4 percent from the beginning of the fiscal year to May 24, 2016, at which time the Sub-Adviser sold the stock. OSIS detracted 71 basis points from Fund performance over the fiscal year.
Stocks in the healthcare sector, the second worst performing sector for the Fund, underperformed stocks in the benchmark by 16.5 percent over the fiscal year. A stock that detracted from Fund performance was Progenics Pharmaceuticals, Inc. (PGNX) (holding percentage**: 0.05 percent), a biopharmaceutical company that develops and distributes therapeutic products to treat the unmet medical needs of patients with debilitating conditions and life-threatening diseases. Detracting 49 basis points from Fund performance over the fiscal year, the stock was down 35.1 percent from the beginning of the fiscal year until April 8, 2016, at which time the Sub-Adviser sold the stock.
Going forward, the Sub-Adviser plans to continue its sector-, beta-, and market-capitalization-neutral bottom-up stock picking strategy without regard to outside economic factors, interest rate changes, or any other top-down methodology. The qualitative review of small-cap stocks that meet the criteria for consideration for investment within the Fund may, however, lead the Sub-Adviser to consider the impact of macro-economic factors when assessing various risks specific to each company. The Sub-Adviser will continue to analyze its multi-factor model, only making adjustments when it is deemed that a particular metric is no longer working properly or it is found that a new fundamental or technical indicator may be more useful.
| * | Holdings percentage(s) as of 10/31/2016. |
| ** | Holdings percentage(s) as of the date prior to the sale of the security. |
Growth of $100,000 Investment
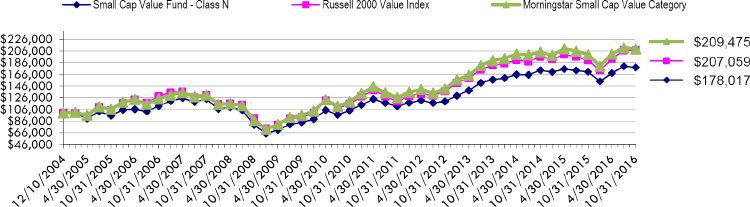
Total Returns as of October 31, 2016
| Annualized Since | |||||||||||
| Annualized | Annualized | Annualized | Inception | ||||||||
| One Year | Three Years | Five Years | Ten Years | (12/10/04) | |||||||
| Class N | 4.58% | 4.29% | 9.82% | 4.77% | 4.97% | ||||||
| Class C | 3.52% | 3.28% | 8.73% | 3.73% | 3.94% | ||||||
| Class A with load of 5.75% | (1.71)% | 2.02% | 8.31% | N/A | 3.41%* | ||||||
| Class A without load | 4.33% | 4.06% | 9.59% | N/A | 4.03%* | ||||||
| Russell 2000 Value Index | 8.81% | 4.47% | 11.63% | 4.91% | 6.31% | ||||||
| Morningstar Small Cap Value Category | 4.74% | 3.33% | 10.70% | 5.38% | 6.41% |
| * | Class A commenced operations on January 3, 2007. |
The Russell 2000 Value Index is an unmanaged index that measures the performance of small cap companies in the Russell 2000 Index with lower price-to-book ratios and lower forecasted growth rates. Investors cannot invest directly in an index or benchmark.
The Morningstar Small Cap Value Category is generally representative of mutual funds that primarily invest in small (small capitalization) U.S. companies that are less expensive or growing more slowly than other small-cap stocks.
As disclosed in the Trust’s latest registration statement, the Fund’s total annual operating expenses, including underlying funds, are 1.80% for Class N, 2.80% for Class C and 2.05% for Class A. Class A shares are subject to a sales load of 5.75% and a deferred sales charge of up to 0.75%. The performance data quoted here represents past performance, which is not indicative of future results. Current performance may be lower or higher than the performance data quoted. The investment return and NAV will fluctuate, so that an investor’s shares, when redeemed, may be worth more or less than their original cost. Total returns are calculated assuming reinvestment of all dividends and capital gains distributions, if any. The returns do not reflect the deductions of taxes a shareholder would pay on the redemption of fund shares or fund distributions. For performance information current to the most recent month-end, please call 1-800-442-4358 or visit our website www.dunham.com.
64
| SCHEDULE OF INVESTMENTS |
| Dunham Small Cap Value Fund |
| October 31, 2016 |
| Security | Shares | Value | ||||||
| COMMON STOCK - 99.0 % | ||||||||
| AUTO PARTS & EQUIPMENT - 2.1 % | ||||||||
| Cooper Tire & Rubber Co. | 9,487 | $ | 348,647 | |||||
| Superior Industries International, Inc. ^ | 9,786 | 239,757 | ||||||
| 588,404 | ||||||||
| BANKS - 17.6 % | ||||||||
| Camden National Corp. | 4,800 | 158,496 | ||||||
| CenterState Banks, Inc. | 7,466 | 139,465 | ||||||
| Central Pacific Financial Corp. | 12,519 | 320,862 | ||||||
| Customers Bancorp, Inc. * | 5,607 | 151,781 | ||||||
| First Citizens BancShares, Inc. - Class B | 1,110 | 323,010 | ||||||
| First Financial Corp. | 1,828 | 73,303 | ||||||
| First Horizon National Corp. | 20,750 | 319,757 | ||||||
| First Interstate BancSystem, Inc. ^ | 8,468 | 270,129 | ||||||
| Great Western Bancorp, Inc. ^ | 9,457 | 304,894 | ||||||
| Heartland Financial USA, Inc. | 5,560 | 208,222 | ||||||
| IBERIABANK Corp. | 4,870 | 319,715 | ||||||
| Old National Bancorp ^ | 22,810 | 335,307 | ||||||
| Peoples Bancorp, Inc. | 4,730 | 117,162 | ||||||
| Prosperity Bancshares, Inc. | 5,990 | 332,265 | ||||||
| Renasant Corp. | 8,720 | 294,213 | ||||||
| Simmons First National Corp. | 4,970 | 245,270 | ||||||
| State Bank Financial Corp. | 3,592 | 79,204 | ||||||
| TriCo Bancshares | 5,993 | 157,736 | ||||||
| Umpqua Holdings Corp. ^ | 20,280 | 309,878 | ||||||
| United Community Banks, Inc. | 15,539 | 335,176 | ||||||
| WesBanco, Inc. | 5,786 | 190,417 | ||||||
| 4,986,262 | ||||||||
| BIOTECHNOLOGY - 1.0 % | ||||||||
| Five Prime Therapeutics, Inc. * | 2,809 | 136,321 | ||||||
| Spectrum Pharmaceuticals, Inc. * | 39,352 | 139,306 | ||||||
| 275,627 | ||||||||
| CHEMICALS - 2.7 % | ||||||||
| Cabot Corp. | 4,508 | 235,047 | ||||||
| Innophos Holdings, Inc. | 6,579 | 301,581 | ||||||
| OMNOVA Solutions, Inc. * | 28,320 | 215,232 | ||||||
| 751,860 | ||||||||
| COMMERCIAL SERVICES - 5.9 % | ||||||||
| CRA International, Inc. * | 5,985 | 186,373 | ||||||
| Ennis, Inc. | 10,200 | 149,430 | ||||||
| Green Dot Corp. * | 9,200 | 204,240 | ||||||
| Huron Consulting Group, Inc. * | 4,861 | 272,459 | ||||||
| LendingTree, Inc. ^* | 3,100 | 247,535 | ||||||
| McGrath RentCorp ^ | 11,227 | 337,933 | ||||||
| Quad/Graphics, Inc. | 10,940 | 259,934 | ||||||
| 1,657,904 | ||||||||
| COMPUTERS - 3.9 % | ||||||||
| DST Systems, Inc. | 3,070 | 295,211 | ||||||
| Insight Enterprises, Inc. * | 12,460 | 358,723 | ||||||
| Mentor Graphics Corp. ^ | 15,190 | 438,991 | ||||||
| 1,092,925 | ||||||||
| DISTRIBUTION/WHOLESALE - 0.6 % | ||||||||
| Fossil Group, Inc. ^* | 6,680 | 182,164 | ||||||
| DIVERSIFIED FINANCIAL SERVICES - 2.3 % | ||||||||
| KCG Holdings, Inc. | 23,423 | 298,877 | ||||||
| Piper Jaffray Cos. ^* | 6,256 | 353,777 | ||||||
| 652,654 | ||||||||
| ELECTRIC - 2.9 % | ||||||||
| Hawaiian Electric Industries, Inc. | 9,900 | 292,050 | ||||||
| NRG Energy, Inc. | 17,300 | 183,899 | ||||||
| PNM Resources, Inc. ^ | 10,190 | 334,741 | ||||||
| 810,690 | ||||||||
| ELECTRICAL COMPONENTS & EQUIPMENT - 0.9 % | ||||||||
| EnerSys | 4,080 | 265,730 | ||||||
| Security | Shares | Value | ||||||
| ELECTRONICS - 2.4 % | ||||||||
| FARO Technologies, Inc. * | 8,265 | $ | 277,291 | |||||
| II-VI, Inc. * | 14,840 | 412,552 | ||||||
| 689,843 | ||||||||
| ENGINEERING & CONSTRUCTION - 1.9 % | ||||||||
| KBR, Inc. | 20,120 | 297,977 | ||||||
| Tutor Perini Corp. ^* | 12,360 | 235,458 | ||||||
| 533,435 | ||||||||
| ENTERTAINMENT - 0.8 % | ||||||||
| International Speedway Corp. | 7,104 | 233,722 | ||||||
| FOOD - 2.1 % | ||||||||
| John B Sanfilippo & Son, Inc. ^ | 5,716 | 289,687 | ||||||
| Lancaster Colony Corp. ^ | 2,330 | 304,414 | ||||||
| 594,101 | ||||||||
| GAS - 2.5 % | ||||||||
| Southwest Gas Corp. ^ | 5,910 | 428,239 | ||||||
| Spire, Inc. | 4,550 | 285,740 | ||||||
| 713,979 | ||||||||
| HAND / MACHINE TOOLS - 1.0 % | ||||||||
| Regal Beloit Corp. ^ | 5,030 | 297,273 | ||||||
| HEALTHCARE - PRODUCTS - 2.0 % | ||||||||
| Haemonetics Corp. * | 8,350 | 278,974 | ||||||
| OraSure Technologies, Inc. * | 36,842 | 276,683 | ||||||
| 555,657 | ||||||||
| HEALTHCARE - SERVICES - 1.0 % | ||||||||
| LifePoint Health, Inc. * | 4,800 | 287,280 | ||||||
| HOME BUILDERS- 1.6 % | ||||||||
| M/I Homes, Inc. * | 10,658 | 229,254 | ||||||
| Taylor Morrison Home Corp. * | 13,000 | 221,780 | ||||||
| 451,034 | ||||||||
| HOUSEHOLD PRODUCTS / WARES - 1.6 % | ||||||||
| ACCO Brands Corp. ^* | 23,869 | 264,946 | ||||||
| Central Garden & Pet Co. ^* | 8,227 | 200,081 | ||||||
| 465,027 | ||||||||
| INSURANCE - 5.3 % | ||||||||
| American Equity Investment Life Holding Co. ^ | 19,136 | 343,108 | ||||||
| Aspen Insurance Holdings Ltd. | 5,750 | 277,438 | ||||||
| Maiden Holdings Ltd. ^ | 21,107 | 288,111 | ||||||
| ProAssurance Corp. | 5,400 | 287,820 | ||||||
| Selective Insurance Group, Inc. | 8,597 | 317,659 | ||||||
| 1,514,136 | ||||||||
| INTERNET - 0.7 % | ||||||||
| FTD Cos, Inc. ^* | 9,200 | 185,104 | ||||||
| IRON / STEEL - 0.8 % | ||||||||
| Commercial Metals Co. ^ | 13,980 | 219,626 | ||||||
| LODGING - 0.4 % | ||||||||
| La Quinta Holdings, Inc. * | 12,790 | 128,028 | ||||||
| METAL FABRICATE / HARDWARE - 1.1 % | ||||||||
| Timken Co. ^ | 9,050 | 299,103 | ||||||
| MISCELLANEOUS MANUFACTURING - 2.4 % | ||||||||
| ITT Corp. | 9,090 | 320,150 | ||||||
| Lydall, Inc. | 7,800 | 364,650 | ||||||
| 684,800 | ||||||||
| OFFICE FURNISHINGS - 1.0 % | ||||||||
| Interface, Inc. | 17,900 | 283,715 | ||||||
See accompanying notes to financial statements.
65
| SCHEDULE OF INVESTMENTS |
| Dunham Small Cap Value Fund (Continued) |
| October 31, 2016 |
| Security | Shares | Value | ||||||
| OIL & GAS - 3.2 % | ||||||||
| Diamond Offshore Drilling, Inc. ^ | 10,300 | $ | 169,847 | |||||
| Murphy USA, Inc. ^ | 4,211 | 289,633 | ||||||
| SM Energy Co. ^ | 6,100 | 205,143 | ||||||
| Unit Corp. * | 13,678 | 234,304 | ||||||
| 898,927 | ||||||||
| OIL & GAS SERVICES - 2.4 % | ||||||||
| Flotek Industries, Inc. ^* | 21,156 | 249,218 | ||||||
| Gulf Island Fabrication, Inc. | 11,440 | 114,400 | ||||||
| Oceaneering International, Inc. ^ | 6,840 | 162,792 | ||||||
| TETRA Technologies, Inc. * | 29,500 | 160,775 | ||||||
| 687,185 | ||||||||
| PHARMACEUTICALS - 0.7 % | ||||||||
| Anika Therpeutics, Inc. * | 4,273 | 189,550 | ||||||
| REITS - 12.2 % | ||||||||
| Cousins Properties, Inc. ^ | 33,480 | 260,140 | ||||||
| DCT Industrial Trust, Inc. | 7,664 | 358,292 | ||||||
| Invesco Mortgage Capital, Inc. | 20,700 | 309,051 | ||||||
| Mack-Cali Realty Corp. ^ | 11,000 | 282,480 | ||||||
| Pebblebrook Hotel Trust ^ | 11,366 | 275,966 | ||||||
| Pennsylvania Real Estate Investment Trust ^ | 12,930 | 252,264 | ||||||
| Piedmont Office Realty Trust, Inc. | 15,545 | 318,362 | ||||||
| PS Business Parks, Inc. ^ | 2,800 | 307,412 | ||||||
| Ramco-Gershenson Properties Trust ^ | 16,500 | 286,110 | ||||||
| Summit Hotel Properties, Inc. | 21,310 | 276,817 | ||||||
| Washington Real Estate Investment Trust | 10,120 | 297,730 | ||||||
| Whitestone REIT | 16,400 | 218,120 | ||||||
| 3,442,744 | ||||||||
| RETAIL - 2.4 % | ||||||||
| Abercrombie & Fitch Co. | 8,170 | 119,364 | ||||||
| American Eagle Outfitters, Inc. ^ | 18,160 | 309,446 | ||||||
| DineEquity, Inc. | 3,316 | 262,296 | ||||||
| 691,106 | ||||||||
| SAVINGS & LOANS - 2.8 % | ||||||||
| First Defiance Financial Corp. | 3,173 | 125,270 | ||||||
| Flagstar Bancorp, Inc. * | 7,982 | 218,946 | ||||||
| HomeStreet, Inc. * | 12,335 | 339,829 | ||||||
| OceanFirst Financial Corp. ^ | 5,105 | 105,571 | ||||||
| 789,616 | ||||||||
| Security | Shares | Value | ||||||
| SEMICONDUCTORS - 2.4 % | ||||||||
| Nanometrics, Inc. * | 11,862 | $ | 247,797 | |||||
| Teradyne, Inc. | 13,200 | 307,428 | ||||||
| Xcerra Corp. * | 22,751 | 125,358 | ||||||
| 680,583 | ||||||||
| SOFTWARE - 1.3 % | ||||||||
| MicroStrategy, Inc. ^* | 1,860 | 362,347 | ||||||
| TELECOMMUNICATIONS - 2.2 % | ||||||||
| Ixia * | 11,000 | 131,451 | ||||||
| Sonus Networks, Inc. * | 16,000 | 92,640 | ||||||
| Spok Holdings, Inc. | 10,330 | 186,457 | ||||||
| West Corp. | 10,880 | 214,554 | ||||||
| 625,102 | ||||||||
| TRANSPORTATION - 0.9 % | ||||||||
| Hub Group, Inc. * | 7,150 | 260,617 | ||||||
| TOTAL COMMON STOCK - (Cost - $27,230,957) | 28,027,860 | |||||||
| SHORT-TERM INVESTMENT - 1.0 % | ||||||||
| MONEY MARKET FUND - 1.0 % | ||||||||
| Invesco STIT-Treasury Portfolio Institutional - 0.25% + | 270,538 | 270,538 | ||||||
| (Cost - $270,538) | ||||||||
| COLLATERAL FOR SECURITIES LOANED - 29.8 % | ||||||||
| Mount Vernon Prime Portfolio 0.67% + | 8,419,723 | 8,419,723 | ||||||
| (Cost - $8,419,723) | ||||||||
| TOTAL INVESTMENTS - 129.8 % (Cost - $35,921,218) | $ | 36,718,121 | ||||||
| LIABILITIES IN EXCESS OF OTHER ASSETS - (29.8) % | (8,420,463 | ) | ||||||
| NET ASSETS - 100.0% | $ | 28,297,658 | ||||||
REIT - Real Estate Investment Trust
| ^ | All or a portion of these securities are on loan. Total loaned securities had a value of $8,271,513 at October 31, 2016. |
| * | Non Income producing security. |
| + | Variable rate security - interest rate is as October 31, 2016. |
Portfolio Composition * - (Unaudited)
| Financial | 31.0 | % | Energy | 4.3 | % | |||||
| Collateral for Securities Loaned | 22.9 | % | Utilities | 4.2 | % | |||||
| Consumer, Non-Cyclical | 11.0 | % | Basic Materials | 2.7 | % | |||||
| Industrial | 8.2 | % | Communications | 2.2 | % | |||||
| Consumer, Cyclical | 7.0 | % | Short-Term Investment | 0.7 | % | |||||
| Technology | 5.8 | % | Total | 100.0 | % |
| * | Based on total value of investments as of October 31, 2016. |
Percentage may differ from Schedule of Investments which are based on Fund net assets.
See accompanying notes to financial statements.
66
| Dunham Emerging Markets Stock Fund |
| Message from the Sub-Adviser (Bailard, Inc.) |
Emerging market equities, as measured by the MSCI Emerging Markets Index, had a volatile fiscal year ended October 31, 2016, gaining 9.3 percent. With various geopolitical concerns and volatile commodity prices during the first six months of the fiscal period, emerging market equities decreased 0.1 percent. In the final six months of the fiscal period emerging markets surged 9.4 percent as oil volatility calmed. The index outperformed its U.S. counterpart, as measured by the S&P 500 Index, which increased 4.5 percent over the fiscal year.
The Sub-Adviser continued to focus on individual countries and bottom-up stock selection within those countries, with overweights or underweights to economic sectors being largely incidental. On an absolute basis, top performing countries in the Fund included Taiwan, Russia, and Hungary, while Vietnam, Turkey, and South Africa lagged. For the fiscal year, overall country selection benefited performance while stock selection detracted relative to the benchmark index.
The largest country allocation within the Fund was the allocation to Chinese equities, which contributed through both stock and country selection. A Chinese holding that contributed to the Fund’s positive performance was NetEase Inc. ADR (NTES) (holding percentage*: 2.74 percent), an internet technology company that develops applications, services and other internet technologies. Its core businesses consist of e-mail service, web portal and online entertainment, including online gaming services. The company also offers online advertising, search, mobile applications, and e-commerce. The Sub-Adviser attributes positive performance to the production of multiple popular video games as well as better monetization of the company’s smaller assets. This holding rose 80.6 percent during the fiscal quarter. Another Chinese holding, Geely Automobile Holdings Ltd. (175 HK) (holding percentage* 1.19 percent), which manufactures and sells automobiles and related components, was a contributor to the Fund over the fiscal year. The holding gained 93.6 percent through the fiscal year.
The allocation to Taiwan within the Fund added to absolute returns, with the Fund’s stock selection contributing and country selection detracting from Fund performance. A contributor was Micro-Star International Co. (2377 TT) (holding percentage*: 0.87 percent), a company that manufactures and markets motherboards and video graphic accelerator cards. Micro-Star exports products to Europe, North America, and other Asian countries. The Sub-Adviser believes outperformance by the company was linked to sales of its high-end graphics cards. The holding was purchased in the beginning of April and gained 90.1 percent through the end of the fiscal year. The Fund allocation to Russia benefited on a relative and absolute basis, as stock and country selection added to performance. A holding that contributed to performance over the fiscal year was Severstal PJSC (SVST LI) (holding percentage*: 1.55 percent), which is a steel and mining company that has three main business divisions in resources, Russian steel, and international business operations. Severstal PSCJ was purchased near the end of April and gained 30.6 percent over the rest of the fiscal year.
As mentioned above, the Fund’s allocation to South Africa detracted from Fund performance. The country allocation aided performance while the stock selection detracted. A holding that still eked out positive performance from the country was Gold Fields Ltd. (GFI SJ) (holding percentage*: 0.55 percent), a gold producer with annualized production of approximately 2 million gold equivalent ounces from six operating mines in Australia, Ghana, Peru, and South Africa. The company also has four major projects at the resource development or feasibility levels. The Sub-Adviser believes a weakening in the price of gold during the fiscal year and a decline in the company’s output caused the holding to underperform relative to other holdings in the Fund. Gold Fields Ltd. was added to the Fund mid-January and gained 5.4 percent through the fiscal year. The allocation to Turkey also detracted from performance, on a stock and country basis. A Turkish holding that declined was Turk Hava Yollari AO (THYAO TI) (holding percentage**: 0.61 percent), also known as Turkish Airlines, which provides passenger and cargo air transportation services. The position was initiated in mid-December of 2015 and exited near the beginning of May, declining 24.8 percent during the time period.
Going forward, the Sub-Adviser is optimistic for emerging markets companies and believes value can be found. The Sub-Adviser has seen stronger performance in Asia and believes investors will rotate to focus on investing with more countries in the area. They attribute this improved growth in Asia to a concentration on building out infrastructure. The Sub-Adviser believes that favorable prices in commodities have allowed the boom in infrastructure. China is still a concern as its issues may never go away, in terms of growth, but investors are getting accustomed to this slowdown. The Sub-Adviser believes that growth in emerging markets stocks has been promoted by companies focusing on expanding businesses rather than strong earnings reports. They conclude that this will allow emerging markets to outperform in comparison to global markets, which may provide a strong opportunity for investors. Additionally, political change all over the world will need to be monitored closely as these changes could potentially contribute to the volatility of many emerging markets countries.
| * | Holdings percentage(s) as of 10/31/2016. |
| ** | Holdings percentage(s) as of the date prior to the sale of the security. |
Growth of $100,000 Investment
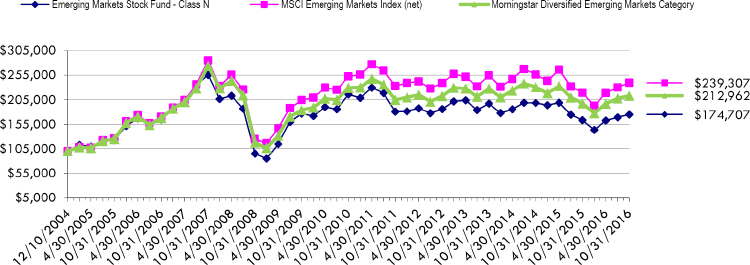
Total Returns as of October 31, 2016
| Annualized | Annualized | Annualized | Annualized Since Inception | ||||||||
| One Year | Three Years | Five Years | Ten Years | (12/10/04) | |||||||
| Class N | 7.13.% | (3.93)% | (0.65)% | 0.63% | 4.80% | ||||||
| Class C | 6.10% | (4.90)% | 1.63)% | (0.37)% | 3.78% | ||||||
| Class A with load of 5.75% | 0.73% | (6.06)% | (2.05)% | N/A | (1.41)%* | ||||||
| Class A without load | 6.84% | (4.18)% | (0.88)% | N/A | (0.82)%* | ||||||
| MSCI Emerging Markets Index (net) | 9.27% | (2.05)% | 0.55% | 3.49% | 7.61% | ||||||
| Morningstar Diversified Emerging Markets Category | 7.89% | (2.18)% | 0.82% | 2.44% | 6.56% |
| * | Class A commenced operations on January 3, 2007. |
The MSCI Emerging Markets Index (net) is a free float-adjusted market capitalization index that is designed to measure equity market performance in the global emerging markets. Investors cannot invest directly in an index or benchmark.
The Morningstar Diversified Emerging Markets Category is generally representative of mutual funds that primarily invest among 20 or more developing nations, with a general focus on the emerging markets of Asia and Latin America rather than on the emerging markets countries in the Middle East, Africa, or Europe.
As disclosed in the Trust’s latest registration statement, the Fund’s total annual operating expenses, including underlying funds, are 1.80% for Class N, 2.80% for Class C and 2.05% for Class A. Class A shares are subject to a sales load of 5.75% and a deferred sales charge of up to 0.75%. The performance data quoted here represents past performance, which is not indicative of future results. Current performance may be lower or higher than the performance data quoted. The investment return and NAV will fluctuate, so that an investor’s shares, when redeemed, may be worth more or less than their original cost. Total returns are calculated assuming reinvestment of all dividends and capital gains distributions, if any. The returns do not reflect the deductions of taxes a shareholder would pay on the redemption of fund shares or fund distributions. For performance information current to the most recent month-end, please call 1-800-442-4358 or visit our website www.dunham.com.
67
| SCHEDULE OF INVESTMENTS |
| Dunham Emerging Markets Stock Fund |
| October 31, 2016 |
| Security | Shares | Value | ||||||
| COMMON STOCK - 96.1 % | ||||||||
| ADVERTISING - 0.4 % | ||||||||
| Smiles SA | 12,000 | $ | 221,362 | |||||
| AGRICULTURE - 1.4 % | ||||||||
| Adecoagro SA * | 30,000 | 330,000 | ||||||
| KT&G Corp. | 4,500 | 443,836 | ||||||
| 773,836 | ||||||||
| APPAREL - 0.6 % | ||||||||
| Peak Sport Products Co. Ltd. | 1,000,000 | 332,999 | ||||||
| AUTO MANUFACTURERS - 1.2 % | ||||||||
| Geely Automobile Holdings Ltd. | 650,000 | 668,879 | ||||||
| BANKS - 20.0 % | ||||||||
| Akbank TAS | 100,000 | 267,417 | ||||||
| Banco Bradesco SA - ADR | 40,000 | 416,400 | ||||||
| Banco Macro SA -ADR | 7,000 | 533,610 | ||||||
| Bank Rakyat Indonesia Persero Tbk PT | 570,000 | 532,249 | ||||||
| Bank Tabungan Negara Persero Tbk PT | 2,000,000 | 292,539 | ||||||
| China Construction Bank Corp. | 1,250,000 | 912,891 | ||||||
| China Merchants Bank Co. Ltd. | 170,000 | 413,434 | ||||||
| Commercial International Bank Egypt SAE - GDR | 274,999 | 1,215,496 | ||||||
| Credicorp Ltd. | 5,000 | 743,400 | ||||||
| FirstRand Ltd. | 150,000 | 537,915 | ||||||
| Industrial & Commercial Bank of China Ltd. | 600,000 | 360,176 | ||||||
| Kasikornbank PCL - NVDR | 65,000 | 319,060 | ||||||
| Krung Thai Bank PCL - NVDR | 1,500,000 | 736,684 | ||||||
| National Bank of Pakistan | 750,000 | 513,906 | ||||||
| OTP Bank PLC | 53,000 | 1,486,360 | ||||||
| Sberbank of Russia - ADR | 120,000 | 1,140,000 | ||||||
| Woori Bank | 45,000 | 490,416 | ||||||
| Yapi ve Kredi Bankasi AS * | 250,000 | 299,072 | ||||||
| 11,211,025 | ||||||||
| CHEMICALS - 5.1 % | ||||||||
| Engro Corp Ltd./Pakistan | 300,000 | 798,888 | ||||||
| Formosa Chemicals & Fibre Corp. | 100,000 | 296,901 | ||||||
| Kingboard Chemical Holdings Ltd. | 225,000 | 665,172 | ||||||
| Lotte Chemical Corp. | 2,000 | 502,505 | ||||||
| UPL Ltd. | 60,000 | 627,868 | ||||||
| 2,891,334 | ||||||||
| COAL - 1.0 % | ||||||||
| Adaro Energy Tbk PT | 3,000,000 | 364,203 | ||||||
| Coal India Ltd. | 40,000 | 194,749 | ||||||
| 558,952 | ||||||||
| COMMERCIAL SERVICES - 1.4 % | ||||||||
| Qualicorp SA | 75,000 | 488,731 | ||||||
| Zhejiang Expressway Co., Ltd. | 300,000 | 314,113 | ||||||
| 802,844 | ||||||||
| COMPUTERS - 1.7 % | ||||||||
| Infosys Ltd. - ADR | 25,000 | 381,500 | ||||||
| Lite-On Technology Corp. | 400,000 | 573,440 | ||||||
| 954,940 | ||||||||
| DISTRIBUTION / WHOLESALE - 1.1 % | ||||||||
| Hanwha Corp. | 19,500 | 635,084 | ||||||
| DIVERSIFIED FINANCIAL SERVICES - 2.3 % | ||||||||
| BM&FBovespa SA - Bolsa de Valores Mercadorias e Futuros | 100,000 | 592,258 | ||||||
| Fubon Financial Holding Co. Ltd. | 200,000 | 282,982 | ||||||
| Hana Financial Group, Inc. | 15,000 | 429,033 | ||||||
| 1,304,273 | ||||||||
| ELECTRIC - 1.3 % | ||||||||
| Korea Electric Power Corp. | 10,000 | 432,607 | ||||||
| Transmissora Alianca de Energia Eletrica SA | 48,000 | 312,333 | ||||||
| 744,940 | ||||||||
| Security | Shares | Value | ||||||
| ELECTRICAL COMPONENTS & EQUIPMENT - 1.5 % | ||||||||
| China High Speed Transmission Equipment Group Co. Ltd. | 350,000 | $ | 362,808 | |||||
| LG Electronics, Inc. | 12,000 | 500,248 | ||||||
| 863,056 | ||||||||
| ELECTRONICS - 3.1 % | ||||||||
| Hon Hai Precision Industry Co. Ltd. | 462,000 | 1,247,938 | ||||||
| Micro-Star International Co. Ltd. | 170,000 | 489,056 | ||||||
| 1,736,994 | ||||||||
| ENGINEERING & CONSTRUCTION - 0.5 % | ||||||||
| Airports of Thailand PLC - NVDR | 25,000 | 271,984 | ||||||
| FOOD - 3.8 % | ||||||||
| Charoen Pokphand Foods PCL - NVDR | 600,000 | 539,597 | ||||||
| Indofood CBP Sukses Makmur Tbk PT | 600,000 | 432,192 | ||||||
| M Dias Branco SA | 6,500 | 279,599 | ||||||
| Sao Martinho SA | 25,000 | 503,893 | ||||||
| SPAR Group Ltd. | 25,000 | 354,479 | ||||||
| 2,109,760 | ||||||||
| FOREST PRODUCTS & PAPER - 0.8 % | ||||||||
| Mondi Ltd. | 22,500 | 439,544 | ||||||
| HOLDING COMPANIES - DIVERSIFIED - 1.1 % | ||||||||
| Siam Cement PCL - NVDR | 25,000 | 356,993 | ||||||
| Tekfen Holding AS | 100,000 | 253,539 | ||||||
| 610,532 | ||||||||
| HOME BUILDERS - 0.5 % | ||||||||
| MRV Engenharia e Participacoes SA | 75,000 | 291,391 | ||||||
| HOME FURNISHINGS - 0.9 % | ||||||||
| Steinhoff International Holdings Ltd. | 95,000 | 512,541 | ||||||
| INSURANCE - 1.0 % | ||||||||
| China Life Insurance Co. Ltd. | 600,000 | 553,059 | ||||||
| INTERNET- 2.4 % | ||||||||
| Tencent Holdings Ltd. | 50,000 | 1,325,236 | ||||||
| IRON / STEEL- 1.6 % | ||||||||
| Severstal PAO - GDR | 62,000 | 874,200 | ||||||
| LEISURE TIME - 0.6 % | ||||||||
| Bajaj Auto Ltd. | 8,000 | 341,539 | ||||||
| MEDIA - 0.4 % | ||||||||
| Naspers Ltd. | 1,500 | 251,244 | ||||||
| MINING - 1.6 % | ||||||||
| Cia de Minas Buenaventura SAA - ADR | 45,000 | 598,050 | ||||||
| Gold Fields Ltd. - ADR | 75,000 | 311,250 | ||||||
| 909,300 | ||||||||
| OIL & GAS - 9.4 % | ||||||||
| Cosan SA Industria e Comercio | 67,500 | 910,632 | ||||||
| Gazprom OAO - ADR | 220,000 | 952,600 | ||||||
| Lukoil OAO - ADR | 37,000 | 1,803,750 | ||||||
| MOL Hungarian Oil & Gas PLC | 7,500 | 481,402 | ||||||
| Pakistan Petroleum Ltd. | 200,000 | 282,667 | ||||||
| PTT PCL - NVDR | 40,000 | 393,851 | ||||||
| SK Innovation Co. Ltd. | 3,500 | 460,720 | ||||||
| 5,285,622 | ||||||||
| PACKAGING & CONTAINERS - 0.7 % | ||||||||
| Lee & Man Paper Manufacturing Ltd. | 500,000 | 375,721 | ||||||
See accompanying notes to financial statements.
68
| SCHEDULE OF INVESTMENTS |
| Dunham Emerging Markets Stock Fund (Continued) |
| October 31, 2016 |
| Security | Shares | Value | ||||||
| PHARMACEUTICALS - 1.5 % | ||||||||
| Richter Gedeon Nyrt | 25,000 | $ | 537,069 | |||||
| Sinopharm Group Co. Ltd. | 66,800 | 324,410 | ||||||
| 861,479 | ||||||||
| REAL ESTATE - 3.8 % | ||||||||
| China Overseas Land & Investment Ltd. | 160,000 | 491,227 | ||||||
| Country Garden Holdings Co. Ltd. | 750,000 | 389,261 | ||||||
| Emlak Konut Gayrimenkul Yatirim Ortakligi AS - REIT | 220,000 | 224,508 | ||||||
| Guangzhou R&F Properties Co. Ltd. | 170,000 | 239,609 | ||||||
| Highwealth Construction Corp. | 320,000 | 473,913 | ||||||
| Redefine Properties Ltd. - REIT | 400,000 | 342,308 | ||||||
| 2,160,826 | ||||||||
| RETAIL - 2.2 % | ||||||||
| CP ALL PCL - NVDR | 300,000 | 520,019 | ||||||
| Matahari Department Store Tbk PT | 370,000 | 510,253 | ||||||
| Xtep International Holdings Ltd. | 500,000 | 220,066 | ||||||
| 1,250,338 | ||||||||
| SEMICONDUCTORS - 8.0 % | ||||||||
| Dongbu HiTek Co. Ltd. * | 37,500 | 557,203 | ||||||
| Powertech Technology, Inc. | 120,000 | 342,385 | ||||||
| Samsung Electronics Co. Ltd. | 1,250 | 1,787,911 | ||||||
| Taiwan Semiconductor Manufacturing Co. Ltd. - ADR | 58,000 | 1,803,800 | ||||||
| 4,491,299 | ||||||||
| SOFTWARE - 4.5 % | ||||||||
| HCL Technologies Ltd. | 40,000 | 457,260 | ||||||
| NetEase, Inc. - ADR | 6,000 | 1,541,940 | ||||||
| TravelSky Technology Ltd. | 265,000 | 565,446 | ||||||
| 2,564,646 | ||||||||
| TELECOMMUNICATIONS - 5.9 % | ||||||||
| BYD Electronic International Co. Ltd. | 840,000 | 660,959 | ||||||
| China Mobile Ltd. | 130,000 | 1,489,466 | ||||||
| Telekomunikasi Indonesia Persero Tbk PT | 1,620,000 | 523,056 | ||||||
| Vodacom Group Ltd. | 60,000 | 647,397 | ||||||
| 3,320,878 | ||||||||
| TRANSPORTATION - 2.2 % | ||||||||
| Rumo Logistica Operadora Multimodal SA * | 300,000 | 677,543 | ||||||
| Super Group Ltd. * | 185,000 | 546,067 | ||||||
| 1,223,610 | ||||||||
| WATER - 0.6 % | ||||||||
| Cia de Saneamento Basico do Estado de Sao Paulo | 30,000 | 319,345 | ||||||
| TOTAL COMMON STOCK (Cost - $48,819,777) | 54,044,612 | |||||||
| Security | Shares | Value | ||||||
| PREFERRED STOCK - 2.7 % | ||||||||
| BANKS - 0.9 % | ||||||||
| Banco Bradesco SA | 15,000 | $ | 158,583 | |||||
| Itau Unibanco Holding SA | 29,500 | 358,564 | ||||||
| 517,147 | ||||||||
| CHEMICALS - 0.8 % | ||||||||
| Braskem SA | 50,000 | 447,589 | ||||||
| HOLDING COMPANIES - DIVERSIFIED - 1.0 % | ||||||||
| Itausa - Investimentos Itau SA - Preference | 190,000 | 565,346 | ||||||
| TOTAL PREFERRED STOCK (Cost - $1,393,450) | 1,530,082 | |||||||
| EXCHANGE TRADED FUND - 0.6 % | ||||||||
| EQUITY FUNDS - 0.6 % | ||||||||
| iShares MSCI All Peru Capped ETF (Cost - $299,207) | 10,000 | 328,300 | ||||||
| SHORT-TERM INVESTMENT - 0.8 % | ||||||||
| MONEY MARKET - 0.8 % | ||||||||
| First American Government Obligations Fund 0.25% + | ||||||||
| (Cost - $441,234) | 441,234 | 441,234 | ||||||
| TOTAL INVESTMENTS - 100.2 % (Cost - $50,953,668) | $ | 56,344,228 | ||||||
| LIABILITIES IN EXCESS OF OTHER ASSETS - (0.2) % | (135,190 | ) | ||||||
| NET ASSETS - 100.0 % | $ | 56,209,038 | ||||||
| ADR - American Depositary Receipt | ETF - Exchange Traded Fund |
| GDR - Global Depositary Receipt | NVDR - Non-Voting Depositary Receipt |
REIT - Real Estate Investment Trust
| * | Non-income producing security |
| + | Variable rate security. Interest rate is as of October 31, 2016. |
Portfolio Composition * - (Unaudited)
| China | 14.7 | % | South Africa | 7.0 | % | |||||
| Brazil | 11.6 | % | Hong Kong | 6.0 | % | |||||
| South Korea | 11.0 | % | Thailand | 5.6 | % | |||||
| Taiwan | 10.8 | % | Indonesia | 4.7 | % | |||||
| Russia | 8.5 | % | Other Countries | 20.1 | % | |||||
| Total | 100.0 | % |
| * | Based on total value of investments as of October 31, 2016. |
Percentage may differ from Schedule of Investments which is based on Fund net assets.
See accompanying notes to financial statements.
69
| Dunham Small Cap Growth Fund |
| Message from the Sub-Adviser (Pier Capital, LLC) |
Following a volatile year for small capitalization growth stocks, fiscal year 2016 experienced a downturn and low returns, as small capitalization growth stocks, measured by the Russell 2000 Growth Index, declined 0.5 percent for the fiscal year ending October 31, 2016. Growth stocks in the small capitalization space lagged their larger capitalization peers, as measured by the Russell 1000 Growth Index, which rose 2.3 percent for the fiscal year as investors grew cautious of small capitalization growth stocks and opted for their larger brethren as the preferred risk option. Small capitalization growth stocks fell behind small capitalization value stocks, as measured by the Russell 2000 Value Index, which gained 8.8 percent after also experiencing a volatile year. Small capitalization growth stocks, in general, lagged the market as a whole, as measured by the Russell 3000 Index, which saw an increase of 4.2 percent for the year ending October 31, 2016.
During the fiscal year, there were no material changes to the Sub-Adviser’s investment decision making process. The Sub-Adviser continued to implement a bottom-up process to selecting stocks for the Fund, focusing on individual firm characteristics rather than sector weightings or the economy as a whole. It seeks companies on the verge of experiencing large increases in market share. By seeking out and identifying market catalysts, the Sub-Adviser believes that the securities it selects for the Fund are tailored towards organic growth due to some kind of market advantage. Given that the U.S. economy is on more solid ground than many economies around the globe bodes well for the companies in which the Fund invests. Having said that, the Sub-Adviser remains aware of global concerns and how that may impact the competitive position of U.S. small cap growth companies with their global peers.
A sector that provided a strong benefit to the Fund during the fiscal year was the information technology sector. This sector was primarily helped by Acacia Communications, Inc. (ACIA) (holding percentage*: 0.23 percent), which designs, develops, manufactures, and markets communication equipment. The company offers high-speed coherent optical interconnected products for cloud infrastructure operators and content and communication service providers. The Sub-Adviser initiated the position in mid-May of 2016, where the holding gained 148.9 percent from initiation to the end of the fiscal year. Another strong information technology holding was Gigamon, Inc. (GIMO) (holding percentage*: 1.07 percent), which designs and markets networking products and solutions around the world. The company provides high-density networking traffic switches that replicate, filter, stream, monitor, analyze, and record information. The holding realized a gain of 110.8 percent during the fiscal year.
Sectors within the Fund that contained underperforming holdings for the fiscal year were the industrials and financials sectors. The industrials sector was hurt by the performance of Allegiant Travel Co. (ALGT) (holding percentage**: 0.41 percent), which is a leisure travel company that operates a passenger airline marketed to travelers in small cities at discount prices. The Sub-Adviser credits poor performance to a fall in oil prices that has allowed larger airline competitors to match the discount rates of smaller airlines, reducing market share. The Sub-Adviser lost conviction in the holding and exited the position in the beginning of August of 2016, realizing a drop of 33.9 percent for the Fund. Bank of the Ozarks (OZRK) (holdings percentage*: 0.91 percent), a holding from the financials sector, detracted from Fund performance as well. The company provides a wide range of retail and commercial banking services to businesses, individuals, and government agencies through the company’s banking offices. The Sub-Adviser initiated the position in the beginning of March of 2016, experiencing a 12.5 percent decline through the fiscal year.
The Sub-Adviser is hesitant about short-term U.S. economic improvement after seeing a less hawkish stance by the Fed, volatility over the coming U.S. presidential election, negative interest rates abroad, and global insecurity in the markets. The Sub-Adviser believes these events have created negative investor sentiment, which may slowly change as these events conclude. They regard this market environment as one centered on timing, and see the conclusion of these events as catalysts for growth in 2017. The Sub-Adviser believes it has positioned the portfolio to take advantage of this growth on the horizon. In addition, the Sub-Adviser believes consumer sentiment and manufacturing levels will improve in the near future, which they see as a benefit to the types of holdings the Sub-Adviser seeks out.
| * | Holdings percentage(s) as of 10/31/2016. |
| ** | Holdings percentage(s) as of the date prior to the sale of the security. |
Growth of $100,000 Investment
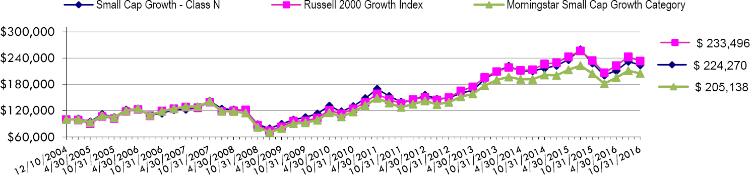
Total Returns as of October 31, 2016
| Annualized | Annualized | Annualized | Annualized Since Inception | ||||||||
| One Year | Three Years | Five Years | Ten Years | (12/10/04) | |||||||
| Class N | (1.88)% | 2.31% | 9.84% | 6.98% | 7.03% | ||||||
| Class C | (2.82)% | 1.30% | 8.76% | 5.92% | 5.97% | ||||||
| Class A with load of 5.75% | (7.73)% | 0.05% | 8.28% | N/A | 5.82%* | ||||||
| Class A without load | (2.12)% | 2.05% | 9.57% | N/A | 4.46%* | ||||||
| Russell 2000 Growth Index | (0.49)% | 3.70% | 11.33% | 6.92% | 7.39% | ||||||
| Morningstar Small Cap Growth Category | 0.28% | 2.57% | 9.95% | 5.60% | 6.22% |
| * | Class A commenced operations on January 3, 2007. |
The Russell 2000 Growth Index measures the performance of the Russell 2000 companies with higher price-to-book ratios and higher forecasted growth values. Investors cannot invest directly in an index or benchmark.
The Morningstar Small Cap Growth Category is generally representative of mutual funds that primarily invest in small (small capitalization) U.S. companies that are projected to grow faster than other small-cap stocks.
As disclosed in the Trust’s latest registration statement, the Fund’s total annual operating expenses, including the cost of underlying funds, are 1.58% for Class N, 2.58% for Class C and 1.83% for Class A. Class A shares are subject to a sales load of 5.75% and a deferred sales charge of up to 0.75%. The performance data quoted here represents past performance, which is not indicative of future results. Current performance may be lower or higher than the performance data quoted. The investment return and NAV will fluctuate, so that an investor’s shares, when redeemed, may be worth more or less than their original cost. Total returns are calculated assuming reinvestment of all dividends and capital gains distributions, if any. The returns do not reflect the deductions of taxes a shareholder would pay on the redemption of fund shares or fund distributions. For performance information current to the most recent month-end, please call 1-800-442-4358 or visit our website www.dunham.com
70
| SCHEDULE OF INVESTMENTS |
| Dunham Small Cap Growth Fund |
| October 31, 2016 |
| Security | Shares | Value | ||||||
| COMMON STOCK - 94.3 % | ||||||||
| BANKS - 2.7 % | ||||||||
| Bank of the Ozarks ^ | 8,154 | $ | 301,372 | |||||
| FCB Financial Holdings, Inc. * | 8,057 | 300,526 | ||||||
| Western Alliance Bancorp * ^ | 8,674 | 324,061 | ||||||
| 925,959 | ||||||||
| BIOTECHNOLOGY - 1.6 % | ||||||||
| Exact Sciences Corp. * ^ | 15,542 | 242,144 | ||||||
| Sage Therapeutics, Inc. | 6,867 | 298,989 | ||||||
| 541,133 | ||||||||
| COMMERICAL SERVICES - 3.6 % | ||||||||
| Bright Horizons Family Solutions, Inc. * | 4,943 | 330,736 | ||||||
| HMS Holdings Corp.* ^ | 13,778 | 290,302 | ||||||
| Nord Anglia Education, Inc. * ^ | 13,428 | 289,239 | ||||||
| Vantiv, Inc. * | 5,126 | 299,153 | ||||||
| 1,209,430 | ||||||||
| COMPUTERS - 4.8 % | ||||||||
| Globant SA * | 3,612 | 157,122 | ||||||
| Lumentum Holdings, Inc. ^ | 7,946 | 266,986 | ||||||
| Mercury Systems, Inc. * ^ | 20,995 | 583,241 | ||||||
| Nutanix, Inc. ^ | 9,863 | 241,644 | ||||||
| Vocera Communications, Inc. | 19,982 | 367,669 | ||||||
| 1,616,662 | ||||||||
| COSMETICS - 0.9 % | ||||||||
| elf Beauty, Inc. | 12,338 | 319,061 | ||||||
| DISTRIBUTION/WHOLESALE - 1.7 % | ||||||||
| Beacon Roofing Supply, Inc. * ^ | 6,831 | 287,175 | ||||||
| SiteOne Landscape Supply, Inc. * | 9,371 | 292,188 | ||||||
| 579,363 | ||||||||
| DIVERSIFIED FINANCIAL SERVICES - 1.9 % | ||||||||
| Ellie Mae, Inc.* | 3,140 | 332,495 | ||||||
| WageWorks, Inc. * | 5,141 | 303,062 | ||||||
| 635,557 | ||||||||
| ELECTRICAL COMPONENTS & EQUIPMENT - 0.4 % | ||||||||
| Universal Display Corp. * ^ | 2,960 | 153,032 | ||||||
| ELECTRONICS - 2.1 % | ||||||||
| IMAX Corp. * ^ | 12,425 | 375,856 | ||||||
| Orbotech Ltd. * | 11,597 | 317,758 | ||||||
| 693,614 | ||||||||
| ENGINEERING & CONSTRUCTION - 2.1 % | ||||||||
| Granite Construction, Inc. ^ | 8,379 | 411,912 | ||||||
| MasTec, Inc. | 10,992 | 313,822 | ||||||
| 725,734 | ||||||||
| ENTERTAINMENT - 2.0 % | ||||||||
| Red Rock Resorts, Inc. | 13,913 | 304,695 | ||||||
| Vail Resorts, Inc. ^ | 2,286 | 364,480 | ||||||
| 669,175 | ||||||||
| FOOD - 1.0 % | ||||||||
| Blue Buffalo Pet Products, Inc. * | 12,016 | 301,842 | ||||||
| HEALTHCARE-PRODUCTS - 9.1 % | ||||||||
| Cerus Corp. * ^ | 46,350 | 223,407 | ||||||
| CryoLife, Inc. | 18,471 | 314,007 | ||||||
| Edwards Lifesciences Corp. * | 1,610 | 153,304 | ||||||
| Security | Shares | Value | ||||||
| HEALTHCARE-PRODUCTS (CONTINUED) - 9.1 % | ||||||||
| Endologix, Inc. * ^ | 12,140 | $ | 126,984 | |||||
| ICU Medical, Inc. | 2,164 | 301,445 | ||||||
| Merit Medical Systems, Inc. * | 14,641 | 321,370 | ||||||
| Nevro Corp. * ^ | 1,711 | 157,275 | ||||||
| NuVasive, Inc. * ^ | 2,733 | 163,242 | ||||||
| NxStage Medical, Inc. | 12,221 | 277,906 | ||||||
| Obalon Therapeutics, Inc. ^ | 22,941 | 296,627 | ||||||
| Penumbra, Inc. | 4,287 | 282,728 | ||||||
| Spectranetics Corp. * | 6,786 | 147,256 | ||||||
| West Pharmaceutical Services, Inc. | 3,840 | 291,955 | ||||||
| 3,057,506 | ||||||||
| HEALTHCARE-SERVICES - 1.6 % | ||||||||
| Surgical Care Affiliates, Inc. * | 6,149 | 263,116 | ||||||
| Surgery Partners, Inc. ^ | 17,343 | 279,223 | ||||||
| 542,339 | ||||||||
| HOME BUILDERS - 1.7% | ||||||||
| Installed Building Products, Inc.* | 8,829 | 291,798 | ||||||
| LGI Homes, Inc. * ^ | 9,642 | 286,946 | ||||||
| 578,744 | ||||||||
| INTERNET - 10.3 % | ||||||||
| 8x8, Inc. * | 21,644 | 308,427 | ||||||
| Etsy, Inc. | 23,680 | 307,366 | ||||||
| Mimecast Ltd. | 7,582 | 153,460 | ||||||
| Proofpoint, Inc. ^ | 4,399 | 344,794 | ||||||
| Ringcentral, Inc. * | 17,910 | 370,737 | ||||||
| Shopify, Inc. * | 7,730 | 320,409 | ||||||
| Shutterstock, Inc. ^ | 5,181 | 305,627 | ||||||
| Splunk, Inc. ^ | 6,415 | 386,119 | ||||||
| The Trade Desk, Inc. ^ | 11,828 | 297,829 | ||||||
| Wix.com Ltd.* ^ | 3,819 | 152,760 | ||||||
| Yelp, Inc. | 7,627 | 249,098 | ||||||
| Zendesk, Inc. * | 10,481 | 275,545 | ||||||
| 3,472,171 | ||||||||
| LEISURE TIME - 1.1 % | ||||||||
| Planet Fitness, Inc. * ^ | 17,159 | 363,771 | ||||||
| MACHINERY-CONSTRUCTION & MINING - 1.3 % | ||||||||
| Astec Industries, Inc. ^ | 5,264 | 291,415 | ||||||
| Cognex Corp. | 3,015 | 155,574 | ||||||
| 446,989 | ||||||||
| METAL FABRICATE/HARDWARE - 1.2 % | ||||||||
| Mueller Water Products, Inc. | 32,516 | 400,597 | ||||||
| MINING - 1.1 % | ||||||||
| US Silica Holdings, Inc. ^ | 7,848 | 362,499 | ||||||
| MISCELLANEOUS MANUFACTURING - 2.4 % | ||||||||
| Fabrinet | 7,830 | 297,227 | ||||||
| John Bean Technologies Corp. ^ | 6,231 | 497,545 | ||||||
| 794,772 | ||||||||
| OIL & GAS - 3.6 % | ||||||||
| Oasis Petroleum, Inc. | 27,754 | 291,139 | ||||||
| Parsley Energy , Inc. * | 10,004 | 329,132 | ||||||
| PDC Energy, Inc. * | 4,588 | 281,382 | ||||||
| RSP Permian, Inc. * | 8,733 | 315,261 | ||||||
| 1,216,914 | ||||||||
See accompanying notes to financial statements.
71
| SCHEDULE OF INVESTMENTS |
| Dunham Small Cap Growth Fund (Continued) |
| October 31, 2016 |
| Security | Shares | Value | ||||||
| PHARMACEUTICALS - 3.3 % | ||||||||
| Collegium Pharmaceutical, Inc. ^ | 13,456 | $ | 201,436 | |||||
| Eagle Pharmaceuticals, Inc. ^ | 5,271 | 294,543 | ||||||
| Patheon NV * | 12,008 | 304,883 | ||||||
| PRA Health Sciences, Inc. * | 5,961 | 317,244 | ||||||
| 1,118,106 | ||||||||
| RETAIL - 2.1 % | ||||||||
| American Eagle Outfitters, Inc. ^ | 9,268 | 157,927 | ||||||
| BMC Stock Holdings, Inc.* | 15,436 | 255,466 | ||||||
| Five Below, Inc. * | 7,720 | 290,118 | ||||||
| 703,511 | ||||||||
| SEMICONDUCTORS - 10.4 % | ||||||||
| Ambarella, Inc. ^ | 2,490 | 152,811 | ||||||
| Advanced Micro Devices, Inc. * ^ | 58,698 | 424,387 | ||||||
| Cavium, Inc. * | 6,486 | 366,135 | ||||||
| CEVA, Inc. * | 10,081 | 302,934 | ||||||
| Himax Technologies, Inc. ^ | 47,225 | 370,716 | ||||||
| Impinj, Inc. ^ | 11,255 | 277,886 | ||||||
| Inphi Corp. * ^ | 7,562 | 280,550 | ||||||
| MKS Instruments, Inc. | 6,591 | 332,516 | ||||||
| Monolithic Power Systems, Inc. ^ | 4,684 | 369,146 | ||||||
| Nanometrics, Inc. * | 7,888 | 164,780 | ||||||
| NVIDIA Corp. ^ | 6,598 | 469,514 | ||||||
| 3,511,375 | ||||||||
| SOFTWARE - 17.3 % | ||||||||
| Activision Blizzard, Inc. | 8,099 | 349,634 | ||||||
| Aspen Technology, Inc.* | 7,392 | 363,982 | ||||||
| Box, Inc. ^ | 27,665 | 398,929 | ||||||
| Broadsoft, Inc. * | 3,507 | 145,716 | ||||||
| CommVault Systems, Inc. * | 8,783 | 469,891 | ||||||
| Cornerstone OnDemand, Inc.* | 4,421 | 182,587 | ||||||
| Coupa Software, Inc. | 11,243 | 281,075 | ||||||
| Evolent Health, Inc.* ^ | 13,258 | 279,081 | ||||||
| Five9, Inc. * | 18,707 | 267,884 | ||||||
| HubSpot, Inc. * ^ | 5,781 | 303,213 | ||||||
| Instructure, Inc. ^ | 9,730 | 247,629 | ||||||
| Medidata Solutions, Inc. * | 5,872 | 281,797 | ||||||
| Omnicell, Inc.* | 7,974 | 260,152 | ||||||
| Security | Shares | Value | ||||||
| SOFTWARE (CONTINUED) - 17.3 % | ||||||||
| Red Hat, Inc.* | 4,461 | $ | 345,504 | |||||
| ServiceNow, Inc.* ^ | 4,680 | 411,419 | ||||||
| Take-Two Interactive Software, Inc.* ^ | 8,554 | 379,712 | ||||||
| Talend SA* | 12,804 | 277,463 | ||||||
| Twilio, Inc. | 6,702 | 228,672 | ||||||
| Tyler Technologies, Inc. * | 2,159 | 346,304 | ||||||
| 5,820,644 | ||||||||
| TELECOMMUNICATIONS - 1.3 % | ||||||||
| Acacia Communications, Inc. * | 1,093 | 76,171 | ||||||
| Gigamon, Inc. * ^ | 6,418 | 354,915 | ||||||
| 431,086 | ||||||||
| TRANSPORTATION - 1.7 % | ||||||||
| Air Transport Services Group, Inc. * | 32,150 | 425,344 | ||||||
| Covenant Transportation Group, Inc. * | 9,459 | 151,249 | ||||||
| 576,593 | ||||||||
| TOTAL COMMON STOCK (Cost - $29,299,070) | 31,768,179 | |||||||
| SHORT-TERM INVESTMENT - 4.3 % | ||||||||
| MONEY MARKET FUND - 4.3 % | ||||||||
| Fidelity Institutional Money Market Funds - | ||||||||
| Government Portfolio, 0.27% + | 1,459,638 | 1,459,638 | ||||||
| TOTAL SHORT-TERM INVESTMENT (Cost - $1,459,638) | ||||||||
| COLLATERAL FOR SECURITIES LOANED - 32.8 % | ||||||||
| Mount Vernon Prime Portfolio 0.67% + (Cost - $11,064,256) | 11,064,256 | 11,064,256 | ||||||
| TOTAL INVESTMENTS - 131.4 % (Cost - $41,822,964) | $ | 44,292,073 | ||||||
| LIABILITIES IN EXCESS OF OTHER ASSETS - (31.4) % | (10,587,458 | ) | ||||||
| NET ASSETS - 100.0 % | $ | 33,704,615 | ||||||
| ^ | All or a portion of these securities are on loan. Total loaned securities had a value of $10,570,250 at October 31, 2016. Securities loaned with a value of $161,982 have been sold and are pending settleme |
| * | Non-Income producing security. |
| + | Variable rate security. Interest rate is as of October 31, 2016. |
Portfolio Composition * - (Unaudited)
| Collateral For Securities Loaned | 25.0 | % | Consumer, Cyclical | 6.5 | % | |||||
| Technology | 24.7 | % | Financial | 3.5 | % | |||||
| Consumer, Non-Cyclical | 16.0 | % | Field Energy | 2.8 | % | |||||
| Communication | 8.8 | % | Basic Materials | 0.8 | % | |||||
| Industrial | 8.6 | % | Short-Term Investment | 3.3 | % | |||||
| Total | 100.0 | % |
| * | Based on total value of investments as of October 31, 2016. |
Percentage may differ from Schedule of Investments which is based on Fund net assets.
See accompanying notes to financial statements.
72
| STATEMENTS OF ASSETS AND LIABILITIES |
| October 31, 2016 |
| Dunham | Dunham | Dunham | ||||||||||||||||||||||||||
| Dunham | Monthly | Corporate / | Dunham | Dunham | International | Dunham | ||||||||||||||||||||||
| Floating Rate | Distribution | Government | Dynamic Macro | High-Yield | Opportunity | Appreciation & | ||||||||||||||||||||||
| Bond Fund | Fund | Bond Fund | Fund | Bond Fund | Bond Fund | Income Fund | ||||||||||||||||||||||
| Assets: | ||||||||||||||||||||||||||||
| Investments in securities, at cost | $ | 120,416,768 | $ | 281,459,983 | $ | 63,457,185 | $ | 44,452,745 | $ | 113,300,072 | $ | 27,637,163 | $ | 28,523,803 | ||||||||||||||
| Investments in securities, at value | $ | 120,150,326 | $ | 284,006,046 | $ | 64,631,974 | $ | 45,736,974 | $ | 116,403,085 | $ | 27,074,724 | $ | 27,907,374 | ||||||||||||||
| Foreign currency, at value (Cost $791,756, $16,097, and $78,420 respectively) | — | 797,396 | — | 15,649 | — | 76,772 | — | |||||||||||||||||||||
| Deposits with brokers | — | 4,624,272 | — | — | — | 99,613 | — | |||||||||||||||||||||
| Unrealized appreciation on swap contracts | — | 2,518,239 | — | — | — | — | — | |||||||||||||||||||||
| Unrealized appreciation on futures | — | — | — | 387,520 | — | 10,562 | — | |||||||||||||||||||||
| Cash | 52,330 | 11,887,299 | — | 45,651 | — | — | — | |||||||||||||||||||||
| Receivable for securities sold | 360,448 | 4,770,563 | 66,481 | — | 1,132,050 | 776,079 | — | |||||||||||||||||||||
| Interest and dividends receivable | 587,679 | 275,448 | 434,134 | 3,887 | 1,524,735 | 275,161 | 109,473 | |||||||||||||||||||||
| Receivable for fund shares sold | 79,799 | 96,205 | 174,191 | 82,945 | 47,728 | 19,974 | 5,290 | |||||||||||||||||||||
| Receivable for open forward foreign currency contracts | — | 69,656 | — | — | — | 104,211 | — | |||||||||||||||||||||
| Prepaid expenses and other assets | 24,857 | 39,879 | 24,158 | 35,241 | 19,297 | 26,807 | 18,702 | |||||||||||||||||||||
| Total Assets | 121,255,439 | 309,085,003 | 65,330,938 | 46,307,867 | 119,126,895 | 28,463,903 | 28,040,839 | |||||||||||||||||||||
| Liabilities: | ||||||||||||||||||||||||||||
| Option contracts written (premiums received $6,055,973 and $19,056, respectively) | — | 6,385,631 | — | 27,685 | — | — | — | |||||||||||||||||||||
| Currency overdraft (cost $341,039) | — | — | — | 329,504 | — | — | — | |||||||||||||||||||||
| Payable upon return of securities loaned | 506,125 | 8,851,794 | 7,559,736 | 11,005,156 | 22,131,280 | — | 4,189,895 | |||||||||||||||||||||
| Securities sold short (proceeds $34,548,796) | — | 40,371,996 | — | — | — | — | — | |||||||||||||||||||||
| Unrealized depreciation on swaps | — | 2,096,023 | — | — | — | — | — | |||||||||||||||||||||
| Unrealized depreciation on futures | — | — | — | 202,276 | — | 46,085 | — | |||||||||||||||||||||
| Payable for dividends on short sales | — | 39,590 | — | — | — | — | — | |||||||||||||||||||||
| Payable for securities purchased | 10,914,677 | 12,923,391 | 1,453,495 | 3,471 | 429,350 | 226,236 | — | |||||||||||||||||||||
| Payable for fund shares redeemed | 13,926 | 116,656 | 3,534 | 1,067 | 55,718 | 1,761 | 48,080 | |||||||||||||||||||||
| Payable for open forward foreign currency contracts | — | 52,147 | — | — | — | 79,856 | — | |||||||||||||||||||||
| Distributions payable | 9,758 | 60,059 | 242 | — | 13,868 | — | — | |||||||||||||||||||||
| Payable to adviser | 54,177 | 131,477 | 23,711 | 18,714 | 49,386 | 14,372 | 13,425 | |||||||||||||||||||||
| Payable to sub-adviser | 20,750 | 133,784 | 12,881 | 10,076 | 16,930 | 4,971 | 5,909 | |||||||||||||||||||||
| Payable for distribution fees | 2,367 | 45,945 | 5,184 | — | 18,236 | 1,218 | 7,954 | |||||||||||||||||||||
| Payable for administration fees | 18,963 | 28,361 | 14,584 | 3,982 | 15,532 | 741 | 3,564 | |||||||||||||||||||||
| Payable for fund accounting fees | 5,060 | 14,526 | 2,673 | 2,035 | 7,641 | 3,028 | 1,883 | |||||||||||||||||||||
| Payable for transfer agent fees | 2,762 | 3,302 | 3,522 | 1,914 | 3,124 | 1,625 | 2,898 | |||||||||||||||||||||
| Payable for custody fees | 1,443 | 14,925 | 5,594 | 1,983 | 1,919 | — | 1,179 | |||||||||||||||||||||
| Payable for non 12b-1 shareholder servicing fees | — | 17,468 | 1,589 | 1,475 | 1,846 | — | — | |||||||||||||||||||||
| Accrued expenses and other liabilities | 19,243 | 43,587 | 23,046 | 20,351 | 23,698 | 34,403 | 17,973 | |||||||||||||||||||||
| Total Liabilities | 11,569,251 | 71,330,662 | 9,109,791 | 11,629,689 | 22,768,528 | 414,296 | 4,292,760 | |||||||||||||||||||||
| Net Assets | $ | 109,686,188 | $ | 237,754,341 | $ | 56,221,147 | $ | 34,678,178 | $ | 96,358,367 | $ | 28,049,607 | $ | 23,748,079 | ||||||||||||||
| Net Assets: | ||||||||||||||||||||||||||||
| Paid in capital | $ | 112,073,699 | $ | 261,317,495 | $ | 56,854,282 | $ | 35,417,329 | $ | 105,798,993 | $ | 28,395,022 | $ | 26,059,477 | ||||||||||||||
| Accumulated net investment income (loss) | 12,588 | (1,211,967 | ) | 3,392 | (9,192 | ) | 167,801 | (24,355 | ) | 466,372 | ||||||||||||||||||
| Accumulated net realized gain (loss) on investments, options, securities sold short, futures, swap contracts, and foreign currency transactions | (2,133,657 | ) | (19,199,219 | ) | (1,811,316 | ) | (2,201,890 | ) | (12,711,440 | ) | 254,196 | (2,161,341 | ) | |||||||||||||||
| Net unrealized appreciation (depreciation) on investments, options, securities sold short, futures, swap contracts, and foreign currency translations | (266,442 | ) | (3,151,968 | ) | 1,174,789 | 1,471,931 | 3,103,013 | (575,256 | ) | (616,429 | ) | |||||||||||||||||
| Net Assets | $ | 109,686,188 | $ | 237,754,341 | $ | 56,221,147 | $ | 34,678,178 | $ | 96,358,367 | $ | 28,049,607 | $ | 23,748,079 | ||||||||||||||
| Net Asset Value Per Share | ||||||||||||||||||||||||||||
| Class N Shares: | ||||||||||||||||||||||||||||
| Net Assets | $ | 94,218,535 | $ | 153,084,208 | $ | 48,024,607 | $ | 28,650,290 | $ | 78,193,706 | $ | 24,727,569 | $ | 16,928,864 | ||||||||||||||
| Shares of beneficial interest outstanding (no par value; unlimited shares authorized) | 9,709,568 | 4,283,651 | 3,450,212 | 3,001,068 | 8,744,606 | 2,640,406 | 2,101,918 | |||||||||||||||||||||
| Net asset value, offering and redemption price per share | $ | 9.70 | $ | 35.74 | $ | 13.92 | $ | 9.55 | $ | 8.94 | $ | 9.37 | $ | 8.05 | ||||||||||||||
| Class A Shares: | ||||||||||||||||||||||||||||
| Net Assets | $ | 10,923,020 | $ | 45,552,303 | $ | 4,832,050 | $ | 3,897,096 | $ | 10,477,776 | $ | 2,117,885 | $ | 3,637,816 | ||||||||||||||
| Shares of beneficial interest outstanding (no par value; unlimited shares authorized) | 1,126,507 | 1,305,134 | 347,535 | 409,349 | 1,161,949 | 227,167 | 452,966 | |||||||||||||||||||||
| Net asset value and redemption price per share * | $ | 9.70 | $ | 34.90 | $ | 13.90 | $ | 9.52 | $ | 9.02 | $ | 9.32 | $ | 8.03 | ||||||||||||||
| Front-end sales charge factor | 0.9550 | 0.9425 | 0.9550 | 0.9425 | 0.9550 | 0.9550 | 0.9425 | |||||||||||||||||||||
| Offering price per share (Net asset value per share / front-end sales charge factor) | $ | 10.16 | $ | 37.03 | $ | 14.55 | $ | 10.10 | $ | 9.45 | $ | 9.76 | $ | 8.52 | ||||||||||||||
| Class C Shares: | ||||||||||||||||||||||||||||
| Net Assets | $ | 4,544,633 | $ | 39,117,830 | $ | 3,364,490 | $ | 2,130,792 | $ | 7,686,885 | $ | 1,204,153 | $ | 3,181,399 | ||||||||||||||
| Shares of beneficial interest outstanding (no par value; unlimited shares authorized) | 468,859 | 1,351,630 | 243,560 | 230,878 | 865,424 | 130,672 | 404,779 | |||||||||||||||||||||
| Net asset value, offering and redemption price per share | $ | 9.69 | $ | 28.94 | $ | 13.81 | $ | 9.23 | $ | 8.88 | $ | 9.22 | $ | 7.86 | ||||||||||||||
| * | For certain purchases of $1 million or more, a 0.75% contingent deferred sales charge may apply to redemptions made within eighteen months of purchase. |
See accompanying notes to financial statements.
73
| STATEMENTS OF ASSETS AND LIABILITIES (Continued) |
| October 31, 2016 |
| Dunham | Dunham | |||||||||||||||||||||||||||||||
| Dunham | Dunham | Focused | Dunham | Dunham | Dunham | Emerging | Dunham | |||||||||||||||||||||||||
| Alternative | Large Cap | Large Cap | International | Real Estate | Small Cap | Markets | Small Cap | |||||||||||||||||||||||||
| Dividend Fund | Value Fund | Growth Fund | Stock Fund | Stock Fund | Value Fund | Stock Fund | Growth Fund | |||||||||||||||||||||||||
| Assets: | ||||||||||||||||||||||||||||||||
| Investments in securities, at cost | $ | 24,338,000 | $ | 68,968,876 | $ | 67,498,180 | $ | 95,183,259 | $ | 46,166,951 | $ | 35,921,218 | $ | 50,953,668 | $ | 41,822,964 | ||||||||||||||||
| Investments in securities, at value | $ | 23,970,183 | $ | 75,488,037 | $ | 80,952,711 | $ | 100,967,623 | $ | 50,654,115 | $ | 36,718,121 | $ | 56,344,228 | $ | 44,292,073 | ||||||||||||||||
| Foreign currency, at value (Cost $198,925 and $18,742, respectively) | — | — | — | 198,417 | — | — | 18,742 | — | ||||||||||||||||||||||||
| Cash | — | 3,953 | — | 9,886 | — | — | — | — | ||||||||||||||||||||||||
| Receivable for securities sold | 1,408,012 | 812,264 | — | 209,666 | 1,665,300 | — | 1,373,598 | 769,956 | ||||||||||||||||||||||||
| Interest and dividends receivable | 72,319 | 62,494 | 182,353 | 244,769 | 27,294 | 9,671 | 63,235 | 5,797 | ||||||||||||||||||||||||
| Receivable for fund shares sold | — | 15,141 | 12,775 | 61,568 | 6,626 | 19,540 | 11,595 | 22,950 | ||||||||||||||||||||||||
| Receivable for open forward foreign currency contracts | — | — | — | 345 | — | — | — | — | ||||||||||||||||||||||||
| Prepaid expenses and other assets | 6,854 | 27,285 | 30,463 | 29,348 | 23,315 | 24,286 | 25,210 | 20,937 | ||||||||||||||||||||||||
| Total Assets | 25,457,368 | 76,409,174 | 81,178,302 | 101,721,622 | 52,376,650 | 36,771,618 | 57,836,608 | 45,111,713 | ||||||||||||||||||||||||
| Liabilities: | ||||||||||||||||||||||||||||||||
| Payable upon return of securities loaned | — | 18,963,231 | 15,156,286 | 5,780,012 | 12,692,392 | 8,419,723 | — | 11,064,256 | ||||||||||||||||||||||||
| Payable for securities purchased and foreign currency transactions | 1,054,349 | 852,777 | — | 292,808 | 1,519,602 | — | 1,425,684 | 252,398 | ||||||||||||||||||||||||
| Payable for fund shares redeemed | 12,703 | 96,371 | 91,102 | 36,459 | 52,486 | 911 | 105,798 | 30,322 | ||||||||||||||||||||||||
| Payable for open forward foreign currency contracts | — | — | — | 68 | — | — | — | — | ||||||||||||||||||||||||
| Payable to adviser | 12,358 | 31,207 | 36,558 | 52,618 | 21,293 | 15,824 | 31,223 | 19,285 | ||||||||||||||||||||||||
| Payable to sub-adviser | 883 | 5,065 | 11,344 | 52,618 | 59 | 2,783 | 7,419 | 4,844 | ||||||||||||||||||||||||
| Payable for distribution fees | 237 | 5,973 | 6,060 | 10,953 | 1,187 | 3,396 | 6,740 | 8,666 | ||||||||||||||||||||||||
| Payable for administration fees | 1,550 | 5,665 | 4,724 | 19,330 | 3,103 | 2,925 | 5,118 | 3,802 | ||||||||||||||||||||||||
| Payable for fund accounting fees | 875 | 2,964 | 2,207 | 4,328 | 1,639 | 1,818 | 2,994 | 1,844 | ||||||||||||||||||||||||
| Payable for transfer agent fees | 2,095 | 2,641 | 1,922 | 1,999 | 1,917 | 2,824 | 3,186 | 2,362 | ||||||||||||||||||||||||
| Payable for custody fees | 450 | — | 1,425 | 21,331 | — | 2,480 | 13,830 | 3,734 | ||||||||||||||||||||||||
| Payable for non 12b-1 shareholder servicing fees | 17 | — | 248 | 1,174 | 76 | 1,896 | 1,229 | 53 | ||||||||||||||||||||||||
| Accrued expenses and other liabilities | 20,314 | 23,710 | 16,390 | 19,813 | 17,327 | 19,380 | 24,349 | 15,532 | ||||||||||||||||||||||||
| Total Liabilities | 1,105,831 | 19,989,604 | 15,328,266 | 6,293,511 | 14,311,081 | 8,473,960 | 1,627,570 | 11,407,098 | ||||||||||||||||||||||||
| Net Assets | $ | 24,351,537 | $ | 56,419,570 | $ | 65,850,036 | $ | 95,428,111 | $ | 38,065,569 | $ | 28,297,658 | $ | 56,209,038 | $ | 33,704,615 | ||||||||||||||||
| Net Assets: | ||||||||||||||||||||||||||||||||
| Paid in capital | $ | 24,838,930 | $ | 50,973,998 | $ | 54,673,137 | $ | 95,298,901 | $ | 28,591,828 | $ | 26,436,251 | $ | 61,460,362 | $ | 31,804,843 | ||||||||||||||||
| Accumulated net investment income (loss) | 30,441 | 739,093 | (402,872 | ) | (161,564 | ) | 440,040 | 129,834 | 528,087 | (123,870 | ) | |||||||||||||||||||||
| Accumulated net realized gain (loss) on investments and foreign currency transactions | (150,017 | ) | (1,812,682 | ) | (1,874,760 | ) | (5,480,464 | ) | 4,546,537 | 934,670 | (11,172,582 | ) | (445,467 | ) | ||||||||||||||||||
| Net unrealized appreciation (depreciation) on investments and foreign currency translations | (367,817 | ) | 6,519,161 | 13,454,531 | 5,771,238 | 4,487,164 | 796,903 | 5,393,171 | 2,469,109 | |||||||||||||||||||||||
| Net Assets | $ | 24,351,537 | $ | 56,419,570 | $ | 65,850,036 | $ | 95,428,111 | $ | 38,065,569 | $ | 28,297,658 | $ | 56,209,038 | $ | 33,704,615 | ||||||||||||||||
| Net Asset Value Per Share | ||||||||||||||||||||||||||||||||
| Class N Shares: | ||||||||||||||||||||||||||||||||
| Net Assets | $ | 23,933,711 | $ | 45,025,579 | $ | 51,242,380 | $ | 78,639,763 | $ | 25,478,574 | $ | 22,254,263 | $ | 46,480,707 | $ | 26,009,542 | ||||||||||||||||
| Shares of beneficial interest outstanding (no par value; unlimited shares authorized) | 2,041,744 | 3,686,053 | 3,218,087 | 5,524,151 | 1,391,576 | 1,544,250 | 3,651,020 | 1,695,574 | ||||||||||||||||||||||||
| Net asset value, offering and redemption price per share | $ | 11.72 | $ | 12.22 | $ | 15.92 | $ | 14.24 | $ | 18.31 | $ | 14.41 | $ | 12.73 | $ | 15.34 | ||||||||||||||||
| Class A Shares: | ||||||||||||||||||||||||||||||||
| Net Assets | $ | 12 | $ | 6,543,806 | $ | 9,619,848 | $ | 10,305,425 | $ | 9,376,205 | $ | 3,802,100 | $ | 6,347,952 | $ | 5,540,086 | ||||||||||||||||
| Shares of beneficial interest outstanding (no par value; unlimited shares authorized) | 1 | 538,075 | 611,712 | 727,090 | 510,979 | 266,145 | 509,825 | 373,081 | ||||||||||||||||||||||||
| Net asset value, and redemption price per share * | $ | 11.72 | ** | $ | 12.16 | $ | 15.73 | $ | 14.17 | $ | 18.35 | $ | 14.29 | $ | 12.45 | $ | 14.85 | |||||||||||||||
| Front-end sales charge factor | 0.9425 | 0.9425 | 0.9425 | 0.9425 | 0.9425 | 0.9425 | 0.9425 | 0.9425 | ||||||||||||||||||||||||
| Offering price per share (Net asset value per share / front-end sales charge factor) | $ | 12.44 | $ | 12.90 | $ | 16.69 | $ | 15.03 | $ | 19.47 | $ | 15.16 | $ | 13.21 | $ | 15.76 | ||||||||||||||||
| Class C Shares: | ||||||||||||||||||||||||||||||||
| Net Assets | $ | 417,814 | $ | 4,850,185 | $ | 4,987,808 | $ | 6,482,923 | $ | 3,210,790 | $ | 2,241,295 | $ | 3,380,379 | $ | 2,154,987 | ||||||||||||||||
| Shares of beneficial interest outstanding (no par value; unlimited shares authorized) | 35,687 | 416,233 | 328,822 | 476,856 | 182,964 | 172,201 | 286,007 | 168,520 | ||||||||||||||||||||||||
| Net asset value, offering and redemption price per share | $ | 11.71 | $ | 11.65 | $ | 15.17 | $ | 13.60 | $ | 17.55 | $ | 13.02 | $ | 11.82 | $ | 12.79 | ||||||||||||||||
| * | For certain purchases of $1 million or more, a 0.75% contingent deferred sales charge may apply to redemptions made within eighteen months of purchase. |
| ** | NAV does not recalculate due to rounding. |
See accompanying notes to financial statements.
74
| STATEMENTS OF OPERATIONS |
| For the Year Ended October 31, 2016 |
| Dunham | Dunham | Dunham | ||||||||||||||||||||||||||
| Dunham | Monthly | Corporate / | Dunham | Dunham | International | Dunham | ||||||||||||||||||||||
| Floating Rate | Distribution | Government | Dynamic Macro | High-Yield | Opportunity | Appreciation & | ||||||||||||||||||||||
| Bond Fund | Fund | Bond Fund | Fund | Bond Fund | Bond Fund | Income Fund | ||||||||||||||||||||||
| Investment Income: | ||||||||||||||||||||||||||||
| Interest income | $ | 4,362,915 | $ | 750,036 | $ | 1,953,749 | $ | 31,783 | $ | 5,808,195 | $ | 530,794 | $ | 853,281 | ||||||||||||||
| Dividend income | 15,787 | 5,170,714 | 27,393 | 486,343 | 924 | — | 234,901 | |||||||||||||||||||||
| Securities lending income | — | 11,445 | 7,800 | 40,000 | 43,481 | — | 18,461 | |||||||||||||||||||||
| Less: Foreign withholding taxes | — | (26,824 | ) | — | — | — | (2,159 | ) | — | |||||||||||||||||||
| Total Investment Income | 4,378,702 | 5,905,371 | 1,988,942 | 558,126 | 5,852,600 | 528,635 | 1,106,643 | |||||||||||||||||||||
| Operating Expenses: | ||||||||||||||||||||||||||||
| Investment advisory fees | 543,315 | 1,659,368 | 264,596 | 226,768 | 569,532 | 187,466 | 169,547 | |||||||||||||||||||||
| Sub-advisory fees | 362,210 | 1,920,633 | 158,758 | 261,656 | 379,688 | 140,600 | 118,065 | |||||||||||||||||||||
| Sub-advisory performance fees | 4,694 | (1,048,973 | ) | (52,997 | ) | (56,566 | ) | (194,823 | ) | (91,903 | ) | (47,615 | ) | |||||||||||||||
| Fund accounting fees | 27,415 | 80,658 | 16,575 | 10,597 | 31,721 | 9,493 | 8,659 | |||||||||||||||||||||
| Distribution fees- Class C Shares | 28,886 | 435,975 | 27,433 | 21,556 | 61,768 | 10,041 | 32,233 | |||||||||||||||||||||
| Distribution fees- Class A Shares | 23,453 | 146,158 | 13,273 | 9,043 | 25,598 | 6,543 | 9,839 | |||||||||||||||||||||
| Administration fees | 109,296 | 164,572 | 79,035 | 23,134 | 84,916 | 30,953 | 20,018 | |||||||||||||||||||||
| Registration fees | 34,997 | 67,581 | 42,619 | 40,812 | 50,767 | 29,506 | 44,367 | |||||||||||||||||||||
| Transfer agent fees | 23,688 | 45,189 | 22,024 | 16,594 | 24,609 | 15,343 | 17,508 | |||||||||||||||||||||
| Custodian fees | 45,926 | 57,359 | 23,258 | 8,650 | 8,146 | 40,237 | 4,598 | |||||||||||||||||||||
| Professional fees | 21,210 | 33,955 | 22,206 | 17,881 | 22,509 | 20,150 | 18,146 | |||||||||||||||||||||
| Chief Compliance Officer fees | 14,482 | 41,514 | 8,446 | 4,728 | 15,102 | 6,566 | 4,878 | |||||||||||||||||||||
| Printing and postage expense | 15,966 | 84,723 | 7,868 | 1,440 | 12,312 | 2,838 | 4,148 | |||||||||||||||||||||
| Trustees’ fees | 4,989 | 14,408 | 2,513 | 1,847 | 5,327 | 1,580 | 1,459 | |||||||||||||||||||||
| Insurance expense | 280 | 365 | 1,376 | 417 | 352 | 1,314 | 59 | |||||||||||||||||||||
| Non 12b-1 shareholder servicing fees | 912 | 55,738 | 372 | 2,283 | 5,533 | 2,072 | 2,750 | |||||||||||||||||||||
| Dividend expenses on short sales | — | 1,109,557 | — | — | — | — | — | |||||||||||||||||||||
| Security borrowing fees | — | 429,323 | — | — | — | — | — | |||||||||||||||||||||
| Miscellaneous expenses | 7,380 | 21,551 | 4,258 | 6,982 | 9,053 | 4,182 | 10,762 | |||||||||||||||||||||
| Total Operating Expenses | 1,269,099 | 5,319,654 | 641,613 | 597,822 | 1,112,110 | 416,981 | 419,421 | |||||||||||||||||||||
| Less: Advisory/Sub-advisory fees waived | — | (31,929 | ) | — | — | — | — | — | ||||||||||||||||||||
| Net Operating Expenses | 1,269,099 | 5,287,725 | 641,613 | 597,822 | 1,112,110 | 416,981 | 419,421 | |||||||||||||||||||||
| Net Investment Income (Loss) | 3,109,603 | 617,646 | 1,347,329 | (39,696 | ) | 4,740,490 | 111,654 | 687,222 | ||||||||||||||||||||
| Realized and Unrealized Gain (Loss) on Investments, Futures, Options Purchased, Securities Sold Short, Written Options, Swap Contracts, Foreign Currency Transactions, Capital Gain Distribution from Regulated Investment Companies, and Foreign Currency Exchange Contracts: | ||||||||||||||||||||||||||||
| Net realized gain (loss) from: | ||||||||||||||||||||||||||||
| Investments | (1,050,725 | ) | (15,981,115 | ) | (391,669 | ) | (458,964 | ) | (4,616,046 | ) | (1,455,944 | ) | (2,201,104 | ) | ||||||||||||||
| Futures | — | — | — | (1,055,780 | ) | — | 44,527 | — | ||||||||||||||||||||
| Options purchased | — | (6,165,788 | ) | — | 177,424 | — | — | — | ||||||||||||||||||||
| Securities sold short | — | (3,743,925 | ) | — | — | — | — | — | ||||||||||||||||||||
| Written options | — | 9,642,109 | — | 20,592 | — | — | — | |||||||||||||||||||||
| Swap contracts | — | (1,325,675 | ) | — | — | — | — | — | ||||||||||||||||||||
| Foreign currency transactions | — | (170,265 | ) | — | 7,211 | — | 70,051 | — | ||||||||||||||||||||
| Capital gain distribution from regulated investment companies | — | — | — | 16,065 | — | — | — | |||||||||||||||||||||
| Foreign currency exchange contracts | — | 3,250,373 | — | 1,533 | — | 595,869 | — | |||||||||||||||||||||
| Net change in unrealized appreciation (depreciation) on: | ||||||||||||||||||||||||||||
| Investments | 2,127,148 | 18,347,154 | 1,137,437 | 745,207 | 4,880,003 | 2,274,189 | 851,564 | |||||||||||||||||||||
| Futures | — | — | — | (155,340 | ) | — | (25,598 | ) | — | |||||||||||||||||||
| Options purchased | — | 375,471 | — | (220,062 | ) | — | — | — | ||||||||||||||||||||
| Securities sold short | — | (3,725,027 | ) | — | — | — | — | — | ||||||||||||||||||||
| Written options | — | 2,052,591 | — | (20,089 | ) | — | — | — | ||||||||||||||||||||
| Swap contracts | — | 138,588 | — | — | — | — | — | |||||||||||||||||||||
| Foreign currency translations | — | 20,952 | — | (22,881 | ) | — | 38,396 | — | ||||||||||||||||||||
| Foreign currency exchange contracts | — | (133,779 | ) | — | — | — | (37,175 | ) | — | |||||||||||||||||||
| Net Realized and Unrealized Gain (Loss) | 1,076,423 | 2,581,664 | 745,768 | (965,084 | ) | 263,957 | 1,504,315 | (1,349,540 | ) | |||||||||||||||||||
| Net Increase (Decrease) in Net Assets Resulting From Operations | $ | 4,186,026 | $ | 3,199,310 | $ | 2,093,097 | $ | (1,004,780 | ) | $ | 5,004,447 | $ | 1,615,969 | $ | (662,318 | ) | ||||||||||||
See accompanying notes to financial statements.
75
| STATEMENTS OF OPERATIONS (Continued) |
| For the Year or Period Ended October 31, 2016 |
| Dunham | Dunham | |||||||||||||||||||||||||||||||
| Dunham | Dunham | Focused | Dunham | Dunham | Dunham | Emerging | Dunham | |||||||||||||||||||||||||
| Alternative | Large Cap | Large Cap | International | Real Estate | Small Cap | Markets | Small Cap | |||||||||||||||||||||||||
| Dividend Fund* | Value Fund | Growth Fund | Stock Fund | Stock Fund | Value Fund | Stock Fund | Growth Fund | |||||||||||||||||||||||||
| Investment Income: | ||||||||||||||||||||||||||||||||
| Interest income | $ | 2,854 | $ | 2,636 | $ | 1,543 | $ | 3,545 | $ | 1,364 | $ | 542 | $ | 2,258 | $ | 2,010 | ||||||||||||||||
| Dividend income | 86,019 | 1,492,624 | 321,539 | 2,785,456 | 1,239,549 | 563,382 | 1,735,331 | 203,644 | ||||||||||||||||||||||||
| Securities lending income | — | 16,426 | 30,520 | 32,293 | 14,682 | 18,637 | 11,523 | 60,803 | ||||||||||||||||||||||||
| Less: Foreign withholding taxes | (1,037 | ) | — | (100 | ) | (306,177 | ) | — | — | (197,454 | ) | (18 | ) | |||||||||||||||||||
| Total Investment Income | 87,836 | 1,511,686 | 353,502 | 2,515,117 | 1,255,595 | 582,561 | 1,551,658 | 266,439 | ||||||||||||||||||||||||
| Operating Expenses: | ||||||||||||||||||||||||||||||||
| Investment advisory fees | 20,806 | 358,282 | 416,072 | 582,548 | 278,179 | 179,163 | 335,015 | 216,301 | ||||||||||||||||||||||||
| Sub-advisory fees | 9,603 | 165,361 | 224,039 | 582,548 | 170,925 | 124,036 | 258,399 | 166,832 | ||||||||||||||||||||||||
| Sub-advisory performance fees | (4,821 | ) | (176,941 | ) | (55,096 | ) | (98,079 | ) | (87,856 | ) | (14,709 | ) | (169,031 | ) | (120,338 | ) | ||||||||||||||||
| Fund accounting fees | 875 | 16,098 | 18,887 | 27,226 | 12,938 | 9,262 | 15,777 | 10,200 | ||||||||||||||||||||||||
| Distribution fees- Class C Shares | 376 | 54,724 | 53,146 | 68,986 | 29,135 | 23,483 | 32,851 | 23,481 | ||||||||||||||||||||||||
| Distribution fees- Class A Shares | — | 15,849 | 24,108 | 22,810 | 25,118 | 9,253 | 12,694 | 14,315 | ||||||||||||||||||||||||
| Administration fees | 1,550 | 34,059 | 37,957 | 118,648 | 25,654 | 12,983 | 42,845 | 21,698 | ||||||||||||||||||||||||
| Registration fees | 543 | 40,557 | 47,264 | 44,602 | 43,610 | 39,523 | 43,317 | 45,293 | ||||||||||||||||||||||||
| Transfer agent fees | 2,258 | 17,989 | 20,564 | 29,935 | 18,516 | 17,928 | 19,918 | 17,551 | ||||||||||||||||||||||||
| Custodian fees | 450 | 15,134 | 7,261 | 121,916 | 10,239 | 9,939 | 59,601 | 13,193 | ||||||||||||||||||||||||
| Professional fees | 22,770 | 16,525 | 18,991 | 21,567 | 17,845 | 16,882 | 19,480 | 16,668 | ||||||||||||||||||||||||
| Chief Compliance Officer fees | 1,279 | 8,409 | 9,876 | 12,882 | 6,629 | 1,697 | 7,013 | 5,410 | ||||||||||||||||||||||||
| Printing and postage expense | 3,770 | 7,602 | 8,373 | 10,082 | 5,689 | 4,302 | 11,120 | 5,246 | ||||||||||||||||||||||||
| Trustees’ fees | 10 | 3,326 | 3,580 | 4,913 | 2,421 | 2,154 | 3,560 | 1,881 | ||||||||||||||||||||||||
| Insurance expense | — | 297 | 191 | — | 153 | 783 | 1,102 | 104 | ||||||||||||||||||||||||
| Interest expense | — | — | — | — | 1,073 | — | — | — | ||||||||||||||||||||||||
| Non 12b-1 shareholder servicing fees | 101 | 183 | 4,538 | 2,183 | 5,234 | 2,483 | 1,283 | 3,654 | ||||||||||||||||||||||||
| Miscellaneous expenses | 1,002 | 4,448 | 5,064 | 10,668 | 11,397 | 563 | 6,129 | 7,829 | ||||||||||||||||||||||||
| Net Operating Expenses | 60,572 | 581,902 | 844,815 | 1,563,435 | 576,899 | 439,725 | 701,073 | 449,318 | ||||||||||||||||||||||||
| Net Investment Income (Loss) | 27,264 | 929,784 | (491,313 | ) | 951,682 | 678,696 | 142,836 | 850,585 | (182,879 | ) | ||||||||||||||||||||||
| Realized and Unrealized Gain (Loss) on Investments, Options Purchased and Foreign Currency Purchased Transactions: | ||||||||||||||||||||||||||||||||
| Net realized gain (loss) from: | ||||||||||||||||||||||||||||||||
| Investments | (129,605 | ) | (1,062,540 | ) | (1,355,084 | ) | (4,324,879 | ) | 5,144,472 | 1,004,619 | (3,037,150 | ) | (256,335 | ) | ||||||||||||||||||
| Foreign currency transactions | — | — | — | (254,336 | ) | — | — | 161,210 | — | |||||||||||||||||||||||
| Foreign currency exchange contracts | — | — | — | (1,011,194 | ) | — | — | (288,412 | ) | — | ||||||||||||||||||||||
| Options purchased | (20,412 | ) | — | — | — | — | — | — | — | |||||||||||||||||||||||
| Net change in unrealized appreciation (depreciation) on: | ||||||||||||||||||||||||||||||||
| Investments | (322,481 | ) | 1,012,440 | (1,728,147 | ) | 4,795,843 | (2,930,583 | ) | 114,680 | 6,273,000 | 383,831 | |||||||||||||||||||||
| Foreign currency translations | — | — | — | 13,692 | — | — | 13,989 | — | ||||||||||||||||||||||||
| Foreign currency exchange contracts | — | — | — | (255,851 | ) | — | — | — | ||||||||||||||||||||||||
| Options purchased | (45,336 | ) | — | — | — | — | — | — | — | |||||||||||||||||||||||
| Net Realized and Unrealized Gain (Loss) | (517,834 | ) | (50,100 | ) | (3,083,231 | ) | (1,036,725 | ) | 2,213,889 | 1,119,299 | 3,122,637 | 127,496 | ||||||||||||||||||||
| Net Increase (Decrease) in Net Assets Resulting From Operations | $ | (490,570 | ) | $ | 879,684 | $ | (3,574,544 | ) | $ | (85,043 | ) | $ | 2,892,585 | $ | 1,262,135 | $ | 3,973,222 | $ | (55,383 | ) | ||||||||||||
| * | Fund commenced operations on August 31, 2016. |
See accompanying notes to financial statements.
76
| STATEMENTS OF CHANGES IN NET ASSETS |
| Dunham | Dunham | Dunham | Dunham | Dunham | ||||||||||||||||||||||||||||||||||||
| Floating Rate | Monthly Distribution | Corporate/Government | Dynamic Macro | High-Yield | ||||||||||||||||||||||||||||||||||||
| Bond Fund | Fund | Bond Fund | Fund | Bond Fund | ||||||||||||||||||||||||||||||||||||
| Year Ended | Year Ended | Year Ended | Year Ended | Year Ended | Year Ended | Year Ended | Year Ended | Year Ended | Year Ended | |||||||||||||||||||||||||||||||
| Oct. 31, 2016 | Oct. 31, 2015 | Oct. 31, 2016 | Oct. 31, 2015 | Oct. 31, 2016 | Oct. 31, 2015 | Oct. 31, 2016 | Oct. 31, 2015 | Oct. 31, 2016 | Oct. 31, 2015 | |||||||||||||||||||||||||||||||
| Operations: | ||||||||||||||||||||||||||||||||||||||||
| Net investment income (loss) | $ | 3,109,603 | $ | 2,659,546 | $ | 617,646 | $ | (2,091,574 | ) | $ | 1,347,329 | $ | 1,579,986 | $ | (39,696 | ) | $ | (367,594 | ) | $ | 4,740,490 | $ | 5,358,316 | |||||||||||||||||
| Net realized gain (loss) from investments, futures options purchased, securities sold short, written options, swap contracts foreign currency transactions and foreign currency exchange contracts | (1,050,725 | ) | (989,927 | ) | (14,494,286 | ) | 8,665,171 | (391,669 | ) | (802,542 | ) | (1,307,984 | ) | (784,599 | ) | (4,616,046 | ) | (4,691,852 | ) | |||||||||||||||||||||
| Capital gain distributions from regulated investment companies | — | — | — | — | — | — | 16,065 | — | — | — | ||||||||||||||||||||||||||||||
| Net change in unrealized appreciation (depreciation) on investments, futures, options purchased, securities sold short, written options foreign currency transactions, and foreign currency translations | 2,127,148 | (1,351,525 | ) | 17,075,950 | (12,530,696 | ) | 1,137,437 | (628,811 | ) | 326,835 | 885,984 | 4,880,003 | (2,895,283 | ) | ||||||||||||||||||||||||||
| Net Increase (Decrease) in Net Assets Resulting From Operations | 4,186,026 | 318,094 | 3,199,310 | (5,957,099 | ) | 2,093,097 | 148,633 | (1,004,780 | ) | (266,209 | ) | 5,004,447 | (2,228,819 | ) | ||||||||||||||||||||||||||
| Distributions to Shareholders From: | ||||||||||||||||||||||||||||||||||||||||
| Net Realized Gains: | ||||||||||||||||||||||||||||||||||||||||
| Class N | — | — | — | (3,465,984 | ) | — | — | — | — | — | — | |||||||||||||||||||||||||||||
| Class A | — | — | — | (1,580,917 | ) | — | — | — | — | — | — | |||||||||||||||||||||||||||||
| Class C | — | — | — | (1,315,549 | ) | — | — | — | — | — | — | |||||||||||||||||||||||||||||
| Net Investment Income: | ||||||||||||||||||||||||||||||||||||||||
| Class N | (2,713,303 | ) | (2,306,306 | ) | (2,340,282 | ) | — | (1,222,601 | ) | (1,444,152 | ) | — | — | (3,843,760 | ) | (4,206,990 | ) | |||||||||||||||||||||||
| Class A | (304,360 | ) | (280,234 | ) | (932,730 | ) | — | (133,317 | ) | (123,639 | ) | — | — | (486,798 | ) | (633,882 | ) | |||||||||||||||||||||||
| Class C | (106,752 | ) | (90,378 | ) | (825,662 | ) | — | (75,263 | ) | (89,766 | ) | — | — | (351,832 | ) | (426,203 | ) | |||||||||||||||||||||||
| Distributions From Paid In Capital: | ||||||||||||||||||||||||||||||||||||||||
| Class N | — | — | (2,992,066 | ) | (1,924,706 | ) | — | — | — | — | — | — | ||||||||||||||||||||||||||||
| Class A | — | — | (1,107,072 | ) | (906,907 | ) | — | — | — | — | — | — | ||||||||||||||||||||||||||||
| Class C | — | — | (1,018,406 | ) | (731,788 | ) | — | — | — | — | — | — | ||||||||||||||||||||||||||||
| Total Distributions to Shareholders | (3,124,415 | ) | (2,676,918 | ) | (9,216,218 | ) | (9,925,851 | ) | (1,431,181 | ) | (1,657,557 | ) | — | — | (4,682,390 | ) | (5,267,075 | ) | ||||||||||||||||||||||
| Share Transactions of Beneficial Interest: | ||||||||||||||||||||||||||||||||||||||||
| Net proceeds from shares sold | ||||||||||||||||||||||||||||||||||||||||
| Class N | 31,114,732 | 26,805,380 | 33,193,976 | 59,506,155 | 12,243,447 | 11,821,827 | 9,668,935 | 19,642,140 | 11,238,721 | 14,380,469 | ||||||||||||||||||||||||||||||
| Class A | 4,944,773 | 7,478,894 | 10,795,276 | 32,835,909 | 2,890,580 | 2,730,333 | 2,600,999 | 2,239,845 | 2,527,980 | 7,270,669 | ||||||||||||||||||||||||||||||
| Class C | 1,700,297 | 1,313,889 | 6,193,711 | 20,947,149 | 925,221 | 982,704 | 1,008,278 | 671,518 | 1,389,655 | 1,348,348 | ||||||||||||||||||||||||||||||
| Reinvestment of distributions | ||||||||||||||||||||||||||||||||||||||||
| Class N | 2,712,469 | 2,305,799 | 5,121,998 | 5,020,988 | 1,221,719 | 1,443,731 | — | — | 3,778,722 | 4,059,205 | ||||||||||||||||||||||||||||||
| Class A | 282,009 | 263,845 | 1,739,112 | 2,064,283 | 120,244 | 118,869 | — | — | 405,699 | 539,405 | ||||||||||||||||||||||||||||||
| Class C | 105,282 | 89,580 | 1,495,861 | 1,582,690 | 71,622 | 87,339 | — | — | 302,390 | 362,639 | ||||||||||||||||||||||||||||||
| Cost of shares redeemed | ||||||||||||||||||||||||||||||||||||||||
| Class N | (13,814,046 | ) | (16,957,527 | ) | (46,252,134 | ) | (49,477,110 | ) | (7,944,853 | ) | (13,876,442 | ) | (8,718,724 | ) | (2,621,968 | ) | (15,743,954 | ) | (36,343,091 | ) | ||||||||||||||||||||
| Class A | (3,023,031 | ) | (12,506,881 | ) | (39,725,577 | ) | (35,643,072 | ) | (3,065,377 | ) | (1,627,587 | ) | (1,876,087 | ) | (658,270 | ) | (2,742,308 | ) | (18,668,200 | ) | ||||||||||||||||||||
| Class C | (884,861 | ) | (1,119,025 | ) | (17,096,041 | ) | (16,937,091 | ) | (1,378,310 | ) | (958,740 | ) | (752,842 | ) | (453,699 | ) | (3,228,961 | ) | (3,431,763 | ) | ||||||||||||||||||||
| Net Increase (Decrease) in Net Assets From Share Transactions of Beneficial Interest | 23,137,624 | 7,673,954 | (44,533,818 | ) | 19,899,901 | 5,084,293 | 722,034 | 1,930,559 | 18,819,566 | (2,072,056 | ) | (30,482,319 | ) | |||||||||||||||||||||||||||
| Total Increase (Decrease) in Net Assets | 24,199,235 | 5,315,130 | (50,550,726 | ) | 4,016,951 | 5,746,209 | (786,890 | ) | 925,779 | 18,553,357 | (1,749,999 | ) | (37,978,213 | ) | ||||||||||||||||||||||||||
| Net Assets: | ||||||||||||||||||||||||||||||||||||||||
| Beginning of Year | 85,486,953 | 80,171,823 | 288,305,067 | 284,288,116 | 50,474,938 | 51,261,828 | 33,752,399 | 15,199,042 | 98,108,366 | 136,086,579 | ||||||||||||||||||||||||||||||
| End of Year * | $ | 109,686,188 | $ | 85,486,953 | $ | 237,754,341 | $ | 288,305,067 | $ | 56,221,147 | $ | 50,474,938 | $ | 34,678,178 | $ | 33,752,399 | $ | 96,358,367 | $ | 98,108,366 | ||||||||||||||||||||
| * Includes accumulated net investment income (loss) at end of year | $ | 12,588 | $ | 27,400 | $ | (1,211,967 | ) | $ | (1,394,669 | ) | $ | 3,392 | $ | 16,342 | $ | (9,192 | ) | $ | (42,659 | ) | $ | 167,801 | $ | 108,995 | ||||||||||||||||
See accompanying notes to financial statements.
77
| STATEMENTS OF CHANGES IN NET ASSETS (Continued) |
| Dunham | Dunham | Dunham | Dunham | Dunham | ||||||||||||||||||||||||||||||||
| International Opportunity | Appreciation & | Alternative | Large Cap | Focused Large Cap | ||||||||||||||||||||||||||||||||
| Bond Fund | Income Fund | Dividend Fund | Value Fund | Growth Fund | ||||||||||||||||||||||||||||||||
| Year Ended | Year Ended | Year Ended | Year Ended | Period Ended | Year Ended | Year Ended | Year Ended | Year Ended | ||||||||||||||||||||||||||||
| Oct. 31, 2016 | Oct. 31, 2015 | Oct. 31, 2016 | Oct. 31, 2015 | October 31, 2016^ | Oct. 31, 2016 | Oct. 31, 2015 | Oct. 31, 2016 | Oct. 31, 2015 | ||||||||||||||||||||||||||||
| Operations: | ||||||||||||||||||||||||||||||||||||
| Net investment income (loss) | $ | 111,654 | $ | 219,651 | $ | 687,222 | $ | 765,356 | $ | 27,264 | $ | 929,784 | $ | 496,880 | $ | (491,313 | ) | $ | (678,553 | ) | ||||||||||||||||
| Net realized gain (loss) from investments and foreign currency transactions | (745,497 | ) | (3,043,314 | ) | (2,201,104 | ) | 898,618 | (150,017 | ) | (1,062,540 | ) | 15,237,873 | (1,355,084 | ) | 638,277 | |||||||||||||||||||||
| Net change in unrealized appreciation (depreciation) on investments and foreign currency translations | 2,249,812 | (1,185,869 | ) | 851,564 | (2,532,611 | ) | (367,817 | ) | 1,012,440 | (15,021,215 | ) | (1,728,147 | ) | 7,298,519 | ||||||||||||||||||||||
| Net Increase (Decrease) in Net Assets Resulting From Operations | 1,615,969 | (4,009,532 | ) | (662,318 | ) | (868,637 | ) | (490,570 | ) | 879,684 | 713,538 | (3,574,544 | ) | 7,258,243 | ||||||||||||||||||||||
| Distributions to Shareholders From: | ||||||||||||||||||||||||||||||||||||
| Net Realized Gains: | ||||||||||||||||||||||||||||||||||||
| Class N | — | — | (403,190 | ) | (2,968,783 | ) | — | (11,078,720 | ) | — | (291,262 | ) | — | |||||||||||||||||||||||
| Class A | — | — | (86,592 | ) | (748,302 | ) | — | (1,618,488 | ) | — | (56,919 | ) | — | |||||||||||||||||||||||
| Class C | — | — | (104,911 | ) | (649,083 | ) | — | (1,560,943 | ) | — | (33,681 | ) | — | |||||||||||||||||||||||
| Net Investment Income: | ||||||||||||||||||||||||||||||||||||
| Class N | (26,161 | ) | (20,234 | ) | (786,055 | ) | (287,785 | ) | — | (494,656 | ) | (323,640 | ) | — | — | |||||||||||||||||||||
| Class A | (1,468 | ) | (1,136 | ) | (158,001 | ) | (61,328 | ) | — | (56,644 | ) | (42,004 | ) | — | — | |||||||||||||||||||||
| Class C | (112 | ) | — | (157,682 | ) | (23,109 | ) | — | (12,668 | ) | — | — | — | |||||||||||||||||||||||
| Total Distributions to Shareholders | (27,741 | ) | (21,370 | ) | (1,696,431 | ) | (4,738,390 | ) | — | (14,822,119 | ) | (365,644 | ) | (381,862 | ) | — | ||||||||||||||||||||
| Share Transactions of Beneficial Interest: | ||||||||||||||||||||||||||||||||||||
| Net proceeds from shares sold | ||||||||||||||||||||||||||||||||||||
| Class N | 5,357,077 | 12,663,574 | 2,852,756 | 6,612,666 | 24,751,166 | 7,574,814 | 10,056,662 | 12,060,706 | 18,681,958 | |||||||||||||||||||||||||||
| Class A | 929,673 | 4,644,903 | 754,836 | 1,658,013 | 12 | 1,925,829 | 2,688,351 | 4,522,263 | 9,683,964 | |||||||||||||||||||||||||||
| Class C | 349,149 | 674,903 | 993,090 | 2,201,019 | 424,059 | 739,554 | 1,091,246 | 1,855,230 | 1,171,037 | |||||||||||||||||||||||||||
| Reinvestment of distributions | ||||||||||||||||||||||||||||||||||||
| Class N | 26,161 | 20,234 | 1,183,251 | 3,247,305 | — | 11,569,073 | 323,513 | 289,776 | — | |||||||||||||||||||||||||||
| Class A | 1,390 | 1,098 | 190,060 | 583,948 | — | 1,655,337 | 41,709 | 55,382 | — | |||||||||||||||||||||||||||
| Class C | 111 | — | 230,784 | 669,690 | — | 1,571,854 | — | 30,681 | — | |||||||||||||||||||||||||||
| Cost of shares redeemed | ||||||||||||||||||||||||||||||||||||
| Class N | (13,978,227 | ) | (19,792,147 | ) | (5,730,350 | ) | (4,405,250 | ) | (333,069 | ) | (7,907,047 | ) | (8,002,850 | ) | (9,460,088 | ) | (9,982,425 | ) | ||||||||||||||||||
| Class A | (2,163,714 | ) | (4,479,173 | ) | (1,189,036 | ) | (1,625,832 | ) | — | (2,032,040 | ) | (3,835,677 | ) | �� | (3,121,382 | ) | (22,089,093 | ) | ||||||||||||||||||
| Class C | (840,513 | ) | (753,425 | ) | (2,555,588 | ) | (1,088,712 | ) | (61 | ) | (1,737,158 | ) | (950,437 | ) | (1,722,420 | ) | (843,277 | ) | ||||||||||||||||||
| Net Increase (Decrease) in Net Assets From Share Transactions of Beneficial Interest | (10,318,893 | ) | (7,020,033 | ) | (3,270,197 | ) | 7,852,847 | 24,842,107 | 13,360,216 | 1,412,517 | 4,510,148 | (3,377,836 | ) | |||||||||||||||||||||||
| Total Increase (Decrease) in Net Assets | (8,730,665 | ) | (11,050,935 | ) | (5,628,946 | ) | 2,245,820 | 24,351,537 | (582,219 | ) | 1,760,411 | 553,742 | 3,880,407 | |||||||||||||||||||||||
| Net Assets: | ||||||||||||||||||||||||||||||||||||
| Beginning of Period | 36,780,272 | 47,831,207 | 29,377,025 | 27,131,205 | $ | — | 57,001,789 | 55,241,378 | 65,296,294 | 61,415,887 | ||||||||||||||||||||||||||
| End of Period * | $ | 28,049,607 | $ | 36,780,272 | $ | 23,748,079 | $ | 29,377,025 | $ | 24,351,537 | $ | 56,419,570 | $ | 57,001,789 | $ | 65,850,036 | $ | 65,296,294 | ||||||||||||||||||
| * Includes accumulated net investment income (loss) at end of period | $ | (24,355 | ) | $ | (70,155 | ) | $ | 466,372 | $ | 956,577 | $ | 30,441 | $ | 739,093 | $ | 373,351 | $ | (402,872 | ) | $ | (612,912 | ) | ||||||||||||||
| ^ | Dunham Alternative Dividend Fund commenced operations on August 31, 2016 |
See accompanying notes to financial statements.
78
| STATEMENTS OF CHANGES IN NET ASSETS (Continued) |
| Dunham | Dunham | Dunham | Dunham | Dunham | ||||||||||||||||||||||||||||||||||||
| International | Real Estate | Small Cap | Emerging Markets | Small Cap | ||||||||||||||||||||||||||||||||||||
| Stock Fund | Stock Fund | Value Fund | Stock Fund | Growth Fund | ||||||||||||||||||||||||||||||||||||
| Year Ended | Year Ended | Year Ended | Year Ended | Year Ended | Year Ended | Year Ended | Year Ended | Year Ended | Year Ended | |||||||||||||||||||||||||||||||
| Oct. 31, 2016 | Oct. 31, 2015 | Oct. 31, 2016 | Oct. 31, 2015 | Oct. 31, 2016 | Oct. 31, 2015 | Oct. 31, 2016 | Oct. 31, 2015 | Oct. 31, 2016 | Oct. 31, 2015 | |||||||||||||||||||||||||||||||
| Operations: | ||||||||||||||||||||||||||||||||||||||||
| Net investment income (loss) | $ | 951,682 | $ | (61,967 | ) | $ | 678,696 | $ | 330,722 | $ | 142,836 | $ | (62,459 | ) | $ | 850,585 | $ | 220,476 | $ | (182,879 | ) | $ | (481,979 | ) | ||||||||||||||||
| Net realized gain (loss) from investments and foreign currency transactions | (5,590,409 | ) | (522,400 | ) | 5,144,472 | 4,411,509 | 1,004,619 | 960,175 | (3,164,352 | ) | (4,267,938 | ) | (256,335 | ) | 3,247,630 | |||||||||||||||||||||||||
| Net change in unrealized appreciation (depreciation) on investments and foreign currency translations | 4,553,684 | (2,388,134 | ) | (2,930,583 | ) | (2,058,419 | ) | 114,680 | (1,248,260 | ) | 6,286,989 | (4,292,625 | ) | 383,831 | (1,058,568 | ) | ||||||||||||||||||||||||
| Net Increase (Decrease) in Net Assets Resulting From Operations | (85,043 | ) | (2,972,501 | ) | 2,892,585 | 2,683,812 | 1,262,135 | (350,544 | ) | 3,973,222 | (8,340,087 | ) | (55,383 | ) | 1,707,083 | |||||||||||||||||||||||||
| Distributions to Shareholders From: | ||||||||||||||||||||||||||||||||||||||||
| Net Realized Gains: | ||||||||||||||||||||||||||||||||||||||||
| Class N | — | (213,428 | ) | (2,998,341 | ) | (1,801,657 | ) | (721,628 | ) | (1,480,348 | ) | — | — | (1,889,987 | ) | (1,843,030 | ) | |||||||||||||||||||||||
| Class A | — | (29,714 | ) | (955,297 | ) | (494,611 | ) | (123,232 | ) | (199,656 | ) | — | — | (500,800 | ) | (582,886 | ) | |||||||||||||||||||||||
| Class C | — | (24,848 | ) | (377,983 | ) | (214,050 | ) | (87,966 | ) | (163,574 | ) | — | — | (305,357 | ) | (313,703 | ) | |||||||||||||||||||||||
| Net Investment Income: | ||||||||||||||||||||||||||||||||||||||||
| Class N | (43,319 | ) | (1,143,359 | ) | (353,676 | ) | (214,891 | ) | (13,002 | ) | (55,192 | ) | (286,567 | ) | (471,950 | ) | — | — | ||||||||||||||||||||||
| Class A | — | (136,048 | ) | (86,476 | ) | (48,514 | ) | — | — | (20,580 | ) | (46,968 | ) | — | — | |||||||||||||||||||||||||
| Class C | — | (70,549 | ) | (4,842 | ) | — | — | — | — | (18,608 | ) | — | — | |||||||||||||||||||||||||||
| Distributions From Paid In Capital: | ||||||||||||||||||||||||||||||||||||||||
| Class N | — | — | — | — | — | — | — | — | (54,926 | ) | — | |||||||||||||||||||||||||||||
| Class A | — | — | — | — | — | — | — | — | (14,554 | ) | — | |||||||||||||||||||||||||||||
| Class C | — | — | — | — | — | — | — | — | (8,874 | ) | — | |||||||||||||||||||||||||||||
| Total Distributions to Shareholders | (43,319 | ) | (1,617,946 | ) | (4,776,615 | ) | (2,773,723 | ) | (945,828 | ) | (1,898,770 | ) | (307,147 | ) | (537,526 | ) | (2,774,498 | ) | (2,739,619 | ) | ||||||||||||||||||||
| Share Transactions of Beneficial Interest: | ||||||||||||||||||||||||||||||||||||||||
| Net proceeds from shares sold | ||||||||||||||||||||||||||||||||||||||||
| Class N | 11,593,024 | 30,030,021 | 4,921,239 | 10,087,909 | 3,216,505 | 5,052,309 | 10,467,796 | 18,180,906 | 8,676,971 | 6,472,774 | ||||||||||||||||||||||||||||||
| Class A | 3,460,232 | 4,446,411 | 1,598,423 | 9,349,776 | 946,333 | 1,406,383 | 2,816,620 | 2,545,109 | 1,105,692 | 1,939,467 | ||||||||||||||||||||||||||||||
| Class C | 1,189,320 | 1,892,802 | 836,149 | 1,047,720 | 367,054 | 373,937 | 929,078 | 1,043,954 | 438,741 | 650,423 | ||||||||||||||||||||||||||||||
| Reinvestment of distributions | ||||||||||||||||||||||||||||||||||||||||
| Class N | 43,140 | 1,356,407 | 3,276,127 | 1,959,665 | 734,047 | 1,534,285 | 286,387 | 471,942 | 1,940,454 | 1,836,187 | ||||||||||||||||||||||||||||||
| Class A | — | 146,152 | 1,027,941 | 537,515 | 119,701 | 197,400 | 20,108 | 46,050 | 363,529 | 414,220 | ||||||||||||||||||||||||||||||
| Class C | — | 94,504 | 351,559 | 205,692 | 87,856 | 163,312 | 18,512 | 313,976 | 312,902 | |||||||||||||||||||||||||||||||
| Cost of shares redeemed | ||||||||||||||||||||||||||||||||||||||||
| Class N | (9,905,060 | ) | (8,142,350 | ) | (14,843,844 | ) | (15,912,244 | ) | (4,020,261 | ) | (6,542,402 | ) | (10,120,339 | ) | (4,402,409 | ) | (5,872,142 | ) | (5,627,001 | ) | ||||||||||||||||||||
| Class A | (2,206,684 | ) | (2,889,429 | ) | (3,203,589 | ) | (3,240,007 | ) | (1,114,590 | ) | (801,068 | ) | (1,487,050 | ) | (1,122,138 | ) | (1,667,965 | ) | (2,284,547 | ) | ||||||||||||||||||||
| Class C | (1,909,025 | ) | (833,335 | ) | (1,626,251 | ) | (1,555,919 | ) | (606,898 | ) | (428,369 | ) | (1,010,559 | ) | (764,943 | ) | (1,405,211 | ) | (801,682 | ) | ||||||||||||||||||||
| Net Increase (Decrease) in Net Assets From Share Transactions of Beneficial Interest | 2,264,947 | 26,101,183 | (7,662,246 | ) | 2,480,107 | (270,253 | ) | 955,787 | 1,902,041 | 16,016,983 | 3,894,045 | 2,912,743 | ||||||||||||||||||||||||||||
| Total Increase (Decrease) in Net Assets | 2,136,585 | 21,510,736 | (9,546,276 | ) | 2,390,196 | 46,054 | (1,293,527 | ) | 5,568,116 | 7,139,370 | 1,064,164 | 1,880,207 | ||||||||||||||||||||||||||||
| Net Assets: | ||||||||||||||||||||||||||||||||||||||||
| Beginning of Year | 93,291,526 | 71,780,790 | 47,611,845 | 45,221,649 | 28,251,604 | 29,545,131 | 50,640,922 | 43,501,552 | 32,640,451 | 30,760,244 | ||||||||||||||||||||||||||||||
| End of Year * | $ | 95,428,111 | $ | 93,291,526 | $ | 38,065,569 | $ | 47,611,845 | $ | 28,297,658 | $ | 28,251,604 | $ | 56,209,038 | $ | 50,640,922 | $ | 33,704,615 | $ | 32,640,451 | ||||||||||||||||||||
| * Includes accumulated net investment income (loss) at end of period | $ | (161,564 | ) | $ | (322,883 | ) | $ | 440,040 | $ | 206,337 | $ | 129,834 | $ | — | $ | 528,087 | $ | 108,161 | $ | (123,870 | ) | $ | — | |||||||||||||||||
See accompanying notes to financial statements.
79
| FINANCIAL HIGHLIGHTS |
| Dunham Floating Rate Bond Fund |
| The table sets forth financial data for one share of beneficial interest outstanding throughout each year. |
| Class N | Class A | Class C | ||||||||||||||||||||||||||||||||||
| Year Ended | Year Ended | Year Ended | Year Ended | Year Ended | Year Ended | Year Ended | Year Ended | Year Ended | ||||||||||||||||||||||||||||
| October 31, | October 31, | October 31, | October 31, | October 31, | October 31, | October 31, | October 31, | October 31, | ||||||||||||||||||||||||||||
| 2016 | 2015 | 2014* | 2016 | 2015 | 2014* | 2016 | 2015 | 2014* | ||||||||||||||||||||||||||||
| Net asset value, beginning of year | $ | 9.60 | $ | 9.87 | $ | 10.00 | $ | 9.59 | $ | 9.87 | $ | 10.00 | $ | 9.59 | $ | 9.86 | $ | 10.00 | ||||||||||||||||||
| Income (loss) from investment operations: | ||||||||||||||||||||||||||||||||||||
| Net investment income** | 0.33 | 0.32 | 0.29 | 0.31 | 0.30 | 0.28 | 0.26 | 0.24 | 0.22 | |||||||||||||||||||||||||||
| Net realized and unrealized gain (loss) | 0.10 | (0.27 | ) | (0.15 | ) | 0.11 | (0.28 | ) | (0.16 | ) | 0.10 | (0.26 | ) | (0.16 | ) | |||||||||||||||||||||
| Total income (loss) from investment operations | 0.43 | 0.05 | 0.14 | 0.42 | 0.02 | 0.12 | 0.36 | (0.02 | ) | 0.06 | ||||||||||||||||||||||||||
| Less distributions: | ||||||||||||||||||||||||||||||||||||
| Distributions from net investment income | (0.33 | ) | (0.32 | ) | (0.27 | ) | (0.31 | ) | (0.30 | ) | (0.25 | ) | (0.26 | ) | (0.25 | ) | (0.20 | ) | ||||||||||||||||||
| Total distributions | (0.33 | ) | (0.32 | ) | (0.27 | ) | (0.31 | ) | (0.30 | ) | (0.25 | ) | (0.26 | ) | (0.25 | ) | (0.20 | ) | ||||||||||||||||||
| Net asset value, end of year | $ | 9.70 | $ | 9.60 | $ | 9.87 | $ | 9.70 | $ | 9.59 | $ | 9.87 | $ | 9.69 | $ | 9.59 | $ | 9.86 | ||||||||||||||||||
| Total return + | 4.63 | % | 0.51 | % | 1.43 | % | 4.49 | % | 0.16 | % | 1.20 | % | 3.87 | % | (0.23 | )% | 0.63 | % | ||||||||||||||||||
| Ratios/Supplemental Data: | ||||||||||||||||||||||||||||||||||||
| Net assets, end of year (in 000s) | $ | 94,219 | $ | 73,316 | $ | 63,120 | $ | 10,923 | $ | 8,598 | $ | 13,664 | $ | 4,545 | $ | 3,573 | $ | 3,888 | ||||||||||||||||||
| Ratios of expenses to average net assets: | 1.34 | % | 1.27 | % | 1.27 | % | 1.59 | % | 1.52 | % | 1.52 | % | 2.10 | % | 2.02 | % | 2.02 | % | ||||||||||||||||||
| Ratios of net investment income to average net assets: | 3.24 | % | 3.24 | % | 2.87 | % | 3.49 | % | 2.99 | % | 2.84 | % | 2.74 | % | 2.49 | % | 2.24 | % | ||||||||||||||||||
| Portfolio turnover rate | 62 | % | 51 | % | 50 | % | 62 | % | 51 | % | 50 | % | 62 | % | 51 | % | 50 | % | ||||||||||||||||||
| * | The Fund commenced operations on November 1, 2013. |
| ** | The net investment income per share data was determined using the average shares outstanding throughout each year. |
| + | Assumes reinvestment of all dividends and distributions, if any. Aggregate (not annualized) total return is shown for any period shorter than one year. Total return does not reflect the deductions of taxes that a shareholder would pay on distributions or on the redemption of shares. |
See accompanying notes to financial statements.
80
| FINANCIAL HIGHLIGHTS |
| Dunham Monthly Distribution Fund |
| The table sets forth financial data for one share of beneficial interest outstanding throughout each year. |
| Class N | ||||||||||||||||||||||||||||||||||||||||
| Year Ended | ||||||||||||||||||||||||||||||||||||||||
| October 31, | ||||||||||||||||||||||||||||||||||||||||
| 2016 | 2015 | 2014 | 2013 | 2012 | ||||||||||||||||||||||||||||||||||||
| Net asset value, beginning of year | $ | 36.36 | $ | 38.16 | $ | 38.47 | $ | 37.22 | $ | 35.87 | ||||||||||||||||||||||||||||||
| Income (loss) from investment operations: | ||||||||||||||||||||||||||||||||||||||||
| Net investment income (loss)* | 0.14 | (0.18 | ) | 0.17 | 0.36 | 0.14 | ||||||||||||||||||||||||||||||||||
| Net realized and unrealized gain (loss) | 0.49 | (0.39 | ) | 1.35 | 2.13 | 2.41 | ||||||||||||||||||||||||||||||||||
| Total income (loss) from investment operations | 0.63 | (0.57 | ) | 1.52 | 2.49 | 2.55 | ||||||||||||||||||||||||||||||||||
| Less distributions: | ||||||||||||||||||||||||||||||||||||||||
| Distributions from net investment income | (0.55 | ) | — | — | (0.41 | ) | (0.22 | ) | ||||||||||||||||||||||||||||||||
| Distributions from net realized gains | — | (0.80 | ) | (1.59 | ) | (0.83 | ) | (0.32 | ) | |||||||||||||||||||||||||||||||
| Tax return of capital | (0.70 | ) | (0.43 | ) | (0.24 | ) | 0.00 | (0.66 | ) | |||||||||||||||||||||||||||||||
| Total distributions | (1.25 | ) | (1.23 | ) | (1.83 | ) | (1.24 | ) | (1.20 | ) | ||||||||||||||||||||||||||||||
| Net asset value, end of year | $ | 35.74 | $ | 36.36 | $ | 38.16 | $ | 38.47 | $ | 37.22 | ||||||||||||||||||||||||||||||
| Total return + | 1.79 | % | (1.53 | )% | 4.01 | % | 6.75 | % | 7.19 | % | ||||||||||||||||||||||||||||||
| Ratios/Supplemental Data: | ||||||||||||||||||||||||||||||||||||||||
| Net assets, end of year (in 000s) | $ | 153,084 | $ | 163,843 | $ | 156,964 | $ | 161,347 | $ | 127,346 | ||||||||||||||||||||||||||||||
| Ratios of expenses to average net assets: | ||||||||||||||||||||||||||||||||||||||||
| After waivers | 1.85 | % | 2.09 | % | 2.53 | % | 2.23 | % | 2.75 | % | ||||||||||||||||||||||||||||||
| Dividends/borrowings on short sales | 0.61 | % | 0.47 | % | 0.59 | % | 0.24 | % | 0.52 | % | ||||||||||||||||||||||||||||||
| Excluding dividends/borrowings on short sales: | ||||||||||||||||||||||||||||||||||||||||
| Before fee waivers | 1.26 | % | 2.17 | % | 2.11 | % | 2.10 | % | 2.23 | % | ||||||||||||||||||||||||||||||
| After fee waivers | 1.24 | % | 1.62 | % | 1.94 | % | 1.99 | % | 2.23 | % | ||||||||||||||||||||||||||||||
| Ratios of net investment income (loss) to average net assets: | ||||||||||||||||||||||||||||||||||||||||
| Before fee waivers | 0.39 | % | (0.56 | )% | 0.26 | % | 0.84 | % | 0.39 | % | ||||||||||||||||||||||||||||||
| After fee waivers | 0.40 | % | (0.48 | )% | 0.43 | % | 0.95 | % | 0.39 | % | ||||||||||||||||||||||||||||||
| Portfolio turnover rate | 208 | % | 155 | % | 229 | % | 227 | % | 205 | % | ||||||||||||||||||||||||||||||
| Class A | Class C | |||||||||||||||||||||||||||||||||||||||
| Year Ended | Year Ended | |||||||||||||||||||||||||||||||||||||||
| October 31, | October 31, | |||||||||||||||||||||||||||||||||||||||
| 2016 | 2015 | 2014 | 2013 | 2012 | 2016 | 2015 | 2014 | 2013 | 2012 | |||||||||||||||||||||||||||||||
| Net asset value, beginning of year | $ | 35.63 | $ | 37.52 | $ | 37.95 | $ | 36.82 | $ | 35.58 | $ | 29.99 | $ | 32.01 | $ | 32.87 | $ | 32.29 | $ | 31.55 | ||||||||||||||||||||
| Income (loss) from investment operations: | ||||||||||||||||||||||||||||||||||||||||
| Net investment income (loss)* | 0.13 | (0.27 | ) | 0.07 | 0.24 | 0.03 | (0.14 | ) | (0.46 | ) | (0.20 | ) | (0.07 | ) | (0.18 | ) | ||||||||||||||||||||||||
| Net realized and unrealized gain (loss) | 0.39 | (0.39 | ) | 1.33 | 2.13 | 2.40 | 0.34 | (0.33 | ) | 1.17 | 1.89 | 2.09 | ||||||||||||||||||||||||||||
| Total income (loss) from investment operations | 0.52 | (0.66 | ) | 1.40 | 2.37 | 2.43 | 0.20 | (0.79 | ) | 0.97 | 1.82 | 1.91 | ||||||||||||||||||||||||||||
| Less distributions: | ||||||||||||||||||||||||||||||||||||||||
| Distributions from net investment income | (0.55 | ) | — | — | (0.41 | ) | (0.21 | ) | (0.55 | ) | — | — | (0.41 | ) | (0.19 | ) | ||||||||||||||||||||||||
| Distributions from net realized gains | — | (0.80 | ) | (1.59 | ) | (0.83 | ) | (0.32 | ) | — | (0.80 | ) | (1.59 | ) | (0.83 | ) | (0.32 | ) | ||||||||||||||||||||||
| Tax return of capital | (0.70 | ) | (0.43 | ) | (0.24 | ) | 0.00 | (0.66 | ) | (0.70 | ) | (0.43 | ) | (0.24 | ) | 0.00 | (0.66 | ) | ||||||||||||||||||||||
| Total distributions | (1.25 | ) | (1.23 | ) | (1.83 | ) | (1.24 | ) | (1.19 | ) | (1.25 | ) | (1.23 | ) | (1.83 | ) | (1.24 | ) | (1.17 | ) | ||||||||||||||||||||
| Net asset value, end of year | $ | 34.90 | $ | 35.63 | $ | 37.52 | $ | 37.95 | $ | 36.82 | $ | 28.94 | $ | 29.99 | $ | 32.01 | $ | 32.87 | $ | 32.29 | ||||||||||||||||||||
| Total return + | 1.54 | % | (1.80 | )% | 3.74 | % | 6.50 | % | 6.92 | % | 0.75 | % | (2.53 | )% | 2.99 | % | 5.71 | % | 6.13 | % | ||||||||||||||||||||
| Ratios/Supplemental Data: | ||||||||||||||||||||||||||||||||||||||||
| Net assets, end of year (in 000s) | $ | 45,552 | $ | 74,247 | $ | 79,132 | $ | 68,427 | $ | 51,485 | $ | 39,118 | $ | 50,215 | $ | 48,193 | $ | 37,577 | $ | 30,206 | ||||||||||||||||||||
| Ratios of expenses to average net assets: | ||||||||||||||||||||||||||||||||||||||||
| After waivers | 2.06 | % | 2.33 | % | 2.78 | % | 2.48 | % | 3.00 | % | 2.83 | % | 3.09 | % | 3.53 | % | 3.23 | % | 3.75 | % | ||||||||||||||||||||
| Dividends/borrowings on short sales | 0.59 | % | 0.47 | % | 0.59 | % | 0.24 | % | 0.52 | % | 0.60 | % | 0.47 | % | 0.59 | % | 0.24 | % | 0.52 | % | ||||||||||||||||||||
| Excluding dividends/borrowings on short sales: | ||||||||||||||||||||||||||||||||||||||||
| Before fee waivers | 1.49 | % | 2.42 | % | 2.36 | % | 2.34 | % | 2.48 | % | 2.24 | % | 3.16 | % | 3.11 | % | 3.10 | % | 3.23 | % | ||||||||||||||||||||
| After fee waivers | 1.48 | % | 1.86 | % | 2.19 | % | 2.24 | % | 2.48 | % | 2.23 | % | 2.62 | % | 2.94 | % | 2.99 | % | 3.23 | % | ||||||||||||||||||||
| Ratios of net investment income (loss) to average net assets: | ||||||||||||||||||||||||||||||||||||||||
| Before fee waivers | 0.36 | % | (0.79 | )% | 0.01 | % | 0.52 | % | 0.14 | % | (0.50 | )% | (1.54 | )% | (0.74 | )% | (0.32 | )% | (0.61 | )% | ||||||||||||||||||||
| After fee waivers | 0.37 | % | (0.71 | )% | 0.18 | % | 0.63 | % | 0.14 | % | (0.48 | )% | (1.46 | )% | (0.57 | )% | (0.21 | )% | (0.61 | )% | ||||||||||||||||||||
| Portfolio turnover rate | 208 | % | 155 | % | 229 | % | 227 | % | 205 | % | 208 | % | 155 | % | 229 | % | 227 | % | 205 | % | ||||||||||||||||||||
| * | The net investment income (loss) per share data was determined using the average shares outstanding throughout each year. |
| + | Assumes reinvestment of all dividends and distributions, if any. Aggregate (not annualized) total return is shown for any period shorter than one year. Total return does not reflect the deductions of taxes that a shareholder would pay on distributions or on the redemption of shares. |
See accompanying notes to financial statements.
81
| FINANCIAL HIGHLIGHTS |
| Dunham Corporate/Government Bond Fund |
| The table sets forth financial data for one share of beneficial interest outstanding throughout each year. |
| Class N | ||||||||||||||||||||||||||||||||||||||||
| Year Ended October 31, | ||||||||||||||||||||||||||||||||||||||||
| 2016 | 2015 | 2014 | 2013 | 2012 | ||||||||||||||||||||||||||||||||||||
| Net asset value, beginning of year | $ | 13.75 | $ | 14.14 | $ | 14.07 | $ | 14.74 | $ | 14.32 | ||||||||||||||||||||||||||||||
| Income from investment operations: | ||||||||||||||||||||||||||||||||||||||||
| Net investment income* | 0.36 | 0.42 | 0.38 | 0.37 | 0.36 | |||||||||||||||||||||||||||||||||||
| Net realized and unrealized gain (loss) | 0.19 | (0.37 | ) | 0.16 | (0.36 | ) | 0.77 | |||||||||||||||||||||||||||||||||
| Total income from investment operations | 0.55 | 0.05 | 0.54 | 0.01 | 1.13 | |||||||||||||||||||||||||||||||||||
| Less distributions: | ||||||||||||||||||||||||||||||||||||||||
| Distributions from net investment income | (0.38 | ) | (0.44 | ) | (0.42 | ) | (0.41 | ) | (0.42 | ) | ||||||||||||||||||||||||||||||
| Distributions from net realized gains | — | — | (0.05 | ) | (0.27 | ) | (0.29 | ) | ||||||||||||||||||||||||||||||||
| Total distributions | (0.38 | ) | (0.44 | ) | (0.47 | ) | (0.68 | ) | (0.71 | ) | �� | |||||||||||||||||||||||||||||
| Net asset value, end of year | $ | 13.92 | $ | 13.75 | $ | 14.14 | $ | 14.07 | $ | 14.74 | ||||||||||||||||||||||||||||||
| Total return +# | 4.09 | % | 0.36 | % | 3.85 | % | 0.09 | % | 8.10 | % | ||||||||||||||||||||||||||||||
| Ratios/Supplemental Data: | ||||||||||||||||||||||||||||||||||||||||
| Net assets, end of year (in 000s) | $ | 48,025 | $ | 41,989 | $ | 43,888 | $ | 81,201 | $ | 103,912 | ||||||||||||||||||||||||||||||
| Ratios of expenses to average net assets: | 1.13 | % | 1.06 | % | 1.37 | % | 1.21 | % | 1.14 | % | ||||||||||||||||||||||||||||||
| Ratios of net investment income to average net assets: | 2.61 | % | 3.00 | % | 2.69 | % | 2.56 | % | 2.50 | % | ||||||||||||||||||||||||||||||
| Portfolio turnover rate | 58 | % | 54 | % | 60 | % | 173 | % | 211 | % | ||||||||||||||||||||||||||||||
| Class A | Class C | |||||||||||||||||||||||||||||||||||||||
| Year Ended October 31, | Year Ended October 31, | |||||||||||||||||||||||||||||||||||||||
| 2016 | 2015 | 2014 | 2013 | 2012 | 2016 | 2015 | 2014 | 2013 | 2012 | |||||||||||||||||||||||||||||||
| Net asset value, beginning of year | $ | 13.73 | $ | 14.13 | $ | 14.06 | $ | 14.73 | $ | 14.31 | $ | 13.65 | $ | 14.05 | $ | 13.98 | $ | 14.64 | $ | 14.23 | ||||||||||||||||||||
| Income (loss) from investment operations: | ||||||||||||||||||||||||||||||||||||||||
| Net investment income* | 0.33 | 0.38 | 0.35 | 0.34 | 0.29 | 0.26 | 0.31 | 0.27 | 0.26 | 0.27 | ||||||||||||||||||||||||||||||
| Net realized and unrealized gain (loss) | 0.19 | (0.37 | ) | 0.15 | (0.36 | ) | 0.79 | 0.18 | (0.37 | ) | 0.16 | (0.35 | ) | 0.74 | ||||||||||||||||||||||||||
| Total income (loss) from investment operations | 0.52 | 0.01 | 0.50 | (0.02 | ) | 1.08 | 0.44 | (0.06 | ) | 0.43 | (0.09 | ) | 1.01 | |||||||||||||||||||||||||||
| Less distributions: | ||||||||||||||||||||||||||||||||||||||||
| Distributions from net investment income | (0.35 | ) | (0.41 | ) | (0.38 | ) | (0.38 | ) | (0.37 | ) | (0.28 | ) | (0.34 | ) | (0.31 | ) | (0.30 | ) | (0.31 | ) | ||||||||||||||||||||
| Distributions from net realized gains | — | — | (0.05 | ) | (0.27 | ) | (0.29 | ) | — | — | (0.05 | ) | (0.27 | ) | (0.29 | ) | ||||||||||||||||||||||||
| Total distributions | (0.35 | ) | (0.41 | ) | (0.43 | ) | (0.65 | ) | (0.66 | ) | (0.28 | ) | (0.34 | ) | (0.36 | ) | (0.57 | ) | (0.60 | ) | ||||||||||||||||||||
| Net asset value, end of year | $ | 13.90 | $ | 13.73 | $ | 14.13 | $ | 14.06 | $ | 14.73 | $ | 13.81 | $ | 13.65 | $ | 14.05 | $ | 13.98 | $ | 14.64 | ||||||||||||||||||||
| Total return + # | 3.86 | % | 0.04 | % | 3.59 | % | (0.15 | )% | 7.78 | % | 3.27 | % | (0.45 | )% | 3.08 | % | (0.59 | )% | 7.30 | % | ||||||||||||||||||||
| Ratios/Supplemental Data: | ||||||||||||||||||||||||||||||||||||||||
| Net assets, end of year (in 000s) | $ | 4,832 | $ | 4,788 | $ | 3,684 | $ | 6,888 | $ | 3,598 | $ | 3,364 | $ | 3,698 | $ | 3,690 | $ | 7,733 | $ | 9,007 | ||||||||||||||||||||
| Ratios of expenses to average net assets: | 1.38 | % | 1.31 | % | 1.62 | % | 1.46 | % | 1.39 | % | 1.88 | % | 1.81 | % | 2.12 | % | 1.96 | % | 1.89 | % | ||||||||||||||||||||
| Ratios of net investment income to average net assets: | 2.40 | % | 2.74 | % | 2.44 | % | 2.37 | % | 2.25 | % | 1.89 | % | 2.27 | % | 1.94 | % | 1.80 | % | 1.75 | % | ||||||||||||||||||||
| Portfolio turnover rate | 58 | % | 54 | % | 60 | % | 173 | % | 211 | % | 58 | % | 54 | % | 60 | % | 173 | % | 211 | % | ||||||||||||||||||||
| * | The net investment income per share data was determined using the average shares outstanding throughout each year |
| + | Assumes reinvestment of all dividends and distributions, if any. Total return does not reflect the deductions of taxes that a shareholder would pay on distributions or on the redemption of share |
| # | Includes adjustments in accordance with accounting principles generally accepted in the United States and, consequently, the net asset value for financial reporting purposes and the returns based upon those net asset values may differ from the net asset values and returns for shareholder transactions. |
See accompanying notes to financial statements.
82
| FINANCIAL HIGHLIGHTS |
| Dunham Dynamic Macro Fund |
| The table sets forth financial data for one share of beneficial interest outstanding throughout each year |
| Class N | ||||||||||||||||||||||||||||||||||||||||
| Year Ended October 31, | ||||||||||||||||||||||||||||||||||||||||
| 2016 | 2015 | 2014 | 2013 | 2012 | ||||||||||||||||||||||||||||||||||||
| Net asset value, beginning of year | $ | 9.81 | $ | 9.65 | $ | 9.67 | $ | 9.95 | $ | 10.10 | ||||||||||||||||||||||||||||||
| Income from investment operations: | ||||||||||||||||||||||||||||||||||||||||
| Net investment income (loss) * | (0.00 | ) | (0.14 | ) | 0.19 | 0.33 | 0.30 | |||||||||||||||||||||||||||||||||
| Net realized and unrealized gain (loss) ** | (0.26 | ) | 0.30 | (0.02 | ) | (0.25 | ) | 0.02 | ||||||||||||||||||||||||||||||||
| Total income from investment operations | (0.26 | ) | 0.16 | 0.17 | 0.08 | 0.32 | ||||||||||||||||||||||||||||||||||
| Less distributions: | ||||||||||||||||||||||||||||||||||||||||
| Distributions from net investment income | — | — | (0.19 | ) | (0.33 | ) | (0.35 | ) | ||||||||||||||||||||||||||||||||
| Tax return of capital | — | — | — | (0.03 | ) | (0.12 | ) | |||||||||||||||||||||||||||||||||
| Total distributions | — | — | (0.19 | ) | (0.36 | ) | (0.47 | ) | ||||||||||||||||||||||||||||||||
| Net asset value, end of year | $ | 9.55 | $ | 9.81 | $ | 9.65 | $ | 9.67 | $ | 9.95 | ||||||||||||||||||||||||||||||
| Total return + # | (2.68 | )% | 1.66 | % | 1.80 | % | 0.80 | % | 3.29 | % | ||||||||||||||||||||||||||||||
| Ratios/Supplemental Data: | ||||||||||||||||||||||||||||||||||||||||
| Net assets, end of year (in 000s) | $ | 28,650 | $ | 28,518 | $ | 11,758 | $ | 7,185 | $ | 9,002 | ||||||||||||||||||||||||||||||
| Ratios of expenses to average net assets: | 1.63 | % | 2.15 | % | 1.90 | % | 1.67 | % | 2.28 | % | ||||||||||||||||||||||||||||||
| Ratios of net investment income (loss) to average net assets: | (0.03 | )% | (1.37 | )% | 1.96 | % | 3.35 | % | 2.94 | % | ||||||||||||||||||||||||||||||
| Portfolio turnover rate | 54 | % | 70 | % | 238 | % | 292 | % | 418 | % | ||||||||||||||||||||||||||||||
| Class A | Class C | |||||||||||||||||||||||||||||||||||||||
| Year Ended October 31, | Year Ended October 31, | |||||||||||||||||||||||||||||||||||||||
| 2016 | 2015 | 2014 | 2013 | 2012 | 2016 | 2015 | 2014 | 2013 | 2012 | |||||||||||||||||||||||||||||||
| Net asset value, beginning of year | $ | 9.81 | $ | 9.68 | $ | 9.70 | $ | 9.98 | $ | 10.06 | $ | 9.58 | $ | 9.52 | $ | 9.56 | $ | 9.86 | $ | 9.96 | ||||||||||||||||||||
| Income (loss) from investment operations: | ||||||||||||||||||||||||||||||||||||||||
| Net investment income (loss) * | (0.02 | ) | (0.14 | ) | 0.18 | 0.31 | 0.26 | (0.09 | ) | (0.26 | ) | 0.11 | 0.23 | 0.17 | ||||||||||||||||||||||||||
| Net realized and unrealized gain (loss) ** | (0.27 | ) | 0.27 | (0.04 | ) | (0.25 | ) | 0.03 | (0.26 | ) | 0.32 | (0.04 | ) | (0.26 | ) | 0.05 | ||||||||||||||||||||||||
| Total income (loss) from investment operations | (0.29 | ) | 0.13 | 0.14 | 0.06 | 0.29 | (0.35 | ) | 0.06 | 0.07 | (0.03 | ) | 0.22 | |||||||||||||||||||||||||||
| Less distributions: | ||||||||||||||||||||||||||||||||||||||||
| Distributions from net investment income | — | — | (0.16 | ) | (0.31 | ) | (0.25 | ) | — | — | (0.11 | ) | (0.24 | ) | (0.20 | ) | ||||||||||||||||||||||||
| Tax return of capital | — | — | — | (0.03 | ) | (0.12 | ) | — | — | — | (0.03 | ) | (0.12 | ) | ||||||||||||||||||||||||||
| Total distributions | — | — | (0.16 | ) | (0.34 | ) | (0.37 | ) | — | — | (0.11 | ) | (0.27 | ) | (0.32 | ) | ||||||||||||||||||||||||
| Net asset value, end of year | $ | 9.52 | $ | 9.81 | $ | 9.68 | $ | 9.70 | $ | 9.98 | $ | 9.23 | $ | 9.58 | $ | 9.52 | $ | 9.56 | $ | 9.86 | ||||||||||||||||||||
| Total return + # | (2.95 | )% | 1.34 | % | 1.52 | % | 0.55 | % | 3.00 | % | (3.66 | )% | 0.63 | % | 0.78 | % | (0.29 | )% | 2.27 | % | ||||||||||||||||||||
| Ratios/Supplemental Data: | ||||||||||||||||||||||||||||||||||||||||
| Net assets, end of year (in 000s) | $ | 3,897 | $ | 3,296 | $ | 1,729 | $ | 1,782 | $ | 2,230 | $ | 2,131 | $ | 1,938 | $ | 1,712 | $ | 2,053 | $ | 1,786 | ||||||||||||||||||||
| Ratios of expenses to average net assets: | 1.88 | % | 2.40 | % | 2.15 | % | 1.92 | % | 2.53 | % | 2.63 | % | 3.15 | % | 2.90 | % | 2.67 | % | 3.28 | % | ||||||||||||||||||||
| Ratios of net investment income (loss) to average net assets: | (0.26 | )% | (1.63 | )% | 1.92 | % | 3.13 | % | 2.69 | % | (1.02 | )% | (2.35 | )% | 1.19 | % | 2.38 | % | 1.94 | % | ||||||||||||||||||||
| Portfolio turnover rate | 54 | % | 70 | % | 238 | % | 292 | % | 418 | % | 54 | % | 70 | % | 238 | % | 292 | % | 418 | % | ||||||||||||||||||||
| * | The net investment income (loss) per share data was determined using the average shares outstanding throughout each year. |
| ** | The amount of net realized and unrealized gain (loss) on investment per share for the years ended October 31, 2015 and 2014 does not accord with the amounts in the Statements of Operations due to the timing of purchases and sales of Fund shares in relation to fluctuating market values. |
| + | Assumes reinvestment of all dividends and distributions, if any. Total return does not reflect the deductions of taxes that a shareholder would pay on distributions or on the redemption of shares. |
| # | Includes adjustments in accordance with accounting principles generally accepted in the United States and, consequently, the net asset value for financial reporting purposes and the returns based upon those net asset values may differ from the net asset values and returns for shareholder transactions. |
See accompanying notes to financial statements.
83
| FINANCIAL HIGHLIGHTS |
| Dunham High-Yield Bond Fund |
| The table sets forth financial data for one share of beneficial interest outstanding throughout each year |
| Class N | ||||||||||||||||||||||||||||||||||||||||
| Year Ended | ||||||||||||||||||||||||||||||||||||||||
| October 31, | ||||||||||||||||||||||||||||||||||||||||
| 2016 | 2015 | 2014 | 2013 | 2012 | ||||||||||||||||||||||||||||||||||||
| Net asset value, beginning of year | $ | 8.92 | $ | 9.51 | $ | 9.61 | $ | 9.52 | $ | 9.08 | ||||||||||||||||||||||||||||||
| Income (loss) from investment operations: | ||||||||||||||||||||||||||||||||||||||||
| Net investment income* | 0.44 | 0.44 | 0.46 | 0.47 | 0.53 | |||||||||||||||||||||||||||||||||||
| Net realized and unrealized gain (loss) | 0.02 | (0.59 | ) | (0.10 | ) | 0.09 | 0.44 | |||||||||||||||||||||||||||||||||
| Total income (loss) from investment operations | 0.46 | (0.15 | ) | 0.36 | 0.56 | 0.97 | ||||||||||||||||||||||||||||||||||
| Less distributions: | ||||||||||||||||||||||||||||||||||||||||
| Distributions from net investment income | (0.44 | ) | (0.44 | ) | (0.46 | ) | (0.47 | ) | (0.53 | ) | ||||||||||||||||||||||||||||||
| Total distributions | (0.44 | ) | (0.44 | ) | (0.46 | ) | (0.47 | ) | (0.53 | ) | ||||||||||||||||||||||||||||||
| Net asset value, end of year | $ | 8.94 | $ | 8.92 | $ | 9.51 | $ | 9.61 | $ | 9.52 | ||||||||||||||||||||||||||||||
| Total return + | 5.39 | % | (1.63 | )% | 3.77 | % | 6.05 | % | 10.96 | % | ||||||||||||||||||||||||||||||
| Ratios/Supplemental Data: | ||||||||||||||||||||||||||||||||||||||||
| Net assets, end of year (in 000s) | $ | 78,194 | $ | 78,654 | $ | 102,412 | $ | 134,487 | $ | 114,810 | ||||||||||||||||||||||||||||||
| Ratios of expenses to average net assets: | 1.08 | % | 1.02 | % | 1.09 | % | 1.11 | % | 1.23 | % | ||||||||||||||||||||||||||||||
| Ratios of net investment income to average net assets: | 5.09 | % | 4.77 | % | 4.72 | % | 4.89 | % | 5.70 | % | ||||||||||||||||||||||||||||||
| Portfolio turnover rate | 62 | % | 51 | % | 62 | % | 94 | % | 58 | % | ||||||||||||||||||||||||||||||
| Class A | Class C | |||||||||||||||||||||||||||||||||||||||
| Year Ended | Year Ended | |||||||||||||||||||||||||||||||||||||||
| October 31, | October 31, | |||||||||||||||||||||||||||||||||||||||
| 2016 | 2015 | 2014 | 2013 | 2012 | 2016 | 2015 | 2014 | 2013 | 2012 | |||||||||||||||||||||||||||||||
| Net asset value, beginning of year | $ | 8.99 | $ | 9.58 | $ | 9.68 | $ | 9.59 | $ | 9.15 | $ | 8.86 | $ | 9.46 | $ | 9.55 | $ | 9.47 | $ | 9.04 | ||||||||||||||||||||
| Income (loss) from investment operations: | ||||||||||||||||||||||||||||||||||||||||
| Net investment income* | 0.42 | 0.41 | 0.44 | 0.45 | 0.51 | 0.37 | 0.37 | 0.38 | 0.40 | 0.47 | ||||||||||||||||||||||||||||||
| Net realized and unrealized gain (loss) | 0.03 | (0.59 | ) | (0.10 | ) | 0.09 | 0.44 | 0.02 | (0.60 | ) | (0.08 | ) | 0.08 | 0.43 | ||||||||||||||||||||||||||
| Total income (loss) from investment operations | 0.45 | (0.18 | ) | 0.34 | 0.54 | 0.95 | 0.39 | (0.23 | ) | 0.30 | 0.48 | 0.90 | ||||||||||||||||||||||||||||
| Less distributions: | ||||||||||||||||||||||||||||||||||||||||
| Distributions from net investment income | (0.42 | ) | (0.41 | ) | (0.44 | ) | (0.45 | ) | (0.51 | ) | (0.37 | ) | (0.37 | ) | (0.39 | ) | (0.40 | ) | (0.47 | ) | ||||||||||||||||||||
| Total distributions | (0.42 | ) | (0.41 | ) | (0.44 | ) | (0.45 | ) | (0.51 | ) | (0.37 | ) | (0.37 | ) | (0.39 | ) | (0.40 | ) | (0.47 | ) | ||||||||||||||||||||
| Net asset value, end of year | $ | 9.02 | $ | 8.99 | $ | 9.58 | $ | 9.68 | $ | 9.59 | $ | 8.88 | $ | 8.86 | $ | 9.46 | $ | 9.55 | $ | 9.47 | ||||||||||||||||||||
| Total return + | 5.21 | % | (1.88 | )% | 3.49 | % | 5.74 | % | 10.70 | % | 4.65 | % | (2.47 | )% | 3.13 | % | 5.17 | % | 10.19 | % | ||||||||||||||||||||
| Ratios/Supplemental Data: | ||||||||||||||||||||||||||||||||||||||||
| Net assets, end of year (in 000s) | $ | 10,478 | $ | 10,224 | $ | 22,022 | $ | 19,888 | $ | 13,722 | $ | 7,687 | $ | 9,231 | $ | 11,652 | $ | 13,741 | $ | 14,457 | ||||||||||||||||||||
| Ratios of expenses to average net assets: | 1.33 | % | 1.27 | % | 1.34 | % | 1.36 | % | 1.48 | % | 1.83 | % | 1.77 | % | 1.84 | % | 1.86 | % | 1.98 | % | ||||||||||||||||||||
| Ratios of net investment income to average net assets: | 4.84 | % | 4.52 | % | 4.47 | % | 4.64 | % | 5.45 | % | 4.34 | % | 4.02 | % | 3.97 | % | 4.15 | % | 4.95 | % | ||||||||||||||||||||
| Portfolio turnover rate | 62 | % | 51 | % | 62 | % | 94 | % | 58 | % | 62 | % | 51 | % | 62 | % | 94 | % | 58 | % | ||||||||||||||||||||
| * | The net investment income per share data was determined using the average shares outstanding throughout each year |
| + | Assumes reinvestment of all dividends and distributions, if any. Total return does not reflect the deductions of taxes that a shareholder would pay on distributions or on the redemption of shares. |
See accompanying notes to financial statements.
84
| FINANCIAL HIGHLIGHTS |
| Dunham International Opportunity Bond Fund |
| The table sets forth financial data for one share of beneficial interest outstanding for each year |
| Class N | Class A | Class C | ||||||||||||||||||||||||||||||||||
| Year Ended October 31, | Year Ended October 31, | Year Ended October 31, | ||||||||||||||||||||||||||||||||||
| 2016 | 2015 | 2014* | 2016 | 2015 | 2014* | 2016 | 2015 | 2014* | ||||||||||||||||||||||||||||
| Net asset value, beginning of year | $ | 8.92 | $ | 9.64 | $ | 10.00 | $ | 8.90 | $ | 9.64 | $ | 10.00 | $ | 8.84 | $ | 9.62 | $ | 10.00 | ||||||||||||||||||
| Income (loss) from investment operations: | ||||||||||||||||||||||||||||||||||||
| Net investment income (loss)** | 0.04 | 0.05 | 0.07 | 0.01 | 0.02 | 0.04 | (0.03 | ) | (0.02 | ) | (0.01 | ) | ||||||||||||||||||||||||
| Net realized and unrealized gain (loss) | 0.42 | (0.77 | ) | (0.37 | ) | 0.41 | (0.76 | ) | (0.36 | ) | 0.41 | (0.76 | ) | (0.36 | ) | |||||||||||||||||||||
| Total income (loss) from investment operations | 0.46 | (0.72 | ) | (0.30 | ) | 0.42 | (0.74 | ) | (0.32 | ) | 0.38 | (0.78 | ) | (0.37 | ) | |||||||||||||||||||||
| Less distributions: | ||||||||||||||||||||||||||||||||||||
| Distributions from net investment income | (0.01 | ) | — | — | (0.00 | ) (a) | — | — | (0.00 | ) (a) | — | — | ||||||||||||||||||||||||
| Tax return of capital | — | — | (0.06 | ) | — | — | (0.04 | ) | — | — | (0.01 | ) | ||||||||||||||||||||||||
| Total distributions | (0.01 | ) | — | (0.06 | ) | (0.00 | ) (a) | — | (0.04 | ) | (0.00 | ) (a) | — | (0.01 | ) | |||||||||||||||||||||
| Net asset value, end of year | $ | 9.37 | $ | 8.92 | $ | 9.64 | $ | 9.32 | $ | 8.90 | $ | 9.64 | $ | 9.22 | $ | 8.84 | $ | 9.62 | ||||||||||||||||||
| Total return + | 5.14 | % | (7.42 | )% | (2.99 | )% | 4.77 | % | (7.65 | )% | (3.22 | )% | 4.31 | % | (8.11 | )% | (3.72 | )% | ||||||||||||||||||
| Ratios/Supplemental Data: | ||||||||||||||||||||||||||||||||||||
| Net assets, end of year (in 000s) | $ | 24,728 | $ | 31,935 | $ | 42,440 | $ | 2,118 | $ | 3,208 | $ | 3,513 | $ | 1,204 | $ | 1,638 | $ | 1,879 | ||||||||||||||||||
| Ratios of expenses to average net assets | 1.28 | % | 1.38 | % | 1.38 | % | 1.53 | % | 1.63 | % | 1.63 | % | 2.03 | % | 2.13 | % | 2.13 | % | ||||||||||||||||||
| Ratios of net investment income (loss) to average net assets | 0.41 | % | 0.52 | % | 0.66 | % | 0.10 | % | 0.29 | % | 0.41 | % | (0.33 | )% | (0.24 | )% | (0.09 | )% | ||||||||||||||||||
| Portfolio turnover rate | 64 | % | 52 | % | 60 | % | 64 | % | 52 | % | 60 | % | 64 | % | 52 | % | 60 | % | ||||||||||||||||||
| * | The Fund commenced operations on November 1, 2013. |
| ** | The net investment income (loss) per share data was determined using the average shares outstanding throughout the year |
| (a) | Represents less than $0.01 per share. |
| + | Assumes reinvestment of all dividends and distributions, if any. Total return does not reflect the deductions of taxes that a shareholder would pay on distributions or on the redemption of shares |
See accompanying notes to financial statements.
85
| FINANCIAL HIGHLIGHTS |
| Dunham Appreciation & Income Fund |
| The table sets forth financial data for one share of beneficial interest outstanding throughout each year |
| Class N | ||||||||||||||||||||||||||||||||||||||||
| Year Ended | ||||||||||||||||||||||||||||||||||||||||
| October 31, | ||||||||||||||||||||||||||||||||||||||||
| 2016 | 2015 | 2014 | 2013 | 2012 | ||||||||||||||||||||||||||||||||||||
| Net asset value, beginning of year | $ | 8.75 | $ | 10.88 | $ | 10.09 | $ | 8.90 | $ | 8.86 | ||||||||||||||||||||||||||||||
| Income (loss) from investment operations: | ||||||||||||||||||||||||||||||||||||||||
| Net investment income* | 0.23 | 0.27 | 0.11 | 0.16 | 0.10 | |||||||||||||||||||||||||||||||||||
| Net realized and unrealized gain (loss) | (0.39 | ) | (0.51 | ) | 0.83 | 1.28 | 0.05 | |||||||||||||||||||||||||||||||||
| Total income (loss) from investment operations | (0.16 | ) | (0.24 | ) | 0.94 | 1.44 | 0.15 | |||||||||||||||||||||||||||||||||
| Less distributions: | ||||||||||||||||||||||||||||||||||||||||
| Distributions from net investment income | (0.36 | ) | (0.17 | ) | (0.15 | ) | (0.25 | ) | (0.11 | ) | ||||||||||||||||||||||||||||||
| Distributions from net realized gains | (0.18 | ) | (1.72 | ) | — | — | — | |||||||||||||||||||||||||||||||||
| Total distributions | (0.54 | ) | (1.89 | ) | (0.15 | ) | (0.25 | ) | (0.11 | ) | ||||||||||||||||||||||||||||||
| Net asset value, end of year | $ | 8.05 | $ | 8.75 | $ | 10.88 | $ | 10.09 | $ | 8.90 | ||||||||||||||||||||||||||||||
| Total return + | (1.92 | )% | (2.67 | )% | 9.37 | % | 16.59 | % | 1.83 | % | ||||||||||||||||||||||||||||||
| Ratios/Supplemental Data: | ||||||||||||||||||||||||||||||||||||||||
| Net assets, end of year (in 000s) | $ | 16,929 | $ | 20,210 | $ | 18,576 | $ | 15,855 | $ | 23,843 | ||||||||||||||||||||||||||||||
| Ratios of expenses to average net assets: | 1.42 | % | 1.34 | % | 1.44 | % | 1.39 | % | 1.60 | % | ||||||||||||||||||||||||||||||
| Ratios of net investment income to average net assets: | 2.83 | % | 2.83 | % | 1.07 | % | 1.70 | % | 1.13 | % | ||||||||||||||||||||||||||||||
| Portfolio turnover rate | 96 | % | 82 | % | 129 | % | 62 | % | 51 | % | ||||||||||||||||||||||||||||||
| Class A | Class C | |||||||||||||||||||||||||||||||||||||||
| Year Ended | Year Ended | |||||||||||||||||||||||||||||||||||||||
| October 31, | October 31, | |||||||||||||||||||||||||||||||||||||||
| 2016 | 2015 | 2014 | 2013 | 2012 | 2016 | 2015 | 2014 | 2013 | 2012 | |||||||||||||||||||||||||||||||
| Net asset value, beginning of year | $ | 8.73 | $ | 10.85 | $ | 10.06 | $ | 8.88 | $ | 8.83 | $ | 8.56 | $ | 10.66 | $ | 9.90 | $ | 8.74 | $ | 8.70 | ||||||||||||||||||||
| Income (loss) from investment operations: | �� | |||||||||||||||||||||||||||||||||||||||
| Net investment income (loss)* | 0.20 | 0.24 | 0.09 | 0.13 | 0.08 | 0.14 | 0.18 | 0.01 | 0.06 | 0.01 | ||||||||||||||||||||||||||||||
| Net realized and unrealized gain (loss) | (0.39 | ) | (0.50 | ) | 0.82 | 1.27 | 0.06 | (0.39 | ) | (0.50 | ) | 0.80 | 1.26 | 0.06 | ||||||||||||||||||||||||||
| Total income (loss) from investment operations | (0.19 | ) | (0.26 | ) | 0.91 | 1.40 | 0.14 | (0.25 | ) | (0.32 | ) | 0.81 | 1.32 | 0.07 | ||||||||||||||||||||||||||
| Less distributions: | ||||||||||||||||||||||||||||||||||||||||
| Distributions from net investment income | (0.33 | ) | (0.14 | ) | (0.12 | ) | (0.22 | ) | (0.09 | ) | (0.27 | ) | (0.06 | ) | (0.05 | ) | (0.16 | ) | (0.03 | ) | ||||||||||||||||||||
| Distributions from net realized gains | (0.18 | ) | (1.72 | ) | — | — | — | (0.18 | ) | (1.72 | ) | — | — | — | ||||||||||||||||||||||||||
| Total distributions | (0.51 | ) | (1.86 | ) | (0.12 | ) | (0.22 | ) | (0.09 | ) | (0.45 | ) | (1.78 | ) | (0.05 | ) | (0.16 | ) | (0.03 | ) | ||||||||||||||||||||
| Net asset value, end of year | $ | 8.03 | $ | 8.73 | $ | 10.85 | $ | 10.06 | $ | 8.88 | $ | 7.86 | $ | 8.56 | $ | 10.66 | $ | 9.90 | $ | 8.74 | ||||||||||||||||||||
| Total return + | (2.19 | )% | (2.84 | )% | 9.10 | % | 16.21 | % | 1.63 | % | (2.95 | )% | (3.53 | )% | 8.21 | % | 15.35 | % | 0.84 | % | ||||||||||||||||||||
| Ratios/Supplemental Data: | ||||||||||||||||||||||||||||||||||||||||
| Net assets, end of year (in 000s) | $ | 3,638 | $ | 4,211 | $ | 4,509 | $ | 4,368 | $ | 4,470 | $ | 3,181 | $ | 4,956 | $ | 4,046 | $ | 3,765 | $ | 3,867 | ||||||||||||||||||||
| Ratios of expenses to average net assets: | 1.67 | % | 1.59 | % | 1.69 | % | 1.64 | % | 1.85 | % | 2.44 | % | 2.34 | % | 2.44 | % | 2.39 | % | 2.60 | % | ||||||||||||||||||||
| Ratios of net investment income (loss) to average net assets: | 2.57 | % | 2.56 | % | 0.83 | % | 1.45 | % | 0.88 | % | 1.81 | % | 1.91 | % | 0.08 | % | 0.70 | % | 0.13 | % | ||||||||||||||||||||
| Portfolio turnover rate | 96 | % | 82 | % | 129 | % | 62 | % | 51 | % | 96 | % | 82 | % | 129 | % | 62 | % | 51 | % | ||||||||||||||||||||
| * | The net investment income (loss) per share data was determined using the average shares outstanding throughout each year |
| + | Assumes reinvestment of all dividends and distributions, if any. Total return does not reflect the deductions of taxes that a shareholder would pay on distributions or on the redemption of shares. |
See accompanying notes to financial statements.
86
| FINANCIAL HIGHLIGHTS |
| Dunham Alternative Dividend Fund |
| The table sets forth financial data for one share of beneficial interest outstanding throughout the Period |
| Class N | Class A | Class C | ||||||||||
| Period Ended | Period Ended | Period Ended | ||||||||||
| October 31, | October 31, | October 31, | ||||||||||
| 2016* | 2016* | 2016* | ||||||||||
| Net asset value, beginning of period | $ | 12.00 | $ | 12.00 | $ | 12.00 | ||||||
| Income (loss) from investment operations: | ||||||||||||
| Net investment income** | 0.02 | 0.08 | 0.01 | |||||||||
| Net realized and unrealized loss | (0.30 | ) | (0.36 | ) | (0.30 | ) | ||||||
| Total loss from investment operations | (0.28 | ) | (0.28 | ) | (0.29 | ) | ||||||
| Net asset value, end of period | $ | 11.72 | $ | 11.72 | $ | 11.71 | ||||||
| Total return + | (2.33 | )% | (2.33 | )% | (2.42 | )% | ||||||
| Ratios/Supplemental Data: | ||||||||||||
| Net assets, end of period | $ | 23,934 | $ | 12 | $ | 418 | ||||||
| Ratios of expenses to average net assets: ^ | 1.88 | % | 2.61 | % | 2.74 | % | ||||||
| Ratios of net investment income to average net assets: ^ | 0.86 | % | 4.18 | % | 0.44 | % | ||||||
| Portfolio turnover rate | 41 | % (1) | 41 | % (1) | 41 | % (1) | ||||||
| * | The Fund commenced operations on August 31, 2016. |
| ** | The net investment income per share data was determined using the average shares outstanding throughout the period. |
| + | Assumes reinvestment of all dividends and distributions, if any. Aggregate (not annualized) total return is shown for any period shorter than one year. Total return does not reflect the deductions of taxes that a shareholder would pay on distributions or on the redemption of shares. |
| (1) | Not annualized. |
| ^ | Annualized for periods less than one year. |
See accompanying notes to financial statements.
87
| FINANCIAL HIGHLIGHTS |
| Dunham Large Cap Value Fund |
| The table sets forth financial data for one share of beneficial interest outstanding throughout each year. |
| Class N | ||||||||||||||||||||||||||||||||||||||||
| Year Ended October 31, | ||||||||||||||||||||||||||||||||||||||||
| 2016 | 2015 | 2014 | 2013 | 2012 | ||||||||||||||||||||||||||||||||||||
| Net asset value, beginning of year | $ | 16.32 | $ | 16.21 | $ | 14.55 | $ | 11.74 | $ | 10.60 | ||||||||||||||||||||||||||||||
| Income from investment operations: | ||||||||||||||||||||||||||||||||||||||||
| Net investment income * | 0.22 | 0.17 | 0.13 | 0.16 | 0.12 | |||||||||||||||||||||||||||||||||||
| Net realized and unrealized gain (loss) | (0.04 | ) | 0.06 | 1.70 | 2.78 | 1.07 | ||||||||||||||||||||||||||||||||||
| Total income from investment operations | 0.18 | 0.23 | 1.83 | 2.94 | 1.19 | |||||||||||||||||||||||||||||||||||
| Less distributions: | ||||||||||||||||||||||||||||||||||||||||
| Distributions from net investment income | (0.18 | ) | (0.12 | ) | (0.17 | ) | (0.13 | ) | (0.05 | ) | ||||||||||||||||||||||||||||||
| Distributions from net realized gains | (4.10 | ) | — | — | — | — | ||||||||||||||||||||||||||||||||||
| Total distributions | (4.28 | ) | (0.12 | ) | (0.17 | ) | (0.13 | ) | (0.05 | ) | ||||||||||||||||||||||||||||||
| Net asset value, end of year | $ | 12.22 | $ | 16.32 | $ | 16.21 | $ | 14.55 | $ | 11.74 | ||||||||||||||||||||||||||||||
| Total return +,# | 1.73 | % | 1.41 | % | 12.64 | % | 25.30 | % | 11.29 | % | ||||||||||||||||||||||||||||||
| Ratios/Supplemental Data: | ||||||||||||||||||||||||||||||||||||||||
| Net assets, end of year (in 000s) | $ | 45,026 | $ | 44,620 | $ | 41,917 | $ | 37,688 | $ | 37,650 | ||||||||||||||||||||||||||||||
| Ratios of expenses to average net assets: | 0.93 | % | 1.12 | % | 1.26 | % | 1.00 | % | 1.17 | % | ||||||||||||||||||||||||||||||
| Ratios of net investment income to average net assets: | 1.81 | % | 1.03 | % | 0.82 | % | 1.25 | % | 1.04 | % | ||||||||||||||||||||||||||||||
| Portfolio turnover rate | 59 | % | 101 | % | 22 | % | 16 | % | 30 | % | ||||||||||||||||||||||||||||||
| Class A | Class C | |||||||||||||||||||||||||||||||||||||||
| Year Ended October 31, | Year Ended October 31, | |||||||||||||||||||||||||||||||||||||||
| 2016 | 2015 | 2014 | 2013 | 2012 | 2016 | 2015 | 2014 | 2013 | 2012 | |||||||||||||||||||||||||||||||
| Net asset value, beginning of year | $ | 16.26 | $ | 16.16 | $ | 14.52 | $ | 11.72 | $ | 10.57 | $ | 15.74 | $ | 15.68 | $ | 14.09 | $ | 11.36 | $ | 10.31 | ||||||||||||||||||||
| Income from investment operations: | ||||||||||||||||||||||||||||||||||||||||
| Net investment income (loss)* | 0.19 | 0.13 | 0.09 | 0.13 | 0.09 | 0.10 | 0.00 | (a) | (0.03 | ) | 0.03 | 0.00 | (a) | |||||||||||||||||||||||||||
| Net realized and unrealized gain (loss) | (0.05 | ) | 0.06 | 1.69 | 2.77 | 1.08 | (0.06 | ) | 0.06 | 1.65 | 2.71 | 1.05 | ||||||||||||||||||||||||||||
| Total income from investment operations | 0.14 | 0.19 | 1.78 | 2.90 | 1.17 | 0.04 | 0.06 | 1.62 | 2.74 | 1.05 | ||||||||||||||||||||||||||||||
| Less distributions: | ||||||||||||||||||||||||||||||||||||||||
| Distributions from net investment income | (0.14 | ) | (0.09 | ) | (0.14 | ) | (0.10 | ) | (0.02 | ) | (0.03 | ) | — | (0.03 | ) | (0.01 | ) | — | ||||||||||||||||||||||
| Distributions from net realized gains | (4.10 | ) | — | — | — | — | (4.10 | ) | — | — | — | — | ||||||||||||||||||||||||||||
| Total distributions | (4.24 | ) | (0.09 | ) | (0.14 | ) | (0.10 | ) | (0.02 | ) | (4.13 | ) | — | (0.03 | ) | (0.01 | ) | — | ||||||||||||||||||||||
| Net asset value, end of year | $ | 12.16 | $ | 16.26 | $ | 16.16 | $ | 14.52 | $ | 11.72 | $ | 11.65 | $ | 15.74 | $ | 15.68 | $ | 14.09 | $ | 11.36 | ||||||||||||||||||||
| Total return +, # | 1.43 | % | 1.15 | % | 12.31 | % | 24.99 | % | 11.04 | % | 0.66 | % | 0.38 | % | 11.49 | % | 24.09 | % | 10.18 | % | ||||||||||||||||||||
| Ratios/Supplemental Data: | ||||||||||||||||||||||||||||||||||||||||
| Net assets, end of year (in 000s) | $ | 6,544 | $ | 6,577 | $ | 7,685 | $ | 4,980 | $ | 2,969 | $ | 4,850 | $ | 5,805 | $ | 5,639 | $ | 5,029 | $ | 5,431 | ||||||||||||||||||||
| Ratios of expenses to average net assets: | 1.18 | % | 1.37 | % | 1.51 | % | 1.25 | % | 1.42 | % | 1.93 | % | 2.12 | % | 2.26 | % | 2.00 | % | 2.17 | % | ||||||||||||||||||||
| Ratios of net investment income (loss)to average net assets: | 1.57 | % | 0.78 | % | 0.57 | % | 0.99 | % | 0.79 | % | 0.83 | % | 0.03 | % | (0.18 | )% | 0.25 | % | 0.04 | % | ||||||||||||||||||||
| Portfolio turnover rate | 59 | % | 101 | % | 22 | % | 16 | % | 30 | % | 59 | % | 101 | % | 22 | % | 16 | % | 30 | % | ||||||||||||||||||||
| * | The net investment income (loss) per share data was determined using the average shares outstanding throughout each year. |
| + | Assumes reinvestment of all dividends and distributions, if any. Total return does not reflect the deductions of taxes that a shareholder would pay on distributions or on the redemption of shares. |
| (a) | Represents less than $0.01 per share. |
| # | Includes adjustments in accordance with accounting principles generally accepted in the United States and, consequently, the net asset value for financial reporting purposes and the returns based upon those net asset values may differ from the net asset values and returns for shareholder transactions. |
See accompanying notes to financial statements.
88
| FINANCIAL HIGHLIGHTS |
| Dunham Focused Large Cap Growth Fund |
| The table sets forth financial data for one share of beneficial interest outstanding throughout each period. |
| Class N | ||||||||||||||||||||||||||||||||||||||||
| Year Ended | Year Ended | Year Ended | Year Ended | Period Ended | ||||||||||||||||||||||||||||||||||||
| October 31, | October 31, | October 31, | October 31, | October 31, | ||||||||||||||||||||||||||||||||||||
| 2016 | 2015 | 2014 | 2013 | 2012* | ||||||||||||||||||||||||||||||||||||
| Net asset value, beginning of period | $ | 16.97 | $ | 15.01 | $ | 14.02 | $ | 10.42 | $ | 10.00 | ||||||||||||||||||||||||||||||
| Income (loss) from investment operations: | ||||||||||||||||||||||||||||||||||||||||
| Net investment loss** | (0.10 | ) | (0.16 | ) | (0.11 | ) | (0.10 | ) | (0.16 | ) | ||||||||||||||||||||||||||||||
| Net realized and unrealized gain (loss) | (0.86 | ) | 2.12 | 1.29 | 3.70 | 0.58 | ||||||||||||||||||||||||||||||||||
| Total income (loss) from investment operations | (0.96 | ) | 1.96 | 1.18 | 3.60 | 0.42 | ||||||||||||||||||||||||||||||||||
| Less distributions: | ||||||||||||||||||||||||||||||||||||||||
| Distributions from net realized gains | (0.09 | ) | — | (0.19 | ) | — | — | |||||||||||||||||||||||||||||||||
| Total distributions | (0.09 | ) | — | (0.19 | ) | — | — | |||||||||||||||||||||||||||||||||
| Net asset value, end of period | $ | 15.92 | $ | 16.97 | $ | 15.01 | $ | 14.02 | $ | 10.42 | ||||||||||||||||||||||||||||||
| Total return + | (5.66 | )% | 13.06 | % | 8.48 | % | 34.55 | % | 4.20 | % | ||||||||||||||||||||||||||||||
| Ratios/Supplemental Data: | ||||||||||||||||||||||||||||||||||||||||
| Net assets, end of period (in 000s) | $ | 51,242 | $ | 51,312 | $ | 37,106 | $ | 814 | $ | 450 | ||||||||||||||||||||||||||||||
| Ratios of expenses to average net assets: | ||||||||||||||||||||||||||||||||||||||||
| Before fee waivers ^ | 1.20 | % | 1.34 | % | 1.16 | % | 1.71 | % | 2.11 | % | ||||||||||||||||||||||||||||||
| After fee waivers ^ | 1.20 | % | 1.34 | % | 1.16 | % | 1.69 | % | 1.80 | % | ||||||||||||||||||||||||||||||
| Ratios of net investment loss to average net assets: | ||||||||||||||||||||||||||||||||||||||||
| Before fee waivers ^ | (0.64 | )% | (1.00 | )% | (0.76 | )% | (0.70 | )% | (1.06 | )% | ||||||||||||||||||||||||||||||
| After fee waivers ^ | (0.64 | )% | (1.00 | )% | (0.76 | )% | (0.67 | )% | (0.75 | )% | ||||||||||||||||||||||||||||||
| Portfolio turnover rate | 29 | % | 45 | % | 29 | % | 91 | % | 27 | % (1) | ||||||||||||||||||||||||||||||
| Class A | Class C | |||||||||||||||||||||||||||||||||||||||
| Year Ended | Year Ended | Year Ended | Year Ended | Year Ended | Year Ended | Year Ended | Year Ended | Year Ended | Year Ended | |||||||||||||||||||||||||||||||
| October 31, | October 31, | October 31, | October 31, | October 31, | October 31, | October 31, | October 31, | October 31, | October 31, | |||||||||||||||||||||||||||||||
| 2016 | 2015 | 2014 | 2103 | 2012 | 2016 | 2015 | 2014 | 2103 | 2012* | |||||||||||||||||||||||||||||||
| Net asset value, beginning of period | $ | 16.80 | $ | 14.91 | $ | 13.96 | $ | 10.39 | $ | 10.00 | $ | 16.33 | $ | 14.59 | $ | 13.76 | $ | 10.33 | $ | 10.00 | ||||||||||||||||||||
| Income (loss) from investment operations: | ||||||||||||||||||||||||||||||||||||||||
| Net investment loss** | (0.14 | ) | (0.19 | ) | (0.21 | ) | (0.11 | ) | (0.09 | ) | (0.25 | ) | (0.31 | ) | (0.26 | ) | (0.26 | ) | (0.30 | ) | ||||||||||||||||||||
| Net realized and unrealized gain (loss) | (0.84 | ) | 2.08 | 1.35 | 3.68 | 0.48 | (0.82 | ) | 2.05 | 1.28 | 3.69 | 0.63 | ||||||||||||||||||||||||||||
| Total income (loss) from investment operations | (0.98 | ) | 1.89 | 1.14 | 3.57 | 0.39 | (1.07 | ) | 1.74 | 1.02 | 3.43 | 0.33 | ||||||||||||||||||||||||||||
| Less distributions: | ||||||||||||||||||||||||||||||||||||||||
| Distributions from net realized gains | (0.09 | ) | — | (0.19 | ) | — | — | (0.09 | ) | — | (0.19 | ) | — | — | ||||||||||||||||||||||||||
| Total distributions | (0.09 | ) | — | (0.19 | ) | 0.00 | 0.00 | (0.09 | ) | — | (0.19 | ) | — | — | ||||||||||||||||||||||||||
| Net asset value, end of period | $ | 15.73 | $ | 16.80 | $ | 14.91 | $ | 13.96 | $ | 10.39 | $ | 15.17 | $ | 16.33 | $ | 14.59 | $ | 13.76 | $ | 10.33 | ||||||||||||||||||||
| Total return + | (5.84 | )% | 12.68 | % | 8.23 | % | 34.36 | % | 3.90 | % | (6.56 | )% | 11.93 | % | 7.47 | % | 33.20 | % | 3.30 | % | ||||||||||||||||||||
| Ratios/Supplemental Data: | ||||||||||||||||||||||||||||||||||||||||
| Net assets, end of period (in 000s) | $ | 9,620 | $ | 8,762 | $ | 19,949 | $ | 11,399 | $ | 10,344 | $ | 4,988 | $ | 5,222 | $ | 4,361 | $ | 510 | $ | 146 | ||||||||||||||||||||
| Ratios of expenses to average net assets: | ||||||||||||||||||||||||||||||||||||||||
| Before fee waivers ^ | 1.45 | % | 1.59 | % | 1.41 | % | 1.96 | % | 2.36 | % | 2.20 | % | 2.34 | % | 2.16 | % | 2.71 | % | 3.11 | % | ||||||||||||||||||||
| After fee waivers ^ | 1.45 | % | 1.59 | % | 1.41 | % | 1.94 | % | 2.05 | % | 2.20 | % | 2.34 | % | 2.16 | % | 2.69 | % | 2.80 | % | ||||||||||||||||||||
| Ratios of net investment loss to average net assets: | ||||||||||||||||||||||||||||||||||||||||
| Before fee waivers ^ | (0.91 | )% | (1.20 | )% | (1.48 | )% | (0.95 | )% | (1.31 | )% | (1.67 | )% | (2.00 | )% | (1.87 | )% | (1.70 | )% | (2.06 | )% | ||||||||||||||||||||
| After fee waivers ^ | (0.91 | )% | (1.20 | )% | (1.48 | )% | (0.92 | )% | (1.00 | )% | (1.67 | )% | (2.00 | )% | (1.87 | )% | (1.67 | )% | (1.75 | )% | ||||||||||||||||||||
| Portfolio turnover rate | 29 | % | 45 | % | 29 | % | 91 | % | 27 | % (1) | 29 | % | 45 | % | 29 | % | 91 | % | 27 | % (1) | ||||||||||||||||||||
| * | The Fund commenced operations on December 8, 2011. |
| ** | The net investment loss per share data was determined using the average shares outstanding throughout each period. |
| ^ | Annualized for periods less than a year. |
| + | Assumes reinvestment of all dividends and distributions, if any. Aggregate (not annualized) total return is shown for any period shorter than one year. Total return does not reflect the deductions of taxes that a shareholder would pay on distributions or on the redemption of shares. |
| (1) | Not annualized. |
See accompanying notes to financial statements.
89
| FINANCIAL HIGHLIGHTS |
| Dunham International Stock Fund |
| The table sets forth financial data for one share of beneficial interest outstanding throughout each year. |
| Class N | ||||||||||||||||||||||||||||||||||||||||
| Year Ended October 31, | ||||||||||||||||||||||||||||||||||||||||
| 2016 | 2015 | 2014 | 2013 | 2012 | ||||||||||||||||||||||||||||||||||||
| Net asset value, beginning of year | $ | 14.24 | $ | 15.21 | $ | 15.22 | $ | 12.05 | $ | 11.85 | ||||||||||||||||||||||||||||||
| Income (loss) from investment operations: | ||||||||||||||||||||||||||||||||||||||||
| Net investment income * | 0.16 | 0.00 | 0.15 | 0.07 | 0.14 | |||||||||||||||||||||||||||||||||||
| Net realized and unrealized gain (loss) | (0.15 | ) | (0.61 | ) | 0.10 | 3.24 | 0.22 | |||||||||||||||||||||||||||||||||
| Total income (loss) from investment operations | 0.01 | (0.61 | ) | 0.25 | 3.31 | 0.36 | ||||||||||||||||||||||||||||||||||
| Less distributions: | ||||||||||||||||||||||||||||||||||||||||
| Distributions from net investment income | (0.01 | ) | (0.30 | ) | (0.26 | ) | (0.14 | ) | (0.16 | ) | ||||||||||||||||||||||||||||||
| Distributions from net realized gains | — | (0.06 | ) | — | — | — | ||||||||||||||||||||||||||||||||||
| Total distributions | (0.01 | ) | (0.36 | ) | (0.26 | ) | (0.14 | ) | (0.16 | ) | ||||||||||||||||||||||||||||||
| Net asset value, end of year | $ | 14.24 | $ | 14.24 | $ | 15.21 | $ | 15.22 | $ | 12.05 | ||||||||||||||||||||||||||||||
| Total return + # | 0.06 | % | (4.10 | )% | 1.66 | % | 27.64 | % | 3.16 | % | ||||||||||||||||||||||||||||||
| Ratios/Supplemental Data: | ||||||||||||||||||||||||||||||||||||||||
| Net assets, end of year (in 000s) | $ | 78,640 | $ | 76,992 | $ | 57,359 | $ | 49,815 | $ | 44,947 | ||||||||||||||||||||||||||||||
| Ratios of expenses to average net assets: | 1.63 | % | 2.04 | % | 2.04 | % | 2.11 | % | 1.97 | % | ||||||||||||||||||||||||||||||
| Ratios of net investment income to average net assets: | 1.17 | % | 0.03 | % | 0.99 | % | 0.52 | % | 1.24 | % | ||||||||||||||||||||||||||||||
| Portfolio turnover rate | 143 | % | 125 | % | 117 | % | 131 | % | 142 | % | ||||||||||||||||||||||||||||||
| Class A | Class C | |||||||||||||||||||||||||||||||||||||||
| Year Ended October 31, | Year Ended October 31, | |||||||||||||||||||||||||||||||||||||||
| 2016 | 2015 | 2014 | 2013 | 2012 | 2016 | 2015 | 2014 | 2013 | 2012 | |||||||||||||||||||||||||||||||
| �� | ||||||||||||||||||||||||||||||||||||||||
| Net asset value, beginning of year | $ | 14.21 | $ | 15.16 | $ | 15.19 | $ | 12.03 | $ | 11.84 | $ | 13.73 | $ | 14.68 | $ | 14.70 | $ | 11.64 | $ | 11.44 | ||||||||||||||||||||
| Income (loss) from investment operations: | ||||||||||||||||||||||||||||||||||||||||
| Net investment income (loss)* | 0.13 | (0.03 | ) | 0.15 | 0.06 | 0.10 | 0.03 | (0.14 | ) | (0.00 | ) (a) | (0.06 | ) | 0.03 | ||||||||||||||||||||||||||
| Net realized and unrealized gain (loss) | (0.17 | ) | (0.60 | ) | 0.06 | 3.22 | 0.22 | (0.16 | ) | (0.59 | ) | 0.10 | 3.13 | 0.21 | ||||||||||||||||||||||||||
| Total income (loss) from investment operations | (0.04 | ) | (0.63 | ) | 0.21 | 3.28 | 0.32 | (0.13 | ) | (0.73 | ) | 0.10 | 3.07 | 0.24 | ||||||||||||||||||||||||||
| Less distributions: | ||||||||||||||||||||||||||||||||||||||||
| Distributions from net investment income | — | (0.26 | ) | (0.24 | ) | (0.12 | ) | (0.13 | ) | — | (0.16 | ) | (0.12 | ) | (0.01 | ) | (0.04 | ) | ||||||||||||||||||||||
| Distributions from net realized gains | — | (0.06 | ) | — | — | — | — | (0.06 | ) | — | — | — | ||||||||||||||||||||||||||||
| Total distributions | — | (0.32 | ) | (0.24 | ) | (0.12 | ) | (0.13 | ) | — | (0.22 | ) | (0.12 | ) | (0.01 | ) | (0.04 | ) | ||||||||||||||||||||||
| Net asset value, end of year | $ | 14.17 | $ | 14.21 | $ | 15.16 | $ | 15.19 | $ | 12.03 | $ | 13.60 | $ | 13.73 | $ | 14.68 | $ | 14.70 | $ | 11.64 | ||||||||||||||||||||
| Total return + # | (0.28 | )% | (4.26 | )% | 1.35 | % | 27.40 | % | 2.80 | % | (0.95 | )% | (5.06 | )% | 0.67 | % | 26.40 | % | 2.10 | % | ||||||||||||||||||||
| Ratios/Supplemental Data: | ||||||||||||||||||||||||||||||||||||||||
| Net assets, end of year (in 000s) | $ | 10,305 | $ | 9,032 | $ | 7,871 | $ | 4,741 | $ | 1,580 | $ | 6,483 | $ | 7,268 | $ | 6,551 | $ | 5,627 | $ | 5,881 | ||||||||||||||||||||
| Ratios of expenses to average net assets: | 1.88 | % | 2.29 | % | 2.29 | % | 2.36 | % | 2.22 | % | 2.63 | % | 3.04 | % | 3.04 | % | 3.11 | % | 2.97 | % | ||||||||||||||||||||
| Ratios of net investment income (loss) to average net assets: | 0.93 | % | (0.19 | )% | 0.97 | % | 0.41 | % | 0.99 | % | 0.20 | % | (0.94 | )% | (0.02 | )% | (0.46 | )% | 0.24 | % | ||||||||||||||||||||
| Portfolio turnover rate | 143 | % | 125 | % | 117 | % | 131 | % | 142 | % | 143 | % | 125 | % | 117 | % | 131 | % | 142 | % | ||||||||||||||||||||
| * | The net investment income (loss) per share data was determined using the average shares outstanding throughout each period |
| + | Assumes reinvestment of all dividends and distributions, if any. Total return does not reflect the deductions of taxes that a shareholder would pay on distributions or on the redemption of shares |
| # | Includes adjustments in accordance with accounting principles generally accepted in the United States and, consequently, the net asset value for financial reporting purposes and the returns based upon those net asset values may differ from the net asset values and returns for shareholder transactions |
| (a) | Represents less than $0.01 per share. |
See accompanying notes to financial statements.
90
| FINANCIAL HIGHLIGHTS |
| Dunham Real Estate Stock Fund |
| The table sets forth financial data for one share of beneficial interest outstanding throughout each year |
| Class N | ||||||||||||||||||||||||||||||||||||||||
| Year Ended | ||||||||||||||||||||||||||||||||||||||||
| October 31, | ||||||||||||||||||||||||||||||||||||||||
| 2016 | 2015 | 2014 | 2013 | 2012 | ||||||||||||||||||||||||||||||||||||
| Net asset value, beginning of year | $ | 19.23 | $ | 19.27 | $ | 16.53 | $ | 15.79 | $ | 13.80 | ||||||||||||||||||||||||||||||
| Income from investment operations: | ||||||||||||||||||||||||||||||||||||||||
| Net investment income * | 0.32 | 0.15 | 0.13 | 0.23 | 0.21 | |||||||||||||||||||||||||||||||||||
| Net realized and unrealized gain | 0.73 | 0.85 | 3.20 | 1.27 | 1.90 | |||||||||||||||||||||||||||||||||||
| Total income from investment operations | 1.05 | 1.00 | 3.33 | 1.50 | 2.11 | |||||||||||||||||||||||||||||||||||
| Less distributions: | ||||||||||||||||||||||||||||||||||||||||
| Distributions from net investment income | (0.21 | ) | (0.11 | ) | (0.20 | ) | (0.23 | ) | (0.12 | ) | ||||||||||||||||||||||||||||||
| Distributions from net realized gains | (1.76 | ) | (0.93 | ) | (0.39 | ) | (0.53 | ) | — | |||||||||||||||||||||||||||||||
| Total distributions | (1.97 | ) | (1.04 | ) | (0.59 | ) | (0.76 | ) | (0.12 | ) | ||||||||||||||||||||||||||||||
| Net asset value, end of year | $ | 18.31 | $ | 19.23 | $ | 19.27 | $ | 16.53 | $ | 15.79 | ||||||||||||||||||||||||||||||
| Total return + | 5.77 | % | 5.13 | % | 21.09 | % | 9.85 | % | 15.46 | % | ||||||||||||||||||||||||||||||
| Ratios/Supplemental Data: | ||||||||||||||||||||||||||||||||||||||||
| Net assets, end of year (in 000s) | $ | 25,479 | $ | 33,379 | $ | 37,143 | $ | 33,545 | $ | 20,424 | ||||||||||||||||||||||||||||||
| Ratios of expenses to average net assets: | 1.21 | % | 1.64 | % | 1.59 | % | 1.30 | % | 1.46 | % | ||||||||||||||||||||||||||||||
| Ratios of net investment income to average net assets: | 1.74 | % | 0.80 | % | 0.77 | % | 1.40 | % | 1.42 | % | ||||||||||||||||||||||||||||||
| Portfolio turnover rate | 110 | % | 110 | % | 97 | % | 163 | % | 123 | % | ||||||||||||||||||||||||||||||
| Class A | Class C | |||||||||||||||||||||||||||||||||||||||
| Year Ended | Year Ended | |||||||||||||||||||||||||||||||||||||||
| October 31, | October 31, | |||||||||||||||||||||||||||||||||||||||
| 2016 | 2015 | 2014 | 2013 | 2012 | 2016 | 2015 | 2014 | 2013 | 2012 | |||||||||||||||||||||||||||||||
| Net asset value, beginning of year | $ | 19.26 | $ | 19.33 | $ | 16.55 | $ | 15.77 | $ | 13.80 | 50$18. | 65$18. | $ | 16.02 | $ | 15.33 | $ | 13.40 | ||||||||||||||||||||||
| Income from investment operations: | ||||||||||||||||||||||||||||||||||||||||
| Net investment income (loss) * | 0.27 | 0.10 | 0.08 | 0.15 | 0.21 | 0.13 | (0.04 | ) | (0.04 | ) | 0.07 | 0.07 | ||||||||||||||||||||||||||||
| Net realized and unrealized gain | 0.74 | 0.85 | 3.22 | 1.31 | 1.87 | 0.70 | 0.82 | 3.11 | 1.23 | 1.86 | ||||||||||||||||||||||||||||||
| Total income from investment operations | 1.01 | 0.95 | 3.30 | 1.46 | 2.08 | 0.83 | 0.78 | 3.07 | 1.30 | 1.93 | ||||||||||||||||||||||||||||||
| Less distributions: | ||||||||||||||||||||||||||||||||||||||||
| Distributions from net investment income | (0.16 | ) | (0.09 | ) | (0.13 | ) | (0.15 | ) | (0.11 | ) | (0.02 | ) | 0.00 | (0.05 | ) | (0.08 | ) | 0.00 | ||||||||||||||||||||||
| Distributions from net realized gains | (1.76 | ) | (0.93 | ) | (0.39 | ) | (0.53 | ) | — | (1.76 | ) | (0.93 | ) | (0.39 | ) | (0.53 | ) | — | ||||||||||||||||||||||
| Total distributions | (1.92 | ) | (1.02 | ) | (0.52 | ) | (0.68 | ) | (0.11 | ) | (1.78 | ) | (0.93 | ) | (0.44 | ) | (0.61 | ) | 0.00 | |||||||||||||||||||||
| Net asset value, end of year | $ | 18.35 | $ | 19.26 | $ | 19.33 | $ | 16.55 | $ | 15.77 | $ | 17.55 | $ | 18.50 | $ | 18.65 | $ | 16.02 | $ | 15.33 | ||||||||||||||||||||
| Total return + | 5.54 | % | 4.85 | % | 20.73 | % | 9.60 | % | 15.20 | % | 4.73 | % | 4.08 | % | 19.88 | % | 8.73 | % | 14.40 | % | ||||||||||||||||||||
| Ratios/Supplemental Data: | ||||||||||||||||||||||||||||||||||||||||
| Net assets, end of year (in 000s) | $ | 9,376 | 10,386 | $ | $ | 3,913 | $ | 2,539 | $ | 709 | $ | 3,211 | $ | 3,847 | $ | 4,166 | $ | 2,684 | $ | 2,370 | ||||||||||||||||||||
| Ratios of expenses to average net assets: | 1.45 | % | 1.89 | % | 1.84 | % | 1.55 | % | 1.71 | % | 2.21 | % | 2.64 | % | 2.59 | % | 2.30 | % | 2.46 | % | ||||||||||||||||||||
| Ratios of net investment income (loss) to average net assets: | 1.45 | % | 0.53 | % | 0.48 | % | 1.15 | % | 1.17 | % | 0.70 | % | (0.21 | )% | (0.24 | )% | 0.40 | % | 0.42 | % | ||||||||||||||||||||
| Portfolio turnover rate | 110 | % | 110 | % | 97 | % | 163 | % | 123 | % | 110 | % | 110 | % | 97 | % | 163 | % | 123 | % | ||||||||||||||||||||
| * | The net investment income (loss) per share data was determined using the average shares outstanding throughout each year |
| + | Assumes reinvestment of all dividends and distributions, if any. Total return does not reflect the deductions of taxes that a shareholder would pay on distributions or on the redemption of shares. |
See accompanying notes to financial statements.
91
| FINANCIAL HIGHLIGHTS |
| Dunham Small Cap Value Fund |
| The table sets forth financial data for one share of beneficial interest outstanding throughout each year |
| Class N | ||||||||||||||||||||||||||||||||||||||||
| Year Ended October 31, | ||||||||||||||||||||||||||||||||||||||||
| 2016 | 2015 | 2014 | 2013 | 2012 | ||||||||||||||||||||||||||||||||||||
| Net asset value, beginning of year | $ | 14.27 | $ | 15.45 | $ | 14.65 | $ | 11.21 | $ | 10.44 | ||||||||||||||||||||||||||||||
| Income (loss) from investment operations: | ||||||||||||||||||||||||||||||||||||||||
| Net investment income (loss) * | 0.09 | (0.01 | ) | 0.04 | 0.07 | 0.00 | (a) | |||||||||||||||||||||||||||||||||
| Net realized and unrealized gain (loss) | 0.54 | (0.18 | ) | 1.45 | 3.40 | 0.77 | ||||||||||||||||||||||||||||||||||
| Total income (loss) from investment operations | 0.63 | (0.19 | ) | 1.49 | 3.47 | 0.77 | ||||||||||||||||||||||||||||||||||
| Less distributions: | ||||||||||||||||||||||||||||||||||||||||
| Distributions from net investment income | (0.01 | ) | (0.04 | ) | (0.02 | ) | (0.03 | ) | — | |||||||||||||||||||||||||||||||
| Distributions from net realized gains | (0.48 | ) | (0.95 | ) | (0.67 | ) | — | — | ||||||||||||||||||||||||||||||||
| Total distributions | (0.49 | ) | (0.99 | ) | (0.69 | ) | (0.03 | ) | — | |||||||||||||||||||||||||||||||
| Net asset value, end of year | $ | 14.41 | $ | 14.27 | $ | 15.45 | $ | 14.65 | $ | 11.21 | ||||||||||||||||||||||||||||||
| Total return + # | 4.58 | % | (1.59 | )% | 10.30 | % | 31.05 | % | 7.38 | % | ||||||||||||||||||||||||||||||
| Ratios/Supplemental Data: | ||||||||||||||||||||||||||||||||||||||||
| Net assets, end of year (in 000s) | $ | 22,254 | $ | 22,068 | $ | 23,783 | $ | 16,640 | $ | 15,764 | ||||||||||||||||||||||||||||||
| Ratios of expenses to average net assets: | 1.48 | % | 1.79 | % | 1.45 | % | 1.29 | % | 2.02 | % | ||||||||||||||||||||||||||||||
| Ratios of net investment income (loss) to average net assets: | 0.64 | % | (0.10 | )% | 0.27 | % | 0.62 | % | 0.04 | % | ||||||||||||||||||||||||||||||
| Portfolio turnover rate | 129 | % | 122 | % | 106 | % | 147 | % | 62 | % | ||||||||||||||||||||||||||||||
| Class A | Class C | |||||||||||||||||||||||||||||||||||||||
| Year Ended October 31, | Year Ended October 31, | |||||||||||||||||||||||||||||||||||||||
| 2016 | 2015 | 2014 | 2013 | 2012 | 2016 | 2015 | 2014 | 2013 | 2012 | |||||||||||||||||||||||||||||||
| Net asset value, beginning of year | $ | 14.18 | $ | 15.36 | $ | 14.59 | $ | 11.16 | $ | 10.40 | $ | 13.06 | $ | 14.32 | $ | 13.74 | $ | 10.59 | $ | 9.96 | ||||||||||||||||||||
| Income (loss) from investment operations: | ||||||||||||||||||||||||||||||||||||||||
| Net investment income (loss)* | 0.05 | (0.05 | ) | (0.00 | ) | 0.01 | 0.00 | (a) | (0.05 | ) | (0.15 | ) | (0.10 | ) | (0.03 | ) | (0.10 | ) | ||||||||||||||||||||||
| Net realized and unrealized gain (loss) | 0.54 | (0.18 | ) | 1.44 | 3.42 | 0.76 | 0.49 | (0.16 | ) | 1.35 | 3.18 | 0.73 | ||||||||||||||||||||||||||||
| Total income (loss) from investment operations | 0.59 | (0.23 | ) | 1.44 | 3.43 | 0.76 | 0.44 | (0.31 | ) | 1.25 | 3.15 | 0.63 | ||||||||||||||||||||||||||||
| Less distributions: | ||||||||||||||||||||||||||||||||||||||||
| Distributions from net realized gains | (0.48 | ) | (0.95 | ) | (0.67 | ) | — | — | (0.48 | ) | (0.95 | ) | (0.67 | ) | — | — | ||||||||||||||||||||||||
| Total distributions | (0.48 | ) | (0.95 | ) | (0.67 | ) | — | — | (0.48 | ) | (0.95 | ) | (0.67 | ) | — | — | ||||||||||||||||||||||||
| Net asset value, end of year | $ | 14.29 | $ | 14.18 | $ | 15.36 | $ | 14.59 | $ | 11.16 | $ | 13.02 | $ | 13.06 | $ | 14.32 | $ | 13.74 | $ | 10.59 | ||||||||||||||||||||
| Total return + # | 4.33 | % | (1.83 | )% | 10.02 | % | 30.74 | % | 7.31 | % | 3.52 | % | (2.56 | )% | 9.22 | % | 29.75 | % | 6.33 | % | ||||||||||||||||||||
| Ratios/Supplemental Data: | ||||||||||||||||||||||||||||||||||||||||
| Net assets, end of year (in 000s) | $ | 3,802 | $ | 3,801 | $ | 3,268 | $ | 1,756 | $ | 567 | $ | 2,241 | $ | 2,383 | $ | 2,494 | $ | 2,057 | $ | 2,099 | ||||||||||||||||||||
| Ratios of expenses to average net assets: | 1.73 | % | 2.04 | % | 1.70 | % | 1.54 | % | 2.27 | % | 2.48 | % | 2.79 | % | 2.45 | % | 2.29 | % | 3.02 | % | ||||||||||||||||||||
| Ratios of net investment income (loss) to average net assets: | 0.40 | % | (0.36 | )% | (0.06 | )% | 0.15 | % | (0.21 | )% | (0.36 | )% | (1.11 | )% | (0.70 | )% | (0.37 | )% | (0.96 | )% | ||||||||||||||||||||
| Portfolio turnover rate | 129 | % | 122 | % | 106 | % | 147 | % | 62 | % | 129 | % | 122 | % | 106 | % | 147 | % | 62 | % | ||||||||||||||||||||
| * | The net investment income (loss) per share data was determined using the average shares outstanding throughout each year |
| + | Assumes reinvestment of all dividends and distributions, if any. Total return does not reflect the deductions of taxes that a shareholder would pay on distributions or on the redemption of shares |
| (a) | Represents less than $0.01 per share. |
| # | Includes adjustments in accordance with accounting principles generally accepted in the United States and, consequently, the net asset value for financial reporting purposes and the returns based upon those net asset values may differ from the net asset values and returns for shareholder transactions |
See accompanying notes to financial statements.
92
| FINANCIAL HIGHLIGHTS |
| Dunham Emerging Markets Stock Fund |
| The table sets forth financial data for one share of beneficial interest outstanding throughout each year |
| Class N | ||||||||||||||||||||||||||||||||||||||||
| Year Ended October 31, | ||||||||||||||||||||||||||||||||||||||||
| 2016 | 2015 | 2014 | 2013 | 2012 | ||||||||||||||||||||||||||||||||||||
| Net asset value, beginning of year | $ | 11.97 | $ | 14.75 | $ | 14.66 | $ | 13.82 | $ | 13.43 | ||||||||||||||||||||||||||||||
| Income (loss) from investment operations: | ||||||||||||||||||||||||||||||||||||||||
| Net investment income* | 0.20 | 0.08 | 0.20 | 0.00 | (a) | 0.04 | ||||||||||||||||||||||||||||||||||
| Net realized and unrealized gain (loss) ** | 0.64 | (2.67 | ) | (0.11 | ) | 0.84 | 0.35 | |||||||||||||||||||||||||||||||||
| Total income (loss) from investment operations | 0.84 | (2.59 | ) | 0.09 | 0.84 | 0.39 | ||||||||||||||||||||||||||||||||||
| Less distributions: | ||||||||||||||||||||||||||||||||||||||||
| Distributions from net investment income | (0.08 | ) | (0.19 | ) | — | — | — | |||||||||||||||||||||||||||||||||
| Total distributions | (0.08 | ) | (0.19 | ) | — | — | — | |||||||||||||||||||||||||||||||||
| Net asset value, end of year | $ | 12.73 | $ | 11.97 | $ | 14.75 | $ | 14.66 | $ | 13.82 | ||||||||||||||||||||||||||||||
| Total return + # | 7.13 | % | (17.73 | )% | 0.61 | % | 6.08 | % | 2.90 | % | ||||||||||||||||||||||||||||||
| Ratios/Supplemental Data: | ||||||||||||||||||||||||||||||||||||||||
| Net assets, end of year (in 000s) | $ | 46,481 | $ | 42,831 | $ | 35,872 | $ | 24,736 | $ | 16,017 | ||||||||||||||||||||||||||||||
| Ratios of expenses to average net assets: | 1.27 | % | 1.76 | % | 1.29 | % | 2.00 | % | 1.75 | % | ||||||||||||||||||||||||||||||
| Ratios of net investment income (loss) to average net assets: | 1.73 | % | 0.59 | % | 1.39 | % | 0.03 | % | 0.29 | % | ||||||||||||||||||||||||||||||
| Portfolio turnover rate | 97 | % | 137 | % | 108 | % | 166 | % | 104 | % | ||||||||||||||||||||||||||||||
| Class A | Class C | |||||||||||||||||||||||||||||||||||||||
| Year Ended October 31, | Year Ended October 31, | |||||||||||||||||||||||||||||||||||||||
| 2016 | 2015 | 2014 | 2013 | 2012 | 2016 | 2015 | 2014 | 2013 | 2012 | |||||||||||||||||||||||||||||||
| Net asset value, beginning of year | $ | 11.71 | $ | 14.44 | $ | 14.39 | $ | 13.59 | $ | 13.23 | $ | 11.14 | $ | 13.76 | $ | 13.82 | $ | 13.16 | $ | 12.90 | ||||||||||||||||||||
| Income (loss) from investment operations: | ||||||||||||||||||||||||||||||||||||||||
| Net investment income (loss)* | 0.17 | 0.05 | 0.16 | (0.07 | ) | 0.05 | 0.08 | (0.06 | ) | 0.04 | (0.14 | ) | (0.09 | ) | ||||||||||||||||||||||||||
| Net realized and unrealized gain (loss) ** | 0.62 | (2.62 | ) | (0.11 | ) | 0.87 | 0.31 | 0.60 | (2.49 | ) | (0.10 | ) | 0.80 | 0.35 | ||||||||||||||||||||||||||
| Total income (loss) from investment operations | 0.79 | (2.57 | ) | 0.05 | 0.80 | 0.36 | 0.68 | (2.55 | ) | (0.06 | ) | 0.66 | 0.26 | |||||||||||||||||||||||||||
| Less distributions: | ||||||||||||||||||||||||||||||||||||||||
| Distributions from net investment income | (0.05 | ) | (0.16 | ) | — | — | — | — | (0.07 | ) | — | — | — | |||||||||||||||||||||||||||
| Total distributions | (0.05 | ) | (0.16 | ) | — | — | — | — | (0.07 | ) | — | — | — | |||||||||||||||||||||||||||
| Net asset value, end of year | $ | 12.45 | $ | 11.71 | $ | 14.44 | $ | 14.39 | $ | 13.59 | $ | 11.82 | $ | 11.14 | $ | 13.76 | $ | 13.82 | $ | 13.16 | ||||||||||||||||||||
| Total return + # | 6.84 | % | (17.94 | )% | 0.35 | % | 5.89 | % | 2.72 | % | 6.10 | % | (18.60 | )% | (0.43 | )% | 5.02 | % | 2.02 | % | ||||||||||||||||||||
| Ratios/Supplemental Data: | ||||||||||||||||||||||||||||||||||||||||
| Net assets, end of year (in 000s) | $ | 6,348 | $ | 4,594 | $ | 4,036 | $ | 2,475 | $ | 11,364 | $ | 3,380 | $ | 3,216 | $ | 3,593 | $ | 2,735 | $ | 2,497 | ||||||||||||||||||||
| Ratios of expenses to average net assets: | 1.52 | % | 2.01 | % | 1.54 | % | 2.25 | % | 2.00 | % | 2.27 | % | 2.76 | % | 2.29 | % | 3.00 | % | 2.75 | % | ||||||||||||||||||||
| Ratios of net investment income (loss) to average net assets: | 1.46 | % | 0.40 | % | 1.14 | % | (0.48 | )% | 0.04 | % | 0.77 | % | (0.48 | )% | 0.34 | % | (1.03 | )% | (0.71 | )% | ||||||||||||||||||||
| Portfolio turnover rate | 97 | % | 137 | % | 108 | % | 166 | % | 104 | % | 97 | % | 137 | % | 108 | % | 166 | % | 104 | % | ||||||||||||||||||||
| * | The net investment income (loss) per share data was determined using the average shares outstanding throughout each year |
| (a) | Represents less than $0.01 per share. |
| ** | The amount of net realized and unrealized loss on investment per share for the year ended October 31, 2014 does not accord with the amounts in the Statements of Operations due to the timing of purchases and sales of Fund shares in relation to fluctuating market values. |
| + | Assumes reinvestment of all dividends and distributions, if any. Total return does not reflect the deductions of taxes that a shareholder would pay on distributions or on the redemption of shares. |
| # | Includes adjustments in accordance with accounting principles generally accepted in the United States and, consequently, the net asset value for financial reporting purposes and the returns based upon those net asset values may differ from the net asset values and returns for shareholder transactions. |
See accompanying notes to financial statements.
93
| FINANCIAL HIGHLIGHTS |
| Dunham Small Cap Growth Fund |
| The table sets forth financial data for one share of beneficial interest outstanding throughout each year. |
| Class N | ||||||||||||||||||||||||||||||||||||||||
| Year Ended | ||||||||||||||||||||||||||||||||||||||||
| October 31, | ||||||||||||||||||||||||||||||||||||||||
| 2016 | 2015 | 2014 | 2013 | 2012 | ||||||||||||||||||||||||||||||||||||
| Net asset value, beginning of year | $ | 17.08 | $ | 17.71 | $ | 20.62 | $ | 15.69 | $ | 14.75 | ||||||||||||||||||||||||||||||
| Income from investment operations: | ||||||||||||||||||||||||||||||||||||||||
| Net investment loss* | (0.06 | ) | (0.24 | ) | (0.29 | ) | (0.19 | ) | (0.17 | ) | ||||||||||||||||||||||||||||||
| Net realized and unrealized gain (loss) ^ | (0.24 | ) | 1.19 | 1.11 | 6.10 | 1.11 | ||||||||||||||||||||||||||||||||||
| Total income (loss) from investment operations | (0.30 | ) | 0.95 | 0.82 | 5.91 | 0.94 | ||||||||||||||||||||||||||||||||||
| Less distributions: | ||||||||||||||||||||||||||||||||||||||||
| Distributions from net realized gains | (1.40 | ) | (1.58 | ) | (3.73 | ) | (0.98 | ) | — | |||||||||||||||||||||||||||||||
| Tax return of capital | (0.04 | ) | — | — | — | — | ||||||||||||||||||||||||||||||||||
| Total distributions | (1.44 | ) | (1.58 | ) | (3.73 | ) | (0.98 | ) | — | |||||||||||||||||||||||||||||||
| Net asset value, end of year | $ | 15.34 | $ | 17.08 | $ | 17.71 | $ | 20.62 | $ | 15.69 | ||||||||||||||||||||||||||||||
| Total return + # | (1.88 | )% | 5.36 | % | 3.64 | % | 40.28 | % | 6.37 | % | ||||||||||||||||||||||||||||||
| Ratios/Supplemental Data: | ||||||||||||||||||||||||||||||||||||||||
| Net assets, end of year (in 000s) | $ | 26,010 | $ | 23,152 | $ | 21,153 | $ | 16,146 | $ | 14,627 | ||||||||||||||||||||||||||||||
| Ratios of expenses to average net assets: | 1.23 | % | 1.58 | % | 1.84 | % | 1.35 | % | 1.34 | % | ||||||||||||||||||||||||||||||
| Ratios of net investment loss to average net assets: | (0.38 | )% | (1.30 | )% | (1.61 | )% | (1.08 | )% | (1.12 | )% | ||||||||||||||||||||||||||||||
| Portfolio turnover rate | 181 | % | 138 | % | 192 | % | 231 | % | 211 | % | ||||||||||||||||||||||||||||||
| Class A | Class C | |||||||||||||||||||||||||||||||||||||||
| Year Ended | Year Ended | |||||||||||||||||||||||||||||||||||||||
| October 31, | October 31, | |||||||||||||||||||||||||||||||||||||||
| 2016 | 2015 | 2014 | 2013 | 2012 | 2016 | 2015 | 2014 | 2013 | 2012 | |||||||||||||||||||||||||||||||
| Net asset value, beginning of year | $ | 16.62 | $ | 17.31 | $ | 20.28 | $ | 15.49 | $ | 14.59 | $ | 14.61 | $ | 15.51 | $ | 18.66 | $ | 14.43 | $ | 13.69 | ||||||||||||||||||||
| Income from investment operations: | ||||||||||||||||||||||||||||||||||||||||
| Net investment loss* | (0.10 | ) | (0.27 | ) | (0.34 | ) | (0.24 | ) | (0.21 | ) | (0.18 | ) | (0.36 | ) | (0.42 | ) | (0.32 | ) | (0.30 | ) | ||||||||||||||||||||
| Net realized and unrealized gain (loss) ^ | (0.23 | ) | 1.16 | 1.10 | 6.01 | 1.11 | (0.20 | ) | 1.04 | 1.00 | 5.53 | 1.04 | ||||||||||||||||||||||||||||
| Total income (loss) from investment operations | (0.33 | ) | 0.89 | 0.76 | 5.77 | 0.90 | (0.38 | ) | 0.68 | 0.58 | 5.21 | 0.74 | ||||||||||||||||||||||||||||
| Less distributions: | ||||||||||||||||||||||||||||||||||||||||
| Distributions from net realized gains | (1.40 | ) | (1.58 | ) | (3.73 | ) | (0.98 | ) | — | (1.40 | ) | (1.58 | ) | (3.73 | ) | (0.98 | ) | — | ||||||||||||||||||||||
| Tax return of capital | (0.04 | ) | — | — | — | — | (0.04 | ) | — | — | — | — | ||||||||||||||||||||||||||||
| Total distributions | (1.44 | ) | (1.58 | ) | (3.73 | ) | (0.98 | ) | — | (1.44 | ) | (1.58 | ) | (3.73 | ) | (0.98 | ) | — | ||||||||||||||||||||||
| Net asset value, end of year | $ | 14.85 | $ | 16.62 | $ | 17.31 | $ | 20.28 | $ | 15.49 | $ | 12.79 | $ | 14.61 | $ | 15.51 | $ | 18.66 | $ | 14.43 | ||||||||||||||||||||
| Total return + # | (2.12 | )% | 5.12 | % | 3.36 | % | 39.88 | % | 6.17 | % | (2.82 | )% | 4.29 | % | 2.56 | % | 38.87 | % | 5.41 | % | ||||||||||||||||||||
| Ratios/Supplemental Data: | ||||||||||||||||||||||||||||||||||||||||
| Net assets, end of year (in 000s) | $ | 5,540 | $ | 6,326 | $ | 6,443 | $ | 5,890 | $ | 2,418 | $ | 2,155 | $ | 3,163 | $ | 3,165 | $ | 2,685 | $ | 2,694 | ||||||||||||||||||||
| Ratios of expenses to average net assets: | 1.48 | % | 1.83 | % | 2.09 | % | 1.60 | % | 1.59 | % | 2.23 | % | 2.58 | % | 2.84 | % | 2.35 | % | 2.34 | % | ||||||||||||||||||||
| Ratios of net investment loss to average net assets: | (0.69 | )% | (1.53 | )% | (1.86 | )% | (1.33 | )% | (1.37 | )% | (1.45 | )% | (2.29 | )% | (2.61 | )% | (2.08 | )% | (2.12 | )% | ||||||||||||||||||||
| Portfolio turnover rate | 181 | % | 138 | % | 192 | % | 231 | % | 211 | % | 181 | % | 138 | % | 192 | % | 231 | % | 211 | % | ||||||||||||||||||||
| * | The net investment loss per share data was determined using the average shares outstanding throughout each year. |
| + | Assumes reinvestment of all dividends and distributions, if any. Total return does not reflect the deductions of taxes that a shareholder would pay on distributions or on the redemption of shares. |
| # | Includes adjustments in accordance with accounting principles generally accepted in the United States and, consequently, the net asset value for financial reporting purposes and the returns based upon those net asset values may differ from the net asset values and returns for shareholder transactions. |
| ^ | The amount of net realized and unrealized gain (loss) on investment per share for the year ended October 31, 2016 does not accord with the amounts in the Statements of Operations due to the timing of purchases and sales of Fund shares in relation to fluctuating market values. |
See accompanying notes to financial statements.
94
| NOTES TO FINANCIAL STATEMENTS |
| October 31, 2016 |
| 1. | ORGANIZATION |
Each Dunham Fund (each, a “Fund” and collectively the “Funds”) is a series of shares of beneficial interest in the Dunham Funds (the “Trust”), a Delaware Business Trust organized on November 28, 2007 and registered under the Investment Company Act of 1940, as amended, (the “1940 Act”) as an open-end management investment company. Prior to that date, the Dunham Funds were a series of AdvisorOne Funds, also a Delaware Business Trust. The Dunham Funds currently consist of fifteen funds: Floating Rate Bond Fund; Monthly Distribution Fund; Corporate/Government Bond Fund; Dynamic Macro Fund; High-Yield Bond Fund; International Opportunity Bond Fund; Appreciation & Income Fund; Alternative Dividend Fund; Large Cap Value Fund; Focused Large Cap Growth Fund; International Stock Fund; Real Estate Stock Fund; Small Cap Value Fund; Emerging Markets Stock Fund; and Small Cap Growth Fund. With the exception of Focused Large Cap Growth Fund, International Opportunity Bond Fund, and Real Estate Stock Fund. These remaining Funds are diversified funds within the meaning of the 1940 Act.
| Fund | Primary Objective |
| Floating Rate Bond | High level of current income |
| Monthly Distribution | Positive returns in rising and falling market environments |
| Corporate/Government Bond | Current income and capital appreciation |
| Dynamic Macro | Maximize total return from capital appreciation and dividends |
| High-Yield Bond | High level of current income |
| International Opportunity Bond | High level of current income |
| Appreciation & Income | Total return under varying market conditions through both current income and capital appreciation |
| Alternative Dividend | Current income while preserving capital during market downturns |
| Large Cap Value | Maximize total return from capital appreciation and dividends |
| Focused Large Cap Growth | Maximize capital appreciation |
| International Stock | Maximize total return from capital appreciation and dividends |
| Real Estate Stock | Maximize total return from capital appreciation and dividends |
| Small Cap Value | Maximize total return from capital appreciation and income |
| Emerging Markets Stock | Maximize capital appreciation |
| Small Cap Growth | Maximize capital appreciation |
Currently, each Fund offers Class A, Class C and Class N shares. Each class represents an interest in the same assets of the applicable Fund with the only differences being that Class A shares are subject to a front-end sales charge and an annual service fee, Class C shares are subject to an annual service and distribution fee and Class N shares have a higher minimum investment amount. Investors that purchase $1,000,000 or more of Class A shares will not pay any initial sales charge on the purchase. However, purchases of $1,000,000 or more of Class A shares may be subject to a contingent deferred sales charge (“CDSC”) on shares redeemed during the first 18 months after their purchase in the amount of the commissions paid on the shares redeemed. The Class C and Class N shares, with the exception of Monthly Distribution, High-Yield Bond, Dynamic Macro, Focused Large Cap Growth, Floating Rate Bond, International Opportunity Bond, and Alternative Dividend commenced operations on December 10, 2004 and were formed as a result of tax-free conversions from common trusts. The conversions were accomplished through the exchange of the common trust securities, cash, and other assets for equivalent value of the Funds’ shares. High-Yield Bond Class C and Class N shares commenced operations on July 1, 2005. The Class A shares for all Funds except Monthly Distribution, Dynamic Macro, Focused Large Cap Growth, Floating Rate Bond, International Opportunity Bond, and Alternative Dividend commenced operations on January 3, 2007. Monthly Distribution’s Predecessor Fund’s Class A shares and Class C shares commenced operations on December 26, 2000. Monthly Distribution’s Class N shares commenced operations on September 29, 2008. Dynamic Macro commenced operations on April 30, 2010. Focused Large Cap Growth commenced operations on December 8, 2011. Floating Rate Bond and International Opportunity Bond commenced operations on November 1, 2013. Alternative Dividend Fund’s Class A, Class C and Class N shares commenced operations on August 31, 2016.
| 2. | SUMMARY OF SIGNIFICANT ACCOUNTING POLICIES |
The preparation of financial statements in conformity with accounting principles generally accepted in the United States of America (“GAAP”) requires management to make estimates and assumptions that affect the reported amounts of assets and liabilities and disclosure of contingent assets and liabilities at the date of the financial statements and the reported amounts of increases and decreases in net assets from operations during the reporting period. Actual results could differ from those estimates. The Funds follow the specialized accounting and reporting requirements under GAAP that are applicable to investment companies.
The following is a summary of significant accounting policies followed by the Funds in preparation of their financial statements.
a. Security Valuation – In determining each Fund’s Net Asset Value (“NAV”) per share, equity securities for which market quotations are readily available are valued at current market value using the last reported sales price. NASDAQ traded securities are valued using the NASDAQ official closing price (“NOCP”). If no sale price is reported, the mean between the current bid and ask price is used. If market quotations are not readily available, then securities are valued at fair value as determined by the Board of Trustees of the Trust (the “Board”) (or its delegate). U.S. Government and agency securities are valued at the mean between the most recent bid and ask prices. Short-term debt instruments with a remaining maturity of more than 60 days, intermediate and long-term bonds, convertible
95
| NOTES TO FINANCIAL STATEMENTS |
| October 31, 2016 (Continued) |
bonds, bank loans and other debt securities are generally valued on the basis of dealer supplied quotations or by a pricing system selected by Dunham & Associates Investment Counsel, Inc. (“Dunham & Associates” or the “Adviser”) and approved by the Board. Where such prices are not available, valuations will be obtained from brokers who are market makers for such securities. However, in circumstances where the Adviser deems it appropriate to do so, the mean of the bid and ask prices for over-the-counter securities or the last available sale price for exchange-traded debt securities may be used. Where no last sale price for exchange traded debt securities is available, the mean of the bid and ask prices may be used. Short-term debt securities with a remaining maturity of 60 days or less may be valued at amortized cost, provided such valuations represent fair value.
Options are valued at the last reported sale price at the close of the exchange on which the security is primarily traded. If no sales are reported for the exchange-traded options, or the options are not exchange-traded, then they are valued at the mean of their most recent quoted bid and ask price.
Equity swaps are valued at the last reported sale price at the close of the exchange on which the underlying security is primarily traded. If no sale price is reported, then they are valued at the mean of their most recent quoted bid and asked price.
Futures and future options are valued at the final settled price or, in the absence of a settled price, at the mean between the current bid and ask prices on the day of valuation.
Trading in securities on far eastern securities exchanges and over-the-counter markets is normally completed well before the close of business on each business day in New York (i.e., a day on which the New York Stock Exchange (“NYSE”) is open). In addition, far eastern securities trading generally, or in a particular country or countries, may not take place on all business days in New York. Furthermore, trading takes place in Japanese markets on certain Saturdays and in various foreign markets on days, which are not business days in New York, and on which a Fund’s NAV is not calculated. Each Fund calculates NAV per share, and therefore effects sales, redemptions and repurchases of its shares, as of the close of regular trading on the NYSE once on each day on which the NYSE is open. Such calculation may not take place contemporaneously with the determination of the prices of the majority of the portfolio securities used in such calculation. If events that may materially affect the value of such securities occur between the time when their price is determined and the time when the Fund’s NAV is calculated, such securities may be valued at fair value as determined in good faith in accordance with procedures approved by the Board.
Securities in which the Funds invest may be traded in markets that close before 4:00 p.m. Eastern Time (“ET”). Normally, developments that occur between the close of the foreign markets and 4:00 p.m. ET will not be reflected in a Fund’s NAV. However, Funds may determine that such developments are so significant that they will materially affect the value of a Fund’s securities, and the Fund may adjust the previous closing prices to reflect what the Board believes to be the fair value of these securities as of 4:00 p.m. ET. Both International Stock and Emerging Markets Stock utilize fair value prices as provided by an independent pricing vendor on a daily basis for those securities traded on a foreign exchange.
Securities for which current market quotations are not readily available, or for which quotations are not deemed to be representative of market values, are valued at fair value as determined in good faith by or under the direction of the Board in accordance with the Trust’s Portfolio Securities Valuation Procedures (the “Procedures”). The Procedures consider, among others, the following factors to determine a security’s fair value: the nature and pricing history (if any) of the security; whether any dealer quotations for the security are available; and possible valuation methodologies that could be used to determine the fair value of the security.
Valuation of Fund of Funds - The Funds may invest in portfolios of open-end investment companies. Open-end investment companies are valued at their respective net asset values as reported by such investment companies. Open-end investment companies value securities in their portfolios for which market quotations are readily available at their market values (generally the last reported sale price) and all other securities and assets at their fair value based on the methods established by the board of directors of the open-end funds.
The Funds utilize various methods to measure the fair value of most of their investments on a recurring basis. GAAP establishes a hierarchy that prioritizes inputs to valuation methods. The three levels of input are:
Level 1 – Unadjusted quoted prices in active markets for identical assets and liabilities.
Level 2 – Observable inputs other than quoted prices included in Level 1 that are observable for the asset or liability, either directly or indirectly. These inputs may include quoted prices for the identical instrument on an inactive market, prices for similar instruments, interest rates, prepayment speeds, credit risk, yield curves, default rates and similar data.
Level 3 – Unobservable inputs for the asset or liability, to the extent relevant observable inputs are not available, representing the Funds’ own assumptions about the assumptions a market participant would use in valuing the asset or liability, and would be based on the best information available.
The availability of observable inputs can vary from security to security and is affected by a wide variety of factors, including, for example, the type of security, whether the security is new and not yet established in the marketplace, the liquidity of markets, and other characteristics particular to the security. To the extent that valuation is based on models or inputs that are less observable or unobservable in the market, the determination of fair value requires more judgment. Accordingly, the degree of judgment exercised in determining fair value is greatest for instruments categorized in Level 3.
96
| NOTES TO FINANCIAL STATEMENTS |
| October 31, 2016 (Continued) |
The inputs used to measure fair value may fall into different levels of the fair value hierarchy. In such cases, for disclosure purposes, the level in the fair value hierarchy within which the fair value measurement falls in its entirety, is determined based on the lowest level input that is significant to the fair value measurement in its entirety.
The inputs or methodology used for valuing securities are not necessarily an indication of the risk associated with investing in those securities. The following tables summarize the inputs used as of October 31, 2016 for the Funds’ assets and liabilities measured at fair value:
| Floating Rate Bond | ||||||||||||||||
| �� | ||||||||||||||||
| Assets | Level 1 | Level 2 | Level 3 | Total | ||||||||||||
| Exchange Traded Fund * | $ | 1,087,953 | $ | — | $ | — | $ | 1,087,953 | ||||||||
| Bank Loans * | — | 100,589,411 | — | 100,589,411 | ||||||||||||
| Bonds & Notes * | — | 5,757,772 | — | 5,757,772 | ||||||||||||
| Asset Backed Securities | — | 2,097,192 | 2,097,192 | |||||||||||||
| Private Placements | 267,300 | 267,300 | ||||||||||||||
| Short-Term Investment | 9,844,573 | — | — | 9,844,573 | ||||||||||||
| Collateral for Securities Loaned | 506,125 | — | — | 506,125 | ||||||||||||
| Total | $ | 11,438,651 | $ | 108,711,675 | $ | — | $ | 120,150,326 | ||||||||
| Monthly Distribution | ||||||||||||||||
| Assets | Level 1 | Level 2 | Level 3 | Total | ||||||||||||
| Common Stock * | $ | 207,046,319 | $ | — | $ | — | $ | 207,046,319 | ||||||||
| Rights | 72,251 | — | — | 72,251 | ||||||||||||
| Warrants | 11,611 | — | — | 11,611 | ||||||||||||
| Closed End Funds | 6,315,191 | — | — | 6,315,191 | ||||||||||||
| Preferred Stock | 3,954,722 | — | — | 3,954,722 | ||||||||||||
| Bonds & Notes * | — | 18,421,882 | — | 18,421,882 | ||||||||||||
| Purchased Call Options | 2,340 | — | — | 2,340 | ||||||||||||
| Purchased Put Options | 684,677 | — | — | 684,677 | ||||||||||||
| Short-Term Investment | 38,645,259 | — | — | 38,645,259 | ||||||||||||
| Collateral for Securities Loaned | 8,851,794 | 8,851,794 | ||||||||||||||
| Total Assets | $ | 265,584,164 | $ | 18,421,882 | $ | — | $ | 284,006,046 | ||||||||
| Asset - Derivatives | ||||||||||||||||
| Forward Currency Exchange Contracts | — | 69,656 | — | 69,656 | ||||||||||||
| Equity Swap Contracts | 2,518,239 | — | 2,518,239 | |||||||||||||
| Total Derivatives | $ | 2,518,239 | $ | 69,656 | $ | — | $ | 2,587,895 | ||||||||
| Liabilities-Securities Sold Short | 40,371,996 | — | 40,371,996 | |||||||||||||
| Total Liabilities | $ | 40,371,996 | $ | — | $ | — | $ | 40,371,996 | ||||||||
| Liabilities-Derivatives | ||||||||||||||||
| Written Call Options | 6,315,934 | — | — | 6,315,934 | ||||||||||||
| Written Put Options | 69,697 | — | — | 69,697 | ||||||||||||
| Equity Swap Contracts | 2,096,023 | — | — | 2,096,023 | ||||||||||||
| Forward Currency Exchange Contracts | — | 52,147 | — | 52,147 | ||||||||||||
| Total Derivatives | $ | 8,481,654 | $ | 52,147 | $ | — | $ | 8,533,801 | ||||||||
97
| NOTES TO FINANCIAL STATEMENTS |
| October 31, 2016 (Continued) |
| Corporate/Government Bond | ||||||||||||||||
| Assets | Level 1 | Level 2 | Level 3 | Total | ||||||||||||
| Corporate Bonds & Notes * | $ | — | $ | 31,687,498 | $ | — | $ | 31,687,498 | ||||||||
| Foreign Government Bonds | — | 164,175 | — | 164,175 | ||||||||||||
| Municipal | — | 2,046,533 | — | 2,046,533 | ||||||||||||
| U.S. Government & Agency | — | 17,943,753 | — | 17,943,753 | ||||||||||||
| Bank Loans * | — | 2,140,168 | — | 2,140,168 | ||||||||||||
| Preferred Stock * | 774,840 | — | — | 774,840 | ||||||||||||
| Short-Term Investment | 2,315,271 | — | — | 2,315,271 | ||||||||||||
| Collateral for Securities Loaned | 7,559,736 | — | — | 7,559,736 | ||||||||||||
| Total | $ | 10,649,847 | $ | 53,982,127 | $ | — | $ | 64,631,974 | ||||||||
| Dynamic Macro | ||||||||||||||||
| Assets | Level 1 | Level 2 | Level 3 | Total | ||||||||||||
| Exchange Traded Funds * | $ | 18,679,102 | $ | — | $ | — | $ | 18,679,102 | ||||||||
| Short-Term Investments | 14,047,029 | — | — | 14,047,029 | ||||||||||||
| Collateral for Securities Loaned | 11,005,156 | — | — | 11,005,156 | ||||||||||||
| Asset - Derivatives | ||||||||||||||||
| Purchased Options | 2,005,687 | — | — | 2,005,687 | ||||||||||||
| Futures | 387,520 | — | — | 387,520 | ||||||||||||
| Total | $ | 46,124,494 | $ | — | $ | — | $ | 46,124,494 | ||||||||
| Liabilities - Derivatives | ||||||||||||||||
| Futures | $ | 202,276 | $ | — | $ | — | $ | 202,276 | ||||||||
| Written Options | 27,685 | — | — | 27,685 | ||||||||||||
| Total | $ | 229,961 | $ | — | $ | — | $ | 229,961 | ||||||||
| High-Yield Bond | ||||||||||||||||
| Assets | Level 1 | Level 2 | Level 3 | Total | ||||||||||||
| Bonds & Notes * | $ | — | $ | 92,380,002 | $ | — | $ | 92,380,002 | ||||||||
| Short-Term Investment | 1,891,803 | — | — | 1,891,803 | ||||||||||||
| Collateral for Securities Loaned | 22,131,280 | — | — | 22,131,280 | ||||||||||||
| Total | $ | 24,023,083 | $ | 92,380,002 | $ | — | $ | 116,403,085 | ||||||||
| International Opportunity Bond | ||||||||||||||||
| Assets | Level 1 | Level 2 | Level 3 | Total | ||||||||||||
| Corporate Bonds & Notes * | $ | — | $ | 10,823,757 | $ | — | $ | 10,823,757 | ||||||||
| Foreign Government Bonds * | — | 15,642,087 | — | 15,642,087 | ||||||||||||
| Mortgage Backed Securities | — | 215,065 | — | 215,065 | ||||||||||||
| Whole Loan Collateral | — | 249,459 | — | 249,459 | ||||||||||||
| Short-Term Investment | 144,356 | — | — | 144,356 | ||||||||||||
| Total Assets | $ | 144,356 | $ | 26,930,368 | $ | — | $ | 27,074,724 | ||||||||
| Asset - Derivatives | ||||||||||||||||
| Futures Contracts | $ | 10,562 | $ | — | $ | — | $ | 10,562 | ||||||||
| Foreign Currency Exchange Contracts | — | 104,211 | — | 104,211 | ||||||||||||
| Total Derivatives | $ | 10,562 | $ | 104,211 | $ | — | $ | 114,773 | ||||||||
| Liabilities-Derivatives | ||||||||||||||||
| Futures Contracts | $ | 46,085 | $ | — | $ | — | $ | 46,085 | ||||||||
| Foreign Currency Exchange Contracts | — | 79,856 | — | 79,856 | ||||||||||||
| Total Derivatives | $ | 46,085 | $ | 79,856 | $ | — | $ | 125,941 | ||||||||
98
| NOTES TO FINANCIAL STATEMENTS |
| October 31, 2016 (Continued) |
| Appreciation & Income | ||||||||||||||||
| Assets | Level 1 | Level 2 | Level 3 | Total | ||||||||||||
| Common Stock | $ | 108 | $ | — | $ | — | $ | 108 | ||||||||
| Convertible Bonds * | — | 18,815,763 | — | 18,815,763 | ||||||||||||
| Preferred Stock * | 2,617,424 | — | — | 2,617,424 | ||||||||||||
| Short-Term Investment | 2,284,184 | — | — | 2,284,184 | ||||||||||||
| Collateral for Securities Loaned | 4,189,895 | — | — | 4,189,895 | ||||||||||||
| Total | $ | 9,091,611 | $ | 18,815,763 | $ | — | $ | 27,907,374 | ||||||||
| Alternative Dividend | ||||||||||||||||
| Assets | Level 1 | Level 2 | Level 3 | Total | ||||||||||||
| Common Stock * | $ | 17,845,992 | $ | — | $ | — | $ | 17,845,992 | ||||||||
| Exchange Traded Funds | 2,060,364 | — | — | 2,060,364 | ||||||||||||
| Asset - Derivatives | ||||||||||||||||
| Purchased Options | 164,340 | 573,078 | — | 737,418 | ||||||||||||
| Short-Term Investment | 3,326,409 | — | — | 3,326,409 | ||||||||||||
| Total | $ | 23,397,105 | $ | 573,078 | $ | — | $ | 23,970,183 | ||||||||
| Large Cap Value | ||||||||||||||||
| Assets | Level 1 | Level 2 | Level 3 | Total | ||||||||||||
| Common Stock * | $ | 56,021,802 | $ | — | $ | — | $ | 56,021,802 | ||||||||
| Short-Term Investment | 503,004 | — | — | 503,004 | ||||||||||||
| Collateral for Securities Loaned | 18,963,231 | — | — | 18,963,231 | ||||||||||||
| Total | $ | 75,488,037 | $ | — | $ | — | $ | 75,488,037 | ||||||||
| Focused Large Cap Growth | ||||||||||||||||
| Assets | Level 1 | Level 2 | Level 3 | Total | ||||||||||||
| Common Stock * | $ | 65,376,546 | $ | — | $ | — | $ | 65,376,546 | ||||||||
| Short-Term Investment | 419,879 | — | — | 419,879 | ||||||||||||
| Collateral for Securities Loaned | 15,156,286 | — | — | 15,156,286 | ||||||||||||
| Total | $ | 80,952,711 | $ | — | $ | — | $ | 80,952,711 | ||||||||
| International Stock | ||||||||||||||||
| Assets | Level 1 | Level 2 | Level 3 | Total | ||||||||||||
| Common Stock * | $ | 31,922,033 | $ | 60,198,809 | $ | — | $ | 92,120,842 | ||||||||
| Preferred Stock * | 507,191 | 931,188 | — | 1,438,379 | ||||||||||||
| Short-Term Investment | 1,628,390 | — | — | 1,628,390 | ||||||||||||
| Collateral for Securities Loaned | 5,780,012 | — | — | 5,780,012 | ||||||||||||
| Total Assets | $ | 39,837,626 | $ | 61,129,997 | $ | — | $ | 100,967,623 | ||||||||
| Assets - Derivatives | ||||||||||||||||
| Forward Currency Exchange Contracts | $ | — | $ | 345 | $ | — | $ | 345 | ||||||||
| Liabilities - Derivatives | ||||||||||||||||
| Forward Currency Exchange Contracts | $ | — | $ | 68 | $ | — | $ | 68 | ||||||||
| Real Estate Stock | ||||||||||||||||
| Assets | Level 1 | Level 2 | Level 3 | Total | ||||||||||||
| Common Stock | $ | 292,444 | $ | — | $ | — | $ | 292,444 | ||||||||
| REITS * | 37,123,682 | — | — | 37,123,682 | ||||||||||||
| Short-Term Investment | 545,597 | — | — | 545,597 | ||||||||||||
| Collateral for Securities Loaned | 12,692,392 | — | — | 12,692,392 | ||||||||||||
| Total | $ | 50,654,115 | $ | — | $ | — | $ | 50,654,115 | ||||||||
99
| NOTES TO FINANCIAL STATEMENTS |
| October 31, 2016 (Continued) |
| Small Cap Value | �� | |||||||||||||||
| Assets | Level 1 | Level 2 | Level 3 | Total | ||||||||||||
| Common Stock * | $ | 28,027,860 | $ | — | $ | — | $ | 28,027,860 | ||||||||
| Short-Term Investment | 270,538 | — | — | 270,538 | ||||||||||||
| Collateral for Securities Loaned | 8,419,723 | — | — | 8,419,723 | ||||||||||||
| Total | $ | 36,718,121 | $ | — | $ | — | $ | 36,718,121 | ||||||||
| Emerging Markets Stock | ||||||||||||||||
| Assets | Level 1 | Level 2 | Level 3 | Total | ||||||||||||
| Common Stock * | $ | 18,128,552 | $ | 35,916,060 | $ | — | $ | 54,044,612 | ||||||||
| Preferred Stock * | 1,530,082 | — | — | 1,530,082 | ||||||||||||
| Exchange Traded Fund | 328,300 | — | — | 328,300 | ||||||||||||
| Short-Term Investment | 441,234 | — | — | 441,234 | ||||||||||||
| Total | $ | 20,428,168 | $ | 35,916,060 | $ | — | $ | 56,344,228 | ||||||||
| Small Cap Growth | ||||||||||||||||
| Assets | Level 1 | Level 2 | Level 3 | Total | ||||||||||||
| Common Stock * | $ | 31,768,179 | $ | — | $ | — | $ | 31,768,179 | ||||||||
| Short-Term Investment | 1,459,638 | — | — | 1,459,638 | ||||||||||||
| Collateral for Securities Loaned | 11,064,256 | — | — | 11,064,256 | ||||||||||||
| Total | $ | 44,292,073 | $ | — | $ | — | $ | 44,292,073 | ||||||||
| * | See each Fund’s Schedule of Investments for breakdown by industry. |
The Funds did not hold any Level 3 securities during the period.
There were no transfers into or out of Level 1 or Level 2 during the period. It is the Funds’ policy to recognize transfers into and out of Level 1 and Level 2 at the end of the reporting period.
b. Foreign Currency Translations – The accounting records of the Funds are maintained in U.S. dollars. Investment securities and other assets and liabilities denominated in a foreign currency, and income receipts and expense payments, are translated into U.S. dollars using the prevailing exchange rate at the London market close. Purchases and sales of securities are translated into U.S. dollars at the contractual currency rates established at the approximate time of the trade.
Net realized gains and losses on foreign currency transactions represent net gains and losses from currency realized between the trade and settlement dates on securities transactions and the difference between income accrued versus income received. The effects of changes in foreign currency exchange rates on investments in securities are included with the net realized and unrealized gain or loss on investment securities.
c. Forward Currency Contracts – As foreign securities are purchased, a Fund generally enters into forward currency exchange contracts in order to hedge against foreign currency exchange rate risks. The market value of the contract fluctuates with changes in currency exchange rates. The contract is marked-to-market daily and the change in market value is recorded by a Fund as an unrealized gain or loss. As foreign securities are sold, a portion of the contract is generally closed and the Fund records a realized gain or loss equal to the difference between the value of the contract at the time it was opened and the value at the time it was closed. A Fund may also enter into forward currency contracts as an investment strategy consistent with that Fund’s investment objective. Realized gains and losses from contract transactions are included as a component of net realized gains (losses) from investments and foreign currency in the Statements of Operations.
d. Options – Monthly Distribution, Dynamic Macro, and Alternative Dividend are subject to stock market risk in the normal course of pursuing their investment objectives and may purchase or sell options to help hedge against this risk.
A Fund may write call options only if it (i) owns an offsetting position in the underlying security or (ii) has an absolute or immediate right to acquire that security without additional cash consideration or exchange of other securities held in its portfolio. When a Fund writes an option, there is no taxable event and an amount equal to the premium received is recorded by that Fund as a liability. The liability is thereafter valued to reflect the current value of the option. If the option is not exercised and expires, or if a Fund effects a closing purchase transaction, the Fund realizes a gain (or loss in the case of a closing purchase transaction where the cost to close the transaction exceeds the original premium received), and the liability related to the option is extinguished. Any such gain or loss generally is a short-term capital gain or loss for federal income tax purposes. If a call option that a Fund has written on any equity security is exercised, that Fund will realize a capital gain or loss (long-term or short-term, depending on the holding period of the underlying security) from the sale of the underlying security, and the proceeds from such sale are increased by the premium originally received. If a put option that a Fund has written on an equity security is exercised, the amount of the premium originally received reduces the cost of the security that a Fund purchases upon exercise of the option. When a Fund writes a put option, that Fund must deposit cash or liquid securities into a segregated account equal to the put option’s exercise value (number of shares times strike price).
100
| NOTES TO FINANCIAL STATEMENTS |
| October 31, 2016 (Continued) |
A Fund may purchase put and call options. Put options are purchased to hedge against a decline in the value of securities held in that Fund’s portfolio. If such a decline occurs, the put options will permit that Fund to sell the securities underlying such options at the exercise price, or to close out the options at a profit. The premium paid for a put or call option plus any transaction costs will reduce the benefit, if any, realized by that Fund upon exercise of the option, and, unless the price of the underlying security rises or declines sufficiently, the option may expire worthless to that Fund. In addition, in the event that the price of the security in connection with which an option was purchased moves in a direction favorable to that Fund, the benefits realized by that Fund as a result of such favorable movement will be reduced by the amount of the premium paid for the option and related transaction costs. Written and purchased options are non-income producing securities.
e. Swap Agreements – Monthly Distribution is subject to stock market risk in the normal course of pursuing its investment objectives. The Fund may enter into various swap transactions for investment purposes to manage equity risk. These are two-party contracts entered into primarily to exchange the returns (or differentials in rates of returns) earned or realized on particular pre-determined investments or instruments. The gross returns to be exchanged or “swapped” between parties are calculated with respect to a notional amount, i.e., the return on or increase in value of a particular dollar amount invested at a particular interest rate, in a particular foreign currency, or in a “basket” of securities representing a particular index or market segment. Changes in the value of swap agreements are recognized as unrealized gains or losses in the Statement of Operations by “marking to market” on a daily basis to reflect the value of the swap agreement at the end of each trading day. Payments received or paid at the beginning of the agreement are reflected as such on the Statements of Assets and Liabilities and may be referred to as upfront payments. The Fund amortizes upfront payments and/or accrues for the fixed payment stream on swap agreements on a daily basis with the net amount recorded as a component of unrealized gain or loss on the Statement of Operations. A liquidation payment received or made at the termination of the swap agreement is recorded as a realized gain or loss on the Statements of Operations. The Fund segregates liquid securities having a value at least equal to the amount of its current obligation under any swap transaction. Entering into these agreements involves, to varying degrees, lack of liquidity and elements of credit, market, and counterparty risk in excess of amounts recognized on the Statements of Assets and Liabilities. The Fund’s maximum risk of loss from counterparty credit risk is the discounted net value of the cash flows to be received from/paid to the counterparty over the contract’s remaining life, to the extent that that amount is positive.
f. Futures Contracts – International Opportunity Bond and Dynamic Macro are subject to equity interest rate risk and forward currency exchange rate risk in the normal course of pursuing their investment objectives. The Funds may purchase or sell futures contracts to gain exposure to, or hedge against, changes in the value of equities and interest rates. Initial margin deposits required upon entering into futures contracts are satisfied by the segregation of specific securities or cash as collateral for the account of the broker (the Fund’s agent in acquiring the futures position). During the period the futures contracts are open, changes in the value of the contracts are recognized as unrealized gains or losses by “marking to market” on a daily basis to reflect the market value of the contracts at the end of each day’s trading. Variation margin payments are received or made depending upon whether unrealized gains or losses are incurred. When the contracts are closed, the Funds recognize a realized gain or loss equal to the difference between the proceeds from, or cost of, the closing transaction and the Fund’s basis in the contract. If the Funds were unable to liquidate a futures contract and/or enter into an offsetting closing transaction, the Funds would continue to be subject to market risk with respect to the value of the contracts and continue to be required to maintain the margin deposits on the futures contracts. The Funds segregate cash having a value at least equal to the amount of the current obligation under any open futures contract. Risks may exceed amounts recognized in the Statements of Assets and Liabilities. With futures, there is minimal counterparty credit risk to the Funds since futures are exchange traded and the exchange’s clearinghouse, as counterparty to all exchange traded futures, guarantees the futures against default.
The notional value of the derivative instruments outstanding as of October 31, 2016 as disclosed in the Schedule of Investments and the amounts realized and changes in unrealized gains and losses on derivative instruments during the period as disclosed above and within the Statements of Operations serve as indicators of the volume of derivative activity for the Funds.
g. Short Sales – A “short sale” is a transaction in which a Fund sells a security it does not own but has borrowed in anticipation that the market price of that security will decline. The Fund would be obligated to replace the security borrowed by purchasing it on the open market at a later date. If the price of the security sold short increases between the time of the short sale and the time the Fund replaces the borrowed security, the Fund will incur a loss. Conversely, if the price declines, the Fund will realize a gain.
h. Impact of Derivatives on the Statements of Assets and Liabilities and Statements of Operations – The following is a summary of the location of derivative investments of each Fund in the Statement of Assets and Liabilities as of October 31, 2016:
101
| NOTES TO FINANCIAL STATEMENTS |
| October 31, 2016 (Continued) |
| Location on the Statements of Assets and Liabilities | ||||
| Derivates Investment Type | Asset Derivatives | Liability Derivatives | ||
| Equity/Currency/Commodity | Investment in securities | Options contracts written | ||
| Interest rate contracts | Unrealized appreciation on Swap Contracts | Unrealized depreciation on Swap Contracts | ||
| Unrealized appreciation on futures | Unrealized depreciation on futures | |||
| Receivable for open forward foreign currency contracts | Payable for open forward foreign currency contracts | |||
| Asset Derivatives Investment Value | ||||||||||||||||||||
| Total value at | ||||||||||||||||||||
| Equity | Currency | Commodity | Interest Rate | October 31, | ||||||||||||||||
| Contracts | Contracts | Contracts | Contracts | 2016 | ||||||||||||||||
| Monthly Distribution | ||||||||||||||||||||
| Forward Foreign Currency Contracts | $ | — | $ | 69,656 | $ | — | $ | — | $ | 69,656 | ||||||||||
| Swaps | 2,518,239 | — | — | — | 2,518,239 | |||||||||||||||
| Purchased Options | 687,017 | — | — | — | 687,017 | |||||||||||||||
| Dynamic Macro | ||||||||||||||||||||
| Futures | $ | 83,512 | $ | — | $ | — | $ | 304,008 | $ | 387,520 | ||||||||||
| Purchased Options | 80,545 | — | — | 1,925,142 | 2,005,687 | |||||||||||||||
| International Opportunity Bond | ||||||||||||||||||||
| Forward Foreign Currency Contracts | $ | — | $ | 104,211 | $ | — | $ | — | $ | 104,211 | ||||||||||
| Futures | — | — | — | 10,562 | 10,562 | |||||||||||||||
| Alternative Dividend | ||||||||||||||||||||
| Purchased Options | $ | 737,418 | $ | — | $ | — | $ | — | $ | 737,418 | ||||||||||
| International Stock | ||||||||||||||||||||
| Forward Foreign Currency Contracts | $ | — | $ | 345 | $ | — | $ | — | $ | 345 | ||||||||||
The following table sets forth the fair value of each Fund’s derivative contracts by primary risk exposure as of October 31, 2016:
| Liability Derivatives Investment Value | ||||||||||||||||||||
| Total value at | ||||||||||||||||||||
| Equity | Currency | Commodity | Interest Rate | October 31, | ||||||||||||||||
| Contracts | Contracts | Contracts | Contracts | 2016 | ||||||||||||||||
| Monthly Distribution | ||||||||||||||||||||
| Forward Foreign Currency Contracts | $ | — | $ | 52,147 | $ | — | $ | — | $ | 52,147 | ||||||||||
| Swaps | 2,096,023 | — | — | — | 2,096,023 | |||||||||||||||
| Written Options | 6,385,631 | — | — | — | 6,385,631 | |||||||||||||||
| Dynamic Macro | ||||||||||||||||||||
| Futures | $ | 42,255 | $ | — | $ | — | $ | 160,021 | $ | 202,276 | ||||||||||
| Written Options | 27,685 | — | — | — | 27,685 | |||||||||||||||
| International Opportunity Bond | ||||||||||||||||||||
| Forward Foreign Currency Contracts | $ | — | $ | 79,856 | $ | — | $ | — | $ | 79,856 | ||||||||||
| Futures | — | — | — | 46,085 | 46,085 | |||||||||||||||
| International Stock | ||||||||||||||||||||
| Forward Foreign Currency Contracts | $ | — | $ | 68 | $ | — | $ | — | $ | 68 | ||||||||||
The following is a summary of the location of derivative investments of each Fund in the Statements of Operations for the year ended October 31, 2016.
| Derivative Investment Type | Location of Gain (Loss) on Derivatives |
| Equity/Currency/Commodity/ Interest rate contracts | Net Realized gain (loss) from: Futures, Options purchased, Written options, Swap contracts, Foreign currency exchange contracts Net change in unrealized appreciation (depreciation) on: Futures, Options purchased, Written options, Swap contracts, Foreign currency exchange contracts |
The following is a summary of each Fund’s realized gain (loss) and change in unrealized appreciation (depreciation) on derivative investments recognized in the Statements of Operations categorized by primary risk exposure for the year ended October 31, 2016:
102
| NOTES TO FINANCIAL STATEMENTS |
| October 31, 2016 (Continued) |
| Realized gain/(loss) on derivatives recognized in the Statements of Operations | ||||||||||||||||||||
| Total value at | ||||||||||||||||||||
| Equity | Currency | Commodity | Interest Rate | October 31, | ||||||||||||||||
| Derivative Investment type | Contracts | Contracts | Contracts | Contracts | 2016 | |||||||||||||||
| Monthly Distribution | ||||||||||||||||||||
| Forward Foreign Currency Contracts | $ | — | $ | 3,250,373 | $ | — | $ | — | $ | 3,250,373 | ||||||||||
| Swaps | (1,325,675 | ) | — | — | — | (1,325,675 | ) | |||||||||||||
| Purchased Options | (6,165,788 | ) | — | — | — | (6,165,788 | ) | |||||||||||||
| Written Options | 9,642,109 | — | — | — | 9,642,109 | |||||||||||||||
| Dynamic Macro | ||||||||||||||||||||
| Futures | $ | (577,652 | ) | $ | — | $ | — | $ | (478,128 | ) | $ | (1,055,780 | ) | |||||||
| Forward Foreign Currency Contracts | — | 1,533 | — | — | 1,533 | |||||||||||||||
| Purchased Options | (527,753 | ) | — | — | 705,177 | 177,424 | ||||||||||||||
| Written Options | 20,592 | — | — | — | 20,592 | |||||||||||||||
| International Opportunity Bond | ||||||||||||||||||||
| Forward Foreign Currency Contracts | $ | — | $ | 595,869 | $ | — | $ | — | $ | 595,869 | ||||||||||
| Futures | — | — | — | 44,527 | 44,527 | |||||||||||||||
| Alternative Dividend | ||||||||||||||||||||
| Purchased Options | $ | (20,412 | ) | $ | — | $ | — | $ | — | $ | (20,412 | ) | ||||||||
| International Stock | ||||||||||||||||||||
| Forward Foreign Currency Contracts | $ | — | $ | (1,011,194 | ) | $ | — | $ | — | $ | (1,011,194 | ) | ||||||||
| Emerging Markets Stock | ||||||||||||||||||||
| Forward Foreign Currency Contracts | $ | — | $ | (288,412 | ) | $ | — | $ | — | $ | (288,412 | ) | ||||||||
| Changes in unrealized appreciation/(depreciation) on derivatives recognized in the Statements of Operations | ||||||||||||||||||||
| Total value at | ||||||||||||||||||||
| Equity | Currency | Commodity | Interest Rate | October 31, | ||||||||||||||||
| Derivative Investment type | Contracts | Contracts | Contracts | Contracts | 2016 | |||||||||||||||
| Monthly Distribution | ||||||||||||||||||||
| Forward Foreign Currency Contracts | $ | — | $ | (133,779 | ) | $ | — | $ | — | $ | (133,779 | ) | ||||||||
| Swaps | 138,588 | — | — | — | 138,588 | |||||||||||||||
| Purchased Options | 375,471 | — | — | — | 375,471 | |||||||||||||||
| Written Options | 2,052,591 | — | — | — | 2,052,591 | |||||||||||||||
| Dynamic Macro | ||||||||||||||||||||
| Futures | (453,717 | ) | — | — | 298,377 | (155,340 | ) | |||||||||||||
| Purchased Options | (9,354 | ) | — | — | (210,708 | ) | (220,062 | ) | ||||||||||||
| Written Options | (20,089 | ) | — | — | — | (20,089 | ) | |||||||||||||
| International Opportunity Bond | ||||||||||||||||||||
| Forward Foreign Currency Contracts | $ | — | $ | (37,175 | ) | $ | — | $ | — | $ | (37,175 | ) | ||||||||
| Futures | — | — | (25,598 | ) | (25,598 | ) | ||||||||||||||
| Alternative Dividend | ||||||||||||||||||||
| Purchased Options | $ | (45,336 | ) | $ | — | $ | — | $ | — | $ | (45,336 | ) | ||||||||
| International Stock | ||||||||||||||||||||
| Forward Foreign Currency Contracts | $ | — | $ | (255,851 | ) | $ | — | $ | — | $ | (255,851 | ) | ||||||||
i. Offsetting of Financial Assets and Derivative Assets – Monthly Distribution, International Opportunity Bond, Dynamic Macro and International Stock policies are to recognize a net asset or liability equal to the unrealized on futures contracts, forward foreign currency contracts, swaps and written options. During the year ended October 31, 2016, the Funds are subject to a master netting arrangement for the swaps. The following table shows additional information regarding the offsetting of assets and liabilities at October 31, 2016.
103
| NOTES TO FINANCIAL STATEMENTS |
| October 31, 2016 (Continued) |
| Monthly Distribution | ||||||||||||||||||||||||
| Gross Amounts Not Offset in the | ||||||||||||||||||||||||
| Assets: | Statement of Assets & Liabilities | |||||||||||||||||||||||
| Gross Amounts | Net Amounts of | |||||||||||||||||||||||
| Gross Amounts | Offset in the | Assets Presented in | Cash | |||||||||||||||||||||
| of Recognized | Statement of Assets | the Statement of | Financial | Collateral | ||||||||||||||||||||
| Description | Assets | & Liabilities | Assets & Liabilities | Instruments | Received | Net Amount | ||||||||||||||||||
| Equity Swap Contracts | $ | 2,518,239 | $ | — | $ | 2,518,239 | $ | (2,096,023 | ) | $ | — | $ | 422,216 | |||||||||||
| Forward Foreign Currency | ||||||||||||||||||||||||
| Contracts | 69,656 | — | 69,656 | (52,147 | ) | — | 17,509 | |||||||||||||||||
| Total | $ | 2,587,895 | $ | — | $ | 2,587,895 | $ | (2,148,170 | ) | $ | — | $ | 439,725 | |||||||||||
| Liabilities: | Gross Amounts Not Offset in the | |||||||||||||||||||||||
| Gross Amounts | Net Amounts of | |||||||||||||||||||||||
| Gross Amounts | Offset in the | Liabilities Presented | Cash | |||||||||||||||||||||
| of Recognized | Statement of Assets | in the Statement of | Financial | Collateral | ||||||||||||||||||||
| Description | Liabilities | & Liabilities | Assets & Liabilities | Instruments | Pledged (1) | Net Amount | ||||||||||||||||||
| Written Options | $ | (6,385,631 | ) | $ | — | $ | (6,385,631 | ) | $ | 6,385,631 | $ | — | $ | — | ||||||||||
| Equity Swap Contracts | (2,096,023 | ) | — | (2,096,023 | ) | 2,096,023 | — | — | ||||||||||||||||
| Forward Foreign Currency | ||||||||||||||||||||||||
| Contracts | (52,147 | ) | — | (52,147 | ) | 52,147 | — | — | ||||||||||||||||
| Total | $ | (8,533,801 | ) | $ | — | $ | (8,533,801 | ) | $ | 8,533,801 | $ | — | $ | — | ||||||||||
| (1) | The amount is limited to the derivative liability balance and accordingly, does not include excess collateral pledged. |
| Dynamic Macro | ||||||||||||||||||||||||
| Gross Amounts Not Offset in | ||||||||||||||||||||||||
| the Statement of Assets & Liabilities | ||||||||||||||||||||||||
| Assets: | ||||||||||||||||||||||||
| Gross | Gross Amounts | Net Amounts of | ||||||||||||||||||||||
| Amounts of | Offset in the | Assets Presented in | Cash | |||||||||||||||||||||
| Recognized | Statement of Assets | the Statement of | Financial | Collateral | ||||||||||||||||||||
| Description | Assets | & Liabilities | Assets & Liabilities | Instruments | Pledged | Net Amount | ||||||||||||||||||
| Futures Contracts | $ | 387,520 | $ | — | $ | 387,520 | $ | (202,276 | ) | $ | — | $ | 185,244 | |||||||||||
| Total | $ | 387,520 | $ | — | $ | 387,520 | $ | (202,276 | ) | $ | — | $ | 185,244 | |||||||||||
| Gross Amounts Not Offset in | ||||||||||||||||||||||||
| the Statement of Assets & Liabilities | ||||||||||||||||||||||||
| Liabilities: | ||||||||||||||||||||||||
| Gross | Gross Amounts | Net Amounts of | ||||||||||||||||||||||
| Amounts of | Offset in the | Liabilities Presented | Cash | |||||||||||||||||||||
| Recognized | Statement of Assets | in the Statement of | Financial | Collateral | ||||||||||||||||||||
| Description | Liabilities | & Liabilities | Assets & Liabilities | Instruments | Pledged (1) | Net Amount | ||||||||||||||||||
| Futures Contracts | $ | (202,276 | ) | $ | — | $ | (202,276 | ) | $ | 202,276 | $ | — | $ | — | ||||||||||
| Written Options | (27,685 | ) | — | $ | (27,685 | ) | — | $ | 27,685 | — | ||||||||||||||
| Total | $ | (229,961 | ) | $ | — | $ | (229,961 | ) | $ | 202,276 | $ | 27,685 | $ | — | ||||||||||
| (1) | The amount is limited to the derivative liability balance and accordingly, does not include excess collateral pledged. |
104
| NOTES TO FINANCIAL STATEMENTS |
| October 31, 2016 (Continued) |
| International Opportunity Bond | ||||||||||||||||||||||||
| Gross Amounts Not Offset in | ||||||||||||||||||||||||
| the Statement of Assets & | ||||||||||||||||||||||||
| Assets: | Liabilities | |||||||||||||||||||||||
| Gross | Gross Amounts | Net Amounts of | ||||||||||||||||||||||
| Amounts of | Offset in the | Assets Presented in | Cash | |||||||||||||||||||||
| Recognized | Statement of Assets | the Statement of | Financial | Collateral | ||||||||||||||||||||
| Description | Assets | & Liabilities | Assets & Liabilities | Instruments | Pledged | Net Amount | ||||||||||||||||||
| Forward Foreign | ||||||||||||||||||||||||
| Currency Contracts | $ | 104,211 | $ | — | $ | 104,211 | $ | (79,856 | ) | $ | — | $ | 24,355 | |||||||||||
| Futures Contracts | 10,562 | — | 10,562 | (10,562 | ) | — | — | |||||||||||||||||
| Total | $ | 114,773 | $ | — | $ | 114,773 | $ | (90,418 | ) | $ | — | $ | 24,355 | |||||||||||
| Gross Amounts Not Offset in | ||||||||||||||||||||||||
| the Statement of Assets & Liabilities | ||||||||||||||||||||||||
| Liabilities: | ||||||||||||||||||||||||
| Gross | Gross Amounts | Net Amounts of | ||||||||||||||||||||||
| Amounts of | Offset in the | Liabilities Presented | Cash | |||||||||||||||||||||
| Recognized | Statement of Assets | in the Statement of | Financial | Collateral | ||||||||||||||||||||
| Description | Liabilities | & Liabilities | Assets & Liabilities | Instruments | Pledged (1) | Net Amount | ||||||||||||||||||
| Forward Foreign | ||||||||||||||||||||||||
| Currency Contracts | $ | (79,856 | ) | $ | — | $ | (79,856 | ) | $ | 79,856 | $ | — | $ | — | ||||||||||
| Futures Contracts | (46,085 | ) | — | (46,085 | ) | 10,562 | 35,523 | — | ||||||||||||||||
| Total | $ | (125,941 | ) | $ | — | $ | (125,941 | ) | $ | 90,418 | $ | 35,523 | $ | — | ||||||||||
| International Stock | ||||||||||||||||||||||||
| Gross Amounts Not Offset in | ||||||||||||||||||||||||
| the Statement of Assets & | ||||||||||||||||||||||||
| Assets: | Liabilities | |||||||||||||||||||||||
| Gross | Gross Amounts | Net Amounts of | ||||||||||||||||||||||
| Amounts of | Offset in the | Assets Presented in | Cash | |||||||||||||||||||||
| Recognized | Statement of Assets | the Statement of | Financial | Collateral | ||||||||||||||||||||
| Description | Assets | & Liabilities | Assets & Liabilities | Instruments | Pledged | Net Amount | ||||||||||||||||||
| Forward Foreign | ||||||||||||||||||||||||
| Currency Contracts | $ | 345 | $ | — | $ | 345 | $ | (68 | ) | $ | — | $ | 277 | |||||||||||
| Total | $ | 345 | $ | — | $ | 345 | $ | (68 | ) | $ | — | $ | 277 | |||||||||||
| Gross Amounts Not Offset in | ||||||||||||||||||||||||
| the Statement of Assets & | ||||||||||||||||||||||||
| Liabilities: | Liabilities | |||||||||||||||||||||||
| Gross | Gross Amounts | Net Amounts of | ||||||||||||||||||||||
| Amounts of | Offset in the | Liabilities Presented | Cash | |||||||||||||||||||||
| Recognized | Statement of Assets | in the Statement of | Financial | Collateral | ||||||||||||||||||||
| Description | Liabilities | & Liabilities | Assets & Liabilities | Instruments | Pledged (1) | Net Amount | ||||||||||||||||||
| Forward Foreign | ||||||||||||||||||||||||
| Currency Contracts | $ | (68 | ) | $ | — | $ | (68 | ) | $ | 68 | $ | — | $ | — | ||||||||||
| Total | $ | (68 | ) | $ | — | $ | (68 | ) | $ | 68 | $ | — | $ | — | ||||||||||
| (1) | The amount is limited to the derivative liability balance and accordingly, does not include excess collateral pledged. |
105
| NOTES TO FINANCIAL STATEMENTS |
| October 31, 2016 (Continued) |
j. Exchange Traded Funds – The Funds may invest in exchange traded funds (“ETFs”). ETFs are a type of index fund bought and sold on a securities exchange. An ETF trades like common stock and represents a fixed portfolio of securities. A Fund may purchase an ETF to temporarily gain exposure to a portion of the U.S. or a foreign market while awaiting purchase of underlying securities. The risks of owning an ETF generally reflect the risks of owning the underlying securities they are designed to track, although the lack of liquidity on an ETF could result in it being more volatile. Additionally, ETFs have fees and expenses that reduce their value.
k. Investment Transactions, Investment Income and Expenses – Investment transactions are recorded on a trade date basis. Realized gains and losses from investment transactions and foreign exchange transactions are calculated using the identified cost method. Dividend income and expense is recorded on the ex-dividend date (“ex-date”) except in the case of certain dividends from foreign securities, which are recorded as soon after the ex-date as the respective Fund, using reasonable diligence, becomes aware of such dividends. Interest income is recorded on an accrual basis. Discounts are accreted and premiums are amortized as adjustments to interest income and the identified cost of investments. Expenses of the Trust that are directly identifiable to a specific fund are charged to that fund. Expenses, which are not readily identifiable to a specific fund, are allocated in such a manner as deemed equitable, taking into consideration the nature and type of expense and the relative sizes of the funds. Each Fund’s income, expenses (other than the class specific distribution fees) and realized and unrealized gains and losses are allocated proportionally each day between the classes based upon the relative net assets of each class.
l. Concentration of Risk – Investing in securities of foreign issuers and currency transactions may involve certain considerations and risks not typically associated with investments in the United States. These risks include revaluation of currencies, adverse fluctuations in foreign currency values and possible adverse political, social and economic developments, including those particular to a specific industry, country or region. These conditions could cause the securities and their markets to be less liquid and prices more volatile than those of comparable U.S. companies and U.S. government securities.
Small capitalization (“small cap”) companies may be more vulnerable than larger capitalization companies to adverse business or economic developments. Small cap companies may also have limited product lines, markets or financial resources, and may be dependent on a relatively small management group. Securities of such companies may be less liquid and more volatile than securities of larger capitalization companies or the market averages in general and therefore may involve greater risk than investing in larger capitalization companies.
The ability of issuers of debt securities held by the Funds to meet their obligations may be affected by economic and political developments particular to a specific industry, country, state or region. Investments in lower grade debt securities are subject to special risks, including greater price volatility and a greater risk of loss of principal and interest.
Certain Funds may invest in collateralized mortgage obligations which are secured by groups of individual mortgages, but are similar to a conventional bond where the investor looks only to the issuer for payment of principal and interest. Although the obligations are recourse obligations to the issuer, the issuer typically has no significant assets, other than assets pledged as collateral for the obligations, and the market value of the collateral, which is sensitive to interest rate movements, may affect the market value of the obligations. A public market for a particular collateralized mortgage obligation may or may not develop and thus, there can be no guarantee of liquidity of an investment in such obligations.
The risk in writing a call option is that a Fund may forgo the opportunity of profit if the market value of the underlying security increases and the option is exercised, although any potential loss is reduced by the amount of option premium received. The risk in writing a put option is that a Fund may be called on to pay the exercise price of the option for a security that has decreased (potentially to zero) in market price, although any potential loss is reduced by the amount of option premium received. Generally, option transactions also involve risks concerning liquidity of the options market. An illiquid market for an option may limit a Fund’s ability to write options or enter closing transactions. As the options written by the Funds are traded on a national exchange, counterparty and credit risk are limited to the failure of the exchange on which the options are traded.
m. Federal Income Taxes – It is each Fund’s policy to continue to comply with all sections of the Internal Revenue Code applicable to regulated investment companies and to distribute all of its taxable income and gains, if any, to its shareholders and therefore, no provision for federal income tax has been made. Each Fund is treated as a separate taxpayer for federal income tax purposes. The Funds recognize the tax benefits of uncertain tax positions only when the position is “more likely than not” to be sustained assuming examination by tax authorities. Management has reviewed the tax positions in the open tax years of 2012 to 2015 and expected to be taken in tax year 2016 and concluded that no liability for unrecognized tax benefits should be recorded related to uncertain tax positions taken in the above open tax years. The Funds identify their major tax jurisdictions as U.S. Federal. The Funds recognize interest and penalties, if any, related to unrecognized tax benefits as income tax expense in the Statements of Operations. During the year, the Funds did not incur any interest or penalties. Generally tax authorities can examine tax returns filed for the last three years.
n. Distributions to Shareholders – It is each Fund’s policy to distribute its respective net investment income and net capital gains, if any, annually except for Monthly Distribution, Corporate/Government Bond, High-Yield Bond, Floating Rate Bond and International Opportunity Bond which will distribute their respective net investment income, if any, monthly. For Dynamic Macro dividends attributable to earned income, if any, will be declared and paid quarterly. Distributions of net investment income and net capital gains are determined in accordance with income tax regulations which may differ from GAAP. Differences in dividends from net investment income
106
| NOTES TO FINANCIAL STATEMENTS |
| October 31, 2016 (Continued) |
per share between the classes are due to service and distribution related expenses. Dividends and distributions to shareholders are recorded on ex-date. Monthly Distribution’s distribution policy is to make twelve monthly distributions to shareholders. The level of monthly distributions (including any return of capital) is not fixed but is expected to be at or near the level of the prime interest rate (“Prime Rate”). Additionally, Monthly Distribution’s distribution policy is not designed to generate, and is not expected to result in distributions that equal a fixed percentage of Monthly Distribution’s current net asset value per share. Shareholders receiving periodic payments from Monthly Distribution may be under the impression that they are receiving net profits. However, all or a portion of a distribution may consist of a return of capital. Shareholders should not assume that the source of a distribution from Monthly Distribution is net profit.
o. Indemnification – The Trust indemnifies its officers and Trustees for certain liabilities that may arise from the performance of their duties to the Trust. Additionally, in the normal course of business, each Fund enters into contracts that contain a variety of representations and warranties and which provide general indemnities. A Fund’s maximum exposure under these arrangements is unknown, as this would involve future claims that may be made against the Fund that have not yet occurred. However, based on experience, the Funds expect the risk of loss due to these warranties and indemnities to be remote.
| 3. | INVESTMENT ADVISORY FEES AND OTHER TRANSACTIONS WITH AFFILIATES |
| a. | Management Fees – Dunham & Associates serves as each Fund’s investment adviser. Pursuant to an investment advisory agreement with the Trust, on behalf of the Funds, Dunham & Associates, subject to the supervision of the Board and in conformity with the stated policies of the Funds, manages the operations of the Funds. The Adviser, subject to the review and approval of the Board, selects Sub-Advisers for each Fund and supervises and monitors the performance of each Sub-Adviser. As compensation for its services, each Fund pays the Adviser a fixed fee, accrued daily and paid monthly, based on each Fund’s respective average daily net assets. The Adviser has entered into a Sub-Advisory Agreement with each Sub-Adviser and the Trust, on behalf of each Fund. Under the Sub-Advisory Agreements, each Fund pays the Sub-Adviser a “Fulcrum Fee.” A Fulcrum Fee is a performance fee whereby the Sub-Adviser is rewarded when out-performing, or is penalized when under-performing, a Fund’s benchmark index. As a result of the Fulcrum Fee arrangement, the total annual management fee for a Fund will have a range as shown in the table below. |
| Adviser’s | Sub-Adviser’s | ||
| Management Fee | Portion | Portion | |
| Floating Rate Bond | 0.80% – 1.20% | 0.60% | 0.20% – 0.60% |
| Monthly Distribution | 0.90% – 1.90% | 0.65% | 0.25% – 1.25% * |
| Corporate/Government Bond | 0.65% – 0.95% | 0.50% | 0.15% – 0.45% |
| Dynamic Macro | 1.05% – 1.75% | 0.65% | 0.40% – 1.10% |
| High-Yield Bond | 0.80% – 1.20% | 0.60% | 0.20% – 0.60% |
| International Opportunity Bond | 0.80% – 1.30% | 0.60% | 0.20% – 0.70% |
| Appreciation & Income | 0.85% – 1.35% | 0.65% | 0.20% – 0.60% |
| Alternative Dividend | 0.95% – 1.55% | 0.65% | 0.30% - 0.90% |
| Large Cap Value | 0.75% – 1.15% | 0.65% | 0.10% – 0.50% |
| Focused Large Cap Growth | 0.85% – 1.15% | 0.65% | 0.20% – 0.50% |
| International Stock | 0.95% – 1.65% | 0.65% | 0.30% – 1.00% |
| Real Estate Stock | 0.75% – 1.35% | 0.65% | 0.10% – 0.70% |
| Small Cap Value | 0.75% – 1.45% | 0.65% | 0.10% – 0.80% |
| Emerging Markets Stock | 0.75% – 1.55% | 0.65% | 0.10% – 0.90% |
| Small Cap Growth | 0.65% – 1.65% | 0.65% | 0.00% – 1.00% |
| * | Effective April 1, 2013, the Sub-Adviser had contractually agreed to waive a portion of its sub-advisory fee (excluding 12b-1 fees) until at least February 28, 2017, so that such fees, on annual basis will have a range of 0.25%-1.05%, of the Fund’s aggregate average daily net assets of its Class N, Class A and Class C shares. |
Each Fund’s Sub-Advisory Fulcrum Fee is calculated daily using an annual base Sub-Advisory fee of a specified amount of the average daily net assets of the Fund (the “Base Fee”), adjusted by the Fund’s Class N share performance relative to the Fund’s benchmark (the “Performance Fee”). Depending on a Fund’s net performance versus its benchmark, the Sub-Adviser will receive a fee adjustment in accordance with a formula that equates a percentage of out- or under-performance to a percentage of fee increases or decreases, respectively. In addition, most Fulcrum Fees employ a “null zone” around the base fee, whereby small differences in performance versus the benchmark will not trigger a fee increase or decrease. During the first 12 months of the Fulcrum Fee arrangement, the Performance Fee is calculated daily from inception date of the agreement to the calculation date and is applied to the average daily net assets of the Funds during the calculation period. After the initial 12 months, the Performance Fee is calculated on a daily basis based on comparative performance over a rolling 12-month period. All Funds, with the exception of Alternative Dividend which is in its initial year of the Fulcrum Fee arrangement, are calculating Performance Fees on a rolling 12-month basis as of October 31, 2016.
107
| NOTES TO FINANCIAL STATEMENTS |
| October 31, 2016 (Continued) |
Depending on the particular Sub-Advisory Agreement, the Performance Fee can adjust the Base Fee up or down by as much as 100% of the Base Fee, such that the Sub-Advisory fee can vary anywhere from 0.00% (the “Minimum Fee”) to twice the Base Fee (the “Maximum Fee”). However, because each such Sub-Advisory Agreement requires that the Sub-Adviser only be paid out the monthly Minimum Fee during the first year (in most cases, 0.10%), the Sub-Adviser, in most cases, will receive less compensation until the end of the first year. At the end of the first year of the agreement, the Sub-Adviser will be paid a lump sum that reflects the accrued Fulcrum Fee over the year, less any Minimum Fees paid out during the first year. Therefore, in the first year, the Fulcrum Fee methodology has three elements: 1) daily calculation of the Performance Fee and daily accrual of the Fulcrum Fee; 2) monthly payment of the Minimum Fee only (if any); and 3) a lump sum payment at the end of the initial 12-month period of the accrued Fulcrum Fee less the Minimum Fee.
By virtue of using average daily net assets over a “rolling” 12-month period for purposes of calculating the Performance Fee while using average daily net assets for the most recent month for purposes of calculating the Base Fee, the actual total Fulcrum Fee paid by the Fund to the Sub-Adviser may be higher or lower than the maximum or minimum annual rates described above if the average daily net assets do not remain constant during the rolling 12-month period. If the Fund is significantly underperforming versus the Index and the Fund’s net assets have declined significantly, the monthly total Fulcrum Fee can be a negative number (although the performance fee rate can never be negative, the Performance Fee can be negative). In such instances, if the negative Fulcrum Fee is not earned back or offset the following month, the Sub-Adviser must reimburse the Fund the amount of the negative Fulcrum Fee within an agreed upon time. Likewise, in the case where the Fund has significantly underperformed versus the Index but net assets have increased significantly, the monthly total Fulcrum Fee can be positive although the performance fee rate may be 0.00%. In such instances, the Fund will pay the Sub-Adviser the monthly Fulcrum Fee.
The table below lists the current Sub-Advisers along with their Fulcrum Fee arrangements.
| Null | Minimum | Maximum | ||||||||||
| Fund | Sub-Adviser | Benchmark | Base Fee | Zone | Fee | Fee | ||||||
| Floating Rate Bond | New fleet Asset Management, LLC | S&P/LSTA Leveraged Loan Index | 0.40% | +/- 0.00% | 0.20% | 0.60% | ||||||
| Monthly Distribution* | Westchester Capital Management, LLC | IQ Hedge Market Neutral Beta Index | 0.75% | +/- 0.15% | 0.25% | 1.25% | ||||||
| Corporate/Government Bond | New fleet Asset Management, LLC | Barclays Aggregate Bond Index | 0.30% | +/- 0.10% | 0.15% | 0.45% | ||||||
| Dynamic Macro | Mellon Capital Management Corporation | IQ Hedge Global Macro Beta Index | 0.75% | +/- 0.00% | 0.40% | 1.10% | ||||||
| High-Yield Bond | PENN Capital Management Co., Inc. | BofA Merrill Lynch U.S. Non- Distressed BB-B High-Yield Index | 0.40% | +/- 0.20% | 0.20% | 0.60% | ||||||
| International Opportunity Bond | Rogge Global Partners Limited | Barclays Global ex US Aggregate Bond Index | 0.45% | +/- 0.00% | 0.20% | 0.70% | ||||||
| Appreciation & Income | PENN Capital Management Co., Inc. | Merrill Lynch All Convertibles All Qualities Index | 0.40% | +/- 0.00% | 0.20% | 0.60% | ||||||
| Alternative Dividend | Sungarden Fund Management, LLC | Dow Jones Moderately Conservative Index | 0.60% | +/- 0.00% | 0.30% | 0.90% | ||||||
| Large Cap Value | Rothschild Asset Management, Inc. | Russell 1000 Value Index | 0.30% | +/- 0.00% | 0.10% | 0.50% | ||||||
| Focused Large Cap Growth | The Ithaka Group, LLC | Russell 1000 Growth Index | �� | 0.35% | +/- 0.30% | 0.20% | 0.50% | |||||
| International Stock | Arrow street Capital L.P. | MSCI All Country World Index ex USA (Net) | 0.65% | +/- 0.20% | 0.30% | 1.00% | ||||||
| Real Estate Stock | Barings Real Estate Advisers LLC | FTSE NAREIT All REITs Index | 0.40% | +/- 0.00% | 0.10% | 0.70% | ||||||
| Small Cap Value | Piermont Capital Management, LLC | Russell 2000 Value Index | 0.45% | +/- 0.00% | 0.10% | 0.80% | ||||||
| Emerging Markets Stock | Bailard, Inc. | MSCI Emerging Markets Index USD (Net) | 0.50% | +/- 0.00% | 0.10% | 0.90% | ||||||
| Small Cap Growth | Pier Capital, LLC | Russell 2000 Growth Index | 0.50% | +/- 0.20% | 0.00% | 1.00% |
b. Administration, Fund Accounting and Transfer Agency Fees – Gemini Fund Services, LLC (“GFS” or the “Administrator”) serves as the administrator, fund accountant and transfer agent for the Funds. GFS receives from each Fund a monthly fee based on the combined average daily net assets at the following annual rates: 0.07% on the first $250 million of average net assets; 0.06% on average net assets between $250 million and $500 million; 0.05% on average net assets over $500 million; 0.3% on average net assets over $1 billion. Such fees are subject to an annual minimum of $400,000 in total for the entire Trust. For providing fund accounting services, the Administrator receives from each Fund a monthly fee based on the combined average daily net assets at the following rates: 0.03% on the first $500 million of average net assets; 0.01% on average net assets over $500 million. Such fees are subject to an annual minimum $300,000 in total for the entire Trust. For providing transfer agent services, the Administrator receives from the Trust a minimum annual fee of $200,000.
108
| NOTES TO FINANCIAL STATEMENTS |
| October 31, 2016 (Continued) |
Pursuant to the terms of a Custody Administration Agreement, Monthly Distribution pays GFS a monthly fee of $300.
Blu Giant, LLC, (“Blu Giant”), (formerly “Gemcom”), an affiliate of GFS, provides EDGAR conversion and filing services as well as some print management services for the Funds on an ad-hoc basis. For the provision of these services, Blu Giant receives customary fees from the Funds.
An officer of GFS is also an officer of the Trust and is not paid by the Trust.
c. Distributor – The Distributor of the Funds is Dunham & Associates (the “Distributor”). The Funds have adopted a Plan of Distribution (the “Plan”) pursuant to Rule 12b-1 under the 1940 Act, for Class A and Class C shares. The Plan provides for the monthly payment of a distribution fee to the Distributor or other entities at an annualized rate of 0.75% for the equity Funds and 0.50% for the fixed-income Funds, based on the average daily net assets attributable to Class C shares, and 0.25% of the average daily net assets attributable to Class A shares. In addition, the Funds have adopted a Shareholder Servicing Plan which provides for the payment of a shareholder service fee at an annualized rate of up to 0.25% of the average daily net assets attributable to the Class C shares. Class N shares do not pay 12b-1 distribution or shareholder servicing fees.
d. Trustees’ Fees – The Board has approved the following Trustee compensation schedule: Each Trustee who is not an interested person of the Trust will receive $4,250 for each Board meeting attended in-person; $250 for all telephonic Board meetings; $500 for in-person committee meetings and $250 for telephonic committee meetings, unless the committee meeting is on the same day as a Board meeting, in which case the Trustee will not be compensated for the committee meeting. The Funds also reimburse each such Trustee for travel and other expenses incurred in attending meetings of the Board.
With the exception of the Trust’s Chief Compliance Officer as discussed below, officers of the Trust and Trustees who are interested persons of the Trust do not receive any compensation from the Trust or any other Funds managed by the Adviser. The Trust has agreed to pay the Adviser a fee in the amount of $142,000 per annum plus an annual discretionary bonus as may be awarded as compensation for providing an officer or employee of the Adviser to serve as Chief Compliance Officer for the Funds (each Fund bearing its pro rata share of the fee), plus the cost of reasonable expenses related to the performance of the Chief Compliance Officer’s duties, including travel expenses, and may compensate the Adviser for the time of other officers or employees of the Adviser who serve in other compliance capacities for the Funds.
| 4. | INVESTMENT TRANSACTIONS |
The cost of purchases and the proceeds from sales of investments, other than short-term investments, for the year ended October 31, 2016 were as follows:
| Purchases | Sale Proceeds | Proceeds of | ||||||||||||||
| (excluding U.S. | (excluding U.S. | Purchases of | U.S. | |||||||||||||
| Government | Government | U.S. Government | Government | |||||||||||||
| Fund | Securities) | Securities) | Securities | Securities | ||||||||||||
| Floating Rate Bond | $ | 78,495,493 | $ | 55,108,707 | $ | — | $ | — | ||||||||
| Monthly Distribution | 510,805,178 | 608,631,635 | — | — | ||||||||||||
| Corporate/Government Bond | 26,389,396 | 18,916,601 | 11,732,566 | 11,069,884 | ||||||||||||
| Dynamic Macro | 14,114,993 | 9,693,987 | — | — | ||||||||||||
| High-Yield Bond | 55,445,413 | 56,828,125 | — | — | ||||||||||||
| International Opportunity Bond | 19,296,724 | 28,637,171 | — | — | ||||||||||||
| Appreciation & Income | 23,424,310 | 27,662,766 | — | — | ||||||||||||
| Alternative Dividend | 27,608,567 | 7,227,191 | ||||||||||||||
| Large Cap Value | 33,697,852 | 33,093,461 | — | — | ||||||||||||
| Focused Large Cap Growth | 21,785,191 | 18,281,652 | — | — | ||||||||||||
| International Stock | 127,543,981 | 128,721,964 | — | — | ||||||||||||
| Real Estate Stock | 46,881,613 | 58,100,648 | — | — | ||||||||||||
| Small Cap Value | 35,563,627 | 36,440,679 | — | — | ||||||||||||
| Emerging Markets Stock | 52,860,040 | 49,287,069 | — | — | ||||||||||||
| Small Cap Growth | 59,148,652 | 58,495,971 | — | — | ||||||||||||
Transactions in option contracts purchased/written during the year ended October 31, 2016 were as follows:
109
| NOTES TO FINANCIAL STATEMENTS |
| October 31, 2016 (Continued) |
Monthly Distribution
| Options Purchased | Options Written | |||||||||||||||
| Contracts | Premium | Contracts | Premium | |||||||||||||
| Outstanding at October 31, 2015 | 29,327 | $ | 3,546,892 | 42,025 | $ | 8,570,827 | ||||||||||
| Options purchased/written during period | 170,227 | 20,023,341 | 186,216 | 37,875,460 | ||||||||||||
| Options exercised during period | (5,739 | ) | (5,019,903 | ) | (22,130 | ) | (4,663,291 | ) | ||||||||
| Options expired during period | (111,990 | ) | (6,163,264 | ) | (33,057 | ) | (4,901,744 | ) | ||||||||
| Options closed during period | (52,485 | ) | (10,878,061 | ) | (143,078 | ) | (30,825,279 | ) | ||||||||
| Outstanding at October 31, 2016 | 29,340 | $ | 1,509,005 | 29,976 | $ | 6,055,973 | ||||||||||
Dynamic Macro
| Options Purchased | Options Written | |||||||||||||||
| Contracts | Premium | Contracts | Premium | |||||||||||||
| Outstanding at October 31, 2015 | 351 | $ | 1,883,439 | 70 | $ | 18,703 | ||||||||||
| Options purchased/written during period | 3,303 | 12,030,685 | 500 | 142,848 | ||||||||||||
| Options exercised during period | — | — | — | — | ||||||||||||
| Options expired during period | (1,113 | ) | (4,498,307 | ) | (210 | ) | (56,791 | ) | ||||||||
| Options closed during period | (2,014 | ) | (7,410,130 | ) | (290 | ) | (77,075 | ) | ||||||||
| Outstanding at October 31, 2016 | 527 | $ | 2,005,687 | 70 | $ | 27,685 | ||||||||||
Alternative Dividend
| Options Purchased | ||||||||||||||||
| Contracts | Premium | |||||||||||||||
| Outstanding at October 31, 2015 | — | $ | — | |||||||||||||
| Options purchased/written during period | 1,054 | 803,166 | ||||||||||||||
| Options exercised during period | — | — | ||||||||||||||
| Options expired during period | (5 | ) | (20,412 | ) | ||||||||||||
| Options closed during period | — | — | ||||||||||||||
| Outstanding at October 31, 2016 | 1,049 | $ | 782,754 | |||||||||||||
110
| NOTES TO FINANCIAL STATEMENTS |
| October 31, 2016 (Continued) |
| 5. | AGGREGATE UNREALIZED APPRECIATION AND DEPRECIATION – TAX BASIS |
The identified cost of investments in securities owned by each Fund for federal income tax purposes, and its respective gross unrealized appreciation and depreciation at October 31, 2016, were as follows:
| Gross | Gross | Net Unrealized | ||||||||||||||
| Tax | Unrealized | Unrealized | Appreciation | |||||||||||||
| Fund | Cost | Appreciation | Depreciation | (Depreciation) | ||||||||||||
| Floating Rate Bond | $ | 120,417,956 | $ | 1,032,885 | $ | (1,300,515 | ) | $ | (267,630 | ) | ||||||
| Monthly Distribution | 241,311,554 | 12,294,110 | (16,357,245 | ) | (4,063,135 | ) | ||||||||||
| Corporate/Government Bond | 63,457,185 | 1,504,181 | (329,392 | ) | 1,174,789 | |||||||||||
| Dynamic Macro | 44,167,526 | 1,541,763 | — | 1,541,763 | ||||||||||||
| High-Yield Bond | 113,301,711 | 3,569,098 | (467,724 | ) | 3,101,374 | |||||||||||
| International Opportunity Bond | 27,637,163 | 799,307 | (1,361,746 | ) | (562,439 | ) | ||||||||||
| Appreciation & Income | 28,557,403 | 726,556 | (1,376,585 | ) | (650,029 | ) | ||||||||||
| Alternative Dividend | 24,385,706 | 294,597 | (710,120 | ) | (415,523 | ) | ||||||||||
| Large Cap Value | 69,836,689 | 7,874,030 | (2,222,682 | ) | 5,651,348 | |||||||||||
| Focused Large Cap Growth | 67,920,375 | 15,195,481 | (2,163,145 | ) | 13,032,336 | |||||||||||
| International Stock | 95,344,546 | 8,511,804 | (2,888,727 | ) | 5,623,077 | |||||||||||
| Real Estate Stock | 46,602,548 | 5,291,862 | (1,240,295 | ) | 4,051,567 | |||||||||||
| Small Cap Value | 35,939,108 | 2,414,741 | (1,635,728 | ) | 779,013 | |||||||||||
| Emerging Markets Stock | 51,238,804 | 6,964,613 | (1,859,189 | ) | 5,105,424 | |||||||||||
| Small Cap Growth | 41,966,074 | 3,736,171 | (1,410,172 | ) | 2,325,999 | |||||||||||
| 6. | FORWARD FOREIGN CURRENCY CONTRACTS |
At October 31, 2016, Monthly Distribution, International Opportunity Bond, Dynamic Macro and International Stock had the following open forward foreign currency contracts:
| Monthly Distribution: | Unrealized | |||||||||||||||
| Settlement | U.S. Dollar | Appreciation | ||||||||||||||
| Foreign Currency | Date | Counterparty | Local Currency | Value | (Depreciation) | |||||||||||
| To Buy: | ||||||||||||||||
| Canadian Dollar | 11/2/2016 | JP Morgan | 2,665,456 | 2,013,794 | (26,880 | ) | ||||||||||
| Total | $ | (26,880 | ) | |||||||||||||
| To Sell: | ||||||||||||||||
| Canadian Dollar | 11/2/2016 | JP Morgan | 3,574,721 | 2,734,479 | 69,656 | |||||||||||
| Euro | 12/20/2016 | JP Morgan | 4,515,632 | 4,943,494 | (25,267 | ) | ||||||||||
| Total | $ | 44,389 | ||||||||||||||
| $ | 17,509 | |||||||||||||||
111
| NOTES TO FINANCIAL STATEMENTS |
| October 31, 2016 (Continued) |
International Opportunity Bond:
| Unrealized | ||||||||||||||||
| Settlement | Local | U.S. Dollar | Appreciation | |||||||||||||
| Foreign Currency | Date | Counterparty | Currency | Value | (Depreciation) | |||||||||||
| To Buy: | ||||||||||||||||
| Australian Dollar | 12/15/2016 | Barclays | 787,728 | $ | 598,731 | $ | (4,038 | ) | ||||||||
| Australian Dollar | 12/15/2016 | Citigroup | 52,626 | 39,999 | (273 | ) | ||||||||||
| Brazilian Real | 12/7/2016 | Barclays | 450,000 | 140,510 | 628 | |||||||||||
| Brazilian Real | 12/7/2016 | Citigroup | 930,000 | 290,388 | 4,744 | |||||||||||
| Canadian Dollar | 12/15/2016 | Barclays | 159,972 | 119,401 | (2,170 | ) | ||||||||||
| Canadian Dollar | 12/15/2016 | Barclays | 72,000 | 53,740 | (671 | ) | ||||||||||
| Canadian Dollar | 12/15/2016 | Citigroup | 378,407 | 282,438 | (5,134 | ) | ||||||||||
| Euro | 12/15/2016 | Citigroup | 93,000 | 102,158 | (1,982 | ) | ||||||||||
| Euro | 12/15/2016 | Citigroup | 90,000 | 98,863 | (574 | ) | ||||||||||
| Euro | 12/15/2016 | Citigroup | 100,000 | 109,848 | (2,631 | ) | ||||||||||
| Indonesian Rupiah | 12/7/2016 | Barclays | 7,555,070,000 | 576,051 | 11,944 | |||||||||||
| Israeli Shekel | 12/7/2016 | Citigroup | 270,000 | 70,361 | (1,455 | ) | ||||||||||
| Japanese Yen | 12/15/2016 | Barclays | 159,189,923 | 1,517,698 | (42,353 | ) | ||||||||||
| Japanese Yen | 12/15/2016 | Credit Suisse | 8,800,000 | 83,898 | (551 | ) | ||||||||||
| Mexican Peso | 12/7/2016 | Barclays | 2,510,000 | 132,888 | 910 | |||||||||||
| Mexican Peso | 12/7/2016 | Citigroup | 607,000 | 32,137 | 775 | |||||||||||
| Mexican Peso | 12/7/2016 | Citigroup | 15,167,735 | 803,033 | 4,724 | |||||||||||
| New Zealand Dollar | 12/15/2016 | Barclays | 107,497 | 76,771 | (1,304 | ) | ||||||||||
| Russian Ruble | 12/7/2016 | Citigroup | 8,400,000 | 131,438 | (326 | ) | ||||||||||
| Russian Ruble | 12/7/2016 | Barclays | 18,706,000 | 292,701 | 9,362 | |||||||||||
| Russian Ruble | 12/7/2016 | Citigroup | 3,005,000 | 47,020 | 1,803 | |||||||||||
| Singapore Dollar | 12/7/2016 | Barclays | 120,000 | 86,235 | (2,720 | ) | ||||||||||
| South African Rand | 12/7/2016 | Barclays | 70,000 | 5,153 | 87 | |||||||||||
| South African Rand | 12/7/2016 | Citigroup | 1,490,000 | 109,688 | 1,865 | |||||||||||
| Turkish Lira New | 12/7/2016 | Citigroup | 300,000 | 96,117 | (3,610 | ) | ||||||||||
| $ | 5,897,265 | $ | (32,950 | ) | ||||||||||||
International Opportunity Bond:
| Unrealized | ||||||||||||||||
| Settlement | Local | U.S. Dollar | Appreciation | |||||||||||||
| Foreign Currency | Date | Counterparty | Currency | Value | (Depreciation) | |||||||||||
| To Sell: | ||||||||||||||||
| British Pound | 12/15/2016 | Citigroup | (20,397 | ) | $ | (24,929 | ) | $ | 1,147 | |||||||
| Euro | 12/15/2016 | Barclays | (367,363 | ) | (403,540 | ) | 7,971 | |||||||||
| Euro | 12/15/2016 | Barclays | (311,687 | ) | (342,381 | ) | 535 | |||||||||
| Euro | 12/15/2016 | Citigroup | (284,075 | ) | (312,050 | ) | 6,164 | |||||||||
| Euro | 12/15/2016 | Citigroup | (291,123 | ) | (319,791 | ) | 3,352 | |||||||||
| Euro | 12/15/2016 | Citigroup | (71,723 | ) | (78,786 | ) | 790 | |||||||||
| Euro | 12/15/2016 | Credit Suisse | (520,881 | ) | (572,176 | ) | (4,351 | ) | ||||||||
| Indonesian Rupiah | 12/7/2016 | Citigroup | (7,555,070,000 | ) | (576,051 | ) | (1,834 | ) | ||||||||
| Japanese Yen | 12/15/2016 | Credit Suisse | (7,062,075 | ) | (67,329 | ) | 618 | |||||||||
| Malaysian Ringgit | 12/7/2016 | Citigroup | (2,570,000 | ) | (611,383 | ) | 24,929 | |||||||||
| Mexican Peso | 12/7/2016 | Barclays | (3,555,810 | ) | (188,257 | ) | 4,301 | |||||||||
| Mexican Peso | 12/7/2016 | Citigroup | (3,425,834 | ) | (181,376 | ) | 4,164 | |||||||||
| South Korean Won | 12/7/2016 | Citigroup | (55,567,000 | ) | (48,555 | ) | 1,235 | |||||||||
| Taiwan Dollar | 12/7/2016 | Barclays | (18,056,000 | ) | (572,606 | ) | (1,264 | ) | ||||||||
| Turkish Lira New | 12/7/2016 | Citigroup | (300,000 | ) | (96,117 | ) | 1,191 | |||||||||
| $ | (4,395,327 | ) | $ | 48,948 | ||||||||||||
112
| NOTES TO FINANCIAL STATEMENTS |
| October 31, 2016 (Continued) |
International Opportunity Bond:
| Local Currency | U.S. Dollar | U.S. Dollar | Unrealized | |||||||||||||||||||
| Settlement | Amount Purchased | Market Value | Market Value | Appreciation | ||||||||||||||||||
| Foreign Currency | Date | Counterparty | Sell | Buy | Sell | (Depreciation) | ||||||||||||||||
| To Buy: | To Sell: | |||||||||||||||||||||
| Czech Koruna | Euro | 12/7/2016 | Barclays | $ | (41,509 | ) | $ | 45,605 | $ | (45,576 | ) | $ | 29 | |||||||||
| Polish Zloty | Euro | 12/7/2016 | Barclays | (8,486 | ) | 9,334 | (9,317 | ) | 17 | |||||||||||||
| Euro | Danish Krone | 12/15/2016 | Barclays | (1,058,127 | ) | 156,112 | (156,256 | ) | (144 | ) | ||||||||||||
| Euro | Swedish Krona | 12/15/2016 | Barclays | (2,161,648 | ) | 247,429 | (240,162 | ) | 7,267 | |||||||||||||
| Euro | Swiss Franc | 12/15/2016 | Citigroup | (207,915 | ) | 209,082 | (210,800 | ) | (1,718 | ) | ||||||||||||
| Euro | Danish Krone | 12/15/2016 | Citigroup | (200,063 | ) | 29,517 | (29,544 | ) | (27 | ) | ||||||||||||
| British Pound | Euro | 12/15/2016 | Citigroup | (552,758 | ) | 610,851 | (607,191 | ) | 3,660 | |||||||||||||
| Norwegian Krone | Euro | 12/15/2016 | Citigroup | (54,412 | ) | 59,042 | (59,770 | ) | (728 | ) | ||||||||||||
| $ | (4,284,918 | ) | $ | 1,366,972 | $ | (1,358,616 | ) | $ | 8,356 | |||||||||||||
International Stock:
| Settlement | Local | U.S. Dollar | Unrealized | |||||||||||||
| Foreign Currency | Date | Counterparty | Currency | Value | (Depreciation) | |||||||||||
| To Buy: | ||||||||||||||||
| Japanese Yen | 11/1/2016 | JP Morgan Chase | 3,820,149 | $ | 36,399 | $ | (46 | ) | ||||||||
International Stock:
| Unrealized | ||||||||||||||||
| Settlement | Local | U.S. Dollar | Appreciation | |||||||||||||
| Foreign Currency | Date | Counterparty | Currency | Value | (Depreciation) | |||||||||||
| To Sell: | ||||||||||||||||
| Canadian Dollar | 11/1/2016 | Bank of New York/Mellon | (2,135 | ) | $ | (1,593) | $ | 4 | ||||||||
| Hong Kong Dollar | 11/1/2016 | Bank of New York/Mellon | (110,759 | ) | (14,282 | ) | 2 | |||||||||
| Mexican Peso | 11/1/2016 | Bank of New York/Mellon | (1,431,361 | ) | (76,106 | ) | 339 | |||||||||
| Japanese Yen | 11/2/2016 | US Bank | (1,757,794 | ) | (16,727 | ) | (22 | ) | ||||||||
| $ | (108,708 | ) | $ | 323 | ||||||||||||
| 7. | SHARES OF BENEFICIAL INTEREST |
At October 31, 2016, each Fund had an unlimited number of shares authorized with no par value.
Following is a summary of shareholder transactions for each Fund for the year ended October 31, 2016 and the year ended and October 31, 2015, respectively:
113
| NOTES TO FINANCIAL STATEMENTS |
| October 31, 2016 (Continued) |
For the Year or Period Ended October 31, 2016:
| Class N Shares | Class A Shares | |||||||||||||||||||||||||||||||
| Net Increase | Net Increase | |||||||||||||||||||||||||||||||
| Distributions | (Decrease) in | Distributions | (Decrease) in | |||||||||||||||||||||||||||||
| Fund | Issued | Reinvested | Redeemed | Shares | Issued | Reinvested | Redeemed | Shares | ||||||||||||||||||||||||
| Floating Rate Bond | 3,245,963 | 283,827 | (1,457,613 | ) | 2,072,177 | 518,054 | 29,530 | (317,202 | ) | 230,382 | ||||||||||||||||||||||
| Monthly Distribution | 930,533 | 143,378 | (1,296,398 | ) | (222,487 | ) | 308,917 | 49,761 | (1,137,113 | ) | (778,435 | ) | ||||||||||||||||||||
| Corporate/Government Bond | 889,311 | 88,721 | (581,522 | ) | 396,510 | 212,107 | 8,751 | (221,945 | ) | (1,087 | ) | |||||||||||||||||||||
| Dynamic Macro | 1,014,094 | — | (920,799 | ) | 93,295 | 272,164 | — | (198,785 | ) | 73,379 | ||||||||||||||||||||||
| High-Yield Bond | 1,299,855 | 435,039 | (1,812,374 | ) | (77,480 | ) | 290,157 | 46,309 | (312,037 | ) | 24,429 | |||||||||||||||||||||
| International Opportunity Bond | 573,174 | 2,986 | (1,516,131 | ) | (939,971 | ) | 101,064 | 159 | (234,584 | ) | (133,361 | ) | ||||||||||||||||||||
| Appreciation & Income | 363,748 | 145,362 | (715,847 | ) | (206,737 | ) | 95,024 | 23,349 | (147,881 | ) | (29,508 | ) | ||||||||||||||||||||
| Large Cap Value | 616,688 | 968,124 | (632,723 | ) | 952,089 | 155,383 | 138,870 | (160,657 | ) | 133,596 | ||||||||||||||||||||||
| Alternative Dividend | 2,069,758 | — | (28,014 | ) | 2,041,744 | 1 | — | — | 1 | |||||||||||||||||||||||
| Focused Large Cap Growth | 774,330 | 17,116 | (597,687 | ) | 193,759 | 284,636 | 3,304 | (197,810 | ) | 90,130 | ||||||||||||||||||||||
| International Stock | 841,227 | 3,084 | (726,387 | ) | 117,924 | 251,540 | — | (160,223 | ) | 91,317 | ||||||||||||||||||||||
| Real Estate Stock | 267,773 | 184,156 | (796,210 | ) | (344,281 | ) | 85,202 | 57,555 | (170,890 | ) | (28,133 | ) | ||||||||||||||||||||
| Small Cap Value | 235,460 | 53,816 | (291,167 | ) | (1,891 | ) | 70,193 | 8,834 | (80,919 | ) | (1,892 | ) | ||||||||||||||||||||
| Emerging Markets Stock | 913,954 | 25,824 | (867,084 | ) | 72,694 | 245,332 | 1,850 | (129,758 | ) | 117,424 | ||||||||||||||||||||||
| Small Cap Growth | 602,298 | 124,708 | (387,203 | ) | 339,803 | 77,497 | 24,091 | (109,242 | ) | (7,654 | ) | |||||||||||||||||||||
| Class C Shares | ||||||||||||||||||||||||||||||||
| Net Increase | ||||||||||||||||||||||||||||||||
| Distributions | (Decrease) | |||||||||||||||||||||||||||||||
| Fund | Issued | Reinvested | Redeemed | in Shares | ||||||||||||||||||||||||||||
| Floating Rate Bond | 177,846 | 11,030 | (92,549 | ) | 96,327 | |||||||||||||||||||||||||||
| Monthly Distribution | 211,987 | 51,254 | (585,842 | ) | (322,601 | ) | ||||||||||||||||||||||||||
| Corporate/Government Bond | 67,852 | 5,244 | (100,458 | ) | (27,362 | ) | ||||||||||||||||||||||||||
| Dynamic Macro | 109,872 | — | (81,233 | ) | 28,639 | |||||||||||||||||||||||||||
| High-Yield Bond | 160,314 | 35,061 | (371,843 | ) | (176,468 | ) | ||||||||||||||||||||||||||
| International Opportunity Bond | 37,817 | 12 | (92,501 | ) | (54,672 | ) | ||||||||||||||||||||||||||
| Appreciation & Income | 125,002 | 28,776 | (327,962 | ) | (174,184 | ) | ||||||||||||||||||||||||||
| Large Cap Value | 59,330 | 136,802 | (148,707 | ) | 47,425 | |||||||||||||||||||||||||||
| Alternative Dividend | 35,692 | — | (5 | ) | 35,687 | |||||||||||||||||||||||||||
| Focused Large Cap Growth | 121,961 | 1,886 | (114,862 | ) | 8,985 | |||||||||||||||||||||||||||
| International Stock | 90,644 | — | (143,112 | ) | (52,468 | ) | ||||||||||||||||||||||||||
| Real Estate Stock | 46,146 | 20,451 | (91,576 | ) | (24,979 | ) | ||||||||||||||||||||||||||
| Small Cap Value | 29,540 | 7,074 | (46,933 | ) | (10,319 | ) | ||||||||||||||||||||||||||
| Emerging Markets Stock | 87,692 | — | (90,272 | ) | (2,580 | ) | ||||||||||||||||||||||||||
| Small Cap Growth | 124,968 | 28,776 | (327,919 | ) | (174,175 | ) | ||||||||||||||||||||||||||
114
| NOTES TO FINANCIAL STATEMENTS |
| October 31, 2016 (Continued) |
Year Ended October 31, 2015:
| Class N Shares | Class A Shares | |||||||||||||||||||||||||||||||
| Net Increase | Net Increase | |||||||||||||||||||||||||||||||
| Distributions | (Decrease) in | Distributions | (Decrease) in | |||||||||||||||||||||||||||||
| Fund | Issued | Reinvested | Redeemed | Shares | Issued | Reinvested | Redeemed | Shares | ||||||||||||||||||||||||
| Floating Rate Bond | 2,743,474 | 235,935 | (1,738,796 | ) | 1,240,613 | 762,696 | 27,014 | (1,278,597 | ) | (488,887 | ) | |||||||||||||||||||||
| Monthly Distribution | 929,740 | 143,378 | (1,295,605 | ) | (222,487 | ) | 308,533 | 49,761 | (1,136,728 | ) | (778,434 | ) | ||||||||||||||||||||
| Corporate/Government Bond | 845,565 | 103,425 | (998,123 | ) | (49,133 | ) | 196,543 | 8,530 | (117,162 | ) | 87,911 | |||||||||||||||||||||
| Dynamic Macro | 1,956,574 | — | (267,309 | ) | 1,689,265 | 224,440 | — | (67,122 | ) | 157,318 | ||||||||||||||||||||||
| High-Yield Bond | 1,563,647 | 443,465 | (3,951,501 | ) | (1,944,389 | ) | 792,543 | 58,311 | (2,010,978 | ) | (1,160,124 | ) | ||||||||||||||||||||
| International Opportunity Bond | 1,385,937 | 2,121 | (2,208,993 | ) | (820,935 | ) | 499,486 | 115 | (503,468 | ) | (3,867 | ) | ||||||||||||||||||||
| Appreciation & Income | 708,844 | 362,827 | (471,083 | ) | 600,588 | 175,495 | 65,318 | (174,098 | ) | 66,715 | ||||||||||||||||||||||
| Large Cap Value | 620,117 | 19,465 | (491,285 | ) | 148,297 | 166,148 | 2,513 | (239,724 | ) | (71,063 | ) | |||||||||||||||||||||
| Focused Large Cap Growth | 1,177,969 | — | (625,830 | ) | 552,139 | 626,283 | — | (1,443,105 | ) | (816,822 | ) | |||||||||||||||||||||
| International Stock | 2,084,717 | 92,841 | (543,221 | ) | 1,634,337 | 302,319 | 10,011 | (195,629 | ) | 116,701 | ||||||||||||||||||||||
| Real Estate Stock | 525,476 | 100,754 | (817,583 | ) | (191,353 | ) | 476,856 | 27,523 | (167,669 | ) | 336,710 | |||||||||||||||||||||
| Small Cap Value | 348,595 | 101,946 | (443,428 | ) | 7,113 | 96,740 | 13,178 | (54,638 | ) | 55,280 | ||||||||||||||||||||||
| Emerging Markets Stock | 1,440,620 | 33,977 | (327,502 | ) | 1,147,095 | 197,080 | 3,384 | (87,560 | ) | 112,904 | ||||||||||||||||||||||
| Small Cap Growth | 363,216 | 107,442 | (309,334 | ) | 161,324 | 111,426 | 24,863 | (127,706 | ) | 8,583 | ||||||||||||||||||||||
| Class C Shares | ||||||||||||||||||||||||||||||||
| Net Increase | ||||||||||||||||||||||||||||||||
| Distributions | (Decrease) in | |||||||||||||||||||||||||||||||
| Fund | Issued | Reinvested | Redeemed | Shares | ||||||||||||||||||||||||||||
| Floating Rate Bond | 134,346 | 9,176 | (114,562 | ) | 28,960 | |||||||||||||||||||||||||||
| Monthly Distribution | 210,965 | 51,254 | (584,826 | ) | (322,607 | ) | ||||||||||||||||||||||||||
| Corporate/Government Bond | 71,275 | 6,301 | (69,409 | ) | 8,167 | |||||||||||||||||||||||||||
| Dynamic Macro | 68,579 | — | (46,093 | ) | 22,486 | |||||||||||||||||||||||||||
| High-Yield Bond | 147,503 | 39,862 | (377,837 | ) | (190,472 | ) | ||||||||||||||||||||||||||
| International Opportunity Bond | 74,858 | — | (84,776 | ) | (9,918 | ) | ||||||||||||||||||||||||||
| Appreciation & Income | 243,786 | 75,929 | (120,326 | ) | 199,389 | |||||||||||||||||||||||||||
| Large Cap Value | 69,089 | — | (59,967 | ) | 9,122 | |||||||||||||||||||||||||||
| Focused Large Cap Growth | 75,706 | — | (54,770 | ) | 20,936 | |||||||||||||||||||||||||||
| International Stock | 133,023 | 6,655 | (56,755 | ) | 82,923 | |||||||||||||||||||||||||||
| Real Estate Stock | 56,624 | 10,900 | (82,900 | ) | (15,376 | ) | ||||||||||||||||||||||||||
| Small Cap Value | 27,913 | 11,766 | (31,345 | ) | 8,334 | |||||||||||||||||||||||||||
| Emerging Markets Stock | 85,900 | 1,420 | (59,863 | ) | 27,457 | |||||||||||||||||||||||||||
| Small Cap Growth | 41,709 | 21,228 | (50,521 | ) | 12,416 | |||||||||||||||||||||||||||
115
| NOTES TO FINANCIAL STATEMENTS |
| October 31, 2016 (Continued) |
| 8. | DISTRIBUTIONS TO SHAREHOLDERS AND TAX COMPONENTS OF CAPITAL |
The tax character of dividends paid during the year ended October 31, 2016 and October 31, 2015 was as follows:
| For the year or period ended October 31, 2016 | For the year or period ended October 31, 2015 | |||||||||||||||||||||||||||||||
| Ordinary | Long-Term | Return of | Ordinary | Long-Term | Return of | |||||||||||||||||||||||||||
| Fund | Income | Capital Gains | Capital | Total | Income | Capital Gains | Capital | Total | ||||||||||||||||||||||||
| Floating Rate Bond | $ | 3,114,657 | $ | — | $ | — | $ | 3,114,657 | $ | 2,676,918 | $ | — | $ | — | $ | 2,676,918 | ||||||||||||||||
| Monthly Distribution | 4,038,615 | — | 5,117,544 | 9,156,159 | 6,276,573 | — | 3,563,401 | 9,839,974 | ||||||||||||||||||||||||
| Corporate/Government Bond | 1,431,865 | — | — | 1,431,865 | 1,657,557 | — | — | 1,657,557 | ||||||||||||||||||||||||
| Dynamic Macro | — | — | — | — | — | — | — | — | ||||||||||||||||||||||||
| High- Yield Bond | 4,668,522 | — | — | 4,668,522 | 5,267,075 | — | — | 5,267,075 | ||||||||||||||||||||||||
| International Opportunity Bond | — | 27,741 | — | 27,741 | — | — | 21,370 | 21,370 | ||||||||||||||||||||||||
| Appreciation & Income | 1,690,059 | 6,372 | — | 1,696,431 | 821,516 | 3,916,874 | — | 4,738,390 | ||||||||||||||||||||||||
| Alternative Dividend | — | — | — | — | — | — | — | — | ||||||||||||||||||||||||
| Large Cap Value | 564,042 | 14,258,077 | — | 14,822,119 | 365,644 | — | — | 365,644 | ||||||||||||||||||||||||
| Focused Large Cap Growth | — | 381,862 | — | 381,862 | — | — | — | — | ||||||||||||||||||||||||
| International Stock | 43,319 | — | — | 43,319 | 1,350,442 | 267,504 | — | 1,617,946 | ||||||||||||||||||||||||
| Real Estate Stock | 2,119,010 | 2,657,605 | — | 4,776,615 | 1,742,000 | 1,031,723 | — | 2,773,723 | ||||||||||||||||||||||||
| Small Cap Value | 98,604 | 847,224 | — | 945,828 | 1,508,308 | 390,462 | — | 1,898,770 | ||||||||||||||||||||||||
| Emerging Markets Stock | 504,601 | — | — | 504,601 | 537,526 | — | — | 537,526 | ||||||||||||||||||||||||
| Small Cap Growth | 911,397 | 1,784,747 | 78,354 | 2,774,498 | 407,082 | 2,332,537 | — | 2,739,619 | ||||||||||||||||||||||||
Permanent book and tax differences, primarily attributable to the reclass of net operating losses, short-term capital gains, and fund distributions and adjustments for non-deductible expenses, book/tax treatment of foreign currency exchange gains (losses), section 305(c) deemed dividend distributions, paydown gains (losses), C Corp return of capital, swap gains (losses), passive foreign investment companies, reclassifications of gains on contingent payment debt securities, real estate investment trusts, partnerships, grantor trusts, royalty trusts, corporation mergers, and the capitalization of in lieu dividend payments made in connection with short sales of stock that have not been held open for more than 45 days resulted in reclassification for the tax year ended October 31, 2016 as follows:
| Paid | Accumulated | Accumulated | ||||||||||
| In | Net Investment | Net Realized | ||||||||||
| Fund | Capital | Income (Loss) | Gains (Loss) | |||||||||
| Floating Rate Bond | $ | — | $ | — | $ | — | ||||||
| Monthly Distribution | — | 3,663,730 | (3,663,730 | ) | ||||||||
| Corporate/Government Bond | — | 70,902 | (70,902 | ) | ||||||||
| Dynamic Macro | (665,699 | ) | 73,163 | 592,536 | ||||||||
| High-Yield Bond | (706 | ) | 706 | — | ||||||||
| International Opportunity Bond | (1,032,496 | ) | (38,113 | ) | 1,070,609 | |||||||
| Appreciation & Income | — | (75,689 | ) | 75,689 | ||||||||
| Alternative Dividend | (3,177 | ) | 3,177 | — | ||||||||
| Large Cap Value | — | (74 | ) | 74 | ||||||||
| Focused Large Cap Growth | (701,668 | ) | 701,353 | 315 | ||||||||
| International Stock | (141,050 | ) | (747,044 | ) | 888,094 | |||||||
| Real Estate Stock | — | 1 | (1 | ) | ||||||||
| Small Cap Value | — | — | — | |||||||||
| Emerging Markets Stock | — | (123,512 | ) | 123,512 | ||||||||
| Small Cap Growth | (59,009 | ) | 59,009 | — | ||||||||
Net assets were unaffected by the above reclassifications.
116
| NOTES TO FINANCIAL STATEMENTS |
| October 31, 2016 (Continued) |
As of each of the Fund’s tax year-ended October 31, 2016, the components of distributable earnings on a tax basis were as follows:
| Undistributed | Undistributed | Post October | Capital Loss | Other | Unrealized | Total | ||||||||||||||||||||||
| Ordinary | Long-Term | Loss and | Carry | Book/Tax | Appreciation | Accumulated | ||||||||||||||||||||||
| Fund | Income | Capital Gains | Late Year Loss | Forwards | Differences | (Depreciation) | Earnings(Deficits) | |||||||||||||||||||||
| Floating Rate Bond | $ | 22,346 | $ | — | $ | — | $ | (2,132,469 | ) | $ | (9,758 | ) | $ | (267,630 | ) | $ | (2,387,511 | ) | ||||||||||
| Monthly Distribution | — | — | (798,060 | ) | (17,926,947 | ) | (790,114 | ) | (4,048,033 | ) | (23,563,154 | ) | ||||||||||||||||
| Corporate/Government Bond | 3,634 | — | — | (1,811,316 | ) | (242 | ) | 1,174,789 | (633,135 | ) | ||||||||||||||||||
| Dynamic Macro | — | — | (9,192 | ) | (2,546,135 | ) | — | 1,816,176 | (739,151 | ) | ||||||||||||||||||
| High-Yield Bond | 181,669 | — | — | (12,709,801 | ) | (13,868 | ) | 3,101,374 | (9,440,626 | ) | ||||||||||||||||||
| International Opportunity Bond | — | 254,196 | — | — | — | (599,611 | ) | (345,415 | ) | |||||||||||||||||||
| Appreciation & Income | 499,972 | — | — | (2,161,341 | ) | — | (650,029 | ) | (2,311,398 | ) | ||||||||||||||||||
| Alternative Dividend | 30,441 | — | — | (102,311 | ) | — | (415,523 | ) | (487,393 | ) | ||||||||||||||||||
| Large Cap Value | 739,323 | — | — | (944,869 | ) | — | 5,651,348 | 5,445,802 | ||||||||||||||||||||
| Focused Large Cap Growth | — | — | (402,872 | ) | (1,452,565 | ) | — | 13,032,336 | 11,176,899 | |||||||||||||||||||
| International Stock | — | — | — | (5,480,464 | ) | — | 5,609,674 | 129,210 | ||||||||||||||||||||
| Real Estate Stock | 1,673,832 | 3,748,342 | — | — | — | 4,051,567 | 9,473,741 | |||||||||||||||||||||
| Small Cap Value | 937,880 | 144,514 | — | — | — | 779,013 | 1,861,407 | |||||||||||||||||||||
| Emerging Markets Stock | 801,223 | — | — | (11,160,592 | ) | — | 5,108,035 | (5,251,334 | ) | |||||||||||||||||||
| Small Cap Growth | — | — | (123,870 | ) | (302,357 | ) | — | 2,325,999 | 1,899,772 | |||||||||||||||||||
The difference between book basis and tax basis unrealized appreciation (depreciation), undistributed net investment income/(loss) and accumulated net realized gain (loss) from security transactions are primarily attributable to the tax deferral of losses on wash sales and straddles, adjustments for gains on contingent convertible debt securities, the mark-to-market treatment of open forward foreign currency contracts, options, futures and swap contracts, and adjustments for section 305(c) deemed dividend distributions, real estate investment trusts, partnerships, passive foreign investment companies, royalty trusts, constructive sales of securities held short, straddles and C Corporation return of capital distributions. In addition, the amount listed under other book/tax differences are primarily attributable to the tax deferral of losses on straddles and constructive sales, and tax adjustments for accrued dividend payable.
Late year losses incurred after December 31 within the fiscal year are deemed to arise on the first business day of the following fiscal year for tax purposes. The Funds incurred and elected to defer such late year losses as follows:
| Late Year | ||||
| Fund | Losses | |||
| Floating Rate Bond | — | |||
| Monthly Distribution | 798,060 | |||
| Corporate/Government Bond | — | |||
| Dynamic Macro | 9,192 | |||
| High-Yield Bond | — | |||
| International Opportunity Bond | — | |||
| Appreciation & Income | — | |||
| Alternative Dividend | — | |||
| Large Cap Value | — | |||
| Focused Large Cap Growth | 402,872 | |||
| International Stock | — | |||
| Real Estate Stock | — | |||
| Small Cap Value | — | |||
| Emerging Markets Stock | — | |||
| Small Cap Growth | 123,870 | |||
117
| NOTES TO FINANCIAL STATEMENTS |
| October 31, 2016 (Continued) |
At October 31, 2016, the following Funds had capital loss carryforwards for federal income tax purposes available to offset future capital gains through the indicated expiration date as follows:
| Non-Expiring | Non-Expiring | |||||||||||||||
| Fund | Expiring | Short-Term | Long-Term | Total | ||||||||||||
| Floating Rate Bond | $ | — | $ | 627,353 | $ | 1,515,997 | $ | 2,143,350 | ||||||||
| Monthly Distribution | — | 5,380,806 | 12,546,141 | 17,926,947 | ||||||||||||
| Corporate/Government Bond | — | 502,249 | 1,309,067 | 1,811,316 | ||||||||||||
| Dynamic Macro | 152,058 | 1,943,448 | 450,629 | 2,546,135 | ||||||||||||
| High-Yield Bond | 3,403,542 | 3,648,764 | 5,657,495 | 12,709,801 | ||||||||||||
| International Opportunity Bond | — | — | — | — | ||||||||||||
| Appreciation & Income | — | — | 2,161,341 | 2,161,341 | ||||||||||||
| Alternative Dividend | — | 73,481 | 28,830 | 102,311 | ||||||||||||
| Large Cap Value | — | 944,869 | — | 944,869 | ||||||||||||
| Focused Large Cap Growth | — | 1,139,981 | 312,584 | 1,452,565 | ||||||||||||
| International Stock | — | 4,996,453 | 484,011 | 5,480,464 | ||||||||||||
| Real Estate Stock | — | — | — | — | ||||||||||||
| Small Cap Value | — | — | — | — | ||||||||||||
| Emerging Markets Stock | 3,737,864 | 6,242,039 | 1,180,689 | 11,160,592 | ||||||||||||
| Small Cap Growth | — | 302,357 | — | 302,357 | ||||||||||||
For Monthly Distribution, $674,128 of capital loss carryforward expired in the current fiscal year.
| 9. | LINE OF CREDIT |
Currently, the Funds have a $40,000,000 uncommitted line of credit provided by U.S. Bank National Association (the “Bank”) under an agreement (the “Uncommitted Line”). Any advance under the Uncommitted Line is contemplated primarily for temporary or emergency purposes, including the meeting of redemption requests that otherwise might require the untimely disposition of securities. Interest on borrowings is payable on an annualized basis. The Uncommitted Line is not a “committed” line of credit, which is to say that the Bank is not obligated to lend money to a Fund. Accordingly, it is possible that a Fund may wish to borrow money for a temporary or emergency purpose but may not be able to do so.
| 10. | SECURITIES LENDING |
The Funds have entered into a Securities Lending Agreement (“Agreement”) with the Bank. Each participating fund can lend their securities to brokers, dealers and other financial institutions approved by the Board to earn additional income. Loans are collateralized at a value at least equal to 105% of the then current Market Value of any loaned security that are foreign, or 102% of the then current market value of any other loaned security. All interest and dividend payments received on securities which are held as collateral, provided that there is no material default, will be paid to the respective Fund. A portion of the income generated by the investment in the collateral, net of any rebates paid by the Bank to the borrowers is remitted to the Bank as lending agent and the remainder is paid to the Fund(s).
Securities lending income, if any, is disclosed in the Fund’s Statement of Operations. Although risk is mitigated by the collateral, the Fund could experience a delay in recovering its securities and possible loss of income or value if the Borrower fails to return them. Should the borrower of the securities fail financially, each Fund has the right to repurchase the securities using the collateral in the open market.
118
| NOTES TO FINANCIAL STATEMENTS |
| October 31, 2016 (Continued) |
The following table presents financial instruments that are subject to enforceable netting arrangements as of October 31, 2016.
| Gross Amounts of Assets Presented in the Statements of Assets and Liabilities | ||||||||||||
| Market Value of | Market Value of | Percentage of Total | ||||||||||
| Fund | Loaned Securities | collateral (1) | Investment Income | |||||||||
| Floating Rate Bond | $ | 493,658 | $ | 493,658 | 0.00 | % | ||||||
| Monthly Distribution | 8,642,699 | 8,642,699 | 0.00 | % | ||||||||
| Corporate/Government Bond | 7,381,247 | 7,381,247 | 0.00 | % | ||||||||
| Dynamic Macro | 10,755,310 | 10,755,310 | 0.00 | % | ||||||||
| High-Yield Bond | 21,332,052 | 21,332,052 | 0.00 | % | ||||||||
| International Opportunity Bond | — | — | 0.00 | % | ||||||||
| Appreciation & Income | 4,096,292 | 4,096,292 | 0.00 | % | ||||||||
| Alternative Dividend | — | — | 0.00 | % | ||||||||
| Large Cap Value | 18,573,447 | 18,573,447 | 0.00 | % | ||||||||
| Focused Large Cap Growth | 14,852,759 | 14,852,759 | 0.00 | % | ||||||||
| International Stock | 5,684,575 | 5,684,575 | 0.00 | % | ||||||||
| Real Estate Stock | 12,573,071 | 12,573,071 | 0.00 | % | ||||||||
| Small Cap Value | 8,271,513 | 8,271,513 | 0.00 | % | ||||||||
| Emerging Markets Stock | — | — | 0.00 | % | ||||||||
| Small Cap Growth | 10,732,232 | 10,732,232 | 0.00 | % | ||||||||
| (1) | The amount is limited to the loaned securities and accordingly, does not include excess collateral pledged |
| 10. | NEW ACCOUNTING PRONOUNCEMENT |
On October 13, 2016 the Securities and Exchange Commission amended existing rules intended to modernize reporting and disclosure of information. These amendments relate to Regulation S-X which sets forth the form and content of financial statements. At this time, management is evaluating the implications of adopting these amendments and their impact on the financial statements and accompanying notes.
| 11. | SUBSEQUENT EVENTS |
Subsequent events after the date of the Statements of Assets and Liabilities have been evaluated through the date the financial statements were issued. Management has concluded that there is no impact requiring adjustment or disclosure in the financial statements relating to the Funds presented in this report.
119

REPORT OF INDEPENDENT REGISTERED PUBLIC ACCOUNTING FIRM
To the Board of Trustees and the Shareholders of the Dunham Funds
We have audited the accompanying statements of assets and liabilities of Dunham Floating Rate Bond Fund, Dunham Monthly Distribution Fund, Dunham Corporate/Government Bond Fund, Dunham Dynamic Macro Fund, Dunham High-Yield Bond Fund, Dunham International Opportunity Bond Fund, Dunham Appreciation & Income Fund, Dunham Large Cap Value Fund, Dunham Focused Large Cap Growth Fund, Dunham International Stock Fund, Dunham Real Estate Stock Fund, Dunham Small Cap Value Fund, Dunham Emerging Markets Stock Fund, and Dunham Small Cap Growth Fund, each a series of shares of beneficial interest in the Dunham Funds, including the schedules of investments, as of October 31, 2016, and the related statements of operations for the year then ended, the statements of changes in net assets for each of the years in the two-year period then ended and the financial highlights for each of the years or periods presented. We have also audited the statement of assets and liabilities of Dunham Alternative Dividend Fund, including the schedule of investments, as of October 31, 2016, and the related statement of operations, the statement of changes in net assets and the financial highlights for the period August 31, 2016 (commencement of operations) to October 31, 2016. These financial statements and financial highlights are the responsibility of the Funds’ management. Our responsibility is to express an opinion on these financial statements and financial highlights based on our audits.
We conducted our audits in accordance with the standards of the Public Company Accounting Oversight Board (United States). Those standards require that we plan and perform the audits to obtain reasonable assurance about whether the financial statements and financial highlights are free of material misstatement. An audit includes examining, on a test basis, evidence supporting the amounts and disclosures in the financial statements. Our procedures included confirmation of securities owned as of October 31, 2016 by correspondence with the custodian, agent banks, and brokers and by other appropriate auditing procedures where responses from agent banks and brokers were not received. An audit also includes assessing the accounting principles used and significant estimates made by management, as well as evaluating the overall financial statement presentation. We believe that our audits provide a reasonable basis for our opinion.
In our opinion, the financial statements and financial highlights referred to above present fairly, in all material respects, the financial position of the Dunham Funds as of October 31, 2016, and the results of their operations for the year or period then ended, the changes in their net assets for each of the years or period in the two-year period then ended and their financial highlights for each of the years or periods presented, in conformity with accounting principles generally accepted in the United States of America.

BBD, LLP
Philadelphia, Pennsylvania
December 30, 2016
120
| TRUSTEES & OFFICERS (Unaudited) |
Trustees and Officers of the Trust, together with information as to their principal business occupations during the last five years, are shown below. Each Trustee who is considered an “interested person” of the Trust (as defined in Section 2(a)(19) of the 1940 Act) is indicated by an asterisk next to his name. Unless otherwise noted, the address of each Trustee and Officer is 10251 Vista Sorrento Parkway, Suite 200, San Diego, CA 92121.
| Name, Age and Address | Position(s) Held with Trust | Term of Office and Length of Time Served ^ | Principal Occupation(s) During the Past 5 Years and Current Directorships | Number of Funds in the Trust Overseen by Trustee | Other Directorships |
| Non-Interested Trustees | |||||
| Timothy M. Considine 1501 Fifth Ave., Ste. 400, San Diego, CA 92101 Age: 76 | Trustee | Since January 2008 | Accountant, Considine & Considine (certified public accountant), 1960- present. | 16 | HomeFed Corp., 1992-present |
| Henry R. Goldstein 3403 S. Race St. Englewood, CO 80113 Age: 85 | Trustee | Since January 2008 | Self-employed consultant/mediator (financial services), 2009-present; Independent Contractor, RBC Daniels (financial services company for telecom industry), 2007-2009; Managing Director, Daniels & Associates (financial services company for telecom industry), 1998- 2007. | 16 | None |
| Paul A. Rosinack Age: 69 | Trustee | Since January 2008 | President/ Chief Executive Officer / Director, Qualigen, Inc., (manufacturer of medical products and equipment) 2004- present. | 16 | None |
| Interested Trustees and Officers | |||||
| Jeffrey A. Dunham* Age: 55 | Trustee, Chairman of Board, President & Principal Executive Officer | Since January 2008 | Chief Executive Officer, Dunham & Associates Investment Counsel, Inc. (registered investment adviser, broker-dealer and distributor for mutual funds), 1985-present; Chief Executive Officer, Dunham & Associates Holdings, Inc. (holding company), 1999-present; Chief Executive Officer, Dunham & Associates Securities, Inc. (general partner for various limited partnerships), 1986-present; Chief Executive Officer, Asset Managers, Inc. (general partner for various limited partnerships), 1985-present; Chairman and Chief Executive Officer, Dunham Trust Company, 1999-present. | 16 | None |
| Denise S. Iverson Age: 57 | Treasurer & Principal Financial Officer | Since January 2008 | Chief Financial Officer, Dunham & Associates Investment Counsel, Inc. (registered investment adviser, broker-dealer and distributor for mutual funds), 1999-present; Chief Financial Officer, Dunham & Associates Holdings, Inc. (holding company), 1999-present; Chief Financial Officer, Dunham & Associates Securities, Inc. (general partner for various limited partnerships), 1999-present; Chief Financial Officer, Asset Managers, Inc. (general partner for various limited partnerships), 1999-present; Chief Financial Officer and Director, Dunham Trust Company, 1999-present. | N/A | N/A |
| Joseph P. Kelly II Age: 41 | Chief Compliance Officer | Since January 2014 | General Counsel and Chief Compliance Officer, Dunham & Associates, Investment Counsel, Inc. (registered investment adviser, broker-dealer and distributor for mutual funds), November 2013-present; Senior Associate, Dechert LLP (law firm), 2005-October 2013. | N/A | N/A |
| Tamara Beth Wendoll Age: 45 | Secretary and AML Officer | Since October 2015 – Secretary (December 2008 - Assistant Secretary); Since September 2010 – AML Officer | Chief Operating Officer, Dunham & Associates Investment Counsel, Inc. (registered investment adviser, broker-dealer and distributor for mutual funds), 2008- present; Senior Executive Vice President, Marketing and Operations, Kelmoore Investment Co., Inc., 1998-2008. | N/A | N/A |
| Ryan Dykmans Age: 34 | Assistant Secretary | Since October 2015 | Director of Research, June 2013-present; Senior Investment Analyst from 2009- 2013, Dunham & Associates Investment Counsel, Inc. (registered investment adviser, broker-dealer and distributor for mutual funds). | N/A | N/A |
| James Colantino 80 Arkay Dr., Ste. 110 Hauppauge, NY 11788 Age: 47 | Assistant Treasurer | Since January 2008 | Senior Vice President-Fund Administration, 2012-present; Vice President, 2004- 2012; Senior Fund Administrator, 1999-2004, Gemini Fund Services, LLC. | N/A | N/A |
| ^ | Each Trustee will serve an indefinite term until his successor, if any, is duly elected and qualified. Officers of the Trust are elected annually. |
The Trust’s Statement of Additional Information includes additional information about the Trustees and is available free of charge, upon request, by calling toll-free at 1-888-3DUNHAM (338-6426).
121
FACTORS CONSIDERED BY THE INDEPENDENT TRUSTEES IN APPROVAL OF INVESTMENT ADVISORY AND SUB-ADVISORY AGREEMENTS
Meeting of the Board of Trustees Held on June 21, 2016
At a regular meeting (the “Meeting”) of the Board of Trustees (the “Board”) held on June 21, 2016, the Board, including a majority of the Trustees who are not interested persons of the Trust (the “Independent Trustees”), considered the approval of a new investment advisory agreement between the Trust and Dunham & Associates Investment Counsel, Inc. (the “Adviser”) (the “Investment Advisory Agreement”) and a new sub-advisory agreement among the Trust, the Adviser and Sungarden Fund Management, LLC (“Sungarden” or the “Sub-Adviser”) (the ” Sungarden Sub-Advisory Agreement” and together with the Investment Advisory Agreement, the (“Advisory Agreements”)) on behalf of the Dunham Alternative Dividend Fund (the “Fund”), a new series of the Trust. In connection with its review and approval of the Advisory Agreements, the Board considered materials furnished by Sungarden and the Adviser. At the Meeting, representatives from the Adviser and Sungarden presented information regarding Sungarden and the Fund, and responded to questions from the Trustees. The Board reviewed the terms of the Advisory Agreements, and discussed the performance goals and fulcrum fee arrangements set forth in the Sungarden Sub-Advisory Agreement. In their consideration of the proposed Advisory Agreements, the Board, including the Independent Trustees, did not identify any single factor as controlling, and the following summary does not detail all the matters considered. Matters considered by the Board, including the Independent Trustees, in connection with its approval of the Advisory Agreements included the following:
The matters considered by the Independent Trustees in connection with its approval of the Advisory Agreements with respect to Alternative Dividend, included the following:
Nature, Extent and Quality of Services. The Trustees discussed the qualifications of the Adviser’s and the Sub-Adviser’s key personnel. They noted the experience of the Adviser in managing mutual funds, its due diligence in recommending sub-advisers to the Board, negotiating fees and overseeing service providers. The Independent Trustees discussed that although the Sub-Adviser is a new firm, the Sub-Adviser’s lead portfolio manager and head of its investment committee, has prior experience managing a mutual fund. The Independent Trustees then discussed the other members of the portfolio management and research personnel of the Sub-Adviser and noted that they are well qualified to execute the Fund’s hedged investing strategy and the Adviser will provide the necessary oversight of the Sub-Adviser, particularly in the area of mutual fund regulations. The Independent Trustees also reviewed the Sub-Adviser’s compliance initiatives and its methodology, research and analysis for selecting investments. The Trustees discussed that the information provided indicated that the Adviser and Sub-Adviser have the resources and experience necessary to provide quality services to the Fund.
Performance. The Trustees considered the Adviser’s past performance with the existing Funds in the Trust, as well as other factors relating to the Adviser’s track record. The Board concluded that the Adviser’s past performance was acceptable. As for the performance of the Sub-Adviser, the Trustees reviewed data comparing the performance of the Sub-Adviser’s Hedged Dividend Composite to the Fund’s Benchmark Index, the Dow Jones Moderately Conservative Index, for the one-year and since inception (February 1, 2012) time periods through April 30, 2016. The Trustees
122
noted that the returns (gross of fees) for the Composite were reasonable over the longer-term. The Independent Trustees concluded that there is a reasonable expectation that the Sub-Adviser would obtain an acceptable level of investment return for prospective shareholders of the Fund.
Costs of Services and Profitability. As to the cost of the services to be provided and the profits to be realized by the Adviser and Sub-Adviser, the Trustees noted that the proposed advisory fee is consistent with fees paid by other equity funds in the Trust. With regard to the Sub-Adviser, they noted that the fulcrum fee results in a +/-30 basis points adjustment to the Fulcrum Base Fee of 60 basis points based on the performance of the Fund’s Class N shares versus the performance of the Benchmark Index. The Trustees discussed at length the operation of the Performance Fee and the impact on fees and expenses based on various performance results and took into account that the Fulcrum fee range of 0.30%-0.90% is below the minimum and maximum fees charged by the Sub-Adviser to other accounts. The Trustees concluded that the fee adjustments under the Fulcrum fee arrangement are reasonable and appropriate to reward or penalize outperformance or underperformance, respectively and would not be the result of immaterial performance variance. The Independent Trustees discussed information provided by the Adviser and Sub-Adviser, including comparative fee information and anticipated profits to be realized by the Adviser and Sub-Adviser in connection with the operation of the Fund. The Independent Trustees concluded that the Adviser and Sub-Adviser would not reap excessive profits from their relationships with the Fund.
Economies of Scale. As to the extent to which the Fund will realize economies of scale, the Trustees concluded that it would be unlikely that any material economies of scale would be achieved by the Fund in the initial term of the Agreements.
Conclusion. Having requested and received such information from the Adviser and Sub-Adviser as the Board believed to be reasonably necessary to evaluate the terms of the Advisory Agreements, and as assisted by the advice of independent counsel, the Board, including all of the Independent Trustees, unanimously concluded that the terms of the Investment Advisory Agreement and the Sungarden Sub-Advisory Agreement is in the best interests of Alternative Dividend and its prospective shareholders.
Meeting of the Board of Trustees Held on September 13, 2016
At a regular meeting of the Board held on September 13, 2016 (the “Meeting”), the Board considered the continuance of the Sub-Advisory Agreement with PENN Capital Management Co., Inc. (“PENN”) and the Trust (the “Penn Sub-Advisory Agreement”) with respect to the Dunham Appreciation & Income Fund (the “Fund”) and the continuance of the Sub-Advisory Agreement with Mellon Capital Management Corporation (“Mellon”) and the Trust (the “Mellon Sub-Advisory Agreement”) with respect to the Dunham Dynamic Macro Fund.
Dunham Appreciation & Income Fund
In connection with its review and approval of the Penn Sub-Advisory Agreement, the Board considered materials furnished by Penn and the Adviser, including information about, but not limited to, its personnel, operations and resources. The following is a summary of the information
123
reviewed and considered by the Trustees and does not detail all information reviewed and considered.
Matters considered by the Board, including the Independent Trustees, in connection with its approval of continuance of the Penn Sub-Advisory Agreement with respect to Appreciation & Income included the following:
Performance. As to investment performance, the Trustees reviewed the performance data of the Fund for the 1- year period and since Penn was appointed in October 2014, through the calendar quarter ended June 30, 2016. They compared the Fund to the average of a peer group of comparable funds selected by Penn, a group of funds in Morningstar’s convertibles category, the Fund’s benchmark index and another convertible fund that Penn sub-advises in a similar manner as the Fund (the “Other Account”) (collectively, the Penn Comparison Group”). The Trustees observed that for the 1 year period, the Fund underperformed the Penn Comparison Group, however, they noted the Adviser’s report that the performance over the last quarter had been more favorable. The Board considered that in light of the challenges presented by the concentrated nature of the portfolio, the additional volatility of the portfolio is not unexpected. The Trustees further noted adjustments made by Penn to try to manage volatility. The Trustees agreed to monitor the volatility and performance of the Fund and to reevaluate Penn over a longer term.
Nature, Extent and Quality of Services. As to the nature, quality and extent of the services provided by Penn, the Board considered the experience, qualifications and stability of Penn’s investment professionals. The Trustees took into account the Adviser’s overall satisfaction with Penn’s services, noted comments from the Adviser’s CCO regarding enhancements to Penn’s compliance personnel. The Trustees concluded that Penn has the resources necessary to provide quality advisory services to the Fund in a manner that is consistent with the Board’s expectations.
Cost of Services and Profitability. The Trustees discussed that the fulcrum fee is a +/-25 basis point adjustment to the base fee of 45 basis points based on the performance of the Fund’s Class N shares versus the performance benchmark for a fee range of 0.20% to 0.70% and that the sub-adviser earned 0.35% during the prior year. They noted that even with superior performance, the sub-adviser would earn a fee that is reasonable for services provided. The Trustees reviewed an analysis of profitability provided by the sub-adviser that showed that the sub-adviser is not yet earning a profit from its relationship with the Fund. The Board concluded that profitability is not a concern.
Economies of Scale. It was the consensus of the Board that in light of the small size of the Fund and the sub-adviser’s profitability analysis, economies of scale had not been achieved and the absence of breakpoints was acceptable at this time.
Conclusion. The Trustees relied upon the advice of counsel, and their own business judgment in determining the material factors to be considered in evaluating the Penn Sub-Advisory Agreement. During the Board’s deliberations, it was noted that the Trustees did not identify any single piece of information that was all important or controlling. Having requested and received such information from the sub-adviser as the Board believed to be reasonably necessary to evaluate the terms of the Penn Sub-Advisory Agreement, the Board, including a majority of the Independent Trustees, determined that the sub-advisory fee is reasonable and that continuance of the Penn Sub-Advisory Agreement is in the best interest of the Trust and shareholders of Appreciation & Income.
124
Dunham Dynamic Macro Portfolio
In connection with its review and approval of the Mellon Sub-Advisory Agreement, the Board considered materials furnished by Mellon and the Adviser, including information about, but not limited to, its personnel, operations and resources. The following is a summary of the information reviewed and considered by the Trustees and does not detail all information reviewed and considered.
Matters considered by the Board, including the Independent Trustees, in connection with its approval of continuance of the Mellon Sub-Advisory Agreement with respect to the Dunham Dynamic Macro Fund included the following:
Performance. As to investment performance, the Board reviewed the investment performance of the Fund as compared to the performance of the average of a peer group of funds, the average of the Morningstar multi-alternative category and a comparable benchmark index, the IQ Hedge Global Macro Beta Index, for the 1-year period and since Mellon began advising the Fund in October 2014 through June 30, 2016 (collectively, the “Mellon Comparison Group”). The Trustees noted that while the Fund underperformed the Mellon Comparison Group for the one-year period, it had significantly outperformed the Mellon Comparison Group since June 30, 2016. It was the consensus of the Board, including all the Independent Trustees, that the sub-adviser’s investment performance is satisfactory to warrant continuation of the Mellon Sub-Advisory Agreement.
Nature, Extent and Quality of Services. The Board examined the nature, extent and quality of the services provided by the sub-adviser to the Fund. Among other things, the Board considered the depth and qualifications of the sub-adviser’s personnel, including the experience of the Fund’s portfolio managers. The Trustees further considered the Adviser’s overall favorable assessment of the sub-adviser’s services, including the sub-adviser’s processes to try to manage volatility, and its culture of compliance. The Board concluded that the sub-adviser has sufficient quality and depth of personnel, resources, investment methods and compliance policies and procedures to provide satisfactory and reliable services to the Fund.
Cost of Services and Profitability. The Trustees discussed that the fulcrum fee is a +/-35 basis point adjustment to the base fee of 75 basis points based on the performance of the Fund’s Class N shares versus the performance benchmark for a fee range of 0.40% to 1.10% and that the sub-adviser earned 0.94% during the prior year. The Trustees, including the Independent Trustees, noted that based on information provided by Mellon, the maximum fee rate of 1.10%, which would only be earned if the Fund performed very well, is within the 0.80% to 1.60% fee range that, with one exception, is charged for similar global asset allocation strategies it manages. The Trustees reviewed an analysis of profitability provided by the Adviser and agreed that profitability did not appear to be excessive. The Board then took into account possible related benefits derived by Mellon from its relationship with the Fund. The Board concluded that, after further discussion of the profitability analysis provided, and in light of the complex nature of the Fund, excessive profitability from the sub-adviser’s relationship with the Fund was not an issue at this time
Economies of Scale. The Board noted that it did not appear that the Fund or the sub-adviser were achieving meaningful economies of scale and that the addition of break points was determined not to be necessary at this time.
125
Conclusion. The Trustees relied upon the advice of counsel, and their own business judgment in determining the material factors to be considered in evaluating the Mellon Sub-Advisory Agreement. During the Board’s deliberations, it was noted that the Trustees did not identify any single piece of information that was all important or controlling. Having requested and received such information from the sub-adviser as the Board believed to be reasonably necessary to evaluate the terms of the Mellon Sub-Advisory Agreement, the Board, including a majority of the Independent Trustees, determined that the sub-advisory fee is reasonable and that continuance of the Mellon Sub-Advisory Agreement is in the best interest of the Trust and shareholders of Dynamic Macro.
126
| DUNHAM FUNDS’ EXPENSES (Unaudited) |
Example
Shareholders of mutual funds will pay (1) transitional costs, such as sales load, and (2) ongoing expenses, such as advisory fees, distribution and service fees (12b-1), and other fund expenses. The following examples are intended to help you understand the ongoing cost (in dollars) of investing in a fund and to compare these costs with the ongoing costs of investing in other mutual funds. Please note, the expenses shown in the tables are meant to highlight ongoing costs only and do not reflect any transactional costs, such as sales charges (loads), or contingent deferred sales charges on redemptions which may be assessed by mutual funds. This Example is based on an investment of $1,000 invested at the beginning of the period and held for the entire period as indicated below.
Actual Expenses
The columns under the heading entitled “Actual” help you estimate the actual expenses you paid over the period. The “Actual-Ending Account Value” shown is derived from the Fund’s actual return, and the “Actual- Expenses Paid During Period” shows the dollar amount that would have been paid by an investor who started with $1,000 in the Fund. To estimate the expenses you paid on your account during this period, simply divide your account value by $1,000 (for example, an $8,600 account value divided by $1,000 = 8.6), then multiply the result by the number in the column under the heading entitled “Actual-Expenses Paid During Period”.
Hypothetical Examples for Comparison Purposes
The columns under the heading entitled “Hypothetical” provide information about hypothetical account value and hypothetical expenses based on the Fund’s actual expense ratio and an assumed rate of return of 5% per year before expenses, which is not the Fund’s actual return. The hypothetical account values and expenses may not be used to estimate the actual ending account balance or expenses you paid for the period. You may use this information to compare the ongoing costs of investing in the Fund and other funds. To do so, compare this 5% hypothetical example with the 5% hypothetical examples that appear in the shareholder reports of other funds.
Please note that the expenses shown in the table are meant to highlight your ongoing costs only and do not reflect any transactional costs which may be applicable to your account. Therefore, the last column of the table (Hypothetical- Expenses Paid During Period) is useful in comparing ongoing costs only, and will not help you determine the relative total costs of owning different funds. In addition, if these transactional costs were included, your costs would have been higher.
| Hypothetical | |||||||
| Actual | (5% return before expenses) | ||||||
| Fund’s | Beginning | Ending | Expenses | Ending | Expenses | ||
| Annualized | Account Value | Account Value | Paid During | Account Value | Paid During | ||
| Expense Ratio | 5/1/16 | 10/31/16 | Period* | 10/31/16 | Period* | ||
| Class N: | |||||||
| Floating Rate Bond Fund | 1.32% | $1,000.00 | $1,031.10 | $ 6.63 | $1,018.00 | $7.20 | |
| Monthly Distribution Fund | 1.77% | $1,000.00 | $1,021.10 | $ 8.99 | $1,015.69 | $9.53 | |
| Corporate/Government Bond Fund | 1.18% | $1,000.00 | $1,022.60 | $ 6.00 | $1,019.20 | $5.99 | |
| Dynamic Macro Fund | 1.54% | $1,000.00 | $1,019.00 | $ 7.82 | $1,017.39 | $7.81 | |
| High-Yield Bond Fund | 1.08% | $1,000.00 | $1,057,90 | $ 5.59 | $1,019.71 | $5.48 | |
| International Opportunity Bond Fund | 1.23% | $1,000.00 | $ 977.00 | $ 6.11 | $1,018.95 | $6.24 | |
| Appreciation & Income Fund | 1.42% | $1,000.00 | $1,048.20 | $ 7.31 | $1,018.00 | $7.20 | |
| Alternative Dividend Fund | 1.88% | $1,000.00 | $1,000.00 | $ 3.13 | $1,015.69 | $9.53 | |
| Large Cap Value Fund | 1.03% | $1,000.00 | $1,026.90 | $ 5.25 | $1,019.96 | $5.23 | |
| Focused Large Cap Growth Fund | 1.88% | $1,000.00 | $1,036.50 | $ 9.62 | $1,015.69 | $9.53 | |
| International Stock Fund | 1.58% | $1,000.00 | $1,025.90 | $ 8.05 | $1,017.19 | $ 8.01 | |
| Real Estate Stock Fund | 1.21% | $1,000.00 | $1,022.90 | $ 6.15 | $1,019.05 | $ 6.14 | |
| Small Cap Value Fund | 1.26% | $1,000.00 | $1,059.60 | $ 6.52 | $1,018.80 | $ 6.39 | |
| Emerging Markets Stock Fund | 1.26% | $1,000.00 | $1,076.10 | $ 6.58 | $1,018.80 | $ 6.39 | |
| Small Cap Growth Fund | 1.13% | $1,000.00 | $1,061.60 | $ 5.86 | $1,019.46 | $ 5.74 | |
| Class A: | |||||||
| Floating Rate Bond Fund | 1.57% | $1,000.00 | $1,028.70 | $ 7.88 | $1,016.74 | $ 8.47 | |
| Monthly Distribution Fund | 1.99% | $1,000.00 | $1,019.90 | $10.10 | $1,012.02 | $13.20 | |
| Corporate/Government Bond Fund | 1.42% | $1,000.00 | $1,021.30 | $ 7.21 | $1,018.00 | $ 7.20 | |
| Dynamic Macro Fund | 1.79% | $1,000.00 | $1,016.90 | $ 9.07 | $1,016.14 | $ 9.07 | |
| High-Yield Bond Fund | 1.33% | $1,000.00 | $1,057.30 | $ 6.88 | $1,018.45 | $ 6.75 | |
| International Opportunity Bond Fund | 1.48% | $1,000.00 | $ 975.90 | $ 7.35 | $1,017.70 | $ 7.51 | |
| Appreciation & Income Fund | 1.67% | $1,000.00 | $1,048.30 | $ 8.60 | $1,016.74 | $ 8.47 | |
| Alternative Dividend Fund | 2.61% | $1,000.00 | $1,000.00 | $ 4.35 | $1,012.02 | $13.20 | |
| Large Cap Value Fund | 1.28% | $1,000.00 | $1,025.30 | $ 6.52 | $1,018.70 | $ 6.50 | |
| Focused Large Cap Growth Fund | 2.61% | $1,000.00 | $1,035.50 | $13.35 | $1,012.02 | $13.20 | |
| International Stock Fund | 1.84% | $1,000.00 | $1,025.30 | $ 9.37 | $1,015.89 | $ 9.32 | |
| Real Estate Stock Fund | 1.45% | $1,000.00 | $1,021.70 | $ 7.37 | $1,017.85 | $ 7.35 | |
| Small Cap Value Fund | 1.52% | $1,000.00 | $1,059.30 | $ 7.87 | $1,017.50 | $ 7.71 | |
| Emerging Markets Stock Fund | 1.50% | $1,000.00 | $1,074.20 | $ 7.82 | $1,017.60 | $ 7.61 | |
| Small Cap Growth Fund | 1.48% | $1,000.00 | $1,060.00 | $ 7.66 | $1,017.70 | $ 7.51 | |
127
| YOUR FUNDS’ EXPENSES (Unaudited) (Continued) |
| Hypothetical | |||||||
| Actual | (5% return before expenses) | ||||||
| Fund’s | Beginning | Ending | Expenses | Ending | Expenses | ||
| Annualized | Account Value | Account Value | Paid During | Account Value | Paid During | ||
| Expense Ratio | 5/1/16 | 10/31/16 | Period* | 10/31/16 | Period* | ||
| Class C: | |||||||
| Floating Rate Bond Fund | 2.08% | $1,000.00 | $1,026.30 | $10.42 | $1,012.87 | $12.35 | |
| Monthly Distribution Fund | 2.33% | $1,000.00 | $1,016.20 | $11.81 | $1,011.36 | $13.85 | |
| Corporate/Government Bond Fund | 1.93% | $1,000.00 | $1,018.20 | $ 9.79 | $1,015.43 | $ 9.78 | |
| Dynamic Macro Fund | 2.54% | $1,000.00 | $1,013.10 | $12.85 | $1,012.37 | $12.85 | |
| High-Yield Bond Fund | 1.83% | $1,000.00 | $1,053.20 | $ 9.44 | $1,015.94 | $ 9.27 | |
| International Opportunity Bond Fund | 1.98% | $1,000.00 | $ 972.50 | $ 9.82 | $1,015.18 | $10.03 | |
| Appreciation & Income Fund | 2.44% | $1,000.00 | $1,043.80 | $12.54 | $1,012.87 | $12.35 | |
| Alternative Dividend Fund | 1.16% | $1,000.00 | $1,000.00 | $ 1.93 | $1,019.30 | $ 5.89 | |
| Large Cap Value Fund | 2.03% | $1,000.00 | $1,021.00 | $ 9.80 | $1,015.44 | $ 9.77 | |
| Focused Large Cap Growth Fund | 2.74% | $1,000.00 | $1,032.00 | $14.00 | $1,011.36 | $13.85 | |
| International Stock Fund | 2.62% | $1,000.00 | $1,021.00 | $10.31 | $1,014.93 | $10.28 | |
| Real Estate Stock Fund | 2.21% | $1,000.00 | $1,018.00 | $11.21 | $1,014.27 | $11.19 | |
| Small Cap Value Fund | 2.27% | $1,000.00 | $1,055.10 | $11.73 | $1,013.72 | $11.49 | |
| Emerging Markets Stock Fund | 2.25% | $1,000.00 | $1,070.70 | $11.71 | $1,013.83 | $11.39 | |
| Small Cap Growth Fund | 2.23% | $1,000.00 | $1,056.20 | $11.53 | $1,013.93 | $11.76 | |
| * | Expenses Paid During Period are equal to the Fund’s annualized expense ratio, multiplied by the average account value over the period, multiplied by 184 days and divided by 366 (to reflect the number of days in the six month period ending October 31, 2016). |
128
Privacy Notice
October 2016
| FACTS | WHAT DO THE DUNHAM FUNDS DO WITH YOUR PERSONAL INFORMATION? |
| Why? | Financial companies choose how they share your personal information. Federal law gives consumers the right to limit some but not all sharing. Federal law also requires us to tell you how we collect, share, and protect your personal information. Please read this notice carefully to understand what we do. |
| What? | The types of personal information we collect and share depend on the product or service you have with us. This information can include:
■ Social Security number and wire transfer instructions
■ account transactions and transaction history
■ investment experience and purchase history
When you are no longer a customer, we continue to share your information as described in this notice. |
| How? | All financial companies need to share customers’ personal information to run their everyday business. In the section below, we list the reasons financial companies can share their customers’ personal information; the reasons the Dunham Funds chooses to share; and whether you can limit this sharing. |
| Reasons we can share your personal information | Do Dunham Funds share? | Can you limit this sharing? |
| For our everyday business purposes - such as to process your transactions, maintain your account(s), respond to court orders and legal investigations, or report to credit bureaus | Yes | NO |
| For our marketing purposes - to offer our products and services to you | Yes | NO |
| For joint marketing with other financial companies | No | We don’t share |
| For our affiliates’ everyday business purposes - information about your transactions and experiences | No | We don’t share |
| For our affiliates’ everyday business purposes - information about your creditworthiness | No | We don’t share |
| For nonaffiliates to market to you | No | We don’t share |
| Questions? | Call (800) 442-4358 or go to www.dunham.com |
129
| What we do | |
| How do Dunham Funds protect my personal information? | To protect your personal information from unauthorized access and use, we use security measures that comply with federal law. These measures include computer safeguards and secured files and buildings.
We permit only authorized parties and affiliates (as permitted by law) who have signed an agreement (which protects your personal information) with us to have access to customer information. |
| How do Dunham Funds collect my personal information? | We collect your personal information, for example, when you ■ open and account or deposit money
■ direct us to buy securities or direct us to sell your securities
■ seek advice about your investments
We also collect your personal information from others, such as credit bureaus, affiliates, or other companies. |
| Why can’t I limit all sharing? | Federal law gives you the right to limit only ■ sharing for affiliates’ everyday business purposes-information about your creditworthiness
■ affiliates from using your information to market to you
■ sharing for nonaffiliates to market to you
State laws and individual companies may give you additional rights to limit sharing. |
| Definitions | |
| Affiliates | Companies related by common ownership or control. They can be financial and nonfinancial companies.
■ Our affiliates include financial companies, such as Dunham & Associates Investment Counsel, Inc. |
| Nonaffiliates | Companies not related by common ownership or control. They can be financial and nonfinancial companies.
■ Dunham Funds do not share with nonaffiliates so they can market to you. |
| Joint marketing | A formal agreement between nonaffiliated financial companies that together market financial products or services to you.
■ Dunham Funds doesn’t jointly market |
130
How to Obtain Proxy Voting Information
Information regarding how the Funds voted proxies relating to portfolio securities for the most recent 12-month period ended June 30 as well as a description of the policies and procedures that the Funds use to determine how to vote proxies is available without charge, upon request, by calling (888)-3DUNHAM (338-6426) or by referring to the Securities and Exchange Commission’s (“SEC”) website at http://www.sec.gov.
How to Obtain 1st and 3rd Fiscal Quarter Portfolio Holdings
Each Fund files its complete schedule of portfolio holdings with the SEC for the first and third quarters of each fiscal year on Form N-Q. Form N-Q is available on the SEC’s website at http://www.sec.gov and may be reviewed and copied at the SEC’s Public Reference Room in Washington, DC (800)-SEC-0330. The information on Form N-Q is available without charge, upon request, by calling (888)-3DUNHAM (338-6426).

P.O. Box 910309
San Diego, California 92191
(800) 442-4358
Distributed by Dunham & Associates Investment Counsel, Inc. Member FINRA/SIPC.
THIS REPORT AND FINANCIAL STATEMENTS CONTAINED HEREIN ARE NOT INTENDED TO BE A FORECAST OF FUTURE EVENTS, A GUARANTEE OF FUTURE RESULTS, OR INVESTMENT ADVICE. FURTHER, THERE IS NO ASSURANCE THAT CERTAIN SECURITIES WILL REMAIN IN OR OUT OF EACH FUND’S PORTFOLIO.
THE FIGURES IN THIS REPORT REPRESENT PAST PERFORMANCE AND DO NOT GUARANTEE FUTURE RESULTS. THE PRINCIPAL VALUE OF AN INVESTMENT AND INVESTMENT RETURN WILL FLUCTUATE SO THAT AN INVESTOR’S SHARES, WHEN REDEEMED, MAY BE WORTH MORE OR LESS THAN THEIR ORIGINAL COST.
Item 2. Code of Ethics.
(a) As of the end of the period covered by this report, the registrant has adopted a code of ethics that applies to the registrant's principal executive officer, principal financial officer, principal accounting officer or controller, or persons performing similar functions, regardless of whether these individuals are employed by the registrant or a third party.
(b) For purposes of this item, “code of ethics” means written standards that are reasonably designed to deter wrongdoing and to promote:
| (1) | Honest and ethical conduct, including the ethical handling of actual or apparent conflicts of interest between personal and professional relationships; |
| (2) | Full, fair, accurate, timely, and understandable disclosure in reports and documents that a registrant files with, or submits to, the Commission and in other public communications made by the registrant; |
(3) Compliance with applicable governmental laws, rules, and regulations;
| (4) | The prompt internal reporting of violations of the code to an appropriate person or persons identified in the code; and |
(5) Accountability for adherence to the code.
(c) Amendments:
During the period covered by the report, there have not been any amendments to the provisions of the code of ethics.
(d) Waivers:
During the period covered by the report, the registrant has not granted any express or implicit waivers from the provisions of the code of ethics.
Item 3. Audit Committee Financial Expert.
(a) The Board has determined, based on questionnaires completed by the Audit Committee members, that Timothy M. Considine is an audit committee financial expert. Mr. Considine is independent for purposes of this Item 3.
Item 4. Principal Accountant Fees and Services.
| (a) | Audit Fees |
FY 2016 $ 181,600
FY 2015 $ 192,000
| (b) | Audit-Related Fees |
FY 2016 $ 0
FY 2015 $ 0
Nature of the fees:
| (c) | Tax Fees |
FY 2016 $ 30,000
FY 2015 $ 32,000
Nature of the fees: Preparation of federal and state tax returns and review of annual dividend calculations.
| (d) | All Other Fees |
| Registrant | Adviser | |||||||||
| FY 2016 | $ | 0 | $ | 0 | ||||||
| FY 2015 | $ | 0 | $ | 0 | ||||||
Nature of the fees:
| (e) | (1) Audit Committee’s Pre-Approval Policies |
The registrant’s Audit Committee is required to pre-approve all audit services and, when appropriate, any non-audit services (including audit-related, tax and all other services) to the registrant. The registrant’s Audit Committee is also required to pre-approve, when appropriate, any non-audit services (including audit-related, tax and all other services) to its adviser, or any entity controlling, controlled by or under common control with the adviser that provides ongoing services to the registrant to the extent that the services are determined to have a direct impact on the operations or financial reporting of the registrant. Services are reviewed on an engagement by engagement basis by the audit committee.
| (2) | Percentages of 2016 Services Approved by the Audit Committee |
| Registrant | Adviser | |||||||
| Audit-Related Fees: | 0 | % | 0 | % | ||||
| Tax Fees: | 0 | % | 0 | % | ||||
| All Other Fees: | 0 | % | 0 | % | ||||
(f) During audit of registrant's financial statements for the most recent fiscal year, less than 50 percent of the hours expended on the principal accountant's engagement were attributed to work performed by persons other than the principal accountant's full-time, permanent employees.
(g) The aggregate non-audit fees billed by the registrant's accountant for services rendered to the registrant, and rendered to the registrant's investment adviser (not including any sub-adviser whose role is primarily portfolio management and is subcontracted with or overseen by another investment adviser), and any entity controlling, controlled by, or under common control with the adviser that provides ongoing services to the registrant:
| Registrant | Adviser | |||||||||
| FY 2016 | $ | 30,000 | $ None | |||||||
| FY 2015 | $ | 32,000 | $ None | |||||||
(h) Not applicable. All non-audit services to the registrant were pre-approved by the Audit Committee for FY 2011
Item 5. Audit Committee of Listed Companies. Not applicable to open-end investment companies.
Item 6. Schedule of Investments. Schedule of investments in securities of unaffiliated issuers is included under Item 1.
Item 7. Disclosure of Proxy Voting Policies and Procedures for Closed-End Funds. Not applicable to open-end investment companies.
Item 8. Portfolio Managers of Closed-End Funds. Not applicable to open-end investment companies.
Item 9. Purchases of Equity Securities by Closed-End Funds. Not applicable to open-end investment companies.
Item 10. Submission of Matters to a Vote of Security Holders. None
Item 11. Controls and Procedures.
(a) Based on an evaluation of the registrant’s disclosure controls and procedures as of a date within 90 days of filing date of this Form N-CSR, the disclosure controls and procedures are reasonably designed to ensure that the information required in filings on Forms N-CSR is recorded, processed, summarized, and reported on a timely basis.
(b) There were no significant changes in the registrant’s internal control over financial reporting that occurred during the registrant’s last fiscal half-year that have materially affected, or are reasonably likely to materially affect, the registrant’s internal control over financial reporting.
Item 12. Exhibits.
(a)(1) Code of Ethics filed herewith.
(a)(2) Certifications required by Section 302 of the Sarbanes-Oxley Act of 2002 (and Item 11(a)(2) of Form N-CSR) are filed herewith..
(a)(3) Not applicable.
(b) Certifications required by Section 906 of the Sarbanes-Oxley Act of 2002 (and Item 11(b) of Form N-CSR) are filed herewith.
SIGNATURES
Pursuant to the requirements of the Securities Exchange Act of 1934 and the Investment Company Act of 1940, the registrant has duly caused this report to be signed on its behalf by the undersigned, thereunto duly authorized.
(Registrant) Dunham Funds
By (Signature and Title)
/s/Jeffrey Dunham
Jeffrey Dunham, President
Date 1/9/17
Pursuant to the requirements of the Securities Exchange Act of 1934 and the Investment Company Act of 1940, this report has been signed below by the following persons on behalf of the registrant and in the capacities and on the dates indicated.
By (Signature and Title)
/s/Jeffrey Dunham
Jeffrey Dunham, President
Date 1/9/17
By (Signature and Title)
/s/Denise Iverson
Denise Iverson, Treasurer
Date 1/9/17