UNITED STATES
SECURITIES AND EXCHANGE COMMISSION
Washington, D.C. 20549
FORM N-CSR
CERTIFIED SHAREHOLDER REPORT OF REGISTERED MANAGEMENT INVESTMENT COMPANIES
Investment Company Act file number 811-22245
First Trust Exchange-Traded Fund III
(Exact name of registrant as specified in charter)
120 East Liberty Drive, Suite 400
Wheaton, IL 60187
(Address of principal executive offices) (Zip code)
W. Scott Jardine, Esq.
First Trust Portfolios L.P.
120 East Liberty Drive, Suite 400
Wheaton, IL 60187
(Name and address of agent for service)
Registrant’s telephone number, including area code: (630) 765-8000
Date of fiscal year end: July 31
Date of reporting period: July 31, 2023
Form N-CSR is to be used by management investment companies to file reports with the Commission not later than 10 days after the transmission to stockholders of any report that is required to be transmitted to stockholders under Rule 30e-1 under the Investment Company Act of 1940 (17 CFR 270.30e-1). The Commission may use the information provided on Form N-CSR in its regulatory, disclosure review, inspection, and policymaking roles.
A registrant is required to disclose the information specified by Form N-CSR, and the Commission will make this information public. A registrant is not required to respond to the collection of information contained in Form N-CSR unless the Form displays a currently valid Office of Management and Budget ("OMB") control number. Please direct comments concerning the accuracy of the information collection burden estimate and any suggestions for reducing the burden to Secretary, Securities and Exchange Commission, 100 F Street, NE, Washington, DC 20549-0609. The OMB has reviewed this collection of information under the clearance requirements of 44 U.S.C. § 3507.
Item 1. Report to Stockholders.
| (a) | | The registrant’s annual report transmitted to shareholders pursuant to Rule 30e-1 under the Investment Company Act of 1940 is as follows: |
First Trust Exchange-Traded Fund III
First Trust Horizon Managed Volatility Domestic ETF (HUSV)
First Trust Horizon Managed Volatility Developed International ETF (HDMV)
First Trust Horizon Managed Volatility Small/Mid ETF (HSMV)
Annual Report
For the Year Ended
July 31, 2023
First Trust Exchange-Traded Fund III
Annual Report
July 31, 2023
Caution Regarding Forward-Looking Statements
This report contains certain forward-looking statements within the meaning of the Securities Act of 1933, as amended, and the Securities Exchange Act of 1934, as amended. Forward-looking statements include statements regarding the goals, beliefs, plans or current expectations of First Trust Advisors L.P. (“First Trust” or the “Advisor”) and/or Horizon Investments, LLC (“Horizon” or the “Sub-Advisor”) and their respective representatives, taking into account the information currently available to them. Forward-looking statements include all statements that do not relate solely to current or historical fact. For example, forward-looking statements include the use of words such as “anticipate,” “estimate,” “intend,” “expect,” “believe,” “plan,” “may,” “should,” “would” or other words that convey uncertainty of future events or outcomes.
Forward-looking statements involve known and unknown risks, uncertainties and other factors that may cause the actual results, performance or achievements of any series of First Trust Exchange-Traded Fund III (the “Trust”) described in this report (each such series is referred to as a “Fund” and collectively, the “Funds”) to be materially different from any future results, performance or achievements expressed or implied by the forward-looking statements. When evaluating the information included in this report, you are cautioned not to place undue reliance on these forward-looking statements, which reflect the judgment of the Advisor and/or Sub-Advisor and their respective representatives only as of the date hereof. We undertake no obligation to publicly revise or update these forward-looking statements to reflect events and circumstances that arise after the date hereof.
Performance and Risk Disclosure
There is no assurance that any Fund described in this report will achieve its investment objective. Each Fund is subject to market risk, which is the possibility that the market values of securities owned by the Fund will decline and that the value of the Fund’s shares may therefore be less than what you paid for them. Accordingly, you can lose money by investing in a Fund. See “Risk Considerations” in the Additional Information section of this report for a discussion of certain other risks of investing in the Funds.
Performance data quoted represents past performance, which is no guarantee of future results, and current performance may be lower or higher than the figures shown. For the most recent month-end performance figures, please visit www.ftportfolios.com or speak with your financial advisor. Investment returns, net asset value and share price will fluctuate and Fund shares, when sold, may be worth more or less than their original cost.
The Advisor may also periodically provide additional information on Fund performance on each Fund’s web page at www.ftportfolios.com.
How to Read This Report
This report contains information that may help you evaluate your investment. It includes details about each Fund and presents data and analysis that provide insight into each Fund’s performance and investment approach.
By reading the portfolio commentary by the portfolio management team of each Fund, you may obtain an understanding of how the market environment affected each Fund’s performance. The statistical information that follows may help you understand each Fund’s performance compared to that of a relevant market benchmark.
It is important to keep in mind that the opinions expressed by personnel of the Advisor and/or Sub-Advisor are just that: informed opinions. They should not be considered to be promises or advice. The opinions, like the statistics, cover the period through the date on the cover of this report. The material risks of investing in each Fund are spelled out in the prospectus, the statement of additional information, and other Fund regulatory filings.
First Trust Exchange-Traded Fund III
Annual Letter from the Chairman and CEO
July 31, 2023
Dear Shareholders,
First Trust is pleased to provide you with the annual report for the Managed Volatility Funds of First Trust Exchange-Traded Fund III (the “Funds”), which contains detailed information about the Funds for the 12-month period ended July 31, 2023.
In a widely unexpected announcement, Fitch Ratings (“Fitch”), a provider of credit ratings, commentary, and research, downgraded the credit rating of the United States government from its highest rating of AAA to its second-highest rating of AA+ on August 1, 2023. The move marks the first time the U.S. government’s credit rating has been downgraded since 2011. Fitch cited the heightened potential of a near-term economic recession in the U.S. as well as the rising interest burden of government debt as two factors that contributed to their decision to implement the downgrade. We will leave it to the pundits to debate whether the downgrade was warranted or not. What we would like to see is a reduction in government spending. As of June 30, 2023, the U.S. government’s deficit stood at $1.39 trillion, already above the 2022 full year deficit of $1.37 trillion, according to Brian Wesbury, Chief Economist at First Trust. As Fitch noted in the press release of its downgrade, the interest burden on U.S. government debt, among other factors, is expected to catapult the general government deficit to 6.3% of gross domestic product (“GDP”) in 2023, up from 3.7% in 2022.
The Federal Reserve (the “Fed”) has made significant progress in its battle with rising prices. Inflation, as measured by the twelve-month trailing rate on the Consumer Price Index (“CPI”), stood at 3.2% on July 31, 2023, down significantly from its most recent high of 9.1% set on June 30, 2022, but up from 3.0% on June 30, 2023. While a reduction in the CPI is welcome, the metric remains well-above the Fed’s goal of 2.0%. Should the CPI remain stubbornly high, it may prompt further increases to the Federal Funds target rate over the coming months, which could hamper economic growth, in our opinion. That said, U.S. GDP has remained resilient, growing over each of the last four quarters (through June 30, 2023).
Whether the U.S. can avoid an economic recession over the coming months remains to be seen. As mentioned above, despite tighter monetary policy, the U.S. economy posted positive changes to GDP over each of the last four quarters. We continue to hope for a “soft landing,” but also keep our eyes fixated on the data.
Thank you for giving First Trust the opportunity to play a role in your financial future. We value our relationship with you and will report on the Funds again in six months.
Sincerely,
James A. Bowen
Chairman of the Board of Trustees
Chief Executive Officer of First Trust Advisors L.P.
Fund Performance Overview (Unaudited)
First Trust Horizon Managed Volatility Domestic ETF (HUSV)
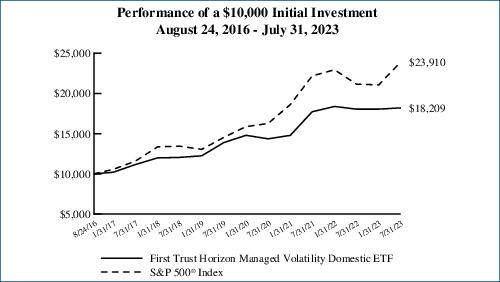
The investment objective of First Trust Horizon Managed Volatility Domestic ETF (the “Fund”) is to provide capital appreciation. Under normal market conditions, the Fund seeks to achieve its investment objective by investing at least 80% of its net assets (including investment borrowings) in common stocks of domestic companies listed and traded on U.S. national securities exchanges that Horizon Investments, LLC (“Horizon” or the “Sub-Advisor”) believes exhibit low future expected volatility. The goal of this strategy is to capture upside price movements in rising markets and reduce downside risk when markets decline. To implement this strategy, the Sub-Advisor employs volatility forecasting models to forecast future expected volatility. The strategy is largely quantitative and rules-based, but also includes multiple parameters over which the Sub-Advisor may exercise discretion (including, but not limited to, the number of holdings and the weightings of particular holdings) in connection with its active management of the Fund. Shares of the Fund are listed and trade on the NYSE Arca, Inc. under the ticker symbol “HUSV.” The first day of secondary market trading in shares of the Fund was August 25, 2016.
| Performance | | | | | | |
| | | Average Annual Total Returns | | Cumulative Total Returns |
| | 1 Year
Ended
7/31/23 | 5 Years
Ended
7/31/23 | Inception
(8/24/16)
to 7/31/23 | | 5 Years
Ended
7/31/23 | Inception
(8/24/16)
to 7/31/23 |
| Fund Performance | | | | | | |
| NAV | 0.88% | 8.61% | 9.03% | | 51.14% | 82.09% |
| Market Price | 0.85% | 8.57% | 9.02% | | 50.84% | 82.03% |
| Index Performance | | | | | | |
| S&P 500® Index | 13.02% | 12.20% | 13.40% | | 77.78% | 139.10% |
(See Notes to Fund Performance Overview on page 9.)
Fund Performance Overview (Unaudited) (Continued)
First Trust Horizon Managed Volatility Domestic ETF (HUSV) (Continued)
| Sector Allocation | % of Total
Long-Term
Investments |
| Information Technology | 17.6% |
| Consumer Staples | 16.8 |
| Health Care | 13.5 |
| Industrials | 13.1 |
| Financials | 12.1 |
| Consumer Discretionary | 10.3 |
| Utilities | 5.5 |
| Real Estate | 3.8 |
| Communication Services | 3.5 |
| Materials | 2.3 |
| Energy | 1.5 |
| Total | 100.0% |
| Top Ten Holdings | % of Total
Long-Term
Investments |
| International Business Machines Corp. | 2.7% |
| Roper Technologies, Inc. | 2.6 |
| Cisco Systems, Inc. | 2.5 |
| Coca-Cola (The) Co. | 2.5 |
| McDonald’s Corp. | 2.4 |
| Johnson & Johnson | 2.4 |
| Yum! Brands, Inc. | 2.3 |
| PepsiCo, Inc. | 2.0 |
| Motorola Solutions, Inc. | 1.8 |
| Amphenol Corp., Class A | 1.8 |
| Total | 23.0% |
Performance figures assume reinvestment of all distributions and do not reflect the deduction of taxes that a shareholder would pay on Fund distributions or the redemption or sale of Fund shares. An index is a statistical composite that tracks a specified financial market or sector. Unlike the Fund, the index does not actually hold a portfolio of securities and therefore does not incur the expenses incurred by the Fund. These expenses negatively impact the performance of the Fund. The Fund’s past performance does not predict future performance.
Frequency Distribution of Discounts and Premiums
Information showing the number of days the market price of the Fund’s shares was greater (at a premium) and less (at a discount) than the Fund’s net asset value for the most recently completed year, and the most recently completed calendar quarters since that year (or life of the Fund, if shorter), is available at https://www.ftportfolios.com/Retail/etf/home.aspx.
Fund Performance Overview (Unaudited) (Continued)
First Trust Horizon Managed Volatility Developed International ETF (HDMV)
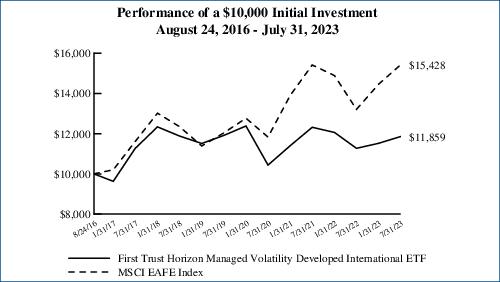
The investment objective of First Trust Horizon Managed Volatility Developed International ETF (the “Fund”) is to provide capital appreciation. Under normal market conditions, the Fund seeks to achieve its investment objective by investing at least 80% of its net assets (including investment borrowings) in common stocks and depositary receipts of developed market companies listed and traded on non-U.S. exchanges that Horizon Investments, LLC (“Horizon” or the “Sub-Advisor”) believes exhibit low future expected volatility. The term “developed market companies” means those companies (i) whose securities are traded principally on a stock exchange in a developed market country, (ii) with a primary business office in a developed market country, or (iii) that have at least 50% of their assets in, or derive at least 50% of their revenues or profits from, a developed market country. The Sub-Advisor considers Australia, Austria, Belgium, Canada, Denmark, Finland, France, Germany, Hong Kong, Ireland, Israel, Italy, Japan, Luxembourg, the Netherlands, New Zealand, Norway, Portugal, Singapore, Spain, Sweden, Switzerland, the United Kingdom and the United States to be developed market countries. However, this list may change in response to market and geopolitical events. Under normal market conditions, the Fund will invest in at least three countries and at least 40% of its net assets in countries other than the United States. Shares of the Fund are listed and trade on the NYSE Arca, Inc. under the ticker symbol “HDMV.” The first day of secondary market trading in shares of the Fund was August 25, 2016.
| Performance | | | | | | |
| | | Average Annual Total Returns | | Cumulative Total Returns |
| | 1 Year
Ended
7/31/23 | 5 Years
Ended
7/31/23 | Inception
(8/24/16)
to 7/31/23 | | 5 Years
Ended
7/31/23 | Inception
(8/24/16)
to 7/31/23 |
| Fund Performance | | | | | | |
| NAV | 5.22% | -0.04% | 2.49% | | -0.22% | 18.59% |
| Market Price | 5.16% | -0.18% | 2.47% | | -0.91% | 18.41% |
| Index Performance | | | | | | |
| MSCI EAFE Index | 16.79% | 4.55% | 6.45% | | 24.89% | 54.28% |
(See Notes to Fund Performance Overview on page 9.)
Fund Performance Overview (Unaudited) (Continued)
First Trust Horizon Managed Volatility Developed International ETF (HDMV) (Continued)
| Sector Allocation | % of Total
Long-Term
Investments |
| Consumer Staples | 21.2% |
| Industrials | 19.1 |
| Financials | 14.5 |
| Communication Services | 11.4 |
| Utilities | 8.3 |
| Real Estate | 7.3 |
| Consumer Discretionary | 6.4 |
| Health Care | 5.7 |
| Information Technology | 3.8 |
| Materials | 1.8 |
| Energy | 0.5 |
| Total | 100.0% |
| Top Ten Holdings | % of Total
Long-Term
Investments |
| Oversea-Chinese Banking Corp., Ltd. | 2.0% |
| Singapore Exchange Ltd. | 1.9 |
| MTR Corp., Ltd. | 1.7 |
| SoftBank Corp. | 1.6 |
| Henkel AG & Co., KGaA | 1.6 |
| Power Assets Holdings Ltd. | 1.5 |
| United Overseas Bank Ltd. | 1.5 |
| Unilever PLC | 1.5 |
| Iberdrola S.A. | 1.4 |
| Koninklijke KPN N.V. | 1.4 |
| Total | 16.1% |
Performance figures assume reinvestment of all distributions and do not reflect the deduction of taxes that a shareholder would pay on Fund distributions or the redemption or sale of Fund shares. An index is a statistical composite that tracks a specified financial market or sector. Unlike the Fund, the index does not actually hold a portfolio of securities and therefore does not incur the expenses incurred by the Fund. These expenses negatively impact the performance of the Fund. The Fund’s past performance does not predict future performance.
Frequency Distribution of Discounts and Premiums
Information showing the number of days the market price of the Fund’s shares was greater (at a premium) and less (at a discount) than the Fund’s net asset value for the most recently completed year, and the most recently completed calendar quarters since that year (or life of the Fund, if shorter), is available at https://www.ftportfolios.com/Retail/etf/home.aspx.
Fund Performance Overview (Unaudited) (Continued)
First Trust Horizon Managed Volatility Small/Mid ETF (HSMV)
The investment objective of First Trust Horizon Managed Volatility Small/Mid ETF (the “Fund”) is to seek to provide investors with capital appreciation. Under normal market conditions, the Fund seeks to achieve its investment objective by investing at least 80% of its net assets (including investment borrowings) in small- and/or mid-capitalization common stocks listed and traded on U.S. national securities exchanges that Horizon Investments, LLC (“Horizon” or the “Sub-Advisor”) believes exhibit low future expected volatility. The goal of this strategy is to capture upside price movements in rising markets and reduce downside risk when markets decline. To implement this strategy, the Sub-Advisor employs volatility forecasting models to forecast future expected volatility. The strategy is largely quantitative and rules-based, but also includes multiple parameters over which the Sub-Advisor may exercise discretion (including, but not limited to, the number of holdings and the weightings of particular holdings) in connection with its active management of the Fund. Shares of the Fund are listed and trade on the NYSE Arca, Inc. under the ticker symbol “HSMV.” The first day of secondary market trading in shares of the Fund was April 7, 2020.
| Performance | | | |
| | | Average Annual
Total Returns | Cumulative
Total Returns |
| | 1 Year Ended
7/31/23 | Inception (4/6/20)
to 7/31/23 | Inception (4/6/20)
to 7/31/23 |
| Fund Performance | | | |
| NAV | 0.57% | 14.39% | 56.22% |
| Market Price | 0.54% | 14.37% | 56.12% |
| Index Performance | | | |
| S&P 1000® Index | 8.89% | 23.01% | 98.82% |
(See Notes to Fund Performance Overview on page 9.)
Fund Performance Overview (Unaudited) (Continued)
First Trust Horizon Managed Volatility Small/Mid ETF (HSMV) (Continued)
| Sector Allocation | % of Total
Long-Term
Investments |
| Industrials | 21.5% |
| Real Estate | 15.9 |
| Financials | 15.1 |
| Utilities | 10.7 |
| Consumer Discretionary | 8.0 |
| Information Technology | 7.5 |
| Health Care | 6.7 |
| Materials | 6.3 |
| Consumer Staples | 6.2 |
| Communication Services | 1.4 |
| Energy | 0.7 |
| Total | 100.0% |
| Top Ten Holdings | % of Total
Long-Term
Investments |
| Retail Opportunity Investments Corp. | 0.9% |
| Corporate Office Properties Trust | 0.8 |
| Carlisle Cos., Inc. | 0.8 |
| RPM International, Inc. | 0.8 |
| EMCOR Group, Inc. | 0.8 |
| Gentex Corp. | 0.8 |
| Jabil, Inc. | 0.8 |
| New York Times (The) Co., Class A | 0.8 |
| Commerce Bancshares, Inc. | 0.8 |
| CommVault Systems, Inc. | 0.8 |
| Total | 8.1% |

Performance figures assume reinvestment of all distributions and do not reflect the deduction of taxes that a shareholder would pay on Fund distributions or the redemption or sale of Fund shares. An index is a statistical composite that tracks a specified financial market or sector. Unlike the Fund, the index does not actually hold a portfolio of securities and therefore does not incur the expenses incurred by the Fund. These expenses negatively impact the performance of the Fund. The Fund’s past performance does not predict future performance.
Frequency Distribution of Discounts and Premiums
Information showing the number of days the market price of the Fund’s shares was greater (at a premium) and less (at a discount) than the Fund’s net asset value for the most recently completed year, and the most recently completed calendar quarters since that year (or life of the Fund, if shorter), is available at https://www.ftportfolios.com/Retail/etf/home.aspx.
Notes to Fund Performance Overview (Unaudited)
Total returns for the periods since inception are calculated from the inception date of each Fund. “Average Annual Total Returns” represent the average annual change in value of an investment over the periods indicated. “Cumulative Total Returns” represent the total change in value of an investment over the periods indicated.
Each Fund’s per share net asset value (“NAV”) is the value of one share of the Fund and is computed by dividing the value of all assets of the Fund (including accrued interest and dividends), less all liabilities (including accrued expenses and dividends declared but unpaid), by the total number of outstanding shares. The price used to calculate market return (“Market Price”) is determined by using the midpoint of the national best bid and offer price (“NBBO”) as of the time that the Fund’s NAV is calculated. Under SEC rules, the NBBO consists of the highest displayed buy and lowest sell prices among the various exchanges trading the Fund at the time the Fund’s NAV is calculated. Prior to January 1, 2019, the price used was the midpoint between the highest bid and the lowest offer on the stock exchange on which shares of the Fund were listed for trading as of the time that the Fund’s NAV was calculated. Since shares of each Fund did not trade in the secondary market until after the Fund’s inception, for the period from inception to the first day of secondary market trading in shares of the Fund, the NAV of each Fund is used as a proxy for the secondary market trading price to calculate market returns. NAV and market returns assume that all distributions have been reinvested in each Fund at NAV and Market Price, respectively.
An index is a statistical composite that tracks a specified financial market or sector. Unlike each Fund, the indices do not actually hold a portfolio of securities and therefore do not incur the expenses incurred by each Fund. These expenses negatively impact the performance of each Fund. Also, market returns do not include brokerage commissions that may be payable on secondary market transactions. If brokerage commissions were included, market returns would be lower. The total returns presented reflect the reinvestment of dividends on securities in the indices. The returns presented do not reflect the deduction of taxes that a shareholder would pay on Fund distributions or the redemption or sale of Fund shares. The investment return and principal value of shares of each Fund will vary with changes in market conditions. Shares of each Fund may be worth more or less than their original cost when they are redeemed or sold in the market. Each Fund’s past performance is no guarantee of future performance.
Portfolio Commentary
First Trust Exchange-Traded Fund III
Annual Report
July 31, 2023 (Unaudited)
Advisor
First Trust Advisors L.P. (“First Trust” or the “Advisor”) serves as the investment advisor to the First Trust Horizon Managed Volatility Domestic ETF (“HUSV”), the First Trust Horizon Managed Volatility Developed International ETF (“HDMV”), and the First Trust Horizon Managed Volatility Small/Mid ETF (“HSMV”) (each a “Fund” and collectively, the “Funds”). First Trust is responsible for the ongoing monitoring of each Fund’s investment portfolio, managing each Fund’s business affairs and providing certain administrative services necessary for the management of each Fund.
Sub-Advisor
Horizon Investments, LLC (“Horizon” or the “Sub-Advisor”) serves as the investment sub-advisor to the Funds.
Portfolio Management Team
The following persons serve as portfolio managers of the Funds:
Michael Dickson, PhD, Head of Research and Product Development and Portfolio Manager of Horizon
Scott Ladner, Chief Investment Officer and Portfolio Manager of Horizon
Steven Clark, PhD, Portfolio Manager of Horizon
The portfolio managers are primarily and jointly responsible for the day-to-day management of the Funds. Each portfolio manager has served as part of the portfolio management team of the Funds since each Fund’s inception.
Commentary
First Trust Horizon Managed Volatility Domestic ETF (“HUSV” or the “Fund”)
Market Recap
For the 12-month period ended July 31, 2023, the S&P 500® Index gained 13.02%. During the period, low volatility as a factor lagged the S&P 500® Index, as the S&P 500® Low Volatility Index returned 0.63%.
This period began with the continuation of high levels of inflation not seen since the early 1980s, and the Federal Reserve (the “Fed”) beginning an aggressive interest rate hiking cycle raising the target rate 75 basis points (“bps”) at a time. Markets were split on whether the Fed would be able to get inflation under control and if the economy would experience a “soft landing” scenario or a recession. This materialized in elevated interest rate volatility and an S&P 500® Index that largely went nowhere until year-over-year Consumer Price Index (“CPI”) was well on its way down. Earnings did not disappoint, and the labor market remained strong, both providing a boost to growth making a recession appear less likely. Throughout the period, the Fed continued to reiterate its commitment to bringing inflation under control as well as a data driven approach. As a result, economic data releases drove price action causing event risk and volatility. As inflation came down, rate hikes slowed from 75 bps to a pause followed by a 25 bps hike.
As 2023 began, advances in artificial intelligence (“AI”) gained the limelight and both AI enabled and AI enabling stocks climbed higher. Large cap tech stocks, which are some of the largest holdings of the S&P 500® Index, led a narrow rally leaving more defensive stocks behind. The top 10 names in the S&P 500® Index were responsible for a large part of its returns over the second half of the 12-month period ended July 31, 2023.
The investment objective of the Fund is to provide capital appreciation. Under normal market conditions, the Fund seeks to achieve its investment objective by investing at least 80% of its net assets (including investment borrowings) in common stocks of domestic companies listed and traded on U.S. national securities exchanges that Horizon believes exhibit low future expected volatility. The goal of this strategy is to capture upside price movements in rising markets and reduce downside risk when markets decline. To implement this strategy, Horizon employs volatility forecasting models to forecast future expected volatility. The strategy is largely quantitative and rules-based, but also includes multiple parameters over which Horizon may exercise discretion (including, but not limited to, the number of holdings and the weightings of particular holdings) in connection with its active management of the Fund.
Performance Analysis
On a net asset value (“NAV”) basis for the 12-month period ended July 31, 2023, the Fund provided a total return of 0.88%, including the reinvestment of dividends. The S&P 500® Index returned 13.02% and the S&P 500® Low Volatility Index returned 0.63% over the same period.
Portfolio Commentary (Continued)
First Trust Exchange-Traded Fund III
Annual Report
July 31, 2023 (Unaudited)
Stocks selected within the Health Care, Consumer Discretionary, and Information Technology sectors contributed the most to the Fund’s return, while stocks selected within the Utilities, Real Estate, and Industrials sectors contributed the least to the Fund’s return.
Single stock positions in Gilead Sciences, Inc, Merck & Co., Inc, and International Business Machines Corp. contributed the most to the Fund’s return for the period. Single stock positions in Jack Henry & Associates, Inc., Assurant, Inc., and Broadridge Financial Solutions, Inc. contributed the least to the Fund’s return for the same period.
During the same period, the Fund realized lower volatility than the S&P 500® Index and had volatility in line with the S&P 500® Low Volatility Index. As a part of the Fund’s portfolio allocation process, Horizon overweights or underweights common stocks of domestic companies based on future expected volatility. An overweight allocation indicates that Horizon expects those stocks to be relatively low risk, while an underweight allocation indicates that Horizon expects those stocks to be relatively higher risk. Due to the long-term defensive tilt of the strategy, it is expected that the Fund will underperform in strong positive markets and outperform in strong negative markets. For the period this was the case and these tilts contributed largely to the relative performance over the fiscal year.
Market and Fund Outlook
At the end of the 12-month period ended July 31, 2023, Horizon believes that overall corporate and economic fundamentals are satisfactory and that financial markets will remain healthy over the course of the next year. Despite this, we do believe that there are risks that could generate high volatility in late 2023 and early 2024. Some of the risks include: the Fed having a policy misstep, a rise in unemployment, and new regulation around AI slowing the current rally. Horizon also believes that additional key risk factors for equity markets are related to trade policy, central bank policy, and global currency stability.
During time periods of persistent volatility, Horizon believes it is important to continue to be responsive to current market conditions when creating a portfolio of expected lower volatility stocks. The Fund continues to use a quantitative and rules-based investment process to mitigate volatility through targeted exposure to stocks that Horizon estimates will have forecasted future low volatility. Horizon also continues to use an active management approach when managing the Fund that provides the flexibility to limit sector concentration and business risk, without being limited by static rebalance requirements.
First Trust Horizon Managed Volatility Developed International ETF (“HDMV” or the “Fund”)
Market Recap
For the 12-month period ended July 31, 2023, the MSCI EAFE Index gained 16.79%. During the period, low volatility underperformed the broad MSCI EAFE Index as the MSCI EAFE Minimum Volatility Index gained 7.93%.
Horizon believes the following key developments were some of the biggest drivers of global markets during the period. U.S. markets lagged Developed International markets broadly as the S&P 500® Index gained 13.02% over this time. The period began with the continuation of high levels of inflation not seen since the early 1980s, and the Fed beginning an aggressive rate hiking cycle raising the target rate 75 bps at a time. The European Central Bank (“ECB”) was slightly behind the U.S. in its tightening cycle but raised its policy rate aggressively as well. Markets were split on whether the Fed would be able to get inflation under control and if the U.S. economy would experience a “soft landing” scenario or a recession. This materialized in elevated interest rate volatility. U.S. earnings did not disappoint, and the U.S. labor market remained strong, both providing a boost to global growth. Throughout this period, both the Fed and the ECB continued to reiterate their commitment to bringing inflation under control as well as a data driven approach. As a result, economic data releases drove price action causing event risk and volatility. Eventually inflation came down and interest rate hikes slowed.
The investment objective of the Fund is to provide capital appreciation. Under normal market conditions, the Fund seeks to achieve its investment objective by investing at least 80% of its net assets (including investment borrowings) in common stocks and depositary receipts of developed market companies listed and traded on non-U.S. exchanges that Horizon believes exhibit low future expected volatility. The goal of this strategy is to capture upside price movements in rising markets and reduce downside risk when markets decline. To implement this strategy, Horizon employs volatility forecasting models to forecast future expected volatility. The strategy is largely quantitative and rules-based, but also includes multiple parameters over which Horizon may exercise discretion (including, but not limited to, the number of holdings and the weightings of particular holdings) in connection with its active management of the Fund.
Performance Analysis
On a NAV basis for the 12-month period ended July 31, 2023, the Fund provided a total return of 5.22%, including the reinvestment of dividends. The MSCI EAFE Index gained 16.79% and the MSCI EAFE Minimum Volatility Index gained 7.93% over the same period.
Portfolio Commentary (Continued)
First Trust Exchange-Traded Fund III
Annual Report
July 31, 2023 (Unaudited)
Stocks selected within Japan, Singapore, and Germany contributed the most to the Fund’s return, while stocks selected within Hong Kong, Australia, and Sweden contributed the least to the Fund’s return.
Single stock positions in Singapore Airlines Ltd., Keppel Corp., Ltd., and Oversea-Chinese Banking Corp., Ltd. contributed the most to the Fund’s return for the fiscal year. Single stock positions in Power Assets Holdings, Ltd., Link REIT, and New World Development Co., Ltd. contributed the least to the Fund’s return for the same period.
For the 12-month period ended July 31, 2023, the Fund realized lower volatility than the MSCI EAFE Index. As a part of the Fund’s portfolio allocation process, Horizon overweights or underweights common stocks and depositary receipts of large and mid-cap securities across developed markets based on future expected volatility. An overweight allocation indicates that Horizon expects those stocks to be relatively low risk, while an underweight allocation indicates that Horizon expects those stocks to be relatively higher risk. Due to the long-term defensive tilt of the strategy, it is expected that the Fund will underperform in strong positive markets. For the fiscal year this was the case and these tilts contributed largely to the relative performance for the period.
Market and Fund Outlook
At the end of the 12-month period ended July 31, 2023, Horizon believes that overall corporate and economic fundamentals are satisfactory and that financial markets will remain healthy over the course of the next year. Key risk factors to watch in international markets are the policies of the Fed and the ECB, trade restrictions with China, and commodity prices.
Horizon believes it is important to continue to be more responsive to current market conditions when creating a portfolio of expected lower volatility stocks when exposed to these risk factors. The Fund continues to use a quantitative and rules-based investment process to mitigate volatility through enhanced security selection of targeted exposure to stocks that Horizon estimates will have forecasted future low volatility. Horizon also continues to use an active management approach when managing the Fund that provides the flexibility to limit sector and country concentration and business risk, without being limited to static rebalance requirements.
First Trust Horizon Managed Volatility Small/Mid ETF (“HSMV” or the “Fund”)
Market Recap
For the 12-month period ended July 31, 2023, the S&P 1000® Index gained 8.89%. During the same period, low volatility as a factor lagged the S&P 1000® Index, as the S&P 400® Low Volatility Index gained 0.22% and the S&P 600® Low Volatility Index lost -7.73%.
Over the same period, the S&P 1000® Index expanded, but not as much as the S&P 500® Index. The period began with the continuation of high levels of inflation not seen since the early 1980s, and the Fed beginning an aggressive rate hiking cycle raising the target rate 75 bps at a time. Markets were split on whether the Fed would be able to get inflation under control and if the economy would experience a “soft landing” scenario or a recession. This materialized in elevated interest rate volatility and an S&P 1000® Index that largely went nowhere until year-over-year CPI was well on its way down. Earnings did not disappoint, and the labor market remained strong, both providing a boost to growth making a recession appear less likely. Throughout this period, the Fed continued to reiterate its commitment to bringing inflation under control as well as a data driven approach. As a result, economic data releases drove price action causing event risk and volatility. As inflation came down, rate hikes slowed from 75 bps to a pause followed by a 25 bps hike.
In the second half of the period, advances in artificial intelligence gained the limelight and both AI enabled and AI enabling stocks climbed. Large cap tech stocks, which are some of the largest holdings of the S&P 500® Index, led the narrow rally. The top 10 names in the S&P 500® Index were responsible for a large part of its returns over the second half of this fiscal year. This narrow large cap-led rally left small market cap stocks behind. Fears of a banking crisis also caused the S&P 1000® Index to sell off in March 2023 as Silicon Valley Bank collapsed.
The investment objective of the Fund is to provide capital appreciation. Under normal market conditions, the Fund seeks to achieve its investment objective by investing at least 80% of its net assets (including investment borrowings) in small- and/or mid-capitalization common stocks listed and traded on U.S. national securities exchanges that Horizon believes exhibit low future expected volatility. The goal of this strategy is to capture upside price movements in rising markets and reduce downside risk when markets decline. To implement this strategy, Horizon employs volatility forecasting models to forecast future expected volatility. The strategy is largely quantitative and rules-based, but also includes multiple parameters over which Horizon may exercise discretion (including, but not limited to, the number of holdings and the weightings of particular holdings) in connection with its active management of the Fund.
Portfolio Commentary (Continued)
First Trust Exchange-Traded Fund III
Annual Report
July 31, 2023 (Unaudited)
Performance Analysis
On a NAV basis for the 12-month period ended July 31, 2023, the Fund provided a total return of 0.57%, including the reinvestment of dividends. The S&P 1000® Index gained 8.89%. Over the period, low volatility as a factor lagged the S&P 1000® Index, as the S&P 400® Low Volatility Index gained 0.22% and the S&P 600® Low Volatility Index lost -7.73%.
Stocks selected within the Industrials, Information Technology, and Consumer Staples sectors contributed the most to the Fund’s return, while stocks selected within the Financials, Real Estate, and Utilities sectors contributed the least to the Fund’s return.
Single stock positions in EMCOR Group, Inc. and Jabil, Inc. contributed the most to the Fund’s return for the fiscal year. Single stock positions in PRA Group, Inc. and Brandywine Realty Trust contributed the least to the Fund’s return since inception.
Since inception, the Fund realized lower volatility than the S&P 1000® Index, higher volatility than the S&P 400® Low Volatility Index, and lower volatility than the S&P 600® Low Volatility Index. As a part of the Fund’s portfolio allocation process, Horizon overweights or underweights common stocks of small and mid-cap domestic companies based on future expected volatility. An overweight allocation indicates that Horizon expects those stocks to be relatively low risk, while an underweight allocation indicates that Horizon expects those stocks to be relatively higher risk. Due to the long-term defensive tilt of the strategy, it is expected that the Fund will underperform in strong positive markets. For the 12-month period ended July 31, 2023, this was the case and these tilts contributed largely to the relative performance for the period.
Market and Fund Outlook
At the end of the 12-month period ended July 31, 2023, Horizon believes that overall corporate and economic fundamentals are satisfactory in developed markets and that financial markets will remain healthy over the course of the next year. Despite this, we do believe that there are risks that could generate high volatility in late 2023 and early 2024. Some of the risks include: the Fed having a policy misstep, a rise in unemployment, and new regulation around AI slowing the current rally. Horizon also believes that additional key risk factors for equity markets are related to trade policy, central bank policy, and global currency stability.
During time periods that contain bouts of volatility, Horizon believes it is important to continue to be responsive to current market conditions when creating a portfolio of expected lower volatility stocks. The Fund continues to use a quantitative and rules-based investment process to mitigate volatility through targeted exposure to stocks that Horizon estimates will have forecasted future low volatility. Horizon also continues to use an active management approach when managing the Fund that provides the flexibility to limit sector concentration and business risk, without being limited to static rebalance requirements.
First Trust Exchange-Traded Fund III
Understanding Your Fund Expenses
July 31, 2023 (Unaudited)
As a shareholder of First Trust Horizon Managed Volatility Domestic ETF, First Trust Horizon Managed Volatility Developed International ETF or First Trust Horizon Managed Volatility Small/Mid ETF (each a “Fund” and collectively, the “Funds”), you incur two types of costs: (1) transaction costs; and (2) ongoing costs, including management fees, distribution and/or service (12b-1) fees, if any, and other Fund expenses. This Example is intended to help you understand your ongoing costs (in U.S. dollars) of investing in the Funds and to compare these costs with the ongoing costs of investing in other funds.
The Example is based on an investment of $1,000 invested at the beginning of the period and held through the six-month period ended July 31, 2023.
Actual Expenses
The first line in the following table provides information about actual account values and actual expenses. You may use the information in this line, together with the amount you invested, to estimate the expenses that you paid over the period. Simply divide your account value by $1,000 (for example, an $8,600 account value divided by $1,000 = 8.6), then multiply the result by the number in the first line under the heading entitled “Expenses Paid During the Six-Month Period” to estimate the expenses you paid on your account during this six-month period.
Hypothetical Example for Comparison Purposes
The second line in the following table provides information about hypothetical account values and hypothetical expenses based on each Fund’s actual expense ratio and an assumed rate of return of 5% per year before expenses, which is not each Fund’s actual return. The hypothetical account values and expenses may not be used to estimate the actual ending account balance or expenses you paid for the period. You may use this information to compare the ongoing costs of investing in the Funds and other funds. To do so, compare this 5% hypothetical example with the 5% hypothetical examples that appear in the shareholder reports of the other funds.
Please note that the expenses shown in the table are meant to highlight your ongoing costs only and do not reflect any transactional costs such as brokerage commissions. Therefore, the second line in the table is useful in comparing ongoing costs only, and will not help you determine the relative total costs of owning different funds. In addition, if these transactional costs were included, your costs would have been higher.
| | Beginning
Account Value
February 1, 2023 | Ending
Account Value
July 31, 2023 | Annualized
Expense Ratio
Based on the
Six-Month
Period | Expenses Paid
During the
Six-Month
Period (a) |
| First Trust Horizon Managed Volatility Domestic ETF (HUSV) |
| Actual | $1,000.00 | $1,008.80 | 0.70% | $3.49 |
| Hypothetical (5% return before expenses) | $1,000.00 | $1,021.32 | 0.70% | $3.51 |
| First Trust Horizon Managed Volatility Developed International ETF (HDMV) |
| Actual | $1,000.00 | $1,029.20 | 0.80% | $4.03 |
| Hypothetical (5% return before expenses) | $1,000.00 | $1,020.83 | 0.80% | $4.01 |
| First Trust Horizon Managed Volatility Small/Mid ETF (HSMV) |
| Actual | $1,000.00 | $975.20 | 0.80% | $3.92 |
| Hypothetical (5% return before expenses) | $1,000.00 | $1,020.83 | 0.80% | $4.01 |
| (a) | Expenses are equal to the annualized expense ratios as indicated in the table multiplied by the average account value over the period (February 1, 2023 through July 31, 2023), multiplied by 181/365 (to reflect the six-month period). |
First Trust Horizon Managed Volatility Domestic ETF (HUSV)
Portfolio of Investments
July 31, 2023
| Shares | | Description | | Value |
| COMMON STOCKS – 95.9% |
| | | Aerospace & Defense – 4.6% | | |
| 7,031 | | General Dynamics Corp. | | $1,571,991 |
| 4,004 | | Huntington Ingalls Industries, Inc. | | 919,599 |
| 2,082 | | Lockheed Martin Corp. | | 929,342 |
| 8,730 | | RTX Corp. | | 767,629 |
| | | | | 4,188,561 |
| | | Beverages – 5.6% | | |
| 36,538 | | Coca-Cola (The) Co. | | 2,262,798 |
| 28,274 | | Keurig Dr. Pepper, Inc. | | 961,599 |
| 10,032 | | PepsiCo, Inc. | | 1,880,599 |
| | | | | 5,104,996 |
| | | Biotechnology – 1.6% | | |
| 6,234 | | Amgen, Inc. | | 1,459,691 |
| | | Capital Markets – 2.8% | | |
| 8,295 | | Cboe Global Markets, Inc. | | 1,158,645 |
| 7,079 | | CME Group, Inc. | | 1,408,438 |
| | | | | 2,567,083 |
| | | Chemicals – 1.5% | | |
| 1,881 | | Air Products & Chemicals, Inc. | | 574,326 |
| 2,125 | | Linde PLC | | 830,174 |
| | | | | 1,404,500 |
| | | Commercial Services &
Supplies – 5.3% | | |
| 1,539 | | Cintas Corp. | | 772,640 |
| 10,762 | | Republic Services, Inc. | | 1,626,246 |
| 20,630 | | Rollins, Inc. | | 842,323 |
| 9,708 | | Waste Management, Inc. | | 1,590,073 |
| | | | | 4,831,282 |
| | | Communications Equipment – 5.7% | | |
| 44,449 | | Cisco Systems, Inc. | | 2,313,126 |
| 45,905 | | Juniper Networks, Inc. | | 1,276,159 |
| 5,772 | | Motorola Solutions, Inc. | | 1,654,428 |
| | | | | 5,243,713 |
| | | Consumer Staples
Distribution & Retail – 1.7% | | |
| 9,693 | | Walmart, Inc. | | 1,549,523 |
| | | Containers & Packaging – 0.7% | | |
| 66,557 | | Amcor PLC | | 682,875 |
| | | Distributors – 1.2% | | |
| 7,130 | | Genuine Parts Co. | | 1,110,284 |
| | | Diversified Telecommunication
Services – 1.1% | | |
| 30,268 | | Verizon Communications, Inc. | | 1,031,533 |
| Shares | | Description | | Value |
|
| | | Electric Utilities – 1.2% | | |
| 14,842 | | Southern (The) Co. | | $1,073,670 |
| | | Electrical Equipment – 1.1% | | |
| 6,647 | | AMETEK, Inc. | | 1,054,214 |
| | | Electronic Equipment,
Instruments & Components – 3.3% | | |
| 18,470 | | Amphenol Corp., Class A | | 1,631,086 |
| 3,740 | | Teledyne Technologies, Inc. (a) | | 1,438,142 |
| | | | | 3,069,228 |
| | | Entertainment – 2.4% | | |
| 9,465 | | Activision Blizzard, Inc. (a) | | 877,973 |
| 9,405 | | Electronic Arts, Inc. | | 1,282,372 |
| | | | | 2,160,345 |
| | | Financial Services – 3.9% | | |
| 4,497 | | Berkshire Hathaway, Inc., Class B (a) | | 1,582,764 |
| 2,294 | | Mastercard, Inc., Class A | | 904,478 |
| 4,717 | | Visa, Inc., Class A | | 1,121,373 |
| | | | | 3,608,615 |
| | | Food Products – 6.1% | | |
| 5,367 | | Hershey (The) Co. | | 1,241,441 |
| 28,091 | | Hormel Foods Corp. | | 1,148,360 |
| 8,658 | | J.M. Smucker (The) Co. | | 1,304,328 |
| 11,327 | | Kellogg Co. | | 757,663 |
| 9,547 | | Kraft Heinz (The) Co. | | 345,410 |
| 11,578 | | Mondelez International, Inc., Class A | | 858,277 |
| | | | | 5,655,479 |
| | | Health Care Equipment &
Supplies – 3.8% | | |
| 5,464 | | Becton Dickinson and Co. | | 1,522,380 |
| 19,743 | | Boston Scientific Corp. (a) | | 1,023,674 |
| 11,692 | | Hologic, Inc. (a) | | 928,579 |
| | | | | 3,474,633 |
| | | Health Care Providers &
Services – 2.6% | | |
| 7,292 | | AmerisourceBergen Corp. | | 1,362,875 |
| 7,644 | | Quest Diagnostics, Inc. | | 1,033,545 |
| | | | | 2,396,420 |
| | | Hotels, Restaurants &
Leisure – 5.8% | | |
| 6,091 | | Darden Restaurants, Inc. | | 1,028,892 |
| 7,571 | | McDonald’s Corp. | | 2,219,817 |
| 15,478 | | Yum! Brands, Inc. | | 2,130,856 |
| | | | | 5,379,565 |
| | | Household Products – 3.4% | | |
| 9,063 | | Colgate-Palmolive Co. | | 691,144 |
| 10,072 | | Kimberly-Clark Corp. | | 1,300,295 |
See Notes to Financial Statements
Page 15
First Trust Horizon Managed Volatility Domestic ETF (HUSV)
Portfolio of Investments (Continued)
July 31, 2023
| Shares | | Description | | Value |
| COMMON STOCKS (Continued) |
| | | Household
Products (Continued) | | |
| 7,458 | | Procter & Gamble (The) Co. | | $1,165,686 |
| | | | | 3,157,125 |
| | | Industrial Conglomerates – 0.9% | | |
| 4,391 | | Honeywell International, Inc. | | 852,425 |
| | | Insurance – 5.3% | | |
| 3,108 | | Aon PLC, Class A | | 989,898 |
| 4,741 | | Arthur J. Gallagher & Co. | | 1,018,367 |
| 4,946 | | Chubb Ltd. | | 1,011,012 |
| 5,656 | | Marsh & McLennan Cos., Inc. | | 1,065,703 |
| 3,791 | | Willis Towers Watson PLC | | 801,152 |
| | | | | 4,886,132 |
| | | IT Services – 4.4% | | |
| 16,948 | | International Business Machines Corp. | | 2,443,562 |
| 7,606 | | VeriSign, Inc. (a) | | 1,604,486 |
| | | | | 4,048,048 |
| | | Machinery – 1.2% | | |
| 11,633 | | Otis Worldwide Corp. | | 1,058,138 |
| | | Multi-Utilities – 2.9% | | |
| 14,198 | | Consolidated Edison, Inc. | | 1,346,823 |
| 21,485 | | Public Service Enterprise Group, Inc. | | 1,356,133 |
| | | | | 2,702,956 |
| | | Oil, Gas & Consumable Fuels – 1.5% | | |
| 41,433 | | Kinder Morgan, Inc. | | 733,778 |
| 18,613 | | Williams (The) Cos., Inc. | | 641,218 |
| | | | | 1,374,996 |
| | | Pharmaceuticals – 5.6% | | |
| 25,962 | | Bristol-Myers Squibb Co. | | 1,614,577 |
| 13,193 | | Johnson & Johnson | | 2,210,223 |
| 11,993 | | Merck & Co., Inc. | | 1,279,054 |
| | | | | 5,103,854 |
| | | Software – 4.1% | | |
| 10,008 | | PTC, Inc. (a) | | 1,459,267 |
| 4,765 | | Roper Technologies, Inc. | | 2,349,383 |
| | | | | 3,808,650 |
| | | Specialty Retail – 3.2% | | |
| 331 | | AutoZone, Inc. (a) | | 821,449 |
| 1,308 | | O’Reilly Automotive, Inc. (a) | | 1,210,933 |
| 10,384 | | TJX (The) Cos., Inc. | | 898,528 |
| | | | | 2,930,910 |
| Shares | | Description | | Value |
|
| | | Water Utilities – 1.4% | | |
| 8,854 | | American Water Works Co., Inc. | | $1,305,345 |
| | | Total Common Stocks | | 88,274,789 |
| | | (Cost $84,784,971) | | |
| REAL ESTATE INVESTMENT TRUSTS – 3.8% |
| | | Residential REITs – 1.3% | | |
| 8,837 | | Equity Residential | | 582,712 |
| 3,916 | | Mid-America Apartment Communities, Inc. | | 586,068 |
| | | | | 1,168,780 |
| | | Retail REITs – 1.4% | | |
| 21,758 | | Realty Income Corp. | | 1,326,585 |
| | | Specialized REITs – 1.1% | | |
| 32,166 | | VICI Properties, Inc. | | 1,012,586 |
| | | Total Real Estate Investment Trusts | | 3,507,951 |
| | | (Cost $3,677,197) | | |
| | | Total Investments – 99.7% | | 91,782,740 |
| | | (Cost $88,462,168) | | |
| | | Net Other Assets and Liabilities – 0.3% | | 254,007 |
| | | Net Assets – 100.0% | | $92,036,747 |
| (a) | Non-income producing security. |
Valuation Inputs
A summary of the inputs used to value the Fund’s investments as of July 31, 2023 is as follows (see Note 2A - Portfolio Valuation in the Notes to Financial Statements):
| | Total
Value at
7/31/2023 | Level 1
Quoted
Prices | Level 2
Significant
Observable
Inputs | Level 3
Significant
Unobservable
Inputs |
| Common Stocks* | $ 88,274,789 | $ 88,274,789 | $ — | $ — |
| Real Estate Investment Trusts* | 3,507,951 | 3,507,951 | — | — |
| Total Investments | $ 91,782,740 | $ 91,782,740 | $— | $— |
| * | See Portfolio of Investments for industry breakout. |
Page 16
See Notes to Financial Statements
First Trust Horizon Managed Volatility Developed International ETF (HDMV)
Portfolio of Investments
July 31, 2023
| Shares | | Description | | Value |
| COMMON STOCKS (a) – 97.4% |
| | | Australia – 6.4% | | |
| 28,250 | | Brambles Ltd. | | $266,986 |
| 811 | | Cochlear Ltd. | | 130,293 |
| 32,402 | | Coles Group Ltd. | | 395,895 |
| 2,227 | | Commonwealth Bank of Australia | | 158,129 |
| 1,089 | | CSL Ltd. | | 196,417 |
| 29,687 | | Endeavour Group Ltd. | | 121,240 |
| 14,110 | | Orica Ltd. | | 149,274 |
| 128,579 | | Telstra Group Ltd. | | 367,921 |
| 9,603 | | Washington H Soul Pattinson & Co., Ltd. | | 212,538 |
| 4,321 | | Wesfarmers Ltd. | | 144,105 |
| 12,976 | | Westpac Banking Corp. | | 194,715 |
| 9,735 | | Woolworths Group Ltd. | | 252,536 |
| | | | | 2,590,049 |
| | | Belgium – 0.8% | | |
| 3,467 | | Anheuser-Busch InBev S.A./N.V. | | 198,413 |
| 1,733 | | Groupe Bruxelles Lambert S.A. | | 140,125 |
| | | | | 338,538 |
| | | Bermuda – 1.2% | | |
| 43,606 | | CK Infrastructure Holdings Ltd. | | 230,641 |
| 5,200 | | Jardine Matheson Holdings Ltd. | | 256,776 |
| | | | | 487,417 |
| | | Cayman Islands – 1.3% | | |
| 42,175 | | CK Asset Holdings Ltd. | | 243,352 |
| 44,475 | | CK Hutchison Holdings Ltd. | | 274,301 |
| | | | | 517,653 |
| | | Denmark – 0.9% | | |
| 1,201 | | Carlsberg A.S., Class B | | 180,131 |
| 9,971 | | Tryg A.S. | | 196,995 |
| | | | | 377,126 |
| | | France – 6.9% | | |
| 930 | | Air Liquide S.A. | | 167,041 |
| 21,870 | | Bollore SE | | 138,265 |
| 6,390 | | Bouygues S.A. | | 228,830 |
| 6,214 | | Bureau Veritas S.A. | | 170,671 |
| 6,622 | | Danone S.A. | | 404,308 |
| 3,999 | | Edenred | | 259,769 |
| 1,675 | | Eiffage S.A. | | 174,258 |
| 10,846 | | Getlink SE | | 190,743 |
| 27,074 | | Orange S.A. | | 306,133 |
| 934 | | Pernod Ricard S.A. | | 206,003 |
| 1,496 | | Sanofi | | 159,699 |
| 2,331 | | Sodexo S.A. | | 239,224 |
| 1,505 | | Vinci S.A. | | 176,694 |
| | | | | 2,821,638 |
| | | Germany – 7.1% | | |
| 699 | | Allianz SE | | 167,083 |
| 1,132 | | Bayerische Motoren Werke AG | | 137,980 |
| Shares | | Description | | Value |
|
| | | Germany (Continued) | | |
| 3,197 | | Beiersdorf AG | | $414,079 |
| 982 | | Deutsche Boerse AG | | 188,193 |
| 11,213 | | Deutsche Telekom AG | | 244,626 |
| 24,867 | | E.ON SE | | 314,561 |
| 3,317 | | GEA Group AG | | 140,739 |
| 9,054 | | Henkel AG & Co., KGaA | | 632,533 |
| 1,833 | | Mercedes-Benz Group AG | | 146,398 |
| 536 | | Muenchener Rueckversicherungs-Gesellschaft AG in Muenchen | | 201,905 |
| 1,197 | | SAP SE | | 163,723 |
| 47,472 | | Telefonica Deutschland Holding AG | | 127,931 |
| | | | | 2,879,751 |
| | | Hong Kong – 6.6% | | |
| 73,500 | | BOC Hong Kong Holdings Ltd. | | 223,358 |
| 47,438 | | CLP Holdings Ltd. | | 385,944 |
| 15,196 | | Hang Seng Bank Ltd. | | 231,285 |
| 263,145 | | Hong Kong & China Gas Co., Ltd. | | 225,054 |
| 145,080 | | MTR Corp., Ltd. | | 666,904 |
| 113,959 | | Power Assets Holdings Ltd. | | 596,177 |
| 16,039 | | Sun Hung Kai Properties Ltd. | | 200,619 |
| 69,600 | | Swire Properties Ltd. | | 174,025 |
| | | | | 2,703,366 |
| | | Ireland – 0.3% | | |
| 1,311 | | Kerry Group PLC, Class A | | 130,249 |
| | | Israel – 0.7% | | |
| 1,638 | | Check Point Software Technologies Ltd. (b) | | 216,560 |
| 1,963 | | Tower Semiconductor Ltd. (b) | | 72,772 |
| | | | | 289,332 |
| | | Italy – 1.2% | | |
| 5,873 | | Assicurazioni Generali S.p.A. | | 125,144 |
| 32,942 | | Snam S.p.A. | | 173,203 |
| 22,056 | | Terna-Rete Elettrica Nazionale S.p.A. | | 186,438 |
| | | | | 484,785 |
| | | Japan – 24.1% | | |
| 8,300 | | Aeon Co., Ltd. | | 179,576 |
| 5,500 | | AGC, Inc. | | 198,559 |
| 3,400 | | Aisin Corp. | | 110,294 |
| 6,300 | | ANA Holdings, Inc. (b) | | 150,830 |
| 3,000 | | Asahi Group Holdings Ltd. | | 117,984 |
| 16,700 | | Asahi Kasei Corp. | | 113,677 |
| 7,300 | | Astellas Pharma, Inc. | | 106,756 |
| 6,100 | | Bandai Namco Holdings, Inc. | | 137,809 |
| 3,300 | | Bridgestone Corp. | | 136,695 |
| 4,400 | | Canon, Inc. | | 113,599 |
| 1,800 | | Central Japan Railway Co. | | 229,452 |
| 8,000 | | Daiwa House Industry Co., Ltd. | | 217,172 |
See Notes to Financial Statements
Page 17
First Trust Horizon Managed Volatility Developed International ETF (HDMV)
Portfolio of Investments (Continued)
July 31, 2023
| Shares | | Description | | Value |
| COMMON STOCKS (a) (Continued) |
| | | Japan (Continued) | | |
| 29,600 | | Daiwa Securities Group, Inc. | | $160,229 |
| 3,700 | | East Japan Railway Co. | | 209,441 |
| 1,900 | | FUJIFILM Holdings Corp. | | 110,142 |
| 7,400 | | Hankyu Hanshin Holdings, Inc. | | 245,566 |
| 30,900 | | Hulic Co., Ltd. | | 262,704 |
| 6,500 | | Iida Group Holdings Co., Ltd. | | 113,972 |
| 6,100 | | Japan Exchange Group, Inc. | | 106,144 |
| 11,800 | | Japan Tobacco, Inc. | | 261,522 |
| 2,200 | | Kao Corp. | | 83,537 |
| 8,500 | | KDDI Corp. | | 250,163 |
| 3,200 | | Keio Corp. | | 106,258 |
| 3,100 | | Kintetsu Group Holdings Co., Ltd. | | 103,962 |
| 15,900 | | Kirin Holdings Co., Ltd. | | 234,982 |
| 2,100 | | Kobayashi Pharmaceutical Co., Ltd. | | 115,403 |
| 3,100 | | Kyocera Corp. | | 166,565 |
| 13,300 | | McDonald’s Holdings Co., Japan Ltd. | | 523,530 |
| 8,500 | | MEIJI Holdings Co., Ltd. | | 196,450 |
| 10,300 | | Mitsubishi Electric Corp. | | 148,493 |
| 10,300 | | Mitsubishi Estate Co., Ltd. | | 125,759 |
| 10,800 | | NGK Insulators Ltd. | | 132,243 |
| 1,500 | | NIPPON EXPRESS HOLDINGS, Inc. | | 87,882 |
| 277,400 | | Nippon Telegraph & Telephone Corp. | | 317,636 |
| 13,700 | | Nisshin Seifun Group, Inc. | | 169,872 |
| 1,100 | | Nissin Foods Holdings Co., Ltd. | | 92,785 |
| 4,200 | | Nomura Real Estate Holdings, Inc. | | 104,007 |
| 19,200 | | Obayashi Corp. | | 177,404 |
| 700 | | Obic Co., Ltd. | | 114,498 |
| 8,700 | | Odayku Electric Railway Co., Ltd. | | 127,016 |
| 22,700 | | Oji Holdings Corp. | | 89,514 |
| 4,200 | | Otsuka Holdings Co., Ltd. | | 154,254 |
| 6,700 | | SCSK Corp. | | 111,262 |
| 2,900 | | Secom Co., Ltd. | | 194,325 |
| 8,500 | | Sekisui Chemical Co., Ltd. | | 128,995 |
| 10,100 | | Sekisui House Ltd. | | 205,812 |
| 19,100 | | Shimizu Corp. | | 131,518 |
| 2,700 | | Shionogi & Co., Ltd. | | 112,581 |
| 58,800 | | SoftBank Corp. | | 652,208 |
| 28,100 | | Sumitomo Chemical Co., Ltd. | | 86,533 |
| 6,800 | | Sumitomo Electric Industries Ltd. | | 86,993 |
| 6,800 | | Takeda Pharmaceutical Co., Ltd. | | 207,492 |
| 8,800 | | Tobu Railway Co., Ltd. | | 232,642 |
| 4,600 | | Toho Co., Ltd. | | 179,130 |
| 16,400 | | Tokyu Corp. | | 208,019 |
| 7,800 | | Tosoh Corp. | | 101,787 |
| 6,500 | | USS Co., Ltd. | | 112,533 |
| Shares | | Description | | Value |
|
| | | Japan (Continued) | | |
| 3,300 | | West Japan Railway Co. | | $135,535 |
| | | | | 9,791,701 |
| | | Netherlands – 5.8% | | |
| 17,380 | | Davide Campari-Milano N.V. | | 233,707 |
| 2,783 | | Heineken Holding N.V. | | 228,116 |
| 2,095 | | Heineken N.V. | | 205,330 |
| 11,797 | | JDE Peet’s N.V. | | 355,919 |
| 6,809 | | Koninklijke Ahold Delhaize N.V. | | 234,963 |
| 154,435 | | Koninklijke KPN N.V. | | 558,986 |
| 7,494 | | QIAGEN N.V. (b) | | 351,421 |
| 1,515 | | Wolters Kluwer N.V. | | 190,228 |
| | | | | 2,358,670 |
| | | New Zealand – 1.0% | | |
| 38,140 | | Auckland International Airport Ltd. (b) | | 198,985 |
| 65,443 | | Spark New Zealand Ltd. | | 210,550 |
| | | | | 409,535 |
| | | Norway – 0.8% | | |
| 27,292 | | Orkla ASA | | 215,642 |
| 8,592 | | Telenor ASA | | 91,981 |
| | | | | 307,623 |
| | | Singapore – 13.0% | | |
| 56,900 | | City Developments Ltd. | | 316,218 |
| 20,900 | | DBS Group Holdings Ltd. | | 538,473 |
| 79,500 | | Oversea-Chinese Banking Corp., Ltd. | | 795,150 |
| 50,900 | | Singapore Airlines Ltd. | | 288,232 |
| 105,600 | | Singapore Exchange Ltd. | | 771,104 |
| 175,200 | | Singapore Technologies Engineering Ltd. | | 491,443 |
| 181,300 | | Singapore Telecommunications Ltd. | | 362,668 |
| 26,300 | | United Overseas Bank Ltd. | | 595,322 |
| 60,700 | | UOL Group Ltd. | | 320,903 |
| 27,400 | | Venture Corp., Ltd. | | 308,669 |
| 165,900 | | Wilmar International Ltd. | | 481,575 |
| | | | | 5,269,757 |
| | | Spain – 3.5% | | |
| 6,061 | | ACS Actividades de Construccion y Servicios S.A. | | 211,851 |
| 8,852 | | Enagas S.A. | | 157,038 |
| 44,960 | | Iberdrola S.A. | | 561,317 |
| 5,840 | | Naturgy Energy Group S.A. | | 178,121 |
| 9,815 | | Redeia Corp. S.A. | | 164,086 |
| 38,905 | | Telefonica S.A. | | 165,843 |
| | | | | 1,438,256 |
| | | Sweden – 0.5% | | |
| 4,445 | | Essity AB, Class B | | 110,171 |
Page 18
See Notes to Financial Statements
First Trust Horizon Managed Volatility Developed International ETF (HDMV)
Portfolio of Investments (Continued)
July 31, 2023
| Shares | | Description | | Value |
| COMMON STOCKS (a) (Continued) |
| | | Sweden (Continued) | | |
| 46,064 | | Telia Co., AB | | $99,030 |
| | | | | 209,201 |
| | | Switzerland – 7.0% | | |
| 1,340 | | Baloise Holding AG | | 207,135 |
| 1,918 | | Banque Cantonale Vaudoise | | 215,103 |
| 6,637 | | Coca-Cola HBC AG | | 195,223 |
| 2,939 | | Nestle S.A. | | 360,209 |
| 2,398 | | Novartis AG | | 250,428 |
| 1,004 | | Roche Holding AG | | 311,545 |
| 469 | | Roche Holding AG | | 155,428 |
| 1,922 | | SGS S.A. | | 186,106 |
| 2,300 | | Swiss Prime Site AG | | 222,602 |
| 844 | | Swisscom AG | | 542,374 |
| 434 | | Zurich Insurance Group AG | | 209,423 |
| | | | | 2,855,576 |
| | | United Kingdom – 8.3% | | |
| 5,172 | | Bunzl PLC | | 191,690 |
| 5,903 | | Coca-Cola Europacific Partners PLC | | 374,191 |
| 13,996 | | Compass Group PLC | | 364,085 |
| 9,225 | | GSK PLC | | 163,921 |
| 2,671 | | Intertek Group PLC | | 149,522 |
| 1,642 | | London Stock Exchange Group PLC | | 178,316 |
| 13,930 | | National Grid PLC | | 184,402 |
| 4,359 | | Reckitt Benckiser Group PLC | | 326,585 |
| 6,130 | | RELX PLC | | 206,114 |
| 12,852 | | Sage Group (The) PLC | | 154,479 |
| 10,257 | | Smiths Group PLC | | 223,645 |
| 79,712 | | Tesco PLC | | 263,930 |
| 11,067 | | Unilever PLC | | 595,241 |
| | | | | 3,376,121 |
| | | Total Common Stocks | | 39,636,344 |
| | | (Cost $39,047,362) | | |
| REAL ESTATE INVESTMENT TRUSTS (a) – 1.8% |
| | | Singapore – 1.8% | | |
| 137,900 | | CapitaLand Ascendas REIT | | 291,408 |
| 173,900 | | CapitaLand Integrated Commercial Trust | | 266,784 |
| 140,600 | | Mapletree Pan Asia Commercial Trust | | 174,461 |
| | | Total Real Estate Investment Trusts | | 732,653 |
| | | (Cost $734,151) | | |
| | | Total Investments – 99.2% | | 40,368,997 |
| | | (Cost $39,781,513) | | |
| | | Net Other Assets and Liabilities – 0.8% | | 318,282 |
| | | Net Assets – 100.0% | | $40,687,279 |
| (a) | Portfolio securities are categorized based upon their country of incorporation. For a breakdown of the portfolio securities by sector, please see the Fund Performance Overview. |
| (b) | Non-income producing security. |
Currency Exposure
Diversification | % of Total
Investments |
| Euro | 25.9% |
| Japanese Yen | 24.3 |
| Singapore Dollar | 14.9 |
| Hong Kong Dollar | 8.5 |
| British Pound Sterling | 7.9 |
| Swiss Franc | 6.6 |
| Australian Dollar | 6.4 |
| United States Dollar | 2.1 |
| New Zealand Dollar | 1.0 |
| Danish Krone | 0.9 |
| Norwegian Krone | 0.8 |
| Swedish Krona | 0.5 |
| Israeli Shekel | 0.2 |
| Total | 100.0% |
Valuation Inputs
A summary of the inputs used to value the Fund’s investments as of July 31, 2023 is as follows (see Note 2A - Portfolio Valuation in the Notes to Financial Statements):
| | Total
Value at
7/31/2023 | Level 1
Quoted
Prices | Level 2
Significant
Observable
Inputs | Level 3
Significant
Unobservable
Inputs |
| Common Stocks* | $ 39,636,344 | $ 39,636,344 | $ — | $ — |
| Real Estate Investment Trusts* | 732,653 | 732,653 | — | — |
| Total Investments | $ 40,368,997 | $ 40,368,997 | $— | $— |
| * | See Portfolio of Investments for country breakout. |
See Notes to Financial Statements
Page 19
First Trust Horizon Managed Volatility Small/Mid ETF (HSMV)
Portfolio of Investments
July 31, 2023
| Shares | | Description | | Value |
| COMMON STOCKS – 83.3% |
| | | Aerospace & Defense – 1.3% | | |
| 704 | | Curtiss-Wright Corp. | | $134,717 |
| 1,147 | | Moog, Inc., Class A | | 120,940 |
| | | | | 255,657 |
| | | Automobile Components – 0.8% | | |
| 4,520 | | Gentex Corp. | | 151,782 |
| | | Banks – 3.6% | | |
| 2,809 | | Commerce Bancshares, Inc. | | 149,383 |
| 10,781 | | FNB Corp. | | 137,889 |
| 2,679 | | International Bancshares Corp. | | 132,985 |
| 7,101 | | Old National Bancorp | | 120,930 |
| 2,147 | | Prosperity Bancshares, Inc. | | 135,948 |
| | | | | 677,135 |
| | | Building Products – 1.5% | | |
| 569 | | Carlisle Cos., Inc. | | 157,727 |
| 326 | | Lennox International, Inc. | | 119,785 |
| | | | | 277,512 |
| | | Capital Markets – 4.2% | | |
| 858 | | Affiliated Managers Group, Inc. | | 118,953 |
| 857 | | Evercore, Inc., Class A | | 115,746 |
| 3,282 | | Federated Hermes, Inc. | | 111,030 |
| 3,771 | | Janus Henderson Group PLC | | 110,679 |
| 2,853 | | Jefferies Financial Group, Inc. | | 104,962 |
| 2,137 | | SEI Investments Co. | | 134,610 |
| 1,716 | | Stifel Financial Corp. | | 109,035 |
| | | | | 805,015 |
| | | Chemicals – 2.2% | | |
| 1,484 | | Ashland, Inc. | | 135,578 |
| 932 | | Balchem Corp. | | 125,578 |
| 1,504 | | RPM International, Inc. | | 155,378 |
| | | | | 416,534 |
| | | Commercial Services &
Supplies – 2.2% | | |
| 3,010 | | ABM Industries, Inc. | | 139,303 |
| 892 | | Clean Harbors, Inc. (a) | | 148,304 |
| 760 | | MSA Safety, Inc. | | 126,160 |
| | | | | 413,767 |
| | | Construction & Engineering – 2.2% | | |
| 1,449 | | AECOM | | 126,063 |
| 706 | | EMCOR Group, Inc. | | 151,818 |
| 6,152 | | MDU Resources Group, Inc. | | 136,082 |
| | | | | 413,963 |
| | | Construction Materials – 0.7% | | |
| 718 | | Eagle Materials, Inc. | | 132,378 |
| Shares | | Description | | Value |
|
| | | Consumer Staples
Distribution & Retail – 2.7% | | |
| 569 | | Casey’s General Stores, Inc. | | $143,764 |
| 3,987 | | Grocery Outlet Holding Corp. (a) | | 133,365 |
| 2,238 | | Performance Food Group Co. (a) | | 133,743 |
| 2,868 | | Sprouts Farmers Market, Inc. (a) | | 112,569 |
| | | | | 523,441 |
| | | Containers & Packaging – 2.0% | | |
| 1,104 | | AptarGroup, Inc. | | 134,092 |
| 2,711 | | Silgan Holdings, Inc. | | 118,878 |
| 2,138 | | Sonoco Products Co. | | 125,372 |
| | | | | 378,342 |
| | | Diversified Consumer
Services – 2.1% | | |
| 1,233 | | Grand Canyon Education, Inc. (a) | | 133,842 |
| 4,146 | | H&R Block, Inc. | | 139,347 |
| 1,908 | | Service Corp. International | | 127,168 |
| | | | | 400,357 |
| | | Diversified Telecommunication
Services – 0.6% | | |
| 1,911 | | Cogent Communications Holdings, Inc. | | 117,030 |
| | | Electric Utilities – 3.9% | | |
| 2,095 | | ALLETE, Inc. | | 120,316 |
| 3,391 | | Hawaiian Electric Industries, Inc. | | 130,181 |
| 1,204 | | IDACORP, Inc. | | 123,795 |
| 3,440 | | OGE Energy Corp. | | 124,356 |
| 2,736 | | PNM Resources, Inc. | | 122,628 |
| 2,620 | | Portland General Electric Co. | | 124,895 |
| | | | | 746,171 |
| | | Electrical Equipment – 1.2% | | |
| 388 | | Hubbell, Inc. | | 121,056 |
| 2,201 | | nVent Electric PLC | | 116,389 |
| | | | | 237,445 |
| | | Electronic Equipment,
Instruments & Components – 5.4% | | |
| 911 | | Arrow Electronics, Inc. (a) | | 129,854 |
| 2,632 | | Avnet, Inc. | | 127,652 |
| 873 | | Insight Enterprises, Inc. (a) | | 128,060 |
| 1,356 | | Jabil, Inc. | | 150,068 |
| 416 | | Littelfuse, Inc. | | 126,714 |
| 1,014 | | OSI Systems, Inc. (a) | | 120,899 |
| 1,242 | | Plexus Corp. (a) | | 122,325 |
| 1,303 | | TD SYNNEX Corp. | | 128,619 |
| | | | | 1,034,191 |
| | | Financial Services – 2.1% | | |
| 2,795 | | Essent Group Ltd. | | 138,632 |
Page 20
See Notes to Financial Statements
First Trust Horizon Managed Volatility Small/Mid ETF (HSMV)
Portfolio of Investments (Continued)
July 31, 2023
| Shares | | Description | | Value |
| COMMON STOCKS (Continued) |
| | | Financial Services (Continued) | | |
| 8,204 | | MGIC Investment Corp. | | $137,335 |
| 2,064 | | Mr Cooper Group, Inc. (a) | | 119,650 |
| | | | | 395,617 |
| | | Food Products – 2.7% | | |
| 5,139 | | Flowers Foods, Inc. | | 126,984 |
| 1,212 | | Ingredion, Inc. | | 134,847 |
| 668 | | Lancaster Colony Corp. | | 128,677 |
| 1,466 | | Post Holdings, Inc. (a) | | 125,050 |
| | | | | 515,558 |
| | | Gas Utilities – 3.0% | | |
| 998 | | Chesapeake Utilities Corp. | | 118,003 |
| 2,442 | | National Fuel Gas Co. | | 129,695 |
| 2,624 | | New Jersey Resources Corp. | | 117,293 |
| 1,090 | | ONE Gas, Inc. | | 86,252 |
| 1,963 | | Spire, Inc. | | 124,788 |
| | | | | 576,031 |
| | | Ground Transportation – 1.5% | | |
| 2,314 | | Knight-Swift Transportation Holdings, Inc. | | 140,575 |
| 679 | | Landstar System, Inc. | | 138,238 |
| | | | | 278,813 |
| | | Health Care Equipment &
Supplies – 1.9% | | |
| 2,141 | | Enovis Corp. (a) | | 136,810 |
| 3,571 | | Envista Holdings Corp. (a) | | 122,878 |
| 1,739 | | Globus Medical, Inc., Class A (a) | | 104,810 |
| | | | | 364,498 |
| | | Health Care Providers &
Services – 3.3% | | |
| 1,676 | | Acadia Healthcare Co., Inc. (a) | | 132,454 |
| 229 | | Chemed Corp. | | 119,330 |
| 1,912 | | Encompass Health Corp. | | 126,249 |
| 1,342 | | Ensign Group (The), Inc. | | 129,999 |
| 3,876 | | Patterson Cos., Inc. | | 127,482 |
| | | | | 635,514 |
| | | Hotels, Restaurants &
Leisure – 2.4% | | |
| 1,093 | | Choice Hotels International, Inc. | | 142,910 |
| 988 | | Churchill Downs, Inc. | | 114,460 |
| 973 | | Cracker Barrel Old Country Store, Inc. | | 90,683 |
| 1,396 | | Papa John’s International, Inc. | | 115,449 |
| | | | | 463,502 |
| | | Household Products – 0.7% | | |
| 3,775 | | Energizer Holdings, Inc. | | 134,768 |
| | | Insurance – 4.8% | | |
| 1,082 | | American Financial Group, Inc. | | 131,582 |
| 2,302 | | First American Financial Corp. | | 145,901 |
| Shares | | Description | | Value |
|
| | | Insurance (Continued) | | |
| 5,101 | | Old Republic International Corp. | | $140,634 |
| 872 | | Reinsurance Group of America, Inc. | | 122,385 |
| 576 | | RenaissanceRe Holdings Ltd. | | 107,574 |
| 953 | | RLI Corp. | | 127,140 |
| 1,278 | | Selective Insurance Group, Inc. | | 131,877 |
| | | | | 907,093 |
| | | Leisure Products – 0.6% | | |
| 5,424 | | Mattel, Inc. (a) | | 115,531 |
| | | Machinery – 5.0% | | |
| 693 | | AGCO Corp. | | 92,238 |
| 2,035 | | Donaldson Co., Inc. | | 127,859 |
| 2,752 | | Flowserve Corp. | | 103,916 |
| 1,475 | | Graco, Inc. | | 117,012 |
| 1,363 | | ITT, Inc. | | 135,755 |
| 640 | | Lincoln Electric Holdings, Inc. | | 128,454 |
| 877 | | Middleby (The) Corp. (a) | | 133,172 |
| 1,303 | | Oshkosh Corp. | | 119,967 |
| | | | | 958,373 |
| | | Media – 0.8% | | |
| 3,679 | | New York Times (The) Co., Class A | | 149,956 |
| | | Metals & Mining – 1.5% | | |
| 491 | | Reliance Steel & Aluminum Co. | | 143,794 |
| 1,107 | | Royal Gold, Inc. | | 132,995 |
| | | | | 276,789 |
| | | Multi-Utilities – 1.9% | | |
| 3,140 | | Avista Corp. | | 121,330 |
| 2,043 | | Black Hills Corp. | | 123,254 |
| 2,142 | | NorthWestern Corp. | | 120,959 |
| | | | | 365,543 |
| | | Oil, Gas & Consumable Fuels – 0.7% | | |
| 2,593 | | DT Midstream, Inc. | | 138,777 |
| | | Pharmaceuticals – 1.4% | | |
| 975 | | Jazz Pharmaceuticals PLC (a) | | 127,160 |
| 2,210 | | Prestige Consumer Healthcare, Inc. (a) | | 144,114 |
| | | | | 271,274 |
| | | Professional Services – 5.2% | | |
| 381 | | CACI International, Inc., Class A (a) | | 133,518 |
| 1,251 | | Exponent, Inc. | | 112,064 |
| 730 | | FTI Consulting, Inc. (a) | | 127,867 |
| 3,297 | | Genpact Ltd. | | 118,989 |
| 1,928 | | KBR, Inc. | | 118,553 |
| 1,607 | | ManpowerGroup, Inc. | | 126,760 |
| 1,456 | | Maximus, Inc. | | 121,954 |
See Notes to Financial Statements
Page 21
First Trust Horizon Managed Volatility Small/Mid ETF (HSMV)
Portfolio of Investments (Continued)
July 31, 2023
| Shares | | Description | | Value |
| COMMON STOCKS (Continued) |
| | | Professional
Services (Continued) | | |
| 1,152 | | Science Applications International Corp. | | $139,784 |
| | | | | 999,489 |
| | | Semiconductors &
Semiconductor Equipment – 0.5% | | |
| 1,270 | | Cirrus Logic, Inc. (a) | | 102,616 |
| | | Software – 1.5% | | |
| 1,916 | | CommVault Systems, Inc. (a) | | 149,314 |
| 2,183 | | Progress Software Corp. | | 131,111 |
| | | | | 280,425 |
| | | Specialty Retail – 0.7% | | |
| 434 | | Murphy USA, Inc. | | 133,251 |
| | | Textiles, Apparel & Luxury
Goods – 1.3% | | |
| 1,630 | | Carter’s, Inc. | | 122,266 |
| 1,649 | | Columbia Sportswear Co. | | 129,628 |
| | | | | 251,894 |
| | | Trading Companies &
Distributors – 1.4% | | |
| 1,005 | | GATX Corp. | | 125,987 |
| 1,296 | | MSC Industrial Direct Co., Inc., Class A | | 130,792 |
| | | | | 256,779 |
| | | Water Utilities – 1.8% | | |
| 1,174 | | American States Water Co. | | 103,793 |
| 1,961 | | California Water Service Group | | 103,972 |
| 1,893 | | SJW Group | | 133,381 |
| | | | | 341,146 |
| | | Total Common Stocks | | 15,893,957 |
| | | (Cost $14,406,082) | | |
| REAL ESTATE INVESTMENT TRUSTS – 16.3% |
| | | Diversified REITs – 0.7% | | |
| 5,251 | | Essential Properties Realty Trust, Inc. | | 128,912 |
| | | Health Care REITs – 3.4% | | |
| 6,448 | | CareTrust REIT, Inc. | | 134,054 |
| 6,727 | | Healthcare Realty Trust, Inc. | | 131,378 |
| 4,092 | | Omega Healthcare Investors, Inc. | | 130,535 |
| 9,029 | | Physicians Realty Trust | | 133,087 |
| 8,726 | | Sabra Health Care REIT, Inc. | | 113,351 |
| | | | | 642,405 |
| | | Industrial REITs – 2.0% | | |
| 728 | | EastGroup Properties, Inc. | | 128,987 |
| 2,399 | | First Industrial Realty Trust, Inc. | | 124,028 |
| Shares | | Description | | Value |
|
| | | Industrial REITs (Continued) | | |
| 2,298 | | Rexford Industrial Realty, Inc. | | $126,597 |
| | | | | 379,612 |
| | | Mortgage Real Estate
Investment Trusts – 0.5% | | |
| 18,531 | | ARMOUR Residential REIT, Inc. | | 94,693 |
| | | Office REITs – 2.4% | | |
| 6,195 | | Corporate Office Properties Trust | | 161,070 |
| 8,707 | | Easterly Government Properties, Inc. | | 128,515 |
| 3,093 | | Highwoods Properties, Inc. | | 78,160 |
| 5,550 | | JBG SMITH Properties | | 92,852 |
| | | | | 460,597 |
| | | Residential REITs – 1.8% | | |
| 3,501 | | Apartment Income REIT Corp. | | 120,925 |
| 7,922 | | Elme Communities | | 128,732 |
| 6,098 | | Independence Realty Trust, Inc. | | 103,910 |
| | | | | 353,567 |
| | | Retail REITs – 2.9% | | |
| 1,939 | | Agree Realty Corp. | | 125,608 |
| 3,004 | | NNN Reit, Inc. | | 128,211 |
| 11,102 | | Retail Opportunity Investments Corp. | | 163,533 |
| 3,213 | | Spirit Realty Capital, Inc. | | 129,580 |
| | | | | 546,932 |
| | | Specialized REITs – 2.6% | | |
| 4,946 | | Four Corners Property Trust, Inc. | | 130,080 |
| 1,380 | | Lamar Advertising Co., Class A | | 136,206 |
| 2,979 | | National Storage Affiliates Trust | | 100,661 |
| 4,245 | | Rayonier, Inc. | | 140,594 |
| | | | | 507,541 |
| | | Total Real Estate Investment Trusts | | 3,114,259 |
| | | (Cost $3,236,753) | | |
| | | Total Investments – 99.6% | | 19,008,216 |
| | | (Cost $17,642,835) | | |
| | | Net Other Assets and Liabilities – 0.4% | | 83,001 |
| | | Net Assets – 100.0% | | $19,091,217 |
| (a) | Non-income producing security. |
Page 22
See Notes to Financial Statements
First Trust Horizon Managed Volatility Small/Mid ETF (HSMV)
Portfolio of Investments (Continued)
July 31, 2023
Valuation Inputs
A summary of the inputs used to value the Fund’s investments as of July 31, 2023 is as follows (see Note 2A - Portfolio Valuation in the Notes to Financial Statements):
| | Total
Value at
7/31/2023 | Level 1
Quoted
Prices | Level 2
Significant
Observable
Inputs | Level 3
Significant
Unobservable
Inputs |
| Common Stocks* | $ 15,893,957 | $ 15,893,957 | $ — | $ — |
| Real Estate Investment Trusts* | 3,114,259 | 3,114,259 | — | — |
| Total Investments | $ 19,008,216 | $ 19,008,216 | $— | $— |
| * | See Portfolio of Investments for industry breakout. |
See Notes to Financial Statements
Page 23
First Trust Exchange-Traded Fund III
Statements of Assets and Liabilities
July 31, 2023
| | First Trust
Horizon
Managed
Volatility
Domestic
ETF
(HUSV) | | First Trust
Horizon
Managed
Volatility
Developed
International
ETF
(HDMV) | | First Trust
Horizon
Managed
Volatility
Small/Mid
ETF
(HSMV) |
| ASSETS: | | | | | |
Investments, at value
| $ 91,782,740 | | $ 40,368,997 | | $ 19,008,216 |
Cash
| 217,316 | | 121,612 | | 85,995 |
Foreign currency
| — | | 344 | | — |
| Receivables: | | | | | |
Investment securities sold
| 3,277,556 | | — | | — |
Dividends
| 102,731 | | 48,227 | | 9,809 |
Dividend reclaims
| 495 | | 175,407 | | — |
Total Assets
| 95,380,838 | | 40,714,587 | | 19,104,020 |
| LIABILITIES: | | | | | |
| Payables: | | | | | |
Capital shares redeemed
| 3,287,000 | | — | | — |
Investment advisory fees
| 57,091 | | 27,308 | | 12,803 |
Total Liabilities
| 3,344,091 | | 27,308 | | 12,803 |
NET ASSETS
| $92,036,747 | | $40,687,279 | | $19,091,217 |
| NET ASSETS consist of: | | | | | |
Paid-in capital
| $ 132,471,629 | | $ 70,728,909 | | $ 19,971,998 |
Par value
| 28,000 | | 14,000 | | 6,000 |
Accumulated distributable earnings (loss)
| (40,462,882) | | (30,055,630) | | (886,781) |
NET ASSETS
| $92,036,747 | | $40,687,279 | | $19,091,217 |
NET ASSET VALUE, per share
| $32.87 | | $29.06 | | $31.82 |
Number of shares outstanding (unlimited number of shares authorized, par value $0.01 per share)
| 2,800,002 | | 1,400,002 | | 600,002 |
Investments, at cost
| $88,462,168 | | $39,781,513 | | $17,642,835 |
Foreign currency, at cost (proceeds)
| $— | | $342 | | $— |
Page 24
See Notes to Financial Statements
First Trust Exchange-Traded Fund III
Statements of Operations
For the Year Ended July 31, 2023
| | First Trust
Horizon
Managed
Volatility
Domestic
ETF
(HUSV) | | First Trust
Horizon
Managed
Volatility
Developed
International
ETF
(HDMV) | | First Trust
Horizon
Managed
Volatility
Small/Mid
ETF
(HSMV) |
| INVESTMENT INCOME: | | | | | |
Dividends
| $ 2,403,768 | | $ 1,687,269 | | $ 383,278 |
Interest
| 8,197 | | 2,408 | | — |
Foreign withholding tax
| — | | (114,079) | | (143) |
Other
| — | | 220 | | 36 |
Total investment income
| 2,411,965 | | 1,575,818 | | 383,171 |
| EXPENSES: | | | | | |
Investment advisory fees
| 679,395 | | 316,404 | | 137,329 |
Total expenses
| 679,395 | | 316,404 | | 137,329 |
NET INVESTMENT INCOME (LOSS)
| 1,732,570 | | 1,259,414 | | 245,842 |
| NET REALIZED AND UNREALIZED GAIN (LOSS): | | | | | |
| Net realized gain (loss) on: | | | | | |
Investments
| (2,312,918) | | (2,319,491) | | (1,432,164) |
In-kind redemptions
| 2,831,121 | | (22,091) | | — |
Foreign currency transactions
| — | | (3,660) | | — |
Net realized gain (loss)
| 518,203 | | (2,345,242) | | (1,432,164) |
| Net change in unrealized appreciation (depreciation) on: | | | | | |
Investments
| (811,009) | | 3,009,563 | | 1,284,546 |
Foreign currency translation
| — | | 17,186 | | — |
Net change in unrealized appreciation (depreciation)
| (811,009) | | 3,026,749 | | 1,284,546 |
NET REALIZED AND UNREALIZED GAIN (LOSS)
| (292,806) | | 681,507 | | (147,618) |
NET INCREASE (DECREASE) IN NET ASSETS RESULTING FROM OPERATIONS
| $ 1,439,764 | | $ 1,940,921 | | $ 98,224 |
See Notes to Financial Statements
Page 25
First Trust Exchange-Traded Fund III
Statements of Changes in Net Assets
| | First Trust Horizon Managed
Volatility Domestic ETF
(HUSV) | | First Trust Horizon Managed
Volatility Developed International ETF
(HDMV) |
| | Year
Ended
7/31/2023 | | Year
Ended
7/31/2022 | | Year
Ended
7/31/2023 | | Year
Ended
7/31/2022 |
| OPERATIONS: | | | | | | | |
Net investment income (loss)
| $ 1,732,570 | | $ 1,753,621 | | $ 1,259,414 | | $ 1,837,495 |
Net realized gain (loss)
| 518,203 | | 10,719,961 | | (2,345,242) | | (571,567) |
Net change in unrealized appreciation (depreciation)
| (811,009) | | (10,221,164) | | 3,026,749 | | (8,141,611) |
Net increase (decrease) in net assets resulting from operations
| 1,439,764 | | 2,252,418 | | 1,940,921 | | (6,875,683) |
| DISTRIBUTIONS TO SHAREHOLDERS FROM: | | | | | | | |
Investment operations
| (1,810,516) | | (1,660,766) | | (1,333,862) | | (1,931,942) |
| SHAREHOLDER TRANSACTIONS: | | | | | | | |
Proceeds from shares sold
| 26,951,541 | | 20,067,842 | | — | | 1,508,580 |
Cost of shares redeemed
| (34,208,623) | | (41,752,654) | | (5,676,683) | | (33,905,829) |
Net increase (decrease) in net assets resulting from shareholder transactions
| (7,257,082) | | (21,684,812) | | (5,676,683) | | (32,397,249) |
Total increase (decrease) in net assets
| (7,627,834) | | (21,093,160) | | (5,069,624) | | (41,204,874) |
| NET ASSETS: | | | | | | | |
Beginning of period
| 99,664,581 | | 120,757,741 | | 45,756,903 | | 86,961,777 |
End of period
| $92,036,747 | | $99,664,581 | | $40,687,279 | | $45,756,903 |
| CHANGES IN SHARES OUTSTANDING: | | | | | | | |
Shares outstanding, beginning of period
| 3,000,002 | | 3,650,002 | | 1,600,002 | | 2,700,002 |
Shares sold
| 850,000 | | 600,000 | | — | | 50,000 |
Shares redeemed
| (1,050,000) | | (1,250,000) | | (200,000) | | (1,150,000) |
Shares outstanding, end of period
| 2,800,002 | | 3,000,002 | | 1,400,002 | | 1,600,002 |
Page 26
See Notes to Financial Statements
First Trust Horizon Managed
Volatility Small/Mid ETF
(HSMV) |
Year
Ended
7/31/2023 | | Year
Ended
7/31/2022 |
| | | |
| $ 245,842 | | $ 167,247 |
| (1,432,164) | | 366,910 |
| 1,284,546 | | (864,174) |
| 98,224 | | (330,017) |
| | | |
| (255,451) | | (133,705) |
| | | |
| 3,180,198 | | 6,741,624 |
| — | | (5,115,847) |
| 3,180,198 | | 1,625,777 |
| 3,022,971 | | 1,162,055 |
| | | |
| 16,068,246 | | 14,906,191 |
| $19,091,217 | | $16,068,246 |
| | | |
| 500,002 | | 450,002 |
| 100,000 | | 200,000 |
| — | | (150,000) |
| 600,002 | | 500,002 |
See Notes to Financial Statements
Page 27
First Trust Exchange-Traded Fund III
Financial Highlights
For a share outstanding throughout each period
First Trust Horizon Managed Volatility Domestic ETF (HUSV)
| | Year Ended July 31, |
| 2023 | | 2022 | | 2021 | | 2020 | | 2019 |
Net asset value, beginning of period
| $ 33.22 | | $ 33.08 | | $ 27.19 | | $ 26.71 | | $ 23.49 |
| Income from investment operations: | | | | | | | | | |
Net investment income (loss)
| 0.58 (a) | | 0.51 | | 0.46 | | 0.37 | | 0.37 |
Net realized and unrealized gain (loss)
| (0.31) | | 0.10 | | 5.87 | | 0.52 | | 3.17 |
Total from investment operations
| 0.27 | | 0.61 | | 6.33 | | 0.89 | | 3.54 |
| Distributions paid to shareholders from: | | | | | | | | | |
Net investment income
| (0.62) | | (0.47) | | (0.44) | | (0.41) | | (0.32) |
Net asset value, end of period
| $32.87 | | $33.22 | | $33.08 | | $27.19 | | $26.71 |
Total return (b)
| 0.88% | | 1.82% | | 23.48% | | 3.41% | | 15.24% |
| Ratios to average net assets/supplemental data: | | | | | | | | | |
Net assets, end of period (in 000’s)
| $ 92,037 | | $ 99,665 | | $ 120,758 | | $ 214,822 | | $ 224,389 |
Ratio of total expenses to average net assets
| 0.70% | | 0.70% | | 0.70% | | 0.70% | | 0.70% |
Ratio of net investment income (loss) to average net assets
| 1.79% | | 1.46% | | 1.42% | | 1.39% | | 1.58% |
Portfolio turnover rate (c)
| 122% | | 76% | | 152% | | 211% | | 147% |
| (a) | Based on average shares outstanding. |
| (b) | Total return is calculated assuming an initial investment made at the net asset value at the beginning of the period, reinvestment of all distributions at net asset value during the period, and redemption at net asset value on the last day of the period. The returns presented do not reflect the deduction of taxes that a shareholder would pay on Fund distributions or the redemption or sale of Fund shares. Total return is calculated for the time period presented and is not annualized for periods of less than a year. |
| (c) | Portfolio turnover is calculated for the time period presented and is not annualized for periods of less than a year and does not include securities received or delivered from processing creations or redemptions and in-kind transactions. |
Page 28
See Notes to Financial Statements
First Trust Exchange-Traded Fund III
Financial Highlights (Continued)
For a share outstanding throughout each period
First Trust Horizon Managed Volatility Developed International ETF (HDMV)
| | Year Ended July 31, |
| 2023 | | 2022 | | 2021 | | 2020 | | 2019 |
Net asset value, beginning of period
| $ 28.60 | | $ 32.21 | | $ 28.12 | | $ 32.92 | | $ 33.72 |
| Income from investment operations: | | | | | | | | | |
Net investment income (loss)
| 0.88 (a) | | 0.90 | | 0.89 | | 0.65 | | 0.86 |
Net realized and unrealized gain (loss)
| 0.52 | | (3.62) | | 4.13 | | (4.61) | | (0.79) |
Total from investment operations
| 1.40 | | (2.72) | | 5.02 | | (3.96) | | 0.07 |
| Distributions paid to shareholders from: | | | | | | | | | |
Net investment income
| (0.94) | | (0.89) | | (0.93) | | (0.84) | | (0.87) |
Net asset value, end of period
| $29.06 | | $28.60 | | $32.21 | | $28.12 | | $32.92 |
Total return (b)
| 5.22% | | (8.50)% | | 18.01% (c) | | (12.37)% | | 0.21% |
| Ratios to average net assets/supplemental data: | | | | | | | | | |
Net assets, end of period (in 000’s)
| $ 40,687 | | $ 45,757 | | $ 86,962 | | $ 123,714 | | $ 128,394 |
Ratio of total expenses to average net assets
| 0.80% | | 0.80% | | 0.80% | | 0.80% | | 0.80% |
Ratio of net investment income (loss) to average net assets
| 3.19% | | 2.53% | | 2.68% | | 2.08% | | 2.74% |
Portfolio turnover rate (d)
| 80% | | 65% | | 127% | | 196% | | 99% |
| (a) | Based on average shares outstanding. |
| (b) | Total return is calculated assuming an initial investment made at the net asset value at the beginning of the period, reinvestment of all distributions at net asset value during the period, and redemption at net asset value on the last day of the period. The returns presented do not reflect the deduction of taxes that a shareholder would pay on Fund distributions or the redemption or sale of Fund shares. Total return is calculated for the time period presented and is not annualized for periods of less than a year. |
| (c) | The Fund received a reimbursement from the advisor in the amount of $6,254, which represents less than $0.01 per share. Since the advisor reimbursed the Fund, there was no effect on the Fund’s total return. |
| (d) | Portfolio turnover is calculated for the time period presented and is not annualized for periods of less than a year and does not include securities received or delivered from processing creations or redemptions and in-kind transactions. |
See Notes to Financial Statements
Page 29
First Trust Exchange-Traded Fund III
Financial Highlights (Continued)
For a share outstanding throughout each period
First Trust Horizon Managed Volatility Small/Mid ETF (HSMV)
| | Year Ended July 31, | | Period
Ended
7/31/2020 (a) |
| 2023 | | 2022 | | 2021 | |
Net asset value, beginning of period
| $ 32.14 | | $ 33.12 | | $ 25.03 | | $ 21.10 |
| Income from investment operations: | | | | | | | |
Net investment income (loss)
| 0.44 (b) | | 0.36 | | 0.29 | | 0.02 |
Net realized and unrealized gain (loss)
| (0.29) | | (1.05) | | 8.09 | | 3.92 |
Total from investment operations
| 0.15 | | (0.69) | | 8.38 | | 3.94 |
| Distributions paid to shareholders from: | | | | | | | |
Net investment income
| (0.47) | | (0.29) | | (0.29) | | (0.01) |
Net realized gain
| — | | — | | (0.00) (c) | | — |
Total distributions
| (0.47) | | (0.29) | | (0.29) | | (0.01) |
Net asset value, end of period
| $31.82 | | $32.14 | | $33.12 | | $25.03 |
Total return (d)
| 0.57% | | (2.11)% | | 33.72% | | 18.67% |
| Ratios to average net assets/supplemental data: | | | | | | | |
Net assets, end of period (in 000’s)
| $ 19,091 | | $ 16,068 | | $ 14,906 | | $ 20,023 |
Ratio of total expenses to average net assets
| 0.80% | | 0.80% | | 0.80% | | 0.80% (e) |
Ratio of net investment income (loss) to average net assets
| 1.43% | | 1.09% | | 1.02% | | 0.60% (e) |
Portfolio turnover rate (f)
| 70% | | 71% | | 118% | | 5% |
| (a) | Inception date is April 6, 2020, which is consistent with the commencement of investment operations and is the date the initial creation units were established. |
| (b) | Based on average shares outstanding. |
| (c) | Amount represents less than $0.01 per share. |
| (d) | Total return is calculated assuming an initial investment made at the net asset value at the beginning of the period, reinvestment of all distributions at net asset value during the period, and redemption at net asset value on the last day of the period. The returns presented do not reflect the deduction of taxes that a shareholder would pay on Fund distributions or the redemption or sale of Fund shares. Total return is calculated for the time period presented and is not annualized for periods of less than a year. |
| (e) | Annualized. |
| (f) | Portfolio turnover is calculated for the time period presented and is not annualized for periods of less than a year and does not include securities received or delivered from processing creations or redemptions and in-kind transactions. |
Page 30
See Notes to Financial Statements
Notes to Financial Statements
First Trust Exchange-Traded Fund III
July 31, 2023
1. Organization
First Trust Exchange-Traded Fund III (the “Trust”) is an open-end management investment company organized as a Massachusetts business trust on January 9, 2008, and is registered with the Securities and Exchange Commission under the Investment Company Act of 1940, as amended (the “1940 Act”).
The Trust currently consists of seventeen funds that are offering shares. This report covers the following funds (each a “Fund” and collectively, the “Funds”) listed below, each a diversified series of the Trust and listed and traded on the NYSE Arca, Inc.
First Trust Horizon Managed Volatility Domestic ETF – (ticker “HUSV”)
First Trust Horizon Managed Volatility Developed International ETF – (ticker “HDMV”)
First Trust Horizon Managed Volatility Small/Mid ETF – (ticker “HSMV”)
Each Fund represents a separate series of shares of beneficial interest in the Trust. Unlike conventional mutual funds, each Fund issues and redeems shares on a continuous basis, at net asset value (“NAV”), only in large blocks of shares known as “Creation Units.”
Each Fund is an actively managed exchange-traded fund. The investment objective of each Fund is to provide capital appreciation.
Under normal market conditions, HUSV seeks to achieve its investment objective by investing at least 80% of its net assets (including investment borrowings) in common stocks of domestic companies listed and traded on U.S. national securities exchanges that Horizon Investments, LLC (“Horizon” or the “Sub-Advisor”) believes exhibit low future expected volatility.
Under normal market conditions, HDMV seeks to achieve its investment objective by investing at least 80% of its net assets (including investment borrowings) in common stocks and depositary receipts of developed market companies listed and traded on non-U.S. exchanges that Horizon believes exhibit low future expected volatility.
Under normal market conditions, HSMV seeks to achieve its investment objective by investing at least 80% of its net assets (including investment borrowings) in small- and/or mid-capitalization common stocks listed and traded on U.S. national securities exchanges that Horizon believes exhibit low future expected volatility.
There can be no assurance that a Fund will achieve its investment objective. The Funds may not be appropriate for all investors.
2. Significant Accounting Policies
The Funds are each considered an investment company and follow accounting and reporting guidance under Financial Accounting Standards Board Accounting Standards Codification Topic 946, “Financial Services-Investment Companies.” The following is a summary of significant accounting policies consistently followed by the Funds in the preparation of the financial statements. The preparation of the financial statements in accordance with accounting principles generally accepted in the United States of America (“U.S. GAAP”) requires management to make estimates and assumptions that affect the reported amounts and disclosures in the financial statements. Actual results could differ from those estimates.
A. Portfolio Valuation
Each Fund’s NAV is determined daily as of the close of regular trading on the New York Stock Exchange (“NYSE”), normally 4:00 p.m. Eastern time, on each day the NYSE is open for trading. If the NYSE closes early on a valuation day, the NAV is determined as of that time. Foreign securities are priced using data reflecting the earlier closing of the principal markets for those securities. Each Fund’s NAV is calculated by dividing the value of all assets of each Fund (including accrued interest and dividends), less all liabilities (including accrued expenses and dividends declared but unpaid), by the total number of shares outstanding.
Each Fund’s investments are valued daily at market value or, in the absence of market value with respect to any portfolio securities, at fair value. Market value prices represent readily available market quotations such as last sale or official closing prices from a national or foreign exchange (i.e., a regulated market) and are primarily obtained from third-party pricing services. Fair value prices represent any prices not considered market value prices and are either obtained from a third-party pricing service or are determined by the Pricing Committee of the Funds’ investment advisor, First Trust Advisors L.P. (“First Trust” or the “Advisor”), in accordance with valuation procedures approved by the Trust’s Board of Trustees, and in accordance with provisions of the 1940 Act and rules thereunder. Investments valued by the Advisor’s Pricing Committee, if any, are footnoted as such in the footnotes to the Portfolio of Investments. Each Fund’s investments are valued as follows:
Common stocks, real estate investment trusts (“REITs”) and other equity securities listed on any national or foreign exchange (excluding The Nasdaq Stock Market LLC (“Nasdaq”) and the London Stock Exchange Alternative Investment Market (“AIM”)) are valued at the last sale price on the exchange on which they are principally traded or, for Nasdaq and AIM securities, the
Notes to Financial Statements (Continued)
First Trust Exchange-Traded Fund III
July 31, 2023
official closing price. Securities traded on more than one securities exchange are valued at the last sale price or official closing price, as applicable, at the close of the securities exchange representing the primary exchange for such securities.
Securities trading on foreign exchanges or over-the-counter markets that close prior to the NYSE close may be valued using a systematic fair valuation model provided by a third-party pricing service. If these foreign securities meet certain criteria in relation to the valuation model, their valuation is systematically adjusted to reflect the impact of movement in the U.S. market after the close of the foreign markets.
Equity securities traded in an over-the-counter market are valued at the close price or the last trade price.
Certain securities may not be able to be priced by pre-established pricing methods. Such securities may be valued by the Advisor’s Pricing Committee at fair value. These securities generally include, but are not limited to, restricted securities (securities which may not be publicly sold without registration under the Securities Act of 1933, as amended) for which a third-party pricing service is unable to provide a market price; securities whose trading has been formally suspended; a security whose market or fair value price is not available from a pre-established pricing source; a security with respect to which an event has occurred that is likely to materially affect the value of the security after the market has closed but before the calculation of a Fund’s NAV or make it difficult or impossible to obtain a reliable market quotation; and a security whose price, as provided by the third-party pricing service, does not reflect the security’s fair value. As a general principle, the current fair value of a security would appear to be the amount which the owner might reasonably expect to receive for the security upon its current sale. When fair value prices are used, generally they will differ from market quotations or official closing prices on the applicable exchanges. A variety of factors may be considered in determining the fair value of such securities, including, but not limited to, the following:
| 1) | the last sale price on the exchange on which they are principally traded or, for Nasdaq and AIM securities, the official closing price; |
| 2) | the type of security; |
| 3) | the size of the holding; |
| 4) | the initial cost of the security; |
| 5) | transactions in comparable securities; |
| 6) | price quotes from dealers and/or third-party pricing services; |
| 7) | relationships among various securities; |
| 8) | information obtained by contacting the issuer, analysts, or the appropriate stock exchange; |
| 9) | an analysis of the issuer’s financial statements; |
| 10) | the existence of merger proposals or tender offers that might affect the value of the security; and |
| 11) | other relevant factors. |
If the securities in question are foreign securities, the following additional information may be considered:
| 1) | the value of similar foreign securities traded on other foreign markets; |
| 2) | ADR trading of similar securities; |
| 3) | closed-end fund or exchange-traded fund trading of similar securities; |
| 4) | foreign currency exchange activity; |
| 5) | the trading prices of financial products that are tied to baskets of foreign securities; |
| 6) | factors relating to the event that precipitated the pricing problem; |
| 7) | whether the event is likely to recur; |
| 8) | whether the effects of the event are isolated or whether they affect entire markets, countries or regions; and |
| 9) | other relevant factors. |
Because foreign markets may be open on different days than the days during which investors may transact in the shares of a Fund, the value of the Fund’s securities may change on the days when investors are not able to transact in the shares of the Fund. The value of securities denominated in foreign currencies is converted into U.S. dollars using exchange rates determined daily as of the close of regular trading on the NYSE.
Notes to Financial Statements (Continued)
First Trust Exchange-Traded Fund III
July 31, 2023
The Funds are subject to fair value accounting standards that define fair value, establish the framework for measuring fair value and provide a three-level hierarchy for fair valuation based upon the inputs to the valuation as of the measurement date. The three levels of the fair value hierarchy are as follows:
| • | Level 1 – Level 1 inputs are quoted prices in active markets for identical investments. An active market is a market in which transactions for the investment occur with sufficient frequency and volume to provide pricing information on an ongoing basis. |
| • | Level 2 – Level 2 inputs are observable inputs, either directly or indirectly, and include the following: |
| o | Quoted prices for similar investments in active markets. |
| o | Quoted prices for identical or similar investments in markets that are non-active. A non-active market is a market where there are few transactions for the investment, the prices are not current, or price quotations vary substantially either over time or among market makers, or in which little information is released publicly. |
| o | Inputs other than quoted prices that are observable for the investment (for example, interest rates and yield curves observable at commonly quoted intervals, volatilities, prepayment speeds, loss severities, credit risks, and default rates). |
| o | Inputs that are derived principally from or corroborated by observable market data by correlation or other means. |
| • | Level 3 – Level 3 inputs are unobservable inputs. Unobservable inputs may reflect the reporting entity’s own assumptions about the assumptions that market participants would use in pricing the investment. |
The inputs or methodologies used for valuing investments are not necessarily an indication of the risk associated with investing in those investments. A summary of the inputs used to value each Fund’s investments as of July 31, 2023, is included with each Fund’s Portfolio of Investments.
B. Securities Transactions and Investment Income
Securities transactions are recorded as of the trade date. Realized gains and losses from securities transactions are recorded on the identified cost basis. Dividend income is recorded on the ex-dividend date. Interest income, if any, is recorded daily on the accrual basis.
Withholding taxes and tax reclaims on foreign dividends have been provided for in accordance with each Fund’s understanding of the applicable country’s tax rules and rates.
Distributions received from a Fund’s investments in REITs may be comprised of return of capital, capital gains, and income. The actual character of the amounts received during the year are not known until after the REITs’ fiscal year end. A Fund records the character of distributions received from the REITs during the year based on estimates available. The characterization of distributions received by a Fund may be subsequently revised based on information received from the REITs after their tax reporting periods conclude.
C. Foreign Currency
The books and records of the Funds are maintained in U.S. dollars. Foreign currencies, investments and other assets and liabilities are translated into U.S. dollars at the exchange rates prevailing at the end of the period. Purchases and sales of investments and items of income and expense are translated on the respective dates of such transactions. Unrealized gains and losses on assets and liabilities, other than investments in securities, which result from changes in foreign currency exchange rates have been included in “Net change in unrealized appreciation (depreciation) on foreign currency translation” on the Statements of Operations. Unrealized gains and losses on investments in securities which result from changes in foreign exchange rates are included with fluctuations arising from changes in market price and are included in “Net change in unrealized appreciation (depreciation) on investments” on the Statements of Operations. Net realized foreign currency gains and losses include the effect of changes in exchange rates between trade date and settlement date on investment security transactions, foreign currency transactions and interest and dividends received and are included in “Net realized gain (loss) on foreign currency transactions” on the Statements of Operations. The portion of foreign currency gains and losses related to fluctuations in exchange rates between the initial purchase settlement date and subsequent sale trade date is included in “Net realized gain (loss) on investments” on the Statements of Operations.
D. Dividends and Distributions to Shareholders
Dividends from net investment income, if any, are declared and paid quarterly by each Fund, or as the Board of Trustees may determine from time to time. Distributions of net realized capital gains earned by each Fund, if any, are distributed at least annually.
Notes to Financial Statements (Continued)
First Trust Exchange-Traded Fund III
July 31, 2023
Distributions from net investment income and realized capital gains are determined in accordance with federal income tax regulations, which may differ from U.S. GAAP. Certain capital accounts in the financial statements are periodically adjusted for permanent differences in order to reflect their tax character. These permanent differences are primarily due to the varying treatment of income and gain/loss on portfolio securities held by the Funds and have no impact on net assets or NAV per share. Temporary differences, which arise from recognizing certain items of income, expense and gain/loss in different periods for financial statement and tax purposes, will reverse at some time in the future.
The tax character of distributions paid by each Fund during the fiscal year ended July 31, 2023, was as follows:
| | Distributions
paid from
Ordinary
Income | | Distributions
paid from
Capital
Gains | | Distributions
paid from
Return of
Capital |
First Trust Horizon Managed Volatility Domestic ETF
| $ 1,810,516 | | $ — | | $ — |
First Trust Horizon Managed Volatility Developed International ETF
| 1,333,862 | | — | | — |
First Trust Horizon Managed Volatility Small/Mid ETF
| 255,451 | | — | | — |
The tax character of distributions paid by each Fund during the fiscal year ended July 31, 2022, was as follows:
| | Distributions
paid from
Ordinary
Income | | Distributions
paid from
Capital
Gains | | Distributions
paid from
Return of
Capital |
First Trust Horizon Managed Volatility Domestic ETF
| $ 1,660,766 | | $ — | | $ — |
First Trust Horizon Managed Volatility Developed International ETF
| 1,931,942 | | — | | — |
First Trust Horizon Managed Volatility Small/Mid ETF
| 133,705 | | — | | — |
As of July 31, 2023, the components of distributable earnings on a tax basis for each Fund were as follows:
| | Undistributed
Ordinary
Income | | Accumulated
Capital and
Other
Gain (Loss) | | Net
Unrealized
Appreciation
(Depreciation) |
First Trust Horizon Managed Volatility Domestic ETF
| $ 178,012 | | $ (43,898,526) | | $ 3,257,632 |
First Trust Horizon Managed Volatility Developed International ETF
| 235,830 | | (30,830,145) | | 538,685 |
First Trust Horizon Managed Volatility Small/Mid ETF
| 28,610 | | (2,152,557) | | 1,237,166 |
E. Income Taxes
Each Fund intends to continue to qualify as a regulated investment company by complying with the requirements under Subchapter M of the Internal Revenue Code of 1986, as amended, which includes distributing substantially all of its net investment income and net realized gains to shareholders. Accordingly, no provision has been made for federal and state income taxes. However, due to the timing and amount of distributions, each Fund may be subject to an excise tax of 4% of the amount by which approximately 98% of each Fund’s taxable income exceeds the distributions from such taxable income for the calendar year.
The Funds are subject to accounting standards that establish a minimum threshold for recognizing, and a system for measuring, the benefits of a tax position taken or expected to be taken in a tax return. For HUSV and HDMV, taxable years ended 2020, 2021, 2022, and 2023 remain open to federal and state audit. For HSMV, the taxable period ended 2020 and taxable years ended 2021, 2022, and 2023 remain open to federal and state audit. As of July 31, 2023, management has evaluated the application of these standards to the Funds and has determined that no provision for income tax is required in the Funds’ financial statements for uncertain tax positions.
The Funds intend to utilize provisions of the federal income tax laws, which allow them to carry a realized capital loss forward indefinitely following the year of the loss and offset such loss against any future realized capital gains. The Funds are subject to certain limitations under U.S. tax rules on the use of capital loss carryforwards and net unrealized built-in losses. These limitations apply when there has been a 50% change in ownership. At July 31, 2023, for federal income tax purposes, each applicable Fund had a capital loss carryforward available that is shown in the following table, to the extent provided by regulations, to offset future capital gains.
Notes to Financial Statements (Continued)
First Trust Exchange-Traded Fund III
July 31, 2023
| | Non-Expiring
Capital Loss
Carryforwards |
First Trust Horizon Managed Volatility Domestic ETF
| $ 43,898,526 |
First Trust Horizon Managed Volatility Developed International ETF
| 30,830,145 |
First Trust Horizon Managed Volatility Small/Mid ETF
| 2,152,557 |
In order to present paid-in capital and accumulated distributable earnings (loss) (which consists of accumulated net investment income (loss), accumulated net realized gain (loss) on investments and net unrealized appreciation (depreciation) on investments) on the Statements of Assets and Liabilities that more closely represent their tax character, certain adjustments have been made to paid-in capital, accumulated net investment income (loss) and accumulated net realized gain (loss) on investments. These adjustments are primarily due to the difference between book and tax treatments of income and gains on various investment securities held by the Funds and in-kind transactions. The results of operations and net assets were not affected by these adjustments. For the fiscal year ended July 31, 2023, the adjustments for each Fund were as follows:
| | Accumulated
Net
Investment
Income (Loss) | | Accumulated
Net Realized
Gain (Loss)
on Investments | | Paid-in
Capital |
First Trust Horizon Managed Volatility Domestic ETF
| $ — | | $ (2,721,381) | | $ 2,721,381 |
First Trust Horizon Managed Volatility Developed International ETF
| 38,862 | | (1,637) | | (37,225) |
First Trust Horizon Managed Volatility Small/Mid ETF
| — | | — | | — |
As of July 31, 2023, the aggregate cost, gross unrealized appreciation, gross unrealized depreciation, and net unrealized appreciation/(depreciation) on investments (including short positions and derivatives, if any) for federal income tax purposes were as follows:
| | Tax Cost | | Gross
Unrealized
Appreciation | | Gross
Unrealized
(Depreciation) | | Net Unrealized
Appreciation
(Depreciation) |
First Trust Horizon Managed Volatility Domestic ETF
| $ 88,525,108 | | $ 5,576,108 | | $ (2,318,476) | | $ 3,257,632 |
First Trust Horizon Managed Volatility Developed International ETF
| 39,833,701 | | 2,540,724 | | (2,005,428) | | 535,296 |
First Trust Horizon Managed Volatility Small/Mid ETF
| 17,771,050 | | 1,847,882 | | (610,716) | | 1,237,166 |
F. Expenses
Expenses, other than the investment advisory fee and other excluded expenses, are paid by the Advisor (See Note 3).
3. Investment Advisory Fee, Affiliated Transactions and Other Fee Arrangements
First Trust, the investment advisor to the Funds, is a limited partnership with one limited partner, Grace Partners of DuPage L.P., and one general partner, The Charger Corporation. The Charger Corporation is an Illinois corporation controlled by James A. Bowen, Chief Executive Officer of First Trust. First Trust is responsible for supervising the selection and ongoing monitoring of the securities in each Fund’s portfolio, managing the Funds’ business affairs and providing certain administrative services necessary for the management of the Funds.
First Trust is paid an annual unitary management fee for each Fund. Pursuant to the Investment Management Agreement between First Trust and the Trust, First Trust manages the investment of the Funds’ assets and is responsible for the expenses of each Fund, including the cost of transfer agency, sub-advisory, custody, fund administration, legal, audit and other services, but excluding fee payments under the Investment Management Agreement, interest, taxes, brokerage commissions and other expenses connected with the execution of portfolio transactions, distribution and service fees payable pursuant to a Rule 12b-1 plan, if any, and extraordinary expenses, which are paid by each respective Fund. First Trust also provides fund reporting services to the Funds for a flat annual fee in the amount of $9,250 per Fund, which is covered under the annual unitary management fee. Effective November 1, 2022, the annual
Notes to Financial Statements (Continued)
First Trust Exchange-Traded Fund III
July 31, 2023
unitary management fee payable by each Fund to First Trust for these services will be reduced at certain levels of each Fund’s net assets (“breakpoints”) and calculated pursuant to the following schedules:
| Breakpoints | | HUSV | | HSMV | | | | | |
| Fund net assets up to and including $2.5 billion | | 0.7000% | | 0.80% | | | | | |
| Fund net assets greater than $2.5 billion up to and including $5 billion | | 0.6825% | | 0.78% | | | | | |
| Fund net assets greater than $5 billion up to and including $7.5 billion | | 0.6650% | | 0.76% | | | | | |
| Fund net assets greater than $7.5 billion up to and including $10 billion | | 0.6475% | | 0.74% | | | | | |
| Fund net assets greater than $10 billion up to and including $15 billion | | 0.6300% | | 0.72% | | | | | |
| Fund net assets greater than $15 billion | | 0.5950% | | 0.68% | | | | | |
| Breakpoints | | HDMV | | | | | | | |
| Fund net assets up to and including $2.5 billion | | 0.80% | | | | | | | |
| Fund net assets greater than $2.5 billion up to and including $5 billion | | 0.78% | | | | | | | |
| Fund net assets greater than $5 billion up to and including $7.5 billion | | 0.76% | | | | | | | |
| Fund net assets greater than $7.5 billion up to and including $10 billion | | 0.74% | | | | | | | |
| Fund net assets greater than $10 billion | | 0.72% | | | | | | | |
Prior to November 1, 2022, HUSV paid First Trust an annual unitary management fee equal to 0.70% of the Fund’s average daily net assets and HDMV and HSMV each paid First Trust an annual unitary management fee of 0.80% of their average daily net assets.
Horizon serves as the Funds’ sub-advisor and manages each Fund’s portfolio subject to First Trust’s supervision. The Sub-Advisor receives a sub-advisory fee from First Trust equal to 50% of any remaining monthly unitary management fee paid to the Advisor after the average Fund’s expenses accrued during the most recent twelve months are subtracted from the unitary management fee for that month. During any period in which First Trust’s management fee is reduced in accordance with the breakpoints described above, the sub-advisory fee will be reduced to reflect the reduction in First Trust’s management fee.
The Trust has multiple service agreements with Brown Brothers Harriman & Co. (“BBH”). Under the service agreements, BBH performs custodial, fund accounting, certain administrative services, and transfer agency services for the Funds. As custodian, BBH is responsible for custody of each Fund’s assets. As fund accountant and administrator, BBH is responsible for maintaining the books and records of each Fund’s securities and cash. As transfer agent, BBH is responsible for maintaining shareholder records for each Fund.
Each Trustee who is not an officer or employee of First Trust, any sub-advisor or any of their affiliates (“Independent Trustees”) is paid a fixed annual retainer that is allocated equally among each fund in the First Trust Fund Complex. Each Independent Trustee is also paid an annual per fund fee that varies based on whether the fund is a closed-end or other actively managed fund, a target outcome fund or an index fund.
Additionally, the Lead Independent Trustee and the Chairs of the Audit Committee, Nominating and Governance Committee and Valuation Committee are paid annual fees to serve in such capacities, with such compensation allocated pro rata among each fund in the First Trust Fund Complex based on net assets. Independent Trustees are reimbursed for travel and out-of-pocket expenses in connection with all meetings. The Lead Independent Trustee and Committee Chairs rotate every three years. The officers and “Interested” Trustee receive no compensation from the Trust for acting in such capacities.
4. Purchases and Sales of Securities
For the fiscal year ended July 31, 2023, the cost of purchases and proceeds from sales of investment securities for each Fund, excluding short-term investments and in-kind transactions, were as follows:
| | Purchases | | Sales |
| First Trust Horizon Managed Volatility Domestic ETF | $ 118,008,007 | | $ 118,096,818 |
| First Trust Horizon Managed Volatility Developed International ETF | 31,483,862 | | 31,530,358 |
| First Trust Horizon Managed Volatility Small/Mid ETF | 12,056,481 | | 11,961,771 |
| | | | |
Notes to Financial Statements (Continued)
First Trust Exchange-Traded Fund III
July 31, 2023
For the fiscal year ended July 31, 2023, the cost of in-kind purchases and proceeds from in-kind sales for each Fund were as follows:
| | Purchases | | Sales |
| First Trust Horizon Managed Volatility Domestic ETF | $ 26,887,784 | | $ 34,091,566 |
| First Trust Horizon Managed Volatility Developed International ETF | — | | 5,602,890 |
| First Trust Horizon Managed Volatility Small/Mid ETF | 3,172,586 | | — |
5. Creations, Redemptions and Transaction Fees
Each Fund generally issues and redeems its shares in primary market transactions through a creation and redemption mechanism and does not sell or redeem individual shares. Instead, financial entities known as “Authorized Participants” have contractual arrangements with a Fund or one of the Fund’s service providers to purchase and redeem Fund shares directly with the Fund in large blocks of shares known as “Creation Units.” Prior to the start of trading on every business day, a Fund publishes through the National Securities Clearing Corporation (“NSCC”) the “basket” of securities, cash or other assets that it will accept in exchange for a Creation Unit of the Fund’s shares. An Authorized Participant that wishes to effectuate a creation of a Fund’s shares deposits with the Fund the “basket” of securities, cash or other assets identified by the Fund that day, and then receives the Creation Unit of the Fund’s shares in return for those assets. After purchasing a Creation Unit, the Authorized Participant may continue to hold the Fund’s shares or sell them in the secondary market. The redemption process is the reverse of the purchase process: the Authorized Participant redeems a Creation Unit of a Fund’s shares for a basket of securities, cash or other assets. The combination of the creation and redemption process with secondary market trading in a Fund’s shares and underlying securities provides arbitrage opportunities that are designed to help keep the market price of a Fund’s shares at or close to the NAV per share of the Fund.
Each Fund imposes fees in connection with the purchase of Creation Units. These fees may vary based upon various fact-based circumstances, including, but not limited to, the composition of the securities included in the Creation Unit or the countries in which the transactions are settled. The price for each Creation Unit will equal the daily NAV per share of a Fund times the number of shares in a Creation Unit, plus the fees described above and, if applicable, any operational processing and brokerage costs, transfer fees, stamp taxes and part or all of the spread between the expected bid and offer side of the market related to the securities comprising the creation basket.
Each Fund also imposes fees in connection with the redemption of Creation Units. These fees may vary based upon various fact-based circumstances, including, but not limited to, the composition of the securities included in the Creation Unit or the countries in which the transactions are settled. The price received for each Creation Unit will equal the daily NAV per share of a Fund times the number of shares in a Creation Unit, minus the fees described above and, if applicable, any operational processing and brokerage costs, transfer fees, stamp taxes and part or all of the spread between the expected bid and offer side of the market related to the securities comprising the redemption basket. Investors who use the services of a broker or other such intermediary in addition to an Authorized Participant to effect a redemption of a Creation Unit may also be assessed an amount to cover the cost of such services. The redemption fee charged by a Fund will comply with Rule 22c-2 of the 1940 Act which limits redemption fees to no more than 2% of the value of the shares redeemed.
6. Distribution Plan
The Board of Trustees adopted a Distribution and Service Plan pursuant to Rule 12b-1 under the 1940 Act. In accordance with the Rule 12b-1 plan, each Fund is authorized to pay an amount up to 0.25% of its average daily net assets each year to reimburse First Trust Portfolios L.P. (“FTP”), the distributor of the Funds, for amounts expended to finance activities primarily intended to result in the sale of Creation Units or to provide investor services. FTP may also use this amount to compensate securities dealers or other persons that are Authorized Participants for providing distribution assistance, including broker-dealer and shareholder support and educational and promotional services.
No 12b-1 fees are currently paid by the Funds, and pursuant to a contractual arrangement, no 12b-1 fees will be paid any time before November 30, 2024.
7. Indemnification
The Trust, on behalf of the Funds, has a variety of indemnification obligations under contracts with its service providers. The Trust’s maximum exposure under these arrangements is unknown. However, the Trust has not had prior claims or losses pursuant to these contracts and expects the risk of loss to be remote.
Notes to Financial Statements (Continued)
First Trust Exchange-Traded Fund III
July 31, 2023
8. Other Matters
By operation of law, HSMV now operates as a diversified open-end management investment company as defined in Section 5(b) of the 1940 Act.
9. Subsequent Events
Management has evaluated the impact of all subsequent events on the Funds through the date the financial statements were issued and has determined that there were no subsequent events requiring recognition or disclosure in the financial statements that have not already been disclosed.
Report of Independent Registered Public Accounting Firm
To the Shareholders and the Board of Trustees of First Trust Exchange-Traded Fund III:
Opinion on the Financial Statements and Financial Highlights
We have audited the accompanying statements of assets and liabilities of First Trust Horizon Managed Volatility Domestic ETF, First Trust Horizon Managed Volatility Developed International ETF, and First Trust Horizon Managed Volatility Small/Mid ETF (the “Funds”), each a series of the First Trust Exchange-Traded Fund III, including the portfolios of investments, as of July 31, 2023, the related statements of operations for the year then ended, the statements of changes in net assets for each of the two years in the period then ended, and the financial highlights for the periods indicated in the table below, and the related notes. In our opinion, the financial statements and financial highlights present fairly, in all material respects, the financial position of each of the Funds as of July 31, 2023, and the results of their operations for the year then ended, the changes in their net assets for each of the two years in the period then ended, and the financial highlights for the periods listed in the table below in conformity with accounting principles generally accepted in the United States of America.
| Individual Funds Included in the Trust | Financial Highlights |
First Trust Horizon Managed Volatility Domestic ETF (HUSV)
First Trust Horizon Managed Volatility Developed International ETF (HDMV) | For the years ended July 31, 2023, 2022, 2021, 2020, and 2019 |
| First Trust Horizon Managed Volatility Small/Mid ETF (HSMV) | For the years ended July 31, 2023, 2022, and 2021, and for the period from April 6, 2020 (commencement of investment operations) through July 31, 2020 |
Basis for Opinion
These financial statements and financial highlights are the responsibility of the Funds’ management. Our responsibility is to express an opinion on the Funds’ financial statements and financial highlights based on our audits. We are a public accounting firm registered with the Public Company Accounting Oversight Board (United States) (PCAOB) and are required to be independent with respect to the Funds in accordance with the U.S. federal securities laws and the applicable rules and regulations of the Securities and Exchange Commission and the PCAOB.
We conducted our audits in accordance with the standards of the PCAOB. Those standards require that we plan and perform the audit to obtain reasonable assurance about whether the financial statements and financial highlights are free of material misstatement, whether due to error or fraud. The Funds are not required to have, nor were we engaged to perform, an audit of their internal control over financial reporting. As part of our audits we are required to obtain an understanding of internal control over financial reporting but not for the purpose of expressing an opinion on the effectiveness of the Funds’ internal control over financial reporting. Accordingly, we express no such opinion.
Our audits included performing procedures to assess the risks of material misstatement of the financial statements and financial highlights, whether due to error or fraud, and performing procedures that respond to those risks. Such procedures included examining, on a test basis, evidence regarding the amounts and disclosures in the financial statements and financial highlights. Our audits also included evaluating the accounting principles used and significant estimates made by management, as well as evaluating the overall presentation of the financial statements and financial highlights. Our procedures included confirmation of securities owned as of July 31, 2023, by correspondence with the custodian and brokers; when replies were not received from brokers, we performed other auditing procedures. We believe that our audits provide a reasonable basis for our opinion.
Chicago, Illinois
September 22, 2023
We have served as the auditor of one or more First Trust investment companies since 2001.
Additional Information
First Trust Exchange-Traded Fund III
July 31, 2023 (Unaudited)
Proxy Voting Policies and Procedures
A description of the policies and procedures that the Trust uses to determine how to vote proxies and information on how each Fund voted proxies relating to portfolio securities during the most recent 12-month period ended June 30 is available (1) without charge, upon request, by calling (800) 988-5891; (2) on each Fund’s website at www.ftportfolios.com; and (3) on the Securities and Exchange Commission’s (“SEC”) website at www.sec.gov.
Portfolio Holdings
Each Fund files portfolio holdings information for each month in a fiscal quarter within 60 days after the end of the relevant fiscal quarter on Form N-PORT. Portfolio holdings information for the third month of each fiscal quarter will be publicly available on the SEC’s website at www.sec.gov. Each Fund’s complete schedule of portfolio holdings for the second and fourth quarters of each fiscal year is included in the semi-annual and annual reports to shareholders, respectively, and is filed with the SEC on Form N-CSR. The semi-annual and annual report for each Fund is available to investors within 60 days after the period to which it relates. Each Fund’s Forms N-PORT and Forms N-CSR are available on the SEC’s website listed above.
Federal Tax Information
For the taxable year ended July 31, 2023, the following percentages of income dividends paid by the Funds qualify for the dividends received deduction available to corporations:
| | Dividends
Received Deduction |
First Trust Horizon Managed Volatility Domestic ETF
| 100.00% |
First Trust Horizon Managed Volatility Developed International ETF
| 0.00% |
First Trust Horizon Managed Volatility Small/Mid ETF
| 100.00% |
For the taxable year ended July 31, 2023, the following percentages of income dividend paid by the Funds are hereby designated as qualified dividend income:
| | Qualified
Dividend Income |
First Trust Horizon Managed Volatility Domestic ETF
| 100.00% |
First Trust Horizon Managed Volatility Developed International ETF
| 70.20% |
First Trust Horizon Managed Volatility Small/Mid ETF
| 100.00% |
A portion of the ordinary dividends (including short-term capital gains) that HUSV and HSMV paid to shareholders during the taxable year ended July 31, 2023, may be eligible for the Qualified Business Income (QBI) Deduction under the Internal Revenue Code of 1986, as amended (the “Code”), section 199A for the aggregate dividends the Funds received from the underlying Real Estate Investment Trusts (REITs) they invest in.
The following Fund met the requirements of Section 853 of the Code and elects to pass through to its shareholders credit for foreign taxes paid. For the taxable year ended July 31, 2023, the total amounts of income received by the Fund from sources within foreign countries and possessions of the United States and of taxes paid to such countries are as follows:
| | Gross Foreign Income | | Foreign Taxes Paid |
| | Amount | | Per Share | | Amount | | Per Share |
First Trust Horizon Managed Volatility Developed International ETF
| $1,687,269 | | $1.21 | | $108,385 | | $0.08 |
The foreign taxes paid will be reported to shareholders on Form 1099-DIV which will be sent to shareholders shortly after the calendar year end. Gross foreign income and foreign taxes paid will be posted on the Fund’s website and disclosed in the tax letter.
Risk Considerations
Risks are inherent in all investing. Certain general risks that may be applicable to a Fund are identified below, but not all of the material risks relevant to each Fund are included in this report and not all of the risks below apply to each Fund. The material risks of investing in each Fund are spelled out in its prospectus, statement of additional information and other regulatory filings. Before investing, you should consider each Fund’s investment objective, risks, charges and expenses, and read each
Additional Information (Continued)
First Trust Exchange-Traded Fund III
July 31, 2023 (Unaudited)
Fund’s prospectus and statement of additional information carefully. You can download each Fund’s prospectus at www.ftportfolios.com or contact First Trust Portfolios L.P. at (800) 621-1675 to request a prospectus, which contains this and other information about each Fund.
Concentration Risk. To the extent that a fund is able to invest a significant percentage of its assets in a single asset class or the securities of issuers within the same country, state, region, industry or sector, an adverse economic, business or political development may affect the value of the fund’s investments more than if the fund were more broadly diversified. A fund that tracks an index will be concentrated to the extent the fund’s corresponding index is concentrated. A concentration makes a fund more susceptible to any single occurrence and may subject the fund to greater market risk than a fund that is more broadly diversified.
Credit Risk. Credit risk is the risk that an issuer of a security will be unable or unwilling to make dividend, interest and/or principal payments when due and the related risk that the value of a security may decline because of concerns about the issuer’s ability to make such payments.
Cyber Security Risk. The funds are susceptible to potential operational risks through breaches in cyber security. A breach in cyber security refers to both intentional and unintentional events that may cause a fund to lose proprietary information, suffer data corruption or lose operational capacity. Such events could cause a fund to incur regulatory penalties, reputational damage, additional compliance costs associated with corrective measures and/or financial loss. In addition, cyber security breaches of a fund’s third-party service providers, such as its administrator, transfer agent, custodian, or sub-advisor, as applicable, or issuers in which the fund invests, can also subject a fund to many of the same risks associated with direct cyber security breaches.
Defined Outcome Funds Risk. To the extent a fund’s investment strategy is designed to deliver returns tied to the price performance of an underlying ETF, an investor may not realize the returns the fund seeks to achieve if that investor does not hold shares for the entire target outcome period. In the event an investor purchases shares after the first day of the target outcome period or sells shares prior to the end of the target outcome period, the buffer that the fund seeks to provide against a decline in the value of the underlying ETF may not be available, the enhanced returns that the fund seeks to provide (if any) may not be available and the investor may not participate in a gain in the value of the underlying ETF up to the cap for the investor’s investment period. Additionally, the fund will not participate in gains of the underlying ETF above the cap and a shareholder may lose their entire investment. If the fund seeks enhanced returns, there are certain time periods when the value of the fund may fall faster than the value of the underlying ETF, and it is very unlikely that, on any given day during which the underlying ETF share price increases in value, the fund’s share price will increase at the same rate as the enhanced returns sought by the fund, which is designed for an entire target outcome period. Trading flexible exchange options involves risks different from, or possibly greater than, the risks associated with investing directly in securities, such as less liquidity and correlation and valuation risks. A fund may experience substantial downside from specific flexible exchange option positions and certain positions may expire worthless.
Derivatives Risk. To the extent a fund uses derivative instruments such as futures contracts, options contracts and swaps, the fund may experience losses because of adverse movements in the price or value of the underlying asset, index or rate, which may be magnified by certain features of the derivative. These risks are heightened when a fund’s portfolio managers use derivatives to enhance the fund’s return or as a substitute for a position or security, rather than solely to hedge (or offset) the risk of a position or security held by the fund.
Equity Securities Risk. To the extent a fund invests in equity securities, the value of the fund’s shares will fluctuate with changes in the value of the equity securities. Equity securities prices fluctuate for several reasons, including changes in investors’ perceptions of the financial condition of an issuer or the general condition of the relevant stock market, such as market volatility, or when political or economic events affecting the issuers occur. In addition, common stock prices may be particularly sensitive to rising interest rates, as the cost of capital rises and borrowing costs increase. Equity securities may decline significantly in price over short or extended periods of time, and such declines may occur in the equity market as a whole, or they may occur in only a particular country, company, industry or sector of the market.
ETF Risk. The shares of an ETF trade like common stock and represent an interest in a portfolio of securities. The risks of owning an ETF generally reflect the risks of owning the underlying securities, although lack of liquidity in an ETF could result in it being more volatile and ETFs have management fees that increase their costs. Shares of an ETF trade on an exchange at market prices rather than net asset value, which may cause the shares to trade at a price greater than net asset value (premium) or less than net asset value (discount). In times of market stress, decisions by market makers to reduce or step away from their role of providing a market for an ETF’s shares, or decisions by an ETF’s authorized participants that they are unable or unwilling to proceed with creation and/or redemption orders of an ETF’s shares, could result in shares of the ETF trading at a discount to net asset value and in greater than normal intraday bid-ask spreads.
Additional Information (Continued)
First Trust Exchange-Traded Fund III
July 31, 2023 (Unaudited)
Fixed Income Securities Risk. To the extent a fund invests in fixed income securities, the fund will be subject to credit risk, income risk, interest rate risk, liquidity risk and prepayment risk. Income risk is the risk that income from a fund’s fixed income investments could decline during periods of falling interest rates. Interest rate risk is the risk that the value of a fund’s fixed income securities will decline because of rising interest rates. Liquidity risk is the risk that a security cannot be purchased or sold at the time desired, or cannot be purchased or sold without adversely affecting the price. Prepayment risk is the risk that the securities will be redeemed or prepaid by the issuer, resulting in lower interest payments received by the fund. In addition to these risks, high yield securities, or “junk” bonds, are subject to greater market fluctuations and risk of loss than securities with higher ratings, and the market for high yield securities is generally smaller and less liquid than that for investment grade securities.
Index or Model Constituent Risk. Certain funds may be a constituent of one or more indices or ETF models. As a result, such a fund may be included in one or more index-tracking exchange-traded funds or mutual funds. Being a component security of such a vehicle could greatly affect the trading activity involving a fund, the size of the fund and the market volatility of the fund. Inclusion in an index could increase demand for the fund and removal from an index could result in outsized selling activity in a relatively short period of time. As a result, a fund’s net asset value could be negatively impacted and the fund’s market price may be significantly below its net asset value during certain periods. In addition, index rebalances may potentially result in increased trading activity in a fund’s shares.
Index Provider Risk. To the extent a fund seeks to track an index, it is subject to Index Provider Risk. There is no assurance that the Index Provider will compile the Index accurately, or that the Index will be determined, maintained, constructed, reconstituted, rebalanced, composed, calculated or disseminated accurately. To correct any such error, the Index Provider may carry out an unscheduled rebalance or other modification of the Index constituents or weightings, which may increase the fund’s costs. The Index Provider does not provide any representation or warranty in relation to the quality, accuracy or completeness of data in the Index, and it does not guarantee that the Index will be calculated in accordance with its stated methodology. Losses or costs associated with any Index Provider errors generally will be borne by the fund and its shareholders.
Investment Companies Risk. To the extent a fund invests in the securities of other investment vehicles, the fund will incur additional fees and expenses that would not be present in a direct investment in those investment vehicles. Furthermore, the fund’s investment performance and risks are directly related to the investment performance and risks of the investment vehicles in which the fund invests.
LIBOR Risk. To the extent a fund invests in floating or variable rate obligations that use the London Interbank Offered Rate (“LIBOR”) as a reference interest rate, it is subject to LIBOR Risk. The United Kingdom’s Financial Conduct Authority, which regulates LIBOR has ceased making LIBOR available as a reference rate over a phase-out period that began December 31, 2021. There is no assurance that any alternative reference rate, including the Secured Overnight Financing Rate (“SOFR”) will be similar to or produce the same value or economic equivalence as LIBOR or that instruments using an alternative rate will have the same volume or liquidity. The unavailability or replacement of LIBOR may affect the value, liquidity or return on certain fund investments and may result in costs incurred in connection with closing out positions and entering into new trades. Any potential effects of the transition away from LIBOR on the fund or on certain instruments in which the fund invests can be difficult to ascertain, and they may vary depending on a variety of factors, and they could result in losses to the fund.
Management Risk. To the extent that a fund is actively managed, it is subject to management risk. In managing an actively-managed fund’s investment portfolio, the fund’s portfolio managers will apply investment techniques and risk analyses that may not have the desired result. There can be no guarantee that a fund will meet its investment objective.
Market Risk. Market risk is the risk that a particular security, or shares of a fund in general, may fall in value. Securities held by a fund, as well as shares of a fund itself, are subject to market fluctuations caused by factors such as general economic conditions, political events, regulatory or market developments, changes in interest rates and perceived trends in securities prices. Shares of a fund could decline in value or underperform other investments as a result of the risk of loss associated with these market fluctuations. In addition, local, regional or global events such as war, acts of terrorism, spread of infectious diseases or other public health issues, recessions, or other events could have a significant negative impact on a fund and its investments. Such events may affect certain geographic regions, countries, sectors and industries more significantly than others. In February 2022, Russia invaded Ukraine which has caused and could continue to cause significant market disruptions and volatility within the markets in Russia, Europe, and the United States. The hostilities and sanctions resulting from those hostilities could have a significant impact on certain fund investments as well as fund performance. The COVID-19 global pandemic and the ensuing policies enacted by governments and central banks have caused and may continue to cause significant volatility and uncertainty in global financial markets. While the U.S. has resumed “reasonably” normal business activity, many countries continue to impose lockdown measures. Additionally, there is no guarantee that vaccines will be effective against emerging variants of the disease. These events also adversely affect the prices and liquidity of a fund’s portfolio securities or other instruments and could result in disruptions in the trading markets. Any of such circumstances could have a materially negative impact on the value of a fund’s shares and result in increased market volatility. During any such events, a fund’s shares may trade at increased premiums or discounts to their net asset value and the bid/ask spread on a fund’s shares may widen.
Additional Information (Continued)
First Trust Exchange-Traded Fund III
July 31, 2023 (Unaudited)
Non-U.S. Securities Risk. To the extent a fund invests in non-U.S. securities, it is subject to additional risks not associated with securities of domestic issuers. Non-U.S. securities are subject to higher volatility than securities of domestic issuers due to: possible adverse political, social or economic developments; restrictions on foreign investment or exchange of securities; capital controls; lack of liquidity; currency exchange rates; excessive taxation; government seizure of assets; the imposition of sanctions by foreign governments; different legal or accounting standards; and less government supervision and regulation of exchanges in foreign countries. Investments in non-U.S. securities may involve higher costs than investments in U.S. securities, including higher transaction and custody costs, as well as additional taxes imposed by non-U.S. governments. These risks may be heightened for securities of companies located, or with significant operations, in emerging market countries.
Operational Risk. Each fund is subject to risks arising from various operational factors, including, but not limited to, human error, processing and communication errors, errors of a fund’s service providers, counterparties or other third-parties, failed or inadequate processes and technology or systems failures. Each fund relies on third-parties for a range of services, including custody. Any delay or failure relating to engaging or maintaining such service providers may affect a fund’s ability to meet its investment objective. Although the funds and the funds’ investment advisor seek to reduce these operational risks through controls and procedures, there is no way to completely protect against such risks.
Passive Investment Risk. To the extent a fund seeks to track an index, the fund will invest in the securities included in, or representative of, the index regardless of their investment merit. A fund generally will not attempt to take defensive positions in declining markets.
Preferred Securities Risk. Preferred securities combine some of the characteristics of both common stocks and bonds. Preferred securities are typically subordinated to bonds and other debt securities in a company’s capital structure in terms of priority to corporate income, subjecting them to greater credit risk than those debt securities. Generally, holders of preferred securities have no voting rights with respect to the issuing company unless preferred dividends have been in arrears for a specified number of periods, at which time the preferred security holders may obtain limited rights. In certain circumstances, an issuer of preferred securities may defer payment on the securities and, in some cases, redeem the securities prior to a specified date. Preferred securities may also be substantially less liquid than other securities, including common stock.
Valuation Risk. The valuation of certain securities may carry more risk than that of common stock. Uncertainties in the conditions of the financial markets, unreliable reference data, lack of transparency and inconsistency of valuation models and processes may lead to inaccurate asset pricing. A fund may hold investments in sizes smaller than institutionally sized round lot positions (sometimes referred to as odd lots). However, third-party pricing services generally provide evaluations on the basis of institutionally-sized round lots. If a fund sells certain of its investments in an odd lot transaction, the sale price may be less than the value at which such securities have been held by the fund. Odd lots often trade at lower prices than institutional round lots. There is no assurance that the fund will be able to sell a portfolio security at the price established by the pricing service, which could result in a loss to the fund.
| NOT FDIC INSURED | NOT BANK GUARANTEED | MAY LOSE VALUE |
Advisory and Sub-Advisory Agreements
Board Considerations Regarding Approval of the Continuation of the Investment Management and Investment Sub-Advisory Agreements
FIRST TRUST HORIZON MANAGED VOLATILITY DOMESTIC ETF
FIRST TRUST HORIZON MANAGED VOLATILITY DEVELOPED INTERNATIONAL ETF
FIRST TRUST HORIZON MANAGED VOLATILITY SMALL/MID ETF
The Board of Trustees of First Trust Exchange-Traded Fund III (the “Trust”), including the Independent Trustees, unanimously approved the continuation of the Investment Management Agreements (as applicable to a specific Fund, the “Advisory Agreement” and collectively, the “Advisory Agreements”) with First Trust Advisors L.P. (the “Advisor”) and the Investment Sub-Advisory Agreement (the “Sub-Advisory Agreement” and together with the Advisory Agreements, the “Agreements”) among the Trust, the Advisor and Horizon Investments, LLC (the “Sub-Advisor”) on behalf of the following series of the Trust (each a “Fund” and collectively, the “Funds”):
First Trust Horizon Managed Volatility Domestic ETF (HUSV)
First Trust Horizon Managed Volatility Developed International ETF (HDMV)
First Trust Horizon Managed Volatility Small/Mid ETF (HSMV)
Additional Information (Continued)
First Trust Exchange-Traded Fund III
July 31, 2023 (Unaudited)
The Board approved the continuation of the applicable Agreements for each Fund for a one-year period ending June 30, 2024 at a meeting held on June 4–5, 2023. The Board determined for each Fund that the continuation of the applicable Agreements is in the best interests of the Fund in light of the nature, extent and quality of the services provided and such other matters as the Board considered to be relevant in the exercise of its business judgment.
To reach this determination for each Fund, the Board considered its duties under the Investment Company Act of 1940, as amended (the “1940 Act”), as well as under the general principles of state law, in reviewing and approving advisory contracts; the requirements of the 1940 Act in such matters; the fiduciary duty of investment advisors with respect to advisory agreements and compensation; the standards used by courts in determining whether investment company boards have fulfilled their duties; and the factors to be considered by the Board in voting on such agreements. At meetings held on April 17, 2023 and June 4–5, 2023, the Board, including the Independent Trustees, reviewed materials provided by the Advisor and the Sub-Advisor responding to requests for information from counsel to the Independent Trustees, submitted on behalf of the Independent Trustees, that, among other things, outlined: the services provided by the Advisor and the Sub-Advisor to each Fund (including the relevant personnel responsible for these services and their experience); the unitary fee rate schedule payable by each Fund as compared to fees charged to a peer group of funds (the “Expense Group”) and a broad peer universe of funds (the “Expense Universe”), each assembled by Broadridge Financial Solutions, Inc. (“Broadridge”), an independent source, and as compared to fees charged to other clients of the Advisor, including other exchange-traded funds (“ETFs”) managed by the Advisor; the sub-advisory fee as compared to fees charged to other clients of the Sub-Advisor; the expense ratio of each Fund as compared to expense ratios of the funds in the Fund’s Expense Group and Expense Universe; performance information for each Fund, including comparisons of each Fund’s performance to that of one or more relevant benchmark indexes and to that of a performance group of funds and a broad performance universe of funds (the “Performance Universe”), each assembled by Broadridge; the nature of expenses incurred in providing services to each Fund and the potential for the Advisor and the Sub-Advisor to realize economies of scale, if any; profitability and other financial data for the Advisor; financial data for the Sub-Advisor; any indirect benefits to the Advisor and its affiliate, First Trust Portfolios L.P. (“FTP”), and the Sub-Advisor; and information on the Advisor’s and the Sub-Advisor’s compliance programs. The Board reviewed initial materials with the Advisor at the meeting held on April 17, 2023, prior to which the Independent Trustees and their counsel met separately to discuss the information provided by the Advisor and the Sub-Advisor. Following the April meeting, counsel to the Independent Trustees, on behalf of the Independent Trustees, requested certain clarifications and supplements to the materials provided, and the information provided in response to those requests was considered at an executive session of the Independent Trustees and their counsel held prior to the June 4–5, 2023 meeting, as well as at the June meeting. The Board applied its business judgment to determine whether the arrangements between the Trust and the Advisor and among the Trust, the Advisor and the Sub-Advisor continue to be reasonable business arrangements from each Fund’s perspective. The Board determined that, given the totality of the information provided with respect to the Agreements, the Board had received sufficient information to renew the Agreements. The Board considered that shareholders chose to invest or remain invested in a Fund knowing that the Advisor and the Sub-Advisor manage the Fund and knowing the Fund’s unitary fee.
In reviewing the applicable Agreements for each Fund, the Board considered the nature, extent and quality of the services provided by the Advisor and the Sub-Advisor under the applicable Agreements. With respect to the Advisory Agreements, the Board considered that the Advisor is responsible for the overall management and administration of the Trust and each Fund and reviewed all of the services provided by the Advisor to the Funds, including the oversight of the Sub-Advisor, as well as the background and experience of the persons responsible for such services. The Board noted that the Advisor oversees the Sub-Advisor’s day-to-day management of each Fund’s investments, including portfolio risk monitoring and performance review. The Board considered that the Sub-Advisor is responsible for the selection and ongoing monitoring of the securities in the Funds’ investment portfolios, but that the Advisor executes each Fund’s portfolio trades. In reviewing the services provided, the Board noted the compliance program that had been developed by the Advisor and considered that it includes a robust program for monitoring the Advisor’s, the Sub-Advisor’s and each Fund’s compliance with the 1940 Act, as well as each Fund’s compliance with its investment objective, policies and restrictions. The Board also considered a report from the Advisor with respect to its risk management functions related to the operation of the Funds. Finally, as part of the Board’s consideration of the Advisor’s services, the Advisor, in its written materials and at the April 17, 2023 meeting, described to the Board the scope of its ongoing investment in additional personnel and infrastructure to maintain and improve the quality of services provided to the Funds and the other funds in the First Trust Fund Complex. With respect to the Sub-Advisory Agreement, the Board noted that each Fund is an actively-managed ETF and the Sub-Advisor actively manages the Fund’s investments. In addition to the written materials provided by the Sub-Advisor, at the June 4–5, 2023 meeting, the Board also received a presentation from representatives of the Sub-Advisor, who discussed the services that the Sub-Advisor provides to each Fund, including the Sub-Advisor’s day-to-day management of the Funds’ investments. In considering the Sub-Advisor’s management of the Funds, the Board noted the background and experience of the Sub-Advisor’s portfolio management team. In light of the information presented and the considerations made, the Board concluded that the nature, extent and quality of the services provided to the Trust
Additional Information (Continued)
First Trust Exchange-Traded Fund III
July 31, 2023 (Unaudited)
and each Fund by the Advisor and the Sub-Advisor under the Agreements have been and are expected to remain satisfactory and that the Sub-Advisor, under the oversight of the Advisor, has managed each Fund consistent with its investment objective, policies and restrictions.
The Board considered the unitary fee rate schedule payable by each Fund under the applicable Advisory Agreement for the services provided. The Board noted that the sub-advisory fee for each Fund is paid by the Advisor from the Fund’s unitary fee. The Board considered that as part of the unitary fee the Advisor is responsible for each Fund’s expenses, including the cost of sub-advisory, transfer agency, custody, fund administration, legal, audit and other services and license fees, if any, but excluding the fee payment under the applicable Advisory Agreement and interest, taxes, brokerage commissions and other expenses connected with the execution of portfolio transactions, distribution and service fees pursuant to a Rule 12b-1 plan, if any, and extraordinary expenses, if any. The Board received and reviewed information showing the fee rates and expense ratios of the peer funds in the Expense Groups, as well as advisory and unitary fee rates charged by the Advisor and the Sub-Advisor to other fund (including ETFs) and non-fund clients, as applicable. Because each Fund pays a unitary fee, the Board determined that expense ratios were the most relevant comparative data point. Based on the information provided, the Board noted that the total (net) expense ratio for HDMV was below the median total (net) expense ratio of the peer funds in its Expense Group and that the total (net) expense ratio for each of HUSV and HSMV was above the median total (net) expense ratio of the peer funds in its respective Expense Group. With respect to the Expense Groups, the Board, at the April 17, 2023 meeting, discussed with Broadridge its methodology for assembling peer groups and discussed with the Advisor limitations in creating peer groups for actively-managed ETFs, including that HDMV’s Expense Group did not include any other actively-managed ETFs, and different business models that may affect the pricing of services among ETF sponsors. The Board also noted that, for each Fund, not all peer funds employ an advisor/sub-advisor management structure. The Board took these limitations and differences into account in considering the peer data. With respect to fees charged to other non-ETF clients, the Board considered differences between the Funds and other non-ETF clients that limited their comparability. In considering the unitary fee rate schedules overall, the Board also considered the Advisor’s statement that it seeks to meet investor needs through innovative and value-added investment solutions and the Advisor’s demonstrated long-term commitment to each Fund and the other funds in the First Trust Fund Complex.
The Board considered performance information for each Fund. The Board noted the process it has established for monitoring each Fund’s performance and portfolio risk on an ongoing basis, which includes quarterly performance reporting from the Advisor and the Sub-Advisor for the Funds. The Board determined that this process continues to be effective for reviewing each Fund’s performance. The Board received and reviewed information comparing each Fund’s performance for one or more periods ended December 31, 2022 to the performance of the funds in its Performance Universe and to that of a benchmark index. Based on the information provided, the Board noted that HDMV underperformed its Performance Universe median for the one-, three- and five-year periods ended December 31, 2022, outperformed its benchmark index for the one-year period ended December 31, 2022 and underperformed its benchmark index for the three- and five-year periods ended December 31, 2022. The Board noted that HUSV underperformed its Performance Universe median for the one-year period ended December 31, 2022 and outperformed its Performance Universe median for the three- and five-year periods ended December 31, 2022. The Board also noted that HUSV outperformed its benchmark index for the one-year period ended December 31, 2022 and underperformed its benchmark index for the three- and five-year periods ended December 31, 2022. The Board noted that HSMV outperformed its Performance Universe median and benchmark index for the one-year period ended December 31, 2022. The Board noted the Advisor’s and the Sub-Advisor’s discussions of HDMV’s performance at the April 17, 2023 and June 4-5, 2023 meetings, respectively.
On the basis of all the information provided on the unitary fee and performance of each Fund and the ongoing oversight by the Board, the Board concluded that the unitary fee for each Fund (out of which the Sub-Advisor is compensated) continues to be reasonable and appropriate in light of the nature, extent and quality of the services provided by the Advisor and the Sub-Advisor to each Fund under the Agreements.
The Board considered information and discussed with the Advisor whether there were any economies of scale in connection with providing advisory services to the Funds at current asset levels and whether the Funds may benefit from any economies of scale. The Board noted that the unitary fee rate schedule for each Fund includes breakpoints pursuant to which the unitary fee rate will be reduced as assets of the Fund meet certain thresholds. The Board considered the Advisor’s statement that it believes that its expenses relating to providing advisory services to the Funds will increase during the next twelve months as the Advisor continues to build infrastructure and add new staff. The Board also noted that under the unitary fee structure, any reduction in expenses associated with the management and operations of the Funds would benefit the Advisor, but that the unitary fee structure provides a level of certainty in expenses for shareholders of the Funds. The Board concluded that the unitary fee rate schedule for each Fund reflects an appropriate level of sharing of any economies of scale that may be realized in the management of the Fund at current asset levels. The Board considered the revenues and allocated costs (including the allocation methodology) of the Advisor in serving as investment advisor to each Fund for the twelve months ended December 31, 2022 and the estimated profitability level for each Fund calculated by the Advisor based on such data, as well as complex-wide and product-line profitability data, for the same period. The Board noted the
Additional Information (Continued)
First Trust Exchange-Traded Fund III
July 31, 2023 (Unaudited)
inherent limitations in the profitability analysis and concluded that, based on the information provided, the Advisor’s profitability level for each Fund was not unreasonable. In addition, the Board considered indirect benefits described by the Advisor that may be realized from its relationship with the Funds. The Board considered that the Advisor had identified as an indirect benefit to the Advisor and FTP their exposure to investors and brokers who, absent their exposure to the Funds, may have had no dealings with the Advisor or FTP, and noted that the Advisor does not utilize soft dollars in connection with the Funds. The Board also considered the Advisor’s compensation for fund reporting services provided to the Funds pursuant to a separate Fund Reporting Services Agreement, which is paid from the unitary fee. The Board concluded that the character and amount of potential indirect benefits to the Advisor were not unreasonable.
The Board considered the Sub-Advisor’s statements to the effect that it is difficult to know if or precisely when measurable economies of scale will be achieved for the Sub-Advisor and that the Sub-Advisor presumes expenses related to providing services will remain approximately the same over the next twelve months. The Board noted that the Advisor pays the Sub-Advisor for each Fund from the unitary fee, that the sub-advisory fee will be reduced consistent with the breakpoints in the unitary fee rate schedule and its understanding that each Fund’s sub-advisory fee was the product of an arm’s length negotiation. The Board did not review the profitability of the Sub-Advisor with respect to each Fund. The Board concluded that the profitability analysis for the Advisor was more relevant. The Board considered the potential indirect benefits to the Sub-Advisor from being associated with the Advisor and the Funds. The Board noted that the Sub-Advisor is not responsible for coordinating execution of Fund trades and that the only known indirect benefit the Sub-Advisor receives from managing the Funds is publicity related to managing an ETF in a closely monitored sector of the ETF universe. The Board concluded that the character and amount of potential indirect benefits to the Sub-Advisor were not unreasonable.
Based on all of the information considered and the conclusions reached, the Board, including the Independent Trustees, unanimously determined that the terms of the Agreements continue to be fair and reasonable and that the continuation of the Agreements is in the best interests of each Fund. No single factor was determinative in the Board’s analysis.
Liquidity Risk Management Program
In accordance with Rule 22e-4 under the Investment Company Act of 1940, as amended (the “1940 Act”), the Funds and each other fund in the First Trust Fund Complex, other than the closed-end funds, have adopted and implemented a liquidity risk management program (the “Program”) reasonably designed to assess and manage the funds’ liquidity risk, i.e., the risk that a fund could not meet requests to redeem shares issued by the fund without significant dilution of remaining investors’ interests in the fund. The Board of Trustees of the First Trust Funds has appointed First Trust Advisors L.P. (the “Advisor”) as the person designated to administer the Program, and in this capacity the Advisor performs its duties primarily through the activities and efforts of the First Trust Liquidity Committee (the “Liquidity Committee”).
Pursuant to the Program, the Liquidity Committee classifies the liquidity of each fund’s portfolio investments into one of the four liquidity categories specified by Rule 22e-4: highly liquid investments, moderately liquid investments, less liquid investments and illiquid investments. The Liquidity Committee determines certain of the inputs for this classification process, including reasonably anticipated trade sizes and significant investor dilution thresholds. The Liquidity Committee also determines and periodically reviews a highly liquid investment minimum for certain funds, monitors the funds’ holdings of assets classified as illiquid investments to seek to ensure they do not exceed 15% of a fund’s net assets and establishes policies and procedures regarding redemptions in kind.
At the April 17, 2023 meeting of the Board of Trustees, as required by Rule 22e-4 and the Program, the Advisor provided the Board with a written report prepared by the Advisor that addressed the operation of the Program during the period from March 17, 2022 through the Liquidity Committee’s annual meeting held on March 23, 2023 and assessed the Program’s adequacy and effectiveness of implementation during this period, including the operation of the highly liquid investment minimum for each fund that is required under the Program to have one, and any material changes to the Program. Note that because the Funds primarily hold assets that are highly liquid investments, the Funds have not adopted any highly liquid investment minimums.
As stated in the written report, during the review period, two funds breached the 15% limitation on illiquid investments for one day each, as a result of an unscheduled week-long closure of the stock exchange in Istanbul following devastating earthquakes in February, causing all Turkish equities to be re-classified as “illiquid” for one day. Each fund filed a Form N-RN on the day after the breach occurred, and one day later after the breach was cured. No fund with a highly liquid investment minimum breached that minimum during the reporting period. The Advisor concluded that each fund’s investment strategy is appropriate for an open-end fund; that the Program operated effectively in all material respects during the review period; and that the Program is reasonably designed to assess and manage the liquidity risk of each fund and to maintain compliance with Rule 22e-4.
Additional Information (Continued)
First Trust Exchange-Traded Fund III
July 31, 2023 (Unaudited)
Board of Trustees
Effective September 10, 2023, the exchange-traded funds, closed-end funds, mutual funds and variable insurance funds (collectively, the “Funds”) advised by First Trust Advisors L.P. (“FTA”) announced the appointment of Ms. Bronwyn Wright as a Trustee of all Funds except the exchange-traded funds included in the First Trust Exchange-Traded Fund and the First Trust Dynamic Europe Equity Income Fund, a closed-end fund. Ms. Wright has acted as an independent director to a number of Irish collective investment funds since 2009. Ms. Wright is a former Managing Director of Citibank Europe plc and Head of Securities and Fund Services for Citi Ireland. In these positions, she was responsible for the management and strategic direction of Citi Ireland’s securities and fund services business which included funds, custody, security finance/lending and global agency and trust. She also had responsibility for leading, managing and growing the Trustee, Custodian and Depositary business in Ireland, the United Kingdom, Luxembourg, Jersey and Cayman.
Board of Trustees and Officers
First Trust Exchange-Traded Fund III
July 31, 2023 (Unaudited)
The following tables identify the Trustees and Officers of the Trust. Unless otherwise indicated, the address of all persons is 120 East Liberty Drive, Suite 400, Wheaton, IL 60187.
The Trust’s statement of additional information includes additional information about the Trustees and is available, without charge, upon request, by calling (800) 988-5891.
| Name, Year of Birth and Position with the Trust | Term of Office and Year First Elected or Appointed | Principal Occupations
During Past 5 Years | Number of Portfolios in the First Trust Fund Complex Overseen by Trustee | Other Trusteeships or Directorships Held by Trustee During Past 5 Years |
| INDEPENDENT TRUSTEES |
Richard E. Erickson, Trustee
(1951) | • Indefinite Term
• Since Inception | Physician, Edward-Elmhurst Medical Group; Physician and Officer, Wheaton Orthopedics (1990 to 2021) | 238 | None |
Thomas R. Kadlec, Trustee
(1957) | • Indefinite Term
• Since Inception | Retired; President, ADM Investor Services, Inc. (Futures Commission Merchant) (2010 to July 2022) | 238 | Director, National Futures Association and ADMIS Singapore Ltd.; Formerly, Director of ADM Investor Services, Inc., ADM Investor Services International, ADMIS Hong Kong Ltd., and Futures Industry Association |
Denise M. Keefe, Trustee
(1964) | • Indefinite Term
• Since 2021 | Executive Vice President, Advocate Aurora Health and President, Advocate Aurora Continuing Health Division (Integrated Healthcare System) | 238 | Director and Board Chair of Advocate Home Health Services, Advocate Home Care Products and Advocate Hospice; Director and Board Chair of Aurora At Home (since 2018); Director of Advocate Physician Partners Accountable Care Organization; Director of RML Long Term Acute Care Hospitals; Director of Senior Helpers (since 2021); and Director of MobileHelp (since 2022) |
Robert F. Keith, Trustee
(1956) | • Indefinite Term
• Since Inception | President, Hibs Enterprises (Financial and Management Consulting) | 238 | Formerly, Director of Trust Company of Illinois |
Niel B. Nielson, Trustee
(1954) | • Indefinite Term
• Since Inception | Senior Advisor (2018 to Present), Managing Director and Chief Operating Officer (2015 to 2018), Pelita Harapan Educational Foundation (Educational Products and Services) | 238 | None |
| INTERESTED TRUSTEE |
James A. Bowen(1), Trustee and
Chairman of the Board
(1955) | • Indefinite Term
• Since Inception | Chief Executive Officer, First Trust Advisors L.P. and First Trust Portfolios L.P.; Chairman of the Board of Directors, BondWave LLC (Software Development Company) and Stonebridge Advisors LLC (Investment Advisor) | 238 | None |
| (1) | Mr. Bowen is deemed an “interested person” of the Trust due to his position as CEO of First Trust Advisors L.P., investment advisor of the Trust. |
Board of Trustees and Officers (Continued)
First Trust Exchange-Traded Fund III
July 31, 2023 (Unaudited)
| Name and Year of Birth | Position and Offices with Trust | Term of Office and Length of Service | Principal Occupations
During Past 5 Years |
| OFFICERS(2) |
James M. Dykas
(1966) | President and Chief Executive Officer | • Indefinite Term
• Since 2016 | Managing Director and Chief Financial Officer, First Trust Advisors L.P. and First Trust Portfolios L.P.; Chief Financial Officer, BondWave LLC (Software Development Company) and Stonebridge Advisors LLC (Investment Advisor) |
Derek D. Maltbie
(1972) | Treasurer, Chief Financial Officer and Chief Accounting Officer | • Indefinite Term
• Since 2023 | Senior Vice President, First Trust Advisors L.P. and First Trust Portfolios L.P., July 2021 to present. Previously, Vice President, First Trust Advisors L.P. and First Trust Portfolios L.P., 2014 to 2021. |
W. Scott Jardine
(1960) | Secretary and Chief Legal Officer | • Indefinite Term
• Since Inception | General Counsel, First Trust Advisors L.P. and First Trust Portfolios L.P.; Secretary and General Counsel, BondWave LLC; Secretary, Stonebridge Advisors LLC |
Daniel J. Lindquist
(1970) | Vice President | • Indefinite Term
• Since Inception | Managing Director, First Trust Advisors L.P. and First Trust Portfolios L.P. |
Kristi A. Maher
(1966) | Chief Compliance Officer and Assistant Secretary | • Indefinite Term
• Since Inception | Deputy General Counsel, First Trust Advisors L.P. and First Trust Portfolios L.P. |
Roger F. Testin
(1966) | Vice President | • Indefinite Term
• Since Inception | Senior Vice President, First Trust Advisors L.P. and First Trust Portfolios L.P. |
Stan Ueland
(1970) | Vice President | • Indefinite Term
• Since Inception | Senior Vice President, First Trust Advisors L.P. and First Trust Portfolios L.P. |
| (2) | The term “officer” means the president, vice president, secretary, treasurer, controller or any other officer who performs a policy making function. |
Privacy Policy
First Trust Exchange-Traded Fund III
July 31, 2023 (Unaudited)
Privacy Policy
First Trust values our relationship with you and considers your privacy an important priority in maintaining that relationship. We are committed to protecting the security and confidentiality of your personal information.
Sources of Information
We collect nonpublic personal information about you from the following sources:
| • | Information we receive from you and your broker-dealer, investment professional or financial representative through interviews, applications, agreements or other forms; |
| • | Information about your transactions with us, our affiliates or others; |
| • | Information we receive from your inquiries by mail, e-mail or telephone; and |
| • | Information we collect on our website through the use of “cookies.” For example, we may identify the pages on our website that your browser requests or visits. |
Information Collected
The type of data we collect may include your name, address, social security number, age, financial status, assets, income, tax information, retirement and estate plan information, transaction history, account balance, payment history, investment objectives, marital status, family relationships and other personal information.
Disclosure of Information
We do not disclose any nonpublic personal information about our customers or former customers to anyone, except as permitted by law. In addition to using this information to verify your identity (as required under law), the permitted uses may also include the disclosure of such information to unaffiliated companies for the following reasons:
| • | In order to provide you with products and services and to effect transactions that you request or authorize, we may disclose your personal information as described above to unaffiliated financial service providers and other companies that perform administrative or other services on our behalf, such as transfer agents, custodians and trustees, or that assist us in the distribution of investor materials such as trustees, banks, financial representatives, proxy services, solicitors and printers. |
| • | We may release information we have about you if you direct us to do so, if we are compelled by law to do so, or in other legally limited circumstances (for example to protect your account from fraud). |
In addition, in order to alert you to our other financial products and services, we may share your personal information within First Trust.
Use of Website Analytics
We currently use third party analytics tools, Google Analytics and AddThis, to gather information for purposes of improving First Trust’s website and marketing our products and services to you. These tools employ cookies, which are small pieces of text stored in a file by your web browser and sent to websites that you visit, to collect information, track website usage and viewing trends such as the number of hits, pages visited, videos and PDFs viewed and the length of user sessions in order to evaluate website performance and enhance navigation of the website. We may also collect other anonymous information, which is generally limited to technical and web navigation information such as the IP address of your device, internet browser type and operating system for purposes of analyzing the data to make First Trust’s website better and more useful to our users. The information collected does not include any personal identifiable information such as your name, address, phone number or email address unless you provide that information through the website for us to contact you in order to answer your questions or respond to your requests. To find out how to opt-out of these services click on: Google Analytics and AddThis.
Confidentiality and Security
With regard to our internal security procedures, First Trust restricts access to your nonpublic personal information to those First Trust employees who need to know that information to provide products or services to you. We maintain physical, electronic and procedural safeguards to protect your nonpublic personal information.
Policy Updates and Inquiries
As required by federal law, we will notify you of our privacy policy annually. We reserve the right to modify this policy at any time, however, if we do change it, we will tell you promptly. For questions about our policy, or for additional copies of this notice, please go to www.ftportfolios.com, or contact us at 1-800-621-1675 (First Trust Portfolios) or 1-800-222-6822 (First Trust Advisors).
March 2023
This page intentionally left blank
This page intentionally left blank
First Trust Exchange-Traded Fund III
INVESTMENT ADVISOR
First Trust Advisors L.P.
120 East Liberty Drive, Suite 400
Wheaton, IL 60187
INVESTMENT SUB-ADVISOR
Horizon Investments, LLC
6210 Ardrey Kell Road, Suite 300
Charlotte, NC 28277
ADMINISTRATOR, CUSTODIAN,
FUND ACCOUNTANT &
TRANSFER AGENT
Brown Brothers Harriman & Co.
50 Post Office Square
Boston, MA 02110
INDEPENDENT REGISTERED
PUBLIC ACCOUNTING FIRM
Deloitte & Touche LLP
111 South Wacker Drive
Chicago, IL 60606
LEGAL COUNSEL
Chapman and Cutler LLP
320 South Canal Street
Chicago, IL 60606
First Trust Exchange-Traded Fund III
First Trust California Municipal High Income ETF (FCAL)
First Trust New York Municipal High Income ETF (FMNY)
Annual Report
For the Year Ended
July 31, 2023
First Trust Exchange-Traded Fund III
Annual Report
July 31, 2023
Caution Regarding Forward-Looking Statements
This report contains certain forward-looking statements within the meaning of the Securities Act of 1933, as amended, and the Securities Exchange Act of 1934, as amended. Forward-looking statements include statements regarding the goals, beliefs, plans or current expectations of First Trust Advisors L.P. (“First Trust” or the “Advisor”) and its representatives, taking into account the information currently available to them. Forward-looking statements include all statements that do not relate solely to current or historical fact. For example, forward-looking statements include the use of words such as “anticipate,” “estimate,” “intend,” “expect,” “believe,” “plan,” “may,” “should,” “would” or other words that convey uncertainty of future events or outcomes.
Forward-looking statements involve known and unknown risks, uncertainties and other factors that may cause the actual results, performance or achievements of any series of First Trust Exchange-Traded Fund III (the “Trust”) described in this report (each such series is referred to as a “Fund” and collectively, the “Funds”) to be materially different from any future results, performance or achievements expressed or implied by the forward-looking statements. When evaluating the information included in this report, you are cautioned not to place undue reliance on these forward-looking statements, which reflect the judgment of the Advisor and its representatives only as of the date hereof. We undertake no obligation to publicly revise or update these forward-looking statements to reflect events and circumstances that arise after the date hereof.
Performance and Risk Disclosure
There is no assurance that any Fund described in this report will achieve its investment objectives. Each Fund is subject to market risk, which is the possibility that the market values of securities owned by the Fund will decline and that the value of the Fund’s shares may therefore be less than what you paid for them. Accordingly, you can lose money by investing in a Fund. See “Risk Considerations” in the Additional Information section of this report for a discussion of certain other risks of investing in the Funds.
Performance data quoted represents past performance, which is no guarantee of future results, and current performance may be lower or higher than the figures shown. For the most recent month-end performance figures, please visit www.ftportfolios.com or speak with your financial advisor. Investment returns, net asset value and share price will fluctuate and Fund shares, when sold, may be worth more or less than their original cost.
The Advisor may also periodically provide additional information on Fund performance on each Fund’s web page at www.ftportfolios.com.
How to Read This Report
This report contains information that may help you evaluate your investment. It includes details about each Fund and presents data and analysis that provide insight into each Fund’s performance and investment approach.
By reading the portfolio commentary by the portfolio management team of each Fund, you may obtain an understanding of how the market environment affected each Fund’s performance. The statistical information that follows may help you understand each Fund’s performance compared to that of a relevant market benchmark.
It is important to keep in mind that the opinions expressed by personnel of the Advisor are just that: informed opinions. They should not be considered to be promises or advice. The opinions, like the statistics, cover the period through the date on the cover of this report. The material risks of investing in each Fund are spelled out in the prospectus, the statement of additional information, and other Fund regulatory filings.
First Trust Exchange-Traded Fund III
Annual Letter from the Chairman and CEO
July 31, 2023
Dear Shareholders,
First Trust is pleased to provide you with the annual report for certain series of First Trust Exchange-Traded Fund III (the “Funds”), which contains detailed information about the Funds for the 12-month period ended July 31, 2023.
In a widely unexpected announcement, Fitch Ratings (“Fitch”), a provider of credit ratings, commentary, and research, downgraded the credit rating of the United States government from its highest rating of AAA to its second-highest rating of AA+ on August 1, 2023. The move marks the first time the U.S. government’s credit rating has been downgraded since 2011. Fitch cited the heightened potential of a near-term economic recession in the U.S. as well as the rising interest burden of government debt as two factors that contributed to their decision to implement the downgrade. We will leave it to the pundits to debate whether the downgrade was warranted or not. What we would like to see is a reduction in government spending. As of June 30, 2023, the U.S. government’s deficit stood at $1.39 trillion, already above the 2022 full year deficit of $1.37 trillion, according to Brian Wesbury, Chief Economist at First Trust. As Fitch noted in the press release of its downgrade, the interest burden on U.S. government debt, among other factors, is expected to catapult the general government deficit to 6.3% of gross domestic product (“GDP”) in 2023, up from 3.7% in 2022.
The Federal Reserve (the “Fed”) has made significant progress in its battle with rising prices. Inflation, as measured by the twelve-month trailing rate on the Consumer Price Index (“CPI”), stood at 3.2% on July 31, 2023, down significantly from its most recent high of 9.1% set on June 30, 2022, but up from 3.0% on June 30, 2023. While a reduction in the CPI is welcome, the metric remains well-above the Fed’s goal of 2.0%. Should the CPI remain stubbornly high, it may prompt further increases to the Federal Funds target rate over the coming months, which could hamper economic growth, in our opinion. That said, U.S. GDP has remained resilient, growing over each of the last four quarters (through June 30, 2023).
Whether the U.S. can avoid an economic recession over the coming months remains to be seen. As mentioned above, despite tighter monetary policy, the U.S. economy posted positive changes to GDP over each of the last four quarters. We continue to hope for a “soft landing,” but also keep our eyes fixated on the data.
Thank you for giving First Trust the opportunity to play a role in your financial future. We value our relationship with you and will report on the Funds again in six months.
Sincerely,
James A. Bowen
Chairman of the Board of Trustees
Chief Executive Officer of First Trust Advisors L.P.
Fund Performance Overview (Unaudited)
First Trust California Municipal High Income ETF (FCAL)
The First Trust California Municipal High Income ETF’s (the “Fund”) primary investment objective is to seek to provide current income that is exempt from regular federal income taxes and California income taxes, and its secondary objective is long-term capital appreciation. Under normal market conditions, the Fund seeks to achieve its investment objectives by investing at least 80% of its net assets (including investment borrowings) in municipal debt securities that pay interest that is exempt from regular federal income taxes and California income taxes (“Municipal Securities”). Municipal Securities will be issued by or on behalf of the State of California or territories or possessions of the U.S. (including but not limited to Puerto Rico, the U.S. Virgin Islands and Guam), and/or the political subdivisions, agencies, authorities and other instrumentalities of such State, territories or possessions. The Fund lists and principally trades its shares on The Nasdaq Stock Market LLC under the ticker symbol “FCAL.”
| Performance | | | | | | |
| | | Average Annual Total Returns | | Cumulative Total Returns |
| | 1 Year
Ended
7/31/23 | 5 Years
Ended
7/31/23 | Inception
(6/20/17)
to 7/31/23 | | 5 Years
Ended
7/31/23 | Inception
(6/20/17)
to 7/31/23 |
| Fund Performance | | | | | | |
| NAV | 1.08% | 1.96% | 2.15% | | 10.21% | 13.90% |
| Market Price | 1.45% | 1.95% | 2.17% | | 10.12% | 14.00% |
| Index Performance | | | | | | |
| Bloomberg 10 Year California Exempt Index | 1.70% | 2.05% | 1.80% | | 10.66% | 11.50% |
(See Notes to Fund Performance Overview on page 9.)
Fund Performance Overview (Unaudited) (Continued)
First Trust California Municipal High Income ETF (FCAL) (Continued)
| Sector Allocation | % of Total
Investments
(including cash) |
| Insured | 10.6% |
| Special Assessment | 10.4 |
| Government Obligation Bond - Unlimited Tax | 10.2 |
| Industrial Development Bond | 7.6 |
| Water & Sewer | 7.1 |
| Education | 6.2 |
| Airport | 4.6 |
| Gas | 4.3 |
| Hospital | 4.2 |
| Local Housing | 4.1 |
| Certificates of Participation | 4.1 |
| Pre-refunded/Escrowed-to-maturity | 4.0 |
| Higher Education | 3.8 |
| Utility | 3.3 |
| Continuing Care Retirement Communities | 3.0 |
| Dedicated Tax | 2.8 |
| Tobacco | 1.5 |
| Toll Road | 1.3 |
| Tax Increment | 1.1 |
| Student Housing | 1.0 |
| Government Obligation Bond - Limited Tax | 0.8 |
| Housing | 0.7 |
| Other Health | 0.4 |
| Cash | 2.9 |
| Total | 100.0% |
| Fund Allocation | % of Net Assets |
| Municipal Bonds | 98.5% |
| Net Other Assets and Liabilities(1) | 1.5 |
| Total | 100.0% |
| Credit Rating(2) | % of Total
Investments
(including cash) |
| AAA | 6.6% |
| AA | 38.2 |
| A | 15.6 |
| BBB | 12.6 |
| BB | 2.4 |
| B | 0.3 |
| Not Rated | 21.4 |
| Cash | 2.9 |
| Total | 100.0% |
| (1) | Includes variation margin on futures contracts. |
| (2) | The credit quality and ratings information presented above reflect the ratings assigned by one or more nationally recognized statistical rating organizations (NRSROs), including S&P Global Ratings, Moody’s Investors Service, Inc., Fitch Ratings or a comparably rated NRSRO. For situations in which a security is rated by more than one NRSRO and the ratings are not equivalent, the highest rating is used. Sub-investment grade ratings are those rated BB+/Ba1 or lower. Investment grade ratings are those rated BBB-/Baa3 or higher. The credit ratings shown relate to the creditworthiness of the issuers of the underlying securities in the Fund, and not to the Fund or its shares. Credit ratings are subject to change. |
Fund Performance Overview (Unaudited) (Continued)
First Trust California Municipal High Income ETF (FCAL) (Continued)
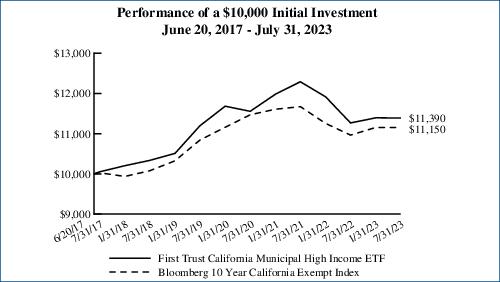
Performance figures assume reinvestment of all distributions and do not reflect the deduction of taxes that a shareholder would pay on Fund distributions or the redemption or sale of Fund shares. An index is a statistical composite that tracks a specified financial market or sector. Unlike the Fund, the index does not actually hold a portfolio of securities and therefore does not incur the expenses incurred by the Fund. These expenses negatively impact the performance of the Fund. The Fund’s past performance does not predict future performance.
Performance in municipal bonds investment strategies can be impacted from the benefits of purchasing odd lot positions. The impact of these investments can be particularly meaningful when funds have limited assets under management and may not be a sustainable source of performance as a fund grows in size.
Frequency Distribution of Discounts and Premiums
Information showing the number of days the market price of the Fund’s shares was greater (at a premium) and less (at a discount) than the Fund’s net asset value for the most recently completed year, and the most recently completed calendar quarters since that year (or life of the Fund, if shorter), is available at https://www.ftportfolios.com/Retail/etf/home.aspx.
Fund Performance Overview (Unaudited) (Continued)
First Trust New York Municipal High Income ETF (FMNY)
The First Trust New York Municipal High Income ETF’s (the “Fund”) primary investment objective is to seek to provide current income that is exempt from regular federal income taxes and New York income taxes, and its secondary objective is long-term capital appreciation. Under normal market conditions, the Fund seeks to achieve its investment objectives by investing at least 80% of its net assets (including investment borrowings) in municipal debt securities that pay interest that is exempt from regular federal income taxes and New York State and New York City income taxes (collectively, “Municipal Securities”). Municipal Securities will be issued by or on behalf of the State of New York or territories or possessions of the U.S. (including, but not limited to, Puerto Rico, the U.S. Virgin Islands and Guam), and/or the political subdivisions, agencies, authorities and other instrumentalities of such State, territories or possessions. The Fund lists and principally trades its shares on The NYSE Arca, Inc. under the ticker symbol “FMNY.”
| Performance | | | |
| | | Average Annual
Total Returns | Cumulative
Total Returns |
| | 1 Year Ended
7/31/23 | Inception (5/12/21)
to 7/31/23 | Inception (5/12/21)
to 7/31/23 |
| Fund Performance | | | |
| NAV | 1.06% | -3.20% | -6.97% |
| Market Price | 1.10% | -3.22% | -7.01% |
| Index Performance | | | |
| Bloomberg Municipal New York 12-17 Years Index | 2.36% | -1.94% | -4.26% |
(See Notes to Fund Performance Overview on page 9.)
Fund Performance Overview (Unaudited) (Continued)
First Trust New York Municipal High Income ETF (FMNY) (Continued)
| Sector Allocation | % of Total
Investments
(including cash) |
| Dedicated Tax | 11.1% |
| Insured | 11.0 |
| Government Obligation Bond - Limited Tax | 10.3 |
| Higher Education | 9.7 |
| Education | 7.3 |
| Industrial Development Bond | 6.6 |
| Water & Sewer | 5.4 |
| Airport | 5.4 |
| Utility | 5.3 |
| Government Obligation Bond - Unlimited Tax | 5.0 |
| Hospital | 4.7 |
| Mass Transit | 4.2 |
| Special Assessment | 4.1 |
| Toll Road | 3.9 |
| Housing | 2.3 |
| Tobacco | 1.9 |
| Cash | 1.8 |
| Total | 100.0% |
| Fund Allocation | % of Net Assets |
| Municipal Bonds | 97.2% |
| Net Other Assets and Liabilities(1) | 2.8 |
| Total | 100.0% |
| Credit Quality(2) | % of Total
Investments
(including cash) |
| AAA | 4.5% |
| AA | 46.8 |
| A | 17.7 |
| BBB | 15.0 |
| BB | 2.7 |
| Not Rated | 9.6 |
| MIG1 (short-term) | 1.9 |
| Cash | 1.8 |
| Total | 100.0% |
| (1) | Includes variation margin on futures contracts. |
| (2) | The credit quality and ratings information presented above reflect the ratings assigned by one or more nationally recognized statistical rating organizations (NRSROs), including S&P Global Ratings, Moody’s Investors Service, Inc., Fitch Ratings or a comparably rated NRSRO. For situations in which a security is rated by more than one NRSRO and the ratings are not equivalent, the highest rating is used. Sub-investment grade ratings are those rated BB+/Ba1 or lower. Investment grade ratings are those rated BBB-/Baa3 or higher. The credit ratings shown relate to the creditworthiness of the issuers of the underlying securities in the Fund, and not to the Fund or its shares. Credit ratings are subject to change. |
Fund Performance Overview (Unaudited) (Continued)
First Trust New York Municipal High Income ETF (FMNY) (Continued)

Performance figures assume reinvestment of all distributions and do not reflect the deduction of taxes that a shareholder would pay on Fund distributions or the redemption or sale of Fund shares. An index is a statistical composite that tracks a specified financial market or sector. Unlike the Fund, the index does not actually hold a portfolio of securities and therefore does not incur the expenses incurred by the Fund. These expenses negatively impact the performance of the Fund. The Fund’s past performance does not predict future performance.
Performance in municipal bond investment strategies can be impacted from the benefits of purchasing odd lot positions. The impact of these investments can be particularly meaningful when funds have limited assets under management and may not be a sustainable source of performance as a fund grows in size.
Frequency Distribution of Discounts and Premiums
Information showing the number of days the market price of the Fund’s shares was greater (at a premium) and less (at a discount) than the Fund’s net asset value for the most recently completed year, and the most recently completed calendar quarters since that year (or life of the Fund, if shorter), is available at https://www.ftportfolios.com/Retail/etf/home.aspx.
Notes to Fund Performance Overview (Unaudited)
Total returns for the periods since inception are calculated from the inception date of each Fund. “Average Annual Total Returns” represent the average annual change in value of an investment over the periods indicated. “Cumulative Total Returns” represent the total change in value of an investment over the periods indicated. The total returns would have been lower if certain fees had not been waived by the Advisor.
Each Fund’s per share net asset value (“NAV”) is the value of one share of the Fund and is computed by dividing the value of all assets of the Fund (including accrued interest and dividends), less all liabilities (including accrued expenses and dividends declared but unpaid), by the total number of outstanding shares. The price used to calculate market return (“Market Price”) is determined by using the midpoint of the national best bid and offer price (“NBBO”) as of the time that the Fund’s NAV is calculated. Under SEC rules, the NBBO consists of the highest displayed buy and lowest sell prices among the various exchanges trading the Fund at the time the Fund’s NAV is calculated. Prior to January 1, 2019, the price used was the midpoint between the highest bid and the lowest offer on the stock exchange on which shares of the Fund were listed for trading as of the time that the Fund’s NAV was calculated. Since shares of each Fund did not trade in the secondary market until after the Fund’s inception, for the period from inception to the first day of secondary market trading in shares of the Fund, the NAV of each Fund is used as a proxy for the secondary market trading price to calculate market returns. NAV and market returns assume that all distributions have been reinvested in each Fund at NAV and Market Price, respectively.
An index is a statistical composite that tracks a specified financial market or sector. Unlike each Fund, the indices do not actually hold a portfolio of securities and therefore do not incur the expenses incurred by each Fund. These expenses negatively impact the performance of each Fund. Also, market returns do not include brokerage commissions that may be payable on secondary market transactions. If brokerage commissions were included, market returns would be lower. The total returns presented reflect the reinvestment of dividends on securities in the indices. The returns presented do not reflect the deduction of taxes that a shareholder would pay on Fund distributions or the redemption or sale of Fund shares. The investment return and principal value of shares of each Fund will vary with changes in market conditions. Shares of each Fund may be worth more or less than their original cost when they are redeemed or sold in the market. Each Fund’s past performance is no guarantee of future performance.
Portfolio Commentary
First Trust Exchange-Traded Fund III
Annual Report
July 31, 2023 (Unaudited)
Advisor
First Trust Advisors L.P. (“First Trust”) serves as the investment advisor to the First Trust California Municipal High Income ETF (“FCAL”) and the First Trust New York Municipal High Income ETF (“FMNY”) (each a “Fund” and collectively, the “Funds”). First Trust is responsible for the ongoing monitoring of each Fund’s investment portfolio, managing each Fund’s business affairs and providing certain administrative services necessary for the management of each Fund.
Portfolio Management Team
Tom Byron, Senior Vice President, Senior Portfolio Manager
Johnathan N. Wilhelm, Senior Vice President, Senior Portfolio Manager
The portfolio managers are primarily and jointly responsible for the day-to-day management of the Funds. Tom Byron has served as portfolio manager since 2022 and Johnathan N. Wilhelm has served as portfolio manager for FCAL since 2017 and for FMNY since 2021.
Commentary
First Trust California Municipal High Income ETF (FCAL)
The Fund is an actively managed exchange-traded fund. The Fund’s primary investment objective is to seek to provide current income that is exempt from regular federal income taxes and California income taxes. The Fund’s secondary investment objective is long-term capital appreciation. Under normal market conditions, the Fund seeks to achieve its investment objectives by investing at least 80% of its net assets (including investment borrowings) in municipal debt securities that pay interest that is exempt from regular federal income taxes and California income taxes (collectively, “Municipal Securities”). In addition, under normal market conditions, the Fund invests at least 50% of its net assets in Municipal Securities that are rated investment grade at the time of purchase and no more than 50% of its net assets in Municipal Securities that at the time of purchase are rated non-investment grade. This commentary discusses the market performance and the Fund’s performance for the 12-month period ended July 31, 2023.
Market Recap
For the 12-month period ended July 31, 2023, municipal bonds generated a total return of 0.93% as measured by the Bloomberg Municipal Bond Index. During the same period, the Bloomberg 10 Year California Exempt Index (the “Benchmark”) produced a total return of 1.70%. By comparison, the Bloomberg U.S. Treasury Index generated a total return of -4.01% during the same period. The following were major factors in explaining the municipal bond market’s performance:
| • | Over the past year, U.S. Treasury rates increased all along the yield curve and municipal interest rates followed U.S. Treasury yields higher. During the 12-month period ended July 31, 2023, 5-Year and 10-Year U.S. Treasury yields increased by approximately 150 basis points (“bps”) and 133 bps, respectively, to 4.17% and 3.96%. As a reminder, the price of a bond moves inversely to a given change in yield, so higher yields resulted in lower U.S. Treasury bond prices. |
| • | Large industry-wide mutual fund and exchange-traded fund (“ETF”) outflows resulted in funds selling municipal bonds to meet redemptions which put additional pressure on municipal bond prices. According to data from the Investment Company Institute, annual fund flows for the 12-month period ended July 31, 2023, were -$55.0 billion (outflow of over $55 billion). |
| • | New issue municipal bond supply has been lower year-to-date compared to figures from a year ago. Through July 31, 2023, year-to-date issuance was approximately $204.4 billion, down approximately 17% compared to the $246.6 billion issued for the same period a year ago. However, J.P. Morgan noted that new issue supply inside of 10 years to maturity increased slightly compared to the same period a year ago. |
| • | According to data from Bloomberg, municipal credit spreads tightened year-to-date. From December 30, 2022 through July 31, 2023, for municipal bonds rated AA, A, and BBB, credit spreads decreased approximately 4 bps, 15 bps, and 21 bps, respectively. |
| • | Looking at the AAA municipal yield curve as prepared by Refinitiv Lipper, year-to-date, 5-Year and 10-Year municipal yields increased by 19 bps and decreased by 11 bps, to 2.66% and 2.57%, respectively. |
Performance Analysis
The Fund’s net asset value (“NAV”) and market performance for the 12-month period ended July 31, 2023 were 1.08% and 1.45%, respectively, versus the Benchmark’s return of 1.70% during the same period.
Portfolio Commentary (Continued)
First Trust Exchange-Traded Fund III
Annual Report
July 31, 2023 (Unaudited)
As of July 31, 2023, the Fund’s market price of $49.05 represented a premium of approximately 0.27% to its NAV of $48.92. The market value of the Fund’s shares fluctuates from time to time and may be higher or lower than the Fund’s NAV. The Fund’s use of Treasury futures was a positive contributor to the Fund’s performance for the 12-month period ended July 31, 2023. Key factors impacting the Fund’s performance over the 12-month period ended July 31, 2023 were:
| • | Years to Maturity: In terms of the Fund’s allocation in years to a bond’s final maturity date, the Fund’s allocation and selection of bonds with a final stated maturity was the largest contributor to the Fund’s underperformance relative to its Benchmark index. Given the general level of higher U.S. Treasury rates and a persistent period of industry fund outflows, we kept a higher percentage of the Fund’s assets in short maturing bonds that we believed would be highly liquid. In addition, the Fund’s underweight allocation to bonds with a stated maturity of 0-2 and 10-12 years were detrimental to Fund performance, as was the Fund’s allocation to bonds with a final stated maturity of 18+ years to maturity relative to the Fund’s Benchmark. |
| • | Effective Duration: Focusing on the effective durations of the Fund’s bonds, the Fund’s selection of bonds with an effective duration of 7-10 years was the largest contributor to the Fund’s underperformance relative to its Benchmark, as was the Fund’s allocation to bonds with an effective duration of 10+ years. The Fund’s selection and allocation of bonds with an effective duration of 3-7 years was a positive contributor to the Fund’s performance relative to the Benchmark. |
| • | Credit Rating: Regarding the Fund’s credit rating allocation relative to the Benchmark, the Fund’s selection of non-rated bonds, AAA rated, A rated, and BBB rated bonds were negative contributors to the Fund’s performance relative to the Benchmark. The Fund’s allocation and selection of bonds in the AA rating category was a positive contributor to the Fund’s performance. |
| • | Sector/Industry: In terms of the Fund’s allocation to municipal bond sectors, the Fund’s selection of bonds in the healthcare, special tax, charter school, utilities, and housing sectors were all detrimental to the Fund’s performance relative to the Benchmark. The Fund’s allocation and selection of state general obligation bonds was a positive contributor to Fund performance. |
| • | Distribution Rate: The distribution of $0.1135 paid on July 31, 2023, represents a tax-exempt annualized distribution rate of 2.78% based on the Fund’s closing market price of $49.05 on July 31, 2023. During the reporting period, the Fund’s distribution rate increased seven times. The Fund’s distribution rate is not constant and is subject to change over time based on the performance of the Fund. |
Market Outlook
According to the Federal Reserve’s (the “Fed”) “Dot Plot,” the Federal Funds rate is expected to reach approximately 5.625% by December 31, 2023. We expect the Fed to raise interest rates by 25 bps at either its September 20, 2023 or November 1, 2023 meeting. During the final months of 2023, we expect longer U.S. Treasury rates to become range-bound. For example, regarding the 10-Year U.S. Treasury yield, we forecast the 10-Year bonds will trade within a range of 3.75%-4.25% and would not be surprised if the yield curve inverts more significantly whereby 2-Year yields are significantly higher than 10-Year yields. During the first half of 2024, given that we forecast that U.S. gross domestic product will grow very slowly or turn negative, we would expect the 10-Year U.S. Treasury yield to gradually decline to a range of 3.50%-3.75%.
Due to our belief that the Fed will only have one more 25 bps interest rate increase before hitting the Federal Funds terminal rate of 5.50%-5.75%, we expect municipal bond price trends to become more dependent on new issue supply and municipal mutual fund/ETF fund flows, rather than U.S. Treasury price and Fed moves. Since the municipal market has experienced significantly lower new issue supply year-to-date and forecast revisions for all of 2023, the key variable going forward will likely be mutual fund/ETF flows. We forecast that fund flows will turn consistently positive at some point during the fourth quarter of 2023 and fund inflows will continue during the first half of 2024. In a $4 trillion market dominated by retail investors, mutual fund, ETF, and separately managed account fund flows are a key determinant to municipal market total returns, in our view. Along with U.S. Treasury yields becoming range-bound and then gradually declining during the fourth quarter of 2023 and first half of 2024, fund flows are the other key variable to our forecast for distinctly positive total returns over the next twelve months.
As measured by municipal bond defaults and credit rating upgrade to downgrade ratios, municipal bond credit quality is currently healthy. Certain sectors have seen significant credit quality recovery including airports, toll roads, and select general obligation bonds. However, for 5 of the past 6 months, negative outlook revisions exceeded positive revisions by the S&P 500® Index. We expect certain sectors of the municipal bond universe will remain under margin pressure, including hospitals and senior living facilities, as well as municipal bonds dependent on office and retail mall occupancy levels and tax receipts. Given an expected slowdown in the U.S. economy, we will focus on municipal credits with leading market positions, growing utilization statistics, and healthy balance sheets. For the Fund, this has meant adding exposure to higher rated credits, specifically in the AA and AAA rating categories. Within the
Portfolio Commentary (Continued)
First Trust Exchange-Traded Fund III
Annual Report
July 31, 2023 (Unaudited)
high yield municipal bond universe, we will focus on higher credit quality securities and reduce exposure to lower rated high yield borrowers. We have been actively reducing fund complex exposure to borrowers that our research team views as having a distinctly negative credit rating momentum.
With this in mind, we continue to practice the discipline of our investment process where we perform fundamental credit analysis and quantitative total return scenario analysis on individual bonds and the portfolio as a whole, looking for bonds that can provide both high income and attractive total return potential over time.
First Trust New York Municipal High Income ETF (FMNY)
The Fund is an actively managed exchange-traded fund. The Fund’s primary investment objective is to seek to provide current income that is exempt from regular federal income taxes and New York income taxes, and its secondary objective is long term capital appreciation. Under normal market conditions, the Fund seeks to achieve its investment objectives by investing at least 80% of its net assets (including investment borrowings) in municipal debt securities that pay interest that is exempt from regular federal income taxes and New York State and New York City income taxes (collectively, “Municipal Securities”). In addition, under normal market conditions, the Fund invests at least 50% of its net assets in Municipal Securities that are rated investment grade at the time of purchase and no more than 50% of its net assets in Municipal Securities that at the time of investment are rated non-investment grade. This commentary discusses the market performance and the Fund’s performance for the 12-month period ended July 31, 2023.
Market Recap
For the 12-month period ended July 31, 2023, the Bloomberg Municipal New York 12-17 Years Index (the “Benchmark”) produced a total return of 2.36%. For the same time period, the Bloomberg Municipal Bond Index generated a total return of 0.93%. By comparison, the Bloomberg U.S. Treasury Index generated a total return of -4.01% during the same period. The following were major factors in explaining the municipal bond market’s performance:
| • | Over the past year, U.S. Treasury rates increased all along the yield curve and municipal interest rates followed U.S. Treasury yields higher. During the 12-month period ended July 31, 2023, 5-Year and 10-Year U.S. Treasury yields increased by approximately 150 bps and 133 bps, respectively, to 4.17% and 3.96%. As a reminder, the price of a bond moves inversely to a given change in yield, so higher yields resulted in lower U.S. Treasury bond prices. |
| • | Large industry-wide mutual fund and ETF outflows resulted in funds selling municipal bonds to meet redemptions which put additional pressure on municipal bond prices. According to data from the Investment Company Institute, annual fund flows for the 12-month period ended July 31, 2023, were -$55.0 billion (outflow of over $55 billion). |
| • | New issue municipal bond supply has been lower year-to-date compared to figures from a year ago. Through July 31, 2023, year-to-date issuance was approximately $204.4 billion, down approximately 17% compared to the $246.6 billion issued for the same period a year ago. However, J.P. Morgan noted that new issue supply inside of 10 years to maturity increased slightly compared to the same period a year ago. |
| • | According to data from Bloomberg, municipal credit spreads tightened year-to-date. From December 30, 2022 through July 31, 2023, for municipal bonds rated AA, A, and BBB, credit spreads decreased approximately 4 bps, 15 bps, and 21 bps, respectively. |
| • | Looking at the AAA municipal yield curve as prepared by Refinitiv Lipper, year-to-date, 5-Year and 10-Year municipal yields increased by 19 bps and decreased by 11 bps, to 2.66% and 2.57%, respectively. |
Performance Analysis
The Fund’s NAV and market performance for the 12-month period ended July 31, 2023, were 1.06% and 1.10%, respectively, versus the Benchmark’s return of 2.36%. As of July 31, 2023, the Fund’s market price of $26.62 represented a premium of 0.19% to its NAV of $26.57. The market value of the Fund’s shares fluctuates from time to time and may be higher or lower than the Fund’s NAV. The Fund’s use of Treasury futures was a positive contributor to the Fund’s performance for the 12-month period ended July 31, 2023. Key factors impacting Fund performance over the 12-month period ended July 31, 2023 were:
| • | Years to Maturity: During the 12-month period ended July 31, 2023, portfolio yield curve and effective duration positions were significant reasons the Fund underperformed relative to the Benchmark. Given the general level of higher U.S. Treasury rates and a persistent period of industry outflows, we kept a higher percentage of the Fund’s assets in shorter maturing bonds that we believed would be highly liquid. In terms of the Fund’s allocation in years to a bond’s final maturity date, the Fund’s selection of bonds in the |
Portfolio Commentary (Continued)
First Trust Exchange-Traded Fund III
Annual Report
July 31, 2023 (Unaudited)
| | 0-2, 8-10 and 18+ year range were the main detractors to the Fund’s performance relative to the Benchmark, while the 2-4 years range was also a negative contributor. The Fund’s allocation to bonds with a final maturity of 16-18 years was a positive contributor to the Fund’s performance. |
| • | Effective Duration: Focusing on the effective durations of the Fund’s bonds, the Fund’s allocation and selection of bonds with effective durations of 0-1 years was the largest single contributor to the Fund’s underperformance relative to the Benchmark. In addition, the Fund’s allocation in bonds with effective durations of 3-10 years and 10+ years were also negative detractors to the Fund’s performance relative to its Benchmark. |
| • | Credit Rating: Regarding the Fund’s credit rating allocation relative to the Benchmark, the Fund’s selection of bonds in the AA rated category was the largest single contributor to the Fund’s underperformance relative to the Benchmark. The AAA, A, BBB, and B credit rated categories were detractors to the Fund’s performance versus the Benchmark, while the selection of bonds in the non-rated category was a positive contributor to Fund performance. |
| • | Sector/Industry: In terms of the Fund’s allocation to municipal bond sectors, the Fund’s investments in the Local General Obligation and Education sectors were the primary detractors to Fund performance relative to the Benchmark, while the Transportation sector was a secondary detractor. The State General Obligation and Special Tax Bonds sectors were positive contributors to Fund performance relative to the Benchmark. |
| • | Distribution Rate: The distribution paid on July 31, 2023, of $0.075 represents a tax-exempt annualized distribution rate of 3.38% based on the Fund’s closing market price of $26.62 on July 31, 2023. During the reporting period, the Fund’s distribution rate increased four times. The Fund’s distribution rate is not constant and is subject to change over time based on the performance of the Fund. |
Market Outlook
According to the Fed’s “Dot Plot,” the Federal Funds rate is expected to reach approximately 5.625% by December 31, 2023. We expect the Fed to raise interest rates by 25 bps at either its September 20, 2023 or November 1, 2023 meeting. During the final months of 2023, we expect longer U.S. Treasury rates to become range-bound. For example, regarding the 10-Year U.S. Treasury yield, we forecast the 10-Year bonds will trade within a range of 3.75%-4.25% and would not be surprised if the yield curve inverts more significantly whereby 2-Year yields are significantly higher than 10-Year yields. During the first half of 2024, given that we forecast that U.S. gross domestic product will grow very slowly or turn negative, we would expect the 10-Year U.S. Treasury yield to gradually decline to a range of 3.50%-3.75%.
Due to our belief that the Fed will only have one more 25 bps interest rate increase before hitting the Federal Funds terminal rate of 5.50%-5.75%, we expect municipal bond price trends to become more dependent on new issue supply and municipal mutual fund/ETF fund flows, rather than U.S. Treasury price and Fed moves. Since the municipal bond market has experienced significantly lower new issue supply year-to-date and forecast revisions for all of 2023, the key variable going forward will likely be mutual fund/ETF flows. We forecast that fund flows will turn consistently positive at some point during the fourth quarter of 2023 and fund inflows will continue during the first half of 2024. In a $4 trillion market dominated by retail investors, mutual fund, ETF, and separately managed account fund flows are a key determinant to municipal market total returns, in our view. Along with U.S. Treasury yields becoming range-bound and then gradually declining during the fourth quarter of 2023 and first half of 2024, fund flows are the other key variable to our forecast for distinctly positive total returns over the next twelve months.
As measured by municipal bond defaults and credit rating upgrade to downgrade ratios, municipal bond credit quality is currently healthy. Certain sectors have seen significant credit quality recovery including airports, toll roads, and select general obligation bonds. However, for 5 of the past 6 months, negative outlook revisions exceeded positive revisions by the S&P 500® Index. We expect certain sectors of the municipal bond universe will remain under margin pressure, including hospitals and senior living facilities, as well as municipal bonds dependent on office and retail mall occupancy levels and tax receipts. Given an expected slowdown in the U.S. economy, we will focus on municipal credits with leading market positions, growing utilization statistics, and healthy balance sheets. For the Fund, we reduced exposure to AAA and AA rated credits, and increased exposure in BBB and non-rated credits that met our credit standards. Within the high yield municipal bond universe, we will focus on higher credit quality securities and reduce exposure to lower rated high yield borrowers. We have been actively reducing fund complex exposure to borrowers that our research team views as having a distinctly negative credit rating momentum.
Portfolio Commentary (Continued)
First Trust Exchange-Traded Fund III
Annual Report
July 31, 2023 (Unaudited)
With this in mind, we continue to practice the discipline of our investment process where we perform fundamental credit analysis and quantitative total return scenario analysis on individual bonds and the portfolio as a whole, looking for bonds that can provide both high income and attractive total return potential over time.
First Trust Exchange-Traded Fund III
Understanding Your Fund Expenses
July 31, 2023 (Unaudited)
As a shareholder of First Trust California Municipal High Income ETF or First Trust New York Municipal High Income ETF (each a “Fund” and collectively, the “Funds”), you incur two types of costs: (1) transaction costs; and (2) ongoing costs, including management fees, distribution and/or service (12b-1) fees, if any, and other Fund expenses. This Example is intended to help you understand your ongoing costs of investing in the Funds and to compare these costs with the ongoing costs of investing in other funds.
The Example is based on an investment of $1,000 invested at the beginning of the period and held through the six-month period ended July 31, 2023.
Actual Expenses
The first line in the following table provides information about actual account values and actual expenses. You may use the information in this line, together with the amount you invested, to estimate the expenses that you paid over the period. Simply divide your account value by $1,000 (for example, an $8,600 account value divided by $1,000 = 8.6), then multiply the result by the number in the first line under the heading entitled “Expenses Paid During the Six-Month Period” to estimate the expenses you paid on your account during this six-month period.
Hypothetical Example for Comparison Purposes
The second line in the following table provides information about hypothetical account values and hypothetical expenses based on each Fund’s actual expense ratio and an assumed rate of return of 5% per year before expenses, which is not each Fund’s actual return. The hypothetical account values and expenses may not be used to estimate the actual ending account balance or expenses you paid for the period. You may use this information to compare the ongoing costs of investing in the Funds and other funds. To do so, compare this 5% hypothetical example with the 5% hypothetical examples that appear in the shareholder reports of the other funds.
Please note that the expenses shown in the table are meant to highlight your ongoing costs only and do not reflect any transactional costs such as brokerage commissions. Therefore, the second line in the table is useful in comparing ongoing costs only, and will not help you determine the relative total costs of owning different funds. In addition, if these transactional costs were included, your costs would have been higher.
| | Beginning
Account Value
February 1, 2023 | Ending
Account Value
July 31, 2023 | Annualized
Expense Ratio
Based on the
Six-Month
Period | Expenses Paid
During the
Six-Month
Period (a) |
| First Trust California Municipal High Income ETF (FCAL) |
| Actual | $1,000.00 | $999.60 | 0.65% | $3.22 |
| Hypothetical (5% return before expenses) | $1,000.00 | $1,021.57 | 0.65% | $3.26 |
| First Trust New York Municipal High Income ETF (FMNY) (b) |
| Actual | $1,000.00 | $997.50 | 0.50% | $2.48 |
| Hypothetical (5% return before expenses) | $1,000.00 | $1,022.32 | 0.50% | $2.51 |
| (a) | Expenses are equal to the annualized expense ratios as indicated in the table multiplied by the average account value over the period (February 1, 2023 through July 31, 2023), multiplied by 181/365 (to reflect the six-month period). |
| (b) | FMNY expense ratios reflect an expense waiver. See Note 3 in the Notes to Financial Statements. |
First Trust California Municipal High Income ETF (FCAL)
Portfolio of Investments
July 31, 2023
Principal
Value | | Description | | Stated
Coupon | | Stated
Maturity | | Value |
| MUNICIPAL BONDS – 98.5% |
| | | California – 93.5% | | | | | | |
| $215,000 | | Antelope Vly E Kern CA Wtr Agy Wtr Rev Ref
| | 5.00% | | 06/01/35 | | $228,270 |
| 1,000,000 | | Bay Area Ca Toll Auth Toll Bridge Rev Var Ref, Ser A (a)
| | 3.30% | | 04/01/55 | | 1,000,000 |
| 100,000 | | Beaumont CA Spl Tax Cmnty Facs Dist No 93-1 Impt Area No 8F
| | 4.00% | | 09/01/33 | | 99,435 |
| 175,000 | | Beaumont CA Spl Tax Cmnty Facs Dist No 93-1 Impt Area No 8F
| | 4.00% | | 09/01/34 | | 173,942 |
| 330,000 | | Beaumont CA Spl Tax Cmnty Facs Dist No 93-1 Impt Area No 8F
| | 4.00% | | 09/01/36 | | 319,498 |
| 620,000 | | Beaumont CA Spl Tax Cmnty Facs Dist No 93-1 Impt Area No 8F
| | 4.00% | | 09/01/40 | | 571,862 |
| 1,080,000 | | Beverly Hills CA Pub Fing Auth Wtr Rev, Ser A
| | 4.00% | | 06/01/40 | | 1,094,520 |
| 1,250,000 | | Burbank CA Wtr & Pwr Elec Rev
| | 5.00% | | 06/01/43 | | 1,376,259 |
| 2,220,000 | | CA Cmnty Choice Fing Auth Clean Energy Proj Rev Green Bond, Ser B-1 (Mandatory put 08/01/31)
| | 4.00% | | 02/01/52 | | 2,208,366 |
| 1,000,000 | | CA Cmnty Choice Fing Auth Clean Energy Proj Rev Green Bonds, Ser D (Mandatory put 11/01/28)
| | 5.50% | | 05/01/54 | | 1,055,368 |
| 1,000,000 | | CA Cmnty Choice Fing Auth Clean Energy Proj Rev Var Green Bonds Clean Energy Proj, Ser C (Mandatory put 10/01/31)
| | 5.25% | | 01/01/54 | | 1,045,108 |
| 20,000 | | CA Cmnty Choice Fing Auth Green Bd Clean Energy Proj Rev, Ser A (Mandatory put 12/01/27)
| | 4.00% | | 10/01/52 | | 19,954 |
| 200,000 | | CA Cnty CA Tobacco Securitization Agy Tobacco Stlmt Ref, Sonoma Cnty Securitization Corp, Ser A
| | 4.00% | | 06/01/35 | | 203,942 |
| 200,000 | | CA Cnty CA Tobacco Securitization Agy Tobacco Stlmt Sr Ref, Ser A
| | 4.00% | | 06/01/35 | | 203,705 |
| 200,000 | | CA Cnty CA Tobacco Securitization Agy Tobacco Stlmt Sr Ref, Ser A
| | 4.00% | | 06/01/39 | | 197,679 |
| 423,240 | | CA Hsg Fin Agy Muni Ctfs, Ser A
| | 4.25% | | 01/15/35 | | 423,725 |
| 360,000 | | CA Pub Fin Auth Rev Ref Henry Mayo Newhall Hosp, Ser A
| | 4.00% | | 10/15/28 | | 363,050 |
| 1,000,000 | | CA Pub Fin Auth Rev Var Sharp Hlthcare Remk 05/04/18, Ser B (a)
| | 3.35% | | 08/01/52 | | 1,000,000 |
| 290,000 | | CA Pub Fin Auth Sr Living Rev ENSO Vlg Proj Green Bond, Ser A (b)
| | 5.00% | | 11/15/36 | | 282,293 |
| 250,000 | | CA Pub Fin Auth Sr Living Rev ENSO Vlg Proj Green Bond, Ser A (b)
| | 5.00% | | 11/15/56 | | 217,023 |
| 750,000 | | CA Pub Fin Auth Sr Living Rev Green Bond Temps 70 ENSO Vlg Proj, Ser B-2 (b)
| | 2.38% | | 11/15/28 | | 726,512 |
| 255,000 | | CA Sch Fin Auth Sch Fac Rev Alliance Clg Ready Pub Schs Proj, Ser A (b)
| | 5.00% | | 07/01/30 | | 260,549 |
| 830,000 | | CA Sch Fin Auth Sch Fac Rev Alliance Clg Ready Pub Schs Proj, Ser C (b)
| | 4.50% | | 07/01/26 | | 837,641 |
| 505,000 | | CA Sch Fin Auth Sch Fac Rev Granada Hills Chrt Oblig Grp (b)
| | 5.00% | | 07/01/34 | | 516,870 |
| 105,000 | | CA Sch Fin Auth Sch Fac Rev Kipp SoCal Pub Schs, Ser A (b)
| | 5.00% | | 07/01/27 | | 109,463 |
| 400,000 | | CA Sch Fin Auth Sch Fac Rev Kipp SoCal Pub Schs, Ser A (b)
| | 5.00% | | 07/01/39 | | 414,544 |
| 675,000 | | CA Sch Fin Auth Sch Fac Rev Ref Granada Hills Chrt Oblig Grp, Ser A (b)
| | 4.00% | | 07/01/48 | | 567,737 |
| 200,000 | | CA Sch Fin Auth Sch Fac Rev Ref HTH Learning Proj, Ser A (b)
| | 4.00% | | 07/01/25 | | 197,172 |
| 200,000 | | CA Sch Fin Auth Sch Fac Rev Ref HTH Learning Proj, Ser A (b)
| | 5.00% | | 07/01/32 | | 196,328 |
| 545,000 | | CA Sch Fin Auth Sch Fac Rev Ref Value Schs, Ser A (b)
| | 5.00% | | 07/01/40 | | 551,219 |
| 450,000 | | CA Sch Fin Auth Sch Fac Rev Ref Value Schs, Ser A (b)
| | 5.25% | | 07/01/48 | | 454,688 |
| 650,000 | | CA Sch Fin Auth Sch Fac Rev, Ser A (b)
| | 5.00% | | 07/01/40 | | 655,792 |
| 1,000,000 | | CA St
| | 5.25% | | 10/01/45 | | 1,146,632 |
| 1,000,000 | | CA St Hlth Facs Fing Auth Rev Kaiser Premanete, Subser A-2
| | 4.00% | | 11/01/44 | | 987,282 |
| 220,000 | | CA St Hlth Facs Fing Auth Rev Ref Sutter Hlth, Ser B
| | 5.00% | | 11/15/33 | | 234,390 |
| 1,000,000 | | CA St Hlth Facs Fing Auth Rev Var Ref Stanford Hlth Care, Ser A (Mandatory put 08/15/25)
| | 3.00% | | 08/15/54 | | 997,439 |
| 1,000,000 | | CA St Infra & Econ Dev Bank Natl Chrt Equitable Sch Revolving Fund Social Bonds, Ser B
| | 5.00% | | 11/01/38 | | 1,066,625 |
| 1,000,000 | | CA St Infra & Econ Dev Bank Rev Var Brightline W Passenger Rail Proj Remk, Ser A, AMT, (Mandatory put 01/31/24) (b)
| | 3.65% | | 01/01/50 | | 995,790 |
Page 16
See Notes to Financial Statements
First Trust California Municipal High Income ETF (FCAL)
Portfolio of Investments (Continued)
July 31, 2023
Principal
Value | | Description | | Stated
Coupon | | Stated
Maturity | | Value |
| MUNICIPAL BONDS (Continued) |
| | | California (Continued) | | | | | | |
| $250,000 | | CA St Muni Fin Auth Chrt Sch Lease Rev Sycamore Acdmy Proj (c)
| | 5.38% | | 07/01/34 | | $250,639 |
| 250,000 | | CA St Muni Fin Auth Chrt Sch Lease Rev Vista Chrt Middle Sch Proj (d)
| | 5.38% | | 07/01/34 | | 250,307 |
| 900,000 | | CA St Muni Fin Auth Chrt Sch Rev John Adams Acdmys Lincoln Proj, Ser A (b)
| | 5.00% | | 10/01/39 | | 863,316 |
| 200,000 | | CA St Muni Fin Auth Chrt Sch Rev Palmdale Aerospace Acdmy Proj (b)
| | 4.00% | | 07/01/26 | | 194,579 |
| 450,000 | | CA St Muni Fin Auth Chrt Sch Rev Palmdale Aerospace Acdmy Proj, Ser A (b)
| | 5.00% | | 07/01/38 | | 440,721 |
| 250,000 | | CA St Muni Fin Auth Chrt Sch Rev, Ser A (b)
| | 5.50% | | 06/01/38 | | 250,563 |
| 785,000 | | CA St Muni Fin Auth Mobile Home Park Rev Ref Sr Caritas Projs, Ser A
| | 5.00% | | 08/15/27 | | 819,771 |
| 85,000 | | CA St Muni Fin Auth Mobile Home Park Rev Senior Caritas Affordable Hsg Inc Projs, Ser A
| | 3.00% | | 08/15/32 | | 78,868 |
| 400,000 | | CA St Muni Fin Auth Mobile Home Park Rev Sr Caritas Affordable Hsg Inc Projs, Ser A
| | 5.25% | | 08/15/39 | | 404,343 |
| 605,000 | | CA St Muni Fin Auth Mobile Home Park Rev Sr Caritas Affordable Hsg Inc Projs, Ser A
| | 5.25% | | 08/15/49 | | 610,466 |
| 245,000 | | CA St Muni Fin Auth Mobile Home Park Rev Sub Ref Caritas Proj, Ser B
| | 3.00% | | 08/15/31 | | 227,172 |
| 295,000 | | CA St Muni Fin Auth Mobile Home Park Rev Sub Ref Caritas Proj, Ser B
| | 4.00% | | 08/15/41 | | 272,708 |
| 435,000 | | CA St Muni Fin Auth Mobile Home Park Rev Sub Ref Caritas Proj, Ser B
| | 4.00% | | 08/15/51 | | 374,953 |
| 500,000 | | CA St Muni Fin Auth Ref Palomar Hlth, Ser A, COPS, AGM
| | 5.25% | | 11/01/34 | | 562,779 |
| 500,000 | | CA St Muni Fin Auth Ref Palomar Hlth, Ser A, COPS, AGM
| | 5.25% | | 11/01/36 | | 552,659 |
| 1,000,000 | | CA St Muni Fin Auth Rev Aldersly Proj, Ser A
| | 5.00% | | 05/15/43 | | 1,086,635 |
| 1,500,000 | | CA St Muni Fin Auth Rev Bethany Home Proj
| | 5.00% | | 11/15/42 | | 1,640,654 |
| 1,000,000 | | CA St Muni Fin Auth Rev CA Baptist Univ, Ser A (b)
| | 5.00% | | 11/01/36 | | 1,008,266 |
| 225,000 | | CA St Muni Fin Auth Rev Ref CA Lutheran Univ
| | 5.00% | | 10/01/30 | | 238,132 |
| 225,000 | | CA St Muni Fin Auth Rev Ref CA Lutheran Univ
| | 5.00% | | 10/01/32 | | 237,128 |
| 475,000 | | CA St Muni Fin Auth Rev Ref Cmnty Med Ctrs, Ser A
| | 5.00% | | 02/01/36 | | 493,358 |
| 200,000 | | CA St Muni Fin Auth Rev Ref Eisenhower Med Ctr, Ser A
| | 5.00% | | 07/01/32 | | 209,420 |
| 250,000 | | CA St Muni Fin Auth Rev Ref Emerson Clg, Ser B
| | 5.00% | | 01/01/33 | | 260,630 |
| 1,080,000 | | CA St Muni Fin Auth Rev Ref HumanGood Oblig Grp, Ser A
| | 4.00% | | 10/01/34 | | 1,083,841 |
| 500,000 | | CA St Muni Fin Auth Rev Ref HumanGood Oblig Grp, Ser A
| | 4.00% | | 10/01/36 | | 499,383 |
| 110,000 | | CA St Muni Fin Auth Rev Ref Retmnt Hsg Fdtn Oblig Grp, Ser A
| | 5.00% | | 11/15/26 | | 117,380 |
| 435,000 | | CA St Muni Fin Auth Rev Ref Retmnt Hsg Fdtn Oblig Grp, Ser A
| | 5.00% | | 11/15/27 | | 474,729 |
| 575,000 | | CA St Muni Fin Auth Rev Ref Southwestern Law Sch
| | 4.00% | | 11/01/41 | | 521,286 |
| 1,250,000 | | CA St Muni Fin Auth Sol Wst Disp Rev Var Ref Rep Svcs Inc Proj Remk, Ser A, AMT (Mandatory put 10/02/23)
| | 4.10% | | 07/01/41 | | 1,249,607 |
| 700,000 | | CA St Muni Fin Auth Spl Fac Rev United Airls Inc Proj, AMT
| | 4.00% | | 07/15/29 | | 694,864 |
| 615,000 | | CA St Muni Fin Auth Sr Living Rev Temps 50 Mt San Antonio Gardens Proj, Ser B-2
| | 2.13% | | 11/15/26 | | 581,620 |
| 550,000 | | CA St Muni Fin Auth Stdt Hsg Rev Chf Davis I, LLC W Vlg Stdt Hsg Proj
| | 5.00% | | 05/15/27 | | 574,421 |
| 350,000 | | CA St Muni Fin Auth Stdt Hsg Rev Chf Davis I, LLC W Vlg Stdt Hsg Proj
| | 5.00% | | 05/15/40 | | 359,453 |
| 1,500,000 | | CA St Poll Control Fin Auth Sol Wst Disp Rev Ref Rep Svcs Remk, Ser A, AMT (Mandatory put 05/01/23) (b)
| | 3.88% | | 08/01/23 | | 1,500,000 |
| 1,000,000 | | CA St Poll Control Fin Auth Sol Wst Disp Rev Ref Waste Mgmt Inc, Ser B-1, AMT
| | 3.00% | | 11/01/25 | | 977,414 |
| 600,000 | | CA St Poll Control Fin Auth Sol Wst Disp Rev Ref Wst Mgmt Inc, Ser A1, AMT
| | 3.38% | | 07/01/25 | | 592,490 |
See Notes to Financial Statements
Page 17
First Trust California Municipal High Income ETF (FCAL)
Portfolio of Investments (Continued)
July 31, 2023
Principal
Value | | Description | | Stated
Coupon | | Stated
Maturity | | Value |
| MUNICIPAL BONDS (Continued) |
| | | California (Continued) | | | | | | |
| $1,000,000 | | CA St Poll Control Fin Auth Sol Wst Disp Rev Ref Wst Mgmt Inc, Ser A3, AMT
| | 4.30% | | 07/01/40 | | $1,008,014 |
| 1,500,000 | | CA St Poll Control Fing Auth Wtr Furnishing Rev Plant Bonds, AMT (b)
| | 5.00% | | 07/01/37 | | 1,500,358 |
| 1,500,000 | | CA St Poll Control Fing Auth Wtr Furnishing Rev Poseidon Res LP Desalination Proj, AMT (b)
| | 5.00% | | 07/01/36 | | 1,575,318 |
| 5,000 | | CA St Prerefunded Various Purp (Pre-refunded maturity 04/01/26)
| | 5.00% | | 10/01/35 | | 5,269 |
| 15,000 | | CA St Pub Wks Brd Lease Rev Judicial Council CA, Ser B
| | 5.00% | | 06/01/34 | | 15,568 |
| 310,000 | | CA St Pub Wks Brd Lease Rev Various Corr Facs, Ser C
| | 5.00% | | 11/01/26 | | 330,860 |
| 75,000 | | CA St Ref
| | 4.00% | | 08/01/34 | | 77,030 |
| 1,000,000 | | CA St Ref
| | 5.00% | | 11/01/39 | | 1,087,952 |
| 700,000 | | CA St Sch Fin Auth Chrt Sch Rev Ref Classical Academies Oceanside Proj, Ser A (b)
| | 5.00% | | 10/01/32 | | 741,059 |
| 600,000 | | CA St Sch Fin Auth Chrt Sch Rev Sustainability Bonds Ref Camino Nuevo Chrt Acdmy, Ser A (b)
| | 5.00% | | 06/01/43 | | 594,549 |
| 1,000,000 | | CA St Stwd Cmntys Dev Auth Mf Var Hsg Iac Proj, Ser W-1 (a)
| | 3.50% | | 08/01/34 | | 1,000,000 |
| 1,000,000 | | CA St Stwd Cmntys Dev Auth Mfh Rev Var Adams Boulevard & Harvard Gardens Apartments Sub, Ser L-1 (Mandatory put 03/01/24)
| | 3.50% | | 03/01/26 | | 993,270 |
| 245,000 | | CA St Stwd Cmntys Dev Auth Rev Ref Front Porch Cmntys & Svcs, Ser A
| | 5.00% | | 04/01/27 | | 254,345 |
| 50,000 | | CA St Stwd Cmntys Dev Auth Rev Ref Front Porch Cmntys & Svcs, Ser A
| | 4.00% | | 04/01/32 | | 50,267 |
| 50,000 | | CA St Stwd Cmntys Dev Auth Rev Ref Insd Enloe Med Ctr, CA MTG INS (Pre-refunded maturity 02/15/26)
| | 5.00% | | 08/15/33 | | 52,599 |
| 500,000 | | CA St Stwd Cmntys Dev Auth Spl Tax Rev Impt Area No 1
| | 4.00% | | 09/01/41 | | 453,576 |
| 200,000 | | CA St Stwd Cmntys Dev Auth Stdt Hsg Rev Ref Chf Irvine LLC
| | 5.00% | | 05/15/30 | | 207,134 |
| 280,000 | | CA St Stwd Cmntys Dev Auth Stdt Hsg Rev Ref Chf Irvine LLC
| | 5.00% | | 05/15/35 | | 287,148 |
| 1,140,000 | | CA St Stwd Cmntys Dev Auth Stwd Rev Stwd Cmnty Infra Prog, Ser C-1
| | 4.00% | | 09/02/31 | | 1,110,634 |
| 500,000 | | CA St Univ Rev, Ser A (e)
| | 5.25% | | 11/01/48 | | 568,767 |
| 95,000 | | CA St Unrefunded Various Purp
| | 5.00% | | 10/01/35 | | 100,070 |
| 1,000,000 | | CA St Various Purp
| | 5.00% | | 05/01/29 | | 1,013,690 |
| 705,000 | | CA Stwd Cmntys Dev Auth Rev Kaiser Permanente J Remk, Ser 2004 (Mandatory put 11/01/29)
| | 5.00% | | 04/01/36 | | 792,231 |
| 250,000 | | CA Stwd Cmntys Dev Auth Rev Loma Linda Univ Med Ctr, Ser A (b)
| | 5.00% | | 12/01/30 | | 255,444 |
| 300,000 | | CA Stwd Cmntys Dev Auth Rev Loma Linda Univ Med Ctr, Ser A (b)
| | 5.00% | | 12/01/33 | | 305,787 |
| 250,000 | | CA Stwd Cmntys Dev Auth Rev Ref CA Baptist Univ, Ser A (b)
| | 5.00% | | 11/01/32 | | 256,418 |
| 100,000 | | CA Stwd Cmntys Dev Auth Rev Ref Front Porch Cmntys & Svcs, Ser A
| | 5.00% | | 04/01/30 | | 104,082 |
| 175,000 | | CA Stwd Cmntys Dev Auth Rev Ref Front Porch Cmntys & Svcs, Ser A
| | 5.00% | | 04/01/31 | | 182,281 |
| 385,000 | | CA Stwd Cmntys Dev Auth Rev Var Adventist Hlth Sys W A Remk, Ser 2007 (Mandatory put 03/01/27)
| | 5.00% | | 03/01/37 | | 398,899 |
| 450,000 | | Chino CA Cmnty Facs Dist Spl Tax #2003-3 Impt Area #7
| | 5.00% | | 09/01/31 | | 475,333 |
| 815,000 | | Clovis CA Unif Sch Dist Cops
| | 5.00% | | 06/01/41 | | 900,053 |
| 500,000 | | Clovis CA Unif Sch Dist Cops
| | 5.00% | | 06/01/42 | | 549,713 |
| 500,000 | | Clovis CA Unif Sch Dist Cops
| | 5.00% | | 06/01/43 | | 548,698 |
| 250,000 | | Compton CA Unif Sch Dist Los Angeles Co Schs Fing Prog, Ser A, COPS, BAM
| | 4.00% | | 06/01/35 | | 255,771 |
| 210,000 | | Cotati-Rohnert Park CA Unif Sch Dist 2016 Election, Ser C, AGM
| | 5.00% | | 08/01/32 | | 223,836 |
| 2,000,000 | | CSCDA Cmnty Impt Auth CA Essential Hsg Rev Union S Bay Social Bonds, Ser A-2 (b)
| | 4.00% | | 07/01/56 | | 1,471,450 |
Page 18
See Notes to Financial Statements
First Trust California Municipal High Income ETF (FCAL)
Portfolio of Investments (Continued)
July 31, 2023
Principal
Value | | Description | | Stated
Coupon | | Stated
Maturity | | Value |
| MUNICIPAL BONDS (Continued) |
| | | California (Continued) | | | | | | |
| $295,000 | | Del Mar CA Union Sch Dist Spl Tax Ref
| | 4.00% | | 09/01/34 | | $293,217 |
| 150,000 | | Dinuba CA Jt Unif Sch Dist, COPS, AGM
| | 4.00% | | 02/01/35 | | 153,499 |
| 920,000 | | E Bay CA Muni Util Dist Wtr Sys Rev Green Bond, Ser A
| | 5.00% | | 06/01/38 | | 1,013,308 |
| 795,000 | | El Dorado CA Irr Dist Rev Ref, Ser C
| | 4.00% | | 03/01/34 | | 814,154 |
| 1,450,000 | | Elk Grove CA Fin Auth Spl Tax Rev Laguna Ridge CFD #2005-1
| | 4.00% | | 09/01/50 | | 1,242,965 |
| 1,000,000 | | Elk Grove CA Unif Sch Dist Election of 2016
| | 4.00% | | 08/01/40 | | 1,007,025 |
| 350,000 | | Folsom Ranch CA Fing Auth Spl Tax Rev Cmnty Facs Dist No 19 Mangini
| | 5.00% | | 09/01/32 | | 366,299 |
| 155,000 | | Fontana CA Spl Tax Cmnty Facs Dist #80 Bella Strada
| | 5.00% | | 09/01/29 | | 163,591 |
| 500,000 | | Fontana CA Spl Tax Cmnty Facs Dist #80 Bella Strada
| | 5.00% | | 09/01/46 | | 507,353 |
| 240,000 | | Fontana CA Spl Tax Spl Tax, The Meadows
| | 4.00% | | 09/01/32 | | 240,030 |
| 165,000 | | Fontana CA Unif Sch Dist Unrefunded, AGM
| | (f) | | 02/01/33 | | 118,281 |
| 140,000 | | Fresno CA Jt Pwrs Fing Auth Lease Rev Ref Master Lease Proj, Ser A, AGM
| | 5.00% | | 04/01/32 | | 151,404 |
| 750,000 | | Golden St Tobacco Securitization Corp CA Tobacco Stlmt Ref, Ser A-1 (Pre-refunded maturity 06/01/28)
| | 5.00% | | 06/01/34 | | 832,091 |
| 1,000,000 | | Golden St Tobacco Securitization Corp CA Tobacco Stlmt Ref, Tobacco Stlmt Asset Backed Bonds, Ser A-1
| | 5.00% | | 06/01/51 | | 1,042,097 |
| 1,000,000 | | Imperial CA Cmnty Clg Dist Election of 2022, Ser , AGM
| | 5.25% | | 08/01/53 | | 1,121,404 |
| 2,000,000 | | Irvine CA Facs Fing Auth Lease Rev Gateway Preserve Land Acq Proj, Ser A
| | 5.25% | | 05/01/48 | | 2,086,126 |
| 2,000,000 | | Irvine CA Spl Tax Great Park Impt Area No 10, BAM (e)
| | 5.25% | | 09/01/53 | | 2,236,929 |
| 150,000 | | Irvine CA Unif Sch Dist Spl Tax Cmnty Facs Dist #09-1, Ser C
| | 5.00% | | 09/01/31 | | 157,717 |
| 1,000,000 | | Kern CA Cmnty Clg Dist, CABS, BANS
| | (f) | | 08/01/23 | | 1,000,000 |
| 1,000,000 | | Kern CA Cmnty Clg Dist, Ser D
| | 5.25% | | 08/01/39 | | 1,167,125 |
| 485,000 | | King City CA Union Sch Dist Cap Apprec Election 1998-C, CABS, AMBAC
| | (f) | | 08/01/29 | | 394,093 |
| 25,000 | | Lammersville CA Jt Unif Sch Dist Spl Tax Cmnty Facs Dist #2014-1 Mountain House Sch Facs
| | 4.00% | | 09/01/33 | | 24,920 |
| 25,000 | | Lammersville CA Jt Unif Sch Dist Spl Tax Cmnty Facs Dist #2014-1 Mountain House Sch Facs
| | 4.00% | | 09/01/34 | | 24,871 |
| 200,000 | | Lammersville CA Jt Unif Sch Dist Spl Tax Cmnty Facs Dist #2014-1 Mountain House Sch Facs
| | 4.00% | | 09/01/40 | | 185,363 |
| 225,000 | | Long Beach CA Arpt Rev Ref, Ser A, AGM
| | 5.00% | | 06/01/30 | | 259,646 |
| 500,000 | | Long Beach CA Arpt Rev, Sec C, AMT, AGM
| | 5.25% | | 06/01/47 | | 534,769 |
| 750,000 | | Long Beach CA Bond Fin Auth Nat Gas Pur Rev, Ser A
| | 5.50% | | 11/15/30 | | 818,741 |
| 500,000 | | Los Angeles CA Dept of Arpts Arpt Rev Green Bond Ref Subord Priv Activity, Ser A, AMT
| | 5.25% | | 05/15/42 | | 548,089 |
| 50,000 | | Los Angeles CA Dept of Arpts Arpt Rev Prerefunded Subord Ref, Ser D, AMT (Pre-refunded maturity 11/15/31)
| | 5.00% | | 05/15/33 | | 56,139 |
| 950,000 | | Los Angeles CA Dept of Arpts Arpt Rev Unrefunded Subord Ref, Ser D, AMT
| | 5.00% | | 05/15/33 | | 1,061,592 |
| 690,000 | | Los Angeles CA Dept of Arpts Arpt Rev Unrefunded Subord Ref, Ser D, AMT
| | 5.00% | | 05/15/36 | | 756,562 |
| 10,000 | | Los Angeles CA Dept of Arpts, Ser E
| | 5.00% | | 05/15/28 | | 10,430 |
| 1,000,000 | | Los Angeles CA Dept of Wtr & Pwr Wtrwks Rev, Ser A
| | 5.00% | | 07/01/48 | | 1,058,404 |
| 1,000,000 | | Los Angeles CA Dept Wtr & Pwr Rev Var Ref Remk, Subser B-6 (a)
| | 3.55% | | 07/01/34 | | 1,000,000 |
| 1,250,000 | | Los Angeles CA Trans
| | 5.00% | | 06/27/24 | | 1,270,379 |
| 650,000 | | Los Angeles Cnty Ca Dev Auth Mf Hsg Rev Var, West La Va Building 156 & 157 Apts, Ser C (Mandatory put 12/01/26)
| | 3.75% | | 12/01/46 | | 650,693 |
| 410,000 | | Los Osos CA Cmnty Svcs Wstwtr Assmnt Dist #1 Ref Reassmnt
| | 3.13% | | 09/02/32 | | 399,667 |
| 100,000 | | Marina CA Redev Agy Successor Agy Tax Allocation Hsg, Ser B
| | 5.00% | | 09/01/27 | | 105,416 |
| 250,000 | | Marina CA Redev Agy Successor Agy Tax Allocation Hsg, Ser B
| | 5.00% | | 09/01/33 | | 263,348 |
| 600,000 | | Menifee CA Spl Tax, Ser A
| | 5.00% | | 09/01/43 | | 615,140 |
See Notes to Financial Statements
Page 19
First Trust California Municipal High Income ETF (FCAL)
Portfolio of Investments (Continued)
July 31, 2023
Principal
Value | | Description | | Stated
Coupon | | Stated
Maturity | | Value |
| MUNICIPAL BONDS (Continued) |
| | | California (Continued) | | | | | | |
| $700,000 | | Menifee CA Spl Tax, Ser A
| | 5.00% | | 09/01/48 | | $706,169 |
| 245,000 | | Menifee CA Union Sch Dist Spl Tax Cmnty Facs Dist #2011-1
| | 5.00% | | 09/01/34 | | 259,580 |
| 500,000 | | Menifee CA Union Sch Dist Spl Tax Cmnty Facs Dist #2011-1
| | 5.00% | | 09/01/44 | | 508,633 |
| 1,000,000 | | Met Wtr Dist of Sthrn CA Wtrwks Rev, Ser A
| | 5.00% | | 04/01/48 | | 1,117,894 |
| 530,000 | | Modesto CA Elem Sch Dist Stanislaus Cnty Election of 2018 Measure D, Ser C
| | 5.00% | | 08/01/41 | | 589,523 |
| 1,125,000 | | Modesto CA Irr Dist Fing Auth Elec Sys Rev, Ser A
| | 5.25% | | 10/01/48 | | 1,265,686 |
| 100,000 | | Modesto CA Spl Tax Ref Cmnty Facs Dist # 2004-1 Vlg 1 #2
| | 5.00% | | 09/01/27 | | 101,882 |
| 200,000 | | Morongo Band of Mission Indians CA Rev Ref, Ser B (b)
| | 5.00% | | 10/01/42 | | 197,342 |
| 1,115,000 | | Natomas CA Unif Sch Dist, AGM
| | 3.00% | | 08/01/36 | | 1,015,600 |
| 250,000 | | Norco CA Spl Tax Ref Norco Ridge Ranch, BAM
| | 5.00% | | 09/01/32 | | 270,988 |
| 1,400,000 | | Nrthrn CA Energy Auth Cmnty Spl Rev, Ser A (Mandatory put 07/01/24)
| | 4.00% | | 07/01/49 | | 1,403,368 |
| 100,000 | | Ontario CA Cmnty Facs Dist #40 Spl Tax Emeral Park Fac
| | 4.00% | | 09/01/34 | | 98,693 |
| 65,000 | | Ontario CA Cmnty Facs Dist #40 Spl Tax Emeral Park Fac
| | 4.00% | | 09/01/35 | | 63,234 |
| 275,000 | | Ontario CA Cmnty Facs Dist #40 Spl Tax Emeral Park Fac
| | 4.00% | | 09/01/39 | | 251,212 |
| 610,000 | | Orange Ctr CA Sch Dist Election of 2022, Ser A, AGM (e)
| | 5.25% | | 08/01/48 | | 660,980 |
| 1,000,000 | | Oxnard CA Sch Dist Election of 2022, Ser A, BAM
| | 5.00% | | 08/01/42 | | 1,113,201 |
| 650,000 | | Palm Desert CA Spl Tax Ref Univ Park
| | 4.00% | | 09/01/51 | | 557,546 |
| 250,000 | | Palomar Hlth CA Rev Ref
| | 5.00% | | 11/01/31 | | 260,045 |
| 210,000 | | Rancho Cordova CA Cmnty Facs Dist Spl Tax No 2018-1 Grantline 208
| | 5.00% | | 09/01/33 | | 222,874 |
| 220,000 | | Rancho Cordova CA Cmnty Facs Dist Spl Tax No 2018-1 Grantline 208
| | 5.00% | | 09/01/34 | | 233,225 |
| 340,000 | | Rancho Cordova CA Cmnty Facs Dist Spl Tax No 2018-1 Grantline 208
| | 5.00% | | 09/01/39 | | 352,484 |
| 525,000 | | Ripon CA Redev Agy Successor Agy Tax Allocation Ref, BAM
| | 4.00% | | 11/01/31 | | 554,675 |
| 500,000 | | River Islands CA Pub Fing Auth Spl Tax Cmnty Facs Dist #2019-1 Phase 2 Pub Impts
| | 5.00% | | 09/01/40 | | 489,626 |
| 575,000 | | Riverside CA Unif Sch Dist Election of 2016, Ser B
| | 3.00% | | 08/01/38 | | 504,960 |
| 185,000 | | Riverside CA Unif Sch Dist Fing Auth Spl Tax Ref, BAM
| | 5.00% | | 09/01/34 | | 191,339 |
| 750,000 | | Riverside CA Wtr Rev, Ser A
| | 5.00% | | 10/01/47 | | 831,640 |
| 185,000 | | Roseville CA Spl Tax Fiddyment Ranch Cmnty Fac
| | 5.00% | | 09/01/32 | | 197,300 |
| 160,000 | | Roseville CA Spl Tax Fiddyment Ranch Cmnty Fac
| | 5.00% | | 09/01/33 | | 170,293 |
| 170,000 | | Roseville CA Spl Tax Fiddyment Ranch Cmnty Fac
| | 4.00% | | 09/01/34 | | 171,018 |
| 150,000 | | Roseville CA Spl Tax Fiddyment Ranch Cmnty Fac
| | 4.00% | | 09/01/35 | | 149,992 |
| 225,000 | | Roseville CA Spl Tax Vlg CFD #1
| | 4.00% | | 09/01/33 | | 224,098 |
| 200,000 | | Sacramento CA Spl Tax Natomas Meadows Cmnty Facs Dist #2007-01 (b)
| | 5.00% | | 09/01/32 | | 208,583 |
| 500,000 | | Sacramento CA Transient Occupancy Tax Rev Sub Convention Ctr Complex, Ser C
| | 5.00% | | 06/01/32 | | 541,966 |
| 1,000,000 | | Sacramento Cnty CA Arpt Sys Rev Ref, Ser C, AMT
| | 5.00% | | 07/01/37 | | 1,046,877 |
| 1,000,000 | | San Diego CA Pub Fac Fing Auth Swr Rev Subord, Ser A
| | 5.00% | | 05/15/47 | | 1,109,002 |
| 1,075,000 | | San Diego CA Pub Fac Fing Auth Wtr Rev, Ser A
| | 5.00% | | 08/01/41 | | 1,132,337 |
| 600,000 | | San Diego CA Pub Facs Fing Auth Lease Rev Capital Impt Projects, Ser A
| | 5.00% | | 10/15/40 | | 677,997 |
| 1,500,000 | | San Diego CA Unif Sch Dist Green Bond, Ser F2
| | 5.00% | | 07/01/42 | | 1,682,071 |
| 1,300,000 | | San Diego CA Unif Sch Dist Ref, Ser R2, CONV CABS
| | 0.00% | | 07/01/41 | | 1,198,701 |
| 800,000 | | San Diego CA Unif Sch Dist, Ser K2, CABS
| | (f) | | 07/01/32 | | 574,966 |
| 510,000 | | San Diego Cnty CA Ltd Rev Obligs Ref Sanford Burnham Prebys Med Discovery Institute, Ser A
| | 5.00% | | 11/01/28 | | 535,213 |
| 130,000 | | San Diego Cnty CA Regl Arpt Auth Arpt Rev Subord Ref, Ser A
| | 5.00% | | 07/01/39 | | 140,935 |
| 1,000,000 | | San Diego Cnty CA Regl Arpt Auth Arpt Rev Subord, Ser B, AMT
| | 5.00% | | 07/01/34 | | 1,098,223 |
Page 20
See Notes to Financial Statements
First Trust California Municipal High Income ETF (FCAL)
Portfolio of Investments (Continued)
July 31, 2023
Principal
Value | | Description | | Stated
Coupon | | Stated
Maturity | | Value |
| MUNICIPAL BONDS (Continued) |
| | | California (Continued) | | | | | | |
| $85,000 | | San Diego Cnty CA Spl Tax Harmony Grove Vlg Impt Area No 2, Ser A
| | 4.00% | | 09/01/33 | | $85,507 |
| 1,000,000 | | San Francisco CA City & City Pub Utils Commn Wtr Rev Reg & Loc Wtr, Ser A
| | 5.25% | | 11/01/48 | | 1,137,750 |
| 140,000 | | San Francisco CA City & Cnty Arpts Commn Intl Arpt Rev Ref Second Ser, Ser 2020A, AMT
| | 5.00% | | 05/01/37 | | 149,491 |
| 2,000,000 | | San Francisco CA City & Cnty Arpts Commn Intl Arpt Rev Ref, Ser A, AMT
| | 5.00% | | 05/01/34 | | 2,209,494 |
| 500,000 | | San Francisco CA City & Cnty Dcnty Dev Spl Tax Dist No 2020-1 Mission Rock Facs & Svcs, Ser A (b)
| | 4.00% | | 09/01/46 | | 421,096 |
| 100,000 | | San Francisco City & Cnty CA Redev Agy Successor Agy Tax Ref Mission Bay N Redev Proj, Ser A
| | 5.00% | | 08/01/35 | | 105,579 |
| 935,000 | | San Francisco City & Cnty CA, Ser B
| | 2.00% | | 06/15/29 | | 865,697 |
| 175,000 | | San Joaquin Hills CA Transprtn Corridor Agy Toll Road Rev Cap Apprec Ref, Ser A, NATL-RE
| | (f) | | 01/15/29 | | 143,190 |
| 120,000 | | San Joaquin Hills CA Transprtn Corridor Agy Toll Road Rev Ref Sr Lien Toll Road, Ser A
| | 4.00% | | 01/15/37 | | 122,504 |
| 1,000,000 | | San Joaquin Hills CA Transprtn Corridor Agy Toll Road Rev Sr Lien Ref, Ser A (Pre-refunded maturity 01/15/25)
| | 5.00% | | 01/15/29 | | 1,029,108 |
| 1,145,000 | | San Jose CA Arpt Rev Ref, Ser A, AMT, BAM
| | 4.00% | | 03/01/34 | | 1,161,447 |
| 1,000,000 | | San Luis Coastal CA Unif Sch Dist Election of 2022, Ser A
| | 5.00% | | 08/01/41 | | 1,132,071 |
| 1,000,000 | | San Luis Obispo Cnty CA Fing Auth Lease Rev Multiple Capital Projs Ref, Ser A
| | 5.25% | | 11/15/40 | | 1,109,683 |
| 1,000,000 | | San Mateo Cnty CA Transprtn Auth Sales Tax Rev Var Subord, Ser B (a)
| | 3.20% | | 06/01/49 | | 1,000,000 |
| 1,500,000 | | Sanger CA Fing Auth Wstwtr Rev Ref, AGM (Pre-refunded maturity 06/15/24)
| | 5.00% | | 06/15/34 | | 1,550,461 |
| 500,000 | | Santa Clara Vly CA Wtr Dist Safe Clean Wtr Rev Green Bond, Ser A
| | 5.00% | | 08/01/40 | | 573,070 |
| 500,000 | | Santa Clara Vly CA Wtr Dist Safe Clean Wtr Rev Green Bond, Ser A
| | 5.00% | | 08/01/41 | | 571,055 |
| 800,000 | | Santa Clarita CA Cmnty Facs Dist Vista Canyon #2016-1 (b)
| | 4.00% | | 09/01/35 | | 786,406 |
| 1,100,000 | | Santa Margarita CA Wtr Dist Spl Tax Ref, Ser A, BAM
| | 5.00% | | 09/01/43 | | 1,201,691 |
| 740,000 | | Simi Vly CA Unif Sch Dist, Ser B
| | 4.00% | | 08/01/38 | | 747,480 |
| 1,500,000 | | South Orange Cnty CA Public Fing Auth Spl Tax Rev Ref, Senior Lien, Ser A
| | 5.00% | | 08/15/28 | | 1,500,921 |
| 150,000 | | Temecula Vly CA Unif Sch Dist Cmnty Facs Dist #2014-1
| | 5.00% | | 09/01/32 | | 157,701 |
| 400,000 | | Temecula Vly Unif Sch Dist Fing Auth CA Spl Tax Rev, BAM
| | 5.00% | | 09/01/34 | | 413,140 |
| 500,000 | | Temescal Vly CA Wtr Dist Spl Tax Terramor Cmnty Facs Dist #4 Impt Area #1
| | 5.00% | | 09/01/31 | | 526,667 |
| 250,000 | | Tracy CA Cmnty Facs Dist
| | 5.00% | | 09/01/33 | | 263,089 |
| 735,000 | | Transbay Jt Powers Auth CA Green Bond Sr Tax Alloc Bonds, Ser A
| | 5.00% | | 10/01/33 | | 795,809 |
| 850,000 | | Tustin CA Cmnty Fac Dist Spl Tax Ref #06-1 Legacy Columbus Vlgs, Ser A
| | 5.00% | | 09/01/35 | | 879,838 |
| 2,000,000 | | Univ of California CA Rev Ref, Ser BN
| | 5.00% | | 05/15/42 | | 2,304,135 |
| 400,000 | | Univ of California CA Rgts Med Center Pooled Ref Var Ref Remk, Ser B-1 (a)
| | 3.35% | | 05/15/32 | | 400,000 |
| 1,000,000 | | Western Placer CA Unif Sch Dist Trans
| | 6.25% | | 06/28/24 | | 1,027,137 |
| 1,295,000 | | Western Placer Wst Mgmt Auth CA Solid Wst Rev Landfill Impt Proj, Ser B
| | 5.00% | | 06/01/42 | | 1,374,075 |
| | | | | 139,482,840 |
| | | Florida – 0.2% | | | | | | |
| 50,000 | | Parkland Preserve CDD FL Spl Assmnt Rev, Ser A
| | 4.50% | | 05/01/24 | | 50,053 |
See Notes to Financial Statements
Page 21
First Trust California Municipal High Income ETF (FCAL)
Portfolio of Investments (Continued)
July 31, 2023
Principal
Value | | Description | | Stated
Coupon | | Stated
Maturity | | Value |
| MUNICIPAL BONDS (Continued) |
| | | Florida (Continued) | | | | | | |
| $245,000 | | Rhodine Road N CDD FL Spl Assmnt 2019 Assmnt Area
| | 4.00% | | 05/01/30 | | $239,319 |
| | | | | 289,372 |
| | | Guam – 0.7% | | | | | | |
| 100,000 | | Guam Govt Busn Privilege Tax Rev Ref, Ser D
| | 5.00% | | 11/15/32 | | 101,482 |
| 1,000,000 | | Guam Intl Arpt Auth Ref Gen, Ser C, AMT (Forward refunding 10/01/23)
| | 6.38% | | 10/01/43 | | 1,004,174 |
| | | | | 1,105,656 |
| | | Illinois – 0.1% | | | | | | |
| 135,000 | | Chicago IL Ref, Ser C, CABS
| | (f) | | 01/01/24 | | 132,688 |
| | | Louisiana – 0.5% | | | | | | |
| 750,000 | | Saint James Parish LA Rev Var Nustar Logistics LP Proj, Ser 2008 (Mandatory put 06/01/30) (b)
| | 6.10% | | 06/01/38 | | 807,962 |
| | | Ohio – 0.4% | | | | | | |
| 640,000 | | Buckeye OH Tobacco Stlmt Fing Auth Ref Sr, Ser B-2, Class 2
| | 5.00% | | 06/01/55 | | 595,739 |
| | | Puerto Rico – 2.6% | | | | | | |
| 500,000 | | Puerto Rico Cmwlth Hwy & Transprtn Auth Restructured Toll Restructured, Ser A, CABS
| | 5.00% | | 07/01/62 | | 492,500 |
| 510,000 | | Puerto Rico Cmwlth Hwy & Transprtn Auth Restructured Toll Restructured, Ser B, CABS
| | (f) | | 07/01/32 | | 325,048 |
| 1,100,000 | | Puerto Rico Cmwlth Restructured, Ser A1
| | 4.00% | | 07/01/33 | | 1,046,207 |
| 500,000 | | Puerto Rico Cmwlth Restructured, Ser A1
| | 4.00% | | 07/01/41 | | 430,598 |
| 1,060,000 | | Puerto Rico Sales Tax Fing Corp Sales Tax Rev Restructured, Ser A-1
| | 4.55% | | 07/01/40 | | 1,027,352 |
| 578,000 | | Puerto Rico Sales Tax Fing Corp Sales Tax Rev Restructured, Ser A-2
| | 4.33% | | 07/01/40 | | 545,536 |
| | | | | 3,867,241 |
| | | Texas – 0.3% | | | | | | |
| 370,000 | | Houston TX Arpt Sys Rev Ref United Airls Inc Terminal Impt Proj, Ser B-2, AMT
| | 5.00% | | 07/15/27 | | 374,181 |
| | | Utah – 0.2% | | | | | | |
| 500,000 | | Military Installation Dev Auth UT Tax Allocation Rev, Ser A-2
| | 4.00% | | 06/01/52 | | 370,729 |
| Total Investments – 98.5%
| | 147,026,408 |
| | (Cost $148,367,733) | | |
| | Net Other Assets and Liabilities – 1.5%
| | 2,191,720 |
| | Net Assets – 100.0%
| | $149,218,128 |
Futures Contracts (See Note 2D - Futures Contracts in the Notes to Financial Statements):
| Futures Contracts | | Position | | Number of
Contracts | | Expiration
Date | | Notional
Value | | Unrealized
Appreciation
(Depreciation)/
Value |
| 10-Year U.S. Treasury Notes | | Short | | 36 | | Sep 2023 | | $ (4,010,625) | | $11,078 |
| Ultra 10-Year U.S. Treasury Notes | | Short | | 30 | | Sep 2023 | | (3,509,531) | | 28,915 |
| | | | | | | | | $(7,520,156) | | $39,993 |
| (a) | Variable Rate Demand bond. Interest rate is reset periodically by the agent based on current market conditions. |
Page 22
See Notes to Financial Statements
First Trust California Municipal High Income ETF (FCAL)
Portfolio of Investments (Continued)
July 31, 2023
| (b) | This security, sold within the terms of a private placement memorandum, is exempt from registration upon resale under Rule 144A of the Securities Act of 1933, as amended (the “1933 Act”), and may be resold in transactions exempt from registration, normally to qualified institutional buyers. Pursuant to procedures adopted by the Trust’s Board of Trustees, this security has been determined to be liquid by First Trust Advisors L.P. (the “Advisor”). Although market instability can result in periods of increased overall market illiquidity, liquidity for each security is determined based on security specific factors and assumptions, which require subjective judgment. At July 31, 2023, securities noted as such amounted to $20,362,838 or 13.6% of net assets. |
| (c) | This security, sold within the terms of a private placement memorandum, is exempt from registration upon resale under Rule 144A of the 1933 Act, and may be resold in transactions exempt from registration, normally to qualified institutional buyers (see Note 2C - Restricted Securities in the Notes to Financial Statements). |
| (d) | Pursuant to procedures adopted by the Trust’s Board of Trustees, this security has been determined to be illiquid by the Advisor. |
| (e) | When-issued security. The interest rate shown reflects the rate in effect at July 31, 2023. Interest will begin accruing on the security’s first settlement date. |
| (f) | Zero coupon bond. |
| Abbreviations throughout the Portfolio of Investments: |
| AGM | Assured Guaranty Municipal Corp. |
| AMBAC | American Municipal Bond Assurance Corp. |
| AMT | Alternative Minimum Tax |
| BAM | Build America Mutual |
| BANS | Bond Anticipation Notes |
| CA MTG INS | California Mortgage Insurance |
| CABS | Capital Appreciation Bonds |
| CONV CABS | Convertible Capital Appreciation Bonds |
| COPS | Certificates of Participation |
| NATL-RE | National Public Finance Guarantee Corp. |
Valuation Inputs
A summary of the inputs used to value the Fund’s investments as of July 31, 2023 is as follows (see Note 2A - Portfolio Valuation in the Notes to Financial Statements):
| | Total
Value at
7/31/2023 | Level 1
Quoted
Prices | Level 2
Significant
Observable
Inputs | Level 3
Significant
Unobservable
Inputs |
Municipal Bonds*
| $ 147,026,408 | $ — | $ 147,026,408 | $ — |
Futures Contracts**
| 39,993 | 39,993 | — | — |
Total
| $ 147,066,401 | $ 39,993 | $ 147,026,408 | $— |
| * | See Portfolio of Investments for state and territory breakout. |
| ** | Includes cumulative appreciation/depreciation on futures contracts as reported in the Futures Contracts table. Only the current day’s variation margin is presented on the Statements of Assets and Liabilities. |
See Notes to Financial Statements
Page 23
First Trust New York Municipal High Income ETF (FMNY)
Portfolio of Investments
July 31, 2023
Principal
Value | | Description | | Stated
Coupon | | Stated
Maturity | | Value |
| MUNICIPAL BONDS – 97.2% |
| | | Florida – 1.9% | | | | | | |
| $250,000 | | Ridge at Apopka CDD Fl Spl Assmnt
| | 5.38% | | 05/01/42 | | $250,085 |
| | | New York – 89.6% | | | | | | |
| 300,000 | | Build NYC Res Corp NY Rev Acad Leadership Chrt Sch Proj
| | 4.00% | | 06/15/31 | | 293,432 |
| 100,000 | | Build NYC Res Corp NY Rev Social Bond E Harlem Scholars Acdmy Chrt Sch Proj (a)
| | 5.75% | | 06/01/42 | | 102,427 |
| 300,000 | | Build NYC Res Corp NY Rev Social Bond Kipp NYC Pub Sch Facs Canal W Proj
| | 5.00% | | 07/01/42 | | 304,971 |
| 300,000 | | Chautauqua Cnty NY Capital Res Corp Exempt Facs Rev Var Ref NRG Energy Proj Remk (Mandatory put 04/03/28)
| | 4.25% | | 04/01/42 | | 298,241 |
| 250,000 | | Dutchess Cnty NY Loc Dev Corp Rev Marist Clg Proj
| | 5.00% | | 07/01/52 | | 260,439 |
| 250,000 | | Elba Twp NY, BANS
| | 5.00% | | 03/14/24 | | 252,177 |
| 250,000 | | Hudson Yards Infra Corp NY 2nd Indenture Rev Ref, Ser A
| | 5.00% | | 02/15/38 | | 261,984 |
| 250,000 | | Irondequoit NY, Ser B, BANS
| | 4.00% | | 12/15/23 | | 250,623 |
| 295,000 | | Livingston Cnty NY Ref
| | 4.00% | | 05/01/33 | | 310,942 |
| 300,000 | | Long Beach NY, Ser B, BAM
| | 5.25% | | 07/15/32 | | 335,163 |
| 350,000 | | Long Island NY Pwr Auth Elec Sys Rev Ref, Ser A
| | 5.00% | | 09/01/35 | | 397,686 |
| 255,000 | | Met Transprtn Auth NY Dedicated Tax Fund Green Bond, Ser B-1
| | 5.00% | | 11/15/36 | | 268,871 |
| 275,000 | | Met Transprtn Auth NY Rev Green Bond Ref, Sec C-1
| | 4.00% | | 11/15/37 | | 272,112 |
| 400,000 | | Nassau Cnty NY Indl Dev Agy Var Ref & Impt Cold Spring (b)
| | 3.65% | | 01/01/34 | | 400,000 |
| 250,000 | | Nassau Cnty NY Loc Econ Asst Corp Edl Rev Roosevelt Children Acdmy Chrt Sch Proj, Ser A
| | 5.00% | | 07/01/43 | | 256,026 |
| 305,000 | | Nassau Cnty NY, Ser A, AGM
| | 5.00% | | 04/01/29 | | 344,155 |
| 300,000 | | New York City NY Hsg Dev Corp Mf Hsg Rev Sustainable Dev Bonds, Ser F-2A (Mandatory put 12/22/26)
| | 3.40% | | 11/01/62 | | 295,233 |
| 125,000 | | New York City NY Muni Wtr Fin Auth Wtr & Swr Sys Rev Adj 2nd Gen Resolution Fiscal 2014, Ser AA-6 (b)
| | 0.33% | | 06/15/48 | | 125,000 |
| 250,000 | | New York City NY Muni Wtr Fin Auth Wtr & Swr Sys Rev Ref 2nd Gen Resolution, Ser EE
| | 5.00% | | 06/15/41 | | 274,119 |
| 250,000 | | New York City NY Transitional Fin Auth Rev Multi Modal Bonds Subord, Ser B-1
| | 5.00% | | 08/01/34 | | 273,919 |
| 250,000 | | New York St Dorm Auth Revs Non St Supported Debt Memorial Sloan Kettering Cancer Ctr, Ser 1
| | 5.00% | | 07/01/39 | | 268,535 |
| 325,000 | | New York St Dorm Auth Revs Non St Supported Debt Ref-Northwell Hlth Oblig Grp, Ser A
| | 5.00% | | 05/01/38 | | 352,636 |
| 250,000 | | New York St Dorm Auth Revs Non St Supported Debt Sch Dists Rev Bond Fing Prog, Ser A, BAM
| | 5.00% | | 10/01/29 | | 282,033 |
| 285,000 | | New York St Dorm Auth Revs Non St Supported Debt, Ser A
| | 5.00% | | 07/01/40 | | 304,348 |
| 250,000 | | NY NY Fiscal 2020, Ser B-1
| | 5.00% | | 10/01/32 | | 280,055 |
| 280,000 | | NY St Dorm Auth Revs Non St Supported Debt Ref New Sch, Ser A
| | 5.00% | | 07/01/31 | | 316,018 |
| 250,000 | | NY St Energy, Ser C
| | 4.00% | | 04/01/34 | | 253,606 |
| 290,000 | | NY St Envrnmntl Facs Corp St Clean Wtr & Drinking Wtr Ref Subord, Ser B
| | 5.00% | | 06/15/44 | | 312,891 |
| 250,000 | | NY St Thruway Auth Gen Rev Jr Indebtedness Obl Subord, Ser B
| | 4.00% | | 01/01/45 | | 242,718 |
| 360,000 | | NY St Transprtn Dev Corp Spl Fac Rev Delta Air Lines Inc LaGuardia Arpt Terminals C&D Redev, AMT
| | 4.00% | | 10/01/30 | | 358,721 |
| 250,000 | | NY St Transprtn Dev Corp Spl Fac Rev Ref American Airls Inc John F Kennedy Intl Arpt Proj, AMT
| | 5.00% | | 08/01/31 | | 250,272 |
| 435,000 | | NY St Transprtn Dev Corp Spl Rev Terminal 4 JFK Intl Arpt Proj, AMT
| | 5.00% | | 12/01/30 | | 469,425 |
| 250,000 | | NY St Urban Dev Corp Rev Personal Income Tax, Ser A
| | 5.00% | | 03/15/35 | | 283,319 |
| 250,000 | | Oyster Bay NY, Ser A, AGM
| | 2.00% | | 03/01/35 | | 211,271 |
| 250,000 | | Port Auth Of NY & NJ NY Ref Two Hundred Ninth Ser
| | 5.00% | | 07/15/32 | | 277,145 |
| 270,000 | | Rockland Cnty NY Sol Wst Mgmt Auth Green Bond, Ser A, AMT
| | 5.00% | | 12/15/28 | | 292,433 |
Page 24
See Notes to Financial Statements
First Trust New York Municipal High Income ETF (FMNY)
Portfolio of Investments (Continued)
July 31, 2023
Principal
Value | | Description | | Stated
Coupon | | Stated
Maturity | | Value |
| MUNICIPAL BONDS (Continued) |
| | | New York (Continued) | | | | | | |
| $290,000 | | Southampton Vlg NY Ambulance Bldg
| | 2.13% | | 03/01/29 | | $266,344 |
| 250,000 | | Syracuse Regl Arpt Auth NY Sr Arpt Rev Ref, AMT
| | 4.00% | | 07/01/36 | | 239,316 |
| 250,000 | | Triborough NY Bridge & Tunnel Auth Revs Ref, Ser B
| | 5.00% | | 11/15/38 | | 264,311 |
| 250,000 | | Westchester Cnty NY Green Bond, Ser B
| | 4.00% | | 12/15/34 | | 272,576 |
| 250,000 | | Westchester NY Tobacco Asset Securitization Ref Sr, Ser B
| | 5.00% | | 06/01/41 | | 255,636 |
| 250,000 | | Yonkers NY, Ser F, BAM
| | 5.00% | | 11/15/41 | | 276,325 |
| | | | | 11,907,454 |
| | | Puerto Rico – 5.7% | | | | | | |
| 400,000 | | Puerto Rico Cmwlth Restructured, Ser A1
| | 4.00% | | 07/01/33 | | 380,439 |
| 400,000 | | Puerto Rico Sales Tax Fing Corp Sales Tax Rev Restructured, Ser A-2
| | 4.33% | | 07/01/40 | | 377,534 |
| | | | | 757,973 |
| Total Investments – 97.2%
| | 12,915,512 |
| | (Cost $12,844,418) | | |
| | Net Other Assets and Liabilities – 2.8%
| | 367,606 |
| | Net Assets – 100.0%
| | $13,283,118 |
Futures Contracts (See Note 2D - Futures Contracts in the Notes to Financial Statements):
| Futures Contracts | | Position | | Number of
Contracts | | Expiration
Date | | Notional
Value | | Unrealized
Appreciation
(Depreciation)/
Value |
| 10-Year U.S. Treasury Notes | | Short | | 1 | | Sep 2023 | | $ (111,406) | | $(953) |
| Ultra 10-Year U.S. Treasury Notes | | Short | | 2 | | Sep 2023 | | (233,969) | | 141 |
| | | | | | | | | $(345,375) | | $(812) |
| (a) | This security, sold within the terms of a private placement memorandum, is exempt from registration upon resale under Rule 144A of the Securities Act of 1933, as amended, and may be resold in transactions exempt from registration, normally to qualified institutional buyers. Pursuant to procedures adopted by the Trust’s Board of Trustees, this security has been determined to be liquid by First Trust Advisors L.P. (the “Advisor”). Although market instability can result in periods of increased overall market illiquidity, liquidity for each security is determined based on security specific factors and assumptions, which require subjective judgment. At July 31, 2023, securities noted as such amounted to $102,427 or 0.8% of net assets. |
| (b) | Variable Rate Demand bond. Interest rate is reset periodically by the agent based on current market conditions. |
| Abbreviations throughout the Portfolio of Investments: |
| AGM | Assured Guaranty Municipal Corp. |
| AMT | Alternative Minimum Tax |
| BAM | Build America Mutual |
| BANS | Bond Anticipation Notes |
See Notes to Financial Statements
Page 25
First Trust New York Municipal High Income ETF (FMNY)
Portfolio of Investments (Continued)
July 31, 2023
Valuation Inputs
A summary of the inputs used to value the Fund’s investments as of July 31, 2023 is as follows (see Note 2A - Portfolio Valuation in the Notes to Financial Statements):
| ASSETS TABLE |
| | Total
Value at
7/31/2023 | Level 1
Quoted
Prices | Level 2
Significant
Observable
Inputs | Level 3
Significant
Unobservable
Inputs |
Municipal Bonds*
| $ 12,915,512 | $ — | $ 12,915,512 | $ — |
Futures Contract**
| 141 | 141 | — | — |
Total
| $ 12,915,653 | $ 141 | $ 12,915,512 | $— |
| |
| LIABILITIES TABLE |
| | Total
Value at
7/31/2023 | Level 1
Quoted
Prices | Level 2
Significant
Observable
Inputs | Level 3
Significant
Unobservable
Inputs |
Futures Contract**
| $ (953) | $ (953) | $ — | $ — |
| * | See Portfolio of Investments for state and territory breakout. |
| ** | Includes cumulative appreciation/depreciation on futures contracts as reported in the Futures Contracts table. Only the current day’s variation margin is presented on the Statements of Assets and Liabilities. |
Page 26
See Notes to Financial Statements
First Trust Exchange-Traded Fund III
Statements of Assets and Liabilities
July 31, 2023
| | First Trust
California
Municipal
High Income
ETF
(FCAL) | | First Trust
New York
Municipal
High Income
ETF
(FMNY) |
| ASSETS: | | | |
Investments, at value
| $ 147,026,408 | | $ 12,915,512 |
Cash
| 4,230,352 | | 234,238 |
Cash segregated as collateral for open futures contracts
| 156,000 | | 7,600 |
| Receivables: | | | |
Interest receivable
| 1,457,799 | | 131,545 |
Investment securities sold
| — | | 247,572 |
Total Assets
| 152,870,559 | | 13,536,467 |
| LIABILITIES: | | | |
| Payables: | | | |
Investment securities purchased
| 3,566,250 | | 247,448 |
Investment advisory fees
| 81,118 | | 5,651 |
Variation margin
| 5,063 | | 250 |
Total Liabilities
| 3,652,431 | | 253,349 |
NET ASSETS
| $149,218,128 | | $13,283,118 |
| NET ASSETS consist of: | | | |
Paid-in capital
| $ 159,878,386 | | $ 14,682,490 |
Par value
| 30,500 | | 5,000 |
Accumulated distributable earnings (loss)
| (10,690,758) | | (1,404,372) |
NET ASSETS
| $149,218,128 | | $13,283,118 |
NET ASSET VALUE, per share
| $48.92 | | $26.57 |
Number of shares outstanding (unlimited number of shares authorized, par value $0.01 per share)
| 3,050,002 | | 500,002 |
Investments, at cost
| $148,367,733 | | $12,844,418 |
See Notes to Financial Statements
Page 27
First Trust Exchange-Traded Fund III
Statements of Operations
For the Year Ended July 31, 2023
| | First Trust
California
Municipal
High Income
ETF
(FCAL) | | First Trust
New York
Municipal
High Income
ETF
(FMNY) |
| INVESTMENT INCOME: | | | |
Interest
| $ 3,928,232 | | $ 463,496 |
Other
| 12,000 | | — |
Total investment income
| 3,940,232 | | 463,496 |
| EXPENSES: | | | |
Investment advisory fees
| 773,003 | | 80,469 |
Total expenses
| 773,003 | | 80,469 |
Fees waived by the investment advisor
| (57,858) | | (18,570) |
Net expenses
| 715,145 | | 61,899 |
NET INVESTMENT INCOME (LOSS)
| 3,225,087 | | 401,597 |
| NET REALIZED AND UNREALIZED GAIN (LOSS): | | | |
| Net realized gain (loss) on: | | | |
Investments
| (6,026,852) | | (294,528) |
Futures contracts
| 444,115 | | 21,657 |
Net realized gain (loss)
| (5,582,737) | | (272,871) |
| Net change in unrealized appreciation (depreciation) on: | | | |
Investments
| 2,351,998 | | 74,120 |
Futures contracts
| 252,415 | | 9,399 |
Net change in unrealized appreciation (depreciation)
| 2,604,413 | | 83,519 |
NET REALIZED AND UNREALIZED GAIN (LOSS)
| (2,978,324) | | (189,352) |
NET INCREASE (DECREASE) IN NET ASSETS RESULTING FROM OPERATIONS
| $ 246,763 | | $ 212,245 |
Page 28
See Notes to Financial Statements
First Trust Exchange-Traded Fund III
Statements of Changes in Net Assets
| | First Trust
California Municipal
High Income
ETF (FCAL) | | First Trust
New York
Municipal High
Income
ETF (FMNY) |
| | Year
Ended
7/31/2023 | | Year
Ended
7/31/2022 | | Year
Ended
7/31/2023 | | Year
Ended
7/31/2022 |
| OPERATIONS: | | | | | | | |
Net investment income (loss)
| $ 3,225,087 | | $ 2,451,597 | | $ 401,597 | | $ 283,942 |
Net realized gain (loss)
| (5,582,737) | | (2,312,252) | | (272,871) | | (1,342,835) |
Net change in unrealized appreciation (depreciation)
| 2,604,413 | | (10,447,640) | | 83,519 | | (217,582) |
Net increase (decrease) in net assets resulting from operations
| 246,763 | | (10,308,295) | | 212,245 | | (1,276,475) |
| DISTRIBUTIONS TO SHAREHOLDERS FROM: | | | | | | | |
Investment operations
| (3,179,922) | | (2,432,622) | | (388,501) | | (202,851) |
Return of capital
| (39,081) | | (15,880) | | — | | — |
Total distributions to shareholders
| (3,219,003) | | (2,448,502) | | (388,501) | | (202,851) |
| SHAREHOLDER TRANSACTIONS: | | | | | | | |
Proceeds from shares sold
| 53,936,928 | | 41,720,854 | | 5,282,016 | | 2,621,647 |
Cost of shares redeemed
| (23,524,755) | | (12,384,469) | | (2,670,964) | | (5,549,769) |
Net increase (decrease) in net assets resulting from shareholder transactions
| 30,412,173 | | 29,336,385 | | 2,611,052 | | (2,928,122) |
Total increase (decrease) in net assets
| 27,439,933 | | 16,579,588 | | 2,434,796 | | (4,407,448) |
| NET ASSETS: | | | | | | | |
Beginning of period
| 121,778,195 | | 105,198,607 | | 10,848,322 | | 15,255,770 |
End of period
| $ 149,218,128 | | $ 121,778,195 | | $ 13,283,118 | | $ 10,848,322 |
| CHANGES IN SHARES OUTSTANDING: | | | | | | | |
Shares outstanding, beginning of period
| 2,450,002 | | 1,900,002 | | 400,002 | | 500,002 |
Shares sold
| 1,100,000 | | 800,000 | | 200,000 | | 100,000 |
Shares redeemed
| (500,000) | | (250,000) | | (100,000) | | (200,000) |
Shares outstanding, end of period
| 3,050,002 | | 2,450,002 | | 500,002 | | 400,002 |
See Notes to Financial Statements
Page 29
First Trust Exchange-Traded Fund III
Financial Highlights
For a share outstanding throughout each period
First Trust California Municipal High Income ETF (FCAL)
| | Year Ended July 31, |
| 2023 | | 2022 | | 2021 | | 2020 | | 2019 |
Net asset value, beginning of period
| $ 49.71 | | $ 55.37 | | $ 53.16 | | $ 52.70 | | $ 50.11 |
| Income from investment operations: | | | | | | | | | |
Net investment income (loss)
| 1.32 (a) | | 1.08 | | 1.16 | | 1.17 | | 1.49 |
Net realized and unrealized gain (loss)
| (0.81) | | (5.65) | | 2.19 (b) | | 0.51 | | 2.60 |
Total from investment operations
| 0.51 | | (4.57) | | 3.35 | | 1.68 | | 4.09 |
| Distributions paid to shareholders from: | | | | | | | | | |
Net investment income
| (1.29) | | (1.08) | | (1.14) | | (1.17) | | (1.50) |
Return of capital
| (0.01) | | (0.01) | | — | | (0.05) | | — |
Total distributions
| (1.30) | | (1.09) | | (1.14) | | (1.22) | | (1.50) |
Net asset value, end of period
| $48.92 | | $49.71 | | $55.37 | | $53.16 | | $52.70 |
Total return (c)
| 1.08% | | (8.33)% | | 6.37% (b) | | 3.23% | | 8.32% |
| Ratios to average net assets/supplemental data: | | | | | | | | | |
Net assets, end of period (in 000’s)
| $ 149,218 | | $ 121,778 | | $ 105,199 | | $ 87,706 | | $ 34,257 |
Ratio of total expenses to average net assets
| 0.65% | | 0.65% | | 0.65% | | 0.65% | | 0.65% |
Ratio of net expenses to average net assets
| 0.60% | | 0.50% | | 0.50% | | 0.50% | | 0.50% |
Ratio of net investment income (loss) to average net assets
| 2.71% | | 2.09% | | 2.16% | | 2.28% | | 3.01% |
Portfolio turnover rate (d)
| 54% | | 30% | | 25% | | 81% | | 69% |
| (a) | Based on average shares outstanding. |
| (b) | The Fund received a reimbursement from the advisor in the amount of $219, which represents less than $0.01 per share. Since the advisor reimbursed the Fund, there was no effect on the Fund’s total return. |
| (c) | Total return is calculated assuming an initial investment made at the net asset value at the beginning of the period, reinvestment of all distributions at net asset value during the period, and redemption at net asset value on the last day of the period. The returns presented do not reflect the deduction of taxes that a shareholder would pay on Fund distributions or the redemption or sale of Fund shares. Total return is calculated for the time period presented and is not annualized for periods of less than a year. The total return would have been lower if certain fees had not been waived by the investment advisor. |
| (d) | Portfolio turnover is calculated for the time period presented and is not annualized for periods of less than a year and does not include securities received or delivered from processing creations or redemptions and in-kind transactions. |
Page 30
See Notes to Financial Statements
First Trust Exchange-Traded Fund III
Financial Highlights (Continued)
For a share outstanding throughout each period
First Trust New York Municipal High Income ETF (FMNY)
| | Year Ended | | Period
Ended
7/31/2021 (a) |
| 7/31/2023 | | 7/31/2022 | |
Net asset value, beginning of period
| $ 27.12 | | $ 30.51 | | $ 30.00 |
| Income from investment operations: | | | | | |
Net investment income (loss)
| 0.86 (b) | | 0.68 | | 0.09 |
Net realized and unrealized gain (loss)
| (0.59) | | (3.61) | | 0.48 |
Total from investment operations
| 0.27 | | (2.93) | | 0.57 |
| Distributions paid to shareholders from: | | | | | |
Net investment income
| (0.82) | | (0.46) | | (0.04) |
Net realized gain
| — | | — | | (0.02) |
Total distributions
| (0.82) | | (0.46) | | (0.06) |
Net asset value, end of period
| $26.57 | | $27.12 | | $30.51 |
Total return (c)
| 1.06% | | (9.66)% | | 1.90% |
| Ratios to average net assets/supplemental data: | | | | | |
Net assets, end of period (in 000’s)
| $ 13,283 | | $ 10,848 | | $ 15,256 |
Ratio of total expenses to average net assets
| 0.65% | | 0.65% | | 0.65% (d) |
Ratio of net expenses to average net assets
| 0.50% | | 0.50% | | 0.50% (d) |
Ratio of net investment income (loss) to average net assets
| 3.24% | | 2.18% | | 1.41% (d) |
Portfolio turnover rate (e)
| 41% | | 154% | | 16% |
| (a) | Inception date is May 12, 2021, which is consistent with the commencement of investment operations and is the date the initial creation units were established. |
| (b) | Based on average shares outstanding. |
| (c) | Total return is calculated assuming an initial investment made at the net asset value at the beginning of the period, reinvestment of all distributions at net asset value during the period, and redemption at net asset value on the last day of the period. The returns presented do not reflect the deduction of taxes that a shareholder would pay on Fund distributions or the redemption or sale of Fund shares. Total return is calculated for the time period presented and is not annualized for periods of less than a year. The total return would have been lower if certain fees had not been waived by the investment advisor. |
| (d) | Annualized. |
| (e) | Portfolio turnover is calculated for the time period presented and is not annualized for periods of less than a year and does not include securities received or delivered from processing creations or redemptions and in-kind transactions. |
See Notes to Financial Statements
Page 31
Notes to Financial Statements
First Trust Exchange-Traded Fund III
July 31, 2023
1. Organization
First Trust Exchange-Traded Fund III (the “Trust”) is an open-end management investment company organized as a Massachusetts business trust on January 9, 2008, and is registered with the Securities and Exchange Commission under the Investment Company Act of 1940, as amended (the “1940 Act”).
The Trust currently consists of seventeen funds that are offering shares. This report covers the following funds, (each a “Fund” and collectively, the “Funds”):
First Trust California Municipal High Income ETF – (The Nasdaq Stock Market LLC ticker “FCAL”)
First Trust New York Municipal High Income ETF – (NYSE Arca, Inc. ticker “FMNY”)
FCAL is a diversified series of the Trust. FMNY is a non-diversified series of the Trust.
Each Fund represents a separate series of shares of beneficial interest in the Trust. Unlike conventional mutual funds, each Fund issues and redeems shares on a continuous basis, at net asset value (“NAV”), only in large blocks of shares known as “Creation Units.”
Each Fund is an actively managed exchange-traded fund. The primary investment objective of each Fund is to seek to provide current income that is exempt from regular federal income taxes and, for FCAL, California income taxes and, for FMNY, New York income taxes. The secondary investment objective of each Fund is long-term capital appreciation. Under normal market conditions, each Fund seeks to achieve its investment objectives by investing at least 80% of its net assets (including investment borrowings) in municipal debt securities that pay interest that is exempt from regular federal income taxes and, for FCAL, California income taxes and, for FMNY, New York State and New York City income taxes. There can be no assurance that a Fund will achieve its investment objectives. The Funds may not be appropriate for all investors.
2. Significant Accounting Policies
The Funds are each considered an investment company and follow accounting and reporting guidance under Financial Accounting Standards Board Accounting Standards Codification Topic 946, “Financial Services-Investment Companies.” The following is a summary of significant accounting policies consistently followed by the Funds in the preparation of the financial statements. The preparation of the financial statements in accordance with accounting principles generally accepted in the United States of America (“U.S. GAAP”) requires management to make estimates and assumptions that affect the reported amounts and disclosures in the financial statements. Actual results could differ from those estimates.
A. Portfolio Valuation
Each Fund’s NAV is determined daily as of the close of regular trading on the New York Stock Exchange (“NYSE”), normally 4:00 p.m. Eastern time, on each day the NYSE is open for trading. If the NYSE closes early on a valuation day, the NAV is determined as of that time. Domestic debt securities are priced using data reflecting the earlier closing of the principal markets for those securities. Each Fund’s NAV is calculated by dividing the value of all assets of each Fund (including accrued interest and dividends), less all liabilities (including accrued expenses and dividends declared but unpaid), by the total number of shares outstanding.
Each Fund’s investments are valued daily at market value or, in the absence of market value with respect to any portfolio securities, at fair value. Market value prices represent readily available market quotations such as last sale or official closing prices from a national or foreign exchange (i.e., a regulated market) and are primarily obtained from third-party pricing services. Fair value prices represent any prices not considered market value prices and are either obtained from a third-party pricing service or are determined by the Pricing Committee of the Funds’ investment advisor, First Trust Advisors L.P. (“First Trust” or the “Advisor”), in accordance with valuation procedures approved by the Trust’s Board of Trustees, and in accordance with provisions of the 1940 Act and rules thereunder. Investments valued by the Advisor’s Pricing Committee, if any, are footnoted as such in the footnotes to the Portfolio of Investments. Each Fund’s investments are valued as follows:
Municipal securities and other debt securities are fair valued on the basis of fair valuations provided by a third-party pricing service approved by the Advisor’s Pricing Committee, which may use the following valuation inputs when available:
| 1) | benchmark yields; |
| 2) | reported trades; |
| 3) | broker/dealer quotes; |
| 4) | issuer spreads; |
| 5) | benchmark securities; |
| 6) | bids and offers; and |
| 7) | reference data including market research publications. |
Notes to Financial Statements (Continued)
First Trust Exchange-Traded Fund III
July 31, 2023
Pricing services generally value fixed-income securities assuming orderly transactions of an institutional round lot size, but a Fund may hold or transact in such securities in smaller, odd lot sizes. Odd lots may trade at lower prices than institutional round lots.
Exchange-traded futures contracts are valued at the end of the day settlement price.
Fixed income and other debt securities having a remaining maturity of sixty days or less when purchased are fair valued at cost adjusted for amortization of premiums and accretion of discounts (amortized cost), provided the Advisor’s Pricing Committee has determined that the use of amortized cost is an appropriate reflection of fair value given market and issuer-specific conditions existing at the time of the determination. Factors that may be considered in determining the appropriateness of the use of amortized cost include, but are not limited to, the following:
| 1) | the credit conditions in the relevant market and changes thereto; |
| 2) | the liquidity conditions in the relevant market and changes thereto; |
| 3) | the interest rate conditions in the relevant market and changes thereto (such as significant changes in interest rates); |
| 4) | issuer-specific conditions (such as significant credit deterioration); and |
| 5) | any other market-based data the Advisor’s Pricing Committee considers relevant. In this regard, the Advisor’s Pricing Committee may use last-obtained market-based data to assist it when valuing portfolio securities using amortized cost. |
Certain securities may not be able to be priced by pre-established pricing methods. Such securities may be valued by the Advisor’s Pricing Committee at fair value. These securities generally include, but are not limited to, restricted securities (securities which may not be publicly sold without registration under the Securities Act of 1933, as amended (the “1933 Act”)) for which a third-party pricing service is unable to provide a market price; securities whose trading has been formally suspended; a security whose market or fair value price is not available from a pre-established pricing source; a security with respect to which an event has occurred that is likely to materially affect the value of the security after the market has closed but before the calculation of a Fund’s NAV or make it difficult or impossible to obtain a reliable market quotation; and a security whose price, as provided by the third-party pricing service, does not reflect the security’s fair value. As a general principle, the current fair value of a security would appear to be the amount which the owner might reasonably expect to receive for the security upon its current sale. When fair value prices are used, generally they will differ from market quotations or official closing prices on the applicable exchanges. A variety of factors may be considered in determining the fair value of such securities, including, but not limited to, the following:
| 1) | the fundamental business data relating to the issuer; |
| 2) | an evaluation of the forces which influence the market in which these securities are purchased and sold; |
| 3) | the type, size and cost of the security; |
| 4) | the financial statements of the issuer; |
| 5) | the credit quality and cash flow of the issuer, based on the Advisor’s or external analysis; |
| 6) | the information as to any transactions in or offers for the security; |
| 7) | the price and extent of public trading in similar securities (or equity securities) of the issuer/borrower, or comparable companies; |
| 8) | the coupon payments; |
| 9) | the quality, value and salability of collateral, if any, securing the security; and |
| 10) | other relevant factors. |
The Funds are subject to fair value accounting standards that define fair value, establish the framework for measuring fair value and provide a three-level hierarchy for fair valuation based upon the inputs to the valuation as of the measurement date. The three levels of the fair value hierarchy are as follows:
| • | Level 1 – Level 1 inputs are quoted prices in active markets for identical investments. An active market is a market in which transactions for the investment occur with sufficient frequency and volume to provide pricing information on an ongoing basis. |
| • | Level 2 – Level 2 inputs are observable inputs, either directly or indirectly, and include the following: |
| o | Quoted prices for similar investments in active markets. |
| o | Quoted prices for identical or similar investments in markets that are non-active. A non-active market is a market where there are few transactions for the investment, the prices are not current, or price quotations vary substantially either over time or among market makers, or in which little information is released publicly. |
Notes to Financial Statements (Continued)
First Trust Exchange-Traded Fund III
July 31, 2023
| o | Inputs other than quoted prices that are observable for the investment (for example, interest rates and yield curves observable at commonly quoted intervals, volatilities, prepayment speeds, loss severities, credit risks, and default rates). |
| o | Inputs that are derived principally from or corroborated by observable market data by correlation or other means. |
| • | Level 3 – Level 3 inputs are unobservable inputs. Unobservable inputs may reflect the reporting entity’s own assumptions about the assumptions that market participants would use in pricing the investment. |
The inputs or methodologies used for valuing investments are not necessarily an indication of the risk associated with investing in those investments. A summary of the inputs used to value each Fund’s investments as of July 31, 2023, is included with each Fund’s Portfolio of Investments.
B. Securities Transactions and Investment Income
Securities transactions are recorded as of the trade date. Realized gains and losses from securities transactions are recorded on the identified cost basis. Interest income is recorded daily on the accrual basis. Amortization of premiums and accretion of discounts are recorded using the effective interest method.
Securities purchased or sold on a when-issued or delayed-delivery basis may have extended settlement periods. The value of the security so purchased is subject to market fluctuations during this period. Each Fund maintains liquid assets with a current value at least equal to the amount of its when-issued or delayed-delivery securities. At July 31, 2023, FCAL held $3,466,676 of when-issued or delayed-delivery securities.
C. Restricted Securities
FCAL invests in restricted securities, which are securities that may not be offered for public sale without first being registered under the 1933 Act. Prior to registration, restricted securities may only be resold in transactions exempt from registration under Rule 144A under the 1933 Act, normally to qualified institutional buyers. As of July 31, 2023, FCAL held restricted securities as shown in the following table that the Advisor has deemed illiquid pursuant to procedures adopted by the Trust’s Board of Trustees. Although market instability can result in periods of increased overall market illiquidity, liquidity for each security is determined based on security-specific factors and assumptions, which require subjective judgment. FCAL does not have the right to demand that such securities be registered. These securities are valued according to the valuation procedures as stated in the Portfolio Valuation note (Note 2A) and are not expressed as a discount to the carrying value of a comparable unrestricted security. There are no unrestricted securities with the same maturity dates and yields for these issuers.
| Security | Acquisition
Date | Principal
Value | Current Price | Carrying
Cost | Value | % of
Net
Assets |
| CA St Muni Fin Auth Chrt Sch Lease Rev Sycamore Acdmy Proj, 5.38%, 07/01/34 | 06/14/18 | $250,000 | $100.26 | $250,759 | $250,639 | 0.17% |
D. Futures Contracts
The Funds may purchase or sell (i.e., are long or short) exchange-listed futures contracts to hedge against changes in interest rates (interest rate risk). Futures contracts are agreements between the Funds and a counterparty to buy or sell a specific quantity of an underlying instrument at a specified price and at a specified date. Depending on the terms of the contract, futures contracts are settled either through physical delivery of the underlying instrument on the settlement date or by payment of a cash settlement amount on the settlement date. Open futures contracts can also be closed out prior to settlement by entering into an offsetting transaction in a matching futures contract. If the Funds are not able to enter into an offsetting transaction, the Funds will continue to be required to maintain margin deposits on the futures contract. When the contract is closed or expires, the Funds record a realized gain or loss equal to the difference between the value of the contract at the time it was opened and the value at the time it was closed or expired. This gain or loss is included in “Net realized gain (loss) on futures contracts” on the Statements of Operations.
Upon entering into a futures contract, the Funds must deposit funds, called margin, with its custodian in the name of the clearing broker equal to a specified percentage of the current value of the contract. Open futures contracts are marked to market daily with the change in value recognized as a component of “Net change in unrealized appreciation (depreciation) on futures contracts” on the Statements of Operations. This daily fluctuation in the value of the contracts is also known as variation margin and is included in “Variation margin” payable or receivable on the Statements of Assets and Liabilities.
Notes to Financial Statements (Continued)
First Trust Exchange-Traded Fund III
July 31, 2023
If market conditions change unexpectedly, the Funds may not achieve the anticipated benefits of the futures contract and may realize a loss. The use of futures contracts involves the risk of imperfect correlation in movements in the price of the futures contracts, interest rates and the underlying instruments.
Restricted cash segregated as collateral for futures contracts in the amounts of $156,000 and $7,600 for FCAL and FMNY, respectively, is shown as “Cash segregated as collateral for open futures contracts” on the Statements of Assets and Liabilities.
E. Dividends and Distributions to Shareholders
Dividends from net investment income, if any, are declared and paid monthly by each Fund, or as the Board of Trustees may determine from time to time. Distributions of net realized capital gains earned by each Fund, if any, are distributed at least annually. The Funds may also designate a portion of the amount paid to redeeming shareholders as a distribution for tax purposes.
Distributions from net investment income and realized capital gains are determined in accordance with federal income tax regulations, which may differ from U.S. GAAP. Certain capital accounts in the financial statements are periodically adjusted for permanent differences in order to reflect their tax character. These permanent differences are primarily due to the varying treatment of income and gain/loss on portfolio securities held by the Funds and have no impact on net assets or NAV per share. Temporary differences, which arise from recognizing certain items of income, expense and gain/loss in different periods for financial statement and tax purposes, will reverse at some time in the future.
The tax character of distributions paid by each Fund during the fiscal year ended July 31, 2023, was as follows:
| | Distributions
paid from
Ordinary
Income | | Distributions
paid from
Capital
Gains | | Distributions
paid from
Tax-exempt
Income | | Distributions
paid from
Return of
Capital |
First Trust California Municipal High Income ETF
| $ 36,889 | | $ — | | $ 3,143,033 | | $ 39,081 |
First Trust New York Municipal High Income ETF
| — | | — | | 388,501 | | — |
The tax character of distributions paid by each Fund during the fiscal year ended July 31, 2022, was as follows:
| | Distributions
paid from
Ordinary
Income | | Distributions
paid from
Capital
Gains | | Distributions
paid from
Tax-exempt
Income | | Distributions
paid from
Return of
Capital |
First Trust California Municipal High Income ETF
| $ 19,131 | | $ — | | $ 2,413,491 | | $ 15,880 |
First Trust New York Municipal High Income ETF
| — | | — | | 202,851 | | — |
As of July 31, 2023, the components of distributable earnings on a tax basis for each Fund were as follows:
| | Undistributed
Ordinary
Income | | Accumulated
Capital and
Other
Gain (Loss) | | Net
Unrealized
Appreciation
(Depreciation) |
First Trust California Municipal High Income ETF
| $ — | | $ (9,504,429) | | $ (1,186,329) |
First Trust New York Municipal High Income ETF
| 101,310 | | (1,585,064) | | 79,382 |
F. Income Taxes
Each Fund intends to continue to qualify as a regulated investment company by complying with the requirements under Subchapter M of the Internal Revenue Code of 1986, as amended (the “Code”), which includes distributing substantially all of its net investment income and net realized gains to shareholders. Accordingly, no provision has been made for federal and state income taxes. However, due to the timing and amount of distributions, each Fund may be subject to an excise tax of 4% of the amount by which approximately 98% of each Fund’s taxable income exceeds the distributions from such taxable income for the calendar year.
In addition, each Fund intends to invest in municipal securities to allow it to pay shareholders “exempt dividends” as defined in the Code.
Notes to Financial Statements (Continued)
First Trust Exchange-Traded Fund III
July 31, 2023
The Funds are subject to accounting standards that establish a minimum threshold for recognizing, and a system for measuring, the benefits of a tax position taken or expected to be taken in a tax return. For FCAL, taxable years ended 2020, 2021, 2022, and 2023 remain open to federal and state audit. For FMNY, the taxable period ended 2021 and the taxable years ended 2022 and 2023 remain open to federal and state audit. As of July 31, 2023, management has evaluated the application of these standards to the Funds and has determined that no provision for income tax is required in the Funds’ financial statements for uncertain tax positions.
The Funds intend to utilize provisions of the federal income tax laws, which allow them to carry a realized capital loss forward indefinitely following the year of the loss and offset such loss against any future realized capital gains. The Funds are subject to certain limitations under U.S. tax rules on the use of capital loss carryforwards and net unrealized built-in losses. These limitations apply when there has been a 50% change in ownership. At July 31, 2023, for federal income tax purposes, each applicable Fund had a capital loss carryforward available that is shown in the following table, to the extent provided by regulations, to offset future capital gains.
| | Non-Expiring
Capital Loss
Carryforward |
First Trust California Municipal High Income ETF
| $ 9,504,429 |
First Trust New York Municipal High Income ETF
| 1,585,064 |
Certain losses realized during the current fiscal year may be deferred and treated as occurring on the first day of the following fiscal year for federal income tax purposes. For the fiscal year ended July 31, 2023, the Funds did not incur any net late year ordinary losses.
In order to present paid-in capital and accumulated distributable earnings (loss) (which consists of accumulated net investment income (loss), accumulated net realized gain (loss) on investments and net unrealized appreciation (depreciation) on investments) on the Statements of Assets and Liabilities that more closely represent their tax character, certain adjustments have been made to paid-in capital, accumulated net investment income (loss) and accumulated net realized gain (loss) on investments. These adjustments are primarily due to the difference between book and tax treatments of income and gains on various investment securities held by the Funds. The results of operations and net assets were not affected by these adjustments. For the fiscal year ended July 31, 2023, the adjustments for each Fund were as follows:
| | Accumulated
Net
Investment
Income (Loss) | | Accumulated
Net Realized
Gain (Loss)
on Investments | | Paid-in
Capital |
First Trust California Municipal High Income ETF
| $ (15,091) | | $ 15,091 | | $ — |
First Trust New York Municipal High Income ETF
| (9,345) | | 9,345 | | — |
As of July 31, 2023, the aggregate cost, gross unrealized appreciation, gross unrealized depreciation, and net unrealized appreciation/(depreciation) on investments (including short positions and derivatives, if any) for federal income tax purposes were as follows:
| | Tax Cost | | Gross
Unrealized
Appreciation | | Gross
Unrealized
(Depreciation) | | Net Unrealized
Appreciation
(Depreciation) |
First Trust California Municipal High Income ETF
| $ 148,252,730 | | $ 1,636,953 | | $ (2,823,282) | | $ (1,186,329) |
First Trust New York Municipal High Income ETF
| 12,835,318 | | 179,022 | | (99,640) | | 79,382 |
G. Expenses
Expenses, other than the investment advisory fee and other excluded expenses, are paid by the Advisor (See Note 3).
3. Investment Advisory Fee, Affiliated Transactions and Other Fee Arrangements
First Trust, the investment advisor to the Funds, is a limited partnership with one limited partner, Grace Partners of DuPage L.P., and one general partner, The Charger Corporation. The Charger Corporation is an Illinois corporation controlled by James A. Bowen, Chief Executive Officer of First Trust. First Trust is responsible for the selection and ongoing monitoring of the securities in each Fund’s portfolio, managing the Funds’ business affairs and providing certain administrative services necessary for the management of the Funds.
Notes to Financial Statements (Continued)
First Trust Exchange-Traded Fund III
July 31, 2023
Pursuant to the Investment Management Agreements between the Trust and the Advisor, First Trust manages the investment of the Funds’ assets and is responsible for the Funds’ expenses, including the cost of transfer agency, custody, fund administration, legal, audit and other services, but excluding fee payments under the Investment Management Agreements, interest, taxes, acquired fund fees and expenses, if any, brokerage commissions and other expenses connected with the execution of portfolio transactions, distribution and service fees pursuant to a Rule 12b-1 plan, if any, and extraordinary expenses. First Trust also provides fund reporting services to each Fund for a flat annual fee in the amount of $9,250, which is covered under the annual unitary management fee. Effective November 1, 2022, the annual unitary management fee payable by each Fund to First Trust for these services will be reduced at certain levels of each Fund’s net assets (“breakpoints”) and calculated pursuant to the following schedule, provided that FMNY is not eligible for any breakpoints until the termination of the Fee Waiver Agreement discussed below.
| Breakpoints | | | | | | | |
| Fund net assets up to and including $2.5 billion | 0.65000% | | | | | | |
| Fund net assets greater than $2.5 billion up to and including $5 billion | 0.63375% | | | | | | |
| Fund net assets greater than $5 billion up to and including $7.5 billion | 0.61750% | | | | | | |
| Fund net assets greater than $7.5 billion up to and including $10 billion | 0.60125% | | | | | | |
| Fund net assets greater than $10 billion | 0.58500% | | | | | | |
Prior to November 1, 2022, First Trust was paid an annual unitary management fee equal to 0.65% of each Fund’s average daily net assets.
The Trust’s Board of Trustees and the Advisor have entered into Fee Waiver Agreements for the Funds pursuant to which the Advisor contractually agreed to waive management fees of 0.15% of average daily net assets until November 30, 2022 and May 11, 2024, for FCAL and FMNY, respectively. As of November 30, 2022, the Fee Waiver Agreement for FCAL terminated. The Fee Waiver Agreement for FMNY may be terminated by action of the Trust’s Board of Trustees at any time upon 60 days’ written notice by the Trust on behalf of FMNY or by the Advisor only after May 11, 2024. First Trust does not have the right to recover the fees waived under the Fee Waiver Agreements. During the fiscal year ended July 31, 2023, the Advisor waived fees of $57,858 and $18,570 for FCAL and FMNY, respectively.
The Trust has multiple service agreements with Brown Brothers Harriman & Co. (“BBH”). Under the service agreements, BBH performs custodial, fund accounting, certain administrative services, and transfer agency services for the Funds. As custodian, BBH is responsible for custody of the Funds’ assets. As fund accountant and administrator, BBH is responsible for maintaining the books and records of the Funds’ securities and cash. As transfer agent, BBH is responsible for maintaining shareholder records for the Funds.
Each Trustee who is not an officer or employee of First Trust, any sub-advisor or any of their affiliates (“Independent Trustees”) is paid a fixed annual retainer that is allocated equally among each fund in the First Trust Fund Complex. Each Independent Trustee is also paid an annual per fund fee that varies based on whether the fund is a closed-end or other actively managed fund, a target outcome fund or an index fund.
Additionally, the Lead Independent Trustee and the Chairs of the Audit Committee, Nominating and Governance Committee and Valuation Committee are paid annual fees to serve in such capacities, with such compensation allocated pro rata among each fund in the First Trust Fund Complex based on net assets. Independent Trustees are reimbursed for travel and out-of-pocket expenses in connection with all meetings. The Lead Independent Trustee and Committee Chairs rotate every three years. The officers and “Interested” Trustee receive no compensation from the Trust for acting in such capacities.
4. Purchases and Sales of Securities
For the fiscal year ended July 31, 2023, the cost of purchases and proceeds from sales of investment securities for each Fund, excluding short-term investments and in-kind transactions, were as follows:
| | Purchases | | Sales |
| First Trust California Municipal High Income ETF | $ 92,290,674 | | $ 62,086,505 |
| First Trust New York Municipal High Income ETF | 6,896,842 | | 4,811,811 |
| | | | |
For the fiscal year ended July 31, 2023, the Funds had no in-kind transactions.
Notes to Financial Statements (Continued)
First Trust Exchange-Traded Fund III
July 31, 2023
5. Derivative Transactions
The following tables present the type of derivatives held by each Fund at July 31, 2023, the primary underlying risk exposure and the location of these instruments as presented on the Statements of Assets and Liabilities.
FCAL
| | | | | Asset Derivatives | | Liability Derivatives |
Derivative
Instrument | | Risk
Exposure | | Statements of Assets and
Liabilities Location | | Value | | Statements of Assets and
Liabilities Location | | Value |
| Futures contracts | | Interest Rate Risk | | Unrealized appreciation
on futures contracts* | | $ 39,993 | | Unrealized depreciation
on futures contracts* | | $ — |
FMNY
| | | | | Asset Derivatives | | Liability Derivatives |
Derivative
Instrument | | Risk
Exposure | | Statements of Assets and
Liabilities Location | | Value | | Statements of Assets and
Liabilities Location | | Value |
| Futures contracts | | Interest Rate Risk | | Unrealized appreciation
on futures contracts* | | $ 141 | | Unrealized depreciation
on futures contracts* | | $ 953 |
*Includes cumulative appreciation/depreciation on futures contracts as reported in each Fund’s Portfolio of Investments. Only the current day’s variation margin is presented on the Statements of Assets and Liabilities.
The following table presents the amount of net realized gain (loss) and change in net unrealized appreciation (depreciation) recognized for the fiscal year ended July 31, 2023, on derivative instruments, as well as the primary underlying risk exposure associated with each instrument.
| | Interest Rate Risk |
| Statements of Operations Location | FCAL | FMNY |
| Net realized gain (loss) on futures contracts | $444,115 | $21,657 |
| Net change in unrealized appreciation (depreciation) on futures contracts | 252,415 | 9,399 |
During the fiscal year ended July 31, 2023, for FCAL, the notional value of futures contracts opened and closed were $68,317,116 and $66,946,545, respectively.
During the fiscal year ended July 31, 2023, for FMNY, the notional value of futures contracts opened and closed were $4,256,003 and $4,307,729, respectively.
The Funds do not have the right to offset financial assets and liabilities related to futures contracts on the Statements of Assets and Liabilities.
6. Creations, Redemptions and Transaction Fees
Each Fund generally issues and redeems its shares in primary market transactions through a creation and redemption mechanism and does not sell or redeem individual shares. Instead, financial entities known as “Authorized Participants” have contractual arrangements with a Fund or one of the Fund’s service providers to purchase and redeem Fund shares directly with the Fund in large blocks of shares known as “Creation Units.” Prior to the start of trading on every business day, a Fund publishes through the National Securities Clearing Corporation (“NSCC”) the “basket” of securities, cash or other assets that it will accept in exchange for a Creation Unit of the Fund’s shares. An Authorized Participant that wishes to effectuate a creation of a Fund’s shares deposits with the Fund the “basket” of securities, cash or other assets identified by the Fund that day, and then receives the Creation Unit of the Fund’s shares in return for those assets. After purchasing a Creation Unit, the Authorized Participant may continue to hold the Fund’s shares or sell them in the secondary market. The redemption process is the reverse of the purchase process: the Authorized Participant redeems a Creation Unit of a Fund’s shares for a basket of securities, cash or other assets. The combination of the creation and redemption process with secondary market trading in a Fund’s shares and underlying securities provides arbitrage opportunities that are designed to help keep the market price of a Fund’s shares at or close to the NAV per share of the Fund.
Notes to Financial Statements (Continued)
First Trust Exchange-Traded Fund III
July 31, 2023
Each Fund imposes fees in connection with the purchase of Creation Units. These fees may vary based upon various fact-based circumstances, including, but not limited to, the composition of the securities included in the Creation Unit or the countries in which the transactions are settled. The price for each Creation Unit will equal the daily NAV per share of a Fund times the number of shares in a Creation Unit, plus the fees described above and, if applicable, any operational processing and brokerage costs, transfer fees, stamp taxes and part or all of the spread between the expected bid and offer side of the market related to the securities comprising the creation basket.
Each Fund also imposes fees in connection with the redemption of Creation Units. These fees may vary based upon various fact-based circumstances, including, but not limited to, the composition of the securities included in the Creation Unit or the countries in which the transactions are settled. The price received for each Creation Unit will equal the daily NAV per share of a Fund times the number of shares in a Creation Unit, minus the fees described above and, if applicable, any operational processing and brokerage costs, transfer fees, stamp taxes and part or all of the spread between the expected bid and offer side of the market related to the securities comprising the redemption basket. Investors who use the services of a broker or other such intermediary in addition to an Authorized Participant to effect a redemption of a Creation Unit may also be assessed an amount to cover the cost of such services. The redemption fee charged by a Fund will comply with Rule 22c-2 of the 1940 Act which limits redemption fees to no more than 2% of the value of the shares redeemed.
7. Distribution Plan
The Board of Trustees adopted a Distribution and Service Plan pursuant to Rule 12b-1 under the 1940 Act. In accordance with the Rule 12b-1 plan, each Fund is authorized to pay an amount up to 0.25% of its average daily net assets each year to reimburse First Trust Portfolios L.P. (“FTP”), the distributor of the Funds, for amounts expended to finance activities primarily intended to result in the sale of Creation Units or to provide investor services. FTP may also use this amount to compensate securities dealers or other persons that are Authorized Participants for providing distribution assistance, including broker-dealer and shareholder support and educational and promotional services.
No 12b-1 fees are currently paid by the Funds, and pursuant to a contractual arrangement, no 12b-1 fees will be paid any time before November 30, 2024.
8. Borrowings
The Trust, on behalf of FCAL, along with First Trust Series Fund and First Trust Exchange-Traded Fund IV have a $550 million Credit Agreement with The Bank of Nova Scotia (“Scotia”) as administrative agent for a group of lenders. Between October 30, 2022 and March 1, 2023, the commitment amount was $305 million, and prior to October 30, 2022, the commitment amount was $280 million. Scotia charges a commitment fee of 0.25% of the daily amount of the excess of the commitment amount over the outstanding principal balance of the loans and an agency fee. First Trust allocates the commitment fee and agency fee amongst the funds that have access to the credit line. To the extent that the Fund accesses the credit line, there would also be an interest fee charged. The Fund did not have any borrowings outstanding during the fiscal year ended July 31, 2023.
9. Indemnification
The Trust, on behalf of the Funds, has a variety of indemnification obligations under contracts with its service providers. The Trust’s maximum exposure under these arrangements is unknown. However, the Trust has not had prior claims or losses pursuant to these contracts and expects the risk of loss to be remote.
10. Subsequent Events
Management has evaluated the impact of all subsequent events to the Funds through the date the financial statements were issued and has determined that there were no subsequent events requiring recognition or disclosure in the financial statements that have not already been disclosed.
Report of Independent Registered Public Accounting Firm
To the Shareholders and the Board of Trustees of First Trust Exchange-Traded Fund III:
Opinion on the Financial Statements and Financial Highlights
We have audited the accompanying statements of assets and liabilities of First Trust California Municipal High Income ETF and First Trust New York Municipal High Income ETF (the “Funds”), each a series of the First Trust Exchange-Traded Fund III, including the portfolios of investments, as of July 31, 2023, the related statements of operations for the year then ended, the statements of changes in net assets for each of the two years in the period then ended and the financial highlights for the periods indicated in the table below, and the related notes. In our opinion, the financial statements and financial highlights present fairly, in all material respects, the financial position of each of the Funds as of July 31, 2023, and the results of their operations for the year then ended, the changes in their net assets for each of the two years in the period then ended, and the financial highlights for the periods listed in the table below in conformity with accounting principles generally accepted in the United States of America.
| Individual Funds Included in the Trust | Financial Highlights |
| First Trust California Municipal High Income ETF (FCAL) | For the years ended July 31, 2023, 2022, 2021, 2020, and 2019 |
| First Trust New York Municipal High Income ETF (FMNY) | For the years ended July 31, 2023, 2022 and the period from May 12, 2021 (commencement of investment operations) through July 31, 2021 |
Basis for Opinion
These financial statements and financial highlights are the responsibility of the Funds’ management. Our responsibility is to express an opinion on the Funds’ financial statements and financial highlights based on our audits. We are a public accounting firm registered with the Public Company Accounting Oversight Board (United States) (PCAOB) and are required to be independent with respect to the Funds in accordance with the U.S. federal securities laws and the applicable rules and regulations of the Securities and Exchange Commission and the PCAOB.
We conducted our audits in accordance with the standards of the PCAOB. Those standards require that we plan and perform the audit to obtain reasonable assurance about whether the financial statements and financial highlights are free of material misstatement, whether due to error or fraud. The Funds are not required to have, nor were we engaged to perform, an audit of their internal control over financial reporting. As part of our audits we are required to obtain an understanding of internal control over financial reporting but not for the purpose of expressing an opinion on the effectiveness of the Funds’ internal control over financial reporting. Accordingly, we express no such opinion.
Our audits included performing procedures to assess the risks of material misstatement of the financial statements and financial highlights, whether due to error or fraud, and performing procedures that respond to those risks. Such procedures included examining, on a test basis, evidence regarding the amounts and disclosures in the financial statements and financial highlights. Our audits also included evaluating the accounting principles used and significant estimates made by management, as well as evaluating the overall presentation of the financial statements and financial highlights. Our procedures included confirmation of securities owned as of July 31, 2023, by correspondence with the custodian and brokers; when replies were not received from brokers, we performed other auditing procedures. We believe that our audits provide a reasonable basis for our opinion.
Chicago, Illinois
September 22, 2023
We have served as the auditor of one or more First Trust investment companies since 2001.
Additional Information
First Trust Exchange-Traded Fund III
July 31, 2023 (Unaudited)
Proxy Voting Policies and Procedures
A description of the policies and procedures that the Trust uses to determine how to vote proxies and information on how each Fund voted proxies relating to portfolio securities during the most recent 12-month period ended June 30 is available (1) without charge, upon request, by calling (800) 988-5891; (2) on each Fund’s website at www.ftportfolios.com; and (3) on the Securities and Exchange Commission’s (“SEC”) website at www.sec.gov.
Portfolio Holdings
Each Fund files portfolio holdings information for each month in a fiscal quarter within 60 days after the end of the relevant fiscal quarter on Form N-PORT. Portfolio holdings information for the third month of each fiscal quarter will be publicly available on the SEC’s website at www.sec.gov. Each Fund’s complete schedule of portfolio holdings for the second and fourth quarters of each fiscal year is included in the semi-annual and annual reports to shareholders, respectively, and is filed with the SEC on Form N-CSR. The semi-annual and annual report for each Fund is available to investors within 60 days after the period to which it relates. Each Fund’s Forms N-PORT and Forms N-CSR are available on the SEC’s website listed above.
Federal Tax Information
For the taxable year ended July 31, 2023, the following distribution information is being provided as required by the Internal Revenue Code of 1986, as amended, or to meet a specific state’s requirement. The Funds designate the following percentages or, if subsequently determined to be different, the maximum amount allowable for their fiscal year ended July 31, 2023:
| | Tax Exempt
Interest Dividends | | Alternative Minimum
Tax (AMT) |
First Trust California Municipal High Income ETF
| 98.84% | | 14.91% |
First Trust New York Municipal High Income ETF
| 100.00% | | 8.65% |
Risk Considerations
Risks are inherent in all investing. Certain general risks that may be applicable to a Fund are identified below, but not all of the material risks relevant to each Fund are included in this report and not all of the risks below apply to each Fund. The material risks of investing in each Fund are spelled out in its prospectus, statement of additional information and other regulatory filings. Before investing, you should consider each Fund’s investment objective, risks, charges and expenses, and read each Fund’s prospectus and statement of additional information carefully. You can download each Fund’s prospectus at www.ftportfolios.com or contact First Trust Portfolios L.P. at (800) 621-1675 to request a prospectus, which contains this and other information about each Fund.
Concentration Risk. To the extent that a fund is able to invest a significant percentage of its assets in a single asset class or the securities of issuers within the same country, state, region, industry or sector, an adverse economic, business or political development may affect the value of the fund’s investments more than if the fund were more broadly diversified. A fund that tracks an index will be concentrated to the extent the fund’s corresponding index is concentrated. A concentration makes a fund more susceptible to any single occurrence and may subject the fund to greater market risk than a fund that is more broadly diversified.
Credit Risk. Credit risk is the risk that an issuer of a security will be unable or unwilling to make dividend, interest and/or principal payments when due and the related risk that the value of a security may decline because of concerns about the issuer’s ability to make such payments.
Cyber Security Risk. The funds are susceptible to potential operational risks through breaches in cyber security. A breach in cyber security refers to both intentional and unintentional events that may cause a fund to lose proprietary information, suffer data corruption or lose operational capacity. Such events could cause a fund to incur regulatory penalties, reputational damage, additional compliance costs associated with corrective measures and/or financial loss. In addition, cyber security breaches of a fund’s third-party service providers, such as its administrator, transfer agent, custodian, or sub-advisor, as applicable, or issuers in which the fund invests, can also subject a fund to many of the same risks associated with direct cyber security breaches.
Defined Outcome Funds Risk. To the extent a fund’s investment strategy is designed to deliver returns tied to the price performance of an underlying ETF, an investor may not realize the returns the fund seeks to achieve if that investor does not hold shares for the entire target outcome period. In the event an investor purchases shares after the first day of the target outcome period or sells shares prior to the end of the target outcome period, the buffer that the fund seeks to provide against a decline in the value of the underlying ETF may not be available, the enhanced returns that the fund seeks to provide (if any) may not be available and the investor may not participate in a gain in the value of the underlying ETF up to the cap for the investor’s investment period. Additionally, the fund will
Additional Information (Continued)
First Trust Exchange-Traded Fund III
July 31, 2023 (Unaudited)
not participate in gains of the underlying ETF above the cap and a shareholder may lose their entire investment. If the fund seeks enhanced returns, there are certain time periods when the value of the fund may fall faster than the value of the underlying ETF, and it is very unlikely that, on any given day during which the underlying ETF share price increases in value, the fund’s share price will increase at the same rate as the enhanced returns sought by the fund, which is designed for an entire target outcome period. Trading flexible exchange options involves risks different from, or possibly greater than, the risks associated with investing directly in securities, such as less liquidity and correlation and valuation risks. A fund may experience substantial downside from specific flexible exchange option positions and certain positions may expire worthless.
Derivatives Risk. To the extent a fund uses derivative instruments such as futures contracts, options contracts and swaps, the fund may experience losses because of adverse movements in the price or value of the underlying asset, index or rate, which may be magnified by certain features of the derivative. These risks are heightened when a fund’s portfolio managers use derivatives to enhance the fund’s return or as a substitute for a position or security, rather than solely to hedge (or offset) the risk of a position or security held by the fund.
Equity Securities Risk. To the extent a fund invests in equity securities, the value of the fund’s shares will fluctuate with changes in the value of the equity securities. Equity securities prices fluctuate for several reasons, including changes in investors’ perceptions of the financial condition of an issuer or the general condition of the relevant stock market, such as market volatility, or when political or economic events affecting the issuers occur. In addition, common stock prices may be particularly sensitive to rising interest rates, as the cost of capital rises and borrowing costs increase. Equity securities may decline significantly in price over short or extended periods of time, and such declines may occur in the equity market as a whole, or they may occur in only a particular country, company, industry or sector of the market.
ETF Risk. The shares of an ETF trade like common stock and represent an interest in a portfolio of securities. The risks of owning an ETF generally reflect the risks of owning the underlying securities, although lack of liquidity in an ETF could result in it being more volatile and ETFs have management fees that increase their costs. Shares of an ETF trade on an exchange at market prices rather than net asset value, which may cause the shares to trade at a price greater than net asset value (premium) or less than net asset value (discount). In times of market stress, decisions by market makers to reduce or step away from their role of providing a market for an ETF’s shares, or decisions by an ETF’s authorized participants that they are unable or unwilling to proceed with creation and/or redemption orders of an ETF’s shares, could result in shares of the ETF trading at a discount to net asset value and in greater than normal intraday bid-ask spreads.
Fixed Income Securities Risk. To the extent a fund invests in fixed income securities, the fund will be subject to credit risk, income risk, interest rate risk, liquidity risk and prepayment risk. Income risk is the risk that income from a fund’s fixed income investments could decline during periods of falling interest rates. Interest rate risk is the risk that the value of a fund’s fixed income securities will decline because of rising interest rates. Liquidity risk is the risk that a security cannot be purchased or sold at the time desired, or cannot be purchased or sold without adversely affecting the price. Prepayment risk is the risk that the securities will be redeemed or prepaid by the issuer, resulting in lower interest payments received by the fund. In addition to these risks, high yield securities, or “junk” bonds, are subject to greater market fluctuations and risk of loss than securities with higher ratings, and the market for high yield securities is generally smaller and less liquid than that for investment grade securities.
Index or Model Constituent Risk. Certain funds may be a constituent of one or more indices or ETF models. As a result, such a fund may be included in one or more index-tracking exchange-traded funds or mutual funds. Being a component security of such a vehicle could greatly affect the trading activity involving a fund, the size of the fund and the market volatility of the fund. Inclusion in an index could increase demand for the fund and removal from an index could result in outsized selling activity in a relatively short period of time. As a result, a fund’s net asset value could be negatively impacted and the fund’s market price may be significantly below its net asset value during certain periods. In addition, index rebalances may potentially result in increased trading activity in a fund’s shares.
Index Provider Risk. To the extent a fund seeks to track an index, it is subject to Index Provider Risk. There is no assurance that the Index Provider will compile the Index accurately, or that the Index will be determined, maintained, constructed, reconstituted, rebalanced, composed, calculated or disseminated accurately. To correct any such error, the Index Provider may carry out an unscheduled rebalance or other modification of the Index constituents or weightings, which may increase the fund’s costs. The Index Provider does not provide any representation or warranty in relation to the quality, accuracy or completeness of data in the Index, and it does not guarantee that the Index will be calculated in accordance with its stated methodology. Losses or costs associated with any Index Provider errors generally will be borne by the fund and its shareholders.
Investment Companies Risk. To the extent a fund invests in the securities of other investment vehicles, the fund will incur additional fees and expenses that would not be present in a direct investment in those investment vehicles. Furthermore, the fund’s investment performance and risks are directly related to the investment performance and risks of the investment vehicles in which the fund invests.
Additional Information (Continued)
First Trust Exchange-Traded Fund III
July 31, 2023 (Unaudited)
LIBOR Risk. To the extent a fund invests in floating or variable rate obligations that use the London Interbank Offered Rate (“LIBOR”) as a reference interest rate, it is subject to LIBOR Risk. The United Kingdom’s Financial Conduct Authority, which regulates LIBOR has ceased making LIBOR available as a reference rate over a phase-out period that began December 31, 2021. There is no assurance that any alternative reference rate, including the Secured Overnight Financing Rate (“SOFR”) will be similar to or produce the same value or economic equivalence as LIBOR or that instruments using an alternative rate will have the same volume or liquidity. The unavailability or replacement of LIBOR may affect the value, liquidity or return on certain fund investments and may result in costs incurred in connection with closing out positions and entering into new trades. Any potential effects of the transition away from LIBOR on the fund or on certain instruments in which the fund invests can be difficult to ascertain, and they may vary depending on a variety of factors, and they could result in losses to the fund.
Management Risk. To the extent that a fund is actively managed, it is subject to management risk. In managing an actively-managed fund’s investment portfolio, the fund’s portfolio managers will apply investment techniques and risk analyses that may not have the desired result. There can be no guarantee that a fund will meet its investment objective.
Market Risk. Market risk is the risk that a particular security, or shares of a fund in general, may fall in value. Securities held by a fund, as well as shares of a fund itself, are subject to market fluctuations caused by factors such as general economic conditions, political events, regulatory or market developments, changes in interest rates and perceived trends in securities prices. Shares of a fund could decline in value or underperform other investments as a result of the risk of loss associated with these market fluctuations. In addition, local, regional or global events such as war, acts of terrorism, spread of infectious diseases or other public health issues, recessions, or other events could have a significant negative impact on a fund and its investments. Such events may affect certain geographic regions, countries, sectors and industries more significantly than others. In February 2022, Russia invaded Ukraine which has caused and could continue to cause significant market disruptions and volatility within the markets in Russia, Europe, and the United States. The hostilities and sanctions resulting from those hostilities could have a significant impact on certain fund investments as well as fund performance. The COVID-19 global pandemic and the ensuing policies enacted by governments and central banks have caused and may continue to cause significant volatility and uncertainty in global financial markets. While the U.S. has resumed “reasonably” normal business activity, many countries continue to impose lockdown measures. Additionally, there is no guarantee that vaccines will be effective against emerging variants of the disease. These events also adversely affect the prices and liquidity of a fund’s portfolio securities or other instruments and could result in disruptions in the trading markets. Any of such circumstances could have a materially negative impact on the value of a fund’s shares and result in increased market volatility. During any such events, a fund’s shares may trade at increased premiums or discounts to their net asset value and the bid/ask spread on a fund’s shares may widen.
Non-U.S. Securities Risk. To the extent a fund invests in non-U.S. securities, it is subject to additional risks not associated with securities of domestic issuers. Non-U.S. securities are subject to higher volatility than securities of domestic issuers due to: possible adverse political, social or economic developments; restrictions on foreign investment or exchange of securities; capital controls; lack of liquidity; currency exchange rates; excessive taxation; government seizure of assets; the imposition of sanctions by foreign governments; different legal or accounting standards; and less government supervision and regulation of exchanges in foreign countries. Investments in non-U.S. securities may involve higher costs than investments in U.S. securities, including higher transaction and custody costs, as well as additional taxes imposed by non-U.S. governments. These risks may be heightened for securities of companies located, or with significant operations, in emerging market countries.
Operational Risk. Each fund is subject to risks arising from various operational factors, including, but not limited to, human error, processing and communication errors, errors of a fund’s service providers, counterparties or other third-parties, failed or inadequate processes and technology or systems failures. Each fund relies on third-parties for a range of services, including custody. Any delay or failure relating to engaging or maintaining such service providers may affect a fund’s ability to meet its investment objective. Although the funds and the funds’ investment advisor seek to reduce these operational risks through controls and procedures, there is no way to completely protect against such risks.
Passive Investment Risk. To the extent a fund seeks to track an index, the fund will invest in the securities included in, or representative of, the index regardless of their investment merit. A fund generally will not attempt to take defensive positions in declining markets.
Preferred Securities Risk. Preferred securities combine some of the characteristics of both common stocks and bonds. Preferred securities are typically subordinated to bonds and other debt securities in a company’s capital structure in terms of priority to corporate income, subjecting them to greater credit risk than those debt securities. Generally, holders of preferred securities have no voting rights with respect to the issuing company unless preferred dividends have been in arrears for a specified number of periods, at which time the preferred security holders may obtain limited rights. In certain circumstances, an issuer of preferred securities may defer payment on the securities and, in some cases, redeem the securities prior to a specified date. Preferred securities may also be substantially less liquid than other securities, including common stock.
Additional Information (Continued)
First Trust Exchange-Traded Fund III
July 31, 2023 (Unaudited)
Valuation Risk. The valuation of certain securities may carry more risk than that of common stock. Uncertainties in the conditions of the financial markets, unreliable reference data, lack of transparency and inconsistency of valuation models and processes may lead to inaccurate asset pricing. A fund may hold investments in sizes smaller than institutionally sized round lot positions (sometimes referred to as odd lots). However, third-party pricing services generally provide evaluations on the basis of institutionally-sized round lots. If a fund sells certain of its investments in an odd lot transaction, the sale price may be less than the value at which such securities have been held by the fund. Odd lots often trade at lower prices than institutional round lots. There is no assurance that the fund will be able to sell a portfolio security at the price established by the pricing service, which could result in a loss to the fund.
| NOT FDIC INSURED | NOT BANK GUARANTEED | MAY LOSE VALUE |
Advisory Agreements
Board Considerations Regarding Approval of Continuation of Investment Management Agreements
The Board of Trustees of First Trust Exchange-Traded Fund III (the “Trust”), including the Independent Trustees, unanimously approved the continuation of the Investment Management Agreements (as applicable to a specific Fund, the “Agreement” and collectively, the “Agreements”) with First Trust Advisors L.P. (the “Advisor”) on behalf of the following series of the Trust (each a “Fund” and collectively, the “Funds”):
First Trust California Municipal High Income ETF (FCAL)
First Trust New York Municipal High Income ETF (FMNY)
The Board approved the continuation of the Agreement for each Fund for a one-year period ending June 30, 2024 at a meeting held on June 4–5, 2023. The Board determined for each Fund that the continuation of the applicable Agreement is in the best interests of the Fund in light of the nature, extent and quality of the services provided and such other matters as the Board considered to be relevant in the exercise of its business judgment.
To reach this determination for each Fund, the Board considered its duties under the Investment Company Act of 1940, as amended (the “1940 Act”), as well as under the general principles of state law, in reviewing and approving advisory contracts; the requirements of the 1940 Act in such matters; the fiduciary duty of investment advisors with respect to advisory agreements and compensation; the standards used by courts in determining whether investment company boards have fulfilled their duties; and the factors to be considered by the Board in voting on such agreements. At meetings held on April 17, 2023 and June 4–5, 2023, the Board, including the Independent Trustees, reviewed materials provided by the Advisor responding to requests for information from counsel to the Independent Trustees, submitted on behalf of the Independent Trustees, that, among other things, outlined: the services provided by the Advisor to each Fund (including the relevant personnel responsible for these services and their experience); the unitary fee rate schedule payable by each Fund as compared to fees charged to a peer group of funds (the “Expense Group”) and a broad peer universe of funds (the “Expense Universe”), each assembled by Broadridge Financial Solutions, Inc. (“Broadridge”), an independent source, and as compared to fees charged to other clients of the Advisor, including other exchange-traded funds (“ETFs”) managed by the Advisor; the expense ratio of each Fund as compared to expense ratios of the funds in the Fund’s Expense Group and Expense Universe; performance information for each Fund, including comparisons of each Fund’s performance to that of one or more relevant benchmark indexes and to that of a performance group of funds and a broad performance universe of funds (the “Performance Universe”), each assembled by Broadridge; the nature of expenses incurred in providing services to each Fund and the potential for the Advisor to realize economies of scale, if any; profitability and other financial data for the Advisor; any indirect benefits to the Advisor and its affiliate, First Trust Portfolios L.P. (“FTP”); and information on the Advisor’s compliance program. The Board reviewed initial materials with the Advisor at the meeting held on April 17, 2023, prior to which the Independent Trustees and their counsel met separately to discuss the information provided by the Advisor. Following the April meeting, counsel to the Independent Trustees, on behalf of the Independent Trustees, requested certain clarifications and supplements to the materials provided, and the information provided in response to those requests was considered at an executive session of the Independent Trustees and their counsel held prior to the June 4–5, 2023 meeting, as well as at the June meeting. The Board applied its business judgment to determine whether the arrangement between the Trust and the Advisor continues to be a reasonable business arrangement from each Fund’s perspective. The Board determined that, given the totality of the information provided with respect to the Agreements, the Board had received sufficient information to renew the Agreements. The Board considered that shareholders chose to invest or remain invested in a Fund knowing that the Advisor manages the Fund and knowing the Fund’s unitary fee.
In reviewing the Agreement for each Fund, the Board considered the nature, extent and quality of the services provided by the Advisor under the Agreement. The Board considered that the Advisor is responsible for the overall management and administration of the Trust and each Fund and reviewed all of the services provided by the Advisor to the Funds, as well as the background and experience of the persons responsible for such services. The Board noted that each Fund is an actively-managed ETF and noted that the Advisor’s
Additional Information (Continued)
First Trust Exchange-Traded Fund III
July 31, 2023 (Unaudited)
Municipal Securities Team is responsible for the day-to-day management of the Funds’ investments. The Board considered the background and experience of the members of the Municipal Securities Team. The Board considered the Advisor’s statement that it applies the same oversight model internally with its Municipal Securities Team as it uses for overseeing external sub-advisors, including portfolio risk monitoring and performance review. In reviewing the services provided, the Board noted the compliance program that had been developed by the Advisor and considered that it includes a robust program for monitoring the Advisor’s and each Fund’s compliance with the 1940 Act, as well as each Fund’s compliance with its investment objectives, policies and restrictions. The Board also considered a report from the Advisor with respect to its risk management functions related to the operation of the Funds. Finally, as part of the Board’s consideration of the Advisor’s services, the Advisor, in its written materials and at the April 17, 2023 meeting, described to the Board the scope of its ongoing investment in additional personnel and infrastructure to maintain and improve the quality of services provided to the Funds and the other funds in the First Trust Fund Complex. In addition to the written materials provided by the Advisor, at the April 17, 2023 meeting, the Board also received a presentation from representatives of the Advisor’s Municipal Securities Team, who discussed the services that the Team provides to each Fund, including the Team’s day-to-day management of the Funds’ investments. In light of the information presented and the considerations made, the Board concluded that the nature, extent and quality of the services provided to the Trust and each Fund by the Advisor under the Agreements have been and are expected to remain satisfactory and that the Advisor has managed each Fund consistent with its investment objectives, policies and restrictions.
The Board considered the unitary fee rate schedule payable by each Fund under the applicable Agreement for the services provided. The Board considered that as part of the unitary fee the Advisor is responsible for each Fund’s expenses, including the cost of transfer agency, custody, fund administration, legal, audit and other services and license fees, if any, but excluding the fee payment under the applicable Agreement and interest, taxes, brokerage commissions and other expenses connected with the execution of portfolio transactions, distribution and service fees pursuant to a Rule 12b-1 plan, if any, and extraordinary expenses, if any. The Board noted that the Advisor had previously agreed to waive a portion of FMNY’s unitary fee in an amount equal to 0.15% of the Fund’s average daily net assets until at least May 11, 2024. The Board received and reviewed information showing the fee rates and expense ratios of the peer funds in the Expense Groups, as well as advisory and unitary fee rates charged by the Advisor to other fund (including ETFs) and non-fund clients, as applicable. Because each Fund pays a unitary fee, the Board determined that expense ratios were the most relevant comparative data point. Based on the information provided, the Board noted that the total (net) expense ratio for each Fund was above the median total (net) expense ratio of the peer funds in its respective Expense Group. With respect to the Expense Groups, the Board, at the April 17, 2023 meeting, discussed with Broadridge its methodology for assembling peer groups and discussed with the Advisor limitations in creating peer groups for actively-managed ETFs, and different business models that may affect the pricing of services among ETF sponsors. The Board took these limitations and differences into account in considering the peer data. With respect to fees charged to other non-ETF clients, the Board considered differences between the Funds and other non-ETF clients that limited their comparability. In considering the unitary fee rate schedules overall, the Board also considered the Advisor’s statement that it seeks to meet investor needs through innovative and value-added investment solutions and the Advisor’s demonstrated long-term commitment to each Fund and the other funds in the First Trust Fund Complex.
The Board considered performance information for each Fund. The Board noted the process it has established for monitoring each Fund’s performance and portfolio risk on an ongoing basis, which includes quarterly performance reporting from the Advisor for the Funds. The Board determined that this process continues to be effective for reviewing each Fund’s performance. The Board received and reviewed information comparing each Fund’s performance for one or more periods ended December 31, 2022 to the performance of the funds in its Performance Universe and to that of a benchmark index. Based on the information provided, the Board noted that FCAL underperformed its Performance Universe median for the one- and three-year periods ended December 31, 2022, outperformed its Performance Universe median for the five-year period ended December 31, 2022 and underperformed its benchmark index for the one-, three- and five-year periods ended December 31, 2022. The Board noted that FMNY underperformed its Performance Universe median and benchmark index for the one-year period ended December 31, 2022. The Board noted the Advisor’s Municipal Securities Team’s discussion of FCAL’s and FMNY’s performance at the April 17, 2023 meeting.
On the basis of all the information provided on the unitary fee and performance of each Fund and the ongoing oversight by the Board, the Board concluded that the unitary fee for each Fund continues to be reasonable and appropriate in light of the nature, extent and quality of the services provided by the Advisor to each Fund under the Agreements.
The Board considered information and discussed with the Advisor whether there were any economies of scale in connection with providing advisory services to the Funds at current asset levels and whether the Funds may benefit from any economies of scale. The Board noted that the unitary fee rate schedule for each Fund includes breakpoints pursuant to which the unitary fee rate will be reduced as assets of the Fund meet certain thresholds. The Board considered the Advisor’s statement that it believes that its expenses relating to providing advisory services to the Funds will increase during the next twelve months as the Advisor continues to build infrastructure and add new staff. The Board also noted that under the unitary fee structure, any reduction in expenses associated with the management and operations of the Funds would benefit the Advisor, but that the unitary fee structure provides a level of certainty
Additional Information (Continued)
First Trust Exchange-Traded Fund III
July 31, 2023 (Unaudited)
in expenses for shareholders of the Funds. The Board concluded that the unitary fee rate schedule for each Fund reflects an appropriate level of sharing of any economies of scale that may be realized in the management of the Fund at current asset levels. The Board considered the revenues and allocated costs (including the allocation methodology) of the Advisor in serving as investment advisor to each Fund for the twelve months ended December 31, 2022 and the estimated profitability level for each Fund calculated by the Advisor based on such data, as well as complex-wide and product-line profitability data, for the same period. The Board noted the inherent limitations in the profitability analysis and concluded that, based on the information provided, the Advisor’s profitability level for each Fund was not unreasonable. In addition, the Board considered indirect benefits described by the Advisor that may be realized from its relationship with the Funds. The Board considered that the Advisor had identified as an indirect benefit to the Advisor and FTP their exposure to investors and brokers who, absent their exposure to the Funds, may have had no dealings with the Advisor or FTP, and noted that the Advisor does not utilize soft dollars in connection with the Funds. The Board also considered the Advisor’s compensation for fund reporting services provided to the Funds pursuant to a separate Fund Reporting Services Agreement, which is paid from the unitary fee. The Board concluded that the character and amount of potential indirect benefits to the Advisor were not unreasonable.
Based on all of the information considered and the conclusions reached, the Board, including the Independent Trustees, unanimously determined that the terms of the Agreements continue to be fair and reasonable and that the continuation of the Agreements is in the best interests of each Fund. No single factor was determinative in the Board’s analysis.
Liquidity Risk Management Program
In accordance with Rule 22e-4 under the Investment Company Act of 1940, as amended (the “1940 Act”), the Funds and each other fund in the First Trust Fund Complex, other than the closed-end funds, have adopted and implemented a liquidity risk management program (the “Program”) reasonably designed to assess and manage the funds’ liquidity risk, i.e., the risk that a fund could not meet requests to redeem shares issued by the fund without significant dilution of remaining investors’ interests in the fund. The Board of Trustees of the First Trust Funds has appointed First Trust Advisors L.P. (the “Advisor”) as the person designated to administer the Program, and in this capacity the Advisor performs its duties primarily through the activities and efforts of the First Trust Liquidity Committee (the “Liquidity Committee”).
Pursuant to the Program, the Liquidity Committee classifies the liquidity of each fund’s portfolio investments into one of the four liquidity categories specified by Rule 22e-4: highly liquid investments, moderately liquid investments, less liquid investments and illiquid investments. The Liquidity Committee determines certain of the inputs for this classification process, including reasonably anticipated trade sizes and significant investor dilution thresholds. The Liquidity Committee also determines and periodically reviews a highly liquid investment minimum for certain funds, monitors the funds’ holdings of assets classified as illiquid investments to seek to ensure they do not exceed 15% of a fund’s net assets and establishes policies and procedures regarding redemptions in kind.
At the April 17, 2023 meeting of the Board of Trustees, as required by Rule 22e-4 and the Program, the Advisor provided the Board with a written report prepared by the Advisor that addressed the operation of the Program during the period from March 17, 2022 through the Liquidity Committee’s annual meeting held on March 23, 2023 and assessed the Program’s adequacy and effectiveness of implementation during this period, including the operation of the highly liquid investment minimum for each fund that is required under the Program to have one, and any material changes to the Program. Note that because the Funds primarily hold assets that are highly liquid investments, the Funds have not adopted any highly liquid investment minimums.
As stated in the written report, during the review period, two funds breached the 15% limitation on illiquid investments for one day each, as a result of an unscheduled week-long closure of the stock exchange in Istanbul following devastating earthquakes in February, causing all Turkish equities to be re-classified as “illiquid” for one day. Each fund filed a Form N-RN on the day after the breach occurred, and one day later after the breach was cured. No fund with a highly liquid investment minimum breached that minimum during the reporting period. The Advisor concluded that each fund’s investment strategy is appropriate for an open-end fund; that the Program operated effectively in all material respects during the review period; and that the Program is reasonably designed to assess and manage the liquidity risk of each fund and to maintain compliance with Rule 22e-4.
Board of Trustees
Effective September 10, 2023, the exchange-traded funds, closed-end funds, mutual funds and variable insurance funds (collectively, the “Funds”) advised by First Trust Advisors L.P. (“FTA”) announced the appointment of Ms. Bronwyn Wright as a Trustee of all Funds except the exchange-traded funds included in the First Trust Exchange-Traded Fund and the First Trust Dynamic Europe Equity Income Fund, a closed-end fund. Ms. Wright has acted as an independent director to a number of Irish collective investment funds since 2009. Ms. Wright is a former Managing Director of Citibank Europe plc and Head of Securities and Fund Services for Citi Ireland. In these positions, she was responsible for the management and strategic direction of Citi Ireland’s securities and fund services
Additional Information (Continued)
First Trust Exchange-Traded Fund III
July 31, 2023 (Unaudited)
business which included funds, custody, security finance/lending and global agency and trust. She also had responsibility for leading, managing and growing the Trustee, Custodian and Depositary business in Ireland, the United Kingdom, Luxembourg, Jersey and Cayman.
Board of Trustees and Officers
First Trust Exchange-Traded Fund III
July 31, 2023 (Unaudited)
The following tables identify the Trustees and Officers of the Trust. Unless otherwise indicated, the address of all persons is 120 East Liberty Drive, Suite 400, Wheaton, IL 60187.
The Trust’s statement of additional information includes additional information about the Trustees and is available, without charge, upon request, by calling (800) 988-5891.
| Name, Year of Birth and Position with the Trust | Term of Office and Year First Elected or Appointed | Principal Occupations
During Past 5 Years | Number of Portfolios in the First Trust Fund Complex Overseen by Trustee | Other Trusteeships or Directorships Held by Trustee During Past 5 Years |
| INDEPENDENT TRUSTEES |
Richard E. Erickson, Trustee
(1951) | • Indefinite Term
• Since Inception | Physician, Edward-Elmhurst Medical Group; Physician and Officer, Wheaton Orthopedics (1990 to 2021) | 238 | None |
Thomas R. Kadlec, Trustee
(1957) | • Indefinite Term
• Since Inception | Retired; President, ADM Investor Services, Inc. (Futures Commission Merchant) (2010 to July 2022) | 238 | Director, National Futures Association and ADMIS Singapore Ltd.; Formerly, Director of ADM Investor Services, Inc., ADM Investor Services International, ADMIS Hong Kong Ltd., and Futures Industry Association |
Denise M. Keefe, Trustee
(1964) | • Indefinite Term
• Since 2021 | Executive Vice President, Advocate Aurora Health and President, Advocate Aurora Continuing Health Division (Integrated Healthcare System) | 238 | Director and Board Chair of Advocate Home Health Services, Advocate Home Care Products and Advocate Hospice; Director and Board Chair of Aurora At Home (since 2018); Director of Advocate Physician Partners Accountable Care Organization; Director of RML Long Term Acute Care Hospitals; Director of Senior Helpers (since 2021); and Director of MobileHelp (since 2022) |
Robert F. Keith, Trustee
(1956) | • Indefinite Term
• Since Inception | President, Hibs Enterprises (Financial and Management Consulting) | 238 | Formerly, Director of Trust Company of Illinois |
Niel B. Nielson, Trustee
(1954) | • Indefinite Term
• Since Inception | Senior Advisor (2018 to Present), Managing Director and Chief Operating Officer (2015 to 2018), Pelita Harapan Educational Foundation (Educational Products and Services) | 238 | None |
| INTERESTED TRUSTEE |
James A. Bowen(1), Trustee and
Chairman of the Board
(1955) | • Indefinite Term
• Since Inception | Chief Executive Officer, First Trust Advisors L.P. and First Trust Portfolios L.P.; Chairman of the Board of Directors, BondWave LLC (Software Development Company) and Stonebridge Advisors LLC (Investment Advisor) | 238 | None |
| (1) | Mr. Bowen is deemed an “interested person” of the Trust due to his position as CEO of First Trust Advisors L.P., investment advisor of the Trust. |
Board of Trustees and Officers (Continued)
First Trust Exchange-Traded Fund III
July 31, 2023 (Unaudited)
| Name and Year of Birth | Position and Offices with Trust | Term of Office and Length of Service | Principal Occupations
During Past 5 Years |
| OFFICERS(2) |
James M. Dykas
(1966) | President and Chief Executive Officer | • Indefinite Term
• Since 2016 | Managing Director and Chief Financial Officer, First Trust Advisors L.P. and First Trust Portfolios L.P.; Chief Financial Officer, BondWave LLC (Software Development Company) and Stonebridge Advisors LLC (Investment Advisor) |
Derek D. Maltbie
(1972) | Treasurer, Chief Financial Officer and Chief Accounting Officer | • Indefinite Term
• Since 2023 | Senior Vice President, First Trust Advisors L.P. and First Trust Portfolios L.P., July 2021 to present. Previously, Vice President, First Trust Advisors L.P. and First Trust Portfolios L.P., 2014 to 2021. |
W. Scott Jardine
(1960) | Secretary and Chief Legal Officer | • Indefinite Term
• Since Inception | General Counsel, First Trust Advisors L.P. and First Trust Portfolios L.P.; Secretary and General Counsel, BondWave LLC; Secretary, Stonebridge Advisors LLC |
Daniel J. Lindquist
(1970) | Vice President | • Indefinite Term
• Since Inception | Managing Director, First Trust Advisors L.P. and First Trust Portfolios L.P. |
Kristi A. Maher
(1966) | Chief Compliance Officer and Assistant Secretary | • Indefinite Term
• Since Inception | Deputy General Counsel, First Trust Advisors L.P. and First Trust Portfolios L.P. |
Roger F. Testin
(1966) | Vice President | • Indefinite Term
• Since Inception | Senior Vice President, First Trust Advisors L.P. and First Trust Portfolios L.P. |
Stan Ueland
(1970) | Vice President | • Indefinite Term
• Since Inception | Senior Vice President, First Trust Advisors L.P. and First Trust Portfolios L.P. |
| (2) | The term “officer” means the president, vice president, secretary, treasurer, controller or any other officer who performs a policy making function. |
Privacy Policy
First Trust Exchange-Traded Fund III
July 31, 2023 (Unaudited)
Privacy Policy
First Trust values our relationship with you and considers your privacy an important priority in maintaining that relationship. We are committed to protecting the security and confidentiality of your personal information.
Sources of Information
We collect nonpublic personal information about you from the following sources:
| • | Information we receive from you and your broker-dealer, investment professional or financial representative through interviews, applications, agreements or other forms; |
| • | Information about your transactions with us, our affiliates or others; |
| • | Information we receive from your inquiries by mail, e-mail or telephone; and |
| • | Information we collect on our website through the use of “cookies.” For example, we may identify the pages on our website that your browser requests or visits. |
Information Collected
The type of data we collect may include your name, address, social security number, age, financial status, assets, income, tax information, retirement and estate plan information, transaction history, account balance, payment history, investment objectives, marital status, family relationships and other personal information.
Disclosure of Information
We do not disclose any nonpublic personal information about our customers or former customers to anyone, except as permitted by law. In addition to using this information to verify your identity (as required under law), the permitted uses may also include the disclosure of such information to unaffiliated companies for the following reasons:
| • | In order to provide you with products and services and to effect transactions that you request or authorize, we may disclose your personal information as described above to unaffiliated financial service providers and other companies that perform administrative or other services on our behalf, such as transfer agents, custodians and trustees, or that assist us in the distribution of investor materials such as trustees, banks, financial representatives, proxy services, solicitors and printers. |
| • | We may release information we have about you if you direct us to do so, if we are compelled by law to do so, or in other legally limited circumstances (for example to protect your account from fraud). |
In addition, in order to alert you to our other financial products and services, we may share your personal information within First Trust.
Use of Website Analytics
We currently use third party analytics tools, Google Analytics and AddThis, to gather information for purposes of improving First Trust’s website and marketing our products and services to you. These tools employ cookies, which are small pieces of text stored in a file by your web browser and sent to websites that you visit, to collect information, track website usage and viewing trends such as the number of hits, pages visited, videos and PDFs viewed and the length of user sessions in order to evaluate website performance and enhance navigation of the website. We may also collect other anonymous information, which is generally limited to technical and web navigation information such as the IP address of your device, internet browser type and operating system for purposes of analyzing the data to make First Trust’s website better and more useful to our users. The information collected does not include any personal identifiable information such as your name, address, phone number or email address unless you provide that information through the website for us to contact you in order to answer your questions or respond to your requests. To find out how to opt-out of these services click on: Google Analytics and AddThis.
Confidentiality and Security
With regard to our internal security procedures, First Trust restricts access to your nonpublic personal information to those First Trust employees who need to know that information to provide products or services to you. We maintain physical, electronic and procedural safeguards to protect your nonpublic personal information.
Policy Updates and Inquiries
As required by federal law, we will notify you of our privacy policy annually. We reserve the right to modify this policy at any time, however, if we do change it, we will tell you promptly. For questions about our policy, or for additional copies of this notice, please go to www.ftportfolios.com, or contact us at 1-800-621-1675 (First Trust Portfolios) or 1-800-222-6822 (First Trust Advisors).
March 2023
This page intentionally left blank
This page intentionally left blank
First Trust Exchange-Traded Fund III
INVESTMENT ADVISOR
First Trust Advisors L.P.
120 East Liberty Drive, Suite 400
Wheaton, IL 60187
ADMINISTRATOR, CUSTODIAN,
FUND ACCOUNTANT &
TRANSFER AGENT
Brown Brothers Harriman & Co.
50 Post Office Square
Boston, MA 02110
INDEPENDENT REGISTERED
PUBLIC ACCOUNTING FIRM
Deloitte & Touche LLP
111 South Wacker Drive
Chicago, IL 60606
LEGAL COUNSEL
Chapman and Cutler LLP
320 South Canal Street
Chicago, IL 60606
First Trust Exchange-Traded Fund III
First Trust Municipal High Income ETF (FMHI)
Annual Report
For the Year Ended
July 31, 2023
First Trust Municipal High Income ETF (FMHI)
Annual Report
July 31, 2023
Caution Regarding Forward-Looking Statements
This report contains certain forward-looking statements within the meaning of the Securities Act of 1933, as amended, and the Securities Exchange Act of 1934, as amended. Forward-looking statements include statements regarding the goals, beliefs, plans or current expectations of First Trust Advisors L.P. (“First Trust” or the “Advisor”) and its representatives, taking into account the information currently available to them. Forward-looking statements include all statements that do not relate solely to current or historical fact. For example, forward-looking statements include the use of words such as “anticipate,” “estimate,” “intend,” “expect,” “believe,” “plan,” “may,” “should,” “would” or other words that convey uncertainty of future events or outcomes.
Forward-looking statements involve known and unknown risks, uncertainties and other factors that may cause the actual results, performance or achievements of the series of First Trust Exchange-Traded Fund III (the “Trust”) described in this report (First Trust Municipal High Income ETF; hereinafter referred to as the “Fund”) to be materially different from any future results, performance or achievements expressed or implied by the forward-looking statements. When evaluating the information included in this report, you are cautioned not to place undue reliance on these forward-looking statements, which reflect the judgment of the Advisor and its representatives only as of the date hereof. We undertake no obligation to publicly revise or update these forward-looking statements to reflect events and circumstances that arise after the date hereof.
Performance and Risk Disclosure
There is no assurance that the Fund will achieve its investment objectives. The Fund is subject to market risk, which is the possibility that the market values of securities owned by the Fund will decline and that the value of the Fund’s shares may therefore be less than what you paid for them. Accordingly, you can lose money by investing in the Fund. See “Risk Considerations” in the Additional Information section of this report for a discussion of certain other risks of investing in the Fund.
Performance data quoted represents past performance, which is no guarantee of future results, and current performance may be lower or higher than the figures shown. For the most recent month-end performance figures, please visit www.ftportfolios.com or speak with your financial advisor. Investment returns, net asset value and share price will fluctuate and Fund shares, when sold, may be worth more or less than their original cost.
The Advisor may also periodically provide additional information on Fund performance on the Fund’s web page at www.ftportfolios.com.
How to Read This Report
This report contains information that may help you evaluate your investment in the Fund. It includes details about the Fund and presents data and analysis that provide insight into the Fund’s performance and investment approach.
By reading the portfolio commentary by the portfolio management team of the Fund, you may obtain an understanding of how the market environment affected the Fund’s performance. The statistical information that follows may help you understand the Fund’s performance compared to that of relevant market benchmarks.
It is important to keep in mind that the opinions expressed by personnel of the Advisor are just that: informed opinions. They should not be considered to be promises or advice. The opinions, like the statistics, cover the period through the date on the cover of this report. The material risks of investing in the Fund are spelled out in the prospectus, the statement of additional information, and other Fund regulatory filings.
First Trust Municipal High Income ETF (FMHI)
Annual Letter from the Chairman and CEO
July 31, 2023
Dear Shareholders,
First Trust is pleased to provide you with the annual report for the First Trust Municipal High Income ETF (the “Fund”), which contains detailed information about the Fund for the 12-month period ended July 31, 2023.
In a widely unexpected announcement, Fitch Ratings (“Fitch”), a provider of credit ratings, commentary, and research, downgraded the credit rating of the United States government from its highest rating of AAA to its second-highest rating of AA+ on August 1, 2023. The move marks the first time the U.S. government’s credit rating has been downgraded since 2011. Fitch cited the heightened potential of a near-term economic recession in the U.S. as well as the rising interest burden of government debt as two factors that contributed to their decision to implement the downgrade. We will leave it to the pundits to debate whether the downgrade was warranted or not. What we would like to see is a reduction in government spending. As of June 30, 2023, the U.S. government’s deficit stood at $1.39 trillion, already above the 2022 full year deficit of $1.37 trillion, according to Brian Wesbury, Chief Economist at First Trust. As Fitch noted in the press release of its downgrade, the interest burden on U.S. government debt, among other factors, is expected to catapult the general government deficit to 6.3% of gross domestic product (“GDP”) in 2023, up from 3.7% in 2022.
The Federal Reserve (the “Fed”) has made significant progress in its battle with rising prices. Inflation, as measured by the twelve-month trailing rate on the Consumer Price Index (“CPI”), stood at 3.2% on July 31, 2023, down significantly from its most recent high of 9.1% set on June 30, 2022, but up from 3.0% on June 30, 2023. While a reduction in the CPI is welcome, the metric remains well-above the Fed’s goal of 2.0%. Should the CPI remain stubbornly high, it may prompt further increases to the Federal Funds target rate over the coming months, which could hamper economic growth, in our opinion. That said, U.S. GDP has remained resilient, growing over each of the last four quarters (through June 30, 2023).
Whether the U.S. can avoid an economic recession over the coming months remains to be seen. As mentioned above, despite tighter monetary policy, the U.S. economy posted positive changes to GDP over each of the last four quarters. We continue to hope for a “soft landing,” but also keep our eyes fixated on the data.
Thank you for giving First Trust the opportunity to play a role in your financial future. We value our relationship with you and will report on the Fund again in six months.
Sincerely,
James A. Bowen
Chairman of the Board of Trustees
Chief Executive Officer of First Trust Advisors L.P.
Fund Performance Overview (Unaudited)
First Trust Municipal High Income ETF (FMHI)
The First Trust Municipal High Income ETF’s (the “Fund”) primary investment objective is to provide federally tax-exempt income, and its secondary objective is long-term capital appreciation. Under normal market conditions, the Fund seeks to achieve its investment objectives by investing at least 80% of its net assets (including investment borrowings) in municipal debt securities that pay interest that is exempt from regular federal income taxes (“Municipal Securities”). Under normal market conditions, the Fund invests at least 50% of its net assets in Municipal Securities that are, at the time of investment, rated below investment grade by at least one nationally recognized statistical rating organization rating such securities (or Municipal Securities that are unrated and determined by the Fund’s advisor to be of comparable quality), commonly referred to as “high yield” or “junk” bonds. The Fund lists and principally trades its shares on The Nasdaq Stock Market LLC under the ticker symbol “FMHI.”
| Performance | | | | | | |
| | | Average Annual Total Returns | | Cumulative Total Returns |
| | 1 Year
Ended
7/31/23 | 5 Years
Ended
7/31/23 | Inception
(11/1/17)
to 7/31/23 | | 5 Years
Ended
7/31/23 | Inception
(11/1/17)
to 7/31/23 |
| Fund Performance | | | | | | |
| NAV | -0.44% | 2.02% | 2.27% | | 10.53% | 13.77% |
| Market Price | -0.41% | 2.03% | 2.28% | | 10.55% | 13.81% |
| Index Performance | | | | | | |
| Bloomberg Municipal Bond Index | 0.93% | 1.87% | 1.72% | | 9.69% | 10.27% |
| Blended Benchmark(1) | 1.59% | 2.69% | 2.73% | | 14.17% | 16.73% |
Total returns for the period since inception are calculated from the inception date of the Fund. “Average Annual Total Returns” represent the average annual change in value of an investment over the periods indicated. “Cumulative Total Returns” represent the total change in value of an investment over the periods indicated. The total returns would have been lower if certain fees had not been waived by the Advisor.
The Fund’s per share net asset value (“NAV”) is the value of one share of the Fund and is computed by dividing the value of all assets of the Fund (including accrued interest and dividends), less all liabilities (including accrued expenses and dividends declared but unpaid), by the total number of outstanding shares. The price used to calculate market return (“Market Price”) is determined by using the midpoint of the national best bid and offer price (“NBBO”) as of the time that the Fund’s NAV is calculated. Under SEC rules, the NBBO consists of the highest displayed buy and lowest sell prices among the various exchanges trading the Fund at the time the Fund’s NAV is calculated. Prior to January 1, 2019, the price used was the midpoint between the highest bid and the lowest offer on the stock exchange on which shares of the Fund were listed for trading as of the time that the Fund’s NAV was calculated. Since shares of the Fund did not trade in the secondary market until after its inception, for the period from inception to the first day of secondary market trading in shares of the Fund, the NAV of the Fund is used as a proxy for the secondary market trading price to calculate market returns. NAV and market returns assume that all distributions have been reinvested in the Fund at NAV and Market Price, respectively.
An index is a statistical composite that tracks a specified financial market or sector. Unlike the Fund, the indices that make up the Blended Benchmark do not actually hold a portfolio of securities and therefore do not incur the expenses incurred by the Fund. These expenses negatively impact the performance of the Fund. Also, market returns do not include brokerage commissions that may be payable on secondary market transactions. If brokerage commissions were included, market returns would be lower. The total returns presented reflect the reinvestment of dividends on securities in the indices. The returns presented do not reflect the deduction of taxes that a shareholder would pay on Fund distributions or the redemption or sale of Fund shares. The investment return and principal value of shares of the Fund will vary with changes in market conditions. Shares of the Fund may be worth more or less than their original cost when they are redeemed or sold in the market. The Fund’s past performance is no guarantee of future performance.
| (1) | The Blended Benchmark consists of the following two indexes: 50% of the Bloomberg High Yield 10-Year Municipal Index (8-12 years) which is comprised of bonds with a final maturity between 8 and 12 years that are part of the Bloomberg Municipal Bond High Yield Index; and 50% of the Bloomberg Revenue 10-Year Municipal Index (8-12 years), which is comprised of revenue bonds that have a final maturity between 8 and 12 years that are part of the Bloomberg Municipal Bond Index. Indexes do not charge management fees or brokerage expenses, and no such fees or expenses were deducted from the index performance shown. Indexes are unmanaged and an investor cannot invest directly in an index. The Blended Benchmark returns are calculated by using the monthly return of the two indices during each period shown above. At the beginning of each month the two indices are rebalanced to a 50-50 ratio to account for divergence from that ratio that occurred during the course of each month. The monthly returns are then compounded for each period shown above, giving the performance for the Blended Benchmark for each period shown above. |
Fund Performance Overview (Unaudited) (Continued)
First Trust Municipal High Income ETF (FMHI) (Continued)
| Sector Allocation | % of Total
Investments
(including cash) |
| Special Assessment | 13.3% |
| Industrial Development Bond | 13.1 |
| Continuing Care Retirement Communities | 10.7 |
| Education | 8.5 |
| Dedicated Tax | 6.2 |
| Government Obligation Bond - Limited Tax | 5.9 |
| Government Obligation Bond - Unlimited Tax | 5.4 |
| Hospital | 5.4 |
| Gas | 4.9 |
| Utility | 4.4 |
| Airport | 4.0 |
| Tobacco | 2.5 |
| Tax Increment | 2.3 |
| Certificates of Participation | 2.0 |
| Insured | 2.0 |
| Higher Education | 2.0 |
| Water & Sewer | 1.7 |
| Student Housing | 1.2 |
| Toll Road | 1.1 |
| Local Housing | 0.9 |
| Skilled Nursing | 0.6 |
| Hotel | 0.5 |
| Pre-refunded/Escrowed-to-maturity | 0.4 |
| Port | 0.3 |
| Housing | 0.2 |
| Student Loan | 0.1 |
| Cash | 0.4 |
| Total | 100.0% |
| Credit Rating(2) | % of Total
Investments
(including cash) |
| AAA | 1.7% |
| AA | 8.0 |
| A | 18.9 |
| BBB | 14.6 |
| BB | 13.8 |
| B | 2.1 |
| Not Rated | 40.5 |
| Cash | 0.4 |
| Total | 100.0% |
| Fund Allocation | % of Net Assets |
| Municipal Bonds | 98.0% |
| Net Other Assets and Liabilities* | 2.0 |
| Total | 100.0% |
| * | Includes variation margin on futures contracts. |
| (2) | The credit quality and ratings information presented above reflect the ratings assigned by one or more nationally recognized statistical rating organizations (NRSROs), including S&P Global Ratings, Moody’s Investors Service, Inc., Fitch Ratings or a comparably rated NRSRO. For situations in which a security is rated by more than one NRSRO and the ratings are not equivalent, the highest rating is used. Sub-investment grade ratings are those rated BB+/Ba1 or lower. Investment grade ratings are those rated BBB-/Baa3 or higher. The credit ratings shown relate to the creditworthiness of the issuers of the underlying securities in the Fund, and not to the Fund or its shares. Credit ratings are subject to change. |
Fund Performance Overview (Unaudited) (Continued)
First Trust Municipal High Income ETF (FMHI) (Continued)
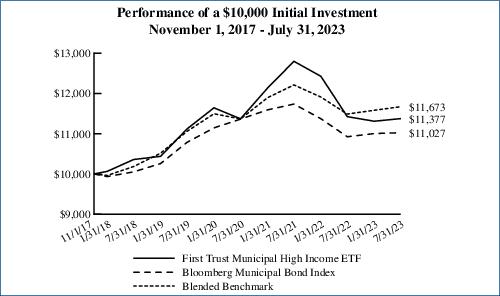
Performance figures assume reinvestment of all distributions and do not reflect the deduction of taxes that a shareholder would pay on Fund distributions or the redemption or sale of Fund shares. An index is a statistical composite that tracks a specified financial market or sector. Unlike the Fund, the indices do not actually hold a portfolio of securities and therefore do not incur the expenses incurred by the Fund. These expenses negatively impact the performance of the Fund. The Fund’s past performance does not predict future performance.
Performance in municipal bond investment strategies can be impacted from the benefits of purchasing odd lot positions. The impact of these investments can be particularly meaningful when funds have limited assets under management and may not be a sustainable source of performance as a fund grows in size.
Frequency Distribution of Discounts and Premiums
Information showing the number of days the market price of the Fund’s shares was greater (at a premium) and less (at a discount) than the Fund’s net asset value for the most recently completed year, and the most recently completed calendar quarters since that year (or life of the Fund, if shorter), is available at https://www.ftportfolios.com/Retail/etf/home.aspx.
Portfolio Commentary
First Trust Municipal High Income ETF (FMHI)
Annual Report
July 31, 2023 (Unaudited)
Advisor
First Trust Advisors L.P. (“First Trust” or the “Advisor”) is the investment advisor to the First Trust Municipal High Income ETF (the “Fund”). First Trust is responsible for the ongoing monitoring of the Fund’s investment portfolio, managing the Fund’s business affairs and providing certain administrative services necessary for the management of the Fund.
Portfolio Management Team
Tom Byron, Senior Vice President, Senior Portfolio Manager
Johnathan N. Wilhelm, Senior Vice President, Senior Portfolio Manager
The portfolio managers are primarily and jointly responsible for the day-to-day management of the Fund. Tom Byron has served as portfolio manager since 2022 and Johnathan N. Wilhelm has served as portfolio manager since 2017.
Commentary
The Fund is an actively managed exchange-traded fund. The Fund’s primary investment objective is to provide federally tax-exempt income. The Fund’s secondary investment objective is to provide long-term capital appreciation. Under normal market conditions, the Fund seeks to achieve its investment objectives by investing at least 80% of its net assets (including investment borrowings) in municipal debt securities that pay interest that is exempt from regular federal income taxes (collectively, “Municipal Securities”). In addition, under normal market conditions, the Fund invests at least 50% of its net assets in Municipal Securities that are rated non-investment grade at the time of purchase and no more than 50% of its net assets in Municipal Securities that at the time of purchase are rated investment grade. This commentary discusses the market performance and the Fund’s performance for the 12-month period ended July 31, 2023.
Market Recap
For the 12-month period ended July 31, 2023, the Fund’s Blended Benchmark generated a total return of 1.59%. The Blended Benchmark consists of the following two indexes: 50% of the Bloomberg High Yield 10-Year Municipal Index (8-12 years), which generated a total return of 1.53% for the period, and 50% of the Bloomberg Revenue 10-Year Municipal Index (8-12 years), which produced a return of 1.64%. For the same period, municipal bonds generated a total return of 0.93% as measured by the Bloomberg Municipal Bond Index, while the Bloomberg High Yield Total Return Index produced a total return of -0.20%. By comparison, the Bloomberg U.S. Treasury Index generated a total return of -4.01% during the same period. The following were major factors in explaining the municipal bond market performance:
| • | Over the past year, U.S. Treasury rates increased all along the yield curve and municipal interest rates followed U.S. Treasury yields higher. During the 12-month period ended July 31, 2023, 5-Year and 10-Year U.S. Treasury yields increased by approximately 150 basis points (“bps”) and 133 bps, respectively, to 4.17% and 3.96%. As a reminder, the price of a bond moves inversely to a given change in yield, so higher yields resulted in lower U.S. Treasury bond prices. |
| • | Large industry-wide mutual fund and exchange-traded fund (“ETF”) outflows resulted in funds selling municipal bonds to meet redemptions which put additional pressure on municipal bond prices. According to data from the Investment Company Institute, annual fund flows for the 12-month period ended July 31, 2023, were -$55.0 billion (outflow of over $55 billion). |
| • | New issue municipal bond supply has been lower year-to-date compared to figures from a year ago. Through July 31, 2023, year-to-date issuance was approximately $204.4 billion, down approximately 17% compared to the $246.6 billion issued for the same period a year ago. However, J.P. Morgan noted that new issue supply inside of 10 years to maturity increased slightly compared to the same period a year ago. |
| • | According to data from Bloomberg, municipal credit spreads tightened year-to-date. From December 30, 2022 through July 31, 2023, for municipal bonds rated AA, A, and BBB, credit spreads decreased approximately 4 bps, 15 bps, and 21 bps, respectively. |
| • | Looking at the AAA municipal yield curve as prepared by Refinitiv Lipper, year-to-date, 5-Year and 10-Year municipal yields increased by 19 bps and decreased by 11 bps, to 2.66% and 2.57%, respectively. |
Performance Analysis
The Fund’s total return based on net asset value (“NAV”) and market performance for the 12-month period ended July 31, 2023 was -0.44% and -0.41%, respectively, versus the Fund’s Blended Benchmark’s return of 1.59%.
Portfolio Commentary (Continued)
First Trust Municipal High Income ETF (FMHI)
Annual Report
July 31, 2023 (Unaudited)
As of July 31, 2023, the Fund’s market price of $47.00 was at a discount of approximately 0.11% to the Fund’s NAV of $47.05. The market value of the Fund’s shares fluctuates from time to time and may be higher or lower than the Fund’s NAV. The Fund’s use of Treasury futures was a positive contributor to the Fund’s performance for the 12-month period ended July 31, 2023. Key factors impacting the Fund’s performance over the 12-month period ended July 31, 2023 were:
| • | Years to Maturity: During the period, the portfolio yield curve and effective duration positions were significant reasons the Fund underperformed relative to the Blended Benchmark. In terms of the Fund’s allocation in years to a bond’s final maturity date, the Fund’s allocation to bonds with a final stated maturity date of 18+ years was the largest single contributor to the Fund’s underperformance relative to the Blended Benchmark. In addition, the Fund’s allocation and/or selection of bonds with 10-12 years to maturity, 16-18 years to maturity, and 0-2 years to maturity detracted from Fund performance. The Fund’s allocation to bonds with a stated maturity of 8-10 years was a positive contributor to the Fund’s performance relative to the Blended Benchmark. |
| • | Effective Duration: Focusing on the Fund’s effective duration allocations, the Fund’s selection of bonds with an effective duration of 10+ years was the largest single contributor to the Fund’s underperformance relative to the Blended Benchmark. The Fund’s selection and allocation of bonds with an effective duration of 0-2 years and selection of bonds with an effective duration of 7-10 years also detracted from Fund performance during the period. |
| • | Credit Rating: Regarding the Fund’s credit rating allocation relative to its Blended Benchmark, the Fund’s selection of non-rated high yield bonds was the largest single contributor to the Fund’s underperformance. The Fund’s selection of bonds in the BB, BBB, and A credit rating categories were detractors to Fund performance. Finally, the Fund’s allocation and selection of bonds rated single B was a positive contributor to Fund performance. |
| • | Sector/Industry: In terms of the Fund’s allocation to municipal bond sectors, the Fund’s selection of bonds in the special tax, health care, and charter school sectors were the largest detractors to Fund performance relative to the Blended Benchmark. The Fund’s allocation and selection of bonds in the lease sector was a modest positive contributor to Fund performance relative to the Blended Benchmark. |
| • | Distribution Rate: The distribution of $0.1545 paid on July 31, 2023 represents a tax-exempt annualized distribution rate of 3.94% based on the Fund’s closing market price of $47.00 on July 31, 2023. During the period, the Fund’s distribution rate increased six times. The Fund’s distribution rate is not constant and is subject to change over time based on the performance of the Fund. |
Market Outlook
According to the Federal Reserve’s (the “Fed”) “Dot Plot,” the Federal Funds rate is expected to reach approximately 5.625% by December 31, 2023. We expect the Fed to raise interest rates by 25 bps at either its September 20, 2023 or November 1, 2023 meeting. During the final months of 2023, we expect longer U.S. Treasury rates to become range-bound. For example, regarding the 10-Year U.S. Treasury yield, we forecast the 10-Year bonds will trade within a range of 3.75%-4.25% and would not be surprised if the yield curve inverts more significantly whereby 2-Year yields are significantly higher than 10-Year yields. During the first half of 2024, given that we forecast that U.S. gross domestic product will grow very slowly or turn negative, we would expect the 10-Year U.S. Treasury yield to gradually decline to a range of 3.50%-3.75%.
Due to our belief that the Fed will only have one more 25 bps interest rate increase before hitting the Federal Funds terminal rate of 5.50%-5.75%, we expect municipal bond price trends to become more dependent on new issue supply and municipal mutual fund/ETF fund flows, rather than U.S. Treasury price and Fed moves. Since the municipal bond market has experienced significantly lower new issue supply year-to-date and forecast revisions for all of 2023, the key variable going forward will likely be mutual fund/ETF flows. We forecast that fund flows will turn consistently positive at some point during the fourth quarter of 2023 and fund inflows will continue during the first half of 2024. In a $4 trillion market dominated by retail investors, mutual fund, ETF, and separately managed account fund flows are a key determinant to municipal market total returns, in our view. Along with U.S. Treasury yields becoming range-bound and then gradually declining during the fourth quarter of 2023 and first half of 2024, fund flows are the other key variable to our forecast for distinctly positive total returns over the next twelve months.
As measured by municipal bond defaults and credit rating upgrade to downgrade ratios, municipal bond credit quality is currently healthy. Certain sectors have seen significant credit quality recovery including airports, toll roads, and select general obligation bonds. However, for 5 of the past 6 months, negative outlook revisions exceeded positive revisions by the S&P 500® Index. We expect certain sectors of the municipal bond universe will remain under margin pressure, including hospitals and senior living facilities, as well as
Portfolio Commentary (Continued)
First Trust Municipal High Income ETF (FMHI)
Annual Report
July 31, 2023 (Unaudited)
municipal bonds dependent on office and retail mall occupancy levels and tax receipts. Given an expected slowdown in the U.S. economy, we will focus on municipal credits with leading market positions, growing utilization statistics, and healthy balance sheets. For the Fund, this has meant adding exposure to higher rated credits, specifically in the A and BB credit rating categories, while reducing exposure to non-rated (which are below investment grade) and single B rated credits. Within the high yield municipal bond universe, we will focus on higher credit quality securities and reduce exposure to lower rated high yield borrowers. We have been actively reducing fund complex exposure to borrowers that our research team views as having a distinctly negative credit rating momentum.
With this in mind, we continue to practice the discipline of our investment process where we perform fundamental credit analysis and quantitative total return scenario analysis on individual bonds and the portfolio as a whole, looking for bonds that can provide both high income and attractive total return potential over time.
First Trust Municipal High Income ETF (FMHI)
Understanding Your Fund Expenses
July 31, 2023 (Unaudited)
As a shareholder of the First Trust Municipal High Income ETF (the “Fund”), you incur two types of costs: (1) transaction costs; and (2) ongoing costs, including management fees, distribution and/or service (12b-1) fees, if any, and other Fund expenses. This Example is intended to help you understand your ongoing costs of investing in the Fund and to compare these costs with the ongoing costs of investing in other funds.
The Example is based on an investment of $1,000 invested at the beginning of the period and held through the six-month period ended July 31, 2023.
Actual Expenses
The first line in the following table provides information about actual account values and actual expenses. You may use the information in this line, together with the amount you invested, to estimate the expenses that you paid over the period. Simply divide your account value by $1,000 (for example, an $8,600 account value divided by $1,000 = 8.6), then multiply the result by the number in the first line under the heading entitled “Expenses Paid During the Six-Month Period” to estimate the expenses you paid on your account during this six-month period.
Hypothetical Example for Comparison Purposes
The second line in the following table provides information about hypothetical account values and hypothetical expenses based on the Fund’s actual expense ratio and an assumed rate of return of 5% per year before expenses, which is not the Fund’s actual return. The hypothetical account values and expenses may not be used to estimate the actual ending account balance or expenses you paid for the period. You may use this information to compare the ongoing costs of investing in the Fund and other funds. To do so, compare this 5% hypothetical example with the 5% hypothetical examples that appear in the shareholder reports of the other funds.
Please note that the expenses shown in the table are meant to highlight your ongoing costs only and do not reflect any transactional costs such as brokerage commissions. Therefore, the second line in the table is useful in comparing ongoing costs only, and will not help you determine the relative total costs of owning different funds. In addition, if these transactional costs were included, your costs would have been higher.
| | Beginning
Account Value
February 1, 2023 | Ending
Account Value
July 31, 2023 | Annualized
Expense Ratio
Based on the
Six-Month
Period | Expenses Paid
During the
Six-Month
Period (a) |
| First Trust Municipal High Income ETF (FMHI) |
| Actual | $1,000.00 | $1,005.70 | 0.70% | $3.48 |
| Hypothetical (5% return before expenses) | $1,000.00 | $1,021.32 | 0.70% | $3.51 |
| (a) | Expenses are equal to the annualized expense ratios as indicated in the table multiplied by the average account value over the period (February 1, 2023 through July 31, 2023), multiplied by 181/365 (to reflect the six-month period). |
First Trust Municipal High Income ETF (FMHI)
Portfolio of Investments
July 31, 2023
Principal
Value | | Description | | Stated
Coupon | | Stated
Maturity | | Value |
| MUNICIPAL BONDS – 98.0% |
| | | Alabama – 2.0% | | | | | | |
| $2,000,000 | | Black Belt Energy Gas Dist AL Gas Proj Rev Proj No. 6, Ser B (Mandatory put 12/01/26)
| | 4.00% | | 10/01/52 | | $1,980,404 |
| 530,000 | | Black Belt Energy Gas Dist AL Gas Proj Rev, Ser C-1 (Mandatory put 6/01/29)
| | 5.25% | | 02/01/53 | | 556,676 |
| 1,340,000 | | Black Belt Energy Gas Dist AL Gas Proj Rev, Ser F (Mandatory put 12/01/28)
| | 5.50% | | 11/01/53 | | 1,413,573 |
| 1,000,000 | | Energy SE AL A Cooperative Dist Energy Sply Rev, Ser A-1 (Mandatory put 01/01/31)
| | 5.50% | | 11/01/53 | | 1,076,847 |
| 2,425,000 | | SE Energy Auth AL Cmdy Sply Rev Proj #1, Ser A (Mandatory put 10/01/28)
| | 4.00% | | 11/01/51 | | 2,389,101 |
| 800,000 | | SE Energy Auth AL Cmdy Sply Rev Proj #4, Ser B-1 (Mandatory put 08/01/28)
| | 5.00% | | 05/01/53 | | 825,653 |
| | | | | 8,242,254 |
| | | Arizona – 3.3% | | | | | | |
| 1,790,000 | | AZ St Indl Dev Auth Edu Rev Acads of Math & Science Proj (a)
| | 5.00% | | 07/01/39 | | 1,736,411 |
| 750,000 | | AZ St Indl Dev Auth Edu Rev Doral Acdmy NV Fire Mesa & Red Rock Cmps Proj, Ser A
| | 5.00% | | 07/15/39 | | 734,926 |
| 500,000 | | AZ St Indl Dev Auth Edu Rev Doral Acdmy NV Pebble, Ser A (a)
| | 5.00% | | 07/15/40 | | 486,386 |
| 400,000 | | AZ St Indl Dev Auth Edu Rev Lone Mountain Cmps Proj, Ser A (a)
| | 5.00% | | 12/15/39 | | 378,984 |
| 1,000,000 | | AZ St Indl Dev Auth Edu Rev Pinecrest Acdmy Horizon Inspirada & St Rose Cmps, Ser A (a)
| | 5.75% | | 07/15/38 | | 1,012,660 |
| 1,055,000 | | AZ St Indl Dev Auth Edu Rev Ref Basis Sch Projs, Ser D (a)
| | 4.00% | | 07/01/27 | | 1,021,882 |
| 290,000 | | AZ St Indl Dev Auth Edu Rev Ref Doral Acdmy of Northern NV Proj, Ser A (a)
| | 4.00% | | 07/15/41 | | 237,876 |
| 1,000,000 | | AZ St Indl Dev Auth Edu Rev Ref Doral Acdmy of Northern NV Proj, Ser A (a)
| | 4.00% | | 07/15/51 | | 745,730 |
| 1,740,000 | | AZ St Indl Dev Auth Edu Rev Somerset Acdmy of LV Aliante & Skye Canyon Cmps Proj, Ser A (a)
| | 4.00% | | 12/15/41 | | 1,402,366 |
| 1,000,000 | | AZ St Indl Dev Auth Edu Rev Somerset Acdmy of LV Aliante & Skye Canyon Cmps Proj, Ser A (a)
| | 4.00% | | 12/15/51 | | 731,068 |
| 500,000 | | Glendale AZ Indl Dev Auth Sr Living Facs Rev Royal Oaks Inspirata Pointe Proj, Ser A
| | 5.00% | | 05/15/41 | | 462,731 |
| 1,035,000 | | Maricopa Cnty AZ Indl Dev Auth Edu Rev Ref Legacy Trad Schs Proj Auth, Ser B (a)
| | 5.00% | | 07/01/49 | | 940,338 |
| 1,000,000 | | Maricopa Cnty AZ Indl Dev Auth Edu Rev Ref Legacy Trad Schs Proj Auth, Ser B (a)
| | 5.00% | | 07/01/54 | | 888,184 |
| 2,000,000 | | Phoenix AZ Indl Dev Auth Hotel Rev Sr Falcon Properties LLC Proj, Ser A (a)
| | 4.00% | | 12/01/51 | | 1,538,174 |
| 100,000 | | Phoenix AZ Indl Dev Auth Stdt Hsg Rev Ref Downtown Phoenix Stdt Hsg LLC AZ St Univ Proj, Ser A
| | 5.00% | | 07/01/27 | | 103,586 |
| 1,000,000 | | Pima Cnty AZ Indl Dev Auth Sr Living Rev La Posada at Pusch Ridge Proj, Ser A (a)
| | 6.75% | | 11/15/42 | | 1,012,925 |
| | | | | 13,434,227 |
| | | Arkansas – 1.5% | | | | | | |
| 3,000,000 | | AR Dev Fin Auth Envrnmntl Rev Green Bond United States Steel Corp Proj, AMT
| | 5.45% | | 09/01/52 | | 2,999,851 |
| 1,000,000 | | AR Dev Fin Auth Envrnmntl Rev Green Bond US Steel Corp Proj, AMT
| | 5.70% | | 05/01/53 | | 1,014,889 |
| 2,000,000 | | AR St Dev Fin Auth Indl Dev Rev Green Bonds Hybar Steel Proj, Ser A, AMT (a)
| | 6.88% | | 07/01/48 | | 2,071,764 |
| | | | | 6,086,504 |
See Notes to Financial Statements
Page 9
First Trust Municipal High Income ETF (FMHI)
Portfolio of Investments (Continued)
July 31, 2023
Principal
Value | | Description | | Stated
Coupon | | Stated
Maturity | | Value |
| MUNICIPAL BONDS (Continued) |
| | | California – 6.2% | | | | | | |
| $2,500,000 | | CA Cmnty Choice Fing Auth Clean Energy Proj Rev Green Bonds, Ser D (Mandatory put 11/01/28)
| | 5.50% | | 05/01/54 | | $2,638,421 |
| 250,000 | | CA Pub Fin Auth Sr Living Rev Enso Vlg Proj Green Bond, Ser A (a)
| | 5.00% | | 11/15/46 | | 225,783 |
| 250,000 | | CA Pub Fin Auth Sr Living Rev Enso Vlg Proj Green Bond, Ser A (a)
| | 5.00% | | 11/15/51 | | 220,450 |
| 250,000 | | CA Sch Fin Auth Sch Fac Rev Ref Value Schs, Ser A (a)
| | 5.25% | | 07/01/48 | | 252,604 |
| 1,050,000 | | CA St Muni Fin Auth Chrt Sch Rev Palmdale Aerospace Acdmy Proj, Ser A (a)
| | 5.00% | | 07/01/38 | | 1,028,348 |
| 450,000 | | CA St Muni Fin Auth Chrt Sch Rev, Ser A (a)
| | 5.50% | | 06/01/38 | | 451,013 |
| 2,000,000 | | CA St Muni Fin Auth Rev CA Baptist Univ, Ser A (a)
| | 5.00% | | 11/01/46 | | 1,943,611 |
| 205,000 | | CA St Muni Fin Auth Rev Ref Eisenhower Med Ctr, Ser A
| | 5.00% | | 07/01/32 | | 214,655 |
| 1,250,000 | | CA St Muni Fin Auth Rev Ref HumanGood Oblig Grp, Ser A
| | 5.00% | | 10/01/44 | | 1,274,079 |
| 1,000,000 | | CA St Muni Fin Auth Spl Fac Rev United Airls Inc Proj, AMT
| | 4.00% | | 07/15/29 | | 992,663 |
| 1,250,000 | | CA St Poll Control Fing Auth Wtr Furnishing Rev Plant Bonds, AMT (a)
| | 5.00% | | 07/01/37 | | 1,250,298 |
| 2,000,000 | | CA St Poll Control Fing Auth Wtr Furnishing Rev Plant Bonds, AMT (a)
| | 5.00% | | 11/21/45 | | 1,990,058 |
| 1,000,000 | | CA St Sch Fin Auth Chrt Sch Rev Ref Classical Academies Oceanside Proj, Ser A (a)
| | 5.00% | | 10/01/42 | | 1,005,846 |
| 550,000 | | CA Stwd Cmntys Dev Auth Rev Loma Linda Univ Med Ctr, Ser A (a)
| | 5.00% | | 12/01/33 | | 560,610 |
| 1,500,000 | | CSCDA Cmnty Impt Auth CA Essential Hsg Rev the Link Glendale Social Bonds, Ser A-2 (a)
| | 4.00% | | 07/01/56 | | 1,053,386 |
| 500,000 | | CSCDA Cmnty Impt Auth CA Essential Hsg Rev Union S Bay Social Bonds, Ser A-2 (a)
| | 4.00% | | 07/01/56 | | 367,862 |
| 1,000,000 | | Golden St Tobacco Securitization Corp CA Tobacco Stlmt Ref, Tobacco Stlmt Asset Backed Bonds, Ser A-1
| | 5.00% | | 06/01/51 | | 1,042,097 |
| 300,000 | | Morongo Band of Mission Indians CA Rev Ref, Ser B (a)
| | 5.00% | | 10/01/42 | | 296,013 |
| 450,000 | | Palm Desert CA Spl Tax Ref Univ Park
| | 4.00% | | 09/01/41 | | 410,770 |
| 400,000 | | Roseville CA Spl Tax Svsp Westpark Federico Cmnty Facs Dt
No. 1
| | 4.00% | | 09/01/41 | | 366,957 |
| 850,000 | | Roseville CA Spl Tax The Ranch at Sierra Vista Cmnty Facs Dt
No. 1
| | 5.00% | | 09/01/48 | | 857,491 |
| 1,100,000 | | Roseville CA Spl Tax The Ranch at Sierra Vista Cmnty Facs Dt
No. 1
| | 5.00% | | 09/01/53 | | 1,105,111 |
| 1,000,000 | | San Diego Cnty CA Regl Arpt Auth Arpt Rev Subord, Ser B, AMT
| | 5.00% | | 07/01/46 | | 1,045,165 |
| 2,000,000 | | San Francisco CA City & Cnty Arpts Commn Intl Arpt Rev, Ser A, AMT
| | 5.00% | | 05/01/44 | | 2,071,541 |
| 1,000,000 | | San Francisco City & Cnty CA Cmnty Facs Dist #2016-1, Ser 2021
| | 4.00% | | 09/01/46 | | 887,848 |
| 1,615,000 | | San Luis Obispo Cnty CA Fing Auth Lease Rev Multiple Capital Projs Ref, Ser A
| | 5.25% | | 11/15/42 | | 1,794,153 |
| | | | | 25,346,833 |
| | | Colorado – 7.5% | | | | | | |
| 1,125,000 | | Allison Vly Met Dist #2 CO Ref
| | 4.70% | | 12/01/47 | | 926,546 |
| 1,000,000 | | Baseline Met Dist #1 CO Spl Rev, Ser A
| | 5.00% | | 12/01/51 | | 891,857 |
| 525,000 | | Brighton Crossing Met Dist #6 CO, Ser A
| | 5.00% | | 12/01/35 | | 500,323 |
| 1,000,000 | | Cascade Ridge Met Dist CO
| | 5.00% | | 12/01/51 | | 838,096 |
| 515,000 | | Chambers Highpoint Met Dist #2 CO
| | 5.00% | | 12/01/41 | | 461,861 |
| 750,000 | | CO St Eductnl & Cultural Facs Auth Rev Ref & Impt Chrt Sch Skyview Acdmy Proj (a)
| | 5.50% | | 07/01/49 | | 741,788 |
| 1,000,000 | | CO St Eductnl & Cultural Facs Auth Rev Ref & Impt Chrt Sch Univ Lab Bldg Corp (a)
| | 5.00% | | 12/15/45 | | 1,009,454 |
Page 10
See Notes to Financial Statements
First Trust Municipal High Income ETF (FMHI)
Portfolio of Investments (Continued)
July 31, 2023
Principal
Value | | Description | | Stated
Coupon | | Stated
Maturity | | Value |
| MUNICIPAL BONDS (Continued) |
| | | Colorado (Continued) | | | | | | |
| $2,000,000 | | CO St Hlth Facs Auth Hosp Rev Aberdeen Ridge, Ser A (b)
| | 5.00% | | 05/15/58 | | $1,458,491 |
| 1,400,000 | | CO St Hlth Facs Auth Rev Ref Christian Living Neighborhoods Proj
| | 5.00% | | 01/01/37 | | 1,272,173 |
| 950,000 | | CO St Hlth Facs Auth Rev Ref Commonspirit Hlth, Ser A-1
| | 4.00% | | 08/01/39 | | 918,719 |
| 670,000 | | CO St Hlth Facs Auth Rev Ref Frasier Proj, Ser 2023A
| | 4.00% | | 05/15/35 | | 606,378 |
| 1,125,000 | | CO St Hlth Facs Auth Rev Ref Frasier Proj, Ser 2023A
| | 4.00% | | 05/15/41 | | 930,517 |
| 625,000 | | CO St Hlth Facs Auth Rev Sr Living Ralston Creek Arvada Proj, Ser A (b) (c)
| | 5.25% | | 11/01/32 | | 300,000 |
| 1,120,000 | | Denver City & Cnty CO Arpt Rev Ref, Ser D, AMT
| | 5.75% | | 11/15/40 | | 1,283,418 |
| 1,100,000 | | Denver City & Cnty CO Arpt Rev Ref, Ser D, AMT
| | 5.75% | | 11/15/45 | | 1,242,370 |
| 1,220,000 | | Denver City & Cnty CO Arpt Rev, Ser A, AMT
| | 5.00% | | 11/15/41 | | 1,301,878 |
| 500,000 | | Denver CO Intl Busn Ctr CO Met Dist #1 Subord, Ser B
| | 6.00% | | 12/01/48 | | 499,953 |
| 1,700,000 | | Elbert & Hwy 86 CO Comml Spl Rev & Tax Supported Ref Sr Bonds, Ser A (a)
| | 5.00% | | 12/01/41 | | 1,541,613 |
| 1,510,000 | | Elbert & Hwy 86 CO Comml Spl Rev & Tax Supported Ref Sr Bonds, Ser A (a)
| | 5.00% | | 12/01/51 | | 1,269,523 |
| 1,500,000 | | Four Corners Busn Impt Dist CO Ltd Tax Supported
| | 6.00% | | 12/01/52 | | 1,382,857 |
| 1,000,000 | | Grandview Reserve Met Dist #3 CO Sr Bonds, Ser A
| | 6.25% | | 12/01/52 | | 948,565 |
| 500,000 | | Independence Met Dist #3 CO, Ser A
| | 6.25% | | 12/01/49 | | 462,324 |
| 575,000 | | Jefferson Ctr CO Met Dist #1 Spl Rev, Ser A-2
| | 4.13% | | 12/01/40 | | 486,541 |
| 1,000,000 | | Meridian Ranch Met Dist 2018 Subdistrict CO
| | 6.75% | | 12/01/52 | | 991,045 |
| 2,000,000 | | Mirabelle Met Dist #2 CO Sr, Ser A
| | 5.00% | | 12/01/49 | | 1,790,147 |
| 905,000 | | Mountain Brook Met Dist CO
| | 4.50% | | 12/01/41 | | 731,841 |
| 500,000 | | Murphy Creek Met Dist #5 CO Sr Bonds, Ser A
| | 6.00% | | 12/01/52 | | 488,490 |
| 500,000 | | Peak Met Dist #1 CO, Ser A (a)
| | 4.00% | | 12/01/35 | | 428,209 |
| 1,000,000 | | Peak Met Dist #1 CO, Ser A (a)
| | 5.00% | | 12/01/41 | | 923,864 |
| 1,500,000 | | Prairie Ctr CO Met Dist #3 Ltd Property Tax Supported Pri Ref, Ser A (a)
| | 5.00% | | 12/15/41 | | 1,483,392 |
| 500,000 | | Prairie Ctr Met Dist #7 CO
| | 4.13% | | 12/15/36 | | 443,413 |
| 785,000 | | Siena Lake Met Dist CO
| | 3.25% | | 12/01/31 | | 666,864 |
| 500,000 | | Siena Lake Met Dist CO
| | 4.00% | | 12/01/51 | | 371,610 |
| 500,000 | | Trails at Crowfoot Met Dist #3 CO Sr Ser, Ser A
| | 5.00% | | 12/01/39 | | 480,538 |
| 700,000 | | W Meadow Met Dist CO Ref Sr Bonds, Ser A (a)
| | 6.00% | | 12/01/38 | | 719,312 |
| | | | | 30,793,970 |
| | | Connecticut – 2.4% | | | | | | |
| 250,000 | | Bridgeport CT, Ser A, BAM
| | 5.00% | | 02/01/31 | | 276,191 |
| 2,000,000 | | CT St Hlth & Eductnl Facs Auth Rev Covenant Home Inc, Ser B
| | 5.00% | | 12/01/40 | | 1,996,606 |
| 2,725,000 | | CT St Hlth & Eductnl Facs Auth Rev Trinity Hlth Corp
| | 5.00% | | 12/01/45 | | 2,776,476 |
| 800,000 | | CT St Hlth & Eductnl Facs Auth Rev, Ser A
| | 4.00% | | 07/01/37 | | 782,374 |
| 1,250,000 | | CT St Spl Tax Oblig Rev, Ser A
| | 5.00% | | 05/01/41 | | 1,376,918 |
| 2,500,000 | | Harbor Point CT Infra Impt Dist Spl Oblig Rev Ref Harbor Point Proj Ltd (a)
| | 5.00% | | 04/01/39 | | 2,507,294 |
| | | | | 9,715,859 |
| | | Delaware – 0.1% | | | | | | |
| 415,000 | | Millsboro DE Spl Oblig Ref Plantation Lakes Spl Dev Dist (a)
| | 5.00% | | 07/01/28 | | 417,862 |
| | | Florida – 13.8% | | | | | | |
| 500,000 | | Alachua Cnty FL Hlth Facs Auth CCRC Ref Oak Hammock at The Univ of FL Inc Proj
| | 4.00% | | 10/01/40 | | 397,842 |
| 1,000,000 | | Ave Maria FL Stewardship Cmnty Dist Capital Impt Rev Phase 4 Master Impt Proj (a) (d)
| | 5.25% | | 05/01/43 | | 996,393 |
| 485,000 | | Babcock Ranch Cmnty Indep Spl Dist FL Spl Assmnt Rev Proj, Ser 2021
| | 4.00% | | 05/01/52 | | 381,272 |
See Notes to Financial Statements
Page 11
First Trust Municipal High Income ETF (FMHI)
Portfolio of Investments (Continued)
July 31, 2023
Principal
Value | | Description | | Stated
Coupon | | Stated
Maturity | | Value |
| MUNICIPAL BONDS (Continued) |
| | | Florida (Continued) | | | | | | |
| $1,000,000 | | Berry Bay CDD FL Spl Assmnt Rev Assmnt Area One
| | 3.63% | | 05/01/41 | | $806,812 |
| 735,000 | | Bridgewater N Cmnty Dev Dist FL Capital Impt Rev
| | 4.00% | | 05/01/42 | | 626,975 |
| 1,000,000 | | Broward Cnty FL Indl Dev Rev Var FL Pwr & Light Co Proj, Ser A, AMT (e)
| | 4.65% | | 12/01/48 | | 1,000,000 |
| 895,000 | | Capital Trust Agy FL Eductnl Facs Rev Academir Chrt Schs Inc Proj, Ser A (a)
| | 4.00% | | 07/01/41 | | 722,964 |
| 525,000 | | Capital Trust Agy FL Eductnl Facs Rev Academir Chrt Schs Inc Proj, Ser A (a)
| | 4.00% | | 07/01/51 | | 384,143 |
| 200,000 | | Capital Trust Agy FL Eductnl Facs Rev Liza Jackson Preparatory Sch Inc Proj, Ser A
| | 4.00% | | 08/01/30 | | 197,401 |
| 1,070,000 | | Capital Trust Agy FL Eductnl Facs Rev Liza Jackson Preparatory Sch Inc Proj, Ser A
| | 5.00% | | 08/01/40 | | 1,074,752 |
| 750,000 | | Charlotte Cnty FL Indl Dev Auth Util Sys Rev Town & Country Utils Proj, Ser A, AMT (a)
| | 4.00% | | 10/01/41 | | 658,511 |
| 1,000,000 | | Charlotte Cnty FL Indl Dev Auth Util Sys Rev Town & Country Utils Proj, Ser A, AMT (a)
| | 4.00% | | 10/01/51 | | 825,855 |
| 595,000 | | Coco Palms FL CDD Spl Assmnt
| | 4.50% | | 05/01/32 | | 590,947 |
| 1,000,000 | | Coco Palms FL CDD Spl Assmnt
| | 5.00% | | 05/01/46 | | 957,962 |
| 1,500,000 | | Connerton E CDD FL Spl Assmnt Area One
| | 5.25% | | 06/15/43 | | 1,520,669 |
| 600,000 | | Cypress Bluff CDD FL Spl Assmnt Del Web Proj, Ser A (a)
| | 3.63% | | 05/01/40 | | 487,567 |
| 2,650,000 | | Edgewater E CDD FL Spl Assmnt Rev Assmnt Area Two
| | 4.00% | | 05/01/42 | | 2,254,287 |
| 3,470,000 | | Epperson N CDD FL Capital Impt Rev Assmnt Area #2
| | 4.00% | | 05/01/51 | | 2,741,460 |
| 1,250,000 | | Fallschase Cmnty Dev Dist FL Spl Assmnt
| | 3.38% | | 05/01/41 | | 976,567 |
| 1,385,000 | | FL St Dev Fin Corp Eductnl Facs Rev Ref Global Outreach Chrt Acdmy Proj, Ser A (a)
| | 4.00% | | 06/30/56 | | 974,128 |
| 2,000,000 | | FL St Dev Fin Corp Sol Wst Disp Rev Var Waste Pro USA Inc Proj, AMT (Mandatory put 07/01/26) (a)
| | 6.13% | | 07/01/32 | | 2,014,673 |
| 1,005,000 | | FL St Dev Fin Corp Sr Living Rev Ref Mayflower Retmnt Cmnty Proj, Ser A (a)
| | 4.00% | | 06/01/41 | | 729,179 |
| 500,000 | | Forest Lake Cmnty Dev Dist FL Spl Assmnt Area 1 Proj (a)
| | 4.00% | | 05/01/40 | | 460,253 |
| 1,060,000 | | Gulfstream Polo Cmnty Dev Dist FL Spl Assmnt Phase 2 Proj
| | 4.38% | | 11/01/49 | | 929,961 |
| 1,000,000 | | Hills Minneola Cmnty Dev Dist FL Spl Assmnt Rev S Parcel Assmnt Area (a)
| | 4.00% | | 05/01/40 | | 865,939 |
| 750,000 | | Lakewood Ranch FL Stewardship Dist Spl Assmnt Rev N E Sector Proj Phase 1A
| | 5.00% | | 05/01/38 | | 753,073 |
| 1,325,000 | | Lakewood Ranch FL Stewardship Dist Spl Assmnt Rev Stewardship Dist Azario Proj
| | 4.00% | | 05/01/50 | | 1,054,097 |
| 2,575,000 | | Lee Cnty FL Indl Dev Auth Hlthcr Facs Rev Shell Point Waterside Hlth Proj
| | 5.00% | | 11/15/49 | | 2,411,231 |
| 1,500,000 | | LTC Ranch West Rsdl Cmnty Dev Dist Spl Assmnt Rev Assmnt Area One Proj, Ser A
| | 4.00% | | 05/01/52 | | 1,177,611 |
| 2,570,000 | | Miami-Dade Cnty FL Aviation Rev Ref, Ser A, AMT
| | 5.00% | | 10/01/38 | | 2,590,509 |
| 1,000,000 | | Miami-Dade Cnty FL Seaport Rev Ref Sr Bonds, Ser A, AMT
| | 5.00% | | 10/01/36 | | 1,082,283 |
| 2,245,000 | | Miami-Dade Cnty FL Wtr & Swr Rev Sub
| | 5.00% | | 10/01/46 | | 2,375,947 |
| 1,250,000 | | Mirada II Cmnty Dev Dist FL Cap Impt Rev
| | 4.00% | | 05/01/51 | | 981,519 |
| 1,520,000 | | N Park Isle Cmnty Dev Dist FL Spl Assmnt Rev Assmnt Area One
| | 4.50% | | 05/01/40 | | 1,408,192 |
| 1,000,000 | | N Springs FL Impt Dist Parkland Bay Assmt Area (a)
| | 4.88% | | 05/01/38 | | 981,003 |
| 1,300,000 | | Old Hickory CDD FL Spl Assmnt Spl Asmt
| | 4.00% | | 06/15/40 | | 1,143,476 |
| 465,000 | | Parkland Preserve CDD FL Spl Assmnt Rev, Ser A
| | 5.25% | | 05/01/39 | | 469,703 |
| 1,000,000 | | Pine Isle Cmnty Dev Dist FL Spl Assmnt 2021 Proj (a)
| | 3.25% | | 12/15/41 | | 799,525 |
| 1,000,000 | | Polk Cnty FL Indl Dev Auth Mineral Dev LLC Secondary Phosphate Tailings Recovery Proj (a)
| | 5.88% | | 01/01/33 | | 1,009,655 |
| 1,710,000 | | Reunion E FL CDD Spl Assmnt, Ser 2021
| | 4.00% | | 05/01/51 | | 1,383,386 |
| 770,000 | | Rivington CDD FL Spl Assmnt Rev Assmnt Area
| | 3.38% | | 05/01/31 | | 698,257 |
Page 12
See Notes to Financial Statements
First Trust Municipal High Income ETF (FMHI)
Portfolio of Investments (Continued)
July 31, 2023
Principal
Value | | Description | | Stated
Coupon | | Stated
Maturity | | Value |
| MUNICIPAL BONDS (Continued) |
| | | Florida (Continued) | | | | | | |
| $500,000 | | Saint Johns Cnty FL Indl Dev Auth Sr Living Rev Ref Vicar’s Landing Proj, Ser A
| | 4.00% | | 12/15/36 | | $428,776 |
| 750,000 | | Saint Johns Cnty FL Indl Dev Auth Sr Living Rev Ref Vicar’s Landing Proj, Ser A
| | 4.00% | | 12/15/41 | | 595,737 |
| 1,000,000 | | Saint Lucie Cnty FL Sol Wst Disp Ref FL Pwr & Light Co Pj (e)
| | 4.65% | | 05/01/24 | | 1,000,000 |
| 2,055,000 | | Sawyers Landing CDD FL Spl Assmnt Rev
| | 4.13% | | 05/01/41 | | 1,760,732 |
| 250,000 | | SE Overtown Park W Cmnty Redev Agy FL Tax, Ser A-1 (a)
| | 5.00% | | 03/01/30 | | 251,575 |
| 490,000 | | Shell Point Cmnty Dev Dist FL Spl Assmnt (a)
| | 5.25% | | 11/01/39 | | 494,357 |
| 1,000,000 | | Shingle Creek At Bronson CDD FL Spl Assmnt
| | 3.50% | | 06/15/41 | | 789,116 |
| 750,000 | | Six Mile Creek FL CDD Capital Impt Rev Assmnt Area 3 Phase 1
| | 4.00% | | 05/01/51 | | 592,534 |
| 2,580,000 | | Stillwater CDD FL Sp Assmnt Spl Assmt 2021 Proj (a)
| | 3.50% | | 06/15/41 | | 2,045,191 |
| 835,000 | | Triple Creek FL CDD Spl Assmnt Villages Q&R Proj (a)
| | 4.00% | | 11/01/51 | | 660,752 |
| 1,055,000 | | Trout Creek CDD FL Capital Impt Rev
| | 4.00% | | 05/01/51 | | 810,905 |
| 230,000 | | Villamar CDD FL Spl Assmnt
| | 4.00% | | 05/01/29 | | 226,008 |
| 2,000,000 | | Westview S CDD FL Spl Assmnt Area One 2023 Proj Area
| | 5.38% | | 05/01/43 | | 1,984,282 |
| 1,190,000 | | Wildblue CDD FL Spl Assmnt (a)
| | 4.25% | | 06/15/39 | | 1,065,231 |
| | | | | 56,601,175 |
| | | Georgia – 3.3% | | | | | | |
| 1,000,000 | | Atlanta GA Arpt Passenger Fac Charge Rev Arpt Rev Subord, Ser D, AMT
| | 4.00% | | 07/01/37 | | 992,531 |
| 1,000,000 | | Bartow Cnty GA Dev Auth Solidwaste Disp Fac Rev Var GA Pwr Co Plant Bowen Proj, AMT (e)
| | 4.80% | | 11/01/62 | | 1,000,000 |
| 4,000,000 | | Burke Cnty GA Dev Auth Poll Control Rev Adj GA Pwr Co Plant Vogtle Proj Remk (e)
| | 4.78% | | 11/01/52 | | 4,000,000 |
| 55,000 | | Fulton Cnty GA Rsdl Care Facs Elderly Auth Retmnt Fac Rev Ref Lenbrook Sq Fdtn Inc
| | 5.00% | | 07/01/31 | | 55,338 |
| 1,500,000 | | Fulton Cnty GA Rsdl Care Facs Elderly Auth Retmnt Fac Rev Ref Lenbrook Sq Fdtn Inc
| | 5.00% | | 07/01/42 | | 1,414,114 |
| 500,000 | | Geo L Smith II GA Congress Ctr Auth Convention Ctr Hotel Second Tier, Ser B (a)
| | 5.00% | | 01/01/36 | | 473,076 |
| 1,750,000 | | Main Street Nat Gas Inc GA Gas Sply Rev, Ser A (Mandatory put 12/01/29)
| | 4.00% | | 09/01/52 | | 1,720,381 |
| 1,285,000 | | Main Street Nat Gas Inc GA Gas Sply Rev, Ser C (Mandatory put 09/01/26)
| | 4.00% | | 03/01/50 | | 1,278,557 |
| 1,000,000 | | Main Street Nat Gas Inc GA Gas Sply Rev, Ser C (Mandatory put 09/01/30)
| | 5.00% | | 09/01/53 | | 1,051,797 |
| 1,000,000 | | Main Street Nat Gas Inc GA Gas Sply Rev, Ser C (Mandatory put 12/01/28)
| | 4.00% | | 05/01/52 | | 987,791 |
| 350,000 | | Muni Elec Auth of GA Plant Vogtle Units 3&4 Proj J, Ser A, AGM
| | 5.00% | | 07/01/30 | | 391,126 |
| | | | | 13,364,711 |
| | | Guam – 0.1% | | | | | | |
| 250,000 | | Guam Govt Busn Privilege Tax Rev Ref, Ser D
| | 5.00% | | 11/15/35 | | 252,023 |
| 155,000 | | Guam Govt Wtrwks Auth Wtr & Wstwtr Sys Rev, Ser A
| | 5.00% | | 01/01/50 | | 157,490 |
| | | | | 409,513 |
| | | Idaho – 0.6% | | | | | | |
| 1,000,000 | | ID Falls ID Auditorium Dist Annual Approp Ctfs, COPS (a)
| | 5.25% | | 05/15/51 | | 957,667 |
| 1,265,000 | | ID St Hlth Facs Auth Rev Ref Madison Memorial Hosp
| | 5.00% | | 09/01/30 | | 1,284,563 |
| | | | | 2,242,230 |
| | | Illinois – 3.2% | | | | | | |
| 300,000 | | Chicago IL Brd of Edu Ref Dedicated, Ser C
| | 5.00% | | 12/01/30 | | 307,533 |
| 3,500,000 | | Chicago IL Brd of Edu Ref, Ser B
| | 5.00% | | 12/01/30 | | 3,697,512 |
See Notes to Financial Statements
Page 13
First Trust Municipal High Income ETF (FMHI)
Portfolio of Investments (Continued)
July 31, 2023
Principal
Value | | Description | | Stated
Coupon | | Stated
Maturity | | Value |
| MUNICIPAL BONDS (Continued) |
| | | Illinois (Continued) | | | | | | |
| $1,000,000 | | Chicago IL Brd of Edu, Ser A
| | 5.00% | | 12/01/35 | | $1,040,375 |
| 750,000 | | Chicago IL Chicago Wks, Ser A
| | 5.50% | | 01/01/40 | | 819,035 |
| 400,000 | | Chicago IL O’Hare Intl Arpt Rev Ref Sr Lien, Ser A, AMT
| | 5.00% | | 01/01/37 | | 420,783 |
| 400,000 | | Chicago IL Ref 2003B Remk
| | 5.25% | | 01/01/29 | | 407,174 |
| 515,000 | | Chicago IL Ref, Ser C, CABS
| | (f) | | 01/01/25 | | 485,757 |
| 65,000 | | Hillside IL Tax Incr Rev Ref
| | 5.00% | | 01/01/24 | | 65,135 |
| 100,000 | | IL St
| | 5.00% | | 04/01/24 | | 100,888 |
| 250,000 | | IL St
| | 5.50% | | 05/01/26 | | 263,442 |
| 200,000 | | IL St
| | 5.00% | | 06/01/27 | | 208,461 |
| 250,000 | | IL St Fin Auth Chrt Sch Rev Ref & Impt Chicago Intl Chrt Sch Proj
| | 5.00% | | 12/01/30 | | 258,488 |
| 250,000 | | IL St Fin Auth Chrt Sch Rev Ref & Impt Chicago Intl Chrt Sch Proj
| | 5.00% | | 12/01/31 | | 258,174 |
| 100,000 | | IL St Fin Auth Stdt Hsg & Acad Fac Rev Chf Chicago LLC Univ IL Chicago Proj, Ser A
| | 5.00% | | 02/15/26 | | 100,684 |
| 300,000 | | IL St Fin Auth Stdt Hsg & Acad Fac Rev Chf Chicago LLC Univ IL Chicago Proj, Ser A
| | 5.00% | | 02/15/27 | | 303,674 |
| 145,000 | | IL St Fin Auth Stdt Hsg & Acad Fac Rev Chf Chicago LLC Univ IL Chicago Proj, Ser A
| | 5.00% | | 02/15/28 | | 147,218 |
| 2,000,000 | | IL St, Ser C
| | 5.00% | | 11/01/29 | | 2,128,206 |
| 545,000 | | IL St, Ser D
| | 5.00% | | 11/01/24 | | 554,441 |
| 1,660,000 | | Lincolnwood IL Tax Incr Allocation Rev Nts Dist 1860 Dev Proj, Ser A, COPS (a)
| | 4.82% | | 01/01/41 | | 1,524,700 |
| | | | | 13,091,680 |
| | | Indiana – 1.7% | | | | | | |
| 250,000 | | Fort Wayne IN Mf Hsg Rev Silver Birch at Cook Road (a)
| | 5.30% | | 01/01/32 | | 219,818 |
| 2,000,000 | | IN Fin Auth Midwestern Disaster Relief Rev OH Vly Elec Corp Proj Remk, Ser A
| | 4.25% | | 11/01/30 | | 2,015,445 |
| 1,360,000 | | IN St Fin Auth Envrnmntl Rev Ref Var Duke Energy IN Inc Proj Remk, Ser A-1, AMT (Mandatory put 06/01/32)
| | 4.50% | | 05/01/35 | | 1,363,779 |
| 750,000 | | IN St Fin Auth Hosp Rev Reid Hlth, AGM
| | 5.00% | | 01/01/41 | | 802,446 |
| 1,275,000 | | IN St Fin Auth Rev BHI Sr Living, Ser A (Pre-refunded maturity 11/15/23)
| | 5.88% | | 11/15/41 | | 1,282,492 |
| 200,000 | | IN St Fin Auth Rev Eductnl Facs Rock Creek Cmnty Acdmy Proj, Ser A (g)
| | 5.25% | | 07/01/28 | | 198,710 |
| 595,000 | | Plainfield IN Mf Hsg Rev Glasswater Creek Proj
| | 5.38% | | 09/01/38 | | 480,532 |
| 600,000 | | Terre Haute IN Mf Hsg Rev Silver Birch of Terre Haute Proj
| | 5.10% | | 01/01/32 | | 518,393 |
| | | | | 6,881,615 |
| | | Iowa – 0.8% | | | | | | |
| 3,000,000 | | IA St Fin Auth Midwstrn Disaster Area Rev Ref IA Fertilizer Company Proj
| | 5.00% | | 12/01/50 | | 3,035,498 |
| 300,000 | | IA St Fin Auth Midwstrn Disaster Area Rev Ref IA Fertilizer Company Proj (Mandatory put 12/01/42)
| | 5.00% | | 12/01/50 | | 306,261 |
| | | | | 3,341,759 |
| | | Kansas – 0.5% | | | | | | |
| 500,000 | | Goddard KS Sales Tax Spl Oblg Rev Ref Olympic Park Star Bond Proj
| | 3.60% | | 06/01/30 | | 474,331 |
| 175,000 | | Shawnee Cnty KS Pub Bldg Commn Rev Corrections and Parks & Rec Projs
| | 5.50% | | 09/01/34 | | 208,045 |
| 1,250,000 | | Wyandotte Cnty KS Kansas City Unif Govt Spl Oblg Rev Ref Vlg E Proj Areas 2B 3 5 (a)
| | 5.75% | | 09/01/39 | | 1,214,225 |
| | | | | 1,896,601 |
Page 14
See Notes to Financial Statements
First Trust Municipal High Income ETF (FMHI)
Portfolio of Investments (Continued)
July 31, 2023
Principal
Value | | Description | | Stated
Coupon | | Stated
Maturity | | Value |
| MUNICIPAL BONDS (Continued) |
| | | Kentucky – 2.6% | | | | | | |
| $2,000,000 | | Boyle Cnty KY Eductnl Facs Rev Ref Centre Clg, Ser A
| | 5.25% | | 06/01/43 | | $2,160,748 |
| 875,000 | | Henderson KY Exempt Facs Rev Pratt Paper LLC Proj, Ser A, AMT (a)
| | 4.45% | | 01/01/42 | | 846,744 |
| 1,000,000 | | KY St Econ Dev Fin Auth Ref Owensboro Hlth, Ser A
| | 5.00% | | 06/01/41 | | 993,865 |
| 230,000 | | KY St Univ KY St Univ Proj, COPS, BAM
| | 4.00% | | 11/01/41 | | 228,620 |
| 1,000,000 | | Louisville & Jefferson Cnty KY Met Govt Hlth Sys Rev Norton Hlthcare Inc, Ser A
| | 4.00% | | 10/01/39 | | 969,059 |
| 5,600,000 | | Meade Cnty KY Indl Bldg Rev Var Nucor Steel Brandenburg Proj Green Bond, Ser B-1 (e)
| | 5.40% | | 08/01/61 | | 5,600,000 |
| | | | | 10,799,036 |
| | | Louisiana – 1.2% | | | | | | |
| 1,500,000 | | LA St Loc Govt Envrnmntl Facs & Cmnty Dev Auth Rev Ref Westlake Chemical Corp Proj Remk
| | 3.50% | | 11/01/32 | | 1,450,331 |
| 200,000 | | Monroe LA Wtr Rev, BAM
| | 5.00% | | 11/01/32 | | 219,697 |
| 1,000,000 | | Saint James Parish LA Rev NuStar Logistics LP Proj Remk, Ser 2010 (a)
| | 6.35% | | 07/01/40 | | 1,079,619 |
| 500,000 | | Saint James Parish LA Rev Var NuStar Logistics LP Proj Remk, Ser 2010B (Mandatory put 06/01/30) (a)
| | 6.10% | | 12/01/40 | | 538,641 |
| 1,500,000 | | Saint John the Baptist Parish LA Rev Ref Var Marathon Oil Corp Proj Remk, Ser A-1 (Mandatory put 07/01/26)
| | 4.05% | | 06/01/37 | | 1,491,408 |
| | | | | 4,779,696 |
| | | Maryland – 0.9% | | | | | | |
| 1,020,000 | | Baltimore MD Spl Oblig Ref E Baltimore Rsrch Park Proj, Ser A
| | 5.00% | | 09/01/38 | | 1,023,514 |
| 175,000 | | Baltimore MD Spl Oblig Ref Sr Lien Harbor Point Proj, Ser A (a)
| | 2.95% | | 06/01/27 | | 164,992 |
| 185,000 | | Baltimore MD Spl Oblig Ref Sr Lien Harbor Point Proj, Ser A (a)
| | 3.05% | | 06/01/28 | | 171,554 |
| 200,000 | | Baltimore MD Spl Oblig Ref Sr Lien Harbor Point Proj, Ser A (a)
| | 3.15% | | 06/01/29 | | 183,300 |
| 190,000 | | Baltimore MD Spl Oblig Ref Sr Lien Harbor Point Proj, Ser A (a)
| | 3.20% | | 06/01/30 | | 172,127 |
| 900,000 | | Frederick Cnty MD Tax Incr & Spl Tax Ref Jefferson Technology Park Proj, Ser B (a)
| | 4.63% | | 07/01/43 | | 873,172 |
| 1,000,000 | | MD St Econ Dev Corp Stdt Hsg Rev Morgan St Univ Proj, Ser A
| | 5.38% | | 07/01/38 | | 1,091,240 |
| | | | | 3,679,899 |
| | | Massachusetts – 1.2% | | | | | | |
| 2,000,000 | | MA St Bay Transprtn Auth Sales Tax Rev Sr, Ser A
| | 5.00% | | 07/01/45 | | 2,042,647 |
| 500,000 | | MA St Dev Fin Agy Rev Linden Ponds Inc Fac (a)
| | 5.00% | | 11/15/28 | | 516,290 |
| 500,000 | | MA St Dev Fin Agy Rev Ref Boston Med Ctr Sustainability Bonds, Ser G
| | 5.25% | | 07/01/48 | | 528,570 |
| 1,020,000 | | MA St Dev Fin Agy Rev Ref Salem Cmnty Corp
| | 5.13% | | 01/01/40 | | 933,540 |
| 1,000,000 | | MA St Dev Fin Agy Rev Umass Dartmouth Stdt Hsg Proj
| | 5.00% | | 10/01/48 | | 920,737 |
| | | | | 4,941,784 |
| | | Michigan – 1.3% | | | | | | |
| 300,000 | | Detroit MI Downtown Dev Auth Tax Incr Rev Ref Catalyst Dev Proj, Ser A, AGM
| | 5.00% | | 07/01/31 | | 303,159 |
| 100,000 | | Detroit MI Social Bonds, Ser A
| | 5.00% | | 04/01/46 | | 100,692 |
| 2,000,000 | | Detroit MI Social Bonds, Ser A
| | 5.00% | | 04/01/50 | | 2,003,124 |
| 2,000,000 | | MI St Fin Auth Rev Henry Ford Hlth Sys, Ser A
| | 5.00% | | 11/15/48 | | 2,069,489 |
| 1,000,000 | | MI St Strategic Fund Ltd Oblg Rev Var Green Bond Recycled Brd Machine Proj, AMT (Mandatory put 10/01/26)
| | 4.00% | | 10/01/61 | | 994,671 |
| | | | | 5,471,135 |
| | | Minnesota – 0.7% | | | | | | |
| 150,000 | | Minneapolis MN Stdt Hsg Rev Riverton Cmnty Hsg Proj (a)
| | 3.80% | | 08/01/27 | | 144,128 |
See Notes to Financial Statements
Page 15
First Trust Municipal High Income ETF (FMHI)
Portfolio of Investments (Continued)
July 31, 2023
Principal
Value | | Description | | Stated
Coupon | | Stated
Maturity | | Value |
| MUNICIPAL BONDS (Continued) |
| | | Minnesota (Continued) | | | | | | |
| $1,300,000 | | Saint Paul MN Hsg & Redev Auth Chrt Sch Lease Rev Ref Hgr Ground Acdmy Proj
| | 4.25% | | 12/01/32 | | $1,285,141 |
| 105,000 | | Saint Paul MN Hsg & Redev Auth Chrt Sch Lease Rev Ref, Ser A
| | 5.00% | | 12/01/30 | | 105,767 |
| 850,000 | | Woodbury MN Chrt Sch Lease Rev Woodbury Leadership Proj, Ser A
| | 4.00% | | 07/01/41 | | 676,846 |
| 660,000 | | Woodbury MN Chrt Sch Lease Rev Woodbury Leadership Proj, Ser A
| | 4.00% | | 07/01/51 | | 478,691 |
| | | | | 2,690,573 |
| | | Mississippi – 1.3% | | | | | | |
| 3,000,000 | | MS St Busn Fin Corp Sol Wst Disp Rev Adj MS Pwr Co Proj Remk, AMT (e)
| | 4.90% | | 07/01/25 | | 3,000,000 |
| 2,500,000 | | MS St Busn Fin Corp Sol Wst Disp Rev Adj MS Pwr Co Proj Remk, AMT (e)
| | 4.90% | | 05/01/28 | | 2,500,000 |
| | | | | 5,500,000 |
| | | Missouri – 1.0% | | | | | | |
| 550,000 | | MO St Hlth & Eductnl Facs Auth Lutheran Sr Svc Projs Svcs Projs, Ser A
| | 5.00% | | 02/01/29 | | 553,626 |
| 1,000,000 | | MO St Hlth & Eductnl Facs Auth Lutheran Sr Svc Projs Svcs Projs, Ser A
| | 5.00% | | 02/01/42 | | 964,904 |
| 80,000 | | MO St Hlth & Eductnl Facs Auth Lutheran Sr Svcs
| | 5.00% | | 02/01/35 | | 79,861 |
| 550,000 | | MO St Hlth & Eductnl Facs Auth Lutheran Sr Svcs Projs
| | 4.00% | | 02/01/32 | | 511,578 |
| 10,000 | | MO St Hlth & Eductnl Facs Auth Med Rsrch Lutheran Svcs, Ser A
| | 5.00% | | 02/01/29 | | 10,054 |
| 2,000,000 | | Taney Cnty MO Indl Dev Auth Sales Tax Rev Big Cedar Infra Proj (a)
| | 6.00% | | 10/01/49 | | 1,978,977 |
| | | | | 4,099,000 |
| | | Nebraska – 0.4% | | | | | | |
| 1,425,000 | | Centrl Plains Energy Proj NE Gas Proj Rev Proj No. 4 (Mandatory put 01/01/24)
| | 5.00% | | 03/01/50 | | 1,429,684 |
| | | Nevada – 0.6% | | | | | | |
| 775,000 | | Henderson NV Loc Impt Dists Rainbow Canyon Phase II Roject
| | 5.00% | | 03/01/38 | | 773,381 |
| 1,000,000 | | Henderson NV Loc Impt Dists Rainbow Canyon Phase II Roject
| | 5.25% | | 03/01/48 | | 986,359 |
| 190,000 | | N Las Vegas NV Loc Impt Vly Vista Spl Impt Dist #64
| | 4.00% | | 06/01/29 | | 184,991 |
| 700,000 | | NV Dept of Busn & Ind NV Doral Acdmy, Ser A
| | 5.00% | | 07/15/37 | | 696,797 |
| | | | | 2,641,528 |
| | | New Hampshire – 0.4% | | | | | | |
| 2,000,000 | | Natl Fin Auth NH Rev Ref Green Bond, Ser B, AMT (Mandatory put 07/02/40) (a)
| | 3.75% | | 07/01/45 | | 1,565,404 |
| | | New Jersey – 0.4% | | | | | | |
| 100,000 | | NJ St Econ Dev Auth Spl Fac Rev Ref Port Newark Container Terminal LLC Proj, AMT
| | 5.00% | | 10/01/25 | | 101,819 |
| 430,000 | | NJ St Hgr Edu Asst Auth Stdt Loan Rev, Ser 1A, AMT
| | 4.00% | | 12/01/30 | | 425,331 |
| 560,000 | | NJ St Transprtn Trust Fund Auth Fun Auth Transprtn Prog Bonds, Ser CC
| | 5.25% | | 06/15/41 | | 619,203 |
| 500,000 | | NJ St Transprtn Trust Fund Auth Ref Transprtn Sys, Ser A
| | 5.00% | | 12/15/30 | | 544,988 |
| | | | | 1,691,341 |
| | | New Mexico – 0.3% | | | | | | |
| 535,000 | | Winrock Town Ctr NM Tax Incr Dev Dist #1 Ref Sr Lien (a)
| | 3.75% | | 05/01/28 | | 506,584 |
| 500,000 | | Winrock Town Ctr NM Tax Incr Dev Dist #1 Ref Sr Lien (a)
| | 4.00% | | 05/01/33 | | 443,918 |
Page 16
See Notes to Financial Statements
First Trust Municipal High Income ETF (FMHI)
Portfolio of Investments (Continued)
July 31, 2023
Principal
Value | | Description | | Stated
Coupon | | Stated
Maturity | | Value |
| MUNICIPAL BONDS (Continued) |
| | | New Mexico (Continued) | | | | | | |
| $500,000 | | Winrock Town Ctr NM Tax Incr Dev Dist #1 Ref Sr Lien (a)
| | 4.25% | | 05/01/40 | | $421,626 |
| | | | | 1,372,128 |
| | | New York – 5.4% | | | | | | |
| 1,000,000 | | Build NYC Res Corp NY Rev Social Bond Kipp NYC Pub Sch Facs Canal W Proj
| | 5.25% | | 07/01/52 | | 1,017,224 |
| 950,000 | | Nassau Cnty NY Loc Econ Asst Corp Edl Rev Roosevelt Children Acdmy Chrt Sch Proj, Ser A
| | 5.00% | | 07/01/43 | | 972,899 |
| 3,000,000 | | New York City NY Indl Dev Agy Rev Liberty 123 Wash Proj Remk (e)
| | 5.25% | | 10/01/42 | | 3,000,000 |
| 2,000,000 | | New York City NY Muni Wtr Fin Auth Wtr & Swr Sys Rev Adjustable 2nd General Resolution Fiscal 2014, Ser AA-2 (e)
| | 4.65% | | 06/15/50 | | 2,000,000 |
| 595,000 | | New York City NY Muni Wtr Fin Auth Wtr & Swr Sys Rev Ref 2nd Gen Resolution Fiscal 2018 Block 4, Ser AA
| | 5.00% | | 06/15/38 | | 632,212 |
| 2,625,000 | | New York City NY Transitional Fin Auth Rev Future Tax Secured Subord Bonds, Ser C-1
| | 4.00% | | 02/01/42 | | 2,598,226 |
| 2,000,000 | | NY NY, Ser B, Subser B-1
| | 5.25% | | 10/01/41 | | 2,275,293 |
| 1,925,000 | | NY St Dorm Auth St Personal Income Tax Rev Ref, Ser A
| | 3.00% | | 03/15/42 | | 1,602,610 |
| 500,000 | | NY St Transprtn Dev Corp Exempt Fac Rev NY St Thruway Srvc Areas Proj, AMT
| | 4.00% | | 10/31/46 | | 439,228 |
| 1,000,000 | | NY St Transprtn Dev Corp Spl Fac Rev Ref American Airls Inc John F Kennedy Intl Arpt Proj, AMT
| | 5.00% | | 08/01/31 | | 1,001,086 |
| 1,865,000 | | NY St Transprtn Dev Corp Spl Fac Rev Ref John F. Kennedy Intl Arpt Proj, AMT
| | 5.25% | | 08/01/31 | | 1,937,198 |
| 500,000 | | Oyster Bay NY, Ser A, AGM
| | 2.00% | | 03/01/35 | | 422,542 |
| 2,810,000 | | Tsasc Inc NY Tsasc Inc Rev Ref Turbo Sub, Ser B
| | 5.00% | | 06/01/48 | | 2,631,529 |
| 100,000 | | Westchester Cnty NY Loc Dev Corp Rev Ref Miriam Osborn Memorial Home Assn Proj
| | 5.00% | | 07/01/34 | | 105,038 |
| 1,000,000 | | Westchester Cnty NY Loc Dev Corp Rev Ref Pur Sr Learning Cmnty Inc Proj, Ser A (a)
| | 5.00% | | 07/01/56 | | 783,906 |
| 460,000 | | Westchester NY Tobacco Asset Securitization Ref Sr, Ser B
| | 5.00% | | 06/01/41 | | 470,370 |
| | | | | 21,889,361 |
| | | North Carolina – 2.0% | | | | | | |
| 3,300,000 | | NC St Med Care Commn Hlth Care Facs Rev Lutheran Svcs For The Aging Ref, Ser A
| | 4.00% | | 03/01/41 | | 2,561,782 |
| 500,000 | | NC St Med Care Commn Hlth Care Facs Rev Ref Pennybyrn at Maryfield
| | 5.00% | | 10/01/30 | | 497,292 |
| 1,940,000 | | NC St Med Care Commn Retmnt Facs Rev Pennybyrn at Maryfield Proj, Ser A
| | 5.00% | | 10/01/45 | | 1,716,729 |
| 2,850,000 | | NC St Med Care Commn Retmnt Facs Rev Ref Southminster Inc
| | 5.00% | | 10/01/37 | | 2,670,834 |
| 715,000 | | NC St Med Care Commn Retmnt Facs Rev The Forest at Duke Proj
| | 4.00% | | 09/01/46 | | 580,545 |
| | | | | 8,027,182 |
| | | North Dakota – 0.1% | | | | | | |
| 520,000 | | Horace ND Ref
| | 3.00% | | 05/01/36 | | 435,433 |
| | | Ohio – 3.8% | | | | | | |
| 1,000,000 | | Brunswick OH City Sch Dist, BAM
| | 5.25% | | 12/01/53 | | 1,086,744 |
| 6,360,000 | | Buckeye OH Tobacco Stlmt Fing Auth Ref Sr, Ser B-2, Class 2
| | 5.00% | | 06/01/55 | | 5,920,160 |
| 1,000,000 | | Cleveland Cuyahoga Cnty OH Port Auth Tax Incr Fing Rev Ref Sr Flats E Bank Proj, Ser A (a)
| | 4.00% | | 12/01/55 | | 853,235 |
| 1,000,000 | | Cleveland OH, Ser A
| | 5.00% | | 12/01/44 | | 1,088,575 |
See Notes to Financial Statements
Page 17
First Trust Municipal High Income ETF (FMHI)
Portfolio of Investments (Continued)
July 31, 2023
Principal
Value | | Description | | Stated
Coupon | | Stated
Maturity | | Value |
| MUNICIPAL BONDS (Continued) |
| | | Ohio (Continued) | | | | | | |
| $3,000,000 | | OH St Air Quality Dev Auth Exempt Facs Rev AMG Vanadium Proj, AMT (a)
| | 5.00% | | 07/01/49 | | $2,755,250 |
| 1,000,000 | | OH St Hgr Eductnl Fac Commn Ref Rev Judson Oblig Grp 2020 Proj, Ser A
| | 5.00% | | 12/01/45 | | 903,940 |
| 2,535,000 | | OH St Hosp Rev Ref Var Univ Hosps Hlth Sys Inc, Ser C (e)
| | 4.50% | | 01/15/51 | | 2,535,000 |
| 490,000 | | Port of Gtr Cincinnati Dev Auth OH Rev (a)
| | 3.75% | | 12/01/31 | | 432,374 |
| | | | | 15,575,278 |
| | | Oklahoma – 0.9% | | | | | | |
| 2,500,000 | | OK St Dev Fin Auth Sr OK Proton Ctr, Ser A1 (a)
| | 7.25% | | 09/01/51 | | 2,563,725 |
| 1,165,000 | | Tulsa Cnty OK Indl Auth Sr Living Cmnty Rev Ref Montereau Inc Proj
| | 5.25% | | 11/15/37 | | 1,170,224 |
| | | | | 3,733,949 |
| | | Oregon – 1.2% | | | | | | |
| 290,000 | | Clackamas Cnty OR Hosp Fac Auth Rev Mary’s Woods at Marylhurst Inc Proj, Ser A
| | 5.00% | | 05/15/26 | | 287,234 |
| 1,000,000 | | Clackamas Cnty OR Hosp Fac Auth Rev Ref Rose Villa Proj, Ser A
| | 5.13% | | 11/15/40 | | 949,865 |
| 2,250,000 | | Clackamas Cnty OR Hosp Fac Auth Rev Ref Rose Villa Proj, Ser A
| | 5.38% | | 11/15/55 | | 2,080,206 |
| 500,000 | | OR St Facs Auth Rev Legacy Hlth Proj, Ser A
| | 4.13% | | 06/01/52 | | 470,825 |
| 500,000 | | Salem OR Hosp Fac Auth Rev Capital Manor Proj
| | 5.00% | | 05/15/38 | | 489,418 |
| 750,000 | | Union Cnty OR Hosp Fac Auth Grande Ronde Hosp
| | 5.00% | | 07/01/42 | | 760,251 |
| | | | | 5,037,799 |
| | | Pennsylvania – 2.7% | | | | | | |
| 300,000 | | Allegheny Cnty PA Hosp Dev Auth Ref Allegheny Hlth Network Obligted Grp Issue, Ser A
| | 5.00% | | 04/01/32 | | 317,193 |
| 1,855,000 | | Allegheny Cnty PA Hosp Dev Auth Ref Allegheny Hlth Network Obligted Grp Issue, Ser A
| | 5.00% | | 04/01/47 | | 1,871,406 |
| 500,000 | | Allegheny Cnty PA Indl Dev Auth Envrnmtl Impt Rev Ref United States Steel Corp Proj
| | 4.88% | | 11/01/24 | | 503,604 |
| 1,030,000 | | Berks Cnty PA Muni Auth Univ Rev Alvernia Univ Proj
| | 5.00% | | 10/01/39 | | 982,668 |
| 100,000 | | Chester Cnty PA Indl Dev Auth Renaissance Acdmy Chrt Sch
| | 5.00% | | 10/01/34 | | 99,671 |
| 250,000 | | Lancaster Cnty PA Hosp Auth Hlthcare Facs Rev Moravian Manors Inc Proj, Ser A
| | 5.00% | | 06/15/28 | | 246,802 |
| 1,110,000 | | Lancaster Cnty PA Hosp Auth Hlthcare Facs Rev Moravian Manors Inc Proj, Ser A
| | 5.00% | | 06/15/38 | | 1,016,036 |
| 250,000 | | Latrobe PA Indl Dev Auth Univ Rev Ref Seton Hill Univ
| | 4.00% | | 03/01/38 | | 220,172 |
| 1,200,000 | | Latrobe PA Indl Dev Auth Univ Rev Ref Seton Hill Univ
| | 4.00% | | 03/01/46 | | 966,207 |
| 1,655,000 | | Montgomery Cnty PA Indl Dev Auth Exempt Facs Rev Var Constellation Energy Genration LLC Proj Ref, Ser C, AMT (Mandatory Put 04/03/28)
| | 4.45% | | 10/01/34 | | 1,684,942 |
| 1,250,000 | | PA St Econ Dev Fing Auth T/E Priv Activity Rev The Penndot Major Bridges Package One Proj P3 Proj, AMT
| | 5.25% | | 06/30/35 | | 1,408,668 |
| 10,000 | | PA St Turnpike Commn Turnpike Rev Ref Sub, Ser B
| | 5.00% | | 06/01/39 | | 10,282 |
| 1,000,000 | | Philadelphia PA Arpt Rev Ref Priv Activity, AGM, AMT
| | 4.00% | | 07/01/38 | | 980,663 |
| 850,000 | | Philadelphia PA Auth For Indl Dev Chrt Sch Rev Philadelphia E&T Chrt High Sch, Ser A
| | 4.00% | | 06/01/56 | | 623,578 |
| 215,000 | | Philadelphia PA Auth for Indl Dev Revs Kipp Philadelphia Chrt Sch Proj, Ser A
| | 5.00% | | 04/01/36 | | 210,642 |
| 125,000 | | W Cornwall Twp PA Muni Auth Ref Lebanon Vly Brethren Home Proj, Ser A
| | 4.00% | | 11/15/41 | | 101,173 |
| | | | | 11,243,707 |
Page 18
See Notes to Financial Statements
First Trust Municipal High Income ETF (FMHI)
Portfolio of Investments (Continued)
July 31, 2023
Principal
Value | | Description | | Stated
Coupon | | Stated
Maturity | | Value |
| MUNICIPAL BONDS (Continued) |
| | | Puerto Rico – 3.5% | | | | | | |
| $1,000,000 | | Puerto Rico Cmwlth Hwy & Transprtn Auth Restructured Toll Restructured, Ser A, CABS
| | 5.00% | | 07/01/62 | | $985,000 |
| 2,000,000 | | Puerto Rico Cmwlth Hwy & Transprtn Auth Restructured Toll Restructured, Ser B, CABS
| | (f) | | 07/01/32 | | 1,274,700 |
| 2,900,000 | | Puerto Rico Cmwlth Restructured, Ser A1
| | 4.00% | | 07/01/33 | | 2,758,182 |
| 2,500,000 | | Puerto Rico Cmwlth Restructured, Ser A1
| | 4.00% | | 07/01/35 | | 2,315,745 |
| 2,000,000 | | Puerto Rico Cmwlth Restructured, Ser A1
| | 4.00% | | 07/01/41 | | 1,722,391 |
| 1,559,000 | | Puerto Rico Sales Tax Fing Corp Sales Tax Rev Restructured, Ser A-1
| | 4.50% | | 07/01/34 | | 1,549,647 |
| 2,294,000 | | Puerto Rico Sales Tax Fing Corp Sales Tax Rev Restructured, Ser A-1
| | 4.55% | | 07/01/40 | | 2,223,344 |
| 1,500,000 | | Puerto Rico Sales Tax Fing Corp Sales Tax Rev Restructured, Ser A-2
| | 4.33% | | 07/01/40 | | 1,415,752 |
| | | | | 14,244,761 |
| | | South Carolina – 0.6% | | | | | | |
| 425,000 | | Berkeley Cnty SC Assmnt Rev Nexton Impt Dist
| | 4.00% | | 11/01/30 | | 402,622 |
| 230,000 | | Lancaster Cnty SC Assmnt Rev Ref Walnut Creek Impt Dist, Ser A-1
| | 5.00% | | 12/01/31 | | 230,090 |
| 245,000 | | SC St Jobs Econ Dev Auth Econ Dev Rev Ref The Woodlands at Furman
| | 4.00% | | 11/15/32 | | 223,886 |
| 1,045,000 | | SC St Jobs Econ Dev Auth Econ Dev Rev Ref The Woodlands at Furman
| | 5.25% | | 11/15/47 | | 962,875 |
| 865,000 | | SC St Jobs Econ Dev Auth Econ Dev Rev Woodlands at Furman Proj, Ser A
| | 5.00% | | 11/15/42 | | 783,359 |
| | | | | 2,602,832 |
| | | Tennessee – 1.1% | | | | | | |
| 1,200,000 | | Chattanooga TN Hlth Eductnl & Hsg Fac Brd Rev Ref Commonspirit Hlth, Ser A-1
| | 4.00% | | 08/01/37 | | 1,180,859 |
| 25,000 | | Chattanooga TN Hlth Eductnl & Hsg Fac Brd Rev Ref Stdt Hsg CDFI Phase I
| | 5.00% | | 10/01/23 | | 25,026 |
| 1,000,000 | | Memphis TN Hlth Eductnl & Hsg Fac Brd Mf Hsg Rev Var Memphis Towers Apts Proj Remk
| | 3.40% | | 12/01/23 | | 996,166 |
| 2,500,000 | | TN St Energy Acq Corp Gas Rev (Mandatory put 11/01/25)
| | 4.00% | | 11/01/49 | | 2,486,771 |
| | | | | 4,688,822 |
| | | Texas – 6.4% | | | | | | |
| 1,200,000 | | Arlington TX Hgr Edu Fin Corp Edu Rev Ref Legacy Trad Schs TX Proj, Ser A
| | 4.00% | | 02/15/31 | | 1,066,906 |
| 1,645,000 | | Arlington TX Hgr Edu Fin Corp Edu Rev Ref Legacy Trad Schs TX Proj, Ser A
| | 4.13% | | 02/15/41 | | 1,248,214 |
| 2,000,000 | | Austin TX Arpt Sys Rev, Ser B, AMT
| | 5.00% | | 11/15/46 | | 2,016,748 |
| 556,000 | | Crandall TX Spl Assmnt Rev Cartwright Ranch Pub Impt Dt Impt Area #1 Proj (a)
| | 4.25% | | 09/15/41 | | 490,023 |
| 500,000 | | Harris Cnty TX Indl Dev Corp Var Ref Energy Transfer Proj (Mandatory put 06/01/33)
| | 4.05% | | 11/01/50 | | 503,777 |
| 2,500,000 | | Houston TX Arpt Sys Rev Ref Subord Lien, Ser A, AGM, AMT
| | 5.25% | | 07/01/48 | | 2,696,729 |
| 1,000,000 | | Houston TX Arpt Sys Rev Ref United Airls Inc Arpt Impt Proj, Ser C, AMT
| | 5.00% | | 07/15/27 | | 1,011,298 |
| 1,250,000 | | Houston TX Arpt Sys Rev Ref United Airls Inc Terminal E Proj, Ser A, AMT
| | 5.00% | | 07/01/27 | | 1,263,864 |
| 1,085,000 | | Houston TX Arpt Sys Rev United Airlines Inc Terminal E Proj, Ser A, AMT
| | 4.00% | | 07/01/41 | | 969,402 |
See Notes to Financial Statements
Page 19
First Trust Municipal High Income ETF (FMHI)
Portfolio of Investments (Continued)
July 31, 2023
Principal
Value | | Description | | Stated
Coupon | | Stated
Maturity | | Value |
| MUNICIPAL BONDS (Continued) |
| | | Texas (Continued) | | | | | | |
| $1,065,000 | | Houston TX Arpt Sys Rev United Airls Inc Terminal Impt Proj, Ser B-1, AMT
| | 4.00% | | 07/15/41 | | $951,393 |
| 450,000 | | Justin TX Spl Assmnt Rev Timberbrook Pub Imp Dt #1 Imp Area #2 Proj (a)
| | 3.38% | | 09/01/41 | | 356,738 |
| 690,000 | | Kyle TX Spl Assmnt Rev 6 Creeks Pub Impt Dist Area #4 (a)
| | 4.50% | | 09/01/33 | | 688,316 |
| 250,000 | | Kyle TX Spl Assmnt Rev 6 Creeks Pub Impt Dist Impt Area #1 (a)
| | 4.13% | | 09/01/29 | | 244,012 |
| 500,000 | | Kyle TX Spl Assmnt Rev 6 Creeks Pub Impt Dist Impt Area #1 (a)
| | 4.63% | | 09/01/39 | | 477,779 |
| 225,000 | | La Vernia TX Hgr Edu Fin Corp Edu Rev Meridian World Sch (a)
| | 4.35% | | 08/15/25 | | 226,906 |
| 1,000,000 | | Liberty Hill TX Spl Assmnt Rev Butler Farms Pub Imp Dt Areas #1 and 2 Proj (a)
| | 3.38% | | 09/01/42 | | 762,626 |
| 1,350,000 | | Liberty Hill TX Spl Assmnt Rev Butler Farms Pub Imp Dt Areas #1 and 2 Proj (a)
| | 4.00% | | 09/01/52 | | 1,057,753 |
| 1,410,000 | | Matagorda Cnty TX Nav Dist #1 Ref AEP Tex Centrl Company Proj, Ser B-2 Remk
| | 4.00% | | 06/01/30 | | 1,404,896 |
| 300,000 | | New Hope Cultural Ed Facs Fin Corp TX Retmnt Fac Rev Ref Longhorn Vlg Proj
| | 5.00% | | 01/01/37 | | 281,549 |
| 285,000 | | New Hope Cultural Edu Facs Fin Corp TX Retmnt Fac Rev Ref Longhorn Vlg Proj
| | 5.00% | | 01/01/32 | | 275,490 |
| 600,000 | | Newark Hgr Edu Fin Corp TX Edu Rev Hughen Ctr Inc Proj, Ser A
| | 5.00% | | 08/15/42 | | 650,369 |
| 2,750,000 | | North Parkway Muni Mgmt Dist #1 TX Spl Assmnt Rev Major Impts Proj (a)
| | 5.00% | | 09/15/51 | | 2,530,129 |
| 1,100,000 | | Princeton TX Spl Assmnt Rev Whitewing Trails Pub Impr Dist #2 Phase 2 Proj Rev (a)
| | 5.13% | | 09/01/43 | | 1,091,098 |
| 1,550,000 | | Princeton TX Spl Assmnt Rev Winchester Pub Impr Dist #2 Proj (a)
| | 5.13% | | 09/01/42 | | 1,527,361 |
| 223,000 | | Rowlett TX Spl Assmnt Rev Trails at Cottonwood Creek Pub Imp Dist Major Imp Area Proj (a)
| | 3.75% | | 09/15/31 | | 206,036 |
| 500,000 | | Rowlett TX Spl Assmnt Rev Trails at Cottonwood Creek Pub Imp Dist Major Imp Area Proj (a)
| | 4.13% | | 09/15/41 | | 440,637 |
| 765,000 | | Rowlett TX Spl Assmnt Rev Trails at Cottonwood Creek Pub Imp Dist Major Imp Area Proj (a)
| | 4.25% | | 09/15/51 | | 647,721 |
| 1,000,000 | | Tarrant Cnty TX Cultural Edu Facs Fin Corp Hosp Rev Methodist Hosp of Dallas Proj
| | 4.00% | | 10/01/41 | | 986,981 |
| 250,000 | | TX St Transprtn Commn Central TX Turnpike Sys Rev Ref, Ser B
| | 5.00% | | 08/15/37 | | 252,523 |
| | | | | 26,327,274 |
| | | Utah – 3.2% | | | | | | |
| 3,000,000 | | Black Desert Pub Infra Dist Sr Bonds, Ser A (a)
| | 4.00% | | 03/01/51 | | 2,284,811 |
| 500,000 | | Downtown E Streetcar Swr Pub Infra Dist Sr Lien, Ser A (a)
| | 5.75% | | 03/01/42 | | 500,251 |
| 1,000,000 | | Med Sch Cmps Pub Infra Dist UT, Ser A (a)
| | 5.25% | | 02/01/40 | | 874,290 |
| 1,000,000 | | Mida Golf & Equestrian Ctr Pub Infra Dist UT Ltd (a)
| | 4.25% | | 06/01/41 | | 771,240 |
| 3,000,000 | | Mida Golf & Equestrian Ctr Pub Infra Dist UT Ltd (a)
| | 4.63% | | 06/01/57 | | 2,112,461 |
| 3,000,000 | | Military Installation Dev Auth UT Tax Allocation Rev, Ser A-2
| | 4.00% | | 06/01/52 | | 2,224,372 |
| 500,000 | | Red Bridge Pub Infra Dist #1 UT Sr Infra Dist, Ser 1-A (a)
| | 4.13% | | 02/01/41 | | 392,865 |
| 1,500,000 | | Red Bridge Pub Infra Dist #1 UT Sr Infra Dist, Ser 1-A (a)
| | 4.38% | | 02/01/51 | | 1,134,436 |
| 475,000 | | UT St Chrt Sch Fin Auth Chrt Sch Rev Mountain W Montessori Acdmy Proj, Ser A (a)
| | 5.00% | | 06/15/39 | | 456,357 |
| 675,000 | | UT St Chrt Sch Fin Auth Chrt Sch Rev Wallace Stegner Acdmy Proj, Ser A (a)
| | 5.00% | | 06/15/39 | | 624,044 |
| 1,605,000 | | UT St Chrt Sch Fin Auth Chrt Sch Rev Wallace Stegner Acdmy, Ser A (a)
| | 5.63% | | 06/15/42 | | 1,564,834 |
| | | | | 12,939,961 |
Page 20
See Notes to Financial Statements
First Trust Municipal High Income ETF (FMHI)
Portfolio of Investments (Continued)
July 31, 2023
Principal
Value | | Description | | Stated
Coupon | | Stated
Maturity | | Value |
| MUNICIPAL BONDS (Continued) |
| | | Virginia – 1.7% | | | | | | |
| $2,250,000 | | Botetourt Cnty VA Rsdl Care Fac Rev Ref Glebe Inc, Ser A
| | 6.00% | | 07/01/44 | | $2,231,339 |
| 1,000,000 | | Henrico Cnty VA Econ Dev Auth Rsdl Care Fac Rev Westminster Cantebury Richmond, Ser A
| | 5.00% | | 10/01/42 | | 1,028,138 |
| 2,000,000 | | VA Small Busn Fing Auth Priv Activity Rev Sr Transform 66 P3 Proj, AMT
| | 5.00% | | 12/31/49 | | 2,021,837 |
| 750,000 | | VA St Small Busn Fing Auth Rsdl Fac Care Rev Ref Lifespire of VA
| | 4.00% | | 12/01/31 | | 721,121 |
| 1,000,000 | | Virginia Beach VA Dev Auth Rsdl Care Fac Rev Ref Westminster Canterbury on Chesapeake Bay
| | 5.00% | | 09/01/29 | | 1,004,409 |
| | | | | 7,006,844 |
| | | Washington – 1.5% | | | | | | |
| 560,000 | | Kalispel Tribe of Indians Priority Dist WA Rev, Ser A (a)
| | 5.00% | | 01/01/32 | | 575,658 |
| 2,000,000 | | Port of Seattle WA Rev Ref Intermediate Lein Priv Activity, Ser C, AMT
| | 5.00% | | 08/01/46 | | 2,093,956 |
| 1,000,000 | | Port of Seattle WA Rev Ref Intermediate Lien Priv Activity, Ser C, AMT
| | 5.00% | | 08/01/39 | | 1,061,784 |
| 875,000 | | WA St Hgr Edu Facs Auth Seattle Univ Proj Rev
| | 4.00% | | 05/01/45 | | 830,747 |
| 710,000 | | WA St Hsg Fin Commn Nonprofit Rev Spokane Int Acad Proj, Ser A (a)
| | 5.00% | | 07/01/50 | | 658,585 |
| 968,350 | | WA St Hsg Fin Commn Social Ctf, Ser A-1
| | 3.50% | | 12/20/35 | | 895,291 |
| | | | | 6,116,021 |
| | | West Virginia – 0.9% | | | | | | |
| 750,000 | | Monongalia Cnty WV Commn TX Incr Rev Ref Dev Dist #4 Univ Twn Centre, Ser A (a)
| | 5.00% | | 06/01/33 | | 768,714 |
| 500,000 | | Monongalia Cnty WV Commn TX Incr Rev Ref Dev Dist #4 Univ Twn Centre, Ser A (a)
| | 5.75% | | 06/01/43 | | 526,423 |
| 2,000,000 | | S Charleston WV Spl Dist Excise Tax Ref S Charleston Park Place Proj, Ser A (a)
| | 4.50% | | 06/01/50 | | 1,549,018 |
| 1,000,000 | | WV St Econ Dev Auth Sol Wst Disp Facs Var Sr Arch Res Proj, AMT (Mandatory put 07/01/25)
| | 5.00% | | 07/01/45 | | 1,001,713 |
| | | | | 3,845,868 |
| | | Wisconsin – 3.4% | | | | | | |
| 445,000 | | Pub Fin Auth WI Chrt Sch Rev Eno River Acdmy Proj, Ser A (a)
| | 4.00% | | 06/15/30 | | 425,612 |
| 810,000 | | Pub Fin Auth WI Chrt Sch Rev Eno River Acdmy Proj, Ser A (a)
| | 5.00% | | 06/15/40 | | 776,967 |
| 685,000 | | Pub Fin Auth WI Chrt Sch Rev Eno River Acdmy Proj, Ser A (a)
| | 5.00% | | 06/15/54 | | 614,759 |
| 475,000 | | Pub Fin Auth WI Chrt Sch Rev Founders of Acdmy Las Vegas Proj, Ser A (a)
| | 4.00% | | 07/01/30 | | 439,104 |
| 405,000 | | Pub Fin Auth WI Chrt Sch Rev Ltd American Prep Acdmy Las Vegas Proj, Ser A (a)
| | 4.20% | | 07/15/27 | | 389,848 |
| 375,000 | | Pub Fin Auth WI Chrt Sch Rev Ltd American Prep Acdmy Las Vegas Proj, Ser A (a)
| | 5.13% | | 07/15/37 | | 361,414 |
| 250,000 | | Pub Fin Auth WI Edu Rev Coral Acdmy Science Las Vegas, Ser A
| | 5.00% | | 07/01/45 | | 249,263 |
| 200,000 | | Pub Fin Auth WI Edu Rev Ref Mountain Island Chrt Sch Ltd
| | 5.00% | | 07/01/52 | | 192,957 |
| 160,000 | | Pub Fin Auth WI Eductnl Rev Piedmont Cmnty Chrt Sch
| | 5.00% | | 06/15/27 | | 163,345 |
| 1,500,000 | | Pub Fin Auth WI Hosp Rev Ref Carson Vly Med Ctr, Ser A
| | 4.00% | | 12/01/41 | | 1,288,521 |
| 1,000,000 | | Pub Fin Auth WI Hotel Rev Sr Lien Grand Hyatt San Antonio Hotel Acq Proj, Ser A
| | 5.00% | | 02/01/42 | | 1,018,777 |
| 1,335,000 | | Pub Fin Auth WI Retmnt Cmntys Rev Acts Retmnt Life Cmntys Inc Oblig Grp, Ser A
| | 5.00% | | 11/15/41 | | 1,289,877 |
| 2,000,000 | | Pub Fin Auth WI Rev Sr Proton Intl AR LLC, Ser A (a)
| | 6.85% | | 01/01/51 | | 1,501,072 |
| 1,000,000 | | Pub Fin Auth WI Rev Unrefunded Roseman Univ Hlth Sciences Proj (a)
| | 4.00% | | 04/01/42 | | 838,666 |
See Notes to Financial Statements
Page 21
First Trust Municipal High Income ETF (FMHI)
Portfolio of Investments (Continued)
July 31, 2023
Principal
Value | | Description | | Stated
Coupon | | Stated
Maturity | | Value |
| MUNICIPAL BONDS (Continued) |
| | | Wisconsin (Continued) | | | | | | |
| $1,275,000 | | Pub Fin Auth WI Sr Living Rev Ref Mary’s Woods at Marylhurst Proj, Ser A (a)
| | 5.00% | | 05/15/32 | | $1,224,936 |
| 1,900,000 | | Pub Fin Auth WI Stdt Hsg Rev NC A&T Real Estate Fdtn LLC Proj, Ser B
| | 5.00% | | 06/01/44 | | 1,851,869 |
| 1,000,000 | | WI St Hlth & Eductnl Facs Auth Rev Bellin Memorial Hosp Inc, Ser A
| | 5.50% | | 12/01/52 | | 1,082,779 |
| | | | | 13,709,766 |
| | | Wyoming – 0.3% | | | | | | |
| 1,000,000 | | Consol Muni Elec Pwr Sys WY Jt Pwrs Brd Sys Jt Pwrs Brd Ref Electrical Sys Proj
| | 5.25% | | 06/01/40 | | 1,100,438 |
| Total Investments – 98.0%
| | 401,053,297 |
| | (Cost $414,464,751) | | |
| | Net Other Assets and Liabilities – 2.0%
| | 8,274,267 |
| | Net Assets – 100.0%
| | $409,327,564 |
Futures Contracts (See Note 2D - Futures Contracts in the Notes to Financial Statements):
| Futures Contracts | | Position | | Number of
Contracts | | Expiration
Date | | Notional
Value | | Unrealized
Appreciation
(Depreciation)/
Value |
| 10-Year U.S. Treasury Notes | | Short | | 91 | | Sep 2023 | | $ (10,137,969) | | $21,922 |
| Ultra 10-Year U.S. Treasury Notes | | Short | | 92 | | Sep 2023 | | (10,762,562) | | 108,660 |
| | | | | | | | | $(20,900,531) | | $130,582 |
| (a) | This security, sold within the terms of a private placement memorandum, is exempt from registration upon resale under Rule 144A of the Securities Act of 1933, as amended (the “1933 Act”), and may be resold in transactions exempt from registration, normally to qualified institutional buyers. Pursuant to procedures adopted by the Trust’s Board of Trustees, this security has been determined to be liquid by First Trust Advisors L.P. (the “Advisor”). Although market instability can result in periods of increased overall market illiquidity, liquidity for each security is determined based on security specific factors and assumptions, which require subjective judgment. At July 31, 2023, securities noted as such amounted to $105,818,387 or 25.9% of net assets. |
| (b) | Pursuant to procedures adopted by the Trust’s Board of Trustees, this security has been determined to be illiquid by the Advisor. |
| (c) | This issuer is in default and interest is not being accrued by the Fund. |
| (d) | When-issued security. The interest rate shown reflects the rate in effect at July 31, 2023. Interest will begin accruing on the security’s first settlement date. |
| (e) | Variable Rate Demand bond. Interest rate is reset periodically by the agent based on current market conditions. |
| (f) | Zero coupon bond. |
| (g) | This security, sold within the terms of a private placement memorandum, is exempt from registration upon resale under Rule 144A of the 1933 Act, and may be resold in transactions exempt from registration, normally to qualified institutional buyers (see Note 2C - Restricted Securities in the Notes to Financial Statements). |
| Abbreviations throughout the Portfolio of Investments: |
| AGM | Assured Guaranty Municipal Corp. |
| AMT | Alternative Minimum Tax |
| BAM | Build America Mutual |
| CABS | Capital Appreciation Bonds |
| COPS | Certificates of Participation |
Page 22
See Notes to Financial Statements
First Trust Municipal High Income ETF (FMHI)
Portfolio of Investments (Continued)
July 31, 2023
Valuation Inputs
A summary of the inputs used to value the Fund’s investments as of July 31, 2023 is as follows (see Note 2A - Portfolio Valuation in the Notes to Financial Statements):
| | Total
Value at
7/31/2023 | Level 1
Quoted
Prices | Level 2
Significant
Observable
Inputs | Level 3
Significant
Unobservable
Inputs |
Municipal Bonds*
| $ 401,053,297 | $ — | $ 401,053,297 | $ — |
Futures Contracts**
| 130,582 | 130,582 | — | — |
Total
| $ 401,183,879 | $ 130,582 | $ 401,053,297 | $— |
| * | See Portfolio of Investments for state and territory breakout. |
| ** | Includes cumulative appreciation/depreciation on futures contracts as reported in the Futures Contracts table. Only the current day’s variation margin is presented on the Statement of Assets and Liabilities. |
See Notes to Financial Statements
Page 23
First Trust Municipal High Income ETF (FMHI)
Statement of Assets and Liabilities
July 31, 2023
| ASSETS: | |
Investments, at value
| $ 401,053,297 |
Cash
| 1,060,677 |
Cash segregated as collateral for open futures contracts
| 439,600 |
| Receivables: | |
Fund shares sold
| 4,706,411 |
Interest
| 4,058,992 |
Investment securities sold
| 222,816 |
Miscellaneous
| 7,625 |
Total Assets
| 411,549,418 |
| LIABILITIES: | |
| Payables: | |
Investment securities purchased
| 1,973,630 |
Investment advisory fees
| 233,912 |
Variation margin
| 14,312 |
Total Liabilities
| 2,221,854 |
NET ASSETS
| $409,327,564 |
| NET ASSETS consist of: | |
Paid-in capital
| $ 456,705,794 |
Par value
| 87,000 |
Accumulated distributable earnings (loss)
| (47,465,230) |
NET ASSETS
| $409,327,564 |
NET ASSET VALUE, per share
| $47.05 |
Number of shares outstanding (unlimited number of shares authorized, par value $0.01 per share)
| 8,700,002 |
Investments, at cost
| $414,464,751 |
Page 24
See Notes to Financial Statements
First Trust Municipal High Income ETF (FMHI)
Statement of Operations
For the Year Ended July 31, 2023
| INVESTMENT INCOME: | |
Interest
| $ 15,006,589 |
Other
| 18,000 |
Total investment income
| 15,024,589 |
| EXPENSES: | |
Investment advisory fees
| 2,321,932 |
Total expenses
| 2,321,932 |
Fees waived by the investment advisor
| (155,286) |
Net expenses
| 2,166,646 |
NET INVESTMENT INCOME (LOSS)
| 12,857,943 |
| NET REALIZED AND UNREALIZED GAIN (LOSS): | |
| Net realized gain (loss) on: | |
Investments
| (16,034,892) |
Futures contracts
| 1,373,309 |
Net realized gain (loss)
| (14,661,583) |
| Net change in unrealized appreciation (depreciation) on: | |
Investments
| (256,896) |
Futures contracts
| 726,895 |
Net change in unrealized appreciation (depreciation)
| 469,999 |
NET REALIZED AND UNREALIZED GAIN (LOSS)
| (14,191,584) |
NET INCREASE (DECREASE) IN NET ASSETS RESULTING FROM OPERATIONS
| $(1,333,641) |
See Notes to Financial Statements
Page 25
First Trust Municipal High Income ETF (FMHI)
Statements of Changes in Net Assets
| | Year
Ended
7/31/2023 | | Year
Ended
7/31/2022 |
| OPERATIONS: | | | |
Net investment income (loss)
| $ 12,857,943 | | $ 9,675,790 |
Net realized gain (loss)
| (14,661,583) | | (17,058,308) |
Net change in unrealized appreciation (depreciation)
| 469,999 | | (32,136,292) |
Net increase (decrease) in net assets resulting from operations
| (1,333,641) | | (39,518,810) |
| DISTRIBUTIONS TO SHAREHOLDERS FROM: | | | |
Investment operations
| (12,644,552) | | (9,560,177) |
Return of capital
| (178,777) | | (505,451) |
Total distributions to shareholders
| (12,823,329) | | (10,065,628) |
| SHAREHOLDER TRANSACTIONS: | | | |
Proceeds from shares sold
| 198,607,434 | | 234,880,882 |
Cost of shares redeemed
| (114,077,874) | | (129,802,313) |
Net increase (decrease) in net assets resulting from shareholder transactions
| 84,529,560 | | 105,078,569 |
Total increase (decrease) in net assets
| 70,372,590 | | 55,494,131 |
| NET ASSETS: | | | |
Beginning of period
| 338,954,974 | | 283,460,843 |
End of period
| $ 409,327,564 | | $ 338,954,974 |
| CHANGES IN SHARES OUTSTANDING: | | | |
Shares outstanding, beginning of period
| 6,900,002 | | 5,000,002 |
Shares sold
| 4,250,000 | | 4,450,000 |
Shares redeemed
| (2,450,000) | | (2,550,000) |
Shares outstanding, end of period
| 8,700,002 | | 6,900,002 |
Page 26
See Notes to Financial Statements
First Trust Municipal High Income ETF (FMHI)
Financial Highlights
For a share outstanding throughout each period
| | Year Ended July 31, |
| 2023 | | 2022 | | 2021 | | 2020 | | 2019 |
Net asset value, beginning of period
| $ 49.12 | | $ 56.69 | | $ 51.93 | | $ 52.48 | | $ 50.32 |
| Income from investment operations: | | | | | | | | | |
Net investment income (loss)
| 1.82 (a) | | 1.50 | | 1.59 | | 1.64 | | 1.69 |
Net realized and unrealized gain (loss)
| (2.08) | | (7.50) | | 4.83 (b) | | (0.48) | | 2.27 |
Total from investment operations
| (0.26) | | (6.00) | | 6.42 | | 1.16 | | 3.96 |
| Distributions paid to shareholders from: | | | | | | | | | |
Net investment income
| (1.78) | | (1.49) | | (1.59) | | (1.62) | | (1.67) |
Return of capital
| (0.03) | | (0.08) | | (0.07) | | (0.09) | | (0.13) |
Total distributions
| (1.81) | | (1.57) | | (1.66) | | (1.71) | | (1.80) |
Net asset value, end of period
| $47.05 | | $49.12 | | $56.69 | | $51.93 | | $52.48 |
Total return (c)
| (0.44)% | | (10.74)% | | 12.57% (b) | | 2.25% | | 8.05% |
| Ratios to average net assets/supplemental data: | | | | | | | | | |
Net assets, end of period (in 000’s)
| $ 409,328 | | $ 338,955 | | $ 283,461 | | $ 111,650 | | $ 62,979 |
Ratio of total expenses to average net assets
| 0.70% | | 0.70% | | 0.70% | | 0.70% | | 0.70% |
Ratio of net expenses to average net assets
| 0.65% | | 0.55% | | 0.55% | | 0.55% | | 0.55% |
Ratio of net investment income (loss) to average net assets
| 3.88% | | 2.87% | | 3.00% | | 3.22% | | 3.44% |
Portfolio turnover rate (d)
| 69% | | 79% | | 19% | | 89% | | 71% |
| (a) | Based on average shares outstanding. |
| (b) | The Fund received a reimbursement from the advisor in the amount of $469 in connection with a trade error, which represents less than $0.01 per share. Since the advisor reimbursed the Fund, there was no effect on the Fund’s total return. |
| (c) | Total return is calculated assuming an initial investment made at the net asset value at the beginning of the period, reinvestment of all distributions at net asset value during the period, and redemption at net asset value on the last day of the period. The returns presented do not reflect the deduction of taxes that a shareholder would pay on Fund distributions or the redemption or sale of Fund shares. Total return is calculated for the time period presented and is not annualized for periods of less than a year. The total returns would have been lower if certain fees had not been waived by the investment advisor. |
| (d) | Portfolio turnover is calculated for the time period presented and is not annualized for periods of less than a year and does not include securities received or delivered from processing creations or redemptions and in-kind transactions. |
See Notes to Financial Statements
Page 27
Notes to Financial Statements
First Trust Municipal High Income ETF (FMHI)
July 31, 2023
1. Organization
First Trust Exchange-Traded Fund III (the “Trust”) is an open-end management investment company organized as a Massachusetts business trust on January 9, 2008, and is registered with the Securities and Exchange Commission under the Investment Company Act of 1940, as amended (the “1940 Act”).
The Trust currently consists of seventeen funds that are offering shares. This report covers the First Trust Municipal High Income ETF (the “Fund”), a diversified series of the Trust, which trades under the ticker “FMHI” on The Nasdaq Stock Market LLC (“Nasdaq”). The Fund represents a separate series of beneficial interest in the Trust. Unlike conventional mutual funds, the Fund issues and redeems shares on a continuous basis, at net asset value (“NAV”), only in large blocks of shares known as “Creation Units.”
The primary investment objective of the Fund is to provide federally tax-exempt income, and its secondary objective is long-term capital appreciation. Under normal market conditions, the Fund seeks to achieve its investment objectives by investing at least 80% of its net assets (including investment borrowings) in municipal debt securities that pay interest that is exempt from regular federal income taxes. There can be no assurance that the Fund will achieve its investment objectives. The Fund may not be appropriate for all investors.
2. Significant Accounting Policies
The Fund is considered an investment company and follows accounting and reporting guidance under Financial Accounting Standards Board (“FASB”) Accounting Standards Codification Topic 946, “Financial Services-Investment Companies.” The following is a summary of significant accounting policies consistently followed by the Fund in the preparation of the financial statements. The preparation of the financial statements in accordance with accounting principles generally accepted in the United States of America (“U.S. GAAP”) requires management to make estimates and assumptions that affect the reported amounts and disclosures in the financial statements. Actual results could differ from those estimates.
A. Portfolio Valuation
The Fund’s NAV is determined daily as of the close of regular trading on the New York Stock Exchange (“NYSE”), normally 4:00 p.m. Eastern time, on each day the NYSE is open for trading. If the NYSE closes early on a valuation day, the NAV is determined as of that time. Domestic debt securities are priced using data reflecting the earlier closing of the principal markets for those securities. The Fund’s NAV is calculated by dividing the value of all assets of the Fund (including accrued interest and dividends), less all liabilities (including accrued expenses and dividends declared but unpaid), by the total number of shares outstanding.
The Fund’s investments are valued daily at market value or, in the absence of market value with respect to any portfolio securities, at fair value. Market value prices represent readily available market quotations such as last sale or official closing prices from a national or foreign exchange (i.e., a regulated market) and are primarily obtained from third-party pricing services. Fair value prices represent any prices not considered market value prices and are either obtained from a third-party pricing service or are determined by the Pricing Committee of the Fund’s investment advisor, First Trust Advisors L.P. (“First Trust” or the “Advisor”), in accordance with valuation procedures approved by the Trust’s Board of Trustees, and in accordance with provisions of the 1940 Act and rules thereunder. Investments valued by the Advisor’s Pricing Committee, if any, are footnoted as such in the footnotes to the Portfolio of Investments. The Fund’s investments are valued as follows:
Municipal securities and other debt securities are fair valued on the basis of fair valuations provided by a third-party pricing service approved by the Advisor’s Pricing Committee, which may use the following valuation inputs when available:
| 1) | benchmark yields; |
| 2) | reported trades; |
| 3) | broker/dealer quotes; |
| 4) | issuer spreads; |
| 5) | benchmark securities; |
| 6) | bids and offers; and |
| 7) | reference data including market research publications. |
Pricing services generally value fixed-income securities assuming orderly transactions of an institutional round lot size, but a
Fund may hold or transact in such securities in smaller, odd lot sizes. Odd lots may trade at lower prices than institutional round
lots.
Exchange-traded futures contracts are valued at the end of the day settlement price.
Notes to Financial Statements (Continued)
First Trust Municipal High Income ETF (FMHI)
July 31, 2023
Fixed income and other debt securities having a remaining maturity of sixty days or less when purchased are fair valued at cost adjusted for amortization of premiums and accretion of discounts (amortized cost), provided the Advisor’s Pricing Committee has determined that the use of amortized cost is an appropriate reflection of fair value given market and issuer-specific conditions existing at the time of the determination. Factors that may be considered in determining the appropriateness of the use of amortized cost include, but are not limited to, the following:
| 1) | the credit conditions in the relevant market and changes thereto; |
| 2) | the liquidity conditions in the relevant market and changes thereto; |
| 3) | the interest rate conditions in the relevant market and changes thereto (such as significant changes in interest rates); |
| 4) | issuer-specific conditions (such as significant credit deterioration); and |
| 5) | any other market-based data the Advisor’s Pricing Committee considers relevant. In this regard, the Advisor’s Pricing Committee may use last-obtained market-based data to assist it when valuing portfolio securities using amortized cost. |
Certain securities may not be able to be priced by pre-established pricing methods. Such securities may be valued by the Advisor’s Pricing Committee at fair value. These securities generally include, but are not limited to, restricted securities (securities which may not be publicly sold without registration under the Securities Act of 1933, as amended (the “1933 Act”)) for which a third-party pricing service is unable to provide a market price; securities whose trading has been formally suspended; a security whose market or fair value price is not available from a pre-established pricing source; a security with respect to which an event has occurred that is likely to materially affect the value of the security after the market has closed but before the calculation of the Fund’s NAV or make it difficult or impossible to obtain a reliable market quotation; and a security whose price, as provided by the third-party pricing service, does not reflect the security’s fair value. As a general principle, the current fair value of a security would appear to be the amount which the owner might reasonably expect to receive for the security upon its current sale. When fair value prices are used, generally they will differ from market quotations or official closing prices on the applicable exchanges. A variety of factors may be considered in determining the fair value of such securities, including, but not limited to, the following:
| 1) | the fundamental business data relating to the issuer; |
| 2) | an evaluation of the forces which influence the market in which these securities are purchased and sold; |
| 3) | the type, size and cost of the security; |
| 4) | the financial statements of the issuer; |
| 5) | the credit quality and cash flow of the issuer, based on the Advisor’s or external analysis; |
| 6) | the information as to any transactions in or offers for the security; |
| 7) | the price and extent of public trading in similar securities (or equity securities) of the issuer/borrower, or comparable companies; |
| 8) | the coupon payments; |
| 9) | the quality, value and salability of collateral, if any, securing the security; and |
| 10) | other relevant factors. |
The Fund is subject to fair value accounting standards that define fair value, establish the framework for measuring fair value and provide a three-level hierarchy for fair valuation based upon the inputs to the valuation as of the measurement date. The three levels of the fair value hierarchy are as follows:
| • | Level 1 – Level 1 inputs are quoted prices in active markets for identical investments. An active market is a market in which transactions for the investment occur with sufficient frequency and volume to provide pricing information on an ongoing basis. |
| • | Level 2 – Level 2 inputs are observable inputs, either directly or indirectly, and include the following: |
| o | Quoted prices for similar investments in active markets. |
| o | Quoted prices for identical or similar investments in markets that are non-active. A non-active market is a market where there are few transactions for the investment, the prices are not current, or price quotations vary substantially either over time or among market makers, or in which little information is released publicly. |
| o | Inputs other than quoted prices that are observable for the investment (for example, interest rates and yield curves observable at commonly quoted intervals, volatilities, prepayment speeds, loss severities, credit risks, and default rates). |
| o | Inputs that are derived principally from or corroborated by observable market data by correlation or other means. |
| • | Level 3 – Level 3 inputs are unobservable inputs. Unobservable inputs may reflect the reporting entity’s own assumptions about the assumptions that market participants would use in pricing the investment. |
Notes to Financial Statements (Continued)
First Trust Municipal High Income ETF (FMHI)
July 31, 2023
The inputs or methodologies used for valuing investments are not necessarily an indication of the risk associated with investing in those investments. A summary of the inputs used to value the Fund’s investments as of July 31, 2023, is included with the Fund’s Portfolio of Investments.
B. Securities Transactions and Investment Income
Securities transactions are recorded as of the trade date. Realized gains and losses from securities transactions are recorded on the identified cost basis. Interest income is recorded daily on the accrual basis. Amortization of premiums and accretion of discounts are recorded using the effective interest method.
Securities purchased or sold on a when-issued or delayed-delivery basis may have extended settlement periods. The value of the security so purchased is subject to market fluctuations during this period. The Fund maintains liquid assets with a current value at least equal to the amount of its when-issued or delayed-delivery securities. At July 31, 2023, the Fund held $996,393 of when-issued or delayed-delivery securities.
C. Restricted Securities
The Fund invests in restricted securities, which are securities that may not be offered for public sale without first being registered under the 1933 Act. Prior to registration, restricted securities may only be resold in transactions exempt from registration under Rule 144A under the 1933 Act, normally to qualified institutional buyers. As of July 31, 2023, the Fund held restricted securities as shown in the following table that the Advisor has deemed illiquid pursuant to procedures adopted by the Trust’s Board of Trustees. Although market instability can result in periods of increased overall market illiquidity, liquidity for each security is determined based on security-specific factors and assumptions, which require subjective judgment. The Fund does not have the right to demand that such securities be registered. These securities are valued according to the valuation procedures as stated in the Portfolio Valuation note (Note 2A) and are not expressed as a discount to the carrying value of a comparable unrestricted security. There are no unrestricted securities with the same maturity dates and yields for these issuers.
| Security | Acquisition
Date | Principal
Value | Current Price | Carrying
Cost | Value | % of
Net
Assets |
| IN St Fin Auth Rev Eductnl Facs Rock Creek Cmnty Acdmy Proj, Ser A, 5.25%, 07/01/28 | 08/31/18 | $200,000 | $99.36 | $201,282 | $198,710 | 0.05% |
D. Futures Contracts
The Fund may purchase or sell (i.e., is long or short) exchange-listed futures contracts to hedge against changes in interest rates (interest rate risk). Futures contracts are agreements between the Fund and a counterparty to buy or sell a specific quantity of an underlying instrument at a specified price and at a specified date. Depending on the terms of the contract, futures contracts are settled either through physical delivery of the underlying instrument on the settlement date or by payment of a cash settlement amount on the settlement date. Open futures contracts can also be closed out prior to settlement by entering into an offsetting transaction in a matching futures contract. If the Fund is not able to enter into an offsetting transaction, the Fund will continue to be required to maintain margin deposits on the futures contract. When the contract is closed or expires, the Fund records a realized gain or loss equal to the difference between the value of the contract at the time it was opened and the value at the time it was closed or expired. This gain or loss is included in “Net realized gain (loss) on futures contracts” on the Statement of Operations.
Upon entering into a futures contract, the Fund must deposit funds, called margin, with its custodian in the name of the clearing broker equal to a specified percentage of the current value of the contract. Open futures contracts are marked to market daily with the change in value recognized as a component of “Net change in unrealized appreciation (depreciation) on futures contracts” on the Statement of Operations. This daily fluctuation in the value of the contracts is also known as variation margin and is included in “Variation margin” payable or receivable on the Statement of Assets and Liabilities.
If market conditions change unexpectedly, the Fund may not achieve the anticipated benefits of the futures contract and may realize a loss. The use of futures contracts involves the risk of imperfect correlation in movements in the price of the futures contracts, interest rates and the underlying instruments.
Restricted cash segregated as collateral for futures contracts in the amount of $439,600 is shown as “Cash segregated as collateral for open futures contracts” on the Statement of Assets and Liabilities.
Notes to Financial Statements (Continued)
First Trust Municipal High Income ETF (FMHI)
July 31, 2023
E. Dividends and Distributions to Shareholders
Dividends from net investment income, if any, are declared and paid monthly by the Fund, or as the Board of Trustees may determine from time to time. Distributions of net realized capital gains earned by the Fund, if any, are distributed at least annually. The Fund may
also designate a portion of the amount paid to redeeming shareholders as a distribution for tax purposes.
Distributions from net investment income and realized capital gains are determined in accordance with federal income tax regulations, which may differ from U.S. GAAP. Certain capital accounts in the financial statements are periodically adjusted for permanent differences in order to reflect their tax character. These permanent differences are primarily due to the varying treatment of income and gain/loss on portfolio securities held by the Fund and have no impact on net assets or NAV per share. Temporary differences, which arise from recognizing certain items of income, expense and gain/loss in different periods for financial statement and tax purposes, will reverse at some time in the future.
The tax character of distributions paid by the Fund during the fiscal years ended July 31, 2023 and 2022, was as follows:
| Distributions paid from: | 2023 | 2022 |
Ordinary income
| $122,735 | $19,097 |
Capital gains
| — | — |
Tax-exempt income
| 12,521,817 | 9,541,080 |
Return of capital
| 178,777 | 505,451 |
As of July 31, 2023, the components of distributable earnings on a tax basis were as follows:
Undistributed ordinary income
| $— |
Accumulated capital and other gain (loss)
| (33,632,415) |
Net unrealized appreciation (depreciation)
| (13,832,815) |
F. Income Taxes
The Fund intends to continue to qualify as a regulated investment company by complying with the requirements under Subchapter M of the Internal Revenue Code of 1986, as amended (the “Code”), which includes distributing substantially all of its net investment income and net realized gains to shareholders. Accordingly, no provision has been made for federal and state income taxes. However, due to the timing and amount of distributions, the Fund may be subject to an excise tax of 4% of the amount by which approximately 98% of the Fund’s taxable income exceeds the distributions from such taxable income for the calendar year.
In addition, the Fund intends to invest in such municipal securities to allow it to pay shareholders “exempt dividends” as defined in the Code.
The Fund is subject to accounting standards that establish a minimum threshold for recognizing, and a system for measuring, the benefits of a tax position taken or expected to be taken in a tax return. Taxable years ended 2020, 2021, 2022, and 2023 remain open to federal and state audit. As of July 31, 2023, management has evaluated the application of these standards to the Fund, and has determined that no provision for income tax is required in the Fund’s financial statements for uncertain tax positions.
The Fund intends to utilize provisions of the federal income tax laws, which allow it to carry a realized capital loss forward indefinitely following the year of the loss and offset such loss against any future realized capital gains. The Fund is subject to certain limitations under U.S. tax rules on the use of capital loss carryforwards and net unrealized built-in losses. These limitations apply when there has been a 50% change in ownership. At July 31, 2023, for federal income tax purposes, the Fund had $33,632,415 of capital loss carryforwards available, to the extent provided by regulations, to offset future capital gains.
Certain losses realized during the current fiscal year may be deferred and treated as occurring on the first day of the following fiscal year for federal income tax purposes. For the fiscal year ended July 31, 2023, the Fund had no net ordinary losses.
In order to present paid-in capital and accumulated distributable earnings (loss) (which consists of accumulated net investment income (loss), accumulated net realized gain (loss) on investments and net unrealized appreciation (depreciation) on investments) on the Statement of Assets and Liabilities that more closely represent their tax character, certain adjustments have been made to paid-in capital, accumulated net investment income (loss) and accumulated net realized gain (loss) on investments. These adjustments are primarily due to the difference between book and tax treatments of income and gains on various investment securities held by the
Notes to Financial Statements (Continued)
First Trust Municipal High Income ETF (FMHI)
July 31, 2023
Fund. The results of operations and net assets were not affected by these adjustments. For the fiscal year ended July 31, 2023, the adjustments for the Fund were as follows:
Accumulated
Net Investment
Income (Loss) | | Accumulated
Net Realized
Gain (Loss)
on Investments | | Paid-in
Capital |
| $(47,011) | | $47,011 | | $— |
As of July 31, 2023, the aggregate cost, gross unrealized appreciation, gross unrealized depreciation, and net unrealized appreciation/(depreciation) on investments (including short positions and derivatives, if any) for federal income tax purposes were as follows:
| Tax Cost | | Gross
Unrealized
Appreciation | | Gross
Unrealized
(Depreciation) | | Net Unrealized
Appreciation
(Depreciation) |
| $415,016,694 | | $4,928,454 | | $(18,761,269) | | $(13,832,815) |
G. Expenses
Expenses, other than the investment advisory fee and other excluded expenses, are paid by the Advisor (See Note 3).
3. Investment Advisory Fee, Affiliated Transactions and Other Fee Arrangements
First Trust, the investment advisor to the Fund, is a limited partnership with one limited partner, Grace Partners of DuPage L.P., and one general partner, The Charger Corporation. The Charger Corporation is an Illinois corporation controlled by James A. Bowen, Chief Executive Officer of First Trust. First Trust is responsible for the selection and ongoing monitoring of the securities in the Fund’s portfolio, managing the Fund’s business affairs and providing certain administrative services necessary for the management of the Fund.
Pursuant to the Investment Management Agreement between the Trust and the Advisor, First Trust manages the investment of the Fund’s assets and is responsible for the Fund’s expenses, including the cost of transfer agency, custody, fund administration, legal, audit and other services, but excluding fee payments under the Investment Management Agreement, interest, taxes, acquired fund fees and expenses, if any, brokerage commissions and other expenses connected with the execution of portfolio transactions, distribution and service fees pursuant to a Rule 12b-1 plan, if any, and extraordinary expenses. First Trust also provides fund reporting services to the Fund for a flat annual fee in the amount of $9,250, which is covered under the annual unitary management fee. Effective November 1, 2022, the annual unitary management fee payable by the Fund to First Trust for these services will be reduced at certain levels of the Fund’s net assets (“breakpoints”) and calculated pursuant to the following schedule:
| Breakpoints | | | | | | | |
| Fund net assets up to and including $2.5 billion | 0.7000% | | | | | | |
| Fund net assets greater than $2.5 billion up to and including $5 billion | 0.6825% | | | | | | |
| Fund net assets greater than $5 billion up to and including $7.5 billion | 0.6650% | | | | | | |
| Fund net assets greater than $7.5 billion up to and including $10 billion | 0.6475% | | | | | | |
| Fund net assets greater than $10 billion | 0.6300% | | | | | | |
Prior to November 1, 2022, the Fund paid First Trust an annual unitary management fee equal to 0.70% of its average daily net assets.
The Trust’s Board of Trustees and the Advisor have entered into a Fee Waiver Agreement for the Fund pursuant to which the Advisor contractually agreed to waive management fees of 0.15% of average daily net assets until November 30, 2022. First Trust does not have the right to recover the fees waived. The Fee Waiver Agreement terminated on November 30, 2022. During the fiscal year ended July 31, 2023, the Advisor waived fees of $155,286.
The Trust has multiple service agreements with Brown Brothers Harriman & Co. (“BBH”). Under the service agreements, BBH
performs custodial, fund accounting, certain administrative services, and transfer agency services for the Fund. As custodian, BBH is responsible for custody of the Fund’s assets. As fund accountant and administrator, BBH is responsible for maintaining the books and records of the Fund’s securities and cash. As transfer agent, BBH is responsible for maintaining shareholder records for the Fund.
Notes to Financial Statements (Continued)
First Trust Municipal High Income ETF (FMHI)
July 31, 2023
Each Trustee who is not an officer or employee of First Trust, any sub-advisor or any of their affiliates (“Independent Trustees”) is paid a fixed annual retainer that is allocated equally among each fund in the First Trust Fund Complex. Each Independent Trustee is also paid an annual per fund fee that varies based on whether the fund is a closed-end or other actively managed fund, a target outcome fund or an index fund.
Additionally, the Lead Independent Trustee and the Chairs of the Audit Committee, Nominating and Governance Committee and Valuation Committee are paid annual fees to serve in such capacities, with such compensation allocated pro rata among each fund in the First Trust Fund Complex based on net assets. Independent Trustees are reimbursed for travel and out-of-pocket expenses in connection with all meetings. The Lead Independent Trustee and Committee Chairs rotate every three years. The officers and “Interested” Trustee receive no compensation from the Trust for acting in such capacities.
4. Purchases and Sales of Securities
For the fiscal year ended July 31, 2023, the cost of purchases and proceeds from sales of investments, excluding short term investments and in-kind transactions, were $303,156,488 and $221,943,850, respectively.
For the fiscal year ended July 31, 2023, the Fund had no in-kind transactions.
5. Derivative Transactions
The following table presents the type of derivatives held by the Fund at July 31, 2023, the primary underlying risk exposure and the location of these instruments as presented on the Statement of Assets and Liabilities.
| | | | | Asset Derivatives | | Liability Derivatives |
Derivative
Instrument | | Risk
Exposure | | Statement of Assets and
Liabilities Location | | Value | | Statement of Assets and
Liabilities Location | | Value |
| Futures contracts | | Interest Rate Risk | | Unrealized appreciation
on futures contracts* | | $ 130,582 | | Unrealized depreciation
on futures contracts* | | $ – |
*Includes cumulative appreciation/depreciation on futures contracts as reported in the Futures Contracts table. Only the current day’s variation margin is presented on the Statement of Assets and Liabilities.
The following table presents the amount of net realized gain (loss) and change in net unrealized appreciation (depreciation) recognized for the fiscal year ended July 31, 2023, on derivative instruments, as well as the primary underlying risk exposure associated with each instrument.
| Statement of Operations Location | |
| Interest Rate Risk Exposure | |
| Net realized gain (loss) on futures contracts | $1,373,309 |
| Net change in unrealized appreciation (depreciation) on futures contracts | 726,895 |
During the fiscal year ended July 31, 2023, the notional value of futures contracts opened and closed were $188,293,979 and $186,507,053, respectively.
The Fund does not have the right to offset financial assets and liabilities related to futures contracts on the Statement of Assets and Liabilities.
6. Creations, Redemptions and Transaction Fees
The Fund generally issues and redeems its shares in primary market transactions through a creation and redemption mechanism and does not sell or redeem individual shares. Instead, financial entities known as “Authorized Participants” have contractual arrangements with the Fund or one of the Fund’s service providers to purchase and redeem Fund shares directly with the Fund in large blocks of shares known as “Creation Units.” Prior to the start of trading on every business day, the Fund publishes through the National Securities Clearing Corporation (“NSCC”) the “basket” of securities, cash or other assets that it will accept in exchange for a Creation Unit of the Fund’s shares. An Authorized Participant that wishes to effectuate a creation of the Fund’s shares deposits with the Fund the “basket” of securities, cash or other assets identified by the Fund that day, and then receives the Creation Unit of the Fund’s shares in return for those assets. After purchasing a Creation Unit, the Authorized Participant may continue to hold the Fund’s shares or sell them in the secondary market. The redemption process is the reverse of the purchase process: the Authorized Participant redeems a Creation Unit of the Fund’s shares for a basket of securities, cash or other assets. The combination of the creation and redemption
Notes to Financial Statements (Continued)
First Trust Municipal High Income ETF (FMHI)
July 31, 2023
process with secondary market trading in the Fund’s shares and underlying securities provides arbitrage opportunities that are designed to help keep the market price of the Fund’s shares at or close to the NAV per share of the Fund.
The Fund imposes fees in connection with the purchase of Creation Units. These fees may vary based upon various fact-based circumstances, including, but not limited to, the composition of the securities included in the Creation Unit or the countries in which the transactions are settled. The price for each Creation Unit will equal the daily NAV per share of the Fund times the number of shares in a Creation Unit, plus the fees described above and, if applicable, any operational processing and brokerage costs, transfer fees, stamp taxes and part or all of the spread between the expected bid and offer side of the market related to the securities comprising the creation basket.
The Fund also imposes fees in connection with the redemption of Creation Units. These fees may vary based upon various fact-based circumstances, including, but not limited to, the composition of the securities included in the Creation Unit or the countries in which the transactions are settled. The price received for each Creation Unit will equal the daily NAV per share of the Fund times the number of shares in a Creation Unit, minus the fees described above and, if applicable, any operational processing and brokerage costs, transfer fees, stamp taxes and part or all of the spread between the expected bid and offer side of the market related to the securities comprising the redemption basket. Investors who use the services of a broker or other such intermediary in addition to an Authorized Participant to effect a redemption of a Creation Unit may also be assessed an amount to cover the cost of such services. The redemption fee charged by the Fund will comply with Rule 22c-2 of the 1940 Act which limits redemption fees to no more than 2% of the value of the shares redeemed.
7. Distribution Plan
The Board of Trustees adopted a Distribution and Service Plan pursuant to Rule 12b-1 under the 1940 Act. In accordance with the Rule 12b-1 plan, the Fund is authorized to pay an amount up to 0.25% of its average daily net assets each year to reimburse First Trust Portfolios L.P. (“FTP”), the distributor of the Fund, for amounts expended to finance activities primarily intended to result in the sale of Creation Units or to provide investor services. FTP may also use this amount to compensate securities dealers or other persons that are Authorized Participants for providing distribution assistance, including broker-dealer and shareholder support and educational and promotional services.
No 12b-1 fees are currently paid by the Fund, and pursuant to a contractual arrangement, no 12b-1 fees will be paid any time before November 30, 2024.
8. Borrowings
The Trust, on behalf of the Fund, along with First Trust Series Fund and First Trust Exchange-Traded Fund IV have a $550 million Credit Agreement with The Bank of Nova Scotia (“Scotia”) as administrative agent for a group of lenders. Between October 30, 2022 and March 1, 2023, the commitment amount was $305 million, and prior to October 30, 2022, the commitment amount was $280 million. Scotia charges a commitment fee of 0.25% of the daily amount of the excess of the commitment amount over the outstanding principal balance of the loans and an agency fee. First Trust allocates the commitment fee and agency fee amongst the funds that have access to the credit line. To the extent that the Fund accesses the credit line, there would also be an interest fee charged. The Fund did not have any borrowings outstanding during the fiscal year ended July 31, 2023.
9. Indemnification
The Trust, on behalf of the Fund, has a variety of indemnification obligations under contracts with its service providers. The Trust’s maximum exposure under these arrangements is unknown. However, the Trust has not had prior claims or losses pursuant to these contracts and expects the risk of loss to be remote.
10. Subsequent Events
Management has evaluated the impact of all subsequent events on the Fund through the date the financial statements were issued and has determined that there were no subsequent events requiring recognition or disclosure in the financial statements that have not already been disclosed.
Report of Independent Registered Public Accounting Firm
To the Shareholders and the Board of Trustees of First Trust Exchange-Traded Fund III:
Opinion on the Financial Statements and Financial Highlights
We have audited the accompanying statement of assets and liabilities, including the portfolio of investments, of First Trust Municipal High Income ETF (the “Fund”), one of the funds constituting the First Trust Exchange-Traded Fund III, as of July 31, 2023, the related statement of operations for the year then ended, the statements of changes in net assets for each of the two years in the period then ended, the financial highlights for each of the five years in the period then ended, and the related notes. In our opinion, the financial statements and financial highlights present fairly, in all material respects, the financial position of the Fund as of July 31, 2023, and the results of its operations for the year then ended, the changes in its net assets for each of the two years in the period then ended, and the financial highlights for each of the five years in the period then ended in conformity with accounting principles generally accepted in the United States of America.
Basis for Opinion
These financial statements and financial highlights are the responsibility of the Fund’s management. Our responsibility is to express an opinion on the Fund’s financial statements and financial highlights based on our audits. We are a public accounting firm registered with the Public Company Accounting Oversight Board (United States) (PCAOB) and are required to be independent with respect to the Fund in accordance with the U.S. federal securities laws and the applicable rules and regulations of the Securities and Exchange Commission and the PCAOB.
We conducted our audits in accordance with the standards of the PCAOB. Those standards require that we plan and perform the audit to obtain reasonable assurance about whether the financial statements and financial highlights are free of material misstatement, whether due to error or fraud. The Fund is not required to have, nor were we engaged to perform, an audit of its internal control over financial reporting. As part of our audits we are required to obtain an understanding of internal control over financial reporting but not for the purpose of expressing an opinion on the effectiveness of the Fund’s internal control over financial reporting. Accordingly, we express no such opinion.
Our audits included performing procedures to assess the risks of material misstatement of the financial statements and financial highlights, whether due to error or fraud, and performing procedures that respond to those risks. Such procedures included examining, on a test basis, evidence regarding the amounts and disclosures in the financial statements and financial highlights. Our audits also included evaluating the accounting principles used and significant estimates made by management, as well as evaluating the overall presentation of the financial statements and financial highlights. Our procedures included confirmation of securities owned as of July 31, 2023, by correspondence with the custodian and brokers; when replies were not received from brokers, we performed other auditing procedures. We believe that our audits provide a reasonable basis for our opinion.
Chicago, Illinois
September 22, 2023
We have served as the auditor of one or more First Trust investment companies since 2001.
Additional Information
First Trust Municipal High Income ETF (FMHI)
July 31, 2023 (Unaudited)
Proxy Voting Policies and Procedures
A description of the policies and procedures that the Trust uses to determine how to vote proxies and information on how the Fund voted proxies relating to portfolio securities during the most recent 12-month period ended June 30 is available (1) without charge, upon request, by calling (800) 988-5891; (2) on the Fund’s website at www.ftportfolios.com; and (3) on the Securities and Exchange Commission’s (“SEC”) website at www.sec.gov.
Portfolio Holdings
The Fund files portfolio holdings information for each month in a fiscal quarter within 60 days after the end of the relevant fiscal quarter on Form N-PORT. Portfolio holdings information for the third month of each fiscal quarter will be publicly available on the SEC’s website at www.sec.gov. The Fund’s complete schedule of portfolio holdings for the second and fourth quarters of each fiscal year is included in the semi-annual and annual reports to shareholders, respectively, and is filed with the SEC on Form N-CSR. The semi-annual and annual report for the Fund is available to investors within 60 days after the period to which it relates. The Fund’s Forms N-PORT and Forms N-CSR are available on the SEC’s website listed above.
Federal Tax Information
For the taxable year ended July 31, 2023, the following distribution information is being provided as required by the Internal Revenue Code of 1986, as amended, or to meet a specific state’s requirement. The Fund designates the following percentages or, if subsequently determined to be different, the maximum amount allowable for its fiscal year ended July 31, 2023:
| Federal and State Income Tax | | Percentages |
| Tax-Exempt Interest Dividends | | 99.03% |
| Alternative Minimum Tax (AMT) | | 15.09% |
Risk Considerations
Risks are inherent in all investing. Certain general risks that may be applicable to a Fund are identified below, but not all of the material risks relevant to each Fund are included in this report and not all of the risks below apply to each Fund. The material risks of investing in each Fund are spelled out in its prospectus, statement of additional information and other regulatory filings. Before investing, you should consider each Fund’s investment objective, risks, charges and expenses, and read each Fund’s prospectus and statement of additional information carefully. You can download each Fund’s prospectus at www.ftportfolios.com or contact First Trust Portfolios L.P. at (800) 621-1675 to request a prospectus, which contains this and other information about each Fund.
Concentration Risk. To the extent that a fund is able to invest a significant percentage of its assets in a single asset class or the securities of issuers within the same country, state, region, industry or sector, an adverse economic, business or political development may affect the value of the fund’s investments more than if the fund were more broadly diversified. A fund that tracks an index will be concentrated to the extent the fund’s corresponding index is concentrated. A concentration makes a fund more susceptible to any single occurrence and may subject the fund to greater market risk than a fund that is more broadly diversified.
Credit Risk. Credit risk is the risk that an issuer of a security will be unable or unwilling to make dividend, interest and/or principal payments when due and the related risk that the value of a security may decline because of concerns about the issuer’s ability to make such payments.
Cyber Security Risk. The funds are susceptible to potential operational risks through breaches in cyber security. A breach in cyber security refers to both intentional and unintentional events that may cause a fund to lose proprietary information, suffer data corruption or lose operational capacity. Such events could cause a fund to incur regulatory penalties, reputational damage, additional compliance costs associated with corrective measures and/or financial loss. In addition, cyber security breaches of a fund’s third-party service providers, such as its administrator, transfer agent, custodian, or sub-advisor, as applicable, or issuers in which the fund invests, can also subject a fund to many of the same risks associated with direct cyber security breaches.
Defined Outcome Funds Risk. To the extent a fund’s investment strategy is designed to deliver returns tied to the price performance of an underlying ETF, an investor may not realize the returns the fund seeks to achieve if that investor does not hold shares for the entire target outcome period. In the event an investor purchases shares after the first day of the target outcome period or sells shares prior to the end of the target outcome period, the buffer that the fund seeks to provide against a decline in the value of the underlying ETF may not be available, the enhanced returns that the fund seeks to provide (if any) may not be available and the investor may not participate in a gain in the value of the underlying ETF up to the cap for the investor’s investment period. Additionally, the fund will
Additional Information (Continued)
First Trust Municipal High Income ETF (FMHI)
July 31, 2023 (Unaudited)
not participate in gains of the underlying ETF above the cap and a shareholder may lose their entire investment. If the fund seeks enhanced returns, there are certain time periods when the value of the fund may fall faster than the value of the underlying ETF, and it is very unlikely that, on any given day during which the underlying ETF share price increases in value, the fund’s share price will increase at the same rate as the enhanced returns sought by the fund, which is designed for an entire target outcome period. Trading flexible exchange options involves risks different from, or possibly greater than, the risks associated with investing directly in securities, such as less liquidity and correlation and valuation risks. A fund may experience substantial downside from specific flexible exchange option positions and certain positions may expire worthless.
Derivatives Risk. To the extent a fund uses derivative instruments such as futures contracts, options contracts and swaps, the fund may experience losses because of adverse movements in the price or value of the underlying asset, index or rate, which may be magnified by certain features of the derivative. These risks are heightened when a fund’s portfolio managers use derivatives to enhance the fund’s return or as a substitute for a position or security, rather than solely to hedge (or offset) the risk of a position or security held by the fund.
Equity Securities Risk. To the extent a fund invests in equity securities, the value of the fund’s shares will fluctuate with changes in the value of the equity securities. Equity securities prices fluctuate for several reasons, including changes in investors’ perceptions of the financial condition of an issuer or the general condition of the relevant stock market, such as market volatility, or when political or economic events affecting the issuers occur. In addition, common stock prices may be particularly sensitive to rising interest rates, as the cost of capital rises and borrowing costs increase. Equity securities may decline significantly in price over short or extended periods of time, and such declines may occur in the equity market as a whole, or they may occur in only a particular country, company, industry or sector of the market.
ETF Risk. The shares of an ETF trade like common stock and represent an interest in a portfolio of securities. The risks of owning an ETF generally reflect the risks of owning the underlying securities, although lack of liquidity in an ETF could result in it being more volatile and ETFs have management fees that increase their costs. Shares of an ETF trade on an exchange at market prices rather than net asset value, which may cause the shares to trade at a price greater than net asset value (premium) or less than net asset value (discount). In times of market stress, decisions by market makers to reduce or step away from their role of providing a market for an ETF’s shares, or decisions by an ETF’s authorized participants that they are unable or unwilling to proceed with creation and/or redemption orders of an ETF’s shares, could result in shares of the ETF trading at a discount to net asset value and in greater than normal intraday bid-ask spreads.
Fixed Income Securities Risk. To the extent a fund invests in fixed income securities, the fund will be subject to credit risk, income risk, interest rate risk, liquidity risk and prepayment risk. Income risk is the risk that income from a fund’s fixed income investments could decline during periods of falling interest rates. Interest rate risk is the risk that the value of a fund’s fixed income securities will decline because of rising interest rates. Liquidity risk is the risk that a security cannot be purchased or sold at the time desired, or cannot be purchased or sold without adversely affecting the price. Prepayment risk is the risk that the securities will be redeemed or prepaid by the issuer, resulting in lower interest payments received by the fund. In addition to these risks, high yield securities, or “junk” bonds, are subject to greater market fluctuations and risk of loss than securities with higher ratings, and the market for high yield securities is generally smaller and less liquid than that for investment grade securities.
Index or Model Constituent Risk. Certain funds may be a constituent of one or more indices or ETF models. As a result, such a fund may be included in one or more index-tracking exchange-traded funds or mutual funds. Being a component security of such a vehicle could greatly affect the trading activity involving a fund, the size of the fund and the market volatility of the fund. Inclusion in an index could increase demand for the fund and removal from an index could result in outsized selling activity in a relatively short period of time. As a result, a fund’s net asset value could be negatively impacted and the fund’s market price may be significantly below its net asset value during certain periods. In addition, index rebalances may potentially result in increased trading activity in a fund’s shares.
Index Provider Risk. To the extent a fund seeks to track an index, it is subject to Index Provider Risk. There is no assurance that the Index Provider will compile the Index accurately, or that the Index will be determined, maintained, constructed, reconstituted, rebalanced, composed, calculated or disseminated accurately. To correct any such error, the Index Provider may carry out an unscheduled rebalance or other modification of the Index constituents or weightings, which may increase the fund’s costs. The Index Provider does not provide any representation or warranty in relation to the quality, accuracy or completeness of data in the Index, and it does not guarantee that the Index will be calculated in accordance with its stated methodology. Losses or costs associated with any Index Provider errors generally will be borne by the fund and its shareholders.
Investment Companies Risk. To the extent a fund invests in the securities of other investment vehicles, the fund will incur additional fees and expenses that would not be present in a direct investment in those investment vehicles. Furthermore, the fund’s investment performance and risks are directly related to the investment performance and risks of the investment vehicles in which the fund invests.
Additional Information (Continued)
First Trust Municipal High Income ETF (FMHI)
July 31, 2023 (Unaudited)
LIBOR Risk. To the extent a fund invests in floating or variable rate obligations that use the London Interbank Offered Rate (“LIBOR”) as a reference interest rate, it is subject to LIBOR Risk. The United Kingdom’s Financial Conduct Authority, which regulates LIBOR has ceased making LIBOR available as a reference rate over a phase-out period that began December 31, 2021. There is no assurance that any alternative reference rate, including the Secured Overnight Financing Rate (“SOFR”) will be similar to or produce the same value or economic equivalence as LIBOR or that instruments using an alternative rate will have the same volume or liquidity. The unavailability or replacement of LIBOR may affect the value, liquidity or return on certain fund investments and may result in costs incurred in connection with closing out positions and entering into new trades. Any potential effects of the transition away from LIBOR on the fund or on certain instruments in which the fund invests can be difficult to ascertain, and they may vary depending on a variety of factors, and they could result in losses to the fund.
Management Risk. To the extent that a fund is actively managed, it is subject to management risk. In managing an actively-managed fund’s investment portfolio, the fund’s portfolio managers will apply investment techniques and risk analyses that may not have the desired result. There can be no guarantee that a fund will meet its investment objective.
Market Risk. Market risk is the risk that a particular security, or shares of a fund in general, may fall in value. Securities held by a fund, as well as shares of a fund itself, are subject to market fluctuations caused by factors such as general economic conditions, political events, regulatory or market developments, changes in interest rates and perceived trends in securities prices. Shares of a fund could decline in value or underperform other investments as a result of the risk of loss associated with these market fluctuations. In addition, local, regional or global events such as war, acts of terrorism, spread of infectious diseases or other public health issues, recessions, or other events could have a significant negative impact on a fund and its investments. Such events may affect certain geographic regions, countries, sectors and industries more significantly than others. In February 2022, Russia invaded Ukraine which has caused and could continue to cause significant market disruptions and volatility within the markets in Russia, Europe, and the United States. The hostilities and sanctions resulting from those hostilities could have a significant impact on certain fund investments as well as fund performance. The COVID-19 global pandemic and the ensuing policies enacted by governments and central banks have caused and may continue to cause significant volatility and uncertainty in global financial markets. While the U.S. has resumed “reasonably” normal business activity, many countries continue to impose lockdown measures. Additionally, there is no guarantee that vaccines will be effective against emerging variants of the disease. These events also adversely affect the prices and liquidity of a fund’s portfolio securities or other instruments and could result in disruptions in the trading markets. Any of such circumstances could have a materially negative impact on the value of a fund’s shares and result in increased market volatility. During any such events, a fund’s shares may trade at increased premiums or discounts to their net asset value and the bid/ask spread on a fund’s shares may widen.
Non-U.S. Securities Risk. To the extent a fund invests in non-U.S. securities, it is subject to additional risks not associated with securities of domestic issuers. Non-U.S. securities are subject to higher volatility than securities of domestic issuers due to: possible adverse political, social or economic developments; restrictions on foreign investment or exchange of securities; capital controls; lack of liquidity; currency exchange rates; excessive taxation; government seizure of assets; the imposition of sanctions by foreign governments; different legal or accounting standards; and less government supervision and regulation of exchanges in foreign countries. Investments in non-U.S. securities may involve higher costs than investments in U.S. securities, including higher transaction and custody costs, as well as additional taxes imposed by non-U.S. governments. These risks may be heightened for securities of companies located, or with significant operations, in emerging market countries.
Operational Risk. Each fund is subject to risks arising from various operational factors, including, but not limited to, human error, processing and communication errors, errors of a fund’s service providers, counterparties or other third-parties, failed or inadequate processes and technology or systems failures. Each fund relies on third-parties for a range of services, including custody. Any delay or failure relating to engaging or maintaining such service providers may affect a fund’s ability to meet its investment objective. Although the funds and the funds’ investment advisor seek to reduce these operational risks through controls and procedures, there is no way to completely protect against such risks.
Passive Investment Risk. To the extent a fund seeks to track an index, the fund will invest in the securities included in, or representative of, the index regardless of their investment merit. A fund generally will not attempt to take defensive positions in declining markets.
Preferred Securities Risk. Preferred securities combine some of the characteristics of both common stocks and bonds. Preferred securities are typically subordinated to bonds and other debt securities in a company’s capital structure in terms of priority to corporate income, subjecting them to greater credit risk than those debt securities. Generally, holders of preferred securities have no voting rights with respect to the issuing company unless preferred dividends have been in arrears for a specified number of periods, at which time the preferred security holders may obtain limited rights. In certain circumstances, an issuer of preferred securities may defer payment on the securities and, in some cases, redeem the securities prior to a specified date. Preferred securities may also be substantially less liquid than other securities, including common stock.
Additional Information (Continued)
First Trust Municipal High Income ETF (FMHI)
July 31, 2023 (Unaudited)
Valuation Risk. The valuation of certain securities may carry more risk than that of common stock. Uncertainties in the conditions of the financial markets, unreliable reference data, lack of transparency and inconsistency of valuation models and processes may lead to inaccurate asset pricing. A fund may hold investments in sizes smaller than institutionally sized round lot positions (sometimes referred to as odd lots). However, third-party pricing services generally provide evaluations on the basis of institutionally-sized round lots. If a fund sells certain of its investments in an odd lot transaction, the sale price may be less than the value at which such securities have been held by the fund. Odd lots often trade at lower prices than institutional round lots. There is no assurance that the fund will be able to sell a portfolio security at the price established by the pricing service, which could result in a loss to the fund.
| NOT FDIC INSURED | NOT BANK GUARANTEED | MAY LOSE VALUE |
Advisory Agreement
Board Considerations Regarding Approval of Continuation of Investment Management Agreement
The Board of Trustees of First Trust Exchange-Traded Fund III (the “Trust”), including the Independent Trustees, unanimously approved the continuation of the Investment Management Agreement (the “Agreement”) with First Trust Advisors L.P. (the “Advisor”) on behalf of the First Trust Municipal High Income ETF (the “Fund”). The Board approved the continuation of the Agreement for a one-year period ending June 30, 2024 at a meeting held on June 4–5, 2023. The Board determined that the continuation of the Agreement is in the best interests of the Fund in light of the nature, extent and quality of the services provided and such other matters as the Board considered to be relevant in the exercise of its business judgment.
To reach this determination, the Board considered its duties under the Investment Company Act of 1940, as amended (the “1940 Act”), as well as under the general principles of state law, in reviewing and approving advisory contracts; the requirements of the 1940 Act in such matters; the fiduciary duty of investment advisors with respect to advisory agreements and compensation; the standards used by courts in determining whether investment company boards have fulfilled their duties; and the factors to be considered by the Board in voting on such agreements. At meetings held on April 17, 2023 and June 4–5, 2023, the Board, including the Independent Trustees, reviewed materials provided by the Advisor responding to requests for information from counsel to the Independent Trustees, submitted on behalf of the Independent Trustees, that, among other things, outlined: the services provided by the Advisor to the Fund (including the relevant personnel responsible for these services and their experience); the unitary fee rate schedule payable by the Fund as compared to fees charged to a peer group of funds (the “Expense Group”) and a broad peer universe of funds (the “Expense Universe”), each assembled by Broadridge Financial Solutions, Inc. (“Broadridge”), an independent source, and as compared to fees charged to other clients of the Advisor, including other exchange-traded funds (“ETFs”) managed by the Advisor; the expense ratio of the Fund as compared to expense ratios of the funds in the Fund’s Expense Group and Expense Universe; performance information for the Fund, including comparisons of the Fund’s performance to that of one or more relevant benchmark indexes and to that of a performance group of funds and a broad performance universe of funds (the “Performance Universe”), each assembled by Broadridge; the nature of expenses incurred in providing services to the Fund and the potential for the Advisor to realize economies of scale, if any; profitability and other financial data for the Advisor; any indirect benefits to the Advisor and its affiliate, First Trust Portfolios L.P. (“FTP”); and information on the Advisor’s compliance program. The Board reviewed initial materials with the Advisor at the meeting held on April 17, 2023, prior to which the Independent Trustees and their counsel met separately to discuss the information provided by the Advisor. Following the April meeting, counsel to the Independent Trustees, on behalf of the Independent Trustees, requested certain clarifications and supplements to the materials provided, and the information provided in response to those requests was considered at an executive session of the Independent Trustees and their counsel held prior to the June 4–5, 2023 meeting, as well as at the June meeting. The Board applied its business judgment to determine whether the arrangement between the Trust and the Advisor continues to be a reasonable business arrangement from the Fund’s perspective. The Board determined that, given the totality of the information provided with respect to the Agreement, the Board had received sufficient information to renew the Agreement. The Board considered that shareholders chose to invest or remain invested in the Fund knowing that the Advisor manages the Fund and knowing the Fund’s unitary fee.
In reviewing the Agreement, the Board considered the nature, extent and quality of the services provided by the Advisor under the Agreement. The Board considered that the Advisor is responsible for the overall management and administration of the Trust and the Fund and reviewed all of the services provided by the Advisor to the Fund, as well as the background and experience of the persons responsible for such services. The Board noted that the Fund is an actively-managed ETF and noted that the Advisor’s Municipal Securities Team is responsible for the day-to-day management of the Fund’s investments. The Board considered the background and experience of the members of the Municipal Securities Team. The Board considered the Advisor’s statement that it applies the same oversight model internally with its Municipal Securities Team as it uses for overseeing external sub-advisors, including portfolio risk monitoring and performance review. In reviewing the services provided, the Board noted the compliance program that had been developed by the Advisor and considered that it includes a robust program for monitoring the Advisor’s and the Fund’s compliance with the 1940 Act, as well as the Fund’s compliance with its investment objectives, policies and restrictions. The Board also
Additional Information (Continued)
First Trust Municipal High Income ETF (FMHI)
July 31, 2023 (Unaudited)
considered a report from the Advisor with respect to its risk management functions related to the operation of the Fund. Finally, as part of the Board’s consideration of the Advisor’s services, the Advisor, in its written materials and at the April 17, 2023 meeting, described to the Board the scope of its ongoing investment in additional personnel and infrastructure to maintain and improve the quality of services provided to the Fund and the other funds in the First Trust Fund Complex. In addition to the written materials provided by the Advisor, at the April 17, 2023 meeting, the Board also received a presentation from representatives of the Advisor’s Municipal Securities Team, who discussed the services that the Team provides to the Fund, including the Team’s day-to-day management of the Fund’s investments. In light of the information presented and the considerations made, the Board concluded that the nature, extent and quality of the services provided to the Trust and the Fund by the Advisor under the Agreement have been and are expected to remain satisfactory and that the Advisor has managed the Fund consistent with its investment objectives, policies and restrictions.
The Board considered the unitary fee rate schedule payable by the Fund under the Agreement for the services provided. The Board considered that as part of the unitary fee the Advisor is responsible for the Fund’s expenses, including the cost of transfer agency, custody, fund administration, legal, audit and other services and license fees, if any, but excluding the fee payment under the Agreement and interest, taxes, brokerage commissions and other expenses connected with the execution of portfolio transactions, distribution and service fees pursuant to a Rule 12b-1 plan, if any, and extraordinary expenses, if any. The Board received and reviewed information showing the fee rates and expense ratios of the peer funds in the Expense Group, as well as advisory and unitary fee rates charged by the Advisor to other fund (including ETFs) and non-fund clients, as applicable. Because the Fund pays a unitary fee, the Board determined that expense ratios were the most relevant comparative data point. Based on the information provided, the Board noted that the total (net) expense ratio for the Fund was above the median total (net) expense ratio of the peer funds in the Expense Group. With respect to the Expense Group, the Board, at the April 17, 2023 meeting, discussed with Broadridge its methodology for assembling peer groups and discussed with the Advisor limitations in creating peer groups for actively-managed ETFs, and different business models that may affect the pricing of services among ETF sponsors. The Board took these limitations and differences into account in considering the peer data. With respect to fees charged to other non-ETF clients, the Board considered differences between the Fund and other non-ETF clients that limited their comparability. In considering the unitary fee rate schedule overall, the Board also considered the Advisor’s statement that it seeks to meet investor needs through innovative and value-added investment solutions and the Advisor’s demonstrated long-term commitment to the Fund and the other funds in the First Trust Fund Complex.
The Board considered performance information for the Fund. The Board noted the process it has established for monitoring the Fund’s performance and portfolio risk on an ongoing basis, which includes quarterly performance reporting from the Advisor for the Fund. The Board determined that this process continues to be effective for reviewing the Fund’s performance. The Board received and reviewed information comparing the Fund’s performance for periods ended December 31, 2022 to the performance of the funds in the Performance Universe and to that of a benchmark index. Based on the information provided, the Board noted that the Fund underperformed the Performance Universe median for the one-year period ended December 31, 2022 and outperformed the Performance Universe median for the three-year and five-year periods ended December 31, 2022. The Board also noted that the Fund underperformed the benchmark index for the one- and three-year periods ended December 31, 2022 and outperformed the benchmark index for the five-year period ended December 31, 2022.
On the basis of all the information provided on the unitary fee and performance of the Fund and the ongoing oversight by the Board, the Board concluded that the unitary fee for the Fund continues to be reasonable and appropriate in light of the nature, extent and quality of the services provided by the Advisor to the Fund under the Agreement.
The Board considered information and discussed with the Advisor whether there were any economies of scale in connection with providing advisory services to the Fund at current asset levels and whether the Fund may benefit from any economies of scale. The Board noted that the unitary fee rate schedule for the Fund includes breakpoints pursuant to which the unitary fee rate will be reduced as assets of the Fund meet certain thresholds. The Board considered the Advisor’s statement that it believes that its expenses relating to providing advisory services to the Fund will increase during the next twelve months as the Advisor continues to build infrastructure and add new staff. The Board also noted that under the unitary fee structure, any reduction in expenses associated with the management and operations of the Fund would benefit the Advisor, but that the unitary fee structure provides a level of certainty in expenses for shareholders of the Fund. The Board concluded that the unitary fee rate schedule for the Fund reflects an appropriate level of sharing of any economies of scale that may be realized in the management of the Fund at current asset levels. The Board considered the revenues and allocated costs (including the allocation methodology) of the Advisor in serving as investment advisor to the Fund for the twelve months ended December 31, 2022 and the estimated profitability level for the Fund calculated by the Advisor based on such data, as well as complex-wide and product-line profitability data, for the same period. The Board noted the inherent limitations in the profitability analysis and concluded that, based on the information provided, the Advisor’s profitability level for the Fund was not unreasonable. In addition, the Board considered indirect benefits described by the Advisor that may be realized from its relationship with the Fund. The Board considered that the Advisor had identified as an indirect benefit to the Advisor and FTP their
Additional Information (Continued)
First Trust Municipal High Income ETF (FMHI)
July 31, 2023 (Unaudited)
exposure to investors and brokers who, absent their exposure to the Fund, may have had no dealings with the Advisor or FTP, and noted that the Advisor does not utilize soft dollars in connection with the Fund. The Board also considered the Advisor’s compensation for fund reporting services provided to the Fund pursuant to a separate Fund Reporting Services Agreement, which is paid from the unitary fee. The Board concluded that the character and amount of potential indirect benefits to the Advisor were not unreasonable.
Based on all of the information considered and the conclusions reached, the Board, including the Independent Trustees, unanimously determined that the terms of the Agreement continue to be fair and reasonable and that the continuation of the Agreement is in the best interests of the Fund. No single factor was determinative in the Board’s analysis.
Liquidity Risk Management Program
In accordance with Rule 22e-4 under the Investment Company Act of 1940, as amended (the “1940 Act”), the Fund and each other fund in the First Trust Fund Complex, other than the closed-end funds, have adopted and implemented a liquidity risk management program (the “Program”) reasonably designed to assess and manage the funds’ liquidity risk, i.e., the risk that a fund could not meet requests to redeem shares issued by the fund without significant dilution of remaining investors’ interests in the fund. The Board of Trustees of the First Trust Funds has appointed First Trust Advisors L.P. (the “Advisor”) as the person designated to administer the Program, and in this capacity the Advisor performs its duties primarily through the activities and efforts of the First Trust Liquidity Committee (the “Liquidity Committee”).
Pursuant to the Program, the Liquidity Committee classifies the liquidity of each fund’s portfolio investments into one of the four liquidity categories specified by Rule 22e-4: highly liquid investments, moderately liquid investments, less liquid investments and illiquid investments. The Liquidity Committee determines certain of the inputs for this classification process, including reasonably anticipated trade sizes and significant investor dilution thresholds. The Liquidity Committee also determines and periodically reviews a highly liquid investment minimum for certain funds, monitors the funds’ holdings of assets classified as illiquid investments to seek to ensure they do not exceed 15% of a fund’s net assets and establishes policies and procedures regarding redemptions in kind.
At the April 17, 2023 meeting of the Board of Trustees, as required by Rule 22e-4 and the Program, the Advisor provided the Board with a written report prepared by the Advisor that addressed the operation of the Program during the period from March 17, 2022 through the Liquidity Committee’s annual meeting held on March 23, 2023 and assessed the Program’s adequacy and effectiveness of implementation during this period, including the operation of the highly liquid investment minimum for each fund that is required under the Program to have one, and any material changes to the Program. Note that because the Fund primarily holds assets that are highly liquid investments, the Fund has not adopted any highly liquid investment minimum.
As stated in the written report, during the review period, two funds breached the 15% limitation on illiquid investments for one day each, as a result of an unscheduled week-long closure of the stock exchange in Istanbul following devastating earthquakes in February, causing all Turkish equities to be re-classified as “illiquid” for one day. Each fund filed a Form N-RN on the day after the breach occurred, and one day later after the breach was cured. No fund with a highly liquid investment minimum breached that minimum during the reporting period. The Advisor concluded that each fund’s investment strategy is appropriate for an open-end fund; that the Program operated effectively in all material respects during the review period; and that the Program is reasonably designed to assess and manage the liquidity risk of each fund and to maintain compliance with Rule 22e-4.
Board of Trustees
Effective September 10, 2023, the exchange-traded funds, closed-end funds, mutual funds and variable insurance funds (collectively, the “Funds”) advised by First Trust Advisors L.P. (“FTA”) announced the appointment of Ms. Bronwyn Wright as a Trustee of all Funds except the exchange-traded funds included in the First Trust Exchange-Traded Fund and the First Trust Dynamic Europe Equity Income Fund, a closed-end fund. Ms. Wright has acted as an independent director to a number of Irish collective investment funds since 2009. Ms. Wright is a former Managing Director of Citibank Europe plc and Head of Securities and Fund Services for Citi Ireland. In these positions, she was responsible for the management and strategic direction of Citi Ireland’s securities and fund services business which included funds, custody, security finance/lending and global agency and trust. She also had responsibility for leading, managing and growing the Trustee, Custodian and Depositary business in Ireland, the United Kingdom, Luxembourg, Jersey and Cayman.
Board of Trustees and Officers
First Trust Municipal High Income ETF (FMHI)
July 31, 2023 (Unaudited)
The following tables identify the Trustees and Officers of the Trust. Unless otherwise indicated, the address of all persons is 120 East Liberty Drive, Suite 400, Wheaton, IL 60187.
The Trust’s statement of additional information includes additional information about the Trustees and is available, without charge, upon request, by calling (800) 988-5891.
| Name, Year of Birth and Position with the Trust | Term of Office and Year First Elected or Appointed | Principal Occupations
During Past 5 Years | Number of Portfolios in the First Trust Fund Complex Overseen by Trustee | Other Trusteeships or Directorships Held by Trustee During Past 5 Years |
| INDEPENDENT TRUSTEES |
Richard E. Erickson, Trustee
(1951) | • Indefinite Term
• Since Inception | Physician, Edward-Elmhurst Medical Group; Physician and Officer, Wheaton Orthopedics (1990 to 2021) | 238 | None |
Thomas R. Kadlec, Trustee
(1957) | • Indefinite Term
• Since Inception | Retired; President, ADM Investor Services, Inc. (Futures Commission Merchant) (2010 to July 2022) | 238 | Director, National Futures Association and ADMIS Singapore Ltd.; Formerly, Director of ADM Investor Services, Inc., ADM Investor Services International, ADMIS Hong Kong Ltd., and Futures Industry Association |
Denise M. Keefe, Trustee
(1964) | • Indefinite Term
• Since 2021 | Executive Vice President, Advocate Aurora Health and President, Advocate Aurora Continuing Health Division (Integrated Healthcare System) | 238 | Director and Board Chair of Advocate Home Health Services, Advocate Home Care Products and Advocate Hospice; Director and Board Chair of Aurora At Home (since 2018); Director of Advocate Physician Partners Accountable Care Organization; Director of RML Long Term Acute Care Hospitals; Director of Senior Helpers (since 2021); and Director of MobileHelp (since 2022) |
Robert F. Keith, Trustee
(1956) | • Indefinite Term
• Since Inception | President, Hibs Enterprises (Financial and Management Consulting) | 238 | Formerly, Director of Trust Company of Illinois |
Niel B. Nielson, Trustee
(1954) | • Indefinite Term
• Since Inception | Senior Advisor (2018 to Present), Managing Director and Chief Operating Officer (2015 to 2018), Pelita Harapan Educational Foundation (Educational Products and Services) | 238 | None |
| INTERESTED TRUSTEE |
James A. Bowen(1), Trustee and
Chairman of the Board
(1955) | • Indefinite Term
• Since Inception | Chief Executive Officer, First Trust Advisors L.P. and First Trust Portfolios L.P.; Chairman of the Board of Directors, BondWave LLC (Software Development Company) and Stonebridge Advisors LLC (Investment Advisor) | 238 | None |
| (1) | Mr. Bowen is deemed an “interested person” of the Trust due to his position as CEO of First Trust Advisors L.P., investment advisor of the Trust. |
Board of Trustees and Officers (Continued)
First Trust Municipal High Income ETF (FMHI)
July 31, 2023 (Unaudited)
| Name and Year of Birth | Position and Offices with Trust | Term of Office and Length of Service | Principal Occupations
During Past 5 Years |
| OFFICERS(2) |
James M. Dykas
(1966) | President and Chief Executive Officer | • Indefinite Term
• Since 2016 | Managing Director and Chief Financial Officer, First Trust Advisors L.P. and First Trust Portfolios L.P.; Chief Financial Officer, BondWave LLC (Software Development Company) and Stonebridge Advisors LLC (Investment Advisor) |
Derek D. Maltbie
(1972) | Treasurer, Chief Financial Officer and Chief Accounting Officer | • Indefinite Term
• Since 2023 | Senior Vice President, First Trust Advisors L.P. and First Trust Portfolios L.P., July 2021 to present. Previously, Vice President, First Trust Advisors L.P. and First Trust Portfolios L.P., 2014 to 2021. |
W. Scott Jardine
(1960) | Secretary and Chief Legal Officer | • Indefinite Term
• Since Inception | General Counsel, First Trust Advisors L.P. and First Trust Portfolios L.P.; Secretary and General Counsel, BondWave LLC; Secretary, Stonebridge Advisors LLC |
Daniel J. Lindquist
(1970) | Vice President | • Indefinite Term
• Since Inception | Managing Director, First Trust Advisors L.P. and First Trust Portfolios L.P. |
Kristi A. Maher
(1966) | Chief Compliance Officer and Assistant Secretary | • Indefinite Term
• Since Inception | Deputy General Counsel, First Trust Advisors L.P. and First Trust Portfolios L.P. |
Roger F. Testin
(1966) | Vice President | • Indefinite Term
• Since Inception | Senior Vice President, First Trust Advisors L.P. and First Trust Portfolios L.P. |
Stan Ueland
(1970) | Vice President | • Indefinite Term
• Since Inception | Senior Vice President, First Trust Advisors L.P. and First Trust Portfolios L.P. |
| (2) | The term “officer” means the president, vice president, secretary, treasurer, controller or any other officer who performs a policy making function. |
Privacy Policy
First Trust Municipal High Income ETF (FMHI)
July 31, 2023 (Unaudited)
Privacy Policy
First Trust values our relationship with you and considers your privacy an important priority in maintaining that relationship. We are committed to protecting the security and confidentiality of your personal information.
Sources of Information
We collect nonpublic personal information about you from the following sources:
| • | Information we receive from you and your broker-dealer, investment professional or financial representative through interviews, applications, agreements or other forms; |
| • | Information about your transactions with us, our affiliates or others; |
| • | Information we receive from your inquiries by mail, e-mail or telephone; and |
| • | Information we collect on our website through the use of “cookies.” For example, we may identify the pages on our website that your browser requests or visits. |
Information Collected
The type of data we collect may include your name, address, social security number, age, financial status, assets, income, tax information, retirement and estate plan information, transaction history, account balance, payment history, investment objectives, marital status, family relationships and other personal information.
Disclosure of Information
We do not disclose any nonpublic personal information about our customers or former customers to anyone, except as permitted by law. In addition to using this information to verify your identity (as required under law), the permitted uses may also include the disclosure of such information to unaffiliated companies for the following reasons:
| • | In order to provide you with products and services and to effect transactions that you request or authorize, we may disclose your personal information as described above to unaffiliated financial service providers and other companies that perform administrative or other services on our behalf, such as transfer agents, custodians and trustees, or that assist us in the distribution of investor materials such as trustees, banks, financial representatives, proxy services, solicitors and printers. |
| • | We may release information we have about you if you direct us to do so, if we are compelled by law to do so, or in other legally limited circumstances (for example to protect your account from fraud). |
In addition, in order to alert you to our other financial products and services, we may share your personal information within First Trust.
Use of Website Analytics
We currently use third party analytics tools, Google Analytics and AddThis, to gather information for purposes of improving First Trust’s website and marketing our products and services to you. These tools employ cookies, which are small pieces of text stored in a file by your web browser and sent to websites that you visit, to collect information, track website usage and viewing trends such as the number of hits, pages visited, videos and PDFs viewed and the length of user sessions in order to evaluate website performance and enhance navigation of the website. We may also collect other anonymous information, which is generally limited to technical and web navigation information such as the IP address of your device, internet browser type and operating system for purposes of analyzing the data to make First Trust’s website better and more useful to our users. The information collected does not include any personal identifiable information such as your name, address, phone number or email address unless you provide that information through the website for us to contact you in order to answer your questions or respond to your requests. To find out how to opt-out of these services click on: Google Analytics and AddThis.
Confidentiality and Security
With regard to our internal security procedures, First Trust restricts access to your nonpublic personal information to those First Trust employees who need to know that information to provide products or services to you. We maintain physical, electronic and procedural safeguards to protect your nonpublic personal information.
Policy Updates and Inquiries
As required by federal law, we will notify you of our privacy policy annually. We reserve the right to modify this policy at any time, however, if we do change it, we will tell you promptly. For questions about our policy, or for additional copies of this notice, please go to www.ftportfolios.com, or contact us at 1-800-621-1675 (First Trust Portfolios) or 1-800-222-6822 (First Trust Advisors).
March 2023
First Trust Exchange-Traded Fund III
INVESTMENT ADVISOR
First Trust Advisors L.P.
120 East Liberty Drive, Suite 400
Wheaton, IL 60187
ADMINISTRATOR, CUSTODIAN,
FUND ACCOUNTANT &
TRANSFER AGENT
Brown Brothers Harriman & Co.
50 Post Office Square
Boston, MA 02110
INDEPENDENT REGISTERED
PUBLIC ACCOUNTING FIRM
Deloitte & Touche LLP
111 South Wacker Drive
Chicago, IL 60606
LEGAL COUNSEL
Chapman and Cutler LLP
320 South Canal Street
Chicago, IL 60606
First Trust Exchange-Traded Fund III
First Trust Short Duration Managed Municipal ETF (FSMB)
First Trust Ultra Short Duration Municipal ETF (FUMB)
Annual Report
For the Year Ended
July 31, 2023
First Trust Exchange-Traded Fund III
Annual Report
July 31, 2023
Caution Regarding Forward-Looking Statements
This report contains certain forward-looking statements within the meaning of the Securities Act of 1933, as amended, and the Securities Exchange Act of 1934, as amended. Forward-looking statements include statements regarding the goals, beliefs, plans or current expectations of First Trust Advisors L.P. (“First Trust” or the “Advisor”) and its representatives, taking into account the information currently available to them. Forward-looking statements include all statements that do not relate solely to current or historical fact. For example, forward-looking statements include the use of words such as “anticipate,” “estimate,” “intend,” “expect,” “believe,” “plan,” “may,” “should,” “would” or other words that convey uncertainty of future events or outcomes.
Forward-looking statements involve known and unknown risks, uncertainties and other factors that may cause the actual results, performance or achievements of any series of First Trust Exchange-Traded Fund III (the “Trust”) described in this report (each such series is referred to as a “Fund” and collectively, the “Funds”) to be materially different from any future results, performance or achievements expressed or implied by the forward-looking statements. When evaluating the information included in this report, you are cautioned not to place undue reliance on these forward-looking statements, which reflect the judgment of the Advisor and its representatives only as of the date hereof. We undertake no obligation to publicly revise or update these forward-looking statements to reflect events and circumstances that arise after the date hereof.
Performance and Risk Disclosure
There is no assurance that any Fund described in this report will achieve its investment objective. Each Fund is subject to market risk, which is the possibility that the market values of securities owned by the Fund will decline and that the value of the Fund’s shares may therefore be less than what you paid for them. Accordingly, you can lose money by investing in a Fund. See “Risk Considerations” in the Additional Information section of this report for a discussion of certain other risks of investing in the Funds.
Performance data quoted represents past performance, which is no guarantee of future results, and current performance may be lower or higher than the figures shown. For the most recent month-end performance figures, please visit www.ftportfolios.com or speak with your financial advisor. Investment returns, net asset value and share price will fluctuate and Fund shares, when sold, may be worth more or less than their original cost.
The Advisor may also periodically provide additional information on Fund performance on each Fund’s web page at www.ftportfolios.com.
How to Read This Report
This report contains information that may help you evaluate your investment. It includes details about each Fund and presents data and analysis that provide insight into each Fund’s performance and investment approach.
By reading the portfolio commentary by the portfolio management team of each Fund, you may obtain an understanding of how the market environment affected each Fund’s performance. The statistical information that follows may help you understand each Fund’s performance compared to that of a relevant market benchmark.
It is important to keep in mind that the opinions expressed by personnel of the Advisor are just that: informed opinions. They should not be considered to be promises or advice. The opinions, like the statistics, cover the period through the date on the cover of this report. The material risks of investing in each Fund are spelled out in the prospectus, the statement of additional information, and other Fund regulatory filings.
First Trust Exchange-Traded Fund III
Annual Letter from the Chairman and CEO
July 31, 2023
Dear Shareholders,
First Trust is pleased to provide you with the annual report for certain series of First Trust Exchange-Traded Fund III (the “Funds”), which contains detailed information about the Funds for the 12-month period ended July 31, 2023.
In a widely unexpected announcement, Fitch Ratings (“Fitch”), a provider of credit ratings, commentary, and research, downgraded the credit rating of the United States government from its highest rating of AAA to its second-highest rating of AA+ on August 1, 2023. The move marks the first time the U.S. government’s credit rating has been downgraded since 2011. Fitch cited the heightened potential of a near-term economic recession in the U.S. as well as the rising interest burden of government debt as two factors that contributed to their decision to implement the downgrade. We will leave it to the pundits to debate whether the downgrade was warranted or not. What we would like to see is a reduction in government spending. As of June 30, 2023, the U.S. government’s deficit stood at $1.39 trillion, already above the 2022 full year deficit of $1.37 trillion, according to Brian Wesbury, Chief Economist at First Trust. As Fitch noted in the press release of its downgrade, the interest burden on U.S. government debt, among other factors, is expected to catapult the general government deficit to 6.3% of gross domestic product (“GDP”) in 2023, up from 3.7% in 2022.
The Federal Reserve (the “Fed”) has made significant progress in its battle with rising prices. Inflation, as measured by the twelve-month trailing rate on the Consumer Price Index (“CPI”), stood at 3.2% on July 31, 2023, down significantly from its most recent high of 9.1% set on June 30, 2022, but up from 3.0% on June 30, 2023. While a reduction in the CPI is welcome, the metric remains well-above the Fed’s goal of 2.0%. Should the CPI remain stubbornly high, it may prompt further increases to the Federal Funds target rate over the coming months, which could hamper economic growth, in our opinion. That said, U.S. GDP has remained resilient, growing over each of the last four quarters (through June 30, 2023).
Whether the U.S. can avoid an economic recession over the coming months remains to be seen. As mentioned above, despite tighter monetary policy, the U.S. economy posted positive changes to GDP over each of the last four quarters. We continue to hope for a “soft landing,” but also keep our eyes fixated on the data.
Thank you for giving First Trust the opportunity to play a role in your financial future. We value our relationship with you and will report on the Funds again in six months.
Sincerely,
James A. Bowen
Chairman of the Board of Trustees
Chief Executive Officer of First Trust Advisors L.P.
Fund Performance Overview (Unaudited)
First Trust Short Duration Managed Municipal ETF (FSMB)
The First Trust Short Duration Managed Municipal ETF (the “Fund”) seeks to provide federally tax-exempt income consistent with capital preservation. Under normal market conditions, the Fund seeks to achieve its investment objective by investing at least 80% of its net assets (including investment borrowings) in municipal debt securities that pay interest that is exempt from regular federal income taxes. The Fund’s investment advisor seeks to construct a portfolio that has a weighted average duration of 1-3 years. The Fund lists and principally trades its shares on NYSE Arca, Inc. under the ticker symbol “FSMB.”
| Performance | | | |
| | | Average Annual
Total Returns | Cumulative
Total Returns |
| | 1 Year Ended
7/31/23 | Inception (11/1/18)
to 7/31/23 | Inception (11/1/18)
to 7/31/23 |
| Fund Performance | | | |
| NAV | 0.45% | 1.47% | 7.17% |
| Market Price | 0.35% | 1.46% | 7.12% |
| Index Performance | | | |
| Bloomberg Municipal Short (1-5) Year Index | 0.22% | 1.26% | 6.10% |
(See Notes to Fund Performance Overview on page 7.)
| Sector Allocation | % of Total
Investments
(including cash) |
| Utility | 11.9% |
| Hospital | 10.2 |
| Insured | 10.0 |
| Gas | 8.8 |
| Government Obligation Bond - Unlimited Tax | 8.4 |
| Industrial Development Bond | 6.8 |
| Pre-refunded/Escrowed-to-maturity | 5.7 |
| Airport | 5.5 |
| Certificates of Participation | 4.7 |
| Water & Sewer | 3.9 |
| Special Assessment | 3.9 |
| Higher Education | 3.8 |
| Dedicated Tax | 2.8 |
| Local Housing | 2.3 |
| Government Obligation Bond - Limited Tax | 2.2 |
| Continuing Care Retirement Communities | 2.1 |
| Toll Road | 1.7 |
| Housing | 1.2 |
| Education | 1.1 |
| Port | 1.1 |
| Tobacco | 0.4 |
| Mass Transit | 0.3 |
| Student Loan | 0.1 |
| Tax Increment | 0.1 |
| Student Housing | 0.0* |
| Cash | 1.0 |
| Total | 100.0% |
| * | Amount is less than 0.1%. |
| Credit Quality(1) | % of Total
Investments
(including cash) |
| AAA | 11.4% |
| AA | 37.7 |
| A | 26.6 |
| BBB | 10.8 |
| BB | 2.5 |
| B | 0.2 |
| Not Rated | 7.3 |
| SP-1+ (short-term) | 0.5 |
| SP-1/MIG1 (short-term) | 1.3 |
| SP-2/MIG2 (short-term) | 0.7 |
| Cash | 1.0 |
| Total | 100.0% |
| (1) | The credit quality and ratings information presented above reflect the ratings assigned by one or more nationally recognized statistical rating organizations (NRSROs), including S&P Global Ratings, Moody’s Investors Service, Inc., Fitch Ratings or a comparably rated NRSRO. For situations in which a security is rated by more than one NRSRO and the ratings are not equivalent, the highest rating is used. Sub-investment grade ratings are those rated BB+/Ba1 or lower. Investment grade ratings are those rated BBB-/Baa3 or higher. The credit ratings shown relate to the creditworthiness of the issuers of the underlying securities in the Fund, and not to the Fund or its shares. Credit ratings are subject to change. |
Fund Performance Overview (Unaudited) (Continued)
First Trust Short Duration Managed Municipal ETF (FSMB) (Continued)
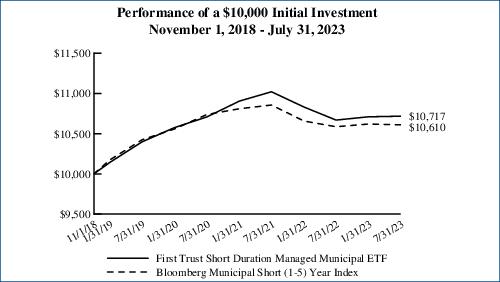
Performance figures assume reinvestment of all distributions and do not reflect the deduction of taxes that a shareholder would pay on Fund distributions or the redemption or sale of Fund shares. An index is a statistical composite that tracks a specified financial market or sector. Unlike the Fund, the index does not actually hold a portfolio of securities and therefore does not incur the expenses incurred by the Fund. These expenses negatively impact the performance of the Fund. The Fund’s past performance does not predict future performance.
Performance in municipal bond investment strategies can be impacted from the benefits of purchasing odd lot positions. The impact of these investments can be particularly meaningful when funds have limited assets under management and may not be a sustainable source of performance as a fund grows in size.
Frequency Distribution of Discounts and Premiums
Information showing the number of days the market price of the Fund’s shares was greater (at a premium) and less (at a discount) than the Fund’s net asset value for the most recently completed year, and the most recently completed calendar quarters since that year (or life of the Fund, if shorter), is available at https://www.ftportfolios.com/Retail/etf/home.aspx.
Fund Performance Overview (Unaudited) (Continued)
First Trust Ultra Short Duration Municipal ETF (FUMB)
The First Trust Ultra Short Duration Municipal ETF (the “Fund”) seeks to provide federally tax-exempt income consistent with capital preservation. Under normal market conditions, the Fund seeks to achieve its investment objective by investing at least 80% of its net assets (including investment borrowings) in municipal debt securities that pay interest that is exempt from regular federal income taxes. Under normal market conditions, the weighted average duration of the Fund’s portfolio is expected to be less than one year. The Fund lists and principally trades its shares on NYSE Arca, Inc. under the ticker symbol “FUMB.”
| Performance | | | |
| | | Average Annual
Total Returns | Cumulative
Total Returns |
| | 1 Year Ended
7/31/23 | Inception (11/1/18)
to 7/31/23 | Inception (11/1/18)
to 7/31/23 |
| Fund Performance | | | |
| NAV | 1.83% | 1.14% | 5.55% |
| Market Price | 1.78% | 1.13% | 5.50% |
| Index Performance | | | |
| Bloomberg Municipal Short-Term Index | 2.14% | 1.24% | 6.02% |
(See Notes to Fund Performance Overview on page 7.)
| Sector Allocation | % of Total
Investments
(including cash) |
| Government Obligation Bond - Unlimited Tax | 19.5% |
| Pre-refunded/Escrowed-to-maturity | 11.3 |
| Gas | 9.3 |
| Industrial Development Bond | 7.8 |
| Water & Sewer | 7.3 |
| Insured | 6.8 |
| Certificates of Participation | 5.7 |
| Hospital | 4.8 |
| Dedicated Tax | 4.4 |
| Airport | 4.2 |
| Government Obligation Bond - Limited Tax | 4.0 |
| Utility | 4.0 |
| Housing | 2.6 |
| Higher Education | 1.9 |
| Toll Road | 1.4 |
| Local Housing | 1.2 |
| Municipals | 1.0 |
| Mass Transit | 0.7 |
| Port | 0.4 |
| Continuing Care Retirement Communities | 0.2 |
| Special Assessment | 0.2 |
| Education | 0.1 |
| Student Loan | 0.1 |
| Cash | 1.1 |
| Total | 100.0% |
| Credit Quality(1) | % of Total
Investments
(including cash) |
| AAA | 11.9% |
| AA | 34.3 |
| A | 23.3 |
| BBB | 8.6 |
| BB | 0.4 |
| Not Rated | 3.2 |
| SP-1+ (short-term) | 8.3 |
| SP-1/MIG1 (short-term) | 7.8 |
| SP-2/MIG2 (short-term) | 1.1 |
| Cash | 1.1 |
| Total | 100.0% |
| (1) | The credit quality and ratings information presented above reflect the ratings assigned by one or more nationally recognized statistical rating organizations (NRSROs), including S&P Global Ratings, Moody’s Investors Service, Inc., Fitch Ratings or a comparably rated NRSRO. For situations in which a security is rated by more than one NRSRO and the ratings are not equivalent, the highest rating is used. Sub-investment grade ratings are those rated BB+/Ba1 or lower. Investment grade ratings are those rated BBB-/Baa3 or higher. The credit ratings shown relate to the creditworthiness of the issuers of the underlying securities in the Fund, and not to the Fund or its shares. Credit ratings are subject to change. |
Fund Performance Overview (Unaudited) (Continued)
First Trust Ultra Short Duration Municipal ETF (FUMB) (Continued)
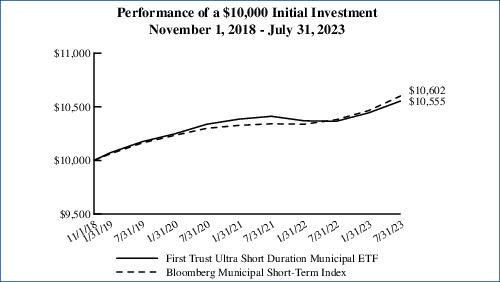
Performance figures assume reinvestment of all distributions and do not reflect the deduction of taxes that a shareholder would pay on Fund distributions or the redemption or sale of Fund shares. An index is a statistical composite that tracks a specified financial market or sector. Unlike the Fund, the index does not actually hold a portfolio of securities and therefore does not incur the expenses incurred by the Fund. These expenses negatively impact the performance of the Fund. The Fund’s past performance does not predict future performance.
Performance in municipal bond investment strategies can be impacted from the benefits of purchasing odd lot positions. The impact of these investments can be particularly meaningful when funds have limited assets under management and may not be a sustainable source of performance as a fund grows in size.
Frequency Distribution of Discounts and Premiums
Information showing the number of days the market price of the Fund’s shares was greater (at a premium) and less (at a discount) than the Fund’s net asset value for the most recently completed year, and the most recently completed calendar quarters since that year (or life of the Fund, if shorter), is available at https://www.ftportfolios.com/Retail/etf/home.aspx.
Notes to Fund Performance Overview (Unaudited)
Total returns for the period since inception are calculated from the inception date of each Fund. “Average Annual Total Returns” represent the average annual change in value of an investment over the periods indicated. “Cumulative Total Returns” represent the total change in value of an investment over the periods indicated. The total returns would have been lower if certain fees had not been waived by the Advisor.
Each Fund’s per share net asset value (“NAV”) is the value of one share of the Fund and is computed by dividing the value of all assets of the Fund (including accrued interest and dividends), less all liabilities (including accrued expenses and dividends declared but unpaid), by the total number of outstanding shares. The price used to calculate market return (“Market Price”) is determined by using the midpoint of the national best bid and offer price (“NBBO”) as of the time that the Fund’s NAV is calculated. Under SEC rules, the NBBO consists of the highest displayed buy and lowest sell prices among the various exchanges trading the Fund at the time the Fund’s NAV is calculated. Prior to January 1, 2019, the price used was the midpoint between the highest bid and the lowest offer on the stock exchange on which shares of the Fund were listed for trading as of the time that the Fund’s NAV was calculated. Since shares of each Fund did not trade in the secondary market until after the Fund’s inception, for the period from inception to the first day of secondary market trading in shares of the Fund, the NAV of each Fund is used as a proxy for the secondary market trading price to calculate market returns. NAV and market returns assume that all distributions have been reinvested in each Fund at NAV and Market Price, respectively.
An index is a statistical composite that tracks a specified financial market or sector. Unlike each Fund, the indices do not actually hold a portfolio of securities and therefore do not incur the expenses incurred by each Fund. These expenses negatively impact the performance of each Fund. Also, market returns do not include brokerage commissions that may be payable on secondary market transactions. If brokerage commissions were included, market returns would be lower. The total returns presented reflect the reinvestment of dividends on securities in the indices. The returns presented do not reflect the deduction of taxes that a shareholder would pay on Fund distributions or the redemption or sale of Fund shares. The investment return and principal value of shares of each Fund will vary with changes in market conditions. Shares of each Fund may be worth more or less than their original cost when they are redeemed or sold in the market. Each Fund’s past performance is no guarantee of future performance.
Portfolio Commentary
First Trust Exchange-Traded Fund III
Annual Report
July 31, 2023 (Unaudited)
Advisor
First Trust Advisors L.P. (“First Trust”) serves as the investment advisor to the First Trust Short Duration Managed Municipal ETF (“FSMB”) and the First Trust Ultra Short Duration Municipal ETF (“FUMB”) (each a “Fund” and collectively, the “Funds”). First Trust is responsible for the ongoing monitoring of each Fund’s investment portfolio, managing each Fund’s business affairs and providing certain administrative services necessary for the management of each Fund.
Portfolio Management Team
Tom Byron, Senior Vice President, Senior Portfolio Manager
Johnathan N. Wilhelm, Senior Vice President, Senior Portfolio Manager
The portfolio managers are primarily and jointly responsible for the day-to-day management of the Funds. Tom Byron has served as portfolio manager since 2022 and Johnathan N. Wilhelm has served as portfolio manager since 2018.
Commentary
First Trust Short Duration Managed Municipal ETF
The First Trust Short Duration Managed Municipal ETF (“FSMB” or the “Fund”) is an actively managed exchange-traded fund. The Fund seeks to provide federally tax-exempt income consistent with capital preservation. Under normal market conditions, the Fund seeks to achieve its investment objective by investing at least 80% of its net assets (including investment borrowings) in municipal debt securities that pay interest that is exempt from regular federal income taxes (collectively, “Municipal Securities”). The Fund’s investment advisor seeks to construct a portfolio that has a weighted average duration of 1 - 3 years. Under normal market conditions, the Fund will primarily invest in Municipal Securities that are, at the time of investment, rated as investment grade (i.e., rated Baa3/BBB- or above) by at least one nationally recognized statistical rating organization rating such securities, or, if unrated, Municipal Securities determined by the Fund’s investment advisor to be of comparable quality. The Fund may invest up to 35% of its net assets in Municipal Securities rated below investment grade by at least one nationally recognized statistical organization rating such securities (or Municipal Securities that are unrated and determined by the Fund’s investment advisor to be of comparable quality), commonly referred to as “high-yield” or “junk” bonds. This commentary discusses the market performance and the Fund’s performance for the 12-month period ended July 31, 2023.
Market Recap
For the 12-month period ended July 31, 2023, the Bloomberg Municipal Short (1-5) Year Index (the “Benchmark”) produced a total return of 0.22%. For the same period, municipal bonds generated a total return of 0.93% as measured by the Bloomberg Municipal Bond Index. By comparison, the Bloomberg U.S. Treasury Index generated a total return of -4.01% during the same period. The following were major factors in explaining the municipal bond market’s performance:
| • | Over the past year, U.S. Treasury rates increased all along the yield curve and municipal interest rates followed U.S. Treasury yields higher. During the 12-month period ended July 31, 2023, 5-Year and 10-Year U.S. Treasury yields increased by approximately 150 basis points (“bps”) and 133 bps, respectively, to 4.17% and 3.96%. As a reminder, the price of a bond moves inversely to a given change in yield, so higher yields resulted in lower U.S. Treasury bond prices. |
| • | Large industry-wide mutual fund and exchange-traded fund (“ETF”) outflows resulted in funds selling municipal bonds to meet redemptions which put additional pressure on municipal bond prices. According to data from the Investment Company Institute, annual fund flows for the 12-month period ended July 31, 2023 were -$55.0 billion (outflow of over $55 billion). |
| • | New issue municipal bond supply has been lower year-to-date compared to figures from a year ago. Through July 31, 2023, year-to-date issuance was approximately $204.4 billion, down approximately 17% compared to the $246.6 billion issued for the same period a year ago. However, J.P. Morgan noted that new issue supply inside of 10 years to maturity increased slightly compared to the same period a year ago. |
| • | According to data from Bloomberg, municipal credit spreads tightened year-to-date. From December 30, 2022 through July 31, 2023, for municipal bonds rated AA, A, and BBB, credit spreads decreased approximately 4 bps, 15 bps, and 21 bps, respectively. |
| • | Looking at the AAA municipal yield curve as prepared by Refinitiv Lipper, year-to-date, 5-Year and 10-Year municipal yields increased by 19 bps and decreased by 11 bps, to 2.66% and 2.57%, respectively. |
Portfolio Commentary (Continued)
First Trust Exchange-Traded Fund III
Annual Report
July 31, 2023 (Unaudited)
Performance Analysis
The Fund’s total return based on net asset value (“NAV”) and market performance for the 12-month period ended July 31, 2023 was 0.45% and 0.35%, respectively, versus the Benchmark’s return of 0.22%.
As of July 31, 2023, the Fund’s market price of $19.73 was essentially identical to the Fund’s NAV of $19.73. The market value of the Fund’s shares fluctuates from time to time and may be higher or lower than the Fund’s NAV. Key factors impacting the Fund’s performance over the 12-month period ended July 31, 2023 were:
| • | Years to Maturity: In terms of the Fund’s allocation in years to a bond’s final maturity date, the Fund’s selection of bonds in the 0-6 year maturity range was a positive contributor to the Fund’s performance relative to the Benchmark, while the Fund’s allocation to bonds with a final maturity of 16-18 years was a detractor to Fund performance. |
| • | Effective Duration: Focusing on the effective durations of the Fund’s bonds, the Fund’s allocation and selection of bonds with effective durations of 0-5 years was a positive contributor to Fund performance relative to the Benchmark. The Fund’s allocation to bonds with an effective duration of 5-7 years was detrimental to Fund performance relative to the Benchmark. |
| • | Credit Rating: Regarding the Fund’s credit rating allocation relative to the Benchmark, the Fund’s selection of bonds in the AAA, AA, and A rating categories and non-rated bonds were positive contributors to the Fund’s performance. No credit rating category was a negative contributor to Fund performance relative to the Benchmark. |
| • | Sector/Industry: In terms of the Fund’s allocation to municipal bond sectors, key positive contributors were the Fund’s selection of industrial development bonds, health care, special tax, local general obligation bonds, and utilities. No sector or industry was a material negative contributor to Fund performance. |
| • | Distribution Rate: The distribution of $0.041 paid on July 31, 2023 represents a tax-exempt annualized distribution rate of 2.49% based on the Fund’s closing market price of $19.73 on July 31, 2023. During the reporting period, the Fund’s distribution rate increased eight times. The Fund’s distribution rate is not constant and is subject to change over time based on the performance of the Fund. |
Market Outlook
According to the Federal Reserve’s (“the Fed”) “Dot Plot,” the Federal Funds rate is expected to reach approximately 5.625% by December 31, 2023. We expect the Fed to raise interest rates by 25 bps at either its September 20, 2023 or November 1, 2023 meeting. During the final months of 2023, we expect longer U.S. Treasury rates to become range-bound. For example, regarding the 10-Year U.S. Treasury yield, we forecast the 10-Year bonds will trade within a range of 3.75%-4.25% and would not be surprised if the yield curve inverts more significantly whereby 2-Year yields are significantly higher than 10-Year yields. During the first half of 2024, given that we forecast that U.S. gross domestic product will grow very slowly or turn negative, we would expect the 10-Year U.S. Treasury yield to gradually decline to a range of 3.50%-3.75%.
Due to our belief that the Fed will only have one more 25 bps interest rate increase before hitting the Federal Funds terminal rate of 5.50%-5.75%, we expect municipal bond price trends to become more dependent on new issue supply and municipal mutual fund/ETF fund flows, rather than U.S. Treasury price and Fed moves. Since the municipal bond market has experienced significantly lower new issue supply year-to-date and forecast revisions for all of 2023, the key variable going forward will likely be mutual fund/ETF flows. We forecast that fund flows will turn consistently positive at some point during the fourth quarter of 2023 and fund inflows will continue during the first half of 2024. In a $4 trillion market dominated by retail investors, mutual fund, ETF, and separately managed account fund flows are a key determinant to municipal market total returns, in our view. Along with U.S. Treasury yields becoming range-bound and then gradually declining during the fourth quarter of 2023 and first half of 2024, fund flows are the other key variable to our forecast for distinctly positive total returns over the next twelve months.
As measured by municipal bond defaults and credit rating upgrade to downgrade ratios, municipal bond credit quality is currently healthy. Certain sectors have seen significant credit quality recovery including airports, toll roads, and select general obligation bonds. However, for 5 of the past 6 months, negative outlook revisions exceeded positive revisions by the S&P 500® Index. We expect certain sectors of the municipal bond universe will remain under margin pressure, including hospitals and senior living facilities, as well as municipal bonds dependent on office and retail mall occupancy levels and tax receipts. Given an expected slowdown in the U.S. economy, we will focus on municipal credits with leading market positions, growing utilization statistics, and healthy balance sheets. For the Fund, this has meant adding exposure to higher rated credits, specifically in the AAA and AA rating categories. Within the high yield municipal bond universe, we will focus on higher credit quality securities and reduce exposure to lower rated high yield
Portfolio Commentary (Continued)
First Trust Exchange-Traded Fund III
Annual Report
July 31, 2023 (Unaudited)
borrowers. We have been actively reducing fund complex exposure to borrowers that our research team views as having a distinctly negative credit rating momentum.
With this in mind, we continue to practice the discipline of our investment process where we perform fundamental credit analysis and quantitative total return scenario analysis on individual bonds and the portfolio as a whole, looking for bonds that can provide both high income and attractive total return potential over time.
First Trust Ultra Short Duration Municipal ETF
The First Trust Ultra Short Duration Municipal ETF (“FUMB” or the “Fund”) is an actively managed exchange-traded fund. The Fund seeks to provide federally tax-exempt income consistent with capital preservation. Under normal market conditions, the Fund seeks to achieve its investment objective by investing at least 80% of its net assets (including investment borrowing) in municipal debt securities that pay interest that is exempt from regular federal income taxes (collectively, “Municipal Securities”). Under normal market conditions, the weighted average duration of the Fund’s portfolio is expected to be less than one year. Under normal market conditions, the Fund will invest at least 80% of its net assets in Municipal Securities that are, at the time of investment, rated as investment grade (i.e., rated Baa3/BBB- or above) by at least one nationally recognized statistical rating organization rating such securities, or if unrated, Municipal Securities determined by the Fund’s investment advisor to be of comparable quality. This commentary discusses the market performance and the Fund’s performance for the 12-month period ended July 31, 2023.
Market Recap
For the 12-month period ended July 31, 2023, the Bloomberg Municipal Short-Term Index (the “Benchmark”) produced a total return of 2.14%. During the same period, the Bloomberg Municipal Bond Index generated a total return of 0.93%. By comparison, the Bloomberg U.S. Treasury Index generated a total return of -4.01% during the same period. The following were major factors in explaining the municipal bond market’s performance:
| • | Over the past year, U.S. Treasury rates increased all along the yield curve and municipal interest rates followed U.S. Treasury yields higher. During the 12-month period ended July 31, 2023, 5-Year and 10-Year U.S. Treasury yields increased by approximately 150 bps and 133 bps, respectively, to 4.17% and 3.96%. As a reminder, the price of a bond moves inversely to a given change in yield, so higher yields resulted in lower U.S. Treasury bond prices. |
| • | Large industry-wide mutual fund and ETF outflows resulted in funds selling municipal bonds to meet redemptions which put additional pressure on municipal bond prices. According to data from the Investment Company Institute, annual fund flows for the 12-month period ended July 31, 2023 were -$55.0 billion (outflow of over $55 billion). |
| • | New issue municipal bond supply has been lower year-to-date compared to figures from a year ago. Through July 31, 2023, year-to-date issuance was approximately $204.4 billion, down approximately 17% compared to the $246.6 billion issued for the same period a year ago. However, J.P. Morgan noted that new issue supply inside of 10 years to maturity increased slightly compared to the same period a year ago. |
| • | According to data from Bloomberg, municipal credit spreads tightened year-to-date. From December 30, 2022 through July 31, 2023, for municipal bonds rated AA, A, and BBB, credit spreads decreased approximately 4 bps, 15 bps, and 21 bps, respectively. |
| • | Looking at the AAA municipal yield curve as prepared by Refinitiv Lipper, year-to-date, 5-Year and 10-Year municipal yields increased by 19 bps and decreased by 11 bps, to 2.66% and 2.57%, respectively. |
Performance Analysis
The Fund’s NAV and market performance for the 12-month period ended July 31, 2023, was 1.83% and 1.78%, respectively, versus the Benchmark’s return of 2.14%.
As of July 31, 2023, the Fund’s market price of $19.97 was equal to its NAV of $19.97. The market value of the Fund’s shares fluctuates from time to time and may be higher or lower than the Fund’s NAV. Key factors impacting the Fund’s performance over the reporting period were:
| • | Years to Maturity: In terms of the Fund’s allocation in years to a bond’s final maturity date, the Fund’s selection of bonds in the 0-2 and 2-4 year range were detractors to the Fund’s performance relative to the Benchmark. |
Portfolio Commentary (Continued)
First Trust Exchange-Traded Fund III
Annual Report
July 31, 2023 (Unaudited)
| • | Effective Duration: Focusing on the effective durations of the Fund’s bonds, the Fund’s allocation and selection of bonds with effective durations of 0-1 years was a positive contributor to the Fund’s performance relative to the Benchmark. The Fund’s allocation to bonds with an effective duration of 1-3 years was a detractor to Fund performance relative to the Benchmark. |
| • | Credit Rating: Regarding the Fund’s credit rating allocation relative to the Benchmark, the Fund’s selection of bonds in the A and AA rating categories were negative contributors to the Fund’s performance versus the Benchmark. |
| • | Sector/Industry: In terms of the Fund’s allocation to municipal bond sectors, the Fund’s investments in the Industrial Development Bond and Transportation sectors were the main detractors from performance relative to the Benchmark, while the Housing sector was also a detractor. The Fund’s selection and allocation to Hospital bonds was a modest positive contributor to the Fund’s performance relative to the Benchmark. |
| • | Distribution Rate: The distribution of $0.039 paid on July 31, 2023, represents a tax-exempt annualized distribution rate of 2.34% based on the Fund’s closing market price of $19.97 on July 31, 2023. During the reporting period, the Fund’s distribution rate increased nine times. The Fund’s distribution rate is not constant and is subject to change over time based on the performance of the Fund. |
Market Outlook
According to the Fed’s “Dot Plot,” the Federal Funds rate is expected to reach approximately 5.625% by December 31, 2023. We expect the Fed to raise interest rates by 25 bps at either its September 20, 2023 or November 1, 2023 meeting. During the final months of 2023, we expect longer U.S. Treasury rates to become range-bound. For example, regarding the 10-Year U.S. Treasury yield, we forecast the 10-Year bonds will trade within a range of 3.75%-4.25% and would not be surprised if the yield curve inverts more significantly whereby 2-Year yields are significantly higher than 10-Year yields. During the first half of 2024, given that we forecast that U.S. gross domestic product will grow very slowly or turn negative, we would expect the 10-Year U.S. Treasury yield to gradually decline to a range of 3.50%-3.75%.
Due to our belief that the Fed will only have one more 25 bps interest rate increase before hitting the Federal Funds terminal rate of 5.50%-5.75%, we expect municipal bond price trends to become more dependent on new issue supply and municipal mutual fund/ETF fund flows, rather than U.S. Treasury price and Fed moves. Since the municipal bond market has experienced significantly lower new issue supply year-to-date and forecast revisions for all of 2023, the key variable going forward will likely be mutual fund/ETF flows. We forecast that fund flows will turn consistently positive at some point during the fourth quarter of 2023 and fund inflows will continue during the first half of 2024. In a $4 trillion market dominated by retail investors, mutual fund, ETF, and separately managed account fund flows are a key determinant to municipal market total returns, in our view. Along with U.S. Treasury yields becoming range-bound and then gradually declining during the fourth quarter of 2023 and first half of 2024, fund flows are the other key variable to our forecast for distinctly positive total returns over the next twelve months.
As measured by municipal bond defaults and credit rating upgrade to downgrade ratios, municipal bond credit quality is currently healthy. Certain sectors have seen significant credit quality recovery including airports, toll roads, and select general obligation bonds. However, for 5 of the past 6 months, negative outlook revisions exceeded positive revisions by the S&P 500® Index. We expect certain sectors of the municipal bond universe will remain under margin pressure, including hospitals and senior living facilities, as well as municipal bonds dependent on office and retail mall occupancy levels and tax receipts. Given an expected slowdown in the U.S. economy, we will focus on municipal credits with leading market positions, growing utilization statistics, and healthy balance sheets. For the Fund, this has meant adding exposure to higher rated credits, specifically in the AAA and AA rating categories.
With this in mind, we continue to practice the discipline of our investment process where we perform fundamental credit analysis and quantitative total return scenario analysis on individual bonds and the portfolio as a whole, looking for bonds that can provide both high income and attractive total return potential over time.
First Trust Exchange-Traded Fund III
Understanding Your Fund Expenses
July 31, 2023 (Unaudited)
As a shareholder of First Trust Short Duration Managed Municipal ETF or First Trust Ultra Short Duration Municipal ETF (each a “Fund” and collectively, the “Funds”), you incur two types of costs: (1) transaction costs; and (2) ongoing costs, including management fees, distribution and/or service (12b-1) fees, if any, and other Fund expenses. This Example is intended to help you understand your ongoing costs of investing in the Funds and to compare these costs with the ongoing costs of investing in other funds.
The Example is based on an investment of $1,000 invested at the beginning of the period and held through the six-month period ended July 31, 2023.
Actual Expenses
The first line in the following table provides information about actual account values and actual expenses. You may use the information in this line, together with the amount you invested, to estimate the expenses that you paid over the period. Simply divide your account value by $1,000 (for example, an $8,600 account value divided by $1,000 = 8.6), then multiply the result by the number in the first line under the heading entitled “Expenses Paid During the Six-Month Period” to estimate the expenses you paid on your account during this six-month period.
Hypothetical Example for Comparison Purposes
The second line in the following table provides information about hypothetical account values and hypothetical expenses based on each Fund’s actual expense ratio and an assumed rate of return of 5% per year before expenses, which is not each Fund’s actual return. The hypothetical account values and expenses may not be used to estimate the actual ending account balance or expenses you paid for the period. You may use this information to compare the ongoing costs of investing in the Funds and other funds. To do so, compare this 5% hypothetical example with the 5% hypothetical examples that appear in the shareholder reports of the other funds.
Please note that the expenses shown in the table are meant to highlight your ongoing costs only and do not reflect any transactional costs such as brokerage commissions. Therefore, the second line in the table is useful in comparing ongoing costs only, and will not help you determine the relative total costs of owning different funds. In addition, if these transactional costs were included, your costs would have been higher.
| | Beginning
Account Value
February 1, 2023 | Ending
Account Value
July 31, 2023 | Annualized
Expense Ratio
Based on the
Six-Month
Period | Expenses Paid
During the
Six-Month
Period (a) |
| First Trust Short Duration Managed Municipal ETF (FSMB) |
| Actual | $1,000.00 | $1,000.70 | 0.55% | $2.73 |
| Hypothetical (5% return before expenses) | $1,000.00 | $1,022.07 | 0.55% | $2.76 |
| First Trust Ultra Short Duration Municipal ETF (FUMB) |
| Actual | $1,000.00 | $1,010.60 | 0.45% | $2.24 |
| Hypothetical (5% return before expenses) | $1,000.00 | $1,022.56 | 0.45% | $2.26 |
| (a) | Expenses are equal to the annualized expense ratios as indicated in the table multiplied by the average account value over the period (February 1, 2023 through July 31, 2023), multiplied by 181/365 (to reflect the six-month period). |
First Trust Short Duration Managed Municipal ETF (FSMB)
Portfolio of Investments
July 31, 2023
Principal
Value | | Description | | Stated
Coupon | | Stated
Maturity | | Value |
| MUNICIPAL BONDS – 98.3% |
| | | Alabama – 3.6% | | | | | | |
| $140,000 | | Birmingham AL Spl Care Facs Fing Auth Hlthcare Fac Ref Children’s Hosp of AL
| | 5.00% | | 06/01/26 | | $143,523 |
| 130,000 | | Black Belt Energy Gas Dist AL Gas Prepay Rev Proj No. 4, Ser A-1 (Mandatory put 12/01/25)
| | 4.00% | | 12/01/49 | | 129,431 |
| 330,000 | | Black Belt Energy Gas Dist AL Gas Prepay Rev, Ser A (Mandatory put 12/01/23)
| | 4.00% | | 12/01/48 | | 329,898 |
| 1,035,000 | | Black Belt Energy Gas Dist AL Gas Proj Rev Bonds, Proj No. 7, Ser C-1 (Mandatory put 12/01/26)
| | 4.00% | | 10/01/52 | | 1,022,334 |
| 490,000 | | Black Belt Energy Gas Dist AL Gas Proj Rev Proj No. 6, Ser B (Mandatory put 12/01/26)
| | 4.00% | | 10/01/52 | | 485,199 |
| 1,165,000 | | Black Belt Energy Gas Dist AL Gas Proj Rev, Ser C-1
| | 5.25% | | 12/01/27 | | 1,222,817 |
| 1,500,000 | | Black Belt Energy Gas Dist AL Gas Proj Rev, Ser E
| | 5.00% | | 06/01/26 | | 1,542,714 |
| 100,000 | | Greenville AL Pub Impt Cooperative Pub Impt Rev Greenville Funding, BAM
| | 5.00% | | 03/01/25 | | 102,647 |
| 1,000,000 | | Hlth Care Auth for Baptist Hlth AL Ref Affiliate of UAB Hlth Sys, Ser A
| | 5.00% | | 11/15/29 | | 1,089,597 |
| 245,000 | | Infirmary Hlth Sys AL Spl Care Facs Fing Auth Rev Infirmary Hlth Sys Inc, Ser A
| | 5.00% | | 02/01/28 | | 252,681 |
| 500,000 | | Infirmary Hlth Sys AL Spl Care Facs Fing Auth Rev Infirmary Hlth Sys Inc, Ser A
| | 5.00% | | 02/01/36 | | 512,378 |
| 2,470,000 | | Lower AL Gas Dist Gas Proj Rev Bonds Proj 2 (Mandatory put 12/01/25)
| | 4.00% | | 12/01/50 | | 2,451,231 |
| 300,000 | | Midcity Impt Dist AL Spl Assmnt Rev
| | 3.88% | | 11/01/27 | | 278,175 |
| 1,335,000 | | SE AL St Gas Sply Dist Gas Sply Rev Proj #2, Ser A (Mandatory put 06/01/24)
| | 4.00% | | 06/01/49 | | 1,331,952 |
| 2,000,000 | | SE Energy Auth AL Cmdy Sply Rev Proj #1, Ser A (Mandatory put 10/01/28)
| | 4.00% | | 11/01/51 | | 1,970,393 |
| 500,000 | | SE Energy Auth AL Cmdy Sply Rev Proj No. 3, Ser A-1
| | 5.00% | | 12/01/26 | | 516,919 |
| 2,000,000 | | Selma AL Indl Dev Brd Rev Var Ref Intl Paper Company Proj, Ser A (Mandatory put 10/01/24)
| | 2.00% | | 11/01/33 | | 1,956,681 |
| | | | | 15,338,570 |
| | | Arizona – 1.4% | | | | | | |
| 155,000 | | AZ St Indl Dev Auth Edu Rev Jerome Fac Proj Social Bonds, Ser B
| | 5.00% | | 07/01/27 | | 159,736 |
| 155,000 | | AZ St Indl Dev Auth Edu Rev Jerome Fac Proj Social Bonds, Ser B
| | 5.00% | | 07/01/29 | | 160,574 |
| 125,000 | | AZ St Indl Dev Auth Edu Rev Ref Basis Schs Projs, Ser A (a)
| | 5.00% | | 07/01/26 | | 125,411 |
| 115,000 | | AZ St Indl Dev Auth Edu Rev Ref Doral Acdmy of Northern NV Proj, Ser A (a)
| | 4.00% | | 07/15/26 | | 111,877 |
| 310,000 | | AZ St Indl Dev Auth Rev Lincoln S Beltway Proj
| | 5.00% | | 11/01/25 | | 322,594 |
| 1,000,000 | | AZ St Indl Dev Auth Rev Lincoln S Beltway Proj
| | 5.00% | | 05/01/27 | | 1,070,596 |
| 1,250,000 | | Chandler AZ Indl Dev Auth Indl Dev Rev Var Intel Corp Proj, Ser 2022-2, AMT (Mandatory put 09/01/27)
| | 5.00% | | 09/01/52 | | 1,285,033 |
| 1,000,000 | | Coconino Cnty AZ Poll Controlcorp Var Ref NV Pwr Co Proj Remk, Ser B (Mandatory put 03/31/26)
| | 3.75% | | 03/01/39 | | 1,003,072 |
| 95,000 | | Glendale AZ Indl Dev Auth Sr Living Facs Rev Ref Royal Oaks Life Care Cmnty
| | 4.00% | | 05/15/29 | | 89,179 |
| 580,000 | | Phoenix AZ Indl Dev Auth Edu Rev Ref Basis Sch (a)
| | 5.00% | | 07/01/35 | | 580,708 |
| 665,000 | | Pima Cnty AZ Indl Dev Auth Sr Living Rev La Posada at Pusch Ridge Proj, Ser A (a)
| | 5.75% | | 11/15/25 | | 665,920 |
| 280,000 | | Santa Cruz Cnty AZ Pledged Rev Ref, AGM
| | 4.00% | | 07/01/34 | | 286,507 |
| | | | | 5,861,207 |
See Notes to Financial Statements
Page 13
First Trust Short Duration Managed Municipal ETF (FSMB)
Portfolio of Investments (Continued)
July 31, 2023
Principal
Value | | Description | | Stated
Coupon | | Stated
Maturity | | Value |
| MUNICIPAL BONDS (Continued) |
| | | California – 4.3% | | | | | | |
| $1,000,000 | | CA Cmnty Choice Fing Auth Clean Energy Proj Rev Green Bond Clean Energy Proj, Ser B-1 (Mandatory put 08/01/29)
| | 5.00% | | 07/01/53 | | $1,049,569 |
| 200,000 | | CA Cmnty Choice Fing Auth Clean Energy Proj Rev Green Bond, Ser A-1
| | 4.00% | | 02/01/24 | | 199,808 |
| 250,000 | | CA Cmnty Choice Fing Auth Clean Energy Proj Rev Green Bond, Ser A-1
| | 4.00% | | 08/01/24 | | 250,554 |
| 350,000 | | CA Cmnty Choice Fing Auth Clean Energy Proj Rev Green Bond, Ser A-1 (Mandatory put 08/01/28)
| | 4.00% | | 05/01/53 | | 349,209 |
| 500,000 | | CA Cmnty Choice Fing Auth Clean Energy Proj Rev Green Bond, Ser B-1 (Mandatory put 08/01/31)
| | 4.00% | | 02/01/52 | | 497,380 |
| 25,000 | | CA St Enterprise Dev Auth Stdt Hsg Rev M@College Proj, Ser A
| | 5.00% | | 08/01/23 | | 25,000 |
| 50,000 | | CA St Enterprise Dev Auth Stdt Hsg Rev M@College Proj, Ser A
| | 5.00% | | 08/01/24 | | 50,430 |
| 605,000 | | CA St Hlth Facs Fing Auth Rev Adventist Hlth Sys W, Ser A
| | 4.00% | | 03/01/33 | | 597,327 |
| 385,000 | | CA St Hlth Facs Fing Auth Rev El Camino Hosp
| | 5.00% | | 02/01/33 | | 409,319 |
| 1,160,000 | | CA St Hlth Facs Fing Auth Rev Var Ref Stanford Hlth Care, Ser A (Mandatory put 08/15/25)
| | 3.00% | | 08/15/54 | | 1,157,030 |
| 525,000 | | CA St Muni Fin Auth Mobile Home Park Rev Ref Sr Caritas Projs, Ser A
| | 5.00% | | 08/15/25 | | 534,796 |
| 100,000 | | CA St Muni Fin Auth Ref Palomar Hlth, Ser A, COPS, AGM
| | 5.00% | | 11/01/27 | | 105,074 |
| 1,500,000 | | CA St Muni Fin Auth Rev Bethany Home Proj
| | 5.00% | | 11/15/42 | | 1,640,654 |
| 1,000,000 | | CA St Poll Control Fin Auth Sol Wst Disp Rev Ref Waste Mgmt Inc, Ser B-1, AMT
| | 3.00% | | 11/01/25 | | 977,414 |
| 500,000 | | CA St Sch Fin Auth Chrt Sch Rev Ref Classical Academies Oceanside Proj, Ser A (a)
| | 4.00% | | 10/01/27 | | 496,681 |
| 40,000 | | CA St Stwd Cmntys Dev Auth Spl Tax Rev Impt Area No. 1
| | 4.00% | | 09/01/23 | | 39,984 |
| 50,000 | | CA St Stwd Cmntys Dev Auth Spl Tax Rev Impt Area No. 1
| | 4.00% | | 09/01/24 | | 49,753 |
| 80,000 | | CA St Stwd Cmntys Dev Auth Spl Tax Rev Impt Area No. 1
| | 4.00% | | 09/01/25 | | 79,308 |
| 355,000 | | CA St Stwd Cmntys Dev Auth Stwd Rev Dev Auth, Ser 2021A
| | 4.00% | | 09/02/25 | | 351,167 |
| 115,000 | | Folsom Ranch CA Fing Auth Spl Tax Rev White Rock Springs Ranch
| | 3.00% | | 09/01/23 | | 114,817 |
| 100,000 | | Folsom Ranch CA Fing Auth Spl Tax Rev White Rock Springs Ranch
| | 4.00% | | 09/01/26 | | 99,833 |
| 1,025,000 | | Kern CA Cmnty Clg Dist, CABS, BANS
| | (b) | | 08/01/23 | | 1,025,000 |
| 200,000 | | Long Beach CA Arpt Rev Ref, Ser A, AGM
| | 5.00% | | 06/01/26 | | 211,577 |
| 1,490,000 | | Los Angeles CA Dept of Arpts Arpt Rev Sub Los Angeles Intl Arpt, Ser B, AMT
| | 5.00% | | 05/15/26 | | 1,551,891 |
| 730,000 | | Los Angeles CA Dept of Arpts Arpt Rev Subord Ref, Ser A, AMT
| | 5.00% | | 05/15/29 | | 795,515 |
| 95,000 | | March Jt Pwrs Redev Agy Successor Agy CA Tax Allocation Ref March Air Force Base Redev Proj, Ser A, BAM
| | 4.00% | | 08/01/27 | | 97,186 |
| 200,000 | | Ontario Pub Fing Auth Lease Rev Capital Projs, AGM (Pre-refunded maturity 10/01/23)
| | 5.38% | | 10/01/40 | | 200,703 |
| 85,000 | | Rancho Cordova CA Cmnty Facs Dist Spl Tax Rev Grantline 208 Cmnty Fac Dt #2018-1
| | 3.00% | | 09/01/23 | | 84,896 |
| 90,000 | | Rancho Cordova CA Cmnty Facs Dist Spl Tax Rev Grantline 208 Cmnty Fac Dt #2018-1
| | 3.00% | | 09/01/24 | | 88,645 |
| 150,000 | | River Islands CA Pub Fing Auth Spl Tax Ref Cmnty Facs Dt #2003-1, Ser A-1, AGM
| | 5.00% | | 09/01/26 | | 158,366 |
| 240,000 | | Roseville CA Fin Auth Spl Tax Rev Ref, Ser A
| | 5.00% | | 09/01/25 | | 248,876 |
| 60,000 | | Roseville CA Spl Tax Svsp Westpark Federico Cmnty Facs Dt
No. 1
| | 3.00% | | 09/01/24 | | 58,572 |
| 70,000 | | Roseville CA Spl Tax Svsp Westpark Federico Cmnty Facs Dt
No. 1
| | 3.00% | | 09/01/25 | | 67,111 |
| 85,000 | | Roseville CA Spl Tax Svsp Westpark Federico Cmnty Facs Dt
No. 1
| | 4.00% | | 09/01/26 | | 84,252 |
| 65,000 | | San Diego CA Unif Sch Dist Ref Election 1998, Ser C-2, AGM
| | 5.50% | | 07/01/25 | | 68,169 |
Page 14
See Notes to Financial Statements
First Trust Short Duration Managed Municipal ETF (FSMB)
Portfolio of Investments (Continued)
July 31, 2023
Principal
Value | | Description | | Stated
Coupon | | Stated
Maturity | | Value |
| MUNICIPAL BONDS (Continued) |
| | | California (Continued) | | | | | | |
| $100,000 | | San Diego Cnty CA Regl Arpt Auth Arpt Rev Subord Ref, Ser A
| | 5.00% | | 07/01/24 | | $101,648 |
| 140,000 | | San Francisco CA City & Cnty Arpts Commn Intl Arpt Rev Ref 2nd Ser, Ser A
| | 4.00% | | 05/01/26 | | 143,665 |
| 200,000 | | San Francisco CA City & Cnty Dcnty Dev Spl Tax Dist No Mission Rock Fac and Svcs, Ser A (a)
| | 4.00% | | 09/01/26 | | 198,353 |
| 400,000 | | San Francisco City & Cnty CA Cmnty Facs Dist #2016-1, Ser 2021
| | 4.00% | | 09/01/26 | | 398,417 |
| 1,500,000 | | San Joaquin Hills CA Transprtn Corridor Agy Toll Road Rev Sr Lien Ref, Ser A (Pre-refunded maturity 01/15/25)
| | 5.00% | | 01/15/29 | | 1,543,661 |
| 175,000 | | San Luis Obispo CA Cmnty Facs Dist #2019-1 Spl Tax
| | 4.00% | | 09/01/25 | | 174,379 |
| 100,000 | | San Luis Obispo CA Cmnty Facs Dist #2019-1 Spl Tax
| | 4.00% | | 09/01/26 | | 99,833 |
| 1,500,000 | | Sanger CA Fing Auth Wstwtr Rev Ref, AGM (Pre-refunded maturity 06/15/24)
| | 5.00% | | 06/15/34 | | 1,550,461 |
| 225,000 | | Western Placer Wst Mgmt Auth CA Solid Wst Rev Landfill Impt Proj, Ser B
| | 5.00% | | 06/01/34 | | 244,983 |
| | | | | 18,271,266 |
| | | Colorado – 1.6% | | | | | | |
| 500,000 | | CO St Eductnl & Cultural Facs Auth Rev Ref & Impt Chrt Sch Univ Lab Bldg Corp (a)
| | 5.00% | | 12/15/28 | | 511,991 |
| 110,000 | | CO St Eductnl & Cultural Facs Auth Rev Ref Chrt Sch Stargate Chrt Sch Proj, Ser A
| | 5.00% | | 12/01/25 | | 112,844 |
| 100,000 | | CO St Eductnl & Cultural Facs Auth Rev Ref N Star Acdmy Chrt Sch Proj
| | 4.00% | | 11/01/23 | | 100,041 |
| 400,000 | | CO St Hlth Facs Auth Rev Commonspirit Hlth Oblig Grp, Ser A
| | 5.00% | | 11/01/26 | | 415,929 |
| 130,000 | | CO St Hlth Facs Auth Rev Ref Commonspirit Hlth, Ser B-1 (Mandatory put 08/01/25)
| | 5.00% | | 08/01/49 | | 132,275 |
| 80,000 | | CO St Hlth Facs Auth Rev Ref Parkview Med Cntr, Ser A
| | 3.25% | | 09/01/25 | | 78,464 |
| 125,000 | | CO St Hlth Facs Auth Rev Var Ref Intermountain Hlthcare, Ser B (Mandatory put 08/17/26)
| | 5.00% | | 05/15/62 | | 131,056 |
| 2,000,000 | | CO St Hlth Facs Auth Rev Var Ref Intermountain Hlthcare, Ser C (Mandatory put 08/15/28)
| | 5.00% | | 05/15/62 | | 2,182,932 |
| 1,000,000 | | Denver City & Cnty CO Arpt Rev Var Ref, Ser B2, AMT (Mandatory put 11/15/25)
| | 5.00% | | 11/15/31 | | 1,026,774 |
| 770,000 | | Denver City & Cnty CO Arpt Rev, Ser A, AMT
| | 5.00% | | 11/15/25 | | 792,660 |
| 1,000,000 | | Denver City & Cnty CO Arpt Rev, Ser A, AMT
| | 5.00% | | 11/15/26 | | 1,046,438 |
| 270,000 | | Gold Hill Mesa Met Dist #2 CO Ltd Tax & Spl Rev Ref, Ser A, BAM
| | 5.00% | | 12/01/25 | | 277,711 |
| | | | | 6,809,115 |
| | | Connecticut – 2.3% | | | | | | |
| 235,000 | | CT St Green Bond, Ser F
| | 5.00% | | 10/15/30 | | 249,647 |
| 50,000 | | CT St Hlth & Eductnl Facs Auth Rev Hartford Hlthcare, Ser E
| | 5.00% | | 07/01/25 | | 50,648 |
| 170,000 | | CT St Hlth & Eductnl Facs Auth Rev Ref St Supported Child Care
| | 5.00% | | 07/01/29 | | 176,835 |
| 100,000 | | CT St Hlth & Eductnl Facs Auth Rev Ref Yale Univ, Ser A-2 (Mandatory put 07/01/26)
| | 2.00% | | 07/01/42 | | 94,756 |
| 1,500,000 | | CT St Hlth & Eductnl Facs Auth Rev Var Remk, Ser A (Mandatory put 02/10/26)
| | 2.80% | | 07/01/48 | | 1,469,002 |
| 215,000 | | CT St Hlth & Eductnl Facs Auth Rev, Ser A
| | 5.00% | | 07/01/30 | | 234,042 |
| 365,000 | | CT St Spl Tax Oblig Rev Ref Transprtn Infra, Ser B
| | 5.00% | | 08/01/27 | | 378,554 |
| 2,000,000 | | CT St Spl Tax Oblig Rev Transptrn Infra, Ser A
| | 5.00% | | 09/01/30 | | 2,120,092 |
| 140,000 | | CT St Spl Tax Oblig Rev, Ser B
| | 5.00% | | 10/01/27 | | 151,825 |
| 1,000,000 | | CT St, Ser 2021A
| | 4.00% | | 01/15/26 | | 1,020,722 |
| 1,000,000 | | CT St, Ser D
| | 4.00% | | 08/15/29 | | 1,027,034 |
See Notes to Financial Statements
Page 15
First Trust Short Duration Managed Municipal ETF (FSMB)
Portfolio of Investments (Continued)
July 31, 2023
Principal
Value | | Description | | Stated
Coupon | | Stated
Maturity | | Value |
| MUNICIPAL BONDS (Continued) |
| | | Connecticut (Continued) | | | | | | |
| $1,500,000 | | E Hartford CT Hsg Auth Multifamily Hsg Rev Var Summerfield Townhouses Proj, Ser A (Mandatory put 02/01/25)
| | 4.25% | | 02/01/27 | | $1,501,641 |
| 200,000 | | Hamden CT Ref, Ser A, BAM
| | 5.00% | | 08/01/25 | | 205,575 |
| 970,000 | | Univ of CT CT, Ser A
| | 5.00% | | 11/01/26 | | 1,027,530 |
| 25,000 | | Univ of CT CT, Ser A
| | 5.00% | | 11/01/35 | | 27,227 |
| | | | | 9,735,130 |
| | | District of Columbia – 0.3% | | | | | | |
| 1,060,000 | | Met Washington DC Arpts Auth Arpt Sys Rev Ref, Ser A, AMT
| | 5.00% | | 10/01/30 | | 1,132,129 |
| 250,000 | | Met Washington DC Arpts Auth Arpt Sys Rev Ref, Ser B, AMT
| | 5.00% | | 10/01/25 | | 256,872 |
| | | | | 1,389,001 |
| | | Florida – 7.6% | | | | | | |
| 110,000 | | Alachua Cnty FL Hlth Facs Auth CCRC Ref Oak Hammock at the Univ of FL Inc Proj
| | 4.00% | | 10/01/24 | | 108,607 |
| 200,000 | | Alachua Cnty FL Hlth Facs Auth CCRC Ref Oak Hammock at the Univ of FL Inc Proj
| | 4.00% | | 10/01/25 | | 195,216 |
| 105,000 | | Alachua Cnty FL Hlth Facs Auth CCRC Ref Oak Hammock at the Univ of FL Inc Proj
| | 4.00% | | 10/01/26 | | 101,273 |
| 1,165,000 | | Babcock Ranch Cmnty Indep Spl Dist FL Spl Assmnt Rev Assmt Area 3A (a)
| | 4.50% | | 11/01/29 | | 1,175,749 |
| 380,000 | | Babcock Ranch Cmnty Indep Spl Dist FL Spl Assmnt Rev Proj, Ser 2021
| | 2.38% | | 05/01/26 | | 360,080 |
| 160,000 | | Berry Bay CDD FL Spl Assmnt Rev Assmnt Area One
| | 2.63% | | 05/01/26 | | 152,521 |
| 645,000 | | Berry Bay CDD FL Spl Assmnt Rev Assmnt Area One
| | 3.13% | | 05/01/31 | | 577,693 |
| 205,000 | | Black Creek FL CDD Spl Assmnt Expansion Area Proj
| | 4.80% | | 06/15/27 | | 206,355 |
| 1,125,000 | | Broward Cnty FL Arpt Sys Rev, Ser A, AMT
| | 5.25% | | 10/01/24 | | 1,127,515 |
| 400,000 | | Broward Cnty FL Port Facs Rev, AMT
| | 5.00% | | 09/01/24 | | 405,571 |
| 460,000 | | Cross Creek N CDD FL Spl Assmnt, Ser 2022
| | 3.40% | | 05/01/27 | | 450,140 |
| 810,000 | | Edgewater E CDD FL Spl Assmnt Rev Assmnt Area Two
| | 3.00% | | 05/01/27 | | 757,383 |
| 265,000 | | Epperson N CDD FL Capital Impt Rev Assmnt Area Three, Ser A
| | 2.45% | | 11/01/26 | | 248,762 |
| 400,000 | | Escambia Cnty FL Envrnmntl Impt Rev Var Ref Intl Paper Company Proj, Ser B (Mandatory put 10/01/24)
| | 2.00% | | 11/01/33 | | 391,336 |
| 500,000 | | FL St Dept Gen Svcs Div Facs Mgmt Rev Ref FL Facs Pool, Ser A
| | 4.00% | | 09/01/30 | | 524,042 |
| 110,000 | | FL St Dev Fin Corp Eductnl Facs Rev River City Science Acdmy Projs, Ser A
| | 4.00% | | 07/01/24 | | 109,216 |
| 330,000 | | FL St Dev Fin Corp Eductnl Facs Rev River City Science Acdmy Projs, Ser A
| | 4.00% | | 07/01/25 | | 326,206 |
| 155,000 | | FL St Dev Fin Corp Eductnl Facs Rev River City Science Acdmy Projs, Ser A
| | 4.00% | | 07/01/26 | | 152,687 |
| 150,000 | | FL St Dev Fin Corp Eductnl Facs Rev River City Science Acdmy Projs, Ser A
| | 4.00% | | 07/01/28 | | 147,256 |
| 105,000 | | FL St Dev Fin Corp Sr Living Rev Ref Glenridge on Palmer Ranch Proj (a)
| | 4.00% | | 06/01/24 | | 104,024 |
| 100,000 | | FL St Dev Fin Corp Sr Living Rev Ref Glenridge on Palmer Ranch Proj (a)
| | 4.00% | | 06/01/25 | | 97,924 |
| 220,000 | | FL St Muni Pwr Agy Ref, Ser A
| | 5.00% | | 10/01/30 | | 230,691 |
| 3,000,000 | | Gainesville FL Utilities Sys Rev Var Ref Remk, Ser B (c)
| | 4.60% | | 10/01/42 | | 3,000,000 |
| 785,000 | | Gtr Orlando FL Aviation Auth Arpt Facs Rev Prerefunded Priority Sub, Ser A, AMT
| | 5.00% | | 10/01/24 | | 795,318 |
| 125,000 | | Gulfstream Polo Cmnty Dev Dist FL Spl Assmnt Phase 2 Proj
| | 3.00% | | 11/01/24 | | 123,109 |
| 2,890,000 | | Halifax FL Hosp Med Ctr Ref
| | 5.00% | | 06/01/27 | | 3,010,450 |
| 210,000 | | Hills Minneola Cmnty Dev Dist FL Spl Assmnt Rev S Parcel Assmnt Area (a)
| | 3.00% | | 05/01/25 | | 205,041 |
Page 16
See Notes to Financial Statements
First Trust Short Duration Managed Municipal ETF (FSMB)
Portfolio of Investments (Continued)
July 31, 2023
Principal
Value | | Description | | Stated
Coupon | | Stated
Maturity | | Value |
| MUNICIPAL BONDS (Continued) |
| | | Florida (Continued) | | | | | | |
| $1,500,000 | | Hillsborough Cnty FL Aviation Auth Tampa Intl, Ser A, AMT (Pre-refunded maturity 10/01/24)
| | 5.00% | | 10/01/44 | | $1,523,141 |
| 55,000 | | Lakes of Sarasota CDD FL Impt Rev Phase 1 Proj Assmnt Area One, Ser A-1
| | 2.75% | | 05/01/26 | | 53,032 |
| 255,000 | | Lakewood Ranch FL Stewardship Dist Spl Assmnt Rev Ref Country Club E Proj, AGM
| | 5.00% | | 05/01/25 | | 261,439 |
| 460,000 | | Lee Cnty FL Indl Dev Auth Hlthcr Facs Rev Shell Point Oblig Grp
| | 4.00% | | 11/15/30 | | 446,935 |
| 550,000 | | LTC Ranch W Rsdl Cmnty Dev Dist Spl Assmnt Rev Assmnt Area One Proj, Ser A
| | 2.50% | | 05/01/26 | | 521,969 |
| 500,000 | | Martin Cnty FL Hlth Facs Auth Martin Mem Med Ctr (Pre-refunded maturity 11/15/24)
| | 5.00% | | 11/15/45 | | 509,521 |
| 1,890,000 | | Miami-Dade Cnty FL Sch Brd Ref, Ser C, COPS
| | 5.00% | | 02/01/32 | | 1,959,064 |
| 4,000,000 | | Miami-Dade Cnty FL Seaport Rev Ref Sr Bonds, Ser A, AMT
| | 5.00% | | 10/01/30 | | 4,373,034 |
| 310,000 | | Mirada II Cmnty Dev Dist FL Cap Impt Rev
| | 2.50% | | 05/01/26 | | 294,201 |
| 385,000 | | N Springs FL Impt Dist Heron Bay Wtr Mgmt Proj, Ser 2021-1, AGM
| | 2.00% | | 05/01/26 | | 361,904 |
| 25,000 | | Orange Cnty FL Hlth Facs Auth Rev Ref Presbyterian Retmnt Cmntys
| | 5.00% | | 08/01/31 | | 25,750 |
| 1,770,000 | | Palm Beach Cnty FL Hlth Facs Auth Ref Acts Retmnt Life Cmntys Inc Oblig Grp
| | 5.00% | | 11/15/32 | | 1,791,776 |
| 165,000 | | Pine Isle Cmnty Dev Dist FL Spl Assmnt 2021 Proj (a)
| | 2.38% | | 12/15/26 | | 155,527 |
| 100,000 | | Poinciana FL W CDD Spl Assmnt Ref Sr, Ser 1, AGM
| | 3.60% | | 05/01/26 | | 100,879 |
| 40,000 | | Rhodine Road N CDD FL Spl Assmnt 2019 Assmnt Area
| | 3.50% | | 05/01/24 | | 39,767 |
| 415,000 | | Rhodine Road N CDD FL Spl Assmnt 2019 Assmnt Area
| | 4.00% | | 05/01/30 | | 405,377 |
| 115,000 | | Saint Johns Cnty FL Indl Dev Auth Sr Living Rev Ref Vicar’s Landing Proj, Ser A
| | 4.00% | | 12/15/23 | | 114,538 |
| 145,000 | | Saint Johns Cnty FL Indl Dev Auth Sr Living Rev Ref Vicar’s Landing Proj, Ser A
| | 4.00% | | 12/15/24 | | 142,852 |
| 960,000 | | San Simeon Cmnty Dev Dist FL Spl Assmnt (a)
| | 3.75% | | 06/15/31 | | 896,335 |
| 375,000 | | Sarasota Natl FL CDD Spl Assmnt Ref
| | 3.00% | | 05/01/24 | | 371,262 |
| 240,000 | | Sarasota Natl FL CDD Spl Assmnt Ref
| | 3.00% | | 05/01/25 | | 234,411 |
| 740,000 | | Shell Point Cmnty Dev Dist FL Spl Assmnt (a)
| | 4.50% | | 11/01/29 | | 741,128 |
| 155,000 | | Shingle Creek at Bronson CDD FL Spl Assmnt
| | 2.50% | | 06/15/26 | | 146,765 |
| 305,000 | | Silver Palms W CDD FL Spl Assmnt 2022 Proj
| | 2.60% | | 06/15/27 | | 280,280 |
| 215,000 | | Six Mile Creek FL CDD Capital Impt Rev Assmnt Area 3 Phase 1
| | 2.50% | | 05/01/26 | | 203,461 |
| 470,000 | | Summer Woods CDD FL Spl Assmnt Area Two 2020 Proj
| | 3.30% | | 05/01/31 | | 423,956 |
| 30,000 | | Tampa FL Capital Impt Cigarette Tax Allocation H Lee Moffitt Cancer Ctr Proj, Ser A
| | 5.00% | | 09/01/24 | | 30,431 |
| 425,000 | | Timber Creek SW CDD FL Spl Assmnt Area Two Proj
| | 2.35% | | 12/15/26 | | 397,497 |
| 285,000 | | V-Dana CDD FL Spl Assmnt CDD Assmnt Area One 2021 Proj
| | 2.60% | | 05/01/26 | | 271,983 |
| 115,000 | | Vlg FL CDD #6 Spl Assmnt Rev Ref
| | 4.00% | | 05/01/25 | | 115,836 |
| 190,000 | | Westside Haines City CDD Spl Assmnt Area One Proj
| | 2.50% | | 05/01/26 | | 180,898 |
| | | | | 32,459,114 |
| | | Georgia – 5.7% | | | | | | |
| 2,000,000 | | Atlanta GA Arpt Rev Ref, Ser B, AMT
| | 5.00% | | 07/01/26 | | 2,080,026 |
| 915,000 | | Atlanta GA Arpt Rev, Ser B, AMT
| | 5.00% | | 07/01/25 | | 937,898 |
| 1,500,000 | | Bartow Cnty GA Dev Auth Var GA Pwr Comp Plant Bowen Proj Remk (Mandatory put 08/19/25)
| | 2.88% | | 08/01/43 | | 1,454,418 |
| 100,000 | | Burke Cnty GA Dev Auth Poll Control Rev Var GA Pwr Co Plant Vogtle Proj Remk (Mandatory put 06/13/24)
| | 2.15% | | 10/01/32 | | 97,790 |
| 2,000,000 | | Burke Cnty GA Dev Auth Poll Control Rev Var Ref GA Pwr Co Plant Vogtle Proj (c)
| | 5.05% | | 11/01/52 | | 2,000,000 |
| 735,000 | | GA St Ref Bid Grp 3, Ser C
| | 4.00% | | 07/01/25 | | 748,242 |
See Notes to Financial Statements
Page 17
First Trust Short Duration Managed Municipal ETF (FSMB)
Portfolio of Investments (Continued)
July 31, 2023
Principal
Value | | Description | | Stated
Coupon | | Stated
Maturity | | Value |
| MUNICIPAL BONDS (Continued) |
| | | Georgia (Continued) | | | | | | |
| $175,000 | | Gainesville & Hall Cnty GA Hosp Auth Ref NE GA Hlth Sys Inc Proj, Ser A
| | 5.00% | | 02/15/24 | | $175,775 |
| 1,600,000 | | Heard Cnty GA Dev Auth Adj GA Pwr Co Plt Wansley Proj (c)
| | 4.81% | | 09/01/26 | | 1,600,000 |
| 120,000 | | Main Street Nat Gas Inc GA Gas Rev, Ser A
| | 5.50% | | 09/15/23 | | 120,134 |
| 240,000 | | Main Street Nat Gas Inc GA Gas Sply Rev, Ser A
| | 5.00% | | 05/15/25 | | 242,024 |
| 2,000,000 | | Main Street Nat Gas Inc GA Gas Sply Rev, Ser A
| | 5.00% | | 06/01/29 | | 2,070,282 |
| 3,265,000 | | Main Street Nat Gas Inc GA Gas Sply Rev, Ser A (Mandatory put 09/01/27)
| | 4.00% | | 07/01/52 | | 3,253,067 |
| 800,000 | | Main Street Nat Gas Inc GA Gas Sply Rev, Ser B
| | 5.00% | | 06/01/26 | | 811,847 |
| 2,000,000 | | Main Street Nat Gas Inc GA Gas Sply Rev, Ser B (Mandatory put 03/01/30)
| | 5.00% | | 07/01/53 | | 2,098,079 |
| 1,290,000 | | Main Street Nat Gas Inc GA Gas Sply Rev, Ser C (Mandatory put 09/01/26)
| | 4.00% | | 03/01/50 | | 1,283,532 |
| 1,000,000 | | Monroe Cnty GA Dev Auth Poll Control Rev GA Pwr Co Plant Scherer Proj Remk, 1st Ser
| | 2.25% | | 07/01/25 | | 951,549 |
| 1,700,000 | | Monroe Cnty GA Dev Auth Poll Control Rev Var GA Pwr Co Plt Scherer Proj Remk, 2nd Ser (Mandatory put 03/06/26)
| | 3.88% | | 10/01/48 | | 1,690,890 |
| 1,275,000 | | Monroe Cnty GA Dev Auth Var Gulf Pwr Co Proj, AMT (c)
| | 4.60% | | 10/01/49 | | 1,275,000 |
| 200,000 | | Muni Elec Auth of GA Plant Vogtle Units 3&4 Proj J Bonds, Ser A, AGM
| | 5.00% | | 07/01/30 | | 223,501 |
| 200,000 | | Muni Elec Auth of GA Plant Vogtle Units 3&4 Proj J, Ser A, AGM
| | 5.00% | | 07/01/26 | | 209,642 |
| 405,000 | | Muni Elec Auth of GA Plant Vogtle Units 3&4 Proj M, Ser A, AGM
| | 5.00% | | 07/01/28 | | 440,630 |
| 150,000 | | Muni Elec Auth of GA Ref Subord General Resolution Projs, Ser A
| | 4.00% | | 01/01/25 | | 150,945 |
| 285,000 | | Priv Clgs & Univs Auth GA Ref Mercer Univ Proj
| | 5.00% | | 10/01/24 | | 289,658 |
| 225,000 | | Priv Clgs & Univs Auth GA Ref Mercer Univ Proj
| | 5.00% | | 10/01/25 | | 231,989 |
| | | | | 24,436,918 |
| | | Hawaii – 0.5% | | | | | | |
| 2,000,000 | | HI St Dept of Budget & Fin Spl Purp Rev Ref Hawaiian Elec Co Inc, Ser A, AMT
| | 3.10% | | 05/01/26 | | 1,936,395 |
| 150,000 | | Honolulu City & Cnty HI Wstwtr Sys Rev Ref Sr First Bd Resolution, Ser B
| | 4.00% | | 07/01/32 | | 152,042 |
| | | | | 2,088,437 |
| | | Idaho – 0.3% | | | | | | |
| 1,350,000 | | ID St Hlth Facs Auth Rev Ref St Lukes Hlth System Proj, Ser A
| | 5.00% | | 03/01/24 | | 1,360,199 |
| | | Illinois – 9.1% | | | | | | |
| 590,000 | | Bolingbrook IL Ref, Ser A, AGM
| | 5.00% | | 01/01/32 | | 635,972 |
| 115,000 | | Chicago IL Brd of Edu Chicago Sch Reform Brd, Ser A, NATL-RE
| | 5.50% | | 12/01/26 | | 118,818 |
| 175,000 | | Chicago IL Brd of Edu Green Bond, Ser E
| | 5.13% | | 12/01/32 | | 175,765 |
| 110,000 | | Chicago IL Brd of Edu Ref, Ser A
| | 5.00% | | 12/01/26 | | 113,539 |
| 1,000,000 | | Chicago IL Met Wtr Reclamation Dist Greater Chicago Ref, Ser C
| | 5.00% | | 12/01/24 | | 1,020,094 |
| 500,000 | | Chicago IL Mf Hsg Rev Var Covent Apartments Proj (Mandatory put 09/01/24)
| | 4.00% | | 09/01/25 | | 500,140 |
| 1,000,000 | | Chicago IL Midway Arpt Rev Ref 2nd Lien, Ser A, AMT
| | 5.00% | | 01/01/27 | | 1,002,591 |
| 520,000 | | Chicago IL O’Hare Intl Arpt Rev Gen Sr Lien, Ser D, AMT
| | 5.00% | | 01/01/29 | | 543,081 |
| 500,000 | | Chicago IL O’Hare Intl Arpt Rev Ref Sr Lien Ohare Intl Arpt, Ser C, AMT
| | 5.00% | | 01/01/26 | | 512,611 |
| 100,000 | | Chicago IL O’Hare Intl Arpt Rev Ref, Ser B
| | 5.00% | | 01/01/26 | | 101,988 |
| 140,000 | | Chicago IL O’Hare Intl Arpt Rev Sr Lien, Ser E
| | 5.00% | | 01/01/25 | | 143,321 |
| 80,000 | | Chicago IL Prerefunded, Ser A
| | 5.00% | | 01/01/26 | | 83,462 |
| 125,000 | | Chicago IL Ref Proj, Ser A (Forward refunding maturity 01/01/24)
| | 5.00% | | 01/01/27 | | 125,845 |
| 210,000 | | Chicago IL Ref Remk, 2003B
| | 5.00% | | 01/01/26 | | 213,307 |
Page 18
See Notes to Financial Statements
First Trust Short Duration Managed Municipal ETF (FSMB)
Portfolio of Investments (Continued)
July 31, 2023
Principal
Value | | Description | | Stated
Coupon | | Stated
Maturity | | Value |
| MUNICIPAL BONDS (Continued) |
| | | Illinois (Continued) | | | | | | |
| $100,000 | | Chicago IL Ref Remk, 2003B (Pre-refunded maturity 01/01/25)
| | 5.13% | | 01/01/27 | | $102,543 |
| 110,000 | | Chicago IL Ref, Ser C
| | 5.00% | | 01/01/26 | | 113,552 |
| 260,000 | | Chicago IL Ref, Ser C
| | 5.00% | | 01/01/35 | | 264,731 |
| 65,000 | | Chicago IL Ref, Ser C, CABS
| | (b) | | 01/01/25 | | 61,309 |
| 70,000 | | Chicago IL Unrefunded, Ser A
| | 5.00% | | 01/01/26 | | 71,102 |
| 1,500,000 | | Chicago IL Wtrwks Rev 2nd Lien Remk, BAM
| | 5.00% | | 11/01/30 | | 1,584,721 |
| 2,230,000 | | Chicago IL Wtrwks Rev Ref 2nd Lien, AGM
| | 5.25% | | 11/01/34 | | 2,401,993 |
| 675,000 | | Cook Cnty IL Sales Tax Rev Ref, Ser A
| | 5.00% | | 11/15/29 | | 751,224 |
| 2,311,000 | | Gilberts IL Spl Svc Area #15 Ref, AGM
| | 5.00% | | 03/01/29 | | 2,325,279 |
| 205,000 | | Glencoe IL, Ser A
| | 3.00% | | 12/15/28 | | 204,410 |
| 15,000 | | Hillside IL Tax Incr Rev Ref
| | 5.00% | | 01/01/24 | | 15,031 |
| 125,000 | | IL St
| | 5.00% | | 05/01/24 | | 126,247 |
| 195,000 | | IL St
| | 5.00% | | 06/01/27 | | 203,250 |
| 345,000 | | IL St Fin Auth Hlth Svcs Facs Lease Rev Univ of IL Hlth Svcs Fac Proj
| | 5.00% | | 10/01/24 | | 349,181 |
| 1,265,000 | | IL St Fin Auth Rev Centegra Hlth Sys, Ser A (Pre-refunded maturity 09/01/24)
| | 5.00% | | 09/01/39 | | 1,287,060 |
| 225,000 | | IL St Fin Auth Rev Ref Ascension Hlth Credit Grp, Ser C
| | 5.00% | | 02/15/27 | | 238,532 |
| 2,000,000 | | IL St Fin Auth Rev Ref Ascension Hlth Credit Grp, Ser C
| | 5.00% | | 02/15/30 | | 2,121,665 |
| 1,000,000 | | IL St Fin Auth Rev Ref Rush Univ Med Ctr, Ser A
| | 5.00% | | 11/15/24 | | 1,016,079 |
| 1,755,000 | | IL St Fin Auth Rev Ref Rush Univ Med Ctr, Ser A
| | 5.00% | | 11/15/30 | | 1,798,741 |
| 1,500,000 | | IL St Fin Auth Rev Var Uchicago Medicine, Ser B2 (Mandatory put 08/15/27)
| | 5.00% | | 08/15/52 | | 1,595,162 |
| 1,000,000 | | IL St Hsg Dev Auth Mf Hsg Rev Var Berry Manor (Mandatory put 09/01/24)
| | 4.00% | | 09/01/25 | | 999,652 |
| 625,000 | | IL St Hsg Dev Auth Mf Hsg Rev Var S Shore (Mandatory put 06/01/25)
| | 4.00% | | 06/01/26 | | 625,151 |
| 2,000,000 | | IL St Muni Elec Agy Pwr Sply Ref, Ser A
| | 5.00% | | 02/01/26 | | 2,061,988 |
| 215,000 | | IL St Ref
| | 4.00% | | 08/01/25 | | 215,020 |
| 415,000 | | IL St Ref, Ser B
| | 5.00% | | 03/01/25 | | 424,189 |
| 500,000 | | IL St Sales Tax Rev Ref, Subser C, BAM
| | 4.00% | | 06/15/27 | | 503,557 |
| 180,000 | | IL St Toll Hwy Auth Sr, Ser B
| | 5.00% | | 01/01/33 | | 188,531 |
| 250,000 | | IL St, Ser B
| | 5.00% | | 05/01/28 | | 268,267 |
| 2,200,000 | | IL St, Ser C
| | 5.00% | | 11/01/29 | | 2,341,027 |
| 280,000 | | IL St, Ser D
| | 5.00% | | 11/01/23 | | 280,883 |
| 725,000 | | Macon Cnty IL Sch Dist #61 Ref, Ser C, AGM
| | 4.00% | | 01/01/30 | | 747,989 |
| 710,000 | | Railsplitter IL Tobacco Stlmt Auth
| | 5.00% | | 06/01/27 | | 743,893 |
| 1,055,000 | | Rock Island Cnty IL Sch Dist #41 Rock Island, BAM
| | 5.00% | | 12/01/29 | | 1,153,141 |
| 585,000 | | Sales Tax Securitization Corp IL Ref Sales Tax Securitiztn, Ser A
| | 5.00% | | 01/01/29 | | 626,627 |
| 2,750,000 | | Schaumburg IL Ref
| | 4.00% | | 12/01/24 | | 2,760,916 |
| 355,000 | | Springfield IL Elec Rev Ref Sr Lien
| | 5.00% | | 03/01/26 | | 360,940 |
| 1,000,000 | | Springfield IL Elec Rev Ref Sr Lien
| | 5.00% | | 03/01/28 | | 1,016,886 |
| 400,000 | | Univ of Illinois IL Revs Ref Auxiliary Facs Sys, Ser A
| | 5.00% | | 04/01/27 | | 409,043 |
| 1,000,000 | | Wauconda IL Spl Svc Area #1 Spl Tax Ref, BAM
| | 5.00% | | 03/01/33 | | 1,013,972 |
| | | | | 38,664,018 |
| | | Indiana – 3.4% | | | | | | |
| 125,000 | | IN Bond Bank Rev Hamilton Co Projs, CABS
| | (b) | | 01/15/26 | | 114,506 |
| 1,000,000 | | IN St Fin Auth Econ Dev Rev Ref Rep Svcs Inc Proj Remk, Ser A, AMT (Mandatory put 09/01/23)
| | 4.05% | | 05/01/34 | | 999,828 |
| 2,000,000 | | IN St Fin Auth Envrnmntl Facs Rev Var Ref IN Pwr & Light Co Proj, Ser A
| | 1.40% | | 08/01/29 | | 1,743,574 |
| 3,000,000 | | IN St Fin Auth Envrnmntl Rev Var Ref Fulcrum Centerpoint LLC Proj, AMT (Mandatory put 11/15/23)
| | 4.50% | | 12/15/46 | | 2,994,112 |
See Notes to Financial Statements
Page 19
First Trust Short Duration Managed Municipal ETF (FSMB)
Portfolio of Investments (Continued)
July 31, 2023
Principal
Value | | Description | | Stated
Coupon | | Stated
Maturity | | Value |
| MUNICIPAL BONDS (Continued) |
| | | Indiana (Continued) | | | | | | |
| $1,635,000 | | IN St Fin Auth Hlth Sys Rev IN Univ Hlth Oblig Group, Ser B (Mandatory put 07/01/25)
| | 2.25% | | 12/01/58 | | $1,588,533 |
| 105,000 | | IN St Fin Auth Rev BHI Sr Living, Ser A
| | 4.00% | | 11/15/26 | | 102,749 |
| 1,000,000 | | Rockport IN Poll Control Rev Ref AEP Generating Company Proj Remk, Ser A
| | 3.13% | | 07/01/25 | | 978,019 |
| 1,000,000 | | Rockport IN Poll Control Rev Ref AEP Generating Company Proj Remk, Ser B
| | 3.13% | | 07/01/25 | | 978,019 |
| 3,610,000 | | Rockport IN Poll Control Rev Ref IN MI Pwr Co Proj Remk, Ser A
| | 3.05% | | 06/01/25 | | 3,551,564 |
| 1,360,000 | | Whiting IN Envrnmntl Facs Rev Ref BP Products N America Inc Proj, Ser A, AMT (Mandatory put 06/05/26)
| | 5.00% | | 12/01/44 | | 1,398,696 |
| | | | | 14,449,600 |
| | | Iowa – 1.5% | | | | | | |
| 2,305,000 | | Johnston IA Cmnty Sch Dist Infra Sales Svcs & Ref, AGM
| | 8.35% | | 07/01/24 | | 2,407,709 |
| 110,000 | | Pefa Inc IA Gas Proj Rev
| | 5.00% | | 09/01/26 | | 111,919 |
| 3,810,000 | | Pefa Inc IA Gas Proj Rev (Mandatory put 09/01/26)
| | 5.00% | | 09/01/49 | | 3,880,886 |
| | | | | 6,400,514 |
| | | Kansas – 0.6% | | | | | | |
| 2,660,000 | | Johnson Cnty KS Unif Sch Dist #512 Shawnee Mission Ref, Ser A
| | 3.25% | | 10/01/28 | | 2,656,116 |
| | | Kentucky – 2.3% | | | | | | |
| 165,000 | | Estrn KY Univ Gen Recpts, Ser A
| | 5.00% | | 04/01/28 | | 173,271 |
| 240,000 | | KY St Econ Dev Fin Auth Hlth Sys Rev Norton Hlthcare Inc, Ser B, CABS, NATL-RE
| | (b) | | 10/01/25 | | 220,173 |
| 20,000 | | KY St Econ Dev Fin Auth Ref Owensboro Hlth, Ser A
| | 5.00% | | 06/01/25 | | 20,337 |
| 355,000 | | KY St Hgr Edu Stdt Loan Corp Sr, Ser A, AMT
| | 5.00% | | 06/01/26 | | 366,070 |
| 300,000 | | KY St Muni Pwr Agy Pwr Sys Rev Ref, Ser A, NATL-RE
| | 5.00% | | 09/01/25 | | 308,591 |
| 175,000 | | KY St Muni Pwr Agy Pwr Sys Rev Ref, Ser A, NATL-RE
| | 5.00% | | 09/01/30 | | 179,058 |
| 475,000 | | KY St Pub Energy Auth Gas Sply Rev Gas Sply, Ser B (Mandatory put 01/01/25)
| | 4.00% | | 01/01/49 | | 474,942 |
| 325,000 | | KY St Pub Energy Auth Gas Sply Rev Var, Ser C (Mandatory put 02/01/28)
| | 4.00% | | 02/01/50 | | 322,044 |
| 975,000 | | KY St Pub Energy Auth Gas Sply Rev, Ser A (Mandatory put 06/01/26)
| | 4.00% | | 12/01/50 | | 973,041 |
| 100,000 | | Louisville & Jefferson Cnty KY Met Govt Hlth Sys Rev Ref Norton Hlthcare Inc, Ser A (d)
| | 5.00% | | 10/01/24 | | 101,665 |
| 330,000 | | Louisville & Jefferson Cnty KY Met Govt Hlth Sys Rev Ref Norton Hlthcare Inc, Ser A (d)
| | 5.00% | | 10/01/25 | | 340,935 |
| 325,000 | | Louisville & Jefferson Cnty KY Met Govt Hlth Sys Rev Ref Norton Hlthcare Inc, Ser A
| | 5.00% | | 10/01/28 | | 337,289 |
| 160,000 | | Louisville & Jefferson Cnty KY Met Govt Hlth Sys Rev Ref Norton Hlthcare Inc, Ser A
| | 5.00% | | 10/01/30 | | 166,414 |
| 570,000 | | Louisville & Jefferson Cnty KY Met Govt Hlth Sys Rev Ref Norton Hlthcare Inc, Ser A
| | 5.00% | | 10/01/31 | | 592,894 |
| 200,000 | | Louisville & Jefferson Cnty KY Met Govt Hlth Sys Rev Var Norton Hlthcare Inc, Ser C (Mandatory put 10/01/26)
| | 5.00% | | 10/01/47 | | 206,861 |
| 1,035,000 | | Louisville & Jefferson Cnty KY Met Swr Dist Swr & Drain Sys Sub Safe Clean Waterways, BANS
| | 4.00% | | 10/06/23 | | 1,036,223 |
| 2,600,000 | | Meade Cnty KY Indl Bldg Rev Var Nucor Steel Brandenburg Proj Green Bond, Ser B-1 (c)
| | 5.40% | | 08/01/61 | | 2,600,000 |
| 1,195,000 | | Paducah KY Elec Plant Brd Rev Ref, Ser A, AGM
| | 5.00% | | 10/01/30 | | 1,250,145 |
| 210,000 | | Paducah KY Elec Plant Brd Rev Ref, Ser A, AGM
| | 5.00% | | 10/01/34 | | 218,539 |
| | | | | 9,888,492 |
Page 20
See Notes to Financial Statements
First Trust Short Duration Managed Municipal ETF (FSMB)
Portfolio of Investments (Continued)
July 31, 2023
Principal
Value | | Description | | Stated
Coupon | | Stated
Maturity | | Value |
| MUNICIPAL BONDS (Continued) |
| | | Louisiana – 1.3% | | | | | | |
| $500,000 | | E Baton Rouge Parish LA Sales Tax Rev Ref Road & Street Impt
| | 5.00% | | 08/01/28 | | $513,548 |
| 150,000 | | LA St Univ & Agric & Mech Clg Ref Auxiliary, Ser A
| | 5.00% | | 07/01/26 | | 155,749 |
| 495,000 | | LA St, Ser A (Forward refunding maturity 02/01/24)
| | 4.00% | | 02/01/29 | | 496,648 |
| 20,000 | | New Orleans LA Aviation Brd Gen Arpt N Term, Ser B, AMT
| | 5.00% | | 01/01/28 | | 20,838 |
| 455,000 | | New Orleans LA Aviation Brd, Ser B, AMT
| | 5.00% | | 01/01/31 | | 461,406 |
| 100,000 | | New Orleans LA Aviation Brd, Ser B, AMT, AGM
| | 5.00% | | 01/01/32 | | 101,569 |
| 150,000 | | New Orleans LA Wtr Rev
| | 5.00% | | 12/01/26 | | 154,792 |
| 1,000,000 | | Saint James Parish LA Rev Var Nustar Logistics LP Proj Remk, Ser 2011 (Mandatory put 06/01/25) (a)
| | 5.85% | | 08/01/41 | | 1,023,220 |
| 2,150,000 | | Saint John the Baptist Parish LA Rev Var Ref Marathon Oil Corp Proj Remk, Subser 2017B-1 (Mandatory put 07/01/24)
| | 2.13% | | 06/01/37 | | 2,111,127 |
| 550,000 | | Saint John the Baptist Parish LA Rev Var Ref Marathon Oil Corp Proj Remk, Subser 2017B-2 (Mandatory put 07/01/26)
| | 2.38% | | 06/01/37 | | 521,861 |
| | | | | 5,560,758 |
| | | Maryland – 1.0% | | | | | | |
| 480,000 | | Howard Cnty MD Ref, Ser A
| | 5.00% | | 08/15/24 | | 489,044 |
| 1,550,000 | | MD St Econ Dev Corp Var Ref Constellation Energy Grp Proj Remk, Ser B (Mandatory put 04/03/28)
| | 4.10% | | 10/01/36 | | 1,578,299 |
| 1,000,000 | | MD St First Ser
| | 4.00% | | 06/01/29 | | 1,006,218 |
| 100,000 | | MD St Hlth & Hgr Eductnl Facs Auth Rev Ref Stevenson Univ Proj, Ser A
| | 5.00% | | 06/01/28 | | 105,902 |
| 925,000 | | MD St Stadium Auth Rev Football Stadium Issue, Ser A
| | 5.00% | | 03/01/25 | | 949,776 |
| | | | | 4,129,239 |
| | | Massachusetts – 0.6% | | | | | | |
| 575,000 | | Chelmsford MA Wtr Dist Ref
| | 3.00% | | 01/15/24 | | 573,752 |
| 1,850,000 | | MA St Bay Transprtn Auth Sales Tax Rev Prerefunded Subord Sustainability Bonds, BANS
| | 4.00% | | 05/01/25 | | 1,878,841 |
| 150,000 | | MA St Bay Transprtn Auth Sales Tax Rev Unrefunded Subord Sustainability Bonds, BANS
| | 4.00% | | 05/01/25 | | 152,390 |
| | | | | 2,604,983 |
| | | Michigan – 1.4% | | | | | | |
| 220,000 | | Detroit MI
| | 5.00% | | 04/01/26 | | 224,755 |
| 20,000 | | Detroit MI Downtown Dev Auth Tax Incr Rev Ref Catalyst Dev Proj, Ser A, AGM
| | 5.00% | | 07/01/31 | | 20,211 |
| 375,000 | | Great Lakes MI Wtr Auth Sewage Disposal Sys Rev Ref 2nd Lien, Ser C
| | 5.00% | | 07/01/36 | | 391,310 |
| 140,000 | | Great Lakes MI Wtr Auth Wtr Sply Sys Rev Ref Second Lien, Ser D
| | 5.00% | | 07/01/36 | | 146,089 |
| 100,000 | | Great Lakes MI Wtr Auth Wtr Sply Sys Rev Sr Lien Bond, Ser A
| | 5.00% | | 07/01/25 | | 103,157 |
| 110,000 | | MI St Fin Auth Rev Ref Ascension Sr Credit Grp Remk, Ser E-1 (Mandatory put 08/15/24)
| | 4.00% | | 11/15/44 | | 110,280 |
| 85,000 | | MI St Fin Auth Rev Ref Henry Ford Hlth Sys
| | 4.00% | | 11/15/36 | | 84,665 |
| 155,000 | | MI St Fin Auth Rev Ref Hosp McLaren Hlth Care, Ser A
| | 5.00% | | 05/15/27 | | 159,375 |
| 1,000,000 | | MI St Fin Auth Rev Ref Loc Govt Loan Prog Great Lakes Wtr Auth, Ser D4
| | 5.00% | | 07/01/30 | | 1,010,171 |
| 500,000 | | MI St Fin Auth Rev Ref Sr Lien Great Lakes Wtr Auth, Ser C-6
| | 5.00% | | 07/01/32 | | 505,579 |
| 1,680,000 | | MI St Fin Auth Rev Sr Lien Great Lakes Wtr Auth, Ser C-3, AGM
| | 5.00% | | 07/01/29 | | 1,698,898 |
| 1,500,000 | | MI St Strategic Fund Ltd Oblg Rev Var Green Bond Recycled Brd Machine Proj, AMT (Mandatory put 10/01/26)
| | 4.00% | | 10/01/61 | | 1,492,007 |
| 90,000 | | Wayne Cnty MI Arpt Auth Rev Ref, Ser F, AMT
| | 5.00% | | 12/01/25 | | 92,692 |
| | | | | 6,039,189 |
See Notes to Financial Statements
Page 21
First Trust Short Duration Managed Municipal ETF (FSMB)
Portfolio of Investments (Continued)
July 31, 2023
Principal
Value | | Description | | Stated
Coupon | | Stated
Maturity | | Value |
| MUNICIPAL BONDS (Continued) |
| | | Minnesota – 3.1% | | | | | | |
| $650,000 | | Alexandria MN Indep Sch Dist #206 Ref Sch Bldg, Ser B
| | 5.00% | | 02/01/24 | | $655,376 |
| 2,250,000 | | Buffalo MN Indep Sch Dist #877
| | 3.00% | | 02/01/29 | | 2,230,777 |
| 210,000 | | Dakota Cnty MN Cmnty Dev Agy Mf Hsg Rev REE Aster House Apts Proj Remk
| | 4.13% | | 06/01/24 | | 209,996 |
| 3,510,000 | | Hennepin Cnty MN Sales Tax Rev Ref 1st Lien Ballpark Proj, Ser A
| | 5.00% | | 12/15/30 | | 3,720,571 |
| 1,500,000 | | Minneapolis MN Hlth Care Sys Rev Var Allina Hlth Sys, Ser A (Mandatory put 11/15/28)
| | 5.00% | | 11/15/52 | | 1,614,178 |
| 1,000,000 | | Minneapolis MN Mf Rev Var Greenway Apartments Proj (Mandatory put 08/01/24)
| | 2.70% | | 08/01/25 | | 979,893 |
| 2,500,000 | | MN Muni Gas Agy Cmdy Sply Rev, Ser A
| | 4.00% | | 12/01/25 | | 2,508,327 |
| 1,250,000 | | MN St Rural Wtr Fin Auth Pub Projs Constr Notes
| | 2.63% | | 12/01/23 | | 1,240,959 |
| | | | | 13,160,077 |
| | | Mississippi – 0.4% | | | | | | |
| 225,000 | | MS St Busn Fin Corp Sol Wst Disp Rev Waste Mgmt Inc Proj Remk, AMT (Mandatory put 06/03/24)
| | 2.20% | | 03/01/27 | | 221,606 |
| 1,500,000 | | MS St Hosp Equipment & Facs Auth Ref Adj Baptist Memorial Hlth Care Corp Remk, Ser A-2 (Mandatory put 08/30/23)
| | 3.15% | | 09/01/36 | | 1,498,829 |
| | | | | 1,720,435 |
| | | Missouri – 1.0% | | | | | | |
| 635,000 | | Met Saint Louis MO Swr Dist Wstwtr Sys Rev Ref & Impt, Ser B (Forward refunding maturity 05/01/25)
| | 5.00% | | 05/01/33 | | 652,339 |
| 1,230,000 | | MO St Hlth & Eductnl Facs Auth Hlth Facs Rev Ref Saint Lukes Hlth Sys Inc
| | 4.00% | | 11/15/33 | | 1,245,570 |
| 2,000,000 | | MO St Hlth & Eductnl Facs Auth Hlth Facs Rev Ref SSM Hlth Care, Ser A (Pre-refunded maturity 06/01/24)
| | 5.00% | | 06/01/29 | | 2,023,855 |
| 235,000 | | MO St Hlth & Eductnl Facs Auth Lutheran Sr Svcs Projs
| | 4.00% | | 02/01/27 | | 229,234 |
| 200,000 | | Plaza at Noah’s Ark Cmnty Impt Dist MO Tax Incr & Impt Ref
| | 3.00% | | 05/01/24 | | 197,638 |
| | | | | 4,348,636 |
| | | Montana – 0.1% | | | | | | |
| 240,000 | | Forsyth MT Poll Control Rev Ref Puget Sound Energy Proj, Ser A (Mandatory put 09/01/23)
| | 3.90% | | 03/01/31 | | 232,634 |
| | | Nebraska – 1.0% | | | | | | |
| 70,000 | | Centrl Plains Energy Proj NE Gas Proj Rev Proj No. 4
| | 5.00% | | 01/01/24 | | 70,240 |
| 2,290,000 | | Centrl Plains Energy Proj NE Gas Proj Rev Proj No. 4 (Mandatory put 01/01/24)
| | 5.00% | | 03/01/50 | | 2,297,527 |
| 330,000 | | Centrl Plains Energy Proj NE Gas Proj Rev Ref Proj #3, Ser A
| | 5.00% | | 09/01/26 | | 337,474 |
| 400,000 | | Muni Energy Agy of NE Ref
| | 5.00% | | 04/01/28 | | 422,517 |
| 1,235,000 | | Omaha NE Pub Facs Corp Lease Rev, Ser A
| | 4.00% | | 04/15/25 | | 1,248,542 |
| | | | | 4,376,300 |
| | | Nevada – 0.4% | | | | | | |
| 120,000 | | Clark Cnty NV Sch Dist Bldg Cr, Ser B, AGM
| | 5.00% | | 06/15/31 | | 132,236 |
| 275,000 | | Las Vegas NV Spl Impt Dist #808 & #810 Ref
| | 5.00% | | 06/01/28 | | 276,867 |
| 300,000 | | Las Vegas NV Spl Impt Dist #816 Spl Impt Dist No 816 Summerlin Vlg 22
| | 2.00% | | 06/01/24 | | 293,735 |
| 225,000 | | Las Vegas NV Spl Impt Dist #816 Spl Impt Dist No 816 Summerlin Vlg 22
| | 2.00% | | 06/01/26 | | 208,617 |
| 275,000 | | Reno NV Capital Impt Rev Ref, Ser A-1, AGM
| | 5.00% | | 06/01/25 | | 281,583 |
| 500,000 | | Yerington NV USDA Interim DEBS
| | 1.63% | | 11/01/23 | | 496,307 |
| | | | | 1,689,345 |
Page 22
See Notes to Financial Statements
First Trust Short Duration Managed Municipal ETF (FSMB)
Portfolio of Investments (Continued)
July 31, 2023
Principal
Value | | Description | | Stated
Coupon | | Stated
Maturity | | Value |
| MUNICIPAL BONDS (Continued) |
| | | New Hampshire – 0.4% | | | | | | |
| $1,500,000 | | Natl Fin Auth NH Sol Wst Disp Rev Var Ref Waste Mgmt Inc Proj Remk, Ser A-3, AMT (Mandatory put 09/01/23)
| | 4.00% | | 04/01/24 | | $1,499,804 |
| 220,000 | | Natl Fin Auth NH Sr Living Rev Ref Springpoint Sr Living
| | 4.00% | | 01/01/24 | | 219,423 |
| | | | | 1,719,227 |
| | | New Jersey – 4.1% | | | | | | |
| 1,000,000 | | Casino Reinvestment Dev Auth NJ Luxury Tax Rev Ref, AGM
| | 5.00% | | 11/01/29 | | 1,022,221 |
| 1,000,000 | | Gloucester Twp NJ, Ser A, BANS
| | 5.00% | | 07/25/24 | | 1,012,843 |
| 3,000,000 | | Newark NJ, Ser D, BANS
| | 4.00% | | 09/29/23 | | 3,000,631 |
| 1,000,000 | | NJ St
| | 2.00% | | 06/01/24 | | 983,903 |
| 2,000,000 | | NJ St
| | 2.00% | | 06/01/29 | | 1,823,997 |
| 250,000 | | NJ St Covid-19 Go Emergency Bonds, Ser A
| | 4.00% | | 06/01/30 | | 265,056 |
| 1,000,000 | | NJ St Econ Dev Auth Ref Sch Facs Constr, Ser N-1, NATL-RE
| | 5.50% | | 09/01/23 | | 1,001,531 |
| 580,000 | | NJ St Econ Dev Auth Rev Portal N Bridge Proj NJ Transit Transprtn Proj Bonds, Ser A
| | 5.00% | | 11/01/26 | | 610,360 |
| 110,000 | | NJ St Econ Dev Auth Rev Ref Sch Facs Constr, Ser PP
| | 3.50% | | 06/15/27 | | 109,191 |
| 1,000,000 | | NJ St Econ Dev Auth Spl Fac Rev Continental Airls Inc Pj
| | 5.13% | | 09/15/23 | | 1,000,243 |
| 2,000,000 | | NJ St Hlth Care Facs Fing Auth Rev Ref Rwj Barnabas Hlth Oblig Grp Issue, Ser B-2 (Mandatory put 07/01/25)
| | 5.00% | | 07/01/42 | | 2,055,275 |
| 340,000 | | NJ St Hlth Care Facs Fing Auth Rev Ref Rwj Barnabas Hlth Oblig Grp Issue, Ser B-3 (Mandatory put 07/01/26)
| | 5.00% | | 07/01/45 | | 353,413 |
| 1,000,000 | | NJ St Hsg & Mtge Fin Agy Rev Ref Sf Hsg, Ser D, AMT
| | 4.00% | | 04/01/24 | | 999,458 |
| 2,150,000 | | NJ St Transprtn Trust Fund Auth Cap Apprec Transprtn Sys, Ser C, AMBAC
| | (b) | | 12/15/25 | | 1,971,544 |
| 225,000 | | NJ St Transprtn Trust Fund Auth Fed Hwy Reimb Nts, Ser A-1, GARVEE
| | 5.00% | | 06/15/27 | | 235,414 |
| 1,000,000 | | Tobacco Stlmt Fing Corp NJ Ref, Ser A
| | 5.00% | | 06/01/24 | | 1,011,625 |
| | | | | 17,456,705 |
| | | New Mexico – 0.5% | | | | | | |
| 2,000,000 | | Farmington NM Poll Control Rev Var Ref Pub Svc Co NM San Juan Proj Remk, Ser D (Mandatory put 06/01/28)
| | 3.90% | | 06/01/40 | | 2,006,480 |
| | | New York – 3.4% | | | | | | |
| 2,000,000 | | Chautauqua Cnty NY Capital Res Corp Exempt Facs Rev Var Ref NRG Energy Proj Remk (Mandatory put 04/03/28)
| | 4.25% | | 04/01/42 | | 1,988,273 |
| 125,000 | | Long Beach NY, Ser B
| | 5.50% | | 07/15/25 | | 128,728 |
| 2,000,000 | | New York City NY Hsg Dev Corp Mf Hsg Rev Sustainable Dev Bonds, Ser F-2A (Mandatory put 12/22/26)
| | 3.40% | | 11/01/62 | | 1,968,219 |
| 1,350,000 | | New York City NY Muni Wtr Fin Auth Wtr & Swr Sys Rev 2nd General Resolution, Ser DD
| | 5.00% | | 06/15/35 | | 1,366,806 |
| 3,000,000 | | New York City NY Muni Wtr Fin Auth Wtr & Swr Sys Rev Var Ref Sub 2nd General Resolution, Ser DD (c)
| | 4.18% | | 06/15/33 | | 3,000,000 |
| 340,000 | | New York City NY Transitional Fin Auth Bldg Aid Rev Ref Fiscal 2018, Ser S-1
| | 5.00% | | 07/15/35 | | 365,909 |
| 735,000 | | New York City NY Transitional Fin Auth Rev Ref Sub Future Tax Secured, Ser F, Subser F-1
| | 5.00% | | 11/01/23 | | 738,077 |
| 2,000,000 | | New York City NY Transitional Fin Auth Rev Var Future Tax Secd Remk, Subser G-6 (c)
| | 4.48% | | 05/01/34 | | 2,000,000 |
| 1,000,000 | | NY NY Adj Fiscal 2020, Subser B-3 (c)
| | 4.18% | | 10/01/46 | | 1,000,000 |
| 405,000 | | NY St Transprtn Dev Corp Spl Fac Rev Ref American Airls Inc John F Kennedy Intl Arpt Proj, AMT
| | 2.25% | | 08/01/26 | | 390,043 |
| 180,000 | | Onondaga NY Civic Dev Corp Le Moyne Clg Proj
| | 5.00% | | 07/01/26 | | 185,041 |
| 1,180,000 | | Port Auth of NY & NJ NY Ref, 194th Ser
| | 5.00% | | 10/15/34 | | 1,225,335 |
| | | | | 14,356,431 |
See Notes to Financial Statements
Page 23
First Trust Short Duration Managed Municipal ETF (FSMB)
Portfolio of Investments (Continued)
July 31, 2023
Principal
Value | | Description | | Stated
Coupon | | Stated
Maturity | | Value |
| MUNICIPAL BONDS (Continued) |
| | | North Carolina – 1.9% | | | | | | |
| $1,000,000 | | Columbus Cnty NC Indl Facs & Poll Control Fing Auth Rev Var Ref Intl Paper Co Proj, Ser A (Mandatory put 06/16/25)
| | 1.38% | | 05/01/34 | | $954,474 |
| 400,000 | | NC St Capital Facs Fin Agy Eductnl Facs Rev Ref High Point Univ
| | 5.00% | | 05/01/28 | | 428,138 |
| 3,335,000 | | NC St Med Care Commn Hosp Rev Caromont Hlth, Ser B (Mandatory put 02/01/26)
| | 5.00% | | 02/01/51 | | 3,476,353 |
| 2,500,000 | | NC St Turnpike Auth, BANS
| | 5.00% | | 02/01/24 | | 2,518,088 |
| 170,000 | | Raleigh Durham NC Arpt Auth Arpt Rev Ref, Ser A, AMT
| | 5.00% | | 05/01/29 | | 183,569 |
| 580,000 | | Raleigh Durham NC Arpt Auth Arpt Rev Ref, Ser A, AMT
| | 5.00% | | 05/01/35 | | 605,127 |
| | | | | 8,165,749 |
| | | North Dakota – 0.5% | | | | | | |
| 1,400,000 | | Cass Cnty ND Jt Wtr Res Dist, Ser A
| | 0.48% | | 05/01/24 | | 1,350,513 |
| 1,000,000 | | Larimore ND Loan Anticipation Temp Impt Bonds
| | 0.85% | | 05/01/24 | | 968,200 |
| | | | | 2,318,713 |
| | | Ohio – 2.9% | | | | | | |
| 75,000 | | NE OH Med Univ Gen Recpts Ref, Ser A
| | 5.00% | | 12/01/24 | | 75,950 |
| 1,000,000 | | NW OH Loc Sch Dist Hamilton & Butler Cntys Sch Impt (Pre-refunded maturity 12/01/23)
| | 5.00% | | 12/01/45 | | 1,005,497 |
| 1,000,000 | | OH St Air Quality Dev Auth American Elec Pwr Co Proj Remk, Ser A (Mandatory put 10/01/29)
| | 2.40% | | 12/01/38 | | 872,390 |
| 1,000,000 | | OH St Air Quality Dev Auth OH Vly Elec Corp Proj Remk, Ser C (Mandatory put 11/04/25)
| | 1.50% | | 02/01/26 | | 915,822 |
| 900,000 | | OH St Air Quality Dev Auth Ref American Elec Pwr Company Proj Remk, Ser B, AMT (Mandatory put 10/01/24)
| | 2.10% | | 07/01/28 | | 871,603 |
| 2,700,000 | | OH St Air Quality Dev Auth Var OH Vly Elec Corp Proj Remk, Ser B (Mandatory put 11/01/24)
| | 1.38% | | 02/01/26 | | 2,569,015 |
| 870,000 | | OH St Air Quality Dev Auth Var Ref Duke Energy Corp Proj, Ser A, AMT (Mandatory put 06/01/27)
| | 4.25% | | 11/01/39 | | 862,973 |
| 1,500,000 | | OH St Hgr Eductnl Fac Commn Ref Case Western Reserve Univ Proj
| | 5.00% | | 12/01/23 | | 1,508,246 |
| 200,000 | | OH St Hosp Fac Rev Ref Cleveland Clinic Hlth Sys, Ser A
| | 5.00% | | 01/01/25 | | 204,688 |
| 235,000 | | OH St Hosp Fac Rev Ref Cleveland Clinic Hlth Sys, Ser A
| | 5.00% | | 01/01/33 | | 254,996 |
| 1,250,000 | | OH St Hosp Rev Var Cleveland Clinic Hlth Sys Remk, Ser C (Mandatory put 05/01/28)
| | 2.75% | | 01/01/52 | | 1,220,933 |
| 1,990,000 | | OH St, Ser A
| | 5.00% | | 02/01/31 | | 2,073,859 |
| | | | | 12,435,972 |
| | | Oklahoma – 0.1% | | | | | | |
| 300,000 | | Oklahoma Cnty OK Fin Auth Eductnl Facs Lease Rev Midwest City De City Pub Schs Proj
| | 5.00% | | 10/01/26 | | 315,223 |
| | | Oregon – 0.6% | | | | | | |
| 260,000 | | Port of Portland OR Arpt Rev Portland Intl Arpt, Ser 25B, AMT
| | 5.00% | | 07/01/27 | | 272,497 |
| 1,170,000 | | Port of Portland OR Arpt Rev Ref Portland Intl Arpt, Ser 23
| | 5.00% | | 07/01/34 | | 1,205,814 |
| 130,000 | | Port of Portland OR Arpt Rev, Ser 24B, AMT
| | 5.00% | | 07/01/33 | | 135,733 |
| 260,000 | | Salem OR Hosp Fac Auth Rev Ref Capital Manor Proj
| | 5.00% | | 05/15/25 | | 261,126 |
| 265,000 | | Salem OR Hosp Fac Auth Rev Ref Capital Manor Proj
| | 5.00% | | 05/15/26 | | 266,090 |
| 100,000 | | Union Cnty OR Hosp Fac Auth Grande Ronde Hosp
| | 5.00% | | 07/01/25 | | 101,650 |
| 100,000 | | Union Cnty OR Hosp Fac Auth Grande Ronde Hosp
| | 5.00% | | 07/01/26 | | 102,634 |
| | | | | 2,345,544 |
Page 24
See Notes to Financial Statements
First Trust Short Duration Managed Municipal ETF (FSMB)
Portfolio of Investments (Continued)
July 31, 2023
Principal
Value | | Description | | Stated
Coupon | | Stated
Maturity | | Value |
| MUNICIPAL BONDS (Continued) |
| | | Pennsylvania – 5.6% | | | | | | |
| $1,500,000 | | Allegheny Cnty PA Indl Dev Auth Envrnmtl Impt Rev Ref United States Steel Corp Proj
| | 4.88% | | 11/01/24 | | $1,510,813 |
| 235,000 | | Cmwlth Fing Auth PA Tobacco Master Stlmt Payment Rev Bonds
| | 5.00% | | 06/01/26 | | 244,698 |
| 1,000,000 | | Cmwlth Fing Auth PA Tobacco Master Stlmt Payment Rev Bonds
| | 5.00% | | 06/01/30 | | 1,078,049 |
| 395,000 | | Cumberland Cnty PA Muni Auth Prerefunded Ref Diakon Lutheran Ministries Proj (Pre-refunded maturity 01/01/25)
| | 5.00% | | 01/01/38 | | 404,369 |
| 660,000 | | Dauphin Cnty PA Gen Auth Hlth Sys Rev Ref Pinnacle Hlth Sys Proj, Ser A
| | 4.00% | | 06/01/32 | | 666,414 |
| 265,000 | | Deer Creek PA Drain Basin Allegheny Cnty Swr Rev Ref, AGM
| | 5.00% | | 12/01/26 | | 281,367 |
| 90,000 | | E Hempfield Twp PA Indl Dev Auth Ref Willow Vly Cmntys Proj
| | 5.00% | | 12/01/24 | | 91,222 |
| 175,000 | | E Hempfield Twp PA Indl Dev Auth Ref Willow Vly Cmntys Proj
| | 5.00% | | 12/01/25 | | 179,486 |
| 390,000 | | E Hempfield Twp PA Indl Dev Auth Ref Willow Vly Cmntys Proj
| | 5.00% | | 12/01/28 | | 401,990 |
| 170,000 | | E Hempfield Twp PA Indl Dev Auth Ref Willow Vly Cmntys Proj
| | 5.00% | | 12/01/30 | | 175,020 |
| 50,000 | | Erie PA Hgr Edu Bldg Auth Aicup Fing Prog Gannon Uni Proj Ref, Ser TT1
| | 5.00% | | 05/01/24 | | 50,041 |
| 75,000 | | Erie PA Hgr Edu Bldg Auth Aicup Fing Prog Gannon Uni Proj Ref, Ser TT1
| | 5.00% | | 05/01/25 | | 75,312 |
| 75,000 | | Erie PA Hgr Edu Bldg Auth Aicup Fing Prog Gannon Uni Proj Ref, Ser TT1
| | 5.00% | | 05/01/26 | | 75,975 |
| 500,000 | | Lancaster PA Ref, BAM
| | 5.00% | | 05/01/25 | | 512,113 |
| 80,000 | | Latrobe PA Indl Dev Auth Univ Rev Ref Seton Hill Univ
| | 5.00% | | 03/01/24 | | 80,179 |
| 150,000 | | Latrobe PA Indl Dev Auth Univ Rev Ref Seton Hill Univ
| | 5.00% | | 03/01/25 | | 150,976 |
| 255,000 | | Lehigh Cnty PA Gen Purp Auth Revs Ref Lehigh Carbon Cmnty Clg, Ser 2016, BAM
| | 5.00% | | 11/01/26 | | 266,586 |
| 1,000,000 | | Lehigh Cnty PA Indl Dev Auth Ref Ppl Elec Util Corp Proj 2016 Remk, Ser B
| | 2.63% | | 02/15/27 | | 960,182 |
| 1,840,000 | | Lehigh Cnty PA Indl Dev Auth Ref Ppl Elec Util Corp Proj Remk, Ser A
| | 3.00% | | 09/01/29 | | 1,786,516 |
| 175,000 | | Montgomery Cnty PA Indl Dev Auth Ref Waverly Heights Ltd Proj
| | 4.00% | | 12/01/26 | | 175,182 |
| 2,000,000 | | N Wales PA Wtr Auth Ref
| | 3.00% | | 11/01/23 | | 1,995,964 |
| 400,000 | | Northampton Cnty PA Gen Purp Auth Clg Rev Ref Moravian Clg
| | 5.00% | | 10/01/25 | | 404,511 |
| 210,000 | | Northampton Cnty PA Gen Purp Auth Clg Rev Ref Moravian Clg
| | 5.00% | | 10/01/27 | | 214,704 |
| 150,000 | | Northampton Cnty PA Gen Purp Auth Clg Rev Ref Moravian Clg
| | 5.00% | | 10/01/30 | | 154,115 |
| 180,000 | | PA St Econ Dev Fing Auth Rev Ref UPMC
| | 4.00% | | 03/15/35 | | 181,133 |
| 1,500,000 | | PA St Econ Dev Fing Auth Solid Waste Disposal Rev Var Ref Rep Svcs Inc Proj Remk, Ser A-2, AMT (Mandatory put 10/16/23)
| | 4.10% | | 04/01/34 | | 1,499,560 |
| 2,100,000 | | PA St Econ Dev Fing Auth T/E Priv Activity Rev The Penndot Major Bridges Package One Proj P3 Proj, AMT
| | 5.00% | | 12/31/29 | | 2,289,576 |
| 465,000 | | PA St Hsg Fin Agy SF Mtge Rev Non Ace, Ser 123B
| | 3.45% | | 10/01/32 | | 455,538 |
| 405,000 | | PA St Ref, Ser 1
| | 5.00% | | 09/15/27 | | 429,163 |
| 150,000 | | PA St Turnpike Commn Turnpike Rev Ref Sub, Ser A
| | 5.00% | | 12/01/36 | | 155,985 |
| 80,000 | | PA St Turnpike Commn Turnpike Rev Ref Sub, Ser B
| | 5.00% | | 06/01/39 | | 82,254 |
| 1,735,000 | | PA St Turnpike Commn Turnpike Rev, Ser A-1
| | 5.00% | | 12/01/36 | | 1,808,103 |
| 185,000 | | PA St, 1st Ser 2020
| | 5.00% | | 05/01/29 | | 207,548 |
| 570,000 | | Philadelphia PA Auth for Indl Dev Chrt Sch Rev Ref String Theory Chrt Sch Proj (a)
| | 5.00% | | 06/15/24 | | 572,905 |
| 300,000 | | Philadelphia PA Auth for Indl Dev Chrt Sch Rev Ref String Theory Chrt Sch Proj (a)
| | 5.00% | | 06/15/25 | | 303,396 |
| 330,000 | | Philadelphia PA Auth for Indl Dev Temple Univ Rev Ref, 1st Ser 2015
| | 5.00% | | 04/01/27 | | 339,454 |
| 35,000 | | Philadelphia PA Ref, Ser A
| | 5.00% | | 08/01/27 | | 37,675 |
| 1,000,000 | | Scranton PA Sch Dist Ref
| | 5.00% | | 12/01/23 | | 1,003,776 |
| 820,000 | | Scranton PA Sch Dist Ref, Ser D
| | 5.00% | | 06/01/27 | | 845,360 |
| 1,240,000 | | Wilkes-Barre PA Area Sch Dist, Ser B, BAM
| | 5.00% | | 08/01/27 | | 1,313,763 |
See Notes to Financial Statements
Page 25
First Trust Short Duration Managed Municipal ETF (FSMB)
Portfolio of Investments (Continued)
July 31, 2023
Principal
Value | | Description | | Stated
Coupon | | Stated
Maturity | | Value |
| MUNICIPAL BONDS (Continued) |
| | | Pennsylvania (Continued) | | | | | | |
| $375,000 | | Wyoming PA Area Sch Dist Ref, Ser A, AGM
| | 4.00% | | 11/01/24 | | $378,575 |
| | | | | 23,839,548 |
| | | Puerto Rico – 0.2% | | | | | | |
| 389,448 | | Puerto Rico Cmwlth Restructured, Ser A, CABS
| | (b) | | 07/01/24 | | 374,061 |
| 169,000 | | Puerto Rico Sales Tax Fing Corp Sales Tax Rev Restructured, Ser A-1, CABS
| | (b) | | 07/01/24 | | 163,212 |
| 328,000 | | Puerto Rico Sales Tax Fing Corp Sales Tax Rev Restructured, Ser A-1, CABS
| | (b) | | 07/01/27 | | 280,363 |
| | | | | 817,636 |
| | | Rhode Island – 0.4% | | | | | | |
| 1,670,000 | | Providence RI Pub Bldgs Auth Rev, Ser A, AGM
| | 5.00% | | 09/15/30 | | 1,816,866 |
| | | South Carolina – 0.3% | | | | | | |
| 400,000 | | Berkeley Cnty SC Assmnt Rev Nexton Impt Dist
| | 4.00% | | 11/01/30 | | 378,938 |
| 850,000 | | SC St Jobs Econ Dev Auth Econ Dev Rev Ref The Woodlands at Furman
| | 4.00% | | 11/15/27 | | 822,929 |
| 250,000 | | SC St Pub Svc Auth Rev Ref, Ser A
| | 5.00% | | 12/01/24 | | 254,501 |
| | | | | 1,456,368 |
| | | South Dakota – 0.4% | | | | | | |
| 355,000 | | SD St Hlth & Eductnl Facs Auth Ref Sanford Oblig Grp
| | 5.00% | | 11/01/27 | | 368,914 |
| 330,000 | | SD St Hlth & Eductnl Facs Auth Ref Sanford Oblig Grp
| | 5.00% | | 11/01/35 | | 340,491 |
| 150,000 | | SD St Hlth & Eductnl Facs Auth Ref Westhills Vlg Retmnt Cmnty Issue
| | 3.00% | | 09/01/26 | | 145,999 |
| 990,000 | | SD St Hsg Dev Auth Ref Homeownership Mtge, Ser E, AMT
| | 2.80% | | 11/01/25 | | 962,789 |
| | | | | 1,818,193 |
| | | Tennessee – 1.2% | | | | | | |
| 145,000 | | Met Govt Nashville & Davidson Cnty TN Hlth & Eductnl Fac Brd Trevecca Nazarene Univ Proj, Ser B
| | 4.00% | | 10/01/26 | | 142,766 |
| 450,000 | | Met Nashville TN Arpt Auth Arpt Rev, Ser B, AMT
| | 5.00% | | 07/01/27 | | 473,306 |
| 2,000,000 | | Montgomery Cnty TN Ref, Ser A
| | 5.00% | | 04/01/24 | | 2,023,023 |
| 1,595,000 | | TN St Energy Acq Corp Gas Rev (Mandatory put 11/01/25)
| | 4.00% | | 11/01/49 | | 1,586,560 |
| 765,000 | | TN St Energy Acq Corp Gas Rev, Ser A
| | 5.25% | | 09/01/26 | | 780,484 |
| | | | | 5,006,139 |
| | | Texas – 13.1% | | | | | | |
| 250,000 | | Arlington TX Hgr Edu Fin Corp Edu Rev Ref Uplift Edu, Ser A
| | 4.00% | | 12/01/30 | | 255,777 |
| 150,000 | | Arlington TX Hgr Edu Fin Corp Edu Rev Trinity Basin Preparatory Inc
| | 5.00% | | 08/15/27 | | 158,599 |
| 150,000 | | Arlington TX Hgr Edu Fin Corp Edu Rev Trinity Basin Preparatory Inc
| | 5.00% | | 08/15/28 | | 164,013 |
| 500,000 | | Arlington TX Hsg Fin Corp Mf Hsg Rev Var 6900 Matlok Road (Mandatory put 04/01/27)
| | 4.50% | | 04/01/41 | | 508,361 |
| 500,000 | | Austin TX Arpt Sys Rev, AMT
| | 5.00% | | 11/15/25 | | 514,604 |
| 250,000 | | Austin TX Arpt Sys Rev, AMT
| | 5.00% | | 11/15/28 | | 253,362 |
| 2,000,000 | | Austin TX Ref
| | 3.15% | | 09/01/28 | | 1,976,327 |
| 240,000 | | Brazoria Cnty TX Ref
| | 5.00% | | 03/01/27 | | 249,849 |
| 290,000 | | Centrl TX Regl Mobility Auth Rev Ref
| | 5.00% | | 01/01/27 | | 299,881 |
| 250,000 | | Centrl TX Regl Mobility Auth Rev, Ser C
| | 5.00% | | 01/01/27 | | 259,458 |
| 150,000 | | Chisum TX Indep Sch Dist Ref Sch Bldg
| | 5.00% | | 08/15/23 | | 150,080 |
| 35,000 | | Clifton TX Hgr Edu Fin Corp Edu Rev Idea Pub Schs, Ser B
| | 5.00% | | 08/15/24 | | 35,392 |
Page 26
See Notes to Financial Statements
First Trust Short Duration Managed Municipal ETF (FSMB)
Portfolio of Investments (Continued)
July 31, 2023
Principal
Value | | Description | | Stated
Coupon | | Stated
Maturity | | Value |
| MUNICIPAL BONDS (Continued) |
| | | Texas (Continued) | | | | | | |
| $150,000 | | Club Muni Mgmt Dist #1 TX Spl Assmnt Rev Impt Area #2 Proj (a)
| | 2.50% | | 09/01/26 | | $138,679 |
| 1,000,000 | | Collin Cnty TX Ref
| | 4.00% | | 02/15/27 | | 1,020,857 |
| 400,000 | | Corpus Christi TX Util Sys Rev Junior Lien, Ser B
| | 5.00% | | 07/15/26 | | 420,646 |
| 207,000 | | Crandall TX Spl Assmnt Rev Cartwright Ranch Pub Impt Dt Impt Area #1 Proj (a)
| | 3.38% | | 09/15/26 | | 192,955 |
| 100,000 | | Cypress Fairbanks TX Indep Sch Dist Ref Sch Bldg
| | 5.00% | | 02/15/27 | | 104,791 |
| 1,000,000 | | Denton Cnty TX Hsg Fin Corp Var Pathway on Woodrow Apts (Mandatory put 02/01/25)
| | 5.00% | | 02/01/26 | | 1,017,205 |
| 1,005,000 | | Fort Bend Cnty TX Muni Util Dist #182, BAM
| | 5.25% | | 09/01/26 | | 1,059,602 |
| 280,000 | | Fort Bend Cnty TX Muni Util Dist #184, BAM
| | 6.00% | | 04/01/27 | | 304,947 |
| 295,000 | | Fort Bend Cnty TX Muni Util Dist #184, BAM
| | 6.00% | | 04/01/28 | | 321,837 |
| 840,000 | | Fort Bend TX Indep Sch Dist Ref
| | 5.00% | | 08/15/26 | | 889,832 |
| 1,250,000 | | Fort Bend TX Indep Sch Dist Var Remk, Ser A (Mandatory put 08/01/24)
| | 2.38% | | 08/01/49 | | 1,230,077 |
| 585,000 | | Fort Bend TX Muni Util Dist #169 Contract Rev Road Facs, Ser B, BAM
| | 4.00% | | 12/01/25 | | 595,136 |
| 585,000 | | Fort Bend TX Muni Util Dist #169 Contract Rev Road Facs, Ser B, BAM
| | 4.00% | | 12/01/26 | | 600,803 |
| 465,000 | | Galveston Cnty TX Muni Util Dist #54 Ref
| | 2.00% | | 12/01/25 | | 428,574 |
| 560,000 | | Galveston Cnty TX Muni Util Dist #54 Ref
| | 2.00% | | 12/01/27 | | 493,281 |
| 1,500,000 | | Grayson Cnty TX Ref
| | 3.00% | | 01/01/26 | | 1,457,568 |
| 1,475,000 | | Harris Cnty TX Cultural Edu Facs Fin Corp Med Facs Rev Ref Baylor Clg of Med
| | 5.00% | | 11/15/23 | | 1,480,956 |
| 1,000,000 | | Harris Cnty TX Cultural Edu Facs Fin Corp Rev Memorial Herman Hlth Sys, Ser A
| | 5.00% | | 12/01/26 | | 1,024,078 |
| 1,340,000 | | Harris Cnty TX Cultural Edu Facs Fin Corp Rev Var Memorial Hermann Hlth System, Ser B-2 (Mandatory put 12/01/24)
| | 5.00% | | 07/01/49 | | 1,362,201 |
| 1,000,000 | | Harris Cnty TX Cultural Edu Facs Fin Corp Thermal Util Re Ref Teco Proj
| | 5.00% | | 11/15/29 | | 1,080,094 |
| 230,000 | | Harris Cnty TX Muni Util Dist #536, BAM
| | 5.50% | | 09/01/26 | | 243,611 |
| 240,000 | | Harris Cnty TX Muni Util Dist #536, BAM
| | 5.50% | | 09/01/27 | | 258,746 |
| 2,000,000 | | Hays Cnty TX Ref
| | 3.38% | | 02/15/29 | | 1,991,858 |
| 100,000 | | Houston TX Arpt Sys Rev Ref Sub, Ser B
| | 5.00% | | 07/01/26 | | 105,391 |
| 335,000 | | Houston TX Arpt Sys Rev Ref Sub, Ser C, AMT
| | 5.00% | | 07/01/27 | | 352,350 |
| 1,835,000 | | Houston TX Arpt Sys Rev Ref Subord Lien, Ser A, AMT, AGM
| | 5.00% | | 07/01/27 | | 1,928,666 |
| 900,000 | | Houston TX Arpt Sys Rev Ref United Airls Inc Terminal Impt Proj, Ser B-2, AMT
| | 5.00% | | 07/15/27 | | 910,169 |
| 200,000 | | Houston TX Arpt Sys Rev Sub, Ser A, AMT
| | 5.00% | | 07/01/28 | | 212,710 |
| 300,000 | | Houston TX Arpt Sys Rev Sub, Ser A, AMT
| | 5.00% | | 07/01/29 | | 323,579 |
| 625,000 | | Kingsville TX Ctfs Oblig, BAM
| | 2.00% | | 08/01/23 | | 625,000 |
| 925,000 | | Kyle TX Spl Assmnt Rev 6 Creeks Pub Impt Dist Impt Area #1 (a)
| | 4.13% | | 09/01/29 | | 902,843 |
| 975,000 | | La Vernia TX Hgr Edu Fin Corp Edu Rev Meridian World Sch, Ser A (Pre-refunded maturity 08/15/24) (a)
| | 5.25% | | 08/15/35 | | 988,209 |
| 1,300,000 | | Love Field TX Arpt Modernization Corp Gen Arpt Rev, AMT
| | 5.00% | | 11/01/23 | | 1,302,563 |
| 405,000 | | Love Field TX Arpt Modernization Corp Gen Arpt Rev, AMT
| | 5.00% | | 11/01/31 | | 420,393 |
| 700,000 | | Love Field TX Arpt Modernization Corp Gen Arpt Rev, AMT
| | 5.00% | | 11/01/33 | | 723,757 |
| 200,000 | | Lower CO River TX Auth Trans Contract Rev Ref Lcra Trans Svcs Corp Proj
| | 5.00% | | 05/15/33 | | 208,519 |
| 1,500,000 | | Matagorda Cnty TX Nav Dist #1 Var Rev Cent Pwr & Lt Ref Remk, AMT (Mandatory put 09/01/23)
| | 0.90% | | 05/01/30 | | 1,494,715 |
| 1,500,000 | | Mission TX Econ Dev Corp Sol Wst Disp Rev Var Rep Svcs Inc Proj Remk, Ser A, AMT (Mandatory put 08/01/23)
| | 3.88% | | 05/01/50 | | 1,500,000 |
| 440,000 | | Montgomery Cnty TX Muni Util Dist #105, BAM
| | 4.63% | | 09/01/25 | | 451,603 |
| 450,000 | | Montgomery Cnty TX Muni Util Dist #105, BAM
| | 4.63% | | 09/01/26 | | 467,846 |
See Notes to Financial Statements
Page 27
First Trust Short Duration Managed Municipal ETF (FSMB)
Portfolio of Investments (Continued)
July 31, 2023
Principal
Value | | Description | | Stated
Coupon | | Stated
Maturity | | Value |
| MUNICIPAL BONDS (Continued) |
| | | Texas (Continued) | | | | | | |
| $400,000 | | N Parkway Muni Mgmt Dist #1 TX Contract Rev Legacy Hills Pub Impt Dt Phase #1A-1B Impts (a)
| | 3.00% | | 09/15/26 | | $376,893 |
| 1,000,000 | | N TX Tollway Auth Rev Ref 2nd Tier, Ser A
| | 5.00% | | 01/01/35 | | 1,016,636 |
| 45,000 | | N TX Tollway Auth Rev Ref 2nd Tier, Ser B
| | 5.00% | | 01/01/31 | | 47,097 |
| 500,000 | | N TX Tollway Auth Rev Ref First Tier Bonds, Ser A
| | 5.00% | | 01/01/24 | | 503,297 |
| 1,000,000 | | N TX Tollway Auth Rev Ref First Tier Bonds, Ser A
| | 5.00% | | 01/01/26 | | 1,043,751 |
| 150,000 | | N TX Tollway Auth Rev Ref Second Tier Bonds, Ser C
| | 5.00% | | 01/01/27 | | 159,842 |
| 105,000 | | N TX Tollway Auth Rev Ref Sys 1st Tier, Ser A
| | 5.00% | | 01/01/25 | | 105,750 |
| 1,000,000 | | N TX Tollway Auth Rev Ref, Ser A
| | 5.00% | | 01/01/25 | | 1,007,141 |
| 300,000 | | N TX Tollway Auth Rev Second Tier, Ser B
| | 5.00% | | 01/01/27 | | 319,684 |
| 10,000 | | N TX Tollway Auth Rev Unrefunded Ref 2nd Tier, Ser B
| | 5.00% | | 01/01/24 | | 10,012 |
| 635,000 | | New Hope Cultural Edu Facs Fin Corp TX Edu Rev Ref Jubilee Acad Ctr (a)
| | 4.00% | | 08/15/25 | | 620,087 |
| 1,490,000 | | New Hope Cultural Edu Facs Fin Corp TX Stdt Hsg Rev CHF Clegiate Hsg San Antonio I-TX A&M Univ San Antonio, Ser A (Pre-refunded maturity 04/01/26)
| | 5.00% | | 04/01/48 | | 1,554,699 |
| 50,000 | | Oak Point TX Spl Assmnt Rev Wildridge Pub Impt Dist #1 Impt Area #2 Proj Accd Inv (a)
| | 3.50% | | 09/01/23 | | 49,964 |
| 1,000,000 | | Tarrant Cnty TX Cultural Edu Facs Fin Corp Hosp Rev Ref Baylor Scott & White Hlth Proj, Ser A
| | 5.00% | | 11/15/28 | | 1,049,396 |
| 680,000 | | Tarrant Cnty TX Cultural Edu Facs Fin Corp Hosp Rev Var Baylor Scott & White Hlth Proj, Ser E (Mandatory put 05/15/26)
| | 5.00% | | 11/15/52 | | 705,152 |
| 875,000 | | Travis Cnty TX Hsg Fin Corp Mf Hsg Rev Var Kensington Apts (Mandatory put 08/01/25)
| | 3.75% | | 08/01/26 | | 872,800 |
| 700,000 | | TX St Muni Gas Acq & Sply Corp III Gas Sply Rev Ref
| | 5.00% | | 12/15/25 | | 708,049 |
| 480,000 | | TX St Wtr Dev Brd St Wtr Implementation Fund, Ser A
| | 5.00% | | 04/15/25 | | 494,589 |
| 340,000 | | Univ of Houston TX Univ Revs Ref Consol, Ser C
| | 5.00% | | 02/15/30 | | 353,841 |
| 4,000,000 | | Univ of Texas TX Permanent Univ Fnd Bonds, Ser A
| | 5.00% | | 07/01/26 | | 4,221,348 |
| 1,650,000 | | Univ of Texas TX Univ Revs Ref, Ser H
| | 5.00% | | 08/15/25 | | 1,711,862 |
| 1,580,000 | | Univ of Texas TX Univ Revs, Ser D
| | 5.00% | | 08/15/26 | | 1,674,204 |
| 630,000 | | Viridian TX Muni Mgmt Dist Unlimited Tax Road Impt Bonds, BAM
| | 4.00% | | 12/01/29 | | 648,250 |
| 385,000 | | Wilbarger Creek TX Muni Util Dist #2, AGM
| | 4.00% | | 09/01/26 | | 394,749 |
| 760,000 | | Williamson Cnty TX Muni Util Dist #10 Ref, BAM
| | 3.00% | | 08/01/26 | | 751,184 |
| | | | | 55,862,627 |
| | | Utah – 0.6% | | | | | | |
| 650,000 | | Salt Lake City UT Arpt Rev, Ser A, AMT (d)
| | 5.00% | | 07/01/26 | | 675,460 |
| 1,895,000 | | Utah Cnty UT Hosp Rev IHC Hlth Svcs Inc, Ser B-1 (Mandatory put 08/01/24)
| | 5.00% | | 05/15/60 | | 1,921,474 |
| | | | | 2,596,934 |
| | | Vermont – 0.0% | | | | | | |
| 100,000 | | VT St Econ Dev Auth Solid Wst Disp Rev Var Casella Waste Sys Inc Remk, AMT (Mandatory put 04/03/28) (a)
| | 4.63% | | 04/01/36 | | 98,694 |
| | | Virginia – 2.5% | | | | | | |
| 2,000,000 | | Arlington Cnty VA Indl Dev Auth Mf Rev Park Shirlington Apartments, Ser A
| | 5.00% | | 01/01/26 | | 2,059,282 |
| 310,000 | | Hampton Roads VA Santn Dist Wstwtr Rev Prerefunded Sub, Ser A (Pre-refunded maturity 08/01/26)
| | 5.00% | | 08/01/28 | | 328,304 |
| 600,000 | | Henrico Cnty VA Econ Dev Auth Rsdl Care Fac Rev Ref Westminster Canterbury Proj
| | 5.00% | | 10/01/30 | | 620,322 |
| 1,490,000 | | Loudoun Cnty VA, Ser B
| | 4.00% | | 12/01/28 | | 1,509,040 |
Page 28
See Notes to Financial Statements
First Trust Short Duration Managed Municipal ETF (FSMB)
Portfolio of Investments (Continued)
July 31, 2023
Principal
Value | | Description | | Stated
Coupon | | Stated
Maturity | | Value |
| MUNICIPAL BONDS (Continued) |
| | | Virginia (Continued) | | | | | | |
| $1,000,000 | | Louisa VA Indl Dev Auth Poll Control Rev Var VA Elec & Pwr Co Proj Remk, Ser A (Mandatory put 10/01/27)
| | 3.65% | | 11/01/35 | | $994,841 |
| 1,525,000 | | Norfolk VA Wtr Rev Ref
| | 5.00% | | 11/01/31 | | 1,666,450 |
| 845,000 | | Richmond VA Redev & Hsg Auth Mf Rev Var Townes at River South (Mandatory put 03/01/25)
| | 4.25% | | 03/01/26 | | 849,004 |
| 125,000 | | VA Clg Bldg Auth Eductnl Facs Rev Ref Regent Univ Proj
| | 5.00% | | 06/01/26 | | 127,819 |
| 1,585,000 | | VA St Pub Bldg Auth Pub Facs Rev, Ser C, AMT
| | 5.00% | | 08/01/29 | | 1,662,636 |
| 445,000 | | VA St Res Auth Clean Wtr Rev Ref Revolving Fund, Ser B
| | 4.00% | | 10/01/27 | | 447,984 |
| 380,000 | | Wise Cnty VA Indl Dev Auth Sol Wst & Sewage Disp Rev VA Elec & Pwr Co Remk, Ser A (Mandatory put 05/31/24)
| | 1.20% | | 11/01/40 | | 369,271 |
| | | | | 10,634,953 |
| | | Washington – 1.6% | | | | | | |
| 1,315,000 | | King Cnty WA Swr Rev Ref, Ser B
| | 5.00% | | 07/01/26 | | 1,335,248 |
| 1,500,000 | | Port of Seattle WA Rev Ref Intermediate Lien, Ser B, AMT
| | 5.00% | | 08/01/26 | | 1,557,089 |
| 150,000 | | Seattle WA Wtr Sys Rev Ref & Impt
| | 5.00% | | 05/01/28 | | 154,585 |
| 100,000 | | WA St Hlth Care Facs Auth Ref Seattle Cancer Care Alliance
| | 5.00% | | 09/01/27 | | 105,183 |
| 2,120,000 | | WA St Hsg Fin Commn Nonprofit Hsg Rev Heron’s Key, Ser A (Pre-refunded maturity 07/01/25) (a)
| | 7.00% | | 07/01/45 | | 2,245,492 |
| 1,555,000 | | WA St, Ser B, COPS
| | 5.00% | | 07/01/24 | | 1,578,662 |
| | | | | 6,976,259 |
| | | West Virginia – 0.4% | | | | | | |
| 1,500,000 | | WV St Econ Dev Auth Sol Wst Disp Facs Var Sr Arch Res Proj, AMT (Mandatory put 07/01/25)
| | 5.00% | | 07/01/45 | | 1,502,569 |
| | | Wisconsin – 2.5% | | | | | | |
| 2,000,000 | | Oak Creek WI, Ser B, NANS
| | 4.00% | | 04/01/26 | | 2,003,345 |
| 100,000 | | Pub Fin Auth WI Edu Rev Coral Acdmy of Science Las Vegas, Ser A
| | 4.00% | | 07/01/26 | | 98,027 |
| 185,000 | | Pub Fin Auth WI Eductnl Rev Piedmont Cmnty Chrt Sch
| | 5.00% | | 06/15/25 | | 186,505 |
| 250,000 | | Pub Fin Auth WI Hosp Rev Ref Carson Vly Med Ctr, Ser A
| | 3.00% | | 12/01/26 | | 237,517 |
| 4,000,000 | | Pub Fin Auth WI Poll Control Rev Var Ref Duke Engery Progress Proj, Ser A-1 (Mandatory put 10/01/26)
| | 3.30% | | 10/01/46 | | 3,974,168 |
| 285,000 | | Pub Fin Auth WI Retmnt Fac Rev Ref United Methodist Retmnt Homes, Ser A
| | 4.00% | | 10/01/25 | | 280,581 |
| 605,000 | | Pub Fin Auth WI Retmnt Fac Rev Ref United Methodist Retmnt Homes, Ser A
| | 4.00% | | 10/01/26 | | 590,744 |
| 325,000 | | Pub Fin Auth WI Retmnt Fac Rev Ref United Methodist Retmnt Homes, Ser A
| | 4.00% | | 10/01/29 | | 308,586 |
| 225,000 | | Pub Fin Auth WI Rev Unrefunded Roseman Univ Hlth Scienes Proj (a)
| | 3.00% | | 04/01/25 | | 218,100 |
| 800,000 | | Pub Fin Auth WI Sr Living Rev Rose Villa Proj, Ser A (Pre-refunded maturity 11/15/24) (a)
| | 5.75% | | 11/15/44 | | 819,661 |
| 1,000,000 | | Waukesha WI, Ser A, NANS
| | 4.00% | | 07/01/24 | | 1,000,441 |
| 275,000 | | WI St Clean Wtr Rev Ref (Pre-refunded maturity 06/01/24)
| | 5.00% | | 06/01/26 | | 278,958 |
| 400,000 | | WI St Hlth & Eductnl Facs Auth Rev Ref Ascension Hlth Credit Grp, Ser A
| | 5.00% | | 11/15/36 | | 413,751 |
| 155,000 | | WI St Hlth & Eductnl Facs Auth Rev Three Pillars Sr Living Cmntys, Ser A
| | 4.00% | | 08/15/24 | | 153,605 |
| | | | | 10,563,989 |
| | | Wyoming – 0.3% | | | | | | |
| 250,000 | | Consol Muni Elec Pwr Sys WY Jt Pwrs Brd Sys Jt Pwrs Brd Ref Electrical Sys Proj
| | 5.00% | | 06/01/26 | | 262,246 |
See Notes to Financial Statements
Page 29
First Trust Short Duration Managed Municipal ETF (FSMB)
Portfolio of Investments (Continued)
July 31, 2023
Principal
Value | | Description | | Stated
Coupon | | Stated
Maturity | | Value |
| MUNICIPAL BONDS (Continued) |
| | | Wyoming (Continued) | | | | | | |
| $755,000 | | Consol Muni Elec Pwr Sys WY Jt Pwrs Brd Sys Jt Pwrs Brd Ref Electrical Sys Proj
| | 5.25% | | 06/01/37 | | $844,872 |
| | | | | 1,107,118 |
| Total Investments – 98.3%
| | 418,887,230 |
| | (Cost $423,852,281) | | |
| | Net Other Assets and Liabilities – 1.7%
| | 7,244,501 |
| | Net Assets – 100.0%
| | $426,131,731 |
| (a) | This security, sold within the terms of a private placement memorandum, is exempt from registration upon resale under Rule 144A of the Securities Act of 1933, as amended, and may be resold in transactions exempt from registration, normally to qualified institutional buyers. Pursuant to procedures adopted by the Trust’s Board of Trustees, this security has been determined to be liquid by First Trust Advisors L.P. (the “Advisor”). Although market instability can result in periods of increased overall market illiquidity, liquidity for each security is determined based on security specific factors and assumptions, which require subjective judgment. At July 31, 2023, securities noted as such amounted to $14,617,767 or 3.4% of net assets. |
| (b) | Zero coupon bond. |
| (c) | Variable Rate Demand bond. Interest rate is reset periodically by the agent based on current market conditions. |
| (d) | When-issued security. The interest rate shown reflects the rate in effect at July 31, 2023. Interest will begin accruing on the security’s first settlement date. |
| Abbreviations throughout the Portfolio of Investments: |
| AGM | Assured Guaranty Municipal Corp. |
| AMBAC | American Municipal Bond Assurance Corp. |
| AMT | Alternative Minimum Tax |
| BAM | Build America Mutual |
| BANS | Bond Anticipation Notes |
| CABS | Capital Appreciation Bonds |
| COPS | Certificates of Participation |
| GARVEE | Grant Anticipation Revenue Vehicle |
| NANS | Note Anticipation Notes |
| NATL-RE | National Public Finance Guarantee Corp. |
Valuation Inputs
A summary of the inputs used to value the Fund’s investments as of July 31, 2023 is as follows (see Note 2A - Portfolio Valuation in the Notes to Financial Statements):
| | Total
Value at
7/31/2023 | Level 1
Quoted
Prices | Level 2
Significant
Observable
Inputs | Level 3
Significant
Unobservable
Inputs |
Municipal Bonds*
| $ 418,887,230 | $ — | $ 418,887,230 | $ — |
| * | See Portfolio of Investments for state and territory breakout. |
Page 30
See Notes to Financial Statements
First Trust Ultra Short Duration Municipal ETF (FUMB)
Portfolio of Investments
July 31, 2023
Principal
Value | | Description | | Stated
Coupon | | Stated
Maturity | | Value |
| MUNICIPAL BONDS – 98.7% |
| | | Alabama – 3.5% | | | | | | |
| $325,000 | | AL St Hwy Fin Corp Spl Oblig Rev, Ser A
| | 5.00% | | 08/01/23 | | $325,000 |
| 200,000 | | Black Belt Energy Gas Dist AL Gas Prepay Rev Proj #5, Ser A-1
| | 4.00% | | 10/01/24 | | 200,127 |
| 480,000 | | Black Belt Energy Gas Dist AL Gas Prepay Rev Proj No. 4, Ser A-1
| | 4.00% | | 06/01/24 | | 479,846 |
| 300,000 | | Black Belt Energy Gas Dist AL Gas Prepay Rev, Ser A
| | 5.00% | | 12/01/23 | | 300,855 |
| 1,955,000 | | Black Belt Energy Gas Dist AL Gas Prepay Rev, Ser A (Mandatory put 12/01/23)
| | 4.00% | | 12/01/48 | | 1,954,392 |
| 525,000 | | Black Belt Energy Gas Dist AL Gas Proj Rev, Ser C-1
| | 5.25% | | 12/01/23 | | 526,922 |
| 385,000 | | Black Belt Energy Gas Dist AL Gas Proj Rev, Ser C-1
| | 5.25% | | 06/01/24 | | 388,512 |
| 625,000 | | Black Belt Energy Gas Dist AL Gas Proj Rev, Ser C-1
| | 5.25% | | 12/01/24 | | 634,111 |
| 2,000,000 | | Columbia AL Indl Dev Brd Poll Control Rev Var Ref AL Pwr Co Proj, Ser A (a)
| | 4.70% | | 12/01/37 | | 2,000,000 |
| 1,155,000 | | Lower AL Gas Dist Gas Proj Rev Bonds Proj 2 (Mandatory put 12/01/25)
| | 4.00% | | 12/01/50 | | 1,146,223 |
| 1,120,000 | | SE AL St Gas Sply Dist Gas Sply Rev Proj #2, Ser A (Mandatory put 06/01/24)
| | 4.00% | | 06/01/49 | | 1,117,443 |
| 500,000 | | SE Energy Auth AL Cmdy Sply Rev Proj #4, Ser B-1
| | 5.00% | | 08/01/23 | | 500,000 |
| | | | | 9,573,431 |
| | | Alaska – 0.1% | | | | | | |
| 300,000 | | AK St, Ser A
| | 5.00% | | 08/01/23 | | 300,000 |
| | | Arizona – 2.4% | | | | | | |
| 1,565,000 | | AZ St Transprtn Brd Excise Tax Rev Ref
| | 5.00% | | 07/01/25 | | 1,622,079 |
| 1,740,000 | | Chandler AZ Indl Dev Auth Indl Dev Rev Var Intel Corp Proj Remk, AMT (Mandatory put 08/14/23)
| | 2.70% | | 12/01/37 | | 1,738,906 |
| 500,000 | | Phoenix AZ Civic Impt Corp Arpt Rev Ref Sr Lien, AMT
| | 5.00% | | 07/01/25 | | 513,258 |
| 2,000,000 | | Phoenix AZ Civic Impt Corp Wtr Sys Rev Junior Lien, Ser A (Pre-refunded maturity 07/01/24)
| | 4.75% | | 07/01/44 | | 2,026,513 |
| 180,000 | | Pima Cnty AZ Indl Dev Auth Sr Living Rev La Posada at Pusch Ridge Proj, Ser A (b)
| | 5.75% | | 11/15/23 | | 180,056 |
| 520,000 | | Salt Verde AZ Finl Corp Sr Gas Rev Sr
| | 5.25% | | 12/01/23 | | 521,149 |
| | | | | 6,601,961 |
| | | California – 1.9% | | | | | | |
| 200,000 | | CA Cmnty Choice Fing Auth Clean Energy Proj Rev Var Green Bonds Clean Energy Proj, Ser C
| | 5.00% | | 10/01/24 | | 201,200 |
| 3,000,000 | | CA St Infra & Econ Dev Bank Rev Var Brightline W Passenger Rail Proj Remk, Ser A, AMT, (Mandatory put 01/31/24) (b)
| | 3.65% | | 01/01/50 | | 2,987,370 |
| 335,000 | | Long Beach CA Bond Fin Auth Nat Gas Pur Rev, Ser A
| | 5.25% | | 11/15/23 | | 335,838 |
| 1,700,000 | | Sch Proj for Util Rate Reduction CA Nat Gas Pur Prog, RANS
| | 4.00% | | 08/01/23 | | 1,700,000 |
| | | | | 5,224,408 |
| | | Colorado – 2.8% | | | | | | |
| 350,000 | | Adams & Arapahoe Cntys CO Jt Sch Dist #28J Aurora Ref
| | 5.00% | | 12/01/23 | | 351,820 |
| 1,275,000 | | Arapahoe Cnty CO Sch Dist #5 Cherry Creek Ref & Impt, AGM
| | 2.00% | | 12/15/23 | | 1,269,023 |
| 400,000 | | CO St Hlth Facs Auth Rev Commonspirit Hlth Oblig Grp, Ser A
| | 5.00% | | 11/01/23 | | 401,087 |
| 185,000 | | CO St Hlth Facs Auth Rev Ref Commonspirit Hlth, Ser B-1 (Mandatory put 08/01/25)
| | 5.00% | | 08/01/49 | | 188,237 |
| 2,355,000 | | CO St Ref UCDHSC Fitzsimons Acad Projs, Ser A, COPS (Pre-refunded maturity 11/01/23)
| | 5.00% | | 11/01/28 | | 2,364,565 |
| 700,000 | | Denver City & Cnty CO Arpt Rev Ref, Ser C
| | 5.00% | | 11/15/23 | | 703,390 |
| 2,000,000 | | Denver CO Convention Ctr Hotel Auth Rev Ref Sr
| | 5.00% | | 12/01/23 | | 2,004,451 |
| 250,000 | | Leyden Rock Met Dist CO Ref, AGM
| | 5.00% | | 12/01/23 | | 251,217 |
| | | | | 7,533,790 |
See Notes to Financial Statements
Page 31
First Trust Ultra Short Duration Municipal ETF (FUMB)
Portfolio of Investments (Continued)
July 31, 2023
Principal
Value | | Description | | Stated
Coupon | | Stated
Maturity | | Value |
| MUNICIPAL BONDS (Continued) |
| | | Connecticut – 2.8% | | | | | | |
| $850,000 | | Bridgeport CT Ref, Ser C
| | 5.00% | | 02/15/24 | | $857,275 |
| 900,000 | | CT St Hgr Edu Supplement Loan Auth Rev Chesla Ln Prog, Ser A, AMT
| | 5.00% | | 11/15/23 | | 903,853 |
| 2,500,000 | | CT St Ref, Ser H
| | 5.00% | | 11/15/23 | | 2,511,749 |
| 2,250,000 | | CT St Spl Tax Oblig Rev Ref Transprtn Infra Purp, Ser B
| | 5.00% | | 01/01/24 | | 2,265,487 |
| 30,000 | | Hamden CT, BAM
| | 5.00% | | 08/15/23 | | 30,013 |
| 1,080,000 | | New Haven CT, Ser A, AGM
| | 5.00% | | 08/01/23 | | 1,080,000 |
| | | | | 7,648,377 |
| | | District of Columbia – 0.7% | | | | | | |
| 1,985,000 | | Met WA DC Arpts Auth Dulles Toll Road Rev Cap Apprec 2nd Sr Lien, Ser B, AGC
| | (c) | | 10/01/23 | | 1,972,609 |
| | | Florida – 6.4% | | | | | | |
| 85,000 | | Alachua Cnty FL Hlth Facs Auth CCRC Ref Oak Hammock at the Univ of FL Inc Proj
| | 4.00% | | 10/01/23 | | 84,841 |
| 2,065,000 | | Broward Cnty FL Arpt Sys Rev, Ser A, AMT (Pre-refunded maturity 10/01/23)
| | 5.13% | | 10/01/38 | | 2,069,707 |
| 1,500,000 | | Collier Cnty FL Eductnl Facs Auth Rev Eductnl Facs Hodges Univ Inc (Pre-refunded maturity 11/01/23)
| | 6.13% | | 11/01/43 | | 1,509,745 |
| 100,000 | | Gtr Orlando FL Aviation Auth Arpt Facs Rev Ref Priority Sub Arpt Facs, AMT
| | 5.00% | | 10/01/23 | | 100,151 |
| 445,000 | | Hollywood Beach FL Cmnty Dev Dist Rev CDD Ref Pub Pkg Fac Proj, Ser I
| | 5.00% | | 10/01/23 | | 446,080 |
| 730,000 | | Jacksonville FL Spl Rev Ref, Ser D
| | 5.00% | | 10/01/23 | | 731,808 |
| 1,100,000 | | JEA FL Wtr & Swr Rev Ref, Ser A
| | 5.00% | | 10/01/24 | | 1,122,398 |
| 175,000 | | Lakewood Ranch FL Stewardship Dist Spl Assmnt Rev Ref Country Club E Proj, AGM
| | 5.00% | | 05/01/25 | | 179,419 |
| 2,000,000 | | Miami-Dade Cnty FL Sch Brd Ref, Ser B, COPS
| | 5.00% | | 05/01/24 | | 2,023,672 |
| 1,000,000 | | Miami-Dade Cnty FL Seaport Rev Ref Sr Bonds, Ser A, AMT
| | 5.00% | | 10/01/25 | | 1,027,908 |
| 2,500,000 | | Miami-Dade Cnty FL Seaport Rev, Ser B, AMT (Pre-refunded maturity 10/01/23)
| | 6.25% | | 10/01/38 | | 2,510,766 |
| 400,000 | | Monroe Cnty FL Sch Dist Sales Tax Rev, AGM
| | 5.00% | | 10/01/23 | | 401,004 |
| 2,650,000 | | Orange Cnty FL Hlth Facs Auth Rev Ref Presbyterian Retmnt Cmntys
| | 5.00% | | 08/01/41 | | 2,729,500 |
| 1,195,000 | | Palm Beach Cnty FL Sch Brd, Ser B, COPS
| | 5.00% | | 08/01/23 | | 1,195,000 |
| 145,000 | | Sarasota Cnty FL Util Sys Rev (Pre-refunded maturity 10/01/23)
| | 5.00% | | 10/01/38 | | 145,398 |
| 515,000 | | Seminole Cnty FL Wtr & Swr Rev Ref, Ser A
| | 5.00% | | 10/01/23 | | 516,352 |
| 455,000 | | Tampa FL Capital Impt Cigarette Tax Allocation H Lee Moffitt Cancer Ctr Proj, Ser A
| | 5.00% | | 09/01/24 | | 461,530 |
| | | | | 17,255,279 |
| | | Georgia – 4.1% | | | | | | |
| 1,170,000 | | Atlanta GA Arpt Rev Ref, Ser B, AMT
| | 5.00% | | 07/01/24 | | 1,182,846 |
| 480,000 | | Atlanta GA Wtr & Wstwtr Rev Ref, Ser B
| | 5.00% | | 11/01/23 | | 481,950 |
| 2,000,000 | | Burke Cnty GA Dev Auth Poll Control Rev Var Ref GA Pwr Co Plant Vogtle Proj (a)
| | 5.05% | | 11/01/52 | | 2,000,000 |
| 250,000 | | Main Street Nat Gas Inc GA Gas Sply Rev Var, Ser B (Mandatory put 12/02/24)
| | 4.00% | | 08/01/49 | | 250,481 |
| 500,000 | | Main Street Nat Gas Inc GA Gas Sply Rev, Ser A
| | 4.00% | | 12/01/23 | | 499,675 |
| 650,000 | | Main Street Nat Gas Inc GA Gas Sply Rev, Ser A
| | 5.00% | | 06/01/24 | | 652,242 |
| 550,000 | | Main Street Nat Gas Inc GA Gas Sply Rev, Ser A
| | 5.00% | | 06/01/25 | | 554,711 |
| 250,000 | | Main Street Nat Gas Inc GA Gas Sply Rev, Ser B
| | 5.00% | | 03/01/24 | | 251,416 |
| 500,000 | | Main Street Nat Gas Inc GA Gas Sply Rev, Ser B
| | 5.00% | | 06/01/24 | | 502,008 |
| 250,000 | | Main Street Nat Gas Inc GA Gas Sply Rev, Ser B
| | 5.00% | | 09/01/24 | | 252,661 |
Page 32
See Notes to Financial Statements
First Trust Ultra Short Duration Municipal ETF (FUMB)
Portfolio of Investments (Continued)
July 31, 2023
Principal
Value | | Description | | Stated
Coupon | | Stated
Maturity | | Value |
| MUNICIPAL BONDS (Continued) |
| | | Georgia (Continued) | | | | | | |
| $1,105,000 | | Main Street Nat Gas Inc GA Gas Sply Rev, Subser C (Mandatory put 12/01/23)
| | 4.00% | | 08/01/48 | | $1,106,219 |
| 2,100,000 | | Met Atlanta GA Rapid Transit Auth Sales Tax Rev Ref, Ser A
| | 4.00% | | 07/01/24 | | 2,116,045 |
| 1,370,000 | | Monroe Cnty GA Dev Auth Poll Control Rev GA Pwr Co Plant Scherer Proj Remk, 1st Ser
| | 2.25% | | 07/01/25 | | 1,303,623 |
| | | | | 11,153,877 |
| | | Hawaii – 1.2% | | | | | | |
| 2,500,000 | | HI St Arpts Sys Rev Ref, Ser B, AMT
| | 5.00% | | 07/01/24 | | 2,524,754 |
| 615,000 | | Honolulu City & Cnty HI, Ser A
| | 5.00% | | 10/01/23 | | 616,646 |
| | | | | 3,141,400 |
| | | Illinois – 6.6% | | | | | | |
| 230,000 | | Chicago IL O’Hare Intl Arpt Rev Ref Sr Lien O’Hare Intl Arpt, Ser C, AMT
| | 5.00% | | 01/01/24 | | 231,138 |
| 600,000 | | Chicago IL Ref, Ser A
| | 5.00% | | 01/01/24 | | 602,713 |
| 1,000,000 | | Chicago IL Ref, Ser C
| | 5.00% | | 01/01/24 | | 1,004,521 |
| 165,000 | | Chicago IL Wtr Rev Second Lien
| | 5.00% | | 11/01/23 | | 165,156 |
| 1,250,000 | | Cook Cnty IL Ref, Ser A
| | 5.00% | | 11/15/23 | | 1,255,012 |
| 500,000 | | DuPage & Cook Cntys IL Cmnty Consolidated Sch Dist #181 Hinsdale Ref Sch, Ser B
| | 3.00% | | 05/01/24 | | 498,170 |
| 450,000 | | DuPage Cnty IL High Sch Dist #88 Ref
| | 4.00% | | 01/15/24 | | 450,920 |
| 180,000 | | IL St Fin Auth Hlth Svcs Facs Lease Rev Univ of IL Hlth Svcs Fac Proj
| | 5.00% | | 10/01/23 | | 180,317 |
| 250,000 | | IL St Fin Auth Hlth Svcs Facs Lease Rev Univ of IL Hlth Svcs Fac Proj
| | 5.00% | | 10/01/24 | | 253,030 |
| 530,000 | | IL St Fin Auth Rev Ref Ann & Robert H Lurie Childrens Hosp
| | 5.00% | | 08/15/23 | | 530,288 |
| 500,000 | | IL St Fin Auth Rev Ref Ascension Hlth Credit Grp, Ser C
| | 5.00% | | 02/15/24 | | 504,040 |
| 500,000 | | IL St Fin Auth Rev Var Ref Northwestern Memorial Hlthcare, Ser C (a)
| | 4.43% | | 07/15/55 | | 500,000 |
| 625,000 | | IL St Hsg Dev Auth Mf Hsg Rev Var S Shore (Mandatory put 06/01/25)
| | 4.00% | | 06/01/26 | | 625,151 |
| 1,500,000 | | IL St Hsg Dev Auth Rev Var Social Bonds, Ser H (Mandatory put 12/01/23)
| | 3.47% | | 10/01/53 | | 1,495,961 |
| 100,000 | | IL St Ref
| | 4.00% | | 08/01/25 | | 100,009 |
| 1,000,000 | | IL St Ref, Ser C
| | 4.00% | | 03/01/24 | | 1,002,099 |
| 2,090,000 | | IL St, Ser D
| | 5.00% | | 11/01/24 | | 2,126,203 |
| 1,240,000 | | McLean & Woodford Cntys IL Cmnty Unit Sch Dist #5 Ref, Ser A
| | 4.00% | | 12/01/23 | | 1,241,517 |
| 1,805,000 | | Mount Vernon IL Ref, BAM
| | 4.00% | | 12/15/23 | | 1,808,067 |
| 2,500,000 | | Schaumburg IL Ref
| | 4.00% | | 12/01/23 | | 2,501,989 |
| 840,000 | | Schaumburg IL Ref
| | 4.00% | | 12/01/24 | | 843,335 |
| | | | | 17,919,636 |
| | | Indiana – 2.3% | | | | | | |
| 3,500,000 | | IN St Fin Auth Envrnmntl Rev Var Ref Fulcrum Centerpoint LLC Proj, AMT (Mandatory put 11/15/23)
| | 4.50% | | 12/15/46 | | 3,493,131 |
| 275,000 | | IN St Muni Pwr Agy Ref, Ser A
| | 5.00% | | 01/01/24 | | 276,848 |
| 2,325,000 | | Johnson Cnty IN
| | 5.50% | | 12/31/23 | | 2,340,935 |
| | | | | 6,110,914 |
| | | Iowa – 0.4% | | | | | | |
| 1,000,000 | | IA St Fin Auth Sol Wst Facs Rev Var Green Bond Gevo Nw Rng LLC Renewable Natrl Gas Proj, AMT (Mandatory put 04/01/24)
| | 1.50% | | 01/01/42 | | 977,106 |
See Notes to Financial Statements
Page 33
First Trust Ultra Short Duration Municipal ETF (FUMB)
Portfolio of Investments (Continued)
July 31, 2023
Principal
Value | | Description | | Stated
Coupon | | Stated
Maturity | | Value |
| MUNICIPAL BONDS (Continued) |
| | | Kansas – 1.8% | | | | | | |
| $150,000 | | Burlington KS Envrn Impt Rev Ref Kansas City Pwr & Light Co Proj Remk, Ser A
| | 2.95% | | 12/01/23 | | $149,510 |
| 1,500,000 | | KS St Dept of Transprtn Hwy Rev Ref, Ser A
| | 2.75% | | 09/01/23 | | 1,498,180 |
| 3,000,000 | | Leawood KS Temp Nts, Ser 1
| | 3.00% | | 09/01/23 | | 2,998,048 |
| 320,000 | | Wichita KS Hlthcare Facs Rev Ref & Impt Larksfield Place, Ser III (Pre-refunded maturity 12/15/23)
| | 5.50% | | 12/15/25 | | 322,198 |
| | | | | 4,967,936 |
| | | Kentucky – 6.7% | | | | | | |
| 1,400,000 | | KY St Econ Dev Fin Auth Sol Wst Disp Rev Ref Rep Svcs Inc Pj Remk, Ser B (Mandatory put 09/01/23)
| | 3.80% | | 04/01/31 | | 1,399,897 |
| 505,000 | | KY St Muni Pwr Agy Pwr Sys Rev Ref, Ser A, NATL-RE
| | 5.00% | | 09/01/23 | | 505,507 |
| 2,500,000 | | KY St Property & Bldgs Commn Rev Ref Proj #112, Ser B
| | 5.00% | | 11/01/23 | | 2,508,659 |
| 2,500,000 | | KY St Pub Energy Auth Gas Sply Rev Gas Sply, Ser C-1
| | 4.00% | | 12/01/23 | | 2,500,756 |
| 165,000 | | KY St Pub Energy Auth Gas Sply Rev Gas Sply, Ser C-1 (Mandatory put 06/01/25)
| | 4.00% | | 12/01/49 | | 164,253 |
| 2,500,000 | | KY St Pub Energy Auth Gas Sply Rev, Ser A (Mandatory put 04/01/24)
| | 4.00% | | 04/01/48 | | 2,498,467 |
| 1,595,000 | | Louisville & Jefferson Cnty KY Met Govt Hlth Sys Rev Var Norton Hlthcare Inc, Ser B (Mandatory put 10/01/23)
| | 5.00% | | 10/01/47 | | 1,599,109 |
| 3,455,000 | | Louisville & Jefferson Cnty KY Met Swr Dist Swr & Drain Sys Sub Safe Clean Waterways, BANS
| | 4.00% | | 10/06/23 | | 3,459,083 |
| 2,665,000 | | Nthrn KY Wtr Dist Rev Ref, Ser B
| | 4.00% | | 02/01/25 | | 2,694,345 |
| 610,000 | | Univ of Louisville KY Rev, Ser B, BAM
| | 5.00% | | 09/01/23 | | 610,598 |
| | | | | 17,940,674 |
| | | Louisiana – 1.4% | | | | | | |
| 1,500,000 | | LA St Loc Govt Envrnmntl Facs & Cmnty Dev Auth Rev Var American Biocarbon Ct LLC Proj Remk, AMT (Mandatory put 03/22/24) (d)
| | 0.00% | | 12/01/46 | | 1,499,569 |
| 1,000,000 | | LA St Loc Govt Envrnmntl Facs & Cmnty Dev Auth Rev Var American Biocarbon Ct LLC Proj Remk, AMT (Mandatory put 08/01/23)
| | 3.85% | | 12/01/46 | | 1,000,000 |
| 15,000 | | New Orleans LA Wtr Rev Ref (Pre-refunded maturity 12/01/24)
| | 5.00% | | 12/01/29 | | 15,347 |
| 35,000 | | New Orleans LA Wtr Rev Ref (Pre-refunded maturity 12/01/24)
| | 5.00% | | 12/01/34 | | 35,809 |
| 280,000 | | New Orleans LA Wtr Rev Ref (Pre-refunded maturity 12/01/24)
| | 5.00% | | 12/01/44 | | 286,471 |
| 1,000,000 | | Saint James Parish LA Rev Var Nustar Logistics LP Proj Remk, Ser 2011 (Mandatory put 06/01/25) (b)
| | 5.85% | | 08/01/41 | | 1,023,220 |
| | | | | 3,860,416 |
| | | Maryland – 0.4% | | | | | | |
| 925,000 | | MD St Stadium Auth Rev Football Stadium Issue, Ser A
| | 5.00% | | 03/01/25 | | 949,776 |
| | | Massachusetts – 0.7% | | | | | | |
| 250,000 | | MA St Dev Fin Agy Hosp Rev Ref Cape Cod Hlthcare Oblig Grp (Pre-refunded maturity 11/15/23)
| | 5.25% | | 11/15/41 | | 251,354 |
| 1,025,000 | | MA St Dev Fin Agy Rev N Hill Cmntys, Ser A (Pre-refunded maturity 11/15/23) (b)
| | 6.50% | | 11/15/43 | | 1,033,267 |
| 475,000 | | MA St Dev Fin Agy Rev Ref Boston Med Ctr Sustainability Bonds, Ser G
| | 5.00% | | 07/01/24 | | 480,044 |
| | | | | 1,764,665 |
| | | Michigan – 0.6% | | | | | | |
| 400,000 | | Great Lakes MI Wtr Auth Wtr Sply Sys Rev Junior Lien Bond, Ser B
| | 5.00% | | 07/01/24 | | 405,509 |
Page 34
See Notes to Financial Statements
First Trust Ultra Short Duration Municipal ETF (FUMB)
Portfolio of Investments (Continued)
July 31, 2023
Principal
Value | | Description | | Stated
Coupon | | Stated
Maturity | | Value |
| MUNICIPAL BONDS (Continued) |
| | | Michigan (Continued) | | | | | | |
| $560,000 | | MI St Hosp Fin Auth Ascension Hlth Credit Grp Remk, Ser A-4
| | 5.00% | | 11/01/23 | | $562,079 |
| 545,000 | | Wayne Cnty MI Arpt Auth Rev Ref Junior Lien, Ser A
| | 5.00% | | 12/01/23 | | 547,472 |
| | | | | 1,515,060 |
| | | Minnesota – 1.7% | | | | | | |
| 1,260,000 | | Dakota Cnty MN Cmnty Dev Agy Mf Hsg Rev REE Aster House Apts Proj Remk
| | 4.13% | | 06/01/24 | | 1,259,977 |
| 1,000,000 | | MN St Hsg Fin Agy Calvary Ctr Apartments, Ser D
| | 3.65% | | 02/01/25 | | 998,026 |
| 1,250,000 | | MN St Rural Wtr Fin Auth Pub Projs Constr Notes
| | 2.63% | | 12/01/23 | | 1,240,959 |
| 1,000,000 | | Saint Paul MN Hsg & Redev Auth Mf Hsg Rev Var Dale Street Proj (Mandatory put 06/01/24)
| | 3.50% | | 12/01/25 | | 992,582 |
| | | | | 4,491,544 |
| | | Mississippi – 0.9% | | | | | | |
| 400,000 | | MS St Dev Bank Spl Oblg Jackson Wtr & Swr Sys Proj, AGM
| | 6.75% | | 12/01/26 | | 403,829 |
| 100,000 | | MS St Dev Bank Spl Oblg Jackson Wtr & Swr Sys Proj, AGM
| | 6.75% | | 12/01/32 | | 101,039 |
| 2,000,000 | | MS St Hosp Equipment & Facs Auth Ref Adj Baptist Memorial Hlth Care Corp Remk, Ser A-2 (Mandatory put 08/30/23)
| | 3.15% | | 09/01/36 | | 1,998,438 |
| | | | | 2,503,306 |
| | | Missouri – 0.8% | | | | | | |
| 625,000 | | Kansas City MO Spl Oblg MO Projs, Ser A
| | 5.00% | | 04/01/24 | | 631,989 |
| 1,500,000 | | MO St Pub Util Commn Rev Nts
| | 4.00% | | 12/01/24 | | 1,502,630 |
| | | | | 2,134,619 |
| | | Nebraska – 0.6% | | | | | | |
| 150,000 | | Centrl Plains Energy Proj NE Gas Proj Rev Proj No. 4
| | 5.00% | | 01/01/24 | | 150,514 |
| 1,525,000 | | Centrl Plains Energy Proj NE Gas Proj Rev Proj No. 4 (Mandatory put 01/01/24)
| | 5.00% | | 03/01/50 | | 1,530,013 |
| | | | | 1,680,527 |
| | | Nevada – 1.1% | | | | | | |
| 1,000,000 | | Henderson NV Pub Impt Trust Rev Ref Touro Clg & Univ Sys Oblig Grp (Pre-refunded maturity 07/01/24)
| | 5.50% | | 01/01/44 | | 1,019,044 |
| 1,885,000 | | Yerington NV USDA Interim DEBS
| | 1.63% | | 11/01/23 | | 1,871,079 |
| | | | | 2,890,123 |
| | | New Hampshire – 0.7% | | | | | | |
| 2,000,000 | | Natl Fin Auth NH Sol Wst Disp Rev Var Ref Waste Mgmt Inc Proj Remk, Ser A-3, AMT (Mandatory put 09/01/23)
| | 4.00% | | 04/01/24 | | 1,999,739 |
| | | New Jersey – 10.8% | | | | | | |
| 3,000,000 | | Dover NJ, BANS
| | 5.00% | | 01/24/24 | | 3,024,511 |
| 2,660,000 | | Hudson Cnty NJ Impt Auth Loc Unit Loan Prog, Ser B-1
| | 3.00% | | 08/04/23 | | 2,659,863 |
| 2,500,000 | | Jersey City NJ, Ser A, BANS
| | 5.00% | | 10/26/23 | | 2,509,094 |
| 2,694,350 | | Kinnelon NJ, BANS
| | 4.00% | | 09/29/23 | | 2,695,763 |
| 2,000,000 | | Margate City NJ, BANS
| | 4.50% | | 11/29/23 | | 2,006,860 |
| 610,000 | | Newark NJ Ref, Ser A, AGM
| | 5.00% | | 10/01/23 | | 611,379 |
| 1,170,000 | | Newark NJ Ref, Ser A, AGM
| | 5.00% | | 10/01/24 | | 1,190,865 |
| 340,000 | | Newark NJ Ref, Ser B, AGM
| | 5.00% | | 10/01/23 | | 340,769 |
| 3,000,000 | | Newark NJ, Ser D, BANS
| | 4.00% | | 09/29/23 | | 3,000,631 |
| 1,000,000 | | NJ St Econ Dev Auth Ref Sch Facs Constr, Ser N-1, NATL-RE
| | 5.50% | | 09/01/23 | | 1,001,531 |
| 630,000 | | NJ St Econ Dev Auth Rev Portal N Bridge Proj NJ Transit Transprtn Proj Bonds, Ser A
| | 5.00% | | 11/01/23 | | 632,260 |
| 1,080,000 | | NJ St Econ Dev Auth Rev Ref, Ser XX
| | 5.00% | | 06/15/24 | | 1,094,094 |
| 100,000 | | NJ St Hgr Edu Asst Auth Stdt Loan Rev Sr, Ser 2015-1A, AMT
| | 5.00% | | 12/01/24 | | 101,280 |
See Notes to Financial Statements
Page 35
First Trust Ultra Short Duration Municipal ETF (FUMB)
Portfolio of Investments (Continued)
July 31, 2023
Principal
Value | | Description | | Stated
Coupon | | Stated
Maturity | | Value |
| MUNICIPAL BONDS (Continued) |
| | | New Jersey (Continued) | | | | | | |
| $255,000 | | NJ St Hgr Edu Asst Auth Stdt Loan Rev, Ser B, AMT
| | 5.00% | | 12/01/23 | | $255,904 |
| 690,000 | | NJ St Transprtn Trust Fund Auth Transn Sys, Ser A
| | 5.50% | | 12/15/23 | | 694,904 |
| 180,000 | | NJ St Transprtn Trust Fund Auth Transn Sys, Ser B, AMBAC
| | 5.25% | | 12/15/23 | | 181,116 |
| 525,000 | | NJ St Transprtn Trust Fund Auth Transn Sys, Ser D
| | 5.00% | | 12/15/23 | | 527,779 |
| 2,500,000 | | Ocean City NJ, BANS
| | 4.50% | | 10/17/23 | | 2,505,524 |
| 2,000,000 | | Robbinsville Twp NJ Mercer Cnty, Ser B, BANS
| | 5.00% | | 07/11/24 | | 2,027,866 |
| 2,000,000 | | Verona Twp NJ, BANS
| | 5.00% | | 10/26/23 | | 2,007,764 |
| | | | | 29,069,757 |
| | | New Mexico – 0.1% | | | | | | |
| 300,000 | | Albuquerque NM Met Arroyo Flood Control Auth
| | 5.00% | | 08/01/23 | | 300,000 |
| | | New York – 5.7% | | | | | | |
| 2,000,000 | | Batavia Town NY, BANS
| | 4.75% | | 03/07/24 | | 2,015,756 |
| 370,000 | | Met Transprtn Auth NY Rev Transprtn, Ser A-1
| | 5.00% | | 11/15/23 | | 371,024 |
| 1,965,000 | | New York City NY Hsg Dev Corp Mf Hsg Rev Sustainable Dev Bonds Var, Ser F-2 (Mandatory put 07/01/25)
| | 0.60% | | 05/01/61 | | 1,821,775 |
| 2,000,000 | | New York NY Var Fiscal 2019, Ser D, Subser D-4 (a)
| | 4.48% | | 12/01/47 | | 2,000,000 |
| 100,000 | | NY NY, Ser C
| | 5.00% | | 08/01/23 | | 100,000 |
| 125,000 | | NY St Hsg Fin Agy Affordable Hsg, Ser E
| | 2.13% | | 11/01/23 | | 124,545 |
| 180,000 | | NY St Hsg Fin Agy Sustainability Bonds, Ser Q
| | 1.35% | | 11/01/23 | | 178,962 |
| 175,000 | | NY St Mtge Agy Rev Mtge, 55th Ser, AMT
| | 2.65% | | 10/01/23 | | 174,633 |
| 265,000 | | NY St Mtge Agy Rev, Ser 51
| | 2.25% | | 10/01/23 | | 264,361 |
| 1,295,000 | | NY St Transprtn Dev Corp Spl Fac Rev Ref Terminal 4 JFK Intl Arpt Proj, Ser A, AMT
| | 5.00% | | 12/01/24 | | 1,313,591 |
| 255,000 | | Onondaga NY Civic Dev Corp Le Moyne Clg Proj
| | 5.00% | | 07/01/24 | | 256,840 |
| 1,500,000 | | Phelps Clifton Springs NY Centrl Sch Dist, BANS
| | 4.50% | | 06/28/24 | | 1,511,561 |
| 1,500,000 | | Triborough NY Bridge & Tunnel Auth Payroll Mobility Tax, Ser A, BANS
| | 5.00% | | 08/15/24 | | 1,524,728 |
| 2,095,525 | | Wappingers NY Centrl Sch Dist, BANS
| | 4.00% | | 08/10/23 | | 2,095,787 |
| 1,500,000 | | Waterloo NY Centrl Sch Dist, BANS
| | 4.50% | | 06/28/24 | | 1,511,168 |
| | | | | 15,264,731 |
| | | North Carolina – 1.3% | | | | | | |
| 335,000 | | NC St Turnpike Auth Ref Sr Lien, AGM
| | 5.00% | | 01/01/24 | | 336,961 |
| 3,205,000 | | NC St Turnpike Auth, BANS
| | 5.00% | | 02/01/24 | | 3,228,188 |
| | | | | 3,565,149 |
| | | North Dakota – 0.6% | | | | | | |
| 1,500,000 | | Cass Cnty ND Jt Wtr Res Dist, Ser A
| | 0.48% | | 05/01/24 | | 1,446,979 |
| 50,000 | | Grand Forks ND Hlthcare Sys Rev Altru Hlth System Ref
| | 5.00% | | 12/01/23 | | 50,037 |
| | | | | 1,497,016 |
| | | Ohio – 3.0% | | | | | | |
| 150,000 | | Butler Cnty OH Hosp Facs Ref UC Hlth
| | 4.00% | | 11/15/23 | | 149,628 |
| 555,000 | | Cloverleaf OH Loc Sch Dist, COPS, BAM
| | 3.00% | | 12/01/23 | | 553,619 |
| 280,000 | | Montgomery Cnty OH Hosp Rev Ref Kettering Hlth Network Oblig Grp Proj
| | 5.00% | | 08/01/23 | | 280,000 |
| 1,000,000 | | NW OH Loc Sch Dist Hamilton & Butler Cntys Sch Impt (Pre-refunded maturity 12/01/23)
| | 5.00% | | 12/01/45 | | 1,005,497 |
| 500,000 | | OH St Air Quality Dev Auth Ref American Elec Pwr Company Proj Remk, Ser B, AMT (Mandatory put 10/01/24)
| | 2.10% | | 07/01/28 | | 484,224 |
| 1,500,000 | | OH St Air Quality Dev Auth Ref American Elec Pwr Company Proj Remk, Ser C, AMT (Mandatory put 10/01/24)
| | 2.10% | | 04/01/28 | | 1,452,673 |
| 1,345,000 | | OH St Hosp Fac Rev Ref Cleveland Clinic Hlth Sys, Ser A
| | 5.00% | | 01/01/24 | | 1,353,592 |
Page 36
See Notes to Financial Statements
First Trust Ultra Short Duration Municipal ETF (FUMB)
Portfolio of Investments (Continued)
July 31, 2023
Principal
Value | | Description | | Stated
Coupon | | Stated
Maturity | | Value |
| MUNICIPAL BONDS (Continued) |
| | | Ohio (Continued) | | | | | | |
| $400,000 | | OH St Hosp Fac Rev Ref Cleveland Clinic Hlth Sys, Ser A
| | 5.00% | | 01/01/25 | | $409,376 |
| 2,500,000 | | Plain City OH, BANS
| | 4.00% | | 09/28/23 | | 2,501,370 |
| | | | | 8,189,979 |
| | | Oregon – 1.5% | | | | | | |
| 1,360,000 | | OR St Dept of Transprtn Hwy User Tax Rev Sr Lien, Ser A
| | 5.00% | | 11/15/23 | | 1,366,666 |
| 2,500,000 | | Portland OR Wtr Sys Rev Ref Second Lien, Ser B
| | 5.00% | | 05/01/25 | | 2,580,301 |
| | | | | 3,946,967 |
| | | Pennsylvania – 5.4% | | | | | | |
| 465,000 | | Cmwlth Fing Auth PA Tobacco Master Stlmt Payment Rev Tobacco Master Stlmt Payment Bonds
| | 5.00% | | 06/01/24 | | 470,089 |
| 1,250,000 | | Lancaster Cnty PA Sol Wst Mgmt Auth Sol Wst Disp Rev, Ser A (Pre-refunded maturity 12/15/23)
| | 5.25% | | 12/15/28 | | 1,258,835 |
| 1,340,000 | | N Wales PA Wtr Auth Ref
| | 3.00% | | 11/01/23 | | 1,337,296 |
| 1,500,000 | | PA St Econ Dev Fing Auth Solid Waste Disposal Rev Var Ref Rep Svcs Inc Proj Remk, Ser A-2, AMT (Mandatory put 10/16/23)
| | 4.10% | | 04/01/34 | | 1,499,560 |
| 750,000 | | PA St Econ Dev Fing Auth Solid Waste Disposal Rev Var Waste Mgmt Inc Proj Remk, AMT (Mandatory put 11/01/23)
| | 3.88% | | 08/01/45 | | 750,000 |
| 260,000 | | PA St Econ Dev Fing Auth UPMC Rev Ref, Ser B
| | 5.00% | | 05/15/24 | | 262,904 |
| 225,000 | | PA St Econ Dev Fing Auth UPMC Rev, Ser A-2
| | 5.00% | | 05/15/24 | | 227,513 |
| 335,000 | | PA St Turnpike Commn Oil Franchise Tax Rev Ref, Subser B
| | 4.00% | | 12/01/23 | | 335,653 |
| 2,580,000 | | PA St Turnpike Commn Turnpike Rev, Ser A (Forward refunding maturity 12/01/24)
| | 5.00% | | 12/01/38 | | 2,630,935 |
| 100,000 | | Philadelphia PA Gas Wks Rev Ref
| | 5.00% | | 08/01/23 | | 100,000 |
| 1,000,000 | | Philadelphia PA Redev Auth Ref Neighborhood Transform Preservation Initiative, Ser C
| | 5.00% | | 04/15/24 | | 1,012,006 |
| 215,000 | | Philadelphia PA Ref, Ser A
| | 5.00% | | 08/01/23 | | 215,000 |
| 260,000 | | Philadelphia PA Sch Dist, Ser A
| | 5.00% | | 09/01/23 | | 260,231 |
| 500,000 | | Pottsville PA Hosp Auth Hlth Ctr Rev Schuylkill Hlth Sys Proj (b)
| | 6.00% | | 07/01/24 | | 509,349 |
| 255,000 | | Riverside PA Sch Dist Ref, BAM
| | 3.00% | | 10/15/23 | | 254,585 |
| 300,000 | | Riverside PA Sch Dist Ref, BAM
| | 4.00% | | 10/15/24 | | 302,216 |
| 275,000 | | Riverside PA Sch Dist Ref, BAM
| | 4.00% | | 10/15/25 | | 278,883 |
| 785,000 | | Scranton PA Sch Dist Ref
| | 5.00% | | 12/01/24 | | 798,312 |
| 2,000,000 | | Tender Option Bond Trust Receipts / Ctfs Various States JPM Putters Xm1120, AGM (a) (b)
| | 4.72% | | 10/01/26 | | 2,000,000 |
| | | | | 14,503,367 |
| | | Rhode Island – 0.6% | | | | | | |
| 1,500,000 | | RI St & Providence Plantations Ref Cons Cap Dev Ln, Ser 1
| | 4.00% | | 10/15/23 | | 1,501,239 |
| | | South Carolina – 2.0% | | | | | | |
| 2,500,000 | | Cnty Sq Redev Corp SC Installment Pur Rev Greenville Co SC Proj, BANS
| | 5.00% | | 02/09/24 | | 2,519,540 |
| 2,750,000 | | Patriots Energy Grp Fing Agy SC Gas Sply Rev, Ser A (Mandatory put 02/01/24)
| | 4.00% | | 10/01/48 | | 2,752,440 |
| | | | | 5,271,980 |
| | | Tennessee – 0.9% | | | | | | |
| 750,000 | | Johnson City TN Hlth & Eductnl Facs Brd Hosp Rev Ref Ballad Hlth, Ser A
| | 5.00% | | 07/01/24 | | 758,437 |
| 500,000 | | Memphis TN Hlth Eductnl & Hsg Fac Brd Mf Hsg Rev Var Memphis Towers Apts Proj Remk
| | 3.40% | | 12/01/23 | | 498,083 |
| 135,000 | | Met Govt Nashville & Davidson Cnty TN Hlth & Eductnl Fac Brd Trevecca Nazarene Univ Proj, Ser B
| | 4.00% | | 10/01/23 | | 134,854 |
See Notes to Financial Statements
Page 37
First Trust Ultra Short Duration Municipal ETF (FUMB)
Portfolio of Investments (Continued)
July 31, 2023
Principal
Value | | Description | | Stated
Coupon | | Stated
Maturity | | Value |
| MUNICIPAL BONDS (Continued) |
| | | Tennessee (Continued) | | | | | | |
| $910,000 | | TN St Energy Acq Corp Gas Rev, Ser A
| | 5.25% | | 09/01/24 | | $919,759 |
| | | | | 2,311,133 |
| | | Texas – 9.9% | | | | | | |
| 240,000 | | Arlington TX Hgr Edu Fin Corp Edu Rev Kipp TX Inc
| | 5.00% | | 08/15/23 | | 240,126 |
| 2,500,000 | | Austin TX Arpt Sys Rev Ref, AMT
| | 5.00% | | 11/15/23 | | 2,507,583 |
| 305,000 | | Brazoria Cnty TX Muni Util Dist #55, BAM
| | 4.00% | | 09/01/23 | | 305,018 |
| 1,000,000 | | Dallas Fort Worth TX Intl Arpt Rev Ref, Ser A
| | 5.00% | | 11/01/23 | | 1,003,713 |
| 1,185,000 | | Dallas TX Area Rapid Transit Sales Tax Rev Ref Sr Lien
| | 5.00% | | 12/01/25 | | 1,234,456 |
| 805,000 | | Fort Bend Cnty TX Muni Util Dist #182, BAM
| | 5.25% | | 09/01/23 | | 806,040 |
| 1,320,000 | | Fort Bend TX Indep Sch Dist Var Remk, Ser A (Mandatory put 08/01/24)
| | 2.38% | | 08/01/49 | | 1,298,961 |
| 1,555,000 | | Fort Worth TX Wtr & Swr Rev Impt Ref, Ser A
| | 5.00% | | 02/15/25 | | 1,598,237 |
| 1,265,000 | | Harris Cnty TX Cultural Edu Facs Fin Corp Med Facs Rev Ref Baylor Clg of Med
| | 5.00% | | 11/15/23 | | 1,270,108 |
| 1,000,000 | | Harris Cnty TX Toll Road Rev Ref, Ser A
| | 5.00% | | 08/15/25 | | 1,037,091 |
| 200,000 | | Houston TX Ref Pub Impt, Ser A
| | 5.00% | | 03/01/24 | | 201,914 |
| 175,000 | | Houston TX Util Sys Rev Ref Comb 1st Lien, Ser D
| | 5.00% | | 11/15/23 | | 175,797 |
| 600,000 | | Houston TX Util Sys Rev Rev Ref First Lien, Ser A
| | 5.00% | | 11/15/24 | | 613,292 |
| 700,000 | | Love Field TX Arpt Modernization Corp Gen Arpt Rev, AMT
| | 5.00% | | 11/01/24 | | 708,313 |
| 1,000,000 | | Matagorda Cnty TX Nav Dist #1 Var Rev Cent Pwr & Lt Ref Remk, AMT (Mandatory put 09/01/23)
| | 0.90% | | 05/01/30 | | 996,477 |
| 265,000 | | McLendon Chisholm TX Spl Assmnt Rev Ref Sonoma Pub Impt Dt Phase 1 Proj, BAM
| | 4.00% | | 09/15/23 | | 265,046 |
| 2,000,000 | | Mission TX Econ Dev Corp Sol Wst Disp Rev Var Rep Svcs Inc Proj Remk, Ser A, AMT (Mandatory put 08/01/23)
| | 3.88% | | 05/01/50 | | 2,000,000 |
| 420,000 | | Montgomery Cnty TX Muni Util Dist #105, BAM
| | 4.63% | | 09/01/23 | | 420,301 |
| 430,000 | | Montgomery Cnty TX Muni Util Dist #105, BAM
| | 4.63% | | 09/01/24 | | 434,720 |
| 2,355,000 | | N TX Tollway Auth Rev Unrefunded Ref Sys 1st Tier, Ser A
| | 5.00% | | 01/01/24 | | 2,370,530 |
| 130,000 | | Newark Hgr Edu Fin Corp TX Edu Rev The Hughen Ctr Inc, Ser A
| | 4.00% | | 08/15/23 | | 129,997 |
| 395,000 | | Stafford TX Econ Dev Corp Sales Tax Rev Ref, BAM
| | 5.00% | | 09/01/23 | | 395,458 |
| 865,000 | | Tarrant Cnty TX Hosp Dist
| | 5.00% | | 08/15/24 | | 880,500 |
| 875,000 | | Travis Cnty TX Hsg Fin Corp Mf Hsg Rev Var Kensington Apts (Mandatory put 08/01/25)
| | 3.75% | | 08/01/26 | | 872,800 |
| 335,000 | | TX St Muni Gas Acq & Sply Corp I Gas Sply Rev Sr Lien, Ser A
| | 5.25% | | 12/15/23 | | 336,275 |
| 575,000 | | TX St Turnpike Auth Centrl TX Turnpike Sys Rev Unrefunded 1st Tier, Ser A, CABS, AMBAC
| | (c) | | 08/15/24 | | 553,701 |
| 2,000,000 | | United TX Indep Sch Dist Sch Bldg (Pre-refunded maturity 08/15/24)
| | 5.00% | | 08/15/44 | | 2,033,273 |
| 1,870,000 | | Univ of Texas TX Univ Rev Ref, Ser H
| | 5.00% | | 08/15/23 | | 1,871,051 |
| 250,000 | | Viridian TX Muni Mgmt Dist Unlimited Tax Road Impt Bonds, BAM
| | 4.00% | | 12/01/23 | | 250,281 |
| | | | | 26,811,059 |
| | | Virginia – 1.0% | | | | | | |
| 845,000 | | Richmond VA Redev & Hsg Auth Mf Rev Var Townes at River South (Mandatory put 03/01/25)
| | 4.25% | | 03/01/26 | | 849,004 |
| 175,000 | | VA Clg Bldg Auth Eductnl Facs Rev Ref Regent Univ Proj
| | 5.00% | | 06/01/24 | | 175,533 |
| 1,250,000 | | VA St Clg Bldg Auth Eductnl Facs Rev 21st Century Clg & Equipment Programs, Ser A
| | 5.00% | | 02/01/24 | | 1,260,399 |
| 385,000 | | VA St Pub Bldg Auth Pub Facs Rev, Ser A
| | 5.00% | | 08/01/23 | | 385,000 |
| | | | | 2,669,936 |
Page 38
See Notes to Financial Statements
First Trust Ultra Short Duration Municipal ETF (FUMB)
Portfolio of Investments (Continued)
July 31, 2023
Principal
Value | | Description | | Stated
Coupon | | Stated
Maturity | | Value |
| MUNICIPAL BONDS (Continued) |
| | | Washington – 2.2% | | | | | | |
| $2,430,000 | | Grant Cnty WA Pub Util Dist #2 Priest Rapids Hydro Elec R Ref, Ser B, AMT (Pre-refunded maturity 07/01/24)
| | 5.00% | | 01/01/29 | | $2,459,959 |
| 1,865,000 | | King Cnty WA Rural Library Dist Ref
| | 4.00% | | 12/01/23 | | 1,869,680 |
| 1,700,000 | | WA St Hlth Care Facs Auth Ref Commonspirit Hlth, Ser B1 (Mandatory put 08/01/24)
| | 5.00% | | 08/01/49 | | 1,708,625 |
| | | | | 6,038,264 |
| | | Wisconsin – 1.1% | | | | | | |
| 1,650,000 | | Fox Point & Bayside WI Jt Sch Dist #2 Prm Nts
| | 3.50% | | 09/05/23 | | 1,649,419 |
| 410,000 | | Milwaukee WI Ref Prom Nts, Ser N2
| | 4.00% | | 03/15/25 | | 410,472 |
| 490,000 | | Milwaukee WI Ref Promissory Nts, Ser N4
| | 5.00% | | 04/01/24 | | 493,355 |
| 165,000 | | WI St Hlth & Eductnl Facs Auth Rev Ref Saint John’s Cmntys Inc, Ser B
| | 3.00% | | 09/15/23 | | 164,678 |
| 150,000 | | WI St Hlth & Eductnl Facs Auth Rev Three Pillars Sr Living Cmntys, Ser A
| | 4.00% | | 08/15/23 | | 149,947 |
| | | | | 2,867,871 |
| Total Investments – 98.7%
| | 265,919,621 |
| | (Cost $266,904,197) | | |
| | Net Other Assets and Liabilities – 1.3%
| | 3,625,084 |
| | Net Assets – 100.0%
| | $269,544,705 |
| (a) | Variable Rate Demand bond. Interest rate is reset periodically by the agent based on current market conditions. |
| (b) | This security, sold within the terms of a private placement memorandum, is exempt from registration upon resale under Rule 144A of the Securities Act of 1933, as amended, and may be resold in transactions exempt from registration, normally to qualified institutional buyers. Pursuant to procedures adopted by the Trust’s Board of Trustees, this security has been determined to be liquid by First Trust Advisors L.P. (the “Advisor”). Although market instability can result in periods of increased overall market illiquidity, liquidity for each security is determined based on security specific factors and assumptions, which require subjective judgment. At July 31, 2023, securities noted as such amounted to $7,733,262 or 2.9% of net assets. |
| (c) | Zero coupon bond. |
| (d) | Floating or variable rate security. |
| Abbreviations throughout the Portfolio of Investments: |
| AGC | Assured Guaranty Corp. |
| AGM | Assured Guaranty Municipal Corp. |
| AMBAC | American Municipal Bond Assurance Corp. |
| AMT | Alternative Minimum Tax |
| BAM | Build America Mutual |
| BANS | Bond Anticipation Notes |
| CABS | Capital Appreciation Bonds |
| COPS | Certificates of Participation |
| NATL-RE | National Public Finance Guarantee Corp. |
| RANS | Revenue Anticipation Notes |
See Notes to Financial Statements
Page 39
First Trust Ultra Short Duration Municipal ETF (FUMB)
Portfolio of Investments (Continued)
July 31, 2023
Valuation Inputs
A summary of the inputs used to value the Fund’s investments as of July 31, 2023 is as follows (see Note 2A - Portfolio Valuation in the Notes to Financial Statements):
| | Total
Value at
7/31/2023 | Level 1
Quoted
Prices | Level 2
Significant
Observable
Inputs | Level 3
Significant
Unobservable
Inputs |
Municipal Bonds*
| $ 265,919,621 | $ — | $ 265,919,621 | $ — |
| * | See Portfolio of Investments for state and territory breakout. |
Page 40
See Notes to Financial Statements
First Trust Exchange-Traded Fund III
Statements of Assets and Liabilities
July 31, 2023
| | First Trust
Short Duration
Managed
Municipal
ETF (FSMB) | | First Trust
Ultra Short
Duration
Municipal
ETF (FUMB) |
| ASSETS: | | | |
Investments, at value
| $ 418,887,230 | | $ 265,919,621 |
Cash
| 4,047,757 | | 2,976,527 |
Interest receivable
| 4,518,266 | | 3,497,682 |
Total Assets
| 427,453,253 | | 272,393,830 |
| LIABILITIES: | | | |
| Payables: | | | |
Investment securities purchased
| 1,120,816 | | 2,744,418 |
Investment advisory fees
| 200,706 | | 104,707 |
Total Liabilities
| 1,321,522 | | 2,849,125 |
NET ASSETS
| $426,131,731 | | $269,544,705 |
| NET ASSETS consist of: | | | |
Paid-in capital
| $ 436,519,657 | | $ 270,483,299 |
Par value
| 216,000 | | 135,000 |
Accumulated distributable earnings (loss)
| (10,603,926) | | (1,073,594) |
NET ASSETS
| $426,131,731 | | $269,544,705 |
NET ASSET VALUE, per share
| $19.73 | | $19.97 |
Number of shares outstanding (unlimited number of shares authorized, par value $0.01 per share)
| 21,600,002 | | 13,500,002 |
Investments, at cost
| $423,852,281 | | $266,904,197 |
See Notes to Financial Statements
Page 41
First Trust Exchange-Traded Fund III
Statements of Operations
For the Year Ended July 31, 2023
| | First Trust
Short Duration
Managed
Municipal
ETF (FSMB) | | First Trust
Ultra Short
Duration
Municipal
ETF (FUMB) |
| INVESTMENT INCOME: | | | |
Interest
| $ 10,743,072 | | $ 7,417,429 |
Total investment income
| 10,743,072 | | 7,417,429 |
| EXPENSES: | | | |
Investment advisory fees
| 2,212,986 | | 1,440,487 |
Total expenses
| 2,212,986 | | 1,440,487 |
Fees waived by the investment advisor
| (232,733) | | (208,049) |
Net expenses
| 1,980,253 | | 1,232,438 |
NET INVESTMENT INCOME (LOSS)
| 8,762,819 | | 6,184,991 |
| NET REALIZED AND UNREALIZED GAIN (LOSS): | | | |
Net realized gain (loss) on investments
| (5,127,926) | | 5,122 |
Net change in unrealized appreciation (depreciation) on investments
| 96,999 | | (190,325) |
NET REALIZED AND UNREALIZED GAIN (LOSS)
| (5,030,927) | | (185,203) |
NET INCREASE (DECREASE) IN NET ASSETS RESULTING FROM OPERATIONS
| $ 3,731,892 | | $ 5,999,788 |
Page 42
See Notes to Financial Statements
First Trust Exchange-Traded Fund III
Statements of Changes in Net Assets
| | First Trust Short
Duration Managed
Municipal ETF (FSMB) | | First Trust Ultra
Short Duration
Municipal ETF (FUMB) |
| | Year
Ended
7/31/2023 | | Year
Ended
7/31/2022 | | Year
Ended
7/31/2023 | | Year
Ended
7/31/2022 |
| OPERATIONS: | | | | | | | |
Net investment income (loss)
| $ 8,762,819 | | $ 2,383,019 | | $ 6,184,991 | | $ 1,091,207 |
Net realized gain (loss)
| (5,127,926) | | (715,285) | | 5,122 | | (222,475) |
Net change in unrealized appreciation (depreciation)
| 96,999 | | (7,616,372) | | (190,325) | | (1,308,746) |
Net increase (decrease) in net assets resulting from operations
| 3,731,892 | | (5,948,638) | | 5,999,788 | | (440,014) |
| DISTRIBUTIONS TO SHAREHOLDERS FROM: | | | | | | | |
Investment operations
| (8,538,673) | | (2,336,031) | | (6,108,951) | | (1,061,950) |
Return of capital
| (113,528) | | (174,270) | | — | | — |
Total distributions to shareholders
| (8,652,201) | | (2,510,301) | | (6,108,951) | | (1,061,950) |
| SHAREHOLDER TRANSACTIONS: | | | | | | | |
Proceeds from shares sold
| 178,360,260 | | 199,500,283 | | 83,686,597 | | 157,813,719 |
Cost of shares redeemed
| (50,275,222) | | (18,005,523) | | (99,839,409) | | (35,979,272) |
Net increase (decrease) in net assets resulting from shareholder transactions
| 128,085,038 | | 181,494,760 | | (16,152,812) | | 121,834,447 |
Total increase (decrease) in net assets
| 123,164,729 | | 173,035,821 | | (16,261,975) | | 120,332,483 |
| NET ASSETS: | | | | | | | |
Beginning of period
| 302,967,002 | | 129,931,181 | | 285,806,680 | | 165,474,197 |
End of period
| $426,131,731 | | $302,967,002 | | $269,544,705 | | $285,806,680 |
| CHANGES IN SHARES OUTSTANDING: | | | | | | | |
Shares outstanding, beginning of period
| 15,100,002 | | 6,200,002 | | 14,300,002 | | 8,200,002 |
Shares sold
| 9,050,000 | | 9,800,000 | | 4,200,000 | | 7,900,000 |
Shares redeemed
| (2,550,000) | | (900,000) | | (5,000,000) | | (1,800,000) |
Shares outstanding, end of period
| 21,600,002 | | 15,100,002 | | 13,500,002 | | 14,300,002 |
See Notes to Financial Statements
Page 43
First Trust Exchange-Traded Fund III
Financial Highlights
For a share outstanding throughout each period
First Trust Short Duration Managed Municipal ETF (FSMB)
| | Year Ended July 31, | | Period
Ended
7/31/2019 (a) |
| 2023 | | 2022 | | 2021 | | 2020 | |
Net asset value, beginning of period
| $ 20.06 | | $ 20.96 | | $ 20.66 | | $ 20.48 | | $ 20.00 |
| Income from investment operations: | | | | | | | | | |
Net investment income (loss)
| 0.43 (b) | | 0.21 | | 0.27 | | 0.38 | | 0.34 |
Net realized and unrealized gain (loss)
| (0.34) | | (0.88) | | 0.33 | | 0.22 | | 0.45 |
Total from investment operations
| 0.09 | | (0.67) | | 0.60 | | 0.60 | | 0.79 |
| Distributions paid to shareholders from: | | | | | | | | | |
Net investment income
| (0.41) | | (0.21) | | (0.27) | | (0.41) | | (0.31) |
Return of capital
| (0.01) | | (0.02) | | (0.03) | | (0.01) | | — |
Total distributions
| (0.42) | | (0.23) | | (0.30) | | (0.42) | | (0.31) |
Net asset value, end of period
| $19.73 | | $20.06 | | $20.96 | | $20.66 | | $20.48 |
Total return (c)
| 0.45% | | (3.19)% | | 2.92% | | 2.98% | | 3.98% |
| Ratios to average net assets/supplemental data: | | | | | | | | | |
Net assets, end of period (in 000’s)
| $ 426,132 | | $ 302,967 | | $ 129,931 | | $ 61,967 | | $ 19,454 |
Ratio of total expenses to average net assets
| 0.55% | | 0.55% | | 0.55% | | 0.55% | | 0.55% (d) |
Ratio of net expenses to average net assets
| 0.49% | | 0.35% | | 0.43% | | 0.45% | | 0.45% (d) |
Ratio of net investment income (loss) to average net assets
| 2.18% | | 1.14% | | 1.33% | | 2.00% | | 2.23% (d) |
Portfolio turnover rate (e)
| 50% | | 35% | | 16% | | 58% | | 66% |
| (a) | Inception date is November 1, 2018, which is consistent with the commencement of operations and is the date the initial creation units were established. |
| (b) | Based on average shares outstanding. |
| (c) | Total return is calculated assuming an initial investment made at the net asset value at the beginning of the period, reinvestment of all distributions at net asset value during the period, and redemption at net asset value on the last day of the period. The returns presented do not reflect the deduction of taxes that a shareholder would pay on Fund distributions or the redemption or sale of Fund shares. Total return is calculated for the time period presented and is not annualized for periods of less than a year. The total returns would have been lower if certain fees had not been waived by the investment advisor. |
| (d) | Annualized. |
| (e) | Portfolio turnover is calculated for the time period presented and is not annualized for periods of less than a year and does not include securities received or delivered from processing creations or redemptions and in-kind transactions. |
Page 44
See Notes to Financial Statements
First Trust Exchange-Traded Fund III
Financial Highlights (Continued)
For a share outstanding throughout each period
First Trust Ultra Short Duration Municipal ETF (FUMB)
| | Year Ended July 31, | | Period
Ended
7/31/2019 (a) |
| 2023 | | 2022 | | 2021 | | 2020 | |
Net asset value, beginning of period
| $ 19.99 | | $ 20.18 | | $ 20.16 | | $ 20.10 | | $ 20.00 |
| Income from investment operations: | | | | | | | | | |
Net investment income (loss)
| 0.39 (b) | | 0.10 | | 0.12 | | 0.25 | | 0.26 |
Net realized and unrealized gain (loss)
| (0.03) | | (0.19) | | 0.02 | | 0.07 | | 0.09 |
Total from investment operations
| 0.36 | | (0.09) | | 0.14 | | 0.32 | | 0.35 |
| Distributions paid to shareholders from: | | | | | | | | | |
Net investment income
| (0.38) | | (0.10) | | (0.12) | | (0.26) | | (0.25) |
Net realized gain
| — | | — | | — | | (0.00) (c) | | — |
Return of capital
| — | | — | | — | | (0.00) (c) | | — |
Total distributions
| (0.38) | | (0.10) | | (0.12) | | (0.26) | | (0.25) |
Net asset value, end of period
| $19.97 | | $19.99 | | $20.18 | | $20.16 | | $20.10 |
Total return (d)
| 1.83% | | (0.45)% | | 0.72% | | 1.61% | | 1.75% |
| Ratios to average net assets/supplemental data: | | | | | | | | | |
Net assets, end of period (in 000’s)
| $ 269,545 | | $ 285,807 | | $ 165,474 | | $ 83,661 | | $ 20,098 |
Ratio of total expenses to average net assets
| 0.45% | | 0.45% | | 0.45% | | 0.45% | | 0.45% (e) |
Ratio of net expenses to average net assets
| 0.39% | | 0.25% | | 0.26% | | 0.35% | | 0.35% (e) |
Ratio of net investment income (loss) to average net assets
| 1.93% | | 0.56% | | 0.61% | | 1.20% | | 1.73% (e) |
Portfolio turnover rate (f)
| 121% | | 79% | | 44% | | 149% | | 145% |
| (a) | Inception date is November 1, 2018, which is consistent with the commencement of operations and is the date the initial creation units were established. |
| (b) | Based on average shares outstanding. |
| (c) | Amount is less than $0.01. |
| (d) | Total return is calculated assuming an initial investment made at the net asset value at the beginning of the period, reinvestment of all distributions at net asset value during the period, and redemption at net asset value on the last day of the period. The returns presented do not reflect the deduction of taxes that a shareholder would pay on Fund distributions or the redemption or sale of Fund shares. Total return is calculated for the time period presented and is not annualized for periods of less than a year. The total returns would have been lower if certain fees had not been waived by the investment advisor. |
| (e) | Annualized. |
| (f) | Portfolio turnover is calculated for the time period presented and is not annualized for periods of less than a year and does not include securities received or delivered from processing creations or redemptions and in-kind transactions. |
See Notes to Financial Statements
Page 45
Notes to Financial Statements
First Trust Exchange-Traded Fund III
July 31, 2023
1. Organization
First Trust Exchange-Traded Fund III (the “Trust”) is an open-end management investment company organized as a Massachusetts business trust on January 9, 2008, and is registered with the Securities and Exchange Commission under the Investment Company Act of 1940, as amended (the “1940 Act”).
The Trust currently consists of seventeen funds that are offering shares. This report covers the following funds (each a “Fund” and collectively, the “Funds”), each a diversified series of the Trust:
First Trust Short Duration Managed Municipal ETF – (NYSE Arca, Inc. (“NYSE Arca”) ticker “FSMB”)
First Trust Ultra Short Duration Municipal ETF – (NYSE Arca ticker “FUMB”)
Each Fund represents a separate series of shares of beneficial interest in the Trust. Unlike conventional mutual funds, each Fund issues and redeems shares on a continuous basis, at net asset value (“NAV”), only in large blocks of shares known as “Creation Units.”
Each Fund is an actively managed exchange-traded fund. The investment objective of each Fund is to seek to provide federally tax-exempt income consistent with capital preservation. Under normal market conditions, each Fund seeks to achieve its investment objective by investing at least 80% of its net assets (including investment borrowings) in municipal debt securities that pay interest that is exempt from regular federal income taxes.
There can be no assurance that a Fund will achieve its investment objective. The Funds may not be appropriate for all investors.
2. Significant Accounting Policies
The Funds are each considered an investment company and follow accounting and reporting guidance under Financial Accounting Standards Board Accounting Standards Codification Topic 946, “Financial Services-Investment Companies.” The following is a summary of significant accounting policies consistently followed by the Funds in the preparation of the financial statements. The preparation of the financial statements in accordance with accounting principles generally accepted in the United States of America (“U.S. GAAP”) requires management to make estimates and assumptions that affect the reported amounts and disclosures in the financial statements. Actual results could differ from those estimates.
A. Portfolio Valuation
Each Fund’s NAV is determined daily as of the close of regular trading on the New York Stock Exchange (“NYSE”), normally 4:00 p.m. Eastern time, on each day the NYSE is open for trading. If the NYSE closes early on a valuation day, the NAV is determined as of that time. Each Fund’s NAV is calculated by dividing the value of all assets of each Fund (including accrued interest and dividends), less all liabilities (including accrued expenses and dividends declared but unpaid), by the total number of shares outstanding.
Each Fund’s investments are valued daily at market value or, in the absence of market value with respect to any portfolio securities, at fair value. Market value prices represent readily available market quotations such as last sale or official closing prices from a national or foreign exchange (i.e., a regulated market) and are primarily obtained from third-party pricing services. Fair value prices represent any prices not considered market value prices and are either obtained from a third-party pricing service or are determined by the Pricing Committee of the Funds’ investment advisor, First Trust Advisors L.P. (“First Trust” or the “Advisor”), in accordance with valuation procedures approved by the Trust’s Board of Trustees, and in accordance with provisions of the 1940 Act and rules thereunder. Investments valued by the Advisor’s Pricing Committee, if any, are footnoted as such in the footnotes to the Portfolio of Investments. Each Fund’s investments are valued as follows:
Municipal securities and other debt securities are fair valued on the basis of fair valuations provided by a third-party pricing service approved by the Advisor’s Pricing Committee, which may use the following valuation inputs when available:
| 1) | benchmark yields; |
| 2) | reported trades; |
| 3) | broker/dealer quotes; |
| 4) | issuer spreads; |
| 5) | benchmark securities; |
| 6) | bids and offers; and |
| 7) | reference data including market research publications. |
Notes to Financial Statements (Continued)
First Trust Exchange-Traded Fund III
July 31, 2023
Pricing services generally value fixed-income securities assuming orderly transactions of an institutional round lot size, but a Fund may hold or transact in such securities in smaller, odd lot sizes. Odd lots may trade at lower prices than institutional round lots.
Exchange-traded futures contracts are valued at the end of the day settlement price.
Fixed income and other debt securities having a remaining maturity of sixty days or less when purchased are fair valued at cost adjusted for amortization of premiums and accretion of discounts (amortized cost), provided the Advisor’s Pricing Committee has determined that the use of amortized cost is an appropriate reflection of fair value given market and issuer-specific conditions existing at the time of the determination. Factors that may be considered in determining the appropriateness of the use of amortized cost include, but are not limited to, the following:
| 1) | the credit conditions in the relevant market and changes thereto; |
| 2) | the liquidity conditions in the relevant market and changes thereto; |
| 3) | the interest rate conditions in the relevant market and changes thereto (such as significant changes in interest rates); |
| 4) | issuer-specific conditions (such as significant credit deterioration); and |
| 5) | any other market-based data the Advisor’s Pricing Committee considers relevant. In this regard, the Advisor’s Pricing Committee may use last-obtained market-based data to assist it when valuing portfolio securities using amortized cost. |
Certain securities may not be able to be priced by pre-established pricing methods. Such securities may be valued by the Advisor’s Pricing Committee at fair value. These securities generally include, but are not limited to, restricted securities (securities which may not be publicly sold without registration under the Securities Act of 1933, as amended) for which a third-party pricing service is unable to provide a market price; securities whose trading has been formally suspended; a security whose market or fair value price is not available from a pre-established pricing source; a security with respect to which an event has occurred that is likely to materially affect the value of the security after the market has closed but before the calculation of a Fund’s NAV or make it difficult or impossible to obtain a reliable market quotation; and a security whose price, as provided by the third-party pricing service, does not reflect the security’s fair value. As a general principle, the current fair value of a security would appear to be the amount which the owner might reasonably expect to receive for the security upon its current sale. When fair value prices are used, generally they will differ from market quotations or official closing prices on the applicable exchanges. A variety of factors may be considered in determining the fair value of such securities, including, but not limited to, the following:
| 1) | the fundamental business data relating to the issuer; |
| 2) | an evaluation of the forces which influence the market in which these securities are purchased and sold; |
| 3) | the type, size and cost of the security; |
| 4) | the financial statements of the issuer; |
| 5) | the credit quality and cash flow of the issuer, based on the Advisor’s or external analysis; |
| 6) | the information as to any transactions in or offers for the security; |
| 7) | the price and extent of public trading in similar securities (or equity securities) of the issuer/borrower, or comparable companies; |
| 8) | the coupon payments; |
| 9) | the quality, value and salability of collateral, if any, securing the security; and |
| 10) | other relevant factors. |
The Funds are subject to fair value accounting standards that define fair value, establish the framework for measuring fair value and provide a three-level hierarchy for fair valuation based upon the inputs to the valuation as of the measurement date. The three levels of the fair value hierarchy are as follows:
| • | Level 1 – Level 1 inputs are quoted prices in active markets for identical investments. An active market is a market in which transactions for the investment occur with sufficient frequency and volume to provide pricing information on an ongoing basis. |
| • | Level 2 – Level 2 inputs are observable inputs, either directly or indirectly, and include the following: |
| o | Quoted prices for similar investments in active markets. |
| o | Quoted prices for identical or similar investments in markets that are non-active. A non-active market is a market where there are few transactions for the investment, the prices are not current, or price quotations vary substantially either over time or among market makers, or in which little information is released publicly. |
Notes to Financial Statements (Continued)
First Trust Exchange-Traded Fund III
July 31, 2023
| o | Inputs other than quoted prices that are observable for the investment (for example, interest rates and yield curves observable at commonly quoted intervals, volatilities, prepayment speeds, loss severities, credit risks, and default rates). |
| o | Inputs that are derived principally from or corroborated by observable market data by correlation or other means. |
| • | Level 3 – Level 3 inputs are unobservable inputs. Unobservable inputs may reflect the reporting entity’s own assumptions about the assumptions that market participants would use in pricing the investment. |
The inputs or methodologies used for valuing investments are not necessarily an indication of the risk associated with investing in those investments. A summary of the inputs used to value each Fund’s investments as of July 31, 2023, is included with each Fund’s Portfolio of Investments.
B. Securities Transactions and Investment Income
Securities transactions are recorded as of the trade date. Realized gains and losses from securities transactions are recorded on the identified cost basis. Interest income is recorded daily on the accrual basis. Amortization of premiums and accretion of discounts are recorded using the effective interest method.
Securities purchased or sold on a when-issued, delayed-delivery or forward purchase commitment basis may have extended settlement periods. The value of the security so purchased is subject to market fluctuations during this period. The Fund maintains liquid assets with a current value at least equal to the amount of its when-issued, delayed-delivery or forward purchase commitments until payment is made. At July 31, 2023, FSMB and FUMB held $1,118,060 and $0, respectively, of when-issued or delayed-delivery securities.
C. Futures Contracts
FSMB may purchase or sell (i.e., is long or short) exchange-listed futures contracts to hedge against changes in interest rates (interest rate risk). Futures contracts are agreements between the Fund and a counterparty to buy or sell a specific quantity of an underlying instrument at a specified price and at a specified date. Depending on the terms of the contract, futures contracts are settled either through physical delivery of the underlying instrument on the settlement date or by payment of a cash settlement amount on the settlement date. Open futures contracts can also be closed out prior to settlement by entering into an offsetting transaction in a matching futures contract. If the Fund is not able to enter into an offsetting transaction, the Fund will continue to be required to maintain margin deposits on the futures contract. When the contract is closed or expires, the Fund records a realized gain or loss equal to the difference between the value of the contract at the time it was opened and the value at the time it was closed or expired. This gain or loss is included in “Net realized gain (loss) on futures contracts” on the Statements of Operations.
Upon entering into a futures contract, the Fund must deposit funds, called margin, with its custodian in the name of the clearing broker equal to a specified percentage of the current value of the contract. Open futures contracts are marked to market daily with the change in value recognized as a component of “Net change in unrealized appreciation (depreciation) on futures contracts” on the Statements of Operations. Pursuant to the contract, the Fund agrees to receive from or pay to the broker an amount of cash equal to the daily fluctuation in value of the contract. Such receipts or payments are known as variation margin and are included in “Variation margin” payable or receivable on the Statements of Assets and Liabilities.
If market conditions change unexpectedly, the Fund may not achieve the anticipated benefits of the futures contract and may realize a loss. The use of futures contracts involves the risk of imperfect correlation in movements in the price of the futures contracts, interest rates and the underlying instruments. The Fund did not hold any futures contracts at July 31, 2023.
D. Dividends and Distributions to Shareholders
Dividends from net investment income, if any, are declared and paid monthly by each Fund, or as the Board of Trustees may determine from time to time. Distributions of net realized capital gains earned by each Fund, if any, are distributed at least annually. A Fund may also designate a portion of the amount paid to redeeming shareholders as a distribution for tax purposes.
Distributions from net investment income and realized capital gains are determined in accordance with federal income tax regulations, which may differ from U.S. GAAP. Certain capital accounts in the financial statements are periodically adjusted for permanent differences in order to reflect their tax character. These permanent differences are primarily due to the varying treatment of income and gain/loss on portfolio securities held by the Funds and have no impact on net assets or NAV per share. Temporary differences, which arise from recognizing certain items of income, expense and gain/loss in different periods for financial statement and tax purposes, will reverse at some time in the future.
Notes to Financial Statements (Continued)
First Trust Exchange-Traded Fund III
July 31, 2023
The tax character of distributions paid by each Fund during the fiscal year ended July 31, 2023, was as follows:
| | Distributions
paid from
Tax-Exempt
Income | | Distributions
paid from
Ordinary
Income | | Distributions
paid from
Capital
Gains | | Distributions
paid from
Return of
Capital |
First Trust Short Duration Managed Municipal ETF
| $ 8,494,392 | | $ 44,281 | | $ — | | $$ 113,528 |
First Trust Ultra Short Duration Municipal ETF
| 6,076,905 | | 32,046 | | — | | — |
The tax character of distributions paid by each Fund during the fiscal year ended July 31, 2022, was as follows:
| | Distributions
paid from
Tax-Exempt
Income | | Distributions
paid from
Ordinary
Income | | Distributions
paid from
Capital
Gains | | Distributions
paid from
Return of
Capital |
First Trust Short Duration Managed Municipal ETF
| $ 2,331,384 | | $ 4,647 | | $ — | | $ 174,270 |
First Trust Ultra Short Duration Municipal ETF
| 1,060,324 | | 1,626 | | — | | — |
As of July 31, 2023, the components of distributable earnings on a tax basis for each Fund were as follows:
| | Undistributed
Ordinary
Income | | Accumulated
Capital and
Other
Gain (Loss) | | Net
Unrealized
Appreciation
(Depreciation) |
First Trust Short Duration Managed Municipal ETF
| $ — | | $ (5,939,838) | | $ (4,664,088) |
First Trust Ultra Short Duration Municipal ETF
| 51,846 | | (211,433) | | (914,007) |
E. Income Taxes
Each Fund intends to continue to qualify as a regulated investment company by complying with the requirements under Subchapter M of the Internal Revenue Code of 1986, as amended (the “Code”), which includes distributing substantially all of its net investment income and net realized gains to shareholders. Accordingly, no provision has been made for federal and state income taxes. However, due to the timing and amount of distributions, each Fund may be subject to an excise tax of 4% of the amount by which approximately 98% of each Fund’s taxable income exceeds the distributions from such taxable income for the calendar year.
In addition, each Fund intends to invest in municipal securities to allow it to pay shareholders “exempt dividends” as defined in the Code.
The Funds are subject to accounting standards that establish a minimum threshold for recognizing, and a system for measuring, the benefits of a tax position taken or expected to be taken in a tax return. Taxable years ended 2020, 2021, 2022, and 2023 remain open to federal and state audit. As of July 31, 2023, management has evaluated the application of these standards to the Funds and has determined that no provision for income tax is required in the Funds’ financial statements for uncertain tax positions.
The Funds intend to utilize provisions of the federal income tax laws, which allow them to carry a realized capital loss forward indefinitely following the year of the loss and offset such loss against any future realized capital gains. The Funds are subject to certain limitations under U.S. tax rules on the use of capital loss carryforwards and net unrealized built-in losses. These limitations apply when there has been a 50% change in ownership. At July 31, 2023, for federal income tax purposes, each applicable Fund had a capital loss carryforward available that is shown in the following table, to the extent provided by regulations, to offset future capital gains.
| | Non-Expiring
Capital Loss
Carryforward |
First Trust Short Duration Managed Municipal ETF
| $ 5,939,838 |
First Trust Ultra Short Duration Municipal ETF
| 211,433 |
Certain losses realized during the current fiscal year may be deferred and treated as occurring on the first day of the following fiscal year for federal income tax purposes. For the fiscal year ended July 31, 2023, the Funds did not incur any net late year ordinary losses.
Notes to Financial Statements (Continued)
First Trust Exchange-Traded Fund III
July 31, 2023
In order to present paid-in capital and accumulated distributable earnings (loss) (which consists of accumulated net investment income (loss), accumulated net realized gain (loss) on investments and net unrealized appreciation (depreciation) on investments) on the Statements of Assets and Liabilities that more closely represent their tax character, certain adjustments have been made to paid-in capital, accumulated net investment income (loss) and accumulated net realized gain (loss) on investments. These adjustments are primarily due to the difference between book and tax treatments of income and gains on various investment securities held by the Funds. The results of operations and net assets were not affected by these adjustments. For the fiscal year ended July 31, 2023, the adjustments for each Fund were as follows:
| | Accumulated
Net
Investment
Income (Loss) | | Accumulated
Net Realized
Gain (Loss)
on Investments | | Paid-in
Capital |
First Trust Short Duration Managed Municipal ETF
| $ (5,036) | | $ 5,036 | | $ — |
First Trust Ultra Short Duration Municipal ETF
| (3,590) | | 3,590 | | — |
As of July 31, 2023, the aggregate cost, gross unrealized appreciation, gross unrealized depreciation, and net unrealized appreciation/(depreciation) on investments (including short positions and derivatives, if any) for federal income tax purposes were as follows:
| | Tax Cost | | Gross
Unrealized
Appreciation | | Gross
Unrealized
(Depreciation) | | Net Unrealized
Appreciation
(Depreciation) |
First Trust Short Duration Managed Municipal ETF
| $ 423,551,318 | | $ 823,076 | | $ (5,487,164) | | $ (4,664,088) |
First Trust Ultra Short Duration Municipal ETF
| 266,833,628 | | 72,631 | | (986,638) | | (914,007) |
F. Expenses
Expenses, other than the investment advisory fee and other excluded expenses, are paid by the Advisor (See Note 3).
3. Investment Advisory Fee, Affiliated Transactions and Other Fee Arrangements
First Trust, the investment advisor to the Funds, is a limited partnership with one limited partner, Grace Partners of DuPage L.P., and one general partner, The Charger Corporation. The Charger Corporation is an Illinois corporation controlled by James A. Bowen, Chief Executive Officer of First Trust. First Trust is responsible for the selection and ongoing monitoring of the securities in each Fund’s portfolio, managing the Funds’ business affairs and providing certain administrative services necessary for the management of the Funds.
Pursuant to the Investment Management Agreement between First Trust and the Trust, First Trust manages the investment of the Funds’ assets and is responsible for the expenses of each Fund, including the cost of transfer agency, custody, fund administration, legal, audit and other services, but excluding fee payments under the Investment Management Agreement, interest, taxes, brokerage commissions and other expenses connected with the execution of portfolio transactions, distribution and service fees payable pursuant to a Rule 12b-1 plan, if any, and extraordinary expenses, which are paid by each respective Fund. First Trust also provides fund reporting services to each Fund for a flat annual fee in the amount of $9,250, which is covered under the annual unitary management fee. Effective November 1, 2022, the annual unitary management fee payable by each Fund to First Trust for these services will be reduced at certain levels of each Fund’s net assets (“breakpoints”) and calculated pursuant to the following schedules:
| Breakpoints | | FSMB | | FUMB | | | | | |
| Fund net assets up to and including $2.5 billion | | 0.55000% | | 0.45000% | | | | | |
| Fund net assets greater than $2.5 billion up to and including $5 billion | | 0.53625% | | 0.43875% | | | | | |
| Fund net assets greater than $5 billion up to and including $7.5 billion | | 0.52250% | | 0.42750% | | | | | |
| Fund net assets greater than $7.5 billion up to and including $10 billion | | 0.50875% | | 0.41625% | | | | | |
| Fund net assets greater than $10 billion | | 0.49500% | | 0.40500% | | | | | |
Prior to November 1, 2022, FSMB and FUMB paid First Trust an annual unitary management fee of 0.55% and 0.45% of FSMB’s and FUMB’s average daily net assets, respectively.
Notes to Financial Statements (Continued)
First Trust Exchange-Traded Fund III
July 31, 2023
Pursuant to two separate contractual agreements for each Fund, First Trust agreed to waive management fees of 0.20% of average daily net assets for each Fund until November 30, 2022. As of November 30, 2022, the waiver agreements terminated. First Trust does not have the right to recover the fees waived. During the fiscal year ended July 31, 2023, the Advisor waived fees of $232,733 and $208,049 for FSMB and FUMB, respectively.
The Trust has multiple service agreements with Brown Brothers Harriman & Co. (“BBH”). Under the service agreements, BBH performs custodial, fund accounting, certain administrative services, and transfer agency services for the Funds. As custodian, BBH is responsible for custody of each Fund’s assets. As fund accountant and administrator, BBH is responsible for maintaining the books and records of each Fund’s securities and cash. As transfer agent, BBH is responsible for maintaining shareholder records for each Fund.
Each Trustee who is not an officer or employee of First Trust, any sub-advisor or any of their affiliates (“Independent Trustees”) is paid a fixed annual retainer that is allocated equally among each fund in the First Trust Fund Complex. Each Independent Trustee is also paid an annual per fund fee that varies based on whether the fund is a closed-end or other actively managed fund, a target outcome fund or an index fund.
Additionally, the Lead Independent Trustee and the Chairs of the Audit Committee, Nominating and Governance Committee and Valuation Committee are paid annual fees to serve in such capacities, with such compensation allocated pro rata among each fund in the First Trust Fund Complex based on net assets. Independent Trustees are reimbursed for travel and out-of-pocket expenses in connection with all meetings. The Lead Independent Trustee and Committee Chairs rotate every three years. The officers and “Interested” Trustee receive no compensation from the Trust for acting in such capacities.
4. Purchases and Sales of Securities
For the fiscal year ended July 31, 2023, the cost of purchases and proceeds from sales of investment securities for each Fund, excluding short-term investments and in-kind transactions, were as follows:
| | Purchases | | Sales |
| First Trust Short Duration Managed Municipal ETF | $ 329,727,080 | | $ 187,689,338 |
| First Trust Ultra Short Duration Municipal ETF | 324,156,783 | | 279,612,803 |
| | | | |
For the fiscal year ended July 31, 2023, the Funds had no in-kind transactions.
5. Creations, Redemptions and Transaction Fees
Each Fund generally issues and redeems its shares in primary market transactions through a creation and redemption mechanism and does not sell or redeem individual shares. Instead, financial entities known as “Authorized Participants” have contractual arrangements with a Fund or one of the Fund’s service providers to purchase and redeem Fund shares directly with the Fund in large blocks of shares known as “Creation Units.” Prior to the start of trading on every business day, a Fund publishes through the National Securities Clearing Corporation (“NSCC”) the “basket” of securities, cash or other assets that it will accept in exchange for a Creation Unit of the Fund’s shares. An Authorized Participant that wishes to effectuate a creation of a Fund’s shares deposits with the Fund the “basket” of securities, cash or other assets identified by the Fund that day, and then receives the Creation Unit of the Fund’s shares in return for those assets. After purchasing a Creation Unit, the Authorized Participant may continue to hold the Fund’s shares or sell them in the secondary market. The redemption process is the reverse of the purchase process: the Authorized Participant redeems a Creation Unit of a Fund’s shares for a basket of securities, cash or other assets. The combination of the creation and redemption process with secondary market trading in a Fund’s shares and underlying securities provides arbitrage opportunities that are designed to help keep the market price of a Fund’s shares at or close to the NAV per share of the Fund.
Each Fund imposes fees in connection with the purchase of Creation Units. These fees may vary based upon various fact-based circumstances, including, but not limited to, the composition of the securities included in the Creation Unit or the countries in which the transactions are settled. The price for each Creation Unit will equal the daily NAV per share of a Fund times the number of shares in a Creation Unit, plus the fees described above and, if applicable, any operational processing and brokerage costs, transfer fees, stamp taxes and part or all of the spread between the expected bid and offer side of the market related to the securities comprising the creation basket.
Each Fund also imposes fees in connection with the redemption of Creation Units. These fees may vary based upon various fact-based circumstances, including, but not limited to, the composition of the securities included in the Creation Unit or the countries in which the transactions are settled. The price received for each Creation Unit will equal the daily NAV per share of a Fund times the number of shares in a Creation Unit, minus the fees described above and, if applicable, any operational processing and brokerage costs, transfer
Notes to Financial Statements (Continued)
First Trust Exchange-Traded Fund III
July 31, 2023
fees, stamp taxes and part or all of the spread between the expected bid and offer side of the market related to the securities comprising the redemption basket. Investors who use the services of a broker or other such intermediary in addition to an Authorized Participant to effect a redemption of a Creation Unit may also be assessed an amount to cover the cost of such services. The redemption fee charged by a Fund will comply with Rule 22c-2 of the 1940 Act which limits redemption fees to no more than 2% of the value of the shares redeemed.
6. Distribution Plan
The Board of Trustees adopted a Distribution and Service Plan pursuant to Rule 12b-1 under the 1940 Act. In accordance with the Rule 12b-1 plan, each Fund is authorized to pay an amount up to 0.25% of its average daily net assets each year to reimburse First Trust Portfolios L.P. (“FTP”), the distributor of the Funds, for amounts expended to finance activities primarily intended to result in the sale of Creation Units or to provide investor services. FTP may also use this amount to compensate securities dealers or other persons that are Authorized Participants for providing distribution assistance, including broker-dealer and shareholder support and educational and promotional services.
No 12b-1 fees are currently paid by the Funds, and pursuant to a contractual arrangement, no 12b-1 fees will be paid any time before November 30, 2024.
7. Indemnification
The Trust, on behalf of the Funds, has a variety of indemnification obligations under contracts with its service providers. The Trust’s maximum exposure under these arrangements is unknown. However, the Trust has not had prior claims or losses pursuant to these contracts and expects the risk of loss to be remote.
8. Subsequent Events
Management has evaluated the impact of all subsequent events on the Funds through the date the financial statements were issued and has determined that there were no subsequent events requiring recognition or disclosure in the financial statements that have not already been disclosed.
Report of Independent Registered Public Accounting Firm
To the Shareholders and the Board of Trustees of First Trust Exchange-Traded Fund III:
Opinion on the Financial Statements and Financial Highlights
We have audited the accompanying statements of assets and liabilities of First Trust Short Duration Managed Municipal ETF and First Trust Ultra Short Duration Municipal ETF (the “Funds”), each a series of the First Trust Exchange-Traded Fund III, including the portfolios of investments, as of July 31, 2023, the related statements of operations for the year then ended, the statements of changes in net assets for each of the two years in the period then ended, the financial highlights for the years ended July 31, 2023, 2022, 2021, 2020, and the period from November 1, 2018 (commencement of investment operations) through July 31, 2019, and the related notes. In our opinion, the financial statements and financial highlights present fairly, in all material respects, the financial position of each of the Funds as of July 31, 2023, and the results of their operations for the year then ended, the changes in their net assets for each of the two years in the period then ended, and the financial highlights for the years ended July 31, 2023, 2022, 2021, 2020, and the period from November 1, 2018 (commencement of investment operations) through July 31, 2019 in conformity with accounting principles generally accepted in the United States of America.
Basis for Opinion
These financial statements and financial highlights are the responsibility of the Funds’ management. Our responsibility is to express an opinion on the Funds’ financial statements and financial highlights based on our audits. We are a public accounting firm registered with the Public Company Accounting Oversight Board (United States) (PCAOB) and are required to be independent with respect to the Funds in accordance with the U.S. federal securities laws and the applicable rules and regulations of the Securities and Exchange Commission and the PCAOB.
We conducted our audits in accordance with the standards of the PCAOB. Those standards require that we plan and perform the audit to obtain reasonable assurance about whether the financial statements and financial highlights are free of material misstatement, whether due to error or fraud. The Funds are not required to have, nor were we engaged to perform, an audit of their internal control over financial reporting. As part of our audits we are required to obtain an understanding of internal control over financial reporting but not for the purpose of expressing an opinion on the effectiveness of the Funds’ internal control over financial reporting. Accordingly, we express no such opinion.
Our audits included performing procedures to assess the risks of material misstatement of the financial statements and financial highlights, whether due to error or fraud, and performing procedures that respond to those risks. Such procedures included examining, on a test basis, evidence regarding the amounts and disclosures in the financial statements and financial highlights. Our audits also included evaluating the accounting principles used and significant estimates made by management, as well as evaluating the overall presentation of the financial statements and financial highlights. Our procedures included confirmation of securities owned as of July 31, 2023, by correspondence with the custodian and brokers; when replies were not received from brokers, we performed other auditing procedures. We believe that our audits provide a reasonable basis for our opinion.
Chicago, Illinois
September 22, 2023
We have served as the auditor of one or more First Trust investment companies since 2001.
Additional Information
First Trust Exchange-Traded Fund III
July 31, 2023 (Unaudited)
Proxy Voting Policies and Procedures
A description of the policies and procedures that the Trust uses to determine how to vote proxies and information on how each Fund voted proxies relating to portfolio securities during the most recent 12-month period ended June 30 is available (1) without charge, upon request, by calling (800) 988-5891; (2) on each Fund’s website at www.ftportfolios.com; and (3) on the Securities and Exchange Commission’s (“SEC”) website at www.sec.gov.
Portfolio Holdings
Each Fund files portfolio holdings information for each month in a fiscal quarter within 60 days after the end of the relevant fiscal quarter on Form N-PORT. Portfolio holdings information for the third month of each fiscal quarter will be publicly available on the SEC’s website at www.sec.gov. Each Fund’s complete schedule of portfolio holdings for the second and fourth quarters of each fiscal year is included in the semi-annual and annual reports to shareholders, respectively, and is filed with the SEC on Form N-CSR. The semi-annual and annual report for each Fund is available to investors within 60 days after the period to which it relates. Each Fund’s Forms N-PORT and Forms N-CSR are available on the SEC’s website listed above.
Tax Information
For the taxable year ended July 31, 2023, the following distribution information is being provided as required by the Internal Revenue Code of 1986, as amended, or to meet a specific state’s requirement. The Funds designate the following percentages or, if subsequently determined to be different, the maximum amount allowable for their fiscal year ended July 31, 2023:
| | Tax-Exempt
Interest Dividends | | Alternative Minimum
Tax (AMT) |
First Trust Short Duration Managed Municipal ETF
| 99.48% | | 15.80% |
First Trust Ultra Short Duration Municipal ETF
| 99.48% | | 16.62% |
Risk Considerations
Risks are inherent in all investing. Certain general risks that may be applicable to a Fund are identified below, but not all of the material risks relevant to each Fund are included in this report and not all of the risks below apply to each Fund. The material risks of investing in each Fund are spelled out in its prospectus, statement of additional information and other regulatory filings. Before investing, you should consider each Fund’s investment objective, risks, charges and expenses, and read each Fund’s prospectus and statement of additional information carefully. You can download each Fund’s prospectus at www.ftportfolios.com or contact First Trust Portfolios L.P. at (800) 621-1675 to request a prospectus, which contains this and other information about each Fund.
Concentration Risk. To the extent that a fund is able to invest a significant percentage of its assets in a single asset class or the securities of issuers within the same country, state, region, industry or sector, an adverse economic, business or political development may affect the value of the fund’s investments more than if the fund were more broadly diversified. A fund that tracks an index will be concentrated to the extent the fund’s corresponding index is concentrated. A concentration makes a fund more susceptible to any single occurrence and may subject the fund to greater market risk than a fund that is more broadly diversified.
Credit Risk. Credit risk is the risk that an issuer of a security will be unable or unwilling to make dividend, interest and/or principal payments when due and the related risk that the value of a security may decline because of concerns about the issuer’s ability to make such payments.
Cyber Security Risk. The funds are susceptible to potential operational risks through breaches in cyber security. A breach in cyber security refers to both intentional and unintentional events that may cause a fund to lose proprietary information, suffer data corruption or lose operational capacity. Such events could cause a fund to incur regulatory penalties, reputational damage, additional compliance costs associated with corrective measures and/or financial loss. In addition, cyber security breaches of a fund’s third-party service providers, such as its administrator, transfer agent, custodian, or sub-advisor, as applicable, or issuers in which the fund invests, can also subject a fund to many of the same risks associated with direct cyber security breaches.
Defined Outcome Funds Risk. To the extent a fund’s investment strategy is designed to deliver returns tied to the price performance of an underlying ETF, an investor may not realize the returns the fund seeks to achieve if that investor does not hold shares for the entire target outcome period. In the event an investor purchases shares after the first day of the target outcome period or sells shares prior to the end of the target outcome period, the buffer that the fund seeks to provide against a decline in the value of the underlying ETF may not be available, the enhanced returns that the fund seeks to provide (if any) may not be available and the investor may not participate in a gain in the value of the underlying ETF up to the cap for the investor’s investment period. Additionally, the fund will
Additional Information (Continued)
First Trust Exchange-Traded Fund III
July 31, 2023 (Unaudited)
not participate in gains of the underlying ETF above the cap and a shareholder may lose their entire investment. If the fund seeks enhanced returns, there are certain time periods when the value of the fund may fall faster than the value of the underlying ETF, and it is very unlikely that, on any given day during which the underlying ETF share price increases in value, the fund’s share price will increase at the same rate as the enhanced returns sought by the fund, which is designed for an entire target outcome period. Trading flexible exchange options involves risks different from, or possibly greater than, the risks associated with investing directly in securities, such as less liquidity and correlation and valuation risks. A fund may experience substantial downside from specific flexible exchange option positions and certain positions may expire worthless.
Derivatives Risk. To the extent a fund uses derivative instruments such as futures contracts, options contracts and swaps, the fund may experience losses because of adverse movements in the price or value of the underlying asset, index or rate, which may be magnified by certain features of the derivative. These risks are heightened when a fund’s portfolio managers use derivatives to enhance the fund’s return or as a substitute for a position or security, rather than solely to hedge (or offset) the risk of a position or security held by the fund.
Equity Securities Risk. To the extent a fund invests in equity securities, the value of the fund’s shares will fluctuate with changes in the value of the equity securities. Equity securities prices fluctuate for several reasons, including changes in investors’ perceptions of the financial condition of an issuer or the general condition of the relevant stock market, such as market volatility, or when political or economic events affecting the issuers occur. In addition, common stock prices may be particularly sensitive to rising interest rates, as the cost of capital rises and borrowing costs increase. Equity securities may decline significantly in price over short or extended periods of time, and such declines may occur in the equity market as a whole, or they may occur in only a particular country, company, industry or sector of the market.
ETF Risk. The shares of an ETF trade like common stock and represent an interest in a portfolio of securities. The risks of owning an ETF generally reflect the risks of owning the underlying securities, although lack of liquidity in an ETF could result in it being more volatile and ETFs have management fees that increase their costs. Shares of an ETF trade on an exchange at market prices rather than net asset value, which may cause the shares to trade at a price greater than net asset value (premium) or less than net asset value (discount). In times of market stress, decisions by market makers to reduce or step away from their role of providing a market for an ETF’s shares, or decisions by an ETF’s authorized participants that they are unable or unwilling to proceed with creation and/or redemption orders of an ETF’s shares, could result in shares of the ETF trading at a discount to net asset value and in greater than normal intraday bid-ask spreads.
Fixed Income Securities Risk. To the extent a fund invests in fixed income securities, the fund will be subject to credit risk, income risk, interest rate risk, liquidity risk and prepayment risk. Income risk is the risk that income from a fund’s fixed income investments could decline during periods of falling interest rates. Interest rate risk is the risk that the value of a fund’s fixed income securities will decline because of rising interest rates. Liquidity risk is the risk that a security cannot be purchased or sold at the time desired, or cannot be purchased or sold without adversely affecting the price. Prepayment risk is the risk that the securities will be redeemed or prepaid by the issuer, resulting in lower interest payments received by the fund. In addition to these risks, high yield securities, or “junk” bonds, are subject to greater market fluctuations and risk of loss than securities with higher ratings, and the market for high yield securities is generally smaller and less liquid than that for investment grade securities.
Index or Model Constituent Risk. Certain funds may be a constituent of one or more indices or ETF models. As a result, such a fund may be included in one or more index-tracking exchange-traded funds or mutual funds. Being a component security of such a vehicle could greatly affect the trading activity involving a fund, the size of the fund and the market volatility of the fund. Inclusion in an index could increase demand for the fund and removal from an index could result in outsized selling activity in a relatively short period of time. As a result, a fund’s net asset value could be negatively impacted and the fund’s market price may be significantly below its net asset value during certain periods. In addition, index rebalances may potentially result in increased trading activity in a fund’s shares.
Index Provider Risk. To the extent a fund seeks to track an index, it is subject to Index Provider Risk. There is no assurance that the Index Provider will compile the Index accurately, or that the Index will be determined, maintained, constructed, reconstituted, rebalanced, composed, calculated or disseminated accurately. To correct any such error, the Index Provider may carry out an unscheduled rebalance or other modification of the Index constituents or weightings, which may increase the fund’s costs. The Index Provider does not provide any representation or warranty in relation to the quality, accuracy or completeness of data in the Index, and it does not guarantee that the Index will be calculated in accordance with its stated methodology. Losses or costs associated with any Index Provider errors generally will be borne by the fund and its shareholders.
Investment Companies Risk. To the extent a fund invests in the securities of other investment vehicles, the fund will incur additional fees and expenses that would not be present in a direct investment in those investment vehicles. Furthermore, the fund’s investment performance and risks are directly related to the investment performance and risks of the investment vehicles in which the fund invests.
Additional Information (Continued)
First Trust Exchange-Traded Fund III
July 31, 2023 (Unaudited)
LIBOR Risk. To the extent a fund invests in floating or variable rate obligations that use the London Interbank Offered Rate (“LIBOR”) as a reference interest rate, it is subject to LIBOR Risk. The United Kingdom’s Financial Conduct Authority, which regulates LIBOR has ceased making LIBOR available as a reference rate over a phase-out period that began December 31, 2021. There is no assurance that any alternative reference rate, including the Secured Overnight Financing Rate (“SOFR”) will be similar to or produce the same value or economic equivalence as LIBOR or that instruments using an alternative rate will have the same volume or liquidity. The unavailability or replacement of LIBOR may affect the value, liquidity or return on certain fund investments and may result in costs incurred in connection with closing out positions and entering into new trades. Any potential effects of the transition away from LIBOR on the fund or on certain instruments in which the fund invests can be difficult to ascertain, and they may vary depending on a variety of factors, and they could result in losses to the fund.
Management Risk. To the extent that a fund is actively managed, it is subject to management risk. In managing an actively-managed fund’s investment portfolio, the fund’s portfolio managers will apply investment techniques and risk analyses that may not have the desired result. There can be no guarantee that a fund will meet its investment objective.
Market Risk. Market risk is the risk that a particular security, or shares of a fund in general, may fall in value. Securities held by a fund, as well as shares of a fund itself, are subject to market fluctuations caused by factors such as general economic conditions, political events, regulatory or market developments, changes in interest rates and perceived trends in securities prices. Shares of a fund could decline in value or underperform other investments as a result of the risk of loss associated with these market fluctuations. In addition, local, regional or global events such as war, acts of terrorism, spread of infectious diseases or other public health issues, recessions, or other events could have a significant negative impact on a fund and its investments. Such events may affect certain geographic regions, countries, sectors and industries more significantly than others. In February 2022, Russia invaded Ukraine which has caused and could continue to cause significant market disruptions and volatility within the markets in Russia, Europe, and the United States. The hostilities and sanctions resulting from those hostilities could have a significant impact on certain fund investments as well as fund performance. The COVID-19 global pandemic and the ensuing policies enacted by governments and central banks have caused and may continue to cause significant volatility and uncertainty in global financial markets. While the U.S. has resumed “reasonably” normal business activity, many countries continue to impose lockdown measures. Additionally, there is no guarantee that vaccines will be effective against emerging variants of the disease. These events also adversely affect the prices and liquidity of a fund’s portfolio securities or other instruments and could result in disruptions in the trading markets. Any of such circumstances could have a materially negative impact on the value of a fund’s shares and result in increased market volatility. During any such events, a fund’s shares may trade at increased premiums or discounts to their net asset value and the bid/ask spread on a fund’s shares may widen.
Non-U.S. Securities Risk. To the extent a fund invests in non-U.S. securities, it is subject to additional risks not associated with securities of domestic issuers. Non-U.S. securities are subject to higher volatility than securities of domestic issuers due to: possible adverse political, social or economic developments; restrictions on foreign investment or exchange of securities; capital controls; lack of liquidity; currency exchange rates; excessive taxation; government seizure of assets; the imposition of sanctions by foreign governments; different legal or accounting standards; and less government supervision and regulation of exchanges in foreign countries. Investments in non-U.S. securities may involve higher costs than investments in U.S. securities, including higher transaction and custody costs, as well as additional taxes imposed by non-U.S. governments. These risks may be heightened for securities of companies located, or with significant operations, in emerging market countries.
Operational Risk. Each fund is subject to risks arising from various operational factors, including, but not limited to, human error, processing and communication errors, errors of a fund’s service providers, counterparties or other third-parties, failed or inadequate processes and technology or systems failures. Each fund relies on third-parties for a range of services, including custody. Any delay or failure relating to engaging or maintaining such service providers may affect a fund’s ability to meet its investment objective. Although the funds and the funds’ investment advisor seek to reduce these operational risks through controls and procedures, there is no way to completely protect against such risks.
Passive Investment Risk. To the extent a fund seeks to track an index, the fund will invest in the securities included in, or representative of, the index regardless of their investment merit. A fund generally will not attempt to take defensive positions in declining markets.
Preferred Securities Risk. Preferred securities combine some of the characteristics of both common stocks and bonds. Preferred securities are typically subordinated to bonds and other debt securities in a company’s capital structure in terms of priority to corporate income, subjecting them to greater credit risk than those debt securities. Generally, holders of preferred securities have no voting rights with respect to the issuing company unless preferred dividends have been in arrears for a specified number of periods, at which time the preferred security holders may obtain limited rights. In certain circumstances, an issuer of preferred securities may defer payment on the securities and, in some cases, redeem the securities prior to a specified date. Preferred securities may also be substantially less liquid than other securities, including common stock.
Additional Information (Continued)
First Trust Exchange-Traded Fund III
July 31, 2023 (Unaudited)
Valuation Risk. The valuation of certain securities may carry more risk than that of common stock. Uncertainties in the conditions of the financial markets, unreliable reference data, lack of transparency and inconsistency of valuation models and processes may lead to inaccurate asset pricing. A fund may hold investments in sizes smaller than institutionally sized round lot positions (sometimes referred to as odd lots). However, third-party pricing services generally provide evaluations on the basis of institutionally-sized round lots. If a fund sells certain of its investments in an odd lot transaction, the sale price may be less than the value at which such securities have been held by the fund. Odd lots often trade at lower prices than institutional round lots. There is no assurance that the fund will be able to sell a portfolio security at the price established by the pricing service, which could result in a loss to the fund.
| NOT FDIC INSURED | NOT BANK GUARANTEED | MAY LOSE VALUE |
Advisory Agreement
Board Considerations Regarding Approval of Continuation of Investment Management Agreements
The Board of Trustees of First Trust Exchange-Traded Fund III (the “Trust”), including the Independent Trustees, unanimously approved the continuation of the Investment Management Agreement (the “Agreement”) with First Trust Advisors L.P. (the “Advisor”) on behalf of the following series of the Trust (each a “Fund” and collectively, the “Funds”):
First Trust Short Duration Managed Municipal ETF (FSMB)
First Trust Ultra Short Duration Municipal ETF (FUMB)
The Board approved the continuation of the Agreement for each Fund for a one-year period ending June 30, 2024 at a meeting held on June 4–5, 2023. The Board determined for each Fund that the continuation of the Agreement is in the best interests of the Fund in light of the nature, extent and quality of the services provided and such other matters as the Board considered to be relevant in the exercise of its business judgment.
To reach this determination for each Fund, the Board considered its duties under the Investment Company Act of 1940, as amended (the “1940 Act”), as well as under the general principles of state law, in reviewing and approving advisory contracts; the requirements of the 1940 Act in such matters; the fiduciary duty of investment advisors with respect to advisory agreements and compensation; the standards used by courts in determining whether investment company boards have fulfilled their duties; and the factors to be considered by the Board in voting on such agreements. At meetings held on April 17, 2023 and June 4–5, 2023, the Board, including the Independent Trustees, reviewed materials provided by the Advisor responding to requests for information from counsel to the Independent Trustees, submitted on behalf of the Independent Trustees, that, among other things, outlined: the services provided by the Advisor to each Fund (including the relevant personnel responsible for these services and their experience); the unitary fee rate schedule payable by each Fund as compared to fees charged to a peer group of funds (the “Expense Group”) and a broad peer universe of funds (the “Expense Universe”), each assembled by Broadridge Financial Solutions, Inc. (“Broadridge”), an independent source, and as compared to fees charged to other clients of the Advisor, including other exchange-traded funds (“ETFs”) managed by the Advisor; the expense ratio of each Fund as compared to expense ratios of the funds in the Fund’s Expense Group and Expense Universe; performance information for each Fund, including comparisons of each Fund’s performance to that of one or more relevant benchmark indexes and to that of a performance group of funds and a broad performance universe of funds (the “Performance Universe”), each assembled by Broadridge; the nature of expenses incurred in providing services to each Fund and the potential for the Advisor to realize economies of scale, if any; profitability and other financial data for the Advisor; any indirect benefits to the Advisor and its affiliate, First Trust Portfolios L.P. (“FTP”); and information on the Advisor’s compliance program. The Board reviewed initial materials with the Advisor at the meeting held on April 17, 2023, prior to which the Independent Trustees and their counsel met separately to discuss the information provided by the Advisor. Following the April meeting, counsel to the Independent Trustees, on behalf of the Independent Trustees, requested certain clarifications and supplements to the materials provided, and the information provided in response to those requests was considered at an executive session of the Independent Trustees and their counsel held prior to the June 4–5, 2023 meeting, as well as at the June meeting. The Board applied its business judgment to determine whether the arrangement between the Trust and the Advisor continues to be a reasonable business arrangement from each Fund’s perspective. The Board determined that, given the totality of the information provided with respect to the Agreement, the Board had received sufficient information to renew the Agreement. The Board considered that shareholders chose to invest or remain invested in a Fund knowing that the Advisor manages the Fund and knowing the Fund’s unitary fee.
In reviewing the Agreement for each Fund, the Board considered the nature, extent and quality of the services provided by the Advisor under the Agreement. The Board considered that the Advisor is responsible for the overall management and administration of the Trust and each Fund and reviewed all of the services provided by the Advisor to the Funds, as well as the background and experience of the persons responsible for such services. The Board noted that each Fund is an actively-managed ETF and noted that the Advisor’s Municipal Securities Team is responsible for the day-to-day management of the Funds’ investments. The Board considered the
Additional Information (Continued)
First Trust Exchange-Traded Fund III
July 31, 2023 (Unaudited)
background and experience of the members of the Municipal Securities Team. The Board considered the Advisor’s statement that it applies the same oversight model internally with its Municipal Securities Team as it uses for overseeing external sub-advisors, including portfolio risk monitoring and performance review. In reviewing the services provided, the Board noted the compliance program that had been developed by the Advisor and considered that it includes a robust program for monitoring the Advisor’s and each Fund’s compliance with the 1940 Act, as well as each Fund’s compliance with its investment objective, policies and restrictions. The Board also considered a report from the Advisor with respect to its risk management functions related to the operation of the Funds. Finally, as part of the Board’s consideration of the Advisor’s services, the Advisor, in its written materials and at the April 17, 2023 meeting, described to the Board the scope of its ongoing investment in additional personnel and infrastructure to maintain and improve the quality of services provided to the Funds and the other funds in the First Trust Fund Complex. In addition to the written materials provided by the Advisor, at the April 17, 2023 meeting, the Board also received a presentation from representatives of the Advisor’s Municipal Securities Team, who discussed the services that the Team provides to each Fund, including the Team’s day-to-day management of the Funds’ investments. In light of the information presented and the considerations made, the Board concluded that the nature, extent and quality of the services provided to the Trust and each Fund by the Advisor under the Agreement have been and are expected to remain satisfactory and that the Advisor has managed each Fund consistent with its investment objective, policies and restrictions.
The Board considered the unitary fee rate schedule payable by each Fund under the Agreement for the services provided. The Board considered that as part of the unitary fee the Advisor is responsible for each Fund’s expenses, including the cost of transfer agency, custody, fund administration, legal, audit and other services and license fees, if any, but excluding the fee payment under the Agreement and interest, taxes, brokerage commissions and other expenses connected with the execution of portfolio transactions, distribution and service fees pursuant to a Rule 12b-1 plan, if any, and extraordinary expenses, if any. The Board received and reviewed information showing the fee rates and expense ratios of the peer funds in the Expense Groups, as well as advisory and unitary fee rates charged by the Advisor to other fund (including ETFs) and non-fund clients, as applicable. Because each Fund pays a unitary fee, the Board determined that expense ratios were the most relevant comparative data point. Based on the information provided, the Board noted that the total expense ratio for each Fund was above the median total (net) expense ratio of the peer funds in its respective Expense Group. With respect to the Expense Groups, the Board, at the April 17, 2023 meeting, discussed with Broadridge its methodology for assembling peer groups and discussed with the Advisor limitations in creating peer groups for actively-managed ETFs, and different business models that may affect the pricing of services among ETF sponsors. The Board took these limitations and differences into account in considering the peer data. With respect to fees charged to other non-ETF clients, the Board considered differences between the Funds and other non-ETF clients that limited their comparability. In considering the unitary fee rate schedules overall, the Board also considered the Advisor’s statement that it seeks to meet investor needs through innovative and value-added investment solutions and the Advisor’s demonstrated long-term commitment to each Fund and the other funds in the First Trust Fund Complex.
The Board considered performance information for each Fund. The Board noted the process it has established for monitoring each Fund’s performance and portfolio risk on an ongoing basis, which includes quarterly performance reporting from the Advisor for the Funds. The Board determined that this process continues to be effective for reviewing each Fund’s performance. The Board received and reviewed information comparing each Fund’s performance for periods ended December 31, 2022 to the performance of the funds in its Performance Universe and to that of a benchmark index. Based on the information provided, the Board noted that FSMB underperformed its Performance Universe median and benchmark index for the one-year period ended December 31, 2022 and outperformed its Performance Universe median and benchmark index for the three-year period ended December 31, 2022. The Board noted that FUMB outperformed its Performance Universe median and underperformed its benchmark index for the one- and three-year periods ended December 31, 2022.
On the basis of all the information provided on the unitary fee and performance of each Fund and the ongoing oversight by the Board, the Board concluded that the unitary fee for each Fund continues to be reasonable and appropriate in light of the nature, extent and quality of the services provided by the Advisor to each Fund under the Agreement.
The Board considered information and discussed with the Advisor whether there were any economies of scale in connection with providing advisory services to the Funds at current asset levels and whether the Funds may benefit from any economies of scale. The Board noted that the unitary fee rate schedule for each Fund includes breakpoints pursuant to which the unitary fee rate will be reduced as assets of the Fund meet certain thresholds. The Board considered the Advisor’s statement that it believes that its expenses relating to providing advisory services to the Funds will increase during the next twelve months as the Advisor continues to build infrastructure and add new staff. The Board also noted that under the unitary fee structure, any reduction in expenses associated with the management and operations of the Funds would benefit the Advisor, but that the unitary fee structure provides a level of certainty in expenses for shareholders of the Funds. The Board concluded that the unitary fee rate schedule for each Fund reflects an appropriate level of sharing of any economies of scale that may be realized in the management of the Fund at current asset levels. The Board considered the revenues and allocated costs (including the allocation methodology) of the Advisor in serving as investment
Additional Information (Continued)
First Trust Exchange-Traded Fund III
July 31, 2023 (Unaudited)
advisor to each Fund for the twelve months ended December 31, 2022 and the estimated profitability level for each Fund calculated by the Advisor based on such data, as well as complex-wide and product-line profitability data, for the same period. The Board noted the inherent limitations in the profitability analysis and concluded that, based on the information provided, the Advisor’s profitability level for each Fund was not unreasonable. In addition, the Board considered indirect benefits described by the Advisor that may be realized from its relationship with the Funds. The Board considered that the Advisor had identified as an indirect benefit to the Advisor and FTP their exposure to investors and brokers who, absent their exposure to the Funds, may have had no dealings with the Advisor or FTP, and noted that the Advisor does not utilize soft dollars in connection with the Funds. The Board also considered the Advisor’s compensation for fund reporting services provided to each Fund pursuant to a separate Fund Reporting Services Agreement, which is paid from the unitary fee. The Board concluded that the character and amount of potential indirect benefits to the Advisor were not unreasonable.
Based on all of the information considered and the conclusions reached, the Board, including the Independent Trustees, unanimously determined that the terms of the Agreement continue to be fair and reasonable and that the continuation of the Agreement is in the best interests of each Fund. No single factor was determinative in the Board’s analysis.
Liquidity Risk Management Program
In accordance with Rule 22e-4 under the Investment Company Act of 1940, as amended (the “1940 Act”), the Funds and each other fund in the First Trust Fund Complex, other than the closed-end funds, have adopted and implemented a liquidity risk management program (the “Program”) reasonably designed to assess and manage the funds’ liquidity risk, i.e., the risk that a fund could not meet requests to redeem shares issued by the fund without significant dilution of remaining investors’ interests in the fund. The Board of Trustees of the First Trust Funds has appointed First Trust Advisors L.P. (the “Advisor”) as the person designated to administer the Program, and in this capacity the Advisor performs its duties primarily through the activities and efforts of the First Trust Liquidity Committee (the “Liquidity Committee”).
Pursuant to the Program, the Liquidity Committee classifies the liquidity of each fund’s portfolio investments into one of the four liquidity categories specified by Rule 22e-4: highly liquid investments, moderately liquid investments, less liquid investments and illiquid investments. The Liquidity Committee determines certain of the inputs for this classification process, including reasonably anticipated trade sizes and significant investor dilution thresholds. The Liquidity Committee also determines and periodically reviews a highly liquid investment minimum for certain funds, monitors the funds’ holdings of assets classified as illiquid investments to seek to ensure they do not exceed 15% of a fund’s net assets and establishes policies and procedures regarding redemptions in kind.
At the April 17, 2023 meeting of the Board of Trustees, as required by Rule 22e-4 and the Program, the Advisor provided the Board with a written report prepared by the Advisor that addressed the operation of the Program during the period from March 17, 2022 through the Liquidity Committee’s annual meeting held on March 23, 2023 and assessed the Program’s adequacy and effectiveness of implementation during this period, including the operation of the highly liquid investment minimum for each fund that is required under the Program to have one, and any material changes to the Program. Note that because the Funds primarily hold assets that are highly liquid investments, the Funds have not adopted any highly liquid investment minimums.
As stated in the written report, during the review period, two funds breached the 15% limitation on illiquid investments for one day each, as a result of an unscheduled week-long closure of the stock exchange in Istanbul following devastating earthquakes in February, causing all Turkish equities to be re-classified as “illiquid” for one day. Each fund filed a Form N-RN on the day after the breach occurred, and one day later after the breach was cured. No fund with a highly liquid investment minimum breached that minimum during the reporting period. The Advisor concluded that each fund’s investment strategy is appropriate for an open-end fund; that the Program operated effectively in all material respects during the review period; and that the Program is reasonably designed to assess and manage the liquidity risk of each fund and to maintain compliance with Rule 22e-4.
Board of Trustees
Effective September 10, 2023, the exchange-traded funds, closed-end funds, mutual funds and variable insurance funds (collectively, the “Funds”) advised by First Trust Advisors L.P. (“FTA”) announced the appointment of Ms. Bronwyn Wright as a Trustee of all Funds except the exchange-traded funds included in the First Trust Exchange-Traded Fund and the First Trust Dynamic Europe Equity Income Fund, a closed-end fund. Ms. Wright has acted as an independent director to a number of Irish collective investment funds since 2009. Ms. Wright is a former Managing Director of Citibank Europe plc and Head of Securities and Fund Services for Citi Ireland. In these positions, she was responsible for the management and strategic direction of Citi Ireland’s securities and fund services business which included funds, custody, security finance/lending and global agency and trust. She also had responsibility for leading, managing and growing the Trustee, Custodian and Depositary business in Ireland, the United Kingdom, Luxembourg, Jersey and Cayman.
Board of Trustees and Officers
First Trust Exchange-Traded Fund III
July 31, 2023 (Unaudited)
The following tables identify the Trustees and Officers of the Trust. Unless otherwise indicated, the address of all persons is 120 East Liberty Drive, Suite 400, Wheaton, IL 60187.
The Trust’s statement of additional information includes additional information about the Trustees and is available, without charge, upon request, by calling (800) 988-5891.
| Name, Year of Birth and Position with the Trust | Term of Office and Year First Elected or Appointed | Principal Occupations
During Past 5 Years | Number of Portfolios in the First Trust Fund Complex Overseen by Trustee | Other Trusteeships or Directorships Held by Trustee During Past 5 Years |
| INDEPENDENT TRUSTEES |
Richard E. Erickson, Trustee
(1951) | • Indefinite Term
• Since Inception | Physician, Edward-Elmhurst Medical Group; Physician and Officer, Wheaton Orthopedics (1990 to 2021) | 238 | None |
Thomas R. Kadlec, Trustee
(1957) | • Indefinite Term
• Since Inception | Retired; President, ADM Investor Services, Inc. (Futures Commission Merchant) (2010 to July 2022) | 238 | Director, National Futures Association and ADMIS Singapore Ltd.; Formerly, Director of ADM Investor Services, Inc., ADM Investor Services International, ADMIS Hong Kong Ltd., and Futures Industry Association |
Denise M. Keefe, Trustee
(1964) | • Indefinite Term
• Since 2021 | Executive Vice President, Advocate Aurora Health and President, Advocate Aurora Continuing Health Division (Integrated Healthcare System) | 238 | Director and Board Chair of Advocate Home Health Services, Advocate Home Care Products and Advocate Hospice; Director and Board Chair of Aurora At Home (since 2018); Director of Advocate Physician Partners Accountable Care Organization; Director of RML Long Term Acute Care Hospitals; Director of Senior Helpers (since 2021); and Director of MobileHelp (since 2022) |
Robert F. Keith, Trustee
(1956) | • Indefinite Term
• Since Inception | President, Hibs Enterprises (Financial and Management Consulting) | 238 | Formerly, Director of Trust Company of Illinois |
Niel B. Nielson, Trustee
(1954) | • Indefinite Term
• Since Inception | Senior Advisor (2018 to Present), Managing Director and Chief Operating Officer (2015 to 2018), Pelita Harapan Educational Foundation (Educational Products and Services) | 238 | None |
| INTERESTED TRUSTEE |
James A. Bowen(1), Trustee and
Chairman of the Board
(1955) | • Indefinite Term
• Since Inception | Chief Executive Officer, First Trust Advisors L.P. and First Trust Portfolios L.P.; Chairman of the Board of Directors, BondWave LLC (Software Development Company) and Stonebridge Advisors LLC (Investment Advisor) | 238 | None |
| (1) | Mr. Bowen is deemed an “interested person” of the Trust due to his position as CEO of First Trust Advisors L.P., investment advisor of the Trust. |
Board of Trustees and Officers (Continued)
First Trust Exchange-Traded Fund III
July 31, 2023 (Unaudited)
| Name and Year of Birth | Position and Offices with Trust | Term of Office and Length of Service | Principal Occupations
During Past 5 Years |
| OFFICERS(2) |
James M. Dykas
(1966) | President and Chief Executive Officer | • Indefinite Term
• Since 2016 | Managing Director and Chief Financial Officer, First Trust Advisors L.P. and First Trust Portfolios L.P.; Chief Financial Officer, BondWave LLC (Software Development Company) and Stonebridge Advisors LLC (Investment Advisor) |
Derek D. Maltbie
(1972) | Treasurer, Chief Financial Officer and Chief Accounting Officer | • Indefinite Term
• Since 2023 | Senior Vice President, First Trust Advisors L.P. and First Trust Portfolios L.P., July 2021 to present. Previously, Vice President, First Trust Advisors L.P. and First Trust Portfolios L.P., 2014 to 2021. |
W. Scott Jardine
(1960) | Secretary and Chief Legal Officer | • Indefinite Term
• Since Inception | General Counsel, First Trust Advisors L.P. and First Trust Portfolios L.P.; Secretary and General Counsel, BondWave LLC; Secretary, Stonebridge Advisors LLC |
Daniel J. Lindquist
(1970) | Vice President | • Indefinite Term
• Since Inception | Managing Director, First Trust Advisors L.P. and First Trust Portfolios L.P. |
Kristi A. Maher
(1966) | Chief Compliance Officer and Assistant Secretary | • Indefinite Term
• Since Inception | Deputy General Counsel, First Trust Advisors L.P. and First Trust Portfolios L.P. |
Roger F. Testin
(1966) | Vice President | • Indefinite Term
• Since Inception | Senior Vice President, First Trust Advisors L.P. and First Trust Portfolios L.P. |
Stan Ueland
(1970) | Vice President | • Indefinite Term
• Since Inception | Senior Vice President, First Trust Advisors L.P. and First Trust Portfolios L.P. |
| (2) | The term “officer” means the president, vice president, secretary, treasurer, controller or any other officer who performs a policy making function. |
Privacy Policy
First Trust Exchange-Traded Fund III
July 31, 2023 (Unaudited)
Privacy Policy
First Trust values our relationship with you and considers your privacy an important priority in maintaining that relationship. We are committed to protecting the security and confidentiality of your personal information.
Sources of Information
We collect nonpublic personal information about you from the following sources:
| • | Information we receive from you and your broker-dealer, investment professional or financial representative through interviews, applications, agreements or other forms; |
| • | Information about your transactions with us, our affiliates or others; |
| • | Information we receive from your inquiries by mail, e-mail or telephone; and |
| • | Information we collect on our website through the use of “cookies.” For example, we may identify the pages on our website that your browser requests or visits. |
Information Collected
The type of data we collect may include your name, address, social security number, age, financial status, assets, income, tax information, retirement and estate plan information, transaction history, account balance, payment history, investment objectives, marital status, family relationships and other personal information.
Disclosure of Information
We do not disclose any nonpublic personal information about our customers or former customers to anyone, except as permitted by law. In addition to using this information to verify your identity (as required under law), the permitted uses may also include the disclosure of such information to unaffiliated companies for the following reasons:
| • | In order to provide you with products and services and to effect transactions that you request or authorize, we may disclose your personal information as described above to unaffiliated financial service providers and other companies that perform administrative or other services on our behalf, such as transfer agents, custodians and trustees, or that assist us in the distribution of investor materials such as trustees, banks, financial representatives, proxy services, solicitors and printers. |
| • | We may release information we have about you if you direct us to do so, if we are compelled by law to do so, or in other legally limited circumstances (for example to protect your account from fraud). |
In addition, in order to alert you to our other financial products and services, we may share your personal information within First Trust.
Use of Website Analytics
We currently use third party analytics tools, Google Analytics and AddThis, to gather information for purposes of improving First Trust’s website and marketing our products and services to you. These tools employ cookies, which are small pieces of text stored in a file by your web browser and sent to websites that you visit, to collect information, track website usage and viewing trends such as the number of hits, pages visited, videos and PDFs viewed and the length of user sessions in order to evaluate website performance and enhance navigation of the website. We may also collect other anonymous information, which is generally limited to technical and web navigation information such as the IP address of your device, internet browser type and operating system for purposes of analyzing the data to make First Trust’s website better and more useful to our users. The information collected does not include any personal identifiable information such as your name, address, phone number or email address unless you provide that information through the website for us to contact you in order to answer your questions or respond to your requests. To find out how to opt-out of these services click on: Google Analytics and AddThis.
Confidentiality and Security
With regard to our internal security procedures, First Trust restricts access to your nonpublic personal information to those First Trust employees who need to know that information to provide products or services to you. We maintain physical, electronic and procedural safeguards to protect your nonpublic personal information.
Policy Updates and Inquiries
As required by federal law, we will notify you of our privacy policy annually. We reserve the right to modify this policy at any time, however, if we do change it, we will tell you promptly. For questions about our policy, or for additional copies of this notice, please go to www.ftportfolios.com, or contact us at 1-800-621-1675 (First Trust Portfolios) or 1-800-222-6822 (First Trust Advisors).
March 2023
This page intentionally left blank
This page intentionally left blank
First Trust Exchange-Traded Fund III
INVESTMENT ADVISOR
First Trust Advisors L.P.
120 East Liberty Drive, Suite 400
Wheaton, IL 60187
ADMINISTRATOR, CUSTODIAN,
FUND ACCOUNTANT &
TRANSFER AGENT
Brown Brothers Harriman & Co.
50 Post Office Square
Boston, MA 02110
INDEPENDENT REGISTERED
PUBLIC ACCOUNTING FIRM
Deloitte & Touche LLP
111 South Wacker Drive
Chicago, IL 60606
LEGAL COUNSEL
Chapman and Cutler LLP
320 South Canal Street
Chicago, IL 60606
First Trust Exchange-Traded Fund III
First Trust Merger Arbitrage ETF (MARB)
Annual Report
For the Year Ended
July 31, 2023
First Trust Merger Arbitrage ETF (MARB)
Annual Report
July 31, 2023
Caution Regarding Forward-Looking Statements
This report contains certain forward-looking statements within the meaning of the Securities Act of 1933, as amended, and the Securities Exchange Act of 1934, as amended. Forward-looking statements include statements regarding the goals, beliefs, plans or current expectations of First Trust Advisors L.P. (“First Trust” or the “Advisor”) and/or First Trust Capital Management L.P. (“First Trust Capital Management” or the “Sub-Advisor”) and their respective representatives, taking into account the information currently available to them. Forward-looking statements include all statements that do not relate solely to current or historical fact. For example, forward-looking statements include the use of words such as “anticipate,” “estimate,” “intend,” “expect,” “believe,” “plan,” “may,” “should,” “would” or other words that convey uncertainty of future events or outcomes.
Forward-looking statements involve known and unknown risks, uncertainties and other factors that may cause the actual results, performance or achievements of the series of First Trust Exchange-Traded Fund III (the “Trust”) described in this report (First Trust Merger Arbitrage ETF; hereinafter referred to as the “Fund”) to be materially different from any future results, performance or achievements expressed or implied by the forward-looking statements. When evaluating the information included in this report, you are cautioned not to place undue reliance on these forward-looking statements, which reflect the judgment of the Advisor and/or Sub-Advisor and their respective representatives only as of the date hereof. We undertake no obligation to publicly revise or update these forward-looking statements to reflect events and circumstances that arise after the date hereof.
Performance and Risk Disclosure
There is no assurance that the Fund will achieve its investment objective. The Fund is subject to market risk, which is the possibility that the market values of securities owned by the Fund will decline and that the value of the Fund’s shares may therefore be less than what you paid for them. Accordingly, you can lose money by investing in the Fund. See “Risk Considerations” in the Additional Information section of this report for a discussion of certain other risks of investing in the Fund.
Performance data quoted represents past performance, which is no guarantee of future results, and current performance may be lower or higher than the figures shown. For the most recent month-end performance figures, please visit www.ftportfolios.com or speak with your financial advisor. Investment returns, net asset value and share price will fluctuate and Fund shares, when sold, may be worth more or less than their original cost.
The Advisor may also periodically provide additional information on Fund performance on the Fund’s web page at www.ftportfolios.com.
How to Read This Report
This report contains information that may help you evaluate your investment in the Fund. It includes details about the Fund and presents data and analysis that provide insight into the Fund’s performance and investment approach.
By reading the portfolio commentary by the portfolio management team of the Fund, you may obtain an understanding of how the market environment affected the Fund’s performance. The statistical information that follows may help you understand the Fund’s performance compared to that of relevant market benchmarks.
It is important to keep in mind that the opinions expressed by personnel of the Advisor and/or Sub-Advisor are just that: informed opinions. They should not be considered to be promises or advice. The opinions, like the statistics, cover the period through the date on the cover of this report. The material risks of investing in the Fund are spelled out in the prospectus, the statement of additional information, and other Fund regulatory filings.
First Trust Merger Arbitrage ETF (MARB)
Annual Letter from the Chairman and CEO
July 31, 2023
Dear Shareholders,
First Trust is pleased to provide you with the annual report for the First Trust Merger Arbitrage ETF (the “Fund”), which contains detailed information about the Fund for the 12-month period ended July 31, 2023.
In a widely unexpected announcement, Fitch Ratings (“Fitch”), a provider of credit ratings, commentary, and research, downgraded the credit rating of the United States government from its highest rating of AAA to its second-highest rating of AA+ on August 1, 2023. The move marks the first time the U.S. government’s credit rating has been downgraded since 2011. Fitch cited the heightened potential of a near-term economic recession in the U.S. as well as the rising interest burden of government debt as two factors that contributed to their decision to implement the downgrade. We will leave it to the pundits to debate whether the downgrade was warranted or not. What we would like to see is a reduction in government spending. As of June 30, 2023, the U.S. government’s deficit stood at $1.39 trillion, already above the 2022 full year deficit of $1.37 trillion, according to Brian Wesbury, Chief Economist at First Trust. As Fitch noted in the press release of its downgrade, the interest burden on U.S. government debt, among other factors, is expected to catapult the general government deficit to 6.3% of gross domestic product (“GDP”) in 2023, up from 3.7% in 2022.
The Federal Reserve (the “Fed”) has made significant progress in its battle with rising prices. Inflation, as measured by the twelve-month trailing rate on the Consumer Price Index (“CPI”), stood at 3.2% on July 31, 2023, down significantly from its most recent high of 9.1% set on June 30, 2022, but up from 3.0% on June 30, 2023. While a reduction in the CPI is welcome, the metric remains well-above the Fed’s goal of 2.0%. Should the CPI remain stubbornly high, it may prompt further increases to the Federal Funds target rate over the coming months, which could hamper economic growth, in our opinion. That said, U.S. GDP has remained resilient, growing over each of the last four quarters (through June 30, 2023).
Whether the U.S. can avoid an economic recession over the coming months remains to be seen. As mentioned above, despite tighter monetary policy, the U.S. economy posted positive changes to GDP over each of the last four quarters. We continue to hope for a “soft landing,” but also keep our eyes fixated on the data.
Thank you for giving First Trust the opportunity to play a role in your financial future. We value our relationship with you and will report on the Fund again in six months.
Sincerely,
James A. Bowen
Chairman of the Board of Trustees
Chief Executive Officer of First Trust Advisors L.P.
Fund Performance Overview (Unaudited)
First Trust Merger Arbitrage ETF (MARB)
The First Trust Merger Arbitrage ETF’s (the “Fund”) investment objective is to seek to provide investors with capital appreciation. Under normal market conditions, the Fund seeks to achieve its investment objective by establishing long and short positions in the equity securities of companies that are involved in a publicly-announced significant corporate event, such as a merger or acquisition. The Fund’s portfolio may include equity securities issued by U.S. and non-U.S. companies, including American Depositary Receipts and derivatives, including total return swaps. The Fund may invest in securities issued by small, mid and large capitalization issuers. The Fund lists and principally trades its shares on NYSE Arca, Inc. under the ticker symbol “MARB.”
| Performance | | | |
| | | Average Annual
Total Returns | Cumulative
Total Returns |
| | 1 Year Ended
7/31/23 | Inception (2/4/20)
to 7/31/23 | Inception (2/4/20)
to 7/31/23 |
| Fund Performance | | | |
| NAV | 1.17% | 0.34% | 1.17% |
| Market Price | 0.87% | 0.26% | 0.92% |
| Index Performance | | | |
| Credit Suisse Merger Arbitrage Liquid Index(1) | 4.17% | 3.29% | 11.93% |
| S&P 500® Index | 13.02% | 11.76% | 47.32% |
Total returns for the period since inception are calculated from the inception date of the Fund. “Average Annual Total Returns” represent the average annual change in value of an investment over the period indicated. “Cumulative Total Returns” represent the total change in value of an investment over the period indicated.
The Fund’s per share net asset value (“NAV”) is the value of one share of the Fund and is computed by dividing the value of all assets of the Fund (including accrued interest and dividends), less all liabilities (including accrued expenses and dividends declared but unpaid), by the total number of outstanding shares. The price used to calculate market return (“Market Price”) is determined by using the midpoint of the national best bid and offer price (“NBBO”) as of the time that the Fund’s NAV is calculated. Under SEC rules, the NBBO consists of the highest displayed buy and lowest sell prices among the various exchanges trading the Fund at the time the Fund’s NAV is calculated. Since shares of the Fund did not trade in the secondary market until after its inception, for the period from inception to the first day of secondary market trading in shares of the Fund, the NAV of the Fund is used as a proxy for the secondary market trading price to calculate market returns. NAV and market returns assume that all distributions have been reinvested in the Fund at NAV and Market Price, respectively.
An index is a statistical composite that tracks a specified financial market or sector. Unlike the Fund, the indices do not actually hold a portfolio of securities and therefore do not incur the expenses incurred by the Fund. These expenses negatively impact the performance of the Fund. Also, market returns do not include brokerage commissions that may be payable on secondary market transactions. If brokerage commissions were included, market returns would be lower. The total returns presented reflect the reinvestment of dividends on securities in the indices. The returns presented do not reflect the deduction of taxes that a shareholder would pay on Fund distributions or the redemption or sale of Fund shares. The investment return and principal value of shares of the Fund will vary with changes in market conditions. Shares of the Fund may be worth more or less than their original cost when they are redeemed or sold in the market. The Fund’s past performance is no guarantee of future performance.
| (1) | Effective as of August 1, 2023, the Credit Suisse Merger Arbitrage Liquid Index replaced the Hedge Fund Research Merger Arbitrage Index, which is no longer available for use by the Fund. |
Fund Performance Overview (Unaudited) (Continued)
First Trust Merger Arbitrage ETF (MARB)
| Portfolio Sector Allocation | % of Total
Investments -
Long Positions |
| Health Care | 29.1% |
| Financials | 17.7 |
| Industrials | 10.2 |
| Information Technology | 9.7 |
| Energy | 9.6 |
| Communication Services | 9.2 |
| Consumer Staples | 7.6 |
| Consumer Discretionary | 6.9 |
| Total | 100.0% |
| Portfolio Sector Allocation | % of Total
Investments
Sold Short |
| Energy | 66.3% |
| Financials | 33.7 |
| Real Estate | 0.0* |
| Total | 100.0% |
| * | Amount is less than 0.1%. |
| Top Ten Investments - Long Positions | % of
Net Assets |
| Focus Financial Partners, Inc., Class A | 6.2% |
| Horizon Therapeutics PLC | 5.4 |
| Albertsons Cos., Inc., Class A | 5.3 |
| Syneos Health, Inc. | 5.0 |
| Amedisys, Inc. | 4.5 |
| Univar Solutions, Inc. | 4.1 |
| ForgeRock, Inc., Class A | 3.8 |
| Radius Global Infrastructure, Inc. | 3.8 |
| Magellan Midstream Partners, L.P. | 3.6 |
| Argo Group International Holdings Ltd. | 3.5 |
| Total | 45.2% |
| Top Investments Sold Short | % of
Net Assets |
| Exxon Mobil Corp. | -3.2% |
| Provident Financial Services, Inc. | -2.9 |
| ONEOK, Inc. | -2.5 |
| Extra Space Storage, Inc. | 0.0* |
| Total | -8.6% |
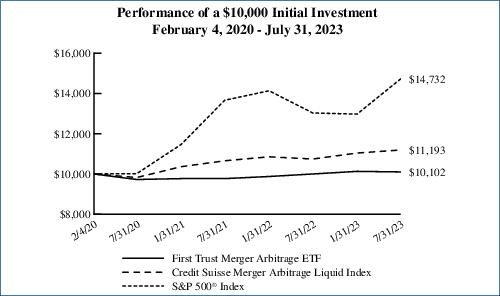
Performance figures assume reinvestment of all distributions and do not reflect the deduction of taxes that a shareholder would pay on Fund distributions or the redemption or sale of Fund shares. An index is a statistical composite that tracks a specified financial market or sector. Unlike the Fund, the indices do not actually hold a portfolio of securities and therefore do not incur the expenses incurred by the Fund. These expenses negatively impact the performance of the Fund. The Fund’s past performance does not predict future performance.
Frequency Distribution of Discounts and Premiums
Information showing the number of days the market price of the Fund’s shares was greater (at a premium) and less (at a discount) than the Fund’s net asset value for the most recently completed year, and the most recently completed calendar quarters since that year (or life of the Fund, if shorter), is available at https://www.ftportfolios.com/Retail/etf/home.aspx.
Portfolio Commentary
First Trust Merger Arbitrage ETF (MARB)
Annual Report
July 31, 2023 (Unaudited)
Advisor
First Trust Advisors L.P. (“First Trust”) serves as the investment advisor to the First Trust Merger Arbitrage ETF (the “Fund” or “MARB”). First Trust is responsible for the ongoing monitoring of the Fund’s investment portfolio, managing the Fund’s business affairs and providing certain administrative services necessary for the management of the Fund.
Sub-Advisor
First Trust Capital Management L.P.
First Trust Capital Management L.P. (“First Trust Capital Management” or the “Sub-Advisor”) serves as the Fund’s investment sub-advisor. First Trust Capital Management is an SEC registered investment advisor, founded in 2013 and headquartered in Chicago, Illinois, that specializes in structuring and managing alternative investment, multi-manager, and multi-strategy mutual funds. First Trust Capital Management prides itself on its ability to combine rigorous research and risk management processes with disciplined portfolio construction and management.
Portfolio Management Team
Michael Peck, CFA – Chief Executive Officer and Co-Chief Investment Officer
Brian Murphy – Co-Chief Investment Officer and Portfolio Manager
Michael Grayson – Portfolio Manager
The portfolio managers are primarily and jointly responsible for the day to day management of the Fund. Each portfolio manager has served in such capacity for the Fund since 2020.
Commentary
Market Recap
In August 2022, deal flow continued to improve, particularly for the typically quiet late summer period. Sixteen new deals were announced with the vast majority being strategic in nature. While strategic deals represented the bulk of deal flow, the largest deal announced was Vista Equity Partners Management, LLC’s (“Vista”) $8.4 billion leveraged buyout of tax management software maker, Avalara. There was also a notable uptick in activity by large pharmaceutical companies with the announcement of four acquisitions in the Biotech space.
In September 2022, we were able to take advantage of a handful of deal opportunities. There were 8 new definitive acquisitions announced. The largest deal was GIC’s (the Singaporean sovereign wealth fund) $9 billion acquisition of Store Capital Corporation, a real estate investment trust.
In October 2022, activity rebounded with 15 new deals announced, up from 8 deals in September 2022, which was an encouraging development. The largest deal announced was the controversial acquisition of Albertsons Companies, Inc. by Kroger. Valued at $24.6 billion, this was a large strategic deal bringing together two of the biggest grocery companies in the country. There were also several multi-billion dollar deals in diverse sectors including the Energy sector (Continental Resources, Inc. and Archaea Energy, Inc.), the Software sector (ForgeRock, Inc. and KnowBe4, Inc.), and the Industrials sector (Altra Industrial Motion and Regal Rexnord Corporation).
In November 2022, we saw thirteen deals announced, including two deals over $5 billion in valuation and another two over $10 billion. Deals were announced in a diverse group of sectors including Medical Devices, International Maritime Shipping, Automotive Wholesaling, and Gold Mining. Out of this group of new deals, strategic acquirers represented a heavy percentage of new activity which was an interesting shift from the private equity driven leveraged buyout deals seen earlier in the year. The largest deal in November was Johnson & Johnson’s $16.6 billion acquisition of Abiomed, Inc., a medical device developer and manufacturer specializing in cardiovascular products.
As we closed 2022, deal flow was down 37% from the all-time record high set in 2021, but still roughly in line with pre-pandemic numbers. The year was a tale of two halves in regard to deal flow, with the first half of the year being quite good, but the second half trailing off substantially as headwinds on inflation, war, and rising interest rates started to bite harder.
Merger activity began 2023 on a slower note as the market continued to find its footing in an uncertain macro environment. That said, there were opportunities to be had. With 11 new acquisitions announced in January, including four in the Biotech sector, corporate boardrooms were on the hunt to make financially sound deals. The bulk of the mergers were strategic in nature, although large private
Portfolio Commentary (Continued)
First Trust Merger Arbitrage ETF (MARB)
Annual Report
July 31, 2023 (Unaudited)
equity firms continued to be active in the application software space with Vista’s $8.6 billion acquisition of Duck Creek Technologies, Inc. and Thoma Bravo L.P.’s $1.7 billion acquisition of Canadian firm Magnet Forensics, Inc.
Announced deal flow in February 2023 kept pace with January, yielding 11 new deals. Strategic deals once again dominated, with only three private equity leveraged buyouts announced. The largest deal of the month was the $10.6 billion acquisition of Oak Street Health by CVS Health® (“CVS”). The CVS board had been active on the merger front over the past year. Even while their first deal, an $8 billion acquisition of Signify Health, was being reviewed by the Department of Justice, CVS continued to execute their M&A strategy with the announcement of two deals in the last six months. One of the leveraged buyouts this month was Centerbridge Partners and GIC’s $868 million acquisition of Indus Realty Trust, Inc. Another deal that caught our attention was Globus Medical Inc.’s $3.1 billion acquisition of NuVasive, Inc.
March 2023 began to show potential green shoots of new deal activity. Pfizer Inc. announced the largest acquisition of 2023 with its $42 billion acquisition of the cancer-focused Biotech firm Seagen Inc. The second largest deal of the year was Silver Lake’s $11.2 billion acquisition of Qualtrics, an experience management software company. Even more promising, as strategic acquirers have been sharpening their pencils and looking to do deals, so have private equity funds. With Apollo Global Management, Inc.’s $8.1 billion acquisition of Univar Solutions Inc. and Blackstone Inc.’s $4.5 billion acquisition of Cvent Holding Corp., we began to see the much-anticipated pick up in announced deal flow from this group as well.
In April 2023, announced deal flow came from a variety of sectors but Pharma continued to be the most active, accounting for three of the thirteen deals announced during April. Of those deals announced, three were below $1 billion, five were between $1 billion and $5 billion, while five were over $5 billion in market capitalization. The Fund initiated positions in two of those Biotech deals, including Astellas Pharma Inc.’s $5.9 billion acquisition of Iveric Bio, Inc., and the largest deal of the month, Merck & Co., Inc.’s $10.8 billion acquisition of Prometheus Biosciences, Inc.
In May 2023, the newly announced deal flow was in line with April’s activity, with thirteen new transactions. There was a diversity of sectors represented, including Biotech, Real Estate Investment Trusts, Energy, Industrials and Healthcare targets. Private equity accounted for two of the largest deals of the month – Apollo Global Management, Inc.’s $5.2 billion acquisition of aluminum manufacturer Arconic Corporation, and an Elliott Investment Management-led consortium’s $7.1 billion acquisition of biopharmaceutical solutions provider Syneos Health. With the interest rate picture starting to take shape, we hoped that private equity would begin using more of their dry powder to initiate more transactions through the balance of the year.
In June 2023, the newly announced deal flow remained choppy with continued conservativeness from corporate boardrooms. With that said, the Energy and Biotech sectors remained very active with two of the biggest announced deals of the month. Novartis AG announced its $3.5 billion acquisition of clinical phase Biotech firm Chinook Therapeutics, Inc. (“KDNY”); while Patterson-UTI Energy and NexTier Oilfield Solutions announced a $5.4 billion all-stock merger of equals. Eli Lilly and Company also announced a $2.4 billion tender offer for clinical stage biotech firm DICE Therapeutics, Inc. (“DICE”), joining other pharmaceutical majors like Merck & Co., Inc., Pfizer Inc., and Amgen Inc., in using M&A to replenish clinical pipelines. The Fund initiated a position in DICE and KDNY and evaluated the other new deals for good risk adjusted opportunities.
Finally, in July 2023, Goldman Sachs Group Inc. remarked in their second quarter earnings call that bankers are seeing “green shoots” in capital markets and are looking for a pickup in deal flow later in the year. Moelis & Company seemed to think similarly as company executives stated publicly that they are positioning for a “revival in mergers and acquisitions” by hiring top talent from Wall Street. In our opinion, these are all signs that we may be seeing a revival of a steadier deal flow in the coming quarters.
Performance Analysis
For the 12-month period ended July 31, 2023, based on net asset value (“NAV”), the Fund was up 1.17%. Comparatively, the Fund’s benchmark, the Credit Suisse Merger Arbitrage Liquid Index, was up 4.17% for the same period. Another widely known public merger index that we follow, the S&P Merger Arbitrage Index, was down 1.20% for the same period.
Many of our investors are also using the Fund as a ‘core bond’ replacement, or a fixed income alternative, given that the Fund has bond-like volatility but does not suffer from interest rate sensitivity. Accordingly, we always reference the bond indices as benchmarks given that is how many of our advisory clients are viewing the Fund. For the 12-month period ended July 31, 2023, the Bloomberg US Aggregate Bond Index was down 3.37%. On a relative basis, the Fund was able to eke out a small positive return despite a very challenging environment for bond indices.
With that said, we were not proud of our absolute return during the 12-month period ended July 31, 2023. Primary detractors reflected the results of four challenging deals in our portfolio.
Portfolio Commentary (Continued)
First Trust Merger Arbitrage ETF (MARB)
Annual Report
July 31, 2023 (Unaudited)
The initial event was the proposed merger between Rogers Corporation (“ROG”) and DuPont de Nemours, Inc. (“DD”), which was announced in 2021. The Chinese regulatory review, State Administration for Market Regulation (“SAMR”), was the critical path item. The companies filed with SAMR in late November 2021. At the request of SAMR, they withdrew and refiled their SAMR application in September 2022. The walk date was auto-extended twice to accommodate the SAMR review. On the final extended walk date of November 1, 2022, DD terminated the merger agreement because SAMR had not cleared the transaction. All other shareholder and regulatory approvals were obtained. But as is customary with China’s regulatory reviews, we had zero transparency into the SAMR process. ROG was responsible for -0.89% negative attribution for the Fund.
Additionally, TD Bank, N.A. (“TD”) terminated its $13.3 billion deal to acquire First Horizon Bank (“FHN”) in May 2023. With an announcement back in February 2022, this was a long-running deal within the increasingly challenging environment for banks to combine. After watching this deal from the sidelines for several months, we took a position once the transaction appeared to be on the path to approval with the announcement of a $50 billion community benefits plan. Despite solid fundamentals, FHN came under pressure as the events surrounding Silicon Valley Bank shook the entire regional banking sector to its core. As the regional banking crisis was playing out, TD revealed that they would not likely be able to meet the regulators’ deal requirements before the recently extended deal deadline and sought to further extend the merger agreement beyond the extended termination date of May 27, 2023. The most unusual part of this situation was that TD’s regulators were not allowing them to share details regarding their delay. This led to concern within our team even as the companies on both sides of the transaction signaled that the deal was still on firm ground. Unfortunately, on May 4, TD unexpectedly terminated the transaction several weeks ahead of the contractual termination date, citing an inability to gauge when they would be able to achieve regulatory approval. Using aggressive risk management, we exited the balance of the position following the termination for a negative attribution of -1.26% for the Fund.
May 2023 also brought an unexpected turn with the Federal Trade Commission (the “FTC”) suing to block Amgen Inc.’s $27 billion acquisition of Horizon Therapeutics. This deal had been going through the process of a second request review by the FTC. Amgen continued to guide to a first-half close and scheduled their Irish High Court hearing for May 22, 2023, which could be interpreted as the parties getting close to completing antitrust review. While Horizon’s product offering did not create a traditional anticompetitive situation, the FTC and U.S. Senator Elizabeth Warren expressed concern over Amgen’s historical drug pricing behavior. This was a novel approach for blocking a transaction, and when the news hit, Horizon shares re-priced to reflect the duration of a trial and ruling outcome. We continue to hold the position in the Fund and expect the deal to close successfully. However, there was a negative attribution of -0.39% from this investment in the Fund.
Lastly, Standard General L.P.’s acquisition of media company Tegna Inc. (“TGNA”) was a detractor throughout 2023. We got comfortable investing in this deal around the DOJ approval in February 2023, after which the only outstanding approval was the Federal Communications Commission (the “FCC”). As precedent, the FCC had never blocked a deal that had already received DOJ approval. However, the TGNA merger was a highly politicized deal, and the FCC ultimately decided to issue a “hearing designation order” (“HDO”) in March 2023 to scuttle the deal. HDOs are very rare. However, in this case the financing expired prior to the hearing taking place. The TGNA deal break cost the Fund -1.00% in attribution.
These four deals resulted in -3.54% aggregate negative attribution over the 12-month period ended July 31, 2023. While we found our spots during the year to invest in high quality merger transactions, we did unfortunately incur a few deal breaks that dented overall performance. As we have said for years, avoiding broken deals is the crux of a successful merger arbitrageur. While we were able to avoid several other deal breaks in the M&A universe by not forcing investment into those suboptimal deals, we were not completely unscathed in a few transactions that caught us off guard.
Market and Fund Outlook
Our expectation is that the Fund is going to pace at a 5-6% return based on NAV, going forward. High-quality merger spreads price off the risk free rate. Therefore, higher base rates generally equate to wider merger arbitrage spreads. A-Grade mergers (95%+ closure probabilities) are currently offering 7-8% gross yields. We believe the Fund can achieve a Treasury Bills + 100-200 basis points return profile in the near-term going forward.
As discussed, we have recently seen an aggressive regulatory posture where the FTC has challenged vertical mergers. That is not bearing fruit, as the FTC is racking up loss after loss. The FTC’s record is now 0-4 in court, and 0-11 when you include settlements prior to litigation. Our strong opinion is that the regulatory environment of the past 6-8 months – where several “good” mergers have been challenged – may be coming to an end. We have already seen the FTC begin to relax its posture in recent weeks. In fact, in August 2023, the FTC just dismissed another suit against Black Knight, Inc./Intercontinental Exchange, Inc., which will allow that merger to proceed towards completion. Perceived risk creates opportunity for wider arbitrage spreads that can create potential outsized return potential for the Fund in certain mispriced deals.
Portfolio Commentary (Continued)
First Trust Merger Arbitrage ETF (MARB)
Annual Report
July 31, 2023 (Unaudited)
Finally, on the macro front, we have witnessed a vicious bear market rally pulled by thin volume and a mini Artificial Intelligence bubble. In our view, we will likely see some magnitude of correction before year-end as the effects of tightening monetary policy set in. We are already witnessing this in August, although the tightening cycle, given its velocity, is still early in its life (on a weighted average basis, only about 8-months old). Thus, we continue to believe market neutral strategies (like merger arbitrage) are becoming increasingly important from a diversification standpoint.
First Trust Merger Arbitrage ETF (MARB)
Understanding Your Fund Expenses
July 31, 2023 (Unaudited)
As a shareholder of the First Trust Merger Arbitrage ETF (the “Fund”), you incur two types of costs: (1) transaction costs; and (2) ongoing costs, including management fees, distribution and/or service (12b-1) fees, if any, and other Fund expenses. This Example is intended to help you understand your ongoing costs of investing in the Fund and to compare these costs with the ongoing costs of investing in other funds.
The Example is based on an investment of $1,000 invested at the beginning of the period and held through the six-month period ended July 31, 2023.
Actual Expenses
The first line in the following table provides information about actual account values and actual expenses. You may use the information in this line, together with the amount you invested, to estimate the expenses that you paid over the period. Simply divide your account value by $1,000 (for example, an $8,600 account value divided by $1,000 = 8.6), then multiply the result by the number in the first line under the heading entitled “Expenses Paid During the Six-Month Period” to estimate the expenses you paid on your account during this six-month period.
Hypothetical Example for Comparison Purposes
The second line in the following table provides information about hypothetical account values and hypothetical expenses based on the Fund’s actual expense ratio and an assumed rate of return of 5% per year before expenses, which is not the Fund’s actual return. The hypothetical account values and expenses may not be used to estimate the actual ending account balance or expenses you paid for the period. You may use this information to compare the ongoing costs of investing in the Fund and other funds. To do so, compare this 5% hypothetical example with the 5% hypothetical examples that appear in the shareholder reports of the other funds.
Please note that the expenses shown in the table are meant to highlight your ongoing costs only and do not reflect any transactional costs such as brokerage commissions. Therefore, the second line in the table is useful in comparing ongoing costs only, and will not help you determine the relative total costs of owning different funds. In addition, if these transactional costs were included, your costs would have been higher.
| | Beginning
Account Value
February 1, 2023 | Ending
Account Value
July 31, 2023 | Annualized
Expense Ratio
Based on the
Six-Month
Period | Expenses Paid
During the
Six-Month
Period (a) |
| First Trust Merger Arbitrage ETF (MARB) |
| Actual | $1,000.00 | $997.30 | 1.79% | $8.86 |
| Hypothetical (5% return before expenses) | $1,000.00 | $1,015.92 | 1.79% | $8.95 |
| (a) | Expenses are equal to the annualized expense ratios as indicated in the table multiplied by the average account value over the period (February 1, 2023 through July 31, 2023), multiplied by 181/365 (to reflect the six-month period). |
First Trust Merger Arbitrage ETF (MARB)
Portfolio of Investments
July 31, 2023
| Shares | | Description | | Value |
| COMMON STOCKS – 66.9% |
| | | Banks – 2.8% | | |
| 128,824 | | Lakeland Bancorp, Inc. | | $1,946,531 |
| | | Biotechnology – 7.9% | | |
| 43,869 | | Chinook Therapeutics, Inc. (a) | | 1,718,788 |
| 36,894 | | Horizon Therapeutics PLC (a) (b) | | 3,699,361 |
| | | | | 5,418,149 |
| | | Capital Markets – 6.2% | | |
| 81,198 | | Focus Financial Partners, Inc., Class A (a) (b) | | 4,249,091 |
| | | Consumer Staples
Distribution & Retail – 5.4% | | |
| 169,889 | | Albertsons Cos., Inc., Class A (b) | | 3,691,688 |
| | | Diversified Telecommunication
Services – 3.8% | | |
| 174,929 | | Radius Global Infrastructure, Inc., Class A (a) | | 2,608,191 |
| | | Electronic Equipment,
Instruments & Components – 3.1% | | |
| 35,878 | | National Instruments Corp. | | 2,116,802 |
| | | Health Care Providers &
Services – 4.5% | | |
| 34,134 | | Amedisys, Inc. (a) | | 3,100,733 |
| | | Household Durables – 2.0% | | |
| 34,698 | | iRobot Corp. (a) (b) | | 1,387,920 |
| | | Insurance – 3.5% | | |
| 81,725 | | Argo Group International Holdings Ltd. (b) | | 2,427,232 |
| | | Life Sciences Tools &
Services – 5.0% | | |
| 81,691 | | Syneos Health, Inc. (a) | | 3,464,515 |
| | | Machinery – 3.1% | | |
| 38,236 | | CIRCOR International, Inc. (a) | | 2,129,745 |
| | | Media – 2.7% | | |
| 111,742 | | TEGNA, Inc. (b) | | 1,888,440 |
| | | Oil, Gas & Consumable Fuels – 3.1% | | |
| 24,681 | | Denbury, Inc. (a) | | 2,169,707 |
| | | Pharmaceuticals – 3.1% | | |
| 45,854 | | DICE Therapeutics, Inc. (a) | | 2,155,138 |
| | | Software – 3.8% | | |
| 126,635 | | ForgeRock, Inc., Class A (a) (b) | | 2,615,013 |
| | | Specialty Retail – 2.8% | | |
| 65,421 | | Franchise Group, Inc. | | 1,946,929 |
| Shares | | Description | | Value |
|
| | | Trading Companies &
Distributors – 4.1% | | |
| 78,305 | | Univar Solutions, Inc. (a) | | $2,829,943 |
| | | Total Common Stocks | | 46,145,767 |
| | | (Cost $47,556,232) | | |
| Units | | Description | | Value |
| MASTER LIMITED PARTNERSHIPS – 3.6% |
| | | Oil, Gas & Consumable Fuels – 3.6% | | |
| 37,744 | | Magellan Midstream Partners, L.P. | | 2,501,295 |
| | | (Cost $2,442,241) | | |
| Shares | | Description | | Value |
| REAL ESTATE INVESTMENT TRUSTS – 2.9% |
| | | Specialized REITs – 2.9% | | |
| 14,372 | | Extra Space Storage, Inc. | | 2,005,900 |
| | | (Cost $2,139,757) | | |
| RIGHTS – 0.0% |
| | | Pharmaceuticals – 0.0% | | |
| 7,137 | | Contra Abiomed, Inc., expiring December 31, 2029 (a) (c) (d) (e) | | 0 |
| | | (Cost $0) | | |
| | | Total Investments – 73.4% | | 50,652,962 |
| | | (Cost $52,138,230) | | |
| COMMON STOCKS SOLD SHORT – (8.6)% |
| | | Banks – (2.9)% | | |
| (107,160) | | Provident Financial Services, Inc. | | (1,986,746) |
| | | Oil, Gas & Consumable Fuels – (5.7)% | | |
| (20,789) | | Exxon Mobil Corp. | | (2,229,413) |
| (25,176) | | ONEOK, Inc. | | (1,687,799) |
| | | | | (3,917,212) |
| | | Total Common Stocks Sold Short | | (5,903,958) |
| | | (Proceeds $6,259,226) | | |
REAL ESTATE INVESTMENT TRUSTS SOLD SHORT –
(2.9)% |
| | | Specialized REITs – (2.9)% | | |
| (14,374) | | Extra Space Storage, Inc. | | (2,006,179) |
| | | (Proceeds $2,168,009) | | |
| | | Total Investments Sold Short – (11.5)% | | (7,910,137) |
| | | (Proceeds $8,427,235) | | |
| | | Net Other Assets and Liabilities – 38.1% | | 26,251,899 |
| | | Net Assets – 100.0% | | $68,994,724 |
See Notes to Financial Statements
Page 9
First Trust Merger Arbitrage ETF (MARB)
Portfolio of Investments (Continued)
July 31, 2023
| (a) | Non-income producing security. |
| (b) | This security or a portion of this security is segregated as collateral for investments sold short. At July 31, 2023, the segregated value of these securities amounts to $12,780,602. |
| (c) | This security is fair valued by the Advisor’s Pricing Committee in accordance with procedures approved by the Trust’s Board of Trustees, and in accordance with the provisions of the Investment Company Act of 1940 and rules thereunder, as amended. At July 31, 2023, securities noted as such are valued at $0 or 0.0% of net assets. |
| (d) | Pursuant to procedures adopted by the Trust’s Board of Trustees, this security has been determined to be illiquid by First Trust Advisors L.P., the Fund’s advisor. |
| (e) | This security’s value was determined using significant unobservable inputs (see Note 2A – Portfolio Valuation in the Notes to Financial Statements). |
Valuation Inputs
A summary of the inputs used to value the Fund’s investments as of July 31, 2023 is as follows (see Note 2A - Portfolio Valuation in the Notes to Financial Statements):
| ASSETS TABLE |
| | Total
Value at
7/31/2023 | Level 1
Quoted
Prices | Level 2
Significant
Observable
Inputs | Level 3
Significant
Unobservable
Inputs |
| Common Stocks* | $ 46,145,767 | $ 46,145,767 | $ — | $ — |
| Master Limited Partnerships* | 2,501,295 | 2,501,295 | — | — |
| Real Estate Investment Trusts* | 2,005,900 | 2,005,900 | — | — |
| Rights* | —** | — | — | —** |
| Total Investments | $ 50,652,962 | $ 50,652,962 | $— | $—** |
| |
| LIABILITIES TABLE |
| | Total
Value at
7/31/2023 | Level 1
Quoted
Prices | Level 2
Significant
Observable
Inputs | Level 3
Significant
Unobservable
Inputs |
| Common Stocks Sold Short* | $ (5,903,958) | $ (5,903,958) | $ — | $ — |
| Real Estate Investment Trusts Sold Short* | (2,006,179) | (2,006,179) | — | — |
| Total Investments | $ (7,910,137) | $ (7,910,137) | $— | $— |
| * | See Portfolio of Investments for industry breakout. |
| ** | Investment is valued at $0. |
Level 3 investments are fair valued by the Advisor’s Pricing Committee and are footnoted in the Portfolio of Investments. All Level 3 values are based on unobservable inputs.
Page 10
See Notes to Financial Statements
First Trust Merger Arbitrage ETF (MARB)
Statement of Assets and Liabilities
July 31, 2023
| ASSETS: | |
Investments, at value
| $ 50,652,962 |
Cash
| 9,781,193 |
Restricted Cash
| 13,651,696 |
| Receivables: | |
Investment securities sold
| 2,864,446 |
Margin interest rebate
| 38,189 |
Dividends
| 20,978 |
Total Assets
| 77,009,464 |
| LIABILITIES: | |
Investments sold short, at value (proceeds $8,427,235)
| 7,910,137 |
| Payables: | |
Investment advisory fees
| 80,560 |
Dividends on investments sold short
| 24,043 |
Total Liabilities
| 8,014,740 |
NET ASSETS
| $68,994,724 |
| NET ASSETS consist of: | |
Paid-in capital
| $ 69,193,033 |
Par value
| 34,500 |
Accumulated distributable earnings (loss)
| (232,809) |
NET ASSETS
| $68,994,724 |
NET ASSET VALUE, per share
| $20.00 |
Number of shares outstanding (unlimited number of shares authorized, par value $0.01 per share)
| 3,450,002 |
Investments, at cost
| $52,138,230 |
See Notes to Financial Statements
Page 11
First Trust Merger Arbitrage ETF (MARB)
Statement of Operations
For the Year Ended July 31, 2023
| INVESTMENT INCOME: | |
Interest
| $ 1,073,760 |
Dividends
| 1,015,497 |
Margin interest rebate
| 398,345 |
Other
| 200 |
Total investment income
| 2,487,802 |
| EXPENSES: | |
Investment advisory fees
| 1,046,930 |
Dividend expense on investments sold short
| 461,144 |
Total expenses
| 1,508,074 |
NET INVESTMENT INCOME (LOSS)
| 979,728 |
| NET REALIZED AND UNREALIZED GAIN (LOSS): | |
| Net realized gain (loss) on: | |
Investments
| 852,867 |
In-kind redemptions
| (242,502) |
Investments sold short
| 141,374 |
Net realized gain (loss)
| 751,739 |
| Net change in unrealized appreciation (depreciation) on: | |
Investments
| (1,836,720) |
Investments sold short
| 687,613 |
Net change in unrealized appreciation (depreciation)
| (1,149,107) |
NET REALIZED AND UNREALIZED GAIN (LOSS)
| (397,368) |
NET INCREASE (DECREASE) IN NET ASSETS RESULTING FROM OPERATIONS
| $ 582,360 |
Page 12
See Notes to Financial Statements
First Trust Merger Arbitrage ETF (MARB)
Statements of Changes in Net Assets
| | Year
Ended
7/31/2023 | | Year
Ended
7/31/2022 |
| OPERATIONS: | | | |
Net investment income (loss)
| $ 979,728 | | $ (171,542) |
Net realized gain (loss)
| 751,739 | | 237,811 |
Net change in unrealized appreciation (depreciation)
| (1,149,107) | | 381,649 |
Net increase (decrease) in net assets resulting from operations
| 582,360 | | 447,918 |
| DISTRIBUTIONS TO SHAREHOLDERS FROM: | | | |
Investment operations
| (1,115,075) | | — |
| SHAREHOLDER TRANSACTIONS: | | | |
Proceeds from shares sold
| 80,588,123 | | 41,694,635 |
Cost of shares redeemed
| (55,091,737) | | (8,863,931) |
Net increase (decrease) in net assets resulting from shareholder transactions
| 25,496,386 | | 32,830,704 |
Total increase (decrease) in net assets
| 24,963,671 | | 33,278,622 |
| NET ASSETS: | | | |
Beginning of period
| 44,031,053 | | 10,752,431 |
End of period
| $68,994,724 | | $44,031,053 |
| CHANGES IN SHARES OUTSTANDING: | | | |
Shares outstanding, beginning of period
| 2,200,002 | | 550,002 |
Shares sold
| 4,000,000 | | 2,100,000 |
Shares redeemed
| (2,750,000) | | (450,000) |
Shares outstanding, end of period
| 3,450,002 | | 2,200,002 |
See Notes to Financial Statements
Page 13
First Trust Merger Arbitrage ETF (MARB)
Financial Highlights
For a share outstanding throughout each period
| | Year Ended | | Period
Ended
7/31/2020 (a) |
| 7/31/2023 | | 7/31/2022 | | 7/31/2021 | |
Net asset value, beginning of period
| $ 20.01 | | $ 19.55 | | $ 19.46 | | $ 20.01 |
| Income from investment operations: | | | | | | | |
Net investment income (loss)
| 0.23 (b) | | (0.24) (b) | | (0.26) | | (0.07) |
Net realized and unrealized gain (loss)
| 0.01 (c) | | 0.70 | | 0.35 | | (0.48) |
Total from investment operations
| 0.24 | | 0.46 | | 0.09 | | (0.55) |
| Distributions paid to shareholders from: | | | | | | | |
Net investment income
| (0.15) | | — | | — | | — |
Net realized gain
| (0.10) | | — | | — | | — |
Total distributions
| (0.25) | | — | | — | | — |
Net asset value, end of period
| $20.00 | | $20.01 | | $19.55 | | $19.46 |
Total return (d)
| 1.17% | | 2.35% | | 0.46% | | (2.75)% |
| Ratios to average net assets/supplemental data: | | | | | | | |
Net assets, end of period (in 000’s)
| $ 68,995 | | $ 44,031 | | $ 10,752 | | $ 12,649 |
Ratio of total expenses to average net assets
| 1.80% | | 1.87% | | 2.23% | | 2.30% (e) |
Ratio of total expenses to average net assets excluding dividend expense and margin interest expense
| 1.25% | | 1.25% | | 1.25% | | 1.25% (e) |
Ratio of net investment income (loss) to average net assets
| 1.17% | | (1.23)% | | (1.15)% | | (1.71)% (e) |
Portfolio turnover rate (f)
| 367% | | 246% | | 280% | | 137% |
| (a) | Inception date is February 4, 2020, which is consistent with the commencement of investment operations and is the date the initial creation units were established. |
| (b) | Based on average shares outstanding. |
| (c) | The per share amount does not correlate with the aggregate realized and unrealized gain (loss) due to the timing of the Fund share sales and repurchases in relation to market value fluctuation of the underlying investments. |
| (d) | Total return is calculated assuming an initial investment made at the net asset value at the beginning of the period, reinvestment of all distributions at net asset value during the period, and redemption at net asset value on the last day of the period. The returns presented do not reflect the deduction of taxes that a shareholder would pay on Fund distributions or the redemption or sale of Fund shares. Total return is calculated for the time period presented and is not annualized for periods of less than a year. |
| (e) | Annualized. |
| (f) | Portfolio turnover is calculated for the time period presented and is not annualized for periods of less than a year and does not include securities received or delivered from processing creations or redemptions and in-kind transactions. |
Notes to Financial Statements
First Trust Merger Arbitrage ETF (MARB)
July 31, 2023
1. Organization
First Trust Exchange-Traded Fund III (the “Trust”) is an open-end management investment company organized as a Massachusetts business trust on January 9, 2008, and is registered with the Securities and Exchange Commission under the Investment Company Act of 1940, as amended (the “1940 Act”).
The Trust currently consists of seventeen funds that are offering shares. This report covers the First Trust Merger Arbitrage ETF (the “Fund”), a diversified series of the Trust, which trades under the ticker “MARB” on NYSE Arca, Inc. The Fund represents a separate series of beneficial interest in the Trust. Unlike conventional mutual funds, the Fund issues and redeems shares on a continuous basis, at net asset value (“NAV”), only in large blocks of shares known as “Creation Units.”
The Fund is an actively managed exchange-traded fund. The investment objective of the Fund is to seek to provide investors with capital appreciation. Under normal market conditions, the Fund seeks to achieve its investment objective by establishing long and short positions in the equity securities of companies that are involved in a publicly-announced significant corporate event, such as a merger or acquisition. The Fund’s portfolio may include equity securities issued by U.S. and non-U.S. companies, including American Depositary Receipts, and derivatives, including total return swaps. The Fund may invest in securities issued by small, mid and large capitalization issuers.
2. Significant Accounting Policies
The Fund is considered an investment company and follows accounting and reporting guidance under Financial Accounting Standards Board Accounting Standards Codification Topic 946, “Financial Services-Investment Companies.” The following is a summary of significant accounting policies consistently followed by the Fund in the preparation of the financial statements. The preparation of the financial statements in accordance with accounting principles generally accepted in the United States of America (“U.S. GAAP”) requires management to make estimates and assumptions that affect the reported amounts and disclosures in the financial statements. Actual results could differ from those estimates.
A. Portfolio Valuation
The Fund’s NAV is determined daily as of the close of regular trading on the New York Stock Exchange (“NYSE”), normally 4:00 p.m. Eastern time, on each day the NYSE is open for trading. If the NYSE closes early on a valuation day, the NAV is determined as of that time. Foreign securities are priced using data reflecting the earlier closing of the principal markets for those securities. The Fund’s NAV is calculated by dividing the value of all assets of the Fund (including accrued interest and dividends), less all liabilities (including accrued expenses and dividends declared but unpaid), by the total number of shares outstanding.
The Fund’s investments are valued daily at market value or, in the absence of market value with respect to any portfolio securities, at fair value. Market value prices represent readily available market quotations such as last sale or official closing prices from a national or foreign exchange (i.e., a regulated market) and are primarily obtained from third-party pricing services. Fair value prices represent any prices not considered market value prices and are either obtained from a third-party pricing service or are determined by the Pricing Committee of the Fund’s investment advisor, First Trust Advisors L.P. (“First Trust” or the “Advisor”), in accordance with valuation procedures approved by the Trust’s Board of Trustees, and in accordance with provisions of the 1940 Act and rules thereunder. Investments valued by the Advisor’s Pricing Committee, if any, are footnoted as such in the footnotes to the Portfolio of Investments. The Fund’s investments are valued as follows:
Common stocks, master limited partnerships (“MLPs”), real estate investment trusts (“REITs”), and other equity securities listed on any national or foreign exchange (excluding The Nasdaq Stock Market LLC (“Nasdaq”) and the London Stock Exchange Alternative Investment Market (“AIM”)) are valued at the last sale price on the exchange on which they are principally traded or, for Nasdaq and AIM securities, the official closing price. Securities traded on more than one securities exchange are valued at the last sale price or official closing price, as applicable, at the close of the securities exchange representing the primary exchange for such securities.
Equity securities traded in an over-the-counter market are valued at the close price or the last trade price.
Certain securities may not be able to be priced by pre-established pricing methods. Such securities may be valued by the Advisor’s Pricing Committee at fair value. These securities generally include, but are not limited to, restricted securities (securities which may not be publicly sold without registration under the Securities Act of 1933, as amended) for which a third-party pricing service is unable to provide a market price; securities whose trading has been formally suspended; a security whose market or fair value price is not available from a pre-established pricing source; a security with respect to which an event has occurred that is likely to materially affect the value of the security after the market has closed but before the calculation of the Fund’s NAV or make it difficult or impossible to obtain a reliable market quotation; and a security whose price, as provided by the third-party pricing service, does not reflect the security’s fair value. As a general principle, the current fair value of a security would appear to be the amount which the owner might
Notes to Financial Statements (Continued)
First Trust Merger Arbitrage ETF (MARB)
July 31, 2023
reasonably expect to receive for the security upon its current sale. When fair value prices are used, generally they will differ from market quotations or official closing prices on the applicable exchanges. A variety of factors may be considered in determining the fair value of such securities, including, but not limited to, the following:
| 1) | the last sale price on the exchange on which they are principally traded or, for Nasdaq and AIM securities, the official closing price; |
| 2) | the type of security; |
| 3) | the size of the holding; |
| 4) | the initial cost of the security; |
| 5) | transactions in comparable securities; |
| 6) | price quotes from dealers and/or third-party pricing services; |
| 7) | relationships among various securities; |
| 8) | information obtained by contacting the issuer, analysts, or the appropriate stock exchange; |
| 9) | an analysis of the issuer’s financial statements; |
| 10) | the existence of merger proposals or tender offers that might affect the value of the security; and |
| 11) | other relevant factors. |
The Fund is subject to fair value accounting standards that define fair value, establish the framework for measuring fair value and provide a three-level hierarchy for fair valuation based upon the inputs to the valuation as of the measurement date. The three levels of the fair value hierarchy are as follows:
| • | Level 1 – Level 1 inputs are quoted prices in active markets for identical investments. An active market is a market in which transactions for the investment occur with sufficient frequency and volume to provide pricing information on an ongoing basis. |
| • | Level 2 – Level 2 inputs are observable inputs, either directly or indirectly, and include the following: |
| o | Quoted prices for similar investments in active markets. |
| o | Quoted prices for identical or similar investments in markets that are non-active. A non-active market is a market where there are few transactions for the investment, the prices are not current, or price quotations vary substantially either over time or among market makers, or in which little information is released publicly. |
| o | Inputs other than quoted prices that are observable for the investment (for example, interest rates and yield curves observable at commonly quoted intervals, volatilities, prepayment speeds, loss severities, credit risks, and default rates). |
| o | Inputs that are derived principally from or corroborated by observable market data by correlation or other means. |
| • | Level 3 – Level 3 inputs are unobservable inputs. Unobservable inputs may reflect the reporting entity’s own assumptions about the assumptions that market participants would use in pricing the investment. |
The inputs or methodologies used for valuing investments are not necessarily an indication of the risk associated with investing in those investments. A summary of the inputs used to value the Fund’s investments as of July 31, 2023, is included with the Fund’s Portfolio of Investments.
B. Securities Transactions and Investment Income
Securities transactions are recorded as of the trade date. Realized gains and losses from securities transactions are recorded on the identified cost basis. Dividend income is recorded on the ex-dividend date. Interest income, if any, is recorded daily on the accrual basis.
Distributions received from the Fund’s investments in REITs may be comprised of return of capital, capital gains, and income. The actual character of the amounts received during the year are not known until after the REITs’ fiscal year end. The Fund records the character of distributions received from the REITs during the year based on estimates available. The characterization of distributions received by the Fund may be subsequently revised based on information received from the REITs after their tax reporting periods conclude.
C. Short Sales
Short sales are utilized for investment and risk management purposes and are transactions in which securities or other instruments (such as options, forwards, futures or other derivative contracts) are sold by the Fund, but are not currently owned in the Fund’s portfolio. When the Fund engages in a short sale, the Fund must borrow the security sold short and deliver the security to the counterparty. Short selling allows the Fund to profit from a decline in a market price to the extent such decline exceeds the transaction
Notes to Financial Statements (Continued)
First Trust Merger Arbitrage ETF (MARB)
July 31, 2023
costs and the costs of borrowing the securities. The Fund will pay a fee or premium to borrow the securities sold short and is obligated to repay the lenders of the securities. Any dividends or interest that accrues on the securities during the period of the loan are due to the lenders. A gain, limited to the price at which the security was sold short, or a loss, unlimited in size, will be recognized upon the termination of the short sale; which is affected by the Fund purchasing the security sold short and delivering the security to the lender. Any such gain or loss may be offset, completely or in part, by the change in the value of the long portion of the Fund’s portfolio. The Fund is subject to the risk that it may be unable to reacquire a security to terminate a short position except at a price substantially in excess of the last quoted price. Also, there is the risk that the counterparty to a short sale may fail to honor its contractual terms, causing a loss to the Fund.
The Fund has established an account with BNP Paribas Prime Brokerage International, Ltd. for the purpose of borrowing securities that the Fund intends to sell short. The Fund is charged interest on debit margin balances at a rate equal to the Overnight Bank Funding Rate plus 85 basis points. With regard to securities held short, the Fund is credited a rebate equal to the market value of its short positions at a rate equal to the Overnight Bank Funding Rate less 35 basis points. This rebate rate applies to easy to borrow securities. Securities that are hard to borrow may earn a rebate that is less than the foregoing or may be subject to a premium charge on a security by security basis. The different rebate rate is determined at the time of a short sale request. For the fiscal year ended July 31, 2023, the Fund had margin interest rebate of $398,345 as shown on the Statement of Operations. Restricted cash in the amount of $13,651,696, as shown on the Statement of Assets and Liabilities, is associated with collateral at the broker as of July 31, 2023.
D. Dividends and Distributions to Shareholders
Dividends from net investment income, if any, are declared and paid quarterly by the Fund, or as the Board of Trustees may determine from time to time. Distributions of net realized capital gains earned by the Fund, if any, are distributed at least annually. The Fund may also designate a portion of the amount paid to redeeming shareholders as a distribution for tax purposes.
Distributions from net investment income and realized capital gains are determined in accordance with federal income tax regulations, which may differ from U.S. GAAP. Certain capital accounts in the financial statements are periodically adjusted for permanent differences in order to reflect their tax character. These permanent differences are primarily due to the varying treatment of income and gain/loss on portfolio securities held by the Fund and have no impact on net assets or NAV per share. Temporary differences, which arise from recognizing certain items of income, expense and gain/loss in different periods for financial statement and tax purposes, will reverse at some time in the future.
The tax character of distributions paid by the Fund during the fiscal year ended July 31, 2023, was as follows:
| Distributions paid from: | 2023 |
Ordinary income
| $1,115,075 |
Capital gains
| — |
Return of capital
| — |
No distributions were paid by the Fund during the fiscal year ended July 31, 2022.
As of July 31, 2023, the components of distributable earnings on a tax basis were as follows:
Undistributed ordinary income
| $832,373 |
Accumulated capital and other gain (loss)
| — |
Net unrealized appreciation (depreciation)
| (1,065,182) |
E. Income Taxes
The Fund intends to continue to qualify as a regulated investment company by complying with the requirements under Subchapter M of the Internal Revenue Code of 1986, as amended, which includes distributing substantially all of its net investment income and net realized gains to shareholders. Accordingly, no provision has been made for federal and state income taxes. However, due to the timing and amount of distributions, the Fund may be subject to an excise tax of 4% of the amount by which approximately 98% of the Fund’s taxable income exceeds the distributions from such taxable income for the calendar year.
The Fund is subject to accounting standards that establish a minimum threshold for recognizing, and a system for measuring, the benefits of a tax position taken or expected to be taken in a tax return. Taxable period ended 2020 and taxable years ended 2021, 2022, and 2023 remain open to federal and state audit. As of July 31, 2023, management has evaluated the application of these standards to the Fund and has determined that no provision for income tax is required in the Fund’s financial statements for uncertain tax positions.
Notes to Financial Statements (Continued)
First Trust Merger Arbitrage ETF (MARB)
July 31, 2023
The Fund intends to utilize provisions of the federal income tax laws, which allow it to carry a realized capital loss forward indefinitely following the year of the loss and offset such loss against any future realized capital gains. The Fund is subject to certain limitations under U.S. tax rules on the use of capital loss carryforwards and net unrealized built-in losses. These limitations apply when there has been a 50% change in ownership. At July 31, 2023, for federal income tax purposes, the Fund had no capital loss carryforwards available, to offset future capital gains.
During the fiscal year ended July 31, 2023, the Fund utilized $49,480 of capital loss carryforwards.
In order to present paid-in capital and accumulated distributable earnings (loss) (which consists of accumulated net investment income (loss), accumulated net realized gain (loss) on investments and net unrealized appreciation (depreciation) on investments) on the Statement of Assets and Liabilities that more closely represent their tax character, certain adjustments have been made to paid-in capital, accumulated net investment income (loss) and accumulated net realized gain (loss) on investments. These adjustments are primarily due to the difference between book and tax treatments of income and gains on various investment securities held by the Fund and in-kind transactions. The results of operations and net assets were not affected by these adjustments. For the fiscal year ended July 31, 2023, the adjustments for the Fund were as follows:
Accumulated
Net Investment
Income (Loss) | | Accumulated
Net Realized
Gain (Loss)
on Investments | | Paid-in
Capital |
| $(31,408) | | $297,417 | | $(266,009) |
As of July 31, 2023, the aggregate cost, gross unrealized appreciation, gross unrealized depreciation, and net unrealized appreciation/(depreciation) on investments (including short positions and derivatives, if any) for federal income tax purposes were as follows:
| Tax Cost | | Gross
Unrealized
Appreciation | | Gross
Unrealized
(Depreciation) | | Net Unrealized
Appreciation
(Depreciation) |
| $43,808,007 | | $1,294,854 | | $(2,360,036) | | $(1,065,182) |
F. Expenses
Expenses, other than the investment advisory fee, dividend and interest expenses on investments sold short and other excluded expenses, are paid by the Advisor (See Note 3).
3. Investment Advisory Fee, Affiliated Transactions and Other Fee Arrangements
First Trust, the investment advisor to the Fund, is a limited partnership with one limited partner, Grace Partners of DuPage L.P., and one general partner, The Charger Corporation. The Charger Corporation is an Illinois corporation controlled by James A. Bowen, Chief Executive Officer of First Trust. First Trust is responsible for supervising the selection and ongoing monitoring of the securities in the Fund’s portfolio, managing the Fund’s business affairs and providing certain administrative services necessary for the management of the Fund.
Pursuant to an investment management agreement between First Trust and the Trust, on behalf of the Fund (the “Investment Management Agreement”), First Trust oversees First Trust Capital Management L.P.’s (“First Trust Capital Management” or the “Sub-Advisor”) management of the Fund’s assets. First Trust is responsible for the expenses of the Fund including the cost of transfer agency, custody, fund administration, legal, audit and other services, but excluding fee payments under the Investment Management Agreement, interest, taxes, acquired fund fees and expenses, if any, brokerage commissions and other expenses connected with the execution of portfolio transactions, expenses associated with short sales transactions, distribution and service fees pursuant to a Rule 12b-1 plan, if any, and extraordinary expenses. First Trust also provides fund reporting services to the Fund for a flat annual fee in the amount of $9,250, which is covered under the annual unitary management fee. Effective November 1, 2022, the annual unitary management fee payable by the Fund to First Trust for these services will be reduced at certain levels of the Fund’s net assets (“breakpoints”) and calculated pursuant to the following schedule:
Notes to Financial Statements (Continued)
First Trust Merger Arbitrage ETF (MARB)
July 31, 2023
| Breakpoints | | | | | | | |
| Fund net assets up to and including $2.5 billion | 1.25000% | | | | | | |
| Fund net assets greater than $2.5 billion up to and including $5 billion | 1.21875% | | | | | | |
| Fund net assets greater than $5 billion up to and including $7.5 billion | 1.18750% | | | | | | |
| Fund net assets greater than $7.5 billion up to and including $10 billion | 1.15625% | | | | | | |
| Fund net assets greater than $10 billion | 1.12500% | | | | | | |
Prior to November 1, 2022, the Fund agreed to pay First Trust an annual unitary management fee equal to 1.25% of its average daily net assets.
In connection with the introduction of the breakpoints discussed above, the Fund’s investment sub-advisory agreement was amended to reflect that the investment sub-advisory fee paid to First Trust Capital Management, the Fund’s investment sub-advisor, is based on First Trust’s management fee. Accordingly, during any period in which First Trust’s management fee is reduced in accordance with the breakpoints described above, the investment sub-advisory fee will be reduced to reflect the reduction in First Trust’s management fee.
First Trust Capital Partners, LLC, an affiliate of First Trust, owns a 50% ownership interest in First Trust Capital Management through First Trust Capital Solutions L.P.
The Trust has multiple service agreements with Brown Brothers Harriman & Co. (“BBH”). Under the service agreements, BBH performs custodial, fund accounting, certain administrative services, and transfer agency services for the Fund. As custodian, BBH is responsible for custody of the Fund’s assets. As fund accountant and administrator, BBH is responsible for maintaining the books and records of the Fund’s investments and cash. As transfer agent, BBH is responsible for maintaining shareholder records for the Fund.
Each Trustee who is not an officer or employee of First Trust, any sub-advisor or any of their affiliates (“Independent Trustees”) is paid a fixed annual retainer that is allocated equally among each fund in the First Trust Fund Complex. Each Independent Trustee is also paid an annual per fund fee that varies based on whether the fund is a closed-end or other actively managed fund, a target outcome fund or an index fund.
Additionally, the Lead Independent Trustee and the Chairs of the Audit Committee, Nominating and Governance Committee and Valuation Committee are paid annual fees to serve in such capacities, with such compensation allocated pro rata among each fund in the First Trust Fund Complex based on net assets. Independent Trustees are reimbursed for travel and out-of-pocket expenses in connection with all meetings. The Lead Independent Trustee and Committee Chairs rotate every three years. The officers and “Interested” Trustee receive no compensation from the Trust for acting in such capacities.
4. Purchases and Sales of Securities
For the fiscal year ended July 31, 2023, the cost of purchases and proceeds from sales of investments, excluding short term investments, investments sold short and in-kind transactions were $173,938,701 and $157,844,877, respectively. The cost of purchases to cover short sales and the proceeds of short sales were $27,406,281 and $31,208,997, respectively.
For the fiscal year ended July 31, 2023, the cost of in-kind purchases and proceeds from in-kind sales were $34,322,182 and $25,412,060, respectively. The cost of in-kind purchases to cover short sales and the proceeds from in-kind sales were $0 and $0, respectively.
5. Creations, Redemptions and Transaction Fees
The Fund generally issues and redeems its shares in primary market transactions through a creation and redemption mechanism and does not sell or redeem individual shares. Instead, financial entities known as “Authorized Participants” have contractual arrangements with the Fund or one of the Fund’s service providers to purchase and redeem Fund shares directly with the Fund in large blocks of shares known as “Creation Units.” Prior to the start of trading on every business day, the Fund publishes through the National Securities Clearing Corporation (“NSCC”) the “basket” of securities, cash or other assets that it will accept in exchange for a Creation Unit of the Fund’s shares. An Authorized Participant that wishes to effectuate a creation of the Fund’s shares deposits with the Fund the “basket” of securities, cash or other assets identified by the Fund that day, and then receives the Creation Unit of the Fund’s shares in return for those assets. After purchasing a Creation Unit, the Authorized Participant may continue to hold the Fund’s shares or sell them in the secondary market. The redemption process is the reverse of the purchase process: the Authorized Participant redeems a Creation Unit of the Fund’s shares for a basket of securities, cash or other assets. The combination of the creation and redemption process with secondary market trading in the Fund’s shares and underlying securities provides arbitrage opportunities that are designed to help keep the market price of the Fund’s shares at or close to the NAV per share of the Fund.
Notes to Financial Statements (Continued)
First Trust Merger Arbitrage ETF (MARB)
July 31, 2023
The Fund imposes fees in connection with the purchase of Creation Units. These fees may vary based upon various fact-based circumstances, including, but not limited to, the composition of the securities included in the Creation Unit or the countries in which the transactions are settled. The price for each Creation Unit will equal the daily NAV per share of the Fund times the number of shares in a Creation Unit, plus the fees described above and, if applicable, any operational processing and brokerage costs, transfer fees, stamp taxes and part or all of the spread between the expected bid and offer side of the market related to the securities comprising the creation basket.
The Fund also imposes fees in connection with the redemption of Creation Units. These fees may vary based upon various fact-based circumstances, including, but not limited to, the composition of the securities included in the Creation Unit or the countries in which the transactions are settled. The price received for each Creation Unit will equal the daily NAV per share of the Fund times the number of shares in a Creation Unit, minus the fees described above and, if applicable, any operational processing and brokerage costs, transfer fees, stamp taxes and part or all of the spread between the expected bid and offer side of the market related to the securities comprising the redemption basket. Investors who use the services of a broker or other such intermediary in addition to an Authorized Participant to effect a redemption of a Creation Unit may also be assessed an amount to cover the cost of such services. The redemption fee charged by the Fund will comply with Rule 22c-2 of the 1940 Act which limits redemption fees to no more than 2% of the value of the shares redeemed.
6. Distribution Plan
The Board of Trustees adopted a Distribution and Service Plan pursuant to Rule 12b-1 under the 1940 Act. In accordance with the Rule 12b-1 plan, the Fund is authorized to pay an amount up to 0.25% of its average daily net assets each year to reimburse First Trust Portfolios L.P. (“FTP”), the distributor of the Fund, for amounts expended to finance activities primarily intended to result in the sale of Creation Units or to provide investor services. FTP may also use this amount to compensate securities dealers or other persons that are Authorized Participants for providing distribution assistance, including broker-dealer and shareholder support and educational and promotional services.
No 12b-1 fees are currently paid by the Fund, and pursuant to a contractual arrangement, no 12b-1 fees will be paid any time before November 30, 2024.
7. Indemnification
The Trust, on behalf of the Fund, has a variety of indemnification obligations under contracts with its service providers. The Trust’s maximum exposure under these arrangements is unknown. However, the Trust has not had prior claims or losses pursuant to these contracts and expects the risk of loss to be remote.
8. Other Matters
By operation of law, the Fund now operates as a diversified open-end management investment company as defined in Section 5(b) of the 1940 Act.
9. Subsequent Events
Management has evaluated the impact of all subsequent events on the Fund through the date the financial statements were issued and has determined that there were no subsequent events requiring recognition or disclosure in the financial statements that have not already been disclosed.
Report of Independent Registered Public Accounting Firm
To the Shareholders and the Board of Trustees of First Trust Exchange-Traded Fund III:
Opinion on the Financial Statements and Financial Highlights
We have audited the accompanying statement of assets and liabilities, including the portfolio of investments, of First Trust Merger Arbitrage ETF (the “Fund”), one of the funds constituting the First Trust Exchange-Traded Fund III, as of July 31, 2023, the related statement of operations for the year then ended, the statement of changes in net assets for each of the two years in the period then ended, and the financial highlights for the years ended July 31, 2023, 2022, 2021, and the period from February 4, 2020 (commencement of investment operations) through July 31, 2020, and the related notes. In our opinion, the financial statements and financial highlights present fairly, in all material respects, the financial position of the Fund as of July 31, 2023 and the results of its operations for the year then ended, the changes in its net assets for each of the two years in the period then ended, and the financial highlights for the years ended July 31, 2023, 2022, 2021, and the period from February 4, 2020 (commencement of investment operations) through July 31, 2020 in conformity with accounting principles generally accepted in the United States of America.
Basis for Opinion
These financial statements and financial highlights are the responsibility of the Fund’s management. Our responsibility is to express an opinion on the Fund’s financial statements and financial highlights based on our audits. We are a public accounting firm registered with the Public Company Accounting Oversight Board (United States) (PCAOB) and are required to be independent with respect to the Fund in accordance with the U.S. federal securities laws and the applicable rules and regulations of the Securities and Exchange Commission and the PCAOB.
We conducted our audits in accordance with the standards of the PCAOB. Those standards require that we plan and perform the audit to obtain reasonable assurance about whether the financial statements and financial highlights are free of material misstatement, whether due to error or fraud. The Fund is not required to have, nor were we engaged to perform, an audit of its internal control over financial reporting. As part of our audits, we are required to obtain an understanding of internal control over financial reporting but not for the purpose of expressing an opinion on the effectiveness of the Fund’s internal control over financial reporting. Accordingly, we express no such opinion.
Our audits included performing procedures to assess the risks of material misstatement of the financial statements and financial highlights, whether due to error or fraud, and performing procedures that respond to those risks. Such procedures included examining, on a test basis, evidence regarding the amounts and disclosures in the financial statements and financial highlights. Our audits also included evaluating the accounting principles used and significant estimates made by management, as well as evaluating the overall presentation of the financial statements and financial highlights. Our procedures included confirmation of securities owned as of July 31, 2023, by correspondence with the custodian and brokers; when replies were not received from brokers, we performed other auditing procedures. We believe that our audits provide a reasonable basis for our opinion.
Chicago, Illinois
September 22, 2023
We have served as the auditor of one or more First Trust investment companies since 2001.
Additional Information
First Trust Merger Arbitrage ETF (MARB)
July 31, 2023 (Unaudited)
Proxy Voting Policies and Procedures
A description of the policies and procedures that the Trust uses to determine how to vote proxies and information on how the Fund voted proxies relating to portfolio securities during the most recent 12-month period ended June 30 is available (1) without charge, upon request, by calling (800) 988-5891; (2) on the Fund’s website at www.ftportfolios.com; and (3) on the Securities and Exchange Commission’s (“SEC”) website at www.sec.gov.
Portfolio Holdings
The Fund files portfolio holdings information for each month in a fiscal quarter within 60 days after the end of the relevant fiscal quarter on Form N-PORT. Portfolio holdings information for the third month of each fiscal quarter will be publicly available on the SEC’s website at www.sec.gov. The Fund’s complete schedule of portfolio holdings for the second and fourth quarters of each fiscal year is included in the semi-annual and annual reports to shareholders, respectively, and is filed with the SEC on Form N-CSR. The semi-annual and annual report for the Fund is available to investors within 60 days after the period to which it relates. The Fund’s Forms N-PORT and Forms N-CSR are available on the SEC’s website listed above.
Federal Tax Information
For the taxable year ended July 31, 2023, the following percentage of income dividends paid by the Fund qualifies for the dividends received deduction available to corporations and is hereby designated as qualified dividend income:
| Dividends Received Deduction | | Qualified Dividend Income |
| 41.23% | | 41.23% |
A portion of the ordinary dividends (including short-term capital gains) that the Fund paid to shareholders during the taxable year ended July 31, 2023, may be eligible for the Qualified Business Income (QBI) Deduction under the Internal Revenue Code of 1986, as amended, section 199A for the aggregate dividends the Fund received from the underlying Real Estate Investment Trusts (REITs) it invests in.
Risk Considerations
Risks are inherent in all investing. Certain general risks that may be applicable to a Fund are identified below, but not all of the material risks relevant to each Fund are included in this report and not all of the risks below apply to each Fund. The material risks of investing in each Fund are spelled out in its prospectus, statement of additional information and other regulatory filings. Before investing, you should consider each Fund’s investment objective, risks, charges and expenses, and read each Fund’s prospectus and statement of additional information carefully. You can download each Fund’s prospectus at www.ftportfolios.com or contact First Trust Portfolios L.P. at (800) 621-1675 to request a prospectus, which contains this and other information about each Fund.
Concentration Risk. To the extent that a fund is able to invest a significant percentage of its assets in a single asset class or the securities of issuers within the same country, state, region, industry or sector, an adverse economic, business or political development may affect the value of the fund’s investments more than if the fund were more broadly diversified. A fund that tracks an index will be concentrated to the extent the fund’s corresponding index is concentrated. A concentration makes a fund more susceptible to any single occurrence and may subject the fund to greater market risk than a fund that is more broadly diversified.
Credit Risk. Credit risk is the risk that an issuer of a security will be unable or unwilling to make dividend, interest and/or principal payments when due and the related risk that the value of a security may decline because of concerns about the issuer’s ability to make such payments.
Cyber Security Risk. The funds are susceptible to potential operational risks through breaches in cyber security. A breach in cyber security refers to both intentional and unintentional events that may cause a fund to lose proprietary information, suffer data corruption or lose operational capacity. Such events could cause a fund to incur regulatory penalties, reputational damage, additional compliance costs associated with corrective measures and/or financial loss. In addition, cyber security breaches of a fund’s third-party service providers, such as its administrator, transfer agent, custodian, or sub-advisor, as applicable, or issuers in which the fund invests, can also subject a fund to many of the same risks associated with direct cyber security breaches.
Defined Outcome Funds Risk. To the extent a fund’s investment strategy is designed to deliver returns tied to the price performance of an underlying ETF, an investor may not realize the returns the fund seeks to achieve if that investor does not hold shares for the entire target outcome period. In the event an investor purchases shares after the first day of the target outcome period or sells shares prior to the end of the target outcome period, the buffer that the fund seeks to provide against a decline in the value of the underlying
Additional Information (Continued)
First Trust Merger Arbitrage ETF (MARB)
July 31, 2023 (Unaudited)
ETF may not be available, the enhanced returns that the fund seeks to provide (if any) may not be available and the investor may not participate in a gain in the value of the underlying ETF up to the cap for the investor’s investment period. Additionally, the fund will not participate in gains of the underlying ETF above the cap and a shareholder may lose their entire investment. If the fund seeks enhanced returns, there are certain time periods when the value of the fund may fall faster than the value of the underlying ETF, and it is very unlikely that, on any given day during which the underlying ETF share price increases in value, the fund’s share price will increase at the same rate as the enhanced returns sought by the fund, which is designed for an entire target outcome period. Trading flexible exchange options involves risks different from, or possibly greater than, the risks associated with investing directly in securities, such as less liquidity and correlation and valuation risks. A fund may experience substantial downside from specific flexible exchange option positions and certain positions may expire worthless.
Derivatives Risk. To the extent a fund uses derivative instruments such as futures contracts, options contracts and swaps, the fund may experience losses because of adverse movements in the price or value of the underlying asset, index or rate, which may be magnified by certain features of the derivative. These risks are heightened when a fund’s portfolio managers use derivatives to enhance the fund’s return or as a substitute for a position or security, rather than solely to hedge (or offset) the risk of a position or security held by the fund.
Equity Securities Risk. To the extent a fund invests in equity securities, the value of the fund’s shares will fluctuate with changes in the value of the equity securities. Equity securities prices fluctuate for several reasons, including changes in investors’ perceptions of the financial condition of an issuer or the general condition of the relevant stock market, such as market volatility, or when political or economic events affecting the issuers occur. In addition, common stock prices may be particularly sensitive to rising interest rates, as the cost of capital rises and borrowing costs increase. Equity securities may decline significantly in price over short or extended periods of time, and such declines may occur in the equity market as a whole, or they may occur in only a particular country, company, industry or sector of the market.
ETF Risk. The shares of an ETF trade like common stock and represent an interest in a portfolio of securities. The risks of owning an ETF generally reflect the risks of owning the underlying securities, although lack of liquidity in an ETF could result in it being more volatile and ETFs have management fees that increase their costs. Shares of an ETF trade on an exchange at market prices rather than net asset value, which may cause the shares to trade at a price greater than net asset value (premium) or less than net asset value (discount). In times of market stress, decisions by market makers to reduce or step away from their role of providing a market for an ETF’s shares, or decisions by an ETF’s authorized participants that they are unable or unwilling to proceed with creation and/or redemption orders of an ETF’s shares, could result in shares of the ETF trading at a discount to net asset value and in greater than normal intraday bid-ask spreads.
Fixed Income Securities Risk. To the extent a fund invests in fixed income securities, the fund will be subject to credit risk, income risk, interest rate risk, liquidity risk and prepayment risk. Income risk is the risk that income from a fund’s fixed income investments could decline during periods of falling interest rates. Interest rate risk is the risk that the value of a fund’s fixed income securities will decline because of rising interest rates. Liquidity risk is the risk that a security cannot be purchased or sold at the time desired, or cannot be purchased or sold without adversely affecting the price. Prepayment risk is the risk that the securities will be redeemed or prepaid by the issuer, resulting in lower interest payments received by the fund. In addition to these risks, high yield securities, or “junk” bonds, are subject to greater market fluctuations and risk of loss than securities with higher ratings, and the market for high yield securities is generally smaller and less liquid than that for investment grade securities.
Index or Model Constituent Risk. Certain funds may be a constituent of one or more indices or ETF models. As a result, such a fund may be included in one or more index-tracking exchange-traded funds or mutual funds. Being a component security of such a vehicle could greatly affect the trading activity involving a fund, the size of the fund and the market volatility of the fund. Inclusion in an index could increase demand for the fund and removal from an index could result in outsized selling activity in a relatively short period of time. As a result, a fund’s net asset value could be negatively impacted and the fund’s market price may be significantly below its net asset value during certain periods. In addition, index rebalances may potentially result in increased trading activity in a fund’s shares.
Index Provider Risk. To the extent a fund seeks to track an index, it is subject to Index Provider Risk. There is no assurance that the Index Provider will compile the Index accurately, or that the Index will be determined, maintained, constructed, reconstituted, rebalanced, composed, calculated or disseminated accurately. To correct any such error, the Index Provider may carry out an unscheduled rebalance or other modification of the Index constituents or weightings, which may increase the fund’s costs. The Index Provider does not provide any representation or warranty in relation to the quality, accuracy or completeness of data in the Index, and it does not guarantee that the Index will be calculated in accordance with its stated methodology. Losses or costs associated with any Index Provider errors generally will be borne by the fund and its shareholders.
Additional Information (Continued)
First Trust Merger Arbitrage ETF (MARB)
July 31, 2023 (Unaudited)
Investment Companies Risk. To the extent a fund invests in the securities of other investment vehicles, the fund will incur additional fees and expenses that would not be present in a direct investment in those investment vehicles. Furthermore, the fund’s investment performance and risks are directly related to the investment performance and risks of the investment vehicles in which the fund invests.
LIBOR Risk. To the extent a fund invests in floating or variable rate obligations that use the London Interbank Offered Rate (“LIBOR”) as a reference interest rate, it is subject to LIBOR Risk. The United Kingdom’s Financial Conduct Authority, which regulates LIBOR has ceased making LIBOR available as a reference rate over a phase-out period that began December 31, 2021. There is no assurance that any alternative reference rate, including the Secured Overnight Financing Rate (“SOFR”) will be similar to or produce the same value or economic equivalence as LIBOR or that instruments using an alternative rate will have the same volume or liquidity. The unavailability or replacement of LIBOR may affect the value, liquidity or return on certain fund investments and may result in costs incurred in connection with closing out positions and entering into new trades. Any potential effects of the transition away from LIBOR on the fund or on certain instruments in which the fund invests can be difficult to ascertain, and they may vary depending on a variety of factors, and they could result in losses to the fund.
Management Risk. To the extent that a fund is actively managed, it is subject to management risk. In managing an actively-managed fund’s investment portfolio, the fund’s portfolio managers will apply investment techniques and risk analyses that may not have the desired result. There can be no guarantee that a fund will meet its investment objective.
Market Risk. Market risk is the risk that a particular security, or shares of a fund in general, may fall in value. Securities held by a fund, as well as shares of a fund itself, are subject to market fluctuations caused by factors such as general economic conditions, political events, regulatory or market developments, changes in interest rates and perceived trends in securities prices. Shares of a fund could decline in value or underperform other investments as a result of the risk of loss associated with these market fluctuations. In addition, local, regional or global events such as war, acts of terrorism, spread of infectious diseases or other public health issues, recessions, or other events could have a significant negative impact on a fund and its investments. Such events may affect certain geographic regions, countries, sectors and industries more significantly than others. In February 2022, Russia invaded Ukraine which has caused and could continue to cause significant market disruptions and volatility within the markets in Russia, Europe, and the United States. The hostilities and sanctions resulting from those hostilities could have a significant impact on certain fund investments as well as fund performance. The COVID-19 global pandemic and the ensuing policies enacted by governments and central banks have caused and may continue to cause significant volatility and uncertainty in global financial markets. While the U.S. has resumed “reasonably” normal business activity, many countries continue to impose lockdown measures. Additionally, there is no guarantee that vaccines will be effective against emerging variants of the disease. These events also adversely affect the prices and liquidity of a fund’s portfolio securities or other instruments and could result in disruptions in the trading markets. Any of such circumstances could have a materially negative impact on the value of a fund’s shares and result in increased market volatility. During any such events, a fund’s shares may trade at increased premiums or discounts to their net asset value and the bid/ask spread on a fund’s shares may widen.
Non-U.S. Securities Risk. To the extent a fund invests in non-U.S. securities, it is subject to additional risks not associated with securities of domestic issuers. Non-U.S. securities are subject to higher volatility than securities of domestic issuers due to: possible adverse political, social or economic developments; restrictions on foreign investment or exchange of securities; capital controls; lack of liquidity; currency exchange rates; excessive taxation; government seizure of assets; the imposition of sanctions by foreign governments; different legal or accounting standards; and less government supervision and regulation of exchanges in foreign countries. Investments in non-U.S. securities may involve higher costs than investments in U.S. securities, including higher transaction and custody costs, as well as additional taxes imposed by non-U.S. governments. These risks may be heightened for securities of companies located, or with significant operations, in emerging market countries.
Operational Risk. Each fund is subject to risks arising from various operational factors, including, but not limited to, human error, processing and communication errors, errors of a fund’s service providers, counterparties or other third-parties, failed or inadequate processes and technology or systems failures. Each fund relies on third-parties for a range of services, including custody. Any delay or failure relating to engaging or maintaining such service providers may affect a fund’s ability to meet its investment objective. Although the funds and the funds’ investment advisor seek to reduce these operational risks through controls and procedures, there is no way to completely protect against such risks.
Passive Investment Risk. To the extent a fund seeks to track an index, the fund will invest in the securities included in, or representative of, the index regardless of their investment merit. A fund generally will not attempt to take defensive positions in declining markets.
Preferred Securities Risk. Preferred securities combine some of the characteristics of both common stocks and bonds. Preferred securities are typically subordinated to bonds and other debt securities in a company’s capital structure in terms of priority to corporate income, subjecting them to greater credit risk than those debt securities. Generally, holders of preferred securities have no voting rights
Additional Information (Continued)
First Trust Merger Arbitrage ETF (MARB)
July 31, 2023 (Unaudited)
with respect to the issuing company unless preferred dividends have been in arrears for a specified number of periods, at which time the preferred security holders may obtain limited rights. In certain circumstances, an issuer of preferred securities may defer payment on the securities and, in some cases, redeem the securities prior to a specified date. Preferred securities may also be substantially less liquid than other securities, including common stock.
Valuation Risk. The valuation of certain securities may carry more risk than that of common stock. Uncertainties in the conditions of the financial markets, unreliable reference data, lack of transparency and inconsistency of valuation models and processes may lead to inaccurate asset pricing. A fund may hold investments in sizes smaller than institutionally sized round lot positions (sometimes referred to as odd lots). However, third-party pricing services generally provide evaluations on the basis of institutionally-sized round lots. If a fund sells certain of its investments in an odd lot transaction, the sale price may be less than the value at which such securities have been held by the fund. Odd lots often trade at lower prices than institutional round lots. There is no assurance that the fund will be able to sell a portfolio security at the price established by the pricing service, which could result in a loss to the fund.
| NOT FDIC INSURED | NOT BANK GUARANTEED | MAY LOSE VALUE |
Advisory and Sub-Advisory Agreements
Board Considerations Regarding Approval of Continuation of Investment Management and Investment Sub-Advisory Agreements
The Board of Trustees of First Trust Exchange-Traded Fund III (the “Trust”), including the Independent Trustees, unanimously approved the continuation of the Investment Management Agreement (the “Advisory Agreement”) with First Trust Advisors L.P. (the “Advisor”) on behalf of the First Trust Merger Arbitrage ETF (the “Fund”) and the Investment Sub-Advisory Agreement (the “Sub-Advisory Agreement” and together with the Advisory Agreement, the “Agreements”) among the Trust, on behalf of the Fund, the Advisor and First Trust Capital Management L.P. (the “Sub-Advisor”). The Board approved the continuation of the Agreements for a one-year period ending June 30, 2024 at a meeting held on June 4–5, 2023. The Board determined that the continuation of the Agreements is in the best interests of the Fund in light of the nature, extent and quality of the services provided and such other matters as the Board considered to be relevant in the exercise of its business judgment.
To reach this determination, the Board considered its duties under the Investment Company Act of 1940, as amended (the “1940 Act”), as well as under the general principles of state law, in reviewing and approving advisory contracts; the requirements of the 1940 Act in such matters; the fiduciary duty of investment advisors with respect to advisory agreements and compensation; the standards used by courts in determining whether investment company boards have fulfilled their duties; and the factors to be considered by the Board in voting on such agreements. At meetings held on April 17, 2023 and June 4–5, 2023, the Board, including the Independent Trustees, reviewed materials provided by the Advisor and the Sub-Advisor responding to requests for information from counsel to the Independent Trustees, submitted on behalf of the Independent Trustees, that, among other things, outlined: the services provided by the Advisor and the Sub-Advisor to the Fund (including the relevant personnel responsible for these services and their experience); the unitary fee rate schedule payable by the Fund as compared to fees charged to a peer group of funds (the “Expense Group”) and a broad peer universe of funds (the “Expense Universe”), each assembled by Broadridge Financial Solutions, Inc. (“Broadridge”), an independent source, and as compared to fees charged to other clients of the Advisor, including other exchange-traded funds (“ETFs”) managed by the Advisor; the sub-advisory fee as compared to fees charged to other clients of the Sub-Advisor; the expense ratio of the Fund as compared to expense ratios of the funds in the Fund’s Expense Group and Expense Universe; performance information for the Fund, including comparisons of the Fund’s performance to that of one or more relevant benchmark indexes and to that of a performance group of funds and a broad performance universe of funds (the “Performance Universe”), each assembled by Broadridge; the nature of expenses incurred in providing services to the Fund and the potential for the Advisor and the Sub-Advisor to realize economies of scale, if any; profitability and other financial data for the Advisor; financial data for the Sub-Advisor; any indirect benefits to the Advisor and its affiliates, First Trust Portfolios L.P. (“FTP”) and First Trust Capital Partners, LLC (“FTCP”), and the Sub-Advisor; and information on the Advisor’s and the Sub-Advisor’s compliance programs. The Board reviewed initial materials with the Advisor at the meeting held on April 17, 2023, prior to which the Independent Trustees and their counsel met separately to discuss the information provided by the Advisor and the Sub-Advisor. Following the April meeting, counsel to the Independent Trustees, on behalf of the Independent Trustees, requested certain clarifications and supplements to the materials provided, and the information provided in response to those requests was considered at an executive session of the Independent Trustees and their counsel held prior to the June 4–5, 2023 meeting, as well as at the June meeting. The Board applied its business judgment to determine whether the arrangements between the Trust and the Advisor and among the Trust, the Advisor and the Sub-Advisor continue to be reasonable business arrangements from the Fund’s perspective. The Board determined that, given the totality of the information provided with respect to the Agreements, the Board had received sufficient information to renew the Agreements. The Board considered that shareholders chose to invest or remain invested in the Fund knowing that the Advisor and the Sub-Advisor manage the Fund and knowing the Fund’s unitary fee.
Additional Information (Continued)
First Trust Merger Arbitrage ETF (MARB)
July 31, 2023 (Unaudited)
In reviewing the Agreements, the Board considered the nature, extent and quality of the services provided by the Advisor and the Sub-Advisor under the Agreements. With respect to the Advisory Agreement, the Board considered that the Advisor is responsible for the overall management and administration of the Trust and the Fund and reviewed all of the services provided by the Advisor to the Fund, including the oversight of the Sub-Advisor, as well as the background and experience of the persons responsible for such services. The Board noted that the Advisor oversees the Sub-Advisor’s day-to-day management of the Fund’s investments, including portfolio risk monitoring and performance review. In reviewing the services provided, the Board noted the compliance program that had been developed by the Advisor and considered that it includes a robust program for monitoring the Advisor’s, the Sub-Advisor’s and the Fund’s compliance with the 1940 Act, as well as the Fund’s compliance with its investment objective, policies and restrictions. The Board also considered a report from the Advisor with respect to its risk management functions related to the operation of the Fund. Finally, as part of the Board’s consideration of the Advisor’s services, the Advisor, in its written materials and at the April 17, 2023 meeting, described to the Board the scope of its ongoing investment in additional personnel and infrastructure to maintain and improve the quality of services provided to the Fund and the other funds in the First Trust Fund Complex. With respect to the Sub-Advisory Agreement, the Board noted that the Fund is an actively-managed ETF and the Sub-Advisor actively manages the Fund’s investments. The Board reviewed the materials provided by the Sub-Advisor and considered the services that the Sub-Advisor provides to the Fund, including the Sub-Advisor’s day-to-day management of the Fund’s investments. In considering the Sub-Advisor’s management of the Fund, the Board noted the background and experience of the Sub-Advisor’s portfolio management team, including the Board’s prior meetings with members of the portfolio management team. In light of the information presented and the considerations made, the Board concluded that the nature, extent and quality of the services provided to the Trust and the Fund by the Advisor and the Sub-Advisor under the Agreements have been and are expected to remain satisfactory and that the Sub-Advisor, under the oversight of the Advisor, has managed the Fund consistent with its investment objective, policies and restrictions.
The Board considered the unitary fee rate schedule payable by the Fund under the Advisory Agreement for the services provided. The Board noted that the sub-advisory fee is paid by the Advisor from the unitary fee. The Board considered that as part of the unitary fee the Advisor is responsible for the Fund’s expenses, including the cost of sub-advisory, transfer agency, custody, fund administration, legal, audit and other services and license fees, if any, but excluding the fee payment under the Advisory Agreement and interest, taxes, brokerage commissions and other expenses connected with the execution of portfolio transactions, distribution and service fees pursuant to a Rule 12b-1 plan, if any, and extraordinary expenses, if any. The Board received and reviewed information showing the fee rates and expense ratios of the peer funds in the Expense Group, as well as advisory and unitary fee rates charged by the Advisor and the Sub-Advisor to other fund (including ETFs) and non-fund clients, as applicable. Because the Fund pays a unitary fee, the Board determined that expense ratios were the most relevant comparative data point. Based on the information provided, the Board noted that the unitary fee rate for the Fund was above the median total (net) expense ratio of the peer funds in the Expense Group. With respect to the Expense Group, the Board, at the April 17, 2023 meeting, discussed with Broadridge its methodology for assembling peer groups and discussed with the Advisor limitations in creating peer groups for actively-managed ETFs, including the limited number of actively-managed ETFs following a merger arbitrage strategy and that the Expense Group contained both actively-managed ETFs and open-end mutual funds, and different business models that may affect the pricing of services among ETF sponsors. The Board also noted that not all peer funds employ an advisor/sub-advisor management structure. The Board took these limitations and differences into account in considering the peer data. With respect to fees charged to other non-ETF clients, the Board considered differences between the Fund and other non-ETF clients that limited their comparability. In considering the unitary fee rate schedule overall, the Board also considered the Advisor’s statement that it seeks to meet investor needs through innovative and value-added investment solutions and the Advisor’s demonstrated long-term commitment to the Fund and the other funds in the First Trust Fund Complex.
The Board considered performance information for the Fund. The Board noted the process it has established for monitoring the Fund’s performance and portfolio risk on an ongoing basis, which includes quarterly performance reporting from the Advisor and the Sub-Advisor for the Fund. The Board determined that this process continues to be effective for reviewing the Fund’s performance. The Board received and reviewed information comparing the Fund’s performance for the one-year period ended December 31, 2022 to the performance of the funds in the Performance Universe and to that of a benchmark index. Based on the information provided, the Board noted that the Fund outperformed the Performance Universe median and the benchmark index for the one-year period ended December 31, 2022.
On the basis of all the information provided on the unitary fee and performance of the Fund and the ongoing oversight by the Board, the Board concluded that the unitary fee for the Fund (out of which the Sub-Advisor is compensated) continues to be reasonable and appropriate in light of the nature, extent and quality of the services provided by the Advisor and the Sub-Advisor to the Fund under the Agreements.
The Board considered information and discussed with the Advisor whether there were any economies of scale in connection with providing advisory services to the Fund at current asset levels and whether the Fund may benefit from any economies of scale. The Board noted that the unitary fee rate schedule for the Fund includes breakpoints pursuant to which the unitary fee rate will be reduced
Additional Information (Continued)
First Trust Merger Arbitrage ETF (MARB)
July 31, 2023 (Unaudited)
as assets of the Fund meet certain thresholds. The Board considered the Advisor’s statement that it believes that its expenses relating to providing advisory services to the Fund will increase during the next twelve months as the Advisor continues to build infrastructure and add new staff. The Board also noted that under the unitary fee structure, any reduction in expenses associated with the management and operations of the Fund would benefit the Advisor, but that the unitary fee structure provides a level of certainty in expenses for shareholders of the Fund. The Board concluded that the unitary fee rate schedule for the Fund reflects an appropriate level of sharing of any economies of scale that may be realized in the management of the Fund at current asset levels. The Board considered the revenues and allocated costs (including the allocation methodology) of the Advisor in serving as investment advisor to the Fund for the twelve months ended December 31, 2022 and the estimated profitability level for the Fund calculated by the Advisor based on such data, as well as complex-wide and product-line profitability data, for the same period. The Board noted the inherent limitations in the profitability analysis and concluded that, based on the information provided, the Advisor’s profitability level for the Fund was not unreasonable. In addition, the Board considered indirect benefits described by the Advisor that may be realized from its relationship with the Fund. The Board noted that FTCP has an ownership interest in the Sub-Advisor and considered potential indirect benefits to the Advisor from such ownership interest. The Board also considered that the Advisor had identified as an indirect benefit to the Advisor and FTP their exposure to investors and brokers who, absent their exposure to the Fund, may have had no dealings with the Advisor or FTP. In addition, the Board considered the Advisor’s compensation for fund reporting services provided to the Fund pursuant to a separate Fund Reporting Services Agreement, which is paid from the unitary fee. The Board concluded that the character and amount of potential indirect benefits to the Advisor were not unreasonable.
The Board considered the Sub-Advisor’s statement that it believes that the sub-advisory fee is appropriate based on expected economies of scale. The Board noted the Sub-Advisor’s statements that the majority of its expenses are fixed and are shared and allocated across various funds advised or sub-advised by the Sub-Advisor and that it has added additional personnel over the past year. The Board noted that the Advisor pays the Sub-Advisor from the unitary fee, that the sub-advisory fee will be reduced consistent with the breakpoints in the unitary fee rate schedule and its understanding that the Fund’s sub-advisory fee was the product of an arm’s length negotiation. The Board did not review the profitability of the Sub-Advisor with respect to the Fund. The Board concluded that the profitability analysis for the Advisor was more relevant. The Board considered the potential indirect benefits to the Sub-Advisor from being associated with the Advisor and the Fund, and noted the Sub-Advisor’s statement that, although it benefits from the name recognition associated with its role as sub-advisor to the Fund, it has not received and does not anticipate receiving any reduction in fees incurred for research or other services as a result of its management of the Fund. The Board also noted the Sub-Advisor’s statement that the Sub-Advisor does not intend to use soft dollars in connection with the Fund. The Board noted the potential indirect benefits to the Sub-Advisor from the ownership interest of FTCP in the Sub-Advisor. The Board concluded that the character and amount of potential indirect benefits to the Sub-Advisor were not unreasonable.
Based on all of the information considered and the conclusions reached, the Board, including the Independent Trustees, unanimously determined that the terms of the Agreements continue to be fair and reasonable and that the continuation of the Agreements is in the best interests of the Fund. No single factor was determinative in the Board’s analysis.
Liquidity Risk Management Program
In accordance with Rule 22e-4 under the Investment Company Act of 1940, as amended (the “1940 Act”), the Fund and each other fund in the First Trust Fund Complex, other than the closed-end funds, have adopted and implemented a liquidity risk management program (the “Program”) reasonably designed to assess and manage the funds’ liquidity risk, i.e., the risk that a fund could not meet requests to redeem shares issued by the fund without significant dilution of remaining investors’ interests in the fund. The Board of Trustees of the First Trust Funds has appointed First Trust Advisors L.P. (the “Advisor”) as the person designated to administer the Program, and in this capacity the Advisor performs its duties primarily through the activities and efforts of the First Trust Liquidity Committee (the “Liquidity Committee”).
Pursuant to the Program, the Liquidity Committee classifies the liquidity of each fund’s portfolio investments into one of the four liquidity categories specified by Rule 22e-4: highly liquid investments, moderately liquid investments, less liquid investments and illiquid investments. The Liquidity Committee determines certain of the inputs for this classification process, including reasonably anticipated trade sizes and significant investor dilution thresholds. The Liquidity Committee also determines and periodically reviews a highly liquid investment minimum for certain funds, monitors the funds’ holdings of assets classified as illiquid investments to seek to ensure they do not exceed 15% of a fund’s net assets and establishes policies and procedures regarding redemptions in kind.
At the April 17, 2023 meeting of the Board of Trustees, as required by Rule 22e-4 and the Program, the Advisor provided the Board with a written report prepared by the Advisor that addressed the operation of the Program during the period from March 17, 2022 through the Liquidity Committee’s annual meeting held on March 23, 2023 and assessed the Program’s adequacy and effectiveness of implementation during this period, including the operation of the highly liquid investment minimum for each fund that is required
Additional Information (Continued)
First Trust Merger Arbitrage ETF (MARB)
July 31, 2023 (Unaudited)
under the Program to have one, and any material changes to the Program. Note that because the Fund primarily holds assets that are highly liquid investments, the Fund has not adopted any highly liquid investment minimum.
As stated in the written report, during the review period, two funds breached the 15% limitation on illiquid investments for one day each, as a result of an unscheduled week-long closure of the stock exchange in Istanbul following devastating earthquakes in February, causing all Turkish equities to be re-classified as “illiquid” for one day. Each fund filed a Form N-RN on the day after the breach occurred, and one day later after the breach was cured. No fund with a highly liquid investment minimum breached that minimum during the reporting period. The Advisor concluded that each fund’s investment strategy is appropriate for an open-end fund; that the Program operated effectively in all material respects during the review period; and that the Program is reasonably designed to assess and manage the liquidity risk of each fund and to maintain compliance with Rule 22e-4.
Board of Trustees
Effective September 10, 2023, the exchange-traded funds, closed-end funds, mutual funds and variable insurance funds (collectively, the “Funds”) advised by First Trust Advisors L.P. (“FTA”) announced the appointment of Ms. Bronwyn Wright as a Trustee of all Funds except the exchange-traded funds included in the First Trust Exchange-Traded Fund and the First Trust Dynamic Europe Equity Income Fund, a closed-end fund. Ms. Wright has acted as an independent director to a number of Irish collective investment funds since 2009. Ms. Wright is a former Managing Director of Citibank Europe plc and Head of Securities and Fund Services for Citi Ireland. In these positions, she was responsible for the management and strategic direction of Citi Ireland’s securities and fund services business which included funds, custody, security finance/lending and global agency and trust. She also had responsibility for leading, managing and growing the Trustee, Custodian and Depositary business in Ireland, the United Kingdom, Luxembourg, Jersey and Cayman.
Board of Trustees and Officers
First Trust Merger Arbitrage ETF (MARB)
July 31, 2023 (Unaudited)
The following tables identify the Trustees and Officers of the Trust. Unless otherwise indicated, the address of all persons is 120 East Liberty Drive, Suite 400, Wheaton, IL 60187.
The Trust’s statement of additional information includes additional information about the Trustees and is available, without charge, upon request, by calling (800) 988-5891.
| Name, Year of Birth and Position with the Trust | Term of Office and Year First Elected or Appointed | Principal Occupations
During Past 5 Years | Number of Portfolios in the First Trust Fund Complex Overseen by Trustee | Other Trusteeships or Directorships Held by Trustee During Past 5 Years |
| INDEPENDENT TRUSTEES |
Richard E. Erickson, Trustee
(1951) | • Indefinite Term
• Since Inception | Physician, Edward-Elmhurst Medical Group; Physician and Officer, Wheaton Orthopedics (1990 to 2021) | 238 | None |
Thomas R. Kadlec, Trustee
(1957) | • Indefinite Term
• Since Inception | Retired; President, ADM Investor Services, Inc. (Futures Commission Merchant) (2010 to July 2022) | 238 | Director, National Futures Association and ADMIS Singapore Ltd.; Formerly, Director of ADM Investor Services, Inc., ADM Investor Services International, ADMIS Hong Kong Ltd., and Futures Industry Association |
Denise M. Keefe, Trustee
(1964) | • Indefinite Term
• Since 2021 | Executive Vice President, Advocate Aurora Health and President, Advocate Aurora Continuing Health Division (Integrated Healthcare System) | 238 | Director and Board Chair of Advocate Home Health Services, Advocate Home Care Products and Advocate Hospice; Director and Board Chair of Aurora At Home (since 2018); Director of Advocate Physician Partners Accountable Care Organization; Director of RML Long Term Acute Care Hospitals; Director of Senior Helpers (since 2021); and Director of MobileHelp (since 2022) |
Robert F. Keith, Trustee
(1956) | • Indefinite Term
• Since Inception | President, Hibs Enterprises (Financial and Management Consulting) | 238 | Formerly, Director of Trust Company of Illinois |
Niel B. Nielson, Trustee
(1954) | • Indefinite Term
• Since Inception | Senior Advisor (2018 to Present), Managing Director and Chief Operating Officer (2015 to 2018), Pelita Harapan Educational Foundation (Educational Products and Services) | 238 | None |
| INTERESTED TRUSTEE |
James A. Bowen(1), Trustee and
Chairman of the Board
(1955) | • Indefinite Term
• Since Inception | Chief Executive Officer, First Trust Advisors L.P. and First Trust Portfolios L.P.; Chairman of the Board of Directors, BondWave LLC (Software Development Company) and Stonebridge Advisors LLC (Investment Advisor) | 238 | None |
| (1) | Mr. Bowen is deemed an “interested person” of the Trust due to his position as CEO of First Trust Advisors L.P., investment advisor of the Trust. |
Board of Trustees and Officers (Continued)
First Trust Merger Arbitrage ETF (MARB)
July 31, 2023 (Unaudited)
| Name and Year of Birth | Position and Offices with Trust | Term of Office and Length of Service | Principal Occupations
During Past 5 Years |
| OFFICERS(2) |
James M. Dykas
(1966) | President and Chief Executive Officer | • Indefinite Term
• Since Inception | Managing Director and Chief Financial Officer, First Trust Advisors L.P. and First Trust Portfolios L.P.; Chief Financial Officer, BondWave LLC (Software Development Company) and Stonebridge Advisors LLC (Investment Advisor) |
Derek D. Maltbie
(1972) | Treasurer, Chief Financial Officer and Chief Accounting Officer | • Indefinite Term
• Since 2023 | Senior Vice President, First Trust Advisors L.P. and First Trust Portfolios L.P., July 2021 to present. Previously, Vice President, First Trust Advisors L.P. and First Trust Portfolios L.P., 2014 to 2021. |
W. Scott Jardine
(1960) | Secretary and Chief Legal Officer | • Indefinite Term
• Since Inception | General Counsel, First Trust Advisors L.P. and First Trust Portfolios L.P.; Secretary and General Counsel, BondWave LLC; Secretary, Stonebridge Advisors LLC |
Daniel J. Lindquist
(1970) | Vice President | • Indefinite Term
• Since Inception | Managing Director, First Trust Advisors L.P. and First Trust Portfolios L.P. |
Kristi A. Maher
(1966) | Chief Compliance Officer and Assistant Secretary | • Indefinite Term
• Since Inception | Deputy General Counsel, First Trust Advisors L.P. and First Trust Portfolios L.P. |
Roger F. Testin
(1966) | Vice President | • Indefinite Term
• Since Inception | Senior Vice President, First Trust Advisors L.P. and First Trust Portfolios L.P. |
Stan Ueland
(1970) | Vice President | • Indefinite Term
• Since Inception | Senior Vice President, First Trust Advisors L.P. and First Trust Portfolios L.P. |
| (2) | The term “officer” means the president, vice president, secretary, treasurer, controller or any other officer who performs a policy making function. |
Privacy Policy
First Trust Merger Arbitrage ETF (MARB)
July 31, 2023 (Unaudited)
Privacy Policy
First Trust values our relationship with you and considers your privacy an important priority in maintaining that relationship. We are committed to protecting the security and confidentiality of your personal information.
Sources of Information
We collect nonpublic personal information about you from the following sources:
| • | Information we receive from you and your broker-dealer, investment professional or financial representative through interviews, applications, agreements or other forms; |
| • | Information about your transactions with us, our affiliates or others; |
| • | Information we receive from your inquiries by mail, e-mail or telephone; and |
| • | Information we collect on our website through the use of “cookies.” For example, we may identify the pages on our website that your browser requests or visits. |
Information Collected
The type of data we collect may include your name, address, social security number, age, financial status, assets, income, tax information, retirement and estate plan information, transaction history, account balance, payment history, investment objectives, marital status, family relationships and other personal information.
Disclosure of Information
We do not disclose any nonpublic personal information about our customers or former customers to anyone, except as permitted by law. In addition to using this information to verify your identity (as required under law), the permitted uses may also include the disclosure of such information to unaffiliated companies for the following reasons:
| • | In order to provide you with products and services and to effect transactions that you request or authorize, we may disclose your personal information as described above to unaffiliated financial service providers and other companies that perform administrative or other services on our behalf, such as transfer agents, custodians and trustees, or that assist us in the distribution of investor materials such as trustees, banks, financial representatives, proxy services, solicitors and printers. |
| • | We may release information we have about you if you direct us to do so, if we are compelled by law to do so, or in other legally limited circumstances (for example to protect your account from fraud). |
In addition, in order to alert you to our other financial products and services, we may share your personal information within First Trust.
Use of Website Analytics
We currently use third party analytics tools, Google Analytics and AddThis, to gather information for purposes of improving First Trust’s website and marketing our products and services to you. These tools employ cookies, which are small pieces of text stored in a file by your web browser and sent to websites that you visit, to collect information, track website usage and viewing trends such as the number of hits, pages visited, videos and PDFs viewed and the length of user sessions in order to evaluate website performance and enhance navigation of the website. We may also collect other anonymous information, which is generally limited to technical and web navigation information such as the IP address of your device, internet browser type and operating system for purposes of analyzing the data to make First Trust’s website better and more useful to our users. The information collected does not include any personal identifiable information such as your name, address, phone number or email address unless you provide that information through the website for us to contact you in order to answer your questions or respond to your requests. To find out how to opt-out of these services click on: Google Analytics and AddThis.
Confidentiality and Security
With regard to our internal security procedures, First Trust restricts access to your nonpublic personal information to those First Trust employees who need to know that information to provide products or services to you. We maintain physical, electronic and procedural safeguards to protect your nonpublic personal information.
Policy Updates and Inquiries
As required by federal law, we will notify you of our privacy policy annually. We reserve the right to modify this policy at any time, however, if we do change it, we will tell you promptly. For questions about our policy, or for additional copies of this notice, please go to www.ftportfolios.com, or contact us at 1-800-621-1675 (First Trust Portfolios) or 1-800-222-6822 (First Trust Advisors).
March 2023
This page intentionally left blank
First Trust Exchange-Traded Fund III
INVESTMENT ADVISOR
First Trust Advisors L.P.
120 East Liberty Drive, Suite 400
Wheaton, IL 60187
INVESTMENT SUB-ADVISOR
First Trust Capital Management L.P.
225 West Wacker Drive, Suite 2100
Chicago, IL 60606
ADMINISTRATOR, CUSTODIAN,
FUND ACCOUNTANT &
TRANSFER AGENT
Brown Brothers Harriman & Co.
50 Post Office Square
Boston, MA 02110
INDEPENDENT REGISTERED
PUBLIC ACCOUNTING FIRM
Deloitte & Touche LLP
111 South Wacker Drive
Chicago, IL 60606
LEGAL COUNSEL
Chapman and Cutler LLP
320 South Canal Street
Chicago, IL 60606
Item 2. Code of Ethics.
| (a) | | The registrant, as of the end of the period covered by this report, has adopted a code of ethics that applies to the registrant’s principal executive officer, principal financial officer, principal accounting officer or controller, or persons performing similar functions, regardless of whether these individuals are employed by the registrant or a third party. |
| (c) | | There have been no amendments, during the period covered by this report, to a provision of the code of ethics that applies to the registrant’s principal executive officer, principal financial officer, principal accounting officer or controller, or persons performing similar functions, regardless of whether these individuals are employed by the registrant or a third party, and that relates to any element of the code of ethics description. |
| (d) | | The registrant, during the period covered by this report, has not granted any waivers, including an implicit waiver, from a provision of the code of ethics that applies to the registrant’s principal executive officer, principal financial officer, principal accounting officer or controller, or persons performing similar functions, regardless of whether these individuals are employed by the registrant or a third party, that relates to one or more of the items set forth in paragraph (b) of this item’s instructions. |
| (f) | | A copy of the code of ethics that applies to the registrant’s principal executive officer, principal financial officer, principal accounting officer or controller is filed as an exhibit pursuant to Item 13(a)(1). |
Item 3. Audit Committee Financial Expert.
As of the end of the period covered by the report, the registrant’s board of trustees has determined that Thomas R. Kadlec and Robert F. Keith are qualified to serve as audit committee financial experts serving on its audit committee and that each of them is “independent,” as defined by Item 3 of Form N-CSR.
Item 4. Principal Accountant Fees and Services.
(a) Audit Fees (Registrant) -- The aggregate fees billed for professional services rendered by the principal accountant for the audit of the registrant’s annual financial statements or services that are normally provided by the accountant in connection with statutory and regulatory filings or engagements were $292,000 for the fiscal year ended July 31, 2022 and $296,000 for the fiscal year ended July 31, 2023.
(b) Audit-Related Fees (Registrant) -- The aggregate fees billed for assurance and related services by the principal accountant that are reasonably related to the performance of the audit of the registrant’s financial statements and are not reported under paragraph (a) of this Item were $0 for the fiscal year ended July 31, 2022 and $0 for the fiscal year ended July 31, 2023.
Audit-Related Fees (Investment Advisor and Distributor) -- The aggregate fees billed for assurance and related services by the principal accountant that are reasonably related to the performance of the audit of the registrant’s financial statements and are not reported under paragraph (a) of this Item were $0 for the fiscal year ended July 31, 2022 and $0 for the fiscal year ended July 31, 2023.
(c) Tax Fees (Registrant) -- The aggregate fees billed for professional services rendered by the principal accountant for tax compliance, tax advice, and tax planning to the registrant were $130,825 for the fiscal year ended July 31, 2022 and $92,114 for the fiscal year ended July 31, 2023. These fees were for tax consultation and/or tax return preparation and professional services rendered for PFIC (Passive Foreign Investment Company) Identification Services.
Tax Fees (Investment Advisor and Distributor) -- The aggregate fees billed for professional services rendered by the principal accountant for tax compliance, tax advice, and tax planning to the registrant’s advisor and distributor were $0 for the fiscal year ended July 31, 2022 and $0 for the fiscal year ended July 31, 2023.
(d) All Other Fees (Registrant) -- The aggregate fees billed for products and services provided by the principal accountant to the registrant, other than the services reported in paragraphs (a) through (c) of this Item were $0 for the fiscal year ended July 31, 2022 and $0 for the fiscal year ended July 31, 2023.
All Other Fees (Investment Advisor and Distributor) -- The aggregate fees billed for products and services provided by the principal accountant to the registrant’s investment advisor and distributor, other than the services reported in paragraphs (a) through (c) of this Item were $0 for the fiscal year ended July 31, 2022 and $0 for the fiscal year ended July 31, 2023.
(e)(1) Disclose the audit committee’s pre-approval policies and procedures described in paragraph (c) (7) of Rule 2-01 of Regulation S-X.
Pursuant to its charter and its Audit and Non-Audit Services Pre-Approval Policy, the Audit Committee (the “Committee”) is responsible for the pre-approval of all audit services and permitted non-audit services (including the fees and terms thereof) to be performed for the registrant by its independent auditors. The Chairman of the Committee is authorized to give such pre-approvals on behalf of the Committee up to $25,000 and report any such pre-approval to the full Committee.
The Committee is also responsible for the pre-approval of the independent auditor’s engagements for non-audit services with the registrant’s advisor (not including a sub-advisor whose role is primarily portfolio management and is sub-contracted or overseen by another investment advisor) and any entity controlling, controlled by or under common control with the investment advisor that provides ongoing services to the registrant, if the engagement relates directly to the operations and financial reporting of the registrant, subject to the de minimis exceptions for non-audit services described in Rule 2-01 of Regulation S-X. If the independent auditor has provided non-audit services to the registrant’s advisor (other than any sub-advisor whose role is primarily portfolio management and is sub-contracted with or overseen by another investment advisor) and any entity controlling, controlled by or under common control with the investment advisor that provides ongoing services to the registrant that were not pre-approved pursuant to its policies, the Committee will consider whether the provision of such non-audit services is compatible with the auditor’s independence.
(e)(2) The percentage of services described in each of paragraphs (b) through (d) for the registrant and the registrant’s investment advisor and distributor of this Item that were approved by the audit committee pursuant to the pre-approval exceptions included in paragraph (c)(7)(i)(C) or paragraph(C)(7)(ii) of Rule 2-01 of Regulation S-X are as follows:
| | Registrant: | | Advisor and Distributor: | |
| | | | | |
| | (b) 0% | | (b) 0% | |
| | (c) 0% | | (c) 0% | |
| | (d) 0% | | (d) 0% | |
(f) The percentage of hours expended on the principal accountant’s engagement to audit the registrant’s financial statements for the most recent fiscal year that were attributed to work performed by persons other than the principal accountant’s full-time, permanent employees was less than fifty percent.
(g) The aggregate non-audit fees billed by the registrant’s accountant for services rendered to the registrant, and rendered to the registrant’s investment advisor (not including any sub-advisor whose role is primarily portfolio management and is subcontracted with or overseen by another investment advisor), and any entity controlling, controlled by, or under common control with the advisor that provides ongoing services to the registrant for the fiscal year ended July 31, 2022 were $130,825 for the registrant, $16,500 for the registrant’s investment advisor and $29,500 for the registrant’s distributor and for the fiscal year ended July 31, 2023 were $92,114 for the registrant, $31,000 for the registrant’s investment advisor and $45,500 for the registrant’s distributor.
(h) The registrant’s audit committee of its Board of Trustees has determined that the provision of non-audit services that were rendered to the registrant’s investment advisor (not including any sub-advisor whose role is primarily portfolio management and is subcontracted with or overseen by another investment advisor), and any entity controlling, controlled by, or under common control with the investment advisor that provides ongoing services to the registrant that were not pre-approved pursuant to paragraph (c)(7)(ii) of Rule 2-01 of Regulation S-X is compatible with maintaining the principal accountant’s independence.
(i) Not applicable.
(j) Not applicable.
Items 5. Audit Committee of Listed Registrants.
The registrant has a separately designated standing audit committee established in accordance with Section 3(a)(58)(A) of the Securities Exchange Act of 1934. The audit committee of the registrant is comprised of Richard E. Erickson, Thomas R. Kadlec, Denise M. Keefe, Robert F. Keith and Niel B. Nielson.
Item 6. Investments.
| (a) | | Schedule of Investments in securities of unaffiliated issuers as of the close of the reporting period is included as part of the report to shareholders filed under Item 1 of this form. |
Item 7. Disclosure of Proxy Voting Policies and Procedures for Closed-End Management Investment Companies.
Not applicable.
Item 8. Portfolio Managers of Closed-End Management Investment Companies.
Not applicable.
Item 9. Purchases of Equity Securities by Closed-End Management Investment Company and Affiliated Purchasers.
Not applicable.
Item 10. Submission of Matters to a Vote of Security Holders.
There have been no material changes to the procedures by which the shareholders may recommend nominees to the registrant’s board of directors, where those changes were implemented after the registrant last provided disclosure in response to the requirements of Item 407 (c) (2) (iv) of Regulation S-K (17 CFR 229.407) (as required by Item 22 (b) (15) of Schedule 14A (17 CFR 240.14a-101)), or this Item.
Item 11. Controls and Procedures.
| (a) | | The registrant’s principal executive and principal financial officers, or persons performing similar functions, have concluded that the registrant’s disclosure controls and procedures (as defined in Rule 30a-3(c) under the Investment Company Act of 1940, as amended (the “1940 Act”) (17 CFR 270.30a-3 (c))) are effective, as of a date within 90 days of the filing date of the report that includes the disclosure required by this paragraph, based on their evaluation of these controls and procedures required by Rule 30a-3(b) under the 1940 Act (17 CFR 270.30a-3(b)) and Rules 13a-15(b) or 15d-15(b) under the Securities Exchange Act of 1934, as amended (17 CFR 240.13a-15(b) or 240.15d-15 (b)). |
| (b) | | There were no changes in the registrant’s internal control over financial reporting (as defined in Rule 30a-3(d) under the 1940 Act (17 CFR 270.30a-3(d)) that occurred during the period covered by this report that have materially affected, or are reasonably likely to materially affect, the registrant’s internal control over financial reporting. |
Item 12. Disclosure of Securities Lending Activities for Closed-End Management Investment Companies.
Not applicable.
Item 13. Exhibits.
SIGNATURES
Pursuant to the requirements of the Securities Exchange Act of 1934 and the Investment Company Act of 1940, the registrant has duly caused this report to be signed on its behalf by the undersigned, thereunto duly authorized.
| (registrant) | | First Trust Exchange-Traded Fund III |
| By (Signature and Title)* | | /s/ James M. Dykas |
| | | James M. Dykas, President and Chief Executive Officer
(principal executive officer) |
Pursuant to the requirements of the Securities Exchange Act of 1934 and the Investment Company Act of 1940, this report has been signed below by the following persons on behalf of the registrant and in the capacities and on the dates indicated.
| By (Signature and Title)* | | /s/ James M. Dykas |
| | | James M. Dykas, President and Chief Executive Officer
(principal executive officer) |
| By (Signature and Title)* | | /s/ Derek D. Maltbie |
| | | Derek D. Maltbie, Treasurer, Chief Financial Officer
and Chief Accounting Officer
(principal financial officer) |
* Print the name and title of each signing officer under his or her signature.