UNITED STATES
SECURITIES AND EXCHANGE COMMISSION
Washington, D.C. 20549
FORM N-CSRS
CERTIFIED SHAREHOLDER REPORT OF REGISTERED MANAGEMENT
INVESTMENT COMPANIES
Investment Company Act file number 811-22209
Global X Funds
(Exact name of registrant as specified in charter)
605 Third Avenue, 43rd floor
New York, NY 10158
(Address of principal executive offices) (Zip code)
Ryan O’Connor
Global X Management Company LLC
605 Third Avenue, 43rd floor
New York, NY 10158
(Name and address of agent for service)
With a copy to:
Global X Management Company LLC 605 Third Avenue, 43rd floor New York, NY 10158 | Eric S. Purple, Esq. Stradley Ronon Stevens & Young, LLP 2000 K Street, N.W., Suite 700 Washington, DC 20006-1871 |
Registrant’s telephone number, including area code: (212) 644-6440
Date of fiscal year end: October 31, 2024
Date of reporting period: April 30, 2024
Item 1. Reports to Stockholders.
(a) A copy of the report transmitted to stockholders pursuant to Rule 30e-1 under the Investment Company Act of 1940, as amended (the “Act”) (17 CFR § 270.30e-1), is attached hereto.

Global X Lithium & Battery Tech ETF (ticker: LIT)
Global X SuperDividend® ETF (ticker: SDIV)
Global X Social Media ETF (ticker: SOCL)
Global X Guru® Index ETF (ticker: GURU)
Global X SuperIncome™ Preferred ETF (ticker: SPFF)
Global X SuperDividend® U.S. ETF (ticker: DIV)
Global X MSCI SuperDividend® Emerging Markets ETF (ticker: SDEM)
Global X SuperDividend® REIT ETF (ticker: SRET)
Global X Renewable Energy Producers ETF (ticker: RNRG)
Global X S&P 500® Catholic Values ETF (ticker: CATH)
Global X MSCI SuperDividend® EAFE ETF (ticker: EFAS)
Global X E-commerce ETF (ticker: EBIZ)
Global X S&P Catholic Values Developed ex-U.S. ETF (ticker: CEFA)
Global X NASDAQ 100® Tail Risk ETF (ticker: QTR)
Global X NASDAQ 100® Collar 95-110 ETF (ticker: QCLR)
Global X S&P 500® Tail Risk ETF (ticker: XTR)
Global X S&P 500® Collar 95-110 ETF (ticker: XCLR)
Global X Disruptive Materials ETF (ticker: DMAT)
Semi-Annual Report
April 30, 2024
As permitted by regulations adopted by the Securities and Exchange Commission, paper copies of the Funds’ (defined below) shareholder reports will no longer be sent by mail, unless you specifically request paper copies of the reports from your financial intermediary (such as a broker-dealer or bank). Instead, shareholder reports will be available on the Funds’ website (www.globalxetfs.com/explore), and you will be notified by mail each time a report is posted and provided with a website link to access the report.
If you already elected to receive shareholder reports electronically, you will not be affected by this change and you need not take any action. You may elect to receive shareholder reports and other communications from the Funds electronically anytime by contacting your financial intermediary.
You may elect to receive all future Fund shareholder reports in paper free of charge. Please contact your financial intermediary to inform them that you wish to continue receiving paper copies of Fund shareholder reports and for details about whether your election to receive reports in paper will apply to all funds held with your financial intermediary.

Table of Contents
Shares are bought and sold at market price (not net asset value (“NAV”)) and are not individually redeemed from the Fund. Shares may only be redeemed directly from the Fund by Authorized Participants, in very large creation/ redemption units. Brokerage commissions will reduce returns.
The Fund files its complete schedule of Fund holdings with the Securities and Exchange Commission (the “SEC” or “Commission”) for the first and third quarters of each fiscal year as an exhibit to its reports on Form N-PORT. The Fund’s Form N-PORT is available on the Commission’s website at https://www.sec.gov, and may be reviewed and copied at the Commission’s Public Reference Room in Washington, DC. Information on the operation of the Public Reference Room may be obtained by calling 1-800-SEC-0330.
A description of the policies and procedures that Global X Funds uses to determine how to vote proxies relating to Fund securities, as well as information relating to how the Fund voted proxies relating to Fund securities during the most recent 12-month period ended June 30, is available (i) without charge, upon request, by calling 1-888-493-8631; and (ii) on the Commission’s website at https://www.sec.gov.
| Schedule of Investments | April 30, 2024 (Unaudited) |
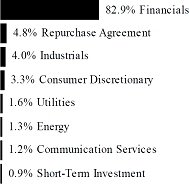
| Global X Lithium & Battery Tech ETF |
Sector Weightings †:
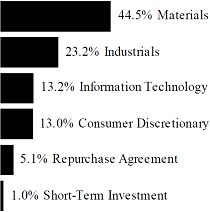
† Sector weightings percentages are based on the total market value of investments. Total investments do not include derivatives such as options, futures contracts, forward contracts, and swap contracts, if applicable.
| | | Shares | | | Value | |
| COMMON STOCK — 99.9% | | | | | | | | |
| AUSTRALIA — 13.9% | | | | | | | | |
| Materials — 13.9% | | | | | | | | |
| Core Lithium * (A) | | | 20,291,316 | | | $ | 1,910,546 | |
| IGO | | | 6,560,361 | | | | 33,696,400 | |
| Latin Resources * | | | 25,562,184 | | | | 3,734,735 | |
| Liontown Resources * (A) | | | 15,113,169 | | | | 12,218,114 | |
| Mineral Resources | | | 1,856,834 | | | | 87,042,108 | |
| Pilbara Minerals | | | 28,877,207 | | | | 76,130,818 | |
| Sayona Mining * (A) | | | 100,866,916 | | | | 2,226,932 | |
| | | | | | | | | |
| TOTAL AUSTRALIA | | | | | | | 216,959,653 | |
| BRAZIL — 0.5% | | | | | | | | |
| Materials — 0.5% | | | | | | | | |
| Sigma Lithium * (A) | | | 500,699 | | | | 7,195,045 | |
| | | | | | | | | |
| CANADA — 1.4% | | | | | | | | |
| Materials — 1.4% | | | | | | | | |
| Lithium Americas * | | | 1,444,124 | | | | 6,412,022 | |
| Lithium Americas Argentina * (A) | | | 1,343,386 | | | | 6,903,450 | |
| Patriot Battery Metals * (A) | | | 1,330,179 | | | | 6,457,979 | |
The accompanying notes are an integral part of the financial statements.
1
| Schedule of Investments | April 30, 2024 (Unaudited) |
| Global X Lithium & Battery Tech ETF |
| | | Shares | | | Value | |
| COMMON STOCK — continued | | | | | | | | |
| Materials — continued | | | | | | | | |
| Standard Lithium * (A) | | | 1,789,952 | | | $ | 2,266,999 | |
| | | | | | | | | |
| TOTAL CANADA | | | | | | | 22,040,450 | |
| CHILE — 4.7% | | | | | | | | |
| Industrials — 4.7% | | | | | | | | |
| Sociedad Quimica y Minera de Chile ADR (A) | | | 1,584,016 | | | | 72,373,691 | |
| | | | | | | | | |
| CHINA — 34.9% | | | | | | | | |
| Consumer Discretionary — 4.1% | | | | | | | | |
| BYD, Cl H | | | 2,296,674 | | | | 63,310,351 | |
| | | | | | | | | |
| Industrials — 13.3% | | | | | | | | |
| Contemporary Amperex Technology, Cl A | | | 2,218,909 | | | | 61,981,809 | |
| Eve Energy, Cl A | | | 12,256,988 | | | | 62,476,764 | |
| Jiangxi Special Electric Motor, Cl A * | | | 14,897,677 | | | | 19,965,038 | |
| Sunwoda Electronic, Cl A | | | 14,584,091 | | | | 30,583,972 | |
| Wuxi Lead Intelligent Equipment, Cl A | | | 10,663,046 | | | | 32,784,719 | |
| | | | | | | | 207,792,302 | |
| Information Technology — 4.0% | | | | | | | | |
| NAURA Technology Group, Cl A | | | 1,415,241 | | | | 62,245,276 | |
| | | | | | | | | |
| Materials — 13.5% | | | | | | | | |
| Ganfeng Lithium Group, Cl A | | | 7,464,040 | | | | 36,286,208 | |
| Guangzhou Tinci Materials Technology, Cl A | | | 12,395,914 | | | | 35,890,802 | |
| Shanghai Putailai New Energy Technology, Cl A | | | 9,341,553 | | | | 23,840,251 | |
| Sinomine Resource Group, Cl A | | | 5,537,926 | | | | 27,182,066 | |
| Tianqi Lithium, Cl A | | | 11,070,988 | | | | 60,308,528 | |
| Yunnan Energy New Material, Cl A | | | 4,879,859 | | | | 27,995,634 | |
| | | | | | | | 211,503,489 | |
| TOTAL CHINA | | | | | | | 544,851,418 | |
| FRANCE — 0.6% | | | | | | | | |
| Materials — 0.6% | | | | | | | | |
| Eramet | | | 98,937 | | | | 9,663,821 | |
The accompanying notes are an integral part of the financial statements.
2
| Schedule of Investments | April 30, 2024 (Unaudited) |
| Global X Lithium & Battery Tech ETF |
| | | Shares | | | Value | |
| COMMON STOCK — continued | | | | | | | | |
| JAPAN — 7.4% | | | | | | | | |
| Consumer Discretionary — 3.8% | | | | | | | | |
| Panasonic Holdings | | | 6,659,792 | | | $ | 58,487,164 | |
| | | | | | | | | |
| Information Technology — 3.6% | | | | | | | | |
| TDK | | | 1,257,323 | | | | 56,600,109 | |
| | | | | | | | | |
| TOTAL JAPAN | | | | | | | 115,087,273 | |
| JERSEY — 6.6% | | | | | | | | |
| Materials — 6.6% | | | | | | | | |
| Arcadium Lithium * | | | 11,945,133 | | | | 52,558,585 | |
| Arcadium Lithium CDI * | | | 11,455,563 | | | | 49,987,911 | |
| | | | | | | | | |
| TOTAL JERSEY | | | | | | | 102,546,496 | |
| NETHERLANDS — 0.5% | | | | | | | | |
| Materials — 0.5% | | | | | | | | |
| AMG Critical Materials | | | 336,592 | | | | 7,961,052 | |
| | | | | | | | | |
| SOUTH KOREA — 10.6% | | | | | | | | |
| Industrials — 4.1% | | | | | | | | |
| LG Energy Solution * | | | 229,370 | | | | 64,557,507 | |
| | | | | | | | | |
| Information Technology — 6.5% | | | | | | | | |
| L&F * | | | 278,755 | | | | 33,056,902 | |
| Samsung SDI | | | 217,200 | | | | 68,204,037 | |
| | | | | | | | 101,260,939 | |
| TOTAL SOUTH KOREA | | | | | | | 165,818,446 | |
| UNITED STATES — 18.8% | | | | | | | | |
| Consumer Discretionary — 6.0% | | | | | | | | |
| Lucid Group * (A) | | | 9,496,485 | | | | 24,216,037 | |
| Tesla * | | | 383,182 | | | | 70,229,597 | |
| | | | | | | | 94,445,634 | |
| Industrials — 2.6% | | | | | | | | |
| EnerSys | | | 442,296 | | | | 40,005,673 | |
The accompanying notes are an integral part of the financial statements.
3
| Schedule of Investments | April 30, 2024 (Unaudited) |
| Global X Lithium & Battery Tech ETF |
| | | Shares | | | Value | |
| COMMON STOCK — continued | | | | | | | | |
| Materials — 10.2% | | | | | | | | |
| Albemarle | | | 1,305,218 | | | $ | 157,030,778 | |
| Piedmont Lithium * (A) | | | 183,945 | | | | 2,253,326 | |
| | | | | | | | 159,284,104 | |
| TOTAL UNITED STATES | | | | | | | 293,735,411 | |
TOTAL COMMON STOCK
(Cost $1,916,495,080) | | | | | | | 1,558,232,756 | |
| | | | | | | | | |
| SHORT-TERM INVESTMENT(B)(C) — 1.0% | | | | | | | | |
Fidelity Investments Money Market Government Portfolio, Cl Institutional, 5.240%
(Cost $15,813,189) | | | 15,813,189 | | | | 15,813,189 | |
| | | | | | | | |
| | | Face Amount | | | | | |
| REPURCHASE AGREEMENT(C) — 5.4% | | | | | | | | |
BNP Paribas
5.270%, dated 04/30/2024, to be repurchased on 05/01/2024, repurchase price $83,912,933 (collateralized by U.S. Treasury Obligations, ranging in par value $5,737,704 - $13,754,205, 2.875%, 05/15/2032, with a total market value of $85,612,981)
(Cost $83,900,651) | | $ | 83,900,651 | | | | 83,900,651 | |
TOTAL INVESTMENTS — 106.3%
(Cost $2,016,208,920) | | | | | | $ | 1,657,946,596 | |
Percentages are based on Net Assets of $1,560,358,070.
| * | Non-income producing security. |
| (A) | This security or a partial position of this security is on loan at April 30, 2024. The total market value of securities on loan at April 30, 2024 was $96,214,633. |
| (B) | The rate reported on the Schedule of Investments is the 7-day effective yield as of April 30, 2024. |
| (C) | These securities were purchased with cash collateral held from securities on loan. The total value of such securities as of April 30, 2024 was $99,713,840. The total value of non-cash collateral held from securities on loan as of April 30, 2024 was $–. |
The accompanying notes are an integral part of the financial statements.
4
| Schedule of Investments | April 30, 2024 (Unaudited) |
| Global X Lithium & Battery Tech ETF |
The following is a summary of the level of inputs used as of April 30, 2024, in valuing the Fund’s investments carried at value:
| Investments in Securities | | Level 1 | | | Level 2 | | | Level 3 | | | Total | |
| Common Stock | | $ | 1,558,232,756 | | | $ | — | | | $ | — | | | $ | 1,558,232,756 | |
| Short-Term Investment | | | 15,813,189 | | | | — | | | | — | | | | 15,813,189 | |
| Repurchase Agreement | | | — | | | | 83,900,651 | | | | — | | | | 83,900,651 | |
| Total Investments in Securities | | $ | 1,574,045,945 | | | $ | 83,900,651 | | | $ | — | | | $ | 1,657,946,596 | |
Amounts designated as “—” are $0 or have been rounded to $0.
See “Glossary” for abbreviations.
The accompanying notes are an integral part of the financial statements.
5
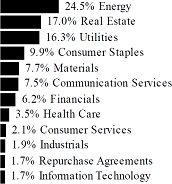
| Schedule of Investments | April 30, 2024 (Unaudited) |
| Global X SuperDividend® ETF |
Sector Weightings †:
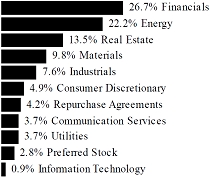
† Sector weightings percentages are based on the total market value of investments. Total investments do not include derivatives such as options, futures contracts, forward contracts, and swap contracts, if applicable.
| | | Shares | | | Value | |
| COMMON STOCK — 96.2% | | | | | | | | |
| AUSTRALIA — 5.2% | | | | | | | | |
| Energy — 2.7% | | | | | | | | |
| New Hope | | | 2,383,954 | | | $ | 7,043,501 | |
| Woodside Energy Group | | | 379,782 | | | | 6,961,848 | |
| Yancoal Australia (A) | | | 1,846,353 | | | | 6,654,064 | |
| | | | | | | | 20,659,413 | |
| Financials — 0.9% | | | | | | | | |
| Magellan Financial Group | | | 1,197,717 | | | | 6,945,203 | |
| Industrials — 1.6% | | | | | | | | |
| APM Human Services International ltd | | | 6,803,055 | | | | 5,367,345 | |
| McMillan Shakespeare | | | 550,108 | | | | 6,615,585 | |
| | | | | | | | 11,982,930 | |
| TOTAL AUSTRALIA | | | | | | | 39,587,546 | |
| BELGIUM — 2.1% | | | | | | | | |
| Communication Services — 0.9% | | | | | | | | |
| Proximus | | | 902,203 | | | | 6,670,801 | |
The accompanying notes are an integral part of the financial statements.
6
| Schedule of Investments | April 30, 2024 (Unaudited) |
| Global X SuperDividend® ETF |
| | | Shares | | | Value | |
| COMMON STOCK — continued | | | | | | | | |
| Materials — 1.2% | | | | | | | | |
| Solvay | | | 290,829 | | | $ | 9,456,615 | |
| | | | | | | | | |
| TOTAL BELGIUM | | | | | | | 16,127,416 | |
| BERMUDA — 1.3% | | | | | | | | |
| Energy — 1.3% | | | | | | | | |
| Avance Gas Holding | | | 671,073 | | | | 9,792,661 | |
| | | | | | | | | |
| BRAZIL — 3.1% | | | | | | | | |
| Consumer Discretionary — 1.5% | | | | | | | | |
| Mahle-Metal Leve | | | 1,009,000 | | | | 5,964,724 | |
| Vulcabras | | | 1,862,800 | | | | 5,689,283 | |
| | | | | | | | 11,654,007 | |
| Materials — 1.6% | | | | | | | | |
| Cia Siderurgica Nacional | | | 2,323,400 | | | | 6,239,843 | |
| CSN Mineracao | | | 6,206,200 | | | | 5,915,114 | |
| | | | | | | | 12,154,957 | |
| TOTAL BRAZIL | | | | | | | 23,808,964 | |
| CHILE — 1.0% | | | | | | | | |
| Industrials — 1.0% | | | | | | | | |
| Quinenco | | | 2,219,344 | | | | 7,764,338 | |
| | | | | | | | | |
| CHINA — 11.0% | | | | | | | | |
| Energy — 0.9% | | | | | | | | |
| Yankuang Energy Group, Cl H | | | 2,990,000 | | | | 6,514,294 | |
| | | | | | | | | |
| Financials — 2.7% | | | | | | | | |
| Chongqing Rural Commercial Bank, Cl H | | | 18,078,100 | | | | 7,766,381 | |
| Lufax Holding ADR | | | 2,923,526 | | | | 12,834,279 | |
| | | | | | | | 20,600,660 | |
| Industrials — 1.4% | | | | | | | | |
| SITC International Holdings (A) | | | 4,813,000 | | | | 10,486,053 | |
| | | | | | | | | |
| Materials — 3.1% | | | | | | | | |
| China National Building Material, Cl H | | | 20,561,800 | | | | 8,018,398 | |
| Fufeng Group (A) | | | 11,654,100 | | | | 8,538,075 | |
The accompanying notes are an integral part of the financial statements.
7
| Schedule of Investments | April 30, 2024 (Unaudited) |
| Global X SuperDividend® ETF |
| | | Shares | | | Value | |
| COMMON STOCK — continued | | | | | | | | |
| Materials — continued | | | | | | | | |
| Shougang Fushan Resources Group | | | 17,580,800 | | | $ | 6,721,039 | |
| | | | | | | | 23,277,512 | |
| Real Estate — 2.1% | | | | | | | | |
| China Overseas Grand Oceans Group | | | 31,445,000 | | | | 6,794,616 | |
| Longfor Group Holdings (A) | | | 6,332,500 | | | | 9,553,969 | |
| | | | | | | | 16,348,585 | |
| Utilities — 0.8% | | | | | | | | |
| Guangdong Investment | | | 12,400,000 | | | | 6,500,281 | |
| | | | | | | | | |
| TOTAL CHINA | | | | | | | 83,727,385 | |
| CZECH REPUBLIC — 1.0% | | | | | | | | |
| Utilities — 1.0% | | | | | | | | |
| CEZ | | | 204,975 | | | | 7,573,917 | |
| | | | | | | | | |
| DENMARK — 1.0% | | | | | | | | |
| Industrials — 1.0% | | | | | | | | |
| D/S Norden | | | 171,069 | | | | 7,244,623 | |
| | | | | | | | | |
| FRANCE — 2.9% | | | | | | | | |
| Financials — 1.0% | | | | | | | | |
| Coface | | | 492,171 | | | | 7,604,409 | |
| | | | | | | | | |
| Real Estate — 1.9% | | | | | | | | |
| ICADE ‡ | | | 265,715 | | | | 7,102,932 | |
| Nexity (A) | | | 687,426 | | | | 7,747,260 | |
| | | | | | | | 14,850,192 | |
| TOTAL FRANCE | | | | | | | 22,454,601 | |
| GERMANY — 0.9% | | | | | | | | |
| Financials — 0.9% | | | | | | | | |
| Deutsche Pfandbriefbank (A) | | | 1,498,053 | | | | 7,131,221 | |
The accompanying notes are an integral part of the financial statements.
8
| Schedule of Investments | April 30, 2024 (Unaudited) |
| Global X SuperDividend® ETF |
| | | Shares | | | Value | |
| COMMON STOCK — continued | | | | | | | | |
| GREECE — 1.9% | | | | | | | | |
| Consumer Discretionary — 0.9% | | | | | | | | |
| OPAP | | | 401,006 | | | $ | 6,693,224 | |
| | | | | | | | | |
| Energy — 1.0% | | | | | | | | |
| Okeanis Eco Tankers | | | 247,578 | | | | 7,712,954 | |
| | | | | | | | | |
| TOTAL GREECE | | | | | | | 14,406,178 | |
| HONG KONG — 5.4% | | | | | | | | |
| Communication Services — 1.8% | | | | | | | | |
| HKBN | | | 20,101,710 | | | | 6,065,570 | |
| PCCW | | | 14,669,500 | | | | 7,352,381 | |
| | | | | | | | 13,417,951 | |
| Consumer Discretionary — 1.7% | | | | | | | | |
| Yue Yuen Industrial Holdings | | | 7,348,000 | | | | 13,096,599 | |
| | | | | | | | | |
| Industrials — 0.9% | | | | | | | | |
| Orient Overseas International | | | 492,800 | | | | 7,201,841 | |
| | | | | | | | | |
| Information Technology — 1.0% | | | | | | | | |
| VTech Holdings | | | 1,292,600 | | | | 7,494,938 | |
| | | | | | | | | |
| TOTAL HONG KONG | | | | | | | 41,211,329 | |
| INDONESIA — 2.8% | | | | | | | | |
| Energy — 2.8% | | | | | | | | |
| Adaro Energy | | | 43,556,500 | | | | 7,259,417 | |
| Bukit Asam | | | 41,355,400 | | | | 7,706,449 | |
| Indo Tambangraya Megah | | | 4,218,100 | | | | 6,543,762 | |
| | | | | | | | | |
| TOTAL INDONESIA | | | | | | | 21,509,628 | |
| ISRAEL — 0.7% | | | | | | | | |
| Energy — 0.7% | | | | | | | | |
| Oil Refineries | | | 18,700,363 | | | | 5,456,120 | |
The accompanying notes are an integral part of the financial statements.
9
| Schedule of Investments | April 30, 2024 (Unaudited) |
| Global X SuperDividend® ETF |
| | | Shares | | | Value | |
| COMMON STOCK — continued | | | | | | | | |
| ITALY — 1.3% | | | | | | | | |
| Communication Services — 1.3% | | | | | | | | |
| MFE-MediaForEurope, Cl A (A) | | | 3,254,003 | | | $ | 9,596,078 | |
| | | | | | | | | |
| KUWAIT — 0.9% | | | | | | | | |
| Consumer Discretionary — 0.9% | | | | | | | | |
| Humansoft Holding KSC | | | 716,512 | | | | 6,744,049 | |
| | | | | | | | | |
| MEXICO — 1.0% | | | | | | | | |
| Materials — 1.0% | | | | | | | | |
| Alpek, Cl A (A) | | | 10,536,422 | | | | 7,878,277 | |
| | | | | | | | | |
| NETHERLANDS — 1.0% | | | | | | | | |
| Financials — 1.0% | | | | | | | | |
| Van Lanschot Kempen | | | 214,833 | | | | 7,660,875 | |
| | | | | | | | | |
| NORWAY — 2.0% | | | | | | | | |
| Energy — 2.0% | | | | | | | | |
| FLEX LNG (A) | | | 294,042 | | | | 7,648,032 | |
| Var Energi | | | 2,265,684 | | | | 7,443,062 | |
| | | | | | | | | |
| TOTAL NORWAY | | | | | | | 15,091,094 | |
| RUSSIA — 0.0% | | | | | | | | |
| Materials — 0.0% | | | | | | | | |
| Magnitogorsk Iron & Steel Works PJSC *(B) | | | 6,332,020 | | | | — | |
| PhosAgro PJSC GDR *(B) | | | 119 | | | | — | |
| Severstal PJSC *(B) | | | 312,897 | | | | — | |
| | | | | | | | — | |
| Utilities — 0.0% | | | | | | | | |
| Unipro PJSC *(B) | | | 209,143,887 | | | | — | |
| | | | | | | | | |
| TOTAL RUSSIA | | | | | | | — | |
| SINGAPORE — 3.4% | | | | | | | | |
| Energy — 2.3% | | | | | | | | |
| BW LPG | | | 674,985 | | | | 9,819,271 | |
The accompanying notes are an integral part of the financial statements.
10
| Schedule of Investments | April 30, 2024 (Unaudited) |
| Global X SuperDividend® ETF |
| | | Shares | | | Value | |
| COMMON STOCK — continued | | | | | | | | |
| Energy — continued | | | | | | | | |
| Hafnia | | | 1,019,092 | | | $ | 7,748,455 | |
| | | | | | | | 17,567,726 | |
| Real Estate — 1.1% | | | | | | | | |
| Cromwell European Real Estate Investment Trust ‡ | | | 5,096,500 | | | | 8,119,698 | |
| | | | | | | | | |
| TOTAL SINGAPORE | | | | | | | 25,687,424 | |
| SOUTH AFRICA — 3.9% | | | | | | | | |
| Energy — 1.0% | | | | | | | | |
| Exxaro Resources (A) | | | 763,114 | | | | 7,333,501 | |
| | | | | | | | | |
| Materials — 1.0% | | | | | | | | |
| African Rainbow Minerals (A) | | | 762,374 | | | | 7,942,825 | |
| | | | | | | | | |
| Real Estate — 1.9% | | | | | | | | |
| Equites Property Fund ‡ | | | 11,185,220 | | | | 7,363,522 | |
| Redefine Properties ‡ | | | 34,815,927 | | | | 7,319,688 | |
| | | | | | | | 14,683,210 | |
| | | | | | | | | |
| TOTAL SOUTH AFRICA | | | | | | | 29,959,536 | |
| SPAIN — 2.1% | | | | | | | | |
| Materials — 1.1% | | | | | | | | |
| Ence Energia y Celulosa | | | 2,413,933 | | | | 8,641,562 | |
| | | | | | | | | |
| Utilities — 1.0% | | | | | | | | |
| Enagas | | | 509,542 | | | | 7,496,870 | |
| | | | | | | | | |
| TOTAL SPAIN | | | | | | | 16,138,432 | |
| TAIWAN — 1.1% | | | | | | | | |
| Industrials — 1.1% | | | | | | | | |
| Wisdom Marine Lines | | | 3,993,400 | | | | 8,351,776 | |
| | | | | | | | | |
| THAILAND — 1.9% | | | | | | | | |
| Energy — 1.0% | | | | | | | | |
| Banpu NVDR | | | 48,747,800 | | | | 7,300,332 | |
The accompanying notes are an integral part of the financial statements.
11
| Schedule of Investments | April 30, 2024 (Unaudited) |
| Global X SuperDividend® ETF |
| | | Shares | | | Value | |
| COMMON STOCK — continued | | | | | | | | |
| Industrials — 0.9% | | | | | | | | |
| Regional Container Lines NVDR | | | 12,701,876 | | | $ | 7,060,406 | |
| | | | | | | | | |
| TOTAL THAILAND | | | | | | | 14,360,738 | |
| UNITED ARAB EMIRATES — 1.1% | | | | | | | | |
| Materials — 1.1% | | | | | | | | |
| Fertiglobe | | | 10,548,983 | | | | 8,013,195 | |
| | | | | | | | | |
| UNITED KINGDOM — 3.0% | | | | | | | | |
| Energy — 2.2% | | | | | | | | |
| Diversified Energy (A) | | | 626,858 | | | | 8,838,161 | |
| Serica Energy | | | 3,195,456 | | | | 7,442,180 | |
| | | | | | | | 16,280,341 | |
| Financials — 0.8% | | | | | | | | |
| M&G PLC | | | 2,519,122 | | | | 6,343,306 | |
| | | | | | | | | |
| TOTAL UNITED KINGDOM | | | | | | | 22,623,647 | |
| UNITED STATES — 33.2% | | | | | | | | |
| Energy — 5.2% | | | | | | | | |
| Berry | | | 1,053,452 | | | | 8,943,808 | |
| Civitas Resources | | | 108,792 | | | | 7,828,672 | |
| Kimbell Royalty Partners | | | 481,602 | | | | 7,628,576 | |
| Kinetik Holdings, Cl A | | | 213,244 | | | | 8,175,775 | |
| Sitio Royalties, Cl A | | | 314,235 | | | | 7,302,821 | |
| | | | | | | | 39,879,652 | |
| Financials — 20.2% | | | | | | | | |
| AGNC Investment ‡ | | | 775,137 | | | | 7,092,504 | |
| Annaly Capital Management ‡ | | | 380,425 | | | | 7,129,164 | |
| Apollo Commercial Real Estate Finance ‡ | | | 679,866 | | | | 6,547,110 | |
| Arbor Realty Trust ‡ | | | 578,182 | | | | 7,418,075 | |
| B Riley Financial (A) | | | 335,317 | | | | 11,534,905 | |
| Blackstone Mortgage Trust, Cl A ‡ | | | 374,523 | | | | 6,606,586 | |
| BrightSpire Capital, Cl A ‡ | | | 1,111,863 | | | | 6,993,618 | |
| Chimera Investment ‡ | | | 1,689,249 | | | | 6,959,706 | |
| Claros Mortgage Trust ‡ | | | 767,322 | | | | 6,675,701 | |
| Dynex Capital ‡ | | | 600,021 | | | | 7,002,245 | |
| Ellington Financial ‡ | | | 656,573 | | | | 7,511,195 | |
The accompanying notes are an integral part of the financial statements.
12
| Schedule of Investments | April 30, 2024 (Unaudited) |
| Global X SuperDividend® ETF |
| | | Shares | | | Value | |
| COMMON STOCK — continued | | | | | | | | |
| Financials — continued | | | | | | | | |
| Franklin BSP Realty Trust ‡ | | | 582,723 | | | $ | 7,278,210 | |
| KKR Real Estate Finance Trust ‡ | | | 754,927 | | | | 7,103,863 | |
| MFA Financial ‡ | | | 666,473 | | | | 7,057,949 | |
| New York Mortgage Trust ‡ | | | 1,041,105 | | | | 7,131,569 | |
| PennyMac Mortgage Investment Trust ‡ | | | 524,133 | | | | 7,259,242 | |
| Ready Capital ‡ | | | 864,557 | | | | 7,366,026 | |
| Redwood Trust ‡ | | | 1,237,830 | | | | 6,845,200 | |
| Rithm Capital ‡ | | | 679,865 | | | | 7,560,099 | |
| Starwood Property Trust ‡ | | | 366,977 | | | | 6,961,554 | |
| Two Harbors Investment ‡ | | | 582,672 | | | | 7,359,147 | |
| | | | | | | | 153,393,668 | |
| Real Estate — 6.8% | | | | | | | | |
| Brandywine Realty Trust ‡ | | | 1,708,313 | | | | 7,755,741 | |
| Gladstone Commercial ‡ | | | 580,775 | | | | 7,764,962 | |
| Global Net Lease ‡ | | | 1,001,782 | | | | 6,962,385 | |
| Medical Properties Trust ‡ | | | 1,681,800 | | | | 7,736,280 | |
| Omega Healthcare Investors ‡ | | | 244,053 | | | | 7,421,651 | |
| Sabra Health Care REIT ‡ | | | 545,748 | | | | 7,596,812 | |
| Uniti Group ‡ | | | 1,139,172 | | | | 6,550,239 | |
| | | | | | | | 51,788,070 | |
| Utilities — 1.0% | | | | | | | | |
| NextEra Energy Partners (A) | | | 258,722 | | | | 7,337,356 | |
| | | | | | | | | |
| TOTAL UNITED STATES | | | | | | | 252,398,746 | |
TOTAL COMMON STOCK
(Cost $787,632,857) | | | | | | | 732,299,794 | |
| | | | | | | | | |
| PREFERRED STOCK — 2.9% | | | | | | | | |
| BRAZIL—2.9% | | | | | | | | |
| Energy — 1.0% | | | | | | | | |
| Petroleo Brasileiro (C) | | | 911,900 | | | | 7,392,880 | |
| Materials — 1.9% | | | | | | | | |
| Bradespar (C) | | | 1,778,800 | | | | 6,839,823 | |
| Metalurgica Gerdau, Cl A (C) | | | 3,760,100 | | | | 7,675,302 | |
| | | | | | | | 14,515,125 | |
| TOTAL BRAZIL | | | | | | | 21,908,005 | |
TOTAL PREFERRED STOCK
(Cost $23,643,747) | | | | | | | 21,908,005 | |
The accompanying notes are an integral part of the financial statements.
13
| Schedule of Investments | April 30, 2024 (Unaudited) |
| Global X SuperDividend® ETF |
| | | Face Amount | | | Value | |
| REPURCHASE AGREEMENTS(D) — 4.3% | | | | | | | | |
Bank of America Securities
5.320%, dated 04/30/2024, to be repurchased on 05/01/2024, repurchase price $7,681,692 (collateralized by various U.S. Government Obligations, ranging in par value $4,904 - $6,222,489, 2.000% - 7.500%, 10/17/2025 - 08/20/2063, with a total market value of $7,834,168) | | $ | 7,680,557 | | | $ | 7,680,557 | |
Citigroup Global Markets Inc.
5.320%, dated 04/30/2024, to be repurchased on 05/01/2024, repurchase price $7,681,692 (collateralized by various U.S. Government Obligations, ranging in par value $153,705 - $3,856,019, 2.000% - 6.500%, 12/01/2033 - 05/01/2054, with a total market value of $7,834,170) | | | 7,680,557 | | | | 7,680,557 | |
Deutsche Bank
5.310%, dated 04/30/2024, to be repurchased on 05/01/2024, repurchase price $1,961,285 (collateralized by various U.S. Government Obligations, ranging in par value $1,194 - $410,467, 2.000% - 7.000%, 02/01/2037 - 02/01/2054, with a total market value of $2,000,216) | | | 1,960,996 | | | | 1,960,996 | |
Nomura Securities International
5.310%, dated 04/30/2024, to be repurchased on 05/01/2024, repurchase price $7,681,690 (collateralized by various U.S. Government Obligations, ranging in par value $3,279 - $1,543,912, 2.000% - 7.500%, 10/01/2029 - 03/15/2058, with a total market value of $7,837,061) | | | 7,680,557 | | | | 7,680,557 | |
The accompanying notes are an integral part of the financial statements.
14
| Schedule of Investments | April 30, 2024 (Unaudited) |
| Global X SuperDividend® ETF |
| | | Face Amount | | | Value | |
| REPURCHASE AGREEMENTS — continued | | | | | | | | |
RBC Dominion Securities
5.320%, dated 04/30/2024, to be repurchased on 05/01/2024, repurchase price $7,681,692 (collateralized by various U.S. Government Obligations and U.S. Treasury Obligations, ranging in par value $7,304 - $16,350,522, 0.000% - 5.500%, 05/09/2024 - 02/15/2054, with a total market value of $7,834,168) | | $ | 7,680,557 | | | $ | 7,680,557 | |
TOTAL REPURCHASE AGREEMENTS
(Cost $32,683,224) | | | | | | | 32,683,224 | |
TOTAL INVESTMENTS — 103.4%
(Cost $843,959,828) | | | | | | $ | 786,891,023 | |
Percentages are based on Net Assets of $761,226,179.
A list of the open futures contracts held by the Fund at April 30, 2024, is as follows:
| Type of Contract | | | Number of
Contracts | | | Expiration
Date | | Notional Amount | | | Value | | | Unrealized
Depreciation | |
| Long Contracts | | | | | | | | | | | | | | | | | | |
| MSCI EAFE Index | | | 32 | | | Jun-2024 | | $ | 3,708,338 | | | $ | 3,628,000 | | | $ | (80,338 | ) |
| S&P Mid Cap 400 Index E-MINI | | | 12 | | | Jun-2024 | | | 3,531,880 | | | | 3,452,640 | | | | (79,240 | ) |
| | | | | | | | | $ | 7,240,218 | | | $ | 7,080,640 | | | $ | (159,578 | ) |
| * | Non-income producing security. |
| ‡ | Real Estate Investment Trust |
| (A) | This security or a partial position of this security is on loan at April 30, 2024. The total market value of securities on loan at April 30, 2024 was $35,558,121. |
| (B) | Level 3 security in accordance with fair value hierarchy. |
| (C) | There is currently no stated interest rate. |
| (D) | These securities were purchased with cash collateral held from securities on loan. The total value of such securities as of April 30, 2024 was $32,683,224. The total value of non-cash collateral held from securities on loan as of April 30, 2024 was $5,616,243. |
The accompanying notes are an integral part of the financial statements.
15
| Schedule of Investments | April 30, 2024 (Unaudited) |
| Global X SuperDividend® ETF |
The following is a summary of the level of inputs used as of April 30, 2024, in valuing the Fund’s investments and other financial instruments carried at value:
| Investments in Securities | | Level 1 | | | Level 2 | | | Level 3(1) | | | Total | |
| Common Stock | | $ | 732,299,794 | | | $ | — | | | $ | — | ^ | | $ | 732,299,794 | |
| Preferred Stock | | | 21,908,005 | | | | — | | | | — | | | | 21,908,005 | |
| Repurchase Agreements | | | — | | | | 32,683,224 | | | | — | | | | 32,683,224 | |
| Total Investments in Securities | | $ | 754,207,799 | | | $ | 32,683,224 | | | $ | — | | | $ | 786,891,023 | |
| | | | | | | | | | | | | | | | | |
| Other Financial Instruments | | Level 1 | | | Level 2 | | | Level 3 | | | Total | |
| Futures Contracts* | | | | | | | | | | | | | | | | |
| Unrealized Depreciation | | $ | (159,578) | | | $ | — | | | $ | — | | | $ | (159,578) | |
| Total Other Financial Instruments | | $ | (159,578) | | | $ | — | | | $ | — | | | $ | (159,578) | |
| * | Futures contracts are valued at the unrealized appreciation (depreciation) on the instrument. |
| ^ | Includes Securities in which the fair value is $0 or has been rounded to $0. |
| (1) | A reconciliation of Level 3 investments and disclosures of significant unobservable inputs are presented when the Fund has a significant amount of Level 3 investments at the end of the period in relation to Net Assets. Management has concluded that Level 3 investments are not material in relation to Net Assets. |
Amounts designated as “—” are $0 or have been rounded to $0.
See “Glossary” for abbreviations.
The accompanying notes are an integral part of the financial statements.
16
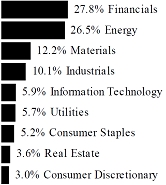
| Schedule of Investments | | April 30, 2024 (Unaudited) |
| | Global X Social Media ETF | |
Sector Weightings †:
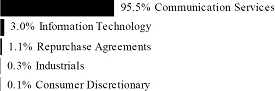
† Sector weightings percentages are based on the total market value of investments. Total investments do not include derivatives such as options, futures contracts, forward contracts, and swap contracts, if applicable.
| | | Shares | | | Value | |
| COMMON STOCK — 99.9% | | | | | | | | |
| CHINA — 35.3% | | | | | | | | |
| Communication Services — 35.3% | | | | | | | | |
| Baidu ADR * | | | 64,415 | | | $ | 6,660,511 | |
| Bilibili ADR * | | | 173,283 | | | | 2,190,297 | |
| Hello Group ADR | | | 100,440 | | | | 585,565 | |
| HUYA ADR * | | | 60,612 | | | | 272,148 | |
| JOYY ADR | | | 19,613 | | | | 639,776 | |
| Kuaishou Technology, Cl B * | | | 1,443,988 | | | | 10,329,761 | |
| Meitu (A) | | | 1,932,100 | | | | 805,330 | |
| NetEase ADR | | | 68,635 | | | | 6,415,314 | |
| Tencent Holdings | | | 338,527 | | | | 15,027,946 | |
| Tencent Music Entertainment Group ADR * | | | 443,759 | | | | 5,569,175 | |
| Weibo ADR | | | 56,614 | | | | 488,013 | |
| | | | | | | | | |
| TOTAL CHINA | | | | | | | 48,983,836 | |
| GERMANY — 1.0% | | | | | | | | |
| Communication Services — 1.0% | | | | | | | | |
| United Internet | | | 55,341 | | | | 1,339,692 | |
| | | | | | | | | |
| HONG KONG — 0.2% | | | | | | | | |
| Information Technology — 0.2% | | | | | | | | |
| Newborn Town * | | | 500,000 | | | | 217,997 | |
| | | | | | | | | |
| JAPAN — 4.7% | | | | | | | | |
| Communication Services — 4.7% | | | | | | | | |
| DeNA * (A) | | | 51,223 | | | | 519,505 | |
| giftee * (A) | | | 11,845 | | | | 89,647 | |
The accompanying notes are an integral part of the financial statements.
17
| Schedule of Investments | | April 30, 2024 (Unaudited) |
| | Global X Social Media ETF | |
| | | Shares | | | Value | |
| COMMON STOCK — continued | | | | | | | | |
| Communication Services — continued | | | | | | | | |
| Gree | | | 33,400 | | | $ | 99,119 | |
| Kakaku.com | | | 85,465 | | | | 990,344 | |
| MIXI | | | 24,035 | | | | 368,089 | |
| Nexon | | | 284,642 | | | | 4,470,452 | |
| | | | | | | | | |
| TOTAL JAPAN | | | | | | | 6,537,156 | |
| SINGAPORE — 0.1% | | | | | | | | |
| Communication Services — 0.1% | | | | | | | | |
| Grindr * | | | 7,926 | | | | 77,596 | |
| | | | | | | | | |
| SOUTH KOREA — 13.0% | | | | | | | | |
| Communication Services — 13.0% | | | | | | | | |
| AfreecaTV | | | 5,575 | | | | 455,003 | |
| Com2uSCorp | | | 4,927 | | | | 142,595 | |
| Kakao | | | 184,828 | | | | 6,499,270 | |
| NAVER | | | 81,734 | | | | 10,904,963 | |
| | | | | | | | | |
| TOTAL SOUTH KOREA | | | | | | | 18,001,831 | |
| TAIWAN — 0.0% | | | | | | | | |
| Consumer Discretionary — 0.0% | | | | | | | | |
| PChome Online * | | | 77,626 | | | | 74,975 | |
| | | | | | | | | |
| UNITED ARAB EMIRATES — 0.2% | | | | | | | | |
| Communication Services — 0.2% | | | | | | | | |
| Yalla Group ADR * | | | 67,002 | | | | 314,910 | |
| | | | | | | | | |
| UNITED KINGDOM — 0.4% | | | | | | | | |
| Communication Services — 0.4% | | | | | | | | |
| Trustpilot Group * | | | 235,009 | | | | 559,692 | |
| | | | | | | | | |
| UNITED STATES — 45.0% | | | | | | | | |
| Communication Services — 41.7% | | | | | | | | |
| Alphabet, Cl A * | | | 40,001 | | | | 6,511,363 | |
| Angi, Cl A * | | | 47,898 | | | | 101,065 | |
| Bumble, Cl A * | | | 64,692 | | | | 653,389 | |
| IAC * | | | 52,762 | | | | 2,509,361 | |
| Match Group * | | | 187,434 | | | | 5,776,716 | |
The accompanying notes are an integral part of the financial statements.
18
| Schedule of Investments | | April 30, 2024 (Unaudited) |
| | Global X Social Media ETF | |
| | | Shares | | | Value | |
| COMMON STOCK — continued | | | | | | | | |
| Communication Services — continued | | | | | | | | |
| Meta Platforms, Cl A | | | 26,100 | | | $ | 11,227,437 | |
| Nextdoor Holdings * (A) | | | 101,741 | | | | 207,552 | |
| Pinterest, Cl A * | | | 337,988 | | | | 11,305,698 | |
| Reddit, Cl A * | | | 19,039 | | | | 846,093 | |
| Rumble * (A) | | | 42,761 | | | | 301,893 | |
| Snap, Cl A * | | | 601,382 | | | | 9,050,799 | |
| Spotify Technology * | | | 20,645 | | | | 5,789,684 | |
| Trump Media & Technology Group * | | | 26,913 | | | | 1,343,766 | |
| Vimeo * | | | 96,306 | | | | 345,738 | |
| Yelp, Cl A * | | | 45,986 | | | | 1,850,477 | |
| | | | | | | | 57,821,031 | |
| Consumer Discretionary — 0.1% | | | | | | | | |
| Groupon, Cl A * (A) | | | 14,465 | | | | 167,215 | |
| | | | | | | | | |
| Industrials — 0.4% | | | | | | | | |
| Fiverr International * | | | 23,399 | | | | 479,913 | |
| | | | | | | | | |
| Information Technology — 2.8% | | | | | | | | |
| Life360, CDI,* (A) | | | 136,825 | | | | 1,223,429 | |
| Sprinklr, Cl A * | | | 83,679 | | | | 978,207 | |
| Sprout Social, Cl A * | | | 33,617 | | | | 1,695,978 | |
| | | | | | | | 3,897,614 | |
| TOTAL UNITED STATES | | | | | | | 62,365,773 | |
TOTAL COMMON STOCK
(Cost $189,486,946) | | | | | | | 138,473,458 | |
| | | | | | | | |
| | | Face Amount | | | | | |
| REPURCHASE AGREEMENTS(B) — 1.1% | | | | | | | | |
Bank of America Securities
5.320%, dated 04/30/2024, to be repurchased on 05/01/2024, repurchase price $357,548 (collateralized by various U.S. Government Obligations, ranging in par value $228 - $289,629, 2.000% - 7.500%, 10/17/2025 - 08/20/2063, with a total market value of $364,645) | | $ | 357,495 | | | | 357,495 | |
The accompanying notes are an integral part of the financial statements.
19
| Schedule of Investments | | April 30, 2024 (Unaudited) |
| | Global X Social Media ETF | |
| | | Face Amount | | | Value | |
| REPURCHASE AGREEMENTS — continued | | | | | | | | |
Citigroup Global Markets Inc.
5.320%, dated 04/30/2024, to be repurchased on 05/01/2024, repurchase price $357,548 (collateralized by various U.S. Government Obligations, ranging in par value $7,154 - $179,480, 2.000% - 6.500%, 12/01/2033 - 05/01/2054, with a total market value of $364,645) | | $ | 357,495 | | | $ | 357,495 | |
Deutsche Bank
5.310%, dated 04/30/2024, to be repurchased on 05/01/2024, repurchase price $98,441 (collateralized by various U.S. Government Obligations, ranging in par value $60 - $20,602, 2.000% - 7.000%, 02/01/2037 - 02/01/2054, with a total market value of $100,395) | | | 98,426 | | | | 98,426 | |
HSBC Securities
5.310%, dated 04/30/2024, to be repurchased on 05/01/2024, repurchase price $350,397 (collateralized by various U.S. Government Obligations, ranging in par value $21,897 - $529,154, 2.500% - 3.000%, 04/20/2043 - 10/20/2051, with a total market value of $357,352) | | | 350,345 | | | | 350,345 | |
Nomura Securities International
5.310%, dated 04/30/2024, to be repurchased on 05/01/2024, repurchase price $357,548 (collateralized by various U.S. Government Obligations, ranging in par value $153 - $71,862, 2.000% - 7.500%, 10/01/2029 - 03/15/2058, with a total market value of $364,780) | | | 357,495 | | | | 357,495 | |
TOTAL REPURCHASE AGREEMENTS
(Cost $1,521,256) | | | | | | | 1,521,256 | |
TOTAL INVESTMENTS — 101.0%
(Cost $191,008,202) | | | | | | $ | 139,994,714 | |
Percentages are based on Net Assets of $138,642,875.
The accompanying notes are an integral part of the financial statements.
20
| Schedule of Investments | | April 30, 2024 (Unaudited) |
| | Global X Social Media ETF | |
| * | Non-income producing security. |
| (A) | This security or a partial position of this security is on loan at April 30, 2024. The total market value of securities on loan at April 30, 2024 was $1,427,310. |
| (B) | These securities were purchased with cash collateral held from securities on loan. The total value of such securities as of April 30, 2024 was $1,521,256. The total value of non-cash collateral held from securities on loan as of April 30, 2024 was $–. |
The following is a summary of the level of inputs used as of April 30, 2024, in valuing the Fund’s investments carried at value:
| Investments in Securities | | Level 1 | | | Level 2 | | | Level 3 | | | Total | |
| Common Stock | | $ | 138,473,458 | | | $ | — | | | $ | — | | | $ | 138,473,458 | |
| Repurchase Agreements | | | — | | | | 1,521,256 | | | | — | | | | 1,521,256 | |
| Total Investments in Securities | | $ | 138,473,458 | | | $ | 1,521,256 | | | $ | — | | | $ | 139,994,714 | |
Amounts designated as “—” are $0 or have been rounded to $0.
See “Glossary” for abbreviations.
The accompanying notes are an integral part of the financial statements.
21
| Schedule of Investments | | April 30, 2024 (Unaudited) |
| | Global X Guru® Index ETF | |
Sector Weightings †:
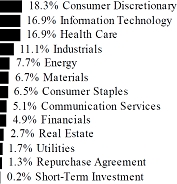
† Sector weightings percentages are based on the total market value of investments. Total investments do not include derivatives such as options, futures contracts, forward contracts, and swap contracts, if applicable.
| | | Shares | | | Value | |
| COMMON STOCK — 100.0% | | | | | | |
| SOUTH KOREA — 2.4% | | | | | | |
| Consumer Discretionary — 2.4% | | | | | | |
| Coupang, Cl A * | | | 42,576 | | | $ | 957,960 | |
| | | | | | | | | |
| UNITED KINGDOM — 1.4% | | | | | | | | |
| Health Care — 1.4% | | | | | | | | |
| Immunocore Holdings ADR * | | | 9,520 | | | | 562,442 | |
| | | | | | | | | |
| UNITED STATES — 96.2% | | | | | | | | |
| Communication Services — 5.2% | | | | | | | | |
| Alphabet, Cl A * | | | 4,699 | | | | 764,903 | |
| Endeavor Group Holdings, Cl A | | | 27,358 | | | | 722,525 | |
| Meta Platforms, Cl A | | | 1,389 | | | | 597,506 | |
| | | | | | | | 2,084,934 | |
| Consumer Discretionary — 16.2% | | | | | | | | |
| Amazon.com * | | | 3,971 | | | | 694,925 | |
| Asbury Automotive Group * | | | 3,041 | | | | 639,340 | |
| Chipotle Mexican Grill, Cl A * | | | 256 | | | | 808,858 | |
| Expedia Group * | | | 4,868 | | | | 655,379 | |
| Green Brick Partners * | | | 12,148 | | | | 657,571 | |
The accompanying notes are an integral part of the financial statements.
22
| Schedule of Investments | | April 30, 2024 (Unaudited) |
| | Global X Guru® Index ETF | |
| | | Shares | | | Value | |
| COMMON STOCK — continued | | | | | | | | |
| Consumer Discretionary — continued | | | | | | | | |
| Home Depot | | | 1,859 | | | $ | 621,315 | |
| Lithia Motors, Cl A | | | 2,206 | | | | 561,162 | |
| Planet Fitness, Cl A * | | | 9,925 | | | | 593,912 | |
| RH * | | | 2,434 | | | | 601,320 | |
| United Parks & Resorts * | | | 14,092 | | | | 716,155 | |
| | | | | | | | 6,549,937 | |
| Consumer Staples — 6.6% | | | | | | | | |
| Albertsons, Cl A | | | 31,603 | | | | 644,701 | |
| Kellanova | | | 12,109 | | | | 700,627 | |
| Kenvue | | | 35,216 | | | | 662,765 | |
| Post Holdings * | | | 6,356 | | | | 674,689 | |
| | | | | | | | 2,682,782 | |
| Energy — 7.8% | | | | | | | | |
| Chesapeake Energy (A) | | | 8,618 | | | | 774,586 | |
| Pioneer Natural Resources | | | 2,899 | | | | 780,759 | |
| Targa Resources | | | 7,202 | | | | 821,460 | |
| Texas Pacific Land | | | 1,353 | | | | 779,734 | |
| | | | | | | | 3,156,539 | |
| Financials — 4.9% | | | | | | | | |
| Fiserv * | | | 4,541 | | | | 693,274 | |
| S&P Global | | | 1,583 | | | | 658,259 | |
| Visa, Cl A | | | 2,395 | | | | 643,321 | |
| | | | | | | | 1,994,854 | |
| Health Care — 15.7% | | | | | | | | |
| Amicus Therapeutics * | | | 47,945 | | | | 478,971 | |
| IDEXX Laboratories * | | | 1,180 | | | | 581,457 | |
| Incyte * | | | 11,382 | | | | 592,433 | |
| IQVIA Holdings * | | | 2,785 | | | | 645,479 | |
| MoonLake Immunotherapeutics, Cl A * | | | 11,177 | | | | 457,251 | |
| Nuvalent, Cl A * | | | 7,942 | | | | 547,045 | |
| PTC Therapeutics * | | | 26,117 | | | | 839,662 | |
| Roivant Sciences * | | | 58,593 | | | | 638,664 | |
| Tenet Healthcare * | | | 7,467 | | | | 838,469 | |
| United Therapeutics * | | | 3,127 | | | | 732,750 | |
| | | | | | | | 6,352,181 | |
The accompanying notes are an integral part of the financial statements.
23
| Schedule of Investments | | April 30, 2024 (Unaudited) |
| | Global X Guru® Index ETF | |
| | | Shares | | | Value | |
| COMMON STOCK — continued | | | | | | | | |
| Industrials — 11.3% | | | | | | | | |
| Array Technologies * | | | 44,129 | | | $ | 544,552 | |
| Avis Budget Group | | | 5,552 | | | | 529,938 | |
| Carrier Global | | | 12,015 | | | | 738,802 | |
| Delta Air Lines | | | 16,423 | | | | 822,300 | |
| Ferguson | | | 3,384 | | | | 710,301 | |
| Hertz Global Holdings * | | | 85,356 | | | | 388,370 | |
| Quanta Services | | | 3,135 | | | | 810,586 | |
| | | | | | | | 4,544,849 | |
| Information Technology — 17.2% | | | | | | | | |
| Apple | | | 3,666 | | | | 624,430 | |
| CyberArk Software * | | | 2,538 | | | | 607,216 | |
| Elastic * | | | 5,058 | | | | 517,029 | |
| GoDaddy, Cl A * | | | 6,022 | | | | 736,972 | |
| Guidewire Software * | | | 5,557 | | | | 613,493 | |
| Microsoft | | | 1,651 | | | | 642,784 | |
| NVIDIA | | | 931 | | | | 804,403 | |
| Oracle | | | 5,945 | | | | 676,244 | |
| Salesforce | | | 2,306 | | | | 620,176 | |
| Seagate Technology Holdings | | | 7,617 | | | | 654,376 | |
| Snowflake, Cl A * | | | 2,895 | | | | 449,304 | |
| | | | | | | | 6,946,427 | |
| Materials — 6.8% | | | | | | | | |
| Ashland Global Holdings | | | 7,259 | | | | 692,001 | |
| Linde PLC | | | 1,565 | | | | 690,102 | |
| Sherwin-Williams | | | 2,146 | | | | 642,963 | |
| Vulcan Materials | | | 2,772 | | | | 714,150 | |
| | | | | | | | 2,739,216 | |
| Real Estate — 2.8% | | | | | | | | |
| American Tower ‡ | | | 3,556 | | | | 610,067 | |
| ProLogis ‡ | | | 5,049 | | | | 515,251 | |
| | | | | | | | 1,125,318 | |
The accompanying notes are an integral part of the financial statements.
24
| Schedule of Investments | | April 30, 2024 (Unaudited) |
| | Global X Guru® Index ETF | |
| | | Shares | | | Value | |
| COMMON STOCK — continued | | | | | | | | |
| Utilities — 1.7% | | | | | | | | |
| PG&E | | | 40,584 | | | $ | 694,392 | |
| | | | | | | | | |
| TOTAL UNITED STATES | | | | | | | 38,871,429 | |
TOTAL COMMON STOCK
(Cost $39,902,778) | | | | | | | 40,391,831 | |
| | | | | | | | | |
| SHORT-TERM INVESTMENT(B)(C) — 0.2% | | | | | | | | |
Fidelity Investments Money Market Government Portfolio, Cl Institutional, 5.240%
(Cost $97,216) | | | 97,216 | | | | 97,216 | |
| | | | | | | | |
| | | Face Amount | | | | | |
| REPURCHASE AGREEMENT(C) — 1.3% | | | | | | | | |
BNP Paribas
5.270%, dated 04/30/2024, to be repurchased on 05/01/2024, repurchase price $515,876 (collateralized by U.S. Treasury Obligations, ranging in par value $35,274 - $84,557, 2.875%, 05/15/2032, with a total market value of $526,326)
(Cost $515,800) | | $ | 515,800 | | | | 515,800 | |
TOTAL INVESTMENTS — 101.5%
(Cost $40,515,794) | | | | | | $ | 41,004,847 | |
Percentages are based on Net Assets of $40,394,795.
| * | Non-income producing security. |
| ‡ | Real Estate Investment Trust |
| (A) | This security or a partial position of this security is on loan at April 30, 2024. The total market value of securities on loan at April 30, 2024 was $580,894. |
| (B) | The rate reported on the Schedule of Investments is the 7-day effective yield as of April 30, 2024. |
| (C) | These securities were purchased with cash collateral held from securities on loan. The total value of such securities as of April 30, 2024 was $613,016. The total value of non-cash collateral held from securities on loan as of April 30, 2024 was $–. |
The accompanying notes are an integral part of the financial statements.
25
| Schedule of Investments | | April 30, 2024 (Unaudited) |
| | Global X Guru® Index ETF | |
The following is a summary of the level of inputs used as of April 30, 2024, in valuing the Fund’s investments carried at value:
| Investments in Securities | | Level 1 | | | Level 2 | | | Level 3 | | | Total | |
| Common Stock | | $ | 40,391,831 | | | $ | — | | | $ | — | | | $ | 40,391,831 | |
| Short-Term Investment | | | 97,216 | | | | — | | | | — | | | | 97,216 | |
| Repurchase Agreement | | | — | | | | 515,800 | | | | — | | | | 515,800 | |
| Total Investments in Securities | | $ | 40,489,047 | | | $ | 515,800 | | | $ | — | | | $ | 41,004,847 | |
Amounts designated as “—” are $0 or have been rounded to $0.
See “Glossary” for abbreviations.
The accompanying notes are an integral part of the financial statements.
26
| Schedule of Investments | | April 30, 2024 (Unaudited) |
| | Global X SuperIncome™ Preferred ETF | |
Sector Weightings †:
† Sector weightings percentages are based on the total market value of investments. Total investments do not include derivatives such as options, futures contracts, forward contracts, and swap contracts, if applicable.
| | | Shares | | | Value | |
| PREFERRED STOCK — 99.7% | | | | | | |
| UNITED STATES— 99.7% | | | | | | |
| Communication Services — 1.2% | | | | | | |
| Telephone and Data Systems, 6.000% | | | 123,426 | | | $ | 1,856,327 | |
| Consumer Discretionary — 3.5% | | | | | | | | |
| Ford Motor, 6.500% | | | 107,449 | | | | 2,632,500 | |
| Qurate Retail, 8.000% | | | 56,959 | | | | 2,629,797 | |
| | | | | | | | 5,262,297 | |
| Energy — 1.4% | | | | | | | | |
| Energy Transfer, 9.250% | | | 185,412 | | | | 2,033,970 | |
| Financials — 87.7% | | | | | | | | |
| AGNC Investment, 6.125%, CME Term SOFR + 4.697% ‡ (A) | | | 102,915 | | | | 2,404,094 | |
| Allstate, 7.375% | | | 107,448 | | | | 2,866,713 | |
| Apollo Global Management, 7.625%, H15T5Y + 3.226% (A) | | | 107,970 | | | | 2,852,567 | |
| Apollo Global Management, 6.750% | | | 129,261 | | | | 7,882,336 | |
| Athene Holding, 7.750%, H15T5Y + 3.962% (A) | | | 89,497 | | | | 2,381,515 | |
| Athene Holding, 6.375%, H15T5Y + 5.970% (A) | | | 107,976 | | | | 2,702,639 | |
| Athene Holding, 6.350%, US0003M + 4.253% (A) | | | 154,604 | | | | 3,634,740 | |
The accompanying notes are an integral part of the financial statements.
27
| Schedule of Investments | | April 30, 2024 (Unaudited) |
| | Global X SuperIncome™ Preferred ETF | |
| | | Shares | | | Value | |
| PREFERRED STOCK — continued | | | | | | | | |
| Financials — continued | | | | | | | | |
| Banc of California, 7.750%, H15T5Y + 4.820% (A) | | | 91,840 | | | $ | 2,087,523 | |
| Bank of America, 7.250% * | | | 9,058 | | | | 10,416,700 | |
| Bank of America, 4.750% | | | 81,069 | | | | 1,640,026 | |
| Bank of America, 4.250% | | | 151,699 | | | | 2,776,092 | |
| Brighthouse Financial, 5.375% | | | 102,858 | | | | 1,893,616 | |
| Capital One Financial, 4.800% | | | 224,064 | | | | 4,113,815 | |
| Capital One Financial, 4.375% | | | 120,776 | | | | 2,042,322 | |
| Charles Schwab, 4.450% (B) | | | 107,446 | | | | 2,134,952 | |
| F&G Annuities & Life, 7.950% | | | 62,401 | | | | 1,622,426 | |
| Huntington Bancshares, 6.875%, H15T5Y + 2.704% (A) (B) | | | 58,797 | | | | 1,460,518 | |
| Jackson Financial, 8.000%, H15T5Y + 3.728% (A) (B) | | | 98,483 | | | | 2,578,285 | |
| JPMorgan Chase, 4.625% | | | 255,286 | | | | 5,302,290 | |
| JPMorgan Chase, 4.550% | | | 206,915 | | | | 4,204,513 | |
| JPMorgan Chase, 4.200% | | | 276,002 | | | | 5,249,558 | |
| KeyCorp, 6.200%, H15T5Y + 3.132% (A) | | | 107,403 | | | | 2,405,827 | |
| KeyCorp, 6.125%, TSFR3M + 4.154% (A) | | | 89,453 | | | | 2,062,786 | |
| Lincoln National, 9.000% | | | 89,501 | | | | 2,412,052 | |
| MetLife, 4.750% | | | 179,221 | | | | 3,659,693 | |
| Morgan Stanley, 6.500% | | | 179,350 | | | | 4,535,762 | |
| Morgan Stanley, 5.850%, + 0.000% (A) (B) | | | 179,318 | | | | 4,296,459 | |
| Morgan Stanley, 4.250% | | | 233,148 | | | | 4,329,558 | |
| New York Community Bancorp, 6.375%, US0003M + 3.821% (A) | | | 93,129 | | | | 1,454,675 | |
| Regions Financial, 5.700%, TSFR3M + 3.410% (A) | | | 89,412 | | | | 1,954,546 | |
| Reinsurance Group of America, 7.125%, H15T5Y + 3.456% (A) | | | 125,944 | | | | 3,298,473 | |
| State Street, 5.350%, TSFR3M + 3.971% (A) (B) | | | 89,535 | | | | 2,129,142 | |
| Synchrony Financial, 8.250%, H15T5Y + 4.044% (A) | | | 89,462 | | | | 2,248,180 | |
| TPG Operating Group II, 6.950% (B) | | | 71,527 | | | | 1,844,681 | |
| Truist Financial, 5.250% | | | 103,011 | | | | 2,293,025 | |
| Truist Financial, 4.750% | | | 165,737 | | | | 3,286,565 | |
| US Bancorp, 4.000% | | | 135,541 | | | | 2,339,438 | |
| Wells Fargo, 7.500% * | | | 6,677 | | | | 7,648,103 | |
| Wells Fargo, 4.750% | | | 135,159 | | | | 2,753,189 | |
The accompanying notes are an integral part of the financial statements.
28
| Schedule of Investments | | April 30, 2024 (Unaudited) |
| | Global X SuperIncome™ Preferred ETF | |
| | | Shares | | | Value | |
| PREFERRED STOCK — continued | | | | | | | | |
| Financials — continued | | | | | | | | |
| Wells Fargo, 4.700% (B) | | | 79,326 | | | $ | 1,599,212 | |
| Wells Fargo, 4.375% | | | 71,223 | | | | 1,356,798 | |
| Wells Fargo, 4.250% (B) | | | 84,726 | | | | 1,565,737 | |
| | | | | | | | 131,721,141 | |
| Industrials — 4.2% | | | | | | | | |
| Chart Industries, 6.750% | | | 36,001 | | | | 2,068,617 | |
| Clarivate, 5.250% | | | 64,968 | | | | 1,761,283 | |
| WESCO International, 10.625%, H15T5Y + 10.325% (A) | | | 96,402 | | | | 2,544,049 | |
| | | | | | | | 6,373,949 | |
| Utilities — 1.7% | | | | | | | | |
| SCE Trust VII, 7.500% | | | 99,410 | | | | 2,594,601 | |
| TOTAL UNITED STATES | | | | | | | 149,842,285 | |
TOTAL PREFERRED STOCK
(Cost $155,167,934) | | | | | | | 149,842,285 | |
| | | | | | | | | |
| SHORT-TERM INVESTMENT(C)(D) — 1.0% | | | | | | | | |
Fidelity Investments Money Market Government Portfolio, Cl Institutional, 5.240%
(Cost $1,442,869) | | | 1,442,869 | | | | 1,442,869 | |
| | | | | | | | |
| | | Face Amount | | | | | |
| REPURCHASE AGREEMENT(D) — 5.1% | | | | | | | | |
BNP Paribas
5.270%, dated 04/30/2024 , to be repurchased on 05/01/2024, repurchase price $7,656,607 (collateralized by U.S. Treasury Obligations, ranging in par value $523,535 - $1,254,998, 2.875%, 05/15/2032, with a total market value of $7,811,725)
(Cost $7,655,486) | | $ | 7,655,486 | | | | 7,655,486 | |
TOTAL INVESTMENTS — 105.8%
(Cost $164,266,289) | | | | | | $ | 158,940,640 | |
Percentages are based on Net Assets of $150,256,312.
| * | Non-income producing security. |
| ‡ | Real Estate Investment Trust |
The accompanying notes are an integral part of the financial statements.
29
| Schedule of Investments | | April 30, 2024 (Unaudited) |
| | Global X SuperIncome™ Preferred ETF | |
| (A) | Variable or floating rate security. The rate shown is the effective interest rate as of period end. The rates on certain securities are not based on published reference rates and spreads and are either determined by the issuer or agent based on current market conditions; by using a formula based on the rates of underlying loans; or by adjusting periodically based on prevailing interest rates. |
| (B) | This security or a partial position of this security is on loan at April 30, 2024. The total market value of securities on loan at April 30, 2024 was $8,785,171. |
| (C) | The rate reported on the Schedule of Investments is the 7-day effective yield as of April 30, 2024. |
| (D) | These securities were purchased with cash collateral held from securities on loan. The total value of such securities as of April 30, 2024 was $9,098,355. The total value of non-cash collateral held from securities on loan as of April 30, 2024 was $–. |
The following is a summary of the level of inputs used as of April 30, 2024, in valuing the Fund’s investments carried at value:
| Investments in Securities | | Level 1 | | | Level 2 | | | Level 3 | | | Total | |
| Preferred Stock | | $ | 44,852,506 | | | $ | 104,989,779 | | | $ | — | | | $ | 149,842,285 | |
| Short-Term Investment | | | 1,442,869 | | | | — | | | | — | | | | 1,442,869 | |
| Repurchase Agreement | | | — | | | | 7,655,486 | | | | — | | | | 7,655,486 | |
| Total Investments in Securities | | $ | 46,295,375 | | | $ | 112,645,265 | | | $ | — | | | $ | 158,940,640 | |
See “Glossary” for abbreviations.
The accompanying notes are an integral part of the financial statements.
30
| Schedule of Investments | | April 30, 2024 (Unaudited) |
| | Global X SuperDividend® U.S. ETF | |
Sector Weightings †:
† Sector weightings percentages are based on the total market value of investments. Total investments do not include derivatives such as options, futures contracts, forward contracts, and swap contracts, if applicable.
| | | Shares | | | Value | |
| COMMON STOCK — 83.9% | | | | | | |
| NORWAY — 2.0% | | | | | | |
| Energy — 2.0% | | | | | | |
| SFL | | | 923,686 | | | $ | 12,312,734 | |
| | | | | | | | | |
| UNITED STATES — 81.9% | | | | | | | | |
| Communication Services — 7.6% | | | | | | | | |
| AT&T | | | 700,092 | | | | 11,824,554 | |
| Cogent Communications Holdings | | | 155,131 | | | | 9,956,307 | |
| Telephone and Data Systems | | | 845,985 | | | | 13,239,665 | |
| Verizon Communications | | | 291,181 | | | | 11,498,738 | |
| | | | | | | | 46,519,264 | |
| Consumer Services — 2.1% | | | | | | | | |
| Wendy’s | | | 639,707 | | | | 12,787,743 | |
| | | | | | | | | |
| Consumer Staples — 10.1% | | | | | | | | |
| Altria Group | | | 295,678 | | | | 12,953,653 | |
| Kraft Heinz | | | 338,679 | | | | 13,076,396 | |
| Philip Morris International | | | 132,773 | | | | 12,605,469 | |
| Universal | | | 239,358 | | | | 12,310,182 | |
The accompanying notes are an integral part of the financial statements.
31
| Schedule of Investments | | April 30, 2024 (Unaudited) |
| | Global X SuperDividend® U.S. ETF | |
| | | Shares | | | Value | |
| COMMON STOCK — continued | | | | | | |
| Consumer Staples — continued | | | | | | |
| Vector Group | | | 1,040,590 | | | $ | 10,770,107 | |
| | | | | | | | 61,715,807 | |
| Energy — 10.9% | | | | | | | | |
| Berry | | | 1,739,125 | | | | 14,765,171 | |
| Chesapeake Energy (A) | | | 150,871 | | | | 13,560,285 | |
| Chord Energy | | | 72,706 | | | | 12,867,508 | |
| Coterra Energy | | | 481,291 | | | | 13,168,122 | |
| Kinder Morgan | | | 694,307 | | | | 12,691,932 | |
| | | | | | | | 67,053,018 | |
| Financials — 6.3% | | | | | | | | |
| TFS Financial | | | 881,153 | | | | 10,582,648 | |
| Virtu Financial, Cl A | | | 707,853 | | | | 15,360,410 | |
| Western Union | | | 928,746 | | | | 12,482,346 | |
| | | | | | | | 38,425,404 | |
| Health Care — 3.6% | | | | | | | | |
| AbbVie | | | 66,946 | | | | 10,888,097 | |
| Pfizer | | | 426,853 | | | | 10,935,974 | |
| | | | | | | | 21,824,071 | |
| Industrials — 1.9% | | | | | | | | |
| Ennis | | | 581,083 | | | | 11,563,552 | |
| | | | | | | | | |
| Information Technology — 1.7% | | | | | | | | |
| International Business Machines | | | 62,844 | | | | 10,444,673 | |
| | | | | | | | | |
| Materials — 5.8% | | | | | | | | |
| Dow | | | 214,550 | | | | 12,207,895 | |
| International Paper | | | 329,336 | | | | 11,507,000 | |
| LyondellBasell Industries, Cl A | | | 121,834 | | | | 12,179,745 | |
| | | | | | | | 35,894,640 | |
| Real Estate — 17.3% | | | | | | | | |
| Alexander’s ‡ | | | 52,985 | | | | 11,209,507 | |
| CBL & Associates Properties ‡ | | | 508,385 | | | | 11,057,374 | |
| Community Healthcare Trust ‡ | | | 436,933 | | | | 11,591,832 | |
| Easterly Government Properties, Cl A ‡ | | | 1,009,400 | | | | 11,799,886 | |
The accompanying notes are an integral part of the financial statements.
32
| Schedule of Investments | | April 30, 2024 (Unaudited) |
| | Global X SuperDividend® U.S. ETF | |
| | | Shares | | | Value | |
| COMMON STOCK — continued | | | | | | | | |
| Real Estate — continued | | | | | | | | |
| Gaming and Leisure Properties ‡ | | | 260,879 | | | $ | 11,147,360 | |
| LTC Properties ‡ | | | 377,755 | | | | 12,503,690 | |
| National Health Investors ‡ | | | 222,999 | | | | 14,062,317 | |
| Omega Healthcare Investors ‡ | | | 380,924 | | | | 11,583,899 | |
| Universal Health Realty Income Trust ‡ | | | 296,914 | | | | 10,697,811 | |
| | | | | | | | 105,653,676 | |
| Utilities — 14.6% | | | | | | | | |
| Avangrid | | | 375,628 | | | | 13,721,691 | |
| Avista | | | 353,912 | | | | 12,733,754 | |
| Dominion Energy | | | 259,551 | | | | 13,231,910 | |
| Duke Energy | | | 129,550 | | | | 12,729,583 | |
| Northwest Natural Holding | | | 323,100 | | | | 12,326,265 | |
| Northwestern Energy Group | | | 241,448 | | | | 12,178,637 | |
| OGE Energy | | | 360,705 | | | | 12,498,428 | |
| | | | | | | | 89,420,268 | |
| TOTAL UNITED STATES | | | | | | | 501,302,116 | |
TOTAL COMMON STOCK
(Cost $516,163,930) | | | | | | | 513,614,850 | |
| | | | | | | | | |
| MASTER LIMITED PARTNERSHIPS — 15.7% | | | | | | | | |
| UNITED STATES— 15.7% | | | | | | | | |
| Energy — 11.9% | | | | | | | | |
| Black Stone Minerals | | | 781,080 | | | | 12,458,226 | |
| CrossAmerica Partners | | | 541,011 | | | | 12,443,253 | |
| Global Partners | | | 249,042 | | | | 11,677,579 | |
| MPLX | | | 304,974 | | | | 12,747,913 | |
| NuStar Energy | | | 505,557 | | | | 11,410,422 | |
| USA Compression Partners | | | 492,308 | | | | 11,928,623 | |
| | | | | | | | 72,666,016 | |
| Materials — 1.9% | | | | | | | | |
| Westlake Chemical Partners | | | 528,465 | | | | 11,552,245 | |
| Utilities — 1.9% | | | | | | | | |
| Suburban Propane Partners | | | 602,342 | | | | 11,763,739 | |
| TOTAL UNITED STATES | | | | | | | 95,982,000 | |
TOTAL MASTER LIMITED PARTNERSHIPS
(Cost $58,720,628) | | | | | | | 95,982,000 | |
The accompanying notes are an integral part of the financial statements.
33
| Schedule of Investments | | April 30, 2024 (Unaudited) |
| | Global X SuperDividend® U.S. ETF | |
| | | Face Amount | | | Value | |
| REPURCHASE AGREEMENTS(B) — 1.8% | | | | | | | | |
Bank of America Securities
5.320%, dated 04/30/2024, to be repurchased on 05/01/2024, repurchase price $2,532,438 (collateralized by various U.S. Government Obligations, ranging in par value $1,617 - $2,051,380, 2.000% - 7.500%, 10/17/2025 - 08/20/2063, with a total market value of $2,582,705) | | $ | 2,532,064 | | | $ | 2,532,064 | |
Citigroup Global Markets Inc.
5.320%, dated 04/30/2024, to be repurchased on 05/01/2024, repurchase price $2,532,438 (collateralized by various U.S. Government Obligations, ranging in par value $50,672 - $1,271,221, 2.000% - 6.500%, 12/01/2033 - 05/01/2054, with a total market value of $2,582,706) | | | 2,532,064 | | | | 2,532,064 | |
Deutsche Bank
5.310%, dated 04/30/2024, to be repurchased on 05/01/2024, repurchase price $646,583 (collateralized by various U.S. Government Obligations, ranging in par value $394 - $135,320, 2.000% - 7.000%, 02/01/2037 - 02/01/2054, with a total market value of $659,418) | | | 646,488 | | | | 646,488 | |
Nomura Securities International
5.310%, dated 04/30/2024, to be repurchased on 05/01/2024, repurchase price $2,532,437 (collateralized by various U.S. Government Obligations, ranging in par value $1,081 - $508,984, 2.000% - 7.500%, 10/01/2029 - 03/15/2058, with a total market value of $2,583,659) | | | 2,532,064 | | | | 2,532,064 | |
The accompanying notes are an integral part of the financial statements.
34
| Schedule of Investments | | April 30, 2024 (Unaudited) |
| | Global X SuperDividend® U.S. ETF | |
| | | Face Amount | | | Value | |
| REPURCHASE AGREEMENTS — continued | | | | | | |
RBC Dominion Securities
5.320%, dated 04/30/2024, to be repurchased on 05/01/2024, repurchase price $2,532,438 (collateralized by various U.S. Government Obligations and U.S. Treasury Obligations, ranging in par value $2,408 - $5,390,308, 0.000% - 5.500%, 05/09/2024 - 02/15/2054, with a total market value of $2,582,705) | | $ | 2,532,064 | | | $ | 2,532,064 | |
TOTAL REPURCHASE AGREEMENTS
(Cost $10,774,744) | | | | | | | 10,774,744 | |
TOTAL INVESTMENTS — 101.4%
(Cost $585,659,302) | | | | | | $ | 620,371,594 | |
Percentages are based on Net Assets of $611,778,481.
| ‡ | Real Estate Investment Trust |
| (A) | This security or a partial position of this security is on loan at April 30, 2024. The total market value of securities on loan at April 30, 2024 was $10,170,192. |
| (B) | These securities were purchased with cash collateral held from securities on loan. The total value of such securities as of April 30, 2024 was $10,774,744. The total value of non-cash collateral held from securities on loan as of April 30, 2024 was $–. |
The following is a summary of the level of inputs used as of April 30, 2024, in valuing the Fund’s investments carried at value:
| Investments in Securities | | Level 1 | | | Level 2 | | | Level 3 | | | Total | |
| Common Stock | | $ | 513,614,850 | | | $ | — | | | $ | — | | | $ | 513,614,850 | |
| Master Limited Partnerships | | | 95,982,000 | | | | — | | | | — | | | | 95,982,000 | |
| Repurchase Agreements | | | — | | | | 10,774,744 | | | | — | | | | 10,774,744 | |
| Total Investments in Securities | | $ | 609,596,850 | | | $ | 10,774,744 | | | $ | — | | | $ | 620,371,594 | |
Amounts designated as “—” are $0 or have been rounded to $0.
See “Glossary” for abbreviations.
The accompanying notes are an integral part of the financial statements.
35
| Schedule of Investments | April 30, 2024 (Unaudited) |
Global X MSCI SuperDividend® Emerging Markets ETF
Sector Weightings †:
† Sector weightings percentages are based on the total market value of investments. Total investments do not include derivatives such as options, futures contracts, forward contracts, and swap contracts, if applicable.
| | | Shares | | | Value | |
| COMMON STOCK — 92.4% | | | | | | | | |
| BRAZIL — 5.3% | | | | | | | | |
| Financials — 3.5% | | | | | | | | |
| Banco do Brasil | | | 184,600 | | | $ | 976,584 | |
| BB Seguridade Participacoes | | | 99,700 | | | | 619,386 | |
| | | | | | | | 1,595,970 | |
| Materials — 1.8% | | | | | | | | |
| Cia Siderurgica Nacional | | | 303,351 | | | | 814,695 | |
| | | | | | | | | |
| TOTAL BRAZIL | | | | | | | 2,410,665 | |
| CHILE — 6.7% | | | | | | | | |
| Financials — 1.8% | | | | | | | | |
| Banco de Chile | | | 7,538,391 | | | | 839,702 | |
| | | | | | | | | |
| Industrials — 1.4% | | | | | | | | |
| Cia Sud Americana de Vapores | | | 8,229,205 | | | | 644,668 | |
| | | | | | | | | |
| Materials — 2.0% | | | | | | | | |
| Empresas CMPC | | | 451,360 | | | | 895,072 | |
The accompanying notes are an integral part of the financial statements.
36
| Schedule of Investments | April 30, 2024 (Unaudited) |
Global X MSCI SuperDividend® Emerging Markets ETF
| | | Shares | | | Value | |
| COMMON STOCK — continued | | | | | | | | |
| Utilities — 1.5% | | | | | | | | |
| Enel Chile | | | 11,236,594 | | | $ | 669,894 | |
| | | | | | | | | |
| TOTAL CHILE | | | | | | | 3,049,336 | |
| CHINA — 34.0% | | | | | | | | |
| Consumer Staples — 1.3% | | | | | | | | |
| Tingyi Cayman Islands Holding | | | 522,000 | | | | 578,650 | |
| | | | | | | | | |
| Energy — 14.2% | | | | | | | | |
| China Shenhua Energy, Cl H | | | 230,864 | | | | 965,230 | |
| Guanghui Energy, Cl A | | | 824,600 | | | | 840,181 | |
| Jizhong Energy Resources, Cl A | | | 731,000 | | | | 754,891 | |
| Shaanxi Coal Industry, Cl A | | | 339,900 | | | | 1,149,566 | |
| Shanxi Coking Coal Energy Group, Cl A | | | 664,500 | | | | 961,988 | |
| Shanxi Lu’an Environmental Energy Development, Cl A | | | 351,900 | | | | 1,025,675 | |
| Yankuang Energy Group, Cl H | | | 357,350 | | | | 778,556 | |
| | | | | | | | 6,476,087 | |
| Financials — 7.7% | | | | | | | | |
| Bank of China, Cl H | | | 1,959,900 | | | | 884,576 | |
| Bank of Communications, Cl H | | | 1,211,180 | | | | 876,500 | |
| China CITIC Bank, Cl H | | | 1,440,300 | | | | 847,105 | |
| China Construction Bank, Cl H | | | 1,443,400 | | | | 941,204 | |
| | | | | | | | 3,549,385 | |
| Industrials — 3.3% | | | | | | | | |
| COSCO SHIPPING Holdings, Cl A | | | 514,200 | | | | 834,438 | |
| Shanxi Coal International Energy Group, Cl A | | | 354,800 | | | | 700,017 | |
| | | | | | | | 1,534,455 | |
| Information Technology — 1.7% | | | | | | | | |
| Xinjiang Daqo New Energy, Cl A | | | 228,492 | | | | 769,941 | |
| | | | | | | | | |
| Materials — 4.8% | | | | | | | | |
| Western Mining, Cl A | | | 458,200 | | | | 1,269,803 | |
| Zangge Mining, Cl A | | | 231,600 | | | | 920,914 | |
| | | | | | | | 2,190,717 | |
The accompanying notes are an integral part of the financial statements.
37
| Schedule of Investments | April 30, 2024 (Unaudited) |
Global X MSCI SuperDividend® Emerging Markets ETF
| | | Shares | | | Value | |
| COMMON STOCK — continued | | | | | | | | |
| Utilities — 1.0% | | | | | | | | |
| Guangdong Investment | | | 890,400 | | | $ | 466,762 | |
| | | | | | | | | |
| TOTAL CHINA | | | | | | | 15,565,997 | |
| CZECH REPUBLIC — 3.4% | | | | | | | | |
| Financials — 2.0% | | | | | | | | |
| Moneta Money Bank | | | 228,668 | | | | 923,605 | |
| | | | | | | | | |
| Utilities — 1.4% | | | | | | | | |
| CEZ | | | 17,210 | | | | 635,917 | |
| | | | | | | | | |
| TOTAL CZECH REPUBLIC | | | | | | | 1,559,522 | |
| EGYPT — 1.5% | | | | | | | | |
| Consumer Staples — 1.5% | | | | | | | | |
| Eastern SAE | | | 1,511,961 | | | | 695,154 | |
| | | | | | | | | |
| GREECE — 3.0% | | | | | | | | |
| Consumer Discretionary — 3.0% | | | | | | | | |
| JUMBO | | | 22,705 | | | | 708,416 | |
| OPAP | | | 40,818 | | | | 681,297 | |
| | | | | | | | | |
| TOTAL GREECE | | | | | | | 1,389,713 | |
| INDIA — 5.8% | | | | | | | | |
| Energy — 3.3% | | | | | | | | |
| Coal India | | | 280,618 | | | | 1,527,930 | |
| | | | | | | | | |
| Materials — 2.5% | | | | | | | | |
| Vedanta | | | 236,383 | | | | 1,127,148 | |
| | | | | | | | | |
| TOTAL INDIA | | | | | | | 2,655,078 | |
| INDONESIA — 3.1% | | | | | | | | |
| Energy — 1.9% | | | | | | | | |
| Adaro Energy | | | 5,046,100 | | | | 841,017 | |
| | | | | | | | | |
| Industrials — 1.2% | | | | | | | | |
| Astra International | | | 1,751,800 | | | | 554,844 | |
| | | | | | | | | |
| TOTAL INDONESIA | | | | | | | 1,395,861 | |
The accompanying notes are an integral part of the financial statements.
38
| Schedule of Investments | April 30, 2024 (Unaudited) |
Global X MSCI SuperDividend® Emerging Markets ETF
| | | Shares | | | Value | |
| COMMON STOCK — continued | | | | | | | | |
| MEXICO — 3.6% | | | | | | | | |
| Financials — 2.0% | | | | | | | | |
| Banco del Bajio | | | 245,540 | | | $ | 910,192 | |
| | | | | | | | | |
| Real Estate — 1.6% | | | | | | | | |
| Fibra Uno Administracion ‡ | | | 497,000 | | | | 717,271 | |
| | | | | | | | | |
| TOTAL MEXICO | | | | | | | 1,627,463 | |
| POLAND — 1.9% | | | | | | | | |
| Energy — 1.9% | | | | | | | | |
| Polski Koncern Naftowy Orlen S.A. | | | 53,174 | | | | 873,114 | |
| | | | | | | | | |
| QATAR — 2.0% | | | | | | | | |
| Industrials — 2.0% | | | | | | | | |
| Industries Qatar QSC | | | 269,419 | | | | 906,450 | |
| | | | | | | | | |
| ROMANIA — 2.0% | | | | | | | | |
| Real Estate — 2.0% | | | | | | | | |
| NEPI Rockcastle | | | 136,175 | | | | 918,165 | |
| | | | | | | | | |
| RUSSIA — 0.0% | | | | | | | | |
| Materials — 0.0% | | | | | | | | |
| Alrosa PJSC (A) | | | 1,194,381 | | | | — | |
| PhosAgro PJSC GDR *(A) | | | 42 | | | | — | |
| Severstal PJSC *(A) | | | 71,665 | | | | — | |
| | | | | | | | | |
| TOTAL RUSSIA | | | | | | | — | |
| SOUTH AFRICA — 1.8% | | | | | | | | |
| Information Technology — 1.8% | | | | | | | | |
| Sasol | | | 115,032 | | | | 813,838 | |
| | | | | | | | | |
| TAIWAN — 4.5% | | | | | | | | |
| Industrials — 2.1% | | | | | | | | |
| Evergreen Marine Taiwan | | | 165,920 | | | | 965,599 | |
The accompanying notes are an integral part of the financial statements.
39
| Schedule of Investments | April 30, 2024 (Unaudited) |
Global X MSCI SuperDividend® Emerging Markets ETF
| | | Shares | | | Value | |
| COMMON STOCK — continued | | | | | | | | |
| Information Technology — 2.4% | | | | | | | | |
| MediaTek | | | 35,800 | | | $ | 1,090,646 | |
| | | | | | | | | |
| TOTAL TAIWAN | | | | | | | 2,056,245 | |
| TURKEY — 11.4% | | | | | | | | |
| Energy — 3.2% | | | | | | | | |
| Turkiye Petrol Rafinerileri | | | 246,135 | | | | 1,488,525 | |
| | | | | | | | | |
| Financials — 8.2% | | | | | | | | |
| Akbank | | | 1,077,047 | | | | 1,977,683 | |
| Yapi ve Kredi Bankasi | | | 1,773,978 | | | | 1,768,690 | |
| | | | | | | | 3,746,373 | |
| TOTAL TURKEY | | | | | | | 5,234,898 | |
| UNITED STATES — 2.4% | | | | | | | | |
| Consumer Staples — 2.4% | | | | | | | | |
| JBS | | | 239,148 | | | | 1,081,521 | |
| | | | | | | | | |
TOTAL COMMON STOCK
(Cost $39,603,463) | | | | | | | 42,233,020 | |
| | | | | | | | | |
| PREFERRED STOCK — 7.2% | | | | | | | | |
| BRAZIL—3.6% | | | | | | | | |
| Energy — 1.8% | | | | | | | | |
| Petroleo Brasileiro (B) | | | 103,500 | | | | 839,087 | |
| Utilities — 1.8% | | | | | | | | |
| Cia Energetica de Minas Gerais (B) | | | 436,085 | | | | 822,008 | |
| TOTAL BRAZIL | | | | | | | 1,661,095 | |
| CHILE—1.1% | | | | | | | | |
| Materials — 1.1% | | | | | | | | |
| Sociedad Quimica y Minera de Chile, Cl B (B) | | | 11,230 | | | | 515,046 | |
| TOTAL CHILE | | | | | | | 515,046 | |
| COLOMBIA—2.5% | | | | | | | | |
| Financials — 2.5% | | | | | | | | |
| Bancolombia (B) | | | 137,300 | | | | 1,132,416 | |
| TOTAL COLOMBIA | | | | | | | 1,132,416 | |
The accompanying notes are an integral part of the financial statements.
40
| Schedule of Investments | April 30, 2024 (Unaudited) |
Global X MSCI SuperDividend® Emerging Markets ETF
| | | Shares | | | Value | |
| PREFERRED STOCK — continued | | | | | | | | |
| RUSSIA—0.0% | | | | | | | | |
| Energy — 0.0% | | | | | | | | |
| Surgutneftegas PJSC (B) | | | 3,166,303 | | | $ | — | |
| TOTAL RUSSIA | | | | | | | — | |
TOTAL PREFERRED STOCK
(Cost $4,674,639) | | | | | | | 3,308,557 | |
TOTAL INVESTMENTS — 99.6%
(Cost $44,278,102) | | | | | | $ | 45,541,577 | |
Percentages are based on Net Assets of $45,711,651.
A list of the open futures contracts held by the Fund at April 30, 2024, is as follows:
| Type of Contract | | Number of
Contracts | | Expiration
Date | | Notional Amount | | | Value | | | Unrealized
Depreciation | |
Long Contracts
MSCI Emerging Markets | | 1 | | Jun-2024 | | $ | 52,954 | | | $ | 52,100 | | | $ | (854) | |
| * | Non-income producing security. |
| ‡ | Real Estate Investment Trust |
| (A) | Level 3 security in accordance with fair value hierarchy. |
| (B) | There is currently no stated interest rate. |
The accompanying notes are an integral part of the financial statements.
41
| Schedule of Investments | April 30, 2024 (Unaudited) |
Global X MSCI SuperDividend® Emerging Markets ETF
The following is a summary of the level of inputs used as of April 30, 2024, in valuing the Fund’s investments and other financial instruments carried at value:
| Investments in Securities | | Level 1 | | | Level 2 | | | Level 3(1) | | | Total | |
| Common Stock | | $ | 42,233,020 | | | $ | — | | | $ | — | ^ | | $ | 42,233,020 | |
| Preferred Stock | | | 3,308,557 | | | | — | | | | — | | | | 3,308,557 | |
| Total Investments in Securities | | $ | 45,541,577 | | | $ | — | | | $ | — | | | $ | 45,541,577 | |
| | | | | | | | | | | | | | | | |
| Other Financial Instruments | | Level 1 | | | Level 2 | | | Level 3 | | | Total | |
| Futures Contracts* | | | | | | | | | | | | | | | | |
| Unrealized Depreciation | | $ | (854) | | | $ | — | | | $ | — | | | $ | (854) | |
| Total Other Financial Instruments | | $ | (854) | | | $ | — | | | $ | — | | | $ | (854) | |
| * | Futures contracts are valued at the unrealized appreciation (depreciation) on the instrument. |
| ^ | Includes Securities in which the fair value is $0 or has been rounded to $0. |
| (1) | A reconciliation of Level 3 investments and disclosures of significant unobservable inputs are presented when the Fund has a significant amount of Level 3 investments at the end of the period in relation to Net Assets. Management has concluded that Level 3 investments are not material in relation to Net Assets. |
Amounts designated as “—” are $0 or have been rounded to $0.
See “Glossary” for abbreviations.
The accompanying notes are an integral part of the financial statements.
42
| Schedule of Investments | April 30, 2024 (Unaudited) |
Global X SuperDividend® REIT ETF
Sector Weightings †:

† Sector weightings percentages are based on the total market value of investments. Total investments do not include derivatives such as options, futures contracts, forward contracts, and swap contracts, if applicable.
| | | Shares | | | Value | |
| COMMON STOCK — 99.7% | | | | | | | | |
| AUSTRALIA — 3.2% | | | | | | | | |
| Real Estate — 3.2% | | | | | | | | |
| Charter Hall Long Wale ‡ | | | 2,954,799 | | | $ | 6,504,395 | |
| | | | | | | | | |
| CANADA — 3.1% | | | | | | | | |
| Real Estate — 3.1% | | | | | | | | |
| SmartCentres ‡ | | | 400,215 | | | | 6,490,367 | |
| | | | | | | | | |
| FRANCE — 3.8% | | | | | | | | |
| Real Estate — 3.8% | | | | | | | | |
| Covivio ‡ | | | 157,074 | | | | 7,870,243 | |
| | | | | | | | | |
| HONG KONG — 3.0% | | | | | | | | |
| Real Estate — 3.0% | | | | | | | | |
| Link ‡ | | | 1,430,200 | | | | 6,189,878 | |
| | | | | | | | | |
| MEXICO — 2.4% | | | | | | | | |
| Real Estate — 2.4% | | | | | | | | |
| Fibra Uno Administracion ‡ | | | 3,430,200 | | | | 4,950,472 | |
| | | | | | | | | |
| SINGAPORE — 6.5% | | | | | | | | |
| Real Estate — 6.5% | | | | | | | | |
| Frasers Logistics & Commercial Trust ‡ | | | 8,912,546 | | | | 6,502,646 | |
| Keppel ‡ | | | 10,856,210 | | | | 7,005,290 | |
| | | | | | | | | |
| TOTAL SINGAPORE | | | | | | | 13,507,936 | |
| SOUTH AFRICA — 3.2% | | | | | | | | |
| Real Estate — 3.2% | | | | | | | | |
| Growthpoint Properties ‡ | | | 11,460,188 | | | | 6,656,232 | |
The accompanying notes are an integral part of the financial statements.
43
| Schedule of Investments | April 30, 2024 (Unaudited) |
Global X SuperDividend® REIT ETF
| | | Shares | | | Value | |
| COMMON STOCK — continued | | | | | | | | |
| UNITED STATES — 74.5% | | | | | | | | |
| Financials — 38.6% | | | | | | | | |
| Annaly Capital Management ‡ | | | 389,454 | | | $ | 7,298,368 | |
| Apollo Commercial Real Estate Finance ‡ | | | 712,549 | | | | 6,861,847 | |
| BrightSpire Capital, Cl A ‡ | | | 1,086,015 | | | | 6,831,034 | |
| Dynex Capital ‡ | | | 628,019 | | | | 7,328,982 | |
| Ellington Financial ‡ | | | 626,277 | | | | 7,164,609 | |
| Invesco Mortgage Capital ‡ | | | 109,772 | | | | 938,550 | |
| KKR Real Estate Finance Trust ‡ | | | 583,718 | | | | 5,492,786 | |
| Ladder Capital, Cl A ‡ | | | 698,664 | | | | 7,496,665 | |
| MFA Financial ‡ | | | 678,091 | | | | 7,180,984 | |
| Orchid Island Capital, Cl A ‡ | | | 112,643 | | | | 938,316 | |
| Ready Capital ‡ | | | 839,715 | | | | 7,154,372 | |
| Rithm Capital ‡ | | | 711,024 | | | | 7,906,587 | |
| Starwood Property Trust ‡ | | | 374,278 | | | | 7,100,054 | |
| | | | | | | | 79,693,154 | |
| Real Estate — 35.9% | | | | | | | | |
| Broadstone Net Lease, Cl A ‡ | | | 455,772 | | | | 6,636,040 | |
| EPR Properties ‡ | | | 168,213 | | | | 6,827,766 | |
| Gaming and Leisure Properties ‡ | | | 159,678 | | | | 6,823,041 | |
| Getty Realty ‡ | | | 269,577 | | | | 7,305,537 | |
| Global Net Lease ‡ | | | 135,803 | | | | 943,831 | |
| Healthcare Realty Trust, Cl A ‡ | | | 463,168 | | | | 6,590,881 | |
| LTC Properties ‡ | | | 238,783 | | | | 7,903,717 | |
| National Health Investors ‡ | | | 143,022 | | | | 9,018,967 | |
| Omega Healthcare Investors ‡ | | | 257,748 | | | | 7,838,117 | |
| Sabra Health Care REIT ‡ | | | 559,059 | | | | 7,782,101 | |
| WP Carey ‡ | | | 118,734 | | | | 6,511,372 | |
| | | | | | | | 74,181,370 | |
| TOTAL UNITED STATES | | | | | | | 153,874,524 | |
TOTAL COMMON STOCK
(Cost $228,107,553) | | | | | | | 206,044,047 | |
TOTAL INVESTMENTS — 99.7%
(Cost $228,107,553) | | | | | | $ | 206,044,047 | |
Percentages are based on Net Assets of $206,691,884.
| ‡ | Real Estate Investment Trust |
The accompanying notes are an integral part of the financial statements.
44
| Schedule of Investments | April 30, 2024 (Unaudited) |
Global X SuperDividend® REIT ETF
As of April 30, 2024, all of the Fund’s investments were considered Level 1, in accordance with authoritative guidance on fair value measurements and disclosure under U.S. GAAP.
See “Glossary” for abbreviations.
The accompanying notes are an integral part of the financial statements.
45
| Schedule of Investments | April 30, 2024 (Unaudited) |
Global X Renewable Energy Producers ETF
Sector Weightings †:
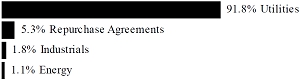
† Sector weightings percentages are based on the total market value of investments. Total investments do not include derivatives such as options, futures contracts, forward contracts, and swap contracts, if applicable.
| | | Shares | | | Value | |
| COMMON STOCK — 94.5% | | | | | | | | |
| AUSTRIA — 6.0% | | | | | | | | |
| Utilities — 6.0% | | | | | | | | |
| Verbund | | | 29,918 | | | $ | 2,290,484 | |
| | | | | | | | | |
| BRAZIL — 12.1% | | | | | | | | |
| Utilities — 12.1% | | | | | | | | |
| AES Brasil Energia | | | 202,296 | | | | 369,613 | |
| Centrais Eletricas Brasileiras | | | 296,155 | | | | 2,163,267 | |
| Engie Brasil Energia | | | 221,084 | | | | 1,744,581 | |
| Serena Energia * | | | 205,862 | | | | 326,481 | |
| | | | | | | | | |
| TOTAL BRAZIL | | | | | | | 4,603,942 | |
| CANADA — 6.2% | | | | | | | | |
| Utilities — 6.2% | | | | | | | | |
| Boralex, Cl A | | | 33,969 | | | | 683,163 | |
| Innergex Renewable Energy | | | 67,400 | | | | 393,946 | |
| Northland Power (A) | | | 84,409 | | | | 1,290,849 | |
| | | | | | | | | |
| TOTAL CANADA | | | | | | | 2,367,958 | |
| CHINA — 3.5% | | | | | | | | |
| Utilities — 3.5% | | | | | | | | |
| China Datang Renewable Power, Cl H (A) | | | 818,200 | | | | 174,704 | |
| China Longyuan Power Group, Cl H | | | 1,110,500 | | | | 782,342 | |
| Xinyi Energy Holdings (A) | | | 2,720,100 | | | | 382,564 | |
| | | | | | | | | |
| TOTAL CHINA | | | | | | | 1,339,610 | |
The accompanying notes are an integral part of the financial statements.
46
| Schedule of Investments | April 30, 2024 (Unaudited) |
Global X Renewable Energy Producers ETF
| | | Shares | | | Value | |
| COMMON STOCK — continued | | | | | | | | |
| DENMARK — 6.3% | | | | | | | | |
| Utilities — 6.3% | | | | | | | | |
| Orsted * | | | 43,554 | | | $ | 2,408,306 | |
| | | | | | | | | |
| FRANCE — 4.1% | | | | | | | | |
| Utilities — 4.1% | | | | | | | | |
| Neoen | | | 50,747 | | | | 1,560,561 | |
| | | | | | | | | |
| GERMANY — 3.7% | | | | | | | | |
| Energy — 1.2% | | | | | | | | |
| VERBIO Vereinigte BioEnergie (A) | | | 21,017 | | | | 440,911 | |
| | | | | | | | | |
| Utilities — 2.5% | | | | | | | | |
| Encavis * | | | 53,720 | | | | 970,743 | |
| | | | | | | | | |
| TOTAL GERMANY | | | | | | | 1,411,654 | |
| GREECE — 2.0% | | | | | | | | |
| Utilities — 2.0% | | | | | | | | |
| Terna Energy | | | 39,400 | | | | 768,427 | |
| | | | | | | | | |
| INDIA — 1.3% | | | | | | | | |
| Utilities — 1.3% | | | | | | | | |
| ReNew Energy Global, Cl A * | | | 84,043 | | | | 474,003 | |
| | | | | | | | | |
| ISRAEL — 3.4% | | | | | | | | |
| Utilities — 3.4% | | | | | | | | |
| Energix-Renewable Energies | | | 180,081 | | | | 675,946 | |
| Enlight Renewable Energy * | | | 38,780 | | | | 627,039 | |
| | | | | | | | | |
| TOTAL ISRAEL | | | | | | | 1,302,985 | |
| ITALY — 3.6% | | | | | | | | |
| Utilities — 3.6% | | | | | | | | |
| ERG | | | 50,147 | | | | 1,356,585 | |
| | | | | | | | | |
| JAPAN — 1.3% | | | | | | | | |
| Utilities — 1.3% | | | | | | | | |
| RENOVA * | | | 26,054 | | | | 246,360 | |
The accompanying notes are an integral part of the financial statements.
47
| Schedule of Investments | April 30, 2024 (Unaudited) |
Global X Renewable Energy Producers ETF
| | | Shares | | | Value | |
| COMMON STOCK — continued | | | | | | | | |
| Utilities — continued | | | | | | | | |
| West Holdings | | | 15,207 | | | $ | 256,856 | |
| | | | | | | | | |
| TOTAL JAPAN | | | | | | | 503,216 | |
| NEW ZEALAND — 14.8% | | | | | | | | |
| Utilities — 14.8% | | | | | | | | |
| Contact Energy | | | 262,658 | | | | 1,347,562 | |
| Mercury NZ | | | 459,706 | | | | 1,735,561 | |
| Meridian Energy | | | 717,075 | | | | 2,545,979 | |
| | | | | | | | | |
| TOTAL NEW ZEALAND | | | | | | | 5,629,102 | |
| PORTUGAL — 1.1% | | | | | | | | |
| Utilities — 1.1% | | | | | | | | |
| Greenvolt-Energias Renovaveis * (A) | | | 46,021 | | | | 408,428 | |
| | | | | | | | | |
| RUSSIA — 0.0% | | | | | | | | |
| Utilities — 0.0% | | | | | | | | |
| RusHydro PJSC (B) | | | 271,804,543 | | | | — | |
| | | | | | | | | |
| SOUTH AFRICA — 1.0% | | | | | | | | |
| Utilities — 1.0% | | | | | | | | |
| Scatec * | | | 52,446 | | | | 386,212 | |
| | | | | | | | | |
| SPAIN — 8.3% | | | | | | | | |
| Utilities — 8.3% | | | | | | | | |
| Atlantica Sustainable Infrastructure | | | 38,329 | | | | 750,099 | |
| EDP Renovaveis | | | 143,430 | | | | 1,973,786 | |
| Solaria Energia y Medio Ambiente * (A) | | | 41,390 | | | | 423,756 | |
| | | | | | | | | |
| TOTAL SPAIN | | | | | | | 3,147,641 | |
| THAILAND — 3.3% | | | | | | | | |
| Utilities — 3.3% | | | | | | | | |
| Energy Absolute NVDR | | | 1,239,165 | | | | 1,028,179 | |
| Gunkul Engineering NVDR | | | 2,916,240 | | | | 203,020 | |
| | | | | | | | | |
| TOTAL THAILAND | | | | | | | 1,231,199 | |
The accompanying notes are an integral part of the financial statements.
48
| Schedule of Investments | April 30, 2024 (Unaudited) |
Global X Renewable Energy Producers ETF
| | | Shares | | | Value | |
| COMMON STOCK — continued | | | | | | | | |
| TURKEY — 0.5% | | | | | | | | |
| Utilities — 0.5% | | | | | | | | |
| Aydem Yenilenebilir Enerji * | | | 232,753 | | | $ | 203,015 | |
| Galata Wind Enerji | | | 1 | | | | 1 | |
| | | | | | | | | |
| TOTAL TURKEY | | | | | | | 203,016 | |
| UNITED KINGDOM — 2.2% | | | | | | | | |
| Utilities — 2.2% | | | | | | | | |
| Drax Group PLC | | | 127,581 | | | | 827,504 | |
| | | | | | | | | |
| UNITED STATES — 9.8% | | | | | | | | |
| Industrials — 2.0% | | | | | | | | |
| Sunrun * | | | 72,016 | | | | 741,045 | |
| | | | | | | | | |
| Utilities — 7.8% | | | | | | | | |
| Clearway Energy, Cl C | | | 27,201 | | | | 635,959 | |
| NextEra Energy Partners (A) | | | 30,875 | | | | 875,615 | |
| Ormat Technologies | | | 20,059 | | | | 1,280,366 | |
| Sunnova Energy International * (A) | | | 40,348 | | | | 169,865 | |
| | | | | | | | 2,961,805 | |
| TOTAL UNITED STATES | | | | | | | 3,702,850 | |
TOTAL COMMON STOCK
(Cost $68,206,941) | | | | | | | 35,923,683 | |
| | | | | | | | | |
| MASTER LIMITED PARTNERSHIP — 5.2% | | | | | | | | |
| CANADA—5.2% | | | | | | | | |
| Utilities — 5.2% | | | | | | | | |
| Brookfield Renewable Partners, Cl A | | | 94,319 | | | | 1,984,073 | |
TOTAL MASTER LIMITED PARTNERSHIP
(Cost $1,704,643) | | | | | | | 1,984,073 | |
The accompanying notes are an integral part of the financial statements.
49
| Schedule of Investments | April 30, 2024 (Unaudited) |
Global X Renewable Energy Producers ETF
| | | Face Amount | | | Value | |
| REPURCHASE AGREEMENTS(C) — 5.6% | | | | | | | | |
Bank of America Securities
5.320%, dated 04/30/2024, to be repurchased on 05/01/2024, repurchase price $503,458 (collateralized by various U.S. Government Obligations, ranging in par value $321 - $407,822, 2.000% - 7.500%, 10/17/2025 - 08/20/2063, with a total market value of $513,452) | | $ | 503,384 | | | $ | 503,384 | |
Citigroup Global Markets Inc.
5.320%, dated 04/30/2024, to be repurchased on 05/01/2024, repurchase price $503,458 (collateralized by various U.S. Government Obligations, ranging in par value $10,074 - $252,724, 2.000% - 6.500%, 12/01/2033 - 05/01/2054, with a total market value of $513,452) | | | 503,384 | | | | 503,384 | |
Deutch Bank Securities
5.310%, dated 04/30/2024, to be repurchased on 05/01/2024, repurchase price $138,612 (collateralized by various U.S. Government Obligations, ranging in par value $84 - $29,009, 2.000% - 7.000%, 02/01/2037 - 02/01/2054, with a total market value of $141,364) | | | 138,592 | | | | 138,592 | |
HSBC Securities USA Inc.,
5.310%, dated 04/30/2024, to be repurchased on 05/01/2024, repurchase price $493,389 (collateralized by various U.S. Government Obligations, ranging in par value $30,833 - $745,095, 2.500% - 3.000%, 04/20/2043 - 10/20/2051, with a total market value of $503,182) | | | 493,316 | | | | 493,316 | |
The accompanying notes are an integral part of the financial statements.
50
| Schedule of Investments | April 30, 2024 (Unaudited) |
Global X Renewable Energy Producers ETF
| | | Face Amount | | | Value | |
| REPURCHASE AGREEMENTS — continued | | | | | | | | |
Nomura Securities International Inc.,
5.310%, dated 04/30/2024, to be repurchased on 05/01/2024, repurchase price $503,458 (collateralized by various U.S. Government Obligations, ranging in par value $215 - $101,188, 2.000% - 7.500%, 10/01/2029 - 03/15/2058, with a total market value of $513,641) | | $ | 503,384 | | | $ | 503,384 | |
TOTAL REPURCHASE AGREEMENTS
(Cost $2,142,060) | | | | | | | 2,142,060 | |
TOTAL INVESTMENTS — 105.3%
(Cost $72,053,644) | | | | | | $ | 40,049,816 | |
Percentages are based on Net Assets of $38,027,098.
| * | Non-income producing security. |
| (A) | This security or a partial position of this security is on loan at April 30, 2024. The total market value of securities on loan at April 30, 2024 was $2,172,911. |
| (B) | Level 3 security in accordance with fair value hierarchy. |
| (C) | These securities were purchased with cash collateral held from securities on loan. The total value of such securities as of April 30, 2024 was $2,142,060. The total value of non-cash collateral held from securities on loan as of April 30, 2024 was $171,350. |
The accompanying notes are an integral part of the financial statements.
51
| Schedule of Investments | April 30, 2024 (Unaudited) |
Global X Renewable Energy Producers ETF
The following is a summary of the level of inputs used as of April 30, 2024, in valuing the Fund’s investments carried at value:
| Investments in Securities | | Level 1 | | | Level 2 | | | Level 3(1) | | | Total | |
| Common Stock | | $ | 35,923,683 | | | $ | — | | | $ | — | ^ | | $ | 35,923,683 | |
| Master Limited Partnership | | | 1,984,073 | | | | — | | | | — | | | | 1,984,073 | |
| Repurchase Agreements | | | — | | | | 2,142,060 | | | | — | | | | 2,142,060 | |
| Total Investments in Securities | | $ | 37,907,756 | | | $ | 2,142,060 | | | $ | — | | | $ | 40,049,816 | |
| (1) | A reconciliation of Level 3 investments and disclosures of significant unobservable inputs are presented when the Fund has a significant amount of Level 3 investments at the end of the period in relation to Net Assets. Management has concluded that Level 3 investments are not material in relation to Net Assets. |
| ^ | Includes Securities in which the fair value is $0 or has been rounded to $0. |
Amounts designated as “—” are $0 or have been rounded to $0.
See “Glossary” for abbreviations.
The accompanying notes are an integral part of the financial statements.
52
| Schedule of Investments | April 30, 2024 (Unaudited) |
Global X S&P 500® Catholic Values ETF
Sector Weightings †:
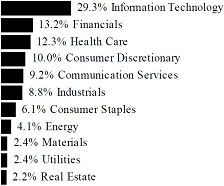
† Sector weightings percentages are based on the total market value of investments. Total investments do not include derivatives such as options, futures contracts, forward contracts, and swap contracts, if applicable.
| | | Shares | | | Value | |
| COMMON STOCK — 99.8% | | | | | | | | |
| CHINA — 0.1% | | | | | | | | |
| Information Technology — 0.1% | | | | | | | | |
| NXP Semiconductors | | | 4,937 | | | $ | 1,264,810 | |
| | | | | | | | | |
| UNITED STATES — 99.7% | | | | | | | | |
| Communication Services — 9.2% | | | | | | | | |
| Alphabet, Cl A * | | | 113,127 | | | | 18,414,813 | |
| Alphabet, Cl C * | | | 94,709 | | | | 15,592,890 | |
| AT&T | | | 138,175 | | | | 2,333,776 | |
| Charter Communications, Cl A * | | | 1,882 | | | | 481,679 | |
| Comcast, Cl A | | | 75,292 | | | | 2,869,378 | |
| Electronic Arts | | | 4,684 | | | | 594,025 | |
| Fox, Cl A | | | 4,987 | | | | 154,647 | |
| Fox, Cl B | | | 3,182 | | | | 91,260 | |
| Interpublic Group | | | 8,272 | | | | 251,800 | |
| Match Group * | | | 5,167 | | | | 159,247 | |
| Meta Platforms, Cl A | | | 42,235 | | | | 18,168,230 | |
| Netflix * | | | 8,302 | | | | 4,571,413 | |
| News, Cl A | | | 8,169 | | | | 194,422 | |
| News, Cl B | | | 2,577 | | | | 63,239 | |
| Omnicom Group | | | 4,047 | | | | 375,723 | |
The accompanying notes are an integral part of the financial statements.
53
| Schedule of Investments | April 30, 2024 (Unaudited) |
Global X S&P 500® Catholic Values ETF
| | | Shares | | | Value | |
| COMMON STOCK — continued | | | | | | | | |
| Communication Services — continued | | | | | | | | |
| Paramount Global, Cl B | | | 11,348 | | | $ | 129,254 | |
| Take-Two Interactive Software * | | | 3,243 | | | | 463,133 | |
| T-Mobile US | | | 9,779 | | | | 1,605,418 | |
| Verizon Communications | | | 81,536 | | | | 3,219,857 | |
| Walt Disney | | | 35,492 | | | | 3,943,161 | |
| Warner Bros Discovery * | | | 43,099 | | | | 317,209 | |
| | | | | | | | 73,994,574 | |
| Consumer Discretionary — 10.0% | | | | | | | | |
| Airbnb, Cl A * | | | 13,311 | | | | 2,110,725 | |
| Aptiv PLC * | | | 7,685 | | | | 545,635 | |
| AutoZone * | | | 526 | | | | 1,555,066 | |
| Bath & Body Works | | | 6,903 | | | | 313,534 | |
| Best Buy | | | 5,473 | | | | 403,032 | |
| Booking Holdings | | | 1,066 | | | | 3,679,864 | |
| BorgWarner | | | 6,660 | | | | 218,248 | |
| CarMax * | | | 4,415 | | | | 300,088 | |
| Carnival * | | | 28,347 | | | | 420,103 | |
| Chipotle Mexican Grill, Cl A * | | | 839 | | | | 2,650,904 | |
| Darden Restaurants | | | 3,459 | | | | 530,645 | |
| Domino’s Pizza | | | 1,022 | | | | 540,914 | |
| DR Horton | | | 8,841 | | | | 1,259,754 | |
| eBay | | | 15,161 | | | | 781,398 | |
| Etsy * | | | 2,698 | | | | 185,272 | |
| Expedia Group * | | | 4,017 | | | | 540,809 | |
| Ford Motor | | | 119,272 | | | | 1,449,155 | |
| Garmin | | | 4,300 | | | | 621,221 | |
| General Motors | | | 35,190 | | | | 1,567,011 | |
| Genuine Parts | | | 3,976 | | | | 625,067 | |
| Hasbro | | | 3,718 | | | | 227,913 | |
| Hilton Worldwide Holdings | | | 7,542 | | | | 1,487,886 | |
| Home Depot | | | 30,400 | | | | 10,160,288 | |
| Lennar, Cl A | | | 7,157 | | | | 1,085,144 | |
| LKQ | | | 7,155 | | | | 308,595 | |
| Lowe’s | | | 17,556 | | | | 4,002,592 | |
| Lululemon Athletica * | | | 3,504 | | | | 1,263,542 | |
| Marriott International, Cl A | | | 7,311 | | | | 1,726,346 | |
| McDonald’s | | | 22,152 | | | | 6,048,382 | |
| Mohawk Industries * | | | 1,118 | | | | 128,928 | |
The accompanying notes are an integral part of the financial statements.
54
| Schedule of Investments | April 30, 2024 (Unaudited) |
Global X S&P 500® Catholic Values ETF
| | | Shares | | | Value | |
| COMMON STOCK — continued | | | | | | | | |
| Consumer Discretionary — continued | | | | | | | | |
| NIKE, Cl B | | | 37,157 | | | $ | 3,428,105 | |
| Norwegian Cruise Line Holdings * | | | 12,056 | | | | 228,100 | |
| NVR * | | | 94 | | | | 699,252 | |
| O’Reilly Automotive * | | | 1,803 | | | | 1,826,908 | |
| Pool | | | 1,183 | | | | 428,873 | |
| PulteGroup | | | 6,483 | | | | 722,336 | |
| Ross Stores | | | 10,290 | | | | 1,333,070 | |
| Starbucks | | | 34,556 | | | | 3,057,860 | |
| Tapestry | | | 5,970 | | | | 238,322 | |
| Tesla * | | | 84,638 | | | | 15,512,453 | |
| TJX | | | 34,785 | | | | 3,272,921 | |
| Tractor Supply | | | 3,076 | | | | 839,994 | |
| Ulta Beauty * | | | 1,411 | | | | 571,229 | |
| Yum! Brands | | | 8,591 | | | | 1,213,479 | |
| | | | | | | | 80,110,963 | |
| Consumer Staples — 6.1% | | | | | | | | |
| Archer-Daniels-Midland | | | 16,101 | | | | 944,485 | |
| Brown-Forman, Cl B | | | 4,762 | | | | 227,862 | |
| Campbell Soup | | | 5,194 | | | | 237,418 | |
| Clorox | | | 3,408 | | | | 503,941 | |
| Coca-Cola | | | 116,511 | | | | 7,196,884 | |
| Colgate-Palmolive | | | 24,701 | | | | 2,270,516 | |
| Conagra Brands | | | 13,751 | | | | 423,256 | |
| Constellation Brands, Cl A | | | 4,911 | | | | 1,244,742 | |
| Costco Wholesale | | | 13,326 | | | | 9,633,365 | |
| Dollar General | | | 6,463 | | | | 899,585 | |
| Dollar Tree * | | | 6,151 | | | | 727,356 | |
| Estee Lauder, Cl A | | | 7,044 | | | | 1,033,425 | |
| General Mills | | | 17,011 | | | | 1,198,595 | |
| Hormel Foods | | | 9,103 | | | | 323,703 | |
| J M Smucker | | | 3,005 | | | | 345,124 | |
| Kellanova | | | 7,338 | | | | 424,577 | |
| Kenvue | | | 51,790 | | | | 974,688 | |
| Keurig Dr Pepper | | | 30,327 | | | | 1,022,020 | |
| Kimberly-Clark | | | 10,284 | | | | 1,404,074 | |
| Kraft Heinz | | | 23,853 | | | | 920,964 | |
| Kroger | | | 19,815 | | | | 1,097,355 | |
| Lamb Weston Holdings | | | 4,664 | | | | 388,698 | |
The accompanying notes are an integral part of the financial statements.
55
| Schedule of Investments | April 30, 2024 (Unaudited) |
Global X S&P 500® Catholic Values ETF
| | | Shares | | | Value | |
| COMMON STOCK — continued | | | | | | | | |
| Consumer Staples — continued | | | | | | | | |
| McCormick | | | 6,957 | | | $ | 529,149 | |
| Molson Coors Beverage, Cl B | | | 6,042 | | | | 345,965 | |
| Monster Beverage * | | | 22,074 | | | | 1,179,855 | |
| Procter & Gamble | | | 70,920 | | | | 11,574,144 | |
| Sysco | | | 15,253 | | | | 1,133,603 | |
| Tyson Foods, Cl A | | | 7,784 | | | | 472,099 | |
| Walgreens Boots Alliance | | | 19,767 | | | | 350,469 | |
| | | | | | | | 49,027,917 | |
| Energy — 4.1% | | | | | | | | |
| APA | | | 6,228 | | | | 195,808 | |
| Baker Hughes, Cl A | | | 19,601 | | | | 639,385 | |
| Chevron | | | 33,130 | | | | 5,342,875 | |
| ConocoPhillips | | | 22,722 | | | | 2,854,338 | |
| Coterra Energy | | | 14,264 | | | | 390,263 | |
| Devon Energy | | | 12,114 | | | | 619,995 | |
| Diamondback Energy | | | 3,357 | | | | 675,193 | |
| EOG Resources | | | 11,126 | | | | 1,470,078 | |
| EQT | | | 6,035 | | | | 241,943 | |
| Exxon Mobil | | | 75,942 | | | | 8,981,660 | |
| Halliburton | | | 16,940 | | | | 634,742 | |
| Hess | | | 5,508 | | | | 867,455 | |
| Kinder Morgan | | | 38,015 | | | | 694,914 | |
| Marathon Oil | | | 11,630 | | | | 312,266 | |
| Marathon Petroleum | | | 7,020 | | | | 1,275,674 | |
| Occidental Petroleum | | | 12,602 | | | | 833,496 | |
| ONEOK | | | 11,297 | | | | 893,819 | |
| Phillips 66 | | | 8,409 | | | | 1,204,253 | |
| Pioneer Natural Resources | | | 4,425 | | | | 1,191,741 | |
| Schlumberger | | | 28,039 | | | | 1,331,292 | |
| Targa Resources | | | 3,878 | | | | 442,325 | |
| Valero Energy | | | 6,501 | | | | 1,039,315 | |
| Williams | | | 23,712 | | | | 909,592 | |
| | | | | | | | 33,042,422 | |
| Financials — 13.2% | | | | | | | | |
| Aflac | | | 10,152 | | | | 849,215 | |
| Allstate | | | 5,152 | | | | 876,149 | |
| American Express | | | 11,014 | | | | 2,577,607 | |
The accompanying notes are an integral part of the financial statements.
56
| Schedule of Investments | April 30, 2024 (Unaudited) |
Global X S&P 500® Catholic Values ETF
| | | Shares | | | Value | |
| COMMON STOCK — continued | | | | | | | | |
| Financials — continued | | | | | | | | |
| American International Group | | | 13,399 | | | $ | 1,009,079 | |
| Ameriprise Financial | | | 1,908 | | | | 785,695 | |
| Aon PLC, Cl A | | | 3,932 | | | | 1,108,863 | |
| Arch Capital Group * | | | 6,722 | | | | 628,776 | |
| Arthur J Gallagher | | | 4,002 | | | | 939,229 | |
| Assurant | | | 978 | | | | 170,563 | |
| Bank of America | | | 131,796 | | | | 4,877,770 | |
| Bank of New York Mellon | | | 15,158 | | | | 856,275 | |
| Berkshire Hathaway, Cl B * | | | 34,775 | | | | 13,796,286 | |
| BlackRock, Cl A | | | 2,683 | | | | 2,024,699 | |
| Blackstone | | | 13,631 | | | | 1,589,511 | |
| Brown & Brown | | | 4,002 | | | | 326,323 | |
| Capital One Financial | | | 7,190 | | | | 1,031,262 | |
| Cboe Global Markets | | | 2,005 | | | | 363,206 | |
| Charles Schwab | | | 28,465 | | | | 2,104,987 | |
| Chubb | | | 7,920 | | | | 1,969,229 | |
| Cincinnati Financial | | | 3,054 | | | | 353,317 | |
| Citigroup | | | 36,606 | | | | 2,245,046 | |
| Citizens Financial Group | | | 8,526 | | | | 290,822 | |
| CME Group, Cl A | | | 6,947 | | | | 1,456,369 | |
| Comerica | | | 2,521 | | | | 126,479 | |
| Corpay * | | | 1,307 | | | | 394,897 | |
| Discover Financial Services | | | 4,948 | | | | 627,060 | |
| Everest Group | | | 811 | | | | 297,159 | |
| FactSet Research Systems | | | 711 | | | | 296,409 | |
| Fidelity National Information Services | | | 11,300 | | | | 767,496 | |
| Fifth Third Bancorp | | | 12,311 | | | | 448,859 | |
| Fiserv * | | | 11,475 | | | | 1,751,888 | |
| Franklin Resources | | | 6,067 | | | | 138,570 | |
| Global Payments | | | 4,803 | | | | 589,664 | |
| Globe Life | | | 1,972 | | | | 150,207 | |
| Goldman Sachs Group | | | 6,239 | | | | 2,662,244 | |
| Hartford Financial Services Group | | | 5,729 | | | | 555,083 | |
| Huntington Bancshares | | | 28,342 | | | | 381,767 | |
| Intercontinental Exchange | | | 10,942 | | | | 1,408,892 | |
| Invesco | | | 6,724 | | | | 95,279 | |
| Jack Henry & Associates | | | 1,382 | | | | 224,838 | |
| JPMorgan Chase | | | 55,359 | | | | 10,614,535 | |
| KeyCorp | | | 18,375 | | | | 266,254 | |
The accompanying notes are an integral part of the financial statements.
57
| Schedule of Investments | April 30, 2024 (Unaudited) |
Global X S&P 500® Catholic Values ETF
| | | Shares | | | Value | |
| COMMON STOCK — continued | | | | | | | | |
| Financials — continued | | | | | | | | |
| Loews | | | 3,834 | | | $ | 288,125 | |
| M&T Bank | | | 3,389 | | | | 489,338 | |
| MarketAxess Holdings | | | 742 | | | | 148,467 | |
| Marsh & McLennan | | | 9,431 | | | | 1,880,824 | |
| Mastercard, Cl A | | | 15,855 | | | | 7,153,776 | |
| MetLife | | | 11,710 | | | | 832,347 | |
| Moody’s | | | 3,052 | | | | 1,130,247 | |
| Morgan Stanley | | | 24,180 | | | | 2,196,511 | |
| MSCI, Cl A | | | 1,546 | | | | 720,111 | |
| Nasdaq | | | 6,469 | | | | 387,170 | |
| Northern Trust | | | 4,003 | | | | 329,807 | |
| PayPal Holdings * | | | 20,475 | | | | 1,390,662 | |
| PNC Financial Services Group | | | 7,825 | | | | 1,199,260 | |
| Principal Financial Group | | | 4,674 | | | | 369,900 | |
| Progressive | | | 11,189 | | | | 2,330,109 | |
| Prudential Financial | | | 6,882 | | | | 760,323 | |
| Raymond James Financial | | | 3,577 | | | | 436,394 | |
| Regions Financial | | | 17,515 | | | | 337,514 | |
| S&P Global | | | 6,148 | | | | 2,556,523 | |
| State Street | | | 5,733 | | | | 415,585 | |
| Synchrony Financial | | | 8,701 | | | | 382,670 | |
| T Rowe Price Group | | | 4,327 | | | | 474,109 | |
| Travelers | | | 4,281 | | | | 908,257 | |
| Truist Financial | | | 26,067 | | | | 978,816 | |
| US Bancorp | | | 28,875 | | | | 1,173,191 | |
| Visa, Cl A | | | 30,320 | | | | 8,144,255 | |
| W R Berkley | | | 3,921 | | | | 301,799 | |
| Wells Fargo | | | 67,897 | | | | 4,027,650 | |
| Willis Towers Watson PLC | | | 2,007 | | | | 504,038 | |
| | | | | | | | 106,275,636 | |
| Health Care — 12.3% | | | | | | | | |
| Align Technology * | | | 4,278 | | | | 1,208,022 | |
| Baxter International | | | 31,486 | | | | 1,271,090 | |
| Boston Scientific * | | | 88,334 | | | | 6,348,565 | |
| Cardinal Health | | | 14,921 | | | | 1,537,460 | |
| Cencora | | | 10,027 | | | | 2,396,954 | |
| Centene * | | | 32,228 | | | | 2,354,578 | |
| Cigna Group | | | 17,654 | | | | 6,303,184 | |
The accompanying notes are an integral part of the financial statements.
58
| Schedule of Investments | April 30, 2024 (Unaudited) |
Global X S&P 500® Catholic Values ETF
| | | Shares | | | Value | |
| COMMON STOCK — continued | | | | | | | | |
| Health Care — continued | | | | | | | | |
| CVS Health | | | 75,761 | | | $ | 5,129,777 | |
| DaVita * | | | 3,217 | | | | 447,195 | |
| Dexcom * | | | 23,250 | | | | 2,961,818 | |
| Edwards Lifesciences * | | | 36,497 | | | | 3,090,201 | |
| Elevance Health | | | 14,014 | | | | 7,407,520 | |
| GE HealthCare Technologies | | | 24,217 | | | | 1,846,304 | |
| Gilead Sciences | | | 74,219 | | | | 4,839,079 | |
| Henry Schein * | | | 8,051 | | | | 557,773 | |
| Hologic * | | | 14,097 | | | | 1,068,130 | |
| Humana | | | 7,229 | | | | 2,183,809 | |
| IDEXX Laboratories * | | | 5,000 | | | | 2,463,800 | |
| Incyte * | | | 11,288 | | | | 587,540 | |
| Insulet * | | | 4,281 | | | | 736,075 | |
| Intuitive Surgical * | | | 21,215 | | | | 7,862,703 | |
| IQVIA Holdings * | | | 11,020 | | | | 2,554,105 | |
| Laboratory Corp of America Holdings | | | 5,102 | | | | 1,027,390 | |
| McKesson | | | 7,910 | | | | 4,249,331 | |
| Medtronic PLC | | | 79,386 | | | | 6,369,933 | |
| Mettler-Toledo International * | | | 1,304 | | | | 1,603,529 | |
| Molina Healthcare * | | | 3,523 | | | | 1,205,218 | |
| Quest Diagnostics | | | 6,890 | | | | 952,060 | |
| ResMed | | | 8,845 | | | | 1,892,742 | |
| Solventum * | | | 3,438 | | | | 223,504 | |
| STERIS PLC | | | 5,937 | | | | 1,214,473 | |
| Stryker | | | 20,398 | | | | 6,863,927 | |
| Teleflex | | | 2,788 | | | | 581,995 | |
| West Pharmaceutical Services | | | 4,446 | | | | 1,589,356 | |
| Zimmer Biomet Holdings | | | 12,565 | | | | 1,511,318 | |
| Zoetis, Cl A | | | 27,293 | | | | 4,346,137 | |
| | | | | | | | 98,786,595 | |
| Industrials — 8.8% | | | | | | | | |
| 3M | | | 13,762 | | | | 1,328,171 | |
| A O Smith | | | 3,405 | | | | 282,070 | |
| Allegion PLC | | | 2,380 | | | | 289,313 | |
| American Airlines Group * | | | 16,732 | | | | 226,049 | |
| AMETEK | | | 5,741 | | | | 1,002,723 | |
| Automatic Data Processing | | | 10,243 | | | | 2,477,679 | |
| Axon Enterprise * | | | 1,817 | | | | 569,920 | |
The accompanying notes are an integral part of the financial statements.
59
| Schedule of Investments | April 30, 2024 (Unaudited) |
Global X S&P 500® Catholic Values ETF
| | | Shares | | | Value | |
| COMMON STOCK — continued | | | | | | | | |
| Industrials — continued | | | | | | | | |
| Broadridge Financial Solutions | | | 3,094 | | | $ | 598,410 | |
| Builders FirstSource * | | | 3,060 | | | | 559,429 | |
| Carrier Global | | | 20,800 | | | | 1,278,992 | |
| Caterpillar | | | 12,702 | | | | 4,249,708 | |
| CH Robinson Worldwide | | | 3,386 | | | | 240,406 | |
| Cintas | | | 2,148 | | | | 1,414,114 | |
| Copart * | | | 21,758 | | | | 1,181,677 | |
| CSX | | | 49,239 | | | | 1,635,720 | |
| Cummins | | | 3,529 | | | | 996,907 | |
| Dayforce * | | | 4,071 | | | | 249,837 | |
| Deere | | | 6,492 | | | | 2,541,034 | |
| Delta Air Lines | | | 16,824 | | | | 842,378 | |
| Dover | | | 3,476 | | | | 623,247 | |
| Eaton PLC | | | 9,960 | | | | 3,169,870 | |
| Emerson Electric | | | 14,243 | | | | 1,535,111 | |
| Equifax | | | 3,181 | | | | 700,424 | |
| Expeditors International of Washington | | | 3,781 | | | | 420,863 | |
| Fastenal | | | 14,242 | | | | 967,601 | |
| FedEx | | | 5,724 | | | | 1,498,429 | |
| Fortive | | | 8,718 | | | | 656,204 | |
| Generac Holdings * | | | 1,574 | | | | 214,001 | |
| Howmet Aerospace | | | 9,981 | | | | 666,232 | |
| Hubbell, Cl B | | | 1,405 | | | | 520,581 | |
| IDEX | | | 1,967 | | | | 433,645 | |
| Illinois Tool Works | | | 6,774 | | | | 1,653,601 | |
| Ingersoll Rand | | | 10,560 | | | | 985,459 | |
| JB Hunt Transport Services | | | 2,022 | | | | 328,717 | |
| Johnson Controls International | | | 16,960 | | | | 1,103,587 | |
| Masco | | | 5,475 | | | | 374,764 | |
| Nordson | | | 1,289 | | | | 332,807 | |
| Norfolk Southern | | | 5,624 | | | | 1,295,320 | |
| Old Dominion Freight Line | | | 4,449 | | | | 808,428 | |
| Otis Worldwide | | | 10,090 | | | | 920,208 | |
| PACCAR | | | 13,656 | | | | 1,449,038 | |
| Parker-Hannifin | | | 3,196 | | | | 1,741,532 | |
| Paychex | | | 7,966 | | | | 946,440 | |
| Paycom Software | | | 1,299 | | | | 244,186 | |
| Pentair PLC | | | 4,185 | | | | 330,992 | |
| Quanta Services | | | 3,691 | | | | 954,345 | |
The accompanying notes are an integral part of the financial statements.
60
| Schedule of Investments | April 30, 2024 (Unaudited) |
Global X S&P 500® Catholic Values ETF
| | | Shares | | | Value | |
| COMMON STOCK — continued | | | | | | | | |
| Industrials — continued | | | | | | | | |
| Republic Services, Cl A | | | 5,088 | | | $ | 975,370 | |
| Robert Half | | | 2,808 | | | | 194,145 | |
| Rockwell Automation | | | 2,965 | | | | 803,396 | |
| Rollins | | | 6,545 | | | | 291,645 | |
| Snap-On | | | 1,366 | | | | 366,033 | |
| Southwest Airlines | | | 15,947 | | | | 413,665 | |
| Stanley Black & Decker | | | 4,199 | | | | 383,789 | |
| Trane Technologies PLC | | | 5,667 | | | | 1,798,366 | |
| TransDigm Group | | | 1,386 | | | | 1,729,770 | |
| Uber Technologies * | | | 51,330 | | | | 3,401,639 | |
| Union Pacific | | | 15,212 | | | | 3,607,678 | |
| United Airlines Holdings * | | | 8,364 | | | | 430,411 | |
| United Parcel Service, Cl B | | | 18,036 | | | | 2,659,949 | |
| United Rentals | | | 1,670 | | | | 1,115,543 | |
| Veralto | | | 5,435 | | | | 509,151 | |
| Verisk Analytics, Cl A | | | 3,607 | | | | 786,182 | |
| Waste Management | | | 9,134 | | | | 1,900,055 | |
| Westinghouse Air Brake Technologies | | | 4,446 | | | | 716,162 | |
| WW Grainger | | | 1,101 | | | | 1,014,406 | |
| Xylem | | | 5,995 | | | | 783,546 | |
| | | | | | | | 70,721,070 | |
| Information Technology — 29.1% | | | | | | | | |
| Accenture PLC, Cl A | | | 12,009 | | | | 3,613,628 | |
| Adobe * | | | 8,613 | | | | 3,986,355 | |
| Advanced Micro Devices * | | | 31,004 | | | | 4,910,414 | |
| Akamai Technologies * | | | 2,859 | | | | 288,559 | |
| Amphenol, Cl A | | | 11,753 | | | | 1,419,410 | |
| Analog Devices | | | 9,486 | | | | 1,902,986 | |
| ANSYS * | | | 1,648 | | | | 535,402 | |
| Apple | | | 278,216 | | | | 47,388,531 | |
| Applied Materials | | | 16,046 | | | | 3,187,538 | |
| Arista Networks * | | | 4,740 | | | | 1,216,094 | |
| Autodesk * | | | 4,240 | | | | 902,484 | |
| Broadcom | | | 8,427 | | | | 10,957,375 | |
| Cadence Design Systems * | | | 5,204 | | | | 1,434,379 | |
| CDW | | | 2,660 | | | | 643,348 | |
| Cisco Systems | | | 77,715 | | | | 3,651,051 | |
| Cognizant Technology Solutions, Cl A | | | 9,500 | | | | 623,960 | |
The accompanying notes are an integral part of the financial statements.
61
| Schedule of Investments | April 30, 2024 (Unaudited) |
Global X S&P 500® Catholic Values ETF
| | | Shares | | | Value | |
| COMMON STOCK — continued | | | | | | | | |
| Information Technology — continued | | | | | | | | |
| Enphase Energy * | | | 2,604 | | | $ | 283,211 | |
| EPAM Systems * | | | 1,019 | | | | 239,730 | |
| F5 * | | | 1,111 | | | | 183,659 | |
| Fair Isaac * | | | 449 | | | | 508,865 | |
| First Solar * | | | 1,945 | | | | 342,903 | |
| Fortinet * | | | 12,166 | | | | 768,648 | |
| Gartner * | | | 1,550 | | | | 639,514 | |
| Gen Digital | | | 11,110 | | | | 223,755 | |
| Hewlett Packard Enterprise | | | 24,728 | | | | 420,376 | |
| HP | | | 16,607 | | | | 466,491 | |
| Intel | | | 79,803 | | | | 2,431,597 | |
| International Business Machines | | | 17,578 | | | | 2,921,464 | |
| Intuit | | | 5,408 | | | | 3,383,353 | |
| Jabil | | | 2,423 | | | | 284,363 | |
| Juniper Networks | | | 6,080 | | | | 211,706 | |
| Keysight Technologies * | | | 3,329 | | | | 492,492 | |
| KLA | | | 2,605 | | | | 1,795,600 | |
| Lam Research | | | 2,527 | | | | 2,260,174 | |
| Microchip Technology | | | 10,690 | | | | 983,266 | |
| Micron Technology | | | 21,051 | | | | 2,377,921 | |
| Microsoft | | | 142,421 | | | | 55,448,768 | |
| Monolithic Power Systems | | | 947 | | | | 633,856 | |
| Motorola Solutions | | | 3,153 | | | | 1,069,340 | |
| NetApp | | | 4,230 | | | | 432,348 | |
| NVIDIA | | | 47,343 | | | | 40,905,299 | |
| ON Semiconductor * | | | 7,985 | | | | 560,228 | |
| Oracle | | | 30,688 | | | | 3,490,760 | |
| Palo Alto Networks * | | | 5,976 | | | | 1,738,359 | |
| PTC * | | | 2,149 | | | | 381,319 | |
| Qorvo * | | | 2,134 | | | | 249,337 | |
| QUALCOMM | | | 21,548 | | | | 3,573,736 | |
| Roper Technologies | | | 2,035 | | | | 1,040,821 | |
| Salesforce | | | 18,672 | | | | 5,021,648 | |
| Seagate Technology Holdings | | | 3,998 | | | | 343,468 | |
| ServiceNow * | | | 3,925 | | | | 2,721,320 | |
| Skyworks Solutions | | | 3,075 | | | | 327,764 | |
| Synopsys * | | | 2,909 | | | | 1,543,486 | |
| TE Connectivity | | | 5,939 | | | | 840,250 | |
| Teledyne Technologies * | | | 996 | | | | 379,954 | |
The accompanying notes are an integral part of the financial statements.
62
| Schedule of Investments | April 30, 2024 (Unaudited) |
Global X S&P 500® Catholic Values ETF
| | | Shares | | | Value | |
| COMMON STOCK — continued | | | | | | | | |
| Information Technology — continued | | | | | | | | |
| Teradyne | | | 3,164 | | | $ | 368,036 | |
| Texas Instruments | | | 17,502 | | | | 3,087,703 | |
| Trimble * | | | 4,959 | | | | 297,887 | |
| Tyler Technologies * | | | 802 | | | | 370,163 | |
| VeriSign * | | | 1,746 | | | | 295,912 | |
| Western Digital * | | | 6,455 | | | | 457,208 | |
| Zebra Technologies, Cl A * | | | 1,105 | | | | 347,589 | |
| | | | | | | | 233,807,161 | |
| Materials — 2.4% | | | | | | | | |
| Air Products & Chemicals | | | 4,247 | | | | 1,003,736 | |
| Albemarle | | | 2,446 | | | | 294,278 | |
| Amcor PLC | | | 31,678 | | | | 283,201 | |
| Avery Dennison | | | 1,652 | | | | 358,947 | |
| Ball | | | 6,395 | | | | 444,900 | |
| CF Industries Holdings | | | 3,472 | | | | 274,184 | |
| Corteva | | | 14,140 | | | | 765,398 | |
| Dow | | | 14,403 | | | | 819,531 | |
| DuPont de Nemours | | | 8,939 | | | | 648,078 | |
| Ecolab | | | 4,968 | | | | 1,123,513 | |
| FMC | | | 2,820 | | | | 166,408 | |
| Freeport-McMoRan | | | 28,561 | | | | 1,426,336 | |
| International Flavors & Fragrances | | | 5,211 | | | | 441,111 | |
| International Paper | | | 7,409 | | | | 258,870 | |
| Linde PLC | | | 9,548 | | | | 4,210,286 | |
| LyondellBasell Industries, Cl A | | | 5,272 | | | | 527,042 | |
| Martin Marietta Materials | | | 1,228 | | | | 720,922 | |
| Mosaic | | | 7,305 | | | | 229,304 | |
| Newmont | | | 22,944 | | | | 932,444 | |
| Nucor | | | 5,000 | | | | 842,650 | |
| Packaging Corp of America | | | 1,815 | | | | 313,959 | |
| PPG Industries | | | 4,728 | | | | 609,912 | |
| Sherwin-Williams | | | 4,715 | | | | 1,412,661 | |
| Steel Dynamics | | | 3,214 | | | | 418,206 | |
| Vulcan Materials | | | 2,598 | | | | 669,323 | |
| Westrock | | | 5,436 | | | | 260,711 | |
| | | | | | | | 19,455,911 | |
The accompanying notes are an integral part of the financial statements.
63
| Schedule of Investments | April 30, 2024 (Unaudited) |
Global X S&P 500® Catholic Values ETF
| | | Shares | | | Value | |
| COMMON STOCK — continued | | | | | | | | |
| Real Estate — 2.1% | | | | | | | | |
| Alexandria Real Estate Equities ‡ | | | 2,954 | | | $ | 342,280 | |
| American Tower ‡ | | | 9,642 | | | | 1,654,182 | |
| AvalonBay Communities ‡ | | | 2,885 | | | | 546,909 | |
| Boston Properties ‡ | | | 3,085 | | | | 190,931 | |
| Camden Property Trust ‡ | | | 2,012 | | | | 200,556 | |
| CBRE Group, Cl A * | | | 6,004 | | | | 521,688 | |
| CoStar Group * | | | 7,829 | | | | 716,588 | |
| Crown Castle ‡ | | | 8,941 | | | | 838,487 | |
| Digital Realty Trust ‡ | | | 6,127 | | | | 850,305 | |
| Equinix ‡ | | | 1,899 | | | | 1,350,398 | |
| Equity Residential ‡ | | | 6,791 | | | | 437,340 | |
| Essex Property Trust ‡ | | | 1,417 | | | | 348,936 | |
| Extra Space Storage ‡ | | | 4,366 | | | | 586,266 | |
| Federal Realty Investment Trust ‡ | | | 1,439 | | | | 149,901 | |
| Host Hotels & Resorts ‡ | | | 15,407 | | | | 290,730 | |
| Invitation Homes ‡ | | | 11,154 | | | | 381,467 | |
| Iron Mountain ‡ | | | 5,777 | | | | 447,833 | |
| Kimco Realty ‡ | | | 12,227 | | | | 227,789 | |
| Mid-America Apartment Communities ‡ | | | 2,401 | | | | 312,130 | |
| ProLogis ‡ | | | 18,732 | | | | 1,911,601 | |
| Public Storage ‡ | | | 3,133 | | | | 812,857 | |
| Realty Income ‡ | | | 16,821 | | | | 900,596 | |
| Regency Centers ‡ | | | 3,242 | | | | 191,991 | |
| SBA Communications, Cl A ‡ | | | 2,322 | | | | 432,171 | |
| Simon Property Group ‡ | | | 6,664 | | | | 936,492 | |
| UDR ‡ | | | 6,009 | | | | 228,823 | |
| Welltower ‡ | | | 11,204 | | | | 1,067,517 | |
| Weyerhaeuser ‡ | | | 15,878 | | | | 479,039 | |
| | | | | | | | 17,355,803 | |
| Utilities — 2.4% | | | | | | | | |
| AES | | | 13,912 | | | | 249,025 | |
| Alliant Energy | | | 5,117 | | | | 254,827 | |
| Ameren | | | 5,242 | | | | 387,226 | |
| American Electric Power | | | 9,757 | | | | 839,395 | |
| American Water Works | | | 3,627 | | | | 443,655 | |
| Atmos Energy | | | 2,494 | | | | 294,043 | |
| CenterPoint Energy | | | 11,382 | | | | 331,671 | |
| CMS Energy | | | 5,863 | | | | 355,356 | |
The accompanying notes are an integral part of the financial statements.
64
| Schedule of Investments | April 30, 2024 (Unaudited) |
Global X S&P 500® Catholic Values ETF
| | | Shares | | | Value | |
| COMMON STOCK — continued | | | | | | | | |
| Utilities — continued | | | | | | | | |
| Consolidated Edison | | | 6,773 | | | $ | 639,371 | |
| Constellation Energy | | | 6,092 | | | | 1,132,746 | |
| Dominion Energy | | | 15,841 | | | | 807,574 | |
| DTE Energy | | | 3,943 | | | | 434,992 | |
| Duke Energy | | | 15,160 | | | | 1,489,622 | |
| Edison International | | | 7,446 | | | | 529,113 | |
| Entergy | | | 4,010 | | | | 427,747 | |
| Evergy | | | 4,823 | | | | 252,966 | |
| Eversource Energy | | | 6,789 | | | | 411,549 | |
| Exelon | | | 19,043 | | | | 715,636 | |
| FirstEnergy | | | 10,838 | | | | 415,529 | |
| NextEra Energy | | | 38,681 | | | | 2,590,467 | |
| NiSource | | | 7,405 | | | | 206,303 | |
| NRG Energy | | | 5,346 | | | | 388,494 | |
| PG&E | | | 37,810 | | | | 646,929 | |
| Pinnacle West Capital | | | 2,446 | | | | 180,148 | |
| PPL | | | 15,128 | | | | 415,415 | |
| Public Service Enterprise Group | | | 9,676 | | | | 668,418 | |
| Sempra | | | 12,561 | | | | 899,744 | |
| Southern | | | 20,814 | | | | 1,529,829 | |
| WEC Energy Group | | | 6,224 | | | | 514,351 | |
| Xcel Energy | | | 10,948 | | | | 588,236 | |
| | | | | | | | 19,040,377 | |
| TOTAL UNITED STATES | | | | | | | 801,618,429 | |
TOTAL COMMON STOCK
(Cost $607,677,565) | | | | | | | 802,883,239 | |
TOTAL INVESTMENTS — 99.8%
(Cost $607,677,565) | | | | | | $ | 802,883,239 | |
Percentages are based on Net Assets of $804,183,646.
| * | Non-income producing security. |
| ‡ | Real Estate Investment Trust |
As of April 30, 2024, all of the Fund’s investments were considered Level 1, in accordance with authoritative guidance on fair value measurements and disclosure under U.S. GAAP.
See “Glossary” for abbreviations.
The accompanying notes are an integral part of the financial statements.
65
| Schedule of Investments | | April 30, 2024 (Unaudited) |
| | Global X MSCI SuperDividend® EAFE ETF | |
Sector Weightings †:

† Sector weightings percentages are based on the total market value of investments. Total investments do not include derivatives such as options, futures contracts, forward contracts, and swap contracts, if applicable.
| | | Shares | | | Value | |
| COMMON STOCK — 96.2% | | | | | | | | |
| AUSTRALIA — 3.2% | | | | | | | | |
| Energy — 1.5% | | | | | | | | |
| Woodside Energy Group | | | 9,286 | | | $ | 170,223 | |
| Real Estate — 1.7% | | | | | | | | |
| Vicinity ‡ | | | 157,649 | | | | 197,061 | |
| TOTAL AUSTRALIA | | | | | | | 367,284 | |
| AUSTRIA — 1.9% | | | | | | | | |
| Energy — 1.9% | | | | | | | | |
| OMV | | | 4,624 | | | | 220,909 | |
| | | | | | | | | |
| BELGIUM — 1.9% | | | | | | | | |
| Financials — 1.9% | | | | | | | | |
| Ageas | | | 4,780 | | | | 220,490 | |
| | | | | | | | | |
| BRAZIL — 1.4% | | | | | | | | |
| Materials — 1.4% | | | | | | | | |
| Yara International | | | 5,463 | | | | 156,626 | |
The accompanying notes are an integral part of the financial statements.
66
| Schedule of Investments | | April 30, 2024 (Unaudited) |
| | Global X MSCI SuperDividend® EAFE ETF | |
| | | Shares | | | Value | |
| COMMON STOCK — continued | | | | | | | | |
| CHINA — 2.4% | | | | | | | | |
| Industrials — 2.4% | | | | | | | | |
| SITC International Holdings | | | 125,400 | | | $ | 273,208 | |
| | | | | | | | | |
| FRANCE — 9.9% | | | | | | | | |
| Communication Services — 1.7% | | | | | | | | |
| Orange | | | 17,352 | | | | 193,422 | |
| Financials — 4.4% | | | | | | | | |
| AXA | | | 7,097 | | | | 246,171 | |
| Credit Agricole | | | 16,593 | | | | 258,149 | |
| | | | | | | | 504,320 | |
| Real Estate — 1.8% | | | | | | | | |
| Covivio ‡ | | | 4,071 | | | | 203,979 | |
| Utilities — 2.0% | | | | | | | | |
| Engie | | | 13,573 | | | | 236,127 | |
| TOTAL FRANCE | | | | | | | 1,137,848 | |
| GERMANY — 4.0% | | | | | | | | |
| Consumer Discretionary — 2.1% | | | | | | | | |
| Mercedes-Benz Group | | | 3,114 | | | | 236,206 | |
| Materials — 1.9% | | | | | | | | |
| BASF | | | 4,146 | | | | 217,911 | |
| TOTAL GERMANY | | | | | | | 454,117 | |
| HONG KONG — 9.7% | | | | | | | | |
| Communication Services — 1.6% | | | | | | | | |
| HKT Trust & HKT | | | 163,120 | | | | 180,614 | |
| Real Estate — 4.5% | | | | | | | | |
| Hang Lung Properties | | | 297,300 | | | | 331,085 | |
| Henderson Land Development | | | 61,500 | | | | 187,146 | |
| | | | | | | | 518,231 | |
| Utilities — 3.6% | | | | | | | | |
| CK Infrastructure Holdings | | | 36,700 | | | | 207,872 | |
The accompanying notes are an integral part of the financial statements.
67
| Schedule of Investments | | April 30, 2024 (Unaudited) |
| | Global X MSCI SuperDividend® EAFE ETF | |
| | | Shares | | | Value | |
| COMMON STOCK — continued | | | | | | | | |
| Utilities — continued | | | | | | | | |
| Power Assets Holdings | | | 36,006 | | | $ | 207,394 | |
| | | | | | | | 415,266 | |
| TOTAL HONG KONG | | | | | | | 1,114,111 | |
| ISRAEL — 1.0% | | | | | | | | |
| Materials — 1.0% | | | | | | | | |
| ICL Group | | | 25,242 | | | | 119,161 | |
| | | | | | | | | |
| ITALY — 8.5% | | | | | | | | |
| Financials — 6.9% | | | | | | | | |
| Assicurazioni Generali | | | 10,366 | | | | 253,821 | |
| Mediobanca Banca di Credito Finanziario | | | 19,943 | | | | 284,678 | |
| Poste Italiane | | | 20,132 | | | | 256,593 | |
| | | | | | | | 795,092 | |
| Utilities — 1.6% | | | | | | | | |
| Snam | | | 38,560 | | | | 177,374 | |
| | | | | | | | | |
| TOTAL ITALY | | | | | | | 972,466 | |
| JAPAN — 6.0% | | | | | | | | |
| Communication Services — 2.0% | | | | | | | | |
| SoftBank | | | 19,481 | | | | 236,572 | |
| | | | | | | | | |
| Financials — 2.4% | | | | | | | | |
| Japan Post Holdings | | | 28,504 | | | | 273,692 | |
| | | | | | | | | |
| Real Estate — 1.6% | | | | | | | | |
| Japan Metropolitan Fund Invest ‡ | | | 296 | | | | 179,445 | |
| | | | | | | | | |
| TOTAL JAPAN | | | | | | | 689,709 | |
| NETHERLANDS — 6.3% | | | | | | | | |
| Financials — 4.2% | | | | | | | | |
| ABN AMRO Bank | | | 14,384 | | | | 232,087 | |
| NN Group | | | 5,580 | | | | 258,646 | |
| | | | | | | | 490,733 | |
The accompanying notes are an integral part of the financial statements.
68
| Schedule of Investments | | April 30, 2024 (Unaudited) |
| | Global X MSCI SuperDividend® EAFE ETF | |
| | | Shares | | | Value | |
| COMMON STOCK — continued | | | | | | | | |
| Materials — 2.1% | | | | | | | | |
| OCI | | | 8,842 | | | $ | 239,195 | |
| | | | | | | | | |
| TOTAL NETHERLANDS | | | | | | | 729,928 | |
| NEW ZEALAND — 1.6% | | | | | | | | |
| Communication Services — 1.6% | | | | | | | | |
| Spark New Zealand | | | 64,285 | | | | 181,454 | |
| | | | | | | | | |
| NORWAY — 7.0% | | | | | | | | |
| Communication Services — 1.9% | | | | | | | | |
| Telenor | | | 19,545 | | | | 225,734 | |
| | | | | | | | | |
| Energy — 2.0% | | | | | | | | |
| Aker BP | | | 9,313 | | | | 228,743 | |
| | | | | | | | | |
| Materials — 3.1% | | | | | | | | |
| Norsk Hydro | | | 56,840 | | | | 353,641 | |
| | | | | | | | | |
| TOTAL NORWAY | | | | | | | 808,118 | |
| PORTUGAL — 1.3% | | | | | | | | |
| Utilities — 1.3% | | | | | | | | |
| EDP - Energias de Portugal | | | 41,001 | | | | 154,582 | |
| | | | | | | | | |
| SPAIN — 6.5% | | | | | | | | |
| Industrials — 2.3% | | | | | | | | |
| ACS Actividades de Construccion y Servicios | | | 6,694 | | | | 268,983 | |
| | | | | | | | | |
| Utilities — 4.2% | | | | | | | | |
| Enagas | | | 11,023 | | | | 162,181 | |
| Endesa | | | 17,499 | | | | 319,956 | |
| | | | | | | | 482,137 | |
| TOTAL SPAIN | | | | | | | 751,120 | |
| SWEDEN — 3.4% | | | | | | | | |
| Materials — 3.4% | | | | | | | | |
| Boliden | | | 11,791 | | | | 395,436 | |
The accompanying notes are an integral part of the financial statements.
69
| Schedule of Investments | | April 30, 2024 (Unaudited) |
| | Global X MSCI SuperDividend® EAFE ETF | |
| | | Shares | | | Value | |
| COMMON STOCK — continued | | | | | | | | |
| SWITZERLAND — 3.9% | | | | | | | | |
| Financials — 1.9% | | | | | | | | |
| Zurich Insurance Group | | | 447 | | | $ | 216,494 | |
| | | | | | | | | |
| Industrials — 2.0% | | | | | | | | |
| Adecco Group | | | 6,651 | | | | 233,798 | |
| | | | | | | | | |
| TOTAL SWITZERLAND | | | | | | | 450,292 | |
| UNITED KINGDOM — 13.8% | | | | | | | | |
| Communication Services — 1.5% | | | | | | | | |
| Vodafone Group PLC | | | 204,700 | | | | 173,422 | |
| | | | | | | | | |
| Consumer Staples — 1.6% | | | | | | | | |
| British American Tobacco PLC | | | 6,384 | | | | 187,932 | |
| | | | | | | | | |
| Financials — 8.9% | | | | | | | | |
| Abrdn PLC | | | 92,681 | | | | 170,013 | |
| Aviva PLC | | | 41,317 | | | | 240,929 | |
| Legal & General Group PLC | | | 72,560 | | | | 214,419 | |
| M&G PLC | | | 84,875 | | | | 213,721 | |
| Phoenix Group Holdings PLC | | | 29,705 | | | | 182,181 | |
| | | | | | | | 1,021,263 | |
| Utilities — 1.8% | | | | | | | | |
| National Grid PLC | | | 15,448 | | | | 202,716 | |
| | | | | | | | | |
| TOTAL UNITED KINGDOM | | | | | | | 1,585,333 | |
| UNITED STATES — 2.5% | | | | | | | | |
| Consumer Discretionary — 2.5% | | | | | | | | |
| Stellantis | | | 12,970 | | | | 289,569 | |
| | | | | | | | | |
TOTAL COMMON STOCK
(Cost $11,053,816) | | | | | | | 11,071,761 | |
The accompanying notes are an integral part of the financial statements.
70
| Schedule of Investments | | April 30, 2024 (Unaudited) |
| | Global X MSCI SuperDividend® EAFE ETF | |
| | | Shares | | | Value | |
| PREFERRED STOCK — 1.8% | | | | | | | | |
| GERMANY— 1.8% | | | | | | | | |
| Consumer Discretionary — 1.8% | | | | | | | | |
| Bayerische Motoren Werke (A) | | | 2,013 | | | $ | 207,708 | |
TOTAL PREFERRED STOCK
(Cost $210,327) | | | | | | | 207,708 | |
TOTAL INVESTMENTS — 98.0%
(Cost $11,264,143) | | | | | | $ | 11,279,469 | |
Percentages are based on Net Assets of $11,513,100.
| ‡ | Real Estate Investment Trust |
| (A) | There is currently no stated interest rate. |
As of April 30, 2024, all of the Fund’s investments were considered Level 1, in accordance with authoritative guidance on fair value measurements and disclosure under U.S. GAAP.
See “Glossary” for abbreviations.
The accompanying notes are an integral part of the financial statements.
71
| Schedule of Investments | | April 30, 2024 (Unaudited) |
| | Global X E-commerce ETF | |
Sector Weightings †:
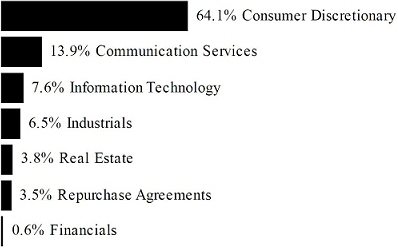
† Sector weightings percentages are based on the total market value of investments. Total investments do not include derivatives such as options, futures contracts, forward contracts, and swap contracts, if applicable.
| | | Shares | | | Value | |
| COMMON STOCK — 99.9% | | | | | | | | |
| AUSTRALIA — 0.6% | | | | | | | | |
| Consumer Discretionary — 0.6% | | | | | | | | |
| Temple & Webster Group * | | | 53,768 | | | $ | 399,420 | |
| | | | | | | | | |
| BRAZIL — 3.5% | | | | | | | | |
| Communication Services — 0.4% | | | | | | | | |
| VTEX, Cl A * | | | 35,006 | | | | 259,744 | |
| | | | | | | | | |
| Consumer Discretionary — 3.1% | | | | | | | | |
| MercadoLibre * | | | 1,508 | | | | 2,199,720 | |
| | | | | | | | | |
| TOTAL BRAZIL | | | | | | | 2,459,464 | |
| CANADA — 7.1% | | | | | | | | |
| Industrials — 4.0% | | | | | | | | |
| RB Global | | | 38,996 | | | | 2,791,334 | |
| | | | | | | | | |
| Information Technology — 3.1% | | | | | | | | |
| Shopify, Cl A * | | | 30,753 | | | | 2,158,860 | |
| | | | | | | | | |
| TOTAL CANADA | | | | | | | 4,950,194 | |
The accompanying notes are an integral part of the financial statements.
72
| Schedule of Investments | | April 30, 2024 (Unaudited) |
| | Global X E-commerce ETF | |
| | | Shares | | | Value | |
| COMMON STOCK — continued | | | | | | | | |
| CHINA — 22.5% | | | | | | | | |
| Communication Services — 3.7% | | | | | | | | |
| NetEase ADR | | | 27,502 | | | $ | 2,570,612 | |
| | | | | | | | | |
| Consumer Discretionary — 18.8% | | | | | | | | |
| Alibaba Group Holding ADR | | | 34,860 | | | | 2,609,271 | |
| JD.com ADR | | | 101,413 | | | | 2,929,822 | |
| PDD Holdings ADR * | | | 16,847 | | | | 2,108,907 | |
| Trip.com Group ADR * | | | 67,266 | | | | 3,246,257 | |
| Vipshop Holdings ADR | | | 150,244 | | | | 2,259,670 | |
| | | | | | | | 13,153,927 | |
| TOTAL CHINA | | | | | | | 15,724,539 | |
| GERMANY — 0.4% | | | | | | | | |
| Consumer Discretionary — 0.4% | | | | | | | | |
| Jumia Technologies ADR * | | | 70,022 | | | | 307,397 | |
| | | | | | | | | |
| HONG KONG — 0.4% | | | | | | | | |
| Consumer Discretionary — 0.4% | | | | | | | | |
| GigaCloud Technology, Cl A * | | | 9,260 | | | | 294,375 | |
| | | | | | | | | |
| ISRAEL — 3.1% | | | | | | | | |
| Consumer Discretionary — 3.1% | | | | | | | | |
| Global-e Online * | | | 63,417 | | | | 2,126,372 | |
| | | | | | | | | |
| JAPAN — 4.1% | | | | | | | | |
| Consumer Discretionary — 3.9% | | | | | | | | |
| Rakuten Group * (A) | | | 554,176 | | | | 2,688,739 | |
| Information Technology — 0.2% | | | | | | | | |
| BASE * | | | 91,851 | | | | 159,928 | |
| | | | | | | | | |
| TOTAL JAPAN | | | | | | | 2,848,667 | |
| SINGAPORE — 6.3% | | | | | | | | |
| Communication Services — 6.3% | | | | | | | | |
| Sea ADR * | | | 69,811 | | | | 4,411,357 | |
The accompanying notes are an integral part of the financial statements.
73
| Schedule of Investments | | April 30, 2024 (Unaudited) |
| | Global X E-commerce ETF | |
| | | Shares | | | Value | |
| COMMON STOCK — continued | | | | | | | | |
| UNITED KINGDOM — 0.3% | | | | | | | | |
| Consumer Discretionary — 0.3% | | | | | | | | |
| ASOS * (A) | | | 49,062 | | | $ | 205,431 | |
| | | | | | | | | |
| UNITED STATES — 51.6% | | | | | | | | |
| Communication Services — 4.0% | | | | | | | | |
| Angi, Cl A * | | | 81,240 | | | | 171,416 | |
| Shutterstock | | | 16,941 | | | | 723,550 | |
| TripAdvisor * | | | 71,932 | | | | 1,893,970 | |
| | | | | | | | 2,788,936 | |
| Consumer Discretionary — 35.7% | | | | | | | | |
| Amazon.com * | | | 16,199 | | | | 2,834,825 | |
| Beyond * | | | 31,148 | | | | 627,009 | |
| Booking Holdings | | | 716 | | | | 2,471,654 | |
| Carvana, Cl A * | | | 58,584 | | | | 4,857,785 | |
| eBay | | | 60,778 | | | | 3,132,498 | |
| Etsy * | | | 35,611 | | | | 2,445,407 | |
| Expedia Group * | | | 16,852 | | | | 2,268,785 | |
| Groupon, Cl A * (A) | | | 13,838 | | | | 159,967 | |
| Qurate Retail, Cl A * | | | 241,194 | | | | 198,141 | |
| Wayfair, Cl A * | | | 49,190 | | | | 2,466,879 | |
| Williams-Sonoma | | | 12,287 | | | | 3,523,666 | |
| | | | | | | | 24,986,616 | |
| Financials — 0.7% | | | | | | | | |
| eHealth * | | | 25,267 | | | | 108,143 | |
| LendingTree * | | | 7,400 | | | | 357,198 | |
| | | | | | | | 465,341 | |
| Industrials — 2.7% | | | | | | | | |
| ACV Auctions, Cl A * | | | 91,925 | | | | 1,604,091 | |
| Liquidity Services * | | | 15,585 | | | | 268,997 | |
| | | | | | | | 1,873,088 | |
| Information Technology — 4.6% | | | | | | | | |
| BigCommerce Holdings * (A) | | | 44,359 | | | | 251,072 | |
| GoDaddy, Cl A * | | | 23,929 | | | | 2,928,431 | |
The accompanying notes are an integral part of the financial statements.
74
| Schedule of Investments | | April 30, 2024 (Unaudited) |
| | Global X E-commerce ETF | |
| | | Shares | | | Value | |
| COMMON STOCK — continued | | | | | | | | |
| Information Technology — continued | | | | | | | | |
| LivePerson * | | | 53,714 | | | $ | 26,905 | |
| | | | | | | | 3,206,408 | |
| Real Estate — 3.9% | | | | | | | | |
| CoStar Group * | | | 30,037 | | | | 2,749,287 | |
| | | | | | | | | |
| TOTAL UNITED STATES | | | | | | | 36,069,676 | |
TOTAL COMMON STOCK
(Cost $78,990,141) | | | | | | | 69,796,892 | |
| | | | | | | | | |
| | | Face Amount | | | | | |
| REPURCHASE AGREEMENTS(B) — 3.6% | | | | | | | | |
Bank of America Securities
5.320%, dated 04/30/2024, to be repurchased on 05/01/2024, repurchase price $590,921 (collateralized by various U.S. Government Obligations, ranging in par value $377 - $478,671, 2.000% - 7.500%, 10/17/2025 - 08/20/2063, with a total market value of $602,651) | | $ | 590,834 | | | | 590,834 | |
Citigroup Global Markets Inc.
5.320%, dated 04/30/2024, to be repurchased on 05/01/2024, repurchase price $590,921 (collateralized by various U.S. Government Obligations, ranging in par value $11,824 - $296,628, 2.000% - 6.500%, 12/01/2033 - 05/01/2054, with a total market value of $602,651) | | | 590,834 | | | | 590,834 | |
Deutsche Bank Securities Inc.,
5.310%, dated 04/30/2024, to be repurchased on 05/01/2024, repurchase price $162,695 (collateralized by various U.S. Government Obligations, ranging in par value $99 - $34,050, 2.000% - 7.000%, 02/01/2037 - 02/01/2054, with a total market value of $165,924) | | | 162,671 | | | | 162,671 | |
The accompanying notes are an integral part of the financial statements.
75
| Schedule of Investments | | April 30, 2024 (Unaudited) |
| | Global X E-commerce ETF | |
| | | Face Amount | | | Value | |
| REPURCHASE AGREEMENTS — continued | | | | | | | | |
HSBC Securities USA Inc.,
5.310%, dated 04/30/2024, to be repurchased on 05/01/2024, repurchase price $579,102 (collateralized by various U.S. Government Obligations, ranging in par value $36,190 - $874,536, 2.500% - 3.000%, 04/20/2043 - 10/20/2051, with a total market value of $590,597) | | $ | 579,017 | | | $ | 579,017 | |
Nomura Securities International Inc.,
5.310%, dated 04/30/2024, to be repurchased on 05/01/2024, repurchase price $590,921 (collateralized by various U.S. Government Obligations, ranging in par value $252 - $118,767, 2.000% - 7.500%, 10/01/2029 - 03/15/2058, with a total market value of $602,873) | | | 590,834 | | | | 590,834 | |
TOTAL REPURCHASE AGREEMENTS
(Cost $2,514,190) | | | | | | | 2,514,190 | |
TOTAL INVESTMENTS — 103.5%
(Cost $81,504,331) | | | | | | $ | 72,311,082 | |
Percentages are based on Net Assets of $69,890,086.
| * | Non-income producing security. |
| (A) | This security or a partial position of this security is on loan at April 30, 2024. The total market value of securities on loan at April 30, 2024 was $2,477,820. |
| (B) | These securities were purchased with cash collateral held from securities on loan. The total value of such securities as of April 30, 2024 was $2,514,190. The total value of non-cash collateral held from securities on loan as of April 30, 2024 was $105,935. |
The accompanying notes are an integral part of the financial statements.
76
| Schedule of Investments | | April 30, 2024 (Unaudited) |
| | Global X E-commerce ETF | |
The following is a summary of the level of inputs used as of April 30, 2024, in valuing the Fund’s investments carried at value:
| Investments in Securities | | Level 1 | | | Level 2 | | | Level 3 | | | Total | |
| Common Stock | | $ | 69,796,892 | | | $ | — | | | $ | — | | | $ | 69,796,892 | |
| Repurchase Agreements | | | — | | | | 2,514,190 | | | | — | | | | 2,514,190 | |
| Total Investments in Securities | | $ | 69,796,892 | | | $ | 2,514,190 | | | $ | — | | | $ | 72,311,082 | |
Amounts designated as “—” are $0 or have been rounded to $0.
See “Glossary” for abbreviations.
The accompanying notes are an integral part of the financial statements.
77
| Schedule of Investments | April 30, 2024 (Unaudited) |
Global X S&P Catholic Values Developed ex-US ETF
Sector Weightings †:
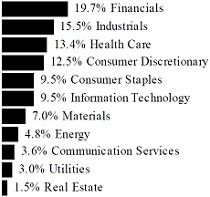
† Sector weightings percentages are based on the total market value of investments. Total investments do not include derivatives such as options, futures contracts, forward contracts, and swap contracts, if applicable.
| | | Shares | | | Value | |
| COMMON STOCK — 99.1% | | | | | | | | |
| AUSTRALIA — 8.3% | | | | | | | | |
| Communication Services — 0.1% | | | | | | | | |
| REA Group | | | 57 | | | $ | 6,649 | |
| Telstra Group | | | 4,934 | | | | 11,758 | |
| | | | | | | | 18,407 | |
| Consumer Discretionary — 0.4% | | | | | | | | |
| Wesfarmers | | | 1,605 | | | | 69,609 | |
| | | | | | | | | |
| Consumer Staples — 0.5% | | | | | | | | |
| Coles Group | | | 2,758 | | | | 29,048 | |
| Woolworths Group | | | 2,472 | | | | 51,206 | |
| | | | | | | | 80,254 | |
| Energy — 0.4% | | | | | | | | |
| Santos | | | 3,873 | | | | 19,365 | |
| Woodside Energy Group | | | 2,364 | | | | 43,335 | |
| | | | | | | | 62,700 | |
| Financials — 2.7% | | | | | | | | |
| ANZ Group Holdings | | | 3,721 | | | | 68,041 | |
| ASX | | | 230 | | | | 9,500 | |
| Commonwealth Bank of Australia | | | 2,100 | | | | 156,191 | |
The accompanying notes are an integral part of the financial statements.
78
| Schedule of Investments | April 30, 2024 (Unaudited) |
Global X S&P Catholic Values Developed ex-US ETF
| | | Shares | | | Value | |
| COMMON STOCK — continued | | | | | | | | |
| Financials — continued | | | | | | | | |
| Macquarie Group | | | 445 | | | $ | 54,171 | |
| National Australia Bank | | | 3,874 | | | | 85,027 | |
| QBE Insurance Group | | | 1,793 | | | | 20,643 | |
| Suncorp Group | | | 1,518 | | | | 16,383 | |
| Westpac Banking | | | 4,476 | | | | 75,453 | |
| | | | | | | | 485,409 | |
| Health Care — 0.8% | | | | | | | | |
| Cochlear | | | 351 | | | | 74,097 | |
| EBOS Group | | | 811 | | | | 16,826 | |
| Sonic Healthcare | | | 2,634 | | | | 45,787 | |
| | | | | | | | 136,710 | |
| Industrials — 0.5% | | | | | | | | |
| Brambles | | | 2,446 | | | | 23,221 | |
| Computershare | | | 1,115 | | | | 19,715 | |
| Transurban Group | | | 5,233 | | | | 42,612 | |
| | | | | | | | 85,548 | |
| Information Technology — 0.1% | | | | | | | | |
| WiseTech Global | | | 214 | | | | 12,894 | |
| | | | | | | | | |
| Materials — 2.5% | | | | | | | | |
| BHP Group | | | 6,489 | | | | 181,313 | |
| Fortescue | | | 2,097 | | | | 35,472 | |
| Glencore | | | 14,078 | | | | 82,445 | |
| Rio Tinto | | | 472 | | | | 39,994 | |
| Rio Tinto PLC | | | 1,433 | | | | 98,185 | |
| South32 | | | 5,773 | | | | 13,458 | |
| | | | | | | | 450,867 | |
| Real Estate — 0.3% | | | | | | | | |
| Goodman Group ‡ | | | 2,124 | | | | 43,708 | |
| Scentre Group ‡ | | | 6,229 | | | | 12,862 | |
| | | | | | | | 56,570 | |
| TOTAL AUSTRALIA | | | | | | | 1,458,968 | |
The accompanying notes are an integral part of the financial statements.
79
| Schedule of Investments | April 30, 2024 (Unaudited) |
Global X S&P Catholic Values Developed ex-US ETF
| | | Shares | | | Value | |
| COMMON STOCK — continued | | | | | | | | |
| AUSTRIA — 0.3% | | | | | | | | |
| Communication Services — 0.0% | | | | | | | | |
| Telekom Austria, Cl A | | | 173 | | | $ | 1,489 | |
| | | | | | | | | |
| Energy — 0.1% | | | | | | | | |
| OMV | | | 173 | | | | 8,265 | |
| | | | | | | | | |
| Financials — 0.1% | | | | | | | | |
| Erste Group Bank | | | 434 | | | | 20,358 | |
| Raiffeisen Bank International | | | 171 | | | | 3,178 | |
| | | | | | | | 23,536 | |
| Industrials — 0.0% | | | | | | | | |
| ANDRITZ | | | 112 | | | | 6,156 | |
| Strabag | | | 21 | | | | 896 | |
| | | | | | | | 7,052 | |
| Materials — 0.0% | | | | | | | | |
| voestalpine | | | 165 | | | | 4,432 | |
| | | | | | | | | |
| Utilities — 0.1% | | | | | | | | |
| EVN | | | 16 | | | | 493 | |
| Verbund | | | 114 | | | | 8,728 | |
| | | | | | | | 9,221 | |
| TOTAL AUSTRIA | | | | | | | 53,995 | |
| BELGIUM — 1.3% | | | | | | | | |
| Consumer Staples — 0.6% | | | | | | | | |
| Anheuser-Busch InBev | | | 1,780 | | | | 106,888 | |
| | | | | | | | | |
| Financials — 0.2% | | | | | | | | |
| Groupe Bruxelles Lambert | | | 122 | | | | 9,112 | |
| KBC Group | | | 425 | | | | 31,765 | |
| | | | | | | | 40,877 | |
| Health Care — 0.5% | | | | | | | | |
| UCB | | | 653 | | | | 86,964 | |
| TOTAL BELGIUM | | | | | | | 234,729 | |
The accompanying notes are an integral part of the financial statements.
80
| Schedule of Investments | April 30, 2024 (Unaudited) |
Global X S&P Catholic Values Developed ex-US ETF
| | | Shares | | | Value | |
| COMMON STOCK — continued | | | | | | | | |
| BRAZIL — 0.0% | | | | | | | | |
| Materials — 0.0% | | | | | | | | |
| Yara International | | | 203 | | | $ | 5,820 | |
| | | | | | | | | |
| CHINA — 0.6% | | | | | | | | |
| Consumer Discretionary — 0.4% | | | | | | | | |
| Chow Tai Fook Jewellery Group | | | 3,100 | | | | 4,265 | |
| Prosus | | | 2,140 | | | | 72,101 | |
| | | | | | | | 76,366 | |
| Consumer Staples — 0.1% | | | | | | | | |
| Budweiser Brewing APAC | | | 3,800 | | | | 5,345 | |
| Wilmar International | | | 6,612 | | | | 15,660 | |
| | | | | | | | 21,005 | |
| Financials — 0.1% | | | | | | | | |
| BOC Hong Kong Holdings | | | 4,500 | | | | 13,895 | |
| | | | | | | | | |
| TOTAL CHINA | | | | | | | 111,266 | |
| DENMARK — 1.2% | | | | | | | | |
| Health Care — 0.5% | | | | | | | | |
| Coloplast, Cl B | | | 679 | | | | 82,391 | |
| | | | | | | | | |
| Industrials — 0.6% | | | | | | | | |
| AP Moller - Maersk, Cl A | | | 4 | | | | 5,711 | |
| AP Moller - Maersk, Cl B | | | 8 | | | | 11,687 | |
| DSV | | | 315 | | | | 45,060 | |
| Svitzer * | | | 24 | | | | 808 | |
| Vestas Wind Systems * | | | 1,770 | | | | 47,806 | |
| | | | | | | | 111,072 | |
| Utilities — 0.1% | | | | | | | | |
| Orsted * | | | 230 | | | | 12,718 | |
| | | | | | | | | |
| TOTAL DENMARK | | | | | | | 206,181 | |
| FINLAND — 0.8% | | | | | | | | |
| Energy — 0.1% | | | | | | | | |
| Neste | | | 513 | | | | 11,706 | |
The accompanying notes are an integral part of the financial statements.
81
| Schedule of Investments | April 30, 2024 (Unaudited) |
Global X S&P Catholic Values Developed ex-US ETF
| | | Shares | | | Value | |
| COMMON STOCK — continued | | | | | | | | |
| Financials — 0.4% | | | | | | | | |
| Nordea Bank Abp | | | 4,421 | | | $ | 51,799 | |
| Sampo, Cl A | | | 573 | | | | 23,233 | |
| | | | | | | | 75,032 | |
| Industrials — 0.2% | | | | | | | | |
| Kone, Cl B | | | 732 | | | | 35,847 | |
| | | | | | | | | |
| Information Technology — 0.1% | | | | | | | | |
| Nokia | | | 6,573 | | | | 23,977 | |
| | | | | | | | | |
| TOTAL FINLAND | | | | | | | 146,562 | |
| FRANCE — 10.7% | | | | | | | | |
| Consumer Discretionary — 2.6% | | | | | | | | |
| Christian Dior | | | 4 | | | | 3,124 | |
| Hermes International SCA | | | 48 | | | | 115,531 | |
| Kering | | | 97 | | | | 34,227 | |
| LVMH Moet Hennessy Louis Vuitton | | | 368 | | | | 304,716 | |
| | | | | | | | 457,598 | |
| Consumer Staples — 2.0% | | | | | | | | |
| Danone | | | 1,234 | | | | 77,400 | |
| L’Oreal | | | 449 | | | | 211,074 | |
| Pernod Ricard | | | 402 | | | | 61,037 | |
| | | | | | | | 349,511 | |
| Energy — 1.2% | | | | | | | | |
| TotalEnergies | | | 2,785 | | | | 204,252 | |
| | | | | | | | | |
| Financials — 1.1% | | | | | | | | |
| AXA | | | 2,223 | | | | 77,108 | |
| BNP Paribas | | | 1,267 | | | | 91,595 | |
| Credit Agricole | | | 1,359 | | | | 21,143 | |
| | | | | | | | 189,846 | |
| Health Care — 1.9% | | | | | | | | |
| EssilorLuxottica | | | 1,541 | | | | 330,863 | |
The accompanying notes are an integral part of the financial statements.
82
| Schedule of Investments | April 30, 2024 (Unaudited) |
Global X S&P Catholic Values Developed ex-US ETF
| | | Shares | | | Value | |
| COMMON STOCK — continued | | | | | | | | |
| Industrials — 0.6% | | | | | | | | |
| Vinci | | | 888 | | | $ | 104,682 | |
| | | | | | | | | |
| Information Technology — 0.4% | | | | | | | | |
| Capgemini | | | 199 | | | | 42,110 | |
| Dassault Systemes | | | 848 | | | | 33,576 | |
| | | | | | | | 75,686 | |
| Materials — 0.7% | | | | | | | | |
| Air Liquide | | | 671 | | | | 131,928 | |
| | | | | | | | | |
| Utilities — 0.2% | | | | | | | | |
| Engie | | | 2,253 | | | | 39,195 | |
| | | | | | | | | |
| TOTAL FRANCE | | | | | | | 1,883,561 | |
| GERMANY — 6.4% | | | | | | | | |
| Communication Services — 0.6% | | | | | | | | |
| Deutsche Telekom | | | 4,346 | | | | 99,864 | |
| | | | | | | | | |
| Consumer Discretionary — 1.1% | | | | | | | | |
| adidas | | | 234 | | | | 56,646 | |
| Bayerische Motoren Werke | | | 414 | | | | 45,352 | |
| Mercedes-Benz Group | | | 1,145 | | | | 86,852 | |
| Volkswagen | | | 38 | | | | 5,396 | |
| | | | | | | | 194,246 | |
| Consumer Staples — 0.2% | | | | | | | | |
| Beiersdorf | | | 203 | | | | 30,508 | |
| Henkel & KGaA | | | 210 | | | | 15,078 | |
| | | | | | | | 45,586 | |
| Financials — 1.5% | | | | | | | | |
| Allianz | | | 490 | | | | 139,681 | |
| Deutsche Boerse | | | 235 | | | | 45,518 | |
| Muenchener Rueckversicherungs-Gesellschaft in Muenchen | | | 172 | | | | 75,809 | |
| | | | | | | | 261,008 | |
| Industrials — 0.6% | | | | | | | | |
| Daimler Truck Holding | | | 907 | | | | 41,033 | |
The accompanying notes are an integral part of the financial statements.
83
| Schedule of Investments | April 30, 2024 (Unaudited) |
Global X S&P Catholic Values Developed ex-US ETF
| | | Shares | | | Value | |
| COMMON STOCK — continued | | | | | | | | |
| Industrials — continued | | | | | | | | |
| Deutsche Post | | | 1,648 | | | $ | 69,181 | |
| Hapag-Lloyd | | | 10 | | | | 1,844 | |
| | | | | | | | 112,058 | |
| Information Technology — 1.7% | | | | | | | | |
| Infineon Technologies | | | 1,664 | | | | 58,217 | |
| SAP | | | 1,321 | | | | 239,699 | |
| | | | | | | | 297,916 | |
| Materials — 0.3% | | | | | | | | |
| BASF | | | 1,129 | | | | 59,339 | |
| | | | | | | | | |
| Utilities — 0.4% | | | | | | | | |
| E.ON | | | 2,877 | | | | 38,146 | |
| RWE | | | 854 | | | | 29,796 | |
| Uniper * | | | 4 | | | | 224 | |
| | | | | | | | 68,166 | |
| TOTAL GERMANY | | | | | | | 1,138,183 | |
| HONG KONG — 1.8% | | | | | | | | |
| Financials — 1.1% | | | | | | | | |
| AIA Group | | | 14,165 | | | | 104,682 | |
| Hang Seng Bank | | | 912 | | | | 12,115 | |
| Hong Kong Exchanges & Clearing | | | 1,494 | | | | 48,060 | |
| Prudential | | | 3,319 | | | | 29,133 | |
| | | | | | | | 193,990 | |
| Industrials — 0.2% | | | | | | | | |
| MTR | | | 2,900 | | | | 9,585 | |
| Techtronic Industries | | | 2,432 | | | | 34,018 | |
| | | | | | | | 43,603 | |
| Real Estate — 0.3% | | | | | | | | |
| CK Asset Holdings | | | 2,500 | | | | 10,756 | |
| Henderson Land Development | | | 1,700 | | | | 5,173 | |
| Link ‡ | | | 3,100 | | | | 13,417 | |
| Sun Hung Kai Properties | | | 1,940 | | | | 18,045 | |
The accompanying notes are an integral part of the financial statements.
84
| Schedule of Investments | April 30, 2024 (Unaudited) |
Global X S&P Catholic Values Developed ex-US ETF
| | | Shares | | | Value | |
| COMMON STOCK — continued | | | | | | | | |
| Real Estate — continued | | | | | | | | |
| Wharf Real Estate Investment | | | 2,000 | | | $ | 6,252 | |
| | | | | | | | 53,643 | |
| Utilities — 0.2% | | | | | | | | |
| CK Infrastructure Holdings | | | 800 | | | | 4,531 | |
| CLP Holdings | | | 2,300 | | | | 18,144 | |
| Hong Kong & China Gas | | | 12,710 | | | | 9,702 | |
| | | | | | | | 32,377 | |
| TOTAL HONG KONG | | | | | | | 323,613 | |
| ISRAEL — 0.7% | | | | | | | | |
| Communication Services — 0.0% | | | | | | | | |
| Bezeq The Israeli Telecommunication | | | 2,362 | | | | 2,941 | |
| | | | | | | | | |
| Consumer Discretionary — 0.0% | | | | | | | | |
| Global-e Online * | | | 104 | | | | 3,487 | |
| | | | | | | | | |
| Consumer Staples — 0.0% | | | | | | | | |
| Strauss Group | | | 113 | | | | 2,083 | |
| | | | | | | | | |
| Energy — 0.0% | | | | | | | | |
| Delek Group | | | 8 | | | | 950 | |
| | | | | | | | | |
| Financials — 0.3% | | | | | | | | |
| Bank Hapoalim | | | 1,463 | | | | 13,272 | |
| Bank Leumi Le-Israel | | | 1,816 | | | | 14,256 | |
| First International Bank of Israel | | | 60 | | | | 2,397 | |
| Israel Discount Bank, Cl A | | | 1,463 | | | | 7,557 | |
| Mizrahi Tefahot Bank | | | 171 | | | | 6,263 | |
| Phoenix Holdings | | | 141 | | | | 1,356 | |
| | | | | | | | 45,101 | |
| Industrials — 0.0% | | | | | | | | |
| Shapir Engineering and Industry | | | 209 | | | | 1,147 | |
| | | | | | | | | |
| Information Technology — 0.3% | | | | | | | | |
| Check Point Software Technologies * | | | 120 | | | | 17,931 | |
| JFrog * | | | 134 | | | | 5,344 | |
| Nice * | | | 82 | | | | 18,397 | |
The accompanying notes are an integral part of the financial statements.
85
| Schedule of Investments | April 30, 2024 (Unaudited) |
Global X S&P Catholic Values Developed ex-US ETF
| | | Shares | | | Value | |
| COMMON STOCK — continued | | | | | | | | |
| Information Technology — continued | | | | | | | | |
| Nova * | | | 36 | | | $ | 6,243 | |
| Tower Semiconductor * | | | 135 | | | | 4,420 | |
| Wix.com * | | | 69 | | | | 8,202 | |
| | | | | | | | 60,537 | |
| Materials — 0.0% | | | | | | | | |
| Israel | | | 5 | | | | 1,200 | |
| | | | | | | | | |
| Real Estate — 0.1% | | | | | | | | |
| Airport City * | | | 95 | | | | 1,472 | |
| Amot Investments | | | 260 | | | | 1,098 | |
| Azrieli Group | | | 32 | | | | 2,076 | |
| Big Shopping Centers * | | | 14 | | | | 1,450 | |
| Melisron | | | 30 | | | | 2,067 | |
| Mivne Real Estate KD | | | 592 | | | | 1,431 | |
| | | | | | | | 9,594 | |
| TOTAL ISRAEL | | | | | | | 127,040 | |
| ITALY — 2.4% | | | | | | | | |
| Consumer Discretionary — 0.4% | | | | | | | | |
| Ferrari | | | 176 | | | | 72,867 | |
| PRADA | | | 600 | | | | 4,933 | |
| | | | | | | | 77,800 | |
| Consumer Staples — 0.1% | | | | | | | | |
| Davide Campari-Milano | | | 1,136 | | | | 11,442 | |
| | | | | | | | | |
| Energy — 0.3% | | | | | | | | |
| Eni | | | 2,990 | | | | 48,391 | |
| | | | | | | | | |
| Financials — 1.1% | | | | | | | | |
| Assicurazioni Generali | | | 1,432 | | | | 35,064 | |
| Intesa Sanpaolo | | | 20,500 | | | | 77,289 | |
| UniCredit | | | 2,192 | | | | 81,049 | |
| | | | | | | | 193,402 | |
| Utilities — 0.5% | | | | | | | | |
| Enel | | | 9,746 | | | | 64,412 | |
| Snam | | | 2,487 | | | | 11,440 | |
The accompanying notes are an integral part of the financial statements.
86
| Schedule of Investments | April 30, 2024 (Unaudited) |
Global X S&P Catholic Values Developed ex-US ETF
| | | Shares | | | Value | |
| COMMON STOCK — continued | | | | | | | | |
| Utilities — continued | | | | | | | | |
| Terna - Rete Elettrica Nazionale | | | 1,692 | | | $ | 13,612 | |
| | | | | | | | 89,464 | |
| TOTAL ITALY | | | | | | | 420,499 | |
| JAPAN — 27.9% | | | | | | | | |
| Communication Services — 1.8% | | | | | | | | |
| Capcom | | | 480 | | | | 7,996 | |
| Dentsu Group | | | 295 | | | | 8,003 | |
| KDDI | | | 1,849 | | | | 51,699 | |
| Konami Group | | | 116 | | | | 7,043 | |
| LY | | | 3,132 | | | | 7,625 | |
| Nexon | | | 548 | | | | 8,607 | |
| Nintendo | | | 1,449 | | | | 71,085 | |
| Nippon Telegraph & Telephone | | | 36,717 | | | | 39,852 | |
| SoftBank | | | 3,482 | | | | 42,284 | |
| SoftBank Group | | | 1,307 | | | | 65,738 | |
| Toho | | | 173 | | | | 5,811 | |
| | | | | | | | 315,743 | |
| Consumer Discretionary — 5.2% | | | | | | | | |
| Aisin | | | 228 | | | | 8,683 | |
| Bandai Namco Holdings | | | 958 | | | | 18,032 | |
| Bridgestone | | | 796 | | | | 35,302 | |
| Denso | | | 3,096 | | | | 52,953 | |
| Fast Retailing | | | 274 | | | | 72,346 | |
| Honda Motor | | | 7,042 | | | | 81,086 | |
| Isuzu Motors | | | 830 | | | | 10,546 | |
| Nissan Motor | | | 3,054 | | | | 11,289 | |
| Nitori Holdings | | | 112 | | | | 15,120 | |
| Oriental Land | | | 1,664 | | | | 46,124 | |
| Pan Pacific International Holdings | | | 706 | | | | 16,716 | |
| Panasonic Holdings | | | 3,426 | | | | 30,088 | |
| Rakuten Group * | | | 2,031 | | | | 9,854 | |
| Sekisui House | | | 967 | | | | 22,282 | |
| Shimano | | | 114 | | | | 18,701 | |
| Subaru | | | 907 | | | | 20,357 | |
| Sumitomo Electric Industries | | | 1,123 | | | | 17,420 | |
| Suzuki Motor | | | 2,784 | | | | 32,570 | |
The accompanying notes are an integral part of the financial statements.
87
| Schedule of Investments | April 30, 2024 (Unaudited) |
| Global X S&P Catholic Values Developed ex-US ETF |
| | | Shares | | | Value | |
| COMMON STOCK — continued | | | | | | | | |
| Consumer Discretionary — continued | | | | | | | | |
| Toyota Motor | | | 17,493 | | | $ | 404,407 | |
| | | | | | | | 923,876 | |
| Consumer Staples — 1.7% | | | | | | | | |
| Aeon | | | 1,782 | | | | 37,392 | |
| Asahi Group Holdings | | | 1,033 | | | | 35,480 | |
| Kao | | | 949 | | | | 39,349 | |
| Kirin Holdings | | | 1,625 | | | | 23,756 | |
| Kobe Bussan | | | 320 | | | | 6,965 | |
| Nissin Foods Holdings | | | 531 | | | | 14,189 | |
| Seven & i Holdings | | | 4,833 | | | | 62,653 | |
| Shiseido | | | 847 | | | | 22,687 | |
| Suntory Beverage & Food | | | 289 | | | | 9,414 | |
| Unicharm | | | 879 | | | | 26,236 | |
| Yakult Honsha | | | 682 | | | | 13,374 | |
| | | | | | | | 291,495 | |
| Energy — 0.2% | | | | | | | | |
| ENEOS Holdings | | | 3,781 | | | | 17,561 | |
| Inpex | | | 1,239 | | | | 18,837 | |
| | | | | | | | 36,398 | |
| Financials — 3.4% | | | | | | | | |
| Dai-ichi Life Holdings | | | 1,283 | | | | 29,750 | |
| Japan Exchange Group | | | 640 | | | | 15,076 | |
| Japan Post Bank | | | 1,719 | | | | 17,516 | |
| Mitsubishi HC Capital | | | 1,350 | | | | 8,780 | |
| Mitsubishi UFJ Financial Group | | | 15,449 | | | | 155,064 | |
| Mizuho Financial Group | | | 3,222 | | | | 62,489 | |
| MS&AD Insurance Group Holdings | | | 1,719 | | | | 31,094 | |
| Nomura Holdings | | | 3,578 | | | | 20,463 | |
| ORIX | | | 1,488 | | | | 30,646 | |
| Resona Holdings | | | 2,871 | | | | 18,263 | |
| Sompo Holdings | | | 1,248 | | | | 24,744 | |
| Sumitomo Mitsui Financial Group | | | 1,675 | | | | 95,584 | |
| Sumitomo Mitsui Trust Holdings | | | 916 | | | | 19,314 | |
| Tokio Marine Holdings | | | 2,473 | | | | 78,434 | |
| | | | | | | | 607,217 | |
The accompanying notes are an integral part of the financial statements.
88
| Schedule of Investments | April 30, 2024 (Unaudited) |
| Global X S&P Catholic Values Developed ex-US ETF |
| | | Shares | | | Value | |
| COMMON STOCK — continued | | | | | | | | |
| Health Care — 4.0% | | | | | | | | |
| Eisai | | | 1,620 | | | $ | 66,935 | |
| Hoya | | | 1,881 | | | | 220,774 | |
| Kyowa Kirin | | | 1,348 | | | | 22,692 | |
| M3 | | | 2,393 | | | | 25,722 | |
| Otsuka Holdings | | | 3,002 | | | | 128,615 | |
| Shionogi | | | 1,491 | | | | 69,867 | |
| Sysmex | | | 2,547 | | | | 41,005 | |
| Terumo | | | 8,112 | | | | 138,847 | |
| | | | | | | | 714,457 | |
| Industrials — 6.1% | | | | | | | | |
| ANA Holdings | | | 316 | | | | 6,024 | |
| Central Japan Railway | | | 1,842 | | | | 42,338 | |
| Daifuku | | | 619 | | | | 12,831 | |
| East Japan Railway | | | 1,954 | | | | 35,922 | |
| FANUC | | | 1,603 | | | | 47,133 | |
| Hankyu Hanshin Holdings | | | 450 | | | | 11,822 | |
| ITOCHU | | | 2,578 | | | | 116,904 | |
| Japan Airlines | | | 205 | | | | 3,647 | |
| Komatsu | | | 1,658 | | | | 50,099 | |
| Kubota | | | 1,827 | | | | 29,553 | |
| Marubeni | | | 3,034 | | | | 54,447 | |
| MINEBEA MITSUMI | | | 783 | | | | 14,835 | |
| Mitsubishi Electric | | | 3,779 | | | | 66,591 | |
| Mitsui | | | 2,695 | | | | 130,824 | |
| Mitsui OSK Lines | | | 600 | | | | 19,026 | |
| NIDEC CORP | | | 952 | | | | 44,604 | |
| Nippon Yusen | | | 920 | | | | 26,109 | |
| Recruit Holdings | | | 2,976 | | | | 130,527 | |
| Secom | | | 395 | | | | 27,561 | |
| SG Holdings | | | 824 | | | | 9,658 | |
| SMC | | | 102 | | | | 54,135 | |
| Sumitomo | | | 2,162 | | | | 57,085 | |
| Tokyu | | | 1,102 | | | | 13,085 | |
| Toyota Industries | | | 331 | | | | 31,614 | |
| West Japan Railway | | | 858 | | | | 16,324 | |
| Yaskawa Electric | | | 484 | | | | 20,238 | |
| | | | | | | | 1,072,936 | |
The accompanying notes are an integral part of the financial statements.
89
| Schedule of Investments | April 30, 2024 (Unaudited) |
| Global X S&P Catholic Values Developed ex-US ETF |
| | | Shares | | | Value | |
| COMMON STOCK — continued | | | | | | | | |
| Information Technology — 3.4% | | | | | | | | |
| Advantest | | | 1,039 | | | $ | 32,986 | |
| Canon | | | 1,300 | | | | 35,357 | |
| Disco | | | 117 | | | | 34,052 | |
| Fujitsu | | | 2,290 | | | | 35,442 | |
| Keyence | | | 253 | | | | 113,023 | |
| Kyocera | | | 1,768 | | | | 21,712 | |
| Lasertec | | | 96 | | | | 21,108 | |
| Murata Manufacturing | | | 2,400 | | | | 44,282 | |
| NEC | | | 342 | | | | 24,993 | |
| Nomura Research Institute | | | 644 | | | | 15,694 | |
| NTT Data Group | | | 811 | | | | 12,750 | |
| Obic | | | 77 | | | | 9,962 | |
| Omron | | | 242 | | | | 8,397 | |
| Oracle Japan | | | 55 | | | | 4,157 | |
| Renesas Electronics | | | 1,815 | | | | 30,316 | |
| Rohm | | | 464 | | | | 6,765 | |
| TDK | | | 463 | | | | 20,843 | |
| Tokyo Electron | | | 608 | | | | 135,691 | |
| | | | | | | | 607,530 | |
| Materials — 1.2% | | | | | | | | |
| Asahi Kasei | | | 1,723 | | | | 12,049 | |
| JFE Holdings | | | 830 | | | | 12,453 | |
| Mitsubishi Chemical Group | | | 1,653 | | | | 9,680 | |
| Nippon Paint Holdings | | | 1,268 | | | | 8,182 | |
| Nippon Sanso Holdings | | | 282 | | | | 8,431 | |
| Nippon Steel | | | 1,255 | | | | 28,240 | |
| Nitto Denko | | | 181 | | | | 15,033 | |
| Shin-Etsu Chemical | | | 2,582 | | | | 101,646 | |
| Sumitomo Metal Mining | | | 344 | | | | 11,616 | |
| Toray Industries | | | 2,061 | | | | 9,459 | |
| | | | | | | | 216,789 | |
| Real Estate — 0.7% | | | | | | | | |
| Daiwa House Industry | | | 806 | | | | 22,741 | |
| Mitsubishi Estate | | | 1,693 | | | | 31,285 | |
| Mitsui Fudosan | | | 3,432 | | | | 35,178 | |
| Nippon Building Fund ‡ | | | 2 | | | | 7,664 | |
The accompanying notes are an integral part of the financial statements.
90
| Schedule of Investments | April 30, 2024 (Unaudited) |
| Global X S&P Catholic Values Developed ex-US ETF |
| | | Shares | | | Value | |
| COMMON STOCK — continued | | | | | | | | |
| Real Estate — continued | | | | | | | | |
| Sumitomo Realty & Development | | | 580 | | | $ | 20,242 | |
| | | | | | | | 117,110 | |
| Utilities — 0.2% | | | | | | | | |
| Chubu Electric Power | | | 923 | | | | 11,877 | |
| Osaka Gas | | | 514 | | | | 11,432 | |
| Tokyo Gas | | | 474 | | | | 10,660 | |
| | | | | | | | 33,969 | |
| TOTAL JAPAN | | | | | | | 4,937,520 | |
| LUXEMBOURG — 0.1% | | | | | | | | |
| Materials — 0.1% | | | | | | | | |
| ArcelorMittal | | | 571 | | | | 14,403 | |
| |
| NETHERLANDS — 5.1% | | | | | | | | |
| Communication Services — 0.1% | | | | | | | | |
| Universal Music Group | | | 940 | | | | 27,841 | |
| |
| Consumer Staples — 0.6% | | | | | | | | |
| Heineken | | | 515 | | | | 50,276 | |
| Koninklijke Ahold Delhaize | | | 1,884 | | | | 57,292 | |
| | | | | | | | 107,568 | |
| Financials — 0.7% | | | | | | | | |
| Adyen * | | | 38 | | | | 45,922 | |
| ING Groep | | | 4,446 | | | | 70,653 | |
| | | | | | | | 116,575 | |
| Health Care — 0.7% | | | | | | | | |
| Argenx * | | | 318 | | | | 119,280 | |
| |
| Industrials — 0.4% | | | | | | | | |
| Wolters Kluwer | | | 434 | | | | 65,316 | |
| |
| Information Technology — 2.6% | | | | | | | | |
| ASML Holding | | | 518 | | | | 461,211 | |
| |
| TOTAL NETHERLANDS | | | | | | | 897,791 | |
The accompanying notes are an integral part of the financial statements.
91
| Schedule of Investments | April 30, 2024 (Unaudited) |
| Global X S&P Catholic Values Developed ex-US ETF |
| | | Shares | | | Value | |
| COMMON STOCK — continued | | | | | | | | |
| NEW ZEALAND — 0.6% | | | | | | | | |
| Communication Services — 0.0% | | | | | | | | |
| Spark New Zealand | | | 2,270 | | | $ | 6,407 | |
| |
| Health Care — 0.3% | | | | | | | | |
| Fisher & Paykel Healthcare | | | 3,263 | | | | 54,972 | |
| |
| Industrials — 0.1% | | | | | | | | |
| Auckland International Airport | | | 2,090 | | | | 9,709 | |
| Infratil | | | 1,325 | | | | 8,562 | |
| | | | | | | | 18,271 | |
| Information Technology — 0.1% | | | | | | | | |
| Xero * | | | 167 | | | | 13,239 | |
| |
| Utilities — 0.1% | | | | | | | | |
| Mercury NZ | | | 760 | | | | 2,869 | |
| Meridian Energy | | | 1,473 | | | | 5,230 | |
| | | | | | | | 8,099 | |
| TOTAL NEW ZEALAND | | | | | | | 100,988 | |
| NORWAY — 0.8% | | | | | | | | |
| Communication Services — 0.1% | | | | | | | | |
| Telenor | | | 770 | | | | 8,893 | |
| |
| Consumer Staples — 0.2% | | | | | | | | |
| Mowi | | | 1,000 | | | | 17,694 | |
| Orkla | | | 1,662 | | | | 11,376 | |
| Salmar | | | 146 | | | | 9,249 | |
| | | | | | | | 38,319 | |
| Energy — 0.2% | | | | | | | | |
| Aker BP | | | 351 | | | | 8,621 | |
| Equinor | | | 1,225 | | | | 33,069 | |
| Var Energi | | | 381 | | | | 1,252 | |
| | | | | | | | 42,942 | |
| Financials — 0.1% | | | | | | | | |
| DNB Bank | | | 1,097 | | | | 19,228 | |
The accompanying notes are an integral part of the financial statements.
92
| Schedule of Investments | April 30, 2024 (Unaudited) |
| Global X S&P Catholic Values Developed ex-US ETF |
| | | Shares | | | Value | |
| COMMON STOCK — continued | | | | | | | | |
| Financials — continued | | | | | | | | |
| Gjensidige Forsikring | | | 230 | | | $ | 3,711 | |
| | | | | | | | 22,939 | |
| Industrials — 0.1% | | | | | | | | |
| AutoStore Holdings * | | | 2,052 | | | | 2,964 | |
| Kongsberg Gruppen | | | 172 | | | | 12,208 | |
| | | | | | | | 15,172 | |
| Materials — 0.1% | | | | | | | | |
| Norsk Hydro | | | 1,687 | | | | 10,496 | |
| |
| TOTAL NORWAY | | | | | | | 138,761 | |
| PORTUGAL — 0.1% | | | | | | | | |
| Utilities — 0.1% | | | | | | | | |
| EDP - Energias de Portugal | | | 3,739 | | | | 14,097 | |
| |
| SINGAPORE — 1.7% | | | | | | | | |
| Communication Services — 0.2% | | | | | | | | |
| Sea ADR * | | | 431 | | | | 27,235 | |
| Singapore Telecommunications | | | 8,290 | | | | 14,467 | |
| | | | | | | | 41,702 | |
| Financials — 0.9% | | | | | | | | |
| DBS Group Holdings | | | 2,568 | | | | 65,718 | |
| Oversea-Chinese Banking | | | 4,894 | | | | 51,138 | |
| United Overseas Bank | | | 1,979 | | | | 44,115 | |
| | | | | | | | 160,971 | |
| Industrials — 0.3% | | | | | | | | |
| Grab Holdings, Cl A * | | | 3,498 | | | | 12,243 | |
| Jardine Cycle & Carriage | | | 200 | | | | 3,886 | |
| Keppel | | | 2,300 | | | | 11,603 | |
| Singapore Airlines | | | 2,263 | | | | 10,853 | |
| Singapore Technologies Engineering | | | 2,728 | | | | 8,062 | |
| | | | | | | | 46,647 | |
| Information Technology — 0.2% | | | | | | | | |
| STMicroelectronics | | | 836 | | | | 33,651 | |
The accompanying notes are an integral part of the financial statements.
93
| Schedule of Investments | April 30, 2024 (Unaudited) |
| Global X S&P Catholic Values Developed ex-US ETF |
| | | Shares | | | Value | |
| COMMON STOCK — continued | | | | | | | | |
| Real Estate — 0.1% | | | | | | | | |
| CapitaLand Integrated Commercial Trust ‡ | | | 5,534 | | | $ | 7,953 | |
| CapitaLand Investment | | | 2,829 | | | | 5,518 | |
| | | | | | | | 13,471 | |
| TOTAL SINGAPORE | | | | | | | 296,442 | |
| SOUTH AFRICA — 0.3% | | | | | | | | |
| Materials — 0.3% | | | | | | | | |
| Anglo American | | | 1,720 | | | | 56,728 | |
| |
| SPAIN — 2.5% | | | | | | | | |
| Communication Services — 0.1% | | | | | | | | |
| Cellnex Telecom | | | 709 | | | | 23,539 | |
| |
| Consumer Discretionary — 0.6% | | | | | | | | |
| Amadeus IT Group | | | 626 | | | | 40,001 | |
| Industria de Diseno Textil | | | 1,584 | | | | 72,575 | |
| | | | | | | | 112,576 | |
| Financials — 1.2% | | | | | | | | |
| Banco Bilbao Vizcaya Argentaria | | | 7,283 | | | | 79,237 | |
| Banco Santander | | | 19,964 | | | | 97,618 | |
| CaixaBank | | | 5,096 | | | | 26,983 | |
| | | | | | | | 203,838 | |
| Utilities — 0.6% | | | | | | | | |
| EDP Renovaveis | | | 354 | | | | 4,872 | |
| Iberdrola | | | 7,392 | | | | 90,974 | |
| Naturgy Energy Group | | | 210 | | | | 5,326 | |
| | | | | | | | 101,172 | |
| TOTAL SPAIN | | | | | | | 441,125 | |
| SWEDEN — 3.5% | | | | | | | | |
| Communication Services — 0.0% | | | | | | | | |
| Telia | | | 3,001 | | | | 6,906 | |
| |
| Consumer Discretionary — 0.1% | | | | | | | | |
| H & M Hennes & Mauritz, Cl B | | | 913 | | | | 14,703 | |
The accompanying notes are an integral part of the financial statements.
94
| Schedule of Investments | April 30, 2024 (Unaudited) |
| Global X S&P Catholic Values Developed ex-US ETF |
| | | Shares | | | Value | |
| COMMON STOCK — continued | | | | | | | | |
| Consumer Discretionary — continued | | | | | | | | |
| Volvo Car, Cl B * | | | 637 | | | $ | 2,027 | |
| | | | | | | | 16,730 | |
| Consumer Staples — 0.2% | | | | | | | | |
| Essity, Cl B | | | 1,241 | | | | 31,048 | |
| |
| Financials — 0.8% | | | | | | | | |
| EQT | | | 427 | | | | 11,761 | |
| Industrivarden, Cl A | | | 227 | | | | 7,387 | |
| Industrivarden, Cl C | | | 221 | | | | 7,186 | |
| Investor, Cl B | | | 2,285 | | | | 56,699 | |
| L E Lundbergforetagen, Cl B | | | 92 | | | | 4,593 | |
| Skandinaviska Enskilda Banken, Cl A | | | 1,998 | | | | 26,450 | |
| Skandinaviska Enskilda Banken, Cl C | | | 4 | | | | 54 | |
| Svenska Handelsbanken, Cl A | | | 1,855 | | | | 16,255 | |
| Svenska Handelsbanken, Cl B | | | 55 | | | | 595 | |
| Swedbank, Cl A | | | 1,112 | | | | 21,519 | |
| | | | | | | | 152,499 | |
| Industrials — 2.0% | | | | | | | | |
| Alfa Laval | | | 506 | | | | 21,834 | |
| Assa Abloy, Cl B | | | 1,739 | | | | 46,739 | |
| Atlas Copco, Cl A | | | 4,525 | | | | 80,578 | |
| Atlas Copco, Cl B | | | 2,732 | | | | 41,692 | |
| Epiroc, Cl A | | | 1,045 | | | | 19,689 | |
| Epiroc, Cl B | | | 661 | | | | 11,117 | |
| Investment Latour, Cl B | | | 239 | | | | 5,869 | |
| Nibe Industrier, Cl B | | | 2,721 | | | | 12,792 | |
| Sandvik | | | 1,888 | | | | 38,307 | |
| Volvo, Cl A | | | 324 | | | | 8,643 | |
| Volvo, Cl B | | | 2,780 | | | | 71,780 | |
| | | | | | | | 359,040 | |
| Information Technology — 0.3% | | | | | | | | |
| Hexagon, Cl B | | | 2,724 | | | | 28,975 | |
| Telefonaktiebolaget LM Ericsson, Cl B | | | 3,927 | | | | 20,114 | |
| | | | | | | | 49,089 | |
The accompanying notes are an integral part of the financial statements.
95
| Schedule of Investments | April 30, 2024 (Unaudited) |
| Global X S&P Catholic Values Developed ex-US ETF |
| | | Shares | | | Value | |
| COMMON STOCK — continued | | | | | | | | |
| Materials — 0.1% | | | | | | | | |
| Svenska Cellulosa, Cl B | | | 752 | | | $ | 11,103 | |
| |
| TOTAL SWEDEN | | | | | | | 626,415 | |
| SWITZERLAND — 4.5% | | | | | | | | |
| Consumer Discretionary — 0.6% | | | | | | | | |
| Cie Financiere Richemont, Cl A | | | 756 | | | | 105,427 | |
| |
| Financials — 1.1% | | | | | | | | |
| UBS Group | | | 3,812 | | | | 100,875 | |
| Zurich Insurance Group | | | 183 | | | | 88,632 | |
| | | | | | | | 189,507 | |
| Health Care — 1.2% | | | | | | | | |
| Alcon | | | 2,678 | | | | 207,606 | |
| |
| Industrials — 0.9% | | | | | | | | |
| ABB | | | 2,822 | | | | 138,123 | |
| Kuehne + Nagel International | | | 102 | | | | 27,103 | |
| | | | | | | | 165,226 | |
| Materials — 0.7% | | | | | | | | |
| DSM-Firmenich | | | 267 | | | | 30,176 | |
| Givaudan | | | 10 | | | | 43,025 | |
| Sika | | | 204 | | | | 58,565 | |
| | | | | | | | 131,766 | |
| TOTAL SWITZERLAND | | | | | | | 799,532 | |
| UNITED KINGDOM — 10.4% | | | | | | | | |
| Communication Services — 0.2% | | | | | | | | |
| BT Group, Cl A | | | 7,882 | | | | 10,126 | |
| Vodafone Group PLC | | | 28,184 | | | | 23,877 | |
| | | | | | | | 34,003 | |
| Consumer Discretionary — 0.4% | | | | | | | | |
| Compass Group | | | 2,520 | | | | 70,429 | |
| |
| Consumer Staples — 2.9% | | | | | | | | |
| Associated British Foods | | | 732 | | | | 24,344 | |
| Coca-Cola Europacific Partners | | | 427 | | | | 30,753 | |
The accompanying notes are an integral part of the financial statements.
96
| Schedule of Investments | April 30, 2024 (Unaudited) |
| Global X S&P Catholic Values Developed ex-US ETF |
| | | Shares | | | Value | |
| COMMON STOCK — continued | | | | | | | | |
| Consumer Staples — continued | | | | | | | | |
| Diageo | | | 4,349 | | | $ | 151,142 | |
| Tesco | | | 14,389 | | | | 53,385 | |
| Unilever | | | 4,947 | | | | 256,446 | |
| | | | | | | | 516,070 | |
| Energy — 2.4% | | | | | | | | |
| BP | | | 20,860 | | | | 135,927 | |
| Shell | | | 8,098 | | | | 290,304 | |
| | | | | | | | 426,231 | |
| Financials — 2.7% | | | | | | | | |
| 3i Group | | | 1,232 | | | | 44,366 | |
| Barclays | | | 17,563 | | | | 44,577 | |
| HSBC Holdings | | | 23,892 | | | | 208,097 | |
| Legal & General Group PLC | | | 7,189 | | | | 21,244 | |
| Lloyds Banking Group | | | 81,051 | | | | 52,672 | |
| London Stock Exchange Group | | | 490 | | | | 54,275 | |
| NatWest Group | | | 6,773 | | | | 25,739 | |
| Standard Chartered | | | 2,957 | | | | 25,541 | |
| | | | | | | | 476,511 | |
| Industrials — 1.3% | | | | | | | | |
| Ashtead Group | | | 790 | | | | 57,789 | |
| CK Hutchison Holdings | | | 4,920 | | | | 24,061 | |
| RELX | | | 3,333 | | | | 137,847 | |
| | | | | | | | 219,697 | |
| Utilities — 0.5% | | | | | | | | |
| National Grid PLC | | | 4,713 | | | | 61,846 | |
| SSE | | | 1,355 | | | | 28,275 | |
| | | | | | | | 90,121 | |
| TOTAL UNITED KINGDOM | | | | | | | 1,833,062 | |
| UNITED STATES — 7.1% | | | | | | | | |
| Communication Services — 0.3% | | | | | | | | |
| Spotify Technology * | | | 175 | | | | 49,077 | |
The accompanying notes are an integral part of the financial statements.
97
| Schedule of Investments | April 30, 2024 (Unaudited) |
| Global X S&P Catholic Values Developed ex-US ETF |
| | | Shares | | | Value | |
| COMMON STOCK — continued | | | | | | | | |
| Consumer Discretionary — 0.4% | | | | | | | | |
| Stellantis | | | 3,123 | | | $ | 69,724 | |
| |
| Consumer Staples — 0.3% | | | | | | | | |
| Haleon | | | 12,567 | | | | 53,423 | |
| |
| Energy — 0.0% | | | | | | | | |
| Tenaris | | | 567 | | | | 9,503 | |
| |
| Health Care — 3.4% | | | | | | | | |
| CSL | | | 2,597 | | | | 466,718 | |
| ICON * | | | 441 | | | | 131,365 | |
| Inmode * | | | 342 | | | | 5,879 | |
| | | | | | | | 603,962 | |
| Industrials — 1.6% | | | | | | | | |
| Experian | | | 1,613 | | | | 65,520 | |
| Schneider Electric | | | 935 | | | | 215,047 | |
| | | | | | | | 280,567 | |
| Information Technology — 0.2% | | | | | | | | |
| CyberArk Software * | | | 51 | | | | 12,202 | |
| Flex * | | | 587 | | | | 16,817 | |
| Monday.com * | | | 33 | | | | 6,248 | |
| | | | | | | | 35,267 | |
| Materials — 0.9% | | | | | | | | |
| CRH | | | 938 | | | | 73,243 | |
| Holcim | | | 697 | | | | 58,654 | |
| James Hardie Industries * | | | 567 | | | | 19,959 | |
| | | | | | | | 151,856 | |
| TOTAL UNITED STATES | | | | | | | 1,253,379 | |
TOTAL COMMON STOCK
(Cost $15,589,102) | | | | | | | 17,520,660 | |
| |
| PREFERRED STOCK — 0.4% | | | | | | | | |
| GERMANY— 0.4% | | | | | | | | |
| Consumer Discretionary — 0.3% | | | | | | | | |
| Bayerische Motoren Werke (A) | | | 76 | | | | 7,842 | |
The accompanying notes are an integral part of the financial statements.
98
| Schedule of Investments | April 30, 2024 (Unaudited) |
| Global X S&P Catholic Values Developed ex-US ETF |
| | | Shares | | | Value | |
| PREFERRED STOCK — continued | | | | | | | | |
| Consumer Discretionary — continued | | | | | | | | |
| Dr Ing hc F Porsche (A) | | | 132 | | | $ | 11,814 | |
| Volkswagen (A) | | | 249 | | | | 30,658 | |
| | | | | | | | 50,314 | |
| Consumer Staples — 0.1% | | | | | | | | |
| Henkel & KGaA (A) | | | 336 | | | | 26,751 | |
| TOTAL GERMANY | | | | | | | 77,065 | |
TOTAL PREFERRED STOCK
(Cost $88,775) | | | | | | | 77,065 | |
TOTAL INVESTMENTS — 99.5%
(Cost $15,677,877) | | | | | | $ | 17,597,725 | |
Percentages are based on Net Assets of $17,677,877.
| * | Non-income producing security. |
| ‡ | Real Estate Investment Trust |
| (A) | There is currently no stated interest rate. |
As of April 30, 2024, all of the Fund’s investments were considered Level 1, in accordance with authoritative guidance on fair value measurements and disclosure under U.S. GAAP.
See “Glossary” for abbreviations.
The accompanying notes are an integral part of the financial statements.
99
| Schedule of Investments | April 30, 2024 (Unaudited) |
Global X NASDAQ 100® Tail Risk ETF
Sector Weightings †:
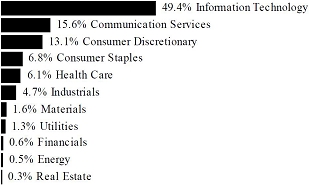
† Sector weightings percentages are based on the total market value of investments. Total investments do not include derivatives such as options, futures contracts, forward contracts, and swap contracts, if applicable.
| | | Shares | | | Value | |
| COMMON STOCK — 99.2% | | | | | | | | |
| BRAZIL — 0.5% | | | | | | | | |
| Consumer Discretionary — 0.5% | | | | | | | | |
| MercadoLibre * | | | 9 | | | $ | 13,128 | |
| | | | | | | | | |
| CHINA — 1.1% | | | | | | | | |
| Consumer Discretionary — 0.6% | | | | | | | | |
| PDD Holdings ADR * | | | 120 | | | | 15,021 | |
| | | | | | | | | |
| Information Technology — 0.5% | | | | | | | | |
| NXP Semiconductors | | | 46 | | | | 11,785 | |
| | | | | | | | | |
| TOTAL CHINA | | | | | | | 26,806 | |
| NETHERLANDS — 0.6% | | | | | | | | |
| Information Technology — 0.6% | | | | | | | | |
| ASML Holding | | | 16 | | | | 13,960 | |
| | | | | | | | | |
| UNITED KINGDOM — 0.6% | | | | | | | | |
| Consumer Staples — 0.3% | | | | | | | | |
| Coca-Cola Europacific Partners PLC | | | 83 | | | | 5,978 | |
The accompanying notes are an integral part of the financial statements.
100
| Schedule of Investments | April 30, 2024 (Unaudited) |
Global X NASDAQ 100® Tail Risk ETF
| | | Shares | | | Value | |
| COMMON STOCK — continued | | | | | | | | |
| Health Care — 0.3% | | | | | | | | |
| AstraZeneca PLC ADR | | | 105 | | | $ | 7,967 | |
| | | | | | | | | |
| TOTAL UNITED KINGDOM | | | | | | | 13,945 | |
| UNITED STATES — 96.4% | | | | | | | | |
| Communication Services — 15.5% | | | | | | | | |
| Alphabet, Cl A * | | | 414 | | | | 67,391 | |
| Alphabet, Cl C * | | | 398 | | | | 65,527 | |
| Charter Communications, Cl A * | | | 26 | | | | 6,654 | |
| Comcast, Cl A | | | 718 | | | | 27,363 | |
| Electronic Arts | | | 48 | | | | 6,087 | |
| Meta Platforms, Cl A | | | 245 | | | | 105,392 | |
| Netflix * | | | 79 | | | | 43,501 | |
| Sirius XM Holdings | | | 703 | | | | 2,067 | |
| Take-Two Interactive Software * | | | 30 | | | | 4,284 | |
| T-Mobile US | | | 215 | | | | 35,296 | |
| Trade Desk, Cl A * | | | 82 | | | | 6,794 | |
| Warner Bros Discovery * | | | 444 | | | | 3,268 | |
| | | | | | | | 373,624 | |
| Consumer Discretionary — 11.9% | | | | | | | | |
| Airbnb, Cl A * | | | 79 | | | | 12,527 | |
| Amazon.com * | | | 729 | | | | 127,575 | |
| Booking Holdings | | | 6 | | | | 20,712 | |
| DoorDash, Cl A * | | | 68 | | | | 8,790 | |
| Lululemon Athletica * | | | 21 | | | | 7,573 | |
| Marriott International, Cl A | | | 53 | | | | 12,515 | |
| O’Reilly Automotive * | | | 10 | | | | 10,133 | |
| Ross Stores | | | 61 | | | | 7,902 | |
| Starbucks | | | 205 | | | | 18,140 | |
| Tesla * | | | 339 | | | | 62,132 | |
| | | | | | | | 287,999 | |
| Consumer Staples — 6.4% | | | | | | | | |
| Costco Wholesale | | | 81 | | | | 58,555 | |
| Dollar Tree * | | | 39 | | | | 4,612 | |
| Keurig Dr Pepper | | | 250 | | | | 8,425 | |
| Kraft Heinz | | | 218 | | | | 8,417 | |
| Mondelez International, Cl A | | | 244 | | | | 17,553 | |
| Monster Beverage * | | | 188 | | | | 10,049 | |
The accompanying notes are an integral part of the financial statements.
101
| Schedule of Investments | April 30, 2024 (Unaudited) |
Global X NASDAQ 100® Tail Risk ETF
| | | Shares | | | Value | |
| COMMON STOCK — continued | | | | | | | | |
| Consumer Staples — continued | | | | | | | | |
| PepsiCo | | | 249 | | | $ | 43,802 | |
| Walgreens Boots Alliance | | | 158 | | | | 2,801 | |
| | | | | | | | 154,214 | |
| Energy — 0.5% | | | | | | | | |
| Baker Hughes, Cl A | | | 180 | | | | 5,872 | |
| Diamondback Energy | | | 33 | | | | 6,637 | |
| | | | | | | | 12,509 | |
| Financials — 0.5% | | | | | | | | |
| PayPal Holdings * | | | 194 | | | | 13,176 | |
| | | | | | | | | |
| Health Care — 5.8% | | | | | | | | |
| Amgen | | | 97 | | | | 26,572 | |
| Biogen * | | | 26 | | | | 5,585 | |
| Dexcom * | | | 70 | | | | 8,917 | |
| GE HealthCare Technologies | | | 82 | | | | 6,252 | |
| Gilead Sciences | | | 225 | | | | 14,670 | |
| IDEXX Laboratories * | | | 15 | | | | 7,392 | |
| Illumina * | | | 28 | | | | 3,445 | |
| Intuitive Surgical * | | | 64 | | | | 23,720 | |
| Moderna * | | | 69 | | | | 7,611 | |
| Regeneron Pharmaceuticals * | | | 19 | | | | 16,923 | |
| Vertex Pharmaceuticals * | | | 47 | | | | 18,462 | |
| | | | | | | | 139,549 | |
| Industrials — 4.6% | | | | | | | | |
| Automatic Data Processing | | | 74 | | | | 17,900 | |
| Cintas | | | 18 | | | | 11,850 | |
| Copart * | | | 173 | | | | 9,395 | |
| CSX | | | 354 | | | | 11,760 | |
| Fastenal | | | 104 | | | | 7,066 | |
| Honeywell International | | | 118 | | | | 22,742 | |
| Old Dominion Freight Line | | | 38 | | | | 6,905 | |
| PACCAR | | | 95 | | | | 10,080 | |
| Paychex | | | 65 | | | | 7,723 | |
| Verisk Analytics, Cl A | | | 26 | | | | 5,667 | |
| | | | | | | | 111,088 | |
The accompanying notes are an integral part of the financial statements.
102
| Schedule of Investments | April 30, 2024 (Unaudited) |
Global X NASDAQ 100® Tail Risk ETF
| | | Shares | | | Value | |
| COMMON STOCK — continued | | | | | | | | |
| Information Technology — 48.0% | | | | | | | | |
| Adobe * | | | 82 | | | $ | 37,952 | |
| Advanced Micro Devices * | | | 293 | | | | 46,405 | |
| Analog Devices | | | 90 | | | | 18,055 | |
| ANSYS * | | | 16 | | | | 5,198 | |
| Apple | | | 1,085 | | | | 184,808 | |
| Applied Materials | | | 151 | | | | 29,996 | |
| Atlassian, Cl A * | | | 28 | | | | 4,824 | |
| Autodesk * | | | 38 | | | | 8,088 | |
| Broadcom | | | 84 | | | | 109,223 | |
| Cadence Design Systems * | | | 49 | | | | 13,506 | |
| CDW | | | 24 | | | | 5,805 | |
| Cisco Systems | | | 734 | | | | 34,483 | |
| Cognizant Technology Solutions, Cl A | | | 91 | | | | 5,977 | |
| Crowdstrike Holdings, Cl A * | | | 42 | | | | 12,287 | |
| Datadog, Cl A * | | | 55 | | | | 6,902 | |
| Fortinet * | | | 137 | | | | 8,656 | |
| GLOBALFOUNDRIES * | | | 101 | | | | 4,937 | |
| Intel | | | 766 | | | | 23,340 | |
| Intuit | | | 51 | | | | 31,907 | |
| KLA | | | 25 | | | | 17,232 | |
| Lam Research | | | 24 | | | | 21,466 | |
| Marvell Technology | | | 156 | | | | 10,282 | |
| Microchip Technology | | | 98 | | | | 9,014 | |
| Micron Technology | | | 200 | | | | 22,592 | |
| Microsoft | | | 522 | | | | 203,230 | |
| MongoDB, Cl A * | | | 13 | | | | 4,747 | |
| NVIDIA | | | 176 | | | | 152,068 | |
| ON Semiconductor * | | | 77 | | | | 5,402 | |
| Palo Alto Networks * | | | 59 | | | | 17,162 | |
| QUALCOMM | | | 203 | | | | 33,668 | |
| Roper Technologies | | | 19 | | | | 9,718 | |
| Synopsys * | | | 28 | | | | 14,857 | |
| Texas Instruments | | | 164 | | | | 28,933 | |
| Workday, Cl A * | | | 38 | | | | 9,300 | |
| Zscaler * | | | 27 | | | | 4,669 | |
| | | | | | | | 1,156,689 | |
The accompanying notes are an integral part of the financial statements.
103
| Schedule of Investments | April 30, 2024 (Unaudited) |
Global X NASDAQ 100® Tail Risk ETF
| | | Shares | | | Value | |
| COMMON STOCK — continued | | | | | | | | |
| Materials — 1.6% | | | | | | | | |
| Linde PLC | | | 88 | | | $ | 38,804 | |
| | | | | | | | | |
| Real Estate — 0.3% | | | | | | | | |
| CoStar Group * | | | 74 | | | | 6,773 | |
| | | | | | | | | |
| Utilities — 1.3% | | | | | | | | |
| American Electric Power | | | 95 | | | | 8,173 | |
| Constellation Energy | | | 57 | | | | 10,599 | |
| Exelon | | | 180 | | | | 6,764 | |
| Xcel Energy | | | 101 | | | | 5,427 | |
| | | | | | | | 30,963 | |
| TOTAL UNITED STATES | | | | | | | 2,325,388 | |
TOTAL COMMON STOCK
(Cost $2,309,389) | | | | | | | 2,393,227 | |
| | | | | | | | | |
PURCHASED OPTIONS — 0.6%
(Cost $26,131) | | | | | | | 14,000 | |
| | | | | | | | | |
TOTAL INVESTMENTS — 99.8%
(Cost $2,335,520) | | | | | | $ | 2,407,227 | |
Percentages are based on Net Assets of $2,411,019.
A list of the exchange traded option contracts held by the Fund at April 30, 2024, is as follows:
| Description | | Number of
Contracts | | Notional
Amount | | | Exercise
Price | | | Expiration
Date | | Value | |
| PURCHASED OPTIONS — 0.6% | | | | | | | | | | | | | |
| Put Options | | | | | | | | | | | | | |
| Nasdaq-100® Reduced-Value Index | | 7 | | $ | 2,441,698 | | | $ | 3,220 | | | 06/21/24 | | $ | 14,000 | |
| * | Non-income producing security. |
The accompanying notes are an integral part of the financial statements.
104
| Schedule of Investments | April 30, 2024 (Unaudited) |
Global X NASDAQ 100® Tail Risk ETF
As of April 30, 2024, all of the Fund’s investments were considered Level 1, in accordance with authoritative guidance on fair value measurements and disclosure under U.S. GAAP.
See “Glossary” for abbreviations.
The accompanying notes are an integral part of the financial statements.
105
| Schedule of Investments | April 30, 2024 (Unaudited) |
Global X NASDAQ 100® Collar 95-110 ETF
Sector Weightings †:
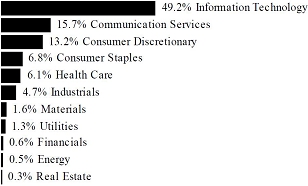
† Sector weightings percentages are based on the total market value of investments. Total investments do not include derivatives such as options, futures contracts, forward contracts, and swap contracts, if applicable.
| | | Shares | | | Value | |
| COMMON STOCK — 98.1% | | | | | | | | |
| BRAZIL — 0.6% | | | | | | | | |
| Consumer Discretionary — 0.6% | | | | | | | | |
| MercadoLibre * | | | 6 | | | $ | 8,752 | |
| | | | | | | | | |
| CHINA — 1.1% | | | | | | | | |
| Consumer Discretionary — 0.6% | | | | | | | | |
| PDD Holdings ADR * | | | 81 | | | | 10,140 | |
| | | | | | | | | |
| Information Technology — 0.5% | | | | | | | | |
| NXP Semiconductors | | | 32 | | | | 8,198 | |
| | | | | | | | | |
| TOTAL CHINA | | | | | | | 18,338 | |
| NETHERLANDS — 0.5% | | | | | | | | |
| Information Technology — 0.5% | | | | | | | | |
| ASML Holding | | | 10 | | | | 8,725 | |
| | | | | | | | | |
| UNITED KINGDOM — 0.6% | | | | | | | | |
| Consumer Staples — 0.3% | | | | | | | | |
| Coca-Cola Europacific Partners PLC | | | 60 | | | | 4,321 | |
The accompanying notes are an integral part of the financial statements.
106
| Schedule of Investments | April 30, 2024 (Unaudited) |
Global X NASDAQ 100® Collar 95-110 ETF
| | | Shares | | | Value | |
| COMMON STOCK — continued | | | | | | | | |
| Health Care — 0.3% | | | | | | | | |
| AstraZeneca PLC ADR | | | 69 | | | $ | 5,236 | |
| | | | | | | | | |
| TOTAL UNITED KINGDOM | | | | | | | 9,557 | |
| UNITED STATES — 95.3% | | | | | | | | |
| Communication Services — 15.3% | | | | | | | | |
| Alphabet, Cl A * | | | 279 | | | | 45,416 | |
| Alphabet, Cl C * | | | 267 | | | | 43,959 | |
| Charter Communications, Cl A * | | | 19 | | | | 4,863 | |
| Comcast, Cl A | | | 487 | | | | 18,559 | |
| Electronic Arts | | | 35 | | | | 4,439 | |
| Meta Platforms, Cl A | | | 166 | | | | 71,408 | |
| Netflix * | | | 53 | | | | 29,184 | |
| Sirius XM Holdings | | | 470 | | | | 1,382 | |
| Take-Two Interactive Software * | | | 20 | | | | 2,856 | |
| T-Mobile US | | | 144 | | | | 23,640 | |
| Trade Desk, Cl A * | | | 54 | | | | 4,474 | |
| Warner Bros Discovery * | | | 295 | | | | 2,171 | |
| | | | | | | | 252,351 | |
| Consumer Discretionary — 11.8% | | | | | | | | |
| Airbnb, Cl A * | | | 53 | | | | 8,404 | |
| Amazon.com * | | | 489 | | | | 85,575 | |
| Booking Holdings | | | 4 | | | | 13,808 | |
| DoorDash, Cl A * | | | 47 | | | | 6,075 | |
| Lululemon Athletica * | | | 16 | | | | 5,770 | |
| Marriott International, Cl A | | | 35 | | | | 8,264 | |
| O’Reilly Automotive * | | | 7 | | | | 7,093 | |
| Ross Stores | | | 41 | | | | 5,312 | |
| Starbucks | | | 139 | | | | 12,300 | |
| Tesla * | | | 227 | | | | 41,605 | |
| | | | | | | | 194,206 | |
| Consumer Staples — 6.3% | | | | | | | | |
| Costco Wholesale | | | 54 | | | | 39,037 | |
| Dollar Tree * | | | 29 | | | | 3,429 | |
| Keurig Dr Pepper | | | 173 | | | | 5,830 | |
| Kraft Heinz | | | 149 | | | | 5,753 | |
| Mondelez International, Cl A | | | 164 | | | | 11,798 | |
| Monster Beverage * | | | 129 | | | | 6,895 | |
The accompanying notes are an integral part of the financial statements.
107
| Schedule of Investments | April 30, 2024 (Unaudited) |
Global X NASDAQ 100® Collar 95-110 ETF
| | | Shares | | | Value | |
| COMMON STOCK — continued | | | | | | | | |
| Consumer Staples — continued | | | | | | | | |
| PepsiCo | | | 169 | | | $ | 29,729 | |
| Walgreens Boots Alliance | | | 104 | | | | 1,844 | |
| | | | | | | | 104,315 | |
| Energy — 0.5% | | | | | | | | |
| Baker Hughes, Cl A | | | 123 | | | | 4,012 | |
| Diamondback Energy | | | 20 | | | | 4,023 | |
| | | | | | | | 8,035 | |
| Financials — 0.6% | | | | | | | | |
| PayPal Holdings * | | | 134 | | | | 9,101 | |
| | | | | | | | | |
| Health Care — 5.7% | | | | | | | | |
| Amgen | | | 66 | | | | 18,080 | |
| Biogen * | | | 19 | | | | 4,082 | |
| Dexcom * | | | 47 | | | | 5,987 | |
| GE HealthCare Technologies | | | 56 | | | | 4,269 | |
| Gilead Sciences | | | 151 | | | | 9,845 | |
| IDEXX Laboratories * | | | 9 | | | | 4,435 | |
| Illumina * | | | 20 | | | | 2,461 | |
| Intuitive Surgical * | | | 44 | | | | 16,307 | |
| Moderna * | | | 45 | | | | 4,964 | |
| Regeneron Pharmaceuticals * | | | 13 | | | | 11,579 | |
| Vertex Pharmaceuticals * | | | 31 | | | | 12,177 | |
| | | | | | | | 94,186 | |
| Industrials — 4.6% | | | | | | | | |
| Automatic Data Processing | | | 50 | | | | 12,094 | |
| Cintas | | | 12 | | | | 7,900 | |
| Copart * | | | 115 | | | | 6,246 | |
| CSX | | | 244 | | | | 8,106 | |
| Fastenal | | | 68 | | | | 4,620 | |
| Honeywell International | | | 81 | | | | 15,611 | |
| Old Dominion Freight Line | | | 28 | | | | 5,088 | |
| PACCAR | | | 63 | | | | 6,685 | |
| Paychex | | | 45 | | | | 5,346 | |
| Verisk Analytics, Cl A | | | 17 | | | | 3,705 | |
| | | | | | | | 75,401 | |
The accompanying notes are an integral part of the financial statements.
108
| Schedule of Investments | April 30, 2024 (Unaudited) |
Global X NASDAQ 100® Collar 95-110 ETF
| | | Shares | | | Value | |
| COMMON STOCK — continued | | | | | | | | |
| Information Technology — 47.3% | | | | | | | | |
| Adobe * | | | 55 | | | $ | 25,456 | |
| Advanced Micro Devices * | | | 199 | | | | 31,518 | |
| Analog Devices | | | 61 | | | | 12,237 | |
| ANSYS * | | | 10 | | | | 3,249 | |
| Apple | | | 727 | | | | 123,830 | |
| Applied Materials | | | 102 | | | | 20,262 | |
| Atlassian, Cl A * | | | 19 | | | | 3,274 | |
| Autodesk * | | | 27 | | | | 5,747 | |
| Broadcom | | | 56 | | | | 72,815 | |
| Cadence Design Systems * | | | 33 | | | | 9,096 | |
| CDW | | | 17 | | | | 4,112 | |
| Cisco Systems | | | 497 | | | | 23,349 | |
| Cognizant Technology Solutions, Cl A | | | 63 | | | | 4,138 | |
| Crowdstrike Holdings, Cl A * | | | 28 | | | | 8,191 | |
| Datadog, Cl A * | | | 40 | | | | 5,020 | |
| Fortinet * | | | 96 | | | | 6,065 | |
| GLOBALFOUNDRIES * | | | 67 | | | | 3,275 | |
| Intel | | | 518 | | | | 15,783 | |
| Intuit | | | 34 | | | | 21,271 | |
| KLA | | | 16 | | | | 11,029 | |
| Lam Research | | | 16 | | | | 14,311 | |
| Marvell Technology | | | 104 | | | | 6,855 | |
| Microchip Technology | | | 67 | | | | 6,163 | |
| Micron Technology | | | 134 | | | | 15,137 | |
| Microsoft | | | 350 | | | | 136,265 | |
| MongoDB, Cl A * | | | 10 | | | | 3,652 | |
| NVIDIA | | | 118 | | | | 101,954 | |
| ON Semiconductor * | | | 52 | | | | 3,648 | |
| Palo Alto Networks * | | | 38 | | | | 11,054 | |
| QUALCOMM | | | 137 | | | | 22,721 | |
| Roper Technologies | | | 14 | | | | 7,160 | |
| Synopsys * | | | 19 | | | | 10,081 | |
| Texas Instruments | | | 110 | | | | 19,406 | |
| Workday, Cl A * | | | 26 | | | | 6,363 | |
| Zscaler * | | | 19 | | | | 3,286 | |
| | | | | | | | 777,773 | |
The accompanying notes are an integral part of the financial statements.
109
| Schedule of Investments | April 30, 2024 (Unaudited) |
Global X NASDAQ 100® Collar 95-110 ETF
| | | Shares | | | Value | |
| COMMON STOCK — continued | | | | | | | | |
| Materials — 1.6% | | | | | | | | |
| Linde PLC | | | 59 | | | $ | 26,017 | |
| | | | | | | | | |
| Real Estate — 0.3% | | | | | | | | |
| CoStar Group * | | | 51 | | | | 4,668 | |
| | | | | | | | | |
| Utilities — 1.3% | | | | | | | | |
| American Electric Power | | | 67 | | | | 5,764 | |
| Constellation Energy | | | 38 | | | | 7,066 | |
| Exelon | | | 122 | | | | 4,585 | |
| Xcel Energy | | | 68 | | | | 3,653 | |
| | | | | | | | 21,068 | |
| TOTAL UNITED STATES | | | | | | | 1,567,121 | |
TOTAL COMMON STOCK
(Cost $1,491,065) | | | | | | | 1,612,493 | |
| | | | | | | | | |
PURCHASED OPTIONS — 1.3%
(Cost $27,292) | | | | | | | 22,400 | |
| | | | | | | | | |
TOTAL INVESTMENTS — 99.4%
(Cost $1,518,357) | | | | | | $ | 1,634,893 | |
| | | | | | | | | |
WRITTEN OPTIONS— (0.0)%
(Premiums Received $(2,712)) | | | | | | $ | (529 | ) |
Percentages are based on Net Assets of $1,644,162.
The accompanying notes are an integral part of the financial statements.
110
| Schedule of Investments | April 30, 2024 (Unaudited) |
Global X NASDAQ 100® Collar 95-110 ETF
A list of the exchange traded option contracts held by the Fund at April 30, 2024, is as follows:
| Description | | Number of
Contracts | | Notional
Amount | | | Exercise
Price | | | Expiration
Date | | Value | |
| PURCHASED OPTIONS — 1.3% | | | | | | | | | | | | | | | | |
| Put Options | | | | | | | | | | | | | | | | |
| Nasdaq-100® Reduced-Value Index | | 4 | | $ | 1,395,256 | | | $ | 3,400 | | | 06/21/24 | | $ | 22,400 | |
| | | | | | | | | | | | | | | | | |
| WRITTEN OPTIONS — 0.0% | | | | | | | | | | | | | | | | |
| Call Options | | | | | | | | | | | | | | | | |
| Nasdaq-100® Reduced-Value Index | | (4) | | $ | (1,395,256) | | | $ | 3,900 | | | 06/21/24 | | $ | (529) | |
| * | Non-income producing security. |
The following is a summary of the level of inputs used as of April 30, 2024, in valuing the Fund’s investments and other financial instruments carried at value:
| Investments in Securities | | Level 1 | | | Level 2 | | | Level 3 | | | Total | |
| Common Stock | | $ | 1,612,493 | | | $ | — | | | $ | — | | | $ | 1,612,493 | |
| Purchased Options | | | 22,400 | | | | | | | | — | | | | 22,400 | |
| Total Investments in Securities | | $ | 1,634,893 | | | $ | — | | | $ | — | | | $ | 1,634,893 | |
| | | | | | | | | | | | | | | | | |
| Other Financial Instruments | | Level 1 | | | Level 2 | | | Level 3 | | | Total | |
| Written Options | | $ | (529) | | | $ | — | | | $ | — | | | $ | (529) | |
| Total Other Financial Instruments | | $ | (529) | | | $ | — | | | $ | — | | | $ | (529) | |
Amounts designated as “—” are $0 or have been rounded to $0.
See “Glossary” for abbreviations.
The accompanying notes are an integral part of the financial statements.
111
| Schedule of Investments | April 30, 2024 (Unaudited) |
Global X S&P 500® Tail Risk ETF
Sector Weightings †:
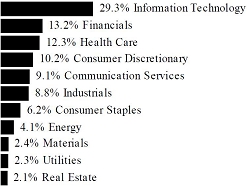
† Sector weightings percentages are based on the total market value of investments. Total investments do not include derivatives such as options, futures contracts, forward contracts, and swap contracts, if applicable.
| | | Shares | | | Value | |
| COMMON STOCK — 99.6% | | | | | | | | |
| CHINA — 0.2% | | | | | | | | |
| Information Technology — 0.2% | | | | | | | | |
| NXP Semiconductors | | | 19 | | | $ | 4,868 | |
| | | | | | | | | |
| UNITED STATES — 99.4% | | | | | | | | |
| Communication Services — 9.1% | | | | | | | | |
| Alphabet, Cl A * | | | 437 | | | | 71,135 | |
| Alphabet, Cl C * | | | 366 | | | | 60,258 | |
| AT&T | | | 530 | | | | 8,952 | |
| Charter Communications, Cl A * | | | 8 | | | | 2,047 | |
| Comcast, Cl A | | | 298 | | | | 11,357 | |
| Electronic Arts | | | 19 | | | | 2,410 | |
| Fox, Cl A | | | 21 | | | | 651 | |
| Fox, Cl B | | | 8 | | | | 229 | |
| Interpublic Group | | | 27 | | | | 822 | |
| Live Nation Entertainment * | | | 10 | | | | 889 | |
| Match Group * | | | 20 | | | | 616 | |
| Meta Platforms, Cl A | | | 163 | | | | 70,118 | |
| Netflix * | | | 32 | | | | 17,620 | |
| News, Cl A | | | 24 | | | | 571 | |
| News, Cl B | | | 4 | | | | 98 | |
The accompanying notes are an integral part of the financial statements.
112
| Schedule of Investments | April 30, 2024 (Unaudited) |
Global X S&P 500® Tail Risk ETF
| | | Shares | | | Value | |
| COMMON STOCK — continued | | | | | | | | |
| Communication Services — continued | | | | | | | | |
| Omnicom Group | | | 14 | | | $ | 1,300 | |
| Paramount Global, Cl B | | | 35 | | | | 399 | |
| Take-Two Interactive Software * | | | 12 | | | | 1,714 | |
| T-Mobile US | | | 39 | | | | 6,403 | |
| Verizon Communications | | | 312 | | | | 12,321 | |
| Walt Disney | | | 136 | | | | 15,110 | |
| Warner Bros Discovery * | | | 164 | | | | 1,207 | |
| | | | | | | | 286,227 | |
| Consumer Discretionary — 10.2% | | | | | | | | |
| Airbnb, Cl A * | | | 32 | | | | 5,074 | |
| Amazon.com * | | | 679 | | | | 118,825 | |
| Aptiv PLC * | | | 20 | | | | 1,420 | |
| AutoZone * | | | 1 | | | | 2,956 | |
| Bath & Body Works | | | 17 | | | | 772 | |
| Best Buy | | | 15 | | | | 1,105 | |
| Booking Holdings | | | 2 | | | | 6,904 | |
| BorgWarner | | | 22 | | | | 721 | |
| Caesars Entertainment * | | | 16 | | | | 573 | |
| CarMax * | | | 11 | | | | 748 | |
| Carnival * | | | 77 | | | | 1,141 | |
| Chipotle Mexican Grill, Cl A * | | | 2 | | | | 6,319 | |
| Darden Restaurants | | | 9 | | | | 1,381 | |
| Deckers Outdoor * | | | 2 | | | | 1,637 | |
| Domino’s Pizza | | | 2 | | | | 1,059 | |
| DR Horton | | | 22 | | | | 3,135 | |
| eBay | | | 43 | | | | 2,216 | |
| Etsy * | | | 11 | | | | 755 | |
| Expedia Group * | | | 11 | | | | 1,481 | |
| Ford Motor | | | 289 | | | | 3,511 | |
| Garmin | | | 11 | | | | 1,589 | |
| General Motors | | | 86 | | | | 3,830 | |
| Genuine Parts | | | 10 | | | | 1,572 | |
| Hasbro | | | 8 | | | | 490 | |
| Hilton Worldwide Holdings | | | 20 | | | | 3,946 | |
| Home Depot | | | 74 | | | | 24,732 | |
| Las Vegas Sands | | | 29 | | | | 1,286 | |
| Lennar, Cl A | | | 18 | | | | 2,729 | |
| LKQ | | | 22 | | | | 949 | |
The accompanying notes are an integral part of the financial statements.
113
| Schedule of Investments | April 30, 2024 (Unaudited) |
Global X S&P 500® Tail Risk ETF
| | | Shares | | | Value | |
| COMMON STOCK — continued | | | | | | | | |
| Consumer Discretionary — continued | | | | | | | | |
| Lowe’s | | | 43 | | | $ | 9,804 | |
| Lululemon Athletica * | | | 9 | | | | 3,245 | |
| Marriott International, Cl A | | | 19 | | | | 4,486 | |
| McDonald’s | | | 54 | | | | 14,744 | |
| MGM Resorts International * | | | 23 | | | | 907 | |
| Mohawk Industries * | | | 4 | | | | 461 | |
| NIKE, Cl B | | | 90 | | | | 8,303 | |
| Norwegian Cruise Line Holdings * | | | 27 | | | | 511 | |
| O’Reilly Automotive * | | | 4 | | | | 4,053 | |
| Pool | | | 3 | | | | 1,088 | |
| PulteGroup | | | 16 | | | | 1,783 | |
| Ralph Lauren, Cl A | | | 3 | | | | 491 | |
| Ross Stores | | | 26 | | | | 3,368 | |
| Royal Caribbean Cruises * | | | 19 | | | | 2,653 | |
| Starbucks | | | 84 | | | | 7,433 | |
| Tapestry | | | 16 | | | | 639 | |
| Tesla * | | | 207 | | | | 37,939 | |
| TJX | | | 85 | | | | 7,998 | |
| Tractor Supply | | | 8 | | | | 2,185 | |
| Ulta Beauty * | | | 3 | | | | 1,215 | |
| Wynn Resorts | | | 7 | | | | 642 | |
| Yum! Brands | | | 21 | | | | 2,966 | |
| | | | | | | | 319,770 | |
| Consumer Staples — 6.2% | | | | | | | | |
| Altria Group | | | 131 | | | | 5,739 | |
| Archer-Daniels-Midland | | | 40 | | | | 2,346 | |
| Brown-Forman, Cl B | | | 15 | | | | 718 | |
| Bunge Global | | | 12 | | | | 1,221 | |
| Campbell Soup | | | 15 | | | | 686 | |
| Church & Dwight | | | 20 | | | | 2,158 | |
| Clorox | | | 9 | | | | 1,331 | |
| Coca-Cola | | | 289 | | | | 17,851 | |
| Colgate-Palmolive | | | 63 | | | | 5,791 | |
| Conagra Brands | | | 33 | | | | 1,016 | |
| Constellation Brands, Cl A | | | 12 | | | | 3,041 | |
| Costco Wholesale | | | 33 | | | | 23,856 | |
| Dollar General | | | 15 | | | | 2,088 | |
| Dollar Tree * | | | 15 | | | | 1,774 | |
The accompanying notes are an integral part of the financial statements.
114
| Schedule of Investments | April 30, 2024 (Unaudited) |
Global X S&P 500® Tail Risk ETF
| | | Shares | | | Value | |
| COMMON STOCK — continued | | | | | | | | |
| Consumer Staples — continued | | | | | | | | |
| Estee Lauder, Cl A | | | 17 | | | $ | 2,494 | |
| General Mills | | | 44 | | | | 3,100 | |
| Hershey | | | 11 | | | | 2,133 | |
| Hormel Foods | | | 21 | | | | 747 | |
| J M Smucker | | | 7 | | | | 804 | |
| Kellanova | | | 22 | | | | 1,273 | |
| Kenvue | | | 130 | | | | 2,447 | |
| Keurig Dr Pepper | | | 73 | | | | 2,460 | |
| Kimberly-Clark | | | 26 | | | | 3,550 | |
| Kraft Heinz | | | 61 | | | | 2,355 | |
| Kroger | | | 50 | | | | 2,769 | |
| Lamb Weston Holdings | | | 10 | | | | 833 | |
| McCormick | | | 18 | | | | 1,369 | |
| Molson Coors Beverage, Cl B | | | 14 | | | | 802 | |
| Mondelez International, Cl A | | | 100 | | | | 7,194 | |
| Monster Beverage * | | | 58 | | | | 3,100 | |
| PepsiCo | | | 102 | | | | 17,943 | |
| Philip Morris International | | | 115 | | | | 10,918 | |
| Procter & Gamble | | | 175 | | | | 28,560 | |
| Sysco | | | 39 | | | | 2,898 | |
| Target | | | 35 | | | | 5,634 | |
| Tyson Foods, Cl A | | | 21 | | | | 1,274 | |
| Walgreens Boots Alliance | | | 53 | | | | 940 | |
| Walmart | | | 320 | | | | 18,992 | |
| | | | | | | | 194,205 | |
| Energy — 4.1% | | | | | | | | |
| APA | | | 23 | | | | 723 | |
| Baker Hughes, Cl A | | | 75 | | | | 2,446 | |
| Chevron | | | 129 | | | | 20,804 | |
| ConocoPhillips | | | 87 | | | | 10,929 | |
| Coterra Energy | | | 53 | | | | 1,450 | |
| Devon Energy | | | 50 | | | | 2,559 | |
| Diamondback Energy | | | 13 | | | | 2,615 | |
| EOG Resources | | | 44 | | | | 5,814 | |
| EQT | | | 28 | | | | 1,123 | |
| Exxon Mobil | | | 295 | | | | 34,890 | |
| Halliburton | | | 66 | | | | 2,473 | |
| Hess | | | 21 | | | | 3,307 | |
The accompanying notes are an integral part of the financial statements.
115
| Schedule of Investments | April 30, 2024 (Unaudited) |
Global X S&P 500® Tail Risk ETF
| | | Shares | | | Value | |
| COMMON STOCK — continued | | | | | | | | |
| Energy — continued | | | | | | | | |
| Kinder Morgan | | | 143 | | | $ | 2,614 | |
| Marathon Oil | | | 47 | | | | 1,262 | |
| Marathon Petroleum | | | 27 | | | | 4,906 | |
| Occidental Petroleum | | | 49 | | | | 3,241 | |
| ONEOK | | | 44 | | | | 3,481 | |
| Phillips 66 | | | 32 | | | | 4,583 | |
| Pioneer Natural Resources | | | 17 | | | | 4,578 | |
| Schlumberger | | | 108 | | | | 5,128 | |
| Targa Resources | | | 18 | | | | 2,053 | |
| Valero Energy | | | 24 | | | | 3,837 | |
| Williams | | | 93 | | | | 3,567 | |
| | | | | | | | 128,383 | |
| Financials — 13.1% | | | | | | | | |
| Aflac | | | 42 | | | | 3,513 | |
| Allstate | | | 19 | | | | 3,231 | |
| American Express | | | 43 | | | | 10,063 | |
| American International Group | | | 52 | | | | 3,916 | |
| Ameriprise Financial | | | 8 | | | | 3,294 | |
| Aon PLC, Cl A | | | 15 | | | | 4,230 | |
| Arch Capital Group * | | | 29 | | | | 2,713 | |
| Arthur J Gallagher | | | 15 | | | | 3,520 | |
| Assurant | | | 4 | | | | 698 | |
| Bank of America | | | 511 | | | | 18,912 | |
| Bank of New York Mellon | | | 55 | | | | 3,107 | |
| Berkshire Hathaway, Cl B * | | | 135 | | | | 53,559 | |
| BlackRock, Cl A | | | 10 | | | | 7,546 | |
| Blackstone | | | 53 | | | | 6,180 | |
| Brown & Brown | | | 19 | | | | 1,549 | |
| Capital One Financial | | | 28 | | | | 4,016 | |
| Cboe Global Markets | | | 7 | | | | 1,268 | |
| Charles Schwab | | | 112 | | | | 8,282 | |
| Chubb | | | 30 | | | | 7,459 | |
| Cincinnati Financial | | | 12 | | | | 1,388 | |
| Citigroup | | | 142 | | | | 8,709 | |
| Citizens Financial Group | | | 33 | | | | 1,126 | |
| CME Group, Cl A | | | 26 | | | | 5,451 | |
| Comerica | | | 9 | | | | 452 | |
| Corpay * | | | 5 | | | | 1,511 | |
The accompanying notes are an integral part of the financial statements.
116
| Schedule of Investments | April 30, 2024 (Unaudited) |
Global X S&P 500® Tail Risk ETF
| | | Shares | | | Value | |
| COMMON STOCK — continued | | | | | | | | |
| Financials — continued | | | | | | | | |
| Discover Financial Services | | | 20 | | | $ | 2,535 | |
| Everest Group | | | 3 | | | | 1,099 | |
| FactSet Research Systems | | | 3 | | | | 1,251 | |
| Fidelity National Information Services | | | 45 | | | | 3,056 | |
| Fifth Third Bancorp | | | 50 | | | | 1,823 | |
| Fiserv * | | | 45 | | | | 6,870 | |
| Franklin Resources | | | 19 | | | | 434 | |
| Global Payments | | | 20 | | | | 2,455 | |
| Globe Life | | | 6 | | | | 457 | |
| Goldman Sachs Group | | | 24 | | | | 10,241 | |
| Hartford Financial Services Group | | | 22 | | | | 2,132 | |
| Huntington Bancshares | | | 106 | | | | 1,428 | |
| Intercontinental Exchange | | | 43 | | | | 5,537 | |
| Invesco | | | 35 | | | | 496 | |
| Jack Henry & Associates | | | 5 | | | | 813 | |
| JPMorgan Chase | | | 215 | | | | 41,224 | |
| KeyCorp | | | 68 | | | | 985 | |
| Loews | | | 14 | | | | 1,052 | |
| M&T Bank | | | 12 | | | | 1,733 | |
| MarketAxess Holdings | | | 3 | | | | 600 | |
| Marsh & McLennan | | | 37 | | | | 7,379 | |
| Mastercard, Cl A | | | 62 | | | | 27,974 | |
| MetLife | | | 45 | | | | 3,199 | |
| Moody’s | | | 12 | | | | 4,444 | |
| Morgan Stanley | | | 93 | | | | 8,448 | |
| MSCI, Cl A | | | 6 | | | | 2,795 | |
| Nasdaq | | | 28 | | | | 1,676 | |
| Northern Trust | | | 16 | | | | 1,318 | |
| PayPal Holdings * | | | 80 | | | | 5,434 | |
| PNC Financial Services Group | | | 30 | | | | 4,598 | |
| Principal Financial Group | | | 15 | | | | 1,187 | |
| Progressive | | | 44 | | | | 9,163 | |
| Prudential Financial | | | 26 | | | | 2,872 | |
| Raymond James Financial | | | 15 | | | | 1,830 | |
| Regions Financial | | | 69 | | | | 1,330 | |
| S&P Global | | | 24 | | | | 9,980 | |
| State Street | | | 22 | | | | 1,595 | |
| Synchrony Financial | | | 33 | | | | 1,451 | |
| T Rowe Price Group | | | 18 | | | | 1,972 | |
The accompanying notes are an integral part of the financial statements.
117
| Schedule of Investments | April 30, 2024 (Unaudited) |
Global X S&P 500® Tail Risk ETF
| | | Shares | | | Value | |
| COMMON STOCK — continued | | | | | | | | |
| Financials — continued | | | | | | | | |
| Travelers | | | 17 | | | $ | 3,607 | |
| Truist Financial | | | 100 | | | | 3,755 | |
| US Bancorp | | | 117 | | | | 4,754 | |
| Visa, Cl A | | | 118 | | | | 31,696 | |
| W R Berkley | | | 16 | | | | 1,232 | |
| Wells Fargo | | | 269 | | | | 15,957 | |
| Willis Towers Watson PLC | | | 7 | | | | 1,758 | |
| | | | | | | | 413,318 | |
| Health Care — 12.3% | | | | | | | | |
| Abbott Laboratories | | | 129 | | | | 13,670 | |
| AbbVie | | | 131 | | | | 21,306 | |
| Agilent Technologies | | | 22 | | | | 3,015 | |
| Align Technology * | | | 5 | | | | 1,412 | |
| Amgen | | | 40 | | | | 10,958 | |
| Baxter International | | | 38 | | | | 1,534 | |
| Becton Dickinson | | | 22 | | | | 5,161 | |
| Biogen * | | | 11 | | | | 2,363 | |
| Bio-Rad Laboratories, Cl A * | | | 1 | | | | 270 | |
| Bio-Techne | | | 11 | | | | 695 | |
| Boston Scientific * | | | 109 | | | | 7,834 | |
| Bristol-Myers Squibb | | | 151 | | | | 6,635 | |
| Cardinal Health | | | 19 | | | | 1,958 | |
| Catalent * | | | 13 | | | | 726 | |
| Cencora | | | 12 | | | | 2,869 | |
| Centene * | | | 43 | | | | 3,142 | |
| Charles River Laboratories International * | | | 4 | | | | 916 | |
| Cigna Group | | | 22 | | | | 7,855 | |
| Cooper | | | 15 | | | | 1,336 | |
| CVS Health | | | 95 | | | | 6,432 | |
| Danaher | | | 48 | | | | 11,838 | |
| DaVita * | | | 4 | | | | 556 | |
| Dexcom * | | | 29 | | | | 3,694 | |
| Edwards Lifesciences * | | | 47 | | | | 3,980 | |
| Elevance Health | | | 18 | | | | 9,514 | |
| Eli Lilly | | | 59 | | | | 46,085 | |
| GE HealthCare Technologies | | | 30 | | | | 2,287 | |
| Gilead Sciences | | | 95 | | | | 6,194 | |
| HCA Healthcare | | | 14 | | | | 4,337 | |
The accompanying notes are an integral part of the financial statements.
118
| Schedule of Investments | April 30, 2024 (Unaudited) |
Global X S&P 500® Tail Risk ETF
| | | Shares | | | Value | |
| COMMON STOCK — continued | | | | | | | | |
| Health Care — continued | | | | | | | | |
| Henry Schein * | | | 9 | | | $ | 624 | |
| Hologic * | | | 18 | | | | 1,364 | |
| Humana | | | 9 | | | | 2,719 | |
| IDEXX Laboratories * | | | 7 | | | | 3,449 | |
| Illumina * | | | 11 | | | | 1,354 | |
| Incyte * | | | 14 | | | | 729 | |
| Insulet * | | | 6 | | | | 1,032 | |
| Intuitive Surgical * | | | 26 | | | | 9,636 | |
| IQVIA Holdings * | | | 13 | | | | 3,013 | |
| Johnson & Johnson | | | 179 | | | | 25,882 | |
| Laboratory Corp of America Holdings | | | 6 | | | | 1,208 | |
| McKesson | | | 10 | | | | 5,372 | |
| Medtronic PLC | | | 99 | | | | 7,944 | |
| Merck | | | 188 | | | | 24,293 | |
| Mettler-Toledo International * | | | 2 | | | | 2,459 | |
| Moderna * | | | 24 | | | | 2,647 | |
| Molina Healthcare * | | | 4 | | | | 1,368 | |
| Pfizer | | | 424 | | | | 10,863 | |
| Quest Diagnostics | | | 8 | | | | 1,105 | |
| Regeneron Pharmaceuticals * | | | 8 | | | | 7,125 | |
| ResMed | | | 11 | | | | 2,354 | |
| Revvity | | | 9 | | | | 922 | |
| Solventum * | | | 9 | | | | 585 | |
| STERIS PLC | | | 8 | | | | 1,636 | |
| Stryker | | | 25 | | | | 8,413 | |
| Teleflex | | | 4 | | | | 835 | |
| Thermo Fisher Scientific | | | 29 | | | | 16,493 | |
| UnitedHealth Group | | | 68 | | | | 32,892 | |
| Universal Health Services, Cl B | | | 4 | | | | 682 | |
| Vertex Pharmaceuticals * | | | 19 | | | | 7,463 | |
| Viatris | | | 87 | | | | 1,007 | |
| Waters * | | | 4 | | | | 1,236 | |
| West Pharmaceutical Services | | | 5 | | | | 1,787 | |
| Zimmer Biomet Holdings | | | 15 | | | | 1,804 | |
| Zoetis, Cl A | | | 34 | | | | 5,414 | |
| | | | | | | | 386,281 | |
| Industrials — 8.8% | | | | | | | | |
| 3M | | | 41 | | | | 3,957 | |
The accompanying notes are an integral part of the financial statements.
119
| Schedule of Investments | April 30, 2024 (Unaudited) |
Global X S&P 500® Tail Risk ETF
| | | Shares | | | Value | |
| COMMON STOCK — continued | | | | | | | | |
| Industrials — continued | | | | | | | | |
| A O Smith | | | 8 | | | $ | 663 | |
| Allegion PLC | | | 5 | | | | 608 | |
| American Airlines Group * | | | 45 | | | | 608 | |
| AMETEK | | | 16 | | | | 2,795 | |
| Automatic Data Processing | | | 31 | | | | 7,499 | |
| Axon Enterprise * | | | 5 | | | | 1,568 | |
| Boeing * | | | 43 | | | | 7,217 | |
| Broadridge Financial Solutions | | | 8 | | | | 1,547 | |
| Builders FirstSource * | | | 9 | | | | 1,645 | |
| Carrier Global | | | 62 | | | | 3,812 | |
| Caterpillar | | | 37 | | | | 12,379 | |
| CH Robinson Worldwide | | | 8 | | | | 568 | |
| Cintas | | | 7 | | | | 4,608 | |
| Copart * | | | 64 | | | | 3,476 | |
| CSX | | | 152 | | | | 5,050 | |
| Cummins | | | 11 | | | | 3,107 | |
| Dayforce * | | | 11 | | | | 675 | |
| Deere | | | 20 | | | | 7,828 | |
| Delta Air Lines | | | 48 | | | | 2,403 | |
| Dover | | | 10 | | | | 1,793 | |
| Eaton PLC | | | 30 | | | | 9,548 | |
| Emerson Electric | | | 44 | | | | 4,742 | |
| Equifax | | | 8 | | | | 1,762 | |
| Expeditors International of Washington | | | 11 | | | | 1,224 | |
| Fastenal | | | 43 | | | | 2,921 | |
| FedEx | | | 17 | | | | 4,450 | |
| Fortive | | | 25 | | | | 1,882 | |
| GE Vernova * | | | 20 | | | | 3,074 | |
| Generac Holdings * | | | 5 | | | | 680 | |
| General Dynamics | | | 16 | | | | 4,594 | |
| General Electric | | | 81 | | | | 13,107 | |
| Honeywell International | | | 48 | | | | 9,251 | |
| Howmet Aerospace | | | 31 | | | | 2,069 | |
| Hubbell, Cl B | | | 4 | | | | 1,482 | |
| Huntington Ingalls Industries | | | 3 | | | | 831 | |
| IDEX | | | 6 | | | | 1,323 | |
| Illinois Tool Works | | | 20 | | | | 4,882 | |
| Ingersoll Rand | | | 29 | | | | 2,706 | |
| Jacobs Solutions | | | 9 | | | | 1,292 | |
The accompanying notes are an integral part of the financial statements.
120
| Schedule of Investments | April 30, 2024 (Unaudited) |
Global X S&P 500® Tail Risk ETF
| | | Shares | | | Value | |
| COMMON STOCK — continued | | | | | | | | |
| Industrials — continued | | | | | | | | |
| JB Hunt Transport Services | | | 7 | | | $ | 1,138 | |
| Johnson Controls International | | | 52 | | | | 3,384 | |
| L3Harris Technologies | | | 15 | | | | 3,211 | |
| Leidos Holdings | | | 10 | | | | 1,402 | |
| Lockheed Martin | | | 16 | | | | 7,439 | |
| Masco | | | 15 | | | | 1,027 | |
| Nordson | | | 3 | | | | 775 | |
| Norfolk Southern | | | 17 | | | | 3,916 | |
| Northrop Grumman | | | 10 | | | | 4,850 | |
| Old Dominion Freight Line | | | 14 | | | | 2,544 | |
| Otis Worldwide | | | 31 | | | | 2,827 | |
| PACCAR | | | 38 | | | | 4,032 | |
| Parker-Hannifin | | | 10 | | | | 5,449 | |
| Paychex | | | 24 | | | | 2,851 | |
| Paycom Software | | | 4 | | | | 752 | |
| Pentair PLC | | | 11 | | | | 870 | |
| Quanta Services | | | 10 | | | | 2,586 | |
| Republic Services, Cl A | | | 16 | | | | 3,067 | |
| Robert Half | | | 7 | | | | 484 | |
| Rockwell Automation | | | 8 | | | | 2,168 | |
| Rollins | | | 18 | | | | 802 | |
| RTX | | | 98 | | | | 9,949 | |
| Snap-On | | | 4 | | | | 1,072 | |
| Southwest Airlines | | | 44 | | | | 1,141 | |
| Stanley Black & Decker | | | 10 | | | | 914 | |
| Textron | | | 14 | | | | 1,184 | |
| Trane Technologies PLC | | | 17 | | | | 5,395 | |
| TransDigm Group | | | 4 | | | | 4,992 | |
| Uber Technologies * | | | 152 | | | | 10,073 | |
| Union Pacific | | | 45 | | | | 10,672 | |
| United Airlines Holdings * | | | 22 | | | | 1,132 | |
| United Parcel Service, Cl B | | | 54 | | | | 7,964 | |
| United Rentals | | | 5 | | | | 3,340 | |
| Veralto | | | 16 | | | | 1,499 | |
| Verisk Analytics, Cl A | | | 11 | | | | 2,398 | |
| Waste Management | | | 27 | | | | 5,617 | |
| Westinghouse Air Brake Technologies | | | 14 | | | | 2,255 | |
| WW Grainger | | | 3 | | | | 2,764 | |
The accompanying notes are an integral part of the financial statements.
121
| Schedule of Investments | April 30, 2024 (Unaudited) |
Global X S&P 500® Tail Risk ETF
| | | Shares | | | Value | |
| COMMON STOCK — continued | | | | | | | | |
| Industrials — continued | | | | | | | | |
| Xylem | | | 17 | | | $ | 2,222 | |
| | | | | | | | 275,783 | |
| Information Technology — 28.9% | | | | | | | | |
| Accenture PLC, Cl A | | | 46 | | | | 13,842 | |
| Adobe * | | | 33 | | | | 15,273 | |
| Advanced Micro Devices * | | | 120 | | | | 19,006 | |
| Akamai Technologies * | | | 11 | | | | 1,110 | |
| Amphenol, Cl A | | | 44 | | | | 5,314 | |
| Analog Devices | | | 36 | | | | 7,222 | |
| ANSYS * | | | 7 | | | | 2,274 | |
| Apple | | | 1,077 | | | | 183,445 | |
| Applied Materials | | | 63 | | | | 12,515 | |
| Arista Networks * | | | 19 | | | | 4,875 | |
| Autodesk * | | | 15 | | | | 3,193 | |
| Broadcom | | | 33 | | | | 42,909 | |
| Cadence Design Systems * | | | 20 | | | | 5,513 | |
| CDW | | | 10 | | | | 2,419 | |
| Cisco Systems | | | 304 | | | | 14,282 | |
| Cognizant Technology Solutions, Cl A | | | 39 | | | | 2,561 | |
| Corning | | | 57 | | | | 1,903 | |
| Enphase Energy * | | | 11 | | | | 1,196 | |
| EPAM Systems * | | | 4 | | | | 941 | |
| F5 * | | | 4 | | | | 661 | |
| Fair Isaac * | | | 2 | | | | 2,267 | |
| First Solar * | | | 7 | | | | 1,234 | |
| Fortinet * | | | 50 | | | | 3,159 | |
| Gartner * | | | 6 | | | | 2,476 | |
| Gen Digital | | | 41 | | | | 826 | |
| Hewlett Packard Enterprise | | | 94 | | | | 1,598 | |
| HP | | | 64 | | | | 1,798 | |
| Intel | | | 316 | | | | 9,628 | |
| International Business Machines | | | 68 | | | | 11,302 | |
| Intuit | | | 21 | | | | 13,138 | |
| Jabil | | | 9 | | | | 1,056 | |
| Juniper Networks | | | 23 | | | | 801 | |
| Keysight Technologies * | | | 14 | | | | 2,071 | |
| KLA | | | 10 | | | | 6,893 | |
| Lam Research | | | 10 | | | | 8,944 | |
The accompanying notes are an integral part of the financial statements.
122
| Schedule of Investments | April 30, 2024 (Unaudited) |
| Global X S&P 500® Tail Risk ETF |
| | | Shares | | | Value | |
| COMMON STOCK — continued | | | | | | | | |
| Information Technology — continued | | | | | | | | |
| Microchip Technology | | | 41 | | | $ | 3,771 | |
| Micron Technology | | | 81 | | | | 9,150 | |
| Microsoft | | | 551 | | | | 214,521 | |
| Monolithic Power Systems | | | 4 | | | | 2,677 | |
| Motorola Solutions | | | 12 | | | | 4,070 | |
| NetApp | | | 16 | | | | 1,635 | |
| NVIDIA | | | 184 | | | | 158,980 | |
| ON Semiconductor * | | | 32 | | | | 2,245 | |
| Oracle | | | 119 | | | | 13,536 | |
| Palo Alto Networks * | | | 23 | | | | 6,690 | |
| PTC * | | | 10 | | | | 1,774 | |
| Qorvo * | | | 8 | | | | 935 | |
| QUALCOMM | | | 83 | | | | 13,766 | |
| Roper Technologies | | | 8 | | | | 4,092 | |
| Salesforce | | | 72 | | | | 19,364 | |
| Seagate Technology Holdings | | | 14 | | | | 1,203 | |
| ServiceNow * | | | 15 | | | | 10,400 | |
| Skyworks Solutions | | | 11 | | | | 1,172 | |
| Super Micro Computer * | | | 4 | | | | 3,435 | |
| Synopsys * | | | 11 | | | | 5,836 | |
| TE Connectivity | | | 24 | | | | 3,395 | |
| Teledyne Technologies * | | | 3 | | | | 1,144 | |
| Teradyne | | | 11 | | | | 1,279 | |
| Texas Instruments | | | 67 | | | | 11,820 | |
| Trimble * | | | 22 | | | | 1,322 | |
| Tyler Technologies * | | | 3 | | | | 1,385 | |
| VeriSign * | | | 6 | | | | 1,017 | |
| Western Digital * | | | 22 | | | | 1,558 | |
| Zebra Technologies, Cl A * | | | 3 | | | | 944 | |
| | | | | | | | 910,761 | |
| Materials — 2.3% | | | | | | | | |
| Air Products & Chemicals | | | 16 | | | | 3,781 | |
| Albemarle | | | 8 | | | | 962 | |
| Amcor PLC | | | 109 | | | | 974 | |
| Avery Dennison | | | 5 | | | | 1,086 | |
| Ball | | | 23 | | | | 1,600 | |
| Celanese, Cl A | | | 8 | | | | 1,229 | |
| CF Industries Holdings | | | 14 | | | | 1,106 | |
The accompanying notes are an integral part of the financial statements.
123
| Schedule of Investments | April 30, 2024 (Unaudited) |
| Global X S&P 500® Tail Risk ETF |
| | | Shares | | | Value | |
| COMMON STOCK — continued | | | | | | | | |
| Materials — continued | | | | | | | | |
| Corteva | | | 54 | | | $ | 2,923 | |
| Dow | | | 53 | | | | 3,016 | |
| DuPont de Nemours | | | 33 | | | | 2,392 | |
| Eastman Chemical | | | 11 | | | | 1,039 | |
| Ecolab | | | 18 | | | | 4,071 | |
| FMC | | | 11 | | | | 649 | |
| Freeport-McMoRan | | | 108 | | | | 5,394 | |
| International Flavors & Fragrances | | | 18 | | | | 1,524 | |
| International Paper | | | 25 | | | | 874 | |
| Linde PLC | | | 36 | | | | 15,875 | |
| LyondellBasell Industries, Cl A | | | 19 | | | | 1,899 | |
| Martin Marietta Materials | | | 4 | | | | 2,348 | |
| Mosaic | | | 25 | | | | 785 | |
| Newmont | | | 87 | | | | 3,536 | |
| Nucor | | | 18 | | | | 3,034 | |
| Packaging Corp of America | | | 8 | | | | 1,384 | |
| PPG Industries | | | 17 | | | | 2,193 | |
| Sherwin-Williams | | | 18 | | | | 5,393 | |
| Steel Dynamics | | | 11 | | | | 1,431 | |
| Vulcan Materials | | | 10 | | | | 2,576 | |
| Westrock | | | 17 | | | | 815 | |
| | | | | | | | 73,889 | |
| Real Estate — 2.1% | | | | | | | | |
| Alexandria Real Estate Equities ‡ | | | 11 | | | | 1,275 | |
| American Tower ‡ | | | 34 | | | | 5,833 | |
| AvalonBay Communities ‡ | | | 10 | | | | 1,896 | |
| Boston Properties ‡ | | | 10 | | | | 619 | |
| Camden Property Trust ‡ | | | 7 | | | | 698 | |
| CBRE Group, Cl A * | | | 22 | | | | 1,912 | |
| CoStar Group * | | | 30 | | | | 2,746 | |
| Crown Castle ‡ | | | 33 | | | | 3,095 | |
| Digital Realty Trust ‡ | | | 21 | | | | 2,914 | |
| Equinix ‡ | | | 7 | | | | 4,978 | |
| Equity Residential ‡ | | | 26 | | | | 1,674 | |
| Essex Property Trust ‡ | | | 4 | | | | 985 | |
| Extra Space Storage ‡ | | | 16 | | | | 2,148 | |
| Federal Realty Investment Trust ‡ | | | 5 | | | | 521 | |
| Healthpeak Properties ‡ | | | 53 | | | | 986 | |
The accompanying notes are an integral part of the financial statements.
124
| Schedule of Investments | April 30, 2024 (Unaudited) |
| Global X S&P 500® Tail Risk ETF |
| | | Shares | | | Value | |
| COMMON STOCK — continued | | | | | | | | |
| Real Estate — continued | | | | | | | | |
| Host Hotels & Resorts ‡ | | | 50 | | | $ | 944 | |
| Invitation Homes ‡ | | | 42 | | | | 1,436 | |
| Iron Mountain ‡ | | | 21 | | | | 1,628 | |
| Kimco Realty ‡ | | | 45 | | | | 838 | |
| Mid-America Apartment Communities ‡ | | | 10 | | | | 1,300 | |
| ProLogis ‡ | | | 68 | | | | 6,939 | |
| Public Storage ‡ | | | 11 | | | | 2,854 | |
| Realty Income ‡ | | | 64 | | | | 3,427 | |
| Regency Centers ‡ | | | 11 | | | | 651 | |
| SBA Communications, Cl A ‡ | | | 7 | | | | 1,303 | |
| Simon Property Group ‡ | | | 25 | | | | 3,513 | |
| UDR ‡ | | | 22 | | | | 838 | |
| Ventas ‡ | | | 29 | | | | 1,284 | |
| VICI Properties, Cl A ‡ | | | 75 | | | | 2,141 | |
| Welltower ‡ | | | 42 | | | | 4,002 | |
| Weyerhaeuser ‡ | | | 55 | | | | 1,659 | |
| | | | | | | | 67,037 | |
| Utilities — 2.3% | | | | | | | | |
| AES | | | 45 | | | | 805 | |
| Alliant Energy | | | 22 | | | | 1,096 | |
| Ameren | | | 22 | | | | 1,625 | |
| American Electric Power | | | 38 | | | | 3,269 | |
| American Water Works | | | 14 | | | | 1,712 | |
| Atmos Energy | | | 10 | | | | 1,179 | |
| CenterPoint Energy | | | 44 | | | | 1,282 | |
| CMS Energy | | | 21 | | | | 1,273 | |
| Consolidated Edison | | | 25 | | | | 2,360 | |
| Constellation Energy | | | 25 | | | | 4,648 | |
| Dominion Energy | | | 63 | | | | 3,212 | |
| DTE Energy | | | 15 | | | | 1,655 | |
| Duke Energy | | | 57 | | | | 5,601 | |
| Edison International | | | 28 | | | | 1,990 | |
| Entergy | | | 15 | | | | 1,600 | |
| Evergy | | | 16 | | | | 839 | |
| Eversource Energy | | | 27 | | | | 1,637 | |
| Exelon | | | 75 | | | | 2,819 | |
| FirstEnergy | | | 39 | | | | 1,495 | |
| NextEra Energy | | | 152 | | | | 10,179 | |
The accompanying notes are an integral part of the financial statements.
125
| Schedule of Investments | April 30, 2024 (Unaudited) |
| Global X S&P 500® Tail Risk ETF |
| | | Shares | | | Value | |
| COMMON STOCK — continued | | | | | | | | |
| Utilities — continued | | | | | | | | |
| NiSource | | | 28 | | | $ | 780 | |
| NRG Energy | | | 17 | | | | 1,235 | |
| PG&E | | | 152 | | | | 2,601 | |
| Pinnacle West Capital | | | 11 | | | | 810 | |
| PPL | | | 54 | | | | 1,483 | |
| Public Service Enterprise Group | | | 36 | | | | 2,487 | |
| Sempra | | | 48 | | | | 3,438 | |
| Southern | | | 83 | | | | 6,101 | |
| WEC Energy Group | | | 22 | | | | 1,818 | |
| Xcel Energy | | | 41 | | | | 2,203 | |
| | | | | | | | 73,232 | |
| TOTAL UNITED STATES | | | | | | | 3,128,886 | |
TOTAL COMMON STOCK
(Cost $2,820,048) | | | | | | | 3,133,754 | |
| | | | | | | | | |
PURCHASED OPTIONS — 0.3%
(Cost $16,582) | | | | | | | 9,832 | |
| | | | | | | | | |
TOTAL INVESTMENTS — 99.9%
(Cost $2,836,630) | | | | | | $ | 3,143,586 | |
Percentages are based on Net Assets of $3,147,022.
A list of the exchange traded option contracts held by the Fund at April 30, 2024, is as follows:
| Description | | Number of
Contracts | | Notional
Amount | | | Exercise
Price | | | Expiration
Date | | Value | |
| PURCHASED OPTIONS — 0.3% | | | | | | | | | | | | | | | | |
| Put Options | | | | | | | | | | | | | | | | |
| Mini-SPX Index | | 2 | | $ | 100,714 | | | $ | 462 | | | 06/21/24 | | $ | 322 | |
| S&P 500 Index | | 6 | | | 3,021,414 | | | | 4,620 | | | 06/21/24 | | | 9,510 | |
| Total Purchased Options | | | | $ | 3,122,128 | | | | | | | | | $ | 9,832 | |
| * | Non-income producing security. |
| ‡ | Real Estate Investment Trust |
The accompanying notes are an integral part of the financial statements.
126
| Schedule of Investments | April 30, 2024 (Unaudited) |
| Global X S&P 500® Tail Risk ETF |
As of April 30, 2024, all of the Fund’s investments were considered Level 1, in accordance with authoritative guidance on fair value measurements and disclosure under U.S. GAAP.
See “Glossary” for abbreviations.
The accompanying notes are an integral part of the financial statements.
127
| Schedule of Investments | April 30, 2024 (Unaudited) |
Global X S&P 500® Collar 95-110 ETF
Sector Weightings †:
† Sector weightings percentages are based on the total market value of investments. Total investments do not include derivatives such as options, futures contracts, forward contracts, and swap contracts, if applicable.
| | | | Shares | | | Value | |
| COMMON STOCK — 99.0% | | | | | | | | |
| CHINA — 0.2% | | | | | | | | |
| Information Technology — 0.2% | | | | | | | | |
| NXP Semiconductors | | | 16 | | | $ | 4,099 | |
| |
| UNITED STATES — 98.8% | | | | | | | | |
| Communication Services — 9.1% | | | | | | | | |
| Alphabet, Cl A * | | | 358 | | | | 58,275 | |
| Alphabet, Cl C * | | | 300 | | | | 49,392 | |
| AT&T | | | 434 | | | | 7,330 | |
| Charter Communications, Cl A * | | | 6 | | | | 1,536 | |
| Comcast, Cl A | | | 241 | | | | 9,184 | |
| Electronic Arts | | | 15 | | | | 1,902 | |
| Fox, Cl A | | | 18 | | | | 558 | |
| Fox, Cl B | | | 9 | | | | 258 | |
| Interpublic Group | | | 27 | | | | 822 | |
| Live Nation Entertainment * | | | 9 | | | | 800 | |
| Match Group * | | | 17 | | | | 524 | |
| Meta Platforms, Cl A | | | 133 | | | | 57,213 | |
| Netflix * | | | 26 | | | | 14,317 | |
| News, Cl A | | | 27 | | | | 643 | |
| News, Cl B | | | 9 | | | | 221 | |
The accompanying notes are an integral part of the financial statements.
128
| Schedule of Investments | April 30, 2024 (Unaudited) |
Global X S&P 500® Collar 95-110 ETF
| | | | Shares | | | Value | |
| COMMON STOCK — continued | | | | | | | | |
| Communication Services — continued | | | | | | | | |
| Omnicom Group | | | 13 | | | $ | 1,207 | |
| Paramount Global, Cl B | | | 36 | | | | 410 | |
| Take-Two Interactive Software * | | | 10 | | | | 1,428 | |
| T-Mobile US | | | 31 | | | | 5,089 | |
| Verizon Communications | | | 255 | | | | 10,070 | |
| Walt Disney | | | 111 | | | | 12,332 | |
| Warner Bros Discovery * | | | 142 | | | | 1,045 | |
| | | | | | | | 234,556 | |
| Consumer Discretionary — 10.2% | | | | | | | | |
| Airbnb, Cl A * | | | 26 | | | | 4,123 | |
| Amazon.com * | | | 553 | | | | 96,775 | |
| Aptiv PLC * | | | 17 | | | | 1,207 | |
| AutoZone * | | | 1 | | | | 2,956 | |
| Bath & Body Works | | | 7 | | | | 318 | |
| Best Buy | | | 11 | | | | 810 | |
| Booking Holdings | | | 2 | | | | 6,904 | |
| BorgWarner | | | 9 | | | | 295 | |
| Caesars Entertainment * | | | 11 | | | | 394 | |
| CarMax * | | | 9 | | | | 612 | |
| Carnival * | | | 67 | | | | 993 | |
| Chipotle Mexican Grill, Cl A * | | | 2 | | | | 6,319 | |
| Darden Restaurants | | | 7 | | | | 1,074 | |
| Deckers Outdoor * | | | 2 | | | | 1,637 | |
| Domino’s Pizza | | | 2 | | | | 1,058 | |
| DR Horton | | | 18 | | | | 2,565 | |
| eBay | | | 33 | | | | 1,701 | |
| Etsy * | | | 9 | | | | 618 | |
| Expedia Group * | | | 9 | | | | 1,212 | |
| Ford Motor | | | 237 | | | | 2,880 | |
| Garmin | | | 9 | | | | 1,300 | |
| General Motors | | | 70 | | | | 3,117 | |
| Genuine Parts | | | 9 | | | | 1,415 | |
| Hasbro | | | 9 | | | | 552 | |
| Hilton Worldwide Holdings | | | 16 | | | | 3,156 | |
| Home Depot | | | 61 | | | | 20,387 | |
| Las Vegas Sands | | | 22 | | | | 976 | |
| Lennar, Cl A | | | 15 | | | | 2,274 | |
| LKQ | | | 18 | | | | 776 | |
The accompanying notes are an integral part of the financial statements.
129
| Schedule of Investments | April 30, 2024 (Unaudited) |
Global X S&P 500® Collar 95-110 ETF
| | | | Shares | | | Value | |
| COMMON STOCK — continued | | | | | | | | |
| Consumer Discretionary — continued | | | | | | | | |
| Lowe’s | | | 35 | | | $ | 7,980 | |
| Lululemon Athletica * | | | 7 | | | | 2,524 | |
| Marriott International, Cl A | | | 15 | | | | 3,542 | |
| McDonald’s | | | 44 | | | | 12,014 | |
| MGM Resorts International * | | | 16 | | | | 631 | |
| Mohawk Industries * | | | 4 | | | | 461 | |
| NIKE, Cl B | | | 74 | | | | 6,827 | |
| Norwegian Cruise Line Holdings * | | | 17 | | | | 322 | |
| O’Reilly Automotive * | | | 4 | | | | 4,053 | |
| Pool | | | 2 | | | | 725 | |
| PulteGroup | | | 11 | | | | 1,226 | |
| Ralph Lauren, Cl A | | | 3 | | | | 491 | |
| Ross Stores | | | 20 | | | | 2,591 | |
| Royal Caribbean Cruises * | | | 13 | | | | 1,815 | |
| Starbucks | | | 69 | | | | 6,106 | |
| Tapestry | | | 14 | | | | 559 | |
| Tesla * | | | 168 | | | | 30,791 | |
| TJX | | | 69 | | | | 6,492 | |
| Tractor Supply | | | 7 | | | | 1,912 | |
| Ulta Beauty * | | | 3 | | | | 1,214 | |
| Wynn Resorts | | | 4 | | | | 367 | |
| Yum! Brands | | | 18 | | | | 2,542 | |
| | | | | | | | 263,589 | |
| Consumer Staples — 6.1% | | | | | | | | |
| Altria Group | | | 107 | | | | 4,688 | |
| Archer-Daniels-Midland | | | 30 | | | | 1,760 | |
| Brown-Forman, Cl B | | | 9 | | | | 431 | |
| Bunge Global | | | 10 | | | | 1,018 | |
| Campbell Soup | | | 11 | | | | 503 | |
| Church & Dwight | | | 12 | | | | 1,295 | |
| Clorox | | | 6 | | | | 887 | |
| Coca-Cola | | | 236 | | | | 14,578 | |
| Colgate-Palmolive | | | 48 | | | | 4,412 | |
| Conagra Brands | | | 25 | | | | 770 | |
| Constellation Brands, Cl A | | | 11 | | | | 2,788 | |
| Costco Wholesale | | | 27 | | | | 19,518 | |
| Dollar General | | | 12 | | | | 1,670 | |
| Dollar Tree * | | | 14 | | | | 1,656 | |
The accompanying notes are an integral part of the financial statements.
130
| Schedule of Investments | April 30, 2024 (Unaudited) |
Global X S&P 500® Collar 95-110 ETF
| | | | Shares | | | Value | |
| COMMON STOCK — continued | | | | | | | | |
| Consumer Staples — continued | | | | | | | | |
| Estee Lauder, Cl A | | | 13 | | | $ | 1,907 | |
| General Mills | | | 36 | | | | 2,537 | |
| Hershey | | | 9 | | | | 1,745 | |
| Hormel Foods | | | 18 | | | | 640 | |
| J M Smucker | | | 6 | | | | 689 | |
| Kellanova | | | 18 | | | | 1,041 | |
| Kenvue | | | 107 | | | | 2,014 | |
| Keurig Dr Pepper | | | 52 | | | | 1,752 | |
| Kimberly-Clark | | | 21 | | | | 2,867 | |
| Kraft Heinz | | | 49 | | | | 1,892 | |
| Kroger | | | 40 | | | | 2,215 | |
| Lamb Weston Holdings | | | 9 | | | | 750 | |
| McCormick | | | 13 | | | | 989 | |
| Molson Coors Beverage, Cl B | | | 13 | | | | 744 | |
| Mondelez International, Cl A | | | 82 | | | | 5,899 | |
| Monster Beverage * | | | 44 | | | | 2,352 | |
| PepsiCo | | | 84 | | | | 14,776 | |
| Philip Morris International | | | 94 | | | | 8,924 | |
| Procter & Gamble | | | 143 | | | | 23,338 | |
| Sysco | | | 31 | | | | 2,304 | |
| Target | | | 29 | | | | 4,668 | |
| Tyson Foods, Cl A | | | 18 | | | | 1,092 | |
| Walgreens Boots Alliance | | | 45 | | | | 798 | |
| Walmart | | | 261 | | | | 15,490 | |
| | | | | | | | 157,397 | |
| Energy — 4.1% | | | | | | | | |
| APA | | | 13 | | | | 409 | |
| Baker Hughes, Cl A | | | 61 | | | | 1,990 | |
| Chevron | | | 105 | | | | 16,933 | |
| ConocoPhillips | | | 72 | | | | 9,045 | |
| Coterra Energy | | | 45 | | | | 1,231 | |
| Devon Energy | | | 40 | | | | 2,047 | |
| Diamondback Energy | | | 12 | | | | 2,414 | |
| EOG Resources | | | 35 | | | | 4,624 | |
| EQT | | | 27 | | | | 1,082 | |
| Exxon Mobil | | | 241 | | | | 28,503 | |
| Halliburton | | | 54 | | | | 2,023 | |
| Hess | | | 18 | | | | 2,835 | |
The accompanying notes are an integral part of the financial statements.
131
| Schedule of Investments | April 30, 2024 (Unaudited) |
Global X S&P 500® Collar 95-110 ETF
| | | | Shares | | | Value | |
| COMMON STOCK — continued | | | | | | | | |
| Energy — continued | | | | | | | | |
| Kinder Morgan | | | 122 | | | $ | 2,230 | |
| Marathon Oil | | | 36 | | | | 967 | |
| Marathon Petroleum | | | 22 | | | | 3,998 | |
| Occidental Petroleum | | | 40 | | | | 2,646 | |
| ONEOK | | | 36 | | | | 2,848 | |
| Phillips 66 | | | 27 | | | | 3,867 | |
| Pioneer Natural Resources | | | 14 | | | | 3,770 | |
| Schlumberger | | | 87 | | | | 4,131 | |
| Targa Resources | | | 13 | | | | 1,483 | |
| Valero Energy | | | 21 | | | | 3,357 | |
| Williams | | | 74 | | | | 2,839 | |
| | | | | | | | 105,272 | |
| Financials — 13.0% | | | | | | | | |
| Aflac | | | 30 | | | | 2,509 | |
| Allstate | | | 14 | | | | 2,381 | |
| American Express | | | 36 | | | | 8,425 | |
| American International Group | | | 42 | | | | 3,163 | |
| Ameriprise Financial | | | 6 | | | | 2,471 | |
| Aon PLC, Cl A | | | 12 | | | | 3,384 | |
| Arch Capital Group * | | | 19 | | | | 1,777 | |
| Arthur J Gallagher | | | 14 | | | | 3,286 | |
| Assurant | | | 3 | | | | 523 | |
| Bank of America | | | 418 | | | | 15,470 | |
| Bank of New York Mellon | | | 47 | | | | 2,655 | |
| Berkshire Hathaway, Cl B * | | | 110 | | | | 43,640 | |
| BlackRock, Cl A | | | 8 | | | | 6,037 | |
| Blackstone | | | 43 | | | | 5,014 | |
| Brown & Brown | | | 14 | | | | 1,142 | |
| Capital One Financial | | | 24 | | | | 3,442 | |
| Cboe Global Markets | | | 7 | | | | 1,268 | |
| Charles Schwab | | | 90 | | | | 6,655 | |
| Chubb | | | 26 | | | | 6,465 | |
| Cincinnati Financial | | | 8 | | | | 925 | |
| Citigroup | | | 115 | | | | 7,053 | |
| Citizens Financial Group | | | 23 | | | | 785 | |
| CME Group, Cl A | | | 23 | | | | 4,822 | |
| Comerica | | | 3 | | | | 150 | |
| Corpay * | | | 4 | | | | 1,209 | |
The accompanying notes are an integral part of the financial statements.
132
| Schedule of Investments | April 30, 2024 (Unaudited) |
Global X S&P 500® Collar 95-110 ETF
| | | | Shares | | | Value | |
| COMMON STOCK — continued | | | | | | | | |
| Financials — continued | | | | | | | | |
| Discover Financial Services | | | 15 | | | $ | 1,901 | |
| Everest Group | | | 3 | | | | 1,099 | |
| FactSet Research Systems | | | 2 | | | | 834 | |
| Fidelity National Information Services | | | 35 | | | | 2,377 | |
| Fifth Third Bancorp | | | 45 | | | | 1,641 | |
| Fiserv * | | | 36 | | | | 5,496 | |
| Franklin Resources | | | 20 | | | | 457 | |
| Global Payments | | | 16 | | | | 1,964 | |
| Globe Life | | | 6 | | | | 457 | |
| Goldman Sachs Group | | | 20 | | | | 8,534 | |
| Hartford Financial Services Group | | | 18 | | | | 1,744 | |
| Huntington Bancshares | | | 90 | | | | 1,212 | |
| Intercontinental Exchange | | | 35 | | | | 4,507 | |
| Invesco | | | 33 | | | | 468 | |
| Jack Henry & Associates | | | 3 | | | | 488 | |
| JPMorgan Chase | | | 174 | | | | 33,363 | |
| KeyCorp | | | 49 | | | | 710 | |
| Loews | | | 11 | | | | 827 | |
| M&T Bank | | | 10 | | | | 1,444 | |
| MarketAxess Holdings | | | 2 | | | | 400 | |
| Marsh & McLennan | | | 31 | | | | 6,182 | |
| Mastercard, Cl A | | | 50 | | | | 22,560 | |
| MetLife | | | 37 | | | | 2,630 | |
| Moody’s | | | 9 | | | | 3,333 | |
| Morgan Stanley | | | 76 | | | | 6,904 | |
| MSCI, Cl A | | | 5 | | | | 2,329 | |
| Nasdaq | | | 22 | | | | 1,317 | |
| Northern Trust | | | 13 | | | | 1,071 | |
| PayPal Holdings * | | | 65 | | | | 4,415 | |
| PNC Financial Services Group | | | 24 | | | | 3,678 | |
| Principal Financial Group | | | 11 | | | | 871 | |
| Progressive | | | 37 | | | | 7,705 | |
| Prudential Financial | | | 22 | | | | 2,431 | |
| Raymond James Financial | | | 11 | | | | 1,342 | |
| Regions Financial | | | 49 | | | | 944 | |
| S&P Global | | | 20 | | | | 8,317 | |
| State Street | | | 18 | | | | 1,305 | |
| Synchrony Financial | | | 25 | | | | 1,099 | |
| T Rowe Price Group | | | 11 | | | | 1,205 | |
The accompanying notes are an integral part of the financial statements.
133
| Schedule of Investments | April 30, 2024 (Unaudited) |
Global X S&P 500® Collar 95-110 ETF
| | | | Shares | | | Value | |
| COMMON STOCK — continued | | | | | | | | |
| Financials — continued | | | | | | | | |
| Travelers | | | 13 | | | $ | 2,758 | |
| Truist Financial | | | 81 | | | | 3,042 | |
| US Bancorp | | | 88 | | | | 3,575 | |
| Visa, Cl A | | | 97 | | | | 26,055 | |
| W R Berkley | | | 12 | | | | 924 | |
| Wells Fargo | | | 219 | | | | 12,991 | |
| Willis Towers Watson PLC | | | 6 | | | | 1,507 | |
| | | | | | | | 335,064 | |
| Health Care — 12.1% | | | | | | | | |
| Abbott Laboratories | | | 105 | | | | 11,127 | |
| AbbVie | | | 108 | | | | 17,565 | |
| Agilent Technologies | | | 17 | | | | 2,330 | |
| Align Technology * | | | 4 | | | | 1,129 | |
| Amgen | | | 32 | | | | 8,766 | |
| Baxter International | | | 33 | | | | 1,332 | |
| Becton Dickinson | | | 17 | | | | 3,988 | |
| Biogen * | | | 8 | | | | 1,719 | |
| Bio-Rad Laboratories, Cl A * | | | 1 | | | | 270 | |
| Bio-Techne | | | 9 | | | | 569 | |
| Boston Scientific * | | | 86 | | | | 6,181 | |
| Bristol-Myers Squibb | | | 123 | | | | 5,405 | |
| Cardinal Health | | | 13 | | | | 1,339 | |
| Catalent * | | | 10 | | | | 558 | |
| Cencora | | | 9 | | | | 2,151 | |
| Centene * | | | 30 | | | | 2,192 | |
| Charles River Laboratories International * | | | 3 | | | | 687 | |
| Cigna Group | | | 18 | | | | 6,427 | |
| Cooper | | | 12 | | | | 1,069 | |
| CVS Health | | | 76 | | | | 5,146 | |
| Danaher | | | 40 | | | | 9,865 | |
| DaVita * | | | 3 | | | | 417 | |
| Dexcom * | | | 23 | | | | 2,930 | |
| Edwards Lifesciences * | | | 38 | | | | 3,217 | |
| Elevance Health | | | 14 | | | | 7,400 | |
| Eli Lilly | | | 48 | | | | 37,493 | |
| GE HealthCare Technologies | | | 26 | | | | 1,982 | |
| Gilead Sciences | | | 76 | | | | 4,955 | |
| HCA Healthcare | | | 12 | | | | 3,718 | |
The accompanying notes are an integral part of the financial statements.
134
| Schedule of Investments | April 30, 2024 (Unaudited) |
Global X S&P 500® Collar 95-110 ETF
| | | | Shares | | | Value | |
| COMMON STOCK — continued | | | | | | | | |
| Health Care — continued | | | | | | | | |
| Henry Schein * | | | 9 | | | $ | 623 | |
| Hologic * | | | 13 | | | | 985 | |
| Humana | | | 8 | | | | 2,417 | |
| IDEXX Laboratories * | | | 5 | | | | 2,464 | |
| Illumina * | | | 11 | | | | 1,354 | |
| Incyte * | | | 13 | | | | 677 | |
| Insulet * | | | 5 | | | | 860 | |
| Intuitive Surgical * | | | 21 | | | | 7,783 | |
| IQVIA Holdings * | | | 12 | | | | 2,781 | |
| Johnson & Johnson | | | 146 | | | | 21,110 | |
| Laboratory Corp of America Holdings | | | 6 | | | | 1,208 | |
| McKesson | | | 8 | | | | 4,298 | |
| Medtronic PLC | | | 82 | | | | 6,580 | |
| Merck | | | 155 | | | | 20,029 | |
| Mettler-Toledo International * | | | 1 | | | | 1,230 | |
| Moderna * | | | 21 | | | | 2,316 | |
| Molina Healthcare * | | | 3 | | | | 1,026 | |
| Pfizer | | | 343 | | | | 8,788 | |
| Quest Diagnostics | | | 6 | | | | 829 | |
| Regeneron Pharmaceuticals * | | | 6 | | | | 5,344 | |
| ResMed | | | 9 | | | | 1,926 | |
| Revvity | | | 7 | | | | 717 | |
| Solventum * | | | 8 | | | | 520 | |
| STERIS PLC | | | 6 | | | | 1,227 | |
| Stryker | | | 21 | | | | 7,066 | |
| Teleflex | | | 4 | | | | 835 | |
| Thermo Fisher Scientific | | | 23 | | | | 13,081 | |
| UnitedHealth Group | | | 56 | | | | 27,087 | |
| Universal Health Services, Cl B | | | 4 | | | | 682 | |
| Vertex Pharmaceuticals * | | | 16 | | | | 6,285 | |
| Viatris | | | 69 | | | | 798 | |
| Waters * | | | 4 | | | | 1,236 | |
| West Pharmaceutical Services | | | 4 | | | | 1,430 | |
| Zimmer Biomet Holdings | | | 13 | | | | 1,564 | |
| Zoetis, Cl A | | | 28 | | | | 4,459 | |
| | | | | | | | 313,542 | |
| Industrials — 8.8% | | | | | | | | |
| 3M | | | 34 | | | | 3,281 | |
The accompanying notes are an integral part of the financial statements.
135
| Schedule of Investments | April 30, 2024 (Unaudited) |
Global X S&P 500® Collar 95-110 ETF
| | | | Shares | | | Value | |
| COMMON STOCK — continued | | | | | | | | |
| Industrials — continued | | | | | | | | |
| A O Smith | | | 4 | | | $ | 331 | |
| Allegion PLC | | | 6 | | | | 729 | |
| American Airlines Group * | | | 46 | | | | 621 | |
| AMETEK | | | 15 | | | | 2,620 | |
| Automatic Data Processing | | | 26 | | | | 6,289 | |
| Axon Enterprise * | | | 4 | | | | 1,255 | |
| Boeing * | | | 34 | | | | 5,707 | |
| Broadridge Financial Solutions | | | 8 | | | | 1,547 | |
| Builders FirstSource * | | | 7 | | | | 1,280 | |
| Carrier Global | | | 47 | | | | 2,890 | |
| Caterpillar | | | 31 | | | | 10,372 | |
| CH Robinson Worldwide | | | 4 | | | | 284 | |
| Cintas | | | 5 | | | | 3,292 | |
| Copart * | | | 54 | | | | 2,933 | |
| CSX | | | 121 | | | | 4,020 | |
| Cummins | | | 8 | | | | 2,260 | |
| Dayforce * | | | 7 | | | | 430 | |
| Deere | | | 16 | | | | 6,263 | |
| Delta Air Lines | | | 40 | | | | 2,003 | |
| Dover | | | 9 | | | | 1,614 | |
| Eaton PLC | | | 25 | | | | 7,956 | |
| Emerson Electric | | | 36 | | | | 3,880 | |
| Equifax | | | 8 | | | | 1,761 | |
| Expeditors International of Washington | | | 9 | | | | 1,002 | |
| Fastenal | | | 36 | | | | 2,446 | |
| FedEx | | | 14 | | | | 3,665 | |
| Fortive | | | 21 | | | | 1,581 | |
| GE Vernova * | | | 16 | | | | 2,459 | |
| Generac Holdings * | | | 4 | | | | 544 | |
| General Dynamics | | | 14 | | | | 4,019 | |
| General Electric | | | 66 | | | | 10,680 | |
| Honeywell International | | | 40 | | | | 7,709 | |
| Howmet Aerospace | | | 24 | | | | 1,602 | |
| Hubbell, Cl B | | | 3 | | | | 1,111 | |
| Huntington Ingalls Industries | | | 2 | | | | 554 | |
| IDEX | | | 5 | | | | 1,102 | |
| Illinois Tool Works | | | 17 | | | | 4,150 | |
| Ingersoll Rand | | | 25 | | | | 2,333 | |
| Jacobs Solutions | | | 9 | | | | 1,292 | |
The accompanying notes are an integral part of the financial statements.
136
| Schedule of Investments | April 30, 2024 (Unaudited) |
Global X S&P 500® Collar 95-110 ETF
| | | | Shares | | | Value | |
| COMMON STOCK — continued | | | | | | | | |
| Industrials — continued | | | | | | | | |
| JB Hunt Transport Services | | | 4 | | | $ | 650 | |
| Johnson Controls International | | | 41 | | | | 2,668 | |
| L3Harris Technologies | | | 12 | | | | 2,569 | |
| Leidos Holdings | | | 9 | | | | 1,262 | |
| Lockheed Martin | | | 13 | | | | 6,044 | |
| Masco | | | 10 | | | | 684 | |
| Nordson | | | 3 | | | | 775 | |
| Norfolk Southern | | | 13 | | | | 2,994 | |
| Northrop Grumman | | | 9 | | | | 4,365 | |
| Old Dominion Freight Line | | | 10 | | | | 1,817 | |
| Otis Worldwide | | | 25 | | | | 2,280 | |
| PACCAR | | | 29 | | | | 3,077 | |
| Parker-Hannifin | | | 8 | | | | 4,359 | |
| Paychex | | | 19 | | | | 2,257 | |
| Paycom Software | | | 3 | | | | 564 | |
| Pentair PLC | | | 9 | | | | 712 | |
| Quanta Services | | | 9 | | | | 2,327 | |
| Republic Services, Cl A | | | 13 | | | | 2,492 | |
| Robert Half | | | 6 | | | | 415 | |
| Rockwell Automation | | | 7 | | | | 1,897 | |
| Rollins | | | 16 | | | | 713 | |
| RTX | | | 81 | | | | 8,223 | |
| Snap-On | | | 3 | | | | 804 | |
| Southwest Airlines | | | 36 | | | | 934 | |
| Stanley Black & Decker | | | 9 | | | | 823 | |
| Textron | | | 13 | | | | 1,100 | |
| Trane Technologies PLC | | | 14 | | | | 4,443 | |
| TransDigm Group | | | 3 | | | | 3,744 | |
| Uber Technologies * | | | 125 | | | | 8,284 | |
| Union Pacific | | | 38 | | | | 9,012 | |
| United Airlines Holdings * | | | 18 | | | | 926 | |
| United Parcel Service, Cl B | | | 44 | | | | 6,489 | |
| United Rentals | | | 4 | | | | 2,672 | |
| Veralto | | | 13 | | | | 1,218 | |
| Verisk Analytics, Cl A | | | 8 | | | | 1,744 | |
| Waste Management | | | 22 | | | | 4,576 | |
| Westinghouse Air Brake Technologies | | | 11 | | | | 1,772 | |
| WW Grainger | | | 3 | | | | 2,764 | |
The accompanying notes are an integral part of the financial statements.
137
| Schedule of Investments | April 30, 2024 (Unaudited) |
Global X S&P 500® Collar 95-110 ETF
| | | | Shares | | | Value | |
| COMMON STOCK — continued | | | | | | | | |
| Industrials — continued | | | | | | | | |
| Xylem | | | 15 | | | $ | 1,960 | |
| | | | | | | | 226,276 | |
| Information Technology — 28.7% | | | | | | | | |
| Accenture PLC, Cl A | | | 38 | | | | 11,435 | |
| Adobe * | | | 28 | | | | 12,959 | |
| Advanced Micro Devices * | | | 98 | | | | 15,521 | |
| Akamai Technologies * | | | 7 | | | | 707 | |
| Amphenol, Cl A | | | 35 | | | | 4,227 | |
| Analog Devices | | | 30 | | | | 6,018 | |
| ANSYS * | | | 5 | | | | 1,624 | |
| Apple | | | 878 | | | | 149,550 | |
| Applied Materials | | | 51 | | | | 10,131 | |
| Arista Networks * | | | 16 | | | | 4,105 | |
| Autodesk * | | | 14 | | | | 2,980 | |
| Broadcom | | | 27 | | | | 35,107 | |
| Cadence Design Systems * | | | 16 | | | | 4,410 | |
| CDW | | | 7 | | | | 1,693 | |
| Cisco Systems | | | 247 | | | | 11,604 | |
| Cognizant Technology Solutions, Cl A | | | 30 | | | | 1,970 | |
| Corning | | | 45 | | | | 1,502 | |
| Enphase Energy * | | | 9 | | | | 979 | |
| EPAM Systems * | | | 3 | | | | 706 | |
| F5 * | | | 4 | | | | 661 | |
| Fair Isaac * | | | 1 | | | | 1,133 | |
| First Solar * | | | 7 | | | | 1,234 | |
| Fortinet * | | | 40 | | | | 2,527 | |
| Gartner * | | | 5 | | | | 2,063 | |
| Gen Digital | | | 36 | | | | 725 | |
| Hewlett Packard Enterprise | | | 81 | | | | 1,377 | |
| HP | | | 52 | | | | 1,461 | |
| Intel | | | 257 | | | | 7,831 | |
| International Business Machines | | | 55 | | | | 9,141 | |
| Intuit | | | 17 | | | | 10,636 | |
| Jabil | | | 7 | | | | 822 | |
| Juniper Networks | | | 18 | | | | 627 | |
| Keysight Technologies * | | | 11 | | | | 1,627 | |
| KLA | | | 8 | | | | 5,514 | |
| Lam Research | | | 8 | | | | 7,155 | |
The accompanying notes are an integral part of the financial statements.
138
| Schedule of Investments | April 30, 2024 (Unaudited) |
Global X S&P 500® Collar 95-110 ETF
| | | | Shares | | | Value | |
| COMMON STOCK — continued | | | | | | | | |
| Information Technology — continued | | | | | | | | |
| Microchip Technology | | | 33 | | | $ | 3,035 | |
| Micron Technology | | | 67 | | | | 7,568 | |
| Microsoft | | | 449 | | | | 174,809 | |
| Monolithic Power Systems | | | 3 | | | | 2,008 | |
| Motorola Solutions | | | 10 | | | | 3,392 | |
| NetApp | | | 12 | | | | 1,227 | |
| NVIDIA | | | 149 | | | | 128,739 | |
| ON Semiconductor * | | | 26 | | | | 1,824 | |
| Oracle | | | 96 | | | | 10,920 | |
| Palo Alto Networks * | | | 18 | | | | 5,236 | |
| PTC * | | | 7 | | | | 1,242 | |
| Qorvo * | | | 4 | | | | 467 | |
| QUALCOMM | | | 68 | | | | 11,278 | |
| Roper Technologies | | | 6 | | | | 3,069 | |
| Salesforce | | | 59 | | | | 15,868 | |
| Seagate Technology Holdings | | | 11 | | | | 945 | |
| ServiceNow * | | | 12 | | | | 8,320 | |
| Skyworks Solutions | | | 9 | | | | 959 | |
| Super Micro Computer * | | | 3 | | | | 2,576 | |
| Synopsys * | | | 9 | | | | 4,775 | |
| TE Connectivity | | | 20 | | | | 2,830 | |
| Teledyne Technologies * | | | 3 | | | | 1,145 | |
| Teradyne | | | 9 | | | | 1,047 | |
| Texas Instruments | | | 55 | | | | 9,703 | |
| Trimble * | | | 15 | | | | 901 | |
| Tyler Technologies * | | | 2 | | | | 923 | |
| VeriSign * | | | 6 | | | | 1,017 | |
| Western Digital * | | | 18 | | | | 1,275 | |
| Zebra Technologies, Cl A * | | | 3 | | | | 944 | |
| | | | | | | | 739,804 | |
| Materials — 2.3% | | | | | | | | |
| Air Products & Chemicals | | | 13 | | | | 3,072 | |
| Albemarle | | | 6 | | | | 722 | |
| Amcor PLC | | | 71 | | | | 635 | |
| Avery Dennison | | | 5 | | | | 1,086 | |
| Ball | | | 16 | | | | 1,113 | |
| Celanese, Cl A | | | 7 | | | | 1,075 | |
| CF Industries Holdings | | | 10 | | | | 790 | |
The accompanying notes are an integral part of the financial statements.
139
| Schedule of Investments | April 30, 2024 (Unaudited) |
Global X S&P 500® Collar 95-110 ETF
| | | | Shares | | | Value | |
| COMMON STOCK — continued | | | | | | | | |
| Materials — continued | | | | | | | | |
| Corteva | | | 45 | | | $ | 2,436 | |
| Dow | | | 43 | | | | 2,447 | |
| DuPont de Nemours | | | 26 | | | | 1,885 | |
| Eastman Chemical | | | 7 | | | | 661 | |
| Ecolab | | | 15 | | | | 3,392 | |
| FMC | | | 9 | | | | 531 | |
| Freeport-McMoRan | | | 87 | | | | 4,345 | |
| International Flavors & Fragrances | | | 15 | | | | 1,270 | |
| International Paper | | | 21 | | | | 734 | |
| Linde PLC | | | 29 | | | | 12,788 | |
| LyondellBasell Industries, Cl A | | | 15 | | | | 1,500 | |
| Martin Marietta Materials | | | 4 | | | | 2,348 | |
| Mosaic | | | 22 | | | | 691 | |
| Newmont | | | 71 | | | | 2,885 | |
| Nucor | | | 15 | | | | 2,528 | |
| Packaging Corp of America | | | 6 | | | | 1,038 | |
| PPG Industries | | | 13 | | | | 1,677 | |
| Sherwin-Williams | | | 14 | | | | 4,194 | |
| Steel Dynamics | | | 10 | | | | 1,301 | |
| Vulcan Materials | | | 9 | | | | 2,319 | |
| Westrock | | | 18 | | | | 863 | |
| | | | | | | | 60,326 | |
| Real Estate — 2.1% | | | | | | | | |
| Alexandria Real Estate Equities ‡ | | | 8 | | | | 927 | |
| American Tower ‡ | | | 29 | | | | 4,975 | |
| AvalonBay Communities ‡ | | | 8 | | | | 1,517 | |
| Boston Properties ‡ | | | 5 | | | | 309 | |
| Camden Property Trust ‡ | | | 4 | | | | 399 | |
| CBRE Group, Cl A * | | | 17 | | | | 1,477 | |
| CoStar Group * | | | 24 | | | | 2,197 | |
| Crown Castle ‡ | | | 25 | | | | 2,344 | |
| Digital Realty Trust ‡ | | | 18 | | | | 2,498 | |
| Equinix ‡ | | | 6 | | | | 4,267 | |
| Equity Residential ‡ | | | 22 | | | | 1,417 | |
| Essex Property Trust ‡ | | | 4 | | | | 985 | |
| Extra Space Storage ‡ | | | 14 | | | | 1,880 | |
| Federal Realty Investment Trust ‡ | | | 3 | | | | 312 | |
| Healthpeak Properties ‡ | | | 36 | | | | 670 | |
The accompanying notes are an integral part of the financial statements.
140
| Schedule of Investments | April 30, 2024 (Unaudited) |
Global X S&P 500® Collar 95-110 ETF
| | | | Shares | | | Value | |
| COMMON STOCK — continued | | | | | | | | |
| Real Estate — continued | | | | | | | | |
| Host Hotels & Resorts ‡ | | | 45 | | | $ | 849 | |
| Invitation Homes ‡ | | | 37 | | | | 1,265 | |
| Iron Mountain ‡ | | | 18 | | | | 1,395 | |
| Kimco Realty ‡ | | | 36 | | | | 671 | |
| Mid-America Apartment Communities ‡ | | | 5 | | | | 650 | |
| ProLogis ‡ | | | 56 | | | | 5,715 | |
| Public Storage ‡ | | | 10 | | | | 2,594 | |
| Realty Income ‡ | | | 51 | | | | 2,731 | |
| Regency Centers ‡ | | | 9 | | | | 533 | |
| SBA Communications, Cl A ‡ | | | 7 | | | | 1,303 | |
| Simon Property Group ‡ | | | 20 | | | | 2,811 | |
| UDR ‡ | | | 18 | | | | 685 | |
| Ventas ‡ | | | 24 | | | | 1,063 | |
| VICI Properties, Cl A ‡ | | | 64 | | | | 1,827 | |
| Welltower ‡ | | | 32 | | | | 3,049 | |
| Weyerhaeuser ‡ | | | 45 | | | | 1,358 | |
| | | | | | | | 54,673 | |
| Utilities — 2.3% | | | | | | | | |
| AES | | | 46 | | | | 824 | |
| Alliant Energy | | | 18 | | | | 896 | |
| Ameren | | | 13 | | | | 960 | |
| American Electric Power | | | 33 | | | | 2,839 | |
| American Water Works | | | 12 | | | | 1,468 | |
| Atmos Energy | | | 7 | | | | 825 | |
| CenterPoint Energy | | | 33 | | | | 962 | |
| CMS Energy | | | 15 | | | | 909 | |
| Consolidated Edison | | | 22 | | | | 2,077 | |
| Constellation Energy | | | 19 | | | | 3,533 | |
| Dominion Energy | | | 53 | | | | 2,702 | |
| DTE Energy | | | 13 | | | | 1,434 | |
| Duke Energy | | | 47 | | | | 4,618 | |
| Edison International | | | 22 | | | | 1,563 | |
| Entergy | | | 14 | | | | 1,493 | |
| Evergy | | | 11 | | | | 577 | |
| Eversource Energy | | | 20 | | | | 1,213 | |
| Exelon | | | 61 | | | | 2,292 | |
| FirstEnergy | | | 31 | | | | 1,189 | |
| NextEra Energy | | | 124 | | | | 8,304 | |
The accompanying notes are an integral part of the financial statements.
141
| Schedule of Investments | April 30, 2024 (Unaudited) |
Global X S&P 500® Collar 95-110 ETF
| | | | Shares | | | Value | |
| COMMON STOCK — continued | | | | | | | | |
| Utilities — continued | | | | | | | | |
| NiSource | | | 27 | | | $ | 752 | |
| NRG Energy | | | 13 | | | | 945 | |
| PG&E | | | 126 | | | | 2,156 | |
| Pinnacle West Capital | | | 7 | | | | 516 | |
| PPL | | | 45 | | | | 1,236 | |
| Public Service Enterprise Group | | | 32 | | | | 2,211 | |
| Sempra | | | 40 | | | | 2,865 | |
| Southern | | | 66 | | | | 4,851 | |
| WEC Energy Group | | | 19 | | | | 1,570 | |
| Xcel Energy | | | 36 | | | | 1,934 | |
| | | | | | | | 59,714 | |
| TOTAL UNITED STATES | | | | | | | 2,550,213 | |
TOTAL COMMON STOCK
(Cost $2,292,045) | | | | | | | 2,554,312 | |
| | | | | | | | | |
PURCHASED OPTIONS — 0.9%
(Cost $27,681) | | | | | | | 22,550 | |
| | | | | | | | | |
TOTAL INVESTMENTS — 99.9%
(Cost $2,319,726) | | | | | | $ | 2,576,862 | |
| | | | | | | | | |
WRITTEN OPTIONS— (0.0)%
(Premiums Received $(4,659)) | | | | | | $ | (300 | ) |
| Percentages are based on Net Assets of $2,580,215 | | | | | | | | |
The accompanying notes are an integral part of the financial statements.
142
| Schedule of Investments | April 30, 2024 (Unaudited) |
Global X S&P 500® Collar 95-110 ETF
A list of the exchange traded option contracts held by the Fund at April 30, 2024, is as follows:
| Description | | Number of
Contracts | | | Notional
Amount | | | Exercise
Price | | | Expiration
Date | | Value | |
| PURCHASED OPTIONS — 0.9% | | | | | | | | | | | | | |
| Put Options | | | | | | | | | | | | | | | | | | |
| Mini-SPX Index | | | 10 | | | $ | 503,570 | | | $ | 488 | | | 06/21/24 | | $ | 4,630 | |
| S&P 500 Index | | | 4 | | | | 2,014,276 | | | | 4,875 | | | 06/21/24 | | | 17,920 | |
| | | | | | | | | | | | | | | | | | | |
| Total Purchased Options | | | | | | $ | 2,517,846 | | | | | | | | | $ | 22,550 | |
| | | | | | | | | | | | | | | | | | | |
| WRITTEN OPTIONS — 0.0% | | | | | | | | | | | | | |
| Call Options | | | | | | | | | | | | | | | | | | |
| Mini-SPX Index | | | (10 | ) | | $ | (503,570 | ) | | $ | 565 | | | 06/21/24 | | $ | (60 | ) |
| S&P 500 Index | | | (4 | ) | | | (2,014,276 | ) | | | 5,650 | | | 06/21/24 | | | (240 | ) |
| | | | | | | | | | | | | | | | | | | |
| Total Written Options | | | | | | $ | (2,517,846 | ) | | | | | | | | $ | (300 | ) |
| * | Non-income producing security. |
| ‡ | Real Estate Investment Trust |
The following is a summary of the level of inputs used as of April 30, 2024, in valuing the Fund’s investments and other financial instruments carried at value:
| Investments in Securities | | Level 1 | | | Level 2 | | | Level 3 | | | Total | |
| Common Stock | | $ | 2,554,312 | | | $ | — | | | $ | — | | | $ | 2,554,312 | |
| Purchased Options | | | 22,550 | | | | — | | | | — | | | | 22,550 | |
| Total Investments in Securities | | $ | 2,576,862 | | | $ | — | | | $ | — | | | $ | 2,576,862 | |
| | | | | | | | | | | | | | | | | |
| Other Financial Instruments | | Level 1 | | | Level 2 | | | Level 3 | | | Total | |
| Written Options | | $ | (300) | | | $ | — | | | $ | — | | | $ | (300) | |
| Total Other Financial Instruments | | $ | (300) | | | $ | — | | | $ | — | | | $ | (300) | |
Amounts designated as “—” are $0 or have been rounded to $0. See “Glossary” for abbreviations.
The accompanying notes are an integral part of the financial statements.
143
| Schedule of Investments | April 30, 2024 (Unaudited) |
Global X Disruptive Materials ETF
Sector Weightings †:

† Sector weightings percentages are based on the total market value of investments. Total investments do not include derivatives such as options, futures contracts, forward contracts, and swap contracts, if applicable.
| | | Shares | | | Value | |
| COMMON STOCK — 99.8% | | | | | | | | |
| AUSTRALIA — 8.8% | | | | | | | | |
| Materials — 8.8% | | | | | | | | |
| IGO | | | 27,138 | | | $ | 139,391 | |
| Lynas Rare Earths * | | | 41,449 | | | | 176,562 | |
| Pilbara Minerals | | | 100,044 | | | | 263,752 | |
| Syrah Resources * | | | 55,020 | | | | 18,757 | |
| | | | | | | | | |
| TOTAL AUSTRALIA | | | | | | | 598,462 | |
| CANADA — 2.4% | | | | | | | | |
| Materials — 2.4% | | | | | | | | |
| HudBay Minerals | | | 16,120 | | | | 135,991 | |
| Lithium Americas * | | | 5,906 | | | | 26,223 | |
| | | | | | | | | |
| TOTAL CANADA | | | | | | | 162,214 | |
| CHILE — 8.5% | | | | | | | | |
| Materials — 8.5% | | | | | | | | |
| Antofagasta | | | 10,406 | | | | 287,959 | |
| Lundin Mining | | | 25,315 | | | | 289,662 | |
| | | | | | | | | |
| TOTAL CHILE | | | | | | | 577,621 | |
| CHINA — 29.0% | | | | | | | | |
| Industrials — 4.4% | | | | | | | | |
| Eve Energy, Cl A | | | 43,800 | | | | 223,259 | |
| Fangda Carbon New Material, Cl A * | | | 113,500 | | | | 79,339 | |
| | | | | | | | 302,598 | |
| Materials — 24.6% | | | | | | | | |
| China Nonferrous Mining | | | 52,500 | | | | 47,995 | |
| China Northern Rare Earth Group High-Tech, Cl A | | | 90,200 | | | | 240,021 | |
The accompanying notes are an integral part of the financial statements.
144
| Schedule of Investments | April 30, 2024 (Unaudited) |
Global X Disruptive Materials ETF
| | | Shares | | | Value | |
| COMMON STOCK — continued | | | | | | | | |
| Materials — continued | | | | | | | | |
| China Rare Earth Resources And Technology, Cl A | | | 28,700 | | | $ | 110,915 | |
| GEM, Cl A | | | 209,300 | | | | 200,846 | |
| KBC, Cl A | | | 5,003 | | | | 25,867 | |
| MMG * | | | 128,300 | | | | 58,727 | |
| Nanjing Hanrui Cobalt, Cl A | | | 10,000 | | | | 39,377 | |
| Shenghe Resources Holding, Cl A | | | 51,800 | | | | 70,205 | |
| Sinofibers Technology, Cl A | | | 11,900 | | | | 40,411 | |
| Tongling Nonferrous Metals Group, Cl A | | | 305,300 | | | | 170,057 | |
| Weihai Guangwei Composites, Cl A | | | 21,660 | | | | 77,795 | |
| Western Mining, Cl A | | | 69,500 | | | | 192,604 | |
| Xiangtan Electrochemical Scientific, Cl A | | | 18,200 | | | | 28,481 | |
| Youngy, Cl A | | | 8,600 | | | | 43,516 | |
| Yunnan Chihong Zinc&Germanium, Cl A | | | 134,200 | | | | 106,206 | |
| Zhejiang Huayou Cobalt, Cl A | | | 55,830 | | | | 219,303 | |
| | | | | | | | 1,672,326 | |
| TOTAL CHINA | | | | | | | 1,974,924 | |
| FRANCE — 0.6% | | | | | | | | |
| Materials — 0.6% | | | | | | | | |
| Eramet | | | 408 | | | | 39,852 | |
| | | | | | | | | |
| GERMANY — 0.3% | | | | | | | | |
| Industrials — 0.3% | | | | | | | | |
| SGL Carbon * | | | 2,885 | | | | 20,761 | |
| | | | | | | | | |
| INDONESIA — 1.1% | | | | | | | | |
| Materials — 1.1% | | | | | | | | |
| Nickel Industries | | | 80,465 | | | | 49,637 | |
| Vale Indonesia | | | 98,442 | | | | 25,731 | |
| | | | | | | | | |
| TOTAL INDONESIA | | | | | | | 75,368 | |
| JAPAN — 5.7% | | | | | | | | |
| Industrials — 0.3% | | | | | | | | |
| Nippon Carbon | | | 531 | | | | 18,795 | |
| | | | | | | | | |
| Materials — 5.4% | | | | | | | | |
| Nippon Denko | | | 8,960 | | | | 17,765 | |
The accompanying notes are an integral part of the financial statements.
145
| Schedule of Investments | April 30, 2024 (Unaudited) |
Global X Disruptive Materials ETF
| | | Shares | | | Value | |
| COMMON STOCK — continued | | | | | | | | |
| Materials — continued | | | | | | | | |
| Sumitomo Metal Mining | | | 8,638 | | | $ | 291,693 | |
| Tokai Carbon | | | 8,691 | | | | 57,934 | |
| | | | | | | | 367,392 | |
| TOTAL JAPAN | | | | | | | 386,187 | |
| JERSEY — 6.3% | | | | | | | | |
| Materials — 6.3% | | | | | | | | |
| Arcadium Lithium * | | | 49,454 | | | | 217,598 | |
| Arcadium Lithium CDI * | | | 49,523 | | | | 216,100 | |
| | | | | | | | | |
| TOTAL JERSEY | | | | | | | 433,698 | |
| MEXICO — 4.2% | | | | | | | | |
| Materials — 4.2% | | | | | | | | |
| Southern Copper | | | 2,467 | | | | 287,825 | |
| | | | | | | | | |
| NETHERLANDS — 0.5% | | | | | | | | |
| Materials — 0.5% | | | | | | | | |
| AMG Critical Materials | | | 1,392 | | | | 32,923 | |
| | | | | | | | | |
| SOUTH AFRICA — 13.9% | | | | | | | | |
| Materials — 13.9% | | | | | | | | |
| African Rainbow Minerals | | | 4,802 | | | | 50,030 | |
| Anglo American Platinum | | | 2,620 | | | | 92,047 | |
| Anglo American PLC | | | 10,901 | | | | 359,531 | |
| Impala Platinum Holdings | | | 41,514 | | | | 186,768 | |
| Northam Platinum Holdings | | | 16,370 | | | | 108,750 | |
| Sibanye Stillwater | | | 129,776 | | | | 149,993 | |
| | | | | | | | | |
| TOTAL SOUTH AFRICA | | | | | | | 947,119 | |
| SWEDEN — 4.6% | | | | | | | | |
| Materials — 4.6% | | | | | | | | |
| Boliden | | | 9,354 | | | | 313,706 | |
| | | | | | | | | |
| UNITED STATES — 9.5% | | | | | | | | |
| Industrials — 0.3% | | | | | | | | |
| GrafTech International | | | 12,431 | | | | 21,381 | |
The accompanying notes are an integral part of the financial statements.
146
| Schedule of Investments | April 30, 2024 (Unaudited) |
Global X Disruptive Materials ETF
| | | Shares | | | Value | |
| COMMON STOCK — continued | | | | | | | | |
| Materials — 9.2% | | | | | | | | |
| Albemarle | | | 2,047 | | | $ | 246,275 | |
| Freeport-McMoRan | | | 5,537 | | | | 276,518 | |
| MP Materials * | | | 6,573 | | | | 105,168 | |
| | | | | | | | 627,961 | |
| TOTAL UNITED STATES | | | | | | | 649,342 | |
| ZAMBIA — 4.4% | | | | | | | | |
| Materials — 4.4% | | | | | | | | |
| First Quantum Minerals | | | 23,505 | | | | 299,063 | |
| | | | | | | | | |
TOTAL COMMON STOCK
(Cost $7,823,178) | | | | | | | 6,799,065 | |
TOTAL INVESTMENTS — 99.8%
(Cost $7,823,178) | | | | | | $ | 6,799,065 | |
Percentages are based on Net Assets of $6,812,853.
| * | Non-income producing security. |
As of April 30, 2024, all of the Fund’s investments were considered Level 1, in accordance with authoritative guidance on fair value measurements and disclosure under U.S. GAAP.
Amounts designated as “—” are $0 or have been rounded to $0.
See “Glossary” for abbreviations.
The accompanying notes are an integral part of the financial statements.
147
| Schedule of Investments | April 30, 2024 (Unaudited) |
Glossary (abbreviations which may be used in preceding Schedule of Investments):
Fund Abbreviations
ADR — American Depositary Receipt
Cl — Class
CME — Chicago Mercantile Exchange
ETF — Exchange-Traded Fund
GDR — Global Depositary Receipt
H15T5Y — U.S. Treasury Yield Curve Rate T Note Constant Maturity 5 Year
NVDR — Non-Voting Depositary Receipt
PJSC — Public Joint-Stock Company
PLC — Public Limited Company
REIT — Real Estate Investment Trust
S&P— Standard & Poor’s
SOFR — Secured Overnight Financing Rate
TSFR3M — Term Secured Overnight Financing Rate 3 Month
USD — U.S. Dollar
US0003M — 3 Month USD Swap Rate
148
Statements of Assets and Liabilities
April 30, 2024 (Unaudited)
| | | Global X Lithium
& Battery Tech
ETF | | | Global X
SuperDividend®
ETF | | | Global X Social
Media ETF | | | Global X Guru®
Index ETF | |
| Assets: | | | | | | | | | | | | | | | | |
| Cost of Investments | | $ | 1,932,308,269 | | | $ | 811,276,604 | | | $ | 189,486,946 | | | $ | 39,999,994 | |
| Cost of Repurchase Agreement | | | 83,900,651 | | | | 32,683,224 | | | | 1,521,256 | | | | 515,800 | |
| Cost (Proceeds) of Foreign Currency | | | 2,299,838 | | | | 1,200,607 | | | | — | | | | — | |
| Investments, at Value | | $ | 1,574,045,945 | * | | $ | 754,207,799 | * | | $ | 138,473,458 | * | | $ | 40,489,047 | * |
| Repurchase Agreement, at Value | | | 83,900,651 | | | | 32,683,224 | | | | 1,521,256 | | | | 515,800 | |
| Cash | | | 1,543,123 | | | | 2,937,770 | | | | — | | | | 15,557 | |
| Foreign Currency, at Value | | | 2,299,357 | | | | 1,204,539 | | | | — | | | | — | |
| Receivable for Investment Securities Sold | | | 134,314,105 | | | | — | | | | 10,074,904 | | | | — | |
| Dividend, Interest, and Securities Lending Income Receivable | | | 1,858,476 | | | | 4,175,821 | | | | 81,283 | | | | 12,052 | |
| Reclaim Receivable | | | 39,259 | | | | 894,999 | | | | 5,490 | | | | 687 | |
| Unrealized Appreciation on Spot Contracts | | | — | | | | — | | | | 127 | | | | — | |
| Receivable for Capital Shares Sold | | | — | | | | — | | | | 2,055,043 | | | | — | |
| Total Assets | | | 1,798,000,916 | | | | 796,104,152 | | | | 152,211,561 | | | | 41,033,143 | |
| Liabilities: | | | | | | | | | | | | | | | | |
| Obligation to Return Securities Lending Collateral | | | 99,713,840 | | | | 32,683,224 | | | | 1,521,256 | | | | 613,016 | |
| Payable for Investment Securities Purchased | | | 128,958,944 | | | | 1,732,302 | | | | 5,752,282 | | | | — | |
| Payable for Capital Shares Redeemed | | | 7,957,341 | | | | — | | | | 6,158,109 | | | | — | |
| Payable due to Investment Adviser | | | 971,742 | | | | 356,560 | | | | 78,208 | | | | 25,332 | |
| Unrealized Depreciation on Spot Contracts | | | 40,979 | | | | 12,827 | | | | — | | | | — | |
| Payable for Income Distributions | | | — | | | | — | | | | 38 | | | | — | |
| Payable for Variation Margin on Futures Contracts | | | — | | | | 93,060 | | | | — | | | | — | |
| Cash Overdraft | | | — | | | | — | | | | 58,793 | | | | — | |
| Total Liabilities | | | 237,642,846 | | | | 34,877,973 | | | | 13,568,686 | | | | 638,348 | |
| Net Assets | | $ | 1,560,358,070 | | | $ | 761,226,179 | | | $ | 138,642,875 | | | $ | 40,394,795 | |
| Net Assets Consist of: | | | | | | | | | | | | | | | | |
| Paid-in Capital | | $ | 2,824,906,115 | | | $ | 1,740,608,427 | | | $ | 306,185,385 | | | $ | 55,206,173 | |
| Total Accumulated Losses | | | (1,264,548,045 | ) | | | (979,382,248 | ) | | | (167,542,510 | ) | | | (14,811,378 | ) |
| Net Assets | | $ | 1,560,358,070 | | | $ | 761,226,179 | | | $ | 138,642,875 | | | $ | 40,394,795 | |
| Outstanding Shares of Beneficial Interest (unlimited authorization — no par value) | | | 35,304,628 | | | | 35,179,412 | | | | 3,400,000 | | | | 980,000 | |
| Net Asset Value, Offering and Redemption Price Per Share | | $ | 44.20 | | | $ | 21.64 | | | $ | 40.78 | | | $ | 41.22 | |
| *Includes Market Value of Securities on Loan | | $ | 96,214,633 | | | $ | 35,558,121 | | | $ | 1,427,310 | | | $ | 580,894 | |
The accompanying notes are an integral part of the financial statements.
149
Statements of Assets and Liabilities
April 30, 2024 (Unaudited)
| | | Global X
SuperIncome™
Preferred ETF | | | Global X
SuperDividend®
U.S. ETF | | | Global X MSCI
SuperDividend®
Emerging
Markets ETF | | | Global X
SuperDividend®
REIT ETF | |
| Assets: | | | | | | | | | | | | | | | | |
| Cost of Investments | | $ | 156,610,803 | | | $ | 574,884,558 | | | $ | 44,278,102 | | | $ | 228,107,553 | |
| Cost of Repurchase Agreement | | | 7,655,486 | | | | 10,774,744 | | | | — | | | | — | |
| Cost (Proceeds) of Foreign Currency | | | — | | | | (2,309 | ) | | | 43,233 | | | | (153,601 | ) |
| Investments, at Value | | $ | 151,285,154 | * | | $ | 609,596,850 | * | | $ | 45,541,577 | | | $ | 206,044,047 | |
| Repurchase Agreement, at Value | | | 7,655,486 | | | | 10,774,744 | | | | — | | | | — | |
| Cash | | | 301,679 | | | | 388,324 | | | | 64,484 | | | | 1,106,542 | |
| Foreign Currency, at Value | | | — | | | | — | | | | 43,968 | | | | — | |
| Receivable for Investment Securities Sold | | | 2,264,998 | | | | — | | | | — | | | | 5,323,903 | |
| Dividend, Interest, and Securities Lending Income Receivable | | | 187,239 | | | | 2,012,171 | | | | 212,656 | | | | 1,066,673 | |
| Reclaim Receivable | | | — | | | | 8,115 | | | | — | | | | 245,736 | |
| Total Assets | | | 161,694,556 | | | | 622,780,204 | | | | 45,862,685 | | | | 213,786,901 | |
| Liabilities: | | | | | | | | | | | | | | | | |
| Obligation to Return Securities Lending Collateral | | | 9,098,355 | | | | 10,774,744 | | | | — | | | | — | |
| Payable for Capital Shares Redeemed | | | 2,277,867 | | | | — | | | | — | | | | 2,922,374 | |
| Payable due to Investment Adviser | | | 62,022 | | | | 224,698 | | | | 24,348 | | | | 99,666 | |
| Payable for Investment Securities Purchased | | | — | | | | — | | | | — | | | | 3,970,857 | |
| Accrued Foreign Capital Gains Tax on Appreciated Securities | | | — | | | | — | | | | 125,971 | | | | — | |
| Payable for Variation Margin on Futures Contracts | | | — | | | | — | | | | 715 | | | | — | |
| Overdraft of Foreign Currency | | | — | | | | 2,281 | | | | — | | | | 102,120 | |
| Total Liabilities | | | 11,438,244 | | | | 11,001,723 | | | | 151,034 | | | | 7,095,017 | |
| Net Assets | | $ | 150,256,312 | | | $ | 611,778,481 | | | $ | 45,711,651 | | | $ | 206,691,884 | |
| Net Assets Consist of: | | | | | | | | | | | | | | | | |
| Paid-in Capital | | $ | 261,127,700 | | | $ | 809,937,916 | | | $ | 75,374,696 | | | $ | 527,067,767 | |
| Total Accumulated Losses | | | (110,871,388 | ) | | | (198,159,435 | ) | | | (29,663,045 | ) | | | (320,375,883 | ) |
| Net Assets | | $ | 150,256,312 | | | $ | 611,778,481 | | | $ | 45,711,651 | | | $ | 206,691,884 | |
| Outstanding Shares of Beneficial Interest (unlimited authorization — no par value) | | | 16,660,000 | | | | 35,730,000 | | | | 1,779,181 | | | | 10,609,193 | |
| Net Asset Value, Offering and Redemption Price Per Share | | $ | 9.02 | | | $ | 17.12 | | | $ | 25.69 | | | $ | 19.48 | |
| *Includes Market Value of Securities on Loan | | $ | 8,785,171 | | | $ | 10,170,192 | | | $ | — | | | $ | — | |
The accompanying notes are an integral part of the financial statements.
150
Statements of Assets and Liabilities
April 30, 2024 (Unaudited)
| | | Global X
Renewable
Energy Producers
ETF | | | Global X S&P
500® Catholic
Values ETF | | | Global X MSCI
SuperDividend®
EAFE ETF | | | Global X
E-commerce ETF | |
| Assets: | | | | | | | | | | | | | | | | |
| Cost of Investments | | $ | 69,911,584 | | | $ | 607,677,565 | | | $ | 11,264,143 | | | $ | 78,990,141 | |
| Cost of Repurchase Agreement | | | 2,142,060 | | | | — | | | | — | | | | 2,514,190 | |
| Cost (Proceeds) of Foreign Currency | | | 1,269 | | | | — | | | | 24,291 | | | | — | |
| Investments, at Value | | $ | 37,907,756 | * | | $ | 802,883,239 | | | $ | 11,279,469 | | | $ | 69,796,892 | * |
| Repurchase Agreement, at Value | | | 2,142,060 | | | | — | | | | — | | | | 2,514,190 | |
| Cash | | | — | | | | 1,000,993 | | | | 2,863 | | | | 106,563 | |
| Foreign Currency, at Value | | | 1,254 | | | | — | | | | 24,291 | | | | — | |
| Reclaim Receivable | | | 102,892 | | | | 3,809 | | | | 86,508 | | | | — | |
| Dividend, Interest, and Securities Lending Income Receivable | | | 66,928 | | | | 489,512 | | | | 124,966 | | | | 16,165 | |
| Unrealized Appreciation on Spot Contracts | | | — | | | | — | | | | 41 | | | | — | |
| Receivable for Capital Shares Sold | | | — | | | | 1,236,987 | | | | — | | | | — | |
| Receivable for Investment Securities Sold | | | — | | | | — | | | | 7,567 | | | | — | |
| Due from Broker | | | — | | | | 34 | | | | — | | | | — | |
| Total Assets | | | 40,220,890 | | | | 805,614,574 | | | | 11,525,705 | | | | 72,433,810 | |
| Liabilities: | | | | | | | | | | | | | | | | |
| Obligation to Return Securities Lending Collateral | | | 2,142,060 | | | | — | | | | — | | | | 2,514,190 | |
| Payable due to Investment Adviser | | | 20,419 | | | | 193,631 | | | | 5,052 | | | | 29,534 | |
| Payable for Investment Securities Purchased | | | — | | | | 1,237,297 | | | | 7,553 | | | | — | |
| Cash Overdraft | | | 31,313 | | | | — | | | | — | | | | — | |
| Total Liabilities | | | 2,193,792 | | | | 1,430,928 | | | | 12,605 | | | | 2,543,724 | |
| Net Assets | | $ | 38,027,098 | | | $ | 804,183,646 | | | $ | 11,513,100 | | | $ | 69,890,086 | |
| Net Assets Consist of: | | | | | | | | | | | | | | | | |
| Paid-in Capital | | $ | 88,349,351 | | | $ | 610,375,610 | | | $ | 13,765,623 | | | $ | 117,782,363 | |
| Total Distributable Earnings (Accumulated Losses) | | | (50,322,253 | ) | | | 193,808,036 | | | | (2,252,523 | ) | | | (47,892,277 | ) |
| Net Assets | | $ | 38,027,098 | | | $ | 804,183,646 | | | $ | 11,513,100 | | | $ | 69,890,086 | |
| Outstanding Shares of Beneficial Interest (unlimited authorization — no par value) | | | 3,970,000 | | | | 13,220,000 | | | | 800,000 | | | | 3,060,002 | |
| Net Asset Value, Offering and Redemption Price Per Share | | $ | 9.58 | | | $ | 60.83 | | | $ | 14.39 | | | $ | 22.84 | |
| *Includes Market Value of Securities on Loan | | $ | 2,172,911 | | | $ | — | | | $ | — | | | $ | 2,477,820 | |
The accompanying notes are an integral part of the financial statements.
151
Statements of Assets and Liabilities
April 30, 2024 (Unaudited)
| | | Global X S&P
Catholic Values
Developed ex-
U.S. ETF | | | Global X
NASDAQ 100®
Tail Risk ETF | | | Global X
NASDAQ 100®
Collar 95-110
ETF | | | Global X S&P
500® Tail Risk
ETF | |
| Assets: | | | | | | | | | | | | | | | | |
| Cost of Investments | | $ | 15,677,877 | | | $ | 2,335,520 | | | $ | 1,518,357 | | | $ | 2,836,630 | |
| Cost (Proceeds) of Foreign Currency | | | 8,193 | | | | — | | | | — | | | | — | |
| Investments, at Value | | $ | 17,597,725 | | | $ | 2,407,227 | | | $ | 1,634,893 | | | $ | 3,143,586 | |
| Cash | | | 24,151 | | | | 4,125 | | | | 10,130 | | | | 2,198 | |
| Foreign Currency, at Value | | | 8,193 | | | | — | | | | — | | | | — | |
| Dividend, Interest, and Securities Lending Income Receivable | | | 67,126 | | | | 172 | | | | 164 | | | | 1,870 | |
| Reclaim Receivable | | | 19,111 | | | | — | | | | — | | | | 15 | |
| Receivable for Investment Securities Sold | | | 3,660 | | | | — | | | | — | | | | — | |
| Total Assets | | | 17,719,966 | | | | 2,411,524 | | | | 1,645,187 | | | | 3,147,669 | |
| Liabilities: | | | | | | | | | | | | | | | | |
| Payable for Investment Securities Purchased | | | 36,927 | | | | — | | | | — | | | | — | |
| Payable due to Investment Adviser | | | 5,094 | | | | 505 | | | | 493 | | | | 647 | |
| Unrealized Depreciation on Spot Contracts | | | 68 | | | | — | | | | — | | | | — | |
| Options Written at Value (Premiums received $–, $–, $2,712 and $–, respectively) | | | — | | | | — | | | | 529 | | | | — | |
| Custodian Fees Payable | | | — | | | | — | | | | 3 | | | | — | |
| Total Liabilities | | | 42,089 | | | | 505 | | | | 1,025 | | | | 647 | |
| Net Assets | | $ | 17,677,877 | | | $ | 2,411,019 | | | $ | 1,644,162 | | | $ | 3,147,022 | |
| Net Assets Consist of: | | | | | | | | | | | | | | | | |
| Paid-in Capital | | $ | 16,111,476 | | | $ | 2,719,642 | | | $ | 1,655,253 | | | $ | 3,055,486 | |
| Total Distributable Earnings (Accumulated Losses) | | | 1,566,401 | | | | (308,623 | ) | | | (11,091 | ) | | | 91,536 | |
| Net Assets | | $ | 17,677,877 | | | $ | 2,411,019 | | | $ | 1,644,162 | | | $ | 3,147,022 | |
| Outstanding Shares of Beneficial Interest (unlimited authorization — no par value) | | | 580,000 | | | | 90,000 | | | | 60,000 | | | | 110,000 | |
| Net Asset Value, Offering and Redemption Price Per Share | | $ | 30.48 | | | $ | 26.79 | | | $ | 27.40 | | | $ | 28.61 | |
The accompanying notes are an integral part of the financial statements.
152
Statements of Assets and Liabilities
April 30, 2024 (Unaudited)
| | | Global X S&P
500® Collar 95-
110 ETF | | | Global X
Disruptive
Materials ETF | |
| Assets: | | | | | | | | |
| Cost of Investments | | $ | 2,319,726 | | | $ | 7,823,178 | |
| Cost (Proceeds) of Foreign Currency | | | — | | | | 3,928 | |
| Investments, at Value | | $ | 2,576,862 | | | $ | 6,799,065 | |
| Cash | | | 2,647 | | | | 698 | |
| Foreign Currency, at Value | | | — | | | | 3,928 | |
| Dividend, Interest, and Securities Lending Income Receivable | | | 1,532 | | | | 10,643 | |
| Reclaim Receivable | | | 12 | | | | 1,729 | |
| Unrealized Appreciation on Spot Contracts | | | — | | | | 17 | |
| Total Assets | | | 2,581,053 | | | | 6,816,080 | |
| Liabilities: | | | | | | | | |
| Payable due to Investment Adviser | | | 537 | | | | 3,224 | |
| Options Written at Value (Premiums received $4,659 and $–, respectively) | | | 300 | | | | — | |
| Custodian Fees Payable | | | 1 | | | | 3 | |
| Total Liabilities | | | 838 | | | | 3,227 | |
| Net Assets | | $ | 2,580,215 | | | $ | 6,812,853 | |
| Net Assets Consist of: | | | | | | | | |
| Paid-in Capital | | $ | 2,526,617 | | | $ | 9,574,676 | |
| Total Distributable Earnings (Accumulated Losses) | | | 53,598 | | | | (2,761,823 | ) |
| Net Assets | | $ | 2,580,215 | | | $ | 6,812,853 | |
| Outstanding Shares of Beneficial Interest (unlimited authorization — no par value) | | | 90,000 | | | | 420,000 | |
| Net Asset Value, Offering and Redemption Price Per Share | | $ | 28.67 | | | $ | 16.22 | |
The accompanying notes are an integral part of the financial statements.
153
Statements of Operations
For the period ended April 30, 2024 (Unaudited)
| | | Global X
Lithium &
Battery Tech
ETF | | Global X
SuperDividend®
ETF | | Global X Social
Media ETF | | Global X Guru®
Index ETF |
| Investment Income: | | | | | | | | | | | | | | | | |
| Dividend Income | | $ | 8,583,111 | | | $ | 29,020,649 | | | $ | 309,387 | | | $ | 256,216 | |
| Interest Income | | | 151,465 | | | | 61,091 | | | | 5,125 | | | | 3,065 | |
| Security Lending Income | | | 3,261,473 | | | | 807,084 | | | | 38,831 | | | | 70,469 | |
| Less: Foreign Taxes Withheld | | | (1,267,046 | ) | | | (890,370 | ) | | | (10,258 | ) | | | (393 | ) |
| Total Investment Income | | | 10,729,003 | | | | 28,998,454 | | | | 343,085 | | | | 329,357 | |
| Expenses: | | | | | | | | | | | | | | | | |
| Supervision and Administration Fees(1) | | | 6,838,699 | | | | 2,151,408 | | | | 503,141 | | | | 170,368 | |
| Custodian Fees(2) | | | 25,190 | | | | 571 | | | | 675 | | | | 86 | |
| Total Expenses | | | 6,863,889 | | | | 2,151,979 | | | | 503,816 | | | | 170,454 | |
| Waiver of Supervision and Administration Fees | | | — | | | | (571 | ) | | | — | | | | — | |
| Net Expenses | | | 6,863,889 | | | | 2,151,408 | | | | 503,816 | | | | 170,454 | |
| Net Investment Income (Loss) | | | 3,865,114 | | | | 26,847,046 | | | | (160,731 | ) | | | 158,903 | |
| Net Realized Gain (Loss) on: | | | | | | | | | | | | | | | | |
| Investments(3) | | | (109,739,542 | ) | | | (15,448,995 | ) | | | (7,329,465 | ) | | | 5,734,939 | |
| Futures Contracts | | | — | | | | 311,473 | | | | — | | | | — | |
| Foreign Currency Transactions | | | (240,925 | ) | | | (347,400 | ) | | | (4,600 | ) | | | — | |
| Net Realized Gain (Loss) | | | (109,980,467 | ) | | | (15,484,922 | ) | | | (7,334,065 | ) | | | 5,734,939 | |
| Net Change in Unrealized Appreciation (Depreciation) on: | | | | | | | | | | | | | | | | |
| Investments | | | (4,689,550 | ) | | | 76,310,957 | | | | 31,355,562 | | | | 3,041,214 | |
| Futures Contracts | | | — | | | | (159,578 | ) | | | — | | | | — | |
| Foreign Currency Translations | | | 37,911 | | | | 15,241 | | | | (1,746 | ) | | | — | |
| Net Change in Unrealized Appreciation (Depreciation) | | | (4,651,639 | ) | | | 76,166,620 | | | | 31,353,816 | | | | 3,041,214 | |
| Net Realized and Unrealized Gain (Loss) | | | (114,632,106 | ) | | | 60,681,698 | | | | 24,019,751 | | | | 8,776,153 | |
| Net Increase (Decrease) in Net Assets Resulting from Operations | | $ | (110,766,992 | ) | | $ | 87,528,744 | | | $ | 23,859,020 | | | $ | 8,935,056 | |
| (1) | The Supervision and Administration fees includes fees paid by the Funds for the investment advisory services provided by the Adviser. (See Note 3 in Notes to Financial Statements.) |
| (2) | See Note 2 in the Notes to Financial Statements. |
| (3) | Includes realized gains (losses) as a result of in-kind redemptions. (See Note 4 in Notes to Financial Statements.) |
The accompanying notes are an integral part of the financial statements.
154
Statements of Operations
For the period ended April 30, 2024 (Unaudited)
| | | Global X
SuperIncome™
Preferred ETF | | Global X
SuperDividend®
U.S. ETF | | Global X MSCI
SuperDividend®
Emerging
Markets ETF | | Global X
SuperDividend®
REIT ETF |
| Investment Income: | | | | | | | | | | | | | | | | |
| Dividend Income | | $ | 5,218,504 | | | $ | 12,557,290 | | | $ | 1,257,538 | | | $ | 8,500,732 | |
| Interest Income | | | 14,170 | | | | 24,003 | | | | 1,563 | | | | 8,791 | |
| Security Lending Income | | | 25,829 | | | | 7,524 | | | | 261 | | | | — | |
| Less: Foreign Taxes Withheld | | | — | | | | — | | | | (165,093 | ) | | | (519,481 | ) |
| Total Investment Income | | | 5,258,503 | | | | 12,588,817 | | | | 1,094,269 | | | | 7,990,042 | |
| Expenses: | | | | | | | | | | | | | | | | |
| Supervision and Administration Fees(1) | | | 393,153 | | | | 1,353,483 | | | | 145,682 | | | | 660,503 | |
| Custodian Fees(2) | | | 733 | | | | 16,104 | | | | 2,108 | | | | 5,877 | |
| Total Expenses | | | 393,886 | | | | 1,369,587 | | | | 147,790 | | | | 666,380 | |
| Net Investment Income | | | 4,864,617 | | | | 11,219,230 | | | | 946,479 | | | | 7,323,662 | |
| Net Realized Gain (Loss) on: | | | | | | | | | | | | | | | | |
| Investments(3) | | | 1,374,639 | | | | (24,789,552 | ) | | | 123,506 | | | | (38,428,860 | ) |
| Foreign Currency Transactions | | | — | | | | (4 | ) | | | (154,969 | ) | | | (71,749 | ) |
| Foreign Capital Gains Tax | | | — | | | | — | | | | 5,575 | | | | — | |
| Net Realized Gain (Loss) | | | 1,374,639 | | | | (24,789,556 | ) | | | (25,888 | ) | | | (38,500,609 | ) |
| Net Change in Unrealized Appreciation (Depreciation) on: | | | | | | | | | | | | | | | | |
| Investments | | | 14,943,685 | | | | 90,036,048 | | | | 6,778,214 | | | | 50,763,600 | |
| Futures Contracts | | | — | | | | — | | | | (854 | ) | | | — | |
| Foreign Capital Gains Tax on Appreciated Securities | | | — | | | | — | | | | (95,106 | ) | | | — | |
| Foreign Currency Translations | | | — | | | | 28 | | | | (3,790 | ) | | | 51,973 | |
| Net Change in Unrealized Appreciation (Depreciation) | | | 14,943,685 | | | | 90,036,076 | | | | 6,678,464 | | | | 50,815,573 | |
| Net Realized and Unrealized Gain (Loss) | | | 16,318,324 | | | | 65,246,520 | | | | 6,652,576 | | | | 12,314,964 | |
| Net Increase in Net Assets Resulting from Operations | | $ | 21,182,941 | | | $ | 76,465,750 | | | $ | 7,599,055 | | | $ | 19,638,626 | |
| (1) | The Supervision and Administration fees includes fees paid by the Funds for the investment advisory services provided by the Adviser. (See Note 3 in Notes to Financial Statements.) |
| (2) | See Note 2 in the Notes to Financial Statements. |
| (3) | Includes realized gains (losses) as a result of in-kind redemptions. (See Note 4 in Notes to Financial Statements.) |
The accompanying notes are an integral part of the financial statements.
155
Statements of Operations
For the period ended April 30, 2024 (Unaudited)
| | | Global X
Renewable
Energy
Producers ETF | | Global X S&P
500® Catholic
Values ETF | | Global X MSCI
SuperDividend®
EAFE ETF | | Global X
E-commerce
ETF |
| Investment Income: | | | | | | | | | | | | | | | | |
| Dividend Income | | $ | 125,275 | | | $ | 5,803,579 | | | $ | 315,713 | | | $ | 322,024 | |
| Interest Income | | | 70,791 | | | | 20,409 | | | | 259 | | | | 1,316 | |
| Security Lending Income | | | 7,988 | | | | — | | | | — | | | | 18,829 | |
| Less: Foreign Taxes Withheld | | | (32,490 | ) | | | (1,543 | ) | | | (31,954 | ) | | | (1,726 | ) |
| Total Investment Income | | | 171,564 | | | | 5,822,445 | | | | 284,018 | | | | 340,443 | |
| Expenses: | | | | | | | | | | | | | | | | |
| Supervision and Administration Fees(1) | | | 139,360 | | | | 1,127,288 | | | | 29,010 | | | | 181,099 | |
| Custodian Fees(2) | | | 740 | | | | 680 | | | | 301 | | | | 63 | |
| Total Expenses | | | 140,100 | | | | 1,127,968 | | | | 29,311 | | | | 181,162 | |
| Net Investment Income | | | 31,464 | | | | 4,694,477 | | | | 254,707 | | | | 159,281 | |
| Net Realized Gain (Loss) on: | | | | | | | | | | | | | | | | |
| Investments(3) | | | (5,126,190 | ) | | | 8,362,029 | | | | 241,344 | | | | (12,541,777 | ) |
| Foreign Currency Transactions | | | (8,073 | ) | | | — | | | | (753 | ) | | | (949 | ) |
| Net Realized Gain (Loss) | | | (5,134,263 | ) | | | 8,362,029 | | | | 240,591 | | | | (12,542,726 | ) |
| Net Change in Unrealized Appreciation (Depreciation) on: | | | | | | | | | | | | | | | | |
| Investments | | | 7,268,399 | | | | 124,023,062 | | | | 1,105,354 | | | | 33,396,572 | |
| Foreign Currency Translations | | | 1,459 | | | | — | | | | 753 | | | | — | |
| Net Change in Unrealized Appreciation (Depreciation) | | | 7,269,858 | | | | 124,023,062 | | | | 1,106,107 | | | | 33,396,572 | |
| Net Realized and Unrealized Gain (Loss) | | | 2,135,595 | | | | 132,385,091 | | | | 1,346,698 | | | | 20,853,846 | |
| Net Increase in Net Assets Resulting from Operations | | $ | 2,167,059 | | | $ | 137,079,568 | | | $ | 1,601,405 | | | $ | 21,013,127 | |
| (1) | The Supervision and Administration fees includes fees paid by the Funds for the investment advisory services provided by the Adviser. (See Note 3 in Notes to Financial Statements.) |
| (2) | See Note 2 in the Notes to Financial Statements. |
| (3) | Includes realized gains (losses) as a result of in-kind redemptions. (See Note 4 in Notes to Financial Statements.) |
The accompanying notes are an integral part of the financial statements.
156
Statements of Operations
For the period ended April 30, 2024 (Unaudited)
| | | Global X S&P
Catholic Values
Developed ex-
U.S. ETF | | Global X
NASDAQ 100®
Tail Risk ETF | | Global X
NASDAQ 100®
Collar 95-110
ETF | | Global X S&P
500® Tail Risk
ETF |
| Investment Income: | | | | | | | | | | | | | | | | |
| Dividend Income | | $ | 254,164 | | | $ | 8,542 | | | $ | 11,698 | | | $ | 20,920 | |
| Interest Income | | | 596 | | | | 42 | | | | 76 | | | | 85 | |
| Less: Foreign Taxes Withheld | | | (26,726 | ) | | | (20 | ) | | | (24 | ) | | | (5 | ) |
| Total Investment Income | | | 228,034 | | | | 8,564 | | | | 11,750 | | | | 21,000 | |
| Expenses: | | | | | | | | | | | | | | | | |
| Supervision and Administration Fees(1) | | | 29,602 | | | | 2,294 | | | | 2,985 | | | | 3,506 | |
| Custodian Fees(2) | | | 27 | | | | — | | | | 31 | | | | (12 | ) |
| Total Expenses | | | 29,629 | | | | 2,294 | | | | 3,016 | | | | 3,494 | |
| Net Investment Income | | | 198,405 | | | | 6,270 | | | | 8,734 | | | | 17,506 | |
| Net Realized Gain (Loss) on: | | | | | | | | | | | | | | | | |
| Investments(3) | | | (67,522 | ) | | | 36,369 | | | | 111,065 | | | | (4,154 | ) |
| Purchased Options | | | — | | | | (24,580 | ) | | | (69,200 | ) | | | (25,088 | ) |
| Written Options | | | — | | | | — | | | | 33,560 | | | | — | |
| Foreign Currency Transactions | | | 115 | | | | — | | | | — | | | | — | |
| Net Realized Gain (Loss) | | | (67,407 | ) | | | 11,789 | | | | 75,425 | | | | (29,242 | ) |
| Net Change in Unrealized Appreciation (Depreciation) on: | | | | | | | | | | | | | | | | |
| Investments | | | 2,662,542 | | | | 224,205 | | | | 317,465 | | | | 474,697 | |
| Purchased Options | | | — | | | | (15,249 | ) | | | (27,148 | ) | | | (15,894 | ) |
| Written Options | | | — | | | | — | | | | (10,247 | ) | | | — | |
| Foreign Currency Translations | | | (778 | ) | | | — | | | | — | | | | — | |
| Net Change in Unrealized Appreciation (Depreciation) | | | 2,661,764 | | | | 208,956 | | | | 280,070 | | | | 458,803 | |
| Net Realized and Unrealized Gain (Loss) | | | 2,594,357 | | | | 220,745 | | | | 355,495 | | | | 429,561 | |
| Net Increase in Net Assets Resulting from Operations | | $ | 2,792,762 | | | $ | 227,015 | | | $ | 364,229 | | | $ | 447,067 | |
| (1) | The Supervision and Administration fees includes fees paid by the Funds for the investment advisory services provided by the Adviser. (See Note 3 in Notes to Financial Statements.) |
| (2) | See Note 2 in the Notes to Financial Statements. |
| (3) | Includes realized gains (losses) as a result of in-kind redemptions. (See Note 4 in Notes to Financial Statements.) |
The accompanying notes are an integral part of the financial statements.
157
Statements of Operations
For the period ended April 30, 2024 (Unaudited)
| | | Global X S&P
500® Collar 95-
110 ETF | | Global X
Disruptive
Materials ETF |
| Investment Income: | | | | | | | | |
| Dividend Income | | $ | 18,505 | | | $ | 41,808 | |
| Interest Income | | | 76 | | | | 497 | |
| Less: Foreign Taxes Withheld | | | (5 | ) | | | (3,952 | ) |
| Total Investment Income | | | 18,576 | | | | 38,353 | |
| Expenses: | | | | | | | | |
| Supervision and Administration Fees(1) | | | 3,112 | | | | 19,451 | |
| Custodian Fees(2) | | | (2 | ) | | | 3 | |
| Registration Fees | | | — | | | | 85 | |
| Total Expenses | | | 3,110 | | | | 19,539 | |
| Net Investment Income | | | 15,466 | | | | 18,814 | |
| Net Realized Gain (Loss) on: | | | | | | | | |
| Investments(3) | | | (2,649 | ) | | | (594,759 | ) |
| Purchased Options | | | (42,112 | ) | | | — | |
| Written Options | | | 4,690 | | | | — | |
| Foreign Currency Transactions | | | — | | | | (889 | ) |
| Net Realized Gain (Loss) | | | (40,071 | ) | | | (595,648 | ) |
| Net Change in Unrealized Appreciation (Depreciation) on: | | | | | | | | |
| Investments | | | 436,352 | | | | 1,471,423 | |
| Purchased Options | | | (36,562 | ) | | | — | |
| Written Options | | | 1,964 | | | | — | |
| Foreign Currency Translations | | | — | | | | (78 | ) |
| Net Change in Unrealized Appreciation (Depreciation) | | | 401,754 | | | | 1,471,345 | |
| Net Realized and Unrealized Gain (Loss) | | | 361,683 | | | | 875,697 | |
| Net Increase in Net Assets Resulting from Operations | | $ | 377,149 | | | $ | 894,511 | |
| (1) | The Supervision and Administration fees includes fees paid by the Funds for the investment advisory services provided by the Adviser. (See Note 3 in Notes to Financial Statements.) |
| (2) | See Note 2 in the Notes to Financial Statements. |
| (3) | Includes realized gains (losses) as a result of in-kind redemptions. (See Note 4 in Notes to Financial Statements.) |
The accompanying notes are an integral part of the financial statements.
158
Statements of Changes in Net Assets
| | | Global X Lithium & Battery Tech
ETF | | Global X SuperDividend® ETF |
| | | Period Ended
April 30, 2024
(Unaudited) | | | Year Ended
October 31, 2023 | | | Period Ended
April 30, 2024
(Unaudited) | | | Year Ended
October 31,
2023‡ | |
| Operations: | | | | | | | | | | | | | | | | |
| Net Investment Income | | $ | 3,865,114 | | | $ | 30,111,235 | | | $ | 26,847,046 | | | $ | 68,823,124 | |
| Net Realized Gain (Loss) | | | (109,980,467 | ) | | | (290,890,467 | ) | | | (15,484,922 | ) | | | (178,018,530 | ) |
| Net Change in Unrealized Appreciation (Depreciation) | | | (4,651,639 | ) | | | (678,297,668 | ) | | | 76,166,620 | | | | 101,559,825 | |
| Net Increase (Decrease) in Net Assets Resulting from Operations | | | (110,766,992 | ) | | | (939,076,900 | ) | | | 87,528,744 | | | | (7,635,581 | ) |
| Distributions: | | | (14,541,383 | ) | | | (38,976,032 | ) | | | (42,715,171 | ) | | | (71,554,165 | ) |
| Return of Capital: | | | — | | | | — | | | | — | | | | (17,865,200 | ) |
| Capital Share Transactions: | | | | | | | | | | | | | | | | |
| Issued | | | 98,088,330 | | | | 18,655,425 | | | | 26,372,086 | | | | 134,701,260 | |
| Redeemed | | | (508,212,530 | ) | | | (844,321,195 | ) | | | (9,070,110 | ) | | | (14,814,220 | ) |
| Increase (Decrease) in Net Assets from Capital Share Transactions | | | (410,124,200 | ) | | | (825,665,770 | ) | | | 17,301,976 | | | | 119,887,040 | |
| Total Increase (Decrease) in Net Assets | | | (535,432,575 | ) | | | (1,803,718,702 | ) | | | 62,115,549 | | | | 22,832,094 | |
| Net Assets: | | | | | | | | | | | | | | | | |
| Beginning of Year/Period | | | 2,095,790,645 | | | | 3,899,509,347 | | | | 699,110,630 | | | | 676,278,536 | |
| End of Year/Period | | $ | 1,560,358,070 | | | $ | 2,095,790,645 | | | $ | 761,226,179 | | | $ | 699,110,630 | |
| Share Transactions: | | | | | | | | | | | | | | | | |
| Issued | | | 2,050,000 | | | | 270,000 | | | | 1,240,000 | | | | 5,620,000 | |
| Redeemed | | | (11,030,000 | ) | | | (14,070,000 | ) | | | (400,000 | ) | | | (613,921 | ) |
| Net Increase (Decrease) in Shares Outstanding from Share Transactions | | | (8,980,000 | ) | | | (13,800,000 | ) | | | 840,000 | | | | 5,006,079 | |
| | |
| ‡ | Share transactions have been adjusted to reflect the effect of a 1 for 3 reverse share split on December 19, 2022 (See Note 9 in the Notes to Financial Statements). |
The accompanying notes are an integral part of the financial statements.
159
Statements of Changes in Net Assets
| | | Global X Social Media ETF | | Global X Guru® Index ETF |
| | | Period Ended
April 30, 2024
(Unaudited) | | | Year Ended
October 31, 2023 | | | Period Ended
April 30, 2024
(Unaudited) | | | Year Ended
October 31,
2023 | |
| Operations: | | | | | | | | | | | | | | | | |
| Net Investment Income (Loss) | | $ | (160,731 | ) | | $ | 726,536 | | | $ | 158,903 | | | $ | 163,577 | |
| Net Realized Gain (Loss) | | | (7,334,065 | ) | | | (23,504,299 | ) | | | 5,734,939 | | | | (2,729,202 | ) |
| Net Change in Unrealized Appreciation (Depreciation) | | | 31,353,816 | | | | 64,247,712 | | | | 3,041,214 | | | | 3,924,121 | |
| Net Increase in Net Assets Resulting from Operations | | | 23,859,020 | | | | 41,469,949 | | | | 8,935,056 | | | | 1,358,496 | |
| Distributions: | | | (221,844 | ) | | | (696,865 | ) | | | (211,405 | ) | | | (140,340 | ) |
| Return of Capital: | | | — | | | | — | | | | — | | | | (13,339 | ) |
| Capital Share Transactions: | | | | | | | | | | | | | | | | |
| Issued | | | 14,207,442 | | | | 50,133,051 | | | | 19,072,665 | | | | — | |
| Redeemed | | | (39,598,739 | ) | | | (53,754,585 | ) | | | (29,158,769 | ) | | | (5,982,656 | ) |
| Decrease in Net Assets from Capital Share Transactions | | | (25,391,297 | ) | | | (3,621,534 | ) | | | (10,086,104 | ) | | | (5,982,656 | ) |
| Total Increase (Decrease) in Net Assets | | | (1,754,121 | ) | | | 37,151,550 | | | | (1,362,453 | ) | | | (4,777,839 | ) |
| Net Assets: | | | | | | | | | | | | | | | | |
| Beginning of Year/Period | | | 140,396,996 | | | | 103,245,446 | | | | 41,757,248 | | | | 46,535,087 | |
| End of Year/Period | | $ | 138,642,875 | | | $ | 140,396,996 | | | $ | 40,394,795 | | | $ | 41,757,248 | |
| Share Transactions: | | | | | | | | | | | | | | | | |
| Issued | | | 350,000 | | | | 1,400,000 | | | | 480,000 | | | | — | |
| Redeemed | | | (990,000 | ) | | | (1,510,000 | ) | | | (720,000 | ) | | | (170,000 | ) |
| Net Decrease in Shares Outstanding from Share Transactions | | | (640,000 | ) | | | (110,000 | ) | | | (240,000 | ) | | | (170,000 | ) |
The accompanying notes are an integral part of the financial statements.
160
Statements of Changes in Net Assets
| | | Global X SuperIncome™ Preferred
ETF | | Global X SuperDividend® U.S. ETF |
| | | Period Ended
April 30, 2024
(Unaudited) | | | Year Ended
October 31, 2023 | | | Period Ended
April 30, 2024
(Unaudited) | | | Year Ended
October 31, 2023 | |
| Operations: | | | | | | | | | | | | | | | | |
| Net Investment Income | | $ | 4,864,617 | | | $ | 12,482,160 | | | $ | 11,219,230 | | | $ | 24,850,832 | |
| Net Realized Gain (Loss) | | | 1,374,639 | | | | (35,344,694 | ) | | | (24,789,556 | ) | | | (40,314,161 | ) |
| Net Change in Unrealized Appreciation (Depreciation) | | | 14,943,685 | | | | 4,801,453 | | | | 90,036,076 | | | | (69,852,699 | ) |
| Net Increase (Decrease) in Net Assets Resulting from Operations | | | 21,182,941 | | | | (18,061,081 | ) | | | 76,465,750 | | | | (85,316,028 | ) |
| Distributions: | | | (5,209,497 | ) | | | (12,843,440 | ) | | | (21,202,380 | ) | | | (32,670,182 | ) |
| Return of Capital: | | | — | | | | — | | | | — | | | | (12,029,058 | ) |
| Capital Share Transactions: | | | | | | | | | | | | | | | | |
| Issued | | | — | | | | 28,847,405 | | | | 18,999,168 | | | | 151,410,242 | |
| Redeemed | | | (23,207,231 | ) | | | (35,612,035 | ) | | | (53,383,557 | ) | | | (114,359,782 | ) |
| Increase (Decrease) in Net Assets from Capital Share Transactions | | | (23,207,231 | ) | | | (6,764,630 | ) | | | (34,384,389 | ) | | | 37,050,460 | |
| Total Increase (Decrease) in Net Assets | | | (7,233,787 | ) | | | (37,669,151 | ) | | | 20,878,981 | | | | (92,964,808 | ) |
| Net Assets: | | | | | | | | | | | | | | | | |
| Beginning of Year/Period | | | 157,490,099 | | | | 195,159,250 | | | | 590,899,500 | | | | 683,864,308 | |
| End of Year/Period | | $ | 150,256,312 | | | $ | 157,490,099 | | | $ | 611,778,481 | | | $ | 590,899,500 | |
| Share Transactions: | | | | | | | | | | | | | | | | |
| Issued | | | — | | | | 2,990,000 | | | | 1,130,000 | | | | 8,650,000 | |
| Redeemed | | | (2,530,000 | ) | | | (3,980,000 | ) | | | (3,220,000 | ) | | | (6,490,000 | ) |
| Net Increase (Decrease) in Shares Outstanding from Share Transactions | | | (2,530,000 | ) | | | (990,000 | ) | | | (2,090,000 | ) | | | 2,160,000 | |
The accompanying notes are an integral part of the financial statements.
161
Statements of Changes in Net Assets
| | | Global X MSCI SuperDividend®
Emerging Markets ETF | | Global X SuperDividend® REIT
ETF |
| | | Period Ended
April 30, 2024
(Unaudited) | | | Year Ended
October 31,
2023‡ | | | Period Ended
April 30, 2024
(Unaudited) | | | Year Ended
October 31,
2023‡ | |
| Operations: | | | | | | | | | | | | | | | | |
| Net Investment Income | | $ | 946,479 | | | $ | 3,538,333 | | | $ | 7,323,662 | | | $ | 15,816,112 | |
| Net Realized Gain (Loss) | | | (25,888 | ) | | | (7,396,703 | ) | | | (38,500,609 | ) | | | (30,591,783 | ) |
| Net Change in Unrealized Appreciation (Depreciation) | | | 6,678,464 | | | | 9,203,211 | | | | 50,815,573 | | | | 769,596 | |
| Net Increase (Decrease) in Net Assets Resulting from Operations | | | 7,599,055 | | | | 5,344,841 | | | | 19,638,626 | | | | (14,006,075 | ) |
| Distributions: | | | (1,722,222 | ) | | | (3,319,170 | ) | | | (8,867,512 | ) | | | (13,547,728 | ) |
| Return of Capital: | | | — | | | | — | | | | — | | | | (6,960,250 | ) |
| Capital Share Transactions: | | | | | | | | | | | | | | | | |
| Issued | | | 252,087 | | | | 2,345,719 | | | | 4,433,503 | | | | 15,653,093 | |
| Redeemed | | | (1,991,170 | ) | | | (1,965,623 | ) | | | (26,165,845 | ) | | | (50,140,564 | ) |
| Increase (Decrease) in Net Assets from Capital Share Transactions | | | (1,739,083 | ) | | | 380,096 | | | | (21,732,342 | ) | | | (34,487,471 | ) |
| Total Increase (Decrease) in Net Assets | | | 4,137,750 | | | | 2,405,767 | | | | (10,961,228 | ) | | | (69,001,524 | ) |
| Net Assets: | | | | | | | | | | | | | | | | |
| Beginning of Year/Period | | | 41,573,901 | | | | 39,168,134 | | | | 217,653,112 | | | | 286,654,636 | |
| End of Year/Period | | $ | 45,711,651 | | | $ | 41,573,901 | | | $ | 206,691,884 | | | $ | 217,653,112 | |
| Share Transactions: | | | | | | | | | | | | | | | | |
| Issued | | | 10,000 | | | | 96,667 | | | | 230,000 | | | | 740,000 | |
| Redeemed | | | (80,000 | ) | | | (80,819 | ) | | | (1,280,000 | ) | | | (2,324,140 | ) |
| Net Increase (Decrease) in Shares Outstanding from Share Transactions | | | (70,000 | ) | | | 15,848 | | | | (1,050,000 | ) | | | (1,584,140 | ) |
‡ Share transactions have been adjusted to reflect the effect of a 1 for 3 reverse share split on December 19, 2022 (See Note 9 in the Notes to Financial Statements).
The accompanying notes are an integral part of the financial statements.
162
Statements of Changes in Net Assets
| | | Global X Renewable Energy
Producers ETF | | Global X S&P 500® Catholic Values
ETF |
| | | Period Ended
April 30, 2024
(Unaudited) | | | Year Ended
October 31, 2023 | | | Period Ended
April 30, 2024
(Unaudited) | | | Year Ended
October 31, 2023 | |
| Operations: | | | | | | | | | | | | | | | | |
| Net Investment Income | | $ | 31,464 | | | $ | 845,464 | | | $ | 4,694,477 | | | $ | 8,138,111 | |
| Net Realized Gain (Loss) | | | (5,134,263 | ) | | | (9,862,211 | ) | | | 8,362,029 | | | | 11,684,291 | |
| Net Change in Unrealized Appreciation (Depreciation) | | | 7,269,858 | | | | (10,198,855 | ) | | | 124,023,062 | | | | 30,978,489 | |
| Net Increase (Decrease) in Net Assets Resulting from Operations | | | 2,167,059 | | | | (19,215,602 | ) | | | 137,079,568 | | | | 50,800,891 | |
| Distributions: | | | (357,729 | ) | | | (839,231 | ) | | | (5,390,628 | ) | | | (7,699,184 | ) |
| Capital Share Transactions: | | | | | | | | | | | | | | | | |
| Issued | | | — | | | | 2,633,738 | | | | 24,332,140 | | | | 119,238,821 | |
| Redeemed | | | (7,578,919 | ) | | | (29,751,744 | ) | | | (23,634,627 | ) | | | (39,830,981 | ) |
| Increase (Decrease) in Net Assets from Capital Share Transactions | | | (7,578,919 | ) | | | (27,118,006 | ) | | | 697,513 | | | | 79,407,840 | |
| Total Increase (Decrease) in Net Assets | | | (5,769,589 | ) | | | (47,172,839 | ) | | | 132,386,453 | | | | 122,509,547 | |
| Net Assets: | | | | | | | | | | | | | | | | |
| Beginning of Year/Period | | | 43,796,687 | | | | 90,969,526 | | | | 671,797,193 | | | | 549,287,646 | |
| End of Year/Period | | $ | 38,027,098 | | | $ | 43,796,687 | | | $ | 804,183,646 | | | $ | 671,797,193 | |
| Share Transactions: | | | | | | | | | | | | | | | | |
| Issued | | | — | | | | 200,000 | | | | 420,000 | | | | 2,350,000 | |
| Redeemed | | | (740,000 | ) | | | (2,460,000 | ) | | | (400,000 | ) | | | (790,000 | ) |
| Net Increase (Decrease) in Shares Outstanding from Share Transactions | | | (740,000 | ) | | | (2,260,000 | ) | | | 20,000 | | | | 1,560,000 | |
The accompanying notes are an integral part of the financial statements.
163
Statements of Changes in Net Assets
| | | Global X MSCI SuperDividend®
EAFE ETF | | Global X E-commerce ETF |
| | | Period Ended
April 30, 2024
(Unaudited) | | | Year Ended
October 31, 2023 | | | Period Ended
April 30, 2024
(Unaudited) | | | Year Ended
October 31, 2023 | |
| Operations: | | | | | | | | | | | | | | | | |
| Net Investment Income (Loss) | | $ | 254,707 | | | $ | 638,408 | | | $ | 159,281 | | | $ | (11,415 | ) |
| Net Realized Gain (Loss) | | | 240,591 | | | | (834,267 | ) | | | (12,542,726 | ) | | | (17,240,809 | ) |
| Net Change in Unrealized Appreciation (Depreciation) | | | 1,106,107 | | | | 1,357,260 | | | | 33,396,572 | | | | 20,074,893 | |
| Net Increase in Net Assets Resulting from Operations | | | 1,601,405 | | | | 1,161,401 | | | | 21,013,127 | | | | 2,822,669 | |
| Distributions: | | | (371,156 | ) | | | (736,065 | ) | | | — | | | | — | |
| Return of Capital: | | | — | | | | — | | | | — | | | | (42,666 | ) |
| Capital Share Transactions: | | | | | | | | | | | | | | | | |
| Issued | | | 3,047,960 | | | | 3,052,141 | | | | — | | | | 33,960,916 | |
| Redeemed | | | (2,847,085 | ) | | | (1,779,069 | ) | | | (13,191,586 | ) | | | (16,912,892 | ) |
| Increase (Decrease) in Net Assets from Capital Share Transactions | | | 200,875 | | | | 1,273,072 | | | | (13,191,586 | ) | | | 17,048,024 | |
| Total Increase in Net Assets | | | 1,431,124 | | | | 1,698,408 | | | | 7,821,541 | | | | 19,828,027 | |
| Net Assets: | | | | | | | | | | | | | | | | |
| Beginning of Year/Period | | | 10,081,976 | | | | 8,383,568 | | | | 62,068,545 | | | | 42,240,518 | |
| End of Year/Period | | $ | 11,513,100 | | | $ | 10,081,976 | | | $ | 69,890,086 | | | $ | 62,068,545 | |
| Share Transactions: | | | | | | | | | | | | | | | | |
| Issued | | | 210,000 | | | | 220,000 | | | | — | | | | 1,830,000 | |
| Redeemed | | | (200,000 | ) | | | (130,000 | ) | | | (600,000 | ) | | | (960,000 | ) |
| Net Increase (Decrease) in Shares Outstanding from Share Transactions | | | 10,000 | | | | 90,000 | | | | (600,000 | ) | | | 870,000 | |
The accompanying notes are an integral part of the financial statements.
164
Statements of Changes in Net Assets
| | | Global X S&P Catholic Values
Developed ex-U.S. ETF | | Global X NASDAQ 100® Tail Risk
ETF |
| | | Period Ended
April 30, 2024
(Unaudited) | | | Year Ended
October 31, 2023 | | | Period Ended
April 30, 2024
(Unaudited) | | | Year Ended
October 31, 2023 | |
| Operations: | | | | | | | | | | | | | | | | |
| Net Investment Income | | $ | 198,405 | | | $ | 343,263 | | | $ | 6,270 | | | $ | 5,298 | |
| Net Realized Gain (Loss) | | | (67,407 | ) | | | (309,284 | ) | | | 11,789 | | | | (265,723 | ) |
| Net Change in Unrealized Appreciation (Depreciation) | | | 2,661,764 | | | | 257,408 | | | | 208,956 | | | | 517,504 | |
| Net Increase in Net Assets Resulting from Operations | | | 2,792,762 | | | | 291,387 | | | | 227,015 | | | | 257,079 | |
| Distributions: | | | (184,613 | ) | | | (253,178 | ) | | | (5,326 | ) | | | (4,771 | ) |
| Capital Share Transactions: | | | | | | | | | | | | | | | | |
| Issued | | | 585,113 | | | | 8,854,084 | | | | 1,328,808 | | | | — | |
| Redeemed | | | — | | | | — | | | | (501,847 | ) | | | (797,923 | ) |
| Increase (Decrease) in Net Assets from Capital Share Transactions | | | 585,113 | | | | 8,854,084 | | | | 826,961 | | | | (797,923 | ) |
| Total Increase (Decrease) in Net Assets | | | 3,193,262 | | | | 8,892,293 | | | | 1,048,650 | | | | (545,615 | ) |
| Net Assets: | | | | | | | | | | | | | | | | |
| Beginning of Year/Period | | | 14,484,615 | | | | 5,592,322 | | | | 1,362,369 | | | | 1,907,984 | |
| End of Year/Period | | $ | 17,677,877 | | | $ | 14,484,615 | | | $ | 2,411,019 | | | $ | 1,362,369 | |
| Share Transactions: | | | | | | | | | | | | | | | | |
| Issued | | | 20,000 | | | | 320,000 | | | | 50,000 | | | | — | |
| Redeemed | | | — | | | | — | | | | (20,000 | ) | | | (40,000 | ) |
| Net Increase (Decrease) in Shares Outstanding from Share Transactions | | | 20,000 | | | | 320,000 | | | | 30,000 | | | | (40,000 | ) |
The accompanying notes are an integral part of the financial statements.
165
Statements of Changes in Net Assets
| | | Global X NASDAQ 100® Collar
95-110 ETF | | Global X S&P 500® Tail Risk ETF |
| | | Period Ended
April 30, 2024
(Unaudited) | | | Year Ended
October 31, 2023 | | | Period Ended
April 30, 2024
(Unaudited) | | | Year Ended
October 31, 2023 | |
| Operations: | | | | | | | | | | | | |
| Net Investment Income | | $ | 8,734 | | | $ | 9,816 | | | $ | 17,506 | | | $ | 32,283 | |
| Net Realized Gain (Loss) | | | 75,425 | | | | (679,364 | ) | | | (29,242 | ) | | | (119,231 | ) |
| Net Change in Unrealized Appreciation (Depreciation) | | | 280,070 | | | | 881,750 | | | | 458,803 | | | | 292,159 | |
| Net Increase in Net Assets Resulting from Operations | | | 364,229 | | | | 212,202 | | | | 447,067 | | | | 205,211 | |
| Distributions: | | | (8,449 | ) | | | (8,877 | ) | | | (19,285 | ) | | | (32,745 | ) |
| Capital Share Transactions: | | | | | | | | | | | | | | | | |
| Issued | | | — | | | | — | | | | 295,892 | | | | — | |
| Redeemed | | | (823,652 | ) | | | (1,171,831 | ) | | | — | | | | (766,526 | ) |
| Increase (Decrease) in Net Assets from Capital Share Transactions | | | (823,652 | ) | | | (1,171,831 | ) | | | 295,892 | | | | (766,526 | ) |
| Total Increase (Decrease) in Net Assets | | | (467,872 | ) | | | (968,506 | ) | | | 723,674 | | | | (594,060 | ) |
| Net Assets: | | | | | | | | | | | | | | | | |
| Beginning of Year/Period | | | 2,112,034 | | | | 3,080,540 | | | | 2,423,348 | | | | 3,017,408 | |
| End of Year/Period | | $ | 1,644,162 | | | $ | 2,112,034 | | | $ | 3,147,022 | | | $ | 2,423,348 | |
| Share Transactions: | | | | | | | | | | | | | | | | |
| Issued | | | — | | | | — | | | | 10,000 | | | | — | |
| Redeemed | | | (30,000 | ) | | | (50,000 | ) | | | — | | | | (30,000 | ) |
| Net Increase (Decrease) in Shares Outstanding from Share Transactions | | | (30,000 | ) | | | (50,000 | ) | | | 10,000 | | | | (30,000 | ) |
The accompanying notes are an integral part of the financial statements.
166
Statements of Changes in Net Assets
| | | Global X S&P 500® Collar 95-110
ETF | | Global X Disruptive Materials ETF |
| | | Period Ended
April 30, 2024
(Unaudited) | | | Year Ended
October 31, 2023 | | | Period Ended
April 30, 2024
(Unaudited) | | | Year Ended
October 31, 2023 | |
| Operations: | | | | | | | | | | | | | | | | |
| Net Investment Income | | $ | 15,466 | | | $ | 36,472 | | | $ | 18,814 | | | $ | 101,617 | |
| Net Realized Gain (Loss) | | | (40,071 | ) | | | (287,823 | ) | | | (595,648 | ) | | | (861,308 | ) |
| Net Change in Unrealized Appreciation (Depreciation) | | | 401,754 | | | | 370,100 | | | | 1,471,345 | | | | (1,250,478 | ) |
| Net Increase (Decrease) in Net Assets Resulting from Operations | | | 377,149 | | | | 118,749 | | | | 894,511 | | | | (2,010,169 | ) |
| Distributions: | | | (18,097 | ) | | | (40,011 | ) | | | (57,314 | ) | | | (77,885 | ) |
| Capital Share Transactions: | | | | | | | | | | | | | | | | |
| Issued | | | — | | | | — | | | | 564,397 | | | | 6,774,401 | |
| Redeemed | | | — | | | | (1,772,256 | ) | | | (2,272,588 | ) | | | (435,664 | ) |
| Increase (Decrease) in Net Assets from Capital Share Transactions | | | — | | | | (1,772,256 | ) | | | (1,708,191 | ) | | | 6,338,737 | |
| Total Increase (Decrease) in Net Assets | | | 359,052 | | | | (1,693,518 | ) | | | (870,994 | ) | | | 4,250,683 | |
| Net Assets: | | | | | | | | | | | | | | | | |
| Beginning of Year/Period | | | 2,221,163 | | | | 3,914,681 | | | | 7,683,847 | | | | 3,433,164 | |
| End of Year/Period | | $ | 2,580,215 | | | $ | 2,221,163 | | | $ | 6,812,853 | | | $ | 7,683,847 | |
| Share Transactions: | | | | | | | | | | | | | | | | |
| Issued | | | — | | | | — | | | | 40,000 | | | | 370,000 | |
| Redeemed | | | — | | | | (70,000 | ) | | | (160,000 | ) | | | (20,000 | ) |
| Net Increase (Decrease) in Shares Outstanding from Share Transactions | | | — | | | | (70,000 | ) | | | (120,000 | ) | | | 350,000 | |
The accompanying notes are an integral part of the financial statements.
167
Page intentionally left blank.
168
Financial Highlights
| Selected Per Share Data & Ratios |
| For a Share Outstanding Throughout the Period |
| | | Net
Asset Value,
Beginning
of Period
($) | | Net Investment
Income (Loss)
($)* | | Net Realized
and Unrealized
Gain (Loss) on
Investments
($) | | Total from
Operations
($) | | Distribution
from Net
Investment
Income ($) | | Distribution
from Capital
Gains ($) | | Return of
Capital ($) |
| Global X Lithium & Battery Tech ETF | | | | | | | | | | | | | | | | | | | | | | | | | | | | |
| 2024 (Unaudited) | | | 47.33 | | | | 0.10 | | | | (2.87 | ) | | | (2.77 | ) | | | (0.36 | ) | | | — | | | | — | |
| 2023 | | | 67.13 | | | | 0.58 | | | | (19.66 | ) | | | (19.08 | ) | | | (0.72 | ) | | | — | | | | — | |
| 2022 | | | 91.07 | | | | 0.26 | | | | (23.99 | ) | | | (23.73 | ) | | | (0.21 | ) | | | — | | | | — | |
| 2021 | | | 42.86 | | | | 0.12 | | | | 48.21 | | | | 48.33 | | | | (0.12 | ) | | | — | | | | — | |
| 2020 | | | 25.04 | | | | 0.40 | | | | 17.86 | | | | 18.26 | | | | (0.44 | ) | | | — | | | | — | |
| 2019 | | | 30.32 | | | | 0.48 | | | | (4.86 | ) | | | (4.38 | ) | | | (0.90 | ) | | | — | | | | — | |
| Global X SuperDividend® ETF | | | | | | | | | | | | | | | | | | | | | | | | | | | | |
| 2024 (Unaudited) | | | 20.36 | | | | 0.78 | | | | 1.74 | | | | 2.52 | | | | (1.24 | ) | | | — | | | | — | |
| 2023(1) | | | 23.05 | | | | 2.11 | | | | (2.02 | ) | | | 0.09 | | | | (2.22 | ) | | | — | | | | (0.56 | ) |
| 2022(1) | | | 39.03 | | | | 2.31 | | | | (14.68 | ) | | | (12.37 | ) | | | (2.65 | ) | | | — | | | | (0.96 | ) |
| 2021(1) | | | 31.83 | | | | 2.82 | | | | 7.38 | | | | 10.20 | | | | (3.00 | ) | | | — | | | | — | |
| 2020(1) | | | 51.75 | | | | 2.58 | | | | (19.02 | ) | | | (16.44 | ) | | | (3.12 | ) | | | — | | | | (0.36 | ) |
| 2019(1) | | | 57.18 | | | | 3.72 | | | | (4.41 | ) | | | (0.69 | ) | | | (4.14 | ) | | | — | | | | (0.60 | ) |
| Global X Social Media ETF | | | | | | | | | | | | | | | | | | | | | | | | | | | | |
| 2024 (Unaudited) | | | 34.75 | | | | (0.04 | ) | | | 6.12 | | | | 6.08 | | | | (0.05 | ) | | | — | | | | — | |
| 2023 | | | 24.88 | | | | 0.19 | | | | 9.87 | | | | 10.06 | | | | (0.19 | ) | | | — | | | | — | |
| 2022 | | | 61.26 | | | | 0.03 | | | | (36.29 | ) | | | (36.26 | ) | | | — | | | | — | | | | (0.12 | ) |
| 2021 | | | 51.95 | | | | (0.31 | ) | | | 9.62 | | | | 9.31 | | | | — | | | | — | | | | — | |
| 2020 | | | 31.92 | | | | (0.11 | ) | | | 20.14 | | | | 20.03 | | | | — | | | | — | | | | — | |
| 2019 | | | 29.10 | | | | (0.10 | ) | | | 2.92 | | | | 2.82 | | | | — | | | | — | | | | — | |
| * | Per share data calculated using average shares method. |
| ** | Total Return is for the period indicated and has not been annualized. The return shown does not reflect the deduction of taxes that a shareholder would pay on Fund distributions or the redemption of Fund shares. |
| † | Annualized. |
| †† | Portfolio turnover rate is for the period indicated and periods of less than one year have not been annualized. Excludes effect of in-kind transfers. |
| (1) | Per share amounts have been adjusted for a 1 for 3 reverse share split on December 19, 2022 (See Note 9 in the Notes to Financial Statements.) |
Amounts designated as “—” are either $0 or have been rounded to $0.
The accompanying notes are an integral part of the financial statements.
169
Financial Highlights
Total from
Distributions ($) | | Net
Asset Value,
End of
Period ($) | | Total
Return
(%)** | | Net Assets, End of
Period ($)(000) | | Ratio of Expenses
to Average Net
Assets (%) | | Ratio of Net
Investment Income
(Loss) to Average
Net Assets (%) | | Portfolio
Turnover (%)†† |
| | | | | | | | | | | | | | | | | | | | | | | | | | | |
| | (0.36) | | | | 44.20 | | | | (5.95 | ) | | | 1,560,358 | | | | 0.75 | † | | | 0.42 | † | | | 10.48 | |
| | (0.72) | | | | 47.33 | | | | (28.63 | ) | | | 2,095,791 | | | | 0.75 | | | | 0.92 | | | | 19.76 | |
| | (0.21) | | | | 67.13 | | | | (26.10 | ) | | | 3,899,509 | | | | 0.75 | | | | 0.33 | | | | 38.73 | |
| | (0.12) | | | | 91.07 | | | | 112.89 | | | | 5,375,399 | | | | 0.75 | | | | 0.17 | | | | 39.09 | |
| | (0.44) | | | | 42.86 | | | | 73.82 | | | | 868,894 | | | | 0.75 | | | | 1.30 | | | | 65.14 | |
| | (0.90) | | | | 25.04 | | | | (14.61 | ) | | | 455,124 | | | | 0.75 | | | | 1.75 | | | | 35.28 | |
| | | | | | | | | | | | | | | | | | | | | | | | | | | |
| | (1.24) | | | | 21.64 | | | | 12.57 | | | | 761,226 | | | | 0.58 | † | | | 7.24 | † | | | 54.48 | |
| | (2.78) | | | | 20.36 | | | | (0.31 | ) | | | 699,111 | | | | 0.58 | | | | 9.18 | | | | 91.59 | |
| | (3.61) | | | | 23.05 | | | | (33.80 | ) | | | 676,279 | | | | 0.61 | | | | 7.39 | | | | 91.10 | |
| | (3.00) | | | | 39.03 | | | | 32.21 | | | | 930,431 | | | | 0.58 | | | | 6.98 | | | | 82.37 | |
| | (3.48) | | | | 31.83 | | | | (32.80 | ) | | | 626,871 | | | | 0.59 | | | | 6.62 | | | | 124.55 | |
| | (4.74) | | | | 51.75 | | | | (1.02 | ) | | | 932,111 | | | | 0.59 | | | | 7.03 | | | | 56.85 | |
| | | | | | | | | | | | | | | | | | | | | | | | | | | |
| | (0.05) | | | | 40.78 | | | | 17.51 | | | | 138,643 | | | | 0.65 | † | | | (0.21 | )† | | | 9.56 | |
| | (0.19) | | | | 34.75 | | | | 40.40 | | | | 140,397 | | | | 0.65 | | | | 0.53 | | | | 29.09 | |
| | (0.12) | | | | 24.88 | | | | (59.24 | ) | | | 103,245 | | | | 0.65 | | | | 0.06 | | | | 21.59 | |
| | — | | | | 61.26 | | | | 17.94 | | | | 401,893 | | | | 0.65 | | | | (0.48 | ) | | | 30.89 | |
| | — | | | | 51.95 | | | | 62.75 | | | | 225,999 | | | | 0.65 | | | | (0.28 | ) | | | 19.23 | |
| | — | | | | 31.92 | | | | 9.69 | | | | 121,289 | | | | 0.65 | | | | (0.33 | ) | | | 16.92 | |
The accompanying notes are an integral part of the financial statements.
170
Financial Highlights
| Selected Per Share Data & Ratios |
| For a Share Outstanding Throughout the Period |
| | | Net
Asset Value,
Beginning
of Period
($) | | Net Investment
Income
($)* | | Net Realized
and Unrealized
Gain (Loss) on
Investments
($) | | Total from
Operations
($) | | Distribution
from Net
Investment
Income ($) | | Distribution
from Capital
Gains ($) | | Return of
Capital ($) |
| Global X Guru® Index ETF | | | | | | | | | | | | | | | | | | | | | | | | | | | | |
| 2024 (Unaudited) | | | 34.23 | | | | 0.14 | | | | 7.03 | | | | 7.17 | | | | (0.18 | ) | | | — | | | | — | |
| 2023 | | | 33.48 | | | | 0.12 | | | | 0.75 | | | | 0.87 | | | | (0.11 | ) | | | — | | | | (0.01 | ) |
| 2022 | | | 50.24 | | | | 0.01 | | | | (16.72 | ) | | | (16.71 | ) | | | (0.01 | ) | | | — | | | | (0.04 | ) |
| 2021 | | | 37.31 | | | | 0.69 | | | | 13.14 | | | | 13.83 | | | | (0.90 | ) | | | — | | | | — | |
| 2020 | | | 34.02 | | | | 0.33 | | | | 3.32 | | | | 3.65 | | | | (0.34 | ) | | | — | | | | (0.02 | ) |
| 2019 | | | 30.09 | | | | 0.12 | | | | 4.02 | | | | 4.14 | | | | (0.17 | ) | | | — | | | | (0.04 | ) |
| Global X SuperIncome™ Preferred ETF | | | | | | | | | | | | | | | | | | | | | | | | | | | | |
| 2024 (Unaudited) | | | 8.21 | | | | 0.27 | | | | 0.83 | | | | 1.10 | | | | (0.29 | ) | | | — | | | | — | |
| 2023 | | | 9.67 | | | | 0.60 | | | | (1.44 | ) | | | (0.84 | ) | | | (0.62 | ) | | | — | | | | — | |
| 2022 | | | 11.94 | | | | 0.54 | | | | (2.13 | ) | | | (1.59 | ) | | | (0.65 | ) | | | — | | | | (0.03 | ) |
| 2021 | | | 11.12 | | | | 0.61 | | | | 0.89 | | | | 1.50 | | | | (0.68 | ) | | | — | | | | — | |
| 2020 | | | 11.73 | | | | 0.60 | | | | (0.53 | ) | | | 0.07 | | | | (0.65 | ) | | | — | | | | (0.03 | ) |
| 2019 | | | 11.49 | | | | 0.66 | | | | 0.32 | | | | 0.98 | | | | (0.73 | ) | | | — | | | | (0.01 | ) |
| Global X SuperDividend® U.S. ETF | | | | | | | | | | | | | | | | | | | | | | | | | | | | |
| 2024 (Unaudited) | | | 15.62 | | | | 0.31 | | | | 1.78 | | | | 2.09 | | | | (0.59 | ) | | | — | | | | — | |
| 2023 | | | 19.18 | | | | 0.69 | | | | (3.02 | ) | | | (2.33 | ) | | | (0.90 | ) | | | — | | | | (0.33 | ) |
| 2022 | | | 20.13 | | | | 0.67 | | | | (0.41 | ) | | | 0.26 | | | | (0.81 | ) | | | — | | | | (0.40 | ) |
| 2021 | | | 14.99 | | | | 0.65 | | | | 5.59 | | | | 6.24 | | | | (0.99 | ) | | | — | | | | (0.11 | ) |
| 2020 | | | 23.34 | | | | 0.62 | | | | (7.45 | ) | | | (6.83 | ) | | | (1.14 | ) | | | — | | | | (0.38 | ) |
| 2019 | | | 24.53 | | | | 1.12 | | | | (0.56 | ) | | | 0.56 | | | | (1.49 | ) | | | — | | | | (0.26 | ) |
| * | Per share data calculated using average shares method. |
| ** | Total Return is for the period indicated and has not been annualized. The return shown does not reflect the deduction of taxes that a shareholder would pay on Fund distributions or the redemption of Fund shares. |
| † | Annualized. |
| †† | Portfolio turnover rate is for the period indicated and periods of less than one year have not been annualized. Excludes effect of in-kind transfers. |
Amounts designated as “—” are either $0 or have been rounded to $0.
The accompanying notes are an integral part of the financial statements.
171
Financial Highlights
Total from
Distributions ($) | | Net
Asset Value,
End of
Period ($) | | Total
Return
(%)** | | Net Assets, End of
Period ($)(000) | | Ratio of Expenses
to Average Net
Assets (%) | | Ratio of Net
Investment Income
to Average Net
Assets (%) | | Portfolio
Turnover (%)†† |
| | | | | | | | | | | | | | | | | | | | | | | | | | | |
| | (0.18) | | | | 41.22 | | | | 20.95 | | | | 40,395 | | | | 0.75 | † | | | 0.70 | † | | | 65.97 | |
| | (0.12) | | | | 34.23 | | | | 2.58 | | | | 41,757 | | | | 0.75 | | | | 0.35 | | | | 100.70 | |
| | (0.05) | | | | 33.48 | | | | (33.28 | ) | | | 46,535 | | | | 0.75 | | | | 0.02 | | | | 111.39 | |
| | (0.90) | | | | 50.24 | | | | 37.43 | | | | 75,856 | | | | 0.75 | | | | 1.47 | | | | 121.91 | |
| | (0.36) | | | | 37.31 | | | | 10.84 | | | | 55,961 | | | | 0.75 | | | | 0.96 | | | | 124.90 | |
| | (0.21) | | | | 34.02 | | | | 13.90 | | | | 56,134 | | | | 0.75 | | | | 0.38 | | | | 126.44 | |
| | | | | | | | | | | | | | | | | | | | | | | | | | | |
| | (0.29) | | | | 9.02 | | | | 13.38 | | | | 150,256 | | | | 0.48 | † | | | 5.94 | † | | | 38.56 | |
| | (0.62) | | | | 8.21 | | | | (9.26 | ) | | | 157,490 | | | | 0.53 | | | | 6.47 | | | | 109.60 | |
| | (0.68) | | | | 9.67 | | | | (13.81 | ) | | | 195,159 | | | | 0.58 | | | | 5.04 | | | | 39.39 | |
| | (0.68) | | | | 11.94 | | | | 13.71 | | | | 234,953 | | | | 0.58 | | | | 5.13 | | | | 98.47 | |
| | (0.68) | | | | 11.12 | | | | 0.81 | | | | 184,015 | | | | 0.58 | | | | 5.47 | | | | 67.65 | |
| | (0.74) | | | | 11.73 | | | | 8.87 | | | | 201,092 | | | | 0.58 | | | | 5.72 | | | | 55.98 | |
| | | | | | | | | | | | | | | | | | | | | | | | | | | |
| | (0.59) | | | | 17.12 | | | | 13.51 | | | | 611,778 | | | | 0.46 | † | | | 3.73 | † | | | 44.18 | |
| | (1.23) | | | | 15.62 | | | | (12.60 | ) | | | 590,900 | | | | 0.45 | | | | 3.91 | | | | 63.24 | |
| | (1.21) | | | | 19.18 | | | | 1.16 | | | | 683,864 | | | | 0.45 | | | | 3.34 | | | | 38.51 | |
| | (1.10) | | | | 20.13 | | | | 42.53 | | | | 669,734 | | | | 0.45 | | | | 3.41 | | | | 60.53 | |
| | (1.52) | | | | 14.99 | | | | (30.12 | ) | | | 412,110 | | | | 0.45 | | | | 3.50 | | | | 93.44 | |
| | (1.75) | | | | 23.34 | | | | 2.61 | | | | 544,884 | | | | 0.46 | | | | 4.83 | | | | 60.00 | |
The accompanying notes are an integral part of the financial statements.
172
Financial Highlights
| Selected Per Share Data & Ratios |
| For a Share Outstanding Throughout the Period |
| | | Net
Asset Value,
Beginning
of Period
($) | | Net Investment
Income
($)* | | Net Realized
and Unrealized
Gain (Loss) on
Investments
($) | | Total from
Operations
($) | | Distribution
from Net
Investment
Income ($) | | Distribution
from Capital
Gains ($) | | Return of
Capital ($) |
| Global X MSCI SuperDividend® Emerging Markets ETF | | | | | | | | | | | | | | | | | | | | | | | | | | | | |
| 2024 (Unaudited) | | | 22.48 | | | | 0.52 | | | | 3.64 | | | | 4.16 | | | | (0.95 | ) | | | — | | | | — | |
| 2023(1) | | | 21.36 | | | | 1.95 | | | | 1.00 | | | | 2.95 | | | | (1.83 | ) | | | — | | | | — | |
| 2022(1) | | | 33.78 | | | | 1.67 | | | | (11.44 | ) | | | (9.77 | ) | | | (2.19 | ) | | | — | | | | (0.46 | ) |
| 2021(1) | | | 28.59 | | | | 3.06 | | | | 4.35 | | | | 7.41 | | | | (2.22 | ) | | | — | | | | — | |
| 2020(1) | | | 38.85 | | | | 1.65 | | | | (9.51 | ) | | | (7.86 | ) | | | (1.98 | ) | | | — | | | | (0.42 | ) |
| 2019(1) | | | 38.73 | | | | 2.61 | | | | 0.15 | | | | 2.76 | | | | (2.64 | ) | | | — | | | | — | |
| Global X SuperDividend® REIT ETF | | | | | | | | | | | | | | | | | | | | | | | | | | | | |
| 2024 (Unaudited) | | | 18.67 | | | | 0.66 | | | | 0.94 | | | | 1.60 | | | | (0.79 | ) | | | — | | | | — | |
| 2023(1) | | | 21.65 | | | | 1.28 | | | | (2.60 | ) | | | (1.32 | ) | | | (1.10 | ) | | | — | | | | (0.56 | ) |
| 2022(1) | | | 29.46 | | | | 1.13 | | | | (7.14 | ) | | | (6.01 | ) | | | (1.10 | ) | | | — | | | | (0.70 | ) |
| 2021(1) | | | 22.68 | | | | 1.14 | | | | 7.50 | | | | 8.64 | | | | (1.23 | ) | | | — | | | | (0.63 | ) |
| 2020(1) | | | 45.99 | | | | 1.68 | | | | (22.23 | ) | | | (20.55 | ) | | | (2.58 | ) | | | — | | | | (0.18 | ) |
| 2019(1) | | | 43.86 | | | | 2.97 | | | | 2.73 | | | | 5.70 | | | | (3.57 | ) | | | — | | | | — | |
| Global X Renewable Energy Producers ETF | | | | | | | | | | | | | | | | | | | | | | | | | | | | |
| 2024 (Unaudited) | | | 9.30 | | | | 0.01 | | | | 0.35 | | | | 0.36 | | | | (0.08 | ) | | | — | | | | — | |
| 2023 | | | 13.05 | | | | 0.15 | | | | (3.76 | ) | | | (3.61 | ) | | | (0.14 | ) | | | — | | | | — | |
| 2022 | | | 16.82 | | | | 0.15 | | | | (3.76 | ) | | | (3.61 | ) | | | (0.16 | ) | | | — | | | | — | |
| 2021 | | | 14.87 | | | | 0.23 | | | | 2.05 | | | | 2.28 | | | | (0.30 | ) | | | (0.03 | ) | | | — | |
| 2020 | | | 13.79 | | | | 0.41 | | | | 1.13 | | | | 1.54 | | | | (0.46 | ) | | | — | | | | — | |
| 2019 | | | 11.52 | | | | 0.13 | | | | 2.61 | | | | 2.74 | | | | (0.47 | ) | | | — | | | | — | |
| * | Per share data calculated using average shares method. |
| ** | Total Return is for the period indicated and has not been annualized. The return shown does not reflect the deduction of taxes that a shareholder would pay on Fund distributions or the redemption of Fund shares. |
| † | Annualized. |
| †† | Portfolio turnover rate is for the period indicated and periods of less than one year have not been annualized. Excludes effect of in-kind transfers. |
| (1) | Per share amounts have been adjusted for a 1 for 3 reverse share split on December 19, 2022 (See Note 9 in the Notes to Financial Statements.) |
Amounts designated as “—” are either $0 or have been rounded to $0.
The accompanying notes are an integral part of the financial statements.
173
Financial Highlights
Total from
Distributions ($) | | Net
Asset Value,
End of
Period ($) | | Total
Return
(%)** | | Net Assets, End of
Period ($)(000) | | Ratio of Expenses
to Average Net
Assets (%) | | Ratio of Net
Investment Income
to Average Net
Assets (%) | | Portfolio
Turnover (%)†† |
| | | | | | | | | | | | | | | | | | | | | | | | | | | |
| | (0.95) | | | | 25.69 | | | | 18.74 | | | | 45,712 | | | | 0.66 | † | | | 4.23 | † | | | 19.59 | |
| | (1.83) | | | | 22.48 | | | | 13.77 | | | | 41,574 | | | | 0.68 | | | | 8.22 | | | | 87.06 | |
| | (2.65) | | | | 21.36 | | | | (30.80 | ) | | | 39,168 | | | | 0.67 | | | | 5.88 | | | | 101.78 | |
| | (2.22) | | | | 33.78 | | | | 25.83 | | | | 62,696 | | | | 0.72 | | | | 8.59 | | | | 102.27 | |
| | (2.40) | | | | 28.59 | | | | (21.01 | ) | | | 20,007 | | | | 0.67 | | | | 5.04 | | | | 93.04 | |
| | (2.64) | | | | 38.85 | | | | 7.14 | | | | 17,489 | | | | 0.66 | | | | 6.51 | | | | 66.65 | |
| | | | | | | | | | | | | | | | | | | | | | | | | | | |
| | (0.79) | | | | 19.48 | | | | 8.44 | | | | 206,692 | | | | 0.59 | † | | | 6.44 | † | | | 75.92 | |
| | (1.66) | | | | 18.67 | | | | (6.97 | ) | | | 217,653 | | | | 0.59 | | | | 5.90 | | | | 92.84 | |
| | (1.80) | | | | 21.65 | | | | (21.21 | ) | | | 286,655 | | | | 0.59 | | | | 4.36 | | | | 82.67 | |
| | (1.86) | | | | 29.46 | | | | 38.84 | | | | 467,934 | | | | 0.58 | | | | 3.99 | | | | 59.44 | |
| | (2.76) | | | | 22.68 | | | | (45.94 | ) | | | 311,625 | | | | 0.58 | | | | 5.74 | | | | 106.23 | |
| | (3.57) | | | | 45.99 | | | | 13.68 | | | | 364,790 | | | | 0.59 | | | | 6.71 | | | | 34.16 | |
| | | | | | | | | | | | | | | | | | | | | | | | | | | |
| | (0.08) | | | | 9.58 | | | | 3.75 | | | | 38,027 | | | | 0.65 | † | | | 0.15 | † | | | 5.06 | |
| | (0.14) | | | | 9.30 | | | | (27.93 | ) | | | 43,797 | | | | 0.65 | | | | 1.18 | | | | 12.68 | |
| | (0.16) | | | | 13.05 | | | | (21.57 | ) | | | 90,970 | | | | 0.66 | | | | 1.01 | | | | 18.33 | |
| | (0.33) | | | | 16.82 | | | | 15.37 | | | | 146,976 | | | | 0.65 | | | | 1.39 | | | | 55.97 | |
| | (0.46) | | | | 14.87 | | | | 11.39 | | | | 66,192 | | | | 0.65 | | | | 2.89 | | | | 29.27 | |
| | (0.47) | | | | 13.79 | | | | 24.34 | | | | 26,205 | | | | 0.65 | | | | 1.01 | | | | 87.06 | |
The accompanying notes are an integral part of the financial statements.
174
Financial Highlights
| Selected Per Share Data & Ratios |
| For a Share Outstanding Throughout the Period |
| | | Net
Asset Value,
Beginning
of Period
($) | | Net Investment
Income (Loss)
($)* | | Net Realized
and Unrealized
Gain (Loss) on
Investments
($) | | Total from
Operations
($) | | Distribution
from Net
Investment
Income ($) | | Distribution
from Capital
Gains ($) | | Return of
Capital ($) |
| Global X S&P 500® Catholic Values ETF | | | | | | | | | | | | | | | | | | | | | | | | | | | | |
| 2024 (Unaudited) | | | 50.89 | | | | 0.36 | | | | 9.99 | | | | 10.35 | | | | (0.41 | ) | | | — | | | | — | |
| 2023 | | | 47.19 | | | | 0.65 | | | | 3.68 | | | | 4.33 | | | | (0.63 | ) | | | — | | | | — | |
| 2022 | | | 57.22 | | | | 0.61 | | | | (9.99 | ) | | | (9.38 | ) | | | (0.57 | ) | | | (0.08 | ) | | | — | |
| 2021 | | | 40.32 | | | | 0.56 | | | | 16.89 | | | | 17.45 | | | | (0.55 | ) | | | — | | | | — | |
| 2020 | | | 37.23 | | | | 0.58 | | | | 3.08 | | | | 3.66 | | | | (0.55 | ) | | | (0.02 | ) | | | — | |
| 2019 | | | 33.59 | | | | 0.58 | | | | 3.92 | | | | 4.50 | | | | (0.81 | ) | | | (0.05 | ) | | | — | |
| Global X MSCI SuperDividend® EAFE ETF | | | | | | | | | | | | | | | | | | | | | | | | | | | | |
| 2024 (Unaudited) | | | 12.76 | | | | 0.34 | | | | 1.78 | | | | 2.12 | | | | (0.49 | ) | | | — | | | | — | |
| 2023 | | | 11.98 | | | | 0.78 | | | | 0.92 | | | | 1.70 | | | | (0.92 | ) | | | — | | | | — | |
| 2022 | | | 15.62 | | | | 1.00 | | | | (3.70 | ) | | | (2.70 | ) | | | (0.94 | ) | | | — | | | | — | |
| 2021 | | | 11.44 | | | | 0.79 | | | | 4.10 | | | | 4.89 | | | | (0.71 | ) | | | — | | | | — | |
| 2020 | | | 16.11 | | | | 0.56 | | | | (4.53 | ) | | | (3.97 | ) | | | (0.55 | ) | | | — | | | | (0.15 | ) |
| 2019 | | | 15.96 | | | | 0.82 | | | | 0.36 | | | | 1.18 | | | | (1.03 | ) | | | — | | | | — | |
| Global X E-commerce ETF | | | | | | | | | | | | | | | | | | | | | | | | | | | | |
| 2024 (Unaudited) | | | 16.96 | | | | 0.05 | | | | 5.83 | | | | 5.88 | | | | — | | | | — | | | | — | |
| 2023 | | | 15.14 | | | | — | | | | 1.84 | | | | 1.84 | | | | — | | | | — | | | | (0.02 | ) |
| 2022 | | | 31.19 | | | | 0.08 | | | | (15.97 | ) | | | (15.89 | ) | | | (0.05 | ) | | | (0.10 | ) | | | (0.01 | ) |
| 2021 | | | 26.79 | | | | (0.04 | ) | | | 4.70 | | | | 4.66 | | | | (0.13 | ) | | | (0.13 | ) | | | — | |
| 2020 | | | 17.58 | | | | 0.19 | | | | 9.05 | | | | 9.24 | | | | (0.03 | ) | | | — | | | | — | |
| 2019(1) | | | 15.00 | | | | (0.05 | ) | | | 2.63 | | | | 2.58 | | | | — | | | | — | | | | — | |
| | |
| * | Per share data calculated using average shares method. |
| ** | Total Return is for the period indicated and has not been annualized. The return shown does not reflect the deduction of taxes that a shareholder would pay on Fund distributions or the redemption of Fund shares. |
| † | Annualized. |
| †† | Portfolio turnover rate is for the period indicated and periods of less than one year have not been annualized. Excludes effect of in-kind transfers. |
| (1) | The Fund commenced operations on November 27, 2018. |
Amounts designated as “—” are either $0 or have been rounded to $0.
The accompanying notes are an integral part of the financial statements.
175
Financial Highlights
Total from
Distributions ($) | | Net
Asset Value,
End of
Period ($) | | Total
Return
(%)** | | Net Assets, End of
Period ($)(000) | | Ratio of Expenses
to Average Net
Assets (%) | | Ratio of Net
Investment Income
(Loss) to Average
Net Assets (%) | | Portfolio
Turnover (%)†† |
| | | | | | | | | | | | | | | | | | | | | | | | | | | |
| | (0.41) | | | | 60.83 | | | | 20.37 | | | | 804,184 | | | | 0.29 | † | | | 1.21 | † | | | 2.72 | |
| | (0.63) | | | | 50.89 | | | | 9.22 | | | | 671,797 | | | | 0.29 | | | | 1.28 | | | | 6.70 | |
| | (0.65) | | | | 47.19 | | | | (16.53 | ) | | | 549,288 | | | | 0.29 | | | | 1.17 | | | | 6.79 | |
| | (0.55) | | | | 57.22 | | | | 43.54 | | | | 593,985 | | | | 0.29 | | | | 1.09 | | | | 8.29 | |
| | (0.57) | | | | 40.32 | | | | 9.89 | | | | 379,053 | | | | 0.29 | | | | 1.51 | | | | 5.55 | |
| | (0.86) | | | | 37.23 | | | | 13.86 | | | | 275,511 | | | | 0.29 | | | | 1.66 | | | | 8.54 | |
| | | | | | | | | | | | | | | | | | | | | | | | | | | |
| | (0.49) | | | | 14.39 | | | | 16.79 | | | | 11,513 | | | | 0.56 | † | | | 4.83 | † | | | 25.90 | |
| | (0.92) | | | | 12.76 | | | | 14.08 | | | | 10,082 | | | | 0.56 | | | | 5.76 | | | | 37.00 | |
| | (0.94) | | | | 11.98 | | | | (18.12 | ) | | | 8,384 | | | | 0.57 | | | | 6.89 | | | | 34.00 | |
| | (0.71) | | | | 15.62 | | | | 43.05 | | | | 14,058 | | | | 0.55 | | | | 5.12 | | | | 88.53 | |
| | (0.70) | | | | 11.44 | | | | (25.24 | ) | | | 7,436 | | | | 0.56 | | | | 4.07 | | | | 59.28 | |
| | (1.03) | | | | 16.11 | | | | 7.81 | | | | 18,527 | | | | 0.56 | | | | 5.23 | | | | 29.81 | |
| | | | | | | | | | | | | | | | | | | | | | | | | | | |
| | — | | | | 22.84 | | | | 7.09 | | | | 69,890 | | | | 0.50 | † | | | 0.44 | † | | | 17.12 | |
| | (0.02) | | | | 16.96 | | | | 12.13 | | | | 62,069 | | | | 0.50 | | | | (0.02 | ) | | | 26.67 | |
| | (0.16) | | | | 15.14 | | | | (51.19 | ) | | | 42,241 | | | | 0.50 | | | | 0.34 | | | | 25.82 | |
| | (0.26) | | | | 31.19 | | | | 17.39 | | | | 197,751 | | | | 0.50 | | | | (0.11 | ) | | | 14.64 | |
| | (0.03) | | | | 26.79 | | | | 52.67 | | | | 91,083 | | | | 0.50 | | | | 0.75 | | | | 42.01 | |
| | — | | | | 17.58 | | | | 17.20 | | | | 3,517 | | | | 0.68 | † | | | (0.32 | )† | | | 23.50 | |
The accompanying notes are an integral part of the financial statements.
176
Financial Highlights
| Selected Per Share Data & Ratios |
| For a Share Outstanding Throughout the Period |
| | | Net
Asset Value,
Beginning
of Period
($) | | Net Investment
Income (Loss)
($)* | | Net Realized
and Unrealized
Gain (Loss) on
Investments
($) | | Total from
Operations
($) | | Distribution
from Net
Investment
Income ($) | | Distribution
from Capital
Gains ($) | | Return of
Capital ($) |
| Global X S&P Catholic Values Developed ex-U.S. ETF | | | | | | | | | | | | | | | | | | | | | | | | | | | | |
| 2024 (Unaudited) | | | 25.87 | | | | 0.35 | | | | 4.58 | | | | 4.93 | | | | (0.32 | ) | | | — | | | | — | |
| 2023 | | | 23.30 | | | | 0.77 | | | | 2.39 | | | | 3.16 | | | | (0.59 | ) | | | — | | | | — | |
| 2022 | | | 32.80 | | | | 0.77 | | | | (9.11 | ) | | | (8.34 | ) | | | (0.79 | ) | | | (0.37 | ) | | | — | |
| 2021 | | | 24.98 | | | | 0.70 | | | | 7.71 | | | | 8.41 | | | | (0.59 | ) | | | — | | | | — | |
| 2020(1) | | | 25.05 | | | | 0.19 | | | | (0.26 | ) | | | (0.07 | ) | | | — | | | | — | | | | — | |
| Global X NASDAQ 100® Tail Risk ETF | | | | | | | | | | | | | | | | | | | | | | | | | | | | |
| 2024 (Unaudited) | | | 22.71 | | | | 0.09 | | | | 4.10 | | | | 4.19 | | | | (0.11 | ) | | | — | | | | — | |
| 2023 | | | 19.08 | | | | 0.07 | | | | 3.63 | | | | 3.70 | | | | (0.07 | ) | | | — | | | | — | |
| 2022 | | | 25.59 | | | | 0.04 | | | | (6.03 | ) | | | (5.99 | ) | | | (0.03 | ) | | | (0.49 | ) | | | — | |
| 2021(2) | | | 25.13 | | | | (0.01 | ) | | | 0.47 | | | | 0.46 | | | | — | | | | — | | | | — | |
| Global X NASDAQ 100® Collar 95-110 ETF | | | | | | | | | | | | | | | | | | | | | | | | | | | | |
| 2024 (Unaudited) | | | 23.47 | | | | 0.10 | | | | 3.92 | | | | 4.02 | | | | (0.09 | ) | | | — | | | | — | |
| 2023 | | | 22.00 | | | | 0.08 | | | | 1.46 | | | | 1.54 | | | | (0.07 | ) | | | — | | | | — | |
| 2022 | | | 25.78 | | | | 0.04 | | | | (3.38 | ) | | | (3.34 | ) | | | (0.02 | ) | | | (0.42 | ) | | | — | |
| 2021(2) | | | 25.27 | | | | (0.01 | ) | | | 0.52 | | | | 0.51 | | | | — | | | | — | | | | — | |
| | |
| * | Per share data calculated using average shares method. |
| ** | Total Return is for the period indicated and has not been annualized. The return shown does not reflect the deduction of taxes that a shareholder would pay on Fund distributions or the redemption of Fund shares. |
| † | Annualized. |
| †† | Portfolio turnover rate is for the period indicated and periods of less than one year have not been annualized. Excludes effect of in-kind transfers. |
| (1) | The Fund commenced operations on June 22, 2020. |
| (2) | The Fund commenced operations on August 25, 2021. |
| (3) | Includes fees charged by the Fund custodian that were reimbursed by the custodian to the Fund subsequent to the reporting period. Excluding these fees, the ratio to average net assets would have been 0.61%. |
Amounts designated as “—” are either $0 or have been rounded to $0.
The accompanying notes are an integral part of the financial statements.
177
Financial Highlights
Total from
Distributions ($) | | Net
Asset Value,
End of
Period ($) | | Total
Return
(%)** | | Net Assets, End of
Period ($)(000) | | Ratio of Expenses
to Average Net
Assets (%) | | Ratio of Net
Investment Income
(Loss) to Average
Net Assets (%) | | Portfolio
Turnover (%)†† |
| | | | | | | | | | | | | | | | | | | | | | | | | | | |
| | (0.32) | | | | 30.48 | | | | 19.11 | | | | 17,678 | | | | 0.35 | † | | | 2.35 | † | | | 3.61 | |
| | (0.59) | | | | 25.87 | | | | 13.45 | | | | 14,485 | | | | 0.35 | | | | 2.80 | | | | 13.64 | |
| | (1.16) | | | | 23.30 | | | | (26.11 | ) | | | 5,592 | | | | 0.35 | | | | 2.83 | | | | 12.83 | |
| | (0.59) | | | | 32.80 | | | | 33.79 | | | | 4,264 | | | | 0.35 | | | | 2.22 | | | | 17.17 | |
| | — | | | | 24.98 | | | | (0.28 | ) | | | 2,498 | | | | 0.35 | † | | | 2.02 | † | | | 4.04 | |
| | | | | | | | | | | | | | | | | | | | | | | | | | | |
| | (0.11) | | | | 26.79 | | | | 18.45 | | | | 2,411 | | | | 0.25 | † | | | 0.68 | † | | | 6.04 | |
| | (0.07) | | | | 22.71 | | | | 19.42 | | | | 1,362 | | | | 0.53 | | | | 0.35 | | | | 19.43 | |
| | (0.52) | | | | 19.08 | | | | (23.90 | ) | | | 1,908 | | | | 0.61 | | | | 0.19 | | | | 13.88 | |
| | — | | | | 25.59 | | | | 1.83 | | | | 3,326 | | | | 0.60 | † | | | (0.12 | )† | | | 1.71 | |
| | | | | | | | | | | | | | | | | | | | | | | | | | | |
| | (0.09) | | | | 27.40 | | | | 17.16 | | | | 1,644 | | | | 0.25 | † | | | 0.73 | † | | | 7.98 | |
| | (0.07) | | | | 23.47 | | | | 7.01 | | | | 2,112 | | | | 0.55 | | | | 0.35 | | | | 18.56 | |
| | (0.44) | | | | 22.00 | | | | (13.19 | ) | | | 3,081 | | | | 0.62 | (3) | | | 0.18 | | | | 9.89 | |
| | — | | | | 25.78 | | | | 2.06 | | | | 2,836 | | | | 0.60 | † | | | (0.11 | )† | | | 2.11 | |
The accompanying notes are an integral part of the financial statements.
178
Financial Highlights
| Selected Per Share Data & Ratios |
| For a Share Outstanding Throughout the Period |
| | | Net
Asset Value,
Beginning
of Period
($) | | Net Investment
Income
($)* | | Net Realized
and Unrealized
Gain (Loss) on
Investments
($) | | Total from
Operations
($) | | Distribution
from Net
Investment
Income ($) | | Distribution
from Capital
Gains ($) | | Return of
Capital ($) |
| Global X S&P 500® Tail Risk ETF | | | | | | | | | | | | | | | | | | | | | | | | | | | | |
| 2024 (Unaudited) | | | 24.23 | | | | 0.17 | | | | 4.40 | | | | 4.57 | | | | (0.19 | ) | | | — | | | | — | |
| 2023 | | | 23.21 | | | | 0.27 | | | | 1.00 | | | | 1.27 | | | | (0.25 | ) | | | — | | | | — | |
| 2022 | | | 27.72 | | | | 0.23 | | | | (4.00 | ) | | | (3.77 | ) | | | (0.16 | ) | | | (0.58 | ) | | | — | |
| 2021(1) | | | 27.33 | | | | 0.03 | | | | 0.36 | | | | 0.39 | | | | — | | | | — | | | | — | |
| Global X S&P 500® Collar 95-110 ETF | | | | | | | | | | | | | | | | | | | | | | | | | | | | |
| 2024 (Unaudited) | | | 24.68 | | | | 0.17 | | | | 4.02 | | | | 4.19 | | | | (0.20 | ) | | | — | | | | — | |
| 2023 | | | 24.47 | | | | 0.28 | | | | 0.26 | | | | 0.54 | | | | (0.33 | ) | | | — | | | | — | |
| 2022 | | | 27.57 | | | | 0.23 | | | | (2.77 | ) | | | (2.54 | ) | | | (0.16 | ) | | | (0.40 | ) | | | — | |
| 2021(1) | | | 27.28 | | | | 0.03 | | | | 0.26 | | | | 0.29 | | | | — | | | | — | | | | — | |
| Global X Disruptive Materials ETF | | | | | | | | | | | | | | | | | | | | | | | | | | | | |
| 2024 (Unaudited) | | | 14.23 | | | | 0.04 | | | | 2.07 | | | | 2.11 | | | | (0.12 | ) | | | — | | | | — | |
| 2023 | | | 18.07 | | | | 0.34 | | | | (3.88 | ) | | | (3.54 | ) | | | (0.30 | ) | | | — | | | | — | |
| 2022(3) | | | 23.75 | | | | 0.45 | | | | (5.88 | ) | | | (5.43 | ) | | | (0.25 | ) | | | — | | | | — | |
| | |
| * | Per share data calculated using average shares method. |
| ** | Total Return is for the period indicated and has not been annualized. The return shown does not reflect the deduction of taxes that a shareholder would pay on Fund distributions or the redemption of Fund shares. |
| † | Annualized. |
| †† | Portfolio turnover rate is for the period indicated and periods of less than one year have not been annualized. Excludes effect of in-kind transfers. |
| (1) | The Fund commenced operations on August 25, 2021. |
| (2) | Includes fees charged by the Fund custodian that were reimbursed by the custodian to the Fund subsequent to the reporting period. Excluding these fees, the ratio to average net assets would have been 0.61%. |
| (3) | The Fund commenced operations on January 24, 2022. |
Amounts designated as “—” are either $0 or have been rounded to $0.
The accompanying notes are an integral part of the financial statements.
179
Financial Highlights
Total from
Distributions ($) | | Net
Asset Value,
End of
Period ($) | | Total
Return
(%)** | | Net Assets, End of
Period ($)(000) | | Ratio of Expenses
to Average Net
Assets (%) | | Ratio of Net
Investment Income
to Average Net
Assets (%) | | Portfolio
Turnover (%)†† |
| | | | | | | | | | | | | | | | | | | | | | | | | | | |
| | (0.19) | | | | 28.61 | | | | 18.91 | | | | 3,147 | | | | 0.25 | † | | | 1.25 | † | | | 1.27 | |
| | (0.25) | | | | 24.23 | | | | 5.51 | | | | 2,423 | | | | 0.54 | | | | 1.10 | | | | 2.71 | |
| | (0.74) | | | | 23.21 | | | | (13.98 | ) | | | 3,017 | | | | 0.61 | | | | 0.92 | | | | 7.40 | |
| | — | | | | 27.72 | | | | 1.43 | | | | 3,604 | | | | 0.60 | † | | | 0.58 | † | | | 6.21 | |
| | | | | | | | | | | | | | | | | | | | | | | | | | | |
| | (0.20) | | | | 28.67 | | | | 17.02 | | | | 2,580 | | | | 0.25 | † | | | 1.24 | † | | | 1.04 | |
| | (0.33) | | | | 24.68 | | | | 2.20 | | | | 2,221 | | | | 0.55 | | | | 1.11 | | | | 3.09 | |
| | (0.56) | | | | 24.47 | | | | (9.40 | ) | | | 3,915 | | | | 0.64 | (2) | | | 0.90 | | | | 8.96 | |
| | — | | | | 27.57 | | | | 1.06 | | | | 3,308 | | | | 0.60 | † | | | 0.58 | † | | | 6.44 | |
| | | | | | | | | | | | | | | | | | | | | | | | | | | |
| | (0.12) | | | | 16.22 | | | | 14.90 | | | | 6,813 | | | | 0.59 | † | | | 0.57 | † | | | 11.59 | |
| | (0.30) | | | | 14.23 | | | | (19.96 | ) | | | 7,684 | | | | 0.59 | | | | 1.84 | | | | 36.55 | |
| | (0.25) | | | | 18.07 | | | | (22.98 | ) | | | 3,433 | | | | 0.60 | † | | | 2.72 | † | | | 25.34 | |
The accompanying notes are an integral part of the financial statements.
180
Notes to Financial Statements
April 30, 2024 (Unaudited)
1. ORGANIZATION
The Global X Funds (the “Trust”) is a Delaware statutory trust formed on March 6, 2008. The Trust is registered under the Investment Company Act of 1940 (the “1940 Act”), as amended, as an open-end management investment company. As of April 30, 2024, the Trust had ninety seven portfolios, ninety one of which were operational. The financial statements herein and the related notes pertain to the Global X Lithium and Battery Tech ETF, Global X SuperDividend® ETF, Global X Social Media ETF, Global X Guru® Index ETF, Global X SuperIncome™ Preferred ETF, Global X SuperDividend® U.S. ETF, Global X MSCI SuperDividend® Emerging Markets ETF, Global X SuperDividend® REIT ETF, Global X Renewable Energy Producers ETF, Global X S&P 500® Catholic Values ETF, Global X MSCI SuperDividend® EAFE ETF, Global X E-commerce ETF, Global X S&P Catholic Values Developed ex-U.S. ETF, Global X NASDAQ 100® Tail Risk ETF, Global X NASDAQ 100® Collar 95-110 ETF, Global X S&P 500® Tail Risk ETF, Global X S&P 500® Collar 95-110 ETF and Global X Disruptive Materials ETF, (each a “Fund”, collectively, the “Funds”).
Each Fund (except the Global X SuperDividend® ETF, Global X SuperDividend® U.S. ETF, Global X MSCI SuperDividend® Emerging Markets ETF, Global X MSCI SuperDividend® EAFE ETF, Global X SuperDividend® REIT ETF, Global X SuperIncomeTM Preferred ETF, Global X Guru® Index ETF, Global X S&P 500® Catholic Values ETF, Global X S&P 500® Tail Risk ETF and Global X S&P 500® Collar 95-110 ETF) has elected non-diversified status under the 1940 Act.
2. SIGNIFICANT ACCOUNTING POLICIES
The following is a summary of the significant accounting policies followed by the Funds:
USE OF ESTIMATES – The Funds are investment companies that apply the accounting and reporting guidance issued in Topic 946 by the U.S. Financial Accounting Standards Board. The preparation of financial statements in conformity with U.S. generally accepted accounting principles (“U.S. GAAP”) requires management to make estimates and assumptions that affect the reported amounts of assets and liabilities and disclosure of contingent assets and liabilities at the date of the financial statements and the reported amounts of increases and decreases in net assets from operations during the reporting period. Actual results could materially differ from those estimates.
RETURN OF CAPITAL ESTIMATES – Distributions received by the Funds from underlying master limited partnership (“MLP”) and real estate investment trust (“REIT”) investments generally are comprised of income and return of capital. The Funds record investment income and return of capital based on estimates made at the time such distributions are received. Such estimates are based on historical information available from the MLPs, REITs and other industry sources. These estimates may subsequently be revised based on information received from the MLPs and REITs after their tax reporting periods are concluded.
181
Notes to Financial Statements (Continued)
April 30, 2024 (Unaudited)
2. SIGNIFICANT ACCOUNTING POLICIES (continued)
MLPs – Certain Funds may invest in MLPs. MLPs are publicly traded partnerships engaged in the transportation, storage and processing of minerals and natural resources. By confining their operations to these specific activities, their interests, or units, are able to trade on public securities exchanges exactly like the shares of a corporation, without entity level taxation. To qualify as an MLP and to not be taxed as a corporation, a partnership must receive at least 90% of its income from qualifying sources as set forth in Section 7704(d) of the Internal Revenue Code of 1986, as amended (the “Code”). These qualifying sources include natural resource-based activities such as the processing, transportation and storage of mineral or natural resources. MLPs generally have two classes of owners: the general partner and limited partners. The general partner of an MLP is typically owned by a major energy company, an investment fund, the direct management of the MLP, or is an entity owned by one or more of such parties. The general partner may be structured as a private or publicly traded corporation or other entity.
The general partner typically controls the operations and management of the MLP through an up to 2% equity interest in the MLP plus, in many cases, ownership of common units and subordinated units.
Limited partners typically own the remainder of the partnership through ownership of common units, and have a limited role in the partnership’s operations and management. MLPs are typically structured such that common units and general partner interests have first priority to receive quarterly cash distributions up to an established minimum amount (“minimum quarterly distributions” or “MQD”). Common and general partner interests also accrue arrearages in distributions to the extent the MQD is not paid. Once common and general partner interests have been paid, subordinated units receive distributions of up to the MQD; however, subordinated units do not accrue arrearages. Distributable cash in excess of the MQD is paid to both common and subordinated units and is distributed to both common and subordinated units generally on a pro rata basis. The general partner is also eligible to receive incentive distributions if the general partner operates the business in a manner which results in distributions paid per common unit surpassing specified target levels. As the general partner increases cash distributions to the limited partners, the general partner receives an increasingly higher percentage of the incremental cash distributions.
SECURITY VALUATION - Securities listed on a securities exchange, market or automated quotation system for which quotations are readily available (except for securities traded on the NASDAQ Stock Market (“NASDAQ”)), including securities traded over the counter, are valued at the last quoted sale price on the primary exchange or market (foreign or domestic) on which they are traded (or at approximately 4:00 pm Eastern Time if a security’s primary exchange is normally open at that time), or, if there is no such reported sale, at the most recent mean between the quoted bid and asked prices, which approximates fair value (absent both bid and asked prices on such exchange, the bid price may be used).
182
Notes to Financial Statements (Continued)
April 30, 2024 (Unaudited)
2. SIGNIFICANT ACCOUNTING POLICIES (continued)
For securities traded on NASDAQ, the NASDAQ Official Closing Price will be used. The prices for foreign securities are reported in local currency and converted to U.S. dollars using currency exchange rates as of the reporting date. The exchange rates used by the Trust for valuation are captured as of the New York or London close each day.
Options traded on an exchange will be valued at the mean of the bid and ask quotations for the current day at the close of the market. If either the bid or the ask is not available, the last closing price will be used.
Securities for which market prices are not “readily available” are valued in accordance with fair value procedures (the “Fair Value Procedures”) established by Global X Management Company LLC, the Funds’ investment adviser (the “Adviser”), and approved by the Funds’ Board of Trustees (the “Board”). Pursuant to Rule 2a-5 under the 1940 Act, the Board has designated the Adviser as the “valuation designee” to determine the fair value of securities and other instruments for which no readily available market quotations are available. The
Fair Value Procedures are implemented through a fair value committee (the “Committee”) of the Adviser. Some of the more common reasons that may necessitate that a security be valued using the Fair Value Procedures include: the security’s trading has been halted or suspended; the security has been de-listed from its primary trading exchange; the security’s primary trading market is temporarily closed at a time when, under normal conditions, it would be open; the security has not been traded for an extended period of time; the security’s primary pricing source is not able or willing to provide a price; or trading of the security is subject to local government-imposed restrictions. In addition, the Funds may fair value a security if an event that may materially affect the value of the Funds’ security that is traded outside the United States (a “Significant Event”) has occurred between the time of the security’s last close and the time that each Fund calculates its net asset value (“NAV”). A Significant Event may relate to a single issuer or to an entire market sector. Events that may be Significant Events include: government actions, natural disasters, armed conflict, acts of terrorism and significant market fluctuations. If the Adviser becomes aware of a Significant Event that has occurred with respect to a security or group of securities after the closing of the exchange or market on which the security or securities principally trade, but before the time at which the Funds calculate their NAV, it may request that a Committee meeting be called. When a security is valued in accordance with the Fair Value Procedures, the Committee will determine the value after taking into consideration all relevant information reasonably available to the Committee.
If available, debt securities are priced based upon valuations provided by independent, third-party pricing agents. Such values generally reflect the last reported sales price if the security is actively traded. The third-party pricing agents may also value debt securities at an evaluated bid price by employing methodologies that utilize actual market transactions, broker-supplied valuations, or other methodologies designed to identify the market value for such securities. Debt obligations with remaining maturities of sixty days or less will
183
Notes to Financial Statements (Continued)
April 30, 2024 (Unaudited)
2. SIGNIFICANT ACCOUNTING POLICIES (continued)
be valued at their market value. Prices for most securities held by the Funds are provided daily by recognized independent pricing agents. If a security price cannot be obtained from an independent, third-party pricing agent, the Funds seek to obtain a bid price from at least one independent broker.
In accordance with the authoritative guidance on fair value measurements and disclosure under U.S. GAAP, the Funds disclose the fair value of their investments in a hierarchy that prioritizes the inputs to valuation techniques used to measure the fair value. The objective of a fair value measurement is to determine the price that would be received upon the sale of an asset or paid to transfer a liability in an orderly transaction between market participants at the measurement date (an exit price). Accordingly, the fair value hierarchy gives the highest priority to quoted prices (unadjusted) in active markets for identical assets or liabilities (Level 1) and the lowest priority to unobservable inputs (Level 3). The three levels of the fair value hierarchy are described below:
Level 1 – Unadjusted quoted prices in active markets for identical, unrestricted assets or liabilities that the Funds have the ability to access at the measurement date
Level 2 – Other significant observable inputs (including quoted prices in non-active markets, quoted prices for similar investments, fair value of investments for which the Funds have the ability to fully redeem tranches at NAV as of the measurement date or within the near term, and short-term investments valued at amortized cost)
Level 3 – Significant unobservable inputs (including the Funds’ own assumptions in determining the fair value of investments, and fair value of investments for which the Funds do not have the ability to fully redeem tranches at NAV as of the measurement date or within the near term)
Investments are classified within the level of the lowest significant input considered in determining fair value. Investments classified within Level 3 whose fair value measurement considers several inputs may include Level 1 or Level 2 inputs as components of the overall fair value measurement. For details of the investment classification, reference the Schedule of Investments.
The unobservable inputs used to determine fair value of Level 3 assets may have similar or diverging impacts on valuation. Significant increases and decreases in these inputs in isolation and interrelationships between those inputs could result in significantly higher or lower fair value measurement.
DUE TO/FROM BROKERS – Due to/from brokers includes cash and collateral balances with the Funds’ clearing brokers or counterparties as of October 31, 2023. The Funds continuously monitor the credit standing of each broker or counterparty with whom they
184
Notes to Financial Statements (Continued)
April 30, 2024 (Unaudited)
2. SIGNIFICANT ACCOUNTING POLICIES (continued)
conduct business. In the event a broker or counterparty is unable to fulfill its obligations, the Funds would be subject to counterparty credit risk.
REPURCHASE AGREEMENTS - Securities pledged as collateral for repurchase agreements by BNP Paribas are held by Brown Brothers Harriman & Co. (“BBH”) or The Bank of New York Mellon (“BNY Mellon”), as appropriate, in their roles as Custodian to respective Funds (each, a “Custodian” and together, the “Custodians”), and are designated as being held on each Fund’s behalf by the Custodian under a book-entry system. Each Fund monitors the adequacy of the collateral on a daily basis and can require the seller to provide additional collateral in the event the market value of the securities pledged falls below the carrying value of the repurchase agreement, including accrued interest.
It is the Funds’ policy to only enter into repurchase agreements with banks and other financial institutions which are deemed by the Adviser to be creditworthy. The Funds bear the risk of loss in the event that the counterparty to a repurchase agreement defaults on its obligations and the Funds are prevented from exercising their rights to dispose of the underlying securities received as collateral. For financial statement purposes, the Funds record the securities lending collateral (included in repurchase agreements, at value or restricted cash) as an asset and the obligation to return securities lending collateral as a liability on the Statements of Assets and Liabilities.
Repurchase agreements are entered into by the Funds under Master Repurchase Agreements (“MRA”) which permit the Funds, under certain circumstances, including an event of default (such as bankruptcy or insolvency), to offset payables and/or receivables under the MRA with collateral held and/or posted to the counterparty and create one single net payment due to or from the Funds.
FEDERAL INCOME TAXES – It is each Fund’s intention to qualify, or continue to qualify, as a regulated investment company for Federal income tax purposes by complying with the appropriate provisions of Subchapter M of the Code. Accordingly, no provisions for Federal income taxes have been made in the financial statements except as described below.
The Funds evaluate tax positions taken or expected to be taken in the course of preparing the Funds’ tax returns to determine whether it is “more-likely-than-not” (i.e., greater than 50 percent) that each tax position will be sustained upon examination by a taxing authority based on the technical merits of the position. Tax positions not deemed to meet the more-likely-than-not threshold are recorded as a tax benefit or expense in the current year. The Funds did not record any tax positions in the current period; however, management’s conclusions regarding tax positions may be subject to review and adjustment at a later date based on factors including, but not limited to, examination by tax authorities (i.e., the last three tax year ends, as applicable), and on-going analysis of and changes to tax laws and regulations, and interpretations thereof.
185
Notes to Financial Statements (Continued)
April 30, 2024 (Unaudited)
2. SIGNIFICANT ACCOUNTING POLICIES (continued)
If a Fund has foreign tax filings that have not been made, the tax years that remain subject to examination may date back to the inception of the Fund.
As of and during the reporting period ended April 30, 2024, the Funds did not have a liability for any unrecognized tax benefits. The Funds recognize interest and penalties, if any, related to unrecognized tax benefits as an income tax expense on the Statements of Operations. During the reporting period, the Funds did not incur any interest or penalties.
SECURITY TRANSACTIONS AND INVESTMENT INCOME – Security transactions are accounted for on the trade date for financial reporting purposes. Costs used in determining realized gains and losses on the sale of investment securities are based on specific identification. Dividend income is recorded on the ex-dividend date. Interest income is recognized on the accrual basis from the settlement date. Amortization of premiums and accretion of discounts is included in interest income.
FOREIGN CURRENCY TRANSACTIONS AND TRANSLATION – The books and records of the Funds are maintained in U.S. dollars. Investment securities and other assets and liabilities denominated in a foreign currency are translated into U.S. dollars on the date of valuation. Purchases and sales of investment securities, income and expenses are translated into U.S. dollars at the relevant rates of exchange prevailing on the respective dates of such transactions. The Funds do not isolate that portion of realized or unrealized gains and losses resulting from changes in the foreign exchange rate from fluctuations arising from changes in the market prices of the securities. These gains and losses are included in net realized and unrealized gains and losses on investments on the Statements of Operations. Net realized and unrealized gains and losses on foreign currency transactions and translations represent net foreign exchange gains or losses from foreign currency spot contracts, disposition of foreign currencies, currency gains or losses realized between trade and settlement dates on securities transactions and the difference between the amount of the investment income and foreign withholding taxes recorded on the Funds’ books and the U.S. dollar equivalent amounts actually received or paid.
FUTURES CONTRACTS – To the extent consistent with its investment objective and strategies, each Fund may use futures contracts for tactical hedging purposes as well as to enhance the Fund’s returns. Initial margin deposits of cash or securities are made upon entering into futures contracts. The contracts are marked to market daily and the resulting changes in value are accounted for as unrealized gains and losses. Variation margin payments are paid or received, depending upon whether unrealized gains or losses are incurred. When the contract is closed, the Fund records a realized gain or loss equal to the difference between the proceeds from (or cost of) the closing transaction and the amount invested in the contract.
Risks of entering into futures contracts include the possibility that there will be an imperfect price correlation between the futures and the underlying securities. Second, it is possible
186
Notes to Financial Statements (Continued)
April 30, 2024 (Unaudited)
2. SIGNIFICANT ACCOUNTING POLICIES (continued)
that a lack of liquidity for futures contracts could exist in the secondary market, resulting in an inability to close a position prior to its maturity date. Third, a futures contract involves the risk that the Fund could lose more than the original margin deposit required to initiate a futures transaction.
Futures contracts shall be valued at the settlement price established each day by the board of the exchange on which they are traded. The daily settlement prices for financial futures are provided by an independent source.
Finally, the risk exists that losses could exceed amounts disclosed on the Statements of Assets and Liabilities. Refer to the Funds’ Schedule of Investments for details regarding open futures contracts as of April 30, 2024, if applicable.
DIVIDENDS AND DISTRIBUTIONS TO SHAREHOLDERS – The Funds distribute their net investment income on a pro rata basis. Any net investment income and net realized capital gains are distributed at least annually. All distributions are recorded on the ex-dividend date.
INVESTMENTS IN REITs – With respect to the Funds, dividend income is recorded based on the income included in distributions received from REIT investments using published REIT reclassifications, including some management estimates when actual amounts are not available. Distributions received in excess of these estimated amounts are recorded as a reduction of the cost of investments or reclassified to capital gains. The actual amounts of income, return of capital, and capital gains are only determined by each REIT after its fiscal year end, and may differ from the estimated amounts.
CREATION UNITS – The Funds issue and redeem their shares (“Shares”) on a continuous basis at net asset value (“NAV”) and only in large blocks of 10,000 Shares, referred to as “Creation Units”. Purchasers of Creation Units (“Authorized Participants”) at NAV must pay a standard creation transaction fee per transaction. The fee is a single charge and will be the same regardless of the number of Creation Units purchased by an Authorized Participant on the same day.
An Authorized Participant who holds Creation Units and wishes to redeem at NAV would also pay a standard redemption fee per transaction to the Fund’s Custodian, on the date of such redemption, regardless of the number of Creation Units redeemed that day.
If a Creation Unit is purchased or redeemed for cash, an additional variable fee may be charged. The following table discloses Creation Unit breakdown:
187
Notes to Financial Statements (Continued)
April 30, 2024 (Unaudited)
2. SIGNIFICANT ACCOUNTING POLICIES (continued)
| | | Creation
Unit
Shares | | Creation
Fee | | Value at
April 30,
2024 | | Redemption
Fee |
| Global X Lithium & Battery Tech ETF | | | 10,000 | | | $ | 600 | | | $ | 442,000 | | | $ | 600 | |
| Global X SuperDividend® ETF | | | 10,000 | | | | 900 | | | | 216,400 | | | | 900 | |
| Global X Social Media ETF | | | 10,000 | | | | 250 | | | | 407,800 | | | | 250 | |
| Global X Guru® Index ETF | | | 10,000 | | | | 250 | | | | 412,200 | | | | 250 | |
| Global X SuperIncome™ Preferred ETF | | | 10,000 | | | | 250 | | | | 90,200 | | | | 250 | |
| Global X SuperDividend® U.S. ETF | | | 10,000 | | | | 150 | | | | 171,200 | | | | 150 | |
| Global X MSCI SuperDividend® Emerging Markets ETF | | | 10,000 | | | | 900 | | | | 256,900 | | | | 900 | |
| Global X SuperDividend® REIT ETF | | | 10,000 | | | | 250 | | | | 194,800 | | | | 250 | |
| Global X Renewable Energy Producers ETF | | | 10,000 | | | | 400 | | | | 95,800 | | | | 400 | |
| Global X S&P 500® Catholic Values ETF | | | 10,000 | | | | 1,400 | | | | 608,300 | | | | 1,400 | |
| Global X MSCI SuperDividend® EAFE ETF | | | 10,000 | | | | 300 | | | | 143,900 | | | | 300 | |
| Global X E-commerce ETF | | | 10,000 | | | | 250 | | | | 228,400 | | | | 250 | |
| Global X S&P Catholic Values Developed ex-U.S. ETF | | | 10,000 | | | | 2,700 | | | | 304,800 | | | | 2,700 | |
| Global X NASDAQ 100® Tail Risk ETF | | | 10,000 | | | | 250 | | | | 267,900 | | | | 250 | |
| Global X NASDAQ 100® Collar 95-110 ETF | | | 10,000 | | | | 300 | | | | 274,000 | | | | 300 | |
| Global X S&P 500® Tail Risk ETF | | | 10,000 | | | | 800 | | | | 286,100 | | | | 800 | |
| Global X S&P 500® Collar 95-110 ETF | | | 10,000 | | | | 1,700 | | | | 286,700 | | | | 1,700 | |
| Global X Disruptive Materials ETF | | | 10,000 | | | | 400 | | | | 162,200 | | | | 400 | |
CASH OVERDRAFT CHARGES – Per the terms of an agreement with BBH, if a Fund for which BBH is Custodian has a cash overdraft on a given day, it will be assessed an overdraft charge equal to the applicable BBH Base Rate plus 2.00%. Per the terms of an agreement with BNY Mellon, if a Fund for which BNY Mellon is Custodian has a cash overdraft, it will be charged interest at a rate then charged by BNY Mellon to its institutional custody clients in the relevant currency. Cash overdraft charges are included in custodian fees on the Statements of Operations.
OPTIONS/SWAPTIONS WRITING/PURCHASING – To the extent consistent with their investment policies, certain Funds may either purchase or write options.
When a Fund purchases an option, the premium paid by it is recorded as an asset of the Fund. When a Fund writes an option, an amount equal to the net premium (the premium less the commission) received by the Fund is included in the liability section of the Fund’s Statement of Assets and Liabilities as a deferred credit. The amount of this asset or deferred credit will be subsequently marked-to-market to reflect the current value of the option purchased or written. The current value of the traded option is the last sale price or, in the absence of a sale, the current bid price. If an option purchased by a Fund expires unexercised, the Fund realizes a loss equal to the premium paid. If a Fund enters into a closing sale transaction on an option purchased by it, the Fund will realize a gain if the premium received by the Fund on the closing transaction is more than the premium paid
188
Notes to Financial Statements (Continued)
April 30, 2024 (Unaudited)
2. SIGNIFICANT ACCOUNTING POLICIES (continued)
to purchase the option, or a loss if it is less. If an option written by a Fund expires on the stipulated expiration date or if a Fund enters into a closing purchase transaction, it will realize a gain (or loss if the cost of a closing purchase transaction exceeds the net premium received when the option is sold) and the deferred credit related to such option will be eliminated. If an option written by a Fund is exercised, the proceeds of the sale will be increased by the net premium originally received and the Fund will realize a gain or loss.
Risks may arise from an imperfect correlation between the change in market value of the securities held and the prices of options relating to the securities purchased or sold and from possible lack of a liquid secondary market for an option. The maximum exposure to loss for any purchased option is limited to the premium initially paid for the option. Written uncovered call options subject a Fund to unlimited risk of loss. Written covered call options limit the upside potential of a security above the strike price. Written put options expose a Fund to risk of loss if the value of the security declines below the strike price.
The Global X NASDAQ 100® Tail Risk ETF, Global X NASDAQ 100® Collar 95-110 ETF, Global X S&P 500® Tail Risk ETF and Global X S&P 500® Collar 95-110 ETF may write covered call and/or put options that correspond to their respective reference index. By writing a covered call option, a Fund, in exchange for the premium, foregoes the opportunity for capital appreciation above the strike price should the market price of the underlying security increase. Conversely, by writing a put option, the Fund, in exchange for the premium, accepts the risk of having to purchase a security at a fixed strike price even should the price of the underlying security decrease, exposing the Fund to downside risk in the underlying security.
When the written option expires, is terminated or is sold, a Fund will record a gain or loss. The net realized gain or loss on options contracts is reflected in the Statements of Operations and the net unrealized gains/(losses) are included as a component of the net change in unrealized appreciation/(depreciation) on options contracts in the Statements of Operations.
3. RELATED PARTIES AND SERVICE PROVIDER TRANSACTIONS
On July 2, 2018, the Adviser consummated a transaction pursuant to which it became an indirect, wholly-owned subsidiary of Mirae Asset Global Investments Co., Ltd. (“Mirae”). In this manner, the Adviser is ultimately controlled by Mirae.
The Adviser serves as the investment adviser and the administrator for the Funds. Subject to the supervision of the Board, the Adviser is responsible for managing the investment activities of the Funds and the Funds’ business affairs and other administrative matters and provides, or causes to be furnished, all supervisory, administrative and other services reasonably necessary for the operation of the Funds, including certain distribution services (provided pursuant to a separate distribution agreement), certain shareholder and
189
Notes to Financial Statements (Continued)
April 30, 2024 (Unaudited)
3. RELATED PARTIES AND SERVICE PROVIDER TRANSACTIONS (continued)
distribution-related services (provided pursuant to a separate Rule 12b-1 Plan and related agreements) and investment advisory services (provided pursuant to a separate Investment Advisory Agreement), under what is essentially an “all-in” fee structure.
For the Adviser’s service to the respective Funds, under a supervision and administration agreement (the “Supervision and Administration Agreement”), each Fund pays a monthly fee to the Adviser at the annual rate below (stated as a percentage of the average daily net assets of each Fund) (“Supervision and Administration Fee”). In addition, the Funds bear other expenses, directly and indirectly, that are not covered by the Supervision and Administration Agreement, which may vary and affect the total expense ratios of the Funds, such as taxes, brokerage fees, commissions, certain custodian fees, acquired fund fees, and other transaction expenses, interest expenses and extraordinary expenses (such as litigation and indemnification expenses).
The following table discloses supervision and administration fees payable pursuant to the Supervision and Administration Agreement:
| | | Supervision and
Administration Fee |
| | | |
| Global X Lithium & Battery Tech ETF | | | 0.75 | % |
| Global X SuperDividend® ETF(1) | | | 0.58 | % |
| Global X Social Media ETF | | | 0.65 | % |
| Global X Guru® Index ETF | | | 0.75 | % |
| Global X SuperIncomeTM Preferred ETF | | | 0.48 | % |
| Global X SuperDividend® U.S. ETF | | | 0.45 | % |
| Global X MSCI SuperDividend® Emerging Markets ETF | | | 0.65 | % |
| Global X SuperDividend® REIT ETF | | | 0.58 | % |
| Global X Renewable Energy Producers ETF | | | 0.65 | % |
| Global X S&P 500® Catholic Values ETF | | | 0.29 | % |
| Global X MSCI SuperDividend® EAFE ETF | | | 0.55 | % |
| Global X E-commerce ETF | | | 0.50 | % |
| Global X S&P 500® Catholic Values Developed ex-U.S. ETF | | | 0.35 | % |
| Global X NASDAQ 100® Tail Risk ETF | | | 0.25 | % |
| Global X NASDAQ 100® Collar 95-110 ETF | | | 0.25 | % |
| Global X S&P 500® Tail Risk ETF | | | 0.25 | % |
| Global X S&P 500® Collar 95-110 ETF | | | 0.25 | % |
| Global X Disruptive Materials ETF | | | 0.59 | % |
190
Notes to Financial Statements (Continued)
April 30, 2024 (Unaudited)
3. RELATED PARTIES AND SERVICE PROVIDER TRANSACTIONS (continued)
(1) Pursuant to an Expense Limitation Agreement, the Adviser has contractually agreed to reimburse or waive fees and/or limit expenses for the Global X SuperDividend® ETF to the extent necessary to assure that the operating expenses of the Global X SuperDividend® ETF (exclusive of taxes, brokerage fees, commissions, and other transaction expenses and extraordinary expenses (such as litigation and indemnification expenses)) will not exceed 0.58% of the average daily net assets of the Global X SuperDividend® ETF per year until at least March 1, 2025.
SEI Investments Global Funds Services (“SEIGFS”) serves as sub-administrator to the Funds. As sub-administrator, SEIGFS provides the Funds with all required general administrative services, including, without limitation: office space, equipment, and personnel; clerical and general back office services; bookkeeping, internal accounting and secretarial services; the calculation of NAV; and assistance with the preparation and filing of reports, registration statements, proxy statements, and other materials required to be filed or furnished by the Funds under federal and state securities laws. As compensation for these services, SEIGFS receives certain out-of-pocket costs, transaction fees, and asset-based fees which are accrued daily and paid monthly by the Adviser.
SEI Investments Distribution Co. (“SIDCO”) serves as the Funds’ underwriter and distributor of Creation Units pursuant to a distribution agreement (the “Distribution Agreement”). SIDCO has no obligation to sell any specific quantity of Shares of the Funds.
SIDCO bears the following costs and expenses relating to the distribution of Shares: (i) the costs of processing and maintaining records of creations of Creation Units; (ii) all costs of maintaining the records required of a registered broker/dealer; (iii) the expenses of maintaining its registration or qualification as a dealer or broker under federal or state laws; (iv) filing fees; and (v) all other expenses incurred in connection with the distribution services as contemplated in the Distribution Agreement. SIDCO receives no fee from the Funds for its distribution services under the Distribution Agreement, rather, the Adviser compensates SIDCO for certain expenses, out-of-pocket costs, and transaction fees.
BBH serves as Custodian and transfer agent of the Global X Lithium & Battery Tech ETF, Global X Guru® Index ETF, Global X SuperIncome™ Preferred ETF, Global X S&P 500® Catholic Values ETF, Global X NASDAQ 100® Collar 95-110 ETF and the Global X S&P 500® Collar 95-110 ETF. For the Funds for which it serves as Custodian, BBH has agreed to (i) make receipts and disbursements of money on behalf of the Funds; (ii) collect and receive all income and other payments and distributions on account of the Funds’ portfolio investments; (iii) respond to correspondence from shareholders, security brokers and others relating to its duties; and (iv) make periodic reports to the Funds concerning the Funds’ operations. BBH does not exercise any supervisory function over the purchase and sale of securities. As compensation for these services, BBH receives certain out-of-pocket costs, transaction fees and asset-based fees which are accrued daily and paid monthly by the Adviser from its fees. For the funds which it serves as transfer agent, BBH has agreed to (i) issue and redeem Shares of each Fund; (ii) make dividend and other distributions to shareholders of each Fund; (iii) respond to correspondence by shareholders and others
191
Notes to Financial Statements (Continued)
April 30, 2024 (Unaudited)
3. RELATED PARTIES AND SERVICE PROVIDER TRANSACTIONS (continued)
relating to its duties; (iv) maintain shareholder accounts; and (v) make periodic reports to the Funds. As compensation for these services, BBH receives certain out-of-pocket costs, transaction fees and asset-based fees which are accrued daily and paid monthly by the Adviser from its fees.
For all Funds other than the Global X Lithium & Battery Tech ETF, Global X Guru® Index ETF, Global X SuperIncome™ Preferred ETF, Global X S&P 500® Catholic Values ETF, Global X NASDAQ 100® Collar 95-110 ETF and Global X S&P 500® Collar 95-110 ETF, BNY Mellon serves as Custodian and transfer agent to the Trust on behalf of the Funds. As Custodian, BNY Mellon may appoint domestic and foreign sub-custodians and use depositories from time to time to hold securities and other instruments purchased by the Trust in foreign countries and to hold cash and currencies for the Trust on behalf of the Funds. Under its transfer agency agreement with the Trust, BNY Mellon has undertaken with the Trust to provide the following services with respect to the Funds for which it serves as transfer agent: (i) perform and facilitate the performance of purchases and redemptions of Creation Units, (ii) prepare and transmit by means of Depository Trust Company’s book-entry system payments for dividends and distributions on or with respect to the Shares declared by the Trust on behalf of the Fund, as applicable, (iii) prepare and deliver reports, information and documents as specified in the transfer agency agreement, (iv) perform the customary services of a transfer agent and dividend disbursing agent, and (v) render certain other miscellaneous services as specified in the transfer agency agreement or as otherwise agreed upon.
192
Notes to Financial Statements (Continued)
April 30, 2024 (Unaudited)
4. INVESTMENT TRANSACTIONS
For the period ended April 30, 2024, the purchases and sales of investments in securities, excluding in-kind transactions, long-term U.S. Government and short-term securities were:
| | | Purchases | | Sales and
Maturities |
| Global X Lithium & Battery Tech ETF | | $ | 191,290,497 | | | $ | 358,724,625 | |
| Global X SuperDividend® ETF | | | 401,165,236 | | | | 400,984,701 | |
| Global X Social Media ETF | | | 14,634,352 | | | | 16,812,389 | |
| Global X Guru® Index ETF | | | 29,438,849 | | | | 29,531,894 | |
| Global X SuperIncome™ Preferred ETF | | | 62,476,579 | | | | 62,502,353 | |
| Global X SuperDividend® U.S. ETF | | | 265,038,335 | | | | 282,322,553 | |
| Global X MSCI SuperDividend® Emerging Markets ETF | | | 8,703,200 | | | | 10,536,986 | |
| Global X SuperDividend® REIT ETF | | | 171,421,493 | | | | 173,439,284 | |
| Global X Renewable Energy Producers ETF | | | 2,156,182 | | | | 3,951,735 | |
| Global X S&P 500® Catholic Values ETF | | | 21,008,382 | | | | 21,892,270 | |
| Global X MSCI SuperDividend® EAFE ETF | | | 2,746,719 | | | | 2,808,912 | |
| Global X E-commerce ETF | | | 12,390,859 | | | | 12,304,473 | |
| Global X S&P Catholic Values Developed ex-U.S. ETF | | | 904,550 | | | | 607,465 | |
| Global X NASDAQ 100® Tail Risk ETF | | | 110,795 | | | | 151,482 | |
| Global X NASDAQ 100® Collar 95-110 ETF | | | 180,310 | | | | 236,622 | |
| Global X S&P 500® Tail Risk ETF | | | 35,341 | | | | 59,907 | |
| Global X S&P 500® Collar 95-110 ETF | | | 25,533 | | | | 68,346 | |
| Global X Disruptive Materials ETF | | | 763,619 | | | | 1,325,012 | |
During the period ended April 30, 2024, there were no purchases or sales of long-term U.S. Government securities for the Funds.
193
Notes to Financial Statements (Continued)
April 30, 2024 (Unaudited)
4. INVESTMENT TRANSACTIONS (continued)
For the period ended April 30, 2024, in-kind transactions associated with creations and redemptions were:
| | | Purchases | | Sales | | Realized
Gain/(Loss) |
| Global X Lithium & Battery Tech ETF | | $ | 50,912,257 | | | $ | 286,936,239 | | | $ | 30,754,273 | |
| Global X SuperDividend® ETF | | | 7,869,510 | | | | 7,784,070 | | | | 1,250,869 | |
| Global X Social Media ETF | | | 12,180,660 | | | | 36,064,105 | | | | 9,153,603 | |
| Global X Guru® Index ETF | | | 19,076,281 | | | | 29,085,353 | | | | 6,926,385 | |
| Global X SuperIncome™ Preferred ETF | | | – | | | | 23,089,002 | | | | 543,495 | |
| Global X SuperDividend® U.S. ETF | | | 18,436,734 | | | | 43,513,851 | | | | 5,290,790 | |
| Global X MSCI SuperDividend® Emerging Markets ETF | | | – | | | | 750,792 | | | | 119,019 | |
| Global X SuperDividend® REIT ETF | | | 4,419,013 | | | | 26,140,619 | | | | 1,486,421 | |
| Global X Renewable Energy Producers ETF | | | – | | | | 6,042,893 | | | | (3,548,646 | ) |
| Global X S&P 500® Catholic Values ETF | | | 24,312,163 | | | | 23,716,642 | | | | 10,592,489 | |
| Global X MSCI SuperDividend® EAFE ETF | | | 2,840,011 | | | | 2,870,276 | | | | 525,491 | |
| Global X E-commerce ETF | | | – | | | | 13,172,995 | | | | 3,254,574 | |
| Global X S&P Catholic Values Developed ex-U.S. ETF | | | 279,666 | | | | – | | | | – | |
| Global X NASDAQ 100® Tail Risk ETF | | | 1,331,450 | | | | 504,146 | | | | 64,183 | |
| Global X NASDAQ 100® Collar 95-110 ETF | | | – | | | | 811,531 | | | | 122,966 | |
| Global X S&P 500® Tail Risk ETF | | | 291,538 | | | | – | | | | – | |
| Global X S&P 500® Collar 95-110 ETF | | | – | | | | – | | | | – | |
| Global X Disruptive Materials ETF | | | 386,696 | | | | 1,577,192 | | | | (119,199 | ) |
5. DERIVATIVE TRANSACTIONS
The following tables show the derivatives categorized by underlying risk exposure.
The fair value of derivative instruments as of April 30, 2024 was as follows:
| | | Asset Derivatives | | | | | | | Liability Derivatives | | | |
| | | Statements of Assets
and Liability Location | | Fair Value | | | | | Statements of Assets
and Liability Location | | Fair Value | |
| Derivatives not accounted for as hedging instruments: |
| | | | | | | | | | | | | | | |
| Global X SuperDividend® ETF |
| Equity contracts | | Unrealized appreciation on Future Contracts | | $ | – | | | Equity contracts | | Unrealized depreciation on Future Contracts | | $ | 159,578 | * |
| Total Derivatives not accounted for as hedging instruments | | $ | – | | | | | | | $ | 159,578 | |
194
Notes to Financial Statements (Continued)
April 30, 2024 (Unaudited)
5. DERIVATIVE TRANSACTIONS (continued)
| | | Asset Derivatives | | | | | | | Liability Derivatives | | | |
| | | Statements of Assets
and Liability Location | | Fair Value | | | | | Statements of Assets
and Liability Location | | Fair Value | |
| Derivatives not accounted for as hedging instruments: |
| | | | | | | | | | | | | | | |
| Global X MSCI SuperDividend® Emerging Markets ETF |
Equity
contracts | | Unrealized appreciation on Future
Contracts | | $ | – | | | Equity contracts | | Unrealized depreciation on Future Contracts | | $ | 854 | * |
| Total Derivatives not accounted for as hedging instruments | | $ | – | | | | | | | $ | 854 | |
| | | | | | | | | | | | | |
| | | Asset Derivatives | | | | | | | Liability Derivatives | | | |
| | | Statements of Assets
and Liability Location | | Fair Value | | | | | Statements of Assets
and Liability Location | | Fair Value | |
| Derivatives not accounted for as hedging instruments: |
| | | | | | | | | | | | | | | |
| Global X NASDAQ 100® Tail Risk ETF |
| Equity contracts | | Investments purchased, at value | | $ | 14,000 | | | Equity contracts | | Options written, at value | | $ | – | |
| Total Derivatives not accounted for as hedging instruments | | $ | 14,000 | | | | | | | $ | – | |
| | | | | | | | | | | | | | | |
| | | Asset Derivatives | | | | | | | | Liability Derivatives | | | | |
| | | Statements of Assets
and Liability Location | | Fair Value | | | | | Statements of Assets
and Liability Location | | Fair Value | |
| Derivatives not accounted for as hedging instruments: |
| | | | | | | | | | | | | | | |
| Global X NASDAQ 100® Collar 95-110 ETF |
| Equity contracts | | Investments purchased, at value | | $ | 22,400 | | | Equity contracts | | Options written, at value | | $ | 529 | |
| Total Derivatives not accounted for as hedging instruments | | $ | 22,400 | | | | | | | $ | 529 | |
| | | | | | | | | | | | | | | |
| | | Asset Derivatives | | | | | | | | Liability Derivatives | | | | |
| | | Statements of Assets
and Liability Location | | Fair Value | | | | | Statements of Assets
and Liability Location | | Fair Value | |
| Derivatives not accounted for as hedging instruments: |
| | | | | | | | | | | | | | | |
| Global X S&P 500® Tail Risk ETF |
| Equity contracts | | Investments purchased, at value | | $ | 9,832 | | | Equity contracts | | Options written, at value | | $ | – | |
| Total Derivatives not accounted for as hedging instruments | | $ | 9,832 | | | | | | | $ | – | |
195
Notes to Financial Statements (Continued)
April 30, 2024 (Unaudited)
5. DERIVATIVE TRANSACTIONS (continued)
| | | Asset Derivatives | | | | | | | Liability Derivatives | | | |
| | | Statements of Assets
and Liability Location | | Fair Value | | | | | Statements of Assets
and Liability Location | | Fair Value | |
| Derivatives not accounted for as hedging instruments: |
| | | | | | | | | | | | | | | |
| Global X S&P 500® Collar 95-110 ETF |
| Equity contracts | | Investments purchased, at value | | $ | 22,550 | | | Equity contracts | | Options written, at value | | $ | 300 | |
| Total Derivatives not accounted for as hedging instruments | | $ | 22,550 | | | | | | | $ | 300 | |
*Includes cumulative appreciation/depreciation of futures contracts as reported in the Schedule of Investments. Only current day’s variation margin is reported within the Statements of Assets and Liabilities.
The effect of derivative instruments on the Statements of Operations for the period ended April 30, 2024:
Amount of realized gain or (loss) on derivatives recognized in income:
| | | Purchased
Options | | Written
Options | | Futures | |
| Global X SuperDividend® ETF | | | | | | | | | | | | | |
| Equity contracts | | $ | – | | | $ | – | | | $ | 311,473 | | |
| | | | | | | | | | | | | | |
| Global X NASDAQ 100® Tail Risk ETF | | | | | | | | | | | | | |
| Equity contracts | | $ | (24,580 | ) | | $ | – | | | $ | – | | |
| | | | | | | | | | | | | | |
| Global X NASDAQ 100® Collar 95-110 ETF | | | | | | | | | | | | | |
| Equity contracts | | $ | (69,200 | ) | | $ | 33,560 | | | $ | – | | |
| | | | | | | | | | | | | | |
| Global X S&P 500® Tail Risk ETF | | | | | | | | | | | | | |
| Equity contracts | | $ | (25,088 | ) | | $ | – | | | $ | – | | |
| | | | | | | | | | | | | | |
| Global X S&P 500® Collar 95-110 ETF | | | | | | | | | | | | | |
| Equity contracts | | $ | (42,112 | ) | | $ | 4,690 | | | $ | – | | |
Change in unrealized appreciation or (depreciation) on derivatives recognized in income:
| | | Purchased
Options | | Written
Options | | Futures | |
| Global X SuperDividend® ETF | | | | | | | | | | | | | |
| Equity contracts | | $ | – | | | $ | – | | | $ | (159,578 | ) | |
| | | | | | | | | | | | | | |
| Global X MSCI SuperDividend® Emerging Markets ETF | | | | | | | | | | | | | |
| Equity contracts | | $ | – | | | $ | – | | | $ | (854 | ) | |
196
Notes to Financial Statements (Continued)
April 30, 2024 (Unaudited)
5. DERIVATIVE TRANSACTIONS (continued)
| | | Purchased
Options | | Written
Options | | Futures | |
| Global X NASDAQ 100® Tail Risk ETF | | | | | | | | | | | | | |
| Equity contracts | | $ | (15,249 | ) | | $ | – | | | $ | – | | |
| | | | | | | | | | | | | | |
| Global X NASDAQ 100® Collar 95-110 ETF | | | | | | | | | | | | | |
| Equity contracts | | $ | (27,148 | ) | | $ | (10,247 | ) | | $ | – | | |
| | | | | | | | | | | | | | |
| Global X S&P 500® Tail Risk ETF | | | | | | | | | | | | | |
| Equity contracts | | $ | (15,894 | ) | | $ | – | | | $ | – | | |
| | | | | | | | | | | | | | |
| Global X S&P 500® Collar 95-110 ETF | | | | | | | | | | | | | |
| Equity contracts | | $ | (36,562 | ) | | $ | 1,964 | | | $ | – | | |
The following table discloses the average monthly balances of the Funds’ Futures activity during the period ended April 30, 2024:
| | | Short Avg | | | Long Avg | |
| Global X SuperDividend® ETF | | | $– | | | | $4,879,962 | |
| Global X MSCI SuperDividend® Emerging Markets ETF | | | – | | | | 8,826 | |
The following table discloses the average monthly balances of the Funds’ options activity during the period ended April 30, 2024:
| | | Short Avg | | | Long Avg | |
| Global X NASDAQ 100® Tail Risk ETF | | | $– | | | | $16,089 | |
| Global X NASDAQ 100® Collar 95-110 ETF | | | (11,248 | ) | | | 32,392 | |
| Global X S&P 500® Tail Risk ETF | | | – | | | | 13,327 | |
| Global X S&P 500® Collar 95-110 ETF | | | (2,980 | ) | | | 22,739 | |
6. TAX INFORMATION
The Global X SuperDividend® REIT ETF has a tax year that ends on December 31. The following tax disclosures are representative as of October 31, 2023. Accordingly, the disclosures are for informational use by shareholders and are subject to change attributable to activity through the end of the tax year ending December 31, 2023.
The amount and character of income and capital gain distributions to be paid, if any, are determined in accordance with Federal income tax regulations, which may differ from U.S. GAAP. As a result, net investment income (loss) and net realized gain (loss) on investment transactions for a reporting period may differ significantly from distributions during such period. These book/tax differences may be temporary or permanent. To the extent these differences are permanent in nature, they are charged or credited to undistributed net investment income (loss), accumulated net realized gain (loss) or paid-in capital, as appropriate, in the period that the differences arise.
197
Notes to Financial Statements (Continued)
April 30, 2024 (Unaudited)
6. TAX INFORMATION (continued)
The tax character of dividends and distributions declared during the periods ended October 31, 2023 and October 31, 2022 were as follows:
| Global X Funds | | Ordinary Income | | | Long-Term
Capital Gain | | | Return of Capital | | | Totals | |
| Global X Lithium & Battery Tech ETF | | | | | | | | | | | | | | | | |
| 2024 | | $ | – | | | $ | – | | | $ | – | | | $ | – | |
| 2023 | | | 38,976,032 | | | | – | | | | – | | | | 38,976,032 | |
| Global X SuperDividend® ETF | | | | | | | | | | | | | | | | |
| 2024 | | $ | – | | | $ | – | | | $ | – | | | $ | – | |
| 2023 | | | 71,554,165 | | | | – | | | | 17,865,200 | | | | 89,419,365 | |
| Global X Social Media ETF | | | | | | | | | | | | | | | | |
| 2024 | | $ | – | | | $ | – | | | $ | – | | | $ | – | |
| 2023 | | | 696,865 | | | | – | | | | – | | | | 696,865 | |
| Global X Guru® Index ETF | | | | | | | | | | | | | | | | |
| 2024 | | $ | – | | | $ | – | | | $ | – | | | $ | – | |
| 2023 | | | 140,340 | | | | – | | | | 13,339 | | | | 153,679 | |
| Global X SuperIncome™ Preferred ETF | | | | | | | | | | | | | | | | |
| 2024 | | $ | – | | | $ | – | | | $ | – | | | $ | – | |
| 2023 | | | 12,843,440 | | | | – | | | | – | | | | 12,843,440 | |
| Global X SuperDividend® U.S. ETF | | | | | | | | | | | | | | | | |
| 2024 | | $ | – | | | $ | – | | | $ | – | | | $ | – | |
| 2023 | | | 32,670,182 | | | | – | | | | 12,029,058 | | | | 44,699,240 | |
| Global X MSCI SuperDividend® Emerging Markets ETF |
| 2024 | | $ | – | | | $ | – | | | $ | – | | | $ | – | |
| 2023 | | | 3,319,170 | | | | – | | | | – | | | | 3,319,170 | |
| Global X SuperDividend® REIT ETF | | | | | | | | | | | | | | | | |
| 2024 | | $ | 8,867,512 | | | $ | – | | | $ | – | | | $ | 8,867,512 | |
| 2023 | | | 17,667,250 | | | | – | | | | 6,960,250 | | | | 24,627,500 | |
| Global X Renewable Energy Producers ETF | | | | | | | | | | | | | | | | |
| 2024 | | $ | 357,729 | | | $ | – | | | $ | – | | | $ | 357,729 | |
| 2023 | | | 839,231 | | | | – | | | | – | | | | 839,231 | |
| Global X S&P 500® Catholic Values ETF | | | | | | | | | | | | | | | | |
| 2024 | | $ | 5,390,628 | | | $ | – | | | $ | – | | | $ | 5,390,628 | |
| 2023 | | | 7,699,184 | | | | – | | | | – | | | | 7,699,184 | |
| Global X MSCI SuperDividend® EAFE ETF | | | | | | | | | | | | | | | | |
| 2024 | | $ | 371,156 | | | $ | – | | | $ | – | | | $ | 371,156 | |
| 2023 | | | 736,065 | | | | – | | | | – | | | | 736,065 | |
| Global X E-commerce ETF | | | | | | | | | | | | | | | | |
| 2024 | | $ | – | | | $ | – | | | $ | – | | | $ | – | |
| 2023 | | | – | | | | – | | | | 42,666 | | | | 42,666 | |
| Global X S&P Catholic Values Developed ex-U.S. ETF | | | | | | | | | | | | | | | | |
| 2024 | | $ | 184,613 | | | $ | – | | | $ | – | | | $ | 184,613 | |
| 2023 | | | 253,178 | | | | – | | | | – | | | | 253,178 | |
| Global X NASDAQ 100® Tail Risk ETF | | | | | | | | | | | | | | | | |
| 2024 | | $ | 4,771 | | | $ | – | | | $ | – | | | $ | 4,771 | |
198
Notes to Financial Statements (Continued)
April 30, 2024 (Unaudited)
6. TAX INFORMATION (continued)
| Global X Funds | | Ordinary Income | | | Long-Term
Capital Gain | | | Return of Capital | | | Totals | |
| 2023 | | | 4,771 | | | | – | | | | – | | | | 4,771 | |
| Global X NASDAQ 100® Collar 95-110 ETF | | | | | | | | | | | | | | | | |
| 2024 | | $ | 8,877 | | | $ | – | | | $ | – | | | $ | 8,877 | |
| 2023 | | | 8,877 | | | | – | | | | – | | | | 8,877 | |
| Global X S&P 500® Tail Risk ETF | | | | | | | | | | | | | | | | |
| 2024 | | $ | 32,745 | | | $ | – | | | $ | – | | | $ | 32,745 | |
| 2023 | | | 32,745 | | | | – | | | | – | | | | 32,745 | |
| Global X S&P 500® Collar 95-110 ETF | | | | | | | | | | | | | | | | |
| 2024 | | $ | 40,011 | | | $ | – | | | $ | – | | | $ | 40,011 | |
| 2023 | | | 40,011 | | | | – | | | | – | | | | 40,011 | |
| Global X Disruptive Materials ETF | | | | | | | | | | | | | | | | |
| 2024 | | $ | 77,885 | | | $ | – | | | $ | – | | | $ | 77,885 | |
| 2023 | | | 77,885 | | | | – | | | | – | | | | 77,885 | |
199
Notes to Financial Statements (Continued)
April 30, 2024 (Unaudited)
6. TAX INFORMATION (continued)
As of October 31, 2023, the components of tax basis distributable earnings (accumulated losses) were as follows:
| | | Global X
Lithium &
Battery Tech
ETF | | Global X
SuperDividend®
ETF | | Global X Social
Media ETF | | Global X Guru®
Index ETF |
| Undistributed Ordinary Income | | $ | 13,418,223 | | | $ | – | | | $ | 221,843 | | | $ | – | |
| Capital Loss Carryforwards | | | (709,741,048 | ) | | | (875,799,892 | ) | | | (102,258,532 | ) | | | (20,896,196 | ) |
| Unrealized Depreciation on Investments and Foreign Currency | | | (442,916,833 | ) | | | (148,395,913 | ) | | | (89,142,998 | ) | | | (2,638,826 | ) |
| Other Temporary Differences | | | (12 | ) | | | (16 | ) | | | 1 | | | | (7 | ) |
| Total Accumulated Losses | | $ | (1,139,239,670 | ) | | $ | (1,024,195,821 | ) | | $ | (191,179,686 | ) | | $ | (23,535,029 | ) |
| | | | | | | | | | | | | | | | | |
| | | Global X
SuperIncome™
Preferred ETF | | Global X
SuperDividend®
U.S. ETF | | Global X MSCI
SuperDividend®
Emerging
Markets ETF | | Global X
SuperDividend®
REIT ETF(1) |
| Undistributed Ordinary Income | | $ | 690,570 | | | $ | – | | | $ | 190,241 | | | $ | – | |
| Capital Loss Carryforwards | | | (107,036,095 | ) | | | (183,409,023 | ) | | | (30,084,393 | ) | | | (223,665,882 | ) |
| Unrealized Depreciation on Investments and Foreign Currency | | | (20,499,314 | ) | | | (70,013,786 | ) | | | (5,645,724 | ) | | | (68,727,995 | ) |
| Other Temporary Differences | | | 7 | | | | 4 | | | | (2 | ) | | | (1,911,500 | ) |
| Total Accumulated Losses | | $ | (126,844,832 | ) | | $ | (253,422,805 | ) | | $ | (35,539,878 | ) | | $ | (294,305,377 | ) |
| | | | | | | | | | | | | | | | | |
| | | Global X
Renewable
Energy
Producers ETF | | Global X S&P
500® Catholic
Values ETF | | Global X MSCI
SuperDividend®
EAFE ETF | | Global X
E-commerce
ETF |
| Undistributed Ordinary Income | | $ | 276,433 | | | $ | 3,291,295 | | | $ | 123,431 | | | $ | – | |
| Capital Loss Carryforwards | | | (11,285,599 | ) | | | (5,249,389 | ) | | | (2,308,676 | ) | | | (21,904,088 | ) |
| Unrealized Appreciation (Depreciation) on Investments and Foreign Currency | | | (41,122,415 | ) | | | 64,077,187 | | | | (1,297,522 | ) | | | (46,987,499 | ) |
| Late Year Loss Deferral | | | – | | | | – | | | | – | | | | (13,818 | ) |
| Other Temporary Differences | | | (2 | ) | | | 3 | | | | (5 | ) | | | 1 | |
| Total Distributable Earnings (Accumulated Losses) | | $ | (52,131,583 | ) | | $ | 62,119,096 | | | $ | (3,482,772 | ) | | $ | (68,905,404 | ) |
| | | | | | | | | | | | | | | | | |
| | | Global X S&P
Catholic Values
Developed ex-
U.S. ETF | | Global X
NASDAQ 100®
Tail Risk ETF | | Global X
NASDAQ 100®
Collar 95-110
ETF | | Global X S&P
500® Tail Risk
ETF |
| Undistributed Ordinary Income | | $ | 152,209 | | | $ | 2,466 | | | $ | 4,067 | | | $ | 11,623 | |
| Capital Loss Carryforwards | | | (305,713 | ) | | | (532,778 | ) | | | (370,940 | ) | | | (347,869 | ) |
| Unrealized Depreciation on Investments and Foreign Currency | | | (888,246 | ) | | | – | | | | – | | | | – | |
| Other Temporary Differences | | | 2 | | | | – | | | | 2 | | | | – | |
| Total Accumulated Losses | | $ | (1,041,748 | ) | | $ | (530,312 | ) | | $ | (366,871 | ) | | $ | (336,246 | ) |
200
Notes to Financial Statements (Continued)
April 30, 2024 (Unaudited)
6. TAX INFORMATION (continued)
| | | Global X S&P
500® Collar 95-
110 ETF | | Global X
Disruptive
Materials ETF |
| Undistributed Ordinary Income | | $ | 11,286 | | | $ | 54,723 | |
| Capital Loss Carryforwards | | | (316,741 | ) | | | (1,020,325 | ) |
| Unrealized Depreciation on Investments and Foreign Currency | | | – | | | | (2,633,416 | ) |
| Other Temporary Differences | | | 1 | | | | (2 | ) |
| Total Accumulated Losses | | $ | (305,454 | ) | | $ | (3,599,020 | ) |
(1) The Global X SuperDividend® REIT ETF has a tax year that ends on December 31.
For taxable years beginning after December 22, 2010, a Registered Investment Company within the meaning of the 1940 Act is permitted to carry forward net capital losses to offset capital gains realized in later years, and the losses carried forward retain their original character as either long-term or short-term losses. Losses carried forward under these provisions are as follows:
| | | Short-Term
Loss | | | Long-Term
Loss | | | Total | |
| Global X NASDAQ 100® Tail Risk ETF | | $ | 66,442 | | | $ | 466,336 | | | $ | 532,778 | |
| Global X NASDAQ 100® Collar 95-110 ETF | | | 17,262 | | | | 353,678 | | | | 370,940 | |
| Global X S&P 500® Tail Risk ETF | | | 21,340 | | | | 326,529 | | | | 347,869 | |
| Global X S&P 500® Collar 95-110 ETF | | | 66,167 | | | | 250,574 | | | | 316,741 | |
| Global X Disruptive Materials ETF | | | 536,299 | | | | 484,026 | | | | 1,020,325 | |
(1) The prior year ending balances of $298,494 (ST) and $447,741 (LT) (not presented herein), have been revised to correct for an error in the accounting for the mixed straddle election. The “as revised” balances (also not presented herein) are $313,824 (ST) and $470,735 (LT). Additionally, the same error resulted in Accumulated Losses and Paid in Capital, as presented on the Statement of Assets and Liabilities as of October 31, 2022, being understated and overstated, respectively, by an equal and offsetting amount totaling $38,325. Management has determined that the impact of these errors are not material to the prior year financial statements.
(2) The prior year ending balances of $213,983 (ST) and $320,974 (LT) (not presented herein), have been revised to correct for an error in the accounting for the mixed straddle election. The “as revised” balances (also not presented herein) are $229,330 (ST) and $343,996 (LT). Additionally, the same error resulted in Accumulated Losses and Paid in Capital, as presented on the Statement of Assets and Liabilities as of October 31, 2022, being understated and overstated, respectively, by an equal and offsetting amount totaling $38,369. Management has determined that the impact of these errors are not material to the prior year financial statements.
201
Notes to Financial Statements (Continued)
April 30, 2024 (Unaudited)
6. TAX INFORMATION (continued)
During the year ended October 31, 2023, the following Funds utilized capital loss carryforwards to offset capital gains amounting to:
| | | Short-Term
Loss | | | Long-Term
Loss | | | Total | |
| Global X NASDAQ 100® Tail Risk ETF | | $ | 247,382 | | | $ | 4,398 | | | $ | 251,780 | |
| Global X NASDAQ 100® Collar 95-110 ETF | | | 212,068 | | | | – | | | | 212,068 | |
| Global X S&P 500® Tail Risk ETF | | | 186,833 | | | | – | | | | 186,833 | |
| Global X S&P 500® Collar 95-110 ETF | | | 93,274 | | | | – | | | | 93,274 | |
The Federal tax cost basis of investments and aggregate gross unrealized appreciation and depreciation on investments held by the Funds at April 30, 2024 were as follows:
| Global X Funds | | Federal Tax
Cost | | Aggregated
Gross
Unrealized
Appreciation | | Aggregated
Gross
Unrealized
Depreciation | | Net Unrealized
Appreciation
(Depreciation) |
| Global X Lithium & Battery Tech ETF | | $2,000,395,732 | | $163,198,812 | | $(521,461,136) | | $(358,262,324) |
| Global X SuperDividend® ETF | | 843,959,828 | | 55,372,150 | | (112,440,955) | | (57,068,805) |
| Global X Social Media ETF | | 191,008,202 | | 11,999,224 | | (63,012,712) | | (51,013,488) |
| Global X Guru® Index ETF | | 39,902,778 | | 3,367,083 | | (2,878,030) | | 489,053 |
| Global X SuperIncome™ Preferred ETF | | 162,823,420 | | 2,607,452 | | (7,933,101) | | (5,325,649) |
| Global X SuperDividend® U.S. ETF | | 585,659,302 | | 66,335,928 | | (31,623,636) | | 34,712,292 |
| Global X MSCI SuperDividend® Emerging Markets ETF | | 44,278,213 | | 8,897,485 | | (7,634,010) | | 1,263,475 |
| Global X SuperDividend® REIT ETF | | 228,107,553 | | 2,300,891 | | (24,364,397) | | (22,063,506) |
| Global X Renewable Energy Producers ETF | | 72,053,644 | | 695,081 | | (32,698,909) | | (32,003,828) |
| Global X S&P 500® Catholic Values ETF | | 607,677,565 | | 228,981,764 | | (33,776,090) | | 195,205,674 |
| Global X MSCI SuperDividend® EAFE ETF | | 11,264,143 | | 837,438 | | (822,112) | | 15,326 |
| Global X E-commerce ETF | | 81,504,331 | | 9,672,304 | | (18,865,553) | | (9,193,249) |
| Global X S&P Catholic Values Developed ex-U.S. ETF | | 15,677,877 | | 2,710,015 | | (790,167) | | 1,919,848 |
| Global X NASDAQ 100® Tail Risk ETF | | 2,335,520 | | 25 | | (16,702) | | (16,677) |
| Global X NASDAQ 100® Collar 95-110 ETF | | 1,518,357 | | 279,060 | | 16,149 | | 295,209 |
| Global X S&P 500® Tail Risk ETF | | 2,836,630 | | 557,180 | | (243,474) | | 313,706 |
| Global X S&P 500® Collar 95-110 ETF | | 2,319,726 | | 480,459 | | (218,294) | | 262,165 |
| Global X Disruptive Materials ETF | | 7,823,178 | | 538,554 | | (1,562,702) | | (1,024,148) |
202
Notes to Financial Statements (Continued)
April 30, 2024 (Unaudited)
7. CONCENTRATION OF RISKS
The Funds invest in securities of foreign issuers in various countries. These investments may involve certain considerations and risks not typically associated with investments in the United States as a result of, among other factors, the possibility of future political and economic developments, the level of governmental supervision and regulation of securities markets in the respective countries.
The securities markets of emerging market countries are less liquid, subject to greater price volatility, and have a smaller market capitalization than the U.S. securities markets. In certain countries, there may be fewer publicly traded securities and the market may be dominated by a few issuers or sectors. Issuers and securities markets in such countries are not subject to as extensive and frequent accounting, financial and other reporting requirements or as comprehensive government regulations as are issuers and securities markets in the United States. In particular, the assets and profits appearing on the financial statements of emerging market country issuers may not reflect their financial position or results of operations in the same manner as financial statements for U.S. issuers. Substantially less information may be publicly available about emerging market country issuers than is available about issuers in the United States.
The Funds may be subject to taxes imposed by countries in which they invest. Such taxes are generally based on either income, gains earned or repatriated. The Funds accrue and apply such taxes to net investment income, net realized gains and net unrealized gains as income and/or capital gains are earned.
The Funds use a replication strategy. A replication strategy is an indexing strategy that involves investing in the securities of an underlying index in approximately the same proportions as in the underlying index. A representative sampling strategy is an indexing strategy that involves investing in a representative sample of securities (including indirect investments through underlying ETFs) that collectively has an investment profile similar to an underlying index in terms of key risk factors, performance attributes and other characteristics. Each Fund may utilize a representative sampling strategy with respect to its underlying index when a replication strategy might be detrimental to its shareholders, such as when there are practical difficulties or substantial costs involved in compiling a portfolio of equity securities to follow their underlying index, or, in certain instances, when securities in the underlying index become temporarily illiquid, unavailable or less liquid, or due to legal restrictions (such as diversification requirements that apply to a Fund but not the underlying index).
Certain Funds may invest in commodity related securities, which are susceptible to fluctuations in certain commodity markets. Any negative changes in commodity markets could have a great impact on those securities.
Certain Funds may have investments in financial instruments that utilize the London Interbank Offered Rate (“LIBOR”) as the reference or benchmark rate for variable interest
203
Notes to Financial Statements (Continued)
April 30, 2024 (Unaudited)
7. CONCENTRATION OF RISKS (continued)
rate calculations. LIBOR was intended to measure the rate generally at which banks can lend and borrow from one another in the relevant currency on an unsecured basis. The UK Financial Conduct Authority (“FCA”), the regulator that oversees LIBOR, announced that the majority of LIBOR rates would cease to be published or would no longer be representative on January 1, 2022. The publication of most LIBOR rates ceased at the end of 2021, and the remaining USD LIBOR rates ceased to be published after June 2023. There remains uncertainty and risks relating to the continuing LIBOR transition and its effects on the Funds and the instruments in which the Funds invest. There can be no assurance that the composition or characteristics of any alternative reference rates (“ARRs”) or financial instruments in which the Funds invest that utilize ARRs will be similar to or produce the same value or economic equivalence as LIBOR or that these instruments will have the same volume or liquidity. Additionally, there remains uncertainty and risks relating to certain “legacy” USD LIBOR instruments that were issued or entered into before December 31, 2021 and the process by which a replacement interest rate will be identified and implemented into these instruments when USD LIBOR is ultimately discontinued. On December 16, 2022, the Federal Reserve Board adopted regulations implementing the Adjustable Interest Rate Act. The regulations provide a statutory fallback mechanism to replace LIBOR, by identifying benchmark rates based on the Secured Overnight Financing Rate (“SOFR”) that replaced LIBOR in certain financial contracts after June 30, 2023. These regulations apply only to contracts governed by U.S. law, among other limitations. The Funds may have instruments linked to other interbank offered rates that may also cease to be published in the future. The effects of such uncertainty and risks in “legacy” USD LIBOR instruments held by the Funds could result in losses to the Funds.
Please refer to each Fund’s prospectus and statement of additional information (“SAI”) for a more complete description of risks.
8. LOANS OF PORTFOLIO SECURITIES
Each Fund may lend portfolio securities having a market value up to one-third of its total assets. Security loans made pursuant to securities lending agreements with BBH and BNY Mellon are initially required to be secured by collateral equal to at least 102% of the value of domestic equity securities and American Depositary Receipts (“ADRs”) and 105% of the value of foreign equity securities (other than ADRs). Such collateral received in connection with these loans will be cash and can be invested in repurchase agreements, short-term investments or U.S. Treasury obligations, and is recognized in the Schedules of Investments and Statements of Assets and Liabilities. The obligation to return securities lending collateral is also recognized as a liability in the Statements of Assets and Liabilities. It is the Funds’ policy to obtain additional collateral from or return excess collateral to the borrower by the end of the next business day, following the valuation date of the securities loaned. Therefore, the value of the collateral held may be temporarily less than the value of the securities on loan.
204
Notes to Financial Statements (Continued)
April 30, 2024 (Unaudited)
8. LOANS OF PORTFOLIO SECURITIES (continued)
Securities pledged as collateral for repurchase agreements held in the Global X Lithium & Battery Tech ETF, Global X SuperDividend® ETF, Global X Social Media ETF, Global X Guru® Index ETF, Global X SuperDividend® U.S. ETF, Global X MSCI SuperDividend® Emerging Markets ETF, Global X Renewable Energy Producers ETF, and Global X E-commerce ETF, are held by BNY Mellon and are designated as being held on each Fund’s behalf under a book-entry system. The Funds monitor the adequacy of the collateral on a daily basis and can require the seller to provide additional collateral in the event the market value of the securities pledged falls below the carrying value of the repurchase agreement, including accrued interest. It is the Funds’ policy to only enter into repurchase agreements with banks and other financial institutions which are deemed by the Adviser to be creditworthy. The Funds bear the risk of loss in the event the other party to a repurchase agreement defaults on its obligations and the Fund is prevented from exercising its rights to dispose of the underlying securities received as collateral and the risk of a possible decline in the value of the underlying securities during the period. For financial statement purposes, the Funds record the securities lending collateral (including in repurchase agreements, at value or restricted cash) as an asset and the obligation to return securities lending collateral as a liability on the Statement of Assets and Liabilities.
Cash collateral received in connection with securities lending is invested in repurchase agreements and short-term investments by the lending agent. The Funds do not have effective control of the non-cash collateral and therefore it is not disclosed in the Funds’ Schedule of Investments.
Securities lending transactions are entered into by the Funds under the Securities Lending Agreement, which permits a Fund, under certain circumstances such as an event of default, to offset amounts payable by the Fund to the same counterparty against amounts receivable from the counterparty to create a net payment due to or from the Fund.
The following is a summary of securities lending agreements held by the Funds, with cash collateral of overnight maturities and non-cash collateral, which would be subject to offset as of April 30, 2024.
205
Notes to Financial Statements (Continued)
April 30, 2024 (Unaudited)
8. LOANS OF PORTFOLIO SECURITIES (continued)
| | | Gross Amount
of Recognized
Assets (Value
of Securities on
Loan) | | | Value of
Cash
Collateral
Received(1) | | | Value of
Non-Cash
Collateral
Received(1) | | | Net Amount | |
| Global X Lithium & Battery Tech ETF | | $ | 96,214,633 | | | $ | 96,214,633 | | | $ | — | | | $ | — | |
| Global X SuperDividend® ETF | | | 35,558,121 | | | | 29,941,878 | | | | 5,616,243 | | | | — | |
| Global X Social Media ETF | | | 1,427,310 | | | | 1,427,310 | | | | — | | | | — | |
| Global X Guru® Index ETF | | | 580,894 | | | | 580,894 | | | | — | | | | — | |
| Global X SuperIncome™ Preferred ETF | | | 8,785,171 | | | | 8,785,171 | | | | — | | | | — | |
| Global X SuperDividend® U.S. ETF | | | 10,170,192 | | | | 10,170,192 | | | | — | | | | — | |
| Global X Renewable Energy Producers ETF | | | 2,172,911 | | | | 2,001,561 | | | | 171,350 | | | | — | |
| Global X E-commerce ETF | | | 2,477,820 | | | | 2,371,885 | | | | 105,935 | | | | — | |
| (1) | Collateral and non-cash collateral received in excess of market value of securities on loan is not presented in this table. The total cash collateral received by the Fund is disclosed in the Statements of Assets and Liabilities. |
The value of loaned securities and related collateral outstanding at April 30, 2024 are shown in the Schedules of Investments. The value of the collateral held may be temporarily less than that required under the lending contract. As of April 30, 2024, the cash collateral was invested in repurchase agreements and the non-cash collateral consisted of U.S. Treasury Bills, Notes, Bonds and U.S. Treasury Inflation Indexed Bonds with the following maturities:
| | | Overnight and
Continuous | | | <30 Days | | | Between
30 & 90
Days | | | >90 Days | | | Total | |
| Global X Lithium & Battery Tech ETF | | | | | | | | | | | | | | | | | | | | |
| Repurchase Agreements | | $ | 83,900,651 | | | | $— | | | | $— | | | | $— | | | | $83,900,651 | |
| Total | | $ | 83,900,651 | | | | $— | | | | $— | | | | $— | | | | $83,900,651 | |
| Global X SuperDividend® ETF | | | | | | | | | | | | | | | | | | | | |
| Repurchase Agreements | | $ | 32,683,224 | | | | $— | | | | $— | | | | $— | | | | $32,683,224 | |
| U.S. Government Securities $ | | | — | | | | $— | | | | $— | | | | $5,616,243 | | | | $5,616,243 | |
| Total | | $ | 32,683,224 | | | | $— | | | | $— | | | | $5,616,243 | | | | $38,299,467 | |
| Global X Social Media ETF | | | | | | | | | | | | | | | | | | | | |
| Repurchase Agreements | | $ | 1,521,256 | | | | $— | | | | $— | | | | $— | | | | $1,521,256 | |
| Total | | $ | 1,521,256 | | | | $— | | | | $— | | | | $— | | | | $1,521,256 | |
206
Notes to Financial Statements (Continued)
April 30, 2024 (Unaudited)
8. LOANS OF PORTFOLIO SECURITIES (continued)
| | | Overnight and
Continuous | | | <30 Days | | | Between
30 & 90
Days | | | >90 Days | | | Total | |
| Global X Guru® Index ETF | | | | | | | | | | | | | | | | | | | | |
| Repurchase Agreements | | $ | 515,800 | | | | $— | | | | $— | | | | $— | | | | $515,800 | |
| Total | | $ | 515,800 | | | | $— | | | | $— | | | | $— | | | | $515,800 | |
| Global X SuperIncome™ Preferred ETF | | | | | | | | | | | | | | | | | | | | |
| Repurchase Agreements | | $ | 7,655,486 | | | | $— | | | | $— | | | | $— | | | | $7,655,486 | |
| Total | | $ | 7,655,486 | | | | $— | | | | $— | | | | $— | | | | $7,655,486 | |
| Global X SuperDividend® U.S. ETF | | | | | | | | | | | | | | | | | | | | |
| Repurchase Agreements | | $ | 10,774,744 | | | | $— | | | | $— | | | | $— | | | | $10,774,744 | |
| Total | | $ | 10,774,744 | | | | $— | | | | $— | | | | $— | | | | $10,774,744 | |
| Global X Renewable Energy Producers ETF | | | | | | | | | | | | | | | | | | | | |
| Repurchase Agreements | | $ | 2,142,060 | | | | $— | | | | $— | | | | $— | | | | $2,142,060 | |
| U.S. Government Securities | | $ | — | | | | $— | | | | $— | | | | $171,350 | | | | $171,350 | |
| Total | | $ | 2,142,060 | | | | $— | | | | $— | | | | $171,350 | | | | $2,313,410 | |
| Global X E-commerce ETF | | | | | | | | | | | | | | | | | | | | |
| Repurchase Agreements | | $ | 2,514,190 | | | | $— | | | | $— | | | | $— | | | | $2,514,190 | |
| U.S. Government Securities | | | — | | | | — | | | | — | | | | 105,935 | | | | 105,935 | |
| Total | | $ | 2,514,190 | | | | $— | | | | $— | | | | $105,935 | | | | $2,620,125 | |
9. REVERSE STOCK SPLIT
The Board of the Trust approved a reverse share split of one to three (1:3) of the issued and outstanding shares of the Global X SuperDividend® ETF, Global X MSCI SuperDividend® Emerging Markets ETF and Global X SuperDividend® REIT ETF, (the “Reverse Share Split”). The Reverse Share Split was completed after the close of business on December 19, 2022. The effect of this transaction for each Fund was to divide the number of outstanding Shares of the Fund by three, resulting in a corresponding increase in the NAV per Share. The capital share activity presented on the Statement of Changes in Net Assets for each of the years in the period then ended, and the per share data in the financial highlights for each of the years in the period then ended, have been given retroactive effect to reflect these reverse share splits. There were no changes in net assets, results of operations or total return as a result of these transactions.
10. CONTRACTUAL OBLIGATION
The Funds enter into contracts in the normal course of business that contain a variety of indemnifications. The Funds’ maximum exposure under these contracts is unknown; however, the Funds have not had prior gains or losses pursuant to these contracts.
207
Notes to Financial Statements (Concluded)
April 30, 2024 (Unaudited)
10. CONTRACTUAL OBLIGATION (continued)
Management has reviewed the Funds’ existing contracts and expects the risk of loss to be remote.
Pursuant to the Trust’s organizational documents, the Trustees of the Trust and the Trust’s officers are indemnified against certain liabilities that may arise out of the performance of their duties.
11. SUBSEQUENT EVENTS
The Funds have been evaluated by management regarding the need for additional disclosures and/or adjustments resulting from subsequent events.
In preparing these financial statements, management has evaluated there is no need for additional disclosures and/or adjustments resulting from subsequent events through the date the financial statements were issued.
Based on this evaluation, no additional adjustments were required to the financial statements.
208
Disclosure of Fund Expenses (Unaudited)
ETFs (such as the Funds) have operating expenses. As a shareholder of an ETF, your investment is affected by these ongoing costs, which include (among others) costs for ETF management, administrative services, brokerage fees, and shareholder reports like this one. It is important for you to understand the impact of these costs on your investment returns. In addition, a shareholder is responsible for brokerage fees as a result of the shareholder’s investment in a Fund.
Operating expenses such as these are deducted from a Fund’s gross income and directly reduce your final investment returns. These expenses are expressed as a percentage of the Fund’s average net assets; this percentage is known as the Fund’s expense ratio.
The following examples use the expense ratio and are intended to help you understand the ongoing costs (in dollars) of investing in a Fund and to compare these costs with those of other funds. The examples are based on an investment of $1,000 made at the beginning of the period shown and held for the entire period from (November 1, 2023 through April 30, 2024).
The table on the next page illustrates the Funds’ costs in two ways:
Actual Fund Return. This section helps you to estimate the actual expenses that your Fund incurred over the period. The “Expenses Paid During Period” column shows the actual dollar expense cost incurred by a $1,000 investment in the Fund, and the “Ending Account Value” number is derived from deducting that expense cost from the Fund’s gross investment return.
You can use this information, together with the actual amount you invested in a Fund, to estimate the expenses you paid over that period. Simply divide your actual account value by $1,000 to arrive at a ratio (for example, an $8,600 account value divided by $1,000 = 8.6), then multiply that ratio by the number shown for your Fund under “Expenses Paid During Period.”
Hypothetical 5% Return. This section helps you compare your Fund’s costs with those of other funds. It assumes that the Fund had an annual 5% return before expenses during the year, but that the expense ratio (Column 3) for the period is unchanged. This example is useful in making comparisons because the Securities and Exchange Commission requires all funds to make this 5% calculation. You can assess your Fund’s comparative cost by comparing the hypothetical result for your Fund in the “Expenses Paid During Period” column with those that appear in the same charts in the shareholder reports for other funds.
NOTE: Because the return is set at 5% for comparison purposes — NOT your Fund’s actual return — the account values shown may not apply to your specific investment.
209
Disclosure of Fund Expenses (Unaudited) (Continued)
| | | Beginning
Account Value
11/1/2023 | | Ending
Account
Value
4/30/2024 | | Annualized
Expense
Ratios | | Expenses
Paid During
Period(1) |
| Global X Lithium & Battery Tech ETF | | | | | | | | | | | | | | | | |
| Actual Fund Return | | | $1,000.00 | | | | $940.50 | | | | 0.75 | % | | | $3.62 | |
| Hypothetical 5% Return | | | 1,000.00 | | | | 1,021.13 | | | | 0.75 | | | | 3.77 | |
| | | | | | | | | | | | | | | | | |
| Global X SuperDividend® ETF | | | | | | | | | | | | | | | | |
| Actual Fund Return | | | $1,000.00 | | | | $1,125.70 | | | | 0.58 | % | | | $3.07 | |
| Hypothetical 5% Return | | | 1,000.00 | | | | 1,021.98 | | | | 0.58 | | | | 2.92 | |
| | | | | | | | | | | | | | | | | |
| Global X Social Media ETF | | | | | | | | | | | | | | | | |
| Actual Fund Return | | | $1,000.00 | | | | $1,175.10 | | | | 0.65 | % | | | $3.52 | |
| Hypothetical 5% Return | | | 1,000.00 | | | | 1,021.63 | | | | 0.65 | | | | 3.27 | |
| | | | | | | | | | | | | | | | | |
| Global X Guru® Index ETF | | | | | | | | | | | | | | | | |
| Actual Fund Return | | | $1,000.00 | | | | $1,209.50 | | | | 0.75 | % | | | $4.12 | |
| Hypothetical 5% Return | | | 1,000.00 | | | | 1,021.13 | | | | 0.75 | | | | 3.77 | |
| | | | | | | | | | | | | | | | | |
| Global X SuperIncome™ Preferred ETF | | | | | | | | | | | | | | | | |
| Actual Fund Return | | | $1,000.00 | | | | $1,133.80 | | | | 0.48 | % | | | $2.55 | |
| Hypothetical 5% Return | | | 1,000.00 | | | | 1,022.48 | | | | 0.48 | | | | 2.41 | |
| | | | | | | | | | | | | | | | | |
| Global X SuperDividend® U.S. ETF | | | | | | | | | | | | | | | | |
| Actual Fund Return | | | $1,000.00 | | | | $1,135.10 | | | | 0.46 | % | | | $2.44 | |
| Hypothetical 5% Return | | | 1,000.00 | | | | 1,022.58 | | | | 0.46 | | | | 2.31 | |
| | | | | | | | | | | | | | | | | |
| Global X MSCI SuperDividend® Emerging Markets ETF | | | | | | | | | | | | | | | | |
| Actual Fund Return | | | $1,000.00 | | | | $1,187.40 | | | | 0.66 | % | | | $3.59 | |
| Hypothetical 5% Return | | | 1,000.00 | | | | 1,021.58 | | | | 0.66 | | | | 3.32 | |
| | | | | | | | | | | | | | | | | |
| Global X SuperDividend® REIT ETF | | | | | | | | | | | | | | | | |
| Actual Fund Return | | | $1,000.00 | | | | $1,084.40 | | | | 0.59 | % | | | $3.06 | |
| Hypothetical 5% Return | | | 1,000.00 | | | | 1,021.93 | | | | 0.59 | | | | 2.97 | |
| | | | | | | | | | | | | | | | | |
| Global X Renewable Energy Producers ETF | | | | | | | | | | | | | | | | |
| Actual Fund Return | | | $1,000.00 | | | | $1,037.50 | | | | 0.65 | % | | | $3.29 | |
| Hypothetical 5% Return | | | 1,000.00 | | | | 1,021.63 | | | | 0.65 | | | | 3.27 | |
| | | | | | | | | | | | | | | | | |
| Global X S&P 500® Catholic Values ETF | | | | | | | | | | | | | | | | |
| Actual Fund Return | | | $1,000.00 | | | | $1,203.70 | | | | 0.29 | % | | | $1.59 | |
| Hypothetical 5% Return | | | 1,000.00 | | | | 1,023.42 | | | | 0.29 | | | | 1.46 | |
210
Disclosure of Fund Expenses (Unaudited) (Concluded)
| | | Beginning
Account Value
11/1/2023 | | Ending
Account
Value
4/30/2024 | | Annualized
Expense
Ratios | | Expenses
Paid During
Period(1) |
| Global X MSCI SuperDividend® EAFE ETF | | | | | | | | | | | | | | | | |
| Actual Fund Return | | | $1,000.00 | | | | $1,167.90 | | | | 0.56 | % | | | $3.02 | |
| Hypothetical 5% Return | | | 1,000.00 | | | | 1,022.08 | | | | 0.56 | | | | 2.82 | |
| | | | | | | | | | | | | | | | | |
| Global X E-commerce ETF | | | | | | | | | | | | | | | | |
| Actual Fund Return | | | $1,000.00 | | | | $1,070.90 | | | | 0.50 | % | | | $2.57 | |
| Hypothetical 5% Return | | | 1,000.00 | | | | 1,022.38 | | | | 0.50 | | | | 2.51 | |
| | | | | | | | | | | | | | | | | |
| Global X S&P Catholic Values Developed ex-U.S. ETF | | | | | | | | | | | | | | | | |
| Actual Fund Return | | | $1,000.00 | | | | $1,191.10 | | | | 0.35 | % | | | $1.91 | |
| Hypothetical 5% Return | | | 1,000.00 | | | | 1,023.12 | | | | 0.35 | | | | 1.76 | |
| | | | | | | | | | | | | | | | | |
| Global X NASDAQ 100® Tail Risk ETF | | | | | | | | | | | | | | | | |
| Actual Fund Return | | | $1,000.00 | | | | $1,184.50 | | | | 0.25 | % | | | $1.36 | |
| Hypothetical 5% Return | | | 1,000.00 | | | | 1,023.62 | | | | 0.25 | | | | 1.26 | |
| | | | | | | | | | | | | | | | | |
| Global X NASDAQ 100® Collar 95-110 ETF | | | | | | | | | | | | | | | | |
| Actual Fund Return | | | $1,000.00 | | | | $1,171.60 | | | | 0.25 | % | | | $1.35 | |
| Hypothetical 5% Return | | | 1,000.00 | | | | 1,023.62 | | | | 0.25 | | | | 1.26 | |
| | | | | | | | | | | | | | | | | |
| Global X S&P 500® Tail Risk ETF | | | | | | | | | | | | | | | | |
| Actual Fund Return | | | $1,000.00 | | | | $1,189.10 | | | | 0.25 | % | | | $1.36 | |
| Hypothetical 5% Return | | | 1,000.00 | | | | 1,023.62 | | | | 0.25 | | | | 1.26 | |
| | | | | | | | | | | | | | | | | |
| Global X S&P 500® Collar 95-110 ETF | | | | | | | | | | | | | | | | |
| Actual Fund Return | | | $1,000.00 | | | | $1,170.20 | | | | 0.25 | % | | | $1.35 | |
| Hypothetical 5% Return | | | 1,000.00 | | | | 1,023.62 | | | | 0.25 | | | | 1.26 | |
| | | | | | | | | | | | | | | | | |
| Global X Disruptive Materials ETF | | | | | | | | | | | | | | | | |
| Actual Fund Return | | | $1,000.00 | | | | $1,149.00 | | | | 0.59 | % | | | $3.15 | |
| Hypothetical 5% Return | | | 1,000.00 | | | | 1,021.93 | | | | 0.59 | | | | 2.97 | |
| (1) | Expenses are equal to the Fund’s annualized expense ratio multiplied by the average account value over the period, multiplied by 182/366 (to reflect the one-half year period). |
211
Renewal of Investment Advisory Agreement (Unaudited)
Section 15(c) of the Investment Company Act of 1940, as amended (“1940 Act”), requires that the board of trustees of an exchange-traded fund (“ETF”), including a majority of those trustees who are not “interested persons” of the ETF, as defined in the 1940 Act (“Independent Trustees”), consider on an initial basis and periodically thereafter (as required by the 1940 Act), at an in person meeting called for such purpose, the terms of each ETF’s investment advisory agreement and whether to approve entering into, or renewing, each agreement.
At a Board meeting of the Trust held on November 16, 2023, called for such purpose, the Board (including the Trust’s Independent Trustees, voting separately) considered and unanimously approved the continuation of (i) the Investment Advisory Agreement (“Renewal Investment Advisory Agreement”) for each Fund included in this Semi-Annual Report (each, a “Renewal Fund” and together, the “Renewal Funds”); and (ii) the Supervision and Administration Agreement (“Renewal Supervision and Administration Agreement”), each between the Trust, on behalf of each Renewal Fund, and Global X Management. The Renewal Investment Advisory Agreement and the Renewal Supervision and Administration Agreement are referred to herein as the “Renewal Agreements.”
In advance of the November 16, 2023 Board meeting, the Board (including the Trust’s Independent Trustees) and the Independent Trustees’ independent legal counsel requested (in writing) detailed information from Global X Management in connection with the Board’s consideration of the Renewal Agreements, and received and reviewed written responses from Global X Management, as well as supporting materials relating to those requests for information. Subsequent to the receipt of that information, the Independent Trustees requested additional information regarding certain changes in senior management of Global X Management, which was provided to them in advance of the Board meeting.
At the November 16, 2023 Board meeting, the Board approved the Renewal Agreements, for the period ending February 29, 2024, in order to ensure continuity of management of the Renewal Funds. However, the Independent Trustees also determined to postpone a vote on the renewal of the Renewal Agreements for a full annual period in order to provide the Independent Trustees with the opportunity to further consider certain changes in Global X Management’s senior leadership, which occurred approximately contemporaneously with the Board’s consideration of the Renewal Agreements, and in order to permit Global X Management to confirm certain information provided in advance of the November 16, 2023 Board meeting. Global X Management subsequently provided additional information to the Board in advance of a second meeting called for the purpose of considering the extension of the Renewal Agreements for a full year. At a Board meeting of the Trust held on December 21, 2023, the Trust’s Board, which was comprised entirely of Independent Trustees, unanimously approved the continuation of the Renewal Agreements for an aggregate one-year period ending November 30, 2024.
In the course of their consideration of the Renewal Agreements, the Trust’s Independent Trustees were advised by their independent legal counsel and, in addition to meetings
212
Renewal of Investment Advisory Agreement (Unaudited) (Continued)
with management of Global X Management, the Independent Trustees met separately in executive sessions with their counsel.
RENEWAL AGREEMENTS
In determining to approve the continuation of the Renewal Agreements for the Renewal Funds, the Board considered a variety of factors, including the factors discussed in greater detail below.
Nature, Extent and Quality of Services
| • | the terms of the Renewal Agreements and the range of services that would continue to be provided to each Renewal Fund in accordance with the Renewal Agreements; |
| | |
| • | Global X Management’s key personnel and the portfolio managers who would continue to provide investment advisory, supervision and administrative services to each Renewal Fund. In considering the key personnel, the Board considered the departures of certain key executives of Global X Management and their replacements, and the plan for identifying a permanent replacement for Global X Management’s chief executive officer; |
| | |
| • | Global X Management’s responsibilities under the Renewal Agreements, among other things, to: (i) manage the investment operations of the Renewal Funds and the composition of the Renewal Funds’ assets, including the purchase, retention and disposition of their holdings, (ii) provide quarterly reports to the Trust’s officers and the Board and other reports as the Board deems necessary or appropriate, (iii) vote proxies, exercise consents, and exercise all other rights relating to securities and assets held by the Renewal Funds, (iv) select broker-dealers to execute portfolio transactions for the Renewal Funds when necessary, (v) assist in the preparation and filing of reports and proxy statements (if any) to the shareholders of the Renewal Funds, and the periodic updating of the registration statement, prospectuses, statements of additional information, and other reports and documents for the Renewal Funds that are required to be filed by the Trust with the SEC and other regulatory and governmental bodies, and (vi) monitor anticipated purchases and redemptions of the shares (including Creation Units) of the Renewal Funds by shareholders and new investors; |
| | |
| • | the nature, extent and quality of all of the services (including advisory, administrative and compliance services) that have been provided by Global X Management or made available to the Renewal Funds; and |
| | |
| • | the quality of Global X Management’s resources and personnel that would continue to be made available to the Renewal Funds, including Global X Management’s experience and the professional qualifications of Global X Management’s key personnel. In evaluating key personnel, the Board considered the qualifications of Global X Management’s chief operating officer and interim chief executive officer, and considered Global X Management’s plans for hiring a permanent chief executive |
213
Renewal of Investment Advisory Agreement (Unaudited) (Continued)
officer.
Based on these considerations, the Board concluded that it was satisfied with the nature, extent and quality of the services provided to the Renewal Funds by Global X Management.
Performance
The Board considered the performance of each Renewal Fund. They examined the performance of the Renewal Funds for the one-year, three-year, five-year and since inception periods, as applicable. Also, the Board considered the total return and investments performance of the Renewal Funds relative to (i) the performance of unaffiliated comparable ETFs and/or other registered funds, which performance information is publicly available from such registered funds, as well as other third party sources; and (ii) the performance of pertinent indexes. The Board considered instances of under-performance and overperformance with respect to the competitor funds. The Board also considered the Renewal Funds’ tracking against their underlying indexes in absolute terms, and in the case of passively managed ETFs, considered their tracking against their underlying indexes.
Based on these considerations and comparisons, the Board concluded that the investment performance of the Renewal Funds did not adversely affect the Board’s approval of the continuance of the Renewal Agreements.
Cost of Services and Profitability
The Board considered Global X Management’s cost to provide investment management, supervision and administrative and related services to the Renewal Funds. In this regard, the Board considered the management fee (“Management Fee”) that has been borne or is expected to be borne by the Renewal Funds under the Renewal Agreements for the various investment advisory, supervisory and administrative services that the Renewal Funds require under a unitary fee structure (including the types of fees and expenses that are not included within the unitary fee and would be borne by the Renewal Funds).
In addition, the Board considered expected profitability to Global X Management, as applicable, from all services provided or expected to be provided to the Renewal Funds and all aspects of Global X Management’s relationship with the Renewal Funds. In connection with these considerations, Global X Management provided the Board with financial information regarding its operations and the services provided to the Renewal Funds and discussed with the Board its current and expected, as applicable, profitability with respect to the Renewal Funds.
Based on these considerations, the Board concluded that the Management Fee rate paid by the Renewal Funds to Global X Management, in light of the nature, extent and quality
214
Renewal of Investment Advisory Agreement (Unaudited) (Continued)
of the services provided, was reasonable and in the best interests of the Renewal Funds’ shareholders.
Comparison of Fees and Services
With respect to this factor, the Board considered:
| • | comparative information with respect to the Management Fee paid to Global X Management by the Renewal Funds. In connection with this consideration, Global X Management provided the Board with comparative expense data for the Renewal Funds, including fees and expenses paid by unaffiliated similar specialized and/or focused ETFs and/or other comparable registered funds. The Board considered the Global X Management’s detailed explanation of the fee structures of any Renewal Fund that was above the average or median for its peer group; |
| | |
| • | the structure of the unitary Management Fee (which includes as one component the investment advisory fee for the Renewal Funds) and the current total expense ratios for the Renewal Funds. In this regard, the Board took into consideration that the purpose of adopting a unitary Management Fee structure for the Renewal Funds was to create a simple, all-inclusive fee that would provide a level of predictability with respect to the overall expense ratio (i.e., the total fees) of the Renewal Funds and that the proposed Management Fees for the Renewal Funds were set at a competitive levels to make the Renewal Funds viable in the marketplace; and |
| | |
| • | that, under the unified Management Fee structure, Global X Management is responsible for most ordinary expenses of the Renewal Funds, including the costs of various third-party services required by the Renewal Funds, including investment advisory, administrative, audit, certain custody, portfolio accounting, legal, transfer agency and printing costs, but that the Renewal Funds would bear other expenses not covered under the proposed all-inclusive Management Fee, such as taxes, brokerage fees, commissions, and other transaction expenses, interest expenses, and extraordinary expenses. |
Based on these considerations, the Board concluded that the services received and the fees charged under the Renewal Agreements were reasonable on a comparative basis.
Economies of Scale
With respect to this factor, the Board considered:
| • | the extent to which economies of scale would be realized as the Renewal Funds grow and whether the unitary Management Fee for the Renewal Funds reflected these economies of scale; |
| | |
| • | the significant investment of time, personnel and other resources that Global X Management has made and intends to continue to make in the Renewal Funds in order |
215
Renewal of Investment Advisory Agreement (Unaudited) (Concluded)
| | to seek to assure that the Renewal Funds are attractive to investors; and |
| | |
| • | that the unitary Management Fee would provide a high level of certainty as to the total level of expenses for the Renewal Funds and their shareholders. |
Based on these considerations, the Board concluded that the unitary Management Fee for the Renewal Funds appropriately addressed economies of scale.
Other Benefits
In considering the Renewal Agreements, in addition to the factors above, the Board considered any other benefits realized by Global X Management as a result of its relationships with the Renewal Funds and concluded that, in the exercise of the Board’s business judgement, all information the Board considered supported approval of the continuation of the Renewal Agreements.
Conclusion
After full consideration of the factors above, as well as other factors that were instructive in its consideration, the Board, including all of the Trust’s Independent Trustees voting separately, concluded, in the exercise of its business judgement, that the Renewal Agreements were fair and reasonable and in the best interest of each Renewal Fund.
In reaching this decision, the Board did not assign relative weights to the factors above nor did the Board deem any one factor or group of them to be controlling in and of themselves. Each member of the Board may have assigned different weights to the various factors.
216
Supplemental Information (unaudited)
NAV is the price per Share at which the Funds issue and redeem Shares. It is calculated in accordance with the standard formula for valuing mutual fund shares. The “Market Price” of a Fund generally is determined using the midpoint between the highest bid and the lowest offer on the stock exchange on which the Shares of the Fund are listed for trading, as of the time that the Fund’s NAV is calculated. A Fund’s Market Price may be at, above or below its NAV. The NAV of a Fund will fluctuate with changes in the market value of the Fund’s holdings. The Market Price of a Fund will fluctuate in accordance with changes in its NAV, as well as market supply and demand.
Premiums or discounts are the differences (expressed as a percentage) between the NAV and Market Price of a Fund on a given day, generally at the time NAV is calculated. A premium is the amount that a Fund is trading above the reported NAV, expressed as a percentage of the NAV. A discount is the amount that a Fund is trading below the reported NAV, expressed as a percentage of the NAV.
Further information regarding premiums and discounts is available on the Funds’ website at www.globalxetfs.com.
217
Notes
218
Notes
219
605 3rd Avenue, 43rd Floor
New York, NY 10158
1-888-493-8631
www.globalxetfs.com
Investment Adviser and Administrator:
Global X Management Company LLC
605 3rd Avenue, 43rd Floor
New York, NY 10158
Distributor:
SEI Investments Distribution Co.
One Freedom Valley Drive
Oaks, PA 19456
Sub-Administrator:
SEI Investments Global Funds Services
One Freedom Valley Drive
Oaks, PA 19456
Counsel for Global X Funds and the Independent Trustees:
Stradley Ronon Stevens & Young, LLP
2000 K Street, N.W.
Suite 700
Washington, DC 20006
Custodians and Transfer Agents:
Brown Brothers Harriman & Co.
40 Water Street
Boston, MA 02109
The Bank of New York Mellon
240 Greenwich Street
New York, NY 10286
Independent Registered Public Accounting Firm:
PricewaterhouseCoopers LLP
Two Commerce Square
Suite 1800
2001 Market Street
Philadelphia, PA 19103
This information must be preceded or accompanied by a current prospectus for the Funds described.
GLX-SA-003-1300
(b) Not applicable.
Item 2. Code of Ethics.
Not applicable for semi-annual report.
Item 3. Audit Committee Financial Expert.
Not applicable for semi-annual report.
Item 4. Principal Accountant Fees and Services.
Not applicable for semi-annual report.
Item 5. Audit Committee of Listed Registrants.
Not applicable for semi-annual report.
Item 6. Investments.
Schedule of Investments is included as part of the report to shareholders filed under Item 1 of this form.
Item 7. Disclosure of Proxy Voting Policies and Procedures for Closed-End Management Investment Companies.
Not applicable to open-end management investment companies.
Item 8. Portfolio Managers of Closed-End Management Investment Companies.
Not applicable to open-end management investment companies.
Item 9. Purchases of Equity Securities by Closed-End Management Investment Company and Affiliated Purchasers.
Not applicable to open-end management investment companies.
Item 10. Submission of Matters to a Vote of Security Holders.
There have been no material changes to the procedures by which shareholders may recommend nominees to the registrant’s board of directors.
Item 11. Controls and Procedures.
(a) The certifying officers, whose certifications are included herewith, have evaluated the registrant’s disclosure controls and procedures within 90 days of the filing date of this report. In their opinion, based on their evaluation, the registrant’s disclosure controls and procedures are adequately designed, and are operating effectively to ensure, that information required to be disclosed by the registrant in the reports it files or submits under the Securities Exchange Act of 1934 is recorded, processed, summarized and reported within the time periods specified in the Securities and Exchange Commission’s rules and forms.
(b) There were no significant changes in the registrant’s internal control over financial reporting that occurred during the period covered by this report that has materially affected, or is reasonably likely to materially affect, the registrant’s internal control over financial reporting.
Item 12. Disclosure of Securities Lending Activities for Closed-End Management Investment Companies.
Not applicable to open-end management investment companies.
Item 18. Recovery of Erroneously Awarded Compensation.
(a) Not applicable.
(b) Not applicable.
Item 19. Exhibits.
(a)(1) Not applicable.
(a)(2) Not applicable.
(a)(3) A separate certification for the principal executive officer and the principal financial officer of the registrant as required by Rule 30a-2(a) under the Investment Company Act of 1940, as amended (17 CFR § 270.30a-2(a)), are filed herewith.
(b) Officer certifications as required by Rule 30a-2(b) under the Investment Company Act of 1940, as amended (17 CFR § 270.30a-2(b)) also accompany this filing as exhibits.
SIGNATURES
Pursuant to the requirements of the Securities Exchange Act of 1934 and the Investment Company Act of 1940, the registrant has duly caused this report to be signed on its behalf by the undersigned, thereunto duly authorized.
| (Registrant) | Global X Funds |
| | |
| By (Signature and Title) | /s/ Ryan O’Connor |
| | Ryan O’Connor
Principal Executive Officer |
Date: July 8, 2024
Pursuant to the requirements of the Securities Exchange Act of 1934 and the Investment Company Act of 1940, this report has been signed below by the following persons on behalf of the registrant and in the capacities and on the dates indicated.
| By (Signature and Title) | /s/ Ryan O’Connor |
| | Ryan O’Connor
Principal Executive Officer |
Date: July 8, 2024
| By (Signature and Title) | /s/ Eric Olsen |
| | Eric Olsen
Principal Financial Officer |
Date: July 8, 2024