UNITED STATES
SECURITIES AND EXCHANGE COMMISSION
Washington, D.C. 20549
FORM N-CSRS
CERTIFIED SHAREHOLDER REPORT OF REGISTERED MANAGEMENT
INVESTMENT COMPANIES
Investment Company Act file number 811-22209
Global X Funds
(Exact name of registrant as specified in charter)
605 Third Avenue, 43rd floor
New York, NY 10158
(Address of principal executive offices) (Zip code)
Ryan O’Connor
Global X Management Company LLC
605 Third Avenue, 43rd floor
New York, NY 10158
(Name and address of agent for service)
With a copy to:
Global X Management Company LLC 605 Third Avenue, 43rd floor New York, NY 10158 | Eric S. Purple, Esq. Stradley Ronon Stevens & Young, LLP 2000 K Street, N.W., Suite 700 Washington, DC 20006-1871 |
Registrant’s telephone number, including area code: (212) 644-6440
Date of fiscal year end: October 31, 2024
Date of reporting period: April 30, 2024
Item 1. Reports to Stockholders.
(a) A copy of the report transmitted to stockholders pursuant to Rule 30e-1 under the Investment Company Act of 1940, as amended (the “Act”) (17 CFR § 270.30e-1), is attached hereto.

Global X Silver Miners ETF (ticker: SIL)
Global X Copper Miners ETF (ticker: COPX)
Global X Gold Explorers ETF (ticker: GOEX)
Global X Uranium ETF (ticker: URA)
Semi-Annual Report
April 30, 2024
As permitted by regulations adopted by the Securities and Exchange Commission, paper copies of the Funds’ (defined below) shareholder reports will no longer be sent by mail, unless you specifically request paper copies of the reports from your financial intermediary (such as a broker-dealer or bank). Instead, shareholder reports will be available on the Funds’ website (www. globalxetfs.com/explore), and you will be notified by mail each time a report is posted and provided with a website link to access the report.
If you already elected to receive shareholder reports electronically, you will not be affected by this change and you need not take any action. You may elect to receive shareholder reports and other communications from the Funds electronically anytime by contacting your financial intermediary.
You may elect to receive all future Fund shareholder reports in paper free of charge. Please contact your financial intermediary to inform them that you wish to continue receiving paper copies of Fund shareholder reports and for details about whether your election to receive reports in paper will apply to all funds held with your financial intermediary.

Table of Contents
Shares are bought and sold at market price (not net asset value (“NAV”)) and are not individually redeemed from a Fund. Shares may only be redeemed directly from a Fund by Authorized Participants, in very large creation/ redemption units. Brokerage commissions will reduce returns.
The Funds file their complete schedules of Fund holdings with the Securities and Exchange Commission (the “SEC” or “Commission”) for the first and third quarters of each fiscal year as an exhibit to their reports on Form N-PORT. The Funds’ Form N-PORT is available on the Commission’s website at https://www.sec.gov, and may be reviewed and copied at the Commission’s Public Reference Room in Washington, DC. Information on the operation of the Public Reference Room may be obtained by calling 1-800-SEC-0330.
A description of the policies and procedures that Global X Funds uses to determine how to vote proxies relating to Fund securities, as well as information relating to how the Funds voted proxies relating to Fund securities during the most recent 12-month period ended June 30, is available (i) without charge, upon request, by calling 1-888-493-8631; and (ii) on the Commission’s website at https://www.sec.gov.
| Schedule of Investments | April 30, 2024 (Unaudited) |
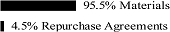
| Global X Silver Miners ETF |
Sector Weightings †:

† Sector weightings percentages are based on the total market value of investments. Total investments do not include derivatives such as options, futures contracts, forward contracts, and swap contracts, if applicable.
| | | Shares | | | Value | |
| COMMON STOCK — 100.0% | | | | | | | | |
| AUSTRALIA — 0.9% | | | | | | | | |
| Materials — 0.9% | | | | | | | | |
| Kingsgate Consolidated * (A) | | | 5,602,191 | | | $ | 5,929,592 | |
| Silver Mines * (A) | | | 33,695,829 | | | | 3,610,267 | |
| | | | | | | | | |
| TOTAL AUSTRALIA | | | | | | | 9,539,859 | |
| BOSNIA AND HERZEGOVINA — 1.9% | | | | | | | | |
| Materials — 1.9% | | | | | | | | |
| Adriatic Metals, Cl CDI * (A) | | | 6,485,185 | | | | 19,202,886 | |
| | | | | | | | | |
| BRAZIL — 22.8% | | | | | | | | |
| Materials — 22.8% | | | | | | | | |
| Wheaton Precious Metals | | | 4,517,452 | | | | 235,539,947 | |
| | | | | | | | | |
| CANADA — 44.1% | | | | | | | | |
| Materials — 44.1% | | | | | | | | |
| AbraSilver Resource * (A) | | | 11,743,025 | | | | 3,846,389 | |
| Aya Gold & Silver * | | | 2,650,722 | | | | 25,545,408 | |
| Discovery Silver * (A) | | | 7,416,629 | | | | 4,642,647 | |
| Dolly Varden Silver * (A) | | | 3,354,299 | | | | 2,221,794 | |
| Endeavour Silver * | | | 5,007,655 | | | | 13,170,133 | |
| First Majestic Silver | | | 7,021,761 | | | | 46,919,071 | |
| Fortuna Silver Mines * | | | 7,591,871 | | | | 34,537,390 | |
| GoGold Resources * | | | 7,479,270 | | | | 7,512,751 | |
| Guanajuato Silver * | | | 8,221,899 | | | | 1,077,222 | |
| MAG Silver * | | | 2,318,267 | | | | 28,568,083 | |
| McEwen Mining * (A) | | | 974,286 | | | | 11,165,318 | |
| New Pacific Metals * (A) | | | 2,264,456 | | | | 4,532,703 | |
| Pan American Silver | | | 7,622,558 | | | | 140,559,969 | |
| Prime Mining * (A) | | | 2,710,370 | | | | 4,241,581 | |
| Silvercorp Metals | | | 4,229,126 | | | | 13,452,182 | |
The accompanying notes are an integral part of the financial statements.
1
| Schedule of Investments | April 30, 2024 (Unaudited) |
| Global X Silver Miners ETF |
| | | Shares | | | Value | |
| COMMON STOCK — continued | | | | | | | | |
| Materials — continued | | | | | | | | |
| SilverCrest Metals * | | | 3,526,655 | | | $ | 28,929,943 | |
| SSR Mining | | | 5,027,647 | | | | 26,948,188 | |
| Triple Flag Precious Metals | | | 3,162,332 | | | | 51,100,026 | |
| Vizsla Silver * | | | 4,622,682 | | | | 5,989,281 | |
| | | | | | | | | |
| TOTAL CANADA | | | | | | | 454,960,079 | |
| MEXICO — 7.0% | | | | | | | | |
| Materials — 7.0% | | | | | | | | |
| Fresnillo | | | 4,461,812 | | | | 31,174,525 | |
| Industrias Penoles * | | | 2,791,342 | | | | 40,728,675 | |
| | | | | | | | | |
| TOTAL MEXICO | | | | | | | 71,903,200 | |
| PERU — 8.9% | | | | | | | | |
| Materials — 8.9% | | | | | | | | |
| Cia de Minas Buenaventura SAA ADR | | | 4,460,085 | | | | 77,159,471 | |
| Hochschild Mining * | | | 7,626,102 | | | | 14,877,311 | |
| | | | | | | | | |
| TOTAL PERU | | | | | | | 92,036,782 | |
| SOUTH KOREA — 4.7% | | | | | | | | |
| Materials — 4.7% | | | | | | | | |
| Korea Zinc | | | 144,323 | | | | 48,400,051 | |
| | | | | | | | | |
| UNITED STATES — 9.7% | | | | | | | | |
| Materials — 9.7% | | | | | | | | |
| Coeur Mining * | | | 9,507,275 | | | | 42,972,883 | |
| Gatos Silver * | | | 1,142,841 | | | | 10,936,988 | |
| Gold Resource * | | | 2,138,659 | | | | 983,783 | |
| Hecla Mining | | | 9,285,988 | | | | 43,922,723 | |
| Hycroft Mining Holding * | | | 400,486 | | | | 1,325,609 | |
| | | | | | | | | |
| TOTAL UNITED STATES | | | | | | | 100,141,986 | |
TOTAL COMMON STOCK
(Cost $1,075,171,154) | | | | | | | 1,031,724,790 | |
The accompanying notes are an integral part of the financial statements.
2
| Schedule of Investments | April 30, 2024 (Unaudited) |
| Global X Silver Miners ETF |
| | | Face Amount | | | Value | |
| REPURCHASE AGREEMENTS(B) — 0.4% | | | | | | | | |
Bank of America Securities
5.320%, dated 04/30/2024, to be repurchased on 05/01/2024, repurchase price $951,841 (collateralized by various U.S. Government Obligations, ranging in par value $608 - $771,030, 2.000% - 7.500%, 10/17/2025 - 08/20/2063, with a total market value of $970,734) | | $ | 951,700 | | | $ | 951,700 | |
Citigroup Global Markets Inc.
5.320%, dated 04/30/2024, to be repurchased on 05/01/2024, repurchase price $951,841 (collateralized by various U.S. Government Obligations, ranging in par value $19,046 - $477,800, 2.000% - 6.500%, 12/01/2033 - 05/01/2054, with a total market value of $970,734) | | | 951,700 | | | | 951,700 | |
Deutsche Bank
5.310%, dated 04/30/2024, to be repurchased on 05/01/2024, repurchase price $243,024 (collateralized by various U.S. Government Obligations, ranging in par value $148 - $50,861, 2.000% - 7.000%, 02/01/2037 - 02/01/2054, with a total market value of $247,848) | | | 242,988 | | | | 242,988 | |
Nomura Securities International
5.310%, dated 04/30/2024, to be repurchased on 05/01/2024, repurchase price $951,840 (collateralized by various U.S. Government Obligations, ranging in par value $406 - $191,307, 2.000% - 7.500%, 10/01/2029 - 03/15/2058, with a total market value of $971,092) | | | 951,700 | | | | 951,700 | |
The accompanying notes are an integral part of the financial statements.
3
| Schedule of Investments | April 30, 2024 (Unaudited) |
| Global X Silver Miners ETF |
| | | Face Amount | | | Value | |
| REPURCHASE AGREEMENTS — continued | | | | | | | | |
RBC Dominion Securities
5.320%, dated 04/30/2024, to be repurchased on 05/01/2024, repurchase price $951,841 (collateralized by various U.S. Government Obligations and U.S. Treasury Obligations, ranging in par value $905 - $2,025,998, 0.000% - 5.500%, 05/09/2024 - 02/15/2054, with a total market value of $970,734) | | $ | 951,700 | | | $ | 951,700 | |
TOTAL REPURCHASE AGREEMENTS
(Cost $4,049,788) | | | | | | | 4,049,788 | |
TOTAL INVESTMENTS — 100.4%
(Cost $1,079,220,942) | | | | | | $ | 1,035,774,578 | |
Percentages are based on Net Assets of $1,031,477,034.
| * | Non-income producing security. |
| (A) | This security or a partial position of this security is on loan at April 30, 2024. The total market value of securities on loan at April 30, 2024 was $4,141,991. |
| (B) | These securities were purchased with cash collateral held from securities on loan. The total value of such securities as of April 30, 2024 was $4,049,788. The total value of non-cash collateral held from securities on loan as of April 30, 2024 was $806,364. |
The following is a summary of the level of inputs used as of April 30, 2024, in valuing the Fund’s investments carried at value:
| | | Level 1 | | | Level 2 | | | Level 3 | | | Total | |
| Investments in Securities | | | | | | | | | | | | |
| Common Stock | | $ | 1,031,724,790 | | | $ | — | | | $ | — | | | $ | 1,031,724,790 | |
| Repurchase Agreements | | | — | | | | 4,049,788 | | | | — | | | | 4,049,788 | |
| Total Investments in Securities | | $ | 1,031,724,790 | | | $ | 4,049,788 | | | $ | — | | | $ | 1,035,774,578 | |
Amounts designated as “—” are $0 or have been rounded to $0.
See “Glossary” for abbreviations.
The accompanying notes are an integral part of the financial statements.
4
| Schedule of Investments | April 30, 2024 (Unaudited) |
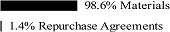
| Global X Copper Miners ETF |
Sector Weightings †:
† Sector weightings percentages are based on the total market value of investments. Total investments do not include derivatives such as options, futures contracts, forward contracts, and swap contracts, if applicable.
| | | Shares | | | Value | |
| COMMON STOCK — 99.9% | | | | | | | | |
| AUSTRALIA — 13.7% | | | | | | | | |
| Materials — 13.7% | | | | | | | | |
| 29Metals * (A) | | | 10,291,495 | | | $ | 3,374,809 | |
| BHP Group | | | 3,554,534 | | | | 99,319,220 | |
| Develop Global * (A) | | | 3,300,063 | | | | 5,250,100 | |
| Glencore | | | 17,624,471 | | | | 103,213,817 | |
| Sandfire Resources * | | | 12,382,093 | | | | 76,785,057 | |
| SolGold * (A) | | | 39,238,460 | | | | 4,520,164 | |
| WA1 Resources * | | | 1,001,820 | | | | 11,228,190 | |
| | | | | | | | | |
| TOTAL AUSTRALIA | | | | | | | 303,691,357 | |
| BRAZIL — 2.3% | | | | | | | | |
| Materials — 2.3% | | | | | | | | |
| ERO Copper * (A) | | | 2,535,349 | | | | 51,801,322 | |
| | | | | | | | | |
| CANADA — 22.8% | | | | | | | | |
| Materials — 22.8% | | | | | | | | |
| Altius Minerals | | | 1,056,862 | | | | 16,739,322 | |
| Capstone Copper * | | | 12,906,114 | | | | 89,525,979 | |
| Filo * | | | 2,150,323 | | | | 38,612,999 | |
| Foran Mining * | | | 6,017,830 | | | | 18,484,727 | |
| HudBay Minerals | | | 9,718,792 | | | | 81,989,154 | |
| Ivanhoe Mines, Cl A * (A) | | | 7,485,584 | | | | 101,671,214 | |
| NGEx Minerals * | | | 3,408,087 | | | | 24,087,437 | |
| Solaris Resources * | | | 1,977,025 | | | | 7,339,104 | |
| Taseko Mines * | | | 7,817,936 | | | | 19,232,122 | |
| Teck Resources, Cl B | | | 2,173,138 | | | | 107,071,158 | |
| | | | | | | | | |
| TOTAL CANADA | | | | | | | 504,753,216 | |
The accompanying notes are an integral part of the financial statements.
5
| Schedule of Investments | April 30, 2024 (Unaudited) |
| Global X Copper Miners ETF |
| | | Shares | | | Value | |
| COMMON STOCK — continued | | | | | | | | |
| CHILE — 9.5% | | | | | | | | |
| Materials — 9.5% | | | | | | | | |
| Antofagasta | | | 3,724,489 | | | $ | 103,065,508 | |
| Lundin Mining | | | 9,298,848 | | | | 106,400,183 | |
| | | | | | | | | |
| TOTAL CHILE | | | | | | | 209,465,691 | |
| CHINA — 13.0% | | | | | | | | |
| Materials — 13.0% | | | | | | | | |
| China Gold International Resources * | | | 6,594,100 | | | | 38,656,406 | |
| China Nonferrous Mining | | | 31,569,400 | | | | 28,860,176 | |
| Jiangxi Copper, Cl H | | | 29,958,301 | | | | 61,669,392 | |
| Jinchuan Group International Resources (A) | | | 135,604,900 | | | | 13,350,352 | |
| MMG * (A) | | | 77,799,500 | | | | 35,611,186 | |
| Wanguo International Mining Group | | | 6,364,690 | | | | 6,583,433 | |
| Zijin Mining Group, Cl H | | | 46,261,935 | | | | 102,328,476 | |
| | | | | | | | | |
| TOTAL CHINA | | | | | | | 287,059,421 | |
| CYPRUS — 0.7% | | | | | | | | |
| Materials — 0.7% | | | | | | | | |
| Atalaya Mining | | | 2,642,340 | | | | 14,706,687 | |
| | | | | | | | | |
| GERMANY — 3.0% | | | | | | | | |
| Materials — 3.0% | | | | | | | | |
| Aurubis | | | 837,886 | | | | 67,372,761 | |
| | | | | | | | | |
| JAPAN — 8.0% | | | | | | | | |
| Materials — 8.0% | | | | | | | | |
| Mitsubishi Materials | | | 3,415,305 | | | | 67,127,623 | |
| Nittetsu Mining | | | 247,399 | | | | 7,837,092 | |
| Sumitomo Metal Mining | | | 3,036,401 | | | | 102,535,093 | |
| | | | | | | | | |
| TOTAL JAPAN | | | | | | | 177,499,808 | |
| JERSEY — 0.8% | | | | | | | | |
| Materials — 0.8% | | | | | | | | |
| Metals Acquisition, Cl A * | | | 1,230,625 | | | | 16,514,987 | |
The accompanying notes are an integral part of the financial statements.
6
| Schedule of Investments | April 30, 2024 (Unaudited) |
| Global X Copper Miners ETF |
| | | Shares | | | Value | |
| COMMON STOCK — continued | | | | | | | | |
| MEXICO — 4.7% | | | | | | | | |
| Materials — 4.7% | | | | | | | | |
| Southern Copper | | | 899,627 | | | $ | 104,959,482 | |
| | | | | | | | | |
| POLAND — 4.8% | | | | | | | | |
| Materials — 4.8% | | | | | | | | |
| KGHM Polska Miedz | | | 3,048,331 | | | | 105,960,447 | |
| | | | | | | | | |
| SAUDI ARABIA — 1.0% | | | | | | | | |
| Materials — 1.0% | | | | | | | | |
| Al Masane Al Kobra Mining | | | 1,428,450 | | | | 22,661,114 | |
| | | | | | | | | |
| SWEDEN — 5.0% | | | | | | | | |
| Materials — 5.0% | | | | | | | | |
| Boliden (A) | | | 3,285,174 | | | | 110,175,252 | |
| | | | | | | | | |
| UNITED KINGDOM — 0.6% | | | | | | | | |
| Materials — 0.6% | | | | | | | | |
| Central Asia Metals | | | 4,903,873 | | | | 12,925,451 | |
| | | | | | | | | |
| UNITED STATES — 4.7% | | | | | | | | |
| Materials — 4.7% | | | | | | | | |
| Freeport-McMoRan | | | 2,070,915 | | | | 103,421,495 | |
| | | | | | | | | |
| ZAMBIA — 5.3% | | | | | | | | |
| Materials — 5.3% | | | | | | | | |
| First Quantum Minerals | | | 9,146,606 | | | | 116,375,640 | |
| | | | | | | | | |
TOTAL COMMON STOCK
(Cost $2,002,882,649) | | | | | | | 2,209,344,131 | |
The accompanying notes are an integral part of the financial statements.
7
| Schedule of Investments | April 30, 2024 (Unaudited) |
| Global X Copper Miners ETF |
| | | Face Amount | | | Value | |
| REPURCHASE AGREEMENTS(B) — 4.7% | | | | | | | | |
Bank of America Securities
5.320%, dated 04/30/2024, to be repurchased on 05/01/2024, repurchase price $24,575,329 (collateralized by various U.S. Government Obligations, ranging in par value $15,687 - $19,907,035, 2.000% - 7.500%, 10/17/2025 - 08/20/2063, with a total market value of $25,063,132) | | $ | 24,571,698 | | | $ | 24,571,698 | |
Citigroup Global Markets Inc.
5.320%, dated 04/30/2024, to be repurchased on 05/01/2024, repurchase price $24,575,329 (collateralized by various U.S. Government Obligations, ranging in par value $491,734 - $12,336,206, 2.000% - 6.500%, 12/01/2033 - 05/01/2054, with a total market value of $25,063,139) | | | 24,571,698 | | | | 24,571,698 | |
Daiwa Capital Markets America
5.350%, dated 04/30/2024, to be repurchased on 05/01/2024, repurchase price $6,274,559 (collateralized by various U.S. Government Obligations and U.S. Treasury Obligations, ranging in par value $494 - $1,566,068, 0.000% - 6.500%, 05/07/2024 - 05/01/2054, with a total market value of $6,399,100) | | | 6,273,627 | | | | 6,273,627 | |
Deutsche Bank
5.310%, dated 04/30/2024, to be repurchased on 05/01/2024, repurchase price $24,575,322 (collateralized by various U.S. Government Obligations, ranging in par value $14,957 - $5,143,234, 2.000% - 7.000%, 02/01/2037 - 02/01/2054, with a total market value of $25,063,132) | | | 24,571,698 | | | | 24,571,698 | |
The accompanying notes are an integral part of the financial statements.
8
| Schedule of Investments | April 30, 2024 (Unaudited) |
| Global X Copper Miners ETF |
| | | Face Amount | | | Value | |
| REPURCHASE AGREEMENTS — continued | | | | | | | | |
Nomura Securities International
5.310%, dated 04/30/2024, to be repurchased on 05/01/2024, repurchase price $24,575,322 (collateralized by various U.S. Government Obligations, ranging in par value $10,489 - $4,939,295, 2.000% - 7.500%, 10/01/2029 - 03/15/2058, with a total market value of $25,072,387) | | $ | 24,571,698 | | | $ | 24,571,698 | |
TOTAL REPURCHASE AGREEMENTS
(Cost $104,560,419) | | | | | | | 104,560,419 | |
TOTAL INVESTMENTS — 104.6%
(Cost $2,107,443,068) | | | | | | $ | 2,313,904,550 | |
Percentages are based on Net Assets of $2,211,560,519.
| * | Non-income producing security. |
| (A) | This security or a partial position of this security is on loan at April 30, 2024. The total market value of securities on loan at April 30, 2024 was $56,795,008. |
| (B) | These securities were purchased with cash collateral held from securities on loan. The total value of such securities as of April 30, 2024 was $104,560,419. The total value of non-cash collateral held from securities on loan as of April 30, 2024 was $325,148. |
The following is a summary of the level of inputs used as of April 30, 2024, in valuing the Fund’s investments carried at value:
| | | Level 1 | | | Level 2 | | | Level 3 | | | Total | |
| Investments in Securities | | | | | | | | | | | | |
| Common Stock | | $ | 2,209,344,131 | | | $ | — | | | $ | — | | | $ | 2,209,344,131 | |
| Repurchase Agreements | | | — | | | | 104,560,419 | | | | — | | | | 104,560,419 | |
| Total Investments in Securities | | $ | 2,209,344,131 | | | $ | 104,560,419 | | | $ | — | | | $ | 2,313,904,550 | |
Amounts designated as “—” are $0 or have been rounded to $0.
See “Glossary” for abbreviations.
The accompanying notes are an integral part of the financial statements.
9
| Schedule of Investments | April 30, 2024 (Unaudited) |
| Global X Gold Explorers ETF |
Sector Weightings †:
† Sector weightings percentages are based on the total market value of investments. Total investments do not include derivatives such as options, futures contracts, forward contracts, and swap contracts, if applicable.
| | | Shares | | | Value | |
| COMMON STOCK — 100.0% | | | | | | | | |
| AUSTRALIA — 32.3% | | | | | | | | |
| Materials — 32.3% | | | | | | | | |
| Bellevue Gold * | | | 782,482 | | | $ | 906,968 | |
| Capricorn Metals * | | | 214,458 | | | | 697,685 | |
| De Grey Mining * | | | 1,043,081 | | | | 890,683 | |
| Emerald Resources NL * | | | 344,996 | | | | 793,043 | |
| Firefinch *(A) (B) | | | 825,148 | | | | 37,667 | |
| Genesis Minerals * | | | 662,002 | | | | 756,574 | |
| Gold Road Resources | | | 709,259 | | | | 755,315 | |
| OceanaGold | | | 489,585 | | | | 1,061,952 | |
| Perseus Mining | | | 947,944 | | | | 1,421,916 | |
| Ramelius Resources | | | 766,406 | | | | 1,040,122 | |
| Red 5 * | | | 1,912,976 | | | | 558,987 | |
| Regis Resources * | | | 522,272 | | | | 752,886 | |
| Resolute Mining * | | | 1,529,859 | | | | 424,685 | |
| Silver Lake Resources * | | | 635,320 | | | | 602,316 | |
| Tietto Minerals * | | | 498,097 | | | | 218,322 | |
| West African Resources * | | | 645,619 | | | | 561,772 | |
| Westgold Resources | | | 316,991 | | | | 463,136 | |
| | | | | | | | | |
| TOTAL AUSTRALIA | | | | | | | 11,944,029 | |
| CANADA — 41.5% | | | | | | | | |
| Materials — 41.5% | | | | | | | | |
| Alamos Gold, Cl A | | | 100,048 | | | | 1,474,668 | |
| Artemis Gold * | | | 91,326 | | | | 596,276 | |
| Calibre Mining * | | | 405,923 | | | | 573,200 | |
| Centerra Gold | | | 148,146 | | | | 903,638 | |
| Dundee Precious Metals | | | 125,890 | | | | 954,816 | |
| Endeavour Silver * (B) | | | 137,756 | | | | 362,978 | |
| Equinox Gold * | | | 206,038 | | | | 1,117,286 | |
| Fortuna Silver Mines * | | | 210,549 | | | | 957,842 | |
The accompanying notes are an integral part of the financial statements.
10
| Schedule of Investments | April 30, 2024 (Unaudited) |
| Global X Gold Explorers ETF |
| | | Shares | | | Value | |
| COMMON STOCK — continued | | | | | | | | |
| Materials — continued | | | | | | | | |
| K92 Mining * | | | 154,341 | | | $ | 822,343 | |
| Karora Resources * | | | 119,338 | | | | 465,591 | |
| Lundin Gold | | | 66,983 | | | | 912,219 | |
| McEwen Mining * | | | 27,057 | | | | 310,073 | |
| New Gold * | | | 449,259 | | | | 778,277 | |
| Novagold Resources * (B) | | | 158,896 | | | | 460,798 | |
| Orla Mining * | | | 138,498 | | | | 539,334 | |
| Osisko Mining * | | | 252,592 | | | | 558,925 | |
| Seabridge Gold * | | | 48,119 | | | | 721,785 | |
| Skeena Resources * | | | 51,116 | | | | 241,842 | |
| SSR Mining | | | 139,567 | | | | 749,721 | |
| Torex Gold Resources * | | | 59,476 | | | | 839,855 | |
| Victoria Gold * | | | 44,604 | | | | 224,343 | |
| Wesdome Gold Mines * | | | 103,021 | | | | 772,367 | |
| | | | | | | | | |
| TOTAL CANADA | | | | | | | 15,338,177 | |
| EGYPT — 3.3% | | | | | | | | |
| Materials — 3.3% | | | | | | | | |
| Centamin | | | 803,434 | | | | 1,219,290 | |
| | | | | | | | | |
| INDONESIA — 6.7% | | | | | | | | |
| Materials — 6.7% | | | | | | | | |
| Aneka Tambang | | | 5,838,234 | | | | 588,850 | |
| Bumi Resources Minerals * | | | 51,314,500 | | | | 482,849 | |
| Merdeka Copper Gold * | | | 8,756,053 | | | | 1,416,262 | |
| | | | | | | | | |
| TOTAL INDONESIA | | | | | | | 2,487,961 | |
| PERU — 1.1% | | | | | | | | |
| Materials — 1.1% | | | | | | | | |
| Hochschild Mining * | | | 211,746 | | | | 413,083 | |
| | | | | | | | | |
| TURKEY — 5.1% | | | | | | | | |
| Materials — 5.1% | | | | | | | | |
| Eldorado Gold * | | | 98,894 | | | | 1,412,309 | |
| Koza Altin Isletmeleri | | | 658,095 | | | | 472,790 | |
| | | | | | | | | |
| TOTAL TURKEY | | | | | | | 1,885,099 | |
The accompanying notes are an integral part of the financial statements.
11
| Schedule of Investments | April 30, 2024 (Unaudited) |
| Global X Gold Explorers ETF |
| | | Shares | | | Value | |
| COMMON STOCK — continued | | | | | | | | |
| UNITED KINGDOM — 1.7% | | | | | | | | |
| Materials — 1.7% | | | | | | | | |
| Greatland Gold * | | | 3,106,398 | | | $ | 235,324 | |
| Pan African Resources | | | 1,312,864 | | | | 397,823 | |
| | | | | | | | | |
| TOTAL UNITED KINGDOM | | | | | | | 633,147 | |
| UNITED STATES — 8.3% | | | | | | | | |
| Materials — 8.3% | | | | | | | | |
| Argonaut Gold * | | | 627,804 | | | | 191,926 | |
| Coeur Mining * | | | 263,896 | | | | 1,192,810 | |
| Hecla Mining | | | 353,902 | | | | 1,673,956 | |
| | | | | | | | | |
| TOTAL UNITED STATES | | | | | | | 3,058,692 | |
TOTAL COMMON STOCK
(Cost $39,128,517) | | | | | | | 36,979,478 | |
| | | | | | | | | |
| | | Number of
Rights | | | | | |
| RIGHTS — 0.0% | | | | | | | | |
| Canada — 0.0% | | | | | | | | |
Great Bear Resources#(A)
Expires (Cost –) | | | 46,614 | | | | — | |
| | | | | | | | | |
| | | Face Amount | | | | | |
| REPURCHASE AGREEMENTS(C) — 1.4% | | | | | | | | |
Citigroup Global Markets Inc.
5.320%, dated 04/30/2024, to be repurchased on 05/01/2024, repurchase price $249,037 (collateralized by various U.S. Government Obligations, ranging in par value $4,983 - $125,010, 2.000% - 6.500%, 12/01/2033 - 05/01/2054, with a total market value of $253,980) | | $ | 249,000 | | | | 249,000 | |
The accompanying notes are an integral part of the financial statements.
12
| Schedule of Investments | April 30, 2024 (Unaudited) |
| Global X Gold Explorers ETF |
| | | Face Amount | | | Value | |
| REPURCHASE AGREEMENTS — continued | | | | | | | | |
Daiwa Capital Markets America
5.350%, dated 04/30/2024, to be repurchased on 05/01/2024, repurchase price $8,113 (collateralized by various U.S. Government Obligations and U.S. Treasury Obligations, ranging in par value $1 - $2,025, 0.000% - 6.500%, 05/07/2024 - 05/01/2054, with a total market value of $8,274) | | $ | 8,112 | | | $ | 8,112 | |
Deutsche Bank
5.310%, dated 04/30/2024, to be repurchased on 05/01/2024, repurchase price $249,037 (collateralized by various U.S. Government Obligations, ranging in par value $152 - $52,120, 2.000% - 7.000%, 02/01/2037 - 02/01/2054, with a total market value of $253,980) | | | 249,000 | | | | 249,000 | |
TOTAL REPURCHASE AGREEMENTS
(Cost $506,112) | | | | | | | 506,112 | |
TOTAL INVESTMENTS — 101.4%
(Cost $39,634,629) | | | | | | $ | 37,485,590 | |
Percentages are based on Net Assets of $36,978,722.
| * | Non-income producing security. |
| # | Expiration date not available. |
| (A) | Level 3 security in accordance with fair value hierarchy. |
| (B) | This security or a partial position of this security is on loan at April 30, 2024. The total market value of securities on loan at April 30, 2024 was $232,333. |
| (C) | These securities were purchased with cash collateral held from securities on loan. The total value of such securities as of April 30, 2024 was $506,112. The total value of non-cash collateral held from securities on loan as of April 30, 2024 was $–. |
The accompanying notes are an integral part of the financial statements.
13
| Schedule of Investments | April 30, 2024 (Unaudited) |
| Global X Gold Explorers ETF |
The following is a summary of the level of inputs used as of April 30, 2024, in valuing the Fund’s investments carried at value:
| | | Level 1 | | | Level 2 | | | Level 3(1) | | | Total | |
| Investments in Securities | | | | | | | | | | | | |
| Common Stock | | $ | 36,941,811 | | | $ | — | | | $ | 37,667 | | | $ | 36,979,478 | |
| Rights | | | — | | | | — | | | | — | ^ | | | — | |
| Repurchase Agreements | | | — | | | | 506,112 | | | | — | | | | 506,112 | |
| Total Investments in Securities | | $ | 36,941,811 | | | $ | 506,112 | | | $ | 37,667 | | | $ | 37,485,590 | |
| | |
| (1) | A reconciliation of Level 3 investments and disclosures of significant unobservable inputs are presented when the Fund has a significant amount of Level 3 investments at the end of the period in relation to Net Assets. Management has concluded that Level 3 investments are not material in relation to Net Assets. |
| ^ | Includes Securities in which the fair value is $0 or has been rounded to $0. |
Amounts designated as “—” are $0 or have been rounded to $0.
See “Glossary” for abbreviations.
The accompanying notes are an integral part of the financial statements.
14
| Schedule of Investments | April 30, 2024 (Unaudited) |
| Global X Uranium ETF |
Sector Weightings †:
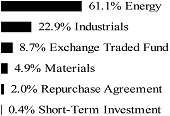
† Sector weightings percentages are based on the total market value of investments. Total investments do not include derivatives such as options, futures contracts, forward contracts, and swap contracts, if applicable.
| | | Shares | | | Value | |
| COMMON STOCK — 91.0% | | | | | | | | |
| AUSTRALIA — 15.3% | | | | | | | | |
| Energy — 12.0% | | | | | | | | |
| Alligator Energy *(A) (B) | | | 231,207,082 | | | $ | 9,008,068 | |
| Aura Energy * | | | 30,697,276 | | | | 3,587,993 | |
| Bannerman Energy *(A) (B) | | | 8,672,593 | | | | 21,399,905 | |
| Berkeley Energia *(A) (B) | | | 26,349,426 | | | | 6,071,556 | |
| Boss Energy *(A) | | | 25,674,224 | | | | 82,357,576 | |
| Deep Yellow *(A) | | | 47,318,421 | | | | 44,706,690 | |
| Elevate Uranium *(A) (B) | | | 17,433,993 | | | | 5,490,576 | |
| Lotus Resources *(A) (B) | | | 94,931,326 | | | | 27,123,236 | |
| Paladin Energy *(A) | | | 19,007,805 | | | | 172,427,943 | |
| Peninsula Energy * | | | 78,045,988 | | | | 5,574,713 | |
| | | | | | | | 377,748,256 | |
| Industrials — 1.2% | | | | | | | | |
| Silex Systems *(A) | | | 11,830,080 | | | | 39,177,538 | |
| | | | | | | | | |
| Materials — 2.1% | | | | | | | | |
| Anson Resources *(A) (B) | | | 62,343,523 | | | | 4,250,695 | |
| BHP Group | | | 2,154,267 | | | | 60,193,577 | |
| | | | | | | | 64,444,272 | |
| TOTAL AUSTRALIA | | | | | | | 481,370,066 | |
| CANADA — 39.3% | | | | | | | | |
| Energy — 36.9% | | | | | | | | |
| Cameco | | | 15,419,198 | | | | 704,938,550 | |
| CanAlaska Uranium * (B) | | | 9,187,912 | | | | 3,945,750 | |
The accompanying notes are an integral part of the financial statements.
15
| Schedule of Investments | April 30, 2024 (Unaudited) |
| Global X Uranium ETF |
| | | Shares | | | Value | |
| COMMON STOCK — continued | | | | | | | | |
| Energy — continued | | | | | | | | |
| Denison Mines * (B) | | | 58,318,409 | | | $ | 116,309,961 | |
| Encore Energy * (B) | | | 10,470,527 | | | | 48,014,208 | |
| F3 Uranium * | | | 25,855,281 | | | | 7,904,224 | |
| Fission Uranium * (B) | | | 43,022,053 | | | | 33,820,153 | |
| Forsys Metals * | | | 8,582,973 | | | | 5,622,648 | |
| GoviEx Uranium, Cl A * (B) | | | 45,702,183 | | | | 2,827,591 | |
| IsoEnergy, Cl Common Subs. Receipt * (B) | | | 7,159,070 | | | | 20,062,175 | |
| Laramide Resources * (B) | | | 14,533,870 | | | | 7,616,833 | |
| Mega Uranium * | | | 20,864,299 | | | | 6,074,695 | |
| NexGen Energy * | | | 24,353,738 | | | | 185,775,139 | |
| Skyharbour Resources * (B) | | | 10,807,361 | | | | 3,539,915 | |
| Uranium Royalty * (B) | | | 6,075,846 | | | | 14,240,437 | |
| | | | | | | | 1,160,692,279 | |
| Industrials — 1.6% | | | | | | | | |
| Aecon Group | | | 3,987,115 | | | | 49,075,310 | |
| | | | | | | | | |
| Materials — 0.8% | | | | | | | | |
| American Lithium * (B) | | | 13,542,740 | | | | 8,181,733 | |
| Global Atomic * (B) | | | 11,826,805 | | | | 17,991,792 | |
| | | | | | | | 26,173,525 | |
| TOTAL CANADA | | | | | | | 1,235,941,114 | |
| CHINA — 1.1% | | | | | | | | |
| Energy — 1.1% | | | | | | | | |
| CGN Mining * (B) | | | 138,554,900 | | | | 36,316,364 | |
| | | | | | | | | |
| JAPAN — 5.1% | | | | | | | | |
| Industrials — 5.1% | | | | | | | | |
| ITOCHU | | | 1,472,350 | | | | 66,766,368 | |
| Mitsubishi Heavy Industries | | | 10,416,100 | | | | 93,825,322 | |
| | | | | | | | | |
| TOTAL JAPAN | | | | | | | 160,591,690 | |
| KAZAKHSTAN — 4.4% | | | | | | | | |
| Energy — 4.4% | | | | | | | | |
| NAC Kazatomprom JSC GDR | | | 3,402,693 | | | | 137,298,663 | |
The accompanying notes are an integral part of the financial statements.
16
| Schedule of Investments | April 30, 2024 (Unaudited) |
| Global X Uranium ETF |
| | | Shares | | | Value | |
| COMMON STOCK — continued | | | | | | | | |
| SOUTH AFRICA — 2.2% | | | | | | | | |
| Materials — 2.2% | | | | | | | | |
| Sibanye Stillwater | | | 58,982,262 | | | $ | 68,170,933 | |
| | | | | | | | | |
| SOUTH KOREA — 11.2% | | | | | | | | |
| Industrials — 11.2% | | | | | | | | |
| Daewoo Engineering & Construction * | | | 11,486,583 | | | | 31,872,546 | |
| Doosan Enerbility * | | | 6,046,610 | | | | 73,499,058 | |
| GS Engineering & Construction *(A) | | | 4,024,703 | | | | 47,990,091 | |
| Hyundai Engineering & Construction | | | 2,685,304 | | | | 68,876,367 | |
| KEPCO Engineering & Construction | | | 1,030,144 | | | | 48,969,294 | |
| Samsung C&T | | | 753,127 | | | | 81,791,739 | |
| | | | | | | | | |
| TOTAL SOUTH KOREA | | | | | | | 352,999,095 | |
| UNITED KINGDOM — 3.6% | | | | | | | | |
| Industrials — 3.6% | | | | | | | | |
| Yellow Cake *(A) | | | 13,897,659 | | | | 112,068,072 | |
| | | | | | | | | |
| UNITED STATES — 8.8% | | | | | | | | |
| Energy — 8.1% | | | | | | | | |
| Centrus Energy, Cl A *(A) | | | 860,802 | | | | 36,954,230 | |
| Energy Fuels *(A) (B) | | | 10,245,703 | | | | 53,173,099 | |
| Uranium Energy *(A) | | | 20,267,942 | | | | 136,808,608 | |
| Ur-Energy *(A) (B) | | | 16,518,564 | | | | 27,586,002 | |
| | | | | | | | 254,521,939 | |
| Industrials — 0.7% | | | | | | | | |
| NuScale Power * (B) | | | 3,851,350 | | | | 22,337,830 | |
| | | | | | | | | |
| TOTAL UNITED STATES | | | | | | | 276,859,769 | |
TOTAL COMMON STOCK
(Cost $2,391,023,904) | | | | | | | 2,861,615,766 | |
| | | | | | | | | |
| EXCHANGE TRADED FUND — 8.9% | | | | | | | | |
| Sprott Physical Uranium Trust * (B) | | | 13,041,197 | | | | 278,982,989 | |
| | | | | | | | | |
TOTAL EXCHANGE TRADED FUND
(Cost $178,671,190) | | | | | | | 278,982,989 | |
The accompanying notes are an integral part of the financial statements.
17
| Schedule of Investments | April 30, 2024 (Unaudited) |
| Global X Uranium ETF |
| | | Shares | | | Value | |
| SHORT-TERM INVESTMENT(C)(D) — 0.4% | | | | | | | | |
Fidelity Investments Money Market Government Portfolio, Cl Institutional, 5.240%
(Cost $11,864,024) | | | 11,864,024 | | | $ | 11,864,024 | |
| | | | | | | | | |
| | | Face Amount | | | | | |
| REPURCHASE AGREEMENT(D) — 2.0% | | | | | | | | |
BNP Paribas
5.270%, dated 04/30/2024, to be repurchased on 05/01/2024, repurchase price $62,956,626 (collateralized by U.S. Treasury Obligations, ranging in par value $4,304,777 - $10,319,248, 2.875%, 05/15/2032, with a total market value of $64,232,107)
(Cost $62,947,411) | | $ | 62,947,411 | | | | 62,947,411 | |
TOTAL INVESTMENTS — 102.3%
(Cost $2,644,506,529) | | | | | | $ | 3,215,410,190 | |
Percentages are based on Net Assets of $3,144,364,544.
| * | Non-income producing security. |
| (A) | Affiliated investment. |
| (B) | This security or a partial position of this security is on loan at April 30, 2024. The total market value of securities on loan at April 30, 2024 was $67,768,013. |
| (C) | The rate reported on the Schedule of Investments is the 7-day effective yield as of April 30, 2024. |
| (D) | These securities were purchased with cash collateral held from securities on loan. The total value of such securities as of April 30, 2024 was $74,811,435. The total value of non-cash collateral held from securities on loan as of April 30, 2024 was $–. |
The accompanying notes are an integral part of the financial statements.
18
| Schedule of Investments | April 30, 2024 (Unaudited) |
| Global X Uranium ETF |
The following is a summary of the level of inputs used as of April 30, 2024, in valuing the Fund’s investments carried at value:
| | | Level 1 | | | Level 2 | | | Level 3 | | | Total | |
| Investments in Securities | | | | | | | | | | | | |
| Common Stock | | $ | 2,861,615,766 | | | $ | — | | | $ | — | | | $ | 2,861,615,766 | |
| Exchange Traded Fund | | | 278,982,989 | | | | — | | | | — | | | | 278,982,989 | |
| Short-Term Investment | | | 11,864,024 | | | | — | | | | — | | | | 11,864,024 | |
| Repurchase Agreement | | | — | | | | 62,947,411 | | | | — | | | | 62,947,411 | |
| Total Investments in Securities | | $ | 3,152,462,779 | | | $ | 62,947,411 | | | $ | — | | | $ | 3,215,410,190 | |
The accompanying notes are an integral part of the financial statements.
19
| Schedule of Investments | April 30, 2024 (Unaudited) |
| Global X Uranium ETF |
The following is a summary of the transactions with affiliates for the period ended April 30, 2024:
Value
10/31/2023 | | | Purchases
at Cost | | | Proceeds
from Sales | | | Change in
Unrealized
Appreciation
(Depreciation) | | | Realized Gain
(Loss) | | | Value
4/30/2024 | | | Income | | | Capital Gains | |
| Alligator Energy | | | | | | | | | | | | | | | | | | | | |
| | | | | | | | | | | | | | | | | | | | | | | | | | | | | | | |
| $ | 5,212,146 | | | $ | 3,472,131 | | | $ | (488,560 | ) | | $ | 950,838 | | | $ | (138,487 | ) | | $ | 9,008,068 | | | $ | — | | | $ | — | |
| Anson Resources | | | | | | | | | | | | | | | | | | | | |
| | | | | | | | | | | | | | | | | | | | | | | | | | | | | | | |
| | 5,672,343 | | | | 1,355,652 | | | | (651,000 | ) | | | (892,675 | ) | | | (1,233,625 | ) | | | 4,250,695 | | | | — | | | | — | |
| Bannerman Energy | | | | | | | | | | | | | | | | | | | | |
| | | | | | | | | | | | | | | | | | | | | | | | | | | | | | | |
| | 12,949,123 | | | | 5,567,490 | | | | (3,965,480 | ) | | | 6,679,403 | | | | 169,369 | | | | 21,399,905 | | | | — | | | | — | |
| Berkeley Energia | | | | | | | | | | | | | | | | | | | | |
| | | | | | | | | | | | | | | | | | | | | | | | | | | | | | | |
| | 4,696,275 | | | | 1,507,756 | | | | (586,522 | ) | | | 747,975 | | | | (293,928 | ) | | | 6,071,556 | | | | — | | | | — | |
| Boss Energy | | | | | | | | | | | | | | | | | | | | |
| | | | | | | | | | | | | | | | | | | | | | | | | | | | | | | |
| | 49,117,727 | | | | 31,140,780 | | | | (4,237,973 | ) | | | 5,231,008 | | | | 1,106,034 | | | | 82,357,576 | | | | — | | | | — | |
| Centrus Energy, Cl A | | | | | | | | | | | | | | | | | | | | |
| | | | | | | | | | | | | | | | | | | | | | | | | | | | | | | |
| | 36,093,491 | | | | 10,801,372 | | | | (2,786,952 | ) | | | (7,617,612 | ) | | | 463,931 | | | | 36,954,230 | | | | — | | | | — | |
| Deep Yellow | | | | | | | | | | | | | | | | | | | | |
| | | | | | | | | | | | | | | | | | | | | | | | | | | | | | | |
| | 28,477,684 | | | | 13,006,418 | | | | (2,325,032 | ) | | | 5,236,508 | | | | 311,112 | | | | 44,706,690 | | | | — | | | | — | |
| Elevate Uranium | | | | | | | | | | | | | | | | | | | | |
| | | | | | | | | | | | | | | | | | | | | | | | | | | | | | | |
| | 2,899,999 | | | | 2,142,273 | | | | (139,204 | ) | | | 555,833 | | | | 31,675 | | | | 5,490,576 | | | | — | | | | — | |
| Energy Fuels | | | | | | | | | | | | | | | | | | | | |
| | | | | | | | | | | | | | | | | | | | | | | | | | | | | | | |
| | 68,385,258 | | | | 20,032,805 | | | | (8,587,409 | ) | | | (25,415,348 | ) | | | (1,242,207 | ) | | | 53,173,099 | | | | — | | | | — | |
| GS Engineering & Construction | | | | | | | | | | | | | | | | | | | | |
| | | | | | | | | | | | | | | | | | | | | | | | | | | | | | | |
| | 29,779,856 | | | | 13,705,213 | | | | (2,711,566 | ) | | | 12,774,507 | | | | (5,557,919 | ) | | | 47,990,091 | | | | — | | | | — | |
| Lotus Resources | | | | | | | | | | | | | | | | | | | | |
| | | | | | | | | | | | | | | | | | | | | | | | | | | | | | | |
| | 8,037,426 | | | | 10,675,927 | | | | (1,010,021 | ) | | | 9,445,111 | | | | (25,207 | ) | | | 27,123,236 | | | | — | | | | — | |
| Paladin Energy | | | | | | | | | | | | | | | | | | | | |
| | | | | | | | | | | | | | | | | | | | | | | | | | | | | | | |
| | 90,077,920 | | | | 154,648,611 | | | | (120,048,247 | ) | | | 46,581,719 | | | | 1,167,940 | | | | 172,427,943 | | | | — | | | | — | |
| Silex Systems | | | | | | | | | | | | | | | | | | | | |
| | | | | | | | | | | | | | | | | | | | | | | | | | | | | | | |
| | 19,397,454 | | | | 10,000,612 | | | | (2,859,961 | ) | | | 12,529,511 | | | | 109,922 | | | | 39,177,538 | | | | — | | | | — | |
| Uranium Energy | | | | | | | | | | | | | | | | | | | | |
| | | | | | | | | | | | | | | | | | | | | | | | | | | | | | | |
| | 122,202,117 | | | | 44,009,228 | | | | (47,830,069 | ) | | | (3,554,540 | ) | | | 21,981,872 | | | | 136,808,608 | | | | — | | | | — | |
| Ur-Energy | | | | | | | | | | | | | | | | | | | | |
| | | | | | | | | | | | | | | | | | | | | | | | | | | | | | | |
| | 22,951,661 | | | | 7,859,434 | | | | (3,733,197 | ) | | | 375,801 | | | | 132,303 | | | | 27,586,002 | | | | — | | | | — | |
| Yellow Cake | | | | | | | | | | | | | | | | | | | | |
| | | | | | | | | | | | | | | | | | | | | | | | | | | | | | | |
| | 73,071,357 | | | | 31,434,968 | | | | (6,508,298 | ) | | | 12,407,445 | | | | 1,662,600 | | | | 112,068,072 | | | | — | | | | — | |
| Totals: | | | | | | | | | | | | | | | | | | | | |
| | | | | | | | | | | | | | | | | | | | | | | | | | | | | | | |
| $ | 579,021,837 | | | $ | 361,360,670 | | | $ | (208,469,491 | ) | | $ | 76,035,484 | | | $ | 18,645,385 | | | $ | 826,593,885 | | | $ | — | | | $ | — | |
Amounts designated as “—” are $0 or have been rounded to $0.
See “Glossary” for abbreviations.
The accompanying notes are an integral part of the financial statements.
20
April 30, 2024 (Unaudited)
Glossary: (abbreviations which may be used in the preceding Schedules of Investments)
Fund Abbreviations
ADR — American Depositary Receipt
Cl — Class
GDR — Global Depositary Receipt
JSC — Joint-Stock Company
21
Statements of Assets and Liabilities
April 30, 2024 (Unaudited)
| | | Global X Silver
Miners ETF | | | Global X Copper
Miners ETF | | | Global X Gold
Explorers ETF | |
| Assets: | | | | | | | | | | | | |
| Cost of Investments | | $ | 1,075,171,154 | | | $ | 2,002,882,649 | | | $ | 39,128,517 | |
| Cost of Repurchase Agreement | | | 4,049,788 | | | | 104,560,419 | | | | 506,112 | |
| Cost/(Proceeds) of Foreign Currency | | | 2,873 | | | | 1,425,396 | | | | 69 | |
| Investments, at Value | | $ | 1,031,724,790 | * | | $ | 2,209,344,131 | * | | $ | 36,979,478 | * |
| Repurchase Agreement, at Value | | | 4,049,788 | | | | 104,560,419 | | | | 506,112 | |
| Cash | | | 960,732 | | | | 8,609,339 | | | | 50,750 | |
| Foreign Currency, at Value | | | 3,115 | | | | 1,448,220 | | | | 69 | |
| Receivable for Investment Securities Sold | | | 46,031,225 | | | | 274,398,524 | | | | 1,906,946 | |
| Dividend, Interest, and Securities Lending Income Receivable | | | 550,408 | | | | 3,992,232 | | | | 326 | |
| Reclaim Receivable | | | 322,074 | | | | 713,632 | | | | 2,232 | |
| Receivable for Capital Shares Sold | | | — | | | | 14,801,390 | | | | — | |
| Total Assets | | | 1,083,642,132 | | | | 2,617,867,887 | | | | 39,445,913 | |
| Liabilities: | | | | | | | | | | | | |
| Obligation to Return Securities Lending Collateral | | | 4,049,788 | | | | 104,560,419 | | | | 506,112 | |
| Payable for Investment Securities Purchased | | | 47,551,252 | | | | 177,994,181 | | | | 1,940,792 | |
| Payable due to Investment Adviser | | | 549,646 | | | | 1,128,492 | | | | 20,078 | |
| Unrealized Depreciation on Spot Contracts | | | 14,412 | | | | 50,268 | | | | 209 | |
| Payable for Capital Shares Redeemed | | | — | | | | 122,574,008 | | | | — | |
| Total Liabilities | | | 52,165,098 | | | | 406,307,368 | | | | 2,467,191 | |
| Net Assets | | $ | 1,031,477,034 | | | $ | 2,211,560,519 | | | $ | 36,978,722 | |
| Net Assets Consist of: | | | | | | | | | | | | |
| Paid-in Capital | | $ | 1,700,420,328 | | | $ | 2,035,217,529 | | | $ | 109,644,116 | |
| Total Distributable Earnings (Accumulated Losses) | | | (668,943,294 | ) | | | 176,342,990 | | | | (72,665,394 | ) |
| Net Assets | | $ | 1,031,477,034 | | | $ | 2,211,560,519 | | | $ | 36,978,722 | |
Outstanding Shares of Beneficial Interest
(unlimited authorization — no par value) | | | 33,547,318 | | | | 47,819,374 | | | | 1,362,054 | |
| Net Asset Value, Offering and Redemption Price Per Share | | | $30.75 | | | | $46.25 | | | | $27.15 | |
| *Includes Market Value of Securities on Loan | | $ | 4,141,991 | | | $ | 56,795,008 | | | $ | 232,333 | |
The accompanying notes are an integral part of the financial statements.
22
Statements of Assets and Liabilities
April 30, 2024 (Unaudited)
| | | Global X
Uranium ETF |
| Assets: | | | | |
| Cost of Investments | | $ | 1,895,147,552 | |
| Cost of Affiliated Investments | | | 686,411,566 | |
| Cost of Repurchase Agreement | | | 62,947,411 | |
| Cost (Proceeds) of Foreign Currency | | | 7,023 | |
| Investments, at Value | | $ | 2,325,868,894 | * |
| Affiliated Investments, at Value | | | 826,593,885 | |
| Repurchase Agreement, at Value | | | 62,947,411 | |
| Cash | | | 4,193,828 | |
| Foreign Currency, at Value | | | 6,930 | |
| Receivable for Capital Shares Sold | | | 37,602,275 | |
| Dividend, Interest, and Securities Lending Income Receivable | | | 1,361,530 | |
| Total Assets | | | 3,258,574,753 | |
| Liabilities: | | | | |
| Obligation to Return Securities Lending Collateral | | | 74,811,435 | |
| Payable for Investment Securities Purchased | | | 37,616,202 | |
| Payable due to Investment Adviser | | | 1,772,785 | |
| Unrealized Depreciation on Spot Contracts | | | 9,787 | |
| Total Liabilities | | | 114,210,209 | |
| Net Assets | | $ | 3,144,364,544 | |
| Net Assets Consist of: | | | | |
| Paid-in Capital | | $ | 3,285,242,168 | |
| Total Accumulated Losses | | | (140,877,624 | ) |
| Net Assets | | $ | 3,144,364,544 | |
Outstanding Shares of Beneficial Interest
(unlimited authorization — no par value) | | | 107,821,666 | |
| Net Asset Value, Offering and Redemption Price Per Share | | | $29.16 | |
| *Includes Market Value of Securities on Loan | | $ | 67,768,013 | |
The accompanying notes are an integral part of the financial statements.
23
Statements of Operations
For the period ended April 30, 2024 (Unaudited)
| | | Global X Silver
Miners ETF | | Global X Copper
Miners ETF | | Global X Gold
Explorers ETF |
| Investment Income: | | | | | | | | | | | | |
| Dividend Income | | $ | 4,728,683 | | | $ | 13,283,496 | | | $ | 90,220 | |
| Interest Income | | | 22,344 | | | | 52,835 | | | | 564 | |
| Security Lending Income | | | 157,359 | | | | 142,027 | | | | 970 | |
| Less: Foreign Taxes Withheld | | | (677,772 | ) | | | (1,359,610 | ) | | | (9,143 | ) |
| Total Investment Income | | | 4,230,614 | | | | 12,118,748 | | | | 82,611 | |
| Expenses: | | | | | | | | | | | | |
| Supervision and Administration Fees(1) | | | 2,842,908 | | | | 5,026,345 | | | | 110,973 | |
| Custodian Fees(2) | | | 1,210 | | | | 38,830 | | | | 9 | |
| Total Expenses | | | 2,844,118 | | | | 5,065,175 | | | | 110,982 | |
| Net Investment Income (Loss) | | | 1,386,496 | | | | 7,053,573 | | | | (28,371 | ) |
| Net Realized Gain (Loss) on: | | | | | | | | | | | | |
| Investments(3) | | | (5,446,483 | ) | | | 91,182,896 | | | | (585,135 | ) |
| Foreign Currency Transactions | | | (11,248 | ) | | | 273,961 | | | | (271 | ) |
| Net Realized Gain (Loss) | | | (5,457,731 | ) | | | 91,456,857 | | | | (585,406 | ) |
| Net Change in Unrealized Appreciation (Depreciation) on: | | | | | | | | | | | | |
| Investments | | | 229,993,588 | | | | 467,362,849 | | | | 7,113,279 | |
| Foreign Currency Translations | | | 2,594 | | | | (85,456 | ) | | | 12 | |
| Net Change in Unrealized Appreciation (Depreciation) | | | 229,996,182 | | | | 467,277,393 | | | | 7,113,291 | |
| Net Realized and Unrealized Gain (Loss) | | | 224,538,451 | | | | 558,734,250 | | | | 6,527,885 | |
| Net Increase in Net Assets Resulting from Operations | | $ | 225,924,947 | | | $ | 565,787,823 | | | $ | 6,499,514 | |
| (1) | The Supervision and Administration fees include fees paid by the Funds for the investment advisory services provided by the Adviser. (See Note 3 in Notes to Financial Statements.) |
| (2) | See Note 2 in the Notes to Financial Statements. |
| (3) | Includes realized gains (losses) as a result of in-kind redemptions. (See Note 4 in Notes to Financial Statements.) |
The accompanying notes are an integral part of the financial statements.
24
Statements of Operations
For the period ended April 30, 2024 (Unaudited)
| | | Global X
Uranium ETF |
| Investment Income: | | | | |
| Dividend Income | | $ | 7,137,652 | |
| Interest Income | | | 182,334 | |
| Security Lending Income | | | 2,093,978 | |
| Less: Foreign Taxes Withheld | | | (977,803 | ) |
| Total Investment Income | | | 8,436,161 | |
| Expenses: | | | | |
| Supervision and Administration Fees(1) | | | 9,289,046 | |
| Custodian Fees(2) | | | 306 | |
| Total Expenses | | | 9,289,352 | |
| Net Investment Loss | | | (853,191 | ) |
| Net Realized Gain (Loss) on: | | | | |
| Investments(3) | | | 53,971,760 | |
| Affiliated Investments | | | 18,645,385 | |
| Foreign Currency Transactions | | | (856,560 | ) |
| Net Realized Gain (Loss) | | | 71,760,585 | |
| Net Change in Unrealized Appreciation (Depreciation) on: | | | | |
| Investments | | | 210,047,581 | |
| Affiliated Investments | | | 76,035,484 | |
| Foreign Currency Translations | | | (33,553 | ) |
| Net Change in Unrealized Appreciation (Depreciation) | | | 286,049,512 | |
| Net Realized and Unrealized Gain (Loss) | | | 357,810,097 | |
| Net Increase in Net Assets Resulting from Operations | | $ | 356,956,906 | |
| (1) | The Supervision and Administration fees include fees paid by the Funds for the investment advisory services provided by the Adviser. (See Note 3 in Notes to Financial Statements.) |
| (2) | See Note 2 in the Notes to Financial Statements. |
| (3) | Includes realized gains (losses) as a result of in-kind redemptions. (See Note 4 in Notes to Financial Statements.) |
The accompanying notes are an integral part of the financial statements.
25
Statements of Changes in Net Assets
| | | Global X Silver Miners ETF | | Global X Copper Miners ETF |
| | | Period Ended
April 30, 2024
(Unaudited) | | Year Ended
October 31, 2023 | | Period Ended
April 30, 2024
(Unaudited) | | Year Ended
October 31, 2023 |
| Operations: | | | | | | | | | | | | | | | | |
| Net Investment Income | | $ | 1,386,496 | | | $ | 4,828,231 | | | $ | 7,053,573 | | | $ | 33,379,506 | |
| Net Realized Gain (Loss) | | | (5,457,731 | ) | | | (45,463,390 | ) | | | 91,456,857 | | | | 111,607,108 | |
| Net Change in Unrealized Appreciation (Depreciation) | | | 229,996,182 | | | | 11,274,037 | | | | 467,277,393 | | | | 136,112,448 | |
| Net Increase (Decrease) in Net Assets Resulting from Operations | | | 225,924,947 | | | | (29,361,122 | ) | | | 565,787,823 | | | | 281,099,062 | |
| Distributions: | | | (4,498,631 | ) | | | (3,186,496 | ) | | | (15,960,994 | ) | | | (38,138,689 | ) |
| Capital Share Transactions: | | | | | | | | | | | | | | | | |
| Issued | | | 59,921,954 | | | | 115,347,129 | | | | 917,898,376 | | | | 562,418,276 | |
| Redeemed | | | (73,618,651 | ) | | | (100,960,271 | ) | | | (574,096,783 | ) | | | (802,934,467 | ) |
| Increase (Decrease) in Net Assets from Capital Share Transactions | | | (13,696,697 | ) | | | 14,386,858 | | | | 343,801,593 | | | | (240,516,191 | ) |
| Total Increase (Decrease) in Net Assets | | | 207,729,619 | | | | (18,160,760 | ) | | | 893,628,422 | | | | 2,444,182 | |
| Net Assets: | | | | | | | | | | | | | | | | |
| Beginning of Year/Period | | | 823,747,415 | | | | 841,908,175 | | | | 1,317,932,097 | | | | 1,315,487,915 | |
| End of Year/Period | | $ | 1,031,477,034 | | | $ | 823,747,415 | | | $ | 2,211,560,519 | | | $ | 1,317,932,097 | |
| Share Transactions: | | | | | | | | | | | | | | | | |
| Issued | | | 2,070,000 | | | | 4,130,000 | | | | 22,130,000 | | | | 14,940,000 | |
| Redeemed | | | (2,750,000 | ) | | | (3,670,000 | ) | | | (14,460,000 | ) | | | (20,570,000 | ) |
| Net Increase (Decrease) in Shares Outstanding from Share Transactions | | | (680,000 | ) | | | 460,000 | | | | 7,670,000 | | | | (5,630,000 | ) |
The accompanying notes are an integral part of the financial statements.
26
Statements of Changes in Net Assets
| | | Global X Gold Explorers ETF | | Global X Uranium ETF |
| | | Period Ended
April 30, 2024
(Unaudited) | | Year Ended
October 31, 2023 | | Period Ended
April 30, 2024
(Unaudited) | | Year Ended
October 31, 2023 |
| Operations: | | | | | | | | | | | | | | | | |
| Net Investment Income (Loss) | | $ | (28,371 | ) | | $ | 89,872 | | | $ | (853,191 | ) | | $ | 6,919,555 | |
| Net Realized Gain (Loss) | | | (585,406 | ) | | | (1,035,205 | ) | | | 71,760,585 | | | | 33,907,790 | |
| Net Change in Unrealized Appreciation (Depreciation) | | | 7,113,291 | | | | 3,981,174 | | | | 286,049,512 | | | | 414,864,164 | |
| Net Increase in Net Assets Resulting from Operations | | | 6,499,514 | | | | 3,035,841 | | | | 356,956,906 | | | | 455,691,509 | |
| Distributions: | | | — | | | | (292,264 | ) | | | (145,494,747 | ) | | | (3,660,937 | ) |
| Return of Capital: | | | — | | | | (18,046 | ) | | | — | | | | — | |
| Capital Share Transactions: | | | | | | | | | | | | | | | | |
| Issued | | | 483,875 | | | | 2,710,559 | | | | 902,147,630 | | | | 510,536,160 | |
| Redeemed | | | (1,935,501 | ) | | | (2,250,041 | ) | | | (144,250,831 | ) | | | (376,090,584 | ) |
| Increase (Decrease) in Net Assets from Capital Share Transactions | | | (1,451,626 | ) | | | 460,518 | | | | 757,896,799 | | | | 134,445,576 | |
| Total Increase in Net Assets | | | 5,047,888 | | | | 3,186,049 | | | | 969,358,958 | | | | 586,476,148 | |
| Net Assets: | | | | | | | | | | | | | | | | |
| Beginning of Year/Period | | | 31,930,834 | | | | 28,744,785 | | | | 2,175,005,586 | | | | 1,588,529,438 | |
| End of Year/Period | | $ | 36,978,722 | | | $ | 31,930,834 | | | $ | 3,144,364,544 | | | $ | 2,175,005,586 | |
| Share Transactions: | | | | | | | | | | | | | | | | |
| Issued | | | 20,000 | | | | 110,000 | | | | 30,720,000 | | | | 21,870,000 | |
| Redeemed | | | (80,000 | ) | | | (100,000 | ) | | | (4,980,000 | ) | | | (18,040,000 | ) |
| Net Increase (Decrease) in Shares Outstanding from Share Transactions | | | (60,000 | ) | | | 10,000 | | | | 25,740,000 | | | | 3,830,000 | |
The accompanying notes are an integral part of the financial statements.
27
Page intentionally left blank.
28
Financial Highlights
| Selected Per Share Data & Ratios |
| For a Share Outstanding Throughout the Year/Period |
| | | | Net
Asset Value,
Beginning
of Period
($) | | Net Investment
Income
($)* | | Net Realized
and Unrealized
Gain (Loss) on
Investments
($) | | Total from
Operations
($) | | Distribution
from Net
Investment
Income ($) | | Distribution
from Capital
Gains ($) | | Return of
Capital ($) |
| Global X Silver Miners ETF |
| 2024 (Unaudited) | | | | 24.07 | | | | 0.04 | | | | 6.78 | | | | 6.82 | | | | (0.14 | ) | | | — | | | | — | |
| 2023 | | | | 24.93 | | | | 0.14 | | | | (0.91 | ) | | | (0.77 | ) | | | (0.09 | ) | | | — | | | | — | |
| 2022 | | | | 38.78 | | | | 0.20 | | | | (13.57 | ) | | | (13.37 | ) | | | (0.37 | ) | | | — | | | | (0.11 | ) |
| 2021 | | | | 42.28 | | | | 0.41 | | | | (3.00 | ) | | | (2.59 | ) | | | (0.91 | ) | | | — | | | | — | |
| 2020 | | | | 30.39 | | | | 0.33 | | | | 12.11 | | | | 12.44 | | | | (0.55 | ) | | | — | | | | — | |
| 2019 | | | | 23.20 | | | | 0.21 | | | | 7.38 | | | | 7.59 | | | | (0.40 | ) | | | — | | | | — | |
| Global X Copper Miners ETF |
| 2024 (Unaudited) | | | | 32.83 | | | | 0.17 | | | | 13.64 | | | | 13.81 | | | | (0.39 | ) | | | — | | | | — | |
| 2023 | | | | 28.74 | | | | 0.75 | | | | 4.24 | | | | 4.99 | | | | (0.90 | ) | | | — | | | | — | |
| 2022 | | | | 37.31 | | | | 1.19 | | | | (8.66 | ) | | | (7.47 | ) | | | (1.10 | ) | | | — | | | | — | |
| 2021 | | | | 21.42 | | | | 0.63 | | | | 15.74 | | | | 16.37 | | | | (0.48 | ) | | | — | | | | — | |
| 2020 | | | | 17.47 | | | | 0.23 | | | | 3.85 | | | | 4.08 | | | | (0.13 | ) | | | — | | | | — | |
| 2019 | | | | 19.38 | | | | 0.37 | | | | (1.58 | ) | | | (1.21 | ) | | | (0.70 | ) | | | — | | | | — | |
| * | Per share data calculated using average shares method. |
| ** | Total Return is for the period indicated and has not been annualized. The return shown does not reflect the deduction of taxes that a shareholder would pay on Fund distributions or the redemption of Fund shares. |
| † | Annualized. |
| †† | Portfolio turnover rate is for the period indicated and periods of less than one year have not been annualized. Excludes effect of in-kind transfers. |
Amounts designated as “—” are either $0 or have been rounded to $0.
The accompanying notes are an integral part of the financial statements.
29
Financial Highlights
Total from
Distributions ($) | | Net
Asset Value,
End of
Period ($) | | Total
Return
(%)** | | Net Assets, End of
Period ($)(000) | | Ratio of Expenses
to Average Net
Assets (%) | | Ratio of Net
Investment Income
to Average Net
Assets (%) | | Portfolio
Turnover (%)†† |
| | | | | | | | | | | | | |
| | (0.14 | ) | | | 30.75 | | | | 28.36 | | | | 1,031,477 | | | | 0.65 | † | | | 0.32 | † | | | 6.07 | |
| | (0.09 | ) | | | 24.07 | | | | (3.12 | ) | | | 823,747 | | | | 0.65 | | | | 0.52 | | | | 19.72 | |
| | (0.48 | ) | | | 24.93 | | | | (34.83 | ) | | | 841,908 | | | | 0.65 | | | | 0.64 | | | | 17.72 | |
| | (0.91 | ) | | | 38.78 | | | | (6.43 | ) | | | 1,100,191 | | | | 0.65 | | | | 0.96 | | | | 15.61 | |
| | (0.55 | ) | | | 42.28 | | | | 41.40 | | | | 984,993 | | | | 0.65 | | | | 0.90 | | | | 19.95 | |
| | (0.40 | ) | | | 30.39 | | | | 33.08 | | | | 525,591 | | | | 0.66 | | | | 0.80 | | | | 42.16 | |
| | | | | | | | | | | | | | | | | | | | | | | | | | | |
| | (0.39 | ) | | | 46.25 | | | | 42.32 | | | | 2,211,561 | | | | 0.66 | † | | | 0.91 | † | | | 10.95 | |
| | (0.90 | ) | | | 32.83 | | | | 17.07 | | | | 1,317,932 | | | | 0.65 | | | | 2.00 | | | | 23.73 | |
| | (1.10 | ) | | | 28.74 | | | | (20.38 | ) | | | 1,315,488 | | | | 0.65 | | | | 3.31 | | | | 30.46 | |
| | (0.48 | ) | | | 37.31 | | | | 76.80 | | | | 994,009 | | | | 0.65 | | | | 1.71 | | | | 20.13 | |
| | (0.13 | ) | | | 21.42 | | | | 23.45 | | | | 103,888 | | | | 0.65 | | | | 1.26 | | | | 16.85 | |
| | (0.70 | ) | | | 17.47 | | | | (6.51 | ) | | | 48,021 | | | | 0.65 | | | | 1.89 | | | | 18.77 | |
The accompanying notes are an integral part of the financial statements.
30
Financial Highlights
| Selected Per Share Data & Ratios |
| For a Share Outstanding Throughout the Year/Period |
| | | Net
Asset Value,
Beginning
of Period
($) | | Net Investment
Income (Loss)
($)* | | Net Realized
and Unrealized
Gain (Loss) on
Investments
($) | | Total from
Operations
($) | | Distribution
from Net
Investment
Income ($) | | Distribution
from Capital
Gains ($) | | Return of
Capital ($) |
| Global X Gold Explorers ETF | | | | | | | | | | | | | | | | | | | | | | | | | | | | |
| 2024 (Unaudited) | | | 22.45 | | | | (0.02 | ) | | | 4.72 | | | | 4.70 | | | | — | | | | — | | | | — | |
| 2023 | | | 20.36 | | | | 0.06 | | | | 2.25 | | | | 2.31 | | | | (0.21 | ) | | | — | | | | (0.01 | ) |
| 2022 | | | 30.10 | | | | 0.17 | | | | (9.32 | ) | | | (9.15 | ) | | | (0.59 | ) | | | — | | | | — | |
| 2021 | | | 33.48 | | | | 0.20 | | | | (2.54 | ) | | | (2.34 | ) | | | (1.04 | ) | | | — | | | | — | |
| 2020 | | | 25.39 | | | | 0.06 | | | | 8.47 | | | | 8.53 | | | | (0.44 | ) | | | — | | | | — | |
| 2019 | | | 18.49 | | | | 0.04 | | | | 6.87 | | | | 6.91 | | | | (0.01 | ) | | | — | | | | — | |
| Global X Uranium ETF | | | | | | | | | | | | | | | | | | | | | | | | | | | | |
| 2024 (Unaudited) | | | 26.50 | | | | (0.01 | ) | | | 4.35 | | | | 4.34 | | | | (1.68 | ) | | | — | | | | — | |
| 2023 | | | 20.30 | | | | 0.09 | | | | 6.16 | | | | 6.25 | | | | (0.05 | ) | | | — | | | | — | |
| 2022 | | | 27.04 | | | | 0.28 | | | | (5.61 | ) | | | (5.33 | ) | | | (1.41 | ) | | | — | | | | — | |
| 2021 | | | 10.87 | | | | 0.39 | | | | 15.91 | | | | 16.30 | | | | (0.13 | ) | | | — | | | | — | |
| 2020 | | | 10.92 | | | | 0.22 | | | | (0.03 | ) | | | 0.19 | | | | (0.24 | ) | | | — | | | | — | |
| 2019 | | | 12.08 | | | | 0.17 | | | | (1.17 | ) | | | (1.00 | ) | | | (0.16 | ) | | | — | | | | — | |
| | |
| * | Per share data calculated using average shares method. |
| ** | Total Return is for the period indicated and has not been annualized. The return shown does not reflect the deduction of taxes that a shareholder would pay on Fund distributions or the redemption of Fund shares. |
| † | Annualized. |
| †† | Portfolio turnover rate is for the period indicated and periods of less than one year have not been annualized. Excludes effect of in-kind transfers. |
Amounts designated as “—” are either $0 or have been rounded to $0.
The accompanying notes are an integral part of the financial statements.
31
Financial Highlights
Total from
Distributions ($) | | Net
Asset Value,
End of
Period ($) | | Total
Return
(%)** | | Net Assets, End of
Period ($)(000) | | Ratio of Expenses
to Average Net
Assets (%) | | Ratio of Net
Investment Income
(Loss) to Average
Net Assets (%) | | Portfolio
Turnover (%)†† |
| | | | | | | | | | | | | |
| | — | | | | 27.15 | | | | 20.94 | | | | 36,979 | | | | 0.65 | † | | | (0.17 | )† | | | 5.63 | |
| | (0.22 | ) | | | 22.45 | | | | 11.24 | | | | 31,931 | | | | 0.65 | | | | 0.24 | | | | 19.87 | |
| | (0.59 | ) | | | 20.36 | | | | (30.94 | ) | | | 28,745 | | | | 0.65 | | | | 0.63 | | | | 30.04 | |
| | (1.04 | ) | | | 30.10 | | | | (7.36 | ) | | | 49,722 | | | | 0.65 | | | | 0.61 | | | | 18.30 | |
| | (0.44 | ) | | | 33.48 | | | | 34.03 | | | | 60,670 | | | | 0.65 | | | | 0.20 | | | | 18.81 | |
| | (0.01 | ) | | | 25.39 | | | | 37.40 | | | | 43,470 | | | | 0.65 | | | | 0.19 | | | | 16.35 | |
| | | | | | | | | | | | | | | | | | | | | | | | | | | |
| | (1.68 | ) | | | 29.16 | | | | 16.78 | | | | 3,144,365 | | | | 0.69 | † | | | (0.06 | )† | | | 11.32 | |
| | (0.05 | ) | | | 26.50 | | | | 30.86 | | | | 2,175,006 | | | | 0.69 | | | | 0.43 | | | | 20.03 | |
| | (1.41 | ) | | | 20.30 | | | | (20.11 | ) | | | 1,588,529 | | | | 0.69 | | | | 1.25 | | | | 26.47 | |
| | (0.13 | ) | | | 27.04 | | | | 150.73 | | | | 1,315,609 | | | | 0.69 | | | | 1.91 | | | | 30.01 | |
| | (0.24 | ) | | | 10.87 | | | | 1.72 | | | | 141,609 | | | | 0.69 | | | | 2.03 | | | | 59.21 | |
| | (0.16 | ) | | | 10.92 | | | | (8.42 | ) | | | 187,616 | | | | 0.71 | | | | 1.46 | | | | 23.93 | |
The accompanying notes are an integral part of the financial statements.
32
Notes to Financial Statements
April 30, 2024 (Unaudited)
1. ORGANIZATION
The Global X Funds (the “Trust”) is a Delaware statutory trust formed on March 6, 2008. The Trust is registered under the Investment Company Act of 1940 (the “1940 Act”), as amended, as an open-end management investment company. As of April 30, 2024, the Trust had ninety seven portfolios, ninety one of which were operational. The financial statements herein and the related notes pertain to the Global X Silver Miners ETF, Global X Copper Miners ETF, Global X Gold Explorers ETF and Global X Uranium ETF (the “Funds”). Each Fund has elected non-diversified status under the 1940 Act.
2. SIGNIFICANT ACCOUNTING POLICIES
The following is a summary of the significant accounting policies followed by the Funds:
USE OF ESTIMATES — The Funds are investment companies that apply the accounting and reporting guidance issued in Topic 946 by the U.S. Financial Accounting Standards Board. The preparation of financial statements in conformity with U.S. generally accepted accounting principles (“U.S. GAAP”) requires management to make estimates and assumptions that affect the reported amounts of assets and liabilities and disclosure of contingent assets and liabilities at the date of the financial statements and the reported amounts of increases and decreases in net assets from operations during the reporting period. Actual results could materially differ from those estimates.
RETURN OF CAPITAL ESTIMATES — Distributions received by the Funds from underlying master limited partnership (“MLP”) and real estate investment trust (“REIT”) investments generally are comprised of income and return of capital. The Funds record investment income and return of capital based on estimates made at the time such distributions are received. Such estimates are based on historical information available from the MLPs, REITs and other industry sources. These estimates may subsequently be revised based on information received from the MLPs and REITs after their tax reporting periods are concluded.
SECURITY VALUATION — Securities listed on a securities exchange, market or automated quotation system for which quotations are readily available (except for securities traded on the NASDAQ Stock Market (“NASDAQ”)), including securities traded over the counter, are valued at the last quoted sale price on the primary exchange or market (foreign or domestic) on which they are traded (or at approximately 4:00 pm Eastern time if a security’s primary exchange is normally open at that time), or, if there is no such reported sale, at the most recent mean between the quoted bid and asked prices, which approximates fair value (absent both bid and asked prices on such exchange, the bid price may be used). For securities traded on NASDAQ, the NASDAQ Official Closing Price will be used. The prices for foreign securities are reported in local currency and converted to U.S. dollars using currency exchange rates as of the reporting date. The exchange rates used by the Trust for valuation are captured as of the New York or London close each day.
33
Notes to Financial Statements (Continued)
April 30, 2024 (Unaudited)
2. SIGNIFICANT ACCOUNTING POLICIES (continued)
Securities for which market prices are not “readily available” are valued in accordance with fair value procedures (the “Fair Value Procedures”) established by Global X Management Company LLC, the Funds’ investment adviser (the “Adviser”), and approved by the Funds’ Board of Trustees (the “Board”). Pursuant to Rule 2a-5 under the 1940 Act, the Board has designated the Adviser as the “valuation designee” to determine the fair value of securities and other instruments for which no readily available market quotations are available. The Fair Value Procedures are implemented through a fair value committee (the “Committee”) of the Adviser. Some of the more common reasons that may necessitate that a security be valued using the Fair Value Procedures include: the security’s trading has been halted or suspended; the security has beende-listed from its primary trading exchange; the security’s primary trading market is temporarily closed at a time when, under normal conditions, it would be open; the security has not been traded for an extended period of time; the security’s primary pricing source is not able or willing to provide a price; or trading of the security is subject to local government-imposed restrictions. In addition, the Funds may fair value a security if an event that may materially affect the value of the Funds’ security that traded outside of the United States (a “Significant Event”) has occurred between the time of the security’s last close and the time that each Fund calculates its net asset value (“NAV”). A Significant Event may relate to a single issuer or to an entire market sector. Events that may be Significant Events include: government actions, natural disasters, armed conflict, acts of terrorism and significant market fluctuations. If the Adviser becomes aware of a Significant Event that has occurred with respect to a security or group of securities after the closing of the exchange or market on which the security or securities principally trade, but before the time at which the Funds calculate their NAV, it may request that a Committee meeting be called. When a security is valued in accordance with the Fair Value Procedures, the Committee will determine the value after taking into consideration all relevant information reasonably available to the Committee.
If available, debt securities are priced based upon valuations provided by independent, third-party pricing agents. Such values generally reflect the last reported sales price if the security is actively traded. The third-party pricing agents may also value debt securities at an evaluated bid price by employing methodologies that utilize actual market transactions, broker-supplied valuations, or other methodologies designed to identify the market value for such securities. Debt obligations with remaining maturities of sixty days or less will be valued at their market value. Prices for most securities held by the Funds are provided daily by recognized independent pricing agents. If a security price cannot be obtained from an independent, third-party pricing agent, the Funds seek to obtain a bid price from at least one independent broker.
In accordance with the authoritative guidance on fair value measurements and disclosure under U.S. GAAP, the Funds disclose the fair value of their investments in a hierarchy that prioritizes the inputs to valuation techniques used to measure the fair value. The objective of a fair value measurement is to determine the price that would be received to sell an asset
34
Notes to Financial Statements (Continued)
April 30, 2024 (Unaudited)
2. SIGNIFICANT ACCOUNTING POLICIES (continued)
or paid to transfer a liability in an orderly transaction between market participants at the measurement date (an exit price). Accordingly, the fair value hierarchy gives the highest priority to quoted prices (unadjusted) in active markets for identical assets or liabilities (Level 1) and the lowest priority to unobservable inputs (Level 3). The three levels of the fair value hierarchy are described below:
Level 1 – Unadjusted quoted prices in active markets for identical, unrestricted assets or liabilities that the Funds have the ability to access at the measurement date
Level 2 – Other significant observable inputs (including quoted prices in non-active markets, quoted prices for similar investments, fair value of investments for which the Funds have the ability to fully redeem tranches at NAV as of the measurement date or within the near term, and short-term investments valued at amortized cost)
Level 3 – Significant unobservable inputs (including the Funds’ own assumptions in determining the fair value of investments and fair value of investments for which the Funds do not have the ability to fully redeem tranches at NAV as of the measurement date or within the near term)
Investments are classified within the level of the lowest significant input considered in determining fair value. Investments classified within Level 3 whose fair value measurement considers several inputs may include Level 1 or Level 2 inputs as components of the overall fair value measurement. For details of the investment classification, reference the Schedules of Investments.
The unobservable inputs used to determine fair value of Level 3 assets may have similar or diverging impacts on valuation. Significant increases and decreases in these inputs in isolation and interrelationships between those inputs could result in significantly higher or lower fair value measurement.
DUE TO/FROM BROKERS — Due to/from brokers includes cash and collateral balances with the Funds’ clearing brokers or counterparties as of April 30, 2024. The Funds continuously monitor the credit standing of each broker or counterparty with whom they conduct business. In the event a broker or counterparty is unable to fulfill its obligations, the Funds would be subject to counterparty credit risk.
REPURCHASE AGREEMENTS — Securities pledged as collateral for repurchase agreements by BNP Paribas are held by Brown Brothers Harriman & Co. (“BBH”), or The Bank of New York Mellon (“BNY Mellon”), as appropriate, in their roles as Custodian to respective Funds (each, a “Custodian” and together, the “Custodians”), and are designated as being held on each Fund’s behalf by the Custodian under a book-entry system. Each Fund monitors the adequacy of the collateral on a daily basis and can require the seller to
35
Notes to Financial Statements (Continued)
April 30, 2024 (Unaudited)
2. SIGNIFICANT ACCOUNTING POLICIES (continued)
provide additional collateral in the event the market value of the securities pledged falls below the carrying value of the repurchase agreement, including accrued interest.
It is the Funds’ policy to only enter into repurchase agreements with banks and other financial institutions which are deemed by the Adviser to be creditworthy. The Funds bear the risk of loss in the event that the counterparty to a repurchase agreement defaults on its obligations, and the Funds are prevented from exercising their rights to dispose of the underlying securities received as collateral. For financial statement purposes, the Funds record the securities lending collateral (included in repurchase agreements, at value or restricted cash) as an asset and the obligation to return securities lending collateral as a liability on the Statements of Assets and Liabilities.
Repurchase agreements are entered into by the Funds under Master Repurchase Agreements (“MRA”) which permit the Funds, under certain circumstances, including an event of default (such as bankruptcy or insolvency), to offset payables and/or receivables under an MRA with collateral held and/or posted to the counterparty and create one single net payment due to or from the Funds.
FEDERAL INCOME TAXES — It is each Fund’s intention to qualify, or continue to qualify, as a regulated investment company for Federal income tax purposes by complying with the appropriate provisions of Subchapter M of the Internal Revenue Code of 1986, as amended. Accordingly, no provisions for Federal income taxes have been made in the financial statements.
The Funds evaluate tax positions taken or expected to be taken in the course of preparing the Funds’ tax returns to determine whether it is “more-likely-than-not” (i.e., greater than 50 percent) that each tax position will be sustained upon examination by a taxing authority based on the technical merits of the position. Tax positions not deemed to meet the more-likely-than-not threshold are recorded as a tax benefit or expense in the current year. The Funds did not record any tax positions in the current period. Management’s conclusions regarding tax positions may be subject to review and adjustment at a later date based on factors including, but not limited to, examination by tax authorities (i.e., the last three tax year ends, as applicable) and on-going analysis of and changes to tax laws and regulations, and interpretations thereof.
If a Fund has foreign tax filings that have not been made, the tax years that remain subject to examination may date back to the inception of the Fund.
As of and during the period ended April 30, 2024, the Funds did not have a liability for any unrecognized tax benefits. The Funds recognize interest and penalties, if any, related to unrecognized tax benefits as income tax expense on the Statements of Operations. During the reporting period, the Funds did not incur any interest or penalties.
36
Notes to Financial Statements (Continued)
April 30, 2024 (Unaudited)
2. SIGNIFICANT ACCOUNTING POLICIES (continued)
SECURITY TRANSACTIONS AND INVESTMENT INCOME — Security transactions are accounted for on the trade date for financial reporting purposes. Costs used in determining realized gains and losses on the sale of investment securities are based on specific identification. Dividend income is recorded on the ex-dividend date. Interest income is recognized on the accrual basis from the settlement date. Amortization of premiums and accretion of discounts is included in interest income.
FOREIGN CURRENCY TRANSACTIONS AND TRANSLATION — The books and records of the Funds are maintained in U.S. dollars. Investment securities and other assets and liabilities denominated in a foreign currency are translated into U.S. dollars on the date of valuation. Purchases and sales of investment securities, income and expenses are translated into U.S. dollars at the relevant rates of exchange prevailing on the respective dates of such transactions. The Funds do not isolate that portion of realized or unrealized gains and losses resulting from changes in the foreign exchange rate from fluctuations arising from changes in the market prices of the securities. These gains and losses are included in net realized and unrealized gains and losses on investments on the Statements of Operations. Net realized and unrealized gains and losses on foreign currency transactions and translations represent net foreign exchange gains or losses from foreign currency spot contracts, disposition of foreign currencies, currency gains or losses realized between trade and settlement dates on securities transactions and the difference between the amount of the investment income and foreign withholding taxes recorded on the Funds’ books and the U.S. dollar equivalent amounts actually received or paid.
DIVIDENDS AND DISTRIBUTIONS TO SHAREHOLDERS — The Funds distribute their net investment income on a pro rata basis. Any net investment income and net realized capital gains are distributed at least annually. All distributions are recorded on the ex-dividend date.
CREATION UNITS — The Funds issue and redeem their shares (“Shares”) on a continuous basis at NAV and only in large blocks of 10,000 Shares, referred to as “Creation Units”. Purchasers of Creation Units (“Authorized Participants”) at NAV must pay a standard creation transaction fee per transaction. The fee is a single charge and will be the same regardless of the number of Creation Units purchased by an Authorized Participant on the same day. An Authorized Participant who holds Creation Units and wishes to redeem at NAV would also pay a standard redemption fee per transaction to BBH or BNY Mellon, as applicable, on the date of such redemption, regardless of the number of Creation Units
37
Notes to Financial Statements (Continued)
April 30, 2024 (Unaudited)
2. SIGNIFICANT ACCOUNTING POLICIES (continued)
redeemed that day. If a Creation Unit is purchased or redeemed for cash, an additional variable fee may be charged. The following table discloses Creation Unit breakdown:
| | | Creation
Unit
Shares | | Creation
Fee | | Value at
April 30,
2024 | | Redemption
Fee |
| Global X Silver Miners ETF | | | 10,000 | | | $ | 250 | | | $ | 307,500 | | | $ | 250 | |
| Global X Copper Miners ETF | | | 10,000 | | | | 300 | | | | 462,500 | | | | 300 | |
| Global X Gold Explorers ETF | | | 10,000 | | | | 400 | | | | 271,500 | | | | 400 | |
| Global X Uranium ETF | | | 10,000 | | | | 600 | | | | 291,600 | | | | 600 | |
CASH OVERDRAFT CHARGES — Per the terms of an agreement with BBH, if a Fund has a cash overdraft on a given day, it will be assessed an overdraft charge equal to the applicable BBH Base Rate plus 2.00%. Per the terms of an agreement with BNY Mellon, if a Fund has a cash overdraft, it will be charged interest at a rate then charged by BNY Mellon to its institutional custody clients in the relevant currency. Cash overdraft charges are included in custodian fees on the Statements of Operations.
3. RELATED PARTIES AND SERVICE PROVIDER TRANSACTIONS
On July 2, 2018, the Adviser consummated a transaction pursuant to which it became an indirect, wholly-owned subsidiary of Mirae Asset Global Investments Co., Ltd. (“Mirae”). In this manner, the Adviser is ultimately controlled by Mirae.
The Adviser serves as the investment adviser and the administrator for the Funds. Subject to the supervision of the Board, the Adviser is responsible for managing the investment activities of the Funds and the Funds’ business affairs and other administrative matters and provides, or causes to be furnished, all supervisory, administrative and other services reasonably necessary for the operation of the Funds, including certain distribution services (provided pursuant to a separate distribution agreement), certain shareholder and distribution-related services (provided pursuant to a separate Rule 12b-1 Plan and related agreements) and investment advisory services (provided pursuant to a separate Investment Advisory Agreement), under what is essentially an “all-in” fee structure. For the Adviser’s service to the respective Funds, under a supervision and administration agreement (the “Supervision and Administration Agreement”), each Fund pays a monthly fee to the Adviser at the annual rate below (stated as a percentage of the average daily net assets of the Fund) (“Supervision and Administrative Fee”). In addition, the Funds bear other expenses, directly and indirectly, that are not covered by the Supervision and Administration Agreement, which may vary and affect the total expense ratios of the Funds, such as taxes, brokerage fees, commissions, certain custodian fees, acquired fund fees and other transaction expenses, interest expenses and extraordinary expenses (such as litigation and indemnification expenses).
38
Notes to Financial Statements (Continued)
April 30, 2024 (Unaudited)
3. RELATED PARTIES AND SERVICE PROVIDER TRANSACTIONS (continued)
The following table discloses supervision and administration fees payable pursuant to the Supervision and Administration Agreement:
| | | Supervision and
Administration Fee |
| Global X Silver Miners ETF | | 0.65% |
| Global X Copper Miners ETF | | 0.65% |
| Global X Gold Explorers ETF | | 0.65% |
| Global X Uranium ETF | | 0.69% |
SEI Investments Global Funds Services (“SEIGFS”) serves as sub-administrator to the Funds. As sub-administrator, SEIGFS provides the Funds with all the required general administrative services, including, without limitation: office space, equipment, and personnel; clerical and general back office services; bookkeeping, internal accounting and secretarial services; the calculation of NAV; and assistance with the preparation and filing of reports, registration statements, proxy statements and other materials required to be filed or furnished by the Funds under federal and state securities laws. As compensation for these services, SEIGFS receives certain out-of-pocket costs, transaction fees and asset-based fees which are accrued daily and paid monthly by the Adviser.
SEI Investments Distribution Co. (“SIDCO”) serves as the Funds’ underwriter and distributor of Creation Units pursuant to a distribution agreement (the “Distribution Agreement”). SIDCO has no obligation to sell any specific quantity of Shares of the Funds. SIDCO bears the following costs and expenses relating to the distribution of Shares: (1) the costs of processing and maintaining records of creations of Creation Units; (2) all costs of maintaining the records required of a registered broker/dealer; (3) the expenses of maintaining its registration or qualification as a dealer or broker under federal or state laws; (4) filing fees; and (5) all other expenses incurred in connection with the distribution services as contemplated in the Distribution Agreement. SIDCO receives no fee from the Funds for its distribution services under the Distribution Agreement; rather, the Adviser compensates SIDCO for certain expenses, out-of-pocket costs, and transaction fees.
BBH serves as transfer agent and Custodian of the Global X Uranium ETF’s assets. As Custodian, BBH has agreed to (1) make receipts and disbursements of money on behalf of the Fund; (2) collect and receive all income and other payments and distributions on account of the portfolio investments; (3) respond to correspondence from shareholders, security brokers and others relating to its duties; and (4) make periodic reports to the Fund concerning the Fund’s operations. BBH does not exercise any supervisory function over the purchase and sale of securities. As compensation for these services, BBH receives certain out-of-pocket costs, transaction fees and asset-based fees which are accrued daily and paid monthly by the Adviser from its fees. As transfer agent, BBH has agreed to (1) issue and redeem Shares of the Fund; (2) make dividend and other distributions
39
Notes to Financial Statements (Continued)
April 30, 2024 (Unaudited)
3. RELATED PARTIES AND SERVICE PROVIDER TRANSACTIONS (continued)
to shareholders of the Fund; (3) respond to correspondence by shareholders and others relating to its duties; (4) maintain shareholder accounts; and (5) make periodic reports to the Fund. As compensation for these services, BBH receives certain out-of-pocket costs, transaction fees and asset-based fees which are accrued daily and paid monthly by the Adviser from its fees.
BNY Mellon serves as Custodian and transfer agent to the Global X Silver Miners ETF, Global X Copper Miners ETF and Global X Gold Explorers ETF. BNY Mellon may appoint domestic and foreign sub-custodians and use depositories from time to time to hold securities and other instruments purchased by the Trust in foreign countries and to hold cash and currencies for the Trust. Under its transfer agency agreement with the Trust, BNY Mellon has undertaken with the Trust to provide the following services with respect to the Funds: (i) perform and facilitate the performance of purchases and redemptions of Creation Units, (ii) prepare and transmit by means of Depository Trust Company’s book-entry system payments for dividends and distributions on or with respect to the Shares declared by the Trust on behalf of the Funds, as applicable, (iii) prepare and deliver reports, information and documents as specified in the transfer agency agreement, (iv) perform the customary upon. services of a transfer agent and dividend disbursing agent, and (v) render certain other miscellaneous services as specified in the transfer agency agreement or as otherwise agreed upon.
4. INVESTMENT TRANSACTIONS
For the period ended April 30, 2024, the purchases and sales of investments in securities, excluding in-kind transactions, long-term U.S. Government and short-term securities were:
| | | Purchases | | Sales and
Maturities |
| Global X Silver Miners ETF | | $ | 53,359,188 | | | $ | 55,758,628 | |
| Global X Copper Miners ETF | | | 319,211,638 | | | | 174,806,415 | |
| Global X Gold Explorers ETF | | | 1,940,792 | | | | 1,959,792 | |
| Global X Uranium ETF | | | 301,623,658 | | | | 314,300,842 | |
For the period ended April 30, 2024, in-kind transactions associated with creations and redemptions were:
| | | Purchases | | Sales | | Realized
Gain/(Loss) |
| Global X Silver Miners ETF | | $ | 56,181,016 | | | $ | 68,245,151 | | | $ | 12,010,994 | |
| Global X Copper Miners ETF | | | 747,962,410 | | | | 565,343,067 | | | | 111,045,663 | |
| Global X Gold Explorers ETF | | | 484,351 | | | | 1,937,405 | | | | 488,941 | |
| Global X Uranium ETF | | | 757,754,778 | | | | 136,041,556 | | | | 70,838,537 | |
During the period ended April 30, 2024, there were no purchases or sales of long-term U.S. Government securities for the Funds.
40
Notes to Financial Statements (Continued)
April 30, 2024 (Unaudited)
5. TAX INFORMATION
The amount and character of income and capital gain distributions to be paid, if any, are determined in accordance with Federal income tax regulations, which may differ from U.S. GAAP. As a result, net investment income (loss) and net realized gain (loss) on investment transactions for a reporting period may differ significantly from distributions during such period. These book/tax differences may be temporary or permanent. To the extent these differences are permanent in nature, they are charged or credited to undistributed net investment income (loss), accumulated net realized gain (loss) or paid-in capital, as appropriate, in the period that the differences arise.
The tax character of dividends and distributions declared during the years ended October 31, 2023 and 2022 were as follows:
| Global X Funds | | Ordinary Income | | Long-Term
Capital Gain | | | Return of Capital | | | Totals |
| Global X Silver Miners ETF | | | | | | | | | | | | | |
| 2023 | | $ | 3,186,496 | | | $ | — | | | $ | — | | | $ | 3,186,496 | |
| 2022 | | | 10,656,479 | | | | — | | | | 3,107,323 | | | | 13,763,802 | |
| Global X Copper Miners ETF | | | | | | | | | | | | | |
| 2023 | | $ | 38,138,689 | | | $ | — | | | $ | — | | | $ | 38,138,689 | |
| 2022 | | | 48,850,684 | | | | — | | | | — | | | | 48,850,684 | |
| Global X Gold Explorers ETF | | | | | | | | | | | | | |
| 2023 | | $ | 292,264 | | | $ | — | | | $ | 18,046 | | | $ | 310,310 | |
| 2022 | | | 967,622 | | | | — | | | | — | | | | 967,622 | |
| Global X Uranium ETF | | | | | | | | | | | | | |
| 2023 | | $ | 3,660,937 | | | $ | — | | | $ | — | | | $ | 3,660,937 | |
| 2022 | | | 74,869,077 | | | | — | | | | — | | | | 74,869,077 | |
As of October 31, 2023, the components of tax basis accumulated losses were as follows:
| | | Global X Funds |
| | | Global X Silver
Miners ETF | | | Global X
Copper Miners
ETF | | | Global X Gold
Explorers ETF | |
| Undistributed Ordinary Income | | $ | 4,498,628 | | | $ | 15,418,184 | | | $ | — | |
| Capital Loss Carryforwards | | | (567,822,644 | ) | | | (97,148,826 | ) | | | (68,980,498 | ) |
| Unrealized Depreciation on Investments and Foreign Currency | | | (327,045,582 | ) | | | (291,754,778 | ) | | | (10,184,404 | ) |
| Other Temporary Differences | | | (12 | ) | | | 1,581 | | | | (6 | ) |
| Total Accumulated Losses | | $ | (890,369,610 | ) | | $ | (373,483,839 | ) | | $ | (79,164,908 | ) |
41
Notes to Financial Statements (Continued)
April 30, 2024 (Unaudited)
5. TAX INFORMATION (continued)
| | | Global X Funds |
| | | Global X
Uranium ETF |
| Undistributed Ordinary Income | | $ | 141,416,179 | |
| Capital Loss Carryforwards | | | (533,820,062 | ) |
| Unrealized Appreciation on Investments and Foreign Currency | | | 40,064,098 | |
| Other Temporary Differences | | | 2 | |
| Total Accumulated Losses | | $ | (352,339,783 | ) |
For taxable years beginning after December 22, 2010, a Registered Investment Company within the meaning of the 1940 Act is permitted to carry forward net capital losses to offset capital gains realized in later years, and the losses carried forward retain their original character as either long-term or short-term losses. Losses carried forward under these provisions are as follows:
| | | Short-Term
Loss | | | Long-Term
Loss | | | Total | |
| Global X Silver Miners ETF | | $ | 135,128,785 | | | $ | 432,693,859 | | | $ | 567,822,644 | |
| Global X Copper Miners ETF | | | 67,986,007 | | | | 29,162,819 | | | | 97,148,826 | |
| Global X Gold Explorers ETF | | | 15,695,120 | | | | 53,285,378 | | | | 68,980,498 | |
| Global X Uranium ETF | | | 146,284,604 | | | | 387,535,458 | | | | 533,820,062 | |
The Federal tax cost and aggregate gross unrealized appreciation and depreciation on investments held by the Funds at April 30, 2024 were as follows:
| Global X Funds | | Federal Tax
Cost | | Aggregated
Gross
Unrealized
Appreciation | | Aggregated
Gross
Unrealized
Depreciation | | Net Unrealized
Appreciation
(Depreciation) |
| Global X Silver Miners ETF | | $ | 1,079,220,942 | | | $ | 108,929,391 | | | $ | (152,375,755 | ) | | $ | (43,446,364 | ) |
| Global X Copper Miners ETF | | | 2,107,443,068 | | | | 268,619,451 | | | | (62,157,969 | ) | | | 206,461,482 | |
| Global X Gold Explorers ETF | | | 39,634,629 | | | | 4,697,460 | | | | (6,846,499 | ) | | | (2,149,039 | ) |
| Global X Uranium ETF | | | 2,632,642,505 | | | | 636,716,599 | | | | (65,812,937 | ) | | | 570,903,662 | |
The preceding differences between book and tax cost are primarily due to mark-to-market treatment of passive foreign investment companies and wash sales.
6. CONCENTRATION OF RISKS
The Funds invest in securities of foreign issuers in various countries. These investments may involve certain considerations and risks not typically associated with investments in the United States as a result of, among other factors, the possibility of future political and economic developments and the level of governmental supervision and regulation of securities markets in the respective countries.
The securities markets of emerging market countries are less liquid, subject to greater price volatility, and have a smaller market capitalization than the U.S. securities markets.
42
Notes to Financial Statements (Continued)
April 30, 2024 (Unaudited)
6. CONCENTRATION OF RISKS (continued)
In certain countries, there may be fewer publicly traded securities and the market may be dominated by a few issuers or sectors. Issuers and securities markets in such countries are not subject to as extensive and frequent accounting, financial and other reporting requirements or as comprehensive government regulations as are issuers and securities markets in the United States. In particular, the assets and profits appearing on the financial statements of emerging market country issuers may not reflect their financial position or results of operations in the same manner as financial statements for U.S. issuers. Substantially less information may be publicly available about emerging market country issuers than is available about issuers in the United States.
The Funds may be subject to taxes imposed by countries in which they invest. Such taxes are generally based on either income or gains earned or repatriated. The Funds accrue and apply such taxes to net investment income, net realized gains and net unrealized gains as income and/or capital gains are earned.
The Funds use a replication strategy. A replication strategy is an indexing strategy that involves investing in the securities of an underlying index in approximately the same proportions as in the underlying index. Each Fund may utilize a representative sampling strategy with respect to its underlying index when a replication strategy might be detrimental to its shareholders, such as when there are practical difficulties or substantial costs involved in compiling a portfolio of equity securities to follow its underlying index, or, in certain instances, when securities in the underlying index become temporarily illiquid, unavailable or less liquid, or due to legal restrictions (such as diversification requirements that apply to the Funds but not the underlying indexes). Commodity related securities are susceptible to fluctuations in certain commodity markets. Any negative changes in commodity markets could have a material impact on the Funds.
Certain Funds may invest in commodity related securities, which are susceptible to fluctuations in certain commodity markets. Any negative changes in commodity markets could have a great impact on those securities.
Certain Funds may have investments in financial instruments that utilize the London Interbank Offered Rate (“LIBOR”) as the reference or benchmark rate for variable interest rate calculations. LIBOR was intended to measure the rate generally at which banks can lend and borrow from one another in the relevant currency on an unsecured basis. The UK Financial Conduct Authority (“FCA”), the regulator that oversees LIBOR, announced that the majority of LIBOR rates would cease to be published or would no longer be representative on January 1, 2022. The publication of most LIBOR rates ceased at the end of 2021, and the remaining USD LIBOR rates ceased to be published after June 2023.There remains uncertainty and risks relating to the continuing LIBOR transition and its effects on the Funds and the instruments in which the Funds invest. There can be no assurance that the composition or characteristics of any alternative reference rates (“ARRs”) or financial
43
Notes to Financial Statements (Continued)
April 30, 2024 (Unaudited)
6. CONCENTRATION OF RISKS (continued)
instruments in which the Funds invest that utilize ARRs will be similar to or produce the same value or economic equivalence as LIBOR or that these instruments will have the same volume or liquidity. Additionally, there remains uncertainty and risks relating to certain “legacy” USD LIBOR instruments that were issued or entered into before December 31, 2021 and the process by which a replacement interest rate will be identified and implemented into these instruments when USD LIBOR is ultimately discontinued. On December 16, 2022, the Federal Reserve Board adopted regulations implementing the Adjustable Interest Rate Act. The regulations provide a statutory fallback mechanism to replace LIBOR, by identifying benchmark rates based on the Secured Overnight Financing Rate (“SOFR”) that replaced LIBOR in certain financial contracts after June 30, 2023. These regulations apply only to contracts governed by U.S. law, among other limitations. The Funds may have instruments linked to other interbank offered rates that may also cease to be published in the future. The effects of such uncertainty and risks in “legacy” USD LIBOR instruments held by the Funds could result in losses to the Funds.
Please refer to each Fund’s prospectus and statement of additional information (“SAI”) for a more complete description of risks.
7. LOANS OF PORTFOLIO SECURITIES
Each Fund may lend portfolio securities having a market value up to one-third of its total assets. Security loans made pursuant to securities lending agreements with BBH and BNY Mellon are initially required to be secured by collateral equal to at least 102% of the value of domestic equity securities and American Depositary Receipts (“ADRs”) and 105% of the value of foreign equity securities (other than ADRs). Such collateral received in connection with these loans will be cash and can be invested in repurchase agreements, short-term investments or U.S. Treasury obligations and is recognized in the Schedules of Investments and Statements of Assets and Liabilities. The obligation to return securities lending collateral is also recognized as a liability in the Statements of Assets and Liabilities. It is the Funds’ policy to obtain additional collateral from or return excess collateral to the borrower by the end of the next business day, following the valuation date of the securities loaned. Therefore, the value of the collateral held may be temporarily less than the value of the securities on loan.
Securities pledged as collateral for repurchase agreements held in the Funds are held by BNY Mellon or BBH, as appropriate, and are designated as being held on the Fund’s behalf under a book-entry system. The Funds monitor the adequacy of the collateral on a daily basis and can require the seller to provide additional collateral in the event the market value of the securities pledged falls below the carrying value of the repurchase agreement, including accrued interest. It is the Funds’ policy to only enter into repurchase agreements with banks and other financial institutions which are deemed by the Adviser to be creditworthy. The Funds bear the risk of loss in the event the other party to a repurchase agreement defaults on its obligations and the Funds are prevented from exercising its rights
44
Notes to Financial Statements (Continued)
April 30, 2024 (Unaudited)
7. LOANS OF PORTFOLIO SECURITIES (continued)
to dispose of the underlying securities received as collateral and the risk of a possible decline in the value of the underlying securities during the period. For financial statement purposes, the Funds record the securities lending collateral (including in repurchase agreements, at value or restricted cash) as an asset and the obligation to return securities lending collateral as a liability- on the Statement of Assets and Liabilities.
Cash collateral received in connection with securities lending is invested in repurchase agreements and short-term investments by the lending agent. The Funds do not have effective control of the non-cash collateral and therefore it is not disclosed in each Fund’s Schedule of Investments.
Securities lending transactions are entered into by the Funds under the Securities Lending Agreement, which permits a Fund, under certain circumstances such as an event of default, to offset amounts payable by the Fund to the same counterparty against amounts receivable from the counterparty to create a net payment due to or from the Fund.
The following is a summary of securities lending agreements held by the Funds, with cash collateral of overnight maturities and non-cash collateral, which would be subject to offset as of April 30, 2024.
| | | Gross Amount
of Recognized
Assets (Value
of Securities on
Loan) | | | Value of
Cash
Collateral
Received(1) | | | Value of
Non-Cash
Collateral
Received(1) | | | Net Amount | |
| Global X Silver Miners ETF | | $ | 4,141,991 | | | $ | 3,335,627 | | | $ | 806,364 | | | $ | — | |
| Global X Copper Miners ETF | | | 56,795,008 | | | | 56,469,860 | | | | 325,148 | | | | — | |
| Global X Gold Explorers ETF | | | 232,332 | | | | 232,332 | | | | — | | | | — | |
| Global X Uranium ETF | | | 67,768,013 | | | | 67,768,013 | | | | — | | | | — | |
| | |
| (1) | Collateral and non-cash collateral received in excess of market value of securities on loan is not presented in this table. The total cash collateral received by the Fund is disclosed in the Statements of Assets and Liabilities. |
The value of loaned securities and related collateral outstanding at April 30, 2024 are shown in the Schedules of Investments. The value of the collateral held may be temporarily less than that required under the lending contract. As of April 30, 2024, the cash collateral was invested in repurchase agreements and short-term investments and the non-cash collateral consisted of U.S. Treasury Bills, Notes, Bonds and U.S. Treasury Inflation Indexed Bonds with the following maturities:
45
Notes to Financial Statements (Concluded)
April 30, 2024 (Unaudited)
7. LOANS OF PORTFOLIO SECURITIES (continued)
| | | Overnight and
Continuous | | | <30 Days | | | Between
30 & 90
Days | | | >90 Days | | | Total | |
| Global X Silver Miners ETF | | | | | | | | | | | | | | | | | | | | |
| Repurchase Agreements | | $ | 4,049,788 | | | $ | — | | | $ | — | | | $ | — | | | $ | 4,049,788 | |
| U.S. Government Securities | | | — | | | | — | | | | — | | | | 806,364 | | | | 806,364 | |
| Total | | $ | 4,049,788 | | | $ | — | | | $ | — | | | $ | 806,364 | | | $ | 4,856,152 | |
| Global X Copper Miners ETF | | | | | | | | | | | | | | | | | | | | |
| Repurchase Agreements | | $ | 104,560,419 | | | $ | — | | | $ | — | | | $ | — | | | $ | 104,560,419 | |
| U.S. Government Securities | | | — | | | | — | | | | — | | | | 325,148 | | | | 325,148 | |
| Total | | $ | 104,560,419 | | | $ | — | | | $ | — | | | $ | 325,148 | | | $ | 104,885,567 | |
| Global X Gold Explorers ETF | | | | | | | | | | | | | | | | | | | | |
| Repurchase Agreements | | $ | 506,112 | | | $ | — | | | $ | — | | | $ | — | | | $ | 506,112 | |
| Total | | $ | 506,112 | | | $ | — | | | $ | — | | | $ | — | | | $ | 506,112 | |
| Global X Uranium ETF | | | | | | | | | | | | | | | | | | | | |
| Repurchase Agreement | | $ | 62,947,411 | | | $ | — | | | $ | — | | | $ | — | | | $ | 62,947,411 | |
| Short-Term Investment | | | 11,864,024 | | | | — | | | | — | | | | — | | | | 11,864,024 | |
| Total | | $ | 74,811,435 | | | $ | — | | | $ | — | | | $ | — | | | $ | 74,811,435 | |
8. CONTRACTUAL OBLIGATION
The Funds enter into contracts in the normal course of business that contain a variety of indemnifications. The Funds’ maximum exposure under these contracts is unknown, however, the Funds have not had prior gains or losses pursuant to these contracts. Management has reviewed the Funds’ existing contracts and expects the risk of loss to be remote.
Pursuant to the Trust’s organizational documents, the Trustees of the Trust and the Trust’s officers are indemnified against certain liabilities that may arise out of the performance of their duties.
9. SUBSEQUENT EVENTS
The Funds have been evaluated by management regarding the need for additional disclosures and/or adjustments resulting from subsequent events. Based on this evaluation, no additional adjustments were required to the financial statements.
46
Disclosure of Fund Expenses (Unaudited)
ETFs (such as the Funds) have operating expenses. As a shareholder of an ETF, your investment is affected by these ongoing costs, which include (among others) costs for ETF management, administrative services, brokerage fees, and shareholder reports like this one. It is important for you to understand the impact of these costs on your investment returns. In addition, a shareholder is responsible for brokerage fees as a result of the shareholder’s investment in a Fund.
Operating expenses such as these are deducted from a Fund’s gross income and directly reduce your final investment return. These expenses are expressed as a percentage of the Fund’s average net assets; this percentage is known as the Fund’s expense ratio.
The following examples use the expense ratio and are intended to help you understand the ongoing costs (in dollars) of investing in a Fund and to compare these costs with those of other funds. The examples are based on an investment of $1,000 made at the beginning of the period shown and held for the entire period from November 1, 2023 through April 30, 2024.
The table on the next page illustrates the Funds’ costs in two ways:
Actual Fund Return. This section helps you to estimate the actual expenses that your Fund incurred over the period. The “Expenses Paid During Period” column shows the actual dollar expense cost incurred by a $1,000 investment in the Fund, and the “Ending Account Value” number is derived from deducting that expense cost from the Fund’s gross investment return.
You can use this information, together with the actual amount you invested in a Fund, to estimate the expenses you paid over that period. Simply divide your actual account value by $1,000 to arrive at a ratio (for example, an $8,600 account value divided by $1,000 = 8.6), then multiply that ratio by the number shown for your Fund under “Expenses Paid During Period.”
Hypothetical 5% Return. This section helps you compare your Fund’s costs with those of other funds. It assumes that the Fund had an annual 5% return before expenses during the year, but that the expense ratio (Column 3) for the period is unchanged. This example is useful in making comparisons because the Securities and Exchange Commission requires all funds to make this 5% calculation. You can assess your Fund’s comparative cost by comparing the hypothetical result for your Fund in the “Expenses Paid During Period” column with those that appear in the same charts in the shareholder reports for other funds.
NOTE: Because the return is set at 5% for comparison purposes — NOT your Fund’s actual return — the account values shown may not apply to your specific investment.
47
Disclosure of Fund Expenses (Unaudited) (Concluded)
| | | Beginning
Account Value
11/1/2023 | | Ending
Account
Value
4/30/2024 | | Annualized
Expense
Ratios | | Expenses
Paid During
Period(1) |
| Global X Silver Miners ETF | | | | | | | | | | | | | | | | |
| Actual Fund Return | | $ | 1,000.00 | | | $ | 1,283.60 | | | | 0.65 | % | | $ | 3.69 | |
| Hypothetical 5% Return | | | 1,000.00 | | | | 1,021.63 | | | | 0.65 | | | | 3.27 | |
| | | | | | | | | | | | | | | | | |
| Global X Copper Miners ETF | | | | | | | | | | | | | | | | |
| Actual Fund Return | | $ | 1,000.00 | | | $ | 1,423.20 | | | | 0.66 | % | | $ | 3.98 | |
| Hypothetical 5% Return | | | 1,000.00 | | | | 1,021.58 | | | | 0.66 | | | | 3.32 | |
| | | | | | | | | | | | | | | | | |
| Global X Gold Explorers ETF | | | | | | | | | | | | | | | | |
| Actual Fund Return | | $ | 1,000.00 | | | $ | 1,209.40 | | | | 0.65 | % | | $ | 3.57 | |
| Hypothetical 5% Return | | | 1,000.00 | | | | 1,021.63 | | | | 0.65 | | | | 3.27 | |
| | | | | | | | | | | | | | | | | |
| Global X Uranium ETF | | | | | | | | | | | | | | | | |
| Actual Fund Return | | $ | 1,000.00 | | | $ | 1,167.80 | | | | 0.69 | % | | $ | 3.72 | |
| Hypothetical 5% Return | | | 1,000.00 | | | | 1,021.43 | | | | 0.69 | | | | 3.47 | |
| | |
| (1) | Expenses are equal to the Fund’s annualized expense ratio multiplied by the average account value over the period, multiplied by 182/366 (to reflect the one-half year period). |
48
Renewal of Investment Advisory Agreement (Unaudited)
Section 15(c) of the Investment Company Act of 1940, as amended (“1940 Act”), requires that the board of trustees of an exchange-traded fund (“ETF”), including a majority of those trustees who are not “interested persons” of the ETF, as defined in the 1940 Act (“Independent Trustees”), consider on an initial basis and periodically thereafter (as required by the 1940 Act), at an in person meeting called for such purpose, the terms of each ETF’s investment advisory agreement and whether to approve entering into, or renewing, each agreement.
At a Board meeting of the Trust held on November 16, 2023, called for such purpose, the Board (including the Trust’s Independent Trustees, voting separately) considered and unanimously approved the continuation of (i) the Investment Advisory Agreement (“Renewal Investment Advisory Agreement”) for each Fund included in this Semi-Annual Report (each, a “Renewal Fund” and together, the “Renewal Funds”); and (ii) the Supervision and Administration Agreement (“Renewal Supervision and Administration Agreement”), each between the Trust, on behalf of each Renewal Fund, and Global X Management. The Renewal Investment Advisory Agreement and the Renewal Supervision and Administration Agreement are referred to herein as the “Renewal Agreements.”
In advance of the November 16, 2023 Board meeting, the Board (including the Trust’s Independent Trustees) and the Independent Trustees’ independent legal counsel requested (in writing) detailed information from Global X Management in connection with the Board’s consideration of the Renewal Agreements, and received and reviewed written responses from Global X Management, as well as supporting materials relating to those requests for information. Subsequent to the receipt of that information, the Independent Trustees requested additional information regarding certain changes in senior management of Global X Management, which was provided to them in advance of the Board meeting.
At the November 16, 2023 Board meeting, the Board approved the Renewal Agreements, for the period ending February 29, 2024, in order to ensure continuity of management of the Renewal Funds. However, the Independent Trustees also determined to postpone a vote on the renewal of the Renewal Agreements for a full annual period in order to provide the Independent Trustees with the opportunity to further consider certain changes in Global X Management’s senior leadership, which occurred approximately contemporaneously with the Board’s consideration of the Renewal Agreements, and in order to permit Global X Management to confirm certain information provided in advance of the November 16, 2023 Board meeting. Global X Management subsequently provided additional information to the Board in advance of a second meeting called for the purpose of considering the extension of the Renewal Agreements for a full year. At a Board meeting of the Trust held on December 21, 2023, the Trust’s Board, which was comprised entirely of Independent Trustees, unanimously approved the continuation of the Renewal Agreements for an aggregate one-year period ending November 30, 2024.
In the course of their consideration of the Renewal Agreements, the Trust’s Independent Trustees were advised by their independent legal counsel and, in addition to meetings
49
Renewal of Investment Advisory Agreement (Unaudited) (Continued)
with management of Global X Management, the Independent Trustees met separately in executive sessions with their counsel.
RENEWAL AGREEMENTS
In determining to approve the continuation of the Renewal Agreements for the Renewal Funds, the Board considered a variety of factors, including the factors discussed in greater detail below.
Nature, Extent and Quality of Services
With respect to this factor, the Board considered:
•
the terms of the Renewal Agreements and the range of services that would continue to be provided to each Renewal Fund in accordance with the Renewal Agreements;
•
Global X Management’s key personnel and the portfolio managers who would continue to provide investment advisory, supervision and administrative services to each Renewal Fund. In considering the key personnel, the Board considered the departures of certain key executives of Global X Management and their replacements, and the plan for identifying a permanent replacement for Global X Management’s chief executive officer;
•
Global X Management’s responsibilities under the Renewal Agreements, among other things, to: (i) manage the investment operations of the Renewal Funds and the composition of the Renewal Funds’ assets, including the purchase, retention and disposition of their holdings, (ii) provide quarterly reports to the Trust’s officers and the Board and other reports as the Board deems necessary or appropriate, (iii) vote proxies, exercise consents, and exercise all other rights relating to securities and assets held by the Renewal Funds, (iv) select broker-dealers to execute portfolio transactions for the Renewal Funds when necessary, (v) assist in the preparation and filing of reports and proxy statements (if any) to the shareholders of the Renewal Funds, and the periodic updating of the registration statement, prospectuses, statements of additional information, and other reports and documents for the Renewal Funds that are required to be filed by the Trust with the SEC and other regulatory and governmental bodies, and (vi) monitor anticipated purchases and redemptions of the shares (including Creation Units) of the Renewal Funds by shareholders and new investors;
•
the nature, extent and quality of all of the services (including advisory, administrative and compliance services) that have been provided by Global X Management or made available to the Renewal Funds; and
•
the quality of Global X Management’s resources and personnel that would continue to be made available to the Renewal Funds, including Global X Management’s experience and the professional qualifications of Global X Management’s key personnel. In evaluating key personnel, the Board considered the qualifications of Global X
50
Renewal of Investment Advisory Agreement (Unaudited) (Continued)
Management’s chief operating officer and interim chief executive officer, and considered Global X Management’s plans for hiring a permanent chief executive officer.
Based on these considerations, the Board concluded that it was satisfied with the nature, extent and quality of the services provided to the Renewal Funds by Global X Management.
Performance
The Board considered the performance of each Renewal Fund. They examined the performance of the Renewal Funds for the one-year, three-year, five-year and since inception periods, as applicable. Also, the Board considered the total return and investments performance of the Renewal Funds relative to (i) the performance of unaffiliated comparable ETFs and/or other registered funds, which performance information is publicly available from such registered funds, as well as other third party sources; and (ii) the performance of pertinent indexes. The Board considered instances of under-performance and overperformance with respect to the competitor funds. The Board also considered the Renewal Funds’ tracking against their underlying indexes in absolute terms, and in the case of passively managed ETFs, considered their tracking against their underlying indexes.
Based on these considerations and comparisons, the Board concluded that the investment performance of the Renewal Funds did not adversely affect the Board’s approval of the continuance of the Renewal Agreements.
Cost of Services and Profitability
The Board considered Global X Management’s cost to provide investment management, supervision and administrative and related services to the Renewal Funds. In this regard, the Board considered the management fee (“Management Fee”) that has been borne or is expected to be borne by the Renewal Funds under the Renewal Agreements for the various investment advisory, supervisory and administrative services that the Renewal Funds require under a unitary fee structure (including the types of fees and expenses that are not included within the unitary fee and would be borne by the Renewal Funds).
In addition, the Board considered expected profitability to Global X Management, as applicable, from all services provided or expected to be provided to the Renewal Funds and all aspects of Global X Management’s relationship with the Renewal Funds. In connection with these considerations, Global X Management provided the Board with financial information regarding its operations and the services provided to the Renewal Funds and discussed with the Board its current and expected, as applicable, profitability with respect to the Renewal Funds.
Based on these considerations, the Board concluded that the Management Fee rate paid by the Renewal Funds to Global X Management, in light of the nature, extent and quality of the services provided, was reasonable and in the best interests of the Renewal Funds’ shareholders.
51
Renewal of Investment Advisory Agreement (Unaudited) (Continued)
Comparison of Fees and Services
With respect to this factor, the Board considered:
•
comparative information with respect to the Management Fee paid to Global X Management by the Renewal Funds. In connection with this consideration, Global X Management provided the Board with comparative expense data for the Renewal Funds, including fees and expenses paid by unaffiliated similar specialized and/or focused ETFs and/or other comparable registered funds. The Board considered the Global X Management’s detailed explanation of the fee structures of any Renewal Fund that was above the average or median for its peer group;
•
the structure of the unitary Management Fee (which includes as one component the investment advisory fee for the Renewal Funds) and the current total expense ratios for the Renewal Funds. In this regard, the Board took into consideration that the purpose of adopting a unitary Management Fee structure for the Renewal Funds was to create a simple, all-inclusive fee that would provide a level of predictability with respect to the overall expense ratio (i.e., the total fees) of the Renewal Funds and that the proposed Management Fees for the Renewal Funds were set at a competitive levels to make the Renewal Funds viable in the marketplace; and
•
that, under the unified Management Fee structure, Global X Management is responsible for most ordinary expenses of the Renewal Funds, including the costs of various third-party services required by the Renewal Funds, including investment advisory, administrative, audit, certain custody, portfolio accounting, legal, transfer agency and printing costs, but that the Renewal Funds would bear other expenses not covered under the proposed all-inclusive Management Fee, such as taxes, brokerage fees, commissions, and other transaction expenses, interest expenses, and extraordinary expenses.
Based on these considerations, the Board concluded that the services received and the fees charged under the Renewal Agreements were reasonable on a comparative basis.
Economies of Scale
With respect to this factor, the Board considered:
•
the extent to which economies of scale would be realized as the Renewal Funds grow and whether the unitary Management Fee for the Renewal Funds reflected these economies of scale;
•
the significant investment of time, personnel and other resources that Global X Management has made and intends to continue to make in the Renewal Funds in order to seek to assure that the Renewal Funds are attractive to investors; and
•
that the unitary Management Fee would provide a high level of certainty as to the total level of expenses for the Renewal Funds and their shareholders.
52
Renewal of Investment Advisory Agreement (Unaudited) (Concluded)
Based on these considerations, the Board concluded that the unitary Management Fee for the Renewal Funds appropriately addressed economies of scale.
Other Benefits
In considering the Renewal Agreements, in addition to the factors above, the Board considered any other benefits realized by Global X Management as a result of its relationships with the Renewal Funds and concluded that, in the exercise of the Board’s business judgement, all information the Board considered supported approval of the continuation of the Renewal Agreements.
Conclusion
After full consideration of the factors above, as well as other factors that were instructive in its consideration, the Board, including all of the Trust’s Independent Trustees voting separately, concluded, in the exercise of its business judgement, that the Renewal Agreements were fair and reasonable and in the best interest of each Renewal Fund.
In reaching this decision, the Board did not assign relative weights to the factors above nor did the Board deem any one factor or group of them to be controlling in and of themselves. Each member of the Board may have assigned different weights to the various factors.
53
Supplemental Information (unaudited)
NAV is the price per Share at which the Funds issue and redeem Shares. It is calculated in accordance with the standard formula for valuing mutual fund shares. The “Market Price” of a Fund generally is determined using the midpoint between the highest bid and the lowest offer on the stock exchange on which the Shares of the Funds are listed for trading, as of the time that the Fund’s NAV is calculated. A Fund’s Market Price may be at, above or below its NAV. The NAV of a Fund will fluctuate with changes in the market value of the Fund’s holdings. The Market Price of a Fund will fluctuate in accordance with changes in its NAV, as well as market supply and demand.
Premiums or discounts are the differences (expressed as a percentage) between the NAV and Market Price of a Fund on a given day, generally at the time NAV is calculated. A premium is the amount that a Fund is trading above the reported NAV, expressed as a percentage of the NAV. A discount is the amount that a Fund is trading below the reported NAV, expressed as a percentage of the NAV.
Further information regarding premiums and discounts is available on the Funds’ website at www.globalxetfs.com.
54
Notes
55
Notes
56
Notes
57
Notes
58
Notes
59
Notes
60
605 Third Avenue, 43rd floor
New York, NY 10158
1-888-493-8631
www.globalxetfs.com
Investment Adviser and Administrator:
Global X Management Company LLC
605 Third Avenue, 43rd floor
New York, NY 10158
Distributor:
SEI Investments Distribution Co.
One Freedom Valley Drive
Oaks, PA 19456
Sub-Administrator:
SEI Investments Global Funds Services
One Freedom Valley Drive
Oaks, PA 19456
Counsel for Global X Funds and the Independent Trustees:
Stradley Ronon Stevens & Young, LLP
2000 K Street, N.W.
Suite 700
Washington, DC 20006
Custodians and Transfer Agents:
Brown Brothers Harriman & Co.
40 Water Street
Boston, MA 02109
The Bank of New York Mellon
240 Greenwich Street
New York, NY 10286
Independent Registered Public Accounting Firm:
PricewaterhouseCoopers LLP
Two Commerce Square
Suite 1800
2001 Market Street
Philadelphia, PA 19103
This information must be preceded or accompanied by a current prospectus for the Funds described.
GLX-SA-001-1600
(b) Not applicable.
Item 2. Code of Ethics.
Not applicable for semi-annual report.
Item 3. Audit Committee Financial Expert.
Not applicable for semi-annual report.
Item 4. Principal Accountant Fees and Services.
Not applicable for semi-annual report.
Item 5. Audit Committee of Listed Registrants.
Not applicable for semi-annual report.
Item 6. Investments.
Schedule of Investments is included as part of the report to shareholders filed under Item 1 of this form.
Item 7. Disclosure of Proxy Voting Policies and Procedures for Closed-End Management Investment Companies.
Not applicable to open-end management investment companies.
Item 8. Portfolio Managers of Closed-End Management Investment Companies.
Not applicable to open-end management investment companies.
Item 9. Purchases of Equity Securities by Closed-End Management Investment Company and Affiliated Purchasers.
Not applicable to open-end management investment companies.
Item 10. Submission of Matters to a Vote of Security Holders.
There have been no material changes to the procedures by which shareholders may recommend nominees to the registrant’s board of directors.
Item 11. Controls and Procedures.
(a) The certifying officers, whose certifications are included herewith, have evaluated the registrant’s disclosure controls and procedures within 90 days of the filing date of this report. In their opinion, based on their evaluation, the registrant’s disclosure controls and procedures are adequately designed, and are operating effectively to ensure, that information required to be disclosed by the registrant in the reports it files or submits under the Securities Exchange Act of 1934 is recorded, processed, summarized and reported within the time periods specified in the Securities and Exchange Commission’s rules and forms.
(b) There were no significant changes in the registrant’s internal control over financial reporting that occurred during the period covered by this report that has materially affected, or is reasonably likely to materially affect, the registrant’s internal control over financial reporting.
Item 12. Disclosure of Securities Lending Activities for Closed-End Management Investment Companies.
Not applicable to open-end management investment companies.
Item 18. Recovery of Erroneously Awarded Compensation.
(a) Not applicable.
(b) Not applicable.
Item 19. Exhibits.
(a)(1) Not applicable.
(a)(2) Not applicable.
(a)(3) A separate certification for the principal executive officer and the principal financial officer of the registrant as required by Rule 30a-2(a) under the Investment Company Act of 1940, as amended (17 CFR § 270.30a-2(a)), are filed herewith.
(b) Officer certifications as required by Rule 30a-2(b) under the Investment Company Act of 1940, as amended (17 CFR § 270.30a-2(b)) also accompany this filing as exhibits.
SIGNATURES
Pursuant to the requirements of the Securities Exchange Act of 1934 and the Investment Company Act of 1940, the registrant has duly caused this report to be signed on its behalf by the undersigned, thereunto duly authorized.
| (Registrant) | Global X Funds |
| | |
| By (Signature and Title) | /s/ Ryan O’Connor |
| | Ryan O’Connor
Principal Executive Officer |
Date: July 8, 2024
Pursuant to the requirements of the Securities Exchange Act of 1934 and the Investment Company Act of 1940, this report has been signed below by the following persons on behalf of the registrant and in the capacities and on the dates indicated.
| By (Signature and Title) | /s/ Ryan O’Connor |
| | Ryan O’Connor
Principal Executive Officer |
Date: July 8, 2024
| By (Signature and Title) | /s/ Eric Olsen |
| | Eric Olsen
Principal Financial Officer |
Date: July 8, 2024