Global X Management Company LLC 605 Third Avenue, 43rd floor New York, NY 10158 | Eric S. Purple, Esq. Stradley Ronon Stevens & Young, LLP 2000 K Street, N.W., Suite 700 Washington, DC 20006-1871 |
Semi-Annual Report
May 31, 2023
As permitted by regulations adopted by the Securities and Exchange Commission, paper copies of the Funds’ (defined below) shareholder reports will no longer be sent by mail, unless you specifically request paper copies of the reports from your financial intermediary (such as a broker-dealer or bank). Instead, shareholder reports will be available on the Funds’website (www. globalxetfs.com/explore), and you will be notified by mail each time a report is posted and provided with a website link to access the report.
If you already elected to receive shareholder reports electronically, you will not be affected by this change and you need not take any action. You may elect to receive shareholder reports and other communications from the Funds electronically anytime by contacting your financial intermediary.
You may elect to receive all future Fund shareholder reports in paper free of charge. Please contact your financial intermediary to inform them that you wish to continue receiving paper copies of Fund shareholder reports and for details about whether your election to receive reports in paper will apply to all funds held with your financial intermediary.
| Table of Contents |
| Schedules of Investments | ||||
| Global X Emerging Markets Bond ETF | 1 | |||
| Global X China Innovation ETF | 15 | |||
| Glossary | 18 | |||
| Statements of Assets and Liabilities | 19 | |||
| Statements of Operations | 20 | |||
| Statements of Changes in Net Assets | 21 | |||
| Financial Highlights | 23 | |||
| Notes to Financial Statements | 25 | |||
| Disclosure of Fund Expenses | 39 | |||
| Liquidity Risk Management Program | 41 | |||
| Supplemental Information | 42 | |||
Shares are bought and sold at market price (not net asset value (“NAV”)) and are not individually redeemed from a Fund. Shares may only be redeemed directly from a Fund by Authorized Participants, in very large creation/ redemption units. Brokerage commissions will reduce returns.
The Funds file their complete schedules of Fund holdings with the Securities and Exchange Commission (the “SEC” or “Commission”) for the first and third quarters of each fiscal year as an exhibit to their reports on Form N-PORT. The Funds’ Forms N-PORT are available on the Commission’s website at https://www.sec.gov, and may be reviewed and copied at the Commission's Public Reference Room in Washington, DC. Information on the operation of the Public Reference Room may be obtained by calling 1-800-SEC-0330.
A description of the policies and procedures that Global X Funds uses to determine how to vote proxies relating to Fund securities, as well as information relating to how the Funds voted proxies relating to Fund securities during the most recent 12-month period ended June 30, is available (i) without charge, upon request, by calling 1-888-493-8631; and (ii) on the Commission’s website at https://www.sec.gov.
| Schedule of Investments | May 31, 2023 (Unaudited) | |
| Global X Emerging Markets Bond ETF | ||
| Face Amount | Value | |||||||
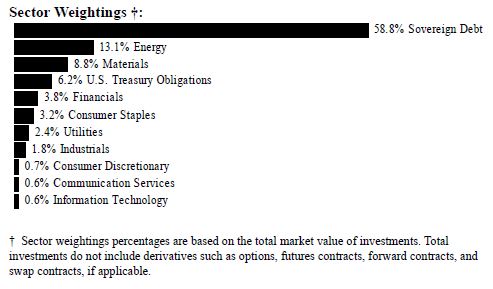
| SOVEREIGN DEBT — 57.6% | ||||||||
| Angola — 0.7% | ||||||||
| Angolan Government International Bond | ||||||||
| 8.750%, 04/14/32 | $ | 1,000,000 | $ | 838,490 | ||||
| Argentina — 1.3% | ||||||||
| Argentine Republic Government International | ||||||||
Bond | ||||||||
| 3.875%, 01/09/38(A) | 2,000,000 | 574,334 | ||||||
| 3.500%, 07/09/41(A) | 1,200,000 | 308,851 | ||||||
| 1.500%, 07/09/35(A) | 2,300,000 | 533,983 | ||||||
| 1,417,168 | ||||||||
| Bahrain — 0.4% | ||||||||
| Bahrain Government International Bond | ||||||||
| 6.750%, 09/20/29 | 200,000 | 195,863 | ||||||
| Bahrain Government International Bond MTN | ||||||||
| 5.250%, 01/25/33 | 300,000 | 255,048 | ||||||
| 450,911 | ||||||||
| Schedule of Investments | May 31, 2023 (Unaudited) | |
| Global X Emerging Markets Bond ETF | ||
| Face Amount | Value | |||||||
| SOVEREIGN DEBT — continued | ||||||||
| Brazil — 2.7% | ||||||||
| Brazilian Government International Bond | ||||||||
| 6.000%, 10/20/33 | $ | 1,800,000 | $ | 1,764,827 | ||||
| 5.625%, 02/21/47 | 400,000 | 331,718 | ||||||
| 4.625%, 01/13/28 | 400,000 | 390,835 | ||||||
| 4.500%, 05/30/29 | 600,000 | 569,918 | ||||||
| 3,057,298 | ||||||||
| Chile — 1.6% | ||||||||
| Chile Government International Bond | ||||||||
| 4.000%, 01/31/52 | 1,000,000 | 799,883 | ||||||
| 3.500%, 01/25/50 | 600,000 | 443,615 | ||||||
| 3.240%, 02/06/28 | 600,000 | 569,554 | ||||||
| 1,813,052 | ||||||||
| Colombia — 2.2% | ||||||||
| Colombia Government International Bond | ||||||||
| 5.200%, 05/15/49 | 1,000,000 | 674,000 | ||||||
| 4.125%, 05/15/51 | 300,000 | 175,079 | ||||||
| 3.875%, 04/25/27 | 1,000,000 | 901,849 | ||||||
| 3.250%, 04/22/32 | 500,000 | 361,376 | ||||||
| 3.125%, 04/15/31 | 400,000 | 296,776 | ||||||
| 2,409,080 | ||||||||
| Costa Rica — 0.7% | ||||||||
| Costa Rica Government International Bond | ||||||||
| 6.550%, 04/03/34(B) | 200,000 | 201,700 | ||||||
| 6.125%, 02/19/31 | 600,000 | 599,335 | ||||||
| 801,035 | ||||||||
| Dominican Republic — 2.8% | ||||||||
| Dominican Republic International Bond | ||||||||
| 7.050%, 02/03/31 | 200,000 | 198,011 | ||||||
| 6.400%, 06/05/49 | 600,000 | 494,991 | ||||||
| 6.000%, 07/19/28 | 400,000 | 386,055 | ||||||
| 5.950%, 01/25/27 | 500,000 | 488,267 | ||||||
| 4.875%, 09/23/32 | 1,000,000 | 838,612 | ||||||
| 4.500%, 01/30/30 | 1,000,000 | 860,829 | ||||||
| 3,266,765 | ||||||||
| Schedule of Investments | May 31, 2023 (Unaudited) | |
| Global X Emerging Markets Bond ETF | ||
| Face Amount | Value | |||||||
| SOVEREIGN DEBT — continued | ||||||||
| Ecuador — 1.7% | ||||||||
| Ecuador Government International Bond | ||||||||
| 5.500%, 07/31/30(A) | $ | 400,000 | $ | 193,071 | ||||
| 2.500%, 07/31/35(A) | 3,000,000 | 1,023,814 | ||||||
| 1.500%, 07/31/40(A) | 2,000,000 | 630,000 | ||||||
| 1,846,885 | ||||||||
| Egypt — 2.1% | ||||||||
| Egypt Government International Bond | ||||||||
| 8.875%, 05/29/50 | 700,000 | 360,093 | ||||||
| 8.700%, 03/01/49 | 800,000 | 408,192 | ||||||
| 7.903%, 02/21/48 | 600,000 | 292,548 | ||||||
| 7.625%, 05/29/32 | 1,000,000 | 551,250 | ||||||
| Egypt Government International Bond MTN | ||||||||
| 5.875%, 02/16/31 | 1,000,000 | 537,500 | ||||||
| 5.800%, 09/30/27 | 200,000 | 125,000 | ||||||
| 2,274,583 | ||||||||
| El Salvador — 0.1% | ||||||||
| El Salvador Government International Bond | ||||||||
| 7.125%, 01/20/50(B) | 200,000 | 98,616 | ||||||
| Ghana — 0.5% | ||||||||
| Ghana Government International Bond | ||||||||
| 8.950%, 03/26/51 | 400,000 | 152,000 | ||||||
| 8.627%, 06/16/49 | 600,000 | 228,000 | ||||||
| 8.125%, 03/26/32 | 600,000 | 240,540 | ||||||
| 620,540 | ||||||||
| Hungary — 3.2% | ||||||||
| Hungary Government International Bond | ||||||||
| 6.750%, 09/25/52 | 600,000 | 605,142 | ||||||
| 6.250%, 09/22/32 | 1,500,000 | 1,524,375 | ||||||
| 5.500%, 06/16/34 | 700,000 | 667,853 | ||||||
| 3.125%, 09/21/51 | 800,000 | 476,240 | ||||||
| 2.125%, 09/22/31 | 400,000 | 304,006 | ||||||
| 3,577,616 | ||||||||
| India — 0.5% | ||||||||
| Export-Import Bank of India | ||||||||
| 3.875%, 02/01/28 | 600,000 | 565,589 | ||||||
| Schedule of Investments | May 31, 2023 (Unaudited) | |
| Global X Emerging Markets Bond ETF | ||
| Face Amount | Value | |||||||
| SOVEREIGN DEBT — continued | ||||||||
| Indonesia — 1.1% | ||||||||
| Indonesia Government International Bond | ||||||||
| 5.650%, 01/11/53 | $ | 400,000 | $ | 415,505 | ||||
| 4.550%, 01/11/28 | 800,000 | 797,340 | ||||||
| 1,212,845 | ||||||||
| Ivory Coast — 1.1% | ||||||||
| Ivory Coast Government International Bond | ||||||||
| 6.125%, 06/15/33 | 1,400,000 | 1,210,306 | ||||||
| Jordan — 0.3% | ||||||||
| Jordan Government International Bond | ||||||||
| 5.750%, 01/31/27 | 400,000 | 377,556 | ||||||
| Kenya — 0.4% | ||||||||
| Kenya Government International Bond | ||||||||
| 8.250%, 02/28/48 | 600,000 | 439,336 | ||||||
| Kuwait — 0.2% | ||||||||
| Kuwait International Government Bond | ||||||||
| 3.500%, 03/20/27 | 200,000 | 195,552 | ||||||
| Mexico — 2.0% | ||||||||
| Mexico Government International Bond | ||||||||
| 6.350%, 02/09/35 | 600,000 | 632,163 | ||||||
| 5.000%, 04/27/51 | 400,000 | 340,185 | ||||||
| 4.750%, 04/27/32 | 600,000 | 573,505 | ||||||
| 4.400%, 02/12/52 | 800,000 | 618,681 | ||||||
| 2,164,534 | ||||||||
| Morocco — 0.9% | ||||||||
| Morocco Government International Bond | ||||||||
| 6.500%, 09/08/33 | 200,000 | 203,650 | ||||||
| 4.000%, 12/15/50 | 200,000 | 132,304 | ||||||
| 2.375%, 12/15/27 | 800,000 | 699,581 | ||||||
| 1,035,535 | ||||||||
| Nigeria — 0.9% | ||||||||
| Nigeria Government International Bond | ||||||||
| 9.248%, 01/21/49 | 400,000 | 302,863 | ||||||
| 7.696%, 02/23/38 | 500,000 | 345,000 | ||||||
| Nigeria Government International Bond MTN | ||||||||
| 7.625%, 11/28/47 | 600,000 | 392,412 | ||||||
| 1,040,275 | ||||||||
| Schedule of Investments | May 31, 2023 (Unaudited) | |
| Global X Emerging Markets Bond ETF | ||
| Face Amount | Value | |||||||
| SOVEREIGN DEBT — continued | ||||||||
| Oman — 3.4% | ||||||||
| Oman Government International Bond | ||||||||
| 6.250%, 01/25/31 | $ | 1,000,000 | $ | 1,012,252 | ||||
| 5.625%, 01/17/28 | 1,300,000 | 1,286,870 | ||||||
| 5.375%, 03/08/27 | 700,000 | 686,781 | ||||||
| 4.750%, 06/15/26 | 200,000 | 193,990 | ||||||
| Oman Government International Bond MTN | ||||||||
| 6.000%, 08/01/29 | 600,000 | 600,750 | ||||||
| 3,780,643 | ||||||||
| Panama — 1.9% | ||||||||
| Panama Government International Bond | ||||||||
| 6.400%, 02/14/35 | 500,000 | 522,654 | ||||||
| 4.500%, 04/01/56 | 600,000 | 443,149 | ||||||
| 3.875%, 03/17/28 | 200,000 | 191,069 | ||||||
| 3.870%, 07/23/60 | 800,000 | 519,040 | ||||||
| 3.750%, 03/16/25 | 400,000 | 390,186 | ||||||
| 2,066,098 | ||||||||
| Paraguay — 0.8% | ||||||||
| Paraguay Government International Bond | ||||||||
| 5.000%, 04/15/26 | 600,000 | 590,460 | ||||||
| 4.950%, 04/28/31 | 400,000 | 382,624 | ||||||
| 973,084 | ||||||||
| Peru — 3.3% | ||||||||
| Peruvian Government International Bond | ||||||||
| 8.750%, 11/21/33 | 1,700,000 | 2,140,188 | ||||||
| 5.625%, 11/18/50 | 400,000 | 399,679 | ||||||
| 3.550%, 03/10/51 | 800,000 | 575,120 | ||||||
| 3.000%, 01/15/34 | 200,000 | 163,447 | ||||||
| 2.783%, 01/23/31 | 200,000 | 170,497 | ||||||
| 2.392%, 01/23/26 | 200,000 | 187,660 | ||||||
| 3,636,591 | ||||||||
| Philippines — 1.5% | ||||||||
| Philippine Government International Bond | ||||||||
| 6.375%, 10/23/34 | 800,000 | 900,219 | ||||||
| 5.500%, 01/17/48 | 400,000 | 414,026 | ||||||
| 3.700%, 02/02/42 | 400,000 | 328,000 | ||||||
| 1,642,245 | ||||||||
| Poland — 2.0% | ||||||||
| Bank Gospodarstwa Krajowego MTN | ||||||||
| 5.375%, 05/22/33 | 1,400,000 | 1,399,065 | ||||||
| Schedule of Investments | May 31, 2023 (Unaudited) | |
| Global X Emerging Markets Bond ETF | ||
| Face Amount | Value | |||||||
| SOVEREIGN DEBT — continued | ||||||||
| Poland — continued | ||||||||
| Republic of Poland Government International | ||||||||
Bond | ||||||||
| 5.500%, 04/04/53 | $ | 800,000 | $ | 803,600 | ||||
| 2,202,665 | ||||||||
| Qatar — 1.8% | ||||||||
| Qatar Government International Bond | ||||||||
| 4.817%, 03/14/49 | 600,000 | 570,058 | ||||||
| 4.400%, 04/16/50 | 1,000,000 | 903,004 | ||||||
| 3.750%, 04/16/30 | 200,000 | 194,256 | ||||||
| 3.400%, 04/16/25 | 400,000 | 390,784 | ||||||
| 2,058,102 | ||||||||
| Romania — 2.7% | ||||||||
| Romanian Government International Bond | ||||||||
| 5.250%, 11/25/27 | 400,000 | 392,122 | ||||||
| 4.000%, 02/14/51 | 800,000 | 544,000 | ||||||
| 3.625%, 03/27/32 | 1,200,000 | 1,009,500 | ||||||
| 3.000%, 02/27/27 | 700,000 | 637,084 | ||||||
| 3.000%, 02/14/31 | 600,000 | 494,604 | ||||||
| 3,077,310 | ||||||||
| Saudi Arabia — 2.0% | ||||||||
| Saudi Government International Bond | ||||||||
| 4.375%, 04/16/29 | 200,000 | 197,376 | ||||||
| Saudi Government International Bond MTN | ||||||||
| 4.500%, 04/17/30 | 600,000 | 594,600 | ||||||
| 3.750%, 01/21/55 | 1,500,000 | 1,119,417 | ||||||
| 2.250%, 02/02/33 | 400,000 | 325,209 | ||||||
| 2,236,602 | ||||||||
| Senegal — 0.6% | ||||||||
| Senegal Government International Bond | ||||||||
| 6.750%, 03/13/48 | 1,000,000 | 663,216 | ||||||
| Serbia — 0.6% | ||||||||
| Serbia International Bond | ||||||||
| 6.500%, 09/26/33 | 700,000 | 679,252 | ||||||
| Schedule of Investments | May 31, 2023 (Unaudited) | |
| Global X Emerging Markets Bond ETF | ||
| Face Amount | Value | |||||||
| SOVEREIGN DEBT — continued | ||||||||
| South Africa — 3.2% | ||||||||
| Republic of South Africa Government | ||||||||
| International Bond | ||||||||
| 7.300%, 04/20/52 | $ | 700,000 | $ | 559,898 | ||||
| 5.875%, 04/20/32 | 600,000 | 514,932 | ||||||
| 5.875%, 09/16/25 | 200,000 | 197,200 | ||||||
| 4.850%, 09/27/27 | 400,000 | 369,000 | ||||||
| 4.850%, 09/30/29 | 1,600,000 | 1,376,032 | ||||||
| 4.300%, 10/12/28 | 600,000 | 516,014 | ||||||
| 3,533,076 | ||||||||
| Sri Lanka — 0.4% | ||||||||
| Sri Lanka Government International Bond | ||||||||
| 7.550%, 03/28/30(C) | 600,000 | 219,166 | ||||||
| 6.750%, 04/18/28 | 600,000 | 217,364 | ||||||
| 436,530 | ||||||||
| Turkey — 1.5% | ||||||||
| Turkey Government International Bond | ||||||||
| 6.625%, 02/17/45 | 400,000 | 290,488 | ||||||
| 6.125%, 10/24/28 | 200,000 | 173,524 | ||||||
| 5.750%, 05/11/47 | 600,000 | 392,280 | ||||||
| 5.250%, 03/13/30 | 600,000 | 475,500 | ||||||
| 4.750%, 01/26/26 | 400,000 | 357,028 | ||||||
| 1,688,820 | ||||||||
| Ukraine — 0.5% | ||||||||
| Ukraine Government International Bond | ||||||||
| 7.750%, 09/01/26 | 400,000 | 73,796 | ||||||
| 7.750%, 09/01/28(C) | 400,000 | 75,445 | ||||||
| 7.375%, 09/25/34(C) | 1,000,000 | 177,048 | ||||||
| 7.253%, 03/15/35(C) | 600,000 | 109,589 | ||||||
| 435,878 | ||||||||
| United Arab Emirates — 3.8% | ||||||||
| Abu Dhabi Government International Bond | ||||||||
| 3.125%, 09/30/49 | 400,000 | 291,237 | ||||||
| Abu Dhabi Government International Bond | ||||||||
MTN | ||||||||
| 3.125%, 10/11/27 | 800,000 | 763,632 | ||||||
| 2.500%, 04/16/25 | 1,400,000 | 1,342,460 | ||||||
| 0.750%, 09/02/23 | 200,000 | 197,500 | ||||||
| Finance Department Government of Sharjah | ||||||||
| 6.500%, 11/23/32 | 400,000 | 407,034 | ||||||
| 6.500%, 11/23/32(B) | 400,000 | 407,034 | ||||||
| Schedule of Investments | May 31, 2023 (Unaudited) | |
| Global X Emerging Markets Bond ETF | ||
| Face Amount | Value | |||||||
| SOVEREIGN DEBT — continued | ||||||||
| United Arab Emirates — continued | ||||||||
| Finance Department Government of Sharjah | ||||||||
| MTN | ||||||||
| 4.375%, 03/10/51 | $ | 1,000,000 | $ | 659,686 | ||||
| 4,068,583 | ||||||||
| Uruguay — 0.2% | ||||||||
| Uruguay Government International Bond | ||||||||
| 4.375%, 01/23/31 | 200,000 | 199,353 | ||||||
| TOTAL SOVEREIGN DEBT | ||||||||
| (Cost $74,254,381) | 64,091,615 | |||||||
| CORPORATE OBLIGATIONS — 34.2% | ||||||||
| Azerbaijan — 0.4% | ||||||||
| Energy — 0.4% | ||||||||
| Southern Gas Corridor CJSC | ||||||||
| 6.875%, 03/24/26 | 400,000 | 408,330 | ||||||
| Brazil — 1.9% | ||||||||
| Industrials — 1.0% | ||||||||
| Rumo Luxembourg Sarl | ||||||||
| 4.200%, 01/18/32 | 700,000 | 554,890 | ||||||
| Sitios Latinoamerica | ||||||||
| 5.375%, 04/04/32 | 600,000 | 538,108 | ||||||
| 1,092,998 | ||||||||
| Materials — 0.9% | ||||||||
| Vale Overseas | ||||||||
| 6.875%, 11/21/36 | 500,000 | 519,706 | ||||||
| 3.750%, 07/08/30 | 500,000 | 442,410 | ||||||
| 962,116 | ||||||||
| 2,055,114 | ||||||||
| Chile — 2.0% | ||||||||
| Consumer Staples — 1.1% | ||||||||
| Agrosuper | ||||||||
| 4.600%, 01/20/32 | 300,000 | 258,284 | ||||||
| Cia Cervecerias Unidas | ||||||||
| 3.350%, 01/19/32 | 1,200,000 | 1,018,800 | ||||||
| 1,277,084 | ||||||||
| Energy — 0.4% | ||||||||
| Empresa Nacional del Petroleo | ||||||||
| 6.150%, 05/10/33 | 500,000 | 496,675 | ||||||
| Schedule of Investments | May 31, 2023 (Unaudited) | |
| Global X Emerging Markets Bond ETF | ||
| Face Amount | Value | |||||||
| CORPORATE OBLIGATIONS — continued | ||||||||
| Materials — 0.5% | ||||||||
| Nacional del Cobre de Chile | ||||||||
| 3.000%, 09/30/29 | $ | 600,000 | $ | 530,632 | ||||
| 2,304,391 | ||||||||
| China — 0.6% | ||||||||
| Communication Services — 0.6% | ||||||||
| Prosus | ||||||||
| 4.987%, 01/19/52 | 500,000 | 349,760 | ||||||
| 3.832%, 02/08/51 | 500,000 | 293,348 | ||||||
| 643,108 | ||||||||
| Colombia — 0.5% | ||||||||
| Energy — 0.5% | ||||||||
| Ecopetrol | ||||||||
| 5.875%, 05/28/45 | 900,000 | 592,439 | ||||||
| Indonesia — 1.7% | ||||||||
| Energy — 0.2% | ||||||||
| Pertamina Persero MTN | ||||||||
| 6.450%, 05/30/44 | 200,000 | 206,641 | ||||||
| Materials — 1.3% | ||||||||
| Freeport Indonesia | ||||||||
| 6.200%, 04/14/52 | 200,000 | 178,069 | ||||||
| Freeport Indonesia MTN | ||||||||
| 5.315%, 04/14/32 | 250,000 | 234,028 | ||||||
| Indonesia Asahan Aluminium | ||||||||
| 6.530%, 11/15/28 | 1,000,000 | 1,037,664 | ||||||
| 1,449,761 | ||||||||
| Utilities — 0.2% | ||||||||
| Perusahaan Perseroan Persero Perusahaan | ||||||||
| Listrik Negara MTN | ||||||||
| 4.125%, 05/15/27 | 200,000 | 191,500 | ||||||
| 1,847,902 | ||||||||
| Israel — 1.3% | ||||||||
| Materials — 1.3% | ||||||||
| ICL Group | ||||||||
| 6.375%, 05/31/38(B) | 1,400,000 | 1,398,880 | ||||||
| Kazakhstan — 1.3% | ||||||||
| Energy — 1.3% | ||||||||
| KazMunayGas National JSC | ||||||||
| 6.375%, 10/24/48 | 800,000 | 652,000 | ||||||
| Schedule of Investments | May 31, 2023 (Unaudited) | |
| Global X Emerging Markets Bond ETF | ||
| Face Amount | Value | |||||||
| CORPORATE OBLIGATIONS — continued | ||||||||
| Energy — continued | ||||||||
| Tengizchevroil Finance International | ||||||||
| 4.000%, 08/15/26 | $ | 200,000 | $ | 176,000 | ||||
| 3.250%, 08/15/30 | 800,000 | 599,424 | ||||||
| 1,427,424 | ||||||||
| Malaysia — 1.7% | ||||||||
| Energy — 1.7% | ||||||||
| Petronas Capital MTN | ||||||||
| 4.550%, 04/21/50 | 1,200,000 | 1,102,848 | ||||||
| 3.500%, 04/21/30 | 300,000 | 280,767 | ||||||
| 3.500%, 03/18/25 | 600,000 | 583,908 | ||||||
| 1,967,523 | ||||||||
| Mexico — 7.7% | ||||||||
| Consumer Discretionary — 0.7% | ||||||||
| Becle | ||||||||
| 2.500%, 10/14/31 | 1,000,000 | 801,380 | ||||||
| Consumer Staples — 0.5% | ||||||||
| Grupo Bimbo | ||||||||
| 4.700%, 11/10/47 | 600,000 | 543,253 | ||||||
| Energy — 3.5% | ||||||||
| Petroleos Mexicanos | ||||||||
| 10.000%, 02/07/33 | 1,200,000 | 1,078,087 | ||||||
| 7.690%, 01/23/50 | 900,000 | 583,655 | ||||||
| 6.840%, 01/23/30 | 1,000,000 | 780,259 | ||||||
| 6.500%, 01/23/29 | 600,000 | 490,211 | ||||||
| 5.950%, 01/28/31 | 1,400,000 | 1,004,317 | ||||||
| 3,936,529 | ||||||||
| Financials — 1.5% | ||||||||
| Banco Nacional de Comercio Exterior SNC | ||||||||
| 2.720%, US Treas Yield Curve Rate | ||||||||
| T Note Const Mat 5 Yr + 2.000%, | ||||||||
08/11/31(D) | 2,000,000 | 1,697,020 | ||||||
| Materials — 1.5% | ||||||||
| Orbia Advance | ||||||||
| 5.500%, 01/15/48 | 600,000 | 479,250 | ||||||
| 2.875%, 05/11/31 | 800,000 | 632,505 | ||||||
| Southern Copper | ||||||||
| 5.875%, 04/23/45 | 500,000 | 506,593 | ||||||
| 1,618,348 | ||||||||
| 8,596,530 | ||||||||
| Schedule of Investments | May 31, 2023 (Unaudited) | |
| Global X Emerging Markets Bond ETF | ||
| Face Amount | Value | |||||||
| CORPORATE OBLIGATIONS — continued | ||||||||
| Morocco — 0.6% | ||||||||
| Materials — 0.6% | ||||||||
| OCP | ||||||||
| 5.125%, 06/23/51 | $ | 1,000,000 | $ | 720,700 | ||||
| Panama — 0.4% | ||||||||
| Industrials — 0.4% | ||||||||
| Aeropuerto Internacional de Tocumen | ||||||||
| 5.125%, 08/11/61 | 600,000 | 451,200 | ||||||
| Peru — 1.2% | ||||||||
| Consumer Staples — 0.5% | ||||||||
| InRetail Consumer | ||||||||
| 3.250%, 03/22/28 | 600,000 | 509,575 | ||||||
| Energy — 0.7% | ||||||||
| Transportadora de Gas del Peru | ||||||||
| 4.250%, 04/30/28 | 800,000 | 769,000 | ||||||
| 1,278,575 | ||||||||
| Saudi Arabia — 4.2% | ||||||||
| Energy — 3.5% | ||||||||
| EIG Pearl Holdings Sarl | ||||||||
| 4.387%, 11/30/46 | 1,000,000 | 776,382 | ||||||
| 3.545%, 08/31/36 | 200,000 | 169,914 | ||||||
| Greensaif Pipelines Bidco Sarl | ||||||||
| 6.510%, 02/23/42 | 200,000 | 209,239 | ||||||
| 6.129%, 02/23/38 | 200,000 | 206,460 | ||||||
| Saudi Arabian Oil | ||||||||
| 1.250%, 11/24/23 | 1,500,000 | 1,467,513 | ||||||
| Saudi Arabian Oil MTN | ||||||||
| 3.500%, 04/16/29 | 800,000 | 744,874 | ||||||
| 2.875%, 04/16/24 | 400,000 | 390,806 | ||||||
| 3,965,188 | ||||||||
| Utilities — 0.7% | ||||||||
| Acwa Power Management And Investments | ||||||||
| One | ||||||||
| 5.950%, 12/15/39 | 798,400 | 771,749 | ||||||
| 4,736,937 | ||||||||
| South Africa — 2.5% | ||||||||
| Materials — 1.0% | ||||||||
| AngloGold Ashanti Holdings | ||||||||
| 3.375%, 11/01/28 | 800,000 | 707,174 | ||||||
| Schedule of Investments | May 31, 2023 (Unaudited) | |
| Global X Emerging Markets Bond ETF | ||
| Face Amount | Value | |||||||
| CORPORATE OBLIGATIONS — continued | ||||||||
| Materials — continued | ||||||||
| Sasol Financing USA | ||||||||
| 5.500%, 03/18/31 | $ | 600,000 | $ | 465,968 | ||||
| 1,173,142 | ||||||||
| Utilities — 1.5% | ||||||||
| Eskom Holdings SOC MTN | ||||||||
| 6.350%, 08/10/28 | 1,800,000 | 1,624,932 | ||||||
| 2,798,074 | ||||||||
| South Korea — 0.5% | ||||||||
| Information Technology — 0.5% | ||||||||
| SK Hynix | ||||||||
| 2.375%, 01/19/31 | 800,000 | 606,972 | ||||||
| Thailand — 1.1% | ||||||||
| Energy — 0.3% | ||||||||
| Thaioil Treasury Center MTN | ||||||||
| 5.375%, 11/20/48 | 400,000 | | 335,005 | |||||
| Materials — 0.8% | ||||||||
| GC Treasury Center MTN | ||||||||
| 5.200%, 03/30/52 | 600,000 | 507,391 | ||||||
| 2.980%, 03/18/31 | 400,000 | 332,384 | ||||||
| 839,775 | ||||||||
| 1,174,780 | ||||||||
| United Arab Emirates — 0.5% | ||||||||
| Energy — 0.2% | ||||||||
| Abu Dhabi Crude Oil Pipeline | ||||||||
| 4.600%, 11/02/47 | 200,000 | 184,796 | ||||||
| Industrials — 0.3% | ||||||||
| DP World Crescent MTN | ||||||||
| 4.848%, 09/26/28 | 200,000 | 199,552 | ||||||
| DP World MTN | ||||||||
| 4.700%, 09/30/49 | 200,000 | 166,843 | ||||||
| 366,395 | ||||||||
| 551,191 | ||||||||
| United Kingdom — 1.1% | ||||||||
| Consumer Staples — 1.1% | ||||||||
| CK Hutchison International 23 | ||||||||
| 4.875%, 04/21/33(B) | 750,000 | 753,435 | ||||||
| 4.875%, 04/21/33 | 250,000 | 251,145 | ||||||
| 4.750%, 04/21/28 | 250,000 | 251,293 | ||||||
| 1,255,873 | ||||||||
| Schedule of Investments | May 31, 2023 (Unaudited) | |
| Global X Emerging Markets Bond ETF | ||
| Face Amount | Value | |||||||
| CORPORATE OBLIGATIONS — continued | ||||||||
| United States — 3.0% | ||||||||
| Financials — 2.2% | ||||||||
| Bank of America MTN | ||||||||
| 4.948%, U.S. SOFR + 2.040%, | ||||||||
| 07/22/28(D) | $ | 1,000,000 | $ | 989,035 | ||||
| JPMorgan Chase | ||||||||
| 3.960%, TSFR3M + 1.507%, 01/29/27(D) | 600,000 | 580,314 | ||||||
| 1.578%, U.S. SOFR + 0.885%, | ||||||||
| 04/22/27(D) | 1,000,000 | 898,674 | ||||||
| 2,468,023 | ||||||||
| Materials — 0.8% | ||||||||
| GCC | ||||||||
| 3.614%, 04/20/32 | 1,000,000 | 852,114 | ||||||
| 3,320,137 | ||||||||
| TOTAL CORPORATE OBLIGATIONS | ||||||||
| (Cost $42,107,603) | 38,136,080 | |||||||
| U.S. TREASURY OBLIGATIONS — 6.0% | ||||||||
| U.S. Treasury Notes | ||||||||
| 3.375%, 05/15/33 | 1,600,000 | 1,565,250 | ||||||
| 3.000%, 07/31/24 | 1,600,000 | 1,563,000 | ||||||
| 0.375%, 11/30/25 | 600,000 | 546,445 | ||||||
| 0.250%, 11/15/23 | 3,000,000 | 2,931,445 | ||||||
| 0.250%, 09/30/23 | 100,000 | 98,317 | ||||||
| TOTAL U.S. TREASURY OBLIGATIONS | ||||||||
| (Cost $6,790,202) | 6,704,457 | |||||||
| TOTAL INVESTMENTS — 97.8% | ||||||||
| (Cost $123,152,186) | $ | 108,932,152 | ||||||
| Percentages are based on Net Assets of $111,374,082. |
| (A) | Step coupon security. Coupon rate will either increase (step-up bond) or decrease (step-down bond) at regular intervals until maturity. Interest rate shown reflects the rate currently in effect. |
| (B) | Security exempt from registration under Rule 144A of the Securities Act of 1933. This security may be resold in transactions exempt from registration normally to qualified institutions. On May 31, 2023, the value of these securities amounted to $2,859,665, representing 2.6% of the Net Assets of the Fund. |
| (C) | Security in default on interest payments. |
| Schedule of Investments | May 31, 2023 (Unaudited) | |
| Global X Emerging Markets Bond ETF | ||
| (D) | Variable or floating rate security. The rate shown is the effective interest rate as of period end. The rates on certain securities are not based on published reference rates and spreads and are either determined by the issuer or agent based on current market conditions; by using a formula based on the rates of underlying loans; or by adjusting periodically based on prevailing interest rates. |
As of May 31, 2023, all of the Fund's investments were considered Level 2, in accordance with authoritative guidance on fair value measurements and disclosure under U.S. GAAP.
See “Glossary” for abbreviations.
| Schedule of Investments | May 31, 2023 (Unaudited) | |
| Global X China Innovation ETF | ||
| Shares | Value | |||||||
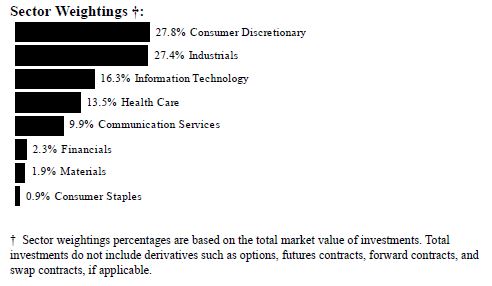
| COMMON STOCK — 91.8% | ||||||||
| CHINA — 90.7% | ||||||||
| Communication Services — 9.1% | ||||||||
| Baidu, Cl A * | 2,700 | $ | 41,182 | |||||
| Kuaishou Technology, Cl B * | 3,100 | 20,988 | ||||||
| Tencent Holdings . | 3,000 | 119,030 | ||||||
| 181,200 | ||||||||
| Consumer Discretionary — 25.5% | ||||||||
| Alibaba Group Holding * | 11,600 | 115,433 | ||||||
| BYD, Cl H . | 6,500 | 196,289 | ||||||
| Fuyao Glass Industry Group, Cl H . | 10,800 | 39,319 | ||||||
| JD.com, Cl A | 1,950 | 31,361 | ||||||
| Meituan, Cl B * | 3,500 | 49,270 | ||||||
| Midea Group, Cl A | 3,200 | 23,051 | ||||||
| PDD Holdings ADR * | 396 | 25,867 | ||||||
| Zhejiang Shuanghuan Driveline, Cl A | 9,000 | 30,477 | ||||||
| 511,067 | ||||||||
| Consumer Staples — 0.8% | ||||||||
| Ping An Healthcare and Technology * | 7,200 | 16,611 | ||||||
| Schedule of Investments | May 31, 2023 (Unaudited) | |
| Global X China Innovation ETF | ||
| Shares | Value | |||||||
| COMMON STOCK — continued | ||||||||
| Financials — 2.1% | ||||||||
| East Money Information, Cl A . | 21,168 | $ | 41,648 | |||||
| Health Care — 12.4% | ||||||||
| Hangzhou Tigermed Consulting, Cl A . | 2,200 | 24,946 | ||||||
| Innovent Biologics * | 5,000 | 23,441 | ||||||
| Jiangsu Hengrui Pharmaceuticals, Cl A | 6,160 | 39,376 | ||||||
| Shenzhen Mindray Bio-Medical Electronics, | ||||||||
| Cl A | 1,300 | 54,836 | ||||||
| WuXi AppTec, Cl H . | 4,920 | 40,538 | ||||||
| Wuxi Biologics Cayman * | 12,500 | 63,951 | ||||||
| 247,088 | ||||||||
| Industrials — 24.1% | ||||||||
| Contemporary Amperex Technology, Cl A . | 3,240 | 100,563 | ||||||
| Estun Automation, Cl A | 6,600 | 23,424 | ||||||
| Eve Energy, Cl A | 3,000 | 26,944 | ||||||
| Guangzhou KDT Machinery, Cl A | 7,720 | 18,331 | ||||||
| Han's Laser Technology Industry Group, Cl A . | 8,300 | 28,141 | ||||||
| Ming Yang Smart Energy Group, Cl A | 5,800 | 14,301 | ||||||
| NARI Technology, Cl A | 16,320 | 62,845 | ||||||
| Riyue Heavy Industry, Cl A . | 6,570 | 19,639 | ||||||
| SF Holding, Cl A | 2,800 | 18,598 | ||||||
| Shenzhen Inovance Technology, Cl A . | 3,700 | 30,682 | ||||||
| Sungrow Power Supply, Cl A | 1,900 | 29,367 | ||||||
| Suzhou Maxwell Technologies, Cl A . | 480 | 10,643 | ||||||
| Wuxi Lead Intelligent Equipment, Cl A . | 13,280 | 62,712 | ||||||
| ZTO Express Cayman ADR | 1,427 | 36,017 | ||||||
| 482,207 | ||||||||
| Information Technology — 15.0% | ||||||||
| BYD Electronic International | 17,500 | 50,969 | ||||||
| Hua Hong Semiconductor * | 13,000 | 42,098 | ||||||
| Iflytek, Cl A | 3,800 | 31,863 | ||||||
| LONGi Green Energy Technology, Cl A . | 13,336 | 53,937 | ||||||
| Luxshare Precision Industry, Cl A . | 8,800 | 33,714 | ||||||
| NavInfo, Cl A . | 8,600 | 14,145 | ||||||
| Tongwei, Cl A | 3,900 | 18,674 | ||||||
| Will Semiconductor Shanghai, Cl A . | 1,215 | 17,032 | ||||||
| Schedule of Investments | May 31, 2023 (Unaudited) | |
| Global X China Innovation ETF | ||
| Shares | Value | |||||||
| COMMON STOCK — continued | ||||||||
| Information Technology — continued | ||||||||
| Xinyi Solar Holdings | 38,000 | $ | 37,523 | |||||
| 299,955 | ||||||||
| Materials — 1.7% | ||||||||
| Ganfeng Lithium Group, Cl H . | 5,520 | 34,940 | ||||||
| TOTAL CHINA | 1,814,716 | |||||||
| HONG KONG — 1.1% | ||||||||
| Industrials — 1.1% | ||||||||
| LK Technology Holdings | 25,000 | 22,195 | ||||||
| TOTAL COMMON STOCK | ||||||||
| (Cost $2,766,426) | 1,836,911 | |||||||
| TOTAL INVESTMENTS — 91.8% | ||||||||
| (Cost $2,766,426) | $ | 1,836,911 | ||||||
| Percentages are based on Net Assets of $2,000,815. |
| * Non-income producing security. |
As of May 31, 2023, all of the Fund's investments were considered Level 1, in accordance with authoritative guidance on fair value measurements and disclosure under U.S. GAAP.
See "Glossary" for abbreviations.
| May 31, 2023 (Unaudited) |
| Glossary (abbreviations which may be used in the preceding Schedules of Investments): |
| Statements of Assets and Liabilities |
| May 31, 2023 (Unaudited) |
Global X Emerging Markets Bond ETF | Global X China Innovation ETF | |||||||
| Assets: | ||||||||
| Cost of Investments | $ | 123,152,186 | $ | 2,766,426 | ||||
| Cost of Foreign Currency | — | 13,756 | ||||||
| Investments, at Value | $ | 108,932,152 | $ | 1,836,911 | ||||
| Cash | 1,149,083 | 148,853 | ||||||
| Foreign Currency, at Value | — | 13,708 | ||||||
| Dividend, Interest, and Securities Lending Income Receivable | 1,330,919 | 2,687 | ||||||
| Unrealized Appreciation on Spot Contracts | — | 1 | ||||||
| Total Assets | 111,412,154 | 2,002,160 | ||||||
| Liabilities: | ||||||||
| Payable due to Investment Adviser | 38,072 | 1,345 | ||||||
| Total Liabilities | 38,072 | 1,345 | ||||||
| Net Assets | $ | 111,374,082 | $ | 2,000,815 | ||||
| Net Assets Consist of: | ||||||||
| Paid-in Capital | $ | 134,529,677 | $ | 4,491,831 | ||||
| Total Distributable Loss | (23,155,595 | ) | (2,491,016 | ) | ||||
| Net Assets | $ | 111,374,082 | $ | 2,000,815 | ||||
| Outstanding Shares of Beneficial Interest | ||||||||
| (unlimited authorization — no par value) | 5,200,000 | 180,000 | ||||||
| Net Asset Value, Offering and Redemption Price Per Share | $ | 21.42 | $ | 11.12 | ||||
| Statements of Operations |
| For the period ended May 31, 2023 (Unaudited) |
Global X Emerging Markets Bond ETF | Global X China Innovation ETF | |||||||
| Investment Income: | ||||||||
| Dividend Income | $ | — | $ | 15,059 | ||||
| Interest Income | 3,082,053 | 1,730 | ||||||
| Less: Foreign Taxes Withheld | — | (569 | ) | |||||
| Total Investment Income | 3,082,053 | 16,220 | ||||||
| Supervision and Administration Fees(1) | 211,730 | 8,466 | ||||||
| Total Expenses | 211,730 | 8,466 | ||||||
| Net Investment Income | 2,870,323 | 7,754 | ||||||
| Net Realized Gain (Loss) on: | ||||||||
| Investments(2) | (3,255,681 | ) | (42,044 | ) | ||||
| Foreign Currency Transactions | (1 | ) | 230 | |||||
| Net Realized Gain (Loss) | (3,255,682 | ) | (41,814 | ) | ||||
| Net Change in Unrealized Appreciation (Depreciation) on: | ||||||||
| Investments | 2,820,306 | (120,717 | ) | |||||
| Foreign Currency Translations | — | (143 | ) | |||||
| Net Change in Unrealized Appreciation (Depreciation) | 2,820,306 | (120,860 | ) | |||||
| Net Realized and Unrealized Gain (Loss) | (435,376 | ) | (162,674 | ) | ||||
| Net Increase (Decrease) in Net Assets Resulting from Operations | $ | 2,434,947 | $ | (154,920 | ) | |||
| (1) | The Supervision and Administration fees reflect the supervisory and administrative fee, which includes fees paid by the Funds for the investment advisory services provided by the Adviser. (See Note 3 in Notes to Financial Statements.) |
| (2) | Includes realized gains (losses) as a result of in-kind redemptions. (See Note 4 in Notes to Financial Statements.) |
| Statements of Changes in Net Assets |
| Global X Emerging Markets Bond ETF | Global X China Innovation ETF | |||||||||||||||
Period Ended May 31, 2023 (Unaudited) | Year Ended November 30, 2022 | Period Ended May 31, 2023 (Unaudited) | Year Ended November 30, 2022 | |||||||||||||
| Operations: | ||||||||||||||||
| Net Investment Income | $ | 2,870,323 | $ | 4,696,506 | $ | 7,754 | $ | 874 | ||||||||
| Net Realized Gain (Loss) | (3,255,682 | ) | (8,832,130 | ) | (41,814 | ) | (932,573 | ) | ||||||||
| Net Change in Unrealized Appreciation (Depreciation) | 2,820,306 | (12,732,226 | ) | (120,860 | ) | (425,844 | ) | |||||||||
| Net Increase (Decrease) in Net Assets | ||||||||||||||||
| Resulting from Operations | 2,434,947 | (16,867,850 | ) | (154,920 | ) | (1,357,543 | ) | |||||||||
| Distributions | (2,420,300 | ) | (6,235,363 | ) | — | — | ||||||||||
| Return of Capital | — | (63,760 | ) | — | (6,080 | ) | ||||||||||
| Capital Share Transactions: | ||||||||||||||||
| Issued | 22,588,276 | 19,243,135 | — | — | ||||||||||||
| Redeemed | (9,704,890 | ) | (33,991,128 | ) | — | (285,085 | ) | |||||||||
| Increase (Decrease) in Net Assets | ||||||||||||||||
| from Capital Share Transactions | 12,883,386 | (14,747,993 | ) | — | (285,085 | ) | ||||||||||
| Total Increase (Decrease) in Net | ||||||||||||||||
| Assets | 12,898,033 | (37,914,966 | ) | (154,920 | ) | (1,648,708 | ) | |||||||||
| Net Assets: | ||||||||||||||||
| Beginning of Year/Period | 98,476,049 | 136,391,015 | 2,155,735 | 3,804,443 | ||||||||||||
| End of Year/Period | $ | 111,374,082 | $ | 98,476,049 | $ | 2,000,815 | $ | 2,155,735 | ||||||||
| Share Transactions: | ||||||||||||||||
| Issued | 1,050,000 | 850,000 | — | — | ||||||||||||
| Redeemed | (450,000 | ) | (1,550,000 | ) | — | (20,000 | ) | |||||||||
| Net Increase (Decrease) in Shares | ||||||||||||||||
| Outstanding from Share | ||||||||||||||||
| Transactions | 600,000 | (700,000 | ) | — | (20,000 | ) | ||||||||||
| Financial Highlights |
| Net Asset Value, Beginning of Period ($) | Net Investment Income ($)* | Net Realized and Unrealized Gain (Loss) on Investments ($) | Total from Operations ($) | Distribution from Net Investment Income ($) | Distribution from Capital Gains ($) | Return of Capital ($) | ||||||||||||||||||||||
| Global X Emerging Markets Bond ETF | ||||||||||||||||||||||||||||
| 2023 (Unaudited) | 21.41 | 0.57 | (0.08 | ) | 0.49 | (0.48 | ) | — | — | |||||||||||||||||||
| 2022 | 25.73 | 0.93 | (4.02 | ) | (3.09 | ) | (0.91 | ) | (0.31 | ) | (0.01 | ) | ||||||||||||||||
| 2021 | 27.50 | 0.90 | (1.30 | ) | (0.40 | ) | (0.99 | ) | (0.38 | ) | — | |||||||||||||||||
2020 (1) | 25.00 | 0.49 | 2.47 | 2.96 | (0.46 | ) | — | — | ||||||||||||||||||||
| Global X China Innovation ETF | ||||||||||||||||||||||||||||
| 2023 (Unaudited) | 11.98 | 0.04 | (0.90 | ) | (0.86 | ) | — | — | — | |||||||||||||||||||
| 2022 | 19.02 | — | (7.01 | ) | (7.01 | ) | — | — | (0.03 | ) | ||||||||||||||||||
2021 (2) | 25.00 | (0.05 | ) | (5.93 | ) | (5.98 | ) | — | — | — | ||||||||||||||||||
| * | Per share data calculated using average shares method. |
| ** | Total Return is for the period indicated and has not been annualized. The return shown does not reflect the |
| deduction of taxes that a shareholder would pay on Fund distributions or the redemption of Fund shares. | |
| † | Annualized. |
| †† | Portfolio turnover rate is for the period indicated and periods of less than one year have not been |
| annualized. Excludes effect of in-kind transfers. | |
| (1) | The Fund commenced operations on June 1, 2020. |
| (2) | The Fund commenced operations on February 22, 2021. |
| Amounts designated as “—” are either $0 or have been rounded to $0. | |
| Financial Highlights |
Total from Distributions ($) | Net Asset Value, End of Period ($) | Total Return (%)** | Net Assets End of Period ($)(000) | Ratio of Expenses to Average Net Assets (%) | Ratio of Net Investment Income to Average Net Assets (%) | Portfolio Turnover (%)†† | |||||||||||||
| (0.48 | ) | 21.42 | 2.29 | 111,374 | 0.39 | † | 5.29 | † | 28.42 | ||||||||||
| (1.23 | ) | 21.41 | (12.26 | ) | 98,476 | 0.39 | 4.10 | 51.59 | |||||||||||
| (1.37 | ) | 25.73 | (1.60 | ) | 136,391 | 0.39 | 3.37 | 70.51 | |||||||||||
| 0.46 | ) | 27.50 | 11.91 | 68,739 | 0.39 | † | 3.72 | † | 38.12 | ||||||||||
| — | 11.12 | (7.18 | ) | 2,001 | 0.75 | † | 0.69 | † | 6.55 | ||||||||||
| (0.03 | ) | 11.98 | (36.87 | ) | 2,156 | 0.75 | 0.03 | 48.76 | |||||||||||
| — | 19.02 | (23.92 | ) | 3,804 | 0.75 | † | (0.30 | )† | 84.85 | ||||||||||
| Notes to Financial Statements |
| May 31, 2023 (Unaudited) |
1. ORGANIZATION
Global X Funds (the “Trust”) is a Delaware statutory trust formed on March 6, 2008. The Trust is registered under the Investment Company Act of 1940, as amended (the "1940 Act"), as an open-end management investment company. As of May 31, 2023, the Trust had one hundred and nineteen portfolios, one hundred and six of which were operational. The financial statements herein and the related notes pertain to the Global X Emerging Markets Bond ETF and the Global X China Innovation ETF (each a "Fund", collectively, the "Funds"). The Funds have elected non-diversified status under the 1940 Act.
2. SIGNIFICANT ACCOUNTING POLICIES
The following is a summary of the significant accounting policies followed by the Funds:
USE OF ESTIMATES – The Funds are investment companies that apply the accounting and reporting guidance issued in Topic 946 by the U.S. Financial Accounting Standards Board. The preparation of financial statements in conformity with U.S. generally accepted accounting principles (“U.S. GAAP”) requires management to make estimates and assumptions that affect the reported amounts of assets and liabilities and disclosure of contingent assets and liabilities at the date of the financial statements and the reported amounts of increases and decreases in net assets from operations during the reporting period. Actual results could materially differ from those estimates.
SECURITY VALUATION — Securities listed on a securities exchange, market or automated quotation system for which quotations are readily available (except for securities traded on the NASDAQ Stock Market ("NASDAQ")), including securities traded over the counter, are valued at the last quoted sale price on the primary exchange or market (foreign or domestic) on which they are traded (or at approximately 4:00 pm Eastern Standard Time if a security’s primary exchange is normally open at that time), or, if there is no such reported sale, at the most recent mean between the quoted bid and asked prices, which approximates fair value (absent both bid and asked prices on such exchange, the bid price may be used).
For securities traded on NASDAQ, the NASDAQ Official Closing Price will be used. The prices for foreign securities are reported in local currencies and converted to U.S. dollars using currency exchange rates as of the reporting date. The exchange rates used by the Trust for valuation are captured as of the New York or London close each day.
Securities for which market prices are not “readily available” are valued in accordance with fair value procedures (the "Fair Value Procedures") established by Global X Management Company LLC, the Funds' investment adviser (the "Adviser"), and approved by the of Trustees of the Trust (the "Board"). Pursuant to Rule 2a-5 under the 1940Act, the Board has designated the Adviser as the "valuation designee" to determine the fair value of securities and other instruments for which no readily available market quotations are available. The Fair Value Procedures are implemented through a Fair Value Committee
| Notes to Financial Statements (Continued) |
| May 31, 2023 (Unaudited) |
2. SIGNIFICANT ACCOUNTING POLICIES (continued)
(the “Committee”) of the Adviser. Some of the more common reasons that may necessitate that a security be valued using the Fair Value Procedures include: the security's trading has been halted or suspended; the security has been de-listed from its primary trading exchange; the security's primary trading market is temporarily closed at a time when, under normal conditions, it would be open; the security has not been traded for an extended period of time; the security's primary pricing source is not able or willing to provide a price; or trading of the security is subject to local government-imposed restrictions. In addition, each Fund may fair value a security if an event that may materially affect the value of a Funds’ security that traded outside of the United States (a “Significant Event”) has occurred between the time of the security's last close and the time that each Fund calculates its net asset value ("NAV"). A Significant Event may relate to a single issuer or to an entire market sector. Events that may be Significant Events include: government actions, natural disasters, armed conflict, acts of terrorism and significant market fluctuations. If the Adviser, becomes aware of a Significant Event that has occurred with respect to a security or group of securities after the closing of the exchange or market on which the security or securities principally trade, but before the time at which the Funds calculate their NAVs, it may request that a Committee meeting be called. When a security is valued in accordance with the Fair Value Procedures, the Committee will determine the value after taking into consideration all relevant information reasonably available to the Committee. As of May 31, 2023, there were no securities priced using the Fair Value Procedures.
If available, debt securities are priced based upon valuations provided by independent, third-party pricing agents. Such values generally reflect the last reported sales price if the security is actively traded. The third-party pricing agents may also value debt securities at an evaluated bid price by employing methodologies that utilize actual market transactions, broker-supplied valuations, or other methodologies designed to identify the market value for such securities. Debt obligations with remaining maturities of sixty days or less will be valued at their market value. Prices for most securities held by the Funds are provided daily by recognized independent pricing agents. If a security price cannot be obtained from an independent, third-party pricing agent, the Funds seek to obtain a bid price from at least one independent broker.
In accordance with the authoritative guidance on fair value measurements and disclosure under U.S. GAAP, the Funds disclose the fair value of their investments in a hierarchy that prioritizes the inputs to valuation techniques used to measure the fair value. The objective of a fair value measurement is to determine the price that would be received upon the sale of an asset or paid to transfer a liability in an orderly transaction between market participants at the measurement date (an exit price). Accordingly, the fair value hierarchy gives the highest priority to quoted prices (unadjusted) in active markets for identical assets or liabilities (Level 1) and the lowest priority to unobservable inputs (Level 3).
| Notes to Financial Statements (Continued) |
| May 31, 2023 (Unaudited) |
2. SIGNIFICANT ACCOUNTING POLICIES (continued)
The three levels of the fair value hierarchy are described below:
Level 1 – Unadjusted quoted prices in active markets for identical, unrestricted assets or liabilities that the Funds have the ability to access at the measurement date;
Level 2 – Other significant observable inputs (including quoted prices in non-active markets, quoted prices for similar investments, fair value of investments for which the Funds have the ability to fully redeem tranches at NAV as of the measurement date or within the near term, and short-term investments valued at amortized cost); and
Level 3 – Significant unobservable inputs (including the Funds’ own assumptions in determining the fair value of investments and fair value of investments for which the Funds do not have the ability to fully redeem tranches at NAV as of the measurement date or within the near term).
Investments are classified within the level of the lowest significant input considered in determining fair value. Investments classified within Level 3 whose fair value measurement considers several inputs may include Level 1 or Level 2 inputs as components of the overall fair value measurement. For details of the investment classification, reference the Schedule of Investments.
The unobservable inputs used to determine fair value of Level 3 assets may have similar or diverging impacts on valuation. Significant increases and decreases in these inputs in isolation and interrelationships between those inputs could result in significantly higher or lower fair value measurement.
DUE TO/FROM BROKERS — Due to/from brokers includes cash and collateral balances with the Funds’ clearing brokers or counterparties at May 31, 2023. The Funds continuously monitor the credit standing of each broker or counterparty with whom they conduct business. In the event a broker or counterparty is unable to fulfill its obligations, the Funds would be subject to counterparty credit risk.
FEDERAL INCOME TAXES — It is each Fund’s intention to qualify, or continue to qualify, as a regulated investment company for Federal income tax purposes by complying with the appropriate provisions of Subchapter M of the Internal Revenue Code of 1986, as amended. Accordingly, no provisions for Federal income taxes have been made in the financial statements except as described below.
The Funds evaluate tax positions taken or expected to be taken in the course of preparing the Funds’ tax returns to determine whether it is “more-likely-than-not” (i.e., greater than 50%) that each tax position will be sustained upon examination by a taxing authority based
| Notes to Financial Statements (Continued) |
| May 31, 2023 (Unaudited) |
2. SIGNIFICANT ACCOUNTING POLICIES (continued)
on the technical merits of the position. Tax positions not deemed to meet the more-likely-than-not threshold are recorded as a tax benefit or expense in the current year. The Funds did not record any tax positions in the current period; however, Management's conclusions regarding tax positions may be subject to review and adjustment at a later date based on factors including, but not limited to, examination by tax authorities (i.e., the last three tax year ends, as applicable), and on-going analysis of and changes to tax laws and regulations, and interpretations thereof. Any foreign tax filings that have not been made will be filed within the prescribed period.
As of and during the reporting period May 31, 2023, the Funds did not have a liability for any unrecognized tax benefits as an income tax expense on the Statements of Operations. During the period, the Funds did not incur any interest or penalties. The Funds are also not aware of any tax positions for which it is reasonably possible that the total amounts of unrecognized tax benefits will significantly change in the next 12 months.
SECURITY TRANSACTIONS AND INVESTMENT INCOME – Security transactions are accounted for on the trade date for financial reporting purposes. Costs used in determining realized gains and losses on the sale of investment securities are based on specific identification. Dividend income is recorded on the ex-dividend date. Interest income is recognized on the accrual basis from the settlement date. Amortization of premiums and accretion of discounts is included in interest income.
FOREIGN CURRENCY TRANSACTIONS AND TRANSLATION – The books and records of the Funds are maintained in U.S. dollars. Investment securities and other assets and liabilities denominated in a foreign currency are translated into U.S. dollars on the date of valuation. Purchases and sales of investment securities, income and expenses are translated into U.S. dollars at the relevant rates of exchange prevailing on the respective dates of such transactions. The Funds do not isolate that portion of realized or unrealized gains and losses resulting from changes in the foreign exchange rate from fluctuations arising from changes in the market prices of the securities. These gains and losses are included in net realized and unrealized gains and losses on investments on the Statements of Operations. Net realized and unrealized gains and losses on foreign currency transactions and translations represent net foreign exchange gains or losses from foreign currency spot contracts, disposition of foreign currencies, currency gains or losses realized between trade and settlement dates on securities transactions and the difference between the amount of the investment income and foreign withholding taxes recorded on the Funds' books and the U.S. dollar equivalent amounts actually received or paid.
DIVIDENDS AND DISTRIBUTIONS TO SHAREHOLDERS – The Funds distribute their net investment income on a pro rata basis. Any net realized capital gains are distributed annually. All distributions are recorded on the ex-dividend date.
| Notes to Financial Statements (Continued) |
| May 31, 2023 (Unaudited) |
2. SIGNIFICANT ACCOUNTING POLICIES (continued)
CASH OVERDRAFT CHARGES – Per the terms of the agreement with Brown Brothers Harriman & Co. ("BBH"), the Funds' custodian (“Custodian”), if a Fund for which BBH is Custodian has a cash overdraft on a given day, it will be assessed an overdraft charge equal to the applicable BBH Base Rate plus 2.00%. Per the terms of an agreement with BNY Mellon, if a Fund for which BNY Mellon is Custodian has a cash overdraft, it will be charged interest at a rate then charged by BNY Mellon to its institutional custody clients in the relevant currency. Cash overdraft charges are included in custodian fees on the Statements of Operations.
CREATION UNITS – The Funds issue and redeem their shares (“Shares”) on a continuous basis at NAV and only in large blocks of Shares (50,000 for Global X Emerging Markets Bond ETF and 10,000 for Global X China Innovation ETF), referred to as “Creation Units”. Purchasers of Creation Units (“Authorized Participants”) at NAV must pay a standard creation transaction fee per transaction. The fee is a single charge and will be the same regardless of the number of Creation Units purchased by an Authorized Participant on the same day.
An Authorized Participant who holds Creation Units and wishes to redeem at NAV would also pay a standard redemption fee per transaction to BBH, on the date of such redemption, regardless of the number of Creation Units redeemed that day. If a Creation Unit is purchased or redeemed for cash, an additional variable fee may be charged. The following table discloses the Creation Unit breakdown:
Creation Unit Shares | Creation Fee | Value at May 31, 2023 | Redemption Fee | ||||||||||||
| Global X Emerging Markets Bond ETF | 50,000 | $ | 500 | $ | 1,071,000 | $ | 500 | ||||||||
| Global X China Innovation ETF | 10,000 | 900 | 111,200 | 900 | |||||||||||
3. RELATED PARTIES AND SERVICE PROVIDER TRANSACTIONS
On July 2, 2018, the Adviser consummated a transaction pursuant to which it became an indirect, wholly-owned subsidiary of Mirae Asset Global Investments Co., Ltd. (“Mirae”). In this manner, the Adviser is ultimately controlled by Mirae, which is a leading financial services company in Korea and is the headquarters for the Mirae Asset Global Investments Group.
The Adviser serves as the investment adviser and the administrator for the Funds. Subject to the supervision of the Board, the Adviser is responsible for managing the investment activities of the Funds and the Funds’ business affairs and other administrative matters and provides, or causes to be furnished, all supervisory, administrative and other services reasonably necessary for the operation of the Funds, including certain distribution services (provided pursuant to a separate distribution agreement), certain shareholder and
| Notes to Financial Statements (Continued) |
| May 31, 2023 (Unaudited) |
3. RELATED PARTIES AND SERVICE PROVIDER TRANSACTIONS (continued)
distribution-related services (provided pursuant to a separate Rule 12b-1 Plan and related agreements) and investment advisory services (provided pursuant to a separate Investment Advisory Agreement), under what is essentially an "all-in" fee structure. For the Adviser’s services to the Funds, under a supervision and administration agreement (the "Supervision and Administration Agreement"), each Fund pays a monthly fee to the Adviser at the annual rate below (stated as a percentage of the average daily net assets of the Fund). In addition, the Funds bear other expenses, directly and indirectly, that are not covered by the Supervision and Administration Agreement, which may vary and affect the total expense ratios of the Funds, such as taxes, brokerage fees, commissions, custodian fees, acquired fund fees, and other transaction expenses, interest expenses and extraordinary expenses (such as litigation and indemnification expenses).
The following table discloses supervision and administration fees payable pursuant to the Supervision and Administration Agreement:
| Supervision and | ||||
| Administration Fee | ||||
| Global X Emerging Markets Bond ETF | 0.39 | % | ||
| Global X China Innovation ETF | 0.75 | % | ||
Sub-Adviser - Global X Emerging Markets Bond ETF:
The Adviser has entered into a sub-advisory agreement with Mirae Asset Global Investments (USA) LLC (the "Mirae USA Sub-Adviser"), an affiliate of the Adviser, under which the Adviser pays the Mirae USA Sub-Adviser for management and operational services it provides to the Global X Emerging Markets Bond ETF. The Mirae USA Sub-Adviser, subject to the supervision and oversight of the Board and the Adviser, is responsible for the management of the Global X Emerging Markets Bond ETF, and has discretion to buy or sell securities in accordance with the Global X Emerging Markets Bond ETF’s investment objective.
The Adviser may from time to time share certain of its profits with, or allocate other resources to, the Mirae USA Sub-Adviser. Any such payments by the Adviser to the Mirae USA Sub-Adviser will be from the Adviser’s own resources.
Sub-Adviser - Global X China Innovation ETF:
The Adviser has entered into a sub-advisory agreement with Mirae Asset Global Investments (Hong Kong) Limited (the "Mirae HK Sub-Adviser" and, together with the Mirae USA Sub-Adviser, the "Sub-Advisers" and, each, a "Sub-Adviser"), an affiliate of the Adviser, under which theAdviser pays the Mirae HK Sub-Adviser for management and operational services it provides to the Global X China Innovation ETF. The Mirae HK Sub-Adviser,
| Notes to Financial Statements (Continued) |
| May 31, 2023 (Unaudited) |
3. RELATED PARTIES AND SERVICE PROVIDER TRANSACTIONS (continued)
| Notes to Financial Statements (Continued) |
| May 31, 2023 (Unaudited) |
3. RELATED PARTIES AND SERVICE PROVIDER TRANSACTIONS (continued)
BBH serves as Custodian and transfer agent of the Funds’ assets. As Custodian, BBH has agreed to (1) make receipts and disbursements of money on behalf of the Funds, (2) collect and receive all income and other payments and distributions on account of the Funds’ portfolio investments, (3) respond to correspondence from shareholders, security brokers and others relating to its duties, and (4) make periodic reports to the Funds concerning the Funds’ operations. BBH does not exercise any supervisory function over the purchase and sale of securities. As compensation for these services, BBH receives certain out-of-pocket costs, transaction fees and asset-based fees which are accrued daily and paid monthly by the Adviser from its fees. As transfer agent, BBH has agreed to (1) issue and redeem Shares of each Fund, (2) make dividend and other distributions to shareholders of each Fund, (3) respond to correspondence by shareholders and others relating to its duties; (4) maintain shareholder accounts, and (5) make periodic reports to the Funds.
As compensation for these services, BBH receives certain out-of-pocket costs, transaction fees and asset-based fees which are accrued daily and paid monthly by the Adviser from its fees.
4. INVESTMENT TRANSACTIONS
For the period ended May 31, 2023, the purchases and sales of investments in securities excluding in-kind transactions, long-term U.S. Government, and short-term securities, were:
| Sales and | ||||||||
| Purchases | Maturities | |||||||
| Global X Emerging Markets Bond ETF | $ | 26,030,208 | $ | 30,138,585 | ||||
| Global X China Innovation ETF | 164,410 | 132,133 | ||||||
For the period ended May 31, 2023, in-kind transactions associated with creations and redemptions were:
| Realized | ||||||||||||
| 2023 | Purchases | Sales | Gain/(Loss) | |||||||||
| Global X Emerging Markets Bond ETF | $ | 22,014,917 | $ | 8,396,141 | $ | (671,261 | ) | |||||
| Global X China Innovation ETF | – | – | – | |||||||||
For the period ended May 31, 2023, the Global X Emerging Markets Bond ETF had purchases and sales of long-term U.S. Government securities of $2,515,727 and $974,258, respectively.
5. TAX INFORMATION
The amount and character of income and capital gain distributions to be paid, if any, are determined in accordance with Federal income tax regulations, which may differ from U.S. GAAP. As a result, net investment income (loss) and net realized gain (loss) on investment
| Notes to Financial Statements (Continued) |
| May 31, 2023 (Unaudited) |
5. TAX INFORMATION (continued)
transactions for a reporting period may differ significantly from distributions during such period. These book/tax differences may be temporary or permanent. To the extent these differences are permanent in nature, they are charged or credited to undistributed net investment income (loss), accumulated net realized gain (loss) or paid in capital, as appropriate, in the period that the differences arise.
The tax character of dividends and distributions declared during the year or period ended November 30, 2022 and November 30, 2021 was as follows:
| Global X Funds | Ordinary Income | Long-Term Capital Gain | Return of Capital | Totals | ||||||||||||
| Global X Emerging Markets Bond ETF | ||||||||||||||||
| 2022 | $ | 6,168,979 | $ | 66,384 | $ | 63,760 | $ | 6,299,123 | ||||||||
| 2021 | 4,845,615 | – | – | 4,845,615 | ||||||||||||
| Global X China Innovation ETF | ||||||||||||||||
| 2022 | $ | – | $ | – | $ | 6,080 | $ | 6,080 | ||||||||
| 2021 | – | – | – | – | ||||||||||||
As of November 30, 2022, the components of tax basis distributable earnings (accumulated losses) were as follows:
| Global X Funds | |||||||
Global X Emerging Markets Bond ETF | Global X China Innovation ETF | ||||||
| Capital Loss Carryforwards | (7,574,859 | ) | (1,425,881 | ) | |||
| Unrealized Depreciation on Investments and Foreign Currency | (15,595,375 | ) | (910,215 | ) | |||
| Other Temporary Differences | (8 | ) | – | ||||
| Total Accumulated Losses | $ | (23,170,242 | ) | (2,336,096 | ) | ||
For taxable years beginning after December 22, 2010, a registered investment company is permitted to carry forward net capital losses to offset capital gains realized in later years, and the losses carried forward retain their original character as either long-term or short-term losses. Losses carried forward under these provisions are as follows:
| Short-Term | Long-Term | ||||||||||
| Loss | Loss | Total | |||||||||
| 8018 Global X Emerging Markets Bond ETF | $ | 3,710,296 | $ | 3,864,563 | $ | 7,574,859 | |||||
| 8030 Global X China Innovation ETF | 1,015,267 | 410,614 | 1,425,881 | ||||||||
| Notes to Financial Statements (Continued) |
| May 31, 2023 (Unaudited) |
5. TAX INFORMATION (continued)
The Federal tax cost and aggregate gross unrealized appreciation and depreciation on investments held by the Funds at May 31, 2023 was as follows:
Federal Tax Cost | Aggregated Gross Unrealized Appreciation | Aggregated Gross Unrealized Depreciation | Net Unrealized Depreciation | |||||||||||||
| Global X Funds | ||||||||||||||||
| Global X Emerging Markets Bond ETF | $ | 123,152,186 | $ | 398,159 | $ | (14,618,193 | ) | $ | (14,220,034 | ) | ||||||
| Global X China Innovation ETF | 2,766,426 | 26,853 | (956,368 | ) | (929,515 | ) | ||||||||||
The difference between book-basis and tax-basis unrealized appreciation (depreciation) is due to differences in the timing of recognition of gains and losses on investments for tax and book purposes. The Funds’ net unrealized depreciation difference is attributable primarily to wash sales and defaulted bonds.
Qualified late year ordinary (including currency and specified gain/loss items) and Post-October capital losses represent losses realized from January 1, 2022 through November 30, 2022 and November 1, 2022 through November 30, 2022, respectively, that in accordance with federal income tax regulations, the Funds have elected to defer and treat as having arisen in the following fiscal year.
6. CONCENTRATION OF RISKS
The Funds invest in securities of foreign issuers in several countries. These investments may involve certain considerations and risks not typically associated with investments in the United States as a result of, among other factors, the possibility of future political and economic developments and the level of governmental supervision and regulation of securities markets in the respective countries. The securities markets of emerging market countries are less liquid and subject to greater price volatility, and have a smaller market capitalization than the U.S. securities markets.
In certain countries, there may be fewer publicly traded securities and the market may be dominated by a few issuers or sectors. Issuers and securities markets in such countries are not subject to as extensive and frequent accounting, financial and other reporting requirements or as comprehensive government regulations or issuers and securities markets in the U.S. In particular, the assets and profits appearing on the financial statements of emerging market country issuers may not reflect their financial position or results of operations in the same manner as financial statements for U.S. issuers.
Substantially less information may be publicly available about emerging market country issuers than is available about issuers in the United States. There may be significant obstacles to obtaining information necessary for investigations into or litigation against emerging market companies and shareholders may have limited legal remedies.
| Notes to Financial Statements (Continued) |
| May 31, 2023 (Unaudited) |
6. CONCENTRATION OF RISKS (continued)
Special Risk Considerations of Investing in China – Variable Interest Entity Investments. For purposes of raising capital offshore on exchanges outside of China, including on U.S. exchanges, many Chinese-based operating companies are structured as Variable Interest Entities (“VIEs”). In this structure, the Chinese-based operating company is the VIE and establishes a shell company in a foreign jurisdiction, such as the Cayman Islands. The shell company lists on a foreign exchange and enters into contractual arrangements with the VIE. This structure allows Chinese companies in which the government restricts foreign ownership to raise capital from foreign investors. While the shell company has no equity ownership of the VIE, these contractual arrangements permit the shell company to consolidate the VIE’s financial statements with its own for accounting purposes and provide for economic exposure to the performance of the underlying Chinese operating company. Therefore, an investor in the listed shell company, such as certain of the Funds, will have exposure to the Chinese-based operating company only through contractual arrangements and has no ownership in the Chinese-based operating company. Furthermore, because the shell company only has specific rights provided for in these service agreements with the VIE, its abilities to control the activities at the Chinese-based operating company are limited and the operating company may engage in activities that negatively impact investment value. While the VIE structure has been widely adopted, it is not formally recognized under Chinese law and therefore there is a risk that the Chinese government could prohibit the existence of such structures or negatively impact the VIE’s contractual arrangements with the listed shell company by declaring them invalid. If these contracts were found to be unenforceable under Chinese law, investors in the listed shell company, such as a Fund, may suffer significant losses with little or no recourse available. If the Chinese government determines that the agreements establishing the VIE structures do not comply with Chinese law and regulations, including those related to restrictions on foreign ownership, it could subject a Chinese-based issuer to penalties, revocation of business and operating licenses, or forfeiture of ownership interest. In addition, the listed shell company’s control over a VIE may also be jeopardized if a natural person who holds the equity interest in the VIE breaches the terms of the agreement, is subject to legal proceedings or if any physical instruments for authenticating documentation, such as chops and seals, are used without the Chinese-based issuer’s authorization to enter into contractual arrangements in China. Chops and seals, which are carved stamps used to sign documents, represent a legally binding commitment by the company. Moreover, any future regulatory action may prohibit the ability of the shell company to receive the economic benefits of the Chinese based operating company, which may cause the value of a Fund’s investment in the listed shell company to suffer a significant loss. For example, in 2021, the Chinese government prohibited use of the VIE structure for investment in after-school tutoring companies. There is no guarantee that the government will not place similar restrictions on other industries.
On June 3, 2021, President Biden expanded upon a previously issued executive order that prohibited U.S. persons from transacting in publicly traded securities designated by the U.S. Department of Defense as “Communist Chinese Military Companies” or “CCMCs”
| Notes to Financial Statements (Continued) |
| May 31, 2023 (Unaudited) |
6. CONCENTRATION OF RISKS (continued)
or in instruments that are derivative of, or are designed to provide investment exposure to, prohibited CCMC securities. President Biden’s executive order (the "Executive Order") retains the structure of the investment-based CCMC sanctions program introduced in late 2020 but expands the prohibitions to address threats from the use of Chinese surveillance technology outside the People’s Republic of China and the development or use of Chinese surveillance technology to facilitate repression or serious human rights abuse.
Under the Executive Order, U.S. persons will be prohibited from engaging in the purchase or sale of publicly traded securities, as well as securities derivative of, or designed to provide investment exposure to, such securities. This prohibition took effect on August 2, 2021 for entities listed in the Appendix to the Executive Order (and 60 days after designation, with respect to subsequently designated entities). In addition, U.S. persons will be required to divest of targeted securities of entities listed in the Appendix to the Executive Order by June 3, 2022 (or 365 days from designation, with respect to subsequently designated entities).
The Executive Order replaces the previous list of CCMCs with a new Non-SDN Chinese Military Industrial Complex Companies List. The U.S. Department of the Treasury, rather than the U.S. Department of Defense, will make designations going forward.
These actions, any future sanctions or other actions, or even the threat of further sanctions or other actions, may negatively affect the value and liquidity of certain of the Funds’ investments. For example, a Fund may be prohibited from investing in securities issued by companies subject to such sanctions. In addition, sanctions may require a Fund to freeze its existing investments, prohibiting such Fund from buying, selling or otherwise transacting in these investments.
Each Fund may be subject to taxes imposed by countries in which it invests. Such taxes are generally based on either income, gains earned or gains repatriated. The Funds accrue and apply such taxes to net investment income, net realized gains and net unrealized gains as income and/or capital gains are earned.
The elimination of the London Inter-Bank Offered Rate ("LIBOR") may adversely affect the interest rates on, and value of, certain Fund investments for which the value is tied to LIBOR. The U.K. Financial Conduct Authority has announced that it intends to stop compelling or inducing banks to submit LIBOR rates after 2021. On March 5, 2021, the administrator of LIBOR clarified that the publication of LIBOR on a representative basis will cease for the one-week and two-month U.S. dollar LIBOR settings immediately after December 31, 2021, and for the remaining U.S. dollar LIBOR settings immediately after June 30, 2023. Alternatives to LIBOR are established or in development in most major currencies, including the Secured Overnight Financing Rate ("SOFR"), which is intended to replace U.S. dollar LIBOR. Markets are slowly developing in response to these new rates. Questions around impacts on liquidity resulting from this transition, and how to
| Notes to Financial Statements (Continued) |
| May 31, 2023 (Unaudited) |
6. CONCENTRATION OF RISKS (continued)
appropriately adjust these rates at the time of transition, remain a concern for the Funds. Accordingly, it is difficult to predict the full impact of the transition away from LIBOR on the Funds until new reference rates and fallbacks for both legacy and new products, instruments and contracts are commercially accepted.
Economic conditions, such as volatile currency exchange rates and interest rates, political events, military action and other conditions may, without prior warning, lead to foreign government intervention (including intervention by the U.S. Government with respect to foreign governments, economic sectors, foreign companies and related securities and interests) and the imposition of capital controls (i.e., government measures designed to limit the flow of foreign capital in and out of the domestic economy) and/or sanctions, which may also include retaliatory actions of one government against another government, such as the seizure of assets. Capital controls and/or sanctions include the prohibition of, or restrictions on, the ability to transfer currency, securities or other assets. Capital controls and/or sanctions may also impact the ability of the Funds to buy, sell or otherwise transfer securities or currency, negatively impact the value and/or liquidity of such instruments, adversely affect the trading market and price for Shares of the Funds, and cause the Funds to decline in value.
A more complete description of risks is included in the Funds’ Prospectus and Statement of Additional Information.
7. LOANS OF PORTFOLIO SECURITIES
Each Fund may lend portfolio securities having a market value up to one-third of its total assets. Security loans made pursuant to a securities lending agreement are initially required to be secured by collateral equal to at least 102% for U.S.-based securities and 105% for foreign based securities. Such collateral received in connection with these loans will be cash and can be invested in repurchase agreements or U.S. Treasury obligations and is recognized in the Schedules of Investments and Statements of Assets and Liabilities. The obligation to return securities lending collateral is also recognized as a liability in the Statements of Assets and Liabilities. It is the Funds’ policy to obtain additional collateral from or return excess collateral to the borrower by the end of the next business day, following the valuation date of the securities loaned. Therefore, the value of the collateral held may be temporarily less than the value of the securities on loan.
Lending securities entails a risk of loss to the Funds if and to the extent that the market value of the securities loans were to increase and the borrower did not increase the collateral accordingly, and the borrower failed to return the securities. In the event the borrower may not provide additional collateral when required or may not return the securities when due, the securities lending agency agreement requires the lending agent to indemnify the Funds by replacing either the security or the security's current market value to the Funds. The Funds could also experience delays and costs in gaining access to the collateral. The Funds
| Notes to Financial Statements (Concluded) |
| May 31, 2023 (Unaudited) |
7. LOANS OF PORTFOLIO SECURITIES (continued)
bear the risk of any deficiency in the amount of the collateral available for return to the borrower due to any loss on the collateral invested. As of May 31, 2023, the Funds had no securities on loan.
8. CONTRACTUAL OBLIGATION
The Funds enter into contracts in the normal course of business that contain a variety of indemnifications. The Funds’ maximum exposure under these arrangements is unknown. However, the Funds have not had prior gains or losses pursuant to these contracts.
Management has reviewed the Funds’ existing contracts and expects the risk of loss to be remote.
Pursuant to the Trust’s organizational documents, the Trustees of the Trust and the Trust’s officers are indemnified against certain liabilities that may arise out of the performance of their duties.
9. SUBSEQUENT EVENTS
The custodian, transfer agent and securities lending agent for Global X Emerging Markets Bond ETF transitioned from Brown Brothers Harriman & Co. to The Bank of New York Mellon on or about June 26, 2023.
The Funds have been evaluated by management regarding the need for additional disclosures (other than what is disclosed in the preceding paragraph) and/or adjustments resulting from subsequent events. Based on this evaluation, no additional adjustments were required to the financial statements.
Disclosure of Fund Expenses (Unaudited) |
ETFs (such as the Funds) have operating expenses. As a shareholder of an ETF, your investment is affected by these ongoing costs, which include (among others) costs for ETF management, administrative services, brokerage fees, and shareholder reports like this one. It is important for you to understand the impact of these costs on your investment returns. In addition, a shareholder is responsible for brokerage fees as a result of the shareholder’s investment in a Fund.
Operating expenses such as these are deducted from a Fund’s gross income and directly reduce your final investment returns. These expenses are expressed as a percentage of the Fund’s average net assets; this percentage is known as the Fund’s expense ratio.
The following examples use the expense ratio and are intended to help you understand the ongoing costs (in dollars) of investing in a Fund and to compare these costs with those of other funds. The examples are based on an investment of $1,000 made at the beginning of the period shown and held for the entire period from December 1, 2022 to May 31, 2023.
The table on the next page illustrates your Funds’ costs in two ways:
Actual Fund Return. This section helps you to estimate the actual expenses that your Fund incurred over the period. The “Expenses Paid During Period” column shows the actual dollar expense cost incurred by a $1,000 investment in the Fund, and the “Ending Account Value” number is derived from deducting that expense cost from the Fund’s gross investment return.
You can use this information, together with the actual amount you invested in a Fund, to estimate the expenses you paid over that period. Simply divide your actual account value by $1,000 to arrive at a ratio (for example, an $8,600 account value divided by $1,000 = 8.6), then multiply that ratio by the number shown for your Fund under “Expenses Paid During Period.”
Hypothetical 5% Return. This section helps you compare your Fund’s costs with those of other funds. It assumes that the Fund had an annual 5% return before expenses during the year, but that the expense ratio (Column 3) for the period is unchanged. This example is useful in making comparisons because the Securities and Exchange Commission requires all funds to make this 5% calculation. You can assess your Fund’s comparative cost by comparing the hypothetical result for your Fund in the “Expenses Paid During Period” column with those that appear in the same charts in the shareholder reports for other funds.
NOTE: Because the return is set at 5% for comparison purposes — NOT your Fund’s actual return — the account values shown may not apply to your specific investment.
| Disclosure of Fund Expenses (Unaudited) (Concluded) |
Beginning Account Value 12/1/2022 | Ending Account Value 5/31/2023 | Annualized Expense Ratios | Expenses Paid During Period(1) | |||||||||||||
| Global X Emerging Markets Bond ETF | ||||||||||||||||
| Actual Fund Return | $ | 1,000.00 | $ | 1,022.90 | 0.39 | % | $ | 1.97 | ||||||||
| Hypothetical 5% Return | 1,000.00 | 1,022.99 | 0.39 | 1.97 | ||||||||||||
| Global X China Innovation ETF | ||||||||||||||||
| Actual Fund Return | $ | 1,000.00 | $ | 928.20 | 0.75 | % | $ | 3.61 | ||||||||
| Hypothetical 5% Return | 1,000.00 | 1,021.19 | 0.75 | 3.78 | ||||||||||||
| (1) | Expenses are equal to the Fund's annualized expense ratio multiplied by the average account value over the period, multiplied by 182/365 (to reflect the one-half year period). |
| Liquidity Risk Management Program (Unaudited) |
Pursuant to Rule 22e-4 under the 1940 Act, the Funds’ investment adviser has adopted, and the Board has approved, a liquidity risk management program (the “Program”) to govern the Funds’ approach to managing liquidity risk. The Program is overseen by the Funds’ Liquidity Risk Management Committee (the “Committee”), and the Program’s principal objectives include assessing, managing and periodically reviewing each Fund’s liquidity risk, based on factors specific to the circumstances of the Funds.
At a meeting of the Board held on May 19, 2023, the Trustees received a report from the Committee addressing the operations of the Program and assessing its adequacy and effectiveness of implementation for the period from January 1, 2022 through December 31, 2022. The Committee’s report noted that the Committee had determined that the Program is reasonably designed to assess and manage each Fund’s Liquidity Risk and operated adequately and effectively to manage each Fund’s Liquidity Risk for the period covered by the report. The Committee’s report noted that during the period covered by the report, there were no liquidity events that impacted the Funds or their ability to timely meet redemptions without dilution to existing shareholders. The Committee’s report noted that one Fund, the Global X Nigeria Fund, was classified as an In-Kind Fund for purposes of Liquidity Reporting. The Committee’s report noted that no other material changes have been made to the Program since its implementation.
There can be no assurance that the Program will achieve its objectives in the future. Please refer to the prospectus for more information regarding a Fund’s exposure to liquidity risk and other principal risks to which an investment in the Funds may be subject.
| Supplemental Information (Unaudited) |
Net asset value, or “NAV”, is the price per Share at which a Fund issues and redeems Shares. It is calculated in accordance with the standard formula for valuing mutual fund shares. The “Market Price” of a Fund generally is determined using the midpoint between the highest bid and the lowest offer on the stock exchange on which the Shares of the Fund are listed for trading, as of the time that the Fund’s NAV is calculated. The Fund’s Market Price may be at, above or below its NAV. The NAV of a Fund will fluctuate with changes in the market value of the Fund’s holdings. The Market Price of a Fund will fluctuate in accordance with changes in its NAV, as well as market supply and demand.
Premiums or discounts are the differences (expressed as a percentage) between the NAV and Market Price of a Fund on a given day, generally at the time NAV is calculated. A premium is the amount that a Fund is trading above the reported NAV, expressed as a percentage of the NAV. A discount is the amount that a Fund is trading below the reported NAV, expressed as a percentage of the NAV.
Further information regarding premiums and discounts is available on the Funds’ website at www.globalxetfs.com.
| 605 3rd Avenue, 43rd Floor |
| New York, NY 10158 |
| 1-888-493-8631 |
| www.globalxetfs.com |
| Investment Adviser and Administrator: |
| Global X Management Company LLC |
| 605 3rd Avenue, 43rd Floor |
| New York, NY 10158 |
| Sub-Adviser - Global X Emerging Markets Bond ETF: |
| Mirae Asset Global Investments (USA) LLC |
| 1212 Avenue of the Americas, 10th Floor |
| New York, NY 10036 |
| Sub-Adviser - Global X China Innovation ETF: |
| Mirae Asset Global Investments (Hong Kong) Limited |
| Unit 1101, 11/F, Lee Garden Three |
| 1 Sunning Road |
| Causeway Bay, Hong Kong |
| Distributor: |
| SEI Investments Distribution Co. |
| One Freedom Valley Drive |
| Oaks, PA 19456 |
| Sub-Administrator: |
| SEI Investments Global Funds Services |
| One Freedom Valley Drive |
| Oaks, PA 19456 |
| Counsel for Global X Funds and the Independent Trustees: |
| Stradley Ronon Stevens & Young, LLP |
| 2000 K Street, N.W. |
| Suite 700 |
| Washington, DC 20006 |
| Custodians and Transfer Agents: |
| Brown Brothers Harriman & Co. |
| 50 Post Office Square |
| Boston, MA 02110 |
| The Bank of New York Mellon |
| 240 Greenwich Street |
| New York, NY 10286 |
| Independent Registered Public Accounting Firm: |
| PricewaterhouseCoopers LLP |
| Two Commerce Square |
| Suite 1800 |
| 2001 Market Street |
| Philadelphia, PA 19103 |
This information must be preceded or accompanied by a current prospectus for the Funds described.
GLX-SA-006-1100
| (Registrant) | Global X Funds |
| By (Signature and Title) | /s/ Luis Berruga Luis Berruga President |
| By (Signature and Title) | /s/ Luis Berruga Luis Berruga President |
| By (Signature and Title) | /s/ John Belanger John Belanger Chief Financial Officer |