Global X Management Company LLC 605 Third Avenue, 43rd floor New York, NY 10158 | Eric S. Purple, Esq. Stradley Ronon Stevens & Young, LLP 2000 K Street, N.W., Suite 700 Washington, DC 20006-1871 |
Global X MSCI Colombia ETF (ticker: GXG)
Global X MSCI China Industrials ETF (ticker: CHII)
Global X MSCI China Consumer Discretionary ETF (ticker: CHIQ)
Global X MSCI China Communication Services ETF (ticker: CHIC)
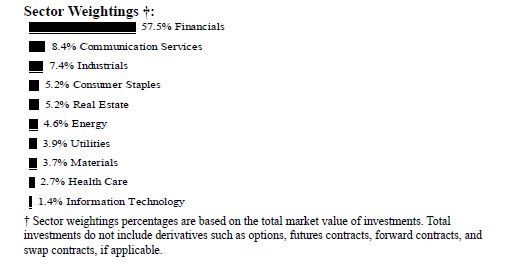
Global X MSCI China Financials ETF (ticker: CHIX)
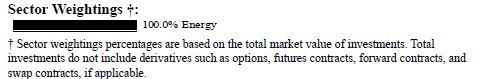
Global X MSCI China Energy ETF (ticker: CHIE)
Global X MSCI China Materials ETF (ticker: CHIM)
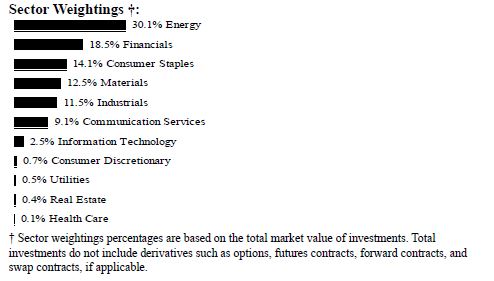
Global X MSCI Norway ETF (ticker: NORW)
Global X FTSE Southeast Asia ETF (ticker: ASEA)
Global X MSCI Argentina ETF (ticker: ARGT)
Global X MSCI Greece ETF (ticker: GREK)
Global X MSCI Nigeria ETF (ticker: NGE)
Global X MSCI Next Emerging & Frontier ETF (ticker: EMFM)
Global X MSCI Portugal ETF (ticker: PGAL)
Global X DAX Germany ETF (ticker: DAX)
Global X MSCI Pakistan ETF (ticker: PAK)
Global X MSCI China Consumer Staples ETF (ticker: CHIS)
Global X MSCI China Health Care ETF (ticker: CHIH)
Global X MSCI China Information Technology ETF (ticker: CHIK)
Global X MSCI China Utilities ETF (ticker: CHIU)
Global X MSCI China Real Estate ETF (ticker: CHIR)
Global X MSCI Vietnam ETF (ticker: VNAM)
Semi-Annual Report
April 30, 2023
As permitted by regulations adopted by the Securities and Exchange Commission, paper copies of the Fund’s(defined below) shareholder reports will no longer be sent by mail, unless you specifically request paper copies of the reports from your financial intermediary (such as a broker-dealer or bank). Instead, shareholder reports will be available on the Fund’s website (www. globalxetfs.com/explore), and you will be notified by mail each time a report is posted and provided with a website link to access the report.
If you already elected to receive shareholder reports electronically, you will not be affected by this change and you need not take any action. You may elect to receive shareholder reports and other communications from the Fund electronically anytime by contacting your financial intermediary.
You may elect to receive all future Fund shareholder reports in paper free of charge. Please contact your financial intermediary to inform them that you wish to continue receiving paper copies of Fund shareholder reports and for details about whether your election to receive reports in paper will apply to all funds held with your financial intermediary.
| Table of Contents |
| Schedules of Investments | |
| Global X MSCI Colombia ETF | 1 |
| Global X MSCI China Industrials ETF | 5 |
| Global X MSCI China Consumer Discretionary ETF | 9 |
| Global X MSCI China Communication Services ETF | 13 |
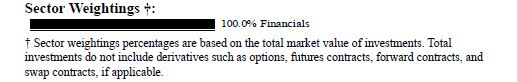
| Global X MSCI China Financials ETF | 15 |
| Global X MSCI China Energy ETF | 18 |
| Global X MSCI China Materials ETF | 20 |
| Global X MSCI Norway ETF | 24 |
| Global X FTSE Southeast Asia ETF | 29 |
| Global X MSCI Argentina ETF | 33 |
| Global X MSCI Greece ETF | 37 |
| Global X MSCI Nigeria ETF | 40 |
| Global X MSCI Next Emerging & Frontier ETF | 43 |
| Global X MSCI Portugal ETF | 57 |
| Global X DAX Germany ETF | 60 |
| Global X MSCI Pakistan ETF | 63 |
| Global X MSCI China Consumer Staples ETF | 65 |
| Global X MSCI China Health Care ETF | 68 |
| Global X MSCI China Information Technology ETF | 72 |
| Global X MSCI China Utilities ETF | 76 |
| Global X MSCI China Real Estate ETF | 78 |
| Global X MSCI Vietnam ETF | 80 |
| Glossary | 84 |
| Statements of Assets and Liabilities | 85 |
| Statements of Operations | 91 |
| Statements of Changes in Net Assets | 97 |
| Financial Highlights | 109 |
| Notes to Financial Statements | 125 |
| Disclosure of Fund Expenses | 153 |
| Approval of Investment Advisory Agreement | 157 |
| Supplemental Information | 161 |
Shares are bought and sold at market price (not NAV) and are not individually redeemed from a Fund. Shares may only be redeemed directly from a Fund by Authorized Participants, in very large creation/redemption units. Brokerage commissions will reduce returns.
The Funds file their complete schedules of Fund holdings with the Securities and Exchange Commission (the “SEC” or “Commission”) for the first and third quarters of each fiscal year as an exhibit to its reports on Form N-PORT. The Funds’ Forms N-PORT are available on the Commission’s website at https://www.sec.gov, and may be reviewed and copied at the Commission's Public Reference Room in Washington, DC. Information on the operation of the Public Reference Room may be obtained by calling 1-800-SEC-0330.
A description of the policies and procedures that Global X Funds uses to determine how to vote proxies relating to Fund securities, as well as information relating to how the Funds voted proxies relating to Fund securities during the most recent 12-month period ended June 30, is available (i) without charge, upon request, by calling 1-888-493-8631; and (ii) on the Commission’s website at https://www.sec.gov.
| Schedule of Investments | April 30, 2023 (Unaudited) | |
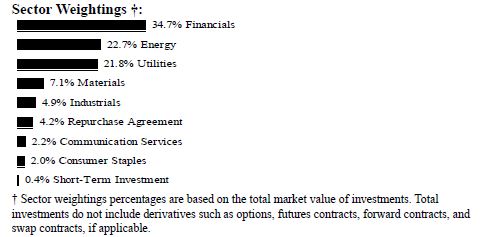
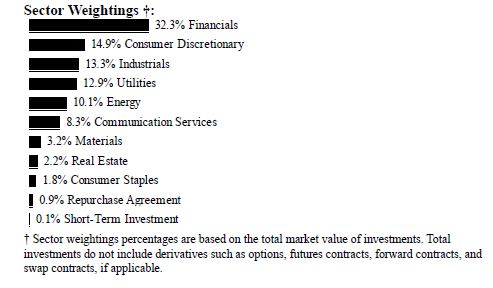
| Global X MSCI Colombia ETF | ||
| Shares | Value | |||||||
| COMMON STOCK — 76.3% | ||||||||
| BRAZIL — 2.1% | ||||||||
| Consumer Staples — 2.1% | ||||||||
| Cia Brasileira de Distribuicao * | 188,865 | $ | 566,272 | |||||
| CANADA — 2.9% | ||||||||
| Energy — 2.9% | ||||||||
| Parex Resources | 38,291 | 776,661 | ||||||
| CHILE — 4.8% | ||||||||
| Energy — 2.3% | ||||||||
| Empresas Copec . | 87,727 | 614,245 | ||||||
| Utilities — 2.5% | ||||||||
| Enel Americas | 5,047,182 | 692,063 | ||||||
| TOTAL CHILE | 1,306,308 | |||||||
| COLOMBIA — 56.6% | ||||||||
| Energy — 18.4% | ||||||||
| Canacol Energy (A) | 81,258 | 602,111 | ||||||
| Ecopetrol | 7,133,548 | 3,501,804 | ||||||
| Geopark . | 84,303 | 921,431 | ||||||
| 5,025,346 | ||||||||
| Shares | Value | |||||||
| COMMON STOCK — continued | ||||||||
| Financials — 13.3% | ||||||||
| Bancolombia . | 264,658 | $ | 2,044,173 | |||||
| Financiera Colombiana | 279,056 | 795,695 | ||||||
| Grupo de Inversiones Suramericana . | 86,095 | 777,476 | ||||||
| 3,617,344 | ||||||||
| Materials — 7.4% | ||||||||
| Cementos Argos | 1,249,183 | 828,161 | ||||||
| Grupo Argos . | 622,102 | 1,181,232 | ||||||
| 2,009,393 | ||||||||
| Utilities — 17.5% | ||||||||
| Celsia ESP | 1,388,453 | 869,850 | ||||||
| Grupo Energia Bogota ESP | 4,296,381 | 1,659,226 | ||||||
| Interconexion Electrica | 575,594 | 2,247,594 | ||||||
| 4,776,670 | ||||||||
| TOTAL COLOMBIA | 15,428,753 | |||||||
| GUATEMALA — 2.3% | ||||||||
| Communication Services — 2.3% | ||||||||
| Millicom International Cellular SDR * (A) | 34,569 | 618,937 | ||||||
| UNITED STATES — 7.6% | ||||||||
| Industrials — 5.0% | ||||||||
| Tecnoglass | 31,386 | 1,376,276 | ||||||
| Utilities — 2.6% | ||||||||
| Brookfield Renewable, Cl A (A) | 20,959 | 699,561 | ||||||
| TOTAL UNITED STATES | 2,075,837 | |||||||
| TOTAL COMMON STOCK | ||||||||
| (Cost $25,876,061) | 20,772,768 | |||||||
| PREFERRED STOCK — 22.7% | ||||||||
| COLOMBIA— 22.7% | ||||||||
| Financials — 22.7% | ||||||||
| Banco Davivienda (B) | 213,452 | 966,302 | ||||||
| Bancolombia (B) | 571,509 | 3,568,176 | ||||||
| Grupo Aval Acciones y Valores (B) | 8,800,311 | 1,110,211 | ||||||
| Shares | Value | |||||||
| PREFERRED STOCK — continued | ||||||||
| Financials — continued | ||||||||
| Grupo de Inversiones Suramericana (B) | 218,301 | $ | 543,306 | |||||
| TOTAL COLOMBIA | 6,187,995 | |||||||
| TOTAL PREFERRED STOCK | ||||||||
| (Cost $11,416,893) | 6,187,995 | |||||||
| SHORT-TERM INVESTMENT(C)(D) — 0.4% | ||||||||
| Fidelity Investments Money Market | ||||||||
| Government Portfolio, Cl Institutional, | ||||||||
| 4.770% | ||||||||
| (Cost $107,278) | 107,278 | 107,278 | ||||||
| Face Amount | ||||||||
| REPURCHASE AGREEMENT(C) — 4.4% | ||||||||
| BNP Paribas | ||||||||
| 4.700%, dated 04/28/2023, to be repurchased | ||||||||
| on 05/01/2023, repurchase price $1,199,160 | ||||||||
| (collateralized by U.S. Treasury Obligations, | ||||||||
| ranging in par value $64,397 - $96,784, | ||||||||
| 1.125% - 2.250%, 01/15/2025 - 08/15/2027, | ||||||||
| with a total market value of $1,220,240) | ||||||||
| (Cost $1,198,692) | $ | 1,198,692 | 1,198,692 | |||||
| TOTAL INVESTMENTS — 103.8% | ||||||||
| (Cost $38,598,924) | $ | 28,266,733 | ||||||
| Percentages are based on Net Assets of $27,234,867. | ||||||||
| * Non-income producing security. | ||||||||
| (A) This security or a partial position of this security is on loan at April 30, 2023. | ||||||||
| (B) There is currently no stated interest rate. | ||||||||
| (C) Security was purchased with cash collateral held from securities on loan. | ||||||||
| (D) The rate reported on the Schedule of Investments is the 7-day effective yield as of April 30, 2023. | ||||||||
The following is a summary of the level of inputs used as of April 30, 2023, in valuing the Fund's investments carried at value:
| Investments in Securities | Level 1 | Level 2 | Level 3 | Total | ||||||||||||
| Common Stock | $ | 20,772,768 | $ | — | $ | — | $ | 20,772,768 | ||||||||
| Preferred Stock | 6,187,995 | — | — | 6,187,995 | ||||||||||||
| Short-Term Investment | 107,278 | — | — | 107,278 | ||||||||||||
| Repurchase Agreement | — | 1,198,692 | — | 1,198,692 | ||||||||||||
| Total Investments in Securities | $ | 27,068,041 | $ | 1,198,692 | $ | — | $ | 28,266,733 | ||||||||
Amounts designated as “—“ are $0 or have been rounded to $0.
See “Glossary” for abbreviations.
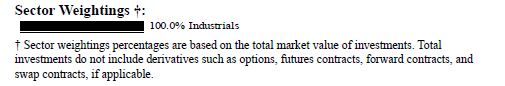
| Schedule of Investments | April 30, 2023 (Unaudited) | |
| Global X MSCI China Industrials ETF | ||
| Shares | Value | |||||||
| COMMON STOCK — 99.8% | ||||||||
| CHINA — 97.5% | ||||||||
| Industrials — 97.5% | ||||||||
| AECC Aero-Engine Control, Cl A | 4,300 | $ | 14,807 | |||||
| AECC Aviation Power, Cl A . | 8,485 | 53,631 | ||||||
| Air China, Cl A * | 24,560 | 37,780 | ||||||
| Air China, Cl H * | 97,000 | 85,509 | ||||||
| AviChina Industry & Technology, Cl H . | 129,710 | 69,896 | ||||||
| AVICOPTER, Cl A . | 1,940 | 11,915 | ||||||
| Beijing Capital International Airport, Cl H * | 98,981 | 76,916 | ||||||
| Beijing Easpring Material Technology, Cl A | 1,700 | 13,139 | ||||||
| Beijing New Building Materials, Cl A . | 5,520 | 21,145 | ||||||
| Beijing United Information Technology, Cl A .. | 1,586 | 13,775 | ||||||
| BOC Aviation . | 10,960 | 86,564 | ||||||
| China Baoan Group, Cl A . | 8,580 | 13,223 | ||||||
| China Communications Services, Cl H . | 125,800 | 68,750 | ||||||
| China Conch Venture Holdings . | 85,730 | 136,296 | ||||||
| China CSSC Holdings, Cl A | 14,110 | 52,806 | ||||||
| China Eastern Airlines, Cl A * | 36,800 | 27,534 | ||||||
| China Energy Engineering, Cl A . | 103,800 | 40,631 | ||||||
| China Everbright Environment Group . | 193,550 | 81,859 | ||||||
| China Lesso Group Holdings . | 57,390 | 49,422 | ||||||
| China Merchants Port Holdings . | 73,581 | 108,920 | ||||||
| China National Chemical Engineering, Cl A . | 19,720 | 30,164 | ||||||
| China Railway Group, Cl A | 64,800 | 86,952 | ||||||
| China Railway Group, Cl H | 221,548 | 169,903 | ||||||
| China Southern Airlines, Cl A * | 35,960 | 40,254 | ||||||
| China Southern Airlines, Cl H * | 97,850 | 68,309 | ||||||
| China State Construction Engineering, Cl A | 132,075 | 125,336 | ||||||
| China State Construction International | ||||||||
Holdings | 105,710 | 131,028 | ||||||
| CITIC | 305,150 | 382,123 | ||||||
| Contemporary Amperex Technology, Cl A . | 13,883 | 462,930 | ||||||
| COSCO SHIPPING Development, Cl A . | 33,180 | 12,461 | ||||||
| COSCO SHIPPING Holdings, Cl A . | 40,210 | 64,526 | ||||||
| Shares | Value | |||||||
| COMMON STOCK — continued | ||||||||
| Industrials — continued | ||||||||
| COSCO SHIPPING Holdings, Cl H . | 166,926 | $ | 193,084 | |||||
| COSCO SHIPPING Ports | 101,030 | 66,282 | ||||||
| CRRC, Cl A | 76,750 | 77,490 | ||||||
| CRRC, Cl H . | 229,800 | 148,420 | ||||||
| Dajin Heavy Industry, Cl A | 2,200 | 9,689 | ||||||
| Daqin Railway, Cl A | 47,300 | 52,607 | ||||||
| Dongfang Electric, Cl A | 8,990 | 22,620 | ||||||
| Eve Energy, Cl A | 6,530 | 61,827 | ||||||
| Fangda Carbon New Material, Cl A * | 12,723 | 11,853 | ||||||
| FAW Jiefang Group, Cl A | 10,400 | 12,228 | ||||||
| Fosun International . | 130,370 | 91,177 | ||||||
| Gaona Aero Material, Cl A | 1,600 | 8,796 | ||||||
| Ginlong Technologies, Cl A . | 1,255 | 20,629 | ||||||
| GoodWe Technologies, Cl A . | 379 | 14,212 | ||||||
| Gotion High-Tech, Cl A | 5,620 | 22,323 | ||||||
| Guangdong Kinlong Hardware Products, Cl A . | 1,054 | 10,634 | ||||||
| Guangzhou Great Power Energy & | ||||||||
Technology, Cl A . | 1,500 | 11,299 | ||||||
| Haitian International Holdings . | 33,246 | 85,975 | ||||||
| Hongfa Technology, Cl A | 1,830 | 8,260 | ||||||
| Hoyuan Green Energy, Cl A | 1,302 | 16,736 | ||||||
| Jiangsu Expressway, Cl H | 64,819 | 65,646 | ||||||
| Jiangsu Hengli Hydraulic, Cl A | 4,158 | 36,966 | ||||||
| Jiangsu Zhongtian Technology, Cl A | 11,010 | 23,202 | ||||||
| Jiangxi Special Electric Motor, Cl A * | 5,700 | 10,316 | ||||||
| Juneyao Airlines, Cl A * | 6,100 | 15,798 | ||||||
| Keda Industrial Group, Cl A | 6,500 | 11,783 | ||||||
| Kuang-Chi Technologies, Cl A | 7,040 | 17,866 | ||||||
| Liaoning Port, Cl A . | 62,400 | 14,601 | ||||||
| Luoyang Xinqianglian Slewing Bearing, Cl A . | 1,137 | 6,696 | ||||||
| Metallurgical Corp of China, Cl A | 57,400 | 37,143 | ||||||
| Ming Yang Smart Energy Group, Cl A | 7,350 | 21,933 | ||||||
| NARI Technology, Cl A | 21,104 | 79,621 | ||||||
| Ningbo Deye Technology, Cl A | 618 | 22,433 | ||||||
| Ningbo Orient Wires & Cables, Cl A . | 2,300 | 15,564 | ||||||
| Ningbo Ronbay New Energy Technology, | ||||||||
| Cl A | 1,387 | 13,319 | ||||||
| North Industries Group Red Arrow, Cl A . | 4,590 | 12,053 | ||||||
| Power Construction Corp of China, Cl A . | 54,750 | 60,814 | ||||||
| Shares | Value | |||||||
| COMMON STOCK — continued | ||||||||
| Industrials — continued | ||||||||
| Pylon Technologies, Cl A | 477 | $ | 16,685 | |||||
| Riyue Heavy Industry, Cl A . | 3,470 | 10,861 | ||||||
| Sany Heavy Equipment International Holdings | 58,200 | 77,107 | ||||||
| Sany Heavy Industry, Cl A | 26,780 | 63,785 | ||||||
| SF Holding, Cl A | 15,435 | 125,852 | ||||||
| Shanghai Construction Group, Cl A | 29,900 | 12,309 | ||||||
| Shanghai Electric Group, Cl A * | 40,900 | 27,707 | ||||||
| Shanghai International Airport, Cl A * | 3,965 | 30,754 | ||||||
| Shanghai International Port Group, Cl A | 30,130 | 24,937 | ||||||
| Shanghai M&G Stationery, Cl A . | 2,993 | 20,038 | ||||||
| Shenzhen Inovance Technology, Cl A . | 8,430 | 75,250 | ||||||
| Shenzhen International Holdings | 75,731 | 68,014 | ||||||
| Shenzhen Kstar Science And Technology, Cl A | 2,000 | 13,491 | ||||||
| Sichuan New Energy Power * | 4,990 | 10,552 | ||||||
| Sichuan Road and Bridge Group, Cl A | 16,720 | 38,279 | ||||||
| Sieyuan Electric, Cl A . | 2,550 | 16,928 | ||||||
| Sungrow Power Supply, Cl A | 4,700 | 76,536 | ||||||
| Sunwoda Electronic, Cl A | 5,620 | 13,654 | ||||||
| Suzhou Maxwell Technologies, Cl A . | 513 | 20,367 | ||||||
| TBEA, Cl A . | 12,250 | 39,971 | ||||||
| Titan Wind Energy Suzhou, Cl A | 6,025 | 11,992 | ||||||
| Weichai Power, Cl A . | 21,460 | 35,709 | ||||||
| Weichai Power, Cl H . | 101,816 | 149,937 | ||||||
| XCMG Construction Machinery, Cl A . | 37,820 | 37,474 | ||||||
| Xiamen C & D, Cl A . | 9,900 | 17,345 | ||||||
| Xinjiang Goldwind Science & Technology, | ||||||||
| Cl A | 11,297 | 17,884 | ||||||
| YTO Express Group, Cl A . | 10,940 | 27,337 | ||||||
| Yunda Holding, Cl A . | 9,540 | 16,728 | ||||||
| Zhefu Holding Group, Cl A | 18,170 | 10,026 | ||||||
| Zhejiang Chint Electrics, Cl A | 6,950 | 26,151 | ||||||
| Zhejiang Dingli Machinery, Cl A | 1,723 | 12,715 | ||||||
| Zhejiang Expressway, Cl H | 73,160 | 60,579 | ||||||
| Zhejiang HangKe Technology, Cl A | 1,424 | 10,231 | ||||||
| Zhejiang Weiming Environment Protection, | ||||||||
| Cl A | 5,650 | 14,918 | ||||||
| Zhejiang Weixing New Building Materials, | ||||||||
| Cl A | 5,110 | 16,334 | ||||||
| Zhuzhou CRRC Times Electric, Cl A | 2,428 | 16,329 | ||||||
| Shares | Value | |||||||
| COMMON STOCK — continued | ||||||||
| Industrials — continued | ||||||||
| Zhuzhou CRRC Times Electric, Cl H | 28,743 | $ | 115,706 | |||||
| Zhuzhou Kibing Group, Cl A | 8,980 | 13,321 | ||||||
| Zoomlion Heavy Industry Science and | ||||||||
Technology, Cl A . | 23,100 | 21,621 | ||||||
| ZTO Express Cayman ADR | 19,416 | 537,435 | ||||||
| TOTAL CHINA | 6,003,248 | |||||||
| HONG KONG — 2.3% | ||||||||
| Industrials — 2.3% | ||||||||
| Orient Overseas International | 6,930 | 140,191 | ||||||
| TOTAL COMMON STOCK | ||||||||
| (Cost $6,819,946) | 6,143,439 | |||||||
| TOTAL INVESTMENTS — 99.8% | ||||||||
| (Cost $6,819,946) | $ | 6,143,439 | ||||||
| Percentages are based on Net Assets of $6,153,899. | ||||||||
| * Non-income producing security. | ||||||||
| As of April 30, 2023, all of the Fund's investments were considered Level 1, in accordance with authoritative guidance on fair value measurements and disclosure under U.S. GAAP. | ||||||||
| See “Glossary” for abbreviations. | ||||||||
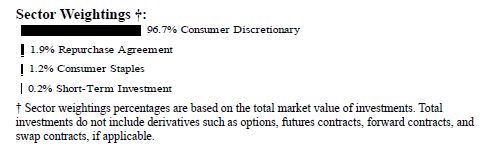
| Schedule of Investments | April 30, 2023 (Unaudited) |
| Global X MSCI China Consumer Discretionary ETF | |
| Shares | Value | |||||||
| COMMON STOCK — 99.9% | ||||||||
| CHINA — 99.9% | ||||||||
| Consumer Discretionary — 98.7% | ||||||||
| Alibaba Group Holding * | 2,564,256 | $ | 26,802,533 | |||||
| ANTA Sports Products . | 821,796 | 10,133,868 | ||||||
| Bethel Automotive Safety Systems, Cl A . | 53,100 | 491,251 | ||||||
| Bosideng International Holdings . | 6,386,600 | 3,140,457 | ||||||
| BTG Hotels Group, Cl A . | 148,100 | 463,344 | ||||||
| BYD, Cl A | 123,949 | 4,580,738 | ||||||
| BYD, Cl H . | 550,480 | 16,549,673 | ||||||
| Changzhou Xingyu Automotive Lighting | ||||||||
| Systems, Cl A | 37,030 | 585,409 | ||||||
| China Meidong Auto Holdings | 1,149,400 | 1,777,566 | ||||||
| China Tourism Group Duty Free, Cl A | 151,050 | 3,512,227 | ||||||
| China Tourism Group Duty Free, Cl H . | 65,700 | 1,401,060 | ||||||
| Chongqing Changan Automobile, Cl A | 1,101,408 | 1,894,742 | ||||||
| Chow Tai Fook Jewellery Group | 1,415,400 | 2,830,836 | ||||||
| Dongfeng Motor Group, Cl H . | 5,096,946 | 2,428,385 | ||||||
| East Buy Holding * (A) | 338,500 | 1,170,751 | ||||||
| Ecovacs Robotics, Cl A . | 76,050 | 763,438 | ||||||
| Fuyao Glass Industry Group, Cl A | 269,014 | 1,319,182 | ||||||
| Fuyao Glass Industry Group, Cl H . | 881,900 | 3,572,583 | ||||||
| Geely Automobile Holdings | 4,671,800 | 5,743,114 | ||||||
| Great Wall Motor, Cl A | 301,300 | 1,168,948 | ||||||
| Great Wall Motor, Cl H . | 2,847,397 | 3,424,175 | ||||||
| Gree Electric Appliances of Zhuhai, Cl A | 235,600 | 1,338,750 | ||||||
| Guangzhou Automobile Group, Cl A . | 540,500 | 830,668 | ||||||
| Guangzhou Automobile Group, Cl H | 4,700,423 | 2,916,096 | ||||||
| H World Group ADR * | 158,098 | 7,414,796 | ||||||
| Haidilao International Holding * | 1,634,800 | 3,969,387 | ||||||
| Shares | Value | |||||||
| COMMON STOCK — continued | ||||||||
| Consumer Discretionary — continued | ||||||||
| Haier Smart Home, Cl A | 840,019 | $ | 2,875,593 | |||||
| Haier Smart Home, Cl H . | 1,988,160 | 6,445,773 | ||||||
| Hangzhou Robam Appliances, Cl A | 125,432 | 471,961 | ||||||
| Huayu Automotive Systems, Cl A . | 417,980 | 988,916 | ||||||
| Huizhou Desay Sv Automotive, Cl A | 61,600 | 919,829 | ||||||
| Jason Furniture Hangzhou, Cl A | 108,810 | 582,615 | ||||||
| JD.com, Cl A | 1,144,654 | 19,816,619 | ||||||
| Jiumaojiu International Holdings | 1,388,700 | 3,092,329 | ||||||
| Li Auto, Cl A * | 823,936 | 9,598,714 | ||||||
| Li Ning | 1,613,400 | 11,478,922 | ||||||
| Meituan, Cl B * | 1,992,400 | 33,757,016 | ||||||
| MINISO Group Holding ADR . | 57,552 | 1,061,259 | ||||||
| Minth Group | 1,184,900 | 3,411,348 | ||||||
| New Oriental Education & Technology | ||||||||
Group * | 1,484,240 | 6,674,438 | ||||||
| Ningbo Joyson Electronic, Cl A | 177,200 | 394,162 | ||||||
| Ningbo Tuopu Group, Cl A | 146,435 | 1,070,250 | ||||||
| NIO ADR * (A) | 856,854 | 6,743,441 | ||||||
| Offcn Education Technology, Cl A * | 276,900 | 196,779 | ||||||
| Oppein Home Group, Cl A | 67,355 | 1,120,273 | ||||||
| PDD Holdings ADR * | 302,833 | 20,638,069 | ||||||
| Pop Mart International Group . | 629,300 | 1,518,356 | ||||||
| SAIC Motor, Cl A . | 1,036,600 | 2,114,150 | ||||||
| Sailun Group, Cl A | 397,553 | 589,733 | ||||||
| Shandong Linglong Tyre, Cl A | 192,834 | 613,325 | ||||||
| Shanghai Jinjiang International Hotels, Cl A | 121,356 | 937,613 | ||||||
| Shanghai Yuyuan Tourist Mart Group, Cl A . | 533,528 | 616,506 | ||||||
| Shenzhen Kedali Industry, Cl A | 30,300 | 599,588 | ||||||
| Shenzhen Overseas Chinese Town, Cl A | 1,089,000 | 788,053 | ||||||
| Shenzhou International Group Holdings . | 652,592 | 6,222,565 | ||||||
| Songcheng Performance Development, Cl A | 346,680 | 730,591 | ||||||
| TAL Education Group ADR * | 580,951 | 3,404,373 | ||||||
| TCL Technology Group, Cl A . | 2,286,005 | 1,320,770 | ||||||
| Tongcheng Travel Holdings * | 1,821,900 | 3,852,729 | ||||||
| Topsports International Holdings | 3,503,200 | 3,110,524 | ||||||
| Trip.com Group ADR * | 375,056 | 13,318,239 | ||||||
| Vipshop Holdings ADR * | 414,145 | 6,502,077 | ||||||
| Wuchan Zhongda Group, Cl A | 698,800 | 550,097 | ||||||
| XPeng, Cl A * | 632,676 | 3,030,436 | ||||||
| Shares | Value | |||||||
| COMMON STOCK — continued | ||||||||
| Consumer Discretionary — continued | ||||||||
| Xtep International Holdings | 1,262,000 | $ | 1,462,974 | |||||
| Yadea Group Holdings . | 1,811,200 | 4,226,956 | ||||||
| Yum China Holdings . | 277,087 | 16,952,183 | ||||||
| Zhejiang Supor, Cl A | 71,126 | 529,085 | ||||||
| Zhongsheng Group Holdings | 762,100 | 3,242,607 | ||||||
| 317,795,813 | ||||||||
| Consumer Staples — 1.2% | ||||||||
| Alibaba Health Information Technology * | 135,900 | 97,122 | ||||||
| JD Health International * | 336,770 | 2,413,192 | ||||||
| Ping An Healthcare and Technology * | 539,400 | 1,341,302 | ||||||
| 3,851,616 | ||||||||
| TOTAL CHINA | 321,647,429 | |||||||
| TOTAL COMMON STOCK | ||||||||
| (Cost $515,353,272) | 321,647,429 | |||||||
| SHORT-TERM INVESTMENT(B)(C) — 0.2% | ||||||||
| Fidelity Investments Money Market | ||||||||
| Government Portfolio, Cl Institutional, | ||||||||
| 4.770% | ||||||||
| (Cost $557,597) | 557,597 | 557,597 | ||||||
| Face Amount | ||||||||
| REPURCHASE AGREEMENT(B) — 1.9% | ||||||||
| BNP Paribas | ||||||||
| 4.700%, dated 04/28/2023, to be repurchased | ||||||||
| on 05/01/2023, repurchase price $6,232,861 | ||||||||
| (collateralized by U.S. Treasury Obligations, | ||||||||
| ranging in par value $334,716 - $503,054, | ||||||||
| 1.125% - 2.250%, 01/15/2025 - 08/15/2027, | ||||||||
| with a total market value of $6,342,426) | ||||||||
| (Cost $6,230,422) | $ | 6,230,422 | 6,230,422 | |||||
| TOTAL INVESTMENTS — 102.0% | ||||||||
| (Cost $522,141,291) | $ | 328,435,448 | ||||||
| Percentages are based on Net Assets of $321,908,427. | ||||||||
| * Non-income producing security. |
| Schedule of Investments | April 30, 2023 (Unaudited) |
| Global X MSCI China Consumer Discretionary ETF | |
The following is a summary of the level of inputs used as of April 30, 2023, in valuing the Fund's investments carried at value:
| Investments in Securities | Level 1 | Level 2 | Level 3 | Total | ||||||||||||
| Common Stock | $ | 321,647,429 | $ | — | $ | — | $ | 321,647,429 | ||||||||
| Short-Term Investment | 557,597 | — | — | 557,597 | ||||||||||||
| Repurchase Agreement | — | 6,230,422 | — | 6,230,422 | ||||||||||||
| Total Investments in Securities | $ | 322,205,026 | $ | 6,230,422 | $ | — | $ | 328,435,448 | ||||||||
Amounts designated as “—“ are $0 or have been rounded to $0.
See “Glossary” for abbreviations.
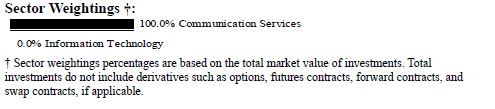
| Schedule of Investments | April 30, 2023 (Unaudited) |
| Global X MSCI China Communication Services ETF | |
| Shares | Value | |||||||
| COMMON STOCK — 99.9% | ||||||||
| CHINA — 99.9% | ||||||||
| Communication Services — 99.9% | ||||||||
| 37 Interactive Entertainment Network | ||||||||
Technology Group, Cl A . | 78,651 | $ | 348,651 | |||||
| Autohome ADR . | 8,476 | 251,313 | ||||||
| Baidu, Cl A * | 38,208 | 563,149 | ||||||
| Beijing Enlight Media, Cl A | 173,800 | 256,561 | ||||||
| Bilibili, Cl Z * | 16,309 | 326,600 | ||||||
| China Literature * | 600 | 2,752 | ||||||
| China Ruyi Holdings * | 1,210,300 | 292,943 | ||||||
| China Tower, Cl H . | 3,099,700 | 394,871 | ||||||
| China United Network Communications, Cl A . | 439,600 | 345,419 | ||||||
| Focus Media Information Technology, Cl A . | 274,200 | 255,061 | ||||||
| G-bits Network Technology Xiamen, Cl A | 4,264 | 322,662 | ||||||
| iQIYI ADR * | 50,041 | 305,250 | ||||||
| JOYY ADR | 8,194 | 249,343 | ||||||
| Kanzhun ADR * | 15,708 | 290,441 | ||||||
| Kingsoft . | 85,700 | 375,010 | ||||||
| Kuaishou Technology, Cl B * | 64,100 | 418,901 | ||||||
| Mango Excellent Media, Cl A . | 54,720 | 283,588 | ||||||
| NetEase | 40,915 | 722,407 | ||||||
| Perfect World, Cl A . | 115,010 | 364,138 | ||||||
| Tencent Holdings . | 14,065 | 617,076 | ||||||
| Tencent Music Entertainment Group ADR * | 534 | 3,957 | ||||||
| Wanda Film Holding, Cl A * | 128,300 | 264,448 | ||||||
| Weibo ADR * | 15,013 | 262,878 | ||||||
| Zhejiang Century Huatong Group, Cl A * | 385,220 | 381,144 | ||||||
| 7,898,563 | ||||||||
| Shares | Value | ||||||||
| COMMON STOCK — continued | |||||||||
| Information Technology — 0.0% | |||||||||
| National Agricultural Holdings *(A) | 204,200 | $ | 3 | ||||||
| TOTAL CHINA | �� | 7,898,566 | |||||||
| TOTAL COMMON STOCK | |||||||||
| (Cost $8,887,523) | 7,898,566 | ||||||||
| TOTAL INVESTMENTS — 99.9% | |||||||||
| (Cost $8,887,523) | $ | 7,898,566 | |||||||
| Percentages are based on Net Assets of $7,904,946. | |||||||||
| * Non-income producing security. | |||||||||
| (A) Level 3 security in accordance with fair value hierarchy. | |||||||||
The following is a summary of the level of inputs used as of April 30, 2023, in valuing the Fund's investments carried at value:
| Investments in Securities | Level 1 | Level 2 | Level 3(1) | Total | ||||||||||||
| Common Stock | $ | 7,898,563 | $ | — | $ | 3 | $ | 7,898,566 | ||||||||
| Total Investments in Securities | $ | 7,898,563 | $ | — | $ | 3 | $ | 7,898,566 | ||||||||
(1) | A reconciliation of Level 3 investments and disclosures of significant unobservable inputs are presented when the Fund has a significant amount of Level 3 investments at the end of the period in relation to Net Assets. Management has concluded that Level 3 investments are not material in relation to Net Assets. |
Amounts designated as “—“ are $0 or have been rounded to $0.
See “Glossary” for abbreviations.
| Schedule of Investments | April 30, 2023 (Unaudited) | |
| Global X MSCI China Financials ETF | ||
| Shares | Value | |||||||
| COMMON STOCK — 99.9% | ||||||||
| CHINA — 99.9% | ||||||||
| Financials — 99.9% | ||||||||
| Agricultural Bank of China, Cl A . | 419,700 | $ | 207,327 | |||||
| Agricultural Bank of China, Cl H | 2,328,388 | 898,740 | ||||||
| AVIC Industry-Finance Holdings, Cl A | 84,500 | 46,624 | ||||||
| Bank of Beijing, Cl A . | 127,300 | 87,156 | ||||||
| Bank of Changsha, Cl A . | 39,450 | 46,668 | ||||||
| Bank of Chengdu, Cl A | 35,000 | 69,462 | ||||||
| Bank of China, Cl A . | 99,000 | 52,480 | ||||||
| Bank of China, Cl H | 5,665,934 | 2,259,185 | ||||||
| Bank of Communications, Cl A | 204,200 | 164,286 | ||||||
| Bank of Communications, Cl H . | 866,271 | 558,393 | ||||||
| Bank of Hangzhou, Cl A | 48,795 | 88,523 | ||||||
| Bank of Jiangsu, Cl A | 97,030 | 108,056 | ||||||
| Bank of Nanjing, Cl A . | 63,284 | 86,106 | ||||||
| Bank of Ningbo, Cl A | 35,620 | 140,870 | ||||||
| Bank of Shanghai, Cl A . | 87,198 | 79,096 | ||||||
| Bank of Suzhou, Cl A | 38,900 | 42,253 | ||||||
| BOC International China, Cl A | 24,740 | 38,343 | ||||||
| Caitong Securities, Cl A | 41,310 | 46,243 | ||||||
| Changjiang Securities, Cl A . | 50,600 | 41,440 | ||||||
| China Cinda Asset Management, Cl H | 1,458,900 | 172,840 | ||||||
| China CITIC Bank Corp Ltd., Cl H . | 967,722 | 522,700 | ||||||
| China Construction Bank, Cl A . | 12,200 | 11,119 | ||||||
| China Construction Bank, Cl H | 3,424,826 | 2,290,518 | ||||||
| China Everbright Bank, Cl A | 228,700 | 105,708 | ||||||
| China Everbright Bank, Cl H . | 640,400 | 204,767 | ||||||
| China Galaxy Securities, Cl A | 35,400 | 55,120 | ||||||
| China Galaxy Securities, Cl H . | 505,050 | 273,438 | ||||||
| China Great Wall Securities, Cl A | 38,300 | 48,295 | ||||||
| China International Capital, Cl A | 8,985 | 54,611 | ||||||
| China International Capital, Cl H . | 164,050 | 343,151 | ||||||
| China Life Insurance, Cl A | 16,802 | 94,649 | ||||||
| China Life Insurance, Cl H . | 557,890 | 1,067,467 | ||||||
| Shares | Value | |||||||
| COMMON STOCK — continued | ||||||||
| Financials — continued | ||||||||
| China Merchants Bank, Cl A | 94,234 | $ | 457,338 | |||||
| China Merchants Bank, Cl H . | 287,824 | 1,380,473 | ||||||
| China Merchants Securities, Cl A | 43,680 | 88,139 | ||||||
| China Minsheng Banking, Cl A | 195,400 | 102,452 | ||||||
| China Minsheng Banking, Cl H . | 694,326 | 254,737 | ||||||
| China Pacific Insurance Group, Cl A | 35,850 | 161,612 | ||||||
| China Pacific Insurance Group, Cl H | 239,062 | 711,104 | ||||||
| China Taiping Insurance Holdings | 205,330 | 234,890 | ||||||
| China Zheshang Bank, Cl A | 123,500 | 54,942 | ||||||
| Chongqing Rural Commercial Bank, Cl A | 77,500 | 43,321 | ||||||
| CITIC Securities, Cl A | 61,180 | 185,751 | ||||||
| CITIC Securities, Cl H . | 217,145 | 455,319 | ||||||
| CSC Financial, Cl A . | 24,925 | 91,085 | ||||||
| Dongxing Securities, Cl A . | 33,500 | 40,307 | ||||||
| East Money Information, Cl A . | 78,872 | 183,304 | ||||||
| Everbright Securities, Cl A . | 30,732 | 67,295 | ||||||
| Far East Horizon | 275,000 | 246,978 | ||||||
| First Capital Securities, Cl A | 57,700 | 49,339 | ||||||
| GF Securities Ltd., Cl A | 35,700 | 79,101 | ||||||
| GF Securities Ltd., Cl H . | 176,800 | 253,154 | ||||||
| Guangzhou Yuexiu Capital Holdings Group, | ||||||||
| Cl A | 41,686 | 41,486 | ||||||
| Guolian Securities, Cl A . | 24,500 | 36,379 | ||||||
| Guosen Securities, Cl A | 44,145 | 60,001 | ||||||
| Guotai Junan Securities, Cl A | 43,544 | 95,098 | ||||||
| Guoyuan Securities, Cl A | 44,020 | 44,508 | ||||||
| Haitong Securities, Cl H | 378,600 | 250,796 | ||||||
| Haitong Securities Ltd., Cl A . | 57,600 | 77,124 | ||||||
| Hithink RoyalFlush Information Network, | ||||||||
| Cl A | 4,235 | 108,878 | ||||||
| Huatai Securities Ltd., Cl A . | 43,550 | 88,380 | ||||||
| Huatai Securities Ltd., Cl H . | 203,450 | 262,285 | ||||||
| Huaxi Securities, Cl A . | 30,090 | 38,421 | ||||||
| Huaxia Bank, Cl A . | 85,400 | 71,051 | ||||||
| Industrial & Commercial Bank of China, Cl A . | 214,100 | 145,965 | ||||||
| Industrial & Commercial Bank of China, Cl H . | 3,999,337 | 2,149,989 | ||||||
| Industrial Bank, Cl A | 105,080 | 261,362 | ||||||
| Industrial Securities, Cl A . | 61,070 | 59,277 | ||||||
| Lufax Holding ADR | 63,545 | 108,026 | ||||||
| Shares | Value | |||||||
| COMMON STOCK — continued | ||||||||
| Financials — continued | ||||||||
| New China Life Insurance C, Cl A . | 13,737 | $ | 77,086 | |||||
| New China Life Insurance C, Cl H | 105,361 | 300,652 | ||||||
| Orient Securities, Cl A | 53,824 | 83,264 | ||||||
| People's Insurance Group of China, Cl A . | 61,100 | 54,894 | ||||||
| People's Insurance Group of China, Cl H | 999,800 | 392,283 | ||||||
| PICC Property & Casualty, Cl H . | 633,263 | 763,959 | ||||||
| Ping An Bank, Cl A | 5,225 | 9,471 | ||||||
| Ping An Insurance Group of China, Cl A . | 1,400 | 10,475 | ||||||
| Ping An Insurance Group of China, Cl H . | 292,154 | 2,110,235 | ||||||
| Postal Savings Bank of China, Cl A | 164,800 | 131,159 | ||||||
| Postal Savings Bank of China, Cl H . | 794,000 | 515,854 | ||||||
| Qifu Technology ADR | 9,267 | 163,470 | ||||||
| SDIC Capital, Cl A | 39,000 | 40,953 | ||||||
| Sealand Securities, Cl A | 69,310 | 34,939 | ||||||
| Shanghai Pudong Development Bank, Cl A . | 146,514 | 160,836 | ||||||
| Shanghai Rural Commercial Bank, Cl A . | 67,900 | 57,962 | ||||||
| Shanxi Securities, Cl A | 45,540 | 38,678 | ||||||
| Shenwan Hongyuan Group, Cl A | 131,200 | 85,657 | ||||||
| SooChow Securities, Cl A | 53,884 | 56,349 | ||||||
| Southwest Securities, Cl A | 73,500 | 40,767 | ||||||
| Western Securities, Cl A . | 42,500 | 41,130 | ||||||
| Zheshang Securities, Cl A | 31,240 | 46,116 | ||||||
| ZhongAn Online P&C Insurance, Cl H * | 60,200 | 186,354 | ||||||
| Zhongtai Securities, Cl A | 46,600 | 50,280 | ||||||
| TOTAL CHINA | 24,798,124 | |||||||
| TOTAL COMMON STOCK | ||||||||
| (Cost $32,769,481) | 24,798,124 | |||||||
| TOTAL INVESTMENTS — 99.9% | ||||||||
| (Cost $32,769,481) | $ | 24,798,124 | ||||||
| Percentages are based on Net Assets of $24,813,696. | ||||||||
| * Non-income producing security. | ||||||||
| As of April 30, 2023, all of the Fund's investments were considered Level 1, in accordance with authoritative guidance on fair value measurements and disclosure under U.S. GAAP. | ||||||||
| See “Glossary” for abbreviations. | ||||||||
| Schedule of Investments | April 30, 2023 (Unaudited) | |
| Global X MSCI China Energy ETF | ||
| Shares | Value | |||||||
| COMMON STOCK — 102.7% | ||||||||
| CHINA — 98.1% | ||||||||
| Energy — 98.1% | ||||||||
| CGN Mining * | 2,367,100 | $ | 256,313 | |||||
| China Coal Energy, Cl H . | 583,700 | 499,683 | ||||||
| China Merchants Energy Shipping, Cl A | 277,200 | 265,459 | ||||||
| China Oilfield Services, Cl H | 536,886 | 629,225 | ||||||
| China Petroleum & Chemical, Cl A . | 54,050 | 52,385 | ||||||
| China Petroleum & Chemical, Cl H | 1,602,997 | 1,047,577 | ||||||
| China Shenhua Energy, Cl A . | 8,900 | 37,383 | ||||||
| China Shenhua Energy, Cl H | 288,755 | 956,398 | ||||||
| COSCO SHIPPING Energy Transportation, | ||||||||
Cl A * | 128,800 | 244,084 | ||||||
| Guanghui Energy, Cl A | 212,050 | 284,540 | ||||||
| Inner Mongolia Dian Tou Energy, Cl A | 144,400 | 280,947 | ||||||
| Inner Mongolia Yitai Coal, Cl B | 321,294 | 475,515 | ||||||
| Jizhong Energy Resources, Cl A | 241,000 | 257,596 | ||||||
| Kinetic Development Group . | 2,881,300 | 238,582 | ||||||
| Offshore Oil Engineering, Cl A | 312,975 | 304,239 | ||||||
| PetroChina, Cl A . | 47,300 | 53,905 | ||||||
| PetroChina, Cl H | 1,618,663 | 1,119,675 | ||||||
| Pingdingshan Tianan Coal Mining, Cl A . | 146,700 | 203,843 | ||||||
| Shaanxi Coal Industry, Cl A | 165,486 | 467,780 | ||||||
| Shan Xi Hua Yang Group New Energy, Cl A | 112,800 | 228,101 | ||||||
| Shanxi Coking Coal Energy Group, Cl A . | 183,453 | 272,136 | ||||||
| Shanxi Lu'an Environmental Energy | ||||||||
Development, Cl A . | 123,265 | 358,761 | ||||||
| Sinopec Kantons Holdings | 915,100 | 338,067 | ||||||
| Yankuang Energy Group, Cl A . | 27,004 | 134,138 | ||||||
| Yankuang Energy Group, Cl H | 270,275 | 924,456 | ||||||
| Yantai Jereh Oilfield Services Group, Cl A | 56,510 | 221,363 | ||||||
| TOTAL CHINA | 10,152,151 | |||||||
| Shares | Value | |||||||
| COMMON STOCK — continued | ||||||||
| HONG KONG — 4.6% | ||||||||
| Energy — 4.6% | ||||||||
| AAG Energy Holdings . | 1,206,900 | $ | 252,145 | |||||
| Productive Technologies * | 2,022,900 | 221,620 | ||||||
| TOTAL HONG KONG | 473,765 | |||||||
| TOTAL COMMON STOCK | ||||||||
| (Cost $9,428,352) | 10,625,916 | |||||||
| TOTAL INVESTMENTS — 102.7% | ||||||||
| (Cost $9,428,352) | $ | 10,625,916 | ||||||
| Percentages are based on Net Assets of $10,345,371. | ||||||||
| * Non-income producing security. | ||||||||
| As of April 30, 2023, all of the Fund's investments were considered Level 1, in accordance with authoritative guidance on fair value measurements and disclosure under U.S. GAAP. | ||||||||
| See “Glossary” for abbreviations. | ||||||||
| Schedule of Investments | April 30, 2023 (Unaudited) | |
| Global X MSCI China Materials ETF | ||

| Shares | Value | |||||||
| COMMON STOCK — 100.0% | ||||||||
| CHINA — 98.2% | ||||||||
| Materials — 98.2% | ||||||||
| Aluminum Corp of China, Cl A | 48,300 | $ | 44,580 | |||||
| Aluminum Corp of China, Cl H . | 204,539 | 120,901 | ||||||
| Anhui Conch Cement, Cl A | 10,300 | 39,990 | ||||||
| Anhui Conch Cement, Cl H . | 57,670 | 181,461 | ||||||
| Anhui Honglu Steel Construction Group, Cl A . | 1,850 | 8,607 | ||||||
| Asia - Potash International Investment | ||||||||
| Guangzhou, Cl A * | 1,800 | 6,341 | ||||||
| Baoshan Iron & Steel, Cl A | 72,300 | 67,253 | ||||||
| BBMG, Cl A | 43,800 | 15,247 | ||||||
| Canmax Technologies, Cl A | 1,275 | 8,950 | ||||||
| Chengtun Mining Group, Cl A . | 8,600 | 6,509 | ||||||
| Chengxin Lithium Group, Cl A . | 1,800 | 8,257 | ||||||
| China Hongqiao Group | 116,000 | 113,637 | ||||||
| China Jushi, Cl A | 14,859 | 31,292 | ||||||
| China National Building Material, Cl H | 187,400 | 139,895 | ||||||
| China Northern Rare Earth Group High-Tech, | ||||||||
| Cl A | 11,800 | 42,883 | ||||||
| China Rare Earth Resources And Technology, | ||||||||
| Cl A * | 2,100 | 10,255 | ||||||
| China Resources Cement Holdings | 125,600 | 56,641 | ||||||
| CMOC Group, Cl A . | 59,400 | 51,136 | ||||||
| CMOC Group, Cl H . | 182,054 | 111,089 | ||||||
| CNGR Advanced Material, Cl A . | 1,165 | 10,418 | ||||||
| CNNC Hua Yuan Titanium Dioxide, Cl A . | 11,770 | 10,727 | ||||||
| Do-Fluoride New Materials, Cl A | 2,135 | 6,269 | ||||||
| Dongyue Group . | 65,300 | 66,133 | ||||||
| Ganfeng Lithium Group, Cl A | 5,090 | 47,781 | ||||||
| Ganfeng Lithium Group, Cl H . | 17,760 | 116,403 | ||||||
| GEM, Cl A . | 19,400 | 19,699 | ||||||
| Guangdong HEC Technology Holding, Cl A . | 5,600 | 6,285 | ||||||
| Guangzhou Tinci Materials Technology, Cl A .. | 4,820 | 29,714 | ||||||
| Hangzhou Oxygen Plant Group, Cl A . | 2,400 | 13,936 | ||||||
| Shares | Value | |||||||
| COMMON STOCK — continued | ||||||||
| Materials — continued | ||||||||
| Henan Shenhuo Coal & Power, Cl A . | 4,500 | $ | 10,595 | |||||
| Hengli Petrochemical, Cl A | 19,120 | 43,635 | ||||||
| Hengyi Petrochemical, Cl A | 16,300 | 18,058 | ||||||
| Hesteel, Cl A | 50,600 | 16,883 | ||||||
| Hoshine Silicon Industry, Cl A . | 1,850 | 19,568 | ||||||
| Huafon Chemical, Cl A | 9,800 | 10,192 | ||||||
| Huaibei Mining Holdings, Cl A | 4,700 | 9,226 | ||||||
| Huaxin Cement, Cl A . | 6,650 | 14,168 | ||||||
| Hubei Feilihua Quartz Glass, Cl A | 1,100 | 7,588 | ||||||
| Hubei Xingfa Chemicals Group, Cl A | 2,100 | 7,492 | ||||||
| Hunan Changyuan Lico, Cl A . | 3,577 | 5,745 | ||||||
| Hunan Valin Steel, Cl A | 29,100 | 22,193 | ||||||
| Inner Mongolia BaoTou Steel Union, Cl A | 152,900 | 40,195 | ||||||
| Inner Mongolia ERDOS Resources, Cl A | 3,220 | 6,721 | ||||||
| Inner Mongolia Junzheng Energy & Chemical | ||||||||
| Industry Group, Cl A | 36,000 | 22,567 | ||||||
| Inner Mongolia Yuan Xing Energy, Cl A | 7,700 | 8,175 | ||||||
| Jiangsu Eastern Shenghong, Cl A | 9,500 | 17,386 | ||||||
| Jiangsu Yangnong Chemical, Cl A | 1,350 | 17,957 | ||||||
| Jiangsu Yoke Technology, Cl A | 1,125 | 10,995 | ||||||
| Jiangxi Copper, Cl A | 8,900 | 26,238 | ||||||
| Jiangxi Copper, Cl H | 57,991 | 102,834 | ||||||
| LB Group, Cl A | 9,600 | 24,016 | ||||||
| Luxi Chemical Group, Cl A . | 4,400 | 7,620 | ||||||
| Ningbo Shanshan, Cl A | 4,700 | 10,292 | ||||||
| Ningxia Baofeng Energy Group, Cl A | 18,600 | 35,409 | ||||||
| Pangang Group Vanadium Titanium & | ||||||||
Resources, Cl A * | 32,400 | 19,656 | ||||||
| Qinghai Salt Lake Industry, Cl A * | 14,100 | 41,588 | ||||||
| Real Gold Mining *(A) | 97,864 | — | ||||||
| Rongsheng Petrochemical, Cl A . | 31,800 | 60,722 | ||||||
| Satellite Chemical, Cl A | 7,792 | 15,971 | ||||||
| Shandong Gold Mining, Cl A | 13,020 | 48,332 | ||||||
| Shandong Gold Mining, Cl H . | 36,650 | 77,970 | ||||||
| Shandong Hualu Hengsheng Chemical, Cl A | 7,920 | 36,470 | ||||||
| Shandong Nanshan Aluminum, Cl A . | 48,400 | 23,699 | ||||||
| Shandong Sun Paper Industry JSC, Cl A | 12,300 | 20,236 | ||||||
| Shandong Weifang Rainbow Chemical, Cl A . | 750 | 8,027 | ||||||
| Shares | Value | |||||||
| COMMON STOCK — continued | ||||||||
| Materials — continued | ||||||||
| Shanghai Putailai New Energy Technology, | ||||||||
| Cl A | 4,680 | $ | 35,300 | |||||
| Shanxi Meijin Energy, Cl A . | 9,100 | 10,397 | ||||||
| Shanxi Taigang Stainless Steel, Cl A . | 25,400 | 14,675 | ||||||
| Shenghe Resources Holding, Cl A | 4,100 | 8,155 | ||||||
| Shenzhen Capchem Technology, Cl A | 1,620 | 11,407 | ||||||
| Shenzhen Dynanonic, Cl A . | 365 | 8,629 | ||||||
| Shenzhen Senior Technology Material, Cl A . | 3,200 | 7,964 | ||||||
| Shenzhen YUTO Packaging Technology, Cl A . | 1,600 | 5,854 | ||||||
| Sichuan Hebang Biotechnology . | 17,800 | 7,096 | ||||||
| Sichuan Yahua Industrial Group, Cl A . | 2,700 | 7,320 | ||||||
| Sinoma Science & Technology, Cl A . | 3,500 | 10,667 | ||||||
| Sinomine Resource Group, Cl A | 900 | 9,880 | ||||||
| Sinopec Shanghai Petrochemical, Cl A . | 32,500 | 16,195 | ||||||
| Skshu Paint, Cl A * | 893 | 13,221 | ||||||
| Tangshan Jidong Cement, Cl A | 5,700 | 6,718 | ||||||
| Tianqi Lithium, Cl A * | 3,800 | 39,113 | ||||||
| Tianshan Aluminum Group, Cl A . | 8,300 | 8,692 | ||||||
| Tibet Summit Resources, Cl A * | 2,575 | 7,290 | ||||||
| Tongkun Group, Cl A . | 10,100 | 18,819 | ||||||
| Tongling Nonferrous Metals Group, Cl A . | 46,500 | 22,097 | ||||||
| Wanhua Chemical Group, Cl A . | 9,422 | 125,450 | ||||||
| Weihai Guangwei Composites, Cl A | 2,200 | 16,565 | ||||||
| Western Mining, Cl A | 4,700 | 8,920 | ||||||
| Western Superconducting Technologies, Cl A .. | 978 | 11,009 | ||||||
| Xiamen Tungsten, Cl A | 6,100 | 17,216 | ||||||
| Xinjiang Zhongtai Chemical, Cl A | 7,425 | 7,014 | ||||||
| Yintai Gold, Cl A . | 12,520 | 23,256 | ||||||
| YongXing Special Materials Technology, Cl A . | 1,196 | 11,015 | ||||||
| Youngy, Cl A * | 655 | 6,670 | ||||||
| Yunnan Aluminium, Cl A | 7,500 | 15,405 | ||||||
| Yunnan Energy New Material, Cl A | 2,775 | 41,726 | ||||||
| Yunnan Tin, Cl A | 3,600 | 8,018 | ||||||
| Yunnan Yuntianhua, Cl A * | 3,700 | 10,224 | ||||||
| Zangge Mining, Cl A | 3,400 | 11,236 | ||||||
| Zhaojin Mining Industry | 50,900 | 80,922 | ||||||
| Zhejiang Huayou Cobalt, Cl A | 5,109 | 38,373 | ||||||
| Zhejiang Juhua, Cl A | 10,700 | 23,415 | ||||||
| Zhejiang Yongtai Technology, Cl A | 2,200 | 5,421 | ||||||
| Shares | Value | |||||||
| COMMON STOCK — continued | ||||||||
| Materials — continued | ||||||||
| Zibo Qixiang Tengda Chemical, Cl A *(A) | 7,700 | $ | 7,919 | |||||
| Zijin Mining Group, Cl A | 4,600 | 8,525 | ||||||
| Zijin Mining Group, Cl H | 206,659 | 348,034 | ||||||
| TOTAL CHINA | 3,356,530 | |||||||
| HONG KONG — 1.8% | ||||||||
| Materials — 1.8% | ||||||||
| China Lumena New Materials *(A) | 48 | — | ||||||
| Nine Dragons Paper Holdings | 85,570 | 59,191 | ||||||
| TOTAL HONG KONG | 59,191 | |||||||
| TOTAL COMMON STOCK | ||||||||
| (Cost $3,969,165) | 3,415,721 | |||||||
| TOTAL INVESTMENTS — 100.0% | ||||||||
| (Cost $3,969,165) | $ | 3,415,721 | ||||||
| Percentages are based on Net Assets of $3,417,247. | ||||||||
| * Non-income producing security. | ||||||||
| (A) Level 3 security in accordance with fair value hierarchy. | ||||||||
The following is a summary of the level of inputs used as of April 30, 2023, in valuing the Fund's investments carried at value:
| Investments in Securities | Level 1 | Level 2 | Level 3(1) | Total | ||||||||||||
| Common Stock | $ | 3,407,802 | $ | — | $ | 7,919 | $ | 3,415,721 | ||||||||
| Total Investments in Securities | $ | 3,407,802 | $ | — | $ | 7,919 | $ | 3,415,721 | ||||||||
(1) A reconciliation of Level 3 investments and disclosures of significant unobservable inputs are presented when the Fund has a significant amount of Level 3 investments at the end of the period in relation to Net Assets. Management has concluded that Level 3 investments are not material in relation to Net Assets.
Amounts designated as “—“ are $0 or have been rounded to $0.
See “Glossary” for abbreviations.
| Schedule of Investments | April 30, 2023 (Unaudited) | |
| Global X MSCI Norway ETF | ||
| Shares | Value | |||||||
| COMMON STOCK — 98.9% | ||||||||
| BERMUDA — 0.1% | ||||||||
| Energy — 0.1% | ||||||||
| Cool | 4,450 | $ | 54,568 | |||||
| BRAZIL — 4.1% | ||||||||
| Materials — 4.1% | ||||||||
| Yara International | 60,977 | 2,445,673 | ||||||
| FAROE ISLANDS — 2.3% | ||||||||
| Consumer Staples — 2.3% | ||||||||
| Bakkafrost P/F | 18,604 | 1,350,348 | ||||||
| FRANCE — 1.4% | ||||||||
| Communication Services — 1.4% | ||||||||
| Adevinta, Cl B * | 106,492 | 816,786 | ||||||
| GABON — 0.1% | ||||||||
| Energy — 0.1% | ||||||||
| BW Energy * | 30,136 | 80,617 | ||||||
| Shares | Value | |||||||
| COMMON STOCK — continued | ||||||||
| HONG KONG — 0.3% | ||||||||
| Industrials — 0.3% | ||||||||
| Cadeler * | 38,848 | $ | 168,748 | |||||
| MEXICO — 0.8% | ||||||||
| Energy — 0.8% | ||||||||
| Borr Drilling * | 70,907 | 488,140 | ||||||
| NETHERLANDS — 0.1% | ||||||||
| Industrials — 0.1% | ||||||||
| Meltwater * | 50,812 | 82,222 | ||||||
| NORWAY — 85.7% | ||||||||
| Communication Services — 7.6% | ||||||||
| Kahoot! * | 98,559 | 255,545 | ||||||
| Schibsted, Cl A . | 26,946 | 475,854 | ||||||
| Schibsted, Cl B . | 35,975 | 580,790 | ||||||
| Telenor | 257,839 | 3,206,377 | ||||||
| 4,518,566 | ||||||||
| Consumer Discretionary — 0.7% | ||||||||
| Europris . | 58,327 | 415,994 | ||||||
| Consumer Staples — 11.7% | ||||||||
| Austevoll Seafood | 33,385 | 312,894 | ||||||
| Grieg Seafood | 15,980 | 133,477 | ||||||
| Leroy Seafood Group . | 97,473 | 511,020 | ||||||
| Mowi . | 152,396 | 2,895,083 | ||||||
| Orkla | 276,265 | 1,979,394 | ||||||
| Salmar | 24,103 | 1,065,247 | ||||||
| 6,897,115 | ||||||||
| Energy — 26.2% | ||||||||
| Aker BP . | 116,399 | 2,770,860 | ||||||
| Aker Solutions | 89,212 | 316,424 | ||||||
| BW Offshore | 32,307 | 85,700 | ||||||
| DNO . | 170,023 | 168,892 | ||||||
| Equinor | 351,722 | 10,034,067 | ||||||
| FLEX LNG . | 10,599 | 366,614 | ||||||
| Frontline | 48,814 | 755,375 | ||||||
| Shares | Value | |||||||
| COMMON STOCK — continued | ||||||||
| Energy — continued | ||||||||
| Odfjell Drilling * | 35,749 | $ | 82,926 | |||||
| PGS * | 312,323 | 224,008 | ||||||
| TGS . | 44,158 | 688,943 | ||||||
| 15,493,809 | ||||||||
| Financials — 18.3% | ||||||||
| DNB Bank | 343,278 | 6,010,760 | ||||||
| Gjensidige Forsikring | 73,209 | 1,268,871 | ||||||
| Protector Forsikring . | 22,831 | 331,005 | ||||||
| Sparebank 1 Nord Norge . | 35,020 | 316,097 | ||||||
| Sparebank 1 Oestlandet . | 12,351 | 144,870 | ||||||
| SpareBank 1 SMN . | 47,984 | 618,477 | ||||||
| SpareBank 1 SR-Bank | 66,236 | 772,571 | ||||||
| Storebrand | 173,922 | 1,334,620 | ||||||
| 10,797,271 | ||||||||
| Health Care — 0.1% | ||||||||
| Nykode Therapeutics * | 35,444 | 85,203 | ||||||
| Industrials — 11.0% | ||||||||
| Aker ASA, Cl A . | 8,117 | 493,499 | ||||||
| Aker Carbon Capture * | 122,512 | 124,791 | ||||||
| Aker Horizons Holding * | 86,933 | 68,222 | ||||||
| Bonheur . | 7,934 | 176,623 | ||||||
| Golden Ocean Group | 47,893 | 439,280 | ||||||
| Hexagon Composites * | 44,043 | 133,146 | ||||||
| Hexagon Purus Holding * | 29,372 | 61,815 | ||||||
| Hoegh Autoliners . | 16,747 | 108,241 | ||||||
| Kongsberg Gruppen . | 32,444 | 1,449,967 | ||||||
| MPC Container Ships | 100,720 | 164,866 | ||||||
| NEL * | 571,078 | 780,144 | ||||||
| Norwegian Air Shuttle * | 239,826 | 231,726 | ||||||
| Stolt-Nielsen | 6,273 | 180,426 | ||||||
| TOMRA Systems | 86,715 | 1,322,085 | ||||||
| Veidekke . | 39,655 | 454,743 | ||||||
| Wallenius Wilhelmsen, Cl B . | 39,992 | 297,758 | ||||||
| 6,487,332 | ||||||||
| Information Technology — 1.5% | ||||||||
| Crayon Group Holding * | 26,194 | 201,274 | ||||||
| Shares | Value | |||||||
| COMMON STOCK — continued | ||||||||
| Information Technology — continued | ||||||||
| Nordic Semiconductor * | 59,872 | $ | 644,860 | |||||
| Volue * | 19,130 | 32,208 | ||||||
| 878,342 | ||||||||
| Materials — 8.2% | ||||||||
| BEWi . | 18,070 | 70,819 | ||||||
| Borregaard | 32,774 | 546,279 | ||||||
| Elkem . | 115,907 | 390,292 | ||||||
| Elopak | 46,705 | 104,628 | ||||||
| Norsk Hydro | 495,807 | 3,627,506 | ||||||
| Norske Skog * | 26,903 | 119,025 | ||||||
| 4,858,549 | ||||||||
| Real Estate — 0.4% | ||||||||
| Entra . | 24,156 | 244,472 | ||||||
| TOTAL NORWAY | 50,676,653 | |||||||
| SINGAPORE — 0.8% | ||||||||
| Energy — 0.8% | ||||||||
| BW LPG . | 31,310 | 251,421 | ||||||
| Hafnia . | 45,494 | 245,319 | ||||||
| TOTAL SINGAPORE | 496,740 | |||||||
| SOUTH AFRICA — 0.5% | ||||||||
| Utilities — 0.5% | ||||||||
| Scatec . | 45,085 | 293,086 | ||||||
| SWEDEN — 0.7% | ||||||||
| Information Technology — 0.7% | ||||||||
| Atea . | 30,852 | 422,476 | ||||||
| UNITED KINGDOM — 1.7% | ||||||||
| Energy — 1.7% | ||||||||
| Subsea 7 | 88,100 | 1,002,457 | ||||||
| Shares | Value | |||||
| COMMON STOCK — continued | ||||||
| UNITED STATES — 0.3% | ||||||
| Information Technology — 0.3% | ||||||
| REC Silicon * | 102,837 | $ | 153,807 | |||
| TOTAL COMMON STOCK | ||||||
| (Cost $78,970,687) | 58,532,321 | |||||
| TOTAL INVESTMENTS — 98.9% | ||||||
| (Cost $78,970,687) | $ | 58,532,321 | ||||
| Percentages are based on Net Assets of $59,174,009. | ||||||
| * Non-income producing security. |
As of April 30, 2023, all of the Fund's investments were considered Level 1, in accordance with authoritative guidance on fair value measurements and disclosure under U.S. GAAP.
See "Glossary" for abbreviations.
| Schedule of Investments | April 30, 2023 (Unaudited) | |
| Global X FTSE Southeast Asia ETF | ||
| Shares | Value | |||||||
| COMMON STOCK — 99.5% | ||||||||
| CHINA — 1.5% | ||||||||
| Consumer Staples — 1.5% | ||||||||
| Wilmar International . | 236,732 | $ | 697,340 | |||||
| INDONESIA — 25.1% | ||||||||
| Communication Services — 3.2% | ||||||||
| Telkom Indonesia Persero | 5,256,475 | 1,522,837 | ||||||
| Consumer Staples — 0.6% | ||||||||
| Hanjaya Mandala Sampoerna | 986,857 | 68,280 | ||||||
| Unilever Indonesia . | 643,474 | 192,998 | ||||||
| 261,278 | ||||||||
| Financials — 19.0% | ||||||||
| Bank Central Asia . | 6,282,339 | 3,875,608 | ||||||
| Bank Mandiri Persero | 5,023,568 | 1,772,118 | ||||||
| Bank Negara Indonesia Persero | 838,796 | 538,899 | ||||||
| Bank Rakyat Indonesia Persero | 7,956,284 | 2,765,988 | ||||||
| 8,952,613 | ||||||||
| Shares | Value | |||||||
| COMMON STOCK — continued | ||||||||
| Industrials — 2.3% | ||||||||
| Astra International . | 2,291,955 | $ | 1,054,580 | |||||
| TOTAL INDONESIA | 11,791,308 | |||||||
| MALAYSIA — 13.3% | ||||||||
| Financials — 8.8% | ||||||||
| CIMB Group Holdings | 761,645 | 864,012 | ||||||
| Hong Leong Bank | 70,400 | 317,869 | ||||||
| Malayan Banking | 805,439 | 1,563,749 | ||||||
| Public Bank . | 1,603,555 | 1,398,459 | ||||||
| 4,144,089 | ||||||||
| Health Care — 0.9% | ||||||||
| IHH Healthcare | 330,297 | 424,303 | ||||||
| Materials — 2.1% | ||||||||
| Petronas Chemicals Group | 318,068 | 504,859 | ||||||
| Press Metal Aluminium Holdings | 395,126 | 456,204 | ||||||
| 961,063 | ||||||||
| Utilities — 1.5% | ||||||||
| Tenaga Nasional | 362,544 | 723,381 | ||||||
| TOTAL MALAYSIA | 6,252,836 | |||||||
| PHILIPPINES — 3.1% | ||||||||
| Financials — 1.5% | ||||||||
| BDO Unibank | 266,968 | 694,111 | ||||||
| Real Estate — 1.6% | ||||||||
| SM Prime Holdings | 1,197,931 | 734,310 | ||||||
| Utilities — 0.0% | ||||||||
| ACEN * | 105,477 | 11,446 | ||||||
| TOTAL PHILIPPINES | 1,439,867 | |||||||
| SINGAPORE — 35.2% | ||||||||
| Communication Services — 3.4% | ||||||||
| Singapore Telecommunications | 852,558 | 1,629,519 | ||||||
| Shares | Value | |||||||
| COMMON STOCK — continued | ||||||||
| Financials — 25.3% | ||||||||
| DBS Group Holdings . | 205,250 | $ | 5,049,136 | |||||
| Oversea-Chinese Banking | 398,808 | 3,760,451 | ||||||
| United Overseas Bank . | 146,202 | 3,092,471 | ||||||
| 11,902,058 | ||||||||
| Industrials — 2.9% | ||||||||
| Keppel . | 157,700 | 729,310 | ||||||
| Singapore Airlines | 143,547 | 629,427 | ||||||
| 1,358,737 | ||||||||
| Real Estate — 3.6% | ||||||||
| CapitaLand Ascott Trust ‡ | 16,489 | 13,348 | ||||||
| CapitaLand Integrated Commercial Trust ‡ | 570,195 | 867,590 | ||||||
| Capitaland Investment | 289,210 | 806,402 | ||||||
| 1,687,340 | ||||||||
| TOTAL SINGAPORE | 16,577,654 | |||||||
| THAILAND — 21.3% | ||||||||
| Communication Services — 1.7% | ||||||||
| Advanced Info Service NVDR | 126,734 | 794,233 | ||||||
| Consumer Staples — 3.1% | ||||||||
| CP ALL NVDR | 674,817 | 1,279,579 | ||||||
| Siam Makro NVDR . | 179,000 | 197,884 | ||||||
| 1,477,463 | ||||||||
| Energy — 4.6% | ||||||||
| PTT NVDR . | 1,620,615 | 1,471,237 | ||||||
| PTT Exploration & Production NVDR . | 156,385 | 677,794 | ||||||
| 2,149,031 | ||||||||
| Financials — 2.6% | ||||||||
| Kasikornbank NVDR . | 170,765 | 625,101 | ||||||
| SCB X NVDR . | 191,107 | 579,239 | ||||||
| 1,204,340 | ||||||||
| Health Care — 1.8% | ||||||||
| Bangkok Dusit Medical Services NVDR . | 1,003,936 | 859,950 | ||||||
| Shares | Value | |||||||
| COMMON STOCK — continued | ||||||||
| Industrials — 2.2% | ||||||||
Airports of Thailand NVDR * | 483,759 | $ | 1,037,714 | |||||
| Information Technology — 1.4% | ||||||||
| Delta Electronics Thailand NVDR . | 314,610 | 670,265 | ||||||
| Materials — 1.6% | ||||||||
| Siam Cement NVDR | 82,365 | 757,379 | ||||||
| Utilities — 2.3% | ||||||||
| Energy Absolute | 188,213 | 373,422 | ||||||
| Gulf Energy Development NVDR | 478,163 | 710,646 | ||||||
| 1,084,068 | ||||||||
| TOTAL THAILAND | 10,034,443 | |||||||
| TOTAL COMMON STOCK | ||||||||
| (Cost $45,444,355) | 46,793,448 | |||||||
| TOTAL INVESTMENTS — 99.5% | ||||||||
| (Cost $45,444,355) | $ | 46,793,448 | ||||||
| Percentages are based on Net Assets of $47,015,162. | ||||||||
| * Non-income producing security. | ||||||||
| ‡ Real Estate Investment Trust |
As of April 30, 2023, all of the Fund's investments were considered Level 1, in accordance with authoritative guidance on fair value measurements and disclosure under U.S. GAAP.
See “Glossary” for abbreviations.
| Schedule of Investments | April 30, 2023 (Unaudited) | |
| Global X MSCI Argentina ETF | ||

| Shares | Value | |||||||
| COMMON STOCK — 96.3% | ||||||||
| ARGENTINA — 46.2% | ||||||||
| Communication Services — 2.5% | ||||||||
| Telecom Argentina ADR | 238,515 | $ | 1,214,041 | |||||
| Consumer Discretionary — 1.8% | ||||||||
| Despegar.com * | 163,584 | 860,452 | ||||||
| Consumer Staples — 1.2% | ||||||||
| Cresud SACIF y A ADR | 95,804 | 591,111 | ||||||
| Energy — 11.3% | ||||||||
| Transportadora de Gas del Sur ADR * | 188,564 | 2,145,858 | ||||||
| YPF ADR * | 297,822 | 3,311,781 | ||||||
| 5,457,639 | ||||||||
| Financials — 12.3% | ||||||||
| Banco BBVA Argentina ADR . | 192,962 | 825,877 | ||||||
| Banco Macro ADR | 116,232 | 2,056,144 | ||||||
| Grupo Financiero Galicia ADR . | 233,142 | 2,685,796 | ||||||
| Grupo Supervielle ADR | 170,005 | 379,111 | ||||||
| 5,946,928 | ||||||||
| Shares | Value | |||||||
| COMMON STOCK — continued | ||||||||
| Industrials — 2.0% | ||||||||
| America Airports * | 88,159 | $ | 942,420 | |||||
| Materials — 4.0% | ||||||||
| Bioceres Crop Solutions * | 84,811 | 950,731 | ||||||
| Loma Negra Cia Industrial Argentina ADR | 158,188 | 968,111 | ||||||
| 1,918,842 | ||||||||
| Real Estate — 1.0% | ||||||||
| IRSA Inversiones y Representaciones ADR . | 87,393 | 482,409 | ||||||
| Utilities — 10.1% | ||||||||
| Central Puerto ADR . | 266,953 | 1,628,413 | ||||||
| Empresa Distribuidora Y Comercializadora | ||||||||
Norte ADR * | 56,570 | 498,947 | ||||||
| Pampa Energia ADR * | 80,946 | 2,763,497 | ||||||
| 4,890,857 | ||||||||
| TOTAL ARGENTINA | 22,304,699 | |||||||
| BRAZIL — 32.1% | ||||||||
| Consumer Discretionary — 28.0% | ||||||||
| Arcos Dorados Holdings, Cl A . | 280,932 | 2,230,600 | ||||||
| MercadoLibre * | 8,838 | 11,290,457 | ||||||
| 13,521,057 | ||||||||
| Consumer Staples — 4.1% | ||||||||
| Adecoagro | 237,515 | 2,009,377 | ||||||
| TOTAL BRAZIL | 15,530,434 | |||||||
| CANADA — 10.0% | ||||||||
| Materials — 10.0% | ||||||||
| Agnico Eagle Mines | 12,492 | 707,908 | ||||||
| Lithium Americas * (A) | 65,056 | 1,298,914 | ||||||
| Pan American Silver | 53,173 | 945,611 | ||||||
| SSR Mining | 129,820 | 1,856,896 | ||||||
| TOTAL CANADA | 4,809,329 | |||||||
| CHILE — 8.0% | ||||||||
| Consumer Staples — 8.0% | ||||||||
| Cencosud | 960,658 | 1,969,874 | ||||||
| Shares | Value | |||||||
| COMMON STOCK — continued | ||||||||
| Consumer Staples — continued | ||||||||
| Cia Cervecerias Unidas . | 229,593 | $ | 1,886,027 | |||||
| TOTAL CHILE | 3,855,901 | |||||||
| TOTAL COMMON STOCK | ||||||||
| (Cost $51,362,754) | 46,500,363 | |||||||
| PREFERRED STOCK — 3.7% | ||||||||
| CHILE— 3.7% | ||||||||
| Consumer Staples — 3.7% | ||||||||
| Embotelladora Andina (B) | ||||||||
| (Cost $1,542,940) | 701,374 | 1,767,981 | ||||||
| SHORT-TERM INVESTMENT(C)(D) — 0.0% | ||||||||
| Fidelity Investments Money Market | ||||||||
| Government Portfolio, Cl Institutional, | ||||||||
| 4.770% | ||||||||
| (Cost $1,032) . | 1,032 | 1,032 | ||||||
| Face Amount | ||||||||
| REPURCHASE AGREEMENT(C) — 0.0% | ||||||||
| BNP Paribas | ||||||||
| 4.700%, dated 04/28/2023, to be repurchased | ||||||||
| on 05/01/2023, repurchase price $11,543 | ||||||||
| (collateralized by U.S. Treasury Obligations, | ||||||||
| ranging in par value $620 - $931, 1.125% | ||||||||
| - 2.250%, 01/15/2025 - 08/15/2027, with a | ||||||||
| total market value of $11,748) | ||||||||
| (Cost $11,537) | $ | 11,537 | 11,537 | |||||
| TOTAL INVESTMENTS — 100.0% | ||||||||
| (Cost $52,918,263) | $ | 48,280,913 | ||||||
| Percentages are based on Net Assets of $48,301,536. | ||||||||
| * Non-income producing security. | ||||||||
| (A) This security or a partial position of this security is on loan at April 30, 2023. | ||||||||
| (B) There is currently no stated interest rate. | ||||||||
| (C) Security was purchased with cash collateral held from securities on loan. | ||||||||
| (D) The rate reported on the Schedule of Investments is the 7-day effective yield as of April 30, 2023. | ||||||||
The following is a summary of the level of inputs used as of April 30, 2023, in valuing the Fund's investments carried at value:
| Investments in Securities | Level 1 | Level 2 | Level 3 | Total | ||||||||||||
| Common Stock | $ | 46,500,363 | $ | — | $ | — | $ | 46,500,363 | ||||||||
| Preferred Stock | 1,767,981 | — | — | 1,767,981 | ||||||||||||
| Short-Term Investment | 1,032 | — | — | 1,032 | ||||||||||||
| Repurchase Agreement | — | 11,537 | — | 11,537 | ||||||||||||
| Total Investments in Securities | $ | 48,269,376 | $ | 11,537 | $ | — | $ | 48,280,913 | ||||||||
Amounts designated as “—“ are $0 or have been rounded to $0.
See “Glossary” for abbreviations.
| Schedule of Investments | April 30, 2023 (Unaudited) | |
| Global X MSCI Greece ETF | ||
| Shares | Value | ||||||
| COMMON STOCK — 99.7% | |||||||
| GREECE — 96.5% | |||||||
| Communication Services — 8.4% | |||||||
| Hellenic Telecommunications Organization . | 906,145 | $ | 13,255,047 | ||||
| Consumer Discretionary — 15.0% | |||||||
| FF Group *(A) | 452,712 | 5 | |||||
| FF Group ADR *(A) | 198,300 | 2 | |||||
| JUMBO | 359,201 | 8,288,034 | |||||
| OPAP . | 907,755 | 15,493,367 | |||||
| 23,781,408 | |||||||
| Consumer Staples — 1.8% | |||||||
| Sarantis . | 360,248 | 2,855,576 | |||||
| Energy — 10.1% | |||||||
| GasLog Partners (C) | 361,508 | 3,065,588 | |||||
| Helleniq Energy Holdings | 475,459 | 3,779,316 | |||||
| Motor Oil Hellas Corinth Refineries | 268,581 | 6,404,670 | |||||
| Tsakos Energy Navigation (B) | 163,026 | 2,797,526 | |||||
| 16,047,100 | |||||||
| Shares | Value | |||||||
| COMMON STOCK — continued | ||||||||
| Financials — 32.5% | ||||||||
| Alpha Services and Holdings * | 10,136,349 | $ | 12,701,210 | |||||
| Eurobank Ergasias Services and Holdings * | 11,923,670 | 16,849,522 | ||||||
| Hellenic Exchanges - Athens Stock Exchange . | 617,562 | 2,733,963 | ||||||
| National Bank of Greece * | 2,239,317 | 11,718,219 | ||||||
| Piraeus Financial Holdings * | 3,107,009 | 7,340,472 | ||||||
| 51,343,386 | ||||||||
| Industrials — 13.4% | ||||||||
| Aegean Airlines * | 373,363 | 3,206,849 | ||||||
| Capital Product Partners (C) | 186,213 | 2,357,457 | ||||||
| Ellaktor * | 1,086,035 | 2,369,182 | ||||||
| GEK Terna Holding Real Estate Construction . | 400,742 | 5,485,980 | ||||||
| Mytilineos . | 269,074 | 7,812,592 | ||||||
| 21,232,060 | ||||||||
| Real Estate — 2.3% | ||||||||
| LAMDA Development * | 576,993 | 3,567,190 | ||||||
| Utilities — 13.0% | ||||||||
| Athens Water Supply & Sewage | 407,551 | 2,834,590 | ||||||
| Holding ADMIE IPTO . | 1,304,378 | 2,534,450 | ||||||
| Public Power * | 837,541 | 7,230,703 | ||||||
| Terna Energy . | 356,066 | 7,893,360 | ||||||
| 20,493,103 | ||||||||
| TOTAL GREECE | 152,574,870 | |||||||
| UNITED STATES — 3.2% | ||||||||
| Materials — 3.2% | ||||||||
| Titan Cement International . | 305,696 | 5,055,559 | ||||||
| TOTAL COMMON STOCK | ||||||||
| (Cost $148,490,266) | 157,630,429 | |||||||
| SHORT-TERM INVESTMENT(D)(E) — 0.1% | ||||||||
| Fidelity Investments Money Market | ||||||||
| Government Portfolio, Cl Institutional, | ||||||||
4.770% | ||||||||
| (Cost $123,631) | 123,631 | 123,631 | ||||||
| Schedule of Investments | April 30, 2023 (Unaudited) | |
| Global X MSCI Greece ETF | ||
| Face Amount | Value | |||||||
| REPURCHASE AGREEMENT(D) — 0.9% | ||||||||
| BNP Paribas | ||||||||
| 4.700%, dated 04/28/2023, to be repurchased | ||||||||
| on 05/01/2023, repurchase price $1,381,951 | ||||||||
| (collateralized by U.S. Treasury Obligations, | ||||||||
| ranging in par value $74,213 - $111,537, | ||||||||
| 1.125% - 2.250%, 01/15/2025 - 08/15/2027, | ||||||||
| with a total market value of $1,406,249) | ||||||||
| (Cost $1,381,411) . | $ | 1,381,411 | $ | 1,381,411 | ||||
| TOTAL INVESTMENTS — 100.7% | ||||||||
| (Cost $149,995,308) | $ | 159,135,471 | ||||||
| Percentages are based on Net Assets of $158,016,613. | ||||||||
| * Non-income producing security. | ||||||||
| (A) Level 3 security in accordance with fair value hierarchy. | ||||||||
| (B) This security or a partial position of this security is on loan at April 30, 2023. | ||||||||
| (C) Security considered Master Limited Partnership. At April 30, 2023, these securities amounted to $5,423,045 or 3.4% of Net Assets. | ||||||||
| (D) Security was purchased with cash collateral held from securities on loan. | ||||||||
| (E) The rate reported on the Schedule of Investments is the 7-day effective yield as of April 30, 2023. | ||||||||
The following is a summary of the level of inputs used as of April 30, 2023, in valuing the Fund's investments carried at value:
| Investments in Securities | Level 1 | Level 2 | Level 3(1) | Total | ||||||||||||
| Common Stock | $ | 157,630,422 | $ | — | $ | 7 | $ | 157,630,429 | ||||||||
| Short-Term Investment | 123,631 | — | — | 123,631 | ||||||||||||
| Repurchase Agreement | — | 1,381,411 | — | 1,381,411 | ||||||||||||
| Total Investments in Securities | $ | 157,754,053 | $ | 1,381,411 | $ | 7 | $ | 159,135,471 | ||||||||
(1) A reconciliation of Level 3 investments and disclosures of significant unobservable inputs are presented when the Fund has a significant amount of Level 3 investments at the end of the period in relation to Net Assets. Management has concluded that Level 3 investments are not material in relation to Net Assets.
Amounts designated as “—“ are $0 or have been rounded to $0.
See “Glossary” for abbreviations.
| Schedule of Investments | April 30, 2023 (Unaudited) | |
| Global X MSCI Nigeria ETF | ||
| Shares | Value | |||||||
| COMMON STOCK — 94.8% | ||||||||
| NIGERIA — 90.7% | ||||||||
| Communication Services — 5.6% | ||||||||
| Nigeria Communications . | 4,864,255 | $ | 2,410,520 | |||||
| Consumer Staples — 19.4% | ||||||||
| Dangote Sugar Refinery | 37,659,094 | 1,591,229 | ||||||
| Flour Mills of Nigeria | 24,022,438 | 1,613,642 | ||||||
| Nestle Nigeria | 1,149,667 | 2,600,265 | ||||||
| Nigerian Breweries . | 16,431,620 | 1,139,354 | ||||||
| UAC of Nigeria . | 38,636,465 | 669,755 | ||||||
| Unilever Nigeria . | 23,730,669 | 694,180 | ||||||
| 8,308,425 | ||||||||
| Financials — 41.4% | ||||||||
| Access Bank | 69,588,623 | 1,530,497 | ||||||
| FBN Holdings | 105,964,770 | 2,491,263 | ||||||
| FCMB Group | 164,030,462 | 1,492,801 | ||||||
| Fidelity Bank | 177,840,873 | 2,184,957 | ||||||
| Guaranty Trust Holding | 62,675,911 | 3,374,857 | ||||||
| Stanbic IBTC Holdings . | 19,605,429 | 1,573,957 | ||||||
| Sterling Bank (A) | 201,593,633 | 594,079 | ||||||
| United Bank for Africa . | 89,619,784 | 1,504,991 | ||||||
| Zenith Bank | 59,101,971 | 2,919,881 | ||||||
| 17,667,283 | ||||||||
| Materials — 18.3% | ||||||||
| Dangote Cement . | 10,522,666 | 6,156,273 | ||||||
| Shares | Value | |||||||
| COMMON STOCK — continued | ||||||||
| Materials — continued | ||||||||
| Lafarge Africa | 31,522,330 | $ | 1,646,128 | |||||
| 7,802,401 | ||||||||
| Utilities — 6.0% | ||||||||
| Transnational Corp of Nigeria | 417,740,027 | 2,543,552 | ||||||
| TOTAL NIGERIA | 38,732,181 | |||||||
| TOGO — 4.1% | ||||||||
| Financials — 4.1% | ||||||||
| Ecobank Transnational . | 72,220,468 | 1,737,047 | ||||||
| TOTAL COMMON STOCK | ||||||||
| (Cost $41,358,570) | 40,469,228 | |||||||
| Face Amount | ||||||||
| U.S. TREASURY OBLIGATION — 17.5% | ||||||||
| U.S. Treasury Bill | ||||||||
| 4.052%, 05/02/23(B) | ||||||||
| (Cost $7,499,156) | $ | 7,500,000 | 7,499,134 | |||||
| TOTAL INVESTMENTS — 112.3% | ||||||||
| (Cost $48,857,726) | $ | 47,968,362 | ||||||
| Percentages are based on Net Assets of $42,703,219. | |||||
| (A) Level 3 security in accordance with fair value hierarchy. | |||||
| (B) Interest rate represents the security's effective yield at the time of purchase. | |||||
The following is a summary of the level of inputs used as of April 30, 2023, in valuing the Fund's investments carried at value:
| Investments in Securities | Level 1 | Level 2 | Level 3 | Total | ||||||||||||
| Common Stock | $ | 39,875,149 | $ | — | $ | 594,079 | $ | 40,469,228 | ||||||||
| U.S. Treasury Obligation | — | 7,499,134 | — | 7,499,134 | ||||||||||||
| Total Investments in Securities | $ | 39,875,149 | $ | 7,499,134 | $ | 594,079 | $ | 47,968,362 | ||||||||
| Schedule of Investments | April 30, 2023 (Unaudited) | |
| Global X MSCI Nigeria ETF | ||
The following is a reconciliation of investments in which significant unobservable inputs (Level 3) were used in determining fair value.
| Investments in | ||||
| Common Stock | ||||
| Beginning Balance as of October 31, 2022 | $ | - | ||
| Transfers out of Level 3 | - | |||
| Transfers into Level 3 | 594,079 | |||
| Net purchases | - | |||
| Net sales | - | |||
| Realized gain/(loss) | - | |||
| Change in unrealized appreciation/(depreciation) | - | |||
| Ending Balance as of April 30, 2023 | $ | 594,079 | ||
For the period ended April 30, 2023, transfers in and out of Level 3 were due to the availability of observable inputs to determine fair value.
The following table summarizes the quantitative inputs and assumptions used for items categorized as material Level 3 investments as of April 30, 2023. The disclosures below also include qualitative information on the sensitivity of the fair value measurements to changes in the significant unobservable inputs.
| Fair Value at | Valuation | Unobservable | Discount | |||||||
| Assets | 4/30/23 | Technique(s) | Input | Percentage | ||||||
| Last Traded Price | ||||||||||
| Discount from the | Comparability | |||||||||
| Common Stock | $ | 594,079 | Last Traded Price | Adjustment % | 15.00 | % | ||||
| Amounts designated as “—“ are $0 or have been rounded to $0. | |||||||
| See “Glossary” for abbreviations. | |||||||
| Shares | Value | |||||||
| COMMON STOCK — 99.6% | ||||||||
| BANGLADESH — 0.7% | ||||||||
| Health Care — 0.5% | ||||||||
| Square Pharmaceuticals | 57,869 | $ | 114,375 | |||||
| Industrials — 0.2% | ||||||||
| Bangladesh Export Import . | 58,288 | 63,477 | ||||||
| TOTAL BANGLADESH | 177,852 | |||||||
| CHILE — 1.0% | ||||||||
| Consumer Discretionary — 0.3% | ||||||||
| Falabella | 36,491 | 78,738 | ||||||
| Financials — 0.7% | ||||||||
| Banco de Chile . | 764,528 | 81,911 | ||||||
| Banco de Credito e Inversiones | 972 | 29,503 | ||||||
| Banco Santander Chile . | 1,129,044 | 54,326 | ||||||
| 165,740 | ||||||||
| TOTAL CHILE | 244,478 | |||||||
| Shares | Value | |||||||
| COMMON STOCK — continued | ||||||||
| COLOMBIA — 0.4% | ||||||||
| Utilities — 0.4% | ||||||||
| Interconexion Electrica | 21,885 | $ | 85,457 | |||||
| CZECH REPUBLIC — 2.1% | ||||||||
| Financials — 0.3% | ||||||||
| Komercni Banka . | 1,260 | 40,789 | ||||||
| Moneta Money Bank | 5,409 | 19,914 | ||||||
| 60,703 | ||||||||
| Utilities — 1.8% | ||||||||
| CEZ | 7,923 | 427,290 | ||||||
| TOTAL CZECH REPUBLIC | 487,993 | |||||||
| EGYPT — 0.3% | ||||||||
| Financials — 0.3% | ||||||||
| Commercial International Bank Egypt SAE | 42,261 | 73,033 | ||||||
| GREECE — 2.1% | ||||||||
| Communication Services — 0.6% | ||||||||
| Hellenic Telecommunications Organization . | 9,808 | 143,471 | ||||||
| Consumer Discretionary — 0.7% | ||||||||
| OPAP . | 9,816 | 167,537 | ||||||
| Financials — 0.4% | ||||||||
| Alpha Services and Holdings * | 38,214 | 47,884 | ||||||
| National Bank of Greece * | 9,403 | 49,205 | ||||||
| 97,089 | ||||||||
| Utilities — 0.4% | ||||||||
| Public Power * | 10,371 | 89,536 | ||||||
| TOTAL GREECE | 497,633 | |||||||
| ICELAND — 1.4% | ||||||||
| Financials — 0.4% | ||||||||
| Arion Banki HF . | 44,501 | 46,709 | ||||||
| Islandsbanki HF | 39,059 | 35,674 | ||||||
| 82,383 | ||||||||
| Shares | Value | |||||||
| COMMON STOCK — continued | ||||||||
| Industrials — 1.0% | ||||||||
| Marel HF | 56,023 | $ | 240,986 | |||||
| TOTAL ICELAND | 323,369 | |||||||
| INDONESIA — 10.6% | ||||||||
| Communication Services — 2.5% | ||||||||
| Sarana Menara Nusantara . | 759,754 | 53,084 | ||||||
| Telkom Indonesia Persero | 1,836,365 | 532,008 | ||||||
| 585,092 | ||||||||
| Consumer Staples — 1.8% | ||||||||
| Charoen Pokphand Indonesia | 273,876 | 85,691 | ||||||
| Indofood CBP Sukses Makmur . | 86,922 | 62,659 | ||||||
| Indofood Sukses Makmur | 163,595 | 71,928 | ||||||
| Sumber Alfaria Trijaya . | 616,677 | 121,906 | ||||||
| Unilever Indonesia . | 282,976 | 84,874 | ||||||
| 427,058 | ||||||||
| Financials — 4.1% | ||||||||
| Bank Central Asia . | 710,325 | 438,203 | ||||||
| Bank Mandiri Persero | 479,544 | 169,164 | ||||||
| Bank Negara Indonesia Persero | 94,138 | 60,481 | ||||||
| Bank Rakyat Indonesia Persero | 873,534 | 303,683 | ||||||
| 971,531 | ||||||||
| Health Care — 0.5% | ||||||||
| Kalbe Farma | 781,618 | 112,954 | ||||||
| Industrials — 1.5% | ||||||||
| Astra International . | 750,629 | 345,381 | ||||||
| Materials — 0.2% | ||||||||
| Semen Indonesia Persero | 126,293 | 51,223 | ||||||
| TOTAL INDONESIA | 2,493,239 | |||||||
| KAZAKHSTAN — 1.5% | ||||||||
| Energy — 0.8% | ||||||||
| NAC Kazatomprom JSC GDR | 6,383 | 181,277 | ||||||
| Financials — 0.7% | ||||||||
| Halyk Savings Bank of Kazakhstan JSC GDR . | 2,893 | 38,766 | ||||||
| Shares | Value | |||||||
| COMMON STOCK — continued | ||||||||
| Financials — continued | ||||||||
| Kaspi.KZ JSC GDR | 1,631 | $ | 134,558 | |||||
| 173,324 | ||||||||
| TOTAL KAZAKHSTAN | 354,601 | |||||||
| KENYA — 0.6% | ||||||||
| Communication Services — 0.6% | ||||||||
| Safaricom | 1,102,711 | 133,785 | ||||||
| KUWAIT — 2.2% | ||||||||
| Financials — 1.9% | ||||||||
| Gulf Bank KSCP | 28,613 | 26,246 | ||||||
| National Bank of Kuwait SAK | 126,380 | 413,772 | ||||||
| 440,018 | ||||||||
| Real Estate — 0.3% | ||||||||
| Mabanee KPSC . | 32,287 | 80,098 | ||||||
| TOTAL KUWAIT | 520,116 | |||||||
| LUXEMBOURG — 0.2% | ||||||||
| Financials — 0.2% | ||||||||
| Reinet Investments SCA | 2,304 | 50,408 | ||||||
| MALAYSIA — 7.0% | ||||||||
| Communication Services — 1.8% | ||||||||
| Axiata Group | 133,600 | 89,556 | ||||||
| CELCOMDIGI . | 151,666 | 149,609 | ||||||
| Maxis | 115,845 | 114,274 | ||||||
| Telekom Malaysia | 56,755 | 63,110 | ||||||
| 416,549 | ||||||||
| Consumer Staples — 1.2% | ||||||||
| Nestle Malaysia . | 3,432 | 104,256 | ||||||
| PPB Group . | 31,543 | 114,985 | ||||||
| QL Resources . | 52,967 | 67,092 | ||||||
| 286,333 | ||||||||
| Energy — 0.3% | ||||||||
| Petronas Dagangan | 14,412 | 73,151 | ||||||
| Shares | Value | |||||||
| COMMON STOCK — continued | ||||||||
| Financials — 1.8% | ||||||||
| CIMB Group Holdings | 117,679 | $ | 133,495 | |||||
| Hong Leong Bank | 11,112 | 50,173 | ||||||
| Public Bank . | 246,935 | 215,352 | ||||||
| RHB Bank | 25,633 | 31,492 | ||||||
| 430,512 | ||||||||
| Health Care — 0.2% | ||||||||
| Top Glove * | 258,205 | 56,729 | ||||||
| Utilities — 1.7% | ||||||||
| Petronas Gas | 39,006 | 147,786 | ||||||
| Tenaga Nasional | 127,100 | 253,602 | ||||||
| 401,388 | ||||||||
| TOTAL MALAYSIA | 1,664,662 | |||||||
| MEXICO — 8.8% | ||||||||
| Communication Services — 0.5% | ||||||||
| Grupo Televisa | 110,265 | 111,494 | ||||||
| Consumer Staples — 2.7% | ||||||||
| Kimberly-Clark de Mexico, Cl A | 69,491 | 157,095 | ||||||
| Wal-Mart de Mexico | 121,280 | 487,366 | ||||||
| 644,461 | ||||||||
| Financials — 2.0% | ||||||||
| Banco del Bajio . | 12,844 | 42,115 | ||||||
| Grupo Financiero Banorte, Cl O | 41,064 | 353,935 | ||||||
| Grupo Financiero Inbursa, Cl O * | 33,655 | 81,642 | ||||||
| 477,692 | ||||||||
| Industrials — 2.8% | ||||||||
| Grupo Aeroportuario del Pacifico, Cl B | 16,336 | 289,690 | ||||||
| Grupo Aeroportuario del Sureste, Cl B . | 8,878 | 253,977 | ||||||
| Promotora y Operadora de Infraestructura . | 10,321 | 106,998 | ||||||
| 650,665 | ||||||||
| Real Estate — 0.8% | ||||||||
| Fibra Uno Administracion ‡ | 140,126 | 192,956 | ||||||
| TOTAL MEXICO | 2,077,268 | |||||||
| Shares | Value | |||||||
| COMMON STOCK — continued | ||||||||
| MOROCCO — 0.3% | ||||||||
| Financials — 0.3% | ||||||||
| Attijariwafa Bank | 1,464 | $ | 58,997 | |||||
| Banque Centrale Populaire | 594 | 13,526 | ||||||
| TOTAL MOROCCO | 72,523 | |||||||
| NIGERIA — 0.5% | ||||||||
| Financials — 0.1% | ||||||||
| Guaranty Trust Holding | 216,406 | 11,653 | ||||||
| Zenith Bank | 230,376 | 11,381 | ||||||
| 23,034 | ||||||||
| Materials — 0.4% | ||||||||
| Dangote Cement . | 146,538 | 85,732 | ||||||
| TOTAL NIGERIA | 108,766 | |||||||
| OMAN — 0.2% | ||||||||
| Financials — 0.2% | ||||||||
| BankMuscat SAOG | 63,670 | 44,817 | ||||||
| PERU — 0.7% | ||||||||
| Financials — 0.7% | ||||||||
| Credicorp . | 1,217 | 164,879 | ||||||
| PHILIPPINES — 5.1% | ||||||||
| Communication Services — 0.4% | ||||||||
| PLDT | 4,213 | 91,585 | ||||||
| Consumer Staples — 0.5% | ||||||||
| Universal Robina . | 42,844 | 113,714 | ||||||
| Financials — 0.8% | ||||||||
| Bank of the Philippine Islands | 33,068 | 64,244 | ||||||
| BDO Unibank | 39,864 | 103,645 | ||||||
| Metropolitan Bank & Trust | 29,702 | 31,426 | ||||||
| 199,315 | ||||||||
| Industrials — 0.8% | ||||||||
| SM Investments . | 12,001 | 193,932 | ||||||
| Shares | Value | |||||||
| COMMON STOCK — continued | ||||||||
| Real Estate — 2.2% | ||||||||
| Ayala Land . | 362,438 | $ | 174,397 | |||||
| SM Prime Holdings | 567,098 | 347,621 | ||||||
| 522,018 | ||||||||
| Utilities — 0.4% | ||||||||
| Manila Electric . | 13,686 | 83,769 | ||||||
| TOTAL PHILIPPINES | 1,204,333 | |||||||
| POLAND — 3.6% | ||||||||
| Communication Services — 0.2% | ||||||||
| Cyfrowy Polsat . | 12,369 | 51,986 | ||||||
| Consumer Discretionary — 0.6% | ||||||||
| Allegro.eu * | 18,227 | 143,703 | ||||||
| Consumer Staples — 1.1% | ||||||||
| Dino Polska * | 2,407 | 245,601 | ||||||
| Financials — 1.4% | ||||||||
| Bank Polska Kasa Opieki . | 3,088 | 71,427 | ||||||
| Powszechna Kasa Oszczednosci Bank Polski | 14,725 | 113,804 | ||||||
| Powszechny Zaklad Ubezpieczen | 10,168 | 93,851 | ||||||
| Santander Bank Polska | 595 | 48,495 | ||||||
| 327,577 | ||||||||
| Utilities — 0.3% | ||||||||
| PGE Polska Grupa Energetyczna * | 43,475 | 72,062 | ||||||
| TOTAL POLAND | 840,929 | |||||||
| QATAR — 4.9% | ||||||||
| Energy — 1.1% | ||||||||
| Qatar Fuel QSC . | 29,095 | 132,206 | ||||||
| Qatar Gas Transport . | 122,466 | 133,232 | ||||||
| 265,438 | ||||||||
| Financials — 1.5% | ||||||||
| Commercial Bank PSQC . | 54,927 | 88,457 | ||||||
| Masraf Al Rayan QSC | 94,660 | 66,314 | ||||||
| Qatar International Islamic Bank QSC | 16,314 | 44,326 | ||||||
| Shares | Value | |||||||
| COMMON STOCK — continued | ||||||||
| Financials — continued | ||||||||
| Qatar Islamic Bank SAQ . | 28,060 | $ | 137,987 | |||||
| 337,084 | ||||||||
| Industrials — 1.1% | ||||||||
| Industries Qatar QSC . | 74,296 | 260,444 | ||||||
| Materials — 0.5% | ||||||||
| Mesaieed Petrochemical Holding . | 215,993 | 117,491 | ||||||
| Real Estate — 0.3% | ||||||||
| Barwa Real Estate | 103,960 | 71,401 | ||||||
| Utilities — 0.4% | ||||||||
| Qatar Electricity & Water QSC . | 21,613 | 99,574 | ||||||
| TOTAL QATAR | 1,151,432 | |||||||
| ROMANIA — 1.7% | ||||||||
| Energy — 0.7% | ||||||||
| OMV Petrom . | 1,530,422 | 166,226 | ||||||
| Financials — 0.4% | ||||||||
| Banca Transilvania | 18,007 | 77,224 | ||||||
| BRD-Groupe Societe Generale | 6,869 | 19,075 | ||||||
| 96,299 | ||||||||
| Real Estate — 0.6% | ||||||||
| NEPI Rockcastle | 22,267 | 134,622 | ||||||
| TOTAL ROMANIA | 397,147 | |||||||
| SAUDI ARABIA — 10.8% | ||||||||
| Communication Services — 2.5% | ||||||||
| Etihad Etisalat | 8,435 | 103,450 | ||||||
| Mobile Telecommunications Saudi Arabia . | 9,961 | 39,730 | ||||||
| Saudi Research & Media Group * | 811 | 45,581 | ||||||
| Saudi Telecom . | 33,911 | 406,856 | ||||||
| 595,617 | ||||||||
| Consumer Discretionary — 0.2% | ||||||||
| Jarir Marketing | 1,316 | 57,262 | ||||||
| Shares | Value | |||||||
| COMMON STOCK — continued | ||||||||
| Consumer Staples — 0.8% | ||||||||
| Almarai JSC | 5,589 | $ | 87,768 | |||||
| Nahdi Medical . | 879 | 41,997 | ||||||
| Savola Group | 5,896 | 50,067 | ||||||
| 179,832 | ||||||||
| Financials — 4.0% | ||||||||
| Al Rajhi Bank | 15,303 | 313,347 | ||||||
| Alinma Bank . | 7,566 | 63,845 | ||||||
| Arab National Bank . | 4,681 | 34,071 | ||||||
| Bank AlBilad | 3,816 | 42,070 | ||||||
| Bank Al-Jazira | 3,137 | 16,243 | ||||||
| Banque Saudi Fransi | 4,595 | 47,289 | ||||||
| Bupa Arabia for Cooperative Insurance . | 587 | 27,607 | ||||||
| Riyad Bank | 10,423 | 83,368 | ||||||
| Saudi British Bank . | 7,141 | 68,826 | ||||||
| Saudi Investment Bank | 3,826 | 16,709 | ||||||
| Saudi National Bank . | 17,131 | 223,347 | ||||||
| Saudi Tadawul Group Holding | 375 | 16,717 | ||||||
| 953,439 | ||||||||
| Health Care — 1.0% | ||||||||
| Dr Sulaiman Al Habib Medical Services | ||||||||
Group . | 1,978 | 151,355 | ||||||
| Mouwasat Medical Services . | 1,096 | 72,118 | ||||||
| 223,473 | ||||||||
| Information Technology — 0.3% | ||||||||
| Elm | 535 | 63,189 | ||||||
| Materials — 1.3% | ||||||||
| SABIC Agri-Nutrients | 4,843 | 172,508 | ||||||
| Saudi Kayan Petrochemical * | 16,434 | 55,471 | ||||||
| Yanbu National Petrochemical . | 5,660 | 67,454 | ||||||
| 295,433 | ||||||||
| Real Estate — 0.2% | ||||||||
| Dar Al Arkan Real Estate Development * | 11,917 | 51,090 | ||||||
| Shares | Value | |||||||
| COMMON STOCK — continued | ||||||||
| Utilities — 0.5% | ||||||||
| Saudi Electricity . | 18,839 | $ | 121,552 | |||||
| TOTAL SAUDI ARABIA | 2,540,887 | |||||||
| SOUTH AFRICA — 7.5% | ||||||||
| Communication Services — 0.5% | ||||||||
| MultiChoice Group . | 18,336 | 114,817 | ||||||
| Consumer Discretionary — 0.8% | ||||||||
| Mr Price Group | 12,626 | 103,874 | ||||||
| Pepkor Holdings . | 98,180 | 91,018 | ||||||
| 194,892 | ||||||||
| Consumer Staples — 2.0% | ||||||||
| Clicks Group . | 12,012 | 175,636 | ||||||
| Shoprite Holdings . | 24,678 | 300,921 | ||||||
| 476,557 | ||||||||
| Financials — 3.3% | ||||||||
| Absa Group . | 14,275 | 138,692 | ||||||
| Capitec Bank Holdings | 1,466 | 127,717 | ||||||
| Nedbank Group | 7,746 | 89,412 | ||||||
| Old Mutual . | 82,435 | 52,391 | ||||||
| Remgro . | 8,898 | 68,147 | ||||||
| Sanlam . | 29,979 | 92,526 | ||||||
| Standard Bank Group . | 22,771 | 213,328 | ||||||
| 782,213 | ||||||||
| Materials — 0.9% | ||||||||
| African Rainbow Minerals | 5,447 | 68,431 | ||||||
| Harmony Gold Mining . | 27,343 | 127,969 | ||||||
| 196,400 | ||||||||
| TOTAL SOUTH AFRICA | 1,764,879 | |||||||
| SRI LANKA — 0.1% | ||||||||
| Industrials — 0.1% | ||||||||
| John Keells Holdings | 64,452 | 27,721 | ||||||
| Shares | Value | |||||||
| COMMON STOCK — continued | ||||||||
| THAILAND — 9.4% | ||||||||
| Communication Services — 1.1% | ||||||||
| Advanced Info Service NVDR | 30,773 | $ | 192,852 | |||||
| Intouch Holdings PCL NVDR | 28,566 | 62,741 | ||||||
| 255,593 | ||||||||
| Consumer Discretionary — 0.7% | ||||||||
| Central Retail NVDR . | 46,316 | 60,697 | ||||||
| Home Product Center NVDR | 151,133 | 61,962 | ||||||
| PTT Oil & Retail Business NVDR . | 81,658 | 53,088 | ||||||
| 175,747 | ||||||||
| Consumer Staples — 1.4% | ||||||||
| Berli Jucker NVDR | 32,583 | 37,213 | ||||||
| CP ALL NVDR | 151,023 | 286,368 | ||||||
| 323,581 | ||||||||
| Energy — 0.9% | ||||||||
| PTT Exploration & Production NVDR . | 36,026 | 156,142 | ||||||
| Thai Oil NVDR . | 33,119 | 45,099 | ||||||
| 201,241 | ||||||||
| Financials — 0.3% | ||||||||
| Kasikornbank NVDR . | 5,193 | 19,009 | ||||||
| Krung Thai Bank NVDR . | 30,600 | 16,130 | ||||||
| Krungthai Card NVDR | 8,508 | 13,143 | ||||||
| SCB X NVDR . | 7,899 | 23,942 | ||||||
| Srisawad NVDR . | 6,212 | 10,096 | ||||||
| 82,320 | ||||||||
| Health Care — 1.4% | ||||||||
| Bangkok Dusit Medical Services NVDR . | 266,807 | 228,541 | ||||||
| Bumrungrad Hospital NVDR | 15,325 | 106,812 | ||||||
| 335,353 | ||||||||
| Industrials — 1.4% | ||||||||
| Airports of Thailand NVDR * | 110,722 | 237,511 | ||||||
| Bangkok Expressway & Metro NVDR . | 195,336 | 50,625 | ||||||
| BTS Group Holdings PCL NVDR | 215,201 | 48,526 | ||||||
| 336,662 | ||||||||
| Shares | Value | |||||||
| COMMON STOCK — continued | ||||||||
| Materials — 0.2% | ||||||||
| SCG Packaging NVDR . | 35,249 | $ | 45,419 | |||||
| Real Estate — 0.7% | ||||||||
| Central Pattana NVDR . | 52,381 | 104,309 | ||||||
| Land & Houses NVDR | 213,635 | 61,311 | ||||||
| 165,620 | ||||||||
| Utilities — 1.3% | ||||||||
| Electricity Generating NVDR . | 7,300 | 33,456 | ||||||
| Energy Absolute NVDR . | 43,580 | 86,465 | ||||||
| Global Power Synergy NVDR . | 19,031 | 35,668 | ||||||
| Gulf Energy Development NVDR | 76,076 | 113,064 | ||||||
| Ratch Group NVDR | 29,465 | 32,574 | ||||||
| 301,227 | ||||||||
| TOTAL THAILAND | 2,222,763 | |||||||
| TURKEY — 2.8% | ||||||||
| Communication Services — 0.4% | ||||||||
| Turkcell Iletisim Hizmetleri | 59,496 | 101,259 | ||||||
| Consumer Staples — 0.8% | ||||||||
| BIM Birlesik Magazalar . | 22,417 | 180,044 | ||||||
| Financials — 0.5% | ||||||||
| Akbank Turk | 53,451 | 44,111 | ||||||
| Haci Omer Sabanci Holding . | 16,907 | 33,209 | ||||||
| Turkiye Is Bankasi, Cl C | 58,025 | 32,312 | ||||||
| 109,632 | ||||||||
| Industrials — 0.3% | ||||||||
| Aselsan Elektronik Sanayi Ve Ticaret . | 33,293 | 76,555 | ||||||
| Materials — 0.8% | ||||||||
| Eregli Demir ve Celik Fabrikalari * | 68,262 | 116,319 | ||||||
| Hektas Ticaret * | 55,521 | 76,909 | ||||||
| 193,228 | ||||||||
| TOTAL TURKEY | 660,718 | |||||||
| Shares | Value | |||||||
| COMMON STOCK — continued | ||||||||
| UNITED ARAB EMIRATES — 7.3% | ||||||||
| Communication Services — 1.8% | ||||||||
| Emirates Telecommunications Group PJSC | 63,286 | $ | 413,634 | |||||
| Consumer Discretionary — 0.7% | ||||||||
| Abu Dhabi National Oil for Distribution PJSC . | 147,026 | 175,774 | ||||||
| Financials — 2.8% | ||||||||
| Abu Dhabi Commercial Bank PJSC | 47,574 | 114,271 | ||||||
| Abu Dhabi Islamic Bank PJSC | 23,464 | 72,590 | ||||||
| Dubai Islamic Bank PJSC | 46,536 | 70,463 | ||||||
| Emirates NBD Bank PJSC | 30,790 | 118,230 | ||||||
| First Abu Dhabi Bank PJSC | 71,801 | 277,271 | ||||||
| 652,825 | ||||||||
| Industrials — 0.9% | ||||||||
| Multiply Group PJSC * | 158,082 | 144,650 | ||||||
| Q Holding PJSC * | 96,763 | 67,197 | ||||||
| 211,847 | ||||||||
| Real Estate — 1.1% | ||||||||
| Aldar Properties PJSC | 181,262 | 266,562 | ||||||
| TOTAL UNITED ARAB EMIRATES | 1,720,642 | |||||||
| VIETNAM — 5.8% | ||||||||
| Consumer Staples — 1.6% | ||||||||
| Masan Group | 55,052 | 171,531 | ||||||
| Saigon Beer Alcohol Beverage | 50 | 367 | ||||||
| Vietnam Dairy Products JSC | 71,296 | 212,724 | ||||||
| 384,622 | ||||||||
| Financials — 0.4% | ||||||||
| Bank for Foreign Trade of Vietnam JSC * | 15,206 | 58,656 | ||||||
| Ho Chi Minh City Development Joint Stock | ||||||||
Commercial Bank * | 10 | 8 | ||||||
| SSI Securities . | 35,850 | 32,930 | ||||||
| 91,594 | ||||||||
| Industrials — 0.3% | ||||||||
| Vietjet Aviation JSC * | 15,380 | 63,589 | ||||||
| Shares | Value | |||||||
| COMMON STOCK — continued | ||||||||
| Materials — 1.1% | ||||||||
| Hoa Phat Group JSC | 276,421 | $ | 255,084 | |||||
| Real Estate — 2.4% | ||||||||
| No Va Land Investment Group * | 64,746 | 39,464 | ||||||
| Vincom Retail JSC * | 89,090 | 105,187 | ||||||
| Vingroup JSC * | 92,929 | 206,368 | ||||||
| Vinhomes JSC | 106,257 | 224,190 | ||||||
| 575,209 | ||||||||
| TOTAL VIETNAM | 1,370,098 | |||||||
| TOTAL COMMON STOCK | ||||||||
| (Cost $22,956,711) | 23,476,428 | |||||||
| Face Amount | ||||||||
| CORPORATE OBLIGATION — 0.0% | ||||||||
| Oman — 0.0% | ||||||||
| Financials — 0.0% | ||||||||
| Bank Muscat SAOG | ||||||||
4.250%(A) | ||||||||
| (Cost $–) | $ | 2,686 | 5,191 | |||||
| TOTAL INVESTMENTS — 99.6% | ||||||||
| (Cost $22,956,711) | $ | 23,481,619 | ||||||
| Percentages are based on Net Assets of $23,575,474. | ||||||||
| * Non-income producing security. | ||||||||
| ‡ Real Estate Investment Trust | ||||||||
| (A) Perpetual security with no stated maturity date. |
The following is a summary of the level of inputs used as of April 30, 2023, in valuing the Fund's investments carried at value:
| Investments in Securities | Level 1 | Level 2 | Level 3 | Total | ||||||||||||
| Common Stock | $ | 18,968,291 | $ | 4,508,137 | $ | — | $ | 23,476,428 | ||||||||
| Corporate Obligation | — | 5,191 | — | 5,191 | ||||||||||||
| Total Investments in Securities | $ | 18,968,291 | $ | 4,513,328 | $ | — | $ | 23,481,619 | ||||||||
Amounts designated as “—“ are $0 or have been rounded to $0.
See “Glossary” for abbreviations.
| Schedule of Investments | April 30, 2023 (Unaudited) | |
| Global X MSCI Portugal ETF | ||

| Shares | Value | |||||||
| COMMON STOCK — 97.4% | ||||||||
| CHINA — 2.8% | ||||||||
| Industrials — 2.8% | ||||||||
| Fosun International . | 600,090 | $ | 419,686 | |||||
| IRELAND — 0.2% | ||||||||
| Industrials — 0.2% | ||||||||
| Fusion Fuel Green, Cl A * | 12,027 | 34,878 | ||||||
| PORTUGAL — 77.6% | ||||||||
| Communication Services — 4.5% | ||||||||
| NOS SGPS . | 140,437 | 618,307 | ||||||
| Pharol SGPS * | 906,383 | 51,233 | ||||||
| 669,540 | ||||||||
| Consumer Discretionary — 1.6% | ||||||||
| Ibersol SGPS . | 32,231 | 239,829 | ||||||
| Consumer Staples — 9.4% | ||||||||
| Jeronimo Martins | 28,958 | 732,102 | ||||||
| Sonae . | 582,488 | 664,929 | ||||||
| 1,397,031 | ||||||||
| Energy — 4.0% | ||||||||
| Galp Energia | 49,404 | 599,415 | ||||||
| Shares | Value | |||||||
| COMMON STOCK — continued | ||||||||
| Financials — 5.0% | ||||||||
| Banco Comercial Portugues, Cl R . | 2,866,231 | $ | 737,284 | |||||
| Industrials — 5.5% | ||||||||
| CTT-Correios de Portugal | 130,206 | 538,333 | ||||||
| Mota-Engil | 125,973 | 275,644 | ||||||
| 813,977 | ||||||||
| Materials — 14.8% | ||||||||
| Altri . | 98,950 | 512,338 | ||||||
| Corticeira Amorim SGPS | 54,977 | 621,511 | ||||||
| Navigator . | 180,555 | 663,776 | ||||||
| Ramada Investimentos E Industria . | 8,681 | 71,495 | ||||||
| Semapa-Sociedade de Investimento e Gestao | 22,418 | 339,561 | ||||||
| 2,208,681 | ||||||||
| Utilities — 32.8% | ||||||||
| EDP - Energias de Portugal | 668,183 | 3,688,358 | ||||||
| Greenvolt-Energias Renovaveis * | 76,720 | 522,167 | ||||||
| REN - Redes Energeticas Nacionais | 230,875 | 671,623 | ||||||
| 4,882,148 | ||||||||
| TOTAL PORTUGAL | 11,547,905 | |||||||
| SPAIN — 16.8% | ||||||||
| Utilities — 16.8% | ||||||||
| EDP Renovaveis . | 112,438 | 2,502,484 | ||||||
| TOTAL COMMON STOCK | ||||||||
| (Cost $14,853,830) | 14,504,953 | |||||||
| TOTAL INVESTMENTS — 97.4% | ||||||||
| (Cost $14,853,830) | $ | 14,504,953 | ||||||
Percentages are based on Net Assets of $14,885,233.
A list of the open futures contracts held by the Fund at April 30, 2023, is as follows:
| Type of Contract | Number of Contracts | Expiration Date | Notional Amount | Value | Unrealized Appreciation | ||||||||||
| Long Contracts | |||||||||||||||
| Euro STOXX 50 | 5 | Jun-2023 | $ | 215,955 | $ | 238,463 | $ | 14,170 | |||||||
| Schedule of Investments | April 30, 2023 (Unaudited) | |
| Global X MSCI Portugal ETF | ||
* Non-income producing security.
The following is a summary of the level of inputs used as of April 30, 2023, in valuing the Fund's investments and other financial instruments carried at value:
| Investments in Securities | Level 1 | Level 2 | Level 3 | Total | ||||||||||||
| Common Stock | $ | 14,504,953 | $ | — | $ | — | $ | 14,504,953 | ||||||||
| Total Investments in Securities | $ | 14,504,953 | $ | — | $ | — | $ | 14,504,953 | ||||||||
| Other Financial Instruments | Level 1 | Level 2 | Level 3 | Total | ||||||||||||
| Futures Contracts* | ||||||||||||||||
| Unrealized Appreciation | $ | 14,170 | $ | — | $ | — | $ | 14,170 | ||||||||
| Total Other Financial Instruments | $ | 14,170 | $ | — | $ | — | $ | 14,170 | ||||||||
Amounts designated as “—“ are $0 or have been rounded to $0.
See “Glossary” for abbreviations.
| Schedule of Investments | April 30, 2023 (Unaudited) | |
| Global X DAX Germany ETF | ||

| Shares | Value | |||||||
| COMMON STOCK — 93.8% | ||||||||
| FRANCE — 6.1% | ||||||||
| Industrials — 6.1% | ||||||||
| Airbus . | 25,268 | $ | 3,547,228 | |||||
| GERMANY — 87.0% | ||||||||
| Communication Services — 6.5% | ||||||||
| Deutsche Telekom | 154,391 | 3,729,383 | ||||||
| Consumer Discretionary — 10.5% | ||||||||
| adidas | 7,113 | 1,252,039 | ||||||
| Bayerische Motoren Werke | 13,038 | 1,460,118 | ||||||
| Continental | 4,572 | 320,111 | ||||||
| Mercedes-Benz Group | 34,022 | 2,650,996 | ||||||
| Zalando * | 9,914 | 406,826 | ||||||
| 6,090,090 | ||||||||
| Consumer Staples — 1.0% | ||||||||
| Beiersdorf | 4,199 | 586,877 | ||||||
| Financials — 17.5% | ||||||||
| Allianz . | 17,287 | 4,340,835 | ||||||
| Commerzbank . | 45,316 | 503,539 | ||||||
| Shares | Value | |||||||
| COMMON STOCK — continued | ||||||||
| Financials — continued | ||||||||
| Deutsche Bank | 87,922 | $ | 965,123 | |||||
| Deutsche Boerse . | 7,937 | 1,515,023 | ||||||
| Hannover Rueck . | 2,572 | 549,723 | ||||||
| Muenchener Rueckversicherungs-Gesellschaft | ||||||||
in Muenchen . | 5,949 | 2,236,293 | ||||||
| 10,110,536 | ||||||||
| Health Care — 8.8% | ||||||||
| Bayer . | 42,510 | 2,804,590 | ||||||
| Fresenius & KGaA | 17,765 | 514,240 | ||||||
| Merck KGaA . | 5,575 | 1,000,459 | ||||||
| Siemens Healthineers . | 12,081 | 752,495 | ||||||
| 5,071,784 | ||||||||
| Industrials — 17.4% | ||||||||
| Brenntag | 6,625 | 539,625 | ||||||
| Daimler Truck Holding | 20,251 | 669,369 | ||||||
| Deutsche Post . | 40,770 | 1,958,832 | ||||||
| MTU Aero Engines . | 2,297 | 602,779 | ||||||
| Rheinmetall . | 1,861 | 545,480 | ||||||
| Siemens | 32,048 | 5,268,213 | ||||||
| Siemens Energy . | 19,723 | 482,950 | ||||||
| 10,067,248 | ||||||||
| Information Technology — 13.9% | ||||||||
| Infineon Technologies | 56,536 | 2,053,783 | ||||||
| SAP . | 44,335 | 6,013,467 | ||||||
| 8,067,250 | ||||||||
| Materials — 6.0% | ||||||||
| BASF | 38,590 | 1,995,961 | ||||||
| Covestro | 8,039 | 353,137 | ||||||
| HeidelbergCement . | 5,892 | 445,966 | ||||||
| Symrise, Cl A | 5,400 | 652,495 | ||||||
| 3,447,559 | ||||||||
| Real Estate — 1.1% | ||||||||
| Vonovia | 29,217 | 633,014 | ||||||
| Shares | Value | |||||||
| COMMON STOCK — continued | ||||||||
| Utilities — 4.3% | ||||||||
| E.ON | 86,168 | $ | 1,142,026 | |||||
| RWE . | 29,194 | 1,371,389 | ||||||
| 2,513,415 | ||||||||
| TOTAL GERMANY | 50,317,156 | |||||||
| UNITED STATES — 0.7% | ||||||||
| Health Care — 0.7% | ||||||||
| QIAGEN * | 9,770 | 436,943 | ||||||
| TOTAL COMMON STOCK | ||||||||
| (Cost $48,133,242) | 54,301,327 | |||||||
| PREFERRED STOCK — 5.5% | ||||||||
| GERMANY— 5.5% | ||||||||
| Consumer Discretionary — 3.8% | ||||||||
| Dr Ing hc F Porsche *(A) | 4,894 | 612,696 | ||||||
| Porsche Automobil Holding (A) | 6,544 | 364,695 | ||||||
| Volkswagen (A) | 8,900 | 1,215,226 | ||||||
| 2,192,617 | ||||||||
| Consumer Staples — 1.0% | ||||||||
| Henkel & KGaA (A) | 7,011 | 567,196 | ||||||
| Health Care — 0.7% | ||||||||
| Sartorius (A) | 1,053 | 408,738 | ||||||
| TOTAL GERMANY | 3,168,551 | |||||||
| TOTAL PREFERRED STOCK | ||||||||
| (Cost $3,512,772) | 3,168,551 | |||||||
| TOTAL INVESTMENTS — 99.3% | ||||||||
| (Cost $51,646,014) | $ | 57,469,878 | ||||||
| Percentages are based on Net Assets of $57,861,670. | ||||||||
| * Non-income producing security. | ||||||||
| (A) There is currently no stated interest rate. |
As of April 30, 2023, all of the Fund's investments were considered Level 1, in accordance with authoritative guidance on fair value measurements and disclosure under U.S. GAAP.
See “Glossary” for abbreviations.
| Schedule of Investments | April 30, 2023 (Unaudited) | |
| Global X MSCI Pakistan ETF | ||
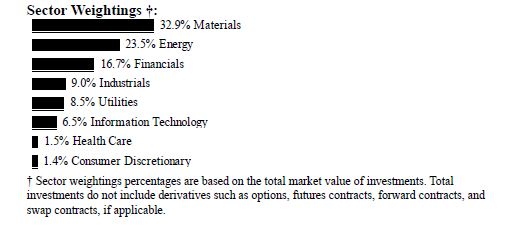
| Shares | Value | |||||||
| COMMON STOCK — 99.2% | ||||||||
| PAKISTAN — 99.2% | ||||||||
| Consumer Discretionary — 1.4% | ||||||||
| Nishat Mills | 1,149,077 | $ | 222,556 | |||||
| Energy — 23.3% | ||||||||
| Mari Petroleum | 139,551 | 782,156 | ||||||
| Oil & Gas Development . | 2,843,377 | 861,754 | ||||||
| Pakistan Oilfields | 649,851 | 937,526 | ||||||
| Pakistan Petroleum | 2,739,991 | 643,124 | ||||||
| Pakistan State Oil | 1,428,619 | 579,234 | ||||||
| 3,803,794 | ||||||||
| Financials — 16.6% | ||||||||
| Bank Alfalah | 4,024,704 | 414,162 | ||||||
| Habib Bank . | 2,688,759 | 687,309 | ||||||
| MCB Bank . | 1,796,075 | 760,131 | ||||||
| United Bank . | 1,973,046 | 853,600 | ||||||
| 2,715,202 | ||||||||
| Health Care — 1.4% | ||||||||
| Searle * | 1,243,192 | 238,637 | ||||||
| Industrials — 9.0% | ||||||||
| Millat Tractors . | 417,296 | 768,009 | ||||||
| Shares | Value | |||||||
| COMMON STOCK — continued | ||||||||
| Industrials — continued | ||||||||
| TRG Pakistan * | 1,804,424 | $ | 696,745 | |||||
| 1,464,754 | ||||||||
| Information Technology — 6.4% | ||||||||
| Systems | 655,839 | 1,051,803 | ||||||
| Materials — 32.7% | ||||||||
| DG Khan Cement | 1,708,812 | 270,846 | ||||||
| Engro . | 1,617,375 | 1,752,337 | ||||||
| Engro Fertilizers . | 3,149,826 | 932,533 | ||||||
| Engro Polymer & Chemicals | 1,933,985 | 312,059 | ||||||
| Fauji Cement * | 7,293,955 | 309,850 | ||||||
| Fauji Fertilizer . | 2,025,229 | 734,454 | ||||||
| Lucky Cement * | 503,609 | 712,236 | ||||||
| Maple Leaf Cement Factory * | 3,217,547 | 314,200 | ||||||
| 5,338,515 | ||||||||
| Utilities — 8.4% | ||||||||
| Hub Power . | 5,419,005 | 1,372,804 | ||||||
| TOTAL PAKISTAN | 16,208,065 | |||||||
| TOTAL COMMON STOCK | ||||||||
| (Cost $27,171,280) | 16,208,065 | |||||||
| TOTAL INVESTMENTS — 99.2% | ||||||||
| (Cost $27,171,280) | $ | 16,208,065 | ||||||
| Percentages are based on Net Assets of $16,338,126. | ||||||||
| * Non-income producing security. |
As of April 30, 2023, all of the Fund's investments were considered Level 1, in accordance with authoritative guidance on fair value measurements and disclosure under U.S. GAAP.
See “Glossary” for abbreviations.
| Schedule of Investments | April 30, 2023 (Unaudited) |
| Global X MSCI China Consumer Staples ETF | |
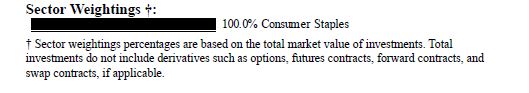
| Shares | Value | |||||||
| COMMON STOCK — 99.9% | ||||||||
| CHINA — 98.8% | ||||||||
| Consumer Staples — 98.8% | ||||||||
| Angel Yeast, Cl A | 34,654 | $ | 200,218 | |||||
| Anhui Gujing Distillery, Cl A | 11,926 | 471,545 | ||||||
| Anhui Gujing Distillery, Cl B | 48,100 | 852,331 | ||||||
| Anhui Kouzi Distillery, Cl A | 23,200 | 201,430 | ||||||
| Anhui Yingjia Distillery, Cl A . | 23,200 | 214,499 | ||||||
| Anjoy Foods Group, Cl A . | 10,200 | 250,284 | ||||||
| Beijing Dabeinong Technology Group, Cl A * | 182,000 | 185,858 | ||||||
| Beijing Yanjing Brewery, Cl A . | 109,900 | 207,791 | ||||||
| By-health, Cl A . | 66,000 | 227,650 | ||||||
| China Feihe . | 1,367,000 | 919,472 | ||||||
| China Mengniu Dairy | 802,100 | 3,223,768 | ||||||
| China Resources Beer Holdings . | 498,475 | 3,832,274 | ||||||
| Chongqing Brewery, Cl A | 15,272 | 229,767 | ||||||
| Chongqing Fuling Zhacai Group, Cl A | 44,000 | 163,906 | ||||||
| Dali Foods Group | 981,700 | 407,692 | ||||||
| DaShenLin Pharmaceutical Group, Cl A | 38,048 | 189,161 | ||||||
| Foshan Haitian Flavouring & Food, Cl A | 88,612 | 903,623 | ||||||
| Fujian Sunner Development, Cl A . | 55,200 | 170,625 | ||||||
| Guangdong Haid Group, Cl A . | 47,991 | 380,490 | ||||||
| Heilongjiang Agriculture, Cl A | 86,600 | 169,741 | ||||||
| Henan Shuanghui Investment & Development, | ||||||||
| Cl A | 98,140 | 353,677 | ||||||
| Hengan International Group | 250,580 | 1,117,250 | ||||||
| Inner Mongolia Yili Industrial Group, Cl A . | 154,529 | 659,788 | ||||||
| Jiangsu King's Luck Brewery JSC, Cl A . | 38,700 | 334,274 | ||||||
| Jiangsu Yanghe Brewery Joint-Stock, Cl A . | 36,294 | 784,778 | ||||||
| JiuGui Liquor, Cl A . | 10,950 | 176,810 | ||||||
| Jonjee Hi-Tech Industrial And Commercial | ||||||||
Holding, Cl A . | 34,000 | 180,479 | ||||||
| Juewei Food, Cl A | 25,800 | 148,131 | ||||||
| Kweichow Moutai, Cl A . | 14,003 | 3,560,837 | ||||||
| Luzhou Laojiao, Cl A . | 34,247 | 1,119,134 | ||||||
| Shares | Value | |||||||
| COMMON STOCK — continued | ||||||||
| Consumer Staples — continued | ||||||||
| Meihua Holdings Group, Cl A | 131,200 | $ | 180,789 | |||||
| Muyuan Foods, Cl A . | 124,364 | 859,900 | ||||||
| New Hope Liuhe, Cl A * | 152,550 | 286,668 | ||||||
| Nongfu Spring, Cl H . | 623,700 | 3,368,817 | ||||||
| Shanghai Bairun Investment Holding Group, | ||||||||
| Cl A | 37,764 | 223,532 | ||||||
| Shanxi Xinghuacun Fen Wine Factory, Cl A . | 28,078 | 1,007,657 | ||||||
| Sichuan Swellfun, Cl A | 18,168 | 172,016 | ||||||
| Smoore International Holdings | 703,000 | 816,744 | ||||||
| Tingyi Cayman Islands Holding | 745,000 | 1,298,309 | ||||||
| Toly Bread, Cl A . | 85,284 | 141,170 | ||||||
| Tsingtao Brewery, Cl A | 3,950 | 66,639 | ||||||
| Tsingtao Brewery, Cl H . | 181,860 | 1,939,092 | ||||||
| Uni-President China Holdings | 589,600 | 588,105 | ||||||
| Want Want China Holdings | 1,819,800 | 1,159,123 | ||||||
| Wens Foodstuffs Group . | 179,644 | 513,250 | ||||||
| Wuliangye Yibin, Cl A | 83,398 | 2,035,787 | ||||||
| Yifeng Pharmacy Chain, Cl A . | 26,730 | 192,312 | ||||||
| Yihai International Holding . | 194,040 | 511,679 | ||||||
| Yihai Kerry Arawana Holdings, Cl A | 45,500 | 285,490 | ||||||
| Yuan Longping High-tech Agriculture, Cl A * | 68,400 | 150,469 | ||||||
| Yunnan Botanee Bio-Technology Group, Cl A . | 10,750 | 177,059 | ||||||
| TOTAL CHINA | 37,811,890 | |||||||
| HONG KONG — 1.1% | ||||||||
| Consumer Staples — 1.1% | ||||||||
| Vinda International Holdings . | 162,500 | 424,368 | ||||||
| TOTAL COMMON STOCK | ||||||||
| (Cost $39,066,899) | 38,236,258 | |||||||
| TOTAL INVESTMENTS — 99.9% | ||||||||
| (Cost $39,066,899) | $ | 38,236,258 | ||||||
| Percentages are based on Net Assets of $38,287,282. | ||||||||
| * Non-income producing security. |
| Schedule of Investments | April 30, 2023 (Unaudited) |
| Global X MSCI China Consumer Staples ETF | |
As of April 30, 2023, all of the Fund's investments were considered Level 1, in accordance with authoritative guidance on fair value measurements and disclosure under U.S. GAAP.
See “Glossary” for abbreviations.
| Schedule of Investments | April 30, 2023 (Unaudited) | |
| Global X MSCI China Health Care ETF | ||
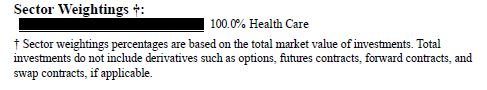
| Shares | Value | |||||||
| COMMON STOCK — 99.9% | ||||||||
| CHINA — 92.3% | ||||||||
| Health Care — 92.3% | ||||||||
| 3SBio | 122,900 | $ | 122,902 | |||||
| Aier Eye Hospital Group, Cl A | 35,448 | 150,839 | ||||||
| Akeso * | 25,000 | 136,467 | ||||||
| Apeloa Pharmaceutical, Cl A . | 7,900 | 23,586 | ||||||
| Asymchem Laboratories Tianjin, Cl A . | 1,858 | 33,936 | ||||||
| Autobio Diagnostics, Cl A . | 1,100 | 9,093 | ||||||
| BeiGene * | 44,439 | 854,825 | ||||||
| Beijing Tongrentang, Cl A . | 7,300 | 61,325 | ||||||
| Beijing Wantai Biological Pharmacy | ||||||||
| Enterprise, Cl A | 2,990 | 45,317 | ||||||
| Betta Pharmaceuticals, Cl A | 2,820 | 27,755 | ||||||
| BGI Genomics, Cl A . | 2,433 | 21,817 | ||||||
| Bloomage Biotechnology, Cl A . | 1,887 | 27,090 | ||||||
| Changchun High & New Technology Industry | ||||||||
| Group, Cl A | 2,065 | 48,591 | ||||||
| China Medical System Holdings . | 107,900 | 178,690 | ||||||
| China Meheco, Cl A . | 9,800 | 20,143 | ||||||
| China Resources Pharmaceutical Group . | 122,700 | 121,607 | ||||||
| China Resources Sanjiu Medical & | ||||||||
| Pharmaceutical, Cl A . | 5,200 | 44,277 | ||||||
| China Traditional Chinese Medicine Holdings . | 234,500 | 127,856 | ||||||
| Chongqing Zhifei Biological Products, Cl A . | 7,833 | 92,051 | ||||||
| CSPC Pharmaceutical Group . | 616,408 | 626,624 | ||||||
| Daan Gene, Cl A . | 8,960 | 20,164 | ||||||
| Dong-E-E-Jiao, Cl E . | 6,200 | 46,093 | ||||||
| Genscript Biotech * | 89,271 | 234,268 | ||||||
| Guangzhou Baiyunshan Pharmaceutical | ||||||||
| Holdings, Cl A | 10,959 | 52,981 | ||||||
| Guangzhou Kingmed Diagnostics Group, Cl A . | 2,740 | 32,374 | ||||||
| Hangzhou Tigermed Consulting, Cl A . | 2,916 | 38,311 | ||||||
| Hangzhou Tigermed Consulting, Cl H . | 9,520 | 78,950 | ||||||
| Hansoh Pharmaceutical Group | 94,500 | 171,908 | ||||||
| Shares | Value | |||||||
| COMMON STOCK — continued | ||||||||
| Health Care — continued | ||||||||
| Huadong Medicine, Cl A . | 10,411 | $ | 62,331 | |||||
| Hualan Biological Engineering, Cl A | 10,470 | 35,206 | ||||||
| Hubei Jumpcan Pharmaceutical, Cl A . | 5,600 | 25,520 | ||||||
| Humanwell Healthcare Group, Cl A . | 9,500 | 37,022 | ||||||
| Hygeia Healthcare Holdings * | 25,600 | 187,518 | ||||||
| Imeik Technology Development, Cl A . | 1,051 | 82,579 | ||||||
| Innovent Biologics * | 78,400 | 374,028 | ||||||
| iRay Technology, Cl A | 617 | 24,561 | ||||||
| Jafron Biomedical, Cl A | 5,200 | 21,632 | ||||||
| Jiangsu Hengrui Pharmaceuticals, Cl A | 29,972 | 210,615 | ||||||
| Jiangsu Yuyue Medical Equipment & Supply, | ||||||||
| Cl A | 5,900 | 26,896 | ||||||
| Joincare Pharmaceutical Group Industry, Cl A . | 12,600 | 23,568 | ||||||
| Joinn Laboratories China, Cl A . | 2,440 | 17,442 | ||||||
| Jointown Pharmaceutical Group, Cl A . | 18,970 | 45,403 | ||||||
| Lepu Medical Technology Beijing, Cl A . | 10,301 | 35,590 | ||||||
| Livzon Pharmaceutical Group, Cl A . | 4,100 | 21,195 | ||||||
| Meinian Onehealth Healthcare Holdings, Cl A | ||||||||
| * | 36,820 | 37,281 | ||||||
| Microport Scientific * | 52,100 | 114,688 | ||||||
| Nanjing King-Friend Biochemical | ||||||||
| Pharmaceutical, Cl A . | 10,036 | 21,019 | ||||||
| Ovctek China, Cl A . | 5,624 | 26,295 | ||||||
| Pharmaron Beijing, Cl A | 5,000 | 35,359 | ||||||
| Pharmaron Beijing, Cl H . | 15,775 | 68,024 | ||||||
| Porton Pharma Solutions, Cl A | 3,400 | 16,859 | ||||||
| Shandong Buchang Pharmaceuticals, Cl A | 11,387 | 35,411 | ||||||
| Shandong Weigao Group Medical Polymer, | ||||||||
| Cl H | 186,300 | 316,595 | ||||||
| Shanghai Fosun Pharmaceutical Group, Cl A . | 12,374 | 56,658 | ||||||
| Shanghai Fosun Pharmaceutical Group, Cl H | 42,500 | 121,005 | ||||||
| Shanghai Junshi Biosciences, Cl A * | 4,180 | 31,867 | ||||||
| Shanghai Medicilon, Cl A | 481 | 10,421 | ||||||
| Shanghai Pharmaceuticals Holding, Cl A | 14,900 | 49,306 | ||||||
| Shanghai Pharmaceuticals Holding, Cl H | 66,900 | 135,677 | ||||||
| Shanghai RAAS Blood Products, Cl A | 39,200 | 37,200 | ||||||
| Shenzhen Kangtai Biological Products, Cl A | 6,448 | 28,229 | ||||||
| Shenzhen Mindray Bio-Medical Electronics, | ||||||||
| Cl A | 5,417 | 244,042 | ||||||
| Shares | Value | |||||||
| COMMON STOCK — continued | ||||||||
| Health Care — continued | �� | |||||||
| Shenzhen New Industries Biomedical | ||||||||
Engineering, Cl A . | 4,400 | $ | 33,607 | |||||
| Shenzhen Salubris Pharmaceuticals, Cl A . | 9,000 | 46,708 | ||||||
| Shijiazhuang Yiling Pharmaceutical, Cl A | 9,827 | 44,669 | ||||||
| Sichuan Kelun Pharmaceutical, Cl A . | 11,300 | 51,903 | ||||||
| Sinopharm Group, Cl H | 101,500 | 358,810 | ||||||
| Topchoice Medical, Cl A * | 1,755 | 30,216 | ||||||
| Walvax Biotechnology, Cl A . | 8,500 | 39,190 | ||||||
| WuXi AppTec, Cl A . | 12,424 | 121,185 | ||||||
| WuXi AppTec, Cl H . | 26,056 | 227,868 | ||||||
| Wuxi Biologics Cayman * | 114,280 | 676,226 | ||||||
| Yunnan Baiyao Group, Cl A | 10,114 | 85,008 | ||||||
| Zai Lab ADR * | 6,574 | 229,959 | ||||||
| Zhangzhou Pientzehuang Pharmaceutical, | ||||||||
| Cl A | 3,016 | 118,462 | ||||||
| Zhejiang Huahai Pharmaceutical, Cl A . | 8,810 | 24,916 | ||||||
| Zhejiang Jiuzhou Pharmaceutical, Cl A | 5,100 | 23,617 | ||||||
| Zhejiang NHU, Cl A | 17,768 | 43,809 | ||||||
| Zhejiang Wolwo Bio-Pharmaceutical, Cl A . | 3,123 | 20,885 | ||||||
| TOTAL CHINA | 8,243,920 | |||||||
| HONG KONG — 4.8% | ||||||||
| Health Care — 4.8% | ||||||||
| Sino Biopharmaceutical | 763,400 | 422,064 | ||||||
| UNITED STATES — 2.8% | ||||||||
| Health Care — 2.8% | ||||||||
| Legend Biotech ADR * | 3,672 | 252,303 | ||||||
| TOTAL COMMON STOCK | ||||||||
| (Cost $11,850,318) | 8,918,287 | |||||||
| TOTAL INVESTMENTS — 99.9% | ||||||||
| (Cost $11,850,318) | $ | 8,918,287 | ||||||
| Percentages are based on Net Assets of $8,930,583. | ||||||||
| * Non-income producing security. |
| Schedule of Investments | April 30, 2023 (Unaudited) | |
| Global X MSCI China Health Care ETF | ||
As of April 30, 2023, all of the Fund's investments were considered Level 1, in accordance with authoritative guidance on fair value measurements and disclosure under U.S. GAAP.
See "Glossary" for abbreviations.
| Schedule of Investments | April 30, 2023 (Unaudited) |
| Global X MSCI China Information Technology ETF | |
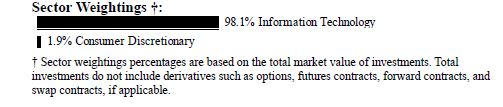
| Shares | Value | |||||||
| COMMON STOCK — 100.0% | ||||||||
| CHINA — 98.9% | ||||||||
| Consumer Discretionary — 1.9% | ||||||||
| TravelSky Technology, Cl H . | 140,900 | $ | 280,368 | |||||
| Information Technology — 97.0% | ||||||||
| 360 Security Technology, Cl A . | 47,559 | 109,705 | ||||||
| 3peak, Cl A | 419 | 14,057 | ||||||
| AAC Technologies Holdings * | 111,500 | 234,366 | ||||||
| Advanced Micro-Fabrication Equipment | ||||||||
| China, Cl A * | 3,891 | 101,978 | ||||||
| Amlogic Shanghai, Cl A * | 1,705 | 20,606 | ||||||
| Avary Holding Shenzhen, Cl A | 11,400 | 42,993 | ||||||
| Beijing Kingsoft Office Software, Cl A | 2,881 | 183,182 | ||||||
| Beijing Shiji Information Technology, Cl A | 34,292 | 94,853 | ||||||
| Beijing Yuanliu Hongyuan Electronic | ||||||||
| Technology, Cl A . | 1,480 | 15,135 | ||||||
| BOE Technology Group, Cl A | 370,500 | 215,132 | ||||||
| BYD Electronic International | 100,600 | 303,085 | ||||||
| CETC Cyberspace Security Technology, Cl A .. | 4,400 | 20,655 | ||||||
| Chaozhou Three-Circle Group, Cl A | 25,289 | 110,496 | ||||||
| China Greatwall Technology Group, Cl A | 30,100 | 50,433 | ||||||
| China National Software & Service, Cl A . | 3,300 | 27,126 | ||||||
| China Railway Signal & Communication, | ||||||||
| Cl A | 29,649 | 27,922 | ||||||
| China Resources Microelectronics, Cl A | 6,300 | 52,096 | ||||||
| China Zhenhua Group Science & Technology, | ||||||||
| Cl A | 3,200 | 41,539 | ||||||
| Chinasoft International . | 346,700 | 230,106 | ||||||
| Daqo New Energy ADR * | 7,893 | 362,447 | ||||||
| DHC Software, Cl A | 63,800 | 71,695 | ||||||
| Flat Glass Group, Cl A . | 10,200 | 45,127 | ||||||
| Flat Glass Group, Cl H . | 50,900 | 142,327 | ||||||
| Foxconn Industrial Internet, Cl A . | 65,350 | 152,160 | ||||||
| Shares | Value | |||||||
| COMMON STOCK — continued | ||||||||
| Information Technology — continued | ||||||||
| GCL Technology Holdings * | 2,418,900 | $ | 603,962 | |||||
| GDS Holdings, Cl A * | 110,880 | 213,288 | ||||||
| GigaDevice Semiconductor, Cl A . | 6,643 | 104,079 | ||||||
| GoerTek, Cl A | 42,200 | 108,133 | ||||||
| GRG Banking Equipment, Cl A . | 21,400 | 36,567 | ||||||
| Guangzhou Haige Communications Group, | ||||||||
| Cl A | 47,200 | 67,153 | ||||||
| Guangzhou Shiyuan Electronic Technology, | ||||||||
| Cl A | 6,400 | 61,003 | ||||||
| Hangzhou Chang Chuan Technology, Cl A | 2,900 | 20,190 | ||||||
| Hangzhou First Applied Material, Cl A | 10,292 | 73,036 | ||||||
| Hangzhou Lion Electronics, Cl A . | 3,300 | 21,974 | ||||||
| Hangzhou Silan Microelectronics, Cl A . | 11,500 | 54,649 | ||||||
| Hengdian Group DMEGC Magnetics, Cl A | 7,000 | 19,211 | ||||||
| Hengtong Optic-electric, Cl A | 11,700 | 24,606 | ||||||
| Hua Hong Semiconductor * | 86,900 | 354,800 | ||||||
| Hundsun Technologies, Cl A | 21,728 | 155,038 | ||||||
| Iflytek . | 26,750 | 234,146 | ||||||
| Ingenic Semiconductor, Cl A | 3,700 | 47,254 | ||||||
| Inspur Electronic Information Industry, Cl A | 13,852 | 82,233 | ||||||
| JA Solar Technology, Cl A . | 23,688 | 138,195 | ||||||
| JCET Group, Cl A | 15,700 | 62,476 | ||||||
| Jiangsu Pacific Quartz, Cl A | 1,600 | 27,432 | ||||||
| Kingboard Holdings | 98,600 | 300,828 | ||||||
| Kingdee International Software Group * | 349,600 | 534,427 | ||||||
| Lenovo Group | 962,000 | 982,846 | ||||||
| Lens Technology, Cl A | 66,700 | 112,335 | ||||||
| Lingyi iTech Guangdong, Cl A * | 62,497 | 53,531 | ||||||
| LONGi Green Energy Technology, Cl A . | 63,991 | 322,300 | ||||||
| Luxshare Precision Industry, Cl A . | 63,452 | 239,208 | ||||||
| Maxscend Microelectronics, Cl A | 4,302 | 63,089 | ||||||
| Montage Technology, Cl A | 6,891 | 60,616 | ||||||
| NAURA Technology Group, Cl A . | 5,058 | 244,394 | ||||||
| NavInfo, Cl A . | 11,500 | 19,667 | ||||||
| Ninestar, Cl A . | 16,470 | 94,159 | ||||||
| Raytron Technology, Cl A | 3,078 | 22,990 | ||||||
| Risen Energy, Cl A * | 4,300 | 15,434 | ||||||
| Sangfor Technologies, Cl A | 4,110 | 70,728 | ||||||
| SG Micro, Cl A . | 3,400 | 60,945 | ||||||
| Shares | Value | |||||||
| COMMON STOCK — continued | ||||||||
| Information Technology — continued | ||||||||
| Shanghai Aiko Solar Energy, Cl A * | 5,700 | $ | 25,687 | |||||
| Shanghai Baosight Software, Cl A | 13,762 | 107,341 | ||||||
| Shanghai Baosight Software, Cl B | 61,950 | 211,869 | ||||||
| Shanghai Friendess Electronic Technology, | ||||||||
| Cl A | 623 | 17,602 | ||||||
| Shanghai Fudan Microelectronics Group, Cl A . | 2,015 | 16,051 | ||||||
| Shanghai Fudan Microelectronics Group, Cl H | 30,200 | 90,986 | ||||||
| Shengyi Technology, Cl A | 21,000 | 48,684 | ||||||
| Shennan Circuits, Cl A . | 4,482 | 53,254 | ||||||
| Shenzhen SC New Energy Technology, Cl A | 3,200 | 47,515 | ||||||
| Shenzhen Sunlord Electronics, Cl A . | 4,900 | 15,599 | ||||||
| Shenzhen Transsion Holdings, Cl A | 4,366 | 68,739 | ||||||
| StarPower Semiconductor, Cl A . | 1,040 | 36,357 | ||||||
| Sunny Optical Technology Group . | 92,780 | 973,316 | ||||||
| Suzhou Dongshan Precision Manufacturing, | ||||||||
| Cl A | 25,100 | 89,549 | ||||||
| TCL Zhonghuan Renewable Energy | ||||||||
| Technology, Cl A . | 31,000 | 186,181 | ||||||
| Thunder Software Technology, Cl A . | 4,300 | 52,476 | ||||||
| Tianjin 712 Communication & Broadcasting, | ||||||||
| Cl A | 7,000 | 32,779 | ||||||
| Tianma Microelectronics, Cl A | 49,800 | 70,925 | ||||||
| Tianshui Huatian Technology, Cl A . | 29,800 | 38,567 | ||||||
| TongFu Microelectronics, Cl A * | 13,300 | 34,368 | ||||||
| Tongwei, Cl A | 29,900 | 172,017 | ||||||
| Trina Solar, Cl A . | 15,575 | 110,684 | ||||||
| Unigroup Guoxin Microelectronics, Cl A | 8,159 | 124,920 | ||||||
| Unisplendour, Cl A | 27,513 | 117,750 | ||||||
| Will Semiconductor Shanghai, Cl A . | 11,785 | 155,329 | ||||||
| Wingtech Technology, Cl A | 12,440 | 94,460 | ||||||
| Wuhan DR Laser Technology, Cl A . | 1,000 | 14,112 | ||||||
| Wuhan Guide Infrared, Cl A . | 30,365 | 48,421 | ||||||
| WUS Printed Circuit Kunshan, Cl A | 17,420 | 55,179 | ||||||
| Wuxi Autowell Technology, Cl A . | 603 | 14,566 | ||||||
| Xiamen Faratronic, Cl A | 1,260 | 24,244 | ||||||
| Xiaomi, Cl B * | 866,400 | 1,220,701 | ||||||
| Xinyi Solar Holdings | 647,900 | 692,478 | ||||||
| Yangzhou Yangjie Electronic Technology, | ||||||||
| Cl A | 2,300 | 14,767 | ||||||
| Shares | Value | |||||||
| COMMON STOCK — continued | ||||||||
| Information Technology — continued | ||||||||
| Yealink Network Technology, Cl A | 7,100 | $ | 67,613 | |||||
| Yonyou Network Technology, Cl A . | 38,956 | 121,596 | ||||||
| Zhejiang Dahua Technology, Cl A . | 53,593 | 181,682 | ||||||
| Zhejiang Jingsheng Mechanical & Electrical, | ||||||||
Cl A | 11,900 | 117,603 | ||||||
| Zhejiang Supcon Technology, Cl A | 2,209 | 30,755 | ||||||
| Zhongji Innolight, Cl A | 7,200 | 93,598 | ||||||
| Zhuzhou Hongda Electronics, Cl A | 3,000 | 17,831 | ||||||
| ZTE, Cl A | 42,731 | 219,850 | ||||||
| ZTE, Cl H . | 116,100 | 372,708 | ||||||
| 14,676,852 | ||||||||
| TOTAL CHINA | 14,957,220 | |||||||
| HONG KONG — 1.1% | ||||||||
| Information Technology — 1.1% | ||||||||
| Kingboard Laminates Holdings | 163,300 | 167,879 | ||||||
| TOTAL COMMON STOCK | ||||||||
| (Cost $20,905,712) | 15,125,099 | |||||||
| TOTAL INVESTMENTS — 100.0% | ||||||||
| (Cost $20,905,712) | $ | 15,125,099 | ||||||
| Percentages are based on Net Assets of $15,126,397. | ||||||||
| * Non-income producing security. |
As of April 30, 2023, all of the Fund's investments were considered Level 1, in accordance with authoritative guidance on fair value measurements and disclosure under U.S. GAAP.
See “Glossary” for abbreviations.
| Schedule of Investments | April 30, 2023 (Unaudited) | |
| Global X MSCI China Utilities ETF | ||

| Shares | Value | |||||||
| COMMON STOCK — 98.9% | ||||||||
| CHINA — 98.9% | ||||||||
| Utilities — 98.9% | ||||||||
| Beijing Enterprises Holdings . | 32,600 | $ | 134,970 | |||||
| Beijing Enterprises Water Group | 298,100 | 75,570 | ||||||
| CECEP Solar Energy, Cl A . | 40,700 | 40,916 | ||||||
| CECEP Wind-Power, Cl A | 63,100 | 34,816 | ||||||
| CGN Power, Cl H . | 437,500 | 115,368 | ||||||
| China Gas Holdings . | 142,190 | 182,223 | ||||||
| China Longyuan Power Group, Cl H | 154,900 | 161,809 | ||||||
| China National Nuclear Power, Cl A | 79,500 | 79,233 | ||||||
| China Power International Development | 252,700 | 95,609 | ||||||
| China Resources Gas Group . | 25,520 | 80,462 | ||||||
| China Resources Power Holdings | 95,950 | 208,281 | ||||||
| China Three Gorges Renewables Group, Cl A . | 107,900 | 84,472 | ||||||
| China Yangtze Power, Cl A | 68,100 | 215,221 | ||||||
| Datang International Power Generation, Cl A *. | 82,100 | 36,880 | ||||||
| ENN Energy Holdings | 13,640 | 185,923 | ||||||
| ENN Natural Gas, Cl A . | 3,400 | 9,969 | ||||||
| GD Power Development, Cl A * | 104,200 | 58,096 | ||||||
| Guangdong Investment | 102,160 | 97,606 | ||||||
| Huadian Power International, Cl A . | 64,000 | 58,424 | ||||||
| Huaneng Power International, Cl A * | 13,100 | 18,354 | ||||||
| Huaneng Power International, Cl H * | 153,200 | 95,239 | ||||||
| Kunlun Energy | 130,360 | 120,564 | ||||||
| Shanghai Electric Power, Cl A * | 24,900 | 37,620 | ||||||
| Shenzhen Energy Group, Cl A | 45,980 | 42,638 | ||||||
| Sichuan Chuantou Energy, Cl A . | 29,800 | 61,896 | ||||||
| TOTAL CHINA | 2,332,159 | |||||||
| TOTAL COMMON STOCK | ||||||||
| (Cost $2,466,224) | 2,332,159 | |||||||
| Face Amount | Value | |||||||
| U.S. TREASURY OBLIGATION — 3.4% | ||||||||
| U.S. Treasury Bill | ||||||||
| 12.007%, 05/02/23(A) | ||||||||
| (Cost $79,991) | $ | 80,000 | $ | 79,991 | ||||
| TOTAL INVESTMENTS — 102.3% | ||||||||
| (Cost $2,546,215) | $ | 2,412,150 | ||||||
| Percentages are based on Net Assets of $2,357,803. | ||||||||
| * Non-income producing security. | ||||||||
| (A) Interest rate represents the security's effective yield at the time of purchase. | ||||||||
The following is a summary of the level of inputs used as of April 30, 2023, in valuing the Fund's investments carried at value:
| Investments in Securities | Level 1 | Level 2 | Level 3 | Total | ||||||||||||
| Common Stock | $ | 2,332,159 | $ | — | $ | — | $ | 2,332,159 | ||||||||
| U.S. Treasury Obligation | — | 79,991 | — | 79,991 | ||||||||||||
| Total Investments in Securities | $ | 2,332,159 | $ | 79,991 | $ | — | $ | 2,412,150 | ||||||||
Amounts designated as “—“ are $0 or have been rounded to $0.
See “Glossary” for abbreviations.
| Schedule of Investments | April 30, 2023 (Unaudited) | |
| Global X MSCI China Real Estate ETF | ||
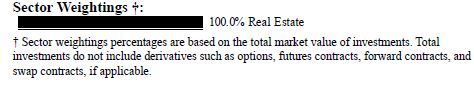
| Shares | Value | |||||||
| COMMON STOCK — 99.9% | ||||||||
| CHINA — 99.9% | ||||||||
| Real Estate — 99.9% | ||||||||
| C&D International Investment Group | 101,800 | $ | 311,888 | |||||
| China Jinmao Holdings Group | 1,549,100 | 288,117 | ||||||
| China Merchants Shekou Industrial Zone | ||||||||
Holdings, Cl A | 142,200 | 280,569 | ||||||
| China Overseas Land & Investment . | 257,800 | 651,569 | ||||||
| China Overseas Property Holdings | 18,900 | 20,923 | ||||||
| China Resources Land | 140,000 | 649,180 | ||||||
| China Resources Mixc Lifestyle Services . | 4,050 | 21,385 | ||||||
| China Vanke, Cl A | 99,500 | 217,590 | ||||||
| China Vanke, Cl H . | 277,800 | 432,453 | ||||||
| Country Garden Holdings | 1,021,300 | 261,508 | ||||||
| Country Garden Services Holdings | 159,300 | 248,389 | ||||||
| Gemdale, Cl A . | 134,400 | 158,409 | ||||||
| Greentown China Holdings | 233,500 | 279,609 | ||||||
| Greentown Service Group . | 450,200 | 275,859 | ||||||
| Hangzhou Binjiang Real Estate Group, Cl A . | 92,300 | 122,920 | ||||||
| KE Holdings ADR * | 34,463 | 540,724 | ||||||
| Longfor Group Holdings . | 207,700 | 564,898 | ||||||
| Poly Developments and Holdings Group, Cl A . | 153,153 | 307,711 | ||||||
| Seazen Holdings, Cl A * | 67,100 | 144,120 | ||||||
| Shanghai Lingang Holdings, Cl A . | 71,100 | 126,215 | ||||||
| Shanghai Lujiazui Finance & Trade Zone | ||||||||
Development, Cl B . | 363,485 | 275,158 | ||||||
| Youngor Group, Cl A | 137,700 | 136,442 | ||||||
| Yuexiu Property . | 230,020 | 331,702 | ||||||
| Shares | Value | |||||
| COMMON STOCK — continued | ||||||
| Real Estate — continued | ||||||
| Zhejiang China Commodities City Group, | ||||||
| Cl A | 162,900 | $ | 227,765 | |||
| TOTAL CHINA | 6,875,103 | |||||
| TOTAL COMMON STOCK | ||||||
| (Cost $8,511,547) | 6,875,103 | |||||
| TOTAL INVESTMENTS — 99.9% | ||||||
| (Cost $8,511,547) | $ | 6,875,103 | ||||
| Percentages are based on Net Assets of $6,878,664. | ||||||
| * Non-income producing security. |
As of April 30, 2023, all of the Fund's investments were considered Level 1, in accordance with authoritative guidance on fair value measurements and disclosure under U.S. GAAP.
See “Glossary” for abbreviations.
| Schedule of Investments | April 30, 2023 (Unaudited) | |
| Global X MSCI Vietnam ETF | ||
| Shares | Value | |||||||
| COMMON STOCK — 100.1% | ||||||||
| VIETNAM — 100.1% | ||||||||
| Consumer Discretionary — 0.5% | ||||||||
| FPT DIGITAL RETAIL JSC | 8,300 | $ | 22,571 | |||||
| Consumer Staples — 20.0% | ||||||||
| HAGL JSC * | 41,500 | 13,479 | ||||||
| Hoang Anh Gia Lai International Agriculture | ||||||||
JSC * | 76,200 | 12,082 | ||||||
| KIDO Group | 29,900 | 81,438 | ||||||
| Masan Group | 86,520 | 269,580 | ||||||
| Saigon Beer Alcohol Beverage | 11,200 | 82,111 | ||||||
| Thanh Thanh Cong - Bien Hoa JSC * | 75,257 | 54,532 | ||||||
| Vietnam Dairy Products JSC | 128,000 | 381,910 | ||||||
| Vinh Hoan . | 21,900 | 56,288 | ||||||
| 951,420 | ||||||||
| Energy — 3.2% | ||||||||
| PetroVietnam Drilling & Well Services JSC * | 68,152 | 60,858 | ||||||
| PetroVietnam Technical Service | 58,400 | 62,978 | ||||||
| Vietnam National Petroleum Group | 17,000 | 27,136 | ||||||
| 150,972 | ||||||||
| Financials — 20.3% | ||||||||
| Bank for Foreign Trade of Vietnam JSC * | 54,575 | 210,521 | ||||||
| Shares | Value | |||||||
| COMMON STOCK — continued | ||||||||
| Financials — continued | ||||||||
| Bank for Investment and Development of | ||||||||
Vietnam JSC * | 45,776 | $ | 84,875 | |||||
| Bao Viet Holdings | 19,300 | 36,937 | ||||||
| Saigon - Hanoi Commercial Joint Stock Bank*. | 154,045 | 73,539 | ||||||
| Saigon - Hanoi Securities JSC * | 60,775 | 26,164 | ||||||
| Saigon Thuong Tin Commercial JSB * | 68,900 | 74,301 | ||||||
| Southeast Asia Commercial Joint Stock Bank*. | 7,800 | 10,622 | ||||||
| SSI Securities . | 191,150 | 175,580 | ||||||
| Vietcap Securities JSC | 50,040 | 67,826 | ||||||
| Vietnam Export Import Commercial JSB * | 62,500 | 50,350 | ||||||
| Vietnam Joint Stock Commercial Bank for | ||||||||
| Industry and Trade * | 49,100 | 60,378 | ||||||
| VNDirect Securities . | 154,240 | 97,957 | ||||||
| 969,050 | ||||||||
| Industrials — 9.3% | ||||||||
| Development Investment Construction JSC * | 46,980 | 37,446 | ||||||
| Gelex Group JSC | 88,100 | 49,380 | ||||||
| Ha Do Group JSC * | 19,008 | 27,303 | ||||||
| Hoang Huy Investment Financial Services | ||||||||
| JSC | 78,316 | 26,171 | ||||||
| IDICO JSC | 26,340 | 43,337 | ||||||
| PC1 Group JSC * | 19,945 | 24,229 | ||||||
| Tasco JSC * | 25,600 | 17,568 | ||||||
| Thaiholdings JSC * | 25,200 | 42,428 | ||||||
| Vietjet Aviation JSC * | 32,500 | 134,372 | ||||||
| Vietnam Construction and Import-Export JSC . | 32,310 | 26,373 | ||||||
| Viettel Construction Joint Stock | 5,469 | 15,502 | ||||||
| 444,109 | ||||||||
| Information Technology — 0.4% | ||||||||
| Digiworld | 12,520 | 18,304 | ||||||
| Materials — 13.9% | ||||||||
| Duc Giang Chemicals JSC | 30,680 | 67,347 | ||||||
| Hoa Phat Group JSC | 499,740 | 461,164 | ||||||
| Hoa Sen Group * | 60,520 | 39,984 | ||||||
| PetroVietNam Ca Mau Fertilizer JSC | 20,600 | 20,810 | ||||||
| Petrovietnam Fertilizer & Chemicals JSC | 34,000 | 48,693 | ||||||
| Shares | Value | |||||||
| COMMON STOCK — continued | ||||||||
| Materials — continued | ||||||||
| Phuoc Hoa Rubber JSC | 14,200 | $ | 24,967 | |||||
| 662,965 | ||||||||
| Real Estate — 28.2% | ||||||||
| Dat Xanh Group JSC * | 47,700 | 27,448 | ||||||
| Khang Dien House Trading and Investment | ||||||||
| JSC * | 62,660 | 79,590 | ||||||
| Kinh Bac City Development Holding * | 62,200 | 68,401 | ||||||
| Kosy JSC * | 3,500 | 5,647 | ||||||
| Nam Long Investment . | 27,200 | 38,723 | ||||||
| No Va Land Investment Group * | 117,091 | 71,370 | ||||||
| Phat Dat Real Estate Development * | 55,289 | 33,346 | ||||||
| Song da Urban & Industrial Zone Investment | ||||||||
| & Development JSC * | 3,100 | 5,484 | ||||||
| Van Phu - Invest Investment JSC | 25,720 | 56,897 | ||||||
| Vincom Retail JSC * | 157,000 | 185,367 | ||||||
| Vingroup JSC * | 166,200 | 369,082 | ||||||
| Vinhomes JSC | 189,100 | 398,979 | ||||||
| 1,340,334 | ||||||||
| Utilities — 4.3% | ||||||||
| Binh Duong Water Enviroment JSC | 10,300 | 18,878 | ||||||
| PetroVietnam Gas JSC | 14,300 | 56,564 | ||||||
| PetroVietnam Nhon Trach 2 Power JSC | 32,900 | 44,243 | ||||||
| PetroVietnam Power * | 110,900 | 61,924 | ||||||
| Pha Lai Thermal Power JSC | 34,400 | 22,507 | ||||||
| 204,116 | ||||||||
| TOTAL VIETNAM | 4,763,841 | |||||||
| TOTAL COMMON STOCK | ||||||||
| (Cost $5,404,644) | 4,763,841 | |||||||
| TOTAL INVESTMENTS — 100.1% | ||||||||
| (Cost $5,404,644) | $ | 4,763,841 | ||||||
| Percentages are based on Net Assets of $4,756,759. | ||||||||
| * Non-income producing security. |
| Schedule of Investments | April 30, 2023 (Unaudited) | |
| Global X MSCI Vietnam ETF | ||
As of April 30, 2023, all of the Fund's investments were considered Level 1, in accordance with authoritative guidance on fair value measurements and disclosure under U.S. GAAP.
See “Glossary” for abbreviations.
| Schedule of Investments | April 30, 2023 (Unaudited) |
| Glossary (abbreviations which may be used in the preceding Schedules of Investments): | |
Fund Abbreviations
| Statements of Assets and Liabilities |
| April 30, 2023 (Unaudited) |
Global X MSCI Colombia ETF | Global X MSCI China Industrials ETF | Global X MSCI China Consumer Discretionary ETF | Global X MSCI China Communication Services ETF | |||||||||||||
| Assets: | ||||||||||||||||
| Cost of Investments | $ | 37,400,232 | $ | 6,819,946 | $ | 515,910,869 | $ | 8,887,523 | ||||||||
| Cost of Repurchase Agreement | 1,198,692 | — | 6,230,422 | — | ||||||||||||
| Cost of Foreign Currency | 335,028 | 150 | 906 | — | ||||||||||||
| Investments, at Value | $ | 27,068,041 | * | $ | 6,143,439 | $ | 322,205,026 | * | $ | 7,898,566 | ||||||
| Repurchase Agreement, at Value | 1,198,692 | — | 6,230,422 | — | ||||||||||||
| Cash | 16,343 | 12,221 | 433,764 | 10,792 | ||||||||||||
| Foreign Currency, at Value | 333,257 | 150 | 900 | — | ||||||||||||
| Receivable for Investment Securities Sold | 65,767 | — | — | — | ||||||||||||
| Dividend, Interest, and Securities Lending Income Receivable | 6,109 | 1,493 | 5,121 | — | ||||||||||||
| Total Assets | 28,688,209 | 6,157,303 | 328,875,233 | 7,909,358 | ||||||||||||
| Liabilities: | ||||||||||||||||
| Obligation to Return Securities Lending Collateral | 1,305,970 | — | 6,788,019 | — | ||||||||||||
| Payable for Investment Securities Purchased | 130,351 | — | — | — | ||||||||||||
| Payable due to Investment Adviser | 13,836 | 3,269 | 178,774 | 4,318 | ||||||||||||
| Unrealized Depreciation on Spot Contracts | 976 | — | — | — | ||||||||||||
| Custodian Fees Payable | 2,209 | 135 | 13 | 94 | ||||||||||||
| Total Liabilities | 1,453,342 | 3,404 | 6,966,806 | 4,412 | ||||||||||||
| Net Assets | $ | 27,234,867 | $ | 6,153,899 | $ | 321,908,427 | $ | 7,904,946 | ||||||||
| Net Assets Consist of: | ||||||||||||||||
| Paid-in Capital | $ | 135,090,298 | $ | 12,374,975 | $ | 708,945,220 | $ | 19,337,391 | ||||||||
| Total Distributable Loss | (107,855,431 | ) | (6,221,076 | ) | (387,036,793 | ) | (11,432,445 | ) | ||||||||
| Net Assets | $ | 27,234,867 | $ | 6,153,899 | $ | 321,908,427 | $ | 7,904,946 | ||||||||
| Outstanding Shares of Beneficial Interest | ||||||||||||||||
| (unlimited authorization — no par value) | 1,379,699 | 460,000 | 17,380,000 | 480,000 | ||||||||||||
| Net Asset Value, Offering and Redemption Price Per Share | $ | 19.74 | $ | 13.38 | $ | 18.52 | $ | 16.47 | ||||||||
| * Includes Market Value of Securities on Loan | $ | 1,238,278 | $ | — | $ | 6,540,520 | $ | — | ||||||||
| Statements of Assets and Liabilities |
| April 30, 2023 (Unaudited) |
Global X MSCI China Financials ETF | Global X MSCI China Energy ETF | Global X MSCI China Materials ETF | Global X MSCI Norway ETF | |||||||||||||
| Assets: | ||||||||||||||||
| Cost of Investments | $ | 32,769,481 | $ | 9,428,352 | $ | 3,969,165 | $ | 78,970,687 | ||||||||
| Cost of Foreign Currency | — | — | — | 66,736 | ||||||||||||
| Investments, at Value | $ | 24,798,124 | $ | 10,625,916 | $ | 3,415,721 | $ | 58,532,321 | ||||||||
| Cash | 27,106 | 7,941 | 3,492 | 71,843 | ||||||||||||
| Foreign Currency, at Value | — | — | — | 66,487 | ||||||||||||
| Dividend, Interest, and Securities Lending Income Receivable | 1,483 | — | — | 376,654 | ||||||||||||
| Unrealized Appreciation on Spot Contracts | — | 31 | — | 231 | ||||||||||||
| Reclaim Receivable | — | — | — | 152,754 | ||||||||||||
| Prepaid Expenses | — | 59 | — | — | ||||||||||||
| Total Assets | 24,826,713 | 10,633,947 | 3,419,213 | 59,200,290 | ||||||||||||
| Liabilities: | ||||||||||||||||
| Payable due to Investment Adviser | 12,972 | 5,577 | 1,889 | 25,060 | ||||||||||||
| Payable for Investment Securities Purchased | — | 282,999 | — | — | ||||||||||||
| Custodian Fees Payable | 45 | — | 77 | 1,221 | ||||||||||||
| Total Liabilities | 13,017 | 288,576 | 1,966 | 26,281 | ||||||||||||
| Net Assets | $ | 24,813,696 | $ | 10,345,371 | $ | 3,417,247 | $ | 59,174,009 | ||||||||
| Net Assets Consist of: | ||||||||||||||||
| Paid-in Capital | $ | 49,948,141 | $ | 10,753,040 | $ | 7,034,546 | $ | 132,265,430 | ||||||||
| Total Distributable Loss | (25,134,445 | ) | (407,669 | ) | (3,617,299 | ) | (73,091,421 | ) | ||||||||
| Net Assets | $ | 24,813,696 | $ | 10,345,371 | $ | 3,417,247 | $ | 59,174,009 | ||||||||
| Outstanding Shares of Beneficial Interest | ||||||||||||||||
| (unlimited authorization — no par value) | 1,960,000 | 650,000 | 189,971 | 2,416,111 | ||||||||||||
| Net Asset Value, Offering and Redemption Price Per Share | $ | 12.66 | $ | 15.92 | $ | 17.99 | $ | 24.49 | ||||||||
| Statements of Assets and Liabilities |
| April 30, 2023 (Unaudited) |
Global X FTSE Southeast Asia ETF | Global X MSCI Argentina ETF | Global X MSCI Greece ETF | Global X MSCI Nigeria ETF | |||||||||||||
| Assets: | ||||||||||||||||
| Cost of Investments | $ | 45,444,355 | $ | 52,906,726 | $ | 148,613,897 | $ | 48,857,726 | ||||||||
| Cost of Repurchase Agreement | — | 11,537 | 1,381,411 | — | ||||||||||||
| Cost of Foreign Currency | 14,774 | 4,857 | 53,117 | 3,334,225 | ||||||||||||
| Investments, at Value | $ | 46,793,448 | $ | 48,269,376 | * | $ | 157,754,060 | * | $ | 47,968,362 | ||||||
| Repurchase Agreement, at Value | — | 11,537 | 1,381,411 | — | ||||||||||||
| Cash | 11,373 | 43,402 | 121,775 | — | ||||||||||||
| Foreign Currency, at Value | 14,774 | 4,857 | 54,022 | 3,145,200 | ||||||||||||
| Dividend, Interest, and Securities Lending Income Receivable | 227,066 | 7,503 | 382 | 503,952 | ||||||||||||
| Unrealized Appreciation on Spot Contracts | 30 | — | — | — | ||||||||||||
| Receivable for Investment Securities Sold | — | — | 299,936 | — | ||||||||||||
| Reclaim Receivable | — | 1,170 | — | — | ||||||||||||
| Total Assets | 47,046,691 | 48,337,845 | 159,611,586 | 51,617,514 | ||||||||||||
| Liabilities: | ||||||||||||||||
| Obligation to Return Securities Lending Collateral | — | 12,569 | 1,505,042 | — | ||||||||||||
| Payable due to Investment Adviser | 25,105 | 23,566 | 71,551 | 858,141 | ||||||||||||
| Payable for Investment Securities Purchased | 6,055 | — | — | 33,364 | ||||||||||||
| Unrealized Depreciation on Spot Contracts | — | 7 | 696 | — | ||||||||||||
| Cash Overdraft | — | — | — | 7,984,446 | ||||||||||||
| Custodian Fees Payable | 369 | 167 | 17,684 | 38,344 | ||||||||||||
| Total Liabilities | 31,529 | 36,309 | 1,594,973 | 8,914,295 | ||||||||||||
| Net Assets | $ | 47,015,162 | $ | 48,301,536 | $ | 158,016,613 | $ | 42,703,219 | ||||||||
| Net Assets Consist of: | ||||||||||||||||
| Paid-in Capital | $ | 55,141,543 | $ | 87,252,376 | $ | 388,032,796 | $ | 71,665,504 | ||||||||
| Total Distributable Loss | (8,126,381 | ) | (38,950,840 | ) | (230,016,183 | ) | (28,962,285 | ) | ||||||||
| Net Assets | $ | 47,015,162 | $ | 48,301,536 | $ | 158,016,613 | $ | 42,703,219 | ||||||||
| Outstanding Shares of Beneficial Interest | ||||||||||||||||
| (unlimited authorization — no par value) | 3,090,000 | 1,224,975 | 5,045,644 | 2,962,135 | ||||||||||||
| Net Asset Value, Offering and Redemption Price Per Share | $ | 15.22 | $ | 39.43 | $ | 31.32 | $ | 14.42 | ||||||||
| * Includes Market Value of Securities on Loan | $ | — | $ | 12,060 | $ | 1,464,932 | $ | — | ||||||||
| Statements of Assets and Liabilities |
| April 30, 2023 (Unaudited) |
Global X MSCI Next Emerging & Frontier ETF | Global X MSCI Portugal ETF | Global X DAX Germany ETF | Global X MSCI Pakistan ETF | |||||||||||||
| Assets: | ||||||||||||||||
| Cost of Investments | $ | 22,956,711 | $ | 14,853,830 | $ | 51,646,014 | $ | 27,171,280 | ||||||||
| Cost of Foreign Currency | 45,441 | (1,530 | ) | 48,020 | 99,323 | |||||||||||
| Investments, at Value | $ | 23,481,619 | $ | 14,504,953 | $ | 57,469,878 | $ | 16,208,065 | ||||||||
| Cash | 41,758 | 30,997 | 22,236 | 1,432,113 | ||||||||||||
| Foreign Currency, at Value | 38,552 | — | 48,148 | 99,324 | ||||||||||||
| Dividend, Interest, and Securities Lending Income Receivable | 48,074 | 105,167 | 115,778 | 48,552 | ||||||||||||
| Reclaim Receivable | 3,249 | 258,206 | 221,109 | — | ||||||||||||
| Unrealized Appreciation on Spot Contracts | 28 | — | — | — | ||||||||||||
| Receivable for Investment Securities Sold | — | — | 1,812,857 | — | ||||||||||||
| Receivable for Variation Margin on Futures Contracts | — | 55 | — | — | ||||||||||||
| Total Assets | 23,613,280 | 14,899,378 | 59,690,006 | 17,788,054 | ||||||||||||
| Liabilities: | ||||||||||||||||
| Payable for Investment Securities Purchased | 15,121 | 4,489 | — | 1,424,673 | ||||||||||||
| Payable due to Investment Adviser | 9,395 | 6,199 | 9,551 | 8,258 | ||||||||||||
| Payable for Capital Shares Redeemed | — | — | 1,817,664 | — | ||||||||||||
| Overdraft of Foreign Currency | — | 1,532 | — | — | ||||||||||||
| Unrealized Depreciation on Spot Contracts | — | — | 8 | 3,238 | ||||||||||||
| Custodian Fees Payable | 13,290 | 1,925 | 1,113 | 13,759 | ||||||||||||
| Total Liabilities | 37,806 | 14,145 | 1,828,336 | 1,449,928 | ||||||||||||
| Net Assets | $ | 23,575,474 | $ | 14,885,233 | $ | 57,861,670 | $ | 16,338,126 | ||||||||
| Net Assets Consist of: | ||||||||||||||||
| Paid-in Capital | $ | 48,237,404 | $ | 34,266,211 | $ | 55,020,118 | $ | 69,416,309 | ||||||||
| Total Distributable Earnings/(Loss) | (24,661,930 | ) | (19,380,978 | ) | 2,841,552 | (53,078,183 | ||||||||||
| Net Assets | $ | 23,575,474 | $ | 14,885,233 | $ | 57,861,670 | $ | 16,338,126 | ||||||||
| Outstanding Shares of Beneficial Interest | ||||||||||||||||
| (unlimited authorization — no par value) | 1,240,000 | 1,340,000 | 1,910,000 | 1,282,293 | ||||||||||||
| Net Asset Value, Offering and Redemption Price Per Share | $ | 19.01 | $ | 11.11 | $ | 30.29 | $ | 12.74 | ||||||||
| Statements of Assets and Liabilities |
| April 30, 2023 (Unaudited) |
Global X MSCI China Consumer Staples ETF | Global X MSCI China Health Care ETF | Global X MSCI China Information Technology ETF | ||||||||||
| Assets: | ||||||||||||
| Cost of Investments | $ | 39,066,899 | $ | 11,850,318 | $ | 20,905,712 | ||||||
| Cost of Foreign Currency | 17,013 | 268 | — | |||||||||
| Investments, at Value | $ | 38,236,258 | $ | 8,918,287 | $ | 15,125,099 | ||||||
| Cash | 54,923 | 17,245 | 3,754 | |||||||||
| Foreign Currency, at Value | 17,051 | 268 | — | |||||||||
| Dividend, Interest, and Securities Lending Income Receivable | — | — | 6,313 | |||||||||
| Total Assets | 38,308,232 | 8,935,800 | 15,135,166 | |||||||||
| Liabilities: | ||||||||||||
| Payable due to Investment Adviser | 20,867 | 5,200 | 8,750 | |||||||||
| Unrealized Depreciation on Spot Contracts | 38 | — | — | |||||||||
| Custodian Fees Payable | 45 | 17 | 19 | |||||||||
| Total Liabilities | 20,950 | 5,217 | 8,769 | |||||||||
| Net Assets | $ | 38,287,282 | $ | 8,930,583 | $ | 15,126,397 | ||||||
| Net Assets Consist of: | ||||||||||||
| Paid-in Capital | $ | 40,072,716 | $ | 16,139,975 | $ | 27,366,596 | ||||||
| Total Distributable Loss | (1,785,434 | ) | (7,209,392 | ) | (12,240,199 | ) | ||||||
| Net Assets | $ | 38,287,282 | $ | 8,930,583 | $ | 15,126,397 | ||||||
| Outstanding Shares of Beneficial Interest | ||||||||||||
| (unlimited authorization — no par value) | 1,770,002 | 540,002 | 880,002 | |||||||||
| Net Asset Value, Offering and Redemption Price Per Share | $ | 21.63 | $ | 16.54 | $ | 17.19 | ||||||
| Statements of Assets and Liabilities |
| April 30, 2023 (Unaudited) |
Global X MSCI China Utilities ETF | Global X MSCI China Real Estate ETF | Global X MSCI Vietnam ETF | ||||||||||
| Assets: | ||||||||||||
| Cost of Investments | $ | 2,546,215 | $ | 8,511,547 | $ | 5,404,644 | ||||||
| Cost of Foreign Currency | — | 57 | 5,082 | |||||||||
| Investments, at Value | $ | 2,412,150 | $ | 6,875,103 | $ | 4,763,841 | ||||||
| Cash | 370 | 7,120 | 8,932 | |||||||||
| Foreign Currency, at Value | — | 57 | 5,134 | |||||||||
| Receivable for Investment Securities Sold | 26,535 | — | 907,239 | |||||||||
| Dividend, Interest, and Securities Lending Income Receivable | — | — | 1,168 | |||||||||
| Total Assets | 2,439,055 | 6,882,280 | 5,686,314 | |||||||||
| Liabilities: | ||||||||||||
| Payable for Investment Securities Purchased | 79,964 | — | 19,340 | |||||||||
| Payable due to Investment Adviser | 1,239 | 3,514 | 2,323 | |||||||||
| Unrealized Depreciation on Spot Contracts | 6 | — | 4 | |||||||||
| Payable for Capital Shares Redeemed | — | — | 907,633 | |||||||||
| Custodian Fees Payable | 43 | 102 | 255 | |||||||||
| Total Liabilities | 81,252 | 3,616 | 929,555 | |||||||||
| Net Assets | $ | 2,357,803 | $ | 6,878,664 | $ | 4,756,759 | ||||||
| Net Assets Consist of: | ||||||||||||
| Paid-in Capital | $ | 2,661,903 | $ | 13,090,958 | $ | 7,976,119 | ||||||
| Total Distributable Loss | (304,100 | ) | (6,212,294 | ) | (3,219,360 | ) | ||||||
| Net Assets | $ | 2,357,803 | $ | 6,878,664 | $ | 4,756,759 | ||||||
| Outstanding Shares of Beneficial Interest | ||||||||||||
| (unlimited authorization — no par value) | 160,002 | 339,879 | 310,000 | |||||||||
| Net Asset Value, Offering and Redemption Price Per Share | $ | 14.74 | $ | 20.24 | $ | 15.34 | ||||||
| Statements of Operations |
| For the period ended April 30, 2023 (Unaudited) |
Global X MSCI Colombia ETF | Global X MSCI China Industrials ETF | Global X MSCI China Consumer Discretionary ETF | Global X MSCI China Communication Services ETF | |||||||||||||
| Investment Income: | ||||||||||||||||
| Dividend Income | $ | 927,741 | $ | 71,685 | $ | 582,574 | $ | 71,408 | ||||||||
| Interest Income | 703 | 251 | 16,085 | 252 | ||||||||||||
| Security Lending Income | 4,092 | — | 93,745 | 569 | ||||||||||||
| Less: Foreign Taxes Withheld | (164,143 | ) | (6,069 | ) | (4,437 | ) | (1,848 | ) | ||||||||
| Total Investment Income | 768,393 | 65,867 | 687,967 | 70,381 | ||||||||||||
Supervision and Administration Fees(1) | 71,480 | 19,352 | 1,030,715 | 23,634 | ||||||||||||
Custodian Fees(2) | 2,644 | 135 | 13 | 93 | ||||||||||||
| Total Expenses | 74,124 | 19,487 | 1,030,728 | 23,727 | ||||||||||||
| Net Investment Income (Loss) | 694,269 | 46,380 | (342,761 | ) | 46,654 | |||||||||||
| Net Realized Gain (Loss) on: | ||||||||||||||||
Investments(3) | (3,088,875 | ) | (212,022 | ) | (44,568,967 | ) | (867,668 | ) | ||||||||
| Foreign Currency Transactions | 22,972 | 306 | 1,015 | (1,111 | ) | |||||||||||
| Net Realized Gain (Loss) | (3,065,903 | ) | (211,716 | ) | (44,567,952 | ) | (868,779 | ) | ||||||||
| Net Change in Unrealized Appreciation (Depreciation) on: | ||||||||||||||||
| Investments | 3,311,644 | 1,409,067 | 90,159,541 | 4,201,947 | ||||||||||||
| Foreign Currency Translations | 1,054 | — | 5 | — | ||||||||||||
| Net Change in Unrealized Appreciation (Depreciation) | 3,312,698 | 1,409,067 | 90,159,546 | 4,201,947 | ||||||||||||
| Net Realized and Unrealized Gain (Loss) | 246,795 | 1,197,351 | 45,591,594 | 3,333,168 | ||||||||||||
| Net Increase in Net Assets Resulting from Operations | $ | 941,064 | $ | 1,243,731 | $ | 45,248,833 | $ | 3,379,822 | ||||||||
| (1) | The Supervision andAdministration fees reflect the supervisory and administrative fee, which includes fees paid by the Funds for the investment advisory services provided by the Adviser. (See Note 3 in Notes to Financial Statements.) |
| (2) | See Note 2 in the Notes to Financial Statements. |
| (3) | Includes realized gains (losses) as a result of in-kind redemptions. (See Note 4 in Notes to Financial Statements.) |
| Statements of Operations |
| For the period ended April 30, 2023 (Unaudited) |
Global X MSCI China Financials ETF | Global X MSCI China Energy ETF | Global X MSCI China Materials ETF | Global X MSCI Norway ETF | |||||||||||||
| Investment Income: | ||||||||||||||||
| Dividend Income | $ | 10,263 | $ | — | $ | 9,780 | $ | 2,488,159 | ||||||||
| Interest Income | 2,390 | 1,912 | 296 | 1,494 | ||||||||||||
| Less: Foreign Taxes Withheld | (373 | ) | — | (309 | ) | (539,575 | ) | |||||||||
| Total Investment Income | 12,280 | 1,912 | 9,767 | 1,950,078 | ||||||||||||
Supervision and Administration Fees(1) | 89,209 | 32,173 | 12,285 | 216,745 | ||||||||||||
Custodian Fees(2) | 45 | 184 | 77 | 2,126 | ||||||||||||
| Total Expenses | 89,254 | 32,357 | 12,362 | 218,871 | ||||||||||||
| Net Investment Income (Loss) | (76,974 | ) | (30,445 | ) | (2,595 | ) | 1,731,207 | |||||||||
| Net Realized Gain (Loss) on: | ||||||||||||||||
Investments(3) | (3,487,087 | ) | (248,587 | ) | (149,431 | ) | (4,323,962 | ) | ||||||||
| Foreign Currency Transactions | (2,118 | ) | 173 | 28 | (5,428 | ) | ||||||||||
| Net Realized Gain (Loss) | (3,489,205 | ) | (248,414 | ) | (149,403 | ) | (4,329,390 | ) | ||||||||
| Net Change in Unrealized Appreciation (Depreciation) on: | ||||||||||||||||
| Investments | 13,317,264 | 1,971,443 | 912,874 | 5,325,374 | ||||||||||||
| Foreign Currency Translations | 19 | 33 | — | 12,305 | ||||||||||||
| Net Change in Unrealized Appreciation (Depreciation) | 13,317,283 | 1,971,476 | 912,874 | 5,337,679 | ||||||||||||
| Net Realized and Unrealized Gain (Loss) | 9,828,078 | 1,723,062 | 763,471 | 1,008,289 | ||||||||||||
| Net Increase in Net Assets Resulting from Operations | $ | 9,751,104 | $ | 1,692,617 | $ | 760,876 | $ | 2,739,496 | ||||||||
| (1) | The Supervision andAdministration fees reflect the supervisory and administrative fee, which includes fees paid by the Funds for the investment advisory services provided by the Adviser. (See Note 3 in Notes to Financial Statements.) |
| (2) | See Note 2 in the Notes to Financial Statements. |
| (3) | Includes realized gains (losses) as a result of in-kind redemptions. (See Note 4 in Notes to Financial Statements.) |
| Statements of Operations |
| For the period ended April 30, 2023 (Unaudited) |
Global X FTSE Southeast Asia ETF | Global X MSCI Argentina ETF | Global X MSCI Greece ETF | Global X MSCI Nigeria ETF | |||||||||||||
| Investment Income: | ||||||||||||||||
| Dividend Income | $ | 1,055,432 | $ | 230,993 | $ | 994,772 | $ | 1,804,841 | ||||||||
| Interest Income | 878 | 1,109 | 6,822 | 14,612 | ||||||||||||
| Security Lending Income | 2,056 | 43,215 | 3,241 | — | ||||||||||||
| Less: Foreign Taxes Withheld | (86,058 | ) | (16,484 | ) | (47,901 | ) | (180,484 | ) | ||||||||
| Total Investment Income | 972,308 | 258,833 | 956,934 | 1,638,969 | ||||||||||||
Supervision and Administration Fees(1) | 145,901 | 118,265 | 368,246 | 136,406 | ||||||||||||
Custodian Fees(2) | 369 | 202 | 12,498 | 28,347 | ||||||||||||
| Total Expenses | 146,270 | 118,467 | 380,744 | 164,753 | ||||||||||||
| Net Investment Income | 826,038 | 140,366 | 576,190 | 1,474,216 | ||||||||||||
| Net Realized Gain (Loss) on: | ||||||||||||||||
Investments(3) | (457,543 | ) | (3,346,182 | ) | 662,648 | 43 | ||||||||||
| Foreign Currency Transactions | 9,908 | 21,327 | 19,422 | (12,895 | ) | |||||||||||
| Net Realized Gain (Loss) | (447,635 | ) | (3,324,855 | ) | 682,070 | (12,852 | ) | |||||||||
| Net Change in Unrealized Appreciation (Depreciation) on: | ||||||||||||||||
| Investments | 3,377,287 | 10,240,629 | 33,768,000 | 4,853,969 | ||||||||||||
| Foreign Currency Translations | 1,085 | 67 | (1,786 | ) | (88,088 | ) | ||||||||||
| Net Change in Unrealized Appreciation (Depreciation) | 3,378,372 | 10,240,696 | 33,766,214 | 4,765,881 | ||||||||||||
| Net Realized and Unrealized Gain (Loss) | 2,930,737 | 6,915,841 | 34,448,284 | 4,753,029 | ||||||||||||
| Net Increase in Net Assets Resulting from Operations | $ | 3,756,775 | $ | 7,056,207 | $ | 35,024,474 | $ | 6,227,245 | ||||||||
| (1) | The Supervision andAdministration fees reflect the supervisory and administrative fee, which includes fees paid by the Funds for the investment advisory services provided by the Adviser. (See Note 3 in Notes to Financial Statements.) |
| (2) | See Note 2 in the Notes to Financial Statements. |
| (3) | Includes realized gains (losses) as a result of in-kind redemptions. (See Note 4 in Notes to Financial Statements.) |
| Statements of Operations |
| For the period ended April 30, 2023 (Unaudited) |
Global X MSCI Next Emerging & Frontier ETF | Global X MSCI Portugal ETF | Global X DAX Germany ETF | Global X MSCI Pakistan ETF | |||||||||||||
| Investment Income: | ||||||||||||||||
| Dividend Income | $ | 431,911 | $ | 303,408 | $ | 668,971 | $ | 562,604 | ||||||||
| Interest Income | 530 | 251 | 381 | 1,331 | ||||||||||||
| Security Lending Income | — | 2,413 | — | — | ||||||||||||
| Less: Foreign Taxes Withheld | (36,551 | ) | (45,511 | ) | (80,403 | ) | (56,964 | ) | ||||||||
| Total Investment Income | 395,890 | 260,561 | 588,949 | 506,971 | ||||||||||||
Supervision and Administration Fees(1) | 53,715 | 34,864 | 50,205 | 47,744 | ||||||||||||
Custodian Fees(2) | 8,380 | 2,514 | 1,646 | 9,341 | ||||||||||||
| Total Expenses | 62,095 | 37,378 | 51,851 | 57,085 | ||||||||||||
| Net Investment Income | 333,795 | 223,183 | 537,098 | 449,886 | ||||||||||||
| Net Realized Gain (Loss) on: | ||||||||||||||||
Investments(3) | (139,184 | ) | 121,512 | 1,045,917 | (1,960,777 | ) | ||||||||||
| Futures Contracts | — | (8,115 | ) | — | — | |||||||||||
| Foreign Currency Transactions | 2,323 | 506 | 897 | (90,336 | ) | |||||||||||
| Net Realized Gain (Loss) | (136,861 | ) | 113,903 | 1,046,814 | (2,051,113 | ) | ||||||||||
| Net Change in Unrealized Appreciation (Depreciation) on: | ||||||||||||||||
| Investments | 1,100,624 | 2,244,295 | 12,120,526 | (1,174,752 | ) | |||||||||||
| Futures Contracts | — | 14,170 | — | — | ||||||||||||
| Foreign Currency Translations | (962 | ) | 24,274 | 18,334 | (249 | ) | ||||||||||
| Net Change in Unrealized Appreciation (Depreciation) | 1,099,662 | 2,282,739 | 12,138,860 | (1,175,001 | ) | |||||||||||
| Net Realized and Unrealized Gain (Loss) | 962,801 | 2,396,642 | 13,185,674 | (3,226,114 | ) | |||||||||||
| Net Increase (Decrease) in Net Assets Resulting from Operations | $ | 1,296,596 | $ | 2,619,825 | $ | 13,722,772 | $ | (2,776,228 | ) | |||||||
| (1) | The Supervision andAdministration fees reflect the supervisory and administrative fee, which includes fees paid by the Funds for the investment advisory services provided by the Adviser. (See Note 3 in Notes to Financial Statements.) |
| (2) | See Note 2 in the Notes to Financial Statements. |
| (3) | Includes realized gains (losses) as a result of in-kind redemptions. (See Note 4 in Notes to Financial Statements.) |
| Statements of Operations |
| For the period ended April 30, 2023 (Unaudited) |
Global X MSCI China Consumer Staples ETF | Global X MSCI China Health Care ETF | Global X MSCI China Information Technology ETF | ||||||||||
| Investment Income: | ||||||||||||
| Dividend Income | $ | 92,623 | $ | 491 | $ | 27,779 | ||||||
| Interest Income | 361 | 47 | 68 | |||||||||
| Security Lending Income | — | — | 39 | |||||||||
| Less: Foreign Taxes Withheld | (6,760 | ) | (49 | ) | (868 | ) | ||||||
| Total Investment Income | 86,224 | 489 | 27,018 | |||||||||
Supervision and Administration Fees(1) | 111,352 | 32,367 | 51,738 | |||||||||
Custodian Fees(2) | 1,078 | 17 | 40 | |||||||||
| Total Expenses | 112,430 | 32,384 | 51,778 | |||||||||
| Net Investment Loss | (26,206 | ) | (31,895 | ) | (24,760 | ) | ||||||
| Net Realized Gain (Loss) on: | ||||||||||||
Investments(3) | (252,237 | ) | (944,647 | ) | (1,528,561 | ) | ||||||
| Foreign Currency Transactions | (5,527 | ) | 92 | (993 | ) | |||||||
| Net Realized Gain (Loss) | (257,764 | ) | (944,555 | ) | (1,529,554 | ) | ||||||
| Net Change in Unrealized Appreciation (Depreciation) on: | ||||||||||||
| Investments | 2,630,913 | 2,864,034 | 3,850,554 | |||||||||
| Foreign Currency Translations | 13 | — | — | |||||||||
| Net Change in Unrealized Appreciation (Depreciation) | 2,630,926 | 2,864,034 | 3,850,554 | |||||||||
| Net Realized and Unrealized Gain (Loss) | 2,373,162 | 1,919,479 | 2,321,000 | |||||||||
| Net Increase in Net Assets Resulting from Operations | $ | 2,346,956 | $ | 1,887,584 | $ | 2,296,240 | ||||||
| (1) | The Supervision andAdministration fees reflect the supervisory and administrative fee, which includes fees paid by the Funds for the investment advisory services provided by the Adviser. (See Note 3 in Notes to Financial Statements.) |
| (2) | See Note 2 in the Notes to Financial Statements. |
| (3) | Includes realized gains (losses) as a result of in-kind redemptions. (See Note 4 in Notes to Financial Statements.) |
| Statements of Operations |
| For the period ended April 30, 2023 (Unaudited) |
Global X MSCI China Utilities ETF | Global X MSCI China Real Estate ETF | Global X MSCI Vietnam ETF | ||||||||||
| Investment Income: | ||||||||||||
| Dividend Income | $ | 3,443 | $ | 8,859 | $ | 35,051 | ||||||
| Interest Income | 78 | 126 | 69 | |||||||||
| Less: Foreign Taxes Withheld | (151 | ) | — | — | ||||||||
| Total Investment Income | 3,370 | 8,985 | 35,120 | |||||||||
Supervision and Administration Fees(1) | 8,151 | 20,981 | 11,554 | |||||||||
Custodian Fees(2) | 67 | 538 | 304 | |||||||||
| Total Expenses | 8,218 | 21,519 | 11,858 | |||||||||
| Net Investment Income (Loss) | (4,848 | ) | (12,534 | ) | 23,262 | |||||||
| Net Realized Gain (Loss) on: | ||||||||||||
Investments(3) | (127,757 | ) | (1,192,531 | ) | (663,082 | ) | ||||||
| Foreign Currency Transactions | (261 | ) | 578 | 8,040 | ||||||||
| Net Realized Gain (Loss) | (128,018 | ) | (1,191,953 | ) | (655,042 | ) | ||||||
| Net Change in Unrealized Appreciation (Depreciation) on: | ||||||||||||
| Investments | 771,472 | 3,041,673 | 787,644 | |||||||||
| Foreign Currency Translations | (6 | ) | 2 | (426 | ) | |||||||
| Net Change in Unrealized Appreciation (Depreciation) | 771,466 | 3,041,675 | 787,218 | |||||||||
| Net Realized and Unrealized Gain (Loss) | 643,448 | 1,849,722 | 132,176 | |||||||||
| Net Increase in Net Assets Resulting from Operations | $ | 638,600 | $ | 1,837,188 | $ | 155,438 | ||||||
| (1) | The Supervision andAdministration fees reflect the supervisory and administrative fee, which includes fees paid by the Funds for the investment advisory services provided by the Adviser. (See Note 3 in Notes to Financial Statements.) |
| (2) | See Note 2 in the Notes to Financial Statements. |
| (3) | Includes realized gains (losses) as a result of in-kind redemptions. (See Note 4 in Notes to Financial Statements.) |
| Statements of Changes in Net Assets |
Global X MSCI Colombia ETF | Global X MSCI China Industrials ETF | |||||||||||||||
Period Ended April 30, 2023 (Unaudited) | Year Ended October 31, 2022 | Period Ended April 30, 2023 (Unaudited) | Year Ended October 31, 2022 | |||||||||||||
| Operations: | ||||||||||||||||
| Net Investment Income | $ | 694,269 | $ | 2,650,707 | $ | 46,380 | $ | 144,287 | ||||||||
| Net Realized Gain (Loss) | (3,065,903 | ) | (3,050,617 | ) | (211,716 | ) | (3,267,632 | ) | ||||||||
| Net Change in Unrealized Appreciation (Depreciation) | 3,312,698 | (9,366,159 | ) | 1,409,067 | (2,360,376 | ) | ||||||||||
| Net Increase (Decrease) in Net Assets Resulting from Operations | 941,064 | (9,766,069 | ) | 1,243,731 | (5,483,721 | ) | ||||||||||
| Distributions | (1,070,710 | ) | (2,097,252 | ) | (140,348 | ) | (68,060 | ) | ||||||||
| Capital Share Transactions: | ||||||||||||||||
| Issued | 6,507,160 | 5,767,466 | 133,293 | 28,588,729 | ||||||||||||
| Redeemed | — | (14,877,594 | ) | — | (21,277,458 | ) | ||||||||||
| Increase (Decrease) in Net Assets from Capital Share Transactions | 6,507,160 | (9,110,128 | ) | 133,293 | 7,311,271 | |||||||||||
| Total Increase (Decrease) in Net Assets | 6,377,514 | (20,973,449 | ) | 1,236,676 | 1,759,490 | |||||||||||
| Net Assets: | ||||||||||||||||
| Beginning of Year/Period | 20,857,353 | 41,830,802 | 4,917,223 | 3,157,733 | ||||||||||||
| End of Year/Period | $ | 27,234,867 | $ | 20,857,353 | $ | 6,153,899 | $ | 4,917,223 | ||||||||
| Share Transactions: | ||||||||||||||||
| Issued | 320,000 | 200,000 | 10,000 | 1,720,000 | ||||||||||||
| Redeemed | — | (500,000 | ) | — | (1,460,000 | ) | ||||||||||
| Net Increase (Decrease) in Shares Outstanding from Share Transactions | 320,000 | (300,000 | ) | 10,000 | 260,000 | |||||||||||
| Global X MSCI China Consumer Discretionary ETF | Global X MSCI China Communication Services ETF | |||||||||||||||
Period Ended April 30, 2023 (Unaudited) | Year Ended October 31, 2022 | Period Ended April 30, 2023 (Unaudited) | Year Ended October 31, 2022 | |||||||||||||
| Operations: | ||||||||||||||||
| Net Investment Income (Loss) | $ | (342,761 | ) | $ | 932,540 | $ | 46,654 | $ | 105,427 | |||||||
| Net Realized Gain (Loss) | (44,567,952 | ) | (67,214,262 | ) | (868,779 | ) | (1,971,753 | ) | ||||||||
| Net Change in Unrealized Appreciation (Depreciation) | 90,159,546 | (207,659,135 | ) | 4,201,947 | (3,936,947 | ) | ||||||||||
| Net Increase (Decrease) in Net Assets Resulting from Operations | 45,248,833 | (273,940,857 | ) | 3,379,822 | (5,803,273 | ) | ||||||||||
| Distributions | (233,827 | ) | (925,757 | ) | (13,635 | ) | (91,893 | ) | ||||||||
| Capital Share Transactions: | ||||||||||||||||
| Issued | 71,865,601 | 73,113,390 | — | — | ||||||||||||
| Redeemed | (9,187,731 | ) | (233,534,253 | ) | (383,157 | ) | (1,520,074 | ) | ||||||||
| Increase (Decrease) in Net Assets from Capital Share Transactions | 62,677,870 | (160,420,863 | ) | (383,157 | ) | (1,520,074 | ) | |||||||||
| Total Increase (Decrease) in Net Assets | 107,692,876 | (435,287,477 | ) | 2,983,030 | (7,415,240 | ) | ||||||||||
| Net Assets: | ||||||||||||||||
| Beginning of Year/Period | 214,215,551 | 649,503,028 | 4,921,916 | 12,337,156 | ||||||||||||
| End of Year/Period | $ | 321,908,427 | $ | 214,215,551 | $ | 7,904,946 | $ | 4,921,916 | ||||||||
| Share Transactions: | ||||||||||||||||
| Issued | 3,150,000 | 3,150,000 | — | — | ||||||||||||
| Redeemed | (490,000 | ) | (10,120,000 | ) | (30,000 | ) | (90,000 | ) | ||||||||
| Net Increase (Decrease) in Shares Outstanding from Share Transactions | 2,660,000 | (6,970,000 | ) | (30,000 | ) | (90,000 | ) | |||||||||
| Statements of Changes in Net Assets |
| Global X MSCI China Financials ETF | Global X MSCI China Energy ETF | |||||||||||||||
Period Ended April 30, 2023 (Unaudited) | Year Ended October 31, 2022 | Period Ended April 30, 2023 (Unaudited) | Year Ended October 31, 2022 | |||||||||||||
| Operations: | ||||||||||||||||
| Net Investment Income (Loss) | $ | (76,974 | ) | $ | 1,749,055 | $ | (30,445 | ) | $ | 320,352 | ||||||
| Net Realized Gain (Loss) | (3,489,205 | ) | (12,951,563 | ) | (248,414 | ) | 1,381,183 | |||||||||
| Net Change in Unrealized Appreciation (Depreciation) | 13,317,283 | (11,700,407 | ) | 1,971,476 | (1,326,379 | ) | ||||||||||
| Net Increase (Decrease) in Net Assets Resulting from Operations | 9,751,104 | (22,902,915 | ) | 1,692,617 | 375,156 | |||||||||||
| Distributions | (1,606,156 | ) | (1,762,014 | ) | (289,602 | ) | (152,497 | ) | ||||||||
| Capital Share Transactions: | ||||||||||||||||
| Issued | — | 78,469,847 | 1,979,408 | 16,176,723 | ||||||||||||
| Redeemed | (10,898,435 | ) | (74,994,024 | ) | (2,176,619 | ) | (11,911,829 | ) | ||||||||
| Increase (Decrease) in Net Assets from Capital Share Transactions | (10,898,435 | ) | 3,475,823 | (197,211 | ) | 4,264,894 | ||||||||||
| Total Increase (Decrease) in Net Assets | (2,753,487 | ) | (21,189,106 | ) | 1,205,804 | 4,487,553 | ||||||||||
| Net Assets: | ||||||||||||||||
| Beginning of Year/Period | 27,567,183 | 48,756,289 | 9,139,567 | 4,652,014 | ||||||||||||
| End of Year/Period | $ | 24,813,696 | $ | 27,567,183 | $ | 10,345,371 | $ | 9,139,567 | ||||||||
| Share Transactions: | ||||||||||||||||
| Issued | — | 5,340,000 | 130,000 | 1,200,000 | ||||||||||||
| Redeemed | (860,000 | ) | (5,900,000 | ) | (150,000 | ) | (920,000 | ) | ||||||||
| Net Increase (Decrease) in Shares Outstanding from Share Transactions | (860,000 | ) | (560,000 | ) | (20,000 | ) | 280,000 | |||||||||
| Statements of Changes in Net Assets |
| Global X MSCI China Materials ETF | Global X MSCI Norway ETF | |||||||||||||||
Period Ended April 30, 2023 (Unaudited) | Year Ended October 31, 2022 | Period Ended April 30, 2023 (Unaudited) | Year Ended October 31, 2022 | |||||||||||||
| Operations: | ||||||||||||||||
| Net Investment Income (Loss) | $ | (2,595 | ) | $ | 97,625 | $ | 1,731,207 | $ | 3,760,508 | |||||||
| Net Realized Gain (Loss) | (149,403 | ) | (214,980 | ) | (4,329,390 | ) | (1,940,807 | ) | ||||||||
| Net Change in Unrealized Appreciation (Depreciation) | 912,874 | (2,138,172 | ) | 5,337,679 | (29,673,725 | ) | ||||||||||
| Net Increase (Decrease) in Net Assets Resulting from Operations | 760,876 | (2,255,527 | ) | 2,739,496 | (27,854,024 | ) | ||||||||||
| Distributions | (41,008 | ) | (95,929 | ) | (1,872,669 | ) | (2,606,650 | ) | ||||||||
| Capital Share Transactions: | ||||||||||||||||
| Issued | 958,505 | 7,850,722 | 756,376 | 57,122,800 | ||||||||||||
| Redeemed | (1,180,842 | ) | (9,137,160 | ) | (41,554,406 | ) | (31,492,167 | ) | ||||||||
| Increase (Decrease) in Net Assets from Capital Share Transactions | (222,337 | ) | (1,286,438 | ) | (40,798,030 | ) | 25,630,633 | |||||||||
| Total Increase (Decrease) in Net Assets | 497,531 | (3,637,894 | ) | (39,931,203 | ) | (4,830,041 | ) | |||||||||
| Net Assets: | ||||||||||||||||
| Beginning of Year/Period | 2,919,716 | 6,557,610 | 99,105,212 | 103,935,253 | ||||||||||||
| End of Year/Period | $ | 3,417,247 | $ | 2,919,716 | $ | 59,174,009 | $ | 99,105,212 | ||||||||
| Share Transactions: | ||||||||||||||||
| Issued | 50,000 | 320,000 | 30,000 | 1,900,000 | ||||||||||||
| Redeemed | (60,000 | ) | (380,000 | ) | (1,670,000 | ) | (1,090,860 | ) | ||||||||
| Net Increase (Decrease) in Shares Outstanding from Share Transactions | (10,000 | ) | (60,000 | ) | (1,640,000 | ) | 809,140 | |||||||||
| Statements of Changes in Net Assets |
| Global X FTSE Southeast Asia ETF | Global X MSCI Argentina ETF | |||||||||||||||
Period Ended April 30, 2023 (Unaudited) | Year Ended October 31, 2022 | Period Ended April 30, 2023 (Unaudited) | Year Ended October 31, 2022 | |||||||||||||
| Operations: | ||||||||||||||||
| Net Investment Income | $ | 826,038 | $ | 1,018,307 | $ | 140,366 | $ | 749,636 | ||||||||
| Net Realized Gain (Loss) | (447,635 | ) | (936,957 | ) | (3,324,855 | ) | (5,435,533 | ) | ||||||||
| Net Change in Unrealized Appreciation (Depreciation) | 3,378,372 | (2,036,439 | ) | 10,240,696 | 2,074,465 | |||||||||||
| Net Increase (Decrease) in Net Assets Resulting from Operations | 3,756,775 | (1,955,089 | ) | 7,056,207 | (2,611,432 | ) | ||||||||||
| Distributions | (492,192 | ) | (1,542,635 | ) | (385,996 | ) | (647,649 | ) | ||||||||
| Capital Share Transactions: | ||||||||||||||||
| Issued | 6,946,617 | 10,665,350 | 21,276,167 | 2,904,673 | ||||||||||||
| Redeemed | (1,056,792 | ) | (5,083,072 | ) | (6,575,154 | ) | (7,525,318 | ) | ||||||||
| Increase (Decrease) in Net Assets from Capital Share Transactions | 5,889,825 | 5,582,278 | 14,701,013 | (4,620,645 | ) | |||||||||||
| Total Increase (Decrease) in Net Assets | 9,154,408 | 2,084,554 | 21,371,224 | (7,879,726 | ) | |||||||||||
| Net Assets: | ||||||||||||||||
| Beginning of Year/Period | 37,860,754 | 35,776,200 | 26,930,312 | 34,810,038 | ||||||||||||
| End of Year/Period | $ | 47,015,162 | $ | 37,860,754 | $ | 48,301,536 | $ | 26,930,312 | ||||||||
| Share Transactions: | ||||||||||||||||
| Issued | 460,000 | 700,000 | 530,000 | 80,000 | ||||||||||||
| Redeemed | (70,000 | ) | (370,000 | ) | (170,000 | ) | (270,000 | ) | ||||||||
| Net Increase (Decrease) in Shares Outstanding from Share Transactions | 390,000 | 330,000 | 360,000 | (190,000 | ) | |||||||||||
Global X MSCI Greece ETF | Global X MSCI Nigeria ETF | |||||||||||||||
Period Ended April 30, 2023 (Unaudited) | Year Ended October 31, 2022 | Period Ended April 30, 2023 (Unaudited) | Year Ended October 31, 2022 | |||||||||||||
| Operations: | ||||||||||||||||
| Net Investment Income | $ | 576,190 | $ | 3,413,437 | $ | 1,474,216 | $ | 2,606,831 | ||||||||
| Net Realized Gain (Loss) | 682,070 | 4,346,778 | (12,852 | ) | (861,809 | ) | ||||||||||
| Net Change in Unrealized Appreciation (Depreciation) | 33,766,214 | (24,621,733 | ) | 4,765,881 | (7,928,237 | ) | ||||||||||
| Net Increase (Decrease) in Net Assets Resulting from Operations | 35,024,474 | (16,861,518 | ) | 6,227,245 | (6,183,215 | ) | ||||||||||
| Distributions | (3,026,423 | ) | (2,877,578 | ) | (1,767,023 | ) | (2,165,774 | ) | ||||||||
| Capital Share Transactions: | ||||||||||||||||
| Issued | 22,710,173 | 11,142,137 | — | — | ||||||||||||
| Redeemed | (3,769,830 | ) | (36,152,985 | ) | — | — | ||||||||||
| Increase (Decrease) in Net Assets from Capital Share Transactions | 18,940,343 | (25,010,848 | ) | — | — | |||||||||||
| Total Increase (Decrease) in Net Assets | 50,938,394 | (44,749,944 | ) | 4,460,222 | (8,348,989 | ) | ||||||||||
| Net Assets: | ||||||||||||||||
| Beginning of Year/Period | 107,078,219 | 151,828,163 | 38,242,997 | 46,591,986 | ||||||||||||
| End of Year/Period | $ | 158,016,613 | $ | 107,078,219 | $ | 42,703,219 | $ | 38,242,997 | ||||||||
| Share Transactions: | ||||||||||||||||
| Issued | 740,000 | 400,000 | — | — | ||||||||||||
| Redeemed | (130,000 | ) | (1,390,000 | ) | — | — | ||||||||||
| Net Increase (Decrease) in Shares Outstanding from Share Transactions | 610,000 | (990,000 | ) | — | — | |||||||||||
| Global X MSCI Next Emerging & Frontier ETF | Global X MSCI Portugal ETF | |||||||||||||||
Period Ended April 30, 2023 (Unaudited) | Year Ended October 31, 2022 | Period Ended April 30, 2023 (Unaudited) | Year Ended October 31, 2022 | |||||||||||||
| Operations: | ||||||||||||||||
| Net Investment Income | $ | 333,795 | $ | 513,545 | $ | 223,183 | $ | 261,887 | ||||||||
| Net Realized Gain (Loss) | (136,861 | ) | (412,927 | ) | 113,903 | (3,342,561 | ) | |||||||||
| Net Change in Unrealized Appreciation (Depreciation) | 1,099,662 | (2,635,852 | ) | 2,282,739 | 113,296 | |||||||||||
| Net Increase (Decrease) in Net Assets Resulting from Operations | 1,296,596 | (2,535,234 | ) | 2,619,825 | (2,967,378 | ) | ||||||||||
| Distributions | (230,426 | ) | (507,163 | ) | (89,551 | ) | (300,309 | ) | ||||||||
| Capital Share Transactions: | ||||||||||||||||
| Issued | 2,990,370 | 933,599 | 7,429,163 | 12,259,897 | ||||||||||||
| Redeemed | — | — | (10,220,018 | ) | (4,851,384 | ) | ||||||||||
| Increase (Decrease) in Net Assets from Capital Share Transactions | 2,990,370 | 933,599 | (2,790,855 | ) | 7,408,513 | |||||||||||
| Total Increase (Decrease) in Net Assets | 4,056,540 | (2,108,798 | ) | (260,581 | ) | 4,140,826 | ||||||||||
| Net Assets: | ||||||||||||||||
| Beginning of Year/Period | 19,518,934 | 21,627,732 | 15,145,814 | 11,004,988 | ||||||||||||
| End of Year/Period | $ | 23,575,474 | $ | 19,518,934 | $ | 14,885,233 | $ | 15,145,814 | ||||||||
| Share Transactions: | ||||||||||||||||
| Issued | 160,000 | 50,000 | 690,000 | 1,190,000 | ||||||||||||
| Redeemed | — | — | (970,000 | ) | (510,000 | ) | ||||||||||
| Net Increase (Decrease) in Shares Outstanding from Share Transactions | 160,000 | 50,000 | (280,000 | ) | 680,000 | |||||||||||
| Global X DAX Germany ETF | Global X MSCI Pakistan ETF | |||||||||||||||
Period Ended April 30, 2023 (Unaudited) | Year Ended October 31, 2022 | Period Ended April 30, 2023 (Unaudited) | Year Ended October 31, 2022 | |||||||||||||
| Operations: | ||||||||||||||||
| Net Investment Income | $ | 537,098 | $ | 1,165,888 | $ | 449,886 | $ | 1,392,809 | ||||||||
| Net Realized Gain (Loss) | 1,046,814 | 1,211,661 | (2,051,113 | ) | (2,644,785 | ) | ||||||||||
| Net Change in Unrealized Appreciation (Depreciation) | 12,138,860 | (11,874,219 | ) | (1,175,001 | ) | (5,849,489 | ) | |||||||||
| Net Increase (Decrease) in Net Assets Resulting from Operations | 13,722,772 | (9,496,670 | ) | (2,776,228 | ) | (7,101,465 | ) | |||||||||
| Distributions | (191,380 | ) | (1,178,656 | ) | (640,501 | ) | (1,339,067 | ) | ||||||||
| Capital Share Transactions: | ||||||||||||||||
| Issued | 6,809,074 | 21,895,926 | 5,407,455 | — | ||||||||||||
| Redeemed | (1,817,664 | ) | (15,914,235 | ) | — | (1,179,537 | ) | |||||||||
| Increase (Decrease) in Net Assets from Capital Share Transactions | 4,991,410 | 5,981,691 | 5,407,455 | (1,179,537 | ) | |||||||||||
| Total Increase (Decrease) in Net Assets | 18,522,802 | (4,693,635 | ) | 1,990,726 | (9,620,069 | ) | ||||||||||
| Net Assets: | ||||||||||||||||
| Beginning of Year/Period | 39,338,868 | 44,032,503 | 14,347,400 | 23,967,469 | ||||||||||||
| End of Year/Period | $ | 57,861,670 | $ | 39,338,868 | $ | 16,338,126 | $ | 14,347,400 | ||||||||
| Share Transactions: | ||||||||||||||||
| Issued | 240,000 | 960,000 | 410,000 | — | ||||||||||||
| Redeemed | (60,000 | ) | (570,000 | ) | — | (50,000 | ) | |||||||||
| Net Increase (Decrease) in Shares Outstanding from Share Transactions | 180,000 | 390,000 | 410,000 | (50,000 | ) | |||||||||||
| Global X MSCI China Consumer Staples ETF | Global X MSCI China Health Care ETF | |||||||||||||||
Period Ended April 30, 2023 (Unaudited) | Year Ended October 31, 2022 | Period Ended April 30, 2023 (Unaudited) | Year Ended October 31, 2022 | |||||||||||||
| Operations: | ||||||||||||||||
| Net Investment Income (Loss) | $ | (26,206 | ) | $ | 259,820 | $ | (31,895 | ) | $ | 43,799 | ||||||
| Net Realized Gain (Loss) | (257,764 | ) | (644,928 | ) | (944,555 | ) | (2,773,705 | ) | ||||||||
| Net Change in Unrealized Appreciation (Depreciation) | 2,630,926 | (5,093,380 | ) | 2,864,034 | (4,712,816 | ) | ||||||||||
| Net Increase (Decrease) in Net Assets Resulting from Operations | 2,346,956 | (5,478,488 | ) | 1,887,584 | (7,442,722 | ) | ||||||||||
| Distributions | (180,115 | ) | (707,626 | ) | (27,342 | ) | (16,856 | ) | ||||||||
| Capital Share Transactions: | ||||||||||||||||
| Issued | 27,501,821 | 14,177,959 | — | 2,063,554 | ||||||||||||
| Redeemed | — | (14,947,194 | ) | (1,005,096 | ) | (3,148,309 | ) | |||||||||
| Increase (Decrease) in Net Assets from Capital Share Transactions | 27,501,821 | (769,235 | ) | (1,005,096 | ) | (1,084,755 | ) | |||||||||
| Total Increase (Decrease) in Net Assets | 29,668,662 | (6,955,349 | ) | 855,146 | (8,544,333 | ) | ||||||||||
| Net Assets: | ||||||||||||||||
| Beginning of Year/Period | 8,618,620 | 15,573,969 | 8,075,437 | 16,619,770 | ||||||||||||
| End of Year/Period | $ | 38,287,282 | $ | 8,618,620 | $ | 8,930,583 | $ | 8,075,437 | ||||||||
| Share Transactions: | ||||||||||||||||
| Issued | 1,270,000 | 630,000 | — | 110,000 | ||||||||||||
| Redeemed | — | (660,000 | ) | (60,000 | ) | (180,000 | ) | |||||||||
| Net Increase (Decrease) in Shares Outstanding from Share Transactions | 1,270,000 | (30,000 | ) | (60,000 | ) | (70,000 | ) | |||||||||
Global X MSCI China Information Technology ETF | Global X MSCI China Utilities ETF | |||||||||||||||
Period Ended April 30, 2023 (Unaudited) | Year Ended October 31, 2022 | Period Ended April 30, 2023 (Unaudited) | Year Ended October 31, 2022 | |||||||||||||
| Operations: | ||||||||||||||||
| Net Investment Income (Loss) | $ | (24,760 | ) | $ | 112,992 | $ | (4,848 | ) | $ | 53,604 | ||||||
| Net Realized Gain (Loss) | (1,529,554 | ) | (3,909,078 | ) | (128,018 | ) | 67,161 | |||||||||
| Net Change in Unrealized Appreciation (Depreciation) | 3,850,554 | (11,042,399 | ) | 771,466 | (1,309,980 | ) | ||||||||||
| Net Increase (Decrease) in Net Assets Resulting from Operations | 2,296,240 | (14,838,485 | ) | 638,600 | (1,189,215 | ) | ||||||||||
| Distributions | (48,891 | ) | (754,839 | ) | (85,511 | ) | (80,857 | ) | ||||||||
| Capital Share Transactions: | ||||||||||||||||
| Issued | — | 4,888,873 | — | 1,868,732 | ||||||||||||
| Redeemed | (1,040,563 | ) | (6,189,174 | ) | (563,063 | ) | (183,465 | ) | ||||||||
| Increase (Decrease) in Net Assets from Capital Share Transactions | (1,040,563 | ) | (1,300,301 | ) | (563,063 | ) | 1,685,267 | |||||||||
| Total Increase (Decrease) in Net Assets | 1,206,786 | (16,893,625 | ) | (9,974 | ) | 415,195 | ||||||||||
| Net Assets: | ||||||||||||||||
| Beginning of Year/Period | 13,919,611 | 30,813,236 | 2,367,777 | 1,952,582 | ||||||||||||
| End of Year/Period | $ | 15,126,397 | $ | 13,919,611 | $ | 2,357,803 | $ | 2,367,777 | ||||||||
| Share Transactions: | ||||||||||||||||
| Issued | — | 170,000 | — | 110,000 | ||||||||||||
| Redeemed | (60,000 | ) | (290,000 | ) | (40,000 | ) | (10,000 | ) | ||||||||
| Net Increase (Decrease) in Shares Outstanding from Share Transactions | (60,000 | ) | (120,000 | ) | (40,000 | ) | 100,000 | |||||||||
| Global X MSCI China Real Estate ETF‡ | Global X MSCI Vietnam ETF | |||||||||||||||
Period Ended April 30, 2023 (Unaudited) | Year Ended October 31, 2022 | Period Ended April 30, 2023 (Unaudited) | Year Ended October 31, 2022(1) | |||||||||||||
| Operations: | ||||||||||||||||
| Net Investment Income (Loss) | $ | (12,534 | ) | $ | 271,006 | $ | 23,262 | $ | 58,887 | |||||||
| Net Realized Gain (Loss) | (1,191,953 | ) | (3,014,362 | ) | (655,042 | ) | (1,955,555 | ) | ||||||||
| Net Change in Unrealized Appreciation (Depreciation) | 3,041,675 | (2,950,506 | ) | 787,218 | (1,428,450 | ) | ||||||||||
| Net Increase (Decrease) in Net Assets Resulting from Operations | 1,837,188 | (5,693,862 | ) | 155,438 | (3,325,118 | ) | ||||||||||
| Distributions | (258,524 | ) | (205,698 | ) | (33,703 | ) | (15,977 | ) | ||||||||
| Capital Share Transactions: | ||||||||||||||||
| Issued | 1,083,396 | 8,122,602 | 2,755,458 | 10,227,557 | ||||||||||||
| Redeemed | (2,665 | ) | (2,408,522 | ) | (907,633 | ) | (4,099,263 | ) | ||||||||
| Increase in Net Assets from Capital Share Transactions | 1,080,731 | 5,714,080 | 1,847,825 | 6,128,294 | ||||||||||||
| Total Increase (Decrease) in Net Assets | 2,659,395 | (185,480 | ) | 1,969,560 | 2,787,199 | |||||||||||
| Net Assets: | ||||||||||||||||
| Beginning of Year/Period | 4,219,269 | 4,404,749 | 2,787,199 | — | ||||||||||||
| End of Year/Period | $ | 6,878,664 | $ | 4,219,269 | $ | 4,756,759 | $ | 2,787,199 | ||||||||
| Share Transactions: | ||||||||||||||||
| Issued | 50,000 | 270,000 | 180,000 | 410,000 | ||||||||||||
| Redeemed | (122 | ) | (103,333 | ) | (60,000 | ) | (220,000 | ) | ||||||||
| Net Increase in Shares Outstanding from Share Transactions | 49,878 | 166,667 | 120,000 | 190,000 | ||||||||||||
(1) | The Fund commenced operations on December 7, 2021. |
‡ | Share transactions have been adjusted to reflect the effect of a 1 for 3 reverse share split on December 19, 2022. (See Note 9 in the Notes to Financial Statements.) |
Page intentionally left blank.
| Financial Highlights |
Net Asset Value, Beginning of Period ($) | Net Investment Income (Loss) ($)* | Net Realized and Unrealized Gain (Loss) on Investments ($) | Total from Operations ($) | Distribution from Net Investment Income ($) | Distribution from Capital Gains ($) | Return of Capital ($) | ||||||||||||||||||||
| Global X MSCI Colombia ETF | ||||||||||||||||||||||||||
| 2023 (Unaudited) | 19.68 | 0.59 | 0.48 | 1.07 | (1.01 | ) | — | — | ||||||||||||||||||
| 2022 | 30.76 | 2.26 | (11.49 | ) | (9.23 | ) | (1.85 | ) | — | — | ||||||||||||||||
| 2021 | 23.26 | 0.64 | 7.73 | 8.37 | (0.87 | ) | — | — | ||||||||||||||||||
| 2020(1) | 38.16 | 1.14 | (15.00 | ) | (13.86 | ) | (1.04 | ) | — | — | ||||||||||||||||
| 2019(1) | 34.72 | 1.04 | 3.96 | 5.00 | (1.56 | ) | — | — | ||||||||||||||||||
| 2018(1) | 38.24 | 0.84 | (3.64 | ) | (2.80 | ) | (0.72 | ) | — | — | ||||||||||||||||
| Global X MSCI China Industrials ETF | ||||||||||||||||||||||||||
| 2023 (Unaudited) | 10.93 | 0.10 | 2.66 | 2.76 | (0.31 | ) | — | — | ||||||||||||||||||
| 2022 | 16.62 | 0.19 | (5.75 | ) | (5.56 | ) | (0.13 | ) | — | — | ||||||||||||||||
| 2021 | 13.43 | 0.21 | 3.27 | 3.48 | (0.29 | ) | — | — | ||||||||||||||||||
| 2020 | 12.92 | 0.23 | 0.49 | 0.72 | (0.21 | ) | — | — | ||||||||||||||||||
| 2019 | 13.59 | 0.27 | (0.49 | ) | (0.22 | ) | (0.45 | ) | — | — | ||||||||||||||||
| 2018 | 16.06 | 0.29 | (2.41 | ) | (2.12 | ) | (0.35 | ) | — | — | ||||||||||||||||
| Global X MSCI China Consumer Discretionary ETF | ||||||||||||||||||||||||||
| 2023 (Unaudited) | 14.55 | (0.02 | ) | 4.01 | 3.99 | (0.02 | ) | — | — | |||||||||||||||||
| 2022 | 29.94 | 0.06 | (15.39 | ) | (15.33 | ) | (0.06 | ) | — | — | ||||||||||||||||
| 2021 | 29.45 | — | 0.51^ | 0.51 | (0.02 | ) | — | — | ||||||||||||||||||
| 2020 | 17.68 | 0.04 | 11.89 | 11.93 | (0.16 | ) | — | — | ||||||||||||||||||
| 2019 | 13.57 | 0.16 | 4.35 | 4.51 | (0.40 | ) | — | — | ||||||||||||||||||
| 2018 | 17.44 | 0.20 | (3.95 | ) | (3.75 | ) | (0.12 | ) | — | — | ||||||||||||||||
| * | Per share data calculated using average shares method. |
| ** | Total Return is for the period indicated and has not been annualized. The return shown does not reflect the |
| deduction of taxes that a shareholder would pay on Fund distributions or the redemption of Fund shares. | |
| † | Annualized. |
| †† | Portfolio turnover rate is for the period indicated and periods of less than one year have not been |
| annualized. Excludes effect of in-kind transfers.�� | |
| # | The ratio of Expenses to Average Net Assets includes the effect of a waiver. If these offsets were excluded, the |
| ratio would have been 0.68% for the year ended October 31, 2018. | |
| ^ | The amount shown for a share outstanding throughout the period does not accord with the aggregate |
| net gains on investments for the period because of the sales and repurchases of fund shares in relation to | |
| fluctuating market value of the investments of the Fund. | |
| (1) | Per share amounts have been adjusted for a 1 for 4 reverse share split on April 28, 2020. (See Note 9 in the |
| Notes to Financial Statements.) |
Amounts designated as “—” are either $0 or have been rounded to $0.
Total from Distributions ($) | Net Asset Value, End of Period ($) | Total Return (%)** | Net Assets End of Period ($)(000) | Ratio of Expenses to Average Net Assets (%) | Ratio of Net Investment Income (Loss) to Average Net Assets (%) | Portfolio Turnover (%)†† | |||||||||||||||||
| (1.01 | ) | 19.74 | 5.37 | 27,235 | 0.63 | † | 5.92 | † | 18.02 | ||||||||||||||
| (1.85 | ) | 19.68 | (31.39 | ) | 20,857 | 0.62 | 8.01 | 50.35 | |||||||||||||||
| (0.87 | ) | 30.76 | 35.98 | 41,831 | 0.61 | 2.21 | 16.08 | ||||||||||||||||
| (1.04 | ) | 23.26 | (36.91 | ) | 34,181 | 0.62 | 3.91 | 20.85 | |||||||||||||||
| (1.56 | ) | 38.16 | 15.05 | 72,282 | 0.62 | 2.81 | 18.05 | ||||||||||||||||
| (0.72 | ) | 34.72 | (7.55 | ) | 82,282 | 0.62 | # | 2.01 | 39.15 | ||||||||||||||
| (0.31 | ) | 13.38 | 25.35 | 6,154 | 0.65 | † | 1.56 | † | 10.00 | ||||||||||||||
| (0.13 | ) | 10.93 | (33.68 | ) | 4,917 | 0.65 | 1.25 | 105.23 | |||||||||||||||
| (0.29 | ) | 16.62 | 26.08 | 3,158 | 0.66 | 1.28 | 66.09 | ||||||||||||||||
| (0.21 | ) | 13.43 | 5.57 | 2,014 | 0.66 | 1.71 | 19.54 | ||||||||||||||||
| (0.45 | ) | 12.92 | (1.66 | ) | 1,938 | 0.66 | 1.99 | 80.17 | |||||||||||||||
| (0.35 | ) | 13.59 | (13.44 | ) | 2,038 | 0.66 | 1.92 | 18.28 | |||||||||||||||
| (0.02 | ) | 18.52 | 27.39 | 321,908 | 0.65 | † | (0.22 | )† | 8.97 | ||||||||||||||
| (0.06 | ) | 14.55 | (51.28 | ) | 214,216 | 0.65 | 0.25 | 22.64 | |||||||||||||||
| (0.02 | ) | 29.94 | 1.73 | 649,503 | 0.65 | — | 34.56 | ||||||||||||||||
| (0.16 | ) | 29.45 | 67.98 | 393,118 | 0.65 | 0.21 | 32.56 | ||||||||||||||||
| (0.40 | ) | 17.68 | 34.20 | 156,486 | 0.65 | 1.03 | 83.41 | ||||||||||||||||
| (0.12 | ) | 13.57 | (21.70 | ) | 120,102 | 0.65 | 1.11 | 17.92 | |||||||||||||||
| Financial Highlights |
Net Asset Value, Beginning of Period ($) | Net Investment Income (Loss) ($)* | Net Realized and Unrealized Gain (Loss) on Investments ($) | Total from Operations ($) | Distribution from Net Investment Income ($) | Distribution from Capital Gains ($) | Return of Capital ($) | |||||||||||||||||||
| Global X MSCI China Communication Services ETF | |||||||||||||||||||||||||
| 2023 (Unaudited) | 9.65 | 0.10 | 6.75 | 6.85 | (0.03 | ) | — | — | |||||||||||||||||
| 2022 | 20.56 | 0.19 | (10.92 | ) | (10.73 | ) | (0.18 | ) | — | — | |||||||||||||||
| 2021 | 26.13 | 0.06 | (5.27 | ) | (5.21 | ) | (0.31 | ) | — | (0.05 | ) | ||||||||||||||
| 2020 | 22.18 | 0.16 | 3.96 | 4.12 | (0.17 | ) | — | — | |||||||||||||||||
| 2019 | 22.40 | 0.09 | (0.21 | ) | (0.12 | ) | (0.10 | ) | — | — | |||||||||||||||
| 2018 | 29.24 | 0.07 | (6.23 | ) | (6.16 | ) | (0.68 | ) | — | — | |||||||||||||||
| Global X MSCI China Financials ETF | |||||||||||||||||||||||||
| 2023 (Unaudited) | 9.78 | (0.03 | ) | 3.59 | 3.56 | (0.68 | ) | — | — | ||||||||||||||||
| 2022 | 14.42 | 0.39 | (4.62 | ) | (4.23 | ) | (0.41 | ) | — | — | |||||||||||||||
| 2021 | 14.25 | 0.62 | 0.07 | ^ | 0.69 | (0.52 | ) | — | — | ||||||||||||||||
| 2020 | 15.83 | 0.41 | (1.50 | ) | (1.09 | ) | (0.49 | ) | — | — | |||||||||||||||
| 2019 | 15.39 | 0.67 | 0.65 | 1.32 | (0.88 | ) | — | — | |||||||||||||||||
| 2018 | 17.63 | 0.48 | (2.38 | ) | (1.90 | ) | (0.34 | ) | — | — | |||||||||||||||
| Global X MSCI China Energy ETF | |||||||||||||||||||||||||
| 2023 (Unaudited) | 13.64 | (0.05 | ) | 2.80 | 2.75 | (0.47 | ) | — | — | ||||||||||||||||
| 2022 | 11.93 | 0.65 | 1.34 | 1.99 | (0.28 | ) | — | — | |||||||||||||||||
| 2021 | 7.79 | 0.48 | 3.93 | 4.41 | (0.27 | ) | — | — | |||||||||||||||||
| 2020 | 10.43 | 0.44 | (2.66 | ) | (2.22 | ) | (0.42 | ) | — | — | |||||||||||||||
| 2019 | 11.82 | 0.30 | (1.12 | ) | (0.82 | ) | (0.57 | ) | — | — | |||||||||||||||
| 2018 | 11.69 | 0.49 | 0.05 | 0.54 | (0.41 | ) | — | — | |||||||||||||||||
| * | Per share data calculated using average shares method. |
| ** | Total Return is for the period indicated and has not been annualized. The return shown does not reflect the |
| deduction of taxes that a shareholder would pay on Fund distributions or the redemption of Fund shares. | |
| † | Annualized. |
| †† | Portfolio turnover rate is for the period indicated and periods of less than one year have not been |
| annualized. Excludes effect of in-kind transfers. | |
| ^ | The amount shown for a share outstanding throughout the period does not accord with the aggregate |
| net gains on investments for the period because of the sales and repurchases of fund shares in relation to | |
| fluctuating market value of the investments of the Fund. |
Amounts designated as “—” are either $0 or have been rounded to $0.
Total from Distributions ($) | Net Asset Value, End of Period ($) | Total Return (%)** | Net Assets End of Period ($)(000) | Ratio of Expenses to Average Net Assets (%) | Ratio of Net Investment Income (Loss) to Average Net Assets (%) | Portfolio Turnover (%)†† | ||||||||||||||||
| (0.03 | ) | 16.47 | 71.01 | 7,905 | 0.65 | † | 1.28 | † | 17.73 | |||||||||||||
| (0.18 | ) | 9.65 | (52.56 | ) | 4,922 | 0.65 | 1.15 | 30.28 | ||||||||||||||
| (0.36 | ) | 20.56 | (20.27 | ) | 12,337 | 0.65 | 0.22 | 65.54 | ||||||||||||||
| (0.17 | ) | 26.13 | 18.61 | 16,984 | 0.65 | 0.67 | 27.78 | |||||||||||||||
| (0.10 | ) | 22.18 | (0.54 | ) | 21,071 | 0.66 | 0.39 | 114.67 | ||||||||||||||
| (0.68 | ) | 22.40 | (21.70 | ) | 24,645 | 0.65 | 0.24 | 33.79 | ||||||||||||||
| (0.68 | ) | 12.66 | 36.91 | 24,814 | 0.65 | † | (0.56 | )† | 3.77 | |||||||||||||
| (0.41 | ) | 9.78 | (30.18 | ) | 27,567 | 0.66 | 2.84 | 37.97 | ||||||||||||||
| (0.52 | ) | 14.42 | 4.65 | 48,756 | 0.65 | 4.00 | 21.42 | |||||||||||||||
| (0.49 | ) | 14.25 | (7.24 | ) | 47,727 | 0.65 | 2.72 | 21.72 | ||||||||||||||
| (0.88 | ) | 15.83 | 8.95 | 60,160 | 0.66 | 4.11 | 54.17 | |||||||||||||||
| (0.34 | ) | 15.39 | (11.04 | ) | 30,784 | 0.66 | 2.67 | 15.09 | ||||||||||||||
| (0.47 | ) | 15.92 | 20.57 | 10,345 | 0.65 | † | (0.62 | )† | 23.49 | |||||||||||||
| (0.28 | ) | 13.64 | 16.86 | 9,140 | 0.66 | 4.73 | 106.55 | |||||||||||||||
| (0.27 | ) | 11.93 | 57.88 | 4,652 | 0.67 | 4.74 | 51.48 | |||||||||||||||
| (0.42 | ) | 7.79 | (22.05 | ) | 1,558 | 0.66 | 5.02 | 34.18 | ||||||||||||||
| (0.57 | ) | 10.43 | (7.04 | ) | 1,564 | 0.66 | 2.67 | 109.41 | ||||||||||||||
| (0.41 | ) | 11.82 | 4.77 | 2,955 | 0.65 | 4.00 | 14.60 | |||||||||||||||
| Financial Highlights |
| Net Asset Value, Beginning of Period ($) | Net Investment Income (Loss) ($)* | Net Realized and Unrealized Gain (Loss) on Investments ($) | Total from Operations ($) | Distribution from Net Investment Income ($) | Distribution from Capital Gains ($) | Return of Capital ($) | |||||||||||||||||||||
| Global X MSCI China Materials ETF | |||||||||||||||||||||||||||
| 2023 (Unaudited) | 14.60 | (0.01 | ) | 3.60 | 3.59 | (0.20 | ) | — | — | ||||||||||||||||||
| 2022 | 25.22 | 0.38 | (10.60 | ) | (10.22 | ) | (0.40 | ) | — | — | |||||||||||||||||
| 2021 | 18.18 | 0.43 | 7.12 | 7.55 | (0.51 | ) | — | — | |||||||||||||||||||
| 2020 | 14.50 | 0.32 | 3.93 | 4.25 | (0.57 | ) | — | — | |||||||||||||||||||
| 2019 | 15.97 | 0.52 | (0.99 | ) | (0.47 | ) | (1.00 | ) | — | — | |||||||||||||||||
| 2018 | 21.59 | 0.46 | (5.84 | ) | (5.38 | ) | (0.24 | ) | — | — | |||||||||||||||||
| Global X MSCI Norway ETF(1) | |||||||||||||||||||||||||||
| 2023 (Unaudited) | 24.43 | 0.50 | 0.03 | 0.53 | (0.47 | ) | — | — | |||||||||||||||||||
| 2022 | 32.01 | 1.05 | (7.93 | ) | (6.88 | ) | (0.70 | ) | — | — | |||||||||||||||||
| 2021 | 20.12 | 0.42 | 11.94 | 12.36 | (0.46 | ) | — | (0.01 | ) | ||||||||||||||||||
| 2020(2) | 24.52 | 0.42 | (4.38 | ) | (3.96 | ) | (0.44 | ) | — | — | |||||||||||||||||
| 2019(2) | 29.31 | 0.88 | (3.78 | ) | (2.90 | ) | (1.89 | ) | — | — | |||||||||||||||||
| 2018(2) | 28.32 | 0.78 | 1.01 | 1.79 | (0.80 | ) | — | — | |||||||||||||||||||
| Global X FTSE Southeast Asia ETF | |||||||||||||||||||||||||||
| 2023 (Unaudited) | 14.02 | 0.27 | 1.09 | 1.36 | (0.16 | ) | — | — | |||||||||||||||||||
| 2022 | 15.10 | 0.39 | (0.86 | ) | (0.47 | ) | (0.61 | ) | — | — | |||||||||||||||||
| 2021 | 11.66 | 0.62 | 3.09 | 3.71 | (0.27 | ) | — | — | |||||||||||||||||||
| 2020 | 15.95 | 0.37 | (4.27 | ) | (3.90 | ) | (0.39 | ) | — | — | |||||||||||||||||
| 2019 | 15.32 | 0.44 | 0.91 | 1.35 | (0.72 | ) | — | — | |||||||||||||||||||
| 2018 | 15.91 | 0.49 | (0.81 | ) | (0.32 | ) | (0.27 | ) | — | — | |||||||||||||||||
| * | Per share data calculated using average shares method. |
| ** | Total Return is for the period indicated and has not been annualized. The return shown does not reflect the |
| deduction of taxes that a shareholder would pay on Fund distributions or the redemption of Fund shares. | |
| † | Annualized. |
| †† | Portfolio turnover rate is for the period indicated and periods of less than one year have not been |
| annualized. Excludes effect of in-kind transfers. | |
| (1) | On October 29, 2021, the Global X MSCI Norway ETF (the “Acquired Fund”) was reorganized into the |
| Global X FTSE Nordic Region ETF (the “Acquiring Fund”), each a separate series of the Trust (together, | |
| the “Combined Fund”) and the Combined Fund was renamed the Global X MSCI Norway ETF. As a | |
| result of the Reorganization as of the close of business on October 29, 2021, the Combined Fund assumed | |
| the performance and accounting history of the Acquired Fund. Accordingly, performance figures for the | |
| Combined Fund for periods prior to the date of the Reorganization represent the performance of the | |
| Acquired Fund (See Note 1 in Notes to Financial Statements). | |
| (2) | Per share data for the Acquired Fund has been restated for periods prior to the reorganization to reflect the |
| conversion ratio of 0.4766 in effect on the reorganization date of October 29, 2021 (See Note 1 in Notes to | |
| Financial Statements). |
Amounts designated as “—” are either $0 or have been rounded to $0.
Total from Distributions ($) | Net Asset Value, End of Period ($) | Total Return (%)** | Net Assets End of Period ($)(000) | Ratio of Expenses to Average Net Assets (%) | Ratio of Net Investment Income (Loss) to Average Net Assets (%) | Portfolio Turnover (%)†† | |||||||||||||||||
| (0.20 | ) | 17.99 | 24.59 | 3,417 | 0.65 | † | (0.14 | )† | 24.54 | ||||||||||||||
| (0.40 | ) | 14.60 | (41.03 | ) | 2,920 | 0.65 | 1.74 | 101.99 | |||||||||||||||
| (0.51 | ) | 25.22 | 41.80 | 6,558 | 0.66 | 1.70 | 26.64 | ||||||||||||||||
| (0.57 | ) | 18.18 | 29.88 | 1,818 | 0.66 | 1.95 | 36.02 | ||||||||||||||||
| (1.00 | ) | 14.50 | (3.13 | ) | 2,175 | 0.66 | 3.30 | 65.67 | |||||||||||||||
| (0.24 | ) | 15.97 | (25.20 | ) | 2,395 | 0.66 | 2.27 | 26.95 | |||||||||||||||
| (0.47 | ) | 24.49 | 2.08 | 59,174 | 0.50 | † | 3.99 | † | 3.50 | ||||||||||||||
| (0.70 | ) | 24.43 | (21.72 | ) | 99,105 | 0.50 | 3.72 | 15.58 | |||||||||||||||
| (0.47 | ) | 32.01 | 64.44 | 103,935 | 0.50 | 3.09 | 9.74 | ||||||||||||||||
| (0.44 | ) | 20.12 | (16.32 | ) | 33,570 | 0.50 | 1.92 | 8.38 | |||||||||||||||
| (1.89 | ) | 24.52 | (9.77 | ) | 78,323 | 0.50 | 3.36 | 9.63 | |||||||||||||||
| (0.80 | ) | 29.31 | 6.47 | 163,471 | 0.50 | 2.64 | 9.55 | ||||||||||||||||
| (0.16 | ) | 15.22 | 9.70 | 47,015 | 0.65 | † | 3.68 | † | 4.88 | ||||||||||||||
| (0.61 | ) | 14.02 | (3.13 | ) | 37,861 | 0.65 | 2.67 | 13.92 | |||||||||||||||
| (0.27 | ) | 15.10 | 31.94 | 35,776 | 0.65 | 4.27 | 13.46 | ||||||||||||||||
| (0.39 | ) | 11.66 | (24.82 | ) | 20,981 | 0.65 | 2.77 | 5.98 | |||||||||||||||
| (0.72 | ) | 15.95 | 8.94 | 26,323 | 0.65 | 2.76 | 7.01 | ||||||||||||||||
| (0.27 | ) | 15.32 | (2.15 | ) | 17,614 | 0.65 | 2.94 | 11.98 | |||||||||||||||
| Net Asset Value, Beginning of Period ($) | Net Investment Income ($)* | Net Realized and Unrealized Gain (Loss) on Investments ($) | Total from Operations ($) | Distribution from Net Investment Income ($) | Distribution from Capital Gains ($) | Return of Capital ($) | ||||||||||||||||||||
| Global X MSCI Argentina ETF | ||||||||||||||||||||||||||
| 2023 (Unaudited) | 31.13 | 0.13 | 8.62 | 8.75 | (0.45 | ) | — | — | ||||||||||||||||||
| 2022 | 33.00 | 0.77 | (1.99 | ) | (1.22 | ) | (0.65 | ) | — | — | ||||||||||||||||
| 2021 | 23.64 | 0.26 | 9.21 | 9.47 | (0.11 | ) | — | — | ||||||||||||||||||
| 2020 | 21.83 | 0.06 | 1.83 | 1.89 | (0.08 | ) | — | — | ||||||||||||||||||
| 2019 | 25.36 | 0.29 | (3.26 | ) | (2.97 | ) | (0.56 | ) | — | — | ||||||||||||||||
| 2018 | 32.05 | 0.35 | (6.87 | ) | (6.52 | ) | (0.17 | ) | — | — | ||||||||||||||||
| Global X MSCI Greece ETF | ||||||||||||||||||||||||||
| 2023 (Unaudited) | 24.14 | 0.12 | 7.75 | 7.87 | (0.69 | ) | — | — | ||||||||||||||||||
| 2022 | 27.98 | 0.73 | (3.94 | ) | (3.21 | ) | (0.63 | ) | — | — | ||||||||||||||||
| 2021 | 17.68 | 0.47 | 10.36 | 10.83 | (0.53 | ) | — | — | ||||||||||||||||||
| 2020(1) | 29.91 | 0.66 | (12.20 | ) | (11.54 | ) | (0.69 | ) | — | — | ||||||||||||||||
| 2019(1) | 23.04 | 0.63 | 6.87 | 7.50 | (0.63 | ) | — | — | ||||||||||||||||||
| 2018(1) | 27.90 | 0.57 | (4.77 | ) | (4.20 | ) | (0.66 | ) | — | — | ||||||||||||||||
| Global X MSCI Nigeria ETF | ||||||||||||||||||||||||||
| 2023 (Unaudited) | 12.91 | 0.50 | 1.61 | 2.11 | (0.60 | ) | — | — | ||||||||||||||||||
| 2022 | 15.73 | 0.88 | (2.97 | ) | (2.09 | ) | (0.73 | ) | — | — | ||||||||||||||||
| 2021 | 14.25 | 0.73 | 1.52 | 2.25 | (0.77 | ) | — | — | ||||||||||||||||||
| 2020 | 12.23 | 0.80 | 1.30 | 2.10 | (0.08 | ) | — | — | ||||||||||||||||||
| 2019 | 17.98 | 0.87 | (4.96 | ) | (4.09 | ) | (1.66 | ) | — | — | ||||||||||||||||
| 2018 | 21.43 | 0.73 | (3.76 | ) | (3.03 | ) | (0.42 | ) | — | — | ||||||||||||||||
| * | Per share data calculated using average shares method. |
| ** | Total Return is for the period indicated and has not been annualized. The return shown does not reflect the |
| deduction of taxes that a shareholder would pay on Fund distributions or the redemption of Fund shares. | |
| † | Annualized. |
| †† | Portfolio turnover rate is for the period indicated and periods of less than one year have not been |
| annualized. Excludes effect of in-kind transfers. | |
| ‡ | The ratio of Expenses to Average Net Assets includes the effect of a waiver. If these offsets were excluded, the |
| ratio would have been 0.66% for the year ended October 31, 2018. | |
| (1) | Per share amounts have been adjusted for a 1 for 3 reverse share split on April 28, 2020. (See Note 9 in the |
| Notes to Financial Statements.) |
Amounts designated as “—” are either $0 or have been rounded to $0.
| Total from Distributions ($) | Net Asset Value, End of Period ($) | Total Return (%)** | Net Assets End of Period ($)(000) | Ratio of Expenses to Average Net Assets (%) | Ratio of Net Investment Income to Average Net Assets (%) | Portfolio Turnover (%)†† | ||||||||||||||||
| (0.45 | ) | 39.43 | 28.32 | 48,302 | 0.59 | † | 0.70 | † | 21.84 | |||||||||||||
| (0.65 | ) | 31.13 | (3.42 | ) | 26,930 | 0.59 | 2.52 | 44.70 | ||||||||||||||
| (0.11 | ) | 33.00 | 40.09 | 34,810 | 0.59 | 0.85 | 31.35 | |||||||||||||||
| (0.08 | ) | 23.64 | 8.61 | 38,421 | 0.60 | 0.25 | 49.17 | |||||||||||||||
| (0.56 | ) | 21.83 | (12.08 | ) | 59,482 | 0.60 | 1.08 | 28.88 | ||||||||||||||
| (0.17 | ) | 25.36 | (20.48 | ) | 89,391 | 0.60 | ‡ | 1.07 | 34.46 | |||||||||||||
| (0.69 | ) | 31.32 | 33.14 | 158,017 | 0.57 | † | 0.86 | † | 10.50 | |||||||||||||
| (0.63 | ) | 24.14 | (11.63 | ) | 107,078 | 0.57 | 2.83 | 24.34 | ||||||||||||||
| (0.53 | ) | 27.98 | 61.52 | 151,828 | 0.56 | 1.76 | 38.42 | |||||||||||||||
| (0.69 | ) | 17.68 | (39.39 | ) | 109,016 | 0.58 | 2.81 | 28.48 | ||||||||||||||
| (0.63 | ) | 29.91 | 33.57 | 338,840 | 0.57 | 2.43 | 12.67 | |||||||||||||||
| (0.66 | ) | 23.04 | (15.63 | ) | 257,901 | 0.59 | 1.98 | 16.38 | ||||||||||||||
| (0.60 | ) | 14.42 | 16.78 | 42,703 | 0.82 | † | 7.35 | † | — | |||||||||||||
| (0.73 | ) | 12.91 | (13.69 | ) | 38,243 | 0.83 | 5.95 | 1.95 | ||||||||||||||
| (0.77 | ) | 15.73 | 16.11 | 46,592 | 0.91 | 5.02 | 5.79 | |||||||||||||||
| (0.08 | ) | 14.25 | 17.25 | 42,199 | 0.89 | 6.81 | 18.79 | |||||||||||||||
| (1.66 | ) | 12.23 | (24.55 | ) | 32,561 | 0.89 | 5.70 | 45.62 | ||||||||||||||
| (0.42 | ) | 17.98 | (14.46 | ) | 40,675 | 0.88 | 3.29 | 62.52 | ||||||||||||||
| Net Asset Value, Beginning of Period ($) | Net Investment Income ($)* | Net Realized and Unrealized Gain (Loss) on Investments ($) | Total from Operations ($) | Distribution from Net Investment Income ($) | Distribution from Capital Gains ($) | Return of Capital ($) | ||||||||||||||||||||
| Global X MSCI Next Emerging & Frontier ETF | ||||||||||||||||||||||||||
| 2023 (Unaudited) | 18.07 | 0.28 | 0.85 | 1.13 | (0.19 | ) | — | — | ||||||||||||||||||
| 2022 | 21.00 | 0.49 | (2.93 | ) | (2.44 | ) | (0.49 | ) | — | — | ||||||||||||||||
| 2021 | 16.46 | 0.46 | 4.56 | 5.02 | (0.48 | ) | — | — | ||||||||||||||||||
| 2020 | 20.09 | 0.41 | (3.55 | ) | (3.14 | ) | (0.49 | ) | — | — | ||||||||||||||||
| 2019 | 20.22 | 0.55 | 0.31 | 0.86 | (0.99 | ) | — | — | ||||||||||||||||||
| 2018 | 23.28 | 0.59 | (3.24 | ) | (2.65 | ) | (0.41 | ) | — | — | ||||||||||||||||
| Global X MSCI Portugal ETF | ||||||||||||||||||||||||||
| 2023 (Unaudited) | 9.35 | 0.18 | 1.64 | 1.82 | (0.06 | ) | — | — | ||||||||||||||||||
| 2022 | 11.71 | 0.24 | (2.25 | ) | (2.01 | ) | (0.35 | ) | — | — | ||||||||||||||||
| 2021 | 8.50 | 0.36 | 3.22 | 3.58 | (0.37 | ) | — | — | ||||||||||||||||||
| 2020 | 10.71 | 0.23 | (2.16 | ) | (1.93 | ) | (0.28 | ) | — | — | ||||||||||||||||
| 2019 | 11.24 | 0.36 | (0.11 | ) | 0.25 | (0.78 | ) | — | — | |||||||||||||||||
| 2018 | 12.49 | 0.36 | (1.25 | ) | (0.89 | ) | (0.36 | ) | — | — | ||||||||||||||||
| Global X DAX Germany ETF(1) | ||||||||||||||||||||||||||
| 2023 (Unaudited) | 22.74 | 0.29 | 7.37 | 7.66 | (0.11 | ) | — | — | ||||||||||||||||||
| 2022 | 32.86 | 0.95 | (10.13 | ) | (9.18 | ) | (0.94 | ) | — | — | ||||||||||||||||
| 2021 | 25.21 | 0.62 | 7.95 | 8.57 | (0.92 | ) | — | — | ||||||||||||||||||
| 2020 | 27.28 | 0.87 | (2.64 | ) | (1.77 | ) | (0.30 | ) | — | — | ||||||||||||||||
| 2019(2) | 25.92 | 0.67 | 1.82 | 2.49 | (1.11 | ) | — | (0.02 | ) | |||||||||||||||||
| 2018(2) | 31.25 | 0.77 | (5.75 | )‡ | (4.98 | ) | (0.35 | ) | — | — | ||||||||||||||||
| * | Per share data calculated using average shares method. |
| ** | Total Return is for the period indicated and has not been annualized. The return shown does not reflect the |
| deduction of taxes that a shareholder would pay on Fund distributions or the redemption of Fund shares. | |
| † | Annualized. |
| †† | Portfolio turnover rate is for the period indicated and periods of less than one year have not been |
| annualized. Excludes effect of in-kind transfers. | |
| ‡ | Includes a $0.10 gain per share derived from a payment from the prior administrator of the Predecessor |
| Fund. | |
| @ | Before payment from the prior administrator of the Predecessor Fund for the loss resulting from an error, the |
| total return for the period would have been (16.37%). | |
| + | Effective March 1, 2021, the Fund’s management fees were permanently lowered to 0.20%. Prior to March |
| 1, 2021, the ratio of Expenses to Average Net Assets included the effect of a waiver. If these offsets were | |
| excluded, the ratio would have been 0.27%, 0.45% and 0.46% for the years ended October 31, 2021, | |
| October 31, 2020 and October 31, 2019, respectively. | |
| (1) | The financial statements include the financial information of the Predecessor Fund through December 21, |
| 2018 (See Note 1 in Notes to Financial Statements). | |
| (2) | As a result of the Reorganization, the Fund assumed the performance and accounting history of the |
| Predecessor Fund. Accordingly, performance figures for the Fund for periods prior to the date of the | |
| Reorganization represent the performance of the Predecessor Fund (See Note 1 in Notes to Financial | |
| Statements). |
Amounts designated as “—” are either $0 or have been rounded to $0.
| Total from Distributions ($) | Net Asset Value, End of Period ($) | Total Return (%)** | Net Assets End of Period ($)(000) | Ratio of Expenses to Average Net Assets (%) | Ratio of Net Investment Income to Average Net Assets (%) | Portfolio Turnover (%)†† | ||||||||||||||
| (0.19 | ) | 19.01 | 6.31 | 23,575 | 0.57 | † | 3.04 | † | 4.78 | |||||||||||
| (0.49 | ) | 18.07 | (11.75 | ) | 19,519 | 0.55 | 2.48 | 20.09 | ||||||||||||
| (0.48 | ) | 21.00 | 30.74 | 21,628 | 0.63 | 2.31 | 28.62 | |||||||||||||
| (0.49 | ) | 16.46 | (15.85 | ) | 13,991 | 0.70 | 2.36 | 31.66 | ||||||||||||
| (0.99 | ) | 20.09 | 4.29 | 18,077 | 0.66 | 2.66 | 78.67 | |||||||||||||
| (0.41 | ) | 20.22 | (11.66 | ) | 13,145 | 0.55 | 2.54 | 14.62 | ||||||||||||
| (0.06 | ) | 11.11 | 19.53 | 14,885 | 0.59 | † | 3.52 | † | 8.79 | |||||||||||
| (0.35 | ) | 9.35 | (17.55 | ) | 15,146 | 0.61 | 2.34 | 40.76 | ||||||||||||
| (0.37 | ) | 11.71 | 42.30 | 11,005 | 0.58 | 3.26 | 53.05 | |||||||||||||
| (0.28 | ) | 8.50 | (18.37 | ) | 13,169 | 0.58 | 2.34 | 25.19 | ||||||||||||
| (0.78 | ) | 10.71 | 2.72 | 22,487 | 0.58 | 3.41 | 20.74 | |||||||||||||
| (0.36 | ) | 11.24 | (7.26 | ) | 25,295 | 0.57 | 2.91 | 21.05 | ||||||||||||
| (0.11 | ) | 30.29 | 33.77 | 57,862 | 0.21 | † | 2.14 | † | 12.96 | |||||||||||
| (0.94 | ) | 22.74 | (28.29 | ) | 39,339 | 0.21 | 3.52 | 10.74 | ||||||||||||
| (0.92 | ) | 32.86 | 34.06 | 44,033 | 0.20 | + | 1.90 | 24.22 | ||||||||||||
| (0.30 | ) | 25.21 | (6.53 | ) | 23,948 | 0.20 | + | 3.30 | 10.93 | |||||||||||
| (1.13 | ) | 27.28 | 9.98 | 16,370 | 0.21 | + | 2.65 | 15.36 | ||||||||||||
| (0.35 | ) | 25.92 | (16.05 | )@ | 16,851 | 0.20 | 2.57 | 7.00 | ||||||||||||
| Financial Highlights |
| Net Asset Value, Beginning of Period ($) | Net Investment Income (Loss) ($)* | Net Realized and Unrealized Gain (Loss) on Investments ($) | Total from Operations ($) | Distribution from Net Investment Income ($) | Distribution from Capital Gains ($) | Return of Capital ($) | ||||||||||||||||||||||
| Global X MSCI Pakistan ETF | ||||||||||||||||||||||||||||
| 2023 (Unaudited) | 16.45 | 0.45 | (3.43 | ) | (2.98 | ) | (0.73 | ) | — | — | ||||||||||||||||||
| 2022 | 25.99 | 1.58 | (9.63 | ) | (8.05 | ) | (1.49 | ) | — | — | ||||||||||||||||||
| 2021 | 27.38 | 1.93 | (1.77 | ) | 0.16 | (1.55 | ) | — | — | |||||||||||||||||||
| 2020(1) | 26.32 | 0.68 | 1.17 | 1.85 | (0.79 | ) | — | — | ||||||||||||||||||||
| 2019(1) | 41.04 | 1.52 | (13.88 | ) | (12.36 | ) | (2.36 | ) | — | — | ||||||||||||||||||
| 2018(1) | 54.24 | 1.88 | (10.72 | ) | (8.84 | ) | (1.76 | ) | (2.60 | ) | — | |||||||||||||||||
| Global X MSCI China Consumer Staples ETF | ||||||||||||||||||||||||||||
| 2023 (Unaudited) | 17.24 | (0.02 | ) | 4.51 | 4.49 | (0.10 | ) | — | — | |||||||||||||||||||
| 2022 | 29.38 | 0.42 | (11.23 | ) | (10.81 | ) | (0.30 | ) | (1.03 | ) | — | |||||||||||||||||
| 2021 | 29.04 | 0.26 | 0.34 | ^ | 0.60 | (0.21 | ) | (0.05 | ) | — | ||||||||||||||||||
| 2020 | 21.08 | 0.31 | 8.41 | 8.72 | (0.25 | ) | (0.51 | ) | — | |||||||||||||||||||
| 2019(2) | 15.00 | 0.28 | 5.93 | 6.21 | (0.13 | ) | — | — | ||||||||||||||||||||
| Global X MSCI China Health Care ETF | ||||||||||||||||||||||||||||
| 2023 (Unaudited) | 13.46 | (0.05 | ) | 3.18 | 3.13 | (0.05 | ) | — | — | |||||||||||||||||||
| 2022 | 24.81 | 0.07 | (11.40 | ) | (11.33 | ) | (0.02 | ) | — | — | ||||||||||||||||||
| 2021 | 23.68 | (0.01 | ) | 1.16 | ^ | 1.15 | (0.02 | ) | — | — | ||||||||||||||||||
| 2020 | 17.70 | 0.03 | 6.06 | 6.09 | (0.04 | ) | (0.07 | ) | — | |||||||||||||||||||
| 2019(2) | 15.00 | 0.09 | 2.64 | 2.73 | (0.03 | ) | — | — | ||||||||||||||||||||
| * | Per share data calculated using average shares method. |
| ** | Total Return is for the period indicated and has not been annualized. The return shown does not reflect the |
| deduction of taxes that a shareholder would pay on Fund distributions or the redemption of Fund shares. | |
| † | Annualized. |
| †† | Portfolio turnover rate is for the period indicated and periods of less than one year have not been |
| annualized. Excludes effect of in-kind transfers. | |
| ^ | The amount shown for a share outstanding throughout the period does not accord with the aggregate |
| net gains on investments for the period because of the sales and repurchases of fund shares in relation to | |
| fluctuating market value of the investments of the Fund. | |
| (1) | Per share amounts have been adjusted for a 1 for 4 reverse share split on April 28, 2020. (See Note 9 in the |
| Notes to Financial Statements.) | |
| (2) | The Fund commenced operations on December 7, 2018. |
| Amounts designated as “—” are either $0 or have been rounded to $0. |
| Total from Distributions ($) | Net Asset Value, End of Period ($) | Total Return (%)** | Net Assets End of Period ($)(000) | Ratio of Expenses to Average Net Assets (%) | Ratio of Net Investment Income (Loss) to Average Net Assets (%) | Portfolio Turnover (%)†† | |||||||||||||||
| (0.73 | ) | 12.74 | (18.70 | ) | 16,338 | 0.81 | † | 6.41 | † | 13.50 | |||||||||||
| (1.49 | ) | 16.45 | (32.01 | ) | 14,347 | 0.80 | 7.65 | 28.59 | |||||||||||||
| (1.55 | ) | 25.99 | 0.02 | 23,967 | 0.76 | 6.59 | 41.83 | ||||||||||||||
| (0.79 | ) | 27.38 | 6.99 | 34,555 | 0.90 | 2.44 | 52.38 | ||||||||||||||
| (2.36 | ) | 26.32 | (30.73 | ) | 41,804 | 0.88 | 5.14 | 19.09 | |||||||||||||
| (4.36 | ) | 41.04 | (17.53 | ) | 40,024 | 0.87 | 3.84 | 44.05 | |||||||||||||
| (0.10 | ) | 21.63 | 26.03 | 38,287 | 0.66 | † | (0.15 | )† | 8.21 | ||||||||||||
| (1.33 | ) | 17.24 | (38.53 | ) | 8,619 | 0.65 | 1.72 | 65.46 | |||||||||||||
| (0.26 | ) | 29.38 | 1.97 | 15,574 | 0.65 | 0.82 | 35.56 | ||||||||||||||
| (0.76 | ) | 29.04 | 42.48 | 17,424 | 0.65 | 1.21 | 44.54 | ||||||||||||||
| (0.13 | ) | 21.08 | 41.48 | 2,109 | 0.67 | † | 1.66 | † | 29.25 | ||||||||||||
| (0.05 | ) | 16.54 | 23.22 | 8,931 | 0.65 | † | (0.64 | )† | 8.22 | ||||||||||||
| (0.02 | ) | 13.46 | (45.67 | ) | 8,075 | 0.65 | 0.37 | 20.49 | |||||||||||||
| (0.02 | ) | 24.81 | 4.84 | 16,620 | 0.65 | (0.05 | ) | 29.41 | |||||||||||||
| (0.11 | ) | 23.68 | 34.62 | 10,656 | 0.65 | 0.16 | 31.60 | ||||||||||||||
| (0.03 | ) | 17.70 | 18.22 | 2,655 | 0.66 | † | 0.60 | † | 12.20 | ||||||||||||
| Net Asset Value, Beginning of Period ($) | Net Investment Income (Loss) ($)* | Net Realized and Unrealized Gain (Loss) on Investments ($) | Total from Operations ($) | Distribution from Net Investment Income ($) | Distribution from Capital Gains ($) | Return of Capital ($) | ||||||||||||||||||||||
| Global X MSCI China Information Technology ETF | ||||||||||||||||||||||||||||
| 2023 (Unaudited) | 14.81 | (0.03 | ) | 2.46 | 2.43 | (0.05 | ) | — | — | |||||||||||||||||||
| 2022 | 29.07 | 0.11 | (13.73 | ) | (13.62 | ) | (0.09 | ) | (0.55 | ) | — | |||||||||||||||||
| 2021 | 27.78 | 0.12 | 1.46^ | 1.58 | (0.12 | ) | (0.17 | ) | — | |||||||||||||||||||
| 2020 | 17.92 | 0.09 | 10.03 | 10.12 | (0.10 | ) | (0.16 | ) | — | |||||||||||||||||||
| 2019(1) | 15.00 | 0.19 | 2.81 | 3.00 | (0.08 | ) | — | — | ||||||||||||||||||||
| Global X MSCI China Utilities ETF | ||||||||||||||||||||||||||||
| 2023 (Unaudited) | 11.84 | (0.03 | ) | 3.40 | 3.37 | (0.25 | ) | (0.22 | ) | — | ||||||||||||||||||
| 2022 | 19.53 | 0.43 | (7.22 | ) | (6.79 | ) | (0.45 | ) | (0.45 | ) | — | |||||||||||||||||
| 2021 | 13.70 | 0.69 | 5.77 | 6.46 | (0.63 | ) | — | — | ||||||||||||||||||||
| 2020 | 15.81 | 0.39 | (2.09 | ) | (1.70 | ) | (0.35 | ) | (0.06 | ) | — | |||||||||||||||||
| 2019(1) | 15.00 | 0.33 | 0.60 | 0.93 | (0.12 | ) | — | — | ||||||||||||||||||||
| * | Per share data calculated using average shares method. |
| ** | Total Return is for the period indicated and has not been annualized. The return shown does not reflect the |
| deduction of taxes that a shareholder would pay on Fund distributions or the redemption of Fund shares. | |
| † | Annualized. |
| ���† | Portfolio turnover rate is for the period indicated and periods of less than one year have not been |
| annualized. Excludes effect of in-kind transfers. | |
| ^ | The amount shown for a share outstanding throughout the period does not accord with the aggregate |
| net gains on investments for the period because of the sales and repurchases of fund shares in relation to | |
| fluctuating market value of the investments of the Fund. | |
| (1) | The Fund commenced operations on December 7, 2018. |
Amounts designated as “—” are either $0 or have been rounded to $0.
| Total from Distributions ($) | Net Asset Value, End of Period ($) | Total Return (%)** | Net Assets End of Period ($)(000) | Ratio of Expenses to Average Net Assets (%) | Ratio of Net Investment Income (Loss) to Average Net Assets (%) | Portfolio Turnover (%)†† | |||||||||||||||
| (0.05 | ) | 17.19 | 16.45 | 15,126 | 0.65 | † | (0.31 | )† | 9.60 | ||||||||||||
| (0.64 | ) | 14.81 | (47.82 | ) | 13,920 | 0.65 | 0.50 | 32.20 | |||||||||||||
| (0.29 | ) | 29.07 | 5.58 | 30,813 | 0.65 | 0.39 | 52.48 | ||||||||||||||
| (0.26 | ) | 27.78 | 57.01 | 20,832 | 0.65 | 0.37 | 29.01 | ||||||||||||||
| (0.08 | ) | 17.92 | 20.06 | 1,792 | 0.66 | † | 1.29 | † | 36.75 | ||||||||||||
| (0.47 | ) | 14.74 | 28.63 | 2,358 | 0.66 | † | (0.39 | )† | 14.39 | ||||||||||||
| (0.90 | ) | 11.84 | (36.59 | ) | 2,368 | 0.66 | 2.62 | 38.78 | |||||||||||||
| (0.63 | ) | 19.53 | 48.14 | 1,953 | 0.67 | 4.11 | 44.06 | ||||||||||||||
| (0.41 | ) | 13.70 | (10.92 | ) | 1,370 | 0.66 | 2.78 | 37.12 | |||||||||||||
| (0.12 | ) | 15.81 | 6.24 | 1,581 | 0.66 | † | 2.42 | † | 28.26 | ||||||||||||
| Net Asset Value, Beginning of Period ($) | Net Investment Income (Loss) ($)* | Net Realized and Unrealized Gain (Loss) on Investments ($) | Total from Operations ($) | Distribution from Net Investment Income ($) | Distribution from Capital Gains ($) | Return of Capital ($) | ||||||||||||||||||||
| Global X MSCI China Real Estate ETF | ||||||||||||||||||||||||||
| 2023(1) (Unaudited) | 14.55 | (0.04 | ) | 6.62 | 6.58 | (0.89 | ) | — | — | |||||||||||||||||
| 2022(1) | 35.70 | 1.05 | (21.23 | ) | (20.18 | ) | (0.97 | ) | — | — | ||||||||||||||||
| 2021(1) | 48.54 | 1.77 | (12.27 | ) | (10.50 | ) | (2.34 | ) | — | — | ||||||||||||||||
| 2020(1) | 51.69 | 2.43 | (3.51 | ) | (1.08 | ) | (2.07 | ) | — | — | ||||||||||||||||
| 2019(1)(2) | 45.00 | 2.01 | 5.46 | 7.47 | (0.78 | ) | — | — | ||||||||||||||||||
| Global X MSCI Vietnam ETF | ||||||||||||||||||||||||||
| 2023 (Unaudited) | 14.67 | 0.08 | 0.71 | 0.79 | (0.12 | ) | — | — | ||||||||||||||||||
| 2022(3) | 25.64 | 0.22 | (11.12 | ) | (10.90 | ) | (0.07 | ) | — | — | ||||||||||||||||
| * | Per share data calculated using average shares method. |
| ** | Total Return is for the period indicated and has not been annualized. The return shown does not reflect the |
| deduction of taxes that a shareholder would pay on Fund distributions or the redemption of Fund shares. | |
| † | Annualized. |
| †† | Portfolio turnover rate is for the period indicated and periods of less than one year have not been |
| annualized. Excludes effect of in-kind transfers. | |
| (1) | Per share amounts have been adjusted for a 1 for 3 reverse share split on December 19, 2022. (See Note 9 in |
| the Notes to Financial Statements.) | |
| (2) | The Fund commenced operations on December 7, 2018. |
| (3) | The Fund commenced operations on December 7, 2021. |
Amounts designated as “—” are either $0 or have been rounded to $0.
| Total from Distributions ($) | Net Asset Value, End of Period ($) | Total Return (%)** | Net Assets End of Period ($)(000) | Ratio of Expenses to Average Net Assets (%) | Ratio of Net Investment Income (Loss) to Average Net Assets (%) | Portfolio Turnover (%)†† | |||||||||||||||
| (0.89 | ) | 20.24 | 44.94 | 6,879 | 0.67 | † | (0.39 | )† | 28.51 | ||||||||||||
| (0.97 | ) | 14.55 | (57.96 | ) | 4,219 | 0.66 | 3.81 | 45.91 | |||||||||||||
| (2.34 | ) | 35.70 | (22.77 | ) | 4,405 | 0.66 | 3.80 | 38.66 | |||||||||||||
| (2.07 | ) | 48.54 | (2.55 | ) | 7,281 | 0.66 | 4.73 | 25.75 | |||||||||||||
| (0.78 | ) | 51.69 | 16.56 | 1,723 | 0.65 | † | 4.44 | † | 14.00 | ||||||||||||
| (0.12 | ) | 15.34 | 5.39 | 4,757 | 0.51 | † | 1.01 | † | 29.53 | ||||||||||||
| (0.07 | ) | 14.67 | (42.60 | ) | 2,787 | 0.50 | † | 1.12 | † | 78.28 | |||||||||||
| Notes to Financial Statements (Unaudited) |
| April 30, 2023 |
1. ORGANIZATION
Global X Funds (the "Trust") is a Delaware statutory trust formed on March 6, 2008. The Trust is registered under the Investment Company Act of 1940, as amended, as an open-end management investment company. As of April 30, 2023, the Trust had one hundred and fourteen portfolios, one hundred and three of which were operational. The financial statements herein and the related notes pertain to the Global X MSCI Colombia ETF, Global X MSCI China Industrials ETF, Global X MSCI China Consumer Discretionary ETF, Global X MSCI China Communication Services ETF, Global X MSCI China Financials ETF, Global X MSCI China Energy ETF, Global X MSCI China Materials ETF, Global X MSCI Norway ETF, Global X FTSE Southeast Asia ETF, Global X MSCI Argentina ETF, Global X MSCI Greece ETF, Global X MSCI Nigeria ETF, Global X MSCI Next Emerging & Frontier ETF, Global X MSCI Portugal ETF, Global X DAX Germany ETF, Global X MSCI Pakistan ETF, Global X MSCI China Consumer Staples ETF, Global X MSCI China Health Care ETF, Global X MSCI China Information Technology ETF, Global X MSCI China Utilities ETF, Global X MSCI China Real Estate ETF and Global X MSCI Vietnam ETF (each a “Fund”, and collectively, the “Funds”). Each Fund (except for the Global X MSCI Next Emerging & Frontier ETF) has elected non-diversified status under the 1940 Act.
Global X MSCI Vietnam ETF commenced operations on December 7, 2021.
On August 4, 2021, the Board of Trustees (the “Board”) of the Trust unanimously approved an Agreement and Plan of Reorganization (the “Agreement”) providing for the tax-free reorganization (the “Reorganization”) of the Global X MSCI Norway ETF (the “Acquired Fund”) with and into the Global X FTSE Nordic Region ETF (the “Acquiring Fund”), each a separate series of the Trust (together, the “Combined Fund”). The Agreement provided for: (1) the transfer of all of the assets of the Acquired Fund to the Acquiring Fund solely in exchange for (A) the issuance of the shares of beneficial interest of the Acquiring Fund (collectively, the “Acquiring Fund Shares” and each, an “Acquiring Fund Share”) to the Acquired Fund, and (B) the assumption by theAcquiring Fund of all of the liabilities of the Acquired Fund on the closing date of the Reorganization (the “Closing Date”), and (2) the distribution by the Acquired Fund, on or promptly after the Closing Date as provided in the Agreement, of the Acquiring Fund Shares to the shareholders of the Acquired Fund in complete liquidation of the Acquired Fund. Effective as of the close of business on October 29, 2021, theAcquired Fund was reorganized into the Combined Fund, and the Combined Fund was renamed the Global X MSCI Norway ETF. The Acquiring Fund is the legal surviving entity in the Reorganization, while theAcquired Fund is the accounting survivor or continuing portfolio for purposes of financial and performance history of the Combined Fund. See Note 10 in the Notes to Financial Statements.
On December 24, 2018, the shareholders of the Horizons DAX Germany ETF (the“Predecessor Fund”) approved a proposed agreement and plan of reorganization (the “Reorganization”) that provided for (a) the transfer of all the assets to the Global X DAX
| Notes to Financial Statements (Unaudited) (Continued) |
| April 30, 2023 |
1. ORGANIZATION (continued)
Germany ETF (the “Germany Fund”) and the assumption of certain of the liabilities of the Predecessor Fund; (b) the issuance of shares of the Germany Fund to the shareholders of the Predecessor Fund; and (c) the liquidation and termination of the Predecessor Fund. The effective date of the Reorganization was December 24, 2018. The Germany Fund had no operations prior to the Reorganization. The Predecessor Fund had substantially similar investment objectives, investment strategies, policies and restrictions as those of the Germany Fund. The financial statements and financial highlights include the financial information of the Predecessor Fund through December 21, 2018.
2. SIGNIFICANT ACCOUNTING POLICIES
The following is a summary of the Significant Accounting Policies followed by the Funds.
USE OF ESTIMATES — The Funds are investment companies that apply the accounting and reporting guidance issued in Topic 946 by the U.S. Financial Accounting Standards Board. The preparation of financial statements in conformity with U.S. generally accepted accounting principles ("U.S. GAAP") requires management to make estimates and assumptions that affect the reported amounts of assets and liabilities and disclosure of contingent assets and liabilities at the date of the financial statements and the reported amounts of increases and decreases in net assets from operations during the reporting period. Actual results could materially differ from those estimates.
RETURN OF CAPITAL ESTIMATES — Distributions received by the Funds from underlying master limited partnership (“MLP”) and real estate investment trust (“REIT”) investments generally are comprised of income and return of capital. The Funds record investment income and return of capital based on estimates made at the time such distributions are received. Such estimates are based on historical information available from the MLPs, REITs and other industry sources. These estimates may subsequently be revised based on information received from the MLPs and REITs after their tax reporting periods are concluded.
SECURITY VALUATION — Securities listed on a securities exchange, market or automated quotation system for which quotations are readily available (except for securities traded on the NASDAQ Stock Market (“NASDAQ”)), including securities traded over the counter, are valued at the last quoted sale price on the primary exchange or market (foreign or domestic) on which they are traded (or at approximately 4:00 pm Eastern Standard Time if a security’s primary exchange is normally open at that time), or, if there is no such reported sale, at the most recent mean between the quoted bid and asked prices, which approximates fair value (absent both bid and asked prices on such exchange, the bid price may be used).
For securities traded on NASDAQ, the NASDAQ Official Closing Price will be used. The prices for foreign securities are reported in local currency and converted to U.S. dollars
| Notes to Financial Statements (Unaudited) (Continued) |
| April 30, 2023 |
2. SIGNIFICANT ACCOUNTING POLICIES (continued)
using currency exchange rates as of the reporting date. The exchange rates used by the Trust for valuation are captured as of the New York or London close each day.
Securities for which market prices are not "readily available" are valued in accordance with fair value procedures (the "Fair Value Procedures") established by Global X Management LLC, the Funds’ investment adviser (the “Adviser”), and approved by the Board. Pursuant to Rule 2a-5 under the 1940 Act, the Board has designated the Adviser as the "valuation designee" to determine the fair value of securities and other instruments for which no readily available market quotations are available. The Fair Value Procedures are implemented through a fair value committee (the "Committee") of the Adviser. Some reasons that may necessitate that a security be valued using the Fair Value Procedures include: the security's trading has been halted or suspended; the security has been de-listed from its primary trading exchange; the security's primary trading market is temporarily closed at a time when, under normal conditions, it would be open; the security has not been traded for an extended period of time; the security's primary pricing source is not able or willing to provide a price; or trading of the security is subject to local government-imposed restrictions. In addition, the Funds may fair value a security if an event that may materially affect the value of the Funds’security that traded outside of the United States (a “Significant Event”) has occurred between the time of the security's last close and the time that each Fund calculates its net asset value (“NAV”). A Significant Event may relate to a single issuer or to an entire market sector. Events that may be Significant Events include: government actions, natural disasters, armed conflict, acts of terrorism and significant market fluctuations. If the Adviser becomes aware of a Significant Event that has occurred with respect to a security or group of securities after the closing of the exchange or market on which the security or securities principally trade, but before the time at which the Funds calculate their NAVs, it may request that a Committee meeting be called. When a security is valued in accordance with the Fair Value Procedures, the Committee will determine the value after taking into consideration all relevant information reasonably available to the Committee.
If available, debt securities are priced based upon valuations provided by independent, third-party pricing agents. Such values generally reflect the last reported sales price if the security is actively traded. The third-party pricing agents may also value debt securities at an evaluated bid price by employing methodologies that utilize actual market transactions, broker-supplied valuations, or other methodologies designed to identify the market value for such securities. Debt obligations with remaining maturities of sixty days or less will be valued at their market value. Prices for most securities held by the Funds are provided daily by recognized independent pricing agents. If a security price cannot be obtained from an independent, third-party pricing agent, the Funds seek to obtain a bid price from at least one independent broker.
| Notes to Financial Statements (Unaudited) (Continued) |
| April 30, 2023 |
2. SIGNIFICANT ACCOUNTING POLICIES (continued)
In accordance with the authoritative guidance on fair value measurements and disclosure under U.S. GAAP, the Funds disclose the fair value of their investments in a hierarchy that prioritizes the inputs to valuation techniques used to measure the fair value. The objective of a fair value measurement is to determine the price that would be received upon the sale of an asset or paid to transfer a liability in an orderly transaction between market participants at the measurement date (an exit price). Accordingly, the fair value hierarchy gives the highest priority to quoted prices (unadjusted) in active markets for identical assets or liabilities (Level 1) and the lowest priority to unobservable inputs (Level 3). The three levels of the fair value hierarchy are described below:
Level 1 – Unadjusted quoted prices in active markets for identical, unrestricted assets or liabilities that the Funds have the ability to access at the measurement date
Level 2 – Other significant observable inputs (including quoted prices in non-active markets, quoted prices for similar investments, fair value of investments for which the Funds have the ability to fully redeem tranches at NAV as of the measurement date or within the near term, and short-term investments valued at amortized cost)
Level 3 – Significant unobservable inputs (including the Funds’ own assumptions in determining the fair value of investments, and fair value of investments for which the Funds do not have the ability to fully redeem tranches at NAV as of the measurement date or within the near term)
Investments are classified within the level of the lowest significant input considered in determining fair value. Investments classified within Level 3 whose fair value measurement considers several inputs may include Level 1 or Level 2 inputs as components of the overall fair value measurement. For details of the investment classification, reference the Schedule of Investments.
The unobservable inputs used to determine fair value of Level 3 assets may have similar or diverging impacts on valuation. Significant increases and decreases in these inputs in isolation and interrelationships between those inputs could result in significantly higher or lower fair value measurement.
DUE TO/FROM BROKERS — Due to/from brokers includes cash and collateral balances with the Funds’ clearing brokers or counterparties as of April 30, 2023. The Funds continuously monitor the credit standing of each broker or counterparty with whom they conduct business. In the event a broker or counterparty is unable to fulfill its obligations, the Funds would be subject to counterparty credit risk.
REPURCHASE AGREEMENTS — Securities pledged as collateral for repurchase agreements by BNP Paribas are held by Brown Brothers Harriman & Co. (“BBH”), the Funds’ custodian (“Custodian”), and are designated as being held on each Fund’s behalf
| Notes to Financial Statements (Unaudited) (Continued) |
| April 30, 2023 |
2. SIGNIFICANT ACCOUNTING POLICIES (continued)
by the Custodian under a book-entry system. Each Fund monitors the adequacy of the collateral on a daily basis and can require the seller to provide additional collateral in the event the market value of the securities pledged falls below the carrying value of the repurchase agreement, including accrued interest. It is the Funds’ policy to only enter into repurchase agreements with banks and other financial institutions which are deemed by the Adviser to be creditworthy. The Funds bear the risk of loss in the event that the counterparty to a repurchase agreement defaults on its obligations and the Funds are prevented from exercising their rights to dispose of the underlying securities received as collateral. For financial statement purposes, the Funds record the securities lending collateral (included in repurchase agreements, at value or restricted cash) as an asset and the obligation to return securities lending collateral as a liability on the Statements of Assets and Liabilities.
Repurchase agreements are entered into by the Funds under Master Repurchase Agreements (“MRA”) which permit the Funds, under certain circumstances, including an event of default (such as bankruptcy or insolvency), to offset payables and/or receivables under the MRA with collateral held and/or posted to the counterparty and create one single net payment due to or from the Funds.
As of April 30, 2023, the open repurchase agreements by counterparty which are subject to an MRA on a net payment basis are as follows:
Repurchase Agreements* | Fair Value of Non-cash Collateral Received(1) | Cash Collateral Received | Net Amount(2) | |||||||||||
| Global X MSCI Colombia ETF | ||||||||||||||
| BNP Paribas | $ | 1,198,692 | $ | 1,198,692 | $ | – | $ | – | ||||||
| Global X MSCI China Consumer Discretionary ETF | ||||||||||||||
| BNP Paribas | 6,230,422 | 6,230,422 | – | – | ||||||||||
| Global X MSCI Argentina ETF | ||||||||||||||
| BNP Paribas | 11,537 | 11,537 | – | – | ||||||||||
| Global X MSCI Greece ETF | ||||||||||||||
| BNP Paribas | 1,381,411 | 1,381,411 | – | – | ||||||||||
* | Repurchase agreements with an overnight and continuous maturity. |
(1) | Excess collateral received is not presented in the table above. Please refer to the Schedules of Investments for the market value of the collateral received for each Fund. |
(2) | Net Amount represents the net amount receivable due from the counterparty in the event of default. |
FEDERAL INCOME TAXES — It is each Fund’s intention to qualify or continue to qualify as a regulated investment company for Federal income tax purposes by complying with the appropriate provisions of Subchapter M of the Internal Revenue Code of 1986, as amended. Accordingly, no provisions for Federal income taxes have been made in the financial statements except as described below.
| Notes to Financial Statements (Unaudited) (Continued) |
| April 30, 2023 |
2. SIGNIFICANT ACCOUNTING POLICIES (continued)
The Funds evaluate tax positions taken or expected to be taken in the course of preparing the Funds’ tax returns to determine whether it is "more-likely-than-not" (i.e., greater than 50 percent) that each tax position will be sustained upon examination by a taxing authority based on the technical merits of the position. Tax positions not deemed to meet the more-likely-than-not threshold are recorded as a tax benefit or expense in the current year. The Funds did not record any tax positions in the current period; however, management’s conclusions regarding tax positions may be subject to review and adjustment at a later date based on factors including, but not limited to, examination by tax authorities (i.e., the last three tax year ends, as applicable), and on-going analysis of and changes to tax laws and regulations, and interpretations thereof.
If a Fund has foreign tax filings that have not been made, the tax years that remain subject to examination may date back to the inception of the Fund.
As of and during the reporting period ended April 30, 2023, the Funds did not have a liability for any unrecognized tax benefits. The Funds recognize interest and penalties, if any, related to unrecognized tax benefits as an income tax expense on the Statements of Operations. During the reporting period, the Funds did not incur any interest or penalties.
The Funds file withholding tax reclaims in certain jurisdictions to recover a portion of amounts previously withheld. The Funds may record a reclaim receivable based on collectability, which includes factors such as the jurisdiction’s applicable laws, payment history and market convention. The Statements of Operations includes tax reclaims recorded as well as professional and other fees, if any, associated with recovery of foreign withholding taxes.
SECURITY TRANSACTIONS AND INVESTMENT INCOME — Security transactions are accounted for on the trade date for financial reporting purposes. Costs used in determining realized gains and losses on the sale of investment securities are based on specific identification. Dividend income is recorded on the ex-dividend date. Interest income is recognized on the accrual basis from the settlement date. Amortization of premiums and accretion of discounts is included in interest income.
FOREIGN CURRENCY TRANSACTIONS AND TRANSLATION — The books and records of the Funds are maintained in U.S. dollars. Investment securities and other assets and liabilities denominated in a foreign currency are translated into U.S. dollars on the date of valuation. Purchases and sales of investment securities, income and expenses are translated into U.S. dollars at the relevant rates of exchange prevailing on the respective dates of such transactions. Foreign governments and their agencies may enact policies that delay or place limits on repatriation of local currency to U.S. dollars. Market quoted rates for immediate currency settlement may have access or transaction volume restrictions that are insufficient to convert a significant portion of a fund’s local currency denominated assets and liabilities to U.S. dollars. Monetary policies enacted by government agencies
| Notes to Financial Statements (Unaudited) (Continued) |
| April 30, 2023 |
2. SIGNIFICANT ACCOUNTING POLICIES (continued)
in Nigeria, limiting its local currency's repatriation to safeguard U.S. dollar reserves and exchange rates, significantly impacts the ability of the Global X MSCI Nigeria ETF and other Funds to convert local denominated assets and liabilities amounts to U.S. dollars using quoted immediate currency settlement rates. As of April 30, 2023, assets and liabilities denominated in Nigerian Naira are translated using the Nigerian Autonomous Foreign Exchange Rate Fixing (“NAFEX”) rate. The use of an alternative exchange rate would impact the effect of currency translation and the results of operations.
The Funds do not isolate that portion of realized or unrealized gains and losses resulting from changes in the foreign exchange rate from fluctuations arising from changes in the market prices of the securities. These gains and losses are included in net realized and unrealized gains and losses on investments on the Statements of Operations. Net realized and unrealized gains and losses on foreign currency transactions and translations represent net foreign exchange gains or losses from foreign currency spot contracts, disposition of foreign currencies, currency gains or losses realized between trade and settlement dates on securities transactions and the difference between the amount of the investment income and foreign withholding taxes recorded on the Funds’books and the U.S. dollar equivalent amounts actually received or paid.
FOREIGN CURRENCY CONTRACTS - To the extent consistent with its investment policies, each Fund may invest in forward foreign currency exchange contracts and foreign currency futures contracts. No Fund, however, expects to engage in currency transactions for speculative purposes or for the purpose of hedging against declines in the value of a Fund's assets that are denominated in a foreign currency. A Fund may enter into forward foreign currency exchange contracts and foreign currency futures contracts to facilitate local settlements or to protect against currency exposure in connection with its distributions to shareholders. Foreign currency exchange contracts involve an obligation to purchase or sell a specified currency on a future date at a price set at the time of the contract. Forward currency contracts do not eliminate fluctuations in the values of portfolio securities but rather allow a Fund to establish a rate of exchange for a future point in time. Foreign currency futures contracts involve an obligation to deliver or acquire the specified amount of a specific currency, at a specified price and at a specified future time. Such futures contracts may be settled on a net cash payment basis rather than by the sale and delivery of the underlying currency. A Fund may incur costs in connection with forward foreign currency exchange and futures contracts and conversions of foreign currencies and U.S. dollars. The net realized gain or loss on forward foreign currency contracts is reflected in the Statements of Operations and the net unrealized gains (losses) are included as a component of the net change in unrealized appreciation (depreciation) on forward foreign currency contracts in the Statements of Operations. As of April 30, 2023, there were no foreign currency exchange contracts and foreign currency futures contracts held by the Funds.
| Notes to Financial Statements (Unaudited) (Continued) |
| April 30, 2023 |
2. SIGNIFICANT ACCOUNTING POLICIES (continued)
FUTURES CONTRACTS – To the extent consistent with its investment objective and strategies, each Fund may use futures contracts for tactical hedging purposes as well as to enhance the Fund’s returns. Initial margin deposits of cash or securities are made upon entering into futures contracts. The contracts are marked to market daily and the resulting changes in value are accounted for as unrealized gains and losses. Variation margin payments are paid or received, depending upon whether unrealized gains or losses are incurred. When the contract is closed, the Fund records a realized gain or loss equal to the difference between the proceeds from (or cost of) the closing transaction and the amount invested in the contract.
Risks of entering into futures contracts include the possibility that there will be an imperfect price correlation between the futures and the underlying securities. Second, it is possible that a lack of liquidity for futures contracts could exist in the secondary market, resulting in an inability to close a position prior to its maturity date. Third, a futures contract involves the risk that the Fund could lose more than the original margin deposit required to initiate a futures transaction.
Futures contracts shall be valued at the settlement price established each day by the board of the exchange on which they are traded. The daily settlement prices for financial futures are provided by an independent source.
Finally, the risk exists that losses could exceed amounts disclosed on the Statement of Assets and Liabilities. Refer to the Funds’ Schedule of Investments for details regarding open futures contracts as of April 30, 2023, if applicable.
The following tables show the derivatives categorized by underlying risk exposure.
The fair value of derivative instruments as of April 30, 2023 was as follows:
| Asset Derivatives | Liability Derivatives | ||||||||
| Statements of Assets | Statements of Assets | ||||||||
| and Liability Location | Fair Value | and Liability Location | Fair Value | ||||||
| Derivatives not accounted for as hedging instruments: | |||||||||
| Global X MSCI Portugal ETF | |||||||||
| Equity | Unrealized | Equity | Unrealized | ||||||
| contracts | appreciation on | contracts | depreciation on | ||||||
| Future Contracts | $ | 14,170 | † | Future Contracts | $ | – | † | ||
| Total Derivatives not accounted for as | |||||||||
| hedging instruments | $ | 14,170 | $ | – | |||||
† Includes cumulative appreciation/depreciation of futures contracts as reported in the Schedule of Investments. Only current day’s variation margin is reported within the Statement of Assets & Liabilities.
| Notes to Financial Statements (Unaudited) (Continued) |
| April 30, 2023 |
2. SIGNIFICANT ACCOUNTING POLICIES (continued)
The effect of derivative instruments on the Statements of Operations for the period ended April 30, 2023:
Amount of realized gain or (loss) on derivatives recognized in income:
| Futures | ||||
| Global X MSCI Portugal ETF | ||||
| Equity contracts | $ | (8,115 | ) | |
Change in unrealized appreciation or (depreciation) on derivatives recognized in income:
| Futures | ||||
| Global X MSCI Portugal ETF | ||||
| Equity contracts | $ | 14,170 | ||
For the period ended April 30, 2023, the average monthly notional values of the futures contracts held by the Funds were as follows:
Short Average | Long Average | ||||||
| Global X MSCI Portugal ETF | $ | – | $ | 164,950 | |||
DIVIDENDS AND DISTRIBUTIONS TO SHAREHOLDERS — The Funds distribute their net investment income on a pro rata basis. Any net investment income and net realized capital gains are distributed at least annually. All distributions are recorded on the ex-dividend date.
CASH OVERDRAFT CHARGES — Per the terms of an agreement with BBH, if a Fund has a cash overdraft on a given day, it will be assessed an overdraft charge equal to the applicable BBH Base Rate plus 2.00%. Cash overdraft charges are included in custodian fees on the Statements of Operations.
CREATION UNITS —The Funds issue and redeem their shares (“Shares”) on a continuous basis at net asset value (“NAV”) and only in large blocks of 10,000 Shares, referred to as “Creation Units”. Purchasers of Creation Units (“Authorized Participants”) at NAV must pay a standard creation transaction fee per transaction. The fee is a single charge and will be the same regardless of the number of Creation Units purchased by an Authorized Participant on the same day. An Authorized Participant who holds Creation Units and wishes to redeem at NAV would also pay a standard redemption fee per transaction to BBH on the date of such redemption, regardless of the number of Creation Units redeemed that day. If a Creation Unit is purchased or redeemed for cash, an additional variable fee may be charged. The following table discloses Creation Unit breakdown:
| Notes to Financial Statements (Unaudited) (Continued) |
| April 30, 2023 |
2. SIGNIFICANT ACCOUNTING POLICIES (continued)
Creation Unit Shares | Creation Fee | Value at April 30, 2023 | Redemption Fee | |||||||||||||
| Global X MSCI Colombia ETF | 10,000 | $ | 1,500 | $ | 197,400 | $ | 1,500 | |||||||||
| Global X MSCI China Industrials ETF | 10,000 | 2,100 | 133,800 | 2,100 | ||||||||||||
| Global X MSCI China Consumer Discretionary ETF | 10,000 | 1,600 | 185,200 | 1,600 | ||||||||||||
| Global X MSCI China Communication Services ETF | 10,000 | 400 | 164,700 | 400 | ||||||||||||
| Global X MSCI China Financials ETF | 10,000 | 2,100 | 126,600 | 2,100 | ||||||||||||
| Global X MSCI China Energy ETF | 10,000 | 800 | 159,200 | 800 | ||||||||||||
| Global X MSCI China Materials ETF | 10,000 | 2,000 | 179,900 | 2,000 | ||||||||||||
| Global X MSCI Norway ETF | 10,000 | 900 | 244,900 | 900 | ||||||||||||
| Global X FTSE Southeast Asia ETF | 10,000 | 2,100 | 152,200 | 2,100 | ||||||||||||
| Global X MSCI Argentina ETF | 10,000 | 500 | 394,300 | 500 | ||||||||||||
| Global X MSCI Greece ETF | 10,000 | 500 | 313,200 | 500 | ||||||||||||
| Global X MSCI Nigeria ETF | 10,000 | 1,300 | 144,200 | 1,300 | ||||||||||||
| Global X MSCI Next Emerging & Frontier ETF | 10,000 | 9,500 | 190,100 | 9,500 | ||||||||||||
| Global X MSCI Portugal ETF | 10,000 | 700 | 111,100 | 700 | ||||||||||||
| Global X DAX Germany ETF | 10,000 | 500 | 302,900 | 500 | ||||||||||||
| Global X MSCI Pakistan ETF | 10,000 | 1,900 | 127,400 | 1,900 | ||||||||||||
| Global X MSCI China Consumer Staples ETF | 10,000 | 1,300 | 216,300 | 1,300 | ||||||||||||
| Global X MSCI China Health Care ETF | 10,000 | 1,400 | 165,400 | 1,400 | ||||||||||||
| Global X MSCI China Information Technology ETF | 10,000 | 1,900 | 171,900 | 1,900 | ||||||||||||
| Global X MSCI China Utilities ETF | 10,000 | 600 | 147,400 | 600 | ||||||||||||
| Global X MSCI China Real Estate ETF | 10,000 | 600 | 202,400 | 600 | ||||||||||||
| Global X MSCI Vietnam ETF | 10,000 | 1,000 | 153,400 | 1,000 |
3. RELATED PARTIES AND SERVICE PROVIDER TRANSACTIONS
On July 2, 2018, the Adviser consummated a transaction pursuant to which it became an indirect, wholly-owned subsidiary of Mirae Asset Global Investments Co., Ltd. (“Mirae”). In this manner, the Adviser is ultimately controlled by Mirae, which is a leading financial services company in Korea and is the headquarters for the MiraeAsset Global Investments Group.
The Adviser serves as the investment adviser and the administrator for the Funds. Subject to the supervision of the Board, the Adviser is responsible for managing the investment activities of the Funds and the Funds’ business affairs and other administrative matters and provides or causes to be furnished all supervisory, administrative and other services reasonably necessary for the operation of the Funds, including certain distribution services (provided pursuant to a separate distribution services agreement), certain shareholder and distribution-related services (provided pursuant to a separate Rule 12b-1 Plan and related
| Notes to Financial Statements (Unaudited) (Continued) |
| April 30, 2023 |
3. RELATED PARTIES AND SERVICE PROVIDER TRANSACTIONS (continued)
agreements) and investment advisory services (provided pursuant to a separate Investment Advisory Agreement), under what is essentially an "all-in" fee structure.
For the Adviser’s service to the respective Funds, under a supervision and administration agreement (the "Supervision and Administration Agreement"), each Fund pays a monthly fee to the Adviser at the annual rate below (stated as a percentage of the average daily net assets of the Fund). In addition, the Funds bear other expenses, directly and indirectly that are not covered by the Supervision and Administration Agreement, which may vary and affect the total expense ratios of the Funds, such as taxes, brokerage fees, commissions, custodian fees and other transaction expenses, interest expenses, acquired fund fees and extraordinary expenses (such as litigation and indemnification expenses).
The following table discloses supervision and administration fees payable pursuant to the Supervision and Administration Agreement:
| Supervision and | ||||
| Administration Fee | ||||
| Global X MSCI Colombia ETF | 0.61 | % | ||
| Global X MSCI China Industrials ETF | 0.65 | % | ||
| Global X MSCI China Consumer Discretionary ETF | 0.65 | % | ||
| Global X MSCI China Communication Services ETF | 0.65 | % | ||
| Global X MSCI China Financials ETF | 0.65 | % | ||
| Global X MSCI China Energy ETF | 0.65 | % | ||
| Global X MSCI China Materials ETF | 0.65 | % | ||
| Global X MSCI Norway ETF | 0.50 | % | ||
| Global X FTSE Southeast Asia ETF | 0.65 | % | ||
| Global X MSCI Argentina ETF | 0.59 | % | ||
| Global X MSCI Greece ETF | 0.55 | % | ||
| Global X MSCI Nigeria ETF | 0.68 | % | ||
| Global X MSCI Next Emerging & Frontier ETF | 0.49 | % | ||
| Global X MSCI Portugal ETF | 0.55 | % | ||
| Global X DAX Germany ETF | 0.20 | % | ||
| Global X MSCI Pakistan ETF | 0.68 | % | ||
| Global X MSCI China Consumer Staples ETF | 0.65 | % | ||
| Global X MSCI China Health Care ETF | 0.65 | % | ||
| Global X MSCI China Information Technology ETF | 0.65 | % | ||
| Global X MSCI China Utilities ETF | 0.65 | % | ||
| Global X MSCI China Real Estate ETF | 0.65 | % | ||
| Notes to Financial Statements (Unaudited) (Continued) |
| April 30, 2023 |
3. RELATED PARTIES AND SERVICE PROVIDER TRANSACTIONS (continued)
| Supervision and | ||||
| Administration Fee | ||||
| Global X MSCI Vietnam ETF | 0.50 | % | ||
SEI Investments Global Funds Services (“SEIGFS”) serves as sub-administrator to the Funds. As sub-administrator, SEIGFS provides the Funds with the required general administrative services, including, without limitation: office space, equipment, and personnel; clerical and general back office services; bookkeeping, internal accounting and secretarial services; the calculation of NAV; and assistance with the preparation and filing of reports, registration statements, proxy statements and other materials required to be filed or furnished by the Funds under federal and state securities laws. As compensation for these services, SEIGFS receives certain out-of-pocket costs, transaction fees and asset-based fees which are accrued daily and paid monthly by the Adviser.
SEI Investments Distribution Co. (“SIDCO”) serves as the Funds’ underwriter and distributor of Creation Units pursuant to a distribution agreement (the "Distribution Agreement"). SIDCO has no obligation to sell any specific quantity of Shares. SIDCO bears the following costs and expenses relating to the distribution of Shares: (i) the costs of processing and maintaining records of creations of Creation Units; (ii) all costs of maintaining the records required of a registered broker/dealer; (iii) the expenses of maintaining its registration or qualification as a dealer or broker under Federal or state laws; (iv) filing fees; and (v) all other expenses incurred in connection with the distribution services as contemplated in the Distribution Agreement. SIDCO receives no fee from the Funds for its distribution services under the Distribution Agreement, rather the Adviser compensates SIDCO for certain expenses, out-of-pocket costs, and transaction fees.
BBH serves as transfer agent and Custodian of the Funds’ assets. As Custodian, BBH has agreed to (1) make receipts and disbursements of money on behalf of the Funds; (2) collect and receive all income and other payments and distributions on account of the Funds’ portfolio investments; (3) respond to correspondence from shareholders, security brokers and others relating to its duties; and (4) make periodic reports to the Funds concerning the Funds’operations. BBH does not exercise any supervisory function over the purchase and sale of securities. As compensation for these services, BBH receives certain out-of-pocket costs, transaction fees and asset-based fees which are accrued daily and paid monthly by the Adviser from its fees. As transfer agent, BBH has agreed to (1) issue and redeem shares of each Fund; (2) make dividend and other distributions to shareholders of each Fund; (3) respond to correspondence by shareholders and others relating to its duties; (4) maintain shareholder accounts; and (5) make periodic reports to the Funds. As compensation for these services, BBH receives certain out of-pocket costs, transaction fees and asset-based fees which are accrued daily and paid monthly by the Adviser from its fees.
| Notes to Financial Statements (Unaudited) (Continued) |
| April 30, 2023 |
4. INVESTMENT TRANSACTIONS
For the period ended April 30, 2023, the purchases and sales of investments in securities, excluding in-kind transactions, long-term U.S. Government and short-term securities were:
| Sales and | ||||||||
| Purchases | Maturities | |||||||
| Global X MSCI Colombia ETF | $ | 9,099,369 | $ | 4,241,190 | ||||
| Global X MSCI China Industrials ETF | 612,405 | 587,437 | ||||||
| Global X MSCI China Consumer Discretionary ETF | 81,099,980 | 27,988,286 | ||||||
| Global X MSCI China Communication Services ETF | 1,261,228 | 1,334,073 | ||||||
| Global X MSCI China Financials ETF | 1,004,805 | 5,045,930 | ||||||
| Global X MSCI China Energy ETF | 3,394,558 | 2,362,708 | ||||||
| Global X MSCI China Materials ETF | 1,172,083 | 907,321 | ||||||
| Global X MSCI Norway ETF | 3,039,755 | 3,685,256 | ||||||
| Global X FTSE Southeast Asia ETF | 3,233,426 | 2,172,916 | ||||||
| Global X MSCI Argentina ETF | 10,772,284 | 8,788,394 | ||||||
| Global X MSCI Greece ETF | 14,114,140 | 16,020,466 | ||||||
| Global X MSCI Nigeria ETF | 33,364 | – | ||||||
| Global X MSCI Next Emerging & Frontier ETF | 2,663,956 | 1,041,554 | ||||||
| Global X MSCI Portugal ETF | 1,123,725 | 1,121,145 | ||||||
| Global X DAX Germany ETF | 6,470,849 | 6,464,086 | ||||||
| Global X MSCI Pakistan ETF | 6,956,266 | 1,913,964 | ||||||
| Global X MSCI China Consumer Staples ETF | 29,861,545 | 2,680,241 | ||||||
| Global X MSCI China Health Care ETF | 788,400 | 1,157,776 | ||||||
| Global X MSCI China Information Technology ETF | 1,496,397 | 2,034,070 | ||||||
| Global X MSCI China Utilities ETF | 354,951 | 652,700 | ||||||
| Global X MSCI China Real Estate ETF | 2,532,294 | 1,793,288 | ||||||
| Global X MSCI Vietnam ETF | 3,154,842 | 1,301,706 | ||||||
During the period endedApril 30, 2023, there were no purchases or sales of long-term U.S. Government securities for the Funds.
4. INVESTMENT TRANSACTIONS (continued)
For the period ended April 30, 2023, in-kind transactions associated with creations and redemptions were:
| Purchases | Sales | Realized Gain/(Losses) | ||||||||||
| Global X MSCI Colombia ETF | $ | 1,035,725 | $ | – | $ | – | ||||||
| Global X MSCI China Industrials ETF | 13,161 | – | – | |||||||||
| Global X MSCI China Consumer Discretionary ETF | 17,120,267 | 8,121,790 | (1,842,863 | ) | ||||||||
| Global X MSCI China Communication Services ETF | – | 277,248 | 9,759 | |||||||||
| Global X MSCI China Financials ETF | – | 8,515,809 | (2,002,256 | ) | ||||||||
| Global X MSCI China Energy ETF | – | 1,249,828 | 171,826 | |||||||||
| Global X MSCI China Materials ETF | – | 531,712 | 24,327 | |||||||||
| Global X MSCI Norway ETF | 753,594 | 41,531,887 | (2,836,237 | ) | ||||||||
| Global X FTSE Southeast Asia ETF | 5,919,201 | 913,468 | 197,160 | |||||||||
| Global X MSCI Argentina ETF | 18,275,361 | 5,767,815 | 2,115,392 | |||||||||
| Global X MSCI Greece ETF | 21,996,188 | 3,770,608 | 1,241,872 | |||||||||
| Global X MSCI Nigeria ETF | – | – | – | |||||||||
| Global X MSCI Next Emerging & Frontier ETF | 1,408,662 | – | – | |||||||||
| Global X MSCI Portugal ETF | 7,235,890 | 10,221,360 | 380,304 | |||||||||
| Global X DAX Germany ETF | 6,808,865 | 1,812,857 | 571,374 | |||||||||
| Global X MSCI Pakistan ETF | – | – | – | |||||||||
| Global X MSCI China Consumer Staples ETF | 79,179 | – | – | |||||||||
| Global X MSCI China Health Care ETF | – | 700,592 | (35,447 | ) | ||||||||
| Global X MSCI China Information Technology ETF | – | 579,383 | (86,901 | ) | ||||||||
| Global X MSCI China Utilities ETF | – | 377,827 | 50,577 | |||||||||
| Global X MSCI China Real Estate ETF | 73,780 | – | – | |||||||||
| Global X MSCI Vietnam ETF | – | – | – |
5. TAX INFORMATION
The amount and character of income and capital gain distributions to be paid, if any, are determined in accordance with Federal income tax regulations, which may differ from U.S. GAAP. As a result, net investment income (loss) and net realized gain (loss) on investment transactions for a reporting period may differ significantly from distributions during such period. These book/tax differences may be temporary or permanent. To the extent these differences are permanent in nature, they are charged or credited to undistributed net investment income (loss), accumulated net realized gain (loss) or paid in capital, as appropriate, in the period that the differences arise.
| Notes to Financial Statements (Unaudited) (Continued) |
| April 30, 2023 |
5. TAX INFORMATION (continued)
The tax character of dividends and distributions declared during the periods ended October 31, 2022 and 2021 were as follows:
| Global X Funds | Ordinary Income | Long-Term Capital Gain | Return of Capital | Totals | ||||||||||||
| Global X MSCI Colombia ETF | ||||||||||||||||
| 2022 | $ | 2,097,252 | $ | – | $ | – | $ | 2,097,252 | ||||||||
| 2021 | 1,240,682 | – | – | 1,240,682 | ||||||||||||
| Global X MSCI China Industrials ETF | ||||||||||||||||
| 2022 | $ | 68,060 | $ | – | $ | – | $ | 68,060 | ||||||||
| 2021 | 44,984 | – | – | 44,984 | ||||||||||||
| Global X MSCI China Consumer Discretionary ETF | ||||||||||||||||
| 2022 | $ | 925,757 | $ | – | $ | – | $ | 925,757 | ||||||||
| 2021 | 380,749 | – | – | 380,749 | ||||||||||||
| Global X MSCI China Communication Services ETF | ||||||||||||||||
| 2022 | $ | 91,893 | $ | – | $ | – | $ | 91,893 | ||||||||
| 2021 | 201,302 | – | 30,513 | 231,815 | ||||||||||||
| Global X MSCI China Financials ETF | ||||||||||||||||
| 2022 | $ | 1,762,014 | $ | – | $ | – | $ | 1,762,014 | ||||||||
| 2021 | 1,869,196 | – | – | 1,869,196 | ||||||||||||
| Global X MSCI China Energy ETF | ||||||||||||||||
| 2022 | $ | 152,497 | $ | – | $ | – | $ | 152,497 | ||||||||
| 2021 | 61,017 | – | – | 61,017 | ||||||||||||
| Global X MSCI China Materials ETF | ||||||||||||||||
| 2022 | $ | 95,929 | $ | – | $ | – | $ | 95,929 | ||||||||
| 2021 | 85,767 | – | – | 85,767 | ||||||||||||
| Global X MSCI Norway ETF | ||||||||||||||||
| 2022 | $ | 2,606,650 | $ | – | $ | – | $ | 2,606,650 | ||||||||
| 2021 | 1,549,127 | – | 28,009 | 1,577,136 | ||||||||||||
| Global X FTSE Southeast Asia ETF | ||||||||||||||||
| 2022 | $ | 1,542,635 | $ | – | $ | – | $ | 1,542,635 | ||||||||
| 2021 | 630,414 | – | – | 630,414 | ||||||||||||
| Global X MSCI Argentina ETF | ||||||||||||||||
| 2022 | $ | 647,649 | $ | – | $ | – | $ | 647,649 | ||||||||
| 2021 | 163,672 | – | – | 163,672 | ||||||||||||
| Global X MSCI Greece ETF | ||||||||||||||||
| 2022 | $ | 2,877,578 | $ | – | $ | – | $ | 2,877,578 | ||||||||
| 2021 | 3,402,946 | – | – | 3,402,946 | ||||||||||||
| Global X MSCI Nigeria ETF | ||||||||||||||||
| 2022 | $ | 2,165,774 | $ | – | $ | – | $ | 2,165,774 | ||||||||
| 2021 | 2,273,637 | – | – | 2,273,637 | ||||||||||||
| Global X MSCI Next Emerging & Frontier ETF | ||||||||||||||||
| 2022 | $ | 507,163 | $ | – | $ | – | $ | 507,163 | ||||||||
| 2021 | 448,516 | – | – | 448,516 | ||||||||||||
5. TAX INFORMATION (continued)
| Global X Funds | Ordinary Income | Long-Term Capital Gain | Return of Capital | Totals | ||||||||||||
| Global X MSCI Portugal ETF | ||||||||||||||||
| 2022 | $ | 300,309 | $ | – | $ | – | $ | 300,309 | ||||||||
| 2021 | 509,812 | – | – | 509,812 | ||||||||||||
| Global X DAX Germany ETF | ||||||||||||||||
| 2022 | $ | 1,178,656 | $ | – | $ | – | $ | 1,178,656 | ||||||||
| 2021 | 1,062,843 | – | – | 1,062,843 | ||||||||||||
| Global X MSCI Pakistan ETF | ||||||||||||||||
| 2022 | $ | 1,339,067 | $ | – | $ | – | $ | 1,339,067 | ||||||||
| 2021 | 1,563,198 | – | – | 1,563,198 | ||||||||||||
| Global X MSCI China Consumer Staples ETF | ||||||||||||||||
| 2022 | $ | 203,537 | $ | 504,089 | $ | – | $ | 707,626 | ||||||||
| 2021 | 165,719 | – | – | 165,719 | ||||||||||||
| Global X MSCI China Health Care ETF | ||||||||||||||||
| 2022 | $ | 16,856 | $ | – | $ | – | $ | 16,856 | ||||||||
| 2021 | 7,709 | – | – | 7,709 | ||||||||||||
| Global X MSCI China Information Technology ETF | ||||||||||||||||
| 2022 | $ | 92,279 | $ | 662,560 | $ | – | $ | 754,839 | ||||||||
| 2021 | 254,780 | 11,340 | – | 266,120 | ||||||||||||
| Global X MSCI China Utilities ETF | ||||||||||||||||
| 2022 | $ | 46,157 | $ | 34,700 | $ | – | $ | 80,857 | ||||||||
| 2021 | 63,139 | – | – | 63,139 | ||||||||||||
| Global X MSCI China Real Estate ETF | ||||||||||||||||
| 2022 | $ | 205,698 | $ | – | $ | – | $ | 205,698 | ||||||||
| 2021 | 311,838 | – | – | 311,838 | ||||||||||||
| Global X MSCI Vietnam ETF | ||||||||||||||||
| 2022 | $ | 15,977 | $ | – | $ | – | $ | 15,977 | ||||||||
As of October 31, 2022, the components of tax basis accumulated losses were as follows:
| Global X Funds | |||||||||||
| Global X MSCI Colombia ETF | Global X MSCI China Industrials ETF | Global X MSCI China Consumer Discretionary ETF | |||||||||
| Undistributed Ordinary Income | $ | 840,443 | $ | 84,274 | $ | 233,832 | |||||
| Capital Loss Carryforwards | (91,801,436 | ) | (5,044,362 | ) | (139,200,177 | ) | |||||
| Unrealized Depreciation on Investments and | |||||||||||
| Foreign Currency | (16,764,792 | ) | (2,364,366 | ) | (293,085,442 | ) | |||||
| Other Temporary Differences | – | (5 | ) | (12 | ) | ||||||
| Total Accumulated Losses | $ | (107,725,785 | ) | $ | (7,324,459 | ) | $ | (432,051,799 | ) | ||
5. TAX INFORMATION (continued)
| Global X Funds | |||||||||||
| Global X MSCI China Communication Services ETF | Global X MSCI China Financials ETF | Global X MSCI China Energy ETF | |||||||||
| Undistributed Ordinary Income | $ | 13,635 | $ | 1,606,157 | $ | 289,602 | |||||
| Capital Loss Carryforwards | (9,315,617 | ) | (12,762,794 | ) | (1,224,288 | ) | |||||
| Unrealized Depreciation on Investments and | |||||||||||
| Foreign Currency | (5,496,651 | ) | (22,122,755 | ) | (875,993 | ) | |||||
| Other Temporary Differences | 1 | (1 | ) | (5 | ) | ||||||
| Total Accumulated Losses | $ | (14,798,632 | ) | $ | (33,279,393 | ) | $ | (1,810,684 | ) | ||
| Global X Funds | |||||||||||
| Global X MSCI China Materials ETF | Global X MSCI Norway ETF | Global X FTSE Southeast Asia ETF | |||||||||
| Undistributed Ordinary Income | $ | 37,508 | $ | 1,149,217 | $ | 407,546 | |||||
| Capital Loss Carryforwards | (2,768,409 | ) | (46,192,377 | ) | (8,952,059 | ) | |||||
| Unrealized Depreciation on Investments and | |||||||||||
| Foreign Currency | (1,606,267 | ) | (28,915,078 | ) | (2,846,451 | ) | |||||
| Other Temporary Differences | 1 | (10 | ) | – | |||||||
| Total Accumulated Losses | $ | (4,337,167 | ) | $ | (73,958,248 | ) | $ | (11,390,964 | ) | ||
| Global X Funds | |||||||||||
| Global X MSCI Argentina ETF | Global X MSCI Greece ETF | Global X MSCI Nigeria ETF | |||||||||
| Undistributed Ordinary Income | $ | 307,087 | $ | 2,713,525 | $ | 1,740,480 | |||||
| Capital Loss Carryforwards | (27,761,223 | ) | (226,844,784 | ) | (23,712,374 | ) | |||||
| Unrealized Depreciation on Investments and | |||||||||||
| Foreign Currency | (18,166,914 | ) | (37,882,958 | ) | (11,450,609 | ) | |||||
| Other Temporary Differences | (1 | ) | (17 | ) | (4 | ) | |||||
| Total Accumulated Losses | $ | (45,621,051 | ) | $ | (262,014,234 | ) | $ | (33,422,507 | ) | ||
| Global X Funds | |||||||||||
| Global X MSCI Next Emerging & Frontier ETF | Global X MSCI Portugal ETF | ||||||||||
Global X DAX Germany ETF | |||||||||||
| Undistributed Ordinary Income | $ | 181,771 | $ | 19,655 | $ | 63,221 | |||||
| Capital Loss Carryforwards | (24,970,057 | ) | (19,153,346 | ) | (3,784,615 | ) | |||||
| Unrealized Depreciation on Investments and | |||||||||||
| Foreign Currency | (939,814 | ) | (2,777,560 | ) | (6,968,445 | ) | |||||
| Other Temporary Differences | – | (1 | ) | (1 | ) | ||||||
| Total Accumulated Losses | $ | (25,728,100 | ) | $ | (21,911,252 | ) | $ | (10,689,840 | ) | ||
5. TAX INFORMATION (continued)
| Global X Funds | |||||||||||
Global X MSCI Pakistan ETF | Global X MSCI Staples ETF | Global X MSCI China Consumer China Health Care ETF | |||||||||
| Undistributed Ordinary Income | $ | 575,371 | $ | 133,383 | $ | 27,342 | |||||
| Capital Loss Carryforwards | (36,960,330 | ) | (534,002 | ) | (3,080,893 | ) | |||||
| Unrealized Depreciation on Investments and | |||||||||||
| Foreign Currency | (13,276,489 | ) | (3,551,656 | ) | (6,016,083 | ) | |||||
| Other Temporary Differences | (6 | ) | – | – | |||||||
| Total Accumulated Losses | $ | (49,661,454 | ) | $ | (3,952,275 | ) | $ | (9,069,634 | ) | ||
| Global X Funds | |||||||||||
| Global X MSCI China Information Technology ETF | Global X MSCI China Utilities ETF | Global X MSCI China Real Estate ETF | |||||||||
| Undistributed Ordinary Income | $ | 45,783 | $ | 45,685 | $ | 256,518 | |||||
| Undistributed Long-Term Capital Gain | – | 39,826 | – | ||||||||
| Capital Loss Carryforwards | (3,937,847 | ) | – | (3,029,414 | ) | ||||||
| Unrealized Depreciation on Investments and | |||||||||||
| Foreign Currency | (10,595,483 | ) | (942,700 | ) | (5,018,062 | ) | |||||
| Other Temporary Differences | (1 | ) | – | – | |||||||
| Total Accumulated Losses | $ | (14,487,548 | ) | $ | (857,189 | ) | $ | (7,790,958 | ) | ||
| Global X Funds | ||||
Global X MSCI Vietnam ETF | ||||
| Undistributed Ordinary Income | $ | 13,589 | ||
| Capital Loss Carryforwards | (1,152,132 | ) | ||
| Unrealized Depreciation on Investments and Foreign Currency | (2,202,552 | ) | ||
| Other Temporary Differences | – | |||
| Total Accumulated Losses | $ | (3,341,095 | ) | |
| Notes to Financial Statements (Unaudited) (Continued) |
| April 30, 2023 |
5. TAX INFORMATION (continued)
For taxable years beginning after December 22, 2010, a registered investment company (“RIC”) is permitted to carry forward net capital losses to offset capital gains realized in later years, and the losses carried forward retain their original character as either long-term or short-term losses. Losses carried forward under these new provisions are as follows:
Short-Term Loss | Long-Term Loss | Total | ||||||||||
| Global X MSCI Colombia ETF | $ | 25,117,812 | $ | 66,683,624 | $ | 91,801,436 | ||||||
| Global X MSCI China Industrials ETF | 2,514,253 | 2,530,109 | 5,044,362 | |||||||||
| Global X MSCI China Consumer Discretionary ETF | 49,345,578 | 89,854,599 | 139,200,177 | |||||||||
| Global X MSCI China Communication Services ETF | 4,477,286 | 4,838,331 | 9,315,617 | |||||||||
| Global X MSCI China Financials ETF | 8,698,309 | 4,064,485 | 12,762,794 | |||||||||
| Global X MSCI China Energy ETF | 257,956 | 966,332 | 1,224,288 | |||||||||
| Global X MSCI China Materials ETF | 907,141 | 1,861,268 | 2,768,409 | |||||||||
| Global X MSCI Norway ETF | 12,648,729 | 33,543,648 | 46,192,377 | * | ||||||||
| Global X FTSE Southeast Asia ETF | 3,149,354 | 5,802,705 | 8,952,059 | |||||||||
| Global X MSCI Argentina ETF | 3,785,212 | 23,976,011 | 27,761,223 | |||||||||
| Global X MSCI Greece ETF | 76,066,205 | 150,778,579 | 226,844,784 | |||||||||
| Global X MSCI Nigeria ETF | 6,704,406 | 17,007,968 | 23,712,374 | |||||||||
| Global X MSCI Next Emerging & Frontier ETF | 6,272,493 | 18,697,564 | 24,970,057 | |||||||||
| Global X MSCI Portugal ETF | 3,818,051 | 15,335,295 | 19,153,346 | |||||||||
| Global X DAX Germany ETF | 1,293,115 | 2,491,500 | 3,784,615 | |||||||||
| Global X MSCI Pakistan ETF | 1,390,733 | 35,569,597 | 36,960,330 | |||||||||
| Global X MSCI China Consumer Staples ETF | 393,268 | 140,734 | 534,002 | |||||||||
| Global X MSCI China Health Care ETF | 560,189 | 2,520,704 | 3,080,893 | |||||||||
| Global X MSCI China Information Technology ETF | 1,239,797 | 2,698,050 | 3,937,847 | |||||||||
| Global X MSCI China Real Estate ETF | 1,312,341 | 1,717,073 | 3,029,414 | |||||||||
| Global X MSCI Vietnam ETF | 1,152,132 | – | 1,152,132 |
| * | The utilization of this amount is subject to limitation under IRC sections 382-384. |
During the year ended October 31, 2022, the following Funds utilized capital loss carryforwards to offset capital gains amounting to:
| Short-Term | Long-Term | |||||||||||
| Loss | Loss | Total | ||||||||||
| Global X MSCI China Energy ETF | $ | 122,291 | $ | 324,498 | $ | 446,789 | ||||||
| Global X MSCI Nigeria ETF | 1,885 | – | 1,885 | |||||||||
5. TAX INFORMATION (continued)
The Federal tax cost basis of investments and aggregate gross unrealized appreciation and depreciation on investments held by the Funds at April 30, 2023 were as follows:
| Aggregated Gross | Aggregated Gross | Net Unrealized | ||||||||||||||
| Global X Funds | Federal Tax Cost | Unrealized Appreciation | Unrealized Depreciation | Appreciation (Depreciation) | ||||||||||||
| Global X MSCI Colombia ETF | $ | 38,598,924 | $ | 1,404,637 | $ | (11,736,828 | ) | $ | (10,332,191 | ) | ||||||
| Global X MSCI China Industrials ETF | 6,819,946 | 379,441 | (1,055,948 | ) | (676,507 | ) | ||||||||||
| Global X MSCI China Consumer | ||||||||||||||||
| Discretionary ETF | 522,141,291 | 7,777,487 | (201,483,330 | ) | (193,705,843 | ) | ||||||||||
| Global X MSCI China Communication | ||||||||||||||||
| Services ETF | 8,887,523 | 1,091,759 | (2,080,716 | ) | (988,957 | ) | ||||||||||
| Global X MSCI China Financials ETF | 32,769,481 | 564,275 | (8,535,632 | ) | (7,971,357 | ) | ||||||||||
| Global X MSCI China Energy ETF | 9,428,352 | 1,461,208 | (263,644 | ) | 1,197,564 | |||||||||||
| Global X MSCI China Materials ETF | 3,969,165 | 427,950 | (981,394 | ) | (553,444 | ) | ||||||||||
| Global X MSCI Norway ETF | 78,970,687 | 1,111,778 | (21,550,144 | ) | (20,438,366 | ) | ||||||||||
| Global X FTSE Southeast Asia ETF | 45,444,355 | 4,182,534 | (2,833,441 | ) | 1,349,093 | |||||||||||
| Global X MSCI Argentina ETF | 52,918,263 | 3,679,536 | (8,316,886 | ) | (4,637,350 | ) | ||||||||||
| Global X MSCI Greece ETF | 149,995,308 | 35,128,291 | (25,988,128 | ) | 9,140,163 | |||||||||||
| Global X MSCI Nigeria ETF | 48,857,726 | 6,989,681 | (7,879,045 | ) | (889,364 | ) | ||||||||||
| Global X MSCI Next Emerging & | ||||||||||||||||
| Frontier ETF | 22,956,711 | 3,355,866 | (2,830,958 | ) | 524,908 | |||||||||||
| Global X MSCI Portugal ETF | 14,853,830 | 598,078 | (946,955 | ) | (348,877 | ) | ||||||||||
| Global X DAX Germany ETF | 51,646,014 | 8,198,389 | (2,374,525 | ) | 5,823,864 | |||||||||||
| Global X MSCI Pakistan ETF | 27,171,280 | – | (10,963,215 | ) | (10,963,215 | ) | ||||||||||
| Global X MSCI China Consumer | ||||||||||||||||
| Staples ETF | 39,066,899 | 2,698,892 | (3,529,533 | ) | (830,641 | ) | ||||||||||
| Global X MSCI China Health Care ETF | 11,850,318 | 540,057 | (3,472,088 | ) | (2,932,031 | ) | ||||||||||
| Global X MSCI China Information | ||||||||||||||||
| Technology ETF | 20,905,712 | 1,343,622 | (7,124,235 | ) | (5,780,613 | ) | ||||||||||
| Global X MSCI China Utilities ETF | 2,546,215 | 154,153 | (288,218 | ) | (134,065 | ) | ||||||||||
| Global X MSCI China Real Estate ETF | 8,511,547 | 256,613 | (1,893,057 | ) | (1,636,444 | ) | ||||||||||
| Global X MSCI Vietnam ETF | 5,404,644 | 156,363 | (797,166 | ) | (640,803 | ) | ||||||||||
The preceding differences between book and tax cost are primarily due to mark-to-market treatment of passive foreign investment companies and wash sales.
6. CONCENTRATION OF RISKS
The Funds invest in securities of foreign issuers in several countries. These investments may involve certain considerations and risks not typically associated with investments in the United States as a result of, among other factors, the possibility of future political and economic developments and the level of governmental supervision and regulation of securities markets in the respective countries.
6. CONCENTRATION OF RISKS (continued)
The securities markets of emerging market countries are less liquid, subject to greater price volatility, and have a smaller market capitalization than the U.S. securities markets.
In certain countries, there may be fewer publicly traded securities and the market may be dominated by a few issuers or sectors. Issuers and securities markets in such countries are not subject to as extensive and frequent accounting, financial and other reporting requirements or as comprehensive government regulations as issuers and securities markets in the United States. In particular, the assets and profits appearing on the financial statements of emerging market country issuers may not reflect their financial position or results of operations in the same manner as financial statements for U.S. issuers.
Substantially less information may be publicly available about emerging market country issuers than is available about issuers in the United States.
The Funds may be subject to taxes imposed by countries in which they invest. Such taxes are generally based on either income, gains earned or gains repatriated. The Funds accrue and apply such taxes to net investment income, net realized gains and net unrealized gains as income and/or capital gains are earned.
The Funds use a replication strategy. A replication strategy is an indexing strategy that involves investing in the securities of an underlying index in approximately the same proportions as the underlying index. A representative sampling strategy is an indexing strategy that involves investing in a representative sample of securities (including indirect investments through underlying ETFs) that collectively has an investment profile similar to an underlying index in terms of key risk factors, performance attributes and other characteristics. Each Fund may utilize a representative sampling strategy with respect to its underlying index when a replication strategy might be detrimental to its shareholders, such as when there are practical difficulties or substantial costs involved in compiling a portfolio of equity securities to follow its underlying index, or, in certain instances, when securities in the underlying index become temporarily illiquid, unavailable or less liquid, or due to legal restrictions (such as diversification requirements that apply to a Fund but not its underlying index).
Certain Funds may invest in commodity related securities, which are susceptible to fluctuations in certain commodity markets. Any negative changes in commodity markets could have a great impact on those securities.
The elimination of the London Inter-Bank Offered Rate (“LIBOR”) may adversely affect the interest rates on, and value of, certain Fund investments for which the value is tied to LIBOR. The U.K. Financial Conduct Authority has announced that it intends to stop compelling or inducing banks to submit LIBOR rates after 2021. On March 5, 2021, the administrator of LIBOR clarified that the publication of LIBOR on a representative basis will cease for the one-week and two-month U.S. dollar LIBOR settings immediately after
| Notes to Financial Statements (Unaudited) (Continued) |
| April 30, 2023 |
6. CONCENTRATION OF RISKS (continued)
December 31, 2021, and for the remaining U.S. dollar LIBOR settings immediately after June 30, 2023. Alternatives to LIBOR are established or in development in most major currencies, including the Secured Overnight Financing Rate (“SOFR”), which is intended to replace U.S. dollar LIBOR. Markets are slowly developing in response to these new rates. Questions regarding the impact of this transition remain a concern for the Funds. Accordingly, it is difficult to predict the full impact of the transition away from LIBOR on the Funds until new reference rates and fallbacks for both legacy and new products, instruments and contracts are commercially accepted.
Economic conditions, such as volatile currency exchange rates and interest rates, political events, military action and other conditions may, without prior warning, lead to foreign government intervention (including intervention by the U.S. government with respect to foreign governments, economic sectors, foreign companies and related securities and interests) and the imposition of capital controls (i.e., government measures designed to limit the flow of foreign capital in and out of the domestic economy) and/or sanctions, which may also include retaliatory actions of one government against another government, such as the seizure of assets. Capital controls and/or sanctions include the prohibition of, or restrictions on, the ability to transfer currency, securities or other assets. Capital controls and/or sanctions may also impact the ability of a Fund to buy, sell or otherwise transfer securities or currency, negatively impact the value and/or liquidity of such instruments, adversely affect the trading market and price for Shares of a Fund, and cause a Fund to decline in value.
The Global X MSCI Nigeria ETF’s investments are largely denominated in naira. Assets denominated in naira are required to be translated to U.S. dollars for financial reporting purposes, which translation is effected utilizing the official exchange rate, i.e. NAFEX. However, the Central Bank of Nigeria has implemented capital controls to manage an official exchange rate that precludes the purchase or sale of naira outside of official markets. As a result, opportunities to repatriate naira into dollars have been limited or non-existent, and in instances where a fund has had a repatriation opportunity, it has experienced extreme delays in repatriating such naira, with such repatriation occurring at times through the Central Bank of Nigeria at a discount to the official exchange rate. These circumstances may create uncertainty regarding the liquidity of transactions repatriating naira to U.S. dollars, as well as uncertainty with respect to the translation of the naira and naira-denominated assets to U.S. dollars.
Special Risk Considerations of Investing in China – Variable Interest Entity Investments. For purposes of raising capital offshore on exchanges outside of China, including on U.S. exchanges, many Chinese-based operating companies are structured as Variable Interest Entities (“VIEs”). In this structure, the Chinese-based operating company is the VIE and establishes a shell company in a foreign jurisdiction, such as the Cayman Islands. The shell company lists on a foreign exchange and enters into contractual arrangements with the
| Notes to Financial Statements (Unaudited) (Continued) |
| April 30, 2023 |
6. CONCENTRATION OF RISKS (continued)
VIE. This structure allows Chinese companies in which the Chinese government restricts foreign ownership to raise capital from foreign investors. While the shell company has no equity ownership of the VIE, these contractual arrangements permit the shell company to consolidate the VIE’s financial statements with its own for accounting purposes and provide for economic exposure to the performance of the underlying Chinese operating company. Therefore, an investor in the listed shell company, such as certain of the Funds, will have exposure to the Chinese-based operating company only through contractual arrangements and has no ownership in the Chinese-based operating company. Furthermore, because the shell company only has specific rights provided for in these service agreements with the VIE, its abilities to control the activities at the Chinese-based operating company are limited and the operating company may engage in activities that negatively impact investment value. While the VIE structure has been widely adopted, it is not formally recognized under Chinese law and therefore there is a risk that the Chinese government could prohibit the existence of such structures or negatively impact the VIE’s contractual arrangements with the listed shell company by declaring them invalid. If these contracts were found to be unenforceable under Chinese law, investors in the listed shell company, such as a Fund, may suffer significant losses with little or no recourse available. If the Chinese government determines that the agreements establishing the VIE structures do not comply with Chinese law and regulations, including those related to restrictions on foreign ownership, it could subject a Chinese-based issuer to penalties, revocation of business and operatinglicenses,orforfeitureofownershipinterest.Inaddition,thelistedshellcompany’s control over a VIE may also be jeopardized if a natural person who holds the equity interest in the VIE breaches the terms of the agreement, is subject to legal proceedings or if any physical instruments for authenticating documentation, such as chops and seals, are used without the Chinese-based issuer’s authorization to enter into contractual arrangements in China. Chops and seals, which are carved stamps used to sign documents, represent a legally binding commitment by the company. Moreover, any future regulatory action may prohibit the ability of the shell company to receive the economic benefits of the Chinese-based operating company, which may cause the value of a Fund’s investment in the listed shell company to suffer a significant loss. For example, in 2021, the Chinese government prohibited use of theVIE structure for investment in after-school tutoring companies.There is no guarantee that the government will not place similar restrictions on other industries.
These actions, any future sanctions or other actions, or even the threat of further sanctions or other actions, may negatively affect the value and liquidity of certain of the Funds’ investments. For example, a Fund may be prohibited from investing in securities issued by companies subject to such sanctions. In addition, sanctions may require a Fund to freeze its existing investments, prohibiting such Fund from buying, selling or otherwise transacting in these investments.
Also, if an affected security is included in a Fund's underlying index, such Fund may, where practicable, seek to eliminate its holdings of the affected security by employing or
6. CONCENTRATION OF RISKS (continued)
augmenting its representative sampling strategy to seek to track the investment results of the underlying index. The use of (or increased use of) a representative sampling strategy may increase such Fund’s tracking error risk.Actions barring some or all transactions with a specific company will likely have a substantial, negative impact on the value of such company’s securities. These sanctions may also lead to changes in a Fund’s underlying index. A Fund’s index provider may remove securities from the underlying index or implement caps on the securities of certain issuers that have been subject to recent economic sanctions. In such an event, it is expected that a Fund will rebalance its portfolio to bring it in line with its respective underlying index as a result of any such changes, which may result in transaction costs and increased tracking error.
Please refer to each Fund’s prospectus and statement of additional information (“SAI”) for a more complete description of risks.
7. LOANS OF PORTFOLIO SECURITIES
Each Fund may lend portfolio securities having a market value up to one-third of its total assets. Security loans made pursuant to a securities lending agreement with BBH are initially required to be secured by collateral equal to at least 102% of the value of domestic equity securities and American Depositary Receipts ("ADRs") and 105% of the value of foreign equity securities (other than ADRs). Such collateral received in connection with these loans will be cash and can be invested in repurchase agreements, short-term investments or U.S. Treasury obligations, and is recognized in the Schedules of Investments and Statements of Assets and Liabilities. The obligation to return securities lending collateral is also recognized as a liability in the Statements of Assets and Liabilities. It is the Funds’ policy to obtain additional collateral from or return excess collateral to the borrower by the end of the next business day, following the valuation date of the securities loaned. Therefore, the value of the collateral held may be temporarily less than the value of the securities on loan.
Lending securities entails a risk of loss to the Funds if and to the extent that the market values of the securities loaned were to increase and the borrower did not increase the collateral accordingly, and the borrower failed to return the securities. In the event the borrower may not provide additional collateral when required or may not return the securities when due, the securities lending agency agreement requires the lending agent to indemnify the Funds by replacing either the security or the security’s current market value to the Funds. The Funds could suffer a loss if the value of an investment purchased with cash collateral falls below the market value of loaned securities or if the value of an investment purchased with cash collateral falls below the value of the original cash collateral received. The Funds could also experience delays and costs in gaining access to the collateral. The Funds bear the risk of any deficiency in the amount of the collateral available for return to the borrower due to any loss on the collateral invested.
7. LOANS OF PORTFOLIO SECURITIES (continued)
At April 30, 2023, the following Funds had securities on loan, by counterparty:
| Market Value | Cash Collateral(1) | ||||||||
| Global X MSCI Colombia ETF | |||||||||
| BofA Securities Inc. | $ | 461,934 | $ | 477,816 | |||||
| J.P. Morgan Securities LLC | 51,869 | 54,320 | |||||||
| Morgan Stanley & Co. LLC | 136,341 | 160,632 | |||||||
| Scotia Capital | 151,161 | 158,304 | |||||||
| UBS AG London Branch | 436,973 | 454,898 | |||||||
| Total | $ | 1,238,278 | $ | 1,305,970 | |||||
| Global X MSCI China Consumer Discretionary ETF | |||||||||
| Morgan Stanley & Co. LLC | $ | 4,453,428 | $ | 4,611,873 | |||||
| Scotia Capital | 1,209,202 | 1,252,223 | |||||||
| UBS AG London Branch | 877,890 | 923,923 | |||||||
| Total | $ | 6,540,520 | $ | 6,788,019 | |||||
| Global X MSCI Argentina ETF | |||||||||
| BofA Securities Inc. | $ | 12,060 | $ | 12,569 | |||||
| Total | $ | 12,060 | $ | 12,569 | |||||
| Global X MSCI Greece ETF | |||||||||
| Citigroup Global Markets Inc. | $ | 104,144 | $ | 106,815 | |||||
| Goldman Sachs & Co. | 844,272 | 863,952 | |||||||
| J.P. Morgan Securities LLC | 516,516 | 534,275 | |||||||
| Total | $ | 1,464,932 | $ | 1,505,042 | |||||
(1) | It is the Funds' policy to obtain additional collateral from or return excess collateral to the borrower by the end of the next business day, following the valuation date of the securities loaned. Therefore, the value of the collateral held may be temporarily less than the value of the securities on loan. |
8. CONTRACTUAL OBLIGATION
The Funds enter into contracts in the normal course of business that contain a variety of indemnifications. The Funds’ maximum exposure under these contracts is unknown, however, the Funds have not had prior gains or losses pursuant to these contracts. Management has reviewed the Funds’ existing contracts and expects the risk of loss to be remote.
Pursuant to the Trust’s organizational documents, the Trustees of the Trust (the "Trustees") and the Trust’s officers are indemnified against certain liabilities that may arise out of the performance of their duties.
9. REVERSE SHARE SPLIT
Effective December 20, 2022, Global X MSCI China Real Estate ETF executed a reverse share split for shareholders of record after the close of markets on December 19, 2022. The effect of this transaction was to divide the number of outstanding Shares of the Fund by the applicable ratio below, resulting in a corresponding increase in the NAV per Share.
9. REVERSE SHARE SPLIT (continued)
The capital share activity presented in the Statement of Changes in Net Assets for each of the years in the period then ended, and per share data in the financial highlights for each of the years in the period then ended, have been given retroactive effect to reflect this reverse share split. There were no changes in net assets, results of operations or total return as a result of this transactions. The details of the reverse split is are follows:
| Fund Name | Ratio |
| Global X MSCI China Real Estate ETF | 1:3 |
Effective April28, 2020, each of the Global X MSCI Colombia ETF, Global X MSCI Greece ETF and Global X MSCI Pakistan ETF executed a reverse share split for shareholders of record after the close of markets on April 27, 2020. The effect of this transaction for each Fund was to divide the number of outstanding Shares of the Fund by the applicable ratio below, resulting in a corresponding increase in the NAV per Share. The capital share activity presented in the Statement of Changes in Net Assets for each of the years in the period then ended, and per share data in the financial highlights for each of the years in the period then ended, have been given retroactive effect to reflect these reverse share splits.
There were no changes in net assets, results of operations or total return as a result of these transactions. The details of the reverse splits are as follows:
Fund Name | Ratio |
| Global X MSCI Colombia ETF | 1:4 |
| Global X MSCI Greece ETF | 1:3 |
| Global X MSCI Pakistan ETF | 1:4 |
10. MERGER
Effective October 29, 2021, the Global X FTSE Nordic Region ETF (the “Acquiring Fund”) acquired all of the assets and assumed all of the liabilities of the Global X MSCI Norway ETF (the “Acquired Fund”) pursuant to a Plan of Reorganization approved by the Board of Directors on August 4, 2021. Effective as of the close of business on October 29, 2021, the Acquired Fund was reorganized into the Acquiring Fund, each a separate series of the Trust (together, the “Combined Fund”) and the Combined Fund was renamed Global X MSCI Norway ETF. The Acquiring Fund is the legal surviving entity in the Reorganization, while theAcquired Fund is the accounting survivor or continuing portfolio for purposes of financial and performance history of the Combined Fund. The acquisition was accomplished by a tax-free exchange as follows:
3,980,000 shares of the Acquired Fund, with net assets of $60,723,560 and including $673,023 of net unrealized depreciation for 1,896,973 shares of the Acquiring Fund with net assets of $43,214,538. For every 1 share of the Acquired Fund, shareholders received
| Notes to Financial Statements (Unaudited) (Continued) |
| April 30, 2023 |
10. MERGER (continued)
0.4766 shares of theAcquiring Fund. Immediately following the acquisition, the Combined Fund held 3,246,971 shares with net assets of $103,938,098.
Assuming that the reorganization had been completed on November 1, 2020, theAcquiring Fund’s pro forma results of operations for the year ended October 31, 2021 would have been as follows:
| Net investment income | $ | 2,153,445 | ||
| Net Realized and unrealized gain (loss) from investments | 26,735,503 | |||
| Net increase (decrease) in net assets from operations | $ | 28,888,948 | ||
11. SUBSEQUENT EVENTS
The custodian, transfer agent and securities lending agent for Global X MSCI Norway ETF, Global X FTSE Southeast Asia ETF and Global X DAX Germany ETF transitioned from Brown Brothers Harriman & Co. to The Bank of New York Mellon on or about May 12, 2023.
The custodian, transfer agent and securities lending agent for Global X MSCI Greece ETF and Global X MSCI Portugal ETF transitioned from Brown Brothers Harriman & Co. to The Bank of New York Mellon on or about June 12, 2023.
The custodian, transfer agent and securities lending agent for Global X MSCI Colombia ETF, Global X MSCI China Industrials ETF, Global X MSCI China Financials ETF, Global X MSCI China Energy ETF, Global X MSCI China Materials ETF, Global X MSCI China Consumer Staples ETF, Global X MSCI China Health Care ETF, Global X MSCI China Information Technology ETF, Global X MSCI China Utilities ETF and Global X MSCI China Real Estate ETF will transition from Brown Brothers Harriman & Co. to The Bank of New York Mellon on or about June 26, 2023.
On June 22, 2023, the Board of the Trust voted to approve the orderly liquidation and terminationoftheGlobalXMSCINigeriaETF(the“Fund”)basedupontherecommendation of the Adviser. Prior to June 14, 2023, Nigeria’s restrictive foreign exchange policies had resulted in the Fund’s sustained inability to convert Naira into other currencies, including U.S. dollars, and in the infrequent instances when there was the ability to convert Naira to U.S.dollars,significantdelayswereexperienced.OnJune14,2023,theNigeriangovernment announced that it would no longer continue its currency peg, whereby the Naira had traded at a fixed exchange rate in relation to the U.S. dollar. The resulting abandonment of the currency peg is anticipated to remove the prior obstacles to converting Naira into other currencies, and should allow the Fund to more readily repatriate Naira into U.S. dollars. In light of the historical uncertainty surrounding the Nigerian government’s currency policies, and certain proposed U.S. regulatory rules that, if adopted, would effectively mandate that the Fund hold securities readily convertible into U.S. dollars, the Adviser believes that it is in the best interests of the Fund and its shareholders for the Fund to liquidate its holdings
11. SUBSEQUENT EVENTS (continued)
and convert all Naira held by the Fund to U.S. dollars in anticipation of a liquidation of the Fund. After considering information presented by the Adviser on the proposed liquidation of the Fund, the Board concluded that it would be in the best interests of the Fund and its shareholders to liquidate and terminate the Fund. As of the close of regular trading on the NYSE Arca (the “NYSE”) on July 28, 2023 (“Closing Date”), the shares of the Fund will cease trading on the NYSE and the Fund will be closed to purchases by investors. In order to facilitate orderly capital markets activity, the Fund anticipates permitting purchases and redemptions of creation units in the Fund until it is delisted from the NYSE. Shareholders may sell their holdings in the Fund prior to the close of regular trading on the Closing Date and customary brokerage charges may apply to these transactions. Prior to the Closing Date, the Fund will be in the process of winding up its operations in an orderly fashion and liquidating its portfolio. This necessary process will result in the Fund not tracking its underlying index and increasing its cash holdings, which may not be consistent with the Fund’s current investment objective and strategy. On or about August 1, 2023, the Fund will liquidate its assets and distribute cash pro rata to all remaining shareholders who have not previously redeemed their shares in an amount equal to the net asset value of their shares as of the close of business on that date. These distributions will be taxable events. In addition, these payments to shareholders will include accrued capital gains and dividends, if any. Once the distributions are complete, the Fund will be terminated. The Adviser will bear all fees and expenses that may be incurred in connection with the liquidation of the Fund and the distribution of cash proceeds to investors in the Fund, other than brokerage fees and expenses. In view of historical uncertainty surrounding the Nigerian government’s currency policies, mentioned above, the timing for the proposed liquidation of the Fund and the Closing Date may be subject to change. Shareholders of the Fund will be promptly notified of any such changes.
The Funds have been evaluated by management regarding the need for additional disclosures (other than what is disclosed in the preceding paragraphs) and/or adjustments resulting from subsequent events. Based on this evaluation, no additional adjustments were required to the financial statements.
| Disclosure of Fund Expenses (Unaudited) |
ETFs (such as the Funds) have operating expenses. As a shareholder of an ETF, your investment is affected by these ongoing costs, which include (among others) costs for ETF management, administrative services, brokerage fees, and shareholder reports like this one. It is important for you to understand the impact of these costs on your investment returns. In addition, a shareholder is responsible for brokerage fees as a result of the shareholder’s investment in a Fund.
Operating expenses such as these are deducted from a Fund’s gross income and directly reduce your final investment returns. These expenses are expressed as a percentage of the Fund’s average net assets; this percentage is known as the Fund’s expense ratio.
The following examples use the expense ratio and are intended to help you understand the ongoing costs (in dollars) of investing in a Fund and to compare these costs with those of other funds. The examples are based on an investment of $1,000 made at the beginning of the period shown and held for the entire period from November 1, 2022 through April 30, 2023.
The table on the next page illustrates the Funds’costs in two ways:
Actual Fund Return. This section helps you to estimate the actual expenses that your Fund incurred over the period. The “Expenses Paid During Period” column shows the actual dollar expense cost incurred by a $1,000 investment in the Fund, and the “Ending Account Value” number is derived from deducting that expense cost from the Fund’s gross investment return.
You can use this information, together with the actual amount you invested in a Fund, to estimate the expenses you paid over that period. Simply divide your actual account value by $1,000 to arrive at a ratio (for example, an $8,600 account value divided by $1,000 = 8.6), then multiply that ratio by the number shown for your Fund under “Expenses Paid During Period.”
Hypothetical 5% Return. This section helps you compare a Fund’s costs with those of other funds. It assumes that the Funds had an annual 5% return before expenses during the year, but that the expense ratio (Column 3) for the period is unchanged. This example is useful in making comparisons because the SEC requires all funds to make this 5% calculation. You can assess your Fund’s comparative cost by comparing the hypothetical result for your Fund in the “Expenses Paid During Period” column with those that appear in the same charts in the shareholder reports for other funds.
NOTE: Because the return is set at 5% for comparison purposes — NOT your Fund’s actual return — the account values shown may not apply to your specific investment.
| Disclosure of Fund Expenses (Unaudited) (Continued) |
Beginning Account Value 11/1/2022 | Ending Account Value 4/30/2023 | Annualized Expenses Ratios | Expense Paid During Ratios(1) | |||||||||||||
| Global X MSCI Colombia ETF | ||||||||||||||||
| Actual Fund Return | $ | 1,000.00 | $ | 1,053.70 | 0.63 | % | $ | 3.21 | ||||||||
| Hypothetical 5% Return | 1,000.00 | 1,021.67 | 0.63 | 3.16 | ||||||||||||
| Global X MSCI China Industrials ETF | ||||||||||||||||
| Actual Fund Return | $ | 1,000.00 | $ | 1,253.50 | 0.65 | % | $ | 3.63 | ||||||||
| Hypothetical 5% Return | 1,000.00 | 1,021.57 | 0.65 | 3.26 | ||||||||||||
| Global X MSCI China Consumer Discretionary ETF | ||||||||||||||||
| Actual Fund Return | $ | 1,000.00 | $ | 1,273.90 | 0.65 | % | $ | 3.66 | ||||||||
| Hypothetical 5% Return | 1,000.00 | 1,021.57 | 0.65 | 3.26 | ||||||||||||
| Global X MSCI China Communication Services ETF | ||||||||||||||||
| Actual Fund Return | $ | 1,000.00 | $ | 1,710.10 | 0.65 | % | $ | 4.37 | ||||||||
| Hypothetical 5% Return | 1,000.00 | 1,021.57 | 0.65 | 3.26 | ||||||||||||
| Global X MSCI China Financials ETF | ||||||||||||||||
| Actual Fund Return | $ | 1,000.00 | $ | 1,369.10 | 0.65 | % | $ | 3.82 | ||||||||
| Hypothetical 5% Return | 1,000.00 | 1,021.57 | 0.65 | 3.26 | ||||||||||||
| Global X MSCI China Energy ETF | ||||||||||||||||
| Actual Fund Return | $ | 1,000.00 | $ | 1,205.70 | 0.65 | % | $ | 3.55 | ||||||||
| Hypothetical 5% Return | 1,000.00 | 1,021.57 | 0.65 | 3.26 | ||||||||||||
| Global X MSCI China Materials ETF | ||||||||||||||||
| Actual Fund Return | $ | 1,000.00 | $ | 1,245.90 | 0.65 | % | $ | 3.62 | ||||||||
| Hypothetical 5% Return | 1,000.00 | 1,021.57 | 0.65 | 3.26 | ||||||||||||
| Global X MSCI Norway ETF | ||||||||||||||||
| Actual Fund Return | $ | 1,000.00 | $ | 1,020.80 | 0.50 | % | $ | 2.51 | ||||||||
| Hypothetical 5% Return | 1,000.00 | 1,022.32 | 0.50 | 2.51 | ||||||||||||
| Global X FTSE Southeast Asia ETF | ||||||||||||||||
| Actual Fund Return | $ | 1,000.00 | $ | 921.50 | 0.65 | % | $ | 3.15 | ||||||||
| Hypothetical 5% Return | 1,000.00 | 1,021.93 | 0.65 | 3.31 | ||||||||||||
| Global X MSCI Argentina ETF | ||||||||||||||||
| Actual Fund Return | $ | 1,000.00 | $ | 1,283.20 | 0.59 | % | $ | 3.34 | ||||||||
| Hypothetical 5% Return | 1,000.00 | 1,021.87 | 0.59 | 2.96 | ||||||||||||
Beginning Account Value 11/1/2022 | Ending Account Value 4/30/2023 | Annualized Expenses Period | Expense Paid During Ratios(1) | |||||||||||||
| Global X MSCI Greece ETF | ||||||||||||||||
| Actual Fund Return | $ | 1,000.00 | $ | 1,331.40 | 0.57 | % | $ | 3.29 | ||||||||
| Hypothetical 5% Return | 1,000.00 | 1,021.97 | 0.57 | 2.86 | ||||||||||||
| Global X MSCI Nigeria ETF | ||||||||||||||||
| Actual Fund Return | $ | 1,000.00 | $ | 1,167.80 | 0.82 | % | $ | 4.41 | ||||||||
| Hypothetical 5% Return | 1,000.00 | 1,020.73 | 0.82 | 4.11 | ||||||||||||
| Global X MSCI Next Emerging & Frontier ETF | ||||||||||||||||
| Actual Fund Return | $ | 1,000.00 | $ | 1,063.10 | 0.57 | % | $ | 2.92 | ||||||||
| Hypothetical 5% Return | 1,000.00 | 1,021.97 | 0.57 | 2.86 | ||||||||||||
| Global X MSCI Portugal ETF | ||||||||||||||||
| Actual Fund Return | $ | 1,000.00 | $ | 1,195.30 | 0.59 | % | $ | 3.21 | ||||||||
| Hypothetical 5% Return | 1,000.00 | 1,021.87 | 0.59 | 2.96 | ||||||||||||
| Global X DAX Germany ETF | ||||||||||||||||
| Actual Fund Return | $ | 1,000.00 | $ | 1,337.70 | 0.21 | % | $ | 1.22 | ||||||||
| Hypothetical 5% Return | 1,000.00 | 1,023.75 | 0.21 | 1.05 | ||||||||||||
| Global X MSCI Pakistan ETF | ||||||||||||||||
| Actual Fund Return | $ | 1,000.00 | $ | 813.00 | 0.81 | % | $ | 3.64 | ||||||||
| Hypothetical 5% Return | 1,000.00 | 1,020.78 | 0.81 | 4.06 | ||||||||||||
| Global X MSCI China Consumer Staples ETF | ||||||||||||||||
| Actual Fund Return | $ | 1,000.00 | $ | 1,260.30 | 0.66 | % | $ | 3.70 | ||||||||
| Hypothetical 5% Return | 1,000.00 | 1,021.52 | 0.66 | 3.31 | ||||||||||||
| Global X MSCI China Health Care ETF | ||||||||||||||||
| Actual Fund Return | $ | 1,000.00 | $ | 1,232.20 | 0.65 | % | $ | 3.60 | ||||||||
| Hypothetical 5% Return | 1,000.00 | 1,021.57 | 0.65 | 3.26 | ||||||||||||
| Global X MSCI China Information Technology ETF | ||||||||||||||||
| Actual Fund Return | $ | 1,000.00 | $ | 1,164.50 | 0.65 | % | $ | 3.49 | ||||||||
| Hypothetical 5% Return | 1,000.00 | 1,021.57 | 0.65 | 3.26 | ||||||||||||
| Global X MSCI China Utilities ETF | ||||||||||||||||
| Actual Fund Return | $ | 1,000.00 | $ | 1,286.30 | 0.66 | % | $ | 3.74 | ||||||||
| Hypothetical 5% Return | 1,000.00 | 1,021.52 | 0.66 | 3.31 | ||||||||||||
Beginning Account Value 11/1/2022 | Ending Account Value 4/30/2023 | Annualized Expense Ratios | Expenses Paid During Period(1) | |||||||||||||
| Global X MSCI China Real Estate ETF | ||||||||||||||||
| Actual Fund Return | $ | 1,000.00 | $ | 1,449.40 | 0.67 | % | $ | 4.07 | ||||||||
| Hypothetical 5% Return | 1,000.00 | 1,021.47 | 0.67 | 3.36 | ||||||||||||
| Global X MSCI Vietnam ETF | ||||||||||||||||
| Actual Fund Return | $ | 1,000.00 | $ | 1,053.90 | 0.51 | % | $ | 2.60 | ||||||||
| Hypothetical 5% Return | 1,000.00 | 1,022.27 | 0.51 | 2.56 | ||||||||||||
| (1) | Expenses are equal to the Fund's annualized expense ratio multiplied by the average account value over the period, multiplied by 181/365 (to reflect the one-half year period). |
| Approval of Investment Advisory Agreement (Unaudited) |
Section 15(c) of the Investment Company Act of 1940, as amended (“1940 Act”), requires that the board of trustees of an exchange-traded fund (“ETF”), including a majority of those trustees who are not “interested persons” of the ETF, as defined in the 1940 Act (“Independent Trustees”), consider on an initial basis and periodically thereafter (as required by the 1940 Act), at an in person meeting called for such purpose, the terms of each ETF’s investment advisory agreement and whether to approve entering into, or renewing, each agreement.
At a Board meeting of the Global X Funds (the “Trust”) held on November 11, 2022, the Board of Trustees (the “Board”) (including the Trust’s Independent Trustees, voting separately) considered and unanimously approved the continuation of (i) the Investment Advisory Agreement (“Renewal Investment Advisory Agreement”) for each Fund included in this Semi-Annual Report (each, a “Renewal Fund”); and (ii) the Supervision and Administration Agreement (“Renewal Supervision and Administration Agreement”), each between the Trust, on behalf of each Renewal Fund, and Global X Management. The Renewal Investment Advisory Agreement and the Renewal Supervision and Administration Agreement are referred to collectively as the “Renewal Agreements.”
In advance of the Board meeting, the Board (including the Trust’s Independent Trustees) and the Independent Trustees’ independent legal counsel requested (in writing) detailed information from Global X Management in connection with the Board’s consideration of the Renewal Agreements and received and reviewed written responses from Global X Management and supporting materials relating to those requests for information. In the course of their consideration of the Renewal Agreements, the Trust’s Independent Trustees were advised by their independent legal counsel and, in addition to meetings with management of Global X Management, the Independent Trustees met separately in executive sessions with their counsel.
RENEWAL AGREEMENTS
In determining to approve the continuation of the Renewal Agreements for the Renewal Funds, the Board considered a variety of factors, including the factors discussed in greater detail below.
Nature, Extent and Quality of Services
With respect to this factor, the Board considered:
• the terms of the Renewal Agreements and the range of services that would continuetobeprovidedtoeachRenewalFundinaccordancewiththeRenewalAgreements;
• Global X Management’s key personnel and the portfolio managers who would continue to provide investment advisory, supervision and administrative services to each Renewal Fund;
| Approval of Investment Advisory Agreement (Unaudited) (Continued) |
• Global X Management’s responsibilities under the Renewal Agreements, among other things, to: (i) manage the investment operations of the Renewal Funds and the composition of the Renewal Funds’ assets, including the purchase, retention and disposition of their holdings, (ii) provide quarterly reports to the Trust’s officers and the Board and other reports as the Board deems necessary or appropriate, (iii) vote proxies, exercise consents, and exercise all other rights relating to securities and assets held by the Renewal Funds, (iv) select broker-dealers to execute portfolio transactions for the Renewal Funds when necessary, (v) assist in the preparation and filing of reports and proxy statements (if any) to the shareholders of the Renewal Funds, and the periodic updating of the registration statement, prospectuses, statements of additional information, and other reports and documents for the Renewal Funds that are required to be filed by the Trust with the Securities and Exchange Commission and other regulatory and governmental bodies, and (vi) monitor anticipated purchases and redemptions of the shares (including Creation Units) of the Renewal Funds by shareholders and new investors;
• the nature, extent and quality of all of the services (including advisory, administrative and compliance services) that have been provided by Global X Management or made available to the Renewal Funds; and
• the quality of Global X Management’s resources and personnel that would continue to be made available to the Renewal Funds, including Global X Management’s experience and the professional qualifications of Global X Management’s key personnel.
Based on these considerations, the Board concluded that it was satisfied with the nature, extent and quality of the services provided to the Renewal Funds by Global X Management.
Performance
The Board considered the performance of each Renewal Fund. They examined the performance of the Renewal Funds for the one-year, three-year, five-year and since-inception periods, as applicable. Also, the Board considered the total return and investments performanceoftheRenewalFundsrelativeto(i)theperformanceofunaffiliatedcomparable ETFs and/or other registered funds, which performance information is publicly available from such registered funds, as well as other third party sources; and (ii) the performance of pertinent indexes. The Board considered instances of under-performance and over-performance with respect to the competitor funds. The Board also considered the Renewal Funds’tracking against their underlying indexes in absolute terms.
Based on these considerations and comparisons, the Board concluded that the investment performance of the Renewal Funds did not adversely affect the Board’s approval of the continuance of the Renewal Agreements.
Cost of Services and Profitability
The Board considered Global X Management’s cost to provide investment management, supervision and administrative and related services to the Renewal Funds. In this regard,
| Approval of Investment Advisory Agreement (Unaudited) (Continued) |
the Board considered the management fee (“Management Fee”) that has been borne or is expected to be borne by the Renewal Funds under the Renewal Agreements for the various investment advisory, supervisory and administrative services that the Renewal Funds require under a unitary fee structure (including the types of fees and expenses that are not included within the unitary fee and would be borne by the Renewal Funds).
In addition, the Board considered expected profitability to Global X Management, as applicable, from all services provided or expected to be provided to the Renewal Funds and all aspects of Global X Management’s relationship with the Renewal Funds. In connection with these considerations, Global X Management provided the Board with financial information regarding its operations and the services provided to the Renewal Funds and discussed with the Board its current and expected, as applicable, profitability with respect to the Renewal Funds.
Based on these considerations, the Board concluded that the Management Fee rate paid by the Renewal Funds to Global X Management, in light of the nature, extent and quality of the services provided, was reasonable and in the best interests of the Renewal Funds’ shareholders.
Comparison of Fees and Services
With respect to this factor, the Board considered:
• comparative information with respect to the Management Fee paid to Global X Management by the Renewal Funds. In connection with this consideration, Global X Management provided the Board with comparative expense data for the Renewal Funds, including fees and expenses paid by unaffiliated similar specialized and/or focused ETFs and/or other comparable registered funds. The Board considered the Global X Management’s detailed explanation of the fee structures of any Renewal Fund that was above the average or median for its peer group;
• the structure of the unitary Management Fee (which includes as one component the investment advisory fee for the Renewal Funds) and the current total expense ratios for the Renewal Funds. In this regard, the Board took into consideration that the purpose of adopting a unitary Management Fee structure for the Renewal Funds was to create a simple, all-inclusive fee that would provide a level of predictability with respect to the overall expense ratio (i.e., the total fees) of the Renewal Funds and that the proposed Management Fees for the Renewal Funds were set at a competitive levels to make the Renewal Funds viable in the marketplace; and
• that, under the unified Management Fee structure, Global X Management is responsible for most ordinary expenses of the Renewal Funds, including the costs of various third-party services required by the Renewal Funds, including investment advisory, administrative, audit, certain custody, portfolio accounting, legal, transfer agency and printing costs, but that the Renewal Funds would bear other expenses not covered under
the proposed all-inclusive Management Fee, such as taxes, brokerage fees, commissions, and other transaction expenses, interest expenses, and extraordinary expenses.
Based on these considerations, the Board concluded that the services received and the fees charged under the Renewal Agreements were reasonable on a comparative basis.
Economies of Scale
With respect to this factor, the Board considered:
• the extent to which economies of scale would be realized as the Renewal Funds grow and whether the unitary Management Fee for the Renewal Funds reflected these economies of scale;
• the significant investment of time, personnel and other resources that Global X Management has made and intends to continue to make in the Renewal Funds in order to seek to assure that the Renewal Funds are attractive to investors; and
• that the unitary Management Fee would provide a high level of certainty as to the total level of expenses for the Renewal Funds and their shareholders.
Based on these considerations, the Board concluded that the unitary Management Fee for the Renewal Funds appropriately addressed economies of scale.
Other Benefits
In considering the Renewal Agreements, in addition to the factors above, the Board considered any other benefits realized by Global X Management as a result of its relationships with the Renewal Funds and concluded that, in the exercise of the Board’s business judgement, all information the Board considered supported approval of the continuation of the Renewal Agreements.
Conclusion
After full consideration of the factors above, as well as other factors that were instructive in its consideration, the Board, including all of the Trust’s Independent Trustees voting separately, concluded, in the exercise of its business judgement, that the Renewal Agreements were fair and reasonable and in the best interest of each Renewal Fund.
In reaching this decision, the Board did not assign relative weights to the factors above nor did the Board deem any one factor or group of them to be controlling in and of themselves. Each member of the Board may have assigned different weights to the various factors.
| Supplemental Information (Unaudited) |
NAV is the price per Share at which the Funds issue and redeem Shares. It is calculated in accordance with the standard formula for valuing mutual fund shares. The “Market Price” of a Fund generally is determined using the midpoint between the highest bid and the lowest offer on the stock exchange on which the Shares of the Fund are listed for trading, as of the time that the Fund’s NAV is calculated. The Funds’Market Price may be at, above or below their NAV. The NAV of the Funds will fluctuate with changes in the market value of the Funds’ holdings. The Market Price of the Funds will fluctuate in accordance with changes in their NAV, as well as market supply and demand.
Premiums or discounts are the differences (expressed as a percentage) between the NAV and Market Price of a Fund on a given day, generally at the time NAV is calculated. A premium is the amount that a Fund is trading above the reported NAV, expressed as a percentage of the NAV. A discount is the amount that a Fund is trading below the reported NAV, expressed as a percentage of the NAV.
Further information regarding premiums and discounts is available on the Funds’ website at www.globalxetfs.com.
| Notes |
| Notes |
| Notes |
605 Third Avenue, 43rd floor
New York, NY 10158
1-888-493-8631
www.globalxetfs.com
Investment Adviser and Administrator:
Global X Management Company LLC
605 Third Avenue, 43rd floor
New York, NY 10158
Distributor:
SEI Investments Distribution Co.
One Freedom Valley Drive
Oaks, PA 19456
Sub-Administrator:
SEI Investments Global Funds Services
One Freedom Valley Drive
Oaks, PA 19456
Counsel for Global X Funds and the Independent Trustees:
Stradley Ronon Stevens & Young, LLP
2000 K Street, N.W.
Suite 700
Washington, DC 20006
Custodians and Transfer Agents:
Brown Brothers Harriman & Co.
40 Water Street
Boston, MA 02109
The Bank of New York Mellon
240 Greenwich Street
New York, NY 10286
Independent Registered Public Accounting Firm:
PricewaterhouseCoopers LLP
Two Commerce Square
Suite 1800
2001 Market Street
Philadelphia, PA 19103
This information must be preceded or accompanied by a current prospectus for the funds described.
GLX-SA-002-1200
President
President
Chief Financial Officer