UNITED STATES
SECURITIES AND EXCHANGE COMMISSION
Washington, D.C. 20549
________
FORM N-CSRS
________
CERTIFIED SHAREHOLDER REPORT OF REGISTERED MANAGEMENT
INVESTMENT COMPANIES
Investment Company Act file number 811-22209
Global X Funds
(Exact name of registrant as specified in charter)
________
605 Third Avenue, 43rd floor
New York, NY 10158
(Address of principal executive offices) (Zip code)
Luis Berruga
Global X Management Company LLC
605 Third Avenue, 43rd floor
New York, NY 10158
(Name and address of agent for service)
With a copy to:
Global X Management Company LLC 605 Third Avenue, 43rd floor New York, NY 10158 | Eric S. Purple, Esq. Stradley Ronon Stevens & Young, LLP 2000 K Street, N.W., Suite 700 Washington, DC 20006-1871 |
Registrant’s telephone number, including area code: (212) 644-6440
Date of fiscal year end: October 31, 2023
Date of reporting period: April 30, 2023
Item 1. Reports to Stockholders.
(a) A copy of the report transmitted to stockholders pursuant to Rule 30e-1 under the Investment Company Act of 1940, as amended (the “Act”) (17 CFR § 270.30e-1), is attached hereto.
(b) Not applicable.

Global X Lithium & Battery Tech ETF (ticker: LIT)
Global X SuperDividend® ETF (ticker: SDIV)
Global X Social Media ETF (ticker: SOCL)
Global X Guru® Index ETF (ticker: GURU)
Global X SuperIncome™ Preferred ETF (ticker: SPFF)
Global X SuperDividend® U.S. ETF (ticker: DIV)
Global X S&P 500® Covered Call ETF (ticker: XYLD)
Global X NASDAQ 100® Covered Call ETF (ticker: QYLD)
Global X MSCI SuperDividend® Emerging Markets ETF (ticker: SDEM)
Global X SuperDividend® REIT ETF (ticker: SRET)
Global X Renewable Energy Producers ETF (ticker: RNRG)
Global X S&P 500® Catholic Values ETF (ticker: CATH)
Global X MSCI SuperDividend® EAFE ETF (ticker: EFAS)
Global X E-commerce ETF (ticker: EBIZ)
Global X Russell 2000 Covered Call ETF (ticker: RYLD)
Global X S&P Catholic Values Developed ex-U.S. ETF (ticker: CEFA)
Global X Nasdaq 100® Covered Call & Growth ETF (ticker: QYLG)
Global X S&P 500® Covered Call & Growth ETF (ticker: XYLG)
Global X Emerging Markets Internet & E-commerce ETF (ticker: EWEB)
Global X NASDAQ 100® Tail Risk ETF (ticker: QTR)
Global X NASDAQ 100® Risk Managed Income ETF (ticker: QRMI)
Global X NASDAQ 100® Collar 95-110 ETF (ticker: QCLR)
Global X S&P 500® Tail Risk ETF (ticker: XTR)
Global X S&P 500® Risk Managed Income ETF (ticker: XRMI)
Global X S&P 500® Collar 95-110 ETF (ticker: XCLR)
Global X Disruptive Materials ETF (ticker: DMAT)
Global X Dow 30® Covered Call ETF (ticker: DJIA)
Global X Russell 2000 Covered Call & Growth ETF (ticker: RYLG)
Global X Financials Covered Call & Growth ETF (ticker: FYLG)
Global X Health Care Covered Call & Growth ETF (ticker: HYLG)
Global X Information Technology Covered Call & Growth ETF (ticker: TYLG)
Global X Nasdaq 100® ESG Covered Call ETF (ticker: QYLE)
Global X S&P 500® ESG Covered Call ETF (ticker: XYLE)
Semi-Annual Report
April 30, 2023
As permitted by regulations adopted by the Securities and Exchange Commission, paper copies of the Funds’(defined below) shareholder reports will no longer be sent by mail, unless you specifically request paper copies of the reports from your financial intermediary (such as a broker-dealer or bank). Instead, shareholder reports will be available on the Funds’ website (www.globalxetfs.com/explore), and you will be notified by mail each time a report is posted and provided with a website link to access the report.
If you already elected to receive shareholder reports electronically, you will not be affected by this change and you need not take any action. You may elect to receive shareholder reports and other communications from the Funds electronically anytime by contacting your financial intermediary.
You may elect to receive all future Fund shareholder reports in paper free of charge. Please contact your financial intermediary to inform them that you wish to continue receiving paper copies of Fund shareholder reports and for details about whether your election to receive reports in paper will apply to all funds held with your financial intermediary.
| |
| |
| Schedules of Investments | | | |
| Global X Lithium & Battery Tech ETF | | | 1 | |
| Global X SuperDividend® ETF | | | 6 | |
| Global X Social Media ETF | | | 16 | |
| Global X Guru® Index ETF | | | 20 | |
| Global X SuperIncome™ Preferred ETF | | | 25 | |
| Global X SuperDividend® U.S. ETF | | | 29 | |
| Global X S&P 500® Covered Call ETF | | | 33 | |
| Global X NASDAQ 100® Covered Call ETF | | | 49 | |
| Global X MSCI SuperDividend® Emerging Markets ETF | | | 55 | |
| Global X SuperDividend® REIT ETF | | | 61 | |
| Global X Renewable Energy Producers ETF | | | 64 | |
| Global X S&P 500® Catholic Values ETF | | | 70 | |
| Global X MSCI SuperDividend® EAFE ETF | | | 83 | |
| Global X E-commerce ETF | | | 89 | |
| Global X Russell 2000 Covered Call ETF | | | 94 | |
| Global X S&P Catholic Values Developed ex-US ETF | | | 150 | |
| Global X Nasdaq 100® Covered Call & Growth ETF | | | 173 | |
| Global X S&P 500® Covered Call & Growth ETF | | | 179 | |
| Global X Emerging Markets Internet & E-commerce ETF | | | 195 | |
| Global X NASDAQ 100® Tail Risk ETF | | | 199 | |
| Global X NASDAQ 100® Risk Managed Income ETF | | | 205 | |
| Global X NASDAQ 100® Collar 95-110 ETF | | | 212 | |
| Global X S&P 500® Tail Risk ETF | | | 219 | |
| Global X S&P 500® Risk Managed Income ETF | | | 235 | |
| Global X S&P 500® Collar 95-110 ETF | | | 251 | |
| Global X Disruptive Materials ETF | | | 267 | |
| Global X Dow 30® Covered Call ETF | | | 271 | |
| Global X Russell 2000 Covered Call & Growth ETF | | | 274 | |
| Global X Financials Covered Call & Growth ETF | | | 276 | |
| Global X Health Care Covered Call & Growth ETF | | | 280 | |
| Global X Information Technology Covered Call & Growth ETF | | | 284 | |
| Global X Nasdaq 100® ESG Covered Call ETF | | | 288 | |
| Global X S&P 500® ESG Covered Call ETF | | | 294 | |
| Glossary | | | 305 | |
| Statements of Assets and Liabilities | | | 306 | |
| Statements of Operations | | | 315 | |
| Statements of Changes in Net Assets | | | 324 | |
| Financial Highlights | | | 342 | |
| Notes to Financial Statements | | | 364 | |
| Disclosure of Fund Expenses | | | 402 | |
| Approval of Investment Advisory Agreement | | | 407 | |
| Supplemental Information | | | 415 | |
Shares are bought and sold at market price (not NAV) and are not individually redeemed from a Fund. Shares may only be redeemed directly from a Fund by Authorized Participants, in very large creation/redemption units. Brokerage commissions will reduce returns.
The Funds file their complete schedules of Fund holdings with the Securities and Exchange Commission (the “SEC” or “Commission”) for the first and third quarters of each fiscal year as an exhibit to its reports on Form N-PORT. The Funds’ Forms N-PORT are available on the Commission’s website at https://www.sec.gov, and may be reviewed and copied at the Commission's Public Reference Room in Washington, DC. Information on the operation of the Public Reference Room may be obtained by calling 1-800-SEC-0330.
A description of the policies and procedures that Global X Funds uses to determine how to vote proxies relating to Fund securities, as well as information relating to how the Funds voted proxies relating to Fund securities during the most recent 12-month period ended June 30, is available (i) without charge, upon request, by calling 1-888-493-8631; and (ii) on the Commission’s website at https://www.sec.gov.
|
|
|
| Schedule of Investments | | April 30, 2023 (Unaudited) |
| Global X Lithium & Battery Tech ETF |
| | | | |
| |
| | | Shares | | | Value | |
| COMMON STOCK — 100.0% | | | | | | |
| AUSTRALIA — 12.5% | | | | | | |
| Materials — 12.5% | | | | | | |
| Allkem * | | | 6,988,328 | | | $ | 56,573,498 | |
| Core Lithium * (A) | | | 19,996,616 | | | | 12,950,491 | |
| IGO | | | 8,813,954 | | | | 80,089,788 | |
| Liontown Resources * (A) | | | 20,241,862 | | | | 36,652,592 | |
| Mineral Resources . | | | 1,979,469 | | | | 96,383,344 | |
| Pilbara Minerals | | | 34,635,128 | | | | 97,047,940 | |
| Sayona Mining * (A) | | | 83,953,295 | | | | 11,096,127 | |
| TOTAL AUSTRALIA | | | | | | | 390,793,780 | |
| BRAZIL — 0.7% | | | | | | | | |
| Materials — 0.7% | | | | | | | | |
| Sigma Lithium * | | | 633,051 | | | | 22,036,505 | |
| CANADA — 0.9% | | | | | | | | |
| Materials — 0.9% | | | | | | | | |
| Lithium Americas * (A) | | | 1,408,404 | | | | 28,120,313 | |
|
|
|
| Schedule of Investments | | April 30, 2023 (Unaudited) |
| Global X Lithium & Battery Tech ETF |
| | | | |
| |
| | | Shares | | | Value | |
| COMMON STOCK — continued | | | | | | |
| CHILE — 3.7% | | | | | | |
| Materials — 3.7% | | | | | | |
| Sociedad Quimica y Minera de Chile ADR | | | 1,705,012 | | | $ | 115,054,210 | |
| CHINA — 38.6% | | | | | | | | |
| Consumer Discretionary — 5.2% | | | | | | | | |
| BYD, Cl H . | | | 5,396,274 | | | | 162,233,998 | |
| Industrials — 13.7% | | | | | | | | |
| Beijing Easpring Material Technology, Cl A | | | 4,315,448 | | | | 33,354,223 | |
| Contemporary Amperex Technology, Cl A . | | | 4,849,009 | | | | 161,686,163 | |
| Eve Energy, Cl A | | | 14,278,188 | | | | 135,187,264 | |
| Sunwoda Electronic, Cl A | | | 14,527,191 | | | | 35,293,735 | |
| Wuxi Lead Intelligent Equipment, Cl A . | | | 11,167,236 | | | | 61,697,436 | |
| | | | | | | | 427,218,821 | |
| Information Technology — 4.2% | | | | | | | | |
| NAURA Technology Group, Cl A . | | | 2,725,841 | | | | 131,708,133 | |
| Materials — 15.5% | | | | | | | | |
| Ganfeng Lithium Group, Cl A | | | 12,521,940 | | | | 117,546,077 | |
| Guangzhou Tinci Materials Technology, Cl A .. | | | 13,223,478 | | | | 81,519,235 | |
| Shanghai Putailai New Energy Technology, | | | | | | | | |
| | | 6,658,356 | | | | 50,221,984 | |
| Shenzhen Capchem Technology, Cl A | | | 5,356,998 | | | | 37,721,251 | |
| Tianqi Lithium, Cl A * | | | 11,493,441 | | | | 118,300,308 | |
| Yunnan Energy New Material, Cl A * | | | 5,258,359 | | | | 79,066,215 | |
| | | | | | | | 484,375,070 | |
| TOTAL CHINA | | | | | | | 1,205,536,022 | |
| JAPAN — 10.9% | | | | | | | | |
| Consumer Discretionary — 5.0% | | | | | | | | |
| Panasonic Holdings | | | 16,712,086 | | | | 156,301,851 | |
| Industrials — 1.0% | | | | | | | | |
| GS Yuasa | | | 869,244 | | | | 15,180,569 | |
| Japan Steel Works . | | | 776,587 | | | | 14,012,957 | |
| | | | | | | | 29,193,526 | |
|
|
|
| Schedule of Investments | | April 30, 2023 (Unaudited) |
| Global X Lithium & Battery Tech ETF |
| | | | |
| |
| | | Shares | | | Value | |
| COMMON STOCK — continued | | | | | | |
| Information Technology — 4.9% | | | | | | |
| TDK | | | 4,514,642 | | | $ | 154,008,094 | |
| TOTAL JAPAN | | | | | | | 339,503,471 | |
| NORWAY — 0.3% | | | | | | | | |
| Industrials — 0.3% | | | | | | | | |
| FREYR Battery * (A) | | | 1,447,384 | | | | 10,233,005 | |
| SOUTH KOREA — 9.9% | | | | | | | | |
| Industrials — 3.7% | | | | | | | | |
| LG Energy Solution * | | | 268,597 | | | | 116,598,070 | |
| Information Technology — 6.2% | | | | | | | | |
| L&F (A) | | | 288,586 | | | | 57,139,338 | |
| Samsung SDI | | | 265,740 | | | | 137,198,401 | |
| | | | | | | | 194,337,739 | |
| TOTAL SOUTH KOREA | | | | | | | 310,935,809 | |
| TAIWAN — 0.6% | | | | | | | | |
| Information Technology — 0.6% | | | | | | | | |
| Simplo Technology . | | | 1,922,580 | | | | 19,261,759 | |
| UNITED STATES — 21.9% | | | | | | | | |
| Consumer Discretionary — 10.4% | | | | | | | | |
| Lucid Group * (A) | | | 7,604,861 | | | | 60,382,596 | |
| QuantumScape, Cl A * (A) | | | 2,730,947 | | | | 19,116,629 | |
| Rivian Automotive, Cl A * | | | 8,426,764 | | | | 108,031,115 | |
| Tesla * | | | 842,633 | | | | 138,453,028 | |
| | | | | | | | 325,983,368 | |
| Industrials — 1.7% | | | | | | | | |
| EnerSys | | | 478,057 | | | | 39,664,389 | |
| Enovix * (A) | | | 1,349,268 | | | | 14,599,080 | |
| | | | | | | | 54,263,469 | |
| Materials — 9.8% | | | | | | | | |
| Albemarle | | | 1,397,322 | | | | 259,147,338 | |
|
|
|
| Schedule of Investments | | April 30, 2023 (Unaudited) |
| Global X Lithium & Battery Tech ETF |
| | | | |
| |
| | | Shares | | | Value | |
| COMMON STOCK — continued | | | | | | |
| Materials — continued | | | | | | |
| Livent * | | | 2,123,541 | | | $ | 46,399,371 | |
| | | | | | | | 305,546,709 | |
| TOTAL UNITED STATES | | | | | | | 685,793,546 | |
| TOTAL COMMON STOCK | | | | | | | | |
| (Cost $3,127,366,329) | | | | | | | 3,127,268,420 | |
| SHORT-TERM INVESTMENT(B)(C) — 0.4% | | | | | | | | |
| Fidelity Investments Money Market | | | | | | | | |
| Government Portfolio, Cl Institutional, | | | | | | | | |
| 4.770% | | | | | | | | |
| (Cost $12,914,900) . | | | 12,914,900 | | | | 12,914,900 | |
| | Face Amount | | | | | |
| REPURCHASE AGREEMENT(B) — 4.6% | | | | | | | | |
| BNP Paribas | | | | | | | | |
| 4.700%, dated 04/28/2023, to be | | | | | | | | |
| repurchased on 05/01/2023, repurchase | | | | | | | | |
| price $144,363,744 (collateralized by U.S. | | | | | | | | |
| Treasury Obligations, ranging in par value | | | | | | | | |
| $7,752,584 - $11,651,586, 1.125% - 2.250%, | | | | | | | | |
| 01/15/2025 - 08/15/2027, with a total market | | | | | | | | |
| value of $146,901,460) | | | | | | | | |
| (Cost $144,307,224) . | | $ | 144,307,224 | | | | 144,307,224 | |
| TOTAL INVESTMENTS — 105.0% | | | | | | | | |
| (Cost $3,284,588,453) | | | | | | $ | 3,284,490,544 | |
| Percentages are based on Net Assets of $3,127,602,337. |
| |
| * | Non-income producing security. |
| (A) | This security or a partial position of this security is on loan at April 30, 2023. |
| (B) | Security was purchased with cash collateral held from securities on loan. |
| (C) | The rate reported on the Schedule of Investments is the 7-day effective yield as of |
| | April 30, 2023. |
|
|
|
| Schedule of Investments | | April 30, 2023 (Unaudited) |
| Global X Lithium & Battery Tech ETF |
The following is a summary of the level of inputs used as of April 30, 2023, in valuing the Fund's investments carried at value:
| Investments in Securities | | Level 1 | | | Level 2 | | | Level 3 | | | Total | |
| Common Stock | | $ | 3,127,268,420 | | | $ | — | | | $ | — | | | $ | 3,127,268,420 | |
| Short-Term Investment | | | 12,914,900 | | | | — | | | | — | | | | 12,914,900 | |
| Repurchase Agreement | | | — | | | | 144,307,224 | | | | — | | | | 144,307,224 | |
| Total Investments in Securities | | $ | 3,140,183,320 | | | $ | 144,307,224 | | | $ | — | | | $ | 3,284,490,544 | |
Amounts designated as “—“ are $0 or have been rounded to $0.
See "Glossary" for abbreviations.
|
|
|
| Schedule of Investments | | April 30, 2023 (Unaudited) |
| Global X SuperDividend® ETF |
| | | | |
| |
| | | Shares | | | Value | |
| COMMON STOCK — 93.6% | | | | | | |
| ARGENTINA — 1.0% | | | | | | |
| Materials — 1.0% | | | | | | |
| Loma Negra Cia Industrial Argentina ADR | | | 1,169,419 | | | $ | 7,156,844 | |
| AUSTRALIA — 9.6% | | | | | | | | |
| Consumer Discretionary — 2.0% | | | | | | | | |
| Harvey Norman Holdings | | | 2,914,920 | | | | 6,954,045 | |
| TABCORP Holdings . | | | 11,815,738 | | |
| 8,198,867 | |
| | | | | | | | 15,152,912 | |
| Energy — 2.0% | | | | | | | | |
| Woodside Energy Group | | | 341,436 | | | | 7,599,501 | |
| Yancoal Australia (A) | | | 1,964,362 | | | | 7,217,719 | |
| | | | | | | | 14,817,220 | |
| Financials — 2.0% | | | | | | | | |
| Magellan Financial Group . | | | 1,418,798 | | | | 7,613,428 | |
| Platinum Asset Management | | | 6,617,160 | | | | 7,674,541 | |
| | | | | | | | 15,287,969 | |
| Materials — 3.6% | | | | | | | | |
| BHP Group | | | 248,709 | | | | 7,297,568 | |
|
|
|
| Schedule of Investments | | April 30, 2023 (Unaudited) |
| Global X SuperDividend® ETF |
| | | | |
| |
| | | Shares | | | Value | |
| COMMON STOCK — continued | | | | | | |
| Materials — continued | | | | | | |
| Grange Resources . | | | 13,704,745 | | | $ | 5,569,930 | |
| Rio Tinto . | | | 96,440 | | | | 7,153,972 | |
| Rio Tinto ADR | | | 106,779 | | | | 6,832,788 | |
| | | | | | | | 26,854,258 | |
| TOTAL AUSTRALIA | | | | | | | 72,112,359 | |
| BRAZIL — 8.1% | | | | | | | | |
| Consumer Staples — 2.0% | | | | | | | | |
| BrasilAgro - Brasileira de Propriedades | | | | | | | | |
| | | 1,578,620 | | | | 7,623,546 | |
| Marfrig Global Foods | | | 5,785,381 | | | | 7,528,275 | |
| | | | | | | | 15,151,821 | |
| Materials — 2.9% | | | | | | | | |
| Cia Siderurgica Nacional | | | 2,491,800 | | | | 7,077,662 | |
| CSN Mineracao . | | | 8,169,100 | | | | 7,576,606 | |
| Vale ADR, Cl B . | | | 465,030 | | | | 6,701,082 | |
| | | | | | | | 21,355,350 | |
| Utilities — 3.2% | | | | | | | | |
| CPFL Energia . | | | 1,239,211 | | | | 8,208,812 | |
| EDP - Energias do Brasil . | | | 1,775,546 | | | | 7,985,405 | |
| Transmissora Alianca de Energia Eletrica . | | | 1,072,223 | | | | 7,816,339 | |
| | | | | | | | 24,010,556 | |
| TOTAL BRAZIL | | | | | | | 60,517,727 | |
| CHILE — 1.0% | | | | | | | | |
| Communication Services — 1.0% | | | | | | | | |
| ENTEL Chile | | | 1,812,795 | | | | 7,588,103 | |
| CHINA — 12.6% | | | | | | | | |
| Energy — 2.1% | | | | | | | | |
| China Petroleum & Chemical, Cl H | | | 12,781,500 | | | | 8,352,857 | |
| China Shenhua Energy, Cl H | | | 2,339,200 | | | | 7,747,768 | |
| | | | | | | | 16,100,625 | |
| Financials — 4.0% | | | | | | | | |
| China Cinda Asset Management, Cl H | | | 57,862,500 | | | | 6,855,135 | |
| China Everbright Bank, Cl H . | | | 25,293,800 | | | | 8,087,675 | |
|
|
|
| Schedule of Investments | | April 30, 2023 (Unaudited) |
| Global X SuperDividend® ETF |
| | | | |
| |
| | | Shares | | | Value | |
| COMMON STOCK — continued | | | | | | |
| Financials — continued | | | | | | |
| Chongqing Rural Commercial Bank, Cl H . | | | 21,880,200 | | | $ | 8,445,586 | |
| Lufax Holding ADR | | | 3,813,492 | | | | 6,482,936 | |
| | | | | | | | 29,871,332 | |
| Industrials — 1.1% | | | | | | | | |
| Shanghai Industrial Holdings | | | 5,722,400 | | | | 8,368,661 | |
| Materials — 2.8% | | | | | | | | |
| China Hongqiao Group | | | 7,222,000 | | | | 7,074,890 | |
| China Resources Cement Holdings | | | 13,410,500 | | | | 6,047,615 | |
| Shougang Fushan Resources Group . | | | 23,277,100 | | | | 7,887,627 | |
| | | | | | | | 21,010,132 | |
| Real Estate — 2.6% | | | | | | | | |
| China Aoyuan Group *(B) | | | 45,008,763 | | | | 860,051 | |
| China Overseas Grand Oceans Group | | | 20,019,900 | | | | 11,553,032 | |
| Midea Real Estate Holding (A) | | | 6,068,400 | | | | 7,228,059 | |
| | | | | | | | 19,641,142 | |
| TOTAL CHINA | | | | | | | 94,991,892 | |
| DENMARK — 1.7% | | | | | | | | |
| Industrials — 1.7% | | | | | | | | |
| AP Moller - Maersk, Cl B | | | 3,145 | | | | 5,680,873 | |
| D/S Norden . | | | 107,074 | | | | 6,730,882 | |
| TOTAL DENMARK | | | | | | | 12,411,755 | |
| GREECE — 0.9% | | | | | | | | |
| Industrials — 0.9% | | | | | | | | |
| Star Bulk Carriers (A) | | | 331,214 | | | | 6,991,928 | |
| HONG KONG — 4.4% | | | | | | | | |
| Communication Services — 2.0% | | | | | | | | |
| HKBN | | | 10,460,400 | | | | 7,369,013 | |
| PCCW | | | 14,917,100 | | | | 7,772,193 | |
| | | | | | | | 15,141,206 | |
| Industrials — 1.3% | | | | | | | | |
| Orient Overseas International | | | 486,400 | | | | 9,839,656 | |
|
|
|
| Schedule of Investments | | April 30, 2023 (Unaudited) |
| Global X SuperDividend® ETF |
| | | | |
| |
| | | Shares | | | Value | |
| COMMON STOCK — continued | | | | | | |
| Information Technology — 1.1% | | | | | | |
| VTech Holdings | | | 1,353,400 | | | $ | 8,111,883 | |
| TOTAL HONG KONG | | | | | | | 33,092,745 | |
| INDONESIA — 2.1% | | | | | | | | |
| Energy — 2.1% | | | | | | | | |
| Bukit Asam | | | 30,710,500 | | | | 8,666,767 | |
| Indo Tambangraya Megah . | | | 3,131,700 | | | | 7,108,767 | |
| TOTAL INDONESIA | | | | | | | 15,775,534 | |
| ISRAEL — 0.8% | | | | | | | | |
| Consumer Discretionary — 0.8% | | | | | | | | |
| Delek Automotive Systems | | | 764,703 | | | | 6,119,390 | |
| ITALY — 1.0% | | | | | | | | |
| Financials — 1.0% | | | | | | | | |
| BFF Bank | | | 741,060 | | | | 7,134,073 | |
| JAPAN — 0.9% | | | | | | | | |
| Industrials — 0.9% | | | | | | | | |
| Mitsui OSK Lines (A) | | | 282,848 | | | | 6,979,542 | |
| KUWAIT — 1.1% | | | | | | | | |
| Consumer Discretionary — 1.1% | | | | | | | | |
| Humansoft Holding KSC | | | 624,999 | | | | 7,956,573 | |
| NETHERLANDS — 1.8% | | | | | | | | |
| Industrials — 1.0% | | | | | | | | |
| PostNL | | | 4,169,034 | | | | 7,497,634 | |
| Materials — 0.8% | | | | | | | | |
| OCI | | | 227,019 | | | | 5,987,507 | |
| TOTAL NETHERLANDS | | | | | | | 13,485,141 | |
| NORWAY — 1.9% | | | | | | | | |
| Energy — 1.0% | | | | | | | | |
| FLEX LNG . | | | 227,413 | | | | 7,825,281 | |
|
|
|
| Schedule of Investments | | April 30, 2023 (Unaudited) |
| Global X SuperDividend® ETF |
| | | | |
| |
| | | Shares | | | Value | |
| COMMON STOCK — continued | | | | | | |
| Industrials — 0.9% | | | | | | |
| Golden Ocean Group | | | 743,672 | | | $ | 6,804,599 | |
| TOTAL NORWAY | | | | | | | 14,629,880 | |
| RUSSIA — 0.0% | | | | | | | | |
| Materials — 0.0% | | | | | | | | |
| Magnitogorsk Iron & Steel Works PJSC *(B) | | | 6,332,020 | | | | — | |
| PhosAgro PJSC GDR *(B) | | | 119 | | | | — | |
| Severstal PJSC *(B) | | | 312,897 | | | | — | |
| | | | | | | | — | |
| Utilities — 0.0% | | | | | | | | |
| Unipro PJSC *(B) | | | 209,143,887 | | | | — | |
| TOTAL RUSSIA | | | | | | | — | |
| SINGAPORE — 1.6% | | | | | | | | |
| Energy — 0.9% | | | | | | | | |
| BW LPG . | | | 890,068 | | | | 7,147,285 | |
| Real Estate — 0.7% | | | | | | | | |
| Manulife US Real Estate Investment Trust ‡ | | | 28,015,405 | | | | 5,014,757 | |
| TOTAL SINGAPORE | | | | | | | 12,162,042 | |
| SOUTH AFRICA — 4.0% | | | | | | | | |
| Energy — 1.0% | | | | | | | | |
| Exxaro Resources (A) | | | 733,206 | | | | 7,692,272 | |
| Financials — 1.0% | | | | | | | | |
| Coronation Fund Managers | | | 4,370,461 | | | | 7,168,667 | |
| Materials — 0.9% | | | | | | | | |
| African Rainbow Minerals | | | 568,703 | | | | 7,144,655 | |
| Real Estate — 1.1% | | | | | | | | |
| Redefine Properties ‡ | | | 38,166,087 | | | | 8,099,237 | |
| TOTAL SOUTH AFRICA | | | | | | | 30,104,831 | |
| TAIWAN — 2.6% | | | | | | | | |
| Information Technology — 1.8% | | | | | | | | |
| Himax Technologies ADR (A) | | | 968,924 | | | | 6,433,655 | |
|
|
|
| Schedule of Investments | | April 30, 2023 (Unaudited) |
| Global X SuperDividend® ETF |
| | | | |
| |
| | | Shares | | | Value | |
| COMMON STOCK — continued | | | | | | |
| Information Technology — continued | | | | | | |
| Innolux | | | 16,344,000 | | | $ | 7,124,001 | |
| | | | | | | | 13,557,656 | |
| Materials — 0.8% | | | | | | | | |
| Nantex Industry . | | | 4,850,000 | | | | 6,223,713 | |
| TOTAL TAIWAN | | | | | | | 19,781,369 | |
| THAILAND — 1.6% | | | | | | | | |
| Industrials — 1.6% | | | | | | | | |
| Precious Shipping NVDR (A) | | | 17,864,500 | | | | 6,487,145 | |
| Regional Container Lines NVDR (A) | | | 8,284,776 | | | | 5,871,340 | |
| TOTAL THAILAND | | | | | | | 12,358,485 | |
| UKRAINE — 0.8% | | | | | | | | |
| Materials — 0.8% | | | | | | | | |
| Ferrexpo | | | 4,643,315 | | | | 6,308,900 | |
| UNITED ARAB EMIRATES — 1.2% | | | | | | | | |
| Energy — 1.2% | | | | | | | | |
| Dana Gas PJSC | | | 36,528,867 | | | | 8,893,466 | |
| UNITED KINGDOM — 3.1% | | | | | | | | |
| Consumer Discretionary — 1.1% | | | | | | | | |
| Persimmon . | | | 500,407 | | | | 8,264,537 | |
| Financials — 2.0% | | | | | | | | |
| Jupiter Fund Management . | | | 4,389,003 | | | | 7,171,483 | |
| M&G . | | | 2,948,741 | | | | 7,601,548 | |
| | | | | | | | 14,773,031 | |
| TOTAL UNITED KINGDOM | | | | | | | 23,037,568 | |
| UNITED STATES — 29.8% | | | | | | | | |
| Consumer Staples — 1.0% | | | | | | | | |
| JBS . | | | 2,100,417 | | | | 7,515,209 | |
| Energy — 2.9% | | | | | | | | |
| Arch Resources | | | 51,758 | | | | 6,327,416 | |
| Diversified Energy | | | 6,465,958 | | | | 7,696,311 | |
|
|
|
| Schedule of Investments | | April 30, 2023 (Unaudited) |
| Global X SuperDividend® ETF |
| | | | |
| |
| | | Shares | | | Value | |
| COMMON STOCK — continued | | | | | | |
| Energy — continued | | | | | | |
| Kimbell Royalty Partners | | | 502,127 | | | $ | 8,054,117 | |
| | | | | | | | 22,077,844 | |
| Financials — 20.0% | | | | | | | | |
| AGNC Investment ‡ | | | 727,135 | | | | 7,205,908 | |
| Annaly Capital Management ‡ | | | 401,670 | | | | 8,025,367 | |
| Apollo Commercial Real Estate Finance ‡ | | | 749,045 | | | | 7,580,335 | |
| Arbor Realty Trust ‡ | | | 613,536 | | | | 7,037,258 | |
| Ares Commercial Real Estate ‡ | | | 765,908 | | | | 6,594,468 | |
| ARMOUR Residential REIT ‡ | | | 1,464,308 | | | | 7,467,971 | |
| Blackstone Mortgage Trust, Cl A ‡ | | | 399,273 | | | | 7,282,739 | |
| Broadmark Realty Capital ‡ | | | 1,602,961 | | | | 7,870,538 | |
| Chimera Investment ‡ | | | 1,381,427 | | | | 7,846,505 | |
| Dynex Capital ‡ | | | 620,420 | | | | 7,358,181 | |
| Ellington Financial ‡ | | | 652,877 | | | | 8,337,239 | |
| KKR Real Estate Finance Trust ‡ | | | 604,089 | | | | 6,487,916 | |
| MFA Financial ‡ | | | 784,175 | | | | 8,382,831 | |
| New York Mortgage Trust ‡ | | | 813,208 | | | | 8,359,778 | |
| PennyMac Mortgage Investment Trust ‡ | | | 609,494 | | | | 7,576,010 | |
| Ready Capital ‡ (A) | | | 736,998 | | | | 7,907,989 | |
| Redwood Trust ‡ | | | 1,068,457 | | | | 6,709,910 | |
| Rithm Capital ‡ | | | 896,405 | | | | 7,314,665 | |
| Starwood Property Trust ‡ (A) | | | 417,074 | | | | 7,461,454 | |
| Two Harbors Investment ‡ | | | 501,446 | | | | 6,985,143 | |
| | | | | | | | 149,792,205 | |
| Industrials — 1.8% | | | | | | | | |
| Eagle Bulk Shipping . | | | 147,739 | | | | 6,606,888 | |
| Genco Shipping & Trading . | | | 448,728 | | | | 6,914,899 | |
| | | | | | | | 13,521,787 | |
| Real Estate — 4.1% | | | | | | | | |
| Global Net Lease ‡ | | | 557,864 | | | | 6,281,549 | |
| Necessity Retail REIT ‡ | | | 1,160,514 | | | | 6,394,432 | |
| Office Properties Income Trust ‡ | | | 546,703 | | | | 3,564,504 | |
| Omega Healthcare Investors ‡ | | | 260,233 | | | | 6,963,835 | |
|
|
|
| Schedule of Investments | | April 30, 2023 (Unaudited) |
| Global X SuperDividend® ETF |
| | | | |
| |
| | | Shares | | | Value | |
| COMMON STOCK — continued | | | | | | |
| Real Estate — continued | | | | | | |
| Sabra Health Care REIT ‡ | | | 654,211 | | | $ | 7,458,005 | |
| | | | | | | | 30,662,325 | |
| TOTAL UNITED STATES | | | | | | | 223,569,370 | |
| TOTAL COMMON STOCK | | | | | | | | |
| (Cost $851,534,881) | | | | | | | 703,159,517 | |
| PREFERRED STOCK — 4.2% | | | | | | | | |
| BRAZIL— 4.2% | | | | | | | | |
| Energy — 1.1% | | | | | | | | |
| Petroleo Brasileiro (C) | | | 1,673,495 | | | | 7,927,847 | |
| Materials — 1.9% | | | | | | | | |
| Gerdau (C) | | | 1,550,608 | | | | 7,804,414 | |
| Unipar Carbocloro (C) | | | 511,469 | | | | 6,670,868 | |
| | | | | | | | 14,475,282 | |
| Utilities — 1.2% | | | | | | | | |
| Cia Paranaense de Energia (C) | | | 5,726,485 | | | | 9,180,049 | |
| TOTAL BRAZIL | | | | | | | 31,583,178 | |
| TOTAL PREFERRED STOCK | | | | | | | | |
| (Cost $34,078,049) | | | | | | | 31,583,178 | |
| SHORT-TERM INVESTMENT(D)(E) — 0.5% | | | | | | | | |
| Fidelity Investments Money Market | | | | | | | | |
| Government Portfolio, Cl Institutional, | | | | | | | | |
| | | | | | | | |
| (Cost $3,643,538) | | | 3,643,538 | | | | 3,643,538 | |
|
|
|
| Schedule of Investments | | April 30, 2023 (Unaudited) |
| Global X SuperDividend® ETF |
| | | | |
| |
| | | Face Amount | | | Value | |
| REPURCHASE AGREEMENT(D) — 5.4% | | | | |
| BNP Paribas | | | | | | |
| 4.700%, dated 04/28/2023, to be | | | | | | |
| repurchased on 05/01/2023, repurchase price | | | | |
| $40,727,750 (collateralized by U.S. Treasury | | | | |
| Obligations, ranging in par value $2,187,151 | | | | |
| - $3,287,133, 1.125% - 2.250%, 01/15/2025 | | | | |
| - 08/15/2027, with a total market value of | | | | |
$41,443,687)
| | | | | | |
| (Cost $40,711,805) . | | $ | 40,711,805 | | | $ | 40,711,805 | |
| TOTAL INVESTMENTS — 103.7% | | | | | | | | |
| (Cost $929,968,273) | | | | | | $ | 779,098,038 | |
|
|
| Percentages are based on Net Assets of $751,151,634. |
| * | Non-income producing security. |
| ‡ | Real Estate Investment Trust |
| (A) | This security or a partial position of this security is on loan at April 30, 2023. |
| (B) | Level 3 security in accordance with fair value hierarchy. |
| (C) | There is currently no stated interest rate. |
| (D) | Security was purchased with cash collateral held from securities on loan. |
| (E) | The rate reported on the Schedule of Investments is the 7-day effective yield as of |
| | April 30, 2023. |
The following is a summary of the level of inputs used as of April 30, 2023, in valuing the Fund's investments carried at value:
| Investments in Securities | | Level 1 | | | Level 2 | | | Level 3(1) | | | Total | |
| Common Stock | | $ | 688,223,503 | | | $ | 14,075,963 | | | $ | 860,051 | | | $ | 703,159,517 | |
| Preferred Stock | | | 31,583,178 | | | | — | | | | — | | | | 31,583,178 | |
| Short-Term Investment | | | 3,643,538 | | | | — | | | | — | | | | 3,643,538 | |
| Repurchase Agreement | | | — | | | | 40,711,805 | | | | — | | | | 40,711,805 | |
| Total Investments in Securities | | $ | 723,450,219 | | | $ | 54,787,768 | | | $ | 860,051 | | | $ | 779,098,038 | |
|
|
|
| Schedule of Investments | | April 30, 2023 (Unaudited) |
| Global X SuperDividend® ETF |
|
| (1) A reconciliation of Level 3 investments and disclosures of significant unobservable inputs are presented when the Fund has a significant amount of Level 3 investments at the end of the period in relation to Net Assets. Management has concluded that Level 3 investments are not material in relation to Net Assets. |
Amounts designated as “—“ are $0 or have been rounded to $0.
See "Glossary" for abbreviations.
|
|
|
| Schedule of Investments | | April 30, 2023 (Unaudited) |
| Global X Social Media ETF |
| | | | |
| |
| | | Shares | | | Value | |
| COMMON STOCK — 99.7% | | | | | | |
| CHINA — 35.1% | | | | | | |
| Communication Services — 35.1% | | | | | | |
| Baidu ADR * | | | 53,104 | | | $ | 6,404,873 | |
| Bilibili ADR * | | | 212,110 | | | | 4,318,560 | |
| DouYu International Holdings ADR * | | | 173,734 | | | | 192,845 | |
| Hello Group ADR * | | | 92,997 | | | | 777,455 | |
| HUYA ADR * | | | 27,625 | | | | 89,781 | |
| Inkeverse Group * | | | 659,000 | | | | 91,506 | |
| JOYY ADR . | | | 19,819 | | | | 603,092 | |
| Kuaishou Technology, Cl B * | | | 1,477,788 | | | | 9,657,515 | |
| Meitu * | | | 1,414,600 | | | | 392,849 | |
| NetEase ADR . | | | 75,604 | | | | 6,738,585 | |
| Tencent Holdings . | | | 309,427 | | | | 13,575,543 | |
| Tencent Music Entertainment Group ADR * | | | 559,146 | | | | 4,143,272 | |
| Weibo ADR * | | | 96,396 | | | | 1,687,894 | |
| TOTAL CHINA | | | | | | | 48,673,770 | |
| GERMANY — 0.6% | | | | | | | | |
| Communication Services — 0.6% | | | | | | | | |
| United Internet | | | 51,030 | | | | 876,603 | |
|
|
|
| Schedule of Investments | | April 30, 2023 (Unaudited) |
| Global X Social Media ETF |
| | | | |
| |
| | | Shares | | | Value | |
| COMMON STOCK — continued | | | | | | |
| JAPAN — 6.5% | | | | | | |
| Communication Services — 6.5% | | | | | | |
| DeNA | | | 46,872 | | | $ | 655,757 | |
| giftee * | | | 12,506 | | | | 205,089 | |
| Gree | | | 34,029 | | | | 175,437 | |
| Kakaku.com . | | | 80,131 | | | | 1,096,347 | |
| MIXI | | | 24,268 | | | | 511,505 | |
| Nexon . | | | 282,433 | | | | 6,367,784 | |
| TOTAL JAPAN | | | | | | | 9,011,919 | |
| SOUTH KOREA — 14.6% | | | | | | | | |
| Communication Services — 14.6% | | | | | | | | |
| AfreecaTV | | | 5,423 | | | | 314,019 | |
| Com2uSCorp | | | 5,525 | | | | 282,359 | |
| Kakao . | | | 146,791 | | | | 6,372,203 | |
| NAVER | | | 91,932 | | | | 13,208,700 | |
| TOTAL SOUTH KOREA | | | | | | | 20,177,281 | |
| TAIWAN — 0.1% | | | | | | | | |
| Consumer Discretionary — 0.1% | | | | | | | | |
| PChome Online . | | | 66,144 | | | | 123,069 | |
| UNITED ARAB EMIRATES — 0.2% | | | | | | | | |
| Communication Services — 0.2% | | | | | | | | |
| Yalla Group ADR * (A) | | | 63,950 | | | | 228,941 | |
| UNITED STATES — 42.6% | | | | | | | | |
| Communication Services — 40.4% | | | | | | | | |
| Alphabet, Cl A * | | | 62,806 | | | | 6,741,596 | |
| Angi, Cl A * | | | 51,408 | | | | 118,238 | |
| Bumble, Cl A * | | | 56,113 | | | | 1,021,818 | |
| IAC * | | | 50,700 | | | | 2,624,739 | |
| Match Group * | | | 181,136 | | | | 6,683,918 | |
| Meta Platforms, Cl A * | | | 65,026 | | | | 15,627,048 | |
| Nextdoor Holdings * | | | 70,600 | | | | 148,966 | |
| Pinterest, Cl A * | | | 380,669 | | | | 8,755,387 | |
| Rumble * | | | 49,973 | | | | 397,785 | |
| Snap, Cl A * | | | 628,867 | | | | 5,477,432 | |
| Spotify Technology * | | | 50,746 | | | | 6,779,666 | |
|
|
|
| Schedule of Investments | | April 30, 2023 (Unaudited) |
| Global X Social Media ETF |
| | | | |
| |
| | | Shares | | | Value | |
| COMMON STOCK — continued | | | | | | |
| Communication Services — continued | | | | | | |
| Vimeo * | | | 97,019 | | | $ | 319,192 | |
| Yelp, Cl A * | | | 41,755 | | | | 1,249,310 | |
| | | | | | | | 55,945,095 | |
| Consumer Discretionary — 0.0% | | | | | | | | |
| Groupon, Cl A * (A) | | | 12,674 | | | | 45,373 | |
| Industrials — 0.6% | | | | | | | | |
| Fiverr International * | | | 20,317 | | | | 741,977 | |
| Information Technology — 1.6% | | | | | | | | |
| Life360, Cl CDI * | | | 65,882 | | | | 221,174 | |
| Sprinklr, Cl A * | | | 46,424 | | | | 555,231 | |
| Sprout Social, Cl A * | | | 29,671 | | | | 1,461,593 | |
| | | | | | | | 2,237,998 | |
| TOTAL UNITED STATES | | | | | | | 58,970,443 | |
| TOTAL COMMON STOCK | | | | | | | | |
| (Cost $231,890,591) | | | | | | | 138,062,026 | |
| SHORT-TERM INVESTMENT(B)(C) — 0.2% | | | | | | | | |
| Fidelity Investments Money Market | | | | | | | | |
| Government Portfolio, Cl Institutional, | | | | | | | | |
4.770%
| | | | | | | | |
| (Cost $282,225) | | | 282,225 | | | | 282,225 | |
| | | Face Amount | | | | | |
| REPURCHASE AGREEMENT(B) — 2.3% | | | | | | | | |
| BNP Paribas | | | | | | | | |
| 4.700%, dated 04/28/2023, to be repurchased | | | | | | | | |
| on 05/01/2023, repurchase price $3,154,736 | | | | | | | | |
| (collateralized by U.S. Treasury Obligations, | | | | | | | | |
| ranging in par value $169,415 - $254,618, | | | | | | | | |
| 1.125% - 2.250%, 01/15/2025 - 08/15/2027, | | | | | | | | |
| with a total market value of $3,210,194) | | | | | | | | |
| (Cost $3,153,500) | | $ | 3,153,500 | | | $
| 3,153,500 | |
| TOTAL INVESTMENTS — 102.2% | | | | | | | | |
| (Cost $235,326,316) | | | | | | $ | 141,497,751 | |
Percentages are based on Net Assets of $138,483,903.
|
|
|
| Schedule of Investments | | April 30, 2023 (Unaudited) |
| Global X Social Media ETF |
|
|
| * | Non-income producing security. |
| (A) | This security or a partial position of this security is on loan at April 30, 2023. |
| (B) | Security was purchased with cash collateral held from securities on loan. |
| (C) | The rate reported on the Schedule of Investments is the 7-day effective yield as of |
| | April 30, 2023. |
The following is a summary of the level of inputs used as of April 30, 2023, in valuing the Fund's investments carried at value:
| Investments in Securities | | Level 1 | | | Level 2 | | | Level 3 | | | Total | |
| Common Stock | | $ | 138,062,026 | | | $ | — | | | $ | — | | | $ | 138,062,026 | |
| Short-Term Investment | | | 282,225 | | | | — | | | | — | | | | 282,225 | |
| Repurchase Agreement | | | — | | | | 3,153,500 | | | | — | | | | 3,153,500 | |
| Total Investments in Securities | | $ | 138,344,251 | | | $ | 3,153,500 | | | $ | — | | | $ | 141,497,751 | |
Amounts designated as “—“ are $0 or have been rounded to $0.
See "Glossary" for abbreviations.
|
|
|
| Schedule of Investments | | April 30, 2023 (Unaudited) |
| Global X Guru® Index ETF |
| | | | |
| |
| | | Shares | | | Value | |
| COMMON STOCK — 98.4% | | | | | | |
| CAMEROON — 1.5% | | | | | | |
| Energy — 1.5% | | | | | | |
| Golar LNG * | | | 29,806 | | | $ | 676,596 | |
| CANADA — 1.5% | | | | | | | | |
| Industrials — 1.5% | | | | | | | | |
| Canadian Pacific Kansas City | | | 8,831 | | | | 696,236 | |
| CHINA — 2.3% | | | | | | | | |
| Consumer Discretionary — 2.3% | | | | | | | | |
| Alibaba Group Holding ADR * | | | 6,793 | | | | 575,299 | |
| JD.com ADR . | | | 13,409 | | | | 478,970 | |
| TOTAL CHINA | | | | | | | 1,054,269 | |
| DENMARK — 0.9% | | | | | | | | |
| Health Care — 0.9% | | | | | | | | |
| Ascendis Pharma ADR * | | | 6,253 | | | | 437,460 | |
|
|
|
| Schedule of Investments | | April 30, 2023 (Unaudited) |
| Global X Guru® Index ETF |
| | | | |
| |
| | | Shares | | | Value | |
| COMMON STOCK — continued | | | | | | |
| UNITED KINGDOM — 1.4% | | | | | | |
| Communication Services — 1.4% | | | | | | |
| Liberty Global, Cl C * | | | 32,205 | | | $ | 655,050 | |
| UNITED STATES — 90.8% | | | | | | | | |
| Communication Services — 7.1% | | | | | | | | |
| Activision Blizzard * | | | 9,014 | | | | 700,478 | |
| Alphabet, Cl C * | | | 7,213 | | | | 780,591 | |
| Frontier Communications Parent * | | | 24,421 | | | | 550,449 | |
| Liberty Broadband, Cl C * | | | 7,419 | | | | 628,983 | |
| Netflix * | | | 1,958 | | | | 646,003 | |
| | | | | | | | 3,306,504 | |
| Consumer Discretionary — 12.6% | | | | | | | | |
| Asbury Automotive Group * | | | 2,991 | | | | 578,639 | |
| Bath & Body Works . | | | 16,200 | | | | 568,620 | |
| Dutch Bros, Cl A * (A) | | | 17,151 | | | | 534,254 | |
| Expedia Group * | | | 6,040 | | | | 567,518 | |
| Hilton Worldwide Holdings . | | | 4,585 | | | | 660,332 | |
| Home Depot . | | | 2,183 | | | | 656,079 | |
| Lithia Motors, Cl A . | | | 2,713 | | | | 599,275 | |
| Lowe's | | | 3,257 | | | | 676,902 | |
| Rivian Automotive, Cl A * | | | 33,112 | | | | 424,496 | |
| SeaWorld Entertainment * | | | 10,558 | | | | 566,542 | |
| | | | | | | | 5,832,657 | |
| Consumer Staples — 7.9% | | | | | | | | |
| Albertsons, Cl A | | | 33,309 | | | | 696,158 | |
| Bunge . | | | 7,046 | | | | 659,506 | |
| Colgate-Palmolive | | | 9,636 | | | | 768,953 | |
| Mondelez International, Cl A . | | | 10,664 | | | | 818,142 | |
| Post Holdings * | | | 7,784 | | | | 704,374 | |
| | | | | | | | 3,647,133 | |
| Energy — 4.2% | | | | | | | | |
| Chesapeake Energy . | | | 8,423 | | | | 696,413 | |
| Chevron . | | | 4,143 | | | | 698,427 | |
| Texas Pacific Land | | | 372 | | | | 549,686 | |
| |
|
|
|
|
|
| 1,944,526
|
|
|
|
|
| Schedule of Investments | | April 30, 2023 (Unaudited) |
| Global X Guru® Index ETF |
| | | | |
| |
| | | Shares | | | Value | |
| COMMON STOCK — continued | | | | | | |
| Financials — 11.6% | | | | | | |
| Arch Capital Group * | | | 10,305 | | | $ | 773,596 | |
| First American Financial | | | 11,475 | | | | 661,075 | |
| Fiserv * | | | 6,008 | | | | 733,697 | |
| KKR . | | | 11,893 | | | | 631,161 | |
| LPL Financial Holdings | | | 2,827 | | | | 590,391 | |
| S&P Global . | | | 1,907 | | | | 691,440 | |
| Visa, Cl A . | | | 3,061 | | | | 712,387 | |
| Wells Fargo . | | | 14,602 | | | | 580,429 | |
| | | | | | | | 5,374,176 | |
| Health Care — 18.7% | | | | | | | | |
| Amicus Therapeutics * | | | 53,431 | | | | 616,594 | |
| Cytokinetics * | | | 16,340 | | | | 611,116 | |
| Elevance Health | | | 1,438 | | | | 673,919 | |
| Immunovant * | | | 38,634 | | | | 623,553 | |
| IQVIA Holdings * | | | 3,087 | | | | 581,066 | |
| Moderna * | | | 3,950 | | | | 524,915 | |
| PerkinElmer | | | 5,177 | | | | 675,547 | |
| Rocket Pharmaceuticals * | | | 35,698 | | | | 639,708 | |
| Seagen * | | | 4,966 | | | | 993,200 | |
| Tenet Healthcare * | | | 11,352 | | | | 832,329 | |
| United Therapeutics * | | | 2,765 | | | | 636,309 | |
| UnitedHealth Group | | | 1,425 | | | | 701,228 | |
| Viatris, Cl W | | | 59,108 | | | | 551,478 | |
| | | | | | | | 8,660,962 | |
| Industrials — 8.2% | | | | | | | | |
| Avis Budget Group * | | | 2,839 | | | | 501,566 | |
| Delta Air Lines * | | | 17,949 | | | | 615,830 | |
| Ferguson . | | | 4,681 | | | | 659,178 | |
| Hertz Global Holdings * | | | 35,320 | | | | 589,138 | |
| Howmet Aerospace . | | | 16,321 | | | | 722,857 | |
| TransDigm Group . | | | 912 | | | | 697,680 | |
| | | | | | | | 3,786,249 | |
| Information Technology — 7.7% | | | | | | | | |
| Apple . | | | 4,510 | | | | 765,257 | |
| GoDaddy, Cl A * | | | 8,699 | | | | 658,340 | |
| Microsoft | | | 2,600 | | | | 798,876 | |
| Snowflake, Cl A * | | | 3,997 | | | | 591,876 | |
|
|
|
| Schedule of Investments | | April 30, 2023 (Unaudited) |
| Global X Guru® Index ETF |
| | | | |
| |
| | | Shares | | | Value | |
| COMMON STOCK — continued | | | | | | |
| Information Technology — continued | | | | | | |
| VMware, Cl A * | | | 5,944 | | | $ | 743,178 | |
| | | | | | | | 3,557,527 | |
| Materials — 5.8% | | | | | | | | |
| Ashland Global Holdings | | | 6,694 | | | | 680,177 | |
| Element Solutions . | | | 34,036 | | | | 617,754 | |
| International Flavors & Fragrances | | | 7,232 | | | | 701,215 | |
| Sherwin-Williams . | | | 3,010 | | | | 714,995 | |
| | | | | | | | 2,714,141 | |
| Real Estate — 4.3% | | | | | | | | |
| American Tower ‡ | | | 3,232 | | | | 660,588 | |
| ProLogis ‡ | | | 5,492 | | | | 687,873 | |
| Zillow Group, Cl C * | | | 14,748 | | | | 642,128 | |
| | | | | | | | 1,990,589 | |
| Utilities — 2.7% | | | | | | | | |
| AES . | | | 26,242 | | | | 620,886 | |
| Constellation Energy . | | | 8,143 | | | | 630,268 | |
| | | | | | | | 1,251,154 | |
| TOTAL UNITED STATES | | | | | | | 42,065,618 | |
| TOTAL COMMON STOCK | | | | | | | | |
| (Cost $46,199,119) | | | | | | | 45,585,229 | |
| MASTER LIMITED PARTNERSHIP — 1.4% | | | | | | | | |
| UNITED STATES— 1.4% | | | | | | | | |
| Industrials — 1.4% | | | | | | | | |
| Icahn Enterprises . | | | 12,891 | | | | 654,734 | |
| TOTAL MASTER LIMITED PARTNERSHIP | | | | | | | | |
| (Cost $565,432) . | | | | | | | 654,734 | |
| SHORT-TERM INVESTMENT(B)(C) — 0.1% | | | | | | | | |
| Fidelity Investments Money Market | | | | | | | | |
Government Portfolio, Cl Institutional, | | | | | | | | |
| 4.770% | | | | | | | | |
| | | 33,383 | | | | 33,383 | |
|
|
|
| Schedule of Investments | | April 30, 2023 (Unaudited) |
| Global X Guru® Index ETF |
| | | | |
| |
| | | Face Amount | | | Value | |
| REPURCHASE AGREEMENT(B) — 0.8% | | | | | | |
| BNP Paribas | | | | | | |
| 4.700%, dated 04/28/2023, to be repurchased | | | | | | |
| on 05/01/2023, repurchase price $373,164 | | | | | | |
| (collateralized by U.S. Treasury Obligations, | | | | | | |
| ranging in par value $20,039 - $30,118, | | | | | | |
| 1.125% - 2.250%, 01/15/2025 - 08/15/2027, | | | | | | |
| with a total market value of $379,722) | | | | | | |
| (Cost $373,017) | | $ | 373,017 | | | $ | 373,017 | |
| TOTAL INVESTMENTS — 100.7% | | | | | | | | |
| (Cost $47,170,951) | | | | | | $ | 46,646,363 | |
|
|
| Percentages are based on Net Assets of $46,325,761. |
| * | Non-income producing security. |
| ‡ | Real Estate Investment Trust |
| (A) | This security or a partial position of this security is on loan at April 30, 2023. |
| (B) | Security was purchased with cash collateral held from securities on loan. |
| (C) | The rate reported on the Schedule of Investments is the 7-day effective yield as of |
| | April 30, 2023. |
The following is a summary of the level of inputs used as of April 30, 2023, in valuing the Fund's investments carried at value:
| Investments in Securities | | Level 1 | | | Level 2 | | | Level 3 | | | Total | |
| Common Stock | | $ | 45,585,229 | | | $ | — | | | $ | — | | | $ | 45,585,229 | |
| Master Limited Partnership | | | 654,734 | | | | — | | | | — | | | | 654,734 | |
| Short-Term Investment | | | 33,383 | | | | — | | | | — | | | | 33,383 | |
| Repurchase Agreement | | | — | | | | 373,017 | | | | — | | | | 373,017 | |
| Total Investments in Securities | | $ | 46,273,346 | | | $ | 373,017 | | | $ | — | | | $ | 46,646,363 | |
Amounts designated as “—“ are $0 or have been rounded to $0.
See "Glossary" for abbreviations.
|
|
|
| Schedule of Investments | | April 30, 2023 (Unaudited) |
| Global X SuperIncome™ Preferred ETF |
| | | | |
| |
| | | Shares | | | Value | |
| PREFERRED STOCK — 99.8% | | | | | | |
| UNITED STATES— 99.8% | | | | | | |
| Communication Services — 9.4% | | | | | | |
| AT&T, 5.000% | | | 273,961 | | | $ | 6,098,372 | |
| AT&T, 4.750% | | | 399,603 | | | | 8,343,711 | |
| Telephone and Data Systems, 6.000% . | | | 157,438 | | | | 2,114,392 | |
| United States Cellular, 6.250% | | | 114,095 | | | | 1,915,655 | |
| | | | | | | | 18,472,130 | |
| Consumer Discretionary — 6.2% | | | | | | | | |
| Ford Motor, 6.500% . | | | 136,964 | | | | 3,299,463 | |
| Ford Motor, 6.200% . | | | 171,226 | | | | 4,297,772 | |
| Ford Motor, 6.000% . | | | 182,620 | | | | 4,444,971 | |
| | | | | | | | 12,042,206 | |
| Consumer Staples — 1.6% | | | | | | | | |
| CHS, Ser 4, 7.500% . | | | 117,750 | | | | 3,109,777 | |
| Energy — 4.0% | | | | | | | | |
| Crestwood Equity Partners, 9.250% . | | | 406,660 | | | | 3,700,606 | |
| Energy Transfer, 7.600%, ICE LIBOR USD 3 | | | | | | | | |
| Month + 5.161% (A) | | | 182,616 | | | | 4,222,082 | |
| | | | | | | | 7,922,688 | |
| Financials — 68.7% | | | | | | | | |
| AGNC Investment, 6.125%, ICE LIBOR USD | | | | | | | | |
| | | 131,218 | | | | 2,680,784 | |
Allstate, 5.100%
|
|
| 262,566
|
|
|
| 6,262,199
|
|
|
|
|
| Schedule of Investments | | April 30, 2023 (Unaudited) |
| Global X SuperIncome™ Preferred ETF |
| | | | | | |
| |
| | | | Shares | | | | Value | |
| PREFERRED STOCK — continued | | | | | | | | |
| Financials — continued | | | | | | | | |
| Annaly Capital Management, 6.750%, ICE | | | | | | | | |
| LIBOR USD 3 Month + 4.989% ‡,(A) | | | 100,992 | | $ | | 2,415,729 | |
| Arch Capital Group, 4.550% | | | 114,097 | | | | 2,188,380 | |
| Athene Holding, 7.750%, US Treas Yield | | | | | | | | |
| Curve Rate T Note Const Mat 5 Yr + | | | | | | | | |
| 3.962%(A) | | | 114,116 | | | | 2,820,948 | |
| Athene Holding, 6.375%, US Treas Yield | | | | | | | | |
| Curve Rate T Note Const Mat 5 Yr + | | | | | | | | |
| 5.970%(A) | | | 136,961 | | | | 3,088,471 | |
| Athene Holding, 6.350%, ICE LIBOR USD 3 | | | | | | | | |
| Month + 4.253% (A) | | | 196,896 | | | | 4,270,674 | |
| Bank of America, 7.250% * | | | 10,726 | | | | 12,698,833 | |
| Bank of America, 5.375% | | | 194,166 | | | | 4,597,851 | |
| Bank of America, 4.750% | | | 95,596 | | | | 1,997,956 | |
| Brighthouse Financial, 5.375% . | | | 129,843 | | | | 2,265,760 | |
| Capital One Financial, 5.000% (B) | | | 342,491 | | | | 7,027,915 | |
| Capital One Financial, 4.800% | | | 285,398 | | | | 5,553,845 | |
| Capital One Financial, 4.375% | | | 154,052 | | | | 2,697,451 | |
| First Republic Bank, 4.250% . | | | 173,861 | | | | 295,564 | |
| First Republic Bank, 4.000% . | | | 174,444 | | | | 301,788 | |
| Goldman Sachs Group, 6.375%, ICE LIBOR | | | | | | | | |
| USD 3 Month + 3.550% (A) | | | 159,775 | | | | 4,031,123 | |
| Huntington Bancshares, 6.875%, US Treas | | | | | | | | |
| Yield Curve Rate T Note Const Mat 5 Yr + | | | | | | | | |
| 2.704%%(A)(B) | | | 74,151 | | | | 1,838,945 | |
| Huntington Bancshares, 4.500% | | | 114,092 | | | | 2,186,003 | |
| Jackson Financial, 8.000%, US Treas Yield | | | | | | | | |
| Curve Rate T Note Const Mat 5 Yr + | | | | | | | | |
| 3.728%%(A)(B) | | | 125,532 | | | | 3,129,513 | |
| JPMorgan Chase, 4.550% | | | 342,495 | | | | 7,295,144 | |
| KeyCorp, 6.200%, US Treas Yield Curve Rate | | | | | | | | |
| T Note Const Mat 5 Yr + 3.132% (A) (B) | | | 136,957 | | | | 3,040,445 | |
| KeyCorp, 6.125%, ICE LIBOR USD 3 Month | | | | | | | | |
| + 3.892%(A) | | | 114,114 | | | | 2,566,424 | |
| Lincoln National, 9.000% | | | 114,121 | | | | 3,009,371 | |
| Morgan Stanley, 6.500% (B) | | | 228,316 | | | | 5,968,180 | |
| New York Community Bancorp, 6.375%, ICE | | | | | | | | |
| LIBOR USD 3 Month + 3.821% (A) | | | 117,560 | | | | 2,752,080 | |
| Prudential Financial, 5.950% . | | | 68,427 | | | | 1,751,731 | |
|
|
|
| Schedule of Investments | | April 30, 2023 (Unaudited) |
| Global X SuperIncome™ Preferred ETF |
| | | Shares | | | Value | |
| PREFERRED STOCK — continued | | | | | | |
| Financials — continued | | | | | | |
| Regions Financial, Ser B, 6.375%, ICE LIBOR | | | | | | |
| USD 3 Month + 3.536% (A) | | | 114,114 | | | $ | 2,734,171 | |
| Regions Financial, 5.700%, ICE LIBOR USD | | | | | | | | |
| 3 Month + 3.148% (A) | | | 114,105 | | | | 2,640,390 | |
| Rithm Capital, 7.000%, US Treas Yield Curve | | | | | | | | |
| Rate T Note Const Mat 5 Yr + 6.223% ‡,(A) | | | 106,094 | | | | 2,118,697 | |
| Synchrony Financial, 5.625% . | | | 171,194 | | | | 2,901,738 | |
| Synovus Financial, 5.875%, US Treas Yield | | | | | | | | |
| Curve Rate T Note Const Mat 5 Yr + | | | | | | | | |
| 4.127%(A) | | | 79,865 | | | | 1,689,943 | |
| Truist Financial, 4.750% | | | 211,180 | | | | 4,538,258 | |
| Wells Fargo, 7.500% * (B) | | | 13,710 | | | | 16,013,691 | |
| Wells Fargo, 4.700% (B) | | | 161,731 | | | | 3,195,805 | |
| | | | | | | | 134,565,800 | |
| Industrials — 4.7% | | | | | | | | |
| Chart Industries, 6.750% . | | | 45,935 | | | | 2,575,576 | |
| Clarivate, 5.250% . | | | 82,048 | | | | 3,281,920 | |
| WESCO International, 10.625%, US Treas | | | | | | | | |
| Yield Curve Rate T Note Const Mat 5 Yr + | | | | | | | | |
| 10.325%(A) | | | 123,326 | | | | 3,354,467 | |
| | | | | | | | 9,211,963 | |
| Utilities — 5.2% | | | | | | | | |
| Duke Energy, 5.750% | | | 228,316 | | | | 5,879,137 | |
| Sempra Energy, 5.750% . | | | 172,949 | | | | 4,261,463 | |
| | | | | | | | 10,140,600 | |
| TOTAL UNITED STATES | | | | | | | 195,465,164 | |
| TOTAL PREFERRED STOCK | | | | | | | | |
| (Cost $200,717,106) | | | | | | | 195,465,164 | |
| SHORT-TERM INVESTMENT(C)(D) — 0.5% | | | | | | | | |
| Fidelity Investments Money Market | | | | | | | | |
| Government Portfolio, Cl Institutional, | | | | | | | | |
| 4.770% | | | | | | | | |
| (Cost $1,007,535) | | | 1,007,535 | | | | 1,007,535 | |
|
|
|
| Schedule of Investments | | April 30, 2023 (Unaudited) |
| Global X SuperIncome™ Preferred ETF |
| | | | |
| |
| | | Face Amount | | | Value | |
| REPURCHASE AGREEMENT(C) — 5.7% | | | | |
| BNP Paribas | | | | | | |
| 4.700%, dated 04/28/2023, to be repurchased | | | | |
| on 05/01/2023, repurchase price $11,262,306 | | | | |
| (collateralized by U.S. Treasury Obligations, | | | | |
| ranging in par value $604,805 - $908,980, | | | | |
| 1.125% - 2.250%, 01/15/2025 - 08/15/2027, | | | | |
| with a total market value of $11,460,280) | | | | |
| (Cost $11,257,896) . | | $ | 11,257,896 | | | $ | 11,257,896 | |
| TOTAL INVESTMENTS — 106.0% | | | | | | | | |
| (Cost $212,982,537) | | | | | | $ | 207,730,595 | |
|
|
| Percentages are based on Net Assets of $195,911,588. |
| * | Non-income producing security. |
| ‡ | Real Estate Investment Trust |
| (A) | Variable or floating rate security. The rate shown is the effective interest rate as of |
| | period end. The rates on certain securities are not based on published reference |
| | rates and spreads and are either determined by the issuer or agent based on current |
| | market conditions; by using a formula based on the rates of underlying loans; or by |
| | adjusting periodically based on prevailing interest rates. |
| (B) | This security or a partial position of this security is on loan at April 30, 2023. |
| (C) | Security was purchased with cash collateral held from securities on loan. |
| (D) | The rate reported on the Schedule of Investments is the 7-day effective yield as of |
| | April 30, 2023. |
The following is a summary of the level of inputs used as of April 30, 2023, in valuing the Fund's investments carried at value:
| Investments in Securities | | Level 1 | | | Level 2 | | | Level 3 | | | Total | |
| Preferred Stock | | $ | 195,465,164 | | | $ | — | | | $ | — | | | $ | 195,465,164 | |
| Short-Term Investment | | | 1,007,535 | | | | — | | | | — | | | | 1,007,535 | |
| Repurchase Agreement | | | — | | | | 11,257,896 | | | | — | | | | 11,257,896 | |
| Total Investments in Securities | | $ | 196,472,699 | | | $ | 11,257,896 | | | $ | — | | | $ | 207,730,595 | |
Amounts designated as “—“ are $0 or have been rounded to $0.
See "Glossary" for abbreviations.
|
|
|
| Schedule of Investments | | April 30, 2023 (Unaudited) |
| Global X SuperDividend® U.S. ETF |
| | | | |
| |
| | | Shares | | | Value | |
| COMMON STOCK — 80.8% | | | | | | |
| UNITED STATES — 80.8% | | | | | | |
| Communication Services — 4.3% | | | | | | |
| Cogent Communications Holdings . | | | 199,774 | | | $ | 13,792,397 | |
| Verizon Communications | | | 337,913 | | | | 13,121,162 | |
| | | | | | | | 26,913,559 | |
| Consumer Discretionary — 1.7% | | | | | | | | |
| PetMed Express . | | | 681,215 | | | | 10,470,275 | |
| Consumer Staples — 15.3% | | | | | | | | |
| Altria Group . | | | 282,732 | | | | 13,432,597 | |
| B&G Foods . | | | 1,089,955 | | | | 17,482,878 | |
| Kraft Heinz | | | 339,767 | | | | 13,342,650 | |
| Philip Morris International | | | 133,490 | | | | 13,344,995 | |
| Universal | | | 254,975 | | | | 13,995,578 | |
| Vector Group . | | | 944,401 | | | | 12,031,669 | |
| Walgreens Boots Alliance | | | 369,720 | | | | 13,032,630 | |
| | | | | | | | 96,662,997 | |
| Energy — 10.3% | | | | | | | | |
| Chesapeake Energy . | | | 169,715 | | | | 14,032,036 | |
| Kimbell Royalty Partners | | | 883,747 | | | | 14,175,302 | |
|
|
|
| Schedule of Investments | | April 30, 2023 (Unaudited) |
| Global X SuperDividend® U.S. ETF |
| | | | |
| |
| | | Shares | | | Value | |
| COMMON STOCK — continued | | | | | | |
| Energy — continued | | | | | | |
| Kinder Morgan . | | | 766,555 | | | $ | 13,146,418 | |
| Sabine Royalty Trust . | | | 177,181 | | | | 13,311,609 | |
| San Juan Basin Royalty Trust | | | 1,345,851 | | | | 10,255,385 | |
| | | | | | | | 64,920,750 | |
| Financials — 13.5% | | | | | | | | |
| AGNC Investment ‡ | | | 1,193,188 | | | | 11,824,493 | |
| Annaly Capital Management ‡ | | | 629,477 | | | | 12,576,950 | |
| KKR Real Estate Finance Trust ‡ | | | 894,702 | | | | 9,609,100 | |
| New York Community Bancorp . | | | 1,447,320 | | | | 15,471,851 | |
| TFS Financial . | | | 941,237 | | | | 11,332,493 | |
| Two Harbors Investment ‡ | | | 792,008 | | | | 11,032,671 | |
| Virtu Financial, Cl A . | | | 670,431 | | | | 13,442,142 | |
| | | | | | | | 85,289,700 | |
| Health Care — 2.2% | | | | | | | | |
| AbbVie | | | 89,840 | | | | 13,576,621 | |
| Industrials — 11.8% | | | | | | | | |
| 3M | | | 120,278 | | | | 12,775,929 | |
| Eagle Bulk Shipping . | | | 237,232 | | | | 10,609,015 | |
| Ennis | | | 627,171 | | | | 12,185,933 | |
| Genco Shipping & Trading . | | | 752,645 | | | | 11,598,259 | |
| Healthcare Services Group * | | | 948,382 | | | | 14,804,243 | |
| National Presto Industries | | | 177,727 | | | | 12,088,991 | |
| | | | | | | | 74,062,370 | |
| Information Technology — 3.7% | | | | | | | | |
| International Business Machines . | | | 100,671 | | | | 12,725,821 | |
| Western Union . | | | 982,652 | | | | 10,740,386 | |
| | | | | | | | 23,466,207 | |
| Materials — 3.4% | | | | | | | | |
| Kronos Worldwide . | | | 1,221,274 | | | | 11,357,848 | |
| Mativ Holdings | | | 508,276 | | | | 9,845,306 | |
| | | | | | | | 21,203,154 | |
| Real Estate — 8.4% | | | | | | | | |
| Alexander's ‡ | | | 60,312 | | | | 11,222,254 | |
| Easterly Government Properties, Cl A ‡ | | | 858,512 | | | | 12,079,264 | |
|
|
|
| Schedule of Investments | | April 30, 2023 (Unaudited) |
| Global X SuperDividend® U.S. ETF |
| | | | |
| |
| | | Shares | | | Value | |
| COMMON STOCK — continued | | | | | | |
| Real Estate — continued | | | | | | |
| Global Net Lease ‡ | | | 942,415 | | | $ | 10,611,593 | |
| Iron Mountain ‡ | | | 258,389 | | | | 14,273,408 | |
| Office Properties Income Trust ‡ | | | 771,316 | | | | 5,028,980 | |
| | | | | | | | 53,215,499 | |
| Utilities — 6.2% | | | | | | | | |
| Avangrid . | | | 328,742 | | | | 13,235,153 | |
| Clearway Energy, Cl C . | | | 414,726 | | | | 12,595,229 | |
| Duke Energy | | | 136,615 | | | | 13,508,491 | |
| | | | | | | | 39,338,873 | |
| TOTAL UNITED STATES | | | | | | | 509,120,005 | |
| TOTAL COMMON STOCK | | | | | | | | |
| (Cost $573,085,207) | | | | | | | 509,120,005 | |
| MASTER LIMITED PARTNERSHIPS — 18.8% | | | | | | | | |
| UNITED STATES— 18.8% | | | | | | | | |
| Energy — 12.5% | | | | | | | | |
| CrossAmerica Partners . | | | 626,587 | | | | 13,396,430 | |
| Global Partners . | | | 377,322 | | | | 11,621,517 | |
| Holly Energy Partners . | | | 733,067 | | | | 12,212,896 | |
| Magellan Midstream Partners . | | | 254,945 | | | | 14,225,931 | |
| MPLX | | | 389,324 | | | | 13,622,447 | |
| USA Compression Partners | | | 662,043 | | | | 13,836,699 | |
| | | | | | | | 78,915,920 | |
| Industrials — 2.0% | | | | | | | | |
| Icahn Enterprises . | | | 250,442 | | | | 12,719,949 | |
| Materials — 2.1% | | | | | | | | |
| Westlake Chemical Partners | | | 574,438 | | | | 12,890,389 | |
| Oil & Gas — 2.2% | | | | | | | | |
| Dorchester Minerals | | | 458,901 | | | | 13,734,907 | |
| TOTAL UNITED STATES | | | | | | | 118,261,165 | |
| TOTAL MASTER LIMITED PARTNERSHIPS | | | | | | | | |
| (Cost $89,488,760) | | | | | | | 118,261,165 | |
| TOTAL INVESTMENTS — 99.6% | | | | | | | | |
| (Cost $662,573,967) | | | | | | $ | 627,381,170 | |
Percentages are based on Net Assets of $629,894,574.
|
|
|
| Schedule of Investments | | April 30, 2023 (Unaudited) |
| Global X SuperDividend® U.S. ETF |
| * | Non-income producing security. |
| ‡ | Real Estate Investment Trust |
As of April 30, 2023, all of the Fund's investments were considered Level 1, in accordance with authoritative guidance on fair value measurements and disclosure under U.S. GAAP. Amounts designated as “—“ are $0 or have been rounded to $0.
See "Glossary" for abbreviations.
|
|
|
| Schedule of Investments | | April 30, 2023 (Unaudited) |
| Global X S&P 500® Covered Call ETF |
| | | | |
| |
| | | Shares | | | Value | |
| COMMON STOCK — 102.1%(A) | | | | | | |
| CHINA — 0.1% | | | | | | |
| Information Technology — 0.1% | | | | | | |
| NXP Semiconductors . | | | 19,564 | | | $ | 3,203,409 | |
| UNITED STATES — 102.0% | | | | | | | | |
| Communication Services — 8.4% | | | | | | | | |
| Activision Blizzard * | | | 54,240 | | | | 4,214,990 | |
| Alphabet, Cl A * | | | 463,176 | | | | 49,717,312 | |
| Alphabet, Cl C * | | | 403,656 | | | | 43,683,652 | |
| AT&T | | | 549,689 | | | | 9,713,005 | |
| Charter Communications, Cl A * | | | 8,277 | | | | 3,051,730 | |
| Comcast, Cl A | | | 325,024 | | | | 13,446,243 | |
| DISH Network, Cl A * | | | 20,121 | | | | 151,109 | |
| Electronic Arts | | | 20,953 | | | | 2,666,898 | |
| Fox, Cl A | | | 26,683 | | | | 887,476 | |
| Fox, Cl B | | | 13,345 | | | | 407,556 | |
| Interpublic Group | | | 32,157 | | | | 1,148,970 | |
| Live Nation Entertainment * | | | 12,383 | | | | 839,320 | |
| Match Group * | | | 24,031 | | | | 886,744 | |
| Meta Platforms, Cl A * | | | 172,944 | | | | 41,561,902 | |
| Netflix * | | | 34,370 | | | | 11,339,694 | |
|
|
|
| Schedule of Investments | | April 30, 2023 (Unaudited) |
| Global X S&P 500® Covered Call ETF |
| | | | |
| |
| | | Shares | | | Value | |
| COMMON STOCK — continued | | | | | | |
| Communication Services — continued | | | | | | |
| News, Cl A . | | | 33,369 | | | $ | 587,628 | |
| News, Cl B . | | | 11,407 | | | | 202,474 | |
| Omnicom Group . | | | 16,499 | | | | 1,494,314 | |
| Paramount Global, Cl B | | | 38,872 | | | | 906,884 | |
| Take-Two Interactive Software * | | | 12,409 | | | | 1,542,315 | |
| T-Mobile US * | | | 45,432 | | | | 6,537,665 | |
| Verizon Communications | | | 324,464 | | | | 12,598,937 | |
| Walt Disney * | | | 141,312 | | | | 14,484,480 | |
| Warner Bros Discovery * | | | 164,374 | | | | 2,237,130 | |
| | | | | | | | 224,308,428 | |
| Consumer Discretionary — 10.1% | | | | | | | | |
| Advance Auto Parts | | | 4,894 | | | | 614,344 | |
| Amazon.com * | | | 693,809 | | | | 73,162,159 | |
| Aptiv * | | | 21,883 | | | | 2,250,885 | |
| AutoZone * | | | 1,419 | | | | 3,779,237 | |
| Bath & Body Works . | | | 20,525 | | | | 720,427 | |
| Best Buy | | | 15,275 | | | | 1,138,293 | |
| Booking Holdings * | | | 3,015 | | | | 8,099,225 | |
| BorgWarner . | | | 19,505 | | | | 938,776 | |
| Caesars Entertainment * | | | 19,381 | | | | 877,765 | |
| CarMax * | | | 13,155 | | | | 921,245 | |
| Carnival * | | | 86,826 | | | | 799,667 | |
| Chipotle Mexican Grill, Cl A * | | | 2,088 | | | | 4,317,191 | |
| Darden Restaurants . | | | 9,786 | | | | 1,486,787 | |
| Domino's Pizza . | | | 2,892 | | | | 918,123 | |
| DR Horton | | | 25,490 | | | | 2,799,312 | |
| eBay | | | 43,013 | | | | 1,997,094 | |
| Etsy * | | | 10,574 | | | | 1,068,291 | |
| Expedia Group * | | | 10,397 | | | | 976,902 | |
| Ford Motor . | | | 296,151 | | | | 3,518,274 | |
| Garmin | | | 13,124 | | | | 1,288,383 | |
| General Motors | | | 105,528 | | | | 3,486,645 | |
| Genuine Parts . | | | 11,577 | | | | 1,948,525 | |
| Hasbro . | | | 12,323 | | | | 729,768 | |
| Hilton Worldwide Holdings . | | | 21,144 | | | | 3,045,159 | |
| Home Depot . | | | 79,070 | | | | 23,763,698 | |
| Las Vegas Sands * | | | 25,679 | | | | 1,639,604 | |
| Lennar, Cl A . | | | 19,885 | | | | 2,243,227 | |
| LKQ | | | 20,094 | | | | 1,160,027 | |
|
|
|
| Schedule of Investments | | April 30, 2023 (Unaudited) |
| Global X S&P 500® Covered Call ETF |
| | | | |
| |
| | | Shares | | | Value | |
| COMMON STOCK — continued | | | | | | |
| Consumer Discretionary — continued | | | | | | |
| Lowe's | | | 46,616 | | | $ | 9,688,203 | |
| Marriott International, Cl A | | | 20,350 | | | | 3,446,069 | |
| McDonald's . | | | 56,730 | | | | 16,777,898 | |
| MGM Resorts International . | | | 25,451 | | | | 1,143,259 | |
| Mohawk Industries * | | | 4,557 | | | | 482,586 | |
| Newell Brands . | | | 33,277 | | | | 404,316 | |
| NIKE, Cl B | | | 96,239 | | | | 12,195,406 | |
| Norwegian Cruise Line Holdings * | | | 34,186 | | | | 456,383 | |
| NVR * | | | 229 | | | | 1,337,360 | |
| O'Reilly Automotive * | | | 4,753 | | | | 4,359,974 | |
| Pool . | | | 2,952 | | | | 1,037,097 | |
| PulteGroup . | | | 17,452 | | | | 1,171,902 | |
| Ralph Lauren, Cl A . | | | 3,634 | | | | 417,147 | |
| Ross Stores | | | 27,244 | | | | 2,907,752 | |
| Royal Caribbean Cruises * | | | 17,089 | | | | 1,118,133 | |
| Starbucks | | | 88,605 | | | | 10,126,665 | |
| Tapestry . | | | 19,354 | | | | 789,837 | |
| Tesla * | | | 208,961 | | | | 34,334,382 | |
| TJX | | | 88,712 | | | | 6,992,280 | |
| Tractor Supply . | | | 8,681 | | | | 2,069,550 | |
| Ulta Beauty * | | | 3,786 | | | | 2,087,714 | |
| VF . | | | 26,426 | | | | 621,275 | |
| Whirlpool | | | 4,503 | | | | 628,574 | |
| Wynn Resorts * | | | 8,572 | | | | 979,608 | |
| Yum! Brands | | | 22,268 | | | | 3,130,435 | |
| | | | | | | | 268,392,838 | |
| Consumer Staples — 7.5% | | | | | | | | |
| Altria Group . | | | 136,833 | | | | 6,500,936 | |
| Archer-Daniels-Midland | | | 41,338 | | | | 3,227,671 | |
| Brown-Forman, Cl B | | | 15,527 | | | | 1,010,652 | |
| Bunge . | | | 11,972 | | | | 1,120,579 | |
| Campbell Soup . | | | 15,445 | | | | 838,664 | |
| Church & Dwight | | | 19,130 | | | | 1,857,906 | |
| Clorox | | | 9,861 | | | | 1,633,179 | |
| Coca-Cola . | | | 301,655 | | | | 19,351,168 | |
| Colgate-Palmolive | | | 63,716 | | | | 5,084,537 | |
| Conagra Brands . | | | 40,124 | | | | 1,523,107 | |
| Constellation Brands, Cl A | | | 13,207 | | | | 3,030,610 | |
| Costco Wholesale | | | 34,360 | | | | 17,290,639 | |
|
|
|
| Schedule of Investments | | April 30, 2023 (Unaudited) |
| Global X S&P 500® Covered Call ETF |
| | | | |
| |
| | | Shares | | | Value | |
| COMMON STOCK — continued | | | | | | |
| Consumer Staples — continued | | | | | | |
| Dollar General . | | | 16,953 | | | $ | 3,754,411 | |
| Dollar Tree * | | | 16,743 | | | | 2,573,567 | |
| Estee Lauder, Cl A . | | | 17,652 | | | | 4,355,101 | |
| General Mills | | | 44,736 | | | | 3,964,952 | |
| Hershey | | | 11,928 | | | | 3,257,060 | |
| Hormel Foods | | | 23,317 | | | | 942,939 | |
| J M Smucker . | | | 8,528 | | | | 1,316,808 | |
| Kellogg . | | | 20,410 | | | | 1,424,006 | |
| Keurig Dr Pepper | | | 63,215 | | | | 2,067,131 | |
| Kimberly-Clark | | | 25,553 | | | | 3,702,374 | |
| Kraft Heinz | | | 59,316 | | | | 2,329,339 | |
| Kroger | | | 51,501 | | | | 2,504,494 | |
| Lamb Weston Holdings . | | | 11,589 | | | | 1,295,766 | |
| McCormick . | | | 19,610 | | | | 1,722,739 | |
| Molson Coors Beverage, Cl B | | | 15,382 | | | | 914,921 | |
| Mondelez International, Cl A . | | | 104,749 | | | | 8,036,343 | |
| Monster Beverage * | | | 57,366 | | | | 3,212,496 | |
| PepsiCo | | | 106,747 | | | | 20,376,935 | |
| Philip Morris International | | | 119,705 | | | | 11,966,909 | |
| Procter & Gamble . | | | 183,177 | | | | 28,645,219 | |
| Sysco . | | | 41,173 | | | | 3,159,616 | |
| Target | | | 35,197 | | | | 5,552,327 | |
| Tyson Foods, Cl A | | | 23,435 | | | | 1,464,453 | |
| Walgreens Boots Alliance | | | 56,983 | | | | 2,008,651 | |
| Walmart | | | 108,604 | | | | 16,395,946 | |
| | | | | | | | 199,414,151 | |
| Energy — 4.8% | | | | | | | | |
| APA . | | | 25,583 | | | | 942,734 | |
| Baker Hughes, Cl A | | | 80,646 | | | | 2,358,089 | |
| Chevron . | | | 138,007 | | | | 23,265,220 | |
| ConocoPhillips . | | | 94,359 | | | | 9,708,598 | |
| Coterra Energy | | | 62,992 | | | | 1,612,595 | |
| Devon Energy | | | 53,151 | | | | 2,839,858 | |
| Diamondback Energy | | | 14,827 | | | | 2,108,399 | |
| EOG Resources | | | 44,871 | | | | 5,360,738 | |
| EQT . | | | 30,638 | | | | 1,067,428 | |
| Exxon Mobil | | | 320,021 | | | | 37,871,285 | |
| Halliburton . | | | 73,479 | | | | 2,406,437 | |
| Hess | | | 22,377 | | | | 3,246,008 | |
|
|
|
| Schedule of Investments | | April 30, 2023 (Unaudited) |
| Global X S&P 500® Covered Call ETF |
| | | | |
| |
| | | Shares | | | Value | |
| COMMON STOCK — continued | | | | | | |
| Energy — continued | | | | | | |
| Kinder Morgan . | | | 157,369 | | | $ | 2,698,878 | |
| Marathon Oil . | | | 52,862 | | | | 1,277,146 | |
| Marathon Petroleum | | | 34,502 | | | | 4,209,244 | |
| Occidental Petroleum . | | | 54,960 | | | | 3,381,689 | |
| ONEOK . | | | 35,491 | | | | 2,321,466 | |
| Phillips 66 . | | | 35,272 | | | | 3,491,928 | |
| Pioneer Natural Resources | | | 19,055 | | | | 4,145,415 | |
| Schlumberger | | | 108,526 | | | | 5,355,758 | |
| Targa Resources | | | 18,856 | | | | 1,424,194 | |
| Valero Energy . | | | 29,171 | | | | 3,345,039 | |
| Williams | | | 96,554 | | | | 2,921,724 | |
| | | | | | | | 127,359,870 | |
| Financials — 13.4% | | | | | | | | |
| Aflac | | | 45,495 | | | | 3,177,826 | |
| Allstate | | | 20,896 | | | | 2,418,921 | |
| American Express . | | | 45,746 | | | | 7,380,660 | |
| American International Group | | | 55,852 | | | | 2,962,390 | |
| Ameriprise Financial | | | 8,427 | | | | 2,571,246 | |
| Aon, Cl A . | | | 15,669 | | | | 5,095,245 | |
| Arch Capital Group * | | | 30,250 | | | | 2,270,868 | |
| Arthur J Gallagher | | | 16,039 | | | | 3,337,074 | |
| Assurant . | | | 4,625 | | | | 569,476 | |
| Bank of America | | | 540,397 | | | | 15,822,824 | |
| Bank of New York Mellon | | | 54,924 | | | | 2,339,213 | |
| Berkshire Hathaway, Cl B * | | | 140,069 | | | | 46,019,670 | |
| BlackRock, Cl A . | | | 11,525 | | | | 7,735,580 | |
| Brown & Brown . | | | 19,027 | | | | 1,225,149 | |
| Capital One Financial | | | 30,847 | | | | 3,001,413 | |
| Cboe Global Markets . | | | 8,422 | | | | 1,176,553 | |
| Charles Schwab . | | | 116,891 | | | | 6,106,386 | |
| Chubb . | | | 31,821 | | | | 6,413,841 | |
| Cincinnati Financial . | | | 13,142 | | | | 1,398,834 | |
| Citigroup | | | 148,785 | | | | 7,003,310 | |
| Citizens Financial Group . | | | 38,881 | | | | 1,202,978 | |
| CME Group, Cl A . | | | 27,461 | | | | 5,101,430 | |
| Comerica | | | 10,760 | | | | 466,661 | |
| Discover Financial Services | | | 20,872 | | | | 2,159,626 | |
| Everest Re Group | | | 2,961 | | | | 1,119,258 | |
| FactSet Research Systems . | | | 2,776 | | | | 1,142,851 | |
|
|
|
| Schedule of Investments | | April 30, 2023 (Unaudited) |
| Global X S&P 500® Covered Call ETF |
| | | | |
| |
| | | Shares | | | Value | |
| COMMON STOCK — continued | | | | | | |
| Financials — continued | | | | | | |
| Fidelity National Information Services . | | | 47,410 | | | $ | 2,783,915 | |
| Fifth Third Bancorp | | | 56,929 | | | | 1,491,540 | |
| First Republic Bank * | | | 14,975 | | | | 52,562 | |
| Fiserv * | | | 48,601 | | | | 5,935,154 | |
| FleetCor Technologies * | | | 5,732 | | | | 1,226,189 | |
| Franklin Resources | | | 24,182 | | | | 650,012 | |
| Global Payments | | | 21,182 | | | | 2,387,423 | |
| Globe Life . | | | 6,626 | | | | 719,054 | |
| Goldman Sachs Group | | | 26,079 | | | | 8,956,572 | |
| Hartford Financial Services Group . | | | 24,847 | | | | 1,763,889 | |
| Huntington Bancshares | | | 114,046 | | | | 1,277,315 | |
| Intercontinental Exchange . | | | 42,586 | | | | 4,638,893 | |
| Invesco | | | 32,568 | | | | 557,890 | |
| Jack Henry & Associates . | | | 5,867 | | | | 958,316 | |
| JPMorgan Chase . | | | 227,849 | | | | 31,497,846 | |
| KeyCorp | | | 78,001 | | | | 878,291 | |
| Lincoln National . | | | 13,163 | | | | 286,032 | |
| Loews . | | | 16,842 | | | | 969,594 | |
| M&T Bank . | | | 13,491 | | | | 1,697,168 | |
| MarketAxess Holdings . | | | 2,745 | | | | 873,926 | |
| Marsh & McLennan . | | | 37,990 | | | | 6,845,418 | |
| Mastercard, Cl A . | | | 65,469 | | | | 24,880,184 | |
| MetLife . | | | 53,434 | | | | 3,277,107 | |
| Moody's . | | | 12,609 | | | | 3,948,130 | |
| Morgan Stanley | | | 100,674 | | | | 9,057,640 | |
| MSCI, Cl A | | | 6,394 | | | | 3,084,785 | |
| Nasdaq . | | | 27,986 | | | | 1,549,585 | |
| Northern Trust . | | | 17,044 | | | | 1,332,159 | |
| PayPal Holdings * | | | 86,716 | | | | 6,590,416 | |
| PNC Financial Services Group | | | 30,405 | | | | 3,960,251 | |
| Principal Financial Group | | | 17,790 | | | | 1,328,735 | |
| Progressive | | | 44,810 | | | | 6,112,084 | |
| Prudential Financial . | | | 29,814 | | | | 2,593,818 | |
| Raymond James Financial . | | | 16,233 | | | | 1,469,573 | |
| Regions Financial . | | | 73,799 | | | | 1,347,570 | |
| S&P Global . | | | 25,358 | | | | 9,194,304 | |
| State Street . | | | 28,757 | | | | 2,077,981 | |
| Synchrony Financial | | | 37,228 | | | | 1,098,598 | |
| T Rowe Price Group | | | 18,188 | | | | 2,043,058 | |
|
|
|
| Schedule of Investments | | April 30, 2023 (Unaudited) |
| Global X S&P 500® Covered Call ETF |
| | | | |
| |
| | | Shares | | | Value | |
| COMMON STOCK — continued | | | | | | |
| Financials — continued | | | | | | |
| Travelers . | | | 17,432 | | | $ | 3,157,632 | |
| Truist Financial | | | 100,054 | | | | 3,259,759 | |
| US Bancorp . | | | 105,428 | | | | 3,614,072 | |
| Visa, Cl A . | | | 126,172 | | | | 29,364,010 | |
| W R Berkley | | | 16,153 | | | | 951,735 | |
| Wells Fargo . | | | 294,386 | | | | 11,701,844 | |
| Willis Towers Watson | | | 8,642 | | | | 2,001,487 | |
| Zions Bancorp . | | | 13,453 | | | | 374,801 | |
| | | | | | | | 355,037,600 | |
| Health Care — 14.7% | | | | | | | | |
| Abbott Laboratories . | | | 134,948 | | | | 14,907,706 | |
| AbbVie | | | 137,171 | | | | 20,729,282 | |
| Agilent Technologies | | | 22,308 | | | | 3,021,172 | |
| Align Technology * | | | 5,727 | | | | 1,862,993 | |
| AmerisourceBergen | | | 13,354 | | | | 2,228,115 | |
| Amgen . | | | 41,163 | | | | 9,868,418 | |
| Baxter International | | | 40,952 | | | | 1,952,591 | |
| Becton Dickinson | | | 21,704 | | | | 5,736,584 | |
| Biogen * | | | 10,873 | | | | 3,307,893 | |
| Bio-Rad Laboratories, Cl A * | | | 1,574 | | | | 709,543 | |
| Bio-Techne | | | 12,640 | | | | 1,009,683 | |
| Boston Scientific * | | | 109,543 | | | | 5,709,381 | |
| Bristol-Myers Squibb . | | | 164,179 | | | | 10,962,232 | |
| Cardinal Health | | | 20,918 | | | | 1,717,368 | |
| Catalent * | | | 15,009 | | | | 752,251 | |
| Centene * | | | 41,332 | | | | 2,849,015 | |
| Charles River Laboratories International * | | | 4,151 | | | | 789,188 | |
| Cigna Group | | | 22,876 | | | | 5,794,262 | |
| Cooper . | | | 4,209 | | | | 1,605,523 | |
| CVS Health . | | | 98,604 | | | | 7,228,659 | |
| Danaher | | | 50,671 | | | | 12,004,467 | |
| DaVita * | | | 4,651 | | | | 420,264 | |
| DENTSPLY SIRONA . | | | 19,626 | | | | 822,918 | |
| Dexcom * | | | 29,277 | | | | 3,552,471 | |
| Edwards Lifesciences * | | | 46,943 | | | | 4,130,045 | |
| Elevance Health | | | 18,384 | | | | 8,615,662 | |
| Eli Lilly | | | 61,170 | | | | 24,214,756 | |
| GE HealthCare Technologies . | | | 27,051 | | | | 2,200,328 | |
| Gilead Sciences | | | 95,964 | | | | 7,889,200 | |
|
|
|
| Schedule of Investments | | April 30, 2023 (Unaudited) |
| Global X S&P 500® Covered Call ETF |
| | | | |
| |
| | | Shares | | | Value | |
| COMMON STOCK — continued | | | | | | |
| Health Care — continued | | | | | | |
| HCA Healthcare | | | 16,170 | | | $ | 4,646,126 | |
| Henry Schein * | | | 10,496 | | | | 848,182 | |
| Hologic * | | | 20,282 | | | | 1,744,455 | |
| Humana | | | 9,502 | | | | 5,040,716 | |
| IDEXX Laboratories * | | | 6,240 | | | | 3,071,078 | |
| Illumina * | | | 12,544 | | | | 2,578,545 | |
| Incyte * | | | 14,039 | | | | 1,044,642 | |
| Insulet * | | | 5,598 | | | | 1,780,388 | |
| Intuitive Surgical * | | | 26,946 | | | | 8,116,674 | |
| IQVIA Holdings * | | | 15,016 | | | | 2,826,462 | |
| Johnson & Johnson . | | | 203,100 | | | | 33,247,470 | |
| Laboratory Corp of America Holdings | | | 7,312 | | | | 1,657,704 | |
| McKesson . | | | 10,393 | | | | 3,785,546 | |
| Medtronic | | | 102,413 | | | | 9,314,462 | |
| Merck . | | | 196,666 | | | | 22,709,023 | |
| Mettler-Toledo International * | | | 1,741 | | | | 2,596,702 | |
| Moderna * | | | 26,505 | | | | 3,522,249 | |
| Molina Healthcare * | | | 4,944 | | | | 1,472,768 | |
| Organon . | | | 20,123 | | | | 495,630 | |
| PerkinElmer | | | 10,297 | | | | 1,343,656 | |
| Pfizer | | | 434,839 | | | | 16,910,889 | |
| Quest Diagnostics . | | | 9,074 | | | | 1,259,562 | |
| Regeneron Pharmaceuticals * | | | 8,233 | | | | 6,601,137 | |
| ResMed | | | 11,901 | | | | 2,867,665 | |
| STERIS | | | 8,067 | | | | 1,521,033 | |
| Stryker . | | | 25,926 | | | | 7,768,726 | |
| Teleflex | | | 3,870 | | | | 1,054,652 | |
| Thermo Fisher Scientific | | | 30,395 | | | | 16,866,186 | |
| UnitedHealth Group | | | 72,593 | | | | 35,722,289 | |
| Universal Health Services, Cl B . | | | 5,386 | | | | 809,785 | |
| Vertex Pharmaceuticals * | | | 19,715 | | | | 6,717,492 | |
| Viatris, Cl W | | | 100,198 | | | | 934,847 | |
| Waters * | | | 4,905 | | | | 1,473,266 | |
| West Pharmaceutical Services | | | 6,063 | | | | 2,190,198 | |
| Zimmer Biomet Holdings . | | | 17,173 | | | | 2,377,430 | |
| Zoetis, Cl A . | | | 35,743 | | | | 6,282,905 | |
| | | | | | | | 389,792,510 | |
| Industrials — 8.7% | | | | | | | | |
| 3M | | | 41,909 | | | | 4,451,574 | |
|
|
|
| Schedule of Investments | | April 30, 2023 (Unaudited) |
| Global X S&P 500® Covered Call ETF |
| | | | |
| |
| | | Shares | | | Value | |
| COMMON STOCK — continued | | | | | | |
| Industrials — continued | | | | | | |
| A O Smith . | | | 10,580 | | | $ | 722,508 | |
| Alaska Air Group * | | | 9,487 | | | | 412,305 | |
| Allegion . | | | 6,620 | | | | 731,378 | |
| American Airlines Group * | | | 55,575 | | | | 758,043 | |
| AMETEK | | | 18,761 | | | | 2,587,705 | |
| Automatic Data Processing | | | 31,800 | | | | 6,996,000 | |
| Boeing * | | | 43,321 | | | | 8,957,916 | |
| Broadridge Financial Solutions . | | | 9,358 | | | | 1,360,747 | |
| Carrier Global | | | 67,729 | | | | 2,832,427 | |
| Caterpillar . | | | 40,066 | | | | 8,766,441 | |
| Ceridian HCM Holding * | | | 12,462 | | | | 791,088 | |
| CH Robinson Worldwide | | | 9,144 | | | | 922,355 | |
| Cintas | | | 6,499 | | | | 2,962,049 | |
| Copart * | | | 34,740 | | | | 2,746,197 | |
| CoStar Group * | | | 32,746 | | | | 2,519,805 | |
| CSX | | | 160,504 | | | | 4,917,842 | |
| Cummins | | | 11,582 | | | | 2,722,233 | |
| Deere . | | | 20,790 | | | | 7,859,036 | |
| Delta Air Lines * | | | 50,735 | | | | 1,740,718 | |
| Dover | | | 11,673 | | | | 1,706,126 | |
| Eaton | | | 30,353 | | | | 5,072,593 | |
| Emerson Electric | | | 43,305 | | | | 3,605,574 | |
| Equifax . | | | 10,150 | | | | 2,115,057 | |
| Expeditors International of Washington . | | | 12,850 | | | | 1,462,844 | |
| Fastenal | | | 45,336 | | | | 2,440,890 | |
| FedEx . | | | 17,646 | | | | 4,019,406 | |
| Fortive . | | | 27,478 | | | | 1,733,587 | |
| Generac Holdings * | | | 4,840 | | | | 494,745 | |
| General Dynamics | | | 17,080 | | | | 3,729,247 | |
| General Electric . | | | 83,829 | | | | 8,296,556 | |
| Honeywell International . | | | 51,531 | | | | 10,297,955 | |
| Howmet Aerospace . | | | 29,322 | | | | 1,298,671 | |
| Huntington Ingalls Industries | | | 3,329 | | | | 671,326 | |
| IDEX . | | | 5,395 | | | | 1,113,096 | |
| Illinois Tool Works | | | 21,171 | | | | 5,122,112 | |
| Ingersoll Rand . | | | 33,464 | | | | 1,908,117 | |
| Jacobs Solutions . | | | 10,693 | | | | 1,234,614 | |
| JB Hunt Transport Services | | | 6,571 | | | | 1,151,831 | |
| Johnson Controls International | | | 51,733 | | | | 3,095,703 | |
|
|
|
| Schedule of Investments | | April 30, 2023 (Unaudited) |
| Global X S&P 500® Covered Call ETF |
| | | | |
| |
| | | Shares | | | Value | |
| COMMON STOCK — continued | | | | | | |
| Industrials — continued | | | | | | |
| L3Harris Technologies . | | | 15,316 | | | $ | 2,988,917 | |
| Leidos Holdings | | | 11,205 | | | | 1,044,978 | |
| Lockheed Martin | | | 17,501 | | | | 8,128,339 | |
| Masco . | | | 20,192 | | | | 1,080,474 | |
| Nordson . | | | 4,559 | | | | 986,157 | |
| Norfolk Southern . | | | 17,264 | | | | 3,505,110 | |
| Northrop Grumman | | | 10,999 | | | | 5,073,509 | |
| Old Dominion Freight Line | | | 7,315 | | | | 2,343,653 | |
| Otis Worldwide | | | 32,992 | | | | 2,814,218 | |
| PACCAR | | | 42,262 | | | | 3,156,549 | |
| Parker-Hannifin | | | 9,686 | | | | 3,146,788 | |
| Paychex | | | 25,474 | | | | 2,798,574 | |
| Paycom Software * | | | 4,138 | | | | 1,201,551 | |
| Pentair | | | 13,399 | | | | 778,214 | |
| Quanta Services . | | | 11,650 | | | | 1,976,306 | |
| Raytheon Technologies | | | 113,112 | | | | 11,299,889 | |
| Republic Services, Cl A | | | 16,562 | | | | 2,395,196 | |
| Robert Half International | | | 9,352 | | | | 682,696 | |
| Rockwell Automation | | | 8,946 | | | | 2,535,386 | |
| Rollins . | | | 19,838 | | | | 838,155 | |
| Snap-On . | | | 4,504 | | | | 1,168,383 | |
| Southwest Airlines . | | | 46,325 | | | | 1,403,184 | |
| Stanley Black & Decker . | | | 13,135 | | | | 1,134,076 | |
| Textron | | | 17,167 | | | | 1,149,159 | |
| Trane Technologies . | | | 18,601 | | | | 3,456,252 | |
| TransDigm Group * | | | 3,920 | | | | 2,998,800 | |
| Union Pacific | | | 47,140 | | | | 9,225,298 | |
| United Airlines Holdings * | | | 26,304 | | | | 1,152,115 | |
| United Parcel Service, Cl B . | | | 56,347 | | | | 10,131,754 | |
| United Rentals . | | | 5,742 | | | | 2,073,494 | |
| Verisk Analytics, Cl A . | | | 12,756 | | | | 2,476,067 | |
| Waste Management . | | | 28,286 | | | | 4,696,890 | |
| Westinghouse Air Brake Technologies | | | 14,345 | | | | 1,401,076 | |
| WW Grainger . | | | 3,366 | | | | 2,341,289 | |
| Xylem . | | | 13,852 | | | | 1,438,392 | |
| | | | | | | | 231,349,305 | |
| Information Technology — 26.1% | | | | | | | | |
| Accenture, Cl A | | | 48,672 | | | | 13,642,275 | |
| Adobe * | | | 35,377 | | | | 13,356,940 | |
|
|
|
| Schedule of Investments | | April 30, 2023 (Unaudited) |
| Global X S&P 500® Covered Call ETF |
| | | | |
| |
| | | Shares | | | Value | |
| COMMON STOCK — continued | | | | | | |
| Information Technology — continued | | | | | | |
| Advanced Micro Devices * | | | 124,452 | | | $ | 11,122,275 | |
| Akamai Technologies * | | | 13,159 | | | | 1,078,643 | |
| Amphenol, Cl A . | | | 44,951 | | | | 3,392,452 | |
| Analog Devices | | | 38,930 | | | | 7,002,728 | |
| ANSYS * | | | 7,052 | | | | 2,213,764 | |
| Apple . | | | 1,158,456 | | | | 196,566,814 | |
| Applied Materials . | | | 64,766 | | | | 7,320,501 | |
| Arista Networks * | | | 18,608 | | | | 2,980,257 | |
| Autodesk * | | | 16,287 | | | | 3,172,545 | |
| Broadcom | | | 32,401 | | | | 20,299,226 | |
| Cadence Design Systems * | | | 20,869 | | | | 4,371,012 | |
| CDW | | | 10,968 | | | | 1,860,063 | |
| Cisco Systems | | | 317,904 | | | | 15,020,964 | |
| Cognizant Technology Solutions, Cl A | | | 40,380 | | | | 2,411,090 | |
| Corning . | | | 56,168 | | | | 1,865,901 | |
| DXC Technology * | | | 20,409 | | | | 486,755 | |
| Enphase Energy * | | | 10,138 | | | | 1,664,660 | |
| EPAM Systems * | | | 4,933 | | | | 1,393,277 | |
| F5 * | | | 5,036 | | | | 676,637 | |
| Fair Isaac * | | | 1,902 | | | | 1,384,561 | |
| First Solar * | | | 8,088 | | | | 1,476,707 | |
| Fortinet * | | | 51,732 | | | | 3,261,703 | |
| Gartner * | | | 5,809 | | | | 1,756,990 | |
| Gen Digital | | | 48,595 | | | | 858,674 | |
| Hewlett Packard Enterprise | | | 102,339 | | | | 1,465,494 | |
| HP | | | 71,550 | | | | 2,125,751 | |
| Intel . | | | 318,905 | | | | 9,905,189 | |
| International Business Machines . | | | 69,627 | | | | 8,801,549 | |
| Intuit . | | | 21,642 | | | | 9,607,966 | |
| Juniper Networks . | | | 27,341 | | | | 824,331 | |
| Keysight Technologies * | | | 14,785 | | | | 2,138,502 | |
| KLA | | | 10,522 | | | | 4,067,174 | |
| Lam Research | | | 10,329 | | | | 5,413,222 | |
| Microchip Technology | | | 44,113 | | | | 3,219,808 | |
| Micron Technology . | | | 83,306 | | | | 5,361,574 | |
| Microsoft | | | 579,736 | | | | 178,129,683 | |
| Monolithic Power Systems . | | | 3,279 | | | | 1,514,800 | |
| Motorola Solutions | | | 12,668 | | | | 3,691,455 | |
| NetApp . | | | 15,137 | | | | 951,966 | |
|
|
|
| Schedule of Investments | | April 30, 2023 (Unaudited) |
| Global X S&P 500® Covered Call ETF |
| | | | |
| |
| | | Shares | | | Value | |
| COMMON STOCK — continued | | | | | | |
| Information Technology — continued | | | | | | |
| NVIDIA . | | | 191,314 | | | $ | 53,087,722 | |
| ON Semiconductor * | | | 34,989 | | | | 2,517,808 | |
| Oracle . | | | 118,644 | | | | 11,237,960 | |
| PTC * | | | 8,513 | | | | 1,070,850 | |
| Qorvo * | | | 7,605 | | | | 700,268 | |
| QUALCOMM . | | | 85,979 | | | | 10,042,347 | |
| Roper Technologies | | | 8,374 | | | | 3,808,328 | |
| Salesforce * | | | 77,405 | | | | 15,354,830 | |
| Seagate Technology Holdings . | | | 14,575 | | | | 856,573 | |
| ServiceNow * | | | 15,578 | | | | 7,156,845 | |
| Skyworks Solutions | | | 13,037 | | | | 1,380,618 | |
| SolarEdge Technologies * | | | 4,541 | | | | 1,297,046 | |
| Synopsys * | | | 11,606 | | | | 4,309,540 | |
| TE Connectivity | | | 25,453 | | | | 3,114,684 | |
| Teledyne Technologies * | | | 3,952 | | | | 1,637,709 | |
| Teradyne . | | | 13,129 | | | | 1,199,728 | |
| Texas Instruments . | | | 70,033 | | | | 11,709,518 | |
| Trimble * | | | 19,802 | | | | 932,674 | |
| Tyler Technologies * | | | 3,509 | | | | 1,330,016 | |
| VeriSign * | | | 7,435 | | | | 1,649,083 | |
| Western Digital * | | | 26,284 | | | | 905,221 | |
| Zebra Technologies, Cl A * | | | 4,335 | | | | 1,248,610 | |
| | | | | | | | 694,403,856 | |
| Materials — 2.7% | | | | | | | | |
| Air Products & Chemicals . | | | 16,958 | | | | 4,991,757 | |
| Albemarle | | | 9,118 | | | | 1,691,024 | |
| Amcor | | | 117,922 | | | | 1,293,604 | |
| Avery Dennison . | | | 6,608 | | | | 1,152,964 | |
| Ball | | | 26,475 | | | | 1,407,941 | |
| Celanese, Cl A . | | | 8,202 | | | | 871,380 | |
| CF Industries Holdings | | | 14,986 | | | | 1,072,698 | |
| Corteva . | | | 57,211 | | | | 3,496,736 | |
| Dow | | | 57,093 | | | | 3,105,859 | |
| DuPont de Nemours . | | | 34,161 | | | | 2,381,705 | |
| Eastman Chemical . | | | 9,351 | | | | 788,009 | |
| Ecolab | | | 18,672 | | | | 3,133,908 | |
| FMC . | | | 10,553 | | | | 1,304,140 | |
| Freeport-McMoRan . | | | 108,713 | | | | 4,121,310 | |
| International Flavors & Fragrances | | | 21,103 | | | | 2,046,147 | |
|
|
|
| Schedule of Investments | | April 30, 2023 (Unaudited) |
| Global X S&P 500® Covered Call ETF |
| | | | |
| |
| | | Shares | | | Value | |
| COMMON STOCK — continued | | | | | | |
| Materials — continued | | | | | | |
| International Paper . | | | 27,602 | | | $ | 913,902 | |
| Linde | | | 38,101 | | | | 14,076,414 | |
| LyondellBasell Industries, Cl A | | | 19,845 | | | | 1,877,535 | |
| Martin Marietta Materials | | | 5,179 | | | | 1,881,013 | |
| Mosaic . | | | 26,742 | | | | 1,145,895 | |
| Newmont | | | 63,179 | | | | 2,994,685 | |
| Nucor | | | 20,389 | | | | 3,021,242 | |
| Packaging Corp of America . | | | 7,741 | | | | 1,047,048 | |
| PPG Industries | | | 17,580 | | | | 2,465,771 | |
| Sealed Air | | | 13,250 | | | | 635,868 | |
| Sherwin-Williams . | | | 17,931 | | | | 4,259,330 | |
| Steel Dynamics | | | 13,574 | | | | 1,411,017 | |
| Vulcan Materials | | | 11,061 | | | | 1,937,002 | |
| Westrock . | | | 22,626 | | | | 677,196 | |
| | | | | | | | 71,203,100 | |
| Real Estate — 2.6% | | | | | | | | |
| Alexandria Real Estate Equities ‡ | | | 12,575 | | | | 1,561,564 | |
| American Tower ‡ | | | 35,786 | | | | 7,314,301 | |
| AvalonBay Communities ‡ | | | 11,473 | | | | 2,069,385 | |
| Boston Properties ‡ | | | 12,979 | | | | 692,559 | |
| Camden Property Trust ‡ | | | 8,429 | | | | 927,611 | |
| CBRE Group, Cl A * | | | 25,426 | | | | 1,949,157 | |
| Crown Castle ‡ | | | 32,895 | | | | 4,049,046 | |
| Digital Realty Trust ‡ | | | 23,136 | | | | 2,293,934 | |
| Equinix ‡ | | | 7,059 | | | | 5,111,281 | |
| Equity Residential ‡ | | | 26,420 | | | | 1,671,065 | |
| Essex Property Trust ‡ | | | 5,276 | | | | 1,159,295 | |
| Extra Space Storage ‡ | | | 10,978 | | | | 1,669,095 | |
| Federal Realty Investment Trust ‡ | | | 6,220 | | | | 615,096 | |
| Healthpeak Properties ‡ | | | 45,806 | | | | 1,006,358 | |
| Host Hotels & Resorts ‡ | | | 61,827 | | | | 999,743 | |
| Invitation Homes ‡ | | | 47,524 | | | | 1,585,876 | |
| Iron Mountain ‡ | | | 20,673 | | | | 1,141,977 | |
| Kimco Realty ‡ | | | 51,086 | | | | 980,340 | |
| Mid-America Apartment Communities ‡ | | | 9,166 | | | | 1,409,731 | |
| ProLogis ‡ | | | 71,089 | | | | 8,903,897 | |
| Public Storage ‡ | | | 11,957 | | | | 3,525,282 | |
| Realty Income ‡ | | | 47,158 | | | | 2,963,409 | |
| Regency Centers ‡ | | | 13,345 | | | | 819,783 | |
|
|
|
| Schedule of Investments | | April 30, 2023 (Unaudited) |
| Global X S&P 500® Covered Call ETF |
| | | | |
| |
| | | Shares | | | Value | |
| COMMON STOCK — continued | | | | | | |
| Real Estate — continued | | | | | | |
| SBA Communications, Cl A ‡ | | | 8,552 | | | $ | 2,231,131 | |
| Simon Property Group ‡ | | | 24,528 | | | | 2,779,513 | |
| UDR ‡ | | | 25,057 | | | | 1,035,606 | |
| Ventas ‡ | | | 31,552 | | | | 1,516,074 | |
| VICI Properties, Cl A ‡ | | | 81,476 | | | | 2,765,295 | |
| Welltower ‡ | | | 38,521 | | | | 3,051,634 | |
| Weyerhaeuser ‡ | | | 58,252 | | | | 1,742,317 | |
| | | | | | | | 69,541,355 | |
| Utilities — 3.0% | | | | | | | | |
| AES . | | | 52,213 | | | | 1,235,359 | |
| Alliant Energy . | | | 19,769 | | | | 1,090,063 | |
| Ameren . | | | 21,370 | | | | 1,901,289 | |
| American Electric Power | | | 38,911 | | | | 3,596,155 | |
| American Water Works | | | 15,521 | | | | 2,300,988 | |
| Atmos Energy | | | 11,756 | | | | 1,341,830 | |
| CenterPoint Energy . | | | 52,841 | | | | 1,610,065 | |
| CMS Energy | | | 20,953 | | | | 1,304,534 | |
| Consolidated Edison | | | 28,693 | | | | 2,825,400 | |
| Constellation Energy . | | | 25,818 | | | | 1,998,313 | |
| Dominion Energy | | | 63,094 | | | | 3,605,191 | |
| DTE Energy . | | | 15,580 | | | | 1,751,348 | |
| Duke Energy | | | 58,922 | | | | 5,826,207 | |
| Edison International . | | | 30,581 | | | | 2,250,761 | |
| Entergy | | | 16,738 | | | | 1,800,674 | |
| Evergy | | | 19,715 | | | | 1,224,499 | |
| Eversource Energy . | | | 28,198 | | | | 2,188,447 | |
| Exelon | | | 74,989 | | | | 3,182,533 | |
| FirstEnergy | | | 43,234 | | | | 1,720,713 | |
| NextEra Energy . | | | 153,540 | | | | 11,765,770 | |
| NiSource . | | | 33,454 | | | | 952,101 | |
| NRG Energy | | | 19,689 | | | | 672,773 | |
| PG&E * | | | 131,862 | | | | 2,256,159 | |
| Pinnacle West Capital | | | 9,602 | | | | 753,373 | |
| PPL | | | 57,914 | | | | 1,663,290 | |
| Public Service Enterprise Group . | | | 37,233 | | | | 2,353,126 | |
| Sempra Energy . | | | 23,831 | | | | 3,705,482 | |
| Southern | | | 83,405 | | | | 6,134,438 | |
| WEC Energy Group . | | | 25,136 | | | | 2,417,329 | |
|
|
|
| Schedule of Investments | | April 30, 2023 (Unaudited) |
| Global X S&P 500® Covered Call ETF |
| | | | |
| |
| | | Shares | | | Value | |
| COMMON STOCK — continued | | | | | | |
| Utilities — continued | | | | | | |
| Xcel Energy | | | 43,758 | | | $ | 3,059,122 | |
| | | | | | | | 78,487,332 | |
| TOTAL UNITED STATES | | | | | | | 2,709,290,345 | |
| TOTAL COMMON STOCK | | | | | | | | |
| (Cost $2,622,785,576) | | | | | | | 2,712,493,754 | |
| TOTAL INVESTMENTS — 102.1% | | | | | | | | |
| (Cost $2,622,785,576) | | | | | | $ | 2,712,493,754 | |
| WRITTEN OPTIONS— (2.2)% | | | | | | | | |
| (Premiums Received $(49,593,884)) | | | | | | $ | (58,675,100 | ) |
Percentages are based on Net Assets of $2,657,440,794.
A list of the exchange traded option contracts held by the Fund at April 30, 2023, is as follows:
|
|
|
|
|
|
| | Number of | Notional | Exercise | Expiration | |
| Description | Contracts | Amount | Price | Date | Value |
| WRITTEN OPTIONS — (2.2)% | | | | |
| Call Options | | | | | |
| S&P 500 Index | (6,505) | $(2,680,060,000) | $4,120.00 | 05/19/23 | $ (58,675,100) |
|
|
| * | Non-income producing security. |
| ‡ | Real Estate Investment Trust |
| (A) | All or a portion of these securities has been segregated as collateral for options |
| | contracts. The aggregate market value of collateral at April 30, 2023 was |
| | $2,712,493,754. |
|
|
|
| Schedule of Investments | | April 30, 2023 (Unaudited) |
| Global X S&P 500® Covered Call ETF |
The following is a summary of the level of inputs used as of April 30, 2023, in valuing the Fund's investments and other financial instruments carried at value:
| Investments in Securities | | Level 1 | | | Level 2 | | | Level 3 | | | Total | |
| Common Stock | | $ | 2,712,493,754 | | | $ | — | | | $ | — | | | $ | 2,712,493,754 | |
| Total Investments in Securities | | $ | 2,712,493,754 | | | $ | — | | | $ | — | | | $ | 2,712,493,754 | |
| Other Financial Instruments | | Level 1 | | | Level 2 | | | Level 3 | | | Total | |
| Written Options | | $ | (58,675,100 | ) | | $ | — | | | $ | — | | | $ | (58,675,100 | ) |
| Total Other Financial Instruments | | $ | (58,675,100 | ) | | $ | — | | | $ | — | | | $ | (58,675,100 | ) |
Amounts designated as “—“ are $0 or have been rounded to $0.
See "Glossary" for abbreviations.
|
|
|
| Schedule of Investments | | April 30, 2023 (Unaudited) |
| Global X NASDAQ 100® Covered Call ETF |
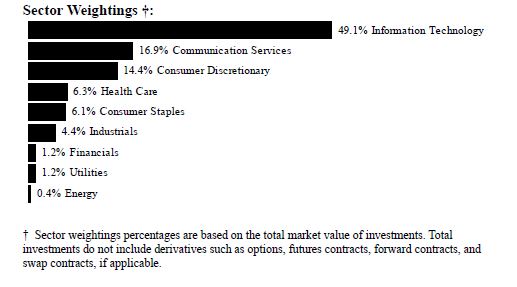
| | | | |
| |
| | | Shares | | | Value | |
| COMMON STOCK — 103.2%(A) | | | | | | |
| BRAZIL — 0.5% | | | | | | |
| Consumer Discretionary — 0.5% | | | | | | |
| MercadoLibre * | | | 28,813 | | | $ | 36,808,319 | |
| CHINA — 0.8% | | | | | | | | |
| Consumer Discretionary — 0.5% | | | | | | | | |
| JD.com ADR . | | | 261,504 | | | | 9,340,923 | |
| PDD Holdings ADR * | | | 339,353 | | | | 23,126,907 | |
| | | | | | | | 32,467,830 | |
| Information Technology — 0.3% | | | | | | | | |
| NXP Semiconductors . | | | 147,984 | | | | 24,230,900 | |
| TOTAL CHINA | | | | | | | 56,698,730 | |
| NETHERLANDS — 0.4% | | | | | | | | |
| Information Technology — 0.4% | | | | | | | | |
| ASML Holding, Cl G . | | | 50,069 | | | | 31,886,943 | |
|
|
|
| Schedule of Investments | | April 30, 2023 (Unaudited) |
| Global X NASDAQ 100® Covered Call ETF |
| | | | |
| |
| | | Shares | | | Value | |
| COMMON STOCK — continued | | | | | | |
| UNITED KINGDOM — 0.4% | | | | | | |
| Health Care — 0.4% | | | | | | |
| AstraZeneca ADR . | | | 343,814 | | | $ | 25,174,061 | |
| UNITED STATES — 101.1% | | | | | | | | |
| Communication Services — 17.5% | | | | | | | | |
| Activision Blizzard * | | | 447,898 | | | | 34,806,154 | |
| Alphabet, Cl A * | | | 2,672,981 | | | | 286,917,780 | |
| Alphabet, Cl C * | | | 2,627,803 | | | | 284,380,841 | |
| Charter Communications, Cl A * | | | 87,072 | | | | 32,103,446 | |
| Comcast, Cl A | | | 2,404,249 | | | | 99,463,781 | |
| Electronic Arts | | | 156,404 | | | | 19,907,101 | |
| Meta Platforms, Cl A * | | | 1,272,728 | | | | 305,861,993 | |
| Netflix * | | | 254,502 | | | | 83,967,845 | |
| Sirius XM Holdings . | | | 2,206,637 | | | | 8,385,221 | |
| T-Mobile US * | | | 697,172 | | | | 100,323,051 | |
| Warner Bros Discovery * | | | 1,384,654 | | | | 18,845,141 | |
| | | | | | | | 1,274,962,354 | |
| Consumer Discretionary — 13.8% | | | | | | | | |
| Airbnb, Cl A * | | | 233,453 | | | | 27,937,321 | |
| Amazon.com * | | | 4,517,465 | | | | 476,366,684 | |
| Booking Holdings * | | | 21,696 | | | | 58,282,182 | |
| eBay | | | 307,154 | | | | 14,261,160 | |
| Lucid Group * | | | 1,065,692 | | | | 8,461,595 | |
| Lululemon Athletica * | | | 69,951 | | | | 26,576,483 | |
| Marriott International, Cl A | | | 175,760 | | | | 29,763,198 | |
| O'Reilly Automotive * | | | 35,351 | | | | 32,427,826 | |
| Rivian Automotive, Cl A * | | | 498,113 | | | | 6,385,809 | |
| Ross Stores | | | 196,427 | | | | 20,964,654 | |
| Starbucks | | | 656,891 | | | | 75,076,072 | |
| Tesla * | | | 1,394,636 | | | | 229,152,641 | |
| | | | | | | | 1,005,655,625 | |
| Consumer Staples — 6.3% | | | | | | | | |
| Costco Wholesale | | | 253,664 | | | | 127,648,798 | |
| Dollar Tree * | | | 126,039 | | | | 19,373,455 | |
| Keurig Dr Pepper | | | 802,408 | | | | 26,238,742 | |
| Kraft Heinz | | | 699,000 | | | | 27,449,730 | |
| Mondelez International, Cl A . | | | 778,607 | | | | 59,734,729 | |
|
|
|
| Schedule of Investments | | April 30, 2023 (Unaudited) |
| Global X NASDAQ 100® Covered Call ETF |
| | | | |
| |
| | | Shares | | | Value | |
| COMMON STOCK — continued | | | | | | |
| Consumer Staples — continued | | | | | | |
| Monster Beverage * | | | 595,454 | | | $ | 33,345,424 | |
| PepsiCo | | | 787,523 | | | | 150,330,265 | |
| Walgreens Boots Alliance | | | 491,413 | | | | 17,322,308 | |
| | | | | | | | 461,443,451 | |
| Energy — 0.4% | | | | | | | | |
| Baker Hughes, Cl A | | | 576,067 | | | | 16,844,199 | |
| Diamondback Energy | | | 104,310 | | | | 14,832,882 | |
| | | | | | | | 31,677,081 | |
| Financials — 1.3% | | | | | | | | |
| Fiserv * | | | 358,854 | | | | 43,823,250 | |
| PayPal Holdings * | | | 646,034 | | | | 49,098,584 | |
| | | | | | | | 92,921,834 | |
| Health Care — 6.2% | | | | | | | | |
| Align Technology * | | | 43,601 | | | | 14,183,405 | |
| Amgen . | | | 305,044 | | | | 73,131,249 | |
| Biogen * | | | 82,414 | | | | 25,072,811 | |
| Dexcom * | | | 220,354 | | | | 26,737,754 | |
| Gilead Sciences | | | 712,540 | | | | 58,577,914 | |
| IDEXX Laboratories * | | | 47,226 | | | | 23,242,748 | |
| Illumina * | | | 90,003 | | | | 18,501,017 | |
| Intuitive Surgical * | | | 200,277 | | | | 60,327,438 | |
| Moderna * | | | 220,382 | | | | 29,286,564 | |
| Regeneron Pharmaceuticals * | | | 61,227 | | | | 49,091,196 | |
| Seagen * | | | 106,667 | | | | 21,333,400 | |
| Vertex Pharmaceuticals * | | | 146,651 | | | | 49,968,395 | |
| | | | | | | | 449,453,891 | |
| Industrials — 4.5% | | | | | | | | |
| Automatic Data Processing | | | 236,818 | | | | 52,099,960 | |
| Cintas | | | 57,824 | | | | 26,354,444 | |
| Copart * | | | 271,504 | | | | 21,462,391 | |
| CoStar Group * | | | 231,823 | | | | 17,838,780 | |
| CSX | | | 1,177,545 | | | | 36,079,979 | |
| Fastenal | | | 325,364 | | | | 17,517,598 | |
| Honeywell International . | | | 381,784 | | | | 76,295,715 | |
| Old Dominion Freight Line | | | 62,537 | | | | 20,036,229 | |
| PACCAR | | | 297,848 | | | | 22,246,267 | |
|
|
|
| Schedule of Investments | | April 30, 2023 (Unaudited) |
| Global X NASDAQ 100® Covered Call ETF |
| | | | |
| |
| | | Shares | | | Value | |
| COMMON STOCK — continued | | | | | | |
| Industrials — continued | | | | | | |
| Paychex | | | 205,565 | | | $ | 22,583,371 | |
| Verisk Analytics, Cl A . | | | 88,079 | | | | 17,097,015 | |
| | | | | | | | 329,611,749 | |
| Information Technology — 49.9% | | | | | | | | |
| Adobe * | | | 261,590 | | | | 98,765,920 | |
| Advanced Micro Devices * | | | 920,955 | | | | 82,305,748 | |
| Analog Devices | | | 289,013 | | | | 51,987,658 | |
| ANSYS * | | | 49,520 | | | | 15,545,318 | |
| Apple . | | | 5,610,479 | | | | 951,986,077 | |
| Applied Materials . | | | 482,593 | | | | 54,547,487 | |
| Atlassian, Cl A * | | | 85,391 | | | | 12,608,835 | |
| Autodesk * | | | 123,074 | | | | 23,973,585 | |
| Broadcom | | | 238,499 | | | | 149,419,624 | |
| Cadence Design Systems * | | | 155,897 | | | | 32,652,627 | |
| Cisco Systems | | | 2,341,444 | | | | 110,633,229 | |
| Cognizant Technology Solutions, Cl A | | | 290,133 | | | | 17,323,841 | |
| Crowdstrike Holdings, Cl A * | | | 124,323 | | | | 14,924,976 | |
| Datadog, Cl A * | | | 167,137 | | | | 11,261,691 | |
| Enphase Energy * | | | 77,812 | | | | 12,776,730 | |
| Fortinet * | | | 447,544 | | | | 28,217,649 | |
| GLOBALFOUNDRIES * | | | 310,463 | | | | 18,255,224 | |
| Intel . | | | 2,363,938 | | | | 73,423,914 | |
| Intuit . | | | 160,387 | | | | 71,203,809 | |
| KLA | | | 79,063 | | | | 30,561,012 | |
| Lam Research | | | 77,110 | | | | 40,411,809 | |
| Marvell Technology . | | | 486,336 | | | | 19,200,545 | |
| Microchip Technology | | | 312,231 | | | | 22,789,741 | |
| Micron Technology . | | | 623,050 | | | | 40,099,498 | |
| Microsoft | | | 3,268,400 | | | | 1,004,248,584 | |
| NVIDIA . | | | 1,412,769 | | | | 392,029,270 | |
| Palo Alto Networks * | | | 172,676 | | | | 31,506,463 | |
| QUALCOMM . | | | 637,117 | | | | 74,415,266 | |
| Synopsys * | | | 86,900 | | | | 32,267,708 | |
| Texas Instruments . | | | 517,829 | | | | 86,581,009 | |
| Workday, Cl A * | | | 116,399 | | | | 21,666,510 | |
| Zoom Video Communications, Cl A * | | | 138,344 | | | | 8,498,472 | |
| Zscaler * | | | 81,566 | | | | 7,349,097 | |
| | | | | | | | 3,643,438,926 | |
|
|
|
| Schedule of Investments | | April 30, 2023 (Unaudited) |
| Global X NASDAQ 100® Covered Call ETF |
| | | | |
| |
| | | Shares | | | Value | |
| COMMON STOCK — continued | | | | | | |
| Utilities — 1.2% | | | | | | |
| American Electric Power | | | 293,478 | | | $ | 27,123,237 | |
| Constellation Energy . | | | 186,003 | | | | 14,396,632 | |
| Exelon | | | 566,772 | | | | 24,053,804 | |
| Xcel Energy | | | 313,310 | | | | 21,903,502 | |
| | | | | | | | 87,477,175 | |
| TOTAL UNITED STATES | | | | | | | 7,376,642,086 | |
| TOTAL COMMON STOCK | | | | | | | | |
| (Cost $6,670,624,647) | | | | | | | 7,527,210,139 | |
| TOTAL INVESTMENTS — 103.2% | | | | | | | | |
| (Cost $6,670,624,647) | | | | | | $ | 7,527,210,139 | |
| WRITTEN OPTIONS— (3.3)% | | | | | | | | |
| (Premiums Received $(177,582,812)) | | | | | | $ | (241,541,820 | ) |
| | | | | | | | | |
| Percentages are based on Net Assets of $7,294,886,912. | | | | | |
A list of the exchange traded option contracts held by the Fund at April 30, 2023, is as follows:
|
|
|
|
|
|
| | Number of | Notional | Exercise | Expiration | |
| Description | Contracts | Amount | Price | Date | Value |
| WRITTEN OPTIONS — (3.3)% | | | | |
| Call Options | | | | | |
| Nasdaq-100 | (5,682) | ($7,372,395,000) | $12,975.00 | 05/19/23 | $ (241,541,820) |
|
|
| * | Non-income producing security. |
| (A) | All or a portion of these securities has been segregated as collateral for options |
| | contracts. The aggregate market value of collateral at April 30, 2023 was |
| | $7,527,210,139. |
|
|
|
| Schedule of Investments | | April 30, 2023 (Unaudited) |
| Global X NASDAQ 100® Covered Call ETF |
The following is a summary of the level of inputs used as of April 30, 2023, in valuing the Fund's investments and other financial instruments carried at value:
| Investments in Securities | | Level 1 | | | Level 2 | | | Level 3 | | | Total | |
| Common Stock | | $ | 7,527,210,139 | | | $ | — | | | $ | — | | | $ | 7,527,210,139 | |
| Total Investments in Securities | | $ | 7,527,210,139 | | | $ | — | | | $ | — | | | $ | 7,527,210,139 | |
| Other Financial Instruments | | Level 1 | | | Level 2 | | | Level 3 | | | Total | |
| Written Options | | $ | (241,541,820 | ) | | $ | — | | | $ | — | | | $ | (241,541,820 | ) |
| Total Other Financial Instruments | | $ | (241,541,820 | ) | | $ | — | | | $ | — | | | $ | (241,541,820 | ) |
Amounts designated as “—“ are $0 or have been rounded to $0.
See "Glossary" for abbreviations.
|
|
| Schedule of Investments | April 30, 2023 (Unaudited) |
| Global X MSCI SuperDividend® Emerging Markets ETF |
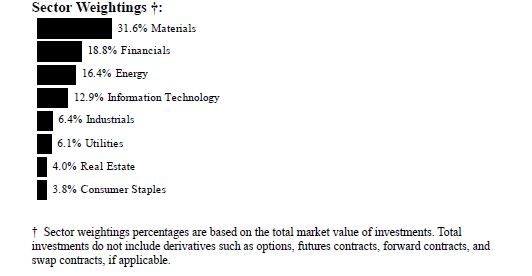
| | | | |
| |
| | | Shares | | | Value | |
| COMMON STOCK — 94.8% | | | | | | |
| BRAZIL — 7.1% | | | | | | |
| Financials — 1.8% | | | | | | |
| Banco do Brasil . | | | 88,800 | | | $ | 760,760 | |
| Materials — 3.7% | | | | | | | | |
| Cia Siderurgica Nacional | | | 259,551 | | | | 737,224 | |
| Vale | | | 61,435 | | | | 889,072 | |
| | | | | | | | 1,626,296 | |
| Utilities — 1.6% | | | | | | | | |
| CPFL Energia . | | | 105,208 | | | | 696,921 | |
| TOTAL BRAZIL | | | | | | | 3,083,977 | |
| CHILE — 4.2% | | | | | | | | |
| Industrials — 1.8% | | | | | | | | |
| Cia Sud Americana de Vapores . | | | 7,796,265 | | | | 801,663 | |
| Materials — 2.4% | | | | | | | | |
| Empresas CMPC | | | 654,871 | | | | 1,032,643 | |
| TOTAL CHILE | | | | | | | 1,834,306 | |
|
|
| Schedule of Investments | April 30, 2023 (Unaudited) |
| Global X MSCI SuperDividend® Emerging Markets ETF |
| | | | |
| |
| | | Shares | | | Value | |
| COMMON STOCK — continued | | | | | | |
| CHINA — 35.4% | | | | | | |
| Energy — 9.8% | | | | | | |
| China Petroleum & Chemical, Cl H | | | 1,987,600 | | | $ | 1,298,919 | |
| China Shenhua Energy, Cl H | | | 314,764 | | | | 1,042,544 | |
| Jizhong Energy Resources, Cl A | | | 699,200 | | | | 747,348 | |
| Yankuang Energy Group, Cl H | | | 346,900 | | | | 1,186,546 | |
| | | | | | | | 4,275,357 | |
| Financials — 9.5% | | | | | | | | |
| Bank of China, Cl H | | | 2,586,500 | | | | 1,031,318 | |
| Bank of Communications, Cl H . | | | 1,499,380 | | | | 966,492 | |
| China CITIC Bank Corp Ltd., Cl H . | | | 1,732,900 | | | | 935,999 | |
| New China Life Insurance C, Cl H | | | 423,500 | | | | 1,208,474 | |
| | | | | | | | 4,142,283 | |
| Industrials — 1.7% | | | | | | | | |
| COSCO SHIPPING Holdings, Cl A . | | | 465,000 | | | | 746,203 | |
| Information Technology — 1.8% | | | | | | | | |
| Kingboard Holdings | | | 257,100 | | | | 784,411 | |
| Materials — 6.6% | | | | | | | | |
| China Hongqiao Group | | | 744,900 | | | | 729,727 | |
| China National Building Material, Cl H | | | 1,124,400 | | | | 839,372 | |
| Luxi Chemical Group, Cl A . | | | 358,636 | | | | 621,102 | |
| Shanxi Taigang Stainless Steel, Cl A . | | | 1,219,900 | | | | 704,813 | |
| | | | | | | | 2,895,014 | |
| Real Estate — 4.0% | | | | | | | | |
| Longfor Group Holdings . | | | 339,300 | | | | 922,821 | |
| Shanghai Lujiazui Finance & Trade Zone | | | | | | | | |
| | | 1,065,300 | | | | 806,432 | |
| | | | | | | | 1,729,253 | |
| Utilities — 2.0% | | | | | | | | |
| Guangdong Investment | | | 925,200 | | | | 883,960 | |
| TOTAL CHINA | | | | | | | 15,456,481 | |
|
|
| Schedule of Investments | April 30, 2023 (Unaudited) |
| Global X MSCI SuperDividend® Emerging Markets ETF |
| | | | |
| |
| | | Shares | | | Value | |
| COMMON STOCK — continued | | | | | | |
| CZECH REPUBLIC — 1.6% | | | | | | |
| Financials — 1.6% | | | | | | |
| Komercni Banka . | | | 21,731 | | | $ | 703,484 | |
| EGYPT — 2.1% | | | | | | | | |
| Consumer Staples — 2.1% | | | | | | | | |
| Eastern SAE . | | | 1,651,792 | | | | 930,135 | |
| INDIA — 4.8% | | | | | | | | |
| Energy — 2.8% | | | | | | | | |
| Coal India | | | 427,108 | | | | 1,216,562 | |
| Materials — 2.0% | | | | | | | | |
| Vedanta . | | | 254,848 | | | | 869,930 | |
| TOTAL INDIA | | | | | | | 2,086,492 | |
| INDONESIA — 1.8% | | | | | | | | |
| Energy — 1.8% | | | | | | | | |
| Adaro Energy . | | | 3,730,100 | | | | 795,856 | |
| MEXICO — 2.1% | | | | | | | | |
| Financials — 2.1% | | | | | | | | |
| Banco del Bajio . | | | 276,540 | | | | 906,777 | |
| RUSSIA — 0.0% | | | | | | | | |
| Materials — 0.0% | | | | | | | | |
| Alrosa PJSC *(A) | | | 1,194,381 | | | | — | |
| PhosAgro PJSC GDR *(A) | | | 42 | | | | — | |
| Severstal PJSC *(A) | | | 71,665 | | | | — | |
| TOTAL RUSSIA | | | | | | | — | |
| SOUTH AFRICA — 8.8% | | | | | | | | |
| Energy — 1.9% | | | | | | | | |
| Exxaro Resources . | | | 79,124 | | | | 830,112 | |
| Materials — 6.9% | | | | | | | | |
| African Rainbow Minerals | | | 65,662 | | | | 824,916 | |
| Anglo American Platinum . | | | 11,482 | | | | 680,257 | |
|
|
| Schedule of Investments | April 30, 2023 (Unaudited) |
| Global X MSCI SuperDividend® Emerging Markets ETF |
| | | | |
| |
| | | Shares | | | Value | |
| COMMON STOCK — continued | | | | | | |
| Materials — continued | | | | | | |
| Kumba Iron Ore | | | 31,999 | | | $ | 776,569 | |
| Sibanye Stillwater . | | | 333,366 | | | | 736,063 | |
| | | | | | | | 3,017,805 | |
| TOTAL SOUTH AFRICA | | | | | | | 3,847,917 | |
| SOUTH KOREA — 3.8% | | | | | | | | |
| Financials — 3.8% | | | | | | | | |
| Korea Investment Holdings . | | | 18,866 | | | | 776,686 | |
| NH Investment & Securities . | | | 125,612 | | | | 877,520 | |
| TOTAL SOUTH KOREA | | | | | | | 1,654,206 | |
| TAIWAN — 19.6% | | | | | | | | |
| Industrials — 2.9% | | | | | | | | |
| Evergreen Marine Taiwan | | | 89,120 | | | | 468,175 | |
| Wan Hai Lines . | | | 378,600 | | | | 800,488 | |
| | | | | | | | 1,268,663 | |
| Information Technology — 11.0% | | | | | | | | |
| Asustek Computer | | | 82,500 | | | | 758,112 | |
| Compal Electronics | | | 1,292,600 | | | | 1,007,002 | |
| Lite-On Technology ADR | | | 471,610 | | | | 1,127,538 | |
| MediaTek . | | | 37,400 | | | | 809,010 | |
| Novatek Microelectronics | | | 81,200 | | | | 1,105,382 | |
| | | | | | | | 4,807,044 | |
| Materials — 5.7% | | | | | | | | |
| Asia Cement | | | 679,100 | | | | 970,853 | |
| China Steel . | | | 745,400 | | | | 705,575 | |
| Nan Ya Plastics . | | | 308,800 | | | | 783,489 | |
| | | | | | | | 2,459,917 | |
| TOTAL TAIWAN | | | | | | | 8,535,624 | |
| TURKEY — 1.9% | | | | | | | | |
| Materials — 1.9% | | | | | | | | |
| Eregli Demir ve Celik Fabrikalari * | | | 491,717 | | | | 837,890 | |
|
|
| Schedule of Investments | April 30, 2023 (Unaudited) |
| Global X MSCI SuperDividend® Emerging Markets ETF |
| | | | |
| |
| | | Shares | | | Value | |
| COMMON STOCK — continued | | | | | | |
| UNITED STATES — 1.6% | | | | | | |
| Consumer Staples — 1.6% | | | | | | |
| JBS . | | | 201,748 | | | $ | 721,846 | |
| TOTAL COMMON STOCK | | | | | | | | |
| (Cost $45,321,335) | | | | | | | 41,394,991 | |
| PREFERRED STOCK — 4.7% | | | | | | | | |
| BRAZIL— 4.7% | | | | | | | | |
| Materials — 2.2% | | | | | | | | |
| Gerdau (B) | | | 190,711 | | | | 959,872 | |
| Utilities — 2.5% | | | | | | | | |
| Cia Energetica de Minas Gerais (B) | | | 441,550 | | | | 1,090,007 | |
| TOTAL BRAZIL | | | | | | | 2,049,879 | |
| RUSSIA— 0.0% | | | | | | | | |
| Energy — 0.0% | | | | | | | | |
| Surgutneftegas PJSC (A),(B) | | | 3,166,303 | | | | — | |
| TOTAL RUSSIA | | | | | | | 0 | |
| TOTAL PREFERRED STOCK | | | | | | | | |
| (Cost $3,411,680) | | | | | | | 2,049,879 | |
| TOTAL INVESTMENTS — 99.5% | | | | | | | | |
| (Cost $48,733,015) | | | | | | $ | 43,444,870 | |
|
|
| Percentages are based on Net Assets of $43,642,630. |
| * | Non-income producing security. |
| (A) | Level 3 security in accordance with fair value hierarchy. |
| (B) | There is currently no stated interest rate. |
|
|
| Schedule of Investments | April 30, 2023 (Unaudited) |
| Global X MSCI SuperDividend® Emerging Markets ETF |
The following is a summary of the level of inputs used as of April 30, 2023, in valuing the Fund's investments and other financial instruments carried at value:
| Investments in Securities | | Level 1 | | | Level 2 | | | Level 3(1) | | | Total | |
| Common Stock | | $ | 40,464,856 | | | $ | 930,135 | | | $ —
| ^ | | $ | 41,394,991 | |
| Preferred Stock | | | 2,049,879 | | | | — | | | —
| ^ | | | 2,049,879 | |
| Total Investments in Securities | | $ | 42,514,735 | | | $ | 930,135 | | | $ | — | | | $ | 43,444,870 | |
(1) A reconciliation of Level 3 investments and disclosures of significant unobservable inputs are presented when the Fund has a significant amount of Level 3 investments at the end of the period in relation to Net Assets. Management has concluded that Level 3 investments are not material in relation to Net Assets.
^ Includes Securities in which the fair value is $0 or has been rounded to $0.
Amounts designated as “—“ are $0 or have been rounded to $0.
See "Glossary" for abbreviations.
|
|
|
| Schedule of Investments | | April 30, 2023 (Unaudited) |
| Global X SuperDividend® REIT ETF |
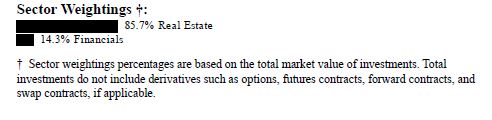
| | | | |
| |
| | | Shares | | | Value | |
| COMMON STOCK — 99.7% | | | | | | |
| AUSTRALIA — 7.2% | | | | | | |
| Real Estate — 7.2% | | | | | | |
| Dexus ‡ | | | 1,718,936 | | | $ | 8,837,775 | |
| Stockland ‡ | | | 3,565,719 | | | | 10,486,023 | |
| TOTAL AUSTRALIA | | | | | | | 19,323,798 | |
| BELGIUM — 3.8% | | | | | | | | |
| Real Estate — 3.8% | | | | | | | | |
| Cofinimmo ‡ * | | | 106,252 | | | | 10,164,204 | |
| CANADA — 3.1% | | | | | | | | |
| Real Estate — 3.1% | | | | | | | | |
| NorthWest Healthcare Properties Real Estate | | | | | | | | |
| Investment Trust ‡ | | | 1,361,969 | | | | 8,184,065 | |
| FRANCE — 3.6% | | | | | | | | |
| Real Estate — 3.6% | | | | | | | | |
| Klepierre ‡ | | | 386,077 | | | | 9,786,187 | |
| MEXICO — 3.8% | | | | | | | | |
| Real Estate — 3.8% | | | | | | | | |
| Fibra Uno Administracion ‡ | | | 7,403,700 | | | | 10,195,017 | |
| SINGAPORE — 17.9% | | | | | | | | |
| Real Estate — 17.9% | | | | | | | | |
| Frasers Logistics & Commercial Trust ‡ | | | 9,910,446 | | | | 10,028,184 | |
| Keppel ‡ | | | 13,897,010 | | | | 9,062,248 | |
| Mapletree Industrial Trust ‡ | | | 5,524,994 | | | | 9,856,078 | |
| Mapletree Pan Asia Commercial Trust ‡ | | | 7,297,633 | | | | 9,626,979 | |
|
|
|
| Schedule of Investments | | April 30, 2023 (Unaudited) |
| Global X SuperDividend® REIT ETF |
| | | | |
| |
| | | Shares | | | Value | |
| COMMON STOCK — continued | | | | | | |
| Real Estate — continued | | | | | | |
| Suntec Real Estate Investment Trust ‡ | | | 9,325,678 | | | $ | 9,436,469 | |
| TOTAL SINGAPORE | | | | | | | 48,009,958 | |
| SOUTH AFRICA — 3.2% | | | | | | | | |
| Real Estate — 3.2% | | | | | | | | |
| Growthpoint Properties ‡ | | | 12,397,035 | | | | 8,631,394 | |
| UNITED KINGDOM — 3.6% | | | | | | | | |
| Real Estate — 3.6% | | | | | | | | |
| Land Securities Group ‡ | | | 1,149,622 | | | | 9,741,898 | |
| UNITED STATES — 53.5% | | | | | | | | |
| Financials — 14.2% | | | | | | | | |
| Arbor Realty Trust ‡ | | | 651,437 | | | | 7,471,982 | |
| Blackstone Mortgage Trust, Cl A ‡ | | | 409,600 | | | | 7,471,104 | |
| KKR Real Estate Finance Trust ‡ | | | 621,486 | | | | 6,674,760 | |
| Ladder Capital, Cl A ‡ | | | 884,174 | | | | 8,267,027 | |
| Starwood Property Trust ‡ | | | 466,558 | | | | 8,346,723 | |
| | | | | | | | 38,231,596 | |
| Real Estate — 39.3% | | | | | | | | |
| Broadstone Net Lease, Cl A ‡ | | | 555,234 | | | | 8,978,134 | |
| CareTrust REIT ‡ | | | 490,051 | | | | 9,551,094 | |
| Easterly Government Properties, Cl A ‡ | | | 613,407 | | | | 8,630,637 | |
| EPR Properties ‡ | | | 228,372 | | | | 9,582,489 | |
| Global Net Lease ‡ | | | 678,836 | | | | 7,643,693 | |
| Highwoods Properties ‡ | | | 330,267 | | | | 7,569,720 | |
| LTC Properties ‡ | | | 266,858 | | | | 8,926,400 | |
| National Health Investors ‡ | | | 172,651 | | | | 8,592,840 | |
| National Storage Affiliates Trust ‡ | | | 228,106 | | | | 8,793,486 | |
| Omega Healthcare Investors ‡ | | | 353,174 | | | | 9,450,936 | |
| Physicians Realty Trust ‡ | | | 633,429 | | | | 9,134,046 | |
|
|
|
| Schedule of Investments | | April 30, 2023 (Unaudited) |
| Global X SuperDividend® REIT ETF |
| | | | |
| |
| | | Shares | | | Value | |
| COMMON STOCK — continued | | | | | | |
| Real Estate — continued | | | | | | |
| Spirit Realty Capital ‡ | | | 224,882 | | | $ | 8,648,962 | |
| | | | | | | | 105,502,437 | |
| TOTAL UNITED STATES | | | | | | | 143,734,033 | |
| TOTAL COMMON STOCK | | | | | | | | |
| (Cost $312,011,606) | | | | | | | 267,770,554 | |
| TOTAL INVESTMENTS — 99.7% | | | | | | | | |
| (Cost $312,011,606) | | | | | | $ | 267,770,554 | |
|
|
| Percentages are based on Net Assets of $268,687,647. |
| * | Non-income producing security. |
| ‡ | Real Estate Investment Trust |
As of April 30, 2023, all of the Fund's investments were considered Level 1, in accordance with authoritative guidance on fair value measurements and disclosure under U.S. GAAP.
See "Glossary" for abbreviations.
|
|
|
| Schedule of Investments | | April 30, 2023 (Unaudited) |
| Global X Renewable Energy Producers ETF |
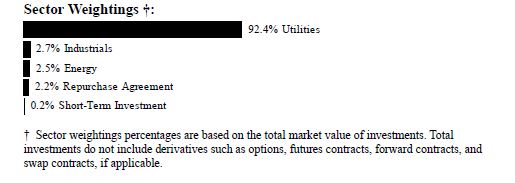
| | | | |
| |
| | | Shares | | | Value | |
| COMMON STOCK — 94.6% | | | | | | |
| AUSTRIA — 7.1% | | | | | | |
| Utilities — 7.1% | | | | | | |
| Verbund | | | 54,372 | | | $ | 4,856,143 | |
| BRAZIL — 11.4% | | | | | | | | |
| Utilities — 11.4% | | | | | | | | |
| AES Brasil Energia . | | | 262,796 | | | | 561,013 | |
| Centrais Eletricas Brasileiras . | | | 577,155 | | | | 3,905,113 | |
| Engie Brasil Energia | | | 349,284 | | | | 2,878,555 | |
| Omega Energia * | | | 273,562 | | | | 505,255 | |
| TOTAL BRAZIL | | | | | | | 7,849,936 | |
| CANADA — 8.5% | | | | | | | | |
| Utilities — 8.5% | | | | | | | | |
| Boralex, Cl A | | | 44,048 | | | | 1,282,825 | |
| Innergex Renewable Energy . | | | 87,495 | | | | 896,690 | |
| Northland Power | | | 105,351 | | | | 2,583,480 | |
| TransAlta Renewables | | | 114,401 | | | | 1,067,001 | |
| TOTAL CANADA | | | | | | | 5,829,996 | |
| CHINA — 4.1% | | | | | | | | |
| Utilities — 4.1% | | | | | | | | |
| China Datang Renewable Power, Cl H . | | | 1,065,700 | | | | 412,709 | |
| China Longyuan Power Group, Cl H | | | 1,439,500 | | | | 1,503,701 | |
| Xinyi Energy Holdings | | | 3,260,100 | | | | 909,517 | |
TOTAL CHINA
|
|
|
|
|
|
| 2,825,927 |
|
|
|
|
| Schedule of Investments | | April 30, 2023 (Unaudited) |
| Global X Renewable Energy Producers ETF |
| | | | |
| |
| | | Shares | | | Value | |
| COMMON STOCK — continued | | | | | | |
| DENMARK — 6.7% | | | | | | |
| Utilities — 6.7% | | | | | | |
| Orsted . | | | 51,210 | | | $ | 4,601,186 | |
| FRANCE — 2.8% | | | | | | | | |
| Utilities — 2.8% | | | | | | | | |
| Neoen . | | | 64,835 | | | | 1,946,911 | |
| GERMANY — 3.2% | | | | | | | | |
| Energy — 1.5% | | | | | | | | |
| VERBIO Vereinigte BioEnergie | | | 27,229 | | | | 1,014,249 | |
| Utilities — 1.7% | | | | | | | | |
| Encavis * | | | 69,001 | | | | 1,194,072 | |
| TOTAL GERMANY | | | | | | | 2,208,321 | |
| GREECE — 1.6% | | | | | | | | |
| Utilities — 1.6% | | | | | | | | |
| Terna Energy . | | | 49,595 | | | | 1,099,434 | |
| INDIA — 0.9% | | | | | | | | |
| Utilities — 0.9% | | | | | | | | |
| ReNew Energy Global, Cl A * (A) | | | 120,733 | | | | 618,153 | |
| ISRAEL — 2.0% | | | | | | | | |
| Utilities — 2.0% | | | | | | | | |
| Energix-Renewable Energies . | | | 233,157 | | | | 686,690 | |
| Enlight Renewable Energy * | | | 43,293 | | | | 709,322 | |
| TOTAL ISRAEL | | | | | | | 1,396,012 | |
| ITALY — 2.8% | | | | | | | | |
| Utilities — 2.8% | | | | | | | | |
| ERG | | | 64,437 | | | | 1,949,187 | |
| JAPAN — 1.4% | | | | | | | | |
| Utilities — 1.4% | | | | | | | | |
| RENOVA * | | | 33,460 | | | | 471,313 | |
|
|
|
| Schedule of Investments | | April 30, 2023 (Unaudited) |
| Global X Renewable Energy Producers ETF |
| | | | |
| |
| | | Shares | | | Value | |
| COMMON STOCK — continued | | | | | | |
| Utilities — continued | | | | | | |
| West Holdings . | | | 20,711 | | | $ | 491,290 | |
| TOTAL JAPAN | | | | | | | 962,603 | |
| NEW ZEALAND — 11.1% | | | | | | | | |
| Utilities — 11.1% | | | | | | | | |
| Contact Energy . | | | 335,273 | | | | 1,621,447 | |
| Mercury NZ | | | 593,512 | | | | 2,324,134 | |
| Meridian Energy . | | | 1,104,466 | | | | 3,724,667 | |
| TOTAL NEW ZEALAND | | | | | | | 7,670,248 | |
| PORTUGAL — 0.6% | | | | | | | | |
| Utilities — 0.6% | | | | | | | | |
| Greenvolt-Energias Renovaveis * (A) | | | 59,445 | | | | 404,591 | |
| RUSSIA — 0.0% | | | | | | | | |
| Utilities — 0.0% | | | | | | | | |
| RusHydro PJSC (B) | | | 271,804,543 | | | | — | |
| SOUTH AFRICA — 0.6% | | | | | | | | |
| Utilities — 0.6% | | | | | | | | |
| Scatec . | | | 67,660 | | | | 439,840 | |
| SPAIN — 9.7% | | | | | | | | |
| Utilities — 9.7% | | | | | | | | |
| Atlantica Sustainable Infrastructure | | | 48,874 | | | | 1,301,026 | |
| EDP Renovaveis * | | | 204,195 | | | | 4,544,680 | |
| Solaria Energia y Medio Ambiente * | | | 53,565 | | | | 846,230 | |
| TOTAL SPAIN | | | | | | | 6,691,936 | |
| THAILAND — 6.1% | | | | | | | | |
| Utilities — 6.1% | | | | | | | | |
| Absolute Clean Energy NVDR * (A) | | | 4,319,556 | | | | 252,994 | |
| BCPG NVDR . | | | 1,231,640 | | | | 351,665 | |
| Energy Absolute NVDR . | | | 1,603,265 | | | | 3,180,942 | |
| Gunkul Engineering NVDR (A) | | | 3,785,440 | | | | 419,034 | |
| TOTAL THAILAND | | | | | | | 4,204,635 | |
|
|
|
| Schedule of Investments | | April 30, 2023 (Unaudited) |
| Global X Renewable Energy Producers ETF |
| | | | |
| |
| | | Shares | | | Value | |
| COMMON STOCK — continued | | | | | | |
| TURKEY — 0.8% | | | | | | |
| Utilities — 0.8% | | | | | | |
| Aydem Yenilenebilir Enerji * | | | 299,310 | | | $ | 201,456 | |
| Ayen Enerji | | | 129,032 | | | | 155,250 | |
| Galata Wind Enerji | | | 226,167 | | | | 182,113 | |
| TOTAL TURKEY | | | | | | | 538,819 | |
| UNITED KINGDOM — 2.0% | | | | | | | | |
| Utilities — 2.0% | | | | | | | | |
| Drax Group . | | | 171,534 | | | | 1,357,421 | |
| UNITED STATES — 11.2% | | | | | | | | |
| Energy — 1.0% | | | | | | | | |
| Enviva | | | 28,692 | | | | 616,878 | |
| Gevo * | | | 104,657 | | | | 121,402 | |
| | | | | | | | 738,280 | |
| Industrials — 2.8% | | | | | | | | |
| Sunrun * | | | 91,317 | | | | 1,921,310 | |
| Utilities — 7.4% | | | | | | | | |
| NextEra Energy Partners . | | | 37,110 | | | | 2,134,196 | |
| Ormat Technologies . | | | 24,124 | | | | 2,070,080 | |
| Sunnova Energy International * (A) | | | 49,135 | | | | 882,465 | |
| | | | | | | | 5,086,741 | |
| TOTAL UNITED STATES | | | | | | | 7,746,331 | |
| TOTAL COMMON STOCK | | | | | | | | |
| (Cost $95,596,520) | | | | | | | 65,197,630 | |
| MASTER LIMITED PARTNERSHIP — 5.3% | | | | | | | | |
| CANADA— 5.3% | | | | | | | | |
| Utilities — 5.3% | | | | | | | | |
| Brookfield Renewable Partners, Cl A | | | 118,186 | | | | 3,643,262 | |
| TOTAL MASTER LIMITED PARTNERSHIP | | | | | | | | |
| (Cost $2,671,488) . | | | | | | | 3,643,262 | |
|
|
|
| Schedule of Investments | | April 30, 2023 (Unaudited) |
| Global X Renewable Energy Producers ETF |
| | | | |
| |
| | | Number of | | | | |
| | | Rights | | | Value | |
| RIGHT — 0.0% | | | | | | |
| Hong Kong — 0.0% | | | | | | |
| Xinyi Energy Holdings LTD RTS 05/26/2023 | | | 325,250 | | | $ | — | |
| TOTAL RIGHT (Cost $–) . | | | | | | | — | |
| | | Shares | | | | | |
| SHORT-TERM INVESTMENT(C)(D) — 0.2% | | | | | | | | |
| Fidelity Investments Money Market | | | | | | | | |
| Government Portfolio, Cl Institutional, | | | | | | | | |
4.770%
| | | | | | | | |
| (Cost $136,617) | | | 136,617 | | | | 136,617 | |
| | Face Amount | | | | | |
| REPURCHASE AGREEMENT(C) — 2.2% | | | | | | | | |
| BNP Paribas | | | | | | | | |
| 4.700%, dated 04/28/2023, to be repurchased | | | | | | | | |
| on 05/01/2023, repurchase price $1,527,110 | | | | | | | | |
| (collateralized by U.S. Treasury Obligations, | | | | | | | | |
| ranging in par value $82,009 - $123,253, | | | | | | | | |
| 1.125% - 2.250%, 01/15/2025 - 08/15/2027, | | | | | | | | |
| with a total market value of $1,553,953) | | | | | | | | |
| (Cost $1,526,513) | | $ | 1,526,513 | | | | 1,526,513 | |
| TOTAL INVESTMENTS — 102.3% | | | | | | | | |
| (Cost $99,931,138) | | | | | | $ | 70,504,022 | |
|
|
| Percentages are based on Net Assets of $68,935,365. |
| * | Non-income producing security. |
| (A) | This security or a partial position of this security is on loan at April 30, 2023. |
| (B) | Level 3 security in accordance with fair value hierarchy. |
| (C) | Security was purchased with cash collateral held from securities on loan. |
| (D) | The rate reported on the Schedule of Investments is the 7-day effective yield as of |
| | April 30, 2023. |
|
|
|
| Schedule of Investments | | April 30, 2023 (Unaudited) |
| Global X Renewable Energy Producers ETF |
The following is a summary of the level of inputs used as of April 30, 2023, in valuing the Fund's investments carried at value:
| Investments in Securities | | Level 1 | | | Level 2 | | | Level 3(1) | | | Total | |
| Common Stock | | $ | 63,801,618 | | | $ | 1,396,012 | | | $ —
| ^ | | $ | 65,197,630 | |
| Master Limited Partnership | | | 3,643,262 | | | | — | | | | — | | | | 3,643,262 | |
| Short-Term Investment | | | 136,617 | | | | — | | | | — | | | | 136,617 | |
| Repurchase Agreement | | | — | | | | 1,526,513 | | | | — | | | | 1,526,513 | |
| Total Investments in Securities | | $ | 67,581,497 | | | $ | 2,922,525 | | | $ | — | | | $ | 70,504,022 | |
(1) A reconciliation of Level 3 investments and disclosures of significant unobservable inputs are presented when the Fund has a significant amount of Level 3 investments at the end of the period in relation to Net Assets. Management has concluded that Level 3 investments are not material in relation to Net Assets.
|
| ^ | Includes Securities in which the fair value is $0 or has been rounded to $0. |
| | |
| Amounts designated as “—“ are $0 or have been rounded to $0. |
| See "Glossary" for abbreviations. |
|
|
|
| Schedule of Investments | | April 30, 2023 (Unaudited) |
| Global X S&P 500® Catholic Values ETF |

| | | | |
| |
| | | Shares | | | Value | |
| COMMON STOCK — 99.8% | | | | | | |
| CHINA — 0.1% | | | | | | |
| Information Technology — 0.1% | | | | | | |
| NXP Semiconductors . | | | 4,891 | | | $ | 800,852 | |
| UNITED STATES — 99.7% | | | | | | | | |
| Communication Services — 8.3% | | | | | | | | |
| Activision Blizzard * | | | 12,388 | | | | 962,671 | |
| Alphabet, Cl A * | | | 109,492 | | | | 11,752,871 | |
| Alphabet, Cl C * | | | 96,094 | | | | 10,399,293 | |
| AT&T | | | 129,456 | | | | 2,287,488 | |
| Charter Communications, Cl A * | | | 1,941 | | | | 715,647 | |
| Comcast, Cl A | | | 79,518 | | | | 3,289,660 | |
| DISH Network, Cl A * | | | 4,959 | | | | 37,242 | |
| Electronic Arts | | | 5,149 | | | | 655,365 | |
| Fox, Cl A | | | 4,662 | | | | 155,058 | |
| Fox, Cl B | | | 3,016 | | | | 92,109 | |
| Interpublic Group | | | 7,774 | | | | 277,765 | |
| Match Group * | | | 4,835 | | | | 178,411 | |
| Meta Platforms, Cl A * | | | 40,914 | | | | 9,832,452 | |
Netflix *
| | | 8,013 | | | | 2,643,729 | |
| News, Cl A . | | | 7,671 | | | | 135,086 | |
|
|
|
| Schedule of Investments | | April 30, 2023 (Unaudited) |
| Global X S&P 500® Catholic Values ETF |
| | | | |
| |
| | | Shares | | | Value | |
| COMMON STOCK — continued | | | | | | |
| Communication Services — continued | | | | | | |
| News, Cl B . | | | 2,411 | | | $ | 42,795 | |
| Omnicom Group . | | | 3,798 | | | | 343,985 | |
| Paramount Global, Cl B | | | 10,767 | | | | 251,194 | |
| Take-Two Interactive Software * | | | 3,077 | | | | 382,440 | |
| T-Mobile US * | | | 10,855 | | | | 1,562,034 | |
| Verizon Communications | | | 75,683 | | | | 2,938,771 | |
| Walt Disney * | | | 33,167 | | | | 3,399,618 | |
| Warner Bros Discovery * | | | 40,391 | | | | 549,722 | |
| | | | | | | | 52,885,406 | |
| Consumer Discretionary — 10.0% | | | | | | | | |
| Advance Auto Parts | | | 993 | | | | 124,651 | |
| Amazon.com * | | | 165,166 | | | | 17,416,755 | |
| Aptiv * | | | 5,254 | | | | 540,426 | |
| AutoZone * | | | 338 | | | | 900,199 | |
| Bath & Body Works . | | | 4,713 | | | | 165,426 | |
| Best Buy | | | 3,644 | | | | 271,551 | |
| Booking Holdings * | | | 700 | | | | 1,880,417 | |
| BorgWarner . | | | 4,308 | | | | 207,344 | |
| CarMax * | | | 2,889 | | | | 202,317 | |
| Carnival * | | | 14,907 | | | | 137,294 | |
| Chipotle Mexican Grill, Cl A * | | | 499 | | | | 1,031,742 | |
| Darden Restaurants . | | | 2,505 | | | | 380,585 | |
| Domino's Pizza . | | | 664 | | | | 210,800 | |
| DR Horton | | | 6,039 | | | | 663,203 | |
| eBay | | | 9,026 | | | | 419,077 | |
| Etsy * | | | 2,437 | | | | 246,210 | |
| Expedia Group * | | | 2,623 | | | | 246,457 | |
| Ford Motor . | | | 72,798 | | | | 864,840 | |
| Garmin | | | 2,732 | | | | 268,200 | |
| General Motors | | | 27,057 | | | | 893,963 | |
| Genuine Parts . | | | 2,865 | | | | 482,208 | |
| Hasbro . | | | 2,446 | | | | 144,852 | |
| Hilton Worldwide Holdings . | | | 5,119 | | | | 737,238 | |
| Home Depot . | | | 18,790 | | | | 5,647,147 | |
| Las Vegas Sands * | | | 6,621 | | | | 422,751 | |
| Lennar, Cl A . | | | 5,035 | | | | 567,998 | |
| LKQ | | | 4,880 | | | | 281,722 | |
| Lowe's | | | 11,393 | | | | 2,367,807 | |
| Marriott International, Cl A | | | 5,047 | | | | 854,659 | |
|
|
|
| Schedule of Investments | | April 30, 2023 (Unaudited) |
| Global X S&P 500® Catholic Values ETF |
| | | | |
| |
| | | Shares | | | Value | |
| COMMON STOCK — continued | | | | | | |
| Consumer Discretionary — continued | | | | | | |
| McDonald's . | | | 13,414 | | | $ | 3,967,191 | |
| Mohawk Industries * | | | 1,035 | | | | 109,607 | |
| NIKE, Cl B | | | 22,858 | | | | 2,896,566 | |
| Norwegian Cruise Line Holdings * | | | 6,607 | | | | 88,203 | |
| NVR * | | | 50 | | | | 292,000 | |
| O'Reilly Automotive * | | | 1,128 | | | | 1,034,726 | |
| Pool . | | | 870 | | | | 305,648 | |
| PulteGroup . | | | 5,295 | | | | 355,559 | |
| Ralph Lauren, Cl A . | | | 1,140 | | | | 130,861 | |
| Ross Stores | | | 6,540 | | | | 698,014 | |
| Starbucks | | | 21,075 | | | | 2,408,662 | |
| Tapestry . | | | 5,543 | | | | 226,210 | |
| Tesla * | | | 49,821 | | | | 8,186,089 | |
| TJX | | | 21,318 | | | | 1,680,285 | |
| Tractor Supply . | | | 2,166 | | | | 516,374 | |
| Ulta Beauty * | | | 926 | | | | 510,624 | |
| VF . | | | 5,496 | | | | 129,211 | |
| Whirlpool | | | 1,260 | | | | 175,883 | |
| Wynn Resorts . | | | 2,127 | | | | 243,074 | |
| Yum! Brands | | | 5,377 | | | | 755,899 | |
| | | | | | | | 63,288,525 | |
| Consumer Staples — 7.2% | | | | | | | | |
| Altria Group . | | | 47,523 | | | | 2,257,818 | |
| Archer-Daniels-Midland | | | 15,050 | | | | 1,175,104 | |
| Brown-Forman, Cl B | | | 4,290 | | | | 279,236 | |
| Campbell Soup . | | | 4,573 | | | | 248,314 | |
| Clorox | | | 3,048 | | | | 504,810 | |
| Coca-Cola . | | | 106,093 | | | | 6,805,866 | |
| Colgate-Palmolive | | | 21,880 | | | | 1,746,024 | |
| Conagra Brands . | | | 12,826 | | | | 486,875 | |
| Constellation Brands, Cl A | | | 4,121 | | | | 945,646 | |
| Costco Wholesale | | | 12,093 | | | | 6,085,439 | |
| Dollar General . | | | 4,130 | | | | 914,630 | |
| Dollar Tree * | | | 4,139 | | | | 636,206 | |
| Estee Lauder, Cl A . | | | 6,026 | | | | 1,486,735 | |
| General Mills | | | 15,525 | | | | 1,375,981 | |
| Hormel Foods | | | 8,562 | | | | 346,247 | |
| J M Smucker . | | | 2,823 | | | | 435,899 | |
| Kellogg . | | | 6,840 | | | | 477,227 | |
|
|
|
| Schedule of Investments | | April 30, 2023 (Unaudited) |
| Global X S&P 500® Catholic Values ETF |
| | | | |
| |
| | | Shares | | | Value | |
| COMMON STOCK — continued | | | | | | |
| Consumer Staples — continued | | | | | | |
| Keurig Dr Pepper | | | 21,729 | | | $ | 710,538 | |
| Kimberly-Clark | | | 8,719 | | | | 1,263,296 | |
| Kraft Heinz | | | 20,311 | | | | 797,613 | |
| Kroger | | | 16,939 | | | | 823,743 | |
| Lamb Weston Holdings . | | | 4,415 | | | | 493,641 | |
| McCormick . | | | 6,162 | | | | 541,332 | |
| Molson Coors Beverage, Cl B | | | 5,710 | | | | 339,631 | |
| Monster Beverage * | | | 20,608 | | | | 1,154,048 | |
| Procter & Gamble . | | | 64,310 | | | | 10,056,798 | |
| Sysco . | | | 13,221 | | | | 1,014,579 | |
| Target | | | 8,461 | | | | 1,334,723 | |
| Tyson Foods, Cl A | | | 7,243 | | | | 452,615 | |
| Walgreens Boots Alliance | | | 18,081 | | | | 637,355 | |
| | | | | | | | 45,827,969 | |
| Energy — 4.7% | | | | | | | | |
| APA . | | | 5,849 | | | | 215,536 | |
| Baker Hughes, Cl A | | | 18,358 | | | | 536,788 | |
| Chevron . | | | 32,298 | | | | 5,444,797 | |
| ConocoPhillips . | | | 22,135 | | | | 2,277,470 | |
| Coterra Energy | | | 15,663 | | | | 400,973 | |
| Devon Energy | | | 11,379 | | | | 607,980 | |
| Diamondback Energy | | | 3,108 | | | | 441,957 | |
| EOG Resources | | | 10,797 | | | | 1,289,917 | |
| EQT . | | | 5,070 | | | | 176,639 | |
| Exxon Mobil | | | 75,298 | | | | 8,910,765 | |
| Halliburton . | | | 17,251 | | | | 564,970 | |
| Hess | | | 5,176 | | | | 750,830 | |
| Kinder Morgan . | | | 35,651 | | | | 611,415 | |
| Marathon Oil . | | | 10,879 | | | | 262,837 | |
| Marathon Petroleum | | | 8,515 | | | | 1,038,830 | |
| Occidental Petroleum . | | | 12,988 | | | | 799,152 | |
| ONEOK . | | | 8,124 | | | | 531,391 | |
| Phillips 66 . | | | 8,732 | | | | 864,468 | |
| Pioneer Natural Resources | | | 4,138 | | | | 900,222 | |
| Schlumberger | | | 26,296 | | | | 1,297,708 | |
| Targa Resources | | | 3,250 | | | | 245,472 | |
| Valero Energy . | | | 7,014 | | | | 804,295 | |
|
|
|
| Schedule of Investments | | April 30, 2023 (Unaudited) |
| Global X S&P 500® Catholic Values ETF |
| | | | |
| |
| | | Shares | | | Value | |
| COMMON STOCK — continued | | | | | | |
| Energy — continued | | | | | | |
| Williams | | | 22,218 | | | $ | 672,317 | |
| | | | | | | | 29,646,729 | |
| Financials — 13.1% | | | | | | | | |
| Aflac | | | 10,263 | | | | 716,871 | |
| Allstate | | | 4,820 | | | | 557,963 | |
| American Express . | | | 11,159 | | | | 1,800,393 | |
| American International Group | | | 13,121 | | | | 695,938 | |
| Ameriprise Financial | | | 1,949 | | | | 594,679 | |
| Aon, Cl A . | | | 3,683 | | | | 1,197,638 | |
| Arch Capital Group * | | | 5,713 | | | | 428,875 | |
| Arthur J Gallagher | | | 3,753 | | | | 780,849 | |
| Assurant . | | | 1,180 | | | | 145,293 | |
| Bank of America | | | 126,803 | | | | 3,712,792 | |
| Bank of New York Mellon | | | 14,430 | | | | 614,574 | |
| Berkshire Hathaway, Cl B * | | | 32,949 | | | | 10,825,394 | |
| BlackRock, Cl A . | | | 2,663 | | | | 1,787,406 | |
| Brown & Brown . | | | 3,593 | | | | 231,353 | |
| Capital One Financial | | | 7,477 | | | | 727,512 | |
| Cboe Global Markets . | | | 2,293 | | | | 320,332 | |
| Charles Schwab . | | | 27,632 | | | | 1,443,496 | |
| Chubb . | | | 7,397 | | | | 1,490,939 | |
| Cincinnati Financial . | | | 2,888 | | | | 307,399 | |
| Citigroup | | | 35,535 | | | | 1,672,633 | |
| Citizens Financial Group . | | | 7,945 | | | | 245,818 | |
| CME Group, Cl A . | | | 6,532 | | | | 1,213,450 | |
| Comerica | | | 2,355 | | | | 102,136 | |
| Discover Financial Services | | | 5,373 | | | | 555,944 | |
| Everest Re Group | | | 728 | | | | 275,184 | |
| FactSet Research Systems . | | | 628 | | | | 258,541 | |
| Fidelity National Information Services . | | | 11,352 | | | | 666,589 | |
| Fifth Third Bancorp | | | 11,481 | | | | 300,802 | |
| First Republic Bank . | | | 3,380 | | | | 11,864 | |
| Fiserv * | | | 11,233 | | | | 1,371,774 | |
| FleetCor Technologies * | | | 1,584 | | | | 338,849 | |
| Franklin Resources | | | 5,735 | | | | 154,157 | |
| Global Payments | | | 5,312 | | | | 598,716 | |
| Globe Life . | | | 1,889 | | | | 204,994 | |
| Goldman Sachs Group | | | 6,225 | | | | 2,137,914 | |
| Hartford Financial Services Group . | | | 6,265 | | | | 444,752 | |
|
|
|
| Schedule of Investments | | April 30, 2023 (Unaudited) |
| Global X S&P 500® Catholic Values ETF |
| | | | |
| |
| | | Shares | | | Value | |
| COMMON STOCK — continued | | | | | | |
| Financials — continued | | | | | | |
| Huntington Bancshares | | | 26,599 | | | $ | 297,909 | |
| Intercontinental Exchange . | | | 10,278 | | | | 1,119,583 | |
| Invesco | | | 6,143 | | | | 105,230 | |
| Jack Henry & Associates . | | | 1,299 | | | | 212,179 | |
| JPMorgan Chase . | | | 53,239 | | | | 7,359,759 | |
| KeyCorp | | | 17,213 | | | | 193,818 | |
| Lincoln National . | | | 3,062 | | | | 66,537 | |
| Loews . | | | 3,585 | | | | 206,389 | |
| M&T Bank . | | | 3,223 | | | | 405,453 | |
| MarketAxess Holdings . | | | 659 | | | | 209,806 | |
| Marsh & McLennan . | | | 9,213 | | | | 1,660,091 | |
| Mastercard, Cl A . | | | 15,439 | | | | 5,867,283 | |
| MetLife . | | | 11,630 | | | | 713,268 | |
| Moody's . | | | 2,886 | | | | 903,664 | |
| Morgan Stanley | | | 23,295 | | | | 2,095,851 | |
| MSCI, Cl A | | | 1,463 | | | | 705,824 | |
| Nasdaq . | | | 6,957 | | | | 385,209 | |
| Northern Trust . | | | 3,754 | | | | 293,413 | |
| PayPal Holdings * | | | 21,333 | | | | 1,621,308 | |
| PNC Financial Services Group | | | 7,327 | | | | 954,342 | |
| Principal Financial Group | | | 4,425 | | | | 330,503 | |
| Progressive | | | 10,756 | | | | 1,467,118 | |
| Prudential Financial . | | | 7,010 | | | | 609,870 | |
| Raymond James Financial . | | | 3,745 | | | | 339,035 | |
| Regions Financial . | | | 19,107 | | | | 348,894 | |
| S&P Global . | | | 6,118 | | | | 2,218,264 | |
| State Street . | | | 6,154 | | | | 444,688 | |
| Synchrony Financial | | | 8,203 | | | | 242,071 | |
| T Rowe Price Group | | | 4,078 | | | | 458,082 | |
| Travelers . | | | 4,509 | | | | 816,760 | |
| Truist Financial | | | 24,478 | | | | 797,493 | |
| US Bancorp . | | | 24,839 | | | | 851,481 | |
| Visa, Cl A . | | | 29,683 | | | | 6,908,125 | |
| W R Berkley | | | 3,672 | | | | 216,354 | |
| Wells Fargo . | | | 68,932 | | | | 2,740,047 | |
| Willis Towers Watson | | | 1,837 | | | | 425,449 | |
| Zions Bancorp . | | | 2,745 | | | | 76,476 | |
| | | | | | | | 83,601,439 | |
|
|
|
| Schedule of Investments | | April 30, 2023 (Unaudited) |
| Global X S&P 500® Catholic Values ETF |
| | | | |
| |
| | | Shares | | | Value | |
| COMMON STOCK — continued | | | | | | |
| Health Care — 14.4% | | | | | | |
| Align Technology * | | | 4,179 | | | $ | 1,359,429 | |
| AmerisourceBergen | | | 10,036 | | | | 1,674,507 | |
| Baxter International | | | 29,534 | | | | 1,408,181 | |
| Boston Scientific * | | | 85,526 | | | | 4,457,615 | |
| Cardinal Health | | | 16,419 | | | | 1,348,000 | |
| Cigna Group | | | 17,599 | | | | 4,457,651 | |
| CVS Health . | | | 75,664 | | | | 5,546,928 | |
| DaVita * | | | 3,510 | | | | 317,164 | |
| DENTSPLY SIRONA . | | �� | 13,476 | | | | 565,049 | |
| Dexcom * | | | 23,051 | | | | 2,797,008 | |
| Edwards Lifesciences * | | | 36,941 | | | | 3,250,069 | |
| Elevance Health | | | 14,076 | | | | 6,596,717 | |
| Gilead Sciences | | | 73,480 | | | | 6,040,791 | |
| Henry Schein * | | | 8,608 | | | | 695,612 | |
| Hologic * | | | 14,576 | | | | 1,253,682 | |
| Humana | | | 7,362 | | | | 3,905,467 | |
| IDEXX Laboratories * | | | 4,898 | | | | 2,410,600 | |
| Incyte * | | | 10,537 | | | | 784,058 | |
| Intuitive Surgical * | | | 20,643 | | | | 6,218,084 | |
| IQVIA Holdings * | | | 11,136 | | | | 2,096,129 | |
| Laboratory Corp of America Holdings | | | 5,286 | | | | 1,198,389 | |
| McKesson . | | | 8,069 | | | | 2,939,053 | |
| Medtronic | | | 78,382 | | | | 7,128,843 | |
| Mettler-Toledo International * | | | 1,309 | | | | 1,952,373 | |
| Molina Healthcare * | | | 3,558 | | | | 1,059,893 | |
| Quest Diagnostics . | | | 7,122 | | | | 988,605 | |
| ResMed | | | 8,548 | | | | 2,059,726 | |
| STERIS | | | 5,840 | | | | 1,101,132 | |
| Stryker . | | | 20,162 | | | | 6,041,543 | |
| Teleflex | | | 2,622 | | | | 714,547 | |
| Waters * | | | 3,530 | | | | 1,060,271 | |
| West Pharmaceutical Services | | | 4,336 | | | | 1,566,337 | |
| Zimmer Biomet Holdings . | | | 12,132 | | | | 1,679,554 | |
| Zoetis, Cl A . | | | 27,461 | | | | 4,827,095 | |
| | | | | | | | 91,500,102 | |
| Industrials — 8.4% | | | | | | | | |
| 3M | | | 14,357 | | | | 1,525,001 | |
| A O Smith . | | | 3,251 | | | | 222,011 | |
| Alaska Air Group * | | | 3,537 | | | | 153,718 | |
|
|
|
| Schedule of Investments | | April 30, 2023 (Unaudited) |
| Global X S&P 500® Catholic Values ETF |
| | | | |
| |
| | | Shares | | | Value | |
| COMMON STOCK — continued | | | | | | |
| Industrials — continued | | | | | | |
| Allegion . | | | 2,214 | | | $ | 244,603 | |
| American Airlines Group * | | | 15,660 | | | | 213,602 | |
| AMETEK | | | 5,774 | | | | 796,408 | |
| Automatic Data Processing | | | 7,742 | | | | 1,703,240 | |
| Broadridge Financial Solutions . | | | 2,162 | | | | 314,376 | |
| Carrier Global | | | 21,620 | | | | 904,148 | |
| Caterpillar . | | | 13,069 | | | | 2,859,497 | |
| Ceridian HCM Holding * | | | 2,115 | | | | 134,260 | |
| CH Robinson Worldwide | | | 3,220 | | | | 324,801 | |
| Cintas | | | 2,291 | | | | 1,044,169 | |
| Copart * | | | 10,697 | | | | 845,598 | |
| CoStar Group * | | | 9,612 | | | | 739,643 | |
| CSX | | | 53,661 | | | | 1,644,173 | |
| Cummins | | | 3,566 | | | | 838,153 | |
| Deere . | | | 7,025 | | | | 2,655,591 | |
| Delta Air Lines * | | | 15,752 | | | | 540,451 | |
| Dover | | | 3,556 | | | | 519,745 | |
| Eaton | | | 9,878 | | | | 1,650,811 | |
| Emerson Electric | | | 14,808 | | | | 1,232,914 | |
| Equifax . | | | 3,027 | | | | 630,766 | |
| Expeditors International of Washington . | | | 4,039 | | | | 459,800 | |
| Fastenal | | | 14,123 | | | | 760,382 | |
| FedEx . | | | 6,110 | | | | 1,391,736 | |
| Fortive . | | | 8,762 | | | | 552,795 | |
| Generac Holdings * | | | 1,491 | | | | 152,410 | |
| Howmet Aerospace . | | | 9,376 | | | | 415,263 | |
| IDEX . | | | 1,852 | | | | 382,105 | |
| Illinois Tool Works | | | 7,159 | | | | 1,732,049 | |
| Ingersoll Rand . | | | 9,896 | | | | 564,270 | |
| JB Hunt Transport Services | | | 2,113 | | | | 370,388 | |
| Johnson Controls International | | | 17,535 | | | | 1,049,294 | |
| Masco . | | | 6,525 | | | | 349,153 | |
| Nordson . | | | 1,194 | | | | 258,274 | |
| Norfolk Southern . | | | 6,129 | | | | 1,244,371 | |
| Old Dominion Freight Line | | | 2,333 | | | | 747,470 | |
| Otis Worldwide | | | 10,927 | | | | 932,073 | |
| PACCAR | | | 12,826 | | | | 957,974 | |
| Parker-Hannifin | | | 3,278 | | | | 1,064,957 | |
| Paychex | | | 5,913 | | | | 649,602 | |
|
|
|
| Schedule of Investments | | April 30, 2023 (Unaudited) |
| Global X S&P 500® Catholic Values ETF |
| | | | |
| |
| | | Shares | | | Value | |
| COMMON STOCK — continued | | | | | | |
| Industrials — continued | | | | | | |
| Paycom Software * | | | 986 | | | $ | 286,305 | |
| Pentair | | | 3,936 | | | | 228,603 | |
| Quanta Services . | | | 3,434 | | | | 582,544 | |
| Republic Services, Cl A | | | 5,112 | | | | 739,297 | |
| Robert Half International | | | 2,642 | | | | 192,866 | |
| Rockwell Automation | | | 2,788 | | | | 790,147 | |
| Rollins . | | | 6,137 | | | | 259,288 | |
| Snap-On . | | | 1,283 | | | | 332,823 | |
| Southwest Airlines . | | | 14,958 | | | | 453,078 | |
| Stanley Black & Decker . | | | 3,950 | | | | 341,043 | |
| Trane Technologies . | | | 5,925 | | | | 1,100,924 | |
| TransDigm Group . | | | 1,400 | | | | 1,071,000 | |
| Union Pacific | | | 15,698 | | | | 3,072,099 | |
| United Airlines Holdings * | | | 7,834 | | | | 343,129 | |
| United Parcel Service, Cl B . | | | 18,636 | | | | 3,350,939 | |
| United Rentals . | | | 1,686 | | | | 608,832 | |
| Verisk Analytics, Cl A . | | | 3,921 | | | | 761,105 | |
| Waste Management . | | | 9,648 | | | | 1,602,050 | |
| Westinghouse Air Brake Technologies | | | 4,652 | | | | 454,361 | |
| WW Grainger . | | | 1,095 | | | | 761,649 | |
| Xylem . | | | 4,507 | | | | 468,007 | |
| | | | | | | | 53,572,134 | |
| Information Technology — 25.6% | | | | | | | | |
| Accenture, Cl A | | | 11,421 | | | | 3,201,192 | |
| Adobe * | | | 8,472 | | | | 3,198,688 | |
| Advanced Micro Devices * | | | 29,719 | | | | 2,655,987 | |
| Akamai Technologies * | | | 3,145 | | | | 257,796 | |
| Amphenol, Cl A . | | | 11,006 | | | | 830,623 | |
| Analog Devices | | | 9,186 | | | | 1,652,378 | |
| ANSYS * | | | 1,565 | | | | 491,285 | |
| Apple . | | | 272,775 | | | | 46,284,462 | |
| Applied Materials . | | | 15,450 | | | | 1,746,313 | |
| Arista Networks * | | | 4,408 | | | | 705,985 | |
| Autodesk * | | | 3,991 | | | | 777,407 | |
| Broadcom | | | 7,663 | | | | 4,800,869 | |
| Cadence Design Systems * | | | 5,056 | | | | 1,058,979 | |
| CDW | | | 2,494 | | | | 422,957 | |
| Cisco Systems | | | 74,754 | | | | 3,532,126 | |
| Cognizant Technology Solutions, Cl A | | | 9,638 | | | | 575,485 | |
|
|
|
| Schedule of Investments | | April 30, 2023 (Unaudited) |
| Global X S&P 500® Catholic Values ETF |
| | | | |
| |
| | | Shares | | | Value | |
| COMMON STOCK — continued | | | | | | |
| Information Technology — continued | | | | | | |
| DXC Technology * | | | 5,045 | | | $ | 120,323 | |
| Enphase Energy * | | | 2,438 | | | | 400,320 | |
| EPAM Systems * | | | 936 | | | | 264,364 | |
| F5 * | | | 1,266 | | | | 170,100 | |
| First Solar * | | | 1,819 | | | | 332,113 | |
| Fortinet * | | | 12,364 | | | | 779,550 | |
| Gartner * | | | 1,467 | | | | 443,709 | |
| Gen Digital | | | 10,446 | | | | 184,581 | |
| Hewlett Packard Enterprise | | | 25,964 | | | | 371,804 | |
| HP | | | 17,196 | | | | 510,893 | |
| Intel . | | | 73,939 | | | | 2,296,545 | |
| International Business Machines . | | | 16,499 | | | | 2,085,639 | |
| Intuit . | | | 5,043 | | | | 2,238,840 | |
| Juniper Networks . | | | 6,947 | | | | 209,452 | |
| Keysight Technologies * | | | 3,427 | | | | 495,681 | |
| KLA | | | 2,577 | | | | 996,114 | |
| Lam Research | | | 2,604 | | | | 1,364,704 | |
| Microchip Technology | | | 10,026 | | | | 731,798 | |
| Micron Technology . | | | 20,682 | | | | 1,331,094 | |
| Microsoft | | | 136,528 | | | | 41,949,593 | |
| Monolithic Power Systems . | | | 864 | | | | 399,142 | |
| Motorola Solutions | | | 2,987 | | | | 870,412 | |
| NetApp . | | | 3,981 | | | | 250,365 | |
| NVIDIA . | | | 44,777 | | | | 12,425,170 | |
| ON Semiconductor * | | | 7,185 | | | | 517,033 | |
| Oracle . | | | 27,169 | | | | 2,573,448 | |
| PTC * | | | 1,983 | | | | 249,442 | |
| Qorvo * | | | 2,051 | | | | 188,856 | |
| QUALCOMM . | | | 20,220 | | | | 2,361,696 | |
| Roper Technologies | | | 1,869 | | | | 849,984 | |
| Salesforce * | | | 18,011 | | | | 3,572,842 | |
| Seagate Technology Holdings . | | | 3,749 | | | | 220,329 | |
| ServiceNow * | | | 3,676 | | | | 1,688,828 | |
| Skyworks Solutions | | | 2,909 | | | | 308,063 | |
| SolarEdge Technologies * | | | 842 | | | | 240,500 | |
| Synopsys * | | | 2,743 | | | | 1,018,531 | |
| TE Connectivity | | | 6,052 | | | | 740,583 | |
| Teledyne Technologies * | | | 913 | | | | 378,347 | |
| Teradyne . | | | 2,998 | | | | 273,957 | |
|
|
|
| Schedule of Investments | | April 30, 2023 (Unaudited) |
| Global X S&P 500® Catholic Values ETF |
| | | | |
| |
| | | Shares | | | Value | |
| COMMON STOCK — continued | | | | | | |
| Information Technology — continued | | | | | | |
| Texas Instruments . | | | 16,392 | | | $ | 2,740,742 | |
| Trimble * | | | 4,627 | | | | 217,932 | |
| Tyler Technologies * | | | 827 | | | | 313,458 | |
| VeriSign * | | | 1,663 | | | | 368,853 | |
| Western Digital * | | | 6,040 | | | | 208,018 | |
| Zebra Technologies, Cl A * | | | 1,022 | | | | 294,367 | |
| | | | | | | | 162,740,647 | |
| Materials — 2.7% | | | | | | | | |
| Air Products & Chemicals . | | | 3,998 | | | | 1,176,851 | |
| Albemarle | | | 2,280 | | | | 422,849 | |
| Amcor | | | 29,881 | | | | 327,795 | |
| Avery Dennison . | | | 1,569 | | | | 273,759 | |
| Ball | | | 5,980 | | | | 318,017 | |
| Celanese, Cl A . | | | 1,967 | | | | 208,974 | |
| CF Industries Holdings | | | 3,223 | | | | 230,702 | |
| Corteva . | | | 13,274 | | | | 811,307 | |
| Dow | | | 13,526 | | | | 735,815 | |
| DuPont de Nemours . | | | 9,522 | | | | 663,874 | |
| Eastman Chemical . | | | 2,715 | | | | 228,793 | |
| Ecolab | | | 4,636 | | | | 778,106 | |
| FMC . | | | 2,654 | | | | 327,981 | |
| Freeport-McMoRan . | | | 26,814 | | | | 1,016,519 | |
| International Flavors & Fragrances | | | 4,879 | | | | 473,068 | |
| International Paper . | | | 6,994 | | | | 231,571 | |
| Linde | | | 8,967 | | | | 3,312,858 | |
| LyondellBasell Industries, Cl A | | | 4,940 | | | | 467,373 | |
| Martin Marietta Materials | | | 1,145 | | | | 415,864 | |
| Mosaic . | | | 6,890 | | | | 295,237 | |
| Newmont | | | 14,646 | | | | 694,220 | |
| Nucor | | | 4,668 | | | | 691,704 | |
| Packaging Corp of America . | | | 1,732 | | | | 234,270 | |
| PPG Industries | | | 4,436 | | | | 622,193 | |
| Sealed Air | | | 2,876 | | | | 138,019 | |
| Sherwin-Williams . | | | 4,423 | | | | 1,050,640 | |
| Steel Dynamics | | | 3,048 | | | | 316,840 | |
| Vulcan Materials | | | 2,603 | | | | 455,837 | |
| Westrock . | | | 5,104 | | | | 152,763 | |
| | | | | | | | 17,073,799 | |
|
|
|
| Schedule of Investments | | April 30, 2023 (Unaudited) |
| Global X S&P 500® Catholic Values ETF |
| | | | |
| |
| | | Shares | | | Value | |
| COMMON STOCK — continued | | | | | | |
| Real Estate — 2.4% | | | | | | |
| Alexandria Real Estate Equities ‡ | | | 2,594 | | | $ | 322,123 | |
| American Tower ‡ | | | 8,869 | | | | 1,812,735 | |
| AvalonBay Communities ‡ | | | 2,719 | | | | 490,426 | |
| Boston Properties ‡ | | | 2,919 | | | | 155,758 | |
| Camden Property Trust ‡ | | | 1,732 | | | | 190,607 | |
| CBRE Group, Cl A * | | | 6,335 | | | | 485,641 | |
| Crown Castle ‡ | | | 8,360 | | | | 1,029,032 | |
| Digital Realty Trust ‡ | | | 5,361 | | | | 531,543 | |
| Equinix ‡ | | | 1,708 | | | | 1,236,729 | |
| Equity Residential ‡ | | | 6,395 | | | | 404,484 | |
| Essex Property Trust ‡ | | | 1,334 | | | | 293,120 | |
| Extra Space Storage ‡ | | | 2,513 | | | | 382,077 | |
| Federal Realty Investment Trust ‡ | | | 1,356 | | | | 134,095 | |
| Host Hotels & Resorts ‡ | | | 14,513 | | | | 234,675 | |
| Invitation Homes ‡ | | | 9,427 | | | | 314,579 | |
| Iron Mountain ‡ | | | 5,369 | | | | 296,584 | |
| Kimco Realty ‡ | | | 11,397 | | | | 218,708 | |
| Mid-America Apartment Communities ‡ | | | 2,235 | | | | 343,743 | |
| ProLogis ‡ | | | 17,614 | | | | 2,206,153 | |
| Public Storage ‡ | | | 2,910 | | | | 857,955 | |
| Realty Income ‡ | | | 11,398 | | | | 716,250 | |
| Regency Centers ‡ | | | 3,003 | | | | 184,474 | |
| SBA Communications, Cl A ‡ | | | 2,156 | | | | 562,479 | |
| Simon Property Group ‡ | | | 6,249 | | | | 708,137 | |
| UDR ‡ | | | 5,594 | | | | 231,200 | |
| Welltower ‡ | | | 8,361 | | | | 662,358 | |
| Weyerhaeuser ‡ | | | 14,944 | | | | 446,975 | |
| | | | | | | | 15,452,640 | |
| Utilities — 2.9% | | | | | | | | |
| AES . | | | 13,082 | | | | 309,520 | |
| Alliant Energy . | | | 4,785 | | | | 263,845 | |
| Ameren . | | | 4,910 | | | | 436,843 | |
| American Electric Power | | | 9,093 | | | | 840,375 | |
| American Water Works | | | 3,378 | | | | 500,789 | |
| Atmos Energy | | | 2,328 | | | | 265,718 | |
| CenterPoint Energy . | | | 10,635 | | | | 324,049 | |
| CMS Energy | | | 5,531 | | | | 344,360 | |
| Consolidated Edison | | | 6,358 | | | | 626,072 | |
| Constellation Energy . | | | 5,971 | | | | 462,155 | |
|
|
|
| Schedule of Investments | | April 30, 2023 (Unaudited) |
| Global X S&P 500® Catholic Values ETF |
| | | | |
| |
| | | Shares | | | Value | |
| COMMON STOCK — continued | | | | | | |
| Utilities — continued | | | | | | |
| Dominion Energy | | | 14,845 | | | $ | 848,243 | |
| DTE Energy . | | | 3,694 | | | | 415,243 | |
| Duke Energy | | | 14,247 | | | | 1,408,743 | |
| Edison International . | | | 6,948 | | | | 511,373 | |
| Entergy | | | 3,761 | | | | 404,608 | |
| Evergy | | | 4,574 | | | | 284,091 | |
| Eversource Energy . | | | 6,374 | | | | 494,686 | |
| Exelon | | | 17,794 | | | | 755,177 | |
| FirstEnergy | | | 10,170 | | | | 404,766 | |
| NextEra Energy . | | | 36,179 | | | | 2,772,397 | |
| NiSource . | | | 6,907 | | | | 196,573 | |
| NRG Energy | | | 5,097 | | | | 174,165 | |
| PG&E * | | | 25,512 | | | | 436,510 | |
| Pinnacle West Capital | | | 2,280 | | | | 178,889 | |
| PPL | | | 14,215 | | | | 408,255 | |
| Public Service Enterprise Group . | | | 9,095 | | | | 574,804 | |
| Sempra Energy . | | | 5,902 | | | | 917,702 | |
| Southern | | | 19,486 | | | | 1,433,195 | |
| WEC Energy Group . | | | 5,809 | | | | 558,652 | |
| Xcel Energy | | | 10,284 | | | | 718,954 | |
| | | | | | | | 18,270,752 | |
| TOTAL UNITED STATES | | | | | | | 633,860,142 | |
| TOTAL COMMON STOCK | | | | | | | | |
| (Cost $552,337,237) | | | | | | | 634,660,994 | |
| TOTAL INVESTMENTS — 99.8% | | | | | | | | |
| (Cost $552,337,237) | | | | | | $ | 634,660,994 | |
|
|
| Percentages are based on Net Assets of $636,028,982. |
| * | Non-income producing security. |
| ‡ | Real Estate Investment Trust |
| As of April 30, 2023, all of the Fund's investments were considered Level 1, in accordance |
| with authoritative guidance on fair value measurements and disclosure under U.S. GAAP. |
| See "Glossary" for abbreviations. |