Global X MLP ETF (ticker: MLPA)
Global X MLP & Energy Infrastructure ETF (ticker: MLPX)
Global X Alternative Income ETF (ticker: ALTY)
Global X Conscious Companies ETF (ticker: KRMA)
Global X Founder-Run Companies ETF (ticker: BOSS)
Global X U.S. Preferred ETF (ticker: PFFD)
Global X S&P 500® Quality Dividend ETF (ticker: QDIV)
Global X Adaptive U.S. Factor ETF (ticker: AUSF)
Global X Variable Rate Preferred ETF (ticker: PFFV)
Global X Adaptive U.S. Risk Management ETF (ticker: ONOF)
Semi-Annual Report
May 31, 2023
As permitted by regulations adopted by the Securities and Exchange Commission, paper copies of the Funds’ (defined below) shareholder reports will no longer be sent by mail, unless you specifically request paper copies of the reports from your financial intermediary (such as a broker-dealer or bank). Instead, shareholder reports will be available on the Funds’website (www. globalxetfs.com/explore), and you will be notified by mail each time a report is posted and provided with a website link to access the report.
If you already elected to receive shareholder reports electronically, you will not be affected by this change and you need not take any action. You may elect to receive shareholder reports and other communications from the Funds electronically anytime by contacting your financial intermediary.
You may elect to receive all future Fund shareholder reports in paper free of charge. Please contact your financial intermediary to inform them that you wish to continue receiving paper copies of Fund shareholder reports and for details about whether your election to receive reports in paper will apply to all funds held with your financial intermediary.
| |
| |
| Schedules of Investments | | | |
| Global X MLP ETF | | | 1 | |
| Global X MLP & Energy Infrastructure ETF | | | 3 | |
| Global X Alternative Income ETF | | | 6 | |
| Global X Conscious Companies ETF | | | 9 | |
| Global X Founder-Run Companies ETF | | | 16 | |
| Global X U.S. Preferred ETF | | | 21 | |
| Global X S&P 500® Quality Dividend ETF | | | 31 | |
| Global X Adaptive U.S. Factor ETF | | | 35 | |
| Global X Variable Rate Preferred ETF | | | 42 | |
| Global X Adaptive U.S. Risk Management ETF | | | 47 | |
| Glossary | | | 62 | |
| Statements of Assets and Liabilities | | | 63 | |
| Statements of Operations | | | 66 | |
| Statements of Changes in Net Assets | | | 69 | |
| Financial Highlights | | | 75 | |
| Notes to Financial Statements | | | 81 | |
| Disclosure of Fund Expenses | | | 102 | |
| Liquidity Risk Management Program | | | 105 | |
| Supplemental Information | | | 106 | |
Shares are bought and sold at market price (not net asset value (“NAV”)) and are not individually redeemed from a Fund. Shares may only be redeemed directly from a Fund by Authorized Participants, in very large creation/ redemption units. Brokerage commissions will reduce returns.
The Funds file their complete schedules of Fund holdings with the Securities and Exchange Commission (the “SEC” or “Commission”) for the first and third quarters of each fiscal year as an exhibit to their reports on Form N-PORT. The Funds’ Forms N-PORT are available on the Commission’s website at https://www.sec.gov, and may be reviewed and copied at the Commission's Public Reference Room in Washington, DC. Information on the operation of the Public Reference Room may be obtained by calling 1-800-SEC-0330.
A description of the policies and procedures that Global X Funds uses to determine how to vote proxies relating to Fund securities, as well as information relating to how the Funds voted proxies relating to Fund securities during the most recent 12-month period ended June 30, is available (i) without charge, upon request, by calling 1-888-493-8631; and (ii) on the Commission’s website at https://www.sec.gov.
|
|
|
| Schedule of Investments | | May 31, 2023 (Unaudited) |
| Global X MLP ETF |
| | | | |
| |
| | | Shares | | | Value | |
| MASTER LIMITED PARTNERSHIPS — 94.4% | | | | | | |
| Energy — 94.4% | | | | | | |
| Cheniere Energy Partners . | | | 1,353,220 | | | $ | 60,150,629 | |
| Crestwood Equity Partners . | | | 2,618,529 | | | | 67,191,454 | |
| DCP Midstream . | | | 1,555,488 | | | | 64,692,746 | |
| Delek Logistics Partners | | | 1,524,657 | | | | 82,026,547 | |
| Energy Transfer . | | | 12,546,542 | | | | 155,577,121 | |
| Enterprise Products Partners . | | | 6,561,095 | | | | 166,192,536 | |
| Genesis Energy (A) | | | 6,284,920 | | | | 60,649,478 | |
| Green Plains Partners . | | | 100 | | | | 1,203 | |
| Holly Energy Partners . | | | 3,866,637 | | | | 66,390,157 | |
| Magellan Midstream Partners . | | | 2,325,235 | | | | 140,002,399 | |
| Martin Midstream Partners . | | | 100 | | | | 205 | |
| MPLX | | | 3,812,110 | | | | 127,095,748 | |
| NGL Energy Partners * | | | 50,000 | | | | 158,500 | |
| NuStar Energy . | | | 3,884,948 | | | | 63,441,201 | |
| Plains All American Pipeline | | | 8,906,438 | | | | 115,071,179 | |
| USD Partners | | | 100 | | | | 94 | |
| Western Midstream Partners . | | | 3,960,585 | | | | 99,965,165 | |
| TOTAL MASTER LIMITED PARTNERSHIPS | | | | | | | | |
| (Cost $761,409,602) | | | | | | | 1,268,606,362 | |
| COMMON STOCK — 6.8% | | | | | | | | |
| Energy — 6.8% | | | | | | | | |
| EnLink Midstream . | | | 4,950,138 | | | | 48,313,347 | |
| Hess Midstream, Cl A | | | 1,574,030 | | | | 43,899,697 | |
| Phillips 66 . | | | 100 | | | | 9,161 | |
| TOTAL COMMON STOCK | | | | | | | | |
| (Cost $79,382,030) | | | | | | | 92,222,205 | |
| TOTAL INVESTMENTS — 101.2% | | | | | | | | |
| (Cost $840,791,632) | | | | | | $ | 1,360,828,567 | |
Percentages are based on Net Assets of $1,344,111,842.
|
|
|
| Schedule of Investments | | May 31, 2023 (Unaudited) |
| Global X MLP ETF |
| * | Non-income producing security. |
| (A) | Affiliated investment. |
As of May 31, 2023, all of the Fund's investments were considered Level 1, in accordance with authoritative guidance on fair value measurements and disclosure under U.S. GAAP.
The following is a summary of the Fund’s transactions with affiliates for the period ended May 31, 2023:
| | | | | | | | | | Changes in | | | | | | | | | | | | | |
| | | | | | | | | | Unrealized | | | | | | | | | | | | | |
| Value at | | | Purchases at | | | Proceeds from | | | Appreciation | | | Realized Gain | | | Value at | | | Dividend | | | Capital | |
| 11/30/22 | | | Cost | | | Sales | | | (Depreciation) | | | (Loss) | | | 5/31/23 | | | Income | | | Gains | |
Genesis Energy | | | | | | | | | | | | | | | | | | | | | | |
| $ | 66,869,171 | | | $ | 7,900,232 | | | $ | (10,791,063 | ) | | $ | (3,087,965 | ) | | $ | (240,897 | ) | | $ | 60,649,478 | | | $ | — | | | $ | — | |
| Totals: | | | | | | | | | | | | | | | | | | | | | | | | | | | | | |
| $ | 66,869,171 | | | $ | 7,900,232 | | | $ | (10,791,063 | ) | | $ | (3,087,965 | ) | | $ | (240,897 | ) | | $ | 60,649,478 | | | $ | — | | | $ | — | |
See “Glossary” for abbreviations.
|
|
|
| Schedule of Investments | | May 31, 2023 (Unaudited) |
| Global X MLP & Energy Infrastructure ETF |
| | | | |
| |
| | | Shares | | | Value | |
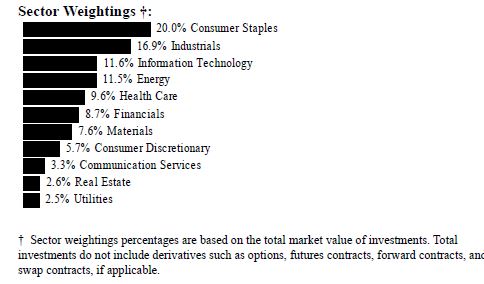
| COMMON STOCK — 76.1% | | | | | | |
| CANADA — 21.6% | | | | | | |
| Energy — 21.6% | | | | | | |
| Enbridge | | | 2,154,087 | | | $ | 75,823,863 | |
| Pembina Pipeline . | | | 1,281,368 | | | | 38,787,009 | |
| TC Energy | | | 1,988,123 | | | | 77,417,510 | |
| TOTAL CANADA | | | | | | | 192,028,382 | |
| UNITED STATES — 54.5% | | | | | | | | |
| Energy — 54.5% | | | | | | | | |
| Antero Midstream . | | | 2,992,869 | | | | 30,557,192 | |
| Archrock . | | | 1,272,258 | | | | 11,450,322 | |
| Cheniere Energy . | | | 497,571 | | | | 69,545,499 | |
| DT Midstream . | | | 849,417 | | | | 38,614,497 | |
| EnLink Midstream . | | | 2,208,537 | | | | 21,555,321 | |
| Equitrans Midstream . | | | 3,994,945 | | | | 34,076,881 | |
| Hess Midstream, Cl A | | | 396,565 | | | | 11,060,198 | |
| Kinder Morgan . | | | 3,815,809 | | | | 61,472,683 | |
| Kinetik Holdings, Cl A (A) | | | 98,535 | | | | 3,205,343 | |
| ONEOK . | | | 1,020,727 | | | | 57,834,392 | |
| Plains GP Holdings, Cl A | | | 1,755,685 | | | | 23,877,316 | |
| Targa Resources | | | 583,371 | | | | 39,698,397 | |
| Williams | | | 2,791,728 | | | | 80,010,924 | |
| TOTAL UNITED STATES | | | | | | | 482,958,965 | |
| TOTAL COMMON STOCK | | | | | | | | |
| (Cost $640,405,668) | | | | | | | 674,987,347 | |
|
|
|
| Schedule of Investments | | May 31, 2023 (Unaudited) |
| Global X MLP & Energy Infrastructure ETF |
| | | |
| |
| | Shares | | | Value | |
| MASTER LIMITED PARTNERSHIPS — 23.8% | | | | | |
| UNITED STATES— 23.8% | | | | | |
| Energy — 23.8% | | | | | |
| Cheniere Energy Partners . | | 122,338 | | | $ | 5,437,924 | |
| Crestwood Equity Partners . | | 256,143 | | | | 6,572,629 | |
| DCP Midstream . | | 256,997 | | | | 10,688,505 | |
| Delek Logistics Partners | | 27,987 | | | | 1,505,701 | |
| Energy Transfer . | | 3,207,616 | | | | 39,774,439 | |
| Enterprise Products Partners . | | 1,543,072 | | | | 39,086,014 | |
| Holly Energy Partners . | | 135,542 | | | | 2,327,256 | |
| Magellan Midstream Partners . | | 628,448 | | | | 37,838,854 | |
| MPLX | | 1,011,097 | | | | 33,709,974 | |
| Plains All American Pipeline | | 1,419,434 | | | | 18,339,087 | |
| Western Midstream Partners . | | 603,870 | | | | 15,241,679 | |
| TOTAL UNITED STATES | | | | | | 210,522,062 | |
| TOTAL MASTER LIMITED PARTNERSHIPS | | | | | | | |
| (Cost $103,104,536) | | | | | | 210,522,062 | |
| SHORT-TERM INVESTMENT(B)(C) — 0.0% | | | | | | | |
| Fidelity Investments Money Market | | | | | | | |
| Government Portfolio, Cl Institutional, | | | | | | | |
5.020%
| | | | | | | |
| (Cost $381,818) | | 381,818 | | | | 381,818 | |
| | Face Amount | | | | | |
| REPURCHASE AGREEMENT(B) — 0.1% | | | | | | | |
| BNP Paribas | | | | | | | |
| 4.990%, dated 05/31/2023, to be repurchased | | | | | | | |
| on 06/01/2023, repurchase price $772,331 | | | | | | | |
| (collateralized by various U.S. Treasury | | | | | | | |
| Obligations, ranging in par value $13,288 | | | | | | | |
| - $92,094, 4.125% - 5.410%, 7/31/2024 | | | | | | | |
| - 9/30/2027, with a total market value of | | | | | | | |
$787,713)
| | | | | | | |
| (Cost $772,224) | $ | 772,224 | | | | 772,224 | |
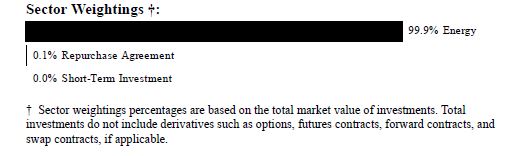
| TOTAL INVESTMENTS — 100.0% | | | | | | | |
| (Cost $744,664,246) | | | | | $ | 886,663,451 | |
Percentages are based on Net Assets of $886,826,064.
| (A) | This security or a partial position of this security is on loan at May 31, 2023. |
|
|
|
| Schedule of Investments | | May 31, 2023 (Unaudited) |
| Global X MLP & Energy Infrastructure ETF |
| (B) | Security was purchased with cash collateral held from securities on loan. |
| (C) | The rate reported on the Schedule of Investments is the 7-day effective yield as of May 31, 2023. |
The following is a summary of the level of inputs used as of May 31, 2023, in valuing the Fund's investments carried at value:
| Investments in Securities | | Level 1 | | | Level 2 | | | Level 3 | | | Total | |
| Common Stock | | $ | 674,987,347 | | | $ | — | | | $ | — | | | $ | 674,987,347 | |
| Master Limited Partnerships | | | 210,522,062 | | | | — | | | | — | | | | 210,522,062 | |
| Short-Term Investment | | | 381,818 | | | | — | | | | — | | | | 381,818 | |
| Repurchase Agreement | | | — | | | | 772,224 | | | | — | | | | 772,224 | |
| Total Investments in Securities | | $ | 885,891,227 | | | $ | 772,224 | | | $ | — | | | $ | 886,663,451 | |
See “Glossary” for abbreviations.
|
|
|
| Schedule of Investments | | May 31, 2023 (Unaudited) |
| Global X Alternative Income ETF |

| | | | |
| |
| | | Shares | | | Value | |
| EXCHANGE TRADED FUNDS — 81.1% | | | | | | |
| Global X Emerging Markets Bond ETF (A) | | | 362,182 | | | $ | 7,802,921 | |
| Global X NASDAQ 100® Covered | | | | | | | | |
| | | 467,634 | | | | 8,249,064 | |
| Global X SuperDividend® REIT ETF (A) | | | 326,094 | | | | 6,799,060 | |
| Global X U.S. Preferred ETF (A) (B) | | | 363,971 | | | | 7,017,361 | |
| TOTAL EXCHANGE TRADED FUNDS | | | | | | | | |
| (Cost $37,833,821) | | | | | | | 29,868,406 | |
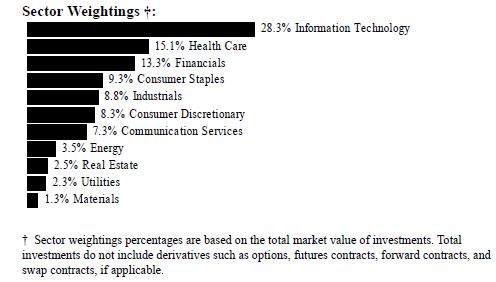
| COMMON STOCK — 9.8% | | | | | | | | |
| Utilities — 9.8% | | | | | | | | |
| ALLETE . | | | 8,238 | | | | 490,738 | |
| Avista | | | 11,564 | | | | 478,171 | |
| Duke Energy | | | 4,451 | | | | 397,430 | |
| Edison International . | | | 7,081 | | | | 478,109 | |
| FirstEnergy | | | 11,517 | | | | 430,621 | |
| NorthWestern | | | 8,763 | | | | 495,898 | |
| OGE Energy . | | | 11,482 | | | | 405,085 | |
| PPL | | | 16,437 | | | | 430,649 | |
| TOTAL COMMON STOCK | | | | | | | | |
| (Cost $3,414,189) | | | | | | | 3,606,701 | |
|
|
|
| Schedule of Investments | | May 31, 2023 (Unaudited) |
| Global X Alternative Income ETF |
| | | |
| |
| | Shares | | | Value | |
| MASTER LIMITED PARTNERSHIPS — 8.7% | | | | | |
| Energy — 6.9% | | | | | |
| Enterprise Products Partners . | | 18,737 | | | $ | 474,608 | |
| Magellan Midstream Partners . | | 9,428 | | | | 567,660 | |
| MPLX | | 14,988 | | | | 499,700 | |
| Sunoco . | | 11,664 | | | | 501,436 | |
| USA Compression Partners | | 27,446 | | | | 512,691 | |
| | | | | | | 2,556,095 | |
| Industrials — 0.6% | | | | | | | |
| Icahn Enterprises . | | 9,144 | | | | 206,380 | |
| Utilities — 1.2% | | | | | | | |
| Suburban Propane Partners . | | 28,156 | | | | 429,942 | |
| TOTAL MASTER LIMITED PARTNERSHIPS | | | | | | | |
| (Cost $1,843,469) | | | | | | 3,192,417 | |
| SHORT-TERM INVESTMENT(C)(D) — 0.6% | | | | | | | |
| Fidelity Investments Money Market | | | | | | | |
| Government Portfolio, Cl Institutional, | | | | | | | |
5.020%
| | | | | | | |
| (Cost $213,297) | | 213,297 | | | | 213,297 | |
| | Face Amount | | | | | |
| REPURCHASE AGREEMENT(C) — 1.2% | | | | | | | |
| BNP Paribas | | | | | | | |
| 4.990%, dated 05/31/2023, to be repurchased | | | | | | | |
| on 06/01/2023, repurchase price $431,451 | | | | | | | |
| (collateralized by various U.S. Treasury | | | | | | | |
| Obligations, ranging in par value $7,423 | | | | | | | |
| - $51,447, 4.125% - 5.410%, 7/31/2024 | | | | | | | |
| - 9/30/2027, with a total market value of | | | | | | | |
$440,043)
| | | | | | | |
| (Cost $431,391) | $ | 431,391 | | | | 431,391 | |
| TOTAL INVESTMENTS — 101.4% | | | | | | | |
| (Cost $43,736,167) | | | | | $ | 37,312,212 | |
Percentages are based on Net Assets of $36,807,045.
| (A) | Affiliated investment. |
| (B) | This security or a partial position of this security is on loan at May 31, 2023. |
| (C) | Security was purchased with cash collateral held from securities on loan. |
| (D) | The rate reported on the Schedule of Investments is the 7-day effective yield as of May 31, 2023. |
|
|
|
| Schedule of Investments | | May 31, 2023 (Unaudited) |
| Global X Alternative Income ETF |
The following is a summary of the level of inputs used as of May 31, 2023, in valuing the Fund's investments carried at value:
| Investments in Securities | | Level 1 | | | Level 2 | | | Level 3 | | | Total | |
| Exchange Traded Funds | | $ | 29,868,406 | | | $ | — | | | $ | — | | | $ | 29,868,406 | |
| Common Stock | | | 3,606,701 | | | | — | | | | — | | | | 3,606,701 | |
| Master Limited Partnerships | | | 3,192,417 | | | | — | | | | — | | | | 3,192,417 | |
| Short-Term Investment | | | 213,297 | | | | — | | | | — | | | | 213,297 | |
| Repurchase Agreement | | | — | | | | 431,391 | | | | — | | | | 431,391 | |
| Total Investments in Securities | | $ | 36,880,821 | | | $ | 431,391 | | | $ | — | | | $ | 37,312,212 | |
The following is a summary of the Fund’s transactions with affiliates for the period ended May 31, 2023:
| | | | | | | | | | Changes in | | | | | | | | | | | | | |
| | | | | | | | | | Unrealized | | | | | | | | | | | | | |
| Value at | | | Purchases at | | | Proceeds from | | | Appreciation | | | Realized Gain | | | Value at | | | Dividend | | | Capital | |
| 11/30/22 | | | Cost | | | Sales | | | (Depreciation) | | | (Loss) | | | 05/31/23 | | | Income | | | Gains | |
| Global X Emerging Markets Bond ETF | | | | | | | | | | | | | | | | | | | |
| $ | 7,746,289 | | | $ | 1,051,506 | | | $ | (924,086 | ) | | $ | (104,988 | ) | | $ | 34,200 | | | $ | 7,802,921 | | | $ | 174,025 | | | $ | — | |
| Global X NASDAQ 100 Covered Call ETF | | | | | | | | | | | | | | | | | | | | | |
| $ | 7,618,510 | | | $ | 1,047,822 | | | $ | (1,444,128 | ) | | $ | 955,075 | | | $ | 71,785 | | | $ | 8,249,064 | | | $ | (72,661 | ) | | $ | 15,007 | |
| Global X SuperDividend® REIT ETF | | | | | | | | | | | | | | | | | | | | | | | | | |
| $ | 7,297,064 | | | $ | 988,326 | | | $ | (990,376 | ) | | $ | (524,990 | ) | | $ | 29,036 | | | $ | 6,799,060 | | | $ | 48,070 | | | $ | 2,537 | |
| Global X U.S. Preferred ETF | | | | | | | | | | | | | | | | | | | | | | | | | |
| $ | 7,325,307 | | | $ | 997,982 | | | $ | (854,266 | ) | | $ | (455,497 | ) | | $ | 3,835 | | | $ | 7,017,361 | | | $ | 228,961 | | | $ | — | |
| Totals: | | | | | | | | | | | | | | | | | | | | | | | | | | | | | |
| $ | 29,987,170 | | | $ | 4,085,636 | | | $ | (4,212,856 | ) | | $ | (130,400 | ) | | $ | 138,856 | | | $ | 29,868,406 | | | $ | 378,395 | | | $ | 17,544 | |
Amounts designated as “—“ are $0 or have been rounded to $0.
See "Glossary" for abbreviations.
|
|
|
| Schedule of Investments | | May 31, 2023 (Unaudited) |
| Global X Conscious Companies ETF |
| | | | |
| |
| | | Shares | | | Value | |
| COMMON STOCK — 99.7% | | | | | | |
| CANADA — 0.4% | | | | | | |
| Financials — 0.4% | | | | | | |
| Toronto-Dominion Bank | | | 50,377 | | | $ | 2,851,338 | |
| UNITED STATES — 99.3% | | | | | | | | |
| Communication Services — 7.3% | | | | | | | | |
| Alphabet, Cl A * | | | 146,243 | | | | 17,968,877 | |
| AT&T | | | 170,611 | | | | 2,683,711 | |
| Comcast, Cl A | | | 82,376 | | | | 3,241,496 | |
| Meta Platforms, Cl A * | | | 14,602 | | | | 3,865,441 | |
| Netflix * | | | 9,481 | | | | 3,747,176 | |
| Omnicom Group . | | | 33,125 | | | | 2,921,294 | |
| Take-Two Interactive Software * | | | 24,866 | | | | 3,424,794 | |
| T-Mobile US * | | | 21,433 | | | | 2,941,679 | |
| Verizon Communications | | | 83,297 | | | | 2,967,872 | |
| Walt Disney * | | | 31,225 | | | | 2,746,551 | |
| | | | | | | | 46,508,891 | |
| Consumer Discretionary — 8.3% | | | | | | | | |
| Amazon.com * | | | 105,296 | | | | 12,696,592 | |
| Best Buy | | | 42,724 | | | | 3,104,753 | |
| BorgWarner . | | | 63,470 | | | | 2,813,625 | |
|
|
|
| Schedule of Investments | | May 31, 2023 (Unaudited) |
| Global X Conscious Companies ETF |
| | | | |
| |
| | | Shares | | | Value | |
| COMMON STOCK — continued | | | | | | |
| Consumer Discretionary — continued | | | | | | |
| eBay | | | 72,117 | | | $ | 3,067,857 | |
| Etsy * | | | 30,463 | | | | 2,469,026 | |
| Home Depot . | | | 10,358 | | | | 2,935,975 | |
| Lear . | | | 23,156 | | | | 2,840,315 | |
| Lowe's | | | 15,116 | | | | 3,040,281 | |
| Lululemon Athletica * | | | 8,227 | | | | 2,730,788 | |
| Marriott International, Cl A | | | 18,335 | | | | 3,076,430 | |
| NIKE, Cl B | | | 24,654 | | | | 2,595,080 | |
| Starbucks | | | 29,307 | | | | 2,861,536 | |
| Tesla * | | | 18,827 | | | | 3,839,390 | |
| Tractor Supply . | | | 12,503 | | | | 2,620,504 | |
| VF . | | | 135,869 | | | | 2,339,664 | |
| | | | | | | | 53,031,816 | |
| Consumer Staples — 9.2% | | | | | | | | |
| Campbell Soup . | | | 57,921 | | | | 2,927,907 | |
| Church & Dwight | | | 33,933 | | | | 3,137,106 | |
| Clorox | | | 18,808 | | | | 2,975,049 | |
| Coca-Cola . | | | 48,539 | | | | 2,895,837 | |
| Colgate-Palmolive | | | 41,156 | | | | 3,061,183 | |
| Costco Wholesale | | | 6,138 | | | | 3,139,955 | |
| Estee Lauder, Cl A . | | | 12,128 | | | | 2,231,916 | |
| General Mills | | | 35,552 | | | | 2,992,056 | |
| Hershey | | | 11,913 | | | | 3,093,806 | |
| Hormel Foods | | | 78,011 | | | | 2,983,921 | |
| J M Smucker . | | | 20,883 | | | | 3,061,239 | |
| Kellogg . | | | 46,198 | | | | 3,084,641 | |
| Kimberly-Clark | | | 21,961 | | | | 2,948,923 | |
| Kroger | | | 64,872 | | | | 2,940,648 | |
| McCormick . | | | 36,281 | | | | 3,110,370 | |
| Mondelez International, Cl A . | | | 43,590 | | | | 3,199,942 | |
| PepsiCo | | | 16,765 | | | | 3,057,098 | |
| Procter & Gamble . | | | 19,920 | | | | 2,838,600 | |
| Target | | | 19,108 | | | | 2,501,810 | |
| Walgreens Boots Alliance | | | 87,062 | | | | 2,644,073 | |
| | | | | | | | 58,826,080 | |
| Energy — 3.5% | | | | | | | | |
| Chevron . | | | 18,377 | | | | 2,767,944 | |
| ConocoPhillips . | | | 30,400 | | | | 3,018,720 | |
|
|
|
| Schedule of Investments | | May 31, 2023 (Unaudited) |
| Global X Conscious Companies ETF |
| | | | |
| |
| | | Shares | | | Value | |
| COMMON STOCK — continued | | | | | | |
| Energy — continued | | | | | | |
| Devon Energy | | | 57,961 | | | $ | 2,672,002 | |
| EOG Resources | | | 26,501 | | | | 2,843,292 | |
| Hess | | | 21,611 | | | | 2,737,465 | |
| ONEOK . | | | 46,884 | | | | 2,656,448 | |
| Phillips 66 . | | | 31,043 | | | | 2,843,849 | |
| Valero Energy . | | | 25,985 | | | | 2,781,435 | |
| | | | | | | | 22,321,155 | |
| Financials — 12.8% | | | | | | | | |
| Aflac | | | 47,116 | | | | 3,025,318 | |
| Allstate | | | 26,854 | | | | 2,912,316 | |
| American Express . | | | 18,978 | | | | 3,009,152 | |
| Bank of America | | | 104,072 | | | | 2,892,161 | |
| Bank of New York Mellon | | | 70,564 | | | | 2,836,673 | |
| Block, Cl A * | | | 48,965 | | | | 2,956,996 | |
| Capital One Financial | | | 32,182 | | | | 3,353,686 | |
| Citigroup | | | 63,403 | | | | 2,810,021 | |
| CME Group, Cl A . | | | 16,380 | | | | 2,927,925 | |
| FactSet Research Systems . | | | 7,460 | | | | 2,871,279 | |
| Hartford Financial Services Group . | | | 44,701 | | | | 3,062,913 | |
| Jack Henry & Associates . | | | 19,779 | | | | 3,024,011 | |
| JPMorgan Chase . | | | 22,122 | | | | 3,002,177 | |
| Mastercard, Cl A . | | | 8,219 | | | | 3,000,099 | |
| MetLife . | | | 51,664 | | | | 2,559,951 | |
| Moody's . | | | 10,238 | | | | 3,244,217 | |
| Morgan Stanley | | | 34,114 | | | | 2,789,161 | |
| Nasdaq . | | | 54,566 | | | | 3,020,228 | |
| Northern Trust . | | | 36,438 | | | | 2,620,621 | |
| PayPal Holdings * | | | 41,911 | | | | 2,598,063 | |
| PNC Financial Services Group | | | 25,195 | | | | 2,918,337 | |
| Principal Financial Group | | | 41,367 | | | | 2,707,884 | |
| Progressive | | | 22,682 | | | | 2,901,255 | |
| Prudential Financial . | | | 36,268 | | | | 2,853,929 | |
| S&P Global . | | | 8,839 | | | | 3,247,714 | |
| T Rowe Price Group | | | 27,132 | | | | 2,907,465 | |
| US Bancorp . | | | 92,737 | | | | 2,772,836 | |
| Visa, Cl A . | | | 13,283 | | | | 2,935,942 | |
| | | | | | | | 81,762,330 | |
|
|
|
| Schedule of Investments | | May 31, 2023 (Unaudited) |
| Global X Conscious Companies ETF |
| | | | |
| |
| | | Shares | | | Value | |
| COMMON STOCK — continued | | | | | | |
| Health Care — 15.1% | | | | | | |
| Abbott Laboratories . | | | 27,770 | | | $ | 2,832,540 | |
| AbbVie | | | 19,137 | | | | 2,640,141 | |
| Agilent Technologies | | | 22,448 | | | | 2,596,560 | |
| Amgen . | | | 12,746 | | | | 2,812,405 | |
| Becton Dickinson | | | 11,897 | | | | 2,876,219 | |
| Biogen * | | | 10,707 | | | | 3,173,662 | |
| Boston Scientific * | | | 60,825 | | | | 3,131,271 | |
| Bristol-Myers Squibb . | | | 43,205 | | | | 2,784,130 | |
| Cigna Group | | | 12,327 | | | | 3,049,823 | |
| CVS Health . | | | 42,676 | | | | 2,903,248 | |
| Danaher | | | 12,293 | | | | 2,822,719 | |
| Edwards Lifesciences * | | | 35,918 | | | | 3,025,373 | |
| Elevance Health | | | 6,898 | | | | 3,089,062 | |
| Eli Lilly | | | 8,067 | | | | 3,464,454 | |
| Gilead Sciences | | | 35,904 | | | | 2,762,454 | |
| Humana | | | 6,243 | | | | 3,133,174 | |
| Intuitive Surgical * | | | 10,353 | | | | 3,187,068 | |
| IQVIA Holdings * | | | 15,364 | | | | 3,025,325 | |
| Johnson & Johnson . | | | 18,558 | | | | 2,877,603 | |
| Laboratory Corp of America Holdings | | | 13,343 | | | | 2,835,788 | |
| Merck . | | | 26,949 | | | | 2,975,439 | |
| Mettler-Toledo International * | | | 2,035 | | | | 2,690,005 | |
| Pfizer | | | 77,304 | | | | 2,939,098 | |
| Quest Diagnostics . | | | 21,722 | | | | 2,881,423 | |
| Regeneron Pharmaceuticals * | | | 3,880 | | | | 2,853,973 | |
| ResMed | | | 13,383 | | | | 2,821,003 | |
| Stryker . | | | 10,238 | | | | 2,821,388 | |
| Thermo Fisher Scientific | | | 5,385 | | | | 2,738,057 | |
| UnitedHealth Group | | | 6,387 | | | | 3,112,002 | |
| Vertex Pharmaceuticals * | | | 9,393 | | | | 3,039,293 | |
| Waters * | | | 10,126 | | | | 2,543,854 | |
| West Pharmaceutical Services | | | 8,495 | | | | 2,842,682 | |
| Zoetis, Cl A . | | | 17,576 | | | | 2,865,064 | |
| | | | | | | | 96,146,300 | |
| Industrials — 8.8% | | | | | | | | |
| 3M | | | 29,751 | | | | 2,776,066 | |
| Automatic Data Processing | | | 14,442 | | | | 3,018,234 | |
| Caterpillar . | | | 14,109 | | | | 2,902,927 | |
| CH Robinson Worldwide | | | 31,530 | | | | 2,980,846 | |
|
|
|
| Schedule of Investments | | May 31, 2023 (Unaudited) |
| Global X Conscious Companies ETF |
| | | | |
| |
| | | Shares | | | Value | |
| COMMON STOCK — continued | | | | | | |
| Industrials — continued | | | | | | |
| Cummins | | | 13,350 | | | $ | 2,728,874 | |
| Deere . | | | 8,036 | | | | 2,780,295 | |
| Expeditors International of Washington . | | | 27,946 | | | | 3,082,723 | |
| Honeywell International . | | | 15,857 | | | | 3,038,201 | |
| Illinois Tool Works | | | 13,162 | | | | 2,878,924 | |
| Leidos Holdings | | | 33,879 | | | | 2,644,595 | |
| Paychex | | | 28,385 | | | | 2,978,438 | |
| Paycom Software . | | | 10,341 | | | | 2,896,824 | |
| Rockwell Automation | | | 11,249 | | | | 3,133,971 | |
| Southwest Airlines . | | | 96,680 | | | | 2,887,832 | |
| Union Pacific | | | 15,385 | | | | 2,961,920 | |
| United Parcel Service, Cl B . | | | 15,926 | | | | 2,659,642 | |
| Verisk Analytics, Cl A . | | | 15,799 | | | | 3,461,719 | |
| Waste Management . | | | 18,820 | | | | 3,047,334 | |
| WW Grainger . | | | 4,641 | | | | 3,012,102 | |
| | | | | | | | 55,871,467 | |
| Information Technology — 28.2% | | | | | | | | |
| Adobe * | | | 8,229 | | | | 3,437,994 | |
| Advanced Micro Devices * | | | 35,155 | | | | 4,155,673 | |
| Akamai Technologies * | | | 38,406 | | | | 3,537,961 | |
| Analog Devices | | | 16,679 | | | | 2,963,691 | |
| Apple . | | | 236,732 | | | | 41,960,747 | |
| Applied Materials . | | | 27,654 | | | | 3,686,278 | |
| Arista Networks * | | | 19,947 | | | | 3,317,984 | |
| Autodesk * | | | 16,020 | | | | 3,194,228 | |
| Cadence Design Systems * | | | 14,592 | | | | 3,369,439 | |
| CDW | | | 19,056 | | | | 3,271,725 | |
| Cisco Systems | | | 65,432 | | | | 3,250,007 | |
| Cognizant Technology Solutions, Cl A | | | 52,257 | | | | 3,265,540 | |
| Dell Technologies, Cl C | | | 72,112 | | | | 3,231,339 | |
F5 *
| | | 23,193 | | | | 3,422,823 | |
| HP | | | 105,448 | | | | 3,064,319 | |
| HubSpot * | | | 7,337 | | | | 3,800,493 | |
| Intuit . | | | 6,965 | | | | 2,919,171 | |
| Keysight Technologies * | | | 20,948 | | | | 3,389,386 | |
| Lam Research | | | 6,009 | | | | 3,705,750 | |
| Microsoft | | | 115,505 | | | | 37,930,687 | |
| Motorola Solutions | | | 10,618 | | | | 2,993,427 | |
| NVIDIA . | | | 21,963 | | | | 8,309,481 | |
|
|
|
| Schedule of Investments | | May 31, 2023 (Unaudited) |
| Global X Conscious Companies ETF |
| | | | |
| |
| | | Shares | | | Value | |
| COMMON STOCK — continued | | | | | | |
| Information Technology — continued | | | | | | |
| ON Semiconductor * | | | 42,149 | | | $ | 3,523,656 | |
| Oracle . | | | 32,672 | | | | 3,461,272 | |
| Salesforce * | | | 15,621 | | | | 3,489,419 | |
| ServiceNow * | | | 6,568 | | | | 3,578,115 | |
| Synopsys * | | | 8,238 | | | | 3,747,960 | |
| Texas Instruments . | | | 17,658 | | | | 3,070,373 | |
| Trimble * | | | 65,502 | | | | 3,056,978 | |
| Workday, Cl A * | | | 16,272 | | | | 3,449,501 | |
| | | | | | | | 179,555,417 | |
| Materials — 1.3% | | | | | | | | |
| Avery Dennison . | | | 17,455 | | | | 2,812,524 | |
| Ecolab | | | 18,769 | | | | 3,097,824 | |
| Steel Dynamics | | | 28,247 | | | | 2,595,899 | |
| | | | | | | | 8,506,247 | |
| Real Estate — 2.5% | | | | | | | | |
| American Tower ‡ | | | 15,229 | | | | 2,808,837 | |
| CBRE Group, Cl A * | | | 43,263 | | | | 3,241,264 | |
| Equinix ‡ | | | 4,344 | | | | 3,238,669 | |
| Jones Lang LaSalle * | | | 23,412 | | | | 3,285,640 | |
| ProLogis ‡ | | | 24,730 | | | | 3,080,121 | |
| | | | | | | | 15,654,531 | |
| Utilities — 2.3% | | | | | | | | |
| American Water Works | | | 20,831 | | | | 3,009,038 | |
| Duke Energy | | | 30,830 | | | | 2,752,811 | |
| Exelon | | | 71,929 | | | | 2,851,985 | |
| NextEra Energy . | | | 39,355 | | | | 2,891,018 | |
| WEC Energy Group . | | | 32,027 | | | | 2,797,558 | |
| | | | | | | | 14,302,410 | |
| TOTAL UNITED STATES | | | | | | | 632,486,644 | |
| TOTAL COMMON STOCK | | | | | | | | |
| (Cost $628,960,787) | | | | | | | 635,337,982 | |
| TOTAL INVESTMENTS — 99.7% | | | | | | | | |
| (Cost $628,960,787) | | | | | | $ | 635,337,982 | |
Percentages are based on Net Assets of $637,026,217.
|
|
|
| Schedule of Investments | | May 31, 2023 (Unaudited) |
| Global X Conscious Companies ETF |
| * | Non-income producing security. |
| ‡ | Real Estate Investment Trust |
As of May 31, 2023, all of the Fund's investments were considered Level 1, in accordance with authoritative guidance on fair value measurements and disclosure under U.S. GAAP.
See “Glossary” for abbreviations.
|
|
|
| Schedule of Investments | | May 31, 2023 (Unaudited) |
| Global X Founder-Run Companies ETF |
| | | | |
| |
| | | Shares | | | Value | |
| COMMON STOCK — 99.8% | | | | | | |
| UNITED STATES — 99.8% | | | | | | |
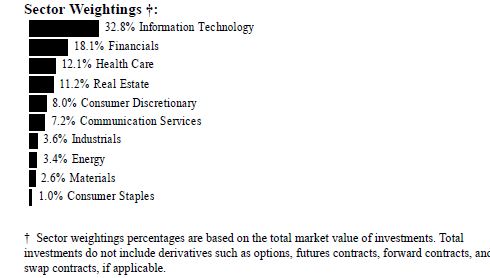
| Communication Services — 7.2% | | | | | | |
| Meta Platforms, Cl A * | | | 249 | | | $ | 65,915 | |
| Nexstar Media Group, Cl A | | | 344 | | | | 51,917 | |
| ROBLOX, Cl A * | | | 1,679 | | | | 70,283 | |
| Roku, Cl A * | | | 1,062 | | | | 61,808 | |
| Snap, Cl A * | | | 6,860 | | | | 69,972 | |
| Trade Desk, Cl A * | | | 929 | | | | 65,104 | |
| ZoomInfo Technologies, Cl A * | | | 2,728 | | | | 67,464 | |
| | | | | | | | 452,463 | |
| Consumer Discretionary — 7.9% | | | | | | | | |
| Airbnb, Cl A * | | | 499 | | | | 54,775 | |
| DoorDash, Cl A * | | | 977 | | | | 63,788 | |
| Life Time Group Holdings * | | | 2,875 | | | | 54,654 | |
| QuantumScape, Cl A * | | | 8,535 | | | | 55,392 | |
| Rivian Automotive, Cl A * | | | 4,661 | | | | 68,657 | |
| Skechers USA, Cl A * | | | 1,123 | | | | 57,688 | |
| Tesla * | | | 363 | | | | 74,027 | |
| Wayfair, Cl A * | | | 1,715 | | | | 69,149 | |
| | | | | | | | 498,130 | |
|
|
|
| Schedule of Investments | | May 31, 2023 (Unaudited) |
| Global X Founder-Run Companies ETF |
| | | | |
| |
| | | Shares | | | Value | |
| COMMON STOCK — continued | | | | | | |
| Consumer Staples — 0.9% | | | | | | |
| National Beverage * | | | 1,203 | | | $ | 59,452 | |
| Energy — 3.4% | | | | | | | | |
| Antero Resources * | | | 2,599 | | | | 53,046 | |
| Matador Resources | | | 1,218 | | | | 53,555 | |
| New Fortress Energy, Cl A | | | 1,973 | | | | 51,831 | |
| Pioneer Natural Resources | | | 275 | | | | 54,846 | |
| | | | | | | | 213,278 | |
| Financials — 18.1% | | | | | | | | |
| Apollo Global Management | | | 942 | | | | 62,973 | |
| Ares Management, Cl A | | | 683 | | | | 59,482 | |
| BlackRock, Cl A . | | | 89 | | | | 58,522 | |
| Blackstone, Cl A . | | | 668 | | | | 57,207 | |
| Block, Cl A * | | | 984 | | | | 59,424 | |
| Blue Owl Capital, Cl A | | | 5,306 | | | | 54,386 | |
| Capital One Financial | | | 613 | | | | 63,881 | |
| Coinbase Global, Cl A * | | | 1,112 | | | | 69,166 | |
| Essent Group . | | | 1,408 | | | | 62,191 | |
| Euronet Worldwide * | | | 539 | | | | 60,045 | |
| FleetCor Technologies * | | | 280 | | | | 63,434 | |
| Focus Financial Partners, Cl A * | | | 1,151 | | | | 59,956 | |
| Intercontinental Exchange . | | | 549 | | | | 58,167 | |
| Kinsale Capital Group . | | | 184 | | | | 55,748 | |
| Pinnacle Financial Partners | | | 1,102 | | | | 53,612 | |
| Robinhood Markets, Cl A * | | | 6,754 | | | | 60,246 | |
| Ryan Specialty Holdings, Cl A * | | | 1,462 | | | | 59,635 | |
| Shift4 Payments, Cl A * | | | 882 | | | | 55,319 | |
| Starwood Property Trust ‡ | | | 3,340 | | | | 58,617 | |
| | | | | | | | 1,132,011 | |
| Health Care — 12.1% | | | | | | | | |
| Evolent Health, Cl A * | | | 1,641 | | | | 47,819 | |
| Inspire Medical Systems * | | | 225 | | | | 65,810 | |
| Ionis Pharmaceuticals * | | | 1,689 | | | | 69,080 | |
| Jazz Pharmaceuticals * | | | 425 | | | | 54,468 | |
| Masimo * | | | 315 | | | | 50,980 | |
| Medpace Holdings * | | | 299 | | | | 61,884 | |
| Neurocrine Biosciences * | | | 591 | | | | 52,912 | |
| Penumbra * | | | 213 | | | | 65,463 | |
|
|
|
| Schedule of Investments | | May 31, 2023 (Unaudited) |
| Global X Founder-Run Companies ETF |
| | | | |
| |
| | | Shares | | | Value | |
| COMMON STOCK — continued | | | | | | |
| Health Care — continued | | | | | | |
| Regeneron Pharmaceuticals * | | | 75 | | | $ | 55,167 | |
| Royalty Pharma, Cl A | | | 1,712 | | | | 56,051 | |
| Ultragenyx Pharmaceutical * | | | 1,368 | | | | 67,525 | |
| United Therapeutics * | | | 262 | | | | 54,952 | |
| Veeva Systems, Cl A * | | | 337 | | | | 55,841 | |
| | | | | | | | 757,952 | |
| Industrials — 3.6% | | | | | | | | |
| Axon Enterprise * | | | 284 | | | | 54,786 | |
| Insperity . | | | 487 | | | | 53,921 | |
| Paycom Software . | | | 208 | | | | 58,267 | |
| SS&C Technologies Holdings | | | 1,021 | | | | 56,114 | |
| | | | | | | | 223,088 | |
| Information Technology — 32.8% | | | | | | | | |
| Akamai Technologies * | | | 734 | | | | 67,616 | |
| AppLovin, Cl A * | | | 3,516 | | | | 87,935 | |
| Atlassian, Cl A * | | | 405 | | | | 73,220 | |
| BILL Holdings * | | | 779 | | | | 80,689 | |
| Cloudflare, Cl A * | | | 1,270 | | | | 87,833 | |
| Crowdstrike Holdings, Cl A * | | | 498 | | | | 79,745 | |
| Datadog, Cl A * | | | 891 | | | | 84,565 | |
| Dell Technologies, Cl C | | | 1,374 | | | | 61,569 | |
| Dropbox, Cl A * | | | 2,937 | | | | 67,610 | |
| EPAM Systems * | | | 214 | | | | 54,917 | |
| Fortinet * | | | 948 | | | | 64,777 | |
| Monolithic Power Systems . | | | 130 | | | | 63,688 | |
| NVIDIA . | | | 215 | | | | 81,343 | |
| Okta, Cl A * | | | 872 | | | | 79,265 | |
| Palantir Technologies, Cl A * | | | 7,712 | | | | 113,443 | |
| Pegasystems . | | | 1,311 | | | | 63,400 | |
| Procore Technologies * | | | 1,119 | | | | 67,666 | |
| RingCentral, Cl A * | | | 2,168 | | | | 75,230 | |
| Salesforce * | | | 301 | | | | 67,237 | |
| SentinelOne, Cl A * | | | 3,719 | | | | 79,512 | |
| Synopsys * | | | 162 | | | | 73,704 | |
| Twilio, Cl A * | | | 1,137 | | | | 79,158 | |
| Ubiquiti | | | 260 | | | | 42,419 | |
| UiPath, Cl A * | | | 4,244 | | | | 75,925 | |
| VeriSign * | | | 269 | | | | 60,073 | |
|
|
|
| Schedule of Investments | | May 31, 2023 (Unaudited) |
| Global X Founder-Run Companies ETF |
| | | | |
| |
| | | Shares | | | Value | |
| COMMON STOCK — continued | | | | | | |
| Information Technology — continued | | | | | | |
| Workday, Cl A * | | | 321 | | | $ | 68,049 | |
| Zoom Video Communications, Cl A * | | | 973 | | | | 65,317 | |
| Zscaler * | | | 663 | | | | 89,823 | |
| | | | | | | | 2,055,728 | |
| Materials — 2.6% | | | | | | | | |
| MP Materials * | | | 2,759 | | | | 57,166 | |
| Steel Dynamics | | | 575 | | | | 52,843 | |
| Westlake | | | 525 | | | | 54,574 | |
| | | | | | | | 164,583 | |
| Real Estate — 11.2% | | | | | | | | |
| American Homes 4 Rent, Cl A ‡ | | | 1,797 | | | | 61,601 | |
| Apartment Income REIT ‡ | | | 1,615 | | | | 56,024 | |
| Camden Property Trust ‡ | | | 543 | | | | 56,727 | |
| CoStar Group * | | | 777 | | | | 61,694 | |
| Invitation Homes ‡ | | | 1,818 | | | | 61,594 | |
| Medical Properties Trust ‡ | | | 6,813 | | | | 56,207 | |
| Phillips Edison ‡ | | | 1,894 | | | | 54,945 | |
| ProLogis ‡ | | | 481 | | | | 59,909 | |
| Rexford Industrial Realty ‡ | | | 1,071 | | | | 58,305 | |
| Terreno Realty ‡ | | | 970 | | | | 59,490 | |
| Vornado Realty Trust ‡ | | | 3,982 | | | | 53,996 | |
| Zillow Group, Cl C * | | | 1,373 | | | | 62,623 | |
| | | | | | | | 703,115 | |
| TOTAL UNITED STATES | | | | | | | 6,259,800 | |
| TOTAL COMMON STOCK | | | | | | | | |
| (Cost $8,139,625) | | | | | | | 6,259,800 | |
| TOTAL INVESTMENTS — 99.8% | | | | | | | | |
| (Cost $8,139,625) | | | | | | $ | 6,259,800 | |
Percentages are based on Net Assets of $6,271,980.
| * | Non-income producing security. |
| ‡ | Real Estate Investment Trust |
As of May 31, 2023, all of the Fund's investments were considered Level 1, in accordance with authoritative guidance on fair value measurements and disclosure under U.S. GAAP.
|
|
|
| Schedule of Investments | | May 31, 2023 (Unaudited) |
| Global X Founder-Run Companies ETF |
See “Glossary” for abbreviations.
|
|
|
| Schedule of Investments | | May 31, 2023 (Unaudited) |
| Global X U.S. Preferred ETF |
| | | | |
| |
| | | Shares | | | Value | |
| PREFERRED STOCK — 99.4% | | | | | | |
| BERMUDA— 0.8% | | | | | | |
| Financials — 0.7% | | | | | | |
| Aspen Insurance Holdings, 5.625% | | | 211,412 | | | $ | 3,868,840 | |
| RenaissanceRe Holdings, 5.750% . | | | 194,351 | | | | 4,497,282 | |
| RenaissanceRe Holdings, 4.200% . | | | 415,774 | | | | 7,413,250 | |
| | | | | | | | 15,779,372 | |
| Industrials — 0.1% | | | | | | | | |
| Triton International, 5.750% . | | | 146,150 | | | | 2,705,237 | |
| TOTAL BERMUDA | | | | | | | 18,484,609 | |
| CANADA— 0.7% | | | | | | | | |
| Utilities — 0.7% | | | | | | | | |
| Algonquin Power & Utilities, 6.200%, ICE | | | | | | | | |
| LIBOR USD 3 Month + 4.010% (A) | | | 291,468 | | | | 7,018,549 | |
| BIP Bermuda Holdings I, 5.125% . | | | 252,428 | | | | 4,331,665 | |
| Brookfield BRP Holdings Canada, 4.625% | | | 292,828 | | | | 4,729,172 | |
| TOTAL CANADA | | | | | | | 16,079,386 | |
| NETHERLANDS— 0.8% | | | | | | | | |
| Financials — 0.8% | | | | | | | | |
| AEGON Funding, 5.100% | | | 770,405 | | | | 16,255,545 | |
| TOTAL NETHERLANDS | | | | | | | 16,255,545 | |
| UNITED STATES— 97.1% | | | | | | | | |
| Communication Services — 6.7% | | | | | | | | |
| AT&T, 5.625% | | | 677,962 | | | | 17,077,863 | |
|
|
|
| Schedule of Investments | | May 31, 2023 (Unaudited) |
| Global X U.S. Preferred ETF |
| | | | |
| |
| | | Shares | | | Value | |
| PREFERRED STOCK — continued | | | | | | |
| Communication Services — continued | | | | | | |
| AT&T, 5.350% | | | 1,099,416 | | | $ | 26,243,060 | |
| AT&T, 5.000% | | | 998,160 | | | | 22,149,170 | |
| AT&T, 4.750% | | | 1,454,227 | | | | 30,742,359 | |
| Paramount Global, 5.750% * | | | 208,608 | | | | 4,877,255 | |
| Qwest, 6.750% | | | 547,684 | | | | 7,809,974 | |
| Qwest, 6.500% | | | 806,600 | | | | 10,727,780 | |
| Telephone and Data Systems, 6.625% . | | | 349,778 | | | | 4,631,061 | |
| Telephone and Data Systems, 6.000% . | | | 572,776 | | | | 6,512,463 | |
| United States Cellular, 6.250% | | | 415,117 | | | | 6,770,558 | |
| United States Cellular, 5.500% | | | 415,930 | | | | 5,947,799 | |
| United States Cellular, 5.500% | | | 416,018 | | | | 5,998,979 | |
| | | | | | | | 149,488,321 | |
| Consumer Discretionary — 2.8% | | | | | | | | |
| Brunswick, 6.375% | | | 191,662 | | | | 4,841,382 | |
| Ford Motor, 6.500% . | | | 500,576 | | | | 12,103,928 | |
| Ford Motor, 6.200% . | | | 624,808 | | | | 15,495,238 | |
| Ford Motor, 6.000% (B) | | | 666,401 | | | | 15,893,664 | |
| Qurate Retail, 8.000% (B) | | | 263,323 | | | | 8,576,430 | |
| QVC, 6.375% . | | | 177,303 | | | | 1,716,293 | |
| QVC, 6.250% . | | | 383,591 | | | | 3,759,192 | |
| | | | | | | | 62,386,127 | |
| Energy — 0.9% | | | | | | | | |
| NuStar Energy, 11.746%, ICE LIBOR USD 3 | | | | | | | | |
| Month + 6.880% (A) | | | 146,022 | | | | 3,760,067 | |
| NuStar Energy, 11.139%, ICE LIBOR USD 3 | | | | | | | | |
| Month + 5.643% (A) | | | 320,021 | | | | 7,574,897 | |
| NuStar Logistics, 11.994%, ICE LIBOR USD | | | | | | | | |
| 3 Month + 6.734% (A) | | | 333,657 | | | | 8,665,072 | |
| | | | | | | | 20,000,036 | |
| Financials — 68.6% | | | | | | | | |
| Affiliated Managers Group, 5.875% | | | 248,877 | | | | 5,574,845 | |
| Affiliated Managers Group, 4.750% | | | 232,177 | | | | 4,232,587 | |
| Allstate, 8.661%, ICE LIBOR USD 3 Month + | | | | | | | | |
| 3.165% (A) | | | 413,036 | | | | 10,548,939 | |
| Allstate, 5.100% . | | | 956,799 | | | | 20,341,547 | |
| Allstate, 4.750% . | | | 249,119 | | | | 5,408,373 | |
| American Equity Investment Life Holding, | | | | | | | | |
| 6.625%, US Treas Yield Curve Rate T Note | | | | | | | | |
| Const Mat 5 Yr + 6.297% (A) | | | 250,439 | | | | 5,982,988 | |
|
|
|
| Schedule of Investments | | May 31, 2023 (Unaudited) |
| Global X U.S. Preferred ETF |
| | | | |
| |
| | | Shares | | | Value | |
| PREFERRED STOCK — continued | | | | | | |
| Financials — continued | | | | | | |
| American Equity Investment Life Holding, | | | | | | |
| 5.950%, US Treas Yield Curve Rate T Note | | | | | | |
| Const Mat 5 Yr + 4.322% (A) | | | 332,342 | | | $ | 7,560,780 | |
| American International Group, 5.850% . | | | 412,154 | | | | 9,928,790 | |
| Apollo Asset Management, 6.375% | | | 248,927 | | | | 5,981,716 | |
| Arch Capital Group, 5.450% | | | 275,228 | | | | 6,580,701 | |
| Arch Capital Group, 4.550% | | | 413,324 | | | | 8,307,812 | |
| Argo Group International Holdings, 7.000%, | | | | | | | | |
| US Treas Yield Curve Rate T Note Const | | | | | | | | |
| Mat 5 Yr + 6.712% (A) | | | 127,859 | | | | 2,901,121 | |
| Assurant, 5.250% | | | 209,773 | | | | 4,115,746 | |
| Athene Holding, 7.750%, US Treas Yield | | | | | | | | |
| Curve Rate T Note Const Mat 5 Yr + | | | | | | | | |
3.962% (A)
| | | 417,583 | | | | 10,159,794 | |
| Athene Holding, 6.375%, US Treas Yield | | | | | | | | |
| Curve Rate T Note Const Mat 5 Yr + | | | | | | | | |
5.970% (A)
| | | 500,694 | | | | 11,505,948 | |
| Athene Holding, 6.350%, ICE LIBOR USD 3 | | | | | | | | |
| Month + 4.253% (A) | | | 718,615 | | | | 14,990,309 | |
| Athene Holding, 5.625% . | | | 286,635 | | | | 5,618,046 | |
| Athene Holding, 4.875% . | | | 475,487 | | | | 7,802,742 | |
| Axis Capital Holdings, 5.500% . | | | 453,466 | | | | 9,658,826 | |
| Bank of America, 7.250% * | | | 54,465 | | | | 63,553,575 | |
| Bank of America, 6.450%, ICE LIBOR USD 3 | | | | | | | | |
| Month + 1.327% (A) | | | 744,796 | | | | 18,731,619 | |
| Bank of America, 6.246%, ICE LIBOR USD 3 | | | | | | | | |
| Month + 0.750% (A) | | | 155,589 | | | | 3,144,454 | |
| Bank of America, 6.146%, ICE LIBOR USD 3 | | | | | | | | |
| Month + 0.650% (A) | | | 212,061 | | | | 4,090,657 | |
| Bank of America, 6.000% | | | 956,767 | | | | 23,613,010 | |
| Bank of America, 5.879%, ICE LIBOR USD 3 | | | | | | | | |
| Month + 0.500% (A) | | | 300,509 | | | | 5,832,880 | |
| Bank of America, 5.875% (B) | | | 603,575 | | | | 14,721,194 | |
| Bank of America, 5.846%, ICE LIBOR USD 3 | | | | | | | | |
| Month + 0.350% (A) | | | 225,090 | | | | 4,501,800 | |
| Bank of America, 5.375% | | | 987,687 | | | | 22,529,140 | |
| Bank of America, 5.000% | | | 925,386 | | | | 19,821,768 | |
| Bank of America, 4.750% | | | 488,752 | | | | 9,921,666 | |
| Bank of America, 4.375% | | | 777,216 | | | | 14,603,889 | |
|
|
|
| Schedule of Investments | | May 31, 2023 (Unaudited) |
| Global X U.S. Preferred ETF |
| | | | |
| |
| | | Shares | | | Value | |
| PREFERRED STOCK — continued | | | | | | |
| Financials — continued | | | | | | |
| Bank of America, 4.250% | | | 920,343 | | | $ | 16,879,091 | |
| Bank of America, 4.125% | | | 647,816 | | | | 11,544,081 | |
| Bank OZK, 4.625% | | | 295,237 | | | | 4,339,984 | |
| Brighthouse Financial, 6.750% . | | | 332,585 | | | | 8,145,007 | |
| Brighthouse Financial, 6.600% . | | | 351,176 | | | | 7,947,113 | |
| Brighthouse Financial, 6.250% . | | | 314,031 | | | | 7,615,252 | |
| Brighthouse Financial, 5.375% . | | | 477,181 | | | | 7,897,346 | |
| Brighthouse Financial, 4.625% . | | | 295,332 | | | | 4,326,614 | |
| Cadence Bank, 5.500% | | | 145,867 | | | | 2,770,014 | |
| Capital One Financial, 5.000% | | | 1,247,249 | | | | 24,583,278 | |
| Capital One Financial, 4.800% | | | 1,040,208 | | | | 19,483,096 | |
| Capital One Financial, 4.375% | | | 558,581 | | | | 9,462,362 | |
| Capital One Financial, 4.250% | | | 352,734 | | | | 5,897,712 | |
| Carlyle Finance, 4.625% | | | 415,437 | | | | 7,905,766 | |
| Charles Schwab, 5.950% (B) | | | 617,206 | | | | 15,454,838 | |
| Charles Schwab, 4.450% (B) | | | 496,199 | | | | 9,844,588 | |
| Citigroup Capital XIII, 11.643%, ICE LIBOR | | | | | | | | |
| USD 3 Month + 6.370% (A) | | | 1,864,383 | | | | 53,377,285 | |
| Citizens Financial Group, 5.000% | | | 374,035 | | | | 6,882,244 | |
| Enstar Group, 7.000%, ICE LIBOR USD 3 | | | | | | | | |
| Month + 4.015% (A) | | | 330,942 | | | | 7,181,441 | |
| Enstar Group, 7.000% . | | | 87,878 | | | | 2,035,254 | |
| Equitable Holdings, 5.250% . | | | 666,946 | | | | 13,285,564 | |
| Equitable Holdings, 4.300% . | | | 250,530 | | | | 4,158,798 | |
| Fifth Third Bancorp, 4.950% . | | | 210,668 | | | | 4,729,497 | |
| First Citizens BancShares, 5.625% | | | 169,663 | | | | 3,452,642 | |
| First Citizens BancShares, 5.375% | | | 287,691 | | | | 5,699,159 | |
| First Horizon, 4.700% . | | | 130,173 | | | | 1,998,156 | |
| First Republic Bank (C) | | | 152,867 | | | | 963 | |
| First Republic Bank (C) | | | 231,927 | | | | 1,206 | |
| First Republic Bank (C) | | | 300,183 | | | | 1,261 | |
| First Republic Bank (C) | | | 392,108 | | | | 1,647 | |
| First Republic Bank (C) | | | 571,755 | | | | 2,287 | |
| First Republic Bank (C) | | | 539,099 | | | | 2,642 | |
| First Republic Bank (C) | | | 509,562 | | | | 3,108 | |
| Fulton Financial, 5.125% | | | 170,575 | | | | 2,724,083 | |
| Goldman Sachs Group, 6.246%, ICE LIBOR | | | | | | | | |
| USD 3 Month + 0.750% (A) | | | 168,883 | | | | 3,538,099 | |
| Goldman Sachs Group, 6.166%, ICE LIBOR | | | | | | | | |
| USD 3 Month + 0.670% (A) | | | 1,122,773 | | | | 23,162,807 | |
|
|
|
| Schedule of Investments | | May 31, 2023 (Unaudited) |
| Global X U.S. Preferred ETF |
| | | | |
| |
| | | Shares | | | Value | |
| PREFERRED STOCK — continued | | | | | | |
| Financials — continued | | | | | | |
| Goldman Sachs Group, 6.087%, ICE LIBOR | | | | | | |
| USD 3 Month + 0.750% (A) | | | 625,460 | | | $ | 12,790,657 | |
| Hartford Financial Services Group, 6.000% | | | 289,054 | | | | 7,168,539 | |
| Huntington Bancshares, 5.700% | | | 135,510 | | | | 2,962,249 | |
| Huntington Bancshares, 4.500% | | | 413,367 | | | | 7,535,680 | |
| JPMorgan Chase, 6.000% | | | 1,536,488 | | | | 38,504,389 | |
| JPMorgan Chase, 5.750% | | | 1,409,071 | | | | 34,804,054 | |
| JPMorgan Chase, 4.750% | | | 749,501 | | | | 16,346,617 | |
| JPMorgan Chase, 4.625% | | | 1,537,129 | | | | 31,895,427 | |
| JPMorgan Chase, 4.550% (B) | | | 1,247,063 | | | | 25,577,262 | |
| JPMorgan Chase, 4.200% | | | 1,661,648 | | | | 32,784,315 | |
| Kemper, 5.875%, US Treas Yield Curve Rate T | | | | | | | | |
| Note Const Mat 5 Yr + 4.140% (A) | | | 128,687 | | | | 2,218,564 | |
| KeyCorp, 6.200%, US Treas Yield Curve Rate | | | | | | | | |
| T Note Const Mat 5 Yr + 3.132% (A) (B) | | | 495,373 | | | | 9,739,033 | |
| KeyCorp, 6.125%, TSFR3M + 4.154% (A) (B) | | | 412,660 | | | | 8,343,985 | |
| KeyCorp, 5.650% . | | | 356,179 | | | | 6,767,401 | |
| KeyCorp, 5.625% . | | | 372,208 | | | | 6,666,245 | |
| KKR Group Finance IX, 4.625% . | | | 413,409 | | | | 7,193,317 | |
| Lincoln National, 9.000% (B) | | | 413,077 | | | | 10,533,463 | |
| M&T Bank, 5.625%, ICE LIBOR USD 3 | | | | | | | | |
| Month + 4.020% (A) | | | 210,583 | | | | 4,887,631 | |
| Merchants Bancorp, 8.250%, US Treas Yield | | | | | | | | |
| Curve Rate T Note Const Mat 5 Yr + | | | | | | | | |
4.340% (A)
| | | 114,906 | | | | 2,735,912 | |
| MetLife, 5.866%, ICE LIBOR USD 3 Month + | | | | | | | | |
1.000% (A)
| | | 500,744 | | | | 11,256,725 | |
| MetLife, 5.625% | | | 670,431 | | | | 16,097,048 | |
| MetLife, 4.750% | | | 832,623 | | | | 17,301,906 | |
| Morgan Stanley, 6.500% | | | 831,826 | | | | 21,727,295 | |
| Morgan Stanley, 6.375%, ICE LIBOR USD 3 | | | | | | | | |
| Month + 3.708% (A) | | | 831,985 | | | | 20,550,030 | |
| Morgan Stanley, 5.960%, ICE LIBOR USD 3 | | | | | | | | |
| Month + 0.700% (A) | | | 915,486 | | | | 19,298,445 | |
| Morgan Stanley, 5.850%, ICE LIBOR USD 3 | | | | | | | | |
| Month + 3.491% (A) | | | 832,107 | | | | 19,879,036 | |
| Morgan Stanley, 4.875% (B) | | | 412,547 | | | | 9,121,414 | |
| Morgan Stanley, 4.250% (B) | | | 1,081,676 | | | | 20,216,524 | |
|
|
|
| Schedule of Investments | | May 31, 2023 (Unaudited) |
| Global X U.S. Preferred ETF |
| | | | |
| |
| | | Shares | | | Value | |
| PREFERRED STOCK — continued | | | | | | |
| Financials — continued | | | | | | |
| National Rural Utilities Cooperative Finance, | | | | | | |
| 5.500%. | | | 210,403 | | | $ | 5,070,712 | |
| Navient, 6.000% . | | | 251,770 | | | | 4,972,458 | |
| New York Community Bancorp, 6.375%, ICE | | | | | | | | |
| LIBOR USD 3 Month + 3.821% (A) | | | 425,896 | | | | 9,280,274 | |
| Northern Trust, 4.700% . | | | 332,259 | | | | 6,864,471 | |
| PacWest Bancorp, 7.750%, US Treas Yield | | | | | | | | |
| Curve Rate T Note Const Mat 5 Yr + | | | | | | | | |
4.820%(A)
| | | 425,504 | | | | 4,999,672 | |
| Prudential Financial, 5.950% . | | | 251,726 | | | | 6,318,323 | |
| Prudential Financial, 5.625% . | | | 471,430 | | | | 11,691,464 | |
| Prudential Financial, 4.125% . | | | 412,940 | | | | 8,225,765 | |
| Regions Financial, Ser B, 6.375%, ICE LIBOR | | | | | | | | |
| USD 3 Month + 3.536% (A) | | | 413,492 | | | | 9,043,070 | |
| Regions Financial, 5.700%, ICE LIBOR USD | | | | | | | | |
| 3 Month + 3.148% (A) | | | 414,192 | | | | 8,201,002 | |
| Regions Financial, 4.450% . | | | 331,835 | | | | 5,448,731 | |
| Reinsurance Group of America, 7.125%, US | | | | | | | | |
| Treas Yield Curve Rate T Note Const Mat 5 | | | | | | | | |
| Yr + 3.456% (A) | | | 575,848 | | | | 14,747,467 | |
| Reinsurance Group of America, 5.750%, ICE | | | | | | | | |
| LIBOR USD 3 Month + 4.040% (A) | | | 331,577 | | | | 8,140,215 | |
| SLM, 6.566%, ICE LIBOR USD 3 Month + | | | | | | | | |
1.700%(A)
| | | 79,763 | | | | 4,347,084 | |
| State Street, 5.350%, TSFR3M + 3.971% (A) (B) . | | | 413,133 | | | | 9,894,535 | |
| Stifel Financial, 6.250% . | | | 123,792 | | | | 2,931,395 | |
| Stifel Financial, 6.125% . | | | 174,706 | | | | 4,079,385 | |
| Stifel Financial, 4.500% . | | | 235,512 | | | | 3,678,697 | |
| Synchrony Financial, 5.625% . | | | 619,502 | | | | 10,562,509 | |
| Synovus Financial, 5.875%, US Treas Yield | | | | | | | | |
| Curve Rate T Note Const Mat 5 Yr + | | | | | | | | |
4.127%(A)
| | | 290,510 | | | | 5,877,017 | |
| Texas Capital Bancshares, 5.750% . | | | 234,692 | | | | 4,186,905 | |
| Truist Financial, 5.250% (B) | | | 474,871 | | | | 10,736,833 | |
| Truist Financial, 4.750% | | | 760,623 | | | | 15,280,916 | |
| Unum Group, 6.250% . | | | 250,386 | | | | 5,949,171 | |
| US Bancorp, 6.280%, ICE LIBOR USD 3 | | | | | | | | |
| Month + 1.020% (A) | | | 11,893 | | | | 8,527,281 | |
|
|
|
| Schedule of Investments | | May 31, 2023 (Unaudited) |
| Global X U.S. Preferred ETF |
| | | | |
| |
| | | Shares | | | Value | |
| PREFERRED STOCK — continued | | | | | | |
| Financials — continued | | | | | | |
| US Bancorp, 5.860%, ICE LIBOR USD 3 | | | | | | |
| Month + 0.600% (A) | | | 822,449 | | | $ | 14,491,551 | |
| US Bancorp, 5.500% | | | 474,462 | | | | 10,784,521 | |
| US Bancorp, 4.500% (B) | | | 373,609 | | | | 7,214,390 | |
| US Bancorp, 4.000% (B) | | | 618,915 | | | | 10,800,067 | |
| US Bancorp, 3.750% | | | 415,446 | | | | 6,854,859 | |
| Voya Financial, 5.350%, US Treas Yield Curve | | | | | | | | |
| Rate T Note Const Mat 5 Yr + 3.210% (A) | | | 249,018 | | | | 5,792,159 | |
| W R Berkley, 5.100% (B) | | | 234,588 | | | | 5,067,101 | |
| W R Berkley, 4.250% | | | 211,286 | | | | 4,092,610 | |
| Washington Federal, 4.875% | | | 234,918 | | | | 3,401,613 | |
| Wells Fargo, 7.500% * (B) | | | 82,294 | | | | 92,705,014 | |
| Wells Fargo, 5.625% . | | | 568,439 | | | | 12,892,197 | |
| Wells Fargo, 4.750% . | | | 1,672,134 | | | | 31,670,218 | |
| Wells Fargo, 4.700% . | | | 960,904 | | | | 17,709,461 | |
| Wells Fargo, 4.375% . | | | 863,641 | | | | 14,897,807 | |
| Wells Fargo, 4.250% . | | | 1,026,771 | | | | 17,372,965 | |
| Western Alliance Bancorp, 4.250%, US Treas | | | | | | | | |
| Yield Curve Rate T Note Const Mat 5 Yr + | | | | | | | | |
3.452% (A)
| | | 234,460 | | | | 3,092,527 | |
| | | | | | | | 1,531,399,122 | |
| Industrials — 1.7% | | | | | | | | |
| Chart Industries, 6.750% . | | | 166,090 | | | | 7,846,091 | |
| FTAI Aviation, 8.250%, ICE LIBOR USD 3 | | | | | | | | |
| Month + 6.886% (A) | | | 85,677 | | | | 1,953,436 | |
| Pitney Bowes, 6.700% | | | 354,096 | | | | 5,672,618 | |
| RBC Bearings, 5.000% | | | 94,976 | | | | 9,497,600 | |
| WESCO International, 10.625%, US Treas | | | | | | | | |
| Yield Curve Rate T Note Const Mat 5 Yr + | | | | | | | | |
10.325%(A)
| | | 445,631 | | | | 11,929,542 | |
| | | | | | | | 36,899,287 | |
| Real Estate — 5.5% | | | | | | | | |
| Brookfield Property Partners, 6.500% | | | 149,004 | | | | 2,184,399 | |
| Brookfield Property Partners, 6.375% | | | 212,708 | | | | 2,911,973 | |
| Brookfield Property Preferred, 6.250% | | | 555,559 | | | | 8,383,385 | |
| Digital Realty Trust, 5.850% ‡ (B) | | | 177,428 | | | | 4,080,844 | |
| Digital Realty Trust, 5.250% ‡ | | | 169,478 | | | | 3,606,492 | |
| Digital Realty Trust, 5.200% ‡ (B) | | | 287,953 | | | | 6,101,724 | |
| Diversified Healthcare Trust, 6.250% ‡ | | | 202,159 | | | | 2,636,153 | |
| Federal Realty Investment Trust, 5.000% ‡ | | | 127,817 | | | | 2,897,611 | |
|
|
|
| Schedule of Investments | | May 31, 2023 (Unaudited) |
| Global X U.S. Preferred ETF |
| | | | |
| |
| | | Shares | | | Value | |
| PREFERRED STOCK — continued | | | | | | |
| Real Estate — continued | | | | | | |
| Global Net Lease, 6.875% ‡ | | | 100,405 | | | $ | 1,917,736 | |
| Hudson Pacific Properties, 4.750% ‡ | | | 361,400 | | | | 3,014,076 | |
| Office Properties Income Trust, 6.375% ‡ | | | 140,290 | | | | 1,802,727 | |
| Public Storage, 5.600% ‡ | | | 237,952 | | | | 6,048,740 | |
| Public Storage, 5.150% ‡ | | | 235,239 | | | | 5,770,413 | |
| Public Storage, 5.050% ‡ | | | 248,987 | | | | 6,060,344 | |
| Public Storage, 4.750% ‡ | | | 194,180 | | | | 4,268,076 | |
| Public Storage, 4.700% ‡ | | | 218,039 | | | | 4,764,152 | |
| Public Storage, 4.625% ‡ | | | 465,851 | | | | 10,043,748 | |
| Public Storage, 4.100% ‡ | | | 211,300 | | | | 4,046,395 | |
| Public Storage, 4.000% ‡ | | | 498,174 | | | | 9,460,324 | |
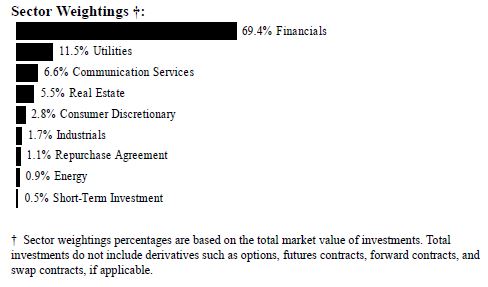
| Public Storage, 4.000% ‡ | | | 362,468 | | | | 6,705,658 | |
| Public Storage, 3.900% ‡ | | | 138,359 | | | | 2,504,298 | |
| Public Storage, 3.875% ‡ | | | 226,254 | | | | 4,090,672 | |
| RLJ Lodging Trust, 1.950% ‡ * | | | 267,254 | | | | 6,267,106 | |
| SL Green Realty, 6.500% ‡ | | | 184,000 | | | | 2,898,000 | |
| Vornado Realty Trust, 5.400% ‡ | | | 232,666 | | | | 2,857,138 | |
| Vornado Realty Trust, 5.250% ‡ | | | 247,579 | | | | 2,933,811 | |
| Vornado Realty Trust, 5.250% ‡ | | | 240,303 | | | | 2,919,681 | |
| Vornado Realty Trust, 4.450% ‡ | | | 235,888 | | | | 2,561,744 | |
| | | | | | | | 123,737,420 | |
| Utilities — 10.9% | | | | | | | | |
| CMS Energy, 5.875% | | | 232,658 | | | | 5,634,977 | |
| CMS Energy, 5.875% | | | 525,365 | | | | 12,787,384 | |
| CMS Energy, 5.625% (B) | | | 168,251 | | | | 4,172,625 | |
| CMS Energy, 4.200% | | | 194,645 | | | | 3,892,900 | |
| DTE Energy, 5.250% | | | 330,709 | | | | 7,771,662 | |
| DTE Energy, 4.375% | | | 194,262 | | | | 4,262,108 | |
| DTE Energy, 4.375% | | | 235,795 | | | | 4,994,138 | |
| Duke Energy, 5.750% | | | 831,940 | | | | 21,131,276 | |
| Duke Energy, 5.625% | | | 413,102 | | | | 10,397,777 | |
| Entergy Arkansas, 4.875% | | | 339,056 | | | | 7,699,962 | |
| Entergy Louisiana, 4.875% | | | 227,109 | | | | 5,302,995 | |
| Entergy Mississippi, 4.900% | | | 218,101 | | | | 5,112,287 | |
| Georgia Power, 5.000% | | | 215,193 | | | | 5,282,988 | |
| NextEra Energy, 6.926% (B) | | | 830,584 | | | | 38,073,971 | |
| NextEra Energy Capital Holdings, 5.650% . | | | 572,971 | | | | 14,289,897 | |
| SCE Trust II, 5.100% . | | | 186,155 | | | | 3,870,163 | |
| SCE Trust IV, 5.375%, ICE LIBOR USD 3 | | | | | | | | |
| | | 273,250 | | | | 5,486,860 | |
|
|
|
| Schedule of Investments | | May 31, 2023 (Unaudited) |
| Global X U.S. Preferred ETF |
| | | | |
| |
| | | Shares | | | Value | |
| PREFERRED STOCK — continued | | | | | | |
| Utilities — continued | | | | | | |
| SCE Trust V, 5.450%, ICE LIBOR USD 3 | | | | | | |
| Month + 3.790% (A) | | | 252,110 | | | $ | 5,672,475 | |
| SCE Trust VI, 5.000% | | | 394,311 | | | | 7,787,642 | |
| Sempra Energy, 5.750% . | | | 623,132 | | | | 15,279,197 | |
| Southern, 5.250% | | | 371,428 | | | | 9,170,557 | |
| Southern, 4.950% | | | 821,155 | | | | 19,042,584 | |
| Southern, 4.200% | | | 618,374 | | | | 13,016,773 | |
| Spire, 5.900% . | | | 195,843 | | | | 4,856,906 | |
| Tennessee Valley Authority, 4.780%, US Treas | | | | | | | | |
| Yield Curve Rate T Note Const Mat 30 Yr + | | | | | | | | |
0.940% (A)
| | | 200,539 | | | | 4,490,068 | |
| Tennessee Valley Authority, 4.720%, US Treas | | | | | | | | |
| Yield Curve Rate T Note Const Mat 30 Yr + | | | | | | | | |
0.840% (A)
| | | 167,097 | | | | 3,674,463 | |
| | | | | | | | 243,154,635 | |
| TOTAL UNITED STATES | | | | | | | 2,167,064,948 | |
| TOTAL PREFERRED STOCK | | | | | | | | |
| (Cost $2,656,651,714) | | | | | | | 2,217,884,488 | |
| SHORT-TERM INVESTMENT(D)(E) — 0.5% | | | | | | | | |
| Fidelity Investments Money Market | | | | | | | | |
| Government Portfolio, Cl Institutional, | | | | | | | | |
5.020%
| | | | | | | | |
| (Cost $12,207,941) . | | | 12,207,941 | | | | 12,207,941 | |
|
|
|
| Schedule of Investments | | May 31, 2023 (Unaudited) |
| Global X U.S. Preferred ETF |
| | | | |
| |
| | | Face Amount | | | Value | |
| REPURCHASE AGREEMENT(D) — 1.1% | | | | | | |
| BNP Paribas | | | | | | |
| 4.990%, dated 05/31/2023, to be | | | | | | |
| repurchased on 06/01/2023, repurchase price | | | | |
| $24,693,874 (collateralized by various U.S. | | | | |
| Treasury Obligations, ranging in par value | | | | | | |
$424,871 - $2,944,528, 4.125% - 5.410%,
| | | | | | |
| 7/31/2024 - 9/30/2027, with a total market | | | | | | |
| value of $25,185,692) | | | | | | |
| (Cost $24,690,452) . | | $ | 24,690,452 | | | $ | 24,690,452 | |
| TOTAL INVESTMENTS — 101.0% | | | | | | | | |
| (Cost $2,693,550,107) | | | | | | $ | 2,254,782,881 | |
Percentages are based on Net Assets of $2,231,602,683.
| * | Non-income producing security. |
| ‡ | Real Estate Investment Trust |
| (A) | Variable or floating rate security. The rate shown is the effective interest rate as of period end. The rates on certain securities are not based on published reference rates and spreads and are either determined by the issuer or agent based on current market conditions; by using a formula based on the rates of underlying loans; or by adjusting periodically based on prevailing interest rates. |
| (B) | This security or a partial position of this security is on loan at May 31, 2023. |
| (C) | There is currently no stated interest rate. |
| (D) | Security was purchased with cash collateral held from securities on loan. |
| (E) | The rate reported on the Schedule of Investments is the 7-day effective yield as of May 31, 2023. |
The following is a summary of the level of inputs used as of May 31, 2023, in valuing the Fund's investments carried at value:
| Investments in Securities | | Level 1 | | | Level 2 | | | Level 3 | | | Total | |
| Preferred Stock | | $ | 2,217,884,488 | | | $ | — | | | $ | — | | | $ | 2,217,884,488 | |
| Short-Term Investment | | | 12,207,941 | | | | — | | | | — | | | | 12,207,941 | |
| Repurchase Agreement | | | — | | | | 24,690,452 | | | | — | | | | 24,690,452 | |
| Total Investments in Securities | | $ | 2,230,092,429 | | | $ | 24,690,452 | | | $ | — | | | $ | 2,254,782,881 | |
Amounts designated as “—“are $0 or have been rounded to $0.
See "Glossary" for abbreviations.
|
|
|
| Schedule of Investments | | May 31, 2023 (Unaudited) |
| Global X S&P 500® Quality Dividend ETF |
| | | | |
| |
| | | Shares | | | Value | |
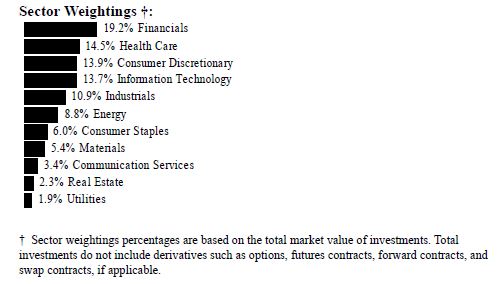
| COMMON STOCK — 99.8% | | | | | | |
| Communication Services — 3.3% | | | | | | |
| Interpublic Group | | | 30,035 | | | $ | 1,117,002 | |
| Omnicom Group . | | | 12,733 | | | | 1,122,923 | |
| | | | | | | | 2,239,925 | |
| Consumer Discretionary — 5.7% | | | | | | | | |
| Best Buy | | | 11,782 | | | | 856,198 | |
| Garmin | | | 10,137 | | | | 1,045,632 | |
| Hasbro . | | | 16,197 | | | | 961,292 | |
| Tapestry . | | | 26,474 | | | | 1,059,489 | |
| | | | | | | | 3,922,611 | |
| Consumer Staples — 20.0% | | | | | | | | |
| Campbell Soup . | | | 17,317 | | | | 875,374 | |
| Coca-Cola . | | | 15,263 | | | | 910,591 | |
| Colgate-Palmolive | | | 12,390 | | | | 921,568 | |
| General Mills | | | 11,226 | | | | 944,780 | |
| J M Smucker . | | | 6,231 | | | | 913,402 | |
| Kellogg . | | | 13,324 | | | | 889,644 | |
| Kimberly-Clark | | | 7,075 | | | | 950,031 | |
| Kraft Heinz | | | 24,129 | | | | 922,210 | |
| Molson Coors Beverage, Cl B | | | 18,361 | | | | 1,135,628 | |
| Mondelez International, Cl A . | | | 14,367 | | | | 1,054,681 | |
| PepsiCo | | | 5,264 | | | | 959,890 | |
|
|
|
| Schedule of Investments | | May 31, 2023 (Unaudited) |
| Global X S&P 500® Quality Dividend ETF |
| | | | |
| |
| | | Shares | | | Value | |
| COMMON STOCK — continued | | | | | | |
| Consumer Staples — continued | | | | | | |
| Procter & Gamble . | | | 6,385 | | | $ | 909,863 | |
| Target | | | 6,330 | | | | 828,787 | |
| Tyson Foods, Cl A | | | 14,928 | | | | 755,954 | |
| Walgreens Boots Alliance | | | 23,519 | | | | 714,272 | |
| | | | | | | | 13,686,675 | |
| Energy — 11.5% | | | | | | | | |
| APA . | | | 22,715 | | | | 721,883 | |
| Chevron . | | | 5,666 | | | | 853,413 | |
| EOG Resources | | | 7,923 | | | | 850,059 | |
| Exxon Mobil | | | 9,307 | | | | 950,989 | |
| Kinder Morgan . | | | 55,233 | | | | 889,803 | |
| Marathon Petroleum | | | 9,021 | | | | 946,393 | |
| ONEOK . | | | 15,168 | | | | 859,419 | |
| Phillips 66 . | | | 9,834 | | | | 900,893 | |
| Valero Energy . | | | 8,406 | | | | 899,778 | |
| | | | | | | | 7,872,630 | |
| Financials — 8.6% | | | | | | | | |
| Aflac | | | 13,777 | | | | 884,621 | |
| BlackRock, Cl A . | | | 1,364 | | | | 896,898 | |
| Discover Financial Services | | | 9,355 | | | | 961,132 | |
| Fidelity National Information Services . | | | 13,544 | | | | 739,096 | |
| Hartford Financial Services Group . | | | 12,913 | | | | 884,799 | |
| Principal Financial Group | | | 10,804 | | | | 707,230 | |
| T Rowe Price Group | | | 8,043 | | | | 861,888 | |
| | | | | | | | 5,935,664 | |
| Health Care — 9.6% | | | | | | | | |
| AbbVie | | | 5,912 | | | | 815,619 | |
| Amgen . | | | 3,461 | | | | 763,670 | |
| Bristol-Myers Squibb . | | | 12,231 | | | | 788,166 | |
| Gilead Sciences | | | 10,814 | | | | 832,029 | |
| Johnson & Johnson . | | | 5,416 | | | | 839,805 | |
| Medtronic | | | 12,261 | | | | 1,014,720 | |
| Pfizer | | | 18,397 | | | | 699,454 | |
| Viatris, Cl W | | | 88,193 | | | | 806,966 | |
| | | | | | | | 6,560,429 | |
| Industrials — 16.8% | | | | | | | | |
| 3M | | | 7,569 | | | | 706,263 | |
| CH Robinson Worldwide | | | 10,110 | | | | 955,800 | |
| Cummins | | | 4,048 | | | | 827,452 | |
|
|
|
| Schedule of Investments | | May 31, 2023 (Unaudited) |
| Global X S&P 500® Quality Dividend ETF |
| | | | |
| |
| | | Shares | | | Value | |
| COMMON STOCK — continued | | | | | | |
| Industrials — continued | | | | | | |
| Emerson Electric | | | 10,104 | | | $ | 784,879 | |
| Fastenal | | | 18,906 | | | | 1,018,088 | |
| Illinois Tool Works | | | 4,385 | | | | 959,131 | |
| Lockheed Martin | | | 1,994 | | | | 885,356 | |
| Paychex | | | 8,067 | | | | 846,470 | |
| Raytheon Technologies | | | 9,807 | | | | 903,617 | |
| Robert Half International | | | 13,044 | | | | 848,121 | |
| Snap-On . | | | 4,121 | | | | 1,025,552 | |
| Union Pacific | | | 4,562 | | | | 878,276 | |
| United Parcel Service, Cl B . | | | 5,425 | | | | 905,975 | |
| | | | | | | | 11,544,980 | |
| Information Technology — 11.6% | | | | | | | | |
| Broadcom | | | 1,768 | | | | 1,428,473 | |
| Cisco Systems | | | 19,883 | | | | 987,589 | |
| Corning . | | | 29,188 | | | | 899,282 | |
| Hewlett Packard Enterprise | | | 59,686 | | | | 860,672 | |
| Juniper Networks . | | | 29,764 | | | | 903,933 | |
| NetApp . | | | 14,986 | | | | 994,321 | |
| QUALCOMM . | | | 8,096 | | | | 918,167 | |
| Texas Instruments . | | | 5,530 | | | | 961,557 | |
| | | | | | | | 7,953,994 | |
| Materials — 7.6% | | | | | | | | |
| Dow | | | 19,196 | | | | 936,381 | |
| Eastman Chemical . | | | 11,316 | | | | 872,351 | |
| International Paper . | | | 26,359 | | | | 776,009 | |
| LyondellBasell Industries, Cl A | | | 11,828 | | | | 1,011,767 | |
| Newmont | | | 20,775 | | | | 842,426 | |
| Westrock . | | | 26,505 | | | | 742,405 | |
| | | | | | | | 5,181,339 | |
| Real Estate — 2.6% | | | | | | | | |
| Public Storage ‡ | | | 3,239 | | | | 917,609 | |
| Weyerhaeuser ‡ | | | 30,620 | | | | 877,569 | |
| | | | | | | | 1,795,178 | |
| Utilities — 2.5% | | | | | | | | |
| DTE Energy . | | | 8,224 | | | | 884,902 | |
|
|
|
| Schedule of Investments | | May 31, 2023 (Unaudited) |
| Global X S&P 500® Quality Dividend ETF |
| | | | |
| |
| | | Shares | | | Value | |
| COMMON STOCK — continued | | | | | | |
| Utilities — continued | | | | | | |
| PPL | | | 32,868 | | | $ | 861,142 | |
| | | | | | | | 1,746,044 | |
| TOTAL COMMON STOCK | | | | | | | | |
| (Cost $73,897,621) | | | | | | | 68,439,469 | |
| TOTAL INVESTMENTS — 99.8% | | | | | | | | |
| (Cost $73,897,621) | | | | | | $ | 68,439,469 | |
Percentages are based on Net Assets of $68,587,548.
‡ Real Estate Investment Trust
As of May 31, 2023, all of the Fund's investments were considered Level 1, in accordance with authoritative guidance on fair value measurements and disclosure under U.S. GAAP.
See "Glossary" for abbreviations.
|
|
|
| Schedule of Investments | | May 31, 2023 (Unaudited) |
| Global X Adaptive U.S. Factor ETF |
| | | | |
| |
| | | Shares | | | Value | |
| COMMON STOCK — 99.7% | | | | | | |
| UNITED STATES — 99.7% | | | | | | |
| Communication Services — 3.4% | | | | | | |
| AT&T | | | 42,521 | | | $ | 668,855 | |
| Frontier Communications Parent * | | | 39,629 | | | | 589,680 | |
| Iridium Communications . | | | 5,751 | | | | 345,290 | |
| Liberty Broadband, Cl C * | | | 10,732 | | | | 795,241 | |
| Nexstar Media Group, Cl A | | | 4,750 | | | | 716,870 | |
| Paramount Global, Cl B | | | 37,134 | | | | 564,808 | |
| TEGNA | | | 49,366 | | | | 764,679 | |
| Verizon Communications | | | 21,703 | | | | 773,278 | |
| World Wrestling Entertainment, Cl A | | | 2,187 | | | | 221,587 | |
| | | | | | | | 5,440,288 | |
| Consumer Discretionary — 13.9% | | | | | | | | |
| Academy Sports & Outdoors . | | | 3,657 | | | | 179,047 | |
| Asbury Automotive Group * | | | 4,060 | | | | 848,987 | |
| Best Buy | | | 11,522 | | | | 837,304 | |
| BorgWarner . | | | 8,869 | | | | 393,163 | |
| Crocs * | | | 2,602 | | | | 292,153 | |
| Deckers Outdoor * | | | 1,249 | | | | 593,275 | |
| Dick's Sporting Goods | | | 2,479 | | | | 316,097 | |
| DR Horton | | | 13,314 | | | | 1,422,468 | |
|
|
|
| Schedule of Investments | | May 31, 2023 (Unaudited) |
| Global X Adaptive U.S. Factor ETF |
| | | | |
| |
| | | Shares | | | Value | |
| COMMON STOCK — continued | | | | | | |
| Consumer Discretionary — continued | | | | | | |
| General Motors | | | 24,225 | | | $ | 785,132 | |
| Genuine Parts . | | | 6,365 | | | | 947,939 | |
| H&R Block . | | | 6,113 | | | | 182,473 | |
| Las Vegas Sands * | | | 15,030 | | | | 828,604 | |
| Lennar, Cl A . | | | 18,807 | | | | 2,014,606 | |
| Lithia Motors, Cl A . | | | 3,782 | | | | 882,265 | |
| Macy's | | | 46,929 | | | | 637,765 | |
| Meritage Homes . | | | 1,504 | | | | 173,456 | |
| Newell Brands . | | | 66,851 | | | | 555,532 | |
| NVR * | | | 124 | | | | 688,723 | |
| PulteGroup . | | | 22,209 | | | | 1,467,571 | |
| Starbucks | | | 39,299 | | | | 3,837,154 | |
| Taylor Morrison Home, Cl A * | | | 25,212 | | | | 1,069,745 | |
| Texas Roadhouse, Cl A | | | 2,785 | | | | 300,501 | |
| Thor Industries | | | 10,528 | | | | 824,027 | |
| Toll Brothers | | | 17,697 | | | | 1,198,087 | |
| Visteon * | | | 1,591 | | | | 212,526 | |
| Wingstop | | | 1,533 | | | | 305,619 | |
| Wynn Resorts . | | | 3,925 | | | | 387,397 | |
| | | | | | | | 22,181,616 | |
| Consumer Staples — 6.0% | | | | | | | | |
| Bunge . | | | 8,659 | | | | 802,170 | |
| Campbell Soup . | | | 8,317 | | | | 420,424 | |
| Celsius Holdings * | | | 1,679 | | | | 210,765 | |
| elf Beauty * | | | 6,442 | | | | 670,097 | |
| General Mills | | | 22,342 | | | | 1,880,303 | |
| Hershey | | | 4,921 | | | | 1,277,983 | |
| Kraft Heinz | | | 21,225 | | | | 811,219 | |
| Lamb Weston Holdings . | | | 10,270 | | | | 1,142,024 | |
| Lancaster Colony . | | | 914 | | | | 179,674 | |
| Monster Beverage * | | | 23,561 | | | | 1,381,146 | |
| Post Holdings * | | | 1,826 | | | | 155,137 | |
| Tyson Foods, Cl A | | | 13,595 | | | | 688,451 | |
| | | | | | | | 9,619,393 | |
| Energy — 8.7% | | | | | | | | |
| Chesapeake Energy . | | | 10,351 | | | | 778,913 | |
| Chord Energy . | | | 5,829 | | | | 833,780 | |
| Civitas Resources | | | 11,754 | | | | 785,167 | |
|
|
|
| Schedule of Investments | | May 31, 2023 (Unaudited) |
| Global X Adaptive U.S. Factor ETF |
| | | | |
| |
| | | Shares | | | Value | |
| COMMON STOCK — continued | | | | | | |
| Energy — continued | | | | | | |
| Coterra Energy | | | 32,596 | | | $ | 757,857 | |
| DT Midstream . | | | 17,417 | | | | 791,777 | |
| Exxon Mobil | | | 36,133 | | | | 3,692,070 | |
| HF Sinclair . | | | 24,092 | | | | 998,372 | |
| Kinder Morgan . | | | 47,598 | | | | 766,804 | |
| Marathon Petroleum | | | 21,884 | | | | 2,295,850 | |
| ONEOK . | | | 12,626 | | | | 715,389 | |
| PBF Energy, Cl A | | | 4,306 | | | | 158,504 | |
| Valero Energy . | | | 12,567 | | | | 1,345,172 | |
| | | | | | | | 13,919,655 | |
| Financials — 19.1% | | | | | | | | |
| Ally Financial | | | 30,517 | | | | 813,888 | |
| American International Group | | | 15,756 | | | | 832,390 | |
| Annaly Capital Management ‡ | | | 43,609 | | | | 823,338 | |
| Arch Capital Group * | | | 17,265 | | | | 1,203,371 | |
| Cadence Bank | | | 38,799 | | | | 696,830 | |
| Capital One Financial | | | 8,436 | | | | 879,116 | |
| Citigroup | | | 16,621 | | | | 736,643 | |
| Citizens Financial Group . | | | 27,465 | | | | 708,048 | |
| Columbia Banking System . | | | 37,631 | | | | 753,749 | |
| Comerica | | | 17,788 | | | | 642,147 | |
| Erie Indemnity, Cl A | | | 1,274 | | | | 272,763 | |
| Essent Group . | | | 19,975 | | | | 882,296 | |
| Fifth Third Bancorp | | | 29,896 | | | | 725,576 | |
| FNB | | | 72,030 | | | | 791,610 | |
| Huntington Bancshares | | | 70,750 | | | | 729,433 | |
| Invesco | | | 47,951 | | | | 689,535 | |
| Jefferies Financial Group | | | 26,443 | | | | 795,141 | |
| KeyCorp | | | 67,660 | | | | 631,944 | |
| Kinsale Capital Group . | | | 776 | | | | 235,113 | |
| MarketAxess Holdings . | | | 1,768 | | | | 481,621 | |
| MGIC Investment . | | | 58,502 | | | | 884,550 | |
| New York Community Bancorp . | | | 90,277 | | | | 928,048 | |
| Old National Bancorp | | | 60,136 | | | | 746,889 | |
| OneMain Holdings, Cl A . | | | 21,441 | | | | 811,756 | |
| Principal Financial Group | | | 10,864 | | | | 711,157 | |
| Progressive | | | 24,699 | | | | 3,159,249 | |
| Radian Group . | | | 35,908 | | | | 917,090 | |
| Rithm Capital ‡ | | | 103,807 | | | | 844,989 | |
|
|
|
| Schedule of Investments | | May 31, 2023 (Unaudited) |
| Global X Adaptive U.S. Factor ETF |
| | | | |
| |
| | | Shares | | | Value | |
| COMMON STOCK — continued | | | | | | |
| Financials — continued | | | | | | |
| RLI . | | | 1,617 | | | $ | 200,265 | |
| Starwood Property Trust ‡ | | | 47,275 | | | | 829,676 | |
| Synchrony Financial | | | 27,207 | | | | 842,329 | |
| Synovus Financial | | | 26,408 | | | | 715,393 | |
| Truist Financial | | | 24,077 | | | | 733,626 | |
| Unum Group | | | 20,221 | | | | 878,602 | |
| Valley National Bancorp | | | 95,188 | | | | 702,487 | |
| Webster Financial | | | 21,095 | | | | 749,927 | |
| Western Alliance Bancorp | | | 20,759 | | | | 703,730 | |
| White Mountains Insurance Group | | | 117 | | | | 158,440 | |
| Zions Bancorp . | | | 25,599 | | | | 698,597 | |
| | | | | | | | 30,541,352 | |
| Health Care — 14.4% | | | | | | | | |
| Cardinal Health | | | 9,213 | | | | 758,230 | |
| Cigna Group | | | 3,271 | | | | 809,278 | |
| Eli Lilly | | | 11,364 | | | | 4,880,384 | |
| Gilead Sciences | | | 60,069 | | | | 4,621,709 | |
| Haemonetics * | | | 2,395 | | | | 202,617 | |
| Karuna Therapeutics * | | | 1,096 | | | | 248,299 | |
| Lantheus Holdings * | | | 2,253 | | | | 195,087 | |
| Madrigal Pharmaceuticals * | | | 596 | | | | 165,932 | |
| Merck . | | | 36,897 | | | | 4,073,798 | |
| Natera * | | | 4,142 | | | | 195,130 | |
| Organon . | | | 35,066 | | | | 679,930 | |
| Perrigo . | | | 23,129 | | | | 739,203 | |
| Pfizer | | | 20,818 | | | | 791,500 | |
| Premier, Cl A . | | | 25,982 | | | | 649,550 | |
| Prometheus Biosciences * | | | 1,942 | | | | 385,875 | |
| QuidelOrtho * | | | 9,243 | | | | 786,949 | |
| Sarepta Therapeutics * | | | 4,082 | | | | 504,535 | |
| Seagen * | | | 6,282 | | | | 1,229,387 | |
| United Therapeutics * | | | 1,721 | | | | 360,963 | |
| Viatris, Cl W | | | 85,219 | | | | 779,754 | |
| | | | | | | | 23,058,110 | |
| Industrials — 10.9% | | | | | | | | |
| AAON . | | | 3,085 | | | | 267,192 | |
| Aerojet Rocketdyne Holdings * | | | 4,401 | | | | 239,767 | |
| AGCO | | | 6,613 | | | | 729,282 | |
|
|
|
| Schedule of Investments | | May 31, 2023 (Unaudited) |
| Global X Adaptive U.S. Factor ETF |
| | | | |
| |
| | | Shares | | | Value | |
| COMMON STOCK — continued | | | | | | |
| Industrials — continued | | | | | | |
| Allison Transmission Holdings . | | | 3,436 | | | $ | 162,523 | |
| Applied Industrial Technologies | | | 1,772 | | | | 217,885 | |
| Atkore * | | | 1,552 | | | | 181,227 | |
| Axon Enterprise * | | | 3,878 | | | | 748,105 | |
| Clean Harbors * | | | 2,006 | | | | 281,642 | |
| Comfort Systems USA . | | | 2,077 | | | | 307,355 | |
| Donaldson . | | | 5,410 | | | | 316,647 | |
| EMCOR Group | | | 2,734 | | | | 450,673 | |
| General Electric . | | | 42,522 | | | | 4,317,259 | |
| Hubbell, Cl B | | | 2,424 | | | | 684,683 | |
| Landstar System . | | | 1,388 | | | | 243,427 | |
| Lincoln Electric Holdings | | | 2,448 | | | | 415,328 | |
| ManpowerGroup | | | 10,537 | | | | 739,381 | |
| MSC Industrial Direct, Cl A | | | 9,314 | | | | 837,515 | |
| PACCAR | | | 24,378 | | | | 1,676,719 | |
| Ryder System | | | 1,868 | | | | 147,254 | |
| Science Applications International . | | | 2,174 | | | | 211,595 | |
| Timken | | | 2,524 | | | | 180,592 | |
| Toro . | | | 4,852 | | | | 474,671 | |
| Trane Technologies . | | | 9,228 | | | | 1,506,286 | |
| Valmont Industries . | | | 851 | | | | 223,192 | |
| Watts Water Technologies, Cl A . | | | 1,012 | | | | 160,351 | |
| WillScot Mobile Mini Holdings * | | | 6,596 | | | | 284,156 | |
| WW Grainger . | | | 2,011 | | | | 1,305,179 | |
| | | | | | | | 17,309,886 | |
| Information Technology — 13.7% | | | | | | | | |
| Amdocs | | | 4,482 | | | | 422,070 | |
| Arista Networks * | | | 9,180 | | | | 1,527,001 | |
| Arrow Electronics * | | | 7,357 | | | | 931,691 | |
| Aspen Technology * | | | 3,672 | | | | 601,914 | |
| Avnet . | | | 20,090 | | | | 880,746 | |
| Axcelis Technologies * | | | 2,510 | | | | 395,451 | |
| Cadence Design Systems * | | | 12,508 | | | | 2,888,222 | |
| Cirrus Logic * | | | 2,138 | | | | 166,080 | |
| Corning . | | | 24,638 | | | | 759,097 | |
| DXC Technology * | | | 33,616 | | | | 841,409 | |
| Fair Isaac * | | | 1,390 | | | | 1,094,861 | |
| First Solar * | | | 10,206 | | | | 2,071,410 | |
| Hewlett Packard Enterprise | | | 55,997 | | | | 807,477 | |
|
|
|
| Schedule of Investments | | May 31, 2023 (Unaudited) |
| Global X Adaptive U.S. Factor ETF |
| | | | |
| |
| | | Shares | | | Value | |
| COMMON STOCK — continued | | | | | | |
| Information Technology — continued | | | | | | |
| Insight Enterprises * | | | 1,634 | | | $ | 220,949 | |
| Intel . | | | 26,893 | | | | 845,516 | |
| International Business Machines . | | | 6,632 | | | | 852,809 | |
| Jabil . | | | 6,389 | | | | 571,943 | |
| Juniper Networks . | | | 26,376 | | | | 801,039 | |
| Lattice Semiconductor * | | | 8,099 | | | | 658,530 | |
| National Instruments . | | | 5,584 | | | | 322,755 | |
| ON Semiconductor * | | | 17,268 | | | | 1,443,605 | |
| Rambus * | | | 6,139 | | | | 392,650 | |
| Super Micro Computer * | | | 3,032 | | | | 679,016 | |
| TD SYNNEX . | | | 9,168 | | | | 819,436 | |
| Texas Instruments . | | | 4,730 | | | | 822,452 | |
| | | | | | | | 21,818,129 | |
| Materials — 5.4% | | | | | | | | |
| Celanese, Cl A . | | | 7,678 | | | | 798,665 | |
| CF Industries Holdings | | | 11,260 | | | | 692,603 | |
| Dow | | | 14,843 | | | | 724,041 | |
| DuPont de Nemours . | | | 11,764 | | | | 790,423 | |
| Eastman Chemical . | | | 10,142 | | | | 781,847 | |
| Huntsman | | | 30,155 | | | | 716,181 | |
| International Paper . | | | 22,907 | | | | 674,382 | |
| LyondellBasell Industries, Cl A | | | 8,692 | | | | 743,514 | |
| Mosaic . | | | 18,436 | | | | 589,215 | |
| Reliance Steel & Aluminum | | | 2,374 | | | | 557,130 | |
| Silgan Holdings . | | | 2,949 | | | | 132,675 | |
| United States Steel . | | | 32,268 | | | | 675,047 | |
| Westrock . | | | 27,172 | | | | 761,088 | |
| | | | | | | | 8,636,811 | |
| Real Estate — 2.3% | | | | | | | | |
| Cousins Properties ‡ | | | 38,552 | | | | 767,956 | |
| Gaming and Leisure Properties ‡ | | | 8,971 | | | | 431,864 | |
| Kilroy Realty ‡ | | | 26,704 | | | | 724,747 | |
| Medical Properties Trust ‡ | | | 98,789 | | | | 815,009 | |
| Spirit Realty Capital ‡ | | | 21,999 | | | | 859,281 | |
| | | | | | | | 3,598,857 | |
| Utilities — 1.9% | | | | | | | | |
| New Jersey Resources . | | | 3,702 | | | | 179,362 | |
|
|
|
| Schedule of Investments | | May 31, 2023 (Unaudited) |
| Global X Adaptive U.S. Factor ETF |
| | | | |
| |
| | | Shares | | | Value | |
| COMMON STOCK — continued | | | | | | |
| Utilities — continued | | | | | | |
| NRG Energy | | | 24,044 | | | $ | 812,447 | |
| PG&E * | | | 75,812 | | | | 1,284,255 | |
| PNM Resources . | | | 2,899 | | | | 133,122 | |
| UGI | | | 23,990 | | | | 671,000 | |
| | | | | | | | 3,080,186 | |
| TOTAL UNITED STATES | | | | | | | 159,204,283 | |
| TOTAL COMMON STOCK | | | | | | | | |
| (Cost $159,930,042) | | | | | | | 159,204,283 | |
| TOTAL INVESTMENTS — 99.7% | | | | | | | | |
| (Cost $159,930,042) | | | | | | $ | 159,204,283 | |
Percentages are based on Net Assets of $159,700,099.
| * | Non-income producing security. |
| ‡ | Real Estate Investment Trust |
As of May 31, 2023, all of the Fund's investments were considered Level 1, in accordance with authoritative guidance on fair value measurements and disclosure under U.S. GAAP.
See “Glossary” for abbreviations.
|
|
|
| Schedule of Investments | | May 31, 2023 (Unaudited) |
| Global X Variable Rate Preferred ETF |
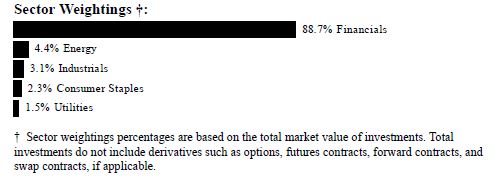
| | | | |
| |
| | | Shares | | | Value | |
| PREFERRED STOCK — 99.4% | | | | | | |
| CANADA— 1.5% | | | | | | |
| Utilities — 1.5% | | | | | | |
| Algonquin Power & Utilities, 6.200%, ICE | | | | | | |
| LIBOR USD 3 Month + 4.010% (A) | | | 149,656 | | | $ | 3,603,716 | |
| TOTAL CANADA | | | | | | | 3,603,716 | |
| UNITED STATES— 97.9% | | | | | | | | |
| Consumer Staples — 2.3% | | | | | | | | |
| CHS, Ser 3, 6.750%, ICE LIBOR USD 3 | | | | | | | | |
| Month + 4.155% (A) | | | 210,459 | | | | 5,314,090 | |
| Energy — 4.4% | | | | | | | | |
| NuStar Energy, 11.746%, ICE LIBOR USD 3 | | | | | | | | |
| Month + 6.880% (A) | | | 73,869 | | | | 1,902,127 | |
| NuStar Energy, 11.139%, ICE LIBOR USD 3 | | | | | | | | |
| Month + 5.643% (A) | | | 164,594 | | | | 3,895,940 | |
| NuStar Logistics, 11.994%, ICE LIBOR USD | | | | | | | | |
| 3 Month + 6.734% (A) | | | 172,037 | | | | 4,467,801 | |
| | | | | | | | 10,265,868 | |
| Financials — 88.1% | | | | | | | | |
| AGNC Investment, 10.371%, ICE LIBOR | | | | | | | | |
| USD 3 Month + 5.111% ‡,(A) | | | 122,555 | | | | 3,071,228 | |
| AGNC Investment, 7.750%, US Treas Yield | | | | | | | | |
| Curve Rate T Note Const Mat 5 Yr + | | | | | | | | |
4.390% ‡,(A)
| | | 56,737 | | | | 1,232,895 | |
| AGNC Investment, 6.500%, ICE LIBOR USD | | | | | | | | |
| 3 Month + 4.993% ‡,(A) | | | 151,765 | | | | 3,341,865 | |
| AGNC Investment, 6.125%, ICE LIBOR USD | | | | | | | | |
| 3 Month + 4.697% ‡,(A) | | | 216,704 | | | | 4,429,430 | |
| Allstate, 8.661%, ICE LIBOR USD 3 Month + | | | | | | | | |
3.165% (A)
| | | 213,656 | | | | 5,456,774 | |
|
|
|
| Schedule of Investments | | May 31, 2023 (Unaudited) |
| Global X Variable Rate Preferred ETF |
| | | | |
| |
| | | Shares | | | Value | |
| PREFERRED STOCK — continued | | | | | | |
| Financials — continued | | | | | | |
| American Equity Investment Life Holding, | | | | | | |
| 6.625%, US Treas Yield Curve Rate T Note | | | | | | |
| Const Mat 5 Yr + 6.297% (A) | | | 128,308 | | | $ | 3,065,278 | |
| American Equity Investment Life Holding, | | | | | | | | |
| 5.950%, US Treas Yield Curve Rate T Note | | | | | | | | |
| Const Mat 5 Yr + 4.322% (A) | �� | | 170,999 | | | | 3,890,227 | |
| Annaly Capital Management, 10.152%, ICE | | | | | | | | |
| LIBOR USD 3 Month + 4.993% ‡,(A) | | | 256,933 | | | | 6,320,552 | |
| Annaly Capital Management, 9.331%, ICE | | | | | | | | |
| LIBOR USD 3 Month + 4.172% ‡,(A) | | | 151,777 | | | | 3,597,115 | |
| Annaly Capital Management, 6.750%, ICE | | | | | | | | |
| LIBOR USD 3 Month + 4.989% ‡,(A) | | | 158,023 | | | | 3,680,356 | |
| Argo Group International Holdings, 7.000%, | | | | | | | | |
| US Treas Yield Curve Rate T Note Const | | | | | | | | |
| Mat 5 Yr + 6.712% (A) | | | 64,303 | | | | 1,459,035 | |
| Athene Holding, 7.750%, US Treas Yield | | | | | | | | |
| Curve Rate T Note Const Mat 5 Yr + | | | | | | | | |
3.962% (A)
| | | 175,729 | | | | 4,275,487 | |
| Athene Holding, 6.375%, US Treas Yield | | | | | | | | |
| Curve Rate T Note Const Mat 5 Yr + | | | | | | | | |
5.970% (A)
| | | 210,844 | | | | 4,845,195 | |
| Athene Holding, 6.350%, ICE LIBOR USD 3 | | | | | | | | |
| Month + 4.253% (A) | | | 302,998 | | | | 6,320,538 | |
| Bank of America, 6.450%, ICE LIBOR USD 3 | | | | | | | | |
| Month + 1.327% (A) | | | 368,745 | | | | 9,273,937 | |
| Bank of America, 6.246%, ICE LIBOR USD 3 | | | | | | | | |
| Month + 0.750% (A) | | | 74,104 | | | | 1,497,642 | |
| Bank of America, 6.146%, ICE LIBOR USD 3 | | | | | | | | |
| Month + 0.650% (A) | | | 105,254 | | | | 2,030,350 | |
| Bank of America, 5.879%, ICE LIBOR USD 3 | | | | | | | | |
| Month + 0.500% (A) | | | 146,896 | | | | 2,851,251 | |
| Bank of America, 5.846%, ICE LIBOR USD 3 | | | | | | | | |
| Month + 0.350% (A) | | | 110,245 | | | | 2,204,900 | |
| Chimera Investment, 7.750%, ICE LIBOR | | | | | | | | |
| USD 3 Month + 4.743% ‡,(A) | | | 111,322 | | | | 2,031,627 | |
| Enstar Group, 7.000%, ICE LIBOR USD 3 | | | | | | | | |
| Month + 4.015% (A) | | | 171,011 | | | | 3,710,939 | |
| Goldman Sachs Group, 6.166%, ICE LIBOR | | | | | | | | |
| USD 3 Month + 0.670% (A) | | | 474,088 | | | | 9,780,435 | |
|
|
|
| Schedule of Investments | | May 31, 2023 (Unaudited) |
| Global X Variable Rate Preferred ETF |
| | | | |
| |
| | | Shares | | | Value | |
| PREFERRED STOCK — continued | | | | | | |
| Financials — continued | | | | | | |
| Goldman Sachs Group, 6.087%, ICE LIBOR | | | | | | |
| USD 3 Month + 0.750% (A) | | | 263,516 | | | $ | 5,388,902 | |
| Kemper, 5.875%, US Treas Yield Curve Rate T | | | | | | | | |
| Note Const Mat 5 Yr + 4.140% (A) | | | 64,369 | | | | 1,109,722 | |
| KeyCorp, 6.200%, US Treas Yield Curve Rate | | | | | | | | |
| T Note Const Mat 5 Yr + 3.132% (A) | | | 256,407 | | | | 5,040,962 | |
| KeyCorp, 6.125%, TSFR3M + 4.154% (A) | | | 213,712 | | | | 4,321,257 | |
| M&T Bank, 5.625%, ICE LIBOR USD 3 | | | | | | | | |
| Month + 4.020% (A) | | | 106,976 | | | | 2,482,913 | |
| Merchants Bancorp, 8.250%, US Treas Yield | | | | | | | | |
| Curve Rate T Note Const Mat 5 Yr + | | | | | | | | |
4.340% (A)
| | | 61,088 | | | | 1,454,505 | |
| MetLife, 5.866%, ICE LIBOR USD 3 Month + | | | | | | | | |
1.000% (A)
| | | 256,376 | | | | 5,763,332 | |
| Morgan Stanley, 6.375%, ICE LIBOR USD 3 | | | | | | | | |
| Month + 3.708% (A) | | | 326,942 | | | | 8,075,467 | |
| Morgan Stanley, 5.960%, ICE LIBOR USD 3 | | | | | | | | |
| Month + 0.700% (A) | | | 359,659 | | | | 7,581,612 | |
| Morgan Stanley, 5.850%, ICE LIBOR USD 3 | | | | | | | | |
| Month + 3.491% (A) | | | 326,952 | | | | 7,810,883 | |
| New York Community Bancorp, 6.375%, ICE | | | | | | | | |
| LIBOR USD 3 Month + 3.821% (A) | | | 220,099 | | | | 4,795,957 | |
| PacWest Bancorp, 7.750%, US Treas Yield | | | | | | | | |
| Curve Rate T Note Const Mat 5 Yr + | | | | | | | | |
4.820% (A)
| | | 219,569 | | | | 2,579,936 | |
| Regions Financial, Ser B, 6.375%, ICE LIBOR | | | | | | | | |
| USD 3 Month + 3.536% (A) | | | 213,681 | | | | 4,673,203 | |
| Regions Financial, 5.700%, ICE LIBOR USD | | | | | | | | |
| 3 Month + 3.148% (A) | | | 213,720 | | | | 4,231,656 | |
| Reinsurance Group of America, 7.125%, US | | | | | | | | |
| Treas Yield Curve Rate T Note Const Mat 5 | | | | | | | | |
| Yr + 3.456% (A) | | | 290,715 | | | | 7,445,211 | |
| Reinsurance Group of America, 5.750%, ICE | | | | | | | | |
| LIBOR USD 3 Month + 4.040% (A) | | | 166,234 | | | | 4,081,045 | |
| Rithm Capital, 7.500%, ICE LIBOR USD 3 | | | | | | | | |
| Month + 5.802% ‡,(A) | | | 66,552 | | | | 1,451,499 | |
| Rithm Capital, 7.125%, ICE LIBOR USD 3 | | | | | | | | |
| Month + 5.640% ‡,(A) | | | 120,886 | | | | 2,514,429 | |
|
|
|
| Schedule of Investments | | May 31, 2023 (Unaudited) |
| Global X Variable Rate Preferred ETF |
| | | | |
| |
| | | Shares | | | Value | |
| PREFERRED STOCK — continued | | | | | | |
| Financials — continued | | | | | | |
| Rithm Capital, 7.000%, US Treas Yield Curve | | | | | | |
| Rate T Note Const Mat 5 Yr + 6.223% ‡,(A) | | | 198,795 | | | $ | 3,874,515 | |
| Rithm Capital, 6.375%, ICE LIBOR USD 3 | | | | | | | | |
| Month + 4.969% ‡,(A) | | | 170,305 | | | | 3,147,236 | |
| SLM, 6.566%, ICE LIBOR USD 3 Month + | | | | | | | | |
1.700% (A)
| | | 42,795 | | | | 2,332,328 | |
| State Street, 5.350%, TSFR3M + 3.971% (A) | | | 213,671 | | | | 5,117,420 | |
| Synovus Financial, 5.875%, US Treas Yield | | | | | | | | |
| Curve Rate T Note Const Mat 5 Yr + | | | | | | | | |
| 4.127% (A) | | | 149,693 | | | | 3,028,289 | |
| Two Harbors Investment, 7.625%, ICE LIBOR | | | | | | | | |
| USD 3 Month + 5.352% ‡,(A) | | | 123,026 | | | | 2,419,921 | |
| Two Harbors Investment, 7.250%, ICE LIBOR | | | | | | | | |
| USD 3 Month + 5.011% ‡,(A) | | | 126,230 | | | | 2,474,108 | |
| US Bancorp, 6.280%, ICE LIBOR USD 3 | | | | | | | | |
| Month + 1.020% (A) | | | 5,725 | | | | 4,104,825 | |
| US Bancorp, 5.860%, ICE LIBOR USD 3 | | | | | | | | |
| Month + 0.600% (A) | | | 398,045 | | | | 7,013,553 | |
| Voya Financial, 5.350%, US Treas Yield Curve | | | | | | | | |
| Rate T Note Const Mat 5 Yr + 3.210% (A) | | | 128,314 | | | | 2,984,584 | |
| Western Alliance Bancorp, 4.250%, US Treas | | | | | | | | |
| Yield Curve Rate T Note Const Mat 5 Yr + | | | | | | | | |
| 3.452% (A) | | | 128,502 | | | | 1,694,941 | |
| | | | | | | | 207,361,267 | |
| Industrials — 3.1% | | | | | | | | |
| FTAI Aviation, 8.250%, ICE LIBOR USD 3 | | | | | | | | |
| Month + 6.886% (A) | | | 44,881 | | | | 1,023,287 | |
| WESCO International, 10.625%, US Treas | | | | | | | | |
| Yield Curve Rate T Note Const Mat 5 Yr + | | | | | | | | |
| 10.325% (A) | | | 230,848 | | | | 6,179,801 | |
| | | | | | | | 7,203,088 | |
| TOTAL UNITED STATES | | | | | | | 230,144,313 | |
| TOTAL PREFERRED STOCK | | | | | | | | |
| (Cost $252,667,957) | | | | | | | 233,748,029 | |
| TOTAL INVESTMENTS — 99.4% | | | | | | | | |
| (Cost $252,667,957) | | | | | | $ | 233,748,029 | |
Percentages are based on Net Assets of $235,226,621.
|
|
|
| Schedule of Investments | | May 31, 2023 (Unaudited) |
| Global X Variable Rate Preferred ETF |
| ‡ | Real Estate Investment Trust |
| (A) | Variable or floating rate security. The rate shown is the effective interest rate as of period end. The rates on certain securities are not based on published reference rates and spreads and are either determined by the issuer or agent based on current market conditions; by using a formula based on the rates of underlying loans; or by adjusting periodically based on prevailing interest rates. |
As of May 31, 2023, all of the Fund's investments were considered Level 1, in accordance with authoritative guidance on fair value measurements and disclosure under U.S. GAAP.
See "Glossary" for abbreviations.
|
|
| Schedule of Investments | May 31, 2023 (Unaudited) |
| Global X Adaptive U.S. Risk Management ETF |
| | | | |
| |
| | | Shares | | | Value | |
| COMMON STOCK — 99.5% | | | | | | |
| BRAZIL — 0.2% | | | | | | |
| Consumer Discretionary — 0.2% | | | | | | |
| MercadoLibre * | | | 94 | | | $ | 116,466 | |
| CHINA — 0.1% | | | | | | | | |
| Consumer Discretionary — 0.1% | | | | | | | | |
| Yum China Holdings . | | | 803 | | | | 45,337 | |
| ISRAEL — 0.0% | | | | | | | | |
| Consumer Discretionary — 0.0% | | | | | | | | |
| Mobileye Global, Cl A * | | | 153 | | | | 6,819 | |
| MEXICO — 0.0% | | | | | | | | |
| Materials — 0.0% | | | | | | | | |
| Southern Copper . | | | 165 | | | | 11,017 | |
| SOUTH KOREA — 0.0% | | | | | | | | |
| Consumer Discretionary — 0.0% | | | | | | | | |
| Coupang, Cl A * | | | 2,343 | | | | 36,551 | |
|
|
| Schedule of Investments | May 31, 2023 (Unaudited) |
| Global X Adaptive U.S. Risk Management ETF |
| | | | |
| |
| | | Shares | | | Value | |
| COMMON STOCK — continued | | | | | | |
| UNITED STATES — 99.2% | | | | | | |
| Communication Services — 8.8% | | | | | | |
| Activision Blizzard * | | | 1,442 | | | $ | 115,648 | |
| Alphabet, Cl A * | | | 12,040 | | | | 1,479,355 | |
| Alphabet, Cl C * | | | 10,527 | | | | 1,298,716 | |
| AT&T | | | 14,364 | | | | 225,946 | |
| Charter Communications, Cl A * | | | 221 | | | | 72,079 | |
| Comcast, Cl A | | | 8,646 | | | | 340,220 | |
| Electronic Arts | | | 548 | | | | 70,144 | |
| Endeavor Group Holdings, Cl A * | | | 240 | | | | 5,405 | |
| Fox, Cl A | | | 584 | | | | 18,221 | |
| Fox, Cl B | | | 251 | | | | 7,332 | |
| Live Nation Entertainment * | | | 301 | | | | 24,062 | |
| Meta Platforms, Cl A * | | | 4,493 | | | | 1,189,387 | |
| Netflix * | | | 881 | | | | 348,198 | |
| Omnicom Group . | | | 402 | | | | 35,452 | |
| Paramount Global, Cl B | | | 1,135 | | | | 17,263 | |
| Pinterest, Cl A * | | | 1,145 | | | | 27,411 | |
| ROBLOX, Cl A * | | | 679 | | | | 28,423 | |
| Sirius XM Holdings . | | | 1,170 | | | | 4,165 | |
| Snap, Cl A * | | | 1,954 | | | | 19,931 | |
| Spotify Technology * | | | 283 | | | | 42,139 | |
| Take-Two Interactive Software * | | | 326 | | | | 44,900 | |
| T-Mobile US * | | | 1,150 | | | | 157,837 | |
| Trade Desk, Cl A * | | | 878 | | | | 61,530 | |
| Verizon Communications | | | 8,474 | | | | 301,929 | |
| Walt Disney * | | | 3,678 | | | | 323,517 | |
| Warner Bros Discovery * | | | 4,418 | | | | 49,835 | |
| Warner Music Group, Cl A . | | | 216 | | | | 5,281 | |
| | | | | | | | 6,314,326 | |
| Consumer Discretionary — 9.9% | | | | | | | | |
| Airbnb, Cl A * | | | 824 | | | | 90,450 | |
| Amazon.com * | | | 18,212 | | | | 2,196,003 | |
| Aptiv * | | | 538 | | | | 47,387 | |
| AutoZone * | | | 37 | | | | 88,313 | |
| Best Buy | | | 391 | | | | 28,414 | |
| Booking Holdings * | | | 76 | | | | 190,667 | |
| Carnival * | | | 1,925 | | | | 21,618 | |
| Chewy, Cl A * | | | 164 | | | | 4,836 | |
|
|
| Schedule of Investments | May 31, 2023 (Unaudited) |
| Global X Adaptive U.S. Risk Management ETF |
| | | | |
| |
| | | Shares | | | Value | |
| COMMON STOCK — continued | | | | | | |
| Consumer Discretionary — continued | | | | | | |
| Chipotle Mexican Grill, Cl A * | | | 54 | | | $ | 112,130 | |
| Darden Restaurants . | | | 242 | | | | 38,362 | |
| Dick's Sporting Goods | | | 135 | | | | 17,214 | |
| Dillard's, Cl A . | | | 16 | | | | 4,405 | |
| DoorDash, Cl A * | | | 518 | | | | 33,820 | |
| DR Horton | | | 632 | | | | 67,523 | |
| eBay | | | 1,077 | | | | 45,816 | |
| Etsy * | | | 246 | | | | 19,938 | |
| Expedia Group * | | | 294 | | | | 28,139 | |
| Ford Motor . | | | 7,915 | | | | 94,980 | |
| Garmin | | | 301 | | | | 31,048 | |
| General Motors | | | 2,749 | | | | 89,095 | |
| Genuine Parts . | | | 276 | | | | 41,105 | |
| Hilton Worldwide Holdings . | | | 531 | | | | 72,280 | |
| Home Depot . | | | 2,058 | | | | 583,340 | |
| Las Vegas Sands * | | | 657 | | | | 36,220 | |
| Lennar, Cl A . | | | 498 | | | | 53,346 | |
| Lennar, Cl B . | | | 20 | | | | 1,891 | |
| Lowe's | | | 1,215 | | | | 244,373 | |
| Lucid Group * | | | 947 | | | | 7,349 | |
| Lululemon Athletica * | | | 245 | | | | 81,323 | |
| Marriott International, Cl A | | | 557 | | | | 93,459 | |
| McDonald's . | | | 1,480 | | | | 421,963 | |
| MGM Resorts International * | | | 601 | | | | 23,613 | |
| NIKE, Cl B | | | 2,507 | | | | 263,887 | |
| NVR * | | | 6 | | | | 33,325 | |
| O'Reilly Automotive * | | | 121 | | | | 109,300 | |
| Pool . | | | 73 | | | | 23,085 | |
| Rivian Automotive, Cl A * | | | 1,260 | | | | 18,560 | |
| Ross Stores | | | 678 | | | | 70,254 | |
| Starbucks | | | 2,267 | | | | 221,350 | |
| Tesla * | | | 5,552 | | | | 1,132,219 | |
| TJX | | | 2,362 | | | | 181,378 | |
| Tractor Supply . | | | 220 | | | | 46,110 | |
| Ulta Beauty * | | | 98 | | | | 40,163 | |
| Yum! Brands | | | 562 | | | | 72,324 | |
| | | | | | | | 7,122,375 | |
| Consumer Staples — 6.6% | | | | | | | | |
| Albertsons, Cl A | | | 232 | | | | 4,724 | |
|
|
| Schedule of Investments | May 31, 2023 (Unaudited) |
| Global X Adaptive U.S. Risk Management ETF |
| | | | |
| |
| | | Shares | | | Value | |
| COMMON STOCK — continued | | | | | | |
| Consumer Staples — continued | | | | | | |
| Altria Group . | | | 3,604 | | | $ | 160,090 | |
| Archer-Daniels-Midland | | | 1,093 | | | | 77,221 | |
| Brown-Forman, Cl B | | | 603 | | | | 37,247 | |
| Campbell Soup . | | | 384 | | | | 19,411 | |
| Church & Dwight | | | 485 | | | | 44,838 | |
| Clorox | | | 244 | | | | 38,596 | |
| Coca-Cola . | | | 7,830 | | | | 467,138 | |
| Colgate-Palmolive | | | 1,673 | | | | 124,438 | |
| Conagra Brands . | | | 947 | | | | 33,022 | |
| Constellation Brands, Cl A | | | 329 | | | | 79,937 | |
| Costco Wholesale | | | 891 | | | | 455,800 | |
| Dollar General . | | | 449 | | | | 90,289 | |
| Dollar Tree * | | | 415 | | | | 55,975 | |
| Estee Lauder, Cl A . | | | 429 | | | | 78,949 | |
| General Mills | | | 1,183 | | | | 99,561 | |
| Hershey | | | 293 | | | | 76,092 | |
| Hormel Foods | | | 557 | | | | 21,305 | |
| J M Smucker . | | | 201 | | | | 29,465 | |
| Kellogg . | | | 516 | | | | 34,453 | |
| Keurig Dr Pepper | | | 1,757 | | | | 54,678 | |
| Kimberly-Clark | | | 678 | | | | 91,042 | |
| Kraft Heinz | | | 1,556 | | | | 59,470 | |
| Kroger | | | 1,486 | | | | 67,360 | |
| McCormick . | | | 494 | | | | 42,351 | |
| Mondelez International, Cl A . | | | 2,745 | | | | 201,510 | |
| Monster Beverage * | | | 1,066 | | | | 62,489 | |
| PepsiCo | | | 2,779 | | | | 506,751 | |
| Philip Morris International | | | 3,122 | | | | 281,011 | |
| Procter & Gamble . | | | 4,780 | | | | 681,150 | |
| Sysco . | | | 1,006 | | | | 70,370 | |
| Target | | | 926 | | | | 121,241 | |
| Tyson Foods, Cl A | | | 559 | | | | 28,308 | |
| Walgreens Boots Alliance | | | 1,420 | | | | 43,125 | |
| Walmart | | | 2,891 | | | | 424,601 | |
| | | | | | | | 4,764,008 | |
| Energy — 4.2% | | | | | | | | |
| Baker Hughes, Cl A | | | 1,990 | | | | 54,227 | |
| Cheniere Energy . | | | 495 | | | | 69,186 | |
| Chevron . | | | 3,535 | | | | 532,442 | |
|
|
| Schedule of Investments | May 31, 2023 (Unaudited) |
| Global X Adaptive U.S. Risk Management ETF |
| | | | |
| |
| | | Shares | | | Value | |
| COMMON STOCK — continued | | | | | | |
| Energy — continued | | | | | | |
| ConocoPhillips . | | | 2,511 | | | $ | 249,342 | |
| Coterra Energy | | | 1,514 | | | | 35,200 | |
| Devon Energy | | | 1,297 | | | | 59,792 | |
| Diamondback Energy | | | 346 | | | | 43,994 | |
| EOG Resources | | | 1,180 | | | | 126,602 | |
| EQT . | | | 652 | | | | 22,670 | |
| Exxon Mobil | | | 8,289 | | | | 846,970 | |
| Halliburton . | | | 1,903 | | | | 54,521 | |
| Hess | | | 555 | | | | 70,302 | |
| Kinder Morgan . | | | 3,929 | | | | 63,296 | |
| Marathon Oil . | | | 1,250 | | | | 27,700 | |
| Marathon Petroleum | | | 935 | | | | 98,091 | |
| Occidental Petroleum . | | | 1,469 | | | | 84,703 | |
| ONEOK . | | | 883 | | | | 50,031 | |
| Phillips 66 . | | | 948 | | | | 86,846 | |
| Pioneer Natural Resources | | | 473 | | | | 94,335 | |
| Schlumberger | | | 2,848 | | | | 121,980 | |
| Targa Resources | | | 441 | | | | 30,010 | |
| Texas Pacific Land | | | 17 | | | | 22,163 | |
| Valero Energy . | | | 771 | | | | 82,528 | |
| Williams | | | 2,435 | | | | 69,787 | |
| | | | | | | | 2,996,718 | |
| Financials — 12.2% | | | | | | | | |
| Aflac | | | 1,128 | | | | 72,429 | |
| Allstate | | | 519 | | | | 56,286 | |
| American Express . | | | 1,216 | | | | 192,809 | |
| American International Group | | | 1,486 | | | | 78,505 | |
| Ameriprise Financial | | | 213 | | | | 63,574 | |
| Aon, Cl A . | | | 420 | | | | 129,482 | |
| Apollo Global Management | | | 770 | | | | 51,474 | |
| Arch Capital Group * | | | 713 | | | | 49,696 | |
| Ares Management, Cl A | | | 300 | | | | 26,127 | |
| Arthur J Gallagher | | | 420 | | | | 84,139 | |
| Bank of America | | | 14,106 | | | | 392,006 | |
| Bank of New York Mellon | | | 1,578 | | | | 63,436 | |
| Berkshire Hathaway, Cl B * | | | 2,619 | | | | 840,908 | |
| BlackRock, Cl A . | | | 304 | | | | 199,895 | |
| Blackstone, Cl A . | | | 1,393 | | | | 119,296 | |
| Block, Cl A * | | | 1,068 | | | | 64,497 | |
|
|
| Schedule of Investments | May 31, 2023 (Unaudited) |
| Global X Adaptive U.S. Risk Management ETF |
| | | | |
| |
| | | Shares | | | Value | |
| COMMON STOCK — continued | | | | | | |
| Financials — continued | | | | | | |
| Blue Owl Capital, Cl A | | | 831 | | | $ | 8,518 | |
| Brown & Brown . | | | 460 | | | | 28,672 | |
| Capital One Financial | | | 754 | | | | 78,574 | |
| Charles Schwab . | | | 2,880 | | | | 151,747 | |
| Chubb . | | | 844 | | | | 156,815 | |
| Cincinnati Financial . | | | 302 | | | | 29,143 | |
| Citigroup | | | 3,893 | | | | 172,538 | |
| Citizens Financial Group . | | | 966 | | | | 24,903 | |
| CME Group, Cl A . | | | 721 | | | | 128,879 | |
| Discover Financial Services | | | 537 | | | | 55,171 | |
| Everest Re Group | | | 83 | | | | 28,222 | |
| FactSet Research Systems . | | | 73 | | | | 28,097 | |
| Fidelity National Information Services . | | | 1,177 | | | | 64,229 | |
| Fifth Third Bancorp | | | 1,349 | | | | 32,740 | |
| Fiserv * | | | 1,279 | | | | 143,491 | |
| FleetCor Technologies * | | | 144 | | | | 32,623 | |
| Franklin Resources | | | 554 | | | | 13,302 | |
| Global Payments | | | 534 | | | | 52,166 | |
| Goldman Sachs Group | | | 682 | | | | 220,900 | |
| Hartford Financial Services Group . | | | 627 | | | | 42,962 | |
| Huntington Bancshares | | | 2,803 | | | | 28,899 | |
| Interactive Brokers Group, Cl A . | | | 192 | | | | 14,828 | |
| Intercontinental Exchange . | | | 1,109 | | | | 117,499 | |
| JPMorgan Chase . | | | 5,930 | | | | 804,760 | |
| KeyCorp | | | 1,819 | | | | 16,989 | |
| KKR . | | | 1,293 | | | | 66,577 | |
| Loews . | | | 385 | | | | 21,560 | |
| LPL Financial Holdings | | | 155 | | | | 30,191 | |
| M&T Bank . | | | 336 | | | | 40,038 | |
| Markel Group * | | | 27 | | | | 35,498 | |
| Marsh & McLennan . | | | 996 | | | | 172,487 | |
| Mastercard, Cl A . | | | 1,710 | | | | 624,184 | |
| MetLife . | | | 1,363 | | | | 67,537 | |
| Moody's . | | | 314 | | | | 99,500 | |
| Morgan Stanley | | | 2,607 | | | | 213,148 | |
| MSCI, Cl A | | | 158 | | | | 74,344 | |
| Nasdaq . | | | 677 | | | | 37,472 | |
| Northern Trust . | | | 397 | | | | 28,552 | |
| PayPal Holdings * | | | 2,290 | | | | 141,957 | |
|
|
| Schedule of Investments | May 31, 2023 (Unaudited) |
| Global X Adaptive U.S. Risk Management ETF |
| | | | |
| |
| | | Shares | | | Value | |
| COMMON STOCK — continued | | | | | | |
| Financials — continued | | | | | | |
| PNC Financial Services Group | | | 804 | | | $ | 93,127 | |
| Principal Financial Group | | | 482 | | | | 31,552 | |
| Progressive | | | 1,177 | | | | 150,550 | |
| Prudential Financial . | | | 735 | | | | 57,837 | |
| Raymond James Financial . | | | 387 | | | | 34,965 | |
| Regions Financial . | | | 1,839 | | | | 31,760 | |
| Rocket, Cl A * | | | 147 | | | | 1,179 | |
| S&P Global . | | | 658 | | | | 241,769 | |
| State Street . | | | 689 | | | | 46,866 | |
| Synchrony Financial | | | 877 | | | | 27,152 | |
| T Rowe Price Group | | | 439 | | | | 47,043 | |
| Tradeweb Markets, Cl A . | | | 214 | | | | 14,327 | |
| Travelers . | | | 469 | | | | 79,374 | |
| Truist Financial | | | 2,643 | | | | 80,532 | |
| US Bancorp . | | | 3,072 | | | | 91,853 | |
| Visa, Cl A . | | | 3,305 | | | | 730,504 | |
| W R Berkley | | | 395 | | | | 21,994 | |
| Wells Fargo . | | | 7,675 | | | | 305,542 | |
| Willis Towers Watson | | | 215 | | | | 47,053 | |
| | | | | | | | 8,749,250 | |
| Health Care — 13.7% | | | | | | | | |
| Abbott Laboratories . | | | 3,496 | | | | 356,592 | |
| AbbVie | | | 3,569 | | | | 492,379 | |
| Agilent Technologies | | | 589 | | | | 68,130 | |
| Align Technology * | | | 148 | | | | 41,834 | |
| Alnylam Pharmaceuticals * | | | 244 | | | | 45,142 | |
| AmerisourceBergen | | | 339 | | | | 57,681 | |
| Amgen . | | | 1,073 | | | | 236,757 | |
| Avantor * | | | 1,269 | | | | 25,304 | |
| Baxter International | | | 1,000 | | | | 40,720 | |
| Becton Dickinson | | | 570 | | | | 137,803 | |
| Biogen * | | | 286 | | | | 84,773 | |
| BioMarin Pharmaceutical * | | | 363 | | | | 31,559 | |
| Bio-Rad Laboratories, Cl A * | | | 40 | | | | 14,934 | |
| Boston Scientific * | | | 2,874 | | | | 147,954 | |
| Bristol-Myers Squibb . | | | 4,283 | | | | 275,997 | |
| Cardinal Health | | | 517 | | | | 42,549 | |
| Centene * | | | 1,120 | | | | 69,899 | |
| Chemed | | | 33 | | | | 17,614 | |
|
|
| Schedule of Investments | May 31, 2023 (Unaudited) |
| Global X Adaptive U.S. Risk Management ETF |
| | | | |
| |
| | | Shares | | | Value | |
| COMMON STOCK — continued | | | | | | |
| Health Care — continued | | | | | | |
| Cigna Group | | | 611 | | | $ | 151,168 | |
| Cooper . | | | 95 | | | | 35,295 | |
| CVS Health . | | | 2,638 | | | | 179,463 | |
| Danaher | | | 1,335 | | | | 306,543 | |
| Dexcom * | | | 770 | | | | 90,290 | |
| Edwards Lifesciences * | | | 1,232 | | | | 103,771 | |
| Elevance Health | | | 481 | | | | 215,401 | |
| Eli Lilly | | | 1,721 | | | | 739,101 | |
| GE HealthCare Technologies . | | | 724 | | | | 57,565 | |
| Gilead Sciences | | | 2,528 | | | | 194,504 | |
| HCA Healthcare | | | 425 | | | | 112,281 | |
| Hologic * | | | 482 | | | | 38,025 | |
| Horizon Therapeutics * | | | 450 | | | | 45,014 | |
| Humana | | | 252 | | | | 126,471 | |
| IDEXX Laboratories * | | | 166 | | | | 77,152 | |
| Illumina * | | | 313 | | | | 61,551 | |
| Incyte * | | | 359 | | | | 22,096 | |
| Insulet * | | | 140 | | | | 38,395 | |
| Intuitive Surgical * | | | 710 | | | | 218,566 | |
| IQVIA Holdings * | | | 360 | | | | 70,888 | |
| Johnson & Johnson . | | | 5,276 | | | | 818,097 | |
| Laboratory Corp of America Holdings | | | 177 | | | | 37,618 | |
| McKesson . | | | 277 | | | | 108,263 | |
| Medtronic | | | 2,676 | | | | 221,466 | |
| Merck . | | | 5,141 | | | | 567,618 | |
| Mettler-Toledo International * | | | 43 | | | | 56,840 | |
| Moderna * | | | 673 | | | | 85,949 | |
| Molina Healthcare * | | | 112 | | | | 30,677 | |
| Pfizer | | | 11,326 | | | | 430,615 | |
| Quest Diagnostics . | | | 224 | | | | 29,714 | |
| Regeneron Pharmaceuticals * | | | 211 | | | | 155,203 | |
| ResMed | | | 289 | | | | 60,918 | |
| Revvity . | | | 249 | | | | 28,715 | |
| Royalty Pharma, Cl A | | | 735 | | | | 24,064 | |
| Seagen * | | | 273 | | | | 53,426 | |
| STERIS | | | 199 | | | | 39,794 | |
| Stryker . | | | 666 | | | | 183,536 | |
| Teleflex | | | 89 | | | | 20,893 | |
| Thermo Fisher Scientific | | | 790 | | | | 401,683 | |
|
|
| Schedule of Investments | May 31, 2023 (Unaudited) |
| Global X Adaptive U.S. Risk Management ETF |
| | | | |
| |
| | | Shares | | | Value | |
| COMMON STOCK — continued | | | | | | |
| Health Care — continued | | | | | | |
| UnitedHealth Group | | | 1,880 | | | $ | 916,011 | |
| Veeva Systems, Cl A * | | | 278 | | | | 46,065 | |
| Vertex Pharmaceuticals * | | | 516 | | | | 166,962 | |
| Viatris, Cl W | | | 2,366 | | | | 21,649 | |
| Waters * | | | 114 | | | | 28,639 | |
| West Pharmaceutical Services | | | 149 | | | | 49,860 | |
| Zimmer Biomet Holdings . | | | 420 | | | | 53,483 | |
| Zoetis, Cl A . | | | 940 | | | | 153,229 | |
| | | | | | | | 9,862,148 | |
| Industrials — 8.2% | | | | | | | | |
3M
| | | 1,108 | | | | 103,388 | |
| AMETEK | | | 458 | | | | 66,442 | |
| Automatic Data Processing | | | 833 | | | | 174,089 | |
| Avis Budget Group * | | | 55 | | | | 9,228 | |
| Axon Enterprise * | | | 152 | | | | 29,322 | |
| Boeing * | | | 1,202 | | | | 247,251 | |
| Broadridge Financial Solutions . | | | 231 | | | | 33,892 | |
| Carlisle | | | 98 | | | | 20,819 | |
| Carrier Global | | | 1,675 | | | | 68,508 | |
| Caterpillar . | | | 1,048 | | | | 215,626 | |
| Cintas | | | 174 | | | | 82,152 | |
| Copart * | | | 949 | | | | 83,123 | |
| CSX | | | 4,213 | | | | 129,213 | |
| Cummins | | | 280 | | | | 57,235 | |
| Deere . | | | 552 | | | | 190,981 | |
| Delta Air Lines * | | | 1,271 | | | | 46,175 | |
| Dover | | | 277 | | | | 36,932 | |
| Eaton | | | 796 | | | | 140,016 | |
| Emerson Electric | | | 1,180 | | | | 91,662 | |
| Equifax . | | | 243 | | | | 50,695 | |
| Expeditors International of Washington . | | | 312 | | | | 34,417 | |
| Fastenal | | | 1,140 | | | | 61,389 | |
| FedEx . | | | 468 | | | | 102,015 | |
| Ferguson . | | | 436 | | | | 63,181 | |
| Fortive . | | | 695 | | | | 45,251 | |
| General Dynamics | | | 484 | | | | 98,823 | |
| General Electric . | | | 2,178 | | | | 221,132 | |
| HEICO | | | 79 | | | | 12,212 | |
| HEICO, Cl A . | | | 147 | | | | 17,912 | |
|
|
| Schedule of Investments | May 31, 2023 (Unaudited) |
| Global X Adaptive U.S. Risk Management ETF |
| | | | |
| |
| | | Shares | | | Value | |
| COMMON STOCK — continued | | | | | | |
| Industrials — continued | | | | | | |
| Honeywell International . | | | 1,351 | | | $ | 258,852 | |
| Howmet Aerospace . | | | 826 | | | | 35,312 | |
| IDEX . | | | 151 | | | | 30,073 | |
| Illinois Tool Works | | | 624 | | | | 136,488 | |
| Ingersoll Rand . | | | 804 | | | | 45,555 | |
| Jacobs Solutions . | | | 247 | | | | 27,071 | |
| JB Hunt Transport Services | | | 164 | | | | 27,383 | |
| Johnson Controls International | | | 1,369 | | | | 81,729 | |
| L3Harris Technologies . | | | 377 | | | | 66,322 | |
| Lennox International . | | | 71 | | | | 19,561 | |
| Lockheed Martin | | | 528 | | | | 234,437 | |
| Nordson . | | | 112 | | | | 24,408 | |
| Norfolk Southern . | | | 465 | | | | 96,804 | |
| Northrop Grumman | | | 312 | | | | 135,873 | |
| Old Dominion Freight Line | | | 201 | | | | 62,398 | |
| Otis Worldwide | | | 832 | | | | 66,152 | |
| PACCAR | | | 1,077 | | | | 74,076 | |
| Parker-Hannifin | | | 256 | | | | 82,033 | |
| Paychex | | | 648 | | | | 67,995 | |
| Paycom Software . | | | 98 | | | | 27,453 | |
| Quanta Services . | | | 280 | | | | 49,722 | |
| Raytheon Technologies | | | 2,961 | | | | 272,827 | |
| Republic Services, Cl A | | | 413 | | | | 58,493 | |
| Rockwell Automation | | | 230 | | | | 64,078 | |
| Rollins . | | | 502 | | | | 19,739 | |
| Southwest Airlines . | | | 1,175 | | | | 35,097 | |
| SS&C Technologies Holdings | | | 433 | | | | 23,798 | |
| Stanley Black & Decker . | | | 297 | | | | 22,266 | |
| Trane Technologies . | | | 461 | | | | 75,249 | |
| TransDigm Group * | | | 102 | | | | 78,912 | |
| TransUnion | | | 379 | | | | 27,280 | |
| Uber Technologies * | | | 3,846 | | | | 145,879 | |
| Union Pacific | | | 1,238 | | | | 238,340 | |
| United Airlines Holdings * | | | 645 | | | | 30,615 | |
| United Parcel Service, Cl B . | | | 1,473 | | | | 245,991 | |
| United Rentals . | | | 140 | | | | 46,731 | |
| Verisk Analytics, Cl A . | | | 308 | | | | 67,486 | |
| Waste Management . | | | 823 | | | | 133,260 | |
| Westinghouse Air Brake Technologies | | | 343 | | | | 31,772 | |
|
|
| Schedule of Investments | May 31, 2023 (Unaudited) |
| Global X Adaptive U.S. Risk Management ETF |
| | | | |
| |
| | | Shares | | | Value | |
| COMMON STOCK — continued | | | | | | |
| Industrials — continued | | | | | | |
| WW Grainger . | | | 88 | | | $ | 57,114 | |
| Xylem . | | | 354 | | | | 35,471 | |
| | | | | | | | 5,893,176 | |
| Information Technology — 28.5% | | | | | | | | |
| Accenture, Cl A | | | 1,342 | | | | 410,545 | |
| Adobe * | | | 938 | | | | 391,887 | |
| Advanced Micro Devices * | | | 3,233 | | | | 382,173 | |
| Akamai Technologies * | | | 302 | | | | 27,820 | |
| Amdocs | | | 272 | | | | 25,614 | |
| Amphenol, Cl A . | | | 1,190 | | | | 89,785 | |
| Analog Devices | | | 1,023 | | | | 181,777 | |
| ANSYS * | | | 175 | | | | 56,628 | |
| Apple . | | | 30,165 | | | | 5,346,746 | |
| Applied Materials . | | | 1,695 | | | | 225,943 | |
| Arista Networks * | | | 473 | | | | 78,679 | |
| Aspen Technology * | | | 54 | | | | 8,852 | |
| Atlassian, Cl A * | | | 292 | | | | 52,791 | |
| Autodesk * | | | 434 | | | | 86,535 | |
| Bentley Systems, Cl B | | | 420 | | | | 20,488 | |
| Broadcom | | | 824 | | | | 665,759 | |
| Cadence Design Systems * | | | 545 | | | | 125,846 | |
| CDW | | | 269 | | | | 46,185 | |
| Cisco Systems | | | 8,342 | | | | 414,347 | |
| Cloudflare, Cl A * | | | 522 | | | | 36,102 | |
| Cognizant Technology Solutions, Cl A | | | 1,026 | | | | 64,115 | |
| Corning . | | | 1,789 | | | | 55,119 | |
| Crowdstrike Holdings, Cl A * | | | 429 | | | | 68,696 | |
| Datadog, Cl A * | | | 575 | | | | 54,573 | |
| Dell Technologies, Cl C | | | 453 | | | | 20,299 | |
| Enphase Energy * | | | 265 | | | | 46,078 | |
| EPAM Systems * | | | 107 | | | | 27,458 | |
| Fair Isaac * | | | 52 | | | | 40,959 | |
| First Solar * | | | 202 | | | | 40,998 | |
| Fortinet * | | | 1,323 | | | | 90,401 | |
| Gartner * | | | 155 | | | | 53,143 | |
| GLOBALFOUNDRIES * | | | 143 | | | | 8,341 | |
| Hewlett Packard Enterprise | | | 2,535 | | | | 36,555 | |
| HP | | | 1,959 | | | | 56,929 | |
| HubSpot * | | | 90 | | | | 46,619 | |
|
|
| Schedule of Investments | May 31, 2023 (Unaudited) |
| Global X Adaptive U.S. Risk Management ETF |
| | | | |
| |
| | | Shares | | | Value | |
| COMMON STOCK — continued | | | | | | |
| Information Technology — continued | | | | | | |
| Intel . | | | 8,319 | | | $ | 261,549 | |
| International Business Machines . | | | 1,821 | | | | 234,162 | |
| Intuit . | | | 550 | | | | 230,516 | |
| Jabil . | | | 288 | | | | 25,782 | |
| Keysight Technologies * | | | 352 | | | | 56,954 | |
| KLA | | | 283 | | | | 125,366 | |
| Lam Research | | | 273 | | | | 168,359 | |
| Marvell Technology . | | | 1,703 | | | | 99,608 | |
| Microchip Technology | | | 1,080 | | | | 81,281 | |
| Micron Technology . | | | 2,192 | | | | 149,494 | |
| Microsoft | | | 14,860 | | | | 4,879,875 | |
| MongoDB, Cl A * | | | 134 | | | | 39,368 | |
| Monolithic Power Systems . | | | 87 | | | | 42,622 | |
| Motorola Solutions | | | 332 | | | | 93,597 | |
| NetApp . | | | 425 | | | | 28,199 | |
| NVIDIA . | | | 4,811 | | | | 1,820,194 | |
| Okta, Cl A * | | | 291 | | | | 26,452 | |
| ON Semiconductor * | | | 859 | | | | 71,812 | |
| Oracle . | | | 3,114 | | | | 329,897 | |
| Palantir Technologies, Cl A * | | | 3,387 | | | | 49,823 | |
| Palo Alto Networks * | | | 594 | | | | 126,754 | |
| QUALCOMM . | | | 2,259 | | | | 256,193 | |
| Roper Technologies | | | 213 | | | | 96,749 | |
| Salesforce * | | | 1,958 | | | | 437,378 | |
| Seagate Technology Holdings . | | | 379 | | | | 22,778 | |
| ServiceNow * | | | 409 | | | | 222,815 | |
| Skyworks Solutions | | | 315 | | | | 32,606 | |
| Snowflake, Cl A * | | | 545 | | | | 90,121 | |
| SolarEdge Technologies * | | | 107 | | | | 30,477 | |
| Splunk * | | | 319 | | | | 31,674 | |
| Synopsys * | | | 303 | | | | 137,853 | |
| TE Connectivity | | | 632 | | | | 77,407 | |
| Teledyne Technologies * | | | 90 | | | | 34,978 | |
| Teradyne . | | | 306 | | | | 30,658 | |
| Texas Instruments . | | | 1,829 | | | | 318,027 | |
| Trimble * | | | 482 | | | | 22,495 | |
| Tyler Technologies * | | | 79 | | | | 31,360 | |
| Ubiquiti | | | 5 | | | | 816 | |
| VeriSign * | | | 184 | | | | 41,091 | |
|
|
| Schedule of Investments | May 31, 2023 (Unaudited) |
| Global X Adaptive U.S. Risk Management ETF |
| | | | |
| |
| | | Shares | | | Value | |
| COMMON STOCK — continued | | | | | | |
| Information Technology — continued | | | | | | |
| VMware, Cl A * | | | 454 | | | $ | 61,876 | |
| Western Digital * | | | 615 | | | | 23,819 | |
| Workday, Cl A * | | | 403 | | | | 85,432 | |
| Zebra Technologies, Cl A * | | | 99 | | | | 25,994 | |
| Zoom Video Communications, Cl A * | | | 426 | | | | 28,597 | |
| Zscaler * | | | 169 | | | | 22,896 | |
| | | | | | | | 20,490,539 | |
| Materials — 2.2% | | | | | | | | |
| Air Products & Chemicals . | | | 446 | | | | 120,037 | |
| Albemarle | | | 234 | | | | 45,286 | |
| Amcor | | | 2,940 | | | | 28,342 | |
| Avery Dennison . | | | 177 | | | | 28,520 | |
| Ball | | | 614 | | | | 31,412 | |
| Celanese, Cl A . | | | 193 | | | | 20,076 | |
| CF Industries Holdings | | | 388 | | | | 23,866 | |
| Corteva . | | | 1,422 | | | | 76,063 | |
| Dow | | | 1,410 | | | | 68,780 | |
| DuPont de Nemours . | | | 907 | | | | 60,941 | |
| Ecolab | | | 506 | | | | 83,515 | |
| FMC . | | | 247 | | | | 25,708 | |
| Freeport-McMoRan . | | | 2,857 | | | | 98,109 | |
| International Flavors & Fragrances | | | 507 | | | | 39,186 | |
| International Paper . | | | 697 | | | | 20,520 | |
| Linde | | | 990 | | | | 350,123 | |
| LyondellBasell Industries, Cl A | | | 513 | | | | 43,882 | |
| Martin Marietta Materials | | | 120 | | | | 47,765 | |
| Mosaic . | | | 672 | | | | 21,477 | |
| Newmont | | | 1,587 | | | | 64,353 | |
| Nucor | | | 511 | | | | 67,483 | |
| PPG Industries | | | 470 | | | | 61,706 | |
| Sherwin-Williams . | | | 478 | | | | 108,879 | |
| Steel Dynamics | | | 326 | | | | 29,959 | |
| Vulcan Materials | | | 258 | | | | 50,439 | |
| | | | | | | | 1,616,427 | |
| Real Estate — 2.4% | | | | | | | | |
| Alexandria Real Estate Equities ‡ | | | 321 | | | | 36,421 | |
| American Tower ‡ | | | 938 | | | | 173,005 | |
| AvalonBay Communities ‡ | | | 272 | | | | 47,322 | |
|
|
| Schedule of Investments | May 31, 2023 (Unaudited) |
| Global X Adaptive U.S. Risk Management ETF |
| | | | |
| |
| | | Shares | | | Value | |
| COMMON STOCK — continued | | | | | | |
| Real Estate — continued | | | | | | |
| Camden Property Trust ‡ | | | 207 | | | $ | 21,625 | |
| CBRE Group, Cl A * | | | 600 | | | | 44,952 | |
| CoStar Group * | | | 802 | | | | 63,679 | |
| Crown Castle ‡ | | | 864 | | | | 97,813 | |
| Digital Realty Trust ‡ | | | 571 | | | | 58,505 | |
| Equinix ‡ | | | 187 | | | | 139,418 | |
| Equity Residential ‡ | | | 729 | | | | 44,323 | |
| Essex Property Trust ‡ | | | 129 | | | | 27,872 | |
| Extra Space Storage ‡ | | | 262 | | | | 37,799 | |
| Healthpeak Properties ‡ | | | 1,048 | | | | 20,918 | |
| Invitation Homes ‡ | | | 1,205 | | | | 40,825 | |
| Mid-America Apartment Communities ‡ | | | 228 | | | | 33,530 | |
| ProLogis ‡ | | | 1,855 | | | | 231,040 | |
| Public Storage ‡ | | | 320 | | | | 90,656 | |
| Realty Income ‡ | | | 1,373 | | | | 81,611 | |
| SBA Communications, Cl A ‡ | | | 214 | | | | 47,461 | |
| Simon Property Group ‡ | | | 652 | | | | 68,558 | |
| Sun Communities ‡ | | | 241 | | | | 30,518 | |
| UDR ‡ | | | 639 | | | | 25,349 | |
| Ventas ‡ | | | 787 | | | | 33,951 | |
| VICI Properties, Cl A ‡ | | | 1,924 | | | | 59,509 | |
| Welltower ‡ | | | 994 | | | | 74,162 | |
| Weyerhaeuser ‡ | | | 1,460 | | | | 41,844 | |
| WP Carey ‡ | | | 408 | | | | 28,299 | |
| | | | | | | | 1,700,965 | |
| Utilities — 2.5% | | | | | | | | |
| AES . | | | 1,291 | | | | 25,484 | |
| Alliant Energy . | | | 493 | | | | 25,370 | |
| Ameren . | | | 511 | | | | 41,427 | |
| American Electric Power | | | 1,030 | | | | 85,614 | |
| American Water Works | | | 413 | | | | 59,658 | |
| Atmos Energy | | | 277 | | | | 31,932 | |
| Avangrid . | | | 127 | | | | 4,766 | |
| CenterPoint Energy . | | | 1,244 | | | | 35,093 | |
| CMS Energy | | | 571 | | | | 33,107 | |
| Consolidated Edison | | | 710 | | | | 66,243 | |
| Constellation Energy . | | | 654 | | | | 54,949 | |
| Dominion Energy | | | 1,672 | | | | 84,068 | |
| DTE Energy . | | | 408 | | | | 43,901 | |
|
|
| Schedule of Investments | May 31, 2023 (Unaudited) |
| Global X Adaptive U.S. Risk Management ETF |
| | | | |
| |
| | | Shares | | | Value | |
| COMMON STOCK — continued | | | | | | |
| Utilities — continued | | | | | | |
| Duke Energy | | | 1,547 | | | $ | 138,132 | |
| Edison International . | | | 761 | | | | 51,383 | |
| Entergy | | | 405 | | | | 39,771 | |
| Evergy | | | 447 | | | | 25,859 | |
| Eversource Energy . | | | 690 | | | | 47,769 | |
| Exelon | | | 1,973 | | | | 78,229 | |
| FirstEnergy | | | 1,077 | | | | 40,269 | |
| NextEra Energy . | | | 4,120 | | | | 302,655 | |
| PG&E * | | | 3,456 | | | | 58,545 | |
| PPL | | | 1,422 | | | | 37,256 | |
| Public Service Enterprise Group . | | | 996 | | | | 59,511 | |
| Sempra Energy . | | | 628 | | | | 90,137 | |
| Southern | | | 2,167 | | | | 151,148 | |
| WEC Energy Group . | | | 627 | | | | 54,768 | |
| Xcel Energy | | | 1,092 | | | | 71,297 | |
| | | | | | | | 1,838,341 | |
| TOTAL UNITED STATES | | | | | | | 71,348,273 | |
| TOTAL COMMON STOCK | | | | | | | | |
| (Cost $68,914,594) | | | | | | | 71,564,463 | |
| EXCHANGE TRADED FUND — 0.4% | | | | | | | | |
| Vanguard S&P 500 ETF | | | | | | | | |
| (Cost $280,853) | | | 750 | | | | 287,918 | |
| TOTAL INVESTMENTS — 99.9% | | | | | | | | |
| (Cost $69,195,447) | | | | | | $ | 71,852,381 | |
Percentages are based on Net Assets of $71,936,247.
| * | Non-income producing security. |
| ‡ | Real Estate Investment Trust |
As of May 31, 2023, all of the Fund's investments were considered Level 1, in accordance with authoritative guidance on fair value measurements and disclosure under U.S. GAAP.
See “Glossary” for abbreviations.
|
|
| Schedule of Investments | May 31, 2023 (Unaudited) |
| Glossary (abbreviations used in preceding Schedule of Investments): |
Fund Abbreviations
Cl — Class
ETF — Exchange-Traded Fund
LIBOR— London Interbank Offered Rate
REIT — Real Estate Investment Trust
TSFR3M — Term Secured Overnight Financing Rate 3-Month
Ser — Series
SOFR — Secured Overnight Financing Rate
USD — U.S. Dollar
|
| Statements of Assets and Liabilities |
| May 31, 2023 (Unaudited) |
| | | Global X MLP ETF | | | Global X MLP & Energy Infrastructure ETF
| | | Global X Alternative Income ETF
| | | Global X Conscious Companies ETF
| |
Assets:
| | | | | | | | | | | | |
| Cost of Investments | | $ | 791,912,021 | | | $ | 743,892,022 | | | $ | 5,470,955 | | | $ | 628,960,787 | |
| Cost of Repurchase Agreement | | | — | | | | 772,224 | | | | 431,391 | | | | — | |
| Cost of Affiliated Investments | | | 48,879,611 | | | | — | | | | 37,833,821 | | | | — | |
| Investments, at Value | | $ | 1,300,179,089 | | | $ | 885,891,227 | * | | $ | 7,012,415 | * | | $ | 635,337,982 | |
| Repurchase Agreement, at Value | | | — | | | | 772,224 | | | | 431,391 | | | | — | |
| Affiliated Investments, at Value | | | 60,649,478 | | | | — | | | | 29,868,406 | | | | — | |
| Cash | | | 2,500,425 | | | | 195,997 | | | | 104,484 | | | | 895,546 | |
| Receivable for Investment Securities Sold | | | 44,182,022 | | | | 26,835,598 | | | | — | | | | 295,838 | |
| Dividend, Interest, and Securities Lending Income Receivable | | | 105 | | | | 1,047,085 | | | | 39,310 | | | | 1,025,143 | |
| Reclaim Receivable | | | — | | | | 546,699 | | | | — | | | | — | |
| Total Assets | | | 1,407,511,119 | | | | 915,288,830 | | | | 37,456,006 | | | | 637,554,509 | |
| Liabilities: | |
| Obligation to Return Securities Lending Collateral | | | — | | | | 1,154,042 | | | | 644,688 | | | | — | |
| Payable for Investment Securities Purchased | | | 39,250,678 | | | | 23,474,456 | | | | — | | | | — | |
| Payable for Capital Shares Redeemed | | | 5,017,371 | | | | 3,470,610 | | | | — | | | | 294,647 | |
| Payable due to Investment Adviser | | | 517,063 | | | | 349,333 | | | | 4,243 | | | | 233,629 | |
| Custodian Fees Payable | | | 13,736 | | | | 14,325 | | | | 30 | | | | 16 | |
| Franchise Tax Payable | | | 10,703 | | | | — | | | | — | | | | — | |
| Other Accrued Expenses | | | 8,792 | | | | — | | | | — | | | | — | |
| Deferred Tax Liability | | | 18,580,934 | | | | — | | | | — | | | | — | |
| Total Liabilities | | | 63,399,277 | | | | 28,462,766 | | | | 648,961 | | | | 528,292 | |
| Net Assets | | $ | 1,344,111,842 | | | $ | 886,826,064 | | | $ | 36,807,045 | | | $ | 637,026,217 | |
| Net Assets Consist of: | |
| Paid-in Capital | | $ | 1,373,892,126 | | | $ | 958,855,946 | | | $ | 45,986,520 | | | $ | 643,992,760 | |
| Total Distributable Loss | | | (29,780,284 | ) | | | (72,029,882 | ) | | | (9,179,475 | ) | | | (6,966,543 | ) |
| Net Assets | | $ | 1,344,111,842 | | | $ | 886,826,064 | | | $ | 36,807,045 | | | $ | 637,026,217 | |
| Outstanding Shares of Beneficial Interest | |
| (unlimited authorization — no par value) | | | 32,318,637 | | | | 22,997,506 | | | | 3,320,000 | | | | 21,620,000 | |
| Net Asset Value, Offering and Redemption Price Per Share | | $ | 41.59 | | | $ | 38.56 | | | $ | 11.09 | | | $ | 29.46 | |
| * Includes Market Value of Securities on Loan | | $ | — | | | $ | 1,155,108 | | | $ | 631,588 | | | $ | — | |
Amounts designated as “—” are either $0 or have been rounded to $0.
|
| Statements of Assets and Liabilities |
| May 31, 2023 (Unaudited) |
| | | Global X Founder-Run Companies ETF | | | Global X U.S. Preferred ETF | | | Global X S&P 500® Quality Dividend ETF | |
Assets:
| | | | | | | | | |
| Cost of Investments | | $ | 8,139,625 | | | $ | 2,668,859,655 | | | $ | 73,897,621 | |
| Cost of Repurchase Agreement | | | — | | | | 24,690,452 | | | | — | |
| Investments, at Value | | $ | 6,259,800 | | | $ | 2,230,092,429 | * | | $ | 68,439,469 | |
| Repurchase Agreement, at Value | | | — | | | | 24,690,452 | | | | — | |
| Cash | | | 13,182 | | | | — | | | | 20,727 | |
| Receivable for Investment Securities Sold | | | 500,559 | | | | 29,014,611 | | | | 760,223 | |
| Dividend, Interest, and Securities Lending Income Receivable | | | 2,682 | | | | 17,302,405 | | | | 264,050 | |
| Receivable for Capital Shares Sold | | | — | | | | — | | | | 596,415 | |
| Reclaim Receivable | | | — | | | | 7,741 | | | | — | |
| Total Assets | | | 6,776,223 | | | | 2,301,107,638 | | | | 70,080,884 | |
| Liabilities: | |
| Obligation to Return Securities Lending Collateral | | | — | | | | 36,898,393 | | | | — | |
| Payable for Capital Shares Redeemed | | | 501,758 | | | | — | | | | — | |
| Payable due to Investment Adviser | | | 2,478 | | | | 427,676 | | | | 11,890 | |
| Payable for Investment Securities Purchased | | | — | | | | 29,469,996 | | | | 1,480,884 | |
| Cash Overdraft | | | — | | | | 2,676,802 | | | | — | |
| Custodian Fees Payable | | | 7 | | | | 32,088 | | | | 562 | |
| Total Liabilities | | | 504,243 | | | | 69,504,955 | | | | 1,493,336 | |
| Net Assets | | $ | 6,271,980 | | | $ | 2,231,602,683 | | | $ | 68,587,548 | |
| Net Assets Consist of: | |
| Paid-in Capital | | $ | 10,853,709 | | | $ | 2,868,886,641 | | | $ | 77,759,770 | |
| Total Distributable Loss | | | (4,581,729 | ) | | | (637,283,958 | ) | | | (9,172,222 | ) |
| Net Assets | | $ | 6,271,980 | | | $ | 2,231,602,683 | | | $ | 68,587,548 | |
| Outstanding Shares of Beneficial Interest | |
| (unlimited authorization — no par value) | | | 250,000 | | | | 115,810,000 | | | | 2,300,002 | |
| Net Asset Value, Offering and Redemption Price Per Share | | $ | 25.09 | | | $ | 19.27 | | | $ | 29.82 | |
| *Includes Market Value of Securities on Loan | | $ | — | | | $ | 36,425,704 | | | $ | — | |
Amounts designated as “—” are either $0 or have been rounded to $0.
|
| Statements of Assets and Liabilities |
| May 31, 2023 (Unaudited) |
| | | Global X Adaptive U.S. Factor ETF | | | Global X Variable Rate Preferred ETF | | |
Global X Adaptive U.S. Risk Management ETF | |
Assets:
| | | | | | | | | |
| Cost of Investments | | $ | 159,930,042 | | | $ | 252,667,957 | | | $ | 69,195,447 | |
| Investments, at Value | | $ | 159,204,283 | | | $ | 233,748,029 | | | $ | 71,852,381 | |
| Cash | | | 154,935 | | | | — | | | | 9,800 | |
| Dividend, Interest, and Securities Lending Income Receivable | | | 379,303 | | | | 1,405,944 | | | | 106,577 | |
| Receivable for Investment Securities Sold | | | — | | | | 23,652,133 | | | | — | |
| Reclaim Receivable | | | — | | | | — | | | | 73 | |
| Total Assets | | | 159,738,521 | | | | 258,806,106 | | | | 71,968,831 | |
| Liabilities: | |
| Payable due to Investment Adviser | | | 38,320 | | | | 53,764 | | | | 23,122 | |
| Payable for Investment Securities Purchased | | | — | | | | 12,756,881 | | | | — | |
| Payable for Capital Shares Redeemed | | | — | | | | 10,548,349 | | | | — | |
| Cash Overdraft | | | — | | | | 215,783 | | | | — | |
| Custodian Fees Payable | | | 102 | | | | 4,708 | | | | 9,462 | |
| Total Liabilities | | | 38,422 | | | | 23,579,485 | | | | 32,584 | |
| Net Assets | | $ | 159,700,099 | | | $ | 235,226,621 | | | $ | 71,936,247 | |
| Net Assets Consist of: | |
| Paid-in Capital | | $ | 171,208,514 | | | $ | 275,903,271 | | | $ | 87,449,479 | |
| Total Distributable Loss | | | (11,508,415 | ) | | | (40,676,650 | ) | | | (15,513,232 | ) |
| Net Assets | | $ | 159,700,099 | | | $ | 235,226,621 | | | $ | 71,936,247 | |
| Outstanding Shares of Beneficial Interest | |
| (unlimited authorization — no par value) | | | 5,410,002 | | | | 10,630,000 | | | | 2,590,000 | |
| Net Asset Value, Offering and Redemption Price Per Share | | $ | 29.52 | | | $ | 22.13 | | | $ | 27.77 | |
Amounts designated as “—” are either $0 or have been rounded to $0.
|
| Statements of Operations |
| For the period ended May 31, 2023 (Unaudited) |
| | | Global X MLP ETF | | | Global X MLP & Energy Infrastructure ETF | | | Global X Alternative Income ETF | | | Global X Conscious
Companies ETF | |
Investment Income:
| | | | | | | | | | | | |
| Distributions from Master Limited Partnerships | | $ | 54,155,659 | | | $ | — | | | $ | — | | | $ | — | |
| Less: Return of Capital Distributions | | | (54,155,659 | ) | | | — | | | | — | | | | — | |
| Dividend Income | | | 2,492,045 | | | | 5,110,228 | | | | 519,676 | | | | 5,441,007 | |
| Interest Income | | | 131,786 | | | | 17,132 | | | | 1,284 | | | | 13,435 | |
| Security Lending Income | | | — | | | | 13,421 | | | | 6,449 | | | | — | |
| Less: Foreign Taxes Withheld | | | — | | | | (1,002,454 | ) | | | — | | | | (10,035 | ) |
| Total Investment Income | | | 2,623,831 | | | | 4,138,327 | | | | 527,409 | | | | 5,444,407 | |
Supervision and Administration Fees(1) | | | 3,045,347 | | | | 2,242,858 | | | | 94,132 | | | | 1,364,797 | |
Custodian Fees(2) | | | 13,738 | | | | 14,296 | | | | 31 | | | | 16 | |
| Net Expenses | | | 3,059,085 | | | | 2,257,154 | | | | 94,163 | | | | 1,364,813 | |
| Net Investment Income (Loss), Before Taxes | | | (435,254 | ) | | | 1,881,173 | | | | 433,246 | | | | 4,079,594 | |
| Tax Benefit/(Expense) | | | 97,324 | | | | — | | | | — | | | | — | |
| Net Investment Income (Loss), Net of Taxes | | | (337,930 | ) | | | 1,881,173 | | | | 433,246 | | | | 4,079,594 | |
| Net Realized Gain (Loss) on: | |
Investments(3) | | | (6,052,069 | ) | | | 41,729,667 | | | | 92,582 | | | | 5,403,200 | |
| Affiliated Investments | | | (240,897 | ) | | | — | | | | 138,856 | | | | — | |
| Capital Gain Distribution from Affiliated Investments | | | — | | | | — | | | | 17,544 | | | | — | |
| Foreign Currency Transactions | | | — | | | | (4,737 | ) | | | — | | | | — | |
| Tax Benefit/(Expense) | | | 1,034,835 | | | | — | | | | — | | | | — | |
Payment from Adviser(4) | | | — | | | | — | | | | 68,375 | | | | — | |
| Net Realized Gain (Loss) | | | (5,258,131 | ) | | | 41,724,930 | | | | 317,357 | | | | 5,403,200 | |
| Net Change in Unrealized Appreciation (Depreciation) on: | |
| Investments | | | 18,412,862 | | | | (136,315,903 | ) | | | (396,553 | ) | | | (9,831,489 | ) |
| Affiliated Investments | | | (3,087,965 | ) | | | — | | | | (130,400 | ) | | | — | |
| Tax Benefit/(Expense) | | | (3,054,376 | ) | | | — | | | | — | | | | — | |
| Net Change in Unrealized Appreciation (Depreciation) | | | 12,270,521 | | | | (136,315,903 | ) | | | (526,953 | ) | | | (9,831,489 | ) |
| Net Realized and Unrealized Gain (Loss) | | | 7,012,390 | | | | (94,590,973 | ) | | | (209,596 | ) | | | (4,428,289 | ) |
| Net Increase (Decrease) in Net Assets Resulting from Operations | | $ | 6,674,460 | | | $ | (92,709,800 | ) | | $ | 223,650 | | | $ | (348,695 | ) |
| (1) | The Supervision and Administration fees reflect the supervisory and administrative fee, which includes fees paid by the Funds for the investment advisory services provided by the Adviser. (See Note 3 in Notes to Financial Statements.) |
| (2) | See Note 2 in the Notes to Financial Statements. |
| (3) | Includes realized gains (losses) as a result of in-kind redemptions. (See Note 4 in Notes to Financial Statements.) |
| (4) | See Note 3 in the Notes to Financial Statements. |
Amounts designated as “—” are either $0 or have been rounded to $0.
|
| Statements of Operations |
| For the period ended May 31, 2023 (Unaudited) |
| | | Global X Founder-Run Companies ETF | | | Global X U.S. Preferred ETF | | | Global X S&P 500® Quality Dividend ETF | |
Investment Income:
| | | | | | | | | |
| Dividend Income | | $ | 20,323 | | | $ | 70,822,776 | | | $ | 1,113,708 | |
| Interest Income | | | 182 | | | | 201,106 | | | | 649 | |
| Security Lending Income | | | — | | | | 601,599 | | | | — | |
| Less: Foreign Taxes Withheld | | | — | | | | (37,318 | ) | | | (962 | ) |
| Total Investment Income | | | 20,505 | | | | 71,588,163 | | | | 1,113,395 | |
Supervision and Administration Fees(1) | | | 15,852 | | | | 2,600,844 | | | | 65,987 | |
Custodian Fees(2) | | | 7 | | | | 32,145 | | | | 573 | |
| Total Expenses | | | 15,859 | | | | 2,632,989 | | | | 66,560 | |
| Net Investment Income | | | 4,646 | | | | 68,955,174 | | | | 1,046,835 | |
| Net Realized Gain (Loss) on: | |
Investments(3) | | | (887,905 | ) | | | (96,466,536 | ) | | | 994,702 | |
| Net Realized Gain (Loss) | | | (887,905 | ) | | | (96,466,536 | ) | | | 994,702 | |
| Net Change in Unrealized Appreciation (Depreciation) on: | |
| Investments | | | 1,115,832 | | | | (44,052,877 | ) | | | (8,286,225 | ) |
| Net Change in Unrealized Appreciation (Depreciation) | | | 1,115,832 | | | | (44,052,877 | ) | | | (8,286,225 | ) |
| Net Realized and Unrealized Gain (Loss) | | | 227,927 | | | | (140,519,413 | ) | | | (7,291,523 | ) |
| Net Increase (Decrease) in Net Assets Resulting from Operations | | $ | 232,573 | | | $ | (71,564,239 | ) | | $ | (6,244,688 | ) |
| (1) | The Supervision and Administration fees reflect the supervisory and administrative fee, which includes fees paid by the Funds for the investment advisory services provided by the Adviser. (See Note 3 in Notes to Financial Statements.) |
| (2) | See Note 2 in the Notes to Financial Statements. |
| (3) | Includes realized gains (losses) as a result of in-kind redemptions. (See Note 4 in Notes to Financial Statements.) |
Amounts designated as “—” are either $0 or have been rounded to $0.
|
| Statements of Operations |
| For the period ended May 31, 2023 (Unaudited) |
| | | Global X Adaptive U.S.
Factor ETF | | | Global X
Variable Rate Preferred ETF | | | Global X Adaptive U.S. Risk Management ETF | |
Investment Income:
| | | | | | | | | |
| Dividend Income | | $ | 1,841,400 | | | $ | 9,375,597 | | | $ | 442,101 | |
| Interest Income | | | — | | | | 29,671 | | | | 368,603 | |
| Less: Foreign Taxes Withheld | | | (1,630 | ) | | | — | | | | (16 | ) |
| Total Investment Income | | | 1,839,770 | | | | 9,405,268 | | | | 810,688 | |
Supervision and Administration Fees(1) | | | 229,096 | | | | 339,826 | | | | 133,455 | |
Custodian Fees(2) | | | 102 | | | | 4,708 | | | | 9,461 | |
| Total Expenses | | | 229,198 | | | | 344,534 | | | | 142,916 | |
| Net Investment Income | | | 1,610,572 | | | | 9,060,734 | | | | 667,772 | |
| Net Realized Gain (Loss) on: | |
Investments(3) | | | (564,907 | ) | | | (10,581,603 | ) | | | 1,304,811 | |
| Net Realized Gain (Loss) | | | (564,907 | ) | | | (10,581,603 | ) | | | 1,304,811 | |
| Net Change in Unrealized Appreciation (Depreciation) on: | |
| Investments | | | (15,960,354 | ) | | | (6,243,589 | ) | | | (2,173,750 | ) |
| Net Change in Unrealized Appreciation (Depreciation) | | | (15,960,354 | ) | | | (6,243,589 | ) | | | (2,173,750 | ) |
| Net Realized and Unrealized Gain (Loss) | | | (16,525,261 | ) | | | (16,825,192 | ) | | | (868,939 | ) |
| Net Decrease in Net Assets Resulting from Operations | | $ | (14,914,689 | ) | | $ | (7,764,458 | ) | | $ | (201,167 | ) |
| (1) | The Supervision and Administration fees reflect the supervisory and administrative fee, which includes fees paid by the Funds for the investment advisory services provided by the Adviser. (See Note 3 in Notes to Financial Statements.) |
| (2) | See Note 2 in the Notes to Financial Statements. |
| (3) | Includes realized gains (losses) as a result of in-kind redemptions. (See Note 4 in Notes to Financial Statements.) |
Amounts designated as “—” are either $0 or have been rounded to $0.
|
| Statements of Changes in Net Assets |
| | |
Global X MLP ETF | | | Global X MLP & Energy Infrastructure ETF | |
| | | Period Ended May 31, 2023 (Unaudited) | | | Year Ended November 30, 2022 | | | Period Ended
May 31, 2023 (Unaudited) | | | Year Ended November 30, 2022 | |
Operations:
| | | | | | | | | | | | |
| Net Investment Income (Loss) | | $ | (337,930 | ) | | $ | (340,029 | ) | | $ | 1,881,173 | | | $ | 17,261,565 | |
| Net Realized Gain (Loss) | | | (5,258,131 | ) | | | 100,398,974 | | | | 41,724,930 | | | | 41,652,165 | |
| Net Change in Unrealized Appreciation (Depreciation) | | | 12,270,521 | | | | 265,733,843 | | | | (136,315,903 | ) | | | 182,187,058 | |
| Net Increase (Decrease) in Net Assets Resulting from Operations | | | 6,674,460 | | | | 365,792,788 | | | | (92,709,800 | ) | | | 241,100,788 | |
| Distributions | | | (32,665,173 | ) | | | (90,450,291 | ) | | | (28,275,882 | ) | | | (32,598,692 | ) |
| Return of Capital | | | (19,398,633 | ) | | | — | | | | — | | | | (17,688,775 | ) |
| Capital Share Transactions: | |
| Issued | | | 85,394,342 | | | | 492,823,248 | | | | 115,647,351 | | | | 280,463,476 | |
| Redeemed | | | (74,171,926 | ) | | | (382,822,455 | ) | | | (197,835,720 | ) | | | (119,368,893 | ) |
| Increase (Decrease) in Net Assets from Capital Share Transactions | | | 11,222,416 | | | | 110,000,793 | | | | (82,188,369 | ) | | | 161,094,583 | |
| Total Increase (Decrease) in Net Assets | | | (34,166,930 | ) | | | 385,343,290 | | | | (203,174,051 | ) | | | 351,907,904 | |
| Net Assets: | |
| Beginning of Year/Period | | | 1,378,278,772 | | | | 992,935,482 | | | | 1,090,000,115 | | | | 738,092,211 | |
| End of Year/Period | | $ | 1,344,111,842 | | | $ | 1,378,278,772 | | | $ | 886,826,064 | | | $ | 1,090,000,115 | |
| Share Transactions: | |
| Issued | | | 2,040,000 | | | | 12,070,000 | | | | 2,810,000 | | | | 6,950,000 | |
| Redeemed | | | (1,780,000 | ) | | | (9,570,000 | ) | | | (4,890,000 | ) | | | (3,030,000 | ) |
| Net Increase (Decrease) in Shares Outstanding from Share Transactions | | | 260,000 | | | | 2,500,000 | | | | (2,080,000 | ) | | | 3,920,000 | |
Amounts designated as “—” are either $0 or have been rounded to $0.
|
| Statements of Changes in Net Assets |
| | | Global X Alternative Income ETF | | | Global X Conscious Companies ETF | |
| | | Period Ended May 31, 2023 (Unaudited) | | | Year Ended November 30, 2022 | | | Period Ended May 31, 2023 (Unaudited) | | | Year Ended November 30, 2022 | |
Operations:
| | | | | | | | | | | | |
| Net Investment Income | | $ | 433,246 | | | $ | 1,835,738 | | | $ | 4,079,594 | | | $ | 6,934,885 | |
| Net Realized Gain (Loss) | | | 317,357 | | | | 834,115 | | | | 5,403,200 | | | | 941,166 | |
| Net Change in Unrealized Appreciation (Depreciation) | | | (526,953 | ) | | | (5,206,398 | ) | | | (9,831,489 | ) | | | (69,340,214 | ) |
| Net Increase (Decrease) in Net Assets Resulting from Operations | | | 223,650 | | | | (2,536,545 | ) | | | (348,695 | ) | | | (61,464,163 | ) |
| Distributions | | | (1,337,952 | ) | | | (2,282,880 | ) | | | (2,851,496 | ) | | | (7,480,197 | ) |
| Return of Capital | | | — | | | | (390,992 | ) | | | — | | | | — | |
| Capital Share Transactions: | |
| Issued | | | 5,112,554 | | | | 10,836,559 | | | | 35,328,328 | | | | 168,852,369 | |
| Redeemed | | | (4,407,580 | ) | | | (4,330,515 | ) | | | (68,834,655 | ) | | | (80,939,741 | ) |
| Increase (Decrease) in Net Assets from Capital Share Transactions | | | 704,974 | | | | 6,506,044 | | | | (33,506,327 | ) | | | 87,912,628 | |
| Total Increase (Decrease) in Net Assets | | | (409,328 | ) | | | 1,295,627 | | | | (36,706,518 | ) | | | 18,968,268 | |
| Net Assets: | |
| Beginning of Year/Period | | | 37,216,373 | | | | 35,920,746 | | | | 673,732,735 | | | | 654,764,467 | |
| End of Year/Period | | $ | 36,807,045 | | | $ | 37,216,373 | | | $ | 637,026,217 | | | $ | 673,732,735 | |
| Share Transactions: | |
| Issued | | | 450,000 | | | | 890,000 | | | | 1,230,000 | | | | 5,560,000 | |
| Redeemed | | | (390,000 | ) | | | (360,000 | ) | | | (2,430,000 | ) | | | (2,600,000 | ) |
| Net Increase (Decrease) in Shares Outstanding from Share Transactions | | | 60,000 | | | | 530,000 | | | | (1,200,000 | ) | | | 2,960,000 | |
Amounts designated as “—” are either $0 or have been rounded to $0.
|
| Statements of Changes in Net Assets |
| | | Global X Founder-Run Companies ETF | | | Global X U.S. Preferred ETF | |
| | | Period Ended May 31, 2023 (Unaudited) | | | Year Ended November 30, 2022 | | | Period Ended May 31, 2023 (Unaudited) | | | Year Ended November 30, 2022 | |
Operations:
| | | | | | | | | | | | |
| Net Investment Income | | $ | 4,646 | | | $ | 27,830 | | | $ | 68,955,174 | | | $ | 121,824,169 | |
| Net Realized Gain (Loss) | | | (887,905 | ) | | | (1,470,548 | ) | | | (96,466,536 | ) | | | (109,993,262 | ) |
| Net Change in Unrealized Appreciation (Depreciation) | | | 1,115,832 | | | | (3,096,300 | ) | | | (44,052,877 | ) | | | (365,525,726 | ) |
| Net Increase (Decrease) in Net Assets Resulting from Operations | | | 232,573 | | | | (4,539,018 | ) | | | (71,564,239 | ) | | | (353,694,819 | ) |
| Distributions | | | (30,472 | ) | | | (31,083 | ) | | | (70,929,600 | ) | | | (128,023,270 | ) |
| Capital Share Transactions: | |
| Issued | | | — | | | | — | | | | 228,225,355 | | | | 973,349,002 | |
| Redeemed | | | (1,909,238 | ) | | | (3,292,599 | ) | | | (68,590,128 | ) | | | (735,191,810 | ) |
| Increase (Decrease) in Net Assets from Capital Share Transactions | | | (1,909,238 | ) | | | (3,292,599 | ) | | | 159,635,227 | | | | 238,157,192 | |
| Total Increase (Decrease) in Net Assets | | | (1,707,137 | ) | | | (7,862,700 | ) | | | 17,141,388 | | | | (243,560,897 | ) |
| Net Assets: | |
| Beginning of Year/Period | | | 7,979,117 | | | | 15,841,817 | | | | 2,214,461,295 | | | | 2,458,022,192 | |
| End of Year/Period | | $ | 6,271,980 | | | $ | 7,979,117 | | | $ | 2,231,602,683 | | | $ | 2,214,461,295 | |
| Share Transactions: | |
| Issued | | | — | | | | — | | | | 11,250,000 | | | | 43,900,000 | |
| Redeemed | | | (80,000 | ) | | | (130,000 | ) | | | (3,420,000 | ) | | | (33,430,000 | ) |
| Net Increase (Decrease) in Shares Outstanding from Share Transactions | | | (80,000 | ) | | | (130,000 | ) | | | 7,830,000 | | | | 10,470,000 | |
Amounts designated as “—” are either $0 or have been rounded to $0.
|
| Statements of Changes in Net Assets |
| | | Global X S&P 500® Quality Dividend ETF | | | Global X Adaptive U.S. Factor ETF | |
| | | Period Ended May 31, 2023 (Unaudited) | | | Year Ended November 30, 2022 | | | Period Ended May 31, 2023 (Unaudited) | | | Year Ended November 30, 2022 | |
Operations:
| | | | | | | | | | | | |
| Net Investment Income | | $ | 1,046,835 | | | $ | 1,524,648 | | | $ | 1,610,572 | | | $ | 3,448,177 | |
| Net Realized Gain (Loss) | | | 994,702 | | | | (2,148,867 | ) | | | (564,907 | ) | | | 8,344,020 | |
| Net Change in Unrealized Appreciation (Depreciation) | | | (8,286,225 | ) | | | 2,598,502 | | | | (15,960,354 | ) | | | 6,336,154 | |
| Net Increase (Decrease) in Net Assets Resulting from Operations | | | (6,244,688 | ) | | | 1,974,283 | | | | (14,914,689 | ) | | | 18,128,351 | |
| Distributions | | | (1,077,242 | ) | | | (1,339,222 | ) | | | (2,044,414 | ) | | | (3,989,881 | ) |
| Return of Capital | | | — | | | | — | | | | — | | | | (204,893 | ) |
| Capital Share Transactions: | |
| Issued | | | 35,023,039 | | | | 81,220,596 | | | | 80,754,748 | | | | 45,617,766 | |
| Redeemed | | | (20,269,665 | ) | | | (30,314,988 | ) | | | (82,629,000 | ) | | | (53,025,393 | ) |
| Increase (Decrease) in Net Assets from Capital Share Transactions | | | 14,753,374 | | | | 50,905,608 | | | | (1,874,252 | ) | | | (7,407,627 | ) |
| Total Increase (Decrease) in Net Assets | | | 7,431,444 | | | | 51,540,669 | | | | (18,833,355 | ) | | | 6,525,950 | |
| Net Assets: | |
| Beginning of Year/Period | | | 61,156,104 | | | | 9,615,435 | | | | 178,533,454 | | | | 172,007,504 | |
| End of Year/Period | | $ | 68,587,548 | | | $ | 61,156,104 | | | $ | 159,700,099 | | | $ | 178,533,454 | |
| Share Transactions: | |
| Issued | | | 1,080,000 | | | | 2,510,000 | | | | 2,620,000 | | | | 1,490,000 | |
| Redeemed | | | (620,000 | ) | | | (980,000 | ) | | | (2,750,000 | ) | | | (1,710,000 | ) |
| Net Increase (Decrease) in Shares Outstanding from Share Transactions | | | 460,000 | | | | 1,530,000 | | | | (130,000 | ) | | | (220,000 | ) |
Amounts designated as “—” are either $0 or have been rounded to $0.
|
| Statements of Changes in Net Assets |
| | | Global X Variable Rate Preferred ETF | | | Global X Adaptive U.S. Risk Management ETF | |
| | | Period Ended May 31, 2023 (Unaudited) | | | Year Ended November 30, 2022 | | | Period Ended May 31, 2023 (Unaudited) | | | Year Ended November 30, 2022 | |
Operations:
| | | | | | | | | | | | |
| Net Investment Income | | $ | 9,060,734 | | | $ | 10,961,676 | | | $ | 667,772 | | | $ | 1,224,335 | |
| Net Realized Gain (Loss) | | | (10,581,603 | ) | | | (11,913,764 | ) | | | 1,304,811 | | | | (18,387,366 | ) |
| Net Change in Unrealized Appreciation (Depreciation) | | | (6,243,589 | ) | | | (10,345,581 | ) | | | (2,173,750 | ) | | | 6,274,011 | |
| Net Decrease in Net Assets Resulting from Operations | | | (7,764,458 | ) | | | (11,297,669 | ) | | | (201,167 | ) | | | (10,889,020 | ) |
| Distributions | | | (8,801,650 | ) | | | (10,414,818 | ) | | | (827,695 | ) | | | (1,002,824 | ) |
| Return of Capital | | | — | | | | (515,682 | ) | | | — | | | | — | |
| Capital Share Transactions: | |
| Issued | | | 22,703,228 | | | | 285,890,415 | | | | 7,105,686 | | | | 24,618,907 | |
| Redeemed | | | (56,299,331 | ) | | | (67,490,783 | ) | | | (548,364 | ) | | | (50,893,766 | ) |
| Increase (Decrease) in Net Assets from Capital Share Transactions | | | (33,596,103 | ) | | | 218,399,632 | | | | 6,557,322 | | | | (26,274,859 | ) |
| Total Increase (Decrease) in Net Assets | | | (50,162,211 | ) | | | 196,171,463 | | | | 5,528,460 | | | | (38,166,703 | ) |
| Net Assets: | |
| Beginning of Year/Period | | | 285,388,832 | | | | 89,217,369 | | | | 66,407,787 | | | | 104,574,490 | |
| End of Year/Period | | $ | 235,226,621 | | | $ | 285,388,832 | | | $ | 71,936,247 | | | $ | 66,407,787 | |
| Share Transactions: | |
| Issued | | | 970,000 | | | | 11,570,000 | | | | 260,000 | | | | 860,000 | |
| Redeemed | | | (2,460,000 | ) | | | (2,720,000 | ) | | | (20,000 | ) | | | (2,010,000 | ) |
| Net Increase (Decrease) in Shares Outstanding from Share Transactions | | | (1,490,000 | ) | | | 8,850,000 | | | | 240,000 | | | | (1,150,000 | ) |
Amounts designated as “—” are either $0 or have been rounded to $0.
Page intentionally left blank.
|
| Financial Highlights |
| Selected Per Share Data & Ratios |
| For a Share Outstanding Throughout the Period |
| | | Net Asset Value, Beginning of Period ($) | | | Net Investment Income (Loss) ($)* | | | Net Realized and Unrealized Gain (Loss) on Investments ($) | | | Total from Operations ($) | | | Distribution from Net Investment Income ($) | | | Distribution from Capital Gains ($) | | | Return of Capital ($) | |
| Global X MLP ETF | | | | | | | | | | | | | | | | | | | | | |
| 2023 (Unaudited) | | | 42.99 | | | | (0.01 | ) | | | 0.22 | | | | 0.21 | | | | (1.01 | ) | | | — | | | | (0.60 | ) |
| 2022 | | | 33.59 | | | | (0.02 | ) | | | 12.44 | | | | 12.42 | | | | (3.02 | ) | | | — | | | | — | |
| 2021 | | | 26.73 | | | | (0.06 | ) | | | 9.97 | | | | 9.91 | | | | — | | | | — | | | | (3.05 | ) |
2020(1) | | | 43.92 | | | | (0.26 | ) | | | (13.13 | ) | | | (13.39 | ) | | | — | | | | — | | | | (3.80 | ) |
2019(1) | | | 51.24 | | | | (0.24 | ) | | | (2.76 | ) | | | (3.00 | ) | | | — | | | | — | | | | (4.32 | ) |
2018(1) | | | 56.52 | | | | (0.24 | ) | | | (0.42 | ) | | | (0.66 | ) | | | (0.12 | ) | | | — | | | | (4.50 | ) |
| Global X MLP & Energy Infrastructure ETF | |
| 2023 (Unaudited) | | | 43.47 | | | | 0.08 | | | | (3.86 | ) | | | (3.78 | ) | | | (1.13 | ) | | | — | | | | — | |
| 2022 | | | 34.89 | | | | 0.75 | | | | 9.98 | | | | 10.73 | | | | (1.39 | ) | | | — | | | | (0.76 | ) |
| 2021 | | | 26.59 | | | | 0.42 | | | | 9.97 | | | | 10.39 | | | | (1.05 | ) | | | — | | | | (1.04 | ) |
2020(2) | | | 33.45 | | | | 0.71 | | | | (5.33 | ) | | | (4.62 | ) | | | (1.95 | ) | | | — | | | | (0.29 | ) |
2019(2) | | | 36.39 | | | | 1.14 | | | | (1.89 | ) | | | (0.75 | ) | | | (2.01 | ) | | | — | | | | (0.18 | ) |
2018(2) | | | 38.40 | | | | 1.05 | | | | (1.11 | ) | | | (0.06 | ) | | | (1.56 | ) | | | — | | | | (0.39 | ) |
| Global X Alternative Income ETF | |
| 2023 (Unaudited) | | | 11.42 | | | | 0.13 | | | | (0.06 | ) | | | 0.07 | | | | (0.40 | ) | | | — | | | | — | |
| 2022 | | | 13.16 | | | | 0.61 | | | | (1.45 | ) | | | (0.84 | ) | | | (0.77 | ) | | | — | | | | (0.13 | ) |
| 2021 | | | 11.51 | | | | 0.49 | | | | 2.05 | | | | 2.54 | | | | (0.62 | ) | | | — | | | | (0.27 | ) |
| 2020 | | | 14.74 | | | | 0.66 | | | | (2.64 | ) | | | (1.98 | ) | | | (0.98 | ) | | | (0.15 | ) | | | (0.12 | ) |
| 2019 | | | 14.52 | | | | 0.94 | | | | 0.44 | | | | 1.38 | | | | (1.07 | ) | | | (0.09 | ) | | | — | |
| 2018 | | | 15.40 | | | | 0.92 | | | | (0.64 | ) | | | 0.28 | | | | (1.16 | ) | | | — | | | | — | |
| * | Per share data calculated using average shares method. |
| ** | Total Return is for the period indicated and has not been annualized. The return shown does not reflect the deduction of taxes that a shareholder would pay on Fund distributions or the redemption of Fund shares. |
| † | Annualized. |
| †† | Portfolio turnover rate is for the period indicated and periods of less than one year have not been annualized. Excludes effect of in-kind transfers. |
| ‡ | The Before Net Deferred Tax Expense/(Benefit) expense ratios for the periods ending November 30, 2018, 2019, 2020, 2021, 2022 and May 31, 2023 was 0.45%, 0.46%, 0.45%, 0.45%, 0.45% and 0.45%. |
| ‡‡ | Amount presented represents impact on expense ratio from tax benefit or expense. Includes amount of tax benefit or expense associated with expenses. Including amount of tax benefit or expense associated for all components of the Statement of Operations, the impact would be (2.29)%. |
| @ | Effective for the fiscal year ended November 30, 2022, the Fund began presenting acquired fund fees borne by the Adviser as part of its unitary fee agreement (See Note 3 in Notes to Financial Statements) as a realized gain on the Statement of Operations as compared to a contra-expense as in prior fiscal years. If such amounts had been presented as a realized gain in the year ended November 30, 2021 (first year of this agreement), the ratio of Expenses to Average Net Assets would have been 0.70%. |
| # | Excludes fees and expenses incurred indirectly as a result of investments in underlying funds. |
| ^ | Effective September 28, 2021, the fund's fees were permanently lowered to 0.50%. |
| (1) | Per share amounts have been adjusted for a 1 for 6 reverse stock split on April 28, 2020 (See Note 9 in the Notes to Financial Statements). |
| (2) | Per share amounts have been adjusted for a 1 for 3 reverse share split on April 28, 2020. (See Note 9 in Notes to Financial Statements.) |
Amounts designated as “—” are either $0 or have been rounded to $0.
Total from Distributions ($) | | | Net Asset Value, End of Period ($) | | | Total Return (%)** | | | Net Assets End of Period ($) (000) | | | Ratio of Expenses to Average Net Assets (%) | | | Tax Expense (%) | | | Ratio of Net Investment Income (Loss) to Average Net Assets (%) | | | Portfolio Turnover (%)†† | |
| | (1.61 | ) | | | 41.59 | | | | 0.53 | | | | 1,344,112 | | | | 0.44 | †‡ | | | (0.01 | ) | | | (0.06 | )† | | | 9.03 | |
| | (3.02 | ) | | | 42.99 | | | | 37.69 | | | | 1,378,279 | | | | 0.44 | ‡ | | | (0.01 | )‡‡ | | | (0.04 | ) | | | 47.13 | |
| | (3.05 | ) | | | 33.59 | | | | 37.49 | | | | 992,935 | | | | 0.43 | ‡ | | | (0.02 | ) | | | (0.19 | ) | | | 33.79 | |
| | (3.80 | ) | | | 26.73 | | | | (30.51 | ) | | | 687,577 | | | | 0.46 | ‡ | | | 0.46 | | | | (0.85 | ) | | | 33.78 | |
| | (4.32 | ) | | | 43.92 | | | | (6.54 | ) | | | 947,045 | | | | 0.46 | ‡ | | | — | | | | (0.46 | ) | | | 55.65 | |
| | (4.62 | ) | | | 51.24 | | | | (1.72 | ) | | | 828,622 | | | | 0.45 | ‡ | | | — | | | | (0.45 | ) | | | 30.35 | |
| | | | | | | | | | | | | | | | | | | | | | | | | | | | | | | |
| | (1.13 | ) | | | 38.56 | | | | (8.81 | ) | | | 886,826 | | | | 0.45 | † | | | — | | | | 0.38 | † | | | 6.66 | |
| | (2.15 | ) | | | 43.47 | | | | 31.26 | | | | 1,090,000 | | | | 0.45 | | | | — | | | | 1.85 | | | | 23.48 | |
| | (2.09 | ) | | | 34.89 | | | | 39.64 | | | | 738,092 | | | | 0.45 | | | | — | | | | 1.25 | | | | 16.88 | |
| | (2.24 | ) | | | 26.59 | | | | (13.34 | ) | | | 538,344 | | | | 0.45 | | | | — | | | | 2.66 | | | | 35.86 | |
| | (2.19 | ) | | | 33.45 | | | | (2.34 | ) | | | 612,300 | | | | 0.45 | | | | — | | | | 3.03 | | | | 36.57 | |
| | (1.95 | ) | | | 36.39 | | | | (0.43 | ) | | | 540,381 | | | | 0.45 | | | | — | | | | 2.65 | | | | 25.68 | |
| | | | | | | | | | | | | | | | | | | | | | | | | | | | | | | |
| | (0.40 | ) | | | 11.09 | | | | 0.62 | | | | 36,807 | | | | 0.50 | † | | | — | | | | 2.30 | † | | | 0.18 | |
| | (0.90 | ) | | | 11.42 | | | | (6.64 | ) | | | 37,216 | | | | 0.50 | # | | | — | | | | 5.03 | | | | 18.10 | |
| | (0.89 | ) | | | 13.16 | | | | 22.52 | | | | 35,921 | | | 0.63 | #^@ | | | — | | | | 3.77 | | | | 86.85 | |
| | (1.25 | ) | | | 11.51 | | | | (13.13 | ) | | | 19,573 | | | | 0.75 | # | | | — | | | | 5.61 | | | | 52.78 | |
| | (1.16 | ) | | | 14.74 | | | | 9.89 | | | | 28,012 | | | | 0.75 | # | | | — | | | | 6.39 | | | | 18.16 | |
| | (1.16 | ) | | | 14.52 | | | | 1.89 | | | | 16,698 | | | | 0.75 | # | | | — | | | | 6.19 | | | | 18.32 | |
|
| Financial Highlights |
| Selected Per Share Data & Ratios |
| For a Share Outstanding Throughout the Period |
| | | Net Asset Value, Beginning of Period ($) | | | Net Investment Income ($)* | | | Net Realized and Unrealized Gain (Loss) on Investments ($) | | | Total from Operations ($) | | | Distribution from Net Investment Income ($) | | | Distribution from Capital Gains ($) | | | Return of Capital ($) | |
| Global X Concious Companies ETF |
| 2023 (Unaudited) | | | 29.52 | | | | 0.19 | | | | (0.13 | ) | | | 0.06 | | | | (0.12 | ) | | | — | | | | — | |
| 2022 | | | 32.97 | | | | 0.31 | | | | (3.40 | ) | | | (3.09 | ) | | | (0.36 | ) | | | — | | | | — | |
| 2021 | | | 26.46 | | | | 0.31 | | | | 6.49 | | | | 6.80 | | | | (0.29 | ) | | | — | | | | — | |
| 2020 | | | 23.10 | | | | 0.33 | | | | 3.32 | | | | 3.65 | | | | (0.27 | ) | | | (0.02 | ) | | | — | |
| 2019 | | | 20.55 | | | | 0.37 | | | | 2.68 | | | | 3.05 | | | | (0.50 | ) | | | — | | | | — | |
| 2018 | | | 19.23 | | | | 0.33 | | | | 1.22 | | | | 1.55 | | | | (0.23 | ) | | | — | | | | — | |
| Global X Founder-Run Companies ETF | |
| 2023 (Unaudited) | | | 24.18 | | | | 0.02 | | | | 0.98 | | | | 1.00 | | | | (0.09 | ) | | | — | | | | — | |
| 2022 | | | 34.44 | | | | 0.07 | | | | (10.26 | ) | | | (10.19 | ) | | | (0.07 | ) | | | — | | | | — | |
| 2021 | | | 28.66 | | | | 0.18 | | | | 5.94 | | | | 6.12 | | | | (0.34 | ) | | | — | | | | — | |
| 2020 | | | 20.50 | | | | 0.09 | | | | 8.14 | | | | 8.23 | | | | (0.07 | ) | | | — | | | | — | |
| 2019 | | | 18.63 | | | | 0.05 | | | | 2.12 | | | | 2.17 | | | | (0.07 | ) | | | (0.23 | ) | | | — | |
| 2018 | | | 17.41 | | | | 0.04 | | | | 1.45 | | | | 1.49 | | | | (0.04 | ) | | | (0.23 | ) | | | — | |
| Global X U.S. Preferred ETF | |
| 2023 (Unaudited) | | | 20.51 | | | | 0.61 | | | | (1.22 | ) | | | (0.61 | ) | | | (0.63 | ) | | | — | | | | — | |
| 2022 | | | 25.21 | | | | 1.23 | | | | (4.64 | ) | | | (3.41 | ) | | | (1.29 | ) | | | — | | | | — | |
| 2021 | | | 25.36 | | | | 1.28 | | | | (0.12 | ) | | | 1.16 | | | | (1.31 | ) | | | — | | | | — | |
| 2020 | | | 24.79 | | | | 1.33 | | | | 0.58 | | | | 1.91 | | | | (1.34 | ) | | | — | | | | — | |
| 2019 | | | 22.97 | | | | 1.36 | | | | 1.83 | | | | 3.19 | | | | (1.37 | ) | | | — | | | | — | |
| 2018 | | | 25.03 | | | | 1.44 | | | | (2.08 | ) | | | (0.64 | ) | | | (1.42 | ) | | | — | | | | — | |
| * | Per share data calculated using average shares method. |
| ** | Total Return is for the period indicated and has not been annualized. The return shown does not reflect the deduction of taxes that a shareholder would pay on Fund distributions or the redemption of Fund shares. |
| † | Annualized. |
| †† | Portfolio turnover rate is for the period indicated and periods of less than one year have not been annualized. Excludes effect of in-kind transfers. |
| ^^ | Effective April 1, 2020, until April 1, 2021, the ratio of Expenses to Average Net Assets included the effect of a waiver. If these offsets were excluded, the ratio would have been 0.23%. |
Amounts designated as “—” are either $0 or have been rounded to $0.
Total from Distributions ($) | | | |
Net Asset Value, End of Period ($) | | | | Total Return (%)** | | | | Net Assets End of Period ($) (000 | | Ratio of Expenses to Average Net Assets (%) | | Ratio of Net Investment Income to Average Net Assets (%) | | | Portfolio Turnover (%)†† | |
| (0.12 | ) | | | 29.46 | | | | 0.24 | | | | 637,026 | | 0.43 | † | 1.29 | † | | 7.60 | |
| (0.36 | ) | | | 29.52 | | | | (9.45 | ) | | | 673,733 | | 0.43 | | 1.06 | | | 31.92 | |
| (0.29 | ) | | | 32.97 | | | | 25.84 | | | | 654,764 | | 0.43 | | 1.00 | | | 22.92 | |
| (0.29 | ) | | | 26.46 | | | | 16.01 | | | | 403,499 | | 0.43 | | 1.45 | | | 48.73 | |
| (0.50 | ) | | | 23.10 | | | | 15.35 | | | | 85,459 | | 0.43 | | 1.73 | | | 34.97 | |
| (0.23 | ) | | | 20.55 | | | | 8.16 | | | | 56,504 | | 0.43 | | 1.65 | | | 36.35 | |
| | | | | | | | | | | | | | | | | | | | | |
| (0.09 | ) | | | 25.09 | | | | 4.20 | | | | 6,272 | | 0.45 | † | 0.13 | † | | 30.13 | |
| (0.07 | ) | | | 24.18 | | | | (29.64 | ) | | | 7,979 | | 0.45 | | 0.25 | | | 33.97 | |
| (0.34 | ) | | | 34.44 | | | | 21.51 | | | | 15,842 | | 0.45 | | 0.54 | | | 47.49 | |
| (0.07 | ) | | | 28.66 | | | | 40.29 | | | | 5,732 | | 0.45 | | 0.39 | | | 31.51 | |
| (0.30 | ) | | | 20.50 | | | | 12.05 | | | | 4,100 | | 0.52 | | 0.29 | | | 33.82 | |
| (0.27 | ) | | | 18.63 | | | | 8.67 | | | | 4,657 | | 0.65 | | 0.13 | | | 25.22 | |
| | | | | | | | | | | | | | | | | | | | | |
| (0.63 | ) | | | 19.27 | | | | (3.06 | ) | | | 2,231,603 | | 0.23 | † | 6.10 | † | | 17.47 | |
| (1.29 | ) | | | 20.51 | | | | (13.82 | ) | | | 2,214,461 | | 0.23 | | 5.51 | | | 33.20 | |
| (1.31 | ) | | | 25.21 | | | | 4.61 | | | | 2,458,022 | | 0.23 | ^^ | 4.99 | | | 47.89 | |
| (1.34 | ) | | | 25.36 | | | | 8.13 | | | | 868,550 | | 0.23 | ^^ | 5.49 | | | 39.14 | |
| (1.37 | ) | | | 24.79 | | | | 14.25 | | | | 585,150 | | 0.24 | | 5.57 | | | 32.93 | |
| (1.42 | ) | | | 22.97 | | | | (2.72 | ) | | | 188,314 | | 0.23 | | 5.98 | | | 42.90 | |
|
| Financial Highlights |
| Selected Per Share Data & Ratios |
| For a Share Outstanding Throughout the Period |
| | | Net Asset Value, Beginning of Period ($) | | | Net Investment Income ($)* | | | Net Realized and Unrealized Gain (Loss) on Investments ($) | | | Total from Operations ($) | | | Distribution from Net Investment Income ($) | | | Distribution from Capital Gains ($) | | | Return of Capital ($) | |
| Global X S&P 500® Quality Dividend ETF |
| 2023 (Unaudited) | | | 33.24 | | | | 0.50 | | | | (3.40 | ) | | | (2.90 | ) | | | (0.52 | ) | | | — | | | | — | |
| 2022 | | | 31.02 | | | | 1.03 | | | | 2.10 | | | | 3.13 | | | | (0.91 | ) | | | — | | | | — | |
| 2021 | | | 25.20 | | | | 0.78 | | | | 5.84 | | | | 6.62 | | | | (0.80 | ) | | | — | | | | — | |
| 2020 | | | 26.51 | | | | 0.75 | | | | (1.24 | ) | | | (0.49 | ) | | | (0.82 | ) | | | — | | | | — | *** |
| 2019 | | | 24.60 | | | | 0.75 | | | | 1.89 | | | | 2.64 | | | | (0.73 | ) | | | — | | | | — | |
2018 (1) | | | 25.00 | | | | 0.26 | | | | (0.44 | ) | | | (0.18 | ) | | | (0.22 | ) | | | — | | | | — | |
| Global X Adaptive U.S. Factor ETF | |
| 2023 (Unaudited) | | | 32.23 | | | | 0.29 | | | | (2.63 | ) | | | (2.34 | ) | | | (0.37 | ) | | | — | | | | — | |
| 2022 | | | 29.86 | | | | 0.62 | | | | 2.50 | | | | 3.12 | | | | (0.71 | ) | | | — | | | | (0.04 | ) |
| 2021 | | | 24.91 | | | | 0.61 | | | | 5.09 | | | | 5.70 | | | | (0.70 | ) | | | — | | | | (0.05 | ) |
| 2020 | | | 25.79 | | | | 0.63 | | | | (0.67 | ) | | | (0.04 | ) | | | (0.70 | ) | | | (0.05 | ) | | | (0.09 | ) |
| 2019 | | | 24.39 | | | | 0.89 | | | | 1.53 | | | | 2.42 | | | | (1.02 | ) | | | — | *** | | | — | |
2018 (2) | | | 25.00 | | | | 0.22 | | | | (0.61 | ) | | | (0.39 | ) | | | (0.19 | ) | | | — | | | | (0.03 | ) |
| Global X Variable Rate Preferred ETF | |
| 2023 (Unaudited) | | | 23.55 | | | | 0.76 | | | | (1.43 | ) | | | (0.67 | ) | | | (0.75 | ) | | | — | | | | — | |
| 2022 | | | 27.28 | | | | 1.45 | | | | (3.70 | ) | | | (2.25 | ) | | | (1.39 | ) | | | (0.02 | ) | | | (0.07 | ) |
| 2021 | | | 26.97 | | | | 1.40 | | | | 0.37 | | | | 1.77 | | | | (1.29 | ) | | | (0.02 | ) | | | (0.15 | ) |
2020 (3) | | | 24.85 | | | | 0.61 | | | | 2.00 | | | | 2.61 | | | | (0.49 | ) | | | — | | | | — | |
| Global X Adaptive U.S. Risk Management ETF | |
| 2023 (Unaudited) | | | 28.26 | | | | 0.27 | | | | (0.43 | ) | | | (0.16 | ) | | | (0.33 | ) | | | — | | | | — | |
| 2022 | | | 29.88 | | | | 0.40 | | | | (1.71 | ) | | | (1.31 | ) | | | (0.31 | ) | | | — | | | | — | |
2021 (4) | | | 24.95 | | | | 0.25 | | | | 4.77 | | | | 5.02 | | | | (0.09 | ) | | | — | | | | — | |
| * | Per share data calculated using average shares method. |
| ** | Total Return is for the period indicated and has not been annualized. The return shown does not reflect the deduction of taxes that a shareholder would pay on Fund distributions or the redemption of Fund shares. |
| *** | Amount is less than $0.005. |
| † | Annualized. |
| †† | Portfolio turnover rate is for the period indicated and periods of less than one year have not been annualized. Excludes effect of in-kind transfers. |
| ‡ | Effective April 1, 2019, the Fund's fees were permanently lowered to 0.20%. Prior to April 1, 2019, the ratio of Expenses to Average Net Assets included the effect of a waiver. If these offsets were excluded, the ratio would have been 0.31% for the year ended November 30, 2019. |
| (1) | The Fund commenced operations on July 13, 2018. |
| (2) | The Fund commenced operations on August 24, 2018. |
| (3) | The Fund commenced operations on June 22, 2020. |
| (4) | The Fund commenced operations on January 12, 2021. |
Amounts designated as “—” are either $0 or have been rounded to $0.
Total from Distributions ($) | | | | Net Asset Value, End of Period ($) | | | | Total Return (%)** | | | | Net Assets End of Period ($) (000) | | Ratio of Expenses to Average Net Assets (%) | | Ratio of Net Investment Income to Average Net Assets (%) | | | Portfolio Turnover (%)†† | |
| (0.52 | ) | | | 29.82 | | | | (8.80 | ) | | | 68,588 | | 0.20 | † | 3.17 | † | | 31.53 | |
| (0.91 | ) | | | 33.24 | | | | 10.25 | | | | 61,156 | | 0.20 | | 3.24 | | | 78.73 | |
| (0.80 | ) | | | 31.02 | | | | 26.45 | | | | 9,615 | | 0.20 | | 2.60 | | | 70.66 | |
| (0.82 | ) | | | 25.20 | | | | (1.47 | ) | | | 6,300 | | 0.20 | | 3.27 | | | 93.40 | |
| (0.73 | ) | | | 26.51 | | | | 11.01 | | | | 9,278 | | 0.28 | ‡
| 2.99 | | | 49.18 | |
| (0.22 | ) | | | 24.60 | | | | (0.72 | ) | | | 2,460 | | 0.36 | † | 2.70 | † | | 1.18 | |
| | | | | | | | | | | | | | | | | | | | | |
| (0.37 | ) | | | 29.52 | | | | (7.29 | ) | | | 159,700 | | 0.27 | † | 1.90 | † | | 92.10 | |
| (0.75 | ) | | | 32.23 | | | | 10.61 | | | | 178,533 | | 0.27 | | 2.03 | | | 115.74 | |
| (0.75 | ) | | | 29.86 | | | | 23.01 | | | | 172,008 | | 0.27 | | 2.09 | | | 96.21 | |
| (0.84 | ) | | | 24.91 | | | | 0.14 | | | | 144,484 | | 0.27 | | 2.78 | | | 159.91 | |
| (1.02 | ) | | | 25.79 | | | | 10.27 | | | | 189,564 | | 0.27 | | 3.63 | | | 112.43 | |
| (0.22 | ) | | | 24.39 | | | | (1.58 | ) | | | 102,438 | | 0.27 | † | 3.31 | † | | 28.89 | |
| | | | | | | | | | | | | | | | | | | | | |
| (0.75 | ) | | | 22.13 | | | | (2.95 | ) | | | 235,227 | | 0.25 | † | 6.67 | † | | 44.75 | |
| (1.48 | ) | | | 23.55 | | | | (8.40 | ) | | | 285,389 | | 0.25 | | 5.93 | | | 74.41 | |
| (1.46 | ) | | | 27.28 | | | | 6.60 | | | | 89,217 | | 0.25 | | 5.01 | | | 26.17 | |
| (0.49 | ) | | | 26.97 | | | | 10.59 | | | | 1,349 | | 0.25 | † | 5.38 | † | | 10.96 | |
| | | | | | | | | | | | | | | | | | | | | |
| (0.33 | ) | | | 27.77 | | | | (0.52 | ) | | | 71,936 | | 0.42 | † | 1.95 | † | | 389.82 | |
| (0.31 | ) | | | 28.26 | | | | (4.28 | ) | | | 66,408 | | 0.39 | | 1.49 | | | 1481.94 | |
| (0.09 | ) | | | 29.88 | | | | 20.13 | | | | 104,574 | | 0.39 | † | 1.01 | † | | 30.10 | |
|
| Notes to Financial Statements |
| May 31, 2023 (Unaudited) |
1. ORGANIZATION
The Global X Funds (the “Trust”) is a Delaware statutory trust formed on March 6, 2008. The Trust is registered under the Investment Company Act of 1940, as amended, (the “1940 Act”) as an open-end management investment company. As of May 31, 2023, the Trust had one hundred and nineteen portfolios, one hundred and six of which were operational. The financial statements herein and the related notes pertain to the Global X MLP ETF, Global X MLP & Energy Infrastructure ETF, Global X Alternative Income ETF (formerly, Global X SuperDividend® Alternatives ETF), Global X Conscious Companies ETF, Global X Founder-Run Companies ETF, Global X U.S. Preferred ETF, Global X S&P 500® Quality Dividend ETF, Global X Adaptive U.S. Factor ETF, Global X Variable Rate Preferred ETF and Global X Adaptive U.S. Risk Management ETF (each a “Fund” and collectively, the “Funds”). Each Fund, other than the Global X Alternative Income ETF, Global X Conscious Companies ETF, Global X Founder-Run Companies ETF and Global X U.S. Preferred ETF, has elected non-diversified status under the 1940 Act.
2. SIGNIFICANT ACCOUNTING POLICIES
The following is a summary of the significant accounting policies followed by the Funds: USE OF ESTIMATES – The Funds are investment companies that apply the accounting and reporting guidance issued in Topic 946 by the U.S. Financial Accounting Standards Board. The preparation of financial statements in conformity with U.S. generally accepted accounting principles ("U.S. GAAP") requires management to make estimates and assumptions that affect the reported amounts of assets and liabilities and disclosure of contingent assets and liabilities at the date of the financial statements and the reported amounts of increases and decreases in net assets from operations during the reporting period. Actual results could materially differ from those estimates.
RETURN OF CAPITAL ESTIMATES – Distributions received by the Funds from underlying master limited partnership (“MLP”) and real estate investment trust (“REIT”) investments generally are comprised of income and return of capital. The Funds record investment income and return of capital based on estimates made at the time such distributions are received. Such estimates are based on historical information available from the MLPs, REITs and other industry sources. These estimates may subsequently be revised based on information received from the MLPs and REITs after their tax reporting periods are concluded.
MLPs – Certain Funds may invest in MLPs. MLPs are publicly-traded partnerships engaged in the transportation, storage and processing of minerals and natural resources. By confining their operations to these specific activities, their interests, or units, are able to trade on public securities exchanges exactly like the shares of a corporation, without entity-level taxation. To qualify as an MLP, and to not be taxed as a corporation, a partnership must receive at least 90% of its income from qualifying sources as set forth in Section 7704(d) of the Internal Revenue Code of 1986, as amended (the “Code”). These qualifying
|
| Notes to Financial Statements (Continued) |
| May 31, 2023 (Unaudited) |
2. SIGNIFICANT ACCOUNTING POLICIES (continued)
sources include natural resource-based activities, such as the processing, transportation and storage of mineral or natural resources. MLPs generally have two classes of owners, the general partner and limited partners. The general partner of an MLP is typically owned by a major energy company, an investment fund, the direct management of the MLP, or is an entity owned by one or more of such parties. The general partner may be structured as a private or publicly-traded corporation or other entity. The general partner typically controls the operations and management of the MLP through an up to 2% equity interest in the MLP plus, in many cases, ownership of common units and subordinated units.
Limited partners typically own the remainder of the partnership, through ownership of common units, and have a limited role in the partnership’s operations and management. MLPs are typically structured such that common units and general partner interests have first priority to receive quarterly cash distributions up to an established minimum amount (“minimum quarterly distributions” or “MQD”). Common and general partner interests also accrue arrearages in distributions to the extent the MQD is not paid. Once common and general partner interests have been paid, subordinated units receive distributions of up to the MQD; however, subordinated units do not accrue arrearages. Distributable cash in excess of the MQD is paid to both common and subordinated units and is distributed to both common and subordinated units generally on a pro rata basis. The general partner is also eligible to receive incentive distributions if the general partner operates the business in a manner which results in distributions paid per common unit surpassing specified target levels. As the general partner increases cash distributions to the limited partners, the general partner receives an increasingly higher percentage of the incremental cash distributions.
SECURITY VALUATION - Securities listed on a securities exchange, market or automated quotation system for which quotations are readily available (except for securities traded on the NASDAQ Stock Market (“NASDAQ”)), including securities traded over the counter, are valued at the last quoted sale price on the primary exchange or market (foreign or domestic) on which they are traded (or at approximately 4:00 pm Eastern Standard Time if a security’s primary exchange is normally open at that time), or, if there is no such reported sale, at the most recent mean between the quoted bid and asked prices, which approximates fair value (absent both bid and asked prices on such exchange, the bid price may be used).
For securities traded on NASDAQ, the NASDAQ Official Closing Price will be used. The prices for foreign securities are reported in local currencies and converted to U.S. dollars using currencies exchange rates as of the reporting date. The exchange rates used by the Trust for valuation are captured as of the New York or London close each day.
Securities for which market prices are not "readily available" are valued in accordance with fair value procedures (the “Fair Value Procedures”) established by Global X Management Company LLC, the Funds' investment adviser (the "Adviser"), and approved by the Board of Trustees (the “Board”) of the Trust. Pursuant to Rule 2a-5 under the 1940 Act, the
|
| Notes to Financial Statements (Continued) |
| May 31, 2023 (Unaudited) |
2. SIGNIFICANT ACCOUNTING POLICIES (continued)
Board has designated the Adviser as the "valuation designee" to determine the fair value of securities and other instruments for which no readily available market quotations are available. The Fair Value Procedures are implemented through a Fair Value Committee (the “Committee”) of the Adviser. Some of the more common reasons that may necessitate that a security be valued using the Fair Value Procedures include: the security's trading has been halted or suspended; the security has been de-listed from its primary trading exchange; the security's primary trading market is temporarily closed at a time when, under normal conditions, it would be open; the security has not been traded for an extended period of time; the security's primary pricing source is not able or willing to provide a price; or trading of the security is subject to local government-imposed restrictions. In addition, each Fund may fair value a security if an event that may materially affect the value of a Fund’s security that traded outside of the United States (a “Significant Event”) has occurred between the time of the security’s last close and the time that each Fund calculates its net asset value (“NAV”). A Significant Event may relate to a single issuer or to an entire market sector. Events that may be Significant Events include: government actions, natural disasters, armed conflict, acts of terrorism and significant market fluctuations. If the Adviser becomes aware of a Significant Event that has occurred with respect to a security or group of securities after the closing of the exchange or market on which the security or securities principally trade, but before the time at which the Funds calculate their NAVs, it may request that a Committee meeting be called. When a security is valued in accordance with the Fair Value Procedures, the Committee will determine the value after taking into consideration all relevant information reasonably available to the Committee. As of May 31, 2023, there were no securities priced using the Fair Value Procedures.
If available, debt securities are priced based upon valuations provided by independent, third-party pricing agents. Such values generally reflect the last reported sales price if the security is actively traded. The third-party pricing agents may also value debt securities at an evaluated bid price by employing methodologies that utilize actual market transactions, broker-supplied valuations, or other methodologies designed to identify the market value for such securities. Debt obligations with remaining maturities of sixty days or less will be valued at their market value. Prices for most securities held by the Funds are provided daily by recognized independent pricing agents. If a security price cannot be obtained from an independent, third-party pricing agent, the Funds seek to obtain a bid price from at least one independent broker.
In accordance with the authoritative guidance on fair value measurements and disclosure under U.S. GAAP, the Funds disclose the fair value of their investments in a hierarchy that prioritizes the inputs to valuation techniques used to measure the fair value. The objective of a fair value measurement is to determine the price that would be received upon the sale of an asset or paid to transfer a liability in an orderly transaction between market participants at the measurement date (an exit price). Accordingly, the fair value hierarchy gives the highest priority to quoted prices (unadjusted) in active markets for identical assets
|
| Notes to Financial Statements (Continued) |
| May 31, 2023 (Unaudited) |
2. SIGNIFICANT ACCOUNTING POLICIES (continued)
or liabilities (Level 1) and the lowest priority to unobservable inputs (Level 3). The three levels of the fair value hierarchy are described below:
Level 1 – Unadjusted quoted prices in active markets for identical, unrestricted assets or liabilities that the Funds have the ability to access at the measurement date;
Level 2 – Other significant observable inputs (including quoted prices in non-active markets, quoted prices for similar investments and fair value of investments for which the Funds have the ability to fully redeem tranches at NAV as of the measurement date or within the near term, and short-term investments valued at amortized cost); and
Level 3 – Significant unobservable inputs (including the Funds’ own assumptions in determining the fair value of investments, and fair value of investments for which the Funds do not have the ability to fully redeem tranches at NAV as of the measurement date or within the near term).
Investments are classified within the level of the lowest significant input considered in determining fair value. Investments classified within Level 3 whose fair value measurement considers several inputs may include Level 1 or Level 2 inputs as components of the overall fair value measurement. For details of the investment classification, reference the Schedule of Investments.
The unobservable inputs used to determine fair value of Level 3 assets may have similar or diverging impacts on valuation. Significant increases and decreases in these inputs in isolation and interrelationships between those inputs could result in significantly higher or lower fair value measurement.
DUE TO/FROM BROKERS – Due to/from brokers includes cash and collateral balances with the Funds’ clearing brokers or counterparties as of May 31, 2023. The Funds continuously monitor the credit standing of each broker or counterparty with whom they conduct business. In the event a broker or counterparty is unable to fulfill its obligations, the Funds would be subject to counterparty credit risk.
REPURCHASE AGREEMENTS – Securities pledged as collateral for repurchase agreements by BNP Paribas are held by Brown Brothers Harriman & Co. (“BBH”), the Funds’ custodian (“Custodian”) and are designated as being held on each Fund’s behalf by the Custodian under a book-entry system. Each Fund monitors the adequacy of the collateral on a daily basis and can require the seller to provide additional collateral in
|
| Notes to Financial Statements (Continued) |
| May 31, 2023 (Unaudited) |
2. SIGNIFICANT ACCOUNTING POLICIES (continued)
the event the market value of the securities pledged falls below the carrying value of the repurchase agreement, including accrued interest.
It is the Funds’ policy to only enter into repurchase agreements with banks and other financial institutions which are deemed by the Adviser to be creditworthy. The Funds bear the risk of loss in the event that the counterparty to a repurchase agreement defaults on its obligations, and the Funds are prevented from exercising their rights to dispose of the underlying securities received as collateral. For financial statement purposes, the Funds record the securities lending collateral (included in repurchase agreements, at value or restricted cash) as an asset and the obligation to return securities lending collateral as a liability on the Statements of Assets and Liabilities.
Repurchase agreements are entered into by the Funds under Master Repurchase Agreements (“MRA”) which permit the Funds, under certain circumstances, including an event of default (such as bankruptcy or insolvency), to offset payables and/or receivables under an MRA with collateral held and/or posted to the counterparty, and create one single net payment due to or from the Funds.
As of May 31, 2023, the open repurchase agreements by counterparty which are subject to an MRA on a net payment basis are as follows:
| | | Repurchase Agreements* | | | Fair Value of Non-Cash Collateral Received(1) | | Cash Collateral Received | | Net Amount(2) | |
| | | | | | | |
| | | | | | | |
| | | | | | | |
| Global X MLP & Energy Infrastructure ETF | | | | | | | | | | |
| BNP Paribas | | $ | 772,224 | | | $ | 772,224 | | $ | - | | $ | - | |
| Global X Alternative Income ETF | | | | | | | | | | | | | | |
| BNP Paribas | | | 431,391 | | | | 431,391 | | | - | | | - | |
| Global X U.S. Preferred ETF | | | | | | | | | | | | | | |
| BNP Paribas | | | 24,690,452 | | | | 24,690,452 | | | - | | | - | |
* Repurchase agreements with an overnight and continuous maturity.
(1) Excess collateral received is not presented in the table above. Please refer to the Schedule of Investments for the market value of the collateral received for each Fund.
(2) Net Amount represents the net amount receivable due from the counterparty in the event of default.
|
| Notes to Financial Statements (Continued) |
| May 31, 2023 (Unaudited) |
2. SIGNIFICANT ACCOUNTING POLICIES (continued)
FEDERAL INCOME TAXES – It is each Fund’s intention, except for Global X MLP ETF, to qualify, or to continue to qualify, as a regulated investment company for Federal income tax purposes by complying with the appropriate provisions of Subchapter M of the Code. Accordingly, no provisions for Federal income taxes have been made in the financial statements, except for Global X MLP ETF as described below.
The Funds evaluate tax positions taken or expected to be taken in the course of preparing the Funds’ tax returns to determine whether it is “more-likely-than-not” (i.e., greater than 50%) that each tax position will be sustained upon examination by a taxing authority based on the technical merits of the position. Tax positions not deemed to meet the more-likely-than-not threshold are recorded as a tax benefit or expense in the current year. The Funds did not record any tax positions in the current period; however, Management’s conclusions regarding tax positions may be subject to review and adjustment at a later date based on factors including, but not limited to, examination by tax authorities (i.e., the last three tax year ends, as applicable), and on-going analysis of and changes to tax laws and regulations, and interpretations thereof. If a Fund has foreign tax filings that have not been made, the tax years that remain subject to examination may date back to the inception of the Fund.
As of and during the reporting period ended May 31, 2023, the Funds did not have a liability for any unrecognized tax benefits. The Funds recognize interest and penalties, if any, related to unrecognized tax benefits as an income tax expense on the Statements of Operations. During the reporting period, the Funds did not incur any interest or penalties. The Funds are also not aware of any tax positions for which it is reasonably possible that the total amounts of unrecognized tax benefits will significantly change in the next 12 months.
Global X MLP ETF is taxed as a regular C-corporation for Federal income tax purposes and as such is obligated to pay Federal and applicable state corporate income tax. Currently, the Federal income tax rate for a corporation is 21%. This differs from most investment companies, which elect to be treated as “regulated investment companies” under Subchapter M of the Code in order to avoid paying entity level income taxes. Under current law, Global X MLP ETF is not eligible to elect treatment as a regulated investment company due to its investments primarily in MLPs invested in energy assets. As a result, Global X MLP ETF will be obligated to pay applicable Federal and state corporate income taxes on its taxable income as opposed to most other investment companies, which are not so obligated. Global X MLP ETF expects that a portion of the distributions that are received from MLPs may be treated as a tax-deferred return of capital, thus reducing Global X MLP ETF’s current tax liability. However, the amount of taxes currently paid by Global X MLP ETF will vary depending on the amount of income and gains derived from investments and/or sales of MLP interests and such taxes have the potential to reduce an investor’s return from an investment in Global X MLP ETF.
|
| Notes to Financial Statements (Continued) |
| May 31, 2023 (Unaudited) |
2. SIGNIFICANT ACCOUNTING POLICIES (continued)
SECURITY TRANSACTIONS AND INVESTMENT INCOME – Security transactions are accounted for on the trade date for financial reporting purposes. Costs used in determining realized gains and losses on the sale of investment securities are based on specific identification. Dividend income is recorded on the ex-dividend date. Interest income is recognized on the accrual basis from the settlement date. Amortization of premiums and accretion of discounts is included in interest income.
FOREIGN CURRENCY TRANSACTIONS AND TRANSLATION – The books and records of the Funds are maintained in U.S. dollars. Investment securities and other assets and liabilities denominated in a foreign currency are translated into U.S. dollars on the date of valuation. Purchases and sales of investment securities, income and expenses are translated into U.S. dollars at the relevant rates of exchange prevailing on the respective dates of such transactions. The Funds do not isolate that portion of realized or unrealized gains and losses resulting from changes in the foreign exchange rate from fluctuations arising from changes in the market prices of the securities. These gains and losses are included in net realized and unrealized gains and losses on investments on the Statements of Operations. Net realized and unrealized gains and losses on foreign currency transactions and translations represent net foreign exchange gains or losses from foreign currency spot contracts, disposition of foreign currencies, currency gains or losses realized between trade and settlement dates on securities transactions and the difference between the amount of the investment income and foreign withholding taxes recorded on the Funds’ books and the U.S. dollar equivalent amounts actually received or paid.
DIVIDENDS AND DISTRIBUTIONS TO SHAREHOLDERS – The Funds distribute their net investment income on a pro rata basis. Any net investment income and net realized capital gains are distributed at least annually. All distributions are recorded on the ex-dividend date.
Cash distributions from MLPs to Global X MLP ETF that exceed the Global X MLP ETF’s allocable share of such MLP’s net taxable income are considered tax-deferred return of capital that will reduce Global X MLP ETF’s adjusted tax basis in the equity securities of the MLP. These reductions in Global X MLP ETF’s adjusted tax basis in MLP equity securities will increase the amount of gain (or decrease the amount of loss) recognized by Global X MLP ETF on a subsequent sale of the securities. Global X MLP ETF will accrue deferred income taxes for any future tax liability associated with (i) that portion of MLP distributions considered to be a tax-deferred return of capital as well as (ii) capital appreciation of its investments. Upon the sale of an MLP security, Global X MLP ETF may be liable for previously deferred taxes. Global X MLP ETF will rely to some extent on information provided by the MLPs, which may not necessarily be timely, to estimate deferred tax liability for purposes of financial statement reporting and determining Global X MLP ETF’s NAV. From time to time, the Adviser will modify the estimates or assumptions related to Global X MLP ETF’s deferred tax liabilities as new information
|
| Notes to Financial Statements (Continued) |
| May 31, 2023 (Unaudited) |
2. SIGNIFICANT ACCOUNTING POLICIES (continued)
becomes available. Global X MLP ETF will generally compute deferred income taxes based on the Federal income tax rate applicable to corporations and an estimated rate attributable to state taxes.
INVESTMENTS IN REITs – With respect to the Funds, dividend income is recorded based on the income included in distributions received from REIT investments using published REIT reclassifications, including some management estimates when actual amounts are not available. Distributions received in excess of these estimated amounts are recorded as a reduction of the cost of investments or reclassified to capital gains. The actual amounts of income, return of capital, and capital gains are only determined by each REIT after its fiscal year end, and may differ from the estimated amounts.
Global X Alternative Income ETF’s dividend income includes reclassifications of prior year and current year dividend income to return of capital/realized gain to align those income amounts to the character of those distributions. Those reclassifications exceeded current year dividend income resulting in a negative dividend income for the current fiscal year.
CASH OVERDRAFT CHARGES – Per the terms of an agreement with the Custodian, if a Fund has a cash overdraft on a given day, it will be assessed an overdraft charge of LIBOR plus 2.00%. Cash overdraft charges are included in custodian fees on the Statements of Operations.
CREATION UNITS – The Funds issue and redeem their shares (“Shares”) on a continuous basis at NAV and only in large blocks of 10,000 Shares, referred to as “Creation Units”. Purchasers of Creation Units (“Authorized Participants”) at NAV must pay a standard creation transaction fee per transaction. The fee is a single charge and will be the same regardless of the number of Creation Units purchased by an Authorized Participant on the same day.
An Authorized Participant who holds Creation Units and wishes to redeem at NAV would also pay a standard redemption fee per transaction to BBH, on the date of such redemption, regardless of the number of Creation Units redeemed that day. If a Creation Unit is purchased or redeemed for cash, an additional variable fee may be charged. The following table discloses the Creation Unit breakdown:
|
| Notes to Financial Statements (Continued) |
| May 31, 2023 (Unaudited) |
2. SIGNIFICANT ACCOUNTING POLICIES (continued)
| | | | Creation Unit Shares | | | | Creation Fee | | | | Value at May 31, 2023 | | | | Redemption
Fee | |
| Global X MLP ETF | | | 10,000 | | | $ | 100 | | | $ | 415,900 | | | $ | 100 | |
| Global X MLP & Energy Infrastructure ETF | | | 10,000 | | | | 250 | | | | 385,600 | | | | 250 | |
| Global X Alternative Income ETF | | | 10,000 | | | | 250 | | | | 110,900 | | | | 250 | |
| Global X Conscious Companies ETF | | | 10,000 | | | | 600 | | | | 294,600 | | | | 600 | |
| Global X Founder-Run Companies ETF | | | 10,000 | | | | 300 | | | | 250,900 | | | | 300 | |
| Global X U.S. Preferred ETF | | | 10,000 | | | | 650 | | | | 192,700 | | | | 650 | |
| Global X S&P 500AE Quality Dividend ETF | | | 10,000 | | | | 300 | | | | 298,200 | | | | 300 | |
| Global X Adaptive U.S. Factor ETF | | | 10,000 | | | | 600 | | | | 295,200 | | | | 600 | |
| Global X Variable Rate Preferred ETF | | | 10,000 | | | | 250 | | | | 221,300 | | | | 250 | |
| Global X Adaptive U.S. Risk Management ETF | | | 10,000 | | | | 1,300 | | | | 277,700 | | | | 1,300 | |
3. RELATED PARTY AND SERVICE PROVIDER TRANSACTIONS
On July 2, 2018, the Adviser consummated a transaction pursuant to which it became an indirect, wholly-owned subsidiary of Mirae Asset Global Investments Co., Ltd. (“Mirae”). In this manner, the Adviser is ultimately controlled by Mirae, which is a leading financial services company in Korea and is the headquarters for the Mirae Asset Global Investments Group.
The Adviser serves as the investment adviser and the administrator for the Funds. Subject to the supervision of the Board, the Adviser is responsible for managing the investment activities of the Funds and the Funds’ business affairs and other administrative matters and provides or causes to be furnished all supervisory, administrative and other services reasonably necessary for the operation of the Funds, including certain distribution services (provided pursuant to a separate distribution agreement), certain shareholder and distribution-related services (provided pursuant to a separate Rule 12b-1 Plan and related agreements) and investment advisory services (provided pursuant to a separate Investment Advisory Agreement), under what is essentially an "all-in" fee structure. For the Adviser’s services to the respective Funds, under a supervision and administration agreement (the "Supervision and Administration Agreement"), each Fund pays a monthly fee to the Adviser at the annual rate below (stated as a percentage of the average daily net assets of the respective Fund). In addition, the Funds bear other expenses, directly and indirectly, that are not covered by the Supervision and Administration Agreement, which may vary and affect the total expense ratios of the Funds, such as taxes, brokerage fees, commissions, custodian fees, acquired fund fees and expenses (except for the Global X Alternative Income ETF with respect to investment in affiliated investment companies), and other transaction expenses, interest expenses and extraordinary expenses (such as litigation and indemnification expenses).
The Supervision and Administration Agreement for the Global X Alternative Income ETF provides that the Adviser also bears the costs for acquired fund fees and expenses generated
|
| Notes to Financial Statements (Continued) |
| May 31, 2023 (Unaudited) |
3. RELATED PARTY AND SERVICE PROVIDER TRANSACTIONS (continued)
by investments by the Fund in affiliated investment companies. For the period ended May 31, 2023, the Adviser paid acquired fund fees and expenses of $68,375 and made such reimbursement payments to the Global X Alternative Income ETF on a monthly basis.
The following table discloses the supervision and administration fees payable pursuant to the Supervision and Administration Agreement:
| | | Supervision and | |
| | | Administration Fee | |
| Global X MLP ETF | | | 0.45 | % |
| Global X MLP & Energy Infrastructure ETF | | | 0.45 | % |
| Global X Alternative Income ETF | | | 0.50 | % |
| Global X Conscious Companies ETF | | | 0.43 | % |
| Global X Founder-Run Companies ETF | | | 0.45 | % |
| Global X U.S. Preferred ETF | | | 0.23 | % |
| Global X S&P 500® Quality Dividend ETF | | | 0.20 | % |
| Global X Adaptive U.S. Factor ETF | | | 0.27 | % |
| Global X Variable Rate Preferred ETF | | | 0.25 | % |
| Global X Adaptive U.S. Risk Management ETF | | | 0.39 | % |
SEI Investments Global Funds Services (“SEIGFS”) serves as sub-administrator to the Funds. As sub-administrator, SEIGFS provides the Funds with required general administrative services, including, without limitation: office space, equipment, and personnel; clerical and general back office services; bookkeeping, internal accounting and secretarial services; the calculation of NAV; and assistance with the preparation and filing of reports, registration statements, proxy statements and other materials required to be filed or furnished by the Funds under federal and state securities laws. As compensation for these services, SEIGFS receives certain out-of-pocket costs, transaction fees and asset-based fees which are accrued daily and paid monthly by the Adviser.
SEI Investments Distribution Co. (“SIDCO”) serves as the Funds’ underwriter and distributor of Creation Units pursuant to a distribution agreement (the "Distribution Agreement"). SIDCO has no obligation to sell any specific quantity of Shares.
SIDCO bears the following costs and expenses relating to the distribution of Shares: (1) the costs of processing and maintaining records of creations of Creation Units; (2) all costs of maintaining the records required of a registered broker/dealer; (3) the expenses of maintaining its registration or qualification as a dealer or broker under Federal or state laws; (4) filing fees; and (5) all other expenses incurred in connection with the distribution services as contemplated in the Distribution Agreement. SIDCO receives no fee from the
|
| Notes to Financial Statements (Continued) |
| May 31, 2023 (Unaudited) |
3. RELATED PARTY AND SERVICE PROVIDER TRANSACTIONS (continued)
Funds for its distribution services under the Distribution Agreement; rather, the Adviser compensates SIDCO for certain expenses, out-of-pocket costs, and transaction fees.
BBH serves as the Custodian and transfer agent of the Funds’ assets. As Custodian, BBH has agreed to (1) make receipts and disbursements of money on behalf of the Funds; (2) collect and receive all income and other payments and distributions on account of the Funds’ portfolio investments; (3) respond to correspondence from shareholders, security brokers and others relating to its duties; and (4) make periodic reports to the Funds concerning the Funds’ operations. BBH does not exercise any supervisory function over the purchase and sale of securities. As transfer agent, BBH has agreed to (1) issue and redeem Shares of each Fund; (2) make dividend and other distributions to shareholders of each Fund; (3) respond to correspondence by shareholders and others relating to its duties; (4) maintain shareholder accounts; and (5) make periodic reports to the Funds. As compensation for these services, BBH receives certain out-of-pocket costs, transaction fees and asset-based fees which are accrued daily and paid monthly by the Adviser from its fees.
4. INVESTMENT TRANSACTIONS
For the period ended May 31, 2023, the purchases and sales of investments in securities, excluding in-kind transactions, long-term U.S. Government, and short-term securities were:
| | | | | | Sales and Maturities | |
| | | Purchases | | | |
| Global X MLP ETF | | $ | 123,927,573 | | | $ | 251,779,953 | |
| Global X MLP & Energy Infrastructure ETF | | | 66,204,063 | | | | 141,735,559 | |
| Global X Alternative Income ETF | | | 66,912 | | | | 1,245,536 | |
| Global X Conscious Companies ETF | | | 50,059,925 | | | | 48,897,025 | |
| Global X Founder-Run Companies ETF | | | 2,123,018 | | | | 2,136,384 | |
| Global X U.S. Preferred ETF | | | 395,429,802 | | | | 397,739,298 | |
| Global X S&P 500® Quality Dividend ETF | | | 21,688,784 | | | | 20,989,534 | |
| Global X Adaptive U.S. Factor ETF | | | 156,619,484 | | | | 155,746,022 | |
| Global X Variable Rate Preferred ETF | | | 121,143,400 | | | | 120,935,974 | |
| Global X Adaptive U.S. Risk Management ETF | | | 268,248,306 | | | | 266,195,853 | |
|
| Notes to Financial Statements (Continued) |
| May 31, 2023 (Unaudited) |
4. INVESTMENT TRANSACTIONS (continued)
For the period ended May 31, 2023, in-kind transactions associated with creations and redemptions were:
| 2023 | | | Purchases | | | | Sales | | | | Realized Gain/(Loss) | |
| Global X MLP ETF | | $ | 85,849,754 | | | $ | – | | | $ | – | |
| Global X MLP & Energy Infrastructure ETF | | | 115,085,151 | | | | 142,467,557 | | | | 35,752,555 | |
| Global X Alternative Income ETF | | | 4,979,196 | | | | 3,984,776 | | | | 210,223 | |
| Global X Conscious Companies ETF | | | 35,243,956 | | | | 68,936,161 | | | | 12,859,510 | |
| Global X Founder-Run Companies ETF | | | – | | | | 1,907,984 | | | | (67,943 | ) |
| Global X U.S. Preferred ETF | | | 225,650,899 | | | | 68,521,447 | | | | 3,695,737 | |
Global X S&P 500® Quality Dividend ETF | | | 35,090,804 | | | | 20,310,981 | | | | 2,127,761 | |
| Global X Adaptive U.S. Factor ETF | | | 79,966,906 | | | | 82,848,854 | | | | 10,815,543 | |
| Global X Variable Rate Preferred ETF | | | 22,200,568 | | | | 56,302,574 | | | | 1,620,626 | |
| Global X Adaptive U.S. Risk Management ETF | | | 4,847,799 | | | | 540,937 | | | | 16,034 | |
During the period ended May 31, 2023, there were no purchases or sales of long-term U.S. Government securities by the Funds.
5. TAX INFORMATION
Global X MLP ETF recognizes interest and penalties, if any, related to unrecognized tax benefits within the income tax expense line in the accompanying Statement of Operations. Accrued interest and penalties, if any, are included within the related tax liability line in the Statement of Assets and Liabilities. For the period ended May 31, 2023, Global X MLP ETF did not incur any interest or penalties.
Since Global X MLP ETF will be subject to taxation on its taxable income, the NAV of Global X MLP ETF shares will also be reduced by the accrual of any current and deferred tax liabilities.
Global X MLP ETF’s income tax expense/(benefit) consists of the following for the period ended May 31, 2023:
| | | | Current MLP | | | | Deferred MLP | | | | Total MLP | |
| Federal | | $ | — | | | $ | 1,613,927 | | | $ | 1,613,927 | |
| State | | | — | | | | 308,290 | | | | 308,290 | |
| Valuation allowance | | | — | | | | — | | | | — | |
| Total tax expense (benefit) | | $ | — | | | $ | 1,922,217 | | | $ | 1,922,217 | |
Deferred income taxes reflect the net tax effect of temporary differences between the carrying amount of assets and liabilities for financial reporting and tax purposes.
|
| Notes to Financial Statements (Continued) |
| May 31, 2023 (Unaudited) |
5. TAX INFORMATION (continued)
Components of the Global X MLP ETF’s deferred tax assets and liabilities are as follows for the period ended May 31, 2023:
| | MLP | |
| Deferred tax assets: | | |
| Federal Net Operating Loss Carryforward | $ | 7,760,261 | |
| State Net Operating Loss Carryforward | | 1,897,486 | |
| Capital Loss Carryforward | | 41,874,150 | |
| Other | | 3,252,198 | |
| Less Variation Allowance | | — | |
| Deferred tax liabilities: | | | |
| Net unrealized gain on investment securities | | (73,365,028 | ) |
| Net Deferred Tax Asset/(Liability) | $ | (18,580,933 | ) |
Global X MLP ETF reviews the recoverability of its deferred tax assets based upon the weight of available evidence. When assessing the recoverability of its deferred tax assets, significant weight is given to the effects of potential future realized and unrealized gains on investments and the period over which these deferred tax assets can be realized. Currently, any capital losses that may be generated by the Global X MLP ETF are eligible to be carried back up to three years and can be carried forward for five years to offset capital gains recognized by Global X MLP ETF in those years.
Global X MLP ETF has estimated net operating loss carryforwards for federal tax income purposes as follows:
| | | Year Ended | | Amount | | Expiration |
| Global X MLP ETF | | 11/30/2023 | | $
| 37,259,202 | | Indefinite |
Global X MLP ETF has estimated capital loss carryforwards for Federal income tax purposes as follows:
| | | Year Ended | | Amount | | Expiration |
| Global X MLP ETF | | 11/30/2019 | | $ | 28,978,317 | | 11/30/2024 |
| | | 11/30/2020 | | | 120,861,367 | | 11/30/2025 |
| | | 11/30/2021 | | | 37,432,903 | | 11/30/2026 |
Based upon Global X MLP ETF’s assessment, it has been determined that it is more likely than not that Global X MLP ETF’s deferred tax assets will be realized through future taxable income of the appropriate character. Accordingly, no valuation allowance has been established for Global X MLP ETF’s deferred tax assets. Global X MLP ETF will continue to assess the need for a valuation allowance in the future. Significant increases or declines in the fair value of its portfolio of investments may change Global X MLP ETF’s assessment of the recoverability of these assets and may result in the recording or removal of a valuation allowance against all or a portion of the Global X MLP ETF’s gross deferred tax assets.
|
| Notes to Financial Statements (Continued) |
| May 31, 2023 (Unaudited) |
5. TAX INFORMATION (continued)
Total income tax expense/benefit (current and deferred) during the period ended May 31, 2023, differs from the amount computed by applying the Federal statutory income tax rate of 21% for Global X MLP ETF to net investment and realized and unrealized gain/(losses) on investment before taxes as follows:
For the period ended May 31, 2023:
| |
| | | MLP | |
| Income tax (benefit) at statutory rate | | $ | 1,805,302 | | | | 21.00 | % |
| State income taxes (net of federal benefit) | | | 116,915 | | | | 1.36 | % |
| Net income tax expense/(benefit) | | $ | 1,922,217 | | | | 22.36 | % |
Global X MLP ETF recognizes the tax benefits of uncertain tax positions only where the position is “more likely than not” to be sustained assuming examination by tax authorities. Management has analyzed Global X MLP ETF’s tax positions, and has concluded that no liability for unrecognized tax benefits should be recorded related to uncertain tax positions taken on U.S. tax returns and state tax returns filed since the inception of Global X MLP ETF. No U.S. Federal or state income tax returns are currently under examination. The tax years ended November 30, 2021, 2020, and 2019 remain subject to examination by tax authorities in the United States. Due to the nature of Global X MLP ETF’s investments, Global X MLP ETF may be required to file income tax returns in several states. Global X MLP ETF is not aware of any tax positions for which it is reasonably possible that the total amounts of unrecognized tax benefits will change materially in the next 12 months.
State franchise taxes are separate and distinct from state income taxes. State franchise taxes are imposed on a corporation for the right to conduct business in the state and typically are based off the net worth or capital apportioned to a state. Due to the nature of Global X MLP ETF’s investments, Global X MLP ETF may be required to file franchise state tax returns in several states.
The amount and character of income and capital gain distributions to be paid, if any, are determined in accordance with Federal income tax regulations, which may differ from U.S. GAAP. As a result, net investment income (loss) and net realized gain (loss) on investment transactions for a reporting period may differ significantly from distributions during such period. These book/tax differences may be temporary or permanent. To the extent these differences are permanent in nature, they are charged or credited to undistributed net investment income (loss), accumulated net realized gain (loss) or paid-in capital, as appropriate, in the period that the differences arise. The permanent differences primarily consist of REIT adjustments, reclassification of distributions, investments in publically traded partnerships, PFIC gain reclassifications, and preferred stock adjustments. The permanent differences that are credited or charged to paid-in capital and distributable earnings are primarily related to redemptions in kind and return of capital distributions.
|
| Notes to Financial Statements (Continued) |
| May 31, 2023 (Unaudited) |
5. TAX INFORMATION (continued)
The tax character of dividends and distributions declared during the years or periods ended November 30, 2022 and November 30, 2021 were as follows:
| Global X Funds | | Ordinary Income | | | Long-Term Capital Gain | | | Return of Capital | | | Totals | |
| Global X MLP ETF | | | | | | | | | | | | |
| 2022 | | $ | 90,450,291 | | | $ | – | | | $ | – | | | $ | 90,450,291 | |
| 2021 | | | – | | | | – | | | | 80,150,843 | | | | 80,150,843 | |
| Global X MLP & Energy Infrastructure ETF | | | | | | | | | | | | | |
| 2022 | | $ | 32,598,692 | | | $ | – | | | $ | 17,688,775 | | | $ | 50,287,467 | |
| 2021 | | | 22,548,205 | | | | – | | | | 22,509,388 | | | | 45,057,593 | |
| Global X Alternative Income ETF | | | | | | | | | | | | | |
| 2022 | | $ | 2,282,880 | | | $ | – | | | $ | 390,992 | | | $ | 2,673,872 | |
| 2021 | | | 1,353,663 | | | | – | | | | 578,074 | | | | 1,931,737 | |
| Global X Conscious Companies ETF | | | | | | | | | | | | | |
| 2022 | | $ | 7,480,197 | | | $ | – | | | $ | – | | | $ | 7,480,197 | |
| 2021 | | | 4,254,673 | | | | – | | | | – | | | | 4,254,673 | |
| Global X Founder-Run Companies ETF | | | | | | | | | | | | | |
| 2022 | | $ | 31,083 | | | $ | – | | | $ | – | | | $ | 31,083 | |
| 2021 | | | 67,743 | | | | – | | | | – | | | | 67,743 | |
| Global X U.S. Preferred ETF | | | | | | | | | | | | | |
| 2022 | | $ | 128,023,270 | | | $ | – | | | $ | – | | | $ | 128,023,270 | |
| 2021 | | | 89,185,080 | | | | – | | | | – | | | | 89,185,080 | |
| Global X S&P 500® Quality Dividend ETF | | | | | | | | | | | | | |
| 2022 | | $ | 1,339,222 | | | $ | – | | | $ | – | | | $ | 1,339,222 | |
| 2021 | | | 224,212 | | | | – | | | | – | | | | 224,212 | |
| Global X Adaptive U.S. Factor ETF | | | | | | | | | | | | | |
| 2022 | | $ | 3,989,881 | | | $ | – | | | $ | 204,893 | | | $ | 4,194,774 | |
| 2021 | | | 4,080,634 | | | | – | | | | 298,947 | | | | 4,379,581 | |
| Global X Variable Rate Preferred ETF | | | | | | | | | | | | | |
| 2022 | | $ | 10,395,351 | | | $ | 19,467 | | | $ | 515,682 | | | $ | 10,930,500 | |
| 2021 | | | 1,419,247 | | | | 8,731 | | | | 167,337 | | | | 1,595,315 | |
| Global X Adaptive U.S. Risk Management ETF | | | | | | | | | |
| 2022 | | $ | 997,056 | | | $ | 5,768 | | | $ | – | | | $ | 1,002,824 | |
| 2021 | | | 241,843 | | | | – | | | | – | | | | 241,843 | |
|
| Notes to Financial Statements (Continued) |
| May 31, 2023 (Unaudited) |
5. TAX INFORMATION (continued)
As of November 30, 2022, the components of tax basis distributable earnings (accumulated losses) were as follows:
| | | | Global X Funds
|
| | | | Global X MLP & Energy Infrastructure ETF | | | | Global X Alternative Income ETF | | | | Global X Conscious Companies ETF | |
| Undistributed Ordinary Income | | $ | – | | | $ | – | | | $ | 2,124,264 | |
| Capital Loss Carryforwards | | | (161,956,054 | ) | | | (1,347,634 | ) | | | (20,101,068 | ) |
| Unrealized Appreciation (Depreciation) on Investments and Foreign Currency | | | 210,911,857 | | | | (6,717,547 | ) | | | 14,210,452 | |
| Other Temporary Differences | | | (3 | ) | | | 8 | | | | – | |
| Total Accumulated Losses | | $ | 48,955,800 | | | $ | (8,065,173 | ) | | $ | (3,766,352 | ) |
| | | | Global X Funds |
| | | | Global X Founder-Run Companies ETF | | | | Global X U.S. Preferred ETF | | | | Global X S&P 500® Quality Dividend ETF | |
| Undistributed Ordinary Income | | $ | 28,185 | | | $ | 3,114,091 | | | $ | 200,491 | |
| Capital Loss Carryforwards | | | (1,779,065 | ) | | | (101,076,974 | ) | | | (4,573,464 | ) |
| Unrealized Appreciation (Depreciation) on Investments and Foreign Currency | | | (3,032,950 | ) | | | (394,213,357 | ) | | | 2,522,681 | |
| Other Temporary Differences | | | – | | | | (2,613,879 | ) | | | – | |
| Total Accumulated Losses | | $ | (4,783,830 | ) | | $ | (494,790,119 | ) | | $ | (1,850,292 | ) |
| | | | Global X Funds |
| | | | Global X Adaptive U.S. Factor ETF | | | | Global X Variable Rate Preferred ETF | | | | Global X Adaptive U.S. Risk Management ETF | |
| Undistributed Ordinary Income | | $ | – | | | $ | – | | | $ | 670,915 | |
| Capital Loss Carryforwards | | | (9,319,061 | ) | | | (8,558,055 | ) | | | (19,468,613 | ) |
| Unrealized Appreciation (Depreciation) on Investments and Foreign Currency | | | 14,769,749 | | | | (16,870,450 | ) | | | 4,313,328 | |
| Other Temporary Differences | | | – | | | | 1,317,963 | | | | – | |
| Total Accumulated Losses | | $ | 5,450,688 | | | $ | (24,110,542 | ) | | $ | (14,484,370 | ) |
|
| Notes to Financial Statements (Continued) |
| May 31, 2023 (Unaudited) |
5. TAX INFORMATION (continued)
For taxable years beginning after December 22, 2010, a registered investment company is permitted to carry forward net capital losses to offset capital gains realized in later years, and the losses carried forward retain their original character as either long-term or short-term losses. Losses carried forward under these provisions are as follows:
| | | Short-Term Loss | | | Long-Term Loss | | | Total | |
| Global X MLP & Energy Infrastructure ETF | | $ | 30,993,988 | | | $ | 130,962,066 | | | $ | 161,956,054 | |
| Global X Alternative Income ETF | | | 185,898 | | | | 1,161,736 | | | | 1,347,634 | |
| Global X Conscious Companies ETF | | | 9,289,825 | | | | 10,811,243 | | | | 20,101,068 | |
| Global X Founder-Run Companies ETF | | | 1,359,850 | | | | 419,215 | | | | 1,779,065 | |
| Global X U.S. Preferred ETF | | | 51,083,388 | | | | 49,993,586 | | | | 101,076,974 | |
Global X S&P 500® Quality Dividend ETF | | | 4,182,129 | | | | 391,335 | | | | 4,573,464 | |
| Global X Adaptive U.S. Factor ETF | | | 9,319,061 | | | | – | | | | 9,319,061 | |
| Global X Variable Rate Preferred ETF | | | 7,215,811 | | | | 1,342,244 | | | | 8,558,055 | |
| Global X Adaptive U.S. Risk Management ETF | | | 19,327,639 | | | | 140,974 | | | | 19,468,613 | |
During the year ended November 30, 2022, the following Fund utilized capital loss carryforwards to offset capital gains amounting to:
| | | Short-Term Loss | | | Long-Term Loss | | | Total | |
| Global X Alternative Income ETF | | $ | 313,561 | | | $ | 267,896 | | | $ | 581,457 | |
The Federal tax cost basis of investments and aggregate gross unrealized appreciation and depreciation on investments held by the Funds at May 31, 2023 were as follows:
| | | Federal Tax Cost | | | Aggregated Gross Unrealized Appreciation | | | Aggregated Gross
Unrealized Depreciation | | | Net Unrealized Appreciation (Depreciation) | |
| Global X MLP ETF | | $ | 1,031,030,390 | | | $ | 331,947,548 | | | $ | (2,149,371 | ) | | $ | 329,798,177 | |
| Global X MLP & Energy Infrastructure ETF | | | 744,664,246 | | | | 188,251,068 | | | | (46,251,863 | ) | | | 141,999,205 | |
| Global X Alternative Income ETF | | | 43,736,167 | | | | 1,677,240 | | | | (8,101,195 | ) | | | (6,423,955 | ) |
| Global X Conscious Companies ETF | | | 628,960,787 | | | | 63,976,290 | | | | (57,599,095 | ) | | | 6,377,195 | |
| Global X Founder-Run Companies ETF | | | 8,139,625 | | | | 326,267 | | | | (2,206,092 | ) | | | (1,879,825 | ) |
| Global X U.S. Preferred ETF | | | 2,693,550,107 | | | | 6,033,251 | | | | (444,800,477 | ) | | | (438,767,226 | ) |
Global X S&P 500® Quality Dividend ETF | | | 73,897,621 | | | | 1,328,782 | | | | (6,786,934 | ) | | | (5,458,152 | ) |
| Global X Adaptive U.S. Factor ETF | | | 159,930,042 | | | | 5,686,478 | | | | (6,412,237 | ) | | | (725,759 | ) |
| Global X Variable Rate Preferred ETF | | | 252,667,957 | | | | 1,134,886 | | | | (20,054,814 | ) | | | (18,919,928 | ) |
| Global X Adaptive U.S. Risk Management ETF | | | 69,195,447 | | | | 4,561,813 | | | | (1,904,879 | ) | | | 2,656,934 | |
|
| Notes to Financial Statements (Continued) |
| May 31, 2023 (Unaudited) |
5. TAX INFORMATION (continued)
The difference between book-basis and tax-basis unrealized appreciation (depreciation) is due to differences in the timing of recognition of gains and losses on investments for tax and book purposes. The Funds’ net unrealized appreciation difference is attributable primarily to wash sales, mark-to-market treatment of passive foreign investment companies and adjustments in preferred stock and partnerships.
6. CONCENTRATION OF RISKS
The Funds may invest in securities in a particular asset class. Securities and other assets held in each Fund's portfolio may underperform in comparison to the general securities markets, a particular securities market or other asset classes.
The Funds, except for Global X U.S. Preferred ETF and Global X Variable Rate Preferred ETF, use a replication strategy. A replication strategy is an indexing strategy that involves investing in the securities of an underlying index in approximately the same proportions as in the underlying index. A representative sampling strategy is an indexing strategy that involves investing in a representative sample of securities (including indirect investments through underlying ETFs) that collectively has an investment profile similar to an underlying index in terms of key risk factors, performance attributes and other characteristics. Each Fund may utilize a representative sampling strategy with respect to its underlying index when a replication strategy might be detrimental to its shareholders, such as when there are practical difficulties or substantial costs involved in compiling a portfolio of equity securities to follow its underlying index, or, in certain instances, when securities in the underlying index become temporarily illiquid, unavailable or less liquid, or due to legal restrictions (such as diversification requirements that apply to a Fund but not its underlying index). The Global X U.S. Preferred ETF and Global X Variable Rate Preferred ETF use a representative sampling strategy.
The Funds may be subject to taxes imposed by countries in which they invest. Such taxes are generally based on either income or gains earned or repatriated. The Funds accrue and apply such taxes to net investment income, net realized gains and net unrealized gains as income and/or capital gains are earned.
The elimination of the London Inter-Bank Offered Rate ("LIBOR") may adversely affect the interest rates on, and value of, certain Fund investments for which the value is tied to LIBOR. The U.K. Financial Conduct Authority has announced that it intends to stop compelling or inducing banks to submit LIBOR rates after 2021. On March 5, 2021, the administrator of LIBOR clarified that the publication of LIBOR on a representative basis will cease for the one-week and two-month U.S. dollar LIBOR settings immediately after December 31, 2021, and for the remaining U.S. dollar LIBOR settings immediately after June 30, 2023. Alternatives to LIBOR are established or in development in most major currencies, including the Secured Overnight Financing Rate ("SOFR"), which is intended to replace U.S. dollar LIBOR. Markets are slowly developing in response to these new
|
| Notes to Financial Statements (Continued) |
| May 31, 2023 (Unaudited) |
6. CONCENTRATION OF RISKS (continued)
rates. Questions around impacts on liquidity resulting from this transition, and how to appropriately adjust these rates at the time of transition, remain a concern for the Funds. Accordingly, it is difficult to predict the full impact of the transition away from LIBOR on the Funds until new reference rates and fallbacks for both legacy and new products, instruments and contracts are commercially accepted.
Economic conditions, such as volatile currency exchange rates and interest rates, political events, military action and other conditions may, without prior warning, lead to foreign government intervention (including intervention by the U.S. Government with respect to foreign governments, economic sectors, foreign companies and related securities and interests) and the imposition of capital controls (i.e., government measures designed to limit the flow of foreign capital in and out of the domestic economy) and/or sanctions, which may also include retaliatory actions of one government against another government, such as the seizure of assets. Capital controls and/or sanctions include the prohibition of, or restrictions on, the ability to transfer currency, securities or other assets. Capital controls and/or sanctions may also impact the ability of a Fund to buy, sell or otherwise transfer securities or currency, negatively impact the value and/or liquidity of such instruments, adversely affect the trading market and price for Shares of a Fund, and cause a Fund to decline in value. Please refer to each Fund’s prospectus and statement of additional information (“SAI”) for a more complete description of risks.
7. LOANS OF PORTFOLIO SECURITIES
Each Fund may lend portfolio securities having a market value up to one-third of its total assets. Security loans made pursuant to a securities lending agreement with BBH are initially required to be secured by collateral equal to at least 102% of the value of domestic equity securities and American Depositary Receipts (“ADRs”) and 105% of the value of foreign equity securities (other than ADRs). Such collateral received in connection with these loans will be cash and can be invested in repurchase agreements, short-term investments or U.S. Treasury obligations and is recognized in the Schedules of Investments and Statements of Assets and Liabilities. The obligation to return securities lending collateral is also recognized as a liability in the Statements of Assets and Liabilities. It is the Funds’ policy to obtain additional collateral from or return excess collateral to the borrower by the end of the next business day, following the valuation date of the securities loaned. Therefore, the value of the collateral held may be temporarily less than the value of the securities on loan.
Lending securities entails a risk of loss to the Funds if and to the extent that the market values of the securities loaned were to increase and the borrower did not increase the collateral accordingly and the borrower failed to return the securities. In the event the borrower may not provide additional collateral when required or may not return the securities when due, the securities lending agency agreement requires the lending agent to indemnify the Funds by replacing either the security or the security’s current market value to the Funds. The
|
| Notes to Financial Statements (Continued) |
| May 31, 2023 (Unaudited) |
7. LOANS OF PORTFOLIO SECURITIES (continued)
Funds could suffer a loss if the value of an investment purchased with cash collateral falls below the market value of loaned securities or if the value of an investment purchased with cash collateral falls below the value of the original cash collateral received. The Funds could also experience delays and costs in gaining access to the collateral. The Funds bear the risk of any deficiency in the amount of the collateral available for return to the borrower due to any loss on the collateral invested.
As of May 31, 2023, the following Funds had securities on loan, by counterparty:
| | | Market Value | | | Cash Collateral(1) | |
| Global X MLP & Energy Infrastructure ETF | | | | | | |
| Barclays Capital Inc. | | $ | 956,675 | | | $ | 955,793 | |
| UBS Securities LLC (equities) | | | 198,433 | | | | 198,250 | |
| Total | | $ | 1,155,108 | | | $ | 1,154,043 | |
| | | Market Value | | | Cash Collateral(1) | |
| Global X Alternative Income ETF | | | | | | |
| J.P. Morgan Securities LLC | | $ | 125,320 | | | $ | 128,375 | |
| UBS AG London Branch (cash) | | | 506,268 | | | | 516,313 | |
| Total | | $ | 631,588 | | | $ | 644,688 | |
| | | Market Value | | | Cash Collateral(1) | |
| Global X U.S. Preferred ETF | | | | | | |
| Barclays Capital Inc. | | $ | 17,888,571 | | | $ | 18,125,425 | |
| BNP Paribas Securities Corp. | | | 118,800 | | | | 119,075 | |
| Citigroup Global Markets Inc. | | | 2,000 | | | | 2,058 | |
| J.P. Morgan Securities LLC | | | 11,377,664 | | | | 11,495,600 | |
| Morgan Stanley & Co. LLC | | | 112,805 | | | | 115,225 | |
| National Financial Services LLC | | | 355,971 | | | | 361,445 | |
| UBS Securities LLC (equities) | | | 6,569,893 | | | | 6,679,565 | |
| Total | | $ | 36,425,704 | | | $ | 36,898,393 | |
(1) It is the Funds' policy to obtain additional collateral from or return excess collateral to the borrower by the end of the next business day, following the valuation date of the securities loaned. Therefore, the value of the collateral held may be temporarily less than the value of the securities on loan.
8. CONTRACTUAL OBLIGATION
The Funds enter into contracts in the normal course of business that contain a variety of indemnifications. The Funds’ maximum exposure under these contracts is unknown. However, the Funds have not had prior gains or losses pursuant to these contracts. Management has reviewed the Funds’ existing contracts and expects the risk of loss to be remote.
|
| Notes to Financial Statements (Concluded) |
| May 31, 2023 (Unaudited) |
8. CONTRACTUAL OBLIGATION (continued)
Pursuant to the Trust’s organizational documents, the Trustees of the Trust (the “Trustees”) and the Trust’s officers are indemnified against certain liabilities that may arise out of the performance of their duties.
9. REVERSE SHARE SPLIT
Effective April 28, 2020, the Global X MLP ETF executed a 1-for-6 reverse share split for shareholders of record after the close of markets on April 27, 2020. The effect of this transaction for the Fund was to divide the number of outstanding Shares of the Fund by six, resulting in a corresponding increase in the NAV per Share. The capital share activity presented in the Statement of Changes in Net Assets for each of the years in the period then ended, and per share data in the financial highlights for each of the years in the period then ended, have been given retroactive effect to reflect this reverse share split. There were no changes in net assets, results of operations or total return as a result of this transaction.
Effective April 28, 2020, the Global X MLP& Energy Infrastructure ETF executed a 1-for-3 reverse share split for shareholders of record after the close of markets on April 27, 2020. The effect of this transaction for the Fund was to divide the number of outstanding Shares of the Fund by three, resulting in a corresponding increase in the NAV per Share. The capital share activity presented in the Statement of Changes in Net Assets for each of the years in the period then ended, and per share data in the financial highlights for each of the years in the period then ended, have been given retroactive effect to reflect these reverse share splits. There were no changes in net assets, results of operations or total return as a result of these transactions.
10. SUBSEQUENT EVENTS
The Funds have been evaluated by management regarding the need for additional disclosures and/or adjustments resulting from subsequent events. Based on this evaluation, no additional adjustments were required to the financial statements.
|
| Disclosure of Fund Expenses (Unaudited) |
ETFs (such as the Funds) have operating expenses. As a shareholder of an ETF, your investment is affected by these ongoing costs, which include (among others) costs for ETF management, administrative services, brokerage fees, and shareholder reports like this one. It is important for you to understand the impact of these costs on your investment returns. In addition, a shareholder is responsible for brokerage fees as a result of the shareholder’s investment in a Fund.
Operating expenses such as these are deducted from a Fund’s gross income and directly reduce your final investment returns. These expenses are expressed as a percentage of the
Fund’s average net assets; this percentage is known as the Fund’s expense ratio.
The following examples use the expense ratio and are intended to help you understand the ongoing costs (in dollars) of investing in a Fund and to compare these costs with those of other funds. The examples are based on an investment of $1,000 made at the beginning of the period shown and held for the entire period from December 1, 2022 to May 31, 2023.
The table on the next page illustrates the Funds’ costs in two ways:
Actual Fund Return. This section helps you to estimate the actual expenses that your Fund incurred over the period. The “Expenses Paid During Period” column shows the actual dollar expense cost incurred by a $1,000 investment in the Fund, and the “Ending Account Value” number is derived from deducting that expense cost from the Fund’s gross investment return.
You can use this information, together with the actual amount you invested in a Fund, to estimate the expenses you paid over that period. Simply divide your actual account value by $1,000 to arrive at a ratio (for example, an $8,600 account value divided by $1,000 = 8.6), then multiply that ratio by the number shown for your Fund under “Expenses Paid During Period.”
Hypothetical 5% Return. This section helps you compare your Fund’s costs with those of other funds. It assumes that the Fund had an annual 5% return before expenses during the year, but that the expense ratio (Column 3) for the period is unchanged. This example is useful in making comparisons because the Securities and Exchange Commission requires all funds to make this 5% calculation. You can assess your Fund’s comparative cost by comparing the hypothetical result for your Fund in the “Expenses Paid During Period” column with those that appear in the same charts in the shareholder reports for other funds.
NOTE: Because the return is set at 5% for comparison purposes — NOT your Fund’s actual return — the account values shown may not apply to your specific investment.
|
| Disclosure of Fund Expenses (Unaudited) (Continued) |
| | | Beginning Account Value 12/1/2022 | | | Ending Account Value 5/31/2023 | | | Annualized Expense
Ratios | | | Expenses Paid During Period(1) | |
| Global X MLP ETF | | | | | | | | | | | | |
| Actual Fund Return | | $ | 1,000.00 | | | $ | 1,005.30 | | | | 0.44 | % | | $ | 2.20 | |
| Hypothetical 5% Return | | | 1,000.00 | | | | 1,022.74 | | | | 0.44 | | | | 2.22 | |
| Global X MLP & Energy Infrastructure ETF | | | | | | | | | | | | | |
| Actual Fund Return | | $ | 1,000.00 | | | $ | 911.90 | | | | 0.45 | % | | $ | 2.14 | |
| Hypothetical 5% Return | | | 1,000.00 | | | | 1,022.69 | | | | 0.45 | | | | 2.27 | |
| Global X Alternative Income ETF | | | | | | | | | | | | | | | | |
| Actual Fund Return | | $ | 1,000.00 | | | $ | 1,006.20 | | | | 0.50 | % | | $ | 2.50 | |
| Hypothetical 5% Return | | | 1,000.00 | | | | 1,022.44 | | | | 0.50 | | | | 2.52 | |
| Global X Conscious Companies ETF | | | | | | | | | | | | | | | | |
| Actual Fund Return | | $ | 1,000.00 | | | $ | 1,002.40 | | | | 0.43 | % | | $ | 2.15 | |
| Hypothetical 5% Return | | | 1,000.00 | | | | 1,022.79 | | | | 0.43 | | | | 2.17 | |
| Global X Founder-Run Companies ETF | | | | | | | | | | | | | |
| Actual Fund Return | | $ | 1,000.00 | | | $ | 1,042.00 | | | | 0.45 | % | | $ | 2.29 | |
| Hypothetical 5% Return | | | 1,000.00 | | | | 1,022.69 | | | | 0.45 | | | | 2.27 | |
| Global X U.S. Preferred ETF | | | | | | | | | | | | | | | | |
| Actual Fund Return | | $ | 1,000.00 | | | $ | 969.40 | | | | 0.23 | % | | $ | 1.13 | |
| Hypothetical 5% Return | | | 1,000.00 | | | | 1,023.78 | | | | 0.23 | | | | 1.16 | |
| Global X S&P 500® Quality Dividend ETF | | | | | | | | | | | | | |
| Actual Fund Return | | $ | 1,000.00 | | | $ | 912.00 | | | | 0.20 | % | | $ | 0.95 | |
| Hypothetical 5% Return | | | 1,000.00 | | | | 1,023.93 | | | | 0.20 | | | | 1.01 | |
| Global X Adaptive U.S. Factor ETF | | | | | | | | | | | | | | | | |
| Actual Fund Return | | $ | 1,000.00 | | | $ | 927.10 | | | | 0.27 | % | | $ | 1.30 | |
| Hypothetical 5% Return | | | 1,000.00 | | | | 1,023.59 | | | | 0.27 | | | | 1.36 | |
| Global X Variable Rate Preferred ETF | | | | | | | | | | | | | | | | |
| Actual Fund Return | | $ | 1,000.00 | | | $ | 970.50 | | | | 0.25 | % | | $ | 1.23 | |
| Hypothetical 5% Return | | | 1,000.00 | | | | 1,023.68 | | | | 0.25 | | | | 1.26 | |
|
Disclosure of Fund Expenses (Unaudited) (Concluded) |
| | | Beginning Account Value 12/1/2022 | | | Ending Account Value 5/31/2023 | | | Annualized Expense
Ratios | | | Expenses Paid During Period(1) | |
| Global X Adaptive U.S. Risk Management ETF | | | | | | | | | | | | |
| Actual Fund Return | | $ | 1,000.00 | | | $ | 994.80 | | | | 0.42 | % | | $ | 2.09 | |
| Hypothetical 5% Return | | | 1,000.00 | | | | 1,022.84 | | | | 0.42 | | | | 2.12 | |
| (1) | Expenses are equal to the Fund's annualized expense ratio multiplied by the average account value over the period, multiplied by 182/365 (to reflect the one-half year period). |
|
| Liquidity Risk Management Program (Unaudited) |
Pursuant to Rule 22e-4 under the 1940 Act, the Funds’ investment adviser has adopted, and the Board has approved, a liquidity risk management program (the “Program”) to govern the Funds’ approach to managing liquidity risk. The Program is overseen by the Funds’ Liquidity Risk Management Committee (the “Committee”), and the Program’s principal objectives include assessing, managing and periodically reviewing each Fund’s liquidity risk, based on factors specific to the circumstances of the Funds.
At a meeting of the Board held on May 19, 2023, the Trustees received a report from the Committee addressing the operations of the Program and assessing its adequacy and effectiveness of implementation for the period from January 1, 2022 through December 31, 2022. The Committee’s report noted that the Committee had determined that the Program is reasonably designed to assess and manage each Fund’s Liquidity Risk and operated adequately and effectively to manage each Fund’s Liquidity Risk for the period covered by the report. The Committee’s report noted that during the period covered by the report, there were no liquidity events that impacted the Funds or their ability to timely meet redemptions without dilution to existing shareholders. The Committee’s report noted that one Fund, the Global X Nigeria Fund, was classified as an In-Kind Fund for purposes of Liquidity Reporting. The Committee’s report noted that no other material changes have been made to the Program since its implementation.
There can be no assurance that the Program will achieve its objectives in the future. Please refer to the prospectus for more information regarding a Fund’s exposure to liquidity risk and other principal risks to which an investment in the Funds may be subject.
|
| Supplemental Information (Unaudited) |
NAV is the price per Share at which the Funds issue and redeem Shares. It is calculated in accordance with the standard formula for valuing mutual fund shares. The “Market Price” of a Fund generally is determined using the midpoint between the highest bid and the lowest offer on the stock exchange on which the Shares of the Funds’are listed for trading, as of the time that the Fund’s NAV is calculated. Each Fund’s Market Price may be at, above or below their NAV. The NAV of the Funds will fluctuate with changes in the market value of the Fund’s holdings. The Market Price of the Funds will fluctuate in accordance with changes in their NAV, as well as market supply and demand.
Premiums or discounts are the differences (expressed as a percentage) between the NAV and Market Price of a Fund on a given day, generally at the time NAV is calculated. A premium is the amount that a Fund is trading above the reported NAV, expressed as a percentage of the NAV. A discount is the amount that a Fund is trading below the reported NAV, expressed as a percentage of the NAV.
Further information regarding premiums and discounts is available on the Funds’ website at www.globalxetfs.com.
|
| 605 3rd Avenue, 43rd Floor |
| New York, NY 10158 |
| 1-888-493-8631 |
| www.globalxetfs.com |
| |
| Investment Adviser and Administrator: |
| Global X Management Company LLC |
| 605 3rd Avenue, 43rd Floor |
| New York, NY 10158 |
| |
| Distributor: |
| SEI Investments Distribution Co. |
| One Freedom Valley Drive |
| Oaks, PA 19456 |
| |
| Sub-Administrator: |
| SEI Investments Global Funds Services |
| One Freedom Valley Drive |
| Oaks, PA 19456 |
| |
| Counsel for Global X Funds and the Independent Trustees: |
| Stradley Ronon Stevens & Young, LLP |
| 2000 K Street, N.W. |
| Suite 700 |
| Washington, DC 20006 |
| |
| Custodian and Transfer Agent: |
| Brown Brothers Harriman & Co. |
| 40 Water Street |
| Boston, MA 02109 |
| |
| Independent Registered Public Accounting Firm: |
| PricewaterhouseCoopers LLP |
| Two Commerce Square |
| Suite 1800 |
| 2001 Market Street |
| Philadelphia, PA 19103 |
This information must be preceded or accompanied by a current prospectus for the Funds described.
GLX-SA-005-1200
(b) Not applicable.
Item 2. Code of Ethics.
Not applicable for semi-annual report.
Item 3. Audit Committee Financial Expert.
Not applicable for semi-annual report.
Item 4. Principal Accountant Fees and Services.
Not applicable for semi-annual report.
Item 5. Audit Committee of Listed Registrants.
Not applicable for semi-annual report.
Item 6. Investments.
Schedule of Investments is included as part of the report to shareholders filed under Item 1 of this form.
Item 7. Disclosure of Proxy Voting Policies and Procedures for Closed-End Management Investment Companies.
Not applicable to open-end management investment companies.
Item 8. Portfolio Managers of Closed-End Management Investment Companies.
Not applicable to open-end management investment companies.
Item 9. Purchases of Equity Securities by Closed-End Management Investment Company and Affiliated Purchasers.
Not applicable to open-end management investment companies.
Item 10. Submission of Matters to a Vote of Security Holders.
There have been no material changes to the procedures by which shareholders may recommend nominees to the registrant’s board of directors.
Item 11. Controls and Procedures.
(a) The certifying officers, whose certifications are included herewith, have evaluated the registrant’s disclosure controls and procedures within 90 days of the filing date of this report. In their opinion, based on their evaluation, the registrant’s disclosure controls and procedures are adequately designed, and are operating effectively to ensure, that information required to be disclosed by the registrant in the reports it files or submits under the Securities Exchange Act of 1934 is recorded, processed, summarized and reported within the time periods specified in the Securities and Exchange Commission’s rules and forms.
(b) There were no significant changes in the registrant’s internal control over financial reporting that occurred during the period covered by this report that has materially affected, or is reasonably likely to materially affect, the registrant’s internal control over financial reporting.
Item 12. Disclosure of Securities Lending Activities for Closed-End Management Investment Companies.
Not applicable to open-end management investment companies.
Item 13. Exhibits.
(a)(1) Not applicable for semi-annual report.
SIGNATURES
Pursuant to the requirements of the Securities Exchange Act of 1934 and the Investment Company Act of 1940, the registrant has duly caused this report to be signed on its behalf by the undersigned, thereunto duly authorized.
(Registrant)
| Global X Funds |
| By (Signature and Title) | /s/ Luis Berruga Luis Berruga
President
|
Date: August 8, 2023
Pursuant to the requirements of the Securities Exchange Act of 1934 and the Investment Company Act of 1940, this report has been signed below by the following persons on behalf of the registrant and in the capacities and on the dates indicated.
| By (Signature and Title) | /s/ Luis Berruga Luis Berruga
President
|
Date: August 8, 2023
| By (Signature and Title) | /s/ John Belanger
John Belanger
Chief Financial Officer |
Date: August 8, 2023