UNITED STATES
SECURITIES AND EXCHANGE COMMISSION
Washington, D.C. 20549
FORM N-CSR
CERTIFIED SHAREHOLDER REPORT OF REGISTERED MANAGEMENT
INVESTMENT COMPANIES
Investment Company Act file number 811-22209
Global X Funds
(Exact name of registrant as specified in charter)
605 Third Avenue, 43rd floor
New York, NY 10158
(Address of principal executive offices) (Zip code)
Jasmin M. Ali, Esquire
Global X Management Company LLC
605 Third Avenue, 43rd floor
New York, NY 10158
(Name and address of agent for service)
With a copy to:
Jasmin M. Ali, Esquire
Global X Management Company LLC
605 Third Avenue, 43rd floor
New York, NY 10158 | Eric S. Purple, Esquire
Stradley Ronon Stevens & Young, LLP
2000 K Street, N.W., Suite 700
Washington, DC 20006-1871 |
Registrant’s telephone number, including area code: (212) 644-6440
Date of fiscal year end: November 30, 2024
Date of reporting period: November 30, 2024
| Item 1. | Reports to Stockholders. |
(a) A copy of the report transmitted to stockholders pursuant to Rule 30e-1 under the Investment Company Act of 1940, as amended (the “Act”) (17 CFR § 270.30e-1), is attached hereto.
Principal Listing Exchange: NYSE Arca, Inc.
Annual Shareholder Report: November 30, 2024
This annual shareholder report contains important information about the Global X MLP ETF (the "Fund") for the period from December 1, 2023 to November 30, 2024. You can find additional information about the Fund at https://www.globalxetfs.com/funds/mlpa. You can also request this information by contacting us at 1-888-493-8631.
What were the Fund costs for the last year?
(based on a hypothetical $10,000 investment)
| Fund Name | Costs of a $10,000 investment | Costs paid as a percentage of a $10,000 investment |
|---|
| Global X MLP ETF | $61 | 0.55% |
|---|
How did the Fund perform in the last year?
The Fund seeks to provide investment results that correspond generally to the price and yield performance, before fees and expenses, of the Solactive MLP Infrastructure Index (“Secondary Index”). The Fund is passively managed, and the investment adviser does not attempt to take defensive positions in declining markets. The Fund generally seeks to fully replicate the Secondary Index.
The Secondary Index is intended to give investors a means of tracking the performance of the energy infrastructure MLP asset class in the United States. The Secondary Index is composed of Midstream Master Limited Partnerships (“MLPs”) engaged in the transportation, storage, and processing of natural resources, as defined by Solactive AG, the provider of the Secondary Index.
For the 12-month period ended November 30, 2024 (the “reporting period”), the Fund increased 22.79%, while the Secondary Index increased 28.60%. The Fund had a net asset value of $46.08 per share on November 30, 2023 and ended the reporting period with a net asset value of $52.44 per share on November 30, 2024.
During the reporting period, the highest returns came from Summit Midstream Corporation and Martin Midstream Partners L.P., which returned 82.56% and 55.28%, respectively. The worst performers were USD Partners LP and Evolve Transition Infrastructure LP, which returned -77.50% and -16.87%, respectively.
During the reporting period the Fund recorded positive performance. The Midstream Energy sector experienced tailwinds as U.S. producers ramped up production, benefiting midstream MLPs involved in energy logistics. Increased oil and gas production in key regions drove higher transportation and processing volumes through pipelines and storage facilities owned by MLPs. Elevated energy commodity prices supported utilization rates and boosted cash flows for MLPs, enabling them to maintain or grow distributions. Mergers and acquisitions activity in the midstream space unlocked value for MLP unitholders, as bolt-on transactions and industry consolidation increased efficiency and enhanced profit margins. Finally, investor appetite for high-yielding assets supported MLP unit prices, as MLPs offered attractive income in a falling interest rate environment, which contributed to the Fund’s performance during the reporting period.
How did the Fund perform during the last 10 years?
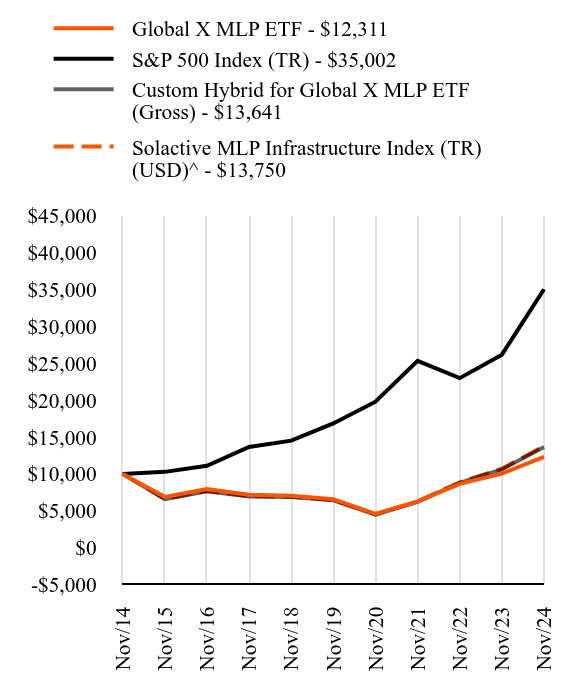
Total Return Based on $10,000 Investment
| Global X MLP ETF - $12311 | S&P 500 Index (TR) - $35002 | Custom Hybrid for Global X MLP ETF (Gross) - $13641 | Solactive MLP Infrastructure Index (TR) (USD)^ - $13750 |
|---|
| Nov/14 | $10000 | $10000 | $10000 | $10000 |
|---|
| Nov/15 | $6892 | $10275 | $6588 | $6640 |
|---|
| Nov/16 | $7949 | $11103 | $7632 | $7692 |
|---|
| Nov/17 | $7166 | $13642 | $6950 | $7006 |
|---|
| Nov/18 | $7043 | $14498 | $6866 | $6920 |
|---|
| Nov/19 | $6582 | $16834 | $6415 | $6466 |
|---|
| Nov/20 | $4574 | $19773 | $4496 | $4531 |
|---|
| Nov/21 | $6289 | $25294 | $6213 | $6262 |
|---|
| Nov/22 | $8659 | $22964 | $8793 | $8863 |
|---|
| Nov/23 | $10026 | $26142 | $10608 | $10692 |
|---|
| Nov/24 | $12311 | $35002 | $13641 | $13750 |
|---|
Average Annual Total Returns as of November 30, 2024
| Fund/Index Name | 1 Year | 5 Years | 10 Years |
|---|
| Global X MLP ETF | 22.79% | 13.34% | 2.10% |
|---|
| S&P 500 Index (TR) | 33.89% | 15.77% | 13.35% |
|---|
| Custom Hybrid for Global X MLP ETF (Gross) | 28.60% | 16.29% | 3.15% |
|---|
| Solactive MLP Infrastructure Index (TR) (USD)^ | 28.60% | 16.29% | 3.24% |
|---|
The line graph represents historical performance of a hypothetical investment of $10,000 in the Fund during the last 10 years. Returns shown are total returns, which assume the reinvestment of dividends and capital gains. The table and graph presented above do not reflect the deduction of taxes a shareholder would pay on Fund distributions or the redemption of Fund shares. Past performance is not indicative of future performance.Call 1-888-493-8631 or visit https://www.globalxetfs.com/funds/mlpa for current month-end performance.
^ The Fund changed its Secondary Index from the Solactive MLP Composite Index to the Solactive MLP Infrastructure Index on April 1, 2015. Performance prior to April 1, 2015 reflects the performance of the Solactive MLP Composite Index.
Key Fund Statistics as of November 30, 2024
| Total Net Assets | Number of Portfolio Holdings | Total Advisory Fees Paid | Portfolio Turnover Rate |
|---|
| $1,754,099,426 | 20 | $6,992,125 | 28.89% |
|---|
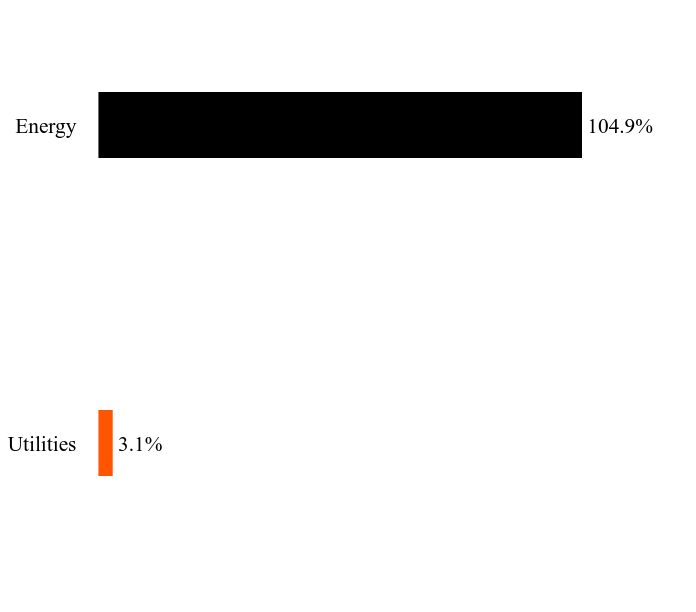
What did the Fund invest in?
Sector WeightingsFootnote Reference*
| Value | Value |
|---|
| Utilities | 3.1% |
| Energy | 104.9% |
| Footnote | Description |
Footnote* | Percentages are calculated based on total net assets. |
| Holding Name | | | Percentage of Total Net Assets |
|---|
| Energy Transfer | | | 15.1% |
| Enterprise Products Partners | | | 13.7% |
| MPLX | | | 12.5% |
| Western Midstream Partners | | | 10.2% |
| Plains All American Pipeline | | | 9.5% |
| Sunoco | | | 8.3% |
| EnLink Midstream | | | 8.3% |
| Hess Midstream, Cl A | | | 8.2% |
| Cheniere Energy Partners | | | 6.0% |
| Global Partners | | | 4.3% |
There were no material changes during the reporting period that are required to be disclosed in this report. For more complete information about other changes to the Fund, you may review the Fund's current prospectus, which is available upon request.
For additional information about the Fund, including its prospectus, financial information, holdings, and proxy voting information, call or visit:
Principal Listing Exchange: NYSE Arca, Inc.
Annual Shareholder Report - November 30, 2024
GX-AR-TSR-11.2024-6
Global X MLP & Energy Infrastructure ETF
Principal Listing Exchange: NYSE Arca, Inc.
Annual Shareholder Report: November 30, 2024
This annual shareholder report contains important information about the Global X MLP & Energy Infrastructure ETF (the "Fund") for the period from December 1, 2023 to November 30, 2024. You can find additional information about the Fund at https://www.globalxetfs.com/funds/mlpx. You can also request this information by contacting us at 1-888-493-8631.
What were the Fund costs for the last year?
(based on a hypothetical $10,000 investment)
| Fund Name | Costs of a $10,000 investment | Costs paid as a percentage of a $10,000 investment |
|---|
| Global X MLP & Energy Infrastructure ETF | $56 | 0.45% |
|---|
How did the Fund perform in the last year?
The Fund seeks to provide investment results that correspond generally to the price and yield performance, before fees and expenses, of the Solactive MLP & Energy Infrastructure Index (“Secondary Index”). The Fund is passively managed, and the investment adviser does not attempt to take defensive positions in declining markets. The Fund generally seeks to fully replicate the Secondary Index.
The Secondary Index is intended to give investors a means of tracking the performance of the Midstream Energy sector, which includes Master Limited Partnerships (“MLPs”) and energy infrastructure corporations. Midstream firms principally own and operate assets used in energy logistics, including, but not limited to, pipelines, storage facilities and other assets used in transporting, storing, gathering, and processing natural gas, natural gas liquids, crude oil or refined products. The Secondary Index limits its exposure to MLPs in order to comply with applicable tax diversification rules. Securities must be publicly traded in the United States. The Secondary Index is maintained by Solactive AG.
For the 12-month period ended November 30, 2024 (the “reporting period”), the Fund increased 50.20%, while the Secondary Index increased 51.27%. The Fund had a net asset value of $44.99 per share on November 30, 2023 and ended the reporting period with a net asset value of $64.25 per share on November 30, 2024.
During the reporting period, the highest returns came from Targa Resources Corp. and DT Midstream, Inc., which returned 130.92% and 93.94% respectively. The worst performers were New Fortress Energy Inc. Class A and Delek Logistics Partners LP, which returned -57.72% and -12.32% respectively.
The Fund benefited from its exposure to companies in the Midstream sector, which saw increased demand for natural gas, natural gas liquids, crude oil and refined products transportation, storage, processing and gathering services. Growing production volumes in key basins drove higher utilization rate across Midstream infrastructure assets. The Fund's holdings generally reported solid financial results, with many firms achieving record operating cash flows, increasing distributions and share buybacks. Improved sentiment, particularly due to positive developments in natural gas, further supported midstream returns. However, the Fund's performance was partially offset by weakness in some of its smaller holdings, which faced project delays or cancellations due to a challenging regulatory environment.
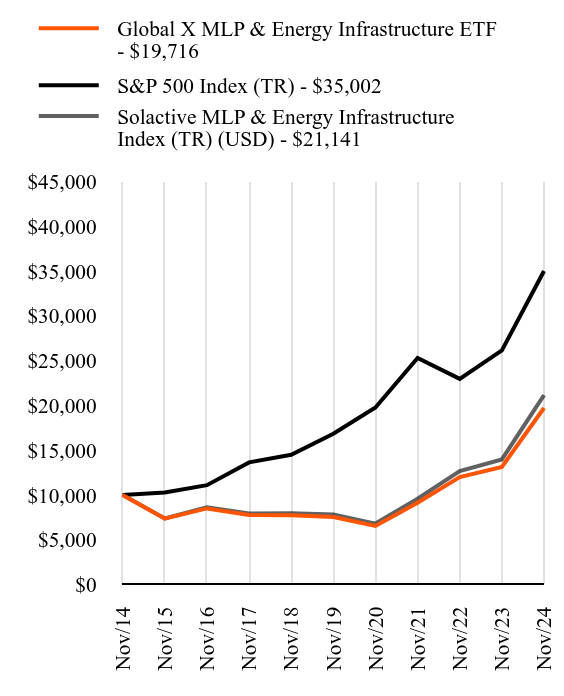
How did the Fund perform during the last 10 years?
Total Return Based on $10,000 Investment
| Global X MLP & Energy Infrastructure ETF - $19716 | S&P 500 Index (TR) - $35002 | Solactive MLP & Energy Infrastructure Index (TR) (USD) - $21141 |
|---|
| Nov/14 | $10000 | $10000 | $10000 |
|---|
| Nov/15 | $7370 | $10275 | $7393 |
|---|
| Nov/16 | $8508 | $11103 | $8644 |
|---|
| Nov/17 | $7767 | $13642 | $7948 |
|---|
| Nov/18 | $7734 | $14498 | $7969 |
|---|
| Nov/19 | $7552 | $16834 | $7822 |
|---|
| Nov/20 | $6545 | $19773 | $6816 |
|---|
| Nov/21 | $9140 | $25294 | $9582 |
|---|
| Nov/22 | $11997 | $22964 | $12677 |
|---|
| Nov/23 | $13127 | $26142 | $13976 |
|---|
| Nov/24 | $19716 | $35002 | $21141 |
|---|
Average Annual Total Returns as of November 30, 2024
| Fund/Index Name | 1 Year | 5 Years | 10 Years |
|---|
| Global X MLP & Energy Infrastructure ETF | 50.20% | 21.16% | 7.02% |
|---|
| S&P 500 Index (TR) | 33.89% | 15.77% | 13.35% |
|---|
| Solactive MLP & Energy Infrastructure Index (TR) (USD) | 51.27% | 22.00% | 7.77% |
|---|
The line graph represents historical performance of a hypothetical investment of $10,000 in the Fund during the last 10 years. Returns shown are total returns, which assume the reinvestment of dividends and capital gains. The table and graph presented above do not reflect the deduction of taxes a shareholder would pay on Fund distributions or the redemption of Fund shares. Past performance is not indicative of future performance.Call 1-888-493-8631 or visit https://www.globalxetfs.com/funds/mlpx for current month-end performance.
Key Fund Statistics as of November 30, 2024
| Total Net Assets | Number of Portfolio Holdings | Total Advisory Fees Paid | Portfolio Turnover Rate |
|---|
| $2,367,633,057 | 27 | $6,602,737 | 23.59% |
|---|
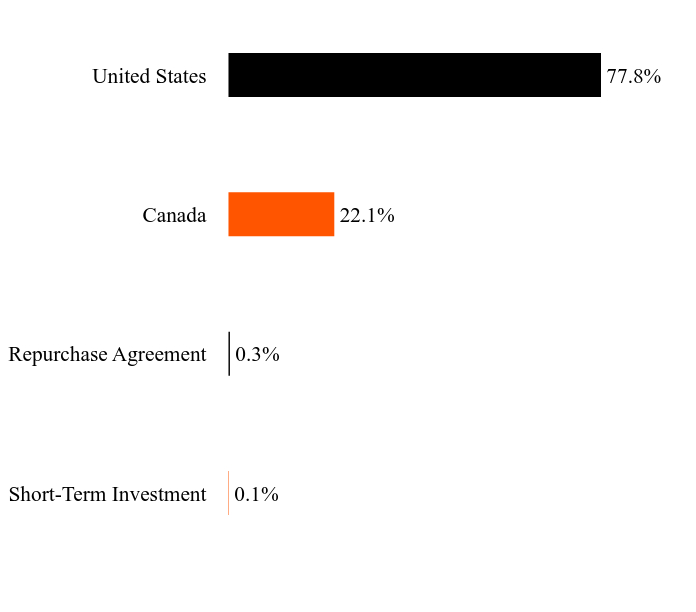
What did the Fund invest in?
Asset/Country WeightingsFootnote Reference*
| Value | Value |
|---|
| Short-Term Investment | 0.1% |
| Repurchase Agreement | 0.3% |
| Canada | 22.1% |
| United States | 77.8% |
| Footnote | Description |
Footnote* | Percentages are calculated based on total net assets. |
| Holding Name | | | Percentage of Total Net AssetsFootnote Reference(A) |
|---|
| Williams | | | 8.9% |
| ONEOK | | | 8.9% |
| Enbridge | | | 8.8% |
| Kinder Morgan | | | 7.9% |
| TC Energy | | | 6.6% |
| Cheniere Energy | | | 6.5% |
| Energy Transfer | | | 4.9% |
| Enterprise Products Partners | | | 4.7% |
| MPLX | | | 4.7% |
| Plains All American Pipeline | | | 4.6% |
| Footnote | Description |
Footnote(A) | Short-Term Investments are not shown in the top ten chart. |
There were no material changes during the reporting period that are required to be disclosed in this report. For more complete information about other changes to the Fund, you may review the Fund's current prospectus, which is available upon request.
For additional information about the Fund, including its prospectus, financial information, holdings, and proxy voting information, call or visit:
Global X MLP & Energy Infrastructure ETF: MLPX
Principal Listing Exchange: NYSE Arca, Inc.
Annual Shareholder Report - November 30, 2024
GX-AR-TSR-11.2024-7
Global X Alternative Income ETF
Principal Listing Exchange: Nasdaq
Annual Shareholder Report: November 30, 2024
This annual shareholder report contains important information about the Global X Alternative Income ETF (the "Fund") for the period from December 1, 2023 to November 30, 2024. You can find additional information about the Fund at https://www.globalxetfs.com/funds/alty/. You can also request this information by contacting us at 1-888-493-8631.
What were the Fund costs for the last year?
(based on a hypothetical $10,000 investment)
| Fund Name | Costs of a $10,000 investment | Costs paid as a percentage of a $10,000 investment |
|---|
| Global X Alternative Income ETF | $55 | 0.50% |
|---|
How did the Fund perform in the last year?
The Fund seeks to provide investment results that correspond generally to the price and yield performance, before fees and expenses, of the Indxx SuperDividend Alternatives Index (“Secondary Index”). The Fund is passively managed, and the investment adviser does not attempt to take defensive positions in declining markets. The Fund generally seeks to fully replicate the Secondary Index.
The Secondary Index targets five income-focused categories: MLPs & Infrastructure, Real Estate, Preferreds, Emerging Market Bonds, and Covered Calls. It achieves this via investments in MLP units and infrastructure shares, as well as in investments in the Global X SuperDividend® REIT ETF, the Global X U.S. Preferred ETF, the Global X Emerging Markets Bond ETF, and the Global X Nasdaq 100 Covered Call ETF, which are affiliates of the Fund.
For the 12-month period ended November 30, 2024 (the "reporting period"), the Fund increased 18.36%, while the Secondary Index increased 18.51%. The Fund had a net asset value of $11.05 per share on November 30, 2023 and ended the reporting period with a net asset value of $12.15 per share on November 30, 2024.
During the reporting period, the highest returns came from holdings Kinder Morgan Inc Class P and Williams Companies, Inc., which returned 70.30% and 66.88%, respectively. The worst performers were USA Compression Partners LP and Kimbell Royalty Partners LP, which returned 2.63% and 3.16%, respectively.
During the reporting period the Fund recorded positive performance. The Fund benefited from its exposure to Infrastructure companies and MLPs, which saw strong returns driven by increased demand and favorable regulatory developments in the Energy sector. The inclusion of the Global X U.S. Preferred ETF and Global X Emerging Markets Bond ETF also contributed positively, as both funds delivered attractive yields. Additionally, the Fund's allocation to the Global X NASDAQ 100 Covered Call ETF provided downside protection and income during periods of market volatility. The Real Estate sector, accessed through the Global X SuperDividend® REIT ETF, experienced a rebound as the economy remained strong, further supporting the Fund's performance. Overall, the Fund's diversified exposure helped mitigate risk while capturing income opportunities.
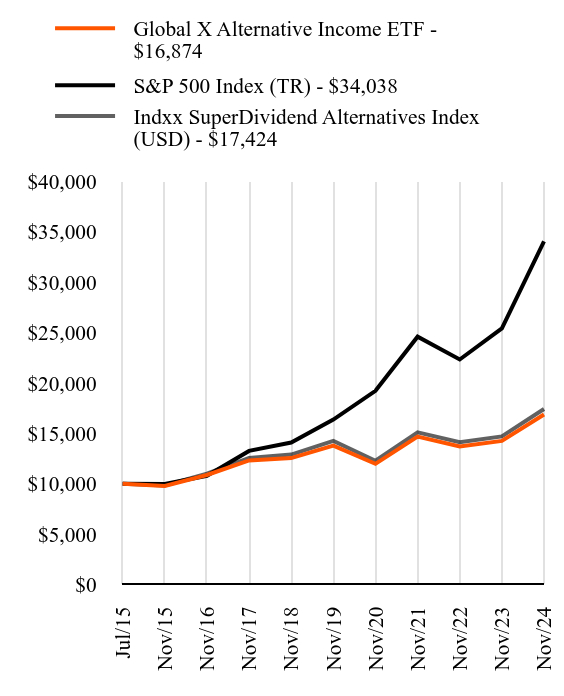
How did the Fund perform since inception?
Total Return Based on $10,000 Investment
| Global X Alternative Income ETF - $16874 | S&P 500 Index (TR) - $34038 | Indxx SuperDividend Alternatives Index (USD) - $17424 |
|---|
| Jul/15 | $10000 | $10000 | $10000 |
|---|
| Nov/15 | $9798 | $9992 | $9833 |
|---|
| Nov/16 | $10880 | $10797 | $11006 |
|---|
| Nov/17 | $12320 | $13267 | $12562 |
|---|
| Nov/18 | $12553 | $14099 | $12904 |
|---|
| Nov/19 | $13794 | $16371 | $14259 |
|---|
| Nov/20 | $11983 | $19228 | $12296 |
|---|
| Nov/21 | $14682 | $24597 | $15101 |
|---|
| Nov/22 | $13707 | $22332 | $14124 |
|---|
| Nov/23 | $14257 | $25422 | $14703 |
|---|
| Nov/24 | $16874 | $34038 | $17424 |
|---|
Average Annual Total Returns as of November 30, 2024
| Fund/Index Name | 1 Year | 5 Years | Annualized Since Inception |
|---|
| Global X Alternative Income ETF | 18.36% | 4.11% | 5.73% |
|---|
| S&P 500 Index (TR) | 33.89% | 15.77% | 13.93% |
|---|
| Indxx SuperDividend Alternatives Index (USD) | 18.51% | 4.09% | 6.09% |
|---|
Since its inception on July 13, 2015. The line graph represents historical performance of a hypothetical investment of $10,000 in the Fund since inception. Returns shown are total returns, which assume the reinvestment of dividends and capital gains. The table and graph presented above do not reflect the deduction of taxes a shareholder would pay on Fund distributions or the redemption of Fund shares. Past performance is not indicative of future performance.Call 1-888-493-8631 or visit https://www.globalxetfs.com/funds/alty/ for current month-end performance.
Key Fund Statistics as of November 30, 2024
| Total Net Assets | Number of Portfolio Holdings | Total Advisory Fees Paid | Portfolio Turnover Rate |
|---|
| $34,271,713 | 22 | $171,805 | 7.16% |
|---|
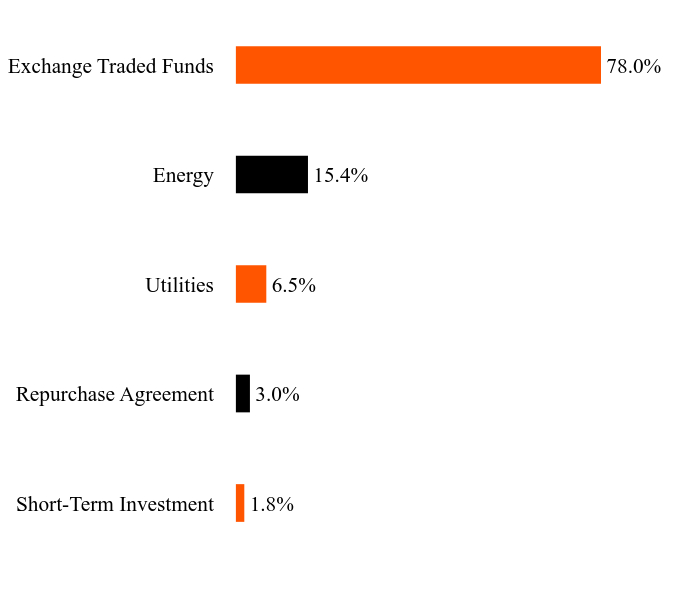
What did the Fund invest in?
Sector WeightingsFootnote Reference*
| Value | Value |
|---|
| Short-Term Investment | 1.8% |
| Repurchase Agreement | 3.0% |
| Utilities | 6.5% |
| Energy | 15.4% |
| Exchange Traded Funds | 78.0% |
| Footnote | Description |
Footnote* | Percentages are calculated based on total net assets. |
| Holding Name | | | Percentage of Total Net AssetsFootnote Reference(A) |
|---|
Global X Nasdaq 100® Covered Call ETFFootnote Reference** | | | 20.0% |
Global X Emerging Markets Bond ETFFootnote Reference** | | | 19.6% |
Global X U.S. Preferred ETFFootnote Reference** | | | 19.5% |
Global X SuperDividend® REIT ETFFootnote Reference** | | | 18.9% |
| Kinder Morgan | | | 1.6% |
| Williams | | | 1.6% |
| Energy Transfer | | | 1.5% |
| Enterprise Products Partners | | | 1.5% |
| MPLX | | | 1.5% |
| Spire | | | 1.4% |
| Footnote | Description |
Footnote** | Affiliated Investment |
Footnote(A) | Short-Term Investments are not shown in the top ten chart. |
There were no material changes during the reporting period that are required to be disclosed in this report. For more complete information about other changes to the Fund, you may review the Fund's current prospectus, which is available upon request.
For additional information about the Fund, including its prospectus, financial information, holdings, and proxy voting information, call or visit:
Global X Alternative Income ETF: ALTY
Principal Listing Exchange: Nasdaq
Annual Shareholder Report - November 30, 2024
GX-AR-TSR-11.2024-8
Global X Conscious Companies ETF
Principal Listing Exchange: Nasdaq
Annual Shareholder Report: November 30, 2024
This annual shareholder report contains important information about the Global X Conscious Companies ETF (the "Fund") for the period from December 1, 2023 to November 30, 2024. You can find additional information about the Fund at https://www.globalxetfs.com/funds/krma/. You can also request this information by contacting us at 1-888-493-8631.
What were the Fund costs for the last year?
(based on a hypothetical $10,000 investment)
| Fund Name | Costs of a $10,000 investment | Costs paid as a percentage of a $10,000 investment |
|---|
| Global X Conscious Companies ETF | $49 | 0.43% |
|---|
How did the Fund perform in the last year?
The Fund seeks to provide investment results that correspond generally to the price and yield performance, before fees and expenses, of the Concinnity Conscious Companies Index (“Secondary Index”). The Fund is passively managed and the investment adviser does not attempt to take defensive positions in declining markets. The Fund generally seeks to fully replicate the Secondary Index.
The Secondary Index looks to provide investors an opportunity to invest in well-managed companies that achieve financial performance in a sustainable and responsible manner as measured by their ability to achieve positive outcomes that are consistent with a multi-stakeholder operating system ("MsOS"), as defined by Concinnity Advisors LP, the provider of the Secondary Index. The MsOS is a corporate governance structure that seeks to account for the multiple stakeholders that are critical for the ongoing success of the business, and incorporate the considerations of these stakeholders into the corporate decision-making and problem-solving process.
For the 12-month period ended November 30, 2024 (the “reporting period”), the Fund increased 28.74%, while the Secondary Index increased 29.36%. The Fund had a net asset value of $31.89 per share on November 30, 2023 and ended the reporting period with a net asset value of $40.61 per share on November 30, 2024.
During the reporting period, the highest returns came from NVIDIA Corporation and Netflix, Inc., which returned 195.68% and 87.10%, respectively. The worst performers were Humana Inc. and Etsy, Inc., which returned -46.31% and -32.15%, respectively.
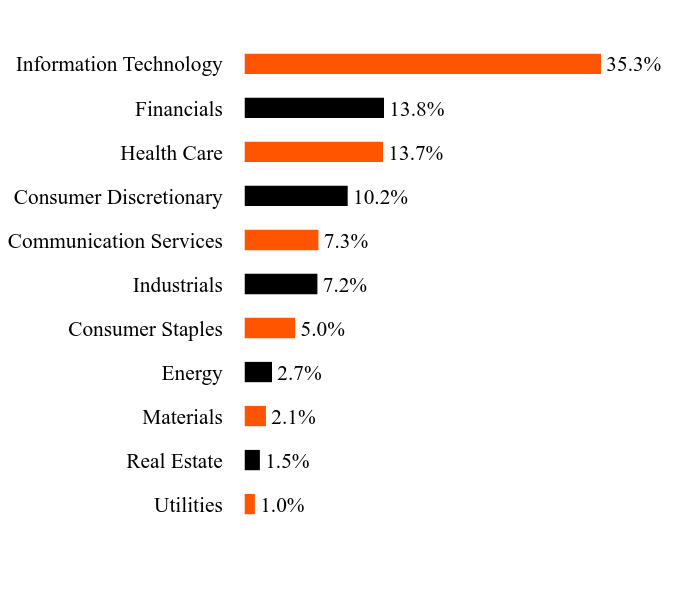
During the reporting period, by sector, the Fund had the highest exposure to Information Technology at 35.3% and Financials at 13.8%.
During the reporting period the Fund recorded positive performance. The Fund benefited from its exposure to companies with strong relationships with key stakeholders including customers, employees, suppliers, stock and debt holders, and the community. These "well-managed" companies demonstrated an ability to achieve solid financial results while operating in a sustainable and responsible manner. Additionally, the Fund's equal-weighting approach and sector balancing helped to mitigate concentration risk and provide diversified exposure during the reporting period.
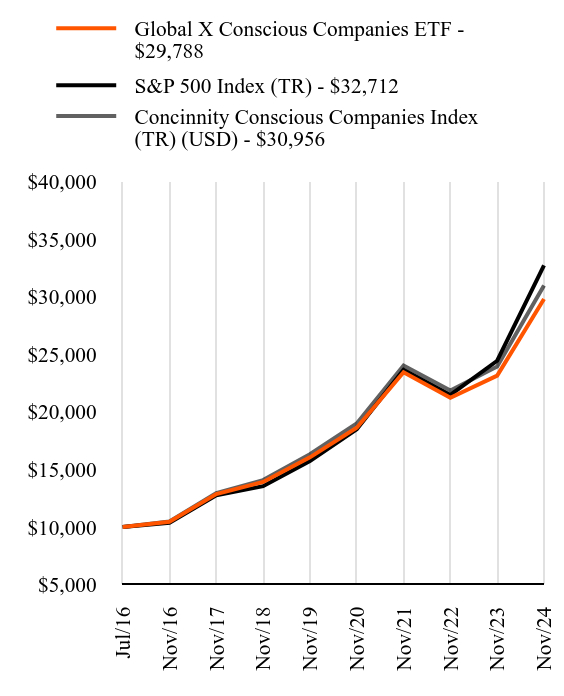
How did the Fund perform since inception?
Total Return Based on $10,000 Investment
| Global X Conscious Companies ETF - $29788 | S&P 500 Index (TR) - $32712 | Concinnity Conscious Companies Index (TR) (USD) - $30956 |
|---|
| Jul/16 | $10000 | $10000 | $10000 |
|---|
| Nov/16 | $10464 | $10377 | $10478 |
|---|
| Nov/17 | $12865 | $12750 | $12941 |
|---|
| Nov/18 | $13914 | $13550 | $14078 |
|---|
| Nov/19 | $16050 | $15733 | $16317 |
|---|
| Nov/20 | $18621 | $18479 | $18996 |
|---|
| Nov/21 | $23433 | $23639 | $24018 |
|---|
| Nov/22 | $21219 | $21462 | $21850 |
|---|
| Nov/23 | $23139 | $24432 | $23929 |
|---|
| Nov/24 | $29788 | $32712 | $30956 |
|---|
Average Annual Total Returns as of November 30, 2024
| Fund/Index Name | 1 Year | 5 Years | Annualized Since Inception |
|---|
| Global X Conscious Companies ETF | 28.74% | 13.16% | 13.89% |
|---|
| S&P 500 Index (TR) | 33.89% | 15.77% | 15.16% |
|---|
| Concinnity Conscious Companies Index (TR) (USD) | 29.36% | 13.66% | 14.41% |
|---|
Since its inception on July 11, 2016. The line graph represents historical performance of a hypothetical investment of $10,000 in the Fund since inception. Returns shown are total returns, which assume the reinvestment of dividends and capital gains. The table and graph presented above do not reflect the deduction of taxes a shareholder would pay on Fund distributions or the redemption of Fund shares. Past performance is not indicative of future performance.Call 1-888-493-8631 or visit https://www.globalxetfs.com/funds/krma/ for current month-end performance.
Key Fund Statistics as of November 30, 2024
| Total Net Assets | Number of Portfolio Holdings | Total Advisory Fees Paid | Portfolio Turnover Rate |
|---|
| $653,742,665 | 151 | $2,736,995 | 21.24% |
|---|
What did the Fund invest in?
Sector WeightingsFootnote Reference*
| Value | Value |
|---|
| Utilities | 1.0% |
| Real Estate | 1.5% |
| Materials | 2.1% |
| Energy | 2.7% |
| Consumer Staples | 5.0% |
| Industrials | 7.2% |
| Communication Services | 7.3% |
| Consumer Discretionary | 10.2% |
| Health Care | 13.7% |
| Financials | 13.8% |
| Information Technology | 35.3% |
| Footnote | Description |
Footnote* | Percentages are calculated based on total net assets. |
| Holding Name | | | Percentage of Total Net Assets |
|---|
| Apple | | | 6.1% |
| NVIDIA | | | 5.7% |
| Microsoft | | | 5.2% |
| Amazon.com | | | 2.7% |
| Alphabet, Cl A | | | 2.6% |
| Meta Platforms, Cl A | | | 1.5% |
| Tesla | | | 0.7% |
| HubSpot | | | 0.7% |
| Discover Financial Services | | | 0.6% |
| Capital One Financial | | | 0.6% |
There were no material changes during the reporting period that are required to be disclosed in this report. For more complete information about other changes to the Fund, you may review the Fund's current prospectus, which is available upon request.
For additional information about the Fund, including its prospectus, financial information, holdings, and proxy voting information, call or visit:
Global X Conscious Companies ETF: KRMA
Principal Listing Exchange: Nasdaq
Annual Shareholder Report - November 30, 2024
GX-AR-TSR-11.2024-9
Global X U.S. Preferred ETF
Principal Listing Exchange: NYSE Arca, Inc.
Annual Shareholder Report: November 30, 2024
This annual shareholder report contains important information about the Global X U.S. Preferred ETF (the "Fund") for the period from December 1, 2023 to November 30, 2024. You can find additional information about the Fund at https://www.globalxetfs.com/funds/pffd/. You can also request this information by contacting us at 1-888-493-8631.
What were the Fund costs for the last year?
(based on a hypothetical $10,000 investment)
| Fund Name | Costs of a $10,000 investment | Costs paid as a percentage of a $10,000 investment |
|---|
| Global X U.S. Preferred ETF | $25 | 0.23% |
|---|
How did the Fund perform in the last year?
The Fund seeks to provide investment results that correspond generally to the price and yield performance, before fees and expenses, of the ICE BofA Diversified Core U.S. Preferred Securities Index (“Secondary Index”). The Fund is passively managed and the investment adviser does not attempt to take defensive positions in declining markets. The Fund generally seeks to fully replicate the Secondary Index.
The Secondary Index is designed to track the broad-based performance of the U.S. preferred securities market. Qualifying securities must be listed on a U.S. exchange, meet a minimum amount outstanding, be denominated in U.S. dollars, and meet minimum price, liquidity, maturity, and other requirements as determined by ICE Data Indices, LLC, the provider of the Underlying Index.
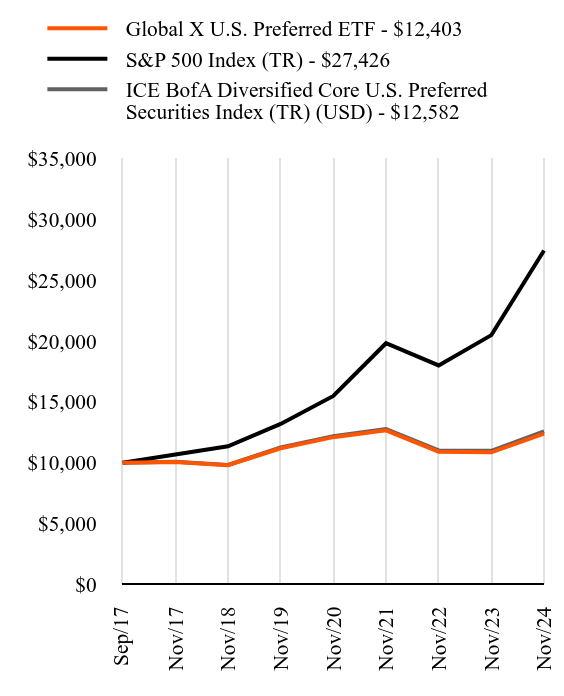
For the 12-month period ended November 30, 2024 (the “reporting period”), the Fund returned 14.20%, while the Secondary Index returned 14.54%. The Fund had a net asset value of $19.13 per share on November 30, 2023 and ended the reporting period with a net asset value of $20.51 per share on November 30, 2024.
During the reporting period, the highest returns came from Qwest Corp 6 1/2 % Notes 2016-01.09.56 and Qwest Corp 6.75 % Notes 2017-15.06.57 Global, which returned 88.80% and 87.32%, respectively. The worst performers were PartnerRe Ltd 4.875 % Non Cum Red Perp Pfd Registered Shs Series J and Diversified Healthcare Trust 5.625% 01-aug-2042, which returned -14.85% and -14.83%, respectively.
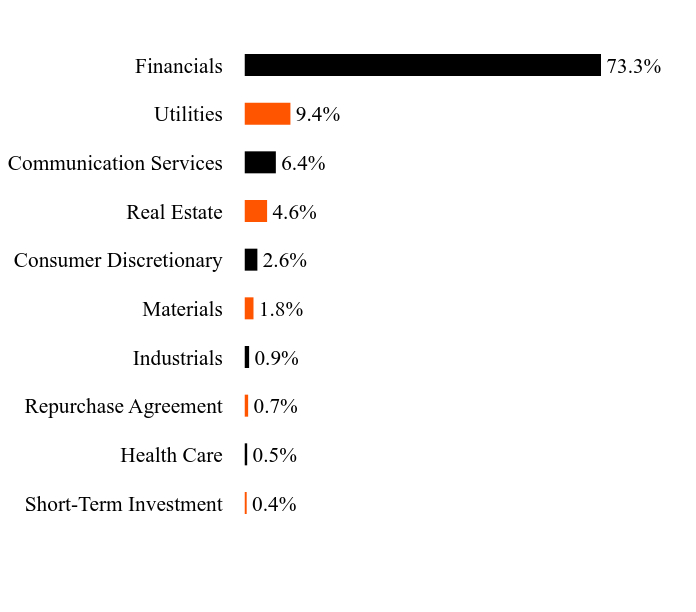
During the reporting period, by sector, the Fund had the highest exposure to Financials at 73.3%.
During the reporting period the Fund recorded positive performance. The Fund benefited from its exposure to the Finance sector, as preferred securities issued by financial institutions saw strong demand amid high interest rates. The Utilities sector also contributed positively, with utility companies' preferred stocks providing stable income in a volatile market environment. Additionally, the Fund's focus on investment grade securities helped mitigate credit risk and supported performance. The Fund's diversified approach across issuers and sectors further enhanced returns by reducing concentration risk. Lastly, the Fund’s underlying securities provided steady income as interest rates came down towards the end of the reporting period.
How did the Fund perform since inception?
Total Return Based on $10,000 Investment
| Global X U.S. Preferred ETF - $12403 | S&P 500 Index (TR) - $27426 | ICE BofA Diversified Core U.S. Preferred Securities Index (TR) (USD) - $12582 |
|---|
| Sep/17 | $10000 | $10000 | $10000 |
|---|
| Nov/17 | $10075 | $10690 | $10080 |
|---|
| Nov/18 | $9801 | $11360 | $9829 |
|---|
| Nov/19 | $11198 | $13191 | $11258 |
|---|
| Nov/20 | $12108 | $15493 | $12189 |
|---|
| Nov/21 | $12667 | $19819 | $12779 |
|---|
| Nov/22 | $10916 | $17994 | $11019 |
|---|
| Nov/23 | $10861 | $20484 | $10984 |
|---|
| Nov/24 | $12403 | $27426 | $12582 |
|---|
Average Annual Total Returns as of November 30, 2024
| Fund/Index Name | 1 Year | 5 Years | Annualized Since Inception |
|---|
| Global X U.S. Preferred ETF | 14.20% | 2.07% | 3.03% |
|---|
| S&P 500 Index (TR) | 33.89% | 15.77% | 14.99% |
|---|
| ICE BofA Diversified Core U.S. Preferred Securities Index (TR) (USD) | 14.54% | 2.25% | 3.23% |
|---|
Since its inception on September 11, 2017. The line graph represents historical performance of a hypothetical investment of $10,000 in the Fund since inception. Returns shown are total returns, which assume the reinvestment of dividends and capital gains. The table and graph presented above do not reflect the deduction of taxes a shareholder would pay on Fund distributions or the redemption of Fund shares. Past performance is not indicative of future performance.Call 1-888-493-8631 or visit https://www.globalxetfs.com/funds/pffd/ for current month-end performance.
Key Fund Statistics as of November 30, 2024
| Total Net Assets | Number of Portfolio Holdings | Total Advisory Fees Paid | Portfolio Turnover Rate |
|---|
| $2,467,525,319 | 214 | $5,511,252 | 27.10% |
|---|
What did the Fund invest in?
Sector WeightingsFootnote Reference*
| Value | Value |
|---|
| Short-Term Investment | 0.4% |
| Health Care | 0.5% |
| Repurchase Agreement | 0.7% |
| Industrials | 0.9% |
| Materials | 1.8% |
| Consumer Discretionary | 2.6% |
| Real Estate | 4.6% |
| Communication Services | 6.4% |
| Utilities | 9.4% |
| Financials | 73.3% |
| Footnote | Description |
Footnote* | Percentages are calculated based on total net assets. |
| Holding Name | | | Percentage of Total Net AssetsFootnote Reference(A) |
|---|
| Wells Fargo, 7.50% | | | 3.9% |
| Bank of America, 7.25% | | | 2.7% |
| Citigroup Capital XIII, 11.22% | | | 2.2% |
| Apollo Global Management, 6.75% | | | 2.2% |
| Albemarle, 7.25% | | | 1.8% |
| NextEra Energy, 7.30% | | | 1.7% |
| JPMorgan Chase, 6.00% | | | 1.5% |
| JPMorgan Chase, 5.75% | | | 1.4% |
| Wells Fargo, 4.75% | | | 1.3% |
| JPMorgan Chase, 4.63% | | | 1.3% |
| Footnote | Description |
Footnote(A) | Short-Term Investments are not shown in the top ten chart. |
There were no material changes during the reporting period that are required to be disclosed in this report. For more complete information about other changes to the Fund, you may review the Fund's current prospectus, which is available upon request.
For additional information about the Fund, including its prospectus, financial information, holdings, and proxy voting information, call or visit:
Global X U.S. Preferred ETF: PFFD
Principal Listing Exchange: NYSE Arca, Inc.
Annual Shareholder Report - November 30, 2024
GX-AR-TSR-11.2024-10
Global X S&P 500® Quality Dividend ETF
Principal Listing Exchange: NYSE Arca, Inc.
Annual Shareholder Report: November 30, 2024
This annual shareholder report contains important information about the Global X S&P 500® Quality Dividend ETF (the "Fund") for the period from December 1, 2023 to November 30, 2024. You can find additional information about the Fund at https://www.globalxetfs.com/funds/qdiv/. You can also request this information by contacting us at 1-888-493-8631.
What were the Fund costs for the last year?
(based on a hypothetical $10,000 investment)
| Fund Name | Costs of a $10,000 investment | Costs paid as a percentage of a $10,000 investment |
|---|
Global X S&P 500® Quality Dividend ETF | $22 | 0.20% |
|---|
How did the Fund perform in the last year?
The Fund seeks investment results that correspond generally to the price and yield performance, before fees and expenses, of the S&P 500 Quality High Dividend Index (“Secondary Index”). The Fund is passively managed and the investment adviser does not attempt to take defensive positions in declining markets. The Fund generally seeks to fully replicate the Secondary Index.
The Secondary Index measures the performance of S&P 500 stocks that exhibit both high quality and high dividend yield characteristics. Index constituents are equally-weighted, subject to a 25% Sector weight cap.
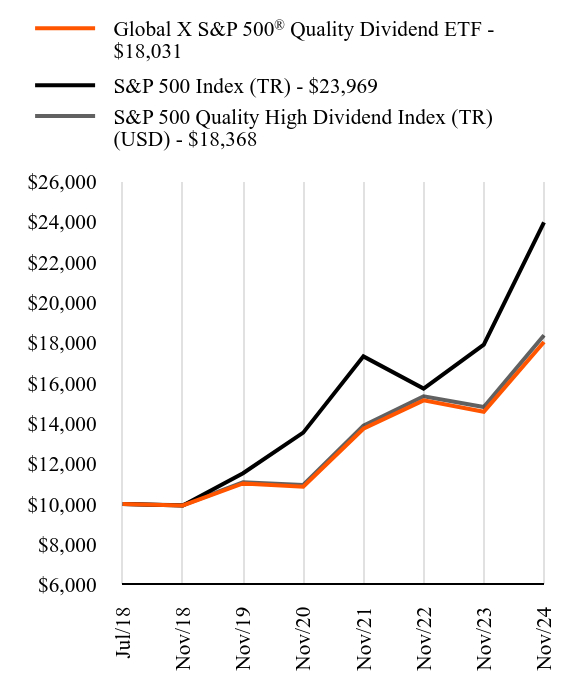
For the 12-month period ended November 30, 2024 (the "reporting period"), the Fund increased 23.69%, while the Secondary Index increased 24.02%. The Fund had a net asset value of $30.97 per share on November 30, 2023 and ended the reporting period with a net asset value of $37.14 per share on November 30, 2024.
During the reporting period, the highest returns came from Cincinnati Financial Corporation and Kellanova, which returned 60.26% and 58.87%, respectively. The worst performers were APA Corporation and Archer Daniels Midland Company, which returned -34.92% and -23.27%, respectively.
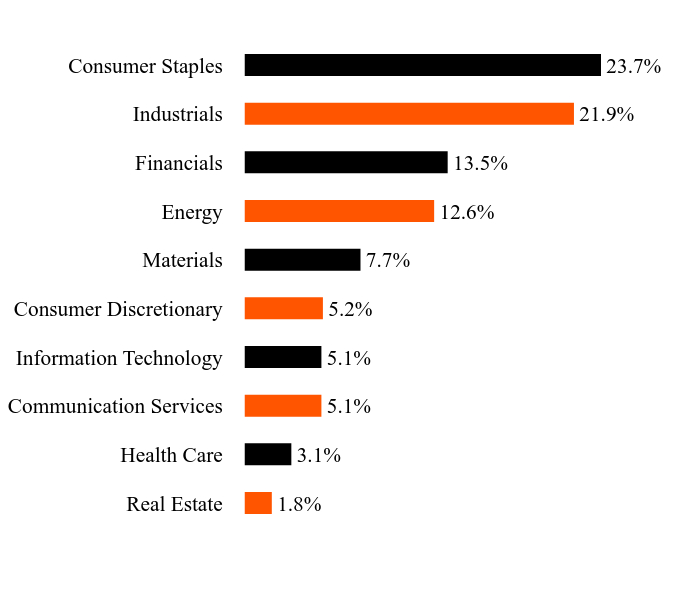
During the reporting period, by sector, the Fund had the highest exposure to Consumer Staples at 23.7% and Industrials at 21.9%.
During the reporting period the Fund recorded positive performance due to both price appreciation and high dividends. Overall, the Industrials and Financials sectors were the leading contributors to the Fund’s price appreciation due to strong economic growth, increased infrastructure spending, and high, albeit lowering, interest rates. The Fund also benefited from its exposure to the Information Technology sector, which saw strong earnings growth and robust demand for cloud computing, cybersecurity, and digital transformation services. On the income side, the Consumer Staples and Industrials sectors provided the highest dividend contributions. Firms in these sectors tend to have stable cash flows and consistent dividend policies, allowing them to maintain or increase their payouts even in volatile market conditions, which contributed to the Fund’s performance during the reporting period.
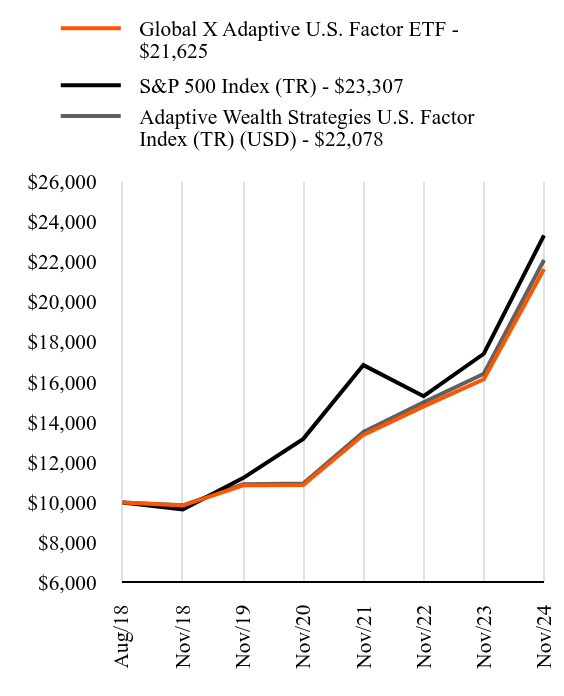
How did the Fund perform since inception?
Total Return Based on $10,000 Investment
| Global X S&P 500® Quality Dividend ETF - $18031 | S&P 500 Index (TR) - $23969 | S&P 500 Quality High Dividend Index (TR) (USD) - $18368 |
|---|
| Jul/18 | $10000 | $10000 | $10000 |
|---|
| Nov/18 | $9928 | $9929 | $9940 |
|---|
| Nov/19 | $11021 | $11528 | $11074 |
|---|
| Nov/20 | $10859 | $13540 | $10945 |
|---|
| Nov/21 | $13732 | $17321 | $13881 |
|---|
| Nov/22 | $15139 | $15726 | $15342 |
|---|
| Nov/23 | $14577 | $17902 | $14811 |
|---|
| Nov/24 | $18031 | $23969 | $18368 |
|---|
Average Annual Total Returns as of November 30, 2024
| Fund/Index Name | 1 Year | 5 Years | Annualized Since Inception |
|---|
Global X S&P 500® Quality Dividend ETF | 23.69% | 10.35% | 9.67% |
|---|
| S&P 500 Index (TR) | 33.89% | 15.77% | 14.66% |
|---|
| S&P 500 Quality High Dividend Index (TR) (USD) | 24.02% | 10.65% | 9.98% |
|---|
Since its inception on July 13, 2018. The line graph represents historical performance of a hypothetical investment of $10,000 in the Fund since inception. Returns shown are total returns, which assume the reinvestment of dividends and capital gains. The table and graph presented above do not reflect the deduction of taxes a shareholder would pay on Fund distributions or the redemption of Fund shares. Past performance is not indicative of future performance.Call 1-888-493-8631 or visit https://www.globalxetfs.com/funds/qdiv/ for current month-end performance.
Key Fund Statistics as of November 30, 2024
| Total Net Assets | Number of Portfolio Holdings | Total Advisory Fees Paid | Portfolio Turnover Rate |
|---|
| $32,308,887 | 64 | $60,188 | 82.76% |
|---|
What did the Fund invest in?
Sector WeightingsFootnote Reference*
| Value | Value |
|---|
| Real Estate | 1.8% |
| Health Care | 3.1% |
| Communication Services | 5.1% |
| Information Technology | 5.1% |
| Consumer Discretionary | 5.2% |
| Materials | 7.7% |
| Energy | 12.6% |
| Financials | 13.5% |
| Industrials | 21.9% |
| Consumer Staples | 23.7% |
| Footnote | Description |
Footnote* | Percentages are calculated based on total net assets. |
| Holding Name | | | Percentage of Total Net Assets |
|---|
| Blackstone | | | 2.4% |
| Cincinnati Financial | | | 2.1% |
| Baker Hughes, Cl A | | | 2.1% |
| Snap-On | | | 2.1% |
| Cummins | | | 2.1% |
| BlackRock Funding | | | 2.0% |
| Fastenal | | | 2.0% |
| Aflac | | | 2.0% |
| International Paper | | | 2.0% |
| Cisco Systems | | | 1.9% |
There were no material changes during the reporting period that are required to be disclosed in this report. For more complete information about other changes to the Fund, you may review the Fund's current prospectus, which is available upon request.
For additional information about the Fund, including its prospectus, financial information, holdings, and proxy voting information, call or visit:
Global X S&P 500® Quality Dividend ETF: QDIV
Principal Listing Exchange: NYSE Arca, Inc.
Annual Shareholder Report - November 30, 2024
GX-AR-TSR-11.2024-11
Global X Adaptive U.S. Factor ETF
Principal Listing Exchange: NYSE Arca, Inc.
Annual Shareholder Report: November 30, 2024
This annual shareholder report contains important information about the Global X Adaptive U.S. Factor ETF (the "Fund") for the period from December 1, 2023 to November 30, 2024. You can find additional information about the Fund at https://www.globalxetfs.com/funds/ausf/. You can also request this information by contacting us at 1-888-493-8631.
What were the Fund costs for the last year?
(based on a hypothetical $10,000 investment)
| Fund Name | Costs of a $10,000 investment | Costs paid as a percentage of a $10,000 investment |
|---|
| Global X Adaptive U.S. Factor ETF | $32 | 0.27% |
|---|
How did the Fund perform in the last year?
The Fund seeks to provide investment results that correspond generally to the price and yield performance, before fees and expenses, of the Adaptive Wealth Strategies® U.S. Factor Index (“Secondary Index”). The Fund is passively managed and the investment adviser does not attempt to take defensive positions in declining markets. The Fund generally seeks to fully replicate the Secondary Index.
The Secondary Index is designed to dynamically allocate across three sub-indices that provide exposure to U.S. equities that exhibit characteristics of one of three primary factors: value, momentum and low volatility. Each factor is represented by a subindex that is derived from the Solactive U.S. Large & Mid Cap Index, which is designed to measure the 1,000 largest companies, by free float market capitalization, that are exchange-listed in the United States.
For the 12-month period ended November 30, 2024 (the "reporting period"), the Fund increased 34.02%, while the Secondary Index increased 34.52%. The Fund had a net asset value of $34.37 per share on November 30, 2023 and ended the reporting period with a net asset value of $44.98 per share on November 30, 2024.
During the reporting period, the highest returns came from Super Micro Computer, Inc and United Airlines Holdings, Inc, which returned 149.97% and 122.28% respectively. The worst performers were Flagstar Financial, Inc and Celanese Corporation, which returned -71.53% and -49.89% respectively.
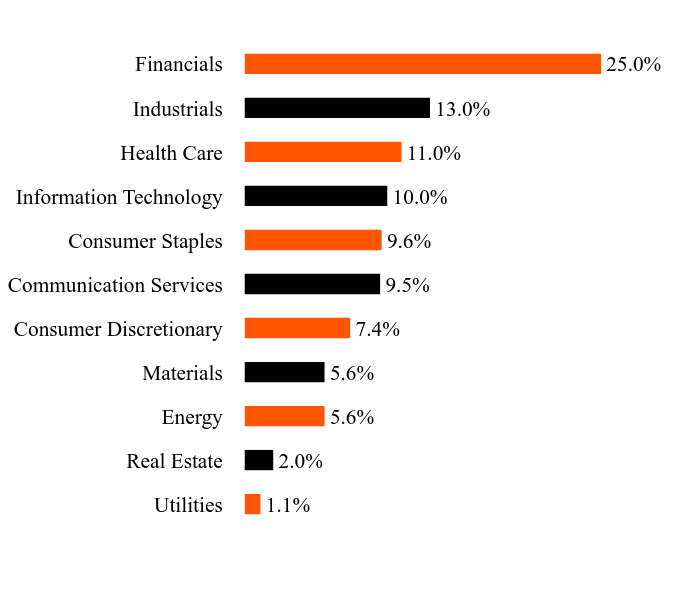
During the reporting period, by sector, the Fund had the highest exposure to Financials at 25.0% and Industrials at 13.0%.
During the reporting period the Fund recorded positive performance as a result of effective factor rotation. The Fund benefited from its exposure to the Technology sector, as technology companies experienced strong earnings growth and saw their valuations expand. The Fund's holdings in the Industrial sector also contributed positively, driven by increased infrastructure spending and a recovery in global trade. Additionally, the Fund's positions in the Financial sector added to returns, as banks and insurance companies benefited from high interest rates and improved credit conditions. Finally, the Fund's focus on high-quality companies with strong balance sheets and consistent earnings growth helped mitigate volatility and downside risk during periods of market turbulence.
How did the Fund perform since inception?
Total Return Based on $10,000 Investment
| Global X Adaptive U.S. Factor ETF - $21625 | S&P 500 Index (TR) - $23307 | Adaptive Wealth Strategies U.S. Factor Index (TR) (USD) - $22078 |
|---|
| Aug/18 | $10000 | $10000 | $10000 |
|---|
| Nov/18 | $9842 | $9654 | $9853 |
|---|
| Nov/19 | $10853 | $11210 | $10900 |
|---|
| Nov/20 | $10867 | $13166 | $10946 |
|---|
| Nov/21 | $13368 | $16843 | $13509 |
|---|
| Nov/22 | $14786 | $15291 | $14985 |
|---|
| Nov/23 | $16136 | $17408 | $16412 |
|---|
| Nov/24 | $21625 | $23307 | $22078 |
|---|
Average Annual Total Returns as of November 30, 2024
| Fund/Index Name | 1 Year | 5 Years | Annualized Since Inception |
|---|
| Global X Adaptive U.S. Factor ETF | 34.02% | 14.79% | 13.08% |
|---|
| S&P 500 Index (TR) | 33.89% | 15.77% | 14.44% |
|---|
| Adaptive Wealth Strategies U.S. Factor Index (TR) (USD) | 34.52% | 15.16% | 13.45% |
|---|
Since its inception on August 24, 2018. The line graph represents historical performance of a hypothetical investment of $10,000 in the Fund since inception. Returns shown are total returns, which assume the reinvestment of dividends and capital gains. The table and graph presented above do not reflect the deduction of taxes a shareholder would pay on Fund distributions or the redemption of Fund shares. Past performance is not indicative of future performance.Call 1-888-493-8631 or visit https://www.globalxetfs.com/funds/ausf/ for current month-end performance.
Key Fund Statistics as of November 30, 2024
| Total Net Assets | Number of Portfolio Holdings | Total Advisory Fees Paid | Portfolio Turnover Rate |
|---|
| $363,880,967 | 193 | $711,227 | 95.79% |
|---|
What did the Fund invest in?
Sector WeightingsFootnote Reference*
| Value | Value |
|---|
| Utilities | 1.1% |
| Real Estate | 2.0% |
| Energy | 5.6% |
| Materials | 5.6% |
| Consumer Discretionary | 7.4% |
| Communication Services | 9.5% |
| Consumer Staples | 9.6% |
| Information Technology | 10.0% |
| Health Care | 11.0% |
| Industrials | 13.0% |
| Financials | 25.0% |
| Footnote | Description |
Footnote* | Percentages are calculated based on total net assets. |
| Holding Name | | | Percentage of Total Net Assets |
|---|
| AT&T | | | 1.9% |
| Verizon Communications | | | 1.9% |
| T-Mobile US | | | 1.6% |
| Walmart | | | 1.6% |
| Republic Services, Cl A | | | 1.5% |
| Cencora | | | 1.5% |
| Boston Scientific | | | 1.5% |
| Visa, Cl A | | | 1.5% |
| Berkshire Hathaway, Cl B | | | 1.5% |
| Marsh & McLennan | | | 1.4% |
There were no material changes during the reporting period that are required to be disclosed in this report. For more complete information about other changes to the Fund, you may review the Fund's current prospectus, which is available upon request.
For additional information about the Fund, including its prospectus, financial information, holdings, and proxy voting information, call or visit:
Global X Adaptive U.S. Factor ETF: AUSF
Principal Listing Exchange: NYSE Arca, Inc.
Annual Shareholder Report - November 30, 2024
GX-AR-TSR-11.2024-12
Global X Variable Rate Preferred ETF
Principal Listing Exchange: NYSE Arca, Inc.
Annual Shareholder Report: November 30, 2024
This annual shareholder report contains important information about the Global X Variable Rate Preferred ETF (the "Fund") for the period from December 1, 2023 to November 30, 2024. You can find additional information about the Fund at https://www.globalxetfs.com/funds/pffv/. You can also request this information by contacting us at 1-888-493-8631.
What were the Fund costs for the last year?
(based on a hypothetical $10,000 investment)
| Fund Name | Costs of a $10,000 investment | Costs paid as a percentage of a $10,000 investment |
|---|
| Global X Variable Rate Preferred ETF | $27 | 0.25% |
|---|
How did the Fund perform in the last year?
The Fund seeks to provide investment results that correspond generally to the price and yield performance, before fees and expenses, of the ICE U.S. Variable Rate Preferred Securities Index (“Secondary Index”). The Fund is passively managed, and the investment adviser does not attempt to take defensive positions in declining markets. The Fund generally seeks to fully replicate the Secondary Index.
The Secondary Index is designed to track the performance of the U.S.-listed variable rate preferred securities market. Qualifying securities must be listed on a U.S. exchange, meet a minimum amount outstanding, be denominated in U.S. dollars, and meet minimum price, liquidity, maturity, and other requirements as determined by ICE Data Indices, LLC, the provider of the Secondary Index.
For the 12-month period ended November 30, 2024 (the “reporting period”), the Fund returned 13.29%, while the Secondary Index returned 13.61%. The Fund had a net asset value of $23.13 per share on November 30, 2023 and ended the reporting period with a net asset value of $24.32 per share on November 30, 2024.
During the reporting period, the highest returns came from Western Alliance Bancorp Depositary Shs Repr 1/400th Fixed-to-Fltg Non-Cum Conv Red Perp Pfd Rg A and Regions Financial Corporation Depositary Shs Repr 1/40th Non-Cum Red Perp Pfd Ser C, which returned 41.84% and 34.85%, respectively. The worst performers were Enstar Group Limited Deposit Shs Repr 1/1000th Non-Cum Red Pfd Registered Shs Series D and Granite Point Mortgage Trust Inc. Cum Conv Red Pfd Registered Shs Series A, which returned -10.26% and -10.21%, respectively.
During the reporting period the Fund recorded positive performance. The Fund benefited from its exposure to preferred securities issued by companies in the Finance sector, as this sector experienced favorable market conditions and strong investor demand. Additionally, the Fund's holdings of floating rate and fixed-to-floating rate preferred securities provided attractive yields in a high-interest-rate environment. The Fund's diversified portfolio across various issuers helped mitigate idiosyncratic risks and contributed to its positive performance. Furthermore, the Fund's focus on investment grade securities issued by companies in countries with stable economic outlooks supported its returns. Lastly, the Fund's market capitalization-weighted approach allowed it to capitalize on the strong performance of larger issuers while maintaining exposure to potential growth opportunities among smaller companies.
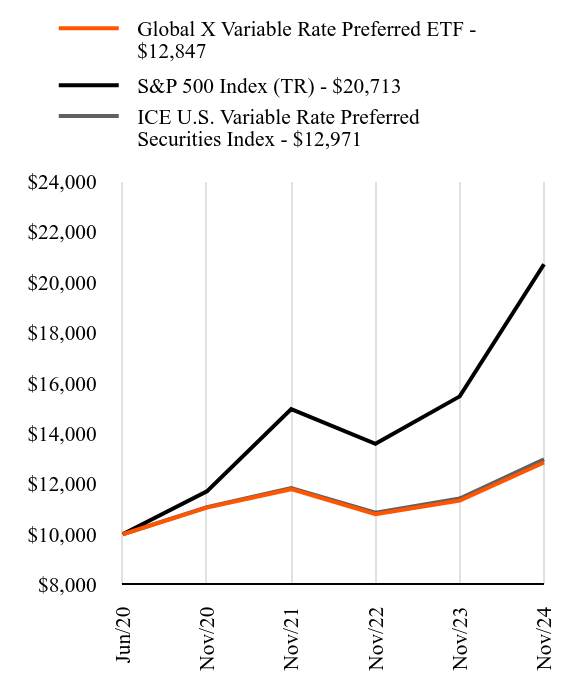
How did the Fund perform since inception?
Total Return Based on $10,000 Investment
| Global X Variable Rate Preferred ETF - $12847 | S&P 500 Index (TR) - $20713 | ICE U.S. Variable Rate Preferred Securities Index - $12971 |
|---|
| Jun/20 | $10000 | $10000 | $10000 |
|---|
| Nov/20 | $11059 | $11701 | $11075 |
|---|
| Nov/21 | $11788 | $14968 | $11837 |
|---|
| Nov/22 | $10798 | $13589 | $10854 |
|---|
| Nov/23 | $11340 | $15470 | $11417 |
|---|
| Nov/24 | $12847 | $20713 | $12971 |
|---|
Average Annual Total Returns as of November 30, 2024
| Fund/Index Name | 1 Year | Annualized Since Inception |
|---|
| Global X Variable Rate Preferred ETF | 13.29% | 5.80% |
|---|
| S&P 500 Index (TR) | 33.89% | 17.81% |
|---|
| ICE U.S. Variable Rate Preferred Securities Index | 13.61% | 6.03% |
|---|
Since its inception on June 22, 2020. The line graph represents historical performance of a hypothetical investment of $10,000 in the Fund since inception. Returns shown are total returns, which assume the reinvestment of dividends and capital gains. The table and graph presented above do not reflect the deduction of taxes a shareholder would pay on Fund distributions or the redemption of Fund shares. Past performance is not indicative of future performance.Call 1-888-493-8631 or visit https://www.globalxetfs.com/funds/pffv/ for current month-end performance.
Key Fund Statistics as of November 30, 2024
| Total Net Assets | Number of Portfolio Holdings | Total Advisory Fees Paid | Portfolio Turnover Rate |
|---|
| $266,034,240 | 53 | $618,674 | 58.94% |
|---|
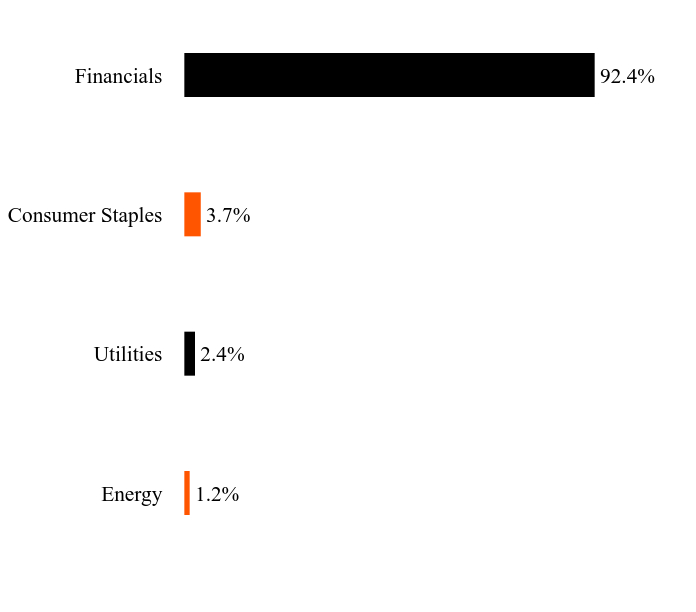
What did the Fund invest in?
Sector WeightingsFootnote Reference*
| Value | Value |
|---|
| Energy | 1.2% |
| Utilities | 2.4% |
| Consumer Staples | 3.7% |
| Financials | 92.4% |
| Footnote | Description |
Footnote* | Percentages are calculated based on total net assets. |
| Holding Name | | | Percentage of Total Net Assets |
|---|
| Goldman Sachs Group, 5.45% | | | 5.2% |
| Bank of America, 6.45% | | | 4.5% |
| Morgan Stanley, 5.62% | | | 4.3% |
| US Bancorp, 5.52% | | | 3.7% |
| Athene Holding, 6.35% | | | 3.5% |
| Annaly Capital Management, 9.70% | | | 3.0% |
| Reinsurance Group of America, 7.13% | | | 3.0% |
| Goldman Sachs Group, 5.53% | | | 2.9% |
| Apollo Global Management, 7.63% | | | 2.7% |
| KeyCorp, 6.20% | | | 2.5% |
There were no material changes during the reporting period that are required to be disclosed in this report. For more complete information about other changes to the Fund, you may review the Fund's current prospectus, which is available upon request.
For additional information about the Fund, including its prospectus, financial information, holdings, and proxy voting information, call or visit:
Global X Variable Rate Preferred ETF: PFFV
Principal Listing Exchange: NYSE Arca, Inc.
Annual Shareholder Report - November 30, 2024
GX-AR-TSR-11.2024-13
Global X Adaptive U.S. Risk Management ETF
Principal Listing Exchange: NYSE Arca, Inc.
Annual Shareholder Report: November 30, 2024
This annual shareholder report contains important information about the Global X Adaptive U.S. Risk Management ETF (the "Fund") for the period from December 1, 2023 to November 30, 2024. You can find additional information about the Fund at https://www.globalxetfs.com/funds/onof. You can also request this information by contacting us at 1-888-493-8631.
What were the Fund costs for the last year?
(based on a hypothetical $10,000 investment)
| Fund Name | Costs of a $10,000 investment | Costs paid as a percentage of a $10,000 investment |
|---|
| Global X Adaptive U.S. Risk Management ETF | $44 | 0.39% |
|---|
How did the Fund perform in the last year?
The Fund seeks to provide investment results that correspond generally to the price and yield performance, before fees and expenses, of the Adaptive Wealth Strategies U.S. Risk Management Index (“Secondary Index”). The Fund is passively managed, and the investment adviser does not attempt to take defensive positions in declining markets. The Fund generally seeks to fully replicate the Secondary Index.
The Secondary Index is owned and was developed by NorthCrest Asset Management (the "Index Provider"), and is designed to dynamically allocate between either 100% exposure to the Solactive GBS United States 500 Index TR (“U.S. Equity Position”) or 100% exposure to a portfolio of U.S. Treasuries with 1-3 years remaining to maturity (“U.S. Treasury Position”). The Secondary Index seeks to provide exposure to the U.S. Equity Position during periods of normal equity market returns and seeks to provide exposure to the U.S. Treasury Position prior to and during periods of adverse market conditions, as determined by the quantitative model that had been developed by the Index Provider.
For the 12-month period ended November 30, 2024 (the “reporting period”), the Fund increased 27.98%, while the Secondary Index increased 28.63%. The Fund had a net asset value of $28.55 per share on November 30, 2023 and ended the reporting period with a net asset value of $36.14 per share on November 30, 2024.
During the reporting period, the highest returns came from AppLovin Corp. Class A and MicroStrategy Incorporated Class A, which returned 311.40% and 269.74%, respectively. The worst performers were Super Micro Computer, Inc. and Celsius Holdings, Inc., which returned -59.74% and -57.57%, respectively.
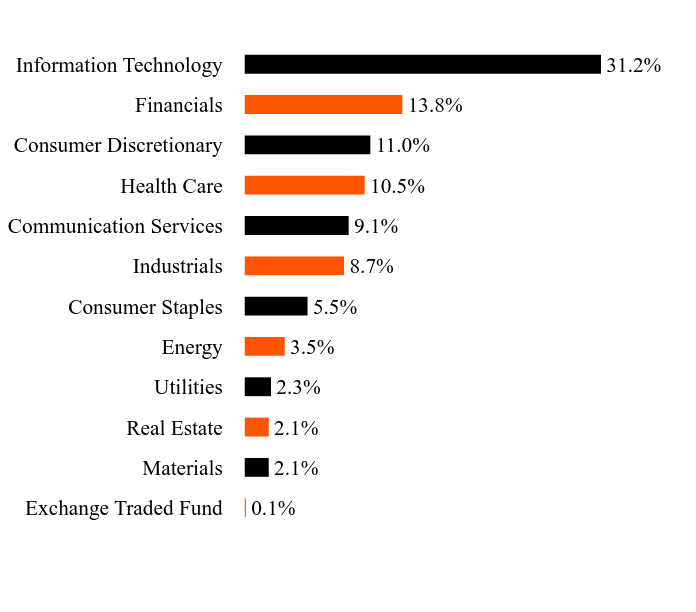
During the reporting period, by sector, the Fund had the highest exposure to Information Technology at 31.2% and Financials at 13.8%.
During the reporting period the Fund recorded positive performance and benefited from its dynamic allocation strategy which allowed it to navigate volatile market conditions. The signals used to determine the Fund's exposure to equities proved effective in identifying favorable entry and exit points. During the reporting period, the broader US equity market experienced robust growth due to easing inflation, loosening monetary policy, low unemployment, and heightened consumer confidence. While the Fund was positioned in a risk-on position for the majority of the period, the Fund's allocation to short-term US Treasury bonds provided stability and downside protection during periods of market uncertainty.
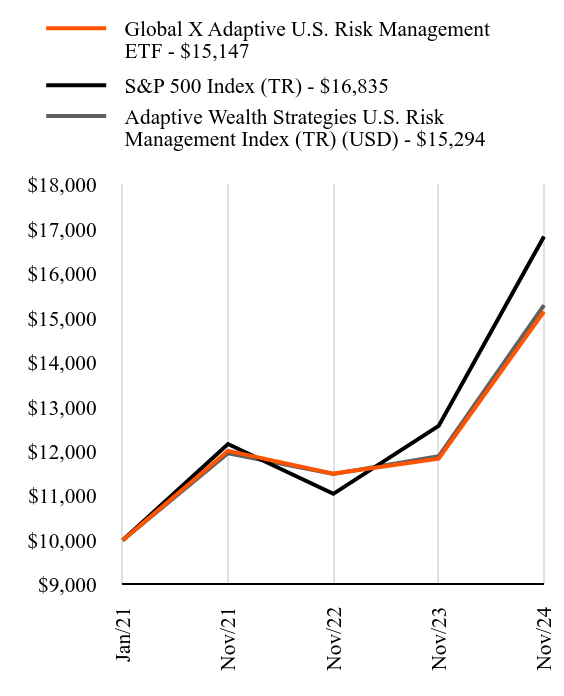
How did the Fund perform since inception?
Total Return Based on $10,000 Investment
| Global X Adaptive U.S. Risk Management ETF - $15147 | S&P 500 Index (TR) - $16835 | Adaptive Wealth Strategies U.S. Risk Management Index (TR) (USD) - $15294 |
|---|
| Jan/21 | $10000 | $10000 | $10000 |
|---|
| Nov/21 | $12013 | $12166 | $11960 |
|---|
| Nov/22 | $11500 | $11045 | $11493 |
|---|
| Nov/23 | $11835 | $12574 | $11889 |
|---|
| Nov/24 | $15147 | $16835 | $15294 |
|---|
Average Annual Total Returns as of November 30, 2024
| Fund/Index Name | 1 Year | Annualized Since Inception |
|---|
| Global X Adaptive U.S. Risk Management ETF | 27.98% | 11.28% |
|---|
| S&P 500 Index (TR) | 33.89% | 14.35% |
|---|
| Adaptive Wealth Strategies U.S. Risk Management Index (TR) (USD) | 28.63% | 11.56% |
|---|
Since its inception on January 12, 2021. The line graph represents historical performance of a hypothetical investment of $10,000 in the Fund since inception. Returns shown are total returns, which assume the reinvestment of dividends and capital gains. The table and graph presented above do not reflect the deduction of taxes a shareholder would pay on Fund distributions or the redemption of Fund shares. Past performance is not indicative of future performance.Call 1-888-493-8631 or visit https://www.globalxetfs.com/funds/onof for current month-end performance.
Key Fund Statistics as of November 30, 2024
| Total Net Assets | Number of Portfolio Holdings | Total Advisory Fees Paid | Portfolio Turnover Rate |
|---|
| $136,248,906 | 507 | $466,742 | 241.46% |
|---|
What did the Fund invest in?
Sector/Asset WeightingsFootnote Reference*
| Value | Value |
|---|
| Exchange Traded Fund | 0.1% |
| Materials | 2.1% |
| Real Estate | 2.1% |
| Utilities | 2.3% |
| Energy | 3.5% |
| Consumer Staples | 5.5% |
| Industrials | 8.7% |
| Communication Services | 9.1% |
| Health Care | 10.5% |
| Consumer Discretionary | 11.0% |
| Financials | 13.8% |
| Information Technology | 31.2% |
| Footnote | Description |
Footnote* | Percentages are calculated based on total net assets. |
| Holding Name | | | Percentage of Total Net Assets |
|---|
| Apple | | | 6.8% |
| NVIDIA | | | 6.3% |
| Microsoft | | | 6.0% |
| Amazon.com | | | 3.8% |
| Meta Platforms, Cl A | | | 2.4% |
| Alphabet, Cl A | | | 1.9% |
| Tesla | | | 1.9% |
| Alphabet, Cl C | | | 1.7% |
| Broadcom | | | 1.4% |
| JPMorgan Chase | | | 1.4% |
There were no material changes during the reporting period that are required to be disclosed in this report. For more complete information about other changes to the Fund, you may review the Fund's current prospectus, which is available upon request.
For additional information about the Fund, including its prospectus, financial information, holdings, and proxy voting information, call or visit:
Global X Adaptive U.S. Risk Management ETF: ONOF
Principal Listing Exchange: NYSE Arca, Inc.
Annual Shareholder Report - November 30, 2024
GX-AR-TSR-11.2024-14
Global X 1-3 Month T-Bill ETF
Principal Listing Exchange: NYSE Arca, Inc.
Annual Shareholder Report: November 30, 2024
This annual shareholder report contains important information about the Global X 1-3 Month T-Bill ETF (the "Fund") for the period from December 1, 2023 to November 30, 2024. You can find additional information about the Fund at https://www.globalxetfs.com/funds/clip. You can also request this information by contacting us at 1-888-493-8631. This annual shareholder report describes changes to the Fund that occurred during the reporting period.
What were the Fund costs for the last year?
(based on a hypothetical $10,000 investment)
| Fund Name | Costs of a $10,000 investment | Costs paid as a percentage of a $10,000 investment |
|---|
| Global X 1-3 Month T-Bill ETF | $7 | 0.07% |
|---|
How did the Fund perform in the last year?
The Fund seeks to provide investment results that correspond generally to the price and yield performance, before fees and expenses, of the Solactive 1-3 Month US T-Bill Index (“Secondary Index”). The Fund is passively managed, and the investment adviser does not attempt to take defensive positions in declining markets. The Fund generally seeks to fully replicate the Secondary Index.
The Secondary Index is designed to measure the performance of public obligations of the U.S. Treasury that have a remaining maturity of greater than or equal to 1 month and less than 3 months. As of each selection date, the Secondary Index is comprised of Treasury bills (“T-bills”) issued by the U.S. government. In addition, each security must be zero coupon, be denominated in U.S. dollars and have an amount outstanding of at least $250 million, as determined by the Index Provider on the selection date. A zero-coupon bond is a bond that is sold at a discount, does not pay intermediary coupons, and pays its face value at maturity.
For the 12-month period ended November 30, 2024 (the "reporting period"), the Fund increased 5.38%, while the Underlying Index increased 5.40%. The Fund had a net asset value of $25.11 per share on November 30, 2023. On June 14, 2024, CLIP effected a reverse stock split at a ratio of 1:4. The reverse stock split increased the price per share of the Fund with a proportionate decrease in the number of shares outstanding. The Fund ended the reporting period with a net asset value of $100.44 on November 30, 2024.
During the reporting period, the Fund benefited from the Federal Reserve's decision to lower interest rates, which supported demand for ultra-short duration U.S. T- bills. Additionally, the Fund's focus on T-bills with maturities between 1-3 months allowed it to capture the higher yields which were localized to the shortest segment of the Treasury yield curve throughout much of 2024. The 1–3-month T-bill strategy enabled investors to maintain cash like exposure and benefit from elevated short-term rates, while limiting the interest rate risk exposure that impacted the performance of long-term bonds. These factors attracted investor flows into ultra-short duration T-bill strategies over the performance period, as investors sought protection from market volatility while seeking to profit from elevated ultra-short-term yields. Furthermore, the monthly rebalancing of the Fund's holdings allowed it to maintain a consistent maturity profile and adapt to changing market conditions.
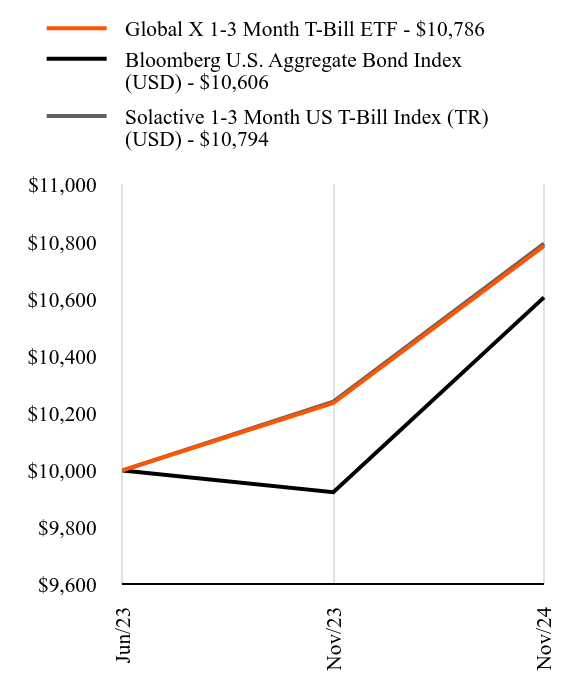
How did the Fund perform since inception?
Total Return Based on $10,000 Investment
| Global X 1-3 Month T-Bill ETF - $10786 | Bloomberg U.S. Aggregate Bond Index (USD) - $10606 | Solactive 1-3 Month US T-Bill Index (TR) (USD) - $10794 |
|---|
| Jun/23 | $10000 | $10000 | $10000 |
|---|
| Nov/23 | $10236 | $9924 | $10241 |
|---|
| Nov/24 | $10786 | $10606 | $10794 |
|---|
Average Annual Total Returns as of November 30, 2024
| Fund/Index Name | 1 Year | Annualized Since Inception |
|---|
| Global X 1-3 Month T-Bill ETF | 5.38% | 5.36% |
|---|
| Bloomberg U.S. Aggregate Bond Index (USD) | 6.88% | 4.14% |
|---|
| Solactive 1-3 Month US T-Bill Index (TR) (USD) | 5.40% | 5.41% |
|---|
Since its inception on June 20, 2023. The line graph represents historical performance of a hypothetical investment of $10,000 in the Fund since inception. Returns shown are total returns, which assume the reinvestment of dividends and capital gains. The table and graph presented above do not reflect the deduction of taxes a shareholder would pay on Fund distributions or the redemption of Fund shares. Past performance is not indicative of future performance.Call 1-888-493-8631 or visit https://www.globalxetfs.com/funds/clip for current month-end performance.
Key Fund Statistics as of November 30, 2024
| Total Net Assets | Number of Portfolio Holdings | Total Advisory Fees Paid | Portfolio Turnover Rate |
|---|
| $900,907,897 | 26 | $312,080 | 0.00% |
|---|
What did the Fund invest in?
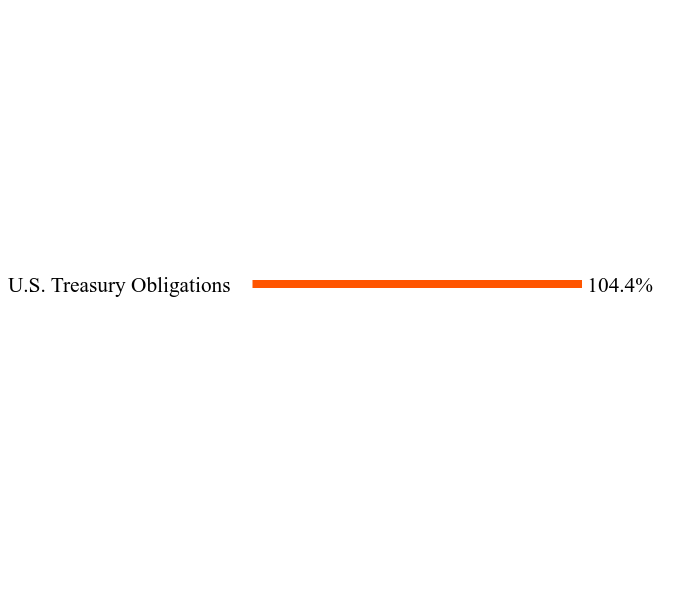
Asset WeightingsFootnote Reference*
| Value | Value |
|---|
| U.S. Treasury Obligations | 104.4% |
| Footnote | Description |
Footnote* | Percentages are calculated based on total net assets. |
| Holding Name | | | Percentage of Total Net Assets |
|---|
| U.S. Treasury Bills, 4.51%, 1/9/2025 | | | 8.3% |
| U.S. Treasury Bills, 4.54%, 1/2/2025 | | | 7.3% |
| U.S. Treasury Bills, 0.92%, 2/13/2025 | | | 6.2% |
| U.S. Cash Management Bill, 4.49%, 1/16/2025 | | | 6.2% |
| U.S. Treasury Bills, 7.43%, 12/26/2024 | | | 6.1% |
| U.S. Treasury Bills, 2.74%, 2/20/2025 | | | 5.7% |
| U.S. Treasury Bills, 4.49%, 1/23/2025 | | | 5.6% |
| U.S. Treasury Bills, 0.76%, 1/28/2025 | | | 5.3% |
| U.S. Treasury Bills, 4.65%, 12/3/2024 | | | 5.1% |
| U.S. Treasury Bills, 2.54%, 2/6/2025 | | | 5.1% |
This is a summary of certain changes to the Fund since December 1, 2023. For more complete information, you may review the Fund's next prospectus, which we expect to be available by April 1, 2025 at https://www.globalxetfs.com/funds/clip or upon request at 1-888-493-8631.
On June 14, 2024, the Fund effected a reverse stock split at a ratio of 1:4. The reverse stock split increased the price per share of the Fund with a proportionate decrease in the number of shares outstanding.
For additional information about the Fund, including its prospectus, financial information, holdings, and proxy voting information, call or visit:
Global X 1-3 Month T-Bill ETF: CLIP
Principal Listing Exchange: NYSE Arca, Inc.
Annual Shareholder Report - November 30, 2024
GX-AR-TSR-11.2024-15
Global X U.S. Cash Flow Kings 100 ETF
Principal Listing Exchange: NYSE Arca, Inc.
Annual Shareholder Report: November 30, 2024
This annual shareholder report contains important information about the Global X U.S. Cash Flow Kings 100 ETF (the "Fund") for the period from December 1, 2023 to November 30, 2024. You can find additional information about the Fund at https://www.globalxetfs.com/funds/flow. You can also request this information by contacting us at 1-888-493-8631.
What were the Fund costs for the last year?
(based on a hypothetical $10,000 investment)
| Fund Name | Costs of a $10,000 investment | Costs paid as a percentage of a $10,000 investment |
|---|
| Global X U.S. Cash Flow Kings 100 ETF | $28 | 0.25% |
|---|
How did the Fund perform in the last year?
The Fund seeks to provide investment results that correspond generally to the price and yield performance, before fees and expenses, of the Global X U.S. Cash Flow Kings 100 Index (“Secondary Index”). The Fund is passively managed, and the investment adviser does not attempt to take defensive positions in declining markets. The Fund generally seeks to fully replicate the Secondary Index.
The Secondary Index is owned and was developed by Global X Management Company LLC (“Index Provider”), an affiliate of the Fund and the Fund's investment adviser. The Secondary Index is administered and calculated by Mirae Asset Global Indices Pvt. Ltd. (the "Index Administrator"), an affiliate of the Index Provider. The Secondary Index is designed to provide exposure to large- and mid-capitalization U.S. equity securities that exhibit high free cash flow yields relative to the eligible universe of companies, as determined by the Index Administrator.
For the 12-month period ended November 30, 2024 (the “reporting period”), the Fund increased 26.89%, while the Secondary Index increased 27.34%. The Fund had a net asset value of $27.07 per share on November 30, 2023 and ended the reporting period with a net asset value of $33.59 per share on November 30, 2024.
During the reporting period, the highest returns came from Vistra Corp. and Allison Transmission Holdings, Inc., which returned 124.52% and 124.17%, respectively. The worst performers were Leggett & Platt, Incorporated and Qorvo, Inc., which returned -47.54% and -40.49%, respectively.
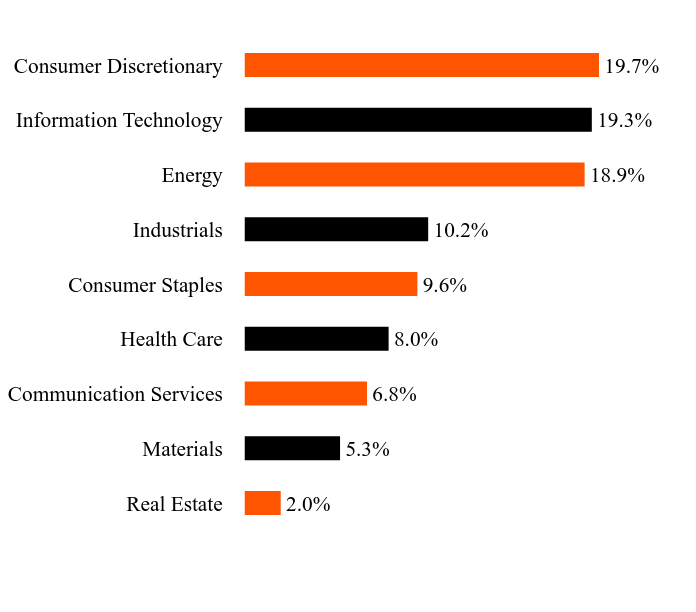
During the reporting period, by sector, the Fund had the highest exposure to Consumer Discretionary at 19.7% and Information Technology at 19.3%.
During the reporting period the Fund recorded positive performance. The Fund benefited from its focus on companies with strong free cash flow yields, as these firms exhibit strength during periods of strong economic growth. The Materials sector contributed significantly to the Fund's returns, as rising commodity prices bolstered the profitability and cash flows of companies in this space. Additionally, the Technology Services sector performed well, with many constituents reporting robust earnings and cash flow growth. The Fund's sector cap helped mitigate concentration risk and ensured diversification across industries. Finally, the Fund's emphasis on companies with strong balance sheets and profitability metrics proved advantageous, as these quality factors enhanced performance during the period.
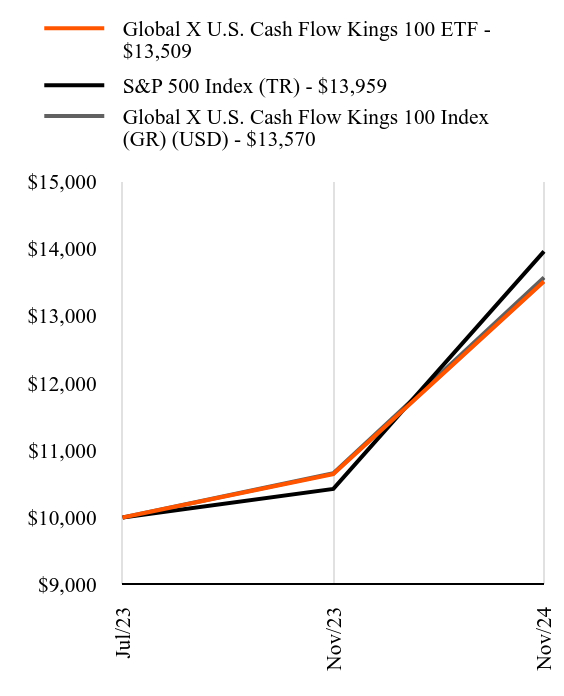
How did the Fund perform since inception?
Total Return Based on $10,000 Investment
| Global X U.S. Cash Flow Kings 100 ETF - $13509 | S&P 500 Index (TR) - $13959 | Global X U.S. Cash Flow Kings 100 Index (GR) (USD) - $13570 |
|---|
| Jul/23 | $10000 | $10000 | $10000 |
|---|
| Nov/23 | $10646 | $10425 | $10657 |
|---|
| Nov/24 | $13509 | $13959 | $13570 |
|---|
Average Annual Total Returns as of November 30, 2024
| Fund/Index Name | 1 Year | Annualized Since Inception |
|---|
| Global X U.S. Cash Flow Kings 100 ETF | 26.89% | 24.07% |
|---|
| S&P 500 Index (TR) | 33.89% | 27.02% |
|---|
| Global X U.S. Cash Flow Kings 100 Index (GR) (USD) | 27.34% | 24.47% |
|---|
Since its inception on July 10, 2023. The line graph represents historical performance of a hypothetical investment of $10,000 in the Fund since inception. Returns shown are total returns, which assume the reinvestment of dividends and capital gains. The table and graph presented above do not reflect the deduction of taxes a shareholder would pay on Fund distributions or the redemption of Fund shares. Past performance is not indicative of future performance.Call 1-888-493-8631 or visit https://www.globalxetfs.com/funds/flow for current month-end performance.
Key Fund Statistics as of November 30, 2024
| Total Net Assets | Number of Portfolio Holdings | Total Advisory Fees Paid | Portfolio Turnover Rate |
|---|
| $4,367,076 | 99 | $8,686 | 87.62% |
|---|
What did the Fund invest in?
Sector WeightingsFootnote Reference*
| Value | Value |
|---|
| Real Estate | 2.0% |
| Materials | 5.3% |
| Communication Services | 6.8% |
| Health Care | 8.0% |
| Consumer Staples | 9.6% |
| Industrials | 10.2% |
| Energy | 18.9% |
| Information Technology | 19.3% |
| Consumer Discretionary | 19.7% |
| Footnote | Description |
Footnote* | Percentages are calculated based on total net assets. |
| Holding Name | | | Percentage of Total Net Assets |
|---|
| ConocoPhillips | | | 3.0% |
| Warner Bros Discovery | | | 2.4% |
| Bristol-Myers Squibb | | | 2.3% |
| Altria Group | | | 2.2% |
| Hewlett Packard Enterprise | | | 2.1% |
| Chevron | | | 2.1% |
| Cencora | | | 2.1% |
| Expedia Group | | | 2.1% |
| Cardinal Health | | | 2.0% |
| AT&T | | | 2.0% |
There were no material changes during the reporting period that are required to be disclosed in this report. For more complete information about other changes to the Fund, you may review the Fund's current prospectus, which is available upon request.
For additional information about the Fund, including its prospectus, financial information, holdings, and proxy voting information, call or visit:
Global X U.S. Cash Flow Kings 100 ETF: FLOW
Principal Listing Exchange: NYSE Arca, Inc.
Annual Shareholder Report - November 30, 2024
GX-AR-TSR-11.2024-16
Global X Short-Term Treasury Ladder ETF
Principal Listing Exchange: NYSE Arca, Inc.
Annual Shareholder Report: November 30, 2024
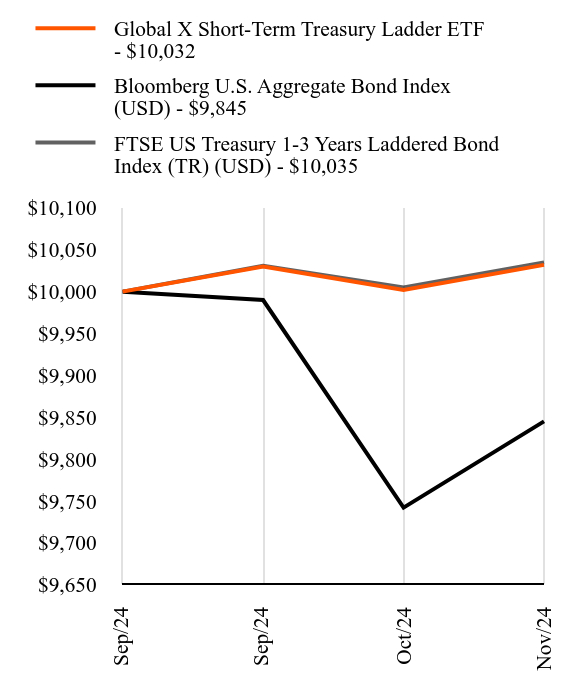
This annual shareholder report contains important information about the Global X Short-Term Treasury Ladder ETF (the "Fund") for the period from September 9, 2024 (commencement of operations) to November 30, 2024. You can find additional information about the Fund at https:www.globalxetfs.com/funds/sldr/. You can also request this information by contacting us at 1-888-493-8631.
What were the Fund costs for the period?
(based on a hypothetical $10,000 investment)
| Fund Name | Costs of a $10,000 investmentFootnote Reference* | Costs paid as a percentage of a $10,000 investment |
|---|
| Global X Short-Term Treasury Ladder ETF | $3 | 0.12% |
|---|
| Footnote | Description |
Footnote* | Costs shown not annualized. If the Fund had been open for the full fiscal year, costs shown would have been higher for the period ended. |
How did the Fund perform in the period?
The Fund seeks to provide investment results that correspond generally to the price and yield performance, before fees and expenses, of the FTSE US Treasury 1-3 Years Laddered Bond Index ("Secondary Index"). The Fund is passively managed, and the investment adviser does not attempt to take defensive positions in declining markets. The Fund generally seeks to fully replicate the Secondary Index.
The Secondary Index is designed to measure the performance of a strategy commonly referred to as bond “laddering” as applied to public obligations of the U.S. Treasury that have maturities between 1 and 3 years as of the last business day of February of each year (each an “annual rebalance”). The Index allocates its holdings equally across two "rungs," each representing a one-year maturity range. Components within each rung are weighted by market capitalization. At each annual rebalance, bonds shift to the next shorter maturity rung, with bonds in the 1-2 year rung removed and new bonds with 2-3 year maturities added.
Since inception through November 30, 2024 (the “reporting period”), the Fund increased 0.32%, while the Secondary Index increased 0.35%. The Fund had a net asset value of $50.03 per share on September 9, 2024 and ended the reporting period with a net asset value of $50.02 per share on November 30, 2024.
During the reporting period, the highest returns came from the 0.25% U.S. Treasury Note maturing May 31, 2025 and the 0.25% U.S. Treasury Note maturing October 31, 2025, which returned 0.90% and 0.47%, respectively. The worst performers were the 4.125% U.S. Treasury Note maturing February 15, 2027 and the 4.625% U.S. Treasury Note maturing June 30, 2026, which returned -1.45% and -1.05%, respectively.
The laddering strategy employed by the Fund helped mitigate interest rate risk by holding bonds that mature at regular intervals, providing a steady stream of capital reinvestment opportunities. The Fund's focus on short-term U.S. Treasuries enhanced stability, as these bonds are less sensitive to interest rate risks than intermediate- and long-term bonds. Short-term rates generally provided higher yields than intermediate- and long-term bonds over the reporting period. These elevated yields also boosted the Fund's income return compared to lower-yielding bond strategies.
How did the Fund perform since inception?
Total Return Based on $10,000 Investment
| Global X Short-Term Treasury Ladder ETF - $10032 | Bloomberg U.S. Aggregate Bond Index (USD) - $9845 | FTSE US Treasury 1-3 Years Laddered Bond Index (TR) (USD) - $10035 |
|---|
| Sep/24 | $10000 | $10000 | $10000 |
|---|
| Sep/24 | $10030 | $9990 | $10031 |
|---|
| Oct/24 | $10002 | $9742 | $10005 |
|---|
| Nov/24 | $10032 | $9845 | $10035 |
|---|
Average Annual Total Returns as of November 30, 2024
| Fund/Index Name | Cumulative Since Inception |
|---|
| Global X Short-Term Treasury Ladder ETF | 0.32% |
|---|
| Bloomberg U.S. Aggregate Bond Index (USD) | -1.55% |
|---|
| FTSE US Treasury 1-3 Years Laddered Bond Index (TR) (USD) | 0.35% |
|---|
Since its inception on September 9, 2024. The line graph represents historical performance of a hypothetical investment of $10,000 in the Fund since inception. Returns shown are total returns, which assume the reinvestment of dividends and capital gains. The table and graph presented above do not reflect the deduction of taxes a shareholder would pay on Fund distributions or the redemption of Fund shares. Past performance is not indicative of future performance.Call 1-888-493-8631 or visit https:www.globalxetfs.com/funds/sldr/ for current month-end performance.
Key Fund Statistics as of November 30, 2024
| Total Net Assets | Number of Portfolio Holdings | Total Advisory Fees Paid | Portfolio Turnover Rate |
|---|
| $4,001,624 | 38 | $880 | 0.00% |
|---|
What did the Fund invest in?
Asset WeightingsFootnote Reference*
| Value | Value |
|---|
| U.S. Treasury Obligations | 99.1% |
| Footnote | Description |
Footnote* | Percentages are calculated based on total net assets. |
| Holding Name | | | Percentage of Total Net Assets |
|---|
| U.S. Treasury Notes, 4.25%, 12/31/2025 | | | 6.1% |
| U.S. Treasury Notes, 0.38%, 11/30/2025 | | | 5.8% |
| U.S. Treasury Notes, 4.13%, 2/15/2027 | | | 3.7% |
| U.S. Treasury Notes, 0.50%, 2/28/2026 | | | 3.6% |
| U.S. Treasury Notes, 0.75%, 5/31/2026 | | | 3.6% |
| U.S. Treasury Notes, 4.63%, 6/30/2026 | | | 3.1% |
| U.S. Treasury Notes, 3.50%, 9/15/2025 | | | 3.1% |
| U.S. Treasury Notes, 2.38%, 4/30/2026 | | | 3.0% |
| U.S. Treasury Notes, 5.00%, 10/31/2025 | | | 3.0% |
| U.S. Treasury Notes, 0.25%, 10/31/2025 | | | 3.0% |
There were no material changes during the reporting period that are required to be disclosed in this report. For more complete information about other changes to the Fund, you may review the Fund's current prospectus, which is available upon request.
For additional information about the Fund, including its prospectus, financial information, holdings, and proxy voting information, call or visit:
Global X Short-Term Treasury Ladder ETF: SLDR
Principal Listing Exchange: NYSE Arca, Inc.
Annual Shareholder Report - November 30, 2024
GX-AR-TSR-11-2024-17
Global X Intermediate-Term Treasury Ladder ETF
Principal Listing Exchange: NYSE Arca, Inc.
Annual Shareholder Report: November 30, 2024
This annual shareholder report contains important information about the Global X Intermediate-Term Treasury Ladder ETF (the "Fund") for the period from September 9, 2024 (commencement of operations) to November 30, 2024. You can find additional information about the Fund at https://www.globalxetfs.com/funds/mldr/. You can also request this information by contacting us at 1-888-493-8631.
What were the Fund costs for the period?
(based on a hypothetical $10,000 investment)
| Fund Name | Costs of a $10,000 investmentFootnote Reference* | Costs paid as a percentage of a $10,000 investment |
|---|
| Global X Intermediate-Term Treasury Ladder ETF | $3 | 0.12% |
|---|
| Footnote | Description |
Footnote* | Costs shown not annualized. If the Fund had been open for the full fiscal year, costs shown would have been higher for the period ended. |
How did the Fund perform in the period?
The Fund seeks to provide investment results that correspond generally to the price and yield performance, before fees and expenses, of the FTSE US Treasury 3-10 Years Laddered Bond Index ("Secondary Index"). The Fund is passively managed, and the investment adviser does not attempt to take defensive positions in declining markets. The Fund generally seeks to fully replicate the Secondary Index.
The Secondary Index is designed to measure the performance of a strategy commonly referred to as bond “laddering” as applied to public obligations of the U.S. Treasury that have maturities between 3 and 10 years as of the last business day of February of each year (each an “annual rebalance”). The Index allocates holdings equally across multiple "rungs," each representing a one-year maturity range. Components within each rung are weighted by market capitalization. At each annual rebalance, bonds shift to the next shorter maturity rung, with bonds in the 3-4 year rung removed and new bonds with 9–10-year maturities added.
Since inception through November 30, 2024 (the “reporting period”), the Fund decreased 1.98%, while the Secondary Index decreased 1.96%. The Fund had a net asset value of $50.04 per share on September 9, 2024 and ended the reporting period with a net asset value of $48.85 per share on November 30, 2024.
During the reporting period, the highest returns came from the 3.375% US Treasury Note maturing May 1, 2033 and the 0.625% US Treasury Note maturing March 31, 2027, which returned 1.64% and -0.78%, respectively. The worst performers were the 4.375% US Treasury Note maturing May 15, 2034 and the 4.0% US Treasury Note maturing February 15, 2034, which returned -4.31% and -4.26%, respectively.
A slower than expected pace of monetary easing implemented through Federal Reserve policy led intermediate-term yields to remain elevated despite falling short-term rates over the performance period. This can be attributed to continued U.S. economic resilience, which delayed market expectations for an expedited pace of interest rate cuts and raised the interest rate outlook across the intermediate segment of the Treasury yield curve. These monetary pressures capped price appreciation across intermediate term bonds as moderate-duration holdings were subject to prevailing duration risk. Additionally, the intermediate segment's lower yields made it less attractive than short- and long-term bonds, which offered higher income potential. These conditions detracted from the Fund’s performance during the reporting period.
How did the Fund perform since inception?
Total Return Based on $10,000 Investment
| Global X Intermediate-Term Treasury Ladder ETF - $9802 | Bloomberg U.S. Aggregate Bond Index (USD) - $9845 | FTSE US Treasury 3-10 Years Laddered Bond Index (TR) (USD) - $9804 |
|---|
| Sep/24 | $10000 | $10000 | $10000 |
|---|
| Sep/24 | $9974 | $9990 | $9983 |
|---|
| Oct/24 | $9730 | $9742 | $9735 |
|---|
| Nov/24 | $9802 | $9845 | $9804 |
|---|
Average Annual Total Returns as of November 30, 2024
| Fund/Index Name | Cumulative Since Inception |
|---|
| Global X Intermediate-Term Treasury Ladder ETF | -1.98% |
|---|
| Bloomberg U.S. Aggregate Bond Index (USD) | -1.55% |
|---|
| FTSE US Treasury 3-10 Years Laddered Bond Index (TR) (USD) | -1.96% |
|---|
Since its inception on September 9, 2024. The line graph represents historical performance of a hypothetical investment of $10,000 in the Fund since inception. Returns shown are total returns, which assume the reinvestment of dividends and capital gains. The table and graph presented above do not reflect the deduction of taxes a shareholder would pay on Fund distributions or the redemption of Fund shares. Past performance is not indicative of future performance.Call 1-888-493-8631 or visit https://www.globalxetfs.com/funds/mldr/ for current month-end performance.
Key Fund Statistics as of November 30, 2024
| Total Net Assets | Number of Portfolio Holdings | Total Advisory Fees Paid | Portfolio Turnover Rate |
|---|
| $2,442,337 | 26 | $652 | 0.19% |
|---|
What did the Fund invest in?
Asset WeightingsFootnote Reference*
| Value | Value |
|---|
| U.S. Treasury Obligations | 99.1% |
| Footnote | Description |
Footnote* | Percentages are calculated based on total net assets. |
| Holding Name | | | Percentage of Total Net Assets |
|---|
| U.S. Treasury Notes, 3.50%, 2/15/2033 | | | 5.9% |
| U.S. Treasury Notes, 4.38%, 11/30/2030 | | | 5.2% |
| U.S. Treasury Notes, 4.00%, 2/28/2030 | | | 5.1% |
| U.S. Treasury Notes, 3.88%, 9/30/2029 | | | 5.1% |
| U.S. Treasury Notes, 4.00%, 2/15/2034 | | | 5.0% |
| U.S. Treasury Notes, 3.75%, 6/30/2030 | | | 5.0% |
| U.S. Treasury Notes, 2.75%, 2/15/2028 | | | 4.9% |
| U.S. Treasury Notes, 2.38%, 3/31/2029 | | | 4.8% |
| U.S. Treasury Notes, 4.50%, 11/15/2033 | | | 4.2% |
| U.S. Treasury Notes, 4.25%, 2/28/2031 | | | 4.1% |
There were no material changes during the reporting period that are required to be disclosed in this report. For more complete information about other changes to the Fund, you may review the Fund's current prospectus, which is available upon request.
For additional information about the Fund, including its prospectus, financial information, holdings, and proxy voting information, call or visit:
Global X Intermediate-Term Treasury Ladder ETF: MLDR
Principal Listing Exchange: NYSE Arca, Inc.
Annual Shareholder Report - November 30, 2024
GX-AR-TSR-11.2024-18
Global X Long-Term Treasury Ladder ETF
Principal Listing Exchange: NYSE Arca, Inc.
Annual Shareholder Report: November 30, 2024
This annual shareholder report contains important information about the Global X Long-Term Treasury Ladder ETF (the "Fund") for the period from September 9, 2024 (commencement of operations) to November 30, 2024. You can find additional information about the Fund at https://www.globalxetfs.com/funds/lldr/. You can also request this information by contacting us at 1-888-493-8631.
What were the Fund costs for the period?
(based on a hypothetical $10,000 investment)
| Fund Name | Costs of a $10,000 investmentFootnote Reference* | Costs paid as a percentage of a $10,000 investment |
|---|
| Global X Long-Term Treasury Ladder ETF | $3 | 0.12% |
|---|
| Footnote | Description |
Footnote* | Costs shown not annualized. If the Fund had been open for the full fiscal year, costs shown would have been higher for the period ended. |
How did the Fund perform in the period?
The Fund seeks to provide investment results that correspond generally to the price and yield performance, before fees and expenses, of the FTSE US Treasury 10-30 Years Laddered Bond Index ("Secondary Index"). The Fund is passively managed, and the investment adviser does not attempt to take defensive positions in declining markets. The Fund generally seeks to fully replicate the Secondary Index.
The Secondary Index is designed to measure the performance of a strategy commonly referred to as bond “laddering” as applied to public obligations of the U.S. Treasury that have maturities between 10 and 30 years as of the last business day of February of each year (each an “annual rebalance”). It allocates holdings equally across multiple "rungs," each representing a one-year maturity range. Components within each rung are weighted by market capitalization. At each annual rebalance, bonds shift to the next shorter maturity rung, with bonds in the 10-11 year rung removed and new bonds with 29–30-year maturities added.
Since inception through November 30, 2024 (the “reporting period”), the Fund decreased 4.66%, while the Secondary Index decreased 4.67%. The Fund had a net asset value of $50.16 per share on September 9, 2024 and ended the reporting period with a net asset value of $47.61 per share on November 30, 2024.
During the reporting period, the highest returns came from the 4.125% US Treasury Bond maturing August 15, 2044 and the 4.75% US Treasury Bond maturing November 15, 2043, which returned 3.02% and 2.62%, respectively. The worst performers were the 1.375% US Treasury Bond maturing August 15, 2050 and the 1.875% US Treasury Bond maturing 15-November 15, 2051, which returned -7.75% and -7.61%, respectively.
During the reporting period the Fund recorded negative performance. The Fund faced challenges due to the volatile interest rate environment, which negatively impacted the prices of its Secondary Treasury bond holdings. Uncertainty related to monetary policy further weighed on the Fund's returns, as rate expectations repriced in response to a stronger-than-expected U.S. economy, leading investors reduce their exposure to longer-duration bonds. Longer duration bonds are particularly sensitive to shifts in interest rates, which led long-term bonds to underperform as interest rate volatility remained heightened over the performance period. Lastly, government bonds underperformed other fixed income sectors during the period, as continued economic resilience led credit assets to outperform, which detracted from the Fund’s performance.
How did the Fund perform since inception?
Total Return Based on $10,000 Investment
| Global X Long-Term Treasury Ladder ETF - $9534 | Bloomberg U.S. Aggregate Bond Index (USD) - $9845 | FTSE US Treasury 10-30 Years Laddered Bond Index (TR) (USD) - $9533 |
|---|
| Sep/24 | $10000 | $10000 | $10000 |
|---|
| Sep/24 | $9852 | $9990 | $9870 |
|---|
| Oct/24 | $9376 | $9742 | $9379 |
|---|
| Nov/24 | $9534 | $9845 | $9533 |
|---|
Average Annual Total Returns as of November 30, 2024
| Fund/Index Name | Cumulative Since Inception |
|---|
| Global X Long-Term Treasury Ladder ETF | -4.66% |
|---|
| Bloomberg U.S. Aggregate Bond Index (USD) | -1.55% |
|---|
| FTSE US Treasury 10-30 Years Laddered Bond Index (TR) (USD) | -4.67% |
|---|
Since its inception on September 9, 2024. The line graph represents historical performance of a hypothetical investment of $10,000 in the Fund since inception. Returns shown are total returns, which assume the reinvestment of dividends and capital gains. The table and graph presented above do not reflect the deduction of taxes a shareholder would pay on Fund distributions or the redemption of Fund shares. Past performance is not indicative of future performance.Call 1-888-493-8631 or visit https://www.globalxetfs.com/funds/lldr/ for current month-end performance.
Key Fund Statistics as of November 30, 2024
| Total Net Assets | Number of Portfolio Holdings | Total Advisory Fees Paid | Portfolio Turnover Rate |
|---|
| $21,424,166 | 83 | $3,442 | 0.43% |
|---|
What did the Fund invest in?
Asset WeightingsFootnote Reference*
| Value | Value |
|---|
| U.S. Treasury Obligations | 99.0% |
| Footnote | Description |
Footnote* | Percentages are calculated based on total net assets. |
| Holding Name | | | Percentage of Total Net Assets |
|---|
| U.S. Treasury Bond, 4.50%, 2/15/2036 | | | 4.3% |
| U.S. Treasury Notes, 4.38%, 5/15/2034 | | | 3.3% |
| U.S. Treasury Bond, 4.50%, 5/15/2038 | | | 3.0% |
| U.S. Treasury Bond, 4.38%, 2/15/2038 | | | 2.6% |
| U.S. Treasury Bond, 5.00%, 5/15/2037 | | | 2.5% |
| U.S. Treasury Bond, 3.50%, 2/15/2039 | | | 2.2% |
| U.S. Treasury Notes, 3.88%, 8/15/2034 | | | 2.2% |
| U.S. Treasury Bond, 2.50%, 2/15/2046 | | | 2.1% |
| U.S. Treasury Bond, 2.88%, 5/15/2049 | | | 1.9% |
| U.S. Treasury Bond, 4.50%, 8/15/2039 | | | 1.7% |
There were no material changes during the reporting period that are required to be disclosed in this report. For more complete information about other changes to the Fund, you may review the Fund's current prospectus, which is available upon request.
For additional information about the Fund, including its prospectus, financial information, holdings, and proxy voting information, call or visit:
Global X Long-Term Treasury Ladder ETF: LLDR
Principal Listing Exchange: NYSE Arca, Inc.
Annual Shareholder Report - November 30, 2024
GX-AR-TSR-11.2024-19
(b) Not applicable.
The registrant has adopted a code of ethics that applies to the registrant’s principal executive officer, principal financial officer, controller or principal accounting officer, and any person who performs a similar function.
| Item 3. | Audit Committee Financial Expert. |
(a)(1) The registrant’s board of directors has determined that the registrant has at least one audit committee financial expert serving on the audit committee.
(a)(2) The audit committee financial experts are Charles A. Baker and Toai Chin and each is independent as defined in Form N-CSR Item 3(a)(2).
| Item 4. | Principal Accountant Fees and Services. |
Fees billed by PricewaterhouseCoopers LLP (“PwC”) relate to the registrant.
PWC billed the registrant aggregate fees for services rendered to the registrant for the last two fiscal years as follows:
| | 2024 | 2023 |
| | | All fees and
services to
the Trust
that were
pre-
approved | All fees and
services to
service
affiliates
that were
pre-
approved | All other
fees and
services to
service
affiliates
that did not
require pre-
approval | All fees and
services to
the Trust
that were
pre-
approved | All fees and
services to
service
affiliates
that were
pre-
approved | All other
fees and
services to
service
affiliates
that did not
require pre-
approval |
| (a) | Audit Fees | $1,727,672 | $0 | $0 | $1,235,693 | $0 | $0 |
| (b) | Audit-Related Fees | $0 | $0 | $0 | $0 | $0 | $0 |
| (c) | Tax Fees(1) | $487,204 | $0 | $0 | $392,972 | $0 | $0 |
| (d) | All Other Fees | $0 | $0 | $0 | $0 | $0 | $0 |
Notes:
| (1) | Tax Compliance and excise distribution services. |
(e)(1) Not applicable.
(e)(2) Percentage of fees billed applicable to non-audit services pursuant to waiver of pre-approval requirement were as follows (PwC):
| | 2024 | 2023 |
| Audit-Related Fees | 0% | 0% |
| Tax Fees | 0% | 0% |
| All Other Fees | 0% | 0% |
(f) Not applicable.
(g) The aggregate non-audit fees and services billed by PwC for the last two fiscal years were $487,204 and $392,972, respectively.
(h) During the past fiscal year, all non-audit services provided by registrant’s principal accountant to either registrant’s investment adviser or to any entity controlling, controlled by, or under common control with registrant’s investment adviser that provides ongoing services to registrant were pre-approved by the audit committee of registrant’s Board of Trustees. Included in the audit committee’s pre-approval was the review and consideration as to whether the provision of these non-audit services is compatible with maintaining the principal accountant’s independence.
(i) Not applicable.
(j) Not applicable.
| Item 5. | Audit Committee of Listed Registrants. |
The registrant has a separately-designated standing Audit Committee, which is composed of the registrant’s Independent Trustees, Charles A. Baker, Toai Chin and Clifford J. Weber.
(a) The Schedules of Investments and Consolidated Schedules of Investments are included as part of the financial statements and financial highlights filed under Item 7 of this form.
(b) Not applicable.
| Item 7. | Financial Statements and Financial Highlights for Open-End Management Investment Companies. |
Financial statements and financial highlights are filed herein.

Global X MLP ETF (ticker: MLPA)
Global X MLP & Energy Infrastructure ETF (ticker: MLPX)
Global X Alternative Income ETF (ticker: ALTY)
Global X Conscious Companies ETF (ticker: KRMA)
Global X U.S. Preferred ETF (ticker: PFFD)
Global X S&P 500® Quality Dividend ETF (ticker: QDIV)
Global X Adaptive U.S. Factor ETF (ticker: AUSF)
Global X Variable Rate Preferred ETF (ticker: PFFV)
Global X Adaptive U.S. Risk Management ETF (ticker: ONOF)
Global X 1-3 Month T-Bill ETF (ticker: CLIP)
Global X U.S. Cash Flow Kings 100 ETF (ticker: FLOW)
Global X Short-Term Treasury Ladder ETF (ticker: SLDR)
Global X Intermediate-Term Treasury Ladder ETF (ticker: MLDR)
Global X Long-Term Treasury Ladder ETF (ticker: LLDR)
Annual Financials and Other Information
November 30, 2024

Table of Contents
Shares are bought and sold at market price (not net asset value (“NAV”)) and are not individually redeemed from a Fund. Shares may only be redeemed directly from a Fund by Authorized Participants, in very large creation/redemption units. Brokerage commissions will reduce returns.
The Funds file their complete schedules of Fund holdings with the Securities and Exchange Commission (the “SEC” or “Commission”) for the first and third quarters of each fiscal year as an exhibit to their reports on Form N-PORT. The Funds’ Forms N-PORT are available on the Commission’s website at https://www.sec.gov, and may be reviewed and copied at the Commission’s Public Reference Room in Washington, DC. Information on the operation of the Public Reference Room may be obtained by calling 1-800-SEC-0330.
A description of the policies and procedures that Global X Funds uses to determine how to vote proxies relating to Fund securities, as well as information relating to how the Funds voted proxies relating to Fund securities during the most recent 12-month period ended June 30, is available (i) without charge, upon request, by calling 1-888-493-8631; and (ii) on the Commission’s website at https://www.sec.gov.
| Schedule of Investments | | November 30, 2024 |
| Global X MLP ETF |
| |
| | | Shares | | | Value | |
| MASTER LIMITED PARTNERSHIPS — 91.5% | | | | | | | | |
| Energy — 88.4% | | | | | | | | |
| Cheniere Energy Partners | | | 1,815,078 | | | $ | 105,728,294 | |
| CrossAmerica Partners | | | 100 | | | | 2,065 | |
| Delek Logistics Partners | | | 743,578 | | | | 29,995,937 | |
| Energy Transfer | | | 13,355,155 | | | | 265,233,378 | |
| Enterprise Products Partners | | | 6,978,937 | | | | 240,284,801 | |
| Genesis Energy | | | 4,314,808 | | | | 51,691,400 | |
| Global Partners | | | 1,336,261 | | | | 75,431,933 | |
| Martin Midstream Partners | | | 100 | | | | 398 | |
| MPLX | | | 4,228,767 | | | | 218,458,103 | |
| NGL Energy Partners * | | | 100 | | | | 482 | |
| Plains All American Pipeline | | | 8,967,102 | | | | 167,415,794 | |
| Sunoco | | | 2,582,517 | | | | 145,808,910 | |
| USA Compression Partners | | | 2,971,985 | | | | 71,297,920 | |
| USD Partners * | | | 100 | | | | 6 | |
| Western Midstream Partners | | | 4,390,550 | | | | 178,739,291 | |
| | | | | | | | 1,550,088,712 | |
| Utilities — 3.1% | | | | | | | | |
| Suburban Propane Partners | | | 2,752,505 | | | | 54,637,224 | |
TOTAL MASTER LIMITED PARTNERSHIPS
(Cost $706,204,428) | | | | | | | 1,604,725,936 | |
| | | | | | | | | |
| COMMON STOCK — 16.5% | | | | | | | | |
| Energy — 16.5% | | | | | | | | |
| EnLink Midstream | | | 9,106,309 | | | | 145,792,007 | |
| Hess Midstream, Cl A | | | 3,800,898 | | | | 144,054,034 | |
| Summit Midstream * | | | 100 | | | | 3,779 | |
| | | | | | | | 289,849,820 | |
| Utilities — 0.0% | | | | | | | | |
| Star Group | | | 100 | | | | 1,266 | |
TOTAL COMMON STOCK
(Cost $200,445,205) | | | | | | | 289,851,086 | |
TOTAL INVESTMENTS — 108.0%
(Cost $906,649,633) | | | | | | $ | 1,894,577,022 | |
Percentages are based on Net Assets of $1,754,099,426.
| * | Non-income producing security. |
The accompanying notes are an integral part of the financial statements.
1
| Schedule of Investments | | November 30, 2024 |
| Global X MLP ETF |
As of November 30, 2024, all of the Fund’s investments were considered Level 1, in accordance with authoritative guidance on fair value measurements and disclosure under U.S. GAAP.
See “Glossary” for abbreviations.
The accompanying notes are an integral part of the financial statements.
2
| Schedule of Investments | | November 30, 2024 |
| Global X MLP & Energy Infrastructure ETF |
| | | Shares | | | Value | |
| COMMON STOCK — 73.1% | | | | | | | | |
| CANADA — 22.1% | | | | | | | | |
| Energy — 22.1% | | | | | | | | |
| Enbridge | | | 4,803,286 | | | $ | 208,366,547 | |
| Pembina Pipeline | | | 2,431,045 | | | | 100,572,331 | |
| South Bow * (A) | | | 2,185,854 | | | | 56,941,497 | |
| TC Energy (A) | | | 3,215,862 | | | | 157,352,128 | |
| | | | | | | | | |
| TOTAL CANADA | | | | | | | 523,232,503 | |
| UNITED STATES — 51.0% | | | | | | | | |
| Energy — 51.0% | | | | | | | | |
| Antero Midstream | | | 3,543,367 | | | | 56,587,571 | |
| Archrock | | | 1,730,553 | | | | 44,336,768 | |
| Cheniere Energy | | | 689,069 | | | | 154,358,347 | |
| DT Midstream | | | 1,004,480 | | | | 106,595,417 | |
| EnLink Midstream | | | 2,706,552 | | | | 43,331,897 | |
| Hess Midstream, Cl A | | | 1,088,914 | | | | 41,269,841 | |
| Kinder Morgan | | | 6,603,509 | | | | 186,681,199 | |
| Kinetik Holdings, Cl A | | | 398,455 | | | | 23,516,814 | |
| New Fortress Energy, Cl A (A) | | | 1,366,112 | | | | 14,576,415 | |
| NextDecade * | | | 1,712,196 | | | | 12,396,299 | |
| ONEOK | | | 1,845,033 | | | | 209,595,749 | |
| Targa Resources | | | 516,442 | | | | 105,509,101 | |
| Williams | | | 3,582,688 | | | | 209,658,902 | |
| | | | | | | | | |
| TOTAL UNITED STATES | | | | | | | 1,208,414,320 | |
TOTAL COMMON STOCK
(Cost $1,227,910,028) | | | | | | | 1,731,646,823 | |
| | | | | | | | | |
| MASTER LIMITED PARTNERSHIPS — 26.8% | | | | | | | | |
| UNITED STATES — 26.8% | | | | | | | | |
| Energy — 26.8% | | | | | | | | |
| Cheniere Energy Partners | | | 511,064 | | | | 29,769,478 | |
| Delek Logistics Partners | | | 205,169 | | | | 8,276,517 | |
| Energy Transfer | | | 5,855,723 | | | | 116,294,659 | |
| Enterprise Products Partners | | | 3,256,374 | | | | 112,116,957 | |
| MPLX | | | 2,153,124 | | | | 111,230,386 | |
| Plains All American Pipeline | | | 5,802,133 | | | | 108,325,823 | |
| Plains GP Holdings, Cl A | | | 2,017,121 | | | | 40,382,762 | |
The accompanying notes are an integral part of the financial statements.
3
| Schedule of Investments | | November 30, 2024 |
| Global X MLP & Energy Infrastructure ETF |
| | | Shares | | | Value | |
| MASTER LIMITED PARTNERSHIPS — continued | | | | | | |
| Energy — continued | | | | | | |
| Western Midstream Partners | | | 2,650,136 | | | $ | 107,887,037 | |
| TOTAL UNITED STATES | | | | | | | 634,283,619 | |
TOTAL MASTER LIMITED PARTNERSHIPS
(Cost $383,331,127) | | | | | | | 634,283,619 | |
| | | | | | | | | |
| SHORT-TERM INVESTMENT(B)(C) — 0.1% | | | | | | | | |
Fidelity Investments Money Market Government Portfolio, Cl Institutional, 4.550%
(Cost $3,476,137) | | | 3,476,137 | | | | 3,476,137 | |
| | | Face Amount | | | | | |
| REPURCHASE AGREEMENT(C) — 0.3% | | | | | | | | |
RBC Capital Markets
4.500%, dated 11/29/2024, to be repurchased on 12/02/2024, repurchase price $5,949,086 (collateralized by a U.S. Treasury Obligations, par value $6,321,113, 0.375%, 12/31/2025, with a total market value of $6,058,787)
(Cost $5,946,856) | | $ | 5,946,856 | | | | 5,946,856 | |
TOTAL INVESTMENTS — 100.3%
(Cost $1,620,664,148) | | | | | | $ | 2,375,353,435 | |
Percentages are based on Net Assets of $2,367,633,057.
| * | Non-income producing security. |
| (A) | This security or a partial position of this security is on loan at November 30, 2024. The total market value of securities on loan at November 30, 2024 was $9,387,108. |
| (B) | The rate reported on the Schedule of Investments is the 7-day effective yield as of November 30, 2024. |
| (C) | These securities were purchased with cash collateral held from securities on loan. The total value of such securities as of November 30, 2024 was $9,422,993. The total value of non-cash collateral held from securities on loan as of November 30, 2024 was $—. |
The accompanying notes are an integral part of the financial statements.
4
| Schedule of Investments | | November 30, 2024 |
| Global X MLP & Energy Infrastructure ETF |
The following is a summary of the level of inputs used as of November 30, 2024, in valuing the Fund’s investments carried at value:
| Investments in Securities | | Level 1 | | | Level 2 | | | Level 3 | | | Total | |
| Common Stock | | $ | 1,731,646,823 | | | $ | — | | | $ | — | | | $ | 1,731,646,823 | |
| Master Limited Partnerships | | | 634,283,619 | | | | — | | | | — | | | | 634,283,619 | |
| Short-Term Investment | | | 3,476,137 | | | | — | | | | — | | | | 3,476,137 | |
| Repurchase Agreement | | | — | | | | 5,946,856 | | | | — | | | | 5,946,856 | |
| Total Investments in Securities | | $ | 2,369,406,579 | | | $ | 5,946,856 | | | $ | — | | | $ | 2,375,353,435 | |
Amounts designated as “—” are $0 or have been rounded to $0.
See “Glossary” for abbreviations.
The accompanying notes are an integral part of the financial statements.
5
| Schedule of Investments | | November 30, 2024 |
| Global X Alternative Income ETF |
| | | Shares | | | Value | |
| EXCHANGE TRADED FUNDS — 78.0% | | | | | | | | |
| Global X Emerging Markets Bond ETF (A) | | | 289,489 | | | $ | 6,715,131 | |
| Global X Nasdaq 100® Covered Call ETF (A) (B) | | | 376,572 | | | | 6,861,142 | |
| Global X SuperDividend® REIT ETF (A) (B) | | | 301,988 | | | | 6,483,682 | |
| Global X U.S. Preferred ETF (A) (B) | | | 325,138 | | | | 6,671,832 | |
TOTAL EXCHANGE TRADED FUNDS
(Cost $32,172,986) | | | | | | | 26,731,787 | |
| | | | | | | | | |
| COMMON STOCK — 12.3% | | | | | | | | |
| Energy — 5.8% | | | | | | | | |
| Antero Midstream | | | 28,740 | | | | 458,978 | |
| Hess Midstream, Cl A | | | 11,882 | | | | 450,328 | |
| Kinder Morgan | | | 19,395 | | | | 548,296 | |
| Williams | | | 9,309 | | | | 544,763 | |
| | | | | | | | 2,002,365 | |
| Utilities — 6.5% | | | | | | | | |
| ALLETE | | | 6,590 | | | | 427,559 | |
| Evergy | | | 6,905 | | | | 446,270 | |
| Northwestern Energy Group | | | 7,452 | | | | 411,649 | |
| OGE Energy | | | 10,456 | | | | 459,646 | |
| Spire | | | 6,395 | | | | 468,050 | |
| | | | | | | | 2,213,174 | |
TOTAL COMMON STOCK
(Cost $3,331,146) | | | | | | | 4,215,539 | |
| | | | | | | | | |
| MASTER LIMITED PARTNERSHIPS — 9.6% | | | | | | | | |
| Energy — 9.6% | | | | | | | | |
| Black Stone Minerals | | | 28,490 | | | | 442,165 | |
| Energy Transfer | | | 26,275 | | | | 521,821 | |
| Enterprise Products Partners | | | 14,569 | | | | 501,611 | |
| Kimbell Royalty Partners | | | 26,290 | | | | 425,372 | |
| MPLX | | | 9,630 | | | | 497,486 | |
| Plains All American Pipeline | | | 23,694 | | | | 442,367 | |
| Sunoco | | | 7,984 | | | | 450,777 | |
TOTAL MASTER LIMITED PARTNERSHIPS
(Cost $1,849,865) | | | | | | | 3,281,599 | |
The accompanying notes are an integral part of the financial statements.
6
| Schedule of Investments | | November 30, 2024 |
| Global X Alternative Income ETF |
| | | Shares | | | Value | |
| SHORT-TERM INVESTMENT(C)(D) — 1.8% | | | | | | | | |
Fidelity Investments Money Market Government Portfolio, Cl Institutional, 4.550%
(Cost $609,088) | | | 609,088 | | | $ | 609,088 | |
| | | Face Amount | | | | | |
| REPURCHASE AGREEMENT(D) — 3.0% | | | | | | | | |
RBC Capital Markets 4.500%, dated 11/29/2024, to be repurchased on 12/02/2024, repurchase price $1,042,398 (collateralized by a U.S. Treasury Obligations, par value $1,107,585, 0.375%, 12/31/2025, with a total market value of $1,061,620)
(Cost $1,042,008) | | $ | 1,042,008 | | | | 1,042,008 | |
TOTAL INVESTMENTS 104.7%
(Cost $39,005,093) | | | | | | $ | 35,880,021 | |
Percentages are based on Net Assets of $34,271,713.
| (A) | Affiliated investment. |
| (B) | This security or a partial position of this security is on loan at November 30, 2024. The total market value of securities on loan at November 30, 2024 was $1,625,548. |
| (C) | The rate reported on the Schedule of Investments is the 7-day effective yield as of November 30, 2024. |
| (D) | These securities were purchased with cash collateral held from securities on loan. The total value of such securities as of November 30, 2024 was $1,651,096. The total value of non-cash collateral held from securities on loan as of November 30, 2024 was $—. |
The accompanying notes are an integral part of the financial statements.
7
| Schedule of Investments | | November 30, 2024 |
| Global X Alternative Income ETF |
The following is a summary of the level of inputs used as of November 30, 2024, in valuing the Fund’s investments carried at value:
| Investments in Securities | | Level 1 | | | Level 2 | | | Level 3 | | | Total | |
| Exchange Traded Funds | | $ | 26,731,787 | | | $ | — | | | $ | — | | | $ | 26,731,787 | |
| Common Stock | | | 4,215,539 | | | | — | | | | — | | | | 4,215,539 | |
| Master Limited Partnerships | | | 3,281,599 | | | | — | | | | — | | | | 3,281,599 | |
| Short-Term Investment | | | 609,088 | | | | — | | | | — | | | | 609,088 | |
| Repurchase Agreement | | | — | | | | 1,042,008 | | | | — | | | | 1,042,008 | |
| Total Investments in Securities | | $ | 34,838,013 | | | $ | 1,042,008 | | | $ | — | | | $ | 35,880,021 | |
The following is a summary of the Fund’s transactions with affiliates for the year ended November 30, 2024:
Value
11/30/2023 | | | Purchases
at Cost | | | Proceeds
from Sales | | | Change in
Unrealized
Appreciation
(Depreciation) | | | Realized Gain
(Loss) | | | Value
11/30/2024 | | | Income | | | Capital Gains | |
| Global X Emerging Markets Bond ETF | | | | | | | | | | | | | | | |
| | | | | | | | | | | | | | | | | | | | | | | | | | | | | | | |
| $ | 7,019,447 | | | $ | 885,450 | | | $ | (1,658,968 | ) | | $ | 490,175 | | | $ | (20,973) | | | $ | 6,715,131 | | | $ | 390,940 | | | $ | — | |
| Global X Nasdaq 100® Covered Call ETF | | | | | | | | | | | | | | | | | | | | | |
| | | | | | | | | | | | | | | | | | | | | | | | | | | | | | | |
| | 6,989,971 | | | | 864,132 | | | | (1,985,491 | ) | | | 771,566 | | | | 220,964 | | | | 6,861,142 | | | | 284,880 | | | | 122,903 | |
| Global X SuperDividend® REIT ETF | | | | | | | | | | | | | | | | | | | | | |
| | | | | | | | | | | | | | | | | | | | | | | | | | | | | | | |
| | 6,840,471 | | | | 847,397 | | | | (1,629,342 | ) | | | 732,866 | | | | (307,710) | | | | 6,483,682 | | | | 453,302 | | | | 2,905 | |
| Global X U.S. Preferred ETF | | | | | | | | | | | | | | | | | | | | | |
| | | | | | | | | | | | | | | | | | | | | | | | | | | | | | | |
| | 6,948,567 | | | | 877,324 | | | | (1,631,593 | ) | | | 601,980 | | | | (124,446) | | | | 6,671,832 | | | | 436,458 | | | | — | |
| Totals: | | | | | | | | | | | | | | | | | | | | | | | | | | | | | |
| | | | | | | | | | | | | | | | | | | | | | | | | | | | | | | |
| $ | 27,798,456 | | | $ | 3,474,303 | | | $ | (6,905,394 | ) | | $ | 2,596,587 | | | $ | (232,165) | | | $ | 26,731,787 | | | $ | 1,565,580 | | | $ | 125,808 | |
Amounts designated as “—” are $0 or have been rounded to $0.
See “Glossary” for abbreviations.
The accompanying notes are an integral part of the financial statements.
8
| Schedule of Investments | | November 30, 2024 |
Global X Conscious Companies ETF
| | | Shares | | | Value | |
| COMMON STOCK — 99.8% | | | | | | | | |
| UNITED STATES — 99.8% | | | | | | | | |
| Communication Services — 7.3% | | | | | | | | |
| Alphabet, Cl A | | | 99,072 | | | $ | 16,738,214 | |
| Comcast, Cl A | | | 79,439 | | | | 3,430,970 | |
| Electronic Arts | | | 22,819 | | | | 3,734,786 | |
| Interpublic Group | | | 109,923 | | | | 3,386,728 | |
| Meta Platforms, Cl A | | | 16,971 | | | | 9,746,785 | |
| Netflix * | | | 4,372 | | | | 3,877,133 | |
| T-Mobile US | | | 14,052 | | | | 3,470,001 | |
| Verizon Communications | | | 79,043 | | | | 3,504,767 | |
| | | | | | | | 47,889,384 | |
| Consumer Discretionary — 10.2% | | | | | | | | |
| Amazon.com * | | | 86,315 | | | | 17,944,025 | |
| BorgWarner | | | 98,929 | | | | 3,395,243 | |
| Dick’s Sporting Goods | | | 16,061 | | | | 3,328,481 | |
| eBay | | | 51,665 | | | | 3,269,878 | |
| Hilton Worldwide Holdings | | | 14,055 | | | | 3,562,099 | |
| Home Depot | | | 8,161 | | | | 3,502,130 | |
| Lear | | | 33,701 | | | | 3,297,306 | |
| Lululemon Athletica * | | | 10,980 | | | | 3,520,847 | |
| Marriott International, Cl A | | | 12,597 | | | | 3,641,667 | |
| NIKE, Cl B | | | 41,553 | | | | 3,273,130 | |
| PulteGroup | | | 24,183 | | | | 3,271,234 | |
| Starbucks | | | 34,062 | | | | 3,489,992 | |
| Tesla * | | | 12,604 | | | | 4,350,397 | |
| Ulta Beauty * | | | 8,992 | | | | 3,476,667 | |
| Yum! Brands | | | 24,687 | | | | 3,430,012 | |
| | | | | | | | 66,753,108 | |
| Consumer Staples — 5.0% | | | | | | | | |
| Coca-Cola | | | 48,828 | | | | 3,128,898 | |
| Colgate-Palmolive | | | 32,957 | | | | 3,184,635 | |
| Costco Wholesale | | | 3,691 | | | | 3,587,209 | |
| General Mills | | | 48,222 | | | | 3,195,190 | |
| Kimberly-Clark | | | 23,971 | | | | 3,340,359 | |
| Mondelez International, Cl A | | | 46,973 | | | | 3,050,897 | |
| PepsiCo | | | 19,074 | | | | 3,117,645 | |
| Procter & Gamble | | | 19,369 | | | | 3,472,087 | |
| Target | | | 22,017 | | | | 2,913,069 | |
The accompanying notes are an integral part of the financial statements.
9
| Schedule of Investments | | November 30, 2024 |
Global X Conscious Companies ETF
| | | Shares | | | Value | |
| COMMON STOCK — continued | | | | | | | | |
| Consumer Staples — continued | | | | | | | | |
| Walmart | | | 39,834 | | | $ | 3,684,645 | |
| | | | | | | | 32,674,634 | |
| Energy — 2.7% | | | | | | | | |
| Chevron | | | 21,974 | | | | 3,558,250 | |
| ConocoPhillips | | | 31,682 | | | | 3,432,428 | |
| EOG Resources | | | 26,418 | | | | 3,520,462 | |
| ONEOK | | | 33,719 | | | | 3,830,478 | |
| Valero Energy | | | 25,171 | | | | 3,500,783 | |
| | | | | | | | 17,842,401 | |
| Financials — 13.8% | | | | | | | | |
| Aflac | | | 29,338 | | | | 3,344,532 | |
| American Express | | | 12,237 | | | | 3,728,369 | |
| Bank of America | | | 77,019 | | | | 3,659,173 | |
| Bank of New York Mellon | | | 42,927 | | | | 3,514,434 | |
| Capital One Financial | | | 21,603 | | | | 4,147,992 | |
| Charles Schwab | | | 45,261 | | | | 3,745,800 | |
| Citigroup | | | 52,543 | | | | 3,723,722 | |
| Discover Financial Services | | | 22,970 | | | | 4,190,417 | |
| FactSet Research Systems | | | 7,217 | | | | 3,541,165 | |
| Hartford Financial Services Group | | | 27,266 | | | | 3,362,170 | |
| JPMorgan Chase | | | 14,606 | | | | 3,647,410 | |
| Mastercard, Cl A | | | 6,434 | | | | 3,428,936 | |
| MetLife | | | 38,951 | | | | 3,436,647 | |
| Moody’s | | | 7,053 | | | | 3,526,359 | |
| Morgan Stanley | | | 27,573 | | | | 3,628,883 | |
| Nasdaq | | | 43,670 | | | | 3,624,173 | |
| PayPal Holdings * | | | 40,365 | | | | 3,502,471 | |
| Principal Financial Group | | | 36,629 | | | | 3,190,020 | |
| Progressive | | | 13,319 | | | | 3,581,213 | |
| Prudential Financial | | | 26,219 | | | | 3,393,001 | |
| S&P Global | | | 6,668 | | | | 3,484,097 | |
| Synchrony Financial | | | 59,449 | | | | 4,013,996 | |
| T Rowe Price Group | | | 29,340 | | | | 3,633,466 | |
| Travelers | | | 12,810 | | | | 3,407,972 | |
| Visa, Cl A | | | 11,694 | | | | 3,684,546 | |
| | | | | | | | 90,140,964 | |
The accompanying notes are an integral part of the financial statements.
10
| Schedule of Investments | | November 30, 2024 |
Global X Conscious Companies ETF
| | | Shares | | | Value | |
| COMMON STOCK — continued | | | | | | | | |
| Health Care — 13.7% | | | | | | | | |
| Abbott Laboratories | | | 28,373 | | | $ | 3,369,861 | |
| AbbVie | | | 17,435 | | | | 3,189,385 | |
| Agilent Technologies | | | 25,299 | | | | 3,490,503 | |
| Amgen | | | 10,429 | | | | 2,950,051 | |
| Boston Scientific * | | | 38,887 | | | | 3,525,495 | |
| Bristol-Myers Squibb | | | 62,506 | | | | 3,701,605 | |
| Cardinal Health | | | 29,512 | | | | 3,607,547 | |
| Centene * | | | 53,707 | | | | 3,222,420 | |
| Cigna Group | | | 10,343 | | | | 3,493,865 | |
| Danaher | | | 13,354 | | | | 3,200,820 | |
| Elevance Health | | | 7,892 | | | | 3,211,728 | |
| Eli Lilly | | | 3,699 | | | | 2,942,000 | |
| Gilead Sciences | | | 37,275 | | | | 3,450,920 | |
| HCA Healthcare | | | 8,239 | | | | 2,695,966 | |
| Intuitive Surgical * | | | 6,421 | | | | 3,480,182 | |
| IQVIA Holdings * | | | 15,501 | | | | 3,113,221 | |
| Johnson & Johnson | | | 20,093 | | | | 3,114,616 | |
| McKesson | | | 6,555 | | | | 4,119,818 | |
| Merck | | | 31,039 | | | | 3,154,804 | |
| Regeneron Pharmaceuticals * | | | 3,546 | | | | 2,660,280 | |
| ResMed | | | 13,822 | | | | 3,441,954 | |
| Stryker | | | 9,180 | | | | 3,599,937 | |
| Thermo Fisher Scientific | | | 5,922 | | | | 3,136,469 | |
| UnitedHealth Group | | | 5,885 | | | | 3,591,027 | |
| Vertex Pharmaceuticals * | | | 7,028 | | | | 3,290,018 | |
| Waters * | | | 10,117 | | | | 3,892,212 | |
| Zoetis, Cl A | | | 18,112 | | | | 3,174,128 | |
| | | | | | | | 89,820,832 | |
| Industrials — 7.2% | | | | | | | | |
| Automatic Data Processing | | | 11,354 | | | | 3,484,883 | |
| Booz Allen Hamilton Holding, Cl A | | | 19,876 | | | | 2,945,226 | |
| Caterpillar | | | 8,500 | | | | 3,451,935 | |
| Cummins | | | 9,888 | | | | 3,708,395 | |
| Deere | | | 7,990 | | | | 3,722,541 | |
| General Dynamics | | | 10,894 | | | | 3,094,005 | |
| Illinois Tool Works | | | 12,857 | | | | 3,568,074 | |
| Jacobs Solutions | | | 23,195 | | | | 3,275,830 | |
| Leidos Holdings | | | 19,605 | | | | 3,242,667 | |
The accompanying notes are an integral part of the financial statements.
11
| Schedule of Investments | | November 30, 2024 |
Global X Conscious Companies ETF
| | | Shares | | | Value | |
| COMMON STOCK — continued | | | | | | | | |
| Industrials — continued | | | | | | | | |
| Lockheed Martin | | | 5,804 | | | $ | 3,072,696 | |
| Paychex | | | 23,207 | | | | 3,394,488 | |
| RTX | | | 26,259 | | | | 3,199,134 | |
| Union Pacific | | | 14,230 | | | | 3,481,512 | |
| United Parcel Service, Cl B | | | 23,910 | | | | 3,245,065 | |
| | | | | | | | 46,886,451 | |
| Information Technology — 35.3% | | | | | | | | |
| Adobe * | | | 6,814 | | | | 3,515,547 | |
| Advanced Micro Devices * | | | 21,424 | | | | 2,938,837 | |
| Akamai Technologies * | | | 31,951 | | | | 3,004,033 | |
| Amphenol, Cl A | | | 47,076 | | | | 3,420,071 | |
| Analog Devices | | | 14,298 | | | | 3,117,679 | |
| Apple | | | 168,174 | | | | 39,912,735 | |
| Applied Materials | | | 17,884 | | | | 3,124,514 | |
| Arista Networks * | | | 8,310 | | | | 3,372,364 | |
| Autodesk * | | | 11,503 | | | | 3,357,726 | |
| Avnet | | | 60,547 | | | | 3,312,526 | |
| Broadcom | | | 19,170 | | | | 3,107,074 | |
| Cadence Design Systems * | | | 13,171 | | | | 4,040,995 | |
| CDW | | | 15,002 | | | | 2,639,302 | |
| Cisco Systems | | | 58,680 | | | | 3,474,443 | |
| Cognizant Technology Solutions, Cl A | | | 43,896 | | | | 3,533,189 | |
| Dell Technologies, Cl C | | | 27,439 | | | | 3,500,942 | |
| Dynatrace * | | | 60,679 | | | | 3,409,553 | |
| Gartner * | | | 6,340 | | | | 3,283,676 | |
| HP | | | 90,078 | | | | 3,191,464 | |
| HubSpot * | | | 5,955 | | | | 4,293,853 | |
| Intuit | | | 5,497 | | | | 3,527,590 | |
| Keysight Technologies * | | | 21,380 | | | | 3,652,559 | |
| Littelfuse | | | 12,847 | | | | 3,168,969 | |
| Micron Technology | | | 30,749 | | | | 3,011,865 | |
| Microsoft | | | 80,739 | | | | 34,189,737 | |
| Motorola Solutions | | | 7,078 | | | | 3,536,877 | |
| NetApp | | | 27,414 | | | | 3,362,053 | |
| NVIDIA | | | 271,438 | | | | 37,526,303 | |
| Oracle | | | 18,825 | | | | 3,479,613 | |
| Palo Alto Networks * | | | 9,059 | | | | 3,513,261 | |
| QUALCOMM | | | 19,550 | | | | 3,099,262 | |
The accompanying notes are an integral part of the financial statements.
12
| Schedule of Investments | | November 30, 2024 |
Global X Conscious Companies ETF
| | | Shares | | | Value | |
| COMMON STOCK — continued | | | | | | | | |
| Information Technology — continued | | | | | | | | |
| Salesforce | | | 11,463 | | | $ | 3,782,675 | |
| ServiceNow * | | | 3,441 | | | | 3,611,123 | |
| Synopsys * | | | 6,687 | | | | 3,734,623 | |
| Texas Instruments | | | 15,895 | | | | 3,195,372 | |
| Trimble * | | | 54,629 | | | | 3,986,278 | |
| VeriSign * | | | 17,746 | | | | 3,321,696 | |
| Workday, Cl A * | | | 13,854 | | | | 3,463,361 | |
| | | | | | | | 230,713,740 | |
| Materials — 2.1% | | | | | | | | |
| Avery Dennison | | | 16,027 | | | | 3,300,761 | |
| Dow | | | 64,425 | | | | 2,848,229 | |
| Nucor | | | 23,434 | | | | 3,625,005 | |
| Steel Dynamics | | | 25,373 | | | | 3,685,936 | |
| | | | | | | | 13,459,931 | |
| Real Estate — 1.5% | | | | | | | | |
| CBRE Group, Cl A * | | | 24,621 | | | | 3,446,694 | |
| Jones Lang LaSalle * | | | 12,006 | | | | 3,368,883 | |
| ProLogis ‡ | | | 27,283 | | | | 3,186,109 | |
| | | | | | | | 10,001,686 | |
| Utilities — 1.0% | | | | | | | | |
| American Water Works | | | 23,654 | | | | 3,239,179 | |
| Exelon | | | 80,700 | | | | 3,192,492 | |
| | | | | | | | 6,431,671 | |
| TOTAL UNITED STATES | | | | | | | 652,614,802 | |
TOTAL COMMON STOCK
(Cost $510,861,561) | | | | | | | 652,614,802 | |
TOTAL INVESTMENTS — 99.8%
(Cost $510,861,561) | | | | | | $ | 652,614,802 | |
Percentages are based on Net Assets of $653,742,665.
| * | Non-income producing security. |
| ‡ | Real Estate Investment Trust |
The accompanying notes are an integral part of the financial statements.
13
| Schedule of Investments | | November 30, 2024 |
Global X Conscious Companies ETF
As of November 30, 2024, all of the Fund’s investments were considered Level 1, in accordance with authoritative guidance on fair value measurements and disclosure under U.S. GAAP.
See “Glossary” for abbreviations.
The accompanying notes are an integral part of the financial statements.
14
| Schedule of Investments | | November 30, 2024 |
Global X U.S. Preferred ETF
| | | Shares | | | Value | |
| PREFERRED STOCK — 99.5% | | | | | | | | |
| BERMUDA — 1.0% | | | | | | | | |
| Financials — 0.9% | | | | | | | | |
| Aspen Insurance Holdings, 8.915%, US0003M + 4.060% (A) | | | 220,510 | | | $ | 5,636,236 | |
| Aspen Insurance Holdings, 5.625% | | | 195,625 | | | | 4,219,631 | |
| RenaissanceRe Holdings, 5.750% | | | 196,782 | | | | 4,807,384 | |
| RenaissanceRe Holdings, 4.200% | | | 397,024 | | | | 7,305,242 | |
| | | | | | | | 21,968,493 | |
| Industrials — 0.1% | | | | | | | | |
| Triton International, 6.875% | | | 109,046 | | | | 2,725,059 | |
| TOTAL BERMUDA | | | | | | | 24,693,552 | |
| CANADA — 1.2% | | | | | | | | |
| Financials — 0.3% | | | | | | | | |
| Brookfield Finance, 4.625% (B) | | | 325,742 | | | | 6,150,009 | |
| Utilities — 0.9% | | | | | | | | |
| Algonquin Power & Utilities, 8.864%, US0003M + 4.010% (A) | | | 271,271 | | | | 6,928,261 | |
| BIP Bermuda Holdings I, 5.125% | | | 243,299 | | | | 4,469,403 | |
| Brookfield BRP Holdings Canada, 7.250% | | | 119,670 | | | | 3,150,911 | |
| Brookfield BRP Holdings Canada, 4.625% | | | 286,209 | | | | 4,705,276 | |
| Brookfield Infrastructure Finance ULC, 7.250% | | | 114,887 | | | | 3,019,230 | |
| | | | | | | | 22,273,081 | |
| TOTAL CANADA | | | | | | | 28,423,090 | |
| NETHERLANDS — 0.7% | | | | | | | | |
| Financials — 0.7% | | | | | | | | |
| AEGON Funding, 5.100% | | | 744,093 | | | | 16,213,787 | |
| TOTAL NETHERLANDS | | | | | | | 16,213,787 | |
| UNITED STATES — 96.6% | | | | | | | | |
| Communication Services — 6.4% | | | | | | | | |
| AT&T, 5.625% | | | 646,075 | | | | 16,242,326 | |
| AT&T, 5.350% | | | 1,061,694 | | | | 25,055,978 | |
| AT&T, 5.000% | | | 961,310 | | | | 20,600,873 | |
| AT&T, 4.750% | | | 1,403,135 | | | | 28,301,233 | |
| Qwest, 6.750% | | | 510,312 | | | | 9,170,307 | |
| Qwest, 6.500% | | | 782,696 | | | | 13,783,277 | |
| Telephone and Data Systems, 6.625% | | | 348,346 | | | | 7,513,823 | |
| Telephone and Data Systems, 6.000% | | | 551,125 | | | | 10,493,420 | |
| United States Cellular, 6.250% | | | 401,124 | | | | 9,398,335 | |
| United States Cellular, 5.500% | | | 405,624 | | | | 9,215,777 | |
| United States Cellular, 5.500% (B) | | | 404,527 | | | | 9,215,125 | |
| | | | | | | | 158,990,474 | |
The accompanying notes are an integral part of the financial statements.
15
| Schedule of Investments | | November 30, 2024 |
Global X U.S. Preferred ETF
| | | Shares | | | Value | |
| PREFERRED STOCK — continued | | | | | | | | |
| Consumer Discretionary — 2.6% | | | | | | | | |
| Brunswick, 6.625% | | | 98,797 | | | $ | 2,487,709 | |
| Brunswick, 6.375% | | | 172,735 | | | | 4,280,373 | |
| Ford Motor, 6.500% | | | 489,744 | | | | 12,145,651 | |
| Ford Motor, 6.200% | | | 606,522 | | | | 14,453,419 | |
| Ford Motor, 6.000% | | | 643,736 | | | | 15,198,607 | |
| Qurate Retail, 8.000% (B) | | | 255,014 | | | | 10,832,995 | |
| QVC, 6.250% | | | 404,606 | | | | 5,004,976 | |
| | | | | | | | 64,403,730 | |
| Financials — 71.4% | | | | | | | | |
| Affiliated Managers Group, 6.750% | | | 363,871 | | | | 9,271,433 | |
| Affiliated Managers Group, 5.875% | | | 228,110 | | | | 5,394,801 | |
| Affiliated Managers Group, 4.750% | | | 205,741 | | | | 4,063,385 | |
| Allstate, 8.083%, TSFR3M + 3.427% (A) | | | 403,791 | | | | 10,676,234 | |
| Allstate, 7.375% | | | 473,282 | | | | 12,906,400 | |
| Allstate, 5.100% | | | 921,212 | | | | 20,985,209 | |
| Allstate, 4.750% (B) | | | 230,174 | | | | 4,875,085 | |
| Apollo Global Management, 7.625%, H15T5Y + 3.226% (A) | | | 468,545 | | | | 12,739,739 | |
| Apollo Global Management, 6.750% | | | 577,208 | | | | 53,495,637 | |
| Arch Capital Group, 5.450% | | | 251,241 | | | | 5,781,055 | |
| Arch Capital Group, 4.550% | | | 399,407 | | | | 7,964,176 | |
| Associated Banc-Corp, 6.625%, H15T5Y + 2.812% (A) | | | 227,401 | | | | 5,682,751 | |
| Assurant, 5.250% | | | 202,778 | | | | 4,450,977 | |
| Athene Holding, 7.750%, H15T5Y + 3.962% (A) | | | 401,437 | | | | 10,975,288 | |
| Athene Holding, 7.250%, H15T5Y + 2.986% (A) | | | 463,797 | | | | 11,989,152 | |
| Athene Holding, 6.350%, US0003M + 4.253% (A) | | | 692,193 | | | | 17,789,360 | |
| Athene Holding, 5.625% | | | 262,504 | | | | 5,903,715 | |
| Athene Holding, 4.875% | | | 465,251 | | | | 9,184,055 | |
| Axis Capital Holdings, 5.500% | | | 446,447 | | | | 10,295,068 | |
| Bank of America, 7.250% * | | | 53,683 | | | | 66,808,493 | |
| Bank of America, 6.450%, + 0.000% | | | 736,972 | | | | 19,279,188 | |
| Bank of America, 6.000% | | | 946,799 | | | | 23,916,143 | |
| Bank of America, 5.875% (B) | | | 598,634 | | | | 15,079,590 | |
| Bank of America, 5.526%, TSFR3M + 1.012% (A) | | | 146,693 | | | | 3,535,301 | |
| Bank of America, 5.426%, TSFR3M + 0.912% (A) | | | 196,626 | | | | 4,534,196 | |
| Bank of America, 5.375% | | | 968,884 | | | | 22,652,508 | |
The accompanying notes are an integral part of the financial statements.
16
| Schedule of Investments | | November 30, 2024 |
Global X U.S. Preferred ETF
| | | Shares | | | Value | |
| PREFERRED STOCK — continued | | | | | | | | |
| Financials — continued | | | | | | | | |
| Bank of America, 5.282%, TSFR3M + 0.762% (A) | | | 279,054 | | | $ | 6,808,918 | |
| Bank of America, 5.135%, TSFR3M + 0.612% (A) | | | 201,597 | | | | 4,955,254 | |
| Bank of America, 5.000% | | | 912,398 | | | | 19,945,020 | |
| Bank of America, 4.750% (B) | | | 484,271 | | | | 10,363,399 | |
| Bank of America, 4.375% | | | 755,828 | | | | 14,715,971 | |
| Bank of America, 4.250% | | | 910,865 | | | | 17,042,284 | |
| Bank of America, 4.125% | | | 620,812 | | | | 11,441,565 | |
| Bank of Hawaii, 8.000% | | | 121,241 | | | | 3,225,011 | |
| Bank OZK, 4.625% (B) | | | 291,895 | | | | 5,149,028 | |
| Brighthouse Financial, 6.750% | | | 322,757 | | | | 8,078,608 | |
| Brighthouse Financial, 6.600% | | | 341,272 | | | | 8,149,575 | |
| Brighthouse Financial, 6.250% | | | 304,124 | | | | 7,435,832 | |
| Brighthouse Financial, 5.375% | | | 459,312 | | | | 9,181,647 | |
| Brighthouse Financial, 4.625% | | | 288,213 | | | | 5,101,370 | |
| Capital One Financial, 5.000% | | | 1,207,485 | | | | 25,345,110 | |
| Capital One Financial, 4.800% | | | 1,003,287 | | | | 20,025,609 | |
| Capital One Financial, 4.375% | | | 537,775 | | | | 10,169,325 | |
| Capital One Financial, 4.250% (B) | | | 339,502 | | | | 6,185,726 | |
| Carlyle Finance, 4.625% (B) | | | 398,095 | | | | 7,802,662 | |
| Charles Schwab, 5.950% | | | 603,490 | | | | 15,358,820 | |
| Charles Schwab, 4.450% (B) | | | 478,646 | | | | 10,171,227 | |
| Citigroup Capital XIII, 11.221%, TSFR3M + 6.632% (A) | | | 1,803,733 | | | | 54,743,297 | |
| Citizens Financial Group, 7.375% | | | 323,619 | | | | 8,828,326 | |
| Citizens Financial Group, 5.000% | | | 363,960 | | | | 7,785,104 | |
| Enstar Group, 7.000%, US0003M + 4.015% (A) | | | 319,704 | | | | 6,573,114 | |
| Equitable Holdings, 5.250% | | | 643,974 | | | | 14,779,203 | |
| Equitable Holdings, 4.300% | | | 252,763 | | | | 4,921,296 | |
| F&G Annuities & Life, 7.950% | | | 276,552 | | | | 7,646,663 | |
| Fifth Third Bancorp, 9.296%, TSFR3M + 3.972% (A) | | | 361,414 | | | | 9,357,008 | |
| Fifth Third Bancorp, 6.000% | | | 147,969 | | | | 3,736,217 | |
| Fifth Third Bancorp, 4.950% (B) | | | 188,393 | | | | 4,474,334 | |
| First Citizens BancShares, 5.625% | | | 148,760 | | | | 3,479,496 | |
| First Citizens BancShares, 5.375% | | | 275,598 | | | | 6,586,792 | |
| Flagstar Financial, 6.375%, US0003M + 3.821% (A) | | | 422,461 | | | | 9,433,554 | |
The accompanying notes are an integral part of the financial statements.
17
| Schedule of Investments | | November 30, 2024 |
Global X U.S. Preferred ETF
| | | Shares | | | Value | |
| PREFERRED STOCK — continued | | | | | | | | |
| Financials — continued | | | | | | | | |
| Globe Life, 4.250% | | | 245,260 | | | $ | 4,247,903 | |
| Goldman Sachs Group, 5.533%, TSFR3M + 1.012% (A) | | | 160,270 | | | | 3,950,655 | |
| Goldman Sachs Group, 5.533%, TSFR3M + 1.012% (A) | | | 603,755 | | | | 14,610,871 | |
| Goldman Sachs Group, 5.453%, TSFR3M + 0.932% (A) | | | 1,083,750 | | | | 25,739,063 | |
| Hartford Financial Services Group, 6.000% | | | 279,794 | | | | 7,109,566 | |
| Huntington Bancshares, 6.875%, H15T5Y + 2.704% (A) | | | 263,502 | | | | 6,974,898 | |
| Huntington Bancshares, 4.500% (B) | | | 405,604 | | | | 7,937,670 | |
| Jackson Financial, 8.000%, H15T5Y + 3.728% (A) | | | 443,403 | | | | 12,180,280 | |
| JPMorgan Chase, 6.000% | | | 1,481,812 | | | | 37,430,571 | |
| JPMorgan Chase, 5.750% | | | 1,359,062 | | | | 34,058,094 | |
| JPMorgan Chase, 4.750% | | | 722,675 | | | | 15,956,664 | |
| JPMorgan Chase, 4.625% | | | 1,482,533 | | | | 31,637,254 | |
| JPMorgan Chase, 4.550% (B) | | | 1,204,179 | | | | 25,071,007 | |
| JPMorgan Chase, 4.200% | | | 1,602,820 | | | | 31,271,018 | |
| Kemper, 5.875%, H15T5Y + 4.140% (A) | | | 121,650 | | | | 2,890,404 | |
| KeyCorp, 6.200%, H15T5Y + 3.132% (A) | | | 490,420 | | | | 12,505,710 | |
| KeyCorp, 6.125%, TSFR3M + 4.154% (A) | | | 409,297 | | | | 10,502,561 | |
| KeyCorp, 5.650% (B) | | | 340,154 | | | | 8,177,302 | |
| KeyCorp, 5.625% | | | 363,906 | | | | 8,868,389 | |
| KKR Group Finance IX, 4.625% | | | 410,242 | | | | 8,130,996 | |
| Lincoln National, 9.000% | | | 399,775 | | | | 11,313,633 | |
| M&T Bank, 7.500% | | | 603,134 | | | | 16,580,154 | |
| M&T Bank, 5.625%, US0003M + 4.020% (A) (B) | | | 188,476 | | | | 4,828,755 | |
| MetLife, 6.208%, TSFR3M + 1.262% (A) | | | 481,398 | | | | 11,938,670 | |
| MetLife, 5.625% | | | 646,850 | | | | 15,686,113 | |
| MetLife, 4.750% | | | 806,987 | | | | 16,979,006 | |
| Morgan Stanley, Ser E, 7.125%, + 0.000% (A) | | | 692,408 | | | | 17,545,619 | |
| Morgan Stanley, Ser F, 6.875%, US0003M + 3.940% (A) | | | 682,492 | | | | 17,280,697 | |
| Morgan Stanley, 6.500% | | | 802,315 | | | | 20,932,398 | |
| Morgan Stanley, 6.375%, + 0.000% (A) | | | 807,815 | | | | 20,478,110 | |
| Morgan Stanley, 5.850% (A) | | | 801,728 | | | | 19,987,079 | |
| Morgan Stanley, 5.618%, TSFR3M + 0.962% (A) | | | 886,605 | | | | 21,269,654 | |
| Morgan Stanley, 4.875% | | | 404,659 | | | | 9,238,365 | |
The accompanying notes are an integral part of the financial statements.
18
| Schedule of Investments | | November 30, 2024 |
Global X U.S. Preferred ETF
| | | Shares | | | Value | |
| PREFERRED STOCK — continued | | | | | | | | |
| Financials — continued | | | | | | | | |
| Morgan Stanley, 4.250% (B) | | | 1,041,743 | | | $ | 20,032,718 | |
| National Rural Utilities Cooperative Finance, 5.500% | | | 211,246 | | | | 5,228,339 | |
| Navient, 6.000% | | | 252,578 | | | | 5,208,158 | |
| New Mountain Finance, 8.250% | | | 93,293 | | | | 2,378,039 | |
| New York Community Capital Trust V, 6.000% * | | | 55,439 | | | | 2,175,981 | |
| Northern Trust, 4.700% | | | 323,646 | | | | 7,091,084 | |
| Prudential Financial, 5.950% | | | 243,299 | | | | 6,330,640 | |
| Prudential Financial, 5.625% | | | 452,008 | | | | 11,304,720 | |
| Prudential Financial, 4.125% | | | 401,226 | | | | 7,912,177 | |
| Regions Financial, 5.700%, TSFR3M + 3.410% (A) | | | 398,920 | | | | 10,044,806 | |
| Regions Financial, 4.450% (B) | | | 320,055 | | | | 6,394,699 | |
| Reinsurance Group of America, 7.125%, H15T5Y + 3.456% (A) | | | 563,436 | | | | 15,100,085 | |
| Reinsurance Group of America, 5.750%, US0003M + 4.040% (A) | | | 320,080 | | | | 8,008,402 | |
| State Street, 5.350%, TSFR3M + 3.971% (A) | | | 401,468 | | | | 10,064,803 | |
| Stifel Financial, 6.125% | | | 168,952 | | | | 4,286,312 | |
| Stifel Financial, 5.200% | | | 182,475 | | | | 4,061,894 | |
| Stifel Financial, 4.500% | | | 224,707 | | | | 4,548,070 | |
| Synchrony Financial, 8.250%, H15T5Y + 4.044% (A) (B) | | | 401,704 | | | | 10,645,156 | |
| Synchrony Financial, 5.625% | | | 599,048 | | | | 12,538,075 | |
| Synovus Financial, 8.397%, H15T5Y + 4.127% (A) | | | 280,515 | | | | 7,514,997 | |
| Synovus Financial, 8.058%, TSFR3M + 3.614% (A) | | | 148,346 | | | | 3,818,426 | |
| Texas Capital Bancshares, 5.750% | | | 239,771 | | | | 5,159,872 | |
| TPG Operating Group II, 6.950% | | | 320,295 | | | | 8,343,685 | |
| Truist Financial, 5.738%, TSFR3M + 0.792% (A) | | | 138,953 | | | | 3,361,273 | |
| Truist Financial, 5.250% (B) | | | 460,126 | | | | 10,674,923 | |
| Truist Financial, 4.750% | | | 744,604 | | | | 15,673,914 | |
| Unum Group, 6.250% | | | 240,271 | | | | 6,076,454 | |
| US Bancorp, 5.938%, TSFR3M + 1.282% (A) | | | 11,463 | | | | 10,175,705 | |
| US Bancorp, 5.518%, TSFR3M + 0.862% (A) | | | 807,934 | | | | 18,647,117 | |
| US Bancorp, 5.500% | | | 469,949 | | | | 11,805,119 | |
| US Bancorp, 4.500% (B) | | | 363,028 | | | | 7,808,732 | |
The accompanying notes are an integral part of the financial statements.
19
| Schedule of Investments | | November 30, 2024 |
Global X U.S. Preferred ETF
| | | Shares | | | Value | |
| PREFERRED STOCK — continued | | | | | | | | |
| Financials — continued | | | | | | | | |
| US Bancorp, 4.000% (B) | | | 610,606 | | | $ | 11,375,590 | |
| Voya Financial, 5.350%, H15T5Y + 3.210% (A) | | | 239,260 | | | | 6,050,885 | |
| W R Berkley, 5.700% | | | 157,748 | | | | 3,975,250 | |
| W R Berkley, 5.100% | | | 251,524 | | | | 5,739,778 | |
| WaFd, 4.875% | | | 227,988 | | | | 4,110,624 | |
| Wells Fargo, 7.500% * | | | 79,676 | | | | 97,250,932 | |
| Wells Fargo, 5.625% | | | 555,631 | | | | 13,707,417 | |
| Wells Fargo, 4.750% | | | 1,612,522 | | | | 32,798,697 | |
| Wells Fargo, 4.700% | | | 939,777 | | | | 19,011,689 | |
| Wells Fargo, 4.375% | | | 843,071 | | | | 16,203,825 | |
| Wells Fargo, 4.250% (B) | | | 1,004,164 | | | | 19,028,908 | |
| Western Alliance Bancorp, 4.250%, H15T5Y + 3.452% (A) | | | 241,396 | | | | 5,298,642 | |
| Zions Bancorporation, 9.448%, US0003M + 4.240% (A) | | | 100,896 | | | | 2,534,508 | |
| | | | | | | | 1,762,035,553 | |
| Health Care — 0.5% | | | | | | | | |
| BrightSpring Health Services, 6.750% | | | 161,460 | | | | 11,484,650 | |
| Industrials — 0.8% | | | | | | | | |
| Chart Industries, 6.750% * | | | 160,442 | | | | 11,545,406 | |
| Pitney Bowes, 6.700% | | | 344,702 | | | | 6,897,487 | |
| | | | | | | | 18,442,893 | |
| Materials — 1.8% | | | | | | | | |
| Albemarle, 7.250% | | | 920,972 | | | | 44,519,787 | |
| Real Estate — 4.6% | | | | | | | | |
| Brookfield Property Partners, 6.500% | | | 145,837 | | | | 2,502,563 | |
| Brookfield Property Partners, 6.375% | | | 202,778 | | | | 3,333,670 | |
| Brookfield Property Preferred, 6.250% | | | 541,798 | | | | 9,053,445 | |
| Digital Realty Trust, 5.850% ‡ | | | 167,277 | | | | 4,171,889 | |
| Digital Realty Trust, 5.200% ‡ | | | 279,794 | | | | 6,289,769 | |
| EPR Properties, 5.750% ‡ * | | | 109,342 | | | | 2,346,479 | |
| Hudson Pacific Properties, 4.750% ‡ | | | 338,701 | | | | 4,819,715 | |
| Kimco Realty, 5.250% ‡ | | | 197,166 | | | | 4,452,008 | |
| Office Properties Income Trust, 6.375% ‡ | | | 131,399 | | | | 1,561,020 | |
| Public Storage, 5.600% ‡ | | | 217,216 | | | | 5,367,407 | |
| Public Storage, 5.150% ‡ | | | 223,929 | | | | 5,183,956 | |
| Public Storage, 5.050% ‡ | | | 241,134 | | | | 5,570,196 | |
| Public Storage, 4.750% ‡ | | | 190,358 | | | | 4,102,215 | |
| Public Storage, 4.700% ‡ | | | 218,282 | | | | 4,605,750 | |
| Public Storage, 4.625% ‡ | | | 453,047 | | | | 9,341,829 | |
The accompanying notes are an integral part of the financial statements.
20
| Schedule of Investments | | November 30, 2024 |
Global X U.S. Preferred ETF
| | | Shares | | | Value | |
| PREFERRED STOCK — continued | | | | | | | | |
| Real Estate — continued | | | | | | | | |
| Public Storage, 4.100% ‡ | | | 212,369 | | | $ | 3,954,311 | |
| Public Storage, 4.000% ‡ | | | 467,346 | | | | 8,351,473 | |
| Public Storage, 4.000% ‡ | | | 351,870 | | | | 6,347,735 | |
| Public Storage, 3.900% ‡ | | | 134,118 | | | | 2,373,889 | |
| RLJ Lodging Trust, 1.950% ‡ * (B) | | | 261,189 | | | | 6,615,918 | |
| SL Green Realty, 6.500% ‡ | | | 174,636 | | | | 4,250,640 | |
| Vornado Realty Trust, 5.400% ‡ | | | 239,620 | | | | 4,363,480 | |
| Vornado Realty Trust, 5.250% ‡ | | | 259,144 | | | | 4,672,366 | |
| | | | | | | | 113,631,723 | |
| Utilities — 8.5% | | | | | | | | |
| CMS Energy, 5.875% | | | 226,807 | | | | 5,565,844 | |
| CMS Energy, 5.875% | | | 514,152 | | | | 12,504,177 | |
| DTE Energy, 5.250% | | | 318,144 | | | | 7,310,949 | |
| DTE Energy, 4.375% | | | 220,212 | | | | 4,272,113 | |
| Duke Energy, 5.750% | | | 807,815 | | | | 20,082,281 | |
| Duke Energy, 5.625% | | | 404,069 | | | | 9,980,504 | |
| Georgia Power, 5.000% | | | 218,344 | | | | 5,006,628 | |
| NextEra Energy, 7.299% | | | 798,169 | | | | 41,369,099 | |
| NextEra Energy Capital Holdings, 5.650% | | | 552,207 | | | | 13,457,285 | |
| SCE Trust V, 5.450%, TSFR3M + 4.052% (A) | | | 250,931 | | | | 6,273,275 | |
| SCE Trust VI, 5.000% | | | 379,356 | | | | 7,765,417 | |
| SCE Trust VII, 7.500% | | | 441,699 | | | | 11,850,784 | |
| SCE Trust VIII, 6.950% | | | 280,513 | | | | 7,366,271 | |
| Sempra, 5.750% | | | 611,982 | | | | 14,712,047 | |
| Southern, 5.250% (B) | | | 358,406 | | | | 8,307,851 | |
| Southern, 4.950% | | | 804,589 | | | | 17,596,361 | |
| Southern, 4.200% (B) | | | 599,048 | | | | 11,837,189 | |
| Tennessee Valley Authority, 2.134%, H15T30Y + 0.940% (A) | | | 201,682 | | | | 4,588,266 | |
| | | | | | | | 209,846,341 | |
| TOTAL UNITED STATES | | | | | | | 2,383,355,151 | |
TOTAL PREFERRED STOCK
(Cost $2,544,307,096) | | | | | | | 2,452,685,580 | |
| | | | | | | | | |
| SHORT-TERM INVESTMENT(C)(D) — 0.4% | | | | | | | | |
Fidelity Investments Money Market Government Portfolio, Cl Institutional, 4.550%
(Cost $10,782,146) | | | 10,782,146 | | | | 10,782,146 | |
The accompanying notes are an integral part of the financial statements.
21
| Schedule of Investments | | November 30, 2024 |
Global X U.S. Preferred ETF
| | | Face Amount | | | Value | |
| REPURCHASE AGREEMENT(D) — 0.7% | | | | | | | | |
RBC Capital Markets
4.500%, dated 11/29/2024, to be repurchased on 12/02/2024, repurchase price $18,452,642 (collateralized by a U.S. Treasury Obligations, par value $19,606,581, 0.375%, 12/31/2025, with a total market value of $18,792,908)
(Cost $18,445,725) | | $ | 18,445,725 | | | $ | 18,445,725 | |
TOTAL INVESTMENTS — 100.6%
(Cost $2,573,534,967) | | | | | | $ | 2,481,913,451 | |
Percentages are based on Net Assets of $2,467,525,319.
| * | Non-income producing security. |
| ‡ | Real Estate Investment Trust |
| (A) | Variable or floating rate security. The rate shown is the effective interest rate as of period end. The rates on certain securities are not based on published reference rates and spreads and are either determined by the issuer or agent based on current market conditions; or by adjusting periodically based on prevailing interest rates. |
| (B) | This security or a partial position of this security is on loan at November 30, 2024. The total market value of securities on loan at November 30, 2024 was $28,494,415. |
| (C) | The rate reported on the Schedule of Investments is the 7-day effective yield as of November 30, 2024. |
| (D) | These securities were purchased with cash collateral held from securities on loan. The total value of such securities as of November 30, 2024 was $29,227,871. The total value of non-cash collateral held from securities on loan as of November 30, 2024 was $–. |
The accompanying notes are an integral part of the financial statements.
22
| Schedule of Investments | | November 30, 2024 |
Global X U.S. Preferred ETF
The following is a summary of the level of inputs used as of November 30, 2024, in valuing the Fund’s investments carried at value:
| Investments in Securities | | Level 1 | | | Level 2 | | | Level 3 | | | Total | |
| Preferred Stock | | $ | 2,452,685,580 | | | $ | — | | | $ | — | | | $ | 2,452,685,580 | |
| Short-Term Investment | | | 10,782,146 | | | | — | | | | — | | | | 10,782,146 | |
| Repurchase Agreement | | | — | | | | 18,445,725 | | | | — | | | | 18,445,725 | |
| Total Investments in Securities | | $ | 2,463,467,726 | | | $ | 18,445,725 | | | $ | — | | | $ | 2,481,913,451 | |
Amounts designated as “—” are $0 or have been rounded to $0.
See “Glossary” for abbreviations.
The accompanying notes are an integral part of the financial statements.
23
| Schedule of Investments | | November 30, 2024 |
Global X S&P 500® Quality Dividend ETF
| | | Shares | | | Value | |
| COMMON STOCK — 99.7% | | | | | | | | |
| Communication Services — 5.1% | | | | | | | | |
| Comcast, Cl A | | | 12,943 | | | $ | 559,008 | |
| Interpublic Group | | | 16,473 | | | | 507,533 | |
| Omnicom Group | | | 5,513 | | | | 577,873 | |
| | | | | | | | 1,644,414 | |
| Consumer Discretionary — 5.2% | | | | | | | | |
| Best Buy | | | 5,557 | | | | 500,130 | |
| Darden Restaurants | | | 3,260 | | | | 574,640 | |
| eBay | | | 9,296 | | | | 588,344 | |
| | | | | | | | 1,663,114 | |
| Consumer Staples — 23.7% | | | | | | | | |
| Archer-Daniels-Midland | | | 6,016 | | | | 328,474 | |
| Bunge Global | | | 3,435 | | | | 308,257 | |
| Campbell Soup | | | 8,072 | | | | 372,926 | |
| Clorox | | | 2,658 | | | | 444,338 | |
| Coca-Cola | | | 5,674 | | | | 363,590 | |
| Colgate-Palmolive | | | 3,751 | | | | 362,459 | |
| General Mills | | | 5,400 | | | | 357,804 | |
| Hershey | | | 1,900 | | | | 334,647 | |
| Kellanova | | | 6,190 | | | | 503,185 | |
| Kenvue | | | 19,658 | | | | 473,365 | |
| Kimberly-Clark | | | 2,544 | | | | 354,506 | |
| Kraft Heinz | | | 10,962 | | | | 350,455 | |
| Kroger | | | 7,047 | | | | 430,431 | |
| McCormick | | | 5,236 | | | | 410,555 | |
| Molson Coors Beverage, Cl B | | | 7,172 | | | | 445,094 | |
| Mondelez International, Cl A | | | 5,391 | | | | 350,145 | |
| PepsiCo | | | 2,168 | | | | 354,360 | |
| Procter & Gamble | | | 2,132 | | | | 382,182 | |
| Sysco | | | 5,024 | | | | 387,401 | |
| Target | | | 2,516 | | | | 332,892 | |
| | | | | | | | 7,647,066 | |
| Energy — 12.6% | | | | | | | | |
| APA | | | 17,478 | | | | 395,877 | |
| Baker Hughes, Cl A | | | 15,642 | | | | 687,466 | |
| Chevron | | | 3,179 | | | | 514,776 | |
| Coterra Energy | | | 18,130 | | | | 484,434 | |
| EOG Resources | | | 4,121 | | | | 549,164 | |
| Exxon Mobil | | | 4,441 | | | | 523,860 | |
| Phillips 66 | | | 3,545 | | | | 474,959 | |
The accompanying notes are an integral part of the financial statements.
24
| Schedule of Investments | | November 30, 2024 |
Global X S&P 500® Quality Dividend ETF
| | | Shares | | | Value | |
| COMMON STOCK — continued | | | | | | | | |
| Energy — continued | | | | | | | | |
| Valero Energy | | | 3,228 | | | $ | 448,950 | |
| | | | | | | | 4,079,486 | |
| Financials — 13.5% | | | | | | | | |
| Aflac | | | 5,583 | | | | 636,462 | |
| BlackRock Funding | | | 632 | | | | 646,410 | |
| Blackstone | | | 4,004 | | | | 765,124 | |
| Cincinnati Financial | | | 4,318 | | | | 690,146 | |
| CME Group, Cl A | | | 2,451 | | | | 583,338 | |
| Everest Group | | | 1,325 | | | | 513,517 | |
| T Rowe Price Group | | | 4,220 | | | | 522,605 | |
| | | | | | | | 4,357,602 | |
| Health Care — 3.1% | | | | | | | | |
| Baxter International | | | 14,390 | | | | 485,087 | |
| Johnson & Johnson | | | 3,328 | | | | 515,873 | |
| | | | | | | | 1,000,960 | |
| Industrials — 21.9% | | | | | | | | |
| Automatic Data Processing | | | 1,992 | | | | 611,404 | |
| CH Robinson Worldwide | | | 5,806 | | | | 612,997 | |
| Cummins | | | 1,814 | | | | 680,323 | |
| Fastenal | | | 7,689 | | | | 642,493 | |
| Honeywell International | | | 2,316 | | | | 539,466 | |
| Illinois Tool Works | | | 2,055 | | | | 570,304 | |
| Lockheed Martin | | | 1,054 | | | | 557,998 | |
| Paychex | | | 3,974 | | | | 581,277 | |
| RTX | | | 4,652 | | | | 566,753 | |
| Snap-On | | | 1,846 | | | | 682,448 | |
| Union Pacific | | | 2,175 | | | | 532,135 | |
| United Parcel Service, Cl B | | | 3,572 | | | | 484,792 | |
| | | | | | | | 7,062,390 | |
| Information Technology — 5.1% | | | | | | | | |
| Cisco Systems | | | 10,608 | | | | 628,099 | |
| Gen Digital | | | 19,868 | | | | 612,928 | |
| Skyworks Solutions | | | 4,666 | | | | 408,695 | |
| | | | | | | | 1,649,722 | |
| Materials — 7.7% | | | | | | | | |
| Dow | | | 8,802 | | | | 389,137 | |
| Eastman Chemical | | | 4,869 | | | | 509,882 | |
| International Paper | | | 10,793 | | | | 634,952 | |
| LyondellBasell Industries, Cl A | | | 5,183 | | | | 431,951 | |
The accompanying notes are an integral part of the financial statements.
25
| Schedule of Investments | | November 30, 2024 |
Global X S&P 500® Quality Dividend ETF
| | | Shares | | | Value | |
| COMMON STOCK — continued | | | | | | | | |
| Materials — continued | | | | | | | | |
| Smurfit WestRock | | | 9,756 | | | $ | 536,775 | |
| | | | | | | | 2,502,697 | |
| Real Estate — 1.8% | | | | | | | | |
| Public Storage ‡ | | | 1,713 | | | | 596,210 | |
TOTAL COMMON STOCK
(Cost $30,293,074) | | | | | | | 32,203,661 | |
TOTAL INVESTMENTS — 99.7%
(Cost $30,293,074) | | | | | | $ | 32,203,661 | |
Percentages are based on Net Assets of $32,308,887.
| ‡ | Real Estate Investment Trust |
As of November 30, 2024, all of the Fund’s investments were considered Level 1, in accordance with authoritative guidance on fair value measurements and disclosure under U.S. GAAP.
See “Glossary” for abbreviations.
The accompanying notes are an integral part of the financial statements.
26
| Schedule of Investments | | November 30, 2024 |
Global X Adaptive U.S. Factor ETF
| | | Shares | | | Value | |
| COMMON STOCK — 99.8% | | | | | | | | |
| BERMUDA — 0.5% | | | | | | | | |
| Financials — 0.5% | | | | | | | | |
| RenaissanceRe Holdings | | | 6,292 | | | $ | 1,800,456 | |
| | | | | | | | | |
| UNITED STATES — 99.3% | | | | | | | | |
| Communication Services — 9.5% | | | | | | | | |
| AT&T | | | 292,138 | | | | 6,765,916 | |
| Comcast, Cl A | | | 41,641 | | | | 1,798,475 | |
| Electronic Arts | | | 30,090 | | | | 4,924,830 | |
| Endeavor Group Holdings, Cl A | | | 157,136 | | | | 4,772,220 | |
| Liberty Broadband, Cl C * | | | 21,493 | | | | 1,829,914 | |
| Nexstar Media Group, Cl A | | | 10,242 | | | | 1,747,183 | |
| T-Mobile US | | | 23,719 | | | | 5,857,170 | |
| Verizon Communications | | | 152,167 | | | | 6,747,085 | |
| | | | | | | | 34,442,793 | |
| Consumer Discretionary — 7.4% | | | | | | | | |
| Asbury Automotive Group * | | | 7,643 | | | | 1,985,881 | |
| Best Buy | | | 18,528 | | | | 1,667,520 | |
| BorgWarner | | | 50,693 | | | | 1,739,784 | |
| Gap | | | 80,527 | | | | 1,952,780 | |
| Garmin | | | 2,157 | | | | 458,578 | |
| General Motors | | | 33,032 | | | | 1,836,249 | |
| Harley-Davidson | | | 50,664 | | | | 1,703,830 | |
| Lear | | | 16,486 | | | | 1,612,990 | |
| Lithia Motors, Cl A | | | 5,234 | | | | 2,025,035 | |
| Macy’s | | | 113,775 | | | | 1,847,706 | |
| McDonald’s | | | 8,488 | | | | 2,512,533 | |
| PVH | | | 19,201 | | | | 2,080,812 | |
| Tapestry | | | 39,740 | | | | 2,475,007 | |
| TJX | | | 2,212 | | | | 278,026 | |
| Whirlpool | | | 17,437 | | | | 1,942,830 | |
| Yum! Brands | | | 6,824 | | | | 948,127 | |
| | | | | | | | 27,067,688 | |
| Consumer Staples — 9.6% | | | | | | | | |
| Albertsons, Cl A | | | 236,661 | | | | 4,697,721 | |
| Altria Group | | | 40,694 | | | | 2,349,672 | |
| Archer-Daniels-Midland | | | 30,822 | | | | 1,682,881 | |
| Bunge Global | | | 19,428 | | | | 1,743,469 | |
The accompanying notes are an integral part of the financial statements.
27
| Schedule of Investments | | November 30, 2024 |
Global X Adaptive U.S. Factor ETF
| | | Shares | | | Value | |
| COMMON STOCK — continued | | | | | | | | |
| Consumer Staples — continued | | | | | | | | |
| Church & Dwight | | | 3,804 | | | $ | 418,935 | |
| Coca-Cola | | | 57,128 | | | | 3,660,762 | |
| Colgate-Palmolive | | | 2,784 | | | | 269,018 | |
| Conagra Brands | | | 58,729 | | | | 1,617,984 | |
| Costco Wholesale | | | 447 | | | | 434,430 | |
| Ingredion | | | 1,852 | | | | 272,874 | |
| Kellanova | | | 3,114 | | | | 253,137 | |
| Kimberly-Clark | | | 1,831 | | | | 255,150 | |
| Kraft Heinz | | | 48,721 | | | | 1,557,610 | |
| Kroger | | | 7,091 | | | | 433,118 | |
| Molson Coors Beverage, Cl B | | | 30,855 | | | | 1,914,861 | |
| Mondelez International, Cl A | | | 3,582 | | | | 232,651 | |
| PepsiCo | | | 14,653 | | | | 2,395,033 | |
| Procter & Gamble | | | 17,088 | | | | 3,063,195 | |
| Walgreens Boots Alliance | | | 185,021 | | | | 1,668,889 | |
| Walmart | | | 62,963 | | | | 5,824,077 | |
| | | | | | | | 34,745,467 | |
| Energy — 5.6% | | | | | | | | |
| Antero Midstream | | | 119,164 | | | | 1,903,049 | |
| Chevron | | | 1,999 | | | | 323,698 | |
| Chord Energy | | | 13,467 | | | | 1,717,312 | |
| Civitas Resources | | | 34,476 | | | | 1,788,615 | |
| DT Midstream | | | 23,896 | | | | 2,535,843 | |
| Exxon Mobil | | | 2,384 | | | | 281,217 | |
| HF Sinclair | | | 40,310 | | | | 1,649,888 | |
| Kinder Morgan | | | 83,155 | | | | 2,350,792 | |
| Noble | | | 54,974 | | | | 1,839,980 | |
| NOV | | | 113,211 | | | | 1,813,640 | |
| ONEOK | | | 17,872 | | | | 2,030,259 | |
| Viper Energy, Cl A | | | 33,445 | | | | 1,809,709 | |
| Williams | | | 6,154 | | | | 360,132 | |
| | | | | | | | 20,404,134 | |
| Financials — 24.5% | | | | | | | | |
| Aflac | | | 3,323 | | | | 378,822 | |
| AGNC Investment ‡ | | | 177,599 | | | | 1,715,606 | |
| Ally Financial | | | 51,175 | | | | 2,045,976 | |
| Arthur J Gallagher | | | 869 | | | | 271,337 | |
The accompanying notes are an integral part of the financial statements.
28
| Schedule of Investments | | November 30, 2024 |
Global X Adaptive U.S. Factor ETF
| | | Shares | | | Value | |
| COMMON STOCK — continued | | | | | | | | |
| Financials — continued | | | | | | | | |
| Bank OZK | | | 39,552 | | | $ | 1,976,413 | |
| Berkshire Hathaway, Cl B * | | | 11,211 | | | | 5,415,137 | |
| Cadence Bank | | | 51,154 | | | | 1,953,571 | |
| Cboe Global Markets | | | 15,764 | | | | 3,402,659 | |
| Chubb | | | 1,007 | | | | 290,751 | |
| Citigroup | | | 27,411 | | | | 1,942,618 | |
| Citizens Financial Group | | | 41,747 | | | | 2,009,701 | |
| CME Group, Cl A | | | 21,414 | | | | 5,096,532 | |
| Columbia Banking System | | | 64,554 | | | | 2,001,820 | |
| Comerica | | | 28,188 | | | | 2,036,583 | |
| Corebridge Financial | | | 54,975 | | | | 1,779,541 | |
| First Horizon | | | 100,508 | | | | 2,123,734 | |
| Fiserv * | | | 1,257 | | | | 277,747 | |
| FNB | | | 119,470 | | | | 2,048,910 | |
| Franklin Resources | | | 86,114 | | | | 1,959,955 | |
| Hartford Financial Services Group | | | 2,388 | | | | 294,464 | |
| Huntington Bancshares | | | 111,323 | | | | 2,004,927 | |
| Intercontinental Exchange | | | 31,806 | | | | 5,119,494 | |
| Jackson Financial, Cl A | | | 17,909 | | | | 1,794,303 | |
| Lincoln National | | | 53,076 | | | | 1,886,321 | |
| Loews | | | 3,113 | | | | 269,990 | |
| Marsh & McLennan | | | 22,407 | | | | 5,225,985 | |
| Mastercard, Cl A | | | 566 | | | | 301,644 | |
| Old National Bancorp | | | 91,484 | | | | 2,118,769 | |
| Old Republic International | | | 8,971 | | | | 349,600 | |
| Progressive | | | 2,493 | | | | 670,318 | |
| Prosperity Bancshares | | | 23,583 | | | | 1,974,605 | |
| Radian Group | | | 50,436 | | | | 1,805,104 | |
| Regions Financial | | | 73,169 | | | | 1,994,587 | |
| Rithm Capital ‡ | | | 167,758 | | | | 1,887,278 | |
| Starwood Property Trust ‡ | | | 87,040 | | | | 1,773,005 | |
| Synchrony Financial | | | 31,451 | | | | 2,123,572 | |
| Tradeweb Markets, Cl A | | | 3,624 | | | | 491,052 | |
| Travelers | | | 1,586 | | | | 421,939 | |
| UMB Financial | | | 16,225 | | | | 2,036,075 | |
| United Bankshares | | | 46,873 | | | | 1,981,322 | |
| Unum Group | | | 31,650 | | | | 2,433,885 | |
| Visa, Cl A | | | 17,257 | | | | 5,437,336 | |
| W R Berkley | | | 5,440 | | | | 351,152 | |
The accompanying notes are an integral part of the financial statements.
29
| Schedule of Investments | | November 30, 2024 |
Global X Adaptive U.S. Factor ETF
| | | Shares | | | Value | |
| COMMON STOCK — continued | | | | | | | | |
| Financials — continued | | | | | | | | |
| Webster Financial | | | 33,610 | | | $ | 2,076,426 | |
| Western Union | | | 149,741 | | | | 1,648,648 | |
| Zions Bancorp | | | 33,349 | | | | 2,018,281 | |
| | | | | | | | 89,217,495 | |
| Health Care — 11.0% | | | | | | | | |
| AbbVie | | | 2,927 | | | | 535,436 | |
| Amgen | | | 896 | | | | 253,452 | |
| Becton Dickinson | | | 1,245 | | | | 276,265 | |
| Boston Scientific * | | | 60,011 | | | | 5,440,597 | |
| Cardinal Health | | | 2,257 | | | | 275,896 | |
| Catalent * | | | 4,232 | | | | 258,618 | |
| Cencora | | | 21,789 | | | | 5,481,023 | |
| Centene * | | | 29,472 | | | | 1,768,320 | |
| Chemed | | | 3,180 | | | | 1,820,200 | |
| Cigna Group | | | 818 | | | | 276,320 | |
| CVS Health | | | 30,463 | | | | 1,823,211 | |
| Hologic * | | | 3,503 | | | | 278,488 | |
| Johnson & Johnson | | | 30,613 | | | | 4,745,321 | |
| McKesson | | | 513 | | | | 322,421 | |
| Medtronic PLC | | | 18,735 | | | | 1,621,327 | |
| Merck | | | 35,880 | | | | 3,646,843 | |
| Organon | | | 100,484 | | | | 1,594,681 | |
| Pfizer | | | 59,938 | | | | 1,570,975 | |
| QIAGEN | | | 41,073 | | | | 1,783,800 | |
| Quest Diagnostics | | | 1,603 | | | | 260,744 | |
| Regeneron Pharmaceuticals * | | | 255 | | | | 191,306 | |
| Royalty Pharma, Cl A | | | 63,233 | | | | 1,685,792 | |
| Solventum * | | | 24,110 | | | | 1,724,106 | |
| UnitedHealth Group | | | 458 | | | | 279,472 | |
| Vertex Pharmaceuticals * | | | 546 | | | | 255,599 | |
| Viatris | | | 149,783 | | | | 1,960,659 | |
| | | | | | | | 40,130,872 | |
| Industrials — 13.0% | | | | | | | | |
| Air Lease, Cl A | | | 40,092 | | | | 2,040,683 | |
| AMETEK | | | 1,665 | | | | 323,643 | |
| Automatic Data Processing | | | 16,841 | | | | 5,169,008 | |
| Boise Cascade | | | 12,917 | | | | 1,906,549 | |
The accompanying notes are an integral part of the financial statements.
30
| Schedule of Investments | | November 30, 2024 |
Global X Adaptive U.S. Factor ETF
| | | Shares | | | Value | |
| COMMON STOCK — continued | | | | | | | | |
| Industrials — continued | | | | | | | | |
| Broadridge Financial Solutions | | | 13,130 | | | $ | 3,098,943 | |
| CACI International, Cl A * | | | 1,385 | | | | 636,934 | |
| CNH Industrial | | | 156,558 | | | | 1,966,368 | |
| General Dynamics | | | 16,685 | | | | 4,738,707 | |
| Honeywell International | | | 1,130 | | | | 263,211 | |
| Huntington Ingalls Industries | | | 7,774 | | | | 1,538,630 | |
| Leidos Holdings | | | 2,232 | | | | 369,173 | |
| Lockheed Martin | | | 9,181 | | | | 4,860,513 | |
| Northrop Grumman | | | 596 | | | | 291,831 | |
| PACCAR | | | 16,675 | | | | 1,950,975 | |
| Republic Services, Cl A | | | 25,743 | | | | 5,619,697 | |
| RTX | | | 41,277 | | | | 5,028,777 | |
| Snap-On | | | 978 | | | | 361,557 | |
| TransDigm Group | | | 1,285 | | | | 1,610,066 | |
| Verisk Analytics, Cl A | | | 1,172 | | | | 344,814 | |
| Waste Management | | | 22,153 | | | | 5,055,758 | |
| | | | | | | | 47,175,837 | |
| Information Technology — 10.0% | | | | | | | | |
| Akamai Technologies * | | | 2,450 | | | | 230,349 | |
| Amdocs | | | 52,536 | | | | 4,555,922 | |
| Apple | | | 1,537 | | | | 364,776 | |
| Arrow Electronics * | | | 13,332 | | | | 1,601,973 | |
| Avnet | | | 32,090 | | | | 1,755,644 | |
| Cisco Systems | | | 86,142 | | | | 5,100,468 | |
| GoDaddy, Cl A * | | | 1,873 | | | | 370,049 | |
| Hewlett Packard Enterprise | | | 89,608 | | | | 1,901,482 | |
| HP | | | 49,839 | | | | 1,765,796 | |
| Intel | | | 78,721 | | | | 1,893,240 | |
| International Business Machines | | | 22,459 | | | | 5,107,401 | |
| Juniper Networks | | | 133,969 | | | | 4,812,166 | |
| MARA Holdings * | | | 95,668 | | | | 2,623,217 | |
| Motorola Solutions | | | 656 | | | | 327,803 | |
| Roper Technologies | | | 476 | | | | 269,625 | |
| Skyworks Solutions | | | 18,222 | | | | 1,596,065 | |
| TD SYNNEX | | | 14,483 | | | | 1,723,332 | |
| VeriSign * | | | 1,614 | | | | 302,109 | |
| | | | | | | | 36,301,417 | |
The accompanying notes are an integral part of the financial statements.
31
| Schedule of Investments | | November 30, 2024 |
Global X Adaptive U.S. Factor ETF
| | | Shares | | | Value | |
| COMMON STOCK — continued | | | | | | | | |
| Materials — 5.6% | | | | | | | | |
| AptarGroup | | | 1,807 | | | $ | 312,539 | |
| Celanese, Cl A | | | 13,797 | | | | 1,010,078 | |
| Dow | | | 33,587 | | | | 1,484,881 | |
| Eastman Chemical | | | 16,161 | | | | 1,692,380 | |
| Ecolab | | | 1,050 | | | | 261,209 | |
| FMC | | | 27,862 | | | | 1,646,366 | |
| International Paper | | | 35,294 | | | | 2,076,346 | |
| Linde PLC | | | 10,488 | | | | 4,834,863 | |
| LyondellBasell Industries, Cl A | | | 19,718 | | | | 1,643,298 | |
| Mosaic | | | 65,900 | | | | 1,743,714 | |
| Packaging Corp of America | | | 1,340 | | | | 333,459 | |
| Sonoco Products | | | 32,825 | | | | 1,702,961 | |
| United States Steel | | | 43,792 | | | | 1,785,400 | |
| | | | | | | | 20,527,494 | |
| Real Estate — 2.0% | | | | | | | | |
| Host Hotels & Resorts ‡ | | | 99,537 | | | | 1,833,471 | |
| Kilroy Realty ‡ | | | 42,175 | | | | 1,751,528 | |
| SL Green Realty ‡ | | | 22,904 | | | | 1,790,864 | |
| VICI Properties, Cl A ‡ | | | 52,678 | | | | 1,717,830 | |
| Welltower ‡ | | | 1,903 | | | | 262,956 | |
| | | | | | | | 7,356,649 | |
| Utilities — 1.1% | | | | | | | | |
| Atmos Energy | | | 1,753 | | | | 265,264 | |
| Consolidated Edison | | | 2,994 | | | | 301,166 | |
| Duke Energy | | | 2,959 | | | | 346,351 | |
| FirstEnergy | | | 5,678 | | | | 241,599 | |
| Pinnacle West Capital | | | 3,338 | | | | 312,771 | |
| Southern | | | 4,792 | | | | 427,111 | |
The accompanying notes are an integral part of the financial statements.
32
| Schedule of Investments | | November 30, 2024 |
Global X Adaptive U.S. Factor ETF
| | | Shares | | | Value | |
| COMMON STOCK — continued | | | | | | | | |
| Utilities — continued | | | | | | | | |
| UGI | | | 69,543 | | | $ | 2,112,021 | |
| | | | | | | | 4,006,283 | |
| TOTAL UNITED STATES | | | | | | | 361,376,129 | |
TOTAL COMMON STOCK
(Cost $328,838,845) | | | | | | | 363,176,585 | |
TOTAL INVESTMENTS — 99.8%
(Cost $328,838,845) | | | | | | $ | 363,176,585 | |
Percentages are based on Net Assets of $363,880,967.
| * | Non-income producing security. |
| ‡ | Real Estate Investment Trust |
As of November 30, 2024, all of the Fund’s investments were considered Level 1, in accordance with authoritative guidance on fair value measurements and disclosure under U.S. GAAP.
See “Glossary” for abbreviations.
The accompanying notes are an integral part of the financial statements.
33
| Schedule of Investments | November 30, 2024 |
| Global X Variable Rate Preferred ETF |
| | | Shares | | | Value | |
| PREFERRED STOCK — 99.7% | | | | | | | | |
| BERMUDA — 1.1% | | | | | | | | |
| Financials — 1.1% | | | | | | | | |
| Aspen Insurance Holdings, 8.915%, US0003M + 4.060% (A) | | | 117,640 | | | $ | 3,006,878 | |
| TOTAL BERMUDA | | | | | | | 3,006,878 | |
| CANADA — 1.5% | | | | | | | | |
| Utilities — 1.5% | | | | | | | | |
| Algonquin Power & Utilities, 8.864%, US0003M + 4.010% (A) | | | 151,070 | | | | 3,858,328 | |
| TOTAL CANADA | | | | | | | 3,858,328 | |
| UNITED STATES — 97.1% | | | | | | | | |
| Consumer Staples — 3.7% | | | | | | | | |
| CHS, Ser 2, 7.100%, US0003M + 4.298% (A) | | | 180,626 | | | | 4,578,869 | |
| CHS, Ser 3, 6.750%, US0003M + 4.155% (A) | | | 211,317 | | | | 5,310,396 | |
| | | | | | | | 9,889,265 | |
| Energy — 1.2% | | | | | | | | |
| NGL Energy Partners, 11.919%, TSFR3M + 7.475% (A) | | | 136,632 | | | | 3,197,189 | |
| Financials — 91.3% | | | | | | | | |
| AGNC Investment, 10.029%, TSFR3M + 5.373% ‡ (A) | | | 141,021 | | | | 3,608,727 | |
| AGNC Investment, 9.250%, TSFR3M + 4.594% ‡(A) | | | 102,202 | | | | 2,602,063 | |
| Allstate, 8.083%, TSFR3M + 3.427% (A) | | | 216,558 | | | | 5,725,793 | |
| Annaly Capital Management, 10.582%, TSFR3M + 4.989% ‡(A) | | | 191,592 | | | | 4,944,989 | |
| Annaly Capital Management, 9.699%, TSFR3M + 5.255% ‡(A) | | | 311,278 | | | | 8,034,085 | |
| Annaly Capital Management, 8.878%, TSFR3M + 4.434% ‡(A) | | | 184,048 | | | | 4,684,022 | |
| Apollo Global Management, 7.625%, H15T5Y + 3.226% (A) | | | 259,715 | | | | 7,061,651 | |
| Arbor Realty Trust, 6.250%, TSFR3M + 5.440% ‡(A) | | | 123,317 | | | | 2,545,263 | |
| Associated Banc-Corp, 6.625%, H15T5Y + 2.812% (A) | | | 128,015 | | | | 3,199,095 | |
| Athene Holding, 7.750%, H15T5Y + 3.962% (A) | | | 209,387 | | | | 5,724,641 | |
| Athene Holding, 7.250%, H15T5Y + 2.986% (A) | | | 242,778 | | | | 6,275,811 | |
| Athene Holding, 6.350%, US0003M + 4.253% (A) | | | 363,828 | | | | 9,350,380 | |
The accompanying notes are an integral part of the financial statements.
34
| Schedule of Investments | November 30, 2024 |
| Global X Variable Rate Preferred ETF |
| | | Shares | | | Value | |
| PREFERRED STOCK — continued | | | | | | | | |
| Financials — continued | | | | | | | | |
| Banc of California, 7.750%, H15T5Y + 4.820% (A) | | | 222,352 | | | $ | 5,558,800 | |
| Bank of America, 6.450%, + 0.000% | | | 453,599 | | | | 11,866,150 | |
| Bank of America, 5.526%, TSFR3M + 1.012% (A) | | | 90,061 | | | | 2,170,470 | |
| Bank of America, 5.426%, TSFR3M + 0.912% (A) | | | 127,477 | | | | 2,939,620 | |
| Bank of America, 5.282%, TSFR3M + 0.762% (A) | | | 180,924 | | | | 4,414,546 | |
| Bank of America, 5.135%, TSFR3M + 0.612% (A) | | | 133,556 | | | | 3,282,806 | |
| Chimera Investment, 10.656%, TSFR3M + 6.053% ‡(A) | | | 141,033 | | | | 3,558,263 | |
| Chimera Investment, 10.203%, TSFR3M + 5.600% ‡(A) | | | 85,367 | | | | 2,151,248 | |
| Enstar Group, 7.000%, US0003M + 4.015% (A) | | | 170,977 | | | | 3,515,287 | |
| Fifth Third Bancorp, 9.296%, TSFR3M + 3.972% (A) | | | 195,001 | | | | 5,048,576 | |
| Flagstar Financial, 6.375%, US0003M + 3.821% (A) | | | 222,024 | | | | 4,957,796 | |
| Goldman Sachs Group, 5.533%, TSFR3M + 1.012% (A) | | | 324,269 | | | | 7,847,310 | |
| Goldman Sachs Group, 5.453%, TSFR3M + 0.932% (A) | | | 583,071 | | | | 13,847,936 | |
| Huntington Bancshares, 6.875%, H15T5Y + 2.704% (A) | | | 141,009 | | | | 3,732,508 | |
| Jackson Financial, 8.000%, H15T5Y + 3.728% (A) | | | 238,123 | | | | 6,541,239 | |
| KeyCorp, 6.200%, H15T5Y + 3.132% (A) | | | 257,967 | | | | 6,578,158 | |
| KeyCorp, 6.125%, TSFR3M + 4.154% (A) | | | 216,588 | | | | 5,557,648 | |
| M&T Bank, 5.625%, US0003M + 4.020% (A) | | | 106,974 | | | | 2,740,674 | |
| MetLife, 6.208%, TSFR3M + 1.262% (A) | | | 259,779 | | | | 6,442,519 | |
| Morgan Stanley, 5.618%, TSFR3M + 0.962% (A) | | | 475,674 | | | | 11,411,419 | |
| Regions Financial, 5.700%, TSFR3M + 3.410% (A) | | | 216,588 | | | | 5,453,686 | |
| Reinsurance Group of America, 7.125%, H15T5Y + 3.456% (A) | | | 299,240 | | | | 8,019,632 | |
| Reinsurance Group of America, 5.750%, US0003M + 4.040% (A) | | | 169,114 | | | | 4,231,232 | |
The accompanying notes are an integral part of the financial statements.
35
| Schedule of Investments | November 30, 2024 |
| Global X Variable Rate Preferred ETF |
| | | Shares | | | Value | |
| PREFERRED STOCK — continued | | | | | | | | |
| Financials — continued | | | | | | | | |
| Rithm Capital, 10.656%, US0003M + 5.802% ‡ (A) | | | 66,198 | | | $ | 1,692,021 | |
| Rithm Capital, 10.494%, US0003M + 5.640% ‡ (A) | | | 120,095 | | | | 3,029,997 | |
| Rithm Capital, 7.000%, H15T5Y + 6.223% ‡ (A) | | | 201,527 | | | | 4,818,511 | |
| Synchrony Financial, 8.250%, H15T5Y + 4.044% (A) | | | 214,427 | | | | 5,682,315 | |
| Synovus Financial, 8.397%, H15T5Y + 4.127% (A) | | | 151,797 | | | | 4,066,642 | |
| Synovus Financial, 8.058%, TSFR3M + 3.614% (A) | | | 85,359 | | | | 2,197,141 | |
| Two Harbors Investment, 7.625%, US0003M + 5.352% ‡(A) | | | 108,589 | | | | 2,540,983 | |
| US Bancorp, 5.938%, TSFR3M + 1.282% (A) | | | 6,224 | | | | 5,525,045 | |
| US Bancorp, 5.518%, TSFR3M + 0.862% (A) | | | 432,165 | | | | 9,974,368 | |
| Voya Financial, 5.350%, H15T5Y + 3.210% (A) | | | 129,307 | | | | 3,270,174 | |
| Western Alliance Bancorp, 4.250%, H15T5Y + 3.452% (A) | | | 128,686 | | | | 2,824,658 | |
| Zions Bancorporation, 9.448%, US0003M + 4.240% (A) | | | 59,512 | | | | 1,494,941 | |
| | | | | | | | 242,740,839 | |
| Utilities — 0.9% | | | | | | | | |
| Tennessee Valley Authority, 2.134%, H15T30Y + 0.940% (A) | | | 109,497 | | | | 2,491,057 | |
| TOTAL UNITED STATES | | | | | | | 258,318,350 | |
TOTAL PREFERRED STOCK
(Cost $253,896,103) | | | | | | | 265,183,556 | |
TOTAL INVESTMENTS — 99.7%
(Cost $253,896,103) | | | | | | $ | 265,183,556 | |
Percentages are based on Net Assets of $266,034,240.
| ‡ | Real Estate Investment Trust |
| (A) | Variable or floating rate security. The rate shown is the effective interest rate as of period end. The rates on certain securities are not based on published reference rates and spreads and are either determined by the issuer or agent based on current market conditions; or by adjusting periodically based on prevailing interest rates. |
The accompanying notes are an integral part of the financial statements.
36
| Schedule of Investments | November 30, 2024 |
| Global X Variable Rate Preferred ETF |
As of November 30, 2024, all of the Fund’s investments were considered Level 1, in accordance with authoritative guidance on fair value measurements and disclosure under U.S. GAAP.
See “Glossary” for abbreviations.
The accompanying notes are an integral part of the financial statements.
37
| Schedule of Investments | November 30, 2024 |
| Global X Adaptive U.S. Risk Management ETF |
| | | Shares | | | Value | |
| COMMON STOCK — 99.8% | | | | | | | | |
| BRAZIL — 0.2% | | | | | | | | |
| Consumer Discretionary — 0.2% | | | | | | | | |
| MercadoLibre * | | | 128 | | | $ | 254,102 | |
| | | | | | | | | |
| GREAT BRITAIN — 0.1% | | | | | | | | |
| Consumer Discretionary — 0.1% | | | | | | | | |
| Flutter Entertainment PLC * | | | 466 | | | | 128,765 | |
| | | | | | | | | |
| IRELAND — 0.4% | | | | | | | | |
| Information Technology — 0.4% | | | | | | | | |
| Accenture PLC, Cl A | | | 1,651 | | | | 598,273 | |
| | | | | | | | | |
| ISRAEL — 0.0% | | | | | | | | |
| Consumer Discretionary — 0.0% | | | | | | | | |
| Mobileye Global, Cl A * | | | 189 | | | | 3,411 | |
| | | | | | | | | |
| MEXICO — 0.0% | | | | | | | | |
| Materials — 0.0% | | | | | | | | |
| Southern Copper | | | 221 | | | | 22,177 | |
| | | | | | | | | |
| SOUTH KOREA — 0.1% | | | | | | | | |
| Consumer Discretionary — 0.1% | | | | | | | | |
| Coupang, Cl A * | | | 2,846 | | | | 72,175 | |
| | | | | | | | | |
| SWITZERLAND — 0.1% | | | | | | | | |
| Information Technology — 0.1% | | | | | | | | |
| TE Connectivity PLC | | | 802 | | | | 121,198 | |
| | | | | | | | | |
| UNITED STATES — 98.9% | | | | | | | | |
| Communication Services — 9.1% | | | | | | | | |
| Alphabet, Cl A | | | 15,412 | | | | 2,603,857 | |
| Alphabet, Cl C | | | 13,720 | | | | 2,339,123 | |
| AT&T | | | 18,814 | | | | 435,732 | |
| Charter Communications, Cl A * | | | 250 | | | | 99,241 | |
| Comcast, Cl A | | | 10,206 | | | | 440,797 | |
| Electronic Arts | | | 628 | | | | 102,785 | |
| Endeavor Group Holdings, Cl A | | | 493 | | | | 14,972 | |
The accompanying notes are an integral part of the financial statements.
38
| Schedule of Investments | November 30, 2024 |
| Global X Adaptive U.S. Risk Management ETF |
| | | Shares | | | Value | |
| COMMON STOCK — continued | | | | | | | | |
| Communication Services — continued | | | | | | | | |
| Fox, Cl A | | | 584 | | | $ | 27,518 | |
| Fox, Cl B | | | 321 | | | | 14,358 | |
| Live Nation Entertainment * | | | 377 | | | | 52,120 | |
| Meta Platforms, Cl A | | | 5,732 | | | | 3,292,002 | |
| Netflix * | | | 1,103 | | | | 978,152 | |
| Omnicom Group | | | 510 | | | | 53,458 | |
| Pinterest, Cl A * | | | 1,542 | | | | 46,754 | |
| ROBLOX, Cl A * | | | 1,290 | | | | 64,668 | |
| Sirius XM Holdings | | | 146 | | | | 3,932 | |
| Snap, Cl A * | | | 2,649 | | | | 31,285 | |
| Spotify Technology * | | | 375 | | | | 178,860 | |
| Take-Two Interactive Software * | | | 426 | | | | 80,250 | |
| TKO Group Holdings, Cl A * | | | 182 | | | | 25,109 | |
| T-Mobile US | | | 1,270 | | | | 313,614 | |
| Trade Desk, Cl A * | | | 1,160 | | | | 149,118 | |
| Verizon Communications | | | 11,073 | | | | 490,977 | |
| Walt Disney | | | 4,800 | | | | 563,856 | |
| Warner Bros Discovery * | | | 5,790 | | | | 60,679 | |
| Warner Music Group, Cl A | | | 321 | | | | 10,439 | |
| | | | | | | | 12,473,656 | |
| Consumer Discretionary — 10.6% | | | | | | | | |
| Airbnb, Cl A * | | | 1,116 | | | | 151,899 | |
| Amazon.com * | | | 24,692 | | | | 5,133,220 | |
| Aptiv PLC * | | | 706 | | | | 39,204 | |
| AutoZone * | | | 47 | | | | 148,968 | |
| Best Buy | | | 506 | | | | 45,540 | |
| Booking Holdings | | | 89 | | | | 462,976 | |
| Carnival * | | | 2,577 | | | | 65,533 | |
| Carvana, Cl A * | | | 293 | | | | 76,303 | |
| Chipotle Mexican Grill, Cl A * | | | 3,582 | | | | 220,365 | |
| Darden Restaurants | | | 312 | | | | 54,996 | |
| Deckers Outdoor * | | | 437 | | | | 85,635 | |
| DoorDash, Cl A * | | | 840 | | | | 151,603 | |
| DR Horton | | | 787 | | | | 132,830 | |
| DraftKings, Cl A * | | | 1,202 | | | | 52,467 | |
| eBay | | | 1,322 | | | | 83,669 | |
| Expedia Group * | | | 328 | | | | 60,555 | |
| Ford Motor | | | 10,284 | | | | 114,461 | |
The accompanying notes are an integral part of the financial statements.
39
| Schedule of Investments | November 30, 2024 |
| Global X Adaptive U.S. Risk Management ETF |
| | | Shares | | | Value | |
| COMMON STOCK — continued | | | | | | | | |
| Consumer Discretionary — continued | | | | | | | | |
| Garmin | | | 398 | | | $ | 84,615 | |
| General Motors | | | 3,021 | | | | 167,937 | |
| Genuine Parts | | | 357 | | | | 45,243 | |
| Hilton Worldwide Holdings | | | 642 | | | | 162,709 | |
| Home Depot | | | 2,611 | | | | 1,120,458 | |
| Las Vegas Sands | | | 950 | | | | 50,407 | |
| Lennar, Cl A | | | 632 | | | | 110,214 | |
| Lennar, Cl B | | | 15 | | | | 2,472 | |
| Lowe’s | | | 1,506 | | | | 410,280 | |
| Lululemon Athletica * | | | 289 | | | | 92,671 | |
| Marriott International, Cl A | | | 634 | | | | 183,283 | |
| McDonald’s | | | 1,886 | | | | 558,275 | |
| MGM Resorts International * | | | 629 | | | | 24,116 | |
| NIKE, Cl B | | | 3,209 | | | | 252,773 | |
| NVR * | | | 8 | | | | 73,885 | |
| O’Reilly Automotive * | | | 154 | | | | 191,456 | |
| PulteGroup | | | 552 | | | | 74,669 | |
| Ross Stores | | | 860 | | | | 133,188 | |
| Royal Caribbean Cruises | | | 575 | | | | 140,335 | |
| Starbucks | | | 2,957 | | | | 302,974 | |
| Tesla * | | | 7,332 | | | | 2,530,713 | |
| TJX | | | 3,023 | | | | 379,961 | |
| Tractor Supply | | | 285 | | | | 80,846 | |
| Ulta Beauty * | | | 122 | | | | 47,170 | |
| Williams-Sonoma | | | 312 | | | | 53,670 | |
| Yum! Brands | | | 733 | | | | 101,843 | |
| | | | | | | | 14,456,387 | |
| Consumer Staples — 5.5% | | | | | | | | |
| Altria Group | | | 4,513 | | | | 260,581 | |
| Archer-Daniels-Midland | | | 1,284 | | | | 70,106 | |
| Brown-Forman, Cl A | | | 114 | | | | 4,715 | |
| Brown-Forman, Cl B | | | 770 | | | | 32,402 | |
| Bunge Global | | | 363 | | | | 32,576 | |
| Campbell Soup | | | 490 | | | | 22,638 | |
| Church & Dwight | | | 635 | | | | 69,933 | |
| Clorox | | | 323 | | | | 53,996 | |
| Coca-Cola | | | 10,252 | | | | 656,948 | |
| Colgate-Palmolive | | | 2,179 | | | | 210,557 | |
The accompanying notes are an integral part of the financial statements.
40
| Schedule of Investments | November 30, 2024 |
| Global X Adaptive U.S. Risk Management ETF |
| | | Shares | | | Value | |
| COMMON STOCK — continued | | | | | | | | |
| Consumer Staples — continued | | | | | | | | |
| Conagra Brands | | | 1,229 | | | $ | 33,859 | |
| Constellation Brands, Cl A | | | 412 | | | | 99,271 | |
| Costco Wholesale | | | 1,166 | | | | 1,133,212 | |
| Dollar General | | | 567 | | | | 43,812 | |
| Dollar Tree * | | | 525 | | | | 37,417 | |
| Estee Lauder, Cl A | | | 553 | | | | 39,882 | |
| General Mills | | | 1,485 | | | | 98,396 | |
| Hershey | | | 384 | | | | 67,634 | |
| Hormel Foods | | | 738 | | | | 23,933 | |
| Kellanova | | | 673 | | | | 54,708 | |
| Kenvue | | | 5,015 | | | | 120,761 | |
| Keurig Dr Pepper | | | 2,773 | | | | 90,538 | |
| Kimberly-Clark | | | 884 | | | | 123,185 | |
| Kraft Heinz | | | 2,059 | | | | 65,826 | |
| Kroger | | | 1,745 | | | | 106,585 | |
| McCormick | | | 652 | | | | 51,123 | |
| Mondelez International, Cl A | | | 3,519 | | | | 228,559 | |
| Monster Beverage * | | | 1,830 | | | | 100,888 | |
| PepsiCo | | | 3,626 | | | | 592,670 | |
| Philip Morris International | | | 4,083 | | | | 543,284 | |
| Procter & Gamble | | | 6,209 | | | | 1,113,025 | |
| Sysco | | | 1,328 | | | | 102,402 | |
| Target | | | 1,212 | | | | 160,360 | |
| Tyson Foods, Cl A | | | 729 | | | | 47,021 | |
| Walmart | | | 11,516 | | | | 1,065,230 | |
| | | | | | | | 7,558,033 | |
| Energy — 3.5% | | | | | | | | |
| Baker Hughes, Cl A | | | 2,647 | | | | 116,336 | |
| Cheniere Energy | | | 590 | | | | 132,166 | |
| Chevron | | | 4,455 | | | | 721,398 | |
| ConocoPhillips | | | 3,434 | | | | 372,040 | |
| Coterra Energy | | | 1,935 | | | | 51,703 | |
| Devon Energy | | | 1,640 | | | | 62,238 | |
| Diamondback Energy | | | 446 | | | | 79,205 | |
| EOG Resources | | | 1,508 | | | | 200,956 | |
| EQT | | | 1,485 | | | | 67,478 | |
| Exxon Mobil | | | 11,698 | | | | 1,379,896 | |
| Halliburton | | | 2,349 | | | | 74,839 | |
The accompanying notes are an integral part of the financial statements.
41
| Schedule of Investments | November 30, 2024 |
| Global X Adaptive U.S. Risk Management ETF |
| | | Shares | | | Value | |
| COMMON STOCK — continued | | | | | | | | |
| Energy — continued | | | | | | | | |
| Hess | | | 725 | | | $ | 106,706 | |
| Kinder Morgan | | | 5,130 | | | | 145,025 | |
| Marathon Petroleum | | | 879 | | | | 137,256 | |
| Occidental Petroleum | | | 1,827 | | | | 92,410 | |
| ONEOK | | | 1,524 | | | | 173,126 | |
| Phillips 66 | | | 1,110 | | | | 148,718 | |
| Schlumberger | | | 3,736 | | | | 164,160 | |
| Targa Resources | | | 573 | | | | 117,064 | |
| Texas Pacific Land | | | 61 | | | | 97,605 | |
| Valero Energy | | | 855 | | | | 118,913 | |
| Williams | | | 3,194 | | | | 186,913 | |
| | | | | | | | 4,746,151 | |
| Financials — 13.8% | | | | | | | | |
| Aflac | | | 1,344 | | | | 153,216 | |
| Allstate | | | 685 | | | | 142,062 | |
| American Express | | | 1,470 | | | | 447,880 | |
| American International Group | | | 1,742 | | | | 133,925 | |
| Ameriprise Financial | | | 259 | | | | 148,658 | |
| Aon PLC, Cl A | | | 516 | | | | 202,035 | |
| Apollo Global Management | | | 1,060 | | | | 185,532 | |
| Arch Capital Group | | | 931 | | | | 93,770 | |
| Ares Management, Cl A | | | 478 | | | | 84,477 | |
| Arthur J Gallagher | | | 565 | | | | 176,416 | |
| Bank of America | | | 17,717 | | | | 841,735 | |
| Bank of New York Mellon | | | 1,975 | | | | 161,693 | |
| Berkshire Hathaway, Cl B * | | | 3,480 | | | | 1,680,910 | |
| BlackRock Funding | | | 390 | | | | 398,892 | |
| Blackstone | | | 1,885 | | | | 360,205 | |
| Block, Cl A * | | | 1,440 | | | | 127,512 | |
| Blue Owl Capital, Cl A | | | 1,256 | | | | 29,805 | |
| Brown & Brown | | | 621 | | | | 70,235 | |
| Capital One Financial | | | 988 | | | | 189,706 | |
| Cboe Global Markets | | | 271 | | | | 58,495 | |
| Charles Schwab | | | 3,922 | | | | 324,585 | |
| Chubb | | | 1,063 | | | | 306,920 | |
| Cincinnati Financial | | | 402 | | | | 64,252 | |
| Citigroup | | | 4,870 | | | | 345,137 | |
| Citizens Financial Group | | | 1,177 | | | | 56,661 | |
The accompanying notes are an integral part of the financial statements.
42
| Schedule of Investments | November 30, 2024 |
| Global X Adaptive U.S. Risk Management ETF |
| | | Shares | | | Value | |
| COMMON STOCK — continued | | | | | | | | |
| Financials — continued | | | | | | | | |
| CME Group, Cl A | | | 939 | | | $ | 223,482 | |
| Coinbase Global, Cl A * | | | 518 | | | | 153,432 | |
| Corpay * | | | 198 | | | | 75,474 | |
| Discover Financial Services | | | 650 | | | | 118,579 | |
| Erie Indemnity, Cl A | | | 77 | | | | 33,923 | |
| Everest Group | | | 87 | | | | 33,718 | |
| FactSet Research Systems | | | 100 | | | | 49,067 | |
| Fidelity National Information Services | | | 1,457 | | | | 124,282 | |
| Fifth Third Bancorp | | | 1,771 | | | | 85,114 | |
| First Citizens BancShares, Cl A | | | 31 | | | | 71,145 | |
| Fiserv * | | | 1,528 | | | | 337,627 | |
| Global Payments | | | 669 | | | | 79,584 | |
| Goldman Sachs Group | | | 828 | | | | 503,896 | |
| Hartford Financial Services Group | | | 775 | | | | 95,565 | |
| Huntington Bancshares | | | 3,738 | | | | 67,321 | |
| Interactive Brokers Group, Cl A | | | 261 | | | | 49,874 | |
| Intercontinental Exchange | | | 1,489 | | | | 239,669 | |
| JPMorgan Chase | | | 7,471 | | | | 1,865,658 | |
| KKR | | | 1,757 | | | | 286,163 | |
| Loews | | | 476 | | | | 41,283 | |
| LPL Financial Holdings | | | 193 | | | | 62,754 | |
| M&T Bank | | | 432 | | | | 95,036 | |
| Markel Group * | | | 38 | | | | 67,751 | |
| Marsh & McLennan | | | 1,301 | | | | 303,432 | |
| Mastercard, Cl A | | | 2,158 | | | | 1,150,085 | |
| MetLife | | | 1,560 | | | | 137,639 | |
| Moody’s | | | 417 | | | | 208,492 | |
| Morgan Stanley | | | 3,256 | | | | 428,522 | |
| MSCI, Cl A | | | 202 | | | | 123,145 | |
| Nasdaq | | | 1,079 | | | | 89,546 | |
| Northern Trust | | | 532 | | | | 59,137 | |
| PayPal Holdings * | | | 2,747 | | | | 238,357 | |
| PNC Financial Services Group | | | 1,045 | | | | 224,382 | |
| Principal Financial Group | | | 610 | | | | 53,125 | |
| Progressive | | | 1,537 | | | | 413,269 | |
| Prudential Financial | | | 959 | | | | 124,104 | |
| Raymond James Financial | | | 492 | | | | 83,286 | |
| Regions Financial | | | 2,388 | | | | 65,097 | |
| Robinhood Markets, Cl A * | | | 1,268 | | | | 47,601 | |
The accompanying notes are an integral part of the financial statements.
43
| Schedule of Investments | November 30, 2024 |
| Global X Adaptive U.S. Risk Management ETF |
| | | Shares | | | Value | |
| COMMON STOCK — continued | | | | | | | | |
| Financials — continued | | | | | | | | |
| Rocket, Cl A * | | | 304 | | | $ | 4,417 | |
| S&P Global | | | 824 | | | | 430,548 | |
| State Street | | | 785 | | | | 77,330 | |
| Synchrony Financial | | | 1,050 | | | | 70,896 | |
| T Rowe Price Group | | | 573 | | | | 70,960 | |
| TPG, Cl A | | | 223 | | | | 15,601 | |
| Tradeweb Markets, Cl A | | | 298 | | | | 40,379 | |
| Travelers | | | 602 | | | | 160,156 | |
| Truist Financial | | | 3,488 | | | | 166,308 | |
| US Bancorp | | | 3,881 | | | | 206,818 | |
| Visa, Cl A | | | 4,398 | | | | 1,385,722 | |
| W R Berkley | | | 786 | | | | 50,736 | |
| Wells Fargo | | | 8,959 | | | | 682,407 | |
| Willis Towers Watson PLC | | | 269 | | | | 86,618 | |
| | | | | | | | 18,743,226 | |
| Health Care — 10.5% | | | | | | | | |
| Abbott Laboratories | | | 4,560 | | | | 541,591 | |
| AbbVie | | | 4,652 | | | | 850,990 | |
| Agilent Technologies | | | 773 | | | | 106,651 | |
| Align Technology * | | | 185 | | | | 43,062 | |
| Alnylam Pharmaceuticals * | | | 324 | | | | 81,995 | |
| Amgen | | | 1,401 | | | | 396,301 | |
| Avantor * | | | 1,687 | | | | 35,528 | |
| Baxter International | | | 1,308 | | | | 44,093 | |
| Becton Dickinson | | | 761 | | | | 168,866 | |
| Biogen * | | | 376 | | | | 60,397 | |
| BioMarin Pharmaceutical * | | | 482 | | | | 31,826 | |
| Boston Scientific * | | | 3,861 | | | | 350,038 | |
| Bristol-Myers Squibb | | | 5,350 | | | | 316,827 | |
| Cardinal Health | | | 633 | | | | 77,378 | |
| Cencora | | | 458 | | | | 115,210 | |
| Centene * | | | 1,395 | | | | 83,700 | |
| Cigna Group | | | 736 | | | | 248,621 | |
| Cooper * | | | 515 | | | | 53,797 | |
| CVS Health | | | 3,296 | | | | 197,266 | |
| Danaher | | | 1,695 | | | | 406,275 | |
| Dexcom * | | | 1,025 | | | | 79,940 | |
| Edwards Lifesciences * | | | 1,576 | | | | 112,448 | |
The accompanying notes are an integral part of the financial statements.
44
| Schedule of Investments | November 30, 2024 |
| Global X Adaptive U.S. Risk Management ETF |
| | | Shares | | | Value | |
| COMMON STOCK — continued | | | | | | | | |
| Health Care — continued | | | | | | | | |
| Elevance Health | | | 621 | | | $ | 252,722 | |
| Eli Lilly | | | 2,240 | | | | 1,781,584 | |
| GE HealthCare Technologies | | | 1,114 | | | | 92,707 | |
| Gilead Sciences | | | 3,275 | | | | 303,199 | |
| HCA Healthcare | | | 502 | | | | 164,264 | |
| Hologic * | | | 604 | | | | 48,018 | |
| Humana | | | 315 | | | | 93,360 | |
| IDEXX Laboratories * | | | 214 | | | | 90,254 | |
| Illumina * | | | 415 | | | | 59,822 | |
| Incyte * | | | 481 | | | | 35,878 | |
| Intuitive Surgical * | | | 932 | | | | 505,144 | |
| IQVIA Holdings * | | | 467 | | | | 93,792 | |
| Johnson & Johnson | | | 6,342 | | | | 983,073 | |
| Labcorp Holdings | | | 219 | | | | 52,814 | |
| McKesson | | | 341 | | | | 214,319 | |
| Medtronic PLC | | | 3,373 | | | | 291,899 | |
| Merck | | | 6,683 | | | | 679,260 | |
| Mettler-Toledo International * | | | 56 | | | | 70,067 | |
| Moderna * | | | 866 | | | | 37,290 | |
| Molina Healthcare * | | | 152 | | | | 45,281 | |
| Pfizer | | | 14,919 | | | | 391,027 | |
| Quest Diagnostics | | | 288 | | | | 46,846 | |
| Regeneron Pharmaceuticals * | | | 274 | | | | 205,560 | |
| ResMed | | | 380 | | | | 94,628 | |
| Revvity | | | 318 | | | | 36,933 | |
| Royalty Pharma, Cl A | | | 968 | | | | 25,807 | |
| STERIS PLC | | | 255 | | | | 55,860 | |
| Stryker | | | 833 | | | | 326,661 | |
| Thermo Fisher Scientific | | | 1,014 | | | | 537,045 | |
| UnitedHealth Group | | | 2,424 | | | | 1,479,125 | |
| Veeva Systems, Cl A * | | | 388 | | | | 88,406 | |
| Vertex Pharmaceuticals * | | | 676 | | | | 316,456 | |
| Viatris | | | 3,093 | | | | 40,487 | |
| Waters * | | | 172 | | | | 66,172 | |
| West Pharmaceutical Services | | | 186 | | | | 60,576 | |
| Zimmer Biomet Holdings | | | 546 | | | | 61,207 | |
| Zoetis, Cl A | | | 1,215 | | | | 212,929 | |
| | | | | | | | 14,343,272 | |
The accompanying notes are an integral part of the financial statements.
45
| Schedule of Investments | November 30, 2024 |
| Global X Adaptive U.S. Risk Management ETF |
| | | Shares | | | Value | |
| COMMON STOCK — continued | | | | | | | | |
| Industrials — 8.7% | | | | | | | | |
| 3M | | | 1,449 | | | $ | 193,485 | |
| AMETEK | | | 600 | | | | 116,628 | |
| Automatic Data Processing | | | 1,085 | | | | 333,019 | |
| Axon Enterprise * | | | 187 | | | | 120,982 | |
| Boeing * | | | 1,529 | | | | 237,668 | |
| Booz Allen Hamilton Holding, Cl A | | | 333 | | | | 49,344 | |
| Broadridge Financial Solutions | | | 304 | | | | 71,750 | |
| Builders FirstSource * | | | 310 | | | | 57,806 | |
| Carlisle | | | 125 | | | | 57,087 | |
| Carrier Global | | | 2,214 | | | | 171,297 | |
| Caterpillar | | | 1,288 | | | | 523,070 | |
| Cintas | | | 903 | | | | 203,888 | |
| Copart * | | | 2,221 | | | | 140,789 | |
| CSX | | | 5,130 | | | | 187,501 | |
| Cummins | | | 357 | | | | 133,889 | |
| Deere | | | 661 | | | | 307,960 | |
| Delta Air Lines | | | 1,673 | | | | 106,771 | |
| Dover | | | 357 | | | | 73,506 | |
| Eaton PLC | | | 1,042 | | | | 391,188 | |
| EMCOR Group | | | 122 | | | | 62,235 | |
| Emerson Electric | | | 1,496 | | | | 198,370 | |
| Equifax | | | 318 | | | | 83,176 | |
| Expeditors International of Washington | | | 364 | | | | 44,277 | |
| Fastenal | | | 1,493 | | | | 124,755 | |
| FedEx | | | 592 | | | | 179,181 | |
| Ferguson Enterprises | | | 508 | | | | 109,692 | |
| Fortive | | | 917 | | | | 72,746 | |
| GE Vernova * | | | 737 | | | | 246,246 | |
| General Dynamics | | | 591 | | | | 167,850 | |
| General Electric | | | 2,869 | | | | 522,617 | |
| HEICO | | | 106 | | | | 28,977 | |
| HEICO, Cl A | | | 193 | | | | 40,748 | |
| Honeywell International | | | 1,714 | | | | 399,242 | |
| Howmet Aerospace | | | 1,064 | | | | 125,956 | |
| Hubbell, Cl B | | | 155 | | | | 71,314 | |
| IDEX | | | 194 | | | | 44,742 | |
| Illinois Tool Works | | | 797 | | | | 221,183 | |
| Ingersoll Rand | | | 1,057 | | | | 110,108 | |
| Jacobs Solutions | | | 324 | | | | 45,759 | |
The accompanying notes are an integral part of the financial statements.
46
| Schedule of Investments | November 30, 2024 |
| Global X Adaptive U.S. Risk Management ETF |
| | | Shares | | | Value | |
| COMMON STOCK — continued | | | | | | | | |
| Industrials — continued | | | | | | | | |
| JB Hunt Transport Services | | | 211 | | | $ | 39,902 | |
| Johnson Controls International | | | 1,753 | | | | 147,007 | |
| L3Harris Technologies | | | 496 | | | | 122,140 | |
| Leidos Holdings | | | 355 | | | | 58,717 | |
| Lennox International | | | 83 | | | | 55,372 | |
| Lockheed Martin | | | 632 | | | | 334,587 | |
| Nordson | | | 141 | | | | 36,800 | |
| Norfolk Southern | | | 590 | | | | 162,751 | |
| Northrop Grumman | | | 389 | | | | 190,474 | |
| Old Dominion Freight Line | | | 501 | | | | 112,795 | |
| Otis Worldwide | | | 1,075 | | | | 110,703 | |
| PACCAR | | | 1,351 | | | | 158,067 | |
| Parker-Hannifin | | | 335 | | | | 235,472 | |
| Paychex | | | 844 | | | | 123,452 | |
| Quanta Services | | | 376 | | | | 129,540 | |
| Republic Services, Cl A | | | 542 | | | | 118,319 | |
| Rockwell Automation | | | 299 | | | | 88,247 | |
| Rollins | | | 768 | | | | 38,653 | |
| RTX | | | 3,494 | | | | 425,674 | |
| Southwest Airlines | | | 1,538 | | | | 49,770 | |
| SS&C Technologies Holdings | | | 566 | | | | 43,774 | |
| Stanley Black & Decker | | | 392 | | | | 35,064 | |
| Trane Technologies PLC | | | 597 | | | | 248,483 | |
| TransDigm Group | | | 150 | | | | 187,946 | |
| TransUnion | | | 502 | | | | 50,953 | |
| Uber Technologies * | | | 5,305 | | | | 381,748 | |
| Union Pacific | | | 1,604 | | | | 392,435 | |
| United Airlines Holdings * | | | 860 | | | | 83,274 | |
| United Parcel Service, Cl B | | | 1,906 | | | | 258,682 | |
| United Rentals | | | 175 | | | | 151,550 | |
| Veralto | | | 571 | | | | 61,776 | |
| Verisk Analytics, Cl A | | | 378 | | | | 111,211 | |
| Vertiv Holdings, Cl A | | | 945 | | | | 120,582 | |
| Waste Management | | | 1,067 | | | | 243,511 | |
| Watsco | | | 91 | | | | 50,196 | |
| Westinghouse Air Brake Technologies | | | 466 | | | | 93,489 | |
| WW Grainger | | | 118 | | | | 142,230 | |
| Xylem | | | 620 | | | | 78,585 | |
| | | | | | | | 11,850,733 | |
The accompanying notes are an integral part of the financial statements.
47
| Schedule of Investments | November 30, 2024 |
| Global X Adaptive U.S. Risk Management ETF |
| | | Shares | | | Value | |
| COMMON STOCK — continued | | | | | | | | |
| Information Technology — 30.7% | | | | | | | | |
| Adobe * | | | 1,167 | | | $ | 602,090 | |
| Advanced Micro Devices * | | | 4,214 | | | | 578,055 | |
| Akamai Technologies * | | | 386 | | | | 36,292 | |
| Amdocs | | | 294 | | | | 25,496 | |
| Amphenol, Cl A | | | 3,111 | | | | 226,014 | |
| Analog Devices | | | 1,330 | | | | 290,007 | |
| ANSYS * | | | 224 | | | | 78,646 | |
| Apple | | | 38,998 | | | | 9,255,395 | |
| Applied Materials | | | 2,174 | | | | 379,820 | |
| AppLovin, Cl A * | | | 587 | | | | 197,672 | |
| Arista Networks * | | | 620 | | | | 251,608 | |
| Atlassian, Cl A * | | | 415 | | | | 109,386 | |
| Autodesk * | | | 567 | | | | 165,507 | |
| Bentley Systems, Cl B | | | 408 | | | | 20,196 | |
| Broadcom | | | 12,061 | | | | 1,954,847 | |
| Cadence Design Systems * | | | 713 | | | | 218,756 | |
| CDW | | | 351 | | | | 61,751 | |
| Cisco Systems | | | 10,612 | | | | 628,337 | |
| Cloudflare, Cl A * | | | 773 | | | | 77,169 | |
| Cognizant Technology Solutions, Cl A | | | 1,302 | | | | 104,798 | |
| Corning | | | 2,010 | | | | 97,827 | |
| Crowdstrike Holdings, Cl A * | | | 595 | | | | 205,852 | |
| Datadog, Cl A * | | | 792 | | | | 120,978 | |
| Dell Technologies, Cl C | | | 791 | | | | 100,924 | |
| Enphase Energy * | | | 343 | | | | 24,473 | |
| Entegris | | | 388 | | | | 40,984 | |
| Fair Isaac * | | | 65 | | | | 154,377 | |
| First Solar * | | | 297 | | | | 59,183 | |
| Fortinet * | | | 1,608 | | | | 152,840 | |
| Gartner * | | | 194 | | | | 100,478 | |
| GLOBALFOUNDRIES * | | | 182 | | | | 7,872 | |
| GoDaddy, Cl A * | | | 350 | | | | 69,150 | |
| Hewlett Packard Enterprise | | | 3,355 | | | | 71,193 | |
| HP | | | 2,576 | | | | 91,268 | |
| HubSpot * | | | 128 | | | | 92,294 | |
| Intel | | | 11,189 | | | | 269,095 | |
| International Business Machines | | | 2,420 | | | | 550,332 | |
| Intuit | | | 717 | | | | 460,120 | |
| Jabil | | | 283 | | | | 38,440 | |
The accompanying notes are an integral part of the financial statements.
48
| Schedule of Investments | November 30, 2024 |
| Global X Adaptive U.S. Risk Management ETF |
| | | Shares | | | Value | |
| COMMON STOCK — continued | | | | | | | | |
| Information Technology — continued | | | | | | | | |
| Keysight Technologies * | | | 455 | | | $ | 77,732 | |
| KLA | | | 354 | | | | 229,049 | |
| Lam Research | | | 3,435 | | | | 253,778 | |
| Marvell Technology | | | 2,249 | | | | 208,460 | |
| Microchip Technology | | | 1,375 | | | | 93,734 | |
| Micron Technology | | | 2,906 | | | | 284,643 | |
| Microsoft | | | 19,321 | | | | 8,181,671 | |
| MicroStrategy, Cl A * | | | 481 | | | | 186,373 | |
| MongoDB, Cl A * | | | 183 | | | | 59,016 | |
| Monolithic Power Systems | | | 131 | | | | 74,361 | |
| Motorola Solutions | | | 440 | | | | 219,868 | |
| NetApp | | | 538 | | | | 65,980 | |
| NVIDIA | | | 62,090 | | | | 8,583,943 | |
| Okta, Cl A * | | | 413 | | | | 32,032 | |
| ON Semiconductor * | | | 1,125 | | | | 80,010 | |
| Oracle | | | 4,266 | | | | 788,527 | |
| Palantir Technologies, Cl A * | | | 5,166 | | | | 346,535 | |
| Palo Alto Networks * | | | 842 | | | | 326,544 | |
| PTC * | | | 307 | | | | 61,418 | |
| Pure Storage, Cl A * | | | 797 | | | | 42,233 | |
| QUALCOMM | | | 2,930 | | | | 464,493 | |
| Roper Technologies | | | 278 | | | | 157,470 | |
| Salesforce | | | 2,446 | | | | 807,156 | |
| Samsara, Cl A * | | | 510 | | | | 27,280 | |
| Seagate Technology Holdings | | | 503 | | | | 50,969 | |
| ServiceNow * | | | 544 | | | | 570,895 | |
| Skyworks Solutions | | | 415 | | | | 36,350 | |
| Snowflake, Cl A * | | | 827 | | | | 144,560 | |
| Super Micro Computer * | | | 1,305 | | | | 42,595 | |
| Synopsys * | | | 402 | | | | 224,513 | |
| Teledyne Technologies * | | | 123 | | | | 59,687 | |
| Teradyne | | | 402 | | | | 44,220 | |
| Texas Instruments | | | 2,382 | | | | 478,854 | |
| Trimble * | | | 637 | | | | 46,482 | |
| Tyler Technologies * | | | 121 | | | | 76,130 | |
| VeriSign * | | | 224 | | | | 41,928 | |
| Western Digital * | | | 832 | | | | 60,728 | |
| Workday, Cl A * | | | 571 | | | | 142,744 | |
| Zebra Technologies, Cl A * | | | 151 | | | | 61,457 | |
The accompanying notes are an integral part of the financial statements.
49
| Schedule of Investments | November 30, 2024 |
| Global X Adaptive U.S. Risk Management ETF |
| | | Shares | | | Value | |
| COMMON STOCK — continued | | | | | | | | |
| Information Technology — continued | | | | | | | | |
| Zoom Video Communications, Cl A * | | | 683 | | | $ | 56,477 | |
| Zscaler * | | | 238 | | | | 49,168 | |
| | | | | | | | 41,809,585 | |
| Materials — 2.1% | | | | | | | | |
| Air Products & Chemicals | | | 573 | | | | 191,571 | |
| Amcor PLC | | | 3,740 | | | | 39,794 | |
| Avery Dennison | | | 206 | | | | 42,426 | |
| Ball | | | 806 | | | | 50,101 | |
| Celanese, Cl A | | | 280 | | | | 20,499 | |
| CF Industries Holdings | | | 472 | | | | 42,319 | |
| Corteva | | | 1,823 | | | | 113,464 | |
| CRH | | | 1,802 | | | | 184,291 | |
| Dow | | | 1,850 | | | | 81,788 | |
| DuPont de Nemours | | | 987 | | | | 82,503 | |
| Ecolab | | | 662 | | | | 164,686 | |
| Freeport-McMoRan | | | 3,747 | | | | 165,617 | |
| International Flavors & Fragrances | | | 664 | | | | 60,663 | |
| Linde PLC | | | 1,266 | | | | 583,613 | |
| LyondellBasell Industries, Cl A | | | 663 | | | | 55,254 | |
| Martin Marietta Materials | | | 162 | | | | 97,200 | |
| Newmont | | | 3,027 | | | | 126,952 | |
| Nucor | | | 627 | | | | 96,991 | |
| PPG Industries | | | 613 | | | | 76,239 | |
| Reliance | | | 148 | | | | 47,544 | |
| Sherwin-Williams | | | 621 | | | | 246,785 | |
| Smurfit WestRock | | | 1,346 | | | | 74,057 | |
| Steel Dynamics | | | 384 | | | | 55,784 | |
| Vulcan Materials | | | 346 | | | | 99,693 | |
| Westlake | | | 82 | | | | 10,529 | |
| | | | | | | | 2,810,363 | |
| Real Estate — 2.1% | | | | | | | | |
| Alexandria Real Estate Equities ‡ | | | 404 | | | | 44,533 | |
| American Tower ‡ | | | 1,226 | | | | 256,234 | |
| AvalonBay Communities ‡ | | | 370 | | | | 87,079 | |
| BXP ‡ | | | 369 | | | | 30,254 | |
| CBRE Group, Cl A * | | | 810 | | | | 113,392 | |
| CoStar Group * | | | 1,058 | | | | 86,058 | |
The accompanying notes are an integral part of the financial statements.
50
| Schedule of Investments | November 30, 2024 |
| Global X Adaptive U.S. Risk Management ETF |
| | | Shares | | | Value | |
| COMMON STOCK — continued | | | | | | | | |
| Real Estate — continued | | | | | | | | |
| Crown Castle ‡ | | | 1,132 | | | $ | 120,275 | |
| Digital Realty Trust ‡ | | | 852 | | | | 166,728 | |
| Equinix ‡ | | | 244 | | | | 239,481 | |
| Equity Residential ‡ | | | 892 | | | | 68,381 | |
| Essex Property Trust ‡ | | | 167 | | | | 51,847 | |
| Extra Space Storage ‡ | | | 549 | | | | 93,857 | |
| Healthpeak Properties ‡ | | | 1,827 | | | | 40,176 | |
| Invitation Homes ‡ | | | 1,488 | | | | 50,964 | |
| Iron Mountain ‡ | | | 756 | | | | 93,494 | |
| Mid-America Apartment Communities ‡ | | | 303 | | | | 49,740 | |
| ProLogis ‡ | | | 2,427 | | | | 283,425 | |
| Public Storage ‡ | | | 415 | | | | 144,441 | |
| Realty Income ‡ | | | 2,284 | | | | 132,221 | |
| SBA Communications, Cl A ‡ | | | 278 | | | | 62,897 | |
| Simon Property Group ‡ | | | 851 | | | | 156,244 | |
| Sun Communities ‡ | | | 319 | | | | 40,299 | |
| Ventas ‡ | | | 1,045 | | | | 66,953 | |
| VICI Properties, Cl A ‡ | | | 2,701 | | | | 88,080 | |
| Welltower ‡ | | | 1,571 | | | | 217,081 | |
| Weyerhaeuser ‡ | | | 1,904 | | | | 61,423 | |
| | | | | | | | 2,845,557 | |
| Utilities — 2.3% | | | | | | | | |
| Alliant Energy | | | 648 | | | | 40,954 | |
| Ameren | | | 680 | | | | 64,185 | |
| American Electric Power | | | 1,378 | | | | 137,607 | |
| American Water Works | | | 509 | | | | 69,703 | |
| Atmos Energy | | | 390 | | | | 59,015 | |
| Avangrid | | | 168 | | | | 6,065 | |
| CenterPoint Energy | | | 1,637 | | | | 53,399 | |
| CMS Energy | | | 773 | | | | 53,886 | |
| Consolidated Edison | | | 904 | | | | 90,933 | |
| Constellation Energy | | | 822 | | | | 210,892 | |
| Dominion Energy | | | 2,190 | | | | 128,663 | |
| DTE Energy | | | 536 | | | | 67,418 | |
| Duke Energy | | | 2,026 | | | | 237,143 | |
| Edison International | | | 1,000 | | | | 87,750 | |
| Entergy | | | 551 | | | | 86,050 | |
| Evergy | | | 583 | | | | 37,679 | |
The accompanying notes are an integral part of the financial statements.
51
| Schedule of Investments | November 30, 2024 |
| Global X Adaptive U.S. Risk Management ETF |
| | | Shares | | | Value | |
| COMMON STOCK — continued | | | | | | | | |
| Utilities — continued | | | | | | | | |
| Eversource Energy | | | 909 | | | $ | 58,621 | |
| Exelon | | | 2,599 | | | | 102,816 | |
| FirstEnergy | | | 1,416 | | | | 60,251 | |
| NextEra Energy | | | 5,325 | | | | 418,918 | |
| PG&E | | | 5,575 | | | | 120,587 | |
| PPL | | | 1,921 | | | | 67,101 | |
| Public Service Enterprise Group | | | 1,308 | | | | 123,344 | |
| Sempra | | | 1,652 | | | | 154,743 | |
| Southern | | | 2,860 | | | | 254,912 | |
| Vistra | | | 945 | | | | 151,049 | |
| WEC Energy Group | | | 824 | | | | 83,265 | |
| Xcel Energy | | | 1,438 | | | | 104,341 | |
| | | | | | | | 3,131,290 | |
| TOTAL UNITED STATES | | | | | | | 134,768,253 | |
TOTAL COMMON STOCK
(Cost $124,926,767) | | | | | | | 135,968,354 | |
| | | | | | | | | |
| EXCHANGE TRADED FUND — 0.1% | | | | | | | | |
| Vanguard S&P 500 ETF | | | 202 | | | | 111,797 | |
TOTAL EXCHANGE TRADED FUND
(Cost $103,279) | | | | | | | 111,797 | |
TOTAL INVESTMENTS — 99.9%
(Cost $125,030,046) | | | | | | $ | 136,080,151 | |
Percentages are based on Net Assets of $136,248,906.
| * | Non-income producing security. |
| ‡ | Real Estate Investment Trust |
As of November 30, 2024, all of the Fund’s investments were considered Level 1, in accordance with authoritative guidance on fair value measurements and disclosure under U.S. GAAP.
See “Glossary” for abbreviations.
The accompanying notes are an integral part of the financial statements.
52
| Schedule of Investments | November 30, 2024 |
| Global X U.S. 1-3 Month T-Bill ETF |
| | | Face Amount | | | Value | |
| U.S. TREASURY OBLIGATIONS — 104.4% | | | | | | | | |
U.S. Cash Management Bill 4.490%, 01/16/25(A) | | $ | 55,820,000 | | | $ | 55,506,972 | |
| U.S. Treasury Bills | | | | | | | | |
| 15.458%, 12/05/24(A) | | | 9,060,000 | | | | 9,056,644 | |
| 9.290%, 12/24/24(A) | | | 14,850,000 | | | | 14,808,697 | |
| 7.427%, 12/26/24(A) | | | 55,030,000 | | | | 54,863,259 | |
| 6.507%, 12/19/24(A) | | | 35,560,000 | | | | 35,483,579 | |
| 4.653%, 12/03/24(A) | | | 46,300,000 | | | | 46,294,238 | |
| 4.620%, 12/17/24(A) | | | 34,410,000 | | | | 34,344,894 | |
| 4.596%, 12/10/24(A) | | | 40,870,000 | | | | 40,828,903 | |
| 4.567%, 12/31/24(A) | | | 25,870,000 | | | | 25,775,283 | |
| 4.542%, 01/02/25(A) | | | 66,307,000 | | | | 66,050,346 | |
| 4.513%, 01/09/25(A) | | | 75,440,000 | | | | 75,082,324 | |
| 4.512%, 01/07/25(A) | | | 33,650,000 | | | | 33,499,627 | |
| 4.506%, 01/21/25(A) | | | 36,540,000 | | | | 36,313,782 | |
| 4.505%, 02/04/25(A) | | | 25,000,000 | | | | 24,802,489 | |
| 4.493%, 01/23/25(A) | | | 50,970,000 | | | | 50,643,955 | |
| 4.480%, 01/14/25(A) | | | 25,194,000 | | | | 25,059,523 | |
| 4.445%, 03/11/25(A) | | | 5,000,000 | | | | 4,939,696 | |
| 4.431%, 02/25/25(A) | | | 200,000 | | | | 197,930 | |
| 3.283%, 02/27/25(A) | | | 38,100,000 | | | | 37,696,481 | |
| 2.969%, 01/30/25(A) | | | 45,820,000 | | | | 45,485,738 | |
| 2.738%, 02/20/25(A) | | | 51,600,000 | | | | 51,096,355 | |
| 2.537%, 02/06/25(A) | | | 46,240,000 | | | | 45,866,997 | |
| 2.216%, 03/04/25(A) | | | 10,000,000 | | | | 9,887,852 | |
| 0.915%, 02/13/25(A) | | | 56,700,000 | | | | 56,193,535 | |
| 0.762%, 01/28/25(A) | | | 48,190,000 | | | | 47,848,744 | |
| 0.000%, 12/12/24(B) | | | 12,960,000 | | | | 12,943,649 | |
| | | | | | | | 885,064,520 | |
TOTAL U.S. TREASURY OBLIGATIONS
(Cost $940,456,027) | | | | | | | 940,571,492 | |
TOTAL INVESTMENTS — 104.4%
(Cost $940,456,027) | | | | | | $ | 940,571,492 | |
Percentages are based on Net Assets of $900,907,897.
| (A) | Interest rate represents the security’s effective yield at the time of purchase. |
| (B) | There is currently no stated interest rate. |
The accompanying notes are an integral part of the financial statements.
53
| Schedule of Investments | November 30, 2024 |
| Global X U.S. 1-3 Month T-Bill ETF |
As of November 30, 2024,, all of the Fund’s investments were considered Level 2, in accordance with authoritative guidance on fair value measurements and disclosure under U.S. GAAP.
See “Glossary” for abbreviations.
The accompanying notes are an integral part of the financial statements.
54
| Schedule of Investments | | November 30, 2024 |
| Global X U.S. Cash Flow Kings 100 ETF |
| | | Shares | | | Value | |
| COMMON STOCK — 99.8% | | | | | | | | |
| SINGAPORE — 0.7% | | | | | | | | |
| Industrials — 0.7% | | | | | | | | |
| Grab Holdings, Cl A * | | | 6,115 | | | $ | 30,575 | |
| | | | | | | | | |
| UNITED STATES — 99.1% | | | | | | | | |
| Communication Services — 6.8% | | | | | | | | |
| AT&T | | | 3,797 | | | | 87,938 | |
| Fox, Cl A | | | 1,304 | | | | 61,444 | |
| Match Group * | | | 890 | | | | 29,139 | |
| Warner Bros Discovery * | | | 9,964 | | | | 104,423 | |
| ZoomInfo Technologies, Cl A * | | | 1,400 | | | | 15,316 | |
| | | | | | | | 298,260 | |
| Consumer Discretionary — 19.7% | | | | | | | | |
| ADT | | | 4,917 | | | | 37,468 | |
| Airbnb, Cl A * | | | 626 | | | | 85,205 | |
| BorgWarner | | | 735 | | | | 25,225 | |
| Carter’s | | | 185 | | | | 10,096 | |
| Columbia Sportswear | | | 288 | | | | 25,125 | |
| Crocs * | | | 219 | | | | 23,126 | |
| Dillard’s, Cl A | | | 50 | | | | 22,156 | |
| Etsy * | | | 449 | | | | 24,632 | |
| Expedia Group * | | | 486 | | | | 89,725 | |
| Gap | | | 2,036 | | | | 49,373 | |
| H&R Block | | | 357 | | | | 21,163 | |
| Harley-Davidson | | | 648 | | | | 21,792 | |
| International Game Technology | | | 1,232 | | | | 23,691 | |
| Lear | | | 211 | | | | 20,644 | |
| Lennar, Cl A | | | 451 | | | | 78,650 | |
| Levi Strauss, Cl A | | | 1,075 | | | | 18,770 | |
| Mattel * | | | 1,505 | | | | 28,625 | |
| PVH | | | 287 | | | | 31,102 | |
| Ralph Lauren, Cl A | | | 174 | | | | 40,264 | |
| Skechers USA, Cl A * | | | 448 | | | | 28,591 | |
| Steven Madden | | | 162 | | | | 7,384 | |
| Tapestry | | | 944 | | | | 58,792 | |
| Thor Industries | | | 187 | | | | 20,869 | |
| Under Armour, Cl A * | | | 1,533 | | | | 14,886 | |
The accompanying notes are an integral part of the financial statements.
55
| Schedule of Investments | | November 30, 2024 |
| Global X U.S. Cash Flow Kings 100 ETF |
| | | Shares | | | Value | |
| COMMON STOCK — continued | | | | | | | | |
| Consumer Discretionary — continued | | | | | | | | |
| Williams-Sonoma | | | 297 | | | $ | 51,090 | |
| | | | | | | | 858,444 | |
| Consumer Staples — 9.6% | | | | | | | | |
| Altria Group | | | 1,629 | | | | 94,059 | |
| Archer-Daniels-Midland | | | 1,338 | | | | 73,055 | |
| Bunge Global | | | 453 | | | | 40,652 | |
| Conagra Brands | | | 1,767 | | | | 48,681 | |
| Ingredion | | | 264 | | | | 38,898 | |
| Maplebear * | | | 517 | | | | 22,577 | |
| Molson Coors Beverage, Cl B | | | 869 | | | | 53,930 | |
| Pilgrim’s Pride * | | | 930 | | | | 47,997 | |
| | | | | | | | 419,849 | |
| Energy — 18.9% | | | | | | | | |
| Chevron | | | 561 | | | | 90,843 | |
| Chord Energy | | | 157 | | | | 20,021 | |
| ConocoPhillips | | | 1,213 | | | | 131,416 | |
| Devon Energy | | | 2,010 | | | | 76,279 | |
| Diamondback Energy | | | 454 | | | | 80,626 | |
| EOG Resources | | | 651 | | | | 86,752 | |
| Halliburton | | | 2,243 | | | | 71,462 | |
| HF Sinclair | | | 1,085 | | | | 44,409 | |
| Marathon Petroleum | | | 499 | | | | 77,919 | |
| Murphy Oil | | | 738 | | | | 23,963 | |
| Ovintiv | | | 842 | | | | 38,244 | |
| Valero Energy | | | 611 | | | | 84,978 | |
| | | | | | | | 826,912 | |
| Health Care — 8.0% | | | | | | | | |
| Bristol-Myers Squibb | | | 1,662 | | | | 98,424 | |
| Cardinal Health | | | 731 | | | | 89,358 | |
| Cencora | | | 360 | | | | 90,558 | |
| Envista Holdings * | | | 528 | | | | 11,769 | |
| Tenet Healthcare * | | | 402 | | | | 57,357 | |
| | | | | | | | 347,466 | |
| Industrials — 9.5% | | | | | | | | |
| Acuity Brands | | | 63 | | | | 20,203 | |
The accompanying notes are an integral part of the financial statements.
56
| Schedule of Investments | | November 30, 2024 |
| Global X U.S. Cash Flow Kings 100 ETF |
| | | Shares | | | Value | |
| COMMON STOCK — continued | | | | | | | | |
| Industrials — continued | | | | | | | | |
| AGCO | | | 318 | | | $ | 32,185 | |
| Allison Transmission Holdings | | | 262 | | | | 31,047 | |
| Core & Main, Cl A * | | | 608 | | | | 29,518 | |
| Lyft, Cl A * | | | 1,035 | | | | 17,968 | |
| ManpowerGroup | | | 138 | | | | 8,883 | |
| MasTec * | | | 285 | | | | 41,057 | |
| Middleby * | | | 175 | | | | 25,093 | |
| MSC Industrial Direct, Cl A | | | 140 | | | | 12,023 | |
| Mueller Industries | | | 312 | | | | 25,200 | |
| Owens Corning | | | 272 | | | | 55,929 | |
| Snap-On | | | 141 | | | | 52,126 | |
| UFP Industries | | | 181 | | | | 24,598 | |
| WESCO International | | | 180 | | | | 38,083 | |
| | | | | | | | 413,913 | |
| Information Technology — 19.3% | | | | | | | | |
| Amdocs | | | 274 | | | | 23,761 | |
| Amkor Technology | | | 565 | | | | 14,939 | |
| Arrow Electronics * | | | 329 | | | | 39,533 | |
| Cirrus Logic * | | | 146 | | | | 15,250 | |
| DocuSign, Cl A * | | | 556 | | | | 44,308 | |
| Dropbox, Cl A * | | | 1,175 | | | | 32,500 | |
| DXC Technology * | | | 1,893 | | | | 42,592 | |
| Gen Digital | | | 2,748 | | | | 84,776 | |
| Hewlett Packard Enterprise | | | 4,366 | | | | 92,646 | |
| HP | | | 2,363 | | | | 83,721 | |
| IPG Photonics * | | | 98 | | | | 7,648 | |
| Jabil | | | 319 | | | | 43,330 | |
| Qorvo * | | | 255 | | | | 17,608 | |
| QUALCOMM | | | 486 | | | | 77,046 | |
| RingCentral, Cl A * | | | 401 | | | | 15,090 | |
| Skyworks Solutions | | | 553 | | | | 48,437 | |
| TD SYNNEX | | | 271 | | | | 32,246 | |
| Teradata * | | | 318 | | | | 9,826 | |
| Twilio, Cl A * | | | 433 | | | | 45,266 | |
| Zoom Video Communications, Cl A * | | | 893 | | | | 73,842 | |
| | | | | | | | 844,365 | |
The accompanying notes are an integral part of the financial statements.
57
| Schedule of Investments | | November 30, 2024 |
| Global X U.S. Cash Flow Kings 100 ETF |
| | | Shares | | | Value | |
| COMMON STOCK — continued | | | | | | | | |
| Materials — 5.3% | | | | | | | | |
| Cleveland-Cliffs * | | | 4,111 | | | $ | 51,182 | |
| Louisiana-Pacific | | | 157 | | | | 18,557 | |
| NewMarket | | | 31 | | | | 16,540 | |
| Nucor | | | 561 | | | | 86,781 | |
| Scotts Miracle-Gro, Cl A | | | 474 | | | | 36,541 | |
| Sealed Air | | | 609 | | | | 22,290 | |
| | | | | | | | 231,891 | |
| Real Estate — 2.0% | | | | | | | | |
| Apple Hospitality REIT ‡ | | | 750 | | | | 12,082 | |
| Kilroy Realty ‡ | | | 505 | | | | 20,973 | |
| WP Carey ‡ | | | 948 | | | | 54,093 | |
| | | | | | | | 87,148 | |
| TOTAL UNITED STATES | | | | | | | 4,328,248 | |
TOTAL COMMON STOCK
(Cost $4,094,144) | | | | | | | 4,358,823 | |
TOTAL INVESTMENTS — 99.8%
(Cost $4,094,144) | | | | | | $ | 4,358,823 | |
Percentages are based on Net Assets of $4,367,076.
| * | Non-income producing security. |
| ‡ | Real Estate Investment Trust |
As of November 30, 2024, all of the Fund’s investments were considered Level 1, in accordance with authoritative guidance on fair value measurements and disclosure under U.S. GAAP.
See “Glossary” for abbreviations.
The accompanying notes are an integral part of the financial statements.
58
| Schedule of Investments | | November 30, 2024 |
| Global X Short-Term Treasury Ladder ETF |
| | | Face Amount | | | Value | |
| U.S. TREASURY OBLIGATIONS — 99.1% | | | | | | | | |
| U.S. Treasury Notes | | | | | | | | |
| 5.000%, 10/31/25 | | $ | 120,000 | | | $ | 120,630 | |
| 4.875%, 04/30/26 | | | 69,000 | | | | 69,553 | |
| 4.875%, 05/31/26 | | | 75,000 | | | | 75,645 | |
| 4.750%, 07/31/25 | | | 90,000 | | | | 90,166 | |
| 4.625%, 06/30/26 | | | 125,000 | | | | 125,703 | |
| 4.625%, 10/15/26 | | | 60,000 | | | | 60,443 | |
| 4.500%, 03/31/26 | | | 120,000 | | | | 120,309 | |
| 4.375%, 07/31/26 | | | 75,000 | | | | 75,158 | |
| 4.250%, 12/31/25 | | | 245,000 | | | | 244,722 | |
| 4.125%, 10/31/26 | | | 5,000 | | | | 4,993 | |
| 4.125%, 02/15/27 | | | 150,000 | | | | 149,836 | |
| 4.000%, 01/15/27 | | | 72,000 | | | | 71,744 | |
| 3.875%, 03/31/25 | | | 100,000 | | | | 99,804 | |
| 3.875%, 04/30/25 | | | 120,000 | | | | 119,727 | |
| 3.750%, 08/31/26 | | | 60,000 | | | | 59,515 | |
| 3.500%, 09/15/25 | | | 125,000 | | | | 124,147 | |
| 3.125%, 08/15/25 | | | 100,000 | | | | 99,100 | |
| 2.875%, 04/30/25 | | | 100,000 | | | | 99,366 | |
| 2.875%, 06/15/25 | | | 100,000 | | | | 99,214 | |
| 2.750%, 08/31/25 | | | 100,000 | | | | 98,760 | |
| 2.500%, 02/28/26 | | | 75,000 | | | | 73,389 | |
| 2.375%, 04/30/26 | | | 125,000 | | | | 121,787 | |
| 2.000%, 08/15/25 | | | 90,000 | | | | 88,488 | |
| 1.875%, 07/31/26 | | | 125,000 | | | | 120,317 | |
| 1.625%, 10/31/26 | | | 125,000 | | | | 119,180 | |
| 1.625%, 11/30/26 | | | 72,000 | | | | 68,512 | |
| 1.500%, 08/15/26 | | | 66,000 | | | | 63,071 | |
| 1.250%, 11/30/26 | | | 125,000 | | | | 118,027 | |
| 1.125%, 10/31/26 | | | 84,000 | | | | 79,285 | |
| 0.750%, 03/31/26 | | | 75,000 | | | | 71,596 | |
| 0.750%, 05/31/26 | | | 150,000 | | | | 142,412 | |
| 0.750%, 08/31/26 | | | 125,000 | | | | 117,754 | |
| 0.500%, 02/28/26 | | | 150,000 | | | | 143,145 | |
| 0.375%, 11/30/25 | | | 240,000 | | | | 230,724 | |
| 0.375%, 01/31/26 | | | 100,000 | | | | 95,531 | |
| 0.250%, 05/31/25 | | | 100,000 | | | | 97,970 | |
| 0.250%, 09/30/25 | | | 90,000 | | | | 86,986 | |
| 0.250%, 10/31/25 | | | 125,000 | | | | 120,411 | |
The accompanying notes are an integral part of the financial statements.
59
| Schedule of Investments | | November 30, 2024 |
| Global X Short-Term Treasury Ladder ETF |
| | | Face Amount | | | Value | |
| U.S. TREASURY OBLIGATIONS — continued | | | | | | | | |
| | | | | | | $ | 3,967,120 | |
TOTAL U.S. TREASURY OBLIGATIONS
(Cost $3,984,417) | | | | | | | 3,967,120 | |
TOTAL INVESTMENTS — 99.1%
(Cost $3,984,417) | | | | | | $ | 3,967,120 | |
Percentages are based on Net Assets of $4,001,624.
As of November 30, 2024, all of the Fund’s investments were considered Level 2, in accordance with authoritative guidance on fair value measurements and disclosure under U.S. GAAP.
Amounts designated as “—” are $0 or have been rounded to $0.
See “Glossary” for abbreviations.
The accompanying notes are an integral part of the financial statements.
60
| Schedule of Investments | | November 30, 2024 |
| Global X Intermediate-Term Treasury Ladder ETF |
| | | Face Amount | | | Value | |
| U.S. TREASURY OBLIGATIONS — 99.1% | | | | | | | | |
| U.S. Treasury Notes | | | | | | | | |
| 4.500%, 11/15/33 | | $ | 100,000 | | | $ | 102,293 | |
| 4.375%, 11/30/30 | | | 125,000 | | | | 126,636 | |
| 4.375%, 05/15/34 | | | 25,000 | | | | 25,340 | |
| 4.250%, 02/28/31 | | | 100,000 | | | | 100,645 | |
| 4.000%, 02/28/30 | | | 125,000 | | | | 124,360 | |
| 4.000%, 02/15/34 | | | 125,000 | | | | 123,115 | |
| 3.875%, 09/30/29 | | | 125,000 | | | | 123,745 | |
| 3.875%, 08/15/33 | | | 100,000 | | | | 97,738 | |
| 3.750%, 06/30/30 | | | 125,000 | | | | 122,749 | |
| 3.500%, 02/15/33 | | | 150,000 | | | | 143,039 | |
| 3.375%, 05/15/33 | | | 7,000 | | | | 6,602 | |
| 3.250%, 06/30/29 | | | 100,000 | | | | 96,449 | |
| 3.125%, 11/15/28 | | | 100,000 | | | | 96,438 | |
| 2.875%, 05/15/32 | | | 100,000 | | | | 91,848 | |
| 2.750%, 02/15/28 | | | 125,000 | | | | 119,907 | |
| 2.750%, 08/15/32 | | | 100,000 | | | | 90,766 | |
| 2.375%, 05/15/27 | | | 100,000 | | | | 95,898 | |
| 2.375%, 03/31/29 | | | 125,000 | | | | 116,445 | |
| 1.750%, 01/31/29 | | | 100,000 | | | | 91,035 | |
| 1.625%, 05/15/31 | | | 100,000 | | | | 85,926 | |
| 1.375%, 11/15/31 | | | 100,000 | | | | 83,399 | |
| 1.250%, 03/31/28 | | | 100,000 | | | | 91,113 | |
| 1.250%, 06/30/28 | | | 75,000 | | | | 67,887 | |
| 1.250%, 08/15/31 | | | 95,000 | | | | 79,073 | |
| 0.625%, 03/31/27 | | | 55,000 | | | | 50,748 | |
| 0.500%, 10/31/27 | | | 75,000 | | | | 67,614 | |
| | | | | | | | 2,420,808 | |
TOTAL U.S. TREASURY OBLIGATIONS
(Cost $2,489,620) | | | | | | | 2,420,808 | |
TOTAL INVESTMENTS — 99.1%
(Cost $2,489,620) | | | | | | $ | 2,420,808 | |
Percentages are based on Net Assets of $2,442,337.
The accompanying notes are an integral part of the financial statements.
61
| Schedule of Investments | | November 30, 2024 |
| Global X Intermediate-Term Treasury Ladder ETF |
As of November 30, 2024, all of the Fund’s investments were considered Level 2, in accordance with authoritative guidance on fair value measurements and disclosure under U.S. GAAP.
Amounts designated as “—” are $0 or have been rounded to $0.
See “Glossary” for abbreviations.
The accompanying notes are an integral part of the financial statements.
62
| Schedule of Investments | | November 30, 2024 |
| Global X Long-Term Treasury Ladder ETF |
| | | Face Amount | | | Value | |
| U.S. TREASURY OBLIGATIONS — 99.0% | | | | | | | | |
| U.S. Treasury Bond | | | | | | | | |
| 5.000%, 05/15/37 | | $ | 506,000 | | | $ | 544,839 | |
| 4.750%, 02/15/37 | | | 130,000 | | | | 136,850 | |
| 4.750%, 11/15/43 | | | 20,000 | | | | 20,746 | |
| 4.750%, 11/15/53 | | | 255,000 | | | | 269,842 | |
| 4.625%, 02/15/40 | | | 287,000 | | | | 296,159 | |
| 4.625%, 05/15/44 | | | 170,000 | | | | 173,161 | |
| 4.500%, 02/15/36 | | | 900,000 | | | | 931,113 | |
| 4.500%, 05/15/38 | | | 627,000 | | | | 642,724 | |
| 4.500%, 08/15/39 | | | 365,000 | | | | 371,958 | |
| 4.500%, 02/15/44 | | | 214,000 | | | | 214,568 | |
| 4.375%, 02/15/38 | | | 552,000 | | | | 559,418 | |
| 4.375%, 11/15/39 | | | 193,000 | | | | 193,882 | |
| 4.375%, 05/15/40 | | | 40,000 | | | | 40,169 | |
| 4.375%, 08/15/43 | | | 140,000 | | | | 138,491 | |
| 4.250%, 05/15/39 | | | 250,000 | | | | 248,369 | |
| 4.250%, 02/15/54 | | | 315,000 | | | | 307,666 | |
| 4.125%, 08/15/44 | | | 50,000 | | | | 47,594 | |
| 4.125%, 08/15/53 | | | 292,000 | | | | 278,575 | |
| 4.000%, 11/15/52 | | | 241,000 | | | | 224,704 | |
| 3.875%, 08/15/40 | | | 100,000 | | | | 94,617 | |
| 3.875%, 02/15/43 | | | 200,000 | | | | 185,445 | |
| 3.875%, 05/15/43 | | | 154,000 | | | | 142,534 | |
| 3.750%, 08/15/41 | | | 30,000 | | | | 27,737 | |
| 3.750%, 11/15/43 | | | 154,000 | | | | 139,352 | |
| 3.625%, 08/15/43 | | | 140,000 | | | | 124,693 | |
| 3.625%, 02/15/44 | | | 132,000 | | | | 117,000 | |
| 3.625%, 02/15/53 | | | 315,000 | | | | 274,518 | |
| 3.625%, 05/15/53 | | | 295,000 | | | | 257,341 | |
| 3.500%, 02/15/39 | | | 520,000 | | | | 477,019 | |
| 3.375%, 08/15/42 | | | 67,000 | | | | 58,149 | |
| 3.375%, 05/15/44 | | | 300,000 | | | | 255,773 | |
| 3.375%, 11/15/48 | | | 400,000 | | | | 332,109 | |
| 3.250%, 05/15/42 | | | 150,000 | | | | 128,256 | |
| 3.125%, 11/15/41 | | | 30,000 | | | | 25,416 | |
| 3.125%, 02/15/42 | | | 181,000 | | | | 152,662 | |
| 3.125%, 02/15/43 | | | 30,000 | | | | 24,928 | |
| 3.125%, 08/15/44 | | | 355,000 | | | | 290,296 | |
| 3.125%, 05/15/48 | | | 320,000 | | | | 254,663 | |
| 3.000%, 05/15/42 | | | 250,000 | | | | 205,977 | |
| 3.000%, 11/15/44 | | | 220,000 | | | | 175,837 | |
| 3.000%, 05/15/45 | | | 304,000 | | | | 242,262 | |
The accompanying notes are an integral part of the financial statements.
63
| Schedule of Investments | | November 30, 2024 |
| Global X Long-Term Treasury Ladder ETF |
| | | Face Amount | | | Value | |
| U.S. TREASURY OBLIGATIONS — continued | | | | | | | | |
| 3.000%, 11/15/45 | | $ | 170,000 | | | $ | 134,964 | |
| 3.000%, 02/15/47 | | | 430,000 | | | | 337,231 | |
| 3.000%, 05/15/47 | | | 320,000 | | | | 250,537 | |
| 3.000%, 02/15/48 | | | 394,000 | | | | 306,951 | |
| 3.000%, 08/15/48 | | | 330,000 | | | | 256,420 | |
| 3.000%, 02/15/49 | | | 341,000 | | | | 264,368 | |
| 3.000%, 08/15/52 | | | 360,000 | | | | 277,608 | |
| 2.875%, 05/15/43 | | | 280,000 | | | | 223,191 | |
| 2.875%, 08/15/45 | | | 374,000 | | | | 291,252 | |
| 2.875%, 11/15/46 | | | 205,000 | | | | 157,682 | |
| 2.875%, 05/15/49 | | | 540,000 | | | | 408,122 | |
| 2.875%, 05/15/52 | | | 445,000 | | | | 334,150 | |
| 2.750%, 08/15/42 | | | 330,000 | | | | 260,661 | |
| 2.750%, 11/15/42 | | | 300,000 | | | | 235,980 | |
| 2.750%, 08/15/47 | | | 366,000 | | | | 273,199 | |
| 2.750%, 11/15/47 | | | 378,000 | | | | 281,625 | |
| 2.500%, 02/15/45 | | | 240,000 | | | | 175,697 | |
| 2.500%, 02/15/46 | | | 618,000 | | | | 447,060 | |
| 2.500%, 05/15/46 | | | 453,000 | | | | 326,620 | |
| 2.375%, 02/15/42 | | | 190,000 | | | | 142,389 | |
| 2.375%, 11/15/49 | | | 400,000 | | | | 272,047 | |
| 2.375%, 05/15/51 | | | 479,000 | | | | 323,568 | |
| 2.250%, 05/15/41 | | | 225,000 | | | | 168,108 | |
| 2.250%, 08/15/46 | | | 426,000 | | | | 291,644 | |
| 2.250%, 08/15/49 | | | 345,000 | | | | 228,576 | |
| 2.250%, 02/15/52 | | | 405,000 | | | | 264,595 | |
| 2.000%, 11/15/41 | | | 430,000 | | | | 304,376 | |
| 2.000%, 02/15/50 | | | 350,000 | | | | 217,930 | |
| 2.000%, 08/15/51 | | | 485,000 | | | | 299,071 | |
| 1.875%, 02/15/41 | | | 412,000 | | | | 290,830 | |
| 1.875%, 02/15/51 | | | 600,000 | | | | 359,977 | |
| 1.875%, 11/15/51 | | | 375,000 | | | | 223,389 | |
| 1.750%, 08/15/41 | | | 460,000 | | | | 314,112 | |
| 1.625%, 11/15/50 | | | 559,000 | | | | 314,459 | |
| 1.375%, 11/15/40 | | | 400,000 | | | | 261,172 | |
| 1.375%, 08/15/50 | | | 543,000 | | | | 285,881 | |
| 1.250%, 05/15/50 | | | 300,000 | | | | 153,363 | |
| 1.125%, 05/15/40 | | | 330,000 | | | | 209,602 | |
| 1.125%, 08/15/40 | | | 341,000 | | | | 214,683 | |
| | | | | | | | 20,010,502 | |
U.S. Treasury Notes
4.375%, 05/15/34 | | | 699,000 | | | | 708,502 | |
The accompanying notes are an integral part of the financial statements.
64
| Schedule of Investments | | November 30, 2024 |
| Global X Long-Term Treasury Ladder ETF |
| | | Face Amount | | | Value | |
| U.S. TREASURY OBLIGATIONS — continued | | | | | | | | |
| 4.250%, 11/15/34 | | $ | 15,000 | | | $ | 15,068 | |
| 3.875%, 08/15/34 | | | 480,000 | | | | 467,700 | |
| | | | | | | | 1,191,270 | |
TOTAL U.S. TREASURY OBLIGATIONS
(Cost $21,448,762) | | | | | | | 21,201,772 | |
TOTAL INVESTMENTS — 99.0%
(Cost $21,448,762) | | | | | | $ | 21,201,772 | |
Percentages are based on Net Assets of $21,424,166.
As of November 30, 2024, all of the Fund’s investments were considered Level 2, in accordance with authoritative guidance on fair value measurements and disclosure under U.S. GAAP.
Amounts designated as “—” are $0 or have been rounded to $0.
See “Glossary” for abbreviations.
The accompanying notes are an integral part of the financial statements.
65
| Schedule of Investments | November 30, 2024 |
| Glossary (abbreviations which may be used in preceding Schedule of Investments): |
Fund Abbreviations
Cl — Class
CME — Chicago Mercantile Exchange
ETF — Exchange-Traded Fund
H15T5Y — U.S. Treasury Yield Curve Rate T Note Constant Maturity 5 Year
REIT — Real Estate Investment Trust
TSFR3M — Term Secured Overnight Financing Rate 3-Month
Ser — Series
US0003M — ICE LIBOR USD 3 Month
USD — U.S. Dollar
66
Statements of Assets and Liabilities
November 30, 2024
| | | Global X MLP
ETF | | | Global X MLP
& Energy
Infrastructure
ETF | | | Global X
Alternative
Income ETF | | | Global X
Conscious
Companies ETF | |
| Assets: | | | | | | | | | | | | | | | | |
| Cost of Investments | | $ | 906,649,633 | | | $ | 1,614,717,292 | | | $ | 5,790,099 | | | $ | 510,861,561 | |
| Cost of Affiliated Investments | | | — | | | | — | | | | 32,172,986 | | | | — | |
| Cost of Repurchase Agreement | | | — | | | | 5,946,856 | | | | 1,042,008 | | | | — | |
| Investments, at Value | | $ | 1,894,577,022 | | | $ | 2,369,406,579 | * | | $ | 8,106,226 | * | | $ | 652,614,802 | |
| Affiliated Investments, at Value | | | — | | | | — | | | | 26,731,787 | | | | — | |
| Repurchase Agreement, at Value | | | — | | | | 5,946,856 | | | | 1,042,008 | | | | — | |
| Cash | | | 697,071 | | | | 69,014 | | | | 41,141 | | | | 708,946 | |
| Prepaid Expenses | | | 91,841 | | | | — | | | | — | | | | — | |
| Receivable for Capital Shares Sold | | | — | | | | 129,696,397 | | | | — | | | | — | |
| Receivable for Investment Securities Sold | | | — | | | | 213,217,966 | | | | — | | | | — | |
| Dividend, Interest, and Securities Lending Income Receivable | | | — | | | | 2,357,092 | | | | 12,235 | | | | 649,195 | |
| Reclaim Receivable | | | — | | | | 294,247 | | | | — | | | | — | |
| Total Assets | | | 1,895,365,934 | | | | 2,720,988,151 | | | | 35,933,397 | | | | 653,972,943 | |
| Liabilities: | | | | | | | | | | | | | | | | |
| Deferred Tax Liability | | | 134,330,052 | | | | — | | | | — | | | | — | |
| Obligation to Return Securities Lending Collateral | | | — | | | | 9,422,993 | | | | 1,651,096 | | | | — | |
| Current Tax Liability | | | 6,212,600 | | | | — | | | | — | | | | — | |
| Payable due to Investment Adviser | | | 613,692 | | | | 815,835 | | | | 4,058 | | | | 230,278 | |
| Payable for Investment Securities Purchased | | | — | | | | 211,335,981 | | | | — | | | | — | |
| Payable for Capital Shares Redeemed | | | — | | | | 131,727,117 | | | | — | | | | — | |
| Custodian Fees Payable | | | 4,146 | | | | 18 | | | | 5 | | | | — | |
| Franchise Tax Payable | | | 10,703 | | | | — | | | | — | | | | — | |
| Due to Broker | | | 95,315 | | | | 53,150 | | | | 6,525 | | | | — | |
| Total Liabilities | | | 141,266,508 | | | | 353,355,094 | | | | 1,661,684 | | | | 230,278 | |
| Net Assets | | $ | 1,754,099,426 | | | $ | 2,367,633,057 | | | $ | 34,271,713 | | | $ | 653,742,665 | |
| Net Assets Consist of: | | | | | | | | | | | | | | | | |
| Paid-in Capital | | $ | 1,449,658,573 | | | $ | 1,796,119,134 | | | $ | 39,529,515 | | | $ | 575,057,115 | |
| Total Distributable Earnings (Accumulated Losses) | | | 304,440,853 | | | | 571,513,923 | | | | (5,257,802 | ) | | | 78,685,550 | |
| Net Assets | | $ | 1,754,099,426 | | | $ | 2,367,633,057 | | | $ | 34,271,713 | | | $ | 653,742,665 | |
| Outstanding Shares of Beneficial Interest (unlimited authorization — no par value) | | | 33,448,637 | | | | 36,847,506 | | | | 2,820,000 | | | | 16,100,000 | |
| Net Asset Value, Offering and Redemption Price Per Share | | | $52.44 | | | | $64.25 | | | | $12.15 | | | | $40.61 | |
| * Includes market value of securities on loan. | | $ | — | | | $ | 9,387,108 | | | $ | 1,625,548 | | | $ | — | |
Amounts designated as “—” are either $0 or have been rounded to $0.
The accompanying notes are an integral part of the financial statements.
67
Statements of Assets and Liabilities
November 30, 2024
| | | Global X U.S.
Preferred ETF | | | Global X S&P
500® Quality
Dividend ETF | | | Global X
Adaptive U.S.
Factor ETF | | | Global X Variable
Rate Preferred
ETF | |
| Assets: | | | | | | | | | | | | | | | | |
| Cost of Investments | | $ | 2,555,089,242 | | | $ | 30,293,074 | | | $ | 328,838,845 | | | $ | 253,896,103 | |
| Cost of Repurchase Agreement | | | 18,445,725 | | | | — | | | | — | | | | — | |
| Investments, at Value | | $ | 2,463,467,726 | * | | $ | 32,203,661 | | | $ | 363,176,585 | | | $ | 265,183,556 | |
| Repurchase Agreement, at Value | | | 18,445,725 | | | | — | | | | — | | | | — | |
| Cash | | | 6,538,403 | | | | 30,510 | | | | 194,910 | | | | 292,848 | |
| Dividend, Interest, and Securities Lending Income Receivable | | | 15,003,229 | | | | 85,592 | | | | 584,403 | | | | 611,226 | |
| Reclaim Receivable | | | — | | | | 1,057 | | | | 2,593 | | | | — | |
| Total Assets | | | 2,503,455,083 | | | | 32,320,820 | | | | 363,958,491 | | | | 266,087,630 | |
| Liabilities: | | | | | | | | | | | | | | | | |
| Obligation to Return Securities Lending Collateral | | | 29,227,871 | | | | — | | | | — | | | | — | |
| Payable for Investment Securities Purchased | | | 6,232,472 | | | | — | | | | — | | | | — | |
| Payable due to Investment Adviser | | | 468,784 | | | | 5,184 | | | | 77,524 | | | | 53,279 | |
| Custodian Fees Payable | | | 637 | | | | — | | | | — | | | | 111 | |
| Due to Broker | | | — | | | | 6,749 | | | | — | | | | — | |
| Total Liabilities | | | 35,929,764 | | | | 11,933 | | | | 77,524 | | | | 53,390 | |
| Net Assets | | $ | 2,467,525,319 | | | $ | 32,308,887 | | | $ | 363,880,967 | | | $ | 266,034,240 | |
| Net Assets Consist of: | | | | | | | | | | | | | | | | |
| Paid-in Capital | | $ | 2,975,984,419 | | | $ | 38,442,269 | | | $ | 363,014,789 | | | $ | 288,374,468 | |
| Total Distributable Earnings (Accumulated Losses) | | | (508,459,100 | ) | | | (6,133,382 | ) | | | 866,178 | | | | (22,340,228 | ) |
| Net Assets | | $ | 2,467,525,319 | | | $ | 32,308,887 | | | $ | 363,880,967 | | | $ | 266,034,240 | |
| Outstanding Shares of Beneficial Interest (unlimited authorization — no par value) | | | 120,300,000 | | | | 870,002 | | | | 8,090,002 | | | | 10,940,000 | |
| Net Asset Value, Offering and Redemption Price Per Share | | | $20.51 | | | | $37.14 | | | | $44.98 | | | | $24.32 | |
| * Includes market value of securities on loan. | | $ | 28,494,415 | | | $ | — | | | $ | — | | | $ | — | |
Amounts designated as “ —” are either $0 or have been rounded to $0.
The accompanying notes are an integral part of the financial statements.
68
Statements of Assets and Liabilities
November 30, 2024
| | | Global X
Adaptive
U.S. Risk
Management
ETF | | | Global X 1-3
Month T-Bill
ETF ‡ | | | Global X U.S.
Cash Flow Kings
100 ETF | | | Global X Short-
Term Treasury
Ladder ETF | |
| Assets: | | | | | | | | | | | | | | | | |
| Cost of Investments | | $ | 125,030,046 | | | $ | 940,456,027 | | | $ | 4,094,144 | | | $ | 3,984,417 | |
| Investments, at Value | | $ | 136,080,151 | | | $ | 940,571,492 | | | $ | 4,358,823 | | | $ | 3,967,120 | |
| Cash | | | 64,615 | | | | 109,911 | | | | 3,081 | | | | 7,184 | |
| Dividend, Interest, and Securities Lending Income Receivable | | | 146,748 | | | | — | | | | 6,293 | | | | 27,713 | |
| Reclaim Receivable | | | 393 | | | | — | | | | 62 | | | | — | |
| Receivable for Investment Securities Sold | | | — | | | | 114,463,718 | | | | — | | | | — | |
| Total Assets | | | 136,291,907 | | | | 1,055,145,121 | | | | 4,368,259 | | | | 4,002,017 | |
| Liabilities: | | | | | | | | | | | | | | | | |
| Payable due to Investment Adviser | | | 43,001 | | | | 49,721 | | | | 875 | | | | 393 | |
| Payable for Investment Securities Purchased | | | — | | | | 154,187,503 | | | | — | | | | — | |
| Due to Broker | | | — | | | | — | | | | 308 | | | | — | |
| Total Liabilities | | | 43,001 | | | | 154,237,224 | | | | 1,183 | | | | 393 | |
| Net Assets | | $ | 136,248,906 | | | $ | 900,907,897 | | | $ | 4,367,076 | | | $ | 4,001,624 | |
| Net Assets Consist of: | | | | | | | | | | | | | | | | |
| Paid-in Capital | | $ | 130,391,916 | | | $ | 899,293,198 | | | $ | 4,228,609 | | | $ | 4,001,726 | |
| Total Distributable Earnings (Accumulated Losses) | | | 5,856,990 | | | | 1,614,699 | | | | 138,467 | | | | (102 | ) |
| Net Assets | | $ | 136,248,906 | | | $ | 900,907,897 | | | $ | 4,367,076 | | | $ | 4,001,624 | |
| Outstanding Shares of Beneficial Interest (unlimited authorization — no par value) | | | 3,770,000 | | | | 8,969,931 | | | | 130,000 | | | | 80,000 | |
| Net Asset Value, Offering and Redemption Price Per Share | | | $36.14 | | | | $100.44 | | | | $33.59 | | | | $50.02 | |
| | |
| ‡ | The Outstanding Shares of Beneficial Interest and Net Asset Value, Offering and Redemption Price Per Share were updated to reflect the effect of a 1 for 4 reverse share split on June 14, 2024. (See Note 9 in the Notes to in the Notes to Financial Statements). |
Amounts designated as “ —” are either $0 or have been rounded to $0.
The accompanying notes are an integral part of the financial statements.
69
Statements of Assets and Liabilities
November 30, 2024
| | | Global X
Intermediate-
Term Treasury
Ladder ETF | | | Global X Long-
Term Treasury
Ladder ETF | |
| Assets: | | | | | | | | |
| Cost of Investments | | $ | 2,489,620 | | | $ | 21,448,762 | |
| Investments, at Value | | $ | 2,420,808 | | | $ | 21,201,772 | |
| Cash | | | 3,663 | | | | 32,172 | |
| Dividend, Interest, and Securities Lending Income Receivable | | | 18,104 | | | | 142,281 | |
| Receivable for Investment Securities Sold | | | — | | | | 50,000 | |
| Total Assets | | | 2,442,575 | | | | 21,426,225 | |
| Liabilities: | | | | | | | | |
| Payable due to Investment Adviser | | | 238 | | | | 2,059 | |
| Total Liabilities | | | 238 | | | | 2,059 | |
| Net Assets | | $ | 2,442,337 | | | $ | 21,424,166 | |
| Net Assets Consist of: | | | | | | | | |
| Paid-in Capital | | $ | 2,502,000 | | | $ | 21,610,040 | |
| Total Accumulated Losses | | | (59,663 | ) | | | (185,874 | ) |
| Net Assets | | $ | 2,442,337 | | | $ | 21,424,166 | |
| Outstanding Shares of Beneficial Interest (unlimited authorization — no par value) | | | 50,000 | | | | 450,000 | |
| Net Asset Value, Offering and Redemption Price Per Share | | | $48.85 | | | | $47.61 | |
Amounts designated as “ —” are either $0 or have been rounded to $0.
The accompanying notes are an integral part of the financial statements.
70
Statements of Operations
For the year ended November 30, 2024
| | | Global X MLP
ETF | | | Global X MLP
& Energy
Infrastructure
ETF | | | Global X
Alternative
Income ETF | | | Global X
Conscious
Companies ETF | |
| Investment Income: | | | | | | | | | | | | | | | | |
| Distributions from Master Limited Partnerships | | $ | 107,770,733 | | | $ | — | | | $ | — | | | $ | — | |
| Less: Return of Capital Distributions | | | (107,770,733 | ) | | | — | | | | — | | | | — | |
| Dividend Income | | | 13,467,816 | | | | 42,617,329 | | | | 202,623 | | | | 8,502,131 | |
| Dividend Income, from Affiliated Investments | | | — | | | | — | | | | 1,565,580 | | | | — | |
| Interest Income | | | 98,125 | | | | 69,640 | | | | 2,612 | | | | 32,970 | |
| Security Lending Income | | | — | | | | 554,014 | | | | 32,334 | | | | — | |
| Less: Foreign Taxes Withheld | | | — | | | | (3,047,502 | ) | | | — | | | | (36,438 | ) |
| Total Investment Income | | | 13,565,941 | | | | 40,193,481 | | | | 1,803,149 | | | | 8,498,663 | |
| Expenses: | | | | | | | | | | | | | | | | |
| Supervision and Administration Fees(1) | | | 6,992,125 | | | | 6,602,737 | | | | 171,805 | | | | 2,736,995 | |
| Custodian Fees(2) | | | 48,542 | | | | 10,640 | | | | 43 | | | | 294 | |
| Net Expenses | | | 7,040,667 | | | | 6,613,377 | | | | 171,848 | | | | 2,737,289 | |
| Net Investment Income, Before Taxes | | | 6,525,274 | | | | 33,580,104 | | | | 1,631,301 | | | | 5,761,374 | |
| Tax Benefit/(Expense) | | | (1,436,879 | ) | | | — | | | | — | | | | — | |
| Net Investment Income, Net of Taxes | | | 5,088,395 | | | | 33,580,104 | | | | 1,631,301 | | | | 5,761,374 | |
| Net Realized Gain (Loss) on: | | | | | | | | | | | | | | | | |
| Investments(3) | | | 39,078,705 | | | | 154,801,859 | | | | 784,269 | | | | 63,030,654 | |
| Affiliated Investments | | | — | | | | — | | | | (232,165 | ) | | | — | |
| Foreign Currency Transactions | | | — | | | | (5,748 | ) | | | — | | | | — | |
| Tax Benefit/(Expense) | | | (8,605,215 | ) | | | — | | | | — | | | | — | |
| Capital Gain Distribution from Affiliated Investments | | | — | | | | — | | | | 125,808 | | | | — | |
| Payment from Adviser(4) | | | — | | | | — | | | | 123,393 | | | | — | |
| Net Realized Gain (Loss) | | | 30,473,490 | | | | 154,796,111 | | | | 801,305 | | | | 63,030,654 | |
| Net Change in Unrealized Appreciation (Depreciation) on: | | | | | | | | | | | | | | | | |
| Investments | | | 372,554,282 | | | | 505,968,916 | | | | 765,525 | | | | 88,325,176 | |
| Affiliated Investments | | | — | | | | — | | | | 2,596,587 | | | | — | |
| Tax Benefit/(Expense) | | | (82,037,251 | ) | | | — | | | | — | | | | — | |
| Net Change in Unrealized Appreciation (Depreciation) | | | 290,517,031 | | | | 505,968,916 | | | | 3,362,112 | | | | 88,325,176 | |
| Net Realized and Unrealized Gain (Loss) | | | 320,990,521 | | | | 660,765,027 | | | | 4,163,417 | | | | 151,355,830 | |
| Net Increase in Net Assets Resulting from Operations | | $ | 326,078,916 | | | $ | 694,345,131 | | | $ | 5,794,718 | | | $ | 157,117,204 | |
| | |
| (1) | The Supervision and Administration fees includes fees paid by the Funds for the investment advisory services provided by the Adviser. (See Note 3 in the Notes to Financial Statements.) |
| (2) | See Note 2 in the Notes to Financial Statements. |
| (3) | Includes realized gains (losses) as a result of in-kind redemptions. (See Note 4 in the Notes to Financial Statements.) |
| (4) | See Note 3 in the Notes to Financial Statements. |
Amounts designated as “ —” are either $0 or have been rounded to $0.
The accompanying notes are an integral part of the financial statements.
71
Statements of Operations
For the year ended November 30, 2024
| | | Global X U.S.
Preferred ETF | | | Global X S&P
500® Quality
Dividend ETF | | | Global X
Adaptive U.S.
Factor ETF | | | Global X
Variable Rate
Preferred ETF | |
| Investment Income: | | | | | | | | | | | | | | | | |
| Dividend Income | | $ | 151,043,021 | | | $ | 830,331 | | | $ | 7,292,016 | | | $ | 17,596,594 | |
| Interest Income | | | 657,291 | | | | 1,475 | | | | — | | | | 133,047 | |
| Security Lending Income | | | 560,356 | | | | — | | | | — | | | | — | |
| Less: Foreign Taxes Withheld | | | (196,068 | ) | | | 1,737 | | | | 654 | | | | — | |
| Total Investment Income | | | 152,064,600 | | | | 833,543 | | | | 7,292,670 | | | | 17,729,641 | |
| Expenses: | | | | | | | | | | | | | | | | |
| Supervision and Administration Fees(1) | | | 5,511,252 | | | | 60,188 | | | | 711,227 | | | | 618,674 | |
| Custodian Fees(2) | | | 27,506 | | | | 689 | | | | 964 | | | | 3,740 | |
| Total Expenses | | | 5,538,758 | | | | 60,877 | | | | 712,191 | | | | 622,414 | |
| Net Investment Income | | | 146,525,842 | | | | 772,666 | | | | 6,580,479 | | | | 17,107,227 | |
| Net Realized Gain (Loss) on: | | | | | | | | | | | | | | | | |
| Investments(3) | | | (46,123,991 | ) | | | 1,691,146 | | | | 50,447,176 | | | | (798,264 | ) |
| Net Realized Gain (Loss) | | | (46,123,991 | ) | | | 1,691,146 | | | | 50,447,176 | | | | (798,264 | ) |
| Net Change in Unrealized Appreciation (Depreciation) on: | | | | | | | | | | | | | | | | |
| Investments | | | 214,747,480 | | | | 4,487,308 | | | | 19,731,209 | | | | 14,272,727 | |
| Net Change in Unrealized Appreciation (Depreciation) | | | 214,747,480 | | | | 4,487,308 | | | | 19,731,209 | | | | 14,272,727 | |
| Net Realized and Unrealized Gain (Loss) | | | 168,623,489 | | | | 6,178,454 | | | | 70,178,385 | | | | 13,474,463 | |
| Net Increase in Net Assets Resulting from Operations | | $ | 315,149,331 | | | $ | 6,951,120 | | | $ | 76,758,864 | | | $ | 30,581,690 | |
| | |
| (1) | The Supervision and Administration fees includes fees paid by the Funds for the investment advisory services provided by the Adviser. (See Note 3 in the Notes to Financial Statements.) |
| (2) | See Note 2 in the Notes to Financial Statements. |
| (3) | Includes realized gains (losses) as a result of in-kind redemptions. (See Note 4 in the Notes to Financial Statements.) |
Amounts designated as “ —” are either $0 or have been rounded to $0.
The accompanying notes are an integral part of the financial statements.
72
Statements of Operations
For the year or period ended November 30, 2024
| | | Global X
Adaptive
U.S. Risk
Management
ETF | | | Global X 1-3
Month T-Bill
ETF | | | Global X U.S.
Cash Flow Kings
100 ETF | | | Global X Short-
Term Treasury
Ladder ETF (1) | |
| Investment Income: | | | | | | | | | | | | | | | | |
| Dividend Income | | $ | 1,493,818 | | | $ | — | | | $ | 78,233 | | | $ | — | |
| Interest Income | | | 201,857 | | | | 23,125,740 | | | | 171 | | | | 29,515 | |
| Less: Foreign Taxes Withheld | | | 98 | | | | — | | | | — | | | | — | |
| Total Investment Income | | | 1,695,773 | | | | 23,125,740 | | | | 78,404 | | | | 29,515 | |
| Expenses: | | | | | | | | | | | | | | | | |
| Supervision and Administration Fees(2) | | | 466,742 | | | | 312,080 | | | | 8,686 | | | | 880 | |
| Custodian Fees(3) | | | 4,351 | | | | 1,781 | | | | 8 | | | | — | |
| Total Expenses | | | 471,093 | | | | 313,861 | | | | 8,694 | | | | 880 | |
| Net Investment Income | | | 1,224,680 | | | | 22,811,879 | | | | 69,710 | | | | 28,635 | |
| Net Realized Gain (Loss) on: | | | | | | | | | | | | | | | | |
| Investments(4) | | | 18,226,745 | | | | 75,871 | | | | 651,691 | | | | — | |
| Net Realized Gain (Loss) | | | 18,226,745 | | | | 75,871 | | | | 651,691 | | | | — | |
| Net Change in Unrealized Appreciation (Depreciation) on: | | | | | | | | | | | | | | | | |
| Investments | | | 9,486,447 | | | | 112,920 | | | | 155,667 | | | | (17,297 | ) |
| Net Change in Unrealized Appreciation (Depreciation) | | | 9,486,447 | | | | 112,920 | | | | 155,667 | | | | (17,297 | ) |
| Net Realized and Unrealized Gain (Loss) | | | 27,713,192 | | | | 188,791 | | | | 807,358 | | | | (17,297 | ) |
| Net Increase in Net Assets Resulting from Operations | | $ | 28,937,872 | | | $ | 23,000,670 | | | $ | 877,068 | | | $ | 11,338 | |
| | |
| (1) | The Fund commenced operations on September 9, 2024. |
| (2) | The Supervision and Administration fees includes fees paid by the Funds for the investment advisory services provided by the Adviser. (See Note 3 in the Notes to Financial Statements.) |
| (3) | See Note 2 in the Notes to Financial Statements. |
| (4) | Includes realized gains (losses) as a result of in-kind redemptions. (See Note 4 in the Notes to Financial Statements.) |
Amounts designated as “ —” are either $0 or have been rounded to $0.
The accompanying notes are an integral part of the financial statements.
73
Statements of Operations
For the period ended November 30, 2024
| | | Global X
Intermediate-
Term Treasury
Ladder ETF (1) | | | Global X Long-
Term Treasury
Ladder ETF (1) | |
| Investment Income: | | | | | | | | |
| Interest Income | | $ | 19,913 | | | $ | 127,381 | |
| Total Investment Income | | | 19,913 | | | | 127,381 | |
| Expenses: | | | | | | | | |
| Supervision and Administration Fees(2) | | | 652 | | | | 3,442 | |
| Custodian Fees(3) | | | — | | | | 44 | |
| Total Expenses | | | 652 | | | | 3,486 | |
| Net Investment Income | | | 19,261 | | | | 123,895 | |
| Net Realized Gain (Loss) on: | | | | | | | | |
| Investments(4) | | | (62 | ) | | | (529 | ) |
| Net Realized Gain (Loss) | | | (62 | ) | | | (529 | ) |
| Net Change in Unrealized Appreciation (Depreciation) on: | | | | | | | | |
| Investments | | | (68,812 | ) | | | (246,990 | ) |
| Net Change in Unrealized Appreciation (Depreciation) | | | (68,812 | ) | | | (246,990 | ) |
| Net Realized and Unrealized Gain (Loss) | | | (68,874 | ) | | | (247,519 | ) |
| Net Decrease in Net Assets Resulting from Operations | | $ | (49,613 | ) | | $ | (123,624 | ) |
| | |
| (1) | The Fund commenced operations on September 9, 2024. |
| (2) | The Supervision and Administration fees includes fees paid by the Funds for the investment advisory services provided by the Adviser. (See Note 3 in the Notes to Financial Statements.) |
| (3) | See Note 2 in the Notes to Financial Statements. |
| (4) | Includes realized gains (losses) as a result of in-kind redemptions. (See Note 4 in the Notes to Financial Statements.) |
Amounts designated as “—” are either $0 or have been rounded to $0. is missing
The accompanying notes are an integral part of the financial statements.
74
Statements of Changes in Net Assets
| | | Global X MLP ETF | | Global X MLP & Energy
Infrastructure ETF |
| | | Year Ended
November 30,
2024 | | Year Ended
November 30,
2023 | | Year Ended
November 30,
2024 | | Year Ended
November 30,
2023 |
| Operations: | | | | | | | | | | | | | | | | |
| Net Investment Income (Loss) | | $ | 5,088,395 | | | $ | (1,638,914 | ) | | $ | 33,580,104 | | | $ | 19,496,685 | |
| Net Realized Gain (Loss) | | | 30,473,490 | | | | 119,271,031 | | | | 154,796,111 | | | | 89,543,720 | |
| Net Change in Unrealized Appreciation (Depreciation) | | | 290,517,031 | | | | 86,633,326 | | | | 505,968,916 | | | | (29,594,737 | ) |
| Net Increase in Net Assets Resulting from Operations | | | 326,078,916 | | | | 204,265,443 | | | | 694,345,131 | | | | 79,445,668 | |
| Distributions: | | | (115,595,860 | ) | | | (106,518,075 | ) | | | (53,140,384 | ) | | | (47,511,225 | ) |
| Return of Capital: | | | (1,982,760 | ) | | | — | | | | (23,571,771 | ) | | | (7,533,664 | ) |
| | | | | | | | | | | | | | | | | |
| Capital Share Transactions: | | | | | | | | | | | | | | | | |
| Issued | | | 273,823,230 | | | | 147,213,966 | | | | 1,041,457,137 | | | | 128,027,131 | |
| Redeemed | | | (217,088,209 | ) | | | (134,375,997 | ) | | | (290,665,313 | ) | | | (243,219,768 | ) |
| Increase (Decrease) in Net Assets from Capital Share Transactions | | | 56,735,021 | | | | 12,837,969 | | | | 750,791,824 | | | | (115,192,637 | ) |
| Total Increase (Decrease) in Net Assets | | | 265,235,317 | | | | 110,585,337 | | | | 1,368,424,800 | | | | (90,791,858 | ) |
| | | | | | | | | | | | | | | | | |
| Net Assets: | | | | | | | | | | | | | | | | |
| Beginning of Year | | | 1,488,864,109 | | | | 1,378,278,772 | | | | 999,208,257 | | | | 1,090,000,115 | |
| End of Year | | $ | 1,754,099,426 | | | $ | 1,488,864,109 | | | $ | 2,367,633,057 | | | $ | 999,208,257 | |
| | | | | | | | | | | | | | | | | |
| Share Transactions: | | | | | | | | | | | | | | | | |
| Issued | | | 5,780,000 | | | | 3,430,000 | | | | 19,630,000 | | | | 3,100,000 | |
| Redeemed | | | (4,640,000 | ) | | | (3,180,000 | ) | | | (4,990,000 | ) | | | (5,970,000 | ) |
| Net Increase (Decrease) in Shares Outstanding from Share Transactions | | | 1,140,000 | | | | 250,000 | | | | 14,640,000 | | | | (2,870,000 | ) |
Amounts designated as “—” are either $0 or have been rounded to $0.
The accompanying notes are an integral part of the financial statements.
75
Statements of Changes in Net Assets
| | | Global X Alternative Income ETF | | Global X Conscious Companies
ETF |
| | | Year Ended
November 30,
2024 | | Year Ended
November 30,
2023 | | Year Ended
November 30,
2024 | | Year Ended
November 30,
2023 |
| Operations: | | | | | | | | | | | | | | | | |
| Net Investment Income | | $ | 1,631,301 | | | $ | 1,580,080 | | | $ | 5,761,374 | | | $ | 7,932,587 | |
| Net Realized Gain (Loss) | | | 801,305 | | | | 393,696 | | | | 63,030,654 | | | | 7,310,769 | |
| Net Change in Unrealized Appreciation (Depreciation) | | | 3,362,112 | | | | (590,182 | ) | | | 88,325,176 | | | | 37,219,381 | |
| Net Increase in Net Assets Resulting from Operations | | | 5,794,718 | | | | 1,383,594 | | | | 157,117,204 | | | | 52,462,737 | |
| Distributions: | | | (2,526,973 | ) | | | (2,657,760 | ) | | | (6,793,472 | ) | | | (6,163,099 | ) |
| | | | | | | | | | | | | | | | | |
| Capital Share Transactions: | | | | | | | | | | | | | | | | |
| Issued | | | 3,974,072 | | | | 6,918,197 | | | | 161,265,915 | | | | 46,353,658 | |
| Redeemed | | | (7,442,007 | ) | | | (8,388,501 | ) | | | (237,587,484 | ) | | | (186,645,529 | ) |
| Decrease in Net Assets from Capital Share Transactions | | | (3,467,935 | ) | | | (1,470,304 | ) | | | (76,321,569 | ) | | | (140,291,871 | ) |
| Total Increase (Decrease) in Net Assets | | | (200,190 | ) | | | (2,744,470 | ) | | | 74,002,163 | | | | (93,992,233 | ) |
| | | | | | | | | | | | | | | | | |
| Net Assets: | | | | | | | | | | | | | | | | |
| Beginning of Year | | | 34,471,903 | | | | 37,216,373 | | | | 579,740,502 | | | | 673,732,735 | |
| End of Year | | $ | 34,271,713 | | | $ | 34,471,903 | | | $ | 653,742,665 | | | $ | 579,740,502 | |
| | | | | | | | | | | | | | | | | |
| Share Transactions: | | | | | | | | | | | | | | | | |
| Issued | | | 340,000 | | | | 610,000 | | | | 4,350,000 | | | | 1,580,000 | |
| Redeemed | | | (640,000 | ) | | | (750,000 | ) | | | (6,430,000 | ) | | | (6,220,000 | ) |
| Net Decrease in Shares Outstanding from Share Transactions | | | (300,000 | ) | | | (140,000 | ) | | | (2,080,000 | ) | | | (4,640,000 | ) |
The accompanying notes are an integral part of the financial statements.
76
Statements of Changes in Net Assets
| | | Global X U.S. Preferred ETF | | Global X S&P 500® Quality
Dividend ETF |
| | | Year Ended
November 30,
2024 | | Year Ended
November 30,
2023 | | Year Ended
November 30,
2024 | | Year Ended
November 30,
2023 |
| Operations: | | | | | | | | | | | | | | | | |
| Net Investment Income | | $ | 146,525,842 | | | $ | 142,965,813 | | | $ | 772,666 | | | $ | 1,921,985 | |
| Net Realized Gain (Loss) | | | (46,123,991 | ) | | | (247,896,463 | ) | | | 1,691,146 | | | | 2,146,424 | |
| Net Change in Unrealized Appreciation (Depreciation) | | | 214,747,480 | | | | 88,345,353 | | | | 4,487,308 | | | | (5,404,794 | ) |
| Net Increase (Decrease) in Net Assets Resulting from Operations | | | 315,149,331 | | | | (16,585,297 | ) | | | 6,951,120 | | | | (1,336,385 | ) |
| Distributions: | | | (150,870,425 | ) | | | (144,784,500 | ) | | | (909,421 | ) | | | (1,991,843 | ) |
| Return of Capital: | | | — | | | | — | | | | (38,624 | ) | | | — | |
| | | | | | | | | | | | | | | | | |
| Capital Share Transactions: | | | | | | | | | | | | | | | | |
| Issued | | | 282,860,066 | | | | 413,172,813 | | | | 23,507,423 | | | | 40,923,453 | |
| Redeemed | | | (257,292,097 | ) | | | (188,585,867 | ) | | | (45,519,473 | ) | | | (50,433,467 | ) |
| Increase (Decrease) in Net Assets from Capital Share Transactions | | | 25,567,969 | | | | 224,586,946 | | | | (22,012,050 | ) | | | (9,510,014 | ) |
| Total Increase (Decrease) in Net Assets | | | 189,846,875 | | | | 63,217,149 | | | | (16,008,975 | ) | | | (12,838,242 | ) |
| | | | | | | | | | | | | | | | | |
| Net Assets: | | | | | | | | | | | | | | | | |
| Beginning of Year | | | 2,277,678,444 | | | | 2,214,461,295 | | | | 48,317,862 | | | | 61,156,104 | |
| End of Year | | $ | 2,467,525,319 | | | $ | 2,277,678,444 | | | $ | 32,308,887 | | | $ | 48,317,862 | |
| | | | | | | | | | | | | | | | | |
| Share Transactions: | | | | | | | | | | | | | | | | |
| Issued | | | 14,100,000 | | | | 21,090,000 | | | | 690,000 | | | | 1,270,000 | |
| Redeemed | | | (12,890,000 | ) | | | (9,980,000 | ) | | | (1,380,000 | ) | | | (1,550,000 | ) |
| Net Increase (Decrease) in Shares Outstanding from Share Transactions | | | 1,210,000 | | | | 11,110,000 | | | | (690,000 | ) | | | (280,000 | ) |
Amounts designated as “—” are either $0 or have been rounded to $0.
The accompanying notes are an integral part of the financial statements.
77
Statements of Changes in Net Assets
| | | Global X Adaptive U.S. Factor ETF | | Global X Variable Rate Preferred
ETF |
| | | Year Ended
November 30,
2024 | | Year Ended
November 30,
2023 | | Year Ended
November 30,
2024 | | Year Ended
November 30,
2023 |
| Operations: | | | | | | | | | | | | | | | | |
| Net Investment Income | | $ | 6,580,479 | | | $ | 3,256,036 | | | $ | 17,107,227 | | | $ | 17,188,257 | |
| Net Realized Gain (Loss) | | | 50,447,176 | | | | 9,554,707 | | | | (798,264 | ) | | | (17,014,142 | ) |
| Net Change in Unrealized Appreciation (Depreciation) | | | 19,731,209 | | | | (628,064 | ) | | | 14,272,727 | | | | 9,691,065 | |
| Net Increase in Net Assets Resulting from Operations | | | 76,758,864 | | | | 12,182,679 | | | | 30,581,690 | | | | 9,865,180 | |
| Distributions: | | | (6,630,997 | ) | | | (3,511,163 | ) | | | (18,281,239 | ) | | | (16,361,150 | ) |
| Return of Capital: | | | (710,305 | ) | | | (453,852 | ) | | | — | | | | — | |
| | | | | | | | | | | | | | | | | |
| Capital Share Transactions: | | | | | | | | | | | | | | | | |
| Issued | | | 360,956,822 | | | | 276,386,515 | | | | 73,596,963 | | | | 45,621,449 | |
| Redeemed | | | (248,331,641 | ) | | | (281,299,409 | ) | | | (42,176,037 | ) | | | (102,201,448 | ) |
| Increase (Decrease) in Net Assets from Capital Share Transactions | | | 112,625,181 | | | | (4,912,894 | ) | | | 31,420,926 | | | | (56,579,999 | ) |
| Total Increase (Decrease) in Net Assets | | | 182,042,743 | | | | 3,304,770 | | | | 43,721,377 | | | | (63,075,969 | ) |
| | | | | | | | | | | | | | | | | |
| Net Assets: | | | | | | | | | | | | | | | | |
| Beginning of Year | | | 181,838,224 | | | | 178,533,454 | | | | 222,312,863 | | | | 285,388,832 | |
| End of Year | | $ | 363,880,967 | | | $ | 181,838,224 | | | $ | 266,034,240 | | | $ | 222,312,863 | |
| | | | | | | | | | | | | | | | | |
| Share Transactions: | | | | | | | | | | | | | | | | |
| Issued | | | 9,050,000 | | | | 8,580,000 | | | | 3,110,000 | | | | 1,990,000 | |
| Redeemed | | | (6,250,000 | ) | | | (8,830,000 | ) | | | (1,780,000 | ) | | | (4,500,000 | ) |
| Net Increase (Decrease) in Shares Outstanding from Share Transactions | | | 2,800,000 | | | | (250,000 | ) | | | 1,330,000 | | | | (2,510,000 | ) |
Amounts designated as “—” are either $0 or have been rounded to $0.
The accompanying notes are an integral part of the financial statements.
78
Statements of Changes in Net Assets
| | | Global X Adaptive U.S. Risk
Management ETF | | Global X 1-3 Month T-Bill ETF (1) |
| | | Year Ended
November 30,
2024 | | Year Ended
November 30,
2023 | | Year Ended
November 30,
2024 | | Period Ended
November 30,
2023(2) |
| Operations: | | | | | | | | | | | | | | | | |
| Net Investment Income | | $ | 1,224,680 | | | $ | 1,294,460 | | | $ | 22,811,879 | | | $ | 1,589,396 | |
| Net Realized Gain (Loss) | | | 18,226,745 | | | | 3,748,699 | | | | 75,871 | | | | (5,740 | ) |
| Net Change in Unrealized Appreciation (Depreciation) | | | 9,486,447 | | | | (3,267,026 | ) | | | 112,920 | | | | 2,545 | |
| Net Increase in Net Assets Resulting from Operations | | | 28,937,872 | | | | 1,776,133 | | | | 23,000,670 | | | | 1,586,201 | |
| Distributions: | | | (1,199,990 | ) | | | (1,310,795 | ) | | | (21,691,011 | ) | | | (1,251,315 | ) |
| | | | | | | | | | | | | | | | | |
| Capital Share Transactions: | | | | | | | | | | | | | | | | |
| Issued | | | 60,086,073 | | | | 28,468,281 | | | | 1,024,726,382 | | | | 155,811,245 | |
| Redeemed | | | (46,368,091 | ) | | | (548,364 | ) | | | (237,887,858 | ) | | | (43,386,417 | ) |
| Increase in Net Assets from Capital Share Transactions | | | 13,717,982 | | | | 27,919,917 | | | | 786,838,524 | | | | 112,424,828 | |
| Total Increase in Net Assets | | | 41,455,864 | | | | 28,385,255 | | | | 788,148,183 | | | | 112,759,714 | |
| | | | | | | | | | | | | | | | | |
| Net Assets: | | | | | | | | | | | | | | | | |
| Beginning of Year/Period | | | 94,793,042 | | | | 66,407,787 | | | | 112,759,714 | | | | — | |
| End of Year/Period | | $ | 136,248,906 | | | $ | 94,793,042 | | | $ | 900,907,897 | | | $ | 112,759,714 | |
| | | | | | | | | | | | | | | | | |
| Share Transactions: | | | | | | | | | | | | | | | | |
| Issued | | | 1,910,000 | | | | 990,000 | | | | 10,220,000 | | | | 1,555,000 | |
| Redeemed | | | (1,460,000 | ) | | | (20,000 | ) | | | (2,372,569 | ) | | | (432,500 | ) |
| Net Increase in Shares Outstanding from Share Transactions | | | 450,000 | | | | 970,000 | | | | 7,847,431 | | | | 1,122,500 | |
| (1) | Share transactions have been adjusted to reflect the effect of a 1 for 4 reverse share split on June 14, 2024. (See Note 9 in the Notes to Financial Statements.) |
| (2) | The Fund commenced operations on June 20, 2023. |
Amounts designated as “—” are either $0 or have been rounded to $0.
The accompanying notes are an integral part of the financial statements.
79
Statements of Changes in Net Assets
| | | Global X U.S. Cash Flow Kings
100 ETF | | | Global X Short-
Term Treasury
Ladder ETF |
| | | Year Ended
November 30,
2024 | | Period Ended
November 30,
2023(1) | | Period Ended
November 30,
2024(2) |
| Operations: | | | | | | | | | | | | |
| Net Investment Income | | $ | 69,710 | | | $ | 27,873 | | | $ | 28,635 | |
| Net Realized Gain (Loss) | | | 651,691 | | | | 54,126 | | | | — | |
| Net Change in Unrealized Appreciation (Depreciation) | | | 155,667 | | | | 109,012 | | | | (17,297 | ) |
| Net Increase in Net Assets Resulting from Operations | | | 877,068 | | | | 191,011 | | | | 11,338 | |
| Distributions: | | | (78,689 | ) | | | (17,340 | ) | | | (11,440 | ) |
| | | | | | | | | | | | | |
| Capital Share Transactions: | | | | | | | | | | | | |
| Issued | | | 4,864,636 | | | | 4,144,105 | | | | 4,001,726 | |
| Redeemed | | | (5,086,109 | ) | | | (527,606 | ) | | | — | |
| Increase (Decrease) in Net Assets from Capital Share Transactions | | | (221,473 | ) | | | 3,616,499 | | | | 4,001,726 | |
| Total Increase in Net Assets | | | 576,906 | | | | 3,790,170 | | | | 4,001,624 | |
| | | | | | | | | | | | | |
| Net Assets: | | | | | | | | | | | | |
| Beginning of Year/Period | | | 3,790,170 | | | | — | | | | — | |
| End of Year/Period | | $ | 4,367,076 | | | $ | 3,790,170 | | | $ | 4,001,624 | |
| | | | | | | | | | | | | |
| Share Transactions: | | | | | | | | | | | | |
| Issued | | | 160,000 | | | | 160,000 | | | | 80,000 | |
| Redeemed | | | (170,000 | ) | | | (20,000 | ) | | | — | |
| Net Increase (Decrease) in Shares Outstanding from Share Transactions | | | (10,000 | ) | | | 140,000 | | | | 80,000 | |
| (1) | The Fund commenced operations on July 10, 2023. |
| (2) | The Fund commenced operations on September 9, 2024. |
Amounts designated as “—” are either $0 or have been rounded to $0.
The accompanying notes are an integral part of the financial statements.
80
Statements of Changes in Net Assets
| | | Global X
Intermediate-
Term Treasury
Ladder ETF | | Global X Long-
Term Treasury
Ladder ETF |
| | | Period Ended
November 30,
2024(1) | | Period Ended
November 30,
2024(1) |
| Operations: | | | | | | | | |
| Net Investment Income | | $ | 19,261 | | | $ | 123,895 | |
| Net Realized Gain (Loss) | | | (62 | ) | | | (529 | ) |
| Net Change in Unrealized Appreciation (Depreciation) | | | (68,812 | ) | | | (246,990 | ) |
| Net Decrease in Net Assets Resulting from Operations | | | (49,613 | ) | | | (123,624 | ) |
| Distributions: | | | (10,050 | ) | | | (62,250 | ) |
| | | | | | | | | |
| Capital Share Transactions: | | | | | | | | |
| Issued | | | 2,502,000 | | | | 21,610,040 | |
| Increase in Net Assets from Capital Share Transactions | | | 2,502,000 | | | | 21,610,040 | |
| Total Increase in Net Assets | | | 2,442,337 | | | | 21,424,166 | |
| | | | | | | | | |
| Net Assets: | | | | | | | | |
| Beginning of Period | | | — | | | | — | |
| End of Period | | $ | 2,442,337 | | | $ | 21,424,166 | |
| | | | | | | | | |
| Share Transactions: | | | | | | | | |
| Issued | | | 50,000 | | | | 450,000 | |
| | | | | | | | | |
| Net Increase in Shares Outstanding from Share Transactions | | | 50,000 | | | | 450,000 | |
| (1) | The Fund commenced operations on September 9, 2024. |
Amounts designated as “—” are either $0 or have been rounded to $0.
The accompanying notes are an integral part of the financial statements.
81
Page intentionally left blank.
82
Financial Highlights
Selected Per Share Data & Ratios
For a Share Outstanding Throughout the Year
| | | Net
Asset Value,
Beginning
of Period
($) | | Net Investment
Income (Loss)
($)* | | Net Realized
and Unrealized
Gain (Loss) on
Investments
($) | | Total from
Operations
($) | | Distribution
from Net
Investment
Income ($) | | Distribution
from Capital
Gains ($) | | Return of
Capital ($) |
| Global X MLP ETF | | | | | | | | | | | | | | | | | | | | | | | | | | | | |
| 2024 | | | 46.08 | | | | 0.20 | | | | 9.74 | | | | 9.94 | | | | (3.52 | ) | | | — | | | | (0.06 | ) |
| 2023 | | | 42.99 | | | | (0.07 | ) | | | 6.48 | | | | 6.41 | | | | (3.32 | ) | | | — | | | | — | |
| 2022 | | | 33.59 | | | | (0.02 | ) | | | 12.44 | | | | 12.42 | | | | (3.02 | ) | | | — | | | | — | |
| 2021 | | | 26.73 | | | | (0.06 | ) | | | 9.97 | | | | 9.91 | | | | — | | | | — | | | | (3.05 | ) |
| 2020(1) | | | 43.92 | | | | (0.26 | ) | | | (13.13 | ) | | | (13.39 | ) | | | — | | | | — | | | | (3.80 | ) |
| Global X MLP & Energy Infrastructure ETF |
| 2024 | | | 44.99 | | | | 1.17 | | | | 20.64 | | | | 21.81 | | | | (1.77 | ) | | | — | | | | (0.78 | ) |
| 2023 | | | 43.47 | | | | 0.83 | | | | 3.02 | | | | 3.85 | | | | (2.01 | ) | | | — | | | | (0.32 | ) |
| 2022 | | | 34.89 | | | | 0.75 | | | | 9.98 | | | | 10.73 | | | | (1.39 | ) | | | — | | | | (0.76 | ) |
| 2021 | | | 26.59 | | | | 0.42 | | | | 9.97 | | | | 10.39 | | | | (1.05 | ) | | | — | | | | (1.04 | ) |
| 2020(2) | | | 33.45 | | | | 0.71 | | | | (5.33 | ) | | | (4.62 | ) | | | (1.95 | ) | | | — | | | | (0.29 | ) |
| Global X Alternative Income ETF | | | | | | | | | | | | | | | | | | | | | | | | | | | | |
| 2024 | | | 11.05 | | | | 0.55 | | | | 1.40 | | | | 1.95 | | | | (0.85 | ) | | | — | | | | — | |
| 2023 | | | 11.42 | | | | 0.48 | | | | (0.04 | ) | | | 0.44 | | | | (0.81 | ) | | | — | | | | — | |
| 2022 | | | 13.16 | | | | 0.61 | | | | (1.45 | ) | | | (0.84 | ) | | | (0.77 | ) | | | — | | | | (0.13 | ) |
| 2021 | | | 11.51 | | | | 0.49 | | | | 2.05 | | | | 2.54 | | | | (0.62 | ) | | | — | | | | (0.27 | ) |
| 2020 | | | 14.74 | | | | 0.66 | | | | (2.64 | ) | | | (1.98 | ) | | | (0.98 | ) | | | (0.15 | ) | | | (0.12 | ) |
| * | Per share data calculated using average shares method. |
| ** | Total Return is for the period indicated and has not been annualized. The return shown does not reflect the deduction of taxes that a shareholder would pay on Fund distributions or the redemption of Fund shares. |
| *** | Supplemental ratio, presented for the purpose of additional analysis. |
| †† | Portfolio turnover rate is for the period indicated and periods of less than one year have not been annualized. Excludes effect of in-kind transfers. |
| ‡ | The Before Net Deferred Tax Expense/(Benefit) expense ratios for the periods ending November 30, 2020, 2021, 2022, 2023 and 2024 was 0.45%, 0.45%, 0.45%, 0.45%, and 0.45%. |
| ‡‡ | Includes amount of tax benefit or expense associated with expenses. Including amount of tax benefit or expense associated for all components of the Statement of Operations, for the periods ending November 30, 2022, 2023 and 2024 the impact would be 2.29%, 4.16% and 5.83%. |
| # | Excludes fees and expenses incurred indirectly as a result of investments in underlying funds. |
| ^ | Effective September 28, 2021, the fund’s fees were permanently lowered to 0.50%. |
| @ | Effective for the fiscal year ended November 30, 2022, the Fund began presenting acquired fund fees borne by the Adviser as part of its unitary fee agreement (See Note 3 in Notes to Financial Statements) as a realized gain on the Statement of Operations as compared to a contra-expense as in prior fiscal years. If such amounts had been presented as a realized gain in the year ended November 30, 2021 (first year of this agreement), the ratio of Expenses to Average Net Assets would have been 0.70%. |
| (1) | Per share amounts have been adjusted for a 1 for 6 reverse stock split on April 28, 2020. (See Note 9 in the Notes to Financial Statements.) |
| (2) | Per share amounts have been adjusted for a 1 for 3 reverse share split on April 28, 2020. (See Note 9 in the Notes to Financial Statements.) |
Amounts designated as “—” are either $0 or have been rounded to $0.
The accompanying notes are an integral part of the financial statements.
83
Financial Highlights
Total from
Distributions ($) | | Net
Asset Value,
End of
Period ($) | | Total
Return
(%)** | | Net Assets, End
of Period ($)
(000) | | Ratio of
Expenses to
Average Net
Assets, Net of
Tax Expense/
(Benefit) (%) | | Tax Expense
/(Benefit)
(%)*** | | Ratio of Net
Investment
Income (Loss)
to Average Net
Assets, Net of Tax
Expense/
(Benefit) (%) | | Portfolio
Turnover Rate
(%)‡‡ |
| | | | | | | | | | | | | | | | | | | | | | | | | | | | | | |
| (3.58 | ) | | | 52.44 | | | | 22.79 | | | | 1,754,099 | | | | 0.55 | ‡ | | | 0.10 | ‡‡ | | | 0.42 | | | | 28.89 | |
| (3.32 | ) | | | 46.08 | | | | 15.79 | | | | 1,488,864 | | | | 0.42 | ‡ | | | (0.03) | ‡‡ | | | (0.15 | ) | | | 42.36 | |
| (3.02 | ) | | | 42.99 | | | | 37.69 | | | | 1,378,279 | | | | 0.44 | ‡ | | | (0.01) | ‡‡ | | | (0.04 | ) | | | 47.13 | |
| (3.05 | ) | | | 33.59 | | | | 37.49 | | | | 992,935 | | | | 0.43 | ‡ | | | (0.02 | ) | | | (0.19 | ) | | | 33.79 | |
| (3.80 | ) | | | 26.73 | | | | (30.51 | ) | | | 687,577 | | | | 0.46 | ‡ | | | 0.46 | | | | (0.85 | ) | | | 33.78 | |
| | | | | | | | | | | | | | | | | | | | | | | | | | | | | | |
| (2.55 | ) | | | 64.25 | | | | 50.20 | | | | 2,367,633 | | | | 0.45 | | | | — | | | | 2.29 | | | | 23.59 | |
| (2.33 | ) | | | 44.99 | | | | 9.42 | | | | 999,208 | | | | 0.45 | | | | — | | | | 2.00 | | | | 24.32 | |
| (2.15 | ) | | | 43.47 | | | | 31.26 | | | | 1,090,000 | | | | 0.45 | | | | — | | | | 1.85 | | | | 23.48 | |
| (2.09 | ) | | | 34.89 | | | | 39.64 | | | | 738,092 | | | | 0.45 | | | | — | | | | 1.25 | | | | 16.88 | |
| (2.24 | ) | | | 26.59 | | | | (13.34 | ) | | | 538,344 | | | | 0.45 | | | | — | | | | 2.66 | | | | 35.86 | |
| | | | | | | | | | | | | | | | | | | | | | | | | | | | | | |
| (0.85 | ) | | | 12.15 | | | | 18.36 | | | | 34,272 | | | | 0.50 | | | | — | | | | 4.75 | | | | 7.16 | |
| (0.81 | ) | | | 11.05 | | | | 4.01 | | | | 34,472 | | | | 0.50 | | | | — | | | | 4.29 | | | | 14.38 | |
| (0.90 | ) | | | 11.42 | | | | (6.64 | ) | | | 37,216 | | | | 0.50 | # | | | — | | | | 5.03 | | | | 18.10 | |
| (0.89 | ) | | | 13.16 | | | | 22.52 | | | | 35,921 | | | | 0.63 | #@^ | | | — | | | | 3.77 | | | | 86.85 | |
| (1.25 | ) | | | 11.51 | | | | (13.13 | ) | | | 19,573 | | | | 0.75 | # | | | — | | | | 5.61 | | | | 52.78 | |
The accompanying notes are an integral part of the financial statements.
84
Financial Highlights
Selected Per Share Data & Ratios
For a Share Outstanding Throughout the Year
| | | Net
Asset Value,
Beginning
of Period
($) | | Net Investment
Income
($)* | | Net Realized
and Unrealized
Gain (Loss) on
Investments
($) | | Total from
Operations
($) | | Distribution
from Net
Investment
Income ($) | | Distribution
from Capital
Gains ($) | | Return of
Capital ($) |
| Global X Conscious Companies ETF | | | | | | | | | | | | | | | | | | | | | | | | | | | | |
| 2024 | | | 31.89 | | | | 0.33 | | | | 8.77 | | | | 9.10 | | | | (0.38 | ) | | | — | | | | — | |
| 2023 | | | 29.52 | | | | 0.38 | | | | 2.27 | | | | 2.65 | | | | (0.28 | ) | | | — | | | | — | |
| 2022 | | | 32.97 | | | | 0.31 | | | | (3.40 | ) | | | (3.09 | ) | | | (0.36 | ) | | | — | | | | — | |
| 2021 | | | 26.46 | | | | 0.31 | | | | 6.49 | | | | 6.80 | | | | (0.29 | ) | | | — | | | | — | |
| 2020 | | | 23.10 | | | | 0.33 | | | | 3.32 | | | | 3.65 | | | | (0.27 | ) | | | (0.02 | ) | | | — | |
| Global X U.S. Preferred ETF | | | | | | | | | | | | | | | | | | | | | | | | | | | | |
| 2024 | | | 19.13 | | | | 1.22 | | | | 1.42 | | | | 2.64 | | | | (1.26 | ) | | | — | | | | — | |
| 2023 | | | 20.51 | | | | 1.24 | | | | (1.36 | ) | | | (0.12 | ) | | | (1.26 | ) | | | — | | | | — | |
| 2022 | | | 25.21 | | | | 1.23 | | | | (4.64 | ) | | | (3.41 | ) | | | (1.29 | ) | | | — | | | | — | |
| 2021 | | | 25.36 | | | | 1.28 | | | | (0.12 | ) | | | 1.16 | | | | (1.31 | ) | | | — | | | | — | |
| 2020 | | | 24.79 | | | | 1.33 | | | | 0.58 | | | | 1.91 | | | | (1.34 | ) | | | — | | | | — | |
| Global X S&P 500® Quality Dividend ETF | | | | | | | | | | | | | | | | | | | | | | | | | | | | |
| 2024 | | | 30.97 | | | | 0.87 | | | | 6.33 | | | | 7.20 | | | | (0.99 | ) | | | — | | | | (0.04 | ) |
| 2023 | | | 33.24 | | | | 0.99 | | | | (2.23 | ) | | | (1.24 | ) | | | (1.03 | ) | | | — | | | | — | |
| 2022 | | | 31.02 | | | | 1.03 | | | | 2.10 | | | | 3.13 | | | | (0.91 | ) | | | — | | | | — | |
| 2021 | | | 25.20 | | | | 0.78 | | | | 5.84 | | | | 6.62 | | | | (0.80 | ) | | | — | | | | — | |
| 2020 | | | 26.51 | | | | 0.75 | | | | (1.24 | ) | | | (0.49 | ) | | | (0.82 | ) | | | — | | | | — | *** |
| * | Per share data calculated using average shares method. |
| ** | Total Return is for the period indicated and has not been annualized. The return shown does not reflect the deduction of taxes that a shareholder would pay on Fund distributions or the redemption of Fund shares. |
| *** | Amount is less than $0.005. |
| †† | Portfolio turnover rate is for the period indicated and periods of less than one year have not been annualized. Excludes effect of in-kind transfers. |
| ^^ | Effective April 1, 2020, until April 1, 2021, the ratio of Expenses to Average Net Assets included the effect of a waiver. If these offsets were excluded, the ratio would have been 0.23%. |
Amounts designated as “—” are either $0 or have been rounded to $0.
The accompanying notes are an integral part of the financial statements.
85
Financial Highlights
Total from
Distributions ($) | | Net
Asset Value,
End of
Period ($) | | Total
Return
(%)** | | Net Assets, End of
Period ($)(000) | | Ratio of Expenses
to Average Net
Assets (%) | | Ratio of Net
Investment Income
to Average Net
Assets (%) | | Portfolio
Turnover Rate
(%)†† |
| | | | | | | | | | | | | | | | | | | | | | | | | | |
| (0.38 | ) | | | 40.61 | | | | 28.74 | | | | 653,743 | | | | 0.43 | | | | 0.91 | | | | 21.24 | |
| (0.28 | ) | | | 31.89 | | | | 9.05 | | | | 579,741 | | | | 0.43 | | | | 1.27 | | | | 27.74 | |
| (0.36 | ) | | | 29.52 | | | | (9.45 | ) | | | 673,733 | | | | 0.43 | | | | 1.06 | | | | 31.92 | |
| (0.29 | ) | | | 32.97 | | | | 25.84 | | | | 654,764 | | | | 0.43 | | | | 1.00 | | | | 22.92 | |
| (0.29 | ) | | | 26.46 | | | | 16.01 | | | | 403,499 | | | | 0.43 | | | | 1.45 | | | | 48.73 | |
| | | | | | | | | | | | | | | | | | | | | | | | | | |
| (1.26 | ) | | | 20.51 | | | | 14.20 | | | | 2,467,525 | | | | 0.23 | | | | 6.12 | | | | 27.10 | |
| (1.26 | ) | | | 19.13 | | | | (0.51 | ) | | | 2,277,678 | | | | 0.23 | | | | 6.38 | | | | 36.65 | |
| (1.29 | ) | | | 20.51 | | | | (13.82 | ) | | | 2,214,461 | | | | 0.23 | | | | 5.51 | | | | 33.20 | |
| (1.31 | ) | | | 25.21 | | | | 4.61 | | | | 2,458,022 | | | | 0.23 | ^^ | | | 4.99 | | | | 47.89 | |
| (1.34 | ) | | | 25.36 | | | | 8.13 | | | | 868,550 | | | | 0.23 | ^^ | | | 5.49 | | | | 39.14 | |
| | | | | | | | | | | | | | | | | | | | | | | | | | |
| (1.03 | ) | | | 37.14 | | | | 23.69 | | | | 32,309 | | | | 0.20 | | | | 2.57 | | | | 82.76 | |
| (1.03 | ) | | | 30.97 | | | | (3.71 | ) | | | 48,318 | | | | 0.20 | | | | 3.16 | | | | 78.89 | |
| (0.91 | ) | | | 33.24 | | | | 10.25 | | | | 61,156 | | | | 0.20 | | | | 3.24 | | | | 78.73 | |
| (0.80 | ) | | | 31.02 | | | | 26.45 | | | | 9,615 | | | | 0.20 | | | | 2.60 | | | | 70.66 | |
| (0.82 | ) | | | 25.20 | | | | (1.47 | ) | | | 6,300 | | | | 0.20 | | | | 3.27 | | | | 93.40 | |
The accompanying notes are an integral part of the financial statements.
86
Financial Highlights
Selected Per Share Data & Ratios
For a Share Outstanding Throughout the Year or Period
| | | Net
Asset Value,
Beginning
of Period
($) | | Net Investment
Income
($)* | | Net Realized
and Unrealized
Gain (Loss) on
Investments
($) | | Total from
Operations
($) | | Distribution
from Net
Investment
Income ($) | | Distribution
from Capital
Gains ($) | | Return of
Capital ($) |
| Global X Adaptive U.S. Factor ETF |
| 2024 | | | 34.37 | | | | 1.01 | | | | 10.57 | | | | 11.58 | | | | (0.88 | ) | | | — | | | | (0.09 | ) |
| 2023 | | | 32.23 | | | | 0.59 | | | | 2.28 | | | | 2.87 | | | | (0.65 | ) | | | — | | | | (0.08 | ) |
| 2022 | | | 29.86 | | | | 0.62 | | | | 2.50 | | | | 3.12 | | | | (0.71 | ) | | | — | | | | (0.04 | ) |
| 2021 | | | 24.91 | | | | 0.61 | | | | 5.09 | | | | 5.70 | | | | (0.70 | ) | | | — | | | | (0.05 | ) |
| 2020 | | | 25.79 | | | | 0.63 | | | | (0.67 | ) | | | (0.04 | ) | | | (0.70 | ) | | | (0.05 | ) | | | (0.09 | ) |
| Global X Variable Rate Preferred ETF |
| 2024 | | | 23.13 | | | | 1.64 | | | | 1.31 | | | | 2.95 | | | | (1.76 | ) | | | — | | | | — | |
| 2023 | | | 23.55 | | | | 1.60 | | | | (0.49 | ) | | | 1.11 | | | | (1.53 | ) | | | — | | | | — | |
| 2022 | | | 27.28 | | | | 1.45 | | | | (3.70 | ) | | | (2.25 | ) | | | (1.39 | ) | | | (0.02 | ) | | | (0.07 | ) |
| 2021 | | | 26.97 | | | | 1.40 | | | | 0.37 | | | | 1.77 | | | | (1.29 | ) | | | (0.02 | ) | | | (0.15 | ) |
| 2020(1) | | | 24.85 | | | | 0.61 | | | | 2.00 | | | | 2.61 | | | | (0.49 | ) | | | — | | | | — | |
| Global X Adaptive U.S. Risk Management ETF |
| 2024 | | | 28.55 | | | | 0.33 | | | | 7.60 | | | | 7.93 | | | | (0.34 | ) | | | — | | | | — | |
| 2023 | | | 28.26 | | | | 0.47 | | | | 0.34 | | | | 0.81 | | | | (0.52 | ) | | | — | | | | — | |
| 2022 | | | 29.88 | | | | 0.40 | | | | (1.71 | ) | | | (1.31 | ) | | | (0.31 | ) | | | — | | | | — | |
| 2021(2) | | | 24.95 | | | | 0.25 | | | | 4.77 | | | | 5.02 | | | | (0.09 | ) | | | — | | | | — | |
| * | Per share data calculated using average shares method. |
| ** | Total Return is for the period indicated and has not been annualized. The return shown does not reflect the deduction of taxes that a shareholder would pay on Fund distributions or the redemption of Fund shares. |
| † | Annualized. |
| †† | Portfolio turnover rate is for the period indicated and periods of less than one year have not been annualized. Excludes effect of in-kind transfers. |
| (1) | The Fund commenced operations on June 22, 2020. |
| (2) | The Fund commenced operations on January 12, 2021. |
Amounts designated as “—” are either $0 or have been rounded to $0.
The accompanying notes are an integral part of the financial statements.
87
Financial Highlights
Total from
Distributions ($) | | Net
Asset Value,
End of
Period ($) | | Total
Return
(%)** | | Net Assets, End of
Period ($)(000) | | Ratio of Expenses
to Average Net
Assets (%) | | Ratio of Net
Investment Income
to Average Net
Assets (%) | | Portfolio
Turnover Rate
(%)†† |
| | | | | | | | | | | | | | | | | | | | | | | | | | |
| (0.97 | ) | | | 44.98 | | | | 34.02 | | | | 363,881 | | | | 0.27 | | | | 2.50 | | | | 95.79 | |
| (0.73 | ) | | | 34.37 | | | | 9.13 | | | | 181,838 | | | | 0.27 | | | | 1.89 | | | | 234.57 | |
| (0.75 | ) | | | 32.23 | | | | 10.61 | | | | 178,533 | | | | 0.27 | | | | 2.03 | | | | 115.74 | |
| (0.75 | ) | | | 29.86 | | | | 23.01 | | | | 172,008 | | | | 0.27 | | | | 2.09 | | | | 96.21 | |
| (0.84 | ) | | | 24.91 | | | | 0.14 | | | | 144,484 | | | | 0.27 | | | | 2.78 | | | | 159.91 | |
| | | | | | | | | | | | | | | | | | | | | | | | | | |
| (1.76 | ) | | | 24.32 | | | | 13.29 | | | | 266,034 | | | | 0.25 | | | | 6.91 | | | | 58.94 | |
| (1.53 | ) | | | 23.13 | | | | 5.01 | | | | 222,313 | | | | 0.25 | | | | 7.01 | | | | 81.87 | |
| (1.48 | ) | | | 23.55 | | | | (8.40 | ) | | | 285,389 | | | | 0.25 | | | | 5.93 | | | | 74.41 | |
| (1.46 | ) | | | 27.28 | | | | 6.60 | | | | 89,217 | | | | 0.25 | | | | 5.01 | | | | 26.17 | |
| (0.49 | ) | | | 26.97 | | | | 10.59 | | | | 1,349 | | | | 0.25 | † | | | 5.38 | † | | | 10.96 | |
| | | | | | | | | | | | | | | | | | | | | | | | | | |
| (0.34 | ) | | | 36.14 | | | | 27.98 | | | | 136,249 | | | | 0.39 | | | | 1.02 | | | | 241.46 | |
| (0.52 | ) | | | 28.55 | | | | 2.92 | | | | 94,793 | | | | 0.40 | | | | 1.67 | | | | 574.56 | |
| (0.31 | ) | | | 28.26 | | | | (4.28 | ) | | | 66,408 | | | | 0.39 | | | | 1.49 | | | | 1481.94 | |
| (0.09 | ) | | | 29.88 | | | | 20.13 | | | | 104,574 | | | | 0.39 | † | | | 1.01 | † | | | 30.10 | |
The accompanying notes are an integral part of the financial statements.
88
Financial Highlights
Selected Per Share Data & Ratios
For a Share Outstanding Throughout the Period
| | | Net
Asset Value,
Beginning
of Period
($) | | Net Investment
Income
($)* | | Net Realized
and Unrealized
Gain (Loss) on
Investments
($) | | Total from
Operations
($) | | Distribution
from Net
Investment
Income ($) | | Distribution
from Capital
Gains ($) | | Return of
Capital ($) |
| Global X 1-3 Month T-Bill ETF |
| 2024(1) | | | 100.44 | | | | 5.13 | | | | 0.12 | | | | 5.25 | | | | (5.25 | ) | | | — | | | | — | |
| 2023(1)(2) | | | 99.96 | | | | 2.40 | | | | (0.08 | ) | | | 2.32 | | | | (1.84 | ) | | | — | | | | — | |
| Global X U.S. Cash Flow Kings 100 ETF |
| 2024 | | | 27.07 | | | | 0.61 | | | | 6.58 | | | | 7.19 | | | | (0.67 | ) | | | — | | | | — | |
| 2023(3) | | | 25.58 | | | | 0.25 | | | | 1.40 | | | | 1.65 | | | | (0.16 | ) | | | — | | | | — | |
| Global X Short-Term Treasury Ladder ETF |
| 2024(4) | | | 50.03 | | | | 0.44 | | | | (0.28 | ) | | | 0.16 | | | | (0.17 | ) | | | — | | | | — | |
| * | Per share data calculated using average shares method. |
| ** | Total Return is for the period indicated and has not been annualized. The return shown does not reflect the deduction of taxes that a shareholder would pay on Fund distributions or the redemption of Fund shares. |
| † | Annualized. |
| †† | Portfolio turnover rate is for the period indicated and periods of less than one year have not been annualized. Excludes effect of in-kind transfers. |
| (1) | Per share amounts have been adjusted for a 1 for 4 reverse share split on June 14, 2024. (See Note 9 in the Notes to in the Notes to Financial Statements.) |
| (2) | The Fund commenced operations on June 20, 2023. |
| (3) | The Fund commenced operations on July 10, 2023. |
| (4) | The Fund commenced operations on September 9, 2024. |
Amounts designated as “—” are either $0 or have been rounded to $0.
The accompanying notes are an integral part of the financial statements.
89
Financial Highlights
Total from
Distributions ($) | | Net
Asset Value,
End of
Period ($) | | Total
Return
(%)** | | Net Assets, End of
Period ($)(000) | | Ratio of Expenses
to Average Net
Assets (%) | | Ratio of Net
Investment Income
to Average Net
Assets (%) | | Portfolio
Turnover Rate
(%)†† |
| | | | | | | | | | | | | | | | | | | | | | | | | | |
| (5.25 | ) | | | 100.44 | | | | 5.38 | | | | 900,908 | | | | 0.07 | | | | 5.12 | | | | 0.00 | |
| (1.84 | ) | | | 100.44 | | | | 2.36 | | | | 112,760 | | | | 0.09 | † | | | 5.34 | † | | | 0.00 | |
| | | | | | | | | | | | | | | | | | | | | | | | | | |
| (0.67 | ) | | | 33.59 | | | | 26.89 | | | | 4,367 | | | | 0.25 | | | | 2.01 | | | | 87.62 | |
| (0.16 | ) | | | 27.07 | | | | 6.46 | | | | 3,790 | | | | 0.25 | † | | | 2.41 | † | | | 14.76 | |
| | | | | | | | | | | | | | | | | | | | | | | | | | |
| (0.17 | ) | | | 50.02 | | | | 0.32 | | | | 4,002 | | | | 0.12 | † | | | 3.86 | † | | | 0.00 | |
The accompanying notes are an integral part of the financial statements.
90
Financial Highlights
Selected Per Share Data & Ratios
For a Share Outstanding Throughout the Period
| | | Net
Asset Value,
Beginning
of Period
($) | | Net Investment
Income
($)* | | Net Realized
and Unrealized
Loss on
Investments
($) | | Total from
Operations
($) | | Distribution
from Net
Investment
Income ($) | | Distribution
from Capital
Gains ($) | | Return of
Capital ($) |
| Global X Intermediate-Term Treasury Ladder ETF |
| 2024(1) | | | 50.04 | | | | 0.39 | | | | (1.38 | ) | | | (0.99 | ) | | | (0.20 | ) | | | — | | | | — | |
| Global X Long-Term Treasury Ladder ETF |
| 2024(1) | | | 50.16 | | | | 0.45 | | | | (2.79 | ) | | | (2.34 | ) | | | (0.21 | ) | | | — | | | | — | |
| * | Per share data calculated using average shares method. |
| ** | Total Return is for the period indicated and has not been annualized. The return shown does not reflect the deduction of taxes that a shareholder would pay on Fund distributions or the redemption of Fund shares. |
| † | Annualized. |
| †† | Portfolio turnover rate is for the period indicated and periods of less than one year have not been annualized. Excludes effect of in-kind transfers. |
| (1) | The Fund commenced operations on September 9, 2024. |
Amounts designated as “—” are either $0 or have been rounded to $0.
The accompanying notes are an integral part of the financial statements.
91
Financial Highlights
Total from
Distributions ($) | | Net
Asset Value,
End of
Period ($) | | Total
Return
(%)** | | Net Assets, End of
Period ($)(000) | | Ratio of Expenses
to Average Net
Assets (%) | | Ratio of Net
Investment Income
to Average Net
Assets (%) | | Portfolio
Turnover Rate
(%)†† |
| | | | | | | | | | | | | | | | | | | | | | | | | | |
| (0.20 | ) | | | 48.85 | | | | (1.98 | ) | | | 2,442 | | | | 0.12 | † | | | 3.50 | † | | | 0.19 | |
| | | | | | | | | | | | | | | | | | | | | | | | | | |
| (0.21 | ) | | | 47.61 | | | | (4.66 | ) | | | 21,424 | | | | 0.12 | † | | | 4.27 | † | | | 0.43 | |
The accompanying notes are an integral part of the financial statements.
92
Notes to Financial Statements
November 30, 2024
1. ORGANIZATION
The Global X Funds (the “Trust”) is a Delaware statutory trust formed on March 6, 2008. The Trust is registered under the Investment Company Act of 1940, as amended, (the “1940 Act”) as an open-end management investment company. As of November 30, 2024, the Trust had one hundred portfolios, ninety-seven of which were operational. The financial statements herein and the related notes pertain to the Global X MLP ETF, Global X MLP & Energy Infrastructure ETF, Global X Alternative Income ETF, Global X Conscious Companies ETF, Global X U.S. Preferred ETF, Global X S&P 500® Quality Dividend ETF, Global X Adaptive U.S. Factor ETF, Global X Variable Rate Preferred ETF, Global X Adaptive U.S. Risk Management ETF, Global X 1-3 Month T-Bill ETF, Global X U.S. Cash Flow Kings 100 ETF, Global X Short-Term Treasury Ladder ETF, Global X Intermediate-Term Treasury Ladder ETF and Global X Long-Term Treasury Ladder ETF (each a “Fund” and collectively, the “Funds”). Each Fund, other than the Global X Alternative Income ETF, Global X Conscious Companies ETF, Global X U.S. Preferred ETF, Global X S&P 500® Quality Dividend ETF, Global X Adaptive U.S. Factor ETF, Global X Variable Rate Preferred ETF, and Global X 1-3 Month T-Bill ETF, has elected non-diversified status under the 1940 Act.
The Global X Short-Term Treasury Ladder ETF, Global X Intermediate-Term Treasury Ladder ETF and Global X Long-Term Treasury Ladder ETF commenced operations on September 9, 2024.
2. SIGNIFICANT ACCOUNTING POLICIES
The following is a summary of the significant accounting policies followed by the Funds:
USE OF ESTIMATES — The Funds are investment companies that apply the accounting and reporting guidance issued in Topic 946 by the U.S. Financial Accounting Standards Board. The preparation of financial statements in conformity with U.S. generally accepted accounting principles (“U.S. GAAP”) requires management to make estimates and assumptions that affect the reported amounts of assets and liabilities, disclosure of contingent assets and liabilities at the date of the financial statements, and the reported amounts of increases and decreases in net assets from operations during the reporting period. Actual results could materially differ from those estimates.
RETURN OF CAPITAL ESTIMATES — Distributions received by the Funds from underlying master limited partnership (“MLP”) and real estate investment trust (“REIT”) investments generally are comprised of income and return of capital. The Funds record investment income and return of capital based on estimates made at the time such distributions are received. Such estimates are based on historical information available from the MLPs, REITs and other industry sources. These estimates may subsequently be revised based on information received from the MLPs and REITs after their tax reporting periods are concluded.
93
Notes to Financial Statements (Continued)
November 30, 2024
2. SIGNIFICANT ACCOUNTING POLICIES (continued)
MLPs — Certain Funds may invest in MLPs. MLPs are publicly-traded partnerships engaged in the transportation, storage and processing of minerals and natural resources. By confining their operations to these specific activities, their interests, or units, are able to trade on public securities exchanges exactly like the shares of a corporation, without entity-level taxation. To qualify as an MLP, and to not be taxed as a corporation, a partnership must receive at least 90% of its income from qualifying sources as set forth in Section 7704(d) of the Internal Revenue Code of 1986, as amended (the “Code”). These qualifying sources include natural resource-based activities, such as the processing, transportation and storage of mineral or natural resources. MLPs generally have two classes of owners, the general partner and limited partners. The general partner of an MLP is typically owned by a major energy company, an investment fund, the direct management of the MLP, or is an entity owned by one or more of such parties. The general partner may be structured as a private or publicly-traded corporation or other entity. The general partner typically controls the operations and management of the MLP through an up to 2% equity interest in the MLP plus, in many cases, ownership of common units and subordinated units.
Limited partners typically own the remainder of the partnership, through ownership of common units, and have a limited role in the partnership’s operations and management. MLPs are typically structured such that common units and general partner interests have first priority to receive quarterly cash distributions up to an established minimum amount (“minimum quarterly distributions” or “MQD”). Common and general partner interests also accrue arrearages in distributions to the extent the MQD is not paid. Once common and general partner interests have been paid, subordinated units receive distributions of up to the MQD; however, subordinated units do not accrue arrearages. Distributable cash in excess of the MQD is paid to both common and subordinated units and is distributed to both common and subordinated units generally on a pro rata basis. The general partner is also eligible to receive incentive distributions if the general partner operates the business in a manner which results in distributions paid per common unit surpassing specified target levels. As the general partner increases cash distributions to the limited partners, the general partner receives an increasingly higher percentage of the incremental cash distributions.
SECURITY VALUATION - Securities listed on a securities exchange, market or automated quotation system for which quotations are readily available (except for securities traded on the NASDAQ Stock Market (“NASDAQ”)), including securities traded over the counter, are valued at the last quoted sale price on the primary exchange or market (foreign or domestic) on which they are traded (or at approximately 4:00 pm Eastern Standard Time if a security’s primary exchange is normally open at that time), or, if there is no such reported sale, at the most recent mean between the quoted bid and asked prices, which approximates fair value (absent both bid and asked prices on such exchange, the bid price may be used).
For securities traded on NASDAQ, the NASDAQ Official Closing Price will be used. The prices for foreign securities are reported in local currencies and converted to U.S. dollars
94
Notes to Financial Statements (Continued)
November 30, 2024
2. SIGNIFICANT ACCOUNTING POLICIES (continued)
using currencies exchange rates as of the reporting date. The exchange rates used by the Trust for valuation are captured as of the New York or London close each day.
Securities for which market prices are not “readily available” are valued in accordance with fair value procedures (the “Fair Value Procedures”) established by Global X Management Company LLC, the Funds’ investment adviser (the “Adviser”), and approved by the Board of Trustees (the “Board”) of the Trust. Pursuant to Rule 2a-5 under the 1940 Act, the Board has designated the Adviser as the “valuation designee” to determine the fair value of securities and other instruments for which no readily available market quotations are available. The Fair Value Procedures are implemented through a fair value committee (the “Committee”) of the Adviser. Some of the more common reasons that may necessitate that a security be valued using the Fair Value Procedures include: the security’s trading has been halted or suspended; the security has been de-listed from its primary trading exchange; the security’s primary trading market is temporarily closed at a time when, under normal conditions, it would be open; the security has not been traded for an extended period of time; the security’s primary pricing source is not able or willing to provide a price; or trading of the security is subject to local government-imposed restrictions. In addition, each Fund may fair value a security if an event that may materially affect the value of a Fund’s security that traded outside of the United States (a “Significant Event”) has occurred between the time of the security’s last close and the time that each Fund calculates its net asset value (“NAV”). A Significant Event may relate to a single issuer or to an entire market sector. Events that may be Significant Events include: government actions, natural disasters, armed conflict, acts of terrorism and significant market fluctuations. If the Adviser becomes aware of a Significant Event that has occurred with respect to a security or group of securities after the closing of the exchange or market on which the security or securities principally trade, but before the time at which the Funds calculate their NAVs, it may request that a Committee meeting be called. When a security is valued in accordance with the Fair Value Procedures, the Committee will determine the value after taking into consideration all relevant information reasonably available to the Committee. As of November 30, 2024, there were no securities priced using the Fair Value Procedures.
If available, debt securities are priced based upon valuations provided by independent, third-party pricing agents. Such values generally reflect the last reported sales price if the security is actively traded. The third-party pricing agents may also value debt securities at an evaluated bid price by employing methodologies that utilize actual market transactions, broker-supplied valuations, or other methodologies designed to identify the market value for such securities. Debt obligations with remaining maturities of sixty days or less will be valued at their market value. Prices for most securities held by the Funds are provided daily by recognized independent pricing agents. If a security price cannot be obtained from
95
Notes to Financial Statements (Continued)
November 30, 2024
2. SIGNIFICANT ACCOUNTING POLICIES (continued)
an independent, third-party pricing agent, the Funds seek to obtain a bid price from at least one independent broker.
In accordance with the authoritative guidance on fair value measurements and disclosure under U.S. GAAP, the Funds disclose the fair value of their investments in a hierarchy that prioritizes the inputs to valuation techniques used to measure the fair value. The objective of a fair value measurement is to determine the price that would be received upon the sale of an asset or paid to transfer a liability in an orderly transaction between market participants at the measurement date (an exit price). Accordingly, the fair value hierarchy gives the highest priority to quoted prices (unadjusted) in active markets for identical assets or liabilities (Level 1) and the lowest priority to unobservable inputs (Level 3). The three levels of the fair value hierarchy are described below:
Level 1 — Unadjusted quoted prices in active markets for identical, unrestricted assets or liabilities that the Funds have the ability to access at the measurement date;
Level 2 — Other significant observable inputs (including quoted prices in non-active markets, quoted prices for similar investments and fair value of investments for which the Funds have the ability to fully redeem tranches at NAV as of the measurement date or within the near term, and short-term investments valued at amortized cost); and
Level 3 — Significant unobservable inputs (including the Funds’ own assumptions in determining the fair value of investments, and fair value of investments for which the Funds do not have the ability to fully redeem tranches at NAV as of the measurement date or within the near term).
Investments are classified within the level of the lowest significant input considered in determining fair value. Investments classified within Level 3 whose fair value measurement considers several inputs may include Level 1 or Level 2 inputs as components of the overall fair value measurement. For details of the investment classification, reference the Schedule of Investments.
The unobservable inputs used to determine fair value of Level 3 assets may have similar or diverging impacts on valuation. Significant increases and decreases in these inputs in isolation and interrelationships between those inputs could result in significantly higher or lower fair value measurement.
DUE TO/FROM BROKERS — Due to/from brokers includes cash and collateral balances with the Funds’ clearing brokers or counterparties as of November 30, 2024. The Funds continuously monitor the credit standing of each broker or counterparty with whom they
96
Notes to Financial Statements (Continued)
November 30, 2024
2. SIGNIFICANT ACCOUNTING POLICIES (continued)
conduct business. In the event a broker or counterparty is unable to fulfill its obligations, the Funds would be subject to counterparty credit risk.
REPURCHASE AGREEMENTS — Securities pledged as collateral for repurchase agreements are held by Brown Brothers Harriman & Co. (“BBH”) or The Bank of New York Mellon (“BNY Mellon”), as appropriate, in their roles as Custodian to respective Funds (each, a “Custodian” and together, the “Custodians”) and are designated as being held on each Fund’s behalf by the Custodian under a book-entry system. Each Fund monitors the adequacy of the collateral on a daily basis and can require the seller to provide additional collateral in the event the market value of the securities pledged falls below the carrying value of the repurchase agreement, including accrued interest.
It is each Fund’s policy to only enter into repurchase agreements with banks and other financial institutions which are deemed by the Adviser to be creditworthy. The Funds bear the risk of loss in the event that the counterparty to a repurchase agreement defaults on its obligations, and the Funds are prevented from exercising their rights to dispose of the underlying securities received as collateral. For financial statement purposes, the Funds record the securities lending collateral (included in repurchase agreements, at value or restricted cash) as an asset and the obligation to return securities lending collateral as a liability on the Statements of Assets and Liabilities.
Repurchase agreements are entered into by the Funds under Master Repurchase Agreements (each, an “MRA”) which permit the Funds, under certain circumstances, including an event of default (such as bankruptcy or insolvency), to offset payables and/or receivables under an MRA with collateral held and/or posted to the counterparty, and create one single net payment due to or from the Funds.
FEDERAL INCOME TAXES — It is each Fund’s intention, except for the Global X MLP ETF, to qualify, or to continue to qualify, as a regulated investment company for Federal income tax purposes by complying with the appropriate provisions of Subchapter M of the Code. Accordingly, no provisions for Federal income taxes have been made in the financial statements, except for Global X MLP ETF as described below.
The Funds evaluate tax positions taken or expected to be taken in the course of preparing the Funds’ tax returns to determine whether it is “more-likely-than-not” (i.e., greater than 50%) that each tax position will be sustained upon examination by a taxing authority based on the technical merits of the position. Tax positions not deemed to meet the more-likely-than-not threshold are recorded as a tax benefit or expense in the current year. The Funds did not record any tax positions in the current period; however, Management’s conclusions regarding tax positions may be subject to review and adjustment at a later date based on factors including, but not limited to, examination by tax authorities (i.e., the last three tax year ends, as applicable), and on-going analysis of and changes to tax laws and regulations,
97
Notes to Financial Statements (Continued)
November 30, 2024
2. SIGNIFICANT ACCOUNTING POLICIES (continued)
and interpretations thereof. If a Fund has foreign tax filings that have not been made, the tax years that remain subject to examination may date back to the inception of the Fund.
As of and during the year ended November 30, 2024, the Funds did not have a liability for any unrecognized tax benefits. The Funds recognize interest and penalties, if any, related to unrecognized tax benefits as an income tax expense on the Statements of Operations. During the reporting period, the Funds did not incur any interest or penalties, except for Global X MLP ETF. The Funds are also not aware of any tax positions for which it is reasonably possible that the total amounts of unrecognized tax benefits will significantly change in the next 12 months.
The Global X MLP ETF is taxed as a C-corporation for Federal income tax purposes and as such is obligated to pay Federal and applicable state corporate income tax. Currently, the Federal income tax rate for a corporation is 21%. This differs from most investment companies, which elect to be treated as “regulated investment companies” under Subchapter M of the Code in order to avoid paying entity level income taxes. Under current law, the Global X MLP ETF is not eligible to elect treatment as a regulated investment company due to its investments primarily in MLPs invested in energy assets. As a result, the Global X MLP ETF will be obligated to pay applicable Federal and state corporate income taxes on its taxable income as opposed to most other investment companies, which are not so obligated. The Global X MLP ETF expects that a portion of the distributions that are received from MLPs may be treated as a tax-deferred return of capital, thus reducing the Global X MLP ETF’s current tax liability. However, the amount of taxes currently paid by the Global X MLP ETF will vary depending on the amount of income and gains derived from investments and/or sales of MLP interests and such taxes have the potential to reduce an investor’s return from an investment in the Global X MLP ETF.
SECURITY TRANSACTIONS AND INVESTMENT INCOME — Security transactions are accounted for on the trade date for financial reporting purposes. Costs used in determining realized gains and losses on the sale of investment securities are based on specific identification. Dividend income is recorded on the ex-dividend date. Interest income is recognized on the accrual basis from the settlement date. Amortization of premiums and accretion of discounts is included in interest income.
FOREIGN CURRENCY TRANSACTIONS AND TRANSLATION — The books and records of the Funds are maintained in U.S. dollars. Investment securities and other assets and liabilities denominated in a foreign currency are translated into U.S. dollars on the date of valuation. Purchases and sales of investment securities, income and expenses are translated into U.S. dollars at the relevant rates of exchange prevailing on the respective dates of such transactions. The Funds do not isolate that portion of realized or unrealized gains and losses resulting from changes in the foreign exchange rate from fluctuations arising from changes in the market prices of the securities. These gains and losses are
98
Notes to Financial Statements (Continued)
November 30, 2024
2. SIGNIFICANT ACCOUNTING POLICIES (continued)
included in net realized and unrealized gains and losses on investments on the Statements of Operations. Net realized and unrealized gains and losses on foreign currency transactions and translations represent net foreign exchange gains or losses from foreign currency spot contracts, disposition of foreign currencies, currency gains or losses realized between trade and settlement dates on securities transactions and the difference between the amount of the investment income and foreign withholding taxes recorded on the Funds’ books and the U.S. dollar equivalent amounts actually received or paid.
DIVIDENDS AND DISTRIBUTIONS TO SHAREHOLDERS — The Funds distribute their net investment income on a pro rata basis. Any net investment income and net realized capital gains are distributed at least annually. All distributions are recorded on the ex-dividend date.
Cash distributions from MLPs to the Global X MLP ETF that exceed the Global X MLP ETF’s allocable share of such MLP’s net taxable income are considered tax-deferred return of capital that will reduce the Global X MLP ETF’s adjusted tax basis in the equity securities of the MLP. These reductions in the Global X MLP ETF’s adjusted tax basis in MLP equity securities will increase the amount of gain (or decrease the amount of loss) recognized by the Global X MLP ETF on a subsequent sale of the securities. The Global X MLP ETF will accrue deferred income taxes for any future tax liability associated with (i) that portion of MLP distributions considered to be a tax-deferred return of capital as well as (ii) capital appreciation of its investments. Upon the sale of an MLP security, the Global X MLP ETF may be liable for previously deferred taxes. The Global X MLP ETF will rely to some extent on information provided by the MLPs, which may not necessarily be timely, to estimate deferred tax liability for purposes of financial statement reporting and determining the Global X MLP ETF’s NAV. From time to time, the Adviser will modify the estimates or assumptions related to the Global X MLP ETF’s deferred tax liabilities as new information becomes available. The Global X MLP ETF will generally compute deferred income taxes based on the Federal income tax rate applicable to corporations and an estimated rate attributable to state taxes.
INVESTMENTS IN REITs — With respect to the Funds, dividend income is recorded based on the income included in distributions received from REIT investments using published REIT reclassifications, including some management estimates when actual amounts are not available. Distributions received in excess of these estimated amounts are recorded as a reduction of the cost of investments or reclassified to capital gains. The actual amounts of income, return of capital, and capital gains are only determined by each REIT after its fiscal year end, and may differ from the estimated amounts.
The Global X Alternative Income ETF’s dividend income includes reclassifications of prior year and current year dividend income to return of capital/realized gain to align those income amounts to the character of those distributions. Those reclassifications exceeded
99
Notes to Financial Statements (Continued)
November 30, 2024
2. SIGNIFICANT ACCOUNTING POLICIES (continued)
current year dividend income resulting in a negative dividend income for the current fiscal year.
CASH OVERDRAFT CHARGES — Per the terms of an agreement with BBH, if a Fund for which BBH is Custodian has a cash overdraft on a given day, it will be assessed an overdraft charge equal to the applicable BBH Base Rate plus 2.00%. Per the terms of an agreement with BNY Mellon, if a Fund for which BNY Mellon is Custodian has a cash overdraft, it will be charged interest at a rate then charged by BNY Mellon to its institutional custody clients in the relevant currency. Cash overdraft charges are included in custodian fees on the Statements of Operations
CREATION UNITS — The Funds issue and redeem their shares (“Shares”) on a continuous basis at NAV and only in large blocks of 10,000 Shares, referred to as “Creation Units”. Purchasers of Creation Units (each, an “Authorized Participants”) at NAV must pay a standard creation transaction fee per transaction. The fee is a single charge and will be the same regardless of the number of Creation Units purchased by an Authorized Participant on the same day.
An Authorized Participant who holds Creation Units and wishes to redeem at NAV would also pay a standard redemption fee per transaction to the Fund’s Custodian, on the date of such redemption, regardless of the number of Creation Units redeemed that day. If a Creation Unit is purchased or redeemed for cash, an additional variable fee may be charged. The following table discloses the Creation Unit breakdown:
| | | Creation
Unit
Shares | | Creation
Fee | | Redemption
Fee |
| Global X MLP ETF | | | 10,000 | | | $ | 100 | | | $ | 100 | |
| Global X MLP & Energy Infrastructure ETF | | | 10,000 | | | | 250 | | | | 250 | |
| Global X Alternative Income ETF | | | 10,000 | | | | 250 | | | | 250 | |
| Global X Conscious Companies ETF | | | 10,000 | | | | 500 | | | | 500 | |
| Global X U.S. Preferred ETF | | | 10,000 | | | | 650 | | | | 650 | |
| Global X S&P 500® Quality Dividend ETF | | | 10,000 | | | | 250 | | | | 250 | |
| Global X Adaptive U.S. Factor ETF | | | 10,000 | | | | 600 | | | | 600 | |
| Global X Variable Rate Preferred ETF | | | 10,000 | | | | 250 | | | | 250 | |
| Global X Adaptive U.S. Risk Management ETF | | | 10,000 | | | | 1,300 | | | | 1,300 | |
| Global X 1-3 Month T-Bill ETF | | | 10,000 | | | | 250 | | | | 250 | |
| Global X U.S. Cash Flow Kings 100 ETF | | | 10,000 | | | | 250 | | | | 250 | |
| Global X Short-Term Treasury Ladder ETF | | | 10,000 | | | | 250 | | | | 250 | |
| Global X Intermediate-Term Treasury Ladder ETF | | | 10,000 | | | | 250 | | | | 250 | |
| Global X Long-Term Treasury Ladder ETF | | | 10,000 | | | | 250 | | | | 250 | |
100
Notes to Financial Statements (Continued)
November 30, 2024
3. RELATED PARTY AND SERVICE PROVIDER TRANSACTIONS
On July 2, 2018, the Adviser consummated a transaction pursuant to which it became an indirect, wholly-owned subsidiary of Mirae Asset Global Investments Co., Ltd. (“Mirae”). In this manner, the Adviser is ultimately controlled by Mirae.
The Adviser serves as the investment adviser and the administrator for the Funds. Subject to the supervision of the Board, the Adviser is responsible for managing the investment activities of the Funds and the Funds’ business affairs and other administrative matters and provides or causes to be furnished all supervisory, administrative and other services reasonably necessary for the operation of the Funds, including certain distribution services (provided pursuant to a separate distribution agreement), certain shareholder and distribution-related services (provided pursuant to a separate Rule 12b-1 Plan and related agreements) and investment advisory services (provided pursuant to a separate investment advisory agreement), under what is essentially an “all-in” fee structure.
For the Adviser’s service to the Funds, under a supervision and administration agreement (the “Supervision and Administration Agreement”), each Fund pays a monthly fee to the Adviser at the annual rate below (stated as a percentage of the average daily net assets of the respective Fund) (the “Supervision and Administration Fee”). In addition, the Funds bear other expenses, directly and indirectly, that are not covered by the Supervision and Administration Agreement, which may vary and affect the total expense ratios of the Funds, such as taxes, brokerage fees, commissions, certain custodian fees, acquired fund fees and expenses (except for the Global X Alternative Income ETF, Global X U.S. Preferred ETF, Global X Variable Rate Preferred ETF and Global X Adaptive U.S. Risk Management ETF with respect to investments in affiliated investment companies), and other transaction expenses, interest expenses and extraordinary expenses (such as litigation and indemnification expenses).
The Supervision and Administration Agreement for each of the Global X Alternative Income ETF, Global X U.S. Preferred ETF, Global X Variable Rate Preferred ETF and Global X Adaptive U.S. Risk Management ETF provides that the Adviser also bears the costs for acquired fund fees and expenses generated by investments by the Funds in affiliated investment companies. For the year ended November 30, 2024, the Adviser paid acquired fund fees and expenses for the Global X Alternative Income ETF of $123,393 and made such reimbursement payments to the Fund on a monthly basis. These amounts are included in Payment from Adviser on the Statement of Operations.
101
Notes to Financial Statements (Continued)
November 30, 2024
3. RELATED PARTY AND SERVICE PROVIDER TRANSACTIONS (continued)
The following table discloses the supervision and administration fees payable pursuant to the Supervision and Administration Agreement:
| | Supervision and
Administration Fee |
| Global X MLP ETF | 0.45% |
| Global X MLP & Energy Infrastructure ETF | 0.45% |
| Global X Alternative Income ETF | 0.50% |
| Global X Conscious Companies ETF | 0.43% |
| Global X U.S. Preferred ETF | 0.23% |
| Global X S&P 500® Quality Dividend ETF | 0.20% |
| Global X Adaptive U.S. Factor ETF | 0.27% |
| Global X Variable Rate Preferred ETF | 0.25% |
| Global X Adaptive U.S. Risk Management ETF | 0.39% |
| Global X 1-3 Month T-Bill ETF | 0.07% |
| Global X U.S. Cash Flow Kings 100 ETF | 0.25% |
| Global X Short-Term Treasury Ladder ETF | 0.12% |
| Global X Intermediate-Term Treasury Ladder ETF | 0.12% |
| Global X Long-Term Treasury Ladder ETF | 0.12% |
SEI Investments Global Funds Services (“SEIGFS”) serves as sub-administrator to the Funds. As sub-administrator, SEIGFS provides the Funds with required general administrative services, including, without limitation: office space, equipment, and personnel; clerical and general back office services; bookkeeping, internal accounting and secretarial services; the calculation of NAV; and assistance with the preparation and filing of reports, registration statements, proxy statements and other materials required to be filed or furnished by the Funds under federal and state securities laws. As compensation for these services, SEIGFS receives certain out-of-pocket costs, transaction fees and asset-based fees which are accrued daily and paid monthly by the Adviser.
SEI Investments Distribution Co. (“SIDCO”) serves as the Funds’ underwriter and distributor of Creation Units pursuant to a distribution agreement (the “Distribution Agreement”). SIDCO has no obligation to sell any specific quantity of Shares.
SIDCO bears the following costs and expenses relating to the distribution of Shares: (1) the costs of processing and maintaining records of creations of Creation Units; (2) all costs of maintaining the records required of a registered broker/dealer; (3) the expenses of maintaining its registration or qualification as a dealer or broker under Federal or state laws; (4) filing fees; and (5) all other expenses incurred in connection with the distribution services as contemplated in the Distribution Agreement. SIDCO receives no fee from the
102
Notes to Financial Statements (Continued)
November 30, 2024
3. RELATED PARTY AND SERVICE PROVIDER TRANSACTIONS (continued)
Funds for its distribution services under the Distribution Agreement; rather, the Adviser compensates SIDCO for certain expenses, out-of-pocket costs, and transaction fees.
For all Funds other than the Global X 1-3 Month T-Bill ETF, Global X U.S. Cash Flow Kings 100 ETF, Global X Short-Term Treasury Ladder ETF, Global X Intermediate-Term Treasury Ladder EFT and Global X Long-Term Treasury Ladder ETF, BBH serves as the Custodian and transfer agent of the Funds’ assets. As Custodian, BBH has agreed to (1) make receipts and disbursements of money on behalf of the Funds; (2) collect and receive all income and other payments and distributions on account of the Funds’ portfolio investments; (3) respond to correspondence from shareholders, security brokers and others relating to its duties; and (4) make periodic reports to the Funds concerning the Funds’ operations. BBH does not exercise any supervisory function over the purchase and sale of securities. As transfer agent, BBH has agreed to (1) issue and redeem Shares of each Fund; (2) make dividend and other distributions to shareholders of each Fund; (3) respond to correspondence by shareholders and others relating to its duties; (4) maintain shareholder accounts; and (5) make periodic reports to the Funds. As compensation for these services, BBH receives certain out-of-pocket costs, transaction fees and asset-based fees which are accrued daily and paid monthly by the Adviser from its fees.
BNY Mellon serves as Custodian and transfer agent to the Trust on behalf of the Global X 1-3 Month T-Bill ETF, Global X U.S. Cash Flow Kings 100 ETF, Global X Short-Term Treasury Ladder ETF, Global X Intermediate-Term Treasury Ladder ETF and Global X Long-Term Treasury Ladder ETF. As Custodian, BNY Mellon may appoint domestic and foreign sub-custodians and use depositories from time to time to hold securities and other instruments purchased by the Trust in foreign countries and to hold cash and currencies for the Trust on behalf of the Funds. Under its transfer agency agreement with the Trust, BNY Mellon has undertaken with the Trust to provide the following services with respect to the Funds for which it serves as Transfer Agent: (i) perform and facilitate the performance of purchases and redemptions of Creation Units, (ii) prepare and transmit by means of Depository Trust Company’s (“DTC”) book-entry system payments for dividends and distributions on or with respect to the Shares declared by the Trust on behalf of the Funds, as applicable, (iii) prepare and deliver reports, information and documents as specified in the transfer agency agreement, (iv) perform the customary services of a transfer agent and dividend disbursing agent, and (v) render certain other miscellaneous services as specified in the transfer agency agreement or as otherwise agreed upon.
4. INVESTMENT TRANSACTIONS
For the year or period ended November 30, 2024, the purchases and sales of investments in securities, excluding in-kind transactions, long-term U.S. Government, and short-term securities were:
103
Notes to Financial Statements (Continued)
November 30, 2024
4. INVESTMENT TRANSACTIONS (continued)
| | | Purchases | | Sales and
Maturities |
| Global X MLP ETF | | $ | 477,965,598 | | | $ | 834,514,277 | |
| Global X MLP & Energy Infrastructure ETF | | | 350,229,143 | | | | 416,599,009 | |
| Global X Alternative Income ETF | | | 2,457,056 | | | | 3,558,062 | |
| Global X Conscious Companies ETF | | | 136,839,325 | | | | 137,557,014 | |
| Global X U.S. Preferred ETF | | | 750,905,702 | | | | 643,549,092 | |
| Global X S&P 500® Quality Dividend ETF | | | 25,365,433 | | | | 25,575,279 | |
| Global X Adaptive U.S. Factor ETF | | | 257,119,646 | | | | 255,136,990 | |
| Global X Variable Rate Preferred ETF | | | 175,612,878 | | | | 145,109,023 | |
| Global X Adaptive U.S. Risk Management ETF | | | 163,443,313 | | | | 162,530,519 | |
| Global X 1-3 Month T-Bill ETF | | | 2,754,253,867 | | | | 1,933,194,730 | |
| Global X U.S. Cash Flow Kings 100 ETF | | | 3,326,853 | | | | 3,306,084 | |
| Global X Short-Term Treasury Ladder ETF | | | – | | | | – | |
| Global X Intermediate-Term Treasury Ladder ETF | | | – | | | | – | |
| Global X Long-Term Treasury Ladder ETF | | | 49,895 | | | | – | |
For the year or period ended November 30, 2024, the below funds had purchases and sales of long-term U.S. Government securities:
| | | Purchases | | | Sales | |
| Global X Adaptive U.S. Risk Management ETF | | $ | 124,202,266 | | | $ | 124,236,816 | |
| Global X Short-Term Treasury Ladder ETF | | | 4,996 | | | | – | |
| Global X Intermediate-Term Treasury Ladder ETF | | | 6,456 | | | | 4,602 | |
| Global X Long-Term Treasury Ladder ETF | | | 187,296 | | | | 64,051 | |
For the year or period ended November 30, 2024, in-kind transactions associated with creations and redemptions were:
| | | Purchases | | | Sales | | | Realized
Gain/(Loss) | |
| Global X MLP ETF | | $ | 277,927,234 | | | $ | – | | | $ | – | |
| Global X MLP & Energy Infrastructure ETF | | | 1,026,161,455 | | | | 250,559,021 | | | | 129,747,883 | |
| Global X Alternative Income ETF | | | 3,970,925 | | | | 6,933,375 | | | | 364,632 | |
| Global X Conscious Companies ETF | | | 160,222,814 | | | | 236,957,792 | | | | 76,839,546 | |
| Global X U.S. Preferred ETF | | | 266,659,783 | | | | 253,621,114 | | | | 17,640,090 | |
| Global X S&P 500® Quality Dividend ETF | | | 23,381,206 | | | | 45,169,852 | | | | 2,759,895 | |
| Global X Adaptive U.S. Factor ETF | | | 358,948,162 | | | | 249,318,875 | | | | 54,391,253 | |
| Global X Variable Rate Preferred ETF | | | 72,727,818 | | | | 42,218,353 | | | | 2,418,045 | |
| Global X Adaptive U.S. Risk Management ETF | | | 59,397,071 | | | | 46,571,415 | | | | 11,699,731 | |
| Global X 1-3 Month T-Bill ETF | | | 984,224,872 | | | | 217,876,439 | | | | 5,640 | |
| Global X U.S. Cash Flow Kings 100 ETF | | | 4,821,980 | | | | 5,068,873 | | | | 771,309 | |
| Global X Short-Term Treasury Ladder ETF | | | 3,968,144 | | | | – | | | | – | |
| Global X Intermediate-Term Treasury Ladder ETF | | | 2,484,424 | | | | – | | | | – | |
| Global X Long-Term Treasury Ladder ETF | | | 21,308,706 | | | | – | | | | – | |
5. TAX INFORMATION
Global X MLP ETF recognizes interest and penalties, if any, related to unrecognized tax benefits within the income tax expense line in the accompanying Statement of Operations.
104
Notes to Financial Statements (Continued)
November 30, 2024
5. TAX INFORMATION (continued)
Accrued interest and penalties, if any, are included within the related tax liability line in the Statement of Assets and Liabilities. For the year ended November 30, 2024, Global X MLP ETF paid $91,114 of penalties and interest.
Since Global X MLP ETF will be subject to taxation on its taxable income, the NAV of Global X MLP ETF shares will also be reduced by the accrual of any current and deferred tax liabilities.
Global X MLP ETF’s income tax expense/(benefit) consists of the following for the year ended November 30, 2024:
| | | Current MLP | | | Deferred
MLP | | | Total MLP | |
| Federal | | $ | 24,039,661 | | | $ | 63,132,969 | | | $ | 87,172,630 | |
| State | | | 1,054,541 | | | | 3,852,175 | | | | 4,906,716 | |
| Valuation allowance | | | — | | | | — | | | | — | |
| Total tax expense (benefit) | | $ | 25,094,202 | | | $ | 66,985,144 | | | $ | 92,079,346 | |
Deferred income taxes reflect the net tax effect of temporary differences between the carrying amount of assets and liabilities for financial reporting and tax purposes.
Components of the Global X MLP ETF’s deferred tax assets and liabilities are as follows for the year ended November 30, 2024:
| | | MLP | |
| Deferred tax assets: | | | | |
| State Net Operating Loss Carryforward | | | $ 95,135 | |
| Capital Loss Carryforward | | | 23,919,300 | |
| Other | | | 1,784,748 | |
| Less Variation Allowance | | | — | |
| | | | | |
| Deferred tax liabilities: | | | | |
| Net unrealized gain on investment securities | | | (115,276,106 | ) |
| Book vs tax partnership income to be recognized | | | (44,853,129 | ) |
| Net Deferred Tax Asset/(Liability) | | | $ (134,330,052 | ) |
The Global X MLP ETF reviews the recoverability of its deferred tax assets based upon the weight of available evidence. When assessing the recoverability of its deferred tax assets, significant weight is given to the effects of potential future realized and unrealized gains on investments and the period over which these deferred tax assets can be realized. Currently, any capital losses that may be generated by the Global X MLP ETF are eligible to be carried back up to three years and can be carried forward for five years to offset capital gains recognized by the Global X MLP ETF in those years.
105
Notes to Financial Statements (Continued)
November 30, 2024
5. TAX INFORMATION (continued)
The Global X MLP ETF has estimated capital loss carryforwards for Federal income tax purposes as follows:
| | | Year Ended | | | Amount | | | Expiration | |
| Global X MLP ETF | | | 11/30/2020 | | | | $ 70,603,684 | | | | 11/30/2025 | |
| | | | 11/30/2021 | | | | 37,432,903 | | | | 11/30/2026 | |
Based upon the Global X MLP ETF’s assessment, it has been determined that it is more likely than not that the Global X MLP ETF’s deferred tax assets will be realized through future taxable income of the appropriate character. Accordingly, no valuation allowance has been established for the Global X MLP ETF’s deferred tax assets. The Global X MLP ETF will continue to assess the need for a valuation allowance in the future. Significant increases or declines in the fair value of its portfolio of investments may change the Global X MLP ETF’s assessment of the recoverability of these assets and may result in the recording or removal of a valuation allowance against all or a portion of the Global X MLP ETF’s gross deferred tax assets.
Total income tax expense/benefit (current and deferred) during the year ended November 30, 2024, differs from the amount computed by applying the Federal statutory income tax rate of 21% for the Global X MLP ETF to net investment and realized and unrealized gain/ (losses) on investment before taxes as follows:
For the year ended November 30, 2024:
| | | MLP |
| Income tax (benefit) at statutory rate | | $ | 87,813,235 | | | | 21.00 | % |
| State income taxes (net of federal benefit) | | | 4,767,004 | | | | 1.14 | % |
| Permanent differences, net | | | (975,664) | | | | -0.23 | % |
| Effect of state tax rate change | | | 474,771 | | | | 0.11 | % |
| Net income tax expense/(benefit) | | $ | 92,079,346 | | | | 22.02 | % |
The Global X MLP ETF recognizes the tax benefits of uncertain tax positions only where the position is “more likely than not” to be sustained assuming examination by tax authorities. Management has analyzed the Global X MLP ETF’s tax positions, and has concluded that no liability for unrecognized tax benefits should be recorded related to uncertain tax positions taken on U.S. tax returns and state tax returns filed since the inception of the Global X MLP ETF. No U.S. Federal or state income tax returns are currently under examination. The tax years ended November 30, 2023, 2022, and 2021 remain subject to examination by tax authorities in the United States. Due to the nature of the Global X MLP ETF’s investments, the Global X MLP ETF may be required to file income tax returns in several states. The Global X MLP ETF is not aware of any tax positions for which it is reasonably possible that the total amounts of unrecognized tax benefits will change materially in the next 12 months.
106
Notes to Financial Statements (Continued)
November 30, 2024
5. TAX INFORMATION (continued)
State franchise taxes are separate and distinct from state income taxes. State franchise taxes are imposed on a corporation for the right to conduct business in the state and typically are based off the net worth or capital apportioned to a state. Due to the nature of the Global X MLP ETF’s investments, the Global X MLP ETF may be required to file franchise state tax returns in several states.
The amount and character of income and capital gain distributions to be paid, if any, are determined in accordance with Federal income tax regulations, which may differ from U.S. GAAP. As a result, net investment income (loss) and net realized gain (loss) on investment transactions for a reporting period may differ significantly from distributions during such period. These book/tax differences may be temporary or permanent. To the extent these differences are permanent in nature, they are charged or credited to undistributed net investment income (loss), accumulated net realized gain (loss) or paid-in capital, as appropriate, in the period that the differences arise.
The differences have been reclassified on the Statements of Assets and Liabilities to/from the Paid-in-Capital and Total Earnings (Accumulated Losses) accounts during the fiscal year ended November 30, 2024 are primarily attributable to REIT adjustments, MLP adjustments, redemptions in-kind, and preferred security adjustments.
The tax character of dividends and distributions declared during the years or periods ended November 30, 2024 and November 30, 2023 were as follows:
| Global X Funds | | Ordinary
Income | | | Long-Term
Capital Gain | | | Return of Capital | | | Totals | |
| Global X MLP ETF | | | | | | | | | | | | | |
| 2024 | | $ | 115,595,860 | | | $ | – | | | $ | 1,982,760 | | | $ | 117,578,620 | |
| 2023 | | | 106,518,075 | | | | – | | | | – | | | | 106,518,075 | |
| Global X MLP & Energy Infrastructure ETF | | | | | | | | | | |
| 2024 | | $ | 53,140,384 | | | $ | – | | | $ | 23,571,771 | | | $ | 76,712,155 | |
| 2023 | | | 47,511,225 | | | | – | | | | 7,533,664 | | | | 55,044,889 | |
| Global X Alternative Income ETF | | | | | | | | | | |
| 2024 | | $ | 2,526,973 | | | $ | – | | | $ | – | | | $ | 2,526,973 | |
| 2023 | | | 2,657,760 | | | | – | | | | – | | | | 2,657,760 | |
| Global X Conscious Companies ETF | | | | | | | | | | |
| 2024 | | $ | 6,793,472 | | | $ | – | | | $ | – | | | $ | 6,793,472 | |
| 2023 | | | 6,163,099 | | | | – | | | | – | | | | 6,163,099 | |
| Global X U.S. Preferred ETF | | | | | | | | | | |
| 2024 | | $ | 150,870,425 | | | $ | – | | | $ | – | | | $ | 150,870,425 | |
| 2023 | | | 144,784,500 | | | | – | | | | – | | | | 144,784,500 | |
| Global X S&P 500® Quality Dividend ETF | | | | | | | | | | |
| 2024 | | $ | 909,421 | | | $ | – | | | $ | 38,624 | | | $ | 948,045 | |
| 2023 | | | 1,991,843 | | | | – | | | | – | | | | 1,991,843 | |
107
Notes to Financial Statements (Continued)
November 30, 2024
5. TAX INFORMATION (continued)
| Global X Funds | | Ordinary
Income | | | Long-Term
Capital Gain | | | Return of Capital | | | Totals | |
| Global X Adaptive U.S. Factor ETF | | | | | | | | | | |
| 2024 | | $ | 6,630,997 | | | $ | – | | | $ | 710,305 | | | $ | 7,341,302 | |
| 2023 | | | 3,511,163 | | | | – | | | | 453,852 | | | | 3,965,015 | |
| Global X Variable Rate Preferred ETF | | | | | | | | | | |
| 2024 | | $ | 18,281,239 | | | $ | – | | | $ | – | | | $ | 18,281,239 | |
| 2023 | | | 16,361,150 | | | | – | | | | – | | | | 16,361,150 | |
| Global X Adaptive U.S. Risk Management ETF | | | | | | | | | | |
| 2024 | | $ | 1,199,990 | | | $ | – | | | $ | – | | | $ | 1,199,990 | |
| 2023 | | | 1,310,795 | | | | – | | | | – | | | | 1,310,795 | |
| Global X 1-3 Month T-Bill ETF | | | | | | | | | | |
| 2024 | | $ | 21,691,011 | | | $ | – | | | $ | – | | | $ | 21,691,011 | |
| 2023 | | | 1,251,315 | | | | – | | | | – | | | | 1,251,315 | |
| Global X U.S. Cash Flow Kings 100 ETF | | | | | | | | | | |
| 2024 | | $ | 78,689 | | | $ | – | | | $ | – | | | $ | 78,689 | |
| 2023 | | | 17,340 | | | | – | | | | – | | | | 17,340 | |
| Global X Short-Term Treasury Ladder ETF | | | | | | | | | | |
| 2024 | | $ | 11,440 | | | $ | – | | | $ | – | | | $ | 11,440 | |
| Global X Intermediate-Term Treasury Ladder ETF | | | | | | | | | | |
| 2024 | | $ | 10,050 | | | $ | – | | | $ | – | | | $ | 10,050 | |
| Global X Long-Term Treasury Ladder ETF | | | | | | | | | | |
| 2024 | | $ | 62,250 | | | $ | – | | | $ | – | | | $ | 62,250 | |
As of November 30, 2024, the components of tax basis distributable earnings (accumulated losses) were as follows:
| | | Global X MLP
& Energy
Infrastructure
ETF | | | Global X
Alternative
Income ETF | |
| Undistributed Ordinary Income | | $ | – | | | $ | 126,506 | |
| Capital Loss Carryforwards | | | (121,011,253 | ) | | | (1,472,606 | ) |
| Unrealized Appreciation (Depreciation) on Investments and Foreign Currency | | | 692,525,174 | | | | (3,911,710 | ) |
| Other Temporary Differences | | | 2 | | | | 8 | |
| Total Distributable Earnings (Accumulated Losses) | | $ | 571,513,923 | | | $ | (5,257,802 | ) |
108
Notes to Financial Statements (Continued)
November 30, 2024
5. TAX INFORMATION (continued)
| | | Global X
Conscious
Companies ETF | | Global X U.S.
Preferred ETF | | Global X S&P
500® Quality
Dividend ETF |
| Undistributed Ordinary Income | | $ | 2,885,935 | | | $ | 1,393,232 | | | $ | – | |
| Capital Loss Carryforwards | | | (63,071,179 | ) | | | (369,032,904 | ) | | | (7,860,515 | ) |
| Unrealized Appreciation (Depreciation) on Investments and Foreign Currency | | | 138,870,795 | | | | (140,820,125 | ) | | | 1,727,135 | |
| Other Temporary Differences | | | (1 | ) | | | 697 | | | | (2 | ) |
| Total Distributable Earnings (Accumulated Losses) | | $ | 78,685,550 | | | $ | (508,459,100 | ) | | $ | (6,133,382 | ) |
| | | | | | | | | | | | | |
| | | Global X
Adaptive U.S.
Factor ETF | | Global X
Variable Rate
Preferred ETF | | Global X
Adaptive
U.S. Risk
Management
ETF |
| Undistributed Ordinary Income | | $ | – | | | $ | 1,198,651 | | | $ | 687,203 | |
| Capital Loss Carryforwards | | | (31,475,088 | ) | | | (30,634,857 | ) | | | (1,130,331 | ) |
| Unrealized Appreciation on Investments and Foreign Currency | | | 32,341,265 | | | | 6,484,748 | | | | 6,300,119 | |
| Other Temporary Differences | | | 1 | | | | 611,230 | | | | (1 | ) |
| Total Distributable Earnings (Accumulated Losses) | | $ | 866,178 | | | $ | (22,340,228 | ) | | $ | 5,856,990 | |
| | | | | | | | | | | | | |
| | | Global X 1-3
Month T-Bill
ETF | | Global X U.S.
Cash Flow
Kings 100 ETF | | Global X Short-
Term Treasury
Ladder ETF |
| Undistributed Ordinary Income | | $ | 1,502,370 | | | $ | 3,520 | | | $ | 17,194 | |
| Capital Loss Carryforwards | | | – | | | | (83,505 | ) | | | – | |
| Unrealized Appreciation (Depreciation) on Investments and Foreign Currency | | | 112,329 | | | | 218,451 | | | | (17,297 | ) |
| Other Temporary Differences | | | – | | | | 1 | | | | 1 | |
| Total Distributable Earnings (Accumulated Losses) | | $ | 1,614,699 | | | $ | 138,467 | | | $ | (102 | ) |
109
Notes to Financial Statements (Continued)
November 30, 2024
5. TAX INFORMATION (continued)
| | | Global X
Intermediate-
Term Treasury
Ladder ETF | | Global X Long-
Term Treasury
Ladder ETF |
| Undistributed Ordinary Income | | $ | 9,211 | | | $ | 61,754 | |
| Capital Loss Carryforwards | | | (62 | ) | | | – | |
| Unrealized Depreciation on Investments and Foreign Currency | | | (68,812 | ) | | | (247,626 | ) |
| Other Temporary Differences | | | – | | | | (2 | ) |
| Total Accumulated Losses | | $ | (59,663 | ) | | $ | (185,874 | ) |
For taxable years beginning after December 22, 2010, a registered investment company is permitted to carry forward net capital losses to offset capital gains realized in later years, and the losses carried forward retain their original character as either long-term or short-term losses.
The Federal tax cost basis of investments and aggregate gross unrealized appreciation and depreciation on investments held by the Funds at November 30, 2024 were as follows:
| Global X Funds | | Federal Tax
Cost | | Aggregated
Gross
Unrealized
Appreciation | | Aggregated
Gross
Unrealized
Depreciation | | Net Unrealized
Appreciation
(Depreciation) |
| Global X MLP ETF | | $1,171,319,393 | | $723,258,177 | | $(548) | | $723,257,629 |
| Global X MLP & Energy Infrastructure ETF | | 1,682,828,261 | | 766,117,307 | | (73,592,133) | | 692,525,174 |
| Global X Alternative Income ETF | | 39,791,731 | | 2,334,269 | | (6,245,979) | | (3,911,710) |
| Global X Conscious Companies ETF | | 513,744,007 | | 149,579,911 | | (10,709,116) | | 138,870,795 |
| Global X U.S. Preferred ETF | | 2,622,733,576 | | 56,020,115 | | (196,840,240) | | (140,820,125) |
| Global X S&P 500® Quality Dividend ETF | | 30,476,526 | | 3,024,084 | | (1,296,949) | | 1,727,135 |
| Global X Adaptive U.S. Factor ETF | | 330,835,320 | | 40,925,818 | | (8,584,553) | | 32,341,265 |
| Global X Variable Rate Preferred ETF | | 258,698,808 | | 12,929,439 | | (6,444,691) | | 6,484,748 |
| Global X Adaptive U.S. Risk Management ETF | | 129,780,032 | | 13,428,201 | | (7,128,082) | | 6,300,119 |
| Global X 1-3 Month T-Bill ETF | | 940,459,163 | | 117,994 | | (5,665) | | 112,329 |
| Global X U.S. Cash Flow Kings 100 ETF | | 4,140,372 | | 412,333 | | (193,882) | | 218,451 |
| Global X Short-Term Treasury Ladder ETF | | 3,984,417 | | 102 | | (17,399) | | (17,297) |
| Global X Intermediate-Term Treasury Ladder ETF | | 2,489,620 | | 144 | | (68,956) | | (68,812) |
| Global X Long-Term Treasury Ladder ETF | | 21,449,398 | | 8,511 | | (256,137) | | (247,626) |
110
Notes to Financial Statements (Continued)
November 30, 2024
5. TAX INFORMATION (continued)
The difference between book-basis and tax-basis unrealized appreciation (depreciation) is due to differences in the timing of recognition of gains and losses on investments for tax and book purposes. The Funds’ net unrealized appreciation difference is attributable primarily to wash sales, mark-to-market treatment of passive foreign investment companies and adjustments in preferred stock and partnerships.
6. CONCENTRATION OF RISKS
The Funds may invest in securities in a particular asset class. Securities and other assets held in each Fund’s portfolio may underperform in comparison to the general securities markets, a particular securities market or other asset classes.
The Funds, except for the Global X U.S. Preferred ETF, Global X 1-3 Month T-Bill ETF, and Global X Variable Rate Preferred ETF, use a replication strategy. A replication strategy is an indexing strategy that involves investing in the securities of an underlying index (also known as a secondary index) in approximately the same proportions as in the underlying index. A representative sampling strategy is an indexing strategy that involves investing in a representative sample of securities (including indirect investments through underlying ETFs) that collectively has an investment profile similar to an underlying index in terms of key risk factors, performance attributes and other characteristics. Each Fund may utilize a representative sampling strategy with respect to its underlying index when a replication strategy might be detrimental to its shareholders, such as when there are practical difficulties or substantial costs involved in compiling a portfolio of equity securities to follow its underlying index, or, in certain instances, when securities in the underlying index become temporarily illiquid, unavailable or less liquid, or due to legal restrictions (such as diversification requirements that apply to a Fund but not its underlying index). The Global X U.S. Preferred ETF, Global X 1-3 Month T-Bill ETF, and Global X Variable Rate Preferred ETF use a representative sampling strategy.
The Funds may be subject to taxes imposed by countries in which they invest. Such taxes are generally based on either income or gains earned or repatriated. The Funds accrue and apply such taxes to net investment income, net realized gains and net unrealized gains as income and/or capital gains are earned.
Economic conditions, such as volatile currency exchange rates and interest rates, political events, military action and other conditions may, without prior warning, lead to foreign government intervention (including intervention by the U.S. Government with respect to foreign governments, economic sectors, foreign companies and related securities and interests) and the imposition of capital controls (i.e., government measures designed to limit the flow of foreign capital in and out of the domestic economy) and/or sanctions, which may also include retaliatory actions of one government against another government, such as the seizure of assets. Capital controls and/or sanctions include the prohibition of, or restrictions on, the ability to transfer currency, securities or other assets. Capital controls
111
Notes to Financial Statements (Continued)
November 30, 2024
6. CONCENTRATION OF RISKS (continued)
and/or sanctions may also impact the ability of a Fund to buy, sell or otherwise transfer securities or currency, negatively impact the value and/or liquidity of such instruments, adversely affect the trading market and price for Shares of a Fund, and cause a Fund to decline in value. Please refer to each Fund’s prospectus and statement of additional information (“SAI”) for a more complete description of risks.
7. LOANS OF PORTFOLIO SECURITIES
Each Fund may lend portfolio securities having a market value up to one-third of its total assets. Security loans made pursuant to a securities lending agreements with BBH and BNY Mellon are initially required to be secured by collateral equal to at least 102% of the value of domestic equity securities and American Depositary Receipts (“ADRs”) and 105% of the value of foreign equity securities (other than ADRs). Such collateral received in connection with these loans will be cash and can be invested in repurchase agreements, short-term investments or U.S. Treasury obligations and is recognized in the Schedules of Investments and Statements of Assets and Liabilities. The obligation to return securities lending collateral is also recognized as a liability in the Statements of Assets and Liabilities. It is each Fund’s policy to obtain additional collateral from or return excess collateral to the borrower by the end of the next business day, following the valuation date of the securities loaned. Therefore, the value of the collateral held may be temporarily less than the value of the securities on loan.
Securities pledged as collateral for repurchase agreements held in the Funds are held by BBH or BNY Mellon, as appropriate, and are designated as being held on each Fund’s behalf under a book-entry system. The Funds monitor the adequacy of the collateral on a daily basis and can require the seller to provide additional collateral in the event the market value of the securities pledged falls below the carrying value of the repurchase agreement, including accrued interest. It is each Fund’s policy to only enter into repurchase agreements with banks and other financial institutions which are deemed by the Adviser to be creditworthy. The Funds bear the risk of loss in the event the other party to a repurchase agreement defaults on its obligations and the Fund is prevented from exercising its rights to dispose of the underlying securities received as collateral and the risk of a possible decline in the value of the underlying securities during the period. For financial statement purposes, the Funds record the securities lending collateral (including in repurchase agreements, at value or restricted cash) as an asset and the obligation to return securities lending collateral as a liability- on the Statement of Assets and Liabilities.
Cash collateral received in connection with securities lending is invested in repurchase agreements and short-term investments by the lending agent. The Funds do not have effective control of the non-cash collateral and therefore it is not disclosed in the Fund’s Schedule of Investments.
112
Notes to Financial Statements (Continued)
November 30, 2024
7. LOANS OF PORTFOLIO SECURITIES (continued)
Securities lending transactions are entered into by the Funds under the Securities Lending Agreement, which permits a Fund, under certain circumstances such as an event of default, to offset amounts payable by the Fund to the same counterparty against amounts receivable from the counterparty to create a net payment due to or from the Fund.
The following is a summary of securities lending agreements held by the Funds, with cash collateral of overnight maturities and non-cash collateral, which would be subject to offset as of November 30, 2024.
| | | Gross Amount
of Recognized
Assets (Value
of Securities on
Loan) | | | Value of
Cash
Collateral
Received(1) | | | Value of
Non-Cash
Collateral
Received(1) | | | Net Amount | |
| Global X MLP & Energy Infrastructure ETF | | $ | 9,387,108 | | | $ | 9,387,108 | | | $ | — | | | $ | — | |
| Global X Alternative Income ETF | | | 1,625,548 | | | | 1,625,548 | | | | — | | | | — | |
| Global X U.S. Preferred ETF | | | 28,494,415 | | | | 28,494,415 | | | | — | | | | — | |
(1) Collateral and non-cash collateral received in excess of market value of securities on loan is not presented in this table. The total cash collateral received by the Fund is disclosed in the Statements of Assets and Liabilities.
The value of loaned securities and related collateral outstanding at November 30, 2024 are shown in the Schedules of Investments. The value of the collateral held may be temporarily less than that required under the lending contract. As of November 30, 2024, the cash collateral was invested in repurchase agreements and the non-cash collateral consisted of U.S. Treasury Bills, Notes, Bonds and U.S. Treasury Inflation Indexed Bonds with the following maturities:
113
Notes to Financial Statements (Continued)
November 30, 2024
7. LOANS OF PORTFOLIO SECURITIES (continued)
| | | Overnight
and
Continuous | | | <30 Days | | | Between
30 & 90
Days | | | >90 Days | | | Total | |
| Global X MLP & Energy Infrastructure ETF | | | | | | | | | | | | | | | | | | | | |
| Repurchase Agreements | | $ | 5,946,856 | | | $ | — | | | $ | — | | | $ | — | | | $ | 5,946,856 | |
| Short-Term Investments | | | 3,476,137 | | | | — | | | | — | | | | — | | | | 3,476,137 | |
| Total | | $ | 9,422,993 | | | $ | — | | | $ | — | | | $ | — | | | $ | 9,422,993 | |
| Global X Alternative Income ETF | | | | | | | | | | | | | | | | | | | | |
| Repurchase Agreements | | $ | 1,042,008 | | | $ | — | | | $ | — | | | $ | — | | | $ | 1,042,008 | |
| Short-Term Investments | | | 609,088 | | | | — | | | | — | | | | — | | | | 60,9088 | |
| Total | | $ | 1,651,096 | | | $ | — | | | $ | — | | | $ | — | | | $ | 1,651,096 | |
| Global X U.S. Preferred ETF | | | | | | | | | | | | | | | | | | | | |
| Repurchase Agreements | | $ | 18,445,725 | | | $ | — | | | $ | — | | | $ | — | | | $ | 18,445,725 | |
| Short-Term Investments | | | 10,782,146 | | | | — | | | | — | | | | — | | | | 10,782,146 | |
| Total | | $ | 29,227,871 | | | $ | — | | | $ | — | | | $ | — | | | $ | 29,227,871 | |
8. CONTRACTUAL OBLIGATION
The Funds enter into contracts in the normal course of business that contain a variety of indemnifications. The Funds’ maximum exposure under these contracts is unknown. However, the Funds have not had prior gains or losses pursuant to these contracts. Management has reviewed the Funds’ existing contracts and expects the risk of loss to be remote.
Pursuant to the Trust’s organizational documents, the Trustees of the Trust (the “Trustees”) and the Trust’s officers are indemnified against certain liabilities that may arise out of the performance of their duties.
9. REVERSE SHARE SPLIT
Effective June 14, 2024 the Global X 1-3 Month T-Bill ETF executed a 1-for-4 reverse share split for shareholders of record after the close of markets on June 13, 2024. The effect of this transaction for the Fund was to divide the number of outstanding Shares of the Fund by four, resulting in a corresponding increase in the NAV per Share. The capital share activity presented in the Statement of Changes in Net Assets for each of the years in the period then ended, and per share data in the financial highlights for each of the years in the period then ended, have been given retroactive effect to reflect this reverse share split.
114
Notes to Financial Statements (Concluded)
November 30, 2024
9. REVERSE SHARE SPLIT (continued)
There were no changes in net assets, results of operations or total return as a result of this transaction.
Effective April 28, 2020, the Global X MLP ETF executed a 1-for-6 reverse share split for shareholders of record after the close of markets on April 27, 2020. The effect of this transaction for the Fund was to divide the number of outstanding Shares of the Fund by six, resulting in a corresponding increase in the NAV per Share. The capital share activity presented in the Statement of Changes in Net Assets for each of the years in the period then ended, and per share data in the financial highlights for each of the years in the period then ended, have been given retroactive effect to reflect this reverse share split. There were no changes in net assets, results of operations or total return as a result of this transaction.
Effective April 28, 2020, the Global X MLP & Energy Infrastructure ETF executed a 1-for-3 reverse share split for shareholders of record after the close of markets on April 27, 2020. The effect of this transaction for the Fund was to divide the number of outstanding Shares of the Fund by three, resulting in a corresponding increase in the NAV per Share. The capital share activity presented in the Statement of Changes in Net Assets for each of the years in the period then ended, and per share data in the financial highlights for each of the years in the period then ended, have been given retroactive effect to reflect these reverse share splits. There were no changes in net assets, results of operations or total return as a result of these transactions.
10. SUBSEQUENT EVENTS
The Funds have been evaluated by management regarding the need for additional disclosures (other than what is disclosed in the preceding paragraphs) and/or adjustments resulting from subsequent events. Based on this evaluation, no additional adjustments were required to the financial statements.
115
Report of Independent Registered Public Accounting Firm
To the Board of Trustees of Global X Funds and Shareholders of each of the fourteen funds listed in the table below
Opinions on the Financial Statements
We have audited the accompanying statements of assets and liabilities, including the schedules of investments, of each of the funds listed in the table below (fourteen of the funds constituting Global X Funds, hereafter collectively referred to as the “Funds”) as of November 30, 2024, the related statements of operations and of changes in net assets for each of the periods indicated in the table below, including the related notes, and the financial highlights for each of the periods indicated therein (collectively referred to as the “financial statements”). In our opinion, the financial statements present fairly, in all material respects, the financial position of each of the Funds listed in the table below as of November 30, 2024, the results of each of their operations for each of the periods indicated in the table below, the changes in each of their net assets for each of the periods indicated in the table below, and each of the financial highlights for each of the periods indicated therein, in conformity with accounting principles generally accepted in the United States of America.
| Global X MLP ETF (1) |
| Global X MLP & Energy Infrastructure ETF (1) |
| Global X Alternative Income ETF (1) |
| Global X Conscious Companies ETF (1) |
| Global X U.S. Preferred ETF (1) |
| Global X S&P 500® Quality Dividend ETF (1) |
| Global X Adaptive U.S. Factor ETF (1) |
| Global X Variable Rate Preferred ETF (1) |
| Global X Adaptive U.S. Risk Management ETF (1) |
| Global X 1-3 Month T-Bill ETF (2) |
| Global X U.S. Cash Flow Kings 100 ETF (3) |
| Global X Short-Term Treasury Ladder ETF (4) |
| Global X Intermediate-Term Treasury Ladder ETF (4) |
| Global X Long-Term Treasury Ladder ETF (4) |
| (1) | Statements of operations for the year ended November 30, 2024 and statements of changes in net assets for each of the two years in the period ended November 30, 2024 |
| (2) | Statement of operations for the year ended November 30, 2024 and statement of changes in net assets for the year ended November 30, 2024 and the period June 20, 2023 (commencement of operations) through November 30, 2023 |
| (3) | Statement of operations for the year ended November 30, 2024 and statement of changes in net assets for the year ended November 30, 2024 and the period July 10, 2023 (commencement of operations) through November 30, 2023 |
| (4) | Statements of operations and statements of changes in net assets for the period September 9, 2024 (commencement of operations) through November 30, 2024 |
116
Report of Independent Registered Public Accounting Firm (Concluded)
Basis for Opinions
These financial statements are the responsibility of the Funds’ management. Our responsibility is to express an opinion on the Funds’ financial statements based on our audits. We are a public accounting firm registered with the Public Company Accounting Oversight Board (United States) (PCAOB) and are required to be independent with respect to the Funds in accordance with the U.S. federal securities laws and the applicable rules and regulations of the Securities and Exchange Commission and the PCAOB.
We conducted our audits of these financial statements in accordance with the standards of the PCAOB. Those standards require that we plan and perform the audit to obtain reasonable assurance about whether the financial statements are free of material misstatement, whether due to error or fraud.
Our audits included performing procedures to assess the risks of material misstatement of the financial statements, whether due to error or fraud, and performing procedures that respond to those risks. Such procedures included examining, on a test basis, evidence regarding the amounts and disclosures in the financial statements. Our audits also included evaluating the accounting principles used and significant estimates made by management, as well as evaluating the overall presentation of the financial statements. Our procedures included confirmation of securities owned as of November 30, 2024, by correspondence with the custodians, transfer agent and brokers; when replies were not received from brokers, we performed other auditing procedures. We believe that our audits provide a reasonable basis for our opinions.
/s/PricewaterhouseCoopers LLP
Philadelphia, Pennsylvania
January 27, 2025
We have served as the auditor of one or more investment companies in Global X Funds since 2016.
117
Notice to Shareholders (UNAUDITED)
For shareholders that do not have a November 30, 2024 tax year end, this notice is for informational purposes only. For shareholders with a November 30, 2024 tax year end, please consult your tax advisor as to the pertinence of this notice. For the fiscal year ended November 30, 2024, the Funds have designated the following items with regard to distributions paid during the year.
| Return of Capital | | Long-Term
Capital Gain
Distributions | | Ordinary Income
Distributions | | Total
Distributions | | Qualifying
for Corporate
Dividends
Received
Deduction(1) | | Qualifying
Dividend
Income(2) |
| Global X MLP ETF | | | | | | | | | | |
| 0.00% | | 0.00% | | 100.00% | | 100.00% | | 0.00% | | 0.00% |
| Global X MLP & Energy Infrastructure ETF | | | | | | | | | | |
| 44.36% | | 0.00% | | 55.64% | | 100.00% | | 7.77% | | 76.21% |
| Global X Alternative Income ETF | | | | | | | | | | |
| 0.00% | | 0.00% | | 100.00% | | 100.00% | | 10.32% | | 11.01% |
| Global X Conscious Companies ETF | | | | | | | | | | |
| 0.00% | | 0.00% | | 100.00% | | 100.00% | | 100.00% | | 100.00% |
| Global X U.S. Preferred ETF | | | | | | | | | | |
| 0.00% | | 0.00% | | 100.00% | | 100.00% | | 7.89% | | 8.08% |
| Global X S&P 500® Quality Dividend ETF | | | | | | | | | | |
| 4.25% | | 0.00% | | 95.75% | | 100.00% | | 81.85% | | 100.00% |
| Global X Adaptive U.S. Factor ETF | | | | | | | | | | |
| 10.71% | | 0.00% | | 89.29% | | 100.00% | | 93.06% | | 97.05% |
| Global X Variable Rate Preferred ETF | | | | | | | | | | |
| 0.00% | | 0.00% | | 100.00% | | 100.00% | | 76.11% | | 77.15% |
| Global X Adaptive U.S. Risk Management ETF | | | | | | | | | | |
| 0.00% | | 0.00% | | 100.00% | | 100.00% | | 85.29% | | 84.23% |
| Global X 1-3 Month T-Bill ETF | | | | | | | | | | |
| 0.00% | | 0.13% | | 99.87% | | 100.00% | | 0.00% | | 0.00% |
| Global X U.S. Cash Flow Kings 100 ETF | | | | | | | | | | |
| 0.00% | | 0.00% | | 100.00% | | 100.00% | | 98.46% | | 99.49% |
| Global X Short-Term Treasury Ladder ETF | | | | | | | | | | |
| 0.00% | | 0.00% | | 100.00% | | 100.00% | | 0.00% | | 0.00% |
| Global X Intermediate-Term Treasury Ladder ETF | | | | | | | | | | |
| 0.00% | | 0.00% | | 100.00% | | 100.00% | | 0.00% | | 0.00% |
| Global X Long-Term Treasury Ladder ETF | | | | | | | | | | |
| 0.00% | | 0.00% | | 100.00% | | 100.00% | | 0.00% | | 0.00% |
(1) Qualifying dividends represent dividends which qualify for the corporate dividends received deduction and is reflected as a percentage of ordinary income distributions (the total of short term capital gain and net investment income distributions).
(2) The percentage in this column represents the amount of “Qualifying Dividend Income” as created by the Jobs and Growth Relief Reconciliation Act of 2003 and its reflected as a percentage of ordinary income distributions (the total of short term capital gain and net investment income distributions). It is the intention of each of the aforementioned Funds to designate the maximum amount permitted by law.
118
Notice to Shareholders (UNAUDITED)
| | | U.S. Government
Interest(3) | | Interest Related
Dividends(4) | | Short Term
Capital Gain
Dividends (5) | | Qualifying
Business
Income(6) | | Foreign Tax
Credit |
| Global X MLP ETF | | | | | | | | | | |
| | | 0.00% | | 0.00% | | 0.00% | | 0.00% | | 0.00% |
| Global X MLP & Energy Infrastructure ETF | | | | | | | | | | |
| | | 0.00% | | 0.31% | | 0.00% | | 0.00% | | 0.00% |
| Global X Alternative Income ETF | | | | | | | | | | |
| | | 0.00% | | 0.19% | | 0.00% | | 0.00% | | 0.00% |
| Global X Conscious Companies ETF | | | | | | | | | | |
| | | 0.00% | | 0.32% | | 0.00% | | 0.00% | | 0.00% |
| Global X U.S. Preferred ETF | | | | | | | | | | |
| | | 0.14% | | 1.09% | | 0.00% | | 0.00% | | 0.00% |
| Global X S&P 500® Quality Dividend ETF | | | | | | | | | | |
| | | 0.00% | | 0.16% | | 0.00% | | 0.00% | | 0.00% |
| Global X Adaptive U.S. Factor ETF | | | | | | | | | | |
| | | 0.00% | | 0.00% | | 0.00% | | 0.00% | | 0.00% |
| Global X Variable Rate Preferred ETF | | | | | | | | | | |
| | | 0.49% | | 1.41% | | 0.00% | | 0.00% | | 0.00% |
| Global X Adaptive U.S. Risk Management ETF | | | | | | | | | | |
| | | 11.78% | | 19.25% | | 0.00% | | 2.83% | | 0.00% |
| Global X 1-3 Month T-Bill ETF | | | | | | | | | | |
| | | 100.00% | | 99.79% | | 100.00% | | 0.00% | | 0.00% |
| Global X U.S. Cash Flow Kings 100 ETF | | | | | | | | | | |
| | | 0.00% | | 0.00% | | 0.00% | | 0.43% | | 0.00% |
| Global X Short-Term Treasury Ladder ETF | | | | | | | | | | |
| | | 100.00% | | 99.85% | | 0.00% | | 0.00% | | 0.00% |
| Global X Intermediate-Term Treasury Ladder ETF | | | | | | | | | | |
| | | 100.00% | | 99.88% | | 0.00% | | 0.00% | | 0.00% |
| Global X Long-Term Treasury Ladder ETF | | | | | | | | | | |
| | | 100.00% | | 99.71% | | 0.00% | | 0.00% | | 0.00% |
(3) “U.S. Government Interest” represents the amount of interest that was derived from U.S. Government Obligations and distributed during the fiscal year. Generally, interest from direct U.S. Government obligations is exempt from state income tax. However, for shareholders who are residents of California, Connecticut and New York, the statutory threshold requirements were not satisfied to permit exemption of these amounts from state income.
(4) The percentage in this column represents the amount of “Qualifying Interest Income” as created by the American Jobs Creation Act of 2004 and is a percentage of net investment income that is exempt from U.S. withholding tax when paid for foreign investors.
(5) The percentage of this column represents the amount of “Short Term Capital Gain Dividend” and is reflected as a percentage of short term capital gain distribution that is exempted from U.S. withholding tax when paid to foreign investors.
(6) The percentage of this column represents that amount of ordinary dividend income that qualified for 20% Business Income Deduction.
The information reported herein may differ from the information and distributions taxable to the shareholders for the calendar year ending December 31, 2024. Complete information will be computed and reported in conjunction with your 2024 Form 1099-DIV.
119
Proxy Voting (Form N-CSR Item 9) (UNAUDITED)
A Special Meeting of Shareholders of the Global X Funds (the “Trust”) was held on August 26, 2024, for the purpose of considering the proposal to elect each of the current Trustees to the Board of Trustees of the Trust. The proposal was approved on August 26, 2024 with the following voting results:
| Trustee | | Shares Voted | |
| Charles A. Baker | | | | |
| For | | | 1,000,273,461 | |
| Against | | | 14,064,552 | |
| Abstain | | | 12,508,484 | |
| Toai Chin | | | | |
| For | | | 999,088,606 | |
| Against | | | 14,951,430 | |
| Abstain | | | 12,806,470 | |
| Clifford J. Weber | | | | |
| For | | | 1,000,103,865 | |
| Against | | | 14,142,432 | |
| Abstain | | | 12,600,202 | |
| Ryan O’Connor | | | | |
| For | | | 1,002,852,035 | |
| Against | | | 11,528,537 | |
| Abstain | | | 12,465,958 | |
120
Approval of Investment Advisory Agreement (Form N-CSR Item 11) (Unaudited)
Section 15(c) of the Investment Company Act of 1940, as amended (“1940 Act”), requires that the board of trustees of an exchange-traded fund (“ETF”), including a majority of those trustees who are not “interested persons” of the ETF, as defined in the 1940 Act (“Independent Trustees”), consider on an initial basis and periodically thereafter (as required by the 1940 Act), at an in person meeting called for such purpose, the terms of each ETF’s investment advisory agreement and whether to approve entering into, or renewing, each agreement.
At a Board meeting of the Global X Funds (the “Trust”) held on May 21, 2024 (the “New Fund Board Meeting”) with respect to the Global X Short-Term Treasury Ladder ETF, Global X Intermediate-Term Treasury Ladder ETF and the Global X Long-Term Treasury Ladder ETF (each a “New Fund”, and together the “New Funds”), the Board of Trustees (the “Board”) (including the Trust’s Independent Trustees, voting separately) considered and unanimously approved (i) the initial Investment Advisory Agreement (the “New Investment Advisory Agreement”); and (ii) the initial Supervision and Administration Agreement (the “New Supervision and Administration Agreement”) between the Trust, on behalf of the New Funds, and Global X Management Company LLC (“Global X Management”). The New Investment Advisory Agreement and New Supervision and Administration Agreement are referred to collectively as the “New Fund Agreements.”
At a Board meeting of the Trust held on November 19, 2024, called for such purpose, the Board (including the Trust’s Independent Trustees, voting separately) considered and unanimously approved the continuation of (i) the Investment Advisory Agreement (“Renewal Investment Advisory Agreement”) for each Fund (each, a “Renewal Fund” and together, the “Renewal Funds”) included in this Annual Report; and (ii) the Supervision and Administration Agreement (“Renewal Supervision and Administration Agreement”) between the Trust, on behalf of each Renewal Fund, and Global X Management. The Renewal Investment Advisory Agreement and the Renewal Supervision and Administration Agreement are referred to herein as the “Renewal Agreements.”
In advance of the Board meetings, the Board (including the Trust’s Independent Trustees) and the Independent Trustees’ independent legal counsel requested (in writing) detailed information from Global X Management in connection with the Board’s consideration of the Renewal Agreements and New Fund Agreements and received and reviewed written responses from Global X Management and supporting materials relating to those requests for information. In the course of their consideration of the Renewal Agreements and New Fund Agreements, the Trust’s Independent Trustees were advised by their independent legal counsel and, in addition to meetings with management of Global X Management, the Independent Trustees met separately in executive sessions with their counsel.
NEW FUND AGREEMENTS
In determining to approve the New Fund Agreements for the New Funds, the Board considered a variety of factors, including the factors discussed in greater detail below.
121
Approval of Investment Advisory Agreement (Form N-CSR Item 11) (Unaudited) (Continued)
Nature, Extent and Quality of Services
With respect to this factor, the Board considered:
| • | the terms of the New Fund Agreements and the range of services proposed to be provided to the New Funds in accordance with the New Fund Agreements; |
| | |
| • | Global X Management’s key personnel and the portfolio managers who would provide investment advisory, supervision and administrative services to the New Funds; |
| | |
| • | Global X Management’s responsibilities under the New Fund Agreements to, among other things, (i) manage the investment operations of the New Funds and the composition of the New Funds’ assets, including the purchase, retention and disposition of its holdings, (ii) provide quarterly reports to the Trust’s officers and the Board and other reports as the Board deems necessary or appropriate, (iii) vote proxies, exercise consents, and exercise all other rights appertaining to securities and assets held by the New Funds, (iv) select broker-dealers to execute portfolio transactions for the New Funds when necessary, (v) assist in the preparation and filing of reports and proxy statements (if any) to the shareholders of the New Funds, and the periodic updating of the registration statements, prospectuses, statements of additional information, and other reports and documents for the New Funds that are required to be filed by the Trust with the U.S. Securities and Exchange Commission (“SEC”) and other regulatory or governmental bodies, and (vi) monitor anticipated purchases and redemptions of the shares (including Creation Units) of the New Funds by shareholders and new investors; |
| | |
| • | the nature, extent and quality of all of the services (including advisory, administrative and compliance services) that are proposed to be provided by Global X Management or made available to the New Funds; and |
| | |
| • | the quality of Global X Management’s resources and personnel that would be made available to the New Funds, including Global X Management’s experience and the professional qualifications of Global X Management’s key personnel. |
Based on these considerations, the Board concluded, at the New Fund Board Meeting, that it was satisfied with the nature, extent and quality of the services proposed to be provided to the New Funds by Global X Management.
Performance
The Board determined that, because the New Funds had not yet begun investment operations as of the dates of the New Fund Board Meeting, meaningful data relating to the investment performance of the New Funds was not available and, therefore, could not be a factor in approving the New Fund Agreements.
Cost of Services and Profitability
122
Approval of Investment Advisory Agreement (Form N-CSR Item 11) (Unaudited) (Continued)
With respect to this factor, the Board considered:
| • | Global X Management’s expected costs to provide investment management, supervision and administrative and related services to each New Fund; |
| | |
| • | the management fee (including the proposed investment advisory fee) (“Management Fee”) that was proposed to be borne by each New Fund under the respective New Fund Agreement for the various investment advisory, supervisory and administrative services that the New Funds require under a unitary fee structure (including the types of fees and expenses that are not included within the unitary fee and would be borne by the New Funds); and |
| | |
| • | the expected profitability to Global X Management, if any, from all of the services proposed to be provided to the New Funds by Global X Management and all aspects of the relationship between Global X Management and the New Funds. |
Based on these considerations, the Board concluded that the proposed Management Fee to be paid by each New Fund to Global X Management, in light of the nature, extent and quality of the services to be provided, was reasonable and in the best interests of each New Fund’s shareholders.
Comparison of Fees and Services
With respect to this factor, the Board considered:
| • | comparative information with respect to the proposed Management Fee to be paid to Global X Management by each New Fund. In connection with this consideration, Global X Management provided the Board with comparative expense data for each New Fund, including fees and expenses paid by unaffiliated similar specialized and/or focused ETFs, and/or other similar registered funds. The Board considered Global X Management’s detailed explanation of the proposed fee structures of the New Funds compared to the average and median of each New Fund’s peer group. |
| | |
| • | the structure of the proposed unitary Management Fee (which includes as one component the proposed investment advisory fee for the New Funds) and the expected total expense ratios for the New Funds. In this regard, the Board took into consideration that the purpose of adopting a unitary Management Fee structure for the New Funds was to create a simple, all-inclusive fee that would provide a level of predictability with respect to the overall expense ratios (i.e., the total fees) of the New Funds and that the proposed Management Fee for each New Fund was set at a competitive level to make the New Fund viable in the marketplace; and |
| | |
| • | that, under the proposed unified Management Fee structure, Global X Management would be responsible for most ordinary expenses of the New Funds, including the costs of various third-party services required by the New Funds, including investment advisory, administrative, audit, certain custody, portfolio accounting, legal, transfer |
123
Approval of Investment Advisory Agreement (Form N-CSR Item 11) (Unaudited) (Continued)
agency and printing costs, but that each New Fund would bear other expenses not covered under the proposed all-inclusive Management Fee, such as taxes, brokerage fees, commissions, and other transaction expenses, interest expenses, and extraordinary expenses.
Based on these considerations, the Board concluded, at the New Fund Board Meeting, that the services to be received and the fees to be charged under the applicable New Fund Agreements were reasonable on a comparative basis.
Economies of Scale
With respect to this factor, the Board considered:
| • | the extent to which economies of scale would be realized as the New Funds grow and whether the proposed unitary Management Fee for each New Fund reflected these economies of scale; |
| | |
| • | the significant investment of time, personnel and other resources that Global X Management intends to make in the New Funds in order to seek to assure that the New Funds are attractive to investors; and |
| | |
| • | that the proposed unitary Management Fee would provide a high level of certainty as to the total level of expenses for each New Fund and its shareholders. |
Based on these considerations, the Board concluded, at the New Fund Board Meeting, that the proposed unitary Management Fees for each New Fund appropriately addressed economies of scale.
Other Benefits
In considering each New Fund Agreement, in addition to the factors discussed above, the Board considered other benefits that may be realized by Global X Management as a result of its relationship with the New Funds. As a result, the Board concluded that, in the case of each New Fund, in the exercise of the Board’s business judgement, all information the Board considered supported approval of the applicable New Fund Agreements.
Conclusion
After full consideration of the factors above, as well as other factors that were instructive in their consideration, the Board, including all of the Trust’s Independent Trustees voting separately, concluded, in the exercise of its business judgement, that the New Fund Agreements were fair and reasonable and in the best interest of the New Funds.
In reaching this decision, the Board did not assign relative weights to the factors above nor did the Board deem any one factor or group of them to be controlling in and of themselves. Each member of the Board may have assigned different weights to the various factors.
124
Approval of Investment Advisory Agreement (Form N-CSR Item 11) (Unaudited) (Continued)
RENEWAL AGREEMENTS
In determining to approve the continuation of the Renewal Agreements for the Renewal Funds, the Board considered a variety of factors, including the factors discussed in greater detail below.
Nature, Extent and Quality of Services
With respect to this factor, the Board considered:
| • | the terms of the Renewal Agreements and the range of services that would continue to be provided to each Renewal Fund in accordance with the Renewal Agreements; |
| | |
| • | Global X Management’s key personnel and the portfolio managers who would continue to provide investment advisory, supervision and administrative services to each Renewal Fund; |
| | |
| • | Global X Management’s responsibilities under the Renewal Agreements, among other things, to: (i) manage the investment operations of the Renewal Funds and the composition of the Renewal Funds’ assets, including the purchase, retention and disposition of their holdings, (ii) provide quarterly reports to the Trust’s officers and the Board and other reports as the Board deems necessary or appropriate, (iii) vote proxies, exercise consents, and exercise all other rights relating to securities and assets held by the Renewal Funds, (iv) select broker-dealers to execute portfolio transactions for the Renewal Funds when necessary, (v) assist in the preparation and filing of reports and proxy statements (if any) to the shareholders of the Renewal Funds, and the periodic updating of the registration statement, prospectuses, statements of additional information, and other reports and documents for the Renewal Funds that are required to be filed by the Trust with the SEC and other regulatory and governmental bodies, and (vi) monitor anticipated purchases and redemptions of the shares (including Creation Units) of the Renewal Funds by shareholders and new investors; |
| | |
| • | the nature, extent and quality of all of the services (including advisory, administrative and compliance services) that have been provided by Global X Management or made available to the Renewal Funds; and |
| | |
| • | the quality of Global X Management’s resources and personnel that would continue to be made available to the Renewal Funds, including Global X Management’s experience and the professional qualifications of Global X Management’s key personnel. |
Based on these considerations, the Board concluded that it was satisfied with the nature, extent and quality of the services provided to the Renewal Funds by Global X Management.
Performance
The Board considered the performance of each Renewal Fund. They examined the performance of the Renewal Funds for the one-year, three-year, five-year and since-
125
Approval of Investment Advisory Agreement (Form N-CSR Item 11) (Unaudited) (Continued)
inception periods, as applicable. Also, the Board considered the total return and investments performance of the Renewal Funds relative to (i) the performance of unaffiliated comparable ETFs and/or other registered funds, which performance information is publicly available from such registered funds, as well as other third party sources; and (ii) the performance of pertinent indexes. The Board considered instances of under-performance and over-performance with respect to the competitor funds. The Board also considered the Renewal Funds’ performance in absolute terms and against each Renewal Fund’s underlying index.
Based on these considerations and comparisons, the Board concluded that the investment performance of the Renewal Funds did not adversely affect the Board’s approval of the continuance of the Renewal Agreements.
Cost of Services and Profitability
The Board considered Global X Management’s cost to provide investment management, supervision and administrative and related services to the Renewal Funds. In this regard, the Board considered the management fee (“Management Fee”) that has been borne or is expected to be borne by the Renewal Funds under the Renewal Agreements for the various investment advisory, supervisory and administrative services that the Renewal Funds require under a unitary fee structure (including the types of fees and expenses that are not included within the unitary fee and would be borne by the Renewal Funds).
In addition, the Board considered expected profitability to Global X Management, as applicable, from all services provided or expected to be provided to the Renewal Funds and all aspects of Global X Management’s relationship with the Renewal Funds. In connection with these considerations, Global X Management provided the Board with financial information regarding its operations and the services provided to the Renewal Funds and discussed with the Board its current and expected, as applicable, profitability with respect to the Renewal Funds.
Based on these considerations, the Board concluded that the Management Fee rate paid by the Renewal Funds to Global X Management, in light of the nature, extent and quality of the services provided, was reasonable and in the best interests of the Renewal Funds’ shareholders.
Comparison of Fees and Services
With respect to this factor, the Board considered:
| • | comparative information with respect to the Management Fee paid to Global X Management by the Renewal Funds. In connection with this consideration, Global X Management provided the Board with comparative expense data for the Renewal Funds, including fees and expenses paid by unaffiliated similar specialized and/or focused ETFs and/or other comparable registered funds. The Board considered the Global X Management’s detailed explanation of the fee structures of any Renewal |
126
Approval of Investment Advisory Agreement (Form N-CSR Item 11) (Unaudited) (Continued)
Fund that was above the average or median for its peer group;
| • | the structure of the unitary Management Fee (which includes as one component the investment advisory fee for the Renewal Funds) and the current total expense ratios for the Renewal Funds. In this regard, the Board took into consideration that the purpose of adopting a unitary Management Fee structure for the Renewal Funds was to create a simple, all-inclusive fee that would provide a level of predictability with respect to the overall expense ratio (i.e., the total fees) of the Renewal Funds and that the proposed Management Fee for each Renewal Fund was set at a competitive level to make the Renewal Funds viable in the marketplace; and |
| | |
| • | that, under the unified Management Fee structure, Global X Management is responsible for most ordinary expenses of the Renewal Funds, including the costs of various third-party services required by the Renewal Funds, including investment advisory, administrative, audit, certain custody, portfolio accounting, legal, transfer agency and printing costs, but that the Renewal Funds would bear other expenses not covered under the proposed all-inclusive Management Fee, such as taxes, brokerage fees, commissions, and other transaction expenses, interest expenses, and extraordinary expenses. |
Based on these considerations, the Board concluded that the services received, and the fees charged under the Renewal Agreements were reasonable on a comparative basis.
Economies of Scale
With respect to this factor, the Board considered:
| • | the extent to which economies of scale would be realized as the Renewal Funds grow and whether the unitary Management Fee for the Renewal Funds reflected these economies of scale; |
| | |
| • | the significant investment of time, personnel and other resources that Global X Management has made and intends to continue to make in the Renewal Funds in order to seek to assure that the Renewal Funds are attractive to investors; and |
| | |
| • | that the unitary Management Fee would provide a high level of certainty as to the total level of expenses for the Renewal Funds and their shareholders. |
Based on these considerations, the Board concluded that the unitary Management Fee for the Renewal Funds appropriately addressed economies of scale.
Other Benefits
In considering the Renewal Agreements, in addition to the factors above, the Board considered any other benefits realized by Global X Management as a result of its relationships with the Renewal Funds and concluded that, in the exercise of the Board’s
127
Approval of Investment Advisory Agreement (Form N-CSR Item 11) (Unaudited) (Concluded)
business judgement, all information the Board considered supported approval of the continuation of the Renewal Agreements.
Conclusion
After full consideration of the factors above, as well as other factors that were instructive in its consideration, the Board, including all of the Trust’s Independent Trustees voting separately, concluded, in the exercise of its business judgement, that the Renewal Agreements were fair and reasonable and in the best interest of each Renewal Fund.
In reaching this decision, the Board did not assign relative weights to the factors above nor did the Board deem any one factor or group of them to be controlling in and of themselves. Each member of the Board may have assigned different weights to the various factors.
128
Notes
129
Notes
130
Notes
131
Notes
132
605 3rd Avenue, 43rd Floor
New York, NY 10158
1-888-493-8631
www.globalxetfs.com
Investment Adviser and Administrator:
Global X Management Company LLC
605 3rd Avenue, 43rd Floor
New York, NY 10158
Distributor:
SEI Investments Distribution Co.
One Freedom Valley Drive
Oaks, PA 19456
Sub-Administrator:
SEI Investments Global Funds Services
One Freedom Valley Drive
Oaks, PA 19456
Counsel for Global X Funds and the Independent Trustees:
Stradley Ronon Stevens & Young, LLP
2000 K Street, N.W.
Suite 700
Washington, DC 20006
Custodians and Transfer Agents:
Brown Brothers Harriman & Co.
40 Water Street
Boston, MA 02109
The Bank of New York Mellon
240 Greenwich Street
New York, NY 10286
Independent Registered Public Accounting Firm:
PricewaterhouseCoopers LLP
Two Commerce Square
Suite 1800
2001 Market Street
Philadelphia, PA 19103
This information must be preceded or accompanied by a current prospectus for the Funds described.
GLX-AR-006-1200
| Item 8. | Changes in and Disagreements with Accountants for Open-End Management Investment Companies. |
There were no changes in or disagreements with accountants on accounting and financial disclosure during the period covered by the report.
| Item 9. | Proxy Disclosures for Open-End Management Investment Companies. |
The disclosure regarding any matters submitted during the period covered by the report to a vote of shareholders, if applicable, is included as part of the financial statements filed under Item 7 of this form.
| Item 10. | Remuneration Paid to Directors, Officers, and Others of Open-End Management Investment Companies. |
| (1) | No remuneration was paid by the company during the period covered by the report to any Trustees on the company’s Board of Trustees for regular compensation. |
| (2) | No remuneration was paid by the company during the period covered by the report to any Trustees on the company’s Board of Trustees for special compensation. |
| (3) | No remuneration was paid by the company during the period covered by the report to any Officers of the company. |
| (4) | No remuneration was paid by the company during the period covered by the report to any Officer or Trustee of the company who is an affiliated person. |
| Item 11. | Statement Regarding Basis for Approval of Investment Advisory Contract. |
The disclosure regarding the approval of any investment advisory contract approved during the registrant’s most recent fiscal half-year, if applicable, is included as part of the financial statements filed under Item 7 of this form.
| Item 12. | Disclosure of Proxy Voting Policies and Procedures for Closed-End Management Investment Companies. |
Not applicable to open-end management investment companies.
| Item 13. | Portfolio Managers of Closed-End Management Investment Companies. |
Not applicable to open-end management investment companies.
| Item 14. | Purchases of Equity Securities by Closed-End Management Company and Affiliated Purchasers. |
Not applicable to open-end management investment companies.
| Item 15. | Submission of Matters to a Vote of Security Holders. |
There have been no material changes to the procedures by which shareholders may recommend nominees to the registrant’s board of directors.
| Item 16. | Controls and Procedures. |
(a) The certifying officers, whose certifications are included herewith, have evaluated the registrant’s disclosure controls and procedures (as defined in Rule 30a-3(c) under the Act) within 90 days of the filing date of this report. In their opinion, based on their evaluation, the registrant’s disclosure controls and procedures are adequately designed, and are operating effectively to ensure, that information required to be disclosed by the registrant in the reports it files or submits under the Securities Exchange Act of 1934 is recorded, processed, summarized and reported within the time periods specified in the Securities and Exchange Commission’s rules and forms.
(b) There were no changes in the registrant’s internal control over financial reporting (as defined in Rule 30a-3(d) under the Act) that occurred during the period covered by this report that have materially affected, or are reasonably likely to materially affect, the registrant’s internal control over financial reporting.
(c) Management has completed the remediation efforts relating to a previously reported material weakness in the Registrant’s internal controls over financial reporting. A material weakness is a deficiency, or a combination of deficiencies, in internal control over financial reporting, such that there is a reasonable
possibility that a material misstatement of the company’s annual or interim financial statements will not be prevented or detected on a timely basis. As of November 30,2023, management concluded that it did not design or maintain controls to evaluate reasonably available observable inputs related to the valuation of certain securities held in the Global X Aging Population ETF, Global X Cannabis ETF and Global X Genomics & Biotechnology ETF for which trading on a recognized exchange were halted. This material weakness did not result in a misstatement of previously issued financial statements. This material weakness resulted in audit adjustments, which adjustments were reflected in the financial statements of the Global X Cannabis ETF to increase Investments, at value and Net change in unrealized appreciation (depreciation) on investments for the year ended November 30, 2023. The Global X Cannabis ETF liquidated on February 20, 2024.
The steps management took to remediate this material weakness included implementing an additional control to track subsequent events for potential observable inputs that relate to the valuation of certain securities for which trading on a recognized exchange has halted. Management created a Subsequent Event Tracking log that is intended to identify halted securities above an established fund weighting threshold, with the intention to formally track subsequent events that may result in observable inputs that would impact the valuation of the security. Secondly, the log tracks communication of such subsequent events to the Valuation Committee, with fair value recommendations reviewed and approved by Committee members.
As a result of these remediation activities, management has determined that the Registrant’s internal controls over financial reporting are designed appropriately and at a sufficient level of precision and have been operating effectively for a sufficient period of time, such that the material weakness previously identified as of November 30, 2023, has been remediated as of November 30, 2024.
| Item 17. | Disclosure of Securities Lending Activities for Closed-End Management Investment Companies. |
Not applicable.
| Item 18. | Recovery of Erroneously Awarded Compensation. |
(a) Not applicable.
(a) Not applicable.
(a)(1) Code of Ethics attached hereto.
(a)(2) Not applicable.
(a)(3) A separate certification for the principal executive officer and the principal financial officer of the registrant, as required by Rule 30a-2(a) under the Act (17 CFR § 270.30a-2(a)), are filed herewith.
(b) Officer certifications as required by Rule 30a-2(b) under the Investment Company Act of 1940, as amended, also accompany this filing as exhibits.
SIGNATURES
Pursuant to the requirements of the Securities Exchange Act of 1934 and the Investment Company Act of 1940, the registrant has duly caused this report to be signed on its behalf by the undersigned, thereunto duly authorized.
| (Registrant) | Global X Funds | |
| | | |
| By (Signature and Title) | /s/ Ryan O’Connor | |
| | Ryan O’Connor | |
| | Principal Executive Officer | |
Date: February 6, 2025
Pursuant to the requirements of the Securities Exchange Act of 1934 and the Investment Company Act of 1940, this report has been signed below by the following persons on behalf of the registrant and in the capacities and on the dates indicated.
| By (Signature and Title) | /s/ Ryan O’Connor | |
| | Ryan O’Connor | |
| | Principal Executive Officer | |
Date: February 6, 2025
| By (Signature and Title) | /s/ Eric Olsen | |
| | Eric Olsen | |
| | Principal Financial Officer | |
Date: February 6, 2025
0001432353glo:AdaptiveWealthStrategiesUSFactorIndexTRUSD4685AdditionalIndexMember2018-08-242024-11-30iso4217:USDxbrli:shares