UNITED STATES
SECURITIES AND EXCHANGE COMMISSION
Washington, D.C. 20549
FORM N-CSR
CERTIFIED SHAREHOLDER REPORT OF REGISTERED MANAGEMENT
INVESTMENT COMPANIES
Investment Company Act file number 811-22209
Global X Funds
(Exact name of registrant as specified in charter)
605 Third Avenue, 43rd floor
New York, NY 10158
(Address of principal executive offices) (Zip code)
Jasmin M. Ali, Esquire
Global X Management Company LLC
605 Third Avenue, 43rd floor
New York, NY 10158
(Name and address of agent for service)
With a copy to:
Jasmin M. Ali, Esquire
Global X Management Company LLC
605 Third Avenue, 43rd floor
New York, NY 10158 | Eric S. Purple, Esquire
Stradley Ronon Stevens & Young, LLP
2000 K Street, N.W., Suite 700
Washington, DC 20006-1871 |
Registrant’s telephone number, including area code: (212) 644-6440
Date of fiscal year end: November 30, 2024
Date of reporting period: November 30, 2024
| Item 1. | Reports to Stockholders. |
(a) A copy of the report transmitted to stockholders pursuant to Rule 30e-1 under the Investment Company Act of 1940, as amended (the “Act”) (17 CFR § 270.30e-1), is attached hereto.
Global X Millennial Consumer ETF
Principal Listing Exchange: Nasdaq
Annual Shareholder Report: November 30, 2024
This annual shareholder report contains important information about the Global X Millennial Consumer ETF (the "Fund") for the period from December 1, 2023 to November 30, 2024. You can find additional information about the Fund at https://www.globalxetfs.com/funds/miln. You can also request this information by contacting us at 1-888-493-8631.
What were the Fund costs for the last year?
(based on a hypothetical $10,000 investment)
| Fund Name | Costs of a $10,000 investment | Costs paid as a percentage of a $10,000 investment |
|---|
| Global X Millennial Consumer ETF | $61 | 0.50% |
|---|
How did the Fund perform in the last year?
The Fund seeks to provide investment results that correspond generally to the price and yield performance, before fees and expenses, of the Indxx Millennials Thematic Index (“Secondary Index”). The Fund is passively managed, and the investment adviser does not attempt to take defensive positions in declining markets. The Fund generally seeks to fully replicate the Secondary Index.
The Secondary Index measures the performance of U.S. listed companies that provide exposure to the Millennial generation (“Millennial Companies”), as defined by Indxx LLC, the provider of the Secondary Index. The Millennial generation refers to the demographic cohort in the U.S. with birth years ranging from 1980 to 2000.
For the 12-month period ended November 30, 2024 (the “reporting period”), the Fund increased 43.42%, while the Secondary Index increased 44.18%. The Fund had a net asset value of $32.86 per share on November 30, 2023 and ended the reporting period with a net asset value of $46.96 per share on November 29, 2024.
During the reporting period, the highest returns came from Carvana Co. Class A and Hims & Hers Health, Inc. Class A, which returned 731.48% and 262.43%, respectively. The worst performers were Chegg, Inc. and 2U, Inc., which returned -78.75% and -74.76%, respectively.
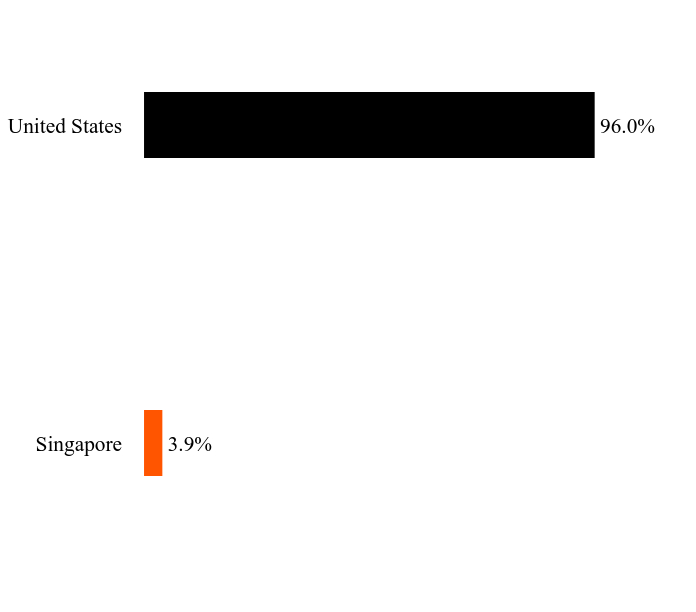
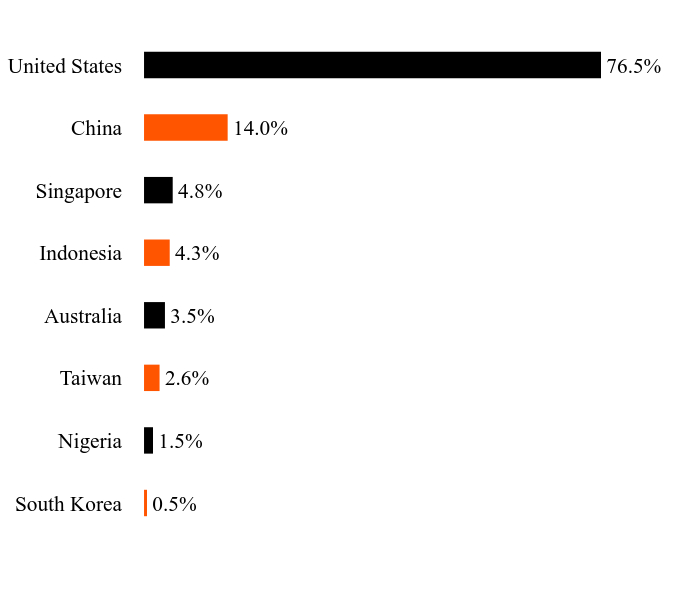
During the reporting period, by sector, the Fund had the highest exposure to Consumer Discretionary at 42.4% and Communication Services at 22.6%. By country, the Fund had the highest exposure to the United States at 96.0% and Singapore at 3.9%. During the reporting period the Fund recorded positive performance. The Fund benefited from its exposure to companies in the Consumer Discretionary sector that cater to millennial spending habits in areas such as travel, entertainment, and online retail. These companies met the Fund's selection criteria of having significant exposure to key millennial spending categories. Additionally, the Fund's holdings in the Technology sector, particularly those focused on social media and digital payments, contributed positively as millennials continued to adopt these technologies at a rapid pace. The Fund's underweight exposure to traditional brick-and-mortar retailers and legacy financial services companies also proved beneficial, as these industries faced challenges in adapting to changing millennial preferences. Overall, the Fund's targeted approach to investing in companies aligned with millennial consumption trends allowed it to capitalize on the generation's growing economic influence during the reporting period.
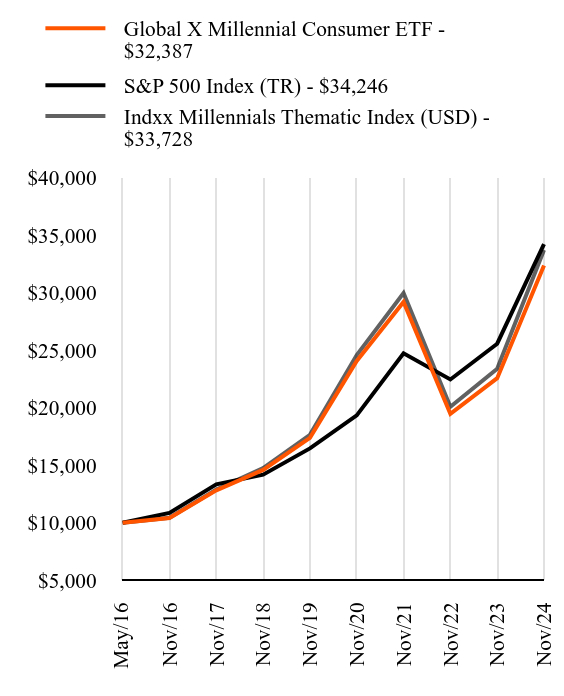
How did the Fund perform since inception?
Total Return Based on $10,000 Investment
| Global X Millennial Consumer ETF - $32387 | S&P 500 Index (TR) - $34246 | Indxx Millennials Thematic Index (USD) - $33728 |
|---|
| May/16 | $10000 | $10000 | $10000 |
|---|
| Nov/16 | $10421 | $10863 | $10441 |
|---|
| Nov/17 | $12823 | $13348 | $12895 |
|---|
| Nov/18 | $14602 | $14185 | $14759 |
|---|
| Nov/19 | $17387 | $16471 | $17659 |
|---|
| Nov/20 | $24076 | $19346 | $24595 |
|---|
| Nov/21 | $29212 | $24747 | $29995 |
|---|
| Nov/22 | $19488 | $22468 | $20093 |
|---|
| Nov/23 | $22581 | $25577 | $23392 |
|---|
| Nov/24 | $32387 | $34246 | $33728 |
|---|
Average Annual Total Returns as of November 30, 2024
| Fund/Index Name | 1 Year | 5 Years | Annualized Since Inception |
|---|
| Global X Millennial Consumer ETF | 43.42% | 13.25% | 14.68% |
|---|
| S&P 500 Index (TR) | 33.89% | 15.77% | 15.43% |
|---|
| Indxx Millennials Thematic Index (USD) | 44.18% | 13.82% | 15.22% |
|---|
Since its inception on May 4, 2016. The line graph represents historical performance of a hypothetical investment of $10,000 in the Fund since inception. Returns shown are total returns, which assume the reinvestment of dividends and capital gains. The table and graph presented above do not reflect the deduction of taxes a shareholder would pay on Fund distributions or the redemption of Fund shares. Past performance is not indicative of future performance.Call 1-888-493-8631 or visit https://www.globalxetfs.com/funds/miln for current month-end performance.
Key Fund Statistics as of November 30, 2024
| Total Net Assets | Number of Portfolio Holdings | Total Advisory Fees Paid | Portfolio Turnover Rate |
|---|
| $131,031,003 | 77 | $584,773 | 10.95% |
|---|
What did the Fund invest in?
Country WeightingsFootnote Reference*
| Value | Value |
|---|
| Singapore | 3.9% |
| United States | 96.0% |
| Footnote | Description |
Footnote* | Percentages are calculated based on total net assets. |
| Holding Name | | | Percentage of Total Net Assets |
|---|
| Sea ADR | | | 3.9% |
| Spotify Technology | | | 3.9% |
| Fiserv | | | 3.5% |
| Booking Holdings | | | 3.5% |
| Netflix | | | 3.5% |
| Apple | | | 3.3% |
| Costco Wholesale | | | 3.3% |
| PayPal Holdings | | | 3.3% |
| DoorDash, Cl A | | | 3.2% |
| Home Depot | | | 3.0% |
There were no material changes during the reporting period that are required to be disclosed in this report. For more complete information about other changes to the Fund, you may review the Fund's current prospectus, which is available upon request.
For additional information about the Fund, including its prospectus, financial information, holdings, and proxy voting information, call or visit:
Global X Millennial Consumer ETF: MILN
Principal Listing Exchange: Nasdaq
Annual Shareholder Report - November 30, 2024
GX-AR-TSR-11.2024-20
Global X Aging Population ETF
Principal Listing Exchange: Nasdaq
Annual Shareholder Report: November 30, 2024
This annual shareholder report contains important information about the Global X Aging Population ETF (the "Fund") for the period from December 1, 2023 to November 30, 2024. You can find additional information about the Fund at https://www.globalxetfs.com/funds/agng. You can also request this information by contacting us at 1-888-493-8631.
What were the Fund costs for the last year?
(based on a hypothetical $10,000 investment)
| Fund Name | Costs of a $10,000 investment | Costs paid as a percentage of a $10,000 investment |
|---|
| Global X Aging Population ETF | $55 | 0.50% |
|---|
How did the Fund perform in the last year?
The Fund seeks to provide investment results that correspond generally to the price and yield performance, before fees and expenses, of the Indxx Aging Population Thematic Index (“Secondary Index”). The Fund is passively managed, and the investment adviser does not attempt to take defensive positions in declining markets. The Fund generally seeks to fully replicate the Secondary Index.
The Secondary Index is designed to track the performance of companies listed in developed markets that are expected to directly or indirectly contribute to increasing the life-spans of the senior population (the “Aging Population”) of the world. The Secondary Index provides access to companies involved in medical devices, pharmaceuticals, senior living facilities and specialized health care services, which respond to the needs of this demographic.
For the 12-month period ended November 30, 2024 (the “reporting period”), the Fund increased 19.41%, while the Secondary Index increased 19.83%. The Fund had a net asset value of $26.93 per share on November 30, 2023 and ended the reporting period with a net asset value of $31.91 per share on November 29, 2024.
During the reporting period, the highest returns came from Silk Road Medical, Inc. and Agios Pharmaceuticals, Inc., which returned 194.64% and 167.16%, respectively. The worst performers were Cano Health, Inc. Class A and agilon health inc, which returned -88.62% and -80.32%, respectively.
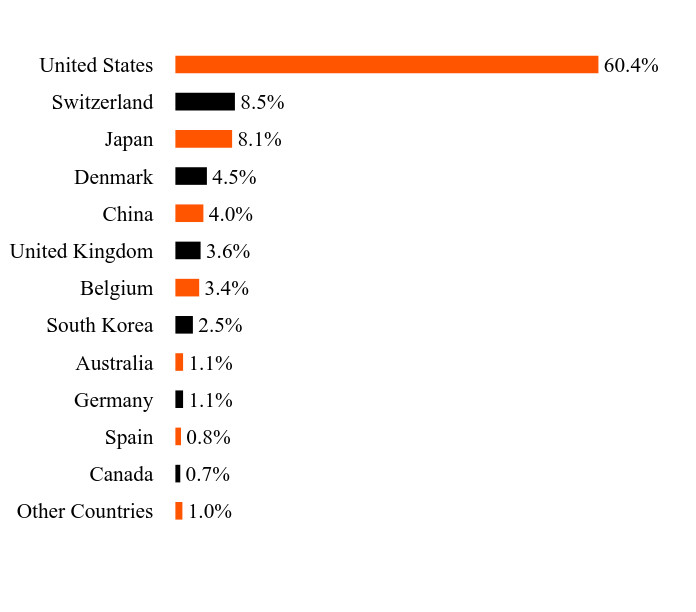
During the reporting period, by sector, the Fund had the highest exposure to Health Care at 91.0% and Real Estate at 8.5%. By country, the Fund had the highest exposure to the United States at 60.4%, Switzerland at 8.5%, and Japan at 8.1%. During the reporting period the Fund recorded positive performance. The Fund benefited from its exposure to companies in the Health Care sector that are focused on developing products and services that cater to the Aging Population. These companies saw increased demand as global senior population growth accelerated. Adoption of new products tailored to the Aging Population also positively contributed. Additionally, the Fund's holdings in the Medical Devices industry contributed positively, as advancements in technology led to new and improved devices that enhance the quality of life for older individuals. The Fund also gained from its allocation to companies operating senior homes, as the need for specialized care and living facilities for the elderly continued to exceed expectations.
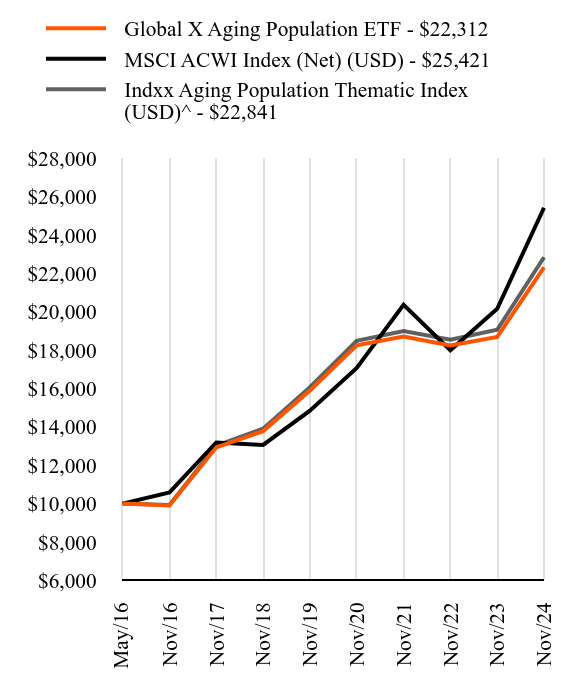
How did the Fund perform since inception?
Total Return Based on $10,000 Investment
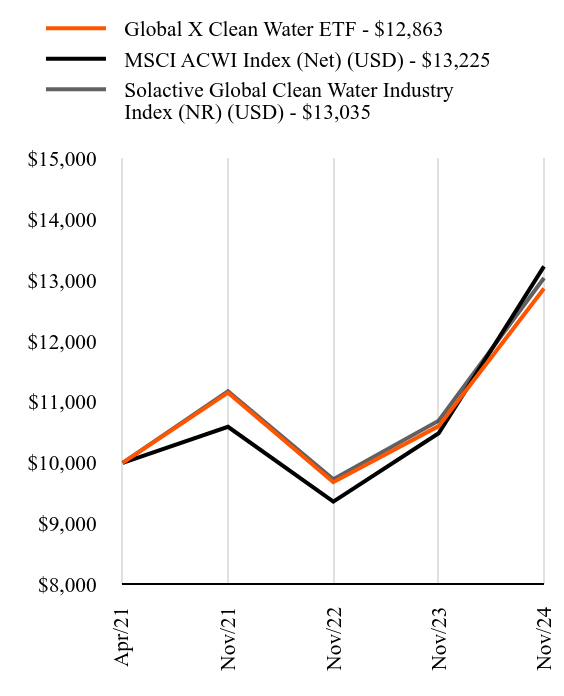
| Global X Aging Population ETF - $22312 | MSCI ACWI Index (Net) (USD) - $25421 | Indxx Aging Population Thematic Index (USD)^ - $22841 |
|---|
| May/16 | $10000 | $10000 | $10000 |
|---|
| Nov/16 | $9902 | $10580 | $9925 |
|---|
| Nov/17 | $12930 | $13187 | $13018 |
|---|
| Nov/18 | $13777 | $13058 | $13902 |
|---|
| Nov/19 | $15896 | $14843 | $16069 |
|---|
| Nov/20 | $18248 | $17071 | $18486 |
|---|
| Nov/21 | $18706 | $20361 | $18988 |
|---|
| Nov/22 | $18244 | $17995 | $18542 |
|---|
| Nov/23 | $18685 | $20157 | $19061 |
|---|
| Nov/24 | $22312 | $25421 | $22841 |
|---|
Average Annual Total Returns as of November 30, 2024
| Fund/Index Name | 1 Year | 5 Years | Annualized Since Inception |
|---|
| Global X Aging Population ETF | 19.41% | 7.02% | 9.82% |
|---|
| MSCI ACWI Index (Net) (USD) | 26.12% | 11.36% | 11.51% |
|---|
| Indxx Aging Population Thematic Index (USD)^ | 19.83% | 7.29% | 10.12% |
|---|
Since its inception on May 9, 2016. The line graph represents historical performance of a hypothetical investment of $10,000 in the Fund since inception. Returns shown are total returns, which assume the reinvestment of dividends and capital gains. The table and graph presented above do not reflect the deduction of taxes a shareholder would pay on Fund distributions or the redemption of Fund shares. Past performance is not indicative of future performance.Call 1-888-493-8631 or visit https://www.globalxetfs.com/funds/agng for current month-end performance.
^ The Fund changed its Secondary Index from the Indxx Global Longevity Thematic Index to the Indxx Aging Population Thematic Index on April 9, 2021. Performance through April 9, 2021 reflects the performance of the Indxx Global Longevity Thematic Index.
Key Fund Statistics as of November 30, 2024
| Total Net Assets | Number of Portfolio Holdings | Total Advisory Fees Paid | Portfolio Turnover Rate |
|---|
| $61,902,250 | 83 | $296,580 | 18.26% |
|---|
What did the Fund invest in?
Country WeightingsFootnote Reference*
| Value | Value |
|---|
| Other Countries | 1.0% |
| Canada | 0.7% |
| Spain | 0.8% |
| Germany | 1.1% |
| Australia | 1.1% |
| South Korea | 2.5% |
| Belgium | 3.4% |
| United Kingdom | 3.6% |
| China | 4.0% |
| Denmark | 4.5% |
| Japan | 8.1% |
| Switzerland | 8.5% |
| United States | 60.4% |
| Footnote | Description |
Footnote* | Percentages are calculated based on total net assets. |
| Holding Name | | | Percentage of Total Net Assets |
|---|
| Welltower | | | 4.2% |
| Boston Scientific | | | 3.6% |
| Chugai Pharmaceutical | | | 3.6% |
| Bristol-Myers Squibb | | | 3.3% |
| UCB | | | 3.2% |
| Stryker | | | 3.1% |
| AbbVie | | | 3.0% |
| Alcon | | | 3.0% |
| Medtronic PLC | | | 2.9% |
| Amgen | | | 2.9% |
There were no material changes during the reporting period that are required to be disclosed in this report. For more complete information about other changes to the Fund, you may review the Fund's current prospectus, which is available upon request.
For additional information about the Fund, including its prospectus, financial information, holdings, and proxy voting information, call or visit:
Global X Aging Population ETF: AGNG
Principal Listing Exchange: Nasdaq
Annual Shareholder Report - November 30, 2024
GX-AR-TSR-11.2024-21
Global X Robotics & Artificial Intelligence ETF
Principal Listing Exchange: Nasdaq
Annual Shareholder Report: November 30, 2024
This annual shareholder report contains important information about the Global X Robotics & Artificial Intelligence ETF (the "Fund") for the period from December 1, 2023 to November 30, 2024. You can find additional information about the Fund at https://www.globalxetfs.com/funds/botz/. You can also request this information by contacting us at 1-888-493-8631.
What were the Fund costs for the last year?
(based on a hypothetical $10,000 investment)
| Fund Name | Costs of a $10,000 investment | Costs paid as a percentage of a $10,000 investment |
|---|
| Global X Robotics & Artificial Intelligence ETF | $77 | 0.68% |
|---|
How did the Fund perform in the last year?
The Fund seeks to provide investment results that correspond generally to the price and yield performance, before fees and expenses, of the Indxx Global Robotics & Artificial Intelligence Thematic Index (“Secondary Index”). The Fund is passively managed and the investment adviser does not attempt to take defensive positions in declining markets. The Fund generally seeks to fully replicate the Secondary Index.
The Secondary Index seeks to invest in companies that potentially stand to benefit from increased adoption and utilization of robotics and artificial intelligence ("AI"), including those involved in Industrial Robots and Automation, Unmanned Vehicles and Drones, Non-industrial Robotics, and AI Applications and Hardware.
For the 12-month period ended November 30, 2024 (the “reporting period”), the Fund increased 25.81%, while the Secondary Index increased 26.55%. The Fund had a net asset value of $26.47 per share on November 30, 2023 and ended the reporting period with a net asset value of $33.25 per share on November 29, 2024.
During the reporting period, the highest returns came from SoundHound AI, Inc Class A and NVIDIA Corporation, which returned 335.05% and 195.68%, respectively. The worst performers were iRobot Corporation and Maytronics Ltd., which returned -78.93% and -73.54%, respectively.
During the reporting period the Fund recorded positive performance due to increased adoption and utilization of robotics and artificial intelligence across various industries. The Industrial sector saw strong demand for automation to boost productivity and efficiency, fueled by reshoring efforts, rising labor costs, and the need for precision manufacturing to meet quality standards, creating significant tailwinds for cost-effective alternatives to manual labor. Advancements in machine learning and data analytics drove growth in the Information Technology sector, which led to increases in demand for industrial analytics and predictive software. Healthcare companies leveraged robotics for surgical procedures and patient care, including minimally invasive surgeries, precision operations, rehabilitation therapy, mobility assistance, and hospital automation. These applications drove a noticeable uptick in surgical robotics sales as providers recognized their value in enhancing outcomes and efficiency. Finally, the rapid development of autonomous vehicles and drones contributed to the Fund's positive performance in the Transportation industry.
How did the Fund perform since inception?
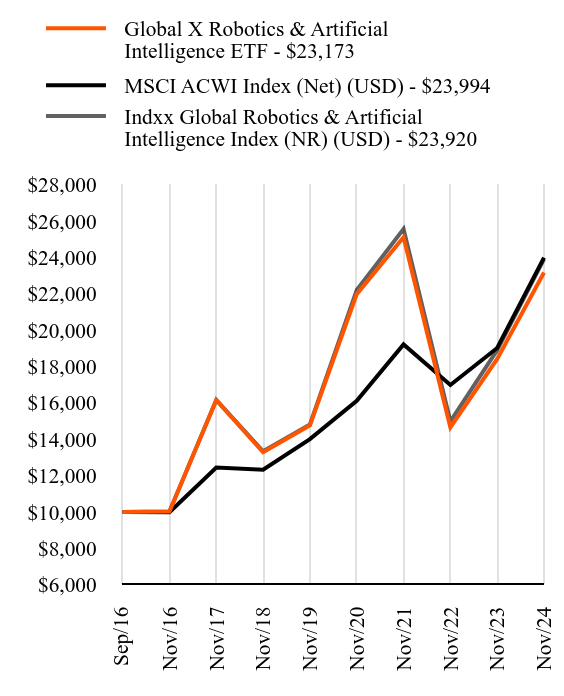
Total Return Based on $10,000 Investment
| Global X Robotics & Artificial Intelligence ETF - $23173 | MSCI ACWI Index (Net) (USD) - $23994 | Indxx Global Robotics & Artificial Intelligence Index (NR) (USD) - $23920 |
|---|
| Sep/16 | $10000 | $10000 | $10000 |
|---|
| Nov/16 | $10020 | $9986 | $10024 |
|---|
| Nov/17 | $16155 | $12447 | $16170 |
|---|
| Nov/18 | $13284 | $12325 | $13336 |
|---|
| Nov/19 | $14766 | $14010 | $14815 |
|---|
| Nov/20 | $21987 | $16113 | $22212 |
|---|
| Nov/21 | $25114 | $19218 | $25562 |
|---|
| Nov/22 | $14648 | $16985 | $14990 |
|---|
| Nov/23 | $18420 | $19025 | $18901 |
|---|
| Nov/24 | $23173 | $23994 | $23920 |
|---|
Average Annual Total Returns as of November 30, 2024
| Fund/Index Name | 1 Year | 5 Years | Annualized Since Inception |
|---|
| Global X Robotics & Artificial Intelligence ETF | 25.81% | 9.43% | 10.76% |
|---|
| MSCI ACWI Index (Net) (USD) | 26.12% | 11.36% | 11.23% |
|---|
| Indxx Global Robotics & Artificial Intelligence Index (NR) (USD) | 26.55% | 10.06% | 11.19% |
|---|
Since its inception on September 12, 2016. The line graph represents historical performance of a hypothetical investment of $10,000 in the Fund since inception. Returns shown are total returns, which assume the reinvestment of dividends and capital gains. The table and graph presented above do not reflect the deduction of taxes a shareholder would pay on Fund distributions or the redemption of Fund shares. Past performance is not indicative of future performance.Call 1-888-493-8631 or visit https://www.globalxetfs.com/funds/botz/ for current month-end performance.
Key Fund Statistics as of November 30, 2024
| Total Net Assets | Number of Portfolio Holdings | Total Advisory Fees Paid | Portfolio Turnover Rate |
|---|
| $2,648,468,039 | 51 | $17,751,189 | 10.43% |
|---|
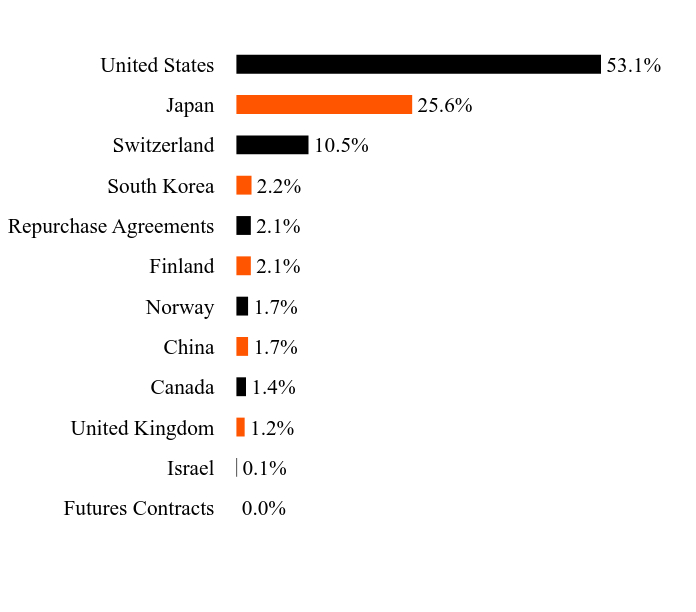
What did the Fund invest in?
Asset/Country WeightingsFootnote Reference*
| Value | Value |
|---|
| Futures Contracts | 0.0% |
| Israel | 0.1% |
| United Kingdom | 1.2% |
| Canada | 1.4% |
| China | 1.7% |
| Norway | 1.7% |
| Finland | 2.1% |
| Repurchase Agreements | 2.1% |
| South Korea | 2.2% |
| Switzerland | 10.5% |
| Japan | 25.6% |
| United States | 53.1% |
| Footnote | Description |
Footnote* | Percentages are calculated based on total net assets. |
| Holding Name | | | Percentage of Total Net Assets |
|---|
| NVIDIA | | | 13.1% |
| Intuitive Surgical | | | 10.5% |
| ABB | | | 9.2% |
| Keyence | | | 6.9% |
| SMC | | | 5.2% |
| Dynatrace | | | 4.8% |
| FANUC | | | 3.7% |
| Pegasystems | | | 3.4% |
| Daifuku | | | 3.4% |
| Cognex | | | 2.9% |
There were no material changes during the reporting period that are required to be disclosed in this report. For more complete information about other changes to the Fund, you may review the Fund's current prospectus, which is available upon request.
For additional information about the Fund, including its prospectus, financial information, holdings, and proxy voting information, call or visit:
Global X Robotics & Artificial Intelligence ETF: BOTZ
Principal Listing Exchange: Nasdaq
Annual Shareholder Report - November 30, 2024
GX-AR-TSR-11.2024-22
Principal Listing Exchange: Nasdaq
Annual Shareholder Report: November 30, 2024
This annual shareholder report contains important information about the Global X FinTech ETF (the "Fund") for the period from December 1, 2023 to November 30, 2024. You can find additional information about the Fund at https://www.globalxetfs.com/funds/finx/. You can also request this information by contacting us at 1-888-493-8631.
What were the Fund costs for the last year?
(based on a hypothetical $10,000 investment)
| Fund Name | Costs of a $10,000 investment | Costs paid as a percentage of a $10,000 investment |
|---|
| Global X FinTech ETF | $86 | 0.68% |
|---|
How did the Fund perform in the last year?
The Fund seeks to provide investment results that correspond generally to the price and yield performance, before fees and expenses, of the Indxx Global FinTech Thematic Index (“Secondary Index”). The Fund is passively managed, and the investment adviser does not attempt to take defensive positions in declining markets. The Fund generally seeks to fully replicate the Secondary Index.
The Secondary Index seeks to invest in companies on the leading edge of the emerging financial technology sector ("FinTech"), which encompasses a range of innovations helping to transform established industries like insurance, investing, fundraising, and third-party lending through unique mobile and digital solutions.
For the 12-month period ended November 30, 2024 (the "reporting period"), the Fund increased 52.18%, while the Secondary Index increased 53.13%. The Fund had a net asset value of $22.37 per share on November 30, 2023 and ended the reporting period with a net asset value of $33.96 per share on November 29, 2024.
During the reporting period, the highest returns came from Zip Co Ltd. and Blend Labs, Inc. Class A, which returned 729.67% and 302.36%, respectively. The worst performers were kakaopay Corp. and StoneCo Ltd. Class A, which returned -50.35% and -39.23%, respectively.
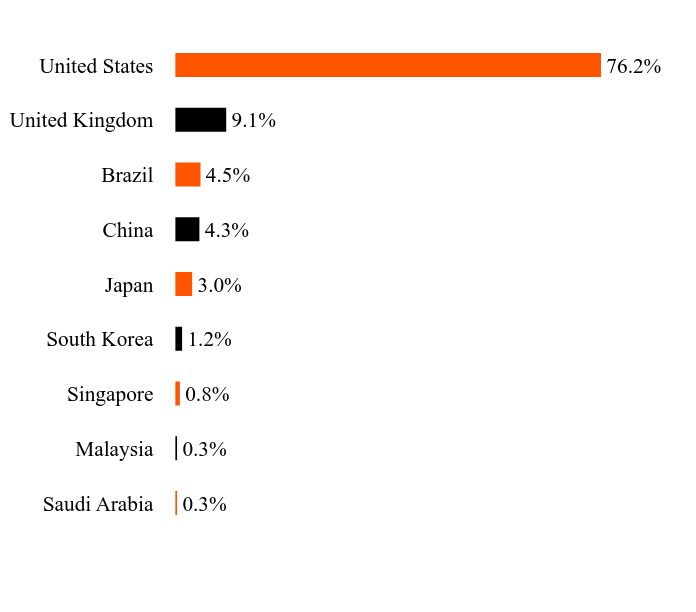
During the reporting period, by sector, the Fund had the highest exposure to Financials at 70.2%, and Information Technology at 23.4%. During the reporting period the Fund recorded positive performance. The Fund benefited from its exposure to companies offering blockchain technology and alternative currencies, as increasing mainstream adoption and institutional interest in digital assets drove growth for these firms. The rise of mobile payments and point-of-sale services also contributed positively, with changing consumer preferences and the shift towards cashless transactions boosting the revenues of companies in this space. Additionally, the Fund's holdings in the personal finance software and automated wealth management segment performed well, as more individuals turned to these technologies to manage their finances. However, the Fund's performance was dampened by its exposure to the lending sector, where increased competition and regulatory scrutiny posed challenges for some companies. Overall, the Fund's diversified exposure across various FinTech segments allowed it to capitalize on the broader growth trends within the industry, while mitigating the impact of any sector-specific headwinds.
How did the Fund perform since inception?
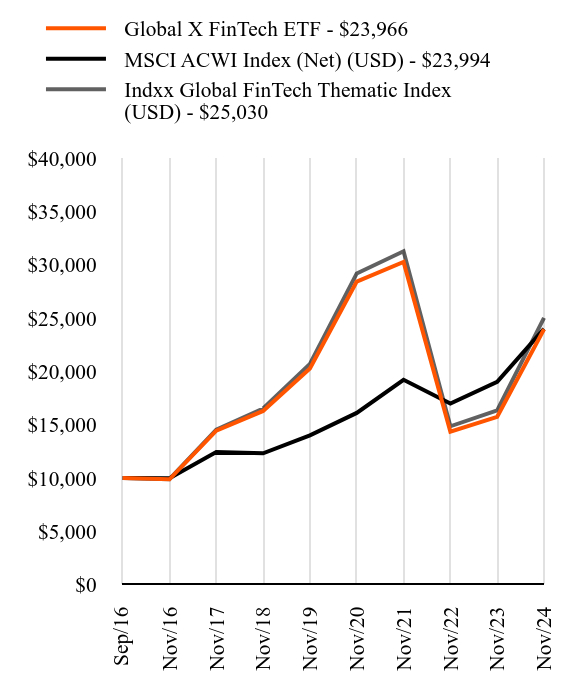
Total Return Based on $10,000 Investment
| Global X FinTech ETF - $23966 | MSCI ACWI Index (Net) (USD) - $23994 | Indxx Global FinTech Thematic Index (USD) - $25030 |
|---|
| Sep/16 | $10000 | $10000 | $10000 |
|---|
| Nov/16 | $9887 | $9986 | $9895 |
|---|
| Nov/17 | $14450 | $12447 | $14546 |
|---|
| Nov/18 | $16298 | $12325 | $16528 |
|---|
| Nov/19 | $20279 | $14010 | $20713 |
|---|
| Nov/20 | $28433 | $16113 | $29194 |
|---|
| Nov/21 | $30275 | $19218 | $31271 |
|---|
| Nov/22 | $14356 | $16985 | $14859 |
|---|
| Nov/23 | $15749 | $19025 | $16346 |
|---|
| Nov/24 | $23966 | $23994 | $25030 |
|---|
Average Annual Total Returns as of November 30, 2024
| Fund/Index Name | 1 Year | 5 Years | Annualized Since Inception |
|---|
| Global X FinTech ETF | 52.18% | 3.40% | 11.22% |
|---|
| MSCI ACWI Index (Net) (USD) | 26.12% | 11.36% | 11.23% |
|---|
| Indxx Global FinTech Thematic Index (USD) | 53.13% | 3.86% | 11.81% |
|---|
Since its inception on September 12, 2016. The line graph represents historical performance of a hypothetical investment of $10,000 in the Fund since inception. Returns shown are total returns, which assume the reinvestment of dividends and capital gains. The table and graph presented above do not reflect the deduction of taxes a shareholder would pay on Fund distributions or the redemption of Fund shares. Past performance is not indicative of future performance.Call 1-888-493-8631 or visit https://www.globalxetfs.com/funds/finx/ for current month-end performance.
Key Fund Statistics as of November 30, 2024
| Total Net Assets | Number of Portfolio Holdings | Total Advisory Fees Paid | Portfolio Turnover Rate |
|---|
| $349,456,951 | 66 | $2,189,288 | 13.79% |
|---|
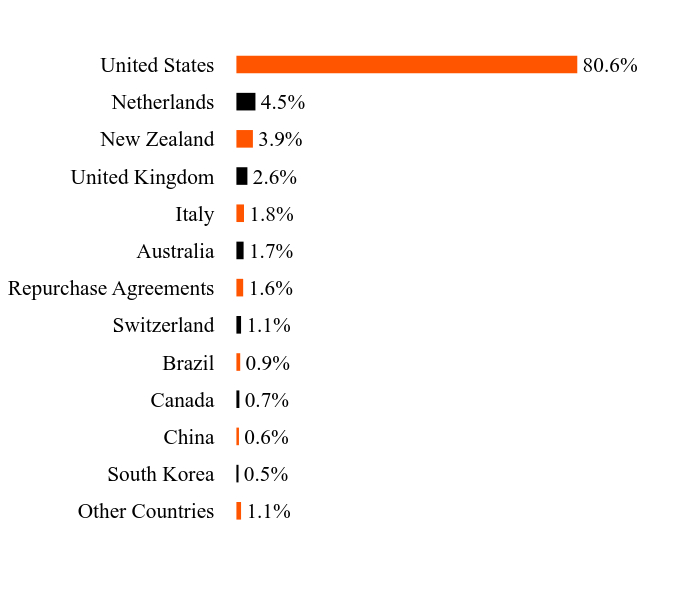
What did the Fund invest in?
Asset/Country WeightingsFootnote Reference*
| Value | Value |
|---|
| Other Countries | 1.1% |
| South Korea | 0.5% |
| China | 0.6% |
| Canada | 0.7% |
| Brazil | 0.9% |
| Switzerland | 1.1% |
| Repurchase Agreements | 1.6% |
| Australia | 1.7% |
| Italy | 1.8% |
| United Kingdom | 2.6% |
| New Zealand | 3.9% |
| Netherlands | 4.5% |
| United States | 80.6% |
| Footnote | Description |
Footnote* | Percentages are calculated based on total net assets. |
| Holding Name | | | Percentage of Total Net Assets |
|---|
| Fiserv | | | 7.2% |
| PayPal Holdings | | | 7.0% |
| Fidelity National Information Services | | | 6.0% |
| Block, Cl A | | | 5.4% |
| Coinbase Global, Cl A | | | 5.3% |
| Intuit | | | 4.7% |
| Adyen | | | 4.5% |
| SS&C Technologies Holdings | | | 4.3% |
| Toast, Cl A | | | 4.2% |
| Affirm Holdings, Cl A | | | 4.1% |
There were no material changes during the reporting period that are required to be disclosed in this report. For more complete information about other changes to the Fund, you may review the Fund's current prospectus, which is available upon request.
For additional information about the Fund, including its prospectus, financial information, holdings, and proxy voting information, call or visit:
Global X FinTech ETF: FINX
Principal Listing Exchange: Nasdaq
Annual Shareholder Report - November 30, 2024
GX-AR-TSR-11.2024-23
Global X Internet of Things ETF
Principal Listing Exchange: Nasdaq
Annual Shareholder Report: November 30, 2024
This annual shareholder report contains important information about the Global X Internet of Things ETF (the "Fund") for the period from December 1, 2023 to November 30, 2024. You can find additional information about the Fund at https://www.globalxetfs.com/funds/snsr/. You can also request this information by contacting us at 1-888-493-8631.
What were the Fund costs for the last year?
(based on a hypothetical $10,000 investment)
| Fund Name | Costs of a $10,000 investment | Costs paid as a percentage of a $10,000 investment |
|---|
| Global X Internet of Things ETF | $72 | 0.68% |
|---|
How did the Fund perform in the last year?
The Fund seeks to provide investment results that correspond generally to the price and yield performance, before fees and expenses, of the Indxx Global Internet of Things Thematic Index (“Secondary Index”). The Fund is passively managed, and the investment adviser does not attempt to take defensive positions in declining markets. The Fund generally seeks to fully replicate the Secondary Index.
The Secondary Index seeks to invest in companies that stand to potentially benefit from the broader adoption of the Internet of Things (“IoT”). This includes the development and manufacturing of semiconductors and sensors, integrated products and solutions, and applications serving smart grids, smart homes, connected cars, and the industrial internet.
For the 12-month period ended November 30, 2024 (the “reporting period”), the Fund increased 12.06%, while the Secondary Index increased 12.75%. The Fund had a net asset value of $32.45 per share on November 30, 2023, and ended the reporting period with a net asset value of $36.14 per share on November 29, 2024.
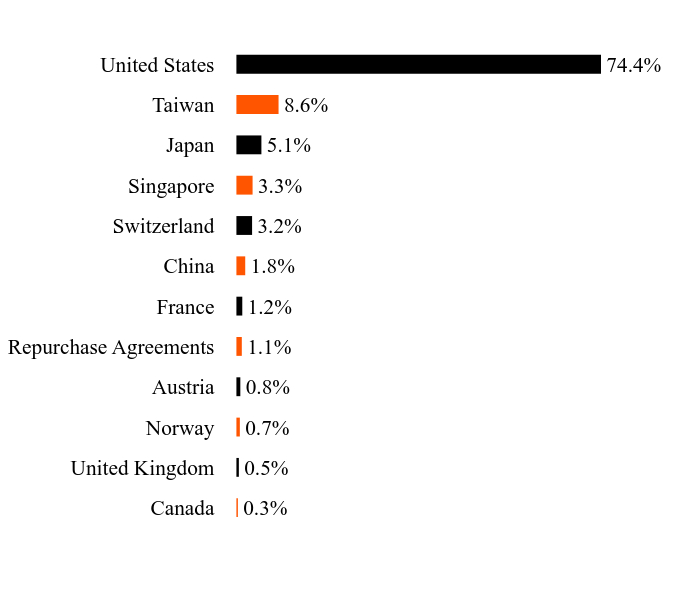
During the reporting period, the highest returns came from Semtech Corporation and Impinj, Inc., which returned 291.20% and 129.94%, respectively. The worst performers were ams-OSRAM AG and STMicroelectronics NV, which returned -67.25% and -45.50%, respectively. During the reporting period, by sector, the Fund had the highest exposure to Information Technology at 66.3% and Industrials at 17.1%. By country, the Fund had the highest exposure to the United States at 74.4%, Taiwan at 8.6%, and Japan at 5.1%. During the reporting period the Fund recorded positive performance. The Fund benefited from increased demand for IoT semiconductors and sensors, as companies across various industries invested in connected devices and smart technologies. The rapid growth of 5G networks provided a tailwind for the Fund's networking infrastructure and software holdings, enabling faster and more reliable IoT deployments. The Fund's exposure to the Industrial and Technology sectors allowed it to capitalize on the accelerating adoption of IoT solutions in manufacturing, logistics, and other enterprise applications. Consumer IoT technology, such as wearables and smart home devices, saw strong sales growth, driven by changing consumer preferences and technological advancements. Finally, the Fund's global diversification helped mitigate the impact of regional economic challenges, as IoT adoption continued to expand worldwide.
How did the Fund perform since inception?
Total Return Based on $10,000 Investment
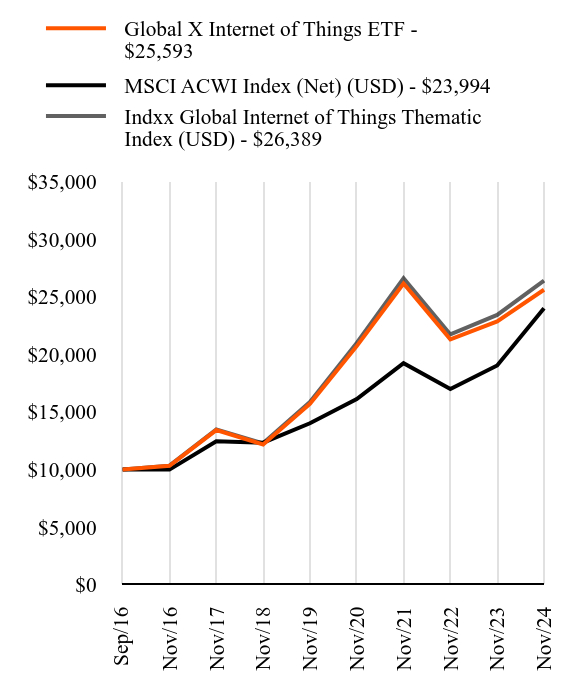
| Global X Internet of Things ETF - $25593 | MSCI ACWI Index (Net) (USD) - $23994 | Indxx Global Internet of Things Thematic Index (USD) - $26389 |
|---|
| Sep/16 | $10000 | $10000 | $10000 |
|---|
| Nov/16 | $10319 | $9986 | $10328 |
|---|
| Nov/17 | $13419 | $12447 | $13478 |
|---|
| Nov/18 | $12167 | $12325 | $12263 |
|---|
| Nov/19 | $15696 | $14010 | $15853 |
|---|
| Nov/20 | $20700 | $16113 | $20978 |
|---|
| Nov/21 | $26133 | $19218 | $26590 |
|---|
| Nov/22 | $21293 | $16985 | $21715 |
|---|
| Nov/23 | $22839 | $19025 | $23405 |
|---|
| Nov/24 | $25593 | $23994 | $26389 |
|---|
Average Annual Total Returns as of November 30, 2024
| Fund/Index Name | 1 Year | 5 Years | Annualized Since Inception |
|---|
| Global X Internet of Things ETF | 12.06% | 10.27% | 12.11% |
|---|
| MSCI ACWI Index (Net) (USD) | 26.12% | 11.36% | 11.23% |
|---|
| Indxx Global Internet of Things Thematic Index (USD) | 12.75% | 10.73% | 12.53% |
|---|
Since its inception on September 12, 2016. The line graph represents historical performance of a hypothetical investment of $10,000 in the Fund since inception. Returns shown are total returns, which assume the reinvestment of dividends and capital gains. The table and graph presented above do not reflect the deduction of taxes a shareholder would pay on Fund distributions or the redemption of Fund shares. Past performance is not indicative of future performance.Call 1-888-493-8631 or visit https://www.globalxetfs.com/funds/snsr/ for current month-end performance.
Key Fund Statistics as of November 30, 2024
| Total Net Assets | Number of Portfolio Holdings | Total Advisory Fees Paid | Portfolio Turnover Rate |
|---|
| $240,722,134 | 59 | $1,829,294 | 19.16% |
|---|
What did the Fund invest in?
Asset/Country WeightingsFootnote Reference*
| Value | Value |
|---|
| Canada | 0.3% |
| United Kingdom | 0.5% |
| Norway | 0.7% |
| Austria | 0.8% |
| Repurchase Agreements | 1.1% |
| France | 1.2% |
| China | 1.8% |
| Switzerland | 3.2% |
| Singapore | 3.3% |
| Japan | 5.1% |
| Taiwan | 8.6% |
| United States | 74.4% |
| Footnote | Description |
Footnote* | Percentages are calculated based on total net assets. |
| Holding Name | | | Percentage of Total Net Assets |
|---|
| Garmin | | | 9.0% |
| Skyworks Solutions | | | 4.9% |
| Renesas Electronics | | | 4.6% |
| Samsara, Cl A | | | 4.1% |
| Dexcom | | | 3.9% |
| Advantech | | | 3.6% |
| STMicroelectronics | | | 3.3% |
| Lattice Semiconductor | | | 3.2% |
| Johnson Controls International | | | 2.7% |
| eMemory Technology | | | 2.7% |
There were no material changes during the reporting period that are required to be disclosed in this report. For more complete information about other changes to the Fund, you may review the Fund's current prospectus, which is available upon request.
For additional information about the Fund, including its prospectus, financial information, holdings, and proxy voting information, call or visit:
Global X Internet of Things ETF: SNSR
Principal Listing Exchange: Nasdaq
Annual Shareholder Report - November 30, 2024
GX-AR-TSR-11.2024-24
Global X U.S. Infrastructure Development ETF
Principal Listing Exchange: Cboe BZX Exchange, Inc.
Annual Shareholder Report: November 30, 2024
This annual shareholder report contains important information about the Global X U.S. Infrastructure Development ETF (the "Fund") for the period from December 1, 2023 to November 30, 2024. You can find additional information about the Fund at https://www.globalxetfs.com/funds/pave. You can also request this information by contacting us at 1-888-493-8631.
What were the Fund costs for the last year?
(based on a hypothetical $10,000 investment)
| Fund Name | Costs of a $10,000 investment | Costs paid as a percentage of a $10,000 investment |
|---|
| Global X U.S. Infrastructure Development ETF | $58 | 0.47% |
|---|
How did the Fund perform in the last year?
The Fund seeks to provide investment results that correspond generally to the price and yield performance, before fees and expenses, of the Indxx U.S. Infrastructure Development Index (“Secondary Index”). The Fund is passively managed, and the investment adviser does not attempt to take defensive positions in declining markets. The Fund generally seeks to fully replicate the Secondary Index.
The Secondary Index is designed to measure the performance of U.S. listed companies that provide exposure to domestic infrastructure development, including companies involved in construction and engineering; production of infrastructure raw materials, composites and products; industrial transportation; and producers/distributors of heavy construction equipment (collectively, "U.S. Infrastructure Development Companies"), as defined by Indxx, LLC, the provider of the Secondary Index.
For the 12-month period ended November 30, 2024 (the “reporting period”), the Fund increased 46.08%, while the Secondary Index increased 47.07%. The Fund had a net asset value of $31.50 per share on November 30, 2023 and ended the reporting period with a net asset value of $45.71 per share on November 30, 2024.
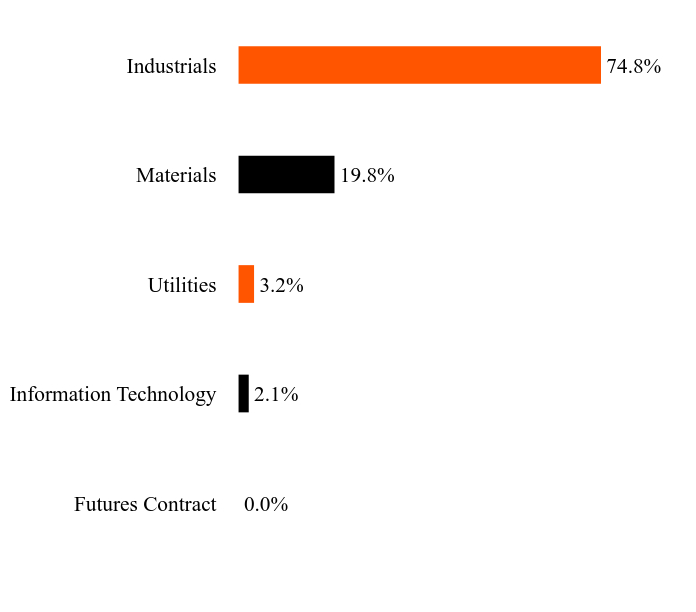
During the reporting period, the highest returns came from Argan, Inc. and Tutor Perini Corporation, which returned 240.56% and 224.73%, respectively. The worst performers were Titan Machinery Inc. and Cleveland-Cliffs Inc, which returned -32.4% and -27.5%, respectively. During the reporting period, by sector, the Fund had the highest exposure to Industrials at 74.8% and Materials at 19.8%. During the reporting period the Fund recorded positive performance driven by strong momentum in U.S. infrastructure development. Legislative tailwinds, including funding from the Infrastructure Investment and Jobs Act, boosted demand across the infrastructure development value chain, while private investment in U.S. manufacturing further drove demand for construction materials and services. Increased infrastructure development led to higher demand for materials like steel and cement, as well as for construction equipment, cranes, and other essential products for large-scale projects. The need to transport infrastructure raw materials and equipment to project sites also benefited some constituents in the Fund. These dynamics were sufficient for the Fund to experience a positive performance during the reporting period, despite the high interest rate and uncertain policy environment in the United States.
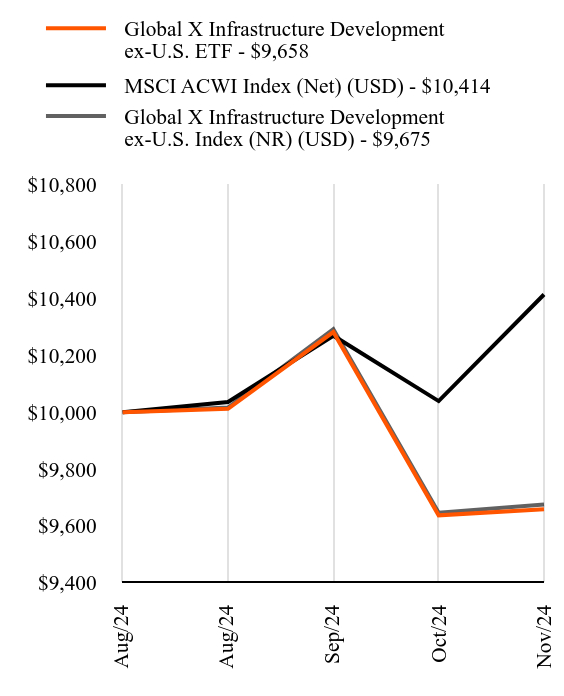
How did the Fund perform since inception?
Total Return Based on $10,000 Investment
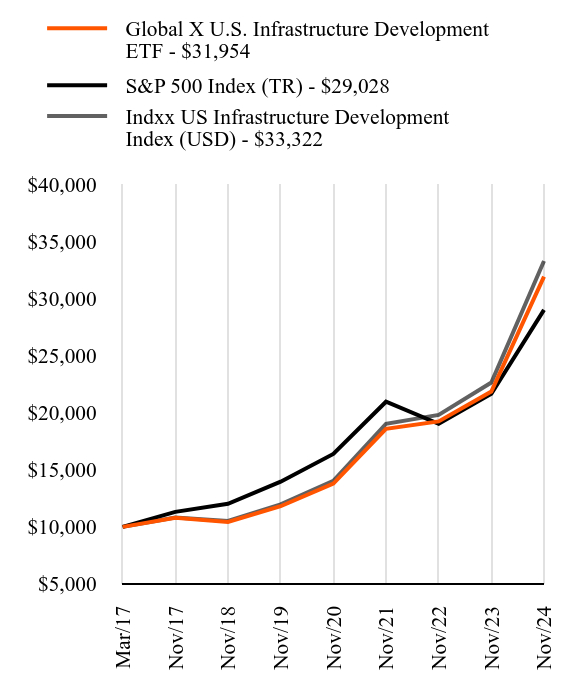
| Global X U.S. Infrastructure Development ETF - $31954 | S&P 500 Index (TR) - $29028 | Indxx US Infrastructure Development Index (USD) - $33322 |
|---|
| Mar/17 | $10000 | $10000 | $10000 |
|---|
| Nov/17 | $10788 | $11314 | $10829 |
|---|
| Nov/18 | $10425 | $12024 | $10515 |
|---|
| Nov/19 | $11810 | $13961 | $11967 |
|---|
| Nov/20 | $13790 | $16398 | $14031 |
|---|
| Nov/21 | $18603 | $20976 | $19043 |
|---|
| Nov/22 | $19251 | $19044 | $19820 |
|---|
| Nov/23 | $21874 | $21680 | $22657 |
|---|
| Nov/24 | $31954 | $29028 | $33322 |
|---|
Average Annual Total Returns as of November 30, 2024
| Fund/Index Name | 1 Year | 5 Years | Annualized Since Inception |
|---|
| Global X U.S. Infrastructure Development ETF | 46.08% | 22.03% | 16.19% |
|---|
| S&P 500 Index (TR) | 33.89% | 15.77% | 14.76% |
|---|
| Indxx US Infrastructure Development Index (USD) | 47.07% | 22.73% | 16.82% |
|---|
Since its inception on March 6, 2017. The line graph represents historical performance of a hypothetical investment of $10,000 in the Fund since inception. Returns shown are total returns, which assume the reinvestment of dividends and capital gains. The table and graph presented above do not reflect the deduction of taxes a shareholder would pay on Fund distributions or the redemption of Fund shares. Past performance is not indicative of future performance.Call 1-888-493-8631 or visit https://www.globalxetfs.com/funds/pave for current month-end performance.
Key Fund Statistics as of November 30, 2024
| Total Net Assets | Number of Portfolio Holdings | Total Advisory Fees Paid | Portfolio Turnover Rate |
|---|
| $9,715,853,492 | 101 | $34,215,409 | 4.41% |
|---|
What did the Fund invest in?
Asset/Sector WeightingsFootnote Reference*
| Value | Value |
|---|
| Futures Contract | 0.0% |
| Information Technology | 2.1% |
| Utilities | 3.2% |
| Materials | 19.8% |
| Industrials | 74.8% |
| Footnote | Description |
Footnote* | Percentages are calculated based on total net assets. |
| Holding Name | | | Percentage of Total Net Assets |
|---|
| Trane Technologies PLC | | | 3.7% |
| Eaton PLC | | | 3.5% |
| Quanta Services | | | 3.4% |
| Parker-Hannifin | | | 3.4% |
| United Rentals | | | 3.4% |
| Howmet Aerospace | | | 3.3% |
| Emerson Electric | | | 3.1% |
| Sempra | | | 2.9% |
| Deere | | | 2.7% |
| Fastenal | | | 2.7% |
There were no material changes during the reporting period that are required to be disclosed in this report. For more complete information about other changes to the Fund, you may review the Fund's current prospectus, which is available upon request.
For additional information about the Fund, including its prospectus, financial information, holdings, and proxy voting information, call or visit:
Global X U.S. Infrastructure Development ETF: PAVE
Principal Listing Exchange: Cboe BZX Exchange, Inc.
Annual Shareholder Report - November 30, 2024
GX-AR-TSR-11.2024-25
Global X Autonomous & Electric Vehicles ETF
Principal Listing Exchange: Nasdaq
Annual Shareholder Report: November 30, 2024
This annual shareholder report contains important information about the Global X Autonomous & Electric Vehicles ETF (the "Fund") for the period from December 1, 2023 to November 30, 2024. You can find additional information about the Fund at https://www.globalxetfs.com/funds/driv. You can also request this information by contacting us at 1-888-493-8631.
What were the Fund costs for the last year?
(based on a hypothetical $10,000 investment)
| Fund Name | Costs of a $10,000 investment | Costs paid as a percentage of a $10,000 investment |
|---|
| Global X Autonomous & Electric Vehicles ETF | $69 | 0.68% |
|---|
How did the Fund perform in the last year?
The Fund seeks to provide investment results that correspond generally to the price and yield performance, before fees and expenses, of the Solactive Autonomous & Electric Vehicles Index (“Secondary Index”). The Fund is passively managed, and the investment adviser does not attempt to take defensive positions in declining markets. The Fund generally seeks to fully replicate the Secondary Index.
The Secondary Index tracks the price movements in shares of companies which are active in the electric vehicles and autonomous driving segments. This particularly includes electric vehicle manufacturers, electric vehicle component producers, companies that mine or produce raw materials that are relevant to the electric vehicle and autonomous vehicle technology segment, companies that build autonomous vehicles, and suppliers of autonomous vehicle technologies.
For the 12-month period ended November 30, 2024 (the "reporting period"), the Fund increased 3.65%, while the Secondary Index increased 3.83%. The Fund had a net asset value of $23.19 per share on November 30, 2023 and ended the reporting period with a net asset value of $23.64 per share on November 29, 2024.
During the reporting period, the highest returns in the Fund came from NVIDIA Corporation and Coherent Corp., which returned 195.68% and 172.25%, respectively. The worst performers were Nikola Corporation and Luminar Technologies, Inc. Class A, which returned -93.11% and -76.32%, respectively.
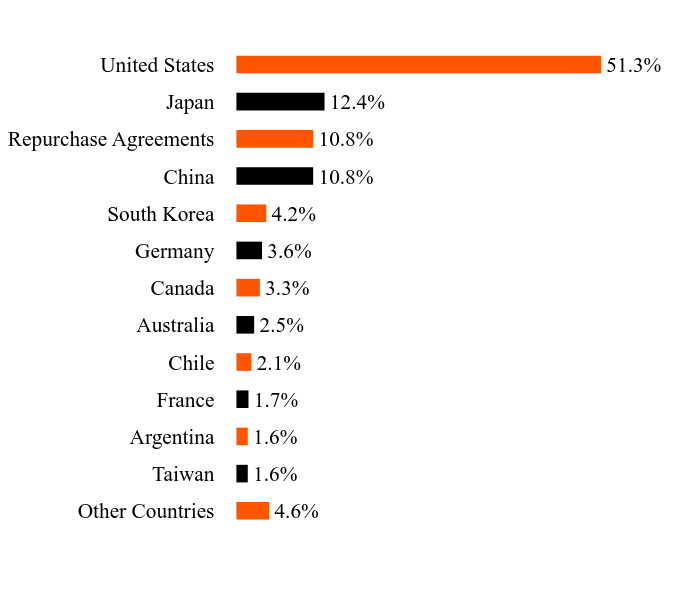
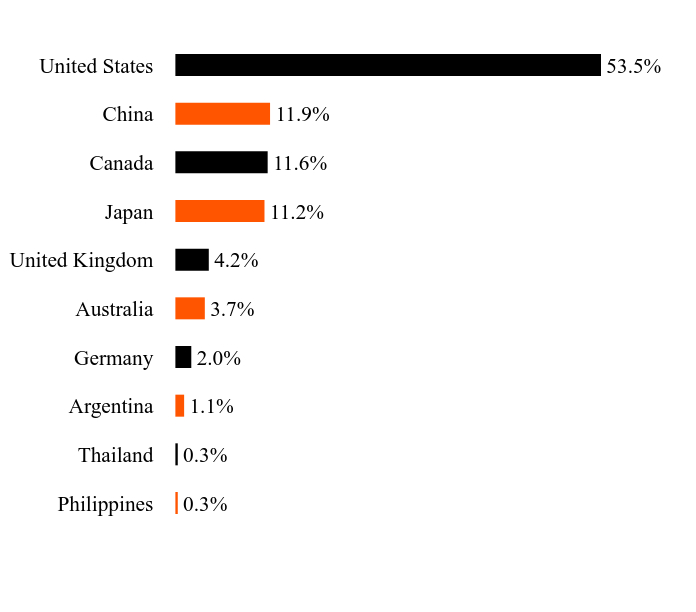
During the reporting period, by sector, the Fund had the highest exposure to Consumer Discretionary at 34.2%, and Information Technology at 26.2%. By country, the Fund had the highest exposure to the United States at 51.3%, Japan at 12.4%, and China at 10.8%. During the reporting period the Fund recorded positive performance. The Fund benefited from its exposure to companies in the Electric Vehicles segment, as increasing consumer demand and government incentives drove growth in this area. The Fund's holdings in the Autonomous Vehicle Technology segment also contributed positively, with advancements in self-driving capabilities and partnerships between technology companies and automakers. Despite some individual company underperformance, overall, the Fund's diversified approach and focus on companies with significant exposure to the Electric Vehicles and Autonomous Driving themes allowed it to generate positive returns during the reporting period.
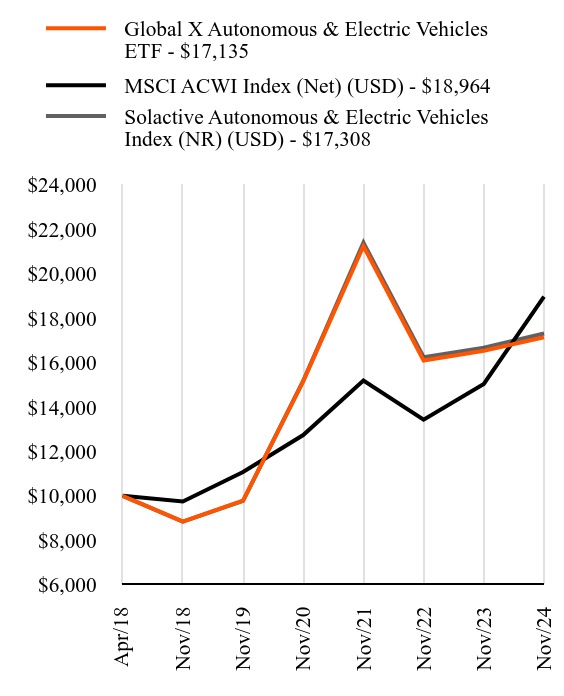
How did the Fund perform since inception?
Total Return Based on $10,000 Investment
| Global X Autonomous & Electric Vehicles ETF - $17135 | MSCI ACWI Index (Net) (USD) - $18964 | Solactive Autonomous & Electric Vehicles Index (NR) (USD) - $17308 |
|---|
| Apr/18 | $10000 | $10000 | $10000 |
|---|
| Nov/18 | $8840 | $9741 | $8840 |
|---|
| Nov/19 | $9778 | $11073 | $9770 |
|---|
| Nov/20 | $15153 | $12735 | $15180 |
|---|
| Nov/21 | $21247 | $15189 | $21399 |
|---|
| Nov/22 | $16094 | $13424 | $16240 |
|---|
| Nov/23 | $16531 | $15037 | $16669 |
|---|
| Nov/24 | $17135 | $18964 | $17308 |
|---|
Average Annual Total Returns as of November 30, 2024
| Fund/Index Name | 1 Year | 5 Years | Annualized Since Inception |
|---|
| Global X Autonomous & Electric Vehicles ETF | 3.65% | 11.87% | 8.45% |
|---|
| MSCI ACWI Index (Net) (USD) | 26.12% | 11.36% | 10.12% |
|---|
| Solactive Autonomous & Electric Vehicles Index (NR) (USD) | 3.83% | 12.12% | 8.62% |
|---|
Since its inception on April 13, 2018. The line graph represents historical performance of a hypothetical investment of $10,000 in the Fund since inception. Returns shown are total returns, which assume the reinvestment of dividends and capital gains. The table and graph presented above do not reflect the deduction of taxes a shareholder would pay on Fund distributions or the redemption of Fund shares. Past performance is not indicative of future performance.Call 1-888-493-8631 or visit https://www.globalxetfs.com/funds/driv for current month-end performance.
Key Fund Statistics as of November 30, 2024
| Total Net Assets | Number of Portfolio Holdings | Total Advisory Fees Paid | Portfolio Turnover Rate |
|---|
| $415,072,792 | 80 | $3,693,361 | 26.13% |
|---|
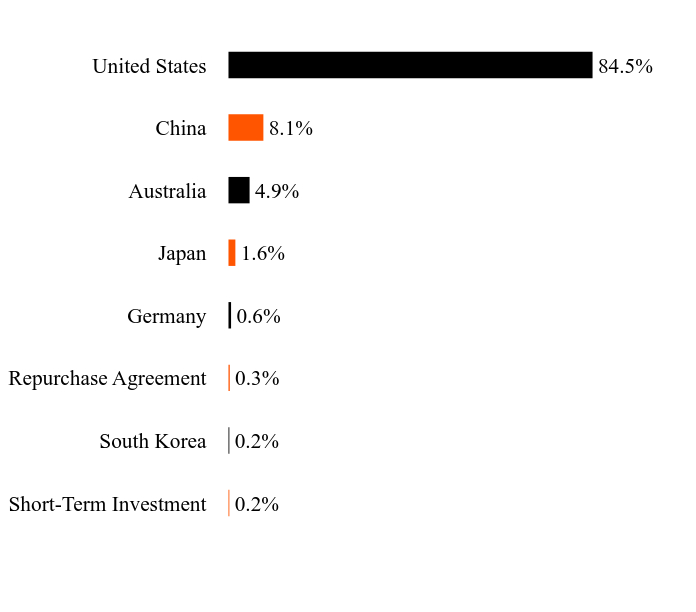
What did the Fund invest in?
Asset/Country WeightingsFootnote Reference*
| Value | Value |
|---|
| Other Countries | 4.6% |
| Taiwan | 1.6% |
| Argentina | 1.6% |
| France | 1.7% |
| Chile | 2.1% |
| Australia | 2.5% |
| Canada | 3.3% |
| Germany | 3.6% |
| South Korea | 4.2% |
| China | 10.8% |
| Repurchase Agreements | 10.8% |
| Japan | 12.4% |
| United States | 51.3% |
| Footnote | Description |
Footnote* | Percentages are calculated based on total net assets. |
| Holding Name | | | Percentage of Total Net Assets |
|---|
| Tesla | | | 4.4% |
| NVIDIA | | | 3.4% |
| Microsoft | | | 3.0% |
| Alphabet, Cl A | | | 2.9% |
| Honeywell International | | | 2.8% |
| Toyota Motor | | | 2.6% |
| QUALCOMM | | | 2.4% |
| Hitachi | | | 2.4% |
| Bloom Energy, Cl A | | | 2.1% |
| Geely Automobile Holdings | | | 1.9% |
There were no material changes during the reporting period that are required to be disclosed in this report. For more complete information about other changes to the Fund, you may review the Fund's current prospectus, which is available upon request.
For additional information about the Fund, including its prospectus, financial information, holdings, and proxy voting information, call or visit:
Global X Autonomous & Electric Vehicles ETF: DRIV
Principal Listing Exchange: Nasdaq
Annual Shareholder Report - November 30, 2024
GX-AR-TSR-11.2024-26
Global X Artificial Intelligence & Technology ETF
Principal Listing Exchange: Nasdaq
Annual Shareholder Report: November 30, 2024
This annual shareholder report contains important information about the Global X Artificial Intelligence & Technology ETF (the "Fund") for the period from December 1, 2023 to November 30, 2024. You can find additional information about the Fund at https://www.globalxetfs.com/funds/aiq/. You can also request this information by contacting us at 1-888-493-8631.
What were the Fund costs for the last year?
(based on a hypothetical $10,000 investment)
| Fund Name | Costs of a $10,000 investment | Costs paid as a percentage of a $10,000 investment |
|---|
| Global X Artificial Intelligence & Technology ETF | $78 | 0.68% |
|---|
How did the Fund perform in the last year?
The Fund seeks to provide investment results that correspond generally to the price and yield performance, before fees and expenses, of the Indxx Artificial Intelligence & Big Data Index (“Secondary Index”). The Fund is passively managed and the investment adviser does not attempt to take defensive positions in declining markets. The Fund generally seeks to fully replicate the Secondary Index.
The Secondary Index is designed to provide exposure to exchange-listed companies in developed markets that are positioned to benefit from the further development and implementation of artificial intelligence technology, as well as to companies that provide critical technology and services for the analysis of large and complex data sets (collectively, “Artificial Intelligence & Big Data Companies”). The Fund also includes exposure to companies that produce semiconductors, memory storage and other hardware that is utilized for artificial intelligence applications.
For the 12-month period ended November 30, 2024 (the “reporting period”), the Fund increased 30.58%, while the Secondary Index increased 31.49%. The Fund had a net asset value of $29.73 per share on November 30, 2023 and ended the reporting period with a net asset value of $38.75 per share on November 29, 2024.
During the reporting period, the highest returns came from Fujikura Ltd and NVIDIA Corporation, which returned 369.97% and 195.68%, respectively. The worst performers were ViaSat, Inc., and Intel Corporation, which returned -54.38% and -45.47%, respectively.
The Fund delivered positive performance, driven by rapid advancements in artificial intelligence (“AI”) and increased demand for AI-related hardware, semiconductors, and services. The growing adoption of cloud computing and big data analytics further bolstered the performance of companies providing AI-as-a-Service solutions. Cloud computing companies also benefited by integrating AI through their products and services, which resulted in market share gains and sales growth. Additionally, the Semiconductor industry saw strong growth, benefiting the Fund's holdings that produce AI-optimized hardware. The increased investment in AI research and development by major technology companies led to more spend on chips, memory, storage, and other AI hardware. Lastly, the ongoing digital transformation across industries created new opportunities for AI-powered automation and efficiency gains, supporting the Fund's performance.
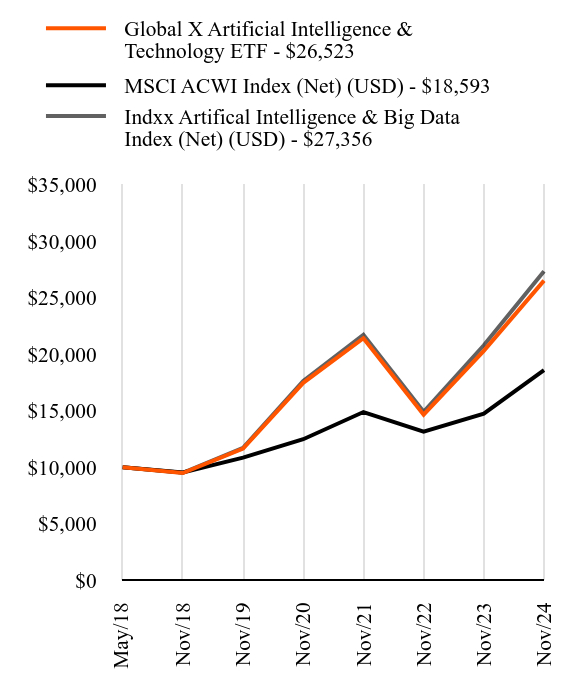
How did the Fund perform since inception?
Total Return Based on $10,000 Investment
| Global X Artificial Intelligence & Technology ETF - $26523 | MSCI ACWI Index (Net) (USD) - $18593 | Indxx Artifical Intelligence & Big Data Index (Net) (USD) - $27356 |
|---|
| May/18 | $10000 | $10000 | $10000 |
|---|
| Nov/18 | $9493 | $9550 | $9512 |
|---|
| Nov/19 | $11664 | $10857 | $11722 |
|---|
| Nov/20 | $17478 | $12486 | $17631 |
|---|
| Nov/21 | $21428 | $14892 | $21721 |
|---|
| Nov/22 | $14660 | $13162 | $14919 |
|---|
| Nov/23 | $20312 | $14743 | $20804 |
|---|
| Nov/24 | $26523 | $18593 | $27356 |
|---|
Average Annual Total Returns as of November 30, 2024
| Fund/Index Name | 1 Year | 5 Years | Annualized Since Inception |
|---|
| Global X Artificial Intelligence & Technology ETF | 30.58% | 17.86% | 16.03% |
|---|
| MSCI ACWI Index (Net) (USD) | 26.12% | 11.36% | 9.91% |
|---|
| Indxx Artifical Intelligence & Big Data Index (Net) (USD) | 31.49% | 18.47% | 16.58% |
|---|
Since its inception on May 11, 2018. The line graph represents historical performance of a hypothetical investment of $10,000 in the Fund since inception. Returns shown are total returns, which assume the reinvestment of dividends and capital gains. The table and graph presented above do not reflect the deduction of taxes a shareholder would pay on Fund distributions or the redemption of Fund shares. Past performance is not indicative of future performance.Call 1-888-493-8631 or visit https://www.globalxetfs.com/funds/aiq/ for current month-end performance.
Key Fund Statistics as of November 30, 2024
| Total Net Assets | Number of Portfolio Holdings | Total Advisory Fees Paid | Portfolio Turnover Rate |
|---|
| $2,490,689,554 | 89 | $11,888,417 | 10.88% |
|---|
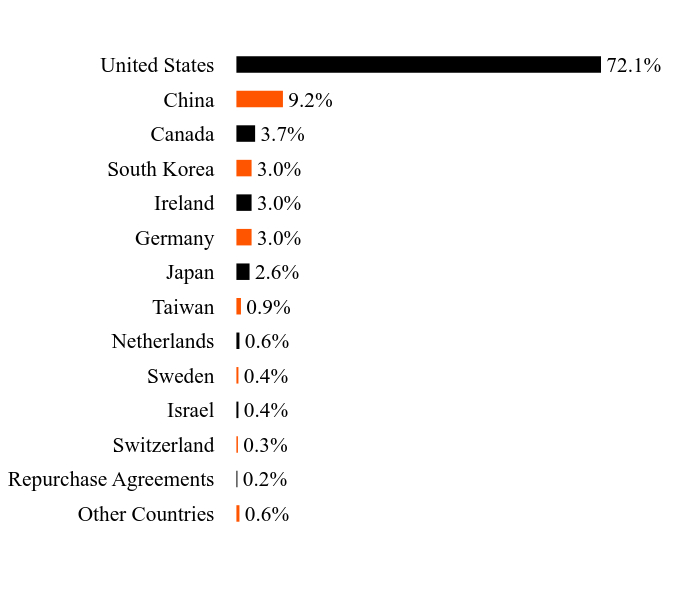
What did the Fund invest in?
Asset/Country WeightingsFootnote Reference*
| Value | Value |
|---|
| Other Countries | 0.6% |
| Repurchase Agreements | 0.2% |
| Switzerland | 0.3% |
| Israel | 0.4% |
| Sweden | 0.4% |
| Netherlands | 0.6% |
| Taiwan | 0.9% |
| Japan | 2.6% |
| Germany | 3.0% |
| Ireland | 3.0% |
| South Korea | 3.0% |
| Canada | 3.7% |
| China | 9.2% |
| United States | 72.1% |
| Footnote | Description |
Footnote* | Percentages are calculated based on total net assets. |
| Holding Name | | | Percentage of Total Net Assets |
|---|
| Tesla | | | 3.9% |
| Netflix | | | 3.8% |
| ServiceNow | | | 3.8% |
| Oracle | | | 3.6% |
| Salesforce | | | 3.5% |
| Cisco Systems | | | 3.5% |
| International Business Machines | | | 3.4% |
| Meta Platforms, Cl A | | | 3.2% |
| Alibaba Group Holding ADR | | | 3.2% |
| NVIDIA | | | 3.1% |
There were no material changes during the reporting period that are required to be disclosed in this report. For more complete information about other changes to the Fund, you may review the Fund's current prospectus, which is available upon request.
For additional information about the Fund, including its prospectus, financial information, holdings, and proxy voting information, call or visit:
Global X Artificial Intelligence & Technology ETF: AIQ
Principal Listing Exchange: Nasdaq
Annual Shareholder Report - November 30, 2024
GX-AR-TSR-11.2024-27
Global X Genomics & Biotechnology ETF
Principal Listing Exchange: Nasdaq
Annual Shareholder Report: November 30, 2024
This annual shareholder report contains important information about the Global X Genomics & Biotechnology ETF (the "Fund") for the period from December 1, 2023 to November 30, 2024. You can find additional information about the Fund at https://www.globalxetfs.com/funds/gnom/. You can also request this information by contacting us at 1-888-493-8631.
What were the Fund costs for the last year?
(based on a hypothetical $10,000 investment)
| Fund Name | Costs of a $10,000 investment | Costs paid as a percentage of a $10,000 investment |
|---|
| Global X Genomics & Biotechnology ETF | $51 | 0.50% |
|---|
How did the Fund perform in the last year?
The Fund seeks to provide investment results that correspond generally to the price and yield performance, before fees and expenses, of the Solactive Genomics Index (“Secondary Index”). The Fund is passively managed and the investment adviser does not attempt to take defensive positions in declining markets. The Fund generally seeks to fully replicate the Secondary Index.
The Secondary Index is designed to provide exposure to exchange-listed companies that are positioned to benefit from further advances in the field of genomic science and biotechnology, as well as applications thereof (collectively, "Genomics & Biotechnology Companies"), as defined by Solactive AG, the provider of the Secondary Index. These companies include those involved in the following business activities: (i) gene editing, (ii) genomic sequencing, (iii) development and testing of genetic medicine/therapies, and/or (iv) computational genomics and genetic diagnostics.
For the 12-month period ended November 29, 2024 (the “reporting period”), the Fund increased 4.03%, while the Secondary Index increased 4.76%. The Fund had a net asset value of $10.41 per share on November 30, 2023 and ended the reporting period with a net asset value of $10.83 per share on November 29, 2024.
During the reporting period, the highest returns came from Avidity Biosciences Inc and Poseida Therapeutics, Inc., which returned 450.96% and 248.69%, respectively. The worst performers were bluebird bio, Inc. and Editas Medicine, Inc., which returned -89.38% and -78.73%, respectively.
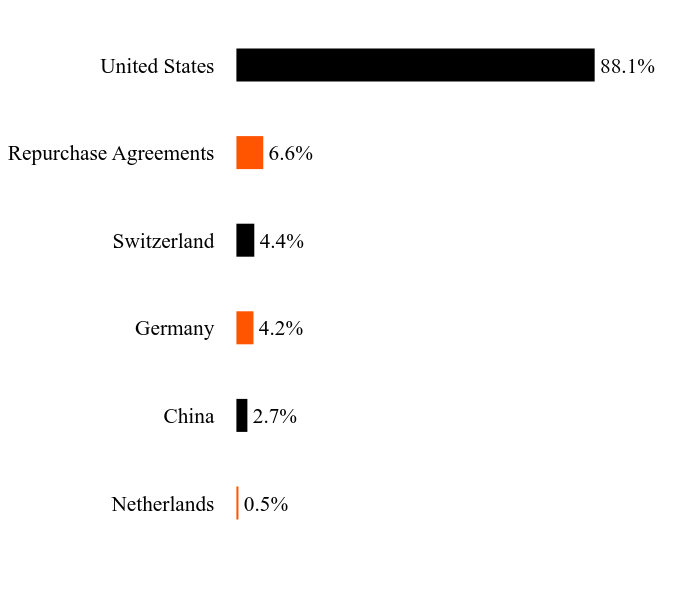
During the reporting period, by country, the Fund had the highest exposure to the United States at 88.1%, Switzerland at 4.4%, and Germany at 4.2%.
During the reporting period the Fund recorded positive performance. The Biotechnology sector experienced growth driven by advancements in gene editing technologies, which boosted the valuations of companies developing innovative therapies. Additionally, the FDA approval of several groundbreaking treatments from companies in the Fund's portfolio provided a tailwind. Robust funding for biomedical research, particularly in areas such as oncology and rare diseases, further supported the sector. The growing demand for personalized medicine solutions and the rising prevalence of chronic diseases globally created favorable market conditions for the Fund's holdings.
How did the Fund perform since inception?
Total Return Based on $10,000 Investment
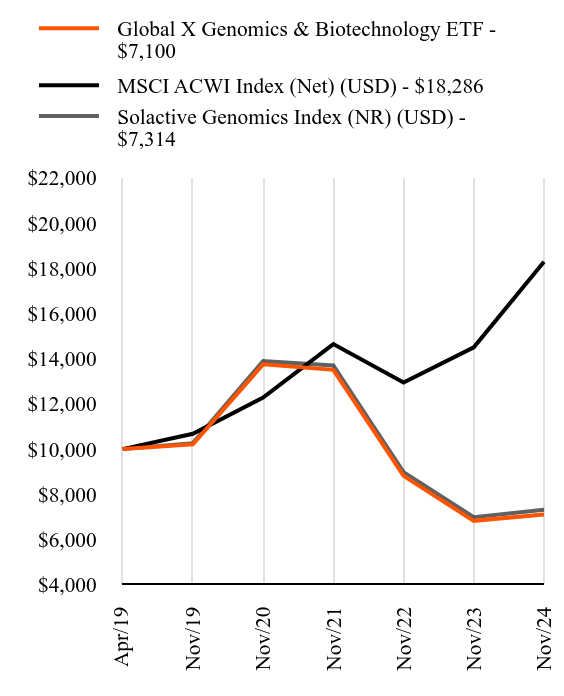
| Global X Genomics & Biotechnology ETF - $7100 | MSCI ACWI Index (Net) (USD) - $18286 | Solactive Genomics Index (NR) (USD) - $7314 |
|---|
| Apr/19 | $10000 | $10000 | $10000 |
|---|
| Nov/19 | $10216 | $10678 | $10263 |
|---|
| Nov/20 | $13750 | $12280 | $13890 |
|---|
| Nov/21 | $13506 | $14647 | $13697 |
|---|
| Nov/22 | $8817 | $12945 | $8976 |
|---|
| Nov/23 | $6824 | $14500 | $6982 |
|---|
| Nov/24 | $7100 | $18286 | $7314 |
|---|
Average Annual Total Returns as of November 30, 2024
| Fund/Index Name | 1 Year | 5 Years | Annualized Since Inception |
|---|
| Global X Genomics & Biotechnology ETF | 4.03% | -7.02% | -5.87% |
|---|
| MSCI ACWI Index (Net) (USD) | 26.12% | 11.36% | 11.25% |
|---|
| Solactive Genomics Index (NR) (USD) | 4.76% | -6.55% | -5.38% |
|---|
Since its inception on April 5, 2019. The line graph represents historical performance of a hypothetical investment of $10,000 in the Fund since inception. Returns shown are total returns, which assume the reinvestment of dividends and capital gains. The table and graph presented above do not reflect the deduction of taxes a shareholder would pay on Fund distributions or the redemption of Fund shares. Past performance is not indicative of future performance.Call 1-888-493-8631 or visit https://www.globalxetfs.com/funds/gnom/ for current month-end performance.
Key Fund Statistics as of November 30, 2024
| Total Net Assets | Number of Portfolio Holdings | Total Advisory Fees Paid | Portfolio Turnover Rate |
|---|
| $79,156,476 | 46 | $451,671 | 18.89% |
|---|
What did the Fund invest in?
Asset/Country WeightingsFootnote Reference*
| Value | Value |
|---|
| Netherlands | 0.5% |
| China | 2.7% |
| Germany | 4.2% |
| Switzerland | 4.4% |
| Repurchase Agreements | 6.6% |
| United States | 88.1% |
| Footnote | Description |
Footnote* | Percentages are calculated based on total net assets. |
| Holding Name | | | Percentage of Total Net Assets |
|---|
| Natera | | | 5.6% |
| Veracyte | | | 5.2% |
| Arrowhead Pharmaceuticals | | | 5.1% |
| CRISPR Therapeutics | | | 4.4% |
| Bio-Techne | | | 4.3% |
| BioNTech ADR | | | 4.2% |
| Agilent Technologies | | | 4.1% |
| QIAGEN | | | 4.1% |
| Sarepta Therapeutics | | | 4.0% |
| Illumina | | | 4.0% |
There were no material changes during the reporting period that are required to be disclosed in this report. For more complete information about other changes to the Fund, you may review the Fund's current prospectus, which is available upon request.
For additional information about the Fund, including its prospectus, financial information, holdings, and proxy voting information, call or visit:
Global X Genomics & Biotechnology ETF: GNOM
Principal Listing Exchange: Nasdaq
Annual Shareholder Report - November 30, 2024
GX-AR-TSR-11.2024-28
Global X Cloud Computing ETF
Principal Listing Exchange: Nasdaq
Annual Shareholder Report: November 30, 2024
This annual shareholder report contains important information about the Global X Cloud Computing ETF (the "Fund") for the period from December 1, 2023 to November 30, 2024. You can find additional information about the Fund at https://www.globalxetfs.com/funds/clou/. You can also request this information by contacting us at 1-888-493-8631.
What were the Fund costs for the last year?
(based on a hypothetical $10,000 investment)
| Fund Name | Costs of a $10,000 investment | Costs paid as a percentage of a $10,000 investment |
|---|
| Global X Cloud Computing ETF | $74 | 0.68% |
|---|
How did the Fund perform in the last year?
The Fund seeks to provide investment results that correspond generally to the price and yield performance, before fees and expenses, of the Indxx Global Cloud Computing Index (“Secondary Index”). The Fund is passively managed, and the investment adviser does not attempt to take defensive positions in declining markets. The Fund generally seeks to fully replicate the Secondary Index.
The Secondary Index is designed to provide exposure to exchange-listed companies in developed and emerging markets that are positioned to benefit from the increased adoption of cloud computing technology, including but not limited to companies whose principal business is in offering computing Software-as-a-Service ("SaaS"), Platform-as-a-Service ("PaaS"), Infrastructure-as-a-Service ("IaaS"), managed server storage space and data center REITs, and/or cloud and edge computing infrastructure and hardware (collectively, “Cloud Computing Companies”), as defined by Indxx LLC, the provider of the Secondary Index.
For the 12-month period ended November 30, 2024 (the "reporting period"), the Fund increased 18.52%, while the Secondary Index increased 19.33%. The Fund had a net asset value of $20.79 per share on November 30, 2023 and ended the reporting period with a net asset value of $24.64 per share on November 30, 2024.
During the reporting period, the highest returns came from Wix.com Ltd. and Vimeo, Inc., which returned 120.43% and 85.51%, respectively. The worst performers were 2U, Inc. and Fastly, Inc. Class A, which returned -68.42% and -48.95%, respectively.
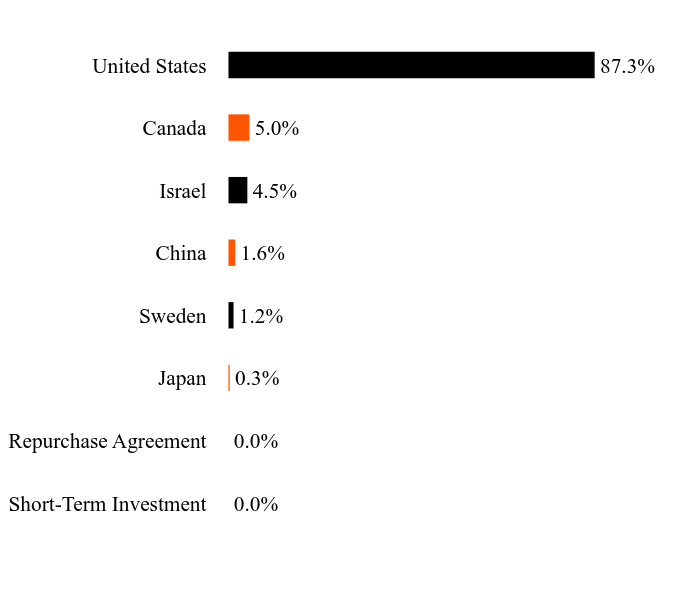
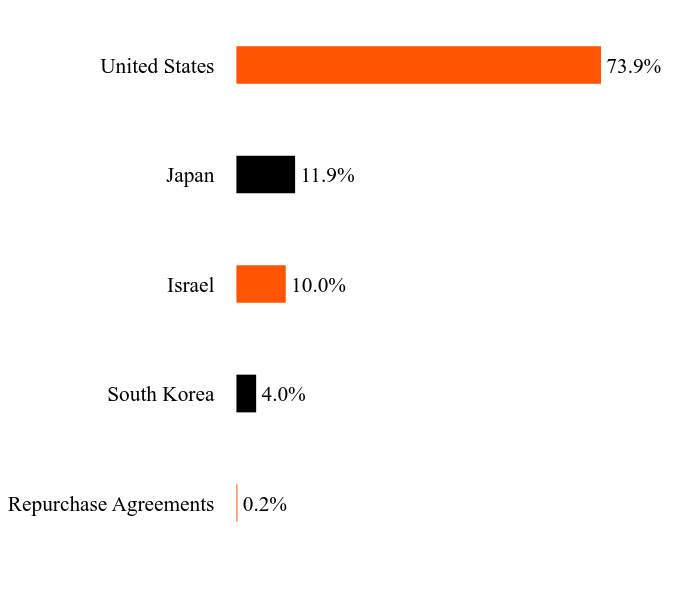
During the reporting period, by sector, the Fund had the highest exposure to Information Technology at 86.9%, and Communication Services at 2.6%. By country, the Fund had the highest exposure to the United States at 87.3%, Canada at 5.0%, and Israel at 4.5%.
During the reporting period the Fund recorded positive performance. The Fund benefited from the continued digital transformation and adoption of cloud computing technologies across various industries. Additionally, the increasing reliance on data analytics and artificial intelligence further boosted the need for scalable and flexible cloud infrastructure. The SaaS and IaaS sub-themes performed particularly well, as businesses sought to optimize their operations and reduce costs through cloud-based applications and services. Furthermore, the expansion of 5G networks and edge computing enhanced the capabilities of cloud computing, creating new opportunities for innovation within the sector.
How did the Fund perform since inception?
Total Return Based on $10,000 Investment
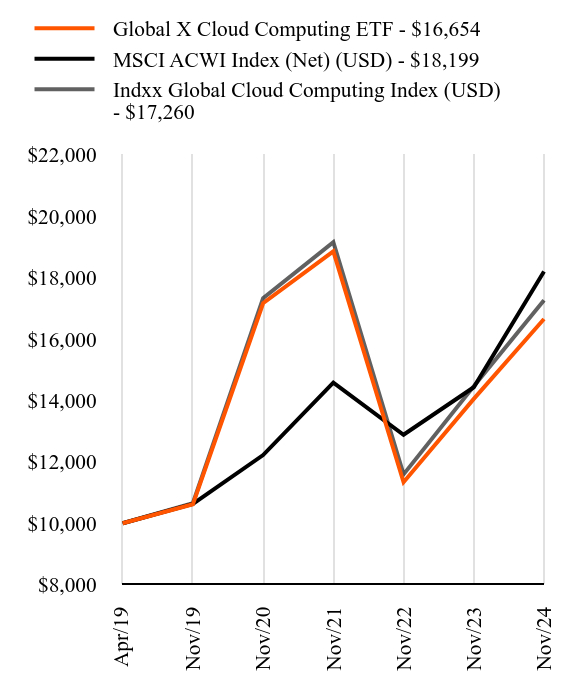
| Global X Cloud Computing ETF - $16654 | MSCI ACWI Index (Net) (USD) - $18199 | Indxx Global Cloud Computing Index (USD) - $17260 |
|---|
| Apr/19 | $10000 | $10000 | $10000 |
|---|
| Nov/19 | $10618 | $10627 | $10652 |
|---|
| Nov/20 | $17166 | $12222 | $17331 |
|---|
| Nov/21 | $18854 | $14577 | $19156 |
|---|
| Nov/22 | $11335 | $12883 | $11592 |
|---|
| Nov/23 | $14052 | $14430 | $14464 |
|---|
| Nov/24 | $16654 | $18199 | $17260 |
|---|
Average Annual Total Returns as of November 30, 2024
| Fund/Index Name | 1 Year | 5 Years | Annualized Since Inception |
|---|
| Global X Cloud Computing ETF | 18.52% | 9.42% | 9.46% |
|---|
| MSCI ACWI Index (Net) (USD) | 26.12% | 11.36% | 11.20% |
|---|
| Indxx Global Cloud Computing Index (USD) | 19.33% | 10.13% | 10.16% |
|---|
Since its inception on April 12, 2019. The line graph represents historical performance of a hypothetical investment of $10,000 in the Fund since inception. Returns shown are total returns, which assume the reinvestment of dividends and capital gains. The table and graph presented above do not reflect the deduction of taxes a shareholder would pay on Fund distributions or the redemption of Fund shares. Past performance is not indicative of future performance.Call 1-888-493-8631 or visit https://www.globalxetfs.com/funds/clou/ for current month-end performance.
Key Fund Statistics as of November 30, 2024
| Total Net Assets | Number of Portfolio Holdings | Total Advisory Fees Paid | Portfolio Turnover Rate |
|---|
| $376,498,010 | 39 | $3,267,124 | 21.22% |
|---|
What did the Fund invest in?
Asset/Country WeightingsFootnote Reference*
| Value | Value |
|---|
| Short-Term Investment | 0.0% |
| Repurchase Agreement | 0.0% |
| Japan | 0.3% |
| Sweden | 1.2% |
| China | 1.6% |
| Israel | 4.5% |
| Canada | 5.0% |
| United States | 87.3% |
| Footnote | Description |
Footnote* | Percentages are calculated based on total net assets. |
| Holding Name | | | Percentage of Total Net AssetsFootnote Reference(A) |
|---|
| Snowflake, Cl A | | | 5.1% |
| Shopify, Cl A | | | 5.0% |
| Wix.com | | | 4.5% |
| HubSpot | | | 4.4% |
| Twilio, Cl A | | | 4.4% |
| Qualys | | | 4.3% |
| Procore Technologies | | | 4.2% |
| SPS Commerce | | | 3.9% |
| Zscaler | | | 3.9% |
| Workiva, Cl A | | | 3.8% |
| Footnote | Description |
Footnote(A) | Short-Term Investments are not shown in the top ten chart. |
There were no material changes during the reporting period that are required to be disclosed in this report. For more complete information about other changes to the Fund, you may review the Fund's current prospectus, which is available upon request.
For additional information about the Fund, including its prospectus, financial information, holdings, and proxy voting information, call or visit:
Global X Cloud Computing ETF: CLOU
Principal Listing Exchange: Nasdaq
Annual Shareholder Report - November 30, 2024
GX-AR-TSR-11.2024-29
Global X Thematic Growth ETF
Principal Listing Exchange: Nasdaq
Annual Shareholder Report: November 30, 2024
This annual shareholder report contains important information about the Global X Thematic Growth ETF (the "Fund") for the period from December 1, 2023 to November 30, 2024. You can find additional information about the Fund at https://www.globalxetfs.com/funds/gxtg/. You can also request this information by contacting us at 1-888-493-8631.
What were the Fund costs for the last year?
(based on a hypothetical $10,000 investment)
| Fund Name | Costs of a $10,000 investment | Costs paid as a percentage of a $10,000 investment |
|---|
| Global X Thematic Growth ETF | $53 | 0.50% |
|---|
How did the Fund perform in the last year?
The Fund seeks to provide investment results that correspond generally to the price and yield performance, before fees and expenses, of the Solactive Thematic Growth Index (“Secondary Index”). The Fund is passively managed and the investment adviser does not attempt to take defensive positions in declining markets. The Fund generally seeks to fully replicate the Secondary Index.
The Secondary Index seeks to provide broad exposure to “structurally disruptive macro-trends” that may stem from advancements in disruptive technology, changing consumer habits and demographics, or changing needs for infrastructure or finite resources, using a portfolio of exchange-traded funds (each, an "Underlying ETF") issued by Global X Funds, an affiliate of the Fund and the Fund’s investment adviser. The Secondary Index allocates index weights among the Underlying ETFs based on a quantitative methodology developed by Solactive AG, the provider of the Secondary Index.
For the 12-month period ended November 30, 2024 (the "reporting period"), the Fund increased 12.78%, while the Secondary Index increased 12.36%. The Fund had a net asset value of $23.05 per share on November 30, 2023 and ended the reporting period with a net asset value of $25.46 per share on November 30, 2024.
During the reporting period, the highest returns within the Fund came from the Global X FinTech ETF and Global X Data Center & Digital Infrastructure ETF, which returned 52.70% and 25.15%, respectively. The worst performers were the Global X Solar ETF and Global X Renewable Energy Producers ETF, which returned -12.51% and -9.06%, respectively.
During the reporting period the Fund recorded positive performance but trailed the broad market indices. The Fund benefited from its exposure to the FinTech and E-commerce theme, which experienced robust revenue growth driven by consumer spending trends. Lower interest rates also helped those themes. Additionally, the recovery in sentiment for the Lithium market alongside demand for disruptive materials and minerals also helped the Fund. The Fund’s performance also benefitted from the uptake of data center investments worldwide, which saw the data center theme benefit. Meanwhile, the Fund's performance was weighed down by challenges in the Genomics and Healthcare sectors, despite advancements in therapies. The Renewable Energy sector also weighed down the Fund's performance, driven by an energy glut and high borrowing costs reducing demand for solutions like solar.
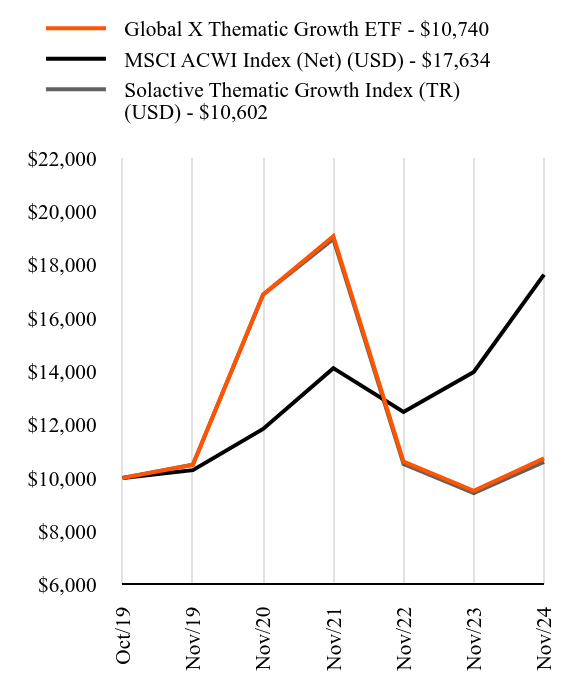
How did the Fund perform since inception?
Total Return Based on $10,000 Investment
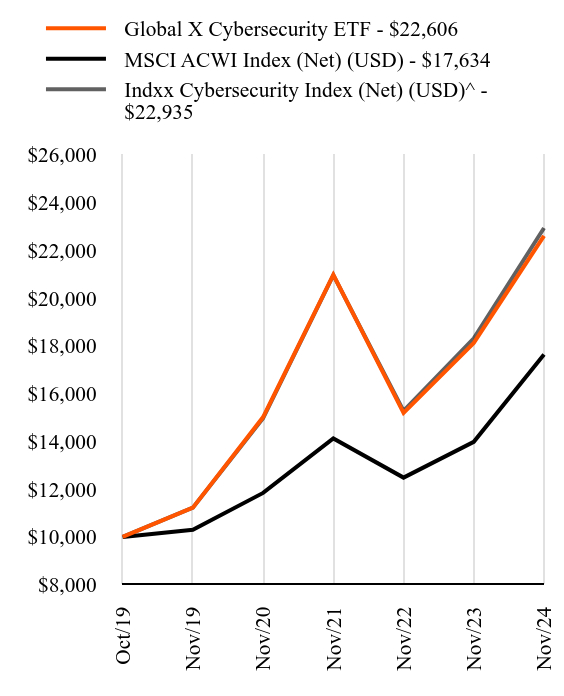
| Global X Thematic Growth ETF - $10740 | MSCI ACWI Index (Net) (USD) - $17634 | Solactive Thematic Growth Index (TR) (USD) - $10602 |
|---|
| Oct/19 | $10000 | $10000 | $10000 |
|---|
| Nov/19 | $10503 | $10297 | $10501 |
|---|
| Nov/20 | $16891 | $11842 | $16880 |
|---|
| Nov/21 | $19079 | $14124 | $18972 |
|---|
| Nov/22 | $10616 | $12483 | $10529 |
|---|
| Nov/23 | $9523 | $13982 | $9435 |
|---|
| Nov/24 | $10740 | $17634 | $10602 |
|---|
Average Annual Total Returns as of November 30, 2024
| Fund/Index Name | 1 Year | 5 Years | Annualized Since Inception |
|---|
| Global X Thematic Growth ETF | 12.78% | 0.45% | 1.41% |
|---|
| MSCI ACWI Index (Net) (USD) | 26.12% | 11.36% | 11.75% |
|---|
| Solactive Thematic Growth Index (TR) (USD) | 12.36% | 0.19% | 1.15% |
|---|
Since its inception on October 25, 2019. The line graph represents historical performance of a hypothetical investment of $10,000 in the Fund since inception. Returns shown are total returns, which assume the reinvestment of dividends and capital gains. The table and graph presented above do not reflect the deduction of taxes a shareholder would pay on Fund distributions or the redemption of Fund shares. Past performance is not indicative of future performance.Call 1-888-493-8631 or visit https://www.globalxetfs.com/funds/gxtg/ for current month-end performance.
Key Fund Statistics as of November 30, 2024
| Total Net Assets | Number of Portfolio Holdings | Total Advisory Fees Paid | Portfolio Turnover Rate |
|---|
| $15,782,874 | 14 | $107,767 | 30.26% |
|---|
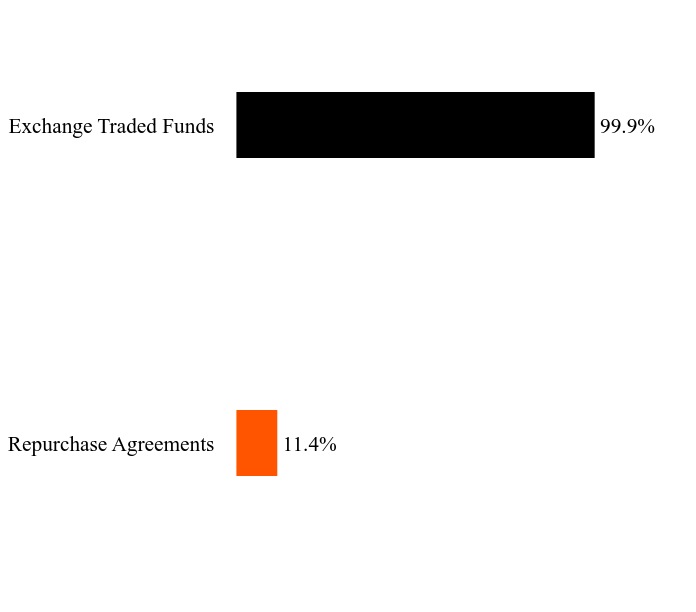
What did the Fund invest in?
Asset WeightingsFootnote Reference*
| Value | Value |
|---|
| Repurchase Agreements | 11.4% |
| Exchange Traded Funds | 99.9% |
| Footnote | Description |
Footnote* | Percentages are calculated based on total net assets. |
| Holding Name | | | Percentage of Total Net Assets |
|---|
Global X FinTech ETFFootnote Reference** | | | 12.7% |
Global X Lithium & Battery Tech ETFFootnote Reference** | | | 12.3% |
Global X E-commerce ETFFootnote Reference** | | | 11.9% |
Global X Disruptive Materials ETFFootnote Reference** | | | 11.6% |
Global X Data Center & Digital Infrastructure ETFFootnote Reference** | | | 11.4% |
Global X Video Games & Esports ETFFootnote Reference** | | | 11.2% |
Global X Solar ETFFootnote Reference** | | | 10.4% |
Global X Genomics & Biotechnology ETFFootnote Reference** | | | 9.5% |
Global X Renewable Energy Producers ETFFootnote Reference** | | | 8.9% |
| Footnote | Description |
Footnote** | Affiliated Investment |
There were no material changes during the reporting period that are required to be disclosed in this report. For more complete information about other changes to the Fund, you may review the Fund's current prospectus, which is available upon request.
For additional information about the Fund, including its prospectus, financial information, holdings, and proxy voting information, call or visit:
Global X Thematic Growth ETF: GXTG
Principal Listing Exchange: Nasdaq
Annual Shareholder Report - November 30, 2024
GX-AR-TSR-11.2024-30
Global X Video Games & Esports ETF
Principal Listing Exchange: Nasdaq
Annual Shareholder Report: November 30, 2024
This annual shareholder report contains important information about the Global X Video Games & Esports ETF (the "Fund") for the period from December 1, 2023 to November 30, 2024. You can find additional information about the Fund at https://www.globalxetfs.com/funds/hero/. You can also request this information by contacting us at 1-888-493-8631.
What were the Fund costs for the last year?
(based on a hypothetical $10,000 investment)
| Fund Name | Costs of a $10,000 investment | Costs paid as a percentage of a $10,000 investment |
|---|
| Global X Video Games & Esports ETF | $56 | 0.50% |
|---|
How did the Fund perform in the last year?
The Fund seeks to provide investment results that correspond generally to the price and yield performance, before fees and expenses, of the Solactive Video Games & Esports Index (“Secondary Index”). The Fund is passively managed, and the Fund generally seeks to fully replicate the Secondary Index.
The Secondary Index is designed to provide is designed to provide exposure to exchange-listed companies that are positioned to benefit from increased consumption related to video games and esports, including companies whose principal business is in video game development/publishing, video game and esports content distribution and streaming, operating/owning esports leagues/teams, and producing video game/esports hardware. A company is considered by the Index Provider to be a Video Games & Esports Company if the company generates at least 50% of its revenues from video games and esports activities, as defined by the Index Provider.
For the 12-month period ended November 30, 2024 (the “reporting period”), the Fund increased 23.14%, while the Secondary Index increased 23.80%. The Fund had a net asset value of $19.93 per share on November 30, 2023 and ended the reporting period with a net asset value of $24.35 per share on November 30, 2024.
During the reporting period, the highest returns came from International Games System Co., Ltd. and AppLovin Corp. Class A, which returned 183.43% and 105.71%, respectively. The worst performers were Ubisoft Entertainment SA and Corsair Gaming, Inc., which returned -53.86% and -43.07%, respectively.
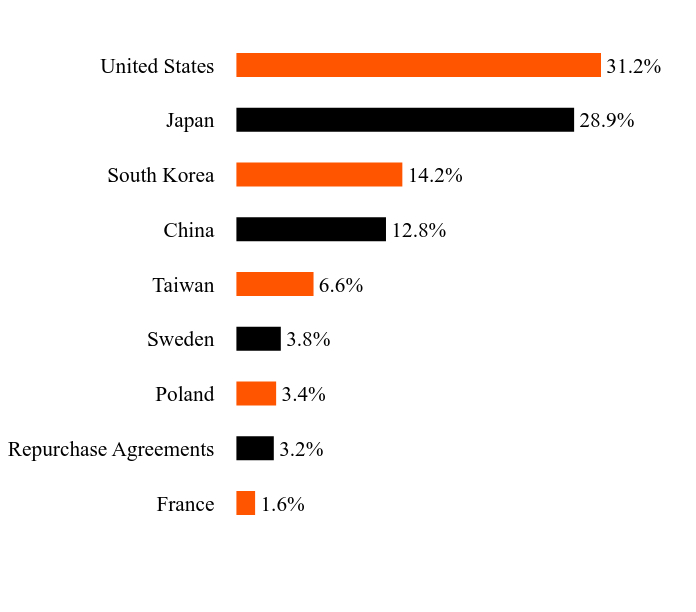
During the reporting period, by sector, the Fund had the highest exposure to Communication Services at 92.6% and Information Technology at 6.4%. By country, the Fund had the highest exposure to the United States at 31.2% and Japan at 28.9%.
During the reporting period the Fund recorded positive performance. The Video Game industry benefited from strong consumer demand, driven by engaging new titles. Technological advancements like cloud gaming and virtual reality expanded the addressable market for companies held by the Fund. The growing popularity of Esports boosted revenue streams for key holdings involved in competitive gaming. Successful monetization strategies, including in-game purchases and subscriptions, lifted profitability for many of the Fund's core positions. Lastly, the Fund's exposure to leading video game publishers with strong development pipelines positioned it well to capitalize on the sector's long-term growth potential.
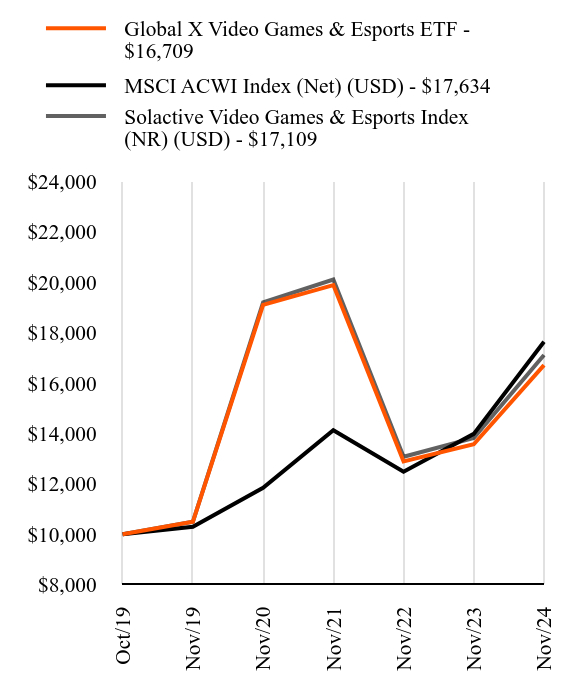
How did the Fund perform since inception?
Total Return Based on $10,000 Investment
| Global X Video Games & Esports ETF - $16709 | MSCI ACWI Index (Net) (USD) - $17634 | Solactive Video Games & Esports Index (NR) (USD) - $17109 |
|---|
| Oct/19 | $10000 | $10000 | $10000 |
|---|
| Nov/19 | $10494 | $10297 | $10496 |
|---|
| Nov/20 | $19102 | $11842 | $19199 |
|---|
| Nov/21 | $19884 | $14124 | $20103 |
|---|
| Nov/22 | $12887 | $12483 | $13074 |
|---|
| Nov/23 | $13569 | $13982 | $13820 |
|---|
| Nov/24 | $16709 | $17634 | $17109 |
|---|
Average Annual Total Returns as of November 30, 2024
| Fund/Index Name | 1 Year | 5 Years | Annualized Since Inception |
|---|
| Global X Video Games & Esports ETF | 23.14% | 9.75% | 10.58% |
|---|
| MSCI ACWI Index (Net) (USD) | 26.12% | 11.36% | 11.75% |
|---|
| Solactive Video Games & Esports Index (NR) (USD) | 23.80% | 10.26% | 11.09% |
|---|
Since its inception on October 25, 2019. The line graph represents historical performance of a hypothetical investment of $10,000 in the Fund since inception. Returns shown are total returns, which assume the reinvestment of dividends and capital gains. The table and graph presented above do not reflect the deduction of taxes a shareholder would pay on Fund distributions or the redemption of Fund shares. Past performance is not indicative of future performance.Call 1-888-493-8631 or visit https://www.globalxetfs.com/funds/hero/ for current month-end performance.
Key Fund Statistics as of November 30, 2024
| Total Net Assets | Number of Portfolio Holdings | Total Advisory Fees Paid | Portfolio Turnover Rate |
|---|
| $108,853,648 | 49 | $607,562 | 30.77% |
|---|
What did the Fund invest in?
Asset/Country WeightingsFootnote Reference*
| Value | Value |
|---|
| France | 1.6% |
| Repurchase Agreements | 3.2% |
| Poland | 3.4% |
| Sweden | 3.8% |
| Taiwan | 6.6% |
| China | 12.8% |
| South Korea | 14.2% |
| Japan | 28.9% |
| United States | 31.2% |
| Footnote | Description |
Footnote* | Percentages are calculated based on total net assets. |
| Holding Name | | | Percentage of Total Net Assets |
|---|
| Take-Two Interactive Software | | | 7.2% |
| ROBLOX, Cl A | | | 7.1% |
| Electronic Arts | | | 6.3% |
| Nintendo | | | 6.0% |
| Unity Software | | | 5.7% |
| International Games System | | | 5.7% |
| Konami Group | | | 5.5% |
| NetEase ADR | | | 5.4% |
| Bilibili ADR | | | 5.3% |
| Krafton | | | 4.8% |
There were no material changes during the reporting period that are required to be disclosed in this report. For more complete information about other changes to the Fund, you may review the Fund's current prospectus, which is available upon request.
For additional information about the Fund, including its prospectus, financial information, holdings, and proxy voting information, call or visit:
Global X Video Games & Esports ETF: HERO
Principal Listing Exchange: Nasdaq
Annual Shareholder Report - November 30, 2024
GX-AR-TSR-11.2024-31
Global X Cybersecurity ETF
Principal Listing Exchange: Nasdaq
Annual Shareholder Report: November 30, 2024
This annual shareholder report contains important information about the Global X Cybersecurity ETF (the "Fund") for the period from December 1, 2023 to November 30, 2024. You can find additional information about the Fund at https://www.globalxetfs.com/funds/bug/. You can also request this information by contacting us at 1-888-493-8631.
What were the Fund costs for the last year?
(based on a hypothetical $10,000 investment)
| Fund Name | Costs of a $10,000 investment | Costs paid as a percentage of a $10,000 investment |
|---|
| Global X Cybersecurity ETF | $57 | 0.51% |
|---|
How did the Fund perform in the last year?
The Fund seeks to provide investment results that correspond generally to the price and yield performance, before fees and expenses, of the Indxx Cybersecurity Index (“Secondary Index”). The Fund is passively managed, and the investment adviser does not attempt to take defensive positions in declining markets. The Fund generally seeks to fully replicate the Secondary Index.
The Secondary Index is designed to provide exposure to exchange-listed companies that are positioned to benefit from increased adoption of cybersecurity technology, including but not limited to companies whose principal business is in the development and management of security protocols preventing intrusion and attacks on systems, networks, applications, computers, and mobile devices, as determined by the index provider.
For the 12-month period ended November 30, 2024 (the "reporting period"), the Fund increased 24.72%, while the Secondary Index increased 25.26%. The Fund had a net asset value of $26.84 per share on November 30, 2023 and ended the reporting period with a net asset value of $33.44 per share on November 30, 2024.
During the reporting period, the highest returns in the Fund came from Fortinet, Inc. and OneSpan Inc., which returned 80.84% and 80.66%, respectively. The worst performers were BlackBerry Limited and Rapid7 Inc., which returned -36.78% and -21.33%, respectively.
During the reporting period, by country, the Fund had the highest exposure to the United States at 73.9%, Japan at 11.9% and Israel at 10.0%.
The period saw strong growth for cybersecurity solutions, as cyber threats continued to evolve and proliferate, compelling enterprises around the world to continue to invest in improving defense mechanisms, which contributed positively to the Fund's performance. Spending within key categories such as end point security, messaging security, data security, cloud security, continued to grow particularly strongly, as IT usage trends such as growth of connected devices, distributed workforces, cloud native applications, continued to show growth as well. Additionally, high-profile data breaches and ransomware attacks highlighted the importance of robust cybersecurity measures, leading to increased budget allocations. Lastly, the ongoing talent shortage in the cybersecurity field is also acting as a catalyst, particularly for the integration of AI first solutions in the industry which are capable of automating cyber defense workflows. The pricing power displayed by the category leading companies was also displayed through the robust revenue growth delivered by the sector during the reporting period.
How did the Fund perform since inception?
Total Return Based on $10,000 Investment
| Global X Cybersecurity ETF - $22606 | MSCI ACWI Index (Net) (USD) - $17634 | Indxx Cybersecurity Index (Net) (USD)^ - $22935 |
|---|
| Oct/19 | $10000 | $10000 | $10000 |
|---|
| Nov/19 | $11225 | $10297 | $11226 |
|---|
| Nov/20 | $15017 | $11842 | $14968 |
|---|
| Nov/21 | $20975 | $14124 | $20959 |
|---|
| Nov/22 | $15194 | $12483 | $15272 |
|---|
| Nov/23 | $18125 | $13982 | $18310 |
|---|
| Nov/24 | $22606 | $17634 | $22935 |
|---|
Average Annual Total Returns as of November 30, 2024
| Fund/Index Name | 1 Year | 5 Years | Annualized Since Inception |
|---|
| Global X Cybersecurity ETF | 24.72% | 15.03% | 17.33% |
|---|
| MSCI ACWI Index (Net) (USD) | 26.12% | 11.36% | 11.75% |
|---|
| Indxx Cybersecurity Index (Net) (USD)^ | 25.26% | 15.36% | 17.66% |
|---|
Since its inception on October 25, 2019. The line graph represents historical performance of a hypothetical investment of $10,000 in the Fund since inception. Returns shown are total returns, which assume the reinvestment of dividends and capital gains. The table and graph presented above do not reflect the deduction of taxes a shareholder would pay on Fund distributions or the redemption of Fund shares. Past performance is not indicative of future performance.Call 1-888-493-8631 or visit https://www.globalxetfs.com/funds/bug/ for current month-end performance.
^ Historic index performance reflects a recalculation of the index by the index provider as of January 28, 2025.
Key Fund Statistics as of November 30, 2024
| Total Net Assets | Number of Portfolio Holdings | Total Advisory Fees Paid | Portfolio Turnover Rate |
|---|
| $819,307,797 | 26 | $3,818,371 | 23.91% |
|---|
What did the Fund invest in?
Asset/Country WeightingsFootnote Reference*
| Value | Value |
|---|
| Repurchase Agreements | 0.2% |
| South Korea | 4.0% |
| Israel | 10.0% |
| Japan | 11.9% |
| United States | 73.9% |
| Footnote | Description |
Footnote* | Percentages are calculated based on total net assets. |
| Holding Name | | | Percentage of Total Net Assets |
|---|
| Fortinet | | | 6.6% |
| Crowdstrike Holdings, Cl A | | | 6.3% |
| Zscaler | | | 6.2% |
| Palo Alto Networks | | | 5.8% |
| Gen Digital | | | 5.8% |
| Check Point Software Technologies | | | 5.7% |
| Qualys | | | 5.3% |
| CyberArk Software | | | 4.8% |
| A10 Networks | | | 4.7% |
Digital ArtsFootnote Reference** | | | 4.7% |
| Footnote | Description |
Footnote** | Affiliated Investment |
There were no material changes during the reporting period that are required to be disclosed in this report. For more complete information about other changes to the Fund, you may review the Fund's current prospectus, which is available upon request.
For additional information about the Fund, including its prospectus, financial information, holdings, and proxy voting information, call or visit:
Global X Cybersecurity ETF: BUG
Principal Listing Exchange: Nasdaq
Annual Shareholder Report - November 30, 2024
GX-AR-TSR-11.2024-32
Global X Telemedicine & Digital Health ETF
Principal Listing Exchange: Nasdaq
Annual Shareholder Report: November 30, 2024
This annual shareholder report contains important information about the Global X Telemedicine & Digital Health ETF (the "Fund") for the period from December 1, 2023 to November 30, 2024. You can find additional information about the Fund at https://www.globalxetfs.com/funds/edoc/. You can also request this information by contacting us at 1-888-493-8631. This annual shareholder report describes changes to the Fund that occurred during the reporting period.
What were the Fund costs for the last year?
(based on a hypothetical $10,000 investment)
| Fund Name | Costs of a $10,000 investment | Costs paid as a percentage of a $10,000 investment |
|---|
| Global X Telemedicine & Digital Health ETF | $74 | 0.68% |
|---|
How did the Fund perform in the last year?
The Fund seeks to provide investment results that correspond generally to the price and yield performance, before fees and expenses, of the Solactive Telemedicine & Digital Health Index (“Secondary Index”). The Fund is passively managed and the investment adviser does not attempt to take defensive positions in declining markets. The Fund generally seeks to fully replicate the Secondary Index.
The Secondary Index is designed to provide exposure to exchange-listed companies that are positioned to benefit from further advances in the field of telemedicine and digital health, as well as applications thereof (collectively, "Telemedicine & Digital Health Companies"), as defined by Solactive AG, the provider of the Secondary Index ("Index Provider"). Telemedicine & Digital Health Companies include those involved in the following business activities: (i) telemedicine, (ii) healthcare analytics, (iii) connected healthcare devices, and/or (iv) administrative digitization.
For the 12-month period ended November 30, 2024 (the “reporting period”), the Fund increased 16.87%, while the Secondary Index increased 17.55%. The Fund had a net asset value of $8.95 per share on November 30, 2023 and ended the reporting period with a net asset value of $10.46 per share on November 30, 2024.
During the reporting period, the highest returns came from Hims & Hers Health, Inc. Class A and Doximity, Inc. Class A, which returned 262.43% and 127.96%, respectively. The worst performers were Pacific Biosciences of California, Inc. and American Well Corporation Class A, which returned -77.48% and -63.13%, respectively.
During the reporting period the Fund recorded positive performance. The adoption of virtual healthcare services accelerated, benefiting companies that facilitate remote medical visits and remove patient management. Advancements in healthcare analytics, such as artificial intelligence and cloud-based platforms for the Healthcare industry, have made inroads, improving efficiency and effectiveness, and ultimately enhancing access to care. The increasing prevalence of Connected Healthcare Devices, which transmit real-time patient data to healthcare providers, contributed to the Fund's positive returns as these devices enable proactive and personalized patient care. Additionally, the ongoing digitization of healthcare administrative processes, including patient intake, staffing solutions, insurance authorization, and billing management, supported the performance of companies that offer innovative solutions in this area.
How did the Fund perform since inception?
Total Return Based on $10,000 Investment
| Global X Telemedicine & Digital Health ETF - $6870 | MSCI ACWI Index (Net) (USD) - $16655 | Solactive Telemedicine & Digital Health Index (NR) (USD) - $7015 |
|---|
| Jul/20 | $10000 | $10000 | $10000 |
|---|
| Nov/20 | $12088 | $11184 | $12109 |
|---|
| Nov/21 | $10719 | $13340 | $10806 |
|---|
| Nov/22 | $8033 | $11790 | $8139 |
|---|
| Nov/23 | $5879 | $13206 | $5967 |
|---|
| Nov/24 | $6870 | $16655 | $7015 |
|---|
Average Annual Total Returns as of November 30, 2024
| Fund/Index Name | 1 Year | Annualized Since Inception |
|---|
| Global X Telemedicine & Digital Health ETF | 16.87% | -8.28% |
|---|
| MSCI ACWI Index (Net) (USD) | 26.12% | 12.46% |
|---|
| Solactive Telemedicine & Digital Health Index (NR) (USD) | 17.55% | -7.84% |
|---|
Since its inception on July 29, 2020. The line graph represents historical performance of a hypothetical investment of $10,000 in the Fund since inception. Returns shown are total returns, which assume the reinvestment of dividends and capital gains. The table and graph presented above do not reflect the deduction of taxes a shareholder would pay on Fund distributions or the redemption of Fund shares. Past performance is not indicative of future performance.Call 1-888-493-8631 or visit https://www.globalxetfs.com/funds/edoc/ for current month-end performance.
Key Fund Statistics as of November 30, 2024
| Total Net Assets | Number of Portfolio Holdings | Total Advisory Fees Paid | Portfolio Turnover Rate |
|---|
| $43,510,577 | 41 | $350,324 | 38.36% |
|---|
What did the Fund invest in?
Asset/Country WeightingsFootnote Reference*
| Value | Value |
|---|
| Short-Term Investment | 0.2% |
| South Korea | 0.2% |
| Repurchase Agreement | 0.3% |
| Germany | 0.6% |
| Japan | 1.6% |
| Australia | 4.9% |
| China | 8.1% |
| United States | 84.5% |
| Footnote | Description |
Footnote* | Percentages are calculated based on total net assets. |
| Holding Name | | | Percentage of Total Net AssetsFootnote Reference(A) |
|---|
| Hims & Hers Health | | | 5.7% |
| Pro Medicus | | | 5.0% |
| Doximity, Cl A | | | 4.8% |
| Masimo | | | 4.6% |
| Insulet | | | 4.3% |
| Labcorp Holdings | | | 4.1% |
| Veracyte | | | 4.1% |
| Dexcom | | | 4.1% |
| ResMed | | | 3.9% |
| Agilent Technologies | | | 3.9% |
| Footnote | Description |
Footnote(A) | Short-Term Investments are not shown in the top ten chart. |
This is a summary of certain changes to the Fund since December 1, 2023. For more complete information, you may review the Fund's next prospectus, which we expect to be available by April 1, 2025 at https://www.globalxetfs.com/funds/edoc or upon request at 1-888-493-8631.
The Board of Trustees of the Trust voted to approve a lower Management Fee for the Fund of 0.50% effective April 1, 2025. Prior to that, the Fund was subject to a Management Fee of 0.68%.
For additional information about the Fund, including its prospectus, financial information, holdings, and proxy voting information, call or visit:
Global X Telemedicine & Digital Health ETF: EDOC
Principal Listing Exchange: Nasdaq
Annual Shareholder Report - November 30, 2024
GX-AR-TSR-11.2024-33
Principal Listing Exchange: Nasdaq
Annual Shareholder Report: November 30, 2024
This annual shareholder report contains important information about the Global X CleanTech ETF (the "Fund") for the period from December 1, 2023 to November 30, 2024. You can find additional information about the Fund at https://www.globalxetfs.com/funds/ctec/. You can also request this information by contacting us at 1-888-493-8631.
What were the Fund costs for the last year?
(based on a hypothetical $10,000 investment)
| Fund Name | Costs of a $10,000 investment | Costs paid as a percentage of a $10,000 investment |
|---|
| Global X CleanTech ETF | $44 | 0.50% |
|---|
How did the Fund perform in the last year?
The Fund seeks to provide investment results that correspond generally to the price and yield performance, before fees and expenses, of the Indxx Global CleanTech Index (“Secondary Index”). The Fund is passively managed and the investment adviser does not attempt to take defensive positions in declining markets. The Fund generally seeks to fully replicate the Secondary Index.
The Secondary Index is designed to provide exposure to exchange-listed companies that are positioned to benefit from the increased adoption of technologies focused on improving the efficiency of renewable energy production and/or mitigating the adverse environmental effects of resource consumption (“CleanTech”), including, but not limited to, companies whose principal business is in developing technology relating to renewable energy, energy efficiency and storage, smart grid, lithium-ion batteries and/or fuel cells, and/or pollution prevention/amelioration (collectively, “CleanTech Companies”), as defined by Indxx LLC, the provider of the Secondary Index (“Index Provider”).
For the 12-month period ended November 30, 2024 (the “reporting period”), the Fund decreased 24.39%, while the Secondary Index decreased 24.38%. The Fund had a net asset value of $9.88 per share on November 30, 2023 and ended the reporting period with a net asset value of $7.41 per share on November 30, 2024.
During the reporting period, the highest returns came from Goldwind Science & Technology Co. Ltd. Class H and Bloom Energy Corporation Class A, which returned 114.18% and 90.10%, respectively. The worst performers were Meyer Burger Technology AG and Varta AG, which returned -97.26% and -89.54%, respectively.
During the reporting period, by sector, the Fund had the highest exposure to Industrials at 52.4% and Information Technology at 39.5%.
During the reporting period the Fund recorded negative performance. High interest rates created a challenging macroeconomic environment, particularly for companies in clean technologies, such as electric vehicles, residential solar, and energy storage, due to customer reliance on various financing options. This ultimately weighed on demand for companies throughout the electric vehicle, energy storage, and renewable energy supply chains, which detracted from the Fund's performance. Additionally, supply-chain disruptions and shifting government policies impacted the availability and costs of cleantech equipment. Companies in the Wind, Solar, and Hydrogen industries were particularly exposed to these dynamics.
How did the Fund perform since inception?
Total Return Based on $10,000 Investment
| Global X CleanTech ETF - $4989 | MSCI ACWI Index (Net) (USD) - $16128 | Indxx Global CleanTech Index (USD) - $4912 |
|---|
| Oct/20 | $10000 | $10000 | $10000 |
|---|
| Nov/20 | $12621 | $10831 | $12626 |
|---|
| Nov/21 | $13566 | $12918 | $13257 |
|---|
| Nov/22 | $10801 | $11417 | $10607 |
|---|
| Nov/23 | $6599 | $12788 | $6496 |
|---|
| Nov/24 | $4989 | $16128 | $4912 |
|---|
Average Annual Total Returns as of November 30, 2024
| Fund/Index Name | 1 Year | Annualized Since Inception |
|---|
| Global X CleanTech ETF | -24.39% | -15.61% |
|---|
| MSCI ACWI Index (Net) (USD) | 26.12% | 12.38% |
|---|
| Indxx Global CleanTech Index (USD) | -24.38% | -15.93% |
|---|
Since its inception on October 27, 2020. The line graph represents historical performance of a hypothetical investment of $10,000 in the Fund since inception. Returns shown are total returns, which assume the reinvestment of dividends and capital gains. The table and graph presented above do not reflect the deduction of taxes a shareholder would pay on Fund distributions or the redemption of Fund shares. Past performance is not indicative of future performance.Call 1-888-493-8631 or visit https://www.globalxetfs.com/funds/ctec/ for current month-end performance.
Key Fund Statistics as of November 30, 2024
| Total Net Assets | Number of Portfolio Holdings | Total Advisory Fees Paid | Portfolio Turnover Rate |
|---|
| $34,845,558 | 40 | $231,786 | 19.45% |
|---|
What did the Fund invest in?
Asset/Country WeightingsFootnote Reference*
| Value | Value |
|---|
| Norway | 0.8% |
| Turkey | 2.1% |
| Canada | 2.2% |
| Switzerland | 3.7% |
| Denmark | 4.2% |
| Taiwan | 4.7% |
| United Kingdom | 5.1% |
| Germany | 5.8% |
| South Korea | 7.8% |
| China | 18.2% |
| Repurchase Agreements | 20.4% |
| United States | 45.3% |
| Footnote | Description |
Footnote* | Percentages are calculated based on total net assets. |
| Holding Name | | | Percentage of Total Net Assets |
|---|
| Bloom Energy, Cl A | | | 10.9% |
| NEXTracker, Cl A | | | 6.7% |
| Xinyi Solar Holdings | | | 5.6% |
| First Solar | | | 5.3% |
| Nordex | | | 5.0% |
| China Everbright Environment Group | | | 4.8% |
| Vestas Wind Systems | | | 4.2% |
| Enphase Energy | | | 4.2% |
| Samsung SDI | | | 4.2% |
| QuantumScape, Cl A | | | 4.1% |
There were no material changes during the reporting period that are required to be disclosed in this report. For more complete information about other changes to the Fund, you may review the Fund's current prospectus, which is available upon request.
For additional information about the Fund, including its prospectus, financial information, holdings, and proxy voting information, call or visit:
Global X CleanTech ETF: CTEC
Principal Listing Exchange: Nasdaq
Annual Shareholder Report - November 30, 2024
GX-AR-TSR-11.2024-34
Global X Data Center & Digital Infrastructure ETF
Principal Listing Exchange: Nasdaq
Annual Shareholder Report: November 30, 2024
This annual shareholder report contains important information about the Global X Data Center & Digital Infrastructure ETF (the "Fund") for the period from December 1, 2023 to November 30, 2024. You can find additional information about the Fund at https://www.globalxetfs.com/funds/dtcr/. You can also request this information by contacting us at 1-888-493-8631. This annual shareholder report describes changes to the Fund that occurred during the reporting period.
What were the Fund costs for the last year?
(based on a hypothetical $10,000 investment)
| Fund Name | Costs of a $10,000 investment | Costs paid as a percentage of a $10,000 investment |
|---|
| Global X Data Center & Digital Infrastructure ETF | $56 | 0.50% |
|---|
How did the Fund perform in the last year?
The Fund seeks to provide investment results that correspond generally to the price and yield performance, before fees and expenses, of the Solactive Data Center REITs & Digital Infrastructure Index ("Secondary Index").
The Secondary Index is designed to provide exposure to companies that have business operations in the fields of data centers, cellular towers, and/or digital infrastructure hardware, such as manufacturing servers, and other hardware often used in data centers and cellular towers, including semiconductors, integrated circuits, and processors. Specifically, the Secondary Index will include securities issued by “Data Center REITs & Digital Infrastructure Companies” as defined by Solactive AG, the provider of the Secondary Index.
For the 12-month period ended November 30, 2024 (the "reporting period"), the Fund increased 24.56%, while the Secondary Index increased 25.45%. The Fund had a net asset value of $14.30 per share on November 30, 2023 and ended the reporting period with a net asset value of $17.57 per share on November 30, 2024.
During the reporting period, the highest returns came from NVIDIA Corporation and Applied Digital Corporation, which returned 195.68% and 105.50%, respectively. The worst performers were Intel Corporation and Winbond Electronics Corp., which returned -45.47% and -45.24%, respectively.
During the reporting period the Fund recorded positive performance. The Fund benefited from strong demand for data center services as businesses continued to shift operations to the cloud and ramped up investments towards AI infrastructure. Additionally, the rapid rollout of 5G networks along with broad growth in mobile traffic boosted demand for cellular tower infrastructure. The Fund's holdings in the Real Estate sector, particularly data center REITs, performed well as they were able to leverage growing demand for data center capacity, particularly due to artificial intelligence, to increase rents and maintain high occupancy rates. The Information Technology exposure also contributed positively, with companies providing chips, servers, processors, and other components to the digital infrastructure industry benefitting from growing investments. However, high interest rates pressured the valuations of some high-growth companies in the portfolio.
How did the Fund perform since inception?
Total Return Based on $10,000 Investment
| Global X Data Center & Digital Infrastructure ETF - $12459 | MSCI ACWI Index (Net) (USD) - $16128 | Solactive Data Center REITs & Digital Infrastructure Index (NR) (USD) - $12538 |
|---|
| Oct/20 | $10000 | $10000 | $10000 |
|---|
| Nov/20 | $9980 | $10831 | $9984 |
|---|
| Nov/21 | $11993 | $12918 | $12002 |
|---|
| Nov/22 | $9222 | $11417 | $9226 |
|---|
| Nov/23 | $10002 | $12788 | $9995 |
|---|
| Nov/24 | $12459 | $16128 | $12538 |
|---|
Average Annual Total Returns as of November 30, 2024
| Fund/Index Name | 1 Year | Annualized Since Inception |
|---|
| Global X Data Center & Digital Infrastructure ETF | 24.56% | 5.51% |
|---|
| MSCI ACWI Index (Net) (USD) | 26.12% | 12.38% |
|---|
| Solactive Data Center REITs & Digital Infrastructure Index (NR) (USD) | 25.45% | 5.68% |
|---|
Since its inception on October 27, 2020. The line graph represents historical performance of a hypothetical investment of $10,000 in the Fund since inception. Returns shown are total returns, which assume the reinvestment of dividends and capital gains. The table and graph presented above do not reflect the deduction of taxes a shareholder would pay on Fund distributions or the redemption of Fund shares. Past performance is not indicative of future performance.Call 1-888-493-8631 or visit https://www.globalxetfs.com/funds/dtcr/ for current month-end performance.
Key Fund Statistics as of November 30, 2024
| Total Net Assets | Number of Portfolio Holdings | Total Advisory Fees Paid | Portfolio Turnover Rate |
|---|
| $138,296,999 | 27 | $395,144 | 28.84% |
|---|
What did the Fund invest in?
Country WeightingsFootnote Reference*
| Value | Value |
|---|
| South Korea | 0.5% |
| Nigeria | 1.5% |
| Taiwan | 2.6% |
| Australia | 3.5% |
| Indonesia | 4.3% |
| Singapore | 4.8% |
| China | 14.0% |
| United States | 76.5% |
| Footnote | Description |
Footnote* | Percentages are calculated based on total net assets. |
| Holding Name | | | Percentage of Total Net Assets |
|---|
| Digital Realty Trust | | | 13.4% |
| Equinix | | | 13.3% |
| American Tower | | | 10.9% |
| Crown Castle | | | 8.4% |
| GDS Holdings ADR | | | 7.0% |
| Keppel DC REIT | | | 4.7% |
| SBA Communications, Cl A | | | 4.4% |
| Uniti Group | | | 4.2% |
| China Tower, Cl H | | | 4.1% |
| NEXTDC | | | 3.5% |
This is a summary of certain changes to the Fund since December 1, 2023. For more complete information, you may review the Fund's next prospectus, which we expect to be available by April 1, 2025 at https://www.globalxetfs.com/funds/dtcr or upon request at 1-888-493-8631.
Effective April 1, 2024, the Fund's name changed from the Global X Data Center REITs & Digital Infrastructure ETF (ticker: VPN) to the Global X Data Center & Digital Infratstructure ETF (ticker: DTCR).
For additional information about the Fund, including its prospectus, financial information, holdings, and proxy voting information, call or visit:
Global X Data Center & Digital Infrastructure ETF: DTCR
Principal Listing Exchange: Nasdaq
Annual Shareholder Report - November 30, 2024
GX-AR-TSR-11.2024-35
Principal Listing Exchange: Nasdaq
Annual Shareholder Report: November 30, 2024
This annual shareholder report contains important information about the Global X Clean Water ETF (the "Fund") for the period from December 1, 2023 to November 30, 2024. You can find additional information about the Fund at https://www.globalxetfs.com/funds/aqwa. You can also request this information by contacting us at 1-888-493-8631.
What were the Fund costs for the last year?
(based on a hypothetical $10,000 investment)
| Fund Name | Costs of a $10,000 investment | Costs paid as a percentage of a $10,000 investment |
|---|
| Global X Clean Water ETF | $55 | 0.50% |
|---|
How did the Fund perform in the last year?
The Fund seeks to provide investment results that correspond generally to the price and yield performance, before fees and expenses, of the Solactive Global Clean Water Industry Index (“Secondary Index”). The Fund is passively managed and the investment adviser does not attempt to take defensive positions in declining markets. The Fund generally seeks to fully replicate the Secondary Index.
The Secondary Index is designed to provide exposure to exchange-listed companies expected to benefit from further advances in the provision of clean water, including, but not limited to, companies whose principal business is in water treatment, recycling (including water reclamation), purification, desalination, storage, distribution, and/or sustainability (collectively, “Clean Water Companies”), as defined by Solactive AG, the provider of the Secondary Index.
For the 12-month period ended November 30, 2024 (the “reporting period”), the Fund increased 21.31%, while the Secondary Index increased 21.94%. The Fund had a net asset value of $15.40 per share on November 30, 2023 and ended the reporting period with a net asset value of $18.43 per share on November 30, 2024.
During the reporting period, the highest returns came from Mueller Water Products, Inc. Class A and Pentair plc, which returned 91.02% and 70.81%, respectively. The worst performers were BGT Group Co., Ltd. Class A and Nomura Micro Science Co., Ltd., which returned -38.24% and -38.15%, respectively.
During the reporting period, by sector, the Fund had the highest exposure to Industrials at 51.6% and Utilities at 35.2%. By country, the Fund had the highest exposure to the United States at 76.2% and the United Kingdom at 9.1%.
During the reporting period the Fund recorded positive performance. The Industrial sector, which includes companies involved in water treatment, purification, and conservation, saw strong growth driven by increasing global demand for clean water solutions as several major cities faced drought conditions and rising supply risks. The Utilities sector also contributed positively as water infrastructure companies benefited from government investments in upgrading aging water systems. Consulting services firms in the Fund that help identify and implement corporate and municipal water efficiency strategies saw rising revenues as businesses and cities sought to reduce waste amid rising water supply risks in many regions. Despite the tailwinds driving the performance of the Fund, constituents did face heightened competition amongst industry peers.
How did the Fund perform since inception?
Total Return Based on $10,000 Investment
| Global X Clean Water ETF - $12863 | MSCI ACWI Index (Net) (USD) - $13225 | Solactive Global Clean Water Industry Index (NR) (USD) - $13035 |
|---|
| Apr/21 | $10000 | $10000 | $10000 |
|---|
| Nov/21 | $11152 | $10592 | $11174 |
|---|
| Nov/22 | $9683 | $9362 | $9732 |
|---|
| Nov/23 | $10603 | $10486 | $10690 |
|---|
| Nov/24 | $12863 | $13225 | $13035 |
|---|
Average Annual Total Returns as of November 30, 2024
| Fund/Index Name | 1 Year | Annualized Since Inception |
|---|
| Global X Clean Water ETF | 21.31% | 7.14% |
|---|
| MSCI ACWI Index (Net) (USD) | 26.12% | 7.96% |
|---|
| Solactive Global Clean Water Industry Index (NR) (USD) | 21.94% | 7.53% |
|---|
Since its inception on April 8, 2021. The line graph represents historical performance of a hypothetical investment of $10,000 in the Fund since inception. Returns shown are total returns, which assume the reinvestment of dividends and capital gains. The table and graph presented above do not reflect the deduction of taxes a shareholder would pay on Fund distributions or the redemption of Fund shares. Past performance is not indicative of future performance.Call 1-888-493-8631 or visit https://www.globalxetfs.com/funds/aqwa for current month-end performance.
Key Fund Statistics as of November 30, 2024
| Total Net Assets | Number of Portfolio Holdings | Total Advisory Fees Paid | Portfolio Turnover Rate |
|---|
| $10,687,200 | 40 | $49,972 | 10.48% |
|---|
What did the Fund invest in?
Country WeightingsFootnote Reference*
| Value | Value |
|---|
| Saudi Arabia | 0.3% |
| Malaysia | 0.3% |
| Singapore | 0.8% |
| South Korea | 1.2% |
| Japan | 3.0% |
| China | 4.3% |
| Brazil | 4.5% |
| United Kingdom | 9.1% |
| United States | 76.2% |
| Footnote | Description |
Footnote* | Percentages are calculated based on total net assets. |
| Holding Name | | | Percentage of Total Net Assets |
|---|
| Pentair PLC | | | 8.5% |
| Ferguson Enterprises | | | 8.3% |
| Ecolab | | | 7.7% |
| American Water Works | | | 7.5% |
| Xylem | | | 7.3% |
| United Utilities Group | | | 4.7% |
| Essential Utilities | | | 4.5% |
| Severn Trent | | | 4.5% |
| Core & Main, Cl A | | | 4.4% |
| Cia de Saneamento Basico do Estado de Sao Paulo SABESP | | | 4.1% |
There were no material changes during the reporting period that are required to be disclosed in this report. For more complete information about other changes to the Fund, you may review the Fund's current prospectus, which is available upon request.
For additional information about the Fund, including its prospectus, financial information, holdings, and proxy voting information, call or visit:
Global X Clean Water ETF: AQWA
Principal Listing Exchange: Nasdaq
Annual Shareholder Report - November 30, 2024
GX-AR-TSR-11.2024-36
Global X AgTech & Food Innovation ETF
Principal Listing Exchange: Nasdaq
Annual Shareholder Report: November 30, 2024
This annual shareholder report contains important information about the Global X AgTech & Food Innovation ETF (the "Fund") for the period from December 1, 2023 to November 30, 2024. You can find additional information about the Fund at https://www.globalxetfs.com/funds/krop/. You can also request this information by contacting us at 1-888-493-8631.
What were the Fund costs for the last year?
(based on a hypothetical $10,000 investment)
| Fund Name | Costs of a $10,000 investment | Costs paid as a percentage of a $10,000 investment |
|---|
| Global X AgTech & Food Innovation ETF | $51 | 0.50% |
|---|
How did the Fund perform in the last year?
The Fund seeks to provide investment results that correspond generally to the price and yield performance, before fees and expenses, of the Solactive AgTech & Food Innovation Index (“Secondary Index”). The Fund is passively managed and the investment adviser does not attempt to take defensive positions in declining markets. The Fund generally seeks to fully replicate the Secondary Index.
The Secondary Index is designed to provide exposure to companies that are positioned to benefit from further advances in the fields of agricultural technology (“AgTech”) and food innovation. Specifically, the Secondary Index will include securities issued by “AgTech & Food Innovation Companies” as defined by Solactive AG, the provider of the Secondary Index.
For the 12-month period ended November 30, 2024 (the “reporting period”), the Fund increased 4.92%, while the Secondary Index increased 5.41%. The Fund had a net asset value of $10.17 per share on November 30, 2023 and ended the reporting period with a net asset value of $10.50 per share on November 30, 2024.
During the reporting period, the highest returns came from Sprouts Farmers Market, Inc. and Kellanova, which returned 258.59% and 58.87%, respectively. The worst performers were NR Instant Produce PCL NVDR and Bioceres Crop Solutions Corp., which returned -66.48% and -41.64%, respectively.
During the reporting period, by sector, the Fund had the highest exposure to Industrials at 36.1% and Materials at 33.3%. By country, the Fund had the highest exposure to the U.S. at 53.5% and Canada at 11.6%.
During the reporting period the Fund recorded positive performance. The Industrials sector contributed significantly to the Fund's returns as companies in this sector experienced increased demand and improved operational efficiency. The Materials sector also played a key role in the Fund's performance, driven by favorable commodity prices and strong global economic growth. Additionally, the Fund's exposure to the United States, which saw robust economic expansion and supportive fiscal policies, further bolstered returns. However, the Fund's performance was partially offset by challenges faced by some companies in adapting to shifting consumer preferences and navigating supply chain disruptions. Overall, the Fund's range of sectors and geographies helped mitigate risks and capture opportunities in the market.
How did the Fund perform since inception?
Total Return Based on $10,000 Investment
| Global X AgTech & Food Innovation ETF - $4290 | MSCI ACWI Index (Net) (USD) - $12537 | Solactive AgTech & Food Innovation Index (NR) (USD) - $4347 |
|---|
| Jul/21 | $10000 | $10000 | $10000 |
|---|
| Nov/21 | $7798 | $10042 | $7809 |
|---|
| Nov/22 | $6233 | $8875 | $6268 |
|---|
| Nov/23 | $4089 | $9941 | $4123 |
|---|
| Nov/24 | $4290 | $12537 | $4347 |
|---|
Average Annual Total Returns as of November 30, 2024
| Fund/Index Name | 1 Year | Annualized Since Inception |
|---|
| Global X AgTech & Food Innovation ETF | 4.92% | -22.10% |
|---|
| MSCI ACWI Index (Net) (USD) | 26.12% | 6.90% |
|---|
| Solactive AgTech & Food Innovation Index (NR) (USD) | 5.41% | -21.80% |
|---|
Since its inception on July 12, 2021. The line graph represents historical performance of a hypothetical investment of $10,000 in the Fund since inception. Returns shown are total returns, which assume the reinvestment of dividends and capital gains. The table and graph presented above do not reflect the deduction of taxes a shareholder would pay on Fund distributions or the redemption of Fund shares. Past performance is not indicative of future performance.Call 1-888-493-8631 or visit https://www.globalxetfs.com/funds/krop/ for current month-end performance.
Key Fund Statistics as of November 30, 2024
| Total Net Assets | Number of Portfolio Holdings | Total Advisory Fees Paid | Portfolio Turnover Rate |
|---|
| $4,726,170 | 30 | $22,149 | 21.57% |
|---|
What did the Fund invest in?
Country WeightingsFootnote Reference*
| Value | Value |
|---|
| Philippines | 0.3% |
| Thailand | 0.3% |
| Argentina | 1.1% |
| Germany | 2.0% |
| Australia | 3.7% |
| United Kingdom | 4.2% |
| Japan | 11.2% |
| Canada | 11.6% |
| China | 11.9% |
| United States | 53.5% |
| Footnote | Description |
Footnote* | Percentages are calculated based on total net assets. |
| Holding Name | | | Percentage of Total Net Assets |
|---|
| Deere | | | 13.5% |
| Corteva | | | 12.4% |
| Nutrien | | | 11.3% |
| Kubota | | | 11.2% |
| CNH Industrial | | | 5.2% |
| AGCO | | | 4.8% |
| FMC | | | 4.5% |
| Hebei Yangyuan Zhihui Beverage, Cl A | | | 4.3% |
| Yuan Longping High-tech Agriculture, Cl A | | | 4.0% |
| Unilever | | | 3.9% |
There were no material changes during the reporting period that are required to be disclosed in this report. For more complete information about other changes to the Fund, you may review the Fund's current prospectus, which is available upon request.
For additional information about the Fund, including its prospectus, financial information, holdings, and proxy voting information, call or visit:
Global X AgTech & Food Innovation ETF: KROP
Principal Listing Exchange: Nasdaq
Annual Shareholder Report - November 30, 2024
GX-AR-TSR-11.2024-37
Principal Listing Exchange: Nasdaq
Annual Shareholder Report: November 30, 2024
This annual shareholder report contains important information about the Global X Blockchain ETF (the "Fund") for the period from December 1, 2023 to November 30, 2024. You can find additional information about the Fund at https://www.globalxetfs.com/funds/bkch/. You can also request this information by contacting us at 1-888-493-8631.
What were the Fund costs for the last year?
(based on a hypothetical $10,000 investment)
| Fund Name | Costs of a $10,000 investment | Costs paid as a percentage of a $10,000 investment |
|---|
| Global X Blockchain ETF | $84 | 0.50% |
|---|
How did the Fund perform in the last year?
The Fund seeks to provide investment results that correspond generally to the price and yield performance, before fees and expenses, of the Solactive Blockchain Index (“Secondary Index”). The Fund is passively managed, and the investment adviser does not attempt to take defensive positions in declining markets. The Fund generally seeks to fully replicate the Secondary Index.
The Secondary Index is designed to provide exposure to companies that are positioned to benefit from further advances in the field of blockchain technology. Specifically, the Secondary Index will include securities issued by “Blockchain Companies” as defined by Solactive AG, the provider of the Secondary Index. “Blockchain Companies” are those companies that derive at least 50% of their revenues, operating income, or assets from the following business activities: (i) digital asset mining; (ii) blockchain & digital asset transactions; (iii) blockchain applications; (iv) blockchain & digital asset hardware; and (v) blockchain & digital asset integration.
For the 12-month period ended November 30, 2024 (the “reporting period”), the Fund increased 136.25%, while the Secondary Index increased 135.46%. The Fund had a net asset value of $30.72 per share on November 30, 2023 and ended the reporting period with a net asset value of $71.18 per share on November 30, 2024.
During the reporting period, the highest returns came from TeraWulf Inc. and Robinhood Markets, Inc. Class A, which returned 580.17% and 326.59%, respectively. The worst performers were Bakkt Holdings, Inc. Class A and Sinohope Technology Holdings Limited, which returned -25.73% and -24.00%, respectively.
During the reporting period the Fund recorded positive performance. The Fund benefited from the continued growth and adoption of blockchain technology across various industries. Additionally, the rise in cryptocurrency prices and trading volumes positively impacted companies involved in digital asset mining and transactions. The Fund's holdings in the Technology sector, which includes companies providing blockchain wallets, blockchain & digital asset integration solutions, blockchain infrastructure and hardware, contributed to the positive performance as businesses sought to integrate blockchain into their operations. Furthermore, regulatory developments and increasing institutional interest in blockchain and digital assets created a favorable environment for the Fund's holdings.
How did the Fund perform since inception?
Total Return Based on $10,000 Investment
| Global X Blockchain ETF - $7673 | MSCI ACWI Index (Net) (USD) - $12537 | Solactive Blockchain Index (NR) (USD) - $7381 |
|---|
| Jul/21 | $10000 | $10000 | $10000 |
|---|
| Nov/21 | $12927 | $10042 | $12922 |
|---|
| Nov/22 | $1719 | $8875 | $1686 |
|---|
| Nov/23 | $3248 | $9941 | $3135 |
|---|
| Nov/24 | $7673 | $12537 | $7381 |
|---|
Average Annual Total Returns as of November 30, 2024
| Fund/Index Name | 1 Year | Annualized Since Inception |
|---|
| Global X Blockchain ETF | 136.25% | -7.52% |
|---|
| MSCI ACWI Index (Net) (USD) | 26.12% | 6.90% |
|---|
| Solactive Blockchain Index (NR) (USD) | 135.46% | -8.57% |
|---|
Since its inception on July 12, 2021. The line graph represents historical performance of a hypothetical investment of $10,000 in the Fund since inception. Returns shown are total returns, which assume the reinvestment of dividends and capital gains. The table and graph presented above do not reflect the deduction of taxes a shareholder would pay on Fund distributions or the redemption of Fund shares. Past performance is not indicative of future performance.Call 1-888-493-8631 or visit https://www.globalxetfs.com/funds/bkch/ for current month-end performance.
Key Fund Statistics as of November 30, 2024
| Total Net Assets | Number of Portfolio Holdings | Total Advisory Fees Paid | Portfolio Turnover Rate |
|---|
| $226,775,697 | 30 | $740,708 | 56.38% |
|---|
What did the Fund invest in?
Asset/Country WeightingsFootnote Reference*
| Value | Value |
|---|
| Thailand | 0.4% |
| Germany | 1.3% |
| Japan | 1.7% |
| China | 3.4% |
| Australia | 4.7% |
| Canada | 11.1% |
| Repurchase Agreements | 15.0% |
| United States | 77.2% |
| Footnote | Description |
Footnote* | Percentages are calculated based on total net assets. |
| Holding Name | | | Percentage of Total Net Assets |
|---|
| MARA Holdings | | | 13.8% |
| Coinbase Global, Cl A | | | 12.4% |
| Core Scientific | | | 11.5% |
| Riot Platforms | | | 8.5% |
| Hut 8 | | | 6.1% |
| Cleanspark | | | 4.9% |
| Iris Energy | | | 4.7% |
Galaxy Digital Holdings, | | | 4.5% |
| Applied Digital | | | 4.0% |
| TeraWulf | | | 4.0% |
There were no material changes during the reporting period that are required to be disclosed in this report. For more complete information about other changes to the Fund, you may review the Fund's current prospectus, which is available upon request.
For additional information about the Fund, including its prospectus, financial information, holdings, and proxy voting information, call or visit:
Global X Blockchain ETF: BKCH
Principal Listing Exchange: Nasdaq
Annual Shareholder Report - November 30, 2024
GX-AR-TSR-11.2024-38
Principal Listing Exchange: Nasdaq
Annual Shareholder Report: November 30, 2024
This annual shareholder report contains important information about the Global X Hydrogen ETF (the "Fund") for the period from December 1, 2023 to November 30, 2024. You can find additional information about the Fund at https://www.globalxetfs.com/funds/hydr/. You can also request this information by contacting us at 1-888-493-8631. This annual shareholder report describes changes to the Fund that occurred during the reporting period.
What were the Fund costs for the last year?
(based on a hypothetical $10,000 investment)
| Fund Name | Costs of a $10,000 investment | Costs paid as a percentage of a $10,000 investment |
|---|
| Global X Hydrogen ETF | $45 | 0.50% |
|---|
How did the Fund perform in the last year?
The Fund seeks to provide investment results that correspond generally to the price and yield performance, before fees and expenses, of the Solactive Global Hydrogen Index (“Secondary Index”). The Fund is passively managed and the investment adviser does not attempt to take defensive positions in declining markets. The Fund generally seeks to fully replicate the Secondary Index.
The Secondary Index is designed to provide exposure to companies that are positioned to benefit from further advances in the field of hydrogen technology, particularly in relation to the development and implementation of hydrogen gas as a renewable fuel source. Specifically, the Secondary Index includes securities issued by “Hydrogen Companies” as defined by Solactive AG, the provider of the Secondary Index. Hydrogen Companies are those companies that derive at least 50% of their revenues, operating income, or assets from the following business activities: (i) hydrogen production; (ii) hydrogen fuel cells; (iii) hydrogen technology; and (iv) hydrogen integration.
For the 12-month period ended November 30, 2024 (the "reporting period"), the Fund decreased 21.60%, while the Secondary Index decreased 21.03%. The Fund had a net asset value of $6.52 per share on November 30, 2023. On June 14, 2024, the Fund effected a reverse stock split at a ratio of 1:5. The reverse stock split increased the price per share of the Fund with a proportionate decrease in the number of shares outstanding. The Fund ended the reporting period with a net asset value of $25.56 on November 30, 2024.
During the reporting period, the highest returns came from Doosan Corporation and Bloom Energy Corporation Class A, which returned 96.47% and 90.10%, respectively. The worst performers were Hyzon Motors Inc. Class A and McPhy Energy SA, which returned -96.92% and -73.32%, respectively.
During the reporting period the Fund recorded negative performance. Regulatory uncertainty around government support and incentives for clean energy created an unfavorable environment for Hydrogen companies in key markets, particularly within the U.S. Slower than anticipated adoption rates of hydrogen technologies in key end markets like transportation also dampened demand. Fluctuations in energy prices, especially natural gas which is a key input in hydrogen production, negatively impacted the cost structures of Hydrogen Production firms. Finally, supply chain disruptions delayed projects for companies involved in Hydrogen Integration and Hydrogen Technology. During the reporting period, by country, the Fund had the highest exposure to the United States at 42.8% and the United Kingdom at 11.7%.
How did the Fund perform since inception?
Total Return Based on $10,000 Investment
| Global X Hydrogen ETF - $2043 | MSCI ACWI Index (Net) (USD) - $12537 | Solactive Global Hydrogen Index (NR) (USD) - $2082 |
|---|
| Jul/21 | $10000 | $10000 | $10000 |
|---|
| Nov/21 | $9736 | $10042 | $9751 |
|---|
| Nov/22 | $4903 | $8875 | $4916 |
|---|
| Nov/23 | $2605 | $9941 | $2637 |
|---|
| Nov/24 | $2043 | $12537 | $2082 |
|---|
Average Annual Total Returns as of November 30, 2024
| Fund/Index Name | 1 Year | Annualized Since Inception |
|---|
| Global X Hydrogen ETF | -21.60% | -37.42% |
|---|
| MSCI ACWI Index (Net) (USD) | 26.12% | 6.90% |
|---|
| Solactive Global Hydrogen Index (NR) (USD) | -21.03% | -37.06% |
|---|
Since its inception on July 12, 2021. The line graph represents historical performance of a hypothetical investment of $10,000 in the Fund since inception. Returns shown are total returns, which assume the reinvestment of dividends and capital gains. The table and graph presented above do not reflect the deduction of taxes a shareholder would pay on Fund distributions or the redemption of Fund shares. Past performance is not indicative of future performance.Call 1-888-493-8631 or visit https://www.globalxetfs.com/funds/hydr/ for current month-end performance.
Key Fund Statistics as of November 30, 2024
| Total Net Assets | Number of Portfolio Holdings | Total Advisory Fees Paid | Portfolio Turnover Rate |
|---|
| $40,636,541 | 32 | $193,592 | 36.79% |
|---|
What did the Fund invest in?
Asset/Country WeightingsFootnote Reference*
| Value | Value |
|---|
| Other Countries | 0.2% |
| France | 0.3% |
| Japan | 1.6% |
| China | 1.8% |
| Denmark | 3.0% |
| Germany | 3.5% |
| Sweden | 3.6% |
| Canada | 4.8% |
| United Kingdom | 11.7% |
| Norway | 12.2% |
| South Korea | 12.9% |
| Repurchase Agreements | 27.4% |
| United States | 42.8% |
| Footnote | Description |
Footnote* | Percentages are calculated based on total net assets. |
| Holding Name | | | Percentage of Total Net Assets |
|---|
| Bloom Energy, Cl A | | | 19.9% |
| Plug Power | | | 11.5% |
| Doosan Fuel Cell | | | 8.9% |
| NEL | | | 8.6% |
| FuelCell Energy | | | 7.7% |
| Ballard Power Systems | | | 4.3% |
| AFC Energy | | | 4.0% |
| Iljin Hysolus ltd | | | 3.7% |
| PowerCell Sweden | | | 3.6% |
| Ceres Power Holdings | | | 3.6% |
This is a summary of certain changes to the Fund since December 1, 2023. For more complete information, you may review the Fund's next prospectus, which we expect to be available by April 1, 2025 at https://www.globalxetfs.com/funds/hydr or upon request at 1-888-493-8631.
On June 14, 2024, the Fund effected a reverse stock split at a ratio of 1:5. The reverse stock split increased the price per share of the Fund with a proportionate decrease in the number of shares outstanding.
For additional information about the Fund, including its prospectus, financial information, holdings, and proxy voting information, call or visit:
Global X Hydrogen ETF: HYDR
Principal Listing Exchange: Nasdaq
Annual Shareholder Report - November 30, 2024
GX-AR-TSR-11.2024-39
Principal Listing Exchange: Nasdaq
Annual Shareholder Report: November 30, 2024
This annual shareholder report contains important information about the Global X Solar ETF (the "Fund") for the period from December 1, 2023 to November 30, 2024. You can find additional information about the Fund at https://www.globalxetfs.com/funds/rays. You can also request this information by contacting us at 1-888-493-8631.
What were the Fund costs for the last year?
(based on a hypothetical $10,000 investment)
| Fund Name | Costs of a $10,000 investment | Costs paid as a percentage of a $10,000 investment |
|---|
| Global X Solar ETF | $47 | 0.50% |
|---|
How did the Fund perform in the last year?
The Fund seeks to provide investment results that correspond generally to the price and yield performance, before fees and expenses, of the Solactive Solar Index (“Secondary Index”). The Fund is passively managed, and the investment adviser does not attempt to take defensive positions in declining markets. The Fund generally seeks to fully replicate the Secondary Index.
The Secondary Index is designed to provide exposure to companies that are positioned to benefit from further advances in the field of solar technology. Specifically, the Secondary Index consists of securities issued by “Solar Companies” as defined by Solactive AG, the provider of the Secondary Index. Solar Companies are those companies that derive at least 50% of their revenues from the following business activities: (i) solar energy materials; (ii) solar energy systems & components; (iii) solar power production; (iv) solar technology; (v) solar installation, integration & maintenance.
For the 12-month period ended November 30, 2024 (the “reporting period”), the Fund decreased 12.88%, while the Secondary Index decreased 12.64%. The Fund had a net asset value of $11.71 per share on November 30, 2023 and ended the reporting period with a net asset value of $10.17 per share on November 30, 2024.
During the reporting period, the highest returns came from Ningbo Deye Technology Co., Ltd. Class A and Sineng Electric Co.Ltd. Class A, which returned 92.93% and 78.06%, respectively. The worst performers were Meyer Burger Technology AG and SunPower Corporation, which returned -99.10% and -89.06%, respectively.
During the reporting period, by sector, the Fund had the highest exposure to Information Technology at 55.9%. By country, the Fund had the highest exposure to China at 58.9% and the United States at 31.4%.
During the reporting period the Fund recorded negative performance. Changes to government incentives and policies in key markets weighed on demand by creating a less predictable and less cost-efficient environment, particularly for residential solar in California. Additionally, the industry experienced a slowdown in demand growth within the residential and commercial segments amid economic headwinds and rising interest rates, which dampened performance. Supply chain disruptions also impacted the availability and cost of key materials and components for solar energy systems. Furthermore, increased competition in the industry put downward pressure on pricing and margins for many solar companies, which detracted from the Fund’s performance during the reporting period.
How did the Fund perform since inception?
Total Return Based on $10,000 Investment
| Global X Solar ETF - $4218 | MSCI ACWI Index (Net) (USD) - $12247 | Solactive Solar Index (NR) (USD) - $4282 |
|---|
| Sep/21 | $10000 | $10000 | $10000 |
|---|
| Nov/21 | $10624 | $9809 | $10636 |
|---|
| Nov/22 | $9121 | $8669 | $9183 |
|---|
| Nov/23 | $4842 | $9711 | $4902 |
|---|
| Nov/24 | $4218 | $12247 | $4282 |
|---|
Average Annual Total Returns as of November 30, 2024
| Fund/Index Name | 1 Year | Annualized Since Inception |
|---|
| Global X Solar ETF | -12.88% | -23.45% |
|---|
| MSCI ACWI Index (Net) (USD) | 26.12% | 6.48% |
|---|
| Solactive Solar Index (NR) (USD) | -12.64% | -23.09% |
|---|
Since its inception on September 8, 2021. The line graph represents historical performance of a hypothetical investment of $10,000 in the Fund since inception. Returns shown are total returns, which assume the reinvestment of dividends and capital gains. The table and graph presented above do not reflect the deduction of taxes a shareholder would pay on Fund distributions or the redemption of Fund shares. Past performance is not indicative of future performance.Call 1-888-493-8631 or visit https://www.globalxetfs.com/funds/rays for current month-end performance.
Key Fund Statistics as of November 30, 2024
| Total Net Assets | Number of Portfolio Holdings | Total Advisory Fees Paid | Portfolio Turnover Rate |
|---|
| $6,608,040 | 53 | $32,738 | 32.91% |
|---|
What did the Fund invest in?
Asset/Country WeightingsFootnote Reference*
| Value | Value |
|---|
| Turkey | 0.3% |
| Japan | 0.3% |
| Canada | 0.7% |
| Taiwan | 1.2% |
| Repurchase Agreement | 1.5% |
| South Korea | 1.9% |
| Spain | 2.4% |
| Germany | 2.8% |
| United States | 31.4% |
| China | 58.9% |
| Footnote | Description |
Footnote* | Percentages are calculated based on total net assets. |
| Holding Name | | | Percentage of Total Net Assets |
|---|
| Enphase Energy | | | 9.5% |
| First Solar | | | 8.8% |
| Ningbo Deye Technology, Cl A | | | 7.8% |
| Sungrow Power Supply, Cl A | | | 7.4% |
| LONGi Green Energy Technology, Cl A | | | 7.4% |
| NEXTracker, Cl A | | | 4.5% |
| TCL Zhonghuan Renewable Energy Technology, Cl A | | | 3.9% |
| Sunrun | | | 3.9% |
| JA Solar Technology, Cl A | | | 3.7% |
| Shenzhen SC New Energy Technology, Cl A | | | 2.8% |
There were no material changes during the reporting period that are required to be disclosed in this report. For more complete information about other changes to the Fund, you may review the Fund's current prospectus, which is available upon request.
For additional information about the Fund, including its prospectus, financial information, holdings, and proxy voting information, call or visit:
Principal Listing Exchange: Nasdaq
Annual Shareholder Report - November 30, 2024
GX-AR-TSR-11.2024-40
Principal Listing Exchange: Nasdaq
Annual Shareholder Report: November 30, 2024
This annual shareholder report contains important information about the Global X Wind Energy ETF (the "Fund") for the period from December 1, 2023 to November 30, 2024. You can find additional information about the Fund at https://www.globalxetfs.com/funds/wndy/. You can also request this information by contacting us at 1-888-493-8631.
What were the Fund costs for the last year?
(based on a hypothetical $10,000 investment)
| Fund Name | Costs of a $10,000 investment | Costs paid as a percentage of a $10,000 investment |
|---|
| Global X Wind Energy ETF | $49 | 0.51% |
|---|
How did the Fund perform in the last year?
The Fund seeks to provide investment results that correspond generally to the price and yield performance, before fees and expenses, of the Solactive Wind Energy Index (“Secondary Index”). The Fund is passively managed and the investment adviser does not attempt to take defensive positions in declining markets. The Fund generally seeks to fully replicate the Secondary Index.
The Secondary Index is designed to provide exposure to companies that are positioned to benefit from further advances in the field of wind energy technology. Specifically, the Secondary Index will include securities issued by “Wind Energy Companies” as defined by Solactive AG, the provider of the Secondary Index (the “Index Provider”). Wind Energy Companies are those companies that derive at least 50% of their revenues from the following business activities: (i) wind energy systems; (ii) wind power production; (iii) wind energy technology; and (iv) wind power integration & maintenance.
For the 12-month period ended November 30, 2024 (the “reporting period”), the Fund decreased 6.53%, while the Secondary Index decreased 6.15%. The Fund had a net asset value of $12.88 per share on November 30, 2023 and ended the reporting period with a net asset value of $11.93 per share on November 30, 2024.
During the reporting period, the highest returns came from Windey Energy Technology Group Co., Ltd Class A and China Datang Corp. Renewable Power Co. Ltd. Class H, which returned 43.19% and 30.46%, respectively. The worst performers were Say Yenilenebilir Enerji Ekipmanlari Sanayi ve Ticaret A.S. and CS BEARING Co., Ltd., which returned -60.82% and -59.52%, respectively.
During the reporting period, by sector, the Fund had the highest exposure to Utilities at 76.5% and Industrials at 49.5%.
During the reporting period the Fund recorded negative performance. The Wind Energy industry faced challenges due to supply chain disruptions that impacted the availability and cost of components like wind turbine blades and towers. Inflationary pressures increased operating expenses for wind energy companies, putting downward pressure on margins. High interest rates made financing new wind energy projects more expensive, slowing growth in the sector. Offshore wind power was particularly impacted by these higher interest rates, which, coupled with rising materials costs, led to delays and cancellations of several projects. Uncertainty around government subsidies and tax credits for renewable energy in some markets also weighed on sentiment for the wind energy industry, which detracted from the Fund's performance.
How did the Fund perform since inception?
Total Return Based on $10,000 Investment
| Global X Wind Energy ETF - $4918 | MSCI ACWI Index (Net) (USD) - $12247 | Solactive Wind Energy Index (NR) (USD) - $4986 |
|---|
| Sep/21 | $10000 | $10000 | $10000 |
|---|
| Nov/21 | $9573 | $9809 | $9587 |
|---|
| Nov/22 | $7104 | $8669 | $7149 |
|---|
| Nov/23 | $5262 | $9711 | $5313 |
|---|
| Nov/24 | $4918 | $12247 | $4986 |
|---|
Average Annual Total Returns as of November 30, 2024
| Fund/Index Name | 1 Year | Annualized Since Inception |
|---|
| Global X Wind Energy ETF | -6.53% | -19.73% |
|---|
| MSCI ACWI Index (Net) (USD) | 26.12% | 6.48% |
|---|
| Solactive Wind Energy Index (NR) (USD) | -6.15% | -19.38% |
|---|
Since its inception on September 8, 2021. The line graph represents historical performance of a hypothetical investment of $10,000 in the Fund since inception. Returns shown are total returns, which assume the reinvestment of dividends and capital gains. The table and graph presented above do not reflect the deduction of taxes a shareholder would pay on Fund distributions or the redemption of Fund shares. Past performance is not indicative of future performance.Call 1-888-493-8631 or visit https://www.globalxetfs.com/funds/wndy/ for current month-end performance.
Key Fund Statistics as of November 30, 2024
| Total Net Assets | Number of Portfolio Holdings | Total Advisory Fees Paid | Portfolio Turnover Rate |
|---|
| $2,146,713 | 26 | $12,320 | 22.82% |
|---|
What did the Fund invest in?
Asset/Country WeightingsFootnote Reference*
| Value | Value |
|---|
| Turkey | 0.3% |
| Repurchase Agreement | 1.3% |
| South Korea | 2.5% |
| India | 2.9% |
| Greece | 3.3% |
| Taiwan | 3.3% |
| Germany | 4.5% |
| Canada | 17.1% |
| Denmark | 29.4% |
| China | 36.3% |
| Footnote | Description |
Footnote* | Percentages are calculated based on total net assets. |
| Holding Name | | | Percentage of Total Net Assets |
|---|
| Vestas Wind Systems | | | 12.9% |
| Orsted | | | 12.4% |
| Northland Power, | | | 10.0% |
| Ming Yang Smart Energy Group, Cl A | | | 7.6% |
| Nordex | | | 4.5% |
| China Longyuan Power Group, Cl H | | | 4.3% |
| Cadeler | | | 4.2% |
| CECEP Wind-Power, Cl A | | | 4.2% |
| Boralex, Cl A | | | 4.1% |
| Dajin Heavy Industry, Cl A | | | 3.5% |
There were no material changes during the reporting period that are required to be disclosed in this report. For more complete information about other changes to the Fund, you may review the Fund's current prospectus, which is available upon request.
For additional information about the Fund, including its prospectus, financial information, holdings, and proxy voting information, call or visit:
Global X Wind Energy ETF: WNDY
Principal Listing Exchange: Nasdaq
Annual Shareholder Report - November 30, 2024
GX-AR-TSR-11.2024-41
Principal Listing Exchange: Nasdaq
Annual Shareholder Report: November 30, 2024
This annual shareholder report contains important information about the Global X PropTech ETF (the "Fund") for the period from December 1, 2023 to November 30, 2024. You can find additional information about the Fund at https://www.globalxetfs.com/funds/ptec/. You can also request this information by contacting us at 1-888-493-8631.
What were the Fund costs for the last year?
(based on a hypothetical $10,000 investment)
| Fund Name | Costs of a $10,000 investment | Costs paid as a percentage of a $10,000 investment |
|---|
| Global X PropTech ETF | $59 | 0.50% |
|---|
How did the Fund perform in the last year?
The Fund seeks to provide investment results that correspond generally to the price and yield performance, before fees and expenses, of the Global X PropTech Index (“Secondary Index”). The Secondary Index is owned and was developed by Global X Management Company LLC, an affiliate of the Fund and the Fund's investment adviser. The Fund is passively managed, and the investment adviser does not attempt to take defensive positions in declining markets. The Fund generally seeks to fully replicate the Secondary Index.
The Secondary Index is designed to track the performance of property technology companies that are positioned to benefit from technology that optimizes the way people buy, sell, rent, design, construct, manage, and research/market residential and commercial properties.
For the 12-month period ended November 30, 2024 (the “reporting period”), the Fund increased 35.95%, while the Secondary Index increased 36.68%. The Fund had a net asset value of $27.26 per share on November 30, 2023 and ended the reporting period with a net asset value of $36.17 per share on November 30, 2024.
During the reporting period, the highest returns came from Blend Labs, Inc. Class A and Hippo Holdings Inc, which returned 302.36% and 173.52%, respectively. The worst performers were SmartRent Inc Class A and Better Home & Finance Holding Company Class A, which returned -43.45% and -41.15%, respectively.
During the reporting period, by sector, the Fund had the highest exposure to Information Technology at 31.3% and Real Estate at 31.3%. By country, the Fund had the highest exposure to the United States at 68.7%, Germany at 9.7%, and China at 8.9%.
During the reporting period the Fund recorded positive performance. The Fund benefited from its exposure to companies providing software solutions for property management, as demand for digital tools to streamline operations and enhance tenant experiences remained robust. Additionally, the Fund's holdings in online real estate marketplaces performed well, driven by the continued shift towards digital platforms for buying, selling, and renting properties. The Fund also saw positive contributions from real estate data analytics and research services, as market participants increasingly relied on data-driven insights to make informed decisions. Furthermore, the Fund's investments in companies developing innovative construction technologies, such as 3D printing and modular building solutions, added to its performance as the industry sought more efficient and sustainable building methods. Lastly, the Fund benefited from its exposure to companies providing virtual and augmented reality solutions for property visualization and design.
How did the Fund perform since inception?
Total Return Based on $10,000 Investment
| Global X PropTech ETF - $14779 | MSCI ACWI Index (Net) (USD) - $13664 | Global X PropTech Index (NR) (USD) - $14890 |
|---|
| Apr/23 | $10000 | $10000 | $10000 |
|---|
| Nov/23 | $10871 | $10835 | $10894 |
|---|
| Nov/24 | $14779 | $13664 | $14890 |
|---|
Average Annual Total Returns as of November 30, 2024
| Fund/Index Name | 1 Year | Annualized Since Inception |
|---|
| Global X PropTech ETF | 35.95% | 26.87% |
|---|
| MSCI ACWI Index (Net) (USD) | 26.12% | 20.95% |
|---|
| Global X PropTech Index (NR) (USD) | 36.68% | 27.45% |
|---|
Since its inception on April 11, 2023. The line graph represents historical performance of a hypothetical investment of $10,000 in the Fund since inception. Returns shown are total returns, which assume the reinvestment of dividends and capital gains. The table and graph presented above do not reflect the deduction of taxes a shareholder would pay on Fund distributions or the redemption of Fund shares. Past performance is not indicative of future performance.Call 1-888-493-8631 or visit https://www.globalxetfs.com/funds/ptec/ for current month-end performance.
Key Fund Statistics as of November 30, 2024
| Total Net Assets | Number of Portfolio Holdings | Total Advisory Fees Paid | Portfolio Turnover Rate |
|---|
| $1,808,302 | 33 | $15,420 | 12.55% |
|---|
What did the Fund invest in?
Country WeightingsFootnote Reference*
| Value | Value |
|---|
| Japan | 0.4% |
| Switzerland | 1.8% |
| Sweden | 2.7% |
| United Kingdom | 4.5% |
| Australia | 6.0% |
| China | 8.9% |
| Germany | 9.7% |
| United States | 68.7% |
| Footnote | Description |
Footnote* | Percentages are calculated based on total net assets. |
| Holding Name | | | Percentage of Total Net Assets |
|---|
| Zillow Group, Cl C | | | 10.7% |
| Guidewire Software | | | 9.3% |
| KE Holdings ADR | | | 8.6% |
| Airbnb, Cl A | | | 7.9% |
| CoStar Group | | | 7.4% |
| Procore Technologies | | | 5.4% |
| Scout24 | | | 4.7% |
| Rightmove | | | 4.5% |
| Resideo Technologies | | | 4.5% |
| REA Group | | | 4.4% |
There were no material changes during the reporting period that are required to be disclosed in this report. For more complete information about other changes to the Fund, you may review the Fund's current prospectus, which is available upon request.
For additional information about the Fund, including its prospectus, financial information, holdings, and proxy voting information, call or visit:
Global X PropTech ETF: PTEC
Principal Listing Exchange: Nasdaq
Annual Shareholder Report - November 30, 2024
GX-AR-TSR-11.2024-42
Global X Defense Tech ETF
Principal Listing Exchange: NYSE Arca, Inc.
Annual Shareholder Report: November 30, 2024
This annual shareholder report contains important information about the Global X Defense Tech ETF (the "Fund") for the period from December 1, 2023 to November 30, 2024. You can find additional information about the Fund at https://www.globalxetfs.com/funds/shld/. You can also request this information by contacting us at 1-888-493-8631.
What were the Fund costs for the last year?
(based on a hypothetical $10,000 investment)
| Fund Name | Costs of a $10,000 investment | Costs paid as a percentage of a $10,000 investment |
|---|
| Global X Defense Tech ETF | $61 | 0.50% |
|---|
How did the Fund perform in the last year?
The Fund seeks to provide investment results that correspond generally to the price and yield performance, before fees and expenses, of the Global X Defense Tech Index (“Secondary Index”). The Fund is passively managed and the investment adviser does not attempt to take defensive positions in declining markets. The Fund generally seeks to fully replicate the Secondary Index.
The Secondary Index is owned and was developed by Global X Management Company LLC (“Index Provider”), an affiliate of the Fund and the Fund's investment adviser. The Secondary Index is administered and calculated by Mirae Asset Global Indices Pvt. Ltd. (“Index Administrator”), an affiliate of the Index Provider. The Secondary Index is designed to provide exposure to defense technology (“Defense Tech”) companies, as defined by the Index Administrator. “Defense Tech Companies” are those companies that derive their revenues from one or more of the following business activities as determined by the Index Administrator: (i) cybersecurity; (ii) defense technology; and (iii) advanced military systems and hardware.
For the 12-month period ended November 30, 2024 (the “reporting period”), the Fund increased 45.89%, while the Secondary Index increased 46.65%. The Fund had a net asset value of $27.03 per share on November 30, 2023 and ended the reporting period with a net asset value of $39.26 per share on November 30, 2024.
During the reporting period, the highest returns came from Palantir Technologies Inc. Class A and Rheinmetall AG, which returned 234.56% and 120.71%, respectively. The worst performers were Terran Orbital Corp and DroneShield Limited, which returned -69.14% and -32.08%, respectively.
The Fund delivered positive performance during the reporting period, driven by increased government defense and military spending and demand for advanced technologies like AI, cybersecurity, and unmanned systems amid heightened geopolitical tensions. The shift towards data-driven analytics in defense operations further supported the Fund's holdings in the defense communications and electronics space. Additionally, the lack of commercial aerospace exposure coupled with a higher focus in pure-defense holdings also benefitted the Fund. Lastly, the Fund’s considerable information technology exposure also worked in its favor, compared with traditional sector-based strategies. However, supply chain constraints weighed on some holdings.
How did the Fund perform since inception?
Total Return Based on $10,000 Investment
| Global X Defense Tech ETF - $15888 | MSCI ACWI Index (Net) (USD) - $12872 | Global X Defense Tech Index (NR) (USD) - $15990 |
|---|
| Sep/23 | $10000 | $10000 | $10000 |
|---|
| Nov/23 | $10890 | $10207 | $10904 |
|---|
| Nov/24 | $15888 | $12872 | $15990 |
|---|
Average Annual Total Returns as of November 30, 2024
| Fund/Index Name | 1 Year | Annualized Since Inception |
|---|
| Global X Defense Tech ETF | 45.89% | 46.07% |
|---|
| MSCI ACWI Index (Net) (USD) | 26.12% | 22.95% |
|---|
| Global X Defense Tech Index (NR) (USD) | 46.65% | 46.83% |
|---|
Since its inception on September 11, 2023. The line graph represents historical performance of a hypothetical investment of $10,000 in the Fund since inception. Returns shown are total returns, which assume the reinvestment of dividends and capital gains. The table and graph presented above do not reflect the deduction of taxes a shareholder would pay on Fund distributions or the redemption of Fund shares. Past performance is not indicative of future performance.Call 1-888-493-8631 or visit https://www.globalxetfs.com/funds/shld/ for current month-end performance.
Key Fund Statistics as of November 30, 2024
| Total Net Assets | Number of Portfolio Holdings | Total Advisory Fees Paid | Portfolio Turnover Rate |
|---|
| $766,036,861 | 37 | $1,289,251 | 14.43% |
|---|
What did the Fund invest in?
Country WeightingsFootnote Reference*
| Value | Value |
|---|
| Japan | 0.0% |
| Australia | 0.1% |
| Turkey | 0.4% |
| Israel | 2.2% |
| Sweden | 2.7% |
| Italy | 3.9% |
| South Korea | 4.6% |
| France | 5.4% |
| Germany | 5.7% |
| United Kingdom | 6.8% |
| United States | 67.9% |
| Footnote | Description |
Footnote* | Percentages are calculated based on total net assets. |
| Holding Name | | | Percentage of Total Net Assets |
|---|
| RTX | | | 8.2% |
| Palantir Technologies, Cl A | | | 8.1% |
| Northrop Grumman | | | 7.9% |
| Lockheed Martin | | | 7.9% |
| General Dynamics | | | 7.9% |
| Rheinmetall | | | 4.9% |
| Leidos Holdings | | | 4.6% |
| L3Harris Technologies | | | 4.5% |
| BAE Systems | | | 4.3% |
| BWX Technologies | | | 4.3% |
There were no material changes during the reporting period that are required to be disclosed in this report. For more complete information about other changes to the Fund, you may review the Fund's current prospectus, which is available upon request.
For additional information about the Fund, including its prospectus, financial information, holdings, and proxy voting information, call or visit:
Global X Defense Tech ETF: SHLD
Principal Listing Exchange: NYSE Arca, Inc.
Annual Shareholder Report - November 30, 2024
GX-AR-TSR-11.2024-43
Global X Infrastructure Development ex-U.S. ETF
Principal Listing Exchange: Cboe BZX Exchange, Inc.
Annual Shareholder Report: November 30, 2024
This annual shareholder report contains important information about the Global X Infrastructure Development ex-U.S. ETF (the "Fund") for the period from August 27, 2024 (commencement of operations) to November 30, 2024. You can find additional information about the Fund at https://www.globalxetfs.com/funds/ipav. You can also request this information by contacting us at 1-888-493-8631.
What were the Fund costs for the period?
(based on a hypothetical $10,000 investment)
| Fund Name | Costs of a $10,000 investmentFootnote Reference* | Costs paid as a percentage of a $10,000 investment |
|---|
| Global X Infrastructure Development ex-U.S. ETF | $14 | 0.56% |
|---|
| Footnote | Description |
Footnote* | Costs shown not annualized. If the Fund had been open for the full fiscal year, costs shown would have been higher for the period ended. |
How did the Fund perform in the period?
The Fund seeks to provide investment results that correspond generally to the price and yield performance, before fees and expenses, of the Global X Infrastructure Development ex-U.S. Index ("Secondary Index"). The Secondary Index is owned and was developed by Global X Management Company LLC, an affiliate of the Fund and the Fund's investment adviser. The Fund is passively managed, and the investment adviser does not attempt to take defensive positions in declining markets. The Fund generally seeks to fully replicate the Secondary Index.
The Secondary Index is designed to track the performance of companies involved in infrastructure development for international markets, including developed and emerging markets but excluding the United States. This includes companies involved in engineering and construction services; production of infrastructure raw materials and composites; producers and distributors of heavy construction equipment and products; infrastructure transportation; and manufacturers and/or distributors of smart grid components.
Since inception through November 30, 2024 (the “reporting period”), the Fund decreased 3.42%, while the Secondary Index decreased 3.25%. The Fund had a net asset value of $24.82 per share on August 27, 2024 (the Fund’s date of inception) and ended the reporting period with a net asset value of $23.97 per share on November 30, 2024.
During the reporting period, the highest returns came from China National Building Material Co. Ltd. Class H and Tenaris S.A. Sponsored ADR, which returned 38.71% and 38.31%, respectively. The worst performers were SAMSUNG E&A CO. LTD. and Sterling and Wilson Renewable Energy Limited, which returned -35.24% and -28.47%, respectively.
During the reporting period the Fund recorded negative performance. High interest rates increased the cost of capital, dampening demand for infrastructure development projects. As a result, many Fund constituents faced greater challenges in launching projects and maintaining profitability. The Industrial Services sector faced challenges as infrastructure development projects experienced delays and cost overruns in several emerging markets, weighing on companies involved in engineering and construction services. Oversupply pressures impacted the Materials sector, particularly affecting companies producing raw and composite materials used in construction. Supply-chain disruptions also created uncertainty for infrastructure development in certain regions. Additionally, regulatory changes and environmental concerns led to project cancellations and reevaluations, affecting companies across the Fund's focus areas.
How did the Fund perform since inception?
Total Return Based on $10,000 Investment
| Global X Infrastructure Development ex-U.S. ETF - $9658 | MSCI ACWI Index (Net) (USD) - $10414 | Global X Infrastructure Development ex-U.S. Index (NR) (USD) - $9675 |
|---|
| Aug/24 | $10000 | $10000 | $10000 |
|---|
| Aug/24 | $10012 | $10036 | $10016 |
|---|
| Sep/24 | $10282 | $10269 | $10292 |
|---|
| Oct/24 | $9637 | $10039 | $9646 |
|---|
| Nov/24 | $9658 | $10414 | $9675 |
|---|
Average Annual Total Returns as of November 30, 2024
| Fund/Index Name | Cumulative Since Inception |
|---|
| Global X Infrastructure Development ex-U.S. ETF | -3.42% |
|---|
| MSCI ACWI Index (Net) (USD) | 4.14% |
|---|
| Global X Infrastructure Development ex-U.S. Index (NR) (USD) | -3.25% |
|---|
Since its inception on August 27, 2024. The line graph represents historical performance of a hypothetical investment of $10,000 in the Fund since inception. Returns shown are total returns, which assume the reinvestment of dividends and capital gains. The table and graph presented above do not reflect the deduction of taxes a shareholder would pay on Fund distributions or the redemption of Fund shares. Past performance is not indicative of future performance.Call 1-888-493-8631 or visit https://www.globalxetfs.com/funds/ipav for current month-end performance.
Key Fund Statistics as of November 30, 2024
| Total Net Assets | Number of Portfolio Holdings | Total Advisory Fees Paid | Portfolio Turnover Rate |
|---|
| $2,397,253 | 100 | $3,446 | 7.99% |
|---|
What did the Fund invest in?
Country WeightingsFootnote Reference*
| Value | Value |
|---|
| Other Countries | 13.1% |
| Taiwan | 2.6% |
| Germany | 3.0% |
| Sweden | 3.7% |
| China | 3.7% |
| Spain | 4.5% |
| South Korea | 4.9% |
| Italy | 5.5% |
| France | 6.7% |
| Canada | 7.9% |
| United States | 9.1% |
| Japan | 13.4% |
| India | 21.6% |
| Footnote | Description |
Footnote* | Percentages are calculated based on total net assets. |
| Holding Name | | | Percentage of Total Net Assets |
|---|
| Cellnex Telecom | | | 3.1% |
| Ferrovial | | | 3.1% |
| Larsen & Toubro | | | 3.1% |
| Tata Steel | | | 3.1% |
| UltraTech Cement | | | 3.1% |
| Tenaris ADR | | | 3.0% |
| Canadian Pacific Kansas City | | | 3.0% |
| Prysmian | | | 3.0% |
| Canadian National Railway | | | 3.0% |
| Holcim | | | 3.0% |
There were no material changes during the reporting period that are required to be disclosed in this report. For more complete information about other changes to the Fund, you may review the Fund's current prospectus, which is available upon request.
For additional information about the Fund, including its prospectus, financial information, holdings, and proxy voting information, call or visit:
Global X Infrastructure Development ex-U.S. ETF: IPAV
Principal Listing Exchange: Cboe BZX Exchange, Inc.
Annual Shareholder Report - November 30, 2024
GX-AR-TSR-11.2024-44
(b) Not applicable.
The registrant has adopted a code of ethics that applies to the registrant’s principal executive officer, principal financial officer, controller or principal accounting officer, and any person who performs a similar function.
| Item 3. | Audit Committee Financial Expert. |
(a)(1) The registrant’s board of directors has determined that the registrant has at least one audit committee financial expert serving on the audit committee.
(a)(2) The audit committee financial experts are Charles A. Baker and Toai Chin and each is independent as defined in Form N-CSR Item 3(a)(2).
| Item 4. | Principal Accountant Fees and Services. |
Fees billed by PricewaterhouseCoopers LLP (“PwC”) relate to the registrant.
PWC billed the registrant aggregate fees for services rendered to the registrant for the last two fiscal years as follows:
| | 2024 | 2023 |
| | | All fees and
services to
the Trust
that were
pre-
approved | All fees and
services to
service
affiliates
that were
pre-
approved | All other
fees and
services to
service
affiliates
that did not
require pre-
approval | All fees and
services to
the Trust
that were
pre-
approved | All fees and
services to
service
affiliates
that were
pre-
approved | All other
fees and
services to
service
affiliates
that did not
require pre-
approval |
| (a) | Audit Fees | $1,727,672 | $0 | $0 | $1,235,693 | $0 | $0 |
| (b) | Audit-Related Fees | $0 | $0 | $0 | $0 | $0 | $0 |
| (c) | Tax Fees(1) | $487,204 | $0 | $0 | $392,972 | $0 | $0 |
| (d) | All Other Fees | $0 | $0 | $0 | $0 | $0 | $0 |
Notes:
| (1) | Tax Compliance and excise distribution services. |
(e)(1) Not applicable.
(e)(2) Percentage of fees billed applicable to non-audit services pursuant to waiver of pre-approval requirement were as follows (PwC):
| | 2024 | 2023 |
| Audit-Related Fees | 0% | 0% |
| Tax Fees | 0% | 0% |
| All Other Fees | 0% | 0% |
(f) Not applicable.
(g) The aggregate non-audit fees and services billed by PwC for the last two fiscal years were $487,204 and $392,972, respectively.
(h) During the past fiscal year, all non-audit services provided by registrant’s principal accountant to either registrant’s investment adviser or to any entity controlling, controlled by, or under common control with registrant’s investment adviser that provides ongoing services to registrant were pre-approved by the audit committee of registrant’s Board of Trustees. Included in the audit committee’s pre-approval was the review and consideration as to whether the provision of these non-audit services is compatible with maintaining the principal accountant’s independence.
(i) Not applicable.
(j) Not applicable.
| Item 5. | Audit Committee of Listed Registrants. |
The registrant has a separately-designated standing Audit Committee, which is composed of the registrant’s Independent Trustees, Charles A. Baker, Toai Chin and Clifford J. Weber.
(a) The Schedules of Investments and Consolidated Schedules of Investments are included as part of the financial statements and financial highlights filed under Item 7 of this form.
(b) Not applicable.
| Item 7. | Financial Statements and Financial Highlights for Open-End Management Investment Companies. |
Financial statements and financial highlights are filed herein.

Global X Millennial Consumer ETF (ticker: MILN)
Global X Aging Population ETF (ticker: AGNG)
Global X Robotics & Artificial Intelligence ETF (ticker: BOTZ)
Global X FinTech ETF (ticker: FINX)
Global X Internet of Things ETF (ticker: SNSR)
Global X U.S. Infrastructure Development ETF (ticker: PAVE)
Global X Autonomous & Electric Vehicles ETF (ticker: DRIV)
Global X Artificial Intelligence & Technology ETF (ticker: AIQ)
Global X Genomics & Biotechnology ETF (ticker: GNOM)
Global X Cloud Computing ETF (ticker: CLOU)
Global X Thematic Growth ETF (ticker: GXTG)
Global X Video Games & Esports ETF (ticker: HERO)
Global X Cybersecurity ETF (ticker: BUG)
Global X Telemedicine & Digital Health ETF (ticker: EDOC)
Global X CleanTech ETF (ticker: CTEC)
Global X Data Center & Digital Infrastructure ETF (ticker: DTCR)
Global X Clean Water ETF (ticker: AQWA)
Global X AgTech & Food Innovation ETF (ticker: KROP)
Global X Blockchain ETF (ticker: BKCH)
Global X Hydrogen ETF (ticker: HYDR)
Global X Solar ETF (ticker: RAYS)
Global X Wind Energy ETF (ticker: WNDY)
Global X PropTech ETF (ticker: PTEC)
Global X Defense Tech ETF (ticker: SHLD)
Global X Infrastructure Development ex-U.S. ETF (ticker: IPAV)
Annual Financials and Other Information Report
November 30, 2024

Table of Contents
Financial Statements (Form N-CSR Item 7)
Shares are bought and sold at market price (not NAV) and are not individually redeemed from a Fund. Shares may only be redeemed directly from a Fund by Authorized Participants, in very large creation/redemption units. Brokerage commissions will reduce returns.
The Funds file their complete schedules of Fund holdings with the Securities and Exchange Commission (the “SEC” or “Commission”) for the first and third quarters of each fiscal year as an exhibit to its reports on Form N-PORT. The Funds’ Form N-PORT is available on the Commission’s website at https://www.sec.gov, and may be reviewed and copied at the Commission’s Public Reference Room in Washington, DC. Information on the operation of the Public Reference Room may be obtained by calling 1-800-SEC-0330.
A description of the policies and procedures that Global X Funds uses to determine how to vote proxies relating to Fund securities, as well as information relating to how the Funds voted proxies relating to Fund securities during the most recent 12-month period ended June 30, is available (i) without charge, upon request, by calling 1-888-493-8631; and (ii) on the Commission’s website at https://www.sec.gov
| Schedule of Investments | November 30, 2024 |
| Global X Millennial Consumer ETF |
| | | Shares | | | Value | |
| COMMON STOCK — 99.9% | | | | | | |
| SINGAPORE — 3.9% | | | | | | |
| Communication Services — 3.9% | | | | | | |
| Sea ADR * | | | 45,184 | | | $ | 5,141,939 | |
| | | | | | | | | |
| UNITED STATES — 96.0% | | | | | | | | |
| Communication Services — 18.7% | | | | | | | | |
| Alphabet, Cl A | | | 20,261 | | | | 3,423,096 | |
| Angi, Cl A * | | | 149,011 | | | | 277,161 | |
| Cargurus, Cl A * | | | 13,989 | | | | 529,064 | |
| Cars.com * | | | 19,046 | | | | 378,444 | |
| Match Group * | | | 23,149 | | | | 757,898 | |
| Meta Platforms, Cl A | | | 6,174 | | | | 3,545,852 | |
| Netflix * | | | 5,138 | | | | 4,556,430 | |
| Snap, Cl A * | | | 120,767 | | | | 1,426,258 | |
| Spotify Technology * | | | 10,640 | | | | 5,074,854 | |
| TripAdvisor * | | | 11,857 | | | | 169,911 | |
| Vimeo * | | | 86,608 | | | | 565,550 | |
| Walt Disney | | | 27,570 | | | | 3,238,648 | |
| Yelp, Cl A * | | | 7,986 | | | | 305,225 | |
| ZipRecruiter, Cl A * | | | 28,250 | | | | 250,295 | |
| | | | | | | | 24,498,686 | |
| Consumer Discretionary — 42.4% | | | | | | | | |
| Airbnb, Cl A * | | | 19,526 | | | | 2,657,684 | |
| Amazon.com * | | | 17,086 | | | | 3,552,009 | |
| AutoNation * | | | 3,595 | | | | 643,110 | |
| Booking Holdings | | | 889 | | | | 4,624,560 | |
| Capri Holdings * | | | 10,009 | | | | 234,311 | |
| CarMax * | | | 13,649 | | | | 1,146,107 | |
| Carter’s | | | 4,284 | | | | 233,778 | |
| Carvana, Cl A * | | | 10,080 | | | | 2,625,034 | |
| Chegg * | | | 43,017 | | | | 90,766 | |
| Chipotle Mexican Grill, Cl A * | | | 53,998 | | | | 3,321,957 | |
| Columbia Sportswear | | | 5,152 | | | | 449,460 | |
| Coursera * | | | 24,354 | | | | 193,614 | |
| Designer Brands, Cl A | | | 36,938 | | | | 183,212 | |
| Dick’s Sporting Goods | | | 5,092 | | | | 1,055,266 | |
| DoorDash, Cl A * | | | 22,916 | | | | 4,135,880 | |
| eBay | | | 44,904 | | | | 2,841,974 | |
| Etsy * | | | 10,227 | | | | 561,053 | |
The accompanying notes are an integral part of the financial statements.
1
| Schedule of Investments | November 30, 2024 |
| Global X Millennial Consumer ETF |
| | | Shares | | | Value | |
| COMMON STOCK — continued | | | | | | | | |
| Consumer Discretionary — continued | | | | | | | | |
| Expedia Group * | | | 11,298 | | | $ | 2,085,837 | |
| Graham Holdings, Cl B | | | 438 | | | | 407,831 | |
| Home Depot | | | 9,299 | | | | 3,990,480 | |
| Laureate Education, Cl A * | | | 21,840 | | | | 414,960 | |
| Life Time Group Holdings * | | | 22,020 | | | | 534,425 | |
| Lowe’s | | | 13,719 | | | | 3,737,467 | |
| Lululemon Athletica * | | | 9,231 | | | | 2,960,012 | |
| NIKE, Cl B | | | 35,107 | | | | 2,765,378 | |
| Peloton Interactive, Cl A * | | | 86,055 | | | | 889,809 | |
| Perdoceo Education | | | 18,305 | | | | 502,472 | |
| Planet Fitness, Cl A * | | | 7,509 | | | | 747,521 | |
| Skechers USA, Cl A * | | | 11,501 | | | | 733,994 | |
| Starbucks | | | 37,600 | | | | 3,852,496 | |
| Strategic Education | | | 3,173 | | | | 313,524 | |
| Stride * | | | 5,344 | | | | 571,113 | |
| Under Armour, Cl A * | | | 48,282 | | | | 468,818 | |
| VF | | | 33,496 | | | | 677,624 | |
| Victoria’s Secret * | | | 16,964 | | | | 658,882 | |
| Wayfair, Cl A * | | | 8,185 | | | | 378,474 | |
| Xponential Fitness, Cl A * | | | 21,529 | | | | 328,102 | |
| | | | | | | | 55,568,994 | |
| Consumer Staples — 5.1% | | | | | | | | |
| Costco Wholesale | | | 4,410 | | | | 4,285,991 | |
| Maplebear * | | | 23,016 | | | | 1,005,109 | |
| Sprouts Farmers Market * | | | 8,747 | | | | 1,351,236 | |
| | | | | | | | 6,642,336 | |
| Financials — 11.8% | | | | | | | | |
| Block, Cl A * | | | 40,343 | | | | 3,572,373 | |
| Fiserv * | | | 21,031 | | | | 4,647,010 | |
| LendingClub * | | | 39,447 | | | | 656,398 | |
| Nelnet, Cl A | | | 3,405 | | | | 370,873 | |
| PayPal Holdings * | | | 49,087 | | | | 4,259,279 | |
| SLM | | | 18,996 | | | | 520,110 | |
| SoFi Technologies * | | | 84,315 | | | | 1,383,609 | |
| | | | | | | | 15,409,652 | |
The accompanying notes are an integral part of the financial statements.
2
| Schedule of Investments | November 30, 2024 |
| Global X Millennial Consumer ETF |
| | | Shares | | | Value | |
| COMMON STOCK — continued | | | | | | | | |
| Health Care — 0.6% | | | | | | | | |
| Accolade * | | | 36,949 | | | $ | 142,623 | |
| Hims & Hers Health * | | | 22,043 | | | | 710,226 | |
| | | | | | | | 852,849 | |
| Industrials — 3.0% | | | | | | | | |
| Avis Budget Group | | | 3,040 | | | | 331,573 | |
| Lyft, Cl A * | | | 33,746 | | | | 585,830 | |
| Uber Technologies * | | | 42,399 | | | | 3,051,032 | |
| | | | | | | | 3,968,435 | |
| Information Technology — 5.9% | | | | | | | | |
| Apple | | | 18,453 | | | | 4,379,451 | |
| Intuit | | | 5,147 | | | | 3,302,984 | |
| | | | | | | | 7,682,435 | |
| Real Estate — 8.5% | | | | | | | | |
| AvalonBay Communities ‡ | | | 12,312 | | | | 2,897,629 | |
| Camden Property Trust ‡ | | | 9,250 | | | | 1,163,650 | |
| Centerspace ‡ | | | 5,250 | | | | 380,625 | |
| Equity Residential ‡ | | | 32,838 | | | | 2,517,361 | |
| Independence Realty Trust ‡ | | | 19,698 | | | | 430,204 | |
| Invitation Homes ‡ | | | 52,946 | | | | 1,813,401 | |
| UDR ‡ | | | 28,465 | | | | 1,305,405 | |
| Zillow Group, Cl A * | | | 7,216 | | | | 588,320 | |
| | | | | | | | 11,096,595 | |
| TOTAL UNITED STATES | | | | | | | 125,719,982 | |
TOTAL COMMON STOCK
(Cost $131,982,166) | | | | | | | 130,861,921 | |
TOTAL INVESTMENTS — 99.9%
(Cost $131,982,166) | | | | | | $ | 130,861,921 | |
Percentages are based on Net Assets of $131,031,003.
| * | Non-income producing security. |
| ‡ | Real Estate Investment Trust |
The accompanying notes are an integral part of the financial statements.
3
| Schedule of Investments | November 30, 2024 |
| Global X Millennial Consumer ETF |
As of November 30, 2024, all of the Fund’s investments were considered Level 1, in accordance with authoritative guidance on fair value measurements and disclosure under U.S. GAAP.
See “Glossary” for abbreviations.
The accompanying notes are an integral part of the financial statements.
4
| Schedule of Investments | November 30, 2024 |
| Global X Aging Population ETF |
| | | Shares | | | Value | |
| COMMON STOCK — 99.7% | | | | | | |
| AUSTRALIA — 1.1% | | | | | | |
| Health Care — 1.1% | | | | | | |
| Cochlear | | | 3,379 | | | $ | 669,707 | |
| | | | | | | | | |
| BELGIUM — 3.4% | | | | | | | | |
| Health Care — 3.2% | | | | | | | | |
| UCB | | | 10,075 | | | | 1,972,350 | |
| | | | | | | | | |
| Real Estate — 0.2% | | | | | | | | |
| Aedifica ‡ | | | 2,731 | | | | 167,444 | |
| | | | | | | | | |
| TOTAL BELGIUM | | | | | | | 2,139,794 | |
| CANADA — 0.7% | | | | | | | | |
| Health Care — 0.7% | | | | | | | | |
| Chartwell Retirement Residences, Cl Trust Units | | | 18,561 | | | | 214,092 | |
| Sienna Senior Living | | | 17,539 | | | | 212,700 | |
| | | | | | | | | |
| TOTAL CANADA | | | | | | | 426,792 | |
| CHINA — 4.0% | | | | | | | | |
| Health Care — 4.0% | | | | | | | | |
| AK Medical Holdings | | | 248,389 | | | | 171,093 | |
| BeiGene ADR * | | | 4,941 | | | | 1,062,315 | |
| Hansoh Pharmaceutical Group | | | 306,643 | | | | 760,544 | |
| Lifetech Scientific * | | | 746,392 | | | | 141,959 | |
| Luye Pharma Group * | | | 472,624 | | | | 153,056 | |
| Microport Scientific * | | | 219,602 | | | | 169,607 | |
| Venus MedTech Hangzhou, Cl H *(A) | | | 102,940 | | | | 44,607 | |
| | | | | | | | | |
| TOTAL CHINA | | | | | | | 2,503,181 | |
| DENMARK — 4.5% | | | | | | | | |
| Consumer Discretionary — 0.2% | | | | | | | | |
| GN Store Nord * | | | 7,771 | | | | 148,575 | |
| | | | | | | | | |
| Health Care — 4.3% | | | | | | | | |
| Demant * | | | 11,536 | | | | 439,809 | |
| Genmab * | | | 3,413 | | | | 737,606 | |
The accompanying notes are an integral part of the financial statements.
5
| Schedule of Investments | November 30, 2024 |
| Global X Aging Population ETF |
| | | Shares | | | Value | |
| COMMON STOCK — continued | | | | | | |
| Health Care — continued | | | | | | |
| Novo Nordisk, Cl B | | | 13,712 | | | $ | 1,470,627 | |
| | | | | | | | 2,648,042 | |
| TOTAL DENMARK | | | | | | | 2,796,617 | |
| GERMANY — 1.1% | | | | | | | | |
| Health Care — 1.1% | | | | | | | | |
| Fresenius Medical Care | | | 15,158 | | | | 666,011 | |
| | | | | | | | | |
| ITALY — 0.5% | | | | | | | | |
| Health Care — 0.5% | | | | | | | | |
| Amplifon | | | 11,660 | | | | 295,937 | |
| | | | | | | | | |
| JAPAN — 8.1% | | | | | | | | |
| Health Care — 8.1% | | | | | | | | |
| Astellas Pharma | | | 93,490 | | | | 972,032 | |
| Chugai Pharmaceutical | | | 50,049 | | | | 2,198,777 | |
| Nipro | | | 20,649 | | | | 189,874 | |
| SUNWELS | | | 10,679 | | | | 63,426 | |
| Terumo | | | 77,093 | | | | 1,566,140 | |
| | | | | | | | | |
| TOTAL JAPAN | | | | | | | 4,990,249 | |
| NEW ZEALAND — 0.3% | | | | | | | | |
| Health Care — 0.3% | | | | | | | | |
| Ryman Healthcare * | | | 63,184 | | | | 173,801 | |
| | | | | | | | | |
| SOUTH KOREA — 2.5% | | | | | | | | |
| Health Care — 2.5% | | | | | | | | |
| Celltrion | | | 11,224 | | | | 1,504,525 | |
| Dentium | | | 1,801 | | | | 76,556 | |
| | | | | | | | | |
| TOTAL SOUTH KOREA | | | | | | | 1,581,081 | |
| SPAIN — 0.8% | | | | | | | | |
| Health Care — 0.8% | | | | | | | | |
| Pharma Mar | | | 5,746 | | | | 473,983 | |
The accompanying notes are an integral part of the financial statements.
6
| Schedule of Investments | November 30, 2024 |
| Global X Aging Population ETF |
| | | Shares | | | Value | |
| COMMON STOCK — continued | | | | | | |
| SWEDEN — 0.2% | | | | | | |
| Health Care — 0.2% | | | | | | |
| Elekta, Cl B | | | 23,276 | | | $ | 138,669 | |
| | | | | | | | | |
| SWITZERLAND — 8.5% | | | | | | | | |
| Health Care — 8.5% | | | | | | | | |
| Alcon | | | 20,840 | | | | 1,854,074 | |
| Sandoz Group | | | 22,230 | | | | 1,012,840 | |
| Sonova Holding | | | 3,078 | | | | 1,050,922 | |
| Straumann Holding | | | 8,218 | | | | 1,069,459 | |
| Ypsomed Holding | | | 703 | | | | 285,669 | |
| | | | | | | | | |
| TOTAL SWITZERLAND | | | | | | | 5,272,964 | |
| UNITED KINGDOM — 3.6% | | | | | | | | |
| Health Care — 3.6% | | | | | | | | |
| AstraZeneca ADR | | | 24,637 | | | | 1,665,954 | |
| Smith & Nephew | | | 45,171 | | | | 572,424 | |
| | | | | | | | | |
| TOTAL UNITED KINGDOM | | | | | | | 2,238,378 | |
| UNITED STATES — 60.4% | | | | | | | | |
| Health Care — 52.1% | | | | | | | | |
| AbbVie | | | 10,214 | | | | 1,868,447 | |
| ACADIA Pharmaceuticals * | | | 9,776 | | | | 159,544 | |
| agilon health * | | | 31,921 | | | | 66,715 | |
| Agios Pharmaceuticals * | | | 5,559 | | | | 330,149 | |
| Alector * | | | 27,243 | | | | 70,559 | |
| Alphatec Holdings * | | | 12,139 | | | | 127,217 | |
| Amedisys * | | | 1,844 | | | | 168,560 | |
| Amgen | | | 6,337 | | | | 1,792,547 | |
| Blueprint Medicines * | | | 3,149 | | | | 303,501 | |
| Boston Scientific * | | | 24,856 | | | | 2,253,445 | |
| Bristol-Myers Squibb | | | 34,833 | | | | 2,062,810 | |
| Brookdale Senior Living * | | | 25,533 | | | | 145,027 | |
| DaVita * | | | 4,522 | | | | 751,421 | |
| Denali Therapeutics * | | | 8,880 | | | | 222,000 | |
| Dexcom * | | | 12,228 | | | | 953,662 | |
| Edwards Lifesciences * | | | 18,686 | | | | 1,333,246 | |
| Eli Lilly | | | 2,253 | | | | 1,791,924 | |
| Embecta | | | 15,456 | | | | 321,948 | |
The accompanying notes are an integral part of the financial statements.
7
| Schedule of Investments | November 30, 2024 |
| Global X Aging Population ETF |
| | | Shares | | | Value | |
| COMMON STOCK — continued | | | | | | | | |
| Health Care — continued | | | | | | | | |
| Ensign Group | | | 2,912 | | | $ | 425,764 | |
| Exact Sciences * | | | 9,372 | | | | 581,814 | |
| Exelixis * | | | 15,584 | | | | 568,193 | |
| Glaukos * | | | 2,543 | | | | 365,302 | |
| Halozyme Therapeutics * | | | 6,535 | | | | 314,987 | |
| Incyte * | | | 11,578 | | | | 863,603 | |
| Insulet * | | | 3,612 | | | | 963,609 | |
| Integer Holdings * | | | 1,721 | | | | 241,801 | |
| Johnson & Johnson | | | 11,499 | | | | 1,782,460 | |
| LivaNova * | | | 3,144 | | | | 165,060 | |
| MannKind * | | | 39,575 | | | | 268,318 | |
| Medtronic PLC | | | 20,823 | | | | 1,802,022 | |
| Merit Medical Systems * | | | 2,981 | | | | 309,726 | |
| National HealthCare | | | 1,895 | | | | 237,254 | |
| Neurocrine Biosciences * | | | 5,129 | | | | 650,101 | |
| Novocure * | | | 12,048 | | | | 241,442 | |
| Regeneron Pharmaceuticals * | | | 1,859 | | | | 1,394,659 | |
| Roche Holding | | | 5,509 | | | | 1,693,345 | |
| Stryker | | | 4,941 | | | | 1,937,613 | |
| Teleflex | | | 2,426 | | | | 467,854 | |
| Theravance Biopharma * | | | 19,038 | | | | 176,102 | |
| United Therapeutics * | | | 2,427 | | | | 899,179 | |
| Zimmer Biomet Holdings | | | 10,581 | | | | 1,186,130 | |
| | | | | | | | 32,259,060 | |
| Real Estate — 8.3% | | | | | | | | |
| LTC Properties ‡ | | | 5,290 | | | | 204,141 | |
| National Health Investors ‡ | | | 2,889 | | | | 221,442 | |
| Omega Healthcare Investors ‡ | | | 12,658 | | | | 514,041 | |
| Sabra Health Care REIT ‡ | | | 12,344 | | | | 231,203 | |
| Ventas ‡ | | | 20,767 | | | | 1,330,542 | |
| Welltower ‡ | | | 18,936 | | | | 2,616,577 | |
| | | | | | | | 5,117,946 | |
| TOTAL UNITED STATES | | | | | | | 37,377,006 | |
TOTAL COMMON STOCK
(Cost $60,918,780) | | | | | | | 61,744,170 | |
The accompanying notes are an integral part of the financial statements.
8
| Schedule of Investments | November 30, 2024 |
| Global X Aging Population ETF |
| | | Number of
Rights | | | Value | |
| RIGHTS — 0.0% | | | | | | |
| United States — 0.0% | | | | | | |
| Radius Health# *(A) | | | 19,104 | | | $ | — | |
TOTAL RIGHTS
(Cost $–) | | | | | | | — | |
TOTAL INVESTMENTS — 99.7%
(Cost $60,918,780) | | | | | | $ | 61,744,170 | |
Percentages are based on Net Assets of $61,902,250.
| * | Non-income producing security. |
| ‡ | Real Estate Investment Trust |
| # | Expiration date not available. |
| (A) | Level 3 security in accordance with fair value hierarchy. |
The following is a summary of the level of inputs used as of November 30, 2024, in valuing the Fund’s investments carried at value:
| Investments in Securities | | Level 1 | | | Level 2 | | | Level 3(1) | | | Total | |
| Common Stock | | $ | 61,699,563 | | | $ | — | | | $ | 44,607 | | | $ | 61,744,170 | |
| Rights | | | — | | | | — | | | | — | ^ | | | — | |
| Total Investments in Securities | | $ | 61,699,563 | | | $ | — | | | $ | 44,607 | | | $ | 61,744,170 | |
(1) A reconciliation of Level 3 investments and disclosures of significant unobservable inputs are presented when the Fund has a significant amount of Level 3 investments at the end of the period in relation to Net Assets. Management has concluded that Level 3 investments are not material in relation to Net Assets.
^ Includes Securities in which the fair value is $0 or has been rounded to $0.
Amounts designated as “—” are $0 or have been rounded to $0.
See “Glossary” for abbreviations.
The accompanying notes are an integral part of the financial statements.
9
| Schedule of Investments | November 30, 2024 |
| Global X Robotics & Artificial Intelligence ETF |
| | | Shares | | | Value | |
| COMMON STOCK — 99.6% | | | | | | |
| CANADA — 1.4% | | | | | | |
| Industrials — 1.4% | | | | | | |
| ATS * | | | 1,123,700 | | | $ | 36,805,258 | |
| | | | | | | | | |
| CHINA — 1.7% | | | | | | | | |
| Consumer Discretionary — 0.5% | | | | | | | | |
| Hesai Group ADR * (A) | | | 1,086,235 | | | | 8,885,402 | |
| Zhixing Automotive Technology Suzhou * (A) | | | 1,241,200 | | | | 2,985,943 | |
| | | | | | | | 11,871,345 | |
| Health Care — 0.5% | | | | | | | | |
| Shanghai MicroPort MedBot Group * (A) | | | 10,827,000 | | | | 13,565,838 | |
| | | | | | | | | |
| Information Technology — 0.7% | | | | | | | | |
| AInnovation Technology Group, Cl H * (A) | | | 6,427,900 | | | | 4,774,533 | |
| RoboSense Technology * (A) | | | 5,515,900 | | | | 13,297,901 | |
| | | | | | | | 18,072,434 | |
| TOTAL CHINA | | | | | | | 43,509,617 | |
| FINLAND — 2.1% | | | | | | | | |
| Industrials — 2.1% | | | | | | | | |
| Cargotec, Cl B | | | 627,743 | | | | 34,888,240 | |
| Kalmar, Cl B * | | | 628,606 | | | | 21,206,050 | |
| | | | | | | | | |
| TOTAL FINLAND | | | | | | | 56,094,290 | |
| ISRAEL — 0.1% | | | | | | | | |
| Consumer Discretionary — 0.1% | | | | | | | | |
| Maytronics | | | 1,243,250 | | | | 3,074,228 | |
| | | | | | | | | |
| JAPAN — 25.6% | | | | | | | | |
| Industrials — 15.5% | | | | | | | | |
| Daifuku | | | 4,309,181 | | | | 89,434,479 | |
| FANUC | | | 3,810,017 | | | | 98,608,623 | |
| Hirata | | | 122,060 | | | | 4,185,565 | |
| Shibaura Machine | | | 305,965 | | | | 7,130,389 | |
| SMC | | | 328,539 | | | | 138,997,690 | |
| Yaskawa Electric (A) | | | 2,721,766 | | | | 71,023,078 | |
| | | | | | | | 409,379,824 | |
The accompanying notes are an integral part of the financial statements.
10
| Schedule of Investments | November 30, 2024 |
| Global X Robotics & Artificial Intelligence ETF |
| | | Shares | | | Value | |
| COMMON STOCK — continued | | | | | | | | |
| Information Technology — 10.1% | | | | | | | | |
| ExaWizards * (A) | | | 961,263 | | | $ | 2,438,600 | |
| Keyence | | | 422,376 | | | | 182,016,677 | |
| Omron | | | 2,340,028 | | | | 74,258,904 | |
| PKSHA Technology * (A) | | | 362,405 | | | | 10,062,449 | |
| | | | | | | | 268,776,630 | |
| TOTAL JAPAN | | | | | | | 678,156,454 | |
| NORWAY — 1.7% | | | | | | | | |
| Industrials — 1.7% | | | | | | | | |
| AutoStore Holdings * | | | 38,925,841 | | | | 43,557,082 | |
| | | | | | | | | |
| SOUTH KOREA — 2.2% | | | | | | | | |
| Industrials — 2.2% | | | | | | | | |
| Doosan Robotics * | | | 737,033 | | | | 34,235,144 | |
| Rainbow Robotics * | | | 219,912 | | | | 23,913,588 | |
| | | | | | | | | |
| TOTAL SOUTH KOREA | | | | | | | 58,148,732 | |
| SWITZERLAND — 10.5% | | | | | | | | |
| Health Care — 1.3% | | | | | | | | |
| Tecan Group | | | 145,418 | | | | 34,695,646 | |
| | | | | | | | | |
| Industrials — 9.2% | | | | | | | | |
| ABB | | | 4,275,778 | | | | 244,025,105 | |
| | | | | | | | | |
| TOTAL SWITZERLAND | | | | | | | 278,720,751 | |
| UNITED KINGDOM — 1.2% | | | | | | | | |
| Information Technology — 1.2% | | | | | | | | |
| Renishaw | | | 826,882 | | | | 32,896,608 | |
| | | | | | | | | |
| UNITED STATES — 53.1% | | | | | | | | |
| Consumer Discretionary — 0.1% | | | | | | | | |
| iRobot * (A) | | | 317,745 | | | | 2,418,039 | |
| | | | | | | | | |
| Energy — 0.7% | | | | | | | | |
| Helix Energy Solutions Group * | | | 1,715,978 | | | | 18,343,805 | |
The accompanying notes are an integral part of the financial statements.
11
| Schedule of Investments | November 30, 2024 |
| Global X Robotics & Artificial Intelligence ETF |
| | | Shares | | | Value | |
| COMMON STOCK — continued | | | | | | |
| Financials — 2.9% | | | | | | |
| Upstart Holdings * | | | 983,110 | | | $ | 77,459,237 | |
| | | | | | | | | |
| Health Care — 13.5% | | | | | | | | |
| Intuitive Surgical * | | | 512,828 | | | | 277,952,776 | |
| Omnicell * | | | 516,377 | | | | 24,058,004 | |
| PROCEPT BioRobotics * | | | 571,996 | | | | 54,677,098 | |
| | | | | | | | 356,687,878 | |
| Industrials — 5.1% | | | | | | | | |
| AeroVironment * | | | 319,077 | | | | 62,060,476 | |
| John Bean Technologies | | | 361,886 | | | | 45,604,874 | |
| Symbotic, Cl A * (A) | | | 1,015,172 | | | | 27,308,127 | |
| | | | | | | | 134,973,477 | |
| Information Technology — 30.8% | | | | | | | | |
| Appian, Cl A * | | | 480,352 | | | | 18,181,323 | |
| C3.ai, Cl A * (A) | | | 1,325,052 | | | | 49,265,434 | |
| Cerence * (A) | | | 472,605 | | | | 3,480,736 | |
| Cognex | | | 1,947,640 | | | | 77,866,647 | |
| Dynatrace * | | | 2,241,905 | | | | 125,972,642 | |
| FARO Technologies * | | | 215,621 | | | | 5,660,051 | |
| NVIDIA | | | 2,500,361 | | | | 345,674,908 | |
| Pegasystems | | | 952,057 | | | | 90,416,853 | |
| PROS Holdings * | | | 532,005 | | | | 12,326,556 | |
| SoundHound AI, Cl A * (A) | | | 2,384,367 | | | | 22,198,457 | |
| UiPath, Cl A * | | | 4,666,551 | | | | 66,311,690 | |
| | | | | | | | 817,355,297 | |
| TOTAL UNITED STATES | | | | | | | 1,407,237,733 | |
TOTAL COMMON STOCK
(Cost $2,566,113,684) | | | | | | | 2,638,200,753 | |
The accompanying notes are an integral part of the financial statements.
12
| Schedule of Investments | November 30, 2024 |
| Global X Robotics & Artificial Intelligence ETF |
| | | Face Amount | | | Value | |
| REPURCHASE AGREEMENTS(B) — 2.1% | | | | | | | | |
Bank of America Securities, Inc.
4.590%, dated 11/29/2024, to be repurchased on 12/02/2024, repurchase price $13,237,413 (collateralized by various U.S. Government Obligations, ranging in par value $3,970 - $6,012,618, 1.500% - 7.500%, 02/01/2034 - 11/20/2054, with a total market value of $13,435,097) | | $ | 13,232,352 | | | $ | 13,232,352 | |
Deutsche Bank Securities, Inc.
4.570%, dated 11/29/2024, to be repurchased on 12/02/2024, repurchase price $13,237,391 (collateralized by various U.S. Treasury Obligations, ranging in par value $542,281 - $4,993,183, 0.000% - 3.750%, 12/15/2024 - 05/15/2029, with a total market value of $13,429,973) | | | 13,232,352 | | | | 13,232,352 | |
HSBC Securities USA, Inc.
4.590%, dated 11/29/2024, to be repurchased on 12/02/2024, repurchase price $11,704,743 (collateralized by various U.S. Government Obligations, ranging in par value $1,170 - $6,065,419, 1.730% - 7.000%, 02/01/2031 - 11/01/2054, with a total market value of $11,894,180) | | | 11,700,268 | | | | 11,700,268 | |
Nomura Securities International, Inc.
4.580%, dated 11/29/2024, to be repurchased on 12/02/2024, repurchase price $13,237,402 (collateralized by various U.S. Government Obligations, ranging in par value $10,311 - $3,057,901, 2.000% - 6.500%, 11/01/2035 - 05/01/2058, with a total market value of $13,442,938) | | | 13,232,352 | | | | 13,232,352 | |
The accompanying notes are an integral part of the financial statements.
13
| Schedule of Investments | November 30, 2024 |
| Global X Robotics & Artificial Intelligence ETF |
| | | Face Amount | | | Value | |
| REPURCHASE AGREEMENTS(B) — continued | | | | | | | | |
Santander US Capital Markets LLC
4.650%, dated 11/29/2024, to be repurchased on 12/02/2024, repurchase price $4,905,120 (collateralized by various U.S. Government Obligations, ranging in par value $2,367 - $1,089,604, 0.010% - 6.917%, 05/27/2031 - 09/20/2070, with a total market value of $4,993,926) | | $ | 4,903,220 | | | $ | 4,903,220 | |
TOTAL REPURCHASE AGREEMENTS
(Cost $56,300,544) | | | | | | | 56,300,544 | |
TOTAL INVESTMENTS — 101.7%
(Cost $2,622,414,228) | | | | | | $ | 2,694,501,297 | |
Percentages are based on Net Assets of $2,648,468,039.
| * | Non-income producing security. |
| (A) | This security or a partial position of this security is on loan at November 30, 2024. The total market value of securities on loan at November 30, 2024 was $66,297,043. |
| (B) | These securities were purchased with cash collateral held from securities on loan. The total value of such securities as of November 30, 2024 was $56,300,544. The total value of non-cash collateral held from securities on loan as of November 30, 2024 was $8,823,252. |
A list of the open futures contracts held by the Fund at November 30, 2024, is as follows:
| Type of Contract | | Number of
Contracts | | Expiration
Date | | Notional Amount | | | Value | | | Unrealized
Appreciation |
| Long Contracts | | | | | | | | | | | | | | | |
| NASDAQ 100 Index E-MINI | | 26 | | Dec-2024 | | $ | 10,532,521 | | | $ | 10,916,620 | | | $ | 384,099 |
The accompanying notes are an integral part of the financial statements.
14
| Schedule of Investments | November 30, 2024 |
| Global X Robotics & Artificial Intelligence ETF |
The following is a summary of the level of inputs used as of November 30, 2024, in valuing the Fund’s investments and Other Financial Instruments carried at value:
| Investments in Securities | | Level 1 | | | Level 2 | | | Level 3 | | | Total | |
| Common Stock | | $ | 2,635,126,525 | | | $ | 3,074,228 | | | $ | — | | | $ | 2,638,200,753 | |
| Repurchase Agreements | | | — | | | | 56,300,544 | | | | — | | | | 56,300,544 | |
| Total Investments in Securities | | $ | 2,635,126,525 | | | $ | 59,374,772 | | | $ | — | | | $ | 2,694,501,297 | |
| | | | | | | | | | | | | | | | | |
| Other Financial Instruments | | Level 1 | | | Level 2 | | | Level 3 | | | Total | |
| Futures Contracts* | | | | | | | | | | | | | | | | |
| Unrealized Appreciation | | $ | 384,099 | | | $ | – | | | $ | – | | | $ | 384,099 | |
| Total Other Financial Instruments | | $ | 384,099 | | | $ | – | | | $ | – | | | $ | 384,099 | |
| * | Futures contracts are valued at the unrealized appreciation on the instrument. |
Amounts designated as “—” are $0 or have been rounded to $0.
See “Glossary” for abbreviations.
The accompanying notes are an integral part of the financial statements.
15
| Schedule of Investments | | November 30, 2024 |
| Global X FinTech ETF |
| | | | | | | |
| | | Shares | | | Value | |
| COMMON STOCK — 100.0% | | | | | | | | |
| AUSTRALIA — 1.7% | | | | | | | | |
| Financials — 1.4% | | | | | | | | |
| HUB24 | | | 63,937 | | | $ | 3,139,287 | |
| Zip * | | | 826,653 | | | | 1,841,746 | |
| | | | | | | | 4,981,033 | |
| Information Technology — 0.3% | | | | | | | | |
| IRESS * | | | 144,309 | | | | 873,352 | |
| | | | | | | | | |
| TOTAL AUSTRALIA | | | | | | | 5,854,385 | |
| BRAZIL — 0.9% | | | | | | | | |
| Financials — 0.9% | | | | | | | | |
| Pagseguro Digital, Cl A * | | | 159,105 | | | | 1,167,831 | |
| StoneCo, Cl A * | | | 220,165 | | | | 2,087,164 | |
| | | | | | | | | |
| TOTAL BRAZIL | | | | | | | 3,254,995 | |
| CANADA — 0.7% | | | | | | | | |
| Information Technology — 0.7% | | | | | | | | |
| Bitfarms * (A) | | | 234,019 | | | | 503,141 | |
| Hut 8 * (A) | | | 69,464 | | | | 1,966,613 | |
| | | | | | | | | |
| TOTAL CANADA | | | | | | | 2,469,754 | |
| CHINA — 0.6% | | | | | | | | |
| Financials — 0.5% | | | | | | | | |
| Lufax Holding ADR | | | 444,307 | | | | 1,088,552 | |
| OSL Group * (A) | | | 484,500 | | | | 485,649 | |
| | | | | | | | 1,574,201 | |
| Information Technology — 0.1% | | | | | | | | |
| Linklogis, Cl B (A) | | | 1,569,500 | | | | 338,848 | |
| | | | | | | | | |
| TOTAL CHINA | | | | | | | 1,913,049 | |
| GERMANY — 0.3% | | | | | | | | |
| Financials — 0.3% | | | | | | | | |
| Hypoport * | | | 5,376 | | | | 1,102,694 | |
The accompanying notes are an integral part of the financial statements.
16
| Schedule of Investments | | November 30, 2024 |
| Global X FinTech ETF |
| | | | | | | |
| | | Shares | | | Value | |
| COMMON STOCK — continued | | | | | | | | |
| ISRAEL — 0.3% | | | | | | | | |
| Information Technology — 0.3% | | | | | | | | |
| Sapiens International | | | 42,737 | | | $ | 1,168,002 | |
| | | | | | | | | |
| ITALY — 1.8% | | | | | | | | |
| Financials — 1.8% | | | | | | | | |
| Nexi * | | | 1,037,148 | | | | 6,138,824 | |
| | | | | | | | | |
| JAPAN — 0.1% | | | | | | | | |
| Financials — 0.1% | | | | | | | | |
| WealthNavi * (A) | | | 38,405 | | | | 347,265 | |
| | | | | | | | | |
| NETHERLANDS — 4.5% | | | | | | | | |
| Financials — 4.5% | | | | | | | | |
| Adyen * | | | 10,732 | | | | 15,624,361 | |
| | | | | | | | | |
| NEW ZEALAND — 3.9% | | | | | | | | |
| Information Technology — 3.9% | | | | | | | | |
| Xero * | | | 119,280 | | | | 13,508,982 | |
| | | | | | | | | |
| SOUTH KOREA — 0.5% | | | | | | | | |
| Financials — 0.5% | | | | | | | | |
| Kakaopay * | | | 104,682 | | | | 1,857,195 | |
| | | | | | | | | |
| SWITZERLAND — 1.1% | | | | | | | | |
| Information Technology — 1.1% | | | | | | | | |
| Temenos | | | 59,376 | | | | 3,898,867 | |
| | | | | | | | | |
| UNITED KINGDOM — 2.6% | | | | | | | | |
| Financials — 2.6% | | | | | | | | |
| Wise, Cl A * | | | 808,876 | | | | 9,068,047 | |
| | | | | | | | | |
| UNITED STATES — 80.6% | | | | | | | | |
| Financials — 57.2% | | | | | | | | |
| Affirm Holdings, Cl A * | | | 205,048 | | | | 14,355,411 | |
| Bakkt Holdings, Cl A * (A) | | | 2,953 | | | | 82,241 | |
The accompanying notes are an integral part of the financial statements.
17
| Schedule of Investments | | November 30, 2024 |
| Global X FinTech ETF |
| | | | | | | |
| | | Shares | | | Value | |
| COMMON STOCK — continued | | | | | | | | |
| Financials — continued | | | | | | | | |
| Block, Cl A * | | | 213,361 | | | $ | 18,893,117 | |
| Cantaloupe * | | | 56,424 | | | | 512,330 | |
| Coinbase Global, Cl A * | | | 62,472 | | | | 18,504,206 | |
| Fidelity National Information Services | | | 245,062 | | | | 20,903,789 | |
| Fiserv * | | | 113,592 | | | | 25,099,288 | |
| Flywire * | | | 93,581 | | | | 2,125,225 | |
| Galaxy Digital Holdings * (A) | | | 83,527 | | | | 1,527,784 | |
| Global Payments | | | 98,048 | | | | 11,663,790 | |
| I3 Verticals, Cl A * | | | 18,025 | | | | 447,020 | |
| Jack Henry & Associates | | | 57,563 | | | | 10,141,449 | |
| Lemonade * (A) | | | 55,237 | | | | 2,861,829 | |
| LendingClub * | | | 87,221 | | | | 1,451,358 | |
| LendingTree * | | | 10,139 | | | | 448,245 | |
| Moneylion * | | | 8,029 | | | | 736,259 | |
| Open Lending, Cl A * | | | 92,840 | | | | 592,319 | |
| Paymentus Holdings, Cl A * | | | 15,924 | | | | 602,087 | |
| Payoneer Global * | | | 285,818 | | | | 3,118,274 | |
| PayPal Holdings * | | | 281,004 | | | | 24,382,717 | |
| Paysafe * | | | 47,834 | | | | 950,940 | |
| Shift4 Payments, Cl A * | | | 44,942 | | | | 5,126,983 | |
| SoFi Technologies * | | | 771,593 | | | | 12,661,841 | |
| Toast, Cl A * | | | 338,897 | | | | 14,755,575 | |
| Upstart Holdings * | | | 68,277 | | | | 5,379,545 | |
| Virtu Financial, Cl A | | | 70,635 | | | | 2,635,392 | |
| | | | | | | | 199,959,014 | |
| Health Care — 2.0% | | | | | | | | |
| HealthEquity * | | | 67,780 | | | | 6,882,381 | |
| | | | | | | | | |
| Industrials — 4.3% | | | | | | | | |
| SS&C Technologies Holdings | | | 195,530 | | | | 15,122,290 | |
| | | | | | | | | |
| Information Technology — 17.1% | | | | | | | | |
| ACI Worldwide * | | | 85,888 | | | | 4,880,156 | |
| BILL Holdings * | | | 83,053 | | | | 7,493,042 | |
| Blend Labs, Cl A * | | | 184,800 | | | | 944,328 | |
| Cipher Mining * | | | 201,174 | | | | 1,347,866 | |
| Guidewire Software * | | | 64,723 | | | | 13,131,649 | |
| Intuit | | | 25,579 | | | | 16,414,812 | |
The accompanying notes are an integral part of the financial statements.
18
| Schedule of Investments | | November 30, 2024 |
| Global X FinTech ETF |
| | | | | | | |
| | | Shares | | | Value | |
| COMMON STOCK — continued | | | | | | | | |
| Information Technology — continued | | | | | | | | |
| MARA Holdings * | | | 175,867 | | | $ | 4,822,273 | |
| Meridianlink * | | | 60,239 | | | | 1,406,581 | |
| Mitek Systems * (A) | | | 35,356 | | | | 329,518 | |
| nCino * | | | 89,372 | | | | 3,752,730 | |
| Pagaya Technologies, Cl A * (A) | | | 36,292 | | | | 396,671 | |
| Riot Platforms * | | | 161,659 | | | | 2,044,986 | |
| Vertex, Cl A * | | | 47,235 | | | | 2,562,499 | |
| | | | | | | | 59,527,111 | |
| TOTAL UNITED STATES | | | | | | | 281,490,796 | |
| URUGUAY — 0.4% | | | | | | | | |
| Financials — 0.4% | | | | | | | | |
| Dlocal, Cl A * (A) | | | 128,062 | | | | 1,465,029 | |
| | | | | | | | | |
TOTAL COMMON STOCK
(Cost $386,079,570) | | | | | | | 349,162,245 | |
| | | | | | | | | |
| | | Face Amount | | | | | |
| REPURCHASE AGREEMENTS(B) — 1.6% | | | | | | | | |
Bank of America Securities, Inc.
4.590%, dated 11/29/2024, to be repurchased on 12/02/2024, repurchase price $1,347,585 (collateralized by various U.S. Government Obligations, ranging in par value $404 - $612,092, 1.500% - 7.500%, 02/01/2034 - 11/20/2054, with a total market value of $1,367,710) | | $ | 1,347,070 | | | | 1,347,070 | |
Citigroup Global Markets, Inc.
4.580%, dated 11/29/2024, to be repurchased on 12/02/2024, repurchase price $1,347,584 (collateralized by various U.S. Government Obligations and U.S. Treasury Obligations, ranging in par value $736 - $845,276, 1.500% - 6.500%, 01/01/2035 - 11/20/2054, with a total market value of $1,365,877) | | | 1,347,070 | | | | 1,347,070 | |
The accompanying notes are an integral part of the financial statements.
19
| Schedule of Investments | | November 30, 2024 |
| Global X FinTech ETF |
| | | | | | | |
| | | Face Amount | | | Value | |
| REPURCHASE AGREEMENTS(B) — continued | | | | | | | | |
Deutsche Bank Securities, Inc.
4.570%, dated 11/29/2024, to be repurchased on 12/02/2024, repurchase price $1,347,583 (collateralized by various U.S. Treasury Obligations, ranging in par value $55,205 - $508,312, 0.000% - 3.750%, 12/15/2024 - 05/15/2029, with a total market value of $1,367,188) | | $ | 1,347,070 | | | $ | 1,347,070 | |
HSBC Securities USA, Inc.
4.590%, dated 11/29/2024, to be repurchased on 12/02/2024, repurchase price $343,359 (collateralized by various U.S. Government Obligations, ranging in par value $34 - $177,929, 1.730% - 7.000%, 02/01/2031 - 11/01/2054, with a total market value of $348,916) | | | 343,228 | | | | 343,228 | |
Nomura Securities International, Inc.
4.580%, dated 11/29/2024, to be repurchased on 12/02/2024, repurchase price $1,347,584 (collateralized by various U.S. Government Obligations, ranging in par value $1,050 - $311,298, 2.000% - 6.500%, 11/01/2035 - 05/01/2058, with a total market value of $1,368,508) | | | 1,347,070 | | | | 1,347,070 | |
TOTAL REPURCHASE AGREEMENTS
(Cost $5,731,508) | | | | | | | 5,731,508 | |
TOTAL INVESTMENTS — 101.6%
(Cost $391,811,078) | | | | | | $ | 354,893,753 | |
Percentages are based on Net Assets of $349,456,951.
| * | Non-income producing security. |
| (A) | This security or a partial position of this security is on loan at November 30, 2024. The total market value of securities on loan at November 30, 2024 was $6,092,397. |
| (B) | These securities were purchased with cash collateral held from securities on loan. The total value of such securities as of November 30, 2024 was $5,731,508. The total value of non-cash collateral held from securities on loan as of November 30, 2024 was $559,973. |
The accompanying notes are an integral part of the financial statements.
20
| Schedule of Investments | | November 30, 2024 |
| Global X FinTech ETF |
The following is a summary of the level of inputs used as of November 30, 2024, in valuing the Fund’s investments carried at value:
| Investments in Securities | | Level 1 | | | Level 2 | | | Level 3 | | | Total | |
| Common Stock | | $ | 349,162,245 | | | $ | — | | | $ | — | | | $ | 349,162,245 | |
| Repurchase Agreements | | | — | | | | 5,731,508 | | | | — | | | | 5,731,508 | |
| Total Investments in Securities | | $ | 349,162,245 | | | $ | 5,731,508 | | | $ | — | | | $ | 354,893,753 | |
Amounts designated as “—” are $0 or have been rounded to $0.
See “Glossary” for abbreviations.
The accompanying notes are an integral part of the financial statements.
21
| Schedule of Investments | November 30, 2024 |
| Global X Internet of Things ETF |
| | | Shares | | | Value | |
| COMMON STOCK — 99.9% | | | | | | | | |
| AUSTRIA — 0.8% | | | | | | | | |
| Information Technology — 0.8% | | | | | | | | |
| ams-OSRAM * | | | 97,044 | | | $ | 625,003 | |
| Kontron (A) | | | 64,309 | | | | 1,164,204 | |
| TOTAL AUSTRIA | | | | | | | 1,789,207 | |
| CANADA — 0.3% | | | | | | | | |
| Information Technology — 0.3% | | | | | | | | |
| BlackBerry * (A) | | | 248,176 | | | | 637,812 | |
| | | | | | | | | |
| CHINA — 1.8% | | | | | | | | |
| Information Technology — 1.8% | | | | | | | | |
| NXP Semiconductors | | | 18,663 | | | | 4,280,732 | |
| | | | | | | | | |
| FRANCE — 1.2% | | | | | | | | |
| Industrials — 1.2% | | | | | | | | |
| Legrand | | | 29,671 | | | | 2,973,399 | |
| | | | | | | | | |
| JAPAN — 5.1% | | | | | | | | |
| Communication Services — 0.2% | | | | | | | | |
| Soracom * (A) | | | 76,325 | | | | 545,814 | |
| Information Technology — 4.9% | | | | | | | | |
| Nippon Ceramic | | | 38,091 | | | | 666,786 | |
| Renesas Electronics | | | 853,036 | | | | 11,152,486 | |
| | | | | | | | 11,819,272 | |
| TOTAL JAPAN | | | | | | | 12,365,086 | |
| NORWAY — 0.7% | | | | | | | | |
| Information Technology — 0.7% | | | | | | | | |
| Nordic Semiconductor * | | | 187,585 | | | | 1,678,886 | |
| | | | | | | | | |
| SINGAPORE — 3.3% | | | | | | | | |
| Information Technology — 3.3% | | | | | | | | |
| STMicroelectronics | | | 309,800 | | | | 7,941,408 | |
The accompanying notes are an integral part of the financial statements.
22
| Schedule of Investments | November 30, 2024 |
| Global X Internet of Things ETF |
| | | Shares | | | Value | |
| COMMON STOCK — continued | | | | | | | | |
| SWITZERLAND — 3.2% | | | | | | | | |
| Industrials — 2.4% | | | | | | | | |
| ABB | | | 100,817 | | | $ | 5,753,779 | |
| | | | | | | | | |
| Information Technology — 0.8% | | | | | | | | |
| Landis+Gyr Group | | | 28,189 | | | | 2,047,782 | |
| | | | | | | | | |
| TOTAL SWITZERLAND | | | | | | | 7,801,561 | |
| TAIWAN — 8.6% | | | | | | | | |
| Information Technology — 8.6% | | | | | | | | |
| Advantech | | | 835,983 | | | | 8,634,433 | |
| eMemory Technology | | | 73,032 | | | | 6,553,837 | |
| MediaTek | | | 129,080 | | | | 4,987,083 | |
| Sercomm | | | 163,850 | | | | 549,815 | |
| | | | | | | | | |
| TOTAL TAIWAN | | | | | | | 20,725,168 | |
| UNITED KINGDOM — 0.5% | | | | | | | | |
| Information Technology — 0.5% | | | | | | | | |
| Spirent Communications * | | | 525,611 | | | | 1,144,419 | |
| | | | | | | | | |
| UNITED STATES — 74.4% | | | | | | | | |
| Communication Services — 0.7% | | | | | | | | |
| Globalstar * | | | 441,205 | | | | 860,349 | |
| Iridium Communications | | | 23,890 | | | | 710,011 | |
| | | | | | | | 1,570,360 | |
| Consumer Discretionary — 11.7% | | | | | | | | |
| ADT | | | 845,920 | | | | 6,445,910 | |
| Garmin | | | 101,866 | | | | 21,656,712 | |
| | | | | | | | 28,102,622 | |
| Health Care — 3.9% | | | | | | | | |
| Dexcom * | | | 121,537 | | | | 9,478,671 | |
| | | | | | | | | |
| Industrials — 13.5% | | | | | | | | |
| Emerson Electric | | | 43,595 | | | | 5,780,697 | |
| Honeywell International | | | 23,463 | | | | 5,465,236 | |
| Johnson Controls International | | | 78,652 | | | | 6,595,757 | |
| Resideo Technologies * | | | 30,934 | | | | 840,786 | |
The accompanying notes are an integral part of the financial statements.
23
| Schedule of Investments | November 30, 2024 |
| Global X Internet of Things ETF |
| | | Shares | | | Value | |
| COMMON STOCK — continued | | | | | | | | |
| Industrials — continued | | | | | | | | |
| Rockwell Automation | | | 12,896 | | | $ | 3,806,125 | |
| Schneider Electric | | | 20,523 | | | | 5,278,204 | |
| Sensata Technologies Holding | | | 147,640 | | | | 4,745,150 | |
| | | | | | | | 32,511,955 | |
| Information Technology — 44.6% | | | | | | | | |
| Alarm.com Holdings * | | | 48,691 | | | | 3,171,732 | |
| Ambarella * | | | 39,212 | | | | 2,805,619 | |
| Analog Devices | | | 24,278 | | | | 5,293,818 | |
| Arlo Technologies * | | | 91,998 | | | | 1,032,218 | |
| Badger Meter | | | 28,637 | | | | 6,209,074 | |
| Belden | | | 40,080 | | | | 4,905,792 | |
| Cisco Systems | | | 96,344 | | | | 5,704,528 | |
| Digi International * | | | 35,138 | | | | 1,167,284 | |
| GLOBALFOUNDRIES * (A) | | | 61,517 | | | | 2,660,610 | |
| Impinj * | | | 26,524 | | | | 5,098,178 | |
| InterDigital | | | 24,867 | | | | 4,872,937 | |
| International Business Machines | | | 25,184 | | | | 5,727,094 | |
| Itron * | | | 44,449 | | | | 5,268,540 | |
| Lattice Semiconductor * | | | 134,179 | | | | 7,614,658 | |
| NETGEAR * | | | 46,061 | | | | 1,133,101 | |
| PTC * | | | 13,438 | | | | 2,688,406 | |
| Qorvo * | | | 10,838 | | | | 748,364 | |
| QUALCOMM | | | 29,555 | | | | 4,685,354 | |
| Rambus * | | | 105,146 | | | | 6,078,490 | |
| Samsara, Cl A * | | | 184,332 | | | | 9,859,919 | |
| Semtech * | | | 32,879 | | | | 2,105,571 | |
| Silicon Laboratories * | | | 31,098 | | | | 3,440,994 | |
| Skyworks Solutions | | | 133,353 | | | | 11,680,389 | |
| SmartRent, Cl A * | | | 238,768 | | | | 422,619 | |
| Synaptics * | | | 38,294 | | | | 3,072,711 | |
| | | | | | | | 107,448,000 | |
| TOTAL UNITED STATES | | | | | | | 179,111,608 | |
TOTAL COMMON STOCK
(Cost $209,094,803) | | | | | | | 240,449,286 | |
The accompanying notes are an integral part of the financial statements.
24
| Schedule of Investments | November 30, 2024 |
| Global X Internet of Things ETF |
| | | Face Amount | | | Value | |
| REPURCHASE AGREEMENTS(B) — 1.1% | | | | | | | | |
Bank of America Securities, Inc.
4.590%, dated 11/29/2024, to be repurchased on 12/02/2024, repurchase price $629,839 (collateralized by various U.S. Government Obligations, ranging in par value $189 - $286,082, 1.500% - 7.500%, 02/01/2034 - 11/20/2054, with a total market value of $639,245) | | $ | 629,598 | | | $ | 629,598 | |
Citigroup Global Markets, Inc.
4.580%, dated 11/29/2024, to be repurchased on 12/02/2024, repurchase price $629,838 (collateralized by various U.S. Government Obligations and U.S. Treasury Obligations, ranging in par value $344 - $395,068, 1.500% - 6.500%, 01/01/2035 - 11/20/2054, with a total market value of $638,388) | | | 629,598 | | | | 629,598 | |
Deutsche Bank Securities, Inc.
4.570%, dated 11/29/2024, to be repurchased on 12/02/2024, repurchase price $629,838 (collateralized by various U.S. Treasury Obligations, ranging in par value $25,802 - $237,577, 0.000% - 3.750%, 12/15/2024 - 05/15/2029, with a total market value of $639,001) | | | 629,598 | | | | 629,598 | |
HSBC Securities USA, Inc.
4.590%, dated 11/29/2024, to be repurchased on 12/02/2024, repurchase price $160,467 (collateralized by various U.S. Government Obligations, ranging in par value $16 - $83,154, 1.730% - 7.000%, 02/01/2031 - 11/01/2054, with a total market value of $163,064) | | | 160,406 | | | | 160,406 | |
The accompanying notes are an integral part of the financial statements.
25
| Schedule of Investments | November 30, 2024 |
| Global X Internet of Things ETF |
| | | Face Amount | | | Value | |
| REPURCHASE AGREEMENTS(B) — continued | | | | | | | | |
Nomura Securities International, Inc.
4.580%, dated 11/29/2024, to be repurchased on 12/02/2024, repurchase price $629,838 (collateralized by various U.S. Government Obligations, ranging in par value $491 - $145,496, 2.000% - 6.500%, 11/01/2035 - 05/01/2058, with a total market value of $639,618) | | $ | 629,598 | | | $ | 629,598 | |
TOTAL REPURCHASE AGREEMENTS
(Cost $2,678,798) | | | | | | | 2,678,798 | |
TOTAL INVESTMENTS — 101.0%
(Cost $211,773,601) | | | | | | $ | 243,128,084 | |
Percentages are based on Net Assets of $240,722,134.
| * | Non-income producing security. |
| (A) | This security or a partial position of this security is on loan at November 30, 2024. The total market value of securities on loan at November 30, 2024 was $2,616,946. |
| (B) | These securities were purchased with cash collateral held from securities on loan. The total value of such securities as of November 30, 2024 was $2,678,798. The total value of non-cash collateral held from securities on loan as of November 30, 2024 was $0. |
The following is a summary of the level of inputs used as of November 30, 2024, in valuing the Fund’s investments carried at value:
| Investments in Securities | | Level 1 | | | Level 2 | | | Level 3 | | | Total | |
| Common Stock | | $ | 240,449,286 | | | $ | — | | | $ | — | | | $ | 240,449,286 | |
| Repurchase Agreements | | | — | | | | 2,678,798 | | | | — | | | | 2,678,798 | |
| Total Investments in Securities | | $ | 240,449,286 | | | $ | 2,678,798 | | | $ | — | | | $ | 243,128,084 | |
Amounts designated as “—” are $0 or have been rounded to $0.
See “Glossary” for abbreviations.
The accompanying notes are an integral part of the financial statements.
26
| Schedule of Investments | November 30, 2024 |
| Global X U.S. Infrastructure Development ETF |
| | | Shares | | | Value | |
| COMMON STOCK — 99.9% | | | | | | | | |
| Industrials — 74.8% | | | | | | | | |
| Acuity Brands | | | 201,780 | | | $ | 64,708,828 | |
| Advanced Drainage Systems | | | 510,427 | | | | 69,055,669 | |
| AECOM | | | 890,529 | | | | 104,165,177 | |
| Amentum Holdings * | | | 823,626 | | | | 20,055,293 | |
| Arcosa | | | 317,978 | | | | 34,545,130 | |
| Argan | | | 496,538 | | | | 77,430,136 | |
| Astec Industries | | | 621,777 | | | | 24,006,810 | |
| Atkore | | | 240,953 | | | | 22,724,277 | |
| Builders FirstSource * | | | 807,503 | | | | 150,575,084 | |
| Carlisle | | | 318,714 | | | | 145,556,684 | |
| Columbus McKinnon | | | 578,443 | | | | 22,727,025 | |
| Construction Partners, Cl A * | | | 522,190 | | | | 53,059,726 | |
| Crane | | | 372,297 | | | | 67,787,838 | |
| CSW Industrials | | | 102,390 | | | | 43,248,512 | |
| CSX | | | 6,255,349 | | | | 228,633,006 | |
| Custom Truck One Source * | | | 3,442,399 | | | | 20,585,546 | |
| Deere | | | 563,326 | | | | 262,453,583 | |
| DNOW * | | | 2,205,353 | | | | 33,190,563 | |
| DXP Enterprises * | | | 675,844 | | | | 49,519,090 | |
| Dycom Industries * | | | 191,219 | | | | 34,641,234 | |
| Eaton PLC | | | 897,015 | | | | 336,757,371 | |
| EMCOR Group | | | 307,830 | | | | 157,030,240 | |
| Emerson Electric | | | 2,278,297 | | | | 302,102,182 | |
| Everus Construction Group * | | | 332,601 | | | | 21,173,380 | |
| Exponent | | | 330,561 | | | | 32,629,676 | |
| Fastenal | | | 3,139,575 | | | | 262,342,887 | |
| Fortive | | | 2,300,344 | | | | 182,486,289 | |
| Gibraltar Industries * | | | 271,493 | | | | 19,666,953 | |
| Gorman-Rupp | | | 654,866 | | | | 27,897,292 | |
| Graco | | | 1,105,318 | | | | 100,672,363 | |
| Granite Construction | | | 482,501 | | | | 47,946,124 | |
| Greenbrier | | | 474,722 | | | | 32,281,096 | |
| H&E Equipment Services | | | 427,197 | | | | 25,520,749 | |
| Herc Holdings | | | 184,577 | | | | 42,821,864 | |
| Howmet Aerospace | | | 2,694,584 | | | | 318,984,854 | |
| Hubbell, Cl B | | | 351,093 | | | | 161,534,378 | |
| IDEX | | | 495,103 | | | | 114,185,605 | |
| Insteel Industries | | | 638,223 | | | | 18,814,814 | |
| Jacobs Solutions | | | 827,116 | | | | 116,813,593 | |
The accompanying notes are an integral part of the financial statements.
27
| Schedule of Investments | November 30, 2024 |
| Global X U.S. Infrastructure Development ETF |
| | | Shares | | | Value | |
| COMMON STOCK — continued | | | | | | | | |
| Industrials — continued | | | | | | | | |
| Lincoln Electric Holdings | | | 374,770 | | | $ | 81,879,750 | |
| MasTec * | | | 516,267 | | | | 74,373,424 | |
| MRC Global * | | | 2,097,025 | | | | 29,295,439 | |
| Mueller Industries | | | 743,704 | | | | 60,068,972 | |
| Mueller Water Products, Cl A | | | 1,528,448 | | | | 38,272,338 | |
| MYR Group * | | | 157,292 | | | | 24,836,407 | |
| Norfolk Southern | | | 903,531 | | | | 249,239,026 | |
| Northwest Pipe * | | | 761,052 | | | | 42,668,380 | |
| Parker-Hannifin | | | 465,203 | | | | 326,991,189 | |
| Pentair PLC | | | 1,082,339 | | | | 117,964,128 | |
| Powell Industries | | | 278,551 | | | | 74,478,966 | |
| Primoris Services | | | 672,674 | | | | 56,309,541 | |
| Quanta Services | | | 950,834 | | | | 327,581,330 | |
| RBC Bearings * | | | 189,936 | | | | 63,649,453 | |
| Regal Rexnord | | | 434,505 | | | | 75,043,359 | |
| Rockwell Automation | | | 717,368 | | | | 211,723,992 | |
| SPX Technologies * | | | 299,174 | | | | 52,786,261 | |
| Sterling Infrastructure * | | | 303,232 | | | | 58,963,462 | |
| Terex | | | 437,428 | | | | 23,966,680 | |
| Tetra Tech | | | 1,744,109 | | | | 72,397,965 | |
| Titan Machinery * | | | 805,465 | | | | 12,444,434 | |
| TopBuild * | | | 208,186 | | | | 81,325,779 | |
| Trane Technologies PLC | | | 862,037 | | | | 358,797,040 | |
| Trinity Industries | | | 850,283 | | | | 32,055,669 | |
| Tutor Perini * | | | 2,572,769 | | | | 69,927,861 | |
| Union Pacific | | | 896,869 | | | | 219,427,970 | |
| United Rentals | | | 377,551 | | | | 326,959,166 | |
| Valmont Industries | | | 136,836 | | | | 47,599,771 | |
| Wabash National | | | 858,434 | | | | 17,022,746 | |
| WESCO International | | | 334,673 | | | | 70,806,767 | |
| Woodward | | | 393,542 | | | | 70,963,493 | |
| Zurn Elkay Water Solutions | | | 1,132,901 | | | | 45,112,118 | |
| | | | | | | | 7,265,263,797 | |
| Information Technology — 2.1% | | | | | | | | |
| Badger Meter | | | 191,273 | | | | 41,471,812 | |
| Calix * | | | 490,788 | | | | 15,965,334 | |
| Crane NXT | | | 369,896 | | | | 23,185,081 | |
| Trimble * | | | 1,628,868 | | | | 118,858,498 | |
| | | | | | | | 199,480,725 | |
The accompanying notes are an integral part of the financial statements.
28
| Schedule of Investments | November 30, 2024 |
| Global X U.S. Infrastructure Development ETF |
| | | Shares | | | Value | |
| COMMON STOCK — continued | | | | | | | | |
| Materials — 19.8% | | | | | | | | |
| Alcoa | | | 1,163,980 | | | $ | 54,043,591 | |
| ATI * | | | 836,187 | | | | 50,313,372 | |
| Carpenter Technology | | | 324,362 | | | | 62,939,202 | |
| Century Aluminum * | | | 1,929,453 | | | | 44,049,412 | |
| Cleveland-Cliffs * | | | 3,311,049 | | | | 41,222,560 | |
| Commercial Metals | | | 763,040 | | | | 47,071,938 | |
| Eagle Materials | | | 227,773 | | | | 70,363,635 | |
| Knife River * | | | 368,223 | | | | 38,111,080 | |
| Louisiana-Pacific | | | 472,567 | | | | 55,857,419 | |
| Martin Marietta Materials | | | 436,250 | | | | 261,750,000 | |
| Materion | | | 182,775 | | | | 21,132,446 | |
| Metallus * | | | 1,068,798 | | | | 17,816,863 | |
| Minerals Technologies | | | 328,335 | | | | 26,782,286 | |
| Nucor | | | 1,270,925 | | | | 196,599,388 | |
| Reliance | | | 376,368 | | | | 120,904,456 | |
| RPM International | | | 843,887 | | | | 117,114,638 | |
| Ryerson Holding | | | 653,358 | | | | 16,791,301 | |
| Steel Dynamics | | | 1,059,337 | | | | 153,889,886 | |
| Summit Materials, Cl A * | | | 779,323 | | | | 39,698,714 | |
| United States Lime & Minerals | | | 477,409 | | | | 73,043,577 | |
| United States Steel | | | 1,462,200 | | | | 59,613,894 | |
| Vulcan Materials | | | 869,649 | | | | 250,571,966 | |
| Westlake | | | 838,945 | | | | 107,720,538 | |
| | | | | | | | 1,927,402,162 | |
| Utilities — 3.2% | | | | | | | | |
| MDU Resources Group | | | 1,327,463 | | | | 26,602,358 | |
| Sempra | | | 3,042,656 | | | | 285,005,588 | |
| | | | | | | | 311,607,946 | |
TOTAL COMMON STOCK
(Cost $6,930,005,889) | | | | | | | 9,703,754,630 | |
TOTAL INVESTMENTS — 99.9%
(Cost $6,930,005,889) | | | | | | $ | 9,703,754,630 | |
Percentages are based on Net Assets of $9,715,853,492.
| * | Non-income producing security. |
The accompanying notes are an integral part of the financial statements.
29
| Schedule of Investments | November 30, 2024 |
| Global X U.S. Infrastructure Development ETF |
A list of the open futures contracts held by the Fund at November 30, 2024, is as follows:
| Type of Contract | | Number of
Contracts | | Expiration
Date | | Notional Amount | | | Value | | | Unrealized
Appreciation |
| Long Contracts | | | | | | | | | | | | | | | | |
| Russell 2000 Index E-MINI | | 85 | | Dec-2024 | | $ | 10,238,259 | | | $ | 10,389,550 | | | $ | 151,291 |
The following is a summary of the level of inputs used as of November 30, 2024, in valuing the Fund’s investments and Other Financial Instruments carried at value:
| Investments in Securities | | Level 1 | | | Level 2 | | | Level 3 | | | Total |
| Common Stock | | $ | 9,703,754,630 | | | $ | — | | | $ | — | | | $ | 9,703,754,630 |
| Total Investments in Securities | | $ | 9,703,754,630 | | | $ | — | | | $ | — | | | $ | 9,703,754,630 |
| | | | | | | | | | | | | | | | |
| Other Financial Instruments | | Level 1 | | | Level 2 | | | Level 3 | | | Total |
| Futures Contracts* | | | | | | | | | | | | | | | |
| Unrealized Appreciation | | $ | 151,291 | | | $ | – | | | $ | – | | | $ | 151,291 |
| Total Other Financial Instruments | | $ | 151,291 | | | $ | – | | | $ | – | | | $ | 151,291 |
| * | Futures contracts are valued at the unrealized appreciation on the instrument. |
Amounts designated as “—” are $0 or have been rounded to $0.
See “Glossary” for abbreviations.
The accompanying notes are an integral part of the financial statements.
30
| Schedule of Investments | November 30, 2024 |
| Global X Autonomous & Electric Vehicles ETF |
| | | Shares | | | Value | |
| COMMON STOCK — 98.7% | | | | | | | | |
| ARGENTINA — 1.6% | | | | | | | | |
| Materials — 1.6% | | | | | | | | |
| Arcadium Lithium * | | | 1,300,234 | | | $ | 6,826,228 | |
| | | | | | | | | |
| AUSTRALIA — 2.5% | | | | | | | | |
| Materials — 2.5% | | | | | | | | |
| IGO | | | 1,133,363 | | | | 3,580,891 | |
| Liontown Resources * (A) | | | 6,881,982 | | | | 3,272,779 | |
| Pilbara Minerals * (A) | | | 2,308,306 | | | | 3,593,946 | |
| | | | | | | | | |
| TOTAL AUSTRALIA | | | | | | | 10,447,616 | |
| CANADA — 3.3% | | | | | | | | |
| Industrials — 0.7% | | | | | | | | |
| Ballard Power Systems * (A) | | | 1,763,327 | | | | 2,627,357 | |
| | | | | | | | | |
| Information Technology — 1.1% | | | | | | | | |
| BlackBerry * (A) | | | 1,818,731 | | | | 4,674,139 | |
| | | | | | | | | |
| Materials — 1.5% | | | | | | | | |
| Lithium Americas * (A) | | | 1,567,908 | | | | 6,282,158 | |
| | | | | | | | | |
| TOTAL CANADA | | | | | | | 13,583,654 | |
| CHILE — 2.1% | | | | | | | | |
| Materials — 2.1% | | | | | | | | |
| Lundin Mining | | | 420,572 | | | | 4,127,172 | |
| Sociedad Quimica y Minera de Chile ADR (A) | | | 114,326 | | | | 4,396,978 | |
| | | | | | | | | |
| TOTAL CHILE | | | | | | | 8,524,150 | |
| CHINA — 10.8% | | | | | | | | |
| Communication Services — 1.3% | | | | | | | | |
| Baidu ADR * (A) | | | 60,975 | | | | 5,185,924 | |
| | | | | | | | | |
| Consumer Discretionary — 5.6% | | | | | | | | |
| Geely Automobile Holdings | | | 4,510,300 | | | | 8,033,458 | |
| Nexteer Automotive Group (A) | | | 9,633,700 | | | | 3,553,112 | |
| NIO ADR * (A) | | | 1,055,966 | | | | 4,730,728 | |
The accompanying notes are an integral part of the financial statements.
31
| Schedule of Investments | November 30, 2024 |
| Global X Autonomous & Electric Vehicles ETF |
| | | Shares | | | Value | |
| COMMON STOCK — continued | | | | | | | | |
| Consumer Discretionary — continued | | | | | | | | |
| XPeng ADR, Cl A * (A) | | | 568,415 | | | $ | 6,849,401 | |
| | | | | | | | 23,166,699 | |
| Information Technology — 2.3% | | | | | | | | |
| indie Semiconductor, Cl A * (A) | | | 628,678 | | | | 3,287,986 | |
| NXP Semiconductors | | | 27,488 | | | | 6,304,922 | |
| | | | | | | | 9,592,908 | |
| Materials — 1.6% | | | | | | | | |
| Ganfeng Lithium Group, Cl H (A) | | | 2,082,633 | | | | 6,731,078 | |
| | | | | | | | | |
| TOTAL CHINA | | | | | | | 44,676,609 | |
| FRANCE — 1.7% | | | | | | | | |
| Consumer Discretionary — 1.7% | | | | | | | | |
| Forvia | | | 371,940 | | | | 3,156,888 | |
| Renault | | | 89,884 | | | | 3,847,736 | |
| | | | | | | | | |
| TOTAL FRANCE | | | | | | | 7,004,624 | |
| GERMANY — 2.6% | | | | | | | | |
| Consumer Discretionary — 1.2% | | | | | | | | |
| Continental | | | 75,444 | | | | 4,943,594 | |
| | | | | | | | | |
| Information Technology — 1.4% | | | | | | | | |
| Infineon Technologies | | | 173,842 | | | | 5,658,004 | |
| | | | | | | | | |
| TOTAL GERMANY | | | | | | | 10,601,598 | |
| ISRAEL — 0.7% | | | | | | | | |
| Consumer Discretionary — 0.7% | | | | | | | | |
| Mobileye Global, Cl A * (A) | | | 169,252 | | | | 3,054,999 | |
| | | | | | | | | |
| JAPAN — 12.4% | | | | | | | | |
| Consumer Discretionary — 6.8% | | | | | | | | |
| Denso | | | 354,418 | | | | 5,024,176 | |
| Honda Motor | | | 599,128 | | | | 5,152,138 | |
| Koito Manufacturing | | | 318,312 | | | | 4,128,720 | |
| Nissan Motor (A) | | | 1,360,710 | | | | 3,251,715 | |
The accompanying notes are an integral part of the financial statements.
32
| Schedule of Investments | November 30, 2024 |
| Global X Autonomous & Electric Vehicles ETF |
| | | Shares | | | Value | |
| COMMON STOCK — continued | | | | | | | | |
| Consumer Discretionary — continued | | | | | | | | |
| Toyota Motor | | | 634,538 | | | $ | 10,780,196 | |
| | | | | | | | 28,336,945 | |
| Industrials — 3.4% | | | | | | | | |
| GS Yuasa | | | 246,249 | | | | 4,225,347 | |
| Hitachi | | | 391,770 | | | | 9,784,794 | |
| | | | | | | | 14,010,141 | |
| Materials — 2.2% | | | | | | | | |
| Denka | | | 331,092 | | | | 4,675,874 | |
| Tokai Carbon (A) | | | 750,086 | | | | 4,526,936 | |
| | | | | | | | 9,202,810 | |
| TOTAL JAPAN | | | | | | | 51,549,896 | |
| LUXEMBOURG — 1.1% | | | | | | | | |
| Materials — 1.1% | | | | | | | | |
| APERAM | | | 160,988 | | | | 4,618,167 | |
| | | | | | | | | |
| NETHERLANDS — 1.1% | | | | | | | | |
| Information Technology — 1.1% | | | | | | | | |
| TomTom * (A) | | | 811,016 | | | | 4,518,541 | |
| | | | | | | | | |
| SINGAPORE — 0.8% | | | | | | | | |
| Information Technology — 0.8% | | | | | | | | |
| STMicroelectronics | | | 133,657 | | | | 3,426,161 | |
| | | | | | | | | |
| SOUTH KOREA — 4.2% | | | | | | | | |
| Consumer Discretionary — 2.1% | | | | | | | | |
| Hyundai Motor | | | 29,416 | | | | 4,607,287 | |
| Kia | | | 62,404 | | | | 4,155,645 | |
| | | | | | | | 8,762,932 | |
| Industrials — 1.3% | | | | | | | | |
| LG Energy Solution * | | | 19,056 | | | | 5,211,185 | |
The accompanying notes are an integral part of the financial statements.
33
| Schedule of Investments | November 30, 2024 |
| Global X Autonomous & Electric Vehicles ETF |
| | | Shares | | | Value | |
| COMMON STOCK — continued | | | | | | | | |
| Information Technology — 0.8% | | | | | | | | |
| Samsung SDI | | | 18,831 | | | $ | 3,435,353 | |
| | | | | | | | | |
| TOTAL SOUTH KOREA | | | | | | | 17,409,470 | |
| TAIWAN — 1.6% | | | | | | | | |
| Industrials — 1.6% | | | | | | | | |
| Advanced Energy Solution Holding | | | 250,200 | | | | 6,778,192 | |
| | | | | | | | | |
| UNITED KINGDOM — 0.9% | | | | | | | | |
| Materials — 0.9% | | | | | | | | |
| Johnson Matthey | | | 213,954 | | | | 3,695,754 | |
| | | | | | | | | |
| UNITED STATES — 51.3% | | | | | | | | |
| Communication Services — 2.9% | | | | | | | | |
| Alphabet, Cl A | | | 70,907 | | | | 11,979,738 | |
| | | | | | | | | |
| Consumer Discretionary — 15.0% | | | | | | | | |
| American Axle & Manufacturing Holdings * | | | 632,134 | | | | 4,178,406 | |
| Aptiv PLC * | | | 74,387 | | | | 4,130,710 | |
| Ford Motor | | | 492,351 | | | | 5,479,867 | |
| General Motors | | | 142,592 | | | | 7,926,689 | |
| Gentherm * | | | 88,411 | | | | 3,722,103 | |
| Lear | | | 40,323 | | | | 3,945,202 | |
| Lucid Group * (A) | | | 1,280,935 | | | | 2,792,438 | |
| Luminar Technologies, Cl A * (A) | | | 151,944 | | | | 1,349,261 | |
| QuantumScape, Cl A * (A) | | | 531,656 | | | | 2,780,561 | |
| Stellantis | | | 313,026 | | | | 4,144,630 | |
| Tesla * | | | 52,504 | | | | 18,122,281 | |
| Visteon * | | | 41,461 | | | | 3,871,214 | |
| | | | | | | | 62,443,362 | |
| Industrials — 10.9% | | | | | | | | |
| Bloom Energy, Cl A * (A) | | | 314,978 | | | | 8,646,146 | |
| EnerSys | | | 44,105 | | | | 4,263,189 | |
| Honeywell International | | | 50,410 | | | | 11,742,001 | |
| Hyster-Yale | | | 63,889 | | | | 3,593,118 | |
| ITT | | | 36,284 | | | | 5,664,658 | |
| Nikola * (A) | | | 463,272 | | | | 931,177 | |
| Plug Power * (A) | | | 1,416,533 | | | | 3,173,034 | |
The accompanying notes are an integral part of the financial statements.
34
| Schedule of Investments | November 30, 2024 |
| Global X Autonomous & Electric Vehicles ETF |
| | | Shares | | | Value | |
| COMMON STOCK — continued | | | | | | | | |
| Industrials — continued | | | | | | | | |
| Westinghouse Air Brake Technologies | | | 35,236 | | | $ | 7,069,046 | |
| | | | | | | | 45,082,369 | |
| Information Technology — 18.7% | | | | | | | | |
| Allegro MicroSystems * | | | 144,197 | | | | 3,133,401 | |
| Ambarella * | | | 71,696 | | | | 5,129,849 | |
| CEVA * | | | 217,868 | | | | 6,479,394 | |
| Coherent * | | | 63,190 | | | | 6,329,110 | |
| Intel * | | | 322,796 | | | | 7,763,244 | |
| Microsoft | | | 29,187 | | | | 12,359,527 | |
| NVIDIA | | | 103,276 | | | | 14,277,907 | |
| ON Semiconductor * | | | 78,155 | | | | 5,558,384 | |
| QUALCOMM | | | 63,560 | | | | 10,076,167 | |
| SiTime * | | | 29,783 | | | | 6,325,313 | |
| | | | | | | | 77,432,296 | |
| Materials — 3.8% | | | | | | | | |
| Albemarle | | | 52,180 | | | | 5,619,786 | |
| ATI * | | | 81,208 | | | | 4,886,285 | |
| Cabot | | | 48,766 | | | | 5,345,729 | |
| | | | | | | | 15,851,800 | |
| TOTAL UNITED STATES | | | | | | | 212,789,565 | |
TOTAL COMMON STOCK
(Cost $599,026,538) | | | | | | | 409,505,224 | |
| | | | | | | | | |
| PREFERRED STOCK — 1.0% | | | | | | | | |
| GERMANY—1.0% | | | | | | | | |
| Consumer Discretionary — 1.0% | | | | | | | | |
| Volkswagen (B) | | | 47,132 | | | | 4,018,310 | |
TOTAL PREFERRED STOCK
(Cost $10,478,810) | | | | | | | 4,018,310 | |
The accompanying notes are an integral part of the financial statements.
35
| Schedule of Investments | November 30, 2024 |
| Global X Autonomous & Electric Vehicles ETF |
| | | Face Amount | | | Value | |
| REPURCHASE AGREEMENTS(C) — 10.8% | | | | | | | | |
Bank of America Securities, Inc.
4.590%, dated 11/29/2024, to be repurchased on 12/02/2024, repurchase price $10,584,612 (collateralized by various U.S. Government Obligations, ranging in par value $3,174 - $4,807,679, 1.500% - 7.500%, 02/01/2034 - 11/20/2054, with a total market value of $10,742,680) | | $ | 10,580,565 | | | $ | 10,580,565 | |
Deutsche Bank Securities, Inc.
4.570%, dated 11/29/2024, to be repurchased on 12/02/2024, repurchase price $10,584,594 (collateralized by various U.S. Treasury Obligations, ranging in par value $433,607 - $3,992,540, 0.000% - 3.750%, 12/15/2024 - 05/15/2029, with a total market value of $10,738,583) | | | 10,580,565 | | | | 10,580,565 | |
HSBC Securities USA, Inc.
4.590%, dated 11/29/2024, to be repurchased on 12/02/2024, repurchase price $9,359,561 (collateralized by various U.S. Government Obligations, ranging in par value $936 - $4,850,141, 1.730% - 7.000%, 02/01/2031 - 11/01/2054, with a total market value of $9,511,041) | | | 9,355,982 | | | | 9,355,982 | |
Nomura Securities International, Inc.
4.580%, dated 11/29/2024, to be repurchased on 12/02/2024, repurchase price $10,584,603 (collateralized by various U.S. Government Obligations, ranging in par value $8,244 - $2,445,092, 2.000% - 6.500%, 11/01/2035 - 05/01/2058, with a total market value of $10,748,949) | | | 10,580,565 | | | | 10,580,565 | |
The accompanying notes are an integral part of the financial statements.
36
| Schedule of Investments | November 30, 2024 |
| Global X Autonomous & Electric Vehicles ETF |
| | | Face Amount | | | Value | |
| REPURCHASE AGREEMENTS(C) — continued | | | | | | | | |
Santander US Capital Markets LLC
4.650%, dated 11/29/2024, to be repurchased on 12/02/2024, repurchase price $3,922,193 (collateralized by various U.S. Government Obligations, ranging in par value $1,893 - $871,261, 0.010% - 6.917%, 05/27/2031 - 09/20/2070, with a total market value of $3,993,204) | | $ | 3,920,674 | | | $ | 3,920,674 | |
TOTAL REPURCHASE AGREEMENTS
(Cost $45,018,351) | | | | | | | 45,018,351 | |
TOTAL INVESTMENTS — 110.5%
(Cost $654,523,699) | | | | | | $ | 458,541,885 | |
Percentages are based on Net Assets of $415,072,792.
| * | Non-income producing security. |
| (A) | This security or a partial position of this security is on loan at November 30, 2024. The total market value of securities on loan at November 30, 2024 was $49,925,088. |
| (B) | There is currently no stated interest rate. |
| (C) | These securities were purchased with cash collateral held from securities on loan. The total value of such securities as of November 30, 2024 was $45,018,351. The total value of non-cash collateral held from securities on loan as of November 30, 2024 was $6,894,601. |
The following is a summary of the level of inputs used as of November 30, 2024, in valuing the Fund’s investments carried at value:
| Investments in Securities | | Level 1 | | | Level 2 | | | Level 3 | | | Total | |
| Common Stock | | $ | 409,505,224 | | | $ | — | | | $ | — | | | $ | 409,505,224 | |
| Preferred Stock | | | 4,018,310 | | | | — | | | | — | | | | 4,018,310 | |
| Repurchase Agreements | | | — | | | | 45,018,351 | | | | — | | | | 45,018,351 | |
| Total Investments in Securities | | $ | 413,523,534 | | | $ | 45,018,351 | | | $ | — | | | $ | 458,541,885 | |
Amounts designated as “—” are $0 or have been rounded to $0.
See “Glossary” for abbreviations.
The accompanying notes are an integral part of the financial statements.
37
| Schedule of Investments | November 30, 2024 |
| Global X Artificial Intelligence & Technology ETF |
| | | Shares | | | Value | |
| COMMON STOCK — 99.8% | | | | | | | | |
| BRAZIL — 0.2% | | | | | | | | |
| Financials — 0.2% | | | | | | | | |
| StoneCo, Cl A * | | | 500,274 | | | $ | 4,742,598 | |
| | | | | | | | | |
| CANADA — 3.7% | | | | | | | | |
| Industrials — 1.1% | | | | | | | | |
| Thomson Reuters | | | 171,065 | | | | 27,813,458 | |
| | | | | | | | | |
| Information Technology — 2.6% | | | | | | | | |
| Celestica * | | | 117,510 | | | | 10,016,552 | |
| Shopify, Cl A * | | | 458,696 | | | | 53,025,258 | |
| | | | | | | | 63,041,810 | |
| TOTAL CANADA | | | | | | | 90,855,268 | |
| CHINA — 9.2% | | | | | | | | |
| Communication Services — 3.3% | | | | | | | | |
| Baidu ADR * (A) | | | 108,944 | | | | 9,265,687 | |
| Tencent Holdings | | | 1,451,643 | | | | 74,246,637 | |
| | | | | | | | 83,512,324 | |
| Consumer Discretionary — 5.0% | | | | | | | | |
| Alibaba Group Holding ADR | | | 900,526 | | | | 78,678,957 | |
| Meituan, Cl B * | | | 2,089,315 | | | | 45,295,274 | |
| | | | | | | | 123,974,231 | |
| Information Technology — 0.9% | | | | | | | | |
| NXP Semiconductors | | | 96,969 | | | | 22,241,779 | |
| | | | | | | | | |
| TOTAL CHINA | | | | | | | 229,728,334 | |
| FINLAND — 0.2% | | | | | | | | |
| Information Technology — 0.2% | | | | | | | | |
| TietoEVRY | | | 333,122 | | | | 5,946,157 | |
| | | | | | | | | |
| GERMANY — 3.0% | | | | | | | | |
| Industrials — 2.4% | | | | | | | | |
| Siemens | | | 303,810 | | | | 58,773,159 | |
The accompanying notes are an integral part of the financial statements.
38
| Schedule of Investments | November 30, 2024 |
| Global X Artificial Intelligence & Technology ETF |
| | | Shares | | | Value | |
| COMMON STOCK — continued | | | | | | | | |
| Information Technology — 0.6% | | | | | | | | |
| Infineon Technologies | | | 493,611 | | | $ | 16,065,467 | |
| | | | | | | | | |
| TOTAL GERMANY | | | | | | | 74,838,626 | |
| IRELAND — 3.0% | | | | | | | | |
| Information Technology — 3.0% | | | | | | | | |
| Accenture PLC, Cl A | | | 207,370 | | | | 75,144,667 | |
| | | | | | | | | |
| ISRAEL — 0.4% | | | | | | | | |
| Information Technology — 0.4% | | | | | | | | |
| Wix.com * | | | 40,158 | | | | 8,984,951 | |
| | | | | | | | | |
| ITALY — 0.2% | | | | | | | | |
| Health Care — 0.2% | | | | | | | | |
| Amplifon | | | 211,141 | | | | 5,358,863 | |
| | | | | | | | | |
| JAPAN — 2.6% | | | | | | | | |
| Consumer Discretionary — 0.3% | | | | | | | | |
| Rakuten Group * | | | 1,180,010 | | | | 6,744,486 | |
| | | | | | | | | |
| Industrials — 0.9% | | | | | | | | |
| FANUC | | | 377,693 | | | | 9,775,229 | |
| Fujikura | | | 339,585 | | | | 12,033,634 | |
| | | | | | | | 21,808,863 | |
| Information Technology — 1.4% | | | | | | | | |
| Fujitsu | | | 780,341 | | | | 14,891,349 | |
| NEC | | | 103,309 | | | | 8,767,009 | |
| Socionext | | | 325,889 | | | | 5,239,265 | |
| Toshiba TEC | | | 301,540 | | | | 7,288,279 | |
| | | | | | | | 36,185,902 | |
| TOTAL JAPAN | | | | | | | 64,739,251 | |
| NETHERLANDS — 0.6% | | | | | | | | |
| Industrials — 0.6% | | | | | | | | |
| Wolters Kluwer | | | 94,037 | | | | 15,687,897 | |
The accompanying notes are an integral part of the financial statements.
39
| Schedule of Investments | November 30, 2024 |
| Global X Artificial Intelligence & Technology ETF |
| | | Shares | | | Value | |
| COMMON STOCK — continued | | | | | | | | |
| SOUTH KOREA — 3.0% | | | | | | | | |
| Information Technology — 3.0% | | | | | | | | |
| Samsung Electronics | | | 1,132,208 | | | $ | 43,988,154 | |
| SK Hynix | | | 276,160 | | | | 31,653,334 | |
| | | | | | | | | |
| TOTAL SOUTH KOREA | | | | | | | 75,641,488 | |
| SWEDEN — 0.4% | | | | | | | | |
| Information Technology — 0.4% | | | | | | | | |
| Telefonaktiebolaget LM Ericsson ADR | | | 1,174,875 | | | | 9,563,482 | |
| | | | | | | | | |
| SWITZERLAND — 0.3% | | | | | | | | |
| Information Technology — 0.3% | | | | | | | | |
| Temenos | | | 93,960 | | | | 6,169,791 | |
| | | | | | | | | |
| TAIWAN — 0.9% | | | | | | | | |
| Information Technology — 0.9% | | | | | | | | |
| Acer | | | 4,864,000 | | | | 5,667,654 | |
| Advantech | | | 603,257 | | | | 6,230,728 | |
| Alchip Technologies | | | 74,650 | | | | 5,090,347 | |
| Global Unichip | | | 147,865 | | | | 5,416,967 | |
| | | | | | | | | |
| TOTAL TAIWAN | | | | | | | 22,405,696 | |
| UNITED STATES — 72.1% | | | | | | | | |
| Communication Services — 10.7% | | | | | | | | |
| Alphabet, Cl A | | | 377,112 | | | | 63,713,072 | |
| Meta Platforms, Cl A | | | 140,302 | | | | 80,578,245 | |
| Netflix * | | | 106,767 | | | | 94,682,043 | |
| Snap, Cl A * | | | 528,231 | | | | 6,238,408 | |
| Trade Desk, Cl A * | | | 167,938 | | | | 21,588,430 | |
| | | | | | | | 266,800,198 | |
| Consumer Discretionary — 7.4% | | | | | | | | |
| Amazon.com * | | | 367,577 | | | | 76,415,583 | |
| eBay | | | 189,383 | | | | 11,986,050 | |
| Tesla * | | | 278,063 | | | | 95,976,225 | |
| | | | | | | | 184,377,858 | |
The accompanying notes are an integral part of the financial statements.
40
| Schedule of Investments | November 30, 2024 |
| Global X Artificial Intelligence & Technology ETF |
| | | Shares | | | Value | |
| COMMON STOCK — continued | | | | | | | | |
| Health Care — 0.6% | | | | | | | | |
| GE HealthCare Technologies | | | 172,348 | | | $ | 14,342,800 | |
| | | | | | | | | |
| Industrials — 4.2% | | | | | | | | |
| Experian | | | 347,036 | | | | 16,545,688 | |
| Genpact | | | 202,905 | | | | 9,366,095 | |
| Hubbell, Cl B | | | 20,390 | | | | 9,381,235 | |
| Rockwell Automation | | | 43,004 | | | | 12,692,201 | |
| Uber Technologies * | | | 792,605 | | | | 57,035,856 | |
| | | | | | | | 105,021,075 | |
| Information Technology — 49.2% | | | | | | | | |
| Adobe * | | | 125,331 | | | | 64,662,023 | |
| Ambarella * | | | 117,433 | | | | 8,402,331 | |
| Apple | | | 304,442 | | | | 72,253,220 | |
| Broadcom | | | 418,433 | | | | 67,819,621 | |
| C3.ai, Cl A * (A) | | | 239,241 | | | | 8,894,980 | |
| Cadence Design Systems * | | | 103,234 | | | | 31,673,224 | |
| CCC Intelligent Solutions Holdings * | | | 608,905 | | | | 7,672,203 | |
| Cisco Systems | | | 1,478,280 | | | | 87,528,959 | |
| CyberArk Software * | | | 25,658 | | | | 8,300,620 | |
| Datadog, Cl A * | | | 116,949 | | | | 17,863,960 | |
| DocuSign, Cl A * | | | 121,140 | | | | 9,653,647 | |
| DXC Technology * | | | 344,087 | | | | 7,741,957 | |
| Fortinet * | | | 288,359 | | | | 27,408,523 | |
| Hewlett Packard Enterprise | | | 493,580 | | | | 10,473,768 | |
| Informatica, Cl A * | | | 272,901 | | | | 7,237,335 | |
| Intel | | | 1,614,925 | | | | 38,838,946 | |
| International Business Machines | | | 372,289 | | | | 84,662,241 | |
| Micron Technology | | | 420,514 | | | | 41,189,346 | |
| Microsoft | | | 154,070 | | | | 65,242,482 | |
| NVIDIA | | | 559,050 | | | | 77,288,663 | |
| Okta, Cl A * | | | 70,724 | | | | 5,485,353 | |
| Oracle | | | 478,706 | | | | 88,484,017 | |
| Pegasystems | | | 108,219 | | | | 10,277,558 | |
| Procore Technologies * | | | 97,036 | | | | 7,879,323 | |
| QUALCOMM | | | 354,399 | | | | 56,182,873 | |
| Salesforce | | | 267,770 | | | | 88,361,422 | |
| Seagate Technology Holdings | | | 78,950 | | | | 8,000,004 | |
| ServiceNow * | | | 89,550 | | | | 93,977,352 | |
The accompanying notes are an integral part of the financial statements.
41
| Schedule of Investments | November 30, 2024 |
| Global X Artificial Intelligence & Technology ETF |
| | | Shares | | | Value | |
| COMMON STOCK — continued | | | | | | | | |
| Information Technology — continued | | | | | | | | |
| Smartsheet, Cl A * | | | 140,718 | | | $ | 7,873,172 | |
| Super Micro Computer * | | | 219,500 | | | | 7,164,480 | |
| Synopsys * | | | 57,996 | | | | 32,390,186 | |
| Teradata * | | | 210,451 | | | | 6,502,936 | |
| Twilio, Cl A * | | | 113,306 | | | | 11,845,009 | |
| UiPath, Cl A * | | | 551,930 | | | | 7,842,925 | |
| Verint Systems * | | | 196,069 | | | | 4,940,939 | |
| Viasat * | | | 392,752 | | | | 3,664,376 | |
| Workday, Cl A * | | | 80,290 | | | | 20,071,697 | |
| Zebra Technologies, Cl A * | | | 20,459 | | | | 8,326,813 | |
| Zscaler * | | | 57,003 | | | | 11,776,250 | |
| | | | | | | | 1,225,854,734 | |
| TOTAL UNITED STATES | | | | | | | 1,796,396,665 | |
TOTAL COMMON STOCK
(Cost $2,100,409,239) | | | | | | | 2,486,203,734 | |
| | | | | | | | | |
| | | Face Amount | | | | | |
| REPURCHASE AGREEMENTS(B) — 0.2% | | | | | | | | |
Bank of America Securities, Inc.
4.590%, dated 11/29/2024, to be repurchased on 12/02/2024, repurchase price $1,152,899 (collateralized by various U.S. Government Obligations, ranging in par value $346 - $523,663, 1.500% - 7.500%, 02/01/2034 - 11/20/2054, with a total market value of $1,170,116) | | $ | 1,152,458 | | | | 1,152,458 | |
Daiwa Capital Markets America, Inc.
4.580%, dated 11/29/2024, to be repurchased on 12/02/2024, repurchase price $293,743 (collateralized by various U.S. Government Obligations and U.S. Treasury Obligations, ranging in par value $40 - $57,374, 0.000% - 7.500%, 02/13/2025 - 12/01/2054, with a total market value of $298,391) | | | 293,631 | | | | 293,631 | |
The accompanying notes are an integral part of the financial statements.
42
| Schedule of Investments | November 30, 2024 |
| Global X Artificial Intelligence & Technology ETF |
| | | Face Amount | | | Value | |
| REPURCHASE AGREEMENTS(B) — continued | | | | | | | | |
Deutsche Bank Securities, Inc.
4.570%, dated 11/29/2024, to be repurchased on 12/02/2024, repurchase price $1,152,897 (collateralized by various U.S. Treasury Obligations, ranging in par value $47,229 - $434,876, 0.000% - 3.750%, 12/15/2024 - 05/15/2029, with a total market value of $1,169,670) | | $ | 1,152,458 | | | $ | 1,152,458 | |
HSBC Securities USA, Inc.
4.590%, dated 11/29/2024, to be repurchased on 12/02/2024, repurchase price $1,152,899 (collateralized by various U.S. Government Obligations, ranging in par value $115 - $597,434, 1.730% - 7.000%, 02/01/2031 - 11/01/2054, with a total market value of $1,171,558) | | | 1,152,458 | | | | 1,152,458 | |
Nomura Securities International, Inc.
4.580%, dated 11/29/2024, to be repurchased on 12/02/2024, repurchase price $1,152,898 (collateralized by various U.S. Government Obligations, ranging in par value $898 - $266,325, 2.000% - 6.500%, 11/01/2035 - 05/01/2058, with a total market value of $1,170,799) | | | 1,152,458 | | | | 1,152,458 | |
TOTAL REPURCHASE AGREEMENTS
(Cost $4,903,463) | | | | | | | 4,903,463 | |
TOTAL INVESTMENTS — 100.0%
(Cost $2,105,312,702) | | | | | | $ | 2,491,107,197 | |
Percentages are based on Net Assets of $2,490,689,554.
| * | Non-income producing security. |
| (A) | This security or a partial position of this security is on loan at November 30, 2024. The total market value of securities on loan at November 30, 2024 was $4,792,740. |
| (B) | These securities were purchased with cash collateral held from securities on loan. The total value of such securities as of November 30, 2024 was $4,903,463. The total value of non-cash collateral held from securities on loan as of November 30, 2024 was $0. |
The accompanying notes are an integral part of the financial statements.
43
| Schedule of Investments | November 30, 2024 |
| Global X Artificial Intelligence & Technology ETF |
The following is a summary of the level of inputs used as of November 30, 2024, in valuing the Fund’s investments carried at value:
| Investments in Securities | | Level 1 | | | Level 2 | | | Level 3 | | | Total | |
| Common Stock | | $ | 2,486,203,734 | | | $ | — | | | $ | — | | | $ | 2,486,203,734 | |
| Repurchase Agreements | | | — | | | | 4,903,463 | | | | — | | | | 4,903,463 | |
| Total Investments in Securities | | $ | 2,486,203,734 | | | $ | 4,903,463 | | | $ | — | | | $ | 2,491,107,197 | |
Amounts designated as “—” are $0 or have been rounded to $0.
See “Glossary” for abbreviations.
The accompanying notes are an integral part of the financial statements.
44
| Schedule of Investments | November 30, 2024 |
| Global X Genomics & Biotechnology ETF |
| | | Shares | | | Value | |
| COMMON STOCK — 99.9% | | | | | | | | |
| CHINA — 2.7% | | | | | | | | |
| Health Care — 2.7% | | | | | | | | |
| Genscript Biotech * (A) | | | 1,542,518 | | | $ | 2,136,894 | |
| | | | | | | | | |
| GERMANY — 4.2% | | | | | | | | |
| Health Care — 4.2% | | | | | | | | |
| BioNTech ADR * | | | 28,033 | | | | 3,318,827 | |
| | | | | | | | | |
| NETHERLANDS — 0.5% | | | | | | | | |
| Health Care — 0.5% | | | | | | | | |
| uniQure * | | | 65,452 | | | | 390,748 | |
| | | | | | | | | |
| SWITZERLAND — 4.4% | | | | | | | | |
| Health Care — 4.4% | | | | | | | | |
| CRISPR Therapeutics * (A) | | | 67,632 | | | | 3,460,730 | |
| | | | | | | | | |
| UNITED STATES — 88.1% | | | | | | | | |
| Health Care — 88.1% | | | | | | | | |
| 10X Genomics, Cl A * | | | 146,738 | | | | 2,333,134 | |
| 2seventy bio * (A) | | | 69,956 | | | | 279,124 | |
| Agilent Technologies | | | 23,386 | | | | 3,226,566 | |
| Allogene Therapeutics * (A) | | | 200,937 | | | | 498,324 | |
| Alnylam Pharmaceuticals * | | | 10,551 | | | | 2,670,142 | |
| Arrowhead Pharmaceuticals * | | | 156,177 | | | | 4,065,287 | |
| Avidity Biosciences * | | | 68,525 | | | | 2,948,631 | |
| Beam Therapeutics * | | | 105,555 | | | | 2,889,040 | |
| BioMarin Pharmaceutical * | | | 44,456 | | | | 2,935,430 | |
| Bio-Techne | | | 44,867 | | | | 3,381,177 | |
| CareDx * | | | 72,698 | | | | 1,784,009 | |
| Caribou Biosciences * | | | 119,714 | | | | 262,174 | |
| Editas Medicine, Cl A * | | | 118,628 | | | | 265,727 | |
| Fulgent Genetics * | | | 28,728 | | | | 525,722 | |
| Gilead Sciences | | | 17,832 | | | | 1,650,887 | |
| Illumina * | | | 21,765 | | | | 3,137,425 | |
| Intellia Therapeutics * (A) | | | 146,991 | | | | 2,295,999 | |
| Legend Biotech ADR * | | | 70,786 | | | | 2,977,967 | |
| Lyell Immunopharma * | | | 199,421 | | | | 188,473 | |
| Maravai LifeSciences Holdings, Cl A * | | | 171,403 | | | | 971,855 | |
The accompanying notes are an integral part of the financial statements.
45
| Schedule of Investments | November 30, 2024 |
| Global X Genomics & Biotechnology ETF |
| | | Shares | | | Value | |
| COMMON STOCK — continued | | | | | | | | |
| Health Care — continued | | | | | | | | |
| Moderna * | | | 58,270 | | | $ | 2,509,106 | |
| Myriad Genetics * | | | 128,713 | | | | 2,094,160 | |
| Natera * | | | 26,220 | | | | 4,399,192 | |
| Pacific Biosciences of California * (A) | | | 377,973 | | | | 721,928 | |
| Poseida Therapeutics, Cl A * | | | 94,278 | | | | 877,728 | |
| QIAGEN | | | 73,862 | | | | 3,207,827 | |
| REGENXBIO * | | | 64,818 | | | | 642,995 | |
| Rocket Pharmaceuticals * | | | 123,474 | | | | 1,776,791 | |
| Sana Biotechnology * (A) | | | 177,163 | | | | 492,513 | |
| Sangamo Therapeutics * | | | 289,646 | | | | 654,600 | |
| Sarepta Therapeutics * | | | 23,953 | | | | 3,193,893 | |
| Scilex Holding *(B) | | | 226,071 | | | | 7,275 | |
| Ultragenyx Pharmaceutical * | | | 56,885 | | | | 2,709,433 | |
| Veracyte * | | | 95,872 | | | | 4,117,702 | |
| Vertex Pharmaceuticals * | | | 3,309 | | | | 1,549,042 | |
| Verve Therapeutics * (A) | | | 90,897 | | | | 509,932 | |
| Vir Biotechnology * | | | 129,875 | | | | 1,033,805 | |
| | | | | | | | | |
| TOTAL UNITED STATES | | | | | | | 69,785,015 | |
TOTAL COMMON STOCK
(Cost $122,172,694) | | | | | | | 79,092,214 | |
| | | | | | | | |
| | | Face Amount | | | | | |
| REPURCHASE AGREEMENTS(C) — 6.6% | | | | | | | | |
Bank of America Securities, Inc.
4.590%, dated 11/29/2024, to be repurchased on 12/02/2024, repurchase price $1,222,936 (collateralized by various U.S. Government Obligations, ranging in par value $367 - $555,474, 1.500% - 7.500%, 02/01/2034 - 11/20/2054, with a total market value of $1,241,199) | | $ | 1,222,468 | | | | 1,222,468 | |
Citigroup Global Markets, Inc.
4.580%, dated 11/29/2024, to be repurchased on 12/02/2024, repurchase price $1,222,935 (collateralized by various U.S. Government Obligations and U.S. Treasury Obligations, ranging in par value $668 - $767,090, 1.500% - 6.500%, 01/01/2035 - 11/20/2054, with a total market value of $1,239,536) | | | 1,222,468 | | | | 1,222,468 | |
The accompanying notes are an integral part of the financial statements.
46
| Schedule of Investments | November 30, 2024 |
| Global X Genomics & Biotechnology ETF |
| | | Face Amount | | | Value | |
| REPURCHASE AGREEMENTS(C) — continued | | | | | | | | |
Deutsche Bank Securities, Inc.
4.570%, dated 11/29/2024, to be repurchased on 12/02/2024, repurchase price $1,222,934 (collateralized by various U.S. Government Obligations and U.S. Treasury Obligations, ranging in par value $50,098 - $461,294, 0.000% - 3.750%, 12/15/2024 - 05/15/2029, with a total market value of $1,240,725) | | $ | 1,222,468 | | | $ | 1,222,468 | |
HSBC Securities USA, Inc.
4.590%, dated 11/29/2024, to be repurchased on 12/02/2024, repurchase price $311,581 (collateralized by various U.S. Government Obligations, ranging in par value $31 - $161,462, 1.730% - 7.000%, 02/01/2031 - 11/01/2054, with a total market value of $316,624) | | | 311,462 | | | | 311,462 | |
Nomura Securities International, Inc.
4.580%, dated 11/29/2024, to be repurchased on 12/02/2024, repurchase price $1,222,935 (collateralized by various U.S. Government Obligations, ranging in par value $953 - $282,504, 2.000% - 6.500%, 11/01/2035 - 05/01/2058, with a total market value of $1,241,923) | | | 1,222,468 | | | | 1,222,468 | |
TOTAL REPURCHASE AGREEMENTS
(Cost $5,201,334) | | | | | | | 5,201,334 | |
TOTAL INVESTMENTS — 106.5%
(Cost $127,374,028) | | | | | | $ | 84,293,548 | |
Percentages are based on Net Assets of $79,156,476.
The accompanying notes are an integral part of the financial statements.
47
| Schedule of Investments | November 30, 2024 |
| Global X Genomics & Biotechnology ETF |
| * | Non-income producing security. |
| (A) | This security or a partial position of this security is on loan at November 30, 2024. The total market value of securities on loan at November 30, 2024 was $5,077,380. |
| (B) | Level 3 security in accordance with fair value hierarchy. |
| (C) | These securities were purchased with cash collateral held from securities on loan. The total value of such securities as of November 30, 2024 was $5,201,334. The total value of non-cash collateral held from securities on loan as of November 30, 2024 was $–. |
The following is a summary of the level of inputs used as of November 30, 2024, in valuing the Fund’s investments carried at value:
| Investments in Securities | | Level 1 | | | Level 2 | | | Level 3(1) | | | Total | |
| Common Stock | | $ | 79,084,939 | | | $ | — | | | $ | 7,275 | | | $ | 79,092,214 | |
| Repurchase Agreements | | | — | | | | 5,201,334 | | | | — | | | | 5,201,334 | |
| Total Investments in Securities | | $ | 79,084,939 | | | $ | 5,201,334 | | | $ | 7,275 | | | $ | 84,293,548 | |
(1) A reconciliation of Level 3 investments and disclosures of significant unobservable inputs are presented when the Fund has a significant amount of Level 3 investments at the end of the period in relation to Net Assets. Management has concluded that Level 3 investments are not material in relation to Net Assets.
Amounts designated as “—” are $0 or have been rounded to $0.
See “Glossary” for abbreviations.
The accompanying notes are an integral part of the financial statements.
48
| Schedule of Investments | November 30, 2024 |
| Global X Cloud Computing ETF |
| | | Shares | | | Value | |
| COMMON STOCK — 99.9% | | | | | | | | |
| CANADA — 5.0% | | | | | | | | |
| Information Technology — 5.0% | | | | | | | | |
| Shopify, Cl A * | | | 162,314 | | | $ | 18,763,499 | |
| | | | | | | | | |
| CHINA — 1.6% | | | | | | | | |
| Consumer Discretionary — 0.3% | | | | | | | | |
| Alibaba Group Holding ADR | | | 12,148 | | | | 1,061,371 | |
| | | | | | | | | |
| Information Technology — 1.3% | | | | | | | | |
| Kingsoft Cloud Holdings ADR * | | | 343,772 | | | | 2,299,834 | |
| Vnet Group ADR * | | | 745,151 | | | | 2,891,186 | |
| | | | | | | | 5,191,020 | |
| TOTAL CHINA | | | | | | | 6,252,391 | |
| ISRAEL — 4.5% | | | | | | | | |
| Information Technology — 4.5% | | | | | | | | |
| Wix.com * | | | 75,947 | | | | 16,992,382 | |
| | | | | | | | | |
| JAPAN — 0.3% | | | | | | | | |
| Information Technology — 0.3% | | | | | | | | |
| Oracle Japan | | | 9,850 | | | | 1,004,774 | |
| | | | | | | | | |
| SWEDEN — 1.2% | | | | | | | | |
| Information Technology — 1.2% | | | | | | | | |
| Sinch * | | | 2,444,538 | | | | 4,465,334 | |
| | | | | | | | | |
| UNITED STATES — 87.3% | | | | | | | | |
| Communication Services — 2.6% | | | | | | | | |
| Alphabet, Cl A | | | 29,847 | | | | 5,042,651 | |
| PubMatic, Cl A * | | | 118,797 | | | | 1,894,812 | |
| Vimeo * | | | 451,802 | | | | 2,950,267 | |
| | | | | | | | 9,887,730 | |
| Consumer Discretionary — 1.9% | | | | | | | | |
| Amazon.com * | | | 34,032 | | | | 7,074,912 | |
The accompanying notes are an integral part of the financial statements.
49
| Schedule of Investments | November 30, 2024 |
| Global X Cloud Computing ETF |
| | | Shares | | | Value | |
| COMMON STOCK — continued | | | | | | | | |
| Health Care — 0.8% | | | | | | | | |
| HealthStream | | | 87,810 | | | $ | 2,906,511 | |
| | | | | | | | | |
| Industrials — 3.7% | | | | | | | | |
| Paycom Software | | | 60,722 | | | | 14,082,646 | |
| | | | | | | | | |
| Information Technology — 74.6% | | | | | | | | |
| Akamai Technologies * | | | 125,824 | | | | 11,829,973 | |
| Box, Cl A * | | | 399,673 | | | | 14,024,526 | |
| C3.ai, Cl A * (A) | | | 357,716 | | | | 13,299,881 | |
| DigitalOcean Holdings * | | | 266,603 | | | | 10,152,242 | |
| Dropbox, Cl A * | | | 491,048 | | | | 13,582,388 | |
| Fastly, Cl A * | | | 400,379 | | | | 3,395,214 | |
| Five9 * | | | 216,318 | | | | 8,929,607 | |
| Freshworks, Cl A * | | | 645,136 | | | | 10,315,725 | |
| HubSpot * | | | 22,882 | | | | 16,499,066 | |
| International Business Machines | | | 4,684 | | | | 1,065,188 | |
| Microsoft | | | 15,611 | | | | 6,610,634 | |
| Procore Technologies * | | | 193,349 | | | | 15,699,939 | |
| Qualys * | | | 106,465 | | | | 16,353,024 | |
| Salesforce | | | 43,554 | | | | 14,372,385 | |
| ServiceNow * | | | 13,603 | | | | 14,275,532 | |
| Snowflake, Cl A * | | | 110,564 | | | | 19,326,587 | |
| SPS Commerce * | | | 76,944 | | | | 14,855,578 | |
| Twilio, Cl A * | | | 157,402 | | | | 16,454,805 | |
| Workday, Cl A * | | | 54,272 | | | | 13,567,457 | |
| Workiva, Cl A * | | | 148,865 | | | | 14,477,121 | |
| Yext * | | | 369,386 | | | | 3,051,128 | |
| Zoom Video Communications, Cl A * | | | 169,845 | | | | 14,044,483 | |
| Zscaler * | | | 70,213 | | | | 14,505,304 | |
| | | | | | | | 280,687,787 | |
| Real Estate — 3.7% | | | | | | | | |
| Digital Realty Trust ‡ | | | 71,209 | | | | 13,934,889 | |
| | | | | | | | | |
| TOTAL UNITED STATES | | | | | | | 328,574,475 | |
TOTAL COMMON STOCK
(Cost $455,831,210) | | | | | | | 376,052,855 | |
The accompanying notes are an integral part of the financial statements.
50
| Schedule of Investments | November 30, 2024 |
| Global X Cloud Computing ETF |
| | | Shares | | | Value | |
| SHORT-TERM INVESTMENT(B)(C) — 0.0% | | | | | | | | |
Fidelity Investments Money Market Government Portfolio, Cl Institutional, 4.550%
(Cost $15,063) | | | 15,063 | | | $ | 15,063 | |
| | | | | | | | | |
| | | Face Amount | | | | | |
| REPURCHASE AGREEMENT(C) — 0.0% | | | | | | | | |
RBC Capital Markets
4.500%, dated 11/29/2024, to be repurchased on 12/02/2024, repurchase price $25,779 (collateralized by a U.S. Treasury Obligations, par value $27,391, 0.375%, 12/31/2025, with a total market value of $26,254)
(Cost $25,769) | | $ | 25,769 | | | | 25,769 | |
TOTAL INVESTMENTS — 99.9%
(Cost $455,872,042) | | | | | | $ | 376,093,687 | |
Percentages are based on Net Assets of $376,498,010.
The accompanying notes are an integral part of the financial statements.
51
| Schedule of Investments | November 30, 2024 |
| Global X Cloud Computing ETF |
| * | Non-income producing security. |
| ‡ | Real Estate Investment Trust |
| (A) | This security or a partial position of this security is on loan at November 30, 2024. The total market value of securities on loan at November 30, 2024 was $40,898. |
| (B) | The rate reported on the Schedule of Investments is the 7-day effective yield as of November 30, 2024. |
| (C) | These securities were purchased with cash collateral held from securities on loan. The total value of such securities as of November 30, 2024 was $40,832. The total value of non-cash collateral held from securities on loan as of November 30, 2024 was $0. |
The following is a summary of the level of inputs used as of November 30, 2024, in valuing the Fund’s investments carried at value:
| Investments in Securities | | Level 1 | | | Level 2 | | | Level 3 | | | Total | |
| Common Stock | | $ | 376,052,855 | | | $ | — | | | $ | — | | | $ | 376,052,855 | |
| Short-Term Investment | | | 15,063 | | | | — | | | | — | | | | 15,063 | |
| Repurchase Agreement | | | — | | | | 25,769 | | | | — | | | | 25,769 | |
| Total Investments in Securities | | $ | 376,067,918 | | | $ | 25,769 | | | $ | — | | | $ | 376,093,687 | |
Amounts designated as “—” are $0 or have been rounded to $0.
See “Glossary” for abbreviations.
The accompanying notes are an integral part of the financial statements.
52
| Schedule of Investments | November 30, 2024 |
| Global X Thematic Growth ETF |
| | | Shares | | | Value | |
| EXCHANGE TRADED FUNDS — 99.9% | | | | | | | | |
| Global X Data Center & Digital Infrastructure ETF(A) (B) | | | 101,631 | | | $ | 1,797,852 | |
| Global X Disruptive Materials ETF(A) | | | 115,377 | | | | 1,823,533 | |
| Global X E-commerce ETF(A) | | | 64,637 | | | | 1,870,595 | |
| Global X FinTech ETF(A) (B) | | | 59,097 | | | | 2,009,298 | |
| Global X Genomics & Biotechnology ETF*(A) | | | 138,721 | | | | 1,503,736 | |
| Global X Lithium & Battery Tech ETF(A) (B) | | | 43,352 | | | | 1,937,834 | |
| Global X Renewable Energy Producers ETF(A) | | | 151,511 | | | | 1,410,567 | |
| Global X Solar ETF(A) | | | 160,286 | | | | 1,641,329 | |
| Global X Video Games & Esports ETF (A) | | | 72,390 | | | | 1,768,488 | |
TOTAL EXCHANGE TRADED FUNDS
(Cost $20,940,748) | | | | | | | 15,763,232 | |
| | | | | | | | | |
| | | Face Amount | | | | | |
| REPURCHASE AGREEMENTS(C) — 11.4% | | | | | | | | |
Bank of America Securities, Inc.
4.590%, dated 11/29/2024, to be repurchased on 12/02/2024, repurchase price $424,547 (collateralized by various U.S. Government Obligations, ranging in par value $127 - $192,835, 1.500% - 7.500%, 02/01/2034 - 11/20/2054, with a total market value of $430,887) | | $ | 424,385 | | | | 424,385 | |
Citigroup Global Markets, Inc.
4.580%, dated 11/29/2024, to be repurchased on 12/02/2024, repurchase price $424,547 (collateralized by various U.S. Government Obligations and U.S. Treasury Obligations, ranging in par value $232 - $266,298, 1.500% - 6.500%, 01/01/2035 - 11/20/2054, with a total market value of $430,310) | | | 424,385 | | | | 424,385 | |
Deutsche Bank Securities, Inc.
4.570%, dated 11/29/2024, to be repurchased on 12/02/2024, repurchase price $424,547 (collateralized by various U.S. Government Obligations and U.S. Treasury Obligations, ranging in par value $17,392 - $160,140, 0.000% - 3.750%, 12/15/2024 - 05/15/2029, with a total market value of $430,723) | | | 424,385 | | | | 424,385 | |
The accompanying notes are an integral part of the financial statements.
53
| Schedule of Investments | November 30, 2024 |
| Global X Thematic Growth ETF |
| | | Face Amount | | | Value | |
| REPURCHASE AGREEMENTS(C) — continued | | | | | | | | |
HSBC Securities USA, Inc.
4.590%, dated 11/29/2024, to be repurchased on 12/02/2024, repurchase price $108,300 (collateralized by various U.S. Government Obligations, ranging in par value $11 - $56,121, 1.730% - 7.000%, 02/01/2031 - 11/01/2054, with a total market value of $110,053) | | $ | 108,259 | | | $ | 108,259 | |
Nomura Securities International, Inc.
4.580%, dated 11/29/2024, to be repurchased on 12/02/2024, repurchase price $424,547 (collateralized by various U.S. Government Obligations, ranging in par value $331 - $98,072, 2.000% - 6.500%, 11/01/2035 - 05/01/2058, with a total market value of $431,139) | | | 424,385 | | | | 424,385 | |
TOTAL REPURCHASE AGREEMENTS
(Cost $1,805,799) | | | | | | | 1,805,799 | |
TOTAL INVESTMENTS — 111.3%
(Cost $22,746,547) | | | | | | $ | 17,569,031 | |
Percentages are based on Net Assets of $15,782,874.
| * | Non-income producing security. |
| (A) | Affiliated investment. |
| (B) | This security or a partial position of this security is on loan at November 30, 2024. The total market value of securities on loan at November 30, 2024 was $1,767,076. |
| (C) | These securities were purchased with cash collateral held from securities on loan. The total value of such securities as of November 30, 2024 was $1,805,799. The total value of non-cash collateral held from securities on loan as of November 30, 2024 was $0. |
The accompanying notes are an integral part of the financial statements.
54
| Schedule of Investments | November 30, 2024 |
| Global X Thematic Growth ETF |
The following is a summary of the level of inputs used as of November 30, 2024, in valuing the Fund’s investments carried at value:
| Investments in Securities | | Level 1 | | | Level 2 | | | Level 3 | | | Total | |
| Exchange Traded Funds | | $ | 15,763,232 | | | $ | — | | | $ | — | | | $ | 15,763,232 | |
| Repurchase Agreements | | | — | | | | 1,805,799 | | | | — | | | | 1,805,799 | |
| Total Investments in Securities | | $ | 15,763,232 | | | $ | 1,805,799 | | | $ | — | | | $ | 17,569,031 | |
The following is a summary of the Fund’s transactions with affiliates for the year ended November 30, 2024:
Value
11/30/2023 | | | Purchases
at Cost | | | Proceeds
from Sales | | | Change in
Unrealized
Appreciation
(Depreciation) | | | Realized Gain
(Loss) | | | Value
11/30/2024 | | | Income | | | Capital Gains | |
| Global X Cannabis ETF | | | | |
| $ | 3,042,663 | | | $ | — | | | $ | (2,928,776) | | | $ | 13,332,421 | | | $ | (13,446,308) | | | $ | — | | | $ | 98,626 | | | $ | — | |
| Global X Data Center & Digital Infrastructure ETF | | | | |
| | 4,264,049 | | | | 341,153 | | | | (3,332,199) | | | | 318,226 | | | | 206,623 | | | | 1,797,852 | | | | 42,759 | | | | — | |
| Global X Disruptive Materials ETF | | | | |
| | 3,261,090 | | | | 845,652 | | | | (2,651,430) | | | | 534,194 | | | | (165,973) | | | | 1,823,533 | | | | 35,886 | | | | — | |
| Global X E-commerce ETF | | | | |
| | — | | | | 1,917,922 | | | | (350,993) | | | | 287,160 | | | | 16,506 | | | | 1,870,595 | | | | — | | | | — | |
| Global X FinTech ETF | | | | |
| | 4,106,456 | | | | 363,963 | | | | (3,637,569) | | | | 2,845,410 | | | | (1,668,962) | | | | 2,009,298 | | | | 5,250 | | | | 167 | |
| Global X Genomics & Biotechnology ETF | | | | |
| | 3,701,656 | | | | 312,578 | | | | (2,714,082) | | | | 1,885,344 | | | | (1,681,760) | | | | 1,503,736 | | | | — | | | | — | |
| Global X Lithium & Battery Tech ETF | | | | |
| | 3,189,028 | | | | 1,119,796 | | | | (2,133,097) | | | | 471,579 | | | | (709,472) | | | | 1,937,834 | | | | 35,480 | | | | — | |
| Global X Renewable Energy Producers ETF | | | | |
| | 3,671,894 | | | | 447,258 | | | | (2,542,067) | | | | 914,778 | | | | (1,081,296) | | | | 1,410,567 | | | | 41,978 | | | | — | |
| Global X Solar ETF | | | | |
| | 3,017,274 | | | | 918,939 | | | | (1,983,192) | | | | 69,001 | | | | (380,693) | | | | 1,641,329 | | | | 5,867 | | | | — | |
| Global X Video Games & Esports ETF | | | | |
| | 3,982,988 | | | | 327,340 | | | | (3,023,053) | | | | 338,699 | | | | 142,514 | | | | 1,768,488 | | | | 26,808 | | | | — | |
| Totals: | | | | | | | | | | | | | | | | | | | | | | | | | | | | | | |
| $ | 32,237,098 | | | $ | 6,594,601 | | | $ | (25,296,458) | | | $ | 20,996,812 | | | $ | (18,768,821) | | | $ | 15,763,232 | | | $ | 292,654 | | | $ | 167 | |
Amounts designated as “—” are $0 or have been rounded to $0.
See “Glossary” for abbreviations.
The accompanying notes are an integral part of the financial statements.
55
| Schedule of Investments | November 30, 2024 |
| Global X Video Games & Esports ETF |
| | | Shares | | | Value | |
| COMMON STOCK — 99.8% | | | | | | | | |
| CHINA — 12.8% | | | | | | | | |
| Communication Services — 12.8% | | | | | | | | |
| Bilibili ADR * | | | 299,715 | | | $ | 5,745,537 | |
| DouYu International Holdings ADR | | | 43,671 | | | | 499,596 | |
| HUYA ADR | | | 105,453 | | | | 339,559 | |
| iDreamSky Technology Holdings * (A) | | | 1,170,500 | | | | 380,562 | |
| NetEase ADR | | | 66,754 | | | | 5,839,640 | |
| XD * (A) | | | 363,900 | | | | 1,117,671 | |
| | | | | | | | | |
| TOTAL CHINA | | | | | | | 13,922,565 | |
| FRANCE — 1.6% | | | | | | | | |
| Communication Services — 1.6% | | | | | | | | |
| Ubisoft Entertainment * | | | 126,638 | | | | 1,665,920 | |
| | | | | | | | | |
| JAPAN — 28.9% | | | | | | | | |
| Communication Services — 28.9% | | | | | | | | |
| Capcom | | | 221,701 | | | | 5,175,508 | |
| DeNA (A) | | | 100,240 | | | | 1,626,894 | |
| GungHo Online Entertainment | | | 55,057 | | | | 1,100,883 | |
| Koei Tecmo Holdings | | | 152,205 | | | | 1,754,282 | |
| Konami Group | | | 60,666 | | | | 5,968,240 | |
| MIXI | | | 48,076 | | | | 899,194 | |
| Nexon | | | 284,798 | | | | 3,903,564 | |
| Nintendo | | | 111,034 | | | | 6,513,364 | |
| Square Enix Holdings | | | 113,162 | | | | 4,544,262 | |
| | | | | | | | | |
| TOTAL JAPAN | | | | | | | 31,486,191 | |
| POLAND — 3.4% | | | | | | | | |
| Communication Services — 3.4% | | | | | | | | |
| CD Projekt (A) | | | 89,321 | | | | 3,674,504 | |
| | | | | | | | | |
| SOUTH KOREA — 14.2% | | | | | | | | |
| Communication Services — 14.2% | | | | | | | | |
| Com2uSCorp | | | 10,753 | | | | 376,920 | |
| Devsisters * | | | 8,294 | | | | 182,818 | |
| Gravity ADR * | | | 9,518 | | | | 642,560 | |
| Kakao Games * | | | 50,479 | | | | 656,746 | |
| Krafton * | | | 23,252 | | | | 5,200,261 | |
The accompanying notes are an integral part of the financial statements.
56
| Schedule of Investments | November 30, 2024 |
| Global X Video Games & Esports ETF |
| | | Shares | | | Value | |
| COMMON STOCK — continued | | | | | | | | |
| Communication Services — continued | | | | | | | | |
| NCSoft | | | 23,985 | | | $ | 4,083,321 | |
| Neowiz | | | 20,461 | | | | 288,497 | |
| Netmarble * | | | 35,607 | | | | 1,352,762 | |
| Nexon Games * | | | 27,271 | | | | 263,513 | |
| Pearl Abyss * | | | 45,389 | | | | 1,290,043 | |
| Wemade * | | | 26,579 | | | | 866,883 | |
| Wemade Max * | | | 41,733 | | | | 282,398 | |
| | | | | | | | | |
| TOTAL SOUTH KOREA | | | | | | | 15,486,722 | |
| SWEDEN — 3.8% | | | | | | | | |
| Communication Services — 3.8% | | | | | | | | |
| Embracer Group, Cl B * | | | 1,022,840 | | | | 2,695,074 | |
| Modern Times Group MTG, Cl B * | | | 123,777 | | | | 1,042,919 | |
| Stillfront Group * | | | 597,112 | | | | 401,398 | |
| | | | | | | | | |
| TOTAL SWEDEN | | | | | | | 4,139,391 | |
| TAIWAN — 6.6% | | | | | | | | |
| Communication Services — 6.6% | | | | | | | | |
| Gamania Digital Entertainment | | | 195,800 | | | | 520,799 | |
| International Games System | | | 209,300 | | | | 6,185,636 | |
| Soft-World International | | | 113,500 | | | | 450,743 | |
| | | | | | | | | |
| TOTAL TAIWAN | | | | | | | 7,157,178 | |
| UNITED STATES — 28.5% | | | | | | | | |
| Communication Services — 21.4% | | | | | | | | |
| Electronic Arts | | | 42,203 | | | | 6,907,365 | |
| Playtika Holding | | | 92,485 | | | | 778,724 | |
| ROBLOX, Cl A * | | | 155,168 | | | | 7,778,572 | |
| Take-Two Interactive Software * | | | 41,403 | | | | 7,799,497 | |
| | | | | | | | 23,264,158 | |
| Consumer Discretionary — 0.7% | | | | | | | | |
| Accel Entertainment, Cl A * | | | 69,040 | | | | 798,102 | |
| | | | | | | | | |
| Information Technology — 6.4% | | | | | | | | |
| Corsair Gaming * | | | 60,203 | | | | 442,492 | |
| Turtle Beach * | | | 19,580 | | | | 338,930 | |
The accompanying notes are an integral part of the financial statements.
57
| Schedule of Investments | November 30, 2024 |
| Global X Video Games & Esports ETF |
| | | Shares | | | Value | |
| COMMON STOCK — continued | | | | | | |
| Information Technology — continued | | | | | | |
| Unity Software * | | | 257,289 | | | $ | 6,203,238 | |
| | | | | | | | 6,984,660 | |
| TOTAL UNITED STATES | | | | | | | 31,046,920 | |
TOTAL COMMON STOCK
(Cost $154,861,278) | | | | | | | 108,579,391 | |
| | | | | | | | | |
| | | Face Amount | | | | | |
| U.S. TREASURY OBLIGATION — 2.7% | | | | | | | | |
U.S. Treasury Bills
4.567%, 12/31/24(B) | | $ | 3,000,000 | | | | 2,989,016 | |
TOTAL U.S. TREASURY OBLIGATION
(Cost $2,989,382) | | | | | | | 2,989,016 | |
| | | | | | | | | |
| REPURCHASE AGREEMENTS(C) — 3.2% | | | | | | | | |
Bank of America Securities, Inc.
4.590%, dated 11/29/2024, to be repurchased on 12/02/2024, repurchase price $824,787 (collateralized by various U.S. Government Obligations, ranging in par value $247 - $374,630, 1.500% - 7.500%, 02/01/2034 - 11/20/2054, with a total market value of $837,105) | | | 824,472 | | | | 824,472 | |
Citigroup Global Markets, Inc.
4.580%, dated 11/29/2024, to be repurchased on 12/02/2024, repurchase price $824,787 (collateralized by various U.S. Government Obligations and U.S. Treasury Obligations, ranging in par value $451 - $517,350, 1.500% - 6.500%, 01/01/2035 - 11/20/2054, with a total market value of $835,983) | | | 824,472 | | | | 824,472 | |
Deutsche Bank Securities, Inc.
4.570%, dated 11/29/2024, to be repurchased on 12/02/2024, repurchase price $824,786 (collateralized by various U.S. Government Obligations and U.S. Treasury Obligations, ranging in par value $33,788 - $311,112, 0.000% - 3.750%, 12/15/2024 - 05/15/2029, with a total market value of $836,785) | | | 824,472 | | | | 824,472 | |
The accompanying notes are an integral part of the financial statements.
58
| Schedule of Investments | November 30, 2024 |
| Global X Video Games & Esports ETF |
| | | Face Amount | | | Value | |
| REPURCHASE AGREEMENTS(C) — continued | | | | | | | | |
HSBC Securities USA, Inc.
4.590%, dated 11/29/2024, to be repurchased on 12/02/2024, repurchase price $210,124 (collateralized by various U.S. Government Obligations, ranging in par value $21 - $108,887, 1.730% - 7.000%, 02/01/2031 - 11/01/2054, with a total market value of $213,525) | | $ | 210,044 | | | $ | 210,044 | |
Nomura Securities International, Inc.
4.580%, dated 11/29/2024, to be repurchased on 12/02/2024, repurchase price $824,787 (collateralized by various U.S. Government Obligations, ranging in par value $642 - $190,530, 2.000% - 6.500%, 11/01/2035 - 05/01/2058, with a total market value of $837,593) | | | 824,472 | | | | 824,472 | |
TOTAL REPURCHASE AGREEMENTS
(Cost $3,507,932) | | | | | | | 3,507,932 | |
TOTAL INVESTMENTS — 105.7%
(Cost $161,358,592) | | | | | | $ | 115,076,339 | |
Percentages are based on Net Assets of $108,853,648.
| * | Non-income producing security. |
| (A) | This security or a partial position of this security is on loan at November 30, 2024. The total market value of securities on loan at November 30, 2024 was $4,545,919. |
| (B) | Interest rate represents the security’s effective yield at the time of purchase. |
| (C) | These securities were purchased with cash collateral held from securities on loan. The total value of such securities as of November 30, 2024 was $3,507,932. The total value of non-cash collateral held from securities on loan as of November 30, 2024 was $1,186,915. |
The accompanying notes are an integral part of the financial statements.
59
| Schedule of Investments | November 30, 2024 |
| Global X Video Games & Esports ETF |
The following is a summary of the level of inputs used as of November 30, 2024, in valuing the Fund’s investments carried at value:
| Investments in Securities | | Level 1 | | | Level 2 | | | Level 3 | | | Total | |
| Common Stock | | $ | 108,579,391 | | | $ | — | | | $ | — | | | $ | 108,579,391 | |
| U.S. Treasury Obligation | | | — | | | | 2,989,016 | | | | — | | | | 2,989,016 | |
| Repurchase Agreements | | | — | | | | 3,507,932 | | | | — | | | | 3,507,932 | |
| Total Investments in Securities | | $ | 108,579,391 | | | $ | 6,496,948 | | | $ | — | | | $ | 115,076,339 | |
Amounts designated as “—” are $0 or have been rounded to $0.
See “Glossary” for abbreviations.
The accompanying notes are an integral part of the financial statements.
60
| Schedule of Investments | November 30, 2024 |
| Global X Cybersecurity ETF |
| | | Shares | | | Value | |
| COMMON STOCK — 99.8% | | | | | | | | |
| ISRAEL — 10.0% | | | | | | | | |
| Information Technology — 10.0% | | | | | | | | |
| Check Point Software Technologies * | | | 257,123 | | | $ | 46,796,386 | |
| Radware * | | | 1,482,926 | | | | 35,234,322 | |
| | | | | | | | | |
| TOTAL ISRAEL | | | | | | | 82,030,708 | |
| JAPAN — 11.9% | | | | | | | | |
| Information Technology — 11.9% | | | | | | | | |
| Digital Arts (A) | | | 966,930 | | | | 38,822,705 | |
| Hennge (A) (B) | | | 2,687,287 | | | | 24,048,432 | |
| Trend Micro | | | 630,006 | | | | 34,519,555 | |
| | | | | | | | | |
| TOTAL JAPAN | | | | | | | 97,390,692 | |
| SOUTH KOREA — 4.0% | | | | | | | | |
| Information Technology — 4.0% | | | | | | | | |
| Ahnlab (A) | | | 774,330 | | | | 33,136,806 | |
| | | | | | | | | |
| UNITED STATES — 73.9% | | | | | | | | |
| Information Technology — 73.9% | | | | | | | | |
| A10 Networks | | | 2,278,889 | | | | 38,855,057 | |
| Crowdstrike Holdings, Cl A * | | | 150,024 | | | | 51,903,803 | |
| CyberArk Software * | | | 120,727 | | | | 39,056,392 | |
| Fortinet * | | | 566,212 | | | | 53,818,451 | |
| Gen Digital | | | 1,529,907 | | | | 47,197,631 | |
| Okta, Cl A * | | | 464,439 | | | | 36,021,889 | |
| OneSpan *(A) | | | 2,001,511 | | | | 36,267,379 | |
| Palo Alto Networks * | | | 123,585 | | | | 47,928,735 | |
| Qualys * | | | 280,089 | | | | 43,021,670 | |
| Rapid7 * | | | 825,937 | | | | 35,184,916 | |
| SentinelOne, Cl A * | | | 1,294,606 | | | | 36,184,238 | |
| Telos *(A) (B) | | | 5,999,315 | | | | 20,397,671 | |
| Tenable Holdings * | | | 842,861 | | | | 35,383,305 | |
| Varonis Systems, Cl B * | | | 662,842 | | | | 33,115,586 | |
| Zscaler * | | | 246,385 | | | | 50,900,677 | |
| | | | | | | | | |
| TOTAL UNITED STATES | | | | | | | 605,237,400 | |
TOTAL COMMON STOCK
(Cost $749,584,817) | | | | | | | 817,795,606 | |
The accompanying notes are an integral part of the financial statements.
61
| Schedule of Investments | November 30, 2024 |
| Global X Cybersecurity ETF |
| | | Face Amount | | | Value | |
| REPURCHASE AGREEMENTS(C) — 0.2% | | | | | | | | |
Bank of America Securities, Inc.
4.590%, dated 11/29/2024, to be repurchased on 12/02/2024, repurchase price $365,051 (collateralized by various U.S. Government Obligations, ranging in par value $109 - $165,811, 1.500% - 7.500%, 02/01/2034 - 11/20/2054, with a total market value of $370,502) | | $ | 364,911 | | | $ | 364,911 | |
Daiwa Capital Markets America, Inc.
4.580%, dated 11/29/2024, to be repurchased on 12/02/2024, repurchase price $92,994 (collateralized by various U.S. Government Obligations and U.S. Treasury Obligations, ranging in par value $13 - $18,164, 0.000% - 7.500%, 02/13/2025 - 12/01/2054, with a total market value of $94,466) | | | 92,959 | | | | 92,959 | |
Deutsche Bank Securities, Inc.
4.570%, dated 11/29/2024, to be repurchased on 12/02/2024, repurchase price $365,050 (collateralized by various U.S. Government Obligations and U.S. Treasury Obligations, ranging in par value $14,955 - $137,698, 0.000% - 3.750%, 12/15/2024 - 05/15/2029, with a total market value of $370,361) | | | 364,911 | | | | 364,911 | |
HSBC Securities USA, Inc.
4.590%, dated 11/29/2024, to be repurchased on 12/02/2024, repurchase price $365,051 (collateralized by various U.S. Government Obligations, ranging in par value $36 - $189,170, 1.730% - 7.000%, 02/01/2031 - 11/01/2054, with a total market value of $370,959) | | | 364,911 | | | | 364,911 | |
The accompanying notes are an integral part of the financial statements.
62
| Schedule of Investments | November 30, 2024 |
| Global X Cybersecurity ETF |
| | | Face Amount | | | Value | |
| REPURCHASE AGREEMENTS(C) — continued | | | | | | |
Nomura Securities International, Inc.
4.580%, dated 11/29/2024, to be repurchased on 12/02/2024, repurchase price $365,050 (collateralized by various U.S. Government Obligations, ranging in par value $284 - $84,328, 2.000% - 6.500%, 11/01/2035 - 05/01/2058, with a total market value of $370,718) | | $ | 364,911 | | | $ | 364,911 | |
TOTAL REPURCHASE AGREEMENTS
(Cost $1,552,603) | | | | | | | 1,552,603 | |
TOTAL INVESTMENTS — 100.0%
(Cost $751,137,420) | | | | | | $ | 819,348,209 | |
Percentages are based on Net Assets of $819,307,797.
| * | Non-income producing security. |
| (A) | Affiliated investment. |
| (B) | This security or a partial position of this security is on loan at November 30, 2024. The total market value of securities on loan at November 30, 2024 was $1,478,182. |
| (C) | These securities were purchased with cash collateral held from securities on loan. The total value of such securities as of November 30, 2024 was $1,552,603. The total value of non-cash collateral held from securities on loan as of November 30, 2024 was $0. |
| | |
The following is a summary of the level of inputs used as of November 30, 2024, in valuing the Fund’s investments carried at value:
| Investments in Securities | | Level 1 | | | Level 2 | | | Level 3 | | | Total | |
| Common Stock | | $ | 817,795,606 | | | $ | — | | | $ | — | | | $ | 817,795,606 | |
| Repurchase Agreements | | | — | | | | 1,552,603 | | | | — | | | | 1,552,603 | |
| Total Investments in Securities | | $ | 817,795,606 | | | $ | 1,552,603 | | | $ | — | | | $ | 819,348,209 | |
The accompanying notes are an integral part of the financial statements.
63
| Schedule of Investments | November 30, 2024 |
| Global X Cybersecurity ETF |
The following is a summary of the Fund’s transactions with affiliates for the year ended November 30, 2024:
Value
11/30/2023 | | | Purchases
at Cost | | | Proceeds
from Sales | | | Change in
Unrealized
Appreciation
(Depreciation) | | | Realized Gain
(Loss) | | | Value
11/30/2024 | | | Income | | | Capital Gains | |
| Ahnlab | | | | | | | | | | | | | | | | | | | | | | |
| $ | 18,800,567 | | | $ | 22,706,959 | | | $ | (2,996,470) | | | $ | (4,686,476) | | | $ | (687,774) | | | $ | 33,136,806 | | | $ | 352,218 | | | $ | — | |
| Digital Arts | | | | | | | | | | | | | | | | | | | | | | | | |
| | 16,045,266 | | | | 20,587,236 | | | | (2,948,111) | | | | 4,854,376 | | | | 283,938 | | | | 38,822,705 | | | | 305,801 | | | | — | |
| Hennge | | | | | | | | | | | | | | | | | | | | | | | | | | | | | |
| | 9,416,158 | | | | 14,293,876 | | | | (1,618,052) | | | | 1,935,450 | | | | 21,000 | | | | 24,048,432 | | | | 26,614 | | | | — | |
| OneSpan | | | | | | | | | | | | | | | | | | | | | | | | | | | | | |
| | 13,906,134 | | | | 12,709,727 | | | | (3,719,392) | | | | 12,209,148 | | | | 1,161,762 | | | | 36,267,379 | | | | — | | | | — | |
| Telos | | | | | | | | | | | | | | | | | | | | | | | | | | | | | |
| | 9,911,429 | | | | 17,614,382 | | | | (1,863,842) | | | | (5,405,194) | | | | 140,896 | | | | 20,397,671 | | | | — | | | | — | |
| Totals: | | | | | | | | | | | | | | | | | | | | | | | | | | | | | |
| | $ | 68,079,554 | | | $ | 87,912,180 | | | $ | (13,145,867) | | | $ | 8,907,304 | | | $ | 919,822 | | | $ | 152,672,993 | | | $ | 684,633 | | | $ | — | |
Amounts designated as “—” are $0 or have been rounded to $0.
See “Glossary” for abbreviations.
The accompanying notes are an integral part of the financial statements.
64
| Schedule of Investments | November 30, 2024 |
| Global X Telemedicine & Digital Health ETF |
| | | Shares | | | Value | |
| COMMON STOCK — 99.9% | | | | | | | | |
| AUSTRALIA — 4.9% | | | | | | | | |
| Health Care — 4.9% | | | | | | | | |
| Pro Medicus | | | 13,135 | | | $ | 2,155,367 | |
| | | | | | | | | |
| CHINA — 8.1% | | | | | | | | |
| Consumer Staples — 8.1% | | | | | | | | |
| Alibaba Health Information Technology * | | | 2,775,400 | | | | 1,301,824 | |
| JD Health International * | | | 444,800 | | | | 1,620,510 | |
| Ping An Healthcare and Technology * | | | 318,500 | | | | 607,404 | |
| | | | | | | | | |
| TOTAL CHINA | | | | | | | 3,529,738 | |
| GERMANY — 0.6% | | | | | | | | |
| Health Care — 0.6% | | | | | | | | |
| CompuGroup Medical | | | 14,595 | | | | 245,257 | |
| | | | | | | | | |
| JAPAN — 1.6% | | | | | | | | |
| Health Care — 1.6% | | | | | | | | |
| JMDC | | | 12,903 | | | | 352,247 | |
| Medley * | | | 11,308 | | | | 329,034 | |
| | | | | | | | | |
| TOTAL JAPAN | | | | | | | 681,281 | |
| SOUTH KOREA — 0.2% | | | | | | | | |
| Health Care — 0.2% | | | | | | | | |
| Genomictree * | | | 9,742 | | | | 91,341 | |
| | | | | | | | | |
| UNITED STATES — 84.5% | | | | | | | | |
| Financials — 3.8% | | | | | | | | |
| Oscar Health, Cl A * | | | 95,429 | | | | 1,653,785 | |
| | | | | | | | | |
| Health Care — 80.7% | | | | | | | | |
| Agilent Technologies | | | 12,313 | | | | 1,698,825 | |
| AMN Healthcare Services * | | | 20,760 | | | | 540,383 | |
| Definitive Healthcare, Cl A * | | | 27,334 | | | | 129,290 | |
| Dexcom * | | | 22,616 | | | | 1,763,822 | |
| DocGo * | | | 45,620 | | | | 197,535 | |
| Doximity, Cl A * | | | 39,571 | | | | 2,097,263 | |
| Evolent Health, Cl A * | | | 60,900 | | | | 786,828 | |
| Fulgent Genetics * | | | 10,821 | | | | 198,024 | |
The accompanying notes are an integral part of the financial statements.
65
| Schedule of Investments | November 30, 2024 |
| Global X Telemedicine & Digital Health ETF |
| | | Shares | | | Value | |
| COMMON STOCK — continued | | | | | | | | |
| Health Care — continued | | | | | | | | |
| GoodRx Holdings, Cl A * | | | 44,526 | | | $ | 215,506 | |
| Hims & Hers Health * | | | 76,654 | | | | 2,469,792 | |
| Illumina * | | | 11,457 | | | | 1,651,527 | |
| Insulet * | | | 6,975 | | | | 1,860,790 | |
| IQVIA Holdings * | | | 7,181 | | | | 1,442,232 | |
| iRhythm Technologies * | | | 16,918 | | | | 1,471,274 | |
| Labcorp Holdings | | | 7,452 | | | | 1,797,124 | |
| LifeMD * | | | 27,825 | | | | 183,367 | |
| LifeStance Health Group * | | | 61,033 | | | | 458,968 | |
| Masimo * | | | 11,538 | | | | 1,990,766 | |
| Omnicell * | | | 24,722 | | | | 1,151,798 | |
| Pacific Biosciences of California * (A) | | | 142,328 | | | | 271,846 | |
| Phreesia * | | | 29,693 | | | | 624,444 | |
| Privia Health Group * | | | 58,333 | | | | 1,252,993 | |
| QIAGEN | | | 38,899 | | | | 1,689,384 | |
| Quest Diagnostics | | | 10,431 | | | | 1,696,706 | |
| ResMed | | | 6,897 | | | | 1,717,491 | |
| Talkspace * | | | 70,170 | | | | 239,981 | |
| Tandem Diabetes Care * | | | 35,772 | | | | 1,095,696 | |
| Teladoc Health * | | | 92,820 | | | | 1,111,984 | |
| Twist Bioscience * | | | 30,903 | | | | 1,519,809 | |
| Veracyte * | | | 41,684 | | | | 1,790,328 | |
| | | | | | | | 35,115,776 | |
| TOTAL UNITED STATES | | | | | | | 36,769,561 | |
TOTAL COMMON STOCK
(Cost $83,118,470) | | | | | | | 43,472,545 | |
| | | | | | | | | |
| SHORT-TERM INVESTMENT(B)(C) — 0.2% | | | | | | | | |
Fidelity Investments Money Market Government Portfolio, Cl Institutional, 4.550%
(Cost $78,503) | | | 78,503 | | | | 78,503 | |
The accompanying notes are an integral part of the financial statements.
66
| Schedule of Investments | November 30, 2024 |
| Global X Telemedicine & Digital Health ETF |
| | | Face Amount | | | Value | |
| REPURCHASE AGREEMENT(C) — 0.3% | | | | | | | | |
RBC Capital Markets
4.500%, dated 11/29/2024, to be repurchased on 12/02/2024, repurchase price $134,350 (collateralized by a U.S. Treasury Obligation, par value $142,751, 0.375%, 12/31/2025, with a total market value of $136,827)
(Cost $134,299) | | $ | 134,299 | | | $ | 134,299 | |
TOTAL INVESTMENTS — 100.4%
(Cost $83,331,272) | | | | | | $ | 43,685,347 | |
Percentages are based on Net Assets of $43,510,577.
| * | Non-income producing security. |
| (A) | This security or a partial position of this security is on loan at November 30, 2024. The total market value of securities on loan at November 30, 2024 was $203,226. |
| (B) | The rate reported on the Schedule of Investments is the 7-day effective yield as of November 30, 2024. |
| (C) | These securities were purchased with cash collateral held from securities on loan. The total value of such securities as of November 30, 2024 was $212,802. The total value of non-cash collateral held from securities on loan as of November 30, 2024 was $0. |
The following is a summary of the level of inputs used as of November 30, 2024, in valuing the Fund’s investments carried at value:
| Investments in Securities | | Level 1 | | | Level 2 | | | Level 3 | | | Total | |
| Common Stock | | $ | 43,472,545 | | | $ | — | | | $ | — | | | $ | 43,472,545 | |
| Short-Term Investment | | | 78,503 | | | | — | | | | — | | | | 78,503 | |
| Repurchase Agreement | | | — | | | | 134,299 | | | | — | | | | 134,299 | |
| Total Investments in Securities | | $ | 43,551,048 | | | $ | 134,299 | | | $ | — | | | $ | 43,685,347 | |
Amounts designated as “—” are $0 or have been rounded to $0.
See “Glossary” for abbreviations.
The accompanying notes are an integral part of the financial statements.
67
| Schedule of Investments | November 30, 2024 |
| Global X CleanTech ETF |
| | | Shares | | | Value | |
| COMMON STOCK — 99.9% | | | | | | | | |
| CANADA — 2.2% | | | | | | | | |
| Industrials — 0.8% | | | | | | | | |
| Ballard Power Systems * (A) | | | 182,224 | | | $ | 271,514 | |
| | | | | | | | | |
| Information Technology — 1.4% | | | | | | | | |
| Canadian Solar * (A) | | | 40,087 | | | | 497,480 | |
| | | | | | | | | |
| TOTAL CANADA | | | | | | | 768,994 | |
| CHINA — 18.2% | | | | | | | | |
| Industrials — 6.8% | | | | | | | | |
| China Everbright Environment Group | | | 3,738,500 | | | | 1,686,314 | |
| Dongfang Electric, Cl H | | | 205,400 | | | | 246,800 | |
| Goldwind Science & Technology, Cl H | | | 466,800 | | | | 442,712 | |
| | | | | | | | 2,375,826 | |
| | | | | | | | | |
| Information Technology — 11.4% | | | | | | | | |
| Daqo New Energy ADR * (A) | | | 40,024 | | | | 801,681 | |
| Flat Glass Group, Cl H (A) | | | 268,200 | | | | 477,701 | |
| JinkoSolar Holding ADR, Ser ADR (A) | | | 32,212 | | | | 714,784 | |
| Xinyi Solar Holdings | | | 4,428,000 | | | | 1,957,492 | |
| | | | | | | | 3,951,658 | |
| TOTAL CHINA | | | | | | | 6,327,484 | |
| DENMARK — 4.2% | | | | | | | | |
| Industrials — 4.2% | | | | | | | | |
| Vestas Wind Systems * | | | 94,782 | | | | 1,472,537 | |
| | | | | | | | | |
| GERMANY — 5.8% | | | | | | | | |
| Industrials — 5.0% | | | | | | | | |
| Nordex * | | | 137,395 | | | | 1,734,144 | |
| | | | | | | | | |
| Information Technology — 0.8% | | | | | | | | |
| SMA Solar Technology | | | 21,068 | | | | 303,963 | |
| | | | | | | | | |
| TOTAL GERMANY | | | | | | | 2,038,107 | |
The accompanying notes are an integral part of the financial statements.
68
| Schedule of Investments | November 30, 2024 |
| Global X CleanTech ETF |
| | | Shares | | | Value | |
| COMMON STOCK — continued | | | | | | | | |
| NORWAY — 0.8% | | | | | | | | |
| Industrials — 0.8% | | | | | | | | |
| NEL * (A) | | | 1,011,790 | | | $ | 277,322 | |
| | | | | | | | | |
| SOUTH KOREA — 7.8% | | | | | | | | |
| Industrials — 3.6% | | | | | | | | |
| CS Wind | | | 25,571 | | | | 735,025 | |
| Doosan Fuel Cell * | | | 39,781 | | | | 526,402 | |
| | | | | | | | 1,261,427 | |
| | | | | | | | | |
| Information Technology — 4.2% | | | | | | | | |
| Samsung SDI | | | 8,016 | | | | 1,462,365 | |
| | | | | | | | | |
| TOTAL SOUTH KOREA | | | | | | | 2,723,792 | |
| SWITZERLAND — 3.7% | | | | | | | | |
| Information Technology — 3.7% | | | | | | | | |
| Landis+Gyr Group | | | 17,552 | | | | 1,275,060 | |
| | | | | | | | | |
| TAIWAN — 4.7% | | | | | | | | |
| Information Technology — 4.7% | | | | | | | | |
| Simplo Technology | | | 113,864 | | | | 1,321,514 | |
| United Renewable Energy * | | | 991,500 | | | | 328,129 | |
| | | | | | | | | |
| TOTAL TAIWAN | | | | | | | 1,649,643 | |
| TURKEY — 2.1% | | | | | | | | |
| Information Technology — 2.1% | | | | | | | | |
| Alfa Solar Enerji Sanayi VE Ticaret | | | 223,963 | | | | 325,622 | |
| Smart Gunes Enerjisi Teknolojileri ArGE Uretim Sanayi ve Ticaret * | | | 368,729 | | | | 416,978 | |
| | | | | | | | | |
| TOTAL TURKEY | | | | | | | 742,600 | |
| UNITED KINGDOM — 5.1% | | | | | | | | |
| Industrials — 1.2% | | | | | | | | |
| Ceres Power Holdings * (A) | | | 116,489 | | | | 245,933 | |
| ITM Power * (A) | | | 374,631 | | | | 161,995 | |
| | | | | | | | 407,928 | |
The accompanying notes are an integral part of the financial statements.
69
| Schedule of Investments | November 30, 2024 |
| Global X CleanTech ETF |
| | | Shares | | | Value | |
| COMMON STOCK — continued | | | | | | | | |
| Materials — 3.9% | | | | | | | | |
| Johnson Matthey | | | 78,905 | | | $ | 1,362,973 | |
| | | | | | | | | |
| TOTAL UNITED KINGDOM | | | | | | | 1,770,901 | |
| UNITED STATES — 45.3% | | | | | | | | |
| Consumer Discretionary — 4.1% | | | | | | | | |
| QuantumScape, Cl A * (A) | | | 274,192 | | | | 1,434,024 | |
| | | | | | | | | |
| Industrials — 30.1% | | | | | | | | |
| Ameresco, Cl A * | | | 20,926 | | | | 589,486 | |
| Array Technologies * | | | 92,451 | | | | 620,346 | |
| Bloom Energy, Cl A * (A) | | | 138,227 | | | | 3,794,331 | |
| Fluence Energy, Cl A * | | | 75,458 | | | | 1,419,365 | |
| NEXTracker, Cl A * | | | 60,908 | | | | 2,324,249 | |
| Plug Power * (A) | | | 533,960 | | | | 1,196,071 | |
| Shoals Technologies Group, Cl A * | | | 101,410 | | | | 529,360 | |
| | | | | | | | 10,473,208 | |
| | | | | | | | | |
| Information Technology — 11.1% | | | | | | | | |
| Enphase Energy * | | | 20,590 | | | | 1,469,096 | |
| First Solar * | | | 9,244 | | | | 1,842,052 | |
| SolarEdge Technologies * | | | 34,875 | | | | 551,025 | |
| | | | | | | | 3,862,173 | |
| TOTAL UNITED STATES | | | | | | | 15,769,405 | |
TOTAL COMMON STOCK
(Cost $100,428,863) | | | | | | | 34,815,845 | |
| | | | | | | | | |
| | | Face Amount | | | | | |
| REPURCHASE AGREEMENTS(B) — 20.4% | | | | | | | | |
Bank of America Securities, Inc.
4.590%, dated 11/29/2024, to be repurchased on 12/02/2024, repurchase price $1,667,468 (collateralized by various U.S. Government Obligations, ranging in par value $500 - $757,387, 1.500% - 7.500%, 02/01/2034 - 11/20/2054, with a total market value of $1,692,369) | | $ | 1,666,830 | | | | 1,666,830 | |
The accompanying notes are an integral part of the financial statements.
70
| Schedule of Investments | November 30, 2024 |
| Global X CleanTech ETF |
| | | Face Amount | | | Value | |
| REPURCHASE AGREEMENTS(B) — continued | | | | | | | | |
Daiwa Capital Markets America, Inc.
4.580%, dated 11/29/2024, to be repurchased on 12/02/2024, repurchase price $424,807 (collateralized by various U.S. Treasury Obligations, ranging in par value $58 - $82,973, 0.000% - 7.500%, 02/13/2025 - 12/01/2054, with a total market value of $431,528) | | $ | 424,645 | | | $ | 424,645 | |
Deutsche Bank Securities, Inc.
4.570%, dated 11/29/2024, to be repurchased on 12/02/2024, repurchase price $1,667,465 (collateralized by various U.S. Treasury Obligations, ranging in par value $68,309 - $628,973, 0.000% - 3.750%, 12/15/2024 - 05/15/2029, with a total market value of $1,691,724) | | | 1,666,830 | | | | 1,666,830 | |
HSBC Securities USA, Inc.
4.590%, dated 11/29/2024, to be repurchased on 12/02/2024, repurchase price $1,667,468 (collateralized by various U.S. Government Obligations, ranging in par value $167 - $864,085, 1.730% - 7.000%, 02/01/2031 - 11/01/2054, with a total market value of $1,694,455) | | | 1,666,830 | | | | 1,666,830 | |
Nomura Securities International, Inc.
4.580%, dated 11/29/2024, to be repurchased on 12/02/2024, repurchase price $1,667,466 (collateralized by various U.S. Government Obligations, ranging in par value $1,299 - $385,192, 2.000% - 6.500%, 11/01/2035 - 05/01/2058, with a total market value of $1,693,357) | | | 1,666,830 | | | | 1,666,830 | |
TOTAL REPURCHASE AGREEMENTS
(Cost $7,091,965) | | | | | | | 7,091,965 | |
TOTAL INVESTMENTS — 120.3%
(Cost $107,520,828) | | | | | | $ | 41,907,810 | |
Percentages are based on Net Assets of $34,845,558.
The accompanying notes are an integral part of the financial statements.
71
| Schedule of Investments | November 30, 2024 |
| Global X CleanTech ETF |
| * | Non-income producing security. |
| (A) | This security or a partial position of this security is on loan at November 30, 2024. The total market value of securities on loan at November 30, 2024 was $7,190,765. |
| (B) | These securities were purchased with cash collateral held from securities on loan. The total value of such securities as of November 30, 2024 was $7,091,965. The total value of non-cash collateral held from securities on loan as of November 30, 2024 was $314,535. |
The following is a summary of the level of inputs used as of November 30, 2024, in valuing the Fund’s investments carried at value:
| Investments in Securities | | Level 1 | | | Level 2 | | | Level 3 | | | Total | |
| Common Stock | | $ | 34,815,845 | | | $ | — | | | $ | — | | | $ | 34,815,845 | |
| Repurchase Agreements | | | — | | | | 7,091,965 | | | | — | | | | 7,091,965 | |
| Total Investments in Securities | | $ | 34,815,845 | | | $ | 7,091,965 | | | $ | — | | | $ | 41,907,810 | |
Amounts designated as “—” are $0 or have been rounded to $0.
See “Glossary” for abbreviations.
The accompanying notes are an integral part of the financial statements.
72
| Schedule of Investments | November 30, 2024 |
| Global X Data Center & Digital Infrastructure ETF |
| | | Shares | | | Value | |
| COMMON STOCK — 99.7% | | | | | | | | |
| AUSTRALIA — 3.5% | | | | | | | | |
| Information Technology — 3.5% | | | | | | | | |
| NEXTDC * | | | 459,567 | | | $ | 4,870,984 | |
| | | | | | | | | |
| CHINA — 14.0% | | | | | | | | |
| Communication Services — 4.1% | | | | | | | | |
| China Tower, Cl H | | | 42,814,500 | | | | 5,612,094 | |
| | | | | | | | | |
| Information Technology — 9.9% | | | | | | | | |
| GDS Holdings ADR * | | | 489,259 | | | | 9,633,510 | |
| Vnet Group ADR * | | | 1,063,613 | | | | 4,126,818 | |
| | | | | | | | 13,760,328 | |
| TOTAL CHINA | | | | | | | 19,372,422 | |
| INDONESIA — 4.3% | | | | | | | | |
| Communication Services — 4.3% | | | | | | | | |
| Dayamitra Telekomunikasi | | | 55,683,800 | | | | 2,178,855 | |
| Sarana Menara Nusantara | | | 83,188,561 | | | | 3,701,353 | |
| | | | | | | | | |
| TOTAL INDONESIA | | | | | | | 5,880,208 | |
| NIGERIA — 1.5% | | | | | | | | |
| Communication Services — 1.5% | | | | | | | | |
| IHS Holding * | | | 653,820 | | | | 2,124,915 | |
| | | | | | | | | |
| SINGAPORE — 4.7% | | | | | | | | |
| Real Estate — 4.7% | | | | | | | | |
| Keppel DC REIT ‡ | | | 3,894,156 | | | | 6,448,384 | |
| | | | | | | | | |
| SOUTH KOREA — 0.5% | | | | | | | | |
| Communication Services — 0.5% | | | | | | | | |
| KINX | | | 12,464 | | | | 668,297 | |
| | | | | | | | | |
| TAIWAN — 2.6% | | | | | | | | |
| Information Technology — 2.6% | | | | | | | | |
| Winbond Electronics * | | | 3,218,319 | | | | 1,590,186 | |
| Wiwynn | | | 34,240 | | | | 2,039,664 | |
| | | | | | | | | |
| TOTAL TAIWAN | | | | | | | 3,629,850 | |
The accompanying notes are an integral part of the financial statements.
73
| Schedule of Investments | November 30, 2024 |
| Global X Data Center & Digital Infrastructure ETF |
| | | Shares | | | Value | |
| COMMON STOCK — continued | | | | | | | | |
| UNITED STATES — 68.6% | | | | | | | | |
| Industrials — 2.6% | | | | | | | | |
| Vertiv Holdings, Cl A | | | 28,589 | | | $ | 3,647,956 | |
| | | | | | | | | |
| Information Technology — 11.3% | | | | | | | | |
| Advanced Micro Devices * | | | 13,957 | | | | 1,914,552 | |
| Applied Digital * | | | 456,406 | | | | 4,609,701 | |
| Intel | | | 72,707 | | | | 1,748,603 | |
| Microchip Technology | | | 27,225 | | | | 1,855,928 | |
| Micron Technology | | | 19,041 | | | | 1,865,066 | |
| NVIDIA | | | 19,509 | | | | 2,697,119 | |
| Super Micro Computer * | | | 28,126 | | | | 918,033 | |
| | | | | | | | 15,609,002 | |
| | | | | | | | | |
| Real Estate — 54.7% | | | | | | | | |
| American Tower ‡ | | | 72,291 | | | | 15,108,819 | |
| Crown Castle ‡ | | | 109,828 | | | | 11,669,225 | |
| Digital Realty Trust ‡ | | | 94,612 | | | | 18,514,622 | |
| Equinix ‡ | | | 18,782 | | | | 18,434,158 | |
| SBA Communications, Cl A ‡ | | | 26,921 | | | | 6,090,876 | |
| Uniti Group ‡ | | | 986,900 | | | | 5,832,579 | |
| | | | | | | | 75,650,279 | |
| TOTAL UNITED STATES | | | | | | | 94,907,237 | |
TOTAL COMMON STOCK
(Cost $127,090,701) | | | | | | | 137,902,297 | |
| | | | | | | | | |
| | | Face Amount | | | | | |
| U.S. TREASURY OBLIGATION — 7.9% | | | | | | | | |
U.S. Treasury Bill
4.567%, 12/31/2024(A) | | $ | 11,000,000 | | | | 10,959,726 | |
TOTAL U.S. TREASURY OBLIGATION
(Cost $10,961,069) | | | | | | | 10,959,726 | |
The accompanying notes are an integral part of the financial statements.
74
| Schedule of Investments | November 30, 2024 |
| Global X Data Center & Digital Infrastructure ETF |
| | | Number of
Rights | | | Value | |
| RIGHT — 0.1% | | | | | | | | |
| Singapore — 0.1% | | | | | | | | |
Keppel DC REIT*(B)
Expires 12/10/2024 | | | 334,897 | | | $ | 47,462 | |
| | | | | | | | | |
TOTAL RIGHT
(Cost $–) | | | | | | | 47,462 | |
TOTAL INVESTMENTS — 107.7%
(Cost $138,051,770) | | | | | | $ | 148,909,485 | |
Percentages are based on Net Assets of $138,296,999.
| * | Non-income producing security. |
| ‡ | Real Estate Investment Trust |
| (A) | Interest rate represents the security’s effective yield at the time of purchase. |
| (B) | Level 3 security in accordance with fair value hierarchy. |
The following is a summary of the level of inputs used as of November 30, 2024, in valuing the Fund’s investments carried at value:
| Investments in Securities | | Level 1 | | | Level 2 | | | Level 3(1) | | | Total | |
| Common Stock | | $ | 137,902,297 | | | $ | — | | | $ | — | | | $ | 137,902,297 | |
| U.S. Treasury Obligation | | | — | | | | 10,959,726 | | | | — | | | | 10,959,726 | |
| Right | | | — | | | | — | | | | 47,462 | | | | 47,462 | |
| Total Investments in Securities | | $ | 137,902,297 | | | $ | 10,959,726 | | | $ | 47,462 | | | $ | 148,909,485 | |
(1) A reconciliation of Level 3 investments and disclosures of significant unobservable inputs are presented when the Fund has a significant amount of Level 3 investments at the end of the period in relation to Net Assets. Management has concluded that Level 3 investments are not material in relation to Net Assets.
Amounts designated as “—” are $0 or have been rounded to $0.
See “Glossary” for abbreviations.
The accompanying notes are an integral part of the financial statements.
75
| Schedule of Investments | November 30, 2024 |
| Global X Clean Water ETF |
| | | Shares | | | Value | |
| COMMON STOCK — 99.7% | | | | | | | | |
| BRAZIL — 4.5% | | | | | | | | |
| Utilities — 4.5% | | | | | | | | |
| Cia de Saneamento Basico do Estado de Sao Paulo SABESP | | | 27,894 | | | $ | 434,389 | |
| Cia de Saneamento de Minas Gerais Copasa MG | | | 10,585 | | | | 44,995 | |
| | | | | | | | | |
| TOTAL BRAZIL | | | | | | | 479,384 | |
| CHINA — 4.3% | | | | | | | | |
| Industrials — 0.9% | | | | | | | | |
| Beijing Originwater Technology, Cl A | | | 116,500 | | | | 94,156 | |
| | | | | | | | | |
| Utilities — 3.4% | | | | | | | | |
| Beijing Capital Eco-Environment Protection Group, Cl A | | | 223,400 | | | | 101,061 | |
| Beijing Enterprises Water Group | | | 235,740 | | | | 64,528 | |
| Chengdu Xingrong Environment, Cl A | | | 80,500 | | | | 78,273 | |
| Chongqing Water Group, Cl A | | | 46,500 | | | | 31,810 | |
| Guangdong Investment | | | 141,100 | | | | 88,487 | |
| | | | | | | | 364,159 | |
| TOTAL CHINA | | | | | | | 458,315 | |
| JAPAN — 3.0% | | | | | | | | |
| Industrials — 3.0% | | | | | | | | |
| Kurita Water Industries | | | 5,799 | | | | 220,091 | |
| Nomura Micro Science | | | 1,636 | | | | 19,237 | |
| Organo | | | 1,462 | | | | 82,939 | |
| | | | | | | | | |
| TOTAL JAPAN | | | | | | | 322,267 | |
| MALAYSIA — 0.3% | | | | | | | | |
| Utilities — 0.3% | | | | | | | | |
| Ranhill Utilities * | | | 103,584 | | | | 31,693 | |
| | | | | | | | | |
| SAUDI ARABIA — 0.3% | | | | | | | | |
| Utilities — 0.3% | | | | | | | | |
| AlKhorayef Water & Power Technologies * | | | 819 | | | | 31,392 | |
The accompanying notes are an integral part of the financial statements.
76
| Schedule of Investments | November 30, 2024 |
| Global X Clean Water ETF |
| | | Shares | | | Value | |
| COMMON STOCK — continued | | | | | | | | |
| SINGAPORE — 0.8% | | | | | | | | |
| Materials — 0.8% | | | | | | | | |
| Keppel Infrastructure Trust | | | 258,318 | | | $ | 86,706 | |
| | | | | | | | | |
| SOUTH KOREA — 1.2% | | | | | | | | |
| Consumer Discretionary — 1.2% | | | | | | | | |
| Coway | | | 2,717 | | | | 128,347 | |
| | | | | | | | | |
| UNITED KINGDOM — 9.1% | | | | | | | | |
| Utilities — 9.1% | | | | | | | | |
| Severn Trent | | | 13,892 | | | | 476,221 | |
| United Utilities Group | | | 35,034 | | | | 498,514 | |
| | | | | | | | | |
| TOTAL UNITED KINGDOM | | | | | | | 974,735 | |
| UNITED STATES — 76.2% | | | | | | | | |
| Industrials — 47.7% | | | | | | | | |
| A O Smith | | | 5,595 | | | | 416,772 | |
| Advanced Drainage Systems | | | 2,995 | | | | 405,193 | |
| Core & Main, Cl A * | | | 9,773 | | | | 474,479 | |
| Energy Recovery * | | | 3,363 | | | | 52,328 | |
| Ferguson Enterprises | | | 4,091 | | | | 883,370 | |
| Franklin Electric | | | 2,116 | | | | 229,163 | |
| Mueller Water Products, Cl A | | | 8,189 | | | | 205,053 | |
| Pentair PLC | | | 8,308 | | | | 905,489 | |
| Reliance Worldwide | | | 35,511 | | | | 126,309 | |
| Watts Water Technologies, Cl A | | | 1,436 | | | | 309,874 | |
| Xylem | | | 6,119 | | | | 775,583 | |
| Zurn Elkay Water Solutions | | | 7,758 | | | | 308,924 | |
| | | | | | | | 5,092,537 | |
| Information Technology — 3.2% | | | | | | | | |
| Badger Meter | | | 1,596 | | | | 346,045 | |
| | | | | | | | | |
| Materials — 7.7% | | | | | | | | |
| Ecolab | | | 3,324 | | | | 826,911 | |
| | | | | | | | | |
| Utilities — 17.6% | | | | | | | | |
| American States Water | | | 2,114 | | | | 180,345 | |
| American Water Works | | | 5,880 | | | | 805,207 | |
The accompanying notes are an integral part of the financial statements.
77
| Schedule of Investments | November 30, 2024 |
| Global X Clean Water ETF |
| | | Shares | | | Value | |
| COMMON STOCK — continued | | | | | | | | |
| Utilities — continued | | | | | | | | |
| Artesian Resources, Cl A | | | 863 | | | $ | 29,981 | |
| California Water Service Group | | | 3,224 | | | | 165,036 | |
| Consolidated Water | | | 1,120 | | | | 30,162 | |
| Essential Utilities | | | 12,039 | | | | 481,921 | |
| Middlesex Water | | | 944 | | | | 61,771 | |
| SJW Group | | | 1,686 | | | | 93,944 | |
| York Water | | | 813 | | | | 29,138 | |
| | | | | | | | 1,877,505 | |
| TOTAL UNITED STATES | | | | | | | 8,142,998 | |
TOTAL COMMON STOCK
(Cost $9,018,742) | | | | | | | 10,655,837 | |
TOTAL INVESTMENTS — 99.7%
(Cost $9,018,742) | | | | | | $ | 10,655,837 | |
Percentages are based on Net Assets of $10,687,200.
| * | Non-income producing security. |
The following is a summary of the level of inputs used as of November 30, 2024, in valuing the Fund’s investments carried at value:
| Investments in Securities | | Level 1 | | | Level 2 | | | Level 3 | | | Total | |
| Common Stock | | $ | 10,624,445 | | | $ | 31,392 | | | $ | — | | | $ | 10,655,837 | |
| Total Investments in Securities | | $ | 10,624,445 | | | $ | 31,392 | | | $ | — | | | $ | 10,655,837 | |
Amounts designated as “—” are $0 or have been rounded to $0.
See “Glossary” for abbreviations.
The accompanying notes are an integral part of the financial statements.
78
| Schedule of Investments | November 30, 2024 |
| Global X AgTech & Food Innovation ETF |
| | | Shares | | | Value | |
| COMMON STOCK — 99.8% | | | | | | | | |
| ARGENTINA — 1.1% | | | | | | | | |
| Materials — 1.1% | | | | | | | | |
| Bioceres Crop Solutions * | | | 7,071 | | | $ | 50,346 | |
| | | | | | | | | |
| AUSTRALIA — 3.7% | | | | | | | | |
| Materials — 3.7% | | | | | | | | |
| Nufarm | | | 70,133 | | | | 173,615 | |
| | | | | | | | | |
| CANADA — 11.6% | | | | | | | | |
| Consumer Staples — 0.3% | | | | | | | | |
| Maple Leaf Foods | | | 835 | | | | 13,567 | |
| | | | | | | | | |
| Materials — 11.3% | | | | | | | | |
| Nutrien | | | 11,459 | | | | 534,677 | |
| | | | | | | | | |
| TOTAL CANADA | | | | | | | 548,244 | |
| CHINA — 11.9% | | | | | | | | |
| Consumer Staples — 11.9% | | | | | | | | |
| Cheng De Lolo, Cl A | | | 125,480 | | | | 159,390 | |
| Hebei Yangyuan Zhihui Beverage, Cl A | | | 68,700 | | | | 203,145 | |
| Yuan Longping High-tech Agriculture, Cl A | | | 123,500 | | | | 188,897 | |
| Zhe Jiang Li Zi Yuan Food, Cl A | | | 8,600 | | | | 13,118 | |
| | | | | | | | | |
| TOTAL CHINA | | | | | | | 564,550 | |
| GERMANY — 2.0% | | | | | | | | |
| Health Care — 2.0% | | | | | | | | |
| Bayer | | | 4,511 | | | | 92,375 | |
| | | | | | | | | |
| JAPAN — 11.2% | | | | | | | | |
| Industrials — 11.2% | | | | | | | | |
| Kubota | | | 42,625 | | | | 531,589 | |
| | | | | | | | | |
| PHILIPPINES — 0.3% | | | | | | | | |
| Consumer Staples — 0.3% | | | | | | | | |
| Monde Nissin | | | 79,305 | | | | 12,524 | |
The accompanying notes are an integral part of the financial statements.
79
| Schedule of Investments | November 30, 2024 |
| Global X AgTech & Food Innovation ETF |
| | | Shares | | | Value | |
| COMMON STOCK — continued | | | | | | | | |
| THAILAND — 0.3% | | | | | | | | |
| Consumer Staples — 0.3% | | | | | | | | |
| NR Instant Produce NVDR * | | | 305,300 | | | $ | 13,797 | |
| | | | | | | | | |
| UNITED KINGDOM — 4.2% | | | | | | | | |
| Consumer Staples — 4.2% | | | | | | | | |
| Barr | | | 1,661 | | | | 13,047 | |
| Unilever | | | 3,112 | | | | 185,949 | |
| | | | | | | | | |
| TOTAL UNITED KINGDOM | | | | | | | 198,996 | |
| UNITED STATES — 53.5% | | | | | | | | |
| Consumer Discretionary — 0.6% | | | | | | | | |
| GrowGeneration * | | | 14,760 | | | | 28,634 | |
| | | | | | | | | |
| Consumer Staples — 9.6% | | | | | | | | |
| Archer-Daniels-Midland | | | 1,918 | | | | 104,723 | |
| Beyond Meat * | | | 16,799 | | | | 83,659 | |
| Hain Celestial Group * | | | 1,980 | | | | 16,375 | |
| Kellanova | | | 1,069 | | | | 86,899 | |
| Laird Superfood * | | | 1,466 | | | | 13,282 | |
| Oatly Group ADR * | | | 145,455 | | | | 101,702 | |
| Sprouts Farmers Market * | | | 300 | | | | 46,344 | |
| | | | | | | | 452,984 | |
| Industrials — 24.9% | | | | | | | | |
| AGCO | | | 2,234 | | | | 226,103 | |
| CNH Industrial | | | 19,667 | | | | 247,018 | |
| Deere | | | 1,368 | | | | 637,351 | |
| Titan Machinery * | | | 4,491 | | | | 69,386 | |
| | | | | | | | 1,179,858 | |
| Information Technology — 1.2% | | | | | | | | |
| Trimble * | | | 758 | | | | 55,311 | |
| | | | | | | | | |
| Materials — 17.2% | | | | | | | | |
| Corteva | | | 9,426 | | | | 586,674 | |
| FMC | | | 3,606 | | | | 213,078 | |
The accompanying notes are an integral part of the financial statements.
80
| Schedule of Investments | November 30, 2024 |
| Global X AgTech & Food Innovation ETF |
| | | Shares | | | Value | |
| COMMON STOCK — continued | | | | | | | | |
| Materials — continued | | | | | | | | |
| Scotts Miracle-Gro, Cl A | | | 185 | | | $ | 14,262 | |
| | | | | | | | 814,014 | |
| TOTAL UNITED STATES | | | | | | | 2,530,801 | |
TOTAL COMMON STOCK
(Cost $5,170,400) | | | | | | | 4,716,837 | |
TOTAL INVESTMENTS — 99.8%
(Cost $5,170,400) | | | | | | $ | 4,716,837 | |
Percentages are based on Net Assets of $4,726,170.
| * | Non-income producing security. |
As of November 30, 2024, all of the Fund’s investments were considered Level 1, in accordance with authoritative guidance on fair value measurements and disclosure under U.S. GAAP.
See “Glossary” for abbreviations.
The accompanying notes are an integral part of the financial statements.
81
| Schedule of Investments | November 30, 2024 |
| Global X Blockchain ETF |
| | | Shares | | | Value | |
| COMMON STOCK — 99.8% | | | | | | | | |
| AUSTRALIA — 4.7% | | | | | | | | |
| Information Technology — 4.7% | | | | | | | | |
| Iris Energy * (A) | | | 789,300 | | | $ | 10,663,443 | |
| | | | | | | | | |
| CANADA — 11.1% | | | | | | | | |
| Information Technology — 11.1% | | | | | | | | |
| Bitfarms * (A) | | | 3,805,528 | | | | 8,425,624 | |
| Hive Digital Technologies * (A) | | | 700,864 | | | | 2,903,268 | |
| Hut 8 * (A) | | | 488,895 | | | | 13,841,230 | |
| | | | | | | | | |
| TOTAL CANADA | | | | | | | 25,170,122 | |
| CHINA — 3.4% | | | | | | | | |
| Financials — 0.4% | | | | | | | | |
| OSL Group * (A) | | | 923,900 | | | | 926,091 | |
| | | | | | | | | |
| Information Technology — 3.0% | | | | | | | | |
| Canaan ADR * (A) | | | 3,221,120 | | | | 6,828,774 | |
| | | | | | | | | |
| TOTAL CHINA | | | | | | | 7,754,865 | |
| GERMANY — 1.3% | | | | | | | | |
| Financials — 0.4% | | | | | | | | |
| Bitcoin Group | | | 15,787 | | | | 967,106 | |
| | | | | | | | | |
| Information Technology — 0.9% | | | | | | | | |
| Northern Data * | | | 51,589 | | | | 2,048,761 | |
| | | | | | | | | |
| TOTAL GERMANY | | | | | | | 3,015,867 | |
| JAPAN — 1.7% | | | | | | | | |
| Financials — 1.7% | | | | | | | | |
| SBI Holdings | | | 151,990 | | | | 3,825,430 | |
| | | | | | | | | |
| THAILAND — 0.4% | | | | | | | | |
| Communication Services — 0.4% | | | | | | | | |
| Jasmine Technology Solution NVDR * | | | 447,800 | | | | 845,398 | |
The accompanying notes are an integral part of the financial statements.
82
| Schedule of Investments | November 30, 2024 |
| Global X Blockchain ETF |
| | | Shares | | | Value | |
| COMMON STOCK — continued | | | | | | | | |
| UNITED STATES — 77.2% | | | | | | | | |
| Financials — 21.6% | | | | | | | | |
| Bakkt Holdings, Cl A * (A) | | | 76,488 | | | $ | 2,130,191 | |
| Block, Cl A * | | | 44,585 | | | | 3,948,002 | |
| Coinbase Global, Cl A * | | | 95,042 | | | | 28,151,440 | |
| Galaxy Digital Holdings * (A) | | | 560,280 | | | | 10,248,024 | |
| Robinhood Markets, Cl A * | | | 119,659 | | | | 4,491,999 | |
| | | | | | | | 48,969,656 | |
| Information Technology — 55.6% | | | | | | | | |
| Applied Digital * | | | 907,512 | | | | 9,165,871 | |
| Bit Digital * (A) | | | 1,624,244 | | | | 7,487,765 | |
| Cipher Mining * | | | 1,337,160 | | | | 8,958,972 | |
| Cleanspark * (A) | | | 767,933 | | | | 11,019,839 | |
| Core Scientific * | | | 1,457,406 | | | | 26,058,419 | |
| MARA Holdings * | | | 1,142,243 | | | | 31,320,303 | |
| NVIDIA | | | 22,862 | | | | 3,160,671 | |
| Riot Platforms * | | | 1,515,890 | | | | 19,176,008 | |
| Stronghold Digital Mining, Cl A * | | | 162,319 | | | | 844,059 | |
| TeraWulf * | | | 1,144,366 | | | | 9,029,048 | |
| | | | | | | | 126,220,955 | |
| TOTAL UNITED STATES | | | | | | | 175,190,611 | |
TOTAL COMMON STOCK
(Cost $137,465,462) | | | | | | | 226,465,736 | |
| | | | | | | | |
| | | Face Amount | | | | | |
| REPURCHASE AGREEMENTS(B) — 15.0% | | | | | | | | |
Bank of America Securities, Inc.
4.590%, dated 11/29/2024, to be repurchased on 12/02/2024, repurchase price $7,972,928 (collateralized by various U.S. Government Obligations, ranging in par value $2,391 - $3,621,416, 1.500% - 7.500%, 02/01/2034 - 11/20/2054, with a total market value of $8,091,994) | | $ | 7,969,880 | | | | 7,969,880 | |
The accompanying notes are an integral part of the financial statements.
83
| Schedule of Investments | November 30, 2024 |
| Global X Blockchain ETF |
| | | Face Amount | | | Value | |
| REPURCHASE AGREEMENTS(B) — continued | | | | | | | | |
Deutsche Bank Securities, Inc.
4.570%, dated 11/29/2024, to be repurchased on 12/02/2024, repurchase price $7,972,915 (collateralized by various U.S. Treasury Obligations, ranging in par value $326,617 - $3,007,407, 0.000% - 3.750%, 12/15/2024 - 05/15/2029, with a total market value of $8,088,908) | | $ | 7,969,880 | | | $ | 7,969,880 | |
HSBC Securities USA, Inc.
4.590%, dated 11/29/2024, to be repurchased on 12/02/2024, repurchase price $7,050,084 (collateralized by various U.S. Government Obligations, ranging in par value $705 - $3,653,366, 1.730% - 7.000%, 02/01/2031 - 11/01/2054, with a total market value of $7,164,186) | | | 7,047,388 | | | | 7,047,388 | |
Nomura Securities International, Inc.
4.580%, dated 11/29/2024, to be repurchased on 12/02/2024, repurchase price $7,972,922 (collateralized by various U.S. Government Obligations, ranging in par value $6,210 - $1,841,782, 2.000% - 6.500%, 11/01/2035 - 05/01/2058, with a total market value of $8,096,716) | | | 7,969,880 | | | | 7,969,880 | |
Santander US Capital Markets LLC
4.650%, dated 11/29/2024, to be repurchased on 12/02/2024, repurchase price $2,954,380 (collateralized by various U.S. Government Obligations, ranging in par value $1,426 - $656,275, 0.010% - 6.917%, 05/27/2031 - 09/20/2070, with a total market value of $3,007,869) | | | 2,953,236 | | | | 2,953,236 | |
| | | | | | | | | |
TOTAL REPURCHASE AGREEMENTS
(Cost $33,910,264) | | | | | | | 33,910,264 | |
TOTAL INVESTMENTS — 114.8%
(Cost $171,375,726) | | | | | | $ | 260,376,000 | |
Percentages are based on Net Assets of $226,775,697.
The accompanying notes are an integral part of the financial statements.
84
| Schedule of Investments | November 30, 2024 |
| Global X Blockchain ETF |
| * | Non-income producing security. |
| (A) | This security or a partial position of this security is on loan at November 30, 2024. The total market value of securities on loan at November 30, 2024 was $33,850,524. |
| (B) | These securities were purchased with cash collateral held from securities on loan. The total value of such securities as of November 30, 2024 was $33,910,264. The total value of non-cash collateral held from securities on loan as of November 30, 2024 was $320,187. |
The following is a summary of the level of inputs used as of November 30, 2024, in valuing the Fund’s investments carried at value:
| Investments in Securities | | Level 1 | | | Level 2 | | | Level 3 | | | Total | |
| Common Stock | | $ | 226,465,736 | | | $ | — | | | $ | — | | | $ | 226,465,736 | |
| Repurchase Agreements | | | — | | | | 33,910,264 | | | | — | | | | 33,910,264 | |
| Total Investments in Securities | | $ | 226,465,736 | | | $ | 33,910,264 | | | $ | — | | | $ | 260,376,000 | |
Amounts designated as “—” are $0 or have been rounded to $0.
See “Glossary” for abbreviations.
The accompanying notes are an integral part of the financial statements.
85
| Schedule of Investments | November 30, 2024 |
| Global X Hydrogen ETF |
| | | Shares | | | Value | |
| COMMON STOCK — 98.4% | | | | | | | | |
| CANADA — 4.8% | | | | | | | | |
| Industrials — 4.8% | | | | | | | | |
| Ballard Power Systems * (A) | | | 1,180,199 | | | $ | 1,758,496 | |
| NFI Group * | | | 16,060 | | | | 167,924 | |
| | | | | | | | | |
| TOTAL CANADA | | | | | | | 1,926,420 | |
| CHINA — 1.8% | | | | | | | | |
| Energy — 0.3% | | | | | | | | |
| Houpu Clean Energy Group, Cl A * | | | 60,900 | | | | 89,537 | |
| | | | | | | | | |
| Industrials — 1.1% | | | | | | | | |
| Beijing Sinohytec, Cl H * | | | 187,240 | | | | 449,960 | |
| | | | | | | | | |
| Information Technology — 0.4% | | | | | | | | |
| Shenzhen Everwin Precision Technology, Cl A* | | | 73,800 | | | | 168,963 | |
| | | | | | | | | |
| TOTAL CHINA | | | | | | | 708,460 | |
| DENMARK — 3.0% | | | | | | | | |
| Industrials — 3.0% | | | | | | | | |
| Green Hydrogen Systems, Cl A * (A) | | | 2,433,202 | | | | 1,226,767 | |
| | | | | | | | | |
| FRANCE — 0.3% | | | | | | | | |
| Consumer Discretionary — 0.2% | | | | | | | | |
| Opmobility | | | 10,065 | | | | 92,540 | |
| | | | | | | | | |
| Industrials — 0.1% | | | | | | | | |
| McPhy Energy * | | | 42,952 | | | | 44,640 | |
| | | | | | | | | |
| TOTAL FRANCE | | | | | | | 137,180 | |
| GERMANY — 3.5% | | | | | | | | |
| Industrials — 3.5% | | | | | | | | |
| SFC Energy * | | | 79,539 | | | | 1,401,272 | |
| | | | | | | | | |
| JAPAN — 1.6% | | | | | | | | |
| Consumer Discretionary — 1.6% | | | | | | | | |
| Toyota Motor | | | 37,949 | | | | 644,717 | |
The accompanying notes are an integral part of the financial statements.
86
| Schedule of Investments | November 30, 2024 |
| Global X Hydrogen ETF |
| | | Shares | | | Value | |
| COMMON STOCK — continued | | | | | | | | |
| NORWAY — 12.2% | | | | | | | | |
| Industrials — 12.2% | | | | | | | | |
| Hexagon Purus * | | | 2,893,908 | | | $ | 1,445,023 | |
| NEL * (A) | | | 12,822,502 | | | | 3,514,524 | |
| | | | | | | | | |
| TOTAL NORWAY | | | | | | | 4,959,547 | |
| SINGAPORE — 0.2% | | | | | | | | |
| Materials — 0.2% | | | | | | | | |
| Nanofilm Technologies International | | | 159,500 | | | | 92,798 | |
| | | | | | | | | |
| SOUTH KOREA — 12.9% | | | | | | | | |
| Consumer Discretionary — 3.7% | | | | | | | | |
| Iljin Hysolus ltd * | | | 114,991 | | | | 1,515,849 | |
| | | | | | | | | |
| Industrials — 9.2% | | | | | | | | |
| Doosan | | | 822 | | | | 113,721 | |
| Doosan Fuel Cell * | | | 272,130 | | | | 3,600,960 | |
| | | | | | | | 3,714,681 | |
| TOTAL SOUTH KOREA | | | | | | | 5,230,530 | |
| SWEDEN — 3.6% | | | | | | | | |
| Industrials — 3.6% | | | | | | | | |
| PowerCell Sweden * (A) | | | 447,525 | | | | 1,473,873 | |
| | | | | | | | | |
| UNITED KINGDOM — 11.7% | | | | | | | | |
| Industrials — 10.8% | | | | | | | | |
| AFC Energy * (A) | | | 12,192,906 | | | | 1,642,769 | |
| Ceres Power Holdings * | | | 695,328 | | | | 1,467,988 | |
| ITM Power * (A) | | | 2,959,219 | | | | 1,279,601 | |
| | | | | | | | 4,390,358 | |
| Materials — 0.9% | | | | | | | | |
| Johnson Matthey | | | 21,993 | | | | 379,898 | |
| | | | | | | | | |
| TOTAL UNITED KINGDOM | | | | | | | 4,770,256 | |
| UNITED STATES — 42.8% | | | | | | | | |
| Industrials — 41.0% | | | | | | | | |
| Bloom Energy, Cl A * | | | 294,572 | | | | 8,086,001 | |
The accompanying notes are an integral part of the financial statements.
87
| Schedule of Investments | November 30, 2024 |
| Global X Hydrogen ETF |
| | | Shares | | | Value | |
| COMMON STOCK — continued | | | | | | | | |
| Industrials — continued | | | | | | | | |
| Cummins | | | 1,878 | | | $ | 704,325 | |
| FuelCell Energy * (A) | | | 262,262 | | | | 3,113,050 | |
| Hyster-Yale | | | 1,838 | | | | 103,369 | |
| Plug Power * (A) | | | 2,087,723 | | | | 4,676,500 | |
| | | | | | | | 16,683,245 | |
| Materials — 1.8% | | | | | | | | |
| Air Products & Chemicals | | | 2,144 | | | | 716,804 | |
| | | | | | | | | |
| TOTAL UNITED STATES | | | | | | | 17,400,049 | |
TOTAL COMMON STOCK
(Cost $66,996,377) | | | | | | | 39,971,869 | |
| | | | | | | | |
| | | Face Amount | | | | | |
| REPURCHASE AGREEMENTS(B) — 27.4% | | | | | | | | |
Bank of America Securities, Inc.
4.590%, dated 11/29/2024, to be repurchased on 12/02/2024, repurchase price $2,618,479 (collateralized by various U.S. Government Obligations, ranging in par value $785 - $1,189,350, 1.500% - 7.500%, 02/01/2034 - 11/20/2054, with a total market value of $2,657,583) | | $ | 2,617,478 | | | | 2,617,478 | |
Daiwa Capital Markets America, Inc.
4.580%, dated 11/29/2024, to be repurchased on 12/02/2024, repurchase price $667,062 (collateralized by various U.S. Government Obligations and U.S. Treasury Obligations, ranging in par value $90 - $130,290, 0.000% - 7.500%, 02/13/2025 - 12/01/2054, with a total market value of $677,616) | | | 666,808 | | | | 666,808 | |
Deutsche Bank Securities, Inc.
4.570%, dated 11/29/2024, to be repurchased on 12/02/2024, repurchase price $2,618,475 (collateralized by various U.S. Treasury Obligations, ranging in par value $107,268 - $987,696, 0.000% - 3.750%, 12/15/2024 - 05/15/2029, with a total market value of $2,656,569) | | | 2,617,478 | | | | 2,617,478 | |
The accompanying notes are an integral part of the financial statements.
88
| Schedule of Investments | November 30, 2024 |
| Global X Hydrogen ETF |
| | | Face Amount | | | Value | |
| REPURCHASE AGREEMENTS(B) — continued | | | | | | | | |
HSBC Securities USA, Inc.
4.590%, dated 11/29/2024, to be repurchased on 12/02/2024, repurchase price $2,618,479 (collateralized by various U.S. Government Obligations, ranging in par value $262 - $1,356,901, 1.730% - 7.000%, 02/01/2031 - 11/01/2054, with a total market value of $2,660,858) | | $ | 2,617,478 | | | $ | 2,617,478 | |
Nomura Securities International, Inc.
4.580%, dated 11/29/2024, to be repurchased on 12/02/2024, repurchase price $2,618,477 (collateralized by various U.S. Government Obligations, ranging in par value $2,040 - $604,880, 2.000% - 6.500%, 11/01/2035 - 05/01/2058, with a total market value of $2,659,134) | | | 2,617,478 | | | | 2,617,478 | |
| | | | | | | | | |
TOTAL REPURCHASE AGREEMENTS
(Cost $11,136,720) | | | | | | | 11,136,720 | |
TOTAL INVESTMENTS — 125.8%
(Cost $78,133,097) | | | | | | $ | 51,108,589 | |
Percentages are based on Net Assets of $40,636,541.
| * | Non-income producing security. |
| (A) | This security or a partial position of this security is on loan at November 30, 2024. The total market value of securities on loan at November 30, 2024 was $10,737,452. |
| (B) | These securities were purchased with cash collateral held from securities on loan. The total value of such securities as of November 30, 2024 was $11,136,720. The total value of non-cash collateral held from securities on loan as of November 30, 2024 was $108,310. |
The accompanying notes are an integral part of the financial statements.
89
| Schedule of Investments | November 30, 2024 |
| Global X Hydrogen ETF |
The following is a summary of the level of inputs used as of November 30, 2024, in valuing the Fund’s investments carried at value:
| Investments in Securities | | Level 1 | | | Level 2 | | | Level 3 | | | Total | |
| Common Stock | | $ | 39,971,869 | | | $ | — | | | $ | — | | | $ | 39,971,869 | |
| Repurchase Agreements | | | — | | | | 11,136,720 | | | | — | | | | 11,136,720 | |
| Total Investments in Securities | | $ | 39,971,869 | | | $ | 11,136,720 | | | $ | — | | | $ | 51,108,589 | |
Amounts designated as “—” are $0 or have been rounded to $0.
See “Glossary” for abbreviations.
The accompanying notes are an integral part of the financial statements.
90
| Schedule of Investments | November 30, 2024 |
| Global X Solar ETF |
| | | Shares | | | Value | |
| COMMON STOCK — 99.9% | | | | | | | | |
| CANADA — 0.7% | | | | | | | | |
| Information Technology — 0.7% | | | | | | | | |
| Canadian Solar * | | | 3,851 | | | $ | 47,791 | |
| | | | | | | | | |
| CHINA — 58.9% | | | | | | | | |
| Consumer Discretionary — 0.9% | | | | | | | | |
| Shanghai Aerospace Automobile Electromechanical, Cl A * | | | 51,600 | | | | 59,068 | |
| | | | | | | | | |
| Industrials — 20.8% | | | | | | | | |
| Ginlong Technologies, Cl A | | | 17,150 | | | | 160,511 | |
| GoodWe Technologies, Cl A | | | 5,180 | | | | 34,264 | |
| Jiangsu Tongling Electric, Cl A | | | 8,400 | | | | 35,717 | |
| Kehua Data, Cl A | | | 22,200 | | | | 73,575 | |
| Ningbo Deye Technology, Cl A | | | 43,320 | | | | 515,376 | |
| Sineng Electric, Cl A | | | 9,861 | | | | 66,873 | |
| Sungrow Power Supply, Cl A | | | 43,740 | | | | 490,330 | |
| | | | | | | | 1,376,646 | |
| Information Technology — 33.6% | | | | | | | | |
| Changzhou Almaden Stock, Cl A | | | 8,600 | | | | 20,591 | |
| EGing Photovoltaic Technology, Cl A * | | | 54,400 | | | | 25,585 | |
| Flat Glass Group, Cl H (A) | | | 33,600 | | | | 59,846 | |
| GCL System Integration Technology, Cl A * | | | 210,700 | | | | 80,495 | |
| Hainan Drinda New Energy Technology, Cl A | | | 7,900 | | | | 75,420 | |
| Hangzhou First Applied Material, Cl A | | | 68,444 | | | | 164,913 | |
| Hengdian Group DMEGC Magnetics, Cl A | | | 51,500 | | | | 95,604 | |
| JA Solar Technology, Cl A | | | 103,104 | | | | 247,429 | |
| Jolywood Suzhou Sunwatt, Cl A | | | 57,100 | | | | 59,064 | |
| LONGi Green Energy Technology, Cl A | | | 190,860 | | | | 486,982 | |
| Risen Energy, Cl A | | | 62,600 | | | | 125,794 | |
| Shanghai Aiko Solar Energy, Cl A * | | | 56,940 | | | | 125,258 | |
| Shenzhen SC New Energy Technology, Cl A | | | 18,700 | | | | 182,265 | |
| Shenzhen Topraysolar, Cl A | | | 53,800 | | | | 27,825 | |
| TCL Zhonghuan Renewable Energy Technology, Cl A | | | 177,300 | | | | 257,247 | |
| Xinyi Solar Holdings | | | 373,900 | | | | 165,290 | |
| Zhejiang Akcome New Energy Technology, Cl A *(B) | | | 280,500 | | | | — | |
The accompanying notes are an integral part of the financial statements.
91
| Schedule of Investments | November 30, 2024 |
| Global X Solar ETF |
| | | Shares | | | Value | |
| COMMON STOCK — continued | | | | | | | | |
| Information Technology — continued | | | | | | | | |
| Zhejiang Sunoren Solar Technology, Cl A | | | 17,400 | | | $ | 21,718 | |
| | | | | | | | 2,221,326 | |
| Materials — 1.1% | | | | | | | | |
| Henan Yicheng New Energy, Cl A * | | | 59,800 | | | | 40,743 | |
| Shanghai Hiuv New Materials, Cl A | | | 5,284 | | | | 29,209 | |
| | | | | | | | 69,952 | |
| Utilities — 2.5% | | | | | | | | |
| CECEP Solar Energy, Cl A | | | 165,000 | | | | 113,329 | |
| Jinko Power Technology, Cl A | | | 126,500 | | | | 51,817 | |
| | | | | | | | 165,146 | |
| TOTAL CHINA | | | | | | | 3,892,138 | |
| GERMANY — 2.8% | | | | | | | | |
| Information Technology — 0.5% | | | | | | | | |
| SMA Solar Technology | | | 2,241 | | | | 32,333 | |
| | | | | | | | | |
| Utilities — 2.3% | | | | | | | | |
| Encavis * | | | 8,377 | | | | 154,836 | |
| | | | | | | | | |
| TOTAL GERMANY | | | | | | | 187,169 | |
| JAPAN — 0.3% | | | | | | | | |
| Industrials — 0.3% | | | | | | | | |
| West Holdings | | | 1,524 | | | | 19,108 | |
| | | | | | | | | |
| SOUTH KOREA — 1.9% | | | | | | | | |
| Information Technology — 0.3% | | | | | | | | |
| HD Hyundai Energy Solutions * | | | 1,335 | | | | 18,278 | |
| | | | | | | | | |
| Materials — 1.6% | | | | | | | | |
| Hanwha Solutions | | | 9,321 | | | | 108,373 | |
| | | | | | | | | |
| TOTAL SOUTH KOREA | | | | | | | 126,651 | |
| SPAIN — 2.4% | | | | | | | | |
| Utilities — 2.4% | | | | | | | | |
| Atlantica Sustainable Infrastructure | | | 4,690 | | | | 102,898 | |
The accompanying notes are an integral part of the financial statements.
92
| Schedule of Investments | November 30, 2024 |
| Global X Solar ETF |
| | | Shares | | | Value | |
| COMMON STOCK — continued | | | | | | | | |
| Utilities — continued | | | | | | | | |
| Solaria Energia y Medio Ambiente * | | | 5,655 | | | $ | 54,114 | |
| | | | | | | | | |
| TOTAL SPAIN | | | | | | | 157,012 | |
| TAIWAN — 1.2% | | | | | | | | |
| Information Technology — 1.2% | | | | | | | | |
| Motech Industries | | | 27,290 | | | | 19,995 | |
| TSEC | | | 41,077 | | | | 24,912 | |
| United Renewable Energy * | | | 105,718 | | | | 34,987 | |
| | | | | | | | | |
| TOTAL TAIWAN | | | | | | | 79,894 | |
| TURKEY — 0.3% | | | | | | | | |
| Utilities — 0.3% | | | | | | | | |
| Esenboga Elektrik Uretim * | | | — | | | | — | |
| Margun Enerji Uretim Sanayi VE Ticaret * | | | 34,149 | | | | 18,748 | |
| | | | | | | | | |
| TOTAL TURKEY | | | | | | | 18,748 | |
| UNITED STATES — 31.4% | | | | | | | | |
| Industrials — 10.4% | | | | | | | | |
| Array Technologies * | | | 10,328 | | | | 69,301 | |
| NEXTracker, Cl A * | | | 7,741 | | | | 295,396 | |
| Shoals Technologies Group, Cl A * | | | 12,537 | | | | 65,443 | |
| Sunrun * | | | 22,152 | | | | 255,413 | |
| | | | | | | | 685,553 | |
| Information Technology — 19.6% | | | | | | | | |
| Enphase Energy * | | | 8,809 | | | | 628,522 | |
| First Solar * | | | 2,904 | | | | 578,680 | |
| SolarEdge Technologies * | | | 5,455 | | | | 86,189 | |
| | | | | | | | 1,293,391 | |
| Utilities — 1.4% | | | | | | | | |
| Altus Power, Cl A * | | | 7,384 | | | | 31,899 | |
| Sunnova Energy International * (A) | | | 11,769 | | | | 65,200 | |
| | | | | | | | 97,099 | |
| TOTAL UNITED STATES | | | | | | | 2,076,043 | |
TOTAL COMMON STOCK
(Cost $8,346,487) | | | | | | | 6,604,554 | |
The accompanying notes are an integral part of the financial statements.
93
| Schedule of Investments | November 30, 2024 |
| Global X Solar ETF |
| | | Face Amount | | | Value | |
| REPURCHASE AGREEMENT(C) — 1.5% | | | | | | | | |
RBC Dominion Securities, Inc.
4.590%, dated 11/29/2024, to be repurchased on 12/02/2024, repurchase price $96,116 (collateralized by various U.S. Government Obligations and U.S. Treasury Obligations, ranging in par value $3 - $35,768, 0.000% - 7.000%, 12/05/2024 - 11/15/2054, with a total market value of $97,608)
(Cost $96,079) | | $ | 96,079 | | | $ | 96,079 | |
TOTAL INVESTMENTS — 101.4%
(Cost $8,442,566) | | | | | | $ | 6,700,633 | |
Percentages are based on Net Assets of $6,608,040.
| * | Non-income producing security. |
| (A) | This security or a partial position of this security is on loan at November 30, 2024. The total market value of securities on loan at November 30, 2024 was $92,442. |
| (B) | Level 3 security in accordance with fair value hierarchy. |
| (C) | These securities were purchased with cash collateral held from securities on loan. The total value of such securities as of November 30, 2024 was $96,079. The total value of non-cash collateral held from securities on loan as of November 30, 2024 was $0. |
The following is a summary of the level of inputs used as of November 30, 2024, in valuing the Fund’s investments carried at value:
| Investments in Securities | | Level 1 | | | Level 2 | | | Level 3(1) | | | Total | |
| Common Stock | | $ | 6,604,554 | | | $ | — | | | $ | — | ^ | | $ | 6,604,554 | |
| Repurchase Agreement | | | — | | | | 96,079 | | | | — | | | | 96,079 | |
| Total Investments in Securities | | $ | 6,604,554 | | | $ | 96,079 | | | $ | — | | | $ | 6,700,633 | |
(1) A reconciliation of Level 3 investments and disclosures of significant unobservable inputs are presented when the Fund has a significant amount of Level 3 investments at the end of the period in relation to Net Assets. Management has concluded that Level 3 investments are not material in relation to Net Assets.
^ Includes Securities in which the fair value is $0 or has been rounded to $0.
The accompanying notes are an integral part of the financial statements.
94
| Schedule of Investments | November 30, 2024 |
| Global X Solar ETF |
Amounts designated as “—” are $0 or have been rounded to $0.
See “Glossary” for abbreviations.
The accompanying notes are an integral part of the financial statements.
95
| Schedule of Investments | November 30, 2024 |
| Global X Wind Energy ETF |
| | | Shares | | | Value | |
| COMMON STOCK — 99.6% | | | | | | | | |
| CANADA — 17.1% | | | | | | | | |
| Utilities — 17.1% | | | | | | | | |
| Boralex, Cl A | | | 4,041 | | | $ | 86,987 | |
| Innergex Renewable Energy | | | 10,227 | | | | 63,766 | |
| Northland Power | | | 14,848 | | | | 215,379 | |
| | | | | | | | | |
| TOTAL CANADA | | | | | | | 366,132 | |
| CHINA — 36.3% | | | | | | | | |
| Industrials — 25.4% | | | | | | | | |
| Dajin Heavy Industry, Cl A | | | 23,550 | | | | 76,198 | |
| Goldwind Science & Technology, Cl H | | | 49,800 | | | | 47,230 | |
| Jiangsu Haili Wind Power Equipment Technology, Cl A * | | | 3,900 | | | | 35,807 | |
| Jinlei Technology, Cl A | | | 15,350 | | | | 51,657 | |
| Ming Yang Smart Energy Group, Cl A | | | 83,200 | | | | 162,944 | |
| Qingdao Tianneng Heavy Industries, Cl A | | | 25,300 | | | | 18,912 | |
| Shanghai Taisheng Wind Power Equipment, Cl A | | | 35,800 | | | | 38,858 | |
| Titan Wind Energy Suzhou, Cl A | | | 50,900 | | | | 64,445 | |
| Windey Energy Technology Group, Cl A | | | 23,500 | | | | 49,297 | |
| | | | | | | | 545,348 | |
| Utilities — 10.9% | | | | | | | | |
| CECEP Wind-Power, Cl A | | | 205,660 | | | | 90,483 | |
| China Datang Renewable Power, Cl H (A) | | | 148,300 | | | | 38,116 | |
| China Longyuan Power Group, Cl H | | | 111,670 | | | | 91,988 | |
| Jiangsu New Energy Development, Cl A | | | 9,000 | | | | 12,847 | |
| | | | | | | | 233,434 | |
| TOTAL CHINA | | | | | | | 778,782 | |
| DENMARK — 29.4% | | | | | | | | |
| Industrials — 17.1% | | | | | | | | |
| Cadeler * | | | 14,765 | | | | 90,556 | |
| Vestas Wind Systems * | | | 17,786 | | | | 276,324 | |
| | | | | | | | 366,880 | |
The accompanying notes are an integral part of the financial statements.
96
| Schedule of Investments | November 30, 2024 |
| Global X Wind Energy ETF |
| | | Shares | | | Value | |
| COMMON STOCK — continued | | | | | | | | |
| Utilities — 12.3% | | | | | | | | |
| Orsted * | | | 4,780 | | | $ | 265,232 | |
| | | | | | | | | |
| TOTAL DENMARK | | | | | | | 632,112 | |
| GERMANY — 4.5% | | | | | | | | |
| Industrials — 4.5% | | | | | | | | |
| Nordex * | | | 7,684 | | | | 96,984 | |
| | | | | | | | | |
| GREECE — 3.3% | | | | | | | | |
| Utilities — 3.3% | | | | | | | | |
| Terna Energy | | | 3,331 | | | | 69,977 | |
| | | | | | | | | |
| INDIA — 2.9% | | | | | | | | |
| Utilities — 2.9% | | | | | | | | |
| ReNew Energy Global, Cl A * | | | 10,415 | | | | 62,802 | |
| | | | | | | | | |
| SOUTH KOREA — 2.5% | | | | | | | | |
| Industrials — 2.5% | | | | | | | | |
| CS Wind | | | 1,883 | | | | 54,126 | |
| | | | | | | | | |
| TAIWAN — 3.3% | | | | | | | | |
| Materials — 3.3% | | | | | | | | |
| Century Iron & Steel Industrial | | | 13,125 | | | | 70,710 | |
| | | | | | | | | |
| TURKEY — 0.3% | | | | | | | | |
| Utilities — 0.3% | | | | | | | | |
| Galata Wind Enerji | | | 9,548 | | | | 6,929 | |
| | | | | | | | | |
TOTAL COMMON STOCK
(Cost $3,162,829) | | | | | | | 2,138,554 | |
The accompanying notes are an integral part of the financial statements.
97
| Schedule of Investments | November 30, 2024 |
| Global X Wind Energy ETF |
| | | Face Amount | | | Value | |
| REPURCHASE AGREEMENT(B) — 1.3% | | | | | | | | |
RBC Dominion Securities, Inc.
4.590%, dated 11/29/2024, to be repurchased on 12/02/2024, repurchase price $27,034 (collateralized by various U.S. Government Obligations and U.S. Treasury Obligations, ranging in par value $1 - $10,060, 0.000% - 7.000%, 12/05/2024 - 11/15/2054, with a total market value of $27,454)
(Cost $27,024) | | $ | 27,024 | | | $ | 27,024 | |
TOTAL INVESTMENTS — 100.9%
(Cost $3,189,853) | | | | | | $ | 2,165,578 | |
Percentages are based on Net Assets of $2,146,713.
| * | Non-income producing security. |
| (A) | This security or a partial position of this security is on loan at November 30, 2024. The total market value of securities on loan at November 30, 2024 was $11,045. |
| (B) | These securities were purchased with cash collateral held from securities on loan. The total value of such securities as of November 30, 2024 was $27,024. The total value of non-cash collateral held from securities on loan as of November 30, 2024 was $0. |
The following is a summary of the level of inputs used as of November 30, 2024, in valuing the Fund’s investments carried at value:
| Investments in Securities | | Level 1 | | | Level 2 | | | Level 3 | | | Total | |
| Common Stock | | $ | 2,138,554 | | | $ | — | | | $ | — | | | $ | 2,138,554 | |
| Repurchase Agreement | | | — | | | | 27,024 | | | | — | | | | 27,024 | |
| Total Investments in Securities | | $ | 2,138,554 | | | $ | 27,024 | | | $ | — | | | $ | 2,165,578 | |
Amounts designated as “—” are $0 or have been rounded to $0.
See “Glossary” for abbreviations.
The accompanying notes are an integral part of the financial statements.
98
| Schedule of Investments | November 30, 2024 |
| Global X PropTech ETF |
| | | Shares | | | Value | |
| COMMON STOCK — 99.9% | | | | | | | | |
| AUSTRALIA — 6.0% | | | | | | | | |
| Communication Services — 4.9% | | | | | | | | |
| Domain Holdings Australia | | | 5,094 | | | $ | 9,557 | |
| REA Group | | | 485 | | | | 79,472 | |
| | | | | | | | 89,029 | |
| Real Estate — 1.1% | | | | | | | | |
| PEXA Group * | | | 2,346 | | | | 19,929 | |
| | | | | | | | | |
| TOTAL AUSTRALIA | | | | | | | 108,958 | |
| CHINA — 8.9% | | | | | | | | |
| Information Technology — 0.3% | | | | | | | | |
| Ming Yuan Cloud Group Holdings | | | 16,490 | | | | 5,658 | |
| | | | | | | | | |
| Real Estate — 8.6% | | | | | | | | |
| KE Holdings ADR | | | 8,214 | | | | 154,834 | |
| | | | | | | | | |
| TOTAL CHINA | | | | | | | 160,492 | |
| GERMANY — 9.7% | | | | | | | | |
| Communication Services — 4.7% | | | | | | | | |
| Scout24 | | | 945 | | | | 84,889 | |
| | | | | | | | | |
| Financials — 1.0% | | | | | | | | |
| Hypoport * | | | 83 | | | | 17,024 | |
| | | | | | | | | |
| Information Technology — 4.0% | | | | | | | | |
| Nemetschek | | | 702 | | | | 72,811 | |
| | | | | | | | | |
| TOTAL GERMANY | | | | | | | 174,724 | |
| JAPAN — 0.4% | | | | | | | | |
| | | | | | | | | |
| Communication Services — 0.2% | | | | | | | | |
| GA Technologies * | | | 367 | | | | 2,993 | |
| | | | | | | | | |
| Real Estate — 0.2% | | | | | | | | |
| SRE Holdings * | | | 200 | | | | 4,315 | |
| | | | | | | | | |
| TOTAL JAPAN | | | | | | | 7,308 | |
The accompanying notes are an integral part of the financial statements.
99
| Schedule of Investments | November 30, 2024 |
| Global X PropTech ETF |
| | | Shares | | | Value | |
| COMMON STOCK — continued | | | | | | | | |
| SWEDEN — 2.7% | | | | | | | | |
| Communication Services — 2.7% | | | | | | | | |
| Hemnet Group | | | 1,625 | | | $ | 48,666 | |
| | | | | | | | | |
| SWITZERLAND — 1.8% | | | | | | | | |
| Real Estate — 1.8% | | | | | | | | |
| International Workplace Group | | | 15,735 | | | | 33,360 | |
| | | | | | | | | |
| UNITED KINGDOM — 4.5% | | | | | | | | |
| Communication Services — 4.5% | | | | | | | | |
| Rightmove | | | 10,029 | | | | 82,221 | |
| | | | | | | | | |
| UNITED STATES — 65.9% | | | | | | | | |
| Communication Services — 0.1% | | | | | | | | |
| Angi, Cl A * | | | 1,362 | | | | 2,533 | |
| | | | | | | | | |
| Consumer Discretionary — 11.6% | | | | | | | | |
| ADT | | | 8,679 | | | | 66,134 | |
| Airbnb, Cl A * | | | 1,051 | | | | 143,052 | |
| | | | | | | | 209,186 | |
| Financials — 3.1% | | | | | | | | |
| Hippo Holdings * | | | 267 | | | | 8,822 | |
| Rocket, Cl A * | | | 2,501 | | | | 36,339 | |
| UWM Holdings | | | 1,774 | | | | 11,549 | |
| | | | | | | | 56,710 | |
| Industrials — 4.5% | | | | | | | | |
| Resideo Technologies * | | | 2,988 | | | | 81,214 | |
| | | | | | | | | |
| Information Technology — 27.0% | | | | | | | | |
| Alarm.com Holdings * | | | 988 | | | | 64,358 | |
| Appfolio, Cl A * | | | 311 | | | | 78,916 | |
| Arlo Technologies * | | | 1,898 | | | | 21,295 | |
| Blend Labs, Cl A * | | | 3,774 | | | | 19,285 | |
| Guidewire Software * | | | 828 | | | | 167,993 | |
| Matterport * | | | 5,660 | | | | 26,942 | |
| Porch Group * | | | 1,471 | | | | 5,384 | |
| Procore Technologies * | | | 1,194 | | | | 96,953 | |
The accompanying notes are an integral part of the financial statements.
100
| Schedule of Investments | November 30, 2024 |
| Global X PropTech ETF |
| | | Shares | | | Value | |
| COMMON STOCK — continued | | | | | | | | |
| Information Technology — continued | | | | | | | | |
| SmartRent, Cl A * | | | 3,530 | | | $ | 6,248 | |
| | | | | | | | 487,374 | |
| Real Estate — 19.6% | | | | | | | | |
| CoStar Group * | | | 1,650 | | | | 134,211 | |
| Opendoor Technologies * | | | 11,570 | | | | 27,074 | |
| Zillow Group, Cl C * | | | 2,283 | | | | 193,393 | |
| | | | | | | | 354,678 | |
| TOTAL UNITED STATES | | | | | | | 1,191,695 | |
TOTAL COMMON STOCK
(Cost $1,359,568) | | | | | | | 1,807,424 | |
| | | | | | | | | |
| | | Face Amount | | | | | |
| U.S. TREASURY OBLIGATION — 2.8% | | | | | | | | |
U.S. Treasury Bill
4.567%, 12/31/2024(A) | | $ | 50,000 | | | | 49,817 | |
TOTAL U.S. TREASURY OBLIGATION
(Cost $49,823) | | | | | | | 49,817 | |
TOTAL INVESTMENTS — 102.7%
(Cost $1,409,391) | | | | | | $ | 1,857,241 | |
Percentages are based on Net Assets of $1,808,302.
| * | Non-income producing security. |
| (A) | Interest rate represents the security’s effective yield at the time of purchase. |
The following is a summary of the level of inputs used as of November 30, 2024, in valuing the Fund’s investments carried at value:
| Investments in Securities | | Level 1 | | | Level 2 | | | Level 3 | | | Total | |
| Common Stock | | $ | 1,807,424 | | | $ | — | | | $ | — | | | $ | 1,807,424 | |
| U.S. Treasury Obligation | | | — | | | | 49,817 | | | | — | | | | 49,817 | |
| Total Investments in Securities | | $ | 1,807,424 | | | $ | 49,817 | | | $ | — | | | $ | 1,857,241 | |
Amounts designated as “—” are $0 or have been rounded to $0.
See “Glossary” for abbreviations.
The accompanying notes are an integral part of the financial statements.
101
| Schedule of Investments | November 30, 2024 |
| Global X Defense Tech ETF |
| | | Shares | | | Value | |
| COMMON STOCK — 99.7% | | | | | | | | |
| AUSTRALIA — 0.1% | | | | | | | | |
| Industrials — 0.1% | | | | | | | | |
| DroneShield * | | | 2,083,132 | | | $ | 1,058,502 | |
| | | | | | | | | |
| FRANCE — 5.4% | | | | | | | | |
| Industrials — 5.4% | | | | | | | | |
| Dassault Aviation | | | 44,682 | | | | 8,891,189 | |
| Thales | | | 215,846 | | | | 32,258,694 | |
| | | | | | | | | |
| TOTAL FRANCE | | | | | | | 41,149,883 | |
| GERMANY — 5.7% | | | | | | | | |
| Industrials — 5.7% | | | | | | | | |
| Hensoldt | | | 165,540 | | | | 6,434,238 | |
| Rheinmetall | | | 56,725 | | | | 37,289,832 | |
| | | | | | | | | |
| TOTAL GERMANY | | | | | | | 43,724,070 | |
| ISRAEL — 2.2% | | | | | | | | |
| Industrials — 2.2% | | | | | | | | |
| Elbit Systems | | | 68,716 | | | | 16,670,337 | |
| | | | | | | | | |
| ITALY — 3.9% | | | | | | | | |
| Industrials — 3.9% | | | | | | | | |
| Leonardo | | | 1,102,759 | | | | 29,665,788 | |
| | | | | | | | | |
| JAPAN — 0.0% | | | | | | | | |
| Information Technology — 0.0% | | | | | | | | |
| Nippon Avionics | | | 15,300 | | | | 237,979 | |
| | | | | | | | | |
| SOUTH KOREA — 4.6% | | | | | | | | |
| Industrials — 4.6% | | | | | | | | |
| Hanwha Aerospace | | | 86,981 | | | | 19,484,293 | |
| Hanwha Systems | | | 179,213 | | | | 2,967,507 | |
| Korea Aerospace Industries | | | 193,786 | | | | 8,112,327 | |
| LIG Nex1 | | | 33,687 | | | | 4,759,476 | |
| | | | | | | | | |
| TOTAL SOUTH KOREA | | | | | | | 35,323,603 | |
The accompanying notes are an integral part of the financial statements.
102
| Schedule of Investments | November 30, 2024 |
| Global X Defense Tech ETF |
| | | Shares | | | Value | |
| COMMON STOCK — continued | | | | | | | | |
| SWEDEN — 2.7% | | | | | | | | |
| Industrials — 2.7% | | | | | | | | |
| Saab, Cl B | | | 958,626 | | | $ | 20,969,957 | |
| | | | | | | | | |
| TURKEY — 0.4% | | | | | | | | |
| Industrials — 0.4% | | | | | | | | |
| Aselsan Elektronik Sanayi Ve Ticaret | | | 1,507,609 | | | | 3,017,434 | |
| | | | | | | | | |
| UNITED KINGDOM — 6.8% | | | | | | | | |
| Industrials — 6.8% | | | | | | | | |
| Babcock International Group | | | 1,307,233 | | | | 8,532,115 | |
| BAE Systems | | | 2,116,937 | | | | 33,015,338 | |
| Chemring Group | | | 708,339 | | | | 3,191,689 | |
| QinetiQ Group | | | 1,362,455 | | | | 7,190,230 | |
| | | | | | | | | |
| TOTAL UNITED KINGDOM | | | | | | | 51,929,372 | |
| UNITED STATES — 67.9% | | | | | | | | |
| Industrials — 58.4% | | | | | | | | |
| AeroVironment * | | | 76,503 | | | | 14,879,833 | |
| BWX Technologies | | | 251,994 | | | | 32,973,415 | |
| General Dynamics | | | 212,507 | | | | 60,354,113 | |
| Huntington Ingalls Industries | | | 107,402 | | | | 21,257,004 | |
| Kratos Defense & Security Solutions * | | | 407,508 | | | | 11,039,392 | |
| L3Harris Technologies | | | 139,956 | | | | 34,464,165 | |
| Leidos Holdings | | | 214,180 | | | | 35,425,372 | |
| Lockheed Martin | | | 114,428 | | | | 60,579,327 | |
| Mercury Systems * | | | 160,183 | | | | 6,588,327 | |
| Moog, Cl A | | | 77,781 | | | | 17,210,602 | |
| National Presto Industries | | | 14,244 | | | | 1,135,532 | |
| Northrop Grumman | | | 123,889 | | | | 60,662,249 | |
| Parsons * | | | 290,937 | | | | 27,903,768 | |
| RTX | | | 516,334 | | | | 62,904,971 | |
| | | | | | | | 447,378,070 | |
| | | | | | | | | |
| Information Technology — 9.5% | | | | | | | | |
| BigBear.ai Holdings * | | | 263,972 | | | | 604,496 | |
| OSI Systems * | | | 43,083 | | | | 7,642,924 | |
| Palantir Technologies, Cl A * | | | 930,521 | | | | 62,419,349 | |
| Red Cat Holdings * | | | 154,800 | | | | 1,821,996 | |
The accompanying notes are an integral part of the financial statements.
103
| Schedule of Investments | November 30, 2024 |
| Global X Defense Tech ETF |
| | | Shares | | | Value | |
| COMMON STOCK — continued | | | | | | | | |
| Information Technology — continued | | | | | | | | |
| Telos * | | | 128,378 | | | $ | 436,485 | |
| | | | | | | | 72,925,250 | |
| TOTAL UNITED STATES | | | | | | | 520,303,320 | |
TOTAL COMMON STOCK
(Cost $706,685,595) | | | | | | | 764,050,245 | |
TOTAL INVESTMENTS — 99.7%
(Cost $706,685,595) | | | | | | $ | 764,050,245 | |
Percentages are based on Net Assets of $766,036,861.
| * | Non-income producing security. |
The following is a summary of the level of inputs used as of November 30, 2024, in valuing the Fund’s investments carried at value:
| Investments in Securities | | Level 1 | | | Level 2 | | | Level 3 | | | Total | |
| Common Stock | | $ | 747,379,908 | | | $ | 16,670,337 | | | $ | — | | | $ | 764,050,245 | |
| Total Investments in Securities | | $ | 747,379,908 | | | $ | 16,670,337 | | | $ | — | | | $ | 764,050,245 | |
Amounts designated as “—” are $0 or have been rounded to $0.
See “Glossary” for abbreviations.
The accompanying notes are an integral part of the financial statements.
104
| Schedule of Investments | November 30, 2024 |
| Global X Infrastructure Development ex-U.S. ETF |
| | | Shares | | | Value | |
| COMMON STOCK — 99.7% | | | | | | | | |
| AUSTRALIA — 0.8% | | | | | | | | |
| Industrials — 0.8% | | | | | | | | |
| Aurizon Holdings | | | 9,055 | | | $ | 19,938 | |
| | | | | | | | | |
| AUSTRIA — 0.4% | | | | | | | | |
| Materials — 0.4% | | | | | | | | |
| voestalpine | | | 547 | | | | 10,584 | |
| | | | | | | | | |
| BRAZIL — 1.3% | | | | | | | | |
| Materials — 1.3% | | | | | | | | |
| Cia Siderurgica Nacional | | | 3,300 | | | | 6,168 | |
| Gerdau ADR | | | 7,131 | | | | 23,960 | |
| | | | | | | | | |
| TOTAL BRAZIL | | | | | | | 30,128 | |
| CANADA — 7.9% | | | | | | | | |
| | | | | | | | | |
| Industrials — 7.9% | | | | | | | | |
| AtkinsRealis Group, Cl Common Subs. Receipt | | | 849 | | | | 46,096 | |
| Canadian National Railway | | | 644 | | | | 71,909 | |
| Canadian Pacific Kansas City | | | 947 | | | | 72,444 | |
| | | | | | | | | |
| TOTAL CANADA | | | | | | | 190,449 | |
| CHINA — 3.7% | | | | | | | | |
| Communication Services — 1.3% | | | | | | | | |
| China Tower, Cl H | | | 238,000 | | | | 31,197 | |
| | | | | | | | | |
| Industrials — 1.2% | | | | | | | | |
| China Communications Services, Cl H | | | 12,000 | | | | 6,292 | |
| China Energy Engineering, Cl H | | | 34,000 | | | | 4,282 | |
| China Lesso Group Holdings | | | 5,000 | | | | 2,255 | |
| China Railway Group, Cl H | | | 21,000 | | | | 10,093 | |
| Zoomlion Heavy Industry Science and Technology, Cl H | | | 7,600 | | | | 5,088 | |
| | | | | | | | 28,010 | |
| | | | | | | | | |
| Materials — 1.2% | | | | | | | | |
| Anhui Conch Cement, Cl H | | | 6,660 | | | | 17,374 | |
| China National Building Material, Cl H | | | 24,000 | | | | 10,240 | |
The accompanying notes are an integral part of the financial statements.
105
| Schedule of Investments | November 30, 2024 |
| Global X Infrastructure Development ex-U.S. ETF |
| | | Shares | | | Value | |
| COMMON STOCK — continued | | | | | | | | |
| Materials — continued | | | | | | | | |
| China Resources Building Materials Technology Holdings | | | 12,000 | | | $ | 2,745 | |
| | | | | | | | 30,359 | |
| TOTAL CHINA | | | | | | | 89,566 | |
| DENMARK — 1.0% | | | | | | | | |
| Industrials — 1.0% | | | | | | | | |
| NKT * | | | 295 | | | | 22,749 | |
| | | | | | | | | |
| FRANCE — 6.7% | | | | | | | | |
| Industrials — 6.7% | | | | | | | | |
| Bouygues | | | 970 | | | | 28,850 | |
| Eiffage | | | 457 | | | | 41,221 | |
| Nexans | | | 175 | | | | 19,851 | |
| Vinci | | | 662 | | | | 69,823 | |
| | | | | | | | | |
| TOTAL FRANCE | | | | | | | 159,745 | |
| GERMANY — 3.0% | | | | | | | | |
| Materials — 3.0% | | | | | | | | |
| Heidelberg Materials | | | 564 | | | | 71,126 | |
| | | | | | | | | |
| INDIA — 21.6% | | | | | | | | |
| Communication Services — 1.1% | | | | | | | | |
| Indus Towers * | | | 6,455 | | | | 26,688 | |
| | | | | | | | | |
| Industrials — 7.5% | | | | | | | | |
| Action Construction Equipment | | | 201 | | | | 3,112 | |
| IRB Infrastructure Developers | | | 10,658 | | | | 6,734 | |
| IRCON International | | | 1,732 | | | | 4,300 | |
| Kalpataru Projects International | | | 532 | | | | 7,178 | |
| KEC International | | | 661 | | | | 8,248 | |
| KEI Industries | | | 294 | | | | 15,008 | |
| Larsen & Toubro | | | 1,679 | | | | 74,014 | |
| NCC | | | 2,246 | | | | 8,232 | |
| Polycab India | | | 350 | | | | 30,229 | |
| Rail Vikas Nigam | | | 3,052 | | | | 15,743 | |
| RITES | | | 700 | | | | 2,359 | |
The accompanying notes are an integral part of the financial statements.
106
| Schedule of Investments | November 30, 2024 |
| Global X Infrastructure Development ex-U.S. ETF |
| | | Shares | | | Value | |
| COMMON STOCK — continued | | | | | | | | |
| Industrials — continued | | | | | | | | |
| Techno Electric & Engineering | | | 246 | | | $ | 4,291 | |
| | | | | | | | 179,448 | |
| | | | | | | | | |
| Materials — 13.0% | | | | | | | | |
| Ambuja Cements | | | 4,155 | | | | 26,136 | |
| Dalmia Bharat | | | 381 | | | | 8,208 | |
| Jindal Stainless | | | 1,421 | | | | 11,490 | |
| Jindal Steel & Power | | | 2,026 | | | | 21,734 | |
| JK Cement | | | 179 | | | | 9,063 | |
| JSW Steel | | | 4,757 | | | | 54,384 | |
| Ramco Cements | | | 592 | | | | 7,110 | |
| Shree Cement | | | 51 | | | | 15,739 | |
| Steel Authority of India | | | 7,740 | | | | 10,728 | |
| Tata Steel | | | 42,903 | | | | 73,390 | |
| UltraTech Cement | | | 552 | | | | 73,182 | |
| | | | | | | | 311,164 | |
| TOTAL INDIA | | | | | | | 517,300 | |
| ISRAEL — 0.2% | | | | | | | | |
| Industrials — 0.2% | | | | | | | | |
| Shapir Engineering and Industry * | | | 685 | | | | 5,053 | |
| | | | | | | | | |
| ITALY — 5.5% | | | | | | | | |
| Communication Services — 0.7% | | | | | | | | |
| Infrastrutture Wireless Italiane | | | 1,728 | | | | 17,795 | |
| | | | | | | | | |
| Energy — 0.7% | | | | | | | | |
| Saipem * | | | 6,513 | | | | 16,792 | |
| | | | | | | | | |
| Industrials — 3.4% | | | | | | | | |
| Maire | | | 709 | | | | 5,426 | |
| Prysmian | | | 1,093 | | | | 72,059 | |
| Webuild | | | 1,563 | | | | 4,368 | |
| | | | | | | | 81,853 | |
| | | | | | | | | |
| Materials — 0.7% | | | | | | | | |
| Buzzi | | | 376 | | | | 15,925 | |
| | | | | | | | | |
| TOTAL ITALY | | | | | | | 132,365 | |
The accompanying notes are an integral part of the financial statements.
107
| Schedule of Investments | November 30, 2024 |
| Global X Infrastructure Development ex-U.S. ETF |
| | | Shares | | | Value | |
| COMMON STOCK — continued | | | | | | | | |
| JAPAN — 13.4% | | | | | | | | |
| Industrials — 4.9% | | | | | | | | |
| COMSYS Holdings | | | 500 | | | $ | 10,863 | |
| EXEO Group | | | 850 | | | | 9,919 | |
| Hitachi Construction Machinery | | | 555 | | | | 12,483 | |
| INFRONEER Holdings | | | 810 | | | | 6,548 | |
| Komatsu | | | 2,650 | | | | 71,038 | |
| SHO-BOND Holdings | | | 170 | | | | 5,876 | |
| | | | | | | | 116,727 | |
| | | | | | | | | |
| Materials — 8.5% | | | | | | | | |
| JFE Holdings | | | 2,900 | | | | 33,000 | |
| Maruichi Steel Tube | | | 270 | | | | 5,828 | |
| Nippon Steel | | | 3,510 | | | | 71,493 | |
| Shin-Etsu Chemical | | | 1,910 | | | | 70,634 | |
| Taiheiyo Cement | | | 560 | | | | 14,180 | |
| Yamato Kogyo | | | 170 | | | | 8,739 | |
| | | | | | | | 203,874 | |
| TOTAL JAPAN | | | | | | | 320,601 | |
| LUXEMBOURG — 2.4% | | | | | | | | |
| Materials — 2.4% | | | | | | | | |
| ArcelorMittal | | | 2,274 | | | | 57,259 | |
| | | | | | | | | |
| MALAYSIA — 1.3% | | | | | | | | |
| Industrials — 1.3% | | | | | | | | |
| Gamuda | | | 11,400 | | | | 22,826 | |
| IJM | | | 13,500 | | | | 9,050 | |
| | | | | | | | | |
| TOTAL MALAYSIA | | | | | | | 31,876 | |
| MEXICO — 2.1% | | | | | | | | |
| Materials — 2.1% | | | | | | | | |
| Cemex ADR | | | 7,918 | | | | 44,104 | |
| Ternium ADR | | | 195 | | | | 6,468 | |
| | | | | | | | | |
| TOTAL MEXICO | | | | | | | 50,572 | |
The accompanying notes are an integral part of the financial statements.
108
| Schedule of Investments | November 30, 2024 |
| Global X Infrastructure Development ex-U.S. ETF |
| | | Shares | | | Value | |
| COMMON STOCK — continued | | | | | | | | |
| NETHERLANDS — 0.8% | | | | | | | | |
| Industrials — 0.8% | | | | | | | | |
| Aalberts | | | 495 | | | $ | 19,020 | |
| | | | | | | | | |
| POLAND — 0.3% | | | | | | | | |
| Industrials — 0.3% | | | | | | | | |
| Budimex | | | 67 | | | | 7,771 | |
| | | | | | | | | |
| SOUTH KOREA — 4.9% | | | | | | | | |
| Industrials — 1.6% | | | | | | | | |
| Doosan Bobcat | | | 286 | | | | 7,954 | |
| KEPCO Engineering & Construction | | | 96 | | | | 4,679 | |
| LS Electric | | | 86 | | | | 8,877 | |
| Samsung E&A * | | | 861 | | | | 11,079 | |
| Taihan Electric Wire * | | | 592 | | | | 4,800 | |
| | | | | | | | 37,389 | |
| | | | | | | | | |
| Materials — 3.3% | | | | | | | | |
| Hyundai Steel | | | 491 | | | | 7,373 | |
| POSCO Holdings | | | 354 | | | | 71,686 | |
| | | | | | | | 79,059 | |
| TOTAL SOUTH KOREA | | | | | | | 116,448 | |
| SPAIN — 4.5% | | | | | | | | |
| Communication Services — 3.1% | | | | | | | | |
| Cellnex Telecom | | | 2,099 | | | | 75,333 | |
| | | | | | | | | |
| Industrials — 0.4% | | | | | | | | |
| Sacyr | | | 2,571 | | | | 8,396 | |
| | | | | | | | | |
| Materials — 0.4% | | | | | | | | |
| Acerinox | | | 884 | | | | 8,879 | |
| | | | | | | | | |
| Utilities — 0.6% | | | | | | | | |
| Acciona | | | 116 | | | | 14,739 | |
| | | | | | | | | |
| TOTAL SPAIN | | | | | | | 107,347 | |
The accompanying notes are an integral part of the financial statements.
109
| Schedule of Investments | November 30, 2024 |
| Global X Infrastructure Development ex-U.S. ETF |
| | | Shares | | | Value | |
| COMMON STOCK — continued | | | | | | | | |
| SWEDEN — 3.7% | | | | | | | | |
| Industrials — 3.1% | | | | | | | | |
| AFRY | | | 482 | | | $ | 6,692 | |
| Epiroc, Cl A | | | 3,331 | | | | 60,632 | |
| Peab, Cl B | | | 815 | | | | 5,983 | |
| | | | | | | | 73,307 | |
| | | | | | | | | |
| Materials — 0.6% | | | | | | | | |
| SSAB, Cl B | | | 3,198 | | | | 14,454 | |
| | | | | | | | | |
| TOTAL SWEDEN | | | | | | | 87,761 | |
| SWITZERLAND — 1.6% | | | | | | | | |
| Industrials — 1.2% | | | | | | | | |
| Georg Fischer | | | 383 | | | | 29,692 | |
| | | | | | | | | |
| Information Technology — 0.4% | | | | | | | | |
| Landis+Gyr Group | | | 132 | | | | 9,589 | |
| | | | | | | | | |
| TOTAL SWITZERLAND | | | | | | | 39,281 | |
| TAIWAN — 2.6% | | | | | | | | |
| Materials — 2.6% | | | | | | | | |
| Asia Cement | | | 12,940 | | | | 16,751 | |
| Goldsun Building Materials | | | 3,580 | | | | 5,952 | |
| TCC Group Holdings | | | 33,600 | | | | 34,652 | |
| Tung Ho Steel Enterprise | | | 2,430 | | | | 5,274 | |
| | | | | | | | | |
| TOTAL TAIWAN | | | | | | | 62,629 | |
| TURKEY — 0.2% | | | | | | | | |
| Materials — 0.2% | | | | | | | | |
| Borusan Birlesik Boru Fabrikalari Sanayi ve Ticaret * | | | 173 | | | | 2,257 | |
| Oyak Cimento Fabrikalari * | | | 1,478 | | | | 3,084 | |
| | | | | | | | | |
| TOTAL TURKEY | | | | | | | 5,341 | |
| UNITED ARAB EMIRATES — 0.3% | | | | | | | | |
| Industrials — 0.3% | | | | | | | | |
| NMDC Group PJSC | | | 1,160 | | | | 7,706 | |
The accompanying notes are an integral part of the financial statements.
110
| Schedule of Investments | November 30, 2024 |
| Global X Infrastructure Development ex-U.S. ETF |
| | | Shares | | | Value | |
| COMMON STOCK — continued | | | | | | | | |
| UNITED KINGDOM — 0.4% | | | | | | | | |
| Materials — 0.4% | | | | | | | | |
| Breedon Group | | | 1,424 | | | $ | 8,344 | |
| | | | | | | | | |
| UNITED STATES — 9.1% | | | | | | | | |
| Energy — 3.0% | | | | | | | | |
| Tenaris ADR | | | 1,896 | | | | 72,674 | |
| | | | | | | | | |
| Industrials — 3.1% | | | | | | | | |
| Ferrovial | | | 1,813 | | | | 74,719 | |
| | | | | | | | | |
| Materials — 3.0% | | | | | | | | |
| Holcim | | | 704 | | | | 71,710 | |
| | | | | | | | | |
| TOTAL UNITED STATES | | | | | | | 219,103 | |
TOTAL COMMON STOCK
(Cost $2,481,394) | | | | | | | 2,390,062 | |
TOTAL INVESTMENTS — 99.7%
(Cost $2,481,394) | | | | | | $ | 2,390,062 | |
Percentages are based on Net Assets of $2,397,253.
| * | Non-income producing security. |
The following is a summary of the level of inputs used as of November 30, 2024, in valuing the Fund’s investments carried at value:
| Investments in Securities | | Level 1 | | | Level 2 | | | Level 3 | | | Total | |
| Common Stock | | $ | 2,385,009 | | | $ | 5,053 | | | $ | — | | | $ | 2,390,062 | |
| Total Investments in Securities | | $ | 2,385,009 | | | $ | 5,053 | | | $ | — | | | $ | 2,390,062 | |
Amounts designated as “—” are $0 or have been rounded to $0.
See “Glossary” for abbreviations.
The accompanying notes are an integral part of the financial statements.
111
| Schedule of Investments | November 30, 2024 |
| Glossary (abbreviations which may be used in the preceding Schedules of Investments): |
Fund Abbreviations
ADR — American Depositary Receipt
Cl — Class
ETF — Exchange-Traded Fund
NVDR — Non-Voting Depositary Receipt
PJSC — Public Joint Stock Company
REIT — Real Estate Investment Trust
112
Statements of Assets and Liabilities
November 30, 2024
| | | Global X
Millennial
Consumer ETF | | | Global X Aging
Population ETF | | | Global X
Robotics &
Artificial
Intelligence ETF | | | Global X FinTech
ETF | |
| Assets: | | | | | | | | | | | | | | | | |
| Cost of Investments | | $ | 131,982,166 | | | $ | 60,918,780 | | | $ | 2,566,113,684 | | | $ | 386,079,570 | |
| Cost of Repurchase Agreement | | | — | | | | — | | | | 56,300,544 | | | | 5,731,508 | |
| Cost (Proceeds) of Foreign Currency | | | — | | | | (46 | ) | | | (19,688 | ) | | | (1,276 | ) |
| Investments, at Value | | $ | 130,861,921 | | | $ | 61,744,170 | | | $ | 2,638,200,753 | * | | $ | 349,162,245 | * |
| Repurchase Agreement, at Value | | | — | | | | — | | | | 56,300,544 | | | | 5,731,508 | |
| Cash | | | 182,980 | | | | 61,463 | | | | 2,187,801 | | | | 231,948 | |
| Dividend, Interest, and Securities Lending Income Receivable | | | 38,070 | | | | 60,476 | | | | 4,149,788 | | | | 23,139 | |
| Reclaim Receivable | | | — | | | | 76,854 | | | | 4,681,241 | | | | 222,229 | |
| Cash pledged as collateral on Futures Contracts | | | — | | | | — | | | | 636,353 | | | | — | |
| Receivable for Variation Margin on Futures Contracts | | | — | | | | — | | | | 93,860 | | | | — | |
| Due from Broker | | | — | | | | 71 | | | | — | | | | — | |
| Total Assets | | | 131,082,971 | | | | 61,943,034 | | | | 2,706,250,340 | | | | 355,371,069 | |
| Liabilities: | | | | | | | | | | | | | | | | |
| Obligation to Return Securities Lending Collateral | | | — | | | | — | | | | 56,300,544 | | | | 5,731,508 | |
| Payable due to Investment Adviser | | | 51,968 | | | | 25,126 | | | | 1,460,608 | | | | 181,360 | |
| Overdraft of Foreign Currency | | | — | | | | 44 | | | | 19,834 | | | | 1,250 | |
| Unrealized Depreciation on Spot Contracts | | | — | | | | 14 | | | | 1,315 | | | | — | |
| Due to Broker | | | — | | | | 15,600 | | | | — | | | | — | |
| Total Liabilities | | | 51,968 | | | | 40,784 | | | | 57,782,301 | | | | 5,914,118 | |
| Net Assets | | $ | 131,031,003 | | | $ | 61,902,250 | | | $ | 2,648,468,039 | | | $ | 349,456,951 | |
| Net Assets Consist of: | | | | | | | | | | | | | | | | |
| Paid-in Capital | | $ | 144,409,911 | | | $ | 64,670,043 | | | $ | 3,100,953,928 | | | $ | 570,937,448 | |
| Total Accumulated Losses | | | (13,378,908 | ) | | | (2,767,793 | ) | | | (452,485,889 | ) | | | (221,480,497 | ) |
| Net Assets | | $ | 131,031,003 | | | $ | 61,902,250 | | | $ | 2,648,468,039 | | | $ | 349,456,951 | |
| Outstanding Shares of Beneficial Interest (unlimited authorization — no par value) | | | 2,790,000 | | | | 1,940,000 | | | | 79,650,000 | | | | 10,290,000 | |
| Net Asset Value, Offering and Redemption Price Per Share | | | $46.96 | | | | $31.91 | | | | $33.25 | | | | $33.96 | |
| *Includes Market Value of Securities on Loan | | $ | — | | | $ | — | | | $ | 66,297,043 | | | $ | 6,092,397 | |
The accompanying notes are an integral part of the financial statements.
113
Statements of Assets and Liabilities
November 30, 2024
| | | Global X Internet
of Things ETF | | | Global X U.S.
Infrastructure
Development
ETF | | | Global X
Autonomous &
Electric Vehicles
ETF | | | Global X
Artificial
Intelligence &
Technology ETF | |
| Assets: | | | | | | | | | | | | | | | | |
| Cost of Investments | | $ | 209,094,803 | | | $ | 6,930,005,889 | | | $ | 609,505,348 | | | $ | 2,100,409,239 | |
| Cost of Repurchase Agreement | | | 2,678,798 | | | | — | | | | 45,018,351 | | | | 4,903,463 | |
| Cost (Proceeds) of Foreign Currency | | | — | | | | — | | | | (5,312 | ) | | | (194 | ) |
| Investments, at Value | | $ | 240,449,286 | * | | $ | 9,703,754,630 | | | $ | 413,523,534 | * | | $ | 2,486,203,734 | * |
| Repurchase Agreement, at Value | | | 2,678,798 | | | | — | | | | 45,018,351 | | | | 4,903,463 | |
| Cash | | | 71,260 | | | | 7,747,488 | | | | 480,270 | | | | 4,199,349 | |
| Reclaim Receivable | | | 207,360 | | | | — | | | | 412,315 | | | | 236,916 | |
| Dividend, Interest, and Securities Lending Income Receivable | | | 126,743 | | | | 7,111,676 | | | | 884,755 | | | | 1,267,995 | |
| Receivable for Capital Shares Sold | | | — | | | | — | | | | — | | | | 9,688,566 | |
| Cash pledged as collateral on Futures Contracts | | | — | | | | 718,610 | | | | — | | | | — | |
| Receivable for Variation Margin on Futures Contracts | | | — | | | | 43,775 | | | | — | | | | — | |
| Due from Broker | | | — | | | | — | | | | 11,333 | | | | 14,225 | |
| Total Assets | | | 243,533,447 | | | | 9,719,376,179 | | | | 460,330,558 | | | | 2,506,514,248 | |
| Liabilities: | | | | | | | | | | | | | | | | |
| Obligation to Return Securities Lending Collateral | | | 2,678,798 | | | | — | | | | 45,018,351 | | | | 4,903,463 | |
| Payable due to Investment Adviser | | | 132,515 | | | | 3,515,019 | | | | 234,180 | | | | 1,327,277 | |
| Payable for Investment Securities Purchased | | | — | | | | — | | | | — | | | | 9,588,171 | |
| Payable for Capital Shares Redeemed | | | — | | | | — | | | | — | | | | 5,449 | |
| Overdraft of Foreign Currency | | | — | | | | — | | | | 5,215 | | | | 201 | |
| Unrealized Depreciation on Spot Contracts | | | — | | | | — | | | | 20 | | | | 133 | |
| Due to Broker | | | — | | | | 7,668 | | | | — | | | | — | |
| Total Liabilities | | | 2,811,313 | | | | 3,522,687 | | | | 45,257,766 | | | | 15,824,694 | |
| Net Assets | | $ | 240,722,134 | | | $ | 9,715,853,492 | | | $ | 415,072,792 | | | $ | 2,490,689,554 | |
| Net Assets Consist of: | | | | | | | | | | | | | | | | |
| Paid-in Capital | | $ | 230,124,315 | | | $ | 6,932,303,198 | | | $ | 757,978,886 | | | $ | 2,137,511,381 | |
| Total Distributable Earnings (Accumulated Losses) | | | 10,597,819 | | | | 2,783,550,294 | | | | (342,906,094 | ) | | | 353,178,173 | |
| Net Assets | | $ | 240,722,134 | | | $ | 9,715,853,492 | | | $ | 415,072,792 | | | $ | 2,490,689,554 | |
| Outstanding Shares of Beneficial Interest (unlimited authorization — no par value) | | | 6,660,000 | | | | 212,540,000 | | | | 17,560,002 | | | | 64,270,002 | |
| Net Asset Value, Offering and Redemption Price Per Share | | | $36.14 | | | | $45.71 | | | | $23.64 | | | | $38.75 | |
| *Includes Market Value of Securities on Loan | | $ | 2,616,946 | | | $ | — | | | $ | 49,925,088 | | | $ | 4,792,740 | |
The accompanying notes are an integral part of the financial statements.
114
Statements of Assets and Liabilities
November 30, 2024
| | | Global X
Genomics &
Biotechnology
ETF | | | Global X Cloud
Computing ETF | | | Global X
Thematic Growth
ETF | | | Global X Video
Games & Esports
ETF | |
| Assets: | | | | | | | | | | | | | | | | |
| Cost of Investments | | $ | 122,172,694 | | | $ | 455,846,273 | | | $ | — | | | $ | 157,850,660 | |
| Cost of Affiliated Investments | | | — | | | | — | | | | 20,940,748 | | | | — | |
| Cost of Repurchase Agreement | | | 5,201,334 | | | | 25,769 | | | | 1,805,799 | | | | 3,507,932 | |
| Cost (Proceeds) of Foreign Currency | | | — | | | | — | | | | — | | | | (736 | ) |
| Investments, at Value | | $ | 79,092,214 | * | | $ | 376,067,918 | * | | $ | — | | | $ | 111,568,407 | * |
| Affiliated Investments, at Value | | | — | | | | — | | | | 15,763,232 | * | | | — | |
| Repurchase Agreement, at Value | | | 5,201,334 | | | | 25,769 | | | | 1,805,799 | | | | 3,507,932 | |
| Cash | | | 94,020 | | | | 598,570 | | | | 15,417 | | | | 209,921 | |
| Dividend, Interest, and Securities Lending Income Receivable | | | 1,333 | | | | 44,762 | | | | 2,174 | | | | 94,893 | |
| Unrealized Appreciation on Spot Contracts | | | — | | | | — | | | | — | | | | 66 | |
| Reclaim Receivable | | | — | | | | — | | | | — | | | | 1,980 | |
| Receivable due from Investment Adviser | | | — | | | | — | | | | 2,051 | | | | — | |
| Due from Broker | | | — | | | | — | | | | — | | | | 12,795 | |
| Total Assets | | | 84,388,901 | | | | 376,737,019 | | | | 17,588,673 | | | | 115,395,994 | |
| Liabilities: | | | | | | | | | | | | | | | | |
| Obligation to Return Securities Lending Collateral | | | 5,201,334 | | | | 40,832 | | | | 1,805,799 | | | | 3,507,932 | |
| Payable due to Investment Adviser | | | 31,091 | | | | 198,177 | | | | — | | | | 44,275 | |
| Payable for Investment Securities Purchased | | | — | | | | — | | | | — | | | | 2,989,382 | |
| Overdraft of Foreign Currency | | | — | | | | — | | | | — | | | | 757 | |
| Total Liabilities | | | 5,232,425 | | | | 239,009 | | | | 1,805,799 | | | | 6,542,346 | |
| Net Assets | | $ | 79,156,476 | | | $ | 376,498,010 | | | $ | 15,782,874 | | | $ | 108,853,648 | |
| Net Assets Consist of: | | | | | | | | | | | | | | | | |
| Paid-in Capital | | $ | 225,325,894 | | | $ | 748,743,136 | | | $ | 71,779,248 | | | $ | 228,977,290 | |
| Total Accumulated Losses | | | (146,169,418 | ) | | | (372,245,126 | ) | | | (55,996,374 | ) | | | (120,123,642 | ) |
| Net Assets | | $ | 79,156,476 | | | $ | 376,498,010 | | | $ | 15,782,874 | | | $ | 108,853,648 | |
| Outstanding Shares of Beneficial Interest (unlimited authorization — no par value) | | | 7,310,000 | | | | 15,280,000 | | | | 620,000 | | | | 4,470,000 | |
| Net Asset Value, Offering and Redemption Price Per Share | | | $10.83 | | | | $24.64 | | | | $25.46 | | | | $24.35 | |
| *Includes Market Value of Securities on Loan | | $ | 5,077,380 | | | $ | 40,898 | | | $ | 1,767,076 | | | $ | 4,545,919 | |
The accompanying notes are an integral part of the financial statements.
115
Statements of Assets and Liabilities
November 30, 2024
| | | Global X
Cybersecurity
ETF | | | Global X
Telemedicine &
Digital Health
ETF | | | Global X
CleanTech ETF | | | Global X Data
Center & Digital
Infrastructure
ETF | |
| Assets: | | | | | | | | | | | | | | | | |
| Cost of Investments | | $ | 586,648,100 | | | $ | 83,196,973 | | | $ | 100,428,863 | | | $ | 138,051,770 | |
| Cost of Affiliated Investments | | | 162,936,717 | | | | — | | | | — | | | | — | |
| Cost of Repurchase Agreement | | | 1,552,603 | | | | 134,299 | | | | 7,091,965 | | | | — | |
| Cost (Proceeds) of Foreign Currency | | | — | | | | 1 | | | | — | | | | 44,657 | |
| Investments, at Value | | $ | 665,122,613 | * | | $ | 43,551,048 | * | | $ | 34,815,845 | * | | $ | 148,909,485 | |
| Affiliated Investments, at Value | | | 152,672,993 | | | | — | | | | — | | | | — | |
| Repurchase Agreement, at Value | | | 1,552,603 | | | | 134,299 | | | | 7,091,965 | | | | — | |
| Cash | | | 1,381,423 | | | | 38,552 | | | | — | | | | 122,242 | |
| Foreign Currency, at Value | | | — | | | | 1 | | | | 31 | | | | 44,657 | |
| Dividend, Interest, and Securities Lending Income Receivable | | | 483,477 | | | | 10,169 | | | | 12,126 | | | | 236,034 | |
| Reclaim Receivable | | | — | | | | 12,942 | | | | 20,362 | | | | — | |
| Due from Broker | | | — | | | | — | | | | 13,524 | | | | — | |
| Total Assets | | | 821,213,109 | | | | 43,747,011 | | | | 41,953,853 | | | | 149,312,418 | |
| Liabilities: | | | | | | | | | | | | | | | | |
| Obligation to Return Securities Lending Collateral | | | 1,552,603 | | | | 212,802 | | | | 7,091,965 | | | | — | |
| Payable due to Investment Adviser | | | 322,390 | | | | 23,626 | | | | 14,236 | | | | 54,332 | |
| Payable for Investment Securities Purchased | | | — | | | | — | | | | — | | | | 10,961,069 | |
| Unrealized Depreciation on Spot Contracts | | | — | | | | — | | | | — | | | | 18 | |
| Cash Overdraft | | | — | | | | — | | | | 2,094 | | | | — | |
| Custodian Fees Payable | | | — | | | | 6 | | | | — | | | | — | |
| Due to Broker | | | 30,319 | | | | — | | | | — | | | | — | |
| Total Liabilities | | | 1,905,312 | | | | 236,434 | | | | 7,108,295 | | | | 11,015,419 | |
| Net Assets | | $ | 819,307,797 | | | $ | 43,510,577 | | | $ | 34,845,558 | | | $ | 138,296,999 | |
| Net Assets Consist of: | | | | | | | | | | | | | | | | |
| Paid-in Capital | | $ | 990,516,135 | | | $ | 203,606,882 | | | $ | 154,136,914 | | | $ | 135,002,633 | |
| Total Distributable Earnings (Accumulated Losses) | | | (171,208,338 | ) | | | (160,096,305 | ) | | | (119,291,356 | ) | | | 3,294,366 | |
| Net Assets | | $ | 819,307,797 | | | $ | 43,510,577 | | | $ | 34,845,558 | | | $ | 138,296,999 | |
| Outstanding Shares of Beneficial Interest (unlimited authorization — no par value) | | | 24,500,000 | | | | 4,160,000 | | | | 4,700,000 | | | | 7,870,000 | |
| Net Asset Value, Offering and Redemption Price Per Share | | | $33.44 | | | | $10.46 | | | | $7.41 | | | | $17.57 | |
| *Includes Market Value of Securities on Loan | | $ | 1,478,182 | | | $ | 203,226 | | | $ | 7,190,765 | | | $ | — | |
The accompanying notes are an integral part of the financial statements.
116
Statements of Assets and Liabilities
November 30, 2024
| | | Global X Clean
Water ETF | | | Global X
AgTech & Food
Innovation ETF | | | Global X
Blockchain ETF | | | Global X
Hydrogen ETF ‡ | |
| Assets: | | | | | | | | | | | | | | | | |
| Cost of Investments | | $ | 9,018,742 | | | $ | 5,170,400 | | | $ | 137,465,462 | | | $ | 66,996,377 | |
| Cost of Repurchase Agreement | | | — | | | | — | | | | 33,910,264 | | | | 11,136,720 | |
| Cost (Proceeds) of Foreign Currency | | | 1,585 | | | | 365 | | | | — | | | | (215,280 | ) |
| Investments, at Value | | $ | 10,655,837 | | | $ | 4,716,837 | | | $ | 226,465,736 | * | | $ | 39,971,869 | * |
| Repurchase Agreement, at Value | | | — | | | | — | | | | 33,910,264 | | | | 11,136,720 | |
| Cash | | | 2,572 | | | | 5,653 | | | | 347,725 | | | | 882,826 | |
| Foreign Currency, at Value | | | 1,599 | | | | 367 | | | | — | | | | — | |
| Dividend, Interest, and Securities Lending Income Receivable | | | 31,502 | | | | 3,631 | | | | 45,864 | | | | 61,462 | |
| Receivable for Investment Securities Sold | | | — | | | | — | | | | — | | | | 304,082 | |
| Reclaim Receivable | | | — | | | | 1,569 | | | | — | | | | 961 | |
| Total Assets | | | 10,691,510 | | | | 4,728,057 | | | | 260,769,589 | | | | 52,357,920 | |
| Liabilities: | | | | | | | | | | | | | | | | |
| Obligation to Return Securities Lending Collateral | | | — | | | | — | | | | 33,910,264 | | | | 11,136,720 | |
| Payable due to Investment Adviser | | | 4,301 | | | | 1,887 | | | | 83,628 | | | | 14,818 | |
| Unrealized Depreciation on Spot Contracts | | | 9 | | | | — | | | | — | | | | 791 | |
| Payable for Investment Securities Purchased | | | — | | | | — | | | | — | | | | 352,163 | |
| Due to Custodian | | | — | | | | — | | | | — | | | | 215,280 | |
| Due to Broker | | | — | | | | — | | | | — | | | | 1,607 | |
| Total Liabilities | | | 4,310 | | | | 1,887 | | | | 33,993,892 | | | | 11,721,379 | |
| Net Assets | | $ | 10,687,200 | | | $ | 4,726,170 | | | $ | 226,775,697 | | | $ | 40,636,541 | |
| Net Assets Consist of: | | | | | | | | | | | | | | | | |
| Paid-in Capital | | $ | 9,671,295 | | | $ | 9,714,029 | | | $ | 284,145,550 | | | $ | 100,421,810 | |
| Total Distributable Earnings (Accumulated Losses) | | | 1,015,905 | | | | (4,987,859 | ) | | | (57,369,853 | ) | | | (59,785,269 | ) |
| Net Assets | | $ | 10,687,200 | | | $ | 4,726,170 | | | $ | 226,775,697 | | | $ | 40,636,541 | |
| Outstanding Shares of Beneficial Interest (unlimited authorization — no par value) | | | 580,000 | | | | 450,000 | | | | 3,185,860 | | | | 1,589,895 | |
| Net Asset Value, Offering and Redemption Price Per Share | | | $18.43 | | | | $10.50 | | | | $71.18 | | | | $25.56 | |
| *Includes Market Value of Securities on Loan | | $ | — | | | $ | — | | | $ | 33,850,524 | | | $ | 10,737,452 | |
| ‡ | The Outstanding Shares of Beneficial Interest and Net Asset Value, Offering and Redemption Price Per Share were updated to reflect the effect of a 1 for 5 reverse share split on June 14, 2024. (See Note 10 in the Notes to Financial Statements.) |
The accompanying notes are an integral part of the financial statements.
117
Statements of Assets and Liabilities
November 30, 2024
| | | Global X Solar
ETF | | | Global X Wind
Energy ETF | | | Global X
PropTech ETF | | | Global X Defense
Tech ETF | |
| Assets: | | | | | | | | | | | | | | | | |
| Cost of Investments | | $ | 8,346,487 | | | $ | 3,162,829 | | | $ | 1,409,391 | | | $ | 706,685,595 | |
| Cost of Repurchase Agreement | | | 96,079 | | | | 27,024 | | | | — | | | | — | |
| Cost (Proceeds) of Foreign Currency | | | 25 | | | | — | | | | 2 | | | | 8,552 | |
| Investments, at Value | | $ | 6,604,554 | * | | $ | 2,138,554 | * | | $ | 1,857,241 | | | $ | 764,050,245 | |
| Repurchase Agreement, at Value | | | 96,079 | | | | 27,024 | | | | — | | | | — | |
| Cash | | | 3,996 | | | | 2,393 | | | | 1,548 | | | | 1,178,213 | |
| Foreign Currency, at Value | | | 25 | | | | — | | | | 2 | | | | 8,542 | |
| Dividend, Interest, and Securities Lending Income Receivable | | | 1,986 | | | | 1,741 | | | | — | | | | 1,094,229 | |
| Reclaim Receivable | | | 229 | | | | 4,900 | | | | 540 | | | | 5,356 | |
| Due from Broker | | | — | | | | — | | | | — | | | | 7,759,604 | |
| Total Assets | | | 6,706,869 | | | | 2,174,612 | | | | 1,859,331 | | | | 774,096,189 | |
| Liabilities: | | | | | | | | | | | | | | | | |
| Obligation to Return Securities Lending Collateral | | | 96,079 | | | | 27,024 | | | | — | | | | — | |
| Payable due to Investment Adviser | | | 2,750 | | | | 875 | | | | 1,206 | | | | 299,587 | |
| Payable for Investment Securities Purchased | | | — | | | | — | | | | 49,823 | | | | — | |
| Payable for Capital Shares Redeemed | | | — | | | | — | | | | — | | | | 7,759,604 | |
| Unrealized Depreciation on Spot Contracts | | | — | | | | — | | | | — | | | | 137 | |
| Total Liabilities | | | 98,829 | | | | 27,899 | | | | 51,029 | | | | 8,059,328 | |
| Net Assets | | $ | 6,608,040 | | | $ | 2,146,713 | | | $ | 1,808,302 | | | $ | 766,036,861 | |
| Net Assets Consist of: | | | | | | | | | | | | | | | | |
| Paid-in Capital | | $ | 11,362,776 | | | $ | 5,426,879 | | | $ | 1,348,968 | | | $ | 708,900,284 | |
| Total Distributable Earnings (Accumulated Losses) | | | (4,754,736 | ) | | | (3,280,166 | ) | | | 459,334 | | | | 57,136,577 | |
| Net Assets | | $ | 6,608,040 | | | $ | 2,146,713 | | | $ | 1,808,302 | | | $ | 766,036,861 | |
| Outstanding Shares of Beneficial Interest (unlimited authorization — no par value) | | | 650,000 | | | | 180,000 | | | | 50,000 | | | | 19,510,000 | |
| Net Asset Value, Offering and Redemption Price Per Share | | | $10.17 | | | | $11.93 | | | | $36.17 | | | | $39.26 | |
| *Includes Market Value of Securities on Loan | | $ | 92,442 | | | $ | 11,045 | | | $ | — | | | $ | — | |
The accompanying notes are an integral part of the financial statements.
118
Statements of Assets and Liabilities
November 30, 2024
| | | Global X
Infrastructure
Development ex-
U.S. ETF |
| Assets: | | | | |
| Cost of Investments | | $ | 2,481,394 | |
| Cost (Proceeds) of Foreign Currency | | | 900 | |
| Investments, at Value | | $ | 2,390,062 | |
| Cash | | | 1,326 | |
| Foreign Currency, at Value | | | 901 | |
| Dividend, Interest, and Securities Lending Income Receivable | | | 6,047 | |
| Reclaim Receivable | | | 1 | |
| Total Assets | | | 2,398,337 | |
| Liabilities: | | | | |
| Payable due to Investment Adviser | | | 1,074 | |
| Unrealized Depreciation on Spot Contracts | | | 10 | |
| Total Liabilities | | | 1,084 | |
| Net Assets | | $ | 2,397,253 | |
| Net Assets Consist of: | | | | |
| Paid-in Capital | | $ | 2,487,556 | |
| Total Accumulated Losses | | | (90,303 | ) |
| Net Assets | | $ | 2,397,253 | |
| Outstanding Shares of Beneficial Interest (unlimited authorization — no par value) | | | 100,000 | |
| Net Asset Value, Offering and Redemption Price Per Share | | $ | 23.97 | |
The accompanying notes are an integral part of the financial statements.
119
Statements of Operations
For the year ended November 30, 2024
| | | Global X
Millennial
Consumer ETF | | | Global X Aging
Population ETF | | | Global X
Robotics &
Artificial
Intelligence ETF | | | Global X
FinTech ETF | |
| Investment Income: | | | | | | | | | | | | | | | | |
| Dividend Income | | $ | 937,540 | | | $ | 801,141 | | | $ | 19,631,336 | | | $ | 2,429,821 | |
| Interest Income | | | 4,876 | | | | 4,339 | | | | 74,545 | | | | 7,616 | |
| Security Lending Income | | | 1,002 | | | | — | | | | 2,546,452 | | | | 142,902 | |
| Reclaim Income | | | — | | | | 39,459 | | | | 1,337,545 | | | | — | |
| Less: Foreign Taxes Withheld | | | — | | | | (74,271 | ) | | | (3,813,743 | ) | | | (162,325 | ) |
| Total Investment Income | | | 943,418 | | | | 770,668 | | | | 19,776,135 | | | | 2,418,014 | |
| Expenses: | | | | | | | | | | | | | | | | |
| Supervision and Administration Fees(1) | | | 584,773 | | | | 296,580 | | | | 17,751,189 | | | | 2,189,288 | |
| Custodian Fees(2) | | | 110 | | | | 258 | | | | 12,275 | | | | 1,179 | |
| Total Expenses | | | 584,883 | | | | 296,838 | | | | 17,763,464 | | | | 2,190,467 | |
| Net Investment Income | | | 358,535 | | | | 473,830 | | | | 2,012,671 | | | | 227,547 | |
| Net Realized Gain (Loss) on: | | | | | | | | | | | | | | | | |
| Investments(3) | | | 7,440,234 | | | | 2,025,422 | | | | 437,006,305 | | | | (34,157,600 | ) |
| Futures Contracts | | | — | | | | — | | | | 1,045,895 | | | | — | |
| Foreign Currency Transactions | | | — | | | | (3,495 | ) | | | (435,911 | ) | | | 2,429 | |
| Net Realized Gain (Loss) | | | 7,440,234 | | | | 2,021,927 | | | | 437,616,289 | | | | (34,155,171 | ) |
| Net Change in Unrealized Appreciation (Depreciation) on: | | | | | | | | | | | | | | | | |
| Investments | | | 34,290,075 | | | | 7,692,593 | | | | 116,133,469 | | | | 169,042,746 | |
| Futures Contracts | | | — | | | | — | | | | 69,859 | | | | — | |
| Foreign Currency Translations | | | — | | | | (2,670 | ) | | | (421,402 | ) | | | (3,466 | ) |
| Net Change in Unrealized Appreciation (Depreciation) | | | 34,290,075 | | | | 7,689,923 | | | | 115,781,926 | | | | 169,039,280 | |
| Net Realized and Unrealized Gain (Loss) | | | 41,730,309 | | | | 9,711,850 | | | | 553,398,215 | | | | 134,884,109 | |
| Net Increase in Net Assets Resulting from Operations | | $ | 42,088,844 | | | $ | 10,185,680 | | | $ | 555,410,886 | | | $ | 135,111,656 | |
| (1) | The Supervision and Administration fees includes fees paid by the Funds for the investment advisory services provided by the Adviser. (See Note 3 in the Notes to Financial Statements.) |
| (2) | See Note 2 in the Notes to Financial Statements. |
| (3) | Includes realized gains (losses) as a result of in-kind redemptions. (See Note 4 in the Notes to Financial Statements.) |
The accompanying notes are an integral part of the financial statements.
120
Statements of Operations
For the year ended November 30, 2024
| | | Global X
Internet of
Things ETF | | | Global X U.S.
Infrastructure
Development
ETF | | | Global X
Autonomous &
Electric Vehicles
ETF | | | Global X
Artificial
Intelligence &
Technology ETF | |
| Investment Income: | | | | | | | | | | | | | | | | |
| Dividend Income | | $ | 3,385,028 | | | $ | 79,466,259 | | | $ | 8,332,629 | | | $ | 15,987,935 | |
| Interest Income | | | 15,075 | | | | 555,918 | | | | 32,159 | | | | 103,489 | |
| Security Lending Income | | | 42,900 | | | | 1,218 | | | | 2,683,544 | | | | 38,602 | |
| Less: Foreign Taxes Withheld | | | (219,032 | ) | | | — | | | | (779,152 | ) | | | (790,285 | ) |
| Total Investment Income | | | 3,223,971 | | | | 80,023,395 | | | | 10,269,180 | | | | 15,339,741 | |
| Expenses: | | | | | | | | | | | | | | | | |
| Supervision and Administration Fees(1) | | | 1,829,294 | | | | 34,215,409 | | | | 3,693,361 | | | | 11,888,417 | |
| Custodian Fees(2) | | | 491 | | | | — | | | | 5,115 | | | | 1,424 | |
| Total Expenses | | | 1,829,785 | | | | 34,215,409 | | | | 3,698,476 | | | | 11,889,841 | |
| Net Investment Income | | | 1,394,186 | | | | 45,807,986 | | | | 6,570,704 | | | | 3,449,900 | |
| Net Realized Gain (Loss) on: | | | | | | | | | | | | | | | | |
| Investments(3) | | | 12,030,052 | | | | 402,682,374 | | | | (18,031,219 | ) | | | 89,840,899 | |
| Futures Contracts | | | — | | | | (8,231 | ) | | | — | | | | — | |
| Foreign Currency Transactions | | | (21,543 | ) | | | — | | | | (55,936 | ) | | | (150,387 | ) |
| Net Realized Gain (Loss) | | | 12,008,509 | | | | 402,674,143 | | | | (18,087,155 | ) | | | 89,690,512 | |
| Net Change in Unrealized Appreciation (Depreciation) on: | | | | | | | | | | | | | | | | |
| Investments | | | 18,518,801 | | | | 2,220,956,351 | | | | 35,512,974 | | | | 338,443,678 | |
| Futures Contracts | | | — | | | | 151,291 | | | | — | | | | — | |
| Foreign Currency Translations | | | (7,233 | ) | | | — | | | | (30,033 | ) | | | (18,715 | ) |
| Net Change in Unrealized Appreciation (Depreciation) | | | 18,511,568 | | | | 2,221,107,642 | | | | 35,482,941 | | | | 338,424,963 | |
| Net Realized and Unrealized Gain (Loss) | | | 30,520,077 | | | | 2,623,781,785 | | | | 17,395,786 | | | | 428,115,475 | |
| Net Increase in Net Assets Resulting from Operations | | $ | 31,914,263 | | | $ | 2,669,589,771 | | | $ | 23,966,490 | | | $ | 431,565,375 | |
| (1) | The Supervision and Administration fees includes fees paid by the Funds for the investment advisory services provided by the Adviser. (See Note 3 in the Notes to Financial Statements.) |
| (2) | See Note 2 in the Notes to Financial Statements. |
| (3) | Includes realized gains (losses) as a result of in-kind redemptions. (See Note 4 in the Notes to Financial Statements.) |
The accompanying notes are an integral part of the financial statements.
121
Statements of Operations
For the year ended November 30, 2024
| | | Global X
Genomics &
Biotechnology
ETF | | | Global X Cloud
Computing ETF | | | Global X
Thematic
Growth ETF | | | Global X Video
Games &
Esports ETF | |
| Investment Income: | | | | | | | | | | | | | | | | |
| Dividend Income | | $ | 222,519 | | | $ | 634,891 | | | $ | — | | | $ | 1,802,917 | |
| Dividend Income, from Affiliated Investments | | | — | | | | — | | | | 292,654 | | | | — | |
| Interest Income | | | 3,840 | | | | 19,992 | | | | 1,670 | | | | 14,918 | |
| Security Lending Income | | | 17,275 | | | | 24,792 | | | | 50,463 | | | | 55,514 | |
| Less: Foreign Taxes Withheld | | | (972 | ) | | | — | | | | — | | | | (129,424 | ) |
| Total Investment Income | | | 242,662 | | | | 679,675 | | | | 344,787 | | | | 1,743,925 | |
| Expenses: | | | | | | | | | | | | | | | | |
| Supervision and Administration Fees(1) | | | 451,671 | | | | 3,267,124 | | | | 107,767 | | | | 607,562 | |
| Custodian Fees(2) | | | 852 | | | | 565 | | | | 914 | | | | 2,875 | |
| Total Expenses | | | 452,523 | | | | 3,267,689 | | | | 108,681 | | | | 610,437 | |
| Net Investment Income (Loss) | | | (209,861 | ) | | | (2,588,014 | ) | | | 236,106 | | | | 1,133,488 | |
| Net Realized Gain (Loss) on: | | | | | | | | | | | | | | | | |
| Investments(3) | | | (4,293,598 | ) | | | (99,310,647 | ) | | | — | | | | (7,819,455 | ) |
| Affiliated Investments | | | — | | | | — | | | | (18,768,821 | ) | | | — | |
| Foreign Currency Transactions | | | (431 | ) | | | (439 | ) | | | — | | | | (15,072 | ) |
| Capital Gain Distribution from Affiliated | | | | | | | | | | | | | | | | |
| Investments | | | — | | | | — | | | | 167 | | | | — | |
| Payment from Adviser(4) | | | — | | | | — | | | | 124,963 | | | | — | |
| Net Realized Gain (Loss) | | | (4,294,029 | ) | | | (99,311,086 | ) | | | (18,643,691 | ) | | | (7,834,527 | ) |
| Net Change in Unrealized Appreciation (Depreciation) on: | | | | | | | | | | | | | | | | |
| Investments | | | 7,941,313 | | | | 152,128,322 | | | | — | | | | 29,592,744 | |
| Affiliated Investments | | | — | | | | — | | | | 20,996,812 | | | | — | |
| Foreign Currency Translations | | | — | | | | — | | | | — | | | | (6,144 | ) |
| Net Change in Unrealized Appreciation (Depreciation) | | | 7,941,313 | | | | 152,128,322 | | | | 20,996,812 | | | | 29,586,600 | |
| Net Realized and Unrealized Gain (Loss) | | | 3,647,284 | | | | 52,817,236 | | | | 2,353,121 | | | | 21,752,073 | |
| Net Increase in Net Assets Resulting from Operations | | $ | 3,437,423 | | | $ | 50,229,222 | | | $ | 2,589,227 | | | $ | 22,885,561 | |
| (1) | The Supervision and Administration fees includes fees paid by the Funds for the investment advisory services provided by the Adviser. (See Note 3 in the Notes to Financial Statements.) |
| (2) | See Note 2 in the Notes to Financial Statements. |
| (3) | Includes realized gains (losses) as a result of in-kind redemptions. (See Note 4 in the Notes to Financial Statements.) |
| (4) | See Note 3 in the Notes to Financial Statements. |
The accompanying notes are an integral part of the financial statements.
122
Statements of Operations
For the year ended November 30, 2024
| | | Global X
Cybersecurity
ETF | | | Global X
Telemedicine &
Digital Health
ETF | | | Global X
CleanTech ETF | | | Global X Data
Center & Digital
Infrastructure
ETF | |
| Investment Income: | | | | | | | | | | | | | | | | |
| Dividend Income | | $ | 4,892,193 | | | $ | 107,217 | | | $ | 571,119 | | | $ | 1,703,861 | |
| Dividend Income, from Affiliated Investments | | | 684,633 | | | | — | | | | — | | | | — | |
| Interest Income | | | 50,752 | | | | 2,448 | | | | 2,468 | | | | 6,752 | |
| Security Lending Income | | | 33,600 | | | | 2,021 | | | | 155,303 | | | | — | |
| Less: Foreign Taxes Withheld | | | (473,628 | ) | | | (3,426 | ) | | | (28,699 | ) | | | (37,292 | ) |
| Total Investment Income | | | 5,187,550 | | | | 108,260 | | | | 700,191 | | | | 1,673,321 | |
| Expenses: | | | | | | | | | | | | | | | | |
| Supervision and Administration Fees(1) | | | 3,818,371 | | | | 350,324 | | | | 231,786 | | | | 395,144 | |
| Custodian Fees(2) | | | 93,890 | | | | 89 | | | | 787 | | | | 616 | |
| Total Expenses | | | 3,912,261 | | | | 350,413 | | | | 232,573 | | | | 395,760 | |
| Net Investment Income (Loss) | | | 1,275,289 | | | | (242,153 | ) | | | 467,618 | | | | 1,277,561 | |
| Net Realized Gain (Loss) on: | | | | | | | | | | | | | | | | |
| Investments(3) | | | (7,995,621 | ) | | | (39,632,355 | ) | | | (27,404,058 | ) | | | (2,701,721 | ) |
| Affiliated Investments | | | 919,822 | | | | — | | | | — | | | | — | |
| Futures Contracts | | | 186,940 | | | | — | | | | — | | | | — | |
| Foreign Currency Transactions | | | (207,016 | ) | | | 642 | | | | (2,803 | ) | | | (18,717 | ) |
| Net Realized Gain (Loss) | | | (7,095,875 | ) | | | (39,631,713 | ) | | | (27,406,861 | ) | | | (2,720,438 | ) |
| Net Change in Unrealized Appreciation (Depreciation) on: | | | | | | | | | | | | | | | | |
| Investments | | | 156,028,795 | | | | 47,423,755 | | | | 14,662,006 | | | | 19,526,073 | |
| Affiliated Investments | | | 8,907,304 | | | | — | | | | — | | | | — | |
| Foreign Currency Translations | | | (7,200 | ) | | | (682 | ) | | | (636 | ) | | | 628 | |
| Net Change in Unrealized Appreciation (Depreciation) | | | 164,928,899 | | | | 47,423,073 | | | | 14,661,370 | | | | 19,526,701 | |
| Net Realized and Unrealized Gain (Loss) | | | 157,833,024 | | | | 7,791,360 | | | | (12,745,491 | ) | | | 16,806,263 | |
| Net Increase (Decrease) in Net Assets Resulting from Operations | | $ | 159,108,313 | | | $ | 7,549,207 | | | $ | (12,277,873 | ) | | $ | 18,083,824 | |
| (1) | The Supervision and Administration fees includes fees paid by the Funds for the investment advisory services provided by the Adviser. (See Note 3 in the Notes to Financial Statements.) |
| (2) | See Note 2 in the Notes to Financial Statements. |
| (3) | Includes realized gains (losses) as a result of in-kind redemptions. (See Note 4 in the Notes to Financial Statements.) |
The accompanying notes are an integral part of the financial statements.
123
Statements of Operations
For the year ended November 30, 2024
| | | Global X Clean
Water ETF | | | Global X
AgTech & Food
Innovation ETF | | | Global X
Blockchain ETF | | | Global X
Hydrogen ETF | |
| Investment Income: | | | | | | | | | | | | | | | | |
| Dividend Income | | $ | 199,949 | | | $ | 107,621 | | | $ | 53,264 | | | $ | 121,798 | |
| Interest Income | | | 510 | | | | 753 | | | | 9,984 | | | | 4,310 | |
| Security Lending Income | | | — | | | | — | | | | 918,372 | | | | 191,618 | |
| Less: Foreign Taxes Withheld | | | (1,958 | ) | | | (6,972 | ) | | | (5,625 | ) | | | (4,791 | ) |
| Total Investment Income | | | 198,501 | | | | 101,402 | | | | 975,995 | | | | 312,935 | |
| Expenses: | | | | | | | | | | | | | | | | |
| Supervision and Administration Fees(1) | | | 49,972 | | | | 22,149 | | | | 740,708 | | | | 193,592 | |
| Custodian Fees(2) | | | 20 | | | | 23 | | | | 1,006 | | | | 157 | |
| Total Expenses | | | 49,992 | | | | 22,172 | | | | 741,714 | | | | 193,749 | |
| Net Investment Income | | | 148,509 | | | | 79,230 | | | | 234,281 | | | | 119,186 | |
| Net Realized Gain (Loss) on: | | | | | | | | | | | | | | | | |
| Investments(3) | | | 258,890 | | | | 37,021 | | | | 37,054,248 | | | | (12,396,832 | ) |
| Foreign Currency Transactions | | | (1,728 | ) | | | (738 | ) | | | (74,816 | ) | | | (11,796 | ) |
| Net Realized Gain (Loss) | | | 257,162 | | | | 36,283 | | | | 36,979,432 | | | | (12,408,628 | ) |
| Net Change in Unrealized Appreciation (Depreciation) on: | | | | | | | | | | | | | | | | |
| Investments | | | 1,460,560 | | | | 133,773 | | | | 91,092,802 | | | | 2,758,440 | |
| Foreign Currency Translations | | | 46 | | | | 333 | | | | 2 | | | | (1,863 | ) |
| Net Change in Unrealized Appreciation (Depreciation) | | | 1,460,606 | | | | 134,106 | | | | 91,092,804 | | | | 2,756,577 | |
| Net Realized and Unrealized Gain (Loss) | | | 1,717,768 | | | | 170,389 | | | | 128,072,236 | | | | (9,652,051 | ) |
| Net Increase (Decrease) in Net Assets Resulting from Operations | | $ | 1,866,277 | | | $ | 249,619 | | | $ | 128,306,517 | | | $ | (9,532,865 | ) |
| (1) | The Supervision and Administration fees includes fees paid by the Funds for the investment advisory services provided by the Adviser. (See Note 3 in the Notes to Financial Statements.) |
| (2) | See Note 2 in the Notes to Financial Statements. |
| (3) | Includes realized gains (losses) as a result of in-kind redemptions. (See Note 4 in the Notes to Financial Statements.) |
The accompanying notes are an integral part of the financial statements.
124
Statements of Operations
For the year ended November 30, 2024
| | | Global X Solar
ETF | | | Global X Wind
Energy ETF | | | Global X
PropTech ETF | | | Global X
Defense Tech
ETF | |
| Investment Income: | | | | | | | | | | | | | | | | |
| Dividend Income | | $ | 68,166 | | | $ | 43,359 | | | $ | 18,306 | | | $ | 3,414,947 | |
| Interest Income | | | 769 | | | | 148 | | | | 198 | | | | 20,598 | |
| Security Lending Income | | | 3,486 | | | | 307 | | | | — | | | | — | |
| Reclaim Income | | | — | | | | 1,525 | | | | — | | | | — | |
| Less: Foreign Taxes Withheld | | | (5,654 | ) | | | (7,088 | ) | | | (701 | ) | | | (68,691 | ) |
| Total Investment Income | | | 66,767 | | | | 38,251 | | | | 17,803 | | | | 3,366,854 | |
| Expenses: | | | | | | | | | | | | | | | | |
| Supervision and Administration Fees(1) | | | 32,738 | | | | 12,320 | | | | 15,420 | | | | 1,289,251 | |
| Custodian Fees(2) | | | 50 | | | | 219 | | | | 2 | | | | 9,578 | |
| Total Expenses | | | 32,788 | | | | 12,539 | | | | 15,422 | | | | 1,298,829 | |
| Net Investment Income | | | 33,979 | | | | 25,712 | | | | 2,381 | | | | 2,068,025 | |
| Net Realized Gain (Loss) on: | | | | | | | | | | | | | | | | |
| Investments(3) | | | (1,082,272 | ) | | | (626,864 | ) | | | 605,100 | | | | 19,808,123 | |
| Foreign Currency Transactions | | | (1,163 | ) | | | (236 | ) | | | (143 | ) | | | (86,237 | ) |
| Net Realized Gain (Loss) | | | (1,083,435 | ) | | | (627,100 | ) | | | 604,957 | | | | 19,721,886 | |
| Net Change in Unrealized Appreciation (Depreciation) on: | | | | | | | | | | | | | | | | |
| Investments | | | 151,597 | | | | 435,337 | | | | 293,238 | | | | 57,084,975 | |
| Foreign Currency Translations | | | 183 | | | | (271 | ) | | | (15 | ) | | | (8,275 | ) |
| Net Change in Unrealized Appreciation (Depreciation) | | | 151,780 | | | | 435,066 | | | | 293,223 | | | | 57,076,700 | |
| Net Realized and Unrealized Gain (Loss) | | | (931,655 | ) | | | (192,034 | ) | | | 898,180 | | | | 76,798,586 | |
| Net Increase (Decrease) in Net Assets Resulting from Operations | | $ | (897,676 | ) | | $ | (166,322 | ) | | $ | 900,561 | | | $ | 78,866,611 | |
| (1) | The Supervision and Administration fees includes fees paid by the Funds for the investment advisory services provided by the Adviser. (See Note 3 in the Notes to Financial Statements.) |
| (2) | See Note 2 in the Notes to Financial Statements. |
| (3) | Includes realized gains (losses) as a result of in-kind redemptions. (See Note 4 in the Notes to Financial Statements.) |
The accompanying notes are an integral part of the financial statements.
125
Statements of Operations
For the period ended November 30, 2024
| | | Global X
Infrastructure
Development ex-
U.S. ETF (1) | |
| Investment Income: | | | | |
| Dividend Income | | $ | 13,170 | |
| Interest Income | | | 327 | |
| Less: Foreign Taxes Withheld | | | (1,847 | ) |
| Total Investment Income | | | 11,650 | |
| Expenses: | | | | |
| Supervision and Administration Fees(2) | | | 3,446 | |
| Custodian Fees(3) | | | 74 | |
| Total Expenses | | | 3,520 | |
| Net Investment Income | | | 8,130 | |
| Net Realized Gain (Loss) on: | | | | |
| Investments | | | (3,709 | ) |
| Foreign Currency Transactions | | | (3,136 | ) |
| Net Realized Gain (Loss) | | | (6,845 | ) |
| Net Change in Unrealized Appreciation (Depreciation) on: | | | | |
| Investments | | | (91,332 | ) |
| Foreign Currency Translations | | | (256 | ) |
| Net Change in Unrealized Appreciation (Depreciation) | | | (91,588 | ) |
| Net Realized and Unrealized Gain (Loss) | | | (98,433 | ) |
| Net Decrease in Net Assets Resulting from Operations | | $ | (90,303 | ) |
| (1) | The Fund commenced operations on August 27, 2024. |
| (2) | The Supervision and Administration fees includes fees paid by the Funds for the investment advisory services provided by the Adviser. (See Note 3 in the Notes to Financial Statements.) |
| (3) | See Note 2 in the Notes to Financial Statements. |
The accompanying notes are an integral part of the financial statements.
126
Statements of Changes in Net Assets
| | | Global X Millennial Consumer ETF | | Global X Aging Population ETF |
| | | Year Ended
November 30,
2024 | | Year Ended
November 30,
2023 | | Year Ended
November 30,
2024 | | Year Ended
November 30,
2023 |
| Operations: | | | | | | | | | | | | | | | | |
| Net Investment Income | | $ | 358,535 | | | $ | 228,214 | | | $ | 473,830 | | | $ | 459,575 | |
| Net Realized Gain (Loss) | | | 7,440,234 | | | | (5,682,630 | ) | | | 2,021,927 | | | | 1,611,929 | |
| Net Change in Unrealized Appreciation (Depreciation) | | | 34,290,075 | | | | 20,164,143 | | | | 7,689,923 | | | | (827,111 | ) |
| Net Increase in Net Assets Resulting from Operations | | | 42,088,844 | | | | 14,709,727 | | | | 10,185,680 | | | | 1,244,393 | |
| Distributions: | | | (409,955 | ) | | | (234,244 | ) | | | (438,748 | ) | | | (279,995 | ) |
| | | | | | | | | | | | | | | | | |
| Capital Share Transactions: | | | | | | | | | | | | | | | | |
| Issued | | | 17,677,930 | | | | 4,599,684 | | | | 11,786,435 | | | | 37,583,461 | |
| Redeemed | | | (33,819,173 | ) | | | (19,040,816 | ) | | | (13,226,750 | ) | | | (26,752,713 | ) |
| Increase (Decrease) in Net Assets from Capital Share Transactions | | | (16,141,243 | ) | | | (14,441,132 | ) | | | (1,440,315 | ) | | | 10,830,748 | |
| Total Increase in Net Assets | | | 25,537,646 | | | | 34,351 | | | | 8,306,617 | | | | 11,795,146 | |
| | | | | | | | | | | | | | | | | |
| Net Assets: | | | | | | | | | | | | | | | | |
| Beginning of Year | | | 105,493,357 | | | | 105,459,006 | | | | 53,595,633 | | | | 41,800,487 | |
| End of Year | | $ | 131,031,003 | | | $ | 105,493,357 | | | $ | 61,902,250 | | | $ | 53,595,633 | |
| | | | | | | | | | | | | | | | | |
| Share Transactions: | | | | | | | | | | | | | | | | |
| Issued | | | 470,000 | | | | 150,000 | | | | 390,000 | | | | 1,390,000 | |
| Redeemed | | | (890,000 | ) | | | (650,000 | ) | | | (440,000 | ) | | | (980,000 | ) |
| Net Increase (Decrease) in Shares Outstanding from Share Transactions | | | (420,000 | ) | | | (500,000 | ) | | | (50,000 | ) | | | 410,000 | |
The accompanying notes are an integral part of the financial statements.
127
Statements of Changes in Net Assets
| | | Global X Robotics & Artificial
Intelligence ETF | | Global X FinTech ETF |
| | | Year Ended
November 30,
2024 | | Year Ended
November 30,
2023 | | Year Ended
November 30,
2024 | | Year Ended
November 30,
2023 |
| Operations: | | | | | | | | | | | | | | | | |
| Net Investment Income | | $ | 2,012,671 | | | $ | 5,073,094 | | | $ | 227,547 | | | $ | 900,991 | |
| Net Realized Gain (Loss) | | | 437,616,289 | | | | 84,219,313 | | | | (34,155,171 | ) | | | (49,991,055 | ) |
| Net Change in Unrealized Appreciation (Depreciation) | | | 115,781,926 | | | | 236,127,298 | | | | 169,039,280 | | | | 81,058,377 | |
| Net Increase in Net Assets Resulting from Operations | | | 555,410,886 | | | | 325,419,705 | | | | 135,111,656 | | | | 31,968,313 | |
| Distributions: | | | (1,998,947 | ) | | | (4,618,009 | ) | | | (709,172 | ) | | | (887,181 | ) |
| Return of Capital: | | | (2,145,659 | ) | | | — | | | | — | | | | (28,497 | ) |
| | | | | | | | | | | | | | | | | |
| Capital Share Transactions: | | | | | | | | | | | | | | | | |
| Issued | | | 886,400,690 | | | | 956,017,585 | | | | 40,238,180 | | | | 10,050,968 | |
| Redeemed | | | (1,059,022,563 | ) | | | (348,937,384 | ) | | | (176,661,379 | ) | | | (145,088,625 | ) |
| Increase (Decrease) in Net Assets from Capital Share Transactions | | | (172,621,873 | ) | | | 607,080,201 | | | | (136,423,199 | ) | | | (135,037,657 | ) |
| Total Increase (Decrease) in Net Assets | | | 378,644,407 | | | | 927,881,897 | | | | (2,020,715 | ) | | | (103,985,022 | ) |
| | | | | | | | | | | | | | | | | |
| Net Assets: | | | | | | | | | | | | | | | | |
| Beginning of Year | | | 2,269,823,632 | | | | 1,341,941,735 | | | | 351,477,666 | | | | 455,462,688 | |
| End of Year | | $ | 2,648,468,039 | | | $ | 2,269,823,632 | | | $ | 349,456,951 | | | $ | 351,477,666 | |
| | | | | | | | | | | | | | | | | |
| Share Transactions: | | | | | | | | | | | | | | | | |
| Issued | | | 28,080,000 | | | | 35,920,000 | | | | 1,480,000 | | | | 450,000 | |
| Redeemed | | | (34,190,000 | ) | | | (13,790,000 | ) | | | (6,900,000 | ) | | | (7,020,000 | ) |
| Net Increase (Decrease) in Shares Outstanding from Share Transactions | | | (6,110,000 | ) | | | 22,130,000 | | | | (5,420,000 | ) | | | (6,570,000 | ) |
The accompanying notes are an integral part of the financial statements.
128
Statements of Changes in Net Assets
| | | Global X Internet of Things ETF | | Global X U.S. Infrastructure
Development ETF |
| | | Year Ended
November 30,
2024 | | Year Ended
November 30,
2023 | | Year Ended
November 30,
2024 | | Year Ended
November 30,
2023 |
| Operations: | | | | | | | | | | | | | | | | |
| Net Investment Income | | $ | 1,394,186 | | | $ | 2,493,430 | | | $ | 45,807,986 | | | $ | 36,150,105 | |
| Net Realized Gain (Loss) | | | 12,008,509 | | | | 21,537,881 | | | | 402,674,143 | | | | 132,455,324 | |
| Net Change in Unrealized Appreciation (Depreciation) | | | 18,511,568 | | | | (4,853,824 | ) | | | 2,221,107,642 | | | | 362,554,425 | |
| Net Increase in Net Assets Resulting from Operations | | | 31,914,263 | | | | 19,177,487 | | | | 2,669,589,771 | | | | 531,159,854 | |
| Distributions: | | | (1,821,857 | ) | | | (2,946,458 | ) | | | (41,670,377 | ) | | | (30,856,526 | ) |
| | | | | | | | | | | | | | | | | |
| Capital Share Transactions: | | | | | | | | | | | | | | | | |
| Issued | | | 24,843 | | | | 91,298,646 | | | | 2,919,209,785 | | | | 1,599,704,351 | |
| Redeemed | | | (76,882,333 | ) | | | (125,739,142 | ) | | | (985,071,513 | ) | | | (694,905,086 | ) |
| Increase (Decrease) in Net Assets from Capital Share Transactions | | | (76,857,490 | ) | | | (34,440,496 | ) | | | 1,934,138,272 | | | | 904,799,265 | |
| Total Increase (Decrease) in Net Assets | | | (46,765,084 | ) | | | (18,209,467 | ) | | | 4,562,057,666 | | | | 1,405,102,593 | |
| | | | | | | | | | | | | | | | | |
| Net Assets: | | | | | | | | | | | | | | | | |
| Beginning of Year | | | 287,487,218 | | | | 305,696,685 | | | | 5,153,795,826 | | | | 3,748,693,233 | |
| End of Year | | $ | 240,722,134 | | | $ | 287,487,218 | | | $ | 9,715,853,492 | | | $ | 5,153,795,826 | |
| | | | | | | | | | | | | | | | | |
| Share Transactions: | | | | | | | | | | | | | | | | |
| Issued | | | — | | | | 2,750,000 | | | | 75,500,000 | | | | 53,210,000 | |
| Redeemed | | | (2,200,000 | ) | | | (3,900,000 | ) | | | (26,550,000 | ) | | | (23,790,000 | ) |
| Net Increase (Decrease) in Shares Outstanding from Share Transactions | | | (2,200,000 | ) | | | (1,150,000 | ) | | | 48,950,000 | | | | 29,420,000 | |
The accompanying notes are an integral part of the financial statements.
129
Statements of Changes in Net Assets
| | | Global X Autonomous & Electric
Vehicles ETF | | Global X Artificial Intelligence &
Technology ETF |
| | | Year Ended
November 30,
2024 | | Year Ended
November 30,
2023 | | Year Ended
November 30,
2024 | | Year Ended
November 30,
2023 |
| Operations: | | | | | | | | | | | | | | | | |
| Net Investment Income | | $ | 6,570,704 | | | $ | 13,303,660 | | | $ | 3,449,900 | | | $ | 902,836 | |
| Net Realized Gain (Loss) | | | (18,087,155 | ) | | | 3,849,804 | | | | 89,690,512 | | | | (3,447,325 | ) |
| Net Change in Unrealized Appreciation (Depreciation) | | | 35,482,941 | | | | 10,857,090 | | | | 338,424,963 | | | | 94,136,286 | |
| Net Increase in Net Assets Resulting from Operations | | | 23,966,490 | | | | 28,010,554 | | | | 431,565,375 | | | | 91,591,797 | |
| Distributions: | | | (10,410,110 | ) | | | (11,305,718 | ) | | | (3,035,733 | ) | | | (724,994 | ) |
| | | | | | | | | | | | | | | | | |
| Capital Share Transactions: | | | | | | | | | | | | | | | | |
| Issued | | | 41,024,642 | | | | 52,145,898 | | | | 1,544,919,362 | | | | 606,811,271 | |
| Redeemed | | | (337,253,139 | ) | | | (254,584,131 | ) | | | (272,634,683 | ) | | | (38,321,292 | ) |
| Increase (Decrease) in Net Assets from Capital Share Transactions | | | (296,228,497 | ) | | | (202,438,233 | ) | | | 1,272,284,679 | | | | 568,489,979 | |
| Total Increase (Decrease) in Net Assets | | | (282,672,117 | ) | | | (185,733,397 | ) | | | 1,700,814,321 | | | | 659,356,782 | |
| | | | | | | | | | | | | | | | | |
| Net Assets: | | | | | | | | | | | | | | | | |
| Beginning of Year | | | 697,744,909 | | | | 883,478,306 | | | | 789,875,233 | | | | 130,518,451 | |
| End of Year | | $ | 415,072,792 | | | $ | 697,744,909 | | | $ | 2,490,689,554 | | | $ | 789,875,233 | |
| | | | | | | | | | | | | | | | | |
| Share Transactions: | | | | | | | | | | | | | | | | |
| Issued | | | 1,780,000 | | | | 2,050,000 | | | | 45,800,000 | | | | 22,120,000 | |
| Redeemed | | | (14,310,000 | ) | | | (10,550,000 | ) | | | (8,100,000 | ) | | | (1,610,000 | ) |
| Net Increase (Decrease) in Shares Outstanding from Share Transactions | | | (12,530,000 | ) | | | (8,500,000 | ) | | | 37,700,000 | | | | 20,510,000 | |
The accompanying notes are an integral part of the financial statements.
130
Statements of Changes in Net Assets
| | | Global X Genomics &
Biotechnology ETF | | Global X Cloud Computing ETF |
| | | Year Ended
November 30,
2024 | | Year Ended
November 30,
2023 | | Year Ended
November 30,
2024 | | Year Ended
November 30,
2023 |
| Operations: | | | | | | | | | | | | | | | | |
| Net Investment Loss | | $ | (209,861 | ) | | $ | (629,498 | ) | | $ | (2,588,014 | ) | | $ | (3,040,126 | ) |
| Net Realized Gain (Loss) | | | (4,294,029 | ) | | | (51,137,922 | ) | | | (99,311,086 | ) | | | (61,707,202 | ) |
| Net Change in Unrealized Appreciation (Depreciation) | | | 7,941,313 | | | | (7,073,797 | ) | | | 152,128,322 | | | | 183,037,719 | |
| Net Increase (Decrease) in Net Assets Resulting from Operations | | | 3,437,423 | | | | (58,841,217 | ) | | | 50,229,222 | | | | 118,290,391 | |
| | | | | | | | | | | | | | | | | |
| Capital Share Transactions: | | | | | | | | | | | | | | | | |
| Issued | | | 12,339,951 | | | | 92,535,940 | | | | 81,157,472 | | | | 27,666,566 | |
| Redeemed | | | (29,649,944 | ) | | | (150,006,428 | ) | | | (336,051,126 | ) | | | (153,879,041 | ) |
| Decrease in Net Assets from Capital Share Transactions | | | (17,309,993 | ) | | | (57,470,488 | ) | | | (254,893,654 | ) | | | (126,212,475 | ) |
| Total Decrease in Net Assets | | | (13,872,570 | ) | | | (116,311,705 | ) | | | (204,664,432 | ) | | | (7,922,084 | ) |
| | | | | | | | | | | | | | | | | |
| Net Assets: | | | | | | | | | | | | | | | | |
| Beginning of Year | | | 93,029,046 | | | | 209,340,751 | | | | 581,162,442 | | | | 589,084,526 | |
| End of Year | | $ | 79,156,476 | | | $ | 93,029,046 | | | $ | 376,498,010 | | | $ | 581,162,442 | |
| | | | | | | | | | | | | | | | | |
| Share Transactions: | | | | | | | | | | | | | | | | |
| Issued | | | 1,050,000 | | | | 8,310,000 | | | | 3,750,000 | | | | 1,470,000 | |
| Redeemed | | | (2,680,000 | ) | | | (14,930,000 | ) | | | (16,430,000 | ) | | | (8,640,000 | ) |
| Net Decrease in Shares Outstanding from Share Transactions | | | (1,630,000 | ) | | | (6,620,000 | ) | | | (12,680,000 | ) | | | (7,170,000 | ) |
The accompanying notes are an integral part of the financial statements.
131
Statements of Changes in Net Assets
| | | Global X Thematic Growth ETF | | Global X Video Games & Esports
ETF |
| | | Year Ended
November 30,
2024 | | Year Ended
November 30,
2023 | | Year Ended
November 30,
2024 | | Year Ended
November 30,
2023 |
| Operations: | | | | | | | | | | | | | | | | |
| Net Investment Income | | $ | 236,106 | | | $ | 186,199 | | | $ | 1,133,488 | | | $ | 794,920 | |
| Net Realized Gain (Loss) | | | (18,643,691 | ) | | | (12,934,581 | ) | | | (7,834,527 | ) | | | (38,573,510 | ) |
| Net Change in Unrealized Appreciation (Depreciation) | | | 20,996,812 | | | | 8,124,094 | | | | 29,586,600 | | | | 44,039,623 | |
| Net Increase (Decrease) in Net Assets Resulting from Operations | | | 2,589,227 | | | | (4,624,288 | ) | | | 22,885,561 | | | | 6,261,033 | |
| Distributions: | | | (412,897 | ) | | | (746,536 | ) | | | (1,027,863 | ) | | | (275,496 | ) |
| Return of Capital: | | | (180,016 | ) | | | — | | | | — | | | | — | |
| | | | | | | | | | | | | | | | | |
| Capital Share Transactions: | | | | | | | | | | | | | | | | |
| Issued | | | — | | | | 10,020,607 | | | | 19,150,310 | | | | 26,104,928 | |
| Redeemed | | | (18,483,328 | ) | | | (23,359,129 | ) | | | (64,493,472 | ) | | | (73,826,120 | ) |
| Decrease in Net Assets from Capital Share Transactions | | | (18,483,328 | ) | | | (13,338,522 | ) | | | (45,343,162 | ) | | | (47,721,192 | ) |
| Total Decrease in Net Assets | | | (16,487,014 | ) | | | (18,709,346 | ) | | | (23,485,464 | ) | | | (41,735,655 | ) |
| | | | | | | | | | | | | | | | | |
| Net Assets: | | | | | | | | | | | | | | | | |
| Beginning of Year | | | 32,269,888 | | | | 50,979,234 | | | | 132,339,112 | | | | 174,074,767 | |
| End of Year | | $ | 15,782,874 | | | $ | 32,269,888 | | | $ | 108,853,648 | | | $ | 132,339,112 | |
| | | | | | | | | | | | | | | | | |
| Share Transactions: | | | | | | | | | | | | | | | | |
| Issued | | | — | | | | 380,000 | | | | 790,000 | | | | 1,300,000 | |
| Redeemed | | | (780,000 | ) | | | (930,000 | ) | | | (2,960,000 | ) | | | (3,840,000 | ) |
| Net Decrease in Shares Outstanding from Share Transactions | | | (780,000 | ) | | | (550,000 | ) | | | (2,170,000 | ) | | | (2,540,000 | ) |
The accompanying notes are an integral part of the financial statements.
132
Statements of Changes in Net Assets
| | | Global X Cybersecurity ETF | | Global X Telemedicine & Digital
Health ETF |
| | | Year Ended
November 30,
2024 | | Year Ended
November 30,
2023 | | Year Ended
November 30,
2024 | | Year Ended
November 30,
2023 |
| Operations: | | | | | | | | | | | | | | | | |
| Net Investment Income (Loss) | | $ | 1,275,289 | | | $ | (852,139 | ) | | $ | (242,153 | ) | | $ | (422,790 | ) |
| Net Realized Gain (Loss) | | | (7,095,875 | ) | | | (150,099,978 | ) | | | (39,631,713 | ) | | | (52,675,645 | ) |
| Net Change in Unrealized Appreciation (Depreciation) | | | 164,928,899 | | | | 254,802,172 | | | | 47,423,073 | | | | 19,467,794 | |
| Net Increase (Decrease) in Net Assets Resulting from Operations | | | 159,108,313 | | | | 103,850,055 | | | | 7,549,207 | | | | (33,630,641 | ) |
| Distributions: | | | (741,657 | ) | | | (12,980,811 | ) | | | — | | | | — | |
| | | | | | | | | | | | | | | | | |
| Capital Share Transactions: | | | | | | | | | | | | | | | | |
| Issued | | | 136,325,379 | | | | 86,862,534 | | | | 3,804,503 | | | | 2,471,288 | |
| Redeemed | | | (122,935,482 | ) | | | (498,122,796 | ) | | | (32,762,447 | ) | | | (53,996,403 | ) |
| Increase (Decrease) in Net Assets from Capital Share Transactions | | | 13,389,897 | | | | (411,260,262 | ) | | | (28,957,944 | ) | | | (51,525,115 | ) |
| Total Increase (Decrease) in Net Assets | | | 171,756,553 | | | | (320,391,018 | ) | | | (21,408,737 | ) | | | (85,155,756 | ) |
| | | | | | | | | | | | | | | | | |
| Net Assets: | | | | | | | | | | | | | | | | |
| Beginning of Year | | | 647,551,244 | | | | 967,942,262 | | | | 64,919,314 | | | | 150,075,070 | |
| End of Year | | $ | 819,307,797 | | | $ | 647,551,244 | | | $ | 43,510,577 | | | $ | 64,919,314 | |
| | | | | | | | | | | | | | | | | |
| Share Transactions: | | | | | | | | | | | | | | | | |
| Issued | | | 4,550,000 | | | | 3,850,000 | | | | 380,000 | | | | 200,000 | |
| Redeemed | | | (4,180,000 | ) | | | (22,080,000 | ) | | | (3,470,000 | ) | | | (5,220,000 | ) |
| Net Increase (Decrease) in Shares Outstanding from Share Transactions | | | 370,000 | | | | (18,230,000 | ) | | | (3,090,000 | ) | | | (5,020,000 | ) |
The accompanying notes are an integral part of the financial statements.
133
Statements of Changes in Net Assets
| | | Global X CleanTech ETF | | Global X Data Center & Digital
Infrastructure ETF |
| | | Year Ended
November 30,
2024 | | Year Ended
November 30,
2023 | | Year Ended
November 30,
2024 | | Year Ended
November 30,
2023 |
| Operations: | | | | | | | | | | | | | | | | |
| Net Investment Income | | $ | 467,618 | | | $ | 379,808 | | | $ | 1,277,561 | | | $ | 610,258 | |
| Net Realized Gain (Loss) | | | (27,406,861 | ) | | | (8,578,972 | ) | | | (2,720,438 | ) | | | (6,514,718 | ) |
| Net Change in Unrealized Appreciation (Depreciation) | | | 14,661,370 | | | | (34,326,335 | ) | | | 19,526,701 | | | | 8,246,620 | |
| Net Increase (Decrease) in Net Assets Resulting from Operations | | | (12,277,873 | ) | | | (42,525,499 | ) | | | 18,083,824 | | | | 2,342,160 | |
| Distributions: | | | (452,237 | ) | | | (205,777 | ) | | | (881,454 | ) | | | (1,330,542 | ) |
| | | | | | | | | | | | | | | | | |
| Capital Share Transactions: | | | | | | | | | | | | | | | | |
| Issued | | | 2,867,916 | | | | 1,315,432 | | | | 96,258,720 | | | | 17,159,209 | |
| Redeemed | | | (14,166,470 | ) | | | (27,551,925 | ) | | | (14,486,966 | ) | | | (41,991,240 | ) |
| Increase (Decrease) in Net Assets from Capital Share Transactions | | | (11,298,554 | ) | | | (26,236,493 | ) | | | 81,771,754 | | | | (24,832,031 | ) |
| Total Increase (Decrease) in Net Assets | | | (24,028,664 | ) | | | (68,967,769 | ) | | | 98,974,124 | | | | (23,820,413 | ) |
| | | | | | | | | | | | | | | | | |
| Net Assets: | | | | | | | | | | | | | | | | |
| Beginning of Year | | | 58,874,222 | | | | 127,841,991 | | | | 39,322,875 | | | | 63,143,288 | |
| End of Year | | $ | 34,845,558 | | | $ | 58,874,222 | | | $ | 138,296,999 | | | $ | 39,322,875 | |
| | | | | | | | | | | | | | | | | |
| Share Transactions: | | | | | | | | | | | | | | | | |
| Issued | | | 310,000 | | | | 80,000 | | | | 6,030,000 | | | | 1,280,000 | |
| Redeemed | | | (1,570,000 | ) | | | (2,010,000 | ) | | | (910,000 | ) | | | (3,200,000 | ) |
| Net Increase (Decrease) in Shares Outstanding from Share Transactions | | | (1,260,000 | ) | | | (1,930,000 | ) | | | 5,120,000 | | | | (1,920,000 | ) |
The accompanying notes are an integral part of the financial statements.
134
Statements of Changes in Net Assets
| | | Global X Clean Water ETF | | Global X AgTech & Food
Innovation ETF |
| | | Year Ended
November 30,
2024 | | Year Ended
November 30,
2023 | | Year Ended
November 30,
2024 | | Year Ended
November 30,
2023 |
| Operations: | | | | | | | | | | | | | | | | |
| Net Investment Income | | $ | 148,509 | | | $ | 146,821 | | | $ | 79,230 | | | $ | 49,639 | |
| Net Realized Gain (Loss) | | | 257,162 | | | | (209,402 | ) | | | 36,283 | | | | (3,362,469 | ) |
| Net Change in Unrealized Appreciation (Depreciation) | | | 1,460,606 | | | | 839,390 | | | | 134,106 | | | | 924,078 | |
| Net Increase (Decrease) in Net Assets Resulting from Operations | | | 1,866,277 | | | | 776,809 | | | | 249,619 | | | | (2,388,752 | ) |
| Distributions: | | | (135,553 | ) | | | (138,123 | ) | | | (73,440 | ) | | | (45,738 | ) |
| | | | | | | | | | | | | | | | | |
| Capital Share Transactions: | | | | | | | | | | | | | | | | |
| Issued | | | 705,409 | | | | 1,634,453 | | | | 816,105 | | | | 312,756 | |
| Redeemed | | | (1,142,463 | ) | | | (459,899 | ) | | | (741,810 | ) | | | (123,074 | ) |
| Increase (Decrease) in Net Assets from Capital Share Transactions | | | (437,054 | ) | | | 1,174,554 | | | | 74,295 | | | | 189,682 | |
| Total Increase (Decrease) in Net Assets | | | 1,293,670 | | | | 1,813,240 | | | | 250,474 | | | | (2,244,808 | ) |
| | | | | | | | | | | | | | | | | |
| Net Assets: | | | | | | | | | | | | | | | | |
| Beginning of Year | | | 9,393,530 | | | | 7,580,290 | | | | 4,475,696 | | | | 6,720,504 | |
| End of Year | | $ | 10,687,200 | | | $ | 9,393,530 | | | $ | 4,726,170 | | | $ | 4,475,696 | |
| | | | | | | | | | | | | | | | | |
| Share Transactions: | | | | | | | | | | | | | | | | |
| Issued | | | 40,000 | | | | 110,000 | | | | 80,000 | | | | 20,000 | |
| Redeemed | | | (70,000 | ) | | | (30,000 | ) | | | (70,000 | ) | | | (10,000 | ) |
| Net Increase (Decrease) in Shares Outstanding from Share Transactions | | | (30,000 | ) | | | 80,000 | | | | 10,000 | | | | 10,000 | |
The accompanying notes are an integral part of the financial statements.
135
Statements of Changes in Net Assets
| | | Global X Blockchain ETF | | Global X Hydrogen ETF‡ |
| | | Year Ended
November 30,
2024 | | Year Ended
November 30,
2023† | | Year Ended
November 30,
2024 | | Year Ended
November 30,
2023 |
| Operations: | | | | | | | | | | | | | | | | |
| Net Investment Income (Loss) | | $ | 234,281 | | | $ | 768,539 | | | $ | 119,186 | | | $ | (84,273 | ) |
| Net Realized Gain (Loss) | | | 36,979,432 | | | | (28,386,547 | ) | | | (12,408,628 | ) | | | (11,214,492 | ) |
| Net Change in Unrealized Appreciation (Depreciation) | | | 91,092,804 | | | | 69,258,253 | | | | 2,756,577 | | | | (14,525,063 | ) |
| Net Increase (Decrease) in Net Assets Resulting from Operations | | | 128,306,517 | | | | 41,640,245 | | | | (9,532,865 | ) | | | (25,823,828 | ) |
| Distributions: | | | (3,111,807 | ) | | | (602,091 | ) | | | — | | | | — | |
| | | | | | | | | | | | | | | | | |
| Capital Share Transactions: | | | | | | | | | | | | | | | | |
| Issued | | | 79,826,525 | | | | 26,723,951 | | | | 14,395,215 | | | | 27,125,045 | |
| Redeemed | | | (65,369,959 | ) | | | (25,864,601 | ) | | | (3,003 | ) | | | (3,558,594 | ) |
| Increase in Net Assets from Capital Share Transactions | | | 14,456,566 | | | | 859,350 | | | | 14,392,212 | | | | 23,566,451 | |
| Total Increase (Decrease) in Net Assets | | | 139,651,276 | | | | 41,897,504 | | | | 4,859,347 | | | | (2,257,377 | ) |
| | | | | | | | | | | | | | | | | |
| Net Assets: | | | | | | | | | | | | | | | | |
| Beginning of Year | | | 87,124,421 | | | | 45,226,917 | | | | 35,777,194 | | | | 38,034,571 | |
| End of Year | | $ | 226,775,697 | | | $ | 87,124,421 | | | $ | 40,636,541 | | | $ | 35,777,194 | |
| | | | | | | | | | | | | | | | | |
| Share Transactions: | | | | | | | | | | | | | | | | |
| Issued | | | 1,600,000 | | | | 1,127,500 | | | | 492,000 | | | | 534,000 | |
| Redeemed | | | (1,250,000 | ) | | | (1,051,640 | ) | | | (105 | ) | | | (56,000 | ) |
| Net Increase in Shares Outstanding from Share Transactions | | | 350,000 | | | | 75,860 | | | | 491,895 | | | | 478,000 | |
† Share transactions have been adjusted to reflect the effect of a 1 for 4 reverse share split on December 19, 2022. (See Note 10 in the Notes to Financial Statements).
‡ Share transactions have been adjusted to reflect the effect of a 1 for 5 reverse share split on June 14, 2024. (See Note 10 in the Notes to Financial Statements).
The accompanying notes are an integral part of the financial statements.
136
Statements of Changes in Net Assets
| | | Global X Solar ETF | | Global X Wind Energy ETF |
| | | Year Ended
November 30,
2024 | | Year Ended
November 30,
2023 | | Year Ended
November 30,
2024 | | Year Ended
November 30,
2023 |
| Operations: | | | | | | | | | | | | | | | | |
| Net Investment Income (Loss) | | $ | 33,979 | | | $ | (7,988 | ) | | $ | 25,712 | | | $ | 55,926 | |
| Net Realized Gain (Loss) | | | (1,083,435 | ) | | | (358,393 | ) | | | (627,100 | ) | | | (2,004,036 | ) |
| Net Change in Unrealized Appreciation (Depreciation) | | | 151,780 | | | | (2,848,293 | ) | | | 435,066 | | | | (603,848 | ) |
| Net Decrease in Net Assets Resulting from Operations | | | (897,676 | ) | | | (3,214,674 | ) | | | (166,322 | ) | | | (2,551,958 | ) |
| Distributions: | | | (17,578 | ) | | | — | | | | (25,575 | ) | | | (47,859 | ) |
| | | | | | | | | | | | | | | | | |
| Capital Share Transactions: | | | | | | | | | | | | | | | | |
| Issued | | | 2,237,833 | | | | 4,287,533 | | | | — | | | | 13,712,475 | |
| Redeemed | | | (689,005 | ) | | | (1,053,849 | ) | | | (366,777 | ) | | | (11,748,196 | ) |
| Increase (Decrease) in Net Assets from Capital Share Transactions | | | 1,548,828 | | | | 3,233,684 | | | | (366,777 | ) | | | 1,964,279 | |
| Total Increase (Decrease) in Net Assets | | | 633,574 | | | | 19,010 | | | | (558,674 | ) | | | (635,538 | ) |
| | | | | | | | | | | | | | | | | |
| Net Assets: | | | | | | | | | | | | | | | | |
| Beginning of Year | | | 5,974,466 | | | | 5,955,456 | | | | 2,705,387 | | | | 3,340,925 | |
| End of Year | | $ | 6,608,040 | | | $ | 5,974,466 | | | $ | 2,146,713 | | | $ | 2,705,387 | |
| | | | | | | | | | | | | | | | | |
| Share Transactions: | | | | | | | | | | | | | | | | |
| Issued | | | 210,000 | | | | 290,000 | | | | — | | | | 730,000 | |
| Redeemed | | | (70,000 | ) | | | (50,000 | ) | | | (30,000 | ) | | | (710,000 | ) |
| Net Increase (Decrease) in Shares Outstanding from Share Transactions | | | 140,000 | | | | 240,000 | | | | (30,000 | ) | | | 20,000 | |
The accompanying notes are an integral part of the financial statements.
137
Statements of Changes in Net Assets
| | | Global X PropTech ETF | | Global X Defense Tech ETF |
| | | Year Ended
November 30,
2024 | | Period Ended
November 30,
2023(1) | | Year Ended
November 30,
2024 | | Period Ended
November 30,
2023(2) |
| Operations: | | | | | | | | | | | | | | | | |
| Net Investment Income | | $ | 2,381 | | | $ | 1,294 | | | $ | 2,068,025 | | | | 10,359 | |
| Net Realized Gain (Loss) | | | 604,957 | | | | 62,538 | | | | 19,721,886 | | | | 48,318 | |
| Net Change in Unrealized Appreciation (Depreciation) | | | 293,223 | | | | 154,612 | | | | 57,076,700 | | | | 279,559 | |
| Net Increase in Net Assets Resulting from Operations | | | 900,561 | | | | 218,444 | | | | 78,866,611 | | | | 338,236 | |
| Distributions: | | | (74,322 | ) | | | (453 | ) | | | (487,195 | ) | | | — | |
| | | | | | | | | | | | | | | | | |
| Capital Share Transactions: | | | | | | | | | | | | | | | | |
| Issued | | | 309,612 | | | | 2,508,000 | | | | 727,260,507 | | | | 4,526,923 | |
| Redeemed | | | (2,053,540 | ) | | | — | | | | (44,197,921 | ) | | | (270,300 | ) |
| Increase (Decrease) in Net Assets from Capital Share Transactions | | | (1,743,928 | ) | | | 2,508,000 | | | | 683,062,586 | | | | 4,256,623 | |
| Total Increase (Decrease) in Net Assets | | | (917,689 | ) | | | 2,725,991 | | | | 761,442,002 | | | | 4,594,859 | |
| | | | | | | | | | | | | | | | | |
| Net Assets: | | | | | | | | | | | | | | | | |
| Beginning of Year/Period | | | 2,725,991 | | | | — | | | | 4,594,859 | | | | — | |
| End of Year/Period | | $ | 1,808,302 | | | $ | 2,725,991 | | | $ | 766,036,861 | | | $ | 4,594,859 | |
| | | | | | | | | | | | | | | | | |
| Share Transactions: | | | | | | | | | | | | | | | | |
| Issued | | | 10,000 | | | | 100,000 | | | | 20,510,000 | | | | 180,000 | |
| Redeemed | | | (60,000 | ) | | | — | | | | (1,170,000 | ) | | | (10,000 | ) |
| Net Increase (Decrease) in Shares Outstanding from Share Transactions | | | (50,000 | ) | | | 100,000 | | | | 19,340,000 | | | | 170,000 | |
| (1) | The Fund commenced operations on April 11, 2023. |
| (2) | The Fund commenced operations on September 11, 2023. |
The accompanying notes are an integral part of the financial statements.
138
Statements of Changes in Net Assets
| | | Global X
Infrastructure
Development
ex-U.S. ETF |
| | | Period Ended
November 30,
2024(1) |
| Operations: | | | | |
| Net Investment Income | | $ | 8,130 | |
| Net Realized Gain (Loss) | | | (6,845 | ) |
| Net Change in Unrealized Appreciation (Depreciation) | | | (91,588 | ) |
| Net Decrease in Net Assets Resulting from Operations | | | (90,303 | ) |
| | | | | |
| Capital Share Transactions: | | | | |
| Issued | | | 2,487,556 | |
| Increase in Net Assets from Capital Share Transactions | | | 2,487,556 | |
| Total Increase in Net Assets | | | 2,397,253 | |
| | | | | |
| Net Assets: | | | | |
| Beginning of Period | | | — | |
| End of Period | | $ | 2,397,253 | |
| | | | | |
| Share Transactions: | | | | |
| Issued | | | 100,000 | |
| | | | | |
| Net Increase in Shares Outstanding from Share Transactions | | | 100,000 | |
| (1) | The Fund commenced operations on August 27, 2024. |
The accompanying notes are an integral part of the financial statements.
139
Page intentionally left blank.
140
Financial Highlights
Selected Per Share Data & Ratios
For a Share Outstanding Throughout the Period |
| | | Net
Asset Value,
Beginning
of Period
($) | | Net Investment
Income
($)* | | Net Realized
and Unrealized
Gain (Loss) on
Investments
($) | | Total from
Operations
($) | | Distribution
from Net
Investment
Income ($) | | Distribution
from Capital
Gains ($) | | Return of
Capital ($) |
| Global X Millennial Consumer ETF | | | | | | | | | | | | | | | | | | | | | | | | |
| 2024 | | | 32.86 | | | | 0.12 | | | | 14.11 | | | | 14.23 | | | | (0.13 | ) | | | — | | | | — | |
| 2023 | | | 28.43 | | | | 0.07 | | | | 4.43 | | | | 4.50 | | | | (0.07 | ) | | | — | | | | — | |
| 2022 | | | 42.68 | | | | 0.05 | | | | (14.23 | ) | | | (14.18 | ) | | | (0.07 | ) | | | — | | | | — | |
| 2021 | | | 35.23 | | | | 0.08 | | | | 7.43 | | | | 7.51 | | | | (0.06 | ) | | | — | | | | — | |
| 2020 | | | 25.55 | | | | 0.05 | | | | 9.74 | | | | 9.79 | | | | (0.10 | ) | | | (0.01 | ) | | | — | |
| Global X Aging Population ETF | | | | | | | | | | | | | | | | | | | | | | | | |
| 2024 | | | 26.93 | | | | 0.24 | | | | 4.97 | | | | 5.21 | | | | (0.23 | ) | | | — | | | | — | |
| 2023 | | | 26.46 | | | | 0.23 | | | | 0.41 | | | | 0.64 | | | | (0.17 | ) | | | — | | | | — | |
| 2022 | | | 27.41 | | | | 0.20 | | | | (0.87 | ) | | | (0.67 | ) | | | (0.26 | ) | | | — | | | | (0.02 | ) |
| 2021 | | | 26.82 | | | | 0.13 | | | | 0.55 | | | | 0.68 | | | | (0.09 | ) | | | — | | | | — | |
| 2020 | | | 23.55 | | | | 0.10 | | | | 3.35 | | | | 3.45 | | | | (0.13 | ) | | | (0.05 | ) | | | — | |
| Global X Robotics & Artificial Intelligence ETF | | | | | | | | | | | | | | | | | | | | | | | | |
| 2024 | | | 26.47 | | | | 0.02 | | | | 6.81 | | | | 6.83 | | | | (0.03 | ) | | | — | | | | (0.02 | ) |
| 2023 | | | 21.09 | | | | 0.07 | | | | 5.36 | | | | 5.43 | | | | (0.05 | ) | | | — | | | | — | |
| 2022 | | | 36.24 | | | | 0.04 | | | | (15.14 | ) | | | (15.10 | ) | | | (0.04 | ) | | | — | | | | (0.01 | ) |
| 2021 | | | 31.78 | | | | 0.02 | | | | 4.50 | | | | 4.52 | | | | (0.02 | ) | | | — | | | | (0.04 | ) |
| 2020 | | | 21.43 | | | | 0.05 | | | | 10.39 | | | | 10.44 | | | | (0.08 | ) | | | — | | | | (0.01 | ) |
| * | Per share data calculated using average shares method. |
| ** | Total Return is for the period indicated and has not been annualized. The return shown does not reflect the deduction of taxes that a shareholder would pay on Fund distributions or the redemption of Fund shares. |
| †† | Portfolio turnover rate is for the period indicated and periods of less than one year have not been annualized. Excludes effect of in-kind transfers. |
| ^ | Effective April 1, 2020, the Fund’s fees were permanently lowered to 0.50%. Prior to April 1, 2020, the ratio of Expenses to Average Net Assets included the effect of a waiver. If these offsets were excluded, the ratio would have been 0.56% for the year ended November 30, 2020. |
| ^^ | Effective April 1, 2020, the Fund’s fees were permanently lowered to 0.50%. Prior to April 1, 2020, the ratio of Expenses to Average Net Assets included the effect of a waiver. If these offsets were excluded, the ratio would have been 0.55% for the year ended November 30, 2020. |
Amounts designated as “—” are either $0 or have been rounded to $0.
The accompanying notes are an integral part of the financial statements.
141
Financial Highlights
Total from
Distributions ($) | | Net
Asset Value,
End of
Period ($) | | Total
Return
(%)** | | Net Assets, End of
Period ($)(000) | | Ratio of Expenses
to Average Net
Assets (%) | | Ratio of Net
Investment Income
to Average Net
Assets (%) | | Portfolio
Turnover Rate
(%)†† |
| | | | | | | | | | | | | |
| (0.13) | | | | 46.96 | | | | 43.42 | | | | 131,031 | | | | 0.50 | | | | 0.31 | | | | 10.95 | |
| (0.07) | | | | 32.86 | | | | 15.87 | | | | 105,493 | | | | 0.50 | | | | 0.23 | | | | 16.60 | |
| (0.07) | | | | 28.43 | | | | (33.29 | ) | | | 105,459 | | | | 0.50 | | | | 0.17 | | | | 14.75 | |
| (0.06) | | | | 42.68 | | | | 21.33 | | | | 227,075 | | | | 0.50 | | | | 0.18 | | | | 11.59 | |
| (0.11) | | | | 35.23 | | | | 38.47 | | | | 114,511 | | | | 0.50 | ^ | | | 0.19 | | | | 7.11 | |
| | | | | | | | | | | | | | | | | | | | | | | | | | |
| (0.23) | | | | 31.91 | | | | 19.41 | | | | 61,902 | | | | 0.50 | | | | 0.80 | | | | 18.26 | |
| (0.17) | | | | 26.93 | | | | 2.42 | | | | 53,596 | | | | 0.50 | | | | 0.87 | | | | 13.34 | |
| (0.28) | | | | 26.46 | | | | (2.47 | ) | | | 41,800 | | | | 0.50 | | | | 0.76 | | | | 13.50 | |
| (0.09) | | | | 27.41 | | | | 2.51 | | | | 59,756 | | | | 0.50 | | | | 0.43 | | | | 19.57 | |
| (0.18) | | | | 26.82 | | | | 14.79 | | | | 42,907 | | | | 0.50 | ^^ | | | 0.43 | | | | 9.10 | |
| | | | | | | | | | | | | | | | | | | | | | | | | | |
| (0.05) | | | | 33.25 | | | | 25.81 | | | | 2,648,468 | | | | 0.68 | | | | 0.08 | | | | 10.43 | |
| (0.05) | | | | 26.47 | | | | 25.75 | | | | 2,269,824 | | | | 0.68 | | | | 0.26 | | | | 8.28 | |
| (0.05) | | | | 21.09 | | | | (41.67 | ) | | | 1,341,942 | | | | 0.69 | | | | 0.16 | | | | 29.86 | |
| (0.06) | | | | 36.24 | | | | 14.23 | | | | 2,703,488 | | | | 0.68 | | | | 0.06 | | | | 22.66 | |
| (0.09) | | | | 31.78 | | | | 48.90 | | | | 2,158,175 | | | | 0.68 | | | | 0.21 | | | | 22.27 | |
The accompanying notes are an integral part of the financial statements.
142
Financial Highlights
Selected Per Share Data & Ratios
For a Share Outstanding Throughout the Period |
| | | Net
Asset Value,
Beginning
of Period
($) | | Net Investment
Income (Loss)
($)* | | Net Realized
and Unrealized
Gain (Loss) on
Investments
($) | | Total from
Operations
($) | | Distribution
from Net
Investment
Income ($) | | Distribution
from Capital
Gains ($) | | Return of
Capital ($) |
| Global X FinTech ETF | | | | | | | | | | | | | | | | | | | | | | |
| 2024 | | | 22.37 | | | | 0.02 | | | | 11.63 | | | | 11.65 | | | | (0.06 | ) | | | — | | | | — | |
| 2023 | | | 20.44 | | | | 0.05 | | | | 1.93 | | | | 1.98 | | | | (0.05 | ) | | | — | | | | — | *** |
| 2022 | | | 45.52 | | | | 0.09 | | | | (22.96 | ) | | | (22.87 | ) | | | (2.16 | ) | | | — | | | | (0.05 | ) |
| 2021 | | | 42.75 | | | | (0.13 | ) | | | 2.90 | | | | 2.77 | | | | — | | | | — | | | | — | |
| 2020 | | | 30.49 | | | | (0.11 | ) | | | 12.37 | | | | 12.26 | | | | — | | | | — | | | | — | |
| Global X Internet of Things ETF | | | | | | | | | | | | | | | | | | | | | | |
| 2024 | | | 32.45 | | | | 0.18 | | | | 3.73 | | | | 3.91 | | | | (0.22 | ) | | | — | | | | — | |
| 2023 | | | 30.54 | | | | 0.25 | | | | 1.95 | | | | 2.20 | | | | (0.29 | ) | | | — | | | | — | |
| 2022 | | | 37.68 | | | | 0.21 | | | | (7.17 | ) | | | (6.96 | ) | | | (0.13 | ) | | | (0.05 | ) | | | — | |
| 2021 | | | 29.95 | | | | 0.13 | | | | 7.72 | | | | 7.85 | | | | (0.12 | ) | | | — | | | | — | |
| 2020 | | | 22.89 | | | | 0.17 | | | | 7.08 | | | | 7.25 | | | | (0.19 | ) | | | — | | | | — | |
| Global X U.S. Infrastructure Development ETF | | | | | | | | | | | | | | | | | | | | | | |
| 2024 | | | 31.50 | | | | 0.24 | | | | 14.21 | | | | 14.45 | | | | (0.24 | ) | | | — | | | | — | |
| 2023 | | | 27.94 | | | | 0.24 | | | | 3.54 | | | | 3.78 | | | | (0.22 | ) | | | — | | | | — | |
| 2022 | | | 27.19 | | | | 0.19 | | | | 0.74 | | | | 0.93 | | | | (0.17 | ) | | | (0.01 | ) | | | — | |
| 2021 | | | 20.24 | | | | 0.17 | | | | 6.87 | | | | 7.04 | | | | (0.09 | ) | | | — | *** | | | — | |
| 2020 | | | 17.43 | | | | 0.16 | | | | 2.74 | | | | 2.90 | | | | (0.09 | ) | | | — | | | | — | |
| * | Per share data calculated using average shares method. |
| ** | Total Return is for the period indicated and has not been annualized. The return shown does not reflect the deduction of taxes that a shareholder would pay on Fund distributions or the redemption of Fund shares. |
| *** | Amount is less than $0.005. |
| †† | Portfolio turnover rate is for the period indicated and periods of less than one year have not been annualized. Excludes effect of in-kind transfers. |
Amounts designated as “—” are either $0 or have been rounded to $0.
The accompanying notes are an integral part of the financial statements.
143
Financial Highlights
Total from
Distributions ($) | | Net
Asset Value,
End of
Period ($) | | Total
Return
(%)** | | Net Assets, End of
Period ($)(000) | | Ratio of Expenses
to Average Net
Assets (%) | | Ratio of Net
Investment Income
(Loss) to Average
Net Assets (%) | | Portfolio
Turnover Rate
(%)†† |
| | | | | | | | | | | | | |
| (0.06 | ) | | | 33.96 | | | | 52.18 | | | | 349,457 | | | | 0.68 | | | | 0.07 | | | | 13.79 | |
| (0.05 | ) | | | 22.37 | | | | 9.70 | | | | 351,478 | | | | 0.68 | | | | 0.23 | | | | 13.12 | |
| (2.21 | ) | | | 20.44 | | | | (52.58 | ) | | | 455,463 | | | | 0.68 | | | | 0.33 | | | | 38.15 | |
| — | | | | 45.52 | | | | 6.48 | | | | 1,289,006 | | | | 0.68 | | | | (0.28 | ) | | | 29.60 | |
| — | | | | 42.75 | | | | 40.21 | | | | 874,175 | | | | 0.68 | | | | (0.33 | ) | | | 15.75 | |
| | | | | | | | | | | | | | | | | | | | | | | | | | |
| (0.22 | ) | | | 36.14 | | | | 12.06 | | | | 240,722 | | | | 0.68 | | | | 0.52 | | | | 19.16 | |
| (0.29 | ) | | | 32.45 | | | | 7.26 | | | | 287,487 | | | | 0.68 | | | | 0.79 | | | | 11.12 | |
| (0.18 | ) | | | 30.54 | | | | (18.52 | ) | | | 305,697 | | | | 0.68 | | | | 0.67 | | | | 8.40 | |
| (0.12 | ) | | | 37.68 | | | | 26.24 | | | | 517,291 | | | | 0.68 | | | | 0.37 | | | | 9.25 | |
| (0.19 | ) | | | 29.95 | | | | 31.88 | | | | 296,508 | | | | 0.68 | | | | 0.71 | | | | 14.28 | |
| | | | | | | | | | | | | | | | | | | | | | | | | | |
| (0.24 | ) | | | 45.71 | | | | 46.08 | | | | 9,715,853 | | | | 0.47 | | | | 0.63 | | | | 4.41 | |
| (0.22 | ) | | | 31.50 | | | | 13.63 | | | | 5,153,796 | | | | 0.47 | | | | 0.82 | | | | 5.99 | |
| (0.18 | ) | | | 27.94 | | | | 3.48 | | | | 3,748,693 | | | | 0.47 | | | | 0.74 | | | | 9.78 | |
| (0.09 | ) | | | 27.19 | | | | 34.90 | | | | 5,186,497 | | | | 0.47 | | | | 0.64 | | | | 10.07 | |
| (0.09 | ) | | | 20.24 | | | | 16.77 | | | | 653,635 | | | | 0.47 | | | | 0.96 | | | | 9.08 | |
The accompanying notes are an integral part of the financial statements.
144
Financial Highlights
Selected Per Share Data & Ratios
For a Share Outstanding Throughout the Period |
| | | Net
Asset Value,
Beginning
of Period
($) | | Net Investment
Income (Loss)
($)* | | Net Realized
and Unrealized
Gain (Loss) on
Investments
($) | | Total from
Operations
($) | | Distribution
from Net
Investment
Income ($) | | Distribution
from Capital
Gains ($) | | Return of
Capital ($) |
| Global X Autonomous & Electric Vehicles ETF | | | | | | | | | | | | | | | | | | | | | | |
| 2024 | | | 23.19 | | | | 0.29 | | | | 0.57 | | | | 0.86 | | | | (0.41 | ) | | | — | | | | — | |
| 2023 | | | 22.89 | | | | 0.38 | | | | 0.23 | | | | 0.61 | | | | (0.31 | ) | | | — | | | | — | |
| 2022 | | | 30.41 | | | | 0.19 | | | | (7.56 | ) | | | (7.37 | ) | | | (0.13 | ) | | | (0.02 | ) | | | — | |
| 2021 | | | 21.75 | | | | 0.09 | | | | 8.65 | | | | 8.74 | | | | (0.08 | ) | | | — | | | | — | |
| 2020 | | | 14.15 | | | | 0.11 | | | | 7.61 | | | | 7.72 | | | | (0.12 | ) | | | — | | | | — | |
| Global X Artificial Intelligence & Technology ETF | | | | | | | | | | | | | | | | | | | | | | |
| 2024 | | | 29.73 | | | | 0.07 | | | | 9.01 | | | | 9.08 | | | | (0.06 | ) | | | — | | | | — | |
| 2023 | | | 21.54 | | | | 0.07 | | | | 8.21 | | | | 8.28 | | | | (0.09 | ) | | | — | | | | — | |
| 2022 | | | 31.58 | | | | 0.11 | | | | (10.08 | ) | | | (9.97 | ) | | | (0.07 | ) | | | — | | | | — | |
| 2021 | | | 25.84 | | | | 0.05 | | | | 5.78 | | | | 5.83 | | | | (0.09 | ) | | | — | | | | — | |
| 2020 | | | 17.35 | | | | 0.17 | | | | 8.44 | | | | 8.61 | | | | (0.12 | ) | | | — | | | | — | |
| Global X Genomics & Biotechnology ETF | | | | | | | | | | | | | | | | | | | | | | |
| 2024 | | | 10.41 | | | | (0.03 | ) | | | 0.45 | | | | 0.42 | | | | — | | | | — | | | | — | |
| 2023 | | | 13.45 | | | | (0.04 | ) | | | (3.00 | ) | | | (3.04 | ) | | | — | | | | — | | | | — | |
| 2022 | | | 20.61 | | | | (0.03 | ) | | | (7.12 | ) | | | (7.15 | ) | | | (0.01 | ) | | | — | | | | — | |
| 2021 | | | 21.01 | | | | (0.08 | ) | | | (0.29 | ) | | | (0.37 | ) | | | — | | | | (0.03 | ) | | | — | |
| 2020 | | | 15.61 | | | | (0.07 | ) | | | 5.47 | | | | 5.40 | | | | — | | | | — | | | | — | |
| ‡ | Effective June 15 2020, the Fund’s fees were permanently lowered to 0.50%. |
| * | Per share data calculated using average shares method. |
| ** | Total Return is for the period indicated and has not been annualized. The return shown does not reflect the deduction of taxes that a shareholder would pay on Fund distributions or the redemption of Fund shares. |
| †† | Portfolio turnover rate is for the period indicated and periods of less than one year have not been annualized. Excludes effect of in-kind transfers. |
Amounts designated as “—” are either $0 or have been rounded to $0.
The accompanying notes are an integral part of the financial statements.
145
Financial Highlights
Total from
Distributions ($) | | Net
Asset Value,
End of
Period ($) | | Total
Return
(%)** | | Net Assets, End of
Period ($)(000) | | Ratio of Expenses
to Average Net
Assets (%) | | Ratio of Net
Investment Income
(Loss) to Average
Net Assets (%) | | Portfolio
Turnover Rate
(%)†† |
| | | | | | | | | | | | | |
| (0.41 | ) | | | 23.64 | | | | 3.65 | | | | 415,073 | | | | 0.68 | | | | 1.21 | | | | 26.13 | |
| (0.31 | ) | | | 23.19 | | | | 2.71 | | | | 697,745 | | | | 0.68 | | | | 1.63 | | | | 26.60 | |
| (0.15 | ) | | | 22.89 | | | | (24.25 | ) | | | 883,478 | | | | 0.68 | | | | 0.74 | | | | 34.76 | |
| (0.08 | ) | | | 30.41 | | | | 40.22 | | | | 1,323,546 | | | | 0.68 | | | | 0.33 | | | | 18.17 | |
| (0.12 | ) | | | 21.75 | | | | 54.98 | | | | 135,923 | | | | 0.68 | | | | 0.67 | | | | 13.76 | |
| | | | | | | | | | | | | | | | | | | | | | | | | | |
| (0.06 | ) | | | 38.75 | | | | 30.58 | | | | 2,490,690 | | | | 0.68 | | | | 0.20 | | | | 10.88 | |
| (0.09 | ) | | | 29.73 | | | | 38.56 | | | | 789,875 | | | | 0.68 | | | | 0.28 | | | | 19.08 | |
| (0.07 | ) | | | 21.54 | | | | (31.58 | ) | | | 130,518 | | | | 0.68 | | | | 0.46 | | | | 21.28 | |
| (0.09 | ) | | | 31.58 | | | | 22.60 | | | | 186,334 | | | | 0.68 | | | | 0.17 | | | | 26.37 | |
| (0.12 | ) | | | 25.84 | | | | 49.84 | | | | 120,169 | | | | 0.68 | | | | 0.79 | | | | 19.45 | |
| | | | | | | | | | | | | | | | | | | | | | | | | | |
| — | | | | 10.83 | | | | 4.03 | | | | 79,156 | | | | 0.50 | | | | (0.23 | ) | | | 18.89 | |
| — | | | | 10.41 | | | | (22.60 | ) | | | 93,029 | | | | 0.50 | | | | (0.34 | ) | | | 16.59 | |
| (0.01 | ) | | | 13.45 | | | | (34.72 | ) | | | 209,341 | | | | 0.50 | | | | (0.21 | ) | | | 39.39 | |
| (0.03 | ) | | | 20.61 | | | | (1.77 | ) | | | 255,572 | | | | 0.50 | | | | (0.35 | ) | | | 29.25 | |
| — | | | | 21.01 | | | | 34.59 | | | | 81,951 | | | | 0.56 | ‡ | | | (0.40 | ) | | | 29.76 | |
The accompanying notes are an integral part of the financial statements.
146
Financial Highlights
Selected Per Share Data & Ratios
For a Share Outstanding Throughout the Period |
| | | Net
Asset Value,
Beginning
of Period
($) | | Net Investment
Income (Loss)
($)* | | Net Realized
and Unrealized
Gain (Loss) on
Investments
($) | | Total from
Operations
($) | | Distribution
from Net
Investment
Income ($) | | Distribution
from Capital
Gains ($) | | Return of
Capital ($) |
| Global X Cloud Computing ETF | | | | | | | | | | | | | | | | | | | | | | |
| 2024 | | | 20.79 | | | | (0.11 | ) | | | 3.96 | | | | 3.85 | | | | — | | | | — | | | | — | |
| 2023 | | | 16.77 | | | | (0.10 | ) | | | 4.12 | | | | 4.02 | | | | — | | | | — | | | | — | |
| 2022 | | | 28.38 | | | | (0.15 | ) | | | (10.99 | ) | | | (11.14 | ) | | | — | | | | (0.47 | ) | | | — | |
| 2021 | | | 25.84 | | | | (0.15 | ) | | | 2.69 | | | | 2.54 | | | | — | | | | — | | | | — | |
| 2020 | | | 15.99 | | | | (0.11 | ) | | | 9.97 | | | | 9.86 | | | | — | | | | (0.01 | ) | | | — | |
| Global X Thematic Growth ETF | | | | | | | | | | | | | | | | | | | | | | |
| 2024 | | | 23.05 | | | | 0.26 | | | | 2.66 | | | | 2.92 | | | | (0.36 | ) | | | — | | | | (0.15 | ) |
| 2023 | | | 26.14 | | | | 0.11 | | | | (2.79 | ) | | | (2.68 | ) | | | (0.41 | ) | | | — | | | | — | |
| 2022 | | | 47.65 | | | | 0.44 | | | | (21.33 | ) | | | (20.89 | ) | | | (0.62 | ) | | | — | | | | — | |
| 2021 | | | 42.45 | | | | 0.39 | | | | 5.10 | | | | 5.49 | | | | (0.29 | ) | | | — | | | | — | |
| 2020 | | | 26.50 | | | | 0.10 | | | | 15.96 | | | | 16.06 | | | | (0.11 | ) | | | — | | | | — | |
| Global X Video Games & Esports ETF | | | | | | | | | | | | | | | | | | | | | | |
| 2024 | | | 19.93 | | | | 0.20 | | | | 4.38 | | | | 4.58 | | | | (0.16 | ) | | | — | | | | — | |
| 2023 | | | 18.96 | | | | 0.10 | | | | 0.90 | | | | 1.00 | | | | (0.03 | ) | | | — | | | | — | |
| 2022 | | | 29.52 | | | | 0.08 | | | | (10.39 | ) | | | (10.31 | ) | | | (0.14 | ) | | | (0.07 | ) | | | (0.04 | ) |
| 2021 | | | 28.57 | | | | 0.04 | | | | 1.14 | | | | 1.18 | | | | (0.23 | ) | | | — | *** | | | — | |
| 2020 | | | 15.73 | | | | 0.02 | | | | 12.86 | | | | 12.88 | | | | (0.04 | ) | | | — | | | | — | |
| * | Per share data calculated using average shares method. |
| ** | Total Return is for the period indicated and has not been annualized. The return shown does not reflect the deduction of taxes that a shareholder would pay on Fund distributions or the redemption of Fund shares. |
| *** | Amount is less than $0.005. |
| †† | Portfolio turnover rate is for the period indicated and periods of less than one year have not been annualized. Excludes effect of in-kind transfers. |
| ‡ | Effective for the fiscal year ended November 30, 2022, the Fund began presenting acquired fund fees borne by the Adviser as part of its unitary fee agreement (See Note 3 in Notes to Financial Statements) as a realized gain on the Statement of Operations as compared to a contra-expense as in prior fiscal years. If such amounts had been presented as a realized gain in years prior to 2022, the ratio of Expenses to Average Net Assets would have been 0.50% each year. |
| # | Excludes fees and expenses incurred indirectly as a result of investments in underlying funds. |
Amounts designated as “—” are either $0 or have been rounded to $0.
The accompanying notes are an integral part of the financial statements.
147
Financial Highlights
Total from
Distributions ($) | | Net
Asset Value,
End of
Period ($) | | Total
Return
(%)** | | Net Assets, End of
Period ($)(000) | | Ratio of Expenses
to Average Net
Assets (%) | | Ratio of Net
Investment Income
(Loss) to Average
Net Assets (%) | | Portfolio
Turnover Rate
(%)†† |
| | | | | | | | | | | | | |
| — | | | | 24.64 | | | | 18.52 | | | | 376,498 | | | | 0.68 | | | | (0.54 | ) | | | 21.22 | |
| — | | | | 20.79 | | | | 23.97 | | | | 581,162 | | | | 0.68 | | | | (0.54 | ) | | | 21.60 | |
| (0.47 | ) | | | 16.77 | | | | (39.88 | ) | | | 589,085 | | | | 0.68 | | | | (0.74 | ) | | | 31.21 | |
| — | | | | 28.38 | | | | 9.83 | | | | 1,317,544 | | | | 0.68 | | | | (0.53 | ) | | | 23.77 | |
| (0.01 | ) | | | 25.84 | | | | 61.68 | | | | 1,405,489 | | | | 0.68 | | | | (0.53 | ) | | | 23.03 | |
| | | | | | | | | | | | | | | | | | | | | | | | | | |
| (0.51 | ) | | | 25.46 | | | | 12.78 | | | | 15,783 | | | | 0.50 | # | | | 1.10 | | | | 30.26 | |
| (0.41 | ) | | | 23.05 | | | | (10.30 | ) | | | 32,270 | | | | 0.50 | # | | | 0.45 | | | | 54.28 | |
| (0.62 | ) | | | 26.14 | | | | (44.36 | ) | | | 50,979 | | | | 0.50 | # | | | 1.32 | | | | 55.00 | |
| (0.29 | ) | | | 47.65 | | | | 12.95 | | | | 110,081 | | | | (0.13 | )#‡ | | | 0.77 | | | | 32.16 | |
| (0.11 | ) | | | 42.45 | | | | 60.81 | | | | 36,081 | | | | (0.12 | )#‡ | | | 0.29 | | | | 103.23 | |
| | | | | | | | | | | | | | | | | | | | | | | | | | |
| (0.16 | ) | | | 24.35 | | | | 23.14 | | | | 108,854 | | | | 0.50 | | | | 0.93 | | | | 30.77 | |
| (0.03 | ) | | | 19.93 | | | | 5.29 | | | | 132,339 | | | | 0.50 | | | | 0.49 | | | | 26.11 | |
| (0.25 | ) | | | 18.96 | | | | (35.19 | ) | | | 174,075 | | | | 0.50 | | | | 0.36 | | | | 55.72 | |
| (0.23 | ) | | | 29.52 | | | | 4.09 | | | | 485,235 | | | | 0.50 | | | | 0.09 | | | | 23.45 | |
| (0.04 | ) | | | 28.57 | | | | 82.04 | | | | 481,341 | | | | 0.50 | | | | 0.04 | | | | 12.02 | |
The accompanying notes are an integral part of the financial statements.
148
Financial Highlights
Selected Per Share Data & Ratios
For a Share Outstanding Throughout the Period |
| | | Net
Asset Value,
Beginning
of Period
($) | | Net Investment
Income (Loss)
($)* | | Net Realized
and Unrealized
Gain (Loss) on
Investments
($) | | Total from
Operations
($) | | Distribution
from Net
Investment
Income ($) | | Distribution
from Capital
Gains ($) | | Return of
Capital ($) |
| Global X Cybersecurity ETF |
| 2024 | | | 26.84 | | | | 0.05 | | | | 6.58 | | | | 6.63 | | | | (0.03 | ) | | | — | | | | — | |
| 2023 | | | 22.85 | | | | (0.03 | ) | | | 4.34 | | | | 4.31 | | | | — | | | | (0.32 | ) | | | — | |
| 2022 | | | 31.75 | | | | (0.03 | ) | | | (8.66 | ) | | | (8.69 | ) | | | (0.09 | ) | | | (0.12 | ) | | | — | |
| 2021 | | | 22.75 | | | | 0.12 | | | | 8.90 | | | | 9.02 | | | | (0.01 | ) | | | (0.01 | ) | | | — | |
| 2020 | | | 17.14 | | | | 0.09 | | | | 5.67 | | | | 5.76 | | | | (0.13 | ) | | | (0.02 | ) | | | — | |
| Global X Telemedicine & Digital Health ETF |
| 2024 | | | 8.95 | | | | (0.04 | ) | | | 1.55 | | | | 1.51 | | | | — | | | | — | | | | — | |
| 2023 | | | 12.23 | | | | (0.04 | ) | | | (3.24 | ) | | | (3.28 | ) | | | — | | | | — | | | | — | |
| 2022 | | | 16.32 | | | | (0.01 | ) | | | (4.08 | ) | | | (4.09 | ) | | | — | | | | — | | | | — | |
| 2021 | | | 18.41 | | | | (0.10 | ) | | | (1.98 | ) | | | (2.08 | ) | | | (0.01 | ) | | | — | | | | — | |
| 2020(1) | | | 15.23 | | | | 0.01 | | | | 3.17 | | | | 3.18 | | | | — | | | | — | | | | — | |
| Global X CleanTech ETF |
| 2024 | | | 9.88 | | | | 0.09 | | | | (2.48 | ) | | | (2.39 | ) | | | (0.08 | ) | | | — | | | | — | |
| 2023 | | | 16.20 | | | | 0.05 | | | | (6.34 | ) | | | (6.29 | ) | | | (0.03 | ) | | | — | | | | — | |
| 2022 | | | 20.43 | | | | 0.03 | | | | (4.19 | ) | | | (4.16 | ) | | | (0.07 | ) | | | — | | | | — | |
| 2021 | | | 19.02 | | | | 0.02 | | | | 1.40 | | | | 1.42 | | | | (0.01 | ) | | | — | | | | — | |
| 2020(2) | | | 15.07 | | | | 0.02 | | | | 3.93 | | | | 3.95 | | | | — | | | | — | | | | — | |
| * | Per share data calculated using average shares method. |
| ** | Total Return is for the period indicated and has not been annualized. The return shown does not reflect the deduction of taxes that a shareholder would pay on Fund distributions or the redemption of Fund shares. |
| † | Annualized. |
| †† | Portfolio turnover rate is for the period indicated and periods of less than one year have not been annualized. Excludes effect of in-kind transfers. |
| ^ | Effective April 1, 2021, the Fund’s management fees were permanently lowered to 0.50%. Prior to April 1, 2021, the ratio of Expenses to Average Net Assets included the effect of a waiver. If these offsets were excluded, the ratio would have been 0.52% and 0.60% for the years ended November 30, 2021 and 2020, respectively. |
| (1) | The Fund commenced operations on July 29, 2020. |
| (2) | The Fund commenced operations on October 27, 2020. |
Amounts designated as “—” are either $0 or have been rounded to $0.
The accompanying notes are an integral part of the financial statements.
149
Financial Highlights
Total from
Distributions ($) | | Net
Asset Value,
End of
Period ($) | | Total
Return
(%)** | | Net Assets, End of
Period ($)(000) | | Ratio of Expenses
to Average Net
Assets (%) | | Ratio of Net
Investment Income
(Loss) to Average
Net Assets (%) | | Portfolio
Turnover Rate
(%)†† |
| | | | | | | | | | | | | | | | | | | | | | | | | | |
| (0.03 | ) | | | 33.44 | | | | 24.72 | | | | 819,308 | | | | 0.51 | | | | 0.17 | | | | 23.91 | |
| (0.32 | ) | | | 26.84 | | | | 19.29 | | | | 647,551 | | | | 0.50 | | | | (0.12 | ) | | | 18.77 | |
| (0.21 | ) | | | 22.85 | | | | (27.56 | ) | | | 967,942 | | | | 0.51 | | | | (0.11 | ) | | | 57.81 | |
| (0.02 | ) | | | 31.75 | | | | 39.68 | | | | 1,132,090 | | | | 0.50 | ^ | | | 0.41 | | | | 26.34 | |
| (0.15 | ) | | | 22.75 | | | | 33.78 | | | | 46,634 | | | | 0.50 | ^ | | | 0.43 | | | | 21.29 | |
| | | | | | | | | | | | | | | | | | | | | | | | | | |
| — | | | | 10.46 | | | | 16.87 | | | | 43,511 | | | | 0.68 | | | | (0.47 | ) | | | 38.36 | |
| — | | | | 8.95 | | | | (26.82 | ) | | | 64,919 | | | | 0.68 | | | | (0.36 | ) | | | 29.92 | |
| — | | | | 12.23 | | | | (25.06 | ) | | | 150,075 | | | | 0.68 | | | | (0.05 | ) | | | 43.26 | |
| (0.01 | ) | | | 16.32 | | | | (11.32 | ) | | | 475,576 | | | | 0.68 | | | | (0.52 | ) | | | 42.39 | |
| — | | | | 18.41 | | | | 20.88 | | | | 490,675 | | | | 0.68 | † | | | 0.18 | † | | | 9.67 | |
| | | | | | | | | | | | | | | | | | | | | | | | | | |
| (0.08 | ) | | | 7.41 | | | | (24.39 | ) | | | 34,846 | | | | 0.50 | | | | 1.01 | | | | 19.45 | |
| (0.03 | ) | | | 9.88 | | | | (38.90 | ) | | | 58,874 | | | | 0.50 | | | | 0.38 | | | | 23.91 | |
| (0.07 | ) | | | 16.20 | | | | (20.38 | ) | | | 127,842 | | | | 0.50 | | | | 0.17 | | | | 15.72 | |
| (0.01 | ) | | | 20.43 | | | | 7.48 | | | | 175,458 | | | | 0.50 | | | | 0.09 | | | | 35.53 | |
| — | | | | 19.02 | | | | 26.21 | | | | 28,523 | | | | 0.50 | † | | | 1.18 | † | | | 0.00 | |
The accompanying notes are an integral part of the financial statements.
150
Financial Highlights
Selected Per Share Data & Ratios
For a Share Outstanding Throughout the Period |
| | | Net
Asset Value,
Beginning
of Period
($) | | Net Investment
Income
($)* | | Net Realized
and Unrealized
Gain (Loss) on
Investments
($) | | Total from
Operations
($) | | Distribution
from Net
Investment
Income ($) | | Distribution
from Capital
Gains ($) | | Return of
Capital ($) |
| Global X Data Center & Digital Infrastructure ETF |
| 2024 | | | 14.30 | | | | 0.25 | | | | 3.22 | | | | 3.47 | | | | (0.20 | ) | | | — | | | | — | |
| 2023 | | | 13.52 | | | | 0.21 | | | | 0.90 | | | | 1.11 | | | | (0.22 | ) | | | (0.11 | ) | | | — | |
| 2022 | | | 17.83 | | | | 0.15 | | | | (4.22 | ) | | | (4.07 | ) | | | (0.16 | ) | | | (0.08 | ) | | | — | |
| 2021 | | | 14.94 | | | | 0.16 | | | | 2.84 | | | | 3.00 | | | | (0.11 | ) | | | — | | | | — | |
| 2020(1) | | | 14.97 | | | | — | | | | (0.03 | ) | | | (0.03 | ) | | | — | | | | — | | | | — | |
| Global X Clean Water ETF |
| 2024 | | | 15.40 | | | | 0.26 | | | | 3.00 | | | | 3.26 | | | | (0.23 | ) | | | — | | | | — | |
| 2023 | | | 14.30 | | | | 0.25 | | | | 1.09 | | | | 1.34 | | | | (0.24 | ) | | | — | | | | — | |
| 2022 | | | 16.73 | | | | 0.23 | | | | (2.41 | ) | | | (2.18 | ) | | | (0.25 | ) | | | — | *** | | | — | |
| 2021(2) | | | 15.04 | | | | 0.26 | | | | 1.47 | | | | 1.73 | | | | (0.04 | ) | | | — | | | | — | |
| Global X AgTech & Food Innovation ETF |
| 2024 | | | 10.17 | | | | 0.19 | | | | 0.31 | | | | 0.50 | | | | (0.17 | ) | | | — | | | | — | |
| 2023 | | | 15.63 | | | | 0.11 | | | | (5.47 | ) | | | (5.36 | ) | | | (0.10 | ) | | | — | | | | — | |
| 2022 | | | 19.76 | | | | 0.11 | | | | (4.04 | ) | | | (3.93 | ) | | | (0.10 | ) | | | (0.10 | ) | | | — | |
| 2021(3) | | | 25.34 | | | | 0.05 | | | | (5.63 | ) | | | (5.58 | ) | | | — | | | | — | | | | — | |
| * | Per share data calculated using average shares method. |
| ** | Total Return is for the period indicated and has not been annualized. The return shown does not reflect the deduction of taxes that a shareholder would pay on Fund distributions or the redemption of Fund shares. |
| *** | Amount is less than $0.005. |
| † | Annualized. |
| †† | Portfolio turnover rate is for the period indicated and periods of less than one year have not been annualized. Excludes effect of in-kind transfers. |
| (1) | The Fund commenced operations on October 27, 2020. |
| (2) | The Fund commenced operations on April 8, 2021. |
| (3) | The Fund commenced operations on July 12, 2021. |
Amounts designated as “—” are either $0 or have been rounded to $0.
The accompanying notes are an integral part of the financial statements.
151
Financial Highlights
Total from
Distributions ($) | | Net
Asset Value,
End of
Period ($) | | Total
Return
(%)** | | Net Assets, End of
Period ($)(000) | | Ratio of Expenses
to Average Net
Assets (%) | | Ratio of Net
Investment Income
to Average Net
Assets (%) | | Portfolio
Turnover Rate
(%)†† |
| | | | | | | | | | | | | | | | | | | | | | | | | | |
| (0.20 | ) | | | 17.57 | | | | 24.56 | | | | 138,297 | | | | 0.50 | | | | 1.62 | | | | 28.84 | |
| (0.33 | ) | | | 14.30 | | | | 8.46 | | | | 39,323 | | | | 0.50 | | | | 1.60 | | | | 62.01 | |
| (0.24 | ) | | | 13.52 | | | | (23.11 | ) | | | 63,143 | | | | 0.50 | | | | 0.99 | | | | 36.96 | |
| (0.11 | ) | | | 17.83 | | | | 20.17 | | | | 78,098 | | | | 0.50 | | | | 0.93 | | | | 15.80 | |
| — | | | | 14.94 | | | | (0.20 | ) | | | 3,736 | | | | 0.50 | † | | | 0.26 | † | | | 0.00 | |
| | | | | | | | | | | | | | | | | | | | | | | | | | |
| (0.23 | ) | | | 18.43 | | | | 21.31 | | | | 10,687 | | | | 0.50 | | | | 1.49 | | | | 10.48 | |
| (0.24 | ) | | | 15.40 | | | | 9.50 | | | | 9,394 | | | | 0.50 | | | | 1.71 | | | | 15.27 | |
| (0.25 | ) | | | 14.30 | | | | (13.18 | ) | | | 7,580 | | | | 0.50 | | | | 1.58 | | | | 28.19 | |
| (0.04 | ) | | | 16.73 | | | | 11.52 | | | | 8,699 | | | | 0.50 | † | | | 2.44 | † | | | 4.84 | |
| | | | | | | | | | | | | | | | | | | | | | | | | | |
| (0.17 | ) | | | 10.50 | | | | 4.92 | | | | 4,726 | | | | 0.50 | | | | 1.79 | | | | 21.57 | |
| (0.10 | ) | | | 10.17 | | | | (34.41 | ) | | | 4,476 | | | | 0.51 | | | | 0.86 | | | | 54.45 | |
| (0.20 | ) | | | 15.63 | | | | (20.06 | ) | | | 6,721 | | | | 0.50 | | | | 0.62 | | | | 55.85 | |
| — | | | | 19.76 | | | | (22.02 | ) | | | 5,533 | | | | 0.51 | † | | | 0.58 | † | | | 32.72 | |
The accompanying notes are an integral part of the financial statements.
152
Financial Highlights
Selected Per Share Data & Ratios
For a Share Outstanding Throughout the Period |
| | | Net
Asset Value,
Beginning
of Period
($) | | Net Investment
Income (Loss)
($)* | | Net Realized
and Unrealized
Gain (Loss) on
Investments
($) | | Total from
Operations
($) | | Distribution
from Net
Investment
Income ($) | | Distribution
from Capital
Gains ($) | | Return of
Capital ($) |
| Global X Blockchain ETF |
| 2024 | | | 30.72 | | | | 0.07 | | | | 41.42 | | | | 41.49 | | | | (1.03 | ) | | | — | | | | — | |
| 2023(1) | | | 16.39 | | | | 0.28 | | | | 14.27 | | | | 14.55 | | | | (0.22 | ) | | | — | | | | — | |
| 2022(1) | | | 129.32 | | | | 0.46 | | | | (109.52 | ) | | | (109.06 | ) | | | (3.80 | ) | | | — | | | | (0.07 | ) |
| 2021(1)(2) | | | 100.04 | | | | 0.24 | | | | 29.04 | | | | 29.28 | | | | — | | | | — | | | | — | |
| Global X Hydrogen ETF |
| 2024(3) | | | 32.60 | | | | 0.08 | | | | (7.12 | ) | | | (7.04 | ) | | | — | | | | — | | | | — | |
| 2023(3) | | | 61.35 | | | | (0.10 | ) | | | (28.65 | ) | | | (28.75 | ) | | | — | | | | — | | | | — | |
| 2022(3) | | | 121.90 | | | | (0.15 | ) | | | (60.35 | ) | | | (60.50 | ) | | | — | | | | (0.05 | ) | | | — | |
| 2021(3)(2) | | | 125.20 | | | | (0.15 | ) | | | (3.15 | ) | | | (3.30 | ) | | | — | | | | — | | | | — | |
| Global X Solar ETF |
| 2024 | | | 11.71 | | | | 0.06 | | | | (1.57 | ) | | | (1.51 | ) | | | (0.03 | ) | | | — | | | | — | |
| 2023 | | | 22.06 | | | | (0.03 | ) | | | (10.32 | ) | | | (10.35 | ) | | | — | | | | — | | | | — | |
| 2022 | | | 25.70 | | | | (0.04 | ) | | | (3.60 | ) | | | (3.64 | ) | | | — | | | | — | *** | | | — | *** |
| 2021(4) | | | 24.19 | | | | (0.01 | ) | | | 1.52 | | | | 1.51 | | | | — | | | | — | | | | — | |
| * | Per share data calculated using average shares method. |
| ** | Total Return is for the period indicated and has not been annualized. The return shown does not reflect the deduction of taxes that a shareholder would pay on Fund distributions or the redemption of Fund shares. |
| *** | Amount is less than $0.005. |
| † | Annualized. |
| †† | Portfolio turnover rate is for the period indicated and periods of less than one year have not been annualized. Excludes effect of in-kind transfers. |
| (1) | Per share amounts have been adjusted for a 1 for 4 reverse share split on December 19, 2022. (See Note 10 in the Notes to Financial Statements.) |
| (2) | The Fund commenced operations on July 12, 2021. |
| (3) | Per share amounts have been adjusted for a 1 for 5 reverse share split on June 14, 2024. (See Note 10 in the Notes to Financial Statements.) |
| (4) | The Fund commenced operations on September 8, 2021. |
Amounts designated as “—” are either $0 or have been rounded to $0.
The accompanying notes are an integral part of the financial statements.
153
Financial Highlights
Total from
Distributions ($) | | Net
Asset Value,
End of
Period ($) | | Total
Return
(%)** | | Net Assets, End of
Period ($)(000) | | Ratio of Expenses
to Average Net
Assets (%) | | Ratio of Net
Investment Income
(Loss) to Average
Net Assets (%) | | Portfolio
Turnover Rate
(%)†† |
| | | | | | | | | | | | | | | | | | | | | | | | | | |
| (1.03 | ) | | | 71.18 | | | | 136.25 | | | | 226,776 | | | | 0.50 | | | | 0.16 | | | | 56.38 | |
| (0.22 | ) | | | 30.72 | | | | 89.03 | | | | 87,124 | | | | 0.50 | | | | 1.16 | | | | 39.77 | |
| (3.87 | ) | | | 16.39 | | | | (86.70 | ) | | | 45,227 | | | | 0.50 | | | | 1.15 | | | | 36.47 | |
| — | | | | 129.32 | | | | 29.27 | | | | 127,720 | | | | 0.50 | † | | | 0.52 | † | | | 19.49 | |
| | | | | | | | | | | | | | | | | | | | | | | | | | |
| — | | | | 25.56 | | | | (21.60 | ) | | | 40,637 | | | | 0.50 | | | | 0.31 | | | | 36.79 | |
| — | | | | 32.60 | | | | (46.86 | ) | | | 35,777 | | | | 0.50 | | | | (0.21 | ) | | | 27.79 | |
| (0.05 | ) | | | 61.35 | | | | (49.64 | ) | | | 38,035 | | | | 0.50 | | | | (0.24 | ) | | | 36.44 | |
| — | | | | 121.90 | | | | (2.64 | ) | | | 32,427 | | | | 0.51 | † | | | (0.33 | )† | | | 40.38 | |
| | | | | | | | | | | | | | | | | | | | | | | | | | |
| (0.03 | ) | | | 10.17 | | | | (12.88 | ) | | | 6,608 | | | | 0.50 | | | | 0.52 | | | | 32.91 | |
| — | | | | 11.71 | | | | (46.92 | ) | | | 5,974 | | | | 0.50 | | | | (0.17 | ) | | | 50.01 | |
| — | *** | | | 22.06 | | | | (14.14 | ) | | | 5,955 | | | | 0.51 | | | | (0.20 | ) | | | 128.22 | |
| — | | | | 25.70 | | | | 6.24 | | | | 8,995 | | | | 0.50 | † | | | (0.22 | )† | | | 9.85 | |
The accompanying notes are an integral part of the financial statements.
154
Financial Highlights
Selected Per Share Data & Ratios
For a Share Outstanding Throughout the Period |
| | | Net
Asset Value,
Beginning
of Period
($) | | Net Investment
Income (Loss)
($)* | | Net Realized
and Unrealized
Gain (Loss) on
Investments
($) | | Total from
Operations
($) | | Distribution
from Net
Investment
Income ($) | | Distribution
from Capital
Gains ($) | | Return of
Capital ($) |
| Global X Wind Energy ETF |
| 2024 | | | 12.88 | | | | 0.13 | | | | (0.96 | ) | | | (0.83 | ) | | | (0.12 | ) | | | — | | | | — | |
| 2023 | | | 17.58 | | | | 0.16 | | | | (4.68 | ) | | | (4.52 | ) | | | (0.18 | ) | | | — | | | | — | |
| 2022 | | | 23.76 | | | | 0.14 | | | | (6.26 | ) | | | (6.12 | ) | | | (0.06 | ) | | | — | | | | — | |
| 2021(1) | | | 24.82 | | | | (0.01 | ) | | | (1.05 | ) | | | (1.06 | ) | | | — | | | | — | | | | — | |
| Global X PropTech ETF |
| 2024 | | | 27.26 | | | | 0.02 | | | | 9.63 | | | | 9.65 | | | | (0.06 | ) | | | (0.68 | ) | | | — | |
| 2023(2) | | | 25.08 | | | | 0.01 | | | | 2.17 | | | | 2.18 | | | | — | *** | | | — | | | | — | |
| Global X Defense Tech ETF |
| 2024 | | | 27.03 | | | | 0.29 | | | | 12.08 | | | | 12.37 | | | | (0.13 | ) | | | (0.01 | ) | | | — | |
| 2023(3) | | | 24.82 | | | | 0.08 | | | | 2.13 | | | | 2.21 | | | | — | | | | — | | | | — | |
| Global X Infrastructure Development ex-U.S. ETF |
| 2024(4) | | | 24.82 | | | | 0.08 | | | | (0.93 | ) | | | (0.85 | ) | | | — | | | | — | | | | — | |
| * | Per share data calculated using average shares method. |
| ** | Total Return is for the period indicated and has not been annualized. The return shown does not reflect the deduction of taxes that a shareholder would pay on Fund distributions or the redemption of Fund shares. |
| *** | Amount is less than $0.005. |
| † | Annualized. |
| †† | Portfolio turnover rate is for the period indicated and periods of less than one year have not been annualized. Excludes effect of in-kind transfers. |
| (1) | The Fund commenced operations on September 8, 2021. |
| (2) | The Fund commenced operations on April 11, 2023. |
| (3) | The Fund commenced operations on September 11, 2023. |
| (4) | The Fund commenced operations on August 27, 2024. |
Amounts designated as “—” are either $0 or have been rounded to $0.
The accompanying notes are an integral part of the financial statements.
155
Financial Highlights
Total from
Distributions ($) | | Net
Asset Value,
End of
Period ($) | | Total
Return
(%)** | | Net Assets, End of
Period ($)(000) | | Ratio of Expenses
to Average Net
Assets (%) | | Ratio of Net
Investment Income
(Loss) to Average
Net Assets (%) | | Portfolio
Turnover Rate
(%)†† |
| | | | | | | | | | | | | | | | | | | | | | | | | | |
| (0.12 | ) | | | 11.93 | | | | (6.53 | ) | | | 2,147 | | | | 0.51 | | | | 1.04 | | | | 22.82 | |
| (0.18 | ) | | | 12.88 | | | | (25.94 | ) | | | 2,705 | | | | 0.51 | | | | 0.95 | | | | 94.18 | |
| (0.06 | ) | | | 17.58 | | | | (25.79 | ) | | | 3,341 | | | | 0.50 | | | | 0.68 | | | | 34.53 | |
| — | | | | 23.76 | | | | (4.27 | ) | | | 4,514 | | | | 0.50 | † | | | (0.10 | )† | | | 23.01 | |
| | | | | | | | | | | | | | | | | | | | | | | | | | |
| (0.74 | ) | | | 36.17 | | | | 35.95 | | | | 1,808 | | | | 0.50 | | | | 0.08 | | | | 12.55 | |
| — | | | | 27.26 | | | | 8.71 | | | | 2,726 | | | | 0.51 | † | | | 0.08 | † | | | 13.73 | |
| | | | | | | | | | | | | | | | | | | | | | | | | | |
| (0.14 | ) | | | 39.26 | | | | 45.89 | | | | 766,037 | | | | 0.50 | | | | 0.80 | | | | 14.43 | |
| — | | | | 27.03 | | | | 8.90 | | | | 4,595 | | | | 0.50 | † | | | 1.39 | † | | | 2.94 | |
| | | | | | | | | | | | | | | | | | | | | | | | | | |
| — | | | | 23.97 | | | | (3.42 | ) | | | 2,397 | | | | 0.56 | † | | | 1.28 | † | | | 7.99 | |
The accompanying notes are an integral part of the financial statements.
156
Notes to Financial Statements
November 30, 2024
1. ORGANIZATION
The Global X Funds (the “Trust”) is a Delaware statutory trust formed on March 6, 2008. The Trust is registered under the Investment Company Act of 1940, as amended, (the “1940 Act”) as an open-end management investment company. As of November 30, 2024, the Trust had one hundred portfolios, ninety-seven of which were operational. The financial statements herein and the related notes pertain to the Global X Millennial Consumer ETF, Global X Aging Population ETF, Global X Robotics &Artificial Intelligence ETF, Global X FinTech ETF, Global X Internet of Things ETF, Global X U.S. Infrastructure Development ETF, Global X Autonomous & Electric Vehicles ETF, Global X Artificial Intelligence & Technology ETF, Global X Genomics & Biotechnology ETF, Global X Cloud Computing ETF, Global X Thematic Growth ETF, Global X Video Games & Esports ETF, Global X Cybersecurity ETF, Global X Telemedicine & Digital Health ETF, Global X CleanTech ETF, Global X Data Center & Digital Infrastructure ETF, Global X Clean Water ETF, Global X AgTech & Food Innovation ETF, Global X Blockchain ETF, Global X Hydrogen ETF, Global X Solar ETF, Global X Wind Energy ETF, Global X PropTech ETF, Global X Defense Tech ETF and Global X Infrastructure Development ex-U.S. ETF (each a “Fund” and collectively, the “Funds”).
Each Fund, other than the Global X Millennial Consumer ETF, Global X Aging Population ETF, Global X U.S. Infrastructure Development ETF, Global X Autonomous & Electric Vehicles ETF, Global X Artificial Intelligence & Technology ETF and Global X Thematic Growth ETF, has elected non-diversified status under the 1940 Act.
The Global X Data Center REITs & Digital Infrastructure ETF was renamed to the Global X Data Center & Digital Infrastructure ETF and its ticker changed to DTCR, effective as of April 1, 2024.
The Global X Infrastructure Development ex-U.S. ETF commenced operations on August 27, 2024.
2. SIGNIFICANT ACCOUNTING POLICIES
The following is a summary of the significant accounting policies followed by the Funds:
USE OF ESTIMATES — The Funds are investment companies that apply the accounting and reporting guidance issued in Topic 946 by the U.S. Financial Accounting Standards Board. The preparation of financial statements in conformity with U.S. generally accepted accounting principles (“U.S. GAAP”) requires management to make estimates and assumptions that affect the reported amounts of assets and liabilities, disclosure of contingent assets and liabilities at the date of the financial statements, and the reported amounts of increases and decreases in net assets from operations during the reporting period. Actual results could materially differ from those estimates.
157
Notes to Financial Statements (Continued)
November 30, 2024
2. SIGNIFICANT ACCOUNTING POLICIES (continued)
RETURN OF CAPITAL ESTIMATES – Distributions received by the Funds from underlying master limited partnership (“MLP”) and real estate investment trust (“REIT”) investments generally are comprised of income and return of capital. The Funds record investment income and return of capital based on estimates made at the time such distributions are received. Such estimates are based on historical information available from the MLPs, REITs and other industry sources. These estimates may subsequently be revised based on information received from the MLPs and REITs after their tax reporting periods are concluded.
SECURITY VALUATION — Securities listed on a securities exchange, market or automated quotation system for which quotations are readily available (except for securities traded on the NASDAQ Stock Market (“NASDAQ”)), including securities traded over the counter, are valued at the last quoted sale price on the primary exchange or market (foreign or domestic) on which they are traded (or at approximately 4:00 pm Eastern Standard Time if a security’s primary exchange is normally open at that time), or, if there is no such reported sale, at the most recent mean between the quoted bid and asked prices, which approximates fair value (absent both bid and asked prices on such exchange, the bid price may be used).
For securities traded on NASDAQ, the NASDAQ Official Closing Price will be used. The prices for foreign securities are reported in local currencies and converted to U.S. dollars using currency exchange rates as of the reporting date. The exchange rates used by the Trust for valuation are captured as of the New York or London close each day.
Securities for which market prices are not “readily available” are valued in accordance with fair value procedures (the “Fair Value Procedures”) established by Global X Management Company LLC, the Funds’ investment adviser (the “Adviser”), and approved by the Funds’ Board of Trustees (the “Board”). Pursuant to Rule 2a-5 under the 1940 Act, the Board has designated the Adviser as the “valuation designee” to determine the fair value of securities and other instruments for which no readily available market quotations are available. The Fair Value Procedures are implemented through a fair value committee (the “Committee”) of the Adviser. Some of the more common reasons that may necessitate that a security be valued using the Fair Value Procedures include: the security’s trading has been halted or suspended; the security has been de-listed from its primary trading exchange; the security’s primary trading market is temporarily closed at a time when, under normal conditions, it would be open; the security has not been traded for an extended period of time; the security’s primary pricing source is not able or willing to provide a price; or trading of the security is subject to local government-imposed restrictions. In addition, each Fund may fair value a security if an event that may materially affect the value of the Fund’s security that is traded outside of the United States (a “Significant Event”) has occurred between the time of the security’s last close and the time the Fund calculates its net asset value (“NAV”). A Significant Event may relate to a single issuer or to an entire market sector. Events that may
158
Notes to Financial Statements (Continued)
November 30, 2024
2. SIGNIFICANT ACCOUNTING POLICIES (continued)
be Significant Events include: government actions, natural disasters, armed conflict, acts of terrorism and significant market fluctuations. If the Adviser becomes aware of a Significant Event that has occurred with respect to a security or group of securities after the closing of the exchange or market on which the security or securities principally trade, but before the time at which the Funds calculate their NAV, it may request that a Committee meeting be called. When a security is valued in accordance with the Fair Value Procedures, the Committee will determine the value after taking into consideration all relevant information reasonably available to the Committee.
If available, debt securities are priced based upon valuations provided by independent, third-party pricing agents. Such values generally reflect the last reported sales price if the security is actively traded. The third-party pricing agents may also value debt securities at an evaluated bid price by employing methodologies that utilize actual market transactions, broker-supplied valuations, or other methodologies designed to identify the market value for such securities. Debt obligations with remaining maturities of sixty days or less will be valued at their market value. Prices for most securities held by the Funds are provided daily by recognized independent pricing agents. If a security price cannot be obtained from an independent, third-party pricing agent, the Funds seek to obtain a bid price from at least one independent broker.
In accordance with the authoritative guidance on fair value measurements and disclosure under U.S. GAAP, the Funds disclose the fair value of their investments in a hierarchy that prioritizes the inputs to valuation techniques used to measure the fair value. The objective of a fair value measurement is to determine the price that would be received upon the sale of an asset or paid to transfer a liability in an orderly transaction between market participants at the measurement date (an exit price). Accordingly, the fair value hierarchy gives the highest priority to quoted prices (unadjusted) in active markets for identical assets or liabilities (Level 1) and the lowest priority to unobservable inputs (Level 3). The three levels of the fair value hierarchy are described below:
Level 1 – Unadjusted quoted prices in active markets for identical, unrestricted assets or liabilities that the Funds have the ability to access at the measurement date;
Level 2 – Other significant observable inputs (including quoted prices in non-active markets, quoted prices for similar investments, fair value of investments for which the Funds have the ability to fully redeem tranches at NAV as of the measurement date or within the near term, and short-term investments valued at amortized cost); and
Level 3 – Significant unobservable inputs (including the Funds’ own assumptions in determining the fair value of investments and fair value of investments for
159
Notes to Financial Statements (Continued)
November 30, 2024
2. SIGNIFICANT ACCOUNTING POLICIES (continued)
which the Funds do not have the ability to fully redeem tranches at NAV as of the measurement date or within the near term).
Investments are classified within the level of the lowest significant input considered in determining fair value. Investments classified within Level 3 whose fair value measurement considers several inputs may include Level 1 or Level 2 inputs as components of the overall fair value measurement. For details of the investment classification, reference the Schedule of Investments.
The unobservable inputs used to determine fair value of Level 3 assets may have similar or diverging impacts on valuation. Significant increases and decreases in these inputs in isolation and interrelationships between those inputs could result in significantly higher or lower fair value measurement.
DUE TO/FROM BROKERS — Due to/from brokers includes cash and collateral balances with the Funds’ clearing brokers or counterparties as of November 30, 2024. The Funds continuously monitor the credit standing of each broker or counterparty with whom they conduct business. In the event a broker or counterparty is unable to fulfill its obligations, the Funds would be subject to counterparty credit risk.
REPURCHASE AGREEMENTS — Securities pledged as collateral for repurchase agreements are held by Brown Brothers Harriman & Co. (“BBH”) or The Bank of New York Mellon (“BNY Mellon”), as appropriate, in their roles as Custodian to respective Funds (each, a “Custodian” and together, the “Custodians”), and are designated as being held on each Fund’s behalf by the Custodian under a book-entry system. Each Fund monitors the adequacy of the collateral on a daily basis and can require the seller to provide additional collateral in the event the market value of the securities pledged falls below the carrying value of the repurchase agreement, including accrued interest.
It is each Fund’s policy to only enter into repurchase agreements with banks and other financial institutions which are deemed by the Adviser to be creditworthy. The Funds bear the risk of loss in the event that the counterparty to a repurchase agreement defaults on its obligations and the Funds are prevented from exercising their rights to dispose of the underlying securities received as collateral. For financial statement purposes, the Funds record the securities lending collateral (included in repurchase agreements, at value or restricted cash) as an asset and the obligation to return securities lending collateral as a liability on the Statements of Assets and Liabilities. Repurchase agreements are entered into by the Funds under Master Repurchase Agreements (each, an “MRA”) which permit the Funds, under certain circumstances, including an event of default (such as bankruptcy or insolvency), to offset payables and/or receivables under the MRA with collateral held and/or posted to the counterparty and create one single net payment due to or from the Funds.
160
Notes to Financial Statements (Continued)
November 30, 2024
2. SIGNIFICANT ACCOUNTING POLICIES (continued)
FEDERAL INCOME TAXES — It is each Fund’s intention to qualify, or continue to qualify, as a regulated investment company for Federal income tax purposes by complying with the appropriate provisions of Subchapter M of the Internal Revenue Code of 1986, as amended (the “Code”). Accordingly, no provisions for Federal income taxes have been made in the financial statements except as described below.
The Funds evaluate tax positions taken or expected to be taken in the course of preparing the Funds’ tax returns to determine whether it is “more-likely-than-not” (i.e., greater than 50%) that each tax position will be sustained upon examination by a taxing authority based on the technical merits of the position. Tax positions not deemed to meet the more-likely-than-not threshold are recorded as a tax benefit or expense in the current year. The Funds did not record any tax positions in the current period, however Management’s conclusions regarding tax positions may be subject to review and adjustment at a later date based on factors including, but not limited to, examination by tax authorities (i.e., the last three tax year ends, as applicable), and on-going analysis of and changes to tax laws and regulations, and interpretations thereof.
If a Fund has foreign tax filings that have not been made, the tax years that remain subject to examination may date back to the inception of the Fund.
As of and during the reporting period ended November 30, 2024, the Funds did not have a liability for any unrecognized tax benefits. The Funds recognize interest and penalties, if any, related to unrecognized tax benefits as income tax expense on the Statements of Operations. During the reporting period, the Funds did not incur any interest or penalties. The Funds are also not aware of any tax positions for which it is reasonably possible that the total amounts of unrecognized tax benefits will significantly change in the next 12 months.
The Funds file withholding tax reclaims in certain jurisdictions to recover a portion of amounts previously withheld. The Funds may record a reclaim receivable based on collectability, which includes factors such as the jurisdiction’s applicable laws, payment history and market convention. The Statements of Operations includes tax reclaims recorded as well as professional and other fees, if any, associated with recovery of foreign withholding taxes.
SECURITY TRANSACTIONS AND INVESTMENT INCOME — Security transactions are accounted for on the trade date for financial reporting purposes. Costs used in determining realized gains and losses on the sale of investment securities are based on specific identification. Dividend income is recorded on the ex-dividend date. Interest income is recognized on the accrual basis from the settlement date. Amortization of premiums and accretion of discounts is included in interest income.
161
Notes to Financial Statements (Continued)
November 30, 2024
2. SIGNIFICANT ACCOUNTING POLICIES (continued)
DIVIDENDS AND DISTRIBUTIONS TO SHAREHOLDERS — The Funds distribute their net investment income on a pro rata basis. Any net investment income and net realized capital gains are distributed at least annually. All distributions are recorded on the ex-dividend date.
INVESTMENTS IN REITs – With respect to the Funds, dividend income is recorded based on the income included in distributions received from REIT investments using published REIT reclassifications, including some management estimates when actual amounts are not available. Distributions received in excess of these estimated amounts are recorded as a reduction of the cost of investments or reclassified to capital gains. The actual amounts of income, return of capital, and capital gains are only determined by each REIT after its fiscal year end, and may differ from the estimated amounts.
CASH OVERDRAFT CHARGES – Per the terms of an agreement with BBH, if a Fund for which BBH is Custodian has a cash overdraft on a given day, it will be assessed an overdraft charge equal to the applicable BBH Base Rate plus 2.00%. Prior to August 12, 2024, with respect to the Global X Robotics & Artificial Intelligence ETF and Global X Autonomous & Electric Vehicles ETF, BBH acted as the Custodian for the respective Funds, and if a Fund had a cash overdraft on a given day, it was assessed an overdraft charge equal to the applicable BBH Base Rate plus 2.00%. Per the terms of an agreement with BNY Mellon, if a Fund for which BNY Mellon is Custodian has a cash overdraft, it will be charged interest at a rate then charged by BNY Mellon to its institutional custody clients in the relevant currency. Cash overdraft charges are included in Custodian fees on the Statements of Operations.
FOREIGN CURRENCY TRANSACTIONS AND TRANSLATION — The books and records of the Funds are maintained in U.S. dollars. Investment securities and other assets and liabilities denominated in a foreign currency are translated into U.S. dollars on the date of valuation. Purchases and sales of investment securities, income and expenses are translated into U.S. dollars at the relevant rates of exchange prevailing on the respective dates of such transactions. The Funds do not isolate that portion of realized or unrealized gains and losses resulting from changes in the foreign exchange rate from fluctuations arising from changes in the market prices of the securities. These gains and losses are included in net realized and unrealized gains and losses on investments on the Statements of Operations. Net realized and unrealized gains and losses on foreign currency transactions and translations represent net foreign exchange gains or losses from foreign currency spot contracts, disposition of foreign currencies, currency gains or losses realized between trade and settlement dates on securities transactions and the difference between the amount of the investment income and foreign withholding taxes recorded on the Funds’ books and the U.S. dollar equivalent amounts actually received or paid.
162
Notes to Financial Statements (Continued)
November 30, 2024
2. SIGNIFICANT ACCOUNTING POLICIES (continued)
FUTURES CONTRACTS — To the extent consistent with its investment objective and strategies, each Fund may use futures contracts for tactical hedging purposes as well as to enhance the Fund’s returns. Initial margin deposits of cash or securities are made upon entering into futures contracts. The contracts are marked to market daily and the resulting changes in value are accounted for as unrealized gains and losses. Variation margin payments are paid or received, depending upon whether unrealized gains or losses are incurred. When the contract is closed, the Fund records a realized gain or loss equal to the difference between the proceeds from (or cost of) the closing transaction and the amount invested in the contract.
Risks of entering into futures contracts include the possibility that there will be an imperfect price correlation between the futures and the underlying securities. Second, it is possible that a lack of liquidity for futures contracts could exist in the secondary market, resulting in an inability to close a position prior to its maturity date. Third, a futures contract involves the risk that the Fund could lose more than the original margin deposit required to initiate a futures transaction.
Futures contracts shall be valued at the settlement price established each day by the board of the exchange on which they are traded. The daily settlement prices for financial futures are provided by an independent source.
Finally, the risk exists that losses could exceed amounts disclosed on the Statements of Assets and Liabilities. Refer to the Funds’ Schedule of Investments for details regarding open futures contracts as of November 30, 2024, if applicable.
CREATION UNITS — The Funds issue and redeem their shares (“Shares”) on a continuous basis at NAV and only in large blocks of 10,000 Shares, referred to as “Creation Units”. Purchasers of Creation Units (each, an “Authorized Participant”) at NAV must pay a standard creation transaction fee per transaction. The fee is a single charge and will be the same regardless of the number of Creation Units purchased by an Authorized Participant on the same day. An Authorized Participant who holds Creation Units and wishes to redeem at NAV would also pay a standard redemption fee per transaction to the Fund’s Custodian, on the date of such redemption, regardless of the number of Creation Units redeemed that day.
If a Creation Unit is purchased or redeemed for cash, an additional variable fee may be charged. The following table discloses Creation Unit breakdown:
| | | Creation
Unit
Shares | | Creation
Fee | | Redemption
Fee |
| Global X Millennial Consumer ETF | | | 10,000 | | | $ | 300 | | | $ | 300 | |
| Global X Aging Population ETF | | | 10,000 | | | | 300 | | | | 300 | |
| Global X Robotics & Artificial Intelligence ETF | | | 10,000 | | | | 400 | | | | 400 | |
163
Notes to Financial Statements (Continued)
November 30, 2024
2. SIGNIFICANT ACCOUNTING POLICIES (continued)
| | | Creation
Unit
Shares | | Creation
Fee | | Redemption
Fee |
| Global X FinTech ETF | | | 10,000 | | | $ | 250 | | | $ | 250 | |
| Global X Internet of Things ETF | | | 10,000 | | | | 250 | | | | 250 | |
| Global X U.S. Infrastructure Development ETF | | | 10,000 | | | | 300 | | | | 300 | |
| Global X Autonomous & Electric Vehicles ETF | | | 10,000 | | | | 700 | | | | 700 | |
| Global X Artificial Intelligence & Technology ETF | | | 10,000 | | | | 300 | | | | 300 | |
| Global X Genomics & Biotechnology ETF | | | 10,000 | | | | 250 | | | | 250 | |
| Global X Cloud Computing ETF | | | 10,000 | | | | 250 | | | | 250 | |
| Global X Thematic Growth ETF | | | 10,000 | | | | 250 | | | | 250 | |
| Global X Video Games & Esports ETF | | | 10,000 | | | | 300 | | | | 300 | |
| Global X Cybersecurity ETF | | | 10,000 | | | | 250 | | | | 250 | |
| Global X Telemedicine & Digital Health ETF | | | 10,000 | | | | 250 | | | | 250 | |
| Global X CleanTech ETF | | | 10,000 | | | | 250 | | | | 250 | |
| Global X Data Center & Digital Infrastructure ETF | | | 10,000 | | | | 250 | | | | 250 | |
| Global X Clean Water ETF | | | 10,000 | | | | 250 | | | | 250 | |
| Global X AgTech & Food Innovation ETF | | | 10,000 | | | | 250 | | | | 250 | |
| Global X Blockchain ETF | | | 10,000 | | | | 250 | | | | 250 | |
| Global X Hydrogen ETF | | | 10,000 | | | | 250 | | | | 250 | |
| Global X Solar ETF | | | 10,000 | | | | 400 | | | | 400 | |
| Global X Wind Energy ETF | | | 10,000 | | | | 300 | | | | 300 | |
| Global X PropTech ETF | | | 10,000 | | | | 250 | | | | 250 | |
| Global X Defense Tech ETF | | | 10,000 | | | | 250 | | | | 250 | |
| Global X Infrastructure Development ex-U.S. ETF | | | 10,000 | | | | 1,100 | | | | 1,100 | |
3. RELATED PARTIES AND SERVICE PROVIDER TRANSACTIONS
On July 2, 2018, the Adviser consummated a transaction pursuant to which it became an indirect, wholly-owned subsidiary of Mirae Asset Global Investments Co., Ltd. (“Mirae”). In this manner, the Adviser is ultimately controlled by Mirae.
The Adviser serves as the investment adviser and the administrator for the Funds. Subject to the supervision of the Board, the Adviser is responsible for managing the investment activities of the Funds and the Funds’ business affairs and other administrative matters and provides, or causes to be furnished, all supervisory, administrative and other services reasonably necessary for the operation of the Funds, including certain distribution services (provided pursuant to a separate distribution services agreement), certain shareholder and distribution-related services (provided pursuant to a separate Rule 12b-1 Plan and related agreements) and investment advisory services (provided pursuant to a separate Investment Advisory Agreement), under what is essentially an “all-in” fee structure.
For the Adviser’s service to the respective Funds, under a supervision and administration agreement (the “Supervision and Administration Agreement”), each Fund pays a monthly fee to the Adviser at the annual rate below (stated as a percentage of the average daily net
164
Notes to Financial Statements (Continued)
November 30, 2024
3. RELATED PARTIES AND SERVICE PROVIDER TRANSACTIONS (continued)
assets of the respective Fund) (the “Supervision and Administration Fee”). In addition, the Funds bear other expenses, directly and indirectly, that are not covered by the Supervision and Administration Agreement, which may vary and affect the total expense ratios of the Funds, such as taxes, brokerage fees, commissions, certain Custodian fees, acquired fund fees and expenses (except for Global X Thematic Growth ETF with respect to investments in affiliated investment companies), and other transaction expenses, interest expenses, and extraordinary expenses (such as litigation and indemnification expenses).
The Supervision and Administration Agreement for the Global X Thematic Growth ETF provides that the Adviser also bears the costs for acquired fund fees and expenses generated by investments by the Fund in affiliated investment companies. For the year ended November 30, 2024, the Adviser paid acquired fund fees and expenses of $124,963 and made such reimbursement payments to the Global X Thematic Growth ETF on a monthly basis. These amounts are included in Payment from Adviser on the Statement of Operations.
The following table discloses the supervision and administration fees payable pursuant to the Supervision and Administration Agreement:
| | Supervision and
Administration Fee |
| Global X Millennial Consumer ETF | 0.50% |
| Global X Aging Population ETF | 0.50% |
| Global X Robotics & Artificial Intelligence ETF | 0.68% |
| Global X FinTech ETF | 0.68% |
| Global X Internet of Things ETF | 0.68% |
| Global X U.S. Infrastructure Development ETF | 0.47% |
| Global X Autonomous & Electric Vehicles ETF | 0.68% |
| Global X Artificial Intelligence & Technology ETF | 0.68% |
| Global X Genomics & Biotechnology ETF | 0.50% |
| Global X Cloud Computing ETF | 0.68% |
| Global X Thematic Growth ETF | 0.50% |
| Global X Video Games & Esports ETF | 0.50% |
| Global X Cybersecurity ETF | 0.50% |
| Global X Telemedicine & Digital Health ETF | 0.68% |
| Global X CleanTech ETF | 0.50% |
| Global X Data Center & Digital Infrastructure ETF | 0.50% |
| Global X Clean Water ETF | 0.50% |
165
Notes to Financial Statements (Continued)
November 30, 2024
3. RELATED PARTIES AND SERVICE PROVIDER TRANSACTIONS (continued)
| | Supervision and
Administration Fee |
| Global X AgTech & Food Innovation ETF | 0.50% |
| Global X Blockchain ETF | 0.50% |
| Global X Hydrogen ETF | 0.50% |
| Global X Solar ETF | 0.50% |
| Global X Wind Energy ETF | 0.50% |
| Global X PropTech ETF | 0.50% |
| Global X Defense Tech ETF | 0.50% |
| Global X Infrastructure Development ex-U.S. ETF | 0.55% |
SEI Investments Global Funds Services (“SEIGFS”) serves as sub-administrator to the Funds. As sub-administrator, SEIGFS provides the Funds with all required general administrative services, including, without limitation: office space, equipment, and personnel; clerical and general back office services; bookkeeping, internal accounting and secretarial services; the calculation of NAV; and assistance with the preparation and filing of reports, registration statements, proxy statements and other materials required to be filed or furnished by the Funds under federal and state securities laws. As compensation for these services, SEIGFS receives certain out-of-pocket costs, transaction fees and asset-based fees which are accrued daily and paid monthly by the Adviser.
SEI Investments Distribution Co. (“SIDCO”) serves as the Funds’ underwriter and distributor of Creation Units pursuant to a distribution agreement (the “Distribution Agreement”). SIDCO has no obligation to sell any specific quantity of Shares of the funds.
SIDCO bears the following costs and expenses relating to the distribution of Shares: (i) the costs of processing and maintaining records of creations of Creation Units; (ii) all costs of maintaining the records required of a registered broker/dealer; (iii) the expenses of maintaining its registration or qualification as a dealer or broker under federal or state laws; (iv) filing fees; and (v) all other expenses incurred in connection with the distribution services as contemplated in the Distribution Agreement. SIDCO receives no fee from the Funds for its distribution services under the Distribution Agreement; rather, the Adviser compensates SIDCO for certain expenses, out-of-pocket costs, and transaction fees.
BBH serves as the Custodian and transfer agent of the Global X Millennial Consumer ETF, Global X U.S. Infrastructure Development ETF, Global X Cloud Computing ETF and Global X Telemedicine & Digital Health ETF. As Custodian, BBH has agreed to (1) make receipts and disbursements of money on behalf of the Funds; (2) collect and receive all income and other payments and distributions on account of the Funds’ portfolio investments; (3) respond to correspondence from shareholders, security brokers and others relating to its duties; and (4) make periodic reports to the Funds concerning the Funds’
166
Notes to Financial Statements (Continued)
November 30, 2024
3. RELATED PARTIES AND SERVICE PROVIDER TRANSACTIONS (continued)
operations. BBH does not exercise any supervisory function over the purchase and sale of securities. As compensation for these services, BBH receives certain out-of-pocket costs, transaction fees and asset-based fees which are accrued daily and paid monthly by the Adviser from its fees. As compensation for these services, BBH receives certain out-of-pocket costs, transaction fees and asset-based fees which are accrued daily and paid monthly by the Adviser from its fees. As transfer agent, BBH has agreed to (1) issue and redeem Shares of each Fund; (2) make dividend and other distributions to shareholders of each Fund; (3) respond to correspondence by shareholders and others relating to its duties; (4) maintain shareholder accounts; and (5) make periodic reports to the Funds. As compensation for these services, BBH receives certain out-of-pocket costs, transaction fees and asset-based fees which are accrued daily and paid monthly by the Adviser from its fees.
BNY Mellon is the Custodian of the Trust’s portfolio securities and cash with respect to all Funds except the Global X Millennial Consumer ETF, Global X U.S. Infrastructure Development ETF, Global X Cloud Computing ETF and Global X Telemedicine & Digital Health ETF. As Custodian, BNY Mellon may appoint domestic and foreign sub-custodians and use depositories from time to time to hold securities and other instruments purchased by the Trust in foreign countries and to hold cash and currencies for the Trust. BNY Mellon also serves as the Trust’s transfer agent on behalf of the Funds. Under its transfer agency agreement with the Trust, BNY Mellon has undertaken with the Trust to provide the following services with respect to the Funds for which it serves as transfer agent: (i) perform and facilitate the performance of purchases and redemptions of Creation Units, (ii) prepare and transmit by means of Depository Trust Company’s (“DTC”) book-entry system payments for dividends and distributions on or with respect to the Shares declared by the Trust on behalf of the Fund, as applicable, (iii) prepare and deliver reports, information and documents as specified in the transfer agency agreement, (iv) perform the customary services of a transfer agent and dividend disbursing agent, and (v) render certain other miscellaneous services as specified in the transfer agency agreement or as otherwise agreed upon.
The Custodian and transfer agent for the Global X Robotics & Artificial Intelligence ETF, and Global X Autonomous & Electric Vehicles ETF transitioned from BBH to BNY Mellon on August 12, 2024.
167
Notes to Financial Statements (Continued)
November 30, 2024
4. INVESTMENT TRANSACTIONS
For the year or period ended November 30, 2024, the purchases and sales of investments in securities excluding in-kind transactions, long-term U.S. Government, and short-term securities, were:
| | | Purchases | | Sales and
Maturities |
| Global X Millennial Consumer ETF | | $ | 12,788,625 | | | $ | 12,911,077 | |
| Global X Aging Population ETF | | | 10,955,618 | | | | 10,784,082 | |
| Global X Robotics & Artificial Intelligence ETF | | | 270,740,083 | | | | 290,444,726 | |
| Global X FinTech ETF | | | 44,645,736 | | | | 46,798,857 | |
| Global X Internet of Things ETF | | | 51,328,688 | | | | 57,513,100 | |
| Global X U.S. Infrastructure Development ETF | | | 375,805,442 | | | | 322,863,647 | |
| Global X Autonomous & Electric Vehicles ETF | | | 143,122,510 | | | | 159,195,671 | |
| Global X Artificial Intelligence & Technology ETF | | | 353,421,472 | | | | 190,152,872 | |
| Global X Genomics & Biotechnology ETF | | | 16,988,110 | | | | 17,061,289 | |
| Global X Cloud Computing ETF | | | 102,128,420 | | | | 103,954,062 | |
| Global X Thematic Growth ETF | | | 6,594,601 | | | | 6,803,346 | |
| Global X Video Games & Esports ETF | | | 40,279,162 | | | | 46,301,220 | |
| Global X Cybersecurity ETF | | | 243,638,049 | | | | 242,064,426 | |
| Global X Telemedicine & Digital Health ETF | | | 19,885,859 | | | | 20,100,085 | |
| Global X CleanTech ETF | | | 9,072,106 | | | | 10,212,673 | |
| Global X Data Center & Digital Infrastructure ETF | | | 56,909,688 | | | | 39,033,102 | |
| Global X Clean Water ETF | | | 1,058,094 | | | | 1,043,223 | |
| Global X AgTech & Food Innovation ETF | | | 1,471,022 | | | | 1,585,074 | |
| Global X Blockchain ETF | | | 113,679,393 | | | | 112,895,677 | |
| Global X Hydrogen ETF | | | 21,112,870 | | | | 19,121,833 | |
| Global X Solar ETF | | | 3,451,037 | | | | 2,580,574 | |
| Global X Wind Energy ETF | | | 566,417 | | | | 665,805 | |
| Global X PropTech ETF | | | 425,929 | | | | 510,850 | |
| Global X Defense Tech ETF | | | 72,741,080 | | | | 38,854,106 | |
| Global X Infrastructure Development ex-U.S. ETF | | | 2,680,860 | | | | 195,757 | |
168
Notes to Financial Statements (Continued)
November 30, 2024
4. INVESTMENT TRANSACTIONS (continued)
For each of the year or period ended November 30, 2024, in-kind transactions associated with creations and redemptions were:
| | | Purchases | | | Sales | | | Realized
Gain/(Loss) |
| Global X Millennial Consumer ETF | | $ | 17,689,543 | | | $ | 33,672,333 | | | $ | 11,373,816 | |
| Global X Aging Population ETF | | | 11,230,253 | | | | 12,846,224 | | | | 3,772,898 | |
| Global X Robotics & Artificial Intelligence ETF | | | 869,420,682 | | | | 1,025,690,848 | | | | 573,570,497 | |
| Global X FinTech ETF | | | 39,548,849 | | | | 174,070,958 | | | | (22,100,503 | ) |
| Global X Internet of Things ETF | | | – | | | | 69,209,797 | | | | 17,240,572 | |
| Global X U.S. Infrastructure Development ETF | | | 2,914,307,134 | | | | 984,827,196 | | | | 394,664,568 | |
| Global X Autonomous & Electric Vehicles ETF | | | 37,148,397 | | | | 320,658,330 | | | | 33,689,679 | |
| Global X Artificial Intelligence & Technology ETF | | | 1,382,123,636 | | | | 276,070,109 | | | | 113,796,777 | |
| Global X Genomics & Biotechnology ETF | | | 12,285,712 | | | | 29,644,345 | | | | 870,246 | |
| Global X Cloud Computing ETF | | | 81,172,364 | | | | 335,826,608 | | | | 38,207,770 | |
| Global X Thematic Growth ETF | | | – | | | | 18,493,112 | | | | (3,677,645 | ) |
| Global X Video Games & Esports ETF | | | 14,899,214 | | | | 51,208,090 | | | | (871,406 | ) |
| Global X Cybersecurity ETF | | | 131,713,480 | | | | 119,869,375 | | | | 28,598,255 | |
| Global X Telemedicine & Digital Health ETF | | | 3,692,750 | | | | 32,606,861 | | | | (16,837,807 | ) |
| Global X CleanTech ETF | | | 2,201,552 | | | | 12,235,657 | | | | (4,836,924 | ) |
| Global X Data Center & Digital Infrastructure ETF | | | 88,261,553 | | | | 14,116,089 | | | | 3,706,633 | |
| Global X Clean Water ETF | | | 639,201 | | | | 1,081,473 | | | | 309,949 | |
| Global X AgTech & Food Innovation ETF | | | 719,223 | | | | 650,951 | | | | 40,060 | |
| Global X Blockchain ETF | | | 75,912,425 | | | | 65,393,669 | | | | 46,272,868 | |
| Global X Hydrogen ETF | | | 12,857,560 | | | | – | | | | – | |
| Global X Solar ETF | | | 1,028,524 | | | | 330,016 | | | | 66,511 | |
| Global X Wind Energy ETF | | | – | | | | 255,427 | | | | (54,441 | ) |
| Global X PropTech ETF | | | 289,792 | | | | 2,069,488 | | | | 578,521 | |
| Global X Defense Tech ETF | | | 692,249,637 | | | | 43,662,503 | | | | 21,532,384 | |
| Global X Infrastructure Development ex-U.S. ETF | | | – | | | | – | | | | – | |
For the year ended November 30, 2024, there were no purchases or sales of long-term U.S. Government securities by the Funds.
5. DERIVATIVE TRANSACTIONS
The following tables show the derivatives categorized by underlying risk exposure.
169
Notes to Financial Statements (Continued)
November 30, 2024
5. DERIVATIVE TRANSACTIONS (continued)
The fair value of derivative instruments as of November 30, 2024 was as follows:
| | | Asset Derivatives | | | | | | | | Liability Derivatives | | | | |
| | | | | Fair Value | | | | | | | Fair Value | |
| Derivatives not accounted for as hedging instruments: | | | | | | | | | |
| | | | | | | | | | | | | | | |
| Global X Robotics & Artificial Intelligence ETF | | | | | | | | | |
| Equity contracts | | Unrealized appreciation on Future Contracts | | $ | 384,099 | | * | Equity contracts | | Unrealized depreciation on Future Contracts | | $ | – | |
| Total Derivatives not accounted for as hedging instruments | | $ | 384,099 | | | | | | | $ | – | |
| | | | | | | | | | | | | | | |
| Derivatives not accounted for as hedging instruments: | | | | | | | | | |
| |
| Global X U.S. Infrastructure Development ETF | | | | | | | | | |
| Equity contracts | | Unrealized appreciation on Future Contracts | | $ | 151,291 | | * | Equity contracts | | Unrealized depreciation on Future Contracts | | $ | – | |
| Total Derivatives not accounted for as hedging instruments | | $ | 151,291 | | | | | | | $ | – | |
* Includes cumulative appreciation (depreciation) of futures contracts as reported in the Schedules of Investments. Only current day’s variation margin, if any, is reported within the Statements of Assets & Liabilities.
The effect of derivative instruments on the Statements of Operations for the year ended November 30, 2024:
Amount of realized gain or (loss) on derivatives recognized in income:
| | | Futures Contracts | |
| Global X Robotics & Artificial Intelligence ETF | | | |
| Equity contracts | | $ | 1,045,895 | |
| |
| Global X U.S. Infrastructure Development ETF | | | | |
| Equity contracts | | $ | (8,231 | ) |
| |
| Global X Cybersecurity ETF | | | | |
| Equity contracts | | $ | 186,940 | |
Change in unrealized appreciation or (depreciation) on derivatives recognized in income:
170
Notes to Financial Statements (Continued)
November 30, 2024
5. DERIVATIVE TRANSACTIONS (continued)
| | | Futures | |
| Global X Robotics & Artificial Intelligence ETF | | | |
| Equity contracts | | $ | 69,859 | |
| | | | | |
| Global X U.S. Infrastructure Development ETF | | | | |
| Equity contracts | | $ | 151,291 | |
The following table discloses the average monthly balances of the Funds’ Futures activity during the year ended November 30, 2024:
| | | Average
Notional
Balance
Short | | | Average
Notional
Balance
Long | |
| Global X Robotics & Artificial Intelligence ETF | | $ | – | | | $ | 6,239,785 | |
| Global X U.S. Infrastructure Development ETF | | $ | – | | | $ | 919,296 | |
| Global X Cybersecurity ETF | | $ | – | | | $ | 750,880 | |
6. TAX INFORMATION
The amount and character of income and capital gain distributions to be paid, if any, are determined in accordance with Federal income tax regulations, which may differ from U.S. GAAP. As a result, net investment income (loss) and net realized gain (loss) on investment transactions for a reporting period may differ significantly from distributions during such period. These book/tax differences may be temporary or permanent. To the extent these differences are permanent in nature, they are charged or credited to undistributed net investment income (loss), accumulated net realized gain (loss) or paid-in capital, as appropriate, in the period that the differences arise.
The permanent differences primarily consist of redemption in kind, return of capital distributions, net operating losses, distribution in excess, and utilization of earnings and profits on shareholder redemptions.
The tax character of dividends and distributions declared during the years or periods ended November 30, 2024 and November 30, 2023 were as follows:
| Global X Funds | | Ordinary
Income | | | Long-Term
Capital Gain | | | Return of Capital | | | Totals | |
| Global X Millennial Consumer ETF | | | | | | | | | | | |
| 2024 | | $ | 409,955 | | | $ | – | | | $ | – | | | $ | 409,955 | |
| 2023 | | | 234,244 | | | | – | | | | – | | | | 234,244 | |
171
Notes to Financial Statements (Continued)
November 30, 2024
6. TAX INFORMATION (continued)
| Global X Funds | | Ordinary
Income | | | Long-Term
Capital Gain | | | Return of Capital | | | Totals | |
| Global X Aging Population ETF | | | | | | | | | | | |
| 2024 | | $ | 438,748 | | | $ | – | | | $ | – | | | $ | 438,748 | |
| 2023 | | | 279,995 | | | | – | | | | – | | | | 279,995 | |
| Global X Robotics & Artificial Intelligence ETF | | | | | | | | | | | |
| 2024 | | $ | 1,998,947 | | | $ | – | | | $ | 2,145,659 | | | $ | 4,144,606 | |
| 2023 | | | 4,618,009 | | | | – | | | | – | | | | 4,618,009 | |
| Global X FinTech ETF | | | | | | | | | | | |
| 2024 | | $ | 709,172 | | | $ | – | | | $ | – | | | $ | 709,172 | |
| 2023 | | | 887,181 | | | | – | | | | 28,497 | | | | 915,678 | |
| Global X Internet of Things ETF | | | | | | | | | | | |
| 2024 | | $ | 1,821,857 | | | $ | – | | | $ | – | | | $ | 1,821,857 | |
| 2023 | | | 2,946,458 | | | | – | | | | – | | | | 2,946,458 | |
| Global X U.S. Infrastructure Development ETF | | | | | | | | | | | |
| 2024 | | $ | 34,799,827 | | | $ | 6,870,550 | | | $ | – | | | $ | 41,670,377 | |
| 2023 | | | 30,856,526 | | | | – | | | | – | | | | 30,856,526 | |
| Global X Autonomous & Electric Vehicles ETF | | | | | | | | | | | |
| 2024 | | $ | 10,410,110 | | | $ | – | | | $ | – | | | $ | 10,410,110 | |
| 2023 | | | 11,305,718 | | | | – | | | | – | | | | 11,305,718 | |
| Global X Artificial Intelligence & Technology ETF | | | | | | | | | | | |
| 2024 | | $ | 3,035,733 | | | $ | – | | | $ | – | | | $ | 3,035,733 | |
| 2023 | | | 724,994 | | | | – | | | | – | | | | 724,994 | |
| Global X Genomics & Biotechnology ETF | | | | | | | | | | | |
| 2024 | | $ | – | | | $ | – | | | $ | – | | | $ | – | |
| 2023 | | | – | | | | – | | | | – | | | | – | |
| Global X Cloud Computing ETF | | | | | | | | | | | |
| 2024 | | $ | – | | | $ | – | | | $ | – | | | $ | – | |
| 2023 | | | – | | | | – | | | | – | | | | – | |
| Global X Thematic Growth ETF | | | | | | | | | | | |
| 2024 | | $ | 412,897 | | | $ | – | | | $ | 180,016 | | | $ | 592,913 | |
| 2023 | | | 746,536 | | | | – | | | | – | | | | 746,536 | |
| Global X Video Games & Esports ETF | | | | | | | | | | | |
| 2024 | | $ | 1,027,863 | | | $ | – | | | $ | – | | | $ | 1,027,863 | |
| 2023 | | | 275,496 | | | | – | | | | – | | | | 275,496 | |
| Global X Cybersecurity ETF | | | | | | | | | | | |
| 2024 | | $ | 741,657 | | | $ | – | | | $ | – | | | $ | 741,657 | |
| 2023 | | | 684,512 | | | | 12,296,299 | | | | – | | | | 12,980,811 | |
| | | | | | | | | | | | | | | | | |
| Global X Telemedicine & Digital Health ETF | | | | | | | | | | | |
| 2024 | | $ | – | | | $ | – | | | $ | – | | | $ | – | |
| 2023 | | | – | | | | – | | | | – | | | | – | |
| Global X CleanTech ETF | | | | | | | | | | | |
| 2024 | | $ | 452,237 | | | $ | – | | | $ | – | | | $ | 452,237 | |
| 2023 | | | 205,777 | | | | – | | | | – | | | | 205,777 | |
| | | | | | | | | | | | | | | | | |
172
Notes to Financial Statements (Continued)
November 30, 2024
6. TAX INFORMATION (continued)
| Global X Funds | | Ordinary
Income | | | Long-Term
Capital Gain | | | Return of Capital | | | Totals | |
| Global X Data Center & Digital Infrastructure ETF | | | | | | | | | | | |
| 2024 | | $ | 881,454 | | | $ | – | | | $ | – | | | $ | 881,454 | |
| 2023 | | | 1,286,237 | | | | 44,305 | | | | – | | | | 1,330,542 | |
| Global X Clean Water ETF | | | | | | | | | | | |
| 2024 | | $ | 135,553 | | | $ | – | | | $ | – | | | $ | 135,553 | |
| 2023 | | | 138,123 | | | | – | | | | – | | | | 138,123 | |
| Global X AgTech & Food Innovation ETF | | | | | | | | | | | |
| 2024 | | $ | 73,440 | | | $ | – | | | $ | – | | | $ | 73,440 | |
| 2023 | | | 45,738 | | | | – | | | | – | | | | 45,738 | |
| Global X Blockchain ETF | | | | | | | | | | | |
| 2024 | | $ | 3,111,807 | | | $ | – | | | $ | – | | | $ | 3,111,807 | |
| 2023 | | | 602,091 | | | | – | | | | – | | | | 602,091 | |
| Global X Hydrogen ETF | | | | | | | | | | | |
| 2024 | | $ | – | | | $ | – | | | $ | – | | | $ | – | |
| 2023 | | | – | | | | – | | | | – | | | | – | |
| Global X Solar ETF | | | | | | | | | | | |
| 2024 | | $ | 17,578 | | | $ | – | | | $ | – | | | $ | 17,578 | |
| 2023 | | | – | | | | – | | | | – | | | | – | |
| Global X Wind Energy ETF | | | | | | | | | | | |
| 2024 | | $ | 25,575 | | | $ | – | | | $ | – | | | $ | 25,575 | |
| 2023 | | | 47,859 | | | | – | | | | – | | | | 47,859 | |
| Global X PropTech ETF | | | | | | | | | | | |
| 2024 | | $ | 69,246 | | | $ | 5,076 | | | $ | – | | | $ | 74,322 | |
| 2023 | | | 453 | | | | – | | | | – | | | | 453 | |
| Global X Defense Tech ETF | | | | | | | | | | | |
| 2024 | | $ | 487,195 | | | $ | – | | | $ | – | | | $ | 487,195 | |
| 2023 | | | – | | | | – | | | | – | | | | – | |
| Global X Infrastructure Development ex-U.S. ETF | | | | | | | | | | | |
| 2024 | | $ | – | | | $ | – | | | $ | – | | | $ | – | |
173
Notes to Financial Statements (Continued)
November 30, 2024
6. TAX INFORMATION (continued)
On February 23, 2024, the Global X Metaverse ETF was liquidated, and closed and paid a long term capital gain distribution of $31,371. The tax character of the distribution will be communicated on Form 1099DIV in 2025.
As of November 30, 2024, the components of tax basis distributable earnings (accumulated losses) were as follows:
| | | Global X
Millennial
Consumer ETF | | Global X Aging
Population ETF | | Global X
Robotics &
Artificial
Intelligence ETF |
| Undistributed Ordinary Income | | $ | 163,979 | | | $ | 239,589 | | | $ | – | |
| Capital Loss Carryforwards | | | (10,656,123 | ) | | | (3,290,012 | ) | | | (471,577,198 | ) |
| Unrealized Appreciation (Depreciation) on Investments and Foreign Currency | | | (2,886,767 | ) | | | 282,631 | | | | 19,145,572 | |
| Late Year Loss Deferral | | | – | | | | – | | | | (54,260 | ) |
| Other Temporary Differences | | | 3 | | | | (1 | ) | | | (3 | ) |
| Total Accumulated Losses | | $ | (13,378,908 | ) | | $ | (2,767,793 | ) | | $ | (452,485,889 | ) |
| | | | | | | | | | | | | |
| | | Global X
FinTech ETF | | Global X
Internet of
Things ETF | | Global X U.S.
Infrastructure
Development
ETF |
| Undistributed Ordinary Income | | $ | 1,677,055 | | | $ | 678,856 | | | $ | 31,957,467 | |
| Capital Loss Carryforwards | | | (174,065,904 | ) | | | (20,567,665 | ) | | | – | |
| Unrealized Appreciation (Depreciation) on Investments and Foreign Currency | | | (49,091,652 | ) | | | 30,486,634 | | | | 2,751,592,832 | |
| Other Temporary Differences | | | 4 | | | | (6 | ) | | | (5 | ) |
| Total Distributable Earnings (Accumulated Losses) | | $ | (221,480,497 | ) | | $ | 10,597,819 | | | $ | 2,783,550,294 | |
| | | | | | | | | | | | | |
| | | Global X
Autonomous &
Electric Vehicles
ETF | | Global X
Artificial
Intelligence &
Technology ETF | | Global X
Genomics &
Biotechnology
ETF |
| Undistributed Ordinary Income | | $ | 4,549,699 | | | $ | 737,334 | | | $ | – | |
| Capital Loss Carryforwards | | | (137,121,744 | ) | | | (7,238,346 | ) | | | (96,994,515 | ) |
| Unrealized Appreciation (Depreciation) on Investments and Foreign Currency | | | (210,334,046 | ) | | | 359,679,190 | | | | (48,983,233 | ) |
| Late Year Loss Deferral | | | – | | | | – | | | | (191,661 | ) |
| Other Temporary Differences | | | (3 | ) | | | (5 | ) | | | (9 | ) |
| Total Distributable Earnings (Accumulated Losses) | | $ | (342,906,094 | ) | | $ | 353,178,173 | | | $ | (146,169,418 | ) |
174
Notes to Financial Statements (Continued)
November 30, 2024
6. TAX INFORMATION (continued)
| | | Global X Cloud
Computing ETF | | Global X
Thematic
Growth ETF | | Global X Video
Games &
Esports ETF |
| Undistributed Ordinary Income | | $ | – | | | $ | – | | | $ | 865,421 | |
| Capital Loss Carryforwards | | | (278,577,166 | ) | | | (50,818,787 | ) | | | (65,019,003 | ) |
| Unrealized Depreciation on Investments and Foreign Currency | | | (91,299,452 | ) | | | (5,177,587 | ) | | | (55,970,060 | ) |
| Late Year Loss Deferral | | | (2,368,511 | ) | | | – | | | | – | |
| Other Temporary Differences | | | 3 | | | | – | | | | – | |
| Total Accumulated Losses | | $ | (372,245,126 | ) | | $ | (55,996,374 | ) | | $ | (120,123,642 | ) |
| | | | | | | | | | | | | |
| | | Global X
Cybersecurity
ETF | | Global X
Telemedicine &
Digital Health
ETF | | Global X
CleanTech ETF |
| Undistributed Ordinary Income | | $ | – | | | $ | – | | | $ | 282,145 | |
| Capital Loss Carryforwards | | | (217,473,528 | ) | | | (118,895,279 | ) | | | (49,573,034 | ) |
| Unrealized Appreciation (Depreciation) on Investments and Foreign Currency | | | 46,716,235 | | | | (40,991,367 | ) | | | (70,000,463 | ) |
| Late Year Loss Deferral | | | (451,048 | ) | | | (209,658 | ) | | | – | |
| Other Temporary Differences | | | 3 | | | | (1 | ) | | | (4 | ) |
| Total Accumulated Losses | | $ | (171,208,338 | ) | | $ | (160,096,305 | ) | | $ | (119,291,356 | ) |
| | | | | | | | | | | | | |
| | | Global X Data
Center & Digital
Infrastructure
ETF | | Global X Clean
Water ETF | | Global X
AgTech & Food
Innovation ETF |
| Undistributed Ordinary Income | | $ | 1,341,303 | | | $ | 83,955 | | | $ | 27,403 | |
| Capital Loss Carryforwards | | | (2,337,878 | ) | | | (524,448 | ) | | | (4,180,290 | ) |
| Unrealized Appreciation (Depreciation) on Investments and Foreign Currency | | | 4,290,939 | | | | 1,456,399 | | | | (834,977 | ) |
| Other Temporary Differences | | | 2 | | | | (1 | ) | | | 5 | |
| Total Distributable Earnings (Accumulated Losses) | | $ | 3,294,366 | | | $ | 1,015,905 | | | $ | (4,987,859 | ) |
| | | | | | | | | | | | | |
| | | Global X
Blockchain ETF | | Global X
Hydrogen ETF | | Global X Solar
ETF |
| Undistributed Ordinary Income | | $ | 11,775,980 | | | $ | 140,070 | | | $ | 14,484 | |
| Capital Loss Carryforwards | | | (136,080,660 | ) | | | (22,166,937 | ) | | | (2,009,340 | ) |
| Unrealized Appreciation (Depreciation) on Investments and Foreign Currency | | | 66,934,832 | | | | (37,758,398 | ) | | | (2,759,879 | ) |
| Other Temporary Differences | | | (5 | ) | | | (4 | ) | | | (1 | ) |
| Total Accumulated Losses | | $ | (57,369,853 | ) | | $ | (59,785,269 | ) | | $ | (4,754,736 | ) |
175
Notes to Financial Statements (Continued)
November 30, 2024
6. TAX INFORMATION (continued)
| | | Global X Wind
Energy ETF | | Global X
PropTech ETF | | Global X
Defense Tech
ETF |
| Undistributed Ordinary Income | | $ | 16,483 | | | $ | – | | | $ | 1,505,401 | |
| Undistributed Long-Term Capital Gain | | | – | | | | 13,720 | | | | – | |
| Capital Loss Carryforwards | | | (2,176,236 | ) | | | – | | | | (740,808 | ) |
| Unrealized Appreciation (Depreciation) on Investments and Foreign Currency | | | (1,120,416 | ) | | | 445,614 | | | | 56,371,986 | |
| Other Temporary Differences | | | 3 | | | | – | | | | (2 | ) |
| Total Distributable Earnings (Accumulated Losses) | | $ | (3,280,166 | ) | | $ | 459,334 | | | $ | 57,136,577 | |
| | | | |
| | | Global X
Infrastructure
Development
ex-U.S. ETF |
| Undistributed Ordinary Income | | $ | 5,833 | |
| Capital Loss Carryforwards | | | (4,529 | ) |
| Unrealized Depreciation on Investments and Foreign Currency | | | (91,608 | ) |
| Other Temporary Differences | | | 1 | |
| Total Accumulated Losses | | $ | (90,303 | ) |
Qualified late year ordinary (including currency and specified gain/loss items) represents losses realized from January 1, 2024 through November 30, 2024, that in accordance with federal income tax regulations, the Funds have elected to defer and treat as having arisen in the following fiscal year.
For taxable years beginning after December 22, 2010, a registered investment company is permitted to carry forward net capital losses to offset capital gains realized in later years, and the losses carried forward retain their original character as either long-term or short-term losses.
The Federal tax cost and aggregated gross unrealized appreciation and depreciation on investments held by the Funds at November 30, 2024, were as follows:
| Global X Funds | | Federal Tax
Cost | | Aggregated
Gross
Unrealized
Appreciation | | Aggregated
Gross
Unrealized
Depreciation | | Net Unrealized
Appreciation
(Depreciation) |
| Global X Millennial Consumer ETF | | $133,748,688 | | $29,778,589 | | $(32,665,356) | | $(2,886,767) |
| Global X Aging Population ETF | | 61,460,692 | | 8,601,821 | | (8,319,190) | | 282,631 |
| Global X Robotics & Artificial Intelligence ETF | | 2,675,306,722 | | 598,380,555 | | (579,234,983) | | 19,145,572 |
| Global X FinTech ETF | | 403,988,276 | | 65,139,310 | | (114,230,962) | | (49,091,652) |
| Global X Internet of Things ETF | | 212,647,432 | | 66,910,274 | | (36,423,640) | | 30,486,634 |
| Global X U.S. Infrastructure Development ETF | | 6,952,161,798 | | 2,838,002,990 | | (86,410,158) | | 2,751,592,832 |
176
Notes to Financial Statements (Continued)
November 30, 2024
6. TAX INFORMATION (continued)
| Global X Funds | | Federal Tax
Cost | | Aggregated
Gross
Unrealized
Appreciation | | Aggregated
Gross
Unrealized
Depreciation | | Net Unrealized
Appreciation
(Depreciation) |
| Global X Autonomous & Electric Vehicles ETF | | $668,847,878 | | $54,614,764 | | $(264,948,810) | | $(210,334,046) |
| Global X Artificial Intelligence & Technology ETF | | 2,131,409,554 | | 457,802,508 | | (98,123,318) | | 359,679,190 |
| Global X Genomics & Biotechnology ETF | | 133,276,780 | | 8,925,174 | | (57,908,407) | | (48,983,233) |
| Global X Cloud Computing ETF | | 467,393,139 | | 55,220,970 | | (146,520,422) | | (91,299,452) |
| Global X Thematic Growth ETF | | 22,746,619 | | 925,042 | | (6,102,629) | | (5,177,587) |
| Global X Video Games & Esports ETF | | 171,043,218 | | 12,198,184 | | (68,168,244) | | (55,970,060) |
| Global X Cybersecurity ETF | | 772,625,520 | | 136,528,416 | | (89,812,181) | | 46,716,235 |
| Global X Telemedicine & Digital Health ETF | | 84,674,956 | | 2,761,364 | | (43,752,731) | | (40,991,367) |
| Global X CleanTech ETF | | 111,905,937 | | 1,151,191 | | (71,151,654) | | (70,000,463) |
| Global X Data Center & Digital Infrastructure ETF | | 144,619,175 | | 16,205,435 | | (11,914,496) | | 4,290,939 |
| Global X Clean Water ETF | | 9,199,449 | | 2,020,530 | | (564,131) | | 1,456,399 |
| Global X AgTech & Food Innovation ETF | | 5,551,779 | | 468,641 | | (1,303,618) | | (834,977) |
| Global X Blockchain ETF | | 193,441,168 | | 89,033,973 | | (22,099,141) | | 66,934,832 |
| Global X Hydrogen ETF | | 88,866,166 | | 4,818,650 | | (42,577,048) | | (37,758,398) |
| Global X Solar ETF | | 9,460,513 | | 443,599 | | (3,203,478) | | (2,759,879) |
| Global X Wind Energy ETF | | 3,285,913 | | 35,127 | | (1,155,543) | | (1,120,416) |
| Global X PropTech ETF | | 1,411,613 | | 462,200 | | (16,586) | | 445,614 |
| Global X Defense Tech ETF | | 707,669,868 | | 73,139,937 | | (16,767,951) | | 56,371,986 |
| Global X Infrastructure Development ex-U.S. ETF | | 2,481,414 | | 71,060 | | (162,668) | | (91,608) |
The preceding differences between book and tax cost are primarily due to mark-to-market passive foreign investment companies, mark-to-market future contracts, late year and specified loss deferrals, and partnership adjustments.
7. CONCENTRATION OF RISKS
The Funds invest in securities of foreign issuers in various countries. These investments may involve certain considerations and risks not typically associated with investments in the United States as a result of, among other factors, the possibility of future political and economic developments and the level of governmental supervision and regulation of securities markets in the respective countries.
The Funds may invest in companies focused on business activities in emerging economic themes. Such thematic companies typically face intense competition and potentially rapid
177
Notes to Financial Statements (Continued)
November 30, 2024
7. CONCENTRATION OF RISKS (continued)
product obsolescence. Thematic companies may have limited product lines, markets, financial resources or personnel. These companies typically engage in significant amounts of spending on research and development, capital expenditures and mergers and acquisitions, and there is no guarantee that the products or services produced by these companies will be successful. These companies are also frequently dependent on intellectual property rights and may be adversely affected by loss or impairment of those rights. There can be no assurance these companies will be able to successfully protect their intellectual property to prevent the misappropriation of their technology, or that competitors will not develop technology that is substantially similar or superior to such companies’ technology. Such companies may be potential targets for cyberattacks, which can have a materially adverse impact on the performance of these companies. The emergent nature of many economic themes could result in increasing regulatory scrutiny in the future, which may impede the growth of companies that develop and/or focus on such economic themes. Similarly, the collection of data from consumers and other sources is frequently a critical component in emerging economic themes which could lead to increased scrutiny as regulators consider how the data is collected, stored, safeguarded and used. Finally, these companies may be involved in young, fast evolving industries with increased exposure to the risks associated with changes in applicable laws (including regulation, other rule changes, and related federal and state enforcement activities), as well as market developments, which may cause businesses to contract or close suddenly and negatively impact the value of these companies.
Special Risk Considerations of Investing in China – Variable Interest Entity Investments. For purposes of raising capital offshore on exchanges outside of China, including on U.S. exchanges, many Chinese-based operating companies are structured as Variable Interest Entities (“VIEs”). In this structure, the Chinese-based operating company is the VIE and establishes a shell company in a foreign jurisdiction, such as the Cayman Islands. The shell company lists on a foreign exchange and enters into contractual arrangements with the VIE. This structure allows Chinese companies in which the government restricts foreign ownership to raise capital from foreign investors. While the shell company has no equity ownership of the VIE, these contractual arrangements permit the shell company to consolidate the VIE’s financial statements with its own for accounting purposes and provide for economic exposure to the performance of the underlying Chinese operating company. Therefore, an investor in the listed shell company, such as certain of the Funds, will have exposure to the Chinese-based operating company only through contractual arrangements and has no ownership in the Chinese-based operating company. Furthermore, because the shell company only has specific rights provided for in these service agreements with the VIE, its abilities to control the activities at the Chinese-based operating company are limited and the operating company may engage in activities that negatively impact investment value. While the VIE structure has been widely adopted, it is not formally recognized under Chinese law and therefore there is a risk that the Chinese government could prohibit the existence of such structures or negatively impact the VIE’s contractual
178
Notes to Financial Statements (Continued)
November 30, 2024
7. CONCENTRATION OF RISKS (continued)
arrangements with the listed shell company by declaring them invalid. If these contracts were found to be unenforceable under Chinese law, investors in the listed shell company, such as the Fund, may suffer significant losses with little or no recourse available. If the Chinese government determines that the agreements establishing the VIE structures do not comply with Chinese law and regulations, including those related to restrictions on foreign ownership, it could subject a Chinese-based issuer to penalties, revocation of business and operating licenses, or forfeiture of ownership interest. In addition, the listed shell company’s control over a VIE may also be jeopardized if a natural person who holds the equity interest in the VIE breaches the terms of the agreement, is subject to legal proceedings or if any physical instruments for authenticating documentation, such as chops and seals, are used without the Chinese-based issuer’s authorization to enter into contractual arrangements in China. Chops and seals, which are carved stamps used to sign documents, represent a legally binding commitment by the company. Moreover, any future regulatory action may prohibit the ability of the shell company to receive the economic benefits of the Chinese based operating company, which may cause the value of a Fund’s investment in the listed shell company to suffer a significant loss. For example, in 2021, the Chinese government prohibited use of the VIE structure for investment in after-school tutoring companies. There is no guarantee that the government will not place similar restrictions on other industries.
These actions, any future sanctions or other actions, or even the threat of further sanctions or other actions, may negatively affect the value and liquidity of certain of the Funds’ investments. For example, a Fund may be prohibited from investing in securities issued by companies subject to such sanctions. In addition, sanctions may require a Fund to freeze its existing investments, prohibiting such Fund from buying, selling or otherwise transacting in these investments.
Each Fund may be subject to taxes imposed by countries in which they invest. Such taxes are generally based on either income or gains earned or repatriated. The Funds accrue and apply such taxes to net investment income, net realized gains and net unrealized gains as income and/or capital gains are earned.
The Funds use a replication strategy. A replication strategy is an indexing strategy that involves investing in the securities of the underlying index (also known as a secondary index) in approximately the same proportions as in the underlying index. The Funds may utilize a representative sampling strategy with respect to their underlying index when a replication strategy might be detrimental to their shareholders, such as when there are practical difficulties or substantial costs involved in compiling a portfolio of equity securities to follow its underlying index, or, in certain instances, when securities in the underlying index become temporarily illiquid, unavailable or less liquid, or due to legal restrictions (such as diversification requirements that apply to the Funds but not to the underlying indexes).
179
Notes to Financial Statements (Continued)
November 30, 2024
7. CONCENTRATION OF RISKS (continued)
Commodity related securities are susceptible to fluctuations in certain commodity markets. Any negative changes in commodity markets could have a substantial impact on these Funds.
Economic conditions, such as volatile currency exchange rates and interest rates, political events, military action and other conditions may, without prior warning, lead to foreign government intervention (including intervention by the U.S. Government with respect to foreign governments, economic sectors, foreign companies and related securities and interests) and the imposition of capital controls (i.e., government measures designed to limit the flow of foreign capital in and out of the domestic economy) and/or sanctions, which may also include retaliatory actions of one government against another government, such as the seizure of assets. Capital controls and/or sanctions include the prohibition of, or restrictions on, the ability to transfer currency, securities or other assets. Capital controls and/or sanctions may also impact the ability of a Fund to buy, sell or otherwise transfer securities or currency, negatively impact the value and/or liquidity of such instruments, adversely affect the trading market and price for Shares of a Fund, and cause a Fund to decline in value.
Please refer to each Fund’s prospectus and statement of additional information (“SAI”) for a more complete description of risks.
8. LOANS OF PORTFOLIO SECURITIES
Each Fund may lend portfolio securities having a market value up to one-third of its total assets. Security loans made pursuant to securities lending agreements with BBH and BNY Mellon are initially required to be secured by collateral equal to at least 102% of the value of domestic equity securities and American Depositary Receipts (“ADRs”) and 105% of the value of foreign equity securities (other than ADRs). Such collateral received in connection with these loans will be cash and can be invested in repurchase agreements, short-term investments, or U.S. Treasury obligations and is recognized in the Schedules of Investments and Statements of Assets and Liabilities. The obligation to return securities lending collateral is also recognized as a liability in the Statements of Assets and Liabilities. It is each Fund’s policy to obtain additional collateral from or return excess collateral to the borrower by the end of the next business day, following the valuation date of the securities loaned. Therefore, the value of the collateral held may be temporarily less than the value of the securities on loan.
Securities pledged as collateral for repurchase agreements held in the Funds are held by BBH or BNY Mellon, as appropriate, and are designated as being held on each Fund’s behalf under a book-entry system. The Funds monitor the adequacy of the collateral on a daily basis and can require the seller to provide additional collateral in the event the market value of the securities pledged falls below the carrying value of the repurchase agreement, including accrued interest. It is each Fund’s policy to only enter into repurchase
180
Notes to Financial Statements (Continued)
November 30, 2024
8. LOANS OF PORTFOLIO SECURITIES (continued)
agreements with banks and other financial institutions which are deemed by the Adviser to be creditworthy. The Funds bear the risk of loss in the event the other party to a repurchase agreement defaults on its obligations and the Fund is prevented from exercising its rights to dispose of the underlying securities received as collateral and the risk of a possible decline in the value of the underlying securities during the period. For financial statement purposes, the Funds record the securities lending collateral (including in repurchase agreements, at value or restricted cash) as an asset and the obligation to return securities lending collateral as a liability on the Statements of Assets and Liabilities.
Cash collateral received in connection with securities lending is invested in repurchase agreements and short-term investments by the lending agent. The Funds do not have effective control of the non-cash collateral and therefore it is not disclosed in the Fund’s Schedule of Investments.
Securities lending transactions are entered into by the Funds under the Securities Lending Agreement, which permits a Fund, under certain circumstances such as an event of default, to offset amounts payable by the Fund to the same counterparty against amounts receivable from the counterparty to create a net payment due to or from the Fund.
The following is a summary of securities lending agreements held by the Funds, with cash collateral of overnight maturities and non-cash collateral, which would be subject to offset as of November 30, 2024.
181
Notes to Financial Statements (Continued)
November 30, 2024
8. LOANS OF PORTFOLIO SECURITIES (continued)
| | | Gross Amount
of Recognized
Assets (Value
of Securities on
Loan) | | | Value of
Cash
Collateral
Received(1) | | | Value of
Non-Cash
Collateral
Received(1) | | | Net Amount | |
| Global X Robotics & Artificial Intelligence ETF | | $ | 66,297,043 | | | $ | 57,473,791 | | | $ | 8,823,252 | | | $ | — | |
| Global X FinTech ETF | | | 6,092,397 | | | | 5,532,424 | | | | 559,973 | | | | — | |
| Global X Internet of Things ETF | | | 2,616,946 | | | | 2,616,946 | | | | — | | | | — | |
| Global X Autonomous & Electric Vehicles ETF | | | 49,925,088 | | | | 43,030,487 | | | | 6,894,601 | | | | — | |
| Global X Artificial Intelligence & Technology ETF | | | 4,792,740 | | | | 4,792,740 | | | | — | | | | — | |
| Global X Genomics & Biotechnology ETF | | | 5,077,380 | | | | 5,077,380 | | | | — | | | | — | |
| Global X Cloud Computing ETF | | | 40,898 | | | | 40,898 | | | | — | | | | — | |
| Global X Thematic Growth ETF | | | 1,767,076 | | | | 1,767,076 | | | | — | | | | — | |
| Global X Video Games & Esports ETF | | | 4,545,919 | | | | 3,359,004 | | | | 1,186,915 | | | | — | |
| Global X Cybersecurity ETF | | | 1,478,182 | | | | 1,478,182 | | | | — | | | | — | |
| Global X Telemedicine & Digital Health ETF | | | 203,226 | | | | 203,226 | | | | — | | | | — | |
| Global X CleanTech ETF | | | 7,190,765 | | | | 6,876,230 | | | | 314,535 | | | | — | |
| Global X Blockchain ETF | | | 33,850,524 | | | | 33,530,337 | | | | 320,187 | | | | — | |
| Global X Hydrogen ETF | | | 10,737,452 | | | | 10,629,142 | | | | 108,310 | | | | — | |
| Global X Solar ETF | | | 92,442 | | | | 92,442 | | | | — | | | | — | |
| Global X Wind Energy ETF | | | 11,045 | | | | 11,045 | | | | — | | | | — | |
| (1) | Collateral and non-cash collateral received in excess of market value of securities on loan is not presented in this table. The total cash collateral received by the Fund is disclosed in the Statements of Assets and Liabilities. |
The value of loaned securities and related collateral outstanding at November 30, 2024 are shown in the Schedules of Investments. The value of the collateral held may be temporarily less than that required under the lending contract. As of November 30 2024, the cash collateral was invested in repurchase agreements, short-term investments and the non-cash collateral consisted of U.S. Treasury Bills, Notes, Bonds and U.S. Treasury Inflation Indexed Bonds with the following maturities:
182
Notes to Financial Statements (Continued)
November 30, 2024
8. LOANS OF PORTFOLIO SECURITIES (continued)
| | | Overnight
and
Continuous | | | <30 Days | | | Between
30 & 90
Days | | | >90 Days | | | Total | |
| Global X Robotics & Artificial Intelligence ETF | | | | | | | | | | | | | | | | | | | | |
| Repurchase Agreements | | $ | 56,300,544 | | | $ | — | | | $ | — | | | $ | — | | | $ | 56,300,544 | |
| U.S. Government Securities | | | — | | | | — | | | | — | | | | 8,823,252 | | | | 8,823,252 | |
| Total | | $ | 56,300,544 | | | $ | — | | | $ | — | | | $ | 8,823,252 | | | $ | 65,123,796 | |
| Global X FinTech ETF | | | | | | | | | | | | | | | | | | | | |
| Repurchase Agreements | | $ | 5,731,508 | | | $ | — | | | $ | — | | | $ | — | | | $ | 5,731,508 | |
| U.S. Government Securities | | | — | | | | — | | | | — | | | | 559,973 | | | | 559,973 | |
| Total | | $ | 5,731,508 | | | $ | — | | | $ | — | | | $ | 559,973 | | | $ | 6,291,481 | |
| Global X Internet of Things ETF | | | | | | | | | | | | | | | | | | | | |
| Repurchase Agreements | | $ | 2,678,798 | | | $ | — | | | $ | — | | | $ | — | | | $ | 2,678,798 | |
| Total | | $ | 2,678,798 | | | $ | — | | | $ | — | | | $ | — | | | $ | 2,678,798 | |
| Global X Autonomous & Electric Vehicles ETF | | | | | | | | | | | | | | | | | | | | |
| Repurchase Agreements | | $ | 45,018,351 | | | $ | — | | | $ | — | | | $ | — | | | $ | 45,018,351 | |
| U.S. Government Securities | | | — | | | | — | | | | — | | | | 6,894,601 | | | | 6,894,601 | |
| Total | | $ | 45,018,351 | | | $ | — | | | $ | — | | | $ | 6,894,601 | | | $ | 51,912,952 | |
| Global X Artificial Intelligence & Technology ETF | | | | | | | | | | | | | | | | | | | | |
| Repurchase Agreements | | $ | 4,903,463 | | | $ | — | | | $ | — | | | $ | — | | | $ | 4,903,463 | |
| Total | | $ | 4,903,463 | | | $ | — | | | $ | — | | | $ | — | | | $ | 4,903,463 | |
| Global X Genomics & Biotechnology ETF | | | | | | | | | | | | | | | | | | | | |
| Repurchase Agreements | | $ | 5,201,334 | | | $ | — | | | $ | — | | | $ | — | | | $ | 5,201,334 | |
| Total | | $ | 5,201,334 | | | $ | — | | | $ | — | | | $ | — | | | $ | 5,201,334 | |
| Global X Cloud Computing ETF | | | | | | | | | | | | | | | | | | | | |
| Repurchase Agreements | | $ | 25,769 | | | $ | — | | | $ | — | | | $ | — | | | $ | 25,769 | |
| Short-Term Investments | | | 15,063 | | | | — | | | | — | | | | — | | | | 15,063 | |
| Total | | $ | 40,832 | | | $ | — | | | $ | — | | | $ | — | | | $ | 40,832 | |
| Global X Thematic Growth ETF | | | | | | | | | | | | | | | | | | | | |
| Repurchase Agreements | | $ | 1,805,799 | | | $ | — | | | $ | — | | | $ | — | | | $ | 1,805,799 | |
| Total | | $ | 1,805,799 | | | $ | — | | | $ | — | | | $ | — | | | $ | 1,805,799 | |
| Global X Video Games & Esports ETF | | | | | | | | | | | | | | | | | | | | |
| Repurchase Agreements | | $ | 3,507,932 | | | $ | — | | | $ | — | | | $ | — | | | $ | 3,507,932 | |
| U.S. Government Securities | | | — | | | | — | | | | — | | | | 1,186,915 | | | | 1,186,915 | |
| Total | | $ | 3,507,932 | | | $ | — | | | $ | — | | | $ | 1,186,915 | | | $ | 4,694,847 | |
183
Notes to Financial Statements (Continued)
November 30, 2024
8. LOANS OF PORTFOLIO SECURITIES (continued)
| | | Overnight
and
Continuous | | | <30 Days | | | Between
30 & 90
Days | | | >90 Days | | | Total | |
| Global X Cybersecurity ETF | | | | | | | | | | | | | | | | | | | | |
| Repurchase Agreements | | $ | 1,552,603 | | | $ | — | | | $ | — | | | $ | — | | | $ | 1,552,603 | |
| Total | | $ | 1,552,603 | | | $ | — | | | $ | — | | | $ | — | | | $ | 1,552,603 | |
| Global X Telemedicine & Digital Health ETF | | | | | | | | | | | | | | | | | | | | |
| Repurchase Agreements | | $ | 134,299 | | | $ | — | | | $ | — | | | $ | — | | | $ | 134,299 | |
| Short-Term Investments | | | 78,503 | | | | — | | | | — | | | | — | | | | 78,503 | |
| Total | | $ | 212,802 | | | $ | — | | | $ | — | | | $ | — | | | $ | 212,802 | |
| Global X CleanTech ETF | | | | | | | | | | | | | | | | | | | | |
| Repurchase Agreements | | $ | 7,091,965 | | | $ | — | | | $ | — | | | $ | — | | | $ | 7,091,965 | |
| U.S. Government Securities | | | — | | | | — | | | | — | | | | 314,535 | | | | 314,535 | |
| Total | | $ | 7,091,965 | | | $ | — | | | $ | — | | | $ | 314,535 | | | $ | 7,406,500 | |
| Global X Blockchain ETF | | | | | | | | | | | | | | | | | | | | |
| Repurchase Agreements | | $ | 33,910,264 | | | $ | — | | | $ | — | | | $ | — | | | $ | 33,910,264 | |
| U.S. Government Securities | | | — | | | | — | | | | — | | | | 320,187 | | | | 320,187 | |
| Total | | $ | 33,910,264 | | | $ | — | | | $ | — | | | $ | 320,187 | | | $ | 34,230,451 | |
| Global X Hydrogen ETF | | | | | | | | | | | | | | | | | | | | |
| Repurchase Agreements | | $ | 11,136,720 | | | $ | — | | | $ | — | | | $ | — | | | $ | 11,136,720 | |
| Total | | $ | 11,136,720 | | | $ | — | | | $ | — | | | $ | — | | | $ | 11,136,720 | |
| Global X Solar ETF | | | | | | | | | | | | | | | | | | | | |
| Repurchase Agreements | | $ | 96,079 | | | $ | — | | | $ | — | | | $ | — | | | $ | 96,079 | |
| Total | | $ | 96,079 | | | $ | — | | | $ | — | | | $ | — | | | $ | 96,079 | |
| Global X Wind Energy ETF | | | | | | | | | | | | | | | | | | | | |
| Repurchase Agreements | | $ | 27,024 | | | $ | — | | | $ | — | | | $ | — | | | $ | 27,024 | |
| Total | | $ | 27,024 | | | $ | — | | | $ | — | | | $ | — | | | $ | 27,024 | |
9. CONTRACTUAL OBLIGATIONS
The Funds enter into contracts in the normal course of business that contain a variety of indemnifications. The Funds’ maximum exposure under these contracts is unknown. However, the Funds have not had prior gains or losses pursuant to these contracts. Management has reviewed the Funds’ existing contracts and expects the risk of loss to be remote.
Pursuant to the Trust’s organizational documents, the Trustees of the Trust and the Trust’s officers are indemnified against certain liabilities that may arise out of the performance of their duties.
184
Notes to Financial Statements (Concluded)
November 30, 2024
10. REVERSE SHARE SPLIT
Effective December 19, 2022, the Board of the Trust approved a reverse share split at the ratio of one to four (1:4) of the issued and outstanding shares of the Global X Blockchain ETF (the “Reverse Share Split”). The Reverse Share Split was completed after the close of business on December 19, 2022. The effect of this transaction for the Fund was to divide the number of outstanding Shares of the Fund by a one to four ratio, resulting in a corresponding increase in the NAV per Share. The capital share activity presented on the State of Changes in Net Assets for each of the years in the period then ended, and the per share data in the financial highlights for each of the years in the period then ended have been given retroactive effect to reflect this reverse share split. There were no changes in net assets, results of operations or total return as a result of this transaction.
Effective June 14, 2024, the Board of the Trust approved a reverse share split at the ratio of one to five (1:5) of the issued and outstanding shares of the Global X Hydrogen ETF (the “Reverse Share Split”). The Reverse Share Split was completed after the close of business on June 14, 2024. The effect of this transaction for the Fund was to divide the number of outstanding Shares of the Fund by a one to five ratio, resulting in a corresponding increase in the NAV per Share. The capital share activity presented on the Statement of Changes in Net Assets for each of the years in the period then ended, and the per share data in the financial highlights for each of the years in the period then ended have been given retroactive effect to reflect this reverse share split. There were no changes in net assets, results of operations or total return as a result of this transaction.
11. SUBSEQUENT EVENTS
On January 15, 2025, the Board approved a proposal to reduce the supervision and administration fee of the Global X Telemedicine & Digital Health ETF so that the management fee of the Fund would be reduced from 0.68% to 0.50% of the Fund’s average daily net assets. On November 19, 2024, the Board approved a proposal to change the name of the Fund to the Global X HealthTech ETF and to change its underlying index from the Solactive Telemedicine & Digital Health Index to the Global X HealthTech Index along with other corresponding changes. All of these changes are expected to be effective on April 1, 2025.
On November 19, 2024, the Board approved a proposal to change the name of the Global X Thematic Growth ETF to the Global X Dorsey Wright Thematic ETF and to change its underlying index from the Solactive Thematic Growth Index to the Nasdaq Dorsey Wright Thematic RotationTM Index along with other corresponding changes. These changes are expected to be effective on April 1, 2025.
The Funds have been evaluated by management regarding the need for additional disclosures (other than what is disclosed in the preceding paragraphs) and/or adjustments resulting from subsequent events. Based on this evaluation, no additional adjustments were required to the financial statements.
185
Report of Independent Registered Public Accounting Firm
To the Board of Trustees of Global X Funds and Shareholders of each of the twenty-five funds listed in the table below
Opinions on the Financial Statements
We have audited the accompanying statements of assets and liabilities, including the schedules of investments, of each of the funds listed in the table below (twenty-five of the funds constituting Global X Funds, hereafter collectively referred to as the “Funds”) as of November 30, 2024, the related statements of operations and of changes in net assets for each of the periods indicated in the table below, including the related notes, and the financial highlights for each of the periods indicated therein (collectively referred to as the “financial statements”). In our opinion, the financial statements present fairly, in all material respects, the financial position of each of the Funds listed in the table below as of November 30, 2024, the results of each of their operations and the changes in each of their net assets for each of the periods indicated in the table below, and each of the financial highlights for each of the periods indicated therein, in conformity with accounting principles generally accepted in the United States of America.
| Global X Millennial Consumer ETF (1) |
| Global X Aging Population ETF (1) |
| Global X Robotics & Artificial Intelligence ETF (1) |
| Global X FinTech ETF (1) |
| Global X Internet of Things ETF (1) |
| Global X U.S. Infrastructure Development ETF (1) |
| Global X Autonomous & Electric Vehicles ETF (1) |
| Global X Artificial Intelligence & Technology ETF (1) |
| Global X Genomics & Biotechnology ETF (1) |
| Global X Cloud Computing ETF (1) |
| Global X Thematic Growth ETF (1) |
| Global X Video Games & Esports ETF (1) |
| Global X Cybersecurity ETF (1) |
| Global X Telemedicine & Digital Health ETF (1) |
| Global X CleanTech ETF (1) |
| Global X Data Center & Digital Infrastructure ETF (1) |
| Global X Clean Water ETF (1) |
| Global X AgTech & Food Innovation ETF (1) |
| Global X Blockchain ETF (1) |
| Global X Hydrogen ETF (1) |
| Global X Solar ETF (1) |
| Global X Wind Energy ETF (1) |
| Global X PropTech ETF (2) |
| Global X Defense Tech ETF (3) |
| Global X Infrastructure Development ex-U.S. ETF (4) |
186
Report of Independent Registered Public Accounting Firm (Concluded)
| (1) | Statements of operations for the year ended November 30, 2024 and statements of changes in net assets for each of the two years in the period ended November 30, 2024 |
| (2) | Statement of operations for the year ended November 30, 2024 and statement of changes in net assets for the year ended November 30, 2024 and the period April 11, 2023 (commencement of operations) through November 30, 2023 |
| (3) | Statement of operations for the year ended November 30, 2024 and statement of changes in net assets for the year ended November 30, 2024 and the period September 11, 2023 (commencement of operations) through November 30, 2023 |
| (4) | Statement of operations and statement of changes in net assets for the period August 27, 2024 (commencement of operations) through November 30, 2024 |
Basis for Opinions
These financial statements are the responsibility of the Funds’ management. Our responsibility is to express an opinion on the Funds’ financial statements based on our audits. We are a public accounting firm registered with the Public Company Accounting Oversight Board (United States) (PCAOB) and are required to be independent with respect to the Funds in accordance with the U.S. federal securities laws and the applicable rules and regulations of the Securities and Exchange Commission and the PCAOB.
We conducted our audits of these financial statements in accordance with the standards of the PCAOB. Those standards require that we plan and perform the audit to obtain reasonable assurance about whether the financial statements are free of material misstatement, whether due to error or fraud.
Our audits included performing procedures to assess the risks of material misstatement of the financial statements, whether due to error or fraud, and performing procedures that respond to those risks. Such procedures included examining, on a test basis, evidence regarding the amounts and disclosures in the financial statements. Our audits also included evaluating the accounting principles used and significant estimates made by management, as well as evaluating the overall presentation of the financial statements. Our procedures included confirmation of securities owned as of November 30, 2024, by correspondence with the custodians, transfer agent and brokers; when replies were not received from brokers, we performed other auditing procedures. We believe that our audits provide a reasonable basis for our opinions.
/s/PricewaterhouseCoopers LLP
Philadelphia, Pennsylvania
January 27, 2025
We have served as the auditor of one or more investment companies in Global X Funds since 2016.
187
Notice to Shareholders (unaudited)
For shareholders that do not have a November 30, 2024 tax year end, this notice is for informational purposes only. For shareholders with a November 30, 2024 tax year end, please consult your tax advisor as to the pertinence of this notice. For the fiscal year ended November 30, 2024, the Funds have designated the following items with regard to distributions paid during the year.
| | | Return of Capital | | Long-Term
Capital
Gain
Distributions | | Ordinary Income
Distributions | | Total
Distributions | | Qualifying
for Corporate
Dividends
Received
Deduction (1) | |
| Global X Millennial Consumer ETF | | | | | | | | | | | |
| | | 0.00% | | 0.00% | | 100.00% | | 100.00% | | 100.00% | |
| Global X Aging Population ETF | | | | | | | | | | | |
| | | 0.00% | | 0.00% | | 100.00% | | 100.00% | | 60.42% | |
| Global X Robotics & Artificial Intelligence ETF | | | | | | | | | | | |
| | | 51.77% | | 0.00% | | 48.23% | | 100.00% | | 49.83% | |
| Global X FinTech ETF | | | | | | | | | | | |
| | | 0.00% | | 0.00% | | 100.00% | | 100.00% | | 8.12% | |
| Global X Internet of Things ETF | | | | | | | | | | | |
| | | 0.00% | | 0.00% | | 100.00% | | 100.00% | | 85.41% | |
| Global X U.S. Infrastructure Development ETF | | | | | | | | | | | |
| | | 0.00% | | 19.59% | | 80.41% | | 100.00% | | 100.00% | |
| Global X Autonomous & Electric Vehicles ETF | | | | | | | | | | | |
| | | 0.00% | | 0.00% | | 100.00% | | 100.00% | | 69.07% | |
| Global X Artificial Intelligence & Technology ETF | | | | | | | | | | | |
| | | 0.00% | | 0.00% | | 100.00% | | 100.00% | | 100.00% | |
| Global X Genomics & Biotechnology ETF | | | | | | | | | | | |
| | | 0.00% | | 0.00% | | 0.00% | | 0.00% | | 0.00% | |
| Global X Cloud Computing ETF | | | | | | | | | | | |
| | | 0.00% | | 0.00% | | 0.00% | | 0.00% | | 0.00% | |
| Global X Thematic Growth ETF | | | | | | | | | | | |
| | | 43.60% | | 0.00% | | 56.40% | | 100.00% | | 58.03% | |
| Global X Video Games & Esports ETF | | | | | | | | | | | |
| | | 0.00% | | 0.00% | | 100.00% | | 100.00% | | 8.47% | |
| Global X Cybersecurity ETF | | | | | | | | | | | |
| | | 0.00% | | 0.00% | | 100.00% | | 100.00% | | 0.00% | |
| Global X Telemedicine & Digital Health ETF | | | | | | | | | | | |
| | | 0.00% | | 0.00% | | 0.00% | | 0.00% | | 0.00% | |
| Global X CleanTech ETF | | | | | | | | | | | |
| | | 0.00% | | 0.00% | | 100.00% | | 100.00% | | 0.00% | |
| Global X Data Center & Digital Infrastructure ETF | | | | | | | | | | | |
| | | 0.00% | | 0.00% | | 100.00% | | 100.00% | | 6.17% | |
| Global X Clean Water ETF | | | | | | | | | | | |
| | | 0.00% | | 0.00% | | 100.00% | | 100.00% | | 55.49% | |
| Global X AgTech & Food Innovation ETF | | | | | | | | | | | |
| | | 0.00% | | 0.00% | | 100.00% | | 100.00% | | 37.34% | |
| Global X Blockchain ETF | | | | | | | | | | | |
| | | 0.00% | | 0.00% | | 100.00% | | 100.00% | | 0.02% | |
| Global X Hydrogen ETF | | | | | | | | | | | |
| | | 0.00% | | 0.00% | | 0.00% | | 0.00% | | 0.00% | |
| Global X Solar ETF | | | | | | | | | | | |
| | | 0.00% | | 0.00% | | 100.00% | | 100.00% | | 0.00% | |
| Global X Wind Energy ETF | | | | | | | | | | | |
| | | 0.00% | | 0.00% | | 100.00% | | 100.00% | | 0.00% | |
| Global X PropTech ETF | | | | | | | | | | | |
| | | 0.00% | | 16.97% | | 83.03% | | 100.00% | | 9.14% | |
| Global X Defense Tech ETF | | | | | | | | | | | |
| | | 0.00% | | 0.00% | | 100.00% | | 100.00% | | 99.46% | |
| Global X Infrastructure Development ex-U.S. ETF | | | | | | | | | | | |
| | | 0.00% | | 0.00% | | 0.00% | | 0.00% | | 0.00% | |
(1) Qualifying dividends represent dividends which qualify for the corporate dividends received deduction and is reflected as a percentage of ordinary income distributions (the total of short term capital gain and net investment income distributions).
188
Notice to Shareholders (unaudited)
| | Qualifying
Dividend
Income (2) | | U.S. Government
Interest(3) | | Interest Related
Dividends(4) | | Short Term
Capital Gain
Dividends(5) | | Qualifying
Business
Income(6) | | Foreign Tax
Credit |
| Global X Millennial Consumer ETF | | | | | | | | | | |
| | 100.00% | | 0.00% | | 0.61% | | 0.00% | | 0.00% | | 0.00% |
| Global X Aging Population ETF | | | | | | | | | | |
| | 100.00% | | 0.00% | | 0.18% | | 0.00% | | 0.00% | | 0.00% |
| Global X Robotics & Artificial Intelligence ETF | | | | | | | | | | |
| | 100.00% | | 0.00% | | 0.36% | | 0.00% | | 0.00% | | 0.00% |
| Global X FinTech ETF | | | | | | | | | | |
| | 13.44% | | 0.00% | | 0.00% | | 0.00% | | 0.00% | | 0.00% |
| Global X Internet of Things ETF | | | | | | | | | | |
| | 100.00% | | 0.00% | | 0.10% | | 0.00% | | 0.00% | | 0.00% |
| Global X U.S. Infrastructure Development ETF | | | | | | | | | | |
| | 100.00% | | 0.00% | | 0.56% | | 0.00% | | 0.00% | | 0.00% |
| Global X Autonomous & Electric Vehicles ETF | | | | | | | | | | |
| | 93.52% | | 0.00% | | 0.36% | | 0.00% | | 0.00% | | 0.00% |
| Global X Artificial Intelligence & Technology ETF | | | | | | | | | | |
| | 100.00% | | 0.00% | | 0.04% | | 0.00% | | 0.00% | | 0.00% |
| Global X Genomics & Biotechnology ETF | | | | | | | | | | |
| | 0.00% | | 0.00% | | 0.00% | | 0.00% | | 0.00% | | 0.00% |
| Global X Cloud Computing ETF | | | | | | | | | | |
| | 0.00% | | 0.00% | | 0.00% | | 0.00% | | 0.00% | | 0.00% |
| Global X Thematic Growth ETF | | | | | | | | | | |
| | 65.52% | | 0.00% | | 0.03% | | 0.00% | | 0.00% | | 0.00% |
| Global X Video Games & Esports ETF | | | | | | | | | | |
| | 84.17% | | 0.00% | | 0.09% | | 0.00% | | 0.00% | | 10.47% |
| Global X Cybersecurity ETF | | | | | | | | | | |
| | 0.00% | | 0.00% | | 0.00% | | 0.00% | | 0.00% | | 0.00% |
| Global X Telemedicine & Digital Health ETF | | | | | | | | | | |
| | 0.00% | | 0.00% | | 0.00% | | 0.00% | | 0.00% | | 0.00% |
| Global X CleanTech ETF | | | | | | | | | | |
| | 60.32% | | 0.00% | | 0.11% | | 0.00% | | 0.00% | | 0.00% |
| Global X Data Center & Digital Infrastructure ETF | | | | | | | | | | |
| | 20.83% | | 0.00% | | 0.10% | | 0.00% | | 47.59% | | 0.00% |
| Global X Clean Water ETF | | | | | | | | | | |
| | 96.80% | | 0.00% | | 0.07% | | 0.00% | | 0.00% | | 0.00% |
| Global X AgTech & Food Innovation ETF | | | | | | | | | | |
| | 96.00% | | 0.00% | | 0.15% | | 0.00% | | 0.00% | | 0.00% |
| Global X Blockchain ETF | | | | | | | | | | |
| | 0.02% | | 0.00% | | 0.06% | | 0.00% | | 0.00% | | 0.00% |
| Global X Hydrogen ETF | | | | | | | | | | |
| | 0.00% | | 0.00% | | 0.00% | | 0.00% | | 0.00% | | 0.00% |
| Global X Solar ETF | | | | | | | | | | |
| | 100.00% | | 0.00% | | 1.10% | | 0.00% | | 0.00% | | 0.00% |
| Global X Wind Energy ETF | | | | | | | | | | |
| | 100.00% | | 0.00% | | 0.75% | | 0.00% | | 0.00% | | 16.13% |
| Global X PropTech ETF | | | | | | | | | | |
| | 21.44% | | 0.00% | | 3.24% | | 100.00% | | 0.00% | | 0.00% |
| Global X Carbon Credits Strategy ETF | | | | | | | | | | |
| | 0.00% | | 100.00% | | 100.00% | | 0.00% | | 0.00% | | 0.00% |
| Global X Defense Tech ETF | | | | | | | | | | |
| | 99.77% | | 0.00% | | 0.00% | | 100.00% | | 0.00% | | 0.00% |
| Global X Infrastructure Development ex-U.S. ETF | | | | | | | | | | |
| | 0.00% | | 0.00% | | 0.00% | | 0.00% | | 0.00% | | 0.00% |
(2) The percentage in this column represents the amount of “Qualifying Dividend Income” as created by the Jobs and Growth Relief Reconciliation Act of 2003 and it is reflected as a percentage of ordinary income distributions (the total of short term capital gain and net investment income distributions). It is the intention of each of the aforementioned Funds to designate the maximum amount permitted by law.
(3) “U.S. Government Interest” represents the amount of interest that was derived from U.S. Government obligations and distributed during the fiscal year. Generally, interest from direct U.S. Government obligations is exempt from state income tax. However, for shareholders who are residents of California, Connecticut and New York, the statutory threshold requirements were not satisfied to permit exemption of these amounts from state income.
(4) The percentage in this column represents the amount of “Interest Related Dividends” as created by the American Jobs Creation Act of 2004 and is a percentage of net investment income that is exempt from U.S. withholding tax when paid for foreign investors.
189
Notice to Shareholders (unaudited)
(5) The percentage of this column represents the amount of “Short Term Capital Gain Dividend’’ and is reflected as a percentage of short term capital gain distribution that is exempted from U.S. withholding tax when paid to foreign investors.
(6) The percentage of this column represents that amount of ordinary dividend income that qualified for 20% Business Income Deduction.
The Funds intend to pass through a foreign tax credit to shareholders. For the fiscal year ended November 30, 2024, the total amount of foreign source income and foreign tax credit are as follows:
| Fund Name | | Foreign Source Income | | Foreign Tax Credit Pass
Through | |
| Global X Video Games & Esports ETF | | | $ | 565,805 | | | | $ | 120,252 | | |
| Global X Wind Energy ETF | | | $ | 30,245 | | | | $ | 4,920 | | |
The information reported herein may differ from the information and distributions taxable to the shareholders for the calendar year ending December 31, 2024. Complete information will be computed and reported in conjunction with your 2024 Form 1099- DIV.
190
Proxy Voting (Form N-CSR Item 9) (unaudited)
A Special Meeting of Shareholders of the Global X Funds (the “Trust”) was held on August 26, 2024, for the purpose of considering the proposal to elect each of the current Trustees to the Board of Trustees of the Trust. The proposal was approved on August 26, 2024 with the following voting results:
| Trustee | | Shares Voted | |
| Charles A. Baker | | | | |
| For | | | 1,000,273,461 | |
| Against | | | 14,064,552 | |
| Abstain | | | 12,508,484 | |
| Toai Chin | | | | |
| For | | | 999,088,606 | |
| Against | | | 14,951,430 | |
| Abstain | | | 12,806,470 | |
| Clifford J. Weber | | | | |
| For | | | 1,000,103,865 | |
| Against | | | 14,142,432 | |
| Abstain | | | 12,600,202 | |
| Ryan O’Connor | | | | |
| For | | | 1,002,852,035 | |
| Against | | | 11,528,537 | |
| Abstain | | | 12,465,958 | |
191
Approval of Investment Advisory Agreement (Form N-CSR Item 11) (Unaudited)
Section 15(c) of the Investment Company Act of 1940, as amended (“1940 Act”), requires that the board of trustees of an exchange-traded fund (“ETF”), including a majority of those trustees who are not “interested persons” of the ETF, as defined in the 1940 Act (“Independent Trustees”), consider on an initial basis and periodically thereafter (as required by the 1940 Act), at an in person meeting called for such purpose, the terms of each ETF’s investment advisory agreement and whether to approve entering into, or renewing, each agreement.
At a Board meeting of the Global X Funds (the “Trust”) held on March 7, 2024 (the “New Fund Board Meeting”), the Board of Trustees (the “Board”) (including the Trust’s Independent Trustees, voting separately) considered and unanimously approved (i) the initial Investment Advisory Agreement (the “New Investment Advisory Agreement”) for the Global X Infrastructure Development ex-U.S. ETF (the “New Fund”); and (ii) the initial Supervision and Administration Agreement (the “New Supervision and Administration Agreement”) between the Trust, on behalf of the New Fund, and Global X Management Company LLC (“Global X Management”). The New Investment Advisory Agreement and New Supervision and Administration Agreement are referred to collectively as the “New Fund Agreements.”
At a Board meeting of the Trust held on November 19, 2024, called for such purpose, the Board (including the Trust’s Independent Trustees, voting separately) considered and unanimously approved the continuation of (i) the Investment Advisory Agreement (“Renewal Investment Advisory Agreement”) for each Fund (each, a “Renewal Fund” and together the “Renewal Funds”) included in this Annual Report; and (ii) the Supervision and Administration Agreement (“Renewal Supervision and Administration Agreement”) between the Trust, on behalf of each Renewal Fund, and Global X Management. The Renewal Investment Advisory Agreement and the Renewal Supervision and Administration Agreement are referred to herein as the “Renewal Agreements.”
In advance of the Board meetings, the Board (including the Trust’s Independent Trustees) and the Independent Trustees’ independent legal counsel requested (in writing) detailed information from Global X Management in connection with the Board’s consideration of the Renewal Agreements and New Fund Agreements and received and reviewed written responses from Global X Management and supporting materials relating to those requests for information. In the course of their consideration of the Renewal Agreements and New Fund Agreements, the Trust’s Independent Trustees were advised by their independent legal counsel and, in addition to meetings with management of Global X Management, the Independent Trustees met separately in executive sessions with their counsel.
NEW FUND AGREEMENTS
In determining to approve the New Fund Agreements for the New Fund, the Board considered a variety of factors, including the factors discussed in greater detail below.
192
Approval of Investment Advisory Agreement (Form N-CSR Item 11) (Unaudited) (Continued)
Nature, Extent and Quality of Services
With respect to this factor, the Board considered:
| • | the terms of the New Fund Agreements and the range of services proposed to be provided to the New Fund in accordance with the New Fund Agreements; |
| | |
| • | Global X Management’s key personnel and the portfolio managers who would provide investment advisory, supervision and administrative services to the New Fund; |
| | |
| • | Global X Management’s responsibilities under the New Fund Agreements to, among other things, (i) manage the investment operations of the New Fund and the composition of the New Fund’s assets, including the purchase, retention and disposition of its holdings, (ii) provide quarterly reports to the Trust’s officers and the Board and other reports as the Board deems necessary or appropriate, (iii) vote proxies, exercise consents, and exercise all other rights appertaining to securities and assets held by the New Fund, (iv) select broker-dealers to execute portfolio transactions for the New Fund when necessary, (v) assist in the preparation and filing of reports and proxy statements (if any) to the shareholders of the New Fund, and the periodic updating of the registration statements, prospectuses, statements of additional information, and other reports and documents for the New Fund that are required to be filed by the Trust with the U.S. Securities and Exchange Commission (“SEC”) and other regulatory or governmental bodies, and (vi) monitor anticipated purchases and redemptions of the shares (including Creation Units) of the New Fund by shareholders and new investors; |
| | |
| • | the nature, extent and quality of all of the services (including advisory, administrative and compliance services) that are proposed to be provided by Global X Management or made available to the New Fund; and |
| | |
| • | the quality of Global X Management’s resources and personnel that would be made available to the New Fund, including Global X Management’s experience and the professional qualifications of Global X Management’s key personnel. |
Based on these considerations, the Board concluded, at the New Fund Board Meeting, that it was satisfied with the nature, extent and quality of the services proposed to be provided to the New Fund by Global X Management.
Performance
The Board determined that, because the New Fund had not yet begun investment operations as of the date of the New Fund Board Meeting, meaningful data relating to the investment performance of the New Fund was not available and, therefore, could not be a factor in approving the New Fund Agreements.
193
Approval of Investment Advisory Agreement (Form N-CSR Item 11) (Unaudited) (Continued)
Cost of Services and Profitability
With respect to this factor, the Board considered:
| • | Global X Management’s expected costs to provide investment management, supervision and administrative and related services to the New Fund; |
| | |
| • | the management fee (including the proposed investment advisory fee) (“Management Fee”) that was proposed to be borne by the New Fund under the New Fund Agreements for the various investment advisory, supervisory and administrative services that the New Fund requires under a unitary fee structure (including the types of fees and expenses that are not included within the unitary fee and would be borne by the New Fund); and |
| | |
| • | the expected profitability to Global X Management, if any, from all of the services proposed to be provided to the New Fund by Global X Management and all aspects of the relationship between Global X Management and the New Fund |
Based on these considerations, the Board concluded that the proposed Management Fee to be paid by the New Fund to Global X Management, in light of the nature, extent and quality of the services to be provided, was reasonable and in the best interests of the New Fund’s shareholders.
Comparison of Fees and Services
With respect to this factor, the Board considered:
| • | comparative information with respect to the proposed Management Fee to be paid to Global X Management by the New Fund. In connection with this consideration, Global X Management provided the Board with comparative expense data for the New Fund, including fees and expenses paid by unaffiliated similar specialized and/ or focused ETFs, and/or other similar registered funds. The Board considered Global X Management’s detailed explanation of the proposed fee structure of the New Fund compared to the average and median of the New Fund’s peer group; |
| | |
| • | the structure of the proposed unitary Management Fee (which includes as one component the proposed investment advisory fee for the New Fund) and the expected total expense ratios for the New Fund. In this regard, the Board took into consideration that the purpose of adopting a unitary Management Fee structure for the New Fund was to create a simple, all-inclusive fee that would provide a level of predictability with respect to the overall expense ratios (i.e., the total fees) of the New Fund and that the proposed Management Fee for the New Fund was set at a competitive level to make the New Fund viable in the marketplace; and |
| | |
| • | that, under the proposed unified Management Fee structure, Global X Management would be responsible for most ordinary expenses of the New Fund, including the costs of various third-party services required by the New Fund, including investment |
194
Approval of Investment Advisory Agreement (Form N-CSR Item 11) (Unaudited) (Continued)
| | advisory, administrative, audit, certain custody, portfolio accounting, legal, transfer agency and printing costs, but that the New Fund would bear other expenses not covered under the proposed all-inclusive Management Fee, such as taxes, brokerage fees, commissions, and other transaction expenses, interest expenses, and extraordinary expenses. |
Based on these considerations, the Board concluded, at the New Fund Board Meeting, that the services to be received and the fees to be charged under the applicable New Fund Agreements were reasonable on a comparative basis.
Economies of Scale
With respect to this factor, the Board considered:
| • | the extent to which economies of scale would be realized as the New Fund grows and whether the proposed unitary Management Fees for the New Fund reflected these economies of scale; |
| | |
| • | the significant investment of time, personnel and other resources that Global X Management intends to make in the New Fund in order to seek to assure that the New Fund is attractive to investors; and |
| | |
| • | that the proposed unitary Management Fee would provide a high level of certainty as to the total level of expenses for the New Fund and its shareholders. |
Based on these considerations, the Board concluded, at the New Fund Board Meeting, that the proposed unitary Management Fees for the New Fund appropriately addressed economies of scale.
Other Benefits
In considering each New Fund Agreement, in addition to the factors discussed above, the Board considered other benefits that may be realized by Global X Management as a result of its relationship with the New Fund. As a result, the Board concluded that, in the case of the New Fund, in the exercise of the Board’s business judgement, all information the Board considered supported approval of the applicable New Fund Agreements.
Conclusion
After full consideration of the factors above, as well as other factors that were instructive in their consideration, the Board, including all of the Trust’s Independent Trustees voting separately, concluded, in the exercise of its business judgement, that the New Fund Agreements were fair and reasonable and in the best interest of the New Fund.
In reaching this decision, the Board did not assign relative weights to the factors above nor did the Board deem any one factor or group of them to be controlling in and of themselves. Each member of the Board may have assigned different weights to the various factors.
195
Approval of Investment Advisory Agreement (Form N-CSR Item 11) (Unaudited) (Continued)
RENEWAL AGREEMENTS
In determining to approve the continuation of the Renewal Agreements for the Renewal Funds, the Board considered a variety of factors, including the factors discussed in greater detail below.
Nature, Extent and Quality of Services
With respect to this factor, the Board considered:
| • | the terms of the Renewal Agreements and the range of services that would continue to be provided to each Renewal Fund in accordance with the Renewal Agreements; |
| | |
| • | Global X Management’s key personnel and the portfolio managers who would continue to provide investment advisory, supervision and administrative services to each Renewal Fund; |
| | |
| • | Global X Management’s responsibilities under the Renewal Agreements, among other things, to: (i) manage the investment operations of the Renewal Funds and the composition of the Renewal Funds’ assets, including the purchase, retention and disposition of their holdings, (ii) provide quarterly reports to the Trust’s officers and the Board and other reports as the Board deems necessary or appropriate, (iii) vote proxies, exercise consents, and exercise all other rights relating to securities and assets held by the Renewal Funds, (iv) select broker-dealers to execute portfolio transactions for the Renewal Funds when necessary, (v) assist in the preparation and filing of reports and proxy statements (if any) to the shareholders of the Renewal Funds, and the periodic updating of the registration statement, prospectuses, statements of additional information, and other reports and documents for the Renewal Funds that are required to be filed by the Trust with the SEC and other regulatory and governmental bodies, and (vi) monitor anticipated purchases and redemptions of the shares (including Creation Units) of the Renewal Funds by shareholders and new investors; |
| | |
| • | the nature, extent and quality of all of the services (including advisory, administrative and compliance services) that have been provided by Global X Management or made available to the Renewal Funds; and |
| | |
| • | the quality of Global X Management’s resources and personnel that would continue to be made available to the Renewal Funds, including Global X Management’s experience and the professional qualifications of Global X Management’s key personnel. |
Based on these considerations, the Board concluded that it was satisfied with the nature, extent and quality of the services provided to the Renewal Funds by Global X Management.
Performance
The Board considered the performance of each Renewal Fund. They examined the performance of the Renewal Funds for the one-year, three-year, five-year and since-
196
Approval of Investment Advisory Agreement (Form N-CSR Item 11) (Unaudited) (Continued)
inception periods, as applicable. Also, the Board considered the total return and investments performance of the Renewal Funds relative to (i) the performance of unaffiliated comparable ETFs and/or other registered funds, which performance information is publicly available from such registered funds, as well as other third party sources; and (ii) the performance of pertinent indexes. The Board considered instances of under-performance and over-performance with respect to the competitor funds. The Board also considered the Renewal Funds’ performance in absolute terms and against each Renewal Fund’s underlying index.
Based on these considerations and comparisons, the Board concluded that the investment performance of the Renewal Funds did not adversely affect the Board’s approval of the continuance of the Renewal Agreements.
Cost of Services and Profitability
The Board considered Global X Management’s cost to provide investment management, supervision and administrative and related services to the Renewal Funds. In this regard, the Board considered the management fee (“Management Fee”) that has been borne or is expected to be borne by the Renewal Funds under the Renewal Agreements for the various investment advisory, supervisory and administrative services that the Renewal Funds require under a unitary fee structure (including the types of fees and expenses that are not included within the unitary fee and would be borne by the Renewal Funds).
In addition, the Board considered expected profitability to Global X Management, as applicable, from all services provided or expected to be provided to the Renewal Funds and all aspects of Global X Management’s relationship with the Renewal Funds. In connection with these considerations, Global X Management provided the Board with financial information regarding its operations and the services provided to the Renewal Funds and discussed with the Board its current and expected, as applicable, profitability with respect to the Renewal Funds.
Based on these considerations, the Board concluded that the Management Fee rate paid by the Renewal Funds to Global X Management, in light of the nature, extent and quality of the services provided, was reasonable and in the best interests of the Renewal Funds’ shareholders.
Comparison of Fees and Services
With respect to this factor, the Board considered:
| • | comparative information with respect to the Management Fee paid to Global X Management by the Renewal Funds. In connection with this consideration, Global X Management provided the Board with comparative expense data for the Renewal Funds, including fees and expenses paid by unaffiliated similar specialized and/or focused ETFs and/or other comparable registered funds. The Board considered the Global X Management’s detailed explanation of the fee structures of any Renewal |
197
Approval of Investment Advisory Agreement (Form N-CSR Item 11) (Unaudited) (Continued)
Fund that was above the average or median for its peer group;
| • | the structure of the unitary Management Fee (which includes as one component the investment advisory fee for the Renewal Funds) and the current total expense ratios for the Renewal Funds. In this regard, the Board took into consideration that the purpose of adopting a unitary Management Fee structure for the Renewal Funds was to create a simple, all-inclusive fee that would provide a level of predictability with respect to the overall expense ratio (i.e., the total fees) of the Renewal Funds and that the proposed Management Fees for each Renewal Fund was set at a competitive level to make the Renewal Funds viable in the marketplace; and |
| | |
| • | that, under the unified Management Fee structure, Global X Management is responsible for most ordinary expenses of the Renewal Funds, including the costs of various third-party services required by the Renewal Funds, including investment advisory, administrative, audit, certain custody, portfolio accounting, legal, transfer agency and printing costs, but that the Renewal Funds would bear other expenses not covered under the proposed all-inclusive Management Fee, such as taxes, brokerage fees, commissions, and other transaction expenses, interest expenses, and extraordinary expenses. |
Based on these considerations, the Board concluded that the services received and the fees charged under the Renewal Agreements were reasonable on a comparative basis.
Economies of Scale
With respect to this factor, the Board considered:
| • | the extent to which economies of scale would be realized as the Renewal Funds grow and whether the unitary Management Fee for the Renewal Funds reflected these economies of scale; |
| | |
| • | the significant investment of time, personnel and other resources that Global X Management has made and intends to continue to make in the Renewal Funds in order to seek to assure that the Renewal Funds are attractive to investors; and |
| | |
| • | that the unitary Management Fee would provide a high level of certainty as to the total level of expenses for the Renewal Funds and their shareholders. |
Based on these considerations, the Board concluded that the unitary Management Fee for the Renewal Funds appropriately addressed economies of scale.
Other Benefits
In considering the Renewal Agreements, in addition to the factors above, the Board considered any other benefits realized by Global X Management as a result of its relationships with the Renewal Funds and concluded that, in the exercise of the Board’s
198
Approval of Investment Advisory Agreement (Form N-CSR Item 11) (Unaudited) (Concluded)
business judgement, all information the Board considered supported approval of the continuation of the Renewal Agreements.
Conclusion
After full consideration of the factors above, as well as other factors that were instructive in its consideration, the Board, including all of the Trust’s Independent Trustees voting separately, concluded, in the exercise of its business judgement, that the Renewal Agreements were fair and reasonable and in the best interest of each Renewal Fund.
In reaching this decision, the Board did not assign relative weights to the factors above nor did the Board deem any one factor or group of them to be controlling in and of themselves. Each member of the Board may have assigned different weights to the various factors.
199
Notes
200
605 Third Avenue, 43rd Floor
New York, NY 10158
1-888-493-8631
www.globalxetfs.com
Investment Adviser and Administrator:
Global X Management Company LLC
605 3rd Avenue, 43rd Floor
New York, NY 10158
Distributor:
SEI Investments Distribution Co.
One Freedom Valley Drive
Oaks, PA 19456
Sub-Administrator:
SEI Investments Global Funds Services
One Freedom Valley Drive
Oaks, PA 19456
Counsel for Global X Funds and the Independent Trustees:
Stradley Ronon Stevens & Young, LLP
2000 K Street, N.W.
Suite 700
Washington, DC 20006
Custodians and Transfer Agents:
Brown Brothers Harriman & Co.
40 Water Street
Boston, MA 02109
The Bank of New York Mellon
240 Greenwich Street
New York, NY 10286
Independent Registered Public Accounting Firm:
PricewaterhouseCoopers LLP
Two Commerce Square
Suite 1800
2001 Market Street
Philadelphia, PA 19103
This information must be preceded or accompanied by a current prospectus for the Funds described.
GLX-AR-007-0900
| Item 8. | Changes in and Disagreements with Accountants for Open-End Management Investment Companies. |
There were no changes in or disagreements with accountants on accounting and financial disclosure during the period covered by the report.
| Item 9. | Proxy Disclosures for Open-End Management Investment Companies. |
The disclosure regarding any matters submitted during the period covered by the report to a vote of shareholders, if applicable, is included as part of the financial statements filed under Item 7 of this form.
| Item 10. | Remuneration Paid to Directors, Officers, and Others of Open-End Management Investment Companies. |
| (1) | No remuneration was paid by the company during the period covered by the report to any Trustees on the company’s Board of Trustees for regular compensation. |
| (2) | No remuneration was paid by the company during the period covered by the report to any Trustees on the company’s Board of Trustees for special compensation. |
| (3) | No remuneration was paid by the company during the period covered by the report to any Officers of the company. |
| (4) | No remuneration was paid by the company during the period covered by the report to any Officer or Trustee of the company who is an affiliated person. |
| Item 11. | Statement Regarding Basis for Approval of Investment Advisory Contract. |
The disclosure regarding the approval of any investment advisory contract approved during the registrant’s most recent fiscal half-year, if applicable, is included as part of the financial statements filed under Item 7 of this form.
| Item 12. | Disclosure of Proxy Voting Policies and Procedures for Closed-End Management Investment Companies. |
Not applicable to open-end management investment companies.
| Item 13. | Portfolio Managers of Closed-End Management Investment Companies. |
Not applicable to open-end management investment companies.
| Item 14. | Purchases of Equity Securities by Closed-End Management Company and Affiliated Purchasers. |
Not applicable to open-end management investment companies.
| Item 15. | Submission of Matters to a Vote of Security Holders. |
There have been no material changes to the procedures by which shareholders may recommend nominees to the registrant’s board of directors.
| Item 16. | Controls and Procedures. |
(a) The certifying officers, whose certifications are included herewith, have evaluated the registrant’s disclosure controls and procedures (as defined in Rule 30a-3(c) under the Act) within 90 days of the filing date of this report. In their opinion, based on their evaluation, the registrant’s disclosure controls and procedures are adequately designed, and are operating effectively to ensure, that information required to be disclosed by the registrant in the reports it files or submits under the Securities Exchange Act of 1934 is recorded, processed, summarized and reported within the time periods specified in the Securities and Exchange Commission’s rules and forms.
(b) There were no changes in the registrant’s internal control over financial reporting (as defined in Rule 30a-3(d) under the Act) that occurred during the period covered by this report that have materially affected, or are reasonably likely to materially affect, the registrant’s internal control over financial reporting.
(c) Management has completed the remediation efforts relating to a previously reported material weakness in the Registrant’s internal controls over financial reporting. A material weakness is a deficiency, or a combination of deficiencies, in internal control over financial reporting, such that there is a reasonable
possibility that a material misstatement of the company’s annual or interim financial statements will not be prevented or detected on a timely basis. As of November 30,2023, management concluded that it did not design or maintain controls to evaluate reasonably available observable inputs related to the valuation of certain securities held in the Global X Aging Population ETF, Global X Cannabis ETF and Global X Genomics & Biotechnology ETF for which trading on a recognized exchange were halted. This material weakness did not result in a misstatement of previously issued financial statements. This material weakness resulted in audit adjustments, which adjustments were reflected in the financial statements of the Global X Cannabis ETF to increase Investments, at value and Net change in unrealized appreciation (depreciation) on investments for the year ended November 30, 2023. The Global X Cannabis ETF liquidated on February 20, 2024.
The steps management took to remediate this material weakness included implementing an additional control to track subsequent events for potential observable inputs that relate to the valuation of certain securities for which trading on a recognized exchange has halted. Management created a Subsequent Event Tracking log that is intended to identify halted securities above an established fund weighting threshold, with the intention to formally track subsequent events that may result in observable inputs that would impact the valuation of the security. Secondly, the log tracks communication of such subsequent events to the Valuation Committee, with fair value recommendations reviewed and approved by Committee members.
As a result of these remediation activities, management has determined that the Registrant’s internal controls over financial reporting are designed appropriately and at a sufficient level of precision and have been operating effectively for a sufficient period of time, such that the material weakness previously identified as of November 30, 2023, has been remediated as of November 30, 2024.
| Item 17. | Disclosure of Securities Lending Activities for Closed-End Management Investment Companies. |
Not applicable.
| Item 18. | Recovery of Erroneously Awarded Compensation. |
(a) Not applicable.
(a) Not applicable.
(a)(1) Code of Ethics attached hereto.
(a)(2) Not applicable.
(a)(3) A separate certification for the principal executive officer and the principal financial officer of the registrant, as required by Rule 30a-2(a) under the Act (17 CFR § 270.30a-2(a)), are filed herewith.
(b) Officer certifications as required by Rule 30a-2(b) under the Investment Company Act of 1940, as amended, also accompany this filing as exhibits.
SIGNATURES
Pursuant to the requirements of the Securities Exchange Act of 1934 and the Investment Company Act of 1940, the registrant has duly caused this report to be signed on its behalf by the undersigned, thereunto duly authorized.
| (Registrant) | Global X Funds | |
| | | |
| By (Signature and Title) | /s/ Ryan O’Connor | |
| | Ryan O’Connor | |
| | Principal Executive Officer | |
Date: February 6, 2025
Pursuant to the requirements of the Securities Exchange Act of 1934 and the Investment Company Act of 1940, this report has been signed below by the following persons on behalf of the registrant and in the capacities and on the dates indicated.
| By (Signature and Title) | /s/ Ryan O’Connor | |
| | Ryan O’Connor | |
| | Principal Executive Officer | |
Date: February 6, 2025
| By (Signature and Title) | /s/ Eric Olsen | |
| | Eric Olsen | |
| | Principal Financial Officer | |
Date: February 6, 2025
iso4217:USDxbrli:shares