| Global X Robotics & Artificial Intelligence ETF (ticker: BOTZ) |
| Global X FinTech ETF (ticker: FINX) |
| Global X Internet of Things ETF (ticker: SNSR) |
| Global X Cloud Computing ETF (ticker: CLOU) |
| Global X Future Analytics Tech ETF (ticker: AIQ) |
| Global X Autonomous & Electric Vehicles ETF (ticker: DRIV) |
| Global X Genomics & Biotechnology ETF (ticker: GNOM) |
| Global X Video Games and Esports ETF (ticker: HERO) |
| Global X Cybersecurity ETF (ticker: BUG) |
| Global X Millennials Thematic ETF (ticker: MILN) |
| Global X Longevity Thematic ETF (ticker: LNGR) |
| Global X Health & Wellness Thematic ETF (ticker: BFIT) |
| Global X Cannabis ETF (ticker: POTX) |
| Global X U.S. Infrastructure Development ETF (ticker: PAVE) |
| Global X Conscious Companies ETF (ticker: KRMA) |
| Global X Founder-Run Companies ETF (ticker: BOSS) |
| Global X Thematic Growth ETF (ticker: GXTG) |
Semi-Annual Report
May 31, 2020
Beginning on January 1, 2021, as permitted by regulations adopted by the Securities and Exchange Commission, paper copies of the Funds’ (defined below) shareholder reports will no longer be sent by mail, unless you specifically request paper copies of the reports from your financial intermediary (such as a broker-dealer or bank). Instead, shareholder reports will be available on the Funds’ website (www.globalxetfs.com), and you will be notified by mail each time a report is posted and provided with a website link to access the report.
If you already elected to receive shareholder reports electronically, you will not be affected by this change and you need not take any action. You may elect to receive shareholder reports and other communications from the Funds electronically anytime by contacting your financial intermediary.
You may elect to receive all future Fund shareholder reports in paper free of charge. Please contact your financial intermediary to inform them that you wish to continue receiving paper copies of Fund shareholder reports and for details about whether your election to receive reports in paper will apply to all funds held with your financial intermediary.
| Schedules of Investments | |
| Global X Robotics & Artificial Intelligence ETF | 1 |
| Global X FinTech ETF | 6 |
| Global X Internet of Things ETF | 10 |
| Global X Cloud Computing ETF | 15 |
| Global X Future Analytics Tech ETF | 18 |
| Global X Autonomous & Electric Vehicles ETF | 25 |
| Global X Genomics & Biotechnology ETF | 32 |
| Global X Video Games & Esports ETF | 35 |
| Global X Cybersecurity ETF | 39 |
| Global X Millennials Thematic ETF | 41 |
| Global X Longevity Thematic ETF | 47 |
| Global X Health & Wellness Thematic ETF | 53 |
| Global X Cannabis ETF | 58 |
| Global X U.S. Infrastructure Development ETF | 62 |
| Global X Conscious Companies ETF | 68 |
| Global X Founder-Run Companies ETF | 75 |
| Global X Thematic Growth ETF | 80 |
| Statements of Assets and Liabilities | 82 |
| Statements of Operations | 87 |
| Statements of Changes in Net Assets | 92 |
| Financial Highlights | 101 |
| Notes to Financial Statements | 109 |
| Disclosure of Fund Expenses | 130 |
| Liquidity Risk Management Program | 133 |
| Supplemental Information | 134 |
Shares are bought and sold at market price (not NAV) and are not individually redeemed from a Fund. Shares may only be redeemed directly from a Fund by Authorized Participants, in very large creation/redemption units. Brokerage commissions will reduce returns.
The Funds file their complete schedules of Fund holdings with the Securities and Exchange Commission (the “SEC” or “Commission”) for the first and third quarters of each fiscal year on Form N-PORT. The Funds’ Forms N-PORT are available on the Commission’s website at http://www.sec.gov, and may be reviewed and copied at the Commission’s Public Reference Room in Washington, DC. Information on the operation of the Public Reference Room may be obtained by calling 1-800-SEC-0330.
A description of the policies and procedures that Global X Funds uses to determine how to vote proxies relating to Fund securities, as well as information relating to how the Funds voted proxies relating to Fund securities during the most recent 12-month period ended June 30, is available (i) without charge, upon request, by calling 1-888-493-8631; and (ii) on the Commission’s website at http://www.sec.gov
| | |
| Schedule of Investments |
| May 31, 2020 (Unaudited) |
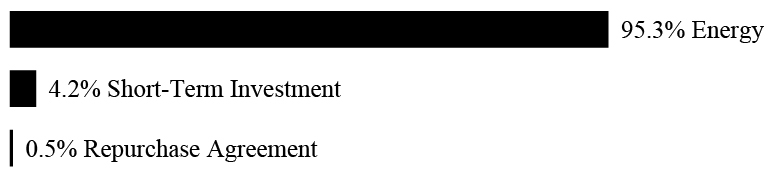
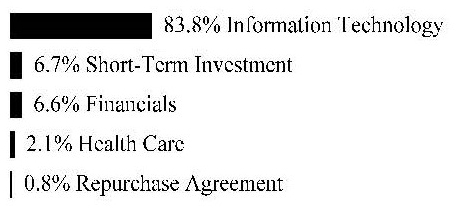
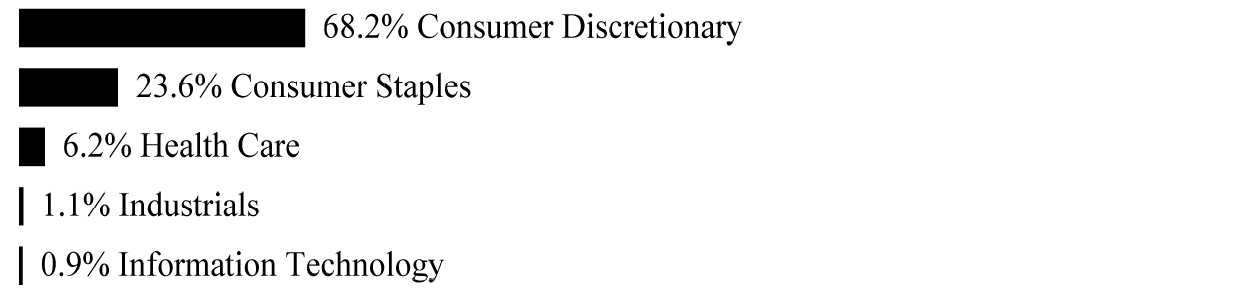
| Global X Robotics & Artificial Intelligence ETF | |
Sector Weightings †:
† Sector weightings percentages are based on the total market value of investments. Repurchase agreements purchased from cash collateral received for securities lending activity are included in total investments. Please see Notes 2 and 7 in Notes to Financial Statements for more detailed information.
| | | Shares | | | Value | |
| COMMON STOCK — 100.2% | | | | | | |
| | | | | | | |
| CANADA— 1.4% | | | | | | |
| Industrials — 1.4% | | | | | | |
ATS Automation Tooling Systems * | | | 1,362,380 | | | $ | 19,723,067 | |
| FINLAND— 1.2% | | | | | | | | |
| Industrials — 1.2% | | | | | | | | |
Cargotec, Cl B | | | 815,089 | | | | 17,861,238 | |
| GERMANY— 0.8% | | | | | | | | |
| Information Technology — 0.8% | | | | | | | | |
Isra Vision (A) | | | 211,473 | | | | 10,938,259 | |
| JAPAN— 43.0% | | | | | | | | |
| Communication Services — 0.5% | | | | | | | | |
RPA Holdings *(A) | | | 841,890 | | | | 7,165,853 | |
| Health Care — 0.7% | | | | | | | | |
CYBERDYNE *(A) | | | 2,014,084 | | | | 9,534,347 | |
| Industrials — 28.3% | | | | | | | | |
Daifuku (A) | | | 966,946 | | | | 75,212,396 | |
| | |
| Schedule of Investments |
| May 31, 2020 (Unaudited) |
| Global X Robotics & Artificial Intelligence ETF | |
| | | Shares | | | Value | |
| COMMON STOCK — continued | | | | | | | | |
| Industrials — continued | | | | | | | | |
FANUC | | | 427,743 | | | $ | 76,289,801 | |
Hirata (A) | | | 156,809 | | | | 9,009,586 | |
Idec | | | 497,660 | | | | 8,226,969 | |
Mitsubishi Electric | | | 6,121,837 | | | | 80,603,572 | |
Nachi-Fujikoshi | | | 365,075 | | | | 11,775,520 | |
Shibaura Machine | | | 437,752 | | | | 9,642,043 | |
SMC | | | 146,120 | | | | 73,741,536 | |
Yaskawa Electric (A) | | | 1,672,759 | | | | 60,087,969 | |
| | | | | | | | 404,589,392 | |
| Information Technology — 13.5% | | | | | | | | |
Autonomous Control Systems Laboratory * (A) | | | 143,430 | | | | 3,594,570 | |
Keyence | | | 265,424 | | | | 109,263,975 | |
Omron | | | 1,027,364 | | | | 68,087,241 | |
PKSHA Technology *(A) | | | 392,352 | | | | 11,508,167 | |
| | | | | | | | 192,453,953 | |
TOTAL JAPAN | | | | | | | 613,743,545 | |
| SOUTH KOREA— 0.3% | | | | | | | | |
| Information Technology — 0.3% | | | | | | | | |
Robostar * | | | 166,375 | | | | 2,068,856 | |
Robotis * | | | 234,428 | | | | 2,527,041 | |
TOTAL SOUTH KOREA | | | | | | | 4,595,897 | |
| SWITZERLAND— 9.8% | | | | | | | | |
| Health Care — 4.3% | | | | | | | | |
Tecan Group | | | 176,508 | | | | 61,659,295 | |
| Industrials — 5.5% | | | | | | | | |
ABB | | | 3,997,854 | | | | 78,608,787 | |
TOTAL SWITZERLAND | | | | | | | 140,268,082 | |
| | |
| Schedule of Investments |
| May 31, 2020 (Unaudited) |
| Global X Robotics & Artificial Intelligence ETF | |
| | | Shares | | | Value | |
| COMMON STOCK — continued | | | | | | | | |
| UNITED KINGDOM— 3.6% | | | | | | | | |
| Information Technology — 3.6% | | | | | | | | |
Renishaw | | | 1,068,532 | | | $ | 50,859,201 | |
| UNITED STATES— 40.1% | | | | | | | | |
| Consumer Discretionary — 2.1% | | | | | | | | |
iRobot * (A) | | | 416,039 | | | | 30,670,395 | |
| Energy — 0.5% | | | | | | | | |
Helix Energy Solutions Group * | | | 2,180,688 | | | | 7,327,112 | |
| Health Care — 6.2% | | | | | | | | |
Accuray * | | | 1,221,986 | | | | 2,566,171 | |
Intuitive Surgical * | | | 148,252 | | | | 85,990,607 | |
TransEnterix * | | | 261,715 | | | | 110,784 | |
| | | | | | | | 88,667,562 | |
| Industrials — 5.3% | | | | | | | | |
AeroVironment * | | | 354,307 | | | | 25,095,564 | |
John Bean Technologies | | | 455,235 | | | | 37,397,555 | |
Maxar Technologies (A) | | | 871,953 | | | | 13,064,786 | |
| | | | | | | | 75,557,905 | |
| Information Technology — 26.0% | | | | | | | | |
Brooks Automation | | | 1,073,007 | | | | 42,888,090 | |
Dynatrace * | | | 2,239,641 | | | | 86,158,990 | |
FARO Technologies * | | | 253,532 | | | | 14,268,781 | |
Medallia * | | | 1,490,369 | | | | 42,147,635 | |
NVIDIA | | | 513,469 | | | | 182,291,764 | |
Veritone * (A) | | | 394,503 | | | | 3,349,330 | |
| | | | | | | | 371,104,590 | |
TOTAL UNITED STATES | | | | | | | 573,327,564 | |
| TOTAL COMMON STOCK | | | | | | | | |
(Cost $1,481,487,682) | | | | | | | 1,431,316,853 | |
| | |
| Schedule of Investments |
| May 31, 2020 (Unaudited) |
| Global X Robotics & Artificial Intelligence ETF | |
| | | Shares/Face Amount | | | Value | |
SHORT-TERM INVESTMENT(B)(C) — 8.2% | | | | | | | | |
| Fidelity Investments Money Market Government Portfolio, Cl Institutional, 0.080% | | | | | | | | |
(Cost $117,433,490) | | | 117,433,490 | | | $ | 117,433,490 | |
| | | | | | | | | |
REPURCHASE AGREEMENT(B) — 1.0% | | | | | | | | |
| BNP Paribas | | | | | | | | |
| 0.050%, dated 05/29/20, to be repurchased on 06/01/20, repurchase price $13,785,227 (collateralized by U.S. Treasury Obligations, ranging in par value $1,677,253 - $12,366,175, 1.500%, 08/15/2026, with a total market value of $14,043,428) | | | | | | | | |
(Cost $13,785,170) | | $ | 13,785,170 | | | | 13,785,170 | |
| TOTAL INVESTMENTS — 109.4% | | | | | | | | |
(Cost $1,612,706,342) | | | | | | $ | 1,562,535,513 | |
Percentages are based on Net Assets of $1,428,054,272.
| * | Non-income producing security. |
| (A) | This security or a partial position of this security is on loan at May 31, 2020. The total value of securities on loan at May 31, 2020 was $122,421,080. |
| (B) | Security was purchased with cash collateral held from securities on loan. The total value of such securities as of May 31, 2020 was $131,218,660. |
| (C) | The rate reported on the Schedule of Investments is the 7-day effective yield as of May 31, 2020. |
Cl - Class
| | |
| Schedule of Investments |
| May 31, 2020 (Unaudited) |
| Global X Robotics & Artificial Intelligence ETF | |
The following is a summary of the level of inputs used as of May 31, 2020, in valuing the Fund’s investments carried at value:
| Investments in Securities | | Level 1 | | | Level 2 | | | Level 3 | | | Total | |
| Common Stock | | $ | 1,426,720,956 | | | $ | 4,595,897 | | | $ | — | | | $ | 1,431,316,853 | |
| Short-Term Investment | | | 117,433,490 | | | | — | | | | — | | | | 117,433,490 | |
| Repurchase Agreement | | | — | | | | 13,785,170 | | | | — | | | | 13,785,170 | |
| Total Investments in Securities | | $ | 1,544,154,446 | | | $ | 18,381,067 | | | $ | — | | | $ | 1,562,535,513 | |
For the period ended May 31, 2020, there were no transfers in or out of Level 3.
| | |
| Schedule of Investments |
| May 31, 2020 (Unaudited) |
| | |
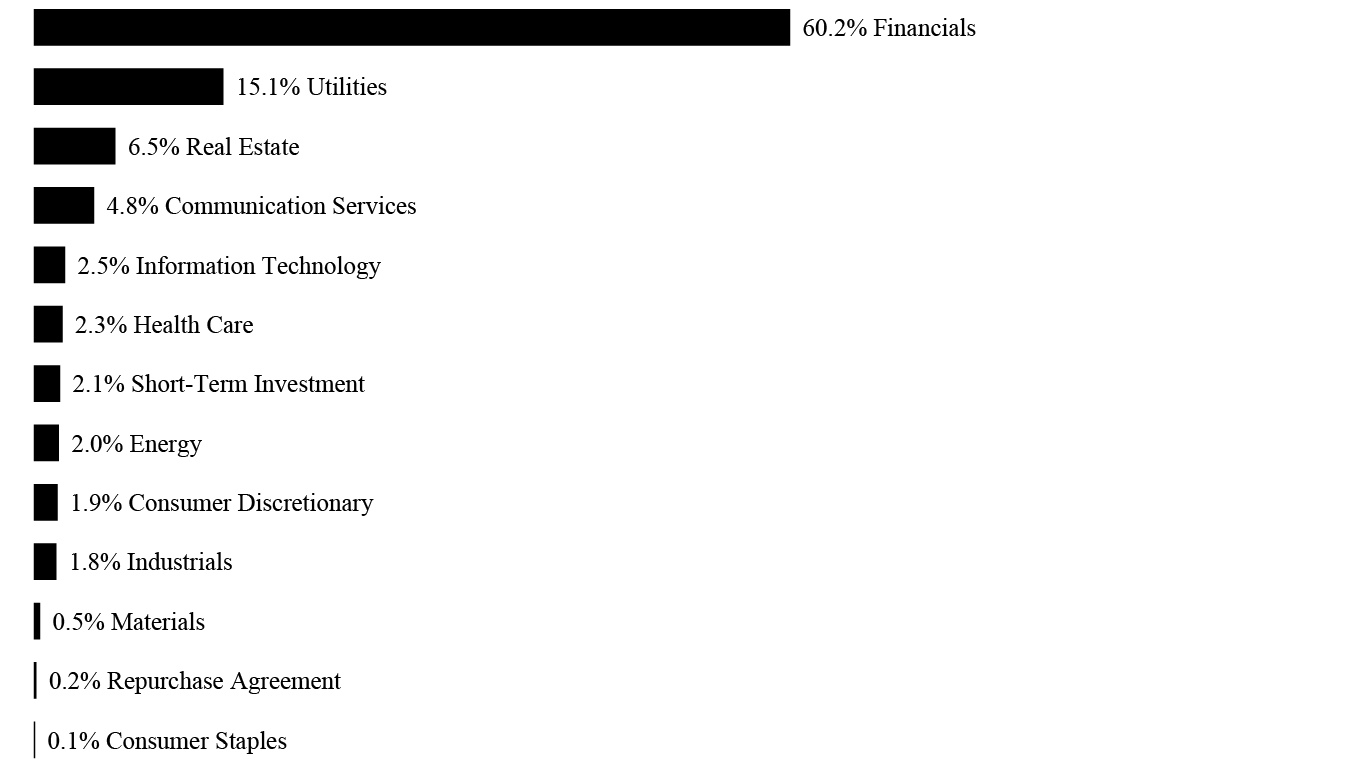
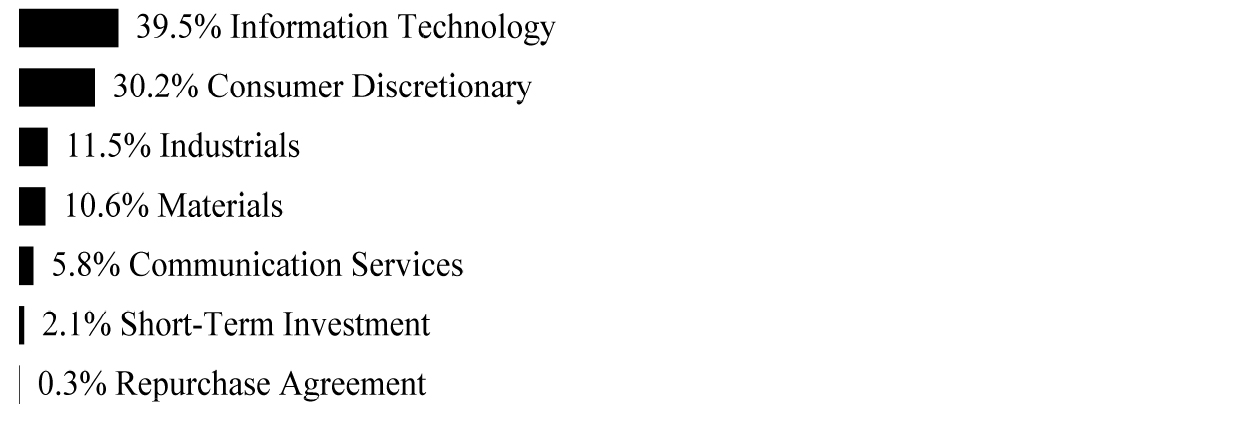
Sector Weightings †:
† Sector weightings percentages are based on the total market value of investments. Repurchase agreements purchased from cash collateral received for securities lending activity are included in total investments. Please see Notes 2 and 7 in Notes to Financial Statements for more detailed information.
| | | Shares | | | Value | |
| COMMON STOCK — 100.0% | | | | | | |
| AUSTRALIA— 6.3% | | | | | | |
| Financials — 0.8% | | | | | | |
HUB24 (A) | | | 200,813 | | | $ | 1,416,973 | |
Zip * (A) | | | 1,116,173 | | | | 2,778,430 | |
| | | | | | | | 4,195,403 | |
| Information Technology — 5.5% | | | | | | | | |
Afterpay * (A) | | | 784,231 | | | | 24,680,309 | |
IRESS | | | 539,897 | | | | 4,017,475 | |
| | | | | | | | 28,697,784 | |
TOTAL AUSTRALIA | | | | | | | 32,893,187 | |
| BRAZIL— 5.7% | | | | | | | | |
| Information Technology — 5.7% | | | | | | | | |
Pagseguro Digital, Cl A * | | | 503,514 | | | | 15,976,499 | |
StoneCo, Cl A * | | | 450,606 | | | | 14,275,198 | |
TOTAL BRAZIL | | | | | | | 30,251,697 | |
| CHINA— 0.1% | | | | | | | | |
| Financials — 0.1% | | | | | | | | |
Yiren Digital ADR * (A) | | | 199,594 | | | | 762,449 | |
| | |
| Schedule of Investments |
| May 31, 2020 (Unaudited) |
| | |
| | | Shares | | | Value | |
| COMMON STOCK — continued | | | | | | | | |
| DENMARK— 2.6% | | | | | | | | |
| Information Technology — 2.6% | | | | | | | | |
SimCorp | | | 126,055 | | | $ | 13,874,008 | |
| GERMANY— 4.7% | | | | | | | | |
| Financials — 1.7% | | | | | | | | |
Hypoport * | | | 19,701 | | | | 8,765,739 | |
| Information Technology — 3.0% | | | | | | | | |
Wirecard (A) | | | 152,369 | | | | 16,026,710 | |
TOTAL GERMANY | | | | | | | 24,792,449 | |
| ITALY— 5.1% | | | | | | | | |
| Information Technology — 5.1% | | | | | | | | |
Nexi * | | | 1,631,745 | | | | 26,808,536 | |
| JAPAN— 0.2% | | | | | | | | |
| Information Technology — 0.2% | | | | | | | | |
Metaps *(A) | | | 133,830 | | | | 968,927 | |
| NETHERLANDS— 8.4% | | | | | | | | |
| Information Technology — 8.4% | | | | | | | | |
Adyen * | | | 33,652 | | | | 44,282,888 | |
| NEW ZEALAND— 4.7% | | | | | | | | |
| Information Technology — 4.7% | | | | | | | | |
Xero * | | | 438,281 | | | | 24,807,645 | |
| SWITZERLAND— 3.9% | | | | | | | | |
| Financials — 0.4% | | | | | | | | |
Leonteq | | | 58,378 | | | | 2,090,354 | |
| Information Technology — 3.5% | | | | | | | | |
Temenos (A) | | | 120,724 | | | | 18,434,694 | |
TOTAL SWITZERLAND | | | | | | | 20,525,048 | |
| | |
| Schedule of Investments |
| May 31, 2020 (Unaudited) |
| | |
| | | Shares | | | Value | |
| COMMON STOCK — continued | | | | | | | | |
| UNITED STATES— 58.3% | | | | | | | | |
| Financials — 4.2% | | | | | | | | |
Blucora * | | | 148,985 | | | $ | 1,810,168 | |
LendingClub * | | | 274,182 | | | | 1,466,874 | |
LendingTree * (A) | | | 39,942 | | | | 10,385,718 | |
On Deck Capital * | | | 340,065 | | | | 254,335 | |
Virtu Financial, Cl A (A) | | | 333,864 | | | | 7,962,657 | |
| | | | | | | | 21,879,752 | |
| Health Care — 2.3% | | | | | | | | |
HealthEquity * | | | 194,594 | | | | 12,058,990 | |
| Information Technology — 51.8% | | | | | | | | |
Black Knight * | | | 356,509 | | | | 27,444,063 | |
Bottomline Technologies * | | | 134,571 | | | | 6,809,293 | |
Envestnet * | | | 161,029 | | | | 11,692,316 | |
| Fidelity National Information Services | | | 209,340 | | | | 29,062,672 | |
Fiserv * | | | 570,898 | | | | 60,954,780 | |
GreenSky, Cl A * (A) | | | 197,885 | | | | 795,498 | |
Guidewire Software * | | | 218,380 | | | | 22,401,420 | |
Intuit | | | 97,229 | | | | 28,227,522 | |
Mitek Systems * | | | 152,329 | | | | 1,421,230 | |
PayPal Holdings * | | | 218,228 | | | | 33,827,522 | |
Square, Cl A * | | | 348,284 | | | | 28,238,867 | |
SS&C Technologies Holdings | | | 373,298 | | | | 21,612,088 | |
| | | | | | | | 272,487,271 | |
TOTAL UNITED STATES | | | | | | | 306,426,013 | |
| TOTAL COMMON STOCK | | | | | | | | |
(Cost $457,875,233) | | | | | | | 526,392,847 | |
| | | | | | | | | |
SHORT-TERM INVESTMENT(B)(C) — 7.2% | | | | | | | | |
| Fidelity Investments Money Market Government Portfolio, Cl Institutional, 0.080% | | | | | | | | |
(Cost $37,918,708) | | | 37,918,708 | | | | 37,918,708 | |
| | |
| Schedule of Investments |
| May 31, 2020 (Unaudited) |
| | |
| | | Face Amount | | | Value | |
REPURCHASE AGREEMENT(B) — 0.8% | | | | | | | | |
| BNP Paribas | | | | | | | | |
| 0.050%, dated 05/29/20, to be repurchased on 06/01/20, repurchase price $4,451,183 (collateralized by U.S. Treasury Obligations, ranging in par value $541,577 - $3,992,978, 1.500%, 08/15/2026, with a total market value of $4,534,555) | | | | | | | | |
(Cost $4,451,165) | | $ | 4,451,165 | | | $ | 4,451,165 | |
| TOTAL INVESTMENTS — 108.0% | | | | | | | | |
(Cost $500,245,106) | | | | | | $ | 568,762,720 | |
Percentages are based on Net Assets of $526,579,348.
| * | Non-income producing security. |
| (A) | This security or a partial position of this security is on loan at May 31, 2020. The total value of securities on loan at May 31, 2020 was $40,174,322. |
| (B) | Security was purchased with cash collateral held from securities on loan. The total value of such securities as of May 31, 2020 was $42,369,873. |
| (C) | The rate reported on the Schedule of Investments is the 7-day effective yield as of May 31, 2020. |
ADR — American Depositary Receipt
Cl — Class
The following is a summary of the level of inputs used as of May 31, 2020, in valuing the Fund’s investments carried at value:
| Investments in Securities | | Level 1 | | | Level 2 | | | Level 3 | | | Total | |
| Common Stock | | $ | 526,392,847 | | | $ | — | | | $ | — | | | $ | 526,392,847 | |
| Short-Term Investment | | | 37,918,708 | | | | — | | | | — | | | | 37,918,708 | |
| Repurchase Agreement | | | — | | | | 4,451,165 | | | | — | | | | 4,451,165 | |
| Total Investments in Securities | | $ | 564,311,555 | | | $ | 4,451,165 | | | $ | — | | | $ | 568,762,720 | |
For the period ended May 31, 2020, there were no transfers in or out of Level 3.
| | |
| Schedule of Investments |
| May 31, 2020 (Unaudited) |
| Global X Internet of Things ETF | |
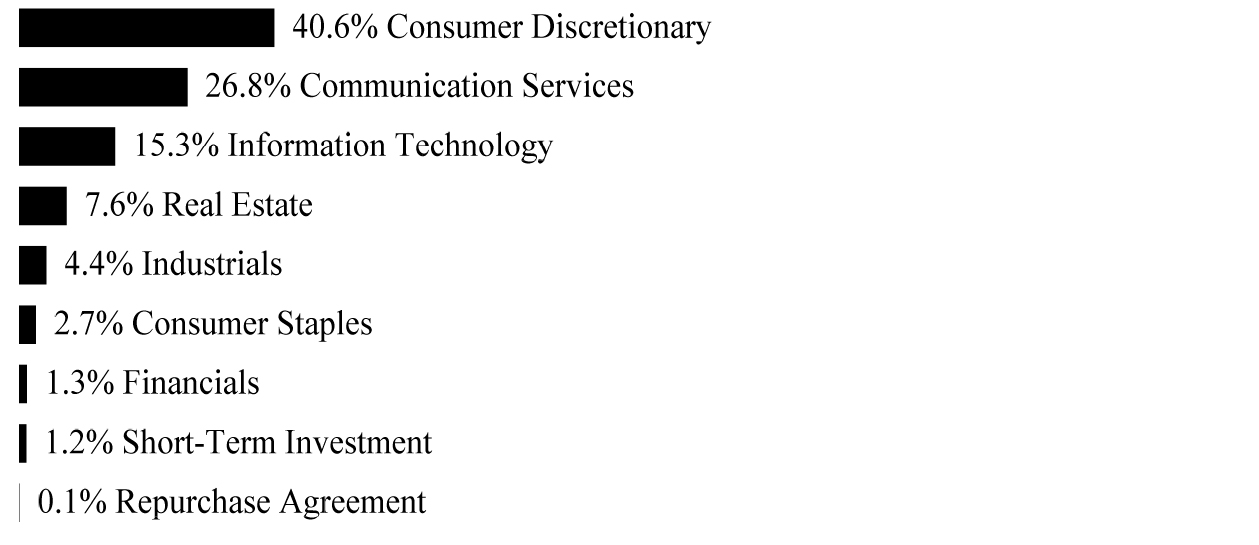
Sector Weightings †:
† Sector weightings percentages are based on the total market value of investments. Repurchase agreements purchased from cash collateral received for securities lending activity are included in total investments. Please see Notes 2 and 7 in Notes to Financial Statements for more detailed information.
| | | Shares | | | Value | |
| COMMON STOCK — 99.7% | | | | | | |
| AUSTRIA— 3.0% | | | | | | |
| Information Technology — 3.0% | | | | | | |
AMS* | | | 342,550 | | | $ | 5,152,334 | |
| CANADA— 0.2% | | | | | | | | |
| Information Technology — 0.2% | | | | | | | | |
Sierra Wireless * (A) | | | 43,361 | | | | 379,842 | |
| CHINA— 2.2% | | | | | | | | |
| Information Technology — 2.2% | | | | | | | | |
Xiaomi, Cl B * | | | 2,459,770 | | | | 3,814,532 | |
| FRANCE— 3.3% | | | | | | | | |
| Industrials — 3.3% | | | | | | | | |
Legrand | | | 29,969 | | | | 2,043,492 | |
Schneider Electric | | | 35,359 | | | | 3,509,941 | |
TOTAL FRANCE | | | | | | | 5,553,433 | |
| | |
| Schedule of Investments |
| May 31, 2020 (Unaudited) |
| Global X Internet of Things ETF | |
| | | Shares | | | Value | |
| COMMON STOCK — continued | | | | | | | | |
| ITALY— 0.5% | | | | | | | | |
| Information Technology — 0.5% | | | | | | | | |
Datalogic | | | 73,098 | | | $ | 919,620 | |
| JAPAN— 1.2% | | | | | | | | |
| Communication Services — 0.2% | | | | | | | | |
And Factory * (A) | | | 24,760 | | | | 288,888 | |
| Information Technology — 1.0% | | | | | | | | |
Nippon Ceramic | | | 33,810 | | | | 648,364 | |
Renesas Electronics * | | | 190,600 | | | | 988,958 | |
| | | | | | | | 1,637,322 | |
TOTAL JAPAN | | | | | | | 1,926,210 | |
| NETHERLANDS— 1.8% | | | | | | | | |
| Information Technology — 1.8% | | | | | | | | |
NXP Semiconductors | | | 31,897 | | | | 3,065,302 | |
| NORWAY— 0.9% | | | | | | | | |
| Information Technology — 0.9% | | | | | | | | |
Nordic Semiconductor * | | | 224,143 | | | | 1,468,898 | |
| SWEDEN— 0.3% | | | | | | | | |
| Information Technology — 0.3% | | | | | | | | |
Fingerprint Cards, Cl B * | | | 236,114 | | | | 487,729 | |
| SWITZERLAND— 11.2% | | | | | | | | |
| Consumer Discretionary — 0.1% | | | | | | | | |
Garrett Motion * | | | 29,059 | | | | 150,235 | |
| Industrials — 1.8% | | | | | | | | |
ABB | | | 159,051 | | | | 3,127,379 | |
| Information Technology — 9.3% | | | | | | | | |
Landis+Gyr Group * | | | 36,891 | | | | 2,426,888 | |
STMicroelectronics | | | 547,605 | | | | 13,455,611 | |
| | | | | | | | 15,882,499 | |
| | |
| Schedule of Investments |
| May 31, 2020 (Unaudited) |
| Global X Internet of Things ETF | |
| | | Shares | | | Value | |
| COMMON STOCK — continued | | | | | | | | |
TOTAL SWITZERLAND | | | | | | $ | 19,160,113 | |
| TAIWAN— 7.4% | | | | | | | | |
| Information Technology — 7.4% | | | | | | | | |
Advantech | | | 871,743 | | | | 8,623,070 | |
eMemory Technology | | | 93,762 | | | | 1,139,821 | |
MediaTek | | | 178,500 | | | | 2,752,556 | |
TOTAL TAIWAN | | | | | | | 12,515,447 | |
| UNITED KINGDOM— 0.4% | | | | | | | | |
| Information Technology — 0.4% | | | | | | | | |
Spirent Communications | | | 250,690 | | | | 770,167 | |
| UNITED STATES— 67.3% | | | | | | | | |
| Communication Services — 0.2% | | | | | | | | |
ORBCOMM * | | | 95,142 | | | | 260,689 | |
| Consumer Discretionary — 6.1% | | | | | | | | |
Garmin | | | 114,748 | | | | 10,346,827 | |
| Health Care — 13.5% | | | | | | | | |
DexCom * | | | 60,266 | | | | 22,799,230 | |
Senseonics Holdings * (A) | | | 217,600 | | | | 101,554 | |
| | | | | | | | 22,900,784 | |
| Industrials — 14.5% | | | | | | | | |
ADT (A) | | | 943,983 | | | | 6,683,400 | |
Emerson Electric | | | 47,703 | | | | 2,910,837 | |
Honeywell International | | | 17,723 | | | | 2,584,900 | |
Johnson Controls International | | | 78,721 | | | | 2,472,627 | |
Resideo Technologies * | | | 20,907 | | | | 147,603 | |
Rockwell Automation | | | 13,301 | | | | 2,875,144 | |
Sensata Technologies Holding * | | | 193,621 | | | | 6,902,589 | |
| | | | | | | | 24,577,100 | |
| | |
| Schedule of Investments |
| May 31, 2020 (Unaudited) |
| Global X Internet of Things ETF | |
| | | Shares | | | Value | |
| COMMON STOCK — continued | | | | | | | | |
| Information Technology — 33.0% | | | | | | | | |
Alarm.com Holdings * | | | 60,272 | | | $ | 2,850,263 | |
Ambarella * | | | 40,816 | | | | 2,315,900 | |
Analog Devices | | | 27,764 | | | | 3,135,944 | |
Arlo Technologies * | | | 110,168 | | | | 243,471 | |
Badger Meter | | | 36,299 | | | | 2,221,136 | |
Belden | | | 49,185 | | | | 1,674,257 | |
Cisco Systems | | | 54,435 | | | | 2,603,082 | |
Fitbit, Cl A * | | | 278,975 | | | | 1,768,702 | |
Impinj * (A) | | | 26,751 | | | | 691,513 | |
Intel | | | 66,247 | | | | 4,168,924 | |
InterDigital | | | 39,556 | | | | 2,174,393 | |
| International Business Machines | | | 22,507 | | | | 2,811,124 | |
Itron * | | | 49,067 | | | | 3,160,895 | |
NETGEAR * | | | 39,239 | | | | 1,009,619 | |
QUALCOMM | | | 42,980 | | | | 3,476,222 | |
Rambus * | | | 137,172 | | | | 2,131,653 | |
Silicon Laboratories * | | | 54,070 | | | | 5,064,196 | |
Skyworks Solutions | | | 123,688 | | | | 14,661,977 | |
| | | | | | | | 56,163,271 | |
TOTAL UNITED STATES | | | | | | | 114,248,671 | |
| TOTAL COMMON STOCK | | | | | | | | |
(Cost $154,580,984) | | | | | | | 169,462,298 | |
| | | | | | | | | |
SHORT-TERM INVESTMENT(B)(C) — 2.3% | | | | | | | | |
| Fidelity Investments Money Market Government Portfolio, Cl Institutional, 0.080% | | | | | | | | |
(Cost $3,938,827) | | | 3,938,827 | | | | 3,938,827 | |
| | | | | | | | | |
| | |
| Schedule of Investments |
| May 31, 2020 (Unaudited) |
| Global X Internet of Things ETF | |
| | | Face Amount | | | Value | |
REPURCHASE AGREEMENT(B) — 0.3% | | | | | | | | |
| BNP Paribas | | | | | | | | |
| 0.050%, dated 05/29/20, to be repurchased on 06/01/20, repurchase price $462,370 (collateralized by U.S. Treasury Obligations, ranging in par value $56,257 - $414,773, 1.500%, 08/15/2026, with a total market value of $471,030) | | | | | | | | |
(Cost $462,367) | | $ | 462,367 | | | $ | 462,367 | |
| TOTAL INVESTMENTS — 102.3% | | | | | | | | |
(Cost $158,982,178) | | | | | | $ | 173,863,492 | |
Percentages are based on Net Assets of $170,036,618.
| * | Non-income producing security. |
| (A) | This security or a partial position of this security is on loan at May 31, 2020. The total value of securities on loan at May 31, 2020 was $4,293,915. |
| (B) | Security was purchased with cash collateral held from securities on loan. The total value of such securities as of May 31, 2020 was $4,401,194. |
| (C) | The rate reported on the Schedule of Investments is the 7-day effective yield as of May 31, 2020. |
Cl – Class
The following is a summary of the level of inputs used as of May 31, 2020, in valuing the Fund’s investments carried at value:
| Investments in Securities | | Level 1 | | | Level 2 | | | Level 3 | | | Total | |
| Common Stock | | $ | 164,507,945 | | | $ | 4,954,353 | | | $ | — | | | $ | 169,462,298 | |
| Short-Term Investment | | | 3,938,827 | | | | — | | | | — | | | | 3,938,827 | |
| Repurchase Agreement | | | — | | | | 462,367 | | | | — | | | | 462,367 | |
| Total Investments in Securities | | $ | 168,446,772 | | | $ | 5,416,720 | | | $ | — | | | $ | 173,863,492 | |
For the period ended May 31, 2020, there were no transfers in or out of Level 3.
| | |
| Schedule of Investments |
| May 31, 2020 (Unaudited) |
| Global X Cloud Computing ETF | |
Sector Weightings †:
† Sector weightings percentages are based on the total market value of investments.
| | | Shares | | | Value | |
| COMMON STOCK — 100.0% | | | | | | |
| CANADA— 4.1% | | | | | | |
| Information Technology — 4.1% | | | | | | |
Shopify, Cl A * | | | 36,837 | | | $ | 27,915,079 | |
| CHINA— 2.7% | | | | | | | | |
| Consumer Discretionary — 1.4% | | | | | | | | |
Alibaba Group Holding ADR * | | | 43,980 | | | | 9,121,012 | |
| Information Technology — 1.3% | | | | | | | | |
21Vianet Group ADR * | | | 509,954 | | | | 7,445,328 | |
Kingsoft | | | 492,700 | | | | 1,592,328 | |
| | | | | | | | 9,037,656 | |
TOTAL CHINA | | | | | | | 18,158,668 | |
| NEW ZEALAND— 3.8% | | | | | | | | |
| Information Technology — 3.8% | | | | | | | | |
Xero * | | | 447,692 | | | | 25,340,328 | |
| UNITED STATES— 89.4% | | | | | | | | |
| Communication Services — 4.5% | | | | | | | | |
Alphabet, Cl A * | | | 4,890 | | | | 7,009,913 | |
Netflix * | | | 55,536 | | | | 23,310,125 | |
| | | | | | | | 30,320,038 | |
| | |
| Schedule of Investments |
| May 31, 2020 (Unaudited) |
| Global X Cloud Computing ETF | |
| | | Shares | | | Value | |
| COMMON STOCK — continued | | | | | | |
| Consumer Discretionary — 1.7% | | | | | | |
Amazon.com * | | | 4,711 | | | $ | 11,506,005 | |
| Information Technology — 77.6% | | | | | | | | |
2U *
| | | 385,573 | | | | 14,061,847 | |
Akamai Technologies * | | | 238,598 | | | | 25,243,668 | |
Anaplan * | | | 570,490 | | | | 26,196,901 | |
Benefitfocus * | | | 193,145 | | | | 2,458,736 | |
Box, Cl A * | | | 913,799 | | | | 18,257,704 | |
Cornerstone OnDemand * | | | 386,556 | | | | 14,940,389 | |
Coupa Software * | | | 132,372 | | | | 30,115,954 | |
Dropbox, Cl A * | | | 1,108,215 | | | | 25,012,413 | |
Everbridge * | | | 208,376 | | | | 30,477,074 | |
| International Business Machines | | | 14,358 | | | | 1,793,314 | |
Microsoft | | | 64,987 | | | | 11,908,868 | |
Mimecast * | | | 379,088 | | | | 15,838,297 | |
Paycom Software * | | | 89,339 | | | | 26,554,231 | |
Paylocity Holding * | | | 203,534 | | | | 26,460,438 | |
Proofpoint * | | | 191,475 | | | | 22,262,798 | |
Qualys * | | | 221,092 | | | | 25,496,329 | |
RealPage * | | | 361,466 | | | | 24,514,624 | |
salesforce.com * | | | 143,921 | | | | 25,155,952 | |
SPS Commerce * | | | 212,249 | | | | 14,466,892 | |
Twilio, Cl A * | | | 207,637 | | | | 41,029,071 | |
Workday, Cl A * | | | 151,440 | | | | 27,778,639 | |
Workiva, Cl A * | | | 232,890 | | | | 10,372,921 | |
Zoom Video Communications, Cl A * | | | 172,451 | | | | 30,951,505 | |
Zscaler * | | | 347,502 | | | | 34,086,471 | |
| | | | | | | | 525,435,036 | |
| Real Estate — 5.6% | | | | | | | | |
CoreSite Realty ‡ | | | 33,567 | | | | 4,189,833 | |
CyrusOne ‡ | | | 102,042 | | | | 7,585,802 | |
| | |
| Schedule of Investments |
| May 31, 2020 (Unaudited) |
| Global X Cloud Computing ETF | |
| | | Shares | | | Value | |
| COMMON STOCK — continued | | | | | | | | |
| Real Estate — continued | | | | | | | | |
Digital Realty Trust ‡ | | | 155,941 | | | $ | 22,386,890 | |
QTS Realty Trust, Cl A ‡ | | | 53,368 | | | | 3,661,045 | |
| | | | | | | | 37,823,570 | |
TOTAL UNITED STATES | | | | | | | 605,084,649 | |
| TOTAL COMMON STOCK | | | | | | | | |
(Cost $575,080,705) | | | | | | | 676,498,724 | |
| TOTAL INVESTMENTS — 100.0% | | | | | | | | |
(Cost $575,080,705) | | | | | | $ | 676,498,724 | |
Percentages are based on Net Assets of $676,825,289.
| * | Non-income producing security. |
| ‡ | Real Estate Investment Trust |
ADR – American Depository Receipt
Cl – Class
The following is a summary of the level of inputs used as of May 31, 2020, in valuing the Fund’s investments carried at value:
| Investments in Securities | | Level 1 | | | Level 2 | | | Level 3 | | | Total | |
| Common Stock | | $ | 674,906,396 | | | $ | 1,592,328 | | | $ | — | | | $ | 676,498,724 | |
| Total Investments in Securities | | $ | 674,906,396 | | | $ | 1,592,328 | | | $ | — | | | $ | 676,498,724 | |
For the period ended May 31, 2020, there were no transfers in or out of Level 3.
| | |
| Schedule of Investments |
| May 31, 2020 (Unaudited) |
| Global X Future Analytics Tech ETF | |
Sector Weightings †:
† Sector weightings percentages are based on the total market value of investments. Repurchase agreements purchased from cash collateral received for securities lending activity are included in total investments. Please see Notes 2 and 7 in Notes to Financial Statements for more detailed information.
| | | Shares | | | Value | |
| COMMON STOCK — 100.0% | | | | | | |
| BRAZIL— 0.2% | | | | | | |
| Information Technology — 0.2% | | | | | | |
StoneCo, Cl A * | | | 3,111 | | | $ | 98,556 | |
| CANADA— 4.9% | | | | | | | | |
| Industrials — 1.3% | | | | | | | | |
Thomson Reuters | | | 8,756 | | | | 589,804 | |
| Information Technology — 3.6% | | | | | | | | |
BlackBerry * (A) | | | 20,590 | | | | 95,538 | |
Open Text | | | 4,723 | | | | 195,453 | |
Shopify, Cl A * | | | 1,816 | | | | 1,376,165 | |
| | | | | | | | 1,667,156 | |
TOTAL CANADA | | | | | | | 2,256,960 | |
| CHINA— 11.5% | | | | | | | | |
| Communication Services — 4.5% | | | | | | | | |
Baidu ADR * | | | 4,805 | | | | 511,973 | |
Tencent Holdings | | | 27,780 | | | | 1,470,896 | |
Tencent Music Entertainment Group ADR * | | | 10,384 | | | | 134,161 | |
| | | | | | | | 2,117,030 | |
| | |
| Schedule of Investments |
| May 31, 2020 (Unaudited) |
| Global X Future Analytics Tech ETF | |
| | | Shares | | | Value | |
| COMMON STOCK — continued | | | | | | | | |
| Consumer Discretionary — 7.0% | | | | | | | | |
Alibaba Group Holding ADR * | | | 6,339 | | | $ | 1,314,645 | |
Meituan Dianping, Cl B * | | | 104,500 | | | | 1,977,829 | |
| | | | | | | | 3,292,474 | |
TOTAL CHINA | | | | | | | 5,409,504 | |
| GERMANY— 3.8% | | | | | | | | |
| Industrials — 2.5% | | | | | | | | |
Siemens | | | 10,803 | | | | 1,184,004 | |
| Information Technology — 1.3% | | | | | | | | |
Infineon Technologies | | | 21,889 | | | | 459,109 | |
Software | | | 3,713 | | | | 143,646 | |
| | | | | | | | 602,755 | |
TOTAL GERMANY | | | | | | | 1,786,759 | |
| ISRAEL— 0.5% | | | | | | | | |
| Information Technology — 0.5% | | | | | | | | |
Wix.com * | | | 976 | | | | 216,994 | |
| JAPAN— 0.5% | | | | | | | | |
| Industrials — 0.5% | | | | | | | | |
Toshiba | | | 7,970 | | | | 217,791 | |
| NEW ZEALAND— 0.3% | | | | | | | | |
| Information Technology — 0.3% | | | | | | | | |
Xero * | | | 2,472 | | | | 139,921 | |
| SOUTH KOREA— 3.1% | | | | | | | | |
| Information Technology — 3.1% | | | | | | | | |
Samsung Electronics | | | 26,532 | | | | 1,086,174 | |
SK Hynix | | | 5,437 | | | | 357,798 | |
TOTAL SOUTH KOREA | | | | | | | 1,443,972 | |
| | |
| Schedule of Investments |
| May 31, 2020 (Unaudited) |
| Global X Future Analytics Tech ETF | |
| | | Shares | | | Value | |
| COMMON STOCK — continued | | | | | | | | |
| SWEDEN— 0.7% | | | | | | | | |
| Information Technology — 0.7% | | | | | | | | |
Hexagon, Cl B | | | 6,149 | | | $ | 337,667 | |
| SWITZERLAND— 0.8% | | | | | | | | |
| Information Technology — 0.8% | | | | | | | | |
STMicroelectronics | | | 15,947 | | | | 391,846 | |
| TAIWAN— 0.7% | | | | | | | | |
| Information Technology — 0.7% | | | | | | | | |
Macronix International | | | 103,400 | | | | 110,546 | |
Phison Electronics | | | 11,590 | | | | 106,153 | |
Winbond Electronics | | | 213,600 | | | | 97,818 | |
TOTAL TAIWAN | | | | | | | 314,517 | |
| UNITED KINGDOM— 1.4% | | | | | | | | |
| Industrials — 1.2% | | | | | | | | |
Experian | | | 15,908 | | | | 553,231 | |
| Information Technology — 0.2% | | | | | | | | |
Computacenter | | | 5,933 | | | | 117,652 | |
TOTAL UNITED KINGDOM | | | | | | | 670,883 | |
| UNITED STATES— 71.6% | | | | | | | | |
| Communication Services — 11.3% | | | | | | | | |
Alphabet, Cl A * | | | 937 | | | | 1,343,208 | |
Facebook, Cl A * | | | 6,323 | | | | 1,423,244 | |
Netflix * | | | 3,971 | | | | 1,666,748 | |
Snap, Cl A * | | | 19,915 | | | | 377,190 | |
Twitter * | | | 13,585 | | | | 420,728 | |
| | |
| Schedule of Investments |
| May 31, 2020 (Unaudited) |
| Global X Future Analytics Tech ETF | |
| | | Shares | | | Value | |
| COMMON STOCK — continued | | | | | | | | |
| Communication Services — continued | | | | | | | | |
Yelp, Cl A * | | | 3,818 | | | $ | 83,003 | |
| | | | | | | | 5,314,121 | |
| Consumer Discretionary — 5.2% | | | | | | | | |
Amazon.com * | | | 738 | | | | 1,802,469 | |
eBay | | | 14,239 | | | | 648,444 | |
| | | | | | | | 2,450,913 | |
| Industrials — 5.7% | | | | | | | | |
Nielsen Holdings | | | 6,418 | | | | 89,146 | |
Northrop Grumman | | | 2,976 | | | | 997,555 | |
Uber Technologies * | | | 30,113 | | | | 1,093,704 | |
Verisk Analytics, Cl A | | | 2,868 | | | | 495,247 | |
| | | | | | | | 2,675,652 | |
| Information Technology — 49.4% | | | | | | | | |
Adobe * | | | 3,949 | | | | 1,526,683 | |
Advanced Micro Devices * | | | 19,671 | | | | 1,058,300 | |
Ambarella * | | | 2,260 | | | | 128,232 | |
Anaplan * | | | 2,411 | | | | 110,713 | |
Cisco Systems | | | 28,355 | | | | 1,355,936 | |
Cloudera * | | | 11,987 | | | | 122,867 | |
Cornerstone OnDemand * | | | 2,329 | | | | 90,016 | |
Crowdstrike Holdings, Cl A * | | | 2,229 | | | | 195,729 | |
DXC Technology | | | 4,462 | | | | 63,405 | |
Envestnet * | | | 1,964 | | | | 142,606 | |
Fair Isaac * | | | 505 | | | | 203,338 | |
FireEye * | | | 8,340 | | | | 104,083 | |
Fortinet * | | | 2,991 | | | | 416,347 | |
| | |
| Schedule of Investments |
| May 31, 2020 (Unaudited) |
| Global X Future Analytics Tech ETF | |
| | | Shares | | | Value | |
| COMMON STOCK — continued | | | | | | | | |
| Information Technology — continued | | | | | | | | |
Genpact | | | 3,311 | | | $ | 119,030 | |
Hewlett Packard Enterprise | | | 22,609 | | | | 219,533 | |
HubSpot * | | | 745 | | | | 148,955 | |
Intel | | | 21,935 | | | | 1,380,370 | |
| International Business Machines | | | 9,721 | | | | 1,214,153 | |
Juniper Networks | | | 5,830 | | | | 141,436 | |
Lattice Semiconductor * | | | 6,099 | | | | 151,682 | |
LivePerson * | | | 3,201 | | | | 119,877 | |
LogMeIn | | | 1,591 | | | | 135,076 | |
Microchip Technology | | | 4,165 | | | | 399,923 | |
Micron Technology * | | | 7,758 | | | | 371,686 | |
Microsoft | | | 8,330 | | | | 1,526,473 | |
NetApp | | | 3,985 | | | | 177,492 | |
NortonLifeLock | | | 10,899 | | | | 248,279 | |
Nuance Communications * | | | 6,926 | | | | 158,467 | |
NVIDIA | | | 5,493 | | | | 1,950,125 | |
Oracle | | | 25,267 | | | | 1,358,607 | |
Pegasystems | | | 1,560 | | | | 148,387 | |
PROS Holdings * | | | 2,127 | | | | 82,847 | |
PTC * | | | 2,016 | | | | 153,982 | |
Pure Storage, Cl A * | | | 7,124 | | | | 125,454 | |
QUALCOMM | | | 15,100 | | | | 1,221,288 | |
salesforce.com * | | | 7,550 | | | | 1,319,665 | |
Seagate Technology | | | 4,592 | | | | 243,560 | |
ServiceNow * | | | 3,330 | | | | 1,291,807 | |
Splunk * | | | 2,730 | | | | 507,343 | |
Synopsys * | | | 2,634 | | | | 476,517 | |
| | |
| Schedule of Investments |
| May 31, 2020 (Unaudited) |
| Global X Future Analytics Tech ETF | |
| | | Shares/Face Amount | | | Value | |
| COMMON STOCK — continued | | | | | | | | |
| Information Technology — continued | | | | | | | | |
Teradata * | | | 5,151 | | | $ | 110,283 | |
Trade Desk, Cl A * | | | 694 | | | | 216,223 | |
Twilio, Cl A * | | | 2,177 | | | | 430,175 | |
Verint Systems * | | | 2,352 | | | | 109,062 | |
Workday, Cl A * | | | 2,924 | | | | 536,349 | |
Xilinx | | | 4,400 | | | | 404,580 | |
Zebra Technologies, Cl A * | | | 941 | | | | 245,902 | |
Zendesk * | | | 1,957 | | | | 167,813 | |
| | | | | | | | 23,130,656 | |
TOTAL UNITED STATES | | | | | | | 33,571,342 | |
| TOTAL COMMON STOCK | | | | | | | | |
(Cost $40,857,440) | | | | | | | 46,856,712 | |
| | | | | | | | | |
SHORT-TERM INVESTMENT(B)(C) — 0.1% | | | | | | | | |
| Fidelity Investments Money Market Government Portfolio, Cl Institutional, 0.080% | | | | | | | | |
(Cost $64,776) | | | 64,776 | | | | 64,776 | |
| | | | | | | | | |
REPURCHASE AGREEMENT(B) — 0.0% | | | | | | | | |
| BNP Paribas | | | | | | | | |
| 0.050%, dated 05/29/20, to be repurchased on 06/01/20, repurchase price $7,604 (collateralized by U.S. Treasury Obligations, ranging in par value $925 - $6,821, 1.500%, 08/15/2026, with a total market value of $7,746) | | | | | | | | |
(Cost $7,604) | | $ | 7,604 | | | | 7,604 | |
| TOTAL INVESTMENTS — 100.1% | | | | | | | | |
(Cost $40,929,820) | | | | | | $ | 46,929,092 | |
Percentages are based on Net Assets of $46,868,278.
| | |
| Schedule of Investments |
| May 31, 2020 (Unaudited) |
| Global X Future Analytics Tech ETF | |
| * | Non-income producing security. |
| (A) | This security or a partial position of this security is on loan at May 31, 2020. The total value of securities on loan at May 31, 2020 was $71,456. |
| (B) | Security was purchased with cash collateral held from securities on loan. The total value of such securities as of May 31, 2020 was $72,380. |
| (C) | The rate reported on the Schedule of Investments is the 7-day effective yield as of May 31, 2020. |
ADR — American Depositary Receipt
Cl — Class
The following is a summary of the level of inputs used as of May 31, 2020, in valuing the Fund’s investments carried at value:
| Investments in Securities | | Level 1 | | | Level 2 | | | Level 3 | | | Total | |
| Common Stock | | $ | 45,204,376 | | | $ | 1,652,336 | | | $ | — | | | $ | 46,856,712 | |
| Short-Term Investment | | | 64,776 | | | | — | | | | — | | | | 64,776 | |
| Repurchase Agreement | | | — | | | | 7,604 | | | | — | | | | 7,604 | |
| Total Investments in Securities | | $ | 45,269,152 | | | $ | 1,659,940 | | | $ | — | | | $ | 46,929,092 | |
For the period ended May 31, 2020, there were no transfers in or out of Level 3.
| | |
| Schedule of Investments |
| May 31, 2020 (Unaudited) |
| Global X Autonomous & Electric Vehicles ETF | |
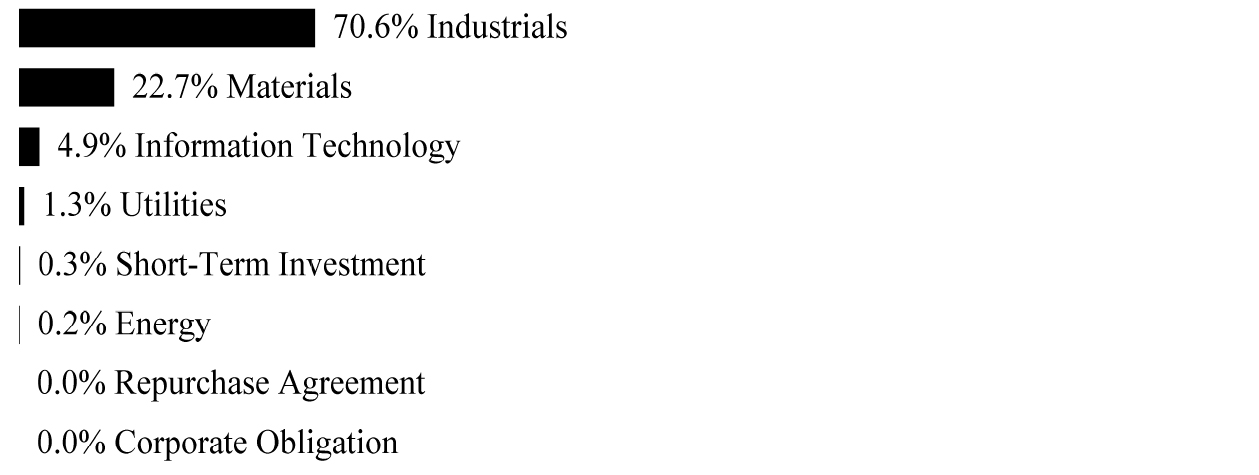
Sector Weightings †:
† Sector weightings percentages are based on the total market value of investments. Repurchase agreements purchased from cash collateral received for securities lending activity are included in total investments. Please see Notes 2 and 7 in Notes to Financial Statements for more detailed information.
| | | Shares | | | Value | |
| COMMON STOCK — 98.6% | | | | | | |
| AUSTRALIA— 1.2% | | | | | | |
| Materials — 1.2% | | | | | | |
Orocobre * (A) | | | 68,685 | | | $ | 107,144 | |
Pilbara Minerals * | | | 665,657 | | | | 114,884 | |
TOTAL AUSTRALIA | | | | | | | 222,028 | |
| BELGIUM— 1.0% | | | | | | | | |
| Materials — 1.0% | | | | | | | | |
Umicore | | | 4,383 | | | | 194,237 | |
| CANADA— 1.0% | | | | | | | | |
| Industrials — 1.0% | | | | | | | | |
Ballard Power Systems * | | | 17,612 | | | | 190,034 | |
| CHILE— 1.6% | | | | | | | | |
| Materials — 1.6% | | | | | | | | |
Lundin Mining | | | 31,892 | | | | 146,285 | |
| Sociedad Quimica y Minera de Chile ADR | | | 6,178 | | | | 150,558 | |
TOTAL CHILE | | | | | | | 296,843 | |
| | |
| Schedule of Investments |
| May 31, 2020 (Unaudited) |
| Global X Autonomous & Electric Vehicles ETF | |
| | | Shares | | | Value | |
| COMMON STOCK — continued | | | | | | | | |
| CHINA— 4.9% | | | | | | | | |
| Communication Services — 1.3% | | | | | | | | |
Baidu ADR * | | | 2,386 | | | $ | 254,228 | |
| Consumer Discretionary — 1.8% | | | | | | | | |
BYD, Cl H (A) | | | 33,300 | | | | 186,886 | |
Geely Automobile Holdings | | | 106,300 | | | | 145,372 | |
| | | | | | | | 332,258 | |
| Materials — 1.8% | | | | | | | | |
China Molybdenum, Cl H | | | 396,572 | | | | 121,770 | |
Ganfeng Lithium, Cl H | | | 60,700 | | | | 217,317 | |
| | | | | | | | 339,087 | |
TOTAL CHINA | | | | | | | 925,573 | |
| FRANCE— 0.6% | | | | | | | | |
| Consumer Discretionary — 0.6% | | | | | | | | |
Renault | | | 4,714 | | | | 105,947 | |
| GERMANY— 3.4% | | | | | | | | |
| Consumer Discretionary — 3.4% | | | | | | | | |
Bayerische Motoren Werke | | | 3,479 | | | | 203,555 | |
Continental * | | | 1,804 | | | | 177,470 | |
Daimler | | | 6,949 | | | | 258,017 | |
TOTAL GERMANY | | | | | | | 639,042 | |
| JAPAN— 7.5% | | | | | | | | |
| Consumer Discretionary — 6.7% | | | | | | | | |
Denso | | | 5,602 | | | | 214,804 | |
Honda Motor | | | 12,256 | | | | 316,710 | |
Nissan Motor | | | 40,404 | | | | 150,350 | |
Toyota Motor | | | 9,470 | | | | 593,770 | |
| | | | | | | | 1,275,634 | |
| | |
| Schedule of Investments |
| May 31, 2020 (Unaudited) |
| Global X Autonomous & Electric Vehicles ETF | |
| | | Shares | | | Value | |
| COMMON STOCK — continued | | | | | | | | |
| Industrials — 0.8% | | | | | | | | |
GS Yuasa | | | 8,350 | | | $ | 147,724 | |
TOTAL JAPAN | | | | | | | 1,423,358 | |
| LUXEMBOURG— 0.8% | | | | | | | | |
| Materials — 0.8% | | | | | | | | |
APERAM | | | 5,820 | | | | 160,228 | |
| NETHERLANDS— 2.0% | | | | | | | | |
| Consumer Discretionary — 0.7% | | | | | | | | |
TomTom * | | | 15,882 | | | | 134,706 | |
| Information Technology — 1.3% | | | | | | | | |
NXP Semiconductors | | | 2,473 | | | | 237,655 | |
TOTAL NETHERLANDS | | | | | | | 372,361 | |
| RUSSIA— 1.1% | | | | | | | | |
| Communication Services — 1.1% | | | | | | | | |
Yandex, Cl A * | | | 5,189 | | | | 208,753 | |
| SOUTH KOREA— 3.8% | | | | | | | | |
| Consumer Discretionary — 1.0% | | | | | | | | |
Hyundai Motor | | | 2,328 | | | | 184,217 | |
| Information Technology — 2.8% | | | | | | | | |
Samsung Electronics | | | 12,806 | | | | 524,256 | |
TOTAL SOUTH KOREA | | | | | | | 708,473 | |
| SWEDEN— 1.6% | | | | | | | | |
| Consumer Discretionary — 1.6% | | | | | | | | |
Autoliv | | | 2,593 | | | | 164,863 | |
Veoneer * (A) | | | 13,316 | | | | 143,546 | |
TOTAL SWEDEN | | | | | | | 308,409 | |
| | |
| Schedule of Investments |
| May 31, 2020 (Unaudited) |
| Global X Autonomous & Electric Vehicles ETF | |
| | | Shares | | | Value | |
| COMMON STOCK — continued | | | | | | | | |
| UNITED KINGDOM— 1.5% | | | | | | | | |
| Consumer Discretionary — 0.8% | | | | | | | | |
Fiat Chrysler Automobiles | | | 17,194 | | | $ | 151,896 | |
| Materials — 0.7% | | | | | | | | |
Johnson Matthey | | | 5,437 | | | | 142,030 | |
TOTAL UNITED KINGDOM | | | | | | | 293,926 | |
| UNITED STATES— 66.6% | | | | | | | | |
| Communication Services — 3.5% | | | | | | | | |
Alphabet, Cl A * | | | 464 | | | | 665,153 | |
| Consumer Discretionary — 13.1% | | | | | | | | |
American Axle & Manufacturing Holdings * | | | 19,742 | | | | 140,366 | |
Aptiv | | | 3,022 | | | | 227,708 | |
BorgWarner | | | 5,100 | | | | 163,965 | |
Dana | | | 11,450 | | | | 144,728 | |
Ford Motor | | | 34,992 | | | | 199,804 | |
General Motors | | | 10,470 | | | | 270,963 | |
Gentherm * | | | 3,921 | | | | 159,585 | |
Harley-Davidson | | | 5,617 | | | | 119,867 | |
Lear | | | 1,546 | | | | 163,953 | |
Tesla * | | | 885 | | | | 738,975 | |
Visteon * | | | 2,123 | | | | 152,856 | |
| | | | | | | | 2,482,770 | |
| Industrials — 9.9% | | | | | | | | |
Bloom Energy, Cl A * (A) | | | 18,991 | | | | 152,498 | |
EnerSys | | | 2,499 | | | | 158,187 | |
General Electric | | | 50,910 | | | | 334,479 | |
Honeywell International | | | 2,456 | | | | 358,207 | |
| Hyster-Yale Materials Handling | | | 2,870 | | | | 105,071 | |
ITT | | | 2,809 | | | | 162,079 | |
Johnson Controls International | | | 7,524 | | | | 236,329 | |
| | |
| Schedule of Investments |
| May 31, 2020 (Unaudited) |
| Global X Autonomous & Electric Vehicles ETF | |
| | | Shares | | | Value | |
| COMMON STOCK — continued | | | | | | | | |
| Industrials — continued | | | | | | | | |
Plug Power * (A) | | | 44,732 | | | $ | 188,322 | |
| Westinghouse Air Brake Technologies | | | 2,987 | | | | 182,416 | |
| | | | | | | | 1,877,588 | |
| Information Technology — 36.4% | | | | | | | | |
Advanced Micro Devices * | | | 8,047 | | | | 432,929 | |
Ambarella * | | | 2,901 | | | | 164,603 | |
Apple | | | 2,125 | | | | 675,623 | |
CEVA * | | | 6,177 | | | | 212,921 | |
Cisco Systems | | | 13,904 | | | | 664,889 | |
II-VI * | | | 5,141 | | | | 244,352 | |
Intel | | | 11,180 | | | | 703,557 | |
Maxim Integrated Products | | | 3,933 | | | | 226,855 | |
Micron Technology * | | | 7,689 | | | | 368,380 | |
Microsoft | | | 4,098 | | | | 750,959 | |
NVIDIA | | | 2,687 | | | | 953,939 | |
ON Semiconductor * | | | 8,601 | | | | 141,830 | |
QUALCOMM | | | 6,698 | | | | 541,734 | |
Rogers * | | | 1,373 | | | | 148,641 | |
Texas Instruments | | | 3,392 | | | | 402,766 | |
Xilinx | | | 2,798 | | | | 257,276 | |
| | | | | | | | 6,891,254 | |
| Materials — 3.7% | | | | | | | | |
Albemarle | | | 2,684 | | | | 205,380 | |
Allegheny Technologies * | | | 9,506 | | | | 82,512 | |
Carpenter Technology | | | 3,886 | | | | 90,816 | |
| Freeport-McMoRan Copper & Gold | | | 19,287 | | | | 174,933 | |
Livent * | | | 21,702 | | | | 146,271 | |
| | | | | | | | 699,912 | |
| | |
| Schedule of Investments |
| May 31, 2020 (Unaudited) |
| Global X Autonomous & Electric Vehicles ETF | |
| | | Shares/Face Amount | | | Value | |
| COMMON STOCK — continued | | | | | | | | |
TOTAL UNITED STATES | | | | | | $ | 12,616,677 | |
| TOTAL COMMON STOCK | | | | | | | | |
(Cost $20,432,827) | | | | | | | 18,665,889 | |
| | | | | | | | | |
| PREFERRED STOCK — 1.2% | | | | | | | | |
| GERMANY— 1.2% | | | | | | | | |
| Consumer Discretionary — 1.2% | | | | | | | | |
Volkswagen *(B) | | | | | | | | |
(Cost $326,845) | | | 1,609 | | | | 237,144 | |
| | | | | | | | | |
SHORT-TERM INVESTMENT(C)(D) — 2.2% | | | | | | | | |
| Fidelity Investments Money Market Government Portfolio, Cl Institutional, 0.080% | | | | | | | | |
(Cost $416,361) | | | 416,361 | | | | 416,361 | |
| | | | | | | | | |
REPURCHASE AGREEMENT(C) — 0.3% | | | | | | | | |
| BNP Paribas | | | | | | | | |
| 0.050%, dated 05/29/20, to be repurchased on 06/01/20, repurchase price $48,875 (collateralized by U.S. Treasury Obligations, ranging in par value $5,947 - $43,844, 1.500%, 08/15/2026, with a total market value of $49,791) | | | | | | | | |
(Cost $48,875) | | $ | 48,875 | | | | 48,875 | |
| TOTAL INVESTMENTS — 102.3% | | | | | | | | |
(Cost $21,224,908) | | | | | | $ | 19,368,269 | |
Percentages are based on Net Assets of $18,924,315.
| * | Non-income producing security. |
| (A) | This security or a partial position of this security is on loan at May 31, 2020. The total value of securities on loan at May 31, 2020 was $445,891. |
| (B) | There is currently no stated interest rate. |
| (C) | Security was purchased with cash collateral held from securities on loan. The total value of such securities as of May 31, 2020 was $465,236. |
| | |
| Schedule of Investments |
| May 31, 2020 (Unaudited) |
| Global X Autonomous & Electric Vehicles ETF | |
| (D) | The rate reported on the Schedule of Investments is the 7-day effective yield as of May 31, 2020. |
ADR — American Depositary Receipt
Cl — Class
The following is a summary of the level of inputs used as of May 31, 2020, in valuing the Fund’s investments carried at value:
| Investments in Securities | | Level 1 | | | Level 2 | | | Level 3 | | | Total | |
| Common Stock | | $ | 17,802,546 | | | $ | 863,343 | | | $ | — | | | $ | 18,665,889 | |
| Preferred Stock | | | 237,144 | | | | — | | | | — | | | | 237,144 | |
| Short-Term Investment | | | 416,361 | | | | — | | | | — | | | | 416,361 | |
| Repurchase Agreement | | | — | | | | 48,875 | | | | — | | | | 48,875 | |
| Total Investments in Securities | | $ | 18,456,051 | | | $ | 912,218 | | | $ | — | | | $ | 19,368,269 | |
For the period ended May 31, 2020, there were no transfers in or out of Level 3.
| | |
| Schedule of Investments |
| May 31, 2020 (Unaudited) |
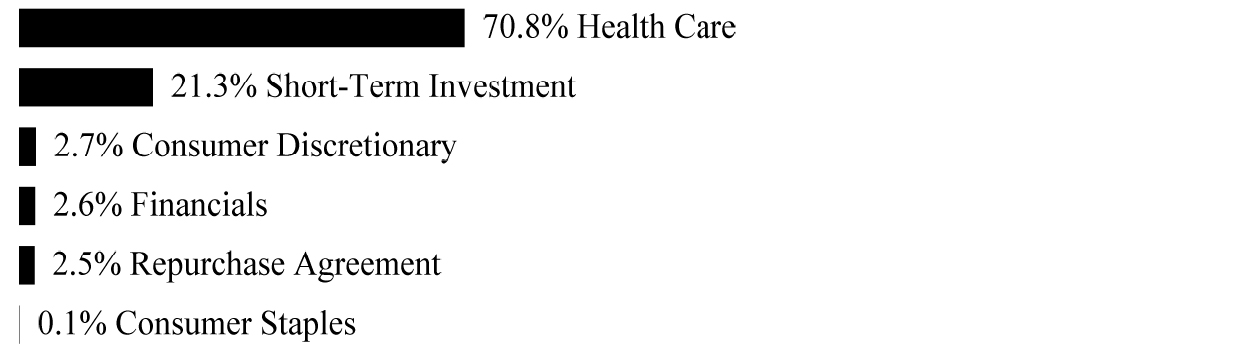
| Global X Genomics & Biotechnology ETF | |
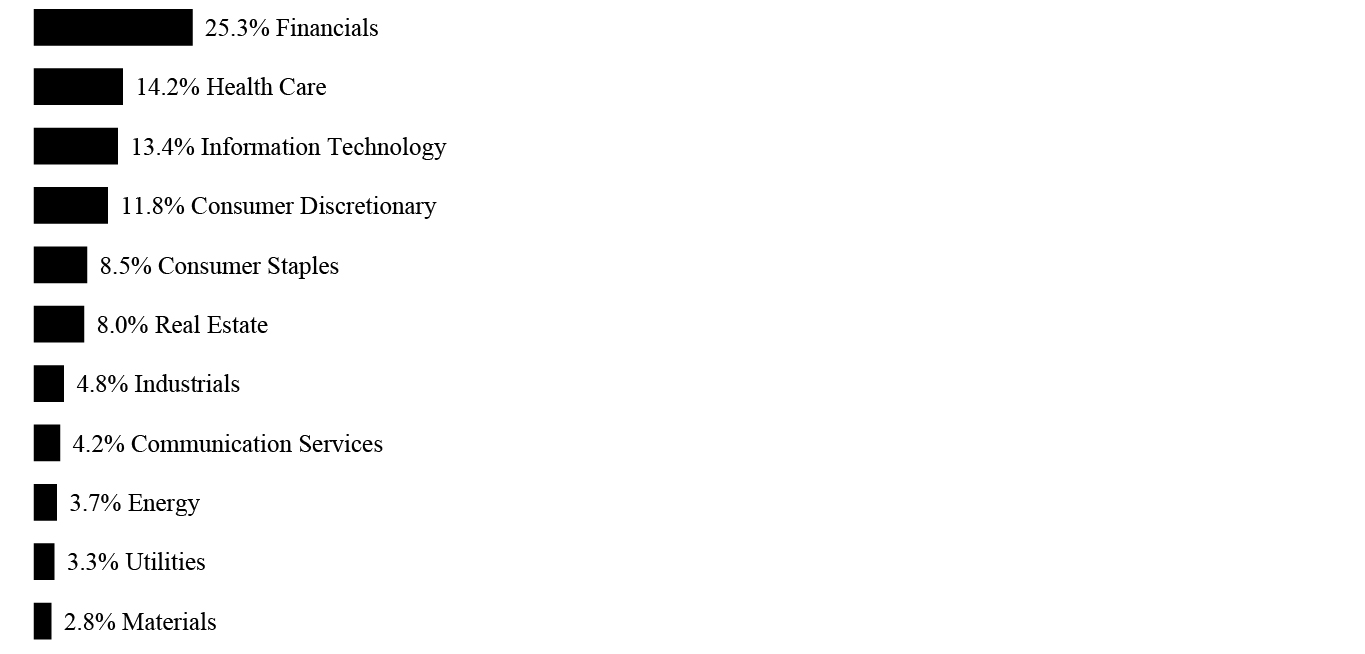
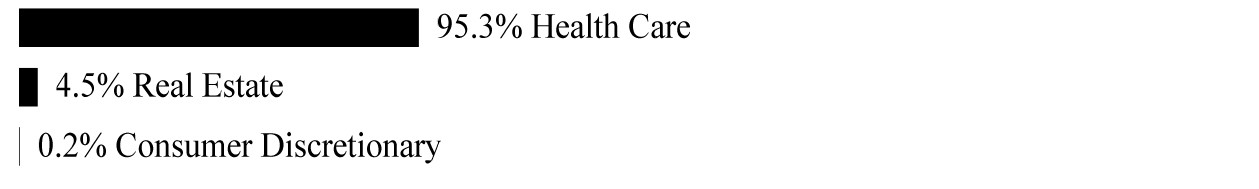
Sector Weightings †:
† Sector weightings percentages are based on the total market value of investments.
| | | Shares | | | Value | |
| COMMON STOCK — 99.9% | | | | | | |
| CHINA— 3.7% | | | | | | |
| Health Care — 3.7% | | | | | | |
Genscript Biotech * | | | 574,718 | | | $ | 1,260,509 | |
| JAPAN— 2.0% | | | | | | | | |
| Health Care — 2.0% | | | | | | | | |
Takara Bio | | | 26,360 | | | | 703,194 | |
| NETHERLANDS— 4.1% | | | | | | | | |
| Health Care — 4.1% | | | | | | | | |
ProQR Therapeutics * | | | 24,225 | | | | 134,691 | |
uniQure * | | | 19,025 | | | | 1,277,719 | |
TOTAL NETHERLANDS | | | | | | | 1,412,410 | |
| SWITZERLAND— 4.3% | | | | | | | | |
| Health Care — 4.3% | | | | | | | | |
CRISPR Therapeutics * | | | 23,239 | | | | 1,500,775 | |
| UNITED STATES— 85.8% | | | | | | | | |
| Health Care — 85.8% | | | | | | | | |
Adverum Biotechnologies * | | | 40,528 | | | | 836,093 | |
Agilent Technologies | | | 16,200 | | | | 1,427,868 | |
Allogene Therapeutics * | | | 29,327 | | | | 1,412,388 | |
Alnylam Pharmaceuticals * | | | 8,692 | | | | 1,175,767 | |
Arrowhead Pharmaceuticals * | | | 32,965 | | | | 1,062,792 | |
BioMarin Pharmaceutical * | | | 13,169 | | | | 1,403,157 | |
Bluebird Bio * | | | 21,910 | | | | 1,394,133 | |
Blueprint Medicines * | | | 17,359 | | | | 1,130,765 | |
CareDx * | | | 23,635 | | | | 759,156 | |
Dicerna Pharmaceuticals * | | | 34,878 | | | | 752,318 | |
| | |
| Schedule of Investments |
| May 31, 2020 (Unaudited) |
| Global X Genomics & Biotechnology ETF | |
| | | Shares | | | Value | |
| COMMON STOCK — continued | | | | | | | | |
| Health Care — continued | | | | | | | | |
Editas Medicine * | | | 30,625 | | | $ | 829,019 | |
Gilead Sciences | | | 7,426 | | | | 577,966 | |
Homology Medicines * | | | 23,401 | | | | 333,230 | |
Illumina * | | | 3,909 | | | | 1,419,162 | |
Intellia Therapeutics * | | | 22,163 | | | | 388,074 | |
Invitae * | | | 66,230 | | | | 1,113,989 | |
Luminex | | | 23,954 | | | | 746,407 | |
Myriad Genetics * | | | 41,368 | | | | 601,077 | |
NanoString Technologies * | | | 20,987 | | | | 640,733 | |
Natera * | | | 33,761 | | | | 1,480,420 | |
Pacific Biosciences of California * | | | 78,839 | | | | 277,513 | |
Precision BioSciences * | | | 19,702 | | | | 138,111 | |
PTC Therapeutics * | | | 24,472 | | | | 1,240,975 | |
QIAGEN * | | | 29,020 | | | | 1,270,786 | |
REGENXBIO * | | | 19,855 | | | | 747,739 | |
Rocket Pharmaceuticals * | | | 29,214 | | | | 549,515 | |
Sangamo Therapeutics * | | | 65,770 | | | | 735,966 | |
Sarepta Therapeutics * | | | 10,651 | | | | 1,621,828 | |
Sorrento Therapeutics * | | | 79,300 | | | | 400,465 | |
Ultragenyx Pharmaceutical * | | | 18,870 | | | | 1,291,840 | |
Veracyte * | | | 27,224 | | | | 678,967 | |
Vertex Pharmaceuticals * | | | 2,242 | | | | 645,606 | |
Voyager Therapeutics * | | | 13,177 | | | | 159,442 | |
WaVe Life Sciences * | | | 15,794 | | | | 160,783 | |
ZIOPHARM Oncology * | | | 112,107 | | | | 331,837 | |
| | |
| Schedule of Investments |
| May 31, 2020 (Unaudited) |
| Global X Genomics & Biotechnology ETF | |
| | | | | | | Value | |
| COMMON STOCK — continued | | | | | | | | |
TOTAL UNITED STATES | | | | | | $ | 29,735,887 | |
| TOTAL COMMON STOCK | | | | | | | | |
(Cost $31,057,668) | | | | | | | 34,612,775 | |
| TOTAL INVESTMENTS — 99.9% | | | | | | | | |
(Cost $31,057,668) | | | | | | $ | 34,612,775 | |
Percentages are based on Net Assets of $34,663,454.
| * | Non-income producing security. |
The following is a summary of the level of inputs used as of May 31, 2020, in valuing the Fund’s investments carried at value:
| Investments in Securities | | Level 1 | | | Level 2 | | | Level 3 | | | Total | |
| Common Stock | | $ | 33,352,266 | | | $ | 1,260,509 | | | $ | — | | | $ | 34,612,775 | |
| Total Investments in Securities | | $ | 33,352,266 | | | $ | 1,260,509 | | | $ | — | | | $ | 34,612,775 | |
For the period ended May 31, 2020, there were no transfers in or out of Level 3.
| | |
| Schedule of Investments |
| May 31, 2020 (Unaudited) |
| Global X Video Games & Esports ETF | |
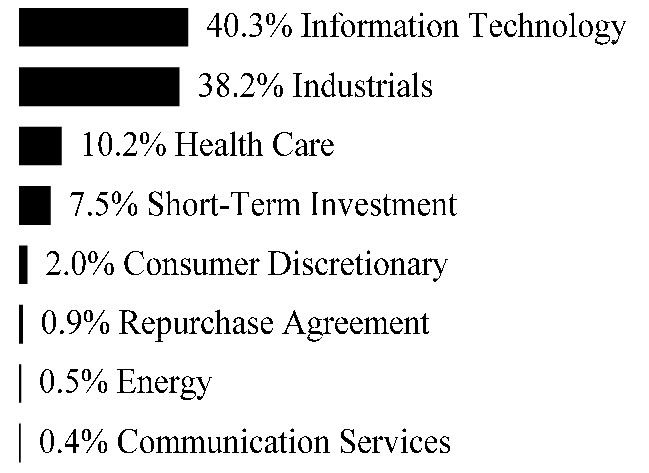
Sector Weightings †:
† Sector weightings percentages are based on the total market value of investments.
| | | Shares | | | Value | |
| COMMON STOCK — 99.8% | | | | | | |
| CHINA— 17.4% | | | | | | |
| Communication Services — 17.4% | | | | | | |
Bilibili ADR * | | | 163,749 | | | $ | 5,310,380 | |
DouYu International Holdings ADR * | | | 257,720 | | | | 2,319,480 | |
HUYA ADR * | | | 48,008 | | | | 745,084 | |
JOYY ADR * | | | 51,156 | | | | 3,123,074 | |
NetEase ADR | | | 14,208 | | | | 5,440,243 | |
TOTAL CHINA | | | | | | | 16,938,261 | |
| FRANCE— 4.3% | | | | | | | | |
| Communication Services — 4.3% | | | | | | | | |
Ubisoft Entertainment * | | | 54,027 | | | | 4,186,341 | |
| IRELAND— 1.0% | | | | | | | | |
| Information Technology — 1.0% | | | | | | | | |
Keywords Studios | | | 45,900 | | | | 1,021,425 | |
| JAPAN— 24.4% | | | | | | | | |
| Communication Services — 24.4% | | | | | | | | |
Aeria | | | 28,880 | | | | 136,981 | |
Akatsuki | | | 5,746 | | | | 217,338 | |
Capcom | | | 104,440 | | | | 3,688,627 | |
DeNA | | | 96,780 | | | | 1,329,507 | |
Gumi * | | | 34,656 | | | | 268,923 | |
GungHo Online Entertainment | | | 61,272 | | | | 996,982 | |
KLab | | | 32,460 | | | | 234,709 | |
| | |
| Schedule of Investments |
| May 31, 2020 (Unaudited) |
| Global X Video Games & Esports ETF | |
| | | Shares | | | Value | |
| COMMON STOCK — continued | | | | | | | | |
| Communication Services — continued | | | | | | | | |
Konami Holdings | | | 81,593 | | | $ | 2,866,566 | |
Nexon | | | 260,400 | | | | 5,428,676 | |
Nintendo | | | 12,767 | | | | 5,159,653 | |
Square Enix Holdings | | | 70,720 | | | | 3,433,105 | |
TOTAL JAPAN | | | | | | | 23,761,067 | |
| SINGAPORE— 0.5% | | | | | | | | |
| Communication Services — 0.5% | | | | | | | | |
IGG | | | 758,200 | | | | 458,774 | |
| SOUTH KOREA— 9.1% | | | | | | | | |
| Communication Services — 9.1% | | | | | | | | |
Com2uSCorp | | | 6,142 | | | | 525,699 | |
Gravity ADR | | | 6,808 | | | | 345,166 | |
NCSoft | | | 6,869 | | | | 4,381,695 | |
Neowiz * | | | 16,024 | | | | 284,653 | |
Netmarble | | | 21,502 | | | | 1,602,515 | |
Nexon GT * | | | 38,451 | | | | 250,555 | |
Pearl Abyss * | | | 6,431 | | | | 1,061,924 | |
Webzen * | | | 17,664 | | | | 261,726 | |
Wemade | | | 7,691 | | | | 194,379 | |
TOTAL SOUTH KOREA | | | | | | | 8,908,312 | |
| SWEDEN— 4.6% | | | | | | | | |
| Communication Services — 4.6% | | | | | | | | |
Embracer Group, Cl B | | | 238,149 | | | | 2,891,413 | |
Stillfront Group * | | | 22,080 | | | | 1,617,608 | |
TOTAL SWEDEN | | | | | | | 4,509,021 | |
| | |
| Schedule of Investments |
| May 31, 2020 (Unaudited) |
| Global X Video Games & Esports ETF | |
| | | Shares/Face Amount | | | Value | |
| COMMON STOCK — continued | | | | | | | | |
| TAIWAN— 8.1% | | | | | | | | |
| Communication Services — 8.1% | | | | | | | | |
Chinese Gamer International * | | | 86,400 | | | $ | 243,445 | |
Gamania Digital Entertainment | | | 124,400 | | | | 258,122 | |
Sea ADR * | | | 90,427 | | | | 7,216,074 | |
X-Legend Entertainment | | | 86,600 | | | | 181,132 | |
TOTAL TAIWAN | | | | | | | 7,898,773 | |
| UNITED STATES— 30.4% | | | | | | | | |
| Communication Services — 23.1% | | | | | | | | |
Activision Blizzard | | | 81,306 | | | | 5,852,405 | |
Electronic Arts * | | | 44,078 | | | | 5,416,305 | |
Glu Mobile * | | | 98,727 | | | | 985,295 | |
Take-Two Interactive Software * | | | 38,286 | | | | 5,213,405 | |
Zynga, Cl A * | | | 559,799 | | | | 5,122,161 | |
| | | | | | | | 22,589,571 | |
| Information Technology — 7.3% | | | | | | | | |
NVIDIA | | | 19,967 | | | | 7,088,684 | |
TOTAL UNITED STATES | | | | | | | 29,678,255 | |
| TOTAL COMMON STOCK | | | | | | | | |
(Cost $83,714,697) | | | | | | | 97,360,229 | |
| | | | | | | | | |
| U.S. TREASURY OBLIGATION — 10.8% | | | | | | | | |
| U.S. Treasury Bill | | | | | | | | |
0.100%, 06/16/20(A) | | | | | | | | |
(Cost $10,499,562) | | $ | 10,500,000 | | | | 10,499,464 | |
| TOTAL INVESTMENTS — 110.6% | | | | | | | | |
(Cost $94,214,259) | | | | | | $ | 107,859,693 | |
Percentages are based on Net Assets of $97,512,244.
| | |
| Schedule of Investments |
| May 31, 2020 (Unaudited) |
| Global X Video Games & Esports ETF | |
| * | Non-income producing security. |
| (A) | The rate reported on the Schedule of Investments is the effective yield at time of purchase. |
ADR — American Depositary Receipt
Cl — Class
The following is a summary of the level of inputs used as of May 31, 2020, in valuing the Fund’s investments carried at value:
| Investments in Securities | | Level 1 | | | Level 2 | | | Level 3 | | | Total | |
| Common Stock | | $ | 92,563,004 | | | $ | 4,797,225 | | | $ | — | | | $ | 97,360,229 | |
| U.S. Treasury Obligation | | | — | | | | 10,499,464 | | | | — | | | | 10,499,464 | |
| Total Investments in Securities | | $ | 92,563,004 | | | $ | 15,296,689 | | | $ | — | | | $ | 107,859,693 | |
For the period ended May 31, 2020, there were no transfers in or out of Level 3.
| | |
| Schedule of Investments |
| May 31, 2020 (Unaudited) |
| Global X Cybersecurity ETF | |
Sector Weightings †:
† Sector weightings percentages are based on the total market value of investments.
| | | Shares | | | Value | |
| COMMON STOCK — 99.8% | | | | | | |
| ISRAEL— 7.6% | | | | | | |
| Information Technology — 7.6% | | | | | | |
Check Point Software Technologies * | | | 5,737 | | | $ | 629,177 | |
RADWARE * | | | 8,195 | | | | 195,205 | |
Tufin Software Technologies * | | | 6,235 | | | | 64,283 | |
TOTAL ISRAEL | | | | | | | 888,665 | |
| JAPAN— 5.9% | | | | | | | | |
| Information Technology — 5.9% | | | | | | | | |
Digital Arts | | | 2,470 | | | | 196,940 | |
Trend Micro | | | 8,930 | | | | 490,700 | |
TOTAL JAPAN | | | | | | | 687,640 | |
| SOUTH KOREA— 0.7% | | | | | | | | |
| Information Technology — 0.7% | | | | | | | | |
Ahnlab | | | 1,774 | | | | 79,214 | |
| UNITED KINGDOM— 4.2% | | | | | | | | |
| Information Technology — 4.2% | | | | | | | | |
Avast | | | 78,848 | | | | 490,320 | |
| UNITED STATES— 81.4% | | | | | | | | |
| Information Technology — 81.4% | | | | | | | | |
A10 Networks * | | | 14,004 | | | | 95,227 | |
Crowdstrike Holdings, Cl A * | | | 6,724 | | | | 590,434 | |
CyberArk Software * | | | 4,603 | | | | 477,699 | |
FireEye * | | | 39,532 | | | | 493,359 | |
Fortinet * | | | 5,630 | | | | 783,697 | |
| | |
| Schedule of Investments |
| May 31, 2020 (Unaudited) |
| Global X Cybersecurity ETF | |
| | | Shares | | | Value | |
| COMMON STOCK — continued | | | | | | | | |
| Information Technology — continued | | | | | | | | |
Mimecast * | | | 11,123 | | | $ | 464,719 | |
MobileIron * | | | 20,318 | | | | 91,837 | |
NortonLifeLock | | | 28,524 | | | | 649,777 | |
Okta, Cl A * | | | 4,009 | | | | 784,080 | |
OneSpan * | | | 7,120 | | | | 144,678 | |
Palo Alto Networks * | | | 3,087 | | | | 726,278 | |
Ping Identity Holding * | | | 14,187 | | | | 401,634 | |
Proofpoint * | | | 3,736 | | | | 434,385 | |
Qualys * | | | 4,317 | | | | 497,836 | |
Rapid7 * | | | 8,972 | | | | 438,641 | |
Sailpoint Technologies Holdings * | | | 16,020 | | | | 365,737 | |
Tenable Holdings * | | | 17,460 | | | | 545,974 | |
Varonis Systems * | | | 5,600 | | | | 472,584 | |
VirnetX Holding | | | 12,460 | | | | 82,859 | |
Zix * | | | 10,073 | | | | 67,691 | |
Zscaler * | | | 9,045 | | | | 887,225 | |
TOTAL UNITED STATES | | | | | | | 9,496,351 | |
| TOTAL COMMON STOCK | | | | | | | | |
(Cost $10,566,799) | | | | | | | 11,642,190 | |
| TOTAL INVESTMENTS — 99.8% | | | | | | | | |
(Cost $10,566,799) | | | | | | $ | 11,642,190 | |
Percentages are based on Net Assets of $11,667,970.
| * | Non-income producing security. |
Cl — Class
The following is a summary of the level of inputs used as of May 31, 2020, in valuing the Fund’s investments carried at value:
| Investments in Securities | | Level 1 | | | Level 2 | | | Level 3 | | | Total | |
| Common Stock | | $ | 11,562,976 | | | $ | 79,214 | | | $ | — | | | $ | 11,642,190 | |
| Total Investments in Securities | | $ | 11,562,976 | | | $ | 79,214 | | | $ | — | | | $ | 11,642,190 | |
For the period ended May 31, 2020, there were no transfers in or out of Level 3.
| | |
| Schedule of Investments |
| May 31, 2020 (Unaudited) |
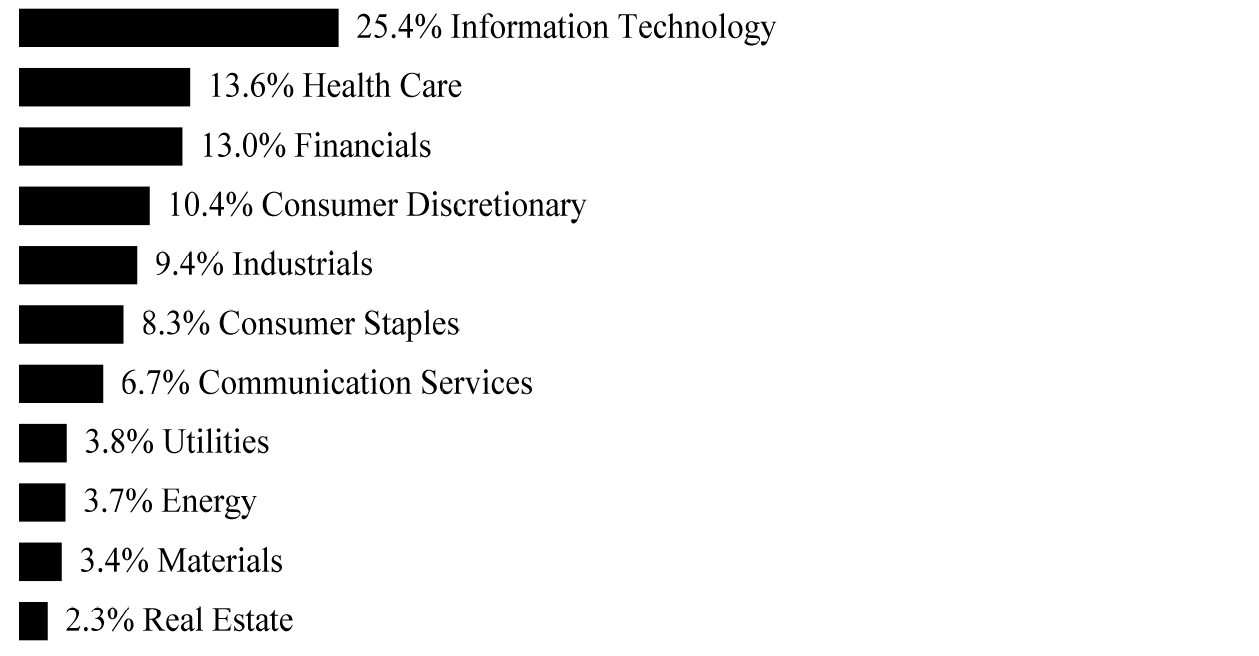
| Global X Millennials Thematic ETF | |
Sector Weightings †:
† Sector weightings percentages are based on the total market value of investments. Repurchase agreements purchased from cash collateral received for securities lending activity are included in total investments. Please see Notes 2 and 7 in Notes to Financial Statements for more detailed information.
| | | Shares | | | Value | |
| COMMON STOCK — 99.9% | | | | | | |
| UNITED STATES— 99.9% | | | | | | |
| Communication Services — 27.1% | | | | | | |
Activision Blizzard | | | 30,742 | | | $ | 2,212,809 | |
Alphabet, Cl A * | | | 1,556 | | | | 2,230,557 | |
Cargurus, Cl A * | | | 9,762 | | | | 253,617 | |
Cars.com * | | | 41,812 | | | | 257,980 | |
Facebook, Cl A * | | | 10,771 | | | | 2,424,444 | |
IAC * | | | 5,175 | | | | 1,399,165 | |
iHeartMedia * (A) | | | 28,596 | | | | 248,785 | |
Live Nation Entertainment * | | | 14,041 | | | | 690,256 | |
Match Group * (A) | | | 4,721 | | | | 420,358 | |
Netflix * | | | 5,059 | | | | 2,123,414 | |
Snap, Cl A * | | | 76,318 | | | | 1,445,463 | |
Spotify Technology * | | | 12,178 | | | | 2,203,366 | |
TripAdvisor | | | 10,718 | | | | 206,643 | |
| | |
| Schedule of Investments |
| May 31, 2020 (Unaudited) |
| Global X Millennials Thematic ETF | |
| | | Shares | | | Value | |
| COMMON STOCK — continued | | | | | | |
| Communication Services — continued | | | | | | |
Twitter * | | | 51,337 | | | $ | 1,589,907 | |
Walt Disney | | | 18,574 | | | | 2,178,730 | |
Yelp, Cl A * | | | 8,615 | | | | 187,290 | |
Zillow Group, Cl A * | | | 4,824 | | | | 279,599 | |
Zynga, Cl A * | | | 62,547 | | | | 572,305 | |
| | | | | | | | 20,924,688 | |
| Consumer Discretionary — 41.1% | | | | | | | | |
Amazon.com * | | | 919 | | | | 2,244,538 | |
AutoNation * | | | 6,193 | | | | 244,500 | |
Bed Bath & Beyond(A) | | | 32,727 | | | | 237,925 | |
Booking Holdings * | | | 1,368 | | | | 2,242,727 | |
Bright Horizons Family Solutions * | | | 3,806 | | | | 425,815 | |
Capri Holdings * | | | 13,524 | | | | 203,401 | |
CarMax * | | | 10,679 | | | | 940,286 | |
Carter’s | | | 2,845 | | | | 244,414 | |
Carvana, Cl A * | | | 4,178 | | | | 388,470 | |
Chegg * | | | 8,156 | | | | 498,168 | |
Children’s Place Retail Stores | | | 8,226 | | | | 342,531 | |
Chipotle Mexican Grill, Cl A * | | | 1,820 | | | | 1,827,116 | |
Columbia Sportswear | | | 4,405 | | | | 321,829 | |
Designer Brands, Cl A | | | 35,531 | | | | 217,805 | |
Dick’s Sporting Goods | | | 7,339 | | | | 264,644 | |
eBay | | | 56,875 | | | | 2,590,087 | |
Etsy * | | | 7,718 | | | | 625,004 | |
Expedia Group | | | 8,801 | | | | 699,503 | |
GoPro, Cl A * (A) | | | 68,344 | | | | 321,900 | |
Graham Holdings, Cl B | | | 524 | | | | 187,713 | |
Groupon, Cl A * | | | 207,326 | | | | 264,341 | |
Grubhub * | | | 5,995 | | | | 340,156 | |
| | |
| Schedule of Investments |
| May 31, 2020 (Unaudited) |
| Global X Millennials Thematic ETF | |
| | | Shares | | | Value | |
| COMMON STOCK — continued | | | | | | |
| Consumer Discretionary — continued | | | | | | |
Home Depot | | | 9,637 | | | $ | 2,394,602 | |
K12 *
| | | 8,032 | | | | 197,748 | |
L Brands | | | 18,044 | | | | 292,132 | |
Laureate Education, Cl A * | | | 18,826 | | | | 183,177 | |
Lowe’s | | | 19,897 | | | | 2,593,573 | |
Lululemon Athletica * | | | 8,137 | | | | 2,441,874 | |
NIKE, Cl B | | | 22,009 | | | | 2,169,647 | |
Peloton Interactive, Cl A * | | | 6,798 | | | | 286,808 | |
Planet Fitness, Cl A * | | | 5,217 | | | | 337,175 | |
Skechers U.S.A., Cl A * | | | 8,774 | | | | 274,802 | |
Starbucks | | | 26,230 | | | | 2,045,678 | |
Strategic Education | | | 1,448 | | | | 245,624 | |
Under Armour, Cl A * | | | 19,139 | | | | 167,466 | |
VF | | | 25,873 | | | | 1,451,475 | |
Wayfair, Cl A * | | | 4,400 | | | | 754,820 | |
WW International * | | | 9,884 | | | | 236,228 | |
| | | | | | | | 31,745,702 | |
| Consumer Staples — 2.8% | | | | | | | | |
Costco Wholesale | | | 6,136 | | | | 1,892,772 | |
Sprouts Farmers Market * | | | 9,940 | | | | 249,792 | |
| | | | | | | | 2,142,564 | |
| Financials — 1.3% | | | | | | | | |
Blucora * | | | 14,523 | | | | 176,454 | |
LendingClub * | | | 23,202 | | | | 124,131 | |
LendingTree * | | | 1,004 | | | | 261,060 | |
Nelnet, Cl A | | | 4,117 | | | | 202,927 | |
| | |
| Schedule of Investments |
| May 31, 2020 (Unaudited) |
| Global X Millennials Thematic ETF | |
| | | Shares | | | Value | |
| COMMON STOCK — continued | | | | | | |
| Financials — continued | | | | | | |
SLM | | | 27,541 | | | $ | 208,761 | |
| | | | | | | | 973,333 | |
| Industrials — 4.4% | | | | | | | | |
Avis Budget Group *(A) | | | 12,934 | | | | 278,469 | |
Lyft, Cl A * | | | 19,495 | | | | 609,414 | |
Uber Technologies * | | | 69,684 | | | | 2,530,923 | |
| | | | | | | | 3,418,806 | |
| Information Technology — 15.5% | | | | | | | | |
2U *
| | | 8,592 | | | | 313,350 | |
Apple | | | 7,056 | | | | 2,243,385 | |
Fiserv * | | | 19,083 | | | | 2,037,492 | |
Fitbit, Cl A * | | | 28,285 | | | | 179,327 | |
Intuit | | | 7,634 | | | | 2,216,303 | |
PayPal Holdings * | | | 17,869 | | | | 2,769,873 | |
Pluralsight, Cl A * | | | 16,217 | | | | 337,800 | |
Square, Cl A * | | | 23,257 | | | | 1,885,678 | |
| | | | | | | | 11,983,208 | |
| Real Estate — 7.7% | | | | | | | | |
American Campus Communities ‡ | | | 8,991 | | | | 290,409 | |
AvalonBay Communities ‡ | | | 9,226 | | | | 1,439,348 | |
Camden Property Trust ‡ | | | 6,521 | | | | 597,128 | |
Equity Residential ‡ | | | 24,384 | | | | 1,476,696 | |
Independence Realty Trust ‡ | | | 21,961 | | | | 217,194 | |
Investors Real Estate Trust ‡ | | | 3,529 | | | | 250,206 | |
Invitation Homes ‡ | | | 35,497 | | | | 933,571 | |
UDR ‡ | | | 19,540 | | | | 722,589 | |
| | | | | | | | 5,927,141 | |
| | |
| Schedule of Investments |
| May 31, 2020 (Unaudited) |
| Global X Millennials Thematic ETF | |
| | | Shares/Face Amount | | | Value | |
| COMMON STOCK — continued | | | | | | | | |
TOTAL UNITED STATES | | | | | | $ | 77,115,442 | |
| TOTAL COMMON STOCK | | | | | | | | |
(Cost $74,240,618) | | | | | | | 77,115,442 | |
| | | | | | | | | |
SHORT-TERM INVESTMENT(B)(C) — 1.2% | | | | | | | | |
| Fidelity Investments Money Market Government Portfolio, Cl Institutional, 0.080% | | | | | | | | |
(Cost $957,810) | | | 957,810 | | | | 957,810 | |
| | | | | | | | | |
REPURCHASE AGREEMENT(B) — 0.2% | | | | | | | | |
| BNP Paribas | | | | | | | | |
| 0.050%, dated 05/29/20, to be repurchased on 06/01/20, repurchase price $112,435 (collateralized by U.S. Treasury Obligations, ranging in par value $13,680 - $100,861, 1.500%, 08/15/2026, with a total market value of $114,541) | | | | | | | | |
(Cost $112,435) | | $ | 112,435 | | | | 112,435 | |
| TOTAL INVESTMENTS — 101.3% | | | | | | | | |
(Cost $75,310,863) | | | | | | $ | 78,185,687 | |
Percentages are based on Net Assets of $77,176,520.
| * | Non-income producing security. |
| ‡ | Real Estate Investment Trust |
| (A) | This security or a partial position of this security is on loan at May 31, 2020. The total value of securities on loan at May 31, 2020 was $1,072,329. |
| (B) | Security was purchased with cash collateral held from securities on loan. The total value of such securities as of May 31, 2020 was $1,070,245. |
| (C) | The rate reported on the Schedule of Investments is the 7-day effective yield as of May 31, 2020. |
Cl — Class
| | |
| Schedule of Investments |
| May 31, 2020 (Unaudited) |
| Global X Millennials Thematic ETF | |
The following is a summary of the level of inputs used as of May 31, 2020, in valuing the Fund’s investments carried at value:
| Investments in Securities | | Level 1 | | | Level 2 | | | Level 3 | | | Total | |
| Common Stock | | $ | 77,115,442 | | | $ | — | | | $ | — | | | $ | 77,115,442 | |
| Short-Term Investment | | | 957,810 | | | | — | | | | — | | | | 957,810 | |
| Repurchase Agreement | | | — | | | | 112,435 | | | | — | | | | 112,435 | |
| Total Investments in Securities | | $ | 78,073,252 | | | $ | 112,435 | | | $ | — | | | $ | 78,185,687 | |
For the period ended May 31, 2020, there were no transfers in or out of Level 3.
| | |
| Schedule of Investments |
| May 31, 2020 (Unaudited) |
| Global X Longevity Thematic ETF | |
Sector Weightings †:
† Sector weightings percentages are based on the total market value of investments.
| | | Shares | | | Value | |
| COMMON STOCK — 100.0% | | | | | | |
| AUSTRALIA— 0.7% | | | | | | |
| Health Care — 0.7% | | | | | | |
Cochlear | | | 1,395 | | | $ | 178,727 | |
| BELGIUM— 1.6% | | | | | | | | |
| Health Care — 1.6% | | | | | | | | |
UCB | | | 4,237 | | | | 424,171 | |
| CANADA— 0.2% | | | | | | | | |
| Health Care — 0.2% | | | | | | | | |
| Chartwell Retirement Residences | | | 10,346 | | | | 61,229 | |
| CHINA— 3.6% | | | | | | | | |
| Health Care — 3.6% | | | | | | | | |
BeiGene ADR * | | | 1,683 | | | | 278,604 | |
Hansoh Pharmaceutical Group * | | | 126,000 | | | | 547,013 | |
Luye Pharma Group | | | 141,147 | | | | 70,473 | |
Venus MedTech Hangzhou, Cl H * | | | 10,500 | | | | 69,088 | |
TOTAL CHINA | | | | | | | 965,178 | |
| DENMARK— 6.4% | | | | | | | | |
| Health Care — 6.4% | | | | | | | | |
Demant * | | | 5,333 | | | | 150,661 | |
Genmab * | | | 1,420 | | | | 436,551 | |
GN Store Nord | | | 3,094 | | | | 167,012 | |
| | |
| Schedule of Investments |
| May 31, 2020 (Unaudited) |
| Global X Longevity Thematic ETF | |
| | | Shares | | | Value | |
| COMMON STOCK — continued | | | | | | |
| Health Care — continued | | | | | | |
H Lundbeck | | | 4,331 | | | $ | 166,371 | |
Novo Nordisk, Cl B | | | 11,855 | | | | 771,821 | |
TOTAL DENMARK | | | | | | | 1,692,416 | |
| FRANCE— 2.3% | | | | | | | | |
| Health Care — 2.3% | | | | | | | | |
BioMerieux | | | 2,578 | | | | 370,211 | |
Korian | | | 2,098 | | | | 75,519 | |
Orpea | | | 1,405 | | | | 165,037 | |
TOTAL FRANCE | | | | | | | 610,767 | |
| GERMANY— 2.1% | | | | | | | | |
| Health Care — 2.1% | | | | | | | | |
Fresenius Medical Care & KGaA * | | | 6,633 | | | | 557,791 | |
| IRELAND— 0.3% | | | | | | | | |
| Health Care — 0.3% | | | | | | | | |
Amarin ADR * | | | 12,021 | | | | 82,464 | |
| ITALY— 0.5% | | | | | | | | |
| Health Care — 0.5% | | | | | | | | |
Amplifon | | | 4,918 | | | | 136,490 | |
| JAPAN— 6.9% | | | | | | | | |
| Health Care — 6.9% | | | | | | | | |
Chugai Pharmaceutical | | | 5,594 | | | | 825,069 | |
Kissei Pharmaceutical | | | 2,963 | | | | 75,082 | |
Miraca Holdings | | | 3,352 | | | | 77,970 | |
Mochida Pharmaceutical | | | 1,810 | | | | 70,142 | |
Nipro | | | 6,575 | | | | 76,897 | |
Terumo | | | 16,526 | | | | 648,860 | |
Toho Holdings | | | 3,263 | | | | 65,148 | |
TOTAL JAPAN | | | | | | | 1,839,168 | |
| | |
| Schedule of Investments |
| May 31, 2020 (Unaudited) |
| Global X Longevity Thematic ETF | |
| | | Shares | | | Value | |
| COMMON STOCK — continued | | | | | | | | |
| NEW ZEALAND— 0.3% | | | | | | | | |
| Health Care — 0.3% | | | | | | | | |
Ryman Healthcare | | | 10,851 | | | $ | 81,306 | |
| SOUTH KOREA— 2.2% | | | | | | | | |
| Health Care — 2.2% | | | | | | | | |
Celltrion * | | | 2,936 | | | | 506,146 | |
Helixmith * | | | 1,491 | | | | 75,366 | |
TOTAL SOUTH KOREA | | | | | | | 581,512 | |
| SPAIN— 0.4% | | | | | | | | |
| Health Care — 0.4% | | | | | | | | |
Pharma Mar * | | | 14,687 | | | | 100,881 | |
| SWEDEN— 0.6% | | | | | | | | |
| Health Care — 0.6% | | | | | | | | |
Attendo | | | 18,181 | | | | 78,258 | |
Elekta, Cl B | | | 8,565 | | | | 90,303 | |
TOTAL SWEDEN | | | | | | | 168,561 | |
| SWITZERLAND— 5.2% | | | | | | | | |
| Health Care — 5.2% | | | | | | | | |
Alcon | | | 10,715 | | | | 690,168 | |
Medacta Group * | | | 1,176 | | | | 100,010 | |
Sonova Holding | | | 1,402 | | | | 307,194 | |
Straumann Holding | | | 346 | | | | 280,200 | |
TOTAL SWITZERLAND | | | | | | | 1,377,572 | |
| UNITED KINGDOM— 1.6% | | | | | | | | |
| Consumer Discretionary — 0.2% | | | | | | | | |
McCarthy & Stone | | | 70,276 | | | | 62,034 | |
| | |
| Schedule of Investments |
| May 31, 2020 (Unaudited) |
| Global X Longevity Thematic ETF | |
| | | Shares | | | Value | |
| COMMON STOCK — continued | | | | | | | | |
| Health Care — 1.4% | | | | | | | | |
Smith & Nephew | | | 19,053 | | | $ | 386,774 | |
TOTAL UNITED KINGDOM | | | | | | | 448,808 | |
| UNITED STATES— 65.1% | | | | | | | | |
| Health Care — 60.6% | | | | | | | | |
AbbVie | | | 8,930 | | | | 827,543 | |
ABIOMED * | | | 980 | | | | 219,422 | |
ACADIA Pharmaceuticals * | | | 3,366 | | | | 167,223 | |
Aerie Pharmaceuticals * | | | 5,213 | | | | 73,138 | |
Agios Pharmaceuticals * | | | 1,718 | | | | 88,889 | |
Align Technology * | | | 1,715 | | | | 421,238 | |
Alkermes * | | | 4,411 | | | | 72,164 | |
Amedisys * | | | 703 | | | | 135,011 | |
Amgen | | | 3,200 | | | | 735,040 | |
Becton Dickinson | | | 2,806 | | | | 692,886 | |
Biogen Idec * | | | 2,213 | | | | 679,590 | |
Bluebird Bio * | | | 1,624 | | | | 103,335 | |
Blueprint Medicines * | | | 1,129 | | | | 73,543 | |
Boston Scientific * | | | 19,969 | | | | 758,622 | |
Bristol-Myers Squibb | | | 12,043 | | | | 719,208 | |
Brookdale Senior Living * | | | 21,964 | | | | 80,388 | |
DaVita * | | | 2,734 | | | | 221,344 | |
DENTSPLY SIRONA | | | 4,819 | | | | 224,180 | |
DexCom * | | | 2,002 | | | | 757,377 | |
Edwards Lifesciences * | | | 3,388 | | | | 761,352 | |
Ensign Group | | | 1,881 | | | | 82,237 | |
Envista Holdings * | | | 4,257 | | | | 89,993 | |
Epizyme * | | | 4,149 | | | | 72,815 | |
Exact Sciences * | | | 3,269 | | | | 280,742 | |
Exelixis * | | | 6,639 | | | | 164,050 | |
FibroGen * | | | 1,919 | | | | 64,171 | |
| | |
| Schedule of Investments |
| May 31, 2020 (Unaudited) |
| Global X Longevity Thematic ETF | |
| | | Shares | | | Value | |
| COMMON STOCK — continued | | | | | | | | |
| Health Care — continued | | | | | | | | |
Glaukos * | | | 2,142 | | | $ | 83,495 | |
Halozyme Therapeutics * | | | 3,948 | | | | 95,818 | |
Incyte * | | | 4,723 | | | | 481,321 | |
Inogen * | | | 1,367 | | | | 51,946 | |
Insulet * | | | 1,385 | | | | 261,169 | |
Integer Holdings * | | | 1,095 | | | | 86,702 | |
Integra LifeSciences Holdings * | | | 1,834 | | | | 95,570 | |
Ionis Pharmaceuticals * | | | 3,029 | | | | 170,260 | |
LHC Group * | | | 685 | | | | 111,319 | |
LivaNova * | | | 1,451 | | | | 77,614 | |
Medtronic | | | 7,066 | | | | 696,566 | |
Merit Medical Systems * | | | 2,089 | | | | 93,984 | |
Myriad Genetics * | | | 4,897 | | | | 71,153 | |
National HealthCare | | | 895 | | | | 60,028 | |
Natus Medical * | | | 2,851 | | | | 61,011 | |
Neurocrine Biosciences * | | | 2,009 | | | | 250,643 | |
Novocure * | | | 2,221 | | | | 149,762 | |
NuVasive * | | | 1,292 | | | | 78,295 | |
Pennant Group * | | | 4,032 | | | | 102,776 | |
Quest Diagnostics | | | 2,906 | | | | 343,721 | |
Radius Health * | | | 5,544 | | | | 70,187 | |
Regeneron Pharmaceuticals * | | | 1,371 | | | | 840,162 | |
Sage Therapeutics * | | | 2,326 | | | | 83,085 | |
Seattle Genetics * | | | 3,760 | | | | 591,110 | |
Silk Road Medical * | | | 1,947 | | | | 74,512 | |
Stryker | | | 3,976 | | | | 778,223 | |
Tactile Systems Technology * | | | 1,532 | | | | 74,225 | |
Varian Medical Systems * | | | 1,974 | | | | 239,624 | |
Vertex Pharmaceuticals * | | | 2,810 | | | | 809,168 | |
Zimmer Biomet Holdings | | | 4,503 | | | | 568,909 | |
| | | | | | | | 16,117,859 | |
| | |
| Schedule of Investments |
| May 31, 2020 (Unaudited) |
| Global X Longevity Thematic ETF | |
| | | Shares | | | Value | |
| COMMON STOCK — continued | | | | | | | | |
| Real Estate — 4.5% | | | | | | | | |
Diversified Healthcare Trust ‡ | | | 23,175 | | | $ | 82,967 | |
LTC Properties ‡ | | | 2,077 | | | | 76,454 | |
National Health Investors ‡ | | | 1,307 | | | | 72,525 | |
Omega Healthcare Investors ‡ | | | 4,841 | | | | 150,748 | |
Sabra Health Care ‡ | | | 5,613 | | | | 75,551 | |
Ventas ‡ | | | 8,118 | | | | 283,725 | |
Welltower ‡ | | | 8,944 | | | | 453,193 | |
| | | | | | | | 1,195,163 | |
TOTAL UNITED STATES | | | | | | | 17,313,022 | |
| TOTAL COMMON STOCK | | | | | | | | |
(Cost $22,892,314) | | | | | | | 26,620,063 | |
| TOTAL INVESTMENTS — 100.0% | | | | | | | | |
(Cost $22,892,314) | | | | | | $ | 26,620,063 | |
Percentages are based on Net Assets of $26,615,378.
| * | Non-income producing security. |
ADR — American Depositary Receipt
Cl — Class
The following is a summary of the level of inputs used as of May 31, 2020, in valuing the Fund’s investments carried at value:
| Investments in Securities | | Level 1 | | | Level 2 | | | Level 3 | | | Total | |
| Common Stock | | $ | 25,351,977 | | | $ | 1,268,086 | | | $ | — | | | $ | 26,620,063 | |
| Total Investments in Securities | | $ | 25,351,977 | | | $ | 1,268,086 | | | $ | — | | | $ | 26,620,063 | |
For the period ended May 31, 2020, there were no transfers in or out of Level 3.
| | |
| Schedule of Investments |
| May 31, 2020 (Unaudited) |
| Global X Health & Wellness Thematic ETF | |
Sector Weightings †:
† Sector weightings percentages are based on the total market value of investments.
| | | Shares | | | Value | |
| COMMON STOCK — 99.9% | | | | | | |
| AUSTRALIA— 0.6% | | | | | | |
| Consumer Staples — 0.6% | | | | | | |
Blackmores | | | 2,044 | | | $ | 111,177 | |
| CANADA— 1.6% | | | | | | | | |
| Consumer Discretionary — 1.6% | | | | | | | | |
Gildan Activewear | | | 23,434 | | | | 323,824 | |
| CHINA— 9.7% | | | | | | | | |
| Consumer Discretionary — 9.7% | | | | | | | | |
ANTA Sports Products | | | 69,836 | | | | 622,586 | |
Li Ning | | | 168,857 | | | | 566,415 | |
| Topsports International Holdings | | | 428,000 | | | | 607,406 | |
Xtep International Holdings | | | 295,000 | | | | 95,149 | |
TOTAL CHINA | | | | | | | 1,891,556 | |
| FRANCE— 2.7% | | | | | | | | |
| Consumer Staples — 2.7% | | | | | | | | |
Danone | | | 7,843 | | | | 537,059 | |
| GERMANY— 5.8% | | | | | | | | |
| Consumer Discretionary — 5.8% | | | | | | | | |
adidas | | | 2,059 | | | | 543,265 | |
Puma | | | 8,225 | | | | 587,186 | |
TOTAL GERMANY | | | | | | | 1,130,451 | |
| | |
| Schedule of Investments |
| May 31, 2020 (Unaudited) |
| Global X Health & Wellness Thematic ETF | |
| | | Shares | | | Value | |
| COMMON STOCK — continued | | | | | | | | |
| HONG KONG— 1.4% | | | | | | | | |
| Consumer Discretionary — 1.4% | | | | | | | | |
Yue Yuen Industrial Holdings | | | 190,179 | | | $ | 272,350 | |
| IRELAND— 1.9% | | | | | | | | |
| Consumer Staples — 1.9% | | | | | | | | |
Glanbia | | | 34,897 | | | | 380,995 | |
| ITALY— 1.0% | | | | | | | | |
| Consumer Discretionary — 1.0% | | | | | | | | |
Technogym | | | 23,659 | | | | 195,404 | |
| JAPAN— 15.2% | | | | | | | | |
| Consumer Discretionary — 10.0% | | | | | | | | |
ABC-Mart | | | 9,807 | | | | 596,239 | |
Asics | | | 22,357 | | | | 237,609 | |
Descente | | | 9,030 | | | | 134,358 | |
Goldwin | | | 5,680 | | | | 363,254 | |
Shimano | | | 3,415 | | | | 627,940 | |
| | | | | | | | 1,959,400 | |
| Consumer Staples — 3.9% | | | | | | | | |
Ariake Japan | | | 3,895 | | | | 270,428 | |
Yakult Honsha | | | 8,066 | | | | 494,135 | |
| | | | | | | | 764,563 | |
| Health Care — 1.3% | | | | | | | | |
Tsumura | | | 9,073 | | | | 252,311 | |
TOTAL JAPAN | | | | | | | 2,976,274 | |
| NETHERLANDS— 0.8% | | | | | | | | |
| Consumer Discretionary — 0.8% | | | | | | | | |
Basic-Fit * | | | 6,428 | | | | 163,024 | |
| | |
| Schedule of Investments |
| May 31, 2020 (Unaudited) |
| Global X Health & Wellness Thematic ETF | |
| | | Shares | | | Value | |
| COMMON STOCK — continued | | | | | | | | |
| SOUTH KOREA— 1.8% | | | | | | | | |
| Consumer Discretionary — 1.8% | | | | | | | | |
Fila Holdings | | | 7,154 | | | $ | 222,109 | |
Youngone | | | 5,207 | | | | 128,866 | |
TOTAL SOUTH KOREA | | | | | | | 350,975 | |
| TAIWAN— 8.1% | | | | | | | | |
| Consumer Discretionary — 8.1% | | | | | | | | |
Feng TAY Enterprise | | | 86,719 | | | | 522,769 | |
| Fulgent Sun International Holding | | | 21,000 | | | | 69,872 | |
Giant Manufacturing | | | 44,326 | | | | 346,931 | |
Johnson Health Tech | | | 36,000 | | | | 86,688 | |
Merida Industry | | | 35,388 | | | | 212,151 | |
Pou Chen | | | 350,086 | | | | 344,548 | |
TOTAL TAIWAN | | | | | | | 1,582,959 | |
| UNITED KINGDOM— 4.3% | | | | | | | | |
| Consumer Discretionary — 4.3% | | | | | | | | |
Frasers Group * | | | 61,141 | | | | 231,753 | |
JD Sports Fashion | | | 74,343 | | | | 605,133 | |
TOTAL UNITED KINGDOM | | | | | | | 836,886 | |
| UNITED STATES— 45.0% | | | | | | | | |
| Consumer Discretionary — 23.7% | | | | | | | | |
Columbia Sportswear | | | 6,678 | | | | 487,895 | |
Dick’s Sporting Goods | | | 7,377 | | | | 266,015 | |
Foot Locker | | | 12,278 | | | | 340,101 | |
Lululemon Athletica * | | | 2,478 | | | | 743,635 | |
NIKE, Cl B | | | 5,694 | | | | 561,315 | |
Peloton Interactive, Cl A * | | | 5,163 | | | | 217,827 | |
Planet Fitness, Cl A * | | | 9,329 | | | | 602,933 | |
Skechers U.S.A., Cl A * | | | 15,858 | | | | 496,673 | |
Under Armour, Cl A * | | | 22,191 | | | | 194,171 | |
| | |
| Schedule of Investments |
| May 31, 2020 (Unaudited) |
| Global X Health & Wellness Thematic ETF | |
| | | Shares | | | Value | |
| COMMON STOCK — continued | | | | | | | | |
| Consumer Discretionary — continued | | | | | | | | |
VF | | | 8,377 | | | $ | 469,950 | |
WW International * | | | 7,937 | | | | 189,694 | |
Zumiez * | | | 3,025 | | | | 73,719 | |
| | | | | | | | 4,643,928 | |
| Consumer Staples — 14.4% | | | | | | | | |
BellRing Brands, Cl A * | | | 4,627 | | | | 92,910 | |
Calavo Growers | | | 2,072 | | | | 121,233 | |
Cal-Maine Foods | | | 5,170 | | | | 230,375 | |
Hain Celestial Group * | | | 12,305 | | | | 387,361 | |
Herbalife Nutrition * | | | 15,898 | | | | 696,967 | |
Medifast | | | 1,382 | | | | 141,434 | |
Nu Skin Enterprises, Cl A | | | 6,538 | | | | 243,083 | |
Sanderson Farms | | | 2,621 | | | | 346,024 | |
Sprouts Farmers Market * | | | 13,853 | | | | 348,126 | |
USANA Health Sciences * | | | 2,537 | | | | 214,935 | |
| | | | | | | | 2,822,448 | |
| Health Care — 4.9% | | | | | | | | |
DexCom * | | | 1,882 | | | | 711,980 | |
Prestige Consumer Healthcare * | | | 5,922 | | | | 249,908 | |
| | | | | | | | 961,888 | |
| Industrials — 1.1% | | | | | | | | |
Healthcare Services Group | | | 8,761 | | | | 209,563 | |
| Information Technology — 0.9% | | | | | | | | |
Fitbit, Cl A * | | | 27,786 | | | | 176,163 | |
TOTAL UNITED STATES | | | | | | | 8,813,990 | |
| | |
| Schedule of Investments |
| May 31, 2020 (Unaudited) |
| Global X Health & Wellness Thematic ETF | |
| | | Value | |
| TOTAL COMMON STOCK | | | |
(Cost $21,296,811) | | $ | 19,566,924 | |
| TOTAL INVESTMENTS — 99.9% | | | | |
(Cost $21,296,811) | | $ | 19,566,924 | |
Percentages are based on Net Assets of $19,593,397.
| * | Non-income producing security. |
Cl — Class
The following is a summary of the level of inputs used as of May 31, 2020, in valuing the Fund’s investments carried at value:
| Investments in Securities | | Level 1 | | | Level 2 | | | Level 3 | | | Total | |
| Common Stock | | $ | 16,148,413 | | | $ | 3,418,511 | | | $ | — | | | $ | 19,566,924 | |
| Total Investments in Securities | | $ | 16,148,413 | | | $ | 3,418,511 | | | $ | — | | | $ | 19,566,924 | |
For the period ended May 31, 2020, there were no transfers in or out of Level 3.
| | |
| Schedule of Investments |
| May 31, 2020 (Unaudited) |
| | |
Sector Weightings †:
† Sector weightings percentages are based on the total market value of investments. Repurchase agreements purchased from cash collateral received for securities lending activity are included in total investments. Please see Notes 2 and 7 in Notes to Financial Statements for more detailed information.
| | | Shares | | | Value | |
| COMMON STOCK — 99.2% | | | | | | |
| AUSTRALIA— 1.6% | | | | | | |
| Consumer Staples — 0.1% | | | | | | |
Elixinol Global * (A) | | | 57,994 | | | $ | 10,202 | |
| Health Care — 1.5% | | | | | | | | |
Cann Group * | | | 236,456 | | | | 183,642 | |
TOTAL AUSTRALIA | | | | | | | 193,844 | |
| CANADA— 77.3% | | | | | | | | |
| Consumer Discretionary — 3.6% | | | | | | | | |
Fire & Flower Holdings * (A) | | | 350,696 | | | | 180,143 | |
Namaste Technologies * | | | 770,517 | | | | 239,706 | |
| | | | | | | | 419,849 | |
| Financials — 3.4% | | | | | | | | |
Canopy Rivers * | | | 384,758 | | | | 395,281 | |
| Health Care — 70.3% | | | | | | | | |
Aleafia Health * (A) | | | 746,922 | | | | 308,020 | |
Aphria * (A) | | | 212,939 | | | | 895,077 | |
Aurora Cannabis * (A) | | | 85,929 | | | | 1,209,881 | |
Auxly Cannabis Group * (A) | | | 1,589,393 | | | | 465,710 | |
| | |
| Schedule of Investments |
| May 31, 2020 (Unaudited) |
| | |
| | | Shares | | | Value | |
| COMMON STOCK — continued | | | | | | | | |
| Health Care — continued | | | | | | | | |
Canopy Growth * | | | 48,465 | | | $ | 848,891 | |
Cronos Group * | | | 121,042 | | | | 790,775 | |
Green Organic Dutchman Holdings * (A) | | | 855,646 | | | | 269,285 | |
HEXO * (A) | | | 876,740 | | | | 539,161 | |
MediPharm Labs * | | | 308,897 | | | | 402,268 | |
Organigram Holdings * (A) | | | 268,508 | | | | 470,112 | |
PharmaCielo * | | | 188,082 | | | | 121,106 | |
Sundial Growers * | | | 188,684 | | | | 160,570 | |
Supreme Cannabis * (A) | | | 973,103 | | | | 246,409 | |
Tetra Bio-Pharma * | | | 572,439 | | | | 89,042 | |
Tilray, Cl 2 * (A) | | | 93,277 | | | | 918,779 | |
Valens Groworks * | | | 263,782 | | | | 505,732 | |
| | | | | | | | 8,240,818 | |
TOTAL CANADA | | | | | | | 9,055,948 | |
| UNITED KINGDOM— 7.4% | | | | | | | | |
| Health Care — 7.4% | | | | | | | | |
GW Pharmaceuticals ADR * | | | 7,124 | | | | 874,471 | |
| UNITED STATES— 12.9% | | | | | | | | |
| Health Care — 12.9% | | | | | | | | |
cbdMD * | | | 90,902 | | | | 133,626 | |
Charlottes Web Holdings * (A) | | | 100,872 | | | | 548,075 | |
Corbus Pharmaceuticals Holdings * | | | 70,898 | | | | 528,899 | |
Zynerba Pharmaceuticals * | | | 57,511 | | | | 302,508 | |
TOTAL UNITED STATES | | | | | | | 1,513,108 | |
| TOTAL COMMON STOCK | | | | | | | | |
(Cost $13,650,060) | | | | | | | 11,637,371 | |
| | | | | | | | | |
| | |
| Schedule of Investments |
| May 31, 2020 (Unaudited) |
| | |
| | | Shares/Face Amount | | | Value | |
SHORT-TERM INVESTMENT(B)(C) — 27.8% | | | | | | | | |
| Fidelity Investments Money Market Government Portfolio, Cl Institutional, 0.080% | | | | | | | | |
(Cost $3,260,589) | | | 3,260,589 | | | $ | 3,260,589 | |
| | | | | | | | | |
REPURCHASE AGREEMENT(B) — 3.3% | | | | | | | | |
| BNP Paribas | | | | | | | | |
| 0.050%, dated 05/29/20, to be repurchased on 06/01/20, repurchase price $382,754 (collateralized by U.S. Treasury Obligations, ranging in par value $46,570 - $343,352, 1.500%, 08/15/2026, with a total market value of $389,922) | | | | | | | | |
(Cost $382,751) | | $ | 382,751 | | | | 382,751 | |
| TOTAL INVESTMENTS — 130.3% | | | | | | | | |
(Cost $17,293,400) | | | | | | $ | 15,280,711 | |
Percentages are based on Net Assets of $11,727,540.
| * | Non-income producing security. |
| (A) | This security or a partial position of this security is on loan at May 31, 2020. The total value of securities on loan at May 31, 2020 was $3,282,607. |
| (B) | Security was purchased with cash collateral held from securities on loan. The total value of such securities as of May 31, 2020 was $3,643,340. |
| (C) | The rate reported on the Schedule of Investments is the 7-day effective yield as of May 31, 2020. |
ADR — American Depositary Receipt
Cl — Class
| | |
| Schedule of Investments |
| May 31, 2020 (Unaudited) |
| | |
The following is a summary of the level of inputs used as of May 31, 2020, in valuing the Fund’s investments carried at value:
| Investments in Securities | | Level 1 | | | Level 2 | | | Level 3 | | | Total | |
| Common Stock | | $ | 11,637,371 | | | $ | — | | | $ | — | | | $ | 11,637,371 | |
| Short-Term Investment | | | 3,260,589 | | | | — | | | | — | | | | 3,260,589 | |
| Repurchase Agreement | | | — | | | | 382,751 | | | | — | | | | 382,751 | |
| Total Investments in Securities | | $ | 14,897,960 | | | $ | 382,751 | | | $ | — | | | $ | 15,280,711 | |
For the period ended May 31, 2020, there were no transfers in or out of Level 3.
| | |
| Schedule of Investments |
| May 31, 2020 (Unaudited) |
| Global X U.S. Infrastructure Development ETF | |
Sector Weightings †:
† Sector weightings percentages are based on the total market value of investments. Repurchase agreements purchased from cash collateral received for securities lending activity are included in total investments. Please see Notes 2 and 7 in Notes to Financial Statements for more detailed information.
| | | Shares | | | Value | |
| COMMON STOCK — 99.7% | | | | | | |
| Energy — 0.2% | | | | | | |
Matrix Service * | | | 19,400 | | | $ | 213,788 | |
| Industrials — 70.6% | | | | | | | | |
Acuity Brands | | | 13,792 | | | | 1,188,181 | |
Advanced Drainage Systems | | | 23,712 | | | | 1,051,390 | |
AECOM * | | | 54,640 | | | | 2,118,393 | |
Aegion, Cl A * | | | 19,026 | | | | 285,580 | |
Altra Industrial Motion | | | 22,392 | | | | 694,152 | |
Arcosa | | | 16,768 | | | | 640,035 | |
Argan | | | 9,835 | | | | 363,797 | |
Astec Industries | | | 9,491 | | | | 403,178 | |
Atkore International Group * | | | 10,153 | | | | 272,507 | |
Columbus McKinnon | | | 10,872 | | | | 330,618 | |
Construction Partners, Cl A * | | | 24,249 | | | | 429,207 | |
Crane | | | 20,825 | | | | 1,160,369 | |
CSW Industrials | | | 5,152 | | | | 368,677 | |
| | |
| Schedule of Investments |
| May 31, 2020 (Unaudited) |
| Global X U.S. Infrastructure Development ETF | |
| | | Shares | | | Value | |
| COMMON STOCK — continued | | | | | | | | |
| Industrials — continued | | | | | | | | |
CSX | | | 54,554 | | | $ | 3,904,975 | |
Dycom Industries * | | | 9,190 | | | | 386,899 | |
Eaton | | | 42,729 | | | | 3,627,692 | |
EMCOR Group | | | 19,527 | | | | 1,240,941 | |
Emerson Electric | | | 53,878 | | | | 3,287,636 | |
Exponent | | | 17,973 | | | | 1,334,316 | |
Fastenal | | | 115,894 | | | | 4,781,786 | |
Fluor | | | 48,607 | | | | 564,327 | |
Fortive | | | 53,868 | | | | 3,284,871 | |
Gibraltar Industries * | | | 7,386 | | | | 325,058 | |
Gorman-Rupp | | | 10,918 | | | | 334,746 | |
Granite Construction | | | 15,237 | | | | 268,171 | |
Greenbrier | | | 15,545 | | | | 329,865 | |
H&E Equipment Services | | | 14,602 | | | | 250,278 | |
HD Supply Holdings * | | | 56,349 | | | | 1,786,827 | |
Herc Holdings * | | | 9,195 | | | | 262,057 | �� |
Howmet Aerospace | | | 141,602 | | | | 1,852,154 | |
Hubbell, Cl B | | | 19,054 | | | | 2,332,591 | |
Insteel Industries | | | 16,974 | | | | 299,591 | |
Jacobs Engineering Group | | | 43,496 | | | | 3,654,534 | |
Kansas City Southern | | | 25,079 | | | | 3,774,891 | |
Lincoln Electric Holdings | | | 21,277 | | | | 1,748,331 | |
Manitowoc * | | | 26,990 | | | | 252,356 | |
MasTec * | | | 26,534 | | | | 1,038,806 | |
MRC Global * | | | 33,220 | | | | 196,662 | |
Mueller Industries | | | 14,088 | | | | 377,277 | |
Mueller Water Products, Cl A | | | 33,829 | | | | 315,963 | |
MYR Group * | | | 12,757 | | | | 367,529 | |
| | |
| Schedule of Investments |
| May 31, 2020 (Unaudited) |
| Global X U.S. Infrastructure Development ETF | |
| | | Shares | | | Value | |
| COMMON STOCK — continued | | | | | | | | |
| Industrials — continued | | | | | | | | |
Norfolk Southern | | | 20,032 | | | $ | 3,571,505 | |
Northwest Pipe * | | | 11,716 | | | | 293,954 | |
NOW * | | | 39,080 | | | | 291,146 | |
Pentair | | | 58,429 | | | | 2,286,911 | |
Powell Industries | | | 9,029 | | | | 240,171 | |
Primoris Services | | | 18,161 | | | | 303,107 | |
Quanta Services | | | 49,479 | | | | 1,827,259 | |
RBC Bearings * | | | 8,677 | | | | 1,220,420 | |
Rexnord | | | 42,350 | | | | 1,274,735 | |
Rockwell Automation | | | 20,653 | | | | 4,464,352 | |
SPX * | | | 15,338 | | | | 613,213 | |
Sterling Construction * | | | 28,413 | | | | 257,138 | |
Team * | | | 26,862 | | | | 132,430 | |
Terex | | | 15,381 | | | | 241,789 | |
Tetra Tech | | | 19,008 | | | | 1,499,731 | |
Titan Machinery * | | | 31,217 | | | | 326,842 | |
Trinity Industries | | | 42,540 | | | | 849,524 | |
Tutor Perini * | | | 36,895 | | | | 387,398 | |
Union Pacific | | | 22,369 | | | | 3,799,598 | |
United Rentals * | | | 26,266 | | | | 3,648,085 | |
Valmont Industries | | | 7,471 | | | | 851,694 | |
Wabash National | | | 33,070 | | | | 315,819 | |
WESCO International * | | | 14,479 | | | | 482,151 | |
Willdan Group * | | | 12,149 | | | | 297,043 | |
| | | | | | | | 80,963,229 | |
| Information Technology — 4.9% | | | | | | | | |
Anixter International * | | | 11,776 | | | | 1,127,081 | |
| | |
| Schedule of Investments |
| May 31, 2020 (Unaudited) |
| Global X U.S. Infrastructure Development ETF | |
| | | Shares | | | Value | |
| COMMON STOCK — continued | | | | | | | | |
| Information Technology — continued | | | | | | | | |
Badger Meter | | | 6,659 | | | $ | 407,464 | |
Calix * | | | 47,129 | | | | 664,519 | |
Trimble * | | | 87,133 | | | | 3,408,643 | |
| | | | | | | | 5,607,707 | |
| Materials — 22.7% | | | | | | | | |
Alcoa * | | | 64,371 | | | | 592,857 | |
Allegheny Technologies * | | | 43,729 | | | | 379,568 | |
Arconic * | | | 35,856 | | | | 518,836 | |
Century Aluminum * | | | 64,443 | | | | 384,080 | |
Cleveland-Cliffs (A) | | | 111,270 | | | | 580,829 | |
Commercial Metals | | | 41,138 | | | | 705,928 | |
Eagle Materials | | | 14,492 | | | | 967,486 | |
Forterra * | | | 28,118 | | | | 248,001 | |
Haynes International | | | 14,925 | | | | 340,738 | |
Martin Marietta Materials | | | 15,579 | | | | 2,992,570 | |
Minerals Technologies | | | 7,178 | | | | 353,947 | |
Nucor | | | 80,830 | | | | 3,415,876 | |
Reliance Steel & Aluminum | | | 23,152 | | | | 2,245,744 | |
RPM International | | | 45,349 | | | | 3,391,198 | |
Ryerson Holding * | | | 37,470 | | | | 186,975 | |
Steel Dynamics | | | 74,858 | | | | 1,988,229 | |
Summit Materials, Cl A * | | | 38,975 | | | | 592,030 | |
TimkenSteel * | | | 61,440 | | | | 215,040 | |
United States Steel (A) | | | 42,636 | | | | 342,793 | |
US Concrete * | | | 10,631 | | | | 221,763 | |
Vulcan Materials | | | 29,332 | | | | 3,177,242 | |
| | |
| Schedule of Investments |
| May 31, 2020 (Unaudited) |
| Global X U.S. Infrastructure Development ETF | |
| | | Shares/Face Amount | | | Value | |
| COMMON STOCK — continued | | | | | | | | |
| Materials — continued | | | | | | | | |
Westlake Chemical | | | 44,635 | | | $ | 2,129,090 | |
| | | | | | | | 25,970,820 | |
| Utilities — 1.3% | | | | | | | | |
MDU Resources Group | | | 69,644 | | | | 1,515,454 | |
| TOTAL COMMON STOCK | | | | | | | | |
(Cost $141,087,032) | | | | | | | 114,270,998 | |
| | | | | | | | | |
| CORPORATE OBLIGATION — 0.0% | | | | | | | | |
| Mueller Industries | | | | | | | | |
| 6.000%, 03/01/27(Cost $1,000) | | $ | 1,000 | | | | 945 | |
| | | | | | | | | |
| | | | | | | | | |
SHORT-TERM INVESTMENT(B)(C) — 0.3% | | | | | | | | |
| Fidelity Investments Money Market Government Portfolio, Cl Institutional, 0.080% | | | | | | | | |
(Cost $330,900) | | | 330,900 | | | | 330,900 | |
| | | | | | | | | |
REPURCHASE AGREEMENT(B) — 0.0% | | | | | | | | |
| BNP Paribas | | | | | | | | |
| 0.050%, dated 05/29/20, to be repurchased on 06/01/20, repurchase price $38,843 (collateralized by U.S. Treasury Obligations, ranging in par value $4,726 - $34,845, 1.500%, 08/15/2026, with a total market value of $39,571) | | | | | | | | |
(Cost $38,843) | | $ | 38,843 | | | | 38,843 | |
| TOTAL INVESTMENTS — 100.0% | | | | | | | | |
(Cost $141,457,775) | | | | | | $ | 114,641,686 | |
Percentages are based on Net Assets of $114,647,220.
| | |
| Schedule of Investments |
| May 31, 2020 (Unaudited) |
| Global X U.S. Infrastructure Development ETF | |
| * | Non-income producing security. |
| (A) | This security or a partial position of this security is on loan at May 31, 2020. The total value of securities on loan at May 31, 2020 was $355,028. |
| (B) | Security was purchased with cash collateral held from securities on loan. The total value of such securities as of May 31, 2020 was $369,743. |
| (C) | The rate reported on the Schedule of Investments is the 7-day effective yield as of May 31, 2020. |
Cl — Class
The following is a summary of the level of inputs used as of May 31, 2020, in valuing the Fund’s investments carried at value:
| Investments in Securities | | Level 1 | | | Level 2 | | | Level 3 | | | Total | |
| Common Stock | | $ | 114,270,998 | | | $ | — | | | $ | — | | | $ | 114,270,998 | |
| Corporate Obligation | | | — | | | | 945 | | | | — | | | | 945 | |
| Short-Term Investment | | | 330,900 | | | | — | | | | — | | | | 330,900 | |
| Repurchase Agreement | | | — | | | | 38,843 | | | | — | | | | 38,843 | |
| Total Investments in Securities | | $ | 114,601,898 | | | $ | 39,788 | | | $ | — | | | $ | 114,641,686 | |
For the period ended May 31, 2020, there were no transfers in or out of Level 3.
| | |
| Schedule of Investments |
| May 31, 2020 (Unaudited) |
| Global X Conscious Companies ETF | |
Sector Weightings †:
† Sector weightings percentages are based on the total market value of investments.
| | | Shares | | | Value | |
| COMMON STOCK — 99.9% | | | | | | |
| CANADA— 1.2% | | | | | | |
| Energy — 0.6% | | | | | | |
Enbridge | | | 44,376 | | | $ | 1,440,001 | |
| Financials — 0.6% | | | | | | | | |
Toronto-Dominion Bank | | | 33,139 | | | | 1,418,349 | |
TOTAL CANADA | | | | | | | 2,858,350 | |
| UNITED STATES— 98.7% | | | | | | | | |
| Communication Services — 6.7% | | | | | | | | |
Alphabet, Cl A * | | | 3,944 | | | | 5,653,803 | |
AT&T | | | 43,199 | | | | 1,333,121 | |
Comcast, Cl A | | | 35,497 | | | | 1,405,682 | |
Facebook, Cl A * | | | 10,993 | | | | 2,474,414 | |
Netflix * | | | 3,002 | | | | 1,260,029 | |
| | |
| Schedule of Investments |
| May 31, 2020 (Unaudited) |
| Global X Conscious Companies ETF | |
| | | Shares | | | Value | |
| COMMON STOCK — continued | | | | | | | | |
| Communication Services — continued | | | | | | | | |
Omnicom Group | | | 24,884 | | | $ | 1,363,394 | |
Verizon Communications | | | 22,242 | | | | 1,276,246 | |
Walt Disney * | | | 12,685 | | | | 1,487,951 | |
| | | | | | | | 16,254,640 | |
| Consumer Discretionary — 10.4% | | | | | | | | |
Amazon.com * | | | 3,026 | | | | 7,390,611 | |
Best Buy | | | 17,975 | | | | 1,403,668 | |
Booking Holdings * | | | 942 | | | | 1,544,334 | |
BorgWarner | | | 48,073 | | | | 1,545,547 | |
eBay | | | 33,790 | | | | 1,538,797 | |
General Motors | | | 59,532 | | | | 1,540,688 | |
Hasbro | | | 17,605 | | | | 1,294,144 | |
Home Depot | | | 6,332 | | | | 1,573,375 | |
Lowe’s | | | 13,202 | | | | 1,720,881 | |
NIKE, Cl B | | | 14,664 | | | | 1,445,577 | |
Starbucks | | | 17,045 | | | | 1,329,340 | |
VF | | | 23,571 | | | | 1,322,333 | |
Whirlpool | | | 12,531 | | | | 1,526,526 | |
| | | | | | | | 25,175,821 | |
| Consumer Staples — 8.3% | | | | | | | | |
Brown-Forman, Cl B | | | 21,187 | | | | 1,396,858 | |
Campbell Soup | | | 25,344 | | | | 1,292,037 | |
Clorox | | | 6,744 | | | | 1,390,950 | |
Coca-Cola | | | 28,423 | | | | 1,326,786 | |
Colgate-Palmolive | | | 17,982 | | | | 1,300,638 | |
Costco Wholesale | | | 4,194 | | | | 1,293,723 | |
Estee Lauder, Cl A | | | 7,871 | | | | 1,554,286 | |
General Mills | | | 21,453 | | | | 1,352,397 | |
Hershey | | | 9,356 | | | | 1,269,422 | |
Hormel Foods | | | 27,138 | | | | 1,325,149 | |
| | |
| Schedule of Investments |
| May 31, 2020 (Unaudited) |
| Global X Conscious Companies ETF | |
| | | Shares | | | Value | |
| COMMON STOCK — continued | | | | | | | | |
| Consumer Staples — continued | | | | | | | | |
Kellogg | | | 19,859 | | | $ | 1,296,991 | |
Kimberly-Clark | | | 9,126 | | | | 1,290,781 | |
McCormick | | | 8,449 | | | | 1,479,928 | |
PepsiCo | | | 9,834 | | | | 1,293,663 | |
Procter & Gamble | | | 10,728 | | | | 1,243,590 | |
| | | | | | | | 20,107,199 | |
| Energy — 3.1% | | | | | | | | |
Baker Hughes, Cl A | | | 94,406 | | | | 1,558,643 | |
Chevron | | | 14,402 | | | | 1,320,663 | |
ConocoPhillips | | | 35,412 | | | | 1,493,678 | |
Hess | | | 30,748 | | | | 1,459,608 | |
ONEOK | | | 43,871 | | | | 1,609,627 | |
| | | | | | | | 7,442,219 | |
| Financials — 12.4% | | | | | | | | |
Aflac | | | 36,562 | | | | 1,333,416 | |
Allstate | | | 12,882 | | | | 1,259,988 | |
American Express | | | 15,537 | | | | 1,477,103 | |
Bank of America | | | 58,581 | | | | 1,412,974 | |
BlackRock, Cl A | | | 2,719 | | | | 1,437,372 | |
Capital One Financial | | | 24,358 | | | | 1,657,318 | |
Citigroup | | | 30,176 | | | | 1,445,732 | |
Discover Financial Services | | | 36,803 | | | | 1,748,510 | |
FactSet Research Systems | | | 4,685 | | | | 1,440,684 | |
JPMorgan Chase | | | 14,332 | | | | 1,394,647 | |
KeyCorp | | | 120,527 | | | | 1,428,245 | |
Moody’s | | | 5,338 | | | | 1,427,435 | |
Morgan Stanley | | | 34,190 | | | | 1,511,198 | |
Northern Trust | | | 16,893 | | | | 1,334,716 | |
PNC Financial Services Group | | | 12,885 | | | | 1,469,405 | |
Progressive | | | 15,694 | | | | 1,219,110 | |
| | |
| Schedule of Investments |
| May 31, 2020 (Unaudited) |
| Global X Conscious Companies ETF | |
| | | Shares | | | Value | |
| COMMON STOCK — continued | | | | | | | | |
| Financials — continued | | | | | | | | |
Prudential Financial | | | 24,067 | | | $ | 1,467,125 | |
S&P Global | | | 4,582 | | | | 1,489,242 | |
T Rowe Price Group | | | 12,729 | | | | 1,538,936 | |
Travelers | | | 12,712 | | | | 1,359,930 | |
US Bancorp | | | 38,394 | | | | 1,365,291 | |
| | | | | | | | 30,218,377 | |
| Health Care — 13.6% | | | | | | | | |
Abbott Laboratories | | | 13,635 | | | | 1,294,234 | |
AbbVie | | | 15,613 | | | | 1,446,856 | |
Agilent Technologies | | | 17,059 | | | | 1,503,581 | |
Amgen | | | 5,510 | | | | 1,265,647 | |
Baxter International | | | 14,026 | | | | 1,262,480 | |
Becton Dickinson | | | 4,832 | | | | 1,193,166 | |
Biogen Idec * | | | 4,384 | | | | 1,346,283 | |
Boston Scientific * | | | 35,191 | | | | 1,336,906 | |
Bristol-Myers Squibb | | | 21,016 | | | | 1,255,076 | |
Edwards Lifesciences * | | | 5,794 | | | | 1,302,028 | |
Eli Lilly | | | 8,009 | | | | 1,224,977 | |
Humana | | | 3,499 | | | | 1,436,864 | |
Illumina * | | | 4,096 | | | | 1,487,053 | |
IQVIA Holdings * | | | 10,035 | | | | 1,500,433 | |
Johnson & Johnson | | | 10,864 | | | | 1,616,019 | |
Merck | | | 15,837 | | | | 1,278,363 | |
Mettler-Toledo International * | | | 1,822 | | | | 1,448,490 | |
PerkinElmer | | | 14,690 | | | | 1,475,904 | |
Pfizer | | | 34,914 | | | | 1,333,366 | |
Regeneron Pharmaceuticals * | | | 2,264 | | | | 1,387,402 | |
Thermo Fisher Scientific | | | 3,997 | | | | 1,395,712 | |
Vertex Pharmaceuticals * | | | 4,781 | | | | 1,376,737 | |
Waters * | | | 6,714 | | | | 1,341,793 | |
| | |
| Schedule of Investments |
| May 31, 2020 (Unaudited) |
| Global X Conscious Companies ETF | |
| | | Shares | | | Value | |
| COMMON STOCK — continued | | | | | | | | |
| Health Care — continued | | | | | | | | |
Zoetis, Cl A | | | 10,360 | | | $ | 1,444,080 | |
| | | | | | | | 32,953,450 | |
| Industrials — 9.4% | | | | | | | | |
| 3M | | | 8,876 | | | | 1,388,561 | |
Caterpillar | | | 11,345 | | | | 1,362,875 | |
Cummins | | | 8,810 | | | | 1,494,177 | |
Deere | | | 9,343 | | | | 1,421,257 | |
FedEx | | | 10,598 | | | | 1,383,675 | |
Illinois Tool Works | | | 8,259 | | | | 1,424,347 | |
Ingersoll Rand * | | | 46,825 | | | | 1,320,465 | |
Owens Corning | | | 34,752 | | | | 1,824,480 | |
Republic Services, Cl A | | | 16,745 | | | | 1,431,028 | |
Rockwell Automation | | | 7,566 | | | | 1,635,467 | |
Southwest Airlines | | | 42,500 | | | | 1,364,250 | |
Trane Technologies | | | 15,307 | | | | 1,380,844 | |
Union Pacific | | | 8,412 | | | | 1,428,862 | |
United Parcel Service, Cl B | | | 12,879 | | | | 1,284,165 | |
Waste Management | | | 13,099 | | | | 1,398,318 | |
Xylem | | | 18,839 | | | | 1,249,779 | |
| | | | | | | | 22,792,550 | |
| Information Technology — 25.3% | | | | | | | | |
Accenture, Cl A | | | 7,410 | | | | 1,494,004 | |
Adobe * | | | 3,820 | | | | 1,476,812 | |
Akamai Technologies * | | | 12,525 | | | | 1,325,145 | |
Analog Devices | | | 12,583 | | | | 1,421,250 | |
Apple | | | 31,778 | | | | 10,103,497 | |
Applied Materials | | | 25,168 | | | | 1,413,938 | |
Automatic Data Processing | | | 9,394 | | | | 1,376,127 | |
Cisco Systems | | | 30,778 | | | | 1,471,804 | |
| Cognizant Technology Solutions, Cl A | | | 24,333 | | | | 1,289,649 | |
| | |
| Schedule of Investments |
| May 31, 2020 (Unaudited) |
| Global X Conscious Companies ETF | |
| | | Shares | | | Value | |
| COMMON STOCK — continued | | | | | | | | |
| Information Technology — continued | | | | | | | | |
Intel | | | 21,697 | | | $ | 1,365,392 | |
Intuit | | | 4,964 | | | | 1,441,148 | |
Juniper Networks | | | 55,378 | | | | 1,343,470 | |
Keysight Technologies * | | | 13,377 | | | | 1,446,455 | |
KLA | | | 8,035 | | | | 1,413,839 | |
Lam Research | | | 4,853 | | | | 1,328,121 | |
Littelfuse | | | 9,701 | | | | 1,576,316 | |
Mastercard, Cl A | | | 5,007 | | | | 1,506,556 | |
Microsoft | | | 59,458 | | | | 10,895,678 | |
NetApp | | | 31,216 | | | | 1,390,361 | |
NVIDIA | | | 4,510 | | | | 1,601,139 | |
ON Semiconductor * | | | 92,050 | | | | 1,517,905 | |
Oracle | | | 24,649 | | | | 1,325,377 | |
QUALCOMM | | | 17,356 | | | | 1,403,753 | |
salesforce.com * | | | 8,444 | | | | 1,475,927 | |
Square, Cl A * | | | 20,722 | | | | 1,680,140 | |
Texas Instruments | | | 11,598 | | | | 1,377,147 | |
Visa, Cl A | | | 7,700 | | | | 1,503,348 | |
VMware, Cl A * | | | 10,133 | | | | 1,583,484 | |
Workday, Cl A * | | | 8,947 | | | | 1,641,148 | |
Xilinx | | | 14,702 | | | | 1,351,849 | |
| | | | | | | | 61,540,779 | |
| Materials — 3.4% | | | | | | | | |
Air Products & Chemicals | | | 6,064 | | | | 1,465,366 | |
Avery Dennison | | | 12,003 | | | | 1,328,372 | |
Ecolab | | | 7,319 | | | | 1,555,872 | |
| International Flavors & Fragrances | | | 10,401 | | | | 1,385,309 | |
Newmont | | | 20,514 | | | | 1,199,454 | |
Sonoco Products | | | 27,326 | | | | 1,415,760 | |
| | | | | | | | 8,350,133 | |
| | |
| Schedule of Investments |
| May 31, 2020 (Unaudited) |
| Global X Conscious Companies ETF | |
| | | Shares | | | Value | |
| COMMON STOCK — continued | | | | | | | | |
| Real Estate — 2.3% | | | | | | | | |
CBRE Group, Cl A * | | | 32,037 | | | $ | 1,408,987 | |
Jones Lang LaSalle | | | 12,615 | | | | 1,291,776 | |
ProLogis ‡ | | | 14,767 | | | | 1,351,181 | |
Ventas ‡ | | | 45,563 | | | | 1,592,427 | |
| | | | | | | | 5,644,371 | |
| Utilities — 3.8% | | | | | | | | |
American Water Works | | | 10,274 | | | | 1,304,798 | |
Entergy | | | 13,210 | | | | 1,345,042 | |
Exelon | | | 35,029 | | | | 1,341,961 | |
NextEra Energy | | | 5,312 | | | | 1,357,535 | |
Pinnacle West Capital | | | 17,055 | | | | 1,328,585 | |
Sempra Energy | | | 10,207 | | | | 1,289,246 | |
WEC Energy Group | | | 13,570 | | | | 1,244,776 | |
| | | | | | | | 9,211,943 | |
TOTAL UNITED STATES | | | | | | | 239,691,482 | |
| TOTAL COMMON STOCK | | | | | | | | |
(Cost $209,101,459) | | | | | | | 242,549,832 | |
| TOTAL INVESTMENTS — 99.9% | | | | | | | | |
(Cost $209,101,459) | | | | | | $ | 242,549,832 | |
Percentages are based on Net Assets of $242,789,162.
| * | Non-income producing security. |
| ‡ | Real Estate Investment Trust |
Cl — Class
As of May 31, 2020, all of the Fund’s investments were considered Level 1, in accordance with authoritative guidance on fair value measurements and disclosure under U.S. GAAP.
For the period ended May 31, 2020, there were no transfers in or out of Level 3.
| | |
| Schedule of Investments |
| May 31, 2020 (Unaudited) |
| Global X Founder-Run Companies ETF | |
Sector Weightings †:
† Sector weightings percentages are based on the total market value of investments.
| | | Shares | | | Value | |
| COMMON STOCK — 100.0% | | | | | | |
| UNITED STATES— 100.0% | | | | | | |
| Communication Services — 8.7% | | | | | | |
Cargurus, Cl A * | | | 1,862 | | | $ | 48,375 | |
Facebook, Cl A * | | | 195 | | | | 43,892 | |
Netflix * | | | 87 | | | | 36,517 | |
Nexstar Media Group, Cl A | | | 626 | | | | 52,152 | |
Roku, Cl A * | | | 298 | | | | 32,634 | |
Snap, Cl A * | | | 2,322 | | | | 43,979 | |
TripAdvisor | | | 2,014 | | | | 38,830 | |
Twitter * | | | 1,292 | | | | 40,013 | |
| World Wrestling Entertainment, Cl A | | | 829 | | | | 38,358 | |
| | | | | | | | 374,750 | |
| Consumer Discretionary — 9.3% | | | | | | | | |
Amazon.com * | | | 15 | | | | 36,636 | |
Carvana, Cl A * | | | 396 | | | | 36,820 | |
Grubhub * | | | 853 | | | | 48,399 | |
| | |
| Schedule of Investments |
| May 31, 2020 (Unaudited) |
| Global X Founder-Run Companies ETF | |
| | | Shares | | | Value | |
| COMMON STOCK — continued | | | | | | | | |
| Consumer Discretionary — continued | | | | | | | | |
L Brands | | | 3,603 | | | $ | 58,333 | |
Las Vegas Sands | | | 848 | | | | 40,653 | |
Skechers U.S.A., Cl A * | | | 1,451 | | | | 45,445 | |
Tesla * | | | 51 | | | | 42,585 | |
Texas Roadhouse, Cl A | | | 810 | | | | 41,998 | |
Wayfair, Cl A * | | | 300 | | | | 51,465 | |
| | | | | | | | 402,334 | |
| Consumer Staples — 1.9% | | | | | | | | |
J&J Snack Foods | | | 315 | | | | 40,518 | |
National Beverage * | | | 710 | | | | 40,456 | |
| | | | | | | | 80,974 | |
| Energy — 1.0% | | | | | | | | |
Pioneer Natural Resources | | | 480 | | | | 43,968 | |
| Financials — 15.1% | | | | | | | | |
| Apollo Global Management, Cl A | | | 954 | | | | 45,410 | |
Athene Holding, Cl A * | | | 1,571 | | | | 45,386 | |
BlackRock, Cl A | | | 78 | | | | 41,234 | |
Blackstone Group, Cl A | | | 767 | | | | 43,566 | |
Capital One Financial | | | 662 | | | | 45,043 | |
Essent Group | | | 1,521 | | | | 50,269 | |
First Republic Bank | | | 371 | | | | 40,131 | |
Intercontinental Exchange | | | 418 | | | | 40,650 | |
KKR | | | 1,573 | | | | 43,651 | |
LendingTree * | | | 172 | | | | 44,723 | |
MarketAxess Holdings | | | 88 | | | | 44,756 | |
SEI Investments | | | 760 | | | | 41,207 | |
Signature Bank NY | | | 395 | | | | 40,650 | |
Starwood Property Trust ‡ | | | 3,305 | | | | 43,824 | |
Wintrust Financial | | | 1,031 | | | | 43,673 | |
| | | | | | | | 654,173 | |
| | |
| Schedule of Investments |
| May 31, 2020 (Unaudited) |
| Global X Founder-Run Companies ETF | |
| | | Shares | | | Value | |
| COMMON STOCK — continued | | | | | | | | |
| Health Care — 14.6% | | | | | | | | |
Allogene Therapeutics * | | | 1,255 | | | $ | 60,441 | |
Guardant Health * | | | 488 | | | | 44,111 | |
Ionis Pharmaceuticals * | | | 639 | | | | 35,918 | |
Jazz Pharmaceuticals * | | | 347 | | | | 41,404 | |
LHC Group * | | | 302 | | | | 49,078 | |
Masimo * | | | 176 | | | | 42,273 | |
Merit Medical Systems * | | | 924 | | | | 41,571 | |
Neurocrine Biosciences * | | | 378 | | | | 47,159 | |
Penumbra * | | | 195 | | | | 33,622 | |
Regeneron Pharmaceuticals * | | | 64 | | | | 39,220 | |
Seattle Genetics * | | | 254 | | | | 39,932 | |
Ultragenyx Pharmaceutical * | | | 561 | | | | 38,406 | |
United Therapeutics * | | | 334 | | | | 39,395 | |
| Universal Health Services, Cl B | | | 365 | | | | 38,489 | |
Veeva Systems, Cl A * | | | 198 | | | | 43,336 | |
| | | | | | | | 634,355 | |
| Industrials — 4.6% | | | | | | | | |
Axon Enterprise * | | | 517 | | | | 39,271 | |
Clean Harbors * | | | 734 | | | | 43,592 | |
CoStar Group * | | | 62 | | | | 40,722 | |
FedEx | | | 302 | | | | 39,429 | |
Lyft, Cl A * | | | 1,162 | | | | 36,324 | |
| | | | | | | | 199,338 | |
| Information Technology — 33.7% | | | | | | | | |
Akamai Technologies * | | | 361 | | | | 38,194 | |
Alteryx, Cl A * | | | 330 | | | | 47,500 | |
Avalara * | | | 436 | | | | 46,678 | |
Dell Technologies, Cl C * | | | 936 | | | | 46,463 | |
Dropbox, Cl A * | | | 1,838 | | | | 41,484 | |
EPAM Systems * | | | 183 | | | | 42,207 | |
| | |
| Schedule of Investments |
| May 31, 2020 (Unaudited) |
| Global X Founder-Run Companies ETF | |
| | | Shares | | | Value | |
| COMMON STOCK — continued | | | | | | | | |
| Information Technology — continued | | | | | | | | |
Euronet Worldwide * | | | 446 | | | $ | 42,249 | |
Fortinet * | | | 355 | | | | 49,416 | |
HubSpot * | | | 252 | | | | 50,385 | |
IPG Photonics * | | | 307 | | | | 47,708 | |
Microchip Technology | | | 453 | | | | 43,497 | |
Monolithic Power Systems | | | 196 | | | | 41,111 | |
New Relic * | | | 718 | | | | 47,496 | |
Nutanix, Cl A * | | | 2,088 | | | | 50,237 | |
NVIDIA | | | 128 | | | | 45,443 | |
Okta, Cl A * | | | 239 | | | | 46,744 | |
Paycom Software * | | | 175 | | | | 52,015 | |
Pegasystems | | | 484 | | | | 46,038 | |
RealPage * | | | 612 | | | | 41,506 | |
RingCentral, Cl A * | | | 153 | | | | 41,960 | |
salesforce.com * | | | 238 | | | | 41,600 | |
Square, Cl A * | | | 599 | | | | 48,567 | |
SS&C Technologies Holdings | | | 725 | | | | 41,974 | |
Synopsys * | | | 243 | | | | 43,961 | |
Trade Desk, Cl A * | | | 143 | | | | 44,553 | |
Twilio, Cl A * | | | 334 | | | | 65,998 | |
Ubiquiti | | | 240 | | | | 44,258 | |
VeriSign * | | | 175 | | | | 38,327 | |
ViaSat * | | | 899 | | | | 37,758 | |
Workday, Cl A * | | | 256 | | | | 46,958 | |
Zendesk * | | | 506 | | | | 43,390 | |
Zscaler * | | | 550 | | | | 53,950 | |
| | | | | | | | 1,459,625 | |
| Materials — 1.0% | | | | | | | | |
Steel Dynamics | | | 1,578 | | | | 41,912 | |
| | |
| Schedule of Investments |
| May 31, 2020 (Unaudited) |
| Global X Founder-Run Companies ETF | |
| | | Shares | | | Value | |
| COMMON STOCK — continued | | | | | | | | |
| Real Estate — 10.1% | | | | | | | | |
American Campus Communities ‡ | | | 1,243 | | | $ | 40,149 | |
American Homes 4 Rent, Cl A ‡ | | | 1,614 | | | | 40,737 | |
Apartment Investment & Management, Cl A ‡ | | | 1,059 | | | | 39,045 | |
Brandywine Realty Trust ‡ | | | 3,744 | | | | 36,130 | |
Camden Property Trust ‡ | | | 444 | | | | 40,657 | |
Healthcare Trust of America, Cl A ‡ | | | 1,574 | | | | 41,664 | |
Invitation Homes ‡ | | | 1,706 | | | | 44,868 | |
Medical Properties Trust ‡ | | | 2,341 | | | | 42,325 | |
ProLogis ‡ | | | 417 | | | | 38,155 | |
STAG Industrial ‡ | | | 1,447 | | | | 38,924 | |
Vornado Realty Trust ‡ | | | 983 | | | | 35,595 | |
| | | | | | | | 438,249 | |
TOTAL UNITED STATES | | | | | | | 4,329,678 | |
| TOTAL COMMON STOCK | | | | | | | | |
(Cost $4,604,247) | | | | | | | 4,329,678 | |
| TOTAL INVESTMENTS — 100.0% | | | | | | | | |
(Cost $4,604,247) | | | | | | $ | 4,329,678 | |
Percentages are based on Net Assets of $4,331,430.
| * | Non-income producing security. |
| ‡ | Real Estate Investment Trust |
Cl — Class
As of May 31, 2020, all of the Fund’s investments were considered Level 1, in accordance with authoritative guidance on fair value measurements and disclosure under U.S. GAAP.
For the period ended May 31, 2020, there were no transfers in or out of Level 3.
| | |
| Schedule of Investments |
| May 31, 2020 (Unaudited) |
| Global X Thematic Growth ETF | |
Sector Weightings †:
† Sector weightings percentages are based on the total market value of investments.
| | | Shares | | | Value | |
| EXCHANGE TRADED FUNDS — 100.0% | | | | | | |
| Affiliated ETF — 100.0% | | | | | | |
Global X E-commerce ETF(A) | | | 52,426 | | | $ | 1,131,290 | |
Global X FinTech ETF*(A) | | | 43,681 | | | | 1,404,345 | |
Global X Internet of Things (A) | | | 23,952 | | | | 545,521 | |
Global X Lithium & Battery Tech ETF (A) | | | 18,168 | | | | 518,515 | |
Global X Longevity Thematic ETF (A) | | | 23,698 | | | | 574,795 | |
Global X Robotics & Artificial Intelligence ETF (A) | | | 25,652 | | | | 594,613 | |
Global X Social Media ETF*(A) | | | 27,555 | | | | 1,048,743 | |
| | | | | | | | | |
| TOTAL EXCHANGE TRADED FUNDS (Cost $5,446,723) | | | | | | | 5,817,822 | |
| TOTAL INVESTMENTS — 100.0% | | | | | | | | |
(Cost $5,446,723) | | | | | | $ | 5,817,822 | |
Percentages are based on Net Assets of $5,819,454.
| * | Non-income producing security. |
| (A) | Affiliated investment. |
ETF — Exchange Traded Fund
As of May 31, 2020, all of the Fund’s investments were considered Level 1, in accordance with authoritative guidance on fair value measurements and disclosure under U.S. GAAP.
For the period ended May 31, 2020, there were no transfers in or out of Level 3.
| | |
| Schedule of Investments |
| May 31, 2020 (Unaudited) |
| Global X Thematic Growth ETF | |
The following is a summary of the transactions with affiliates for the period ended May 31, 2020:
| | | Value at 11/30/19 | | | Purchases at Cost | | | Proceeds from Sales | | | Changes in Unrealized Appreciation (Depreciation) | | | Realized Gain (Loss) | | | Value at 5/31/20 | | | Shares | | | Dividend Income | |
| Global X E-commerce ETF | | $ | 439,566 | | | $ | 684,807 | | | $ | (157,521 | ) | | $ | 184,759 | | | $ | (20,321 | ) | | $ | 1,131,290 | | | | 52,426 | | | $ | 837 | |
| Global X Fintech ETF | | | 459,057 | | | | 913,706 | | | | (3,269 | ) | | | 35,742 | | | | (891 | ) | | | 1,404,345 | | | | 43,681 | | | | − | |
| Global X Internet of Things ETF | | | 296,729 | | | | 451,026 | | | | (181,806 | ) | | | (24,367 | ) | | | 3,939 | | | | 545,521 | | | | 23,952 | | | | 2,379 | |
| Global X Lithium & Battery Tech ETF | | | 263,961 | | | | 486,134 | | | | (219,559 | ) | | | (37,557 | ) | | | 25,536 | | | | 518,515 | | | | 18,168 | | | | 2,926 | |
| Global X Longevity Thematic ETF | | | 272,658 | | | | 416,071 | | | | (114,256 | ) | | | (1,616 | ) | | | 1,938 | | | | 574,795 | | | | 23,698 | | | | 1,249 | |
| Global X Robotics & Artificial Intelligence ETF | | | 285,028 | | | | 428,737 | | | | (153,343 | ) | | | 51,425 | | | | (17,234 | ) | | | 594,613 | | | | 25,652 | | | | 408 | |
| Global X Social Media ETF | | | 631,522 | | | | 1,009,955 | | | | (654,959 | ) | | | 36,248 | | | | 25,977 | | | | 1,048,743 | | | | 27,555 | | | | − | |
| Totals: | | $ | 2,648,521 | | | $ | 4,390,436 | | | $ | (1,484,713 | ) | | $ | 244,634 | | | $ | 18,944 | | | $ | 5,817,822 | | | | 215,132 | | | $ | 7,799 | |
| | |
Statements of Assets and Liabilities |
| |
|
| | | Global X Robotics & Artificial Intelligence ETF | | | Global X FinTech ETF | | | Global X Internet of Things ETF | | | Global X Cloud Computing ETF | |
| Assets: | | | | | | | | | | | | |
| Cost of Investments | | $ | 1,598,921,172 | | | $ | 495,793,941 | | | $ | 158,519,811 | | | $ | 575,080,705 | |
| Cost of Repurchase Agreement | | | 13,785,170 | | | | 4,451,165 | | | | 462,367 | | | | — | |
| Cost of Foreign Currency | | | 1,190 | | | | 13,022 | | | | 1 | | | | 6,151 | |
| Investments, at Value | | $ | 1,548,750,343 | * | | $ | 564,311,555 | * | | $ | 173,401,125 | * | | $ | 676,498,724 | |
| Repurchase Agreement, at Value | | | 13,785,170 | | | | 4,451,165 | | | | 462,367 | | | | — | |
| Cash | | | — | | | | 212,510 | | | | 422,313 | | | | 603,464 | |
| Foreign Currency, at Value | | | 1,197 | | | | 13,148 | | | | 1 | | | | 6,151 | |
| Receivable for Capital Shares Sold | | | 8,133,878 | | | | — | | | | — | | | | — | |
| Dividend and Interest Receivable | | | 3,669,556 | | | | 178,112 | | | | 190,892 | | | | 55,212 | |
| Reclaim Receivable | | | 2,854,952 | | | | 57,917 | | | | 52,393 | | | | — | |
| Receivable for Investment Securities Sold | | | 2,417,657 | | | | — | | | | — | | | | — | |
| Total Assets | | | 1,579,612,753 | | | | 569,224,407 | | | | 174,529,091 | | | | 677,163,551 | |
| Liabilities: | | | | | | | | | | | | | | | | |
| Obligation to Return Securities Lending Collateral | | | 131,218,660 | | | | 42,369,873 | | | | 4,401,194 | | | | — | |
| Payable for Investment Securities Purchased | | | 8,150,610 | | | | — | | | | — | | | | — | |
| Payable due to Investment Adviser | | | 757,251 | | | | 275,186 | | | | 91,279 | | | | 338,262 | |
| Unrealized Depreciation on Spot Contracts | | | 1,445 | | | | — | | | | — | | | | — | |
| Cash Overdraft | | | 11,430,515 | | | | — | | | | — | | | | — | |
| Total Liabilities | | | 151,558,481 | | | | 42,645,059 | | | | 4,492,473 | | | | 338,262 | |
| Net Assets | | $ | 1,428,054,272 | | | $ | 526,579,348 | | | $ | 170,036,618 | | | $ | 676,825,289 | |
| Net Assets Consist of: | | | | | | | | | | | | | | | | |
| Paid-in Capital | | $ | 1,656,701,505 | | | $ | 470,134,605 | | | $ | 157,589,903 | | | $ | 547,693,725 | |
| Total Distributable Earnings/(Loss) | | | (228,647,233 | ) | | | 56,444,743 | | | | 12,446,715 | | | | 129,131,564 | |
| Net Assets | | $ | 1,428,054,272 | | | $ | 526,579,348 | | | $ | 170,036,618 | | | $ | 676,825,289 | |
| Outstanding Shares of Beneficial Interest | | | | | | | | | | | | | | | | |
| (unlimited authorization — no par value) | | | 61,650,000 | | | | 16,350,000 | | | | 7,500,000 | | | | 33,950,000 | |
| Net Asset Value, Offering and Redemption Price Per Share | | $ | 23.16 | | | $ | 32.21 | | | $ | 22.67 | | | $ | 19.94 | |
| *Includes Market Value of Securities on Loan | | $ | 122,421,080 | | | $ | 40,174,322 | | | $ | 4,293,915 | | | $ | — | |
| | |
Statements of Assets and Liabilities |
| |
|
| | | Global X Future Analytics Tech ETF | | | Global X Autonomous & Electric Vehicles ETF | | | Global X Genomics & Biotechnology ETF | | | Global X Video Games and Esports ETF | |
| Assets: | | | | | | | | | | | | |
| Cost of Investments | | $ | 40,922,216 | | | $ | 21,176,033 | | | $ | 31,057,668 | | | $ | 94,214,259 | |
| Cost of Repurchase Agreement | | | 7,604 | | | | 48,875 | | | | — | | | | — | |
| Cost of Foreign Currency | | | 3,973 | | | | 9,204 | | | | — | | | | 1 | |
| Investments, at Value | | $ | 46,921,488 | * | | $ | 19,319,394 | * | | $ | 34,612,775 | | | $ | 107,859,693 | |
| Repurchase Agreement, at Value | | | 7,604 | | | | 48,875 | | | | — | | | | — | |
| Cash | | | — | | | | 21,191 | | | | 69,005 | | | | — | |
| Foreign Currency, at Value | | | 3,957 | | | | 9,195 | | | | — | | | | 1 | |
| Dividend and Interest Receivable | | | 42,520 | | | | 29,606 | | | | — | | | | 129,787 | |
| Reclaim Receivable | | | 6,219 | | | | 4,363 | | | | — | | | | — | |
| Receivable for Investment Securities Sold | | | — | | | | 205,265 | | | | — | | | | 14,762,208 | |
| Total Assets | | | 46,981,788 | | | | 19,637,889 | | | | 34,681,780 | | | | 122,751,689 | |
| Liabilities: | | | | | | | | | | | | | | | | |
| Obligation to Return Securities Lending Collateral | | | 72,380 | | | | 465,236 | | | | — | | | | — | |
| Payable due to Investment Adviser | | | 25,609 | | | | 10,323 | | | | 18,326 | | | | 41,535 | |
| Unrealized Depreciation on Spot Contracts | | | 2 | | | | 88 | | | | — | | | | 2,107 | |
| Payable for Investment Securities Purchased | | | — | | | | 237,927 | | | | — | | | | — | |
| Payable for Capital Shares Redeemed | | | — | | | | — | | | | — | | | | 14,781,452 | |
| Cash Overdraft | | | 15,519 | | | | — | | | | — | | | | 10,414,351 | |
| Total Liabilities | | | 113,510 | | | | 713,574 | | | | 18,326 | | | | 25,239,445 | |
| Net Assets | | $ | 46,868,278 | | | $ | 18,924,315 | | | $ | 34,663,454 | | | $ | 97,512,244 | |
| Net Assets Consist of: | | | | | | | | | | | | | | | | |
| Paid-in Capital | | $ | 38,744,027 | | | $ | 21,831,328 | | | $ | 30,335,147 | | | $ | 80,895,127 | |
| Total Distributable Earnings/(Loss) | | | 8,124,251 | | | | (2,907,013 | ) | | | 4,328,307 | | | | 16,617,117 | |
| Net Assets | | $ | 46,868,278 | | | $ | 18,924,315 | | | $ | 34,663,454 | | | $ | 97,512,244 | |
| Outstanding Shares of Beneficial Interest | | | | | | | | | | | | | | | | |
| (unlimited authorization — no par value) | | | 2,400,002 | | | | 1,400,002 | | | | 2,100,000 | | | | 4,800,000 | |
| Net Asset Value, Offering and Redemption Price Per Share | | $ | 19.53 | | | $ | 13.52 | | | $ | 16.51 | | | $ | 20.32 | |
| *Includes Market Value of Securities on Loan | | $ | 71,456 | | | $ | 445,891 | | | $ | — | | | $ | — | |
| | |
Statements of Assets and Liabilities |
| |
|
| | | Global X Cybersecurity ETF | | | Global X Millennials Thematic ETF | | | Global X Longevity Thematic ETF | | | Global X Health & Wellness Thematic ETF | |
| Assets: | | | | | | | | | | | | |
| Cost of Investments | | $ | 10,566,799 | | | $ | 75,198,428 | | | $ | 22,892,314 | | | $ | 21,296,811 | |
| Cost of Repurchase Agreement | | | — | | | | 112,435 | | | | — | | | | — | |
| Cost of Foreign Currency | | | — | | | | — | | | | 1 | | | | 5,788 | |
| Investments, at Value | | $ | 11,642,190 | | | $ | 78,073,252 | * | | $ | 26,620,063 | | | $ | 19,566,924 | |
| Repurchase Agreement, at Value | | | — | | | | 112,435 | | | | — | | | | — | |
| Cash | | | 21,580 | | | | 73,364 | | | | — | | | | 10,218 | |
| Foreign Currency, at Value | | | — | | | | — | | | | 1 | | | | 5,788 | |
| Dividend and Interest Receivable | | | 7,769 | | | | 19,337 | | | | 10,347 | | | | 17,217 | |
| Unrealized Appreciation on Spot Contracts | | | — | | | | — | | | | — | | | | 28 | |
| Receivable for Capital Shares Sold | | | — | | | | 1,308,112 | | | | — | | | | — | |
| Reclaim Receivable | | | — | | | | — | | | | 10,125 | | | | 970 | |
| Total Assets | | | 11,671,539 | | | | 79,586,500 | | | | 26,640,536 | | | | 19,601,145 | |
| Liabilities: | | | | | | | | | | | | | | | | |
| Obligation to Return Securities Lending Collateral | | | — | | | | 1,070,245 | | | | — | | | | — | |
| Payable due to Investment Adviser | | | 3,569 | | | | 31,198 | | | | 10,765 | | | | 7,748 | |
| Payable for Investment Securities Purchased | | | — | | | | 1,308,537 | | | | — | | | | — | |
| Cash Overdraft | | | — | | | | — | | | | 14,393 | | | | — | |
| Total Liabilities | | | 3,569 | | | | 2,409,980 | | | | 25,158 | | | | 7,748 | |
| Net Assets | | $ | 11,667,970 | | | $ | 77,176,520 | | | $ | 26,615,378 | | | $ | 19,593,397 | |
| Net Assets Consist of: | | | | | | | | | | | | | | | | |
| Paid-in Capital | | $ | 10,442,117 | | | $ | 75,156,730 | | | $ | 22,253,528 | | | $ | 19,901,873 | |
| Total Distributable Earnings/(Loss) | | | 1,225,853 | | | | 2,019,790 | | | | 4,361,850 | | | | (308,476 | ) |
| Net Assets | | $ | 11,667,970 | | | $ | 77,176,520 | | | $ | 26,615,378 | | | $ | 19,593,397 | |
| Outstanding Shares of Beneficial Interest | | | | | | | | | | | | | | | | |
| (unlimited authorization — no par value) | | | 600,000 | | | | 2,950,000 | | | | 1,100,000 | | | | 1,000,000 | |
| Net Asset Value, Offering and Redemption Price Per Share | | $ | 19.45 | | | $ | 26.16 | | | $ | 24.20 | | | $ | 19.59 | |
| *Includes Market Value of Securities on Loan | | $ | — | | | $ | 1,072,329 | | | $ | — | | | $ | — | |
| | |
Statements of Assets and Liabilities |
| |
|
| | | Global X Cannabis ETF | | | Global X U.S. Infrastructure Development ETF | | | Global X Conscious Companies ETF | | | Global X Founder- Run Companies ETF | |
| Assets: | | | | | | | | | | | | |
| Cost of Investments | | $ | 16,910,649 | | | $ | 141,418,932 | | | $ | 209,101,459 | | | $ | 4,604,247 | |
| Cost of Repurchase Agreement | | | 382,751 | | | | 38,843 | | | | — | | | | — | |
| Investments, at Value | | $ | 14,897,960 | * | | $ | 114,602,843 | * | | $ | 242,549,832 | | | $ | 4,329,678 | |
| Repurchase Agreement, at Value | | | 382,751 | | | | 38,843 | | | | — | | | | — | |
| Cash | | | — | | | | 205,567 | | | | — | | | | 2,656 | |
| Dividend and Interest Receivable | | | 134,819 | | | | 198,405 | | | | 438,514 | | | | 643 | |
| Receivable for Capital Shares Sold | | | — | | | | 4,443,345 | | | | — | | | | — | |
| Reclaim Receivable | | | — | | | | 6,238 | | | | — | | | | — | |
| Total Assets | | | 15,415,530 | | | | 119,495,241 | | | | 242,988,346 | | | | 4,332,977 | |
| Liabilities: | | | | | | | | | | | | | | | | |
| Obligation to Return Securities Lending Collateral | | | 3,643,340 | | | | 369,743 | | | | — | | | | — | |
| Payable due to Investment Adviser | | | 4,198 | | | | 40,736 | | | | 84,111 | | | | 1,547 | |
| Payable for Investment Securities Purchased | | | — | | | | 4,437,542 | | | | — | | | | — | |
| Cash Overdraft | | | 40,452 | | | | — | | | | 115,073 | | | | — | |
| Total Liabilities | | | 3,687,990 | | | | 4,848,021 | | | | 199,184 | | | | 1,547 | |
| Net Assets | | $ | 11,727,540 | | | $ | 114,647,220 | | | $ | 242,789,162 | | | $ | 4,331,430 | |
| Net Assets Consist of: | | | | | | | | | | | | | | | | |
| Paid-in Capital | | $ | 14,605,709 | | | $ | 152,378,441 | | | $ | 209,693,351 | | | $ | 5,824,715 | |
| Total Distributable Earnings/(Loss) | | | (2,878,169 | ) | | | (37,731,221 | ) | | | 33,095,811 | | | | (1,493,285 | ) |
| Net Assets | | $ | 11,727,540 | | | $ | 114,647,220 | | | $ | 242,789,162 | | | $ | 4,331,430 | |
| Outstanding Shares of Beneficial Interest | | | | | | | | | | | | | | | | |
| (unlimited authorization — no par value) | | | 1,000,000 | | | | 7,800,000 | | | | 11,200,000 | | | | 200,000 | |
| Net Asset Value, Offering and Redemption Price Per Share | | $ | 11.73 | | | $ | 14.70 | | | $ | 21.68 | | | $ | 21.66 | |
| *Includes Market Value of Securities on Loan | | $ | 3,282,607 | | | $ | 355,028 | | | $ | — | | | $ | — | |
| | |
Statements of Assets and Liabilities |
| |
|
| | | Global X Thematic Growth ETF | |
| Assets: | | | |
| Cost of Affiliated Investments | | $ | 5,446,723 | |
| Affiliated Investments, at Value | | | 5,817,822 | |
| Cash | | | 1,045 | |
| Receivable due from Investment Adviser | | | 587 | |
| Total Assets | | | 5,819,454 | |
| Net Assets | | $ | 5,819,454 | |
| Net Assets Consist of: | | | | |
| Paid-in Capital | | $ | 5,427,153 | |
| Total Distributable Earnings | | | 392,301 | |
| Net Assets | | $ | 5,819,454 | |
| Outstanding Shares of Beneficial Interest | | | | |
| (unlimited authorization — no par value) | | | 200,000 | |
| Net Asset Value, Offering and Redemption Price Per Share | | $ | 29.10 | |
| | |
|
| For the period ended May 31, 2020 (Unaudited) |
|
| | | Global X Robotics & Artificial Intelligence ETF | | | Global X FinTech ETF | | | Global X Internet of Things ETF | | | Global X Cloud Computing ETF | |
| Investment Income: | | | | | | | | | | | | |
| Dividend Income | | $ | 8,700,873 | | | $ | 836,019 | | | $ | 1,012,764 | | | $ | 421,181 | |
| Interest Income | | | 1,849 | | | | 827 | | | | 485 | | | | — | |
| Security Lending Income | | | 962,240 | | | | 209,650 | | | | 109,432 | | | | 976 | |
| Less: Foreign Taxes Withheld | | | (982,135 | ) | | | (37,440 | ) | | | (42,282 | ) | | | — | |
| Total Investment Income | | | 8,682,827 | | | | 1,009,056 | | | | 1,080,399 | | | | 422,157 | |
Supervision and Administration Fees(1) | | | 4,579,595 | | | | 1,515,272 | | | | 477,320 | | | | 1,585,423 | |
Custodian Fees(2) | | | 41,973 | | | | 2,506 | | | | 177 | | | | 1,159 | |
| Total Expenses | | | 4,621,568 | | | | 1,517,778 | | | | 477,497 | | | | 1,586,582 | |
| Net Investment Income (Loss) | | | 4,061,259 | | | | (508,722 | ) | | | 602,902 | | | | (1,164,425 | ) |
| Net Realized Gain (Loss) on: | | | | | | | | | | | | | | | | |
Investments(3) | | | (57,616,942 | ) | | | 5,680,309 | | | | 270,268 | | | | 31,278,637 | |
| Foreign Currency Transactions | | | 79,757 | | | | (64,372 | ) | | | 8,448 | | | | (5,864 | ) |
| Net Realized Gain (Loss) on Investments and Foreign Currency Transactions | | | (57,537,185 | ) | | | 5,615,937 | | | | 278,716 | | | | 31,272,773 | |
| Net Change in Unrealized Appreciation (Depreciation) on: | | | | | | | | | | | | | | | | |
| Investments | | | 136,577,633 | | | | 23,626,291 | | | | (463,214 | ) | | | 91,801,569 | |
| Foreign Currency Translations | | | 139,277 | | | | 648 | | | | 1,376 | | | | — | |
| Net Change in Unrealized Appreciation (Depreciation) on Investments and Foreign Currency Translations | | | 136,716,910 | | | | 23,626,939 | | | | (461,838 | ) | | | 91,801,569 | |
| Net Realized and Unrealized Gain (Loss) on Investments and Foreign Currency Transactions and Translations | | | 79,179,725 | | | | 29,242,876 | | | | (183,122 | ) | | | 123,074,342 | |
| Net Increase in Net Assets Resulting from Operations | | $ | 83,240,984 | | | $ | 28,734,154 | | | $ | 419,780 | | | $ | 121,909,917 | |
| (1) | The Supervision and Administration fees reflect the supervisory and administrative fee, which includes fees paid by the Funds for the investment advisory services provided by the Adviser. (See Note 3 in Notes to Financial Statements.) |
| (2) | See Note 2 in the Notes to Financial Statements. |
| (3) | Includes realized gains (losses) as a result of in-kind redemptions. (See Note 4 in Notes to Financial Statements.) |
| | |
|
| For the period ended May 31, 2020 (Unaudited) |
|
| | | Global X Future Analytics Tech ETF | | | Global X Autonomous & Electric Vehicles ETF | | | Global X Genomics & Biotechnology ETF | | | Global X Video Games and Esports ETF | |
| Investment Income: | | | | | | | | | | | | |
| Dividend Income | | $ | 383,385 | | | $ | 134,634 | | | $ | 11,040 | | | $ | 214,163 | |
| Interest Income | | | — | | | | — | | | | — | | | | 490 | |
| Security Lending Income | | | 59 | | | | 24,335 | | | | — | | | | — | |
| Less: Foreign Taxes Withheld | | | (7,115 | ) | | | (8,501 | ) | | | — | | | | (23,727 | ) |
| Total Investment Income | | | 376,329 | | | | 150,468 | | | | 11,040 | | | | 190,926 | |
Supervision and Administration Fees(1) | | | 151,152 | | | | 57,088 | | | | 74,342 | | | | 102,997 | |
Custodian Fees(2) | | | 153 | | | | 43 | | | | 113 | | | | 1,078 | |
| Total Expenses | | | 151,305 | | | | 57,131 | | | | 74,455 | | | | 104,075 | |
| Net Investment Income (Loss) | | | 225,024 | | | | 93,337 | | | | (63,415 | ) | | | 86,851 | |
| Net Realized Gain (Loss) on: | | | | | | | | | | | | | | | | |
Investments(3) | | | 2,670,198 | | | | (21,318 | ) | | | 951,331 | | | | 2,906,330 | |
| Foreign Currency Transactions | | | 1,591 | | | | 404 | | | | 5,322 | | | | (17,801 | ) |
| Net Realized Gain (Loss) on Investments and Foreign Currency Transactions | | | 2,671,789 | | | | (20,914 | ) | | | 956,653 | | | | 2,888,529 | |
| Net Change in Unrealized Appreciation (Depreciation) on: | | | | | | | | | | | | | | | | |
| Investments | | | 2,348,609 | | | | (1,197,778 | ) | | | 1,619,785 | | | | 13,571,852 | |
| Foreign Currency Translations | | | 88 | | | | (145 | ) | | | — | | | | (776 | ) |
| Net Change in Unrealized Appreciation (Depreciation) on Investments and Foreign Currency Translations | | | 2,348,697 | | | | (1,197,923 | ) | | | 1,619,785 | | | | 13,571,076 | |
| Net Realized and Unrealized Gain (Loss) on Investments and Foreign Currency Transactions and Translations | | | 5,020,486 | | | | (1,218,837 | ) | | | 2,576,438 | | | | 16,459,605 | |
| Net Increase (Decrease) in Net Assets Resulting from Operations | | $ | 5,245,510 | | | $ | (1,125,500 | ) | | $ | 2,513,023 | | | $ | 16,546,456 | |
| (1) | The Supervision and Administration fees reflect the supervisory and administrative fee, which includes fees paid by the Funds for the investment advisory services provided by the Adviser. (See Note 3 in Notes to Financial Statements.) |
| (2) | See Note 2 in the Notes to Financial Statements. |
| (3) | Includes realized gains (losses) as a result of in-kind redemptions. (See Note 4 in Notes to Financial Statements.) |
| | |
|
| For the period ended May 31, 2020 (Unaudited) |
|
| | | Global X Cybersecurity ETF | | | Global X Millennials Thematic ETF | | | Global X Longevity Thematic ETF | | | Global X Health & Wellness Thematic ETF | |
| Investment Income: | | | | | | | | | | | | |
| Dividend Income | | $ | 146,190 | | | $ | 287,277 | | | $ | 136,344 | | | $ | 82,736 | |
| Interest Income | | | — | | | | 264 | | | | 148 | | | | 50 | |
| Security Lending Income | | | — | | | | 9,412 | | | | — | | | | — | |
| Less: Foreign Taxes Withheld | | | (507 | ) | | | — | | | | (5,490 | ) | | | (4,296 | ) |
| Total Investment Income | | | 145,683 | | | | 296,953 | | | | 131,002 | | | | 78,490 | |
Supervision and Administration Fees(1) | | | 14,612 | | | | 231,236 | | | | 77,229 | | | | 65,147 | |
Custodian Fees(2) | | | 63 | | | | 22 | | | | 173 | | | | 75 | |
| Total Expenses | | | 14,675 | | | | 231,258 | | | | 77,402 | | | | 65,222 | |
| Waiver of Supervision and Administration Fees | | | (2,435 | ) | | | (45,898 | ) | | | (14,995 | ) | | | (13,369 | ) |
| Net Expenses | | | 12,240 | | | | 185,360 | | | | 62,407 | | | | 51,853 | |
| Net Investment Income | | | 133,443 | | | | 111,593 | | | | 68,595 | | | | 26,637 | |
| Net Realized Gain (Loss) on: | | | | | | | | | | | | | | | | |
Investments(3) | | | 23,373 | | | | (143,856 | ) | | | 698,914 | | | | 1,533,837 | |
| Foreign Currency Transactions | | | 6,642 | | | | — | | | | (621 | ) | | | (2,144 | ) |
| Net Realized Gain (Loss) on Investments and Foreign Currency Transactions | | | 30,015 | | | | (143,856 | ) | | | 698,293 | | | | 1,531,693 | |
| Net Change in Unrealized Appreciation (Depreciation) on: | | | | | | | | | | | | | | | | |
| Investments | | | 890,558 | | | | 821,960 | | | | 213,599 | | | | (3,102,479 | ) |
| Foreign Currency Translations | | | (10,857 | ) | | | — | | | | 254 | | | | 139 | |
| Net Change in Unrealized Appreciation (Depreciation) on Investments and Foreign Currency Translations | | | 879,701 | | | | 821,960 | | | | 213,853 | | | | (3,102,340 | ) |
| Net Realized and Unrealized Gain (Loss) on Investments and Foreign Currency Transactions and Translations | | | 909,716 | | | | 678,104 | | | | 912,146 | | | | (1,570,647 | ) |
| Net Increase (Decrease) in Net Assets Resulting from Operations | | $ | 1,043,159 | | | $ | 789,697 | | | $ | 980,741 | | | $ | (1,544,010 | ) |
| (1) | The Supervision and Administration fees reflect the supervisory and administrative fee, which includes fees paid by the Funds for the investment advisory services provided by the Adviser. (See Note 3 in Notes to Financial Statements.) |
| (2) | See Note 2 in the Notes to Financial Statements. |
| (3) | Includes realized gains (losses) as a result of in-kind redemptions. (See Note 4 in Notes to Financial Statements.) |
| | |
|
| For the period ended May 31, 2020 (Unaudited) |
|
| | | Global X Cannabis ETF | | | Global X U.S. Infrastructure Development ETF | | | Global X Conscious Companies ETF | | | Global X Founder-Run Companies ETF | |
| Investment Income: | | | | | | | | | | | | |
| Dividend Income | | $ | — | | | $ | 869,994 | | | $ | 1,496,222 | | | $ | 17,204 | |
| Interest Income | | | — | | | | 1,059 | | | | 431 | | | | 17 | |
| Security Lending Income | | | 456,512 | | | | 4,215 | | | | — | | | | — | |
| Less: Foreign Taxes Withheld | | | — | | | | — | | | | (8,359 | ) | | | — | |
| Total Investment Income | | | 456,512 | | | | 875,268 | | | | 1,488,294 | | | | 17,221 | |
Supervision and Administration Fees(1) | | | 19,861 | | | | 346,220 | | | | 306,852 | | | | 14,142 | |
| Tax Expense | | | 22 | | | | — | | | | — | | | | — | |
Custodian Fees(2) | | | 226 | | | | — | | | | 48 | | | | — | |
| Total Expenses | | | 20,109 | | | | 346,220 | | | | 306,900 | | | | 14,142 | |
| Net Investment Income | | | 436,403 | | | | 529,048 | | | | 1,181,394 | | | | 3,079 | |
| Net Realized Gain (Loss) on: | | | | | | | | | | | | | | | | |
Investments(3) | | | (1,162,737 | ) | | | (10,480,749 | ) | | | (620,175 | ) | | | (1,126,644 | ) |
| Foreign Currency Transactions | | | 670 | | | | — | | | | — | | | | — | |
| Net Realized Loss on Investments and Foreign Currency Transactions | | | (1,162,067 | ) | | | (10,480,749 | ) | | | (620,175 | ) | | | (1,126,644 | ) |
| Net Change in Unrealized Appreciation (Depreciation) on: | | | | | | | | | | | | | | | | |
| Investments | | | (906,939 | ) | | | (31,060,405 | ) | | | 19,941,678 | | | | (433,510 | ) |
| Net Change in Unrealized Appreciation (Depreciation) on Investments | | | (906,939 | ) | | | (31,060,405 | ) | | | 19,941,678 | | | | (433,510 | ) |
| Net Realized and Unrealized Gain (Loss) on Investments and Foreign Currency Transactions | | | (2,069,006 | ) | | | (41,541,154 | ) | | | 19,321,503 | | | | (1,560,154 | ) |
| Net Increase (Decrease) in Net Assets Resulting from Operations | | $ | (1,632,603 | ) | | $ | (41,012,106 | ) | | $ | 20,502,897 | | | $ | (1,557,075 | ) |
| (1) | The Supervision and Administration fees reflect the supervisory and administrative fee, which includes fees paid by the Funds for the investment advisory services provided by the Adviser. (See Note 3 in Notes to Financial Statements.) |
| (2) | See Note 2 in the Notes to Financial Statements. |
| (3) | Includes realized gains (losses) as a result of in-kind redemptions. (See Note 4 in Notes to Financial Statements.) |
| | |
|
| For the period ended May 31, 2020 (Unaudited) |
|
| | | Global X Thematic Growth ETF | |
| Investment Income: | | | |
| Dividend Income from Affiliated Investments | | $ | 7,799 | |
| Total Investment Income | | | 7,799 | |
Supervision and Administration Fees(1) | | | 9,894 | |
| Tax Expense | | | 9 | |
| Total Expenses | | | 9,903 | |
| Waiver of Supervision and Administration Fees | | | (9,894 | ) |
| Reimbursement from Adviser | | | (2,570 | ) |
| Net Expenses | | | (2,561 | ) |
| Net Investment Income | | | 10,360 | |
| Net Realized Gain on: | | | | |
| Affiliated Investments | | | 18,944 | |
| Net Realized Gain on Affiliated Investments | | | 18,944 | |
| Net Change in Unrealized Appreciation on: | | | | |
| Affiliated Investments | | | 244,634 | |
| Net Change in Unrealized Appreciation on Affiliated Investments | | | 244,634 | |
| Net Realized and Unrealized Gain on Affiliated Investments | | | 263,578 | |
| Net Increase in Net Assets Resulting from Operations | | $ | 273,938 | |
| (1) | The Supervision and Administration fees reflect the supervisory and administrative fee, which includes fees paid by the Funds for the investment advisory services provided by the Adviser. (See Note 3 in Notes to Financial Statements.) |
| | |
Statements of Changes in Net Assets
|
| | | Global X Robotics & Artificial Intelligence ETF | | | Global X FinTech ETF | |
| | | Period Ended
May 31, 2020
(Unaudited) | | | Year Ended November 30, 2019 | | | Period Ended
May 31, 2020
(Unaudited) | | | Year Ended November 30, 2019 | |
| Operations: | | | | | | | | | | | | |
| Net Investment Income (Loss) | | $ | 4,061,259 | | | $ | 14,691,492 | | | $ | (508,722 | ) | | $ | (1,053,315 | ) |
Net Realized Gain (Loss) on Investments and Foreign Currency Transactions(1) | | | (57,537,185 | ) | | | (71,791,655 | ) | | | 5,615,937 | | | | (4,418,286 | ) |
| Net Change in Unrealized Appreciation (Depreciation) on Investments and Foreign Currency Translations | | | 136,716,910 | | | | 174,540,858 | | | | 23,626,939 | | | | 72,298,458 | |
| Net Increase in Net Assets Resulting from Operations | | | 83,240,984 | | | | 117,440,695 | | | | 28,734,154 | | | | 66,826,857 | |
| Distributions | | | (2,105,582 | ) | | | (30,149,775 | ) | | | — | | | | (60,368 | ) |
| Return of Capital | | | — | | | | — | | | | — | | | | (437,339 | ) |
| Capital Share Transactions: | | | | | | | | | | | | | | | | |
| Issued | | | 55,629,932 | | | | 198,574,452 | | | | 125,866,255 | | | | 112,979,438 | |
| Redeemed | | | (188,694,606 | ) | | | (532,155,618 | ) | | | (41,173,195 | ) | | | (93,890,807 | ) |
| Increase (Decrease) in Net Assets from Capital Share Transactions | | | (133,064,674 | ) | | | (333,581,166 | ) | | | 84,693,060 | | | | 19,088,631 | |
| Total Increase (Decrease) in Net Assets | | | (51,929,272 | ) | | | (246,290,246 | ) | | | 113,427,214 | | | | 85,417,781 | |
| Net Assets: | | | | | | | | | | | | | | | | |
| Beginning of Period | | | 1,479,983,544 | | | | 1,726,273,790 | | | | 413,152,134 | | | | 327,734,353 | |
| End of Period | | $ | 1,428,054,272 | | | $ | 1,479,983,544 | | | $ | 526,579,348 | | | $ | 413,152,134 | |
| Share Transactions: | | | | | | | | | | | | | | | | |
| Issued | | | 2,650,000 | | | | 10,050,000 | | | | 4,200,000 | | | | 3,950,000 | |
| Redeemed | | | (10,050,000 | ) | | | (28,650,000 | ) | | | (1,400,000 | ) | | | (3,750,000 | ) |
| Net Increase (Decrease) in Shares Outstanding from Share Transactions | | | (7,400,000 | ) | | | (18,600,000 | ) | | | 2,800,000 | | | | 200,000 | |
| (1) | Includes realized gains (losses) as a result of in-kind redemptions. (See Note 4 in Notes to Financial Statements.) |
| | |
Statements of Changes in Net Assets
|
| | | Global X Internet of Things ETF | | | Global X Cloud Computing ETF | |
| | | Period Ended May 31, 2020 (Unaudited) | | | Year Ended November 30, 2019 | | | Period Ended May 31, 2020 (Unaudited) | | | Period Ended November 30, 2019(1) | |
| Operations: | | | | | | | | | | | | |
| Net Investment Income (Loss) | | $ | 602,902 | | | $ | 907,798 | | | $ | (1,164,425 | ) | | $ | (1,071,525 | ) |
Net Realized Gain on Investments and Foreign Currency Transactions(2) | | | 278,716 | | | | 2,605,613 | | | | 31,272,773 | | | | 6,663,002 | |
| Net Change in Unrealized Appreciation (Depreciation) on Investments and Foreign Currency Translations | | | (461,838 | ) | | | 19,706,941 | | | | 91,801,569 | | | | 9,616,450 | |
| Net Increase in Net Assets Resulting from Operations | | | 419,780 | | | | 23,220,352 | | | | 121,909,917 | | | | 15,207,927 | |
| Distributions | | | (1,123,968 | ) | | | (1,268,719 | ) | | | (215,999 | ) | | | — | |
| Capital Share Transactions: | | | | | | | | | | | | | | | | |
| Issued | | | 43,531,196 | | | | 46,707,944 | | | | 195,841,979 | | | | 530,991,397 | |
| Redeemed | | | (4,417,878 | ) | | | (20,015,531 | ) | | | (113,096,158 | ) | | | (73,813,774 | ) |
| Increase in Net Assets from Capital Share Transactions | | | 39,113,318 | | | | 26,692,413 | | | | 82,745,821 | | | | 457,177,623 | |
| Total Increase in Net Assets | | | 38,409,130 | | | | 48,644,046 | | | | 204,439,739 | | | | 472,385,550 | |
| Net Assets: | | | | | | | | | | | | | | | | |
| Beginning of Period | | | 131,627,488 | | | | 82,983,442 | | | | 472,385,550 | | | | — | |
| End of Period | | $ | 170,036,618 | | | $ | 131,627,488 | | | $ | 676,825,289 | | | $ | 472,385,550 | |
| Share Transactions: | | | | | | | | | | | | | | | | |
| Issued | | | 1,950,000 | | | | 2,250,000 | | | | 10,900,000 | | | | 34,400,000 | |
| Redeemed | | | (200,000 | ) | | | (1,100,000 | ) | | | (6,500,000 | ) | | | (4,850,000 | ) |
| Net Increase in Shares Outstanding from Share Transactions | | | 1,750,000 | | | | 1,150,000 | | | | 4,400,000 | | | | 29,550,000 | |
| (1) | The Fund commenced operations on April 12, 2019 |
| (2) | Includes realized gains (losses) as a result of in-kind redemptions. (See Note 4 in Notes to Financial Statements.) |
| | |
Statements of Changes in Net Assets
|
| | | Global X Future Analytics Tech ETF | | | Global X Autonomous & Electric Vehicles ETF | |
| | | Period Ended May 31, 2020 (Unaudited) | | | Year Ended November 30, 2019 | | | Period Ended May 31, 2020 (Unaudited) | | | Year Ended November 30, 2019 | |
| Operations: | | | | | | | | | | | | |
| Net Investment Income | | $ | 225,024 | | | $ | 238,611 | | | $ | 93,337 | | | $ | 218,070 | |
Net Realized Gain (Loss) on Investments and Foreign Currency Transactions(1) | | | 2,671,789 | | | | 491,558 | | | | (20,914 | ) | | | (481,109 | ) |
| Net Change in Unrealized Appreciation (Depreciation) on Investments and Foreign Currency Translations | | | 2,348,697 | | | | 7,493,801 | | | | (1,197,923 | ) | | | 1,721,329 | |
| Net Increase (Decrease) in Net Assets Resulting from Operations | | | 5,245,510 | | | | 8,223,970 | | | | (1,125,500 | ) | | | 1,458,290 | |
| Distributions | | | (92,540 | ) | | | (298,087 | ) | | | (73,720 | ) | | | (415,562 | ) |
| Capital Share Transactions: | | | | | | | | | | | | | | | | |
| Issued | | | 7,509,044 | | | | 9,486,924 | | | | 5,268,608 | | | | 6,662,488 | |
| Redeemed | | | (10,038,331 | ) | | | (15,169,333 | ) | | | — | | | | (8,098,341 | ) |
| Increase (Decrease) in Net Assets from Capital Share Transactions | | | (2,529,287 | ) | | | (5,682,409 | ) | | | 5,268,608 | | | | (1,435,853 | ) |
| Total Increase (Decrease) in Net Assets | | | 2,623,683 | | | | 2,243,474 | | | | 4,069,388 | | | | (393,125 | ) |
| Net Assets: | | | | | | | | | | | | | | | | |
| Beginning of Period | | | 44,244,595 | | | | 42,001,121 | | | | 14,854,927 | | | | 15,248,052 | |
| End of Period | | $ | 46,868,278 | | | $ | 44,244,595 | | | $ | 18,924,315 | | | $ | 14,854,927 | |
| Share Transactions: | | | | | | | | | | | | | | | | |
| Issued | | | 400,000 | | | | 600,000 | | | | 350,000 | | | | 500,000 | |
| Redeemed | | | (550,000 | ) | | | (1,000,000 | ) | | | — | | | | (600,000 | ) |
| Net Increase (Decrease) in Shares Outstanding from Share Transactions | | | (150,000 | ) | | | (400,000 | ) | | | 350,000 | | | | (100,000 | ) |
| (1) | Includes realized gains (losses) as a result of in-kind redemptions. (See Note 4 in Notes to Financial Statements.) |
| | |
Statements of Changes in Net Assets
|
| | | Global X Genomics & Biotechnology ETF | | | Global X Video Games & Esports ETF | |
| | | Period Ended May 31, 2020 (Unaudited) | | | Period Ended November 30, 2019(1) | | | Period Ended May 31, 2020 (Unaudited) | | | Period Ended November 30, 2019(2) | |
| Operations: | | | | | | | | | | | | |
| Net Investment Income (Loss) | | $ | (63,415 | ) | | $ | (34,304 | ) | | $ | 86,851 | | | $ | (626 | ) |
Net Realized Gain (Loss) on Investments and Foreign Currency Transactions(3) | | | 956,653 | | | | (85,734 | ) | | | 2,888,529 | | | | 483 | |
| Net Change in Unrealized Appreciation (Depreciation) on Investments and Foreign Currency Translations | | | 1,619,785 | | | | 1,935,322 | | | | 13,571,076 | | | | 73,582 | |
| Net Increase in Net Assets Resulting from Operations | | | 2,513,023 | | | | 1,815,284 | | | | 16,546,456 | | | | 73,439 | |
| Distributions | | | — | | | | — | | | | (2,778 | ) | | | — | |
| Capital Share Transactions: | | | | | | | | | | | | | | | | |
| Issued | | | 17,190,487 | | | | 16,918,798 | | | | 95,030,116 | | | | 1,499,313 | |
| Redeemed | | | (3,774,138 | ) | | | — | | | | (15,634,302 | ) | | | — | |
| Increase in Net Assets from Capital Share Transactions | | | 13,416,349 | | | | 16,918,798 | | | | 79,395,814 | | | | 1,499,313 | |
| Total Increase in Net Assets | | | 15,929,372 | | | | 18,734,082 | | | | 95,939,492 | | | | 1,572,752 | |
| Net Assets: | | | | | | | | | | | | | | | | |
| Beginning of Period | | | 18,734,082 | | | | — | | | | 1,572,752 | | | | — | |
| End of Period | | $ | 34,663,454 | | | $ | 18,734,082 | | | $ | 97,512,244 | | | $ | 1,572,752 | |
| Share Transactions: | | | | | | | | | | | | | | | | |
| Issued | | | 1,150,000 | | | | 1,200,000 | | | | 5,500,000 | | | | 100,000 | |
| Redeemed | | | (250,000 | ) | | | — | | | | (800,000 | ) | | | — | |
| Net Increase in Shares Outstanding from Share Transactions | | | 900,000 | | | | 1,200,000 | | | | 4,700,000 | | | | 100,000 | |
| (1) | The Fund commenced operations on April 5, 2019. |
| (2) | The Fund commenced operations on October 25, 2019. |
| (3) | Includes realized gains (losses) as a result of in-kind redemptions. (See Note 4 in Notes to Financial Statements.) |
| | |
Statements of Changes in Net Assets
|
| | | Global X Cybersecurity ETF | | | Global X Millennials Thematic ETF | |
| | | Period Ended May 31, 2020 (Unaudited) | | | Period Ended November 30, 2019(1) | | | Period Ended May 31, 2020 (Unaudited) | | | Year Ended November 30, 2019 | |
| Operations: | | | | | | | | | | | | |
| Net Investment Income (Loss) | | $ | 133,443 | | | $ | (229 | ) | | $ | 111,593 | | | $ | 219,456 | |
Net Realized Gain (Loss) on Investments and Foreign Currency Transactions(2) | | | 30,015 | | | | 2,135 | | | | (143,856 | ) | | | 6,663,020 | |
| Net Change in Unrealized Appreciation (Depreciation) on Investments and Foreign Currency Translations | | | 879,701 | | | | 184,833 | | | | 821,960 | | | | (396,943 | ) |
| Net Increase in Net Assets Resulting from Operations | | | 1,043,159 | | | | 186,739 | | | | 789,697 | | | | 6,485,533 | |
| Distributions | | | (4,045 | ) | | | — | | | | (270,261 | ) | | | (174,812 | ) |
| Capital Share Transactions: | | | | | | | | | | | | | | | | |
| Issued | | | 8,915,091 | | | | 1,527,026 | | | | 9,294,791 | | | | 64,196,494 | |
| Redeemed | | | — | | | | — | | | | (8,020,623 | ) | | | (26,402,805 | ) |
| Increase in Net Assets from Capital Share Transactions | | | 8,915,091 | | | | 1,527,026 | | | | 1,274,168 | | | | 37,793,689 | |
| Total Increase in Net Assets | | | 9,954,205 | | | | 1,713,765 | | | | 1,793,604 | | | | 44,104,410 | |
| Net Assets: | | | | | | | | | | | | | | | | |
| Beginning of Period | | | 1,713,765 | | | | — | | | | 75,382,916 | | | | 31,278,506 | |
| End of Period | | $ | 11,667,970 | | | $ | 1,713,765 | | | $ | 77,176,520 | | | $ | 75,382,916 | |
| Share Transactions: | | | | | | | | | | | | | | | | |
| Issued | | | 500,000 | | | | 100,000 | | | | 350,000 | | | | 2,600,000 | |
| Redeemed | | | — | | | | — | | | | (350,000 | ) | | | (1,100,000 | ) |
| Net Increase in Shares Outstanding from Share Transactions | | | 500,000 | | | | 100,000 | | | | — | | | | 1,500,000 | |
| (1) | The Fund commenced operations on October 25, 2019. |
| (2) | Includes realized gains (losses) as a result of in-kind redemptions. (See Note 4 in Notes to Financial Statements.) |
| | |
Statements of Changes in Net Assets
|
| | | Global X Longevity Thematic ETF | | | Global X Health & Wellness Thematic ETF | |
| | | Period Ended May 31, 2020
(Unaudited) | | | Year Ended November 30, 2019 | | | Period Ended May 31, 2020 (Unaudited) | | | Year Ended November 30, 2019 | |
| Operations: | | | | | | | | | | | | |
| Net Investment Income | | $ | 68,595 | | | $ | 112,028 | | | $ | 26,637 | | | $ | 125,259 | |
Net Realized Gain on Investments and Foreign Currency Transactions(1) | | | 698,293 | | | | 369,749 | | | | 1,531,693 | | | | 874,756 | |
| Net Change in Unrealized Appreciation (Depreciation) on Investments and Foreign Currency Translations | | | 213,853 | | | | 2,517,693 | | | | (3,102,340 | ) | | | 1,775,531 | |
| Net Increase (Decrease) in Net Assets Resulting from Operations | | | 980,741 | | | | 2,999,470 | | | | (1,544,010 | ) | | | 2,775,546 | |
| Distributions | | | (157,854 | ) | | | (185,161 | ) | | | (62,308 | ) | | | (120,454 | ) |
| Capital Share Transactions: | | | | | | | | | | | | | | | | |
| Issued | | | 4,499,919 | | | | 6,291,263 | | | | 12,110,550 | | | | 13,239,961 | |
| Redeemed | | | (2,254,985 | ) | | | (1,061,405 | ) | | | (11,025,549 | ) | | | (6,002,098 | ) |
| Increase in Net Assets from Capital Share Transactions | | | 2,244,934 | | | | 5,229,858 | | | | 1,085,001 | | | | 7,237,863 | |
| Total Increase (Decrease) in Net Assets | | | 3,067,821 | | | | 8,044,167 | | | | (521,317 | ) | | | 9,892,955 | |
| Net Assets: | | | | | | | | | | | | | | | | |
| Beginning of Period | | | 23,547,557 | | | | 15,503,390 | | | | 20,114,714 | | | | 10,221,759 | |
| End of Period | | $ | 26,615,378 | | | $ | 23,547,557 | | | $ | 19,593,397 | | | $ | 20,114,714 | |
| Share Transactions: | | | | | | | | | | | | | | | | |
| Issued | | | 200,000 | | | | 300,000 | | | | 600,000 | | | | 700,000 | |
| Redeemed | | | (100,000 | ) | | | (50,000 | ) | | | (550,000 | ) | | | (300,000 | ) |
| Net Increase in Shares Outstanding from Share Transactions | | | 100,000 | | | | 250,000 | | | | 50,000 | | | | 400,000 | |
| (1) | Includes realized gains (losses) as a result of in-kind redemptions. (See Note 4 in Notes to Financial Statements.) |
| | |
Statements of Changes in Net Assets
|
| | | Global X Cannabis ETF | | | Global X U.S. Infrastructure Development ETF | |
| | | Period Ended May 31, 2020 (Unaudited) | | | Period Ended November 30, 2019(1) | | | Period Ended May 31, 2020 (Unaudited) | | | Year Ended November 30, 2019 | |
| Operations: | | | | | | | | | | | | |
| Net Investment Income | | $ | 436,403 | | | $ | 37,302 | | | $ | 529,048 | | | $ | 1,121,799 | |
Net Realized Loss on Investments and Foreign Currency Transactions(2) | | | (1,162,067 | ) | | | (91,174 | ) | | | (10,480,749 | ) | | | (125,130 | ) |
| Net Change in Unrealized Appreciation (Depreciation) on Investments | | | (906,939 | ) | | | (1,105,750 | ) | | | (31,060,405 | ) | | | 13,930,447 | |
| Net Increase (Decrease) in Net Assets Resulting from Operations | | | (1,632,603 | ) | | | (1,159,622 | ) | | | (41,012,106 | ) | | | 14,927,116 | |
| Distributions | | | (85,944 | ) | | | — | | | | (563,703 | ) | | | (1,424,719 | ) |
| Capital Share Transactions: | | | | | | | | | | | | | | | | |
| Issued | | | 8,851,624 | | | | 5,754,085 | | | | 30,072,359 | | | | 54,745,683 | |
| Redeemed | | | — | | | | — | | | | (56,913,887 | ) | | | (26,097,564 | ) |
| Increase (Decrease) in Net Assets from Capital Share Transactions | | | 8,851,624 | | | | 5,754,085 | | | | (26,841,528 | ) | | | 28,648,119 | |
| Total Increase (Decrease) in Net Assets | | | 7,133,077 | | | | 4,594,463 | | | | (68,417,337 | ) | | | 42,150,516 | |
| Net Assets: | | | | | | | | | | | | | | | | |
| Beginning of Period | | | 4,594,463 | | | | — | | | | 183,064,557 | | | | 140,914,041 | |
| End of Period | | $ | 11,727,540 | | | $ | 4,594,463 | | | $ | 114,647,220 | | | $ | 183,064,557 | |
| Share Transactions: | | | | | | | | | | | | | | | | |
| Issued | | | 700,000 | | | | 300,000 | | | | 2,050,000 | | | | 3,250,000 | |
| Redeemed | | | — | | | | — | | | | (4,750,000 | ) | | | (1,800,000 | ) |
| Net Increase (Decrease) in Shares Outstanding from Share Transactions | | | 700,000 | | | | 300,000 | | | | (2,700,000 | ) | | | 1,450,000 | |
| (1) | The Fund commenced operations on September 17, 2019. |
| (2) | Includes realized gains (losses) as a result of in-kind redemptions. (See Note 4 in Notes to Financial Statements.) |
| | |
Statements of Changes in Net Assets
|
| | | Global X Conscious Companies ETF | | | Global X Founder-Run Companies ETF | |
| | | Period Ended May 31, 2020 (Unaudited) | | | Year Ended November 30, 2019 | | | Period Ended May 31, 2020 (Unaudited) | | | Year Ended November 30, 2019 | |
| Operations: | | | | | | | | | | | | |
| Net Investment Income | | $ | 1,181,394 | | | $ | 1,109,548 | | | $ | 3,079 | | | $ | 12,129 | |
Net Realized Gain (Loss) on Investments(1) | | | (620,175 | ) | | | 1,212,313 | | | | (1,126,644 | ) | | | 117,490 | |
| Net Change in Unrealized Appreciation (Depreciation) on Investments | | | 19,941,678 | | | | 7,322,687 | | | | (433,510 | ) | | | 409,468 | |
| Net Increase (Decrease) in Net Assets Resulting from Operations | | | 20,502,897 | | | | 9,644,548 | | | | (1,557,075 | ) | | | 539,087 | |
| Distributions | | | (730,904 | ) | | | (1,418,777 | ) | | | (13,936 | ) | | | (73,673 | ) |
| Capital Share Transactions: | | | | | | | | | | | | | | | | |
| Issued | | | 140,647,241 | | | | 26,031,211 | | | | 6,247,607 | | | | — | |
| Redeemed | | | (3,089,508 | ) | | | (5,301,803 | ) | | | (4,444,963 | ) | | | (1,022,118 | ) |
| Increase (Decrease) in Net Assets from Capital Share Transactions | | | 137,557,733 | | | | 20,729,408 | | | | 1,802,644 | | | | (1,022,118 | ) |
| Total Increase (Decrease) in Net Assets | | | 157,329,726 | | | | 28,955,179 | | | | 231,633 | | | | (556,704 | ) |
| Net Assets: | | | | | | | | | | | | | | | | |
| Beginning of Period | | | 85,459,436 | | | | 56,504,257 | | | | 4,099,797 | | | | 4,656,501 | |
| End of Period | | $ | 242,789,162 | | | $ | 85,459,436 | | | $ | 4,331,430 | | | $ | 4,099,797 | |
| Share Transactions: | | | | | | | | | | | | | | | | |
| Issued | | | 7,650,000 | | | | 1,200,000 | | | | 300,000 | | | | — | |
| Redeemed | | | (150,000 | ) | | | (250,000 | ) | | | (300,000 | ) | | | (50,000 | ) |
| Net Increase (Decrease) in Shares Outstanding from Share Transactions | | | 7,500,000 | | | | 950,000 | | | | — | | | | (50,000 | ) |
| (1) | Includes realized gains (losses) as a result of in-kind redemptions. (See Note 4 in Notes to Financial Statements.) |
| | |
Statements of Changes in Net Assets
|
| | | Global X Thematic Growth ETF | |
| | | Period Ended May 31, 2020 (Unaudited) | | | Period Ended November 30, 2019(1) | |
| Operations: | | | | | | |
| Net Investment Income | | $ | 10,360 | | | $ | 352 | |
Net Realized Gain on Affiliated Investments(2) | | | 18,944 | | | | — | |
| Net Change in Unrealized Appreciation (Depreciation) on Affiliated Investments | | | 244,634 | | | | 126,465 | |
| Net Increase in Net Assets Resulting from Operations | | | 273,938 | | | | 126,817 | |
| Distributions | | | (8,454 | ) | | | — | |
| Capital Share Transactions: | | | | | | | | |
| Issued | | | 4,204,270 | | | | 2,523,000 | |
| Redeemed | | | (1,300,117 | ) | | | — | |
| Increase in Net Assets from Capital Share Transactions | | | 2,904,153 | | | | 2,523,000 | |
| Total Increase in Net Assets | | | 3,169,637 | | | | 2,649,817 | |
| Net Assets: | | | | | | | | |
| Beginning of Period | | | 2,649,817 | | | | — | |
| End of Period | | $ | 5,819,454 | | | $ | 2,649,817 | |
| Share Transactions: | | | | | | | | |
| Issued | | | 150,000 | | | | 100,000 | |
| Redeemed | | | (50,000 | ) | | | — | |
| Net Increase in Shares Outstanding from Share Transactions | | | 100,000 | | | | 100,000 | |
| (1) | The Fund commenced operations on October 25, 2019. |
| (2) | Includes realized gains (losses) as a result of in-kind redemptions. (See Note 4 in Notes to Financial Statements.) |
Selected Per Share Data & Ratios
For a Share Outstanding Throughout the Period
| | | Net
Asset Value, Beginning
of Period
($) | | | Net Investment Income (Loss)
($)* | | | Net Realized and Unrealized Gain (Loss) on Investments
($) | | | Total from Operations
($) | | | Distribution from Net Investment Income ($) | | | Distribution from Capital Gains ($) | |
| Global X Robotics & Artificial Intelligence ETF | | | | | | | | | | | | | | | | | | |
| 2020 (Unaudited) | | | 21.43 | | | | 0.06 | | | | 1.70 | | | | 1.76 | | | | (0.03 | ) | | | — | |
| 2019 | | | 19.70 | | | | 0.19 | | | | 1.93 | | | | 2.12 | | | | (0.39 | ) | | | — | |
| 2018 | | | 23.96 | | | | 0.19 | | | | (4.45 | ) | | | (4.26 | ) | | | — | | | | — | |
| 2017 | | | 14.87 | | | | 0.01 | | | | 9.09 | | | | 9.10 | | | | (0.01 | ) | | | — | |
2016(1) | | | 14.84 | | | | 0.02 | | | | 0.01 | | | | 0.03 | | | | — | | | | — | |
| Global X FinTech ETF | | | | | | | | | | | | | | | | | | | | | | | | |
| 2020 (Unaudited) | | | 30.49 | | | | (0.03 | ) | | | 1.75 | | | | 1.72 | | | | — | | | | — | |
| 2019 | | | 24.55 | | | | (0.08 | ) | | | 6.06 | | | | 5.98 | | | | — | | | | — | |
| 2018 | | | 21.79 | | | | (0.08 | ) | | | 2.86 | | | | 2.78 | | | | — | | | | (0.02 | ) |
| 2017 | | | 14.91 | | | | (0.03 | ) | | | 6.91 | | | | 6.88 | | | | — | | | | — | |
2016(1) | | | 15.08 | | | | (0.01 | ) | | | (0.16 | ) | | | (0.17 | ) | | | — | | | | — | |
| Global X Internet of Things ETF | | | | | | | | | | | | | | | | | | | | | | | | |
| 2020 (Unaudited) | | | 22.89 | | | | 0.09 | | | | (0.13 | ) | | | (0.04 | ) | | | (0.18 | ) | | | — | |
| 2019 | | | 18.04 | | | | 0.20 | | | | 4.93 | | | | 5.13 | | | | (0.28 | ) | | | — | |
| 2018 | | | 20.12 | | | | 0.17 | | | | (2.03 | ) | | | (1.86 | ) | | | (0.11 | ) | | | (0.11 | ) |
| 2017 | | | 15.52 | | | | 0.16 | | | | 4.49 | | | | 4.65 | | | | (0.05 | ) | | | — | |
2016(1) | | | 15.04 | | | | 0.09 | | | | 0.39 | | | | 0.48 | | | | — | | | | — | |
| Global X Cloud Computing ETF | | | | | | | | | | | | | | | | | | | | | | | | |
| 2020 (Unaudited) | | | 15.99 | | | | (0.04 | ) | | | 4.00 | | | | 3.96 | | | | — | | | | (0.01 | ) |
2019(2) | | | 15.06 | | | | (0.04 | ) | | | 0.97 | | | | 0.93 | | | | — | | | | — | |
| Global X Future Analytics Tech ETF | | | | | | | | | | | | | | | | | | | | | | | | |
| 2020 (Unaudited) | | | 17.35 | | | | 0.09 | | | | 2.13 | | | | 2.22 | | | | (0.04 | ) | | | — | |
| 2019 | | | 14.24 | | | | 0.10 | | | | 3.13 | | | | 3.23 | | | | (0.12 | ) | | | — | |
2018(3) | | | 15.00 | | | | 0.05 | | | | (0.81 | ) | | | (0.76 | ) | | | — | | | | — | |
Return of Capital ($) | | | Total from Distributions ($) | | | Net Asset Value, End of Period ($) | | | Total Return (%)** | | | Net Assets End of Period ($)(000) | | | Ratio of Expenses to Average Net Assets (%) | | | Ratio of Net Investment Income (Loss) to Average Net Assets (%) | | | Portfolio Turnover (%)†† | |
| | | | | | | | | | | | | | | | | | | | | | | |
| | — | | | | (0.03 | ) | | | 23.16 | | | | 8.22 | | | | 1,428,054 | | | | 0.69 | † | | | 0.60 | † | | | 9.39 | |
| | — | | | | (0.39 | ) | | | 21.43 | | | | 11.16 | | | | 1,479,984 | | | | 0.68 | | | | 0.98 | | | | 10.97 | |
| | — | | | | ***
|
| | | 19.70 | | | | (17.77 | ) | | | 1,726,274 | | | | 0.70 | | | | 0.83 | | | | 28.50 | |
| | — | | | | (0.01 | ) | | | 23.96 | | | | 61.22 | | | | 1,412,589 | | | | 0.69 | | | | 0.05 | | | | 15.29 | |
| | — | | | | — | | | | 14.87 | | | | 0.20 | | | | 2,974 | | | | 0.68 | † | | | 0.62 | † | | | — | |
| | | | | | | | | | | | | | | | | | | | | | | | | | | | | | | |
| | — | | | | — | | | | 32.21 | | | | 5.64 | | | | 526,579 | | | | 0.68 | † | | | (0.23 | )† | | | 4.67 | |
| | (0.04 | ) | | | (0.04 | ) | | | 30.49 | | | | 24.42 | | | | 413,152 | | | | 0.68 | | | | (0.29 | ) | | | 16.40 | |
| | — | | | | (0.02 | ) | | | 24.55 | | | | 12.79 | | | | 327,734 | | | | 0.68 | | | | (0.29 | ) | | | 20.58 | |
| | — | | | | — | | | | 21.79 | | | | 46.14 | | | | 50,106 | | | | 0.68 | | | | (0.13 | ) | | | 11.65 | |
| | — | | | | — | | | | 14.91 | | | | (1.13 | ) | | | 1,491 | | | | 0.68 | † | | | (0.20 | )† | | | — | |
| | | | | | | | | | | | | | | | | | | | | | | | | | | | | | | |
| | — | | | | (0.18 | ) | | | 22.67 | | | | (0.19 | ) | | | 170,037 | | | | 0.68 | † | | | 0.86 | † | | | 7.78 | |
| | — | | | | (0.28 | ) | | | 22.89 | | | | 29.01 | | | | 131,627 | | | | 0.68 | | | | 1.04 | | | | 11.71 | |
| | — | | | | (0.22 | ) | | | 18.04 | | | | (9.33 | ) | | | 82,983 | | | | 0.69 | | | | 0.88 | | | | 16.69 | |
| | — | | | | (0.05 | ) | | | 20.12 | | | | 30.04 | | | | 85,521 | | | | 0.70 | | | | 0.85 | | | | 24.90 | |
| | — | | | | — | | | | 15.52 | | | | 3.19 | | | | 3,881 | | | | 0.68 | † | | | 2.75 | † | | | 0.39 | |
| | | | | | | | | | | | | | | | | | | | | | | | | | | | | | | |
| | — | | | | (0.01 | ) | | | 19.94 | | | | 24.76 | | | | 676,825 | | | | 0.68 | † | | | (0.50 | )† | | | 7.06 | |
| | — | | | | — | | | | 15.99 | | | | 6.18 | | | | 472,386 | | | | 0.68 | † | | | (0.44 | )† | | | 12.52 | |
| | | | | | | | | | | | | | | | | | | | | | | | | | | | | | | |
| | — | | | | (0.04 | ) | | | 19.53 | | | | 12.79 | | | | 46,868 | | | | 0.68 | † | | | 1.01 | † | | | 19.17 | |
| | — | | | | (0.12 | ) | | | 17.35 | | | | 22.87 | | | | 44,245 | | | | 0.68 | | | | 0.61 | | | | 16.34 | |
| | — | | | | — | | | | 14.24 | | | | (5.07 | ) | | | 42,001 | | | | 0.68 | † | | | 0.54 | † | | | 7.93 | |
| * | Per share data calculated using average shares method. |
| ** | Total Return is for the period indicated and has not been annualized. The return shown does not reflect the deduction of taxes that a shareholder would pay on Fund distributions or the redemption of Fund shares. |
| *** | Amount is less than 0.005. |
| † | Annualized. |
| †† | Portfolio turnover rate is for the period indicated and periods of less than one year have not been annualized. Excludes effect of in-kind transfers. |
| (1) | The Fund commenced operations on September 12, 2016. |
| (2) | The Fund commenced operations on April 12, 2019. |
| (3) | The Fund commenced operations on May 11, 2018. |
Amounts designated as “—” are either $0 or have been rounded to $0.
Selected Per Share Data & Ratios
For a Share Outstanding Throughout the Period
| | | Net Asset Value, Beginning of Period ($) | | | Net Investment Income (Loss) ($)* | | | Net Realized and Unrealized Gain (Loss) on Investments ($) | | | Total from Operations ($) | | | Distribution from Net Investment Income ($) | |
| Global X Autonomous & Electric Vehicles ETF | | | | | | | | | | | | | | | |
| 2020 (Unaudited) | | | 14.15 | | | | 0.07 | | | | (0.63 | ) | | | (0.56 | ) | | | (0.07 | ) |
| 2019 | | | 13.26 | | | | 0.22 | | | | 1.11 | | | | 1.33 | | | | (0.44 | ) |
2018(1) | | | 15.00 | | | | 0.11 | | | | (1.85 | ) | | | (1.74 | ) | | | — | |
| Global X Genomics & Biotechnology ETF | | | | | | | | | | | | | | | | | | | | |
| 2020 (Unaudited) | | | 15.61 | | | | (0.04 | ) | | | 0.94 | | | | 0.90 | | | | — | |
2019(2) | | | 15.28 | | | | (0.05 | ) | | | 0.38 | | | | 0.33 | | | | — | |
| Global X Video Games and Esports ETF | | | | | | | | | | | | | | | | | | | | |
| 2020 (Unaudited) | | | 15.73 | | | | 0.05 | | | | 4.57 | | | | 4.62 | | | | (0.03 | ) |
2019(3) | | | 14.99 | | | | — | | | | 0.74 | | | | 0.74 | | | | — | |
| Global X Cybersecurity ETF | | | | | | | | | | | | | | | | | | | | |
| 2020 (Unaudited) | | | 17.14 | | | | 0.46 | | | | 1.89 | | | | 2.35 | | | | (0.02 | ) |
2019(3) | | | 15.27 | | | | — | | | | 1.87 | | | | 1.87 | | | | — | |
Distribution from Capital Gains ($) | | | Total from Distributions ($) | | | Net Asset Value, End of Period ($) | | | Total Return (%)** | | | Net Assets End of Period ($)(000) | | | Ratio of Expenses to Average Net Assets (%) | | | Ratio of Net Investment Income (Loss) to Average Net Assets (%) | | | Portfolio Turnover (%)†† | |
| | | | | | | | | | | | | | | | | | | | | | | |
| | — | | | | (0.07 | ) | | | 13.52 | | | | (4.00 | ) | | | 18,924 | | | | 0.68 | † | | | 1.11 | † | | | 12.62 | |
| | — | | | | (0.44 | ) | | | 14.15 | | | | 10.61 | | | | 14,855 | | | | 0.68 | | | | 1.67 | | | | 31.26 | |
| | — | | | | — | | | | 13.26 | | | | (11.60 | ) | | | 15,248 | | | | 0.68 | † | | | 1.21 | † | | | 23.57 | |
| | | | | | | | | | | | | | | | | | | | | | | | | | | | | | | |
| | — | | | | — | | | | 16.51 | | | | 5.77 | | | | 34,663 | | | | 0.68 | † | | | (0.58 | )† | | | 29.33 | |
| | — | | | | — | | | | 15.61 | | | | 2.16 | | | | 18,734 | | | | 0.68 | † | | | (0.59 | )† | | | 23.12 | |
| | | | | | | | | | | | | | | | | | | | | | | | | | | | | | | |
| | — | | | | (0.03 | ) | | | 20.32 | | | | 29.40 | | | | 97,512 | | | | 0.51 | † | | | 0.42 | † | | | 4.39 | |
| | — | | | | — | | | | 15.73 | | | | 4.94 | | | | 1,573 | | | | 0.50 | † | | | (0.45 | )† | | | 0.27 | |
| | | | | | | | | | | | | | | | | | | | | | | | | | | | | | | |
| | (0.02 | ) | | | (0.04 | ) | | | 19.45 | | | | 13.75 | | | | 11,668 | | | 0.50 | †^ | | | 5.48 | † | | | 23.26 | |
| | — | | | | — | | | | 17.14 | | | | 12.25 | | | | 1,714 | | | 0.50 | †^ | | | (0.16 | )† | | | 3.57 | |
| * | Per share data calculated using average shares method. |
| ** | Total Return is for the period indicated and has not been annualized. The return shown does not reflect the deduction of taxes that a shareholder would pay on Fund distributions or the redemption of Fund shares. |
| † | Annualized. |
| †† | Portfolio turnover rate is for the period indicated and periods of less than one year have not been annualized. Excludes effect of in-kind transfers. |
| ^ | The ratio of Expenses to Average Net Assets includes the effect of a waiver. If these offsets were excluded,the ratio would have been 0.60%. |
| (1) | The Fund commenced operations on April 13, 2018. |
| (2) | The Fund commenced operations on April 5, 2019. |
| (3) | The Fund commenced operations on October 25, 2019. |
Amounts designated as “—” are either $0 or have been rounded to $0.
Selected Per Share Data & Ratios
For a Share Outstanding Throughout the Period
| | | Net Asset Value, Beginning of Period ($) | | | Net Investment Income ($)* | | | Net Realized and Unrealized Gain (Loss) on Investments ($) | | | Total from Operations ($) | | | Distribution from Net Investment Income ($) | | | Distribution from Capital Gains ($) | |
| Global X Millennials Thematic ETF | | | | | | | | | | | | | | | | | | |
| 2020 (Unaudited) | | | 25.55 | | | | 0.04 | | | | 0.66 | | | | 0.70 | | | | (0.08 | ) | | | (0.01 | ) |
| 2019 | | | 21.57 | | | | 0.10 | | | | 3.99 | | | | 4.09 | | | | (0.10 | ) | | | (0.01 | ) |
| 2018 | | | 19.11 | | | | 0.09 | | | | 2.54 | | | | 2.63 | | | | (0.05 | ) | | | (0.12 | ) |
| 2017 | | | 15.58 | | | | 0.07 | | | | 3.51 | | | | 3.58 | | | | (0.05 | ) | | | — | |
2016(1) | | | 14.95 | | | | 0.05 | | | | 0.58 | | | | 0.63 | | | | — | | | | — | |
| Global X Longevity Thematic ETF | | | | | | | | | | | | | | | | | | | | | | | | |
| 2020 (Unaudited) | | | 23.55 | | | | 0.06 | | | | 0.73 | | | | 0.79 | | | | (0.09 | ) | | | (0.05 | ) |
| 2019 | | | 20.67 | | | | 0.13 | | | | 2.99 | | | | 3.12 | | | | (0.18 | ) | | | (0.06 | ) |
| 2018 | | | 19.60 | | | | 0.13 | | | | 1.14 | | | | 1.27 | | | | (0.09 | ) | | | (0.11 | ) |
| 2017 | | | 15.17 | | | | 0.08 | | | | 4.51 | | | | 4.59 | | | | (0.09 | ) | | | (0.07 | ) |
2016(2) | | | 15.32 | | | | 0.07 | | | | (0.22 | ) | | | (0.15 | ) | | | — | | | | — | |
| Global X Health & Wellness Thematic ETF | | | | | | | | | | | | | | | | | | | | | | | | |
| 2020 (Unaudited) | | | 21.17 | | | | 0.02 | | | | (1.55 | ) | | | (1.53 | ) | | | (0.05 | ) | | | — | |
| 2019 | | | 18.59 | | | | 0.14 | | | | 2.60 | | | | 2.74 | | | | (0.16 | ) | | | — | |
| 2018 | | | 16.75 | | | | 0.14 | | | | 2.18 | | | | 2.32 | | | | (0.15 | ) | | | (0.33 | ) |
| 2017 | | | 14.72 | | | | 0.17 | | | | 1.94 | | | | 2.11 | | | | (0.08 | ) | | | — | |
2016(2) | | | 15.13 | | | | 0.07 | | | | (0.48 | ) | | | (0.41 | ) | | | — | | | | — | |
| Global X Cannabis ETF | | | | | | | | | | | | | | | | | | | | | | | | |
| 2020 (Unaudited) | | | 15.31 | | | | 0.62 | | | | (3.99 | ) | | | (3.37 | ) | | | (0.21 | ) | | | — | |
2019(3) | | | 24.41 | | | | 0.22 | | | | (9.32 | ) | | | (9.10 | ) | | | — | | | | — | |
Total from Distributions ($) | | | Net Asset Value, End of Period ($) | | | Total Return (%)** | | | Net Assets End of Period ($)(000) | | | Ratio of Expenses to Average Net Assets (%) | | | Ratio of Net Investment Income to Average Net Assets (%) | | | Portfolio Turnover (%)†† | |
| | | | | | | | | | | | | | | | | | | | |
| | (0.09 | ) | | | 26.16 | | | | 2.75 | | | | 77,177 | | | | 0.50 | †‡ | | | 0.30 | † | | | 7.97 | |
| | (0.11 | ) | | | 25.55 | | | | 19.07 | | | | 75,383 | | | | 0.50 | ‡ | | | 0.42 | | | | 10.44 | |
| | (0.17 | ) | | | 21.57 | | | | 13.87 | | | | 31,279 | | | | 0.50 | ‡ | | | 0.40 | | | | 10.94 | |
| | (0.05 | ) | | | 19.11 | | | | 23.05 | | | | 11,467 | | | | 0.54 | ‡ | | | 0.40 | | | | 20.97 | |
| | — | | | | 15.58 | | | | 4.21 | | | | 3,896 | | | | 0.68 | † | | | 0.59 | † | | | — | |
| | | | | | | | | | | | | | | | | | | | | | | | | | | |
| | (0.14 | ) | | | 24.20 | | | | 3.39 | | | | 26,615 | | | | 0.50 | †‡ | | | 0.55 | † | | | 10.72 | |
| | (0.24 | ) | | | 23.55 | | | | 15.38 | | | | 23,548 | | | | 0.50 | ‡ | | | 0.62 | | | | 14.18 | |
| | (0.20 | ) | | | 20.67 | | | | 6.55 | | | | 15,503 | | | | 0.50 | ‡ | | | 0.63 | | | | 14.39 | |
| | (0.16 | ) | | | 19.60 | | | | 30.58 | | | | 7,841 | | | | 0.52 | ‡ | | | 0.44 | | | | 10.20 | |
| | — | | | | 15.17 | | | | (0.98 | ) | | | 1,517 | | | | 0.68 | † | | | 0.78 | † | | | 2.76 | |
| | | | | | | | | | | | | | | | | | | | | | | | | | | |
| | (0.05 | ) | | | 19.59 | | | | (7.26 | ) | | | 19,593 | | | 0.50 | †^ | | | 0.26 | † | | | 17.14 | |
| | (0.16 | ) | | | 21.17 | | | | 14.89 | | | | 20,115 | | | 0.50 | ^ | | | 0.74 | | | | 18.05 | |
| | (0.48 | ) | | | 18.59 | | | | 14.16 | | | | 10,222 | | | 0.50 | ^ | | | 0.77 | | | | 20.93 | |
| | (0.08 | ) | | | 16.75 | | | | 14.38 | | | | 2,512 | | | 0.54 | ^ | | | 1.08 | | | | 16.73 | |
| | — | | | | 14.72 | | | | (2.71 | ) | | | 1,472 | | | | 0.68 | † | | | 0.82 | † | | | — | |
| | | | | | | | | | | | | | | | | | | | | | | | | | | |
| | (0.21 | ) | | | 11.73 | | | | (22.19 | ) | | | 11,728 | | | | 0.51 | † | | | 10.99 | † | | | 30.17 | |
| | — | | | | 15.31 | | | | (37.28 | ) | | | 4,594 | | | | 0.50 | † | | | 6.19 | † | | | 11.40 | |
| * | Per share data calculated using average shares method. |
| ** | Total Return is for the period indicated and has not been annualized. The return shown does not reflect the deduction of taxes that a shareholder would pay on Fund distributions or the redemption of Fund shares. |
| † | Annualized. |
| †† | Portfolio turnover rate is for the period indicated and periods of less than one year have not been annualized. Excludes effect of in-kind transfers. |
| ‡ | The ratio to Expenses to Average Net Assets includes the affect of a waiver. If these affects were excluded, the ratio would hve been 0.62%, 0.68%, 0.68%, and 0.68% for the period ended May 31, 2020 and years ended November 30, 2019, 2018, and 2017, respectively. |
| ^ | The ratio of Expenses to Average Net Assets includes the effect of a waiver. If these offsets were excluded,the ratio would have been 0.63%, 0.68%, 0.68%, and 0.68% for the period ended May 31, 2020 and years ended November 30, 2019, 2018, and 2017, respectively. |
| (1) | The Fund commenced operations on May 4, 2016. |
| (2) | The Fund commenced operations on May 9, 2016. |
| (3) | The Fund commenced operations on September 17, 2019. |
Selected Per Share Data & Ratios
For a Share Outstanding Throughout the Period
| | | Net Asset Value, Beginning of Period ($) | | | Net Investment Income ($)* | | | Net Realized and Unrealized Gain (Loss) on Investments ($) | | | Total from Operations ($) | | | Distribution from Net Investment Income ($) | | | Distribution from Capital Gains ($) | |
| Global X U.S. Infrastructure Development ETF | | | | | | | | | | | | | | | | | | |
| 2020 (Unaudited) | | | 17.43 | | | | 0.06 | | | | (2.74 | ) | | | (2.68 | ) | | | (0.05 | ) | | | — | |
| 2019 | | | 15.57 | | | | 0.13 | | | | 1.90 | | | | 2.03 | | | | (0.17 | ) | | | — | |
| 2018 | | | 16.16 | | | | 0.14 | | | | (0.68 | ) | | | (0.54 | ) | | | (0.05 | ) | | | — | |
2017(1) | | | 14.98 | | | | 0.10 | | | | 1.08 | | | | 1.18 | | | | — | | | | — | |
| Global X Conscious Companies ETF | | | | | | | | | | | | | | | | | | | | | | | | |
| 2020 (Unaudited) | | | 23.10 | | | | 0.17 | | | | (1.40 | ) | | | (1.23 | ) | | | (0.17 | ) | | | (0.02 | ) |
| 2019 | | | 20.55 | | | | 0.37 | | | | 2.68 | | | | 3.05 | | | | (0.50 | ) | | | — | |
| 2018 | | | 19.23 | | | | 0.33 | | | | 1.22 | | | | 1.55 | | | | (0.23 | ) | | | — | |
| 2017 | | | 15.79 | | | | 0.26 | | | | 3.33 | | | | 3.59 | | | | (0.15 | ) | | | — | |
2016(2) | | | 15.09 | | | | 0.15 | | | | 0.55 | | | | 0.70 | | | | — | | | | — | |
| Global X Founder-Run Companies ETF | | | | | | | | | | | | | | | | | | | | | | | | |
| 2020 (Unaudited) | | | 20.50 | | | | 0.01 | | | | 1.22 | | | | 1.23 | | | | (0.07 | ) | | | — | |
| 2019 | | | 18.63 | | | | 0.05 | | | | 2.12 | | | | 2.17 | | | | (0.07 | ) | | | (0.23 | ) |
| 2018 | | | 17.41 | | | | 0.04 | | | | 1.45 | | | | 1.49 | | | | (0.04 | ) | | | (0.23 | ) |
2017(3) | | | 15.02 | | | | 0.04 | | | | 2.35 | | | | 2.39 | | | | — | | | | — | |
| Global X Thematic Growth ETF | | | | | | | | | | | | | | | | | | | | | | | | |
| 2020 (Unaudited) | | | 26.50 | | | | 0.07 | | | | 2.61 | | | | 2.68 | | | | (0.08 | ) | | | — | |
2019(4) | | | 25.23 | | | | — | | | | 1.27 | | | | 1.27 | | | | — | | | | — | |
Total from Distributions ($) | | | Net Asset Value, End of Period ($) | | | Total Return (%)** | | | Net Assets End of Period ($)(000) | | | Ratio of Expenses to Average Net Assets (%) | | | Ratio of Net Investment Income to Average Net Assets (%) | | | Portfolio Turnover (%)†† | |
| | | | | | | | | | | | | | | | | | | | |
| | (0.05 | ) | | | 14.70 | | | | (15.41 | ) | | | 114,647 | | | | 0.47 | † | | | 0.72 | † | | | 12.48 | |
| | (0.17 | ) | | | 17.43 | | | | 13.28 | | | | 183,065 | | | | 0.47 | ‡ | | | 0.81 | | | | 9.18 | |
| | (0.05 | ) | | | 15.57 | | | | (3.36 | ) | | | 140,914 | | | | 0.47 | ‡ | | | 0.77 | | | | 6.76 | |
| | — | | | | 16.16 | | | | 7.88 | | | | 20,203 | | | | 0.47 | †‡ | | | 0.91 | † | | | — | |
| | | | | | | | | | | | | | | | | | | | | | | | | | | |
| | (0.19 | ) | | | 21.68 | | | | (5.39 | ) | | | 242,789 | | | | 0.43 | † | | | 1.66 | † | | | 27.63 | |
| | (0.50 | ) | | | 23.10 | | | | 15.35 | | | | 85,459 | | | | 0.43 | | | | 1.73 | | | | 34.97 | |
| | (0.23 | ) | | | 20.55 | | | | 8.16 | | | | 56,504 | | | | 0.43 | | | | 1.65 | | | | 36.35 | |
| | (0.15 | ) | | | 19.23 | | | | 22.95 | | | | 48,065 | | | | 0.43 | | | | 1.50 | | | | 41.77 | |
| | — | | | | 15.79 | | | | 4.64 | | | | 33,163 | | | | 0.43 | † | | | 2.57 | † | | | 37.35 | |
| | | | | | | | | | | | | | | | | | | | | | | | | | | |
| | (0.07 | ) | | | 21.66 | | | | 6.02 | | | | 4,331 | | | | 0.45 | † | | | 0.10 | † | | | 26.60 | |
| | (0.30 | ) | | | 20.50 | | | | 12.05 | | | | 4,100 | | | | 0.52 | | | | 0.29 | | | | 33.82 | |
| | (0.27 | ) | | | 18.63 | | | | 8.67 | | | | 4,657 | | | | 0.65 | | | | 0.13 | | | | 25.22 | |
| | — | | | | 17.41 | | | | 15.91 | | | | 3,483 | | | | 0.65 | † | | | 0.33 | † | | | 21.61 | |
| | | | | | | | | | | | | | | | | | | | | | | | | | | |
| | (0.08 | ) | | | 29.10 | | | | 10.15 | | | | 5,820 | | | (0.13) | †^ | | | 0.52 | † | | | 8.44 | |
| | — | | | | 26.50 | | | | 5.03 | | | | 2,650 | | | (0.15) | †^ | | | 0.15 | † | | | — | |
| * | Per share data calculated using average shares method. |
| ** | Total Return is for the period indicated and has not been annualized. The return shown does not reflect the deduction of taxes that a shareholder would pay on Fund distributions or the redemption of Fund shares. |
| † | Annualized. |
| †† | Portfolio turnover rate is for the period indicated and periods of less than one year have not been annualized. Excludes effect of in-kind transfers. |
| ‡ | Effective April 1, 2019, the Fund’s fees were permanently lowered to 0.47%. Prior to April 1, 2019, theratio of Expenses to Average Net Assets included the effect of a waiver. If these offsets were excluded, theratio would have been 0.50%, 0.58% and 0.58%, for the years ended November 30, 2019, 2018 and 2017,respectively. |
| ^ | The ratio of Expenses to Average Net Assets includes the effect of a waiver and reimbursement of acquiredfund fees. If these offsets and acquired fund fees were excluded, the ratio would have been 0.50%. |
| (1) | The Fund commenced operations on March 6, 2017. |
| (2) | The Fund commenced operations on July 11, 2016. |
| (3) | The Fund commenced operations on February 13, 2017. |
| (4) | The Fund commenced operations on October 25, 2019. |
Amounts designated as “—” are either $0 or have been rounded to $0.
| | |
Notes to Financial Statements (unaudited) |
| |
|
1. ORGANIZATION
The Global X Funds (the “Trust”) is a Delaware statutory trust formed on March 6, 2008. The Trust is registered under the Investment Company Act of 1940, as amended, as an open-end management investment company. As of May 31, 2020, the Trust had eighty-nine portfolios, seventy-two of which were operational. The financial statements herein and the related notes pertain to the Global X Robotics & Artificial Intelligence ETF, Global X FinTech ETF, Global X Internet of Things ETF, Global X Cloud Computing ETF, Global X Future Analytics Tech ETF, Global X Autonomous & Electric Vehicles ETF, Global X Genomics & Biotechnology ETF, Global X Video Games & Esports ETF, Global X Cybersecurity ETF, Global X Millennials Thematic ETF, Global X Longevity Thematic ETF, Global X Health & Wellness Thematic ETF, Global X Cannabis ETF, Global X U.S. Infrastructure Development ETF, Global X Conscious Companies ETF, Global X Founder-Run Companies ETF, and Global X Thematic Growth ETF (each a “Fund” and collectively, the “Funds”). Each Fund, other than the Global X Conscious Companies ETF, Global X Millennials Thematic ETF, Global X Longevity Thematic ETF and Global X Health & Wellness Thematic ETF, has elected non-diversified status.
2. SIGNIFICANT ACCOUNTING POLICIES
The following is a summary of the significant accounting policies followed by the Funds:
USE OF ESTIMATES — The Funds are investment companies that apply the accounting and reporting guidance issued in Topic 946 by the U.S. Financial Accounting Standards Board. The preparation of financial statements in conformity with U.S. generally accepted accounting principles (“U.S. GAAP”) requires management to make estimates and assumptions that affect the reported amounts of assets and liabilities and disclosure of contingent assets and liabilities at the date of the financial statements and the reported amounts of increases and decreases in net assets from operations during the reporting period. Actual results could materially differ from those estimates.
RETURN OF CAPITAL ESTIMATES – Distributions received by the Funds from underlying Master Limited Partnership (“MLP”) and real estate investment trust (“REIT”) investments generally are comprised of income and return of capital. The Funds record investment income and return of capital based on estimates made at the time such distributions are received. Such estimates are based on historical information available from the MLPs, REITs and other industry sources. These estimates may subsequently be revised based on information received from the MLPs and REITs after their tax reporting periods are concluded.
SECURITY VALUATION — Securities listed on a securities exchange, market or automated quotation system for which quotations are readily available (except for securities traded on the NASDAQ Stock Market (“NASDAQ”), including securities traded over the counter, are valued at the last quoted sale price on the primary exchange or market (foreign or domestic) on which they are traded (or at approximately 4:00 pm if
| | |
Notes to Financial Statements (unaudited) (continued) |
| |
|
2. SIGNIFICANT ACCOUNTING POLICIES (continued)
a security’s primary exchange is normally open at that time), or, if there is no such reported sale, at the most recent mean between the quoted bid and asked prices, which approximates fair value (absent both bid and asked prices on such exchange, the bid price may be used).
For securities traded on NASDAQ, the NASDAQ official closing price will be used. If available, debt securities are priced based upon valuations provided by independent, third-party pricing agents. Such values generally reflect the last reported sales price if the security is actively traded. The third-party pricing agents may also value debt securities at an evaluated bid price by employing methodologies that utilize actual market transactions, broker-supplied valuations, or other methodologies designed to identify the market value for such securities. Debt obligations with remaining maturities of sixty days or less will be valued at their market value. The prices for foreign securities are reported in local currency and converted to U.S. dollars using currency exchange rates as of reporting date. The exchange rates used by the Trust for valuation are captured as of the New York or London close each day. Prices for most securities held in the Funds are provided daily by recognized independent pricing agents. If a security price cannot be obtained from an independent, third-party pricing agent, the Funds seek to obtain a bid price from at least one independent broker.
Securities for which market prices are not “readily available” are valued in accordance with Fair Value Procedures established by the Board of Trustees (the “Board”). The Funds’ Fair Value Procedures are implemented through a Fair Value Committee (the “Committee”) designated by the Board. Some of the more common reasons that may necessitate that a security be valued using the Fair Value Procedures include: the security’s trading has been halted or suspended; the security has been de-listed from its primary trading exchange; the security’s primary trading market is temporarily closed at a time when, under normal conditions it would be open; the security has not been traded for an extended period of time; the security’s primary pricing source is not able or willing to provide a price; or trading of the security is subject to local government-imposed restrictions. In addition, the Funds may fair value their securities if an event that may materially affect the value of the Funds’ securities that traded outside of the United States (a “Significant Event”) has occurred between the time of the security’s last close and the time that the Funds calculate their net asset values. A Significant Event may relate to a single issuer or to an entire market sector. Events that may be Significant Events include: government actions, natural disasters, armed conflict, acts of terrorism and significant market fluctuations. If Global X Management Company LLC, the Funds’ investment adviser (the “Adviser”), becomes aware of a Significant Event that has occurred with respect to a security or group of securities after the closing of the exchange or market on which the security or securities principally trade, but before the time at which the Funds calculate their net asset values, it may request that a Committee meeting be called. When a security is valued in accordance with the Fair Value Procedures, the Committee will determine the value after taking into consideration all relevant information reasonably
| | |
Notes to Financial Statements (unaudited) (continued) |
| |
|
2. SIGNIFICANT ACCOUNTING POLICIES (continued)
available to the Committee. For the period ended May 31, 2020, there were no securities priced using the Fair Value Procedures.
In accordance with the authoritative guidance on fair value measurements and disclosure under U.S. GAAP, the Funds disclose the fair value of their investments in a hierarchy that prioritizes the inputs to valuation techniques used to measure the fair value. The objective of a fair value measurement is to determine the price that would be received to sell an asset or paid to transfer a liability in an orderly transaction between market participants at the measurement date (an exit price). Accordingly, the fair value hierarchy gives the highest priority to quoted prices (unadjusted) in active markets for identical assets or liabilities (Level 1) and the lowest priority to unobservable inputs (Level 3). The three levels of the fair value hierarchy are described below:
Level 1 – Unadjusted quoted prices in active markets for identical, unrestricted assets or liabilities that the Funds have the ability to access at the measurement date;
Level 2 – Other significant observable inputs (including quoted prices in non-active markets, quoted prices for similar investments, fair value of investments for which the Funds have the ability to fully redeem tranches at net asset value as of the measurement date or within the near term, and short-term investments valued at amortized cost); and
Level 3 – Significant unobservable inputs (including the Funds’ own assumptions in determining the fair value of investments and fair value of investments for which the Funds do not have the ability to fully redeem tranches at net asset value as of the measurement date or within the near term).
Investments are classified within the level of the lowest significant input considered in determining fair value. Investments classified within Level 3 whose fair value measurement considers several inputs may include Level 1 or Level 2 inputs as components of the overall fair value measurement.
For the period ended May 31, 2020 there have been no significant changes to the Funds’ fair valuation methodologies.
REPURCHASE AGREEMENTS – Securities pledged as collateral for repurchase agreements by BNP Paribas are held by Brown Brothers Harriman & Co. (“BBH”), the Funds’ custodian (“Custodian”), and are designated as being held on each Fund’s behalf by the custodian under a book-entry system. Each Fund monitors the adequacy of the collateral on a daily basis and can require the seller to provide additional collateral in the event the market value of the securities pledged falls below the carrying value of the repurchase agreement, including accrued interest.
| | |
Notes to Financial Statements (unaudited) (continued) |
| |
|
2. SIGNIFICANT ACCOUNTING POLICIES (continued)
It is the Funds’ policy to only enter into repurchase agreements with banks and other financial institutions which are deemed by the Adviser to be creditworthy. The Funds bear the risk of loss in the event that the other party to a repurchase agreement defaults on its obligations, and the Funds are prevented from exercising their rights to dispose of the underlying securities received as collateral and the risk of a possible decline in the value of the underlying securities during the period. For financial statement purposes, the Funds record the securities lending collateral (included in repurchase agreements, at value or restricted cash) as an asset and the obligation to return securities lending collateral as a liability on the Statements of Assets and Liabilities. Repurchase agreements are entered into by the Funds under Master Repurchase Agreements (“MRA”) which permit the Funds, under certain circumstances, including an event of default (such as bankruptcy or insolvency), to offset payables and/or receivables under an MRA with collateral held and/or posted to the counterparty and create one single net payment due to or from the Funds.
At May 31, 2020, the open repurchase agreements by counterparty which are subject to an MRA on a net payment basis are as follows:
| | | Repurchase Agreements | | | Fair Value of Non-cash Collateral Received(1) | | | Cash Collateral Received | | | Net Amount(2) | |
| Global X Robotics & Artificial Intelligence ETF | | | | | | | | | | | | |
| BNP Paribas | | $ | 13,785,170 | | | $ | 13,785,170 | | | $ | − | | | $ | − | |
| Global X FinTech ETF | | | | | | | | | | | | | | | | |
| BNP Paribas | | $ | 4,451,165 | | | $ | 4,451,165 | | | $ | − | | | $ | − | |
| Global X Internet of Things ETF | | | | | | | | | | | | | | | | |
| BNP Paribas | | $ | 462,367 | | | $ | 462,367 | | | $ | − | | | $ | − | |
| Global X Future Analytics Tech ETF | | | | | | | | | | | | | | | | |
| BNP Paribas | | $ | 7,604 | | | $ | 7,604 | | | $ | − | | | $ | − | |
| Global X Autonomous & Electric Vehicles ETF | | | | | | | | | | | | | | | | |
| BNP Paribas | | $ | 48,875 | | | $ | 48,875 | | | $ | − | | | $ | − | |
| Global X Millennials Thematic ETF | | | | | | | | | | | | | | | | |
| BNP Paribas | | $ | 112,435 | | | $ | 112,435 | | | $ | − | | | $ | − | |
| Global X Cannabis ETF | | | | | | | | | | | | | | | | |
| BNP Paribas | | $ | 382,751 | | | $ | 382,751 | | | $ | − | | | $ | − | |
| Global X U.S. Infrastructure Development ETF | | | | | | | | | | | | | | | | |
| BNP Paribas | | $ | 38,843 | | | $ | 38,843 | | | $ | − | | | $ | − | |
(1) | Excess collateral received is not presented in the table above. Please refer to the Schedule of Investments for the market value of the collateral received for each Fund. |
(2) | Net Amount represents the net amount receivable due from the counterparty in the event of default. |
FEDERAL INCOME TAXES — It is each Fund’s intention to qualify, or continue to qualify, as a regulated investment company for Federal income tax purposes by complying with the appropriate provisions of Subchapter M of the Internal Revenue Code of 1986, as amended. Accordingly, no provisions for federal income taxes have been made in the financial statements except as described on the following page.
| | |
Notes to Financial Statements (unaudited) (continued) |
| |
|
2. SIGNIFICANT ACCOUNTING POLICIES (continued)
The Funds evaluate tax positions taken or expected to be taken in the course of preparing the Funds’ tax returns to determine whether it is “more-likely-than-not” (i.e., greater than 50%) that each tax position will be sustained upon examination by a taxing authority based on the technical merits of the position. Tax positions not deemed to meet the more-likely-than-not threshold are recorded as a tax benefit or expense in the current year. The Funds did not record any tax provisions in the current period; however, management’s conclusions regarding tax positions may be subject to review and adjustment at a later date based on factors including, but not limited to, examination by tax authorities (i.e., the last three tax year ends, as applicable), on-going analysis of and changes to tax laws, regulations and interpretations thereof. Any foreign tax filings that have not been made, will be filed within the prescribed period.
SECURITY TRANSACTIONS AND INVESTMENT INCOME — Security transactions are accounted for on the trade date for financial reporting purposes. Costs used in determining realized gains and losses on the sale of investment securities are based on specific identification. Dividend income is recorded on the ex-dividend date. Interest income is recognized on the accrual basis from the settlement date.
DIVIDENDS AND DISTRIBUTIONS TO SHAREHOLDERS — The Funds distribute their net investment income on a pro rata basis. Any net realized capital gains are distributed annually. All distributions are recorded on ex-dividend date.
CASH OVERDRAFT CHARGES – Per the terms of an agreement with BBH, if a Fund has a cash overdraft on a given day, it will be assessed an overdraft charge of LIBOR plus 2.00%. Cash overdraft charges are included in custodian fees on the Statement of Operations.
FOREIGN CURRENCY TRANSACTIONS AND TRANSLATION — The books and records of the Funds are maintained in U.S. dollars. Investment securities and other assets and liabilities denominated in a foreign currency are translated into U.S. dollars on the date of valuation. Purchases and sales of investment securities, income and expenses are translated into U.S. dollars at the relevant rates of exchange prevailing on the respective dates of such transactions. The Funds do not isolate that portion of realized or unrealized gains and losses resulting from changes in the foreign exchange rate from fluctuations arising from changes in the market prices of the securities. These gains and losses are included in net realized and unrealized gains and losses on investments on the Statement of Operations. Net realized and unrealized gains and losses on foreign currency transactions and translations represent net foreign exchange gains or losses from foreign currency spot contracts, disposition of foreign currencies, currency gains or losses realized between trade and settlement dates on securities transactions and the difference between the amount of the investment income and foreign withholding taxes recorded on the Funds’ books and the U.S. dollar equivalent amounts actually received or paid.
| | |
Notes to Financial Statements (unaudited) (continued) |
| |
|
2. SIGNIFICANT ACCOUNTING POLICIES (continued)
CREATION UNITS — The Funds issue and redeem their shares (“Shares”) on a continuous basis at net asset value (“NAV”) and only in large blocks of 50,000 Shares, referred to as “Creation Units”. Purchasers of Creation Units (“Authorized Participants”) at NAV must pay a standard creation transaction fee per transaction. The fee is a single charge and will be the same regardless of the number of Creation Units purchased by an Authorized Participant on the same day.
An Authorized Participant who holds Creation Units and wishes to redeem at NAV would also pay a standard redemption fee per transaction to BBH, the Funds’ custodian, on the date of such redemption, regardless of the number of Creation Units redeemed that day.
If a Creation Unit is purchased or redeemed for cash, an additional variable fee may be charged. The following table discloses Creation Unit breakdown:
| | | Creation Unit Shares | | | Creation Fee | | | Value at May 31, 2020 | | | Redemption Fee | |
| Global X Robotics & Artificial Intelligence ETF | | | 50,000 | | | $ | 600 | | | $ | 1,158,000 | | | $ | 600 | |
| Global X FinTech ETF | | | 50,000 | | | | 400 | | | | 1,610,500 | | | | 400 | |
| Global X Internet of Things ETF | | | 50,000 | | | | 600 | | | | 1,133,500 | | | | 600 | |
| Global X Cloud Computing ETF | | | 50,000 | | | | 250 | | | | 997,000 | | | | 250 | |
| Global X Future Analytics Tech ETF | | | 50,000 | | | | 600 | | | | 976,500 | | | | 600 | |
| Global X Autonomous & Electric Vehicles ETF | | | 50,000 | | | | 750 | | | | 676,000 | | | | 750 | |
| Global X Genomics & Biotechnology ETF | | | 50,000 | | | | 250 | | | | 825,500 | | | | 250 | |
| Global X Video Games & Esports ETF | | | 50,000 | | | | 600 | | | | 1,016,000 | | | | 600 | |
| Global X Cybersecurity ETF | | | 50,000 | | | | 250 | | | | 972,500 | | | | 250 | |
| Global X Millennials Thematic ETF | | | 50,000 | | | | 300 | | | | 1,308,000 | | | | 300 | |
| Global X Longevity Thematic ETF | | | 50,000 | | | | 1,000 | | | | 1,210,000 | | | | 1,000 | |
| Global X Health & Wellness Thematic ETF | | | 50,000 | | | | 1,000 | | | | 979,500 | | | | 1,000 | |
| Global X Cannabis ETF | | | 50,000 | | | | 250 | | | | 586,500 | | | | 250 | |
| Global X U.S. Infrastructure Development ETF | | | 50,000 | | | | 400 | | | | 735,000 | | | | 400 | |
| Global X Conscious Companies ETF | | | 50,000 | | | | 750 | | | | 1,084,000 | | | | 750 | |
| Global X Founder-Run Companies ETF | | | 50,000 | | | | 400 | | | | 1,083,000 | | | | 400 | |
| Global X Thematic Growth ETF | | | 50,000 | | | | 250 | | | | 1,455,000 | | | | 250 | |
3. RELATED PARTY TRANSACTIONS AND SERVICE PROVIDER TRANSACTIONS
On July 2, 2018, the Adviser consummated a transaction pursuant to which it became an indirect, wholly-owned subsidiary of Mirae Asset Global Investments Co., Ltd. (“Mirae”). In this manner, the Adviser is ultimately controlled by Mirae, which is a leading financial services company in Korea and is the headquarters for the Mirae Asset Global Investments Group.
| | |
Notes to Financial Statements (unaudited) (continued) |
| |
|
3. RELATED PARTY TRANSACTIONS AND SERVICE PROVIDER TRANSACTIONS (continued)
The Adviser serves as the investment adviser and the administrator for the Funds. Subject to the supervision of the Board, the Adviser is responsible for managing the investment activities of the Funds and the Funds’ business affairs and other administrative matters and provides, or causes to be furnished all supervisory, administrative and other services reasonably necessary for the operation of the Funds, including certain distribution services (provided pursuant to a separate distribution services agreement), certain shareholder and distribution-related services (provided pursuant to a separate Rule 12b-1 Plan and related agreements) and investment advisory services (provided pursuant to a separate investment advisory agreement), under what is essentially an “all-in” fee structure. For the Advisor’s services to the Funds, under the Supervision and Administration Agreement, each Fund pays a monthly fee to the Adviser at the annual rate below (stated as a percentage of the average daily net assets of the respective Fund). In addition, the Funds bear other expenses, directly and indirectly, that are not covered by the Supervision and Administration Agreement, which may vary and affect the total expense ratios of the Funds, such as taxes, brokerage fees, commissions, acquired fund fees and expenses, and other transaction expenses, interest expenses, and extraordinary expenses (such as litigation and indemnification expenses), respectively.
The following table discloses the rates of supervision and administration fees paid by the Funds:
| | | Supervision and Administration Fee | |
| Global X Robotics & Artificial Intelligence Thematic ETF | | 0.68% | |
| Global X FinTech Thematic ETF | | 0.68% | |
| Global X Internet of Things Thematic ETF | | 0.68% | |
| Global X Cloud Computing ETF | | 0.68% | |
| Global X Future Analytics Tech ETF | | 0.68% | |
| Global X Autonomous & Electric Vehicles ETF | | 0.68% | |
| Global X Genomics & Biotechnology ETF | | 0.68% | |
| Global X Video Games & Esports ETF | | 0.50% | |
| Global X Cybersecurity ETF*** | | 0.60% | |
| Global X Millennials Thematic ETF* (1) | | 0.50% | |
| Global X Longevity Thematic ETF* (1) | | 0.50% | |
| Global X Health & Wellness Thematic ETF* (1) | | 0.50% | |
| Global X Cannabis ETF | | 0.50% | |
| Global X U.S. Infrastructure Development ETF** | | 0.47% | |
| Global X Conscious Companies ETF | | 0.43% | |
| Global X Founder-Run Companies ETF | | 0.45% | |
| Global X Thematic Growth ETF | | 0.50% | |
(1) Prior to April 1, 2020 the Fee was 0.68%.
| | |
Notes to Financial Statements (unaudited) (continued) |
| |
|
3. RELATED PARTY TRANSACTIONS AND SERVICE PROVIDER TRANSACTIONS (continued)
* Pursuant to expense limitation agreements between each of the Global X Health & Wellness Thematic ETF, Global X Longevity Thematic ETF and the Global X Millennials Thematic ETF (the “Funds”) and the Adviser prior to April 1, 2020, the Adviser agreed to waive or reimburse fees and/or limit fund expenses to the extent necessary to assure that the operating expenses of the Funds (exclusive of taxes, brokerage fees, commissions, and other transaction expenses, interest, and extraordinary expenses (such as litigation and indemnification expenses)) did not exceed 0.50% of the Funds’ average daily net assets per year until April 1, 2020. Each Fund (at a later date) may reimburse the Adviser for the fees and expenses it waived or reimbursed and/or limited pursuant to the expense limitation agreements during any of the three fiscal years prior to April 1, 2020, provided that, among other things, any reimbursement made to the Adviser does not cause Total Annual Fund Operating Expenses to exceed the maximum permitted rate during the period in which it is paid and the Board has approved such reimbursement to the Adviser. Although the Board voted to permanently reduce the Fund’s management fees to 0.50% and end the expense limitation agreements as of April 1, 2020, waived or reimbursed fees prior to April 1, 2020 are still subject to recoupment. As of May 31, 2020, the amounts of waivers/reimbursements subject to recoupment for the Global X Health & Wellness Thematic ETF, Global X Longevity Thematic ETF and Global X Millennials Thematic ETF, were $2,169 (expiring 2020), $11,634 (expiring 2021), $8,496 (expiring 2022); $5,466 (expiring 2020), $23,346 (expiring 2021), $9,461 (expiring 2022); $7,408 (expiring 2020), $41,063 (expiring 2021) and $18,918 (expiring 2022), respectively.
** Pursuant to an expense limitation agreement between the Global X U.S. Infrastructure Development ETF (the “Fund”) and the Adviser prior to April 1, 2019, the Adviser contractually agreed to reimburse or waive fees and/or limit fund expenses to the extent necessary to assure that the operating expenses of the Fund (exclusive of taxes, brokerage fees, commissions, and other transaction expenses, interest, and extraordinary expenses (such as litigation and indemnification expenses)) (“Total Annual Fund Operating Expenses”) would not exceed 0.47% of the Fund’s average daily net assets per year until April 1, 2019. Pursuant to the expense limitation agreement, the Fund (at a later date) may reimburse the Adviser for the fees it reimbursed or waived and/or limited pursuant to the expense limitation agreement during any of the prior three fiscal years, provided that, among other things, reimbursement to be made to the Adviser does not cause Total Annual Fund Operating Expenses of the Fund to exceed 0.47% during the year in which it is paid and the Board of Trustees has approved such reimbursement to the Adviser. Although the Board voted to permanently reduce the Fund’s fees to 0.47% and end the expense limitation agreement as of April 1, 2019, prior waived or reimbursed fees are still subject to recoupment. As of May 31, 2020, the amounts of waivers/reimbursements subject to recoupment for the Fund were $7,476 (expiring 2020), $102,748 (expiring 2021) and $44,734 (expiring 2022). As of May 31, 2020, there had been no recoupment of previously waived and reimbursed fees.
*** Pursuant to an expense limitation agreement, the Adviser has agreed to waive or reimburse fees and/or limit fund expenses to the extent necessary to assure that the operating expenses of the Global X Cybersecurity ETF (the “Fund”) (exclusive of taxes, brokerage fees, commissions, and other transaction expenses, interest, and extraordinary expenses (such as litigation and indemnification expenses)) will not exceed 0.50% of the Fund’s average daily net assets per year until April 1, 2021.
| | |
Notes to Financial Statements (unaudited) (continued) |
| |
|
3. RELATED PARTY TRANSACTIONS AND SERVICE PROVIDER TRANSACTIONS (continued)
SEI Investments Global Funds Services (“SEIGFS”) serves as sub-administrator to the Funds. As sub-administrator, SEIGFS provides the Funds with required general administrative services, including, without limitation: office space, equipment, and personnel; clerical and general back office services; bookkeeping, internal accounting and secretarial services; the calculation of NAV; and assistance with the preparation and filing of reports, registration statements, proxy statements and other materials required to be filed or furnished by the Funds under federal and state securities laws. As compensation for these services, SEIGFS receives certain out-of-pocket costs, transaction fees and asset-based fees which are accrued daily and paid monthly by the Adviser. SEI Investments Distribution Co. (“SIDCO”) serves as each Fund’s underwriter and distributor of Creation Units pursuant to a distribution agreement. SIDCO has no obligation to sell any specific quantity of Shares. SIDCO bears the following costs and expenses relating to the distribution of Shares: (1) the costs of processing and maintaining records of creations of Creation Units; (2) all costs of maintaining the records required of a registered broker/dealer; (3) the expenses of maintaining its registration or qualification as a dealer or broker under federal or state laws; (4) filing fees; and (5) all other expenses incurred in connection with the distribution services as contemplated in the distribution agreement. SIDCO receives no fee from the Funds for its distribution services under the distribution agreement; rather, the Adviser compensates SIDCO for certain expenses, out-of-pocket costs, and transaction fees.
BBH serves as Custodian and transfer agent of the Funds’ assets. As Custodian, BBH has agreed to (1) make receipts and disbursements of money on behalf of the Funds, (2) collect and receive all income and other payments and distributions on account of the Funds’ portfolio investments, (3) respond to correspondence from shareholders, security brokers and others relating to its duties; and (4) make periodic reports to the Funds concerning the Funds’ operations. BBH does not exercise any supervisory function over the purchase and sale of securities. As transfer agent, BBH has agreed to (1) issue and redeem Shares of each Fund, (2) make dividend and other distributions to shareholders of each Fund, (3) respond to correspondence by shareholders and others relating to its duties; (4) maintain shareholder accounts, and (5) make periodic reports to the Funds. As compensation for these services, BBH receives certain out-of-pocket costs, transaction fees and asset-based fees which are accrued daily and paid monthly by the Adviser from its fees.
| | |
Notes to Financial Statements (unaudited) (continued) |
| |
|
4. INVESTMENT TRANSACTIONS
For the period ended May 31, 2020, the purchases and sales of investments in securities excluding in-kind transactions, long-term U.S. Government, and short-term securities, were:
| 2020 | | Purchases | | | Sales and Maturities | |
| Global X Robotics & Artificial Intelligence ETF | | $ | 137,309,194 | | | $ | 127,838,763 | |
| Global X FinTech ETF | | | 21,289,264 | | | | 22,428,921 | |
| Global X Internet of Things ETF | | | 13,212,774 | | | | 11,082,917 | |
| Global X Cloud Computing ETF | | | 33,967,237 | | | | 35,416,428 | |
| Global X Future Analytics Tech ETF | | | 8,886,349 | | | | 8,682,482 | |
| Global X Autonomous & Electric Vehicles ETF | | | 2,497,278 | | | | 2,124,778 | |
| Global X Genomics & Biotechnology ETF | | | 6,909,711 | | | | 6,616,026 | |
| Global X Video Games & Esports ETF | | | 10,593,189 | | | | 1,834,477 | |
| Global X Cybersecurity ETF | | | 1,417,874 | | | | 1,197,771 | |
| Global X Millennials Thematic ETF | | | 5,910,992 | | | | 5,946,915 | |
| Global X Longevity Thematic ETF | | | 2,680,969 | | | | 2,654,009 | |
| Global X Health & Wellness Thematic ETF | | | 3,705,896 | | | | 3,487,083 | |
| Global X Cannabis ETF | | | 2,696,100 | | | | 2,383,262 | |
| Global X U.S. Infrastructure Development ETF | | | 18,324,549 | | | | 18,353,741 | |
| Global X Conscious Companies ETF | | | 42,281,604 | | | | 40,497,680 | |
| Global X Founder-Run Companies ETF | | | 1,518,533 | | | | 1,524,091 | |
| Global X Thematic Growth ETF | | | 410,884 | | | | 347,027 | |
For the period ended May 31, 2020, in-kind transactions associated with creations and redemptions were:
| 2020 | | Purchases | | | Sales | | | Realized Gain/(Loss) | |
| Global X Robotics & Artificial Intelligence ETF | | $ | 55,398,424 | | | $ | 188,030,710 | | | $ | (27,049,848 | ) |
| Global X FinTech ETF | | | 126,098,861 | | | | 41,228,494 | | | | 8,267,048 | |
| Global X Internet of Things ETF | | | 40,167,327 | | | | 4,116,938 | | | | 1,287,596 | |
| Global X Cloud Computing ETF | | | 195,785,094 | | | | 112,759,387 | | | | 31,270,885 | |
| Global X Future Analytics Tech ETF | | | 7,372,785 | | | | 9,895,908 | | | | 3,258,786 | |
| Global X Autonomous & Electric Vehicles ETF | | | 4,931,490 | | | | − | | | | − | |
| Global X Genomics & Biotechnology ETF | | | 16,841,744 | | | | 3,804,869 | | | | 1,147,792 | |
| Global X Video Games & Esports ETF | | | 84,619,572 | | | | 14,065,768 | | | | 2,893,173 | |
| Global X Cybersecurity ETF | | | 8,794,597 | | | | − | | | | − | |
| Global X Millennials Thematic ETF | | | 9,294,038 | | | | 8,020,751 | | | | 702,883 | |
| Global X Longevity Thematic ETF | | | 4,399,844 | | | | 2,220,693 | | | | 1,126,229 | |
| Global X Health & Wellness Thematic ETF | | | 10,970,471 | | | | 10,139,653 | | | | 1,859,275 | |
| Global X Cannabis ETF | | | 8,819,192 | | | | − | | | | − | |
| Global X U.S. Infrastructure Development ETF | | | 30,053,291 | | | | 56,769,924 | | | | (10,970,420 | ) |
| Global X Conscious Companies ETF | | | 139,230,795 | | | | 3,084,510 | | | | 837,189 | |
| Global X Founder-Run Companies ETF | | | 6,242,948 | | | | 4,435,220 | | | | (1,104,663 | ) |
| Global X Thematic Growth ETF | | | 3,979,552 | | | | 1,137,285 | | | | 61,467 | |
| | |
Notes to Financial Statements (unaudited) (continued) |
| |
|
4. INVESTMENT TRANSACTIONS (continued)
For the year ended November 30, 2019, in-kind transactions associated with creations and redemptions were:
| 2019 | | Purchases | | | Sales | | | Realized Gain/(Loss) | |
| Global X Robotics & Artificial Intelligence ETF | | $ | 196,452,084 | | | $ | 527,329,566 | | | $ | (33,905,075 | ) |
| Global X FinTech ETF | | | 112,937,062 | | | | 93,896,478 | | | | 8,446,928 | |
| Global X Internet of Things ETF | | | 43,369,377 | | | | 19,178,310 | | | | 4,282,434 | |
| Global X Cloud Computing ETF | | | 524,429,030 | | | | 73,776,961 | | | | 7,782,237 | |
| Global X Future Analytics Tech ETF | | | 9,253,548 | | | | 14,737,108 | | | | 977,438 | |
| Global X Autonomous & Electric Vehicles ETF | | | 6,226,367 | | | | 7,556,398 | | | | 102,697 | |
| Global X Genomics & Biotechnology ETF | | | 16,470,842 | | | | − | | | | − | |
| Global X Video Games & Esports ETF | | | 1,343,301 | | | | − | | | | − | |
| Global X Cybersecurity ETF | | | 1,513,438 | | | | − | | | | − | |
| Global X Millennials Thematic ETF | | | 64,052,088 | | | | 26,378,103 | | | | 7,255,226 | |
| Global X Longevity Thematic ETF | | | 6,136,552 | | | | 1,033,564 | | | | 281,906 | |
| Global X Health & Wellness Thematic ETF | | | 12,053,707 | | | | 5,418,018 | | | | 922,860 | |
| Global X Cannabis ETF | | | 5,754,039 | | | | − | | | | − | |
| Global X U.S. Infrastructure Development ETF | | | 54,690,700 | | | | 26,071,935 | | | | 538,144 | |
| Global X Conscious Companies ETF | | | 25,986,382 | | | | 5,288,419 | | | | 1,691,105 | |
| Global X Founder-Run Companies ETF | | | − | | | | 1,021,446 | | | | 192,373 | |
| Global X Thematic Growth ETF | | | 2,522,056 | | | | − | | | | − | |
For the period ended May 31, 2020, there were no purchases or sales of long-term U.S. Government securities by the Funds.
5. TAX INFORMATION
The amount and character of income and capital gain distributions to be paid, if any, are determined in accordance with federal income tax regulations, which may differ from U.S. GAAP. As a result, net investment income (loss) and net realized gain (loss) on investment transactions for a reporting period may differ significantly from distributions during such period. These book/tax differences may be temporary or permanent. To the extent these differences are permanent in nature, they are charged or credited to undistributed net investment income (loss), accumulated net realized gain (loss) or paid-in capital, as appropriate, in the period that the differences arise.
| | |
Notes to Financial Statements (unaudited) (continued) |
| |
|
5. TAX INFORMATION (continued)
The tax character of dividends and distributions declared during the years or periods ended November 30, 2019 and Novemeber 30, 2018 were as follows:
Global X Funds | | Ordinary Income | | | Long-Term Capital Gain | | | Return of Capital | | | Totals | |
| Global X Robotics & Artificial Intelligence ETF | | | | | | | | | | | | |
| 2019 | | $ | 30,149,775 | | | $ | – | | | $ | – | | | $ | 30,149,775 | |
| 2018 | | | 121,571 | | | | – | | | | – | | | | 121,571 | |
| Global X FinTech ETF | | | | | | | | | | | | | | | | |
| 2019 | | $ | – | | | $ | 60,368 | | | $ | 437,339 | | | $ | 497,707 | |
| 2018 | | | 47,896 | | | | 15,114 | | | | – | | | | 63,010 | |
| Global X Internet of Things ETF | | | | | | | | | | | | | | | | |
| 2019 | | $ | 1,268,719 | | | $ | – | | | $ | – | | | $ | 1,268,719 | |
| 2018 | | | 924,105 | | | | 79,852 | | | | – | | | | 1,003,957 | |
| Global X Cloud Computing ETF | | | | | | | | | | | | | | | | |
| 2019 | | $ | – | | | $ | – | | | $ | – | | | $ | – | |
| Global X Future Analytics Tech ETF | | | | | | | | | | | | | | | | |
| 2019 | | $ | 298,087 | | | $ | – | | | $ | – | | | $ | 298,087 | |
| 2018 | | | – | | | | – | | | | – | | | | – | |
| Global X Autonomous & Electric Vehicles ETF | | | | | | | | | | | | | | | | |
| 2019 | | $ | 415,562 | | | $ | – | | | $ | – | | | $ | 415,562 | |
| 2018 | | | – | | | | – | | | | – | | | | – | |
| Global X Genomics & Biotechnology ETF | | | | | | | | | | | | | | | | |
| 2019 | | $ | – | | | $ | – | | | $ | – | | | $ | – | |
| Global X Video Games and Esports ETF | | | | | | | | | | | | | | | | |
| 2019 | | $ | – | | | $ | – | | | $ | – | | | $ | – | |
| Global X Cybersecurity ETF | | | | | | | | | | | | | | | | |
| 2019 | | $ | – | | | $ | – | | | $ | – | | | $ | – | |
| Global X Millennials Thematic ETF | | | | | | | | | | | | | | | | |
| 2019 | | $ | 147,679 | | | $ | 27,133 | | | $ | – | | | $ | 174,812 | |
| 2018 | | | 99,317 | | | | 20,903 | | | | – | | | | 120,220 | |
| Global X Longevity Thematic ETF | | | | | | | | | | | | | | | | |
| 2019 | | $ | 146,505 | | | $ | 38,656 | | | $ | – | | | $ | 185,161 | |
| 2018 | | | 74,051 | | | | 16,585 | | | | – | | | | 90,636 | |
| Global X Health & Wellness Thematic ETF | | | | | | | | | | | | | | | | |
| 2019 | | $ | 120,454 | | | $ | – | | | $ | – | | | $ | 120,454 | |
| 2018 | | | 54,477 | | | | 16,673 | | | | – | | | | 71,150 | |
| Global X Cannabis ETF | | | | | | | | | | | | | | | | |
| 2019 | | $ | – | | | $ | – | | | $ | – | | | $ | – | |
| Global X U.S. Infrastructure Development ETF | | | | | | | | | | | | | | | | |
| 2019 | | $ | 1,424,719 | | | $ | – | | | $ | – | | | $ | 1,424,719 | |
| 2018 | | | 80,930 | | | | – | | | | – | | | | 80,930 | |
| | |
Notes to Financial Statements (unaudited) (continued) |
| |
|
5. TAX INFORMATION (continued)
| Global X Funds | | Ordinary Income | | | Long-Term Capital Gain | | | Return of Capital | | | Totals | |
| Global X Conscious Companies ETF | | |
| | | | | | | | | | |
| 2019 | | $ | 1,418,777 | | | $ | – | | | $ | – | | | $ | 1,418,777 | |
| 2018 | | | 598,437 | | | | – | | | | – | | | | 598,437 | |
| Global X Founder-Run Companies ETF | | | | | | | | | | | | | | | | |
| 2019 | | $ | 70,597 | | | $ | 3,076 | | | $ | – | | | $ | 73,673 | |
| 2018 | | | 53,242 | | | | 781 | | | | – | | | | 54,023 | |
| Global X Thematic Growth ETF | | | | | | | | | | | | | | | | |
| 2019 | | $ | – | | | $ | – | | | $ | – | | | $ | – | |
As of November 30, 2019, the components of tax basis distributable earnings (accumulated losses) were as follows:
| | | Global X Funds | |
| | | Global X Robotics & Artificial Intelligence ETF | | | Global X FinTech ETF | | | Global X Internet of Things ETF | |
| Undistributed Ordinary Income | | $ | 2,105,553 | | | $ | – | | | $ | 397,344 | |
| Capital Loss Carryforwards | | | (118,941,610 | ) | | | (11,853,484 | ) | | | (1,951,432 | ) |
| Unrealized Appreciation (Depreciation) on Investments and Foreign Currency | | | (192,946,578 | ) | | | 40,524,110 | | | | 14,704,995 | |
| Late Year Loss Deferral | | | – | | | | (960,039 | ) | | | – | |
| Other Temporary Differences | | | – | | | | 2 | | | | (4 | ) |
| Total Distributable Earnings (Accumulated Losses) | | $ | (309,782,635 | ) | | $ | 27,710,589 | | | $ | 13,150,903 | |
| | | Global X Funds | |
| | | Global X Cloud Computing ETF | | | Global X Future Analytics Tech ETF | | | Global X Autonomous & Electric Vehicles ETF | |
| Undistributed Ordinary Income | | $ | 210,759 | | | $ | 84,300 | | | $ | 56,036 | |
| Capital Loss Carryforwards | | | – | | | | (496,769 | ) | | | (991,468 | ) |
| Post October Losses | | | (1,219,812 | ) | | | – | | | | – | |
| Unrealized Appreciation (Depreciation) on Investments and Foreign Currency | | | 9,483,867 | | | | 3,383,751 | | | | (772,361 | ) |
| | |
Notes to Financial Statements (unaudited) (continued) |
| |
|
| | | Global X Funds | |
| | | Global X Cloud Computing ETF | | | Global X Future Analytics Tech ETF | | | Global X Autonomous & Electric Vehicles ETF | |
| Late Year Loss Deferral | | | (1,037,168 | ) | | | – | | | | – | |
| Other Temporary Differences | | | – | | | | (1 | ) | | | – | |
| Total Distributable Earnings (Accumulated Losses) | | $ | 7,437,646 | | | $ | 2,971,281 | | | $ | (1,707,793 | ) |
| | | Global X Funds | |
| | | Global X Genomics & Biotechnology ETF | | | Global X Video Games and Esports ETF | | | Global X Cybersecurity ETF | |
| Undistributed Ordinary Income | | $ | – | | | $ | – | | | $ | 2,033 | |
| Unrealized Appreciation on Investments and Foreign Currency | | | 1,815,857 | | | | 73,582 | | | | 184,833 | |
| Late Year Loss Deferral | | | (574 | ) | | | (142 | ) | | | (129 | ) |
| Other Temporary Differences | | | 1 | | | | (1 | ) | | | 2 | |
| Total Distributable Earnings (Accumulated Losses) | | $ | 1,815,284 | | | $ | 73,439 | | | $ | 186,739 | |
| | | Global X Funds | |
| | | Global X Millennials Thematic ETF | | | Global X Longevity Thematic ETF | | | Global X Health & Wellness Thematic ETF | |
| Undistributed Ordinary Income | | $ | 202,230 | | | $ | 108,256 | | | $ | 54,346 | |
| Undistributed Long- Term Capital Gain | | | 1,324 | | | | 38,307 | | | | – | |
| Capital Loss Carryforwards | | | – | | | | – | | | | (86,314 | ) |
| Unrealized Appreciation on Investments and Foreign Currency | | | 1,296,801 | | | | 3,392,400 | | | | 1,329,809 | |
| Other Temporary Differences | | | (1 | ) | | | | | | | 1 | |
| Total Distributable Earnings (Accumulated Losses) | | $ | 1,500,354 | | | $ | 3,538,963 | | | $ | 1,297,842 | |
| | |
Notes to Financial Statements (unaudited) (continued) |
| |
|
5. TAX INFORMATION (continued)
| | | Global X Funds | |
| | | Global X Cannabis ETF | | | Global X U.S. Infrastructure Development ETF | | | Global X Conscious Companies ETF | | | Global X Founder-Run Companies ETF | | | Global X Thematic Growth ETF | |
| Undistributed Ordinary Income | | $ | 44,288 | | | $ | 506,268 | | | $ | 535,548 | | | $ | 8,874 | | | $ | 352 | |
| Capital Loss Carryforwards | | | (10,884 | ) | | | (515,389 | ) | | | (367,291 | ) | | | (77,595 | ) | | | – | |
| Unrealized Appreciation (Depreciation) on Investments and Foreign Currency | | | (1,193,026 | ) | | | 3,853,707 | | | | 13,155,561 | | | | 146,448 | | | | 126,465 | |
| Other Temporary Differences | | | – | | | | 2 | | | | – | | | | (1 | ) | | | – | |
| Total Distributable Earnings (Accumulated Losses) | | $ | (1,159,622 | ) | | $ | 3,844,588 | | | $ | 13,323,818 | | | $ | 77,726 | | | $ | 126,817 | |
For taxable years beginning after December 22, 2010, a RIC is permitted to carry forward net capital losses to offset capital gains realized in later years, and the losses carried forward retain their original character as either long-term or short-term losses. Losses carried forward under these provisions are as follows:
| Global X Funds | | Short-Term Loss | | | Long-Term Loss | | | Total | |
| Global X Robotics & Artificial Intelligence Thematic ETF | | $ | 104,042,882 | | | $ | 14,898,728 | | | $ | 118,941,610 | |
| Global X FinTech ETF | | | 5,673,993 | | | | 6,179,491 | | | | 11,853,484 | |
| Global X Internet of Things Thematic ETF | | | 1,620,664 | | | | 330,768 | | | | 1,951,432 | |
| Global X Future Analytics Tech ETF | | | 496,769 | | | | − | | | | 496,769 | |
| Global X Autonomous & Electric Vehicles ETF | | | 724,421 | | | | 267,047 | | | | 991,468 | |
| Global X Health & Wellness Thematic ETF | | | 21,198 | | | | 65,116 | | | | 86,314 | |
| Global X Cannabis ETF | | | 10,884 | | | | − | | | | 10,884 | |
| Global X U.S. Infrastructure Development ETF | | | 515,389 | | | | − | | | | 515,389 | |
| Global X Conscious Companies ETF | | | 325,980 | | | | 41,311 | | | | 367,291 | |
| Global X Founder-Run Companies ETF | | | 26,773 | | | | 50,822 | | | | 77,595 | |
| | |
Notes to Financial Statements (unaudited) (continued) |
| |
|
5. TAX INFORMATION (continued)
During the year ended November 30, 2019, the following Funds utilized capital loss carryforwards to offset capital gains amounting to:
| Global X Funds | | Short-Term Loss | | | Long-Term Loss | | | Total | |
| Global X U.S. Infrastructure Development ETF | | $ | − | | | $ | 1,738 | | | $ | 1,738 | |
| Global X Health & Wellness Thematic ETF | | | 178 | | | | − | | | | 178 | |
The Federal tax cost and aggregate gross unrealized appreciation and depreciation on investments held by the Funds at May 31, 2020, were as follows:
| Global X Funds | | Federal Tax Cost | | | Aggregated Gross Unrealized Appreciation | | | Aggregated Gross Unrealized Depreciation | | | Net Unrealized Appreciation (Depreciation) | |
| Global X Robotics & Artificial Intelligence ETF | | $ | 1,612,706,342 | | | $ | 231,991,921 | | | $ | (282,162,750 | ) | | $ | (50,170,829 | ) |
| Global X FinTech ETF | | | 500,245,106 | | | | 97,850,326 | | | | (29,332,712 | ) | | | 68,517,614 | |
| Global X Internet of Things ETF | | | 158,982,178 | | | | 26,036,534 | | | | (11,155,220 | ) | | | 14,881,314 | |
| Global X Cloud Computing ETF | | | 575,080,705 | | | | 112,695,798 | | | | (11,277,779 | ) | | | 101,418,019 | |
| Global X Future Analytics Tech ETF | | | 40,929,820 | | | | 8,395,273 | | | | (2,396,001 | ) | | | 5,999,272 | |
| Global X Autonomous & Electric Vehicles ETF | | | 21,224,908 | | | | 2,068,170 | | | | (3,924,809 | ) | | | (1,856,639 | ) |
| Global X Genomics & Biotechnology ETF | | | 31,057,668 | | | | 4,572,164 | | | | (1,017,057 | ) | | | 3,555,107 | |
| Global X Video Games and Esports ETF | | | 94,214,259 | | | | 14,144,765 | | | | (499,331 | ) | | | 13,645,434 | |
| Global X Cybersecurity ETF | | | 10,566,799 | | | | 1,281,366 | | | | (205,975 | ) | | | 1,075,391 | |
| Global X Millennials Thematic ETF | | | 75,310,863 | | | | 9,691,469 | | | | (6,816,645 | ) | | | 2,874,824 | |
| Global X Longevity Thematic ETF | | | 22,892,314 | | | | 5,159,822 | | | | (1,432,073 | ) | | | 3,727,749 | |
| Global X Health & Wellness Thematic ETF | | | 21,296,811 | | | | 1,636,865 | | | | (3,366,752 | ) | | | (1,729,887 | ) |
| Global X Cannabis ETF | | | 17,293,400 | | | | 507,102 | | | | (2,519,791 | ) | | | (2,012,689 | ) |
| Global X U.S. Infrastructure Development ETF | | | 141,457,775 | | | | 3,455,485 | | | | (30,271,574 | ) | | | (26,816,089 | ) |
| Global X Conscious Companies ETF | | | 209,101,459 | | | | 35,278,596 | | | | (1,830,223 | ) | | | 33,448,373 | |
| Global X Founder-Run Companies ETF | | | 4,604,247 | | | | 352,894 | | | | (627,463 | ) | | | (274,569 | ) |
| Global X Thematic Growth ETF | | | 5,446,723 | | | | 403,538 | | | | (32,439 | ) | | | 371,099 | |
The Funds invest in securities of foreign issuers in various countries. These investments may involve certain considerations and risks not typically associated with investments in the United States as a result of, among other factors, the possibility of future political and economic developments and the level of governmental supervision and regulation of securities markets in the respective countries.
6. CONCENTRATION OF RISKS
The Funds may invest in companies focused on business activities in emerging economic themes. Such thematic companies typically face intense competition and potentially rapid product obsolescence. Thematic companies may have limited product lines, markets, financial resources or personnel. These companies typically engage in significant amounts of spending on research and development, capital expenditures and
| | |
Notes to Financial Statements (unaudited) (continued) |
| |
|
6. CONCENTRATION OF RISKS (continued)
mergers and acquisitions, and there is no guarantee that the products or services produced by these companies will be successful. These companies are also frequently dependent on intellectual property rights and may be adversely affected by loss or impairment of those rights. There can be no assurance these companies will be able to successfully protect their intellectual property to prevent the misappropriation of their technology, or that competitors will not develop technology that is substantially similar or superior to such companies’ technology. Such companies may be potential targets for cyberattacks, which can have a materially adverse impact on the performance of these companies. The emergent nature of many economic themes could result in increasing regulatory scrutiny in the future, which may impede the growth of companies that develop and/or focus on such economic themes. Similarly, the collection of data from consumers and other sources is frequently a critical component in emerging economic themes and could face increased scrutiny as regulators consider how the data is collected, stored, safeguarded and used. Finally, these companies may be involved in young, fast evolving industries with increased exposure to the risks associated with changes in applicable laws (including regulation, other rule changes, and related federal and state enforcement activities), as well as market developments, which may cause businesses to contract or close suddenly and negatively impact the value of these companies.
The Funds may be subject to taxes imposed by countries in which they invest. Such taxes are generally based on either income or gains earned or repatriated. The Funds accrue and apply such taxes to net investment income, net realized gains and net unrealized gains as income and/or capital gains are earned. The Funds use a replication strategy. A replication strategy is an indexing strategy that involves investing in the securities of the underlying index in approximately the same proportions as in the underlying index.
The Funds may utilize a representative sampling strategy with respect to their underlying indices when a replication strategy might be detrimental to their shareholders, such as when there are practical difficulties or substantial costs involved in compiling a portfolio of equity securities to follow its underlying index, or, in certain instances, when securities in the underlying index become temporarily illiquid, unavailable or less liquid, or due to legal restrictions (such as diversification requirements that apply to the Funds but not to the underlying indexes). Commodity related securities are susceptible to fluctuations in certain commodity markets. Any negative changes in commodity markets could have a substantial impact on these Funds.
A more complete description of risks is included in each Fund’s Prospectus and Statement of Additional Information.
7. LOANS OF PORTFOLIO SECURITIES
The Funds may lend portfolio securities having a market value up to one-third of the Funds’ total assets. Security loans made pursuant to a securities lending agreement with BBH are required at all times to be secured by collateral equal to at least 102% for U.S.-based securities and 105% for foreign-based securities. Such collateral will be cash or
| | |
Notes to Financial Statements (unaudited) (continued) |
| |
|
7. LOANS OF PORTFOLIO SECURITIES (continued)
securities issued or guaranteed by the U.S. Government or any agencies. Cash collateral received in connection with these loans can be invested in repurchase agreements, short-term investments, or U.S. Treasury obligations and is accounted for in the Schedule of Investments and Statement of Assets and Liabilities. The obligation to return securities lending collateral is also recognized as a liability in the Statement of Assets and Liabilities. It is the Funds’ policy to obtain additional collateral from or return excess collateral to the borrower by the end of the next business day, following the valuation date of the securities loaned. Therefore, the value of the collateral held may be temporarily less than the value of the securities on loan.
Lending securities entails a risk of loss to the Funds if and to the extent that the market values of the securities loaned were to increase and the borrower did not increase the collateral accordingly and the borrower failed to return the securities. The Funds could also experience delays and costs gaining access to the collateral. The Funds bear the risk of any deficiency in the amount of the collateral available for return to the borrower due to any loss on the collateral invested.
As of May 31, 2020, the value of securities on loan was $122,421,080, $40,174,322, $4,293,915, $71,456, $445,891, $1,072,329, $3,282,607, and $355,028, for the Global X Robotics and Artificial Intelligence ETF, Global X FinTech ETF, Global X Internet of Things ETF, Global X Future Analytics Tech ETF, Global X Autonomous & Electric Vehicles ETF, Global X Millenials Thematic ETF, Global X Cannabis ETF and Global X U.S. Infrastructure Development ETF, respectively, and the cash collateral recieved from securities on loan was $131,218,660, $42,369,873, $4,401,194, $72,380, $465,236, $1,070,245, $3,643,340, and $369,743, for the the Global X Robotics and Artificial Intelligence ETF, Global X FinTech ETF, Global X Internet of Things ETF, Global X Future Analytics Tech ETF, Global X Autonomous & Electric Vehicles ETF, Global X Millenials Thematic ETF, Global X Cannabis ETF and Global X U.S. Infrastructure Development ETF, respectively.
| | |
Notes to Financial Statements (unaudited) (continued) |
| |
|
7. LOANS OF PORTFOLIO SECURITIES (continued)
| | | Market Value | | | Cash Collateral | |
| Global X Robotics & Artificial Intelligence ETF | | | | | | |
| Barclays Bank | | $ | 12,481,886 | | | $ | 12,551,215 | (1) |
| BofA Securities | | | 62,878,204 | | | | 65,612,247 | |
| Citigroup | | | 2,010,860 | | | | 2,115,320 | |
| Credit Suisse | | | 250,615 | | | | 263,500 | |
| Goldman Sachs & Co. | | | 3,664,487 | | | | 7,563,704 | |
| JPMorgan | | | 1,642,940 | | | | 1,631,168 | (1) |
| Morgan Stanley | | | 38,899,634 | | | | 40,861,037 | |
| UBS AG London Branch | | | 557,646 | | | | 586,644 | |
| UBS Securities LLC | | | 5,943 | | | | 5,775 | (1) |
| Wells Fargo | | | 28,866 | | | | 28,050 | (1) |
| Global X FinTech ETF | | | | | | | | |
| Barclays Bank | | | 14,606,839 | | | | 14,988,283 | |
| BofA Securities | | | 72,400 | | | | 76,100 | |
| Citigroup | | | 3,168,444 | | | | 3,286,118 | |
| Credit Suisse | | | 6,410,060 | | | | 6,739,210 | |
| Goldman Sachs & Co. | | | 1,341,684 | | | | 2,027,142 | |
| JPMorgan | | | 5,081 | | | | 5,368 | |
| Morgan Stanley | | | 13,991,419 | | | | 14,649,295 | |
| Natl Financial Services Corp | | | 578,396 | | | | 598,357 | |
| Global X Internet of Things ETF | | | | | | | | |
| Barclays Bank | | | 1,109,505 | | | | 1,136,350 | |
| BofA Securities | | | 22,168 | | | | 23,313 | |
| Citigroup | | | 217,912 | | | | 221,895 | |
| Goldman Sachs & Co. | | | 166,846 | | | | 175,461 | |
| JPMorgan | | | 2,777,484 | | | | 2,844,175 | |
| Global X Future Analytics Tech ETF | | | | | | | | |
| Natl Financial Services Corp | | | 71,456 | | | | 72,380 | (1) |
| Global X Autonomous & Electric Vehicles ETF | | | | | | | | |
| BofA Securities | | | 88 | | | | 95 | |
| Goldman Sachs & Co. | | | 438,528 | | | | 457,366 | |
| JPMorgan | | | 7,275 | | | | 7,776 | |
| Global X Millennials Thematic ETF | | | | | | | | |
| BofA Securities | | | 165,213 | | | | 161,415 | (1) |
| Natl Financial Services Corp | | | 367,467 | | | | 366,385 | (1) |
| UBS Securities LLC | | | 539,649 | | | | 542,445 | (1) |
| | |
Notes to Financial Statements (unaudited) (continued) |
| |
|
7. LOANS OF PORTFOLIO SECURITIES (continued)
| | | Market Value | | | Cash Collateral | |
| Global X Cannabis ETF | | | | | | |
| Barclays Bank | | $ | 399,375 | | | $ | 434,605 | |
| Citigroup | | | 401,801 | | | | 443,746 | |
| Credit Suisse | | | 207,292 | | | | 232,848 | |
| Goldman Sachs & Co. | | | 482,957 | | | | 542,427 | |
| JPMorgan | | | 517,306 | | | | 571,407 | |
| Morgan Stanley | | | 356,117 | | | | 393,104 | |
| Scotia Capital | | | 660,404 | | | | 739,864 | |
| UBS AG London Branch | | | 22,699 | | | | 24,516 | |
| UBS Securities LLC | | | 234,657 | | | | 260,823 | |
| Global X U.S. Infrastructure Development ETF | | | | | | | | |
| Goldman Sachs & Co. | | | 32,160 | | | | 33,759 | |
| UBS Securities LLC | | | 127,890 | | | | 129,850 | |
| Wells Fargo | | | 194,978 | | | | 206,134 | |
(1) It is the Funds’ policy to obtain additional collateral from or return excess collateral to the borrower by the end of the next business day, following the valuation date of the securities loaned. Therefore, the value of the collateral held may be temporarily less than the value of the securities on loan.
8. CONTRACTUAL OBLIGATIONS
The Funds enter into contracts in the normal course of business that contain a variety of indemnifications. The Funds’ maximum exposure under these arrangements is unknown. However, the Funds have not had prior gains or losses pursuant to these contracts. Management has reviewed the Funds’ existing contracts and expects the risk of loss to be remote.
Pursuant to the Trust’s organizational documents, the Trustees of the Trust and the Trust’s officers are indemnified against certain liabilities that may arise out of the performance of their duties.
9. REGULATORY MATTERS
On August 17, 2018, the Securities & Exchange Commission adopted amendments to Regulation S-X. These changes are effective for periods after November 5, 2018. The updates to Registered Investment Companies were mainly focused on simplifying the presentation of distributable earnings by eliminating the need to present the components of distributable earnings on a book basis in the Statement of Assets and Liabilities. The update also impacted the presentation of undistributed net investment income and distributions to shareholders on the Statements of Changes in Net Assets. The amounts presented in the current Statements of Changes in Net Assets represent the aggregated total distributions of net investment income and realized capital gains, except for distributions classified as return of capital which are still presented separately.
| | |
Notes to Financial Statements (unaudited) (concluded) |
| |
|
10. NEW ACCOUNTING PRONOUNCEMENTS
In August 2018, the Financial Accounting Standards Board issued Accounting Standards Update 2018-13, Fair Value Measurement (Topic 820). The new guidance includes additions and modifications to disclosures requirements for fair value measurements. For public entities, the amendments are effective for financial statements issued for fiscal years beginning after December 15, 2019, and interim periods within those fiscal years. Management elected to early adopt the removal of certain disclosures and delay the adoption of additional disclosures until the effective date.
11. SUBSEQUENT EVENTS
The Funds have been evaluated regarding the need for additional disclosures and/or adjustments resulting from subsequent events. Based on this evaluation, please note the additional disclosure:
Effective June 15, 2020, the Global X Future Analytics Tech ETF was renamed Global X Artificial Intelligence & Technology ETF.
Effective June 15, 2020, the Management Fee of the Global X Genomics & Biotechnology ETF was reduced to 0.50%.
| | |
Disclosure of Fund Expenses (unaudited)
|
All exchange traded funds (“ETFs”) have operating expenses. As a shareholder of an ETF, your investment is affected by these ongoing costs, which include (among others) costs for ETF management, administrative services, commissions, and shareholder reports like this one. It is important for you to understand the impact of these costs on your investment returns. In addition, a shareholder is responsible for brokerage fees as a result of their investment in the Fund.
Operating expenses such as these are deducted from an ETF’s gross income and directly reduce its final investment return. These expenses are expressed as a percentage of the ETF’s average net assets; this percentage is known as the ETF’s expense ratio.
The following examples use the expense ratio and are intended to help you understand the ongoing costs (in dollars) of investing in your Fund and to compare these costs with those of other funds. The examples are based on an investment of $1,000 made at the beginning of the period shown and held for the entire period (December 1, 2019 to May 31, 2020).
The table on the next page illustrates your Fund’s costs in two ways:
Actual Fund Return. This section helps you to estimate the actual expenses that your Fund incurred over the period. The “Expenses Paid During Period” column shows the actual dollar expense cost incurred by a $1,000 investment in the Fund, and the “Ending Account Value” number is derived from deducting that expense cost from the Fund’s gross investment return.
You can use this information, together with the actual amount you invested in the Funds, to estimate the expenses you paid over that period. Simply divide your actual account value by $1,000 to arrive at a ratio (for example, an $8,600 account value divided by $1,000 = 8.6), then multiply that ratio by the number shown for your Funds under “Expenses Paid During Period.”
Hypothetical 5% Return. This section helps you compare your Fund’s costs with those of other funds. It assumes that the Funds had an annual 5% return before expenses during the period, but that the expense ratio (Column 3) for the period is unchanged. This example is useful in making comparisons because the Securities and Exchange Commission requires all funds to make this 5% calculation. You can assess your Fund’s comparative cost by comparing the hypothetical result for your Fund in the “Expenses Paid During Period” column with those that appear in the same charts in the shareholder reports for other funds.
NOTE: Because the return is set at 5% for comparison purposes — NOT your Fund’s actual return — the account values shown may not apply to your specific investment.
| | |
Disclosure of Fund Expenses (unaudited) (continued)
|
| | | Beginning Account Value 12/1/2019 | | | Ending Account Value 5/31/2020 | | | Annualized Expense Ratios | | | Expenses Paid During Period(1) | |
| Global X Robotics & Artificial Intelligence ETF | | | | | | | | | | | | |
| Actual Fund Return | | $ | 1,000.00 | | | $ | 1,082.20 | | | | 0.69 | % | | $ | 3.59 | |
| Hypothetical 5% Return | | | 1,000.00 | | | | 1,021.55 | | | | 0.69 | | | | 3.49 | |
| | | | | | | | | | | | | | | | | |
| Global X FinTech ETF | | | | | | | | | | | | | | | | |
| Actual Fund Return | | $ | 1,000.00 | | | $ | 1,056.40 | | | | 0.68 | % | | $ | 3.50 | |
| Hypothetical 5% Return | | | 1,000.00 | | | | 1,021.60 | | | | 0.68 | | | | 3.44 | |
| | | | | | | | | | | | | | | | | |
| Global X Internet of Things ETF | | | | | | | | | | | | | | | | |
| Actual Fund Return | | $ | 1,000.00 | | | $ | 998.10 | | | | 0.68 | % | | $ | 3.40 | |
| Hypothetical 5% Return | | | 1,000.00 | | | | 1,021.60 | | | | 0.68 | | | | 3.44 | |
| | | | | | | | | | | | | | | | | |
| Global X Cloud Computing ETF | | | | | | | | | | | | | | | | |
| Actual Fund Return | | $ | 1,000.00 | | | $ | 1,247.60 | | | | 0.68 | % | | $ | 3.82 | |
| Hypothetical 5% Return | | | 1,000.00 | | | | 1,021.60 | | | | 0.68 | | | | 3.44 | |
| | | | | | | | | | | | | | | | | |
| Global X Future Analytics Tech ETF | | | | | | | | | | | | | | | | |
| Actual Fund Return | | $ | 1,000.00 | | | $ | 1,127.90 | | | | 0.68 | % | | $ | 3.62 | |
| Hypothetical 5% Return | | | 1,000.00 | | | | 1,021.60 | | | | 0.68 | | | | 3.44 | |
| | | | | | | | | | | | | | | | | |
| Global X Autonomous & Electric Vehicles ETF | | | | | | | | | | | | | | | | |
| Actual Fund Return | | $ | 1,000.00 | | | $ | 960.00 | | | | 0.68 | % | | $ | 3.33 | |
| Hypothetical 5% Return | | | 1,000.00 | | | | 1,021.60 | | | | 0.68 | | | | 3.44 | |
| | | | | | | | | | | | | | | | | |
| Global X Genomics & Biotechnology ETF | | | | | | | | | | | | | | | | |
| Actual Fund Return | | $ | 1,000.00 | | | $ | 1,057.70 | | | | 0.68 | % | | $ | 3.50 | |
| Hypothetical 5% Return | | | 1,000.00 | | | | 1,021.60 | | | | 0.68 | | | | 3.44 | |
| | | | | | | | | | | | | | | | | |
| Global X Video Games and Esports ETF | | | | | | | | | | | | | | | | |
| Actual Fund Return | | $ | 1,000.00 | | | $ | 1,294.00 | | | | 0.51 | % | | $ | 2.92 | |
| Hypothetical 5% Return | | | 1,000.00 | | | | 1,022.45 | | | | 0.51 | | | | 2.58 | |
| | | | | | | | | | | | | | | | | |
| Global X Cybersecurity ETF | | | | | | | | | | | | | | | | |
| Actual Fund Return | | $ | 1,000.00 | | | $ | 1,137.50 | | | | 0.50 | % | | $ | 2.67 | |
| Hypothetical 5% Return | | | 1,000.00 | | | | 1,022.50 | | | | 0.50 | | | | 2.53 | |
| | | | | | | | | | | | | | | | | |
| Global X Millennials Thematic ETF | | | | | | | | | | | | | | | | |
| Actual Fund Return | | $ | 1,000.00 | | | $ | 1,027.50 | | | | 0.50 | % | | $ | 2.53 | |
| Hypothetical 5% Return | | | 1,000.00 | | | | 1,022.50 | | | | 0.50 | | | | 2.53 | |
| | | | | | | | | | | | | | | | | |
| Global X Longevity Thematic ETF | | | | | | | | | | | | | | | | |
| Actual Fund Return | | $ | 1,000.00 | | | $ | 1,033.90 | | | | 0.50 | % | | $ | 2.54 | |
| Hypothetical 5% Return | | | 1,000.00 | | | | 1,022.50 | | | | 0.50 | | | | 2.53 | |
| | | | | | | | | | | | | | | | | |
| Global X Health & Wellness Thematic ETF | | | | | | | | | | | | | | | | |
| Actual Fund Return | | $ | 1,000.00 | | | $ | 927.40 | | | | 0.50 | % | | $ | 2.41 | |
| Hypothetical 5% Return | | | 1,000.00 | | | | 1,022.50 | | | | 0.50 | | | | 2.53 | |
| | |
Disclosure of Fund Expenses (unaudited) (continued)
|
| | | Beginning Account Value 12/1/2019 | | | Ending Account Value 5/31/2020 | | | Annualized Expense Ratios | | | Expenses Paid During Period(1) | |
| Global X Cannabis ETF | | | | | | | | | | | | |
| Actual Fund Return | | $ | 1,000.00 | | | $ | 778.10 | | | | 0.51 | % | | $ | 2.27 | |
| Hypothetical 5% Return | | | 1,000.00 | | | | 1,022.45 | | | | 0.51 | | | | 2.58 | |
| | | | | | | | | | | | | | | | | |
| Global X U.S. Infrastructure Development ETF | | | | | | | | | | | | | | | | |
| Actual Fund Return | | $ | 1,000.00 | | | $ | 845.90 | | | | 0.47 | % | | $ | 2.17 | |
| Hypothetical 5% Return | | | 1,000.00 | | | | 1,022.65 | | | | 0.47 | | | | 2.38 | |
| | | | | | | | | | | | | | | | | |
| Global X Conscious Companies ETF | | | | | | | | | | | | | | | | |
| Actual Fund Return | | $ | 1,000.00 | | | $ | 946.10 | | | | 0.43 | % | | $ | 2.09 | |
| Hypothetical 5% Return | | | 1,000.00 | | | | 1,022.85 | | | | 0.43 | | | | 2.17 | |
| | | | | | | | | | | | | | | | | |
| Global X Founder-Run Companies ETF | | | | | | | | | | | | | | | | |
| Actual Fund Return | | $ | 1,000.00 | | | $ | 1,060.20 | | | | 0.45 | % | | $ | 2.32 | |
| Hypothetical 5% Return | | | 1,000.00 | | | | 1,022.75 | | | | 0.45 | | | | 2.28 | |
| | | | | | | | | | | | | | | | | |
| Global X Thematic Growth ETF | | | | | | | | | | | | | | | | |
| Actual Fund Return | | $ | 1,000.00 | | | $ | 1,101.50 | | | | 0.00 | % | | $ | 0.00 | |
| Hypothetical 5% Return | | | 1,000.00 | | | | 1,024.35 | | | | 0.00 | | | | 0.00 | |
| (1) | Expenses are equal to the Fund’s annualized expense ratio multiplied by the average account value over the period, multiplied 183/366 (to reflect the one-half year period.) |
| | |
Liquidity Risk Management Program (unaudited)
|
Pursuant to Rule 22e-4 under the 1940 Act, the Funds’ investment adviser has adopted, and the Board has approved, a liquidity risk management program (the “Program”) to govern the Funds’ approach to managing liquidity risk. The Program is overseen by the Funds’ Liquidity Risk Management Committee (the “Committee”), and the Program’s principal objectives include assessing, managing and periodically reviewing each Fund’s liquidity risk, based on factors specific to the circumstances of the Funds.
At a meeting of the Board held on May 29, 2020, the Trustees received a report from the Committee addressing the operations of the Program and assessing its adequacy and effectiveness of implementation for the period from December 1, 2018 through December 31, 2019. The Committee’s report noted that the Committee had determined that the Program is reasonably designed to assess and manage each Fund’s Liquidity Risk and operated adequately and effectively to manage each Fund’s Liquidity Risk for the period covered by the report. The Committee’s report noted that during the period covered by the report, there were no liquidity events that impacted the Funds or their ability to timely meet redemptions without dilution to existing shareholders. The Committee’s report further noted that no material changes have been made to the Program since its implementation.
There can be no assurance that the Program will achieve its objectives in the future. Please refer to the prospectus for more information regarding a Fund’s exposure to liquidity risk and other principal risks to which an investment in the Funds may be subject.
| | |
Supplemental Information (unaudited)
|
Net asset value, or “NAV”, is the price per Share at which the Funds issue and redeem Shares. It is calculated in accordance with the standard formula for valuing mutual fund shares. The “Market Price” of the Funds generally is determined using the midpoint between the highest bid and the lowest offer on the stock exchange on which the Shares of the Funds are listed for trading, as of the time that the Funds’ NAV is calculated. The Funds’ Market Price may be at, above or below their NAV. The NAV of the Funds will fluctuate with changes in the market value of the Funds’ holdings. The Market Price of the Funds will fluctuate in accordance with changes in its NAV, as well as market supply and demand.
Premiums or discounts are the differences (expressed as a percentage) between the NAV and Market Price of the Funds on a given day, generally at the time NAV is calculated. A premium is the amount that the Funds are trading above the reported NAV, expressed as a percentage of the NAV. A discount is the amount that the Funds are trading below the reported NAV, expressed as a percentage of the NAV.
Further information regarding premiums and discounts is available on the Funds’ website at www.globalxetfs.com.
605 3rd Avenue, 43rd Floor
New York, NY 10158
1-888-493-8631
www.globalxetfs.com
Investment Adviser and Administrator:
Global X Management Company LLC
605 3rd Avenue, 43rd Floor
New York, NY 10158
Distributor:
SEI Investments Distribution Co.
One Freedom Valley Drive
Oaks, PA 19456
Sub-Administrator:
SEI Investments Global Funds Services
One Freedom Valley Drive
Oaks, PA 19456
Counsel for Global X Funds and the Independent Trustees:
Stradley Ronon Stevens & Young, LLP
2000 K Street, N.W.
Suite 700
Washington, DC 20006
Custodian and Transfer Agent:
Brown Brothers Harriman & Co.
50 Post Office Square
Boston, MA 02110
Independent Registered Public Accounting Firm:
PricewaterhouseCoopers LLP
Two Commerce Square
Suite 1800
2001 Market Street
Philadelphia, PA 19103
This information must be preceded or accompanied by a current prospectus for the Funds described.
GLX-SA-007-0500
Item 2. Code of Ethics.
Not applicable for semi-annual report.
Item 3. Audit Committee Financial Expert.
Not applicable for semi-annual report.
Item 4. Principal Accountant Fees and Services.
Not applicable for semi-annual report.
Item 5. Audit Committee of Listed Registrants.
Not applicable for semi-annual report.
Item 6. Investments.
Not applicable.
Item 7. Disclosure of Proxy Voting Policies and Procedures for Closed-End Management Investment Companies.
Not applicable to open-end management investment companies.
Item 8. Portfolio Managers of Closed-End Management Investment Companies.
Not applicable to open-end management investment companies.
Item 9. Purchases of Equity Securities by Closed-End Management Company and Affiliated Purchasers.
Not applicable to open-end management investment companies.
Item 10. Submission of Matters to a Vote of Security Holders.
There have been no material changes.
Item 11. Controls and Procedures.
(a) The certifying officers, whose certifications are included herewith, have evaluated the registrant’s disclosure controls and procedures within 90 days of the filing date of this report. In their opinion, based on their evaluation, the registrant’s disclosure controls and procedures are adequately designed, and are operating effectively to ensure, that information required to be disclosed by the registrant in the reports it files or submits under the Securities Exchange Act of 1934 is recorded, processed, summarized and reported within the time periods specified in the Securities and Exchange Commission’s rules and forms.
(b) There were no significant changes in the registrant’s internal control over financial reporting that occurred during the period covered by this report that has materially affected, or is reasonably likely to materially affect, the registrant’s internal control over financial reporting.
Item 12. Disclosure of Securities Lending Activities for Closed-End Management Investment Companies.
Not applicable to open-end management investment companies.
Item 13. Exhibits.
(a)(1) Not applicable for semi-annual report.
SIGNATURES
Pursuant to the requirements of the Securities Exchange Act of 1934 and the Investment Company Act of 1940, the registrant has duly caused this report to be signed on its behalf by the undersigned, thereunto duly authorized.
| (Registrant) | Global X Funds |
| | |
| | /s/ Luis Berruga |
| By (Signature and Title)* | Luis Berruga |
| | President |
Date: August 7, 2020
Pursuant to the requirements of the Securities Exchange Act of 1934 and the Investment Company Act of 1940, this report has been signed below by the following persons on behalf of the registrant and in the capacities and on the dates indicated.
| | /s/ Luis Berruga |
| By (Signature and Title)* | Luis Berruga |
| | President |
| | /s/ Chang Kim
|
| By (Signature and Title)* | Chang Kim
|
| | Chief Financial Officer
|
Date: August 7, 2020
* Print the name and title of each signing officer under his or her signature.