As permitted by regulations adopted by the Securities and Exchange Commission, paper copies of the Funds’ (defined below) shareholder reports will no longer be sent by mail, unless you specifically request paper copies of the reports from your financial intermediary (such as a broker-dealer or bank). Instead, shareholder reports will be available on the Funds’ website (www.globalxetfs.com/explore), and you will be notified by mail each time a report is posted and provided with a website link to access the report.
If you already elected to receive shareholder reports electronically, you will not be affected by this change and you need not take any action. You may elect to receive shareholder reports and other communications from the Funds electronically anytime by contacting your financial intermediary.
You may elect to receive all future Fund shareholder reports in paper free of charge. Please contact your financial intermediary to inform them that you wish to continue receiving paper copies of Fund shareholder reports and for details about whether your election to receive reports in paper will apply to all funds held with your financial intermediary.
Shares are bought and sold at market price (not NAV) and are not individually redeemed from a Fund. Shares may only be redeemed directly from a Fund by Authorized Participants, in very large creation/redemption units. Brokerage commissions will reduce returns.
The Funds file their complete schedules of Fund holdings with the Securities and Exchange Commission (the “SEC” or “Commission”) for the first and third quarters of each fiscal year as an exhibit to its reports on Form N-PORT. The Funds’ Forms N-PORT are available on the Commission’s website at http://www.sec.gov, and may be reviewed and copied at the Commission’s Public Reference Room in Washington, DC. Information on the operation of the Public Reference Room may be obtained by calling 1-800-SEC-0330.
A description of the policies and procedures that Global X Funds uses to determine how to vote proxies relating to Fund securities, as well as information relating to how the Funds voted proxies relating to Fund securities during the most recent 12-month period ended June 30, is available (i) without charge, upon request, by calling 1-888-493-8631; and (ii) on the Commission’s website at http://www.sec.gov
† Sector weightings percentages are based on the total market value of investments. Repurchase agreements purchased from cash collateral received for securities lending activity are included in total investments. Please see Notes 2 and 7 in Notes to Financial Statements for more detailed information.
Percentages are based on Net Assets of $2,536,449,225.
The following is a summary of the level of inputs used as of May 31, 2021, in valuing the Fund’s investments carried at value:
For the period ended May 31, 2021, there were no transfers in or out of Level 3.
| Schedule of Investments | | May 31, 2021 (Unaudited) |
| | Global X Internet of Things ETF | |
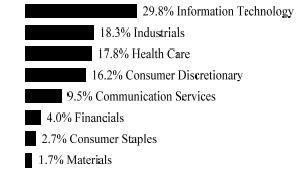
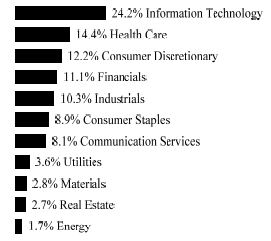
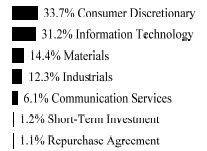
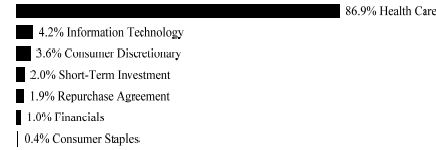
Sector Weightings †:
† Sector weightings percentages are based on the total market value of investments. Repurchase agreements purchased from cash collateral received for securities lending activity are included in total investments. Please see Notes 2 and 7 in Notes to Financial Statements for more detailed information.
| | | | | | | |
| COMMON STOCK — 99.8% | | | | | | |
| AUSTRIA — 4.2% | | | | | | |
| Information Technology — 4.2% | | | | | | |
AMS * | | | 713,611 | | | $ | 14,049,427 | |
S&T (A) | | | 171,113 | | | | 4,293,875 | |
| | | | | | | | | |
TOTAL AUSTRIA | | | | | | | 18,343,302 | |
| | | | | | | | | |
| CANADA — 0.4% | | | | | | | | |
| Information Technology — 0.4% | | | | | | | | |
Sierra Wireless * | | | 104,481 | | | | 1,625,724 | |
| | | | | | | | | |
| CHINA — 2.6% | | | | | | | | |
| Information Technology — 2.6% | | | | | | | | |
NXP Semiconductors | | | 54,390 | | | | 11,499,134 | |
| | | | | | | | | |
| FRANCE — 1.5% | | | | | | | | |
| Industrials — 1.5% | | | | | | | | |
Legrand (A) | | | 61,454 | | | | 6,440,947 | |
| | | | | | | | | |
| ITALY — 0.9% | | | | | | | | |
| Information Technology — 0.9% | | | | | | | | |
Datalogic | | | 149,893 | | | | 3,907,458 | |
| Schedule of Investments | | May 31, 2021 (Unaudited) |
| | Global X Internet of Things ETF | |
| | | | | | | |
| COMMON STOCK — continued | | | | | | | | |
| JAPAN — 1.4% | | | | | | | | |
| Information Technology — 1.4% | | | | | | | | |
Nippon Ceramic | | | 70,382 | | | $ | 1,786,189 | |
Renesas Electronics * | | | 394,336 | | | | 4,227,526 | |
| | | | | | | | | |
TOTAL JAPAN | | | | | | | 6,013,715 | |
| | | | | | | | | |
| NORWAY — 3.0% | | | | | | | | |
| Information Technology — 3.0% | | | | | | | | |
Nordic Semiconductor * | | | 467,361 | | | | 13,021,248 | |
| | | | | | | | | |
| SWEDEN — 0.5% | | | | | | | | |
| Information Technology — 0.5% | | | | | | | | |
Fingerprint Cards, Cl B * | | | 513,707 | | | | 2,129,694 | |
| | | | | | | | | |
| SWITZERLAND — 9.8% | | | | | | | | |
| Industrials — 2.3% | | | | | | | | |
ABB | | | 291,825 | | | | 9,947,437 | |
| | | | | | | | | |
| Information Technology — 7.5% | | | | | | | | |
Landis+Gyr Group | | | 75,950 | | | | 5,535,604 | |
STMicroelectronics | | | 718,034 | | | | 26,817,378 | |
| | | | | | | | 32,352,982 | |
| | | | | | | | | |
TOTAL SWITZERLAND | | | | | | | 42,300,419 | |
| | | | | | | | | |
| TAIWAN — 9.5% | | | | | | | | |
| Information Technology — 9.5% | | | | | | | | |
Advantech | | | 2,006,521 | | | | 23,616,341 | |
eMemory Technology | | | 200,182 | | | | 6,768,830 | |
MediaTek | | | 330,480 | | | | 11,448,650 | |
| | | | | | | | | |
TOTAL TAIWAN | | | | | | | 41,833,821 | |
| Schedule of Investments | | May 31, 2021 (Unaudited) |
| | Global X Internet of Things ETF | |
| | | | | | | |
| COMMON STOCK — continued | | | | | | | | |
| UNITED KINGDOM — 0.2% | | | | | | | | |
| Information Technology — 0.2% | | | | | | | | |
Spirent Communications | | | 306,165 | | | $ | 1,083,509 | |
| | | | | | | | | |
| UNITED STATES — 65.8% | | | | | | | | |
| Consumer Discretionary — 7.8% | | | | | | | | |
Garmin | | | 196,001 | | | | 27,879,182 | |
Vivint Smart Home * | | | 462,393 | | | | 6,431,887 | |
| | | | | | | | 34,311,069 | |
| | | | | | | | | |
| | | | | | | | | |
| Health Care — 4.0% | | | | | | | | |
DexCom * | | | 47,018 | | | | 17,367,979 | |
| | | | | | | | | |
| | | | | | | | | |
| Industrials — 22.1% | | | | | | | | |
ADT | | | 1,978,281 | | | | 20,455,426 | |
Emerson Electric | | | 103,616 | | | | 9,915,015 | |
Honeywell International | | | 43,939 | | | | 10,145,954 | |
Johnson Controls International | | | 182,340 | | | | 12,132,904 | |
Resideo Technologies * | | | 81,358 | | | | 2,432,604 | |
Rockwell Automation | | | 30,230 | | | | 7,972,256 | |
Schneider Electric | | | 59,090 | | | | 9,402,056 | |
Sensata Technologies Holding * | | | 409,005 | | | | 24,307,167 | |
| | | | | | | | 96,763,382 | |
| | | | | | | | | |
| Information Technology — 31.9% | | | | | | | | |
Alarm.com Holdings * | | | 126,838 | | | | 10,385,496 | |
Ambarella * | | | 89,335 | | | | 8,967,447 | |
Analog Devices | | | 52,829 | | | | 8,695,653 | |
Badger Meter | | | 75,686 | | | | 7,233,311 | |
Belden | | | 115,639 | | | | 5,851,333 | |
Cisco Systems | | | 140,909 | | | | 7,454,087 | |
Digi International * | | | 87,924 | | | | 1,667,039 | |
Impinj * | | | 58,836 | | | | 3,062,414 | |
InterDigital | | | 79,840 | | | | 6,449,475 | |
| International Business Machines | | | 52,575 | | | | 7,557,130 | |
| Schedule of Investments | | May 31, 2021 (Unaudited) |
| | Global X Internet of Things ETF | |
| | | | | | | |
| COMMON STOCK — continued | | | | | | | | |
| Information Technology — continued | | | | | | | | |
Itron * | | | 104,582 | | | $ | 9,971,894 | |
NETGEAR * | | | 76,599 | | | | 2,978,169 | |
PTC * | | | 26,582 | | | | 3,565,709 | |
QUALCOMM | | | 71,461 | | | | 9,614,363 | |
Rambus * | | | 294,341 | | | | 5,757,310 | |
Silicon Laboratories * | | | 113,661 | | | | 15,521,546 | |
Skyworks Solutions | | | 149,871 | | | | 25,478,070 | |
| | | | | | | | 140,210,446 | |
| | | | | | | | | |
TOTAL UNITED STATES | | | | | | | 288,652,876 | |
| | | | | | | | | |
| TOTAL COMMON STOCK | | | | | | | | |
(Cost $331,889,217) | | | | | | | 436,851,847 | |
| | | | | | | | | |
SHORT-TERM INVESTMENT(B)(C) — 1.0% | | | | | | | | |
| Fidelity Investments Money Market Government Portfolio, Cl Institutional, 0.010% | | | | | | | | |
(Cost $4,357,766) | | | 4,357,766 | | | | 4,357,766 | |
| | | | | | | | | |
REPURCHASE AGREEMENT(B) — 1.0% | | | | | | | | |
| BNP Paribas | | | | | | | | |
| 0.000%, dated 05/28/2021, to be repurchased on 06/01/21, repurchase price $4,180,906 (collateralized by U.S. Treasury Obligations, ranging in par value $82,948 - $603,053, 2.000%, 10/31/2022, with a total market value of $4,262,472) | | | | | | | | |
(Cost $4,180,906) | | $ | 4,180,906 | | | | 4,180,906 | |
| | | | | | | | | |
| TOTAL INVESTMENTS — 101.8% | | | | | | | | |
(Cost $340,427,889) | | | | | | $ | 445,390,519 | |
Percentages are based on Net Assets of $437,492,500.
| Schedule of Investments | | May 31, 2021 (Unaudited) |
| | Global X Internet of Things ETF | |
| * | Non-income producing security. |
| (A) | This security or a partial position of this security is on loan at May 31, 2021. The total value of securities on loan at May 31, 2021 was $8,025,312. |
| (B) | Security was purchased with cash collateral held from securities on loan. The total value of such securities as of May 31, 2021 was $8,538,672. |
| (C) | The rate reported on the Schedule of Investments is the 7-day effective yield as of May 31, 2021. |
Cl — Class
The following is a summary of the level of inputs used as of May 31, 2021, in valuing the Fund’s investments carried at value:
| Investments in Securities | | | | | | | | | | | | |
| Common Stock | | $ | 436,851,847 | | | $ | — | | | $ | — | | | $ | 436,851,847 | |
| Short-Term Investment | | | 4,357,766 | | | | — | | | | — | | | | 4,357,766 | |
| Repurchase Agreement | | | — | | | | 4,180,906 | | | | — | | | | 4,180,906 | |
| Total Investments in Securities | | $ | 441,209,613 | | | $ | 4,180,906 | | | $ | — | | | $ | 445,390,519 | |
For the period ended May 31, 2021, there were no transfers in or out of Level 3.
| Schedule of Investments | | May 31, 2021 (Unaudited) |
| | | |
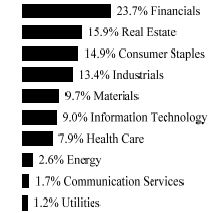
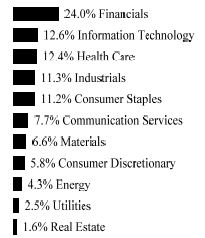
Sector Weightings †:
† Sector weightings percentages are based on the total market value of investments. Repurchase agreements purchased from cash collateral received for securities lending activity are included in total investments. Please see Notes 2 and 7 in Notes to Financial Statements for more detailed information.
| | | | | | | |
| COMMON STOCK — 99.9% | | | | | | |
| AUSTRALIA — 7.4% | | | | | | |
| Financials — 1.4% | | | | | | |
HUB24 | | | 318,212 | | | $ | 6,582,089 | |
Zip * (A) | | | 1,934,415 | | | | 10,722,723 | |
| | | | | | | | 17,304,812 | |
| | | | | | | | | |
| Information Technology — 6.0% | | | | | | | | |
Afterpay * | | | 910,446 | | | | 65,930,301 | |
IRESS | | | 948,997 | | | | 7,791,857 | |
| | | | | | | | 73,722,158 | |
| | | | | | | | | |
TOTAL AUSTRALIA | | | | | | | 91,026,970 | |
| | | | | | | | | |
| BRAZIL — 8.5% | | | | | | | | |
| Information Technology — 8.5% | | | | | | | | |
Pagseguro Digital, Cl A * | | | 896,666 | | | | 44,035,267 | |
StoneCo, Cl A * | | | 894,603 | | | | 59,016,960 | |
| | | | | | | | | |
TOTAL BRAZIL | | | | | | | 103,052,227 | |
| | | | | | | | | |
| CANADA — 1.1% | | | | | | | | |
| Information Technology — 1.1% | | | | | | | | |
Nuvei * | | | 174,465 | | | | 12,992,443 | |
| | | | | | | | | |
| Schedule of Investments | | May 31, 2021 (Unaudited) |
| | Global X FinTech ETF | |
| | | | | | | |
| COMMON STOCK — continued | | | | | | | | |
| CHINA — 4.6% | | | | | | | | |
| Financials — 3.7% | | | | | | | | |
Lufax Holding ADR * (A) | | | 3,726,363 | | | $ | 45,424,364 | |
| | | | | | | | | |
| Information Technology — 0.9% | | | | | | | | |
Yeahka * (A) | | | 1,697,414 | | | | 10,847,354 | |
| | | | | | | | | |
TOTAL CHINA | | | | | | | 56,271,718 | |
| | | | | | | | | |
| DENMARK — 2.2% | | | | | | | | |
| Information Technology — 2.2% | | | | | | | | |
SimCorp | | | 201,678 | | | | 27,320,525 | |
| | | | | | | | | |
| GERMANY — 1.5% | | | | | | | | |
| Financials — 1.5% | | | | | | | | |
Hypoport * | | | 32,316 | | | | 18,084,552 | |
| | | | | | | | | |
| ISRAEL — 0.6% | | | | | | | | |
| Information Technology — 0.6% | | | | | | | | |
Sapiens International | | | 248,904 | | | | 7,146,034 | |
| | | | | | | | | |
| ITALY — 3.6% | | | | | | | | |
| Information Technology — 3.6% | | | | | | | | |
Nexi * | | | 2,139,820 | | | | 43,439,191 | |
| | | | | | | | | |
| JAPAN — 0.3% | | | | | | | | |
| Industrials — 0.3% | | | | | | | | |
Makuake * (A) | | | 56,819 | | | | 3,167,088 | |
| | | | | | | | | |
| NETHERLANDS — 6.4% | | | | | | | | |
| Information Technology — 6.4% | | | | | | | | |
Adyen * | | | 33,500 | | | | 77,624,738 | |
| | | | | | | | | |
| NEW ZEALAND — 4.9% | | | | | | | | |
| Information Technology — 4.9% | | | | | | | | |
Xero * | | | 595,831 | | | | 59,918,430 | |
| Schedule of Investments | | May 31, 2021 (Unaudited) |
| | Global X FinTech ETF | |
| | | | | | | |
| COMMON STOCK — continued | | | | | | | | |
| SWITZERLAND — 3.5% | | | | | | | | |
| Financials — 0.4% | | | | | | | | |
Leonteq | | | 93,876 | | | $ | 4,813,485 | |
| | | | | | | | | |
| Information Technology — 3.1% | | | | | | | | |
Temenos | | | 241,963 | | | | 37,475,298 | |
| | | | | | | | | |
TOTAL SWITZERLAND | | | | | | | 42,288,783 | |
| | | | | | | | | |
| UNITED STATES — 55.3% | | | | | | | | |
| Financials — 3.6% | | | | | | | | |
Blucora * | | | 235,840 | | | | 4,089,466 | |
LendingClub * | | | 481,371 | | | | 7,355,349 | |
LendingTree * | | | 64,947 | | | | 13,330,372 | |
Virtu Financial, Cl A | | | 598,502 | | | | 18,224,386 | |
| | | | | | | | 42,999,573 | |
| | | | | | | | | |
| Health Care — 2.4% | | | | | | | | |
HealthEquity * | | | 355,109 | | | | 29,516,660 | |
| | | | | | | | | |
| Information Technology — 49.3% | | | | | | | | |
Bill.com Holdings * | | | 386,026 | | | | 57,486,992 | |
Black Knight * | | | 499,680 | | | | 36,671,515 | |
Bottomline Technologies * | | | 218,045 | | | | 8,150,522 | |
Envestnet * | | | 266,129 | | | | 19,153,304 | |
| Fidelity National Information Services | | | 348,915 | | | | 51,981,357 | |
Fiserv * | | | 478,669 | | | | 55,142,669 | |
GreenSky, Cl A * | | | 466,990 | | | | 2,736,561 | |
Guidewire Software * | | | 334,655 | | | | 32,709,180 | |
Intuit | | | 164,831 | | | | 72,375,644 | |
Mitek Systems * | | | 247,164 | | | | 4,191,901 | |
nCino * | | | 351,433 | | | | 21,479,585 | |
PayPal Holdings * | | | 284,821 | | | | 74,059,156 | |
Shift4 Payments, Cl A * | | | 145,914 | | | | 13,612,317 | |
Square, Cl A * | | | 465,374 | | | | 103,555,021 | |
SS&C Technologies Holdings | | | 615,394 | | | | 45,459,155 | |
| Schedule of Investments | | May 31, 2021 (Unaudited) |
| | Global X FinTech ETF | |
| | | | | | | |
| COMMON STOCK — continued | | | | | | | | |
| Information Technology — continued | | | | | | | | |
Vertex, Cl A * | | | 96,812 | | | $ | 1,859,759 | |
| | | | | | | | 600,624,638 | |
| | | | | | | | | |
TOTAL UNITED STATES | | | | | | | 673,140,871 | |
| | | | | | | | | |
| TOTAL COMMON STOCK | | | | | | | | |
(Cost $914,726,769) | | | | | | | 1,215,473,570 | |
| | | | | | | | | |
SHORT-TERM INVESTMENT(B)(C) — 1.9% | | | | | | | | |
| Fidelity Investments Money Market Government Portfolio, Cl Institutional, 0.010% | | | | | | | | |
(Cost $22,668,575) | | | 22,668,575 | | | | 22,668,575 | |
| | | | | | | | | |
REPURCHASE AGREEMENT(B) — 1.8% | | | | | | | | |
| BNP Paribas | | | | | | | | |
| 0.000%, dated 05/28/2021, to be repurchased on 06/01/2021, repurchase price $21,748,566 (collateralized by U.S. Treasury Obligations, ranging in par value $431,485 - $3,137,011, 2.000%, 10/31/2022, with a total market value of $22,172,879) | | | | | | | | |
(Cost $21,748,566) | | $ | 21,748,566 | | | | 21,748,566 | |
| | | | | | | | | |
| TOTAL INVESTMENTS — 103.6% | | | | | | | | |
(Cost $959,143,910) | | | | | | $ | 1,259,890,711 | |
Percentages are based on Net Assets of $1,216,182,854.
| Schedule of Investments | | May 31, 2021 (Unaudited) |
| | Global X FinTech ETF | |
| * | Non-income producing security. |
| (A) | This security or a partial position of this security is on loan at May 31, 2021. The total value of securities on loan at May 31, 2021 was $41,722,700. |
| (B) | Security was purchased with cash collateral held from securities on loan. The total value of such securities as of May 31, 2021 was $44,417,141. |
| (C) | The rate reported on the Schedule of Investments is the 7-day effective yield as of May 31, 2021. |
ADR — American Depositary Receipt
Cl — Class
The following is a summary of the level of inputs used as of May 31, 2021, in valuing the Fund’s investments carried at value:
| Investments in Securities | | | | | | | | | | | | |
| Common Stock | | $ | 1,215,473,570 | | | $ | — | | | $ | — | | | $ | 1,215,473,570 | |
| Short-Term Investment | | | 22,668,575 | | | | — | | | | — | | | | 22,668,575 | |
| Repurchase Agreement | | | — | | | | 21,748,566 | | | | — | | | | 21,748,566 | |
| Total Investments in Securities | | $ | 1,238,142,145 | | | $ | 21,748,566 | | | $ | — | | | $ | 1,259,890,711 | |
For the period ended May 31, 2021, there were no transfers in or out of Level 3.
| Schedule of Investments | | May 31, 2021 (Unaudited) |
| | Global X Video Games & Esports ETF | |
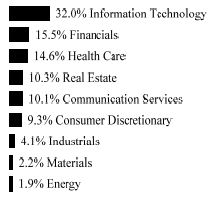
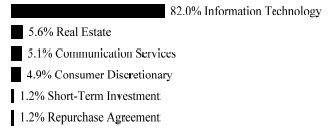
Sector Weightings †:
† Sector weightings percentages are based on the total market value of investments. Repurchase agreements purchased from cash collateral received for securities lending activity are included in total investments. Please see Notes 2 and 7 in Notes to Financial Statements for more detailed information.
| | | | | | | |
| COMMON STOCK — 99.9% | | | | | | |
| CHINA — 13.2% | | | | | | |
| Communication Services — 13.2% | | | | | | |
Bilibili ADR * | | | 247,728 | | | $ | 26,551,487 | |
DouYu International Holdings ADR * | | | 1,449,546 | | | | 11,451,413 | |
HUYA ADR * (A) | | | 266,250 | | | | 4,073,625 | |
NetEase ADR | | | 385,577 | | | | 45,471,096 | |
| | | | | | | | | |
TOTAL CHINA | | | | | | | 87,547,621 | |
| | | | | | | | | |
| FRANCE — 3.3% | | | | | | | | |
| Communication Services — 3.3% | | | | | | | | |
Ubisoft Entertainment * | | | 300,756 | | | | 21,945,238 | |
| | | | | | | | | |
| IRELAND — 1.7% | | | | | | | | |
| Information Technology — 1.7% | | | | | | | | |
Keywords Studios * | | | 309,086 | | | | 11,446,818 | |
| | | | | | | | | |
| JAPAN — 23.4% | | | | | | | | |
| Communication Services — 23.4% | | | | | | | | |
Akatsuki | | | 46,756 | | | | 1,515,664 | |
Capcom | | | 905,524 | | | | 29,065,694 | |
DeNA | | | 399,742 | | | | 8,098,433 | |
Gumi (A) | | | 245,224 | | | | 2,539,760 | |
GungHo Online Entertainment * | | | 348,248 | | | | 6,577,050 | |
KLab * | | | 241,386 | | | | 1,523,272 | |
| Schedule of Investments | | May 31, 2021 (Unaudited) |
| | Global X Video Games & Esports ETF | |
| | | | | | | |
| COMMON STOCK — continued | | | | | | | | |
| Communication Services — continued | | | | | | | | |
Konami Holdings | | | 440,855 | | | $ | 28,541,829 | |
Nexon | | | 966,557 | | | | 22,886,242 | |
Nintendo | | | 64,088 | | | | 39,609,560 | |
Square Enix Holdings | | | 315,486 | | | | 16,954,056 | |
| | | | | | | | | |
TOTAL JAPAN | | | | | | | 157,311,560 | |
| | | | | | | | | |
| | | | | | | | | |
| SINGAPORE — 0.8% | | | | | | | | |
| Communication Services — 0.8% | | | | | | | | |
IGG | | | 3,620,700 | | | | 5,392,681 | |
| | | | | | | | | |
| SOUTH KOREA — 12.3% | | | | | | | | |
| Communication Services — 12.3% | | | | | | | | |
Com2uSCorp | | | 40,706 | | | | 4,832,309 | |
Gravity ADR * | | | 31,059 | | | | 4,067,487 | |
JoyCity * | | | 236,400 | | | | 1,990,313 | |
Kakao Games * | | | 334,752 | | | | 15,637,568 | |
NCSoft | | | 35,748 | | | | 27,308,613 | |
Neowiz * | | | 90,081 | | | | 1,877,865 | |
Netmarble | | | 93,032 | | | | 11,427,763 | |
Nexon GT * | | | 156,457 | | | | 1,809,643 | |
Pearl Abyss * | | | 154,666 | | | | 8,070,977 | |
Webzen * | | | 85,494 | | | | 2,456,812 | |
Wemade | | | 57,648 | | | | 3,013,430 | |
| | | | | | | | | |
TOTAL SOUTH KOREA | | | | | | | 82,492,780 | |
| | | | | | | | | |
| SWEDEN — 7.6% | | | | | | | | |
| Communication Services — 7.6% | | | | | | | | |
Embracer Group, Cl B * | | | 1,191,227 | | | | 34,913,152 | |
Stillfront Group * | | | 1,565,159 | | | | 16,391,118 | |
| | | | | | | | | |
TOTAL SWEDEN | | | | | | | 51,304,270 | |
| Schedule of Investments | | May 31, 2021 (Unaudited) |
| | Global X Video Games & Esports ETF | |
| | | | | | | |
| COMMON STOCK — continued | | | | | | | | |
| TAIWAN — 7.4% | | | | | | | | |
| Communication Services — 7.4% | | | | | | | | |
Chinese Gamer International * | | | 920,500 | | | $ | 1,888,086 | |
Gamania Digital Entertainment | | | 866,100 | | | | 2,007,542 | |
Sea ADR * | | | 179,189 | | | | 45,377,822 | |
| | | | | | | | | |
TOTAL TAIWAN | | | | | | | 49,273,450 | |
| | | | | | | | | |
| UNITED STATES — 30.2% | | | | | | | | |
| Communication Services — 22.1% | | | | | | | | |
Activision Blizzard | | | 446,705 | | | | 43,442,061 | |
Electronic Arts | | | 291,445 | | | | 41,656,234 | |
Take-Two Interactive Software * | | | 154,767 | | | | 28,718,565 | |
Zynga, Cl A * | | | 3,142,062 | | | | 34,059,952 | |
| | | | | | | | 147,876,812 | |
| | | | | | | | | |
| Information Technology — 8.1% | | | | | | | | |
NVIDIA | | | 78,770 | | | | 51,183,170 | |
Turtle Beach * | | | 92,007 | | | | 3,045,432 | |
| | | | | | | | 54,228,602 | |
| | | | | | | | | |
TOTAL UNITED STATES | | | | | | | 202,105,414 | |
| | | | | | | | | |
| TOTAL COMMON STOCK | | | | | | | | |
(Cost $649,445,059) | | | | | | | 668,819,832 | |
| | | | | | | | | |
SHORT-TERM INVESTMENT(B)(C) — 0.2% | | | | | | | | |
| Fidelity Investments Money Market Government Portfolio, Cl Institutional, 0.010% | | | | | | | | |
(Cost $1,406,241) | | | 1,406,241 | | | | 1,406,241 | |
| Schedule of Investments | | May 31, 2021 (Unaudited) |
| | Global X Video Games & Esports ETF | |
| | | | | | | |
REPURCHASE AGREEMENT(B) — 0.2% | | | | | | | | |
| BNP Paribas | | | | | | | | |
| 0.000%, dated 05/28/2021, to be repurchased on 06/01/2021, repurchase price $1,349,169 (collateralized by U.S. Treasury Obligations, ranging in par value $26,767 - $194,604, 2.000%, 10/31/2022, with a total market value of $1,375,491) | | | | | | | | |
(Cost $1,349,169) | | $ | 1,349,169 | | | $ | 1,349,169 | |
| | | | | | | | | |
| TOTAL INVESTMENTS — 100.3% | | | | | | | | |
(Cost $652,200,469) | | | | | | $ | 671,575,242 | |
Percentages are based on Net Assets of $669,813,038.
| * | Non-income producing security. |
| (A) | This security or a partial position of this security is on loan at May 31, 2021. The total value of securities on loan at May 31, 2021 was $2,640,318. |
| (B) | Security was purchased with cash collateral held from securities on loan. The total value of such securities as of May 31, 2021 was $2,755,410. |
| (C) | The rate reported on the Schedule of Investments is the 7-day effective yield as of May 31, 2021. |
ADR — American Depositary Receipt
Cl — Class
The following is a summary of the level of inputs used as of May 31, 2021, in valuing the Fund’s investments carried at value:
| Investments in Securities | | | | | | | | | | | | |
| Common Stock | | $ | 668,819,832 | | | $ | — | | | $ | — | | | $ | 668,819,832 | |
| Short-Term Investment | | | 1,406,241 | | | | — | | | | — | | | | 1,406,241 | |
| Repurchase Agreement | | | — | | | | 1,349,169 | | | | — | | | | 1,349,169 | |
| Total Investments in Securities | | $ | 670,226,073 | | | $ | 1,349,169 | | | $ | — | | | $ | 671,575,242 | |
For the period ended May 31, 2021, there were no transfers in or out of Level 3.
| Schedule of Investments | | May 31, 2021 (Unaudited) |
| | Global X Autonomous & Electric Vehicles ETF | |
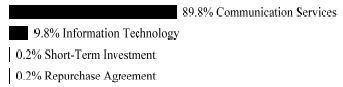
Sector Weightings †:
† Sector weightings percentages are based on the total market value of investments. Repurchase agreements purchased from cash collateral received for securities lending activity are included in total investments. Please see Notes 2 and 7 in Notes to Financial Statements for more detailed information.
| | | | | | | |
| COMMON STOCK — 98.0% | | | | | | |
| AUSTRALIA — 2.1% | | | | | | |
| Materials — 2.1% | | | | | | |
Orocobre * | | | 1,927,620 | | | $ | 9,793,397 | |
Pilbara Minerals * | | | 9,298,742 | | | | 8,781,867 | |
| | | | | | | | | |
TOTAL AUSTRALIA | | | | | | | 18,575,264 | |
| | | | | | | | | |
| BELGIUM — 1.0% | | | | | | | | |
| Materials — 1.0% | | | | | | | | |
Umicore | | | 155,622 | | | | 9,366,666 | |
| | | | | | | | | |
| CANADA — 1.6% | | | | | | | | |
| Industrials — 0.5% | | | | | | | | |
Ballard Power Systems * (A) | | | 237,730 | | | | 4,117,483 | |
| | | | | | | | | |
| Information Technology — 1.1% | | | | | | | | |
BlackBerry * (A) | | | 1,010,095 | | | | 10,171,657 | |
| | | | | | | | | |
TOTAL CANADA | | | | | | | 14,289,140 | |
| | | | | | | | | |
| CHILE — 1.8% | | | | | | | | |
| Materials — 1.8% | | | | | | | | |
Lundin Mining | | | 883,233 | | | | 9,483,056 | |
| Schedule of Investments | | May 31, 2021 (Unaudited) |
| | Global X Autonomous & Electric Vehicles ETF | |
| | | | | | | |
| COMMON STOCK — continued | | | | | | | | |
| Materials — continued | | | | | | | | |
| Sociedad Quimica y Minera de Chile ADR | | | 158,489 | | | $ | 6,873,668 | |
| | | | | | | | | |
TOTAL CHILE | | | | | | | 16,356,724 | |
| | | | | | | | | |
| CHINA — 6.4% | | | | | | | | |
| Communication Services — 1.3% | | | | | | | | |
Baidu ADR * | | | 61,152 | | | | 12,002,303 | |
| | | | | | | | | |
| Consumer Discretionary — 2.6% | | | | | | | | |
BYD, Cl H | | | 303,530 | | | | 6,949,337 | |
Geely Automobile Holdings | | | 2,400,700 | | | | 6,081,010 | |
NIO ADR * | | | 264,277 | | | | 10,206,378 | |
| | | | | | | | 23,236,725 | |
| | | | | | | | | |
| Information Technology — 1.7% | | | | | | | | |
NXP Semiconductors | | | 73,052 | | | | 15,444,654 | |
| | | | | | | | | |
| Materials — 0.8% | | | | | | | | |
Ganfeng Lithium, Cl H | | | 518,424 | | | | 6,953,287 | |
| | | | | | | | | |
TOTAL CHINA | | | | | | | 57,636,969 | |
| | | | | | | | | |
| FRANCE — 0.9% | | | | | | | | |
| Consumer Discretionary — 0.9% | | | | | | | | |
Faurecia | | | 8,815 | | | | 484,067 | |
Renault * | | | 182,263 | | | | 7,576,530 | |
| | | | | | | | | |
TOTAL FRANCE | | | | | | | 8,060,597 | |
| | | | | | | | | |
| GERMANY — 2.5% | | | | | | | | |
| Consumer Discretionary — 1.0% | | | | | | | | |
Continental * | | | 62,092 | | | | 9,202,008 | |
| | | | | | | | | |
| Information Technology — 1.5% | | | | | | | | |
Infineon Technologies | | | 320,621 | | | | 12,972,551 | |
| | | | | | | | | |
TOTAL GERMANY | | | | | | | 22,174,559 | |
| Schedule of Investments | | May 31, 2021 (Unaudited) |
| | Global X Autonomous & Electric Vehicles ETF | |
| | | | | | | |
| COMMON STOCK — continued | | | | | | | | |
| JAPAN — 8.4% | | | | | | | | |
| Consumer Discretionary — 7.7% | | | | | | | | |
Denso | | | 171,451 | | | $ | 11,756,417 | |
Honda Motor | | | 429,632 | | | | 13,548,204 | |
Nissan Motor * | | | 1,634,450 | | | | 8,223,153 | |
Panasonic | | | 829,969 | | | | 9,482,665 | |
Toyota Motor | | | 314,961 | | | | 26,162,025 | |
| | | | | | | | 69,172,464 | |
| | | | | | | | | |
| Industrials — 0.7% | | | | | | | | |
GS Yuasa | | | 235,726 | | | | 6,751,870 | |
| | | | | | | | | |
TOTAL JAPAN | | | | | | | 75,924,334 | |
| | | | | | | | | |
| LUXEMBOURG — 1.0% | | | | | | | | |
| Materials — 1.0% | | | | | | | | |
APERAM | | | 166,425 | | | | 9,167,445 | |
| | | | | | | | | |
| NETHERLANDS — 0.7% | | | | | | | | |
| Consumer Discretionary — 0.7% | | | | | | | | |
TomTom * | | | 663,014 | | | | 6,041,204 | |
| | | | | | | | | |
| RUSSIA — 1.1% | | | | | | | | |
| Communication Services — 1.1% | | | | | | | | |
Yandex, Cl A * | | | 138,921 | | | | 9,382,724 | |
| | | | | | | | | |
| SOUTH KOREA — 2.3% | | | | | | | | |
| Consumer Discretionary — 2.3% | | | | | | | | |
Hyundai Motor | | | 46,588 | | | | 9,691,039 | |
Kia Motors | | | 143,390 | | | | 10,889,566 | |
| | | | | | | | | |
TOTAL SOUTH KOREA | | | | | | | 20,580,605 | |
| | | | | | | | | |
| SWEDEN — 2.0% | | | | | | | | |
| Consumer Discretionary — 2.0% | | | | | | | | |
Autoliv | | | 87,826 | | | | 9,312,191 | |
| Schedule of Investments | | May 31, 2021 (Unaudited) |
| | Global X Autonomous & Electric Vehicles ETF | |
| | | | | | | |
| COMMON STOCK — continued | | | | | | | | |
| Consumer Discretionary — continued | | | | | | | | |
Veoneer * (A) | | | 361,720 | | | $ | 8,561,912 | |
| | | | | | | | | |
TOTAL SWEDEN | | | | | | | 17,874,103 | |
| | | | | | | | | |
| UNITED KINGDOM — 1.0% | | | | | | | | |
| Materials — 1.0% | | | | | | | | |
Johnson Matthey | | | 217,058 | | | | 9,374,281 | |
| | | | | | | | | |
| UNITED STATES — 65.2% | | | | | | | | |
| Communication Services — 3.9% | | | | | | | | |
Alphabet, Cl A * | | | 14,774 | | | | 34,820,102 | |
| | | | | | | | | |
| Consumer Discretionary — 15.5% | | | | | | | | |
American Axle & Manufacturing Holdings * | | | 796,761 | | | | 8,923,723 | |
Aptiv * | | | 79,270 | | | | 11,923,793 | |
BorgWarner | | | 205,193 | | | | 10,524,349 | |
Dana | | | 338,257 | | | | 9,176,912 | |
Ford Motor * | | | 1,186,821 | | | | 17,244,509 | |
General Motors * | | | 304,016 | | | | 18,031,189 | |
Gentherm * | | | 107,414 | | | | 7,790,738 | |
Harley-Davidson | | | 201,528 | | | | 9,768,062 | |
Lear | | | 50,646 | | | | 9,792,911 | |
Stellantis * | | | 535,246 | | | | 10,501,233 | |
Tesla * | | | 30,446 | | | | 19,035,448 | |
Visteon * | | | 53,341 | | | | 6,532,139 | |
| | | | | | | | 139,245,006 | |
| | | | | | | | | |
| Industrials — 11.3% | | | | | | | | |
Bloom Energy, Cl A * | | | 219,641 | | | | 5,308,723 | |
CBAK Energy Technology * (A) | | | 1,001,435 | | | | 4,196,013 | |
EnerSys | | | 84,859 | | | | 7,997,112 | |
General Electric | | | 1,456,139 | | | | 20,473,314 | |
Honeywell International | | | 82,052 | | | | 18,946,627 | |
| Hyster-Yale Materials Handling | | | 96,840 | | | | 7,320,136 | |
ITT | | | 98,690 | | | | 9,266,991 | |
Johnson Controls International | | | 222,097 | | | | 14,778,334 | |
| Schedule of Investments | | May 31, 2021 (Unaudited) |
| | Global X Autonomous & Electric Vehicles ETF | |
| | | | | | | |
| COMMON STOCK — continued | | | | | | | | |
| Industrials — continued | | | | | | | | |
Plug Power * | | | 156,174 | | | $ | 4,794,542 | |
| Westinghouse Air Brake Technologies | | | 107,999 | | | | 8,937,997 | |
| | | | | | | | 102,019,789 | |
| | | | | | | | | |
| Information Technology — 27.5% | | | | | | | | |
Advanced Micro Devices * | | | 179,888 | | | | 14,405,431 | |
Ambarella * | | | 78,416 | | | | 7,871,398 | |
Apple | | | 200,313 | | | | 24,961,003 | |
CEVA * | | | 133,648 | | | | 5,996,786 | |
Cisco Systems | | | 374,762 | | | | 19,824,910 | |
II-VI * | | | 95,425 | | | | 6,428,782 | |
Intel | | | 484,584 | | | | 27,679,438 | |
Maxim Integrated Products * | | | 106,765 | | | | 10,891,098 | |
Micron Technology * | | | 219,040 | | | | 18,430,026 | |
Microsoft | | | 120,086 | | | | 29,983,072 | |
NVIDIA | | | 47,832 | | | | 31,080,277 | |
ON Semiconductor * | | | 247,058 | | | | 9,892,202 | |
QUALCOMM | | | 167,052 | | | | 22,475,176 | |
Rogers * | | | 44,160 | | | | 8,273,376 | |
Xilinx * | | | 78,018 | | | | 9,908,286 | |
| | | | | | | | 248,101,261 | |
| | | | | | | | | |
| Materials — 7.0% | | | | | | | | |
Albemarle | | | 52,166 | | | | 8,715,895 | |
Allegheny Technologies * | | | 402,724 | | | | 9,862,711 | |
Cabot | | | 153,138 | | | | 9,736,514 | |
Carpenter Technology | | | 221,553 | | | | 10,616,820 | |
| Freeport-McMoRan Copper & Gold | | | 399,036 | | | | 17,046,818 | |
Livent * | | | 356,669 | | | | 6,958,612 | |
| | | | | | | | 62,937,370 | |
| | | | | | | | | |
TOTAL UNITED STATES | | | | | | | 587,123,528 | |
| | | | | | | | | |
| TOTAL COMMON STOCK | | | | | | | | |
(Cost $841,166,592) | | | | | | | 881,928,143 | |
| Schedule of Investments | | May 31, 2021 (Unaudited) |
| | Global X Autonomous & Electric Vehicles ETF | |
| | | | | | | |
| PREFERRED STOCK — 1.9% | | | | | | | | |
| GERMANY— 1.9% | | | | | | | | |
| Consumer Discretionary — 1.9% | | | | | | | | |
Volkswagen (B) | | | | | | | | |
(Cost $12,106,072) | | | 61,860 | | | $ | 17,041,416 | |
| | | | | | | | | |
SHORT-TERM INVESTMENT(C)(D) — 1.2% | | | | | | | | |
| Fidelity Investments Money Market Government Portfolio, Cl Institutional, 0.010% | | | | | | | | |
(Cost $10,626,940) | | | 10,626,940 | | | | 10,626,940 | |
| | | | | | | | | |
REPURCHASE AGREEMENT(C) — 1.1% | | | | | | | | |
| BNP Paribas | | | | | | | | |
| 0.000%, dated 05/28/2021, to be repurchased on 06/01/2021, repurchase price $10,195,643 (collateralized by U.S. Treasury Obligations, ranging in par value $202,278 - $1,470,619, 2.000%, 10/31/2022, with a total market value of $10,394,561) | | | | | | | | |
(Cost $10,195,643) | | $ | 10,195,643 | | | | 10,195,643 | |
| | | | | | | | | |
| TOTAL INVESTMENTS — 102.2% | | | | | | | | |
(Cost $874,095,247) | | | | | | $ | 919,792,142 | |
Percentages are based on Net Assets of $900,379,020.
| * | Non-income producing security. |
| (A) | This security or a partial position of this security is on loan at May 31, 2021. The total value of securities on loan at May 31, 2021 was $20,442,006. |
| (B) | There is currently no stated interest rate. |
| (C) | Security was purchased with cash collateral held from securities on loan. The total value of such securities as of May 31, 2021 was $20,822,583. |
| (D) | The rate reported on the Schedule of Investments is the 7-day effective yield as of May 31, 2021. |
ADR — American Depositary Receipt
Cl — Class
The following is a summary of the level of inputs used as of May 31, 2021, in valuing the Fund’s investments carried at value:
| Investments in Securities | | | | | | | | | | | | |
| Common Stock | | $ | 881,928,143 | | | $ | — | | | $ | — | | | $ | 881,928,143 | |
| Preferred Stock | | | 17,041,416 | | | | — | | | | — | | | | 17,041,416 | |
| Short-Term Investment | | | 10,626,940 | | | | — | | | | — | | | | 10,626,940 | |
| Repurchase Agreement | | | — | | | | 10,195,643 | | | | — | | | | 10,195,643 | |
| Total Investments in Securities | | $ | 909,596,499 | | | $ | 10,195,643 | | | $ | — | | | $ | 919,792,142 | |
For the period ended May 31, 2021, there were no transfers in or out of Level 3.
| Schedule of Investments | | May 31, 2021 (Unaudited) |
| | Global X Cloud Computing ETF | |
Sector Weightings †:
† Sector weightings percentages are based on the total market value of investments. Repurchase agreements purchased from cash collateral received for securities lending activity are included in total investments. Please see Notes 2 and 7 in Notes to Financial Statements for more detailed information.
| | | | | | | |
| COMMON STOCK — 99.9% | | | | | | |
| CANADA — 4.3% | | | | | | |
| Information Technology — 4.3% | | | | | | |
Shopify, Cl A * | | | 45,205 | | | $ | 56,183,939 | |
| | | | | | | | | |
| CHINA — 3.2% | | | | | | | | |
| Consumer Discretionary — 1.1% | | | | | | | | |
Alibaba Group Holding ADR * | | | 68,916 | | | | 14,745,267 | |
| | | | | | | | | |
| Information Technology — 2.1% | | | | | | | | |
21Vianet Group ADR * | | | 1,035,936 | | | | 23,122,092 | |
Kingsoft | | | 522,700 | | | | 3,528,890 | |
| | | | | | | | 26,650,982 | |
| | | | | | | | | |
TOTAL CHINA | | | | | | | 41,396,249 | |
| | | | | | | | | |
| NEW ZEALAND — 3.6% | | | | | | | | |
| Information Technology — 3.6% | | | | | | | | |
Xero * | | | 464,909 | | | | 46,752,548 | |
| | | | | | | | | |
| UNITED STATES — 88.8% | | | | | | | | |
| Communication Services — 5.3% | | | | | | | | |
Alphabet, Cl A * | | | 7,625 | | | | 17,970,981 | |
Netflix * | | | 98,689 | | | | 49,621,816 | |
| | | | | | | | 67,592,797 | |
| Schedule of Investments | | May 31, 2021 (Unaudited) |
| | Global X Cloud Computing ETF | |
| | | | | | | |
| COMMON STOCK — continued | | | | | | |
| Consumer Discretionary — 4.0% | | | | | | |
2U * | | | 716,283 | | | $ | 26,087,027 | |
Amazon.com * | | | 7,460 | | | | 24,044,102 | |
| | | | | | | | 50,131,129 | |
| | | | | | | | | |
| Information Technology — 73.8% | | | | | | | | |
Akamai Technologies * | | | 447,454 | | | | 51,103,721 | |
Anaplan * | | | 906,593 | | | | 46,698,605 | |
Benefitfocus * | | | 309,912 | | | | 4,583,598 | |
Box, Cl A * | | | 1,567,045 | | | | 36,527,819 | |
Cornerstone OnDemand * | | | 637,217 | | | | 28,018,431 | |
Coupa Software * | | | 210,966 | | | | 50,252,101 | |
Dropbox, Cl A * | | | 2,010,121 | | | | 54,976,809 | |
Everbridge * | | | 362,338 | | | | 42,574,715 | |
Fastly, Cl A * (A) | | | 1,018,841 | | | | 48,079,107 | |
| International Business Machines | | | 24,723 | | | | 3,553,684 | |
Microsoft | | | 99,160 | | | | 24,758,269 | |
Mimecast * | | | 620,050 | | | | 30,996,300 | |
Paycom Software * | | | 150,672 | | | | 49,661,491 | |
Paylocity Holding * | | | 289,676 | | | | 49,195,675 | |
Proofpoint * | | | 286,938 | | | | 49,585,756 | |
Qualys * | | | 377,066 | | | | 36,454,741 | |
salesforce.com * | | | 226,090 | | | | 53,832,029 | |
SPS Commerce * | | | 345,544 | | | | 32,432,760 | |
Twilio, Cl A * | | | 162,956 | | | | 54,753,216 | |
Workday, Cl A * | | | 210,937 | | | | 48,245,511 | |
Workiva, Cl A * | | | 405,673 | | | | 38,498,368 | |
Zoom Video Communications, Cl A * | | | 168,282 | | | | 55,790,531 | |
Zscaler * | | | 294,576 | | | | 57,206,659 | |
| | | | | | | | 947,779,896 | |
| | | | | | | | | |
| Real Estate — 5.7% | | | | | | | | |
CoreSite Realty ‡ | | | 53,306 | | | | 6,463,353 | |
CyrusOne ‡ | | | 150,604 | | | | 11,107,045 | |
Digital Realty Trust ‡ | | | 329,713 | | | | 49,971,302 | |
| Schedule of Investments | | May 31, 2021 (Unaudited) |
| | Global X Cloud Computing ETF | |
| | | | | | | |
| COMMON STOCK — continued | | | | | | |
| Real Estate — continued | | | | | | |
QTS Realty Trust, Cl A ‡ | | | 84,389 | | | $ | 5,348,575 | |
| | | | | | | | 72,890,275 | |
| | | | | | | | | |
TOTAL UNITED STATES | | | | | | | 1,138,394,097 | |
| | | | | | | | | |
| TOTAL COMMON STOCK | | | | | | | | |
(Cost $1,116,449,830) | | | | | | | 1,282,726,833 | |
| | | | | | | | | |
SHORT-TERM INVESTMENT(B)(C) — 1.2% | | | | | | | | |
| Fidelity Investments Money Market Government Portfolio, Cl Institutional, 0.010% | | | | | | | | |
(Cost $15,855,160) | | | 15,855,160 | | | | 15,855,160 | |
| | | | | | | | | |
REPURCHASE AGREEMENT(B) — 1.2% | | | | | | | | |
| BNP Paribas | | | | | | | | |
| 0.000%, dated 05/28/2021, to be repurchased on 06/01/2021, repurchase price $15,211,675 (collateralized by U.S. Treasury Obligations, ranging in par value $301,795 - $2,194,131, 2.000%, 10/31/2022, with a total market value of $15,508,457) | | | | | | | | |
(Cost $15,211,675) | | $ | 15,211,675 | | | | 15,211,675 | |
| | | | | | | | | |
| TOTAL INVESTMENTS — 102.3% | | | | | | | | |
(Cost $1,147,516,665) | | | | | | $ | 1,313,793,668 | |
Percentages are based on Net Assets of $1,283,700,238.
| Schedule of Investments | | May 31, 2021 (Unaudited) |
| | Global X Cloud Computing ETF | |
| * | Non-income producing security. |
| ‡ | Real Estate Investment Trust |
| (A) | This security or a partial position of this security is on loan at May 31, 2021. The total value of securities on loan at May 31, 2021 was $29,791,047. |
| (B) | Security was purchased with cash collateral held from securities on loan. The total value of such securities as of May 31, 2021 was $31,066,835. |
| (C) | The rate reported on the Schedule of Investments is the 7-day effective yield as of May 31, 2021. |
ADR — American Depositary Receipt
Cl — Class
The following is a summary of the level of inputs used as of May 31, 2021, in valuing the Fund’s investments carried at value:
| Investments in Securities | | | | | | | | | | | | |
| Common Stock | | $ | 1,282,726,833 | | | $ | — | | | $ | — | | | $ | 1,282,726,833 | |
| Short-Term Investment | | | 15,855,160 | | | | — | | | | — | | | | 15,855,160 | |
| Repurchase Agreement | | | — | | | | 15,211,675 | | | | — | | | | 15,211,675 | |
| Total Investments in Securities | | $ | 1,298,581,993 | | | $ | 15,211,675 | | | $ | — | | | $ | 1,313,793,668 | |
For the period ended May 31, 2021, there were no transfers in or out of Level 3.
| Schedule of Investments | | May 31, 2021 (Unaudited) |
| | Global X Data Center REITs & Digital Infrastructure ETF | |
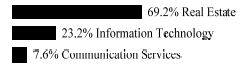
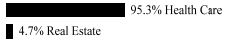
Sector Weightings †:
† Sector weightings percentages are based on the total market value of investments.
| | | | | | | |
| COMMON STOCK — 99.8% | | | | | | |
| AUSTRALIA — 3.2% | | | | | | |
| Information Technology — 3.2% | | | | | | |
NEXTDC * | | | 202,016 | | | $ | 1,720,975 | |
| | | | | | | | | |
| CHINA — 9.0% | | | | | | | | |
| Communication Services — 4.0% | | | | | | | | |
China Tower, Cl H | | | 15,661,400 | | | | 2,138,901 | |
| | | | | | | | | |
| Information Technology — 5.0% | | | | | | | | |
21Vianet Group ADR * | | | 46,482 | | | | 1,037,478 | |
GDS Holdings ADR * | | | 22,361 | | | | 1,681,994 | |
| | | | | | | | 2,719,472 | |
| | | | | | | | | |
TOTAL CHINA | | | | | | | 4,858,373 | |
| | | | | | | | | |
| HONG KONG — 0.6% | | | | | | | | |
| Information Technology — 0.6% | | | | | | | | |
SUNeVision Holdings | | | 288,181 | | | | 299,264 | |
| | | | | | | | | |
| INDONESIA — 2.8% | | | | | | | | |
| Communication Services — 2.8% | | | | | | | | |
Sarana Menara Nusantara | | | 10,921,778 | | | | 898,361 | |
Tower Bersama Infrastructure | | | 3,664,585 | | | | 613,116 | |
| | | | | | | | | |
TOTAL INDONESIA | | | | | | | 1,511,477 | |
| | | | | | | | | |
| SINGAPORE — 2.1% | | | | | | | | |
| Real Estate — 2.1% | | | | | | | | |
Keppel ‡ | | | 581,570 | | | | 1,129,560 | |
| | | | | | | | | |
| Schedule of Investments | | May 31, 2021 (Unaudited) |
| | Global X Data Center REITs & Digital Infrastructure ETF | |
| | | | | | | |
| COMMON STOCK — continued | | | | | | | | |
| TAIWAN — 2.4% | | | | | | | | |
| Information Technology — 2.4% | | | | | | | | |
Winbond Electronics | | | 1,016,204 | | | $ | 1,240,011 | |
| | | | | | | | | |
| UNITED STATES — 79.7% | | | | | | | | |
| Communication Services — 0.8% | | | | | | | | |
Radius Global Infrastructure, Cl A * | | | 27,242 | | | | 435,872 | |
| | | | | | | | | |
| Information Technology — 12.0% | | | | | | | | |
Advanced Micro Devices * | | | 10,900 | | | | 872,872 | |
Microchip Technology | | | 6,632 | | | | 1,040,892 | |
Micron Technology * | | | 12,529 | | | | 1,054,190 | |
NVIDIA | | | 1,876 | | | | 1,218,987 | |
Switch, Cl A | | | 44,132 | | | | 832,771 | |
Western Digital * | | | 20,385 | | | | 1,533,564 | |
| | | | | | | | 6,553,276 | |
| | | | | | | | | |
| Real Estate — 66.9% | | | | | | | | |
American Tower, Cl A ‡ | | | 27,832 | | | | 7,109,963 | |
CoreSite Realty ‡ | | | 18,851 | | | | 2,285,684 | |
Crown Castle International ‡ | | | 39,523 | | | | 7,489,609 | |
CyrusOne ‡ | | | 31,986 | | | | 2,358,968 | |
Digital Realty Trust ‡ | | | 33,963 | | | | 5,147,432 | |
Equinix ‡ | | | 8,708 | | | | 6,415,358 | |
QTS Realty Trust, Cl A ‡ | | | 28,382 | | | | 1,798,851 | |
SBA Communications, Cl A ‡ | | | 8,533 | | | | 2,543,858 | |
Uniti Group ‡ | | | 99,074 | | | | 1,075,944 | |
| | | | | | | | 36,225,667 | |
| | | | | | | | | |
TOTAL UNITED STATES | | | | | | | 43,214,815 | |
| | | | | | | | | |
| TOTAL COMMON STOCK | | | | | | | | |
(Cost $51,999,205) | | | | | | | 53,974,475 | |
| Schedule of Investments | | May 31, 2021 (Unaudited) |
| | Global X Data Center REITs & Digital Infrastructure ETF | |
| | | | | | | | |
| TOTAL INVESTMENTS — 99.8% | | | | | | | | |
(Cost $51,999,205) | | | | | | $ | 53,974,475 | |
Percentages are based on Net Assets of $54,081,522.
| * | Non-income producing security. |
| ‡ | Real Estate Investment Trust |
ADR — American Depositary Receipt
Cl — Class
As of May 31, 2021, all of the Fund’s investments were considered Level 1, in accordance with authoritative guidance on fair value measurements and disclosure under U.S. GAAP.
For the period ended May 31, 2021, there were no transfers in or out of Level 3.
| Schedule of Investments | | May 31, 2021 (Unaudited) |
| | Global X Cybersecurity ETF | |
Sector Weightings †:
† Sector weightings percentages are based on the total market value of investments.
| | | | | | | |
| COMMON STOCK — 100.0% | | | | | | |
| CANADA — 0.6% | | | | | | |
| Information Technology — 0.6% | | | | | | |
Absolute Software | | | 158,039 | | | $ | 2,200,510 | |
| | | | | | | | | |
| ISRAEL — 6.9% | | | | | | | | |
| Information Technology — 6.9% | | | | | | | | |
Check Point Software Technologies * | | | 165,716 | | | | 19,385,458 | |
Radware * | | | 148,732 | | | | 4,342,974 | |
Tufin Software Technologies * | | | 112,833 | | | | 1,025,652 | |
| | | | | | | | | |
TOTAL ISRAEL | | | | | | | 24,754,084 | |
| | | | | | | | | |
| JAPAN — 5.6% | | | | | | | | |
| Information Technology — 5.6% | | | | | | | | |
Cyber Security Cloud * | | | 36,264 | | | | 955,609 | |
Digital Arts | | | 45,539 | | | | 3,354,089 | |
Trend Micro * | | | 311,010 | | | | 15,836,836 | |
| | | | | | | | | |
TOTAL JAPAN | | | | | | | 20,146,534 | |
| | | | | | | | | |
| SOUTH KOREA — 0.5% | | | | | | | | |
| Information Technology — 0.5% | | | | | | | | |
Ahnlab | | | 32,145 | | | | 1,957,003 | |
| | | | | | | | | |
| UNITED KINGDOM — 4.4% | | | | | | | | |
| Information Technology — 4.4% | | | | | | | | |
Avast | | | 2,373,412 | | | | 15,849,892 | |
| | | | | | | | | |
| UNITED STATES — 82.0% | | | | | | | | |
| Information Technology — 82.0% | | | | | | | | |
A10 Networks * | | | 248,485 | | | | 2,417,759 | |
Crowdstrike Holdings, Cl A * | | | 106,298 | | | | 23,614,100 | |
| Schedule of Investments | | May 31, 2021 (Unaudited) |
| | Global X Cybersecurity ETF | |
| | | | | | | |
| COMMON STOCK — continued | | | | | | | | |
| Information Technology — continued | | | | | | | | |
CyberArk Software * | | | 126,300 | | | $ | 15,982,002 | |
FireEye * | | | 770,357 | | | | 17,232,886 | |
Fortinet * | | | 96,329 | | | | 21,051,740 | |
Intrusion * | | | 96,393 | | | | 1,432,400 | |
McAfee, Cl A | | | 524,527 | | | | 13,181,364 | |
Mimecast * | | | 207,879 | | | | 10,391,871 | |
NortonLifeLock | | | 716,484 | | | | 19,817,947 | |
Okta, Cl A * | | | 84,858 | | | | 18,875,814 | |
OneSpan * | | | 129,635 | | | | 3,389,955 | |
Palo Alto Networks * | | | 58,935 | | | | 21,408,139 | |
Ping Identity Holding * | | | 264,641 | | | | 6,380,495 | |
Proofpoint * | | | 86,843 | | | | 15,007,339 | |
Qualys * | | | 126,439 | | | | 12,224,123 | |
Rapid7 * | | | 177,953 | | | | 14,885,768 | |
Sailpoint Technologies Holdings * | | | 297,086 | | | | 13,823,412 | |
Telos * | | | 212,572 | | | | 6,989,367 | |
Tenable Holdings * | | | 341,075 | | | | 14,256,935 | |
Varonis Systems, Cl B * | | | 315,721 | | | | 15,249,324 | |
VirnetX Holding * | | | 223,018 | | | | 1,021,422 | |
Zix * | | | 182,301 | | | | 1,270,638 | |
Zscaler * | | | 118,851 | | | | 23,080,864 | |
| | | | | | | | | |
TOTAL UNITED STATES | | | | | | | 292,985,664 | |
| | | | | | | | | |
| TOTAL COMMON STOCK | | | | | | | | |
(Cost $383,605,863) | | | | | | | 357,893,687 | |
| | | | | | | | | |
| TOTAL INVESTMENTS — 100.0% | | | | | | | | |
(Cost $383,605,863) | | | | | | $ | 357,893,687 | |
Percentages are based on Net Assets of $357,759,420.
| * | Non-income producing security. |
Cl — Class
| Schedule of Investments | | May 31, 2021 (Unaudited) |
| | Global X Cybersecurity ETF | |
As of May 31, 2021, all of the Fund’s investments were considered Level 1, in accordance with authoritative guidance on fair value measurements and disclosure under U.S. GAAP.
For the period ended May 31, 2021, there were no transfers in or out of Level 3.
| Schedule of Investments | | May 31, 2021 (Unaudited) |
| | Global X Artificial Intelligence & Technology ETF | |
Sector Weightings †:
† Sector weightings percentages are based on the total market value of investments. Repurchase agreements purchased from cash collateral received for securities lending activity are included in total investments. Please see Notes 2 and 7 in Notes to Financial Statements for more detailed information.
| | | | | | | |
| COMMON STOCK — 99.9% | | | | | | |
| BRAZIL — 0.6% | | | | | | |
| Consumer Discretionary — 0.3% | | | | | | |
Afya, Cl A * | | | 25,087 | | | $ | 587,287 | |
| | | | | | | | | |
| Information Technology — 0.3% | | | | | | | | |
StoneCo, Cl A * | | | 9,562 | | | | 630,805 | |
| | | | | | | | | |
TOTAL BRAZIL | | | | | | | 1,218,092 | |
| | | | | | | | | |
| CANADA — 4.1% | | | | | | | | |
| Industrials — 1.0% | | | | | | | | |
Thomson Reuters | | | 21,030 | | | | 2,060,309 | |
| | | | | | | | | |
| Information Technology — 3.1% | | | | | | | | |
Shopify, Cl A * | | | 5,089 | | | | 6,324,965 | |
| | | | | | | | | |
TOTAL CANADA | | | | | | | 8,385,274 | |
| | | | | | | | | |
| CHINA — 10.5% | | | | | | | | |
| Communication Services — 3.7% | | | | | | | | |
Baidu ADR * | | | 11,521 | | | | 2,261,227 | |
Tencent Holdings | | | 69,443 | | | | 5,381,687 | |
| | | | | | | | 7,642,914 | |
| | | | | | | | | |
| Schedule of Investments | | May 31, 2021 (Unaudited) |
| | Global X Artificial Intelligence & Technology ETF | |
| | | | | | | |
| COMMON STOCK — continued | | | | | | | | |
| Consumer Discretionary — 4.6% | | | | | | | | |
Alibaba Group Holding ADR * | | | 23,469 | | | $ | 5,021,427 | |
Meituan, Cl B * | | | 127,041 | | | | 4,340,820 | |
| | | | | | | | 9,362,247 | |
| | | | | | | | | |
| Information Technology — 2.2% | | | | | | | | |
21Vianet Group ADR * | | | 15,605 | | | | 348,304 | |
Canaan ADR * (A) | | | 126,637 | | | | 1,063,751 | |
NXP Semiconductors | | | 12,126 | | | | 2,563,679 | |
ZTE, Cl H | | | 202,300 | | | | 546,052 | |
| | | | | | | | 4,521,786 | |
| | | | | | | | | |
TOTAL CHINA | | | | | | | 21,526,947 | |
| | | | | | | | | |
| FINLAND — 0.3% | | | | | | | | |
| Information Technology — 0.3% | | | | | | | | |
TietoEVRY | | | 17,862 | | | | 582,693 | |
| | | | | | | | | |
| FRANCE — 0.2% | | | | | | | | |
| Communication Services — 0.2% | | | | | | | | |
Ubisoft Entertainment * | | | 5,735 | | | | 418,465 | |
| | | | | | | | | |
| GERMANY — 4.4% | | | | | | | | |
| Industrials — 3.3% | | | | | | | | |
Siemens | | | 40,573 | | | | 6,667,273 | |
| | | | | | | | | |
| Information Technology — 1.1% | | | | | | | | |
Infineon Technologies | | | 55,250 | | | | 2,235,454 | |
| | | | | | | | | |
TOTAL GERMANY | | | | | | | 8,902,727 | |
| | | | | | | | | |
| IRELAND — 0.5% | | | | | | | | |
| Information Technology — 0.5% | | | | | | | | |
Seagate Technology Holdings | | | 10,829 | | | | 1,036,877 | |
| | | | | | | | | |
| ISRAEL — 0.7% | | | | | | | | |
| Information Technology — 0.7% | | | | | | | | |
Cognyte Software * | | | 8,318 | | | | 214,105 | |
| Schedule of Investments | | May 31, 2021 (Unaudited) |
| | Global X Artificial Intelligence & Technology ETF | |
| | | | | | | |
| COMMON STOCK — continued | | | | | | | | |
| Information Technology — continued | | | | | | | | |
Tower Semiconductor * | | | 19,916 | | | $ | 547,092 | |
Wix.com * | | | 2,419 | | | | 628,601 | |
| | | | | | | | | |
TOTAL ISRAEL | | | | | | | 1,389,798 | |
| | | | | | | | | |
| ITALY — 0.3% | | | | | | | | |
| Health Care — 0.3% | | | | | | | | |
Amplifon | | | 14,709 | | | | 691,444 | |
| | | | | | | | | |
| JAPAN — 1.8% | | | | | | | | |
| Industrials — 1.7% | | | | | | | | |
FANUC | | | 8,572 | | | | 2,066,322 | |
Fujikura | | | 128,362 | | | | 556,751 | |
Toshiba | | | 21,070 | | | | 890,889 | |
| | | | | | | | 3,513,962 | |
| | | | | | | | | |
| Information Technology — 0.1% | | | | | | | | |
AI inside * | | | 919 | | | | 144,149 | |
| | | | | | | | | |
TOTAL JAPAN | | | | | | | 3,658,111 | |
| | | | | | | | | |
| NETHERLANDS — 0.5% | | | | | | | | |
| Industrials — 0.5% | | | | | | | | |
Wolters Kluwer | | | 11,300 | | | | 1,083,859 | |
| | | | | | | | | |
| SOUTH KOREA — 4.4% | | | | | | | | |
| Information Technology — 4.4% | | | | | | | | |
Samsung Electronics | | | 76,137 | | | | 5,468,102 | |
SK Hynix | | | 30,788 | | | | 3,450,641 | |
| | | | | | | | | |
TOTAL SOUTH KOREA | | | | | | | 8,918,743 | |
| | | | | | | | | |
| SWEDEN — 0.8% | | | | | | | | |
| Information Technology — 0.8% | | | | | | | | |
| Telefonaktiebolaget LM Ericsson ADR | | | 129,856 | | | | 1,743,966 | |
| | | | | | | | | |
| Schedule of Investments | | May 31, 2021 (Unaudited) |
| | Global X Artificial Intelligence & Technology ETF | |
| | | | | | | |
| COMMON STOCK — continued | | | | | | | | |
| SWITZERLAND — 0.7% | | | | | | | | |
| Information Technology — 0.7% | | | | | | | | |
STMicroelectronics (A) | | | 38,459 | | | $ | 1,434,974 | |
| | | | | | | | | |
| TAIWAN — 1.2% | | | | | | | | |
| Industrials — 0.3% | | | | | | | | |
Bizlink Holding | | | 60,300 | | | | 523,866 | |
| | | | | | | | | |
| Information Technology — 0.9% | | | | | | | | |
Acer | | | 708,000 | | | | 811,608 | |
Alchip Technologies | | | 17,690 | | | | 337,979 | |
Global Unichip | | | 43,000 | | | | 553,379 | |
| | | | | | | | 1,702,966 | |
| | | | | | | | | |
TOTAL TAIWAN | | | | | | | 2,226,832 | |
| | | | | | | | | |
| UNITED KINGDOM — 1.1% | | | | | | | | |
| Industrials — 0.7% | | | | | | | | |
Experian | | | 38,732 | | | | 1,484,391 | |
| | | | | | | | | |
| Information Technology — 0.4% | | | | | | | | |
Dialog Semiconductor * | | | 9,517 | | | | 754,710 | |
| | | | | | | | | |
TOTAL UNITED KINGDOM | | | | | | | 2,239,101 | |
| | | | | | | | | |
| UNITED STATES — 67.8% | | | | | | | | |
| Communication Services — 12.5% | | | | | | | | |
Alphabet, Cl A * | | | 3,260 | | | | 7,683,331 | |
Facebook, Cl A * | | | 22,392 | | | | 7,360,922 | |
Netflix * | | | 10,532 | | | | 5,295,595 | |
Snap, Cl A * | | | 52,251 | | | | 3,245,832 | |
Twitter * | | | 33,608 | | | | 1,949,264 | |
| | | | | | | | 25,534,944 | |
| | | | | | | | | |
| Consumer Discretionary — 3.8% | | | | | | | | |
Amazon.com * | | | 1,862 | | | | 6,001,356 | |
| Schedule of Investments | | May 31, 2021 (Unaudited) |
| | Global X Artificial Intelligence & Technology ETF | |
| | | | | | | |
| COMMON STOCK — continued | | | | | | | | |
| Consumer Discretionary — continued | | | | | | | | |
eBay | | | 29,461 | | | $ | 1,793,586 | |
| | | | | | | | 7,794,942 | |
| | | | | | | | | |
| Health Care — 0.3% | | | | | | | | |
ABIOMED * | | | 1,912 | | | | 544,117 | |
| | | | | | | | | |
| Industrials — 4.1% | | | | | | | | |
| Booz Allen Hamilton Holding, Cl A | | | 6,404 | | | | 543,892 | |
Hubbell, Cl B | | | 3,663 | | | | 698,314 | |
Nielsen Holdings | | | 27,885 | | | | 758,751 | |
Rockwell Automation | | | 4,916 | | | | 1,296,447 | |
Uber Technologies * | | | 78,332 | | | | 3,981,616 | |
Verisk Analytics, Cl A | | | 6,876 | | | | 1,188,379 | |
| | | | | | | | 8,467,399 | |
| | | | | | | | | |
| Information Technology — 47.1% | | | | | | | | |
Accenture, Cl A | | | 23,651 | | | | 6,673,366 | |
Adobe * | | | 12,922 | | | | 6,520,183 | |
Apple | | | 44,603 | | | | 5,557,980 | |
Cadence Design Systems * | | | 11,804 | | | | 1,498,990 | |
Cisco Systems | | | 135,326 | | | | 7,158,745 | |
Cornerstone OnDemand * | | | 14,138 | | | | 621,648 | |
Datadog, Cl A * | | | 8,765 | | | | 798,053 | |
DXC Technology * | | | 20,730 | | | | 786,081 | |
FireEye * | | | 26,876 | | | | 601,216 | |
Genpact | | | 14,918 | | | | 682,349 | |
Hewlett Packard Enterprise | | | 54,542 | | | | 870,490 | |
Intel | | | 97,728 | | | | 5,582,223 | |
| International Business Machines | | | 37,710 | | | | 5,420,435 | |
Microsoft | | | 27,123 | | | | 6,772,071 | |
NVIDIA | | | 11,028 | | | | 7,165,774 | |
Okta, Cl A * | | | 5,111 | | | | 1,136,891 | |
Oracle | | | 99,732 | | | | 7,852,898 | |
Pegasystems | | | 4,257 | | | | 502,922 | |
PROS Holdings * | | | 14,428 | | | | 640,170 | |
| Schedule of Investments | | May 31, 2021 (Unaudited) |
| | Global X Artificial Intelligence & Technology ETF | |
| | | | | | | |
| COMMON STOCK — continued | | | | | | | | |
| Information Technology — continued | | | | | | | | |
QUALCOMM | | | 37,042 | | | $ | 4,983,631 | |
salesforce.com * | | | 27,490 | | | | 6,545,369 | |
ServiceNow * | | | 8,270 | | | | 3,918,988 | |
Smartsheet, Cl A * | | | 8,611 | | | | 508,738 | |
Splunk * | | | 6,843 | | | | 829,372 | |
Super Micro Computer * | | | 17,972 | | | | 624,347 | |
Synopsys * | | | 6,470 | | | | 1,645,580 | |
Teradata * | | | 23,402 | | | | 1,120,254 | |
Trade Desk, Cl A * | | | 1,797 | | | | 1,056,887 | |
Twilio, Cl A * | | | 5,920 | | | | 1,989,120 | |
Ubiquiti | | | 2,663 | | | | 802,948 | |
Verint Systems * | | | 8,498 | | | | 391,843 | |
Viasat * | | | 15,556 | | | | 827,268 | |
Workday, Cl A * | | | 7,626 | | | | 1,744,219 | |
Xilinx | | | 10,374 | | | | 1,317,498 | |
Zebra Technologies, Cl A * | | | 2,245 | | | | 1,115,877 | |
Zscaler * | | | 5,669 | | | | 1,100,920 | |
| | | | | | | | 97,365,344 | |
| | | | | | | | | |
TOTAL UNITED STATES | | | | | | | 139,706,746 | |
| | | | | | | | | |
| TOTAL COMMON STOCK | | | | | | | | |
(Cost $188,369,523) | | | | | | | 205,164,649 | |
| | | | | | | | | |
SHORT-TERM INVESTMENT(B)(C) — 0.3% | | | | | | | | |
| Fidelity Investments Money Market Government Portfolio, Cl Institutional, 0.010% | | | | | | | | |
(Cost $624,354) | | | 624,354 | | | | 624,354 | |
| Schedule of Investments | | May 31, 2021 (Unaudited) |
| | Global X Artificial Intelligence & Technology ETF | |
| | | | | | | |
REPURCHASE AGREEMENT(B) — 0.3% | | | | | | | | |
| BNP Paribas | | | | | | | | |
| 0.000%, dated 05/28/2021, to be repurchased on 06/01/2021, repurchase price $599,015 (collateralized by U.S. Treasury Obligations, ranging in par value $11,884 - $86,402, 2.000%, 10/31/2022, with a total market value of $610,702) | | | | | | | | |
(Cost $599,015) | | $ | 599,015 | | | $ | 599,015 | |
| | | | | | | | | |
| TOTAL INVESTMENTS — 100.5% | | | | | | | | |
(Cost $189,592,892) | | | | | | $ | 206,388,018 | |
Percentages are based on Net Assets of $205,446,857.
| * | Non-income producing security. |
| (A) | This security or a partial position of this security is on loan at May 31, 2021. The total value of securities on loan at May 31, 2021 was $1,212,639. |
| (B) | Security was purchased with cash collateral held from securities on loan. The total value of such securities as of May 31, 2021 was $1,223,369. |
| (C) | The rate reported on the Schedule of Investments is the 7-day effective yield as of May 31, 2021. |
ADR — American Depositary Receipt
Cl — Class
The following is a summary of the level of inputs used as of May 31, 2021, in valuing the Fund’s investments carried at value:
| Investments in Securities | | | | | | | | | | | | |
| Common Stock | | $ | 205,164,649 | | | $ | — | | | $ | — | | | $ | 205,164,649 | |
| Short-Term Investment | | | 624,354 | | | | — | | | | — | | | | 624,354 | |
| Repurchase Agreement | | | — | | | | 599,015 | | | | — | | | | 599,015 | |
| Total Investments in Securities | | $ | 205,789,003 | | | $ | 599,015 | | | $ | — | | | $ | 206,388,018 | |
For the period ended May 31, 2021, there were no transfers in or out of Level 3.
| Schedule of Investments | | May 31, 2021 (Unaudited) |
| | Global X Millennial Consumer ETF | |
Sector Weightings †:
† Sector weightings percentages are based on the total market value of investments.
| | | | | | | |
| COMMON STOCK — 99.9% | | | | | | |
| GERMANY — 0.3% | | | | | | |
| Communication Services — 0.3% | | | | | | |
Trivago ADR * | | | 136,325 | | | $ | 539,847 | |
| | | | | | | | | |
| TAIWAN — 3.1% | | | | | | | | |
| Communication Services — 3.1% | | | | | | | | |
Sea ADR * | | | 22,495 | | | | 5,696,634 | |
| | | | | | | | | |
| UNITED STATES — 96.5% | | | | | | | | |
| Communication Services — 27.8% | | | | | | | | |
Activision Blizzard | | | 59,026 | | | | 5,740,279 | |
Alphabet, Cl A * | | | 2,516 | | | | 5,929,835 | |
Angi, Cl A * | | | 36,408 | | | | 516,265 | |
Cargurus, Cl A * | | | 22,654 | | | | 639,296 | |
Cars.com * | | | 41,776 | | | | 610,347 | |
Facebook, Cl A * | | | 18,103 | | | | 5,951,000 | |
IAC * | | | 6,730 | | | | 1,073,233 | |
iHeartMedia * | | | 31,827 | | | | 738,705 | |
Liberty TripAdvisor Holdings, Cl A * | | | 89,801 | | | | 427,453 | |
Match Group * | | | 21,850 | | | | 3,132,853 | |
Netflix * | | | 10,268 | | | | 5,162,853 | |
Snap, Cl A * | | | 90,056 | | | | 5,594,279 | |
Spotify Technology * | | | 15,499 | | | | 3,744,093 | |
TripAdvisor * | | | 10,961 | | | | 476,255 | |
| Schedule of Investments | | May 31, 2021 (Unaudited) |
| | Global X Millennial Consumer ETF | |
| | | | | | | |
| COMMON STOCK — continued | | | | | | | | |
| Communication Services — continued | | | | | | | | |
Twitter * | | | 64,849 | | | $ | 3,761,242 | |
Vimeo * | | | 10,901 | | | | 457,842 | |
Walt Disney * | | | 30,399 | | | | 5,430,781 | |
Yelp, Cl A * | | | 13,784 | | | | 552,876 | |
Zillow Group, Cl A * | | | 4,943 | | | | 584,707 | |
Zynga, Cl A * | | | 87,900 | | | | 952,836 | |
| | | | | | | | 51,477,030 | |
| | | | | | | | | |
| Consumer Discretionary — 39.9% | | | | | | | | |
2U * | | | 13,672 | | | | 497,934 | |
Aaron’s | | | 22,146 | | | | 796,592 | |
Airbnb, Cl A * | | | 9,803 | | | | 1,376,341 | |
Amazon.com * | | | 1,717 | | | | 5,534,011 | |
AutoNation * | | | 6,519 | | | | 665,785 | |
Bed Bath & Beyond * | | | 19,094 | | | | 534,441 | |
Booking Holdings * | | | 2,344 | | | | 5,535,473 | |
Capri Holdings * | | | 12,215 | | | | 692,713 | |
CarMax * | | | 13,188 | | | | 1,519,126 | |
Carter’s | | | 6,202 | | | | 634,092 | |
Carvana, Cl A * | | | 6,353 | | | | 1,684,117 | |
Chegg * | | | 11,365 | | | | 874,081 | |
Children’s Place Retail Stores * | | | 7,877 | | | | 732,482 | |
Chipotle Mexican Grill, Cl A * | | | 2,289 | | | | 3,140,462 | |
Columbia Sportswear | | | 5,366 | | | | 551,249 | |
Designer Brands, Cl A * | | | 32,367 | | | | 566,099 | |
Dick’s Sporting Goods | | | 6,738 | | | | 657,157 | |
eBay | | | 55,276 | | | | 3,365,203 | |
Etsy * | | | 10,231 | | | | 1,685,353 | |
Expedia Group * | | | 11,229 | | | | 1,986,972 | |
GoPro, Cl A * | | | 45,024 | | | | 505,169 | |
Graham Holdings, Cl B | | | 918 | | | | 608,212 | |
Groupon, Cl A * | | | 11,648 | | | | 550,368 | |
Grubhub * | | | 8,665 | | | | 520,853 | |
Home Depot | | | 18,107 | | | | 5,774,503 | |
| Schedule of Investments | | May 31, 2021 (Unaudited) |
| | Global X Millennial Consumer ETF | |
| | | | | | | |
| COMMON STOCK — continued | | | | | | | | |
| Consumer Discretionary — continued | | | | | | | | |
L Brands | | | 22,607 | | | $ | 1,579,551 | |
Laureate Education, Cl A * | | | 42,679 | | | | 623,540 | |
Lowe’s | | | 29,317 | | | | 5,711,831 | |
Lululemon Athletica * | | | 10,166 | | | | 3,284,939 | |
NIKE, Cl B | | | 42,595 | | | | 5,812,513 | |
Peloton Interactive, Cl A * | | | 21,410 | | | | 2,361,737 | |
Planet Fitness, Cl A * | | | 6,718 | | | | 529,177 | |
Skechers USA, Cl A * | | | 13,309 | | | | 632,178 | |
Starbucks | | | 50,371 | | | | 5,736,250 | |
Strategic Education | | | 6,127 | | | | 434,037 | |
Stride * | | | 16,436 | | | | 441,800 | |
Under Armour, Cl A * | | | 24,889 | | | | 561,994 | |
VF | | | 31,812 | | | | 2,536,053 | |
Wayfair, Cl A * | | | 6,260 | | | | 1,918,940 | |
WW International * | | | 18,765 | | | | 737,465 | |
| | | | | | | | 73,890,793 | |
| | | | | | | | | |
| Consumer Staples — 3.5% | | | | | | | | |
Costco Wholesale | | | 15,762 | | | | 5,962,292 | |
Sprouts Farmers Market * | | | 21,804 | | | | 579,986 | |
| | | | | | | | 6,542,278 | |
| | | | | | | | | |
| Financials — 1.5% | | | | | | | | |
Blucora * | | | 33,423 | | | | 579,555 | |
LendingClub * | | | 35,202 | | | | 537,887 | |
LendingTree * | | | 2,512 | | | | 515,588 | |
Nelnet, Cl A | | | 7,576 | | | | 572,140 | |
SLM | | | 29,748 | | | | 602,396 | |
| | | | | | | | 2,807,566 | |
| | | | | | | | | |
| Industrials — 3.9% | | | | | | | | |
Avis Budget Group * | | | 7,619 | | | | 669,101 | |
Lyft, Cl A * | | | 25,978 | | | | 1,483,084 | |
Uber Technologies * | | | 98,459 | | | | 5,004,671 | |
| | | | | | | | 7,156,856 | |
| Schedule of Investments | | May 31, 2021 (Unaudited) |
| | Global X Millennial Consumer ETF | |
| | | | | | | |
| COMMON STOCK — continued | | | | | | | | |
| Information Technology — 14.7% | | | | | | | | |
Apple | | | 43,657 | | | $ | 5,440,099 | |
Fiserv * | | | 45,862 | | | | 5,283,302 | |
Intuit | | | 13,844 | | | | 6,078,762 | |
PayPal Holdings * | | | 21,518 | | | | 5,595,111 | |
Square, Cl A * | | | 22,027 | | | | 4,901,448 | |
| | | | | | | | 27,298,722 | |
| | | | | | | | | |
| Real Estate — 5.2% | | | | | | | | |
AvalonBay Communities ‡ | | | 11,332 | | | | 2,345,045 | |
Camden Property Trust ‡ | | | 8,094 | | | | 1,014,826 | |
Centerspace ‡ | | | 8,343 | | | | 593,938 | |
Equity Residential ‡ | | | 30,252 | | | | 2,343,017 | |
Independence Realty Trust ‡ | | | 34,863 | | | | 595,460 | |
Invitation Homes ‡ | | | 46,022 | | | | 1,669,218 | |
UDR ‡ | | | 24,061 | | | | 1,146,025 | |
| | | | | | | | 9,707,529 | |
| | | | | | | | | |
TOTAL UNITED STATES | | | | | | | 178,880,774 | |
| | | | | | | | | |
| TOTAL COMMON STOCK | | | | | | | | |
(Cost $161,399,846) | | | | | | | 185,117,255 | |
| | | | | | | | | |
| TOTAL INVESTMENTS — 99.9% | | | | | | | | |
(Cost $161,399,846) | | | | | | $ | 185,117,255 | |
Percentages are based on Net Assets of $185,241,722.
| * | Non-income producing security. |
| ‡ | Real Estate Investment Trust |
ADR — American Depositary Receipt
Cl — Class
As of May 31, 2021, all of the Fund’s investments were considered Level 1, in accordance with authoritative guidance on fair value measurements and disclosure under U.S. GAAP.
For the period ended May 31, 2021, there were no transfers in or out of Level 3.
| Schedule of Investments | | May 31, 2021 (Unaudited) |
| | | |
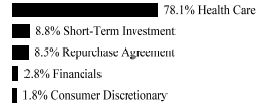
Sector Weightings †:
†�� Sector weightings percentages are based on the total market value of investments.
| | | | | | | |
| COMMON STOCK — 99.4% | | | | | | |
| AUSTRALIA — 5.1% | | | | | | |
| Consumer Discretionary — 5.1% | | | | | | |
G8 Education * | | | 106,034 | | | $ | 82,564 | |
IDP Education | | | 35,122 | | | | 609,240 | |
| | | | | | | | | |
TOTAL AUSTRALIA | | | | | | | 691,804 | |
| | | | | | | | | |
| BRAZIL — 2.6% | | | | | | | | |
| Consumer Discretionary — 2.6% | | | | | | | | |
Arco Platform, Cl A * | | | 3,783 | | | | 109,934 | |
YDUQS Participacoes | | | 38,950 | | | | 247,720 | |
| | | | | | | | | |
TOTAL BRAZIL | | | | | | | 357,654 | |
| | | | | | | | | |
| CANADA — 1.6% | | | | | | | | |
| Information Technology — 1.6% | | | | | | | | |
Docebo * | | | 4,115 | | | | 213,210 | |
| | | | | | | | | |
| CHINA — 25.9% | | | | | | | | |
| Communication Services — 0.2% | | | | | | | | |
iHuman ADR * | | | 2,907 | | | | 26,047 | |
| | | | | | | | | |
| Consumer Discretionary — 25.7% | | | | | | | | |
17 Education & Technology Group ADR * | | | 21,295 | | | | 103,494 | |
China East Education Holdings | | | 277,092 | | | | 600,488 | |
GSX Techedu ADR * | | | 18,257 | | | | 338,485 | |
Koolearn Technology Holding * | | | 125,882 | | | | 204,356 | |
New Oriental Education & Technology Group ADR * | | | 96,842 | | | | 990,694 | |
| Schedule of Investments | | May 31, 2021 (Unaudited) |
| | Global X Education ETF | |
| | | | | | | |
| COMMON STOCK — continued | | | | | | |
| Consumer Discretionary — continued | | | | | | |
Puxin ADR * | | | 10,806 | | | $ | 20,856 | |
Scholar Education Group | | | 70,000 | | | | 48,612 | |
TAL Education Group ADR * | | | 25,592 | | | | 1,022,912 | |
Youdao ADR * | | | 4,374 | | | | 105,195 | |
| | | | | | | | 3,435,092 | |
| | | | | | | | | |
TOTAL CHINA | | | | | | | 3,461,139 | |
| | | | | | | | | |
| JAPAN — 5.9% | | | | | | | | |
| Communication Services — 1.0% | | | | | | | | |
Gakken Holdings | | | 5,569 | | | | 68,666 | |
V-Cube | | | 3,040 | | | | 68,167 | |
| | | | | | | | 136,833 | |
| | | | | | | | | |
| Consumer Discretionary — 4.1% | | | | | | | | |
Benesse Holdings | | | 12,932 | | | | 299,855 | |
Edulab * | | | 1,262 | | | | 64,721 | |
Media Do * | | | 2,036 | | | | 102,193 | |
RareJob | | | 1,286 | | | | 21,107 | |
Riso Kyoiku | | | 19,495 | | | | 55,662 | |
| | | | | | | | 543,538 | |
| | | | | | | | | |
| Industrials — 0.8% | | | | | | | | |
Insource | | | 5,398 | | | | 107,101 | |
| | | | | | | | | |
TOTAL JAPAN | | | | | | | 787,472 | |
| | | | | | | | | |
| NORWAY — 3.4% | | | | | | | | |
| Communication Services — 3.4% | | | | | | | | |
Kahoot! * | | | 56,327 | | | | 451,657 | |
| | | | | | | | | |
| SOUTH KOREA — 0.6% | | | | | | | | |
| Consumer Discretionary — 0.6% | | | | | | | | |
MegaStudyEdu | | | 1,481 | | | | 87,774 | |
| Schedule of Investments | | May 31, 2021 (Unaudited) |
| | Global X Education ETF | |
| | | | | | | |
| COMMON STOCK — continued | | | | | | | | |
| UNITED KINGDOM — 8.2% | | | | | | | | |
| Communication Services — 8.2% | | | | | | | | |
Pearson | | | 95,164 | | | $ | 1,103,988 | |
| | | | | | | | | |
| UNITED STATES — 46.1% | | | | | | | | |
| Communication Services — 6.3% | | | | | | | | |
Bandwidth, Cl A * | | | 2,864 | | | | 338,782 | |
John Wiley & Sons, Cl A | | | 5,901 | | | | 374,006 | |
Scholastic | | | 4,102 | | | | 138,155 | |
| | | | | | | | 850,943 | |
| | | | | | | | | |
| Consumer Discretionary — 22.3% | | | | | | | | |
2U * | | | 9,381 | | | | 341,656 | |
Bright Horizons Family Solutions * | | | 7,675 | | | | 1,060,915 | |
Chegg * | | | 16,928 | | | | 1,301,932 | |
Houghton Mifflin Harcourt * | | | 15,848 | | | | 157,529 | |
Stride * | | | 5,221 | | | | 140,340 | |
| | | | | | | | 3,002,372 | |
| | | | | | | | | |
| Information Technology — 17.5% | | | | | | | | |
8x8 * | | | 13,472 | | | | 317,266 | |
Brightcove * | | | 5,003 | | | | 72,544 | |
RingCentral, Cl A * | | | 2,161 | | | | 567,198 | |
Slack Technologies, Cl A * | | | 16,729 | | | | 736,745 | |
Zoom Video Communications, Cl A * | | | 1,982 | | | | 657,092 | |
| | | | | | | | 2,350,845 | |
| | | | | | | | | |
TOTAL UNITED STATES | | | | | | | 6,204,160 | |
| | | | | | | | | |
| TOTAL COMMON STOCK | | | | | | | | |
(Cost $15,753,282) | | | | | | | 13,358,858 | |
| | | | | | | | | |
| TOTAL INVESTMENTS — 99.4% | | | | | | | | |
(Cost $15,753,282) | | | | | | $ | 13,358,858 | |
Percentages are based on Net Assets of $13,438,444.
| Schedule of Investments | | May 31, 2021 (Unaudited) |
| | Global X Education ETF | |
| * | Non-income producing security. |
ADR — American Depositary Receipt
Cl — Class
As of May 31, 2021, all of the Fund’s investments were considered Level 1, in accordance with authoritative guidance on fair value measurements and disclosure under U.S. GAAP.
For the period ended May 31, 2021, there were no transfers in or out of Level 3.
| Schedule of Investments | | May 31, 2021 (Unaudited) |
| | | |
Sector Weightings †:
† Sector weightings percentages are based on the total market value of investments. Repurchase agreements purchased from cash collateral received for securities lending activity are included in total investments. Please see Notes 2 and 7 in Notes to Financial Statements for more detailed information.
| | | | | | | |
| COMMON STOCK — 100.0% | | | | | | |
| AUSTRALIA — 2.6% | | | | | | |
| Health Care — 2.6% | | | | | | |
Cann Group * (A) | | | 7,756,077 | | | $ | 2,511,412 | |
Creso Pharma * (A) | | | 25,985,442 | | | | 2,804,689 | |
| | | | | | | | | |
TOTAL AUSTRALIA | | | | | | | 5,316,101 | |
| | | | | | | | | |
| CANADA — 83.0% | | | | | | | | |
| Consumer Discretionary — 2.1% | | | | | | | | |
Fire & Flower Holdings * (A) | | | 4,354,158 | | | | 3,892,790 | |
Namaste Technologies * | | | 2,207,117 | | | | 383,688 | |
| | | | | | | | 4,276,478 | |
| | | | | | | | | |
| Financials — 3.4% | | | | | | | | |
RIV Capital * (A) | | | 4,573,362 | | | | 7,003,907 | |
| | | | | | | | | |
| Health Care — 77.5% | | | | | | | | |
Aleafia Health * (A) | | | 10,369,552 | | | | 3,648,228 | |
Aurora Cannabis * (A) | | | 1,767,727 | | | | 17,076,243 | |
Auxly Cannabis Group * (A) | | | 23,074,930 | | | | 7,640,705 | |
Canopy Growth * | | | 586,470 | | | | 15,268,611 | |
Cardiol Therapeutics, Cl A * | | | 710,299 | | | | 1,946,266 | |
Cronos Group * | | | 1,938,432 | | | | 17,346,399 | |
Green Organic Dutchman Holdings * (A) | | | 16,918,060 | | | | 6,652,383 | |
HEXO * (A) | | | 2,362,377 | | | | 16,916,029 | |
| Schedule of Investments | | May 31, 2021 (Unaudited) |
| | Global X Cannabis ETF | |
| | | | | | | |
| COMMON STOCK — continued | | | | | | | | |
| Health Care — continued | | | | | | | | |
MediPharm Labs * (A) | | | 7,666,910 | | | $ | 3,681,132 | |
Organigram Holdings * (A) | | | 3,353,034 | | | | 10,658,651 | |
PharmaCielo * | | | 3,656,015 | | | | 4,388,429 | |
Sundial Growers * | | | 18,301,310 | | | | 17,752,271 | |
Supreme Cannabis * (A) | | | 21,097,431 | | | | 6,199,990 | |
Tetra Bio-Pharma * (A) | | | 11,318,859 | | | | 3,466,869 | |
Tilray, Cl 2 * (A) | | | 861,629 | | | | 14,363,355 | |
Valens * (A) | | | 3,087,485 | | | | 8,817,734 | |
Zenabis Global * | | | 25,787,169 | | | | 3,095,314 | |
| | | | | | | | 158,918,609 | |
| | | | | | | | | |
TOTAL CANADA | | | | | | | 170,198,994 | |
| | | | | | | | | |
| UNITED STATES — 14.4% | | | | | | | | |
| Health Care — 14.4% | | | | | | | | |
cbdMD * (A) | | | 945,662 | | | | 2,865,356 | |
Charlottes Web Holdings * (A) | | | 2,207,905 | | | | 10,765,365 | |
Corbus Pharmaceuticals Holdings * | | | 4,009,680 | | | | 8,701,006 | |
Zynerba Pharmaceuticals * | | | 1,298,547 | | | | 7,375,747 | |
| | | | | | | | | |
TOTAL UNITED STATES | | | | | | | 29,707,474 | |
| | | | | | | | | |
| TOTAL COMMON STOCK | | | | | | | | |
(Cost $219,176,278) | | | | | | | 205,222,569 | |
| | | | | | | | | |
SHORT-TERM INVESTMENT(B)(C) — 10.7% | | | | | | | | |
| Fidelity Investments Money Market Government Portfolio, Cl Institutional, 0.010% | | | | | | | | |
(Cost $21,971,004) | | | 21,971,004 | | | | 21,971,004 | |
| Schedule of Investments | | May 31, 2021 (Unaudited) |
| | Global X Cannabis ETF | |
| | | | | | | |
REPURCHASE AGREEMENT(B) — 10.3% | | | | | | | | |
| BNP Paribas | | | | | | | | |
| 0.000%, dated 05/28/2021, to be repurchased on 06/01/2021, repurchase price $21,079,306 (collateralized by U.S. Treasury Obligations, ranging in par value $418,207 - $3,040,477, 2.000%, 10/31/2022, with a total market value of $21,490,561) | | | | | | | | |
(Cost $21,079,306) | | $ | 21,079,306 | | | $ | 21,079,306 | |
| | | | | | | | | |
| TOTAL INVESTMENTS — 121.0% | | | | | | | | |
(Cost $262,226,588) | | | | | | $ | 248,272,879 | |
Percentages are based on Net Assets of $205,162,620.
| * | Non-income producing security. |
| (A) | This security or a partial position of this security is on loan at May 31, 2021. The total value of securities on loan at May 31, 2021 was $44,029,214. |
| (B) | Security was purchased with cash collateral held from securities on loan. The total value of such securities as of May 31, 2021 was $43,050,310. |
| (C) | The rate reported on the Schedule of Investments is the 7-day effective yield as of May 31, 2021. |
Cl — Class
The following is a summary of the level of inputs used as of May 31, 2021, in valuing the Fund’s investments carried at value:
| Investments in Securities | | | | | | | | | | | | |
| Common Stock | | $ | 205,222,569 | | | $ | — | | | $ | — | | | $ | 205,222,569 | |
| Short-Term Investment | | | 21,971,004 | | | | — | | | | — | | | | 21,971,004 | |
| Repurchase Agreement | | | — | | | | 21,079,306 | | | | — | | | | 21,079,306 | |
| Total Investments in Securities | | $ | 227,193,573 | | | $ | 21,079,306 | | | $ | — | | | $ | 248,272,879 | |
For the period ended May 31, 2021, there were no transfers in or out of Level 3.
| Schedule of Investments | | May 31, 2021 (Unaudited) |
| | Global X Genomics & Biotechnology ETF | |
Sector Weightings †:
† Sector weightings percentages are based on the total market value of investments. Repurchase agreements purchased from cash collateral received for securities lending activity are included in total investments. Please see Notes 2 and 7 in Notes to Financial Statements for more detailed information.
| | | | | | | |
| COMMON STOCK — 100.0% | | | | | | |
| CHINA — 4.2% | | | | | | |
| Health Care — 4.2% | | | | | | |
Genscript Biotech * | | | 2,404,418 | | | $ | 8,472,696 | |
| | | | | | | | | |
| FRANCE — 0.7% | | | | | | | | |
| Health Care — 0.7% | | | | | | | | |
Cellectis ADR * (A) | | | 92,379 | | | | 1,447,579 | |
| | | | | | | | | |
| JAPAN — 1.4% | | | | | | | | |
| Health Care — 1.4% | | | | | | | | |
Takara Bio | | | 102,715 | | | | 2,789,813 | |
| | | | | | | | | |
| NETHERLANDS — 1.9% | | | | | | | | |
| Health Care — 1.9% | | | | | | | | |
ProQR Therapeutics * | | | 113,735 | | | | 709,706 | |
uniQure * | | | 85,043 | | | | 2,953,543 | |
| | | | | | | | | |
TOTAL NETHERLANDS | | | | | | | 3,663,249 | |
| | | | | | | | | |
| SWITZERLAND — 3.7% | | | | | | | | |
| Health Care — 3.7% | | | | | | | | |
CRISPR Therapeutics * | | | 63,802 | | | | 7,540,120 | |
| | | | | | | | | |
| UNITED STATES — 88.1% | | | | | | | | |
| Health Care — 88.1% | | | | | | | | |
Adverum Biotechnologies * | | | 200,321 | | | | 693,111 | |
| Schedule of Investments | | May 31, 2021 (Unaudited) |
| | Global X Genomics & Biotechnology ETF | |
| | | | | | | |
| COMMON STOCK — continued | | | | | | | | |
| Health Care — continued | | | | | | | | |
Agilent Technologies | | | 64,174 | | | $ | 8,864,354 | |
Allogene Therapeutics * | | | 158,233 | | | | 4,066,588 | |
Alnylam Pharmaceuticals * | | | 60,270 | | | | 8,557,737 | |
Arrowhead Pharmaceuticals * | | | 113,872 | | | | 8,267,107 | |
BioMarin Pharmaceutical * | | | 107,506 | | | | 8,310,214 | |
Bluebird Bio * | | | 148,039 | | | | 4,606,974 | |
Blueprint Medicines * | | | 88,936 | | | | 8,124,304 | |
CareDx * | | | 107,516 | | | | 8,644,286 | |
Dicerna Pharmaceuticals * | | | 151,689 | | | | 4,945,061 | |
Editas Medicine, Cl A * | | | 148,817 | | | | 5,052,337 | |
Gilead Sciences | | | 67,075 | | | | 4,434,328 | |
Homology Medicines * | | | 92,079 | | | | 611,405 | |
Illumina * | | | 10,651 | | | | 4,320,472 | |
Intellia Therapeutics * | | | 101,372 | | | | 7,596,818 | |
Invitae * (A) | | | 235,892 | | | | 6,788,972 | |
Luminex | | | 98,589 | | | | 3,636,948 | |
Myriad Genetics * | | | 164,512 | | | | 4,713,269 | |
NanoString Technologies * | | | 100,069 | | | | 5,552,829 | |
Natera * | | | 76,443 | | | | 7,196,344 | |
Pacific Biosciences of California * | | | 257,127 | | | | 6,955,285 | |
Precision BioSciences * | | | 101,538 | | | | 1,069,195 | |
QIAGEN * | | | 177,475 | | | | 8,760,166 | |
REGENXBIO * | | | 81,377 | | | | 2,870,167 | |
Rocket Pharmaceuticals * | | | 130,158 | | | | 5,531,715 | |
Sangamo Therapeutics * | | | 264,894 | | | | 2,855,557 | |
Sarepta Therapeutics * | | | 123,491 | | | | 9,342,094 | |
Sorrento Therapeutics * (A) | | | 584,931 | | | | 4,398,681 | |
Ultragenyx Pharmaceutical * | | | 75,319 | | | | 7,660,696 | |
Veracyte * | | | 148,311 | | | | 5,791,545 | |
Vertex Pharmaceuticals * | | | 20,248 | | | | 4,224,340 | |
Voyager Therapeutics * | | | 126,980 | | | | 540,935 | |
WaVe Life Sciences * | | | 103,900 | | | | 710,676 | |
ZIOPHARM Oncology * (A) | | | 433,899 | | | | 1,319,053 | |
| Schedule of Investments | | May 31, 2021 (Unaudited) |
| | Global X Genomics & Biotechnology ETF | |
| | | | | | | |
| COMMON STOCK — continued | | | | | | | | |
TOTAL UNITED STATES | | | | | | $ | 177,013,563 | |
| | | | | | | | | |
| TOTAL COMMON STOCK | | | | | | | | |
(Cost $208,596,673) | | | | | | | 200,927,020 | |
| | | | | | | | | |
SHORT-TERM INVESTMENT(B)(C) — 1.9% | | | | | | | | |
| Fidelity Investments Money Market Government Portfolio, Cl Institutional, 0.010% | | | | | | | | |
(Cost $3,893,781) | | | 3,893,781 | | | | 3,893,781 | |
| | | | | | | | | |
REPURCHASE AGREEMENT(B) — 1.9% | | | | | | | | |
| BNP Paribas | | | | | | | | |
| 0.000%, dated 05/28/2021, to be repurchased on 06/01/2021, repurchase price $3,735,751 (collateralized by U.S. Treasury Obligations, ranging in par value $74,116 - $538,844, 2.000%, 10/31/2022, with a total market value of $3,808,633) | | | | | | | | |
(Cost $3,735,751) | | $ | 3,735,751 | | | | 3,735,751 | |
| | | | | | | | | |
| TOTAL INVESTMENTS — 103.8% | | | | | | | | |
(Cost $216,226,205) | | | | | | $ | 208,556,552 | |
Percentages are based on Net Assets of $201,012,748.
| * | Non-income producing security. |
| (A) | This security or a partial position of this security is on loan at May 31, 2021. The total value of securities on loan at May 31, 2021 was $7,336,461. |
| (B) | Security was purchased with cash collateral held from securities on loan. The total value of such securities as of May 31, 2021 was $7,629,532. |
| (C) | The rate reported on the Schedule of Investments is the 7-day effective yield as of May 31, 2021. |
ADR — American Depositary Receipt
Cl — Class
| Schedule of Investments | | May 31, 2021 (Unaudited) |
| | Global X Genomics & Biotechnology ETF | |
The following is a summary of the level of inputs used as of May 31, 2021, in valuing the Fund’s investments carried at value:
| Investments in Securities | | | | | | | | | | | | |
| Common Stock | | $ | 200,927,020 | | | $ | — | | | $ | — | | | $ | 200,927,020 | |
| Short-Term Investment | | | 3,893,781 | | | | — | | | | — | | | | 3,893,781 | |
| Repurchase Agreement | | | — | | | | 3,735,751 | | | | — | | | | 3,735,751 | |
| Total Investments in Securities | | $ | 204,820,801 | | | $ | 3,735,751 | | | $ | — | | | $ | 208,556,552 | |
For the period ended May 31, 2021, there were no transfers in or out of Level 3.
| Schedule of Investments | | May 31, 2021 (Unaudited) |
| | Global X China Biotech Innovation ETF | |
Sector Weightings †:
† Sector weightings percentages are based on the total market value of investments.
| | | | | | | |
| COMMON STOCK — 99.8% | | | | | | |
| CHINA — 95.2% | | | | | | |
| Consumer Staples — 4.0% | | | | | | |
Fu Jian Anjoy Foods, Cl A | | | 6,200 | | | $ | 241,877 | |
| Fujian Aonong Biological Technology Group, Cl A | | | 15,320 | | | | 25,475 | |
| | | | | | | | 267,352 | |
| | | | | | | | | |
| Health Care — 91.2% | | | | | | | | |
3SBio * | | | 75,100 | | | | 86,116 | |
Alphamab Oncology * | | | 22,000 | | | | 56,237 | |
| Anhui Anke Biotechnology Group, Cl A | | | 84,780 | | | | 200,218 | |
Ascentage Pharma Group International * | | | 7,300 | | | | 44,299 | |
BeiGene ADR * | | | 1,489 | | | | 533,821 | |
| Beijing SL Pharmaceutical, Cl A | | | 28,700 | | | | 51,465 | |
| Beijing Tiantan Biological Products, Cl A | | | 32,157 | | | | 174,002 | |
| Beijing Wantai Biological Pharmacy Enterprise, Cl A | | | 3,640 | | | | 123,949 | |
Berry Genomics, Cl A * | | | 9,555 | | | | 51,762 | |
BGI Genomics, Cl A | | | 14,738 | | | | 287,262 | |
| Changchun High & New Technology Industry Group, Cl A | | | 6,774 | | | | 425,469 | |
| Da An Gene of Sun Yat-Sen University, Cl A | | | 44,480 | | | | 151,771 | |
Genscript Biotech * | | | 55,950 | | | | 197,157 | |
Getein Biotech, Cl A | | | 6,400 | | | | 31,756 | |
| Guangdong Hybribio Biotech, Cl A | | | 15,142 | | | | 71,948 | |
Guanhao Biotech, Cl A * | | | 13,600 | | | | 48,305 | |
| Hualan Biological Engineering, Cl A | | | 42,600 | | | | 267,032 | |
Jinyu Bio-Technology, Cl A | | | 46,800 | | | | 148,884 | |
Joinn Laboratories China, Cl A | | | 4,500 | | | | 115,989 | |
JW Cayman Therapeutics * | | | 10,500 | | | | 38,826 | |
| Schedule of Investments | | May 31, 2021 (Unaudited) |
| | Global X China Biotech Innovation ETF | |
| | | | | | | |
| COMMON STOCK — continued | | | | | | | | |
| Health Care — continued | | | | | | | | |
Kintor Pharmaceutical * | | | 7,700 | | | $ | 67,759 | |
| PharmaBlock Sciences Nanjing, Cl A | | | 7,981 | | | | 178,180 | |
| Shanghai Haohai Biological Technology, Cl A | | | 1,106 | | | | 31,920 | |
| Shanghai RAAS Blood Products, Cl A | | | 126,900 | | | | 150,642 | |
| Shenzhen Kangtai Biological Products, Cl A | | | 20,071 | | | | 532,369 | |
Shenzhen Neptunus Bioengineering, Cl A * | | | 73,300 | | | | 39,018 | |
| Shenzhen Weiguang Biological Products, Cl A | | | 2,700 | | | | 21,936 | |
| Sichuan Kelun Pharmaceutical, Cl A | | | 42,800 | | | | 148,861 | |
Viva Biotech Holdings | | | 44,900 | | | | 61,089 | |
Walvax Biotechnology, Cl A | | | 55,200 | | | | 588,535 | |
Wuxi Biologics Cayman * | | | 36,950 | | | | 547,954 | |
Zai Lab ADR * | | | 1,665 | | | | 295,804 | |
| Zhejiang Wolwo Bio-Pharmaceutical, Cl A | | | 26,300 | | | | 279,209 | |
| | | | | | | | 6,049,544 | |
| | | | | | | | | |
TOTAL CHINA | | | | | | | 6,316,896 | |
| | | | | | | | | |
| HONG KONG — 4.6% | | | | | | | | |
| Health Care — 4.6% | | | | | | | | |
Sino Biopharmaceutical | | | 272,900 | | | | 302,382 | |
| | | | | | | | | |
| TOTAL COMMON STOCK | | | | | | | | |
(Cost $5,768,522) | | | | | | | 6,619,278 | |
| | | | | | | | | |
| TOTAL INVESTMENTS — 99.8% | | | | | | | | |
(Cost $5,768,522) | | | | | | $ | 6,619,278 | |
Percentages are based on Net Assets of $6,632,105.
| * | Non-income producing security. |
ADR — American Depositary Receipt
Cl — Class
As of May 31, 2021, all of the Fund’s investments were considered Level 1, in accordance with authoritative guidance on fair value measurements and disclosure under U.S. GAAP.
For the period ended May 31, 2021, there were no transfers in or out of Level 3.
| Schedule of Investments | | May 31, 2021 (Unaudited) |
| | Global X Telemedicine & Digital Health ETF | |
Sector Weightings †:
† Sector weightings percentages are based on the total market value of investments. Repurchase agreements purchased from cash collateral received for securities lending activity are included in total investments. Please see Notes 2 and 7 in Notes to Financial Statements for more detailed information.
| | | | | | | |
| COMMON STOCK — 99.9% | | | | | | |
| CHINA — 11.4% | | | | | | |
| Consumer Discretionary — 3.7% | | | | | | |
JD Health International * | | | 1,980,100 | | | $ | 27,144,578 | |
| | | | | | | | | |
| Health Care — 7.7% | | | | | | | | |
Alibaba Health Information Technology * | | | 10,349,000 | | | | 25,627,492 | |
Ping An Healthcare and Technology * | | | 2,666,500 | | | | 30,627,904 | |
| | | | | | | | 56,255,396 | |
| | | | | | | | | |
TOTAL CHINA | | | | | | | 83,399,974 | |
| | | | | | | | | |
| GERMANY — 2.0% | | | | | | | | |
| Health Care — 2.0% | | | | | | | | |
| CompuGroup Medical & KgaA | | | 177,319 | | | | 14,601,623 | |
| | | | | | | | | |
| JAPAN — 4.1% | | | | | | | | |
| Health Care — 4.1% | | | | | | | | |
M3 | | | 447,925 | | | | 30,184,789 | |
| | | | | | | | | |
| UNITED STATES — 82.4% | | | | | | | | |
| Consumer Staples — 0.4% | | | | | | | | |
LifeMD * (A) | | | 241,898 | | | | 3,115,646 | |
| Schedule of Investments | | May 31, 2021 (Unaudited) |
| | Global X Telemedicine & Digital Health ETF | |
| | �� | | | | | |
| COMMON STOCK — continued | | | | | | | | |
| Financials — 1.1% | | | | | | | | |
eHealth * | | | 119,731 | | | $ | 7,812,448 | |
| | | | | | | | | |
| Health Care — 76.6% | | | | | | | | |
1Life Healthcare * | | | 691,388 | | | | 25,581,356 | |
Agilent Technologies | | | 237,409 | | | | 32,793,305 | |
Allscripts Healthcare Solutions * | | | 886,674 | | | | 15,419,261 | |
American Well, Cl A * | | | 1,000,937 | | | | 12,461,666 | |
Cerner | | | 426,946 | | | | 33,408,524 | |
Change Healthcare * | | | 1,380,695 | | | | 32,363,491 | |
Computer Programs and Systems * | | | 89,291 | | | | 2,890,350 | |
DarioHealth * (A) | | | 107,818 | | | | 1,754,199 | |
DexCom * | | | 75,528 | | | | 27,899,288 | |
Evolent Health, Cl A * | | | 554,149 | | | | 10,767,115 | |
GoodRx Holdings, Cl A * (A) | | | 373,462 | | | | 13,859,175 | |
Guardant Health * | | | 195,621 | | | | 24,280,479 | |
Illumina * | | | 78,905 | | | | 32,007,024 | |
Inovalon Holdings, Cl A * | | | 482,512 | | | | 15,131,576 | |
Invitae * (A) | | | 877,054 | | | | 25,241,614 | |
iRhythm Technologies * | | | 186,896 | | | | 14,103,172 | |
Laboratory Corp of America Holdings * | | | 121,836 | | | | 33,441,545 | |
NextGen Healthcare * | | | 352,670 | | | | 5,790,841 | |
Omnicell * | | | 224,570 | | | | 31,215,230 | |
Ontrak * (A) | | | 71,845 | | | | 2,182,651 | |
OptimizeRx * | | | 92,505 | | | | 4,543,846 | |
Personalis * | | | 226,183 | | | | 5,086,856 | |
Phreesia * | | | 280,700 | | | | 13,894,650 | |
R1 RCM * | | | 767,784 | | | | 17,774,200 | |
Signify Health, Cl A * | | | 408,036 | | | | 10,323,311 | |
SmileDirectClub, Cl A * (A) | | | 669,940 | | | | 5,500,207 | |
SOC Telemed, Cl A * (A) | | | 317,096 | | | | 1,902,576 | |
Tabula Rasa HealthCare * (A) | | | 145,343 | | | | 6,280,271 | |
Tandem Diabetes Care * | | | 335,135 | | | | 28,617,178 | |
Teladoc Health * | | | 172,568 | | | | 25,985,289 | |
UnitedHealth Group | | | 81,122 | | | | 33,415,774 | |
| Schedule of Investments | | May 31, 2021 (Unaudited) |
| | Global X Telemedicine & Digital Health ETF | |
| | | | | | | |
| COMMON STOCK — continued | | | | | | | | |
| Health Care — continued | | | | | | | | |
Veracyte * | | | 431,848 | | | $ | 16,863,664 | |
| | | | | | | | 562,779,684 | |
| | | | | | | | | |
| Information Technology — 4.3% | | | | | | | | |
Nuance Communications * | | | 602,725 | | | | 31,884,152 | |
| | | | | | | | | |
TOTAL UNITED STATES | | | | | | | 605,591,930 | |
| | | | | | | | | |
| TOTAL COMMON STOCK | | | | | | | | |
(Cost $714,374,466) | | | | | | | 733,778,316 | |
| | | | | | | | | |
SHORT-TERM INVESTMENT(B)(C) — 2.1% | | | | | | | | |
| Fidelity Investments Money Market Government Portfolio, Cl Institutional, 0.010% | | | | | | | | |
(Cost $15,298,641) | | | 15,298,641 | | | | 15,298,641 | |
| | | | | | | | | |
REPURCHASE AGREEMENT(B) — 2.0% | | | | | | | | |
| BNP Paribas | | | | | | | | |
| 0.000%, dated 05/28/2021, to be repurchased on 06/01/2021, repurchase price $14,677,742 (collateralized by U.S. Treasury Obligations, ranging in par value $291,202 - $2,117,116, 2.000%, 10/31/2022, with a total market value of $14,964,103) | | | | | | | | |
(Cost $14,677,742) | | $ | 14,677,742 | | | | 14,677,742 | |
| | | | | | | | | |
| TOTAL INVESTMENTS — 104.0% | | | | | | | | |
(Cost $744,350,849) | | | | | | $ | 763,754,699 | |
Percentages are based on Net Assets of $734,709,380.
| * | Non-income producing security. |
| (A) | This security or a partial position of this security is on loan at May 31, 2021. The total value of securities on loan at May 31, 2021 was $29,099,220. |
| Schedule of Investments | | May 31, 2021 (Unaudited) |
| | Global X Telemedicine & Digital Health ETF | |
| (B) | Security was purchased with cash collateral held from securities on loan. The total value of such securities as of May 31, 2021 was $29,976,383. |
| (C) | The rate reported on the Schedule of Investments is the 7-day effective yield as of May 31, 2021. |
Cl — Class
The following is a summary of the level of inputs used as of May 31, 2021, in valuing the Fund’s investments carried at value:
| Investments in Securities | | | | | | | | | | | | |
| Common Stock | | $ | 733,778,316 | | | $ | — | | | $ | — | | | $ | 733,778,316 | |
| Short-Term Investment | | | 15,298,641 | | | | — | | | | — | | | | 15,298,641 | |
| Repurchase Agreement | | | — | | | | 14,677,742 | | | | — | | | | 14,677,742 | |
| Total Investments in Securities | | $ | 749,076,957 | | | $ | 14,677,742 | | | $ | — | | | $ | 763,754,699 | |
For the period ended May 31, 2021, there were no transfers in or out of Level 3.
| Schedule of Investments | | May 31, 2021 (Unaudited) |
| | Global X Aging Population ETF | |
Sector Weightings †:
† Sector weightings percentages are based on the total market value of investments.
| | | | | | | |
| COMMON STOCK — 99.7% | | | | | | |
| AUSTRALIA — 0.6% | | | | | | |
| Health Care — 0.6% | | | | | | |
Cochlear | | | 1,621 | | | $ | 281,472 | |
| | | | | | | | | |
| BELGIUM — 1.3% | | | | | | | | |
| Health Care — 1.0% | | | | | | | | |
UCB | | | 4,805 | | | | 451,398 | |
| | | | | | | | | |
| Real Estate — 0.3% | | | | | | | | |
Aedifica ‡ | | | 1,045 | | | | 135,316 | |
| | | | | | | | | |
TOTAL BELGIUM | | | | | | | 586,714 | |
| | | | | | | | | |
| CANADA — 0.3% | | | | | | | | |
| Health Care — 0.3% | | | | | | | | |
| Chartwell Retirement Residences | | | 12,785 | | | | 138,857 | |
| | | | | �� | | | | |
| CHINA — 5.9% | | | | | | | | |
| Health Care — 5.9% | | | | | | | | |
AK Medical Holdings | | | 91,600 | | | | 163,574 | |
BeiGene ADR * | | | 2,312 | | | | 828,875 | |
Beijing Chunlizhengda Medical Instruments, Cl H * | | | 50,300 | | | | 174,655 | |
Hansoh Pharmaceutical Group | | | 147,000 | | | | 626,902 | |
Lifetech Scientific * | | | 254,200 | | | | 157,207 | |
Luye Pharma Group * | | | 221,547 | | | | 150,143 | |
Microport Scientific | | | 44,800 | | | | 349,211 | |
Venus MedTech Hangzhou, Cl H * | | | 14,700 | | | | 131,157 | |
| | | | | | | | | |
TOTAL CHINA | | | | | | | 2,581,724 | |
| Schedule of Investments | | May 31, 2021 (Unaudited) |
| | Global X Aging Population ETF | |
| | | | | | | |
| COMMON STOCK — continued | | | | | | | | |
| DENMARK — 6.2% | | | | | | | | |
| Health Care — 6.2% | | | | | | | | |
Demant * | | | 5,961 | | | $ | 318,416 | |
Genmab * | | | 1,627 | | | | 664,941 | |
GN Store Nord | | | 3,526 | | | | 299,761 | |
Novo Nordisk, Cl B | | | 18,587 | | | | 1,469,490 | |
| | | | | | | | | |
TOTAL DENMARK | | | | | | | 2,752,608 | |
| | | | | | | | | |
| FRANCE — 0.8% | | | | | | | | |
| Health Care — 0.8% | | | | | | | | |
Korian | | | 3,303 | | | | 120,867 | |
Orpea | | | 1,590 | | | | 199,786 | |
| | | | | | | | | |
TOTAL FRANCE | | | | | | | 320,653 | |
| | | | | | | | | |
| GERMANY — 1.2% | | | | | | | | |
| Health Care — 1.2% | | | | | | | | |
| Fresenius Medical Care & KGaA | | | 7,404 | | | | 593,279 | |
| | | | | | | | | |
| IRELAND — 0.2% | | | | | | | | |
| Health Care — 0.2% | | | | | | | | |
Amarin ADR * | | | 20,779 | | | | 94,337 | |
| | | | | | | | | |
| ITALY — 0.6% | | | | | | | | |
| Health Care — 0.6% | | | | | | | | |
Amplifon | | | 5,607 | | | | 263,575 | |
| | | | | | | | | |
| JAPAN — 6.8% | | | | | | | | |
| Health Care — 6.8% | | | | | | | | |
Astellas Pharma | | | 46,954 | | | | 751,648 | |
Chugai Pharmaceutical | | | 32,209 | | | | 1,223,927 | |
Kissei Pharmaceutical | | | 5,880 | | | | 114,365 | |
Nipro | | | 11,346 | | | | 140,516 | |
Terumo | | | 19,203 | | | | 744,023 | |
| | | | | | | | | |
| Schedule of Investments | | May 31, 2021 (Unaudited) |
| | Global X Aging Population ETF | |
| | | | | | | |
| COMMON STOCK — continued | | | | | | | | |
TOTAL JAPAN | | | | | | $ | 2,974,479 | |
| | | | | | | | | |
| NEW ZEALAND — 0.3% | | | | | | | | |
| Health Care — 0.3% | | | | | | | | |
Ryman Healthcare | | | 12,215 | | | | 115,658 | |
| | | | | | | | | |
| SOUTH KOREA — 1.9% | | | | | | | | |
| Health Care — 1.9% | | | | | | | | |
Celltrion * | | | 3,467 | | | | 850,197 | |
| | | | | | | | | |
| SPAIN — 0.2% | | | | | | | | |
| Health Care — 0.2% | | | | | | | | |
Pharma Mar | | | 1,079 | | | | 100,603 | |
| | | | | | | | | |
| SWEDEN — 0.3% | | | | | | | | |
| Health Care — 0.3% | | | | | | | | |
Elekta, Cl B | | | 9,133 | | | | 126,375 | |
| | | | | | | | | |
| SWITZERLAND — 7.9% | | | | | | | | |
| Health Care — 7.9% | | | | | | | | |
Alcon | | | 12,582 | | | | 878,454 | |
Roche Holding | | | 3,689 | | | | 1,394,365 | |
Sonova Holding | | | 1,604 | | | | 568,319 | |
Straumann Holding | | | 397 | | | | 621,932 | |
| | | | | | | | | |
TOTAL SWITZERLAND | | | | | | | 3,463,070 | |
| | | | | | | | | |
| UNITED KINGDOM — 4.6% | | | | | | | | |
| Health Care — 4.6% | | | | | | | | |
AstraZeneca ADR | | | 26,011 | | | | 1,476,645 | |
Smith & Nephew | | | 21,715 | | | | 474,301 | |
| | | | | | | | | |
TOTAL UNITED KINGDOM | | | | | | | 1,950,946 | |
| Schedule of Investments | | May 31, 2021 (Unaudited) |
| | Global X Aging Population ETF | |
| | | | | | | |
| COMMON STOCK — continued | | | | | | | | |
| UNITED STATES — 60.6% | | | | | | | | |
| Health Care — 56.2% | | | | | | | | |
AbbVie | | | 12,134 | | | $ | 1,373,568 | |
ABIOMED * | | | 1,120 | | | | 318,730 | |
ACADIA Pharmaceuticals * | | | 6,050 | | | | 135,157 | |
Aerie Pharmaceuticals * | | | 6,588 | | | | 107,319 | |
Agios Pharmaceuticals * | | | 2,365 | | | | 131,920 | |
Alector * | | | 6,363 | | | | 113,261 | |
Alphatec Holdings * | | | 7,196 | | | | 104,342 | |
Amedisys * | | | 810 | | | | 209,280 | |
Amgen | | | 5,212 | | | | 1,240,143 | |
AngioDynamics * | | | 5,174 | | | | 119,623 | |
Arena Pharmaceuticals * | | | 1,883 | | | | 115,070 | |
Biogen * | | | 3,832 | | | | 1,024,983 | |
Bluebird Bio * | | | 4,332 | | | | 134,812 | |
Blueprint Medicines * | | | 1,419 | | | | 129,626 | |
Boston Scientific * | | | 33,244 | | | | 1,414,533 | |
Bristol-Myers Squibb | | | 20,792 | | | | 1,366,450 | |
Brookdale Senior Living * | | | 17,968 | | | | 121,104 | |
DaVita * | | | 2,742 | | | | 329,232 | |
Denali Therapeutics * | | | 2,966 | | | | 188,608 | |
DexCom * | | | 2,434 | | | | 899,095 | |
Edwards Lifesciences * | | | 15,296 | | | | 1,466,887 | |
Eli Lilly | | | 7,053 | | | | 1,408,766 | |
Ensign Group | | | 1,350 | | | | 112,320 | |
Epizyme * | | | 14,849 | | | | 122,207 | |
Exact Sciences * | | | 4,192 | | | | 463,342 | |
Exelixis * | | | 7,660 | | | | 172,733 | |
FibroGen * | | | 6,651 | | | | 141,334 | |
Glaukos * | | | 1,474 | | | | 108,457 | |
Halozyme Therapeutics * | | | 3,545 | | | | 146,798 | |
Heron Therapeutics * | | | 7,244 | | | | 96,128 | |
Incyte * | | | 5,430 | | | | 454,925 | |
| Schedule of Investments | | May 31, 2021 (Unaudited) |
| | Global X Aging Population ETF | |
| | | | | | | |
| COMMON STOCK — continued | | | | | | | | |
| Health Care — continued | | | | | | | | |
Inogen * | | | 2,389 | | | $ | 147,664 | |
Insulet * | | | 1,638 | | | | 441,719 | |
Integer Holdings * | | | 1,373 | | | | 124,215 | |
Johnson & Johnson | | | 7,900 | | | | 1,337,075 | |
LHC Group * | | | 780 | | | | 153,543 | |
LivaNova * | | | 1,567 | | | | 130,907 | |
MannKind * | | | 28,952 | | | | 127,968 | |
Medtronic | | | 10,668 | | | | 1,350,463 | |
Merit Medical Systems * | | | 2,089 | | | | 126,050 | |
National HealthCare | | | 1,651 | | | | 120,870 | |
Neurocrine Biosciences * | | | 2,313 | | | | 222,557 | |
Novocure * | | | 2,539 | | | | 517,956 | |
NuVasive * | | | 1,856 | | | | 126,579 | |
Omeros * | | | 7,067 | | | | 107,348 | |
Pennant Group * | | | 2,841 | | | | 97,361 | |
Radius Health * | | | 6,292 | | | | 121,373 | |
Regeneron Pharmaceuticals * | | | 2,703 | | | | 1,358,068 | |
Seagen * | | | 4,575 | | | | 710,726 | |
Silk Road Medical * | | | 2,514 | | | | 122,130 | |
Stryker | | | 5,152 | | | �� | 1,315,151 | |
Tactile Systems Technology * | | | 2,412 | | | | 129,693 | |
Teleflex | | | 1,184 | | | | 476,193 | |
Theravance Biopharma * | | | 5,744 | | | | 99,256 | |
United Therapeutics * | | | 1,093 | | | | 203,189 | |
Zimmer Biomet Holdings | | | 5,248 | | | | 883,396 | |
| | | | | | | | 24,822,203 | |
| | | | | | | | | |
| Real Estate — 4.4% | | | | | | | | |
Diversified Healthcare Trust ‡ | | | 25,962 | | | | 94,242 | |
LTC Properties ‡ | | | 2,864 | | | | 112,212 | |
National Health Investors ‡ | | | 1,674 | | | | 110,333 | |
Omega Healthcare Investors ‡ | | | 5,695 | | | | 208,551 | |
Sabra Health Care ‡ | | | 6,764 | | | | 118,167 | |
Ventas ‡ | | | 9,102 | | | | 504,706 | |
| Schedule of Investments | | May 31, 2021 (Unaudited) |
| | Global X Aging Population ETF | |
| | | | | | | |
| COMMON STOCK — continued | | | | | | | | |
| Real Estate — continued | | | | | | | | |
Welltower ‡ | | | 10,517 | | | $ | 786,356 | |
| | | | | | | | 1,934,567 | |
| | | | | | | | | |
TOTAL UNITED STATES | | | | | | | 26,756,770 | |
| | | | | | | | | |
| TOTAL COMMON STOCK | | | | | | | | |
(Cost $40,617,608) | | | | | | | 43,951,317 | |
| | | | | | | | | |
| TOTAL INVESTMENTS — 99.7% | | | | | | | | |
(Cost $40,617,608) | | | | | | $ | 43,951,317 | |
Percentages are based on Net Assets of $44,074,503.
| * | Non-income producing security. |
| ‡ | Real Estate Investment Trust |
ADR — American Depositary Receipt
Cl — Class
As of May 31, 2021, all of the Fund’s investments were considered Level 1, in accordance with authoritative guidance on fair value measurements and disclosure under U.S. GAAP.
For the period ended May 31, 2021, there were no transfers in or out of Level 3.
| Schedule of Investments | | May 31, 2021 (Unaudited) |
| | Global X Health & Wellness ETF | |
Sector Weightings †:
† Sector weightings percentages are based on the total market value of investments.
| | | | | | | |
| COMMON STOCK — 99.8% | | | | | | |
| AUSTRALIA — 0.4% | | | | | | |
| Consumer Staples — 0.4% | | | | | | |
Blackmores | | | 2,307 | | | $ | 123,416 | |
| | | | | | | | | |
| CANADA — 2.6% | | | | | | | | |
| Consumer Discretionary — 2.6% | | | | | | | | |
Gildan Activewear | | | 23,723 | | | | 858,191 | |
| | | | | | | | | |
| CHINA — 10.6% | | | | | | | | |
| Consumer Discretionary — 10.6% | | | | | | | | |
ANTA Sports Products | | | 53,644 | | | | 1,081,657 | |
Li Ning | | | 130,714 | | | | 1,202,470 | |
| Topsports International Holdings | | | 621,870 | | | | 963,071 | |
Xtep International Holdings | | | 304,001 | | | | 334,101 | |
| | | | | | | | | |
TOTAL CHINA | | | | | | | 3,581,299 | |
| | | | | | | | | |
| FRANCE — 2.8% | | | | | | | | |
| Consumer Staples — 2.8% | | | | | | | | |
Danone | | | 12,977 | | | | 924,128 | |
| | | | | | | | | |
| GERMANY — 6.0% | | | | | | | | |
| Consumer Discretionary — 6.0% | | | | | | | | |
adidas | | | 2,818 | | | | 1,027,589 | |
Puma | | | 8,651 | | | | 988,692 | |
| | | | | | | | | |
TOTAL GERMANY | | | | | | | 2,016,281 | |
| | | | | | | | | |
| Schedule of Investments | | May 31, 2021 (Unaudited) |
| | Global X Health & Wellness ETF | |
| | | | | | | |
| COMMON STOCK — continued | | | | | | | | |
| HONG KONG — 1.7% | | | | | | | | |
| Consumer Discretionary — 1.7% | | | | | | | | |
Huayi Tencent Entertainment * | | | 1,601,851 | | | $ | 76,362 | |
Yue Yuen Industrial Holdings * | | | 192,591 | | | | 502,476 | |
| | | | | | | | | |
TOTAL HONG KONG | | | | | | | 578,838 | |
| | | | | | | | | |
| IRELAND — 1.8% | | | | | | | | |
| Consumer Staples — 1.8% | | | | | | | | |
Glanbia | | | 34,834 | | | | 580,906 | |
| | | | | | | | | |
| ITALY — 0.9% | | | | | | | | |
| Consumer Discretionary — 0.9% | | | | | | | | |
Technogym | | | 24,040 | | | | 304,849 | |
| | | | | | | | | |
| JAPAN — 12.7% | | | | | | | | |
| Consumer Discretionary — 8.2% | | | | | | | | |
ABC-Mart | | | 9,861 | | | | 566,688 | |
Asics | | | 22,681 | | | | 544,468 | |
Curves Holdings | | | 11,160 | | | | 89,300 | |
Descente | | | 9,165 | | | | 158,924 | |
Fast Fitness Japan | | | 2,336 | | | | 126,385 | |
Goldwin | | | 5,665 | | | | 315,252 | |
Shimano | | | 3,859 | | | | 879,175 | |
| | | | | | | | 2,680,192 | |
| | | | | | | | | |
| Consumer Staples — 3.6% | | | | | | | | |
Ariake Japan | | | 3,918 | | | | 228,008 | |
Yakult Honsha | | | 18,267 | | | | 986,643 | |
| | | | | | | | 1,214,651 | |
| | | | | | | | | |
| Health Care — 0.9% | | | | | | | | |
Tsumura | | | 9,164 | | | | 297,064 | |
| | | | | | | | | |
TOTAL JAPAN | | | | | | | 4,191,907 | |
| Schedule of Investments | | May 31, 2021 (Unaudited) |
| | Global X Health & Wellness ETF | |
| | | | | | | |
| COMMON STOCK — continued | | | | | | | | |
| NETHERLANDS — 1.0% | | | | | | | | |
| Consumer Discretionary — 1.0% | | | | | | | | |
Basic-Fit * | | | 7,169 | | | $ | 344,774 | |
| | | | | | | | | |
| SOUTH KOREA — 2.2% | | | | | | | | |
| Consumer Discretionary — 2.2% | | | | | | | | |
Fila Holdings | | | 7,250 | | | | 356,877 | |
Hwaseung Enterprise | | | 7,205 | | | | 121,774 | |
Youngone | | | 5,285 | | | | 225,085 | |
| | | | | | | | | |
TOTAL SOUTH KOREA | | | | | | | 703,736 | |
| | | | | | | | | |
| TAIWAN — 7.9% | | | | | | | | |
| Consumer Discretionary — 7.9% | | | | | | | | |
Dyaco International | | | 23,013 | | | | 75,160 | |
Feng TAY Enterprise | | | 105,081 | | | | 928,060 | |
| Fulgent Sun International Holding | | | 22,765 | | | | 101,349 | |
Giant Manufacturing | | | 44,858 | | | | 538,480 | |
Johnson Health Tech | | | 35,901 | | | | 103,146 | |
Merida Industry | | | 35,560 | | | | 411,484 | |
Pou Chen | | | 351,886 | | | | 485,198 | |
| | | | | | | | | |
TOTAL TAIWAN | | | | | | | 2,642,877 | |
| | | | | | | | | |
| UNITED KINGDOM — 4.7% | | | | | | | | |
| Consumer Discretionary — 4.7% | | | | | | | | |
Frasers Group * | | | 62,053 | | | | 509,417 | |
JD Sports Fashion | | | 77,452 | | | | 1,037,980 | |
| | | | | | | | | |
TOTAL UNITED KINGDOM | | | | | | | 1,547,397 | |
| | | | | | | | | |
| UNITED STATES — 44.5% | | | | | | | | |
| Consumer Discretionary — 27.0% | | | | | | | | |
Columbia Sportswear | | | 7,935 | | | | 815,163 | |
Dick’s Sporting Goods | | | 7,831 | | | | 763,757 | |
Foot Locker | | | 12,344 | | | | 781,252 | |
| Schedule of Investments | | May 31, 2021 (Unaudited) |
| | Global X Health & Wellness ETF | |
| | | | | | | |
| COMMON STOCK — continued | | | | | | | | |
| Consumer Discretionary — continued | | | | | | | | |
Hibbett Sports * | | | 1,928 | | | $ | 163,417 | |
Lululemon Athletica * | | | 2,965 | | | | 958,080 | |
Nautilus * | | | 5,354 | | | | 96,426 | |
NIKE, Cl B | | | 6,935 | | | | 946,350 | |
Peloton Interactive, Cl A * | | | 7,500 | | | | 827,324 | |
Planet Fitness, Cl A * | | | 9,937 | | | | 782,738 | |
Shoe Carnival | | | 1,678 | | | | 113,282 | |
Skechers USA, Cl A * | | | 16,349 | | | | 776,578 | |
Under Armour, Cl A * | | | 22,544 | | | | 509,044 | |
VF | | | 11,164 | | | | 889,994 | |
WW International * | | | 8,269 | | | | 324,972 | |
Zumiez * | | | 3,050 | | | | 133,651 | |
| | | | | | | | 8,882,028 | |
| | | | | | | | | |
| Consumer Staples — 12.6% | | | | | | | | |
BellRing Brands, Cl A * | | | 4,703 | | | | 134,882 | |
Calavo Growers | | | 2,112 | | | | 150,374 | |
Cal-Maine Foods | | | 5,259 | | | | 183,592 | |
Celsius Holdings * | | | 8,676 | | | | 568,625 | |
Hain Celestial Group * | | | 11,942 | | | | 486,756 | |
Herbalife Nutrition * | | | 14,126 | | | | 742,603 | |
Medifast | | | 1,402 | | | | 465,815 | |
Nu Skin Enterprises, Cl A | | | 6,074 | | | | 365,412 | |
Sanderson Farms | | | 2,672 | | | | 434,868 | |
Sprouts Farmers Market * | | | 14,092 | | | | 374,847 | |
USANA Health Sciences * | | | 2,463 | | | | 260,438 | |
| | | | | | | | 4,168,212 | |
| | | | | | | | | |
| Health Care — 4.1% | | | | | | | | |
DexCom * | | | 2,455 | | | | 906,852 | |
Prestige Consumer Healthcare * | | | 5,955 | | | | 296,976 | |
Tivity Health * | | | 5,863 | | | | 153,611 | |
| | | | | | | | 1,357,439 | |
| Schedule of Investments | | May 31, 2021 (Unaudited) |
| | Global X Health & Wellness ETF | |
| | | | | | | |
| COMMON STOCK — continued | | | | | | | | |
| Industrials — 0.8% | | | | | | | | |
Healthcare Services Group | | | 8,917 | | | $ | 267,421 | |
| | | | | | | | | |
TOTAL UNITED STATES | | | | | | | 14,675,100 | |
| | | | | | | | | |
| TOTAL COMMON STOCK | | | | | | | | |
(Cost $28,170,100) | | | | | | | 33,073,699 | |
| | | | | | | | | |
| TOTAL INVESTMENTS — 99.8% | | | | | | | | |
(Cost $28,170,100) | | | | | | $ | 33,073,699 | |
Percentages are based on Net Assets of $33,133,293.
| * | Non-income producing security. |
Cl — Class
As of May 31, 2021, all of the Fund’s investments were considered Level 1, in accordance with authoritative guidance on fair value measurements and disclosure under U.S. GAAP.
For the period ended May 31, 2021, there were no transfers in or out of Level 3.
| Schedule of Investments | | May 31, 2021 (Unaudited) |
| | | |
Sector Weightings †:
† Sector weightings percentages are based on the total market value of investments.
| | | | | | | |
| COMMON STOCK — 100.3% | | | | | | |
| CANADA — 4.0% | | | | | | |
| Industrials — 2.7% | | | | | | |
Ballard Power Systems * | | | 210,330 | | | $ | 3,642,916 | |
| | | | | | | | | |
| Information Technology — 1.3% | | | | | | | | |
Canadian Solar * | | | 42,215 | | | | 1,670,870 | |
| | | | | | | | | |
TOTAL CANADA | | | | | | | 5,313,786 | |
| | | | | | | | | |
| CHINA — 17.4% | | | | | | | | |
| Industrials — 2.9% | | | | | | | | |
| China Everbright Environment Group | | | 4,343,000 | | | | 2,590,748 | |
Dongfang Electric, Cl H | | | 498,300 | | | | 452,621 | |
| Xinjiang Goldwind Science & Technology, Cl H | | | 544,700 | | | | 909,529 | |
| | | | | | | | 3,952,898 | |
| | | | | | | | | |
| Information Technology — 14.5% | | | | | | | | |
Daqo New Energy ADR * | | | 49,189 | | | | 3,658,678 | |
Flat Glass Group, Cl H | | | 313,600 | | | | 884,860 | |
GCL-Poly Energy Holdings *(A)(B)(C) | | | 20,561,800 | | | | 4,532,524 | |
JinkoSolar Holding ADR * | | | 31,950 | | | | 1,169,690 | |
Xinyi Solar Holdings | | | 5,057,800 | | | | 8,979,769 | |
| | | | | | | | 19,225,521 | |
| | | | | | | | | |
TOTAL CHINA | | | | | | | 23,178,419 | |
| Schedule of Investments | | May 31, 2021 (Unaudited) |
| | Global X CleanTech ETF | |
| | | | | | | |
| COMMON STOCK — continued | | | | | | | | |
| DENMARK — 7.4% | | | | | | | | |
| Industrials — 7.4% | | | | | | | | |
Vestas Wind Systems | | | 247,577 | | | $ | 9,684,331 | |
| | | | | | | | | |
| GERMANY — 5.7% | | | | | | | | |
| Industrials — 4.7% | | | | | | | | |
Nordex * | | | 82,950 | | | | 1,901,670 | |
Varta * | | | 28,626 | | | | 4,355,342 | |
| | | | | | | | 6,257,012 | |
| | | | | | | | | |
| Information Technology — 1.0% | | | | | | | | |
SMA Solar Technology | | | 24,446 | | | | 1,363,273 | |
| | | | | | | | | |
TOTAL GERMANY | | | | | | | 7,620,285 | |
| | | | | | | | | |
| NETHERLANDS — 1.0% | | | | | | | | |
| Industrials — 1.0% | | | | | | | | |
Alfen Beheer BV * | | | 15,356 | | | | 1,326,244 | |
| | | | | | | | | |
| NORWAY — 1.7% | | | | | | | | |
| Industrials — 1.7% | | | | | | | | |
NEL, Cl A * | | | 1,030,503 | | | | 2,255,694 | |
| | | | | | | | | |
| SOUTH KOREA — 13.7% | | | | | | | | |
| Industrials — 2.8% | | | | | | | | |
CS Wind | | | 29,775 | | | | 2,055,658 | |
Doosan Fuel Cell * | | | 46,277 | | | | 1,773,820 | |
| | | | | | | | 3,829,478 | |
| | | | | | | | | |
| Information Technology — 6.8% | | | | | | | | |
Samsung SDI | | | 15,626 | | | | 8,966,772 | |
| | | | | | | | | |
| Materials — 4.1% | | | | | | | | |
Hanwha Solutions * | | | 135,412 | | | | 5,493,942 | |
| | | | | | | | | |
TOTAL SOUTH KOREA | | | | | | | 18,290,192 | |
| Schedule of Investments | | May 31, 2021 (Unaudited) |
| | Global X CleanTech ETF | |
| | | | | | | |
| COMMON STOCK — continued | | | | | | | | |
| SPAIN — 6.5% | | | | | | | | |
| Industrials — 6.5% | | | | | | | | |
Siemens Gamesa Renewable Energy * | | | 261,678 | | | $ | 8,641,634 | |
| | | | | | | | | |
| SWEDEN — 0.7% | | | | | | | | |
| Industrials — 0.7% | | | | | | | | |
PowerCell Sweden * | | | 36,542 | | | | 914,670 | |
| | | | | | | | | |
| SWITZERLAND — 1.1% | | | | | | | | |
| Information Technology — 1.1% | | | | | | | | |
Landis+Gyr Group | | | 20,351 | | | | 1,483,279 | |
| | | | | | | | | |
| TAIWAN — 1.3% | | | | | | | | |
| Information Technology — 1.3% | | | | | | | | |
Simplo Technology | | | 134,864 | | | | 1,774,494 | |
| | | | | | | | | |
| UNITED KINGDOM — 7.5% | | | | | | | | |
| Industrials — 3.0% | | | | | | | | |
Ceres Power Holdings * | | | 121,624 | | | | 1,874,481 | |
ITM Power * | | | 389,376 | | | | 2,171,880 | |
| | | | | | | | 4,046,361 | |
| | | | | | | | | |
| Materials — 4.5% | | | | | | | | |
Johnson Matthey | | | 137,068 | | | | 5,919,680 | |
| | | | | | | | | |
TOTAL UNITED KINGDOM | | | | | | | 9,966,041 | |
| | | | | | | | | |
| UNITED STATES — 32.3% | | | | | | | | |
| Consumer Discretionary — 2.4% | | | | | | | | |
QuantumScape, Cl A * | | | 121,915 | | | | 3,156,379 | |
| | | | | | | | | |
| Industrials — 12.4% | | | | | | | | |
Ameresco, Cl A * | | | 21,297 | | | | 1,144,927 | |
Array Technologies * | | | 89,797 | | | | 1,463,691 | |
Bloom Energy, Cl A * | | | 101,895 | | | | 2,462,802 | |
FuelCell Energy * | | | 228,095 | | | | 2,239,893 | |
| Schedule of Investments | | May 31, 2021 (Unaudited) |
| | Global X CleanTech ETF | |
| | | | | | | |
| COMMON STOCK — continued | | | | | | | | |
| Industrials — continued | | | | | | | | |
Plug Power * | | | 196,420 | | | $ | 6,030,094 | |
Shoals Technologies Group, Cl A * | | | 66,064 | | | | 1,823,366 | |
TPI Composites * | | | 25,819 | | | | 1,247,058 | |
| | | | | | | | 16,411,831 | |
| | | | | | | | | |
| Information Technology — 17.5% | | | | | | | | |
Enphase Energy * | | | 57,207 | | | | 8,183,461 | |
First Solar * | | | 75,082 | | | | 5,714,491 | |
Maxeon Solar Technologies * | | | 23,580 | | | | 368,320 | |
SolarEdge Technologies * | | | 24,006 | | | | 6,193,788 | |
SunPower, Cl A * | | | 120,660 | | | | 2,822,237 | |
| | | | | | | | 23,282,297 | |
| | | | | | | | | |
TOTAL UNITED STATES | | | | | | | 42,850,507 | |
| | | | | | | | | |
| TOTAL COMMON STOCK | | | | | | | | |
(Cost $163,811,172) | | | | | | | 133,299,576 | |
| | | | | | | | | |
| TOTAL INVESTMENTS — 100.3% | | | | | | | | |
(Cost $163,811,172) | | | | | | $ | 133,299,576 | |
Percentages are based on Net Assets of $132,894,070.
| * | Non-income producing security. |
| (A) | Level 3 security in accordance with fair value hierarchy. |
| (B) | Security considered illiquid. The total value of such securities as of May 31, 2021 was $4,532,524 and represented 3.4% of Net Assets. |
| (C) | Security is fair valued using methods determined in good faith by the Fair Value Committee of the Fund. The total value of such securities as of May 31, 2021, was $4,532,524 and represents 3.4% of Net Assets. |
ADR — American Depositary Receipt
Cl — Class
| Schedule of Investments | | May 31, 2021 (Unaudited) |
| | Global X CleanTech ETF | |
The following is a summary of the level of inputs used as of May 31, 2021, in valuing the Fund’s investments carried at value:
| Investments in Securities | | | | | | | | | | | | |
| Common Stock | | $ | 128,767,052 | | | $ | — | | | $ | 4,532,524 | | | $ | 133,299,576 | |
| Total Investments in Securities | | $ | 128,767,052 | | | $ | — | | | $ | 4,532,524 | | | $ | 133,299,576 | |
The following is a reconciliation of investments in which significant unobservable inputs (Level 3) were used in determining fair value:
| | | Investments in Common Stock | |
| Beginning Balance as of November 30, 2020 | | $ | − | |
| Transfers out of Level 3 | | | − | |
| Transfers into Level 3 | | | 4,532,524 | |
| Net purchases | | | − | |
| Net sales | | | − | |
| Realized gain/(loss) | | | − | |
| Change in unrealized appreciation/(depreciation) | | | − | |
| Ending Balance as of May 31, 2021 | | $ | 4,532,524 | |
| Schedule of Investments | | May 31, 2021 (Unaudited) |
| | Global X U.S. Infrastructure Development ETF | |
Sector Weightings †:
† Sector weightings percentages are based on the total market value of investments. Repurchase agreements purchased from cash collateral received for securities lending activity are included in total investments. Please see Notes 2 and 7 in Notes to Financial Statements for more detailed information.
| | | | | | | |
| COMMON STOCK — 99.8% | | | | | | |
| Consumer Discretionary — 0.7% | | | | | | |
TopBuild * | | | 136,401 | | | $ | 27,014,218 | |
| Industrials — 71.0% | | | | | | | | |
Acuity Brands | | | 149,671 | | | | 27,801,388 | |
Advanced Drainage Systems | | | 290,121 | | | | 32,905,524 | |
AECOM * | | | 605,331 | | | | 39,352,568 | |
Altra Industrial Motion | | | 265,436 | | | | 17,436,491 | |
Arcosa | | | 197,332 | | | | 12,530,582 | |
Argan | | | 209,389 | | | | 10,281,000 | |
Astec Industries | | | 139,949 | | | | 9,590,705 | |
Atkore * | | | 195,257 | | | | 15,073,840 | |
Builders FirstSource * | | | 841,249 | | | | 37,469,230 | |
Carlisle | | | 220,165 | | | | 42,342,133 | |
Columbus McKinnon | | | 218,006 | | | | 11,052,904 | |
Construction Partners, Cl A * | | | 289,094 | | | | 9,311,718 | |
Crane | | | 237,911 | | | | 22,718,121 | |
CSW Industrials | | | 73,491 | | | | 8,952,674 | |
CSX | | | 1,026,806 | | | | 102,803,817 | |
Deere | | | 307,817 | | | | 111,152,719 | |
Dycom Industries * | | | 129,449 | | | | 9,698,319 | |
| Schedule of Investments | | May 31, 2021 (Unaudited) |
| | Global X U.S. Infrastructure Development ETF | |
| | | | | | | |
| COMMON STOCK — continued | | | | | | | | |
| Industrials — continued | | | | | | | | |
Eaton | | | 751,717 | | | $ | 109,186,894 | |
EMCOR Group | | | 225,183 | | | | 28,397,828 | |
Emerson Electric | | | 1,116,447 | | | | 106,832,813 | |
Exponent | | | 211,346 | | | | 19,281,096 | |
Fastenal | | | 1,952,971 | | | | 103,585,582 | |
Fortive | | | 1,343,243 | | | | 97,411,982 | |
Gibraltar Industries * | | | 135,939 | | | | 10,800,354 | |
Gorman-Rupp | | | 281,262 | | | | 10,119,807 | |
Graco | | | 687,057 | | | | 52,023,956 | |
Granite Construction | | | 279,475 | | | | 11,279,611 | |
Greenbrier | | | 255,802 | | | | 11,360,167 | |
H&E Equipment Services | | | 295,672 | | | | 11,058,133 | |
Herc Holdings * | | | 129,810 | | | | 14,930,746 | |
Howmet Aerospace * | | | 1,778,606 | | | | 63,104,941 | |
Hubbell, Cl B | | | 223,278 | | | | 42,565,718 | |
IDEX | | | 313,517 | | | | 69,807,695 | |
Insteel Industries | | | 339,135 | | | | 11,856,160 | |
Jacobs Engineering Group | | | 533,136 | | | | 75,747,963 | |
Kansas City Southern | | | 384,789 | | | | 114,543,990 | |
Lincoln Electric Holdings | | | 242,256 | | | | 31,149,276 | |
Manitowoc * | | | 621,889 | | | | 16,057,174 | |
MasTec * | | | 304,067 | | | | 35,372,114 | |
Matrix Service * | | | 702,092 | | | | 7,652,803 | |
MRC Global * | | | 1,274,497 | | | | 13,688,098 | |
Mueller Industries | | | 247,473 | | | | 11,490,171 | |
Mueller Water Products, Cl A | | | 756,481 | | | | 10,946,280 | |
MYR Group * | | | 143,700 | | | | 12,507,648 | |
Norfolk Southern | | | 383,193 | | | | 107,638,914 | |
Northwest Pipe * | | | 289,205 | | | | 9,156,230 | |
NOW * | | | 1,145,107 | | | | 11,989,270 | |
Parker-Hannifin | | | 335,184 | | | | 103,286,950 | |
Pentair | | | 683,328 | | | | 47,129,132 | |
Powell Industries | | | 306,997 | | | | 10,548,417 | |
| Schedule of Investments | | May 31, 2021 (Unaudited) |
| | Global X U.S. Infrastructure Development ETF | |
| | | | | | | |
| COMMON STOCK — continued | | | | | | | | |
| Industrials — continued | | | | | | | | |
Primoris Services | | | 305,310 | | | $ | 9,705,805 | |
Quanta Services | | | 571,135 | | | | 54,457,722 | |
RBC Bearings * | | | 101,578 | | | | 19,887,957 | |
Rexnord | | | 492,910 | | | | 24,630,713 | |
Rockwell Automation | | | 349,313 | | | | 92,120,824 | |
SPX * | | | 183,209 | | | | 11,474,380 | |
Sterling Construction * | | | 393,149 | | | | 8,845,852 | |
Team * | | | 838,275 | | | | 7,125,337 | |
Terex | | | 282,335 | | | | 14,785,884 | |
Tetra Tech | | | 221,632 | | | | 26,478,375 | |
Titan Machinery * | | | 416,883 | | | | 12,789,970 | |
Trane Technologies | | | 608,794 | | | | 113,479,202 | |
Trinity Industries | | | 470,577 | | | | 13,072,629 | |
Tutor Perini * | | | 568,427 | | | | 8,799,250 | |
Union Pacific | | | 452,414 | | | | 101,670,998 | |
United Rentals * | | | 298,267 | | | | 99,609,247 | |
Valmont Industries | | | 86,008 | | | | 21,329,984 | |
Wabash National | | | 553,080 | | | | 8,821,626 | |
WESCO International * | | | 206,187 | | | | 21,973,349 | |
Willdan Group * | | | 184,016 | | | | 6,690,822 | |
Woodward | | | 256,109 | | | | 32,571,943 | |
| | | | | | | | 2,623,303,515 | |
| Information Technology — 2.8% | | | | | | | | |
Badger Meter | | | 122,029 | | | | 11,662,311 | |
Calix * | | | 267,528 | | | | 11,854,166 | |
Trimble * | | | 1,035,899 | | | | 80,582,583 | |
| | | | | | | | 104,099,060 | |
| Materials — 21.7% | | | | | | | | |
Alcoa * | | | 764,409 | | | | 30,324,105 | |
Allegheny Technologies * | | | 518,763 | | | | 12,704,506 | |
Arconic * | | | 447,196 | | | | 16,175,079 | |
Century Aluminum * | | | 808,065 | | | | 10,997,765 | |
| Schedule of Investments | | May 31, 2021 (Unaudited) |
| | Global X U.S. Infrastructure Development ETF | |
| | | | | | | |
| COMMON STOCK — continued | | | | | | | | |
| Materials — continued | | | | | | | | |
Cleveland-Cliffs * (A) | | | 1,637,900 | | | $ | 32,954,548 | |
Commercial Metals | | | 490,962 | | | | 15,450,574 | |
Eagle Materials | | | 170,104 | | | | 24,964,463 | |
Forterra * | | | 448,332 | | | | 10,482,002 | |
Haynes International | | | 390,651 | | | | 13,594,655 | |
Louisiana-Pacific | | | 447,697 | | | | 30,089,715 | |
Martin Marietta Materials | | | 257,479 | | | | 93,632,238 | |
Minerals Technologies | | | 141,523 | | | | 12,312,501 | |
Nucor | | | 1,240,873 | | | | 127,239,117 | |
Reliance Steel & Aluminum | | | 263,210 | | | | 44,237,705 | |
RPM International | | | 533,287 | | | | 49,878,333 | |
Ryerson Holding * | | | 674,794 | | | | 11,174,589 | |
Steel Dynamics | | | 864,576 | | | | 53,975,480 | |
Summit Materials, Cl A * | | | 469,477 | | | | 16,347,189 | |
United States Steel | | | 904,969 | | | | 23,465,846 | |
US Concrete * | | | 194,954 | | | | 11,110,429 | |
Vulcan Materials | | | 591,898 | | | | 108,506,741 | |
Westlake Chemical | | | 525,950 | | | | 53,052,577 | |
| | | | | | | | 802,670,157 | |
| Utilities — 3.6% | | | | | | | | |
MDU Resources Group | | | 823,088 | | | | 27,705,142 | |
Sempra Energy | | | 768,776 | | | | 104,161,460 | |
| | | | | | | | 131,866,602 | |
| TOTAL COMMON STOCK | | | | | | | | |
(Cost $3,202,149,234) | | | | | | | 3,688,953,552 | |
| | | | | | | | | |
SHORT-TERM INVESTMENT(B)(C) — 0.3% | | | | | | | | |
| Fidelity Investments Money Market Government Portfolio, Cl Institutional, 0.010% | | | | | | | | |
(Cost $10,671,853) | | | 10,671,853 | | | | 10,671,853 | |
| Schedule of Investments | | May 31, 2021 (Unaudited) |
| | Global X U.S. Infrastructure Development ETF | |
| | | | | | | |
REPURCHASE AGREEMENT(B) — 0.3% | | | | | | | | |
| BNP Paribas | | | | | | | | |
| 0.000%, dated 05/28/2021, to be repurchased on 06/01/2021, repurchase price $10,238,734 (collateralized by U.S. Treasury Obligations, ranging in par value $203,133 - $1,476,834, 2.000%, 10/31/2022, with a total market value of $10,438,491) | | | | | | | | |
(Cost $10,238,734) | | $ | 10,238,734 | | | $ | 10,238,734 | |
| | | | | | | | | |
| TOTAL INVESTMENTS — 100.4% | | | | | | | | |
(Cost $3,223,059,821) | | | | | | $ | 3,709,864,139 | |
Percentages are based on Net Assets of $3,695,366,564.
| * | Non-income producing security. |
| (A) | This security or a partial position of this security is on loan at May 31, 2021. The total value of securities on loan at May 31, 2021 was $20,268,144. |
| (B) | Security was purchased with cash collateral held from securities on loan. The total value of such securities as of May 31, 2021 was $20,910,587. |
| (C) | The rate reported on the Schedule of Investments is the 7-day effective yield as of May 31, 2021. |
Cl — Class
The following is a summary of the level of inputs used as of May 31, 2021, in valuing the Fund’s investments carried at value:
| Investments in Securities | | | | | | | | | | | | |
| Common Stock | | $ | 3,688,953,552 | | | $ | — | | | $ | — | | | $ | 3,688,953,552 | |
| Short-Term Investment | | | 10,671,853 | | | | — | | | | — | | | | 10,671,853 | |
| Repurchase Agreement | | | — | | | | 10,238,734 | | | | — | | | | 10,238,734 | |
| Total Investments in Securities | | $ | 3,699,625,405 | | | $ | 10,238,734 | | | $ | — | | | $ | 3,709,864,139 | |
For the period ended May 31, 2021, there were no transfers in or out of Level 3.
| Schedule of Investments | | May 31, 2021 (Unaudited) |
| | | |
Sector Weightings †:
† Sector weightings percentages are based on the total market value of investments.
| | | | | | | |
| COMMON STOCK — 99.7% | | | | | | |
| BRAZIL — 2.1% | | | | | | |
| Utilities — 2.1% | | | | | | |
| Cia de Saneamento Basico do Estado de Sao Paulo | | | 7,160 | | | $ | 54,793 | |
Cia de Saneamento de Minas Gerais-COPASA | | | 4,160 | | | | 13,655 | |
| | | | | | | | | |
TOTAL BRAZIL | | | | | | | 68,448 | |
| | | | | | | | | |
| CHILE — 0.3% | | | | | | | | |
| Utilities — 0.3% | | | | | | | | |
Aguas Andinas, Cl A | | | 53,200 | | | | 10,127 | |
| | | | | | | | | |
| CHINA — 6.3% | | | | | | | | |
| Industrials — 1.7% | | | | | | | | |
| Beijing Originwater Technology, Cl A | | | 39,800 | | | | 44,622 | |
| Zhongyuan Environment-Protection, Cl A | | | 8,200 | | | | 8,125 | |
| | | | | | | | 52,747 | |
| | | | | | | | | |
| Materials — 0.3% | | | | | | | | |
Dalian Bio-Chemical, Cl A | | | 3,900 | | | | 9,259 | |
| | | | | | | | | |
| Utilities — 4.3% | | | | | | | | |
| Beijing Enterprises Water Group | | | 85,540 | | | | 34,165 | |
| Chengdu Xingrong Environment, Cl A | | | 24,000 | | | | 19,747 | |
| Schedule of Investments | | May 31, 2021 (Unaudited) |
| | Global X Clean Water ETF | |
| | | | | | | |
| COMMON STOCK — continued | | | | | | | | |
| Utilities — continued | | | | | | | | |
Guangdong Investment | | | 56,300 | | | $ | 83,853 | |
| | | | | | | | 137,765 | |
| | | | | | | | | |
TOTAL CHINA | | | | | | | 199,771 | |
| | | | | | | | | |
| FRANCE — 4.6% | | | | | | | | |
| Utilities — 4.6% | | | | | | | | |
Suez | | | 6,040 | | | | 147,042 | |
| | | | | | | | | |
| JAPAN — 3.6% | | | | | | | | |
| Industrials — 3.6% | | | | | | | | |
Kurita Water Industries | | | 1,840 | | | | 87,336 | |
METAWATER | | | 460 | | | | 8,328 | |
Nomura Micro Science | | | 280 | | | | 9,980 | |
Organo | | | 160 | | | | 9,486 | |
| | | | | | | | | |
TOTAL JAPAN | | | | | | | 115,130 | |
| | | | | | | | | |
| NORWAY — 0.2% | | | | | | | | |
| Industrials — 0.2% | | | | | | | | |
Vow * | | | 1,500 | | | | 6,789 | |
| | | | | | | | | |
| SINGAPORE — 1.1% | | | | | | | | |
| Utilities — 1.1% | | | | | | | | |
Keppel Infrastructure Trust | | | 85,460 | | | | 35,199 | |
| | | | | | | | | |
| SOUTH KOREA — 2.9% | | | | | | | | |
| Consumer Discretionary — 2.9% | | | | | | | | |
Coway | | | 1,260 | | | | 91,735 | |
| | | | | | | | | |
| UNITED KINGDOM — 12.9% | | | | | | | | |
| Utilities — 12.9% | | | | | | | | |
Pennon Group | | | 8,100 | | | | 121,393 | |
Severn Trent | | | 4,140 | | | | 143,989 | |
United Utilities Group | | | 10,450 | | | | 145,736 | |
| Schedule of Investments | | May 31, 2021 (Unaudited) |
| | Global X Clean Water ETF | |
| | | | | | | |
| COMMON STOCK — continued | | | | | | | | |
TOTAL UNITED KINGDOM | | | | | | $ | 411,118 | |
| | | | | | | | | |
| UNITED STATES — 65.7% | | | | | | | | |
| Industrials — 33.9% | | | | | | | | |
Advanced Drainage Systems | | | 1,180 | | | | 133,836 | |
AO Smith | | | 2,000 | | | | 142,140 | |
Energy Recovery * | | | 640 | | | | 12,166 | |
Evoqua Water Technologies * | | | 2,120 | | | | 65,974 | |
Franklin Electric | | | 770 | | | | 64,595 | |
Mueller Water Products, Cl A | | | 3,000 | | | | 43,410 | |
Pentair | | | 2,880 | | | | 198,634 | |
Reliance Worldwide | | | 16,610 | | | | 66,204 | |
| Watts Water Technologies, Cl A | | | 580 | | | | 78,822 | |
Xylem | | | 2,320 | | | | 274,039 | |
| | | | | | | | 1,079,820 | |
| | | | | | | | | |
| Information Technology — 2.0% | | | | | | | | |
Badger Meter | | | 680 | | | | 64,988 | |
| | | | | | | | | |
| Materials — 8.0% | | | | | | | | |
Ecolab | | | 1,120 | | | | 240,890 | |
Forterra * | | | 540 | | | | 12,625 | |
| | | | | | | | 253,515 | |
| | | | | | | | | |
| Utilities — 21.8% | | | | | | | | |
American States Water | | | 800 | | | | 63,496 | |
American Water Works | | | 1,620 | | | | 251,132 | |
| California Water Service Group | | | 1,100 | | | | 62,524 | |
Essential Utilities | | | 5,060 | | | | 241,868 | |
Middlesex Water | | | 360 | | | | 30,946 | |
SJW Group | | | 600 | | | | 38,670 | |
| | | | | | | | 688,636 | |
| | | | | | | | | |
TOTAL UNITED STATES | | | | | | | 2,086,959 | |
| Schedule of Investments | | May 31, 2021 (Unaudited) |
| | Global X Clean Water ETF | |
| | | | | | | | |
| COMMON STOCK — continued | | | | | | | | |
| TOTAL COMMON STOCK | | | | | | | | |
(Cost $3,060,973) | | | | | | $ | 3,172,318 | |
| | | | | | | | | |
| TOTAL INVESTMENTS — 99.7% | | | | | | | | |
(Cost $3,060,973) | | | | | | $ | 3,172,318 | |
Percentages are based on Net Assets of $3,182,278.
| * | Non-income producing security. |
Cl — Class
As of May 31, 2021, all of the Fund’s investments were considered Level 1, in accordance with authoritative guidance on fair value measurements and disclosure under U.S. GAAP.
For the period ended May 31, 2021, there were no transfers in or out of Level 3.
| Schedule of Investments | | May 31, 2021 (Unaudited) |
| | Global X Thematic Growth ETF | |
Sector Weightings †:
† Sector weightings percentages are based on the total market value of investments. Repurchase agreements purchased from cash collateral received for securities lending activity are included in total investments. Please see Notes 2 and 7 in Notes to Financial Statements for more detailed information.
| | | | | | | |
| EXCHANGE TRADED FUNDS — 99.8% | | | | | | |
Global X Cannabis ETF (A) | | | 578,168 | | | $ | 8,828,625 | |
Global X Cloud Computing ETF * (A) (B) | | | 693,528 | | | | 18,142,692 | |
Global X FinTech ETF * (A) (B) | | | 570,076 | | | | 25,733,230 | |
Global X Genomics & Biotechnology ETF (A) | | | 752,548 | | | | 16,179,782 | |
Global X Lithium & Battery Tech ETF (A) | | | 165,856 | | | | 11,019,473 | |
Global X Robotics & Artificial Intelligence ETF (A) | | | 324,922 | | | | 11,128,579 | |
Global X Social Media ETF * (A) | | | 153,777 | | | | 10,350,730 | |
| TOTAL EXCHANGE TRADED FUNDS | | | | | | | | |
(Cost $106,119,932) | | | | | | | 101,383,111 | |
| | | | | | | | | |
SHORT-TERM INVESTMENT(C)(D) — 5.8% | | | | | | | | |
| Fidelity Investments Money Market Government Portfolio, Cl Institutional, 0.010% | | | | | | | | |
(Cost $5,896,548) | | | 5,896,548 | | | | 5,896,548 | |
| Schedule of Investments | | May 31, 2021 (Unaudited) |
| | Global X Thematic Growth ETF | |
| | | | | | | |
REPURCHASE AGREEMENT(C) — 5.6% | | | | | | | | |
| BNP Paribas | | | | | | | | |
| 0.000%, dated 05/28/2021, to be repurchased on 06/01/2021, repurchase price $5,657,236 (collateralized by U.S. Treasury Obligations, ranging in par value $112,238 - $815,999, 2.000%, 10/31/2022, with a total market value of $5,767,607) | | | | | | | | |
(Cost $5,657,236) | | $ | 5,657,236 | | | $ | 5,657,236 | |
| | | | | | | | | |
| TOTAL INVESTMENTS — 111.2% | | | | | | | | |
(Cost $117,673,716) | | | | | | $ | 112,936,895 | |
Percentages are based on Net Assets of $101,524,579.
| * | Non-income producing security. |
| (A) | Affiliated investment. |
| (B) | This security or a partial position of this security is on loan at May 31, 2021. The total value of securities on loan at May 31, 2021 was $11,266,638. |
| (C) | Security was purchased with cash collateral held from securities on loan. The total value of such securities as of May 31, 2021 was $11,553,784. |
| (D) | The rate reported on the Schedule of Investments is the 7-day effective yield as of May 31, 2021. |
Cl — Class
ETF — Exchange Traded Fund
The following is a summary of the level of inputs used as of May 31, 2021, in valuing the Fund’s investments carried at value:
| Investments in Securities | | | | | | | | | | | | |
| Exchange Traded Funds | | $ | 101,383,111 | | | $ | — | | | $ | — | | | $ | 101,383,111 | |
| Short-Term Investment | | | 5,896,548 | | | | — | | | | — | | | | 5,896,548 | |
| Repurchase Agreement | | | — | | | | 5,657,236 | | | | — | | | | 5,657,236 | |
| Total Investments in Securities | | $ | 107,279,659 | | | $ | 5,657,236 | | | $ | — | | | $ | 112,936,895 | |
For the period ended May 31, 2021, there were no transfers in or out of Level 3.
| Schedule of Investments | | May 31, 2021 (Unaudited) |
| | Global X Thematic Growth ETF | |
The following is a summary of the transactions with affiliates for the period ended May 31, 2021:
| | | Value at 11/30/20 | | | Purchases at Cost | | | Proceeds from Sales | | | Changes in Unrealized Appreciation (Depreciation) | | | Realized Gain (Loss) | | | Value at 05/31/21 | | | Shares | | | Dividend Income | |
| Global X FinTech ETF | | $ | 3,470,146 | | | $ | 25,254,479 | | | $ | (2,075,181 | ) | | $ | (1,258,104 | ) | | $ | 341,890 | | | $ | 25,733,230 | | | | 570,076 | | | $ | − | |
| Global X Lithium & Battery Tech ETF | | | 4,048,721 | | | | 11,455,718 | | | | (5,122,937 | ) | | | (902,406 | ) | | | 1,540,377 | | | | 11,019,473 | | | | 165,856 | | | | 7,215 | |
| Global X Robotics & Artificial Intelligence ETF | | | 3,483,367 | | | | 9,042,576 | | | | (1,553,588 | ) | | | 1,867 | | | | 154,357 | | | | 11,128,579 | | | | 324,922 | | | | − | |
| Global X Social Media ETF | | | 3,585,488 | | | | 10,196,222 | | | | (3,765,035 | ) | | | (760,368 | ) | | | 1,094,423 | | | | 10,350,730 | | | | 153,777 | | | | − | |
| Global X Cannabis ETF | | | 9,262,548 | | | | 27,222,944 | | | | (28,088,784 | ) | | | (2,800,634 | ) | | | 3,232,551 | | | | 8,828,625 | | | | 578,168 | | | | 117,838 | |
| Global X Cloud Computing ETF | | | 6,196,733 | | | | 15,877,765 | | | | (2,989,583 | ) | | | (959,802 | ) | | | 17,579 | | | | 18,142,692 | | | | 693,528 | | | | − | |
| Global X Genomics & Biotechnology ETF | | | 5,982,932 | | | | 16,552,548 | | | | (4,504,474 | ) | | | (2,969,918 | ) | | | 1,118,694 | | | | 16,179,782 | | | | 752,548 | | | | 9,743 | |
| Totals: | | $ | 36,029,935 | | | $ | 115,602,252 | | | $ | (48,099,582 | ) | | $ | (9,649,365 | ) | | $ | 7,499,871 | | | $ | 101,383,111 | | | | 3,238,875 | | | $ | 134,796 | |
| | Statements of Assets and Liabilities | |
| | May 31, 2021 (Unaudited) | |
| | | Global X Robotics & Artificial Intelligence ETF | | | Global X Internet of Things ETF | | | Global X FinTech ETF | |
| Assets: | | | | | | | | | |
| Cost of Investments | | $ | 2,085,729,140 | | | $ | 336,246,983 | | | $ | 937,395,344 | |
| Cost of Repurchase Agreement | | | 80,889,413 | | | | 4,180,906 | | | | 21,748,566 | |
| Cost of Foreign Currency | | | 171,310 | | | | — | | | | 154,603 | |
| Investments, at Value | | $ | 2,615,657,880 | * | | $ | 441,209,613 | * | | $ | 1,238,142,145 | * |
| Repurchase Agreement, at Value | | | 80,889,413 | | | | 4,180,906 | | | | 21,748,566 | |
| Cash | | | — | | | | 297,917 | | | | 802,674 | |
| Foreign Currency, at Value | | | 171,021 | | | | — | | | | 154,211 | |
| Dividend and Interest Receivable | | | 4,236,414 | | | | 416,481 | | | | 308,776 | |
| Reclaim Receivable | | | 4,137,546 | | | | 171,778 | | | | 136,166 | |
| Unrealized Appreciation on Spot Contracts | | | — | | | | — | | | | 268 | |
| Total Assets | | | 2,705,092,274 | | | | 446,276,695 | | | | 1,261,292,806 | |
| Liabilities: | | | | | | | | | | | | |
| Obligation to Return Securities Lending Collateral | | | 165,200,614 | | | | 8,538,672 | | | | 44,417,141 | |
| Payable due to Investment Adviser | | | 1,440,859 | | | | 245,523 | | | | 692,811 | |
| Cash Overdraft | | | 2,001,576 | | | | — | | | | — | |
| Total Liabilities | | | 168,643,049 | | | | 8,784,195 | | | | 45,109,952 | |
| Net Assets | | $ | 2,536,449,225 | | | $ | 437,492,500 | | | $ | 1,216,182,854 | |
| Net Assets Consist of: | | | | | | | | | | | | |
| Paid-in Capital | | $ | 2,092,204,225 | | | $ | 330,198,779 | | | $ | 940,525,113 | |
| Total Distributable Earnings | | | 444,245,000 | | | | 107,293,721 | | | | 275,657,741 | |
| Net Assets | | $ | 2,536,449,225 | | | $ | 437,492,500 | | | $ | 1,216,182,854 | |
| Outstanding Shares of Beneficial Interest | | | | | | | | | | | | |
| (unlimited authorization — no par value) | | | 74,000,000 | | | | 12,620,000 | | | | 26,940,000 | |
| Net Asset Value, Offering and Redemption Price Per Share | | $ | 34.28 | | | $ | 34.67 | | | $ | 45.14 | |
| *Includes Market Value of Securities on Loan | | $ | 156,929,711 | | | $ | 8,025,312 | | | $ | 41,722,700 | |
| | Statements of Assets and Liabilities | |
| | May 31, 2021 (Unaudited) | |
| | | Global X Video Games & Esports ETF | | | Global X Autonomous & Electric Vehicles ETF | | | Global X Cloud Computing ETF | |
| Assets: | | | | | | | | | |
| Cost of Investments | | $ | 650,851,300 | | | $ | 863,899,604 | | | $ | 1,132,304,990 | |
| Cost of Repurchase Agreement | | | 1,349,169 | | | | 10,195,643 | | | | 15,211,675 | |
| Cost of Foreign Currency | | | 5 | | | | 320,132 | | | | 6 | |
| Investments, at Value | | $ | 670,226,073 | * | | $ | 909,596,499 | * | | $ | 1,298,581,993 | * |
| Repurchase Agreement, at Value | | | 1,349,169 | | | | 10,195,643 | | | | 15,211,675 | |
| Cash | | | — | | | | 545,575 | | | | 1,515,068 | |
| Foreign Currency, at Value | | | 5 | | | | 320,135 | | | | 6 | |
| Dividend and Interest Receivable | | | 1,336,474 | | | | 1,037,584 | | | | 128,265 | |
| Receivable for Investment Securities Sold | | | — | | | | — | | | | 10,287,166 | |
| Reclaim Receivable | | | — | | | | 16,302 | | | | — | |
| Total Assets | | | 672,911,721 | | | | 921,711,738 | | | | 1,325,724,173 | |
| Liabilities: | | | | | | | | | | | | |
| Obligation to Return Securities Lending Collateral | | | 2,755,410 | | | | 20,822,583 | | | | 31,066,835 | |
| Payable due to Investment Adviser | | | 280,621 | | | | 510,135 | | | | 754,001 | |
| Payable for Capital Shares Redeemed | | | — | | | | — | | | | 10,203,099 | |
| Cash Overdraft | | | 62,652 | | | | — | | | | — | |
| Total Liabilities | | | 3,098,683 | | | | 21,332,718 | | | | 42,023,935 | |
| Net Assets | | $ | 669,813,038 | | | $ | 900,379,020 | | | $ | 1,283,700,238 | |
| Net Assets Consist of: | | | | | | | | | | | | |
| Paid-in Capital | | $ | 552,138,548 | | | $ | 817,117,848 | | | $ | 1,026,581,624 | |
| Total Distributable Earnings | | | 117,674,490 | | | | 83,261,172 | | | | 257,118,614 | |
| Net Assets | | $ | 669,813,038 | | | $ | 900,379,020 | | | $ | 1,283,700,238 | |
| Outstanding Shares of Beneficial Interest | | | | | | | | | | | | |
| (unlimited authorization — no par value) | | | 20,700,000 | | | | 32,530,002 | | | | 49,070,000 | |
| Net Asset Value, Offering and Redemption Price Per Share | | $ | 32.36 | | | $ | 27.68 | | | $ | 26.16 | |
| *Includes Market Value of Securities on Loan | | $ | 2,640,318 | | | $ | 20,442,006 | | | $ | 29,791,047 | |
| | Statements of Assets and Liabilities | |
| | May 31, 2021 (Unaudited) | |
| | | Global X Data Center REITs & Digital Infrastructure ETF | | | Global X Cybersecurity ETF | | | Global X Artificial Intelligence & Technology ETF | |
| Assets: | | | | | | | | | |
| Cost of Investments | | $ | 51,999,205 | | | $ | 383,605,863 | | | $ | 188,993,877 | |
| Cost of Repurchase Agreement | | | — | | | | — | | | | 599,015 | |
| Cost of Foreign Currency | | | 1 | | | | (36,599 | ) | | | — | |
| Investments, at Value | | $ | 53,974,475 | | | $ | 357,893,687 | | | $ | 205,789,003 | * |
| Repurchase Agreement, at Value | | | — | | | | — | | | | 599,015 | |
| Cash | | | 50,089 | | | | — | | | | 171,069 | |
| Foreign Currency, at Value | | | 1 | | | | — | | | | — | |
| Dividend and Interest Receivable | | | 78,152 | | | | 247,247 | | | | 179,257 | |
| Unrealized Appreciation on Spot Contracts | | | — | | | | 102 | | | | 155 | |
| Receivable for Capital Shares Sold | | | — | | | | 5,748,470 | | | | — | |
| Receivable for Investment Securities Sold | | | — | | | | — | | | | 3,804,652 | |
| Reclaim Receivable | | | — | | | | — | | | | 2,625 | |
| Total Assets | | | 54,102,717 | | | | 363,889,506 | | | | 210,545,776 | |
| Liabilities: | | | | | | | | | | | | |
| Obligation to Return Securities Lending Collateral | | | — | | | | — | | | | 1,223,369 | |
| Payable due to Investment Adviser | | | 21,195 | | | | 158,740 | | | | 118,916 | |
| Payable for Investment Securities Purchased | | | — | | | | 5,760,551 | | | | — | |
| Payable for Capital Shares Redeemed | | | — | | | | — | | | | 3,756,634 | |
| Overdraft of Foreign Currency | | | — | | | | 36,599 | | | | — | |
| Cash Overdraft | | | — | | | | 174,196 | | | | — | |
| Total Liabilities | | | 21,195 | | | | 6,130,086 | | | | 5,098,919 | |
| Net Assets | | $ | 54,081,522 | | | $ | 357,759,420 | | | $ | 205,446,857 | |
| Net Assets Consist of: | | | | | | | | | | | | |
| Paid-in Capital | | $ | 51,850,858 | | | $ | 376,666,997 | | | $ | 167,253,134 | |
| Total Distributable Earnings/(Loss) | | | 2,230,664 | | | | (18,907,577 | ) | | | 38,193,723 | |
| Net Assets | | $ | 54,081,522 | | | $ | 357,759,420 | | | $ | 205,446,857 | |
| Outstanding Shares of Beneficial Interest | | | | | | | | | | | | |
| (unlimited authorization — no par value) | | | 3,300,000 | | | | 13,070,000 | | | | 7,110,002 | |
| Net Asset Value, Offering and Redemption Price Per Share | | $ | 16.39 | | | $ | 27.37 | | | $ | 28.90 | |
| *Includes Market Value of Securities on Loan | | $ | — | | | $ | — | | | $ | 1,212,639 | |
| | Statements of Assets and Liabilities | |
| | May 31, 2021 (Unaudited) | |
| | | Global X Millennial Consumer ETF | | | Global X Education ETF | | | Global X Cannabis ETF | |
| Assets: | | | | | | | | | |
| Cost of Investments | | $ | 161,399,846 | | | $ | 15,753,282 | | | $ | 241,147,282 | |
| Cost of Repurchase Agreement | | | — | | | | — | | | | 21,079,306 | |
| Cost of Foreign Currency | | | — | | | | 1 | | | | (522,216 | ) |
| Investments, at Value | | $ | 185,117,255 | | | $ | 13,358,858 | | | $ | 227,193,573 | * |
| Repurchase Agreement, at Value | | | — | | | | — | | | | 21,079,306 | |
| Cash | | | 174,925 | | | | 7,827 | | | | — | |
| Foreign Currency, at Value | | | — | | | | 1 | | | | — | |
| Dividend and Interest Receivable | | | 27,300 | | | | 17,924 | | | | 513,924 | |
| Receivable for Investment Securities Sold | | | — | | | | 59,674 | | | | 330,384 | |
| Total Assets | | | 185,319,480 | | | | 13,444,284 | | | | 249,117,187 | |
| Liabilities: | | | | | | | | | | | | |
| Obligation to Return Securities Lending Collateral | | | — | | | | — | | | | 43,050,310 | |
| Payable due to Investment Adviser | | | 77,758 | | | | 5,840 | | | | 77,770 | |
| Payable for Investment Securities Purchased | | | — | | | | — | | | | 74,249 | |
| Overdraft of Foreign Currency | | | — | | | | — | | | | 522,216 | |
| Unrealized Depreciation on Spot Contracts | | | — | | | | — | | | | 323 | |
| Cash Overdraft | | | — | | | | — | | | | 229,699 | |
| Total Liabilities | | | 77,758 | | | | 5,840 | | | | 43,954,567 | |
| Net Assets | | $ | 185,241,722 | | | $ | 13,438,444 | | | $ | 205,162,620 | |
| Net Assets Consist of: | | | | | | | | | | | | |
| Paid-in Capital | | $ | 137,484,565 | | | $ | 16,276,843 | | | $ | 242,153,060 | |
| Total Distributable Earnings/(Loss) | | | 47,757,157 | | | | (2,838,399 | ) | | | (36,990,440 | ) |
| Net Assets | | $ | 185,241,722 | | | $ | 13,438,444 | | | $ | 205,162,620 | |
| Outstanding Shares of Beneficial Interest | | | | | | | | | | | | |
| (unlimited authorization — no par value) | | | 4,490,000 | | | | 920,000 | | | | 13,400,000 | |
| Net Asset Value, Offering and Redemption Price Per Share | | $ | 41.26 | | | $ | 14.61 | | | $ | 15.31 | |
| *Includes Market Value of Securities on Loan | | $ | — | | | $ | — | | | $ | 44,029,214 | |
| | Statements of Assets and Liabilities | |
| | May 31, 2021 (Unaudited) | |
| | | Global X Genomics & Biotechnology ETF | | | Global X China Biotech Innovation ETF | | | Global X Telemedicine & Digital Health ETF | |
| Assets: | | | | | | | | | |
| Cost of Investments | | $ | 212,490,454 | | | $ | 5,768,522 | | | $ | 729,673,107 | |
| Cost of Repurchase Agreement | | | 3,735,751 | | | | — | | | | 14,677,742 | |
| Cost of Foreign Currency | | | 2 | | | | 6,261 | | | | — | |
| Investments, at Value | | $ | 204,820,801 | * | | $ | 6,619,278 | | | $ | 749,076,957 | * |
| Repurchase Agreement, at Value | | | 3,735,751 | | | | — | | | | 14,677,742 | |
| Cash | | | 155,176 | | | | 10,099 | | | | 1,304,400 | |
| Foreign Currency, at Value | | | 2 | | | | 6,323 | | | | — | |
| Dividend and Interest Receivable | | | 15,348 | | | | — | | | | 42,148 | |
| Reclaim Receivable | | | — | | | | — | | | | 12,280 | |
| Total Assets | | | 208,727,078 | | | | 6,635,700 | | | | 765,113,527 | |
| Liabilities: | | | | | | | | | | | | |
| Obligation to Return Securities Lending Collateral | | | 7,629,532 | | | | — | | | | 29,976,383 | |
| Payable due to Investment Adviser | | | 84,798 | | | | 3,595 | | | | 427,764 | |
| Total Liabilities | | | 7,714,330 | | | | 3,595 | | | | 30,404,147 | |
| Net Assets | | $ | 201,012,748 | | | $ | 6,632,105 | | | $ | 734,709,380 | |
| Net Assets Consist of: | | | | | | | | | | | | |
| Paid-in Capital | | $ | 205,933,765 | | | $ | 5,818,024 | | | $ | 708,448,102 | |
| Total Distributable Earnings/(Loss) | | | (4,921,017 | ) | | | 814,081 | | | | 26,261,278 | |
| Net Assets | | $ | 201,012,748 | | | $ | 6,632,105 | | | $ | 734,709,380 | |
| Outstanding Shares of Beneficial Interest | | | | | | | | | | | | |
| (unlimited authorization — no par value) | | | 9,340,000 | | | | 350,000 | | | | 39,890,000 | |
| Net Asset Value, Offering and Redemption Price Per Share | | $ | 21.52 | | | $ | 18.95 | | | $ | 18.42 | |
| *Includes Market Value of Securities on Loan | | $ | 7,336,461 | | | $ | — | | | $ | 29,099,220 | |
| | Statements of Assets and Liabilities | |
| | May 31, 2021 (Unaudited) | |
| | | Global X Aging Population ETF | | | Global X Health & Wellness ETF | | | Global X CleanTech ETF | |
| Assets: | | | | | | | | | |
| Cost of Investments | | $ | 40,617,608 | | | $ | 28,170,100 | | | $ | 163,811,172 | |
| Cost of Foreign Currency | | | 120 | | | | 5,078 | | | | 2 | |
| Investments, at Value | | $ | 43,951,317 | | | $ | 33,073,699 | | | $ | 133,299,576 | |
| Cash | | | 90,591 | | | | 38,884 | | | | — | |
| Foreign Currency, at Value | | | 120 | | | | 5,078 | | | | 2 | |
| Dividend and Interest Receivable | | | 32,875 | | | | 20,157 | | | | 99,974 | |
| Reclaim Receivable | | | 17,638 | | | | 8,994 | | | | 9,355 | |
| Unrealized Appreciation on Spot Contracts | | | — | | | | — | | | | 306 | |
| Receivable for Investment Securities Sold | | | — | | | | — | | | | 4,918,349 | |
| Total Assets | | | 44,092,541 | | | | 33,146,812 | | | | 138,327,562 | |
| Liabilities: | | | | | | | | | | | | |
| Payable due to Investment Adviser | | | 18,038 | | | | 13,513 | | | | 59,630 | |
| Payable for Capital Shares Redeemed | | | — | | | | — | | | | 5,199,452 | |
| Unrealized Depreciation on Spot Contracts | | | — | | | | 6 | | | | — | |
| Cash Overdraft | | | — | | | | — | | | | 174,410 | |
| Total Liabilities | | | 18,038 | | | | 13,519 | | | | 5,433,492 | |
| Net Assets | | $ | 44,074,503 | | | $ | 33,133,293 | | | $ | 132,894,070 | |
| Net Assets Consist of: | | | | | | | | | | | | |
| Paid-in Capital | | $ | 33,777,023 | | | $ | 26,900,484 | | | $ | 174,250,678 | |
| Total Distributable Earnings/(Loss) | | | 10,297,480 | | | | 6,232,809 | | | | (41,356,608 | ) |
| Net Assets | | $ | 44,074,503 | | | $ | 33,133,293 | | | $ | 132,894,070 | |
| Outstanding Shares of Beneficial Interest | | | | | | | | | | | | |
| (unlimited authorization — no par value) | | | 1,510,000 | | | | 1,130,000 | | | | 6,900,000 | |
| Net Asset Value, Offering and Redemption Price Per Share | | $ | 29.19 | | | $ | 29.32 | | | $ | 19.26 | |
| | Statements of Assets and Liabilities | |
| | May 31, 2021 (Unaudited) | |
| | | Global X U.S. Infrastructure Development ETF | | | Global X Clean Water ETF | | | Global X Thematic Growth ETF | |
| Assets: | | | | | | | | | |
| Cost of Investments | | $ | 3,212,821,087 | | | $ | 3,060,973 | | | $ | 5,896,548 | |
| Cost of Repurchase Agreement | | | 10,238,734 | | | | — | | | | 5,657,236 | |
| Cost of Affiliated Investments | | | — | | | | — | | | | 106,119,932 | |
| Investments, at Value | | $ | 3,699,625,405 | * | | $ | 3,172,318 | | | $ | 5,896,548 | |
| Repurchase Agreement, at Value | | | 10,238,734 | | | | — | | | | 5,657,236 | |
| Affiliated Investments, at Value | | | — | | | | — | | | | 101,383,111 | * |
| Cash | | | 3,898,949 | | | | 3,386 | | | | 101,696 | |
| Receivable for Capital Shares Sold | | | 10,849,628 | | | | — | | | | — | |
| Dividend and Interest Receivable | | | 3,709,267 | | | | 7,909 | | | | 28,114 | |
| Reclaim Receivable | | | 165,784 | | | | — | | | | — | |
| Receivable due from Investment Adviser | | | — | | | | — | | | | 11,658 | |
| Total Assets | | | 3,728,487,767 | | | | 3,183,613 | | | | 113,078,363 | |
| Liabilities: | | | | | | | | | | | | |
| Obligation to Return Securities Lending Collateral | | | 20,910,587 | | | | — | | | | 11,553,784 | |
| Payable for Investment Securities Purchased | | | 10,819,329 | | | | — | | | | — | |
| Payable due to Investment Adviser | | | 1,391,287 | | | | 1,335 | | | | — | |
| Total Liabilities | | | 33,121,203 | | | | 1,335 | | | | 11,553,784 | |
| Net Assets | | $ | 3,695,366,564 | | | $ | 3,182,278 | | | $ | 101,524,579 | |
| Net Assets Consist of: | | | | | | | | | | | | |
| Paid-in Capital | | $ | 3,202,872,236 | | | $ | 3,062,929 | | | $ | 98,665,175 | |
| Total Distributable Earnings | | | 492,494,328 | | | | 119,349 | | | | 2,859,404 | |
| Net Assets | | $ | 3,695,366,564 | | | $ | 3,182,278 | | | $ | 101,524,579 | |
| Outstanding Shares of Beneficial Interest | | | | | | | | | | | | |
| (unlimited authorization — no par value) | | | 139,630,000 | | | | 200,000 | | | | 2,090,000 | |
| Net Asset Value, Offering and Redemption Price Per Share | | $ | 26.47 | | | $ | 15.91 | | | $ | 48.58 | |
| *Includes Market Value of Securities on Loan | | $ | 20,268,144 | | | $ | — | | | $ | 11,266,638 | |
| | | |
| | For the period ended May 31, 2021 (Unaudited) | |
| | | Global X Robotics & Artificial Intelligence ETF | | | Global X Internet of Things ETF | | | | |
| Investment Income: | | | | | | | | | |
| Dividend Income | | $ | 13,945,030 | | | $ | 2,026,110 | | | $ | 1,766,372 | |
| Interest Income | | | 25 | | | | 19 | | | | 43 | |
| Security Lending Income | | | 1,124,312 | | | | 26,142 | | | | 265,806 | |
| Less: Foreign Taxes Withheld | | | (2,158,544 | ) | | | (83,769 | ) | | | (97,236 | ) |
| Total Investment Income | | | 12,910,823 | | | | 1,968,502 | | | | 1,934,985 | |
Supervision and Administration Fees(1) | | | 8,500,207 | | | | 1,308,248 | | | | 3,909,448 | |
Custodian Fees(2) | | | 12,750 | | | | 219 | | | | 476 | |
| Total Expenses | | | 8,512,957 | | | | 1,308,467 | | | | 3,909,924 | |
| Net Investment Income (Loss) | | | 4,397,866 | | | | 660,035 | | | | (1,974,939 | ) |
| Net Realized Gain (Loss) on: | | | | | | | | | | | | |
Investments(3) | | | 69,154,548 | | | | 7,012,611 | | | | 16,143,562 | |
| Foreign Currency Transactions | | | (60,130 | ) | | | (13,606 | ) | | | (47,436 | ) |
| Net Realized Gain on Investments and Foreign Currency Transactions | | | 69,094,418 | | | | 6,999,005 | | | | 16,096,126 | |
| Net Change in Unrealized Appreciation on: | | | | | | | | | | | | |
| Investments | | | 90,128,169 | | | | 43,382,543 | | | | 16,866,652 | |
| Foreign Currency Translations | | | 49,919 | | | | 4,418 | | | | 1,919 | |
| Net Change in Unrealized Appreciation on Investments and Foreign Currency Translations | | | 90,178,088 | | | | 43,386,961 | | | | 16,868,571 | |
| Net Realized and Unrealized Gain on Investments and Foreign Currency Transactions and Translations | | | 159,272,506 | | | | 50,385,966 | | | | 32,964,697 | |
| Net Increase in Net Assets Resulting from Operations | | $ | 163,670,372 | | | $ | 51,046,001 | | | $ | 30,989,758 | |
| (1) | The Supervision and Administration fees reflect the supervisory and administrative fee, which includes fees paid by the Funds for the investment advisory services provided by the Adviser. (See Note 3 in Notes to Financial Statements.) |
| (2) | See Note 2 in the Notes to Financial Statements. |
| (3) | Includes realized gains (losses) as a result of in-kind redemptions. (See Note 4 in Notes to Financial Statements.) |
| | Statements of Operations | |
| | For the period ended May 31, 2021 (Unaudited) | |
| | | Global X Video Games & Esports ETF | | | Global X Autonomous & Electric Vehicles ETF | | | Global X Cloud Computing ETF | |
| Investment Income: | | | | | | | | | |
| Dividend Income | | $ | 2,801,335 | | | $ | 4,087,935 | | | $ | 1,019,857 | |
| Security Lending Income | | | 81,211 | | | | 360,457 | | | | 11,206 | |
| Less: Foreign Taxes Withheld | | | (328,460 | ) | | | (243,116 | ) | | | — | |
| Total Investment Income | | | 2,554,086 | | | | 4,205,276 | | | | 1,031,063 | |
Supervision and Administration Fees(1) | | | 1,742,701 | | | | 2,269,100 | | | | 4,935,732 | |
Custodian Fees(2) | | | 2,732 | | | | 628 | | | | 1,285 | |
| Total Expenses | | | 1,745,433 | | | | 2,269,728 | | | | 4,937,017 | |
| Net Investment Income (Loss) | | | 808,653 | | | | 1,935,548 | | | | (3,905,954 | ) |
| Net Realized Gain (Loss) on: | | | | | | | | | | | | |
Investments(3) | | | 101,653,587 | | | | 37,137,927 | | | | 104,372,431 | |
| Foreign Currency Transactions | | | (30,997 | ) | | | 7,926 | | | | (596 | ) |
| Net Realized Gain on Investments and Foreign Currency Transactions | | | 101,622,590 | | | | 37,145,853 | | | | 104,371,835 | |
| Net Change in Unrealized Appreciation (Depreciation) on: | | | | | | | | | | | | |
| Investments | | | (50,273,102 | ) | | | 25,382,221 | | | | (85,966,660 | ) |
| Foreign Currency Translations | | | (762 | ) | | | 198 | | | | (10 | ) |
| Net Change in Unrealized Appreciation (Depreciation) on Investments and Foreign Currency Translations | | | (50,273,864 | ) | | | 25,382,419 | | | | (85,966,670 | ) |
| Net Realized and Unrealized Gain on Investments and Foreign Currency Transactions and Translations | | | 51,348,726 | | | | 62,528,272 | | | | 18,405,165 | |
| Net Increase in Net Assets Resulting from Operations | | $ | 52,157,379 | | | $ | 64,463,820 | | | $ | 14,499,211 | |
| (1) | The Supervision and Administration fees reflect the supervisory and administrative fee, which includes fees paid by the Funds for the investment advisory services provided by the Adviser. (See Note 3 in Notes to Financial Statements.) |
| (2) | See Note 2 in the Notes to Financial Statements. |
| (3) | Includes realized gains (losses) as a result of in-kind redemptions. (See Note 4 in Notes to Financial Statements.) |
| | Statements of Operations | |
| | For the period ended May 31, 2021 (Unaudited) | |
| | | Global X Data Center REITs & Digital Infrastructure ETF | | | Global X Cybersecurity ETF | | | Global X Artificial Intelligence & Technology ETF | |
| Investment Income: | | | | | | | | | |
| Dividend Income | | $ | 180,794 | | | $ | 511,696 | | | $ | 950,692 | |
| Security Lending Income | | | — | | | | — | | | | 6,649 | |
| Less: Foreign Taxes Withheld | | | (6,305 | ) | | | (32,750 | ) | | | (82,123 | ) |
| Total Investment Income | | | 174,489 | | | | 478,946 | | | | 875,218 | |
Supervision and Administration Fees(1) | | | 53,667 | | | | 1,298,405 | | | | 610,552 | |
Custodian Fees(2) | | | 35 | | | | 930 | | | | 328 | |
| Total Expenses | | | 53,702 | | | | 1,299,335 | | | | 610,880 | |
| Waiver of Supervision and Administration Fees | | | – | | | | (130,273 | ) | | | – | |
| Net Expenses | | | 53,702 | | | | 1,169,062 | | | | 610,880 | |
| Net Investment Income (Loss) | | | 120,787 | | | | (690,116 | ) | | | 264,338 | |
| Net Realized Gain (Loss) on: | | | | | | | | | | | | |
Investments(3) | | | 152,457 | | | | 7,818,825 | | | | 22,512,981 | |
| Foreign Currency Transactions | | | (2,365 | ) | | | (13,204 | ) | | | (12,661 | ) |
| Net Realized Gain on Investments and Foreign Currency Transactions | | | 150,092 | | | | 7,805,621 | | | | 22,500,320 | |
| Net Change in Unrealized Appreciation (Depreciation) on: | | | | | | | | | | | | |
| Investments | | | 1,984,109 | | | | (30,415,512 | ) | | | (7,485,303 | ) |
| Foreign Currency Translations | | | 24 | | | | 2,192 | | | | 164 | |
| Net Change in Unrealized Appreciation (Depreciation) on Investments and Foreign Currency Translations | | | 1,984,133 | | | | (30,413,320 | ) | | | (7,485,139 | ) |
| Net Realized and Unrealized Gain (Loss) on Investments and Foreign Currency Transactions and Translations | | | 2,134,225 | | | | (22,607,699 | ) | | | 15,015,181 | |
| Net Increase (Decrease) in Net Assets Resulting from Operations | | $ | 2,255,012 | | | $ | (23,297,815 | ) | | $ | 15,279,519 | |
| (1) | The Supervision and Administration fees reflect the supervisory and administrative fee, which includes fees paid by the Funds for the investment advisory services provided by the Adviser. (See Note 3 in Notes to Financial Statements.) |
| (2) | See Note 2 in the Notes to Financial Statements. |
| (3) | Includes realized gains (losses) as a result of in-kind redemptions. (See Note 4 in Notes to Financial Statements.) |
| | Statements of Operations | |
| | For the period ended May 31, 2021 (Unaudited) | |
| | | Global X Millennial Consumer ETF | | | | | | | |
| Investment Income: | | | | | | | | | |
| Dividend Income | | $ | 399,232 | | | $ | 43,875 | | | $ | — | |
| Interest Income | | | 4 | | | | 1 | | | | — | |
| Security Lending Income | | | 490 | | | | — | | | | 1,634,183 | |
| Less: Foreign Taxes Withheld | | | — | | | | (1,216 | ) | | | — | |
| Total Investment Income | | | 399,726 | | | | 42,660 | | | | 1,634,183 | |
Supervision and Administration Fees(1) | | | 391,642 | | | | 29,459 | | | | 355,758 | |
Custodian Fees(2) | | | 459 | | | | 257 | | | | 1,249 | |
| Total Expenses | | | 392,101 | | | | 29,716 | | | | 357,007 | |
| Net Investment Income | | | 7,625 | | | | 12,944 | | | | 1,277,176 | |
| Net Realized Gain (Loss) on: | | | | | | | | | | | | |
Investments(3) | | | 25,640,594 | | | | (223,651 | ) | | | (20,316,417 | ) |
| Foreign Currency Transactions | | | — | | | | 868 | | | | 15,170 | |
| Net Realized Gain (Loss) on Investments and Foreign Currency Transactions | | | 25,640,594 | | | | (222,783 | ) | | | (20,301,247 | ) |
| Net Change in Unrealized Appreciation (Depreciation) on: | | | | | | | | | | | | |
| Investments | | | (4,747,078 | ) | | | (2,854,336 | ) | | | (19,466,214 | ) |
| Foreign Currency Translations | | | — | | | | 71 | | | | (323 | ) |
| Net Change in Unrealized Depreciation on Investments and Foreign Currency Translations | | | (4,747,078 | ) | | | (2,854,265 | ) | | | (19,466,537 | ) |
| Net Realized and Unrealized Gain (Loss) on Investments and Foreign Currency Transactions and Translations | | | 20,893,516 | | | | (3,077,048 | ) | | | (39,767,784 | ) |
| Net Increase (Decrease) in Net Assets Resulting from Operations | | $ | 20,901,141 | | | $ | (3,064,104 | ) | | $ | (38,490,608 | ) |
| (1) | The Supervision and Administration fees reflect the supervisory and administrative fee, which includes fees paid by the Funds for the investment advisory services provided by the Adviser. (See Note 3 in Notes to Financial Statements.) |
| (2) | See Note 2 in the Notes to Financial Statements. |
| (3) | Includes realized gains (losses) as a result of in-kind redemptions. (See Note 4 in Notes to Financial Statements.) |
| | Statements of Operations | |
| | For the period ended May 31, 2021 (Unaudited) | |
| | | Global X Genomics & Biotechnology ETF | | | Global X China Biotech Innovation ETF | | | Global X Telemedicine & Digital Health ETF | |
| Investment Income: | | | | | | | | | |
| Dividend Income | | $ | 109,536 | | | $ | 7,166 | | | $ | 549,644 | |
| Interest Income | | | — | | | | 1 | | | | — | |
| Security Lending Income | | | 48,052 | | | | — | | | | 30,352 | |
| Less: Foreign Taxes Withheld | | | (2,370 | ) | | | (966 | ) | | | (23,281 | ) |
| Total Investment Income | | | 155,218 | | | | 6,201 | | | | 556,715 | |
Supervision and Administration Fees(1) | | | 432,033 | | | | 14,827 | | | | 2,465,110 | |
Custodian Fees(2) | | | 213 | | | | 122 | | | | 1,120 | |
| Total Expenses | | | 432,246 | | | | 14,949 | | | | 2,466,230 | |
| Net Investment Loss | | | (277,028 | ) | | | (8,748 | ) | | | (1,909,515 | ) |
| Net Realized Gain (Loss) on: | | | | | | | | | | | | |
Investments(3) | | | 4,194,765 | | | | (18,444 | ) | | | 11,714,525 | |
| Foreign Currency Transactions | | | (36 | ) | | | (1,477 | ) | | | (301 | ) |
| Net Realized Gain (Loss) on Investments and Foreign Currency Transactions | | | 4,194,729 | | | | (19,921 | ) | | | 11,714,224 | |
| Net Change in Unrealized Appreciation (Depreciation) on: | | | | | | | | | | | | |
| Investments | | | (21,759,253 | ) | | | 908,309 | | | | (35,548,152 | ) |
| Foreign Currency Translations | | | 29 | | | | 62 | | | | 53 | |
| Net Change in Unrealized Appreciation (Depreciation) on Investments and Foreign Currency Translations | | | (21,759,224 | ) | | | 908,371 | | | | (35,548,099 | ) |
| Net Realized and Unrealized Gain (Loss) on Investments and Foreign Currency Transactions and Translations | | | (17,564,495 | ) | | | 888,450 | | | | (23,833,875 | ) |
| Net Increase (Decrease) in Net Assets Resulting from Operations | | $ | (17,841,523 | ) | | $ | 879,702 | | | $ | (25,743,390 | ) |
| (1) | The Supervision and Administration fees reflect the supervisory and administrative fee, which includes fees paid by the Funds for the investment advisory services provided by the Adviser. (See Note 3 in Notes to Financial Statements.) |
| (2) | See Note 2 in the Notes to Financial Statements. |
| (3) | Includes realized gains (losses) as a result of in-kind redemptions. (See Note 4 in Notes to Financial Statements.) |
| | Statements of Operations | |
| | For the period ended May 31, 2021 (Unaudited) | |
| | | Global X Aging Population ETF | | | Global X Health & Wellness ETF | | | | |
| Investment Income: | | | | | | | | | |
| Dividend Income | | $ | 214,685 | | | $ | 166,596 | | | $ | 186,353 | |
| Less: Foreign Taxes Withheld | | | (10,378 | ) | | | (12,035 | ) | | | (14,279 | ) |
| Total Investment Income | | | 204,307 | | | | 154,561 | | | | 172,074 | |
Supervision and Administration Fees(1) | | | 115,011 | | | | 64,794 | | | | 342,682 | |
Custodian Fees(2) | | | 366 | | | | 43 | | | | 47 | |
| Total Expenses | | | 115,377 | | | | 64,837 | | | | 342,729 | |
| Net Investment Income (Loss) | | | 88,930 | | | | 89,724 | | | | (170,655 | ) |
| Net Realized Gain (Loss) on: | | | | | | | | | | | | |
Investments(3) | | | 7,436,268 | | | | 1,677,304 | | | | (10,672,175 | ) |
| Foreign Currency Transactions | | | 2,432 | | | | (2,734 | ) | | | (1,050 | ) |
| Net Realized Gain (Loss) on Investments and Foreign Currency Transactions | | | 7,438,700 | | | | 1,674,570 | | | | (10,673,225 | ) |
| Net Change in Unrealized Appreciation (Depreciation) on: | | | | | | | | | | | | |
| Investments | | | (3,401,358 | ) | | | 3,483,919 | | | | (32,958,404 | ) |
| Foreign Currency Translations | | | 212 | | | | 16 | | | | 355 | |
| Net Change in Unrealized Appreciation (Depreciation) on Investments and Foreign Currency Translations | | | (3,401,146 | ) | | | 3,483,935 | | | | (32,958,049 | ) |
| Net Realized and Unrealized Gain (Loss) on Investments and Foreign Currency Transactions and Translations | | | 4,037,554 | | | | 5,158,505 | | | | (43,631,274 | ) |
| Net Increase (Decrease) in Net Assets Resulting from Operations | | $ | 4,126,484 | | | $ | 5,248,229 | | | $ | (43,801,929 | ) |
| (1) | The Supervision and Administration fees reflect the supervisory and administrative fee, which includes fees paid by the Funds for the investment advisory services provided by the Adviser. (See Note 3 in Notes to Financial Statements.) |
| (2) | See Note 2 in the Notes to Financial Statements. |
| (3) | Includes realized gains (losses) as a result of in-kind redemptions. (See Note 4 in Notes to Financial Statements.) |
| | Statements of Operations | |
| | For the period ended May 31, 2021 (Unaudited) | |
| | | Global X U.S. Infrastructure Development ETF | | | Global X Clean Water ETF(1) | | | Global X Thematic Growth ETF | |
| Investment Income: | | | | | | | | | |
| Dividend Income | | $ | 11,269,458 | | | $ | 10,662 | | | $ | — | |
| Dividend Income, from Affiliated Investments | | | — | | | | — | | | | 134,796 | |
| Interest Income | | | 77 | | | | — | | | | — | |
| Security Lending Income | | | 2,258 | | | | — | | | | 186,612 | |
| Less: Foreign Taxes Withheld | | | — | | | | (311 | ) | | | — | |
| Total Investment Income | | | 11,271,793 | | | | 10,351 | | | | 321,408 | |
Supervision and Administration Fees(2) | | | 4,362,380 | | | | 1,951 | | | | 195,155 | |
Custodian Fees(3) | | | 2,156 | | | | 7 | | | | 199 | |
| Total Expenses | | | 4,364,536 | | | | 1,958 | | | | 195,354 | |
Reimbursement from Adviser(4) | | | – | | | | – | | | | (244,361 | ) |
| Net Expenses | | | 4,364,536 | | | | 1,958 | | | | (49,007 | ) |
| Net Investment Income | | | 6,907,257 | | | | 8,393 | | | | 370,415 | |
| Net Realized Gain (Loss) on: | | | | | | | | | | | | |
Investments(5) | | | (458,576 | ) | | | (403 | ) | | | — | |
| Affiliated Investments | | | — | | | | — | | | | 7,499,871 | |
| Net Realized Gain (Loss) on Investments | | | (458,576 | ) | | | (403 | ) | | | 7,499,871 | |
| Net Change in Unrealized Appreciation (Depreciation) on: | | | | | | | | | | | | |
| Investments | | | 419,635,525 | | | | 111,345 | | | | — | |
| Affiliated Investments | | | — | | | | — | | | | (9,649,365 | ) |
| Foreign Currency Translations | | | — | | | | 14 | | | | — | |
| Net Change in Unrealized Appreciation (Depreciation) on Investments and Foreign Currency Translations | | | 419,635,525 | | | | 111,359 | | | | (9,649,365 | ) |
| Net Realized and Unrealized Gain (Loss) on Investments and Foreign Currency Transactions and Translations | | | 419,176,949 | | | | 110,956 | | | | (2,149,494 | ) |
| Net Increase (Decrease) in Net Assets Resulting from Operations | | $ | 426,084,206 | | | $ | 119,349 | | | $ | (1,779,079 | ) |
| (1) | The Fund commenced operations on April 8, 2021. |
| (2) | The Supervision and Administration fees reflect the supervisory and administrative fee, which includes fees paid by the Funds for the investment advisory services provided by the Adviser. (See Note 3 in Notes to Financial Statements.) |
| (3) | See Note 2 in the Notes to Financial Statements. |
| (4) | See Note 3 in the Notes to Financial Statements. |
| (5) | Includes realized gains (losses) as a result of in-kind redemptions. (See Note 4 in Notes to Financial Statements.) |
| | Statements of Changes in Net Assets | |
| | | |
| | | Global X Robotics & Artificial Intelligence ETF | | | Global X Internet of Things ETF | |
| | | Period Ended May 31, 2021
(Unaudited) | | | Year Ended November 30, 2020 | | | Period Ended May 31, 2021
(Unaudited) | | | Year Ended November 30, 2020 | |
| Operations: | | | | | | | | | | | | |
| Net Investment Income | | $ | 4,397,866 | | | $ | 3,242,472 | | | $ | 660,035 | | | $ | 1,315,269 | |
Net Realized Gain on Investments and Foreign Currency Transactions(1) | | | 69,094,418 | | | | 7,613,107 | | | | 6,999,005 | | | | 16,117,099 | |
| Net Change in Unrealized Appreciation (Depreciation) on Investments and Foreign Currency Translations | | | 90,178,088 | | | | 626,860,201 | | | | 43,386,961 | | | | 46,240,265 | |
| Net Increase in Net Assets Resulting from Operations | | | 163,670,372 | | | | 637,715,780 | | | | 51,046,001 | | | | 63,672,633 | |
| Distributions | | | — | | | | (5,209,655 | ) | | | (670,702 | ) | | | (1,147,071 | ) |
| Return of Capital | | | — | | | | (891,490 | ) | | | — | | | | — | |
| Capital Share Transactions: | | | | | | | | | | | | | | | | |
| Issued | | | 392,508,504 | | | | 410,953,206 | | | | 97,122,019 | | | | 137,037,322 | |
| Redeemed | | | (177,904,238 | ) | | | (364,376,798 | ) | | | (6,512,770 | ) | | | (34,682,420 | ) |
| Increase in Net Assets from Capital Share Transactions | | | 214,604,266 | | | | 46,576,408 | | | | 90,609,249 | | | | 102,354,902 | |
| Total Increase in Net Assets | | | 378,274,638 | | | | 678,191,043 | | | | 140,984,548 | | | | 164,880,464 | |
| Net Assets: | | | | | | | | | | | | | | | | |
| Beginning of Year/Period | | | 2,158,174,587 | | | | 1,479,983,544 | | | | 296,507,952 | | | | 131,627,488 | |
| End of Year/Period | | $ | 2,536,449,225 | | | $ | 2,158,174,587 | | | $ | 437,492,500 | | | $ | 296,507,952 | |
| Share Transactions: | | | | | | | | | | | | | | | | |
| Issued | | | 11,540,000 | | | | 15,950,000 | | | | 2,920,000 | | | | 5,600,000 | |
| Redeemed | | | (5,440,000 | ) | | | (17,100,000 | ) | | | (200,000 | ) | | | (1,450,000 | ) |
| Net Increase (Decrease) in Shares Outstanding from Share Transactions | | | 6,100,000 | | | | (1,150,000 | ) | | | 2,720,000 | | | | 4,150,000 | |
| (1) | Includes realized gains (losses) as a result of in-kind redemptions. (See Note 4 in Notes to Financial Statements.) |
| | Statements of Changes in Net Assets | |
| | | |
| | | | | | Global X Video Games & Esports ETF | |
| | | Period Ended May 31, 2021
(Unaudited) | | | Year Ended November 30, 2020 | | | Period Ended May 31, 2021
(Unaudited) | | | Year Ended November 30, 2020 | |
| Operations: | | | | | | | | | | | | |
| Net Investment Income (Loss) | | $ | (1,974,939 | ) | | $ | (1,840,919 | ) | | $ | 808,653 | | | $ | 67,313 | |
Net Realized Gain (Loss) on Investments and Foreign Currency Transactions(1) | | | 16,096,126 | | | | (13,205,493 | ) | | | 101,622,590 | | | | 14,607,273 | |
| Net Change in Unrealized Appreciation (Depreciation) on Investments and Foreign Currency Translations | | | 16,868,571 | | | | 238,992,156 | | | | (50,273,864 | ) | | | 69,574,661 | |
| Net Increase in Net Assets Resulting from Operations | | | 30,989,758 | | | | 223,945,744 | | | | 52,157,379 | | | | 84,249,247 | |
| Distributions | | | — | | | | — | | | | (3,837,476 | ) | | | (67,560 | ) |
| Capital Share Transactions: | | | | | | | | | | | | | | | | |
| Issued | | | 349,202,448 | | | | 278,249,866 | | | | 459,112,652 | | | | 452,438,823 | |
| Redeemed | | | (38,183,901 | ) | | | (41,173,195 | ) | | | (318,960,232 | ) | | | (56,852,547 | ) |
| Increase in Net Assets from Capital Share Transactions | | | 311,018,547 | | | | 237,076,671 | | | | 140,152,420 | | | | 395,586,276 | |
| Total Increase in Net Assets | | | 342,008,305 | | | | 461,022,415 | | | | 188,472,323 | | | | 479,767,963 | |
| Net Assets: | | | | | | | | | | | | | | | | |
| Beginning of Year/Period | | | 874,174,549 | | | | 413,152,134 | | | | 481,340,715 | | | | 1,572,752 | |
| End of Year/Period | | $ | 1,216,182,854 | | | $ | 874,174,549 | | | $ | 669,813,038 | | | $ | 481,340,715 | |
| Share Transactions: | | | | | | | | | | | | | | | | |
| Issued | | | 7,380,000 | | | | 8,300,000 | | | | 13,920,000 | | | | 19,250,000 | |
| Redeemed | | | (890,000 | ) | | | (1,400,000 | ) | | | (10,070,000 | ) | | | (2,500,000 | ) |
| Net Increase in Shares Outstanding from Share Transactions | | | 6,490,000 | | | | 6,900,000 | | | | 3,850,000 | | | | 16,750,000 | |
| (1) | Includes realized gains (losses) as a result of in-kind redemptions. (See Note 4 in Notes to Financial Statements.) |
| | Statements of Changes in Net Assets | |
| | | |
| | | Global X Autonomous & Electric Vehicles ETF | | | Global X Cloud Computing ETF | |
| | | Period Ended May 31, 2021
(Unaudited) | | | Year Ended November 30, 2020 | | | Period Ended May 31, 2021
(Unaudited) | | | Year Ended November 30, 2020 | |
| Operations: | | | | | | | | | | | | |
| Net Investment Income (Loss) | | $ | 1,935,548 | | | $ | 207,504 | | | $ | (3,905,954 | ) | | $ | (4,118,942 | ) |
Net Realized Gain on Investments and Foreign Currency Transactions(1) | | | 37,145,853 | | | | 1,780,536 | | | | 104,371,835 | | | | 147,392,184 | |
| Net Change in Unrealized Appreciation (Depreciation) on Investments and Foreign Currency Translations | | | 25,382,419 | | | | 20,973,963 | | | | (85,966,670 | ) | | | 242,627,223 | |
| Net Increase in Net Assets Resulting from Operations | | | 64,463,820 | | | | 22,962,003 | | | | 14,499,211 | | | | 385,900,465 | |
| Distributions | | | (200,327 | ) | | | (148,067 | ) | | | — | | | | (216,000 | ) |
| Capital Share Transactions: | | | | | | | | | | | | | | | | |
| Issued | | | 809,748,710 | | | | 102,125,471 | | | | 149,759,244 | | | | 909,735,434 | |
| Redeemed | | | (109,555,720 | ) | | | (3,871,797 | ) | | | (286,047,222 | ) | | | (362,316,444 | ) |
| Increase (Decrease) in Net Assets from Capital Share Transactions | | | 700,192,990 | | | | 98,253,674 | | | | (136,287,978 | ) | | | 547,418,990 | |
| Total Increase (Decrease) in Net Assets | | | 764,456,483 | | | | 121,067,610 | | | | (121,788,767 | ) | | | 933,103,455 | |
| Net Assets: | | | | | | | | | | | | | | | | |
| Beginning of Year/Period | | | 135,922,537 | | | | 14,854,927 | | | | 1,405,489,005 | | | | 472,385,550 | |
| End of Year/Period | | $ | 900,379,020 | | | $ | 135,922,537 | | | $ | 1,283,700,238 | | | $ | 1,405,489,005 | |
| Share Transactions: | | | | | | | | | | | | | | | | |
| Issued | | | 30,500,000 | | | | 5,450,000 | | | | 5,720,000 | | | | 42,050,000 | |
| Redeemed | | | (4,220,000 | ) | | | (250,000 | ) | | | (11,050,000 | ) | | | (17,200,000 | ) |
| Net Increase (Decrease) in Shares Outstanding from Share Transactions | | | 26,280,000 | | | | 5,200,000 | | | | (5,330,000 | ) | | | 24,850,000 | |
| (1) | Includes realized gains (losses) as a result of in-kind redemptions. (See Note 4 in Notes to Financial Statements.) |
| | Statements of Changes in Net Assets | |
| | | |
| | | Global X Data Center REITs & Digital Infrastructure ETF | | | Global X Cybersecurity ETF | |
| | | Period Ended May 31, 2021
(Unaudited) | | | Period Ended November 30, 2020(1) | | | Period Ended May 31, 2021
(Unaudited) | | | Year Ended November 30, 2020 | |
| Operations: | | | | | | | | | | | | |
| Net Investment Income (Loss) | | $ | 120,787 | | | $ | 506 | | | $ | (690,116 | ) | | $ | 86,100 | |
Net Realized Gain on Investments and Foreign Currency Transactions(2) | | | 150,092 | | | | 162 | | | | 7,805,621 | | | | 1,476,776 | |
| Net Change in Unrealized Appreciation (Depreciation) on Investments and Foreign Currency Translations | | | 1,984,133 | | | | (8,833 | ) | | | (30,413,320 | ) | | | 4,518,525 | |
| Net Increase (Decrease) in Net Assets Resulting from Operations | | | 2,255,012 | | | | (8,165 | ) | | | (23,297,815 | ) | | | 6,081,401 | |
| Distributions | | | (16,183 | ) | | | — | | | | (165,949 | ) | | | (130,636 | ) |
| Capital Share Transactions: | | | | | | | | | | | | | | | | |
| Issued | | | 48,896,338 | | | | 3,743,722 | | | | 901,086,071 | | | | 42,185,801 | |
| Redeemed | | | (789,202 | ) | | | — | | | | (566,496,439 | ) | | | (3,216,779 | ) |
| Increase in Net Assets from Capital Share Transactions | | | 48,107,136 | | | | 3,743,722 | | | | 334,589,632 | | | | 38,969,022 | |
| Total Increase in Net Assets | | | 50,345,965 | | | | 3,735,557 | | | | 311,125,868 | | | | 44,919,787 | |
| Net Assets: | | | | | | | | | | | | | | | | |
| Beginning of Year/Period | | | 3,735,557 | | | | — | | | | 46,633,552 | | | | 1,713,765 | |
| End of Year/Period | | $ | 54,081,522 | | | $ | 3,735,557 | | | $ | 357,759,420 | | | $ | 46,633,552 | |
| Share Transactions: | | | | | | | | | | | | | | | | |
| Issued | | | 3,100,000 | | | | 250,000 | | | | 31,990,000 | | | | 2,100,000 | |
| Redeemed | | | (50,000 | ) | | | — | | | | (20,970,000 | ) | | | (150,000 | ) |
| Net Increase in Shares Outstanding from Share Transactions | | | 3,050,000 | | | | 250,000 | | | | 11,020,000 | | | | 1,950,000 | |
| (1) | The Fund commenced operations on October 27, 2020. |
| (2) | Includes realized gains (losses) as a result of in-kind redemptions. (See Note 4 in Notes to Financial Statements.) |
| | Statements of Changes in Net Assets | |
| | | |
| | | Global X Artificial Intelligence & Technology ETF | | | Global X Millennial Consumer ETF | |
| | | Period Ended May 31, 2021
(Unaudited) | | | Year Ended November 30, 2020 | | | Period Ended May 31, 2021
(Unaudited) | | | Year Ended November 30, 2020 | |
| Operations: | | | | | | | | | | | | |
| Net Investment Income | | $ | 264,338 | | | $ | 494,532 | | | $ | 7,625 | | | $ | 157,088 | |
Net Realized Gain on Investments and Foreign Currency Transactions(1) | | | 22,500,320 | | | | 5,048,075 | | | | 25,640,594 | | | | 1,634,770 | |
| Net Change in Unrealized Appreciation (Depreciation) on Investments and Foreign Currency Translations | | | (7,485,139 | ) | | | 20,629,782 | | | | (4,747,078 | ) | | | 26,411,623 | |
| Net Increase in Net Assets Resulting from Operations | | | 15,279,519 | | | | 26,172,389 | | | | 20,901,141 | | | | 28,203,481 | |
| Distributions | | | (295,974 | ) | | | (293,815 | ) | | | (197,478 | ) | | | (326,460 | ) |
| Capital Share Transactions: | | | | | | | | | | | | | | | | |
| Issued | | | 121,136,181 | | | | 65,644,332 | | | | 99,255,688 | | | | 26,317,605 | |
| Redeemed | | | (50,841,378 | ) | | | (15,598,992 | ) | | | (49,228,303 | ) | | | (15,066,868 | ) |
| Increase in Net Assets from Capital Share Transactions | | | 70,294,803 | | | | 50,045,340 | | | | 50,027,385 | | | | 11,250,737 | |
| Total Increase in Net Assets | | | 85,278,348 | | | | 75,923,914 | | | | 70,731,048 | | | | 39,127,758 | |
| Net Assets: | | | | | | | | | | | | | | | | |
| Beginning of Year/Period | | | 120,168,509 | | | | 44,244,595 | | | | 114,510,674 | | | | 75,382,916 | |
| End of Year/Period | | $ | 205,446,857 | | | $ | 120,168,509 | | | $ | 185,241,722 | | | $ | 114,510,674 | |
| Share Transactions: | | | | | | | | | | | | | | | | |
| Issued | | | 4,290,000 | | | | 2,900,000 | | | | 2,440,000 | | | | 900,000 | |
| Redeemed | | | (1,830,000 | ) | | | (800,000 | ) | | | (1,200,000 | ) | | | (600,000 | ) |
| Net Increase in Shares Outstanding from Share Transactions | | | 2,460,000 | | | | 2,100,000 | | | | 1,240,000 | | | | 300,000 | |
| (1) | Includes realized gains (losses) as a result of in-kind redemptions. (See Note 4 in Notes to Financial Statements.) |
| | Statements of Changes in Net Assets | |
| | | |
| | | | | | | |
| | | Period Ended May 31, 2021
(Unaudited) | | | Period Ended November 30, 2020(1) | | | Period Ended May 31, 2021
(Unaudited) | | | Year Ended November 30, 2020 | |
| Operations: | | | | | | | | | | | | |
| Net Investment Income (Loss) | | $ | 12,944 | | | $ | (4,394 | ) | | $ | 1,277,176 | | | $ | 893,403 | |
Net Realized Gain (Loss) on Investments and Foreign Currency Transactions(2) | | | (222,783 | ) | | | 67,416 | | | | (20,301,247 | ) | | | (3,805,246 | ) |
| Net Change in Unrealized Appreciation (Depreciation) on Investments and Foreign Currency Translations | | | (2,854,265 | ) | | | 459,932 | | | | (19,466,537 | ) | | | 6,618,255 | |
| Net Increase (Decrease) in Net Assets Resulting from Operations | | | (3,064,104 | ) | | | 522,954 | | | | (38,490,608 | ) | | | 3,706,412 | |
| Distributions | | | — | | | | — | | | | (544,706 | ) | | | (501,916 | ) |
| Capital Share Transactions: | | | | | | | | | | | | | | | | |
| Issued | | | 9,646,803 | | | | 7,879,257 | | | | 259,366,186 | | | | 28,360,906 | |
| Redeemed | | | — | | | | (1,546,466 | ) | | | (51,328,117 | ) | | | — | |
| Increase in Net Assets from Capital Share Transactions | | | 9,646,803 | | | | 6,332,791 | | | | 208,038,069 | | | | 28,360,906 | |
| Total Increase in Net Assets | | | 6,582,699 | | | | 6,855,745 | | | | 169,002,755 | | | | 31,565,402 | |
| Net Assets: | | | | | | | | | | | | | | | | |
| Beginning of Year/Period | | | 6,855,745 | | | | — | | | | 36,159,865 | | | | 4,594,463 | |
| End of Year/Period | | $ | 13,438,444 | | | $ | 6,855,745 | | | $ | 205,162,620 | | | $ | 36,159,865 | |
| Share Transactions: | | | | | | | | | | | | | | | | |
| Issued | | | 520,000 | | | | 500,000 | | | | 13,200,000 | | | | 2,700,000 | |
| Redeemed | | | — | | | | (100,000 | ) | | | (2,800,000 | ) | | | — | |
| Net Increase in Shares Outstanding from Share Transactions | | | 520,000 | | | | 400,000 | | | | 10,400,000 | | | | 2,700,000 | |
| (1) | The Fund commenced operations on July 10, 2020. |
| (2) | Includes realized gains (losses) as a result of in-kind redemptions. (See Note 4 in Notes to Financial Statements.) |
| | Statements of Changes in Net Assets | |
| | | |
| | | Global X Genomics & Biotechnology ETF | | | Global X China Biotech Innovation ETF | |
| | | Period Ended May 31, 2021
(Unaudited) | | | Year Ended November 30, 2020 | | | Period Ended May 31, 2021
(Unaudited) | | | Period Ended November 30, 2020(1) | |
| Operations: | | | | | | | | | | | | |
| Net Investment Loss | | $ | (277,028 | ) | | $ | (154,881 | ) | | $ | (8,748 | ) | | $ | (2,388 | ) |
Net Realized Gain (Loss) on Investments and Foreign Currency Transactions(2) | | | 4,194,729 | | | | 5,206,530 | | | | (19,921 | ) | | | (5,680 | ) |
| Net Change in Unrealized Appreciation (Depreciation) on Investments and Foreign Currency Translations | | | (21,759,224 | ) | | | 12,154,278 | | | | 908,371 | | | | (57,553 | ) |
| Net Increase (Decrease) in Net Assets Resulting from Operations | | | (17,841,523 | ) | | | 17,205,927 | | | | 879,702 | | | | (65,621 | ) |
| Distributions | | | (157,150 | ) | | | — | | | | — | | | | — | |
| Capital Share Transactions: | | | | | | | | | | | | | | | | |
| Issued | | | 165,735,586 | | | | 57,860,443 | | | | 3,520,275 | | | | 2,297,749 | |
| Redeemed | | | (28,674,972 | ) | | | (11,849,645 | ) | | | — | | | | — | |
| Increase in Net Assets from Capital Share Transactions | | | 137,060,614 | | | | 46,010,798 | | | | 3,520,275 | | | | 2,297,749 | |
| Total Increase in Net Assets | | | 119,061,941 | | | | 63,216,725 | | | | 4,399,977 | | | | 2,232,128 | |
| Net Assets: | | | | | | | | | | | | | | | | |
| Beginning of Year/Period | | | 81,950,807 | | | | 18,734,082 | | | | 2,232,128 | | | | — | |
| End of Year/Period | | $ | 201,012,748 | | | $ | 81,950,807 | | | $ | 6,632,105 | | | $ | 2,232,128 | |
| Share Transactions: | | | | | | | | | | | | | | | | |
| Issued | | | 6,720,000 | | | | 3,350,000 | | | | 200,000 | | | | 150,000 | |
| Redeemed | | | (1,280,000 | ) | | | (650,000 | ) | | | — | | | | — | |
| Net Increase in Shares Outstanding from Share Transactions | | | 5,440,000 | | | | 2,700,000 | | | | 200,000 | | | | 150,000 | |
| (1) | The Fund commenced operations on September 22, 2020. |
| (2) | Includes realized gains (losses) as a result of in-kind redemptions. (See Note 4 in Notes to Financial Statements.) |
| | Statements of Changes in Net Assets | |
| | | |
| | | Global X Telemedicine & Digital Health ETF | | | Global X Aging Population ETF | |
| | | Period Ended May 31, 2021
(Unaudited) | | | Period Ended November 30, 2020(1) | | | Period Ended May 31, 2021
(Unaudited) | | | Year Ended November 30, 2020 | |
| Operations: | | | | | | | | | | | | |
| Net Investment Income (Loss) | | $ | (1,909,515 | ) | | $ | 197,233 | | | $ | 88,930 | | | $ | 130,386 | |
Net Realized Gain on Investments and Foreign Currency Transactions(2) | | | 11,714,224 | | | | 4,212,161 | | | | 7,438,700 | | | | 1,121,071 | |
| Net Change in Unrealized Appreciation (Depreciation) on Investments and Foreign Currency Translations | | | (35,548,099 | ) | | | 54,952,002 | | | | (3,401,146 | ) | | | 3,221,996 | |
| Net Increase (Decrease) in Net Assets Resulting from Operations | | | (25,743,390 | ) | | | 59,361,396 | | | | 4,126,484 | | | | 4,473,453 | |
| Distributions | | | (193,332 | ) | | | — | | | | (101,665 | ) | | | (207,290 | ) |
| Capital Share Transactions: | | | | | | | | | | | | | | | | |
| Issued | | | 339,087,969 | | | | 450,607,051 | | | | 17,415,639 | | | | 18,592,284 | |
| Redeemed | | | (69,116,674 | ) | | | (19,293,640 | ) | | | (20,272,786 | ) | | | (3,499,173 | ) |
| Increase (Decrease) in Net Assets from Capital Share Transactions | | | 269,971,295 | | | | 431,313,411 | | | | (2,857,147 | ) | | | 15,093,111 | |
| Total Increase in Net Assets | | | 244,034,573 | | | | 490,674,807 | | | | 1,167,672 | | | | 19,359,274 | |
| Net Assets: | | | | | | | | | | | | | | | | |
| Beginning of Year/Period | | | 490,674,807 | | | | — | | | | 42,906,831 | | | | 23,547,557 | |
| End of Year/Period | | $ | 734,709,380 | | | $ | 490,674,807 | | | $ | 44,074,503 | | | $ | 42,906,831 | |
| Share Transactions: | | | | | | | | | | | | | | | | |
| Issued | | | 16,900,000 | | | | 27,750,000 | | | | 620,000 | | | | 750,000 | |
| Redeemed | | | (3,660,000 | ) | | | (1,100,000 | ) | | | (710,000 | ) | | | (150,000 | ) |
| Net Increase (Decrease) in Shares Outstanding from Share Transactions | | | 13,240,000 | | | | 26,650,000 | | | | (90,000 | ) | | | 600,000 | |
| (1) | The Fund commenced operations on July 29, 2020. |
| (2) | Includes realized gains (losses) as a result of in-kind redemptions. (See Note 4 in Notes to Financial Statements.) |
| | Statements of Changes in Net Assets | |
| | | |
| | | Global X Health & Wellness ETF | | | | |
| | | Period Ended May 31, 2021
(Unaudited) | | | Year Ended November 30, 2020 | | | Period Ended May 31, 2021
(Unaudited) | | | Period Ended November 30, 2020(1) | |
| Operations: | | | | | | | | | | | | |
| Net Investment Income (Loss) | | $ | 89,724 | | | $ | 94,216 | | | $ | (170,655 | ) | | $ | 10,479 | |
Net Realized Gain (Loss) on Investments and Foreign Currency Transactions(2) | | | 1,674,570 | | | | 2,165,439 | | | | (10,673,225 | ) | | | (2,573 | ) |
| Net Change in Unrealized Appreciation (Depreciation) on Investments and Foreign Currency Translations | | | 3,483,935 | | | | 47,301 | | | | (32,958,049 | ) | | | 2,447,006 | |
| Net Increase (Decrease) in Net Assets Resulting from Operations | | | 5,248,229 | | | | 2,306,956 | | | | (43,801,929 | ) | | | 2,454,912 | |
| Distributions | | | (88,108 | ) | | | (95,104 | ) | | | (9,591 | ) | | | — | |
| Capital Share Transactions: | | | | | | | | | | | | | | | | |
| Issued | | | 14,238,180 | | | | 14,278,870 | | | | 170,435,582 | | | | 26,068,557 | |
| Redeemed | | | (6,760,921 | ) | | | (16,109,523 | ) | | | (22,253,461 | ) | | | — | |
| Increase (Decrease) in Net Assets from Capital Share Transactions | | | 7,477,259 | | | | (1,830,653 | ) | | | 148,182,121 | | | | 26,068,557 | |
| Total Increase in Net Assets | | | 12,637,380 | | | | 381,199 | | | | 104,370,601 | | | | 28,523,469 | |
| Net Assets: | | | | | | | | | | | | | | | | |
| Beginning of Year/Period | | | 20,495,913 | | | | 20,114,714 | | | | 28,523,469 | | | | — | |
| End of Year/Period | | $ | 33,133,293 | | | $ | 20,495,913 | | | $ | 132,894,070 | | | $ | 28,523,469 | |
| Share Transactions: | | | | | | | | | | | | | | | | |
| Issued | | | 530,000 | | | | 700,000 | | | | 6,640,000 | | | | 1,500,000 | |
| Redeemed | | | (250,000 | ) | | | (800,000 | ) | | | (1,240,000 | ) | | | — | |
| Net Increase (Decrease) in Shares Outstanding from Share Transactions | | | 280,000 | | | | (100,000 | ) | | | 5,400,000 | | | | 1,500,000 | |
| (1) | The Fund commenced operations on October 27, 2020. |
| (2) | Includes realized gains (losses) as a result of in-kind redemptions. (See Note 4 in Notes to Financial Statements.) |
| | Statements of Changes in Net Assets | |
| | | |
| | | Global X U.S. Infrastructure Development ETF | | | | |
| | | Period Ended May 31, 2021
(Unaudited) | | | Year Ended November 30, 2020 | | | Period Ended May 31, 2021(1) (Unaudited) | |
| Operations: | | | | | | | | | |
| Net Investment Income | | $ | 6,907,257 | | | $ | 2,019,654 | | | $ | 8,393 | |
Net Realized Loss on Investments(2) | | | (458,576 | ) | | | (8,543,451 | ) | | | (403 | ) |
| Net Change in Unrealized Appreciation (Depreciation) on Investments | | | 419,635,525 | | | | 62,924,477 | | | | 111,359 | |
| Net Increase in Net Assets Resulting from Operations | | | 426,084,206 | | | | 56,400,680 | | | | 119,349 | |
| Distributions | | | (1,999,347 | ) | | | (1,004,004 | ) | | | — | |
| Return of Capital | | | (32,708 | ) | | | — | | | | — | |
| Capital Share Transactions: | | | | | | | | | | | | |
| Issued | | | 2,668,620,394 | | | | 481,978,464 | | | | 3,062,929 | |
| Redeemed | | | (50,941,466 | ) | | | (66,804,212 | ) | | | — | |
| Increase in Net Assets from Capital Share Transactions | | | 2,617,678,928 | | | | 415,174,252 | | | | 3,062,929 | |
| Total Increase in Net Assets | | | 3,041,731,079 | | | | 470,570,928 | | | | 3,182,278 | |
| Net Assets: | | | | | | | | | | | | |
| Beginning of Year/Period | | | 653,635,485 | | | | 183,064,557 | | | | — | |
| End of Year/Period | | $ | 3,695,366,564 | | | $ | 653,635,485 | | | $ | 3,182,278 | |
| Share Transactions: | | | | | | | | | | | | |
| Issued | | | 109,380,000 | | | | 27,150,000 | | | | 200,000 | |
| Redeemed | | | (2,050,000 | ) | | | (5,350,000 | ) | | | — | |
| Net Increase in Shares Outstanding from Share Transactions | | | 107,330,000 | | | | 21,800,000 | | | | 200,000 | |
| (1) | The Fund commenced operations on April 8, 2021. |
| (2) | Includes realized gains (losses) as a result of in-kind redemptions. (See Note 4 in Notes to Financial Statements.) |
| | Statements of Changes in Net Assets | |
| | | |
| | | Global X Thematic Growth ETF | |
| | | Period Ended May 31, 2021
(Unaudited) | | | Year Ended November 30, 2020 | |
| Operations: | | | | | | |
| Net Investment Income | | $ | 370,415 | | | $ | 33,093 | |
Net Realized Gain on Investments(1) | | | 7,499,871 | | | | 2,753,474 | |
| Net Change in Unrealized Appreciation (Depreciation) on Investments | | | (9,649,365 | ) | | | 4,786,079 | |
| Net Increase (Decrease) in Net Assets Resulting from Operations | | | (1,779,079 | ) | | | 7,572,646 | |
| Distributions | | | (168,656 | ) | | | (16,854 | ) |
| Capital Share Transactions: | | | | | | | | |
| Issued | | | 102,231,178 | | | | 47,069,175 | |
| Redeemed | | | (34,839,710 | ) | | | (21,193,938 | ) |
| Increase in Net Assets from Capital Share Transactions | | | 67,391,468 | | | | 25,875,237 | |
| Total Increase in Net Assets | | | 65,443,733 | | | | 33,431,029 | |
| Net Assets: | | | | | | | | |
| Beginning of Year/Period | | | 36,080,846 | | | | 2,649,817 | |
| End of Year/Period | | $ | 101,524,579 | | | $ | 36,080,846 | |
| Share Transactions: | | | | | | | | |
| Issued | | | 1,930,000 | | | | 1,350,000 | |
| Redeemed | | | (690,000 | ) | | | (600,000 | ) |
| Net Increase in Shares Outstanding from Share Transactions | | | 1,240,000 | | | | 750,000 | |
| (1) | Includes realized gains (losses) as a result of in-kind redemptions. (See Note 4 in Notes to Financial Statements.) |
Selected Per Share Data & Ratios
For a Share Outstanding Throughout the Period
| | | Net
Asset Value, Beginning
of Period
($) | | | Net Investment Income (Loss)
($)* | | | Net Realized and Unrealized Gain (Loss) on Investments
($) | | | Total from Operations
($) | | | Distribution from Net Investment Income ($) | | | Distribution from Capital Gains ($) | |
| Global X Robotics & Artificial Intelligence ETF | | | | | | | | | | | | | | | | | | |
| 2021 (Unaudited) | | | 31.78 | | | | 0.06 | | | | 2.44 | | | | 2.50 | | | | — | | | | — | |
| 2020 | | | 21.43 | | | | 0.05 | | | | 10.39 | | | | 10.44 | | | | (0.08 | ) | | | — | |
| 2019 | | | 19.70 | | | | 0.19 | | | | 1.93 | | | | 2.12 | | | | (0.39 | ) | | | — | |
| 2018 | | | 23.96 | | | | 0.19 | | | | (4.45 | ) | | | (4.26 | ) | | | — | | | | — | |
| 2017 | | | 14.87 | | | | 0.01 | | | | 9.09 | | | | 9.10 | | | | (0.01 | ) | | | — | |
2016(1) | | | 14.84 | | | | 0.02 | | | | 0.01 | | | | 0.03 | | | | — | | | | — | |
| Global X Internet of Things ETF | | | | | | | | | | | | | | | | | | | | | | | | |
| 2021 (Unaudited) | | | 29.95 | | | | 0.06 | | | | 4.72 | | | | 4.78 | | | | (0.06 | ) | | | — | |
| 2020 | | | 22.89 | | | | 0.17 | | | | 7.08 | | | | 7.25 | | | | (0.19 | ) | | | — | |
| 2019 | | | 18.04 | | | | 0.20 | | | | 4.93 | | | | 5.13 | | | | (0.28 | ) | | | — | |
| 2018 | | | 20.12 | | | | 0.17 | | | | (2.03 | ) | | | (1.86 | ) | | | (0.11 | ) | | | (0.11 | ) |
| 2017 | | | 15.52 | | | | 0.16 | | | | 4.49 | | | | 4.65 | | | | (0.05 | ) | | | — | |
2016(1) | | | 15.04 | | | | 0.09 | | | | 0.39 | | | | 0.48 | | | | — | | | | — | |
| Global X FinTech ETF | | | | | | | | | | | | | | | | | | | | | | | | |
| 2021 (Unaudited) | | | 42.75 | | | | (0.08 | ) | | | 2.47 | | | | 2.39 | | | | — | | | | — | |
| 2020 | | | 30.49 | | | | (0.11 | ) | | | 12.37 | | | | 12.26 | | | | — | | | | — | |
| 2019 | | | 24.55 | | | | (0.08 | ) | | | 6.06 | | | | 5.98 | | | | — | | | | — | |
| 2018 | | | 21.79 | | | | (0.08 | ) | | | 2.86 | | | | 2.78 | | | | — | | | | (0.02 | ) |
| 2017 | | | 14.91 | | | | (0.03 | ) | | | 6.91 | | | | 6.88 | | | | — | | | | — | |
2016(1) | | | 15.08 | | | | (0.01 | ) | | | (0.16 | ) | | | (0.17 | ) | | | — | | | | — | |
| Global X Video Games & Esports ETF | | | | | | | | | | | | | | | | | | | | | | | | |
| 2021 (Unaudited) | | | 28.57 | | | | 0.05 | | | | 3.94 | | | | 3.99 | | | | (0.20 | ) | | | *** |
|
| 2020 | | | 15.73 | | | | 0.02 | | | | 12.86 | | | | 12.88 | | | | (0.04 | ) | | | — | |
2019(2) | | | 14.99 | | | | — | | | | 0.74 | | | | 0.74 | | | | — | | | | — | |
| Return of Capital ($) | | | Total from Distributions ($) | | | Net
Asset Value,
End of
Period ($) | | | Total Return (%)** | | | Net Assets End of Period ($)(000) | | | Ratio of Expenses to Average Net Assets (%) | | | Ratio of Net Investment Income (Loss) to Average Net Assets (%) | | | Portfolio Turnover (%)†† | |
| | | | | | | | | | | | | | | | | | | | | | | |
| | — | | | | — | | | | 34.28 | | | | 7.87 | | | | 2,536,449 | | | | 0.68 | † | | | 0.35 | † | | | 0.62 | |
| | (0.01 | ) | | | (0.09 | ) | | | 31.78 | | | | 48.90 | | | | 2,158,175 | | | | 0.68 | | | | 0.21 | | | | 22.27 | |
| | — | | | | (0.39 | ) | | | 21.43 | | | | 11.16 | | | | 1,479,984 | | | | 0.68 | | | | 0.98 | | | | 10.97 | |
| | — | | | | — | *** | | | 19.70 | | | | (17.77 | ) | | | 1,726,274 | | | | 0.70 | | | | 0.83 | | | | 28.50 | |
| | — | | | | (0.01 | ) | | | 23.96 | | | | 61.22 | | | | 1,412,589 | | | | 0.69 | | | | 0.05 | | | | 15.29 | |
| | — | | | | — | | | | 14.87 | | | | 0.20 | | | | 2,974 | | | | 0.68 | † | | | 0.62 | † | | | — | |
| | | | | | | | | | | | | | | | | | | | | | | | | | | | | | | |
| | — | | | | (0.06 | ) | | | 34.67 | | | | 15.99 | | | | 437,493 | | | | 0.68 | † | | | 0.34 | † | | | 4.16 | |
| | — | | | | (0.19 | ) | | | 29.95 | | | | 31.88 | | | | 296,508 | | | | 0.68 | | | | 0.71 | | | | 14.28 | |
| | — | | | | (0.28 | ) | | | 22.89 | | | | 29.01 | | | | 131,627 | | | | 0.68 | | | | 1.04 | | | | 11.71 | |
| | — | | | | (0.22 | ) | | | 18.04 | | | | (9.33 | ) | | | 82,983 | | | | 0.69 | | | | 0.88 | | | | 16.69 | |
| | — | | | | (0.05 | ) | | | 20.12 | | | | 30.04 | | | | 85,521 | | | | 0.70 | | | | 0.85 | | | | 24.90 | |
| | — | | | | — | | | | 15.52 | | | | 3.19 | | | | 3,881 | | | | 0.68 | † | | | 2.75 | † | | | 0.39 | |
| | | | | | | | | | | | | | | | | | | | | | | | | | | | | | | |
| | — | | | | — | | | | 45.14 | | | | 5.61 | | | | 1,216,183 | | | | 0.68 | † | | | (0.34 | )† | | | 8.39 | |
| | — | | | | — | | | | 42.75 | | | | 40.21 | | | | 874,175 | | | | 0.68 | | | | (0.33 | ) | | | 15.75 | |
| | (0.04 | ) | | | (0.04 | ) | | | 30.49 | | | | 24.42 | | | | 413,152 | | | | 0.68 | | | | (0.29 | ) | | | 16.40 | |
| | — | | | | (0.02 | ) | | | 24.55 | | | | 12.79 | | | | 327,734 | | | | 0.68 | | | | (0.29 | ) | | | 20.58 | |
| | — | | | | — | | | | 21.79 | | | | 46.14 | | | | 50,106 | | | | 0.68 | | | | (0.13 | ) | | | 11.65 | |
| | — | | | | — | | | | 14.91 | | | | (1.13 | ) | | | 1,491 | | | | 0.68 | † | | | (0.20 | )† | | | — | |
| | | | | | | | | | | | | | | | | | | | | | | | | | | | | | | |
| | — | | | | (0.20 | ) | | | 32.36 | | | | 14.02 | | | | 669,813 | | | | 0.50 | † | | | 0.23 | † | | | 11.86 | |
| | — | | | | (0.04 | ) | | | 28.57 | | | | 82.04 | | | | 481,341 | | | | 0.50 | | | | 0.04 | | | | 12.02 | |
| | — | | | | — | | | | 15.73 | | | | 4.94 | | | | 1,573 | | | | 0.50 | † | | | (0.45 | )† | | | 0.27 | |
| * | Per share data calculated using average shares method. |
| ** | Total Return is for the period indicated and has not been annualized. The return shown does not reflect the deduction of taxes that a shareholder would pay on Fund distributions or the redemption of Fund shares. |
| *** | Amount is less than $0.005. |
| † | Annualized. |
| †† | Portfolio turnover rate is for the period indicated and periods of less than one year have not been annualized. Excludes effect of in-kind transfers. |
| (1) | The Fund commenced operations on September 12, 2016. |
| (2) | The Fund commenced operations on October 25, 2019. |
Amounts designated as “—” are either $0 or have been rounded to $0.
Selected Per Share Data & Ratios
For a Share Outstanding Throughout the Period
| | | Net
Asset Value, Beginning
of Period
($) | | | Net Investment Income (Loss)
($)* | | | Net Realized and Unrealized Gain (Loss) on Investments
($) | | | Total from Operations
($) | | | Distribution from Net Investment Income ($) | | | Distribution from Capital Gains ($) | |
| Global X Autonomous & Electric Vehicles ETF | | | | | | | | | | | | | | | | | | |
| 2021 (Unaudited) | | | 21.75 | | | | 0.08 | | | | 5.87 | | | | 5.95 | | | | (0.02 | ) | | | — | |
| 2020 | | | 14.15 | | | | 0.11 | | | | 7.61 | | | | 7.72 | | | | (0.12 | ) | | | — | |
| 2019 | | | 13.26 | | | | 0.22 | | | | 1.11 | | | | 1.33 | | | | (0.44 | ) | | | — | |
2018(1) | | | 15.00 | | | | 0.11 | | | | (1.85 | ) | | | (1.74 | ) | | | — | | | | — | |
| Global X Cloud Computing ETF | | | | | | | | | | | | | | | | | | | | | | | | |
| 2021 (Unaudited) | | | 25.84 | | | | (0.07 | ) | | | 0.39 | | | | 0.32 | | | | — | | | | — | |
| 2020 | | | 15.99 | | | | (0.11 | ) | | | 9.97 | | | | 9.86 | | | | — | | | | (0.01 | ) |
2019(2) | | | 15.06 | | | | (0.04 | ) | | | 0.97 | | | | 0.93 | | | | — | | | | — | |
| Global X Data Center REITs & Digital Infrastructure ETF | | | | | | | | | | | | | | | | | | | | | | | | |
| 2021 (Unaudited) | | | 14.94 | | | | 0.09 | | | | 1.41 | | | | 1.50 | | | | (0.05 | ) | | | — | |
2020(3) | | | 14.97 | | | | — | | | | (0.03 | ) | | | (0.03 | ) | | | — | | | | — | |
| Global X Cybersecurity ETF | | | | | | | | | | | | | | | | | | | | | | | | |
| 2021 (Unaudited) | | | 22.75 | | | | (0.04 | ) | | | 4.68 | | | | 4.64 | | | | (0.01 | ) | | | (0.01 | ) |
| 2020 | | | 17.14 | | | | 0.09 | | | | 5.67 | | | | 5.76 | | | | (0.13 | ) | | | (0.02 | ) |
2019(4) | | | 15.27 | | | | — | | | | 1.87 | | | | 1.87 | | | | — | | | | — | |
| Total from Distributions ($) | | | Net
Asset Value,
End of
Period ($) | | | Total Return (%)** | | | Net Assets End of Period ($)(000) | | | Ratio of Expenses to Average Net Assets (%) | | | Ratio of Net Investment Income (Loss) to Average Net Assets (%) | | | Portfolio Turnover (%)†† | |
| | | | | | | | | | | | | | | | | | | | |
| | (0.02 | ) | | | 27.68 | | | | 27.37 | | | | 900,379 | | | | 0.68 | † | | | 0.58 | † | | | 9.69 | |
| | (0.12 | ) | | | 21.75 | | | | 54.98 | | | | 135,923 | | | | 0.68 | | | | 0.67 | | | | 13.76 | |
| | (0.44 | ) | | | 14.15 | | | | 10.61 | | | | 14,855 | | | | 0.68 | | | | 1.67 | | | | 31.26 | |
| | — | | | | 13.26 | | | | (11.60 | ) | | | 15,248 | | | | 0.68 | † | | | 1.21 | † | | | 23.57 | |
| | | | | | | | | | | | | | | | | | | | | | | | | | | |
| | — | | | | 26.16 | | | | 1.24 | | | | 1,283,700 | | | | 0.68 | † | | | (0.54 | )† | | | 4.18 | |
| | (0.01 | ) | | | 25.84 | | | | 61.68 | | | | 1,405,489 | | | | 0.68 | | | | (0.53 | ) | | | 23.03 | |
| | — | | | | 15.99 | | | | 6.18 | | | | 472,386 | | | | 0.68 | † | | | (0.44 | )† | | | 12.52 | |
| | | | | | | | | | | | | | | | | | | | | | | | | | | |
| | (0.05 | ) | | | 16.39 | | | | 10.04 | | | | 54,082 | | | | 0.50 | † | | | 1.13 | † | | | 1.34 | |
| | — | | | | 14.94 | | | | (0.20 | ) | | | 3,736 | | | | 0.50 | † | | | 0.26 | † | | | — | |
| | | | | | | | | | | | | | | | | | | | | | | | | | | |
| | (0.02 | ) | | | 27.37 | | | | 20.41 | | | | 357,759 | | | 0.50 | †^ | | | (0.30 | )† | | | 9.50 | |
| | (0.15 | ) | | | 22.75 | | | | 33.78 | | | | 46,634 | | | 0.50 | ^ | | | 0.43 | | | | 21.29 | |
| | — | | | | 17.14 | | | | 12.25 | | | | 1,714 | | | 0.50 | †^ | | | (0.16 | )† | | | 3.57 | |
| * | Per share data calculated using average shares method. |
| ** | Total Return is for the period indicated and has not been annualized. The return shown does not reflect the deduction of taxes that a shareholder would pay on Fund distributions or the redemption of Fund shares. |
| † | Annualized. |
| †† | Portfolio turnover rate is for the period indicated and periods of less than one year have not been annualized. Excludes effect of in-kind transfers. |
| ^ | Effective April 1, 2021, the Fund’s management fees were permanently lowered to 0.50%. Prior to April 1, 2021, the ratio of Expenses to Average Net Assets included the effect of a waiver. If these offsets were excluded, the ratio would have been 0.56%, 0.60% and 0.60% for the period ended May 31, 2021 and years ended November 30, 2020 and November 30, 2019, respectively. |
| (1) | The Fund commenced operations on April 13, 2018. |
| (2) | The Fund commenced operations on April 12, 2019. |
| (3) | The Fund commenced operations on October 27, 2020. |
| (4) | The Fund commenced operations on October 25, 2019. |
Amounts designated as “—” are either $0 or have been rounded to $0.
Selected Per Share Data & Ratios
For a Share Outstanding Throughout the Period
| | | Net
Asset Value, Beginning
of Period
($) | | | Net Investment Income (Loss)
($)* | | | Net Realized and Unrealized Gain (Loss) on Investments
($) | | | Total from Operations
($) | | | Distribution from Net Investment Income ($) | | | Distribution from Capital Gains ($) | |
| Global X Artificial Intelligence & Technology ETF | | | | | | | | | | | | | | | | | | |
| 2021 (Unaudited) | | | 25.84 | | | | 0.04 | | | | 3.07 | | | | 3.11 | | | | (0.05 | ) | | | — | |
| 2020 | | | 17.35 | | | | 0.17 | | | | 8.44 | | | | 8.61 | | | | (0.12 | ) | | | — | |
| 2019 | | | 14.24 | | | | 0.10 | | | | 3.13 | | | | 3.23 | | | | (0.12 | ) | | | — | |
2018(1) | | | 15.00 | | | | 0.05 | | | | (0.81 | ) | | | (0.76 | ) | | | — | | | | — | |
| Global X Millennial Consumer ETF | | | | | | | | | | | | | | | | | | | | | | | | |
| 2021 (Unaudited) | | | 35.23 | | | | — | | | | 6.09 | | | | 6.09 | | | | (0.06 | ) | | | — | |
| 2020 | | | 25.55 | | | | 0.05 | | | | 9.74 | | | | 9.79 | | | | (0.10 | ) | | | (0.01 | ) |
| 2019 | | | 21.57 | | | | 0.10 | | | | 3.99 | | | | 4.09 | | | | (0.10 | ) | | | (0.01 | ) |
| 2018 | | | 19.11 | | | | 0.09 | | | | 2.54 | | | | 2.63 | | | | (0.05 | ) | | | (0.12 | ) |
| 2017 | | | 15.58 | | | | 0.07 | | | | 3.51 | | | | 3.58 | | | | (0.05 | ) | | | — | |
2016(2) | | | 14.95 | | | | 0.05 | | | | 0.58 | | | | 0.63 | | | | — | | | | — | |
| Global X Education ETF | | | | | | | | | | | | | | | | | | | | | | | | |
| 2021 (Unaudited) | | | 17.14 | | | | 0.02 | | | | (2.55 | ) | | | (2.53 | ) | | | — | | | | — | |
2020(3) | | | 15.20 | | | | (0.01 | ) | | | 1.95 | | | | 1.94 | | | | — | | | | — | |
| Global X Cannabis ETF | | | | | | | | | | | | | | | | | | | | | | | | |
| 2021 (Unaudited) | | | 12.05 | | | | 0.14 | | | | 3.27 | | | | 3.41 | | | | (0.15 | ) | | | — | |
| 2020 | | | 15.31 | | | | 0.81 | | | | (3.46 | ) | | | (2.65 | ) | | | (0.61 | ) | | | — | |
2019(4) | | | 24.41 | | | | 0.22 | | | | (9.32 | ) | | | (9.10 | ) | | | — | | | | — | |
| Total from Distributions ($) | | | Net
Asset Value,
End of
Period ($) | | | Total Return (%)** | | | Net Assets End of Period ($)(000) | | | Ratio of Expenses to Average Net Assets (%) | | | Ratio of Net Investment Income (Loss) to Average Net Assets (%) | | | Portfolio Turnover (%)†† | |
| | | | | | | | | | | | | | | | | | | | |
| | (0.05 | ) | | | 28.90 | | | | 12.07 | | | | 205,447 | | | | 0.68 | † | | | 0.29 | † | | | 18.71 | |
| | (0.12 | ) | | | 25.84 | | | | 49.84 | | | | 120,169 | | | | 0.68 | | | | 0.79 | | | | 19.45 | |
| | (0.12 | ) | | | 17.35 | | | | 22.87 | | | | 44,245 | | | | 0.68 | | | | 0.61 | | | | 16.34 | |
| | — | | | | 14.24 | | | | (5.07 | ) | | | 42,001 | | | | 0.68 | † | | | 0.54 | † | | | 7.93 | |
| | | | | | | | | | | | | | | | | | | | | | | | | | | |
| | (0.06 | ) | | | 41.26 | | | | 17.30 | | | | 185,242 | | | | 0.50 | † | | | 0.01 | † | | | 13.27 | |
| | (0.11 | ) | | | 35.23 | | | | 38.47 | | | | 114,511 | | | 0.50 | ^ | | | 0.19 | | | | 7.11 | |
| | (0.11 | ) | | | 25.55 | | | | 19.07 | | | | 75,383 | | | 0.50 | ^ | | | 0.42 | | | | 10.44 | |
| | (0.17 | ) | | | 21.57 | | | | 13.87 | | | | 31,279 | | | 0.50 | ^ | | | 0.40 | | | | 10.94 | |
| | (0.05 | ) | | | 19.11 | | | | 23.05 | | | | 11,467 | | | 0.54 | ^ | | | 0.40 | | | | 20.97 | |
| | — | | | | 15.58 | | | | 4.21 | | | | 3,896 | | | | 0.68 | † | | | 0.59 | † | | | — | |
| | | | | | | | | | | | | | | | | | | | | | | | | | | |
| | — | | | | 14.61 | | | | (14.76 | ) | | | 13,438 | | | | 0.50 | † | | | 0.22 | † | | | 14.64 | |
| | — | | | | 17.14 | | | | 12.76 | | | | 6,856 | | | | 0.51 | † | | | (0.23 | )† | | | 10.62 | |
| | | | | | | | | | | | | | | | | | | | | | | | | | | |
| | (0.15 | ) | | | 15.31 | | | | 28.88 | | | | 205,163 | | | | 0.50 | † | | | 1.79 | † | | | 70.34 | |
| | (0.61 | ) | | | 12.05 | | | | (17.03 | ) | | | 36,160 | | | | 0.51 | | | | 8.11 | | | | 59.79 | |
| | — | | | | 15.31 | | | | (37.28 | ) | | | 4,594 | | | | 0.50 | † | | | 6.19 | † | | | 11.40 | |
| * | Per share data calculated using average shares method. |
| ** | Total Return is for the period indicated and has not been annualized. The return shown does not reflect the deduction of taxes that a shareholder would pay on Fund distributions or the redemption of Fund shares. |
| † | Annualized. |
| †† | Portfolio turnover rate is for the period indicated and periods of less than one year have not been annualized. Excludes effect of in-kind transfers. |
| ^ | Effective April 1, 2020, the Fund’s fees were permanently lowered to 0.50%. Prior to April 1, 2020, the ratio of Expenses to Average Net Assets included the effect of a waiver. If these offsets were excluded, the ratio would have been 0.56%, 0.68%, 0.68% and 0.68%, for the years ended November 30, 2020, 2019, 2018 and 2017, respectively. |
| (1) | The Fund commenced operations on May 11, 2018. |
| (2) | The Fund commenced operations on May 4, 2016. |
| (3) | The Fund commenced operations on July 10, 2020. |
| (4) | The Fund commenced operations on September 17, 2019. |
Selected Per Share Data & Ratios
For a Share Outstanding Throughout the Period
| | | Net
Asset Value, Beginning
of Period
($) | | | Net Investment Income (Loss)
($)* | | | Net Realized and Unrealized Gain (Loss) on Investments
($) | | | Total from Operations
($) | | | Distribution from Net Investment Income ($) | | | Distribution from Capital Gains ($) | |
| Global X Genomics & Biotechnology ETF | | | | | | | | | | | | | | | | | | |
| 2021 (Unaudited) | | | 21.01 | | | | (0.04 | ) | | | 0.58 | | | | 0.54 | | | | — | | | | (0.03 | ) |
| 2020 | | | 15.61 | | | | (0.07 | ) | | | 5.47 | | | | 5.40 | | | | — | | | | — | |
2019(1) | | | 15.28 | | | | (0.05 | ) | | | 0.38 | | | | 0.33 | | | | — | | | | — | |
| Global X China Biotech Innovation ETF | | | | | | | | | | | | | | | | | | | | | | | | |
| 2021 (Unaudited) | | | 14.88 | | | | (0.03 | ) | | | 4.10 | | | | 4.07 | | | | — | | | | — | |
2020(2) | | | 15.09 | | | | (0.02 | ) | | | (0.19 | ) | | | (0.21 | ) | | | — | | | | — | |
| Global X Telemedicine & Digital Health ETF | | | | | | | | | | | | | | | | | | | | | | | | |
| 2021 (Unaudited) | | | 18.41 | | | | (0.05 | ) | | | 0.07 | | | | 0.02 | | | | (0.01 | ) | | | — | |
2020(3) | | | 15.23 | | | | 0.01 | | | | 3.17 | | | | 3.18 | | | | — | | | | — | |
| Global X Aging Population ETF | | | | | | | | | | | | | | | | | | | | | | | | |
| 2021 (Unaudited) | | | 26.82 | | | | 0.05 | | | | 2.37 | | | | 2.42 | | | | (0.05 | ) | | | — | |
| 2020 | | | 23.55 | | | | 0.10 | | | | 3.35 | | | | 3.45 | | | | (0.13 | ) | | | (0.05 | ) |
| 2019 | | | 20.67 | | | | 0.13 | | | | 2.99 | | | | 3.12 | | | | (0.18 | ) | | | (0.06 | ) |
| 2018 | | | 19.60 | | | | 0.13 | | | | 1.14 | | | | 1.27 | | | | (0.09 | ) | | | (0.11 | ) |
| 2017 | | | 15.17 | | | | 0.08 | | | | 4.51 | | | | 4.59 | | | | (0.09 | ) | | | (0.07 | ) |
2016(4) | | | 15.32 | | | | 0.07 | | | | (0.22 | ) | | | (0.15 | ) | | | — | | | | — | |
| Total from Distributions ($) | | | Net
Asset Value,
End of
Period ($) | | | Total Return (%)** | | | Net Assets End of Period ($)(000) | | | Ratio of Expenses to Average Net Assets (%) | | | Ratio of Net Investment Income (Loss) to Average Net Assets (%) | | | Portfolio Turnover (%)†† | |
| | | | | | | | | | | | | | | | | | | | |
| | (0.03 | ) | | | 21.52 | | | | 2.56 | | | | 201,013 | | | | 0.50 | † | | | (0.32 | )† | | | 11.55 | |
| | — | | | | 21.01 | | | | 34.59 | | | | 81,951 | | | | 0.56 | ‡ | | | (0.40 | ) | | | 29.76 | |
| | — | | | | 15.61 | | | | 2.16 | | | | 18,734 | | | | 0.68 | † | | | (0.59 | )† | | | 23.12 | |
| | | | | | | | | | | | | | | | | | | | | | | | | | | |
| | — | | | | 18.95 | | | | 27.35 | | | | 6,632 | | | | 0.66 | † | | | (0.38 | )† | | | 19.55 | |
| | — | | | | 14.88 | | | | (1.39 | ) | | | 2,232 | | | | 0.67 | † | | | (0.65 | )† | | | 10.48 | |
| | | | | | | | | | | | | | | | | | | | | | | | | | | |
| | (0.01 | ) | | | 18.42 | | | | 0.09 | | | | 734,709 | | | | 0.68 | † | | | (0.53 | )† | | | 25.99 | |
| | — | | | | 18.41 | | | | 20.88 | | | | 490,675 | | | | 0.68 | † | | | 0.18 | † | | | 9.67 | |
| | | | | | | | | | | | | | | | | | | | | | | | | | | |
| | (0.05 | ) | | | 29.19 | | | | 9.05 | | | | 44,075 | | | | 0.50 | † | | | 0.39 | † | | | 22.86 | |
| | (0.18 | ) | | | 26.82 | | | | 14.79 | | | | 42,907 | | | 0.50 | ^ | | | 0.43 | | | | 9.10 | |
| | (0.24 | ) | | | 23.55 | | | | 15.38 | | | | 23,548 | | | 0.50 | ^ | | | 0.62 | | | | 14.18 | |
| | (0.20 | ) | | | 20.67 | | | | 6.55 | | | | 15,503 | | | 0.50 | ^ | | | 0.63 | | | | 14.39 | |
| | (0.16 | ) | | | 19.60 | | | | 30.58 | | | | 7,841 | | | 0.52 | ^ | | | 0.44 | | | | 10.20 | |
| | — | | | | 15.17 | | | | (0.98 | ) | | | 1,517 | | | | 0.68 | † | | | 0.78 | † | | | 2.76 | |
| * | Per share data calculated using average shares method. |
| ** | Total Return is for the period indicated and has not been annualized. The return shown does not reflect the deduction of taxes that a shareholder would pay on Fund distributions or the redemption of Fund shares. |
| † | Annualized. |
| †† | Portfolio turnover rate is for the period indicated and periods of less than one year have not been annualized. Excludes effect of in-kind transfers. |
| ‡ | Effective June 15 2020, the Fund’s fees were permanently lowered to 0.50%. |
| ^ | Effective April 1, 2020, the Fund’s fees were permanently lowered to 0.50%. Prior to April 1, 2020, the ratio of Expenses to Average Net Assets included the effect of a waiver. If these offsets were excluded, the ratio would have been 0.55%, 0.68%, 0.68% and 0.68%, for the years ended November 30, 2020, 2019, 2018 and 2017, respectively. |
| (1) | The Fund commenced operations on April 5, 2019. |
| (2) | The Fund commenced operations on September 22, 2020. |
| (3) | The Fund commenced operations on July 29, 2020. |
| (4) | The Fund commenced operations on May 9, 2016. |
Amounts designated as “—” are either $0 or have been rounded to $0.
Selected Per Share Data & Ratios
For a Share Outstanding Throughout the Period
| | | Net
Asset Value, Beginning
of Period
($) | | | Net Investment Income (Loss)
($)* | | | Net Realized and Unrealized Gain (Loss) on Investments
($) | | | Total from Operations
($) | | | Distribution from Net Investment Income ($) | | | Distribution from Capital Gains ($) | |
| Global X Health & Wellness ETF | | | | | | | | | | | | | | | | | | |
| 2021 (Unaudited) | | | 24.11 | | | | 0.09 | | | | 5.22 | | | | 5.31 | | | | (0.10 | ) | | | — | |
| 2020 | | | 21.17 | | | | 0.10 | | | | 2.92 | | | | 3.02 | | | | (0.08 | ) | | | — | |
| 2019 | | | 18.59 | | | | 0.14 | | | | 2.60 | | | | 2.74 | | | | (0.16 | ) | | | — | |
| 2018 | | | 16.75 | | | | 0.14 | | | | 2.18 | | | | 2.32 | | | | (0.15 | ) | | | (0.33 | ) |
| 2017 | | | 14.72 | | | | 0.17 | | | | 1.94 | | | | 2.11 | | | | (0.08 | ) | | | — | |
2016(1) | | | 15.13 | | | | 0.07 | | | | (0.48 | ) | | | (0.41 | ) | | | — | | | | — | |
| Global X CleanTech ETF | | | | | | | | | | | | | | | | | | | | | | | | |
| 2021 (Unaudited) | | | 19.02 | | | | (0.03 | ) | | | 0.27 | | | | 0.24 | | | | *** |
| | | — | |
2020(2) | | | 15.07 | | | | 0.02 | | | | 3.93 | | | | 3.95 | | | | — | | | | — | |
| Global X U.S. Infrastructure Development ETF | | | | | | | | | | | | | | | | | | | | | | | | |
| 2021 (Unaudited) | | | 20.24 | | | | 0.09 | | | | 6.19 | | | | 6.28 | | | | (0.05 | ) | | | — | |
| 2020 | | | 17.43 | | | | 0.16 | | | | 2.74 | | | | 2.90 | | | | (0.09 | ) | | | — | |
| 2019 | | | 15.57 | | | | 0.13 | | | | 1.90 | | | | 2.03 | | | | (0.17 | ) | | | — | |
| 2018 | | | 16.16 | | | | 0.14 | | | | (0.68 | ) | | | (0.54 | ) | | | (0.05 | ) | | | — | |
2017(3) | | | 14.98 | | | | 0.10 | | | | 1.08 | | | | 1.18 | | | | — | | | | — | |
| Global X Clean Water ETF | | | | | | | | | | | | | | | | | | | | | | | | |
2021(4) (Unaudited) | | | 15.04 | | | | 0.05 | | | | 0.82 | | | | 0.87 | | | | — | | | | — | |
| Global X Thematic Growth ETF | | | | | | | | | | | | | | | | | | | | | | | | |
| 2021 (Unaudited) | | | 42.45 | | | | 0.23 | | | | 6.09 | | | | 6.32 | | | | (0.19 | ) | | | — | |
| 2020 | | | 26.50 | | | | 0.10 | | | | 15.96 | | | | 16.06 | | | | (0.11 | ) | | | — | |
2019(5) | | | 25.23 | | | | — | | | | 1.27 | | | | 1.27 | | | | — | | | | — | |
| Total from Distributions ($) | | | Net
Asset Value,
End of
Period ($) | | | Total Return (%)** | | | Net Assets End of Period ($)(000) | | Ratio of Expenses to Average Net Assets (%) | | | Ratio of Net Investment Income (Loss) to Average Net Assets (%) | | | Portfolio Turnover (%)†† | |
| | | | | | | | | | | | | | | | | | | |
| | (0.10 | ) | | | 29.32 | | | | 22.08 | | | | 33,133 | | | | 0.50 | † | | | 0.69 | † | | | 14.53 | |
| | (0.08 | ) | | | 24.11 | | | | 14.34 | | | | 20,496 | | 0.50 | ^ | | | 0.48 | | | | 20.54 | |
| | (0.16 | ) | | | 21.17 | | | | 14.89 | | | | 20,115 | | 0.50 | ^ | | | 0.74 | | | | 18.05 | |
| | (0.48 | ) | | | 18.59 | | | | 14.16 | | | | 10,222 | | 0.50 | ^ | | | 0.77 | | | | 20.93 | |
| | (0.08 | ) | | | 16.75 | | | | 14.38 | | | | 2,512 | | 0.54 | ^ | | | 1.08 | | | | 16.73 | |
| | — | | | | 14.72 | | | | (2.71 | ) | | | 1,472 | | | | 0.68 | † | | | 0.82 | † | | | — | |
| | | | | | | | | | | | | | | | | | | | | | | | | | | |
| | — | | | | 19.26 | | | | 1.28 | | | | 132,894 | | | | 0.50 | † | | | (0.25 | )† | | | 23.75 | |
| | — | | | | 19.02 | | | | 26.21 | | | | 28,523 | | | | 0.50 | † | | | 1.18 | † | | | — | |
| | | | | | | | | | | | | | | | | | | | | | | | | | | |
| | (0.05 | ) | | | 26.47 | | | | 31.12 | | | | 3,695,367 | | | | 0.47 | † | | | 0.74 | † | | | 15.50 | |
| | (0.09 | ) | | | 20.24 | | | | 16.77 | | | | 653,635 | | | | 0.47 | | | | 0.96 | | | | 9.08 | |
| | (0.17 | ) | | | 17.43 | | | | 13.28 | | | | 183,065 | | 0.47 | ^^ | | | 0.81 | | | | 9.18 | |
| | (0.05 | ) | | | 15.57 | | | | (3.36 | ) | | | 140,914 | | 0.47 | ^^ | | | 0.77 | | | | 6.76 | |
| | — | | | | 16.16 | | | | 7.88 | | | | 20,203 | | 0.47 | †^^ | | | 0.91 | † | | | — | |
| | | | | | | | | | | | | | | | | | | | | | | | | | | |
| | — | | | | 15.91 | | | | 5.78 | | | | 3,182 | | | | 0.50 | † | | | 2.15 | † | | | — | |
| | | | | | | | | | | | | | | | | | | | | | | | | | | |
| | (0.19 | ) | | | 48.58 | | | | 14.90 | | | | 101,525 | | | | (0.13 | )†‡ | | | 0.95 | † | | | 17.53 | |
| | (0.11 | ) | | | 42.45 | | | | 60.81 | | | | 36,081 | | | | (0.12 | )‡ | | | 0.29 | | | | 103.23 | |
| | — | | | | 26.50 | | | | 5.03 | | | | 2,650 | | | | (0.15 | )†‡ | | | 0.15 | † | | | — | |
| * | Per share data calculated using average shares method. |
| ** | Total Return is for the period indicated and has not been annualized. The return shown does not reflect the deduction of taxes that a shareholder would pay on Fund distributions or the redemption of Fund shares. |
| *** | Amount is less than $0.005. |
| † | Annualized. |
| †† | Portfolio turnover rate is for the period indicated and periods of less than one year have not been annualized. Excludes effect of in-kind transfers. |
| ‡ | The ratio of Expenses to Average Net Assets includes the effect of a reimbursement of acquired fund fees (See Note 3 in Notes to Financial Statements.) If these offsets and acquired fund fees were excluded, the ratio would have been 0.50%. |
| ^ | Effective April 1, 2020, the Fund’s fees were permanently lowered to 0.50%. Prior to April 1, 2020, the ratio of Expenses to Average Net Assets included the effect of a waiver. If these offsets were excluded, the ratio would have been 0.57%, 0.68%, 0.68% and 0.68%, for the years ended November 30, 2020, 2019, 2018 and 2017, respectively. |
| ^^ | Effective April 1, 2019, the Fund’s fees were permanently lowered to 0.47%. Prior to April 1, 2019, the ratio of Expenses to Average Net Assets included the effect of a waiver. If these offsets were excluded, the ratio would have been 0.50%, 0.58%, and 0.58%, for the years ended November 30, 2019, 2018 and 2017, respectively. |
| (1) | The Fund commenced operations on May 9, 2016. |
| (2) | The Fund commenced operations on October 27, 2020. |
| (3) | The Fund commenced operations on March 6, 2017. |
| (4) | The Fund commenced operations on April 8, 2021. |
| (5) | The Fund commenced operations on October 25, 2019. |
Amounts designated as “—” are either $0 or have been rounded to $0.
| | Notes to Financial Statements (Unaudited) | |
| | May 31, 2021 | |
1. ORGANIZATION
The Global X Funds (the “Trust”) is a Delaware statutory trust formed on March 6, 2008. The Trust is registered under the Investment Company Act of 1940, as amended, as an open-end management investment company. As of May 31, 2021, the Trust had ninety-nine portfolios, eighty-one of which were operational. The financial statements herein and the related notes pertain to the Global X Robotics & Artificial Intelligence ETF, Global X Internet of Things ETF, Global X FinTech ETF, Global X Video Games & Esports ETF, Global X Autonomous & Electric Vehicles ETF, Global X Cloud Computing ETF, Global X Data Center REITs & Digital Infrastructure ETF, Global X Cybersecurity ETF, Global X Artificial Intelligence & Technology ETF, Global X Millennial Consumer ETF, Global X Education ETF, Global X Cannabis ETF, Global X Genomics & Biotechnology ETF, Global X China Biotech Innovation ETF, Global X Telemedicine & Digital Health ETF, Global X Aging Population ETF, Global X Health & Wellness ETF, Global X CleanTech ETF, Global X U.S. Infrastructure Development ETF, Global X Clean Water ETF and Global X Thematic Growth ETF, (each a “Fund” and collectively, the “Funds”). Each Fund, other than the Global X Millennial Consumer ETF, Global X Aging Population ETF, Global X Health & Wellness ETF and Global X U.S. Infrastructure Development ETF, has elected non-diversified status.
Effective April 1, 2021, the Global X Longevity Thematic ETF changed its name to Global X Aging Population ETF, the Global X Millennials Thematic ETF changed its name to Global X Millennial Consumer ETF, and the Global X Health & Wellness Thematic ETF changed its name to Global X Health & Wellness ETF.
2. SIGNIFICANT ACCOUNTING POLICIES
The following is a summary of the significant accounting policies followed by the Funds:
USE OF ESTIMATES — The Funds are investment companies that apply the accounting and reporting guidance issued in Topic 946 by the U.S. Financial Accounting Standards Board. The preparation of financial statements in conformity with U.S. generally accepted accounting principles (“U.S. GAAP”) requires management to make estimates and assumptions that affect the reported amounts of assets and liabilities and disclosure of contingent assets and liabilities at the date of the financial statements and the reported amounts of increases and decreases in net assets from operations during the reporting period. Actual results could materially differ from those estimates.
RETURN OF CAPITAL ESTIMATES – Distributions received by the Funds from underlying Master Limited Partnership (“MLP”) and real estate investment trust (“REIT”) investments generally are comprised of income and return of capital. The Funds record investment income and return of capital based on estimates made at the time such distributions are received. Such estimates are based on historical information available from the MLPs, REITs and other industry sources. These estimates may
| | Notes to Financial Statements (Unaudited) (continued) | |
| | May 31, 2021 | |
2. SIGNIFICANT ACCOUNTING POLICIES (continued)
subsequently be revised based on information received from the MLPs and REITs after their tax reporting periods are concluded.
SECURITY VALUATION — Securities listed on a securities exchange, market or automated quotation system for which quotations are readily available (except for securities traded on the NASDAQ Stock Market (“NASDAQ”), including securities traded over the counter, are valued at the last quoted sale price on the primary exchange or market (foreign or domestic) on which they are traded (or at approximately 4:00 pm Eastern time if a security’s primary exchange is normally open at that time), or, if there is no such reported sale, at the most recent mean between the quoted bid and asked prices, which approximates fair value (absent both bid and asked prices on such exchange, the bid price may be used).
For securities traded on NASDAQ, the NASDAQ official closing price will be used. If available, debt securities are priced based upon valuations provided by independent, third-party pricing agents. Such values generally reflect the last reported sales price if the security is actively traded. The third-party pricing agents may also value debt securities at an evaluated bid price by employing methodologies that utilize actual market transactions, broker-supplied valuations, or other methodologies designed to identify the market value for such securities. Debt obligations with remaining maturities of sixty days or less will be valued at their market value. The prices for foreign securities are reported in local currency and converted to U.S. dollars using currency exchange rates as of reporting date. The exchange rates used by the Trust for valuation are captured as of the New York or London close each day. Prices for most securities held in the Funds are provided daily by recognized independent pricing agents. If a security price cannot be obtained from an independent, third-party pricing agent, the Funds seek to obtain a bid price from at least one independent broker.
Securities for which market prices are not “readily available” are valued in accordance with Fair Value Procedures established by the Board of Trustees (the “Board”). The Funds’ Fair Value Procedures are implemented through a Fair Value Committee (the “Committee”) designated by the Board. Some of the more common reasons that may necessitate that a security be valued using the Fair Value Procedures include: the security’s trading has been halted or suspended; the security has been de-listed from its primary trading exchange; the security’s primary trading market is temporarily closed at a time when, under normal conditions it would be open; the security has not been traded for an extended period of time; the security’s primary pricing source is not able or willing to provide a price; or trading of the security is subject to local government-imposed restrictions. In addition, the Funds may fair value their securities if an event that may materially affect the value of the Funds’ securities that traded outside of the United States (a “Significant Event”) has occurred between the time of the security’s last close and the time that the Funds calculate their net asset values. A Significant Event may relate to a single issuer or to an entire market sector. Events that may be Significant Events include:
| | Notes to Financial Statements (Unaudited) (continued) | |
| | May 31, 2021 | |
2. SIGNIFICANT ACCOUNTING POLICIES (continued)
government actions, natural disasters, armed conflict, acts of terrorism and significant market fluctuations. If Global X Management Company LLC, the Funds’ investment adviser (the “Adviser”), becomes aware of a Significant Event that has occurred with respect to a security or group of securities after the closing of the exchange or market on which the security or securities principally trade, but before the time at which the Funds calculate their net asset values, it may request that a Committee meeting be called. When a security is valued in accordance with the Fair Value Procedures, the Committee will determine the value after taking into consideration all relevant information reasonably available to the Committee. As of May 31, 2021, Global X CleanTech ETF had one fair valued security valued at $4,532,524. There were no other securities priced using the Fair Value Procedures.
In accordance with the authoritative guidance on fair value measurements and disclosure under U.S. GAAP, the Funds disclose the fair value of their investments in a hierarchy that prioritizes the inputs to valuation techniques used to measure the fair value. The objective of a fair value measurement is to determine the price that would be received to sell an asset or paid to transfer a liability in an orderly transaction between market participants at the measurement date (an exit price). Accordingly, the fair value hierarchy gives the highest priority to quoted prices (unadjusted) in active markets for identical assets or liabilities (Level 1) and the lowest priority to unobservable inputs (Level 3). The three levels of the fair value hierarchy are described below:
Level 1 – Unadjusted quoted prices in active markets for identical, unrestricted assets or liabilities that the Funds have the ability to access at the measurement date;
Level 2 – Other significant observable inputs (including quoted prices in non-active markets, quoted prices for similar investments, fair value of investments for which the Funds have the ability to fully redeem tranches at net asset value as of the measurement date or within the near term, and short-term investments valued at amortized cost); and
Level 3 – Significant unobservable inputs (including the Funds’ own assumptions in determining the fair value of investments and fair value of investments for which the Funds do not have the ability to fully redeem tranches at net asset value as of the measurement date or within the near term).
Investments are classified within the level of the lowest significant input considered in determining fair value. Investments classified within Level 3 whose fair value measurement considers several inputs may include Level 1 or Level 2 inputs as components of the overall fair value measurement.
| | Notes to Financial Statements (Unaudited) (continued) | |
| | May 31, 2021 | |
2. SIGNIFICANT ACCOUNTING POLICIES (continued)
For the period ended May 31, 2021 there have been no significant changes to the Funds’ fair valuation methodologies.
The following table summarizes the quantitative inputs and assumptions used for items categorized as material Level 3 investments as of May 31, 2021. The disclosures below also include qualitative information on the sensitivity of the fair value measurements to changes in the significant unobservable inputs.
Global X CleanTech ETF
| Assets | Fair Value at 05/31/21 | Valuation Technique(s) | Unobservable Input | Discount Percentage |
| Common Stock | $4,532,524 | Discount from the Last Traded Price | Last Traded Price Comparability Adjustment % | 13.6% |
The unobservable inputs used to determine fair value of Level 3 assets may have similar or diverging impacts on valuation. Significant increases and decreases in these inputs in isolation and interrelationships between those inputs could result in significantly higher or lower fair value measurement.
REPURCHASE AGREEMENTS – Securities pledged as collateral for repurchase agreements by BNP Paribas are held by Brown Brothers Harriman & Co. (“BBH”), the Funds’ custodian (“custodian”), and are designated as being held on each Fund’s behalf by its custodian under a book-entry system. Each Fund monitors the adequacy of the collateral on a daily basis and can require the seller to provide additional collateral in the event the market value of the securities pledged falls below the carrying value of the repurchase agreement, including accrued interest.
It is the Funds’ policy to only enter into repurchase agreements with banks and other financial institutions which are deemed by the Adviser to be creditworthy. The Funds bear the risk of loss in the event that the other party to a repurchase agreement defaults on its obligations, and the Funds are prevented from exercising their rights to dispose of the underlying securities received as collateral and the risk of a possible decline in the value of the underlying securities during the period. For financial statement purposes, the Funds record the securities lending collateral (included in repurchase agreements, at value or restricted cash) as an asset and the obligation to return securities lending collateral as a liability on the Statements of Assets and Liabilities. Repurchase agreements are entered into by the Funds under Master Repurchase Agreements (“MRA”) which permit the Funds, under certain circumstances, including an event of default (such as bankruptcy or insolvency), to offset payables and/or receivables under an MRA with collateral held and/or posted to the counterparty and create one single net payment due to or from the Funds.
| | Notes to Financial Statements (Unaudited) (continued) | |
| | May 31, 2021 | |
2. SIGNIFICANT ACCOUNTING POLICIES (continued)
At May 31, 2021, the open repurchase agreements by counterparty which are subject to an MRA on a net payment basis are as follows:
| | | Repurchase Agreements | | | Fair Value of Non-cash Collateral Received(1) | | | Cash Collateral Received | | | Net Amount(2) | |
| Global X Robotics & Artificial Intelligence ETF | | | | | | | | | | | | |
| BNP Paribas | | $ | 80,889,413 | | | $ | 80,889,413 | | | $ | − | | | $ | − | |
| Global X Internet of Things ETF | | | | | | | | | | | | | | | | |
| BNP Paribas | | $ | 4,180,906 | | | $ | 4,180,906 | | | $ | − | | | $ | − | |
| Global X FinTech ETF | | | | | | | | | | | | | | | | |
| BNP Paribas | | $ | 21,748,566 | | | $ | 21,748,566 | | | $ | − | | | $ | − | |
| Global X Video Games & Esports ETF | | | | | | | | | | | | | | | | |
| BNP Paribas | | $ | 1,349,169 | | | $ | 1,349,169 | | | $ | − | | | $ | − | |
| Global X Autonomous & Electric Vehicles ETF | | | | | | | | | | | | | | | | |
| BNP Paribas | | $ | 10,195,643 | | | $ | 10,195,643 | | | $ | − | | | $ | − | |
| Global X Cloud Computing ETF | | | | | | | | | | | | | | | | |
| BNP Paribas | | $ | 15,211,675 | | | $ | 15,211,675 | | | $ | − | | | $ | − | |
| Global X Artificial Intelligence & Technology ETF | | | | | | | | | | | | | | | | |
| BNP Paribas | | $ | 599,015 | | | $ | 599,015 | | | $ | − | | | $ | − | |
| Global X Cannabis ETF | | | | | | | | | | | | | | | | |
| BNP Paribas | | $ | 21,078,306 | | | $ | 21,078,306 | | | $ | − | | | $ | − | |
| Global X Genomics & Biotechnology ETF | | | | | | | | | | | | | | | | |
| BNP Paribas | | $ | 3,735,751 | | | $ | 3,735,751 | | | $ | − | | | $ | − | |
| Global X Telemedicine & Digital Health ETF | | | | | | | | | | | | | | | | |
| BNP Paribas | | $ | 14,677,742 | | | $ | 14,677,742 | | | $ | − | | | $ | − | |
| Global X U.S. Infrastructure Development ETF | | | | | | | | | | | | | | | | |
| BNP Paribas | | $ | 10,238,734 | | | $ | 10,238,734 | | | $ | − | | | $ | − | |
| Global X Thematic Growth ETF | | | | | | | | | | | | | | | | |
| BNP Paribas | | $ | 5,657,236 | | | $ | 5,657,236 | | | $ | − | | | $ | − | |
(1) | Excess collateral received is not presented in the table above. Please refer to the Schedules of Investments for the market value of the collateral received for each Fund. |
(2) | Net Amount represents the net amount receivable due from the counterparty in the event of default. |
FEDERAL INCOME TAXES — It is each Fund’s intention to qualify, or continue to qualify, as a regulated investment company for Federal income tax purposes by complying with the appropriate provisions of Subchapter M of the Internal Revenue Code of 1986, as amended. Accordingly, no provisions for federal income taxes have been made in the financial statements except as described below.
The Funds evaluate tax positions taken or expected to be taken in the course of preparing the Funds’ tax returns to determine whether it is “more-likely-than-not” (i.e., greater than 50%) that each tax position will be sustained upon examination by a taxing authority based on the technical merits of the position. Tax positions not deemed to meet the more-likely-than-not threshold are recorded as a tax benefit or expense in the current year. The Funds did not record any tax positions in the current period; however, management’s conclusions regarding tax positions may be subject to review and adjustment at a later date based on factors including, but not limited to, examination by tax authorities (i.e., the last three tax year ends, as applicable), and on-going analysis of and changes to tax
| | Notes to Financial Statements (Unaudited) (continued) | |
| | May 31, 2021 | |
2. SIGNIFICANT ACCOUNTING POLICIES (continued)
laws, and regulations and interpretations thereof. Any foreign tax filings that have not been made will be filed within the prescribed period.
As of and during the period ended May 31, 2021, the Funds did not have a liability for any unrecognized tax benefits. The Funds recognize interest and penalties, if any, related to unrecognized tax benefits as in income tax expense on the Statement of Operations. During the reporting period, the Funds did not incur any interest or penalties. The Funds are also not aware of any tax positions for which it is reasonably possible that the total amounts of unrecognized tax benefits will significantly change in the next 12 months.
SECURITY TRANSACTIONS AND INVESTMENT INCOME — Security transactions are accounted for on the trade date for financial reporting purposes. Costs used in determining realized gains and losses on the sale of investment securities are based on specific identification. Dividend income is recorded on the ex-dividend date. Interest income is recognized on the accrual basis from the settlement date.
DIVIDENDS AND DISTRIBUTIONS TO SHAREHOLDERS — The Funds distribute their net investment income on a pro rata basis. Any net realized capital gains are distributed annually. All distributions are recorded on ex-dividend date.
CASH OVERDRAFT CHARGES – Per the terms of an agreement with BBH, if a Fund has a cash overdraft on a given day, it will be assessed an overdraft charge of LIBOR plus 2.00%. Cash overdraft charges are included in custodian fees on the Statement of Operations.
FOREIGN CURRENCY TRANSACTIONS AND TRANSLATION — The books and records of the Funds are maintained in U.S. dollars. Investment securities and other assets and liabilities denominated in a foreign currency are translated into U.S. dollars on the date of valuation. Purchases and sales of investment securities, income and expenses are translated into U.S. dollars at the relevant rates of exchange prevailing on the respective dates of such transactions. The Funds do not isolate that portion of realized or unrealized gains and losses resulting from changes in the foreign exchange rate from fluctuations arising from changes in the market prices of the securities. These gains and losses are included in net realized and unrealized gains and losses on investments on the Statement of Operations. Net realized and unrealized gains and losses on foreign currency transactions and translations represent net foreign exchange gains or losses from foreign currency spot contracts, disposition of foreign currencies, currency gains or losses realized between trade and settlement dates on securities transactions and the difference between the amount of the investment income and foreign withholding taxes recorded on the Funds’ books and the U.S. dollar equivalent amounts actually received or paid.
| | Notes to Financial Statements (Unaudited) (continued) | |
| | May 31, 2021 | |
2. SIGNIFICANT ACCOUNTING POLICIES (continued)
CREATION UNITS — The Funds issue and redeem their shares (“Shares”) on a continuous basis at net asset value (“NAV”) and only in large blocks of 10,000 Shares, referred to as “Creation Units”. Purchasers of Creation Units (“Authorized Participants”) at NAV must pay a standard creation transaction fee per transaction. The fee is a single charge and will be the same regardless of the number of Creation Units purchased by an Authorized Participant on the same day.
An Authorized Participant who holds Creation Units and wishes to redeem at NAV would also pay a standard redemption fee per transaction to BBH, the Funds’ custodian, on the date of such redemption, regardless of the number of Creation Units redeemed that day.
If a Creation Unit is purchased or redeemed for cash, an additional variable fee may be charged. The following table discloses Creation Unit breakdown:
| | | Creation Unit Shares | | | Creation Fee | | | Value at May 31, 2021 | | | Redemption Fee | |
| Global X Robotics & Artificial Intelligence ETF | | | 10,000 | | | $ | 600 | | | $ | 342,800 | | | $ | 600 | |
| Global X Internet of Things ETF | | | 10,000 | | | | 600 | | | | 346,700 | | | | 600 | |
| Global X FinTech ETF | | | 10,000 | | | | 400 | | | | 451,400 | | | | 400 | |
| Global X Video Games & Esports ETF | | | 10,000 | | | | 600 | | | | 323,600 | | | | 600 | |
| Global X Autonomous & Electric Vehicles ETF | | | 10,000 | | | | 700 | | | | 276,800 | | | | 700 | |
| Global X Cloud Computing ETF | | | 10,000 | | | | 250 | | | | 261,600 | | | | 250 | |
| Global X Data Center REITs & Digital Infrastructure ETF | | | 10,000 | | | | 300 | | | | 163,900 | | | | 300 | |
| Global X Cybersecurity ETF | | | 10,000 | | | | 250 | | | | 273,700 | | | | 250 | |
| Global X Artificial Intelligence & Technology ETF | | | 10,000 | | | | 600 | | | | 289,000 | | | | 600 | |
| Global X Millennial Consumer ETF | | | 10,000 | | | | 300 | | | | 412,600 | | | | 300 | |
| Global X Education ETF | | | 10,000 | | | | 500 | | | | 146,100 | | | | 500 | |
| Global X Cannabis ETF | | | 10,000 | | | | 250 | | | | 153,100 | | | | 250 | |
| Global X Genomics & Biotechnology ETF | | | 10,000 | | | | 250 | | | | 215,200 | | | | 250 | |
| Global X China Biotech Innovation ETF | | | 10,000 | | | | 600 | | | | 189,500 | | | | 600 | |
| Global X Telemedicine & Digital Health ETF | | | 10,000 | | | | 250 | | | | 184,200 | | | | 250 | |
| Global X Aging Population ETF | | | 10,000 | | | | 800 | | | | 291,900 | | | | 800 | |
| Global X Health & Wellness ETF | | | 10,000 | | | | 800 | | | | 293,200 | | | | 800 | |
| Global X CleanTech ETF | | | 10,000 | | | | 600 | | | | 192,600 | | | | 600 | |
| Global X U.S. Infrastructure Development ETF | | | 10,000 | | | | 400 | | | | 264,700 | | | | 400 | |
| Global X Clean Water ETF | | | 10,000 | | | | 500 | | | | 159,100 | | | | 500 | |
| Global X Thematic Growth ETF | | | 10,000 | | | | 250 | | | | 485,700 | | | | 250 | |
| | Notes to Financial Statements (Unaudited) (continued) | |
| | May 31, 2021 | |
3. RELATED PARTY TRANSACTIONS AND SERVICE PROVIDER TRANSACTIONS
On July 2, 2018, the Adviser consummated a transaction pursuant to which it became an indirect, wholly-owned subsidiary of Mirae Asset Global Investments Co., Ltd. (“Mirae”). In this manner, the Adviser is ultimately controlled by Mirae, which is a leading financial services company in Korea and is the headquarters for the Mirae Asset Global Investments Group.
The Adviser serves as the investment adviser and the administrator for the Funds. Subject to the supervision of the Board, the Adviser is responsible for managing the investment activities of the Funds and the Funds’ business affairs and other administrative matters and provides, or causes to be furnished all supervisory, administrative and other services reasonably necessary for the operation of the Funds, including certain distribution services (provided pursuant to a separate distribution services agreement), certain shareholder and distribution-related services (provided pursuant to a separate Rule 12b-1 Plan and related agreements) and investment advisory services (provided pursuant to a separate investment advisory agreement), under what is essentially an “all-in” fee structure. For the Adviser’s services to the Funds, under the Supervision and Administration Agreement, each Fund pays a monthly fee to the Adviser at the annual rate below (stated as a percentage of the average daily net assets of the respective Fund). In addition, the Funds bear other expenses, directly and indirectly, that are not covered by the Supervision and Administration Agreement, which may vary and affect the total expense ratios of the Funds, such as taxes, brokerage fees, commissions, acquired fund fees and expenses, (except for Global X Thematic Growth ETF) and other transaction expenses, interest expenses, and extraordinary expenses (such as litigation and indemnification expenses), respectively.
The Supervision and Administration Agreement for the Global X Thematic Growth ETF provides that the Adviser also bears the costs for acquired fund fees and expenses generated by investments by the Global X Thematic Growth ETF in affiliated investment companies. For the period ended May 31, 2021, the Adviser paid the costs for the acquired fund fees of $244,361.
| | Notes to Financial Statements (Unaudited) (continued) | |
| | May 31, 2021 | |
3. RELATED PARTY TRANSACTIONS AND SERVICE PROVIDER TRANSACTIONS (continued)
The following table discloses the rates of supervision and administration fees paid by the Funds:
| | Supervision and Administration Fee |
| Global X Robotics & Artificial Intelligence ETF | 0.68% |
| Global X Internet of Things ETF | 0.68% |
| Global X FinTech ETF | 0.68% |
| Global X Video Games & Esports ETF | 0.50% |
| Global X Autonomous & Electric Vehicles ETF | 0.68% |
| Global X Cloud Computing ETF | 0.68% |
| Global X Data Center REITs & Digital Infrastructure ETF | 0.50% |
| Global X Cybersecurity ETF*** | 0.50% |
| Global X Artificial Intelligence & Technology ETF | 0.68% |
| Global X Millennial Consumer ETF* | 0.50% |
| Global X Education ETF | 0.50% |
| Global X Cannabis ETF | 0.50% |
| Global X Genomics & Biotechnology ETF | 0.50% |
| Global X China Biotech Innovation ETF | 0.65% |
| Global X Telemedicine & Digital Health ETF | 0.68% |
| Global X Aging Population ETF* | 0.50% |
| Global X Health & Wellness ETF* | 0.50% |
| Global X CleanTech ETF | 0.50% |
| Global X U.S. Infrastructure Development ETF** | 0.47% |
| Global X Clean Water ETF | 0.50% |
| Global X Thematic Growth ETF | 0.50% |
* Pursuant to expense limitation agreements, prior to April 1, 2020, the Adviser contractually agreed to waive or reimburse fees and/or limit fund expenses to the extent necessary to assure that the operating expenses of the Global X Health & Wellness ETF, Global X Aging Population ETF and the Global X Millennial Consumer ETF (the “Funds”) (exclusive of taxes, brokerage fees, commissions, and other transaction expenses, interest, and extraordinary expenses (such as litigation and indemnification expenses)) would not exceed 0.50% of the Funds’ average daily net assets per year until April 1, 2020. Each Fund (at a later date) may reimburse the Adviser for the fees and expenses it waived or reimbursed and/or limited pursuant to the expense limitation agreement during any of the three fiscal years prior to April 1, 2020, provided that, among other things, any reimbursement made to the Adviser does not cause Total Annual Fund Operating Expenses to exceed the maximum permitted rate during the period in which it is paid and the Board has approved such reimbursement to the Adviser. Although the Board voted to permanently reduce each Fund’s management fees to 0.50% and end the expense limitation agreements as of April 1, 2020,
| | Notes to Financial Statements (Unaudited) (continued) | |
| | May 31, 2021 | |
3. RELATED PARTY TRANSACTIONS AND SERVICE PROVIDER TRANSACTIONS (continued)
waived or reimbursed fees prior to April 1, 2020 are still subject to recoupment. As of May 31, 2021, the amounts of waivers/reimbursements subject to recoupment for the Global X Health & Wellness ETF, Global X Aging Population ETF and Global X Millennial Consumer ETF, were $11,634 expiring 2021, $8,496 expiring 2022; $23,346 expiring 2021, $9,461 expiring 2022; $41,063 expiring 2021 and $18,918 expiring 2022, respectively. As of May 31, 2021, there had been no recoupment of previously waived and reimbursed fees.
** Pursuant to an expense limitation agreement between the Global X U.S. Infrastructure Development ETF (the “Fund”) and the Adviser prior to April 1, 2019, the Adviser contractually agreed to reimburse or waive fees and/or limit fund expenses to the extent necessary to assure that the operating expenses of the Fund (exclusive of taxes, brokerage fees, commissions, and other transaction expenses, interest, and extraordinary expenses (such as litigation and indemnification expenses)) (“Total Annual Fund Operating Expenses”) would not exceed 0.47% of the Fund’s average daily net assets per year until April 1, 2019. Pursuant to the expense limitation agreement, the Fund (at a later date) may reimburse the Adviser for the fees it reimbursed or waived and/or limited pursuant to the expense limitation agreement during any of the prior three fiscal years, provided that, among other things, reimbursement to be made to the Adviser does not cause Total Annual Fund Operating Expenses of the Fund to exceed 0.47% during the year in which it is paid and the Board of Trustees has approved such reimbursement to the Adviser. Although the Board voted to permanently reduce the Fund’s fees to 0.47% and end the expense limitation agreement as of April 1, 2019, prior waived or reimbursed fees are still subject to recoupment. As of May 31, 2021, the amounts of waivers/reimbursements subject to recoupment for the Fund were $102,748 expiring in 2021 and $44,734 expiring in 2022. As of May 31, 2021, there had been no recoupment of previously waived and reimbursed fees.
*** Pursuant to an expense limitation agreement between the Global X Cybersecurity ETF (the “Fund”) and the Adviser prior to April 1, 2021, the Adviser contractually agreed to waive or reimburse fees and/or limit fund expenses to the extent necessary to assure that the operating expenses of the Fund (exclusive of taxes, brokerage fees, commissions, and other transaction expenses, interest, and extraordinary expenses (such as litigation and indemnification expenses)) would not exceed 0.50% of the Fund’s average daily net assets per year until April 1, 2021. The Board voted to permanently reduce the Fund’s fees to 0.50% and end the expense limitation agreement as of April 1, 2021.
SEI Investments Global Funds Services (“SEIGFS”) serves as sub-administrator to the Funds. As sub-administrator, SEIGFS provides the Funds with required general administrative services, including, without limitation: office space, equipment, and personnel; clerical and general back office services; bookkeeping, internal accounting and secretarial services; the calculation of NAV; and assistance with the preparation and filing of reports, registration statements, proxy statements and other materials required to be filed or furnished by the Funds under federal and state securities laws. As compensation for these services, SEIGFS receives certain out-of-pocket costs, transaction fees and asset-based fees which are accrued daily and paid monthly by the Adviser. SEI Investments Distribution Co. (“SIDCO”) serves as each Fund’s underwriter and distributor of Creation Units pursuant to a distribution agreement. SIDCO has no
| | Notes to Financial Statements (Unaudited) (continued) | |
| | May 31, 2021 | |
3. RELATED PARTY TRANSACTIONS AND SERVICE PROVIDER TRANSACTIONS (continued)
obligation to sell any specific quantity of Shares. SIDCO bears the following costs and expenses relating to the distribution of Shares: (1) the costs of processing and maintaining records of creations of Creation Units; (2) all costs of maintaining the records required of a registered broker/dealer; (3) the expenses of maintaining its registration or qualification as a dealer or broker under federal or state laws; (4) filing fees; and (5) all other expenses incurred in connection with the distribution services as contemplated in the distribution agreement. SIDCO receives no fee from the Funds for its distribution services under the distribution agreement; rather, the Adviser compensates SIDCO for certain expenses, out-of-pocket costs, and transaction fees.
BBH serves as custodian and transfer agent of the Funds’ assets. As custodian, BBH has agreed to (1) make receipts and disbursements of money on behalf of the Funds, (2) collect and receive all income and other payments and distributions on account of the Funds’ portfolio investments, (3) respond to correspondence from shareholders, security brokers and others relating to its duties; and (4) make periodic reports to the Funds concerning the Funds’ operations. BBH does not exercise any supervisory function over the purchase and sale of securities. As transfer agent, BBH has agreed to (1) issue and redeem Shares of each Fund, (2) make dividend and other distributions to shareholders of each Fund, (3) respond to correspondence by shareholders and others relating to its duties; (4) maintain shareholder accounts, and (5) make periodic reports to the Funds. As compensation for these services, BBH receives certain out-of-pocket costs, transaction fees and asset-based fees which are accrued daily and paid monthly by the Adviser from its fees.
| | Notes to Financial Statements (Unaudited) (continued) | |
| | May 31, 2021 | |
4. INVESTMENT TRANSACTIONS
For the period ended May 31, 2021, the purchases and sales of investments in securities excluding in-kind transactions, long-term U.S. Government, and short-term securities, were:
| 2021 | | Purchases | | | Sales and Maturities | |
| Global X Robotics & Artificial Intelligence ETF | | $ | 19,102,733 | | | $ | 15,152,406 | |
| Global X Internet of Things ETF | | | 26,323,314 | | | | 15,837,008 | |
| Global X FinTech ETF | | | 94,447,269 | | | | 94,701,933 | |
| Global X Video Games & Esports ETF | | | 105,905,100 | | | | 81,259,370 | |
| Global X Autonomous & Electric Vehicles ETF | | | 125,423,004 | | | | 63,328,068 | |
| Global X Cloud Computing ETF | | | 59,686,168 | | | | 63,944,427 | |
| Global X Data Center REITs & Digital Infrastructure ETF | | | 4,236,889 | | | | 312,184 | |
| Global X Cybersecurity ETF | | | 46,006,707 | | | | 43,472,933 | |
| Global X Artificial Intelligence & Technology ETF | | | 45,119,934 | | | | 34,115,506 | |
| Global X Millennial Consumer ETF | | | 20,373,143 | | | | 20,748,739 | |
| Global X Education ETF | | | 2,378,563 | | | | 1,674,500 | |
| Global X Cannabis ETF | | | 94,853,997 | | | | 96,299,113 | |
| Global X Genomics & Biotechnology ETF | | | 19,824,992 | | | | 19,252,140 | |
| Global X China Biotech Innovation ETF | | | 3,764,906 | | | | 893,480 | |
| Global X Telemedicine & Digital Health ETF | | | 202,167,847 | | | | 185,169,832 | |
| Global X Aging Population ETF | | | 10,644,865 | | | | 10,213,716 | |
| Global X Health & Wellness ETF | | | 5,332,712 | | | | 3,783,975 | |
| Global X CleanTech ETF | | | 68,100,244 | | | | 31,135,444 | |
| Global X U.S. Infrastructure Development ETF | | | 292,763,841 | | | | 291,490,057 | |
| Global X Clean Water ETF | | | 361,253 | | | | − | |
| Global X Thematic Growth ETF | | | 13,201,492 | | | | 13,221,835 | |
| | Notes to Financial Statements (Unaudited) (continued) | |
| | May 31, 2021 | |
4. INVESTMENT TRANSACTIONS (continued)
For the period ended May 31, 2021, in-kind transactions associated with creations and redemptions were:
| 2021 | | Purchases | | | Sales | | | Realized Gain/(Loss) | |
| Global X Robotics & Artificial Intelligence ETF | | $ | 392,619,964 | | | $ | 177,876,939 | | | $ | 70,129,308 | |
| Global X Internet of Things ETF | | | 85,879,259 | | | | 5,853,786 | | | | 2,702,825 | |
| Global X FinTech ETF | | | 347,169,575 | | | | 38,134,772 | | | | 16,675,682 | |
| Global X Video Games & Esports ETF | | | 401,395,427 | | | | 289,590,562 | | | | 103,106,099 | |
| Global X Autonomous & Electric Vehicles ETF | | | 747,216,109 | | | | 108,711,660 | | | | 41,490,130 | |
| Global X Cloud Computing ETF | | | 150,903,615 | | | | 286,863,396 | | | | 110,676,498 | |
| Global X Data Center REITs & Digital Infrastructure ETF | | | 44,985,643 | | | | 796,941 | | | | 160,761 | |
| Global X Cybersecurity ETF | | | 893,789,315 | | | | 562,407,775 | | | | 11,784,576 | |
| Global X Artificial Intelligence & Technology ETF | | | 109,367,289 | | | | 50,259,505 | | | | 22,657,588 | |
| Global X Millennial Consumer ETF | | | 99,269,888 | | | | 49,025,262 | | | | 25,487,462 | |
| Global X Education ETF | | | 8,876,876 | | | | − | | | | − | |
| Global X Cannabis ETF | | | 260,299,743 | | | | 49,950,750 | | | | 24,572,961 | |
| Global X Genomics & Biotechnology ETF | | | 164,262,610 | | | | 28,352,255 | | | | 11,618,904 | |
| Global X China Biotech Innovation ETF | | | 630,424 | | | | − | | | | − | |
| Global X Telemedicine & Digital Health ETF | | | 319,004,250 | | | | 69,123,864 | | | | 16,381,038 | |
| Global X Aging Population ETF | | | 16,521,553 | | | | 19,845,490 | | | | 8,006,911 | |
| Global X Health & Wellness ETF | | | 11,952,531 | | | | 6,070,729 | | | | 1,817,874 | |
| Global X CleanTech ETF | | | 129,745,229 | | | | 18,553,541 | | | | 366,316 | |
| Global X U.S. Infrastructure Development ETF | | | 2,666,930,968 | | | | 50,880,495 | | | | 19,521,149 | |
| Global X Clean Water ETF | | | 2,699,720 | | | | − | | | | − | |
| Global X Thematic Growth ETF | | | 102,400,759 | | | | 34,877,748 | | | | 10,769,933 | |
For the period ended May 31, 2021, there were no purchases or sales of long-term U.S. Government securities by the Funds.
| | Notes to Financial Statements (Unaudited) (continued) | |
| | May 31, 2021 | |
4. INVESTMENT TRANSACTIONS (continued)
For the year ended November 30, 2020, in-kind transactions associated with creations and redemptions were:
| 2020 | | Purchases | | | Sales | | | Realized Gain/(Loss) | |
| Global X Robotics & Artificial Intelligence ETF | | $ | 361,874,568 | | | $ | 365,215,738 | | | $ | 43,090,534 | |
| Global X Internet of Things ETF | | | 124,223,802 | | | | 34,531,153 | | | | 18,792,933 | |
| Global X FinTech ETF | | | 278,707,608 | | | | 41,228,494 | | | | 8,267,048 | |
| Global X Video Games & Esports ETF | | | 404,900,530 | | | | 51,302,801 | | | | 14,900,863 | |
| Global X Autonomous & Electric Vehicles ETF | | | 94,454,889 | | | | 3,876,841 | | | | 2,108,375 | |
| Global X Cloud Computing ETF | | | 898,712,110 | | | | 357,026,062 | | | | 151,841,623 | |
| Global X Data Center REITs & Digital Infrastructure ETF | | | 3,494,554 | | | | − | | | | − | |
| Global X Cybersecurity ETF | | | 41,832,394 | | | | 3,133,182 | | | | 1,581,964 | |
| Global X Artificial Intelligence & Technology ETF | | | 59,534,429 | | | | 15,359,452 | | | | 5,699,200 | |
| Global X Millennial Consumer ETF | | | 26,325,170 | | | | 15,069,551 | | | | 2,463,389 | |
| Global X Education ETF | | | 7,065,338 | | | | 1,479,215 | | | | 297,249 | |
| Global X Cannabis ETF | | | 28,284,111 | | | | − | | | | − | |
| Global X Genomics & Biotechnology ETF | | | 56,763,285 | | | | 11,838,830 | | | | 6,006,376 | |
| Global X China Biotech Innovation ETF | | | 381,631 | | | | − | | | | − | |
| Global X Telemedicine & Digital Health ETF | | | 423,596,806 | | | | 19,341,416 | | | | 7,163,396 | |
| Global X Aging Population ETF | | | 17,727,057 | | | | 3,427,727 | | | | 1,538,247 | |
| Global X Health & Wellness ETF | | | 12,677,296 | | | | 14,689,729 | | | | 2,443,155 | |
| Global X CleanTech ETF | | | 19,036,658 | | | | − | | | | − | |
| Global X U.S. Infrastructure Development ETF | | | 481,671,681 | | | | 66,650,851 | | | | (9,164,993 | ) |
| Global X Thematic Growth ETF | | | 44,864,162 | | | | 21,983,043 | | | | 2,875,470 | |
5. TAX INFORMATION
The amount and character of income and capital gain distributions to be paid, if any, are determined in accordance with federal income tax regulations, which may differ from U.S. GAAP. As a result, net investment income (loss) and net realized gain (loss) on investment transactions for a reporting period may differ significantly from distributions during such period. These book/tax differences may be temporary or permanent. To the extent these differences are permanent in nature, they are charged or credited to undistributed net investment income (loss), accumulated net realized gain (loss) or paid-in capital, as appropriate, in the period that the differences arise.
| | Notes to Financial Statements (Unaudited) (continued) | |
| | May 31, 2021 | |
5. TAX INFORMATION (continued)
The tax character of dividends and distributions declared during the years or periods ended November 30, 2020 and November 30, 2019 were as follows:
| Global X Funds | | Ordinary Income | | | Long-Term Capital Gain | | | Return of Capital | | | Totals | |
| Global X Robotics & Artificial Intelligence ETF | | | | | | | | | | | | |
| 2020 | | $ | 5,209,655 | | | $ | – | | | $ | 891,490 | | | $ | 6,101,145 | |
| 2019 | | | 30,149,775 | | | | – | | | | – | | | | 30,149,775 | |
| Global X Internet of Things ETF | | | | | | | | | | | | | | | | |
| 2020 | | $ | 1,147,071 | | | $ | – | | | $ | – | | | $ | 1,147,071 | |
| 2019 | | | 1,268,719 | | | | – | | | | – | | | | 1,268,719 | |
| Global X FinTech ETF | | | | | | | | | | | | | | | | |
| 2020 | | $ | – | | | $ | – | | | $ | – | | | $ | – | |
| 2019 | | | – | | | | 60,368 | | | | 437,339 | | | | 497,707 | |
| Global X Video Games & Esports ETF | | | | | | | | | | | | | | | | |
| 2020 | | $ | 67,560 | | | $ | – | | | $ | – | | | $ | 67,560 | |
| 2019 | | | – | | | | – | | | | – | | | | – | |
| Global X Autonomous & Electric Vehicles ETF | | | | | | | | | | | | | | | | |
| 2020 | | $ | 148,067 | | | $ | – | | | $ | – | | | $ | 148,067 | |
| 2019 | | | 415,562 | | | | – | | | | – | | | | 415,562 | |
| Global X Cloud Computing ETF | | | | | | | | | | | | | | | | |
| 2020 | | $ | 158,369 | | | $ | 57,631 | | | $ | – | | | $ | 216,000 | |
| 2019 | | | – | | | | – | | | | – | | | | – | |
| Global X Data Center REITs & Digital Infrastructure ETF | | | | | | | | | | | | | | | | |
| 2020 | | $ | – | | | $ | – | | | $ | – | | | $ | – | |
| Global X Cybersecurity ETF | | | | | | | | | | | | | | | | |
| 2020 | | $ | 130,636 | | | $ | – | | | $ | – | | | $ | 130,636 | |
| 2019 | | | – | | | | – | | | | – | | | | – | |
| Global X Artificial Intelligence & Technology ETF | | | | | | | | | | | | | | | | |
| 2020 | | $ | 293,815 | | | $ | – | | | $ | – | | | $ | 293,815 | |
| 2019 | | | 298,087 | | | | – | | | | – | | | | 298,087 | |
| Global X Millennial Consumer ETF | | | | | | | | | | | | | | | | |
| 2020 | | $ | 295,120 | | | $ | 31,340 | | | $ | – | | | $ | 326,460 | |
| 2019 | | | 147,679 | | | | 27,133 | | | | – | | | | 174,812 | |
| Global X Education ETF | | | | | | | | | | | | | | | | |
| 2020 | | $ | – | | | $ | – | | | $ | – | | | $ | – | |
| Global X Cannabis ETF | | | | | | | | | | | | | | | | |
| 2020 | | $ | 501,916 | | | $ | – | | | $ | – | | | $ | 501,916 | |
| 2019 | | | – | | | | – | | | | – | | | | – | |
| Global X Genomics & Biotechnology ETF | | | | | | | | | | | | | | | | |
| 2020 | | $ | – | | | $ | – | | | $ | – | | | $ | – | |
| 2019 | | | – | | | | – | | | | – | | | | – | |
| | Notes to Financial Statements (Unaudited) (continued) | |
| | May 31, 2021 | |
5. TAX INFORMATION (continued)
| Global X Funds | | Ordinary Income | | | Long-Term Capital Gain | | | Return of Capital | | | Totals | |
| Global X China Biotech Innovation ETF | | | | | | | | | | | | |
| 2020 | | $ | – | | | $ | – | | | $ | – | | | $ | – | |
| Global X Telemedicine & Digital Health ETF | | | | | | | | | | | | | | | | |
| 2020 | | $ | – | | | $ | – | | | $ | – | | | $ | – | |
| Global X Aging Population ETF | | | | | | | | | | | | | | | | |
| 2020 | | $ | 161,566 | | | $ | 45,724 | | | $ | – | | | $ | 207,290 | |
| 2019 | | | 146,505 | | | | 38,656 | | | | – | | | | 185,161 | |
| Global X Health & Wellness ETF | | | | | | | | | | | | | | | | |
| 2020 | | $ | 95,104 | | | $ | – | | | $ | – | | | $ | 95,104 | |
| 2019 | | | 120,454 | | | | – | | | | – | | | | 120,454 | |
| Global X CleanTech ETF | | | | | | | | | | | | | | | | |
| 2020 | | $ | – | | | $ | – | | | $ | – | | | $ | – | |
| Global X U.S. Infrastructure Development ETF | | | | | | | | | | | | | | | | |
| 2020 | | $ | 1,004,004 | | | $ | – | | | $ | – | | | $ | 1,004,004 | |
| 2019 | | | 1,424,719 | | | | – | | | | – | | | | 1,424,719 | |
| Global X Thematic Growth ETF | | | | | | | | | | | | | | | | |
| 2020 | | $ | 16,854 | | | $ | – | | | $ | – | | | $ | 16,854 | |
| 2019 | | | – | | | | – | | | | – | | | | – | |
As of November 30, 2020, the components of tax basis distributable earnings (accumulated losses) were as follows:
| | | Global X Funds | |
| | | Global X Robotics & Artificial Intelligence ETF | | | Global X Internet of Things ETF | | | Global X FinTech ETF | |
| Undistributed Ordinary Income | | $ | – | | | $ | 573,082 | | | $ | – | |
| Capital Loss Carryforwards | | | (153,940,794 | ) | | | (3,531,785 | ) | | | (32,354,648 | ) |
| Unrealized Appreciation on Investments and Foreign Currency | | | 434,515,422 | | | | 59,877,129 | | | | 278,703,976 | |
| Late Year Loss Deferral | | | – | | | | – | | | | (1,681,347 | ) |
| Other Temporary Differences | | | – | | | | (4 | ) | | | 2 | |
| Total Distributable Earnings | | $ | 280,574,628 | | | $ | 56,918,422 | | | $ | 244,667,983 | |
| | Notes to Financial Statements (Unaudited) (continued) | |
| | May 31, 2021 | |
5. TAX INFORMATION (continued)
| | | Global X Funds | |
| | | Global X Video Games & Esports ETF | | | Global X Autonomous & Electric Vehicles ETF | | | Global X Cloud Computing ETF | |
| Undistributed Ordinary Income | | $ | 3,746,903 | | | $ | 111,443 | | | $ | – | |
| Post October Losses | | | (307,637 | ) | | | – | | | | – | |
| Capital Loss Carryforwards | | | – | | | | (1,044,455 | ) | | | (1,533,536 | ) |
| Unrealized Appreciation on Investments and Foreign Currency | | | 65,915,322 | | | | 19,930,690 | | | | 248,081,412 | |
| Late Year Loss Deferral | | | – | | | | – | | | | (3,928,473 | ) |
| Other Temporary Differences | | | (1 | ) | | | 1 | | | | – | |
| Total Distributable Earnings | | $ | 69,354,587 | | | $ | 18,997,679 | | | $ | 242,619,403 | |
| | | Global X Funds | |
| | | Global X Data Center REITs & Digital Infrastructure ETF | | | Global X Cybersecurity ETF | | | Global X Artificial Intelligence & Technology ETF | |
| Undistributed Ordinary Income | | $ | 668 | | | $ | 87,400 | | | $ | 284,523 | |
| Undistributed Long-Term Capital Gain | | | – | | | | 2,479 | | | | – | |
| Capital Loss Carryforwards | | | – | | | | – | | | | (618,443 | ) |
| Unrealized Appreciation (Depreciation) on Investments and Foreign Currency | | | (8,833 | ) | | | 4,466,305 | | | | 23,544,099 | |
| Other Temporary Differences | | | – | | | | 3 | | | | (1 | ) |
| Total Distributable Earnings (Accumulated Losses) | | $ | (8,165 | ) | | $ | 4,556,187 | | | $ | 23,210,178 | |
| | | Global X Funds | |
| | | Global X Millennial Consumer ETF | | | Global X Education ETF | | | Global X Cannabis ETF | |
| Undistributed Ordinary Income | | $ | 96,149 | | | $ | – | | | $ | 444,914 | |
| Post October Losses | | | – | | | | (215,826 | ) | | | – | |
| Capital Loss Carryforwards | | | (910,515 | ) | | | – | | | | (1,760,034 | ) |
| Unrealized Appreciation on Investments and Foreign Currency | | | 27,867,859 | | | | 446,036 | | | | 3,359,995 | |
| Late Year Loss Deferral | | | – | | | | (4,505 | ) | | | – | |
| Other Temporary Differences | | | 1 | | | | – | | | | (1 | ) |
| Total Distributable Earnings | | $ | 27,053,494 | | | $ | 225,705 | | | $ | 2,044,874 | |
| | Notes to Financial Statements (Unaudited) (continued) | |
| | May 31, 2021 | |
5. TAX INFORMATION (continued)
| | | Global X Funds | |
| | | Global X Genomics & Biotechnology ETF | | | Global X China Biotech Innovation ETF | | | Global X Telemedicine & Digital Health ETF | |
| Undistributed Ordinary Income | | $ | 157,142 | | | $ | – | | | $ | 193,304 | |
| Post October Losses | | | (32,560 | ) | | | (554 | ) | | | (1,378,964 | ) |
| Unrealized Appreciation (Depreciation) on Investments and Foreign Currency | | | 12,953,072 | | | | (62,743 | ) | | | 53,383,660 | |
| Late Year Loss Deferral | | | – | | | | (2,324 | ) | | | – | |
| Other Temporary Differences | | | 2 | | | | – | | | | – | |
| Total Distributable Earnings (Accumulated Losses) | | $ | 13,077,656 | | | $ | (65,621 | ) | | $ | 52,198,000 | |
| | | Global X Funds | |
| | | Global X Aging Population ETF | | | Global X Health & Wellness ETF | | | Global X CleanTech ETF | |
| Undistributed Ordinary Income | | $ | 78,341 | | | $ | 51,423 | | | $ | 7,906 | |
| Capital Loss Carryforwards | | | (279,357 | ) | | | (273,446 | ) | | | – | |
| Unrealized Appreciation on Investments and Foreign Currency | | | 6,473,677 | | | | 1,294,711 | | | | 2,447,006 | |
| Total Distributable Earnings | | $ | 6,272,661 | | | $ | 1,072,688 | | | $ | 2,454,912 | |
| | | Global X Funds | |
| | | Global X U.S. Infrastructure Development ETF | | | Global X Clean Water ETF | | | Global X Thematic Growth ETF | |
| Undistributed Ordinary Income | | $ | 1,554,592 | | | $ | – | | | $ | 16,592 | |
| Capital Loss Carryforwards | | | – | | | | – | | | | (117,716 | ) |
| Unrealized Appreciation on Investments and Foreign Currency | | | 66,887,584 | | | | – | | | | 4,908,265 | |
| Other Temporary Differences | | | 1 | | | | – | | | | (2 | ) |
| Total Distributable Earnings | | $ | 68,442,177 | | | $ | – | | | $ | 4,807,139 | |
Qualified late year ordinary and Post-October capital losses (including currency and specified gain/loss items) represent losses realized from January 1, 2020 through November 30, 2020 and November 1, 2020 through November 30, 2020, respectively, that in accordance with federal income tax regulations, the Funds have elected to defer and treat as having arisen in the following fiscal year.
| | Notes to Financial Statements (Unaudited) (continued) | |
| | May 31, 2021 | |
5. TAX INFORMATION (continued)
For taxable years beginning after December 22, 2010, a registered investment company (“RIC”) is permitted to carry forward net capital losses to offset capital gains realized in later years, and the losses carried forward retain their original character as either long-term or short-term losses. Losses carried forward under these provisions are as follows:
| Global X Funds | | Short-Term Loss | | | Long-Term Loss | | | Total | |
| Global X Robotics & Artificial Intelligence ETF | | $ | 88,408,676 | | | $ | 65,532,118 | | | $ | 153,940,794 | |
| Global X Internet of Things ETF | | | 2,416,287 | | | | 1,115,498 | | | | 3,531,785 | |
| Global X FinTech ETF | | | 10,983,240 | | | | 21,371,408 | | | | 32,354,648 | |
| Global X Autonomous & Electric Vehicles ETF | | | 625,088 | | | | 419,367 | | | | 1,044,455 | |
| Global X Cloud Computing ETF | | | 1,533,536 | | | | − | | | | 1,533,536 | |
| Global X Artificial Intelligence & Technology ETF | | | 461,246 | | | | 157,197 | | | | 618,443 | |
| Global X Millennial Consumer ETF | | | 883,232 | | | | 27,283 | | | | 910,515 | |
| Global X Cannabis ETF | | | 1,613,335 | | | | 146,699 | | | | 1,760,034 | |
| Global X Aging Population ETF | | | 77,714 | | | | 201,643 | | | | 279,357 | |
| Global X Health & Wellness ETF | | | 174,997 | | | | 98,449 | | | | 273,446 | |
| Global X Thematic Growth ETF | | | 117,716 | | | | − | | | | 117,716 | |
During the year ended November 30, 2020 the following funds utilized capital loss carryforwards to offset capital gains amounting to:
| Global X Funds | | Short-Term Loss | | | Long-Term Loss | | | Total | |
| Global X Robotics & Artificial Intelligence ETF | | $ | 15,634,206 | | | $ | − | | | $ | 15,634,206 | |
| Global X Autonomous & Electric Vehicles ETF | | | 99,333 | | | | − | | | | 99,333 | |
| Global X Artificial Intelligence & Technology ETF | | | 35,523.00 | | | | − | | | | 35,523 | |
| Global X U.S. Infrastructure Development ETF | | | 515,103 | | | | − | | | | 515,103 | |
| | Notes to Financial Statements (Unaudited) (continued) | |
| | May 31, 2021 | |
5. TAX INFORMATION (continued)
The Federal tax cost and aggregate gross unrealized appreciation and depreciation on investments held by the Funds at May 31, 2021, were as follows:
| Global X Funds | | Federal Tax Cost | | | Aggregated Gross Unrealized Appreciation | | | Aggregated Gross Unrealized Depreciation | | | Net Unrealized Appreciation (Depreciation) | |
| Global X Robotics & Artificial Intelligence ETF | | $ | 2,166,618,553 | | | $ | 642,754,180 | | | $ | (112,825,440 | ) | | $ | 529,928,740 | |
| Global X Internet of Things ETF | | | 340,427,889 | | | | 106,990,768 | | | | (2,028,138 | ) | | | 104,962,630 | |
| Global X FinTech ETF | | | 959,143,910 | | | | 328,476,762 | | | | (27,729,961 | ) | | | 300,746,801 | |
| Global X Video Games & Esports ETF | | | 652,200,469 | | | | 54,159,854 | | | | (34,785,081 | ) | | | 19,374,773 | |
| Global X Autonomous & Electric Vehicles ETF | | | 874,095,247 | | | | 96,013,960 | | | | (50,317,065 | ) | | | 45,696,895 | |
| Global X Cloud Computing ETF | | | 1,147,516,665 | | | | 195,122,378 | | | | (28,845,375 | ) | | | 166,277,003 | |
| Global X Data Center REITs & Digital Infrastructure ETF | | | 51,999,205 | | | | 3,102,787 | | | | (1,127,517 | ) | | | 1,975,270 | |
| Global X Cybersecurity ETF | | | 383,605,863 | | | | 13,611,474 | | | | (39,323,650 | ) | | | (25,712,176 | ) |
| Global X Artificial Intelligence & Technology ETF | | | 189,592,892 | | | | 22,700,390 | | | | (5,905,264 | ) | | | 16,795,126 | |
| Global X Millennial Consumer ETF | | | 161,399,846 | | | | 25,680,424 | | | | (1,963,015 | ) | | | 23,717,409 | |
| Global X Education ETF | | | 15,753,282 | | | | 846,181 | | | | (3,240,605 | ) | | | (2,394,424 | ) |
| Global X Cannabis ETF | | | 262,226,588 | | | | 13,376,856 | | | | (27,330,565 | ) | | | (13,953,709 | ) |
| Global X Genomics & Biotechnology ETF | | | 216,226,205 | | | | 15,516,260 | | | | (23,185,913 | ) | | | (7,669,653 | ) |
| Global X China Biotech Innovation ETF | | | 5,768,522 | | | | 982,229 | | | | (131,473 | ) | | | 850,756 | |
| Global X Telemedicine & Digital Health ETF | | | 744,350,849 | | | | 75,505,574 | | | | (56,101,724 | ) | | | 19,403,850 | |
| Global X Aging Population ETF | | | 40,617,608 | | | | 4,486,024 | | | | (1,152,315 | ) | | | 3,333,709 | |
| Global X Health & Wellness ETF | | | 28,170,100 | | | | 5,746,214 | | | | (842,615 | ) | | | 4,903,599 | |
| Global X CleanTech ETF | | | 163,811,172 | | | | 1,294,559 | | | | (31,806,155 | ) | | | (30,511,596 | ) |
| Global X U.S. Infrastructure Development ETF | | | 3,223,059,821 | | | | 494,846,011 | | | | (8,041,693 | ) | | | 486,804,318 | |
| Global X Clean Water ETF | | | 3,060,973 | | | | 141,517 | | | | (30,172 | ) | | | 111,345 | |
| Global X Thematic Growth ETF | | | 117,673,716 | | | | 417,553 | | | | (5,154,374 | ) | | | (4,736,821 | ) |
The difference between book-basis and tax-basis unrealized appreciation (depreciation) is due to differences in the timing of recognition of gains and losses on investments for tax and book purposes. The Funds’ net unrealized appreciation difference is attributable primarily to wash sales, mark-to-market treatment of passive foreign investment companies and partnership adjustments.
The Funds invest in securities of foreign issuers in various countries. These investments may involve certain considerations and risks not typically associated with investments in the United States as a result of, among other factors, the possibility of future political and economic developments and the level of governmental supervision and regulation of securities markets in the respective countries.
| | Notes to Financial Statements (Unaudited) (continued) | |
| | May 31, 2021 | |
6. CONCENTRATION OF RISKS
The Funds may invest in companies focused on business activities in emerging economic themes. Such thematic companies typically face intense competition and potentially rapid product obsolescence. Thematic companies may have limited product lines, markets, financial resources or personnel. These companies typically engage in significant amounts of spending on research and development, capital expenditures and mergers and acquisitions, and there is no guarantee that the products or services produced by these companies will be successful. These companies are also frequently dependent on intellectual property rights and may be adversely affected by loss or impairment of those rights. There can be no assurance these companies will be able to successfully protect their intellectual property to prevent the misappropriation of their technology, or that competitors will not develop technology that is substantially similar or superior to such companies’ technology. Such companies may be potential targets for cyberattacks, which can have a materially adverse impact on the performance of these companies. The emergent nature of many economic themes could result in increasing regulatory scrutiny in the future, which may impede the growth of companies that develop and/or focus on such economic themes. Similarly, the collection of data from consumers and other sources is frequently a critical component in emerging economic themes and could face increased scrutiny as regulators consider how the data is collected, stored, safeguarded and used. Finally, these companies may be involved in young, fast evolving industries with increased exposure to the risks associated with changes in applicable laws (including regulation, other rule changes, and related federal and state enforcement activities), as well as market developments, which may cause businesses to contract or close suddenly and negatively impact the value of these companies.
The Funds may be subject to taxes imposed by countries in which they invest. Such taxes are generally based on either income or gains earned or repatriated. The Funds accrue and apply such taxes to net investment income, net realized gains and net unrealized gains as income and/or capital gains are earned. The Funds use a replication strategy. A replication strategy is an indexing strategy that involves investing in the securities of the underlying index in approximately the same proportions as in the underlying index.
The Funds may utilize a representative sampling strategy with respect to their underlying indices when a replication strategy might be detrimental to their shareholders, such as when there are practical difficulties or substantial costs involved in compiling a portfolio of equity securities to follow its underlying index, or, in certain instances, when securities in the underlying index become temporarily illiquid, unavailable or less liquid, or due to legal restrictions (such as diversification requirements that apply to the Funds but not to the underlying indexes). Commodity related securities are susceptible to fluctuations in certain commodity markets. Any negative changes in commodity markets could have a substantial impact on these Funds.
A more complete description of risks is included in each Fund’s Prospectus and Statement of Additional Information.
| | Notes to Financial Statements (Unaudited) (continued) | |
| | May 31, 2021 | |
7. LOANS OF PORTFOLIO SECURITIES
The Funds may lend portfolio securities having a market value up to one-third of the Funds’ total assets. Security loans made pursuant to a securities lending agreement with BBH are initially required to be secured by collateral equal to at least 102% for U.S.-based securities and 105% for foreign-based securities. Such collateral will be cash or securities issued or guaranteed by the U.S. Government or any agencies. Cash collateral received in connection with these loans can be invested in repurchase agreements, short-term investments, or U.S. Treasury obligations and is accounted for in the Schedules of Investments and Statements of Assets and Liabilities. The obligation to return securities lending collateral is also recognized as a liability in the Statements of Assets and Liabilities. It is the Funds’ policy to obtain additional collateral from or return excess collateral to the borrower by the end of the next business day, following the valuation date of the securities loaned. Therefore, the value of the collateral held may be temporarily less than the value of the securities on loan.
Lending securities entails a risk of loss to the Funds if and to the extent that the market values of the securities loaned were to increase and the borrower did not increase the collateral accordingly and the borrower failed to return the securities. The Funds could also experience delays and costs gaining access to the collateral. The Funds bear the risk of any deficiency in the amount of the collateral available for return to the borrower due to any loss on the collateral invested.
As of May 31, 2021, the value of securities on loan was $156,929,711, $8,025,312, $41,722,700, $2,640,318, $20,442,006, $29,791,047, $1,212,639, $44,029,214, $7,336,461, $29,099,220, $20,268,144 and $11,266,638 for the Global X Robotics and Artificial Intelligence ETF, Global X Internet of Things ETF, Global X FinTech ETF, Global X Video Games & Esports ETF, Global X Autonomous & Electric Vehicles ETF, Global X Cloud Computing ETF, Global X Artificial Intelligence & Technology ETF, Global X Cannabis ETF, Global X Genomics & Biotechnology ETF, Global X Telemedicine & Digital Health ETF, Global X U.S. Infrastructure Development ETF and Global X Thematic Growth ETF, respectively, and the cash collateral received from securities on loan was $165,200,614, $8,538,672, $44,417,141, $2,755,410, $20,822,583, $31,066,835, $1,223,369, $43,050,310, $7,629,532, $29,976,383, $20,910,587 and $11,553,784, for the Global X Robotics and Artificial Intelligence ETF, Global X Internet of Things ETF, Global X FinTech ETF, Global X Video Games & Esports ETF, Global X Autonomous & Electric Vehicles ETF, Global X Cloud Computing ETF, Global X Artificial Intelligence & Technology ETF, Global X Cannabis ETF, Global X Genomics & Biotechnology ETF, Global X Telemedicine & Digital Health ETF, Global X U.S. Infrastructure Development ETF and Global X Thematic Growth ETF respectively.
| | Notes to Financial Statements (Unaudited) (continued) | |
| | May 31, 2021 | |
7. LOANS OF PORTFOLIO SECURITIES (continued)
| | | Market Value | | | Cash Collateral | |
| Global X Robotics & Artificial Intelligence ETF | | | | | | |
| Barclays Bank | | $ | 591,407 | | | $ | 622,800 | |
| BofA Securities | | | 28,824,686 | | | | 30,487,240 | |
| Citigroup | | | 47,170,721 | | | | 49,648,500 | |
| Credit Suisse | | | 1,855,967 | | | | 1,953,626 | |
| Goldman Sachs & Co. | | | 6,471,804 | | | | 6,811,134 | |
| JPMorgan | | | 28,813,415 | | | | 29,461,143 | |
| Morgan Stanley | | | 38,916,686 | | | | 40,961,605 | |
| Natl Financial Services Corp | | | 601,264 | | | | 634,400 | |
| Scotia Capital | | | 8,871 | | | | 9,342 | |
| UBS AG London Branch | | | 3,674,890 | | | | 4,610,824 | |
| Global X Internet of Things ETF | | | | | | | | |
| BofA Securities | | | 1,555,815 | | | | 1,639,900 | |
| Credit Suisse | | | 1,662,840 | | | | 1,752,709 | |
| Goldman Sachs & Co. | | | 4,806,657 | | | | 5,146,063 | |
| Global X FinTech ETF | | | | | | | | |
| BofA Securities | | | 12,315,833 | | | | 12,918,996 | |
| Citigroup | | | 147,346 | | | | 1,042,942 | |
| Goldman Sachs & Co. | | | 6,190,864 | | | | 6,471,240 | |
| JPMorgan | | | 2,285,338 | | | | 2,405,060 | |
| Morgan Stanley | | | 16,679,577 | | | | 17,308,995 | |
| Scotia Capital | | | 582,051 | | | | 615,323 | |
| UBS AG London Branch | | | 3,521,691 | | | | 3,654,585 | |
| Global X Video Games & Esports ETF | | | | | | | | |
| BofA Securities | | | 952,835 | | | | 1,061,100 | |
| Citigroup | | | 80,004 | | | | 80,527 | (1) |
| Goldman Sachs & Co. | | | 1,607,479 | | | | 1,613,783 | (1) |
| Global X Autonomous & Electric Vehicles ETF | | | | | | | | |
| Barclays Bank | | | 619,056 | | | | 629,700 | |
| BofA Securities | | | 3,922,358 | | | | 3,981,810 | |
| Citigroup | | | 9,086,310 | | | | 9,265,421 | |
| Credit Suisse | | | 2,943,429 | | | | 2,985,578 | (1) |
| Goldman Sachs & Co. | | | 926,261 | | | | 953,197 | |
| JPMorgan | | | 456,831 | | | | 472,850 | |
| Natl Financial Services Corp | | | 984,036 | | | | 1,008,836 | |
| Scotia Capital | | | 312,444 | | | | 322,080 | |
| UBS AG London Branch | | | 1,191,281 | | | | 1,203,111 | (1) |
| Global X Cloud Computing ETF | | | | | | | | |
| Citigroup | | | 585,156 | | | | 610,080 | |
| HSBC | | | 7,314,450 | | | | 7,626,000 | |
| JPMorgan | | | 6,488,625 | | | | 6,771,875 | |
| Morgan Stanley | | | 15,402,816 | | | | 16,058,880 | |
| | Notes to Financial Statements (Unaudited) (continued) | |
| | May 31, 2021 | |
7. LOANS OF PORTFOLIO SECURITIES (continued)
| | | Market Value | | | Cash Collateral | |
| Global X Artificial Intelligence & Technology ETF | | | | | | |
| Citigroup | | $ | 1,073,199 | | | $ | 1,065,669 | (1) |
| JPMorgan | | | 139,440 | | | | 157,700 | |
| Global X Cannabis ETF | | | | | | | | |
| Barclays Bank | | | 4,831,868 | | | | 4,738,695 | (1) |
| BNP Paribas Securities Corp. | | | 1,378,609 | | | | 1,451,385 | |
| Citigroup | | | 1,404,032 | | | | 1,344,685 | (1) |
| Credit Suisse | | | 1,563,185 | | | | 1,705,520 | |
| Goldman Sachs & Co. | | | 6,531,397 | | | | 6,320,800 | (1) |
| JPMorgan | | | 6,041,189 | | | | 5,904,402 | (1) |
| Morgan Stanley | | | 8,230,794 | | | | 8,055,212 | (1) |
| Scotia Capital | | | 8,012,390 | | | | 7,703,870 | (1) |
| UBS AG London Branch | | | 5,383,700 | | | | 5,208,116 | (1) |
| UBS Securities LLC | | | 652,050 | | | | 617,625 | (1) |
| Global X Genomics & Biotechnology ETF | | | | | | | | |
| BNP Paribas Securities Corp. | | | 199,280 | | | | 210,675 | |
| BofA Securities | | | 4,180,662 | | | | 4,330,214 | |
| Citigroup | | | 117,525 | | | | 118,125 | (1) |
| Goldman Sachs & Co. | | | 2,838,994 | | | | 2,970,518 | |
| Global X Telemedicine & Digital Health ETF | | | | | | | | |
| BofA Securities | | | 15,011,146 | | | | 15,510,540 | |
| Citigroup | | | 1,122,519 | | | | 1,143,622 | |
| Credit Suisse | | | 1,235,341 | | | | 1,242,725 | (1) |
| Goldman Sachs & Co. | | | 11,453,670 | | | | 11,764,680 | |
| UBS AG London Branch | | | 276,544 | | | | 314,816 | |
| Global X U.S. Infrastructure Development ETF | | | | | | | | |
| BofA Securities | | | 20,120,000 | | | | 20,750,000 | |
| HSBC | | | 148,144 | | | | 160,587 | |
| Global X Thematic Growth ETF | | | | | | | | |
| BofA Securities | | | 2,031,300 | | | | 2,070,000 | |
| Citigroup | | | 4,656,480 | | | | 4,743,700 | |
| Credit Suisse | | | 753,838 | | | | 768,200 | |
| Goldman Sachs & Co. | | | 3,343,676 | | | | 3,405,716 | |
| UBS AG London Branch | | | 481,344 | | | | 566,168 | |
| (1) | It is the Funds’ policy to obtain additional collateral from or return excess collateral to the borrower by the end of the next business day, following the valuation date of the securities loaned. Therefore, the value of the collateral held may be temporarily less than the value of the securities on loan. |
| | Notes to Financial Statements (Unaudited) (concluded) | |
| | May 31, 2021 | |
8. CONTRACTUAL OBLIGATIONS
The Funds enter into contracts in the normal course of business that contain a variety of indemnifications. The Funds’ maximum exposure under these arrangements is unknown. However, the Funds have not had prior gains or losses pursuant to these contracts. Management has reviewed the Funds’ existing contracts and expects the risk of loss to be remote.
Pursuant to the Trust’s organizational documents, the Trustees of the Trust and the Trust’s officers are indemnified against certain liabilities that may arise out of the performance of their duties.
9. SUBSEQUENT EVENTS
The Funds have been evaluated regarding the need for additional disclosures and/or adjustments resulting from subsequent events. Based on this evaluation, no additional adjustments were required to the financial statements.
10. OTHER MATTER
The rapid and global spread of a highly contagious novel coronavirus respiratory disease, designated COVID-19, has resulted in extreme volatility in the financial markets and severe losses; reduced liquidity of many instruments; restrictions on international and, in some cases, local travel; significant disruptions to business operations (including business closures); strained healthcare systems; disruptions to supply chains, consumer demand and employee availability; and widespread uncertainty regarding the duration and long-term effects of this pandemic. Some sectors of the economy and individual issuers have experienced particularly large losses. In addition, the COVID-19 pandemic may result in a sustained economic downturn or a global recession, domestic and foreign political and social instability, damage to diplomatic and international trade relations and increased volatility and/or decreased liquidity in the securities markets. The COVID-19 pandemic could adversely affect the value and liquidity of the Funds’ investments and negatively impact Fund performance. In addition, the outbreak of COVID-19, and measures taken to mitigate its effects, could result in disruptions to the services provided to the Funds by their service providers.
| | Disclosure of Fund Expenses (unaudited) | |
| | | |
All exchange traded funds (“ETFs”) have operating expenses. As a shareholder of an ETF, your investment is affected by these ongoing costs, which include (among others) costs for ETF management, administrative services, commissions, and shareholder reports like this one. It is important for you to understand the impact of these costs on your investment returns. In addition, a shareholder is responsible for brokerage fees as a result of their investment in the Fund.
Operating expenses such as these are deducted from an ETF’s gross income and directly reduce its final investment return. These expenses are expressed as a percentage of the ETF’s average net assets; this percentage is known as the ETF’s expense ratio.
The following examples use the expense ratio and are intended to help you understand the ongoing costs (in dollars) of investing in your Fund and to compare these costs with those of other funds. The examples are based on an investment of $1,000 made at the beginning of the period shown and held for the entire period (December 1, 2020 to May 31, 2021).
The table on the next page illustrates your Fund’s costs in two ways:
Actual Fund Return. This section helps you to estimate the actual expenses that your Fund incurred over the period. The “Expenses Paid During Period” column shows the actual dollar expense cost incurred by a $1,000 investment in the Fund, and the “Ending Account Value” number is derived from deducting that expense cost from the Fund’s gross investment return.
You can use this information, together with the actual amount you invested in the Funds, to estimate the expenses you paid over that period. Simply divide your actual account value by $1,000 to arrive at a ratio (for example, an $8,600 account value divided by $1,000 = 8.6), then multiply that ratio by the number shown for your Funds under “Expenses Paid During Period.”
Hypothetical 5% Return. This section helps you compare your Fund’s costs with those of other funds. It assumes that the Funds had an annual 5% return before expenses during the year, but that the expense ratio (Column 3) for the period is unchanged. This example is useful in making comparisons because the Securities and Exchange Commission requires all funds to make this 5% calculation. You can assess your Fund’s comparative cost by comparing the hypothetical result for your Fund in the “Expenses Paid During Period” column with those that appear in the same charts in the shareholder reports for other funds.
NOTE: Because the return is set at 5% for comparison purposes — NOT your Fund’s actual return — the account values shown may not apply to your specific investment.
| | Disclosure of Fund Expenses (unaudited) (continued) | |
| | | |
| | | Beginning Account Value 12/1/2020 | | | Ending Account Value 5/31/2021 | | | Annualized Expense Ratios | | | Expenses Paid During Period(1) | |
| Global X Robotics & Artificial Intelligence ETF | | | | | | | | | | | | |
| Actual Fund Return | | $ | 1,000.00 | | | $ | 1,078.70 | | | | 0.68 | % | | $ | 3.52 | |
| Hypothetical 5% Return | | | 1,000.00 | | | | 1,021.54 | | | | 0.68 | | | | 3.43 | |
| | | | | | | | | | | | | | | | | |
| Global X Internet of Things ETF | | | | | | | | | | | | | | | | |
| Actual Fund Return | | $ | 1,000.00 | | | $ | 1,159.90 | | | | 0.68 | % | | $ | 3.66 | |
| Hypothetical 5% Return | | | 1,000.00 | | | | 1,021.54 | | | | 0.68 | | | | 3.43 | |
| | | | | | | | | | | | | | | | | |
| Global X FinTech ETF | | | | | | | | | | | | | | | | |
| Actual Fund Return | | $ | 1,000.00 | | | $ | 1,056.10 | | | | 0.68 | % | | $ | 3.49 | |
| Hypothetical 5% Return | | | 1,000.00 | | | | 1,021.54 | | | | 0.68 | | | | 3.43 | |
| | | | | | | | | | | | | | | | | |
| Global X Video Games & Esports ETF | | | | | | | | | | | | | | | | |
| Actual Fund Return | | $ | 1,000.00 | | | $ | 1,140.20 | | | | 0.50 | % | | $ | 2.67 | |
| Hypothetical 5% Return | | | 1,000.00 | | | | 1,022.44 | | | | 0.50 | | | | 2.52 | |
| | | | | | | | | | | | | | | | | |
| Global X Autonomous & Electric Vehicles ETF | | | | | | | | | | | | | | | | |
| Actual Fund Return | | $ | 1,000.00 | | | $ | 1,273.70 | | | | 0.68 | % | | $ | 3.85 | |
| Hypothetical 5% Return | | | 1,000.00 | | | | 1,021.54 | | | | 0.68 | | | | 3.43 | |
| | | | | | | | | | | | | | | | | |
| Global X Cloud Computing ETF | | | | | | | | | | | | | | | | |
| Actual Fund Return | | $ | 1,000.00 | | | $ | 1,012.40 | | | | 0.68 | % | | $ | 3.41 | |
| Hypothetical 5% Return | | | 1,000.00 | | | | 1,021.54 | | | | 0.68 | | | | 3.43 | |
| | | | | | | | | | | | | | | | | |
| Global X Data Center REITs & Digital Infrastructure ETF | | | | | | | | | | | | | | | | |
| Actual Fund Return | | $ | 1,000.00 | | | $ | 1,100.40 | | | | 0.50 | % | | $ | 2.62 | |
| Hypothetical 5% Return | | | 1,000.00 | | | | 1,022.44 | | | | 0.50 | | | | 2.52 | |
| | | | | | | | | | | | | | | | | |
| Global X Cybersecurity ETF | | | | | | | | | | | | | | | | |
| Actual Fund Return | | $ | 1,000.00 | | | $ | 1,204.10 | | | | 0.50 | % | | $ | 2.75 | |
| Hypothetical 5% Return | | | 1,000.00 | | | | 1,022.44 | | | | 0.50 | | | | 2.52 | |
| | | | | | | | | | | | | | | | | |
| Global X Artificial Intelligence & Technology ETF | | | | | | | | | | | | | | | | |
| Actual Fund Return | | $ | 1,000.00 | | | $ | 1,120.70 | | | | 0.68 | % | | $ | 3.60 | |
| Hypothetical 5% Return | | | 1,000.00 | | | | 1,021.54 | | | | 0.68 | | | | 3.43 | |
| | | | | | | | | | | | | | | | | |
| Global X Millennial Consumer ETF | | | | | | | | | | | | | | | | |
| Actual Fund Return | | $ | 1,000.00 | | | $ | 1,173.00 | | | | 0.50 | % | | $ | 2.71 | |
| Hypothetical 5% Return | | | 1,000.00 | | | | 1,022.44 | | | | 0.50 | | | | 2.52 | |
| | | | | | | | | | | | | | | | | |
| Global X Education ETF | | | | | | | | | | | | | | | | |
| Actual Fund Return | | $ | 1,000.00 | | | $ | 852.40 | | | | 0.50 | % | | $ | 2.31 | |
| Hypothetical 5% Return | | | 1,000.00 | | | | 1,022.44 | | | | 0.50 | | | | 2.52 | |
| | Disclosure of Fund Expenses (unaudited) (concluded) | |
| | | |
| | | Beginning Account Value 12/1/2020 | | | Ending Account Value 5/31/2021 | | | Annualized Expense Ratios | | | Expenses Paid During Period(1) | |
| Global X Cannabis ETF | | | | | | | | | | | | |
| Actual Fund Return | | $ | 1,000.00 | | | $ | 1,288.80 | | | | 0.50 | % | | $ | 2.85 | |
| Hypothetical 5% Return | | | 1,000.00 | | | | 1,022.44 | | | | 0.50 | | | | 2.52 | |
| | | | | | | | | | | | | | | | | |
| Global X Genomics & Biotechnology ETF | | | | | | | | | | | | | | | | |
| Actual Fund Return | | $ | 1,000.00 | | | $ | 1,025.60 | | | | 0.50 | % | | $ | 2.53 | |
| Hypothetical 5% Return | | | 1,000.00 | | | | 1,022.44 | | | | 0.50 | | | | 2.52 | |
| | | | | | | | | | | | | | | | | |
| Global X China Biotech Innovation ETF | | | | | | | | | | | | | | | | |
| Actual Fund Return | | $ | 1,000.00 | | | $ | 1,273.50 | | | | 0.66 | % | | $ | 3.74 | |
| Hypothetical 5% Return | | | 1,000.00 | | | | 1,021.64 | | | | 0.66 | | | | 3.33 | |
| | | | | | | | | | | | | | | | | |
| Global X Telemedicine & Digital Health ETF | | | | | | | | | | | | | | | | |
| Actual Fund Return | | $ | 1,000.00 | | | $ | 1,000.90 | | | | 0.68 | % | | $ | 3.39 | |
| Hypothetical 5% Return | | | 1,000.00 | | | | 1,021.54 | | | | 0.68 | | | | 3.43 | |
| | | | | | | | | | | | | | | | | |
| Global X Aging Population ETF | | | | | | | | | | | | | | | | |
| Actual Fund Return | | $ | 1,000.00 | | | $ | 1,090.50 | | | | 0.50 | % | | $ | 2.61 | |
| Hypothetical 5% Return | | | 1,000.00 | | | | 1,022.44 | | | | 0.50 | | | | 2.52 | |
| | | | | | | | | | | | | | | | | |
| Global X Health & Wellness ETF | | | | | | | | | | | | | | | | |
| Actual Fund Return | | $ | 1,000.00 | | | $ | 1,220.80 | | | | 0.50 | % | | $ | 2.77 | |
| Hypothetical 5% Return | | | 1,000.00 | | | | 1,022.44 | | | | 0.50 | | | | 2.52 | |
| | | | | | | | | | | | | | | | | |
| Global X CleanTech ETF | | | | | | | | | | | | | | | | |
| Actual Fund Return | | $ | 1,000.00 | | | $ | 1,012.80 | | | | 0.50 | % | | $ | 2.51 | |
| Hypothetical 5% Return | | | 1,000.00 | | | | 1,022.44 | | | | 0.50 | | | | 2.52 | |
| | | | | | | | | | | | | | | | | |
| Global X U.S. Infrastructure Development ETF | | | | | | | | | | | | | | | | |
| Actual Fund Return | | $ | 1,000.00 | | | $ | 1,311.20 | | | | 0.47 | % | | $ | 2.71 | |
| Hypothetical 5% Return | | | 1,000.00 | | | | 1,022.59 | | | | 0.47 | | | | 2.37 | |
| | | | | | | | | | | | | | | | | |
| Global X Clean Water ETF* | | | | | | | | | | | | | | | | |
| Actual Fund Return | | $ | 1,000.00 | | | $ | 1,057.80 | | | | 0.50 | % | | $ | 0.75 | (2) |
| Hypothetical 5% Return | | | 1,000.00 | | | | 1,022.44 | | | | 0.50 | | | | 2.52 | |
| | | | | | | | | | | | | | | | | |
| Global X Thematic Growth ETF | | | | | | | | | | | | | | | | |
| Actual Fund Return | | $ | 1,000.00 | | | $ | 1,149.30 | | | | 0.00 | % | | $ | 0.00 | |
| Hypothetical 5% Return | | | 1,000.00 | | | | 1,024.23 | | | | 0.00 | | | | 0.00 | |
| (1) | Expenses are equal to the Fund’s annualized expense ratio multiplied by the average account value over the period, multiplied by 182/365 (to reflect the one-half year period). |
| (2) | Expenses are equal to the Fund’s annualized expense ratio multiplied by the average account
value over the period, multiplied by 53/365 (to reflect the period from inception to date). |
| * | The Fund commenced operations on April 8, 2021. |
| | Liquidity Risk Management Program (Unaudited) | |
| | May 31, 2021 | |
Pursuant to Rule 22e-4 under the 1940 Act, the Funds’ investment adviser has adopted, and the Board has approved, a liquidity risk management program (the “Program”) to govern the Funds’ approach to managing liquidity risk. The Program is overseen by the Funds’ Liquidity Risk Management Committee (the “Committee”), and the Program’s principal objectives include assessing, managing and periodically reviewing each Fund’s liquidity risk, based on factors specific to the circumstances of the Funds.
At a meeting of the Board held on May 21, 2021, the Trustees received a report from the Committee addressing the operations of the Program and assessing its adequacy and effectiveness of implementation for the period from January 1, 2020 through December 31, 2020. The Committee’s report noted that the Committee had determined that the Program is reasonably designed to assess and manage each Fund’s Liquidity Risk and operated adequately and effectively to manage each Fund’s Liquidity Risk for the period covered by the report. The Committee’s report noted that during the period covered by the report, there were no liquidity events that impacted the Funds or their ability to timely meet redemptions without dilution to existing shareholders. The Committee’s report further noted that no material changes have been made to the Program since its implementation.
There can be no assurance that the Program will achieve its objectives in the future. Please refer to the prospectus for more information regarding a Fund’s exposure to liquidity risk and other principal risks to which an investment in the Funds may be subject.
| | Approval of Investment Advisory Agreement (Unaudited) | |
| | May 31, 2021 | |
Section 15(c) of the Investment Company Act of 1940, as amended (“1940 Act”), requires that the board of trustees of an exchange-traded fund (“ETF”), including a majority of those trustees who are not “interested persons” of the ETF, as defined in the 1940 Act (“Independent Trustees”), consider on an initial basis and periodically thereafter (as required by the 1940 Act), at an in person meeting called for such purpose, the terms of each ETF’s investment advisory agreement and whether to approve entering into, or renewing, each agreement.
At a Board meeting of the Global X Funds (the “Trust”) held by videoconference on February 26, 20211 (the “New Fund Board Meeting”), the Board of Trustees (the “Board”) (including the Trust’s Independent Trustees, voting separately) considered and unanimously approved (i) the initial Investment Advisory Agreement (the “New Investment Advisory Agreement”) for the Global X Clean Water ETF (the “New Fund”) and (ii) the initial Supervision and Administration Agreement between the Trust (the “New Supervision and Administration Agreement”), on behalf of the New Fund, and Global X Management. The New Advisory Agreement and New Supervision and Administration Agreement are referred to collectively as the “New Fund Agreements.”
In advance of the Board meeting, the Board (including the Trust’s Independent Trustees) and the Independent Trustees’ independent legal counsel requested (in writing) detailed information from Global X Management in connection with the Board’s consideration of the New Fund Agreements and received and reviewed written responses from Global X Management and supporting materials relating to those requests for information. In the course of their consideration of the New Fund Agreements, the Trust’s Independent Trustees were advised by their independent legal counsel and, in addition to meetings with management of Global X Management, the Independent Trustees met separately in executive sessions with their counsel.
1 | This meeting was held via videoconference in reliance on an exemptive order issued by the Securities and Exchange Commission on March 25, 2020. Reliance on the exemptive order is necessary and appropriate due to circumstances related to current or potential effects of COVID-19. All Trustees participating in the telephonic meeting were able to hear each other simultaneously during the meeting. Reliance on the exemptive order requires Trustees, including a majority of the Independent Trustees, to ratify actions taken pursuant to the exemptive order by vote cast at the next in-person meeting. |
| | Approval of Investment Advisory Agreement (Unaudited) (continued) | |
| | May 31, 2021 | |
NEW FUND AGREEMENTS
In determining to approve the New Fund Agreements for the New Fund, the Board considered a variety of factors, including the factors discussed in greater detail below.
Nature, Extent and Quality of Services
With respect to this factor, the Board considered:
• the terms of the New Fund Agreements and the range of services proposed to be provided to the New Fund in accordance with the New Fund Agreements;
• Global X Management’s key personnel and the portfolio managers who would provide investment advisory, supervision and administrative services to the New Fund;
• Global X Management’s responsibilities under the New Fund Agreements to, among other things, (i) manage the investment operations of the New Fund and the composition of the New Fund’s assets, including the purchase, retention and disposition of its holdings, (ii) provide quarterly reports to the Trust’s officers and the Board and other reports as the Board deems necessary or appropriate, (iii) vote proxies, exercise consents, and exercise all other rights appertaining to securities and assets held by the New Fund, (iv) select broker-dealers to execute portfolio transactions for the New Fund when necessary, (v) assist in the preparation and filing of reports and proxy statements (if any) to the shareholders of the New Fund, and the periodic updating of the registration statements, prospectuses, statements of additional information, and other reports and documents for the New Fund that are required to be filed by the Trust with the U.S. Securities and Exchange Commission (“SEC”) and other regulatory or governmental bodies, and (vi) monitor anticipated purchases and redemptions of the shares (including Creation Units) of the New Fund by shareholders and new investors;
• the nature, extent and quality of all of the services (including advisory, administrative and compliance services) that are proposed to be provided by Global X Management or made available to the New Fund; and
• the quality of Global X Management’s resources and personnel that would be made available to the New Fund, including Global X Management’s experience and the professional qualifications of Global X Management’s key personnel.
Based on these considerations, the Board concluded, at the New Fund Board Meeting, that it was satisfied with the nature, extent and quality of the services proposed to be provided to the New Fund by Global X Management.
| | Approval of Investment Advisory Agreement (Unaudited) (continued) | |
| | May 31, 2021 | |
Performance
The Board determined that, because the New Fund had not yet begun investment operations as of the dates of the New Fund Board Meeting, meaningful data relating to the investment performance of the New Fund was not available and, therefore, could not be a factor in approving the New Fund Agreements.
Cost of Services and Profitability
With respect to this factor, the Board considered:
• Global X Management’s expected costs to provide investment management, supervision and administrative and related services to the New Fund;
• The management fee (including the proposed investment advisory fee) (“Management Fee”) that was proposed to be borne by the New Fund under the New Fund Agreement for the various investment advisory, supervisory and administrative services that the New Fund requires under a unitary fee structure (including the types of fees and expenses that are not included within the unitary fee and would be borne by the New Fund); and
• the expected profitability to Global X Management, if any, from all of the services proposed to be provided to the New Fund by Global X Management and all aspects of the relationship between Global X Management and the New Fund.
Based on these considerations, the Board concluded that the proposed Management Fee to be paid by the New Fund to Global X Management, in light of the nature, extent and quality of the services to be provided, was reasonable and in the best interests of the New Fund’s shareholders.
Comparison of Fees and Services
With respect to this factor, the Board considered:
• comparative information with respect to the proposed Management Fee to be paid to Global X Management by the New Fund. In connection with this consideration, Global X Management provided the Board with comparative expense data for the New Fund, including fees and expenses paid by unaffiliated similar specialized and/or focused ETFs, and/or other similar registered funds. The Board considered Global X Management’s detailed explanation of the proposed fee structure of the New Fund that was above the average or median for the New Fund’s peer group;
• the structure of the proposed unitary Management Fee (which includes as one component the proposed investment advisory fee for the New Fund) and the expected total expense ratio for the New Fund. In this regard, the Board took into consideration
| | Approval of Investment Advisory Agreement (Unaudited) (continued) | |
| | May 31, 2021 | |
that the purpose of adopting a unitary Management Fee structure for the New Fund was to create a simple, all-inclusive fee that would provide a level of predictability with respect to the overall expense ratio (i.e., the total fee) of the New Fund and that the proposed Management Fee for the New Fund was set at a competitive level to make the New Fund viable in the marketplace; and
• that, under the proposed unified Management Fee structure, Global X Management would be responsible for most ordinary expenses of the New Fund, including the costs of various third-party services required by the New Fund, including investment advisory, administrative, audit, certain custody, portfolio accounting, legal, transfer agency and printing costs, but that the New Fund would bear other expenses not covered under the proposed all-inclusive Management Fee, such as taxes, brokerage fees, commissions, and other transaction expenses, interest expenses, and extraordinary expenses.
Based on these considerations, the Board concluded, at the New Fund Board Meeting, that the services to be received and the fees to be charged under the New Fund Agreements were reasonable on a comparative basis.
Economies of Scale
With respect to this factor, the Board considered:
• the extent to which economies of scale would be realized as the New Fund grows and whether the proposed unitary Management Fee for the New Fund reflected these economies of scale;
• the significant investment of time, personnel and other resources that Global X Management intends to make in the New Fund in order to seek to assure that the New Fund is attractive to investors; and
• that the proposed unitary Management Fee would provide a high level of certainty as to the total level of expenses for the New Fund and its shareholders.
Based on these considerations, the Board concluded, at the New Fund Board Meeting, that the proposed unitary Management Fee for the New Fund appropriately addressed economies of scale.
Other Benefits
In considering each New Fund Agreement, in addition to the factors discussed above, the Board considered other benefits that may be realized by Global X Management as a result of its relationships with the New Fund. As a result, the Board concluded that, in the case
| | Approval of Investment Advisory Agreement (Unaudited) (concluded) | |
| | May 31, 2021 | |
of the New Fund, in the exercise of the Board’s business judgement, all information the Board considered supported approval of the New Fund Agreements.
Conclusion
After full consideration of the factors above, as well as other factors that were instructive in their consideration, the Board, including all of the Trust’s Independent Trustees voting separately, concluded, in the exercise of its business judgement, that the New Fund Agreements were fair and reasonable and in the best interest of the New Fund.
In reaching this decision, the Board did not assign relative weights to the factors above nor did the Board deem any one factor or group of them to be controlling in and of themselves. Each member of the Board may have assigned different weights to the various factors.
| | Supplemental Information (unaudited) | |
| | | |
Net asset value, or “NAV”, is the price per Share at which a Fund issues and redeems Shares. It is calculated in accordance with the standard formula for valuing mutual fund shares. The “Market Price” of a Fund generally is determined using the midpoint between the highest bid and the lowest offer on the stock exchange on which the Shares of the Fund are listed for trading, as of the time that the Fund’s NAV is calculated. The Fund’s Market Price may be at, above or below its NAV. The NAV of a Fund will fluctuate with changes in the market value of the Fund’s holdings. The Market Price of a Fund will fluctuate in accordance with changes in its NAV, as well as market supply and demand.
Premiums or discounts are the differences (expressed as a percentage) between the NAV and Market Price of a Fund on a given day, generally at the time NAV is calculated. A premium is the amount that a Fund is trading above the reported NAV, expressed as a percentage of the NAV. A discount is the amount that a Fund is trading below the reported NAV, expressed as a percentage of the NAV.
Further information regarding premiums and discounts is available on the Funds’ website at www.globalxetfs.com.
605 3rd Avenue, 43rd Floor
New York, NY 10158
1-888-493-8631
www.globalxetfs.com
Investment Adviser and Administrator:
Global X Management Company LLC
605 3rd Avenue, 43rd Floor
New York, NY 10158
Distributor:
SEI Investments Distribution Co.
One Freedom Valley Drive
Oaks, PA 19456
Sub-Administrator:
SEI Investments Global Funds Services
One Freedom Valley Drive
Oaks, PA 19456
Counsel for Global X Funds and the Independent Trustees:
Stradley Ronon Stevens & Young, LLP
2000 K Street, N.W.
Suite 700
Washington, DC 20006
Custodian and Transfer Agent:
Brown Brothers Harriman & Co.
50 Post Office Square
Boston, MA 02110
Independent Registered Public Accounting Firm:
PricewaterhouseCoopers LLP
Two Commerce Square
Suite 1800
2001 Market Street
Philadelphia, PA 19103
This information must be preceded or accompanied by a current prospectus for the Funds described.
GLX-SA-007-0600